Pharmaceuticals in the Baltic Sea Region - Ymparisto.fi
345
County Administrative Board of Östergötland (CAB) in collaboration with Latvian Institute of Aquatic Ecology (LIAE), Institute of Environmental Protection - National Research Institute (IOS, Poland), Finnish Environment Institute (SYKE), Latvian Environment, Geology and Meteorology Centre (LEGMC), Estonian Waterworks Association (EVEL), Berlin Center for Competence of Water (KWB) and Estonian Environmental Research Centre and Finnish medicines agency (EERC). Pharmaceuticals in the Baltic Sea Region – emissions, consumption and environmental risks
-
Upload
khangminh22 -
Category
Documents
-
view
1 -
download
0
Transcript of Pharmaceuticals in the Baltic Sea Region - Ymparisto.fi

County Administrative Board of Östergötland (CAB) in collaboration with Latvian Institute of Aquatic Ecology (LIAE),
Institute of Environmental Protection - National Research Institute (IOS, Poland), Finnish Environment Institute (SYKE),
Latvian Environment, Geology and Meteorology Centre (LEGMC), Estonian Waterworks Association (EVEL), Berlin Center
for Competence of Water (KWB) and Estonian Environmental Research Centre and Finnish medicines agency (EERC).
Pharmaceuticals in the Baltic Sea Region – emissions, consumption and environmental risks

Pharmaceuticals in the Baltic Sea Region – emissions, consumption and
environmental risks
2020:28
Författare Helene Ek Henning, Ieva Putna-Nīmane, Radoslaw Kalinowski,
Noora Perkola, Aleksandra Bogusz, Anete Kublina, Egge Haiba,
Ieva Bārda, Ieva Karkovska, Jan Schütz, Jukka Mehtonen, Katri
Siimes, Kristina Nyhlén, Laura Dzintare, Lauri Äystö, Lauris
Siņics, Mailis Laht, Mari Lehtonen, Michael Stapf, Pernilla Stridh,
Rita Poikāne, Sabina Hoppe, Terhi Lehtinen, Vallo Kõrgma,
Ville Junttila och Ülle Leisk.
Kontaktperson Helene Ek Henning, Länsstyrelsen Östergötland
Foto Eva Siljeholm, Länsstyrelsen Östergötland
ISBN 978-91-985918-8-0
Upplaga Enbart digital upplaga
© Länsstyrelsen Östergötland 2020
Länsstyrelsen Östergötland
Östgötagatan 3, 581 86 Linköping
Växel: 010-223 50 00
E-post: [email protected]
Lansstyrelsen.se/ostergotland
1
Preface
Pharmaceutical residues are widespread in the environment. Some active
pharmaceutical ingredients (APIs) are present at levels that may negatively affect
organisms in surface water, sediment and soil. This report highlights results from
the three year-project Clear Waters from Pharmaceuticals (CWPharma) funded by
the EU’s Interreg Baltic Sea Region Programme. The overall aim of the project was
to decrease the emissions and adverse effects of pharmaceuticals in the Baltic Sea
region. The County Administrative Board of Östergötland participated in the
project together with other authorities, researchers and wastewater organisations
from seven Baltic Sea countries. The project was divided into four work packages
focusing on (1) emissions, consumption and environmental risks of APIs, (2)
advanced wastewater treatment, (3) low-tech risk reduction measures of APIs, and
(4) scenarios, conclusions and action plans.
The County Administrative Board of Östergötland coordinated the work of
mapping the emissions, consumption and environmental risks of about 80 active
pharmaceutical ingredients (APIs) in the Baltic Sea region. Sampling was
performed in selected river basin districts in Sweden, Finland, Estonia, Latvia,
Germany and Poland. Environmental samples were collected from lakes, streams,
coastal waters and agricultural land. We also analyzed emissions of APIs from
municipal wastewater treatment plants, hospitals, pharmaceutical manufacturing
facilities, landfills, and fish and livestock farms. In Sweden, sampling was carried
out within the Motala ström catchment area, from Lake Vättern to Bråviken
Estuary.
This report presents all the results from the mapping of emissions, consumption
and environmental risks of APIs in the Baltic Sea region. The widespread and, in
some places, high prevalence of APIs in the environment shows that immediate
measures are needed to reduce the risk of negative environmental effects and the
development of antibiotic resistance.
Acknowledgements
The County Administrative Board of Östergötland (CAB) would like to thank the
lead partner Finnish Environment Institute (SYKE), the activity leaders at the
Latvian Institute of Aquatic Ecology (LIAE) and the Institute of Environmental
Protection - National Research Institute in Poland (IOS) and the other project
partners that have contributed to this report. We are also grateful for the support
from the project's associated organizations and everyone who has contributed to
the project’s outcome.
CAB's work in the project has, in addition to grants from the EU's Baltic Sea
Program, been co-financed by the Swedish Agency for Marine and Water
Management through the grant 1:11 Measures for a better marine and aquatic
environment.

2
Förord (in Swedish)
Läkemedelsrester är vitt spridda i miljön. Vissa läkemedelssubstanser förekommer
i nivåer som utgör en risk för organismer som lever i vatten, bottensediment och i
jord. Detta visar resultat från det treåriga projektet Clear Waters from
Pharmaceuticals (CWPharma) som finansierades av EU:s Interreg Baltic Sea
Region Program. Syftet med projektet var att minska spridning av
läkemedelsrester till Östersjön. Länsstyrelsen Östergötland deltog i projektet
tillsammans med andra myndigheter, forskare och avloppsreningsverk från sju
östersjöländer. Projektet delades in i fyra arbetspaket med fokus på (1) utsläpp,
miljörisker och konsumtion av aktiva läkemedelssubstanser, (2) avancerad rening
av avloppsvatten, (3) uppströmsåtgärder och (4) scenarier, slutsatser och
handlingsplan.
Länsstyrelsen samordnade arbetet med att kartlägga utsläpp, miljörisker och
konsumtion av ca 80 aktiva läkemedelssubstanser i östersjöregionen.
Provtagningar genomfördes i utvalda avrinningsområden i Sverige, Finland,
Estland, Lettland, Tyskland och Polen. Prover samlades in från sjöar, vattendrag,
kustvatten och jordbruksmark. Vi analyserade även utsläpp av läkemedelsrester
från avloppsreningsverk, sjukhus, läkemedelsindustri, fiskodlingar,
djurbesättningar och deponier. I Sverige genomfördes provtagningar inom Motala
ströms avrinningsområde, från Vättern till Bråviken.
I denna rapport presenteras samtliga resultat från kartläggningen av utsläpp,
miljörisker och konsumtion av läkemedelssubstanser i östersjöregionen. Den
utbredda och ställvis höga förekomsten av läkemedelsrester i miljön visar att det
krävs omedelbara åtgärder för att minska risken för negativa miljöeffekter och
utveckling av antibiotikaresistens.
Tack
Länsstyrelsen Östergötland vill rikta ett stort tack till lead partner Finnish
Environment Institute (SYKE), aktivitetsledarna vid Latvian Intitute of Aquatic
Ecology (LIAE) och Institute of Environmental Protection – National Research
Institute (IOS) i Polen, samt övriga projektpartners som bidragit till denna rapport.
Vi är även tacksamma för stödet från projektets associerade organisationer och
andra som på något sätt hjälpt oss.
Länsstyrelsen Östergötlands arbete i projektet har, utöver bidrag från EU:s
östersjöprogram, även medfinansierats av Havs- och vattenmyndigheten genom
anslag 1:11 Åtgärder för en bättre havs- och vattenmiljö.

3
Pharmaceuticals in the Baltic Sea Region – emissions, consumption and environmental risks
4
This report is an output of CWPharma project’s work package 2, activities 2.1 and 2.2.
Authors:
Helene Ek Henning1, Ieva Putna-Nīmane2, Radoslaw Kalinowski3, Noora Perkola4
Aleksandra Bogusz3, Anete Kublina5, Egge Haiba6, Ieva Bārda2, Ieva Karkovska5, Jan Schütz7,
Jukka Mehtonen4, Katri Siimes4, Kristina Nyhlén1, Laura Dzintare2, Lauri Äystö4, Lauris Siņics5,
Mailis Laht8, Mari Lehtonen4, Michael Stapf7, Pernilla Stridh1, Rita Poikāne2, Sabina Hoppe1, Terhi
Lehtinen9, Vallo Kõrgma8, Ville Junttila4, Ülle Leisk8
1 County administrative board of Östergötland (CAB), Sweden 2 Latvian Institute of Aquatic Ecology (LIAE), Latvia 3 Institute of Environmental Protection - National Research Institute (IOS), Poland 4 Finnish Environment Institute (SYKE), Finland 5 Latvian Environment, Geology and Meteorology Centre (LEGMC), Latvia 6 Estonian Waterworks Association (EVEL), Estonia 7 Berlin Center for Competence of Water (KWB), Germany 8 Estonian Environmental Research Centre (EERC), Estonia 9 Finnish medicines agency (Fimea), Finland
Financier: European Union, Interreg Baltic Sea Region, European Regional Development Fund.
Year of issue: 2020.
Citation example:
Ek Henning, H., Putna.Nimane, I., Kalinowski, R., Perkola, N., Bogusz, A., Kublina, A., Haiba, E.,
Barda, I., Karkovska, I., Schütz, J., Mehtonen, J., Siimes, K., Nyhlén, K., Dzintare, L., Äystö, L.,
Sinics, L., Laht, M., Lehtonen, M., Stapf, M., Stridh, P., Poikāne, R., Hoppe, S., Lehtinen, T.,
Kõrgma, V., Junttila, V., Leisk, Ü. (2020). Pharmaceuticals in the Baltic Sea Region – emissions,
consumption and environmental risks. Report no. 2020:28, Länsstyrelsen Östergötland, Linköping.
Available at: https://www.lansstyrelsen.se/4.f2dbbcc175974692d268b9.html
5
Contents
Summary ........................................................................................................................................... 7
Environmental levels ..................................................................................................................... 7
Environmental risks ....................................................................................................................... 7
Consumption data of APIs ............................................................................................................. 8
Sources and pathways .................................................................................................................... 8
Recommendations ....................................................................................................................... 10
1 Introduction .............................................................................................................................. 11
Scope of the report ............................................................................................................ 12
2 Case study area selection and descriptions .............................................................................. 13
Finnish case study area ..................................................................................................... 13
German case study area .................................................................................................... 16
Estonian case study area ................................................................................................... 18
Latvian case study area ..................................................................................................... 19
Polish case study area ....................................................................................................... 21
Swedish case study area ................................................................................................... 22
3 Sample storage and analysis .................................................................................................... 24
4 Consumption data of APIs ....................................................................................................... 26
Methods ............................................................................................................................ 26
Results and discussion ...................................................................................................... 28
Conclusions ...................................................................................................................... 36
5 Environmental levels of APIs in the Baltic Sea region ............................................................ 39
Environmental levels of APIs in inland and coastal waters ............................................. 39
Environmental levels of APIs in river and estuary sediments .......................................... 64
6 APIs in wastewater and sludge ................................................................................................ 75
Concentrations of APIs in influents, effluents and sludge from municipal wastewater
treatment plants............................................................................................................................ 75
Concentrations of APIs at landfill WWTP ..................................................................... 113
Concentrations of APIs in wastewaters from hospitals .................................................. 124
Concentrations of APIs in the wastewater of pharmaceutical manufacturing plant ....... 132
7 APIs in surface water and sediments near fish, poultry and pig farms .................................. 137
Fish farms ....................................................................................................................... 137
Pig and poultry farms ..................................................................................................... 150
APIs in soil fertilized with sludge or manure ................................................................. 154
8 Linkage between API consumption and levels in WWTP influents ...................................... 166
Materials and methods .................................................................................................... 166
Results and discussion .................................................................................................... 167
Conclusions .................................................................................................................... 170
6
9 Environmental risk assessments of pharmaceuticals ............................................................. 172
Materials and methods .................................................................................................... 172
Results and discussion .................................................................................................... 181
Conclusions .................................................................................................................... 186
10 Overall conclusions and recommendations ........................................................................... 188
Increased knowledge about usage, sources, environmental levels and risks ............................. 188
APIs present in all environmental samples ................................................................................ 188
Some APIs frequently detected in the environment .................................................................. 188
APIs present at risky levels ....................................................................................................... 188
Improved consumption data ...................................................................................................... 189
Several sources and pathways of APIs ...................................................................................... 190
Reducing the API emissions ...................................................................................................... 191
Recommendations ..................................................................................................................... 191
11 Annexes .................................................................................................................................. 193
Annex 1. Method performance of chemical analyses ................................................................ 194
Annex 2. ATC codes and human consumption of the selected APIs ........................................ 201
Annex 3. Environmental levels of APIs in inland and coastal waters ....................................... 215
Annex 4. APIs in river and estuary sediments........................................................................... 231
Annex 5. API concentrations in WWTP influents .................................................................... 232
Annex 6. API concentrations in WWTP effluents .................................................................... 238
Annex 7. Average efficiency of API treatment according to wastewater influent and effluent
data (%) ...................................................................................................................................... 244
Annex 8. APIs in WWTP sludge samples ................................................................................. 245
Annex 9. Partitioning of APIs at WWTPs. ................................................................................ 248
Annex 10. API concentrations at landfill WWTP ..................................................................... 252
Annex 11. Concentration of APIs in wastewater effluents of hospitals .................................... 254
Annex 12. API load from hospitals and comparison with total load to WWTPs ...................... 256
Annex 13. APIs in wastewater effluents of a pharmaceutical manufacturer ............................. 259
Annex 14. APIs in surface water at fishfarms ........................................................................... 261
Annex 15. APIs in sediments at fishfarms ................................................................................ 263
Annex 16. API concentrations near pig and poultry farms ....................................................... 264
Annex 17. API concentrations in soil ........................................................................................ 265
Annex 18. Predicted vs. measured API loads in WWTP influents ........................................... 266
Annex 19. API descriptions ....................................................................................................... 270
Annex 20. Predicted no-effect concentrations in surface water ................................................ 326
Annex 21. Risk assessments of APIs......................................................................................... 336

7
Summary
This report describes the contamination by pharmaceuticals and the environmental risks associated
with their environmental levels in the Baltic Sea Region. Data were collected within the three-year
project Clear Waters from Pharmaceuticals (CWPharma) funded by the EU’s Interreg Baltic Sea
Region Programme. Sampling was performed in the river basin districts of Vantaanjoki in Finland,
Pärnu in Estonia, Lielupe and Daugava in Latvia, Vistula in Poland, Warnow-Peene in Germany
and Motala ström in Sweden. Analyses were performed on surface water, coastal water, sediment
and soil that was fertilized with sewage sludge or manure. Analyses were also performed on
emissions from municipal wastewater treatment plants, hospitals, pharmaceutical manufacturing
facilities, landfills, and fish and livestock farms. In total, the study covered 13 365 data points from
226 samples as well as collection of human and veterinary consumption data of selected active
pharmaceutical ingredients (APIs).
Samples were screened for up to 80 APIs, representing antibiotics, antiepileptics, antihypertensives,
asthma and allergy medications, gastrointestinal disease medications, hormones, metabolic disease
medications, non-steroidal anti-inflammatory drugs (NSAIDs) and analgesics, other cardiovascular
medicines, psychopharmaceuticals, veterinary medicines and caffeine. The measured APIs were
selected based on analytical capacity, consumption rates, identified data gaps and potential
environmental risks. Literature and databases were screened for ecotoxicological information.
Acute toxicity tests were performed for two APIs, nebivolol and cetirizine, for which
ecotoxicological data were lacking. Measured environmental concentrations were compared with
predicted no-effect concentrations (PNEC) to assess environmental risks of the selected APIs.
Environmental levels This study showed a widespread prevalence of APIs in the environment. APIs were detected in all
the studied rivers, lakes, coastal waters, sediments and soils. Surface water samples contained
between 8–49 of 63 analysed APIs. The sum concentration of the detected APIs was 0.0018–12
µg/L, reflecting very different environmental conditions upstream versus downstream of emissions
from e.g. municipal wastewater treatment plants and livestock farms. The most frequently detected
API was an antiepileptic carbamazepine, which was quantified in 98% of the inland surface water
samples and 100% of the coastal water samples. Other frequently detected APIs in surface water
were tramadol and diclofenac (NSAIDs and analgesics), cetirizine (asthma and allergy medication)
and venlafaxine and citalopram (psychopharmaceuticals).
Several APIs were also found in the sediment of Baltic Sea estuaries and Pärnu river. Each coastal
sediment sample contained between 13–27 of 64 analysed APIs. The sum concentration of the
detected APIs varied from 37 to 161 µg/kg d.w. Pärnu river sediment contained 41 APIs with a sum
concentration of 188 µg/kg d.w. close to the river mouth. Five APIs were found in all sediment
samples: metformin (metabolic disease medication), tramadol (NSAIDs and analgesics), oxazepam
and risperidone (psychopharmaceuticals) and caffeine. Paracetamol (NSAIDs and analgesics) and
xylometazoline (asthma and allergy medications) were detected at the highest concentrations in
sediments, up to about 80 µg/kg d.w.
Soil samples from sludge or manure-fertilized agricultural fields contained between 18–25 of 64
analysed APIs. The sum concentration of detected APIs varied from 15 to 166 µg/kg d.w. Five APIs
were detected in all soil samples: trimethoprim (antibiotics), paracetamol and tramadol (NSAIDs
and analgesics), risperidone (psychopharmaceuticals) and fenbendazole (veterinary medicine).
Environmental risks This study showed that some of the analysed APIs, especially some hormones and antibiotics, are
present at levels that may pose a risk to the environment. At least one API was present at a
concentration which may pose an environmental risk in over 75% of the surface water samples. The
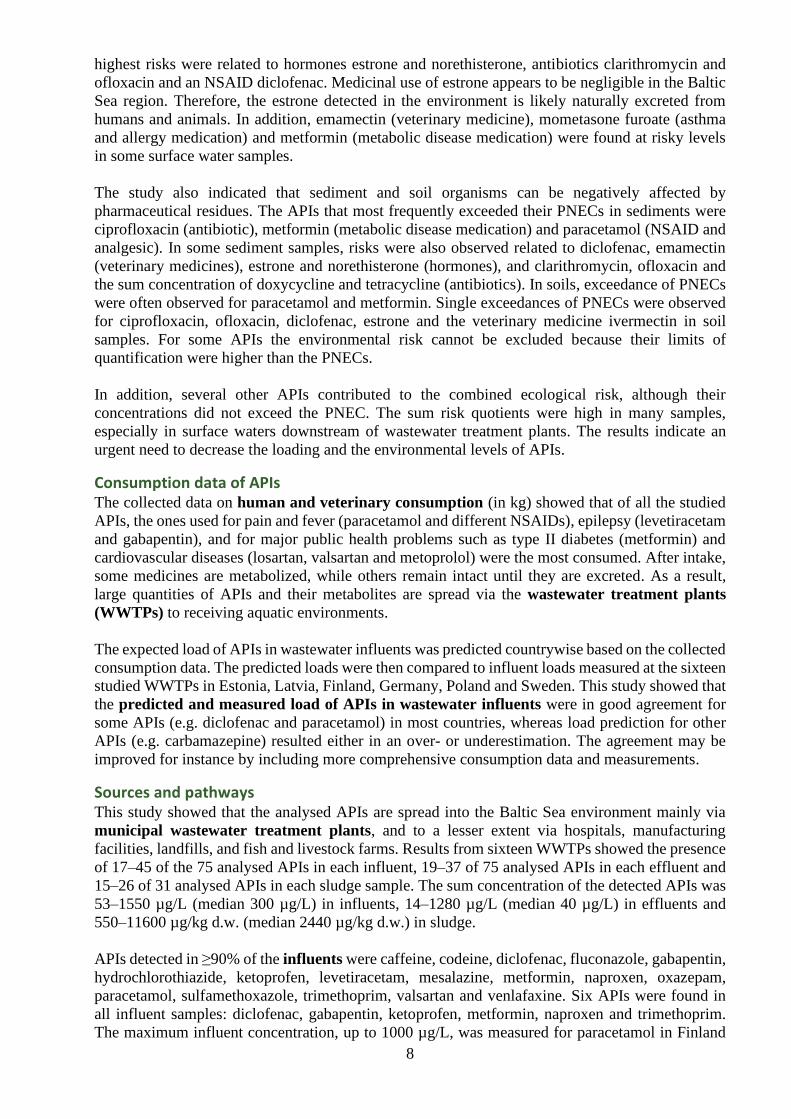
8
highest risks were related to hormones estrone and norethisterone, antibiotics clarithromycin and
ofloxacin and an NSAID diclofenac. Medicinal use of estrone appears to be negligible in the Baltic
Sea region. Therefore, the estrone detected in the environment is likely naturally excreted from
humans and animals. In addition, emamectin (veterinary medicine), mometasone furoate (asthma
and allergy medication) and metformin (metabolic disease medication) were found at risky levels
in some surface water samples.
The study also indicated that sediment and soil organisms can be negatively affected by
pharmaceutical residues. The APIs that most frequently exceeded their PNECs in sediments were
ciprofloxacin (antibiotic), metformin (metabolic disease medication) and paracetamol (NSAID and
analgesic). In some sediment samples, risks were also observed related to diclofenac, emamectin
(veterinary medicines), estrone and norethisterone (hormones), and clarithromycin, ofloxacin and
the sum concentration of doxycycline and tetracycline (antibiotics). In soils, exceedance of PNECs
were often observed for paracetamol and metformin. Single exceedances of PNECs were observed
for ciprofloxacin, ofloxacin, diclofenac, estrone and the veterinary medicine ivermectin in soil
samples. For some APIs the environmental risk cannot be excluded because their limits of
quantification were higher than the PNECs.
In addition, several other APIs contributed to the combined ecological risk, although their
concentrations did not exceed the PNEC. The sum risk quotients were high in many samples,
especially in surface waters downstream of wastewater treatment plants. The results indicate an
urgent need to decrease the loading and the environmental levels of APIs.
Consumption data of APIs The collected data on human and veterinary consumption (in kg) showed that of all the studied
APIs, the ones used for pain and fever (paracetamol and different NSAIDs), epilepsy (levetiracetam
and gabapentin), and for major public health problems such as type II diabetes (metformin) and
cardiovascular diseases (losartan, valsartan and metoprolol) were the most consumed. After intake,
some medicines are metabolized, while others remain intact until they are excreted. As a result,
large quantities of APIs and their metabolites are spread via the wastewater treatment plants
(WWTPs) to receiving aquatic environments.
The expected load of APIs in wastewater influents was predicted countrywise based on the collected
consumption data. The predicted loads were then compared to influent loads measured at the sixteen
studied WWTPs in Estonia, Latvia, Finland, Germany, Poland and Sweden. This study showed that
the predicted and measured load of APIs in wastewater influents were in good agreement for
some APIs (e.g. diclofenac and paracetamol) in most countries, whereas load prediction for other
APIs (e.g. carbamazepine) resulted either in an over- or underestimation. The agreement may be
improved for instance by including more comprehensive consumption data and measurements.
Sources and pathways This study showed that the analysed APIs are spread into the Baltic Sea environment mainly via
municipal wastewater treatment plants, and to a lesser extent via hospitals, manufacturing
facilities, landfills, and fish and livestock farms. Results from sixteen WWTPs showed the presence
of 17–45 of the 75 analysed APIs in each influent, 19–37 of 75 analysed APIs in each effluent and
15–26 of 31 analysed APIs in each sludge sample. The sum concentration of the detected APIs was
53–1550 µg/L (median 300 µg/L) in influents, 14–1280 µg/L (median 40 µg/L) in effluents and
550–11600 µg/kg d.w. (median 2440 µg/kg d.w.) in sludge.
APIs detected in ≥90% of the influents were caffeine, codeine, diclofenac, fluconazole, gabapentin,
hydrochlorothiazide, ketoprofen, levetiracetam, mesalazine, metformin, naproxen, oxazepam,
paracetamol, sulfamethoxazole, trimethoprim, valsartan and venlafaxine. Six APIs were found in
all influent samples: diclofenac, gabapentin, ketoprofen, metformin, naproxen and trimethoprim.
The maximum influent concentration, up to 1000 µg/L, was measured for paracetamol in Finland

9
and Sweden. The APIs that were highly consumed (in kg) and/or excreted largely as unmetabolized
had typically the highest concentrations in influents, while the detection frequency was also highly
related to the limits of the analytical method of quantification.
APIs detected in ≥90% of the effluents were carbamazepine, citalopram, clarithromycin, diclofenac,
erythromycin, fluconazole, hydrochlorothiazide, ketoprofen, metoprolol, naproxen, oxazepam,
sotalol, tramadol, trimethoprim and venlafaxine. Three APIs were found in all effluent samples:
diclofenac, metoprolol and oxazepam. In the effluents, ibuprofen had the highest concentration (up
to 44 µg/L in Latvia), followed by diclofenac (up to 38 µg/L in Estonia) and caffeine (up to 32 µg/L
in Latvia). Eight APIs were found in all WWTP sludge samples: diclofenac, carbamazepine,
venlafaxine, metformin, caffeine, metoprolol, citalopram and sertraline. In sludge, the most
abundant APIs were telmisartan (up to 8700 µg/kg d.w. in Estonia) and ofloxacin (up to 8600 µg/kg
d.w. in Finland).
Wastewater treatment efficiency could be calculated for 50 APIs analysed in influents and effluents
within the project. The calculations showed that 28 APIs had positive removal efficiencies in all the
studied WWTPs, indicating they were at least partly removed in the WWTPs. Substances with high
removal efficiency (≥90%) were allopurinol, caffeine, levetiracetam, mesalazine, metformin,
nebivolol, olanzapine, paracetamol and simvastatin.
For 19 APIs, removal efficiencies depended on the WWTP. Ten APIs had zero or negative average
removal rates (the average efficiency of all the studied WWTPs), which means that the conventional
wastewater treatment plants cannot decrease their emissions. These ten substances were
carbamazepine, diclofenac, hydrochlorothiazide, irbesartan, metoprolol, sotalol, telmisartan,
primidone, ramipril and losartan. Three of these APIs showed negative removal rates in all the
studied WWTPs: metoprolol, primidone and ramipril. Hence, this study confirmed that many APIs
are incompletely removed at conventional WWTPs.
In this study, APIs were analysed in hospital wastewaters in Sweden (Linköping and Norrköping),
Germany (Wismar) and Estonia (Pärnu). The sum concentration of the detected APIs in the hospital
effluents varied between 75–1200 µg/L. Gabapentin, metformin and paracetamol were found at
highest concentrations. The sum concentration of detected APIs (µg/L) was generally higher in
hospital effluents compared to the sum concentrations in the influents of the connected WWTPs.
Because of the comparatively low wastewater flow rates from the hospitals, the total load of the
detected APIs (g/day) in the effluents from hospitals were only up to 3% of the overall load to the
connected WWTPs.
Landfill leachates were analysed before and after treatment at the landfill’s WWTP three times
during one year. The untreated leachate contained 26 out of 74 analysed APIs, whereas treated
effluents contained 21 out of 74 analysed APIs. The sum concentrations of detected APIs varied
over the year from 3.5–172 µg/L in untreated leachate and from 1.1–41 µg/L in treated effluents,
indicating an overall decrease of about 35–76% during the treatment. The APIs found in highest
concentrations in the untreated leachates were hydrochlorothiazide (up to 79 µg/L), paracetamol (74
µg/L) and gabapentin (7.0 µg/L), whereas caffeine (8.8 µg/L), hydrochlorothiazide (4.4 µg/L) and
erythromycin (1.8 µg/L) were the most abundant in the treated effluents. However, because the
landfill WWTP treats relatively low amount of water per day, the total load of APIs (g/day) from
the landfill WWTP was low compared to the API load from municipal WWTPs of the Vantaa case
study area.
This study also covered analyses of APIs in surface waters and sediments at Finnish and Estonian
fish farms. Temporarily elevated concentrations in surface water were found for the antibiotic
trimethoprim near one of the fish farms after an onsite medication event. Otherwise, the number of

10
detected APIs and their sum concentration (0.005–0.09 µg/L) was about the same or lower in the
fish farm waters compared to other studied surface waters.
The watercourses downstream a pig farm and a poultry farm in Latvia contained 7–21 of 59
analysed APIs. The sum concentration of detected APIs was 0.18–0.62 µg/L, which is within the
range found in other surface water samples of the case study areas. However, the concentrations of
the veterinary medicines tiamulin and toltrazuril were higher downstream the pig farm than in other
surface water samples. Hence, this study suggests that at least some livestock farms may be
significant sources of APIs used for veterinary purposes, an issue that needs further attention.
This report contributes to an increased knowledge about sources, environmental levels and risks of
pharmaceutical residues in the Baltic Sea Region. Data will be further used as a base for modelling
of APIs within the Baltic Sea region and to identify efficient measures to reduce the load and
environmental risks of APIs.
Recommendations The recommendations drawn from this study are summarized below.
• APIs should be included in regular environmental monitoring programmes, focusing on
APIs that pose environmental risks. The API list should be continuously updated as we
receive new information on environmental levels and risks.
• The analytical methods should be further refined and developed to make comprehensive
estimates of API concentrations in the environment, including metabolites.
• The statistics on the usage of human and veterinary medicines should be improved, by
making data publicly available in DDD format (defined daily dose) and in mass units (kg of
API) for all types of medicines.
• Further studies should be performed on the use of veterinary medicines and their dispersal
in the environment. Any unnecessary use should be restricted and best practices for manure
storage and application on agricultural fields should be implemented.
• More ecotoxicological data are needed on single APIs and their metabolites as well on
mixture toxicity to assess the combined ecological risks. Ecotoxicological studies should be
performed on different trophic levels and on different matrixes e.g. freshwater, coastal and
marine waters, sediment and soil. Also, knowledge on chronic effects from long-term
exposure to APIs should be improved.
• Further studies should be performed on the environmental levels and risks of antibiotics,
including the spread of antibiotic resistance genes.
• Emissions of APIs from landfill leachates should be further analysed, especially where
household waste is or has been disposed of at landfills.
• The emissions of environmentally risky APIs should be reduced by improved wastewater
treatment and upstream measures.
• The discharges of APIs via WWTP effluents should be followed up, focusing on APIs that
pose environmental risks. The list of environmentally risky APIs should be updated
regularly when new ecotoxicological data and risk assessments are available.
11
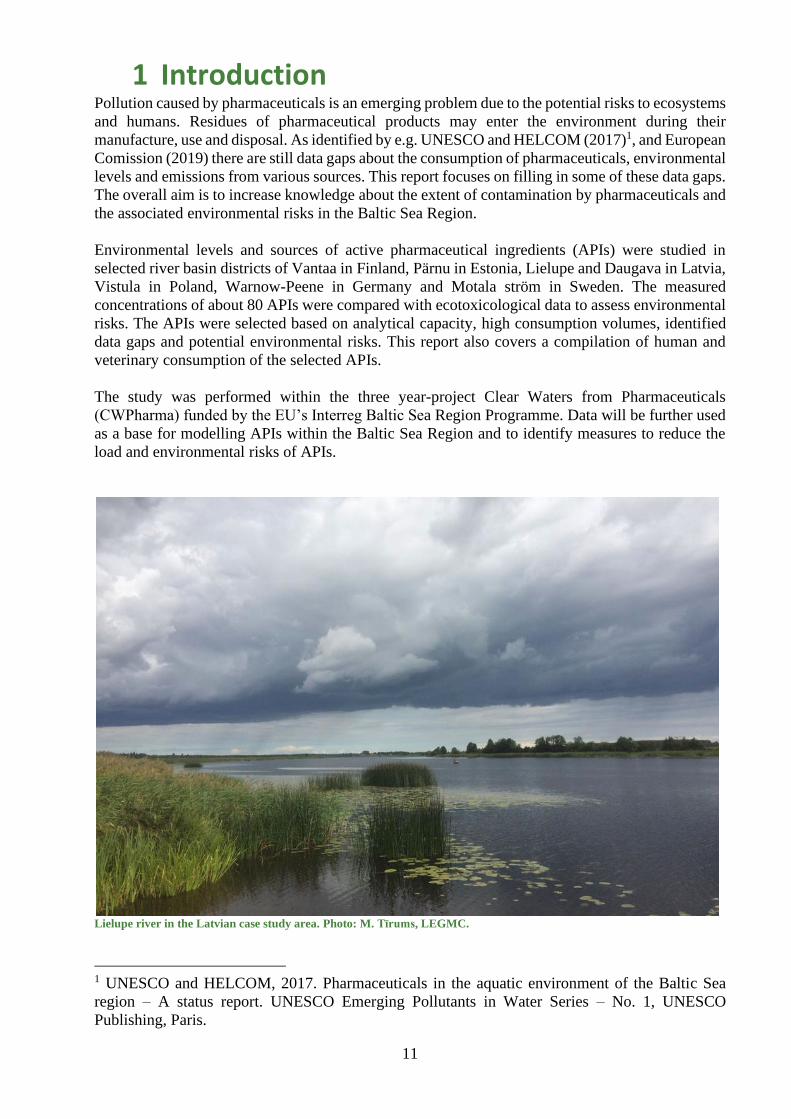
1 Introduction Pollution caused by pharmaceuticals is an emerging problem due to the potential risks to ecosystems
and humans. Residues of pharmaceutical products may enter the environment during their
manufacture, use and disposal. As identified by e.g. UNESCO and HELCOM (2017)1, and European
Comission (2019) there are still data gaps about the consumption of pharmaceuticals, environmental
levels and emissions from various sources. This report focuses on filling in some of these data gaps.
The overall aim is to increase knowledge about the extent of contamination by pharmaceuticals and
the associated environmental risks in the Baltic Sea Region.
Environmental levels and sources of active pharmaceutical ingredients (APIs) were studied in
selected river basin districts of Vantaa in Finland, Pärnu in Estonia, Lielupe and Daugava in Latvia,
Vistula in Poland, Warnow-Peene in Germany and Motala ström in Sweden. The measured
concentrations of about 80 APIs were compared with ecotoxicological data to assess environmental
risks. The APIs were selected based on analytical capacity, high consumption volumes, identified
data gaps and potential environmental risks. This report also covers a compilation of human and
veterinary consumption of the selected APIs.
The study was performed within the three year-project Clear Waters from Pharmaceuticals
(CWPharma) funded by the EU’s Interreg Baltic Sea Region Programme. Data will be further used
as a base for modelling APIs within the Baltic Sea Region and to identify measures to reduce the
load and environmental risks of APIs.
Lielupe river in the Latvian case study area. Photo: M. Tīrums, LEGMC.
1 UNESCO and HELCOM, 2017. Pharmaceuticals in the aquatic environment of the Baltic Sea
region – A status report. UNESCO Emerging Pollutants in Water Series – No. 1, UNESCO
Publishing, Paris.

12
Scope of the report Data collection covered 13 365 data points from 226 individual samples from selected river basin
districts of Finland, Estonia, Latvia, Poland, Germany and Sweden. The screening of APIs covered
about 80 active pharmaceutical ingredients (APIs), representing antibiotics, antiepileptics,
antihypertensives, asthma and allergy medications, caffeine, gastrointestinal disease medications,
hormones, metabolic disease medications, non-steroidal anti-inflammatory drugs (NSAIDs) and
analgesics, other cardiovascular medicines, psycopharmaceuticals and veterinary medicines.
Literature and databases were screened for ecotoxicological data. Additional acute toxicity tests
were performed for two APIs for which no ecotoxicological endpoints were found. The measured
environmental concentrations in surface water, sediment and soil were compared to calculated
predicted no effect concentrations of the selected APIs.
To summarize, this report contains new data on:
• Human and veterinary consumption of APIs
• Levels of APIs in:
o rivers, lakes and Baltic Sea estuaries
o sediments of Baltic Sea estuaries
o influents and effluents from municipal wastewater treatment plants
o sewage sludge from municipal wastewater treatment plants
o soils where sludge or manure have been applied
o coastal waters in the vicinity of fish farms
o watercourses near pig and poultry farms
o effluents from manufacturing facilities
o effluents from hospitals
o leachates from landfills
• Predicted no effect concentrations of the selected APIs.
• Assessments of environmental risks of the measured environmental concentrations.
The case study areas and the chemical analyses are described in Chapters 2 and 3. Chapter 4 presents
the consumption data for the selected APIs. Chapters 5–7 are divided into matrix-specific
subchapters including methods, results, discussion and conclusion. Predicted API load in WWTP
influents, based on the collected consumption data, are presented in chapter 8. Calculations of risk
quotients are presented in chapter 9. At the end of the report there are overall conclusions and
recommendations (chapter 10), followed by annexes.
13
2 Case study area selection and descriptions Finnish case study area
River Vantaanjoki runs to the Gulf of Finland in Helsinki. The river basin, its estuary and the
Helsinki coast were selected as a case study area. The case study area consists of two geographically
overlapping but separate entities: one is a large wastewater treatment plant (WWTP) Viikinmäki in
Helsinki and the coastal area near its outlet pipe in the Baltic Sea Estaury (BSE), and the other one
is river Vantaanjoki and its estuary.
The Vantaanjoki main riverbed is approx. 100 km long with several smaller tributaries (Figure 2.1).
Its drainage area is about 1 700 km2 with around half a million inhabitants, but over 70% of the
inhabitants are linked to WWTP Viikinmäki. However, the headwater and mid-river cities
Riihimäki, Hyvinkää and Nurmijärvi have four municipal WWTPs discharging their treated
wastewater into the river. In addition, there are a couple of very small WWTPs where
pharmacuticals may enter the river: a small nursery type hospital WWTP Rinnekoti and a small
WWTP of a landfill site Metsä-Tuomela. Urban and industrial areas cover approximately 15% of
the river basin area, making the case area one of the most urban catchments in Finnish scale.
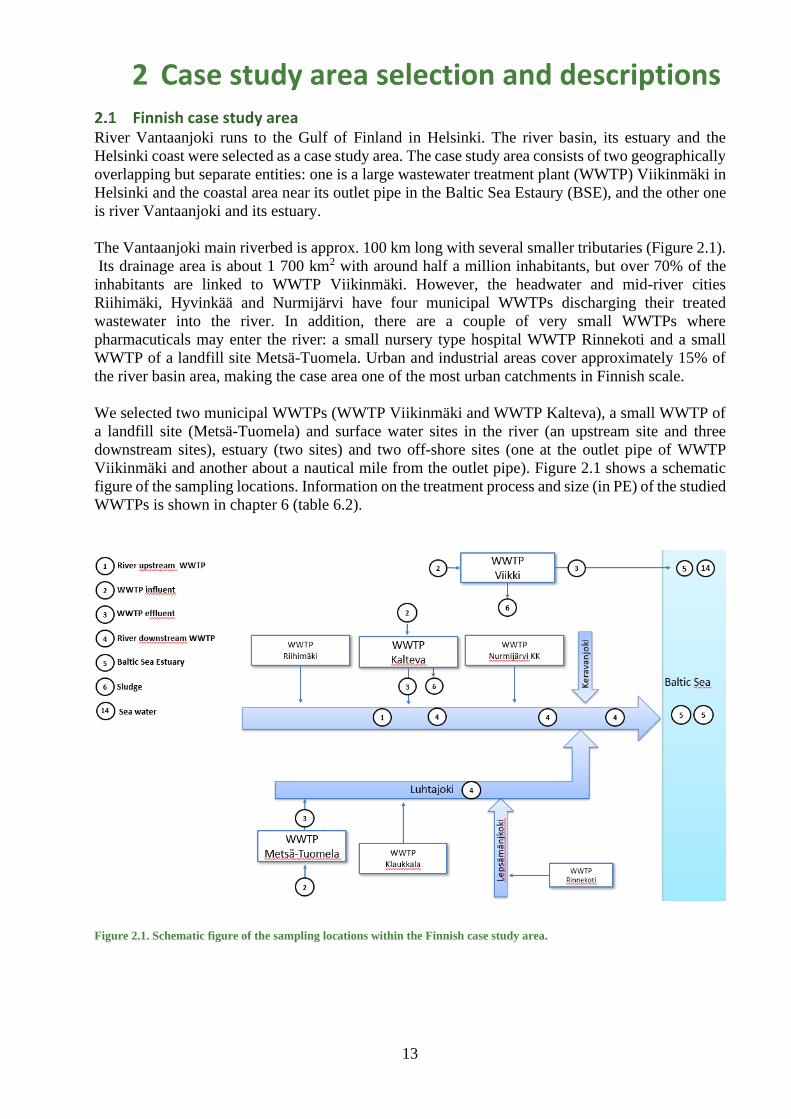
We selected two municipal WWTPs (WWTP Viikinmäki and WWTP Kalteva), a small WWTP of
a landfill site (Metsä-Tuomela) and surface water sites in the river (an upstream site and three
downstream sites), estuary (two sites) and two off-shore sites (one at the outlet pipe of WWTP
Viikinmäki and another about a nautical mile from the outlet pipe). Figure 2.1 shows a schematic
figure of the sampling locations. Information on the treatment process and size (in PE) of the studied
WWTPs is shown in chapter 6 (table 6.2).
Figure 2.1. Schematic figure of the sampling locations within the Finnish case study area.

14
WWTP Viikinmäki is currently the largest WWTP in the Nordic countries, treating the sewage of
over 800 000 inhabitants and several hospitals. The annual average volume of treated wastewater is
100 million m3. Variation of daily sewage flow is presented in Figure 2.2. The treated wastewater
is released to Baltic Sea via a 16 km long pipe. The pipe outlet is located roughly 7 km off the shore
of the Helsinki peninsula at 20 m depth. The WWTP influent and effluent water samples were
collected in December 2018, August 2018 and November 2018. Sludge samples were collected in
December 2017 and August 2018.
Figure 2.2. Variation in average daily sewage flow, calculated from reported weekly flows for the years 2003 – 2009 (Kalteva) and
2003-2017 (Viikinmäki). (Data: YLVA)
The medium-sized WWTP Kalteva (40 000 inhabitants and a hospital) is located 65 km north of the
river mouth. From Kalteva the treated wastewater (almost 4 million m3 per year) is directed into the
River Vantaanjoki. The WWTP influent and effluent were sampled in December 2017, June 2018
and November 2018. One sample of undried raw sludge was taken in June 2018.
River samples were taken at one upstream and several downstream sites from Kalteva WWTP.
About 20 km upstream from Kalteva is another WWTP, which treats the wastewater of approx. 38
000 inhabitants in Riihimäki and neighbouring cities and industrial waters. In addition, there are
vacation homes not connected to any WWTPs and farms in the upstream drainage area.
Sampling was also performed at a landfill WWTP in Metsä-Tuomela. At the landfill site, APIs can
leach from the treated (composted) sludge stored in the area or from the landfill. To balance the
flows before the WWTP, there was a small pond that collected water from the landfill area and the
surface runoff from composted WWTP sludge stored in the open air. The outlet of the WWTP
effluent was in a ditch which runs to a tributane of river Vantaanjoki.
The weather conditions and Vantaanjoki river flow rates were very unusual in 2017–2018. The
average flow measured at the lower reaches of the river Vantaanjoki is approx. 16 m3/s (=1 400 000
m3/d) being usually higher after snow melt and lower in summer. The first sampling campaign was
carried out in December 2017, when the river flow was three times higher than average. The second
sampling was in June 2018, when the flow was only ¼ of the average flow (Figure 2.3). A third
sampling round was carried out in November 2018, but the flow was again lower than usual.
Therefore, the portion of treated wastewater in the river water varied dramatically between the
samplings.

15
Figure 2.3. Daily flows of river Vantaanjoki close to the sampling sites Vantaa 44,1 and Vantaa 4,2 (Data: Hertta\Finnish
Environment Institute).
The estuary and coastal samples were planned to be taken in the same week as river samples.
However, the sampling sites were not reachable in December 2017 due to difficult weather
conditions. In the beginning of March 2018 the coastal sampling site ‘Katajaluoto 125’ was
reachable, but due to boat traffic the other coastal sampling site (Viikinmäki WWTP pipe outlet)
was not. In Katajaluoto 125, samples were taken from three depths: 1 m from the bottom, in the
mid-depth and a 1 m from surface. In June 2018 the same depths were used, and the outlet pipe site
was sampled in the mid-depth (10 m). The two estuary sites were a bridge in the Vantaanjoki river
mouth (Matinsilta, depth about 5 m; sampling in 1 m) and a site in the middle of
Vanhankaupunginselkä (sampling in 1 m). They were sampled in March and June 2018, as well.
Additionally, Matinsilta was sampled in November 2018 in the third river sampling round.
Sampling was performed in Vantaanjoki in Finland. Photo: Lauri Äystö, SYKE.
0
2 000 000
4 000 000
6 000 000
8 000 000
10 000 000
12/2017 3/2018 6/2018 9/2018 12/2018
rive
r fl
ow
m3/d
ay Flow Vantaa 4,2
Flow Vantaa 44,1
Sampling time
Sampling time
16
German case study area The German Baltic Sea catchment region has a total area of about 30 307 km2 and is mainly located
in the Federal State of Mecklenburg-Vorpommern (21 960 km2). The Warnow/Peene river basin
district covers an area of 21 089 km². Main usage of the land area (13 452 km²) is agriculture with
an area of 8774 km² (65% of land area). Besides the rivers Warnow and Peene, other large rivers
are: Mildenitz, Nebel, Recknitz, Tollense and Trebel. The territorial unit has about 1.0 million
inhabitants. The five largest cities are Rostock (204 300 inh.), Neubrandenburg (65 000 inh.),
Stralsund (57 900 inh.), Wismar (44 100 inh.) and Greifswald (55 100 inh.).
In the Federal State of Schleswig-Holstein the Schlei/Trave river basin district discharges into the
Baltic Sea. The Schlei/Trave river basin district has a total area of 9,218 km2, 8,347 km2 in
Schleswig-Holstein and 871 km2 in Meckelenburg-Vorpommern. Main usage of the land area (6184
km²) is agriculture with an area of 5,015 km² (81% of land area). Within this river basin region,
about 1.25 million inhabitants are living. Largest cities are Kiel (235 700 inh.), Lübeck (211 500
inh.) and Flensburg (87 400 inh.).
The Warnow/Peene river basin region in Mecklenburg-Vorpommern was selected as case study area
as it has the largest drainage area. There are 586 municipal WWTPs located in the Federal State of
Mecklenburg-Vorpommern, with a total design capacity of about 3.3 million population equivalents
(PE), of which 2/3 (about 2.2 million PE) are in the study area of the Warnow/Peene river basin
district. The vast majority of the WWTPs (n = 514; 88%) have a smaller design capacity than 5000
PE, but only represent about 11% of the total treatment capacity. On the other hand, the 51 WWTPs
with a treatment capacity of more than 10 000 PE cover 84% of the total treatment capacity. For the
CWPharma measurement campaign three WWTPs of size class 4 (10 001–100 000 PE) and one
WWTP of size class 5 (>100 000 PE) were selected. Information on the treatment process and size
(in PE) of the studied WWTPs is shown in chapter 6 (table 6.2). All selected WWTPs are connected
to the Baltic Sea directly (WWTP Greifswald with 59 232 persons connected, and WWTP Wismar
with 42 963 persons connected) or indirectly via the river Tollense/Peene (WWTP Neubrandenburg
with 63 761 persons connected) and river Warnow (WWTP Rostock with 209 191 persons
connected). Information on the treatment process and size (in PE) of the studied WWTPs is shown
in chapter 6 (table 6.2). Samples were taken in the influent and the effluent of the four WWTPs in
autumn 2017 and summer 2018. Sewage sludge grab samples were also taken in autumn 2017 and
summer 2018 from all four WWTPs.
Surface water samples were taken in two rivers (Tollense and Warnow) and in the estuary of the
river Peene and river Warnow. The WWTP Neubrandenburg discharges into the river Tollense
which is a tributary of the river Peene. Surface water samples of the Tollense were taken upstream
and downstream of the WWTP Neubrandenburg. The Warnow surface water samples were taken
upstream of the WWTP Rostock.
Effluent of the hospital Wismar was sampled in winter 2017 and summer 2018. The hospital effluent
discharges to the WWTP Wismar. Soil samples were taken from an agricultural field outside of
Rerik where sewage sludge of the WWTP Greifswald had been applied two years prior to sampling
in summer 2018.

17
Figure 2.4. Schematic figure of sampling locations within the German case study area.
Collection of water sample upstream of WWTP Neubrandenburg in Tollense river, Germany. Photo: Jan Schütz, KWB.

18
Estonian case study area The Estonian case study area was the Pärnu river, the second longest river in Estonia. The catchment
area covers about 16% of Estonia. The Pärnu river catchment area is situated in Western Estonia
and drains 6690 km² to the Bay of Pärnu. The river Pärnu (length 144 km) is a typical river for
Estonia, characterized with spring snow-melting flood, autumn rain flood and minimal flow in
summer and winter. The mean long-term runoff at the Pärnu - Oore hydrological station
(representing 5160 km²) amounts 49 m³/s or about 9.5 l/s/km² or 300 mm per year. The river flow
is regulated by several dams. Due to the lack of lakes in the river basin, the fluctuation of runoff is
very large. 59% of the catchment area is covered by forests and natural grasslands. 30% of the total
catchment area is arable land.
The population in the drainage area is about 179 000 inhabitants and 56% of them live in cities and
towns. The main cities are Pärnu (41 000 inhabitants), Paide (8400 inhabitants) and Türi (5500
inhabitants). There are about 160 wastewater treatment plants in the catchment area, most of which
are small. There are four wastewater treatment plants more than 2000 PE in the drainage area. Three
of them were selected for the measurement campaign within CWPharma:
• Pärnu WWTP: 62 900 people, several industries, one hospital, several spas and sanatoriums
are connected.
• Paide WWTP: 9 600 people, small enterprises, food proceeding industry, and one hospital
are connected.
• Türi WWTP: 5 860 people and small industries are connected.
Information on the treatment process and size (in PE) of the studied WWTPs is shown in chapter 6
(table 6.2). Sampling locations in the Estonian case study area are presented in Figure 2.5. Samples
were collected from surface water (upstream and downstream of WWTPs, and river estuary), river
and estuary sediments, three WWTPs (influent, effluent and sewage sludge), Roosna-Alliku fish
farm, Pärnu hospital sewage water, and the soils of two fields. All water and sediment samples were
taken in December 2017 and in June 2018. Soil samples were collected in October 2018.
Figure 2.5. Schematic figure of sampling locations within the Estonian case study area of Pärnu river catchment area.
19
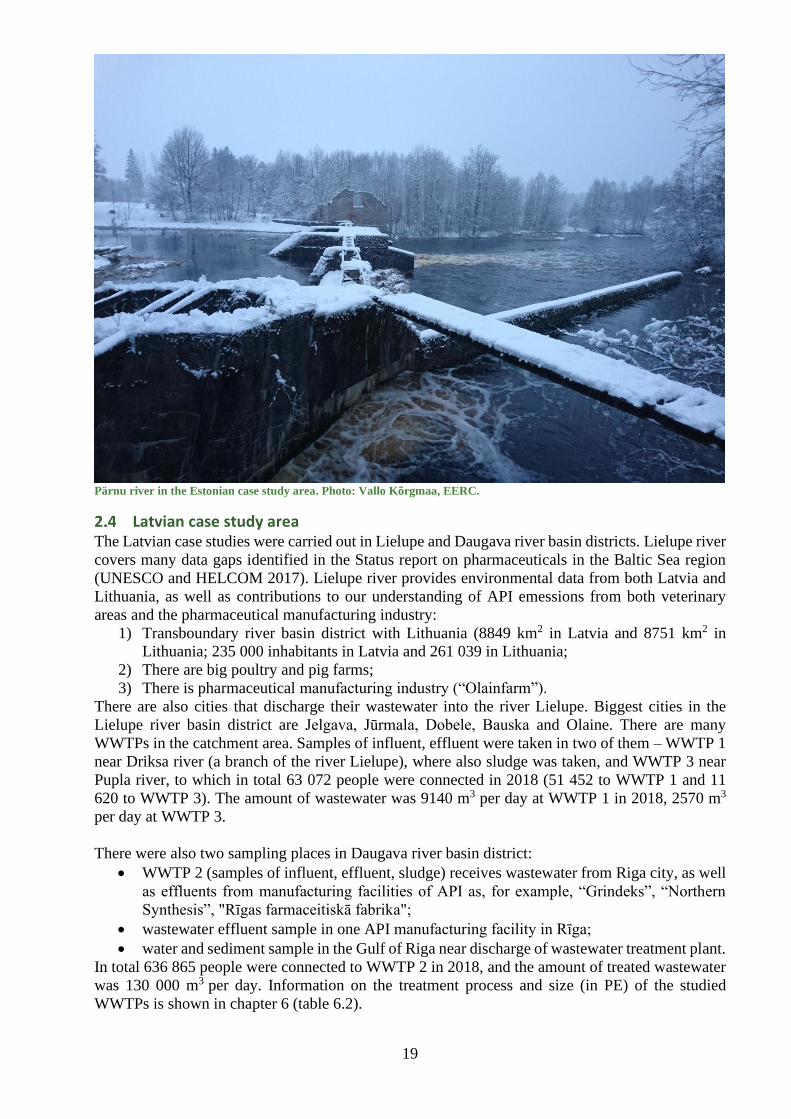
Pärnu river in the Estonian case study area. Photo: Vallo Kõrgmaa, EERC.
Latvian case study area The Latvian case studies were carried out in Lielupe and Daugava river basin districts. Lielupe river
covers many data gaps identified in the Status report on pharmaceuticals in the Baltic Sea region
(UNESCO and HELCOM 2017). Lielupe river provides environmental data from both Latvia and
Lithuania, as well as contributions to our understanding of API emessions from both veterinary
areas and the pharmaceutical manufacturing industry:
1) Transboundary river basin district with Lithuania (8849 km2 in Latvia and 8751 km2 in
Lithuania; 235 000 inhabitants in Latvia and 261 039 in Lithuania;
2) There are big poultry and pig farms;
3) There is pharmaceutical manufacturing industry (“Olainfarm”).
There are also cities that discharge their wastewater into the river Lielupe. Biggest cities in the
Lielupe river basin district are Jelgava, Jūrmala, Dobele, Bauska and Olaine. There are many
WWTPs in the catchment area. Samples of influent, effluent were taken in two of them – WWTP 1
near Driksa river (a branch of the river Lielupe), where also sludge was taken, and WWTP 3 near
Pupla river, to which in total 63 072 people were connected in 2018 (51 452 to WWTP 1 and 11
620 to WWTP 3). The amount of wastewater was 9140 m3 per day at WWTP 1 in 2018, 2570 m3
per day at WWTP 3.
There were also two sampling places in Daugava river basin district:
• WWTP 2 (samples of influent, effluent, sludge) receives wastewater from Riga city, as well
as effluents from manufacturing facilities of API as, for example, “Grindeks”, “Northern
Synthesis”, "Rīgas farmaceitiskā fabrika";
• wastewater effluent sample in one API manufacturing facility in Rīga;
• water and sediment sample in the Gulf of Riga near discharge of wastewater treatment plant.
In total 636 865 people were connected to WWTP 2 in 2018, and the amount of treated wastewater
was 130 000 m3 per day. Information on the treatment process and size (in PE) of the studied
WWTPs is shown in chapter 6 (table 6.2).

20
Sampling locations in the Latvian case study are presented in the schematic figure 2.6. Surface water
samples were taken in five rivers (Mūsa, Mēmele, Pupla, Lielupe and Vērģupe), and in a ditch
downstream a pig farm, and in the Gulf of Riga. Sediment samples were taken in the Gulf of Riga.
Surface water samples were taken in November 2017 (inland waters) or December 2017 (Gulf of
Riga) and May 2018. Samples of WWTP influent, effluent and sludge were taken in December 2017
and May 2018. Soil samples were taken from agricultural field, where manure had been applied, in
June 2018.
Figure 2.6. Schematic figure of sampling locations within the Latvian case study area of Lielupe river and Riga city.
Musa river at the Latvia-Lithuanian border. Photo: M. Tīrums, LEGMC.
21
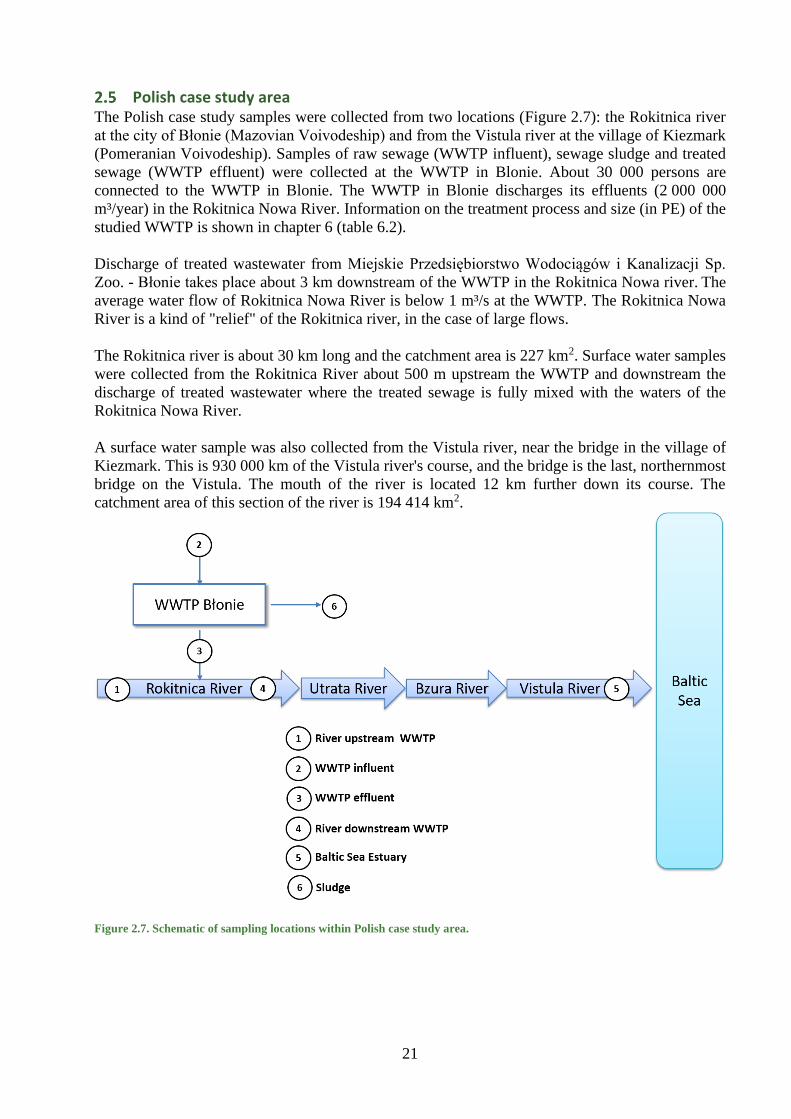
Polish case study area The Polish case study samples were collected from two locations (Figure 2.7): the Rokitnica river
at the city of Błonie (Mazovian Voivodeship) and from the Vistula river at the village of Kiezmark
(Pomeranian Voivodeship). Samples of raw sewage (WWTP influent), sewage sludge and treated
sewage (WWTP effluent) were collected at the WWTP in Blonie. About 30 000 persons are
connected to the WWTP in Blonie. The WWTP in Blonie discharges its effluents (2 000 000
m³/year) in the Rokitnica Nowa River. Information on the treatment process and size (in PE) of the
studied WWTP is shown in chapter 6 (table 6.2).
Discharge of treated wastewater from Miejskie Przedsiębiorstwo Wodociągów i Kanalizacji Sp.
Zoo. - Błonie takes place about 3 km downstream of the WWTP in the Rokitnica Nowa river. The
average water flow of Rokitnica Nowa River is below 1 m³/s at the WWTP. The Rokitnica Nowa
River is a kind of "relief" of the Rokitnica river, in the case of large flows.
The Rokitnica river is about 30 km long and the catchment area is 227 km2. Surface water samples
were collected from the Rokitnica River about 500 m upstream the WWTP and downstream the
discharge of treated wastewater where the treated sewage is fully mixed with the waters of the
Rokitnica Nowa River.
A surface water sample was also collected from the Vistula river, near the bridge in the village of
Kiezmark. This is 930 000 km of the Vistula river's course, and the bridge is the last, northernmost
bridge on the Vistula. The mouth of the river is located 12 km further down its course. The
catchment area of this section of the river is 194 414 km2.
Figure 2.7. Schematic of sampling locations within Polish case study area.
22
Vistula river in the Polish case study area. Photo: Radoslaw Kalinowski.
Swedish case study area The Motala Ström case study area is one of the largest catchment areas in Sweden, covering
approximately 15 500 km² and with a population of approx. 650 000. The main cities are Linköping
and Norrköping, where also the largest hospitals are located. The total length of the river Motala
ström is about 100 km, stretching from Lake Vättern in Motala to Bråviken estuary in Norrköping.
The average water flow of Motala ström is 92 m³/s at the mouth in Norrköping. Motala ström runs
through three large lakes on its way to the Baltic sea: Boren, Roxen and Glan. Also, two other rivers
flow into Lake Roxen: Svartån and Stångån.
There are several WWTPs in the catchment area. Samples of influent, effluent and sludge were
taken at the largest WWTPs located in Motala, Linköping and Norrköping, to which in total 315
500 people are connected (i.e. almost the half of the population in the catchment area). The WWTP
in Motala is located early in the river system, discharging its effluent (3 104 370 m³/year) into Lake
Boren. About 32 500 persons are connected to the WWTP in Motala/Karshult. The WWTP in
Linköping discharges its effluents (14 829 000 m³/year) in the river Stångån, near the mouth of Lake
Roxen. About 147 500 persons are connected to the WWTP in Linköping. The WWTP in Linköping
has installed advanced ozone treatment of APIs, but this treatment was not running during the
sampling occasions. Finally, the WWTP in Norrköping/Slottshagen dicharges its effluents (1 6327
000 m³/year) to the river Motala ström close to the Bråviken estuary. About 135 500 persons are
connected to the WWTP in Norrköping. Further information on the treatment process and size (in
PE) of the studied WWTPs is shown in chapter 6 (table 6.2).
Sampling locations in the Swedish case study area are presented in the schematic Figure 2.8. Surface
water samples were taken in four lakes (Vättern, Boren, Glan and Dovern), two rivers (Svartån and
Stångån, upstream and downstream the WWTP in Linköping) and in the Bråviken estuary outside
Norrköping. Sediment samples were also taken in the Bråviken estuary, approx. 7,5 km downstream
the discharge of treated wastewater from the WWTP in Norrköping. All water and sediment samples
were taken in December 2017 and in June 2018.
Samples of effluents were also taken from the two major hospitals in the catchment area: the
university hospital in Linköping and the Vrinnevi hospital in Norrköping. The hospital effluents are
discharged to the WWTPs in Linköping/Nykvarn and Norrköping/Slottshagen, respectively. Soil
samples were taken from an agricultural field outside of Linköping where sewage sludge had been
applied two years prior to sampling. The sampling of soil and hospital effluents were both performed
in June 2018.

23
Figure 2.8. Schematic figure of sampling locations within the Swedish case study area of Motala ström.
Lake Roxen recives water from three rivers: Motala ström, Svartån and Stångån. Photo: Helene Ek Henning, CAB.

24
3 Sample storage and analysis The APIs that were analysed from the case study samples were based on existing analytical methods
in SYKE laboratory and amended with highly consumed or highly detected APIs and veterinary
APIs. To find out the highly consumed or highly detected APIs, we reviewed the consumption and
environmental concentration data from the Baltic Sea Region. This included a status report on
pharmaceuticals in the Baltic Sea region (HELCOM and UNESCO 20172), where certain APIs
(allopurinol, gabapentin, levetiracetam, mesalazin, valsartan) with high consumption and no
monitoring data were highlighted, and APIs that were suggested as priority substances in the BSR
countries. To estimate the emissions from animal husbandry, we selected nine veterinary APIs that
are used for farm animals and/or fish in the BSR countries. Five of the nine veterinary APIs are also
used for companion animals. The selected veterinary APIs are used only for animals, except
ivermectin which can also be used as an insecticide e.g. against hair lice.
Collected samples were protected from light and frozen within a few hours after the collection. The
samples were delivered to the laboratory as frozen and stored under -20 ± 2 °C prior to the analysis.
Sludge, soil and sediment samples were lyophilized and stored under -20 ± 2 °C prior to the analysis.
Samples were analyzed within six months after arrival to the laboratory.
The APIs were analysed from the case study samples in SYKE laboratory in Finland using an
UHPLC-MS/MS instrument (Waters Acquity UPLC and Xevo TQ). Before the instrumental
analysis, water samples were extracted with solid-phase extraction (SPE) using HLB discs (Atlantic
HLB-M, 47 mm) for surface and estuary waters and HLB cartridges (Oasis HLB 60 µm, 6 cc, 500
mg) for wastewater influents and effluents. The wastewater influents and effluents were also
analysed with direct injection. The solid samples (i.e., wastewater treatment plant sludge, soil and
sediment) were freeze-dried and extracted with solid-liquid extraction using buffer solution and
methanol. The extracts were further purified by SPE using strong anion exchange cartridges (Oasis
MAX 60 µm, 6 cc, 150 mg). All the samples were filtered through a regenerated cellulose filter
(RC, 0.2 µm pore size, Captiva, Agilent Technologies) prior to analysis with UHPLC-MS/MS. The
LC-MS/MS method could not distinquish between enantiomers of APIs (e.g. citalopram end
escitalopram). Also, the concentrations of tetracycline and oxycycline are given as sum parameter,
because chromatographic separation of these compounds was not obtained, and the compounds
cannot be separated by the mass spectrometer.
All samples were spiked with mass-labelled internal standards before extraction. To estimate the
method overall recovery of the compounds for which mass-labelled surrogates were not available,
all sample batches included at least one spiked sample. Contents were reported for those APIs
having absolute recoveries in the range of 30–160%.
For quality assurance and control, blank samples and a control sample were analysed in each sample
batch. In addition, we performed a stability test for wastewater effluent and river water to evaluate
the effect of sample storage and transportation to the API concentrations. The list of analysed APIs,
and the performance of the analytical methods, including recovery correction method, recoveries of
the spiked control samples and the limits of quantification (LOQ), are presented in Annex 1.
2 UNESCO and HELCOM, 2017. Pharmaceuticals in the aquatic environment of the Baltic Sea
region – A status report. UNESCO Emerging Pollutants in Water Series – No. 1, UNESCO
Publishing, Paris.

25
Table 3.1. Analysis of APIs from water, sludge, soil and sediment samples.
Sample type Sample
amount (g)
Extraction
method
Final volume
(mL)
Detection
method
Number of
APIs
WWTP
influent
1 Direct 1 UHPLC-
MS/MS
75
50 SPE 1
WWTP
effluent
1 Direct 1 UHPLC-
MS/MS
76
100 SPE 1
Surface
water
500 SPE 1 UHPLC-
MS/MS
60
Estuary
water
1000 SPE 0.3 UHPLC-
MS/MS
54
WWTP
sludge
0.5 SLE+SPE 1 UHPLC-
MS/MS
31
Soil
2 SLE+SPE 1 UHPLC-
MS/MS
65
Sediment
2 SLE+SPE 1 UHPLC-
MS/MS
65
SLE = Solid-liquid extraction, SPE = Solid-phase extraction, UHPLC-MS/MS = Ultra high-performance liquid chromatography
combined with multiple reaction monitoring mass spectrometry
26
4 Consumption data of APIs Methods
Drug consumption data for the 83 selected APIs was collected based on the available statistics in
each Baltic Sea country. Data are presented in kg for the years 2015-2017. The complete human
consumption data are presented in Annex 2. The consumption data are based on different sources
and is of different quality described for each country below. Information on the consumption of
veterinary medicines was also collected through a questionnaire organized in collaboration with
HELCOM. The results from this questionnaire are incorporated into this chapter when appropriate.
Finland
Drug consumption statistics are based on the amount of medicines sold by drug wholesalers to
pharmacies and hospitals. Drug consumption statistics are available publicly at the Finnish
Medicines Agency (Fimea) website3, expressed as defined daily doses (DDD) per 1000 inhabitants
and per day. This figure offers estimation of what proportion of the population theoretically receives
a certain drug treatment during a certain period. In the statistics drugs are sorted using the latest
Anatomical Therapeutic Chemical (ATC) classification. Due to the uncertainties of the DDD data,
for this project, the Fimea database for consumption data of the 83 API was directly searched for
more accurate calculation of consumption data. For each API, the corresponding ATC codes were
queried from the database (see Annex 2). All formulations and strengths, including combination
products were taken into account. The data represents the wholesale data in kg of the API. All
pharmaceuticals, hospital and outpatient, both prescription and over the counter (OTC) medicines
are included in the data.
Sweden
Statistics about pharmaceutical sales were ordered from the Swedish eHealth Agency. Anyone
selling pharmaceuticals in Sweden is bound by law to provide regular reports of their sales to the
eHealth Agency. The statistics include medicines registered for both human and veterinary use.
Reported sales data covers both prescribed and non-prescribed medicines provided by pharmacy
operators, retailers and wholesalers. The sales statistics consist of all retailers of pharmaceuticals
(both in pharmacies and other stores with a license to sell non-prescribed drugs), medicines sold to
healthcare and other goods that are subsidized in the high-cost protection. Pharmaceutical supplies
to hospitals and healthcare institutions not dispensed through a pharmacy are not included. The sales
data in kg of the API were calculated based on the sales statistics (i.e. sold packages) combined with
the strength (i.e. amount of API in each package). All formulations and strengths, including
combination products were included in the data.
Germany
The German statutory health insurances index (GKV-drug-index) was used for the calculation of
the consumption data for human pharmaceuticals. Within the GKV-drug-index all pharmaceuticals
are documented which have been sold at e.g. pharmacies and were (partly) paid by the German
statutory health insurances. Thus, privately purchased pharmaceuticals are not included in the
dataset. The GKV-drug index-dataset provides the total amount per active drug substance (mono as
well as combination products) in DDD for each year. For the current dataset, the average amount of
substance per DDD for different kind of intakes, defined by the ATC-Index, was calculated and
multiplied with the DDD/year. For veterinary medicines data were only available for antibiotics.
Data were provided by the German Federal Office of Consumer Protection and Food Safety. The
dataset for veterinary medicines only provides the total amount per class of drugs and not per active
drug substance (e.g. fenbendazole belongs to the class of benzimidazoles).
3 https://www.fimea.fi/web/en/databases_and_registeries/consumption
27
Latvia
The calculations are based on quantities sold in Latvia and the consumption of all medicines is
included: both topical and oral medications, non-combined and combined products, as well as
registered and non-registered medicines. API consumption statistics are publicly available in DDD,
but they do not include topical formulations. The calculations of sold quantities of APIs in kg were
performed by the State Agency of Medicines of Latvia specifically for the needs of CWPharma-
project. The calculations were not done based on the DDD values, but in the following way: for
example, if a package contained 0.5 grams of diclofenac, then 0.5 g was multiplied with the number
of sold packages and converted to kilograms.
Estonia
The statistics about Estonian annual drug consumption are based on wholesalers’ reports. Drug
consumption statistics are available publicly at the State Agency of Medicines (SAM) website4. All
the wholesalers report their drug sales data to the State Agency of Medicines four times a year. The
reports include the following data for each product: ATC code, ingredients, trade name,
pharmaceutical form, strength, package size and the manufacturer. The sales data are presented in
monetary value and by unit of volume (number of packages). The statistics of human and veterinary
medicinal products include sales to general and hospital pharmacies and to other institutions, i.e.
state and scientific institutions. The consumption results are presented in the number of DDDs per
1000 inhabitants per day. Due to the uncertainty of the DDD data, an inquiry was made to the
Estonian Medicines Agency to obtain more accurate consumption data for the 83 active substances
selected for the project. For each API, the corresponding ATC codes were queried from the database.
All formulations and strengths, including combination products were considered. The data
represents the wholesale data in kg of the pure API. All pharmaceuticals, hospital and outpatient,
both prescription and OTC medicines are included in the data.
Lithuania
Statistics of the Lithuanian drug consumption as DDDs were received from the project MORPHEUS
study on pharmaceutical consumption patterns in four coastal regions of the South Baltic Sea (Kaiser
et al., 2019)5. The statistics are also available in the Baltic Statistics on Medicines 2013-2015 and
2016-2018, which are available on the websites of the Estonian, Latvian and Lithuanian medicines
regulatory agencies.
Denmark
Statistics of the total sales of medicines in Denmark can be found at medstat.dk. Medstat.dk contains
statistics on the sales of medicines in Denmark based on the data reported to the Register of
Medicinal Product Statistics. It is mandatory to report the sales of medicines, and therefore the data
covers all sales in Denmark. The data are reported by pharmacies and non-pharmacy outlets that
sell medicines. Besides the medicines sold to individuals, the sales of medicines for use in practices
and for medicine stocks at treatment centers are reported. This is the sales in the primary sector, and
statistics are available from 1996 onwards. The Register of Medicinal Product Statistics also
includes data about medicines sold to hospitals - the hospital sector - statistics are available from
1997 onwards. For the OTC sales from shops outside pharmacies the sales for 2016 and 2017
includes only the sales from the major retail chains (e.g. supermarket chains), because the data has
not been yet checked for completeness. The statistics are available as DDD. For some groups of
medicines for which DDD has not been defined by WHO, a national DDD has been defined.
Poland, Russia and Belarussia
No consumption data were available from Poland, Russia and Belarussia for 2015, 2016 and 2017.
However, for a selection of the APIs studied in this project consumption data became available in a
4 https://www.ravimiamet.ee/en/statistics-medicines 5 Kaiser, A., Tränckner, J. et al. (2019). Pharmaceutical consumption patterns in four coastal regions of the South
Baltic Sea. Germany, Sweden, Poland and Lithuania. Project MORPHEUS 2017 - 2019 Deliverable 3.1.Available at:
https://eucc-d-inline.databases.eucc-d.de/files/documents/00001227_MORPHEUS_DEL3.1_Final.pdf

28
report about pharmaceutical consumption patterns in four coastal regions of the South Baltic Sea
(Kaiser et al. 2019). In this report, data for 2015 was presented for the Pomeranian Voivideship
(Poland) for 19 APIs. The 19 APIs in the MORPHEUS project largely overlapped the APIs selected
for CWPharma. Therefore, this data could be used to extrapolate the consumption for the whole
Poland. However, the consumption data were available only for reimbursed and prescribed
medicines. Thus, the consumption of OTC products (e.g. ibuprofen and naproxen) was likely
underestimated in this data.
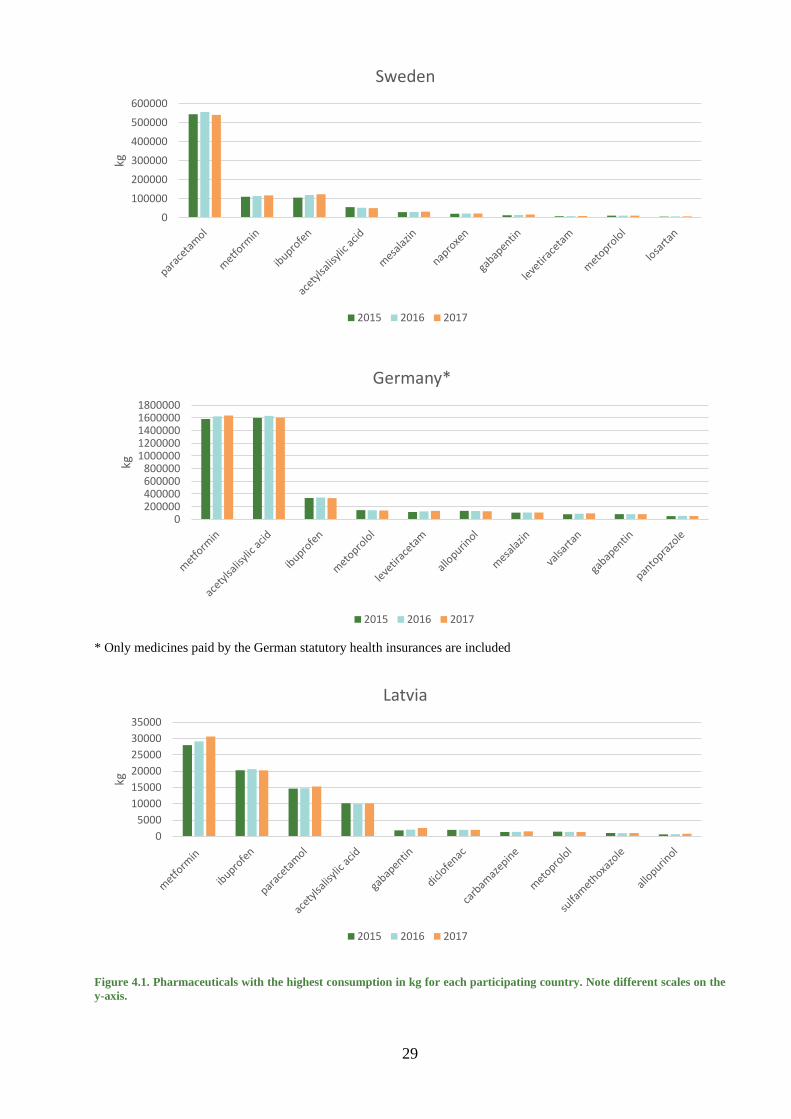
Results and discussion
Human consumption
74 of the 83 APIs studied in this project are primarily used in human medicine. The corresponding
ATC codes and the grouping of the API are presented Annex 2. The top ten consumed APIs in kg
per year for each participating country are presented in figure 4.1. For Lithuania and Denmark data
for human medicines was only available in DDD format and therefore not presented here. The
German data has been converted from DDD data and includes only data for reimbursed medicines.
For Poland, very limited data were available, and therefore the data are not presented. For Russia
and Belarussia no consumption data for 2015, 2016 and 2017 could be obtained from public sources.
0
5000
10000
15000
20000
25000
30000
kg
Estonia
2015 2016 2017
0
50000
100000
150000
200000
250000
kg
Finland
2015 2016 2017
29
* Only medicines paid by the German statutory health insurances are included
Figure 4.1. Pharmaceuticals with the highest consumption in kg for each participating country. Note different scales on the
y-axis.
0
100000
200000
300000
400000
500000
600000kg
Sweden
2015 2016 2017
0200000400000600000800000
10000001200000140000016000001800000
kg
Germany*
2015 2016 2017
0
5000
10000
15000
20000
25000
30000
35000
kg
Latvia
2015 2016 2017

30
Antibiotics The antibiotics for human use considered in this project were ciprofloxacin, clarithromycin,
doxycycline, erythromycin, fluconazole, lincomycin, norfloxacin, ofloxacin, sulfadiazine,
sulfamethoxazole, tetracycline and trimethoprim. Considering the overall antibiotics consumption,
some of the most frequently used antibiotics, such as penicillins, amoxicillin, cefalosporins or
azithromycin were not included in this project. Of note is that lincomycin appears to be
predominantly used for veterinary medicine. In addition, doxycycline, sulfadiazine and
sulfamethoxazole are also used in veterinary medicine, although most of the consumption comes
from human use. In this project, only two antibiotics were among the 10 most consumed APIs. In
Germany tetracycline was the 10th most used API, but this is most likely because only reimbursed
medicines data were available. In Latvia sulfamethoxazole was the 9th most used API.
Antiepileptics The antiepileptics considered in this project included carbamazepine, gabapentin, levetiracetam and
primidone. Some of the commonly used antiepileptics were not included in this project, such as
oxcarbazepine, topiramate, valproate, lamotrigine and pregabaline. Antiepileptics were included
among the 10 most used APIs in each country: gabapentin and levetiracetam in Finland, Sweden
and Germany, gabapentin and carbamazepine in Latvia and carbamazepine in Estonia.
Antihypertensives Medicines used mainly to control high blood pressure, and considered in this project, were
amlodipine, candesartan, enalapril, eprosartan, hydrochlorothiazide, irbesartan, losartan, ramipril,
telmisartan and valsartan. Medicines used also for hypertension, but primarily for other
cardiovascular indications, are included under Other cardiovascular medication. Although the
antihypertensives can be used alone, they are commonly part of a fixed combination product. An
antihypertensive combination product typically includes a diuretic component,
(hydrochlorothiazide) and another blood pressure lowering active ingredient. The proportion of
consumption coming from combination products varies greatly depending on the drug. Of the
antihypertensives studied in this project, losartan was among the 10 most used API in Sweden,
valsartan in Germany, telmisartan in Estonia and both losartan and valsartan in Finland.
Asthma and allergy medications The active pharmaceutical ingredients that were considered in this project included cetirizine,
fexofenadine, fluticasone, mometasone furoate and xylometazoline. Regarding the oral
antihistamines it is important to consider also data for levocetirizine and hydroxyzine.
Levosetirizine is the r-enenthiomer of cetirizine and approximately 45% of the orally administered
hydroxyzine is metabolized into cetirizine. Detection of cetirizine in environmental samples
therefore not only reflects the cetirizine use but also levocetirizine and partly hydroxyzine.
Fluticasone and mometasone are used in inhalation products for allergy and asthma. Mometasone
is also available in topical formulations for dermatological conditions. Xylometazolin is available
alone and in combination with other pharmaceutical ingredients, in a nasal spray formulation for
nasal congestion. None of the APIs studied in this group were among the 10 most used APIs in any
country.
Gastrointestinal disease medications The gastrointestinal disease medications included in this project included the proton-pump
inhibitors esomeprazole, omeprazole and pantoprazole, which are used for conditions such as
gastrointestinal reflux disease. Esomeprazole is the s-enanthiomer of omeprazole, which needs to
be considered when looking at the environmental levels of these medicines. The detection methods
used in this project were not able to distinguish between the enanthiomers. Mesalazine is used to
treat ulcerative colitis and other inflammatory bowel diseases. Typical dose is 1.6 - 2.4 g per day,
which results in rather high overall consumption of the medicine although the proportion of
population using mesalazine is lower than those using e.g. proton pump inhibitors. Olsalazine is a
molecule comprising of two mesalazine molecules and sulfasalazine, which is used for similar

31
indications, metabolises in humans partly into mesalazine. The consumption statistics of
sulfasalazine and olsalazine should be taken into consideration when assessing environmental levels
of mesalazine. Mesalazine was among the 10 most used API in Finland, Sweden and Germany.
Hormones Hormones considered in this project were 17-α-ethinyl estradiol (EE2), 17-β-estradiol (E2), estriol,
estrone, norethisterone, progesterone and testosterone. No consumption for estrone was reported
from any country, suggesting that no medicinal product containing estrone for human is available
in the countries involved. Like many of the hormones studied in this project, estrone is a naturally
occurring hormone in humans and animals. In fertile aged females, the average production of estrone
is between 0.45-1 nmol/day, depending on the stage of the menstrual cycle. The average production
of estrone in males is 0.6 nmol/day.
EE2 is a component in many contraceptive medicines. It is available in contraceptive pills, plasters
and vaginal rings. The total consumption of EE2 is overall quite low in kilograms, due to the very
low amounts of hormones needed to get the desired efficacy. Estriol is available as oral formulations
as well as vaginal cream and suppositories. Norethisterone is available in an oral formulation but is
also available in plasters indicated for hormone replacement therapy. During the use of plasters, 6-
18% of the norethisterone is absorbed and the rest remains in the plaster, which is discarded.
Norethisterone metabolises partly into EE2, which results in a dose of 4-6 micrograms of EE2/1 mg
of norethisterone, when taken orally.
Other hormones are also available in different formulations, such as oral, topical and injections.
Interpretation of environmental levels of these medicines need to consider the metabolism and the
normal excretion of these hormones by humans. For example, the human endogenic testosterone
production is approximately 3.7 mg/day in males and 0.4 mg/day in women. Hormones were not
among the 10 most used APIs in any country.
Metabolic disease medications The metabolic disease medications considered in this project were the type 2 diabetes medication
metformin, lipid lowering medications atorvastatin, simvastatin, bezafibrate and gemfibrozil and
anti-gout medication allopurinol. Metformin is by far the most used oral antidiabetic medication.
The daily dose can be as high as 3 g per day, and type 2 diabetes is a common condition, which
explains the rather high overall consumption. Statins are the first line medical treatment for
hypercholesterolemia. Atorvastatin and simvastatin are among the most frequently prescribed
statins. Other commonly used statins, such as rosuvastatin, pravastatin, lovastatin and fluvastatin
were not included in this project. Fibrates are used for hypercholesterolemia treatment in some
specific situations and if statins are not tolerated. The fibrates included in this project were
bezafibrate and gemfibrozil. One of the most commonly used fibrates, fenofibrate, was not included
in this project. Allopurinol is the first line medical treatment for hyperuricemia that manifests as
gout. Other medicines for the treatment of hyperuricemia, such as febuxostat, probenisid or
benzbromarone were not included in this project.
NSAIDs and analgesics The non-steroidal anti-inflammatory drugs (NSAIDs) and other analgesics considered in this project
included acetylsalisylic acid, codeine, diclofenac, ibuprofen, ketoprofen, naproxen, oxycodone,
paracetamol and tramadol. These are typically available in several different combination products
and in various formulations, such as injections, oral formulations, topical creams, gels or sprays. Of
the NSAIDs ibuprofen was by far the most used in the data collected for this project. Ibuprofen was
among the 10 most used API in all countries. Diclofenac is widely used in topical formulations, and
e.g. approximately 65% of the diclofenac sales in Finland are from topical formulations. There is
no DDD defined for topical diclofenac products, and the consumption data, if only converted from
DDD, is therefore not complete. Diclofenac was among the 10 most consumed API in two countries,
Latvia and Estonia. Naproxen was among the most used API in 3 countries, Finland, Sweden and

32
Estonia. With regards to ketoprofen, also dexketoprofen is available, which is the s-enantiomer of
ketoprofen. Paracetamol is the first recommended medicine for pain and fever in children, pregnant
and elderly, and in long-term conditions such as arthritis. Paracetamol is available alone and in
combination. Paracetamol is among the 10 most API in all countries but Germany. The German
data only included reimbursed medicines and it is possible that paracetamol is mostly bought
without prescription, and therefore not reflected in the German data. Acetylsalisylic acid is used for
pain and fever, but also in lower doses for cardiovascular prevention indications. Due to the
difference in dosing, the DDD for fever and pain is 3 g per day, whereas the DDD for cardiovascular
indications is one UD, (unit dose) which can be, depending on product, for example 50 mg, 100 mg
or 250 mg. Acetylsalicylic acid was also among the 10 most used medicines in all countries but
Germany.
Other cardiovascular medications Other cardiovascular medications considered in this project include beta-blocking agents atenolol,
bisoprolol, metoprolol, nebivolol and sotalol. Dipyridamol is used in cardiovascular disease
prevention and warfarin in the treatment and prevention of deep venous thromboembolism.
Furosemide is a diuretic used to reduce fluid accumulation due to e.g. heart failure. Metoprolol was
among the 10 most used APIs in Sweden, Germany, Latvia and Estonia. The other APIs in this
group did not reach the top 10.
Psychopharmaceuticals The following medicines used for psychiatric indications were considered in this project:
antidepressants citalopram, sertraline and venlafaxine, antipsychotics olanzapine, quetiapine and
risperidone and benzodiazepines oxazepam and temazepam. Citalopram, sertraline and venlafaxine
are amongst the most frequently prescribed antidepressants. Escitalopram is the s-enanthiomer of
citalopram and should be taken into account when environmental levels of citalopram are assessed.
When considering the consumption and environmental concentrations of benzodiazepines, it must
be noted that oxazepam is a metabolite of many other benzodiazepines (e.g. diazepam and
temazepam) and temazepam a minor metabolite of diazepam. None of the medicines in this group
reached the top 10 of most used API in any country.
Caffeine Caffeine was included in this project as one API. However, caffeine from medicines may be
negligible compared to other sources. In some countries, e.g. Finland there is no medicines
registered with caffeine as primary API since 2016. On the other hand, coffee consumption in for
example Sweden and Finland is 9-10 kg/person/year (each cup contains 80 mg/dl caffeine; 1 kg =
130 cups), resulting in more than several hundred tons of caffeine consumed each year in coffee. In
addition, caffeine consumption from cola-drinks, energy drinks, chocolate etc. is likely significant,
compared to medicines. Caffeine from medicines was not among the 10 most used API in any
country.
Discussion on sales statistics Information published on pharmaceutical consumption is often reported in DDD/100
inhabitants/day. Many pharmaceuticals are issued DDD-values that represent the most common
daily dose for the ATC-code. These values are published e.g. by the World Health Organization
(WHO 2018). The DDD/100 inhabitants/day values can thus be converted into mass (e.g. kg/year)
using equation (1).
(1) 𝑪𝒎 = 𝑪𝑫𝑫𝑫 × 𝑷𝒐𝒑 × 𝟑𝟔𝟓 × 𝑫𝑫𝑫
× 𝟏𝟎−𝟔
where
𝑪𝒎 = Sold amount in mass (kg)
𝑪𝑫𝑫𝑫 = Sold amount in defined daily doses (DDD)
𝑷𝒐𝒑 = Population
𝑫𝑫𝑫 = Defined daily dose (g)
However, there are several substances for which the DDD-values are given in some other unit than
mass, or for which no DDD-values are given. This kind of consumption information, given in
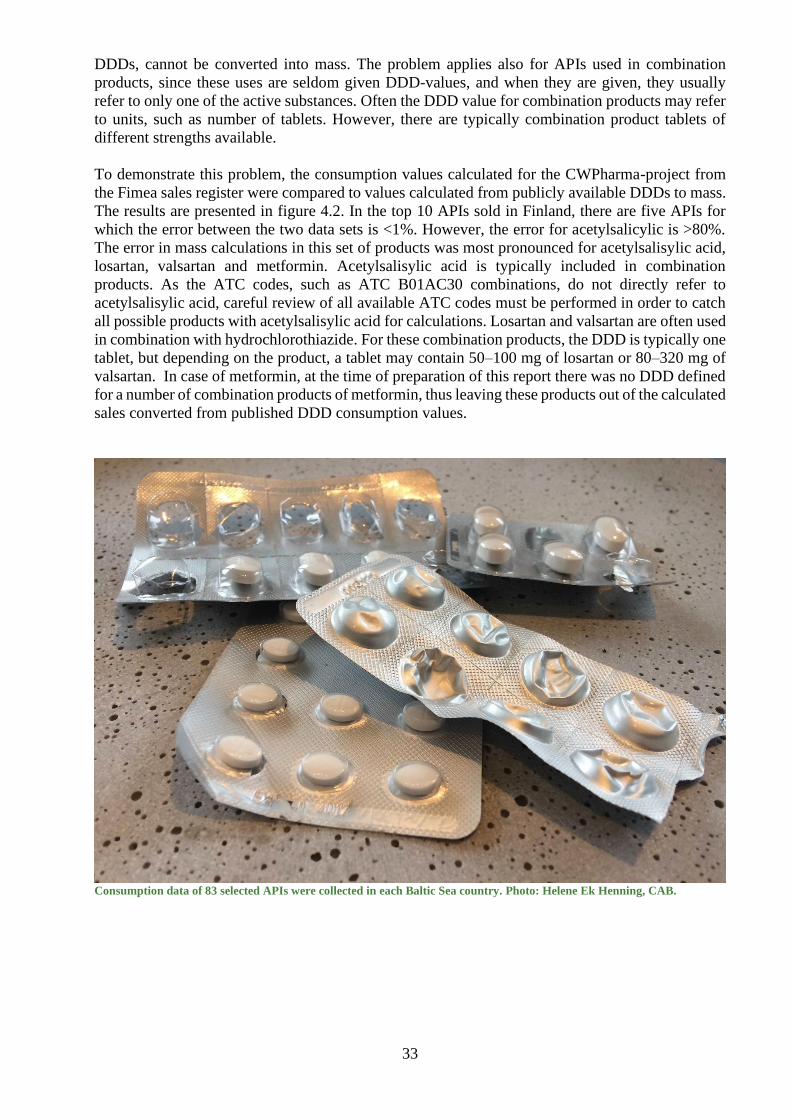
33
DDDs, cannot be converted into mass. The problem applies also for APIs used in combination
products, since these uses are seldom given DDD-values, and when they are given, they usually
refer to only one of the active substances. Often the DDD value for combination products may refer
to units, such as number of tablets. However, there are typically combination product tablets of
different strengths available.
To demonstrate this problem, the consumption values calculated for the CWPharma-project from
the Fimea sales register were compared to values calculated from publicly available DDDs to mass.
The results are presented in figure 4.2. In the top 10 APIs sold in Finland, there are five APIs for
which the error between the two data sets is <1%. However, the error for acetylsalicylic is >80%.
The error in mass calculations in this set of products was most pronounced for acetylsalisylic acid,
losartan, valsartan and metformin. Acetylsalisylic acid is typically included in combination
products. As the ATC codes, such as ATC B01AC30 combinations, do not directly refer to
acetylsalisylic acid, careful review of all available ATC codes must be performed in order to catch
all possible products with acetylsalisylic acid for calculations. Losartan and valsartan are often used
in combination with hydrochlorothiazide. For these combination products, the DDD is typically one
tablet, but depending on the product, a tablet may contain 50–100 mg of losartan or 80–320 mg of
valsartan. In case of metformin, at the time of preparation of this report there was no DDD defined
for a number of combination products of metformin, thus leaving these products out of the calculated
sales converted from published DDD consumption values.
Consumption data of 83 selected APIs were collected in each Baltic Sea country. Photo: Helene Ek Henning, CAB.

34
Figure 4.2. Sales calculated from wholesale data and from published DDD consumption data.

35
Veterinary consumption
9 of the selected 83 APIs in this project are primarily used in veterinary medicine. These included
carprofen, an NSAID, antiparasite products emamectin, fenbendazole, ivermectin and toltrazuril
and antibiotics florfenicol, tiamulin, and tylosin. Ivermectin, is used also in human medicine, but
the use is likely quite limited. Several of the medicines that are used mainly for humans are also
approved for use in veterinary medicine. At least doxycycline, lincomycin, sulfadiazine,
sulfamethoxazole, tetracycline, furosemide, esomeprazole, omeprazole and ketoprofen are used in
veterinary medicine. Some of these are even used in higher quantities in veterinary than in human
treatment. Such examples are ketoprofen and sulfadiazine in Finland, trimethoprim and sulfadiazine
in Sweden and doxycycline, tetracycline and omeprazole+esomeprazole in Latvia. Lincomycin is
used in human medicine only in Latvia, so most of the consumption is veterinary use in the BSR.
The consumption data for veterinary use was more difficult to obtain than consumption data for
human medicines. For some countries only data related to veterinary antibiotic use was available,
and only for different classes of antibiotics and not for a specific API. Some data for veterinary
medicines became available through a HELCOM data call on the use of veterinary medicines and
the treatment of unused veterinary pharmaceuticals carried out 2018-2019. The questionnaire of the
data call was formulated by CWPharma project. In the responses to the questionnaire, data for
additional veterinary medicines that were not considered in this project, were also reported. The
following tables summarise the available data for veterinary consumption for products where at least
1 kg/year of veterinary consumption was reported.
Table 4.1. Veterinary consumption of 9 APIs from the CWPharma project that are primarily used in veterinary medicines,
in kg.
Cou
ntr
y
Yea
r
Flo
rfen
icol
Tia
mu
lin
hyd
rogen
fum
ara
te
Tylo
sin
Lin
com
yci
n
Fen
ben
dazo
le
Tolt
razu
ril
Carp
rofe
n
Em
am
ecti
n-
ben
zoate
Iver
mect
in
Finland 2015 72 23 518 116 1760 190 256 1 20
2016 55 13 468 73 1586 199 274 1 14
2017 97 14 341 258 1468 268 262 1 12
Sweden 2015 0 153 320 0 440 85 421 - -
2016 0 143 328 0 519 85 417 - -
2017 0 76 379 0 616 183 392 - -
Latvia 2015 7 655 533 21 - - - - -
2016 12 556 328 9 - - - - -
2017 14 846 415 32 - - - - -
Estonia 2015 8 931 142 311 39 46 16 0 -
2016 14 728 81 127 43 44 15 0 -
2017 27 692 44 154 58 50 18 0 -
Denmark* 2015 1224 9754 7197 2329 - - - - -
2016 1351 9647 7 926 2061 - - - - -
2017 1481 9315 9203 2270 - - - - -
Lithuania* 2017 112 279 451 198 - - - - -
Poland* 2017 7752 37 789 19 807 6835 2159 698 259 - -
*Data derived from the overview of the results of the HELCOM questionnaire on veterinary
medicines.
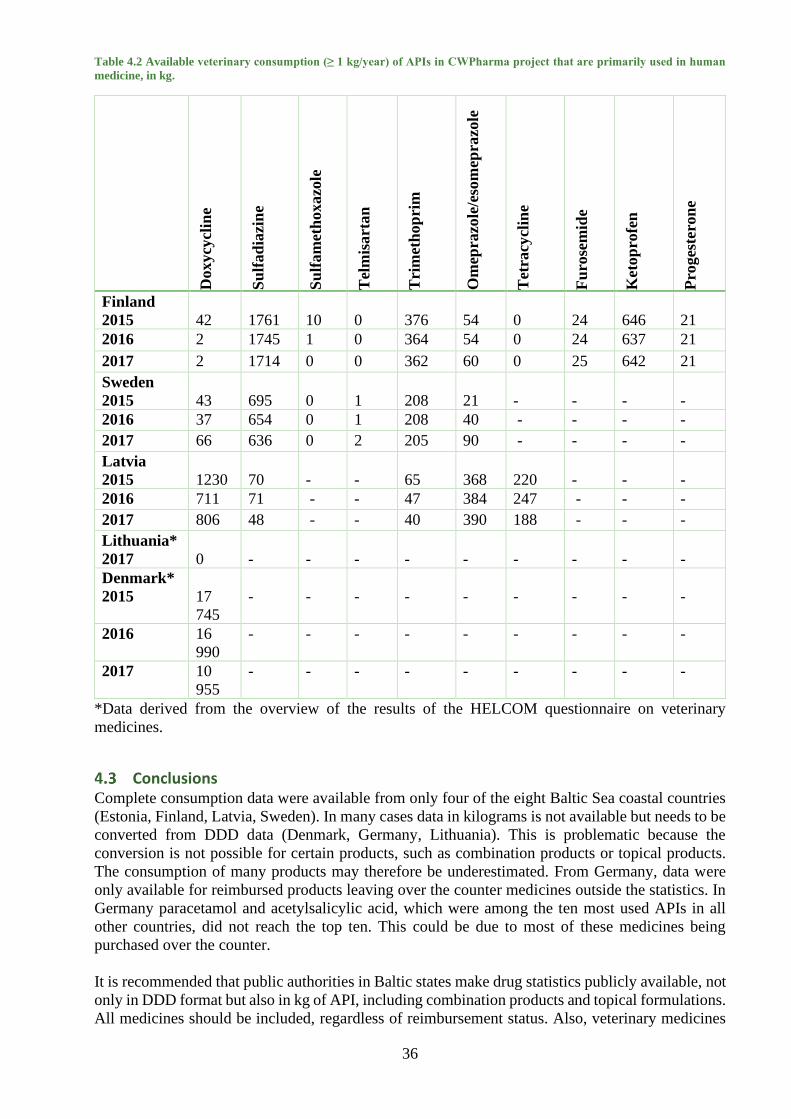
36
Table 4.2 Available veterinary consumption (≥ 1 kg/year) of APIs in CWPharma project that are primarily used in human
medicine, in kg.
Doxycy
clin
e
Su
lfad
iazi
ne
Su
lfam
eth
oxazo
le
Tel
mis
art
an
Tri
met
hop
rim
Om
epra
zole
/eso
mep
razole
Tet
racy
clin
e
Fu
rose
mid
e
Ket
op
rofe
n
Pro
ges
tero
ne
Finland
2015
42
1761
10
0
376
54
0
24
646
21
2016 2 1745 1 0 364 54 0 24 637 21
2017 2 1714 0 0 362 60 0 25 642 21
Sweden
2015
43
695
0
1
208
21
-
-
-
-
2016 37 654 0 1 208 40 - - - -
2017 66 636 0 2 205 90 - - - -
Latvia
2015
1230
70
-
-
65
368
220
-
-
-
2016 711 71 - - 47 384 247 - - -
2017 806 48 - - 40 390 188 - - -
Lithuania*
2017
0
-
-
-
-
-
-
-
-
-
Denmark*
2015
17
745
-
-
-
-
-
-
-
-
-
2016 16
990
- - - - - - - - -
2017 10
955
- - - - - - - - -
*Data derived from the overview of the results of the HELCOM questionnaire on veterinary
medicines.
Conclusions Complete consumption data were available from only four of the eight Baltic Sea coastal countries
(Estonia, Finland, Latvia, Sweden). In many cases data in kilograms is not available but needs to be
converted from DDD data (Denmark, Germany, Lithuania). This is problematic because the
conversion is not possible for certain products, such as combination products or topical products.
The consumption of many products may therefore be underestimated. From Germany, data were
only available for reimbursed products leaving over the counter medicines outside the statistics. In
Germany paracetamol and acetylsalicylic acid, which were among the ten most used APIs in all
other countries, did not reach the top ten. This could be due to most of these medicines being
purchased over the counter.
It is recommended that public authorities in Baltic states make drug statistics publicly available, not
only in DDD format but also in kg of API, including combination products and topical formulations.
All medicines should be included, regardless of reimbursement status. Also, veterinary medicines
37
consumption data for all APIs but especially for antibiotics, in kg, should be made available publicly
for research purposes.
When consumption data are used for estimating the amount of specific APIs in the environment,
several factors must be taken into consideration. If consumption is converted from DDD, significant
underestimation of the consumption may result, in case the API is used in combination products or
in e.g. topical formulations, patches and rings. The DDD may also differ according to the intended
use, like in case of acetylsalisylic acid. Also, stereoisomers, which are often classified as a different
API, need to be reviewed, and as some APIs metabolize to other APIs, the metabolism of the
medicines needs to be considered. When selecting suitable candidates as model APIs for e.g.
modeling the fate of pharmaceuticals, medicines which are commonly used, primarily used as single
ingredient products, and which do not undergo major metabolism should be selected. A good
example of such an API is metformin. Should the selection of the API be driven by factors such as
environmental toxicity, the consumption data of the API should be carefully evaluated. In addition
to stereosisomers and metabolism products of other parent APIs, also other sources need to be
considered, such as natural excretion of hormones by humans and animals.
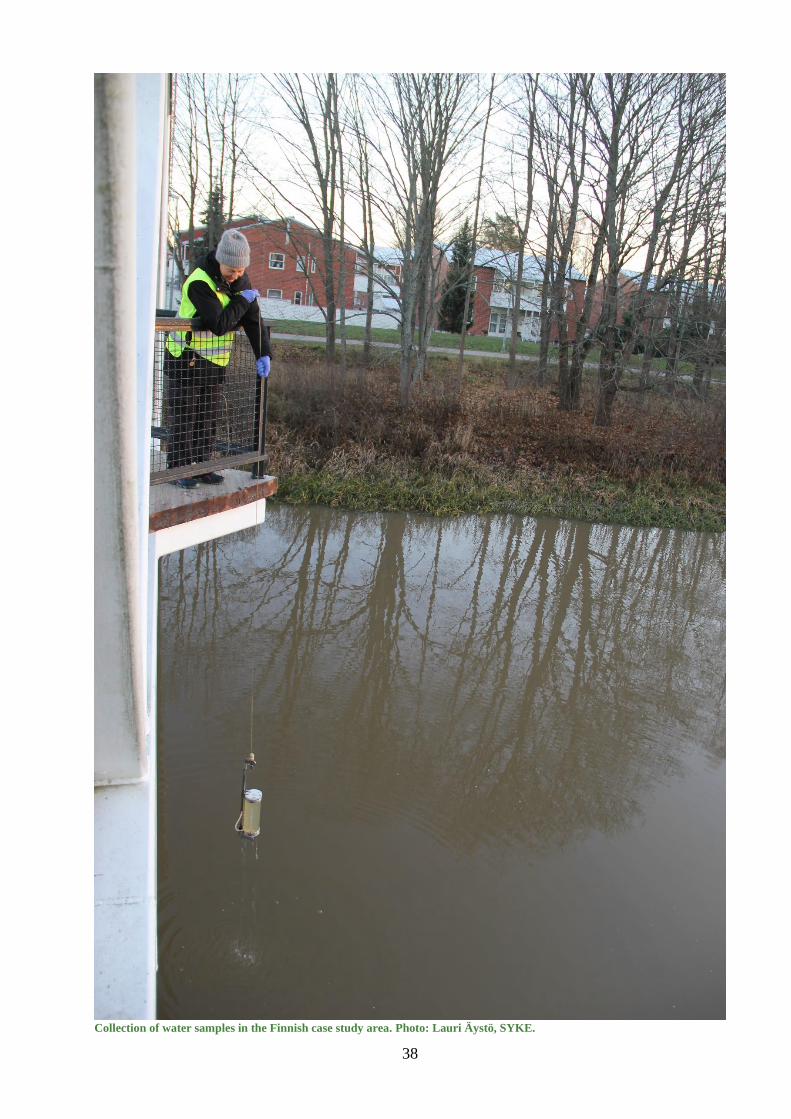
38
Collection of water samples in the Finnish case study area. Photo: Lauri Äystö, SYKE.

39
5 Environmental levels of APIs in the Baltic Sea region
Environmental levels of APIs in inland and coastal waters
Methods
Surface water samples were taken in six case studies in six countries (see chapter 2). Each case
study consisted of several sampling sites, described as upstream or downstream from API sources
like wastewater treatment plants. The sea samples were taken either in the estuaries or in the areas
influenced by the WWTP outlet pipes. The case studies represented anthropogenic areas, where
estimated potential environmental risks caused by pharmaceuticals was higher than average in each
country. An overview of the sampling locations is presented in figure 5.1.
Figure 5.1. Overview of surface water sampling locations and their division into inland and coastal sites. (Sources: Catcment area:
HELCOM 2018; rivers & lakes: European Commission - JRC 2007)
Each site was sampled twice, except the Finnish river Vantaanjoki was sampled three times because
there were extreme flow conditions causing untypical API concentrations in the first two samplings
(high flood in autumn 2017 and extremely low flow in summer and autumn 2018). Samples were
taken as grab samples except the samples taken in Estonia. Information on sampling is presented in
Table 5.1. The methods for chemical analyses are described in the chapter 3.
For many APIs high concentration peaks appeared occasionally, and in order to avoid biased view
of concentrations of APIs in riverine surface waters, the median concentrations are presented with
the minimum and maximum values. Due to limited number of coastal water samples, country
specific average concentrations of APIs were calculated instead of medians. Because LOQs differed
markedly between APIs and to some extent between sea water and freshwater samples, the
concentrations below LOQs were treated as zeroes in all calculations.

40
The potential risk caused by the detected APIs were estimated by calculating a risk quotient (RQ),
see chapter 9. RQ-values exceeding one give a signal of environmental risk. The RQs of all APIs in
each water sample were summed to have a rought estimate of the combined effect of all detected
compounds.
Table 5.1. Number and volume of samples, sampling depths and information concerning sampling.
Country Number of
samples
(inland + coast)
Sampling
depth
Subsamples
(number x volume)
Notes
DE 6 + 4 1 m 6 x 500 mL Sampling carried out using a
standard water sampler
(Ruttner, 1 L).
EE 4 + 2 Inland:
1 m
Coast:
0.5 m
Inland:
64-96 x 50 mL
Coast:
6 x 500 mL
Inland water samples were
taken as time-proportionate
composites.* Grab samples
were taken using a
bathometer.
FI 13 + 12 Inland:
0.3 – 1 m
Coast:
1 – 25 m
Inland:
3 x 1 000 mL
Coast:
2 x 1 000 mL
Samples were taken using a 2
L Limnos water sampler.**
LV 14 + 4 Inland:
0.5–1 m
Coast:
1 / 12 m
Inland:
4 x 800 mL
Coast:
2 x 1000 mL
Samples were taken using a
horizontal bathometer.
PL 4 + 2 0.2–0.5 m 8 x 500 mL Samples were taken using a
bucket sampler.
SE 14 + 2 Inland:
1 m
Coast:
1 / 10 m
2 x 1 000 mL Samples were taken using a
horizontal bathometer.
* Subsamples were taken every 15 minutes, using a composite sampler (MAXX TP6). Number of subsamples varied
because of sampler malfunctioning due to cold weather.
** During winter sampling in estuary and coastal sites, the sampler froze several times between samples, and had to be
rinsed with hot water to melt the ice.
Results and discussion
Observed occurrence and concentration levels of APIs All measured concentrations are presented in Annex 3. 53 to 59 APIs were analysed in each sample
and the number of detected compounds varied from 8 to 49 per sample. Altogether 60 out of 63
analysed APIs were detected in at least one sample. The high detection frequency (DF) was partly
due to the low limits of quantification (LOQ) of the analytical method. For several compounds the
LOQs were lower than 1/1000 of the predicted no effect concentration (PNEC) derived in chapter
9, see Table 5.2. The LOQs were lower than PNEC values for all other APIs except ciprofloxacin
(antibiotic) and estrone (hormone). The low LOQs allowed reliable risk estimations of the analysed
compounds.
In the following sub-chapters, the concentration levels are analysed by API groups. In the end of
the chapter there is a summary table (Table 5.2) of detection frequencies (DF) and concentrations
of each API.
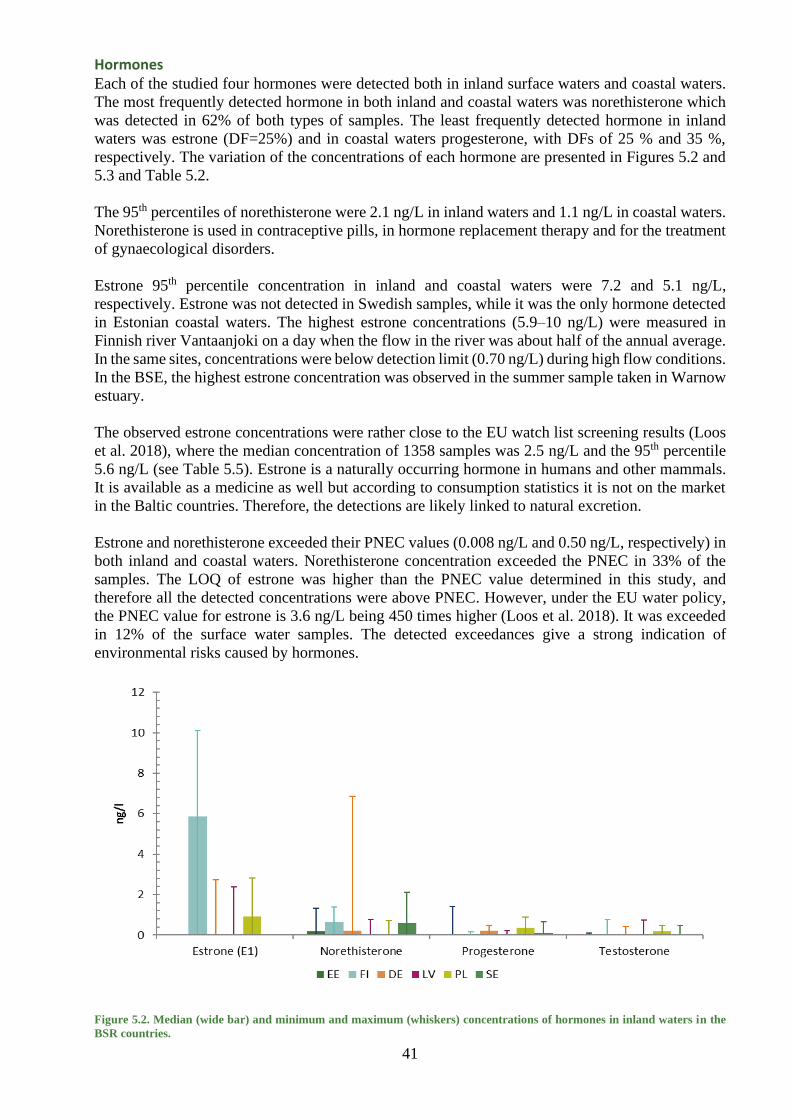
41
Hormones Each of the studied four hormones were detected both in inland surface waters and coastal waters.
The most frequently detected hormone in both inland and coastal waters was norethisterone which
was detected in 62% of both types of samples. The least frequently detected hormone in inland
waters was estrone (DF=25%) and in coastal waters progesterone, with DFs of 25 % and 35 %,
respectively. The variation of the concentrations of each hormone are presented in Figures 5.2 and
5.3 and Table 5.2.
The 95th percentiles of norethisterone were 2.1 ng/L in inland waters and 1.1 ng/L in coastal waters.
Norethisterone is used in contraceptive pills, in hormone replacement therapy and for the treatment
of gynaecological disorders.
Estrone 95th percentile concentration in inland and coastal waters were 7.2 and 5.1 ng/L,
respectively. Estrone was not detected in Swedish samples, while it was the only hormone detected
in Estonian coastal waters. The highest estrone concentrations (5.9–10 ng/L) were measured in
Finnish river Vantaanjoki on a day when the flow in the river was about half of the annual average.
In the same sites, concentrations were below detection limit (0.70 ng/L) during high flow conditions.
In the BSE, the highest estrone concentration was observed in the summer sample taken in Warnow
estuary.
The observed estrone concentrations were rather close to the EU watch list screening results (Loos
et al. 2018), where the median concentration of 1358 samples was 2.5 ng/L and the 95th percentile
5.6 ng/L (see Table 5.5). Estrone is a naturally occurring hormone in humans and other mammals.
It is available as a medicine as well but according to consumption statistics it is not on the market
in the Baltic countries. Therefore, the detections are likely linked to natural excretion.
Estrone and norethisterone exceeded their PNEC values (0.008 ng/L and 0.50 ng/L, respectively) in
both inland and coastal waters. Norethisterone concentration exceeded the PNEC in 33% of the
samples. The LOQ of estrone was higher than the PNEC value determined in this study, and
therefore all the detected concentrations were above PNEC. However, under the EU water policy,
the PNEC value for estrone is 3.6 ng/L being 450 times higher (Loos et al. 2018). It was exceeded
in 12% of the surface water samples. The detected exceedances give a strong indication of
environmental risks caused by hormones.
Figure 5.2. Median (wide bar) and minimum and maximum (whiskers) concentrations of hormones in inland waters in the
BSR countries.

42
Figure 5.3. Average (wide bar) and minimum and maximum (whiskers) concentrations of hormones in coastal waters in the
BSR.
Antibiotics In inland waters the DFs varied from 0% (ciprofloxacin, n=2 and sulfadiazinem n=53) to 100%
(erythromycin, n=2) (Figure 5.4). In coastal waters the DFs of these APIs varied from 4%
(ofloxacin, n=24) to 65% (fluconazole, n=26) (Figure 5.5). Sulfadiazine was analysed only from
three coastal samples and the quantification limit of ciprofloxacin was higher than its PNEC.
In the Polish river samples, the median concentrations of fluconazole (200 ng/L), clarithromycin
(42 ng/L), trimethoprim (12 ng/L) and lincomycin (4.8 ng/L) were higher than in the other countries
(Figure 5.4). Four of the five above mentioned antibiotics were detected in all Polish river samples
(n=4) but trimethroprim only in sampels taken downstream from WWTP. The highest concentration
of antibiotics (590 ng/L) was measured for clarithromycin in the downstream site of the River
Rokitnica in Poland.
In coastal waters, the sampling site specific average concentrations of all studied antibiotics were
below 12 ng/L (Figure 5.5). The highest concentrations were measured for the sum of tetracycline
and doxycycline (23 ng/L) in sample taken in Bråviken (Sweden) and erythromycin (20 ng/l) in
sample taken in the Finnish coast in the mid-depth (14 m) in winter sampling (March).

43
Figure 5.4. Median (wide bar) and minimum and maximum (whiskers) concentrations of antibiotics in inland waters in the
BSR.
Figure 5.5. Average (wide bar) and minimum and maximum (whiskers) concentrations of antibiotics in sea waters in the BSR.
More antibiotics were detected in the winter sampling campaign than in the summer at 26 out of 36
sites, when the number of detected APIs and the sum concentration of antibiotics were used as
indicators. Either of the indicators showed different behaviour in six sites while in the remaining
four sites the results were not clear (no difference between seasons or the two winter sampling times
in Vantaanjoki under different dilution conditions gave contrasting results).
Clarithromycin concentrations exceeded the PNEC-value of 3.9 ng/L in 45% of inland water
samples. Exceedances were detected in samples taken from all partner countries, except Sweden.
The PNEC-value was exceeded most often in Poland and Finland, where the frequency of

44
exceedance was 100% (n=4) and 85% (n=13), respectively. In the Finnish case area, the PNEC-
value was exceeded in every inland water sample during the second (6/2018) and third (11/2018)
sampling campaigns taken during low-flow conditions. Clarithromycin exceeded its PNEC-value in
only one coastal sample, taken at the River Vantaa estuary during the third sampling campaign. The
PNEC value used under the EU water policy (120 ng/L, Loos et al. 2018) was exceeded in only one
sample, taken in November 2017 downstream from the Błonie WWTP in Rokitnica river, Poland.
The median clarithromycin concentration in the EU watch list screening was 15 ng/L and the 95th
percentile 130 ng/L (n=7443) (Loos et al. 2018). In this study, the inland median concentration was
about one fifth of that (3.2 ng/L), while the 95th percentile (100 ng/L) was in the same order of
magnitude as that reported by Loos et al. (2018) (see table 5.5).
Ofloxacin exceeded its PNEC-value (20 ng/L) in inland surface waters occasionally in Latvia,
Poland and Sweden, with an overall frequency of exceedance being 15%. The highest number of
PNEC exceedances were detected in Sweden (5 samples out of 14), all occurring during the first
sampling campaign (12/2017). The sum concentration of tetracycline and doxycycline exceeded the
PNEC of doxycycline (37 ng/L) but not the PNEC value of tetracycline (1730 ng/L) in a Swedish
sample (Stångån upstream).
Antiepileptics All studied antiepileptics were detected in the surface water samples (Figures 5.6 and 5.7). In inland
surface waters, DFs varied from 25% (primidone, n=55) to 98% (carbamazepine, n=55) and in
coastal waters from 19% (levetiracetam, n=26) to 100% (carbamazepine, n=26 and gabapentin, n=3;
gabapentin was analysed in only one Finnish and two Swedish coastal water samples).
The median inland water concentrations of individual APIs varied from <LOQ (levetiracetam and
primidone) to 3.7 ng/L of carbamazepine and 82 ng/L of gabapentin (Figure 5.6). Highest country-
specific median inland water concentrations of gabapentin (900 ng/L), carbamazepine (620 ng/L)
and primidone (12 ng/L) were detected in Polish samples and of levetiracetam (9.4 ng/L) in German
samples. The highest concentration of antiepileptics (1 900 ng/L) was measured for gabapentin in
the downstream site of the River Rokitnica in Poland.
In coastal waters, the concentrations of antiepileptics had 95th percentile of 33 ng/L. The median
concentrations of carbamazepine and gabapentin, which were detected in every coastal water
sample, were 2.0 ng/L and 82 ng/L, respectively. Concentrations of antiepileptics in coastal waters
are presented in Figure 5.7. Case-specific average concentrations of all compounds were mainly
below 7.0 ng/L, but higher values were measured for carbamazepine in Vistula river in Poland (35
ng/L) and in Peene in Germany (17 ng/L). The highest carbamazepine concentration (60 ng/L) in
coastal waters was measured in the Vistula estuary in Poland.
Carbamazepine reached 95th percentiles of 440 ng/L and 48 ng/L in inland and coastal waters,
respectively. The antiepileptic detected in highest concentrations in both inland and coastal waters
was gabapentin, for which the 95th concentration percentile in inland waters was 1 700 ng/L (median
88 ng/L). In coastal samples gabapentin concentrations varied from 34 to 120 ng/L. Since
gabapentin was only analysed from three coastal samples, more data would be needed for proper
comparison between coastal and inland waters. Gabapentin was previously identified as an API for
which there is very little screening data considering its high consumption (UNESCO & HELCOM
20176). The average concentration in the BSR was reported to be approx. 80 ng/L (UNESCO &
6 UNESCO and HELCOM, 2017. Pharmaceuticals in the aquatic environment of the Baltic Sea
region – A status report. UNESCO Emerging Pollutants in Water Series – No. 1, UNESCO
Publishing, Paris.

45
HELCOM 2017), while concentrations reaching 1 300 ng/L have previously been reported from
Germany (UBA 2016). The concentrations detected in the CWPharma-screening campaigns are
well in line with these results.
Primidone was previously also identified as an antiepileptic of concern. The DF was reported to
have reached 100% in water samples taken in Germany (UNESCO & HELCOM 2017), with the
limits of detection ranging from 1 ng/L to 5.7 ng/L. In the CWPharma screening study, the overall
DF was 25%, with LOQ ranging from 0.032 ng/L to 1.4 ng/L. The DF in German coastal water
samples reached 100%, but the total number of samples was very low (n=4). However, considering
the annual sales of primidone are estimated to reach 5 300 kg in Germany, while similar numbers
are <100 kg for Finland, Sweden, Estonia, Latvia and Lithuania combined, it is reasonable to assume
that primidone occurrence is higher in Germany than in the rest of the BSR.
Figure 5.6. Median (wide bar), minimum and maximum (narrow bar) concentrations of antiepileptics in inland waters in the BSR.
Figure 5.7. Average (wide bar) and minimum and maximum (whiskers) concentrations of antiepileptics in sea waters in the BSR.
250
500
750
1000
1250
1500
1750
2000
2250
0
100
200
300
Carbamazepine Gabapentin Levetiracetam Primidone
ng/L
Estonia
Finland
Germany
Latvia
Poland
Sweden

46
Antihypertensives Four of the five studied antihypertensives were detected in at least one surface water sample, only
enalapril was not detected. It should be noted that in coastal waters telmisartan, valsartan,
eprosartan, ramipril, and enalapril were analysed only from three samples.
In inland surface waters, DFs for the detected substances varied from 2% (amlodipine, n=55) to
67% (losartan, n=55) and in coastal waters from 27% (candesartan, n=26) to 69% (losartan, n=26).
Candesartan and losartan were detected in all countries. Amlodipine was detected only in one
Swedish sample.
In inland waters, the concentration of the group of antihypertensives had a 95th percentile of 97 ng/L.
Median concentrations of amlodipine, candesartan, enalapril, eprosartan, irbesartan and ramipril
were below the LOQs. For losartan, telmisartan and valsartan the median concentrations were 1.1,
7.4 and 10 ng/L, respectively.
Figure 5.8. Median (wide bar), minimum and maximum (whiskers) concentrations of antihypertensives in inland waters in the BSR.
Concentrations of telmisartan, valsartan and losartan were markedly higher at some sampling sites
compared to other antihypertensives (Figure 5.9). Highest measured concentrations of irbesartan
(110 ng/L in Germany), telmisartan (2 800 ng/L in Poland) and losartan (200 ng/L in Finland) were
360, 150 and 34 times higher than their quantified median concentrations, respectively.
Nevertheless, no PNEC exceedances were detected for any analysed antihypertensive in any sample.
In coastal water, the concentrations of antihypertensives had an overall 95th percentile of 5.0 ng/L
(Figure 5.10). The sampling site specific median concentrations were below 7.0 ng/L. The highest
concentration (13 ng/L) was measured for candesartan in Bråviken in Sweden.
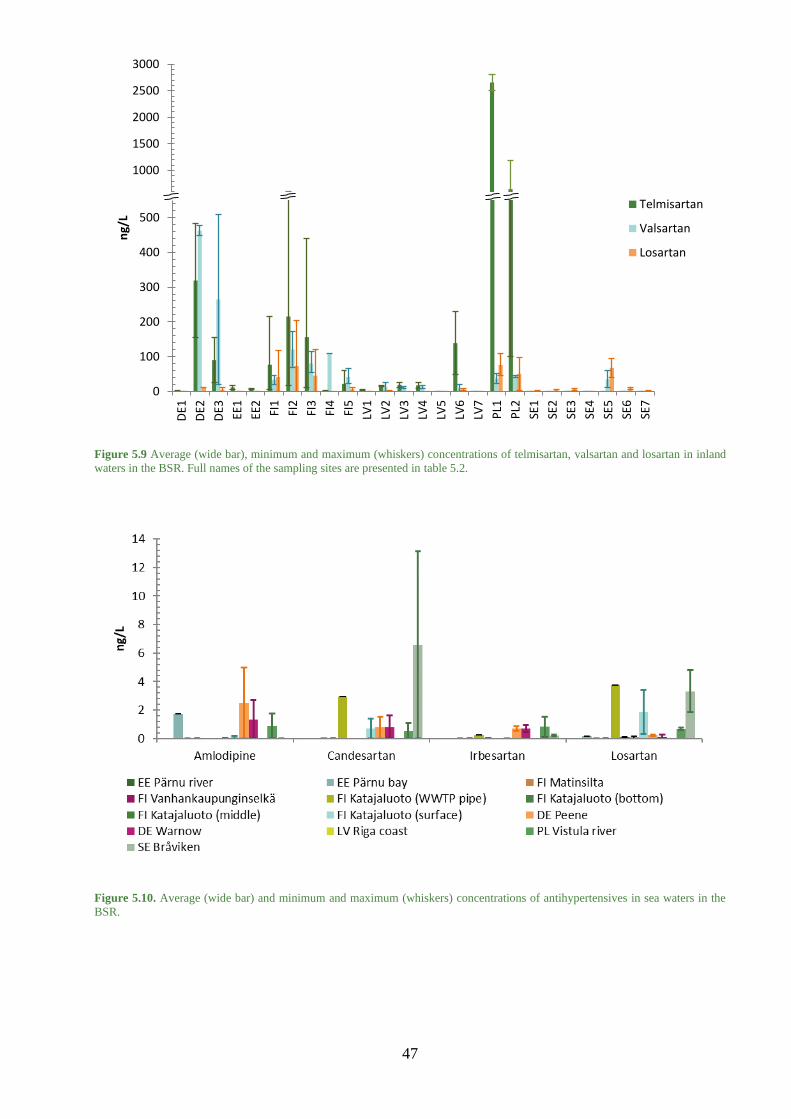
47
Figure 5.9 Average (wide bar), minimum and maximum (whiskers) concentrations of telmisartan, valsartan and losartan in inland
waters in the BSR. Full names of the sampling sites are presented in table 5.2.
Figure 5.10. Average (wide bar) and minimum and maximum (whiskers) concentrations of antihypertensives in sea waters in the
BSR.
500
1000
1500
2000
2500
3000
0
100
200
300
400
500
DE1
DE2
DE3 EE
1
EE2
FI1
FI2
FI3
FI4
FI5
LV1
LV2
LV3
LV4
LV5
LV6
LV7
PL1
PL2
SE1
SE2
SE3
SE4
SE5
SE6
SE7
ng/
L
Telmisartan
Valsartan
Losartan
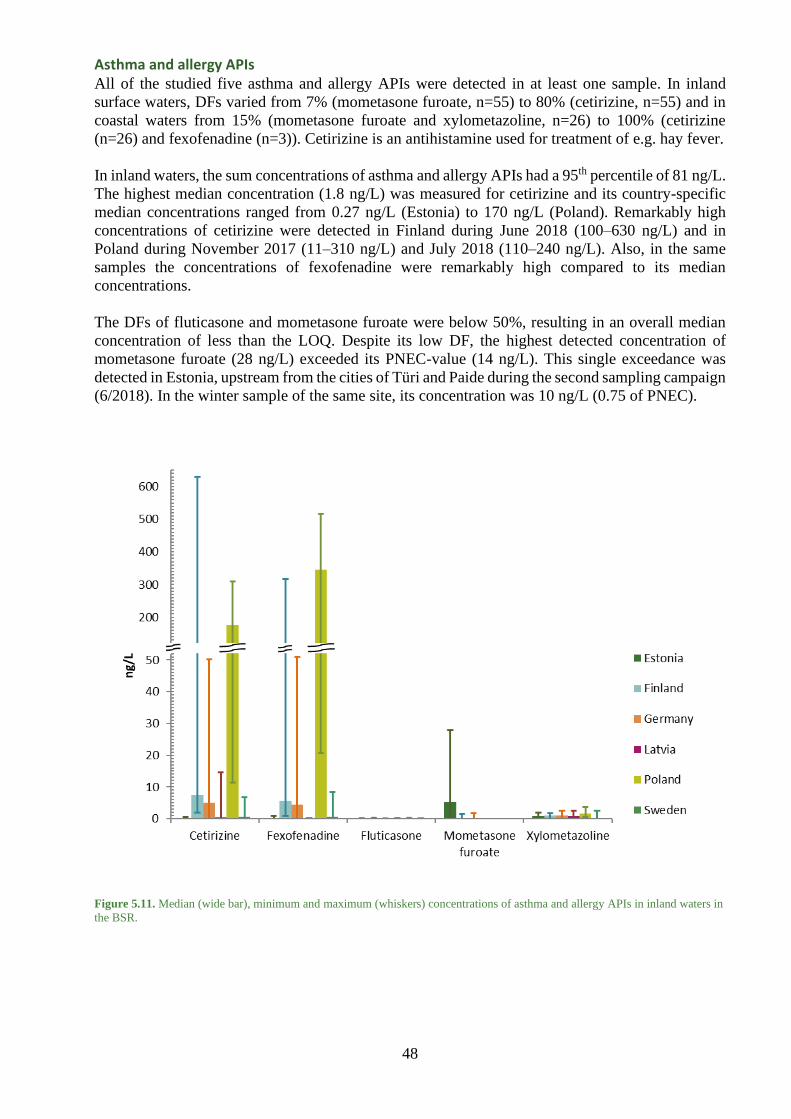
48
Asthma and allergy APIs All of the studied five asthma and allergy APIs were detected in at least one sample. In inland
surface waters, DFs varied from 7% (mometasone furoate, n=55) to 80% (cetirizine, n=55) and in
coastal waters from 15% (mometasone furoate and xylometazoline, n=26) to 100% (cetirizine
(n=26) and fexofenadine (n=3)). Cetirizine is an antihistamine used for treatment of e.g. hay fever.
In inland waters, the sum concentrations of asthma and allergy APIs had a 95th percentile of 81 ng/L.
The highest median concentration (1.8 ng/L) was measured for cetirizine and its country-specific
median concentrations ranged from 0.27 ng/L (Estonia) to 170 ng/L (Poland). Remarkably high
concentrations of cetirizine were detected in Finland during June 2018 (100–630 ng/L) and in
Poland during November 2017 (11–310 ng/L) and July 2018 (110–240 ng/L). Also, in the same
samples the concentrations of fexofenadine were remarkably high compared to its median
concentrations.
The DFs of fluticasone and mometasone furoate were below 50%, resulting in an overall median
concentration of less than the LOQ. Despite its low DF, the highest detected concentration of
mometasone furoate (28 ng/L) exceeded its PNEC-value (14 ng/L). This single exceedance was
detected in Estonia, upstream from the cities of Türi and Paide during the second sampling campaign
(6/2018). In the winter sample of the same site, its concentration was 10 ng/L (0.75 of PNEC).
Figure 5.11. Median (wide bar), minimum and maximum (whiskers) concentrations of asthma and allergy APIs in inland waters in
the BSR.

49
In coastal waters the concentrations of the four asthma and allergy APIs had a 95th percentile of 7.9
ng/L. Site specific average concentrations of cetirizine, which was detected in all samples, ranged
from 0.03 ng/L (Riga coast, Latvia) to 22 ng/L (Matinsilta estuary, Finland). Fexofenadine
concentrations ranged from 0.7 to 3.3 ng/L in the three coastal water samples, where it was analysed.
For other compounds, the sampling site specific average concentrations were below 0.82 ng/L.
Figure 5.12. Average (wide bar) and minimum and maximum (whiskers) concentrations of asthma and allergy APIs in sea waters in
the BSR.
Gastrointestinal and metabolic APIs All studied gastrointestinal and metabolic APIs were detected in at least one surface water sample.
Atorvastatin was analysed only from three coastal samples. In inland waters, mesalazine and
simvastatin were analysed only in two Polish samples and it was detected in both samples.
In inland surface waters, overall DFs varied from 24% (bezafibrate) to 87% (metformin) and in
coastal waters from 27% (bezafibrate) to 78% (mesalazine). Metformin is used for the treatment of
type 2 diabetes and mesalazine in treatment of inflammatory bowel disease. Atorvastatin,
bezafibrate, gemfibrozil and simvastatin are used in the treatment for high cholesterol levels.
In inland water samples, the gastrointestinal and metabolic APIs concentration had an overall 95th
percentile of 560 ng/L. Country-specific median concentrations of metformin in inland waters
varied from 34 ng/L (Latvia) to 260 ng/L (Poland). Metformin and gemfibrozil were the only APIs
in this group which were detected in each country.
In Finland and Latvia concentrations above 1 000 ng/L were measured for atorvastatin and
metformin and in Sweden for metformin. Metformin exceeded its PNEC value (1350 ng/L) in Latvia
(RQ 1.7 in Pupla downstream WWTP site in May), and the concentration was very near the PNEC
in Sweden (RQ 0.96 in Dovern in June) and Finland (RQ 0.96 in Vantaanjoki downstream
Nurmijärvi WWTP in November).
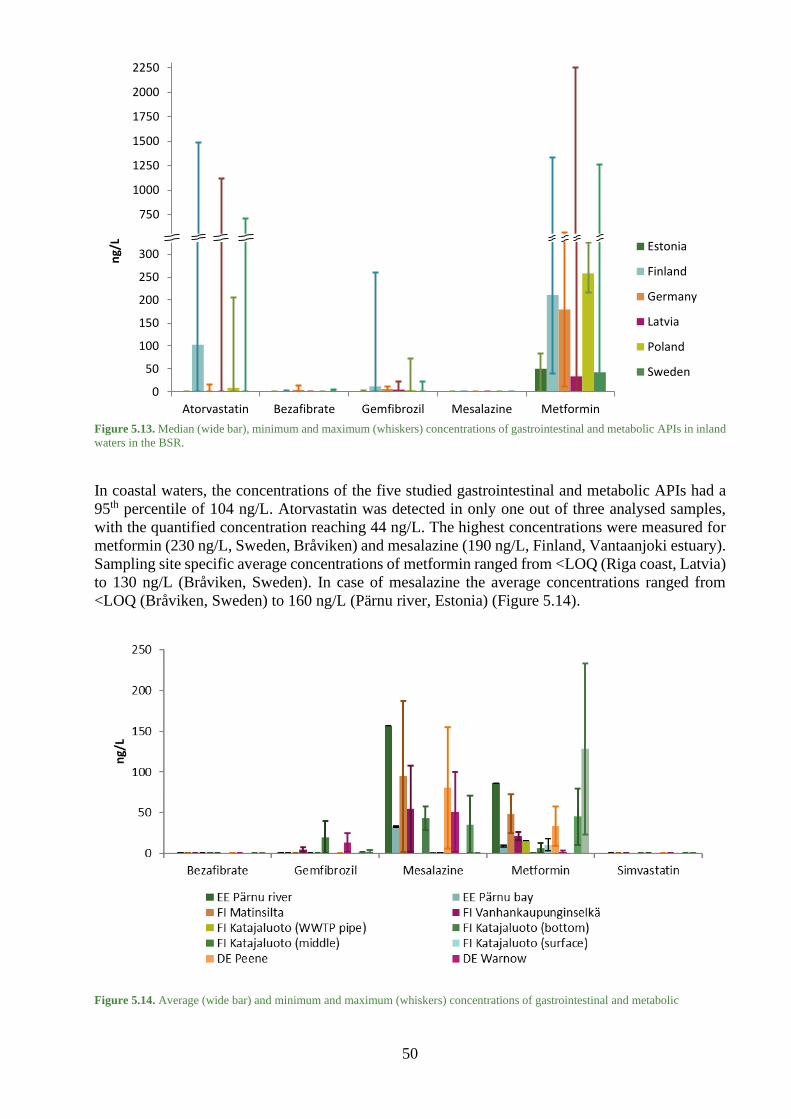
50
Figure 5.13. Median (wide bar), minimum and maximum (whiskers) concentrations of gastrointestinal and metabolic APIs in inland
waters in the BSR.
In coastal waters, the concentrations of the five studied gastrointestinal and metabolic APIs had a
95th percentile of 104 ng/L. Atorvastatin was detected in only one out of three analysed samples,
with the quantified concentration reaching 44 ng/L. The highest concentrations were measured for
metformin (230 ng/L, Sweden, Bråviken) and mesalazine (190 ng/L, Finland, Vantaanjoki estuary).
Sampling site specific average concentrations of metformin ranged from <LOQ (Riga coast, Latvia)
to 130 ng/L (Bråviken, Sweden). In case of mesalazine the average concentrations ranged from
<LOQ (Bråviken, Sweden) to 160 ng/L (Pärnu river, Estonia) (Figure 5.14).
Figure 5.14. Average (wide bar) and minimum and maximum (whiskers) concentrations of gastrointestinal and metabolic
500
750
1000
1250
1500
1750
2000
2250
0
50
100
150
200
250
300
Atorvastatin Bezafibrate Gemfibrozil Mesalazine Metformin
ng/
L Estonia
Finland
Germany
Latvia
Poland
Sweden

51
NSAIDs and analgesics All analysed NSAIDs and analgesics were detected in both inland and coastal waters. All NSAIDs
and analgesics were detected in all countries, with an exception of codeine, which was not detected
in the Estonian inland water samples. In inland surface waters, DFs varied from 49% (ketoprofen)
to 98% (tramadol) and in coastal waters from 19% (ketoprofen) to 96% (tramadol). Tramadol is an
opioid used to treat moderate pain. Diclofenac was detected in 87% and 92% of inland and coastal
water samples, respectively. Diclofenac is used to treat pain and inflammatory diseases and was
listed on the previous EU Water framework directive watch list (2015/495/EY). Median
concentrations of NSAIDs and analgesics in inland water ranged from <LOQ (codeine, ketoprofen
and oxycodone) to 33 ng/L (diclofenac) (Figures 5.15 and 5.16). The 95th concentration percentile
for the group was 360 ng/L. The highest median concentration was measured for diclofenac (33
ng/L), for which country-specific median concentrations ranged from 1.8 ng/L (Sweden) to 1 400
ng/L (Poland). Highest diclofenac concentrations (2 100–2 200 ng/L) were detected in Poland,
downstream from the Błonie WWTP.
Diclofenac exceeded its PNEC-value (85 ng/L) in 35% of all inland water samples. PNEC-
exceedances were most common in Poland (75% of samples (n=4)) and Finland (62% of samples
(n=13)). The PNEC was exceeded occasionally in all Finnish inland sampling sites, and in all
samples during the third, low-flow sampling campaign (11/2018). If the detected concentrations are
compared to the proposed environmental quality standard (EQS) of 50 ng/L (Loos et al. 2018)), the
frequency of exceedance in inland water samples increases to 42%. Similarly, the lowest PNEC-
value reported in literature, 20 ng/L (Orias & Perrodin 2013), is exceeded in 58% of the inland water
samples, and 15% of coastal samples. Highest national median concentrations were detected in
Poland for ketoprofen (7.7 ng/L), naproxen (18 ng/L) and tramadol (430 ng/L), and for codeine and
oxycodone in Finland (10 and 2.4 ng/L, respectively).
Figure 5.15. Average (bar) and minimum and maximum (whiskers) concentrations of tramadol and diclofenac in inland waters in
the BSR. Full names of sampling sites are presented in table 5.2.

52
Figure 5.16. Median (wide bar), minimum and maximum (whiskers) concentrations of NSAIDs and analgesics in inland waters in
the BSR.
In coastal waters, codeine, diclofenac and tramadol were detected in all countries. Highest median
concentrations were measured for diclofenac, for which sampling site specific average
concentrations ranged from <LOQ (Pärnu bay, Estonia) to 35 ng/L (Katajaluoto WWTP pipe,
Finland). Concentrations of diclofenac in the distance of 1.7 km from the Katajaluoto WWTP pipe
ranged from <LOQ to 6.3 ng/L. Ketoprofen was detected only in Riga coast (Latvia), Vistula River
estuary (Poland) and Vantaanjoki estuary (Finland).
Figure 5.17. Average (wide bar) and minimum and maximum (whiskers) concentrations of NSAIDs and analgesics in sea waters in
the BSR.

53
Cardiovascular APIs All cardiovascular APIs were detected, but atenolol and warfarin only in inland water samples. In
inland surface waters, DFs for the detected APIs varied from 7.3% (atenolol) to 85% (metoprolol)
and in coastal waters from 11% (dipyridamole) to 88% (nebivolol).
In inland waters, the median concentrations of cardiovascular APIs varied from <LOQ (atenolol,
dipyridamole, sotalol and warfarin) to 4.5 ng/L (metoprolol) (Figure 5.18). Metoprolol and
nebivolol were detected in all countries. They were also the only cardiovascular APIs with median
concentrations (4.6 ng/L and 0.32 ng/L, respectively) above LOQ. Metoprolol was consistently the
cardiovascular API detected in highest median concentrations in inland waters in each country.
Metoprolol and nebivolol are beta-blockers used to treat high blood pressure.
The highest concentration (290 ng/L) was measured for metoprolol at a Polish sampling site, located
downstream from the Błonie WWTP in the River Rokitnica. Dipyridamole was detected only in two
Finnish inland sampling sites, with a maximum average concentration of 5.4 ng/L being detected
below the Kalteva WWTP.
Figure 5.18. Median (wide bar), minimum and maximum (whiskers) concentrations of cardiovascular APIs in inland waters in the
BSR.
In coastal waters, the overall 95th concentration percentile for the group was 4.5 ng/L. The API
detected in highest median concentrations (0.43 ng/L) was metoprolol. Nebivolol was detected in
each of the countries, with highest concentrations (average 4.4 ng/L) being detected in the Peene
estuary (Germany).
Dipyridamole was detected only in German and Finnish sampling sites. Previously this substance
has been detected in a concentration of 2.8 ng/L in the Baltic Sea water. In this project, the detected
concentrations ranged from 0.92 ng/L to 35 ng/L. The highest concentration was detected in Finland,
at the location of a WWTP discharge pipe. At a sampling site located approx. 1.7 km away from the
discharge pipe, the concentrations for dipyridamole ranged from <LOQ to 2.3 ng/L.
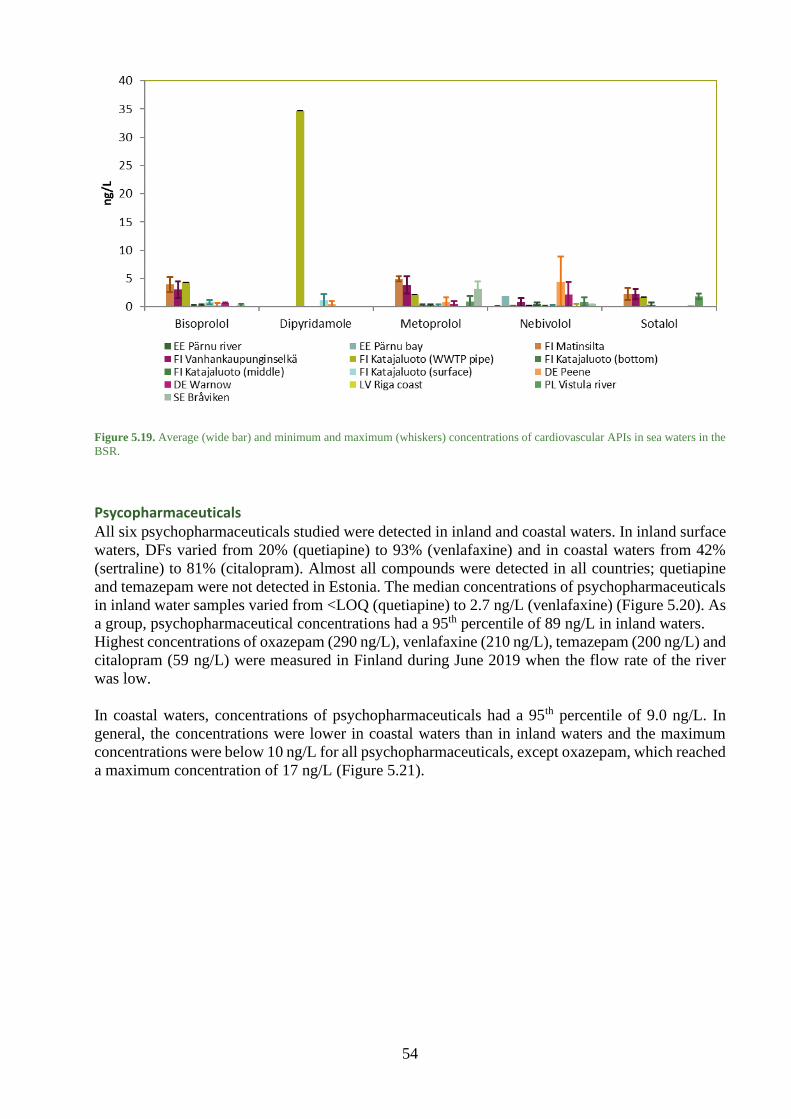
54
Figure 5.19. Average (wide bar) and minimum and maximum (whiskers) concentrations of cardiovascular APIs in sea waters in the
BSR.
Psycopharmaceuticals All six psychopharmaceuticals studied were detected in inland and coastal waters. In inland surface
waters, DFs varied from 20% (quetiapine) to 93% (venlafaxine) and in coastal waters from 42%
(sertraline) to 81% (citalopram). Almost all compounds were detected in all countries; quetiapine
and temazepam were not detected in Estonia. The median concentrations of psychopharmaceuticals
in inland water samples varied from <LOQ (quetiapine) to 2.7 ng/L (venlafaxine) (Figure 5.20). As
a group, psychopharmaceutical concentrations had a 95th percentile of 89 ng/L in inland waters.
Highest concentrations of oxazepam (290 ng/L), venlafaxine (210 ng/L), temazepam (200 ng/L) and
citalopram (59 ng/L) were measured in Finland during June 2019 when the flow rate of the river
was low.
In coastal waters, concentrations of psychopharmaceuticals had a 95th percentile of 9.0 ng/L. In
general, the concentrations were lower in coastal waters than in inland waters and the maximum
concentrations were below 10 ng/L for all psychopharmaceuticals, except oxazepam, which reached
a maximum concentration of 17 ng/L (Figure 5.21).
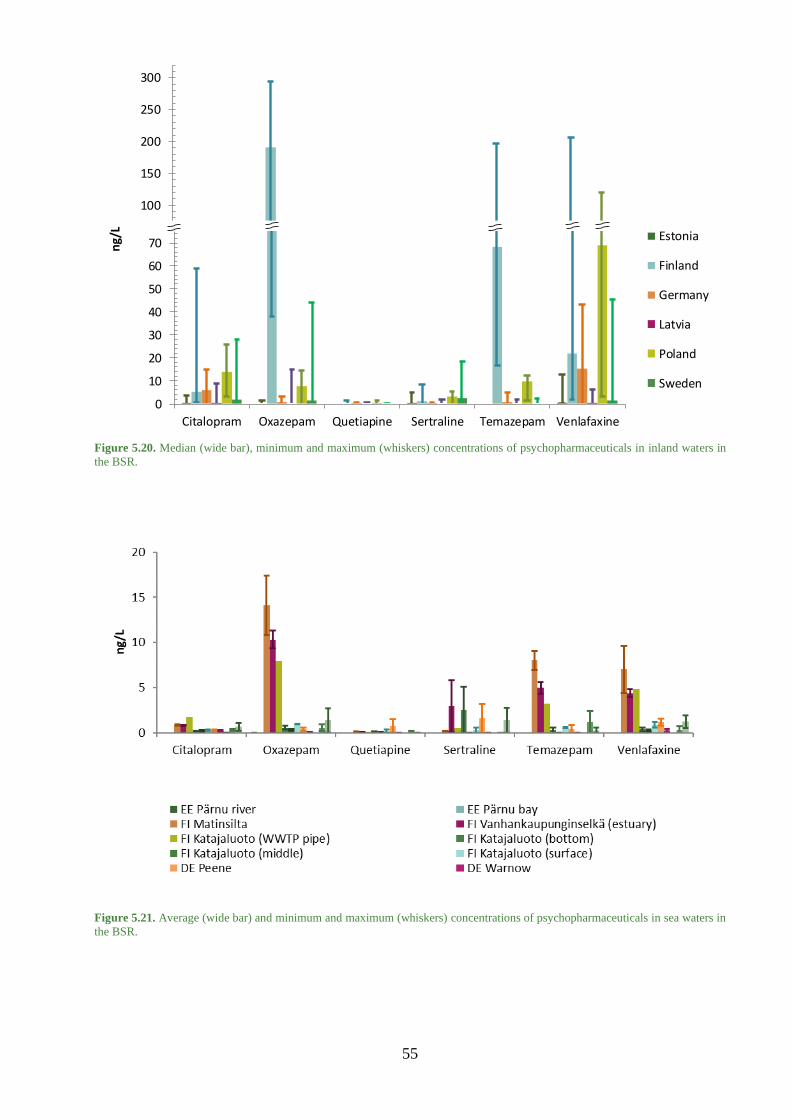
55
Figure 5.20. Median (wide bar), minimum and maximum (whiskers) concentrations of psychopharmaceuticals in inland waters in
the BSR.
Figure 5.21. Average (wide bar) and minimum and maximum (whiskers) concentrations of psychopharmaceuticals in sea waters in
the BSR.
50
100
150
200
250
300
0
10
20
30
40
50
60
70
Citalopram Oxazepam Quetiapine Sertraline Temazepam Venlafaxine
ng/
L
Estonia
Finland
Germany
Latvia
Poland
Sweden

56
Veterinary APIs All six studied veterinary APIs were detected in surface waters. In inland surface waters, DFs varied
from 2% (toltrazuril) to 69% (emamectin) and in coastal waters from 4% (toltrazuril) to 54%
(emamectin and tiamulin). The major application of the most often detected API emamectin is the
treatment of sea lice infestations in aquaculture, but it is also used as pesticide against mites and
other insect species. It is currently approved as a crop protection chemical in EU but e.g. in Finland
and Sweden no products are registered. Tiamulin is an antibiotic used in poultry and pig farming.
In inland waters the median concentrations of veterinary APIs varied from <LOQ (carprofen,
fenbendazole, toltrazuril and tylosin) to 0.15 ng/L (emamectin). The case specific median values
area given in Figure 5.22. The group concentrations of the six veterinary APIs had a 95th percentile
of 4.7 ng/L in inland waters.
Figure 5.22. Median (wide bar), minimum and maximum (whiskers) concentrations of veterinary APIs in inland waters in the BSR.
In coastal waters, concentrations were at the same level as in inland waters. Tiamulin and emamectin
were detected in all countries, reaching the highest sampling site specific median concentrations in
Latvia (0.58 ng/L, site LV5) and Sweden (1.8 ng/L, site SE3), respectively.
Toltrazuril was detected only in Finland: in one inland sample taken in November 2018 and one
coastal sample taken in March 2018. The detections were temporally and spatially unconnected.
The inland water sample with a positive detection was taken from the river Vantaanjoki 68 km
upstream from the river mouth (site FI1), while the coastal water sample was taken 1.7 km from the
WWTP discharge pipe located near Katajaluoto islet, roughly 10 km off the Helsinki coastline. Both
detections were only slightly above the LOQ. To assess whether toltrazuril is widely present at very
low concentrations in surface waters, a screening study using a more sensitive analytical method
would be required.
Emamectin exceeded its PNEC-value (1 ng/L) in at least one sample in all countries except in
Finland. The exceedances were more common in coastal waters than in inland waters. PNEC was
exceeded in one Swedish inland water sample, taken upstream of the lake Roxen. Coastal PNEC-
exceedances were detected occasionally in Germany, Estonia and Latvia. The highest emamectin
concentrations were detected during the second sampling campaign (May 2018) in Germany, when
concentrations in the estuaries of rivers Peene and Warnow reached 7.2 ng/L and 4.6 ng/L,
respectively.

57
Figure 5.23. Average (wide bar) and minimum and maximum (whiskers) concentrations of vaterinary APIs Baltic Sea water.
Caffeine Caffeine was detected in 89% of the inland water samples and in 96% of the coastal water samples.
The median concentration of caffeine was 32 ng/L in surface waters and 6.0 ng/L in coastal waters.
Sampling site specific average surface water concentrations ranged from 1.2 ng/L (Luhtajoki,
Finland) to 220 ng/L (Upstream site of the River Rokitnica, Poland) (Figure 5.24). In coastal water
samples the sampling site specific average concentrations ranged from <LOQ (Pärnu bay, Estonia)
to 77 ng/L (Bråviken, Sweden). The amount of caffeine originating from pharmaceutical use was
assumed negligible in comparison to caffeine originating from coffee and other drinks.
Figure 5.24. Average (wide bar) and range (whiskers) of concentrations of caffeine in the surface waters of the BSR. Full names of
sampling sites are prestented in table 5.2.

58
Figure 5.25. Average (wide bar) and minimum and maximum (whiskers) concentrations of caffeine in coastal waters in the
BSR.
Overview of the API levels in surface waters Carbamazepine, tramadol and venlafaxine were detected in at least 90% of inland water samples.
Corresponding APIs in coastal water samples were carbamazepine, cetirizine, tramadol, caffeine
and diclofenac. Although DFs of carbamazepine and tramadol were over 90% in both inland and
coastal water samples, their median concentrations were 1.9 and 3.8 times higher in inland surface
waters compared to coastal waters, respectively.
In inland waters, the APIs detected in highest median concentrations were gabapentin (88 ng/L),
metformin (78 ng/L) and diclofenac (33 ng/L). In coastal waters corresponding APIs were
metformin (12 ng/L), caffeine (6.0 ng/L) and diclofenac (2.7 ng/L). Also, gabapentin concentrations
were high in coastal waters (34–120 ng/L), but it was analysed in only three samples and therefore
the data are not very comprehensive. Ciprofloxacin, sulfadiazine and enalapril were the only
compounds which were not detected in any surface water sample.
In inland waters, the mean concentrations of antiepileptics, gastrointestinal and metabolic disease
APIs were significantly higher (ANOVA; p < 0.05) compared to other analysed API groups except
caffeine and NSAIDs and analgesics (Figure 5.26). In coastal waters, the concentrations of
gastrointestinal disease APIs and caffeine were significantly higher compared to every other API
group (ANOVA; p < 0.05). The detection frequencies and concentrations of each API are
summarised in Table 5.3.

59
Figure 5.26. Average (plots) and 95% confidence interval (whiskers) concentrations of APIs in surface waters of the BSR.
Table 5.2. Full names of inland water sampling sites.
Code Site name
DE1 Tollense river, upstream WWTP Neubrandenburg
DE2 Tollense river, downstream WWTP Neubrandenburg
DE3 Warnow river, upstream Rostock
EE1 Pärnu river after river Esna, before city of Paide
EE2 Pärnu river, Jändja
FI1 Vantaa 68,2, upstream WWTP Kalteva
FI2 Vantaa 64,8, downstream WWTP Kalteva
FI3 Vantaa 44,1
FI4 Luhtajoki, downstream of a WWTP
FI5 Vantaa 4,2 (4.2 km from the river mouth)
LV1 Mēmele, 0.5 km below Skaistkalne
LV2 Mūsa river, Latvia-Lithuania border
LV3 Driksa river, upstream Jelgava
LV4 Driksa river, downstream Jelgava
LV5 Pupla river, upstream Olaine
LV6 Pupla river, downstream Olaine
LV7 Lielupe, 0.5 km below Kalnciems
PL1 Rokitnica river, downstream Błonie WWTP
PL2 Rokitnica river, upstream Błonie WWTP
SE1 Vättern
SE2 Boren, downstream Motala WWTP
SE3 Svartån
SE4 Stångån, upstream Linköping WWTP
SE5 Stångån-Roxen, downstream Linköping WWTP
SE6 Dovern
SE7 Glan
SE8 Bråviken (BSE), downstream Norrköping WWTP
0
20
40
60
80
100
120
140
ng/
L
Coastal
Inland

60
Table 5.3. Summary of API detection frequencies (DF) and median and maximum concentrations in surface waters.
Substance PNEC
(CWPharma)
(ng/L)
Inland water Coastal water
n DF
(%)
Median
(ng/L)
Max
(ng/L)
n DF
(%)
Median
(ng/L)
Max
(ng/L)
Amlodipine 100 55 2 <LOQ 9.8 26 38 <LOQ 7.0
Atenolol 194 000 55 7 <LOQ 52 26 0 <LOQ <LOQ
Atorvastatin 21 00 53 38 <LOQ 1 500 1 0 <LOQ <LOQ
Bezafibrate 1 260 55 24 <LOQ 13 26 27 <LOQ 0.59
Bisoprolol 8 000 55 36 <LOQ 70 26 50 0.13 5.3
Caffeine 87 000 55 89 32 400 26 96 6.0 140
Candesartan 421 55 42 <LOQ 19 26 27 <LOQ 13
Carbamazepine 1 280 55 98 3.7 920 26 100 2.0 60
Carprofen 37 270 55 47 <LOQ 9.8 26 12 <LOQ 3.0
Cetirizine 78 620 55 80 1.8 630 26 100 1.2 22
Ciprofloxacin 5.1, (89*) 2 0 <LOQ <LOQ 23 0 <LOQ <LOQ
Citalopram 15 400 55 87 2.0 59 26 81 0.25 1.7
Clarithromycin 3.9, (120*) 55 73 3.2 590 26 62 0.080 7.3
Codeine 16 000 38 61 <LOQ 23 25 88 0.18 1.9
Diclofenac 85, (50*) 55 87 33 2 200 26 92 2.7 35
Dipyridamole 2 360 55 9 <LOQ 6.9 26 12 <LOQ 35
Emamectin 1 55 69 0.15 3.2 26 54 0.20 7.2
Enalapril 44 736 53 0 <LOQ <LOQ 1 0 <LOQ <LOQ
Eprosartan 100 000 53 34 <LOQ 4.9 1 100 0.24 0.24
Erythromycin 83.5 2 100 <LOQ 0.13 23 48 <LOQ 20
Estrone (E1) 0.008 55 25 <LOQ 10 26 54 0.27 5.4
Fenbendazole 15 55 29 <LOQ 0.63 26 19 <LOQ 0.51
Fexofenadine 200 000 53 70 0.79 520 1 100 2.2 2.2
Fluconazole 15 000 55 71 1.2 280 26 65 0.33 7.4
Fluticasone 550 55 31 <LOQ 0.41 26 38 <LOQ 0.30
Gabapentin 100 000 53 89 82 1 900 1 100 82 82
Gemfibrozil 825 55 62 4.1 260 26 38 <LOQ 40
Irbesartan 100 000 55 47 <LOQ 110 26 62 0.040 1.5
Ketoprofen 2 000 55 49 <LOQ 280 26 19 <LOQ 3.9
Levetiracetam 100 000 55 38 <LOQ 120 26 19 <LOQ 6.5
Lincomycin 1 290 55 44 <LOQ 9.4 26 50 0.020 1.5
Losartan 7 800 55 67 1.1 200 26 69 0.19 7.7
Mesalazine 911 000 2 100 <LOQ 0.12 23 78 2.3 190
Metformin 1 350 55 87 78 2 300 26 69 12 230
Metoprolol 4 380 55 85 4.6 290 26 54 0.43 6.0
Mometasone furoate 14 55 7 <LOQ 28 26 15 <LOQ 0.36
Naproxen 4 980 53 75 3.1 94 22 73 1.1 16
Nebivolol 377 55 65 0.32 4.0 26 88 0.21 8.9
Norethisterone 0.50 55 62 0.26 6.9 22 59 0.040 1.2
Ofloxacin 20.4 55 24 <LOQ 340 25 4 <LOQ 15
Oxazepam 810 38 79 0.45 290 25 76 0.45 17
Oxycodone 3 304 000 38 68 <LOQ 15 25 52 0.040 0.97
Primidone 100 000 55 25 <LOQ 61 26 23 <LOQ 1.5
Progesterone 2 000 55 45 <LOQ 1.4 26 35 <LOQ 0.24
Quetiapine 10 000 55 20 <LOQ 1.2 26 54 0.010 1.5
Ramipril 100 000 53 26 <LOQ 19 1 0 <LOQ <LOQ
Sertraline 1 070 55 62 0.39 19 26 42 <LOQ 5.8
Simvastatin 22 800 2 100 <LOQ 0.080 23 30 <LOQ 0.14
Sotalol 300 000 55 33 <LOQ 190 26 35 <LOQ 3.4
Sulfadiazine 135 53 0 <LOQ <LOQ 1 0 <LOQ <LOQ
Telmisartan 9 880 53 66 6.4 2 800 1 100 1.8 1.8
Temazepam 930 38 53 <LOQ 200 25 48 <LOQ 9.7
Testosterone 1 500 55 35 <LOQ 0.78 26 54 0.060 5.8
Tetra- + doxycycline 1 730/37 55 9 <LOQ 46 26 46 <LOQ 23
Tiamulin 165 55 58 0.11 0.73 26 54 0.010 3.1
Toltrazuril 440 55 2 <LOQ 5.1 26 4 <LOQ 4.4
Tramadol 170 000 55 98 4.4 690 26 96 1.1 11
Trimethoprim 508 000 55 56 0.69 83 26 54 0.10 3.8
Tylosin 34 55 15 <LOQ 20 26 12 <LOQ 3.5
Valsartan 125 000 53 55 8.2 510 1 100 6.7 6.7
Warfarin 67 600 55 16 <LOQ 3.4 26 0 <LOQ <LOQ
Venlafaxine 3 220 55 93 2.7 210 26 69 0.55 9.6
Xylometazoline 2 030 55 65 1.1 3.8 26 15 <LOQ 1.6

61
Observed concentrations versus PNECs Eight of the detected 60 APIs exceeded their predicted no-effect concentrations (PNEC) in at least
one surface water sample: hormones estrone and norethistrone, antibiotics clatrithromycin,
ofloxacin, an analgesic diclofenac, a veterinary medicine emamectin benzoate, an asthma and
allergy medicine mometasone furoate and a metabolic desease medicine metformin (see chapter 9).
In one sample also the sum concentration of tetracycline and doxycycline exceeded the PNEC of
doxycycline but not the PNEC of tetracycline, which is much higher. These are not the same APIs
as those observed at the highest concentrations. The number of APIs occurring in concentrations
higher than PNEC varied from 0 to 4 per sample (median 1 and average 1.4). In ca. 75% of the
samples at least one API exceeded its PNEC. When the natural hormone estrone was excluded, 63%
of samples had at least one API exceeding its PNEC. The estimation of the risk caused by estrone
is uncertain due to the high LOQ compared to PNEC value and the high variation of PNEC values
reported in different sources.
The RQ values of the detected APIs in each sample were summed together in order to estimate the
potential mixture effects. The sum RQ values are given in Table 5.4. The sum RQ was dominated
by few APIs. However, it must be noted that some APIs that were not analysed in the surface water
may pose a risk.
Concentrations and calculated risks varied between the case study areas, sites within the areas (e.g.
upstream and downstream) and between the sampling occasions. The flow conditions had marked
effects on the variation of concentrations between sampling times. For example, in the Finnish river
Vantaanjoki, extreme flow conditions during the samplings resulted in both extremely low and
exceptionally high dilution conditions for the treated wastewater. Also, the usage of certain APIs as
well as the degradation in WWTPs and surface water varies with seasons. In future screenings and
monitoring campaings, it would be beneficial to have more sampling occasions to get information
on different flow conditions and seasons, and to overcome the non-representative concentrations in
single samples.
The PNEC values have high influence on calculated risk quotients. In this study, the PNECs of
estrone and clarithromycin were lower while PNECs of diclofenac, ciprofloxacin and erythromycin
were higher than those used under the EU water policy watch list screening (Loos et al. 2018), see
Table 5.5. The observed concentrations of estrone and diclofenac were similar for the watch list
screening, but the calculated RQ values differed, especially for estrone, due to differences in the
PNEC values used in the studies. In this study, the RQ values for estrone would be much smaller
using the PNEC value of Loos et al. (2018).
Conclusions
The six case studies gave a good snapshot on the occurrence of the selected APIs in surface waters
within Baltic Sea Region: pharmaceuticals are present in rivers, lakes, estuaries and coastal areas
close to cities and under other anthropogenic influence. In each water sample, 8–49 APIs were
detected, and the sum concentration of the detected APIs varied from 1.8 ng/L to 12 µg/L per
sample. Altogether 60 of the analysed 63 APIs were detected in at least one inland or coastal surface
water sample.
Eight APIs were detected in concentrations exceeding their PNEC values. These APIs were
hormones estrogen and norethisterone, antibiotics clarithromycin and ofloxacin, an analgesic
diclofenac, a veterinary medicine emamectin, an asthma and allergy medication momeasone furoate
and a metabolic disease medicine metformin. At least one API exceeded its PNEC in 63 of 83
surface water samples. In 8 of 83 samples, there were four APIs present in concentrations higher
than PNEC. These results indicate an urgent need to decrease the emissions of pharmaceuticals into
the surface waters. The case study screening results highlight the need to monitor pharmaceuticals

62
and to find ways to decrease their concentrations in the surface waters. The results may be utilized
to design future studies and monitoring.
Table 5.4 A summary of the sum risk quotients (sum RQ) and a list of APIs exceeding the PNEC (APIs with RQ>1) in each
case study area. In the Swedish and Finnish case studies, the RQ for metformin was very close to 1 and thus presented in
brackets. For non-detected concentrations the calculated RQ is marked as ND. Doxycycline RQ was calculated by comparing
the sum concentration of tetracycline and doxyxycline to doxycycline PNEC.
Inland water samples Coastal water sampels
Sum RQ APIs with RQ>1 Sum RQ APIs with RQ>1
Estonia Pärnu river: 2 sites Pärnu estuary / bay
1.2 – 5.2 Norethisterone (ND–2.7)
Clarithromycin (ND–1.3)
Mometasone furoate (ND–2.0)
Emamectin benzoate (ND–1.0)
100 – 215 Estrone (100–213)
Poland Rokitnica river: 2 sites Vistula mouth
11 – 361 Estrone (ND–350)
Clarithromycin (2.1–150)
Diclofenac (0.73–26)
Ofloxacin (ND–3.0)
Norethisterone (ND–1.4)
4.4 – 32 Estrone (ND–31),
Norethisterone (ND–2.4),
Emamectin benzoate (ND–1.6)
Germany Tollense river: 2 sites; Warnow upstream Peene estuary & Warnow river mouth
0.03–352 Estrone (ND–340)
Norethisterone (ND–14)
Clarithromycin (ND–12)
Diclofenac (ND–5.8)
0.4 – 680 Estrone (ND–674),
Norethisterone (ND–1.7),
Emamectin benzoate (ND–7.2)
Latvia 7 river sites Riga (near WWTP pipe)
0.1 – 301 Estrone (ND–300)
Norethisterone (ND–1.6)
Clarithromycin (ND–27)
Diclofenac (ND–13)
Metformin (ND–1.7)
0.1 – 2.3 Emamectin benzoate (ND–2.1)
Sweden Chain of lakes and streams: 7 inland sites Bråviken
0.8 – 20 Ofloxacin (ND–17)
Norethisterone (ND–4.2)
Emamectin benzoate (ND–3.2)
Diclofenac (ND–1.9)
Doxycycline (ND-1.3)
[Metformin (ND–0.93)]
1.0 – 3,1 Norethisterone (ND–1.1)
Finland River Vantaanjoki: 4 sites & a tributary site Estuary of river Vantaa: 2 sites
0.9 – 1283 Estrone (ND–1260)
Clarithromycin (0.49–26)
Diclofenac (0.19–7.5)
Norethistrone (ND–2.8)
[Metformin (0.03–0.98)]
1.5 – 580 Estrone (ND–64)
Finland Helsinki coast, about 7 km offshore
66
0.28 – 126
estrone (RQ 64) at the WWTP pipe outlet
estrone (ND–127) a mile from the pipe
Table 5.5 Comparison of the inland surface water concentrations of the case studies with the results of the EU wide watch
list screening. To improve the comparability of the studies, the presented results were calculated by treating <LOQ results
as LOQ/2.
This study
Watch list screening (Loos et al. 2018)
API PNEC
(ng/L)
n DF
(%)
Media
n
(ng/L)
95th
percentil
e
Max
(ng/L)
PNEC
(ng/L)
n DF
(%)
Media
n
(ng/L)
95th
percentil
e
Max
(ng/L)
Estrone (E1) 0.008 55 25 0.35 7.2 10 3.6 1358 55 2.5 5.7 99
Diclofenac 85 55 87 33 1300 2200 50 17748 69 40 460 7100
Clarithromycin 3.9 55 73 3.2 101 590 120 7443 59 15 130 1600
Erythromycin 83.5 2 100 0.12 - 0.13 20 6313 8.4 10 50 1100
63
References
European Commission - JRC, 2007. CCM River and Catchment Database.
HELCOM 2018. HELCOM Pollution Load Compilation 6, 2018. Sub-catchments of transboundary
and border rivers.
Loos R., Marinov D., Sanseverino I., Napierska D. & Lettieri T. 2018. Review of the 1st Watch List
under the Water Frame-work Directive and recommendations for the 2nd Watch List. EUR 29173
EN, Publications Office of the European Un-ion, Luxembourg, 2018, ISBN 978-92-79-81839-4,
doi:10.2760/614367, JRC111198.
Orias, F. & Perrodin, Y. 2013. Characterisarion of the ecotoxicity of hospital effluents: A review.
Sci Tot Environ, 454–455, 250–276.
UBA 2016. Database – Pharmaceuticals in the environment. Available:
https://www.umweltbundesamt.de/en/databasepharmaceuticals-in-the-environment-0
Vogt, J.V. et al. 2007. A pan-European River and Catchment Database. European Commission -
JRC, Luxembourg, (EUR 22920 EN) 120 pp.

64
Environmental levels of APIs in river and estuary sediments
Methods
Sediment sampling was performed in Bråviken estuary (SE), Pärnu river (EST), Pärnu bay (EST)
and the Gulf of Riga (LV). All sediment samples were frozen at -20° C after sampling and sent to
SYKE for chemical analyses of 75 APIs and dry matter content. Sampling dates and raw data are
presented in Annex 4.
In Sweden, sediment samples were taken from Bråviken estuary in December 2017 and in June
2018. At each visit, six sediment samples were taken using a core sampler and the upper 5 cm of
these subsamples were integrated into one sample for analysis. The sampling location is located
outside the city of Norrköping approx. 7,5 km downstream of the discharge of treated wastewater
from the WWTP in Norrköping. The depth of the sampling location was 12 m.
Estonian sediment samples were taken from Pärnu river in December 2017 and in Pärnu bay in June
2018. The original plan was to take samples from the bay at both sampling time points, but due to
bad weather conditions in December 2017, it was not possible to take sea samples and instead the
samples were taken from the mouth of Pärnu river. For the December sample, five subsamples were
taken in Pärnu river and the upper 10 cm of sediment from each was integrated into one sample for
analysis. For the June sample, ten subsamples were taken from the middle of Pärnu bay and the
upper 5 cm were then integrated into one sample for analysis.
In Latvia, the Gulf of Riga was sampled one nautical mile (~1.85 km) from the shore in December
2017 and May 2018. The depth of the station was 12 m and located near an outlet of a wastewater
treatment plant pipe. At both sampling timepoints, three sediment subsamples were taken using a
Van-Veen grab sampler and the upper 5 cm of the subsamples were integrated into one sample for
analysis.
Results and discussion
Observed occurrence and concentration levels of APIs Sediments from three Baltic Sea Estuaries in Sweden (SE), Latvia (LV) and Estonia (EST), and an
Estonian river, were analysed for 63-65 APIs. The number of detected compounds varied from 13
to 41 per sample. Altogether 47 out of 65 analysed APIs were detected in at least one sample. All
measured concentrations are presented in Annex 4. Substances that were detected above LOQ in at
least one of the studied sediment samples are presented in figure 5.27-5.29. Five APIs were found
in all sediment samples: caffeine, metformin, oxazepam, risperidone and tramadol. The APIs found
in the highest concentrations were the NSAID and analgesic paracetamol in the sediments of
Bråviken estuary and the asthma and allergy medication xylometazoline in Riga coast and in Pärnu
bay.
The concentrations of APIs were generally higher in the sediments from the mouth of Pärnu river
than in Pärnu bay, probably due to higher dilution of APIs in coastal waters. The exceptions were
xylometazoline, hydrochlorothiazide and the sum of tetracycline and doxycycline that were instead
higher in the sediments of Pärnu bay than in Pärnu river. Since the bay and the river were sampled
at different times of year, other explanations for the observed differences are seasonal variations in
consumption of APIs and temperature dependent degradation rates, but further studies are needed
to elucidate this.

65
Sediment sampling in Bråviken estuary, Sweden. Photo: Sabina Hoppe, CAB.

66
Figure 5.27. APIs in sediments of the Bråviken estuary (SE) in December 2017 and June 2018. API below LOQ are marked with ”*” for samples taken in December 2017 and ”^” for samples taken in June
2018. Substances above LOQ in at least one of the sediment samples from the Baltic Sea Estuaries are included.

67
Figure 5.28. APIs in sediments from the Riga coast (LV) in December 2017 and May 2018. API below LOQ are marked with ”*” for samples taken in December 2017 and ”^” for samples taken in May 2018.
Substances above LOQ in at least one of the sediment samples from the Baltic Sea Estuaries are included.

68
Figure 5.29. APIs in Estonian sediments from Pärnu river (December 2017) and Pärny bay (June 2018). API below LOQ are marked with ”*” for samples taken in December 2017 and ”^” for samples taken
in June 2018. Substances above LOQ in at least one of the sediment samples from the Baltic Sea Estuaries are included.

69
Observed concentrations versus PNECs The measured environmental concentrations of APIs were compared with the predicted no effect
concentrations (PNECs) derived from chapter 9 (Table 5.6). Ten of the detected 47 APIs exceeded
their PNECs (Table 5.6-5.7):
• hormones estrone and norethistrone,
• antibiotics clarithromycin, ciprofloxacin, ofloxacin, and the sum of tetracycline and
doxycycline,
• NSAID and analgesic diclofenac and paracetamol,
• a veterinary medicine emamectin benzoate, and
• a metabolic disease medicine metformin.
Also, eight of these APIs were found at problematic levels in some surface water samples (chapter
5.1), while paracetamol and ciprofloxacin exceeded the PNECs in sediments only.
The number of APIs occurring in concentrations higher than PNECs were: 2 in Pärnu bay, 8 in
Pärnu river, 4-6 in Riga coast and 3-5 in Bråviken. Sediment samples collected in chapter 7, that
were close to fish farms, also contained 2-5 APIs that exceeded the PNECs. Hence, all ten collected
sediment samples within the CWPharma-project contained at least two APIs at levels that pose an
environmental risk.
For eight APIs, the environmental risk cannot be excluded because the LOQs were higher than the
PNECs (Annex 20). These compounds were erythromycin, estriol, ivermectin, mometasone,
sulfamethoxazole and tylosin. Also, the LOQs for estrone, norethisterone, and the sum
concentration of tetracycline and doxycycline were higher than the PNEC in some of the analysed
samples. The low LOQs of the other measured APIs allowed reliable risk estimations of these
compounds.
The RQ values of the detected APIs in each sample were summed together in order to estimate the
potential mixture effects. The sum RQ values varied from 96 in Pärnu bay to 19 215 in Riga’s coast
(Table 5.7). The sum RQ was dominated by a few APIs, especially estrone in sediments from Riga’s
coast. When excluding estrone, the sum RQ values varied between 8,9 and 248. The risk quotient
values indicate that both single APIs and the mixture of APIs may pose environmental risks to
organisms in the sediments. In addition, several other APIs that are not covered in the present study
may also contribute to the combined ecological risk. The concentration levels are further described
by API groups.
Hormones At least one of the five analysed hormones was found in each sediment sample. The most frequently
detected hormone was progesterone which was detected in 83 % of the samples (n=6).
Concentrations of hormones varied between below LOQ up to 8.8 µg/kg d.w. Estriol was not
detected in any of the sediment samples, but the LOQ was higher than the PNEC and risk cannot be
excluded. Progesterone and norethisterone were found in the highest concentrations in Bråviken bay
(5.2 µg/kg d.w. and 0.46 µg/kg d.w., respectively) and in Pärnu river (8.8 µg/kg d.w. and 0.71 µg/kg
d.w., respectively), while estrone was found in the highest concentration in Riga coast (4 µg/kg
d.w.). The LOQs for estrone and norethisterone were higher than the PNEC in some of the analysed
samples. The obtained concentrations of estrone in Latvia and norethisterone in Sweden and Estonia
were much higher than their PNECs. Risk Quotients (RQs) were 9 200 – 19 200 for estrone and 105
– 161 for norethisterone. The estrone detected in the environment is likely naturally excreted from
humans and animals, while norethisterone may also derive from medicinal usage (Chapter 4).
Testosterone was detected in sediments from Bråviken and Pärnu river in concentrations below the
PNEC.

70
Table 5.6. Summary of the PNEC, API detection frequencies (DF) and concentration ranges in the sediments. Bold numbers
indicate exceedance of PNEC and an environmental risk. LOQ* means that that limit of quantification was higher than the
PNEC and that risk cannot be excluded.
API PNEC
µg/kg d.w.
DF
(%)
Bråviken bay
(n=2)
µg/kg d.w.
Riga coast
(n=2)
µg/kg d.w.
Pärnu bay
(n=1)
µg/kg d.w.
Pärnu river
(n=1)
µg/kg d.w.
Atenolol 363 0 <LOQ <LOQ <LOQ <LOQ
Amlodipine 0.81 33 <LOQ <LOQ - 0.65 <LOQ 0.24
Bezafibrate 4.1 17 <LOQ - 0.20 <LOQ <LOQ <LOQ
Bisoprolol 31 83 0.069 - 0.16 0.011 - 0.039 <LOQ 0.18
Caffeine 1 470 100 2.4 - 3.4 0.73 - 2.36 2.4 11
Carbamazepine 10 50 <LOQ - 0.18 <LOQ - 0.12 <LOQ 0.21
Cetirizine 403 67 0.13 - 0.52 <LOQ - 0.05 <LOQ 0.17
Ciprofloxacin 6.7 67 <LOQ - 7.1 12 - 14 <LOQ 34
Citalopram 317 67 1.6 - 3.7 <LOQ - 0.10 <LOQ 0.59
Clarithromycin 0.41 50 <LOQ - 0.19 <LOQ - 0.27 <LOQ 1.7
Codeine 28 0 <LOQ <LOQ <LOQ <LOQ
Diclofenac 0.47 33 <LOQ <LOQ 0.10 1.2
Dipyridamole 5.1 67 0.24 - 1.2 <LOQ - 0.23 <LOQ 0.34
Emamectin 0.31 33 <LOQ <LOQ - 0.31 <LOQ 0.47
Enalapril 46 17 <LOQ <LOQ <LOQ 0.55
Eprosartan 4 020 0 <LOQ <LOQ <LOQ <LOQ
Erythromycin 1.2 0 <LOQ* <LOQ* <LOQ* <LOQ*
Estriol (E3) 0.0038 0 <LOQ* <LOQ* <LOQ* <LOQ*
Estrone (E1) 0.00020 33 <LOQ* 1.8 - 3.8 <LOQ* <LOQ*
Fenbendazole 18 67 0.42 - 1.8 <LOQ - 0.43 <LOQ 0.29
Fexofenadine 19 000 67 0.50 - 1.5 <LOQ - 0.043 <LOQ 0.19
Florfenicol 48 67 <LOQ - 0.25 <LOQ - 0.029 0.040 0.10
Fluconazole 17 300 50 <LOQ - 0.12 <LOQ - 0.032 <LOQ 0.088
Fluticasone 3.6 0 <LOQ <LOQ <LOQ <LOQ
Gemfibrozil 13 0 <LOQ <LOQ <LOQ <LOQ
Hydrochlorothiazide 1040 33 <LOQ <LOQ - 22 41 <LOQ
Irbesartan 198 000 33 <LOQ <LOQ N/A 0.082
Ivermectin 0.0077 0 <LOQ* <LOQ* <LOQ* <LOQ*
Ketoprofen 14 67 <LOQ - 0.59 <LOQ - 0.40 0.35 0.61
Levetiracetam 89 17 <LOQ <LOQ - 7.6 <LOQ <LOQ
Lincomycin 1.6 33 <LOQ <LOQ - 0.02 <LOQ 0.77
Metformin 1.6 100 6.8 - 25 8.4 - 8.6 5.8 60
Metoprolol 9.2 67 1.2 - 1.7 <LOQ - 0.10 <LOQ 0.84
Mometasone 0.05 0 <LOQ* <LOQ* <LOQ* <LOQ*
Naproxen 34 33 <LOQ - 2.5 <LOQ <LOQ 1.5
Nebivolol 4.0 67 0.15 - 0.37 <LOQ - 0.15 <LOQ 0.37
Norethisterone 0.0044 40 <LOQ* - 0.46 <LOQ* N/A 0.71
Norfloxacin 637 83 7.8 - 15 8.9 - 19 <LOQ 17
Ofloxacin 0.93 33 <LOQ - 0.73 <LOQ <LOQ 16
Olanzepine 9.8 0 <LOQ <LOQ <LOQ <LOQ
Oxazepam 3.3 100 0.41 - 1.2 0.04 - 0.07 0.10 0.19
Oxycodone 4 320 17 <LOQ <LOQ <LOQ 0.31
Paracetamol 1.3 67 61-84 <LOQ - 3.9 <LOQ 22
Primidone 142 0 <LOQ <LOQ <LOQ <LOQ
Progesterone 123 83 1.6 - 5.2 <LOQ - 0.17 0.39 8.8
Quetiapine 12 33 <LOQ <LOQ - 0.04 <LOQ 0.14
Ramipril 810 0 <LOQ <LOQ <LOQ <LOQ
Risperidone 216 100 0.17 - 1.3 0.27 - 0.73 0.27 0.73
Sertraline 344 83 0.30 - 0.83 0.044 - 0.37 <LOQ 1.7
Simvastatin 3 870 17 <LOQ <LOQ <LOQ 0.57
Sotalol 326 0 <LOQ <LOQ <LOQ <LOQ
Sulfamethoxazole 0.11 0 <LOQ* <LOQ* <LOQ* <LOQ*
Telmisartan 41 60 1.1 <LOQ - 1.28 <LOQ 1.2
Temazepam 15 17 <LOQ <LOQ <LOQ 0.11
Testosterone 21 50 0.60 - 1.1 <LOQ <LOQ 0.61

71
API PNEC
µg/kg d.w.
DF
(%)
Bråviken bay
(n=2)
µg/kg d.w.
Riga coast
(n=2)
µg/kg d.w.
Pärnu bay
(n=1)
µg/kg d.w.
Pärnu river
(n=1)
µg/kg d.w.
Tetracycline/
Doxycycline
1.43/0.037 50 <LOQ* - 5.0 <LOQ* - 2.0 3.4 <LOQ*
Tiamulin 129 0 <LOQ <LOQ <LOQ <LOQ
Toltrazuril 44 0 <LOQ <LOQ <LOQ <LOQ
Tramadol 2 410 100 1.5 - 5.0 0.64 - 1.1 0.93 1.5
Trimethoprim 1 220 83 0.19 - 0.22 <LOQ - 0.09 0.086 0.36
Tylosin 0.097 0 <LOQ* <LOQ* <LOQ* <LOQ*
Valsartan 776 33 <LOQ - 0.17 <LOQ <LOQ 1.4
Warfarin 98 0 <LOQ <LOQ <LOQ <LOQ
Venlafaxine 16 67 0.32 - 0.33 <LOQ - 0.07 <LOQ 0.39
Xylometazoline 2 970 33 <LOQ <LOQ - 75 48 <LOQ
Antibiotics Antibiotics were found in all sediment samples. The most frequently detected of the ten analysed
antibiotics were trimethoprim (DF 83 %) and norfloxacin (DF 83 %) followed by ciprofloxacin (DF
67 %). Clarithromycin, fluconazole, and tetracycline/doxycycline were detected in three out of six
sediment samples. Erythromycin and sulfamethoxazole were not detected in any of the sediment
samples. However, the LOQs for erythromycin and sulfamethoxazole were higher than their PNECs
which means that the environmental risk of those compounds cannot be excluded. Also, the LOQs
for the sum concentration of tetracycline and doxycycline was higher than the PNEC in three of the
analysed samples. The highest concentration of an antibiotic (34 µg/kg d.w.) was measured for
ciprofloxacin in the sediments from the mouth of Pärnu river. In Pärnu river ofloxacin and
clarithromycin were also detected in the highest concentrations (16 µg/kg d.w. and 1.7 µg/kg d.w.,
respectively). Norfloxacin was found in concentrations up to 20 µg/kg d.w. in Riga coast. The
concentration of norfloxacin in sediments collected from Bråviken and Riga coast in May/June was
about twice as high as in sediments collected in December. The sum concentration of doxycycline
and tetracycline was up to 5.0 µg/kg d.w. in Bråviken.
The sediment risk assessment revealed that the levels of ciprofloxacin, clarithromycin and the sum
concentration of doxycycline and tetracycline may pose environmental risks in many of the Baltic
Sea estuaries. The highest risk quotient (RQ of 135) was found for the sum concentration of
doxycycline and tetracycline in sediments of Bråviken sampled in December. The concentrations
of ciprofloxacin and clarithromycin in Pärnu river were 4-5 times higher than their PNECs. Also,
the concentration of ofloxacin exceeded PNEC in Pärnu river (RQ of 7). Lincomycin was detected
in sediments from Pärnu river and one sample from Riga coast, but in concentrations below the
PNEC.
Antiepileptics The concentrations of the three analysed antiepileptics were below their PNECs. The highest
concentration of antiepileptics (7,6 µg/kg d.w.) was measured for levetiracetam in the sediments
from Riga coast sampled in May. Carbamazepine is a commonly detected API in surface waters
(DF 98 %) but was only detected in half of the sediment samples (up to 0,21 µg/kg d.w., n=6).
Primidone was not detected in any of the sediment samples.
Antihypertensives Six of the eight studied antihypertensives were detected in at least one sediment sample. Eprosartan
and ramipril were not detected in any of the sediment samples. The most frequently detected
antihypertensive was telmisartan which was detected in three out of five analysed sediment samples.
The highest concentration of antihypertensives was measured for hydrochlorothiazide in sediments
from Riga coast and Pärnu bay collected in May-June (22 µg/kg d.w. and 41 µg/kg d.w.,
respectively). The levels of hydrochlorothiazide and other analysed antihypertensives in the

72
sediments were below their PNECs, and do not pose an environmental risk. The concentration of
hydrochlorothiazide was below LOQ in the sediment from Bråviken.
Asthma and allergy APIs At least one of the five analysed asthma and allergy APIs was found in each sediment sample. The
most frequently detected asthma and allergy APIs were cetirizine and fexofenadine which were
detected in four of the six analysed sediment samples. Mometasone and fluticasone xylometazoline
were not detected in any of the sediment samples. The highest concentration of antihypertensives
was measured for hydrochlorothiazide in the spring samples collected in Riga coast (75 µg/kg d.w.)
and in Pärnu bay (48 µg/kg d.w.). Xylometazoline is used to treat e.g. allergies and sinus irritation.
This API was not found sediments from Bråviken or in the winter samples from Riga coast or Pärnu
river. The levels of xylometazoline and the other analysed asthma and allergy APIs do not exceed
their PNECs. However, the LOQ for mometazone was higher than the PNEC which means that the
environmental risk of this compounds cannot be excluded.
Metabolic disease medications The metabolic disease medication metformin was found in all sediment samples, in concentrations
ranging from 5.8 to 60 µg/kg d.w. Metformin is slowly degraded in the environment and the
calculations of risk quotients indicate that the levels of metformin pose an environmental risk in all
the studied sediments (RQs of 3,6-16). Gemfibrozil was not detected in any of the sediment samples,
and bezafibrate and simvastatin were only detected in one out of six analysed sediment samples (DF
16 %) and the concentrations were well below the PNECs.
NSAIDs and analgesics The analysed NSAIDs and analgesics were detected in at least one sediment sample, with an
exception of codeine which was not detected at all. The most frequently detected NSAIDs and
analgesic was tramadol which was detected in all sediment samples, followed by ketoprofen and
paracetamol (DF 67 %). The concentrations of tramadol varied between 0,93 to 5,0 µg/kg d.w. and
were below the PNEC. Also, the concentrations of ketoprofen, naproxen and oxycodone were below
their PNECs. The API found in the highest concentration was paracetamol in the sediments of
Bråviken estuary (SE): 61 µg/kg d.w. in December and 84 µg/kg d.w. in June. The presence of
paracetamol in the sediments is surprising given that this API is biodegradable (99% degradation in
5 days according to fass.se) and highly removed in wastewater treatment plants (Chapter 6 and
fass.se). However, this study suggest that parts of the conjugated paracetamol may be converted
back into free paracetamol in the sediment compartment. In addition, the high consumption of
paracetamol (chapter 4) results in a continuous release of this API in such an amount that it is
accumulated in the sediments of the Baltic Sea. The calculations of risk quotients indicate that the
levels of paracetamol in the sediments pose an environmental risk in Bråviken estuary, Pärnu river
and some other coastal areas described in Chapter 7. Diclofenac was only detected in the Estonian
samples, in concentrations up to 1,2 µg/kg d.w. The concentration of diclofenac in the sediment of
Pärnu river was three times above the PNEC.
Cardiovascular APIs The cardiovascular APIs atenolol, sotalol and warfarin were not detected in the collected sediments.
Bisoprolol was detected in five out of six analysed sediment samples, followed by dipyridamole,
metoprolol and nebivolol (DF 67 %). The highest concentration of cardiovascular APIs was
measured for metoprolol in sediments from Bråviken (1,2 – 1,7 µg/kg d.w.). None of the seven
analysed cardiovascular APIs was found in concentrations above their PNECs.
Psycopharmaceuticals Oxazepam and risperidone were found in all sediment samples, in concentrations up to 1,3 µg/kg
d.w. Sertraline was detected in five out of six analysed sediment samples, followed by citalopram
and venlafaxin (DF 67 %). The highest concentration of psychopharmaceuticals was measured for
citalopram in the sediments from Bråviken sampled in December (3,7 µg/kg d.w.). Olanzepine was

73
not detected in any of the sediment samples. Quetiapine was found in Pärnu river and in one
sediment sample from Riga coast. Temazepame was only detected in sediments of Pänu river. The
concentrations of the eight analysed psycopharmaceuticals were all below their PNECs.
Veterinary APIs The most frequently detected veterinary APIs were fenbendazole and florfenicol which were
detected in four out of six analysed sediment samples. The highest concentration of veterinary APIs
was measured for fenbendazole in sediments from Bråviken. The concentration of emamectin in the
sediment collected from Pärnu river (0,47 µg/kg d.w.) exceeded the PNEC (RQ of 1,5). Also, the
concentration of emamectin in one Latvian sediment sample may be environmentally risky (RQ of
1,0). Ivermectin, tiamulin, toltrazuril and tylosin were not detected in the sediments. However, the
LOQ for tylosin was higher than the PNECs and the environmental risk of this compounds cannot
be excluded.
Caffeine Caffeine was detected in all sediment samples in concentrations between 0,73 to 11 µg/kg d.w. The
concentration of caffeine was higher in Pärnu river than in the Baltic Sea estuaries. Caffeine is
mainly originating from coffee and other drinks and not from pharmaceutical use. The measured
concentrations were below the PNEC.
Table 5.7 A summary of the sum risk quotients (sum RQ) and a list of detected APIs exceeding the PNEC (APIs with RQ>1)
in sediments collected from Baltic Sea Estuaries and Pärnu river.
Sum RQ APIs with RQ>1 Sum RQ APIs with RQ>1
Estonia Pärnu bay (June) Pärnu river (December) 96 Metformin (RQ=3,6)
Tetracycline/Doxycycline (RQ=92)
248 Ciprofloxacin (RQ=5,1)
Clarithromycin (RQ=4,2)
Diclofenac (RQ=2,6)
Emamectin (RQ=1,5)
Metformin (RQ=37)
Norethisterone (RQ=161)
Ofloxacin (RQ=17)
Paracetamol (RQ=17)
Latvia Riga coast (May) Riga coast (December)
9 271
(65 excl.
estrone)
Ciprofloxacin (RQ=2,1)
Estrone (E1) (RQ=9 206)
Metformin (RQ=5,3)
Paracetamol (RQ=3,1)
Tetracycline/Doxycycline (RQ=54)
19 215
(8,9 excl.
estrone)
Ciprofloxacin (RQ=1,8)
Estrone (E1) (RQ=19 206)
Metformin (RQ=5,2)
Sweden Bråviken estuary (June) Bråviken estuary (December)
188 Metformin (RQ=16)
Norethisterone (RQ=105)
Paracetamol (RQ=67)
191 Ciprofloxacin (RQ=1,1)
Metformin (RQ=4,2)
Paracetamol (RQ=48)
Tetracycline/Doxycycline (RQ=135)
Conclusions
Analyses of sediments in three Baltic Sea Estuaries in Sweden, Latvia and Estonia showed the
presence of 47 out of 65 analysed APIs, representing all the studied API groups. Five APIs were
found in all sediment samples: metformin, caffeine, tramadol, oxazepam and risperidone. The two
APIs found in the highest concentrations were paracetamol (up to 84 µg/kg d.w.) in the sediments
of Bråviken estuary, and xylometazoline in the sediments of Riga coast (up to 75 µg/kg d.w.) and

74
in Pärnu bay (48 µg/kg d.w.). The concentrations of the antibiotics norfloxacin and ciprofloxacin
were up to 20 µg/kg d.w and 34 µg/kg d.w, respectively. Hormones were detected in all sediment
samples, ranging from below LOQ to 8.8 µg/kg d.w. Depending on the characteristics of each API
even a low level in the sediment may pose a risk to sediment dwelling organisms.
All ten collected sediment samples within the CWPharma-project contained levels of at least two
APIs that pose an environmental risk. The APIs that most frequently exceeded their PNECs were
ciprofloxacin (antibiotic), metformin (metabolic disease medication) and paracetamol (NSAID and
analgesic). In some sediment samples, risks were also observed for diclofenac (NSAID and
analgesic), emamectin (veterinary medicine), estrone and norethisterone (hormones), and
clarithromycin, ofloxacin and the sum concentration of doxycycline and tetracycline (antibiotics).
In addition, several other APIs contributed to the combined ecological risk, although their
concentrations did not exceed the predicted no effect concentration (PNEC). Further studies of API
levels in sediments and their effect are needed to elucidate the impact of APIs on benthic fauna. The
results from the present study indicate an urgent need to implement reduction measures to decrease
API levels and for monitoring of pharmaceuticals in sediments.
75
6 APIs in wastewater and sludge
Concentrations of APIs in influents, effluents and sludge from municipal wastewater treatment plants
Methods
Wastewater samples were taken as integrated, flow-proportional 24-hour samples in Estonia,
Finland, Poland and Sweden, except the effluent of WWTP1 in Latvia. The wastewater treatment
plant sludge was taken as integrated samples (Estonia), integrated time samples (Latvia – WWTP
1) or grab samples (Finland, Sweden, Latvia – WWTP 2). Influent, effluent and sludge samples
were frozen (temperature -18–20 C), and in such way transported to the Laboratory of SYKE in
Helsinki. Time between sampling and freezing was less than four hours.
75 APIs were analysed in the influent and effluent samples, and 31 APIs in sludge samples. Also,
the dry matter contents of the sludge samples were determined.
Influent and effluent samples were taken from 16 wastewater treatment plants two or three times:
• 3 in Estonia: Paide, Pärnu, Türi (December 2017 and June 2018);
• 2 in Finland: Kalteva (Hyvinkää) and Viikki (Helsinki) (December 2017, August 2018 and
November 2018);
• 4 in Germany: Greifswald (February 2018, June 2018 and December 2018), Neubrandenburg
(February 2018 and June 2018), Rostock (March 2018, June 2018 and November 2018) and
Wismar (February 2018 and June 2018);
• 3 in Latvia: WWTP1, WWTP2 and WWTP3 (November/December 2017 and May 2018);
• 1 in Poland: Błonie (November 2017 and July 2018);
• 3 in Sweden: Linköping, Motala, Norrköping (December 2017 and June 2018).
Sludge samples were taken in 12 wastewater treatment plants one to three times:
• 2 in Estonia: Paide and Pärnu (December 2017 and June 2018);
• 2 in Finland: Kalteva (June 2018) and Viikki (December 2017 and August 2018);
• 2 in Germany: Greifswald (February 2018, June 2018 and December 2018) and Rostock (June
2018 and November 2018);
• 2 in Latvia: WWTP1 and WWTP2 (November/December 2017 and May/June 2018);
• 1 in Poland: Błonie (November 2017 and July 2018);
• 3 in Sweden: Linköping, Motala and Norrköping (December 2017 and June 2018).
Different types of sludge were sampled in the case studies. Dewatered sludge was sampled in
Estonia, Latvia, Sweden/Norrköping and Sweden/Motala, and dewatered digested sludge in Poland
and Finland/Viikki. In Sweden/Linköping samples were taken from both dewatered and dewatered
digested sludge. The sludge sample from Finland/Kalteva was taken from raw sludge, before it was
dewatered in a centrifuge.
Calculations of removal efficiency of APIs were performed on selected APIs, that in one season
were measured in both influent and effluent. Some data were excluded from efficiency calculations
based on the following criteria:
1) concentrations of influent or effluent are not available (not analysed, N/A);
2) concentrations of influent are < LOQ;
3) data of landfill stations;
4) concentration of the influent < 5 * LOQ effluent;
5) samples that melted during the delivery to the laboratory.

76
Removal rates were calculated for each sampling occasion, by comparing the effluent and influent
concentrations. During calculations, values lower than LOQ were defined as the LOQ concentration.
This resulted in a conservative estimate of the removal efficiency.
Formulas for calculations are as follows:
1) Residual in effluent: Conc.effl. *100 / conc.infl.
2) Treatment efficiency: 100 - residual in effluent
The API analysis in various samples (influent, effluent and sewage sludge) from different countries
(Latvia, Estonia, Finland, Sweden and Germany) allowed a simple statistical analysis regarding the
fate of APIs during the wastewater treatment process. The aim of this analysis was to provide an
estimation of the mass balances, i.e. the distribution of APIs between effluent and sludge. The API
amount in influent versus the API sum amount in effluent and sludge represents the disappearance
during the treatment process due to decomposition or transformation into different compounds. The
amount of each API in influent, effluent and sludge was calculated based on the measured
concentrations. The API mass in each influent and effluent sample was calculated using the annual
wastewater flow rates, and API mass in sludge using the annual amount of produced sewage sludge
(in terms of dry solids). Only the APIs that were detected in influent and in effluent and/or sludge
during one sampling round were selected for the mass balance calculations. Some data were
excluded from the analysis based on the following criteria:
1) The amount of API in sludge and/or effluent was higher than in influent;
2) The concentration of the API was below LOQ or N/A in all three matrixes or at least in the
influent.
3) The samples had melted during the transport to the analysing laboratory.
The following formulas were used for calculating the mass balance (C = concentration and V =
volume):
1) API amount in influent (kg): C.infl. * Vinfl.
2) API amount in effluent (kg): Ceffl. * Veffl.
3) API amount in sludge (kg): Csludge * Amountsludge
4) API remaining in effluent (%): 100% * API amount in effluent / API amount in influent
5) API remaining in sludge (%): 100% * API amount in sludge / API amount in influent
6) API lost (%): 100% – API remaining in effluent – API remaining in sludge
Results and discussion
Concentrations of APIs in wastewater influents and effluents The following overview includes all the wastewater influent and effluent results of the CWPharma
case studies, except those below LOQ and the results with remark “not available” (where there was
some interference for the compound, mostly due to matrix, and therefore the result could not be
recorded or reported). Detection frequencies (DF) are presented to highlight the most commonly
detected APIs. The API concentrations are presented as micrograms per one litre of sample (µg/L).
Average concentrations were calculated and can be seen in charts below. Values below LOQ are
replaced with LOQ values (the same as in calculations of efficiency – chapter 6.1.2.2. If all samples
for a specific API were below LOQ in both influent and effluent, the API is not shown in the charts.
If the API concentration was <LOQ for one matrix – influent or effluent – the average concentration
was set as 0 and marked with “ * ”. All the measured concentrations in wastewater influents and
effluents are presented in Annex 5 and Annex 6.
Antibiotics
Influent
In influents, we detected nine out of eleven APIs from the antibiotics group (figure 6.1 and 6.2):
clarithromycin, erythromycin, fluconazole, lincomycin, norfloxacin, ofloxacin, sulfamethoxazole,

77
tetracycline+doxycycline (SUM) and trimethoprim. The most frequently detected APIs were
trimethoprim (DF 100%), sulfamethoxazole (DF 94%) and fluconazole (DF 91%). Ciprofloxacin
and sulfadiazine were not detected in any influent sample. Lincomycin was detected only in one
sample in Poland. The highest measured concentration of each API was:
• Ciprofloxacin – not detected, all samples <3.1 µg/L;
• Clarithromycin – 1.9 µg/L in Estonia, Paide in December 2017;
• Erythromycin – 19 µg/L in Estonia, Paide in June 2018;
• Fluconazole – 0.44 µg/L in Poland, Błonie WWTP in November 2017;
• Lincomycin – 0.022 µg/L in Poland, Błonie WWTP in July 2018;
• Norfloxacin – 13 µg/L in Latvia, WWTP 1 in November 2017;
• Ofloxacin – 3.8 µg/L in Germany, Neubrandenburg in June 2018;
• Sulfadiazine – not detected, all samples <0.59 µg/L;
• Sulfamethoxazole – 0.94 µg/L in Latvia, WWTP 2 in December 2017;
• Tetracycline+doxycycline (SUM) – 2.5 µg/L in Finland, Kalteva in December 2017;
• Trimethoprim – 1.4 µg/L in Finland, Viikki in August 2018.
Effluent
In effluents, we detected nine out of eleven APIs of the antibiotics group: clarithromycin,
erythromycin, fluconazole, lincomycin, norfloxacin, ofloxacin, sulfamethoxazole,
tetracycline+doxycycline (SUM) and trimethoprim. The most detected APIs were clarithromycin
(DF 94%), erythromycin (DF 94%), trimethoprim (DF 93%) and fluconazole (DF 91%).
Ciprofloxacin and sulfadiazine were not detected in any effluent sample.
The highest measured concentrations of the APIs were:
• Ciprofloxacin – not detected, all samples <1.6 µg/L;
• Clarithromycin – 2.2 µg/L in Estonia, Paide in December 2017;
• Erythromycin – 8.3 µg/L in Germany, Neubrandenburg in February 2018;
• Fluconazole – 0.51 µg/L in Germany, Greifswald in June 2018;
• Lincomycin – 0.063 µg/L in Latvia, WWTP 2 in May 2018;
• Norfloxacin – 19 µg/L in Estonia, Türi in June 2018;
• Ofloxacin – 0.74 µg/L in Germany, Greifswald in February 2018;
• Sulfadiazine – not detected, all samples <0.30 µg/L;
• Sulfamethoxazole – 0.27 µg/L in Finland, Viikki in August 2018;
• Tetracycline+doxycycline (SUM) – 0.55 µg/L in Estonia, Paide in June 2018;
• Trimethoprim – 0.47 µg/L in Finland, Kalteva in November 2018.
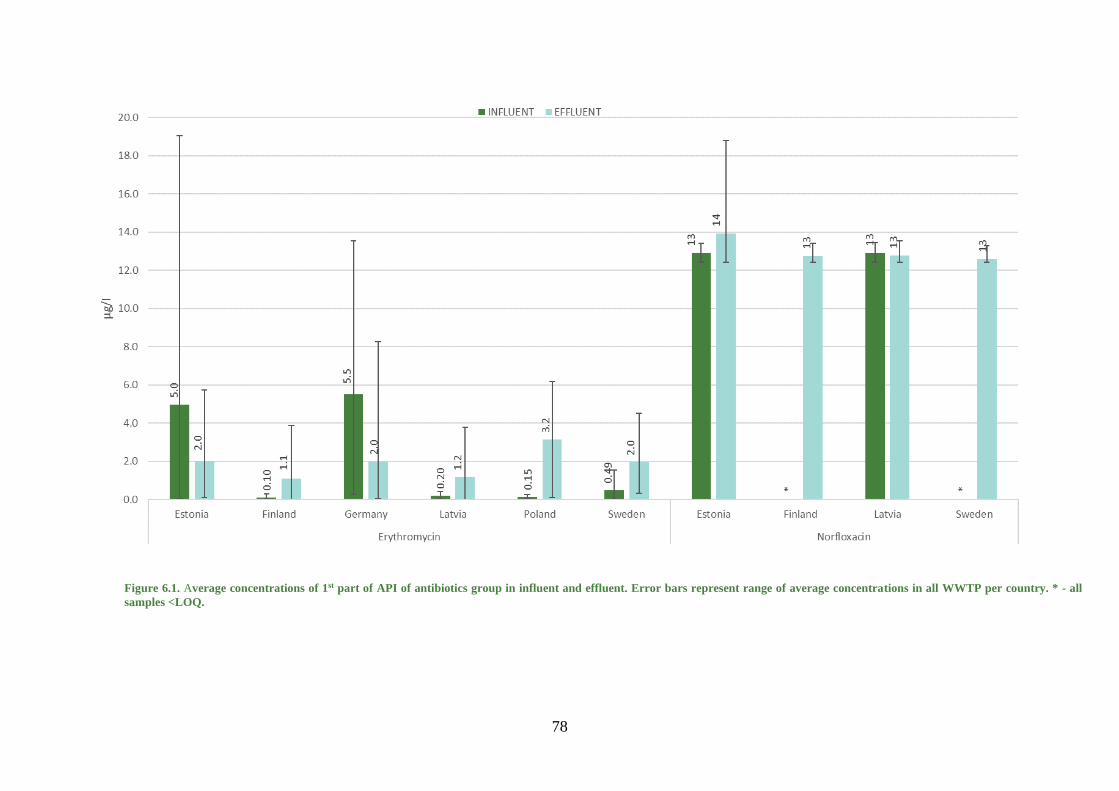
78
Figure 6.1. Average concentrations of 1st part of API of antibiotics group in influent and effluent. Error bars represent range of average concentrations in all WWTP per country. * - all
samples <LOQ.

79
Figure 6.2. Average concentrations of 2nd part of API of antibiotics group in WWTP influent and effluent. Error bars represent the range of average concentrations in all WWTP per
country. * - all samples <LOQ.

80
Antiepileptics
Influents
All the studied APIs of the antiepileptics group were detected in WWTP influents (figure 6.3):
carbamazepine, gabapentin, levetiracetam and primidone. The most frequently detected APIs were
gabapentin (DF 100%) and levetiracetam (DF 97%). The highest concentrations of all the
antiepileptics we obtained in the German influents.
The highest concentration of each API was:
• Carbamazepine – 3.5 µg/L in Germany, Neubrandenburg in February 2018;
• Gabapentin – 95 µg/L in Germany, Neubrandenburg in February 2018;
• Levetiracetam – 27 µg/L in Germany, Greifswald in June 2018;
• Primidone – 0.75 µg/L in Germany, Neubrandenburg in February 2018.
Effluents
Each of the four antiepileptics were detected also in the WWTP effluents: carbamazepine,
gabapentin, levetiracetam and primidone. The most frequently detected APIs were carbamazepine
(DF 97%) and gabapentin (DF 82%).
The maximum concentration of each antiepileptic was:
• Carbamazepine – 2.5 µg/L in Estonia, Paide in June 2018;
• Gabapentin – 14 µg/L in Sweden, Motala in June 2018;
• Levetiracetam – 1.2 µg/L in Sweden, Motala in December 2017;
• Primidone – 0.93 µg/L in Germany, Neubrandenburg in February 2018.
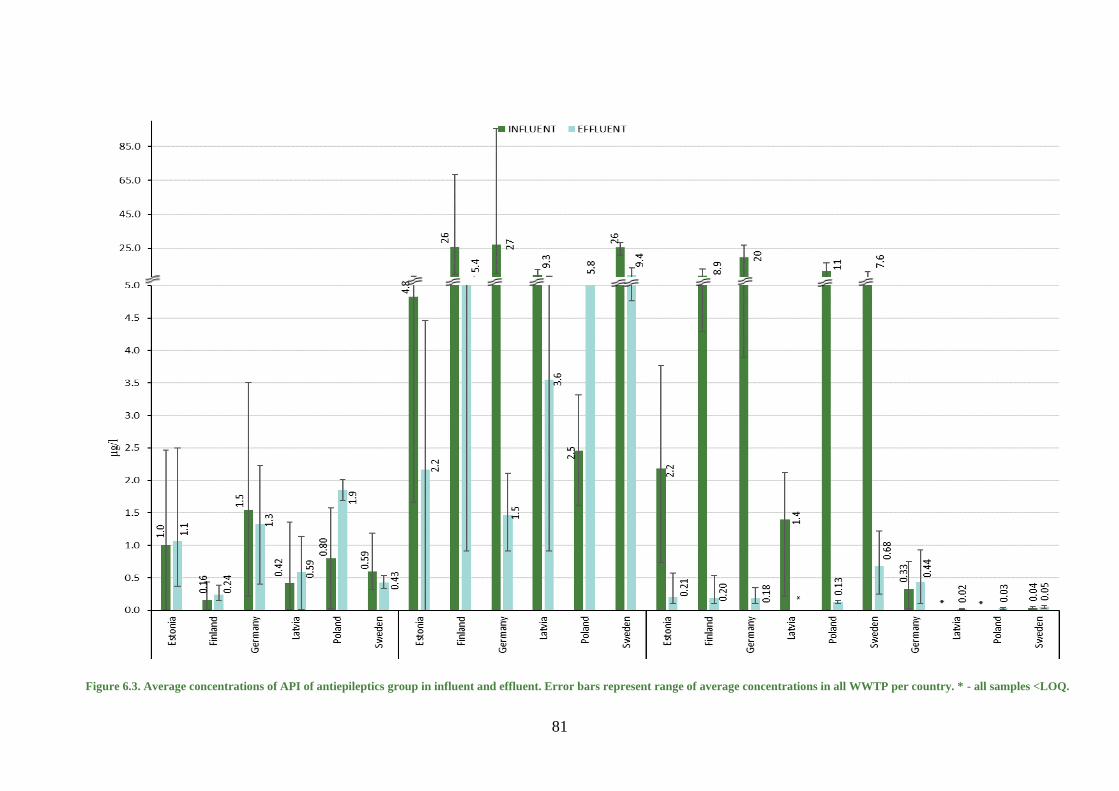
81
Figure 6.3. Average concentrations of API of antiepileptics group in influent and effluent. Error bars represent range of average concentrations in all WWTP per country. * - all samples <LOQ.
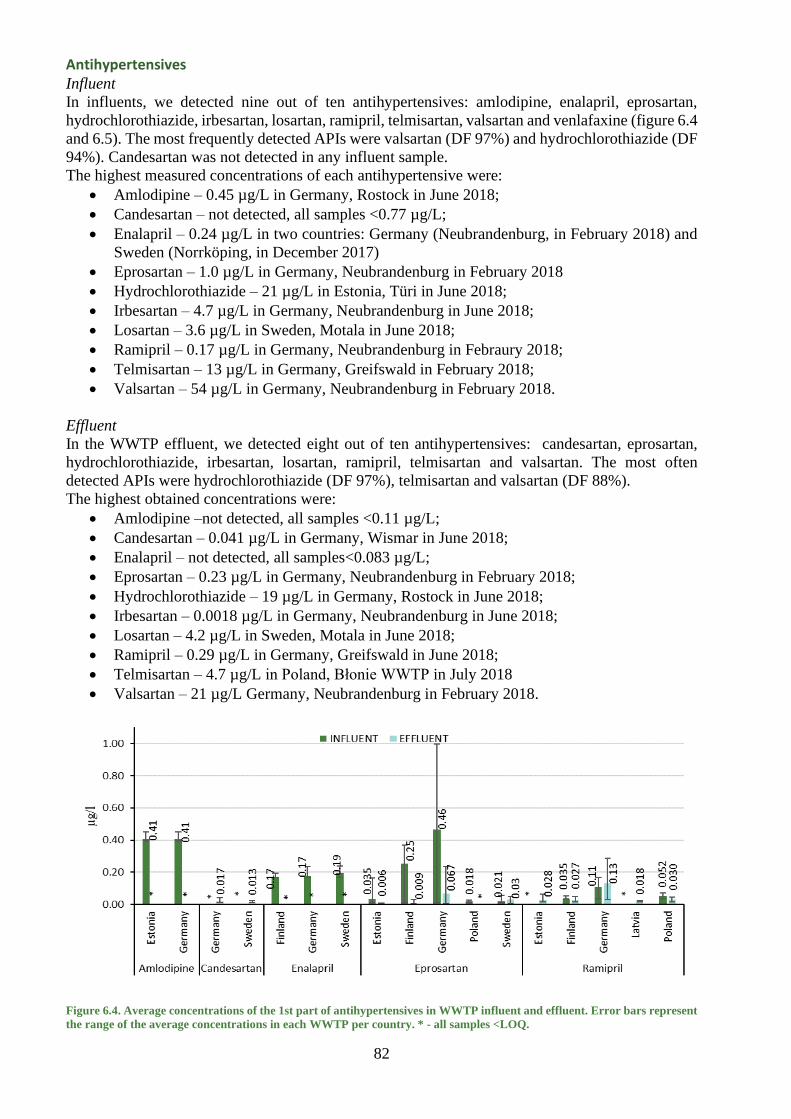
82
Antihypertensives Influent
In influents, we detected nine out of ten antihypertensives: amlodipine, enalapril, eprosartan,
hydrochlorothiazide, irbesartan, losartan, ramipril, telmisartan, valsartan and venlafaxine (figure 6.4
and 6.5). The most frequently detected APIs were valsartan (DF 97%) and hydrochlorothiazide (DF
94%). Candesartan was not detected in any influent sample.
The highest measured concentrations of each antihypertensive were:
• Amlodipine – 0.45 µg/L in Germany, Rostock in June 2018;
• Candesartan – not detected, all samples <0.77 µg/L;
• Enalapril – 0.24 µg/L in two countries: Germany (Neubrandenburg, in February 2018) and
Sweden (Norrköping, in December 2017)
• Eprosartan – 1.0 µg/L in Germany, Neubrandenburg in February 2018
• Hydrochlorothiazide – 21 µg/L in Estonia, Türi in June 2018;
• Irbesartan – 4.7 µg/L in Germany, Neubrandenburg in June 2018;
• Losartan – 3.6 µg/L in Sweden, Motala in June 2018;
• Ramipril – 0.17 µg/L in Germany, Neubrandenburg in Febraury 2018;
• Telmisartan – 13 µg/L in Germany, Greifswald in February 2018;
• Valsartan – 54 µg/L in Germany, Neubrandenburg in February 2018.
Effluent
In the WWTP effluent, we detected eight out of ten antihypertensives: candesartan, eprosartan,
hydrochlorothiazide, irbesartan, losartan, ramipril, telmisartan and valsartan. The most often
detected APIs were hydrochlorothiazide (DF 97%), telmisartan and valsartan (DF 88%).
The highest obtained concentrations were:
• Amlodipine –not detected, all samples <0.11 µg/L;
• Candesartan – 0.041 µg/L in Germany, Wismar in June 2018;
• Enalapril – not detected, all samples<0.083 µg/L;
• Eprosartan – 0.23 µg/L in Germany, Neubrandenburg in February 2018;
• Hydrochlorothiazide – 19 µg/L in Germany, Rostock in June 2018;
• Irbesartan – 0.0018 µg/L in Germany, Neubrandenburg in June 2018;
• Losartan – 4.2 µg/L in Sweden, Motala in June 2018;
• Ramipril – 0.29 µg/L in Germany, Greifswald in June 2018;
• Telmisartan – 4.7 µg/L in Poland, Błonie WWTP in July 2018
• Valsartan – 21 µg/L Germany, Neubrandenburg in February 2018.
Figure 6.4. Average concentrations of the 1st part of antihypertensives in WWTP influent and effluent. Error bars represent
the range of the average concentrations in each WWTP per country. * - all samples <LOQ.
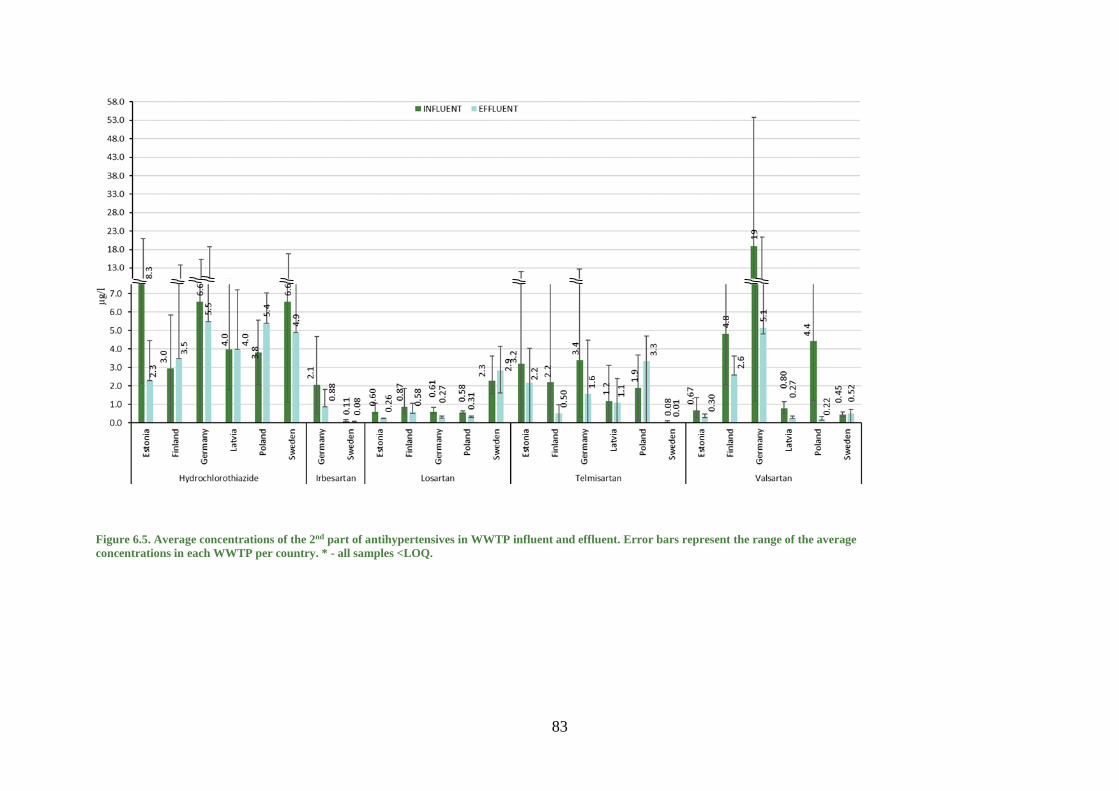
83
Figure 6.5. Average concentrations of the 2nd part of antihypertensives in WWTP influent and effluent. Error bars represent the range of the average
concentrations in each WWTP per country. * - all samples <LOQ.

84
Asthma and allergy medications Influents
Two out of five APIs from the asthma and allergy medication group were detected in influents:
fluticasone and xylometazoline (figure 6.6). Both were detected only in few samples -
xylometazoline in two German samples (DF 6%), and fluticasone in one Estonian influent (DF 3%).
Cetirizine, fexofenidine and mometasone furoate were not detected in any influent sample. The
highest measured concentrations were:
• Cetirizine – not detected, all samples <3.2 µg/L;
• Fexofenadine – not detected, all samples <4.3 µg/L;
• Fluticasone – 0.61 µg/L in Estonia, Pärnu in June 2018;
• Mometasone furoate – not detected, all samples <0.83 µg/L;
• Xylometazoline 0.061 µg/L in Germany, Neubrandenburg in June 2018.
Effluents
In effluent three out of five APIs from asthma and allergy medicaments group were detected:
cetirizine and xylometazoline. The most detected API in this group was xylometazoline (DF 38%).
Cetirizine was detected only once in Finland, and fexofenadine was detected once in Poland.
Fluticasone and mometasone furoate were below LOQ in all effluent samples. The highest measured
concentrations were:
• Cetirizine – 1.3 µg/L in Finland, Kalteva in June 2018;
• Fexofenadine – 1.8 µg/L in Poland, Błonie in July 2018;
• Fluticasone – not detected, all samples <0.15 µg/L);
• Mometasone furoate – not detected, all samples <0.15 µg/L;
• Xylometazoline – 0.099 µg/L in Germany, Neubrandenburg in February 2018.
Figure 6.6. The average concentrations of the APIs of the asthma and allergy medications group in WWTP influent and
effluent. Error bars represent the range of the average concentrations in each WWTP of each country. * - all samples <LOQ.
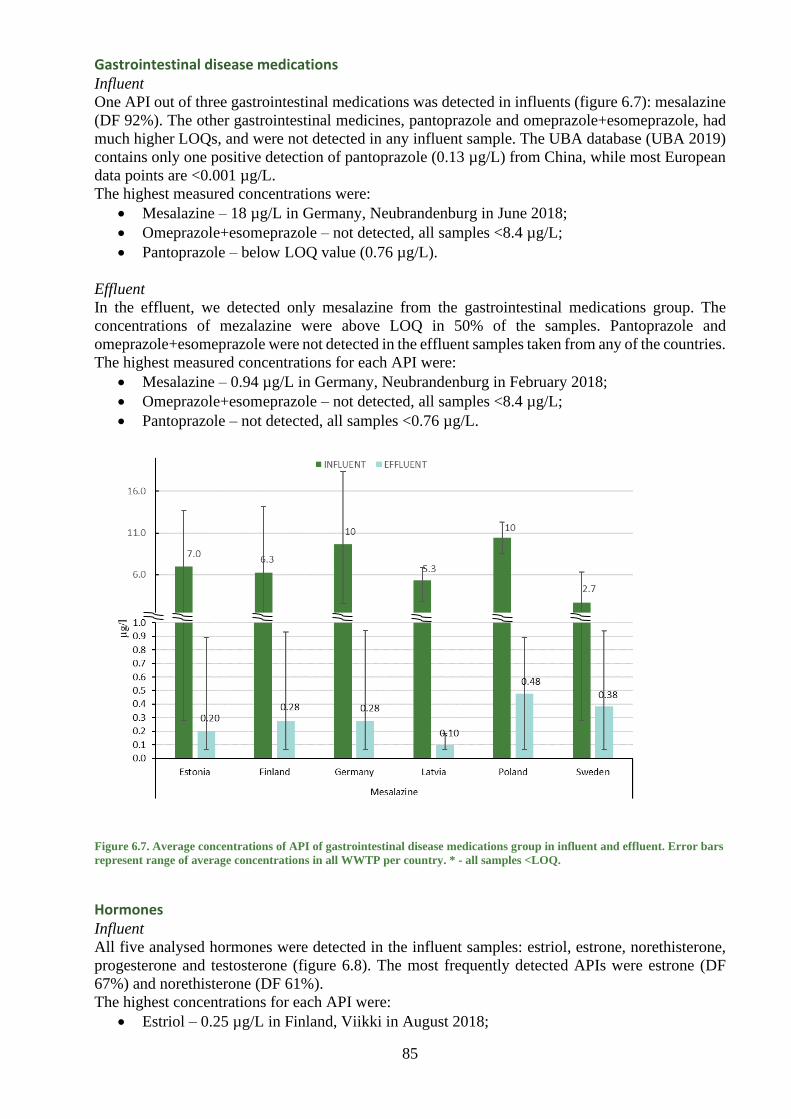
85
Gastrointestinal disease medications Influent
One API out of three gastrointestinal medications was detected in influents (figure 6.7): mesalazine
(DF 92%). The other gastrointestinal medicines, pantoprazole and omeprazole+esomeprazole, had
much higher LOQs, and were not detected in any influent sample. The UBA database (UBA 2019)
contains only one positive detection of pantoprazole (0.13 µg/L) from China, while most European
data points are <0.001 µg/L.
The highest measured concentrations were:
• Mesalazine – 18 µg/L in Germany, Neubrandenburg in June 2018;
• Omeprazole+esomeprazole – not detected, all samples <8.4 µg/L;
• Pantoprazole – below LOQ value (0.76 µg/L).
Effluent
In the effluent, we detected only mesalazine from the gastrointestinal medications group. The
concentrations of mezalazine were above LOQ in 50% of the samples. Pantoprazole and
omeprazole+esomeprazole were not detected in the effluent samples taken from any of the countries.
The highest measured concentrations for each API were:
• Mesalazine – 0.94 µg/L in Germany, Neubrandenburg in February 2018;
• Omeprazole+esomeprazole – not detected, all samples <8.4 µg/L;
• Pantoprazole – not detected, all samples <0.76 µg/L.
Hormones Influent
All five analysed hormones were detected in the influent samples: estriol, estrone, norethisterone,
progesterone and testosterone (figure 6.8). The most frequently detected APIs were estrone (DF
67%) and norethisterone (DF 61%).
The highest concentrations for each API were:
• Estriol – 0.25 µg/L in Finland, Viikki in August 2018;
Figure 6.7. Average concentrations of API of gastrointestinal disease medications group in influent and effluent. Error bars
represent range of average concentrations in all WWTP per country. * - all samples <LOQ.

86
• Estrone – 12 µg/L in Sweden, Norrköping in June 2018;
• Norethisterone - 2.8 µg/L in Germany, Greifswald in February 2018;
• Progesterone – 88 µg/L in Poland, Błonie WWTP in July 2018;
• Testosterone – 0.20 µg/L in Germany, Neubrandenburg in February 2018.
Effluent
In the WWTP effluent, four out of five hormones were detected in at least one sample: estrone,
norethisterone, progesterone and testosterone. The most frequently detected hormone was estrone
(DF 24%). Testosterone was detected only in one sample from Latvia. Estriol was not detected in
any effluent sample.
The highest concentrations for each API were:
• Estriol – not detected, all samples <8.4 µg/L;
• Estrone – 11 µg/L in Latvia, WWTP 3 in December 2017;
• Norethisterone – 0.11 µg/L in Latvia, WWTP 3 in May 2018;
• Progesterone – 0.029 µg/L in Latvia, WWTP 3 in December 2017;
• Testosterone – 0.032 µg/L in WWTP 3 in May 2018.
All the highest effluent concentrations for hormones were observed in Latvia, WWTP 3. The
maximum concentration of estrone was 192 times higher than the second highest value, which was
0.055 µg/L (Finland, Viikinmäki November 2018). As caffeine concentration was also very high in
the Latvian effluent sample (at the same level as the highest influent concentration), it might indicate
some trouble with the WWTP process, as these biologically degradable compounds were not
removed at all.
Figure 6.8. Average concentrations of API of hormones group in influent and effluent. Error bars represent range of
average concentrations in all WWTP per country. * - all samples <LOQ.
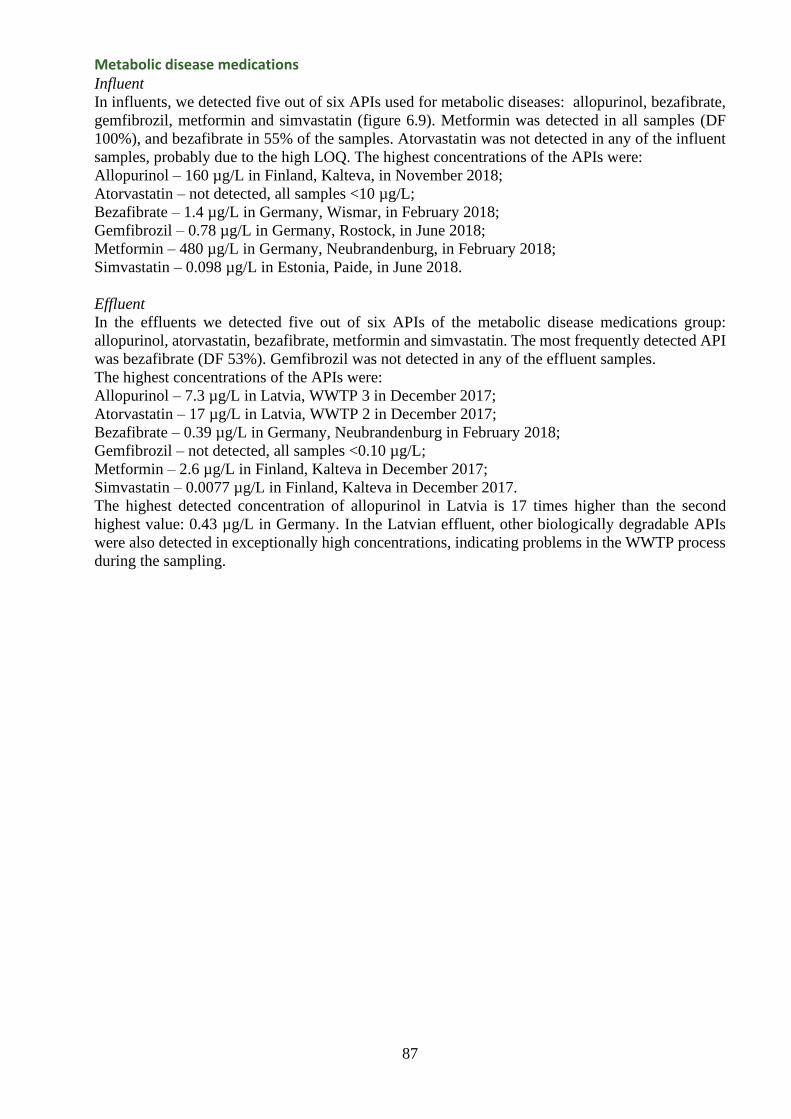
87
Metabolic disease medications Influent
In influents, we detected five out of six APIs used for metabolic diseases: allopurinol, bezafibrate,
gemfibrozil, metformin and simvastatin (figure 6.9). Metformin was detected in all samples (DF
100%), and bezafibrate in 55% of the samples. Atorvastatin was not detected in any of the influent
samples, probably due to the high LOQ. The highest concentrations of the APIs were:
Allopurinol – 160 µg/L in Finland, Kalteva, in November 2018;
Atorvastatin – not detected, all samples <10 µg/L;
Bezafibrate – 1.4 µg/L in Germany, Wismar, in February 2018;
Gemfibrozil – 0.78 µg/L in Germany, Rostock, in June 2018;
Metformin – 480 µg/L in Germany, Neubrandenburg, in February 2018;
Simvastatin – 0.098 µg/L in Estonia, Paide, in June 2018.
Effluent
In the effluents we detected five out of six APIs of the metabolic disease medications group:
allopurinol, atorvastatin, bezafibrate, metformin and simvastatin. The most frequently detected API
was bezafibrate (DF 53%). Gemfibrozil was not detected in any of the effluent samples.
The highest concentrations of the APIs were:
Allopurinol – 7.3 µg/L in Latvia, WWTP 3 in December 2017;
Atorvastatin – 17 µg/L in Latvia, WWTP 2 in December 2017;
Bezafibrate – 0.39 µg/L in Germany, Neubrandenburg in February 2018;
Gemfibrozil – not detected, all samples <0.10 µg/L;
Metformin – 2.6 µg/L in Finland, Kalteva in December 2017;
Simvastatin – 0.0077 µg/L in Finland, Kalteva in December 2017.
The highest detected concentration of allopurinol in Latvia is 17 times higher than the second
highest value: 0.43 µg/L in Germany. In the Latvian effluent, other biologically degradable APIs
were also detected in exceptionally high concentrations, indicating problems in the WWTP process
during the sampling.
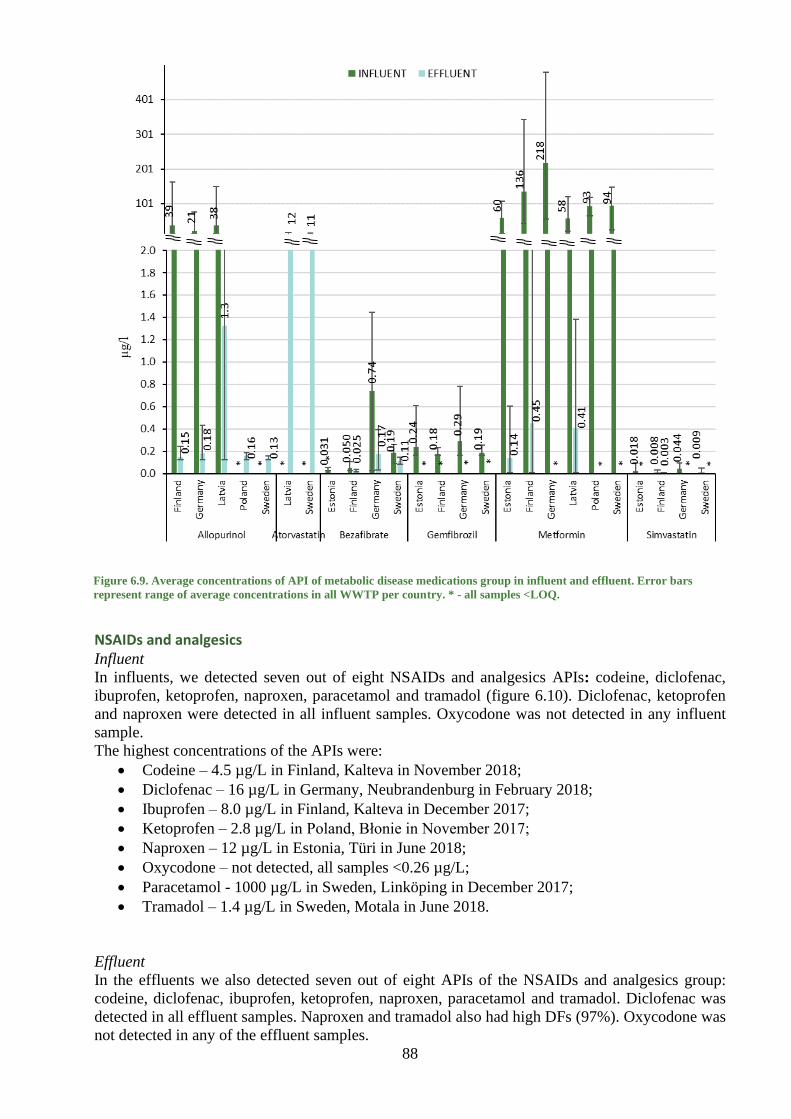
88
NSAIDs and analgesics Influent
In influents, we detected seven out of eight NSAIDs and analgesics APIs: codeine, diclofenac,
ibuprofen, ketoprofen, naproxen, paracetamol and tramadol (figure 6.10). Diclofenac, ketoprofen
and naproxen were detected in all influent samples. Oxycodone was not detected in any influent
sample.
The highest concentrations of the APIs were:
• Codeine – 4.5 µg/L in Finland, Kalteva in November 2018;
• Diclofenac – 16 µg/L in Germany, Neubrandenburg in February 2018;
• Ibuprofen – 8.0 µg/L in Finland, Kalteva in December 2017;
• Ketoprofen – 2.8 µg/L in Poland, Błonie in November 2017;
• Naproxen – 12 µg/L in Estonia, Türi in June 2018;
• Oxycodone – not detected, all samples <0.26 µg/L;
• Paracetamol - 1000 µg/L in Sweden, Linköping in December 2017;
• Tramadol – 1.4 µg/L in Sweden, Motala in June 2018.
Effluent
In the effluents we also detected seven out of eight APIs of the NSAIDs and analgesics group:
codeine, diclofenac, ibuprofen, ketoprofen, naproxen, paracetamol and tramadol. Diclofenac was
detected in all effluent samples. Naproxen and tramadol also had high DFs (97%). Oxycodone was
not detected in any of the effluent samples.
Figure 6.9. Average concentrations of API of metabolic disease medications group in influent and effluent. Error bars
represent range of average concentrations in all WWTP per country. * - all samples <LOQ.

89
Ibuprofen was not analysed in surface water but it was detected in 40% of effluent wastewater
samples at concentrations ranging from 3.7 to 44 µg/L. In order not to exceed the surface water
PNEC value (0.12 ng/L), the effluent emissions would require a dilution factor of more than 31 000
in the receiving waterbody.
The highest concentration of each API was:
• Codeine – 0.66 µg/L in Finland, Viikki in November 2018;
• Diclofenac – 38 µg/L in Estonia, Paide in June 2018;
• Ibuprofen – 44 µg/L in Latvia, WWTP 2 in December 2017;
• Ketoprofen – 0.37 µg/L in Estonia, Pärnu in December 2017;
• Naproxen – 1.3 µg/L in Sweden, Linköping in December 2017;
• Oxycodone –not detected, all samples <0.12 µg/L;
• Paracetamol - 5.4 µg/L in Finland, Kalteva in December 2017;
• Tramadol – 1.5 µg/L in Sweden, Motala in June 2018.

90
Figure 6.10. Average concentrations of API of NSAIDs and analgesics group in influent and effluent. Error bars represent range of average concentrations in all WWTP per country.

91
Other - caffeine Influent
Caffeine was detected in 93% of samples (figure 6.11).
The highest concentration – 24 µg/L – was observed in Germany, Neubrandenburg in June 2018.
Effluent
Caffeine was detected in 15% of the effluent samples.
The highest concentration – 32 µg/L – was observed in Latvia, WWTP 3 in December 2017. The
second highest concentration was ten times less: 3.3 µg/L in Germany (Neubrandenburg, February
2018).
Figure 6.11. Average concentrations of API of caffeine in influent and effluent. Error bars represent range of average
concentrations in all WWTP per country. * - all samples <LOQ.
Other cardiovascular medicines Influent
In influents, we detected all seven APIs of the other cardiovascular medicines group: atenolol,
bisoprolol, dipyridamole, metoprolol, nebivolol, sotalol and warfarin (figure 6.12). The most
frequently detected APIs were metoprolol (DF 79%), sotalol (DF 78%) and bisoprolol (DF 69%).
The highest concentrations were:
• Atenolol – 2.6 µg/L in Sweden, Motala in December 2017;
• Bisoprolol – 1.8 µg/L in Germany, Neubrandenburg in June 2018;
• Dipyridamole – 5 µg/L in Finland, Kalteva in June 2018;
• Metoprolol – 4 µg/L in Germany, Wismar in June 2018;
• Nebivolol – 1.5 µg/L in Estonia, Pärnu in June 2018;
• Sotalol – 0.27 µg/L in Poland, Błonie in July 2018;
• Warfarin – 0.027 µg/L in Finland, Viikki in August 2018.
Effluent
In the effluents we also detected all seven APIs of the other cardiovascular medicines group:
atenolol, bisoprolol, dipyridamole, metoprolol, nebivolol, sotalol and warfarin. The most frequently
detected APIs were metoprolol (DF 100%), sotalol (DF 97%) and bisoprolol (DF 68%). Nebivolol
was detected only once in Estonia. The highest concentrations were:
• Atenolol – 0.54 µg/L in Sweden, Norrköping in December 2017;
• Bisoprolol – 1.4 µg/L in Germany, Neubrandenburg in February 2018;
• Dipyridamole – 0.81 µg/L in Finland, Viikki in December 2017;
• Metoprolol – 7.3 µg/L in Estonia, Türi in June 2018;
• Nebivolol – 0.034 µg/L in Estonia, Paide in June 2018;
• Sotalol – 0.24 µg/L in Latvia, WWTP 2 in May 2018;
• Warfarin – 0.020 µg/L in Finland, Viikki in August 2018.

92
Figure 6.12. Average concentrations of API of other cardiovascular medicines group in influent and effluent. Error bars represent range of average concentrations in all WWTP
per country. * - all samples <LOQ.

93
Psychopharmaceuticals
Influents
In the influents, we detected seven out of eight studied psychopharmaceuticals: citalopram,
olanzapine, oxazepam, quetiapine, sertraline, temazepam and venlafaxine (figure 6.13). Most
frequently detected APIs were oxazepam (DF 96%), venlafaxine (DF 91%), citalopram (DF 89%),
temazepam (DF 67%) and sertraline (DF 67%). Risperidone was not detected in any of the influent
samples.
The highest concentration of each API was:
• Citalopram – 0.81 µg/L in Germany, Neubrandenburg in June 2018;
• Olanzapine – 2.4 µg/L in Poland, Błonie in July 2018;
• Oxazepam – 3.1 µg/L in Finland, Kalteva in November 2018;
• Quetiapine – 0.69 ng/L in Estonia, Türi in June 2018;
• Risperidone – not detected, all samples <0.80 µg/L;
• Sertraline – 0.93 µg/L in Finland, Kalteva in June 2018;
• Temazepam – 2.4 µg/L in November 2018;
• Venlafaxine – 1.5 µg/L in Germany, Neubrandenburg in June 2018.
Effluents
In the WWTP effluent, we detected seven out of eight psychopharmaceuticals: citalopram,
olanzapine, oxazepam, risperidone, sertraline, temazepam and venlafaxine. The detection frequency
of oxazepam was 100%. Citalopram, venlafaxine and temazepam also had high DFs, 97%, 97% and
88%, respectively. Quetiapine was not detected in any of the effluent samples.
The highest concentrations were:
• Citalopram – 0.35 µg/L in Germany, Neubrandenburg in June 2018;
• Olanzapine – 0.43 µg/L in Germany, Wismar in June 2018;
• Oxazepam – 2.7 µg/L in Finland, Kalteva in November 2018;
• Quetiapine – not detected, all samples <0.010 µg/L;
• Risperidone – 0.012 µg/L in Germany, Wismar in June 2018;
• Sertraline – 0.15 µg/L in Sweden, Motala in December 2017;
• Temazepam – 1.8 µg/L in November 2018;
• Venlafaxine – 0.96 µg/L Germany, Rostock in November 2018.
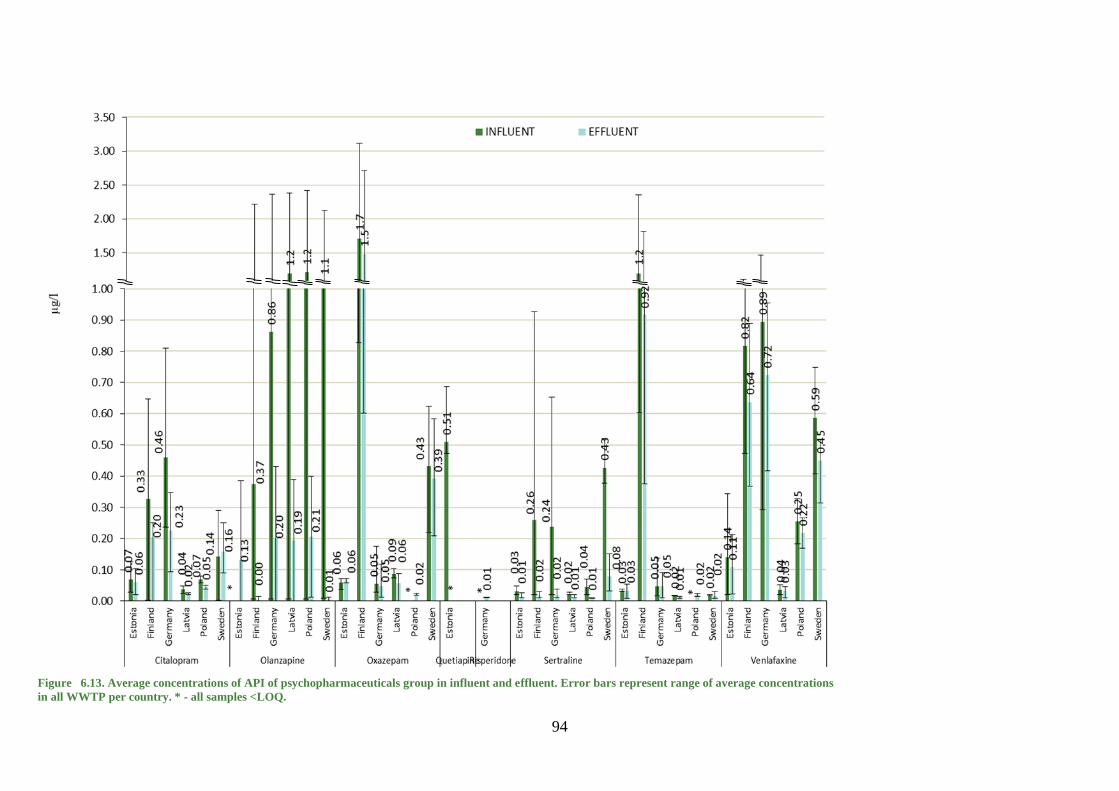
94
Figure 6.13. Average concentrations of API of psychopharmaceuticals group in influent and effluent. Error bars represent range of average concentrations
in all WWTP per country. * - all samples <LOQ.

95
Veterinary medicines
Influents
Two of the eight veterinary APIs were detected in the wastewater influent samples: carprofen and
fenbendazole (figure 6.14). The most often detected API was carprofen (DF 31%). Fenbendazole
was detected only once in a German influent. Emamectin, florfenicol, tiamulin, toltrazuril and
tylosin were not detected in any of the influent samples. The highest concentration for each detected
veterinary API was:
• Carprofen – 0.084 µg/L Germany, Neubrandenburg in February 2018;
• Emamectin –not detected, all samples <0.029 µg/L;
• Fenbendazole – 0.036 µg/L in Germany, Neubrandenburg in February 2018;
• Florfenicol – not detected, all samples <0.064 µg/L;
• Tiamulin – not detected, all samples <0.038 µg/L;
• Toltrazuril –not detected, all samples <9 µg/L;
• Tylosin –not detected, all samples <0.32 µg/L.
Effluents
In the wastewater effluent, four of the seven studied veterinary APIs were detected: carprofen,
emamectin, fenbendazole and tylosin. Most frequently detected API was tylosin (DF 50%).
Fenbendazole was detected only once in Germany. Florfenicol, tiamulin and toltrazuril were not
detected in any effluent sample.
The highest concentration of each API was:
• Carprofen – 0.010 µg/L in Germany, Neubrandenburg in February 2018;
• Emamectin – 0.039 µg/L in Estonia, Paide in June 2018;
• Fenbendazole – 0.015 µg/L in Germany, Wismar in June 2018;
• Florfenicol –not detected, all samples <0.032 µg/L;
• Tiamulin – not detected, all samples <0.019 µg/L;
• Toltrazuril – not detected, all samples <9 µg/L;
• Tylosin – 0.35 µg/L in Germany, Greifswald in June 2018.

96
Figure 6.14. Average concentrations of API of veterinary medicines group in influent and effluent. Error bars represent range of average concentrations in all WWTP per
country. * - all samples <LOQ.
97
Efficiency of wastewater treatment plants - influent and effluent data The API removal efficiencies of the studied wastewater treatment plants are summarized in Annex
7. Site-specific average removal rates were calculated for each WWTP and API. These values are
presented in table 6.1. Previous data about the API removal efficiency are mainly in range of
CWPharma project results or the ranges of the results overlap. There are also differencies in the
results, for example the removal efficiency of metoprolol was negative in CWPharma, whereas in
the literature 3–83% removal rates have been reported. CWPharma project results show some
negative efficiency rates. The negative efficiency rates could be explained by the process where
some pharmaceutical ingredients become metabolised as conjugates in our body, but further along
in the process, in the presence of microorganisms in the wastewater treatment plant, the conjugates
may revert back to the original compounds (Birziņš, 2018; Pereira et al., 2020). Table 6.2
summarises the studied wastewater treatment plants, their capacity in PE and treatment methods.

98
Table 6.1. The average removal efficiencies at the CWPharma case study WWTPs and comparison with literature.
Compound Removal efficiency*,
% (CWPharma)
Number of data points
(CWPharma)
Removal efficiency, %
(literature)
Atenolol 60–82 4 51 (Fick et al. 2011)
20–97 (Gros et al. 2010)
<0–85 (Luo et al. 2014)
8 (Miege et al. 2009)
-5 (Äystö et al. 2020)
Allopurinol 99–100 4 N/A
Bezafibrate 8–82 8 23–99 (Gros et al. 2010)
9–71 (Luo et al. 2014)
68 (Miege et al. 2009)
Bisoprolol -54–79 13 39 (Fick et al. 2011)
23 (Magnér et al. 2016)
32 (Äystö et al. 2020)
Caffeine 90–92 5 89–100% (Al Qarni et al. 2016)
50–100 (Luo et al. 2014)
100 (Äystö et al. 2020)
Carbamazepine -364–98 21 13–28 (Al Qarni et al. 2016)
52 (Fernández-López et al. 2016)
-3 (Fick et al. 2011)
9 (Miehe, 2010)
<0–62 (Luo et al. 2014)
9 (Miege et al. 2009)
<10 (Radjenovic et al. 2007)
0–20 (Tambosi et al. 2010)
-7 (Äystö et al. 2020)
Carprofen 87–88 2 N/A
Citalopram -29–59 25 11 (Fick et al. 2011)
39 (Äystö et al. 2020)
Clarithromycin -23–64 18 54 (Fick et al. 2011)
45 (Miege et al. 2009)
Codeine 47–99 19 68 (Fick et al. 2011)
42 (Kasprzyk-Hordern et al. 2009)
Diclofenac -154–33 29 74 (Fernández-López et al. 2016)
28 (Fick et al. 2011)
30–100 (Gros et al. 2010)
<0–81 (Luo et al. 2014)
32 (Miege et al. 2009)
55 (Papageorgiou et al. 2016
17 (Äystö et al. 2020)
Dipyridamole 41–97 9 >99 (Fick et al. 2011)
Eprosartan 16–98 12 46 (Fick et al. 2011)
Erythromycin -165–99 16 43 (Fick et al. 2011)
<0–83 (Luo et al. 2014)
67 (Miege et al. 2009)
Estrone (E1) 60–100 11 76±46 (Chang et al. 2011)
82 (Esperanza et al. 2007)
75–91 (Luo et al. 2014)
-28 (Mailler et al. 2015)
76–98 (Miehe, 2010)
95 (Äystö et al. 2020)
Fluconazole -60–84 21 33 (Fick et al. 2011)
Gabapentin 41–100 18 84 (Kasprzyk-Hordern et al. 2009)
Gemfibrozil 84 1 30–99 (Gros et al. 2010)
0–17 (Luo et al. 2014)
Hydrochlorothiazide -333–94 27 32 (Gros et al. 2010)
13 (Äystö et al. 2020)
Ibuprofen 86 1 >99 (Carmona et al. 2014)
71 (Fick et al. 2011)
65–100 (Gros et al. 2010)
72–100 (Luo et al. 2014)
74 (Miege et al. 2009)
95–99 (Miehe 2010)
100 (Äystö et al. 2020)
Irbesartan -138–98 4 NA
Ketoprofen -2–99 24 36 (Fick et al. 2011)
40–100 (Gros et al. 2010)
11–100 (Luo et al. 2014)
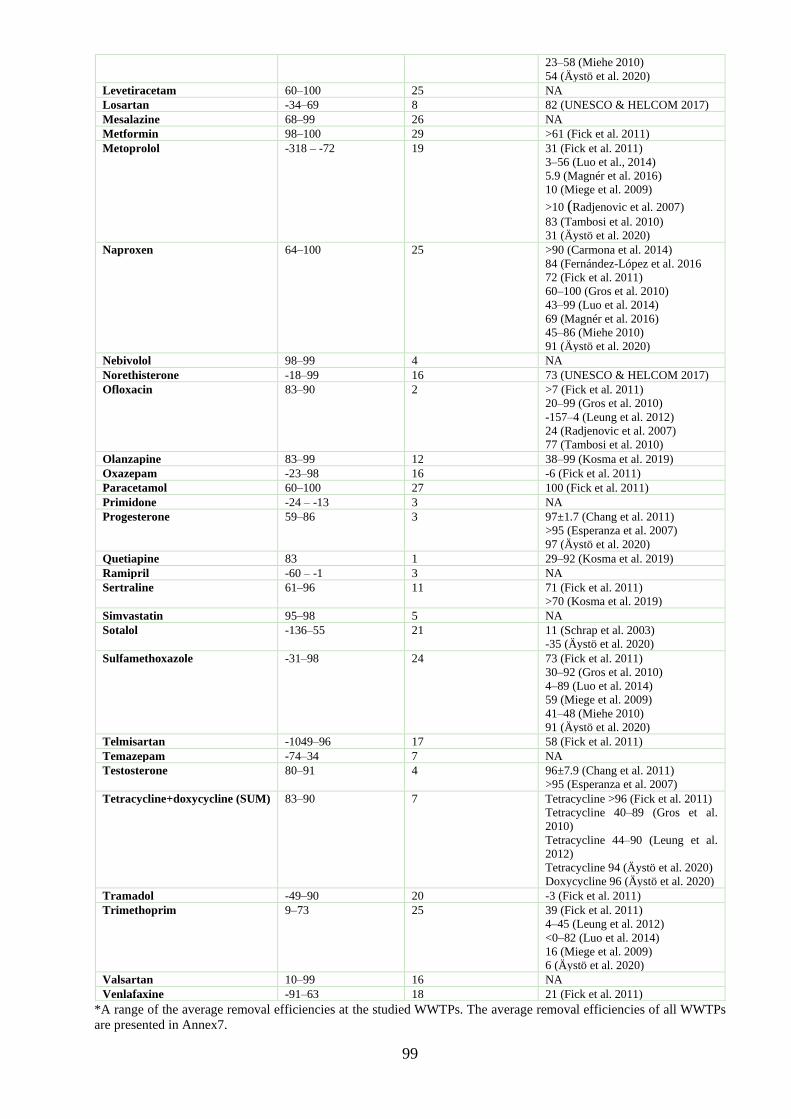
99
*A range of the average removal efficiencies at the studied WWTPs. The average removal efficiencies of all WWTPs
are presented in Annex7.
23–58 (Miehe 2010)
54 (Äystö et al. 2020)
Levetiracetam 60–100 25 NA
Losartan -34–69 8 82 (UNESCO & HELCOM 2017)
Mesalazine 68–99 26 NA
Metformin 98–100 29 >61 (Fick et al. 2011)
Metoprolol -318 – -72 19 31 (Fick et al. 2011)
3–56 (Luo et al., 2014)
5.9 (Magnér et al. 2016)
10 (Miege et al. 2009)
>10 (Radjenovic et al. 2007)
83 (Tambosi et al. 2010)
31 (Äystö et al. 2020)
Naproxen 64–100 25 >90 (Carmona et al. 2014)
84 (Fernández-López et al. 2016
72 (Fick et al. 2011)
60–100 (Gros et al. 2010)
43–99 (Luo et al. 2014)
69 (Magnér et al. 2016)
45–86 (Miehe 2010)
91 (Äystö et al. 2020)
Nebivolol 98–99 4 NA
Norethisterone -18–99 16 73 (UNESCO & HELCOM 2017)
Ofloxacin 83–90 2 >7 (Fick et al. 2011)
20–99 (Gros et al. 2010)
-157–4 (Leung et al. 2012)
24 (Radjenovic et al. 2007)
77 (Tambosi et al. 2010)
Olanzapine 83–99 12 38–99 (Kosma et al. 2019)
Oxazepam -23–98 16 -6 (Fick et al. 2011)
Paracetamol 60–100 27 100 (Fick et al. 2011)
Primidone -24 – -13 3 NA
Progesterone 59–86 3 97±1.7 (Chang et al. 2011)
>95 (Esperanza et al. 2007)
97 (Äystö et al. 2020)
Quetiapine 83 1 29–92 (Kosma et al. 2019)
Ramipril -60 – -1 3 NA
Sertraline 61–96 11 71 (Fick et al. 2011)
>70 (Kosma et al. 2019)
Simvastatin 95–98 5 NA
Sotalol -136–55 21 11 (Schrap et al. 2003)
-35 (Äystö et al. 2020)
Sulfamethoxazole -31–98 24 73 (Fick et al. 2011)
30–92 (Gros et al. 2010)
4–89 (Luo et al. 2014)
59 (Miege et al. 2009)
41–48 (Miehe 2010)
91 (Äystö et al. 2020)
Telmisartan -1049–96 17 58 (Fick et al. 2011)
Temazepam -74–34 7 NA
Testosterone 80–91 4 96±7.9 (Chang et al. 2011)
>95 (Esperanza et al. 2007)
Tetracycline+doxycycline (SUM) 83–90 7 Tetracycline >96 (Fick et al. 2011)
Tetracycline 40–89 (Gros et al.
2010)
Tetracycline 44–90 (Leung et al.
2012)
Tetracycline 94 (Äystö et al. 2020)
Doxycycline 96 (Äystö et al. 2020)
Tramadol -49–90 20 -3 (Fick et al. 2011)
Trimethoprim 9–73 25 39 (Fick et al. 2011)
4–45 (Leung et al. 2012)
<0–82 (Luo et al. 2014)
16 (Miege et al. 2009)
6 (Äystö et al. 2020)
Valsartan 10–99 16 NA
Venlafaxine -91–63 18 21 (Fick et al. 2011)
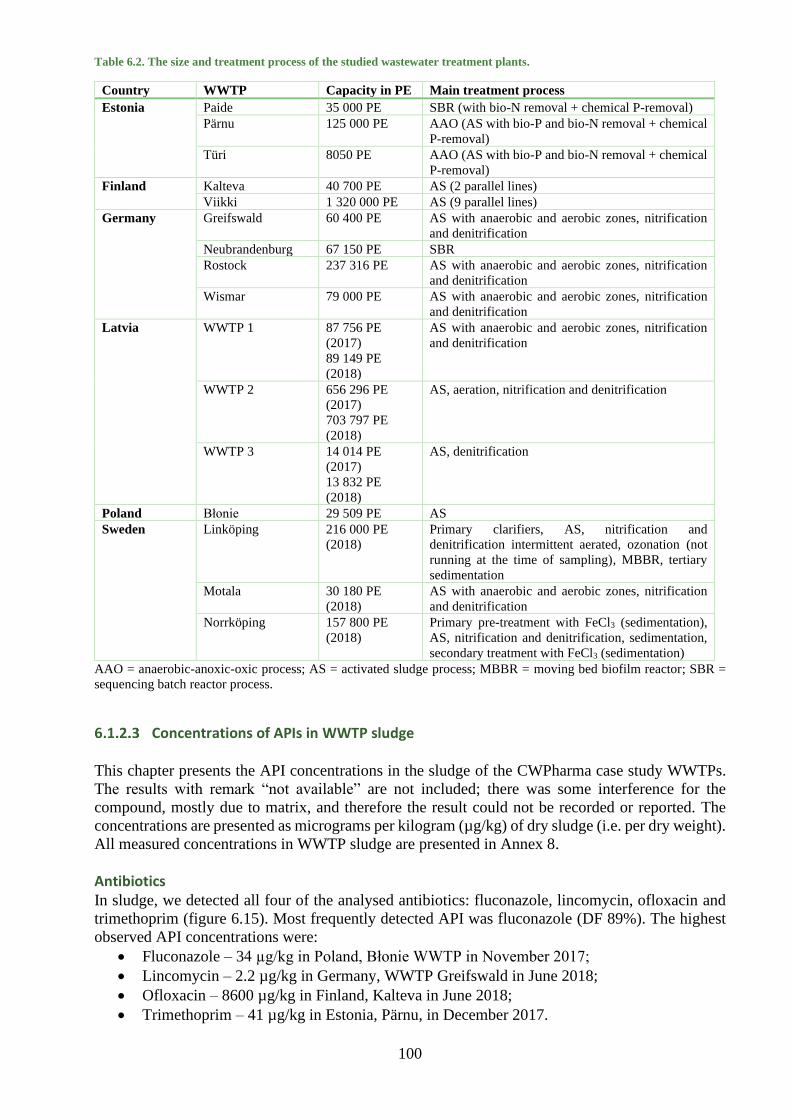
100
Table 6.2. The size and treatment process of the studied wastewater treatment plants.
Country WWTP Capacity in PE Main treatment process
Estonia Paide 35 000 PE SBR (with bio-N removal + chemical P-removal)
Pärnu 125 000 PE AAO (AS with bio-P and bio-N removal + chemical
P-removal)
Türi 8050 PE AAO (AS with bio-P and bio-N removal + chemical
P-removal)
Finland Kalteva 40 700 PE AS (2 parallel lines)
Viikki 1 320 000 PE AS (9 parallel lines)
Germany Greifswald 60 400 PE AS with anaerobic and aerobic zones, nitrification
and denitrification
Neubrandenburg 67 150 PE SBR
Rostock 237 316 PE AS with anaerobic and aerobic zones, nitrification
and denitrification
Wismar 79 000 PE AS with anaerobic and aerobic zones, nitrification
and denitrification
Latvia WWTP 1 87 756 PE
(2017)
89 149 PE
(2018)
AS with anaerobic and aerobic zones, nitrification
and denitrification
WWTP 2 656 296 PE
(2017)
703 797 PE
(2018)
AS, aeration, nitrification and denitrification
WWTP 3 14 014 PE
(2017)
13 832 PE
(2018)
AS, denitrification
Poland Błonie 29 509 PE AS
Sweden Linköping 216 000 PE
(2018)
Primary clarifiers, AS, nitrification and
denitrification intermittent aerated, ozonation (not
running at the time of sampling), MBBR, tertiary
sedimentation
Motala 30 180 PE
(2018)
AS with anaerobic and aerobic zones, nitrification
and denitrification
Norrköping 157 800 PE
(2018)
Primary pre-treatment with FeCl3 (sedimentation),
AS, nitrification and denitrification, sedimentation,
secondary treatment with FeCl3 (sedimentation)
AAO = anaerobic-anoxic-oxic process; AS = activated sludge process; MBBR = moving bed biofilm reactor; SBR =
sequencing batch reactor process.
Concentrations of APIs in WWTP sludge
This chapter presents the API concentrations in the sludge of the CWPharma case study WWTPs.
The results with remark “not available” are not included; there was some interference for the
compound, mostly due to matrix, and therefore the result could not be recorded or reported. The
concentrations are presented as micrograms per kilogram (µg/kg) of dry sludge (i.e. per dry weight).
All measured concentrations in WWTP sludge are presented in Annex 8.
Antibiotics In sludge, we detected all four of the analysed antibiotics: fluconazole, lincomycin, ofloxacin and
trimethoprim (figure 6.15). Most frequently detected API was fluconazole (DF 89%). The highest
observed API concentrations were:
• Fluconazole – 34 µg/kg in Poland, Błonie WWTP in November 2017;
• Lincomycin – 2.2 µg/kg in Germany, WWTP Greifswald in June 2018;
• Ofloxacin – 8600 µg/kg in Finland, Kalteva in June 2018;
• Trimethoprim – 41 µg/kg in Estonia, Pärnu, in December 2017.

101
Figure 6.15. Average concentrations of antibiotics in sludge. Error bars represent the range of average concentrations in
each country.
Antiepileptics All four antiepileptic APIs were detected in sludge: carbamazepine, gabapentin, levetiracetam and
primidone (figure 6.16). Carbamazepine was detected in all samples.
The highest observed API concentrations were:
• Carbamazepine – 600 µg/kg Poland, Błonie WWTP in November 2017;
• Gabapentin – 51 µg/kg in Estonia, Pärnu, in December 2017;
• Levetiracetam – 31 µg/kg in Finland, Kalteva in June 2018;
• Primidone – 5.1 µg/kg in Sweden, Linköping in June 2018.
Figure 6.16. Average concentrations of the antiepileptics in sludge. Error bars represent the range of the average
concentrations in each country.

102
Antihypertensives Three out of the four studied antihypertensive APIs were detected in sludge: enalapril, irbesartan
and telmisartan (figure 6.17). Irbesartan was also frequently detected (DF 93%). Ramipril was not
detected in any of the sludge samples. The highest observed API concentrations were:
• Enalapril – 1.4 µg/kg in Estonia, Pärnu, in December 2017;
• Irbesartan – 51 µg/kg in Germany, WWTP Greiswald in February 2018;
• Ramipril –not detected, all samples <0.46 µg/kg;
• Telmisartan – 8700 µg/kg in Estonia, Paide in December 2017.
Metabolic disease medications From the metabolic disease medications group only metformin was measured in sludge. It was
detected in all samples (figure 6.18). The highest observed concentration of metformin was 510
µg/kg in Estonia, Pärnu, in June 2018.
Figure 6.18. Average concentrations of metformin in sludge. Error bars represent the range of the average concentrations
in each country.
NSAIDs and analgesics in sludge All six APIs of the NSAIDs and analgesics group were detected in sludge: codeine, diclofenac,
ketoprofen, naproxen, oxycodone and tramadol (figure 6.19.). Diclofenac was detected in all
samples. Other frequently detected APIs were tramadol (DF 93%), oxycodone (DF 79%) and
naproxen (DF 71%). The highest observed concentrations were:
• Codeine – 43 µg/kg in Finland, Kalteva in June 2018;
• Diclofenac – 960 µg/kg in Poland, Błonie WWTP in July 2018;
• Ketoprofen – 79 µg/kg in Poland, Błonie WWTP in November 2017;
Figure 6.17. Average concentrations of the antihypertensive APIs in sludge. Error bars represent the range of the average
concentrations in each country.

103
• Naproxen – 42 µg/kg in Finland, Kalteva in June 2018;
• Oxycodone – 100 µg/kg in Estonia, Pärnu in June 2018;
• Tramadol – 71 µg/kg in Poland, Błonie WWTP in November 2017.
Other APIs Caffeine was detected in all sludge samples (figure 6.20.). The highest observed concentration was
160 µg/kg in Estonia, Pärnu in June 2018.
Figure 6.20. Average concentrations of caffeine in sludge. Error bars represent the range of the average concentrations in
each country.
Other cardiovascular medicines Two APIs, bisoprolol and metoprolol, from the other cardiovascular medicines group were
measured in sludge. Metoprolol was detected in all sludge samples, and bisoprolol in 93% of the
samples (figure 6.21).
The highest observed concentrations were:
• Bisoprolol – 120 µg/kg in Germany, Rostock, in November 2018;
• Metoprolol – 410 µg/kg in Sweden, Linköping (digested sludge) in December 2017.
Figure 6.19. Average concentrations of the APIs of NSAIDs and analgesics group in sludge. Error bars represent the range
of the average concentrations in each country.

104
Psychopharmaceuticals All seven psychopharmaceuticals were detected in sludge: citalopram, olanzapine, oxazepam,
risperidone, sertraline, temazepam and venlafaxine (figure 6.22.). Citalopram, sertraline and
venlafaxine were detected in all samples (DF 100%). Oxazepam and temazepam were also
frequently detected (DF 96%).
The highest observed concentrations were:
• Citalopram – 510 µg/kg in Finland, Viikki in August 2018;
• Olanzapine – 180 µg/kg in Poland, Błonie WWTP in July 2018;
• Oxazepam – 140 µg/kg in Finland, Viikki in August 2018;
• Risperidone – 8.4 µg/kg in Poland, Błonie WWTP in November 2017;
• Sertraline – 1400 µg/kg in Sweden, Linköping in December 2017;
• Temazepam – 310 µg/kg in Finland, Viikki in August 2018;
• Venlafaxine – 135 µg/kg in Sweden, Motala in December 2017.
Figure 6.21. Average concentrations of the APIs of other cardiovascular medicines group in sludge. Error bars represent
the range of the average concentrations in each country.

105
Veterinary medicines Two veterinary APIs were measured in the sludge samples. Tylosin was not detected in any sample,
and totrazuril was detected only in one sample from Poland
The highest observed concentrations were:
• Toltrazuril – 31 µg/kg in Poland, Błonie WWTP in July 2018;
• Tylosin – not detected, all samples <53 µg/kg.
However, lincomycin, which is included in the antibiotics group in this report but only known to be
used for humans in Latvia, was detected in several sludge samples.
Mass balance of the APIs - influent, effluent, sludge The distribution of each API between the influent, effluent and sludge was studied. The percentages
are the median results of the calculations and therefore the masses are not balanced. Criteria for
sample selection did not fully match the criteria in the wastewater treatment plant efficiency
calculations, which may produce some inconsistencies in the results (Chapter 6.1.2.2). Negative
efficiency values (Table 6.1) were not included in the mass balance calculations (Table 6.3)
because mass balance could not be calculated if API’s concentration was higher in effluent than in
influent. Therefore, there are certain inconsistencies between the calculated efficiency and mass
balance (Table 6.4) which needs to be considered when interpreting the results.
The following factors impact the accuracy of the results, i.e. are source of errors and uncertainties:
1) small number of measurements with usable results;
2) the annual load of the APIs relies on only a couple of measurements and the total annual amount
of wastewater treated and discharged;
3) the influent, effluent and sludge were sampled at the same time, disregarding the water and
sludge retention times at the plant;
4) Due to data availability and consistency, we had to use the annual wastewater flow rates and
sludge production instead of the data of the sampling days.
Figure 6.22. Average concentrations of psychopharmaceuticals in sludge. Error bars represent the range of the average
concentrations in each country.
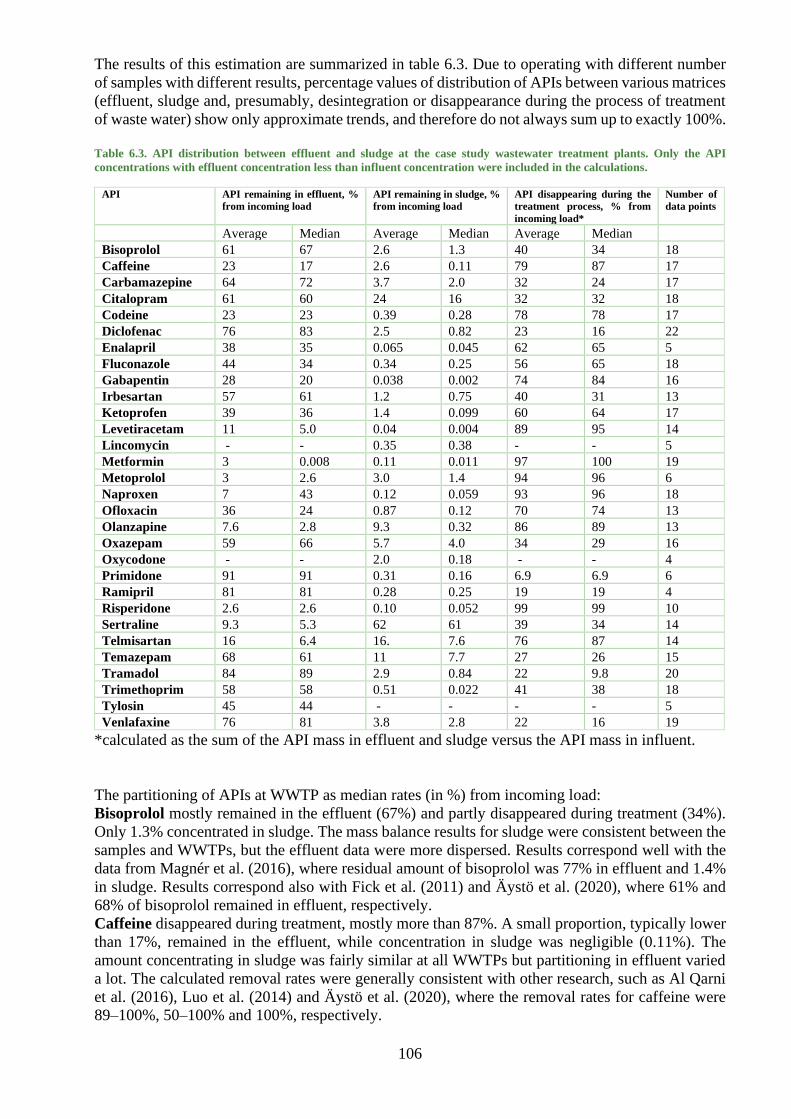
106
The results of this estimation are summarized in table 6.3. Due to operating with different number
of samples with different results, percentage values of distribution of APIs between various matrices
(effluent, sludge and, presumably, desintegration or disappearance during the process of treatment
of waste water) show only approximate trends, and therefore do not always sum up to exactly 100%.
Table 6.3. API distribution between effluent and sludge at the case study wastewater treatment plants. Only the API
concentrations with effluent concentration less than influent concentration were included in the calculations.
API API remaining in effluent, %
from incoming load
API remaining in sludge, %
from incoming load
API disappearing during the
treatment process, % from
incoming load*
Number of
data points
Average Median Average Median Average Median
Bisoprolol 61 67 2.6 1.3 40 34 18
Caffeine 23 17 2.6 0.11 79 87 17
Carbamazepine 64 72 3.7 2.0 32 24 17
Citalopram 61 60 24 16 32 32 18
Codeine 23 23 0.39 0.28 78 78 17
Diclofenac 76 83 2.5 0.82 23 16 22
Enalapril 38 35 0.065 0.045 62 65 5
Fluconazole 44 34 0.34 0.25 56 65 18
Gabapentin 28 20 0.038 0.002 74 84 16
Irbesartan 57 61 1.2 0.75 40 31 13
Ketoprofen 39 36 1.4 0.099 60 64 17
Levetiracetam 11 5.0 0.04 0.004 89 95 14
Lincomycin - - 0.35 0.38 - - 5
Metformin 3 0.008 0.11 0.011 97 100 19
Metoprolol 3 2.6 3.0 1.4 94 96 6
Naproxen 7 43 0.12 0.059 93 96 18
Ofloxacin 36 24 0.87 0.12 70 74 13
Olanzapine 7.6 2.8 9.3 0.32 86 89 13
Oxazepam 59 66 5.7 4.0 34 29 16
Oxycodone - - 2.0 0.18 - - 4
Primidone 91 91 0.31 0.16 6.9 6.9 6
Ramipril 81 81 0.28 0.25 19 19 4
Risperidone 2.6 2.6 0.10 0.052 99 99 10
Sertraline 9.3 5.3 62 61 39 34 14
Telmisartan 16 6.4 16. 7.6 76 87 14
Temazepam 68 61 11 7.7 27 26 15
Tramadol 84 89 2.9 0.84 22 9.8 20
Trimethoprim 58 58 0.51 0.022 41 38 18
Tylosin 45 44 - - - - 5
Venlafaxine 76 81 3.8 2.8 22 16 19
*calculated as the sum of the API mass in effluent and sludge versus the API mass in influent.
The partitioning of APIs at WWTP as median rates (in %) from incoming load:
Bisoprolol mostly remained in the effluent (67%) and partly disappeared during treatment (34%).
Only 1.3% concentrated in sludge. The mass balance results for sludge were consistent between the
samples and WWTPs, but the effluent data were more dispersed. Results correspond well with the
data from Magnér et al. (2016), where residual amount of bisoprolol was 77% in effluent and 1.4%
in sludge. Results correspond also with Fick et al. (2011) and Äystö et al. (2020), where 61% and
68% of bisoprolol remained in effluent, respectively.
Caffeine disappeared during treatment, mostly more than 87%. A small proportion, typically lower
than 17%, remained in the effluent, while concentration in sludge was negligible (0.11%). The
amount concentrating in sludge was fairly similar at all WWTPs but partitioning in effluent varied
a lot. The calculated removal rates were generally consistent with other research, such as Al Qarni
et al. (2016), Luo et al. (2014) and Äystö et al. (2020), where the removal rates for caffeine were
89–100%, 50–100% and 100%, respectively.
107
Carbamazepine mostly remained in the effluent (72%) and 24% disappeared during treatment. A
small amount ended up in sludge (2.0%). The accuracy of sludge results was good, but the effluent
data were scattered. These results were in accordance with the removal rates obtained by most of
the other studies (Radjenovic et al. 2007 (<10%), Miege et al. 2009 (9%), Miehe 2010 (9%),
Tambosi et al. 2010 (0–20%), Al Qarni et al. 2016 (13–28%), Fick et al. 2011 (-3%), Äystö et al.
2020 (-7%)). Fernández-López et al. (2016) and Luo et al. (2014) obtained higher removal rates for
carbamazepine in their research: 52% and up to 62%, respectively. The proportion of carbamazepine
remaining in sludge was roughly in line with 0.94% obtained by Magnér et al. (2016).
Citalopram tended to remain in the effluent (60%) rather than disappeared during the treatment
(32%). 16% accumulated in sludge. However, there was a lot of variation in the mass balance results.
The median removal rate was in line with Fick et al. 2011 and Äystö et al. 2020 where the amount
of citalopram remaining in effluent was 89% and 61%, respectively. Results differed from other
research, where 31.8% remained in effluent and 8.6% in sludge (Magnér et al. 2016).
Codeine tended to disappear during the treatment (78%). 23% of codeine remained in effluent.
Codeine did not concentrate in sludge (0.28%). The mass balance calculations were fairly consistent
and did not vary much. The calculated removal efficiency was a little bit higher than in other studies,
where removal efficiency was 42% (Kasprzyk-Hordern et al., 2009) or 68% (Fick et al., 2011).
Diclofenac remained strongly in the effluent (83%). 16% disappeared during treatment and
concentration in sludge was negligible (0.82%). Partitioning in sludge was consistent and the
proportion remaining in effluent was also fairly accurate. The results corresponded well with the
17% removal rate obtained by Äystö et al. (2020), 28% removal rate obtained by Fick et al. (2011),
32% removal rate obtained by Miege et al. (2009), and the very low partitioning into sludge (0.37%)
obtained by Magnér et al. (2016). Higher removal rates have also been obtained in the literature
(Fernández-López et al. 2016, Gros et al. 2010 and Luo et al. 2014, see Table 6.1).
Enalapril mostly disappeared during treatment (65% or more) rather than remaining in effluent
(35% or less). Concentration in sludge was negligible (0.045%). However, there were very few data
points to calculate the mass balance and the results varied, and we did not find any literature data to
verify our results.
Fluconazole mostly disappeared during treatment (65%) while 34% remained in effluent.
Concentration in sludge was negligible (0.25%). The removal rate in this study was higher than the
33% obtained by Fick et al. (2011). The difference is likely caused by the exclusion of the negative
removal rates in the mass balance calculations and the high variation in the effluent/influent data
(the removal efficiencies of this study are presented in Chapter 6.1.2.2).
Gabapentin mostly disappeared during treatment (84% or more) rather than remaining in effluent
(20%). Very small amounts remained in sludge (0.002% or less). Despite the scattered results, the
proportion remaining in the effluent was in line with the 84% removal rate obtained by Kasprzyk-
Hordern et al. (2009).
Irbesartan partly remained in effluent (61% with a trend to be less), partly disappeared in the
treatment (31% with a trend to be higher). Concentration in sludge was negligible (0.75%). There
was a lot of variation in the effluent/influent data, and we did not find any literature reference.
Ketoprofen mostly disappeared during treatment (64% or more) and partly remained in effluent
(36%). Concentration in sludge was negligible (0.099%). The amount concentrating in sludge
corresponds with 0.014% obtained by Magnér et al. (2016). However, the residual amount of
ketoprofen in effluent varied a lot in this study and in the literature, where it ranges from 0% to 97%
(Table 6.1).
Levetiracetam dissapeared almost totally during treatment (95% or more). 5.0% or less remained
in effluent and concentration in a sludge was negligible (0.004% or less). The data were very
consistent and thus the mass balance results were considered reliable, although we did not find any
literature data to verify our results.
Lincomycin concentrations were often higher in effluents than in influent (only one sample above
LOQ) and it was detected only occasionally in the WWTP samples. Based on the available results
more than 0.38% of lincomycin concentrated in sludge, but other values could not be calculated.

108
Lincomycin is used mainly in veterinary medicine and thus not assumed very relevant API at the
WWTPs.
Metformin disappeared almost completely during the treatment (100%) and a negligible amount
remained in effluent (0.008% and less) or sludge (0.011%). The calculated mass balance was very
consistent and there was almost no dispersion between the WWTPs. These results matched well
with Fick et al. 2011, where removal rate was >61%.
Metoprolol seemed to largely disappear during treatment (96% or more) while less than 2.6%
remained in effluent, when the negative removal rates were excluded in the calculations (i.e. most
data points of this study). In contrast, the average removal rates at the WWTPs, calculated in Chapter
6.1.2.2, were negative as shown in Table 6.1. Most of the removal rates presented in the literature
were also a lot lower (3–56%, see table 6.1), but a higher rate has been reported (83% by Tambiosi
et al. 2010). 1.4% of metoprolol partitioned in sludge, which is in agreement with the 1.3% reported
by Magnér et al. (2016).
Naproxen mostly disappeared during treatment (96% or more) while only 4.3% or less remained in
effluent. Concentration in sludge was negligible (0.059%). The mass balances did not vary much
between the WWTPs, and the removal rate is in line with other studies (43–100%, Table 6.1).
Ofloxacin tended to disappear during treatment (74% or more). 24% or less remained in effluent.
Concentration in sludge was negligible (0.12%). The removal rates varied a lot between different
studies, ranging from -157% to 99% (Table 6.1). Consequently, the removal rates of this study were
much higher than the 24% obtained by Radjenovic et al. (2007), up to 4% by Leung et al. (2012),
and >7% by Fick et al. (2011), but they were accordance with 77% removal rate of Tambosi et al.
(2010) and up to 99% of Gros et al. (2010).
Olanzapine largely disappeared during treatment (89%) and a small fraction remained in effluent
(2.8%). Only 0.32% concentrated in sludge. The fraction remaining in effluent was within the range
of Kosma et al. (2019), where the removal rate of olanzepine was 38–99%.
Oxazepam remained largely in effuent (66%) and 4.0% partitioned in sludge. 29% of the incoming
oxazepam disappeared during treatment. The proportion remaining in effluent is affected by the
exclusion of negative removal rates in the mass balance calculations, and the removal rates
calculated in Chapter 6.1.2.2 range from -23% to 96% (Table 6.1). Fick et al. (2011) have also
obtained a negative removal rate for oxazepam (-6%). Also, the retention in sludge was higher than
the 0.87% reported by Magnér et al. (2016).
Oxycodone was not detected in any influent or effluent sample. However, the partitioning in sludge
was estimated to be >0.18% based on the LOQ in the influent.
Primidone remained in the effluent (91%) and only 6.9% disappeared during treatment. 0.16% or
less partitioned in sludge. The calculations were based on very few effluent results, but the sludge
data were more comprehensive. We did not find any literature data on the fate of primidone at
WWTPs.
Ramipril concentrations were often higher in effluent than in influent. Even if the negative removal
was excluded in the mass balance calculations, the results indicated that ramipril passes through the
treatment (81% remains in effluent while 19% disappeared during the treatment. Only a fraction,
0.25%, ended up in sludge. We did not find any literature data on the fate of ramipril at WWTP.
Risperidone was not detected in any influent sample and it was above LOQ in only one effluent,
but it was detected in most sludge samples. When the influent and effluent LOQs were used for
estimating the mass balance, the much higher value for influents than effluents resulted in <99%
disappearance during the treatment and >2.6% remaining in effluent. At least 0.052% partitioned in
sludge. The mass balance calculated by Magnér et al. (2016) was considered more reliable: 15% of
risperidone partitioned in effluent and 0.47% in sludge.
Sertraline tended to remain in sludge (61%). Also, considerable amounts disappeared during the
treatment (34%) and only a small part (5.3%) remained in the effluents. Accuracy of the effluent
data were good, but the sludge data were quite dispersed. Results are consistent with Magnér et al.
(2016), where 3.4% of sertraline partitioned in effluent and 15% in sludge. Kosma et al. (2019) and
Fick et al. (2011) have reported over 70% removal rates for sertraline.

109
Telmisartan mainly disappeared during treatment (87%) and the remaining amount was distributed
almost equally between sludge (7.6%) and effluent (6.4%). Except a couple of outlier samples, the
overall accuracy of results was fair for both effluent and sludge. The removal rate was higher than
reported previously (58% by Fick et al. 2011).
Temazepam mostly remained in effluent (61%). 26% of temazepam disappeared during the
treatment, while 7.7% partitioned in sludge. The accuracy of the sludge results was good, but the
effluent results were more dispersed.
Tramadol mainly remained in effluent (89%) and only 9.8% disappeared during the treatment.
Concentration in sludge was negligible (0.84%). Good accuracy for sludge data, but effluent data
were more dispersed. Fick et al. (2011) have reported even higher tendency to stay in effluent and
a removal rate of -3%.
Trimethoprim partly remained in effluent (58%) and partly disappeared during the treatment (at
least 38%). Concentration in sludge was negligible (0.022% and less). Data accuracy for sludge was
good, while the effluent results were highly dispersed. The literature presents very varying removal
rates for trimethoprim. The share of trimethoprim remaining in effluent is rather well in line with
some of the reported removal rates (Fick et al., 2011; Leung et al., 2012; Luo et al., 2014). However,
some studies present significantly lower removal rates for trimethoprim: 16% by Miege et al. (2009),
and 6% by Äystö et al. (2020).
Tylosin was not detected in any influent or sludge sample but was detected in several effluents, and
thus the partitioning calculations are highly uncertain. Based on the LOQ in influent, 44% of tylosin
would have remained in effluent.
Venlafaxine mainly remained in effluent (81%) while 16% disappeared during the treatment. 2.8%
concentrated in sludge. The sludge results were fairly accurate, but the effluent results were
dispersed. The percentage of venlafaxine remaining in effluent was similar to Fick et al. (2011),
where 21% removal rate was reported.
To summarize, APIs tending to remain in the effluent (≥50% from the incoming load) are:
• Primidone
• Tramadol
• Ramipril
• Diclofenac
• Venlafaxine
• Temazepam
• Carbamazepine
• Bisoprolol
• Citalopram
• Oxazepam
• Trimethoprim
• Irbesartan
APIs tending to concentrate in sewage sludge were sertraline, citalopram, telmisartan and
temazepam. APIs which disappear during the treatment process, probably due to decomposition
or transformation into another compounds are risperidone, metformin, metoprolol and naproxen.
More than 50% disappearance was also observed for levetiracetam, olanzapine, caffeine, codeine,
telmisartan, gabapentin, ofloxacin, enalapril, ketoprofen and fluconazole (Table 6.3).
The calculated balances are summarized as graphs in Annex 9. The results are also compiled in
Table 6.4 and compared with WWTP efficiency (effluent vs. influent, table 6.1). The removal rates
obtained with balance and efficiency calculations are summarized in table 6.4. The second column
of table 6.4 shows the value of API remaining in effluent, average % from incoming load (value
from table 6.3). In the third column there are the adjusted efficiency values (from table 6.1.), but
taking out negative efficiency values, where concentrations in effluent were higher than in influent.
After comparing these two values, it can be concluded that the values in columns 2 and 3 (API

110
remaining in effluent) match well, with up to 23% difference. The fourth column presents the
removal rate (effluent vs. influent) based on balance calculations (calculated from column 3). The
efficiencies from Table 6.1 were added for comparison in column 5. The APIs for which the
calculated removal rates differed significantly are highlighted with grey background:
carbamazepine, diclofenac, irbesartan, metoprolol, ramipril and telmisartan. The differences in
balance and removal rate results were caused by the different input data, as described in section
6.1.1.
Table 6.4. Comparison of the average API amount remaining in effluent estimated with balance-based calculations and
efficiency-based calculations. API API remaining in
effluent, % from
incoming load
API remaining in effluent,
average %, recalculated
from Table 6.1 and Annex
7.*
Average rate of API removal
(staying in sludge or being
decomposited), recalculated
from Table 6.1 and Annex 7.*
Average efficiency in Table
6.1, calculated from influent
and effluent data**
Bisoprolol 61 61 39 15
Caffeine 23 10 90 91
Carbamazepine 64 58 42 -9
Citalopram 61 64 36 25
Codeine 23 20 80 80
Diclofenac 76 79 21 -16
Enalapril 38 - - -
Fluconazole 44 51 49 22
Gabapentin 28 30 70 69
Irbesartan 57 47 53 -3
Ketoprofen 39 36 64 60
Levetiracetam 11 8 92 92
Lincomycin - - - -
Metformin 3 0.7 99 99
Metoprolol 3 - - -225
Naproxen 7 10 90 89
Ofloxacin 36 13 87 87
Olanzapine 7.6 8 92 91
Oxazepam 59 73 27 19
Oxycodone - - - -
Primidone 91 - - -18
Ramipril 81 78 22 -31
Risperidone 2.6 - - -
Sertraline 9.3 13 87 85
Telmisartan 16 30 70 -41
Temazepam 68 72 28 8
Tramadol 84 80 20 5
Trimethoprim 58 62 38 37
Tylosin 45 - - -
Venlafaxine 76 76 24 12
- Values cannot be calculated
* Amount of API that remains in effluent (recalculations from efficiency data based on influent and effluent data, but taking out
negative efficiency values to go together with balance methodology)
** Including all the samples corresponding to criteria described in chapter 6.1.1.
Very different average removal rates (positive vs. negative) depending on calculation method: balance calculations include only
effluent concentrations that were smaller than the respective influent concentrations, while the efficiency values include also effluent
concentrations higher than influent concentrations.
Conclusions
Influent
The APIs that were detected in at least 90% of the influent samples were caffeine, codeine,
diclofenac, fluconazole, gabapentin, hydrochlorothiazide, ketoprofen, levetiracetam, mesalazine,
metformin, naproxen, oxazepam, paracetamol, sulfamethoxazole, trimethoprim, valsartan and
venlafaxine. Paracetamol was the most abundant API in influents. The three highest paracetamol
concentrations were 1000 µg/L in Linköping and Norrköping (SE) and 980 µg/L in Kalteva (FI).
Altogether 59 out of 75 APIs, representing all 12 studied API groups, were detected in the influents.

111
Six APIs were found in all influent samples: diclofenac, gabapentin, ketoprofen, metformin,
naproxen and trimethoprim. The following APIs were not detected in the influents, because of
relatively high LOQs or as they are used in veterinary medicine: ciprofloxacin, esomeprazole,
sulfadiazine, candesartan, cetirizine, fexofenadine, mometasone furoate, pantoprazole, atorvastatin,
oxycodone, risperidone, emamectin, florfenicol, tiamulin, toltrazuril and tylosin.
Effluent
Fifteen APIs were detected in at least 90% of the effluent samples: carbamazepine, citalopram,
clarithromycin, diclofenac, erythromycin, fluconazole, hydrochlorothiazide, ketoprofen,
metoprolol, naproxen, oxazepam, sotalol, tramadol, trimethoprim and venlafaxine. The APIs with
the highest detected concentrations were ibuprofen (44 µg/L WWTP 2, LV), diclofenac (38 µg/L
Paide, EE) and caffeine (32 µg/L WWTP 3, LV).
60 out of 75 analysed APIs were detected in effluents, representing all 12 studied API groups. Three
APIs were found in all effluent samples: diclofenac, metoprolol and oxazepam. The following APIs
were not detected in any effluent sample, mainly due to relatively high LOQ: ciprofloxacin,
esomeprazole, sulfadiazine, amlodipine, enalapril, fluticasone, mometasone furoate, pantoprazole,
estriol, gemfibrozil, oxycodone and quetiapine. Also, the veterinary medicines florfenicol, tiamulin
and toltrazuril were not detected in any WWTP effluent.
Sludge
The APIs that were detected in at least 90% of the sludge samples were carbamazepine, irbesartan,
venlafaxine, metformin, diclofenac, tramadol, caffeine, bisoprolol, metoprolol, citalopram,
oxazepam, sertraline and temazepam. The APIs with the highest detected concentrations were
telmisartan, with maximum concentrations of 8700 µg/kg d.w. in Paide (EE) and 7100 µg/kg d.w.
in Pärnu (EE), and ofloxacin, up to 8600 µg/kg d.w. in Kalteva (FI). 29 out of 31 analysed APIs
were detected in sludge, representing all the nine studied API groups.
Eight APIs were found in all sludge samples: diclofenac, carbamazepine, venlafaxine, metformin,
caffeine, metoprolol, citalopram and sertraline. The most often detected groups were metabolic
disease medications (detected.e. metformin, DF 100%), other cardiovascular medications (average
DF 96%) and caffeine (DF 100%). Ramipril and tylosin were not above LOQ in any sludge sample.
Removal efficiency – influent and effluent data
Three APIs had negative efficiency values in all WWTPs: metoprolol, primidone and ramipril. The
PNEC values of these APIs are relatively high and were not exceeded in the surface waters of
CWPharma case studies. 28 APIs, 56% of the APIs we calculated the WWTP efficiencies, had
positive efficiency values in all WWTPs. Only nine out of 50 APIs had negative or zero average
efficiency rate: carbamazepine, diclofenac, hydrochlorthiazide, irbesartan, metoprolol, sotalol,
telmisartan, primidone and ramipril. Out of these nine APIs, only diclofenac exceeded the PNEC in
the surface waters of the CWPharma case studies. The average efficiency varied between several
WWTPs for 19 APIs – it was either positive or negative and there was no clear coherence between
treatment efficiency and wastewater treatment technology.
Balance of APIs - influent, effluent, sludge data
While all the effluent concentrations that were higher than the respective influent concentrations
were excluded from the balance calculations, out of 30 APIs included in the balance calculations,
14 APIs were lost by more than 50% during the treatment (probably decomposed or transformed
into different compounds). 12 APIs tended to remain in the effluent. Only one API (setraline)
concentrated in sludge, while only a small or negligible percentage of other APIs concentrated in
sludge. For three APIs (lincomycin, oxycodone and tylosin) there were not enough data to calculate
the balance, because their concentrations were below LOQ in most samples.

112
The calculated partitioning of APIs at WWTPs was at least partially consistent with the literature.
Our results for bisoprolol, caffeine, risperidone, sertraline, gabapentin, metformin and venlafaxine
were well in line with the findings in other studies. Also, our results for citalopram, carbamazepine,
ketoprofen (consistent rate of API concentrated in sludge, but not in effluent), metoprolol (results
in different research are controversial), codeine, naproxen, olanzapine, sertraline and trimethoprim
are mostly consistent with the literature. However, our results for citalopram (regarding rate in
effluent), ketoprofen (regarding rate in effluent), oxazepam (sludge only), diclofenac, fluconazole,
ofloxacin and telmisartan were controversial to the results of other research. The differences can be
at least partly explained by the high dispersion of the API concentrations in effluents and sludge,
and the low number of samples per WWTP in our study. In fact, only a few APIs had relatively
consistent concentrations in both effluent and sludge: levetiracetam, metformin, metoprolol,
naproxen, olanzapine, primidone and risperidone. Also, several factors cause uncertainty for the
presented WWTP removal and balance results. First and foremost, the annual load of the APIs relies
on only a couple of measurements per WWTP and the total annual amount of treated and discharged
wastewater and produced sludge.
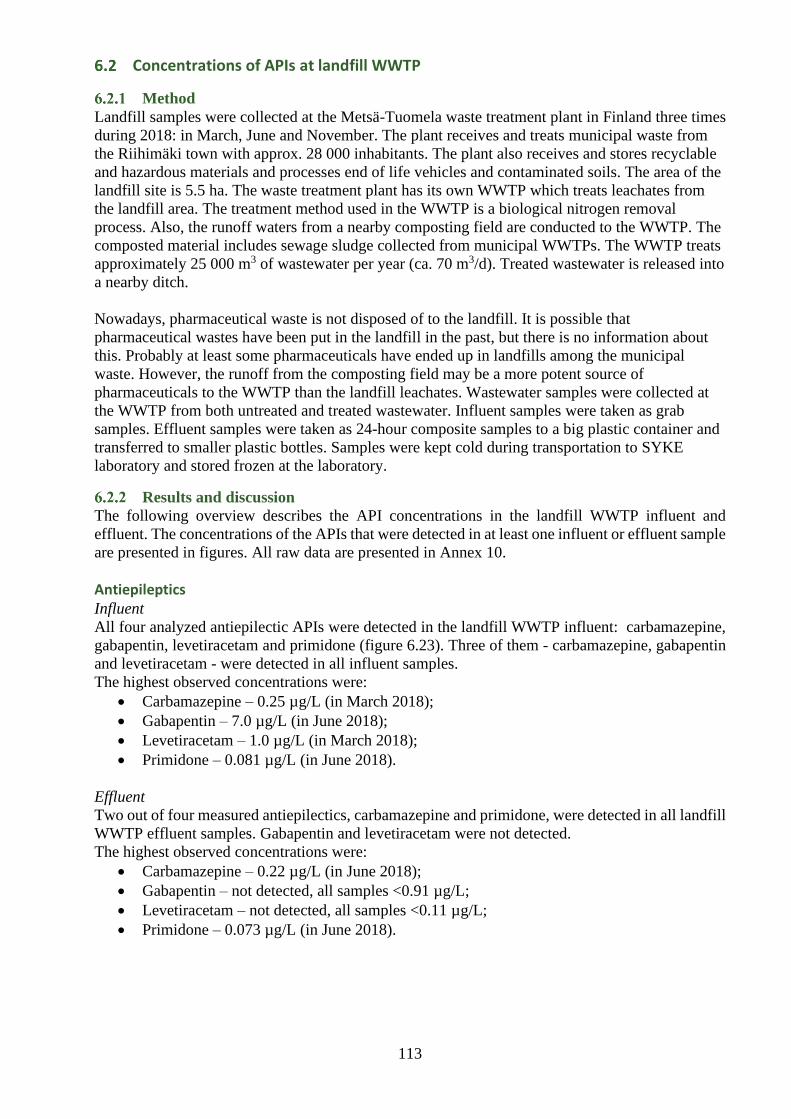
113
Concentrations of APIs at landfill WWTP
Method
Landfill samples were collected at the Metsä-Tuomela waste treatment plant in Finland three times
during 2018: in March, June and November. The plant receives and treats municipal waste from
the Riihimäki town with approx. 28 000 inhabitants. The plant also receives and stores recyclable
and hazardous materials and processes end of life vehicles and contaminated soils. The area of the
landfill site is 5.5 ha. The waste treatment plant has its own WWTP which treats leachates from
the landfill area. The treatment method used in the WWTP is a biological nitrogen removal
process. Also, the runoff waters from a nearby composting field are conducted to the WWTP. The
composted material includes sewage sludge collected from municipal WWTPs. The WWTP treats
approximately 25 000 m3 of wastewater per year (ca. 70 m3/d). Treated wastewater is released into
a nearby ditch.
Nowadays, pharmaceutical waste is not disposed of to the landfill. It is possible that
pharmaceutical wastes have been put in the landfill in the past, but there is no information about
this. Probably at least some pharmaceuticals have ended up in landfills among the municipal
waste. However, the runoff from the composting field may be a more potent source of
pharmaceuticals to the WWTP than the landfill leachates. Wastewater samples were collected at
the WWTP from both untreated and treated wastewater. Influent samples were taken as grab
samples. Effluent samples were taken as 24-hour composite samples to a big plastic container and
transferred to smaller plastic bottles. Samples were kept cold during transportation to SYKE
laboratory and stored frozen at the laboratory.
Results and discussion
The following overview describes the API concentrations in the landfill WWTP influent and
effluent. The concentrations of the APIs that were detected in at least one influent or effluent sample
are presented in figures. All raw data are presented in Annex 10.
Antiepileptics Influent
All four analyzed antiepilectic APIs were detected in the landfill WWTP influent: carbamazepine,
gabapentin, levetiracetam and primidone (figure 6.23). Three of them - carbamazepine, gabapentin
and levetiracetam - were detected in all influent samples.
The highest observed concentrations were:
• Carbamazepine – 0.25 µg/L (in March 2018);
• Gabapentin – 7.0 µg/L (in June 2018);
• Levetiracetam – 1.0 µg/L (in March 2018);
• Primidone – 0.081 µg/L (in June 2018).
Effluent
Two out of four measured antiepilectics, carbamazepine and primidone, were detected in all landfill
WWTP effluent samples. Gabapentin and levetiracetam were not detected.
The highest observed concentrations were:
• Carbamazepine – 0.22 µg/L (in June 2018);
• Gabapentin – not detected, all samples <0.91 µg/L;
• Levetiracetam – not detected, all samples <0.11 µg/L;
• Primidone – 0.073 µg/L (in June 2018).

114
Figure 6.23. Average concentrations of antiepileptics in landfill WWTP influents and effluents. Error bars represent the
concentration range (LOQ–maximum value) detected in the samples. * - all samples <LOQ.
Antibiotics Influent
Only two out of eleven studied antibiotics were detected in landfill WWTP influent: erythromycin
and fluconazole (figure 6.24). Fluconazole was detected in all three samples and erythromycin in
one sample.
The highest observed concentrations were:
• Ciprofloxacin – not detected, all samples <3.1 µg/L;
• Clarithromycin – not detected, all samples <0.031 µg/L;
• Erythromycin – 2.5 µg/L (in March 2018);
• Fluconazole – 0.077 µg/L (in June 2018);
• Lincomycin – not detected, all samples <0.018 µg/L;
• Norfloxacin – not detected, all samples <12 µg/L;
• Ofloxacin – not detected, all samples <0.42 µg/L;
• Sulfadiazine – not detected, all samples <0.59 µg/L;
• Sulfamethoxazole – not detected, all samples <0.042 µg/L;
• Tetracycline+doxycycline (SUM) – not detected, all samples <0.24 µg/L;
• Trimethoprim – not detected, all samples <0.022 µg/L.
Effluent
Only three out of eleven studied antibiotics were detected in landfill WWTP effluent: erythromycin,
fluconazole and lincomycin. Fluconazole was detected in all three samples. Erythromycin was
detected in two out of three samples and lincomycin in one sample.
The highest observed concentrations were:
• Ciprofloxacin – not detected, all samples <1.6 µg/L;
• Clarithromycin – not detected, all samples <0.016 µg/L;
• Erythromycin – 1.8 µg/L (in March 2018);
• Fluconazole –0.029 µg/L (in June 2018);
• Lincomycin – 0.013 µg/L (in March 2018);
• Norfloxacin – not detected, all samples <1.2 µg/L;
• Ofloxacin – not detected, all samples <0.21 µg/L;
• Sulfadiazine – not detected, all samples <0.3 µg/L;

115
• Sulfamethoxazole – not detected, all samples <0.009 µg/L;
• Tetracycline+doxycycline (SUM) – not detected, all samples <0.12 µg/L;
• Trimethoprim – not detected, all samples <0.011 µg/L.
Figure 6.24. Average concentrations of antibiotics at landfill WWTP. Error bars represent the concentration range (LOQ–
maximum value) detected in the samples. * - all samples <LOQ.
Antihypertensives
Influent
Three out of ten antihypertensives were detected in landfill WWTP influent: eprosartan,
hydrochlorothiazide and telmisartan (figure 6.25). Erposartan and hydrochlorothiazide were
detected in two out of three samples, and telmisartan in one sample.
The highest observed concentrations were:
• Amlodipine – not detected, all samples <0.40 µg/L;
• Candesartan – not detected, all samples <0.77 µg/L;
• Enalapril – not detected, all samples <0.17 µg/L;
• Eprosartan – 0.030 µg/L (in June 2018);
• Hydrochlorothiazide – 79 µg/L (in June 2018);
• Irbesartan – not detected, all samples <0.053 µg/L;
• Losartan – not detected, all samples <0.51 µg/L;
• Ramipril – not detected, all samples <0.032 µg/L;
• Telmisartan – 0.077 µg/L (in June 2018);
• Valsartan - not detected, all samples <0.30 µg/L.

116
Effluent
Only one out of ten studied antihypertensives was detected in landfill effluent: hydrochlorothiazide.
It was detected in two out of three samples.
The highest observed concentrations were:
• Amlodipine – not detected, all samples <0.11 µg/L;
• Candesartan - not detected, all samples <0.011 µg/L;
• Enalapril - not detected, all samples <0.083 µg/L;
• Eprosartan – not detected, all samples <0.005 µg/L;
• Hydrochlorothiazide –4.4 µg/L (in March 2018);
• Irbesartan – not detected, all samples <0.070 µg/L;
• Losartan – not detected, all samples <0.25 µg/L;
• Ramipril – not detected, all samples <0.016 µg/L;
• Telmisartan – not detected, all samples <0.011 µg/L;
• Valsartan – not detected, all samples <0.15 µg/L.
Figure 6.25. Average concentrations of antihypertensives in landfill WWTP influents and effluents. Error bars represent
the concentration range (LOQ–maximum value) detected in the samples. * - all samples <LOQ.
Asthma and allergy medications Influent
None of the five studied asthma and allergy APIs were detected in landfill WWTP influent:
• Cetirizine – not detected, all samples <3.2 µg/L;
• Fexofenadine – not detected, all samples <4.3 µg/L;
• Fluticasone – not detected, all samples <0.42 µg/L;
• Mometasone furoate – not detected, all samples <0.83 µg/L;
• Xylometazoline – not detected, all samples <0.051 µg/L.
Effluent
The five asthma and allergy APIs were not detected in landfill WWTP effluent:
• Cetirizine – not detected, all samples <1.2 µg/L;
• Fexofenadine – not detected, all samples <1.6 µg/L;
• Fluticasone – not detected, all samples <0.15 µg/L;
• Mometasone furoate – not detected, all samples <0.027 µg/L;
• Xylometazoline – not detected, all samples <0.026 µg/L.

117
Gastrointestinal disease medications Influent
One of the three measured APIs, mesalazine, was detected in two out of three landfill WWTP
influent samples (figure 6.26.).
The highest observed concertations were:
• Mesalazine – 3.3 µg/L (in June 2018);
• Omeprazole+esomeprazole (SUM) – not detected, all samples <8.4 µg/L;
• Pantoprazole – not detected, all samples <0.76 µg/L.
Effluent
Mesalazine was the only gastrointestinal disease medicine detected in landfill effluent. It was
detected in two out of three samples.
The highest observed concetrations were:
• Mesalazine – 0.95 µg/L (in March 2018);
• Omeprazole+esomeprazole (SUM) – not detected, all samples < 8.4 µg/L;
• Pantoprazole – not detected, all samples <0.76 µg/L.
Figure 6.26. Average concentrations gastrointestinal disease medications group APIs at landfill WWTP. Error bars
represent the concentration range (LOQ–maximum value) detected in the samples. * - all samples <LOQ.
Hormones Influent
Two out of the five measured hormones were detected in landfill WWTP influent: estriol and estrone
(figure 6.27). Both were detected in only one sample.
The highest observed concentrations were:
• Estriol – 0.084 µg/L (in March 2018);
• Estrone – 0.057 µg/L (in March 2018)
• Norethisterone – not detected, all samples <0.024 µg/L;
• Progesterone – not detected, all samples <0.031 µg/L;
• Testosterone – not detected, all samples <0.081 µg/L.
Effluent
Out of five measured hormones, only estrone was detected in one landfill WWTP effluent sample.
The highest observed concentrations were:
• Estriol – not detected, all samples <8.4 µg/L;
• Estrone – 0.65 µg/L (in November 2018);
• Norethisterone – not detected, all samples <0.010 µg/L;
• Progesterone – not detected, all samples <0.012 µg/L;
• Testosterone – not detected, all samples <0.018 µg/L.

118
Figure 6.27. Average concentrations of hormones at landfill WWTP. Error bars represent the concentration range (LOQ–
maximum value) detected in the samples. * - all samples <LOQ.
Metabolic disease medications Influent
Two out of six measured metabolic disease medications were detected in landfill WWTP influent:
gemfibrozil and metformin (figure 6.28). Both were detected in two out of three samples.
The highest observed concentrations were:
• Allopurinol – not detected, all samples <14 µg/L;
• Atorvastatin – not detected, all samples <10 µg/L;
• Bezafibrate – not detected, all samples <27 µg/L;
• Gemfibrozil – 0.35 µg/L (in June 2018);
• Merformin – 2.6 µg/L (in June 2018)
• Simvastatin – not detected, all samples <0.001 µg/L.
Effluent
The metabolic disease medications were not detected in landfill WWTP effluent:
• Allopurinol – not detected, all samples <0.12 µg/L;
• Atorvastatin – not detected, all samples <10 µg/L;
• Bezafibrate – not detected, all samples <0.013 µg/L;
• Gemfibrozil – not detected, all samples <0.10 µg/L;
• Merformin – not detected, all samples <0.008 µg/L;
• Simvastatin – not detected, all samples <0.002 µg/L.
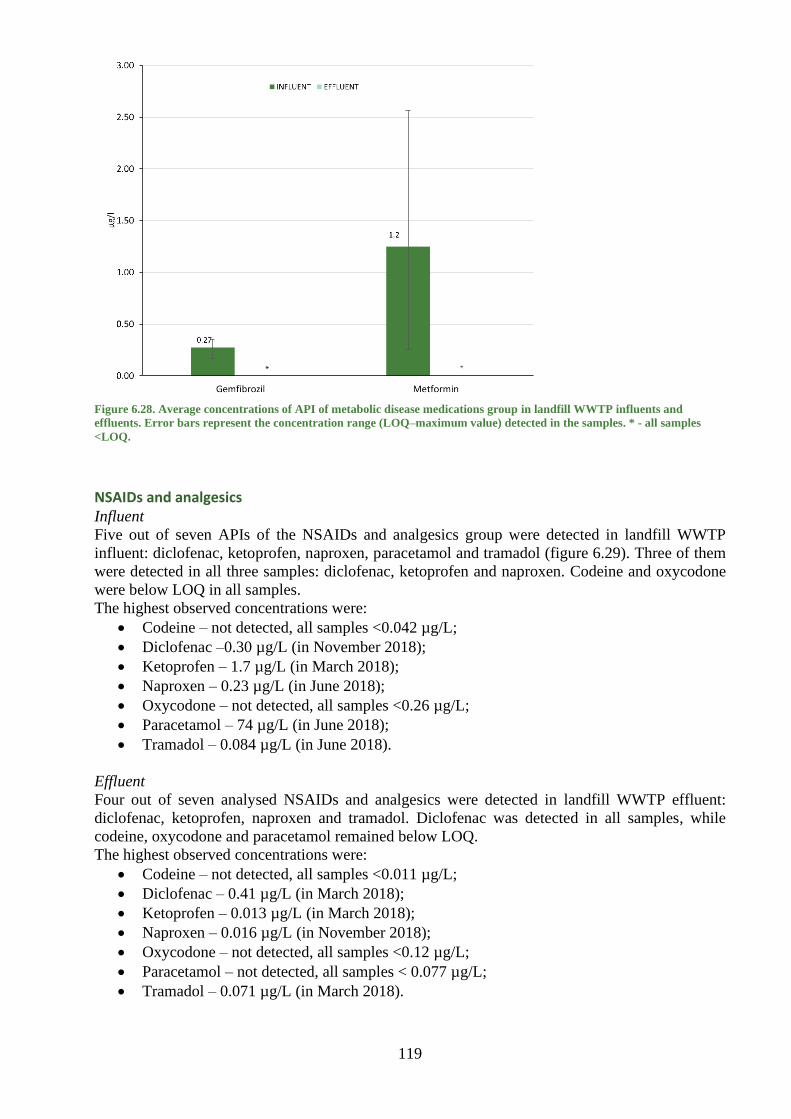
119
Figure 6.28. Average concentrations of API of metabolic disease medications group in landfill WWTP influents and
effluents. Error bars represent the concentration range (LOQ–maximum value) detected in the samples. * - all samples
<LOQ.
NSAIDs and analgesics Influent
Five out of seven APIs of the NSAIDs and analgesics group were detected in landfill WWTP
influent: diclofenac, ketoprofen, naproxen, paracetamol and tramadol (figure 6.29). Three of them
were detected in all three samples: diclofenac, ketoprofen and naproxen. Codeine and oxycodone
were below LOQ in all samples.
The highest observed concentrations were:
• Codeine – not detected, all samples <0.042 µg/L;
• Diclofenac –0.30 µg/L (in November 2018);
• Ketoprofen – 1.7 µg/L (in March 2018);
• Naproxen – 0.23 µg/L (in June 2018);
• Oxycodone – not detected, all samples <0.26 µg/L;
• Paracetamol – 74 µg/L (in June 2018);
• Tramadol – 0.084 µg/L (in June 2018).
Effluent
Four out of seven analysed NSAIDs and analgesics were detected in landfill WWTP effluent:
diclofenac, ketoprofen, naproxen and tramadol. Diclofenac was detected in all samples, while
codeine, oxycodone and paracetamol remained below LOQ.
The highest observed concentrations were:
• Codeine – not detected, all samples <0.011 µg/L;
• Diclofenac – 0.41 µg/L (in March 2018);
• Ketoprofen – 0.013 µg/L (in March 2018);
• Naproxen – 0.016 µg/L (in November 2018);
• Oxycodone – not detected, all samples <0.12 µg/L;
• Paracetamol – not detected, all samples < 0.077 µg/L;
• Tramadol – 0.071 µg/L (in March 2018).
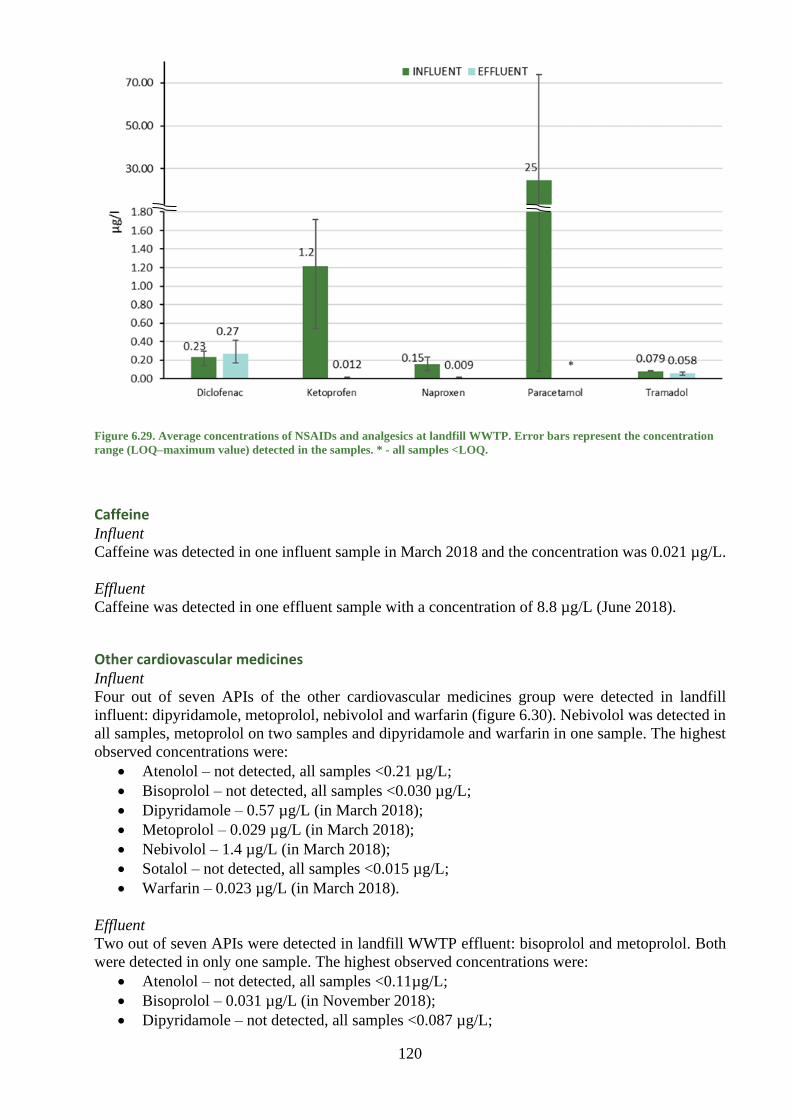
120
Figure 6.29. Average concentrations of NSAIDs and analgesics at landfill WWTP. Error bars represent the concentration
range (LOQ–maximum value) detected in the samples. * - all samples <LOQ.
Caffeine Influent
Caffeine was detected in one influent sample in March 2018 and the concentration was 0.021 µg/L.
Effluent
Caffeine was detected in one effluent sample with a concentration of 8.8 µg/L (June 2018).
Other cardiovascular medicines Influent
Four out of seven APIs of the other cardiovascular medicines group were detected in landfill
influent: dipyridamole, metoprolol, nebivolol and warfarin (figure 6.30). Nebivolol was detected in
all samples, metoprolol on two samples and dipyridamole and warfarin in one sample. The highest
observed concentrations were:
• Atenolol – not detected, all samples <0.21 µg/L;
• Bisoprolol – not detected, all samples <0.030 µg/L;
• Dipyridamole – 0.57 µg/L (in March 2018);
• Metoprolol – 0.029 µg/L (in March 2018);
• Nebivolol – 1.4 µg/L (in March 2018);
• Sotalol – not detected, all samples <0.015 µg/L;
• Warfarin – 0.023 µg/L (in March 2018).
Effluent
Two out of seven APIs were detected in landfill WWTP effluent: bisoprolol and metoprolol. Both
were detected in only one sample. The highest observed concentrations were:
• Atenolol – not detected, all samples <0.11µg/L;
• Bisoprolol – 0.031 µg/L (in November 2018);
• Dipyridamole – not detected, all samples <0.087 µg/L;
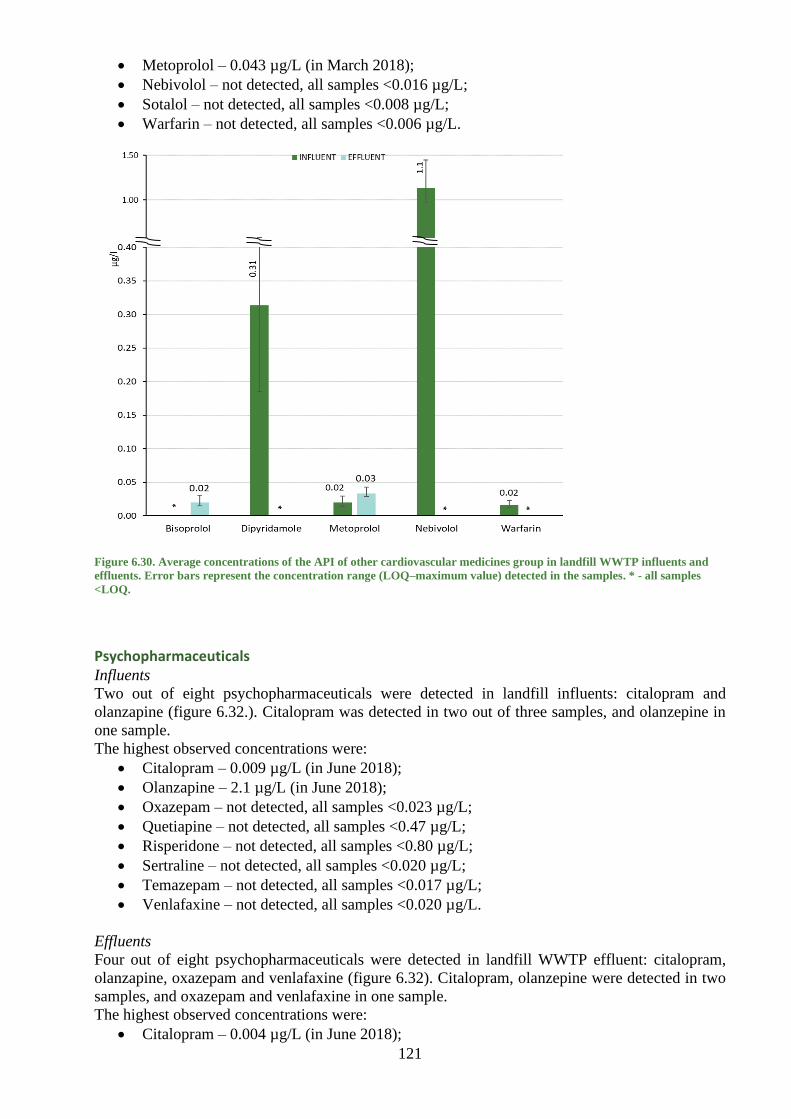
121
• Metoprolol – 0.043 µg/L (in March 2018);
• Nebivolol – not detected, all samples <0.016 µg/L;
• Sotalol – not detected, all samples <0.008 µg/L;
• Warfarin – not detected, all samples <0.006 µg/L.
Figure 6.30. Average concentrations of the API of other cardiovascular medicines group in landfill WWTP influents and
effluents. Error bars represent the concentration range (LOQ–maximum value) detected in the samples. * - all samples
<LOQ.
Psychopharmaceuticals Influents
Two out of eight psychopharmaceuticals were detected in landfill influents: citalopram and
olanzapine (figure 6.32.). Citalopram was detected in two out of three samples, and olanzepine in
one sample.
The highest observed concentrations were:
• Citalopram – 0.009 µg/L (in June 2018);
• Olanzapine – 2.1 µg/L (in June 2018);
• Oxazepam – not detected, all samples <0.023 µg/L;
• Quetiapine – not detected, all samples <0.47 µg/L;
• Risperidone – not detected, all samples <0.80 µg/L;
• Sertraline – not detected, all samples <0.020 µg/L;
• Temazepam – not detected, all samples <0.017 µg/L;
• Venlafaxine – not detected, all samples <0.020 µg/L.
Effluents
Four out of eight psychopharmaceuticals were detected in landfill WWTP effluent: citalopram,
olanzapine, oxazepam and venlafaxine (figure 6.32). Citalopram, olanzepine were detected in two
samples, and oxazepam and venlafaxine in one sample.
The highest observed concentrations were:
• Citalopram – 0.004 µg/L (in June 2018);
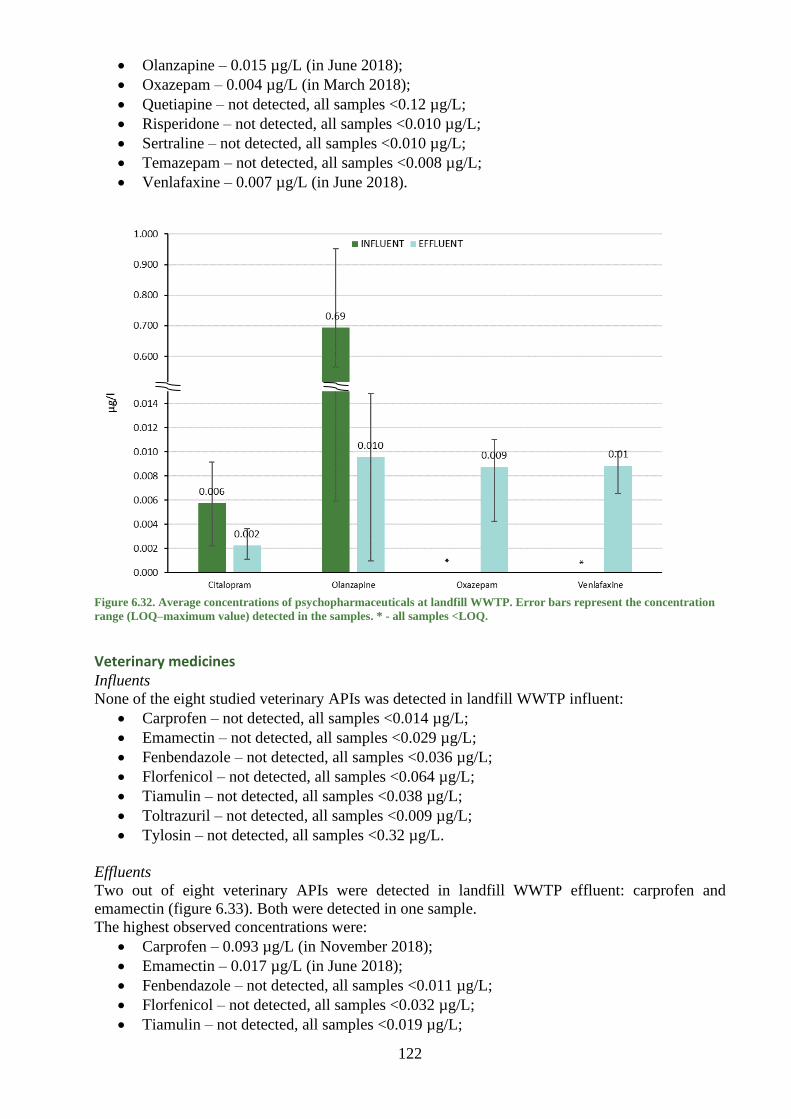
122
• Olanzapine – 0.015 µg/L (in June 2018);
• Oxazepam – 0.004 µg/L (in March 2018);
• Quetiapine – not detected, all samples <0.12 µg/L;
• Risperidone – not detected, all samples <0.010 µg/L;
• Sertraline – not detected, all samples <0.010 µg/L;
• Temazepam – not detected, all samples <0.008 µg/L;
• Venlafaxine – 0.007 µg/L (in June 2018).
Figure 6.32. Average concentrations of psychopharmaceuticals at landfill WWTP. Error bars represent the concentration
range (LOQ–maximum value) detected in the samples. * - all samples <LOQ.
Veterinary medicines Influents
None of the eight studied veterinary APIs was detected in landfill WWTP influent:
• Carprofen – not detected, all samples <0.014 µg/L;
• Emamectin – not detected, all samples <0.029 µg/L;
• Fenbendazole – not detected, all samples <0.036 µg/L;
• Florfenicol – not detected, all samples <0.064 µg/L;
• Tiamulin – not detected, all samples <0.038 µg/L;
• Toltrazuril – not detected, all samples <0.009 µg/L;
• Tylosin – not detected, all samples <0.32 µg/L.
Effluents
Two out of eight veterinary APIs were detected in landfill WWTP effluent: carprofen and
emamectin (figure 6.33). Both were detected in one sample.
The highest observed concentrations were:
• Carprofen – 0.093 µg/L (in November 2018);
• Emamectin – 0.017 µg/L (in June 2018);
• Fenbendazole – not detected, all samples <0.011 µg/L;
• Florfenicol – not detected, all samples <0.032 µg/L;
• Tiamulin – not detected, all samples <0.019 µg/L;

123
• Toltrazuril – not detected, all samples <9.0 µg/L;
• Tylosin – not detected, all samples <0.10 µg/L.
Figure 6.33. Average concentrations of veterinary APIs at landfill WWTP. Error bars represent the concentration range
(LOQ–maximum value) detected in the samples. * - all samples <LOQ.
Conclusions
APIs that were detected in all three samples in landfill WWTP influent were fluconazole,
carbamazepine, gabapentin, levetiracetam, diclofenac, ketoprofen and naproxen. The most abundant
APIs in landfill WWTP influent were hydrochlorothiazide (up to 79 µg/L), paracetamol (up to 74
µg/L) and gabapentin (up to 7.0 µg/L) and their maximum concentrations were detected in June
2018. Altogether 26 out of 74 analysed APIs were detected in at least one influent sample,
representing ten API groups. Only asthma and allergy and veterinary APIs were not detected. APIs
that were found in all effluent samples were diclofenac, carbamazepine, fluconazole and primidone.
The highest detected concentrations in landfill WWTP effluent were for caffeine (8.8 µg/L in June
2018), hydrochlorothiazide (4.4 µg/L in March 2018) and erythromycin (1.8 µg/L in March 2018).
21 out of 74 analysed APIs were detected in at least one effluent sample, representing ten out of
twelve API groups. Only APIs of asthma and allergy medications and metabolic disease medications
were not detected.
The concentrations of certain APIs in landfill WWTP influent and effluent were rather high.
However, the total API load from the landfill WWTP was low compared to municipal WWTPs in
the Vantaanjoki case study area, because the flow rate at the landfill WWTP was only 24 000 m3/a,
corresponding a water volume produced by approximately 300 persons. Because we only studied
the API emissions at one landfill WWTP, further studies are needed to assess the relevance of
landfills as a source of APIs.

124
Concentrations of APIs in wastewaters from hospitals
Methods
General Effluents from hospitals were collected in Linköping (SE), Norrköping (SE), Pärnu (EST) and
Wismar (DE). Time proportional 24-h sampling was performed using automatic samplers. The
composite samples were frozen in -20 °C after sampling and sent to SYKE for chemical analyses of
57–74 APIs. Sampling dates and raw data are presented in µg/L (Annex 11) and g/day (Annex 12).
The water flow (m3/day) was recorded at both the hospitals and the connected WWTPs. The load
of APIs (g/day) originating from the hospitals was compared to the load of APIs in the connected
WWTP influents. No manufacturing facilities were connected to the WWTPs in Linköping,
Norrköping, Pärnu and Wismar. Therefore, the API load to the WWTPs from other sources than
hospitals and households was expected to be negligible.
Sweden The composite samples from the hospitals in Linköping and Norrköping consisted of individual
samples (40 mL and 72 mL, respectively) sampled every 10 minutes during 24 h. The total water
flows of the hospital effluents were 577 m3/day in Norrköping hospital and 195 m3/day in Linköping
hospital on the sampling days. The water flow was 40 043 m³/day at Linköping WWTP (June 15,
2018) and 38 650 m³/day at Norrköping WWTP (June 7, 2018). The University Hospital in
Linköping has 6 150 employees and about 600 care places. The hospital in Norrköping has 2 402
employees and about 300 care places. During 2019, the hospital in Linköping received 342 956
patient visits, and the hospital in Norrköping received 160 137 patient visits.
Estonia The composite samples from Pärnu hospital consisted of individual samples (50 mL, sampled every
15 minutes for 24 hours). The total daily (24 h) water flows of the effluents of Pärnu hospital were
estimated as approx. 83 m³/day, based on the water consumption of about 2000–3000 m3/month.
The volume of the influent to Pärnu WWTP was 39 375 m³/day in December 2017 and 10 759
m³/day in June 2018. The hospital in Pärnu has about 1300 employees and receives 15000 patient
visits each year.
Germany The composite samples from Wismar hospital consisted of individual samples (60 mL sampled
every 30 minutes for 24 hours). The total daily (24 h) water flows of the effluents of Wismar hospital
were 84.6 m³ in February and 75.2 m³ in June. The influent flow to Wismar WWTP was 9 902
m³/day in February 2018 and 10 297 m³/day in June 2018. The Wismar hospital has about 960
employees and treats around 40 000 patients per year.
Results and discussion
Concentrations of APIs in hospital effluents Effluents from hospitals in Pärnu (EST), Wismar (DE), Linköping (SE) and Norrköping (SE) were
analyzed for 57–74 APIs (table 6.5). All raw data are presented in Annex 11. Overall, 55 APIs were
quantified in at least one of the hospital effluents, while 20 APIs were below the limit of
quantification (LOQ) in all effluents. 19–39 APIs were detected in each hospital effluent and the
detection frequencies were 33–53% (table 6.5).
The sum of the quantified APIs varied between 75 and 1220 µg/L in the hospital effluents. The
concentrations of APIs in the hospital effluents from Pärnu, Linköping and Norrköping were about
two to six times higher than the concentrations in the influents of the connected WWTPs. On the
contrary, the API concentrations in the Wismar hospital effluents were lower than the concentrations
in the influents of Wismar WWTP (Table 6.5). The highest total concentration of APIs in hospital
effluents, as well as WWTPs influents, were found in winter samples from Pärnu and Wismar.

125
Table 6.5. The table shows the number of APIs analysed in hospital wastewater effluents and the influents of the connected
WWTPs, the number of APIs above LOQ in hospital effluents, and the detection frequencies (DF) in hospital effluents. The
table also shows the sum of the quantified APIs in the effluents of hospitals and in the influents of the connected WWTPs as
well as the ratio between hospitals and WWTPs (API sum concentration in hospital effluent divided with sum concentration
in WWTP influent).
Number of analysed APIs
Number of APIs above LOQ in hospital effluents
DF in hospital effluents (%)
Sum of APIs in hospital effluents (µg/L)
Sum of APIs in WWTP influents (µg/L)
Hospital effluent vs. WWTP influent
Pärnu hospital, Dec 2017
71 30 42 1 220 198 6.2
Pärnu hospital, June 2018
74 39 53 415 152 2.7
Wismar hospital, Feb 2018
73 33 45 975 1 209 0.81
Wismar hospital, June 2018
74 27 36 75 310 0.24
Linköping hospital, June 2018
57 19 33 93 53 1.8
Norrköping hospital, June 2018
57 22 39 225 99 2.3
Substances detected in at least one of the hospital effluents are presented in figure 6.34–6.36. About
30–50% of the detected APIs were found in concentrations below 1 µg/L, and 75–90% of the
detected APIs were found in concentrations below 10 µg/L. APIs found in concentrations above
100 µg/L were gabapentin in Pärnu hospital effluent, and metformin and paracetamol in Pärnu and
Wismar hospital effluents sampled in winter. In June, the concentration of metformin was also above
100 µg/L in the effluents of the hospitals in Pärnu and Norrköping.
Six APIs were found in all hospital effluents: metformin (3.8–170 µg/L), mesalazine (0.66–14
µg/L), hydrochlorothiazide (1.9–16 µg/L), diclofenac (0.25–9.6 µg/L), carbamazepine (0.038–2.3
µg/L) and bisoprolol (0.038–0.82 µg/L). APIs detected in all analysed effluents (DF 100%, but not
analysed in all samples) were caffeine (0.97–27 µg/L), trimethoprim (0.49–11 µg/L),
sulfamethoxazole (0.31–11 µg/L), ibuprofen (2.8 µg/L), venlafaxine (0.077–0.48 µg/L), sertraline
(0.10–0.52 µg/L) and ramipril (0.037–0.11 µg/L).
Samples in Pärnu and Wismar were taken in winter (December or February) and in summer (June),
enabling seasonal comparisons. In Pärnu and Wismar hospital effluents, the concentrations of
citalopram and venlafaxine (both psycopharmaceuticals), clarithromycin (antibiotic) and diclofenac
(anti-inflammatory medicine) were higher in winter than in summer. Concentrations of nine APIs
were higher in all the effluents sampled in summer than in winter: erythromycin, sulfamethoxazole
and trimethoprim (antibiotics), hydrochlorothiazide (antihypertensive), mesalazine (gastrointestinal
disease medication), estriol (hormone), dipyridamole, metoprolol and nebivolol (both
cardiovascular medicines). Most APIs (39 out of 74) were found in Pärnu hospital effluent in June
(Table 6.5).

126
Figure 6.34. APIs in the Pärnu hospital effluent sampled in December 2017 and June 2018. APIs below LOQ are marked with ”*” for the sample taken in December 2017 and ”^” for the sample
taken in June 2018.

127
Figure 6.35. APIs in Wismar hospital effluent sampled in February 2018 and June 2018. APIs below LOQ are marked with ”*” for the sample taken in February 2018 and ”^” for the sample
taken in June 2018.

128
Figure 6.36. APIs in the effluents from hospitals in Linköping and Norrköping sampled in June 2018. APIs below LOQ are marked with ”*” for the Linköping hospital effluent and ”^” for the
Norrköping hospital effluent.

129
API load from hospitals The load of APIs discharging from each hospital was compared to the load of APIs in the connected
WWTP influents. The total load of the detected APIs in hospital effluents was at maximum 3.2% of
the overall API load (Table 6.6). The comparatively low percentage of APIs in g/day from the
hospitals is due to the low water flows from the hospitals compared to the total influent flows of the
connected WWTPs.
Table 6.6. Sum of the quantified APIs (g/day) in hospitals effluents and in the connected WWTP influents, and % of APIs
from hospitals compared to the overall load. Included are also data on water flow in hospital effluents and WWTPs influents.
Hospital
effluents:
Sum of
APIs
(g/day)
WWTP
influents:
Sum of APIs
(g/day)
APIs
from
hospital
(%)
Water
flow from
hospital
(%)
Hospital
effluent
(m3/day)
WWTP
influent
(m3/day)
Pärnu hospital,
Dec 2017
101 7 754 1.3 0.21 83 39 375
Pärnu hospital,
June 2018
34 1 529 2.3 0.77 83 10 759
Wismar hospital,
Feb 2018
82 11 941 0.69 0.85 85 9 902
Wismar hospital,
June 2018
5.7 2 686 0.21 0.73 75 10 297
Linköping hospital,
June 2018
54 1 665 3.2 1.4 577 40 043
Norrköping hospital,
June 2018
44 3 809 1.1 0.50 195 38 650
Hospitals are significant sources of those APIs that are used to treat patients in hospitals. Table 6.7
presents the APIs for which the hospitals constitute ≥1% of the total load in the WWTP influents.
Effluents from Pärnu hospital contained the highest number of APIs above 1 % compared to the
overall load from the connected WWTP influents. More than 5% of the antibiotics fluconazole and
trimethoprim detected in Pärnu WWTP influent came from Pärnu hospital (Table 6.7), although the
water flow was less than 1% (Table 6.6). Pärnu hospital discharges about one third of the total load
of trimethoprim and an antihypertensive telmisartan (table 6.7 and Annex 12). The hospital in
Linköping discharges 5% of oxazepam (a psycopharmaceutical) and about 10% of caffeine and
carbamazepine (an antiepileptic).
Several APIs were only detected in the effluents of hospitals and not found in the WWTP influents
(Annex 12). One example is oxycodone, an analgesic opioid medication, which was found in the
effluents from hospitals in Wismar, Linköping and Norrköping but not in the influents of the
connected WWTPs. Hence, these APIs were diluted below LOQ and/or degraded on the way to the
WWTP.

130
Table 6.7. Percentage of APIs in hospitals effluents compared to WWTP influents. Only APIs ≥1% in hospital effluents are
shown.
1–5% from hospitals 5–10% from
hospitals
10–35% from hospitals
Pärnu hospital,
Dec 2017
Clarithromycin,
sulfamethoxazole,
metformin, naproxen,
ketoprofen, paracetamol,
venlafaxine
Trimethoprim,
gabapentin
Fluconazole,
citalopram+escitalopram
(SUM)
Pärnu hospital,
June 2018
Erythromycin, gabapentin,
hydrochlorothiazide,
metformin, ketoprofen,
metoprolol, sotalol,
warfarin,
citalopram+escitalopram
(SUM), oxazepam,
sertraline, temazepam
Caffeine, codeine,
naproxen, tramadol
Fluconazole,
sulfamethoxazole,
trimethoprim,
telmisartan
Wismar
hospital,
Feb 2018
Ofloxacin,
sulfamethoxazole,
trimethoprim,
levetiracetam,
hydrochlorothiazide,
mesalazine,
citalopram+escitalopram
(SUM), oxazepam,
sertraline
None None
Wismar
hospital,
June 2018
Clarithromycin,
sulfamethoxazole,
trimethoprim,
hydrochlorothiazide
None None
Linköping
hospital,
June 2018
Erythromycin,
tetracycline+doxycycline
(SUM),
hydrochlorothiazide,
estriol, metformin,
codeine, paracetamol,
bisoprolol, olanzapine
Oxazepam, caffeine Carbamazepine
Norrköping
hospital,
June 2018
Erythromycin,
hydrochlorothiazide,
metformin, codeine,
bisoprolol, caffeine,
oxazepam
None None

131
Conclusions
The concentrations of APIs differ between hospitals. The differences may be due to the number of
patients and specialties in treatment methods at the four hospitals. The degree of dilution and
degradation of APIs in the effluents from the hospitals may also be different depending on e.g. the
pipeline system and sampling location. The highest total concentration as well as load of the
quantified APIs were found in the effluents of Pärnu hospital sampled in December (1220 µg/L and
101 g/day).
Thirteen APIs were found in all the hospital effluent samples where they were analysed: metformin,
caffeine, hydrochlorothiazide, mesalazine, trimethoprim, sulfamethoxazole, diclofenac,
carbamazepine, ibuprofen, bisoprolol, sertraline, venlafaxine and ramipril. Most of the detected
APIs were present in concentrations below 10 µg/L. APIs with concentrations above 100 µg/L were
gabapentin, metformin and paracetamol.
Some consistent seasonal differences were found in the effluents from hospitals in Pärnu and
Wismar, sampled both during winter and summer. However, more samples should be analyzed to
make conclusions about seasonal variations in the load of APIs from hospitals. Several APIs that
were detected in the hospital effluents were not found in the WWTP influents, e.g. oxycodone, an
analgesic opioid medication. Hence, these APIs were diluted and/or degraded on the way to the
WWTP.
The total concentration of the quantified APIs (µg/L) was generally higher in the effluents of
hospitals than in the influents of the connected WWTPs. Because of the comparatively low water
flows from the hospitals, the total load of the quantified APIs (g/day) in the effluents from
hospitals were only 0.2–3.2% of the overall API load. Hence, hospitals have less contribution to
the total load of APIs to the WWTPs compare to the households. It is therefore more cost-efficient
to install advanced treatment technologies at the WWTPs than at the hospitals. However, the
hospitals may be significant sources of some APIs that are predominantly used at hospitals.
Sampling of hospital effluents by using automatic samplers. Photo: Helene Ek Henning, CAB.

132
Concentrations of APIs in the wastewater of pharmaceutical manufacturing plant
Methods
APIs were determined in the effluent of a Latvian pharmaceutical manufacturing plant. The plant
has its own biological WWTP with a moving layer biofilm reactor process. The samples were taken
from the WWTP effluent in December 2017 and May 2018. The average discharge of the WWTP
is 200–500 m3/day. The effluents of the WWTP are released to the municipal wastewater treatment
plant.
Results and discussion
Concentrations of APIs in effluents from API manufacturer Of the 74 APIs analysed in manufacturing plant effluents, 23 were detected in at least one of the
two samples (Annex 13). Six of them – hydrochlorothiazide, telmisartan, estrone, diclofenac,
paracetamol and warfarin – were detected in both samples (Figure 6.37).
The antibiotics detected in the samples were sulfadiazine and tetracycline+doxycycline (SUM),
which were above LOQ in May, and clarithromycine detected slightly above LOQ in December.
The highest concentration of an antibiotic was obtained for sulfadiazine (0.58 µg/L, May). Three
APIs of the antihypertensive medication group were detected in the samples: hydrochlorothiazide,
telmisartan and valsartan. Hydrochlorothiazide was the most abundant antihypertensive in both
samples with concentration of 6.9 µg/L in May and 1.2 µg/L in December.
Xylometazoline was the only asthma and allergy API that was detected in the manufacturing
effluents (0.028 µg/L, May). Three hormones, estrone, norethisterone and testosterone, were
detected in the May samples with a maximum concentration of 0.031 µg/L (testosterone), while
estrone was the only detected hormone in December sample (5.5 µg/L). Allopurinol was the only
detected API of the metabolic disease medications group. It was detected only in December with
a concentration of 4.8 µg/L.
Four APIs from the group NSAIDs and analgesics were detected in May (diclofenac, ketoprofen,
naproxen and paracetamol), while three APIs were detected in December (diclofenac, paracetamol
and tramadol). With the concentration of 16 µg/L in December, paracetamol was the most abundant
of all the analysed APIs in the manufacturing plant effluents. Also, psychopharmaceuticals were
detected more often in the sample taken in May than December. Olanzapine and venlafaxine had
the highest concentrations, 0.39 µg/L and 0.25 µg/L in May.
Warfarin was the only detected API of the other cardiovascular medicines group. It was detected
in both samples with a concentration of up to 2.0 µg/L (May). Caffeine was above LOQ only in
December when the concentration reached 8.8 µg/L.
The pharmaceutical company manufactures over 90 final dosage form (FDF) pharmaceutical
products, including solid form products, solutions for injections, ointments and syrups. According
to permits of polluting activities, their largest production is for tegafur (5 t), meldonium (150 t),
oxytocin (0.07 t), zopiclone (3.15 t), ursodeoxycholic acid (20 t) and xylazine (1.5 t). These APIs
were not analysed within the project. From the 74 APIs measured in manufacturer wastewaters only
ten were listed as products of the manufacturer. Some of the produced APIs like atenolol, ibuprofen
and simvastatin were not detected in the wastewaters, while paracetamol was found at the highest
concentration (Table 6.7).

133
Table 6.7. APIs detected in the manufacturer wastewaters and their dosage and product forms produced by the
manufacturer. N/A = not analysed due to matrix interferences.
API API group Concentration, µg/L Dosage and product
form produced by the
manufacturer Sampling time
07.12.2017.
Sampling time
28.05.2018.
Atenolol other cardiovascular
medicines
<LOQ <LOQ 50 mg /100 mg film-
coated tablets
Diclofenac NSAIDs and analgesics 0.042 0.022 20 mg/g ointment
Ibuprofen NSAIDs and analgesics <LOQ N/A not specified
Ketoprofen NSAIDs and analgesics 0.86 N/A 2.5% gel
Paracetamol NSAIDs and analgesics 4.5 16 500 mg tablets
Risperidone psychopharmaceuticals <LOQ 0.072 2 mg, 4 mg film-coated
tablets
Simvastatin metabolic disease
medications
<LOQ <LOQ 2 mg, 4 mg film-coated
tablets
Sulfadiazine antibiotics 0.58 <LOQ 10 mg/g ointment
Venlafaxine psychopharmaceuticals 0.25 N/A 37.5 mg / 75 mg tablets
Warfarin other cardiovascular
medicines
2.0 0.068 2.5 mg / 3 mg / 5 mg
tablets
API loads from API manufacturer The load of APIs discharging from API manufacturer was compared to the load of APIs in the
connected WWTP influents. The total load of the detected APIs in API manufacturer effluents was
at maximum 5 % of the overall API load in WWTP influent (Table 6.8). The load was calculated
from annual wastewater amount data – for the years 2017 and 2018. The comparatively low
percentage of APIs in t/year from the API manufacturer is due to the low water flows from the API
manufacturer compared to the total influent flows of the connected WWTP.
Table 6.8. Sum of the quantified APIs (t/year) in API manufacturer effluents and in the connected WWTP influents, and %
of APIs from API manufacturer compared to the overall load. Included are also data on wastewater flow in API manufacturer
effluents and WWTPs influents.
API manu-
facturer
effluents:
Sum of APIs
(t/year)
WWTP
influents:
Sum of APIs
(t/year)
APIs from API
manufacturer
(average %)
Water flow
from API
manu-
facturer (%)
API manu-
facturer
effluent
(thousand.
m3/year)
WWTP
influent
(thousand
m3/year)
Dec 2017 0.003 21 5 0.17 87 52 002
May 2018 0.002 0.86 0.21 0.22 104 47 541
6.4.3. Conclusions
23 out of the 74 analysed APIs were detected in the manufacturer wastewaters, representing nine
studied API groups. Only six APIs – hydrochlorothiazide, telmisartan, estrone, diclofenac,
paracetamol and warfarin – were detected in both December and May samples. Ten of the APIs
measured in manufacturer wastewaters were included in the manufactured products. The three APIs
found in the highest concentrations were paracetamol (up to 16 µg/L), caffeine (up to 8 µg/L) and
hydrochlorothiazide (up to 6.9 µg/L).

134
Fig.6.37. APIs in the manufacturer effluents. Abbreviations: AAM - asthma and allergy medications; MDM - metabolic disease medications; Other CM - other cardiovascular
medicines. APIs with measured concentration below detection limit are marked in the chart with “*” (May) and “^” (December). APIs which could not be analysed due to
matrix interferences are marked in the chart with “n.a.”.
6.9
4.55.5
4.8
16
8.8
2.0
4.0
6.0
8.0
10.0
12.0
14.0
16.0
18.0µ
g /
l* May
^ December
*
0.58
0.20
0.02
1
0.59
0.02
8
0.03
1
0.01
8
0.03
1
* 0.04
2
0.86
0.06
9
*
2.0
0.02
2
0.39
* *
0.25
*0.01
8
^ ^
1.20.
022
^ ^ ^ ^ 0.02
2
n.a
.
n.a
.
0.07
7
0.06
8
^ ^ 0.00
4
0.07
2
n.a
.
0.00.20.40.60.81.01.21.41.61.82.02.2
Cla
rith
rom
ycin
Sulf
adia
zine
Te
tra
cycl
ine
/Do
xycy
clin
e
Hyd
roch
loro
thia
zid
e
Telm
isar
tan
Val
sart
an
Xylo
me
tazo
line
Est
ron
e (
E1
)
No
reth
iste
ron
e
Test
oste
ron
e
Allo
puri
nol
Dic
lofe
nac
Ke
top
rofe
n
Na
pro
xe
n
Para
ceta
mol
Tram
ado
l
War
fari
n
Cit
alo
pram
Ola
nzep
ine
Oxa
zepa
m
Ris
peri
don
e
Ven
lafa
xin
e
Caf
fein
e
Antibiotics Antihypertensives AAM Hormones MDM NSAIDs and analgesics Other
CM
Psychopharmaceuticals
135
References Al Qarni, H., Collier, P., O’Keefe, J., Akunna, J., 2016. Investigating the removal of some pharmaceutical
compounds in hospital wastewater treatment plants operating in Saudi Arabia.
Birziņš, U., 19.01.2018. Lūko samazināt dabai kaitīgo medikamentu koncentrāciju vidē. Interview with
Pērkons, I., Bartkevičs, V. Available at: https://www.lsm.lv/raksts/dzive--stils/vide-un-dzivnieki/luko-
samazinat-dabai-kaitigo-medikamentu-koncentraciju-vide.a264854/
Carmona, E., Andreu, V., Picó, Y., 2014. Occurrence of acidic pharmaceuticals and personal care
products in Turia River Basin: From waste to drinking water.
Chang, H., Wan, Y., Wu, S., Fan, Z., Hu, J. 2011. Occurrence of androgens and progestogens in
wastewater treatment plants and receiving river waters: Comparison to estrogens. Water Research,
45 (2): 732-740. https://doi.org/10.1016/j.watres.2010.08.046.
Esperanza, M., Suidan, M.T., Marfil-Vega, R., Gonzalez, C., Sorial, G.A., McCauley, P., Brenner,
R. 2007. Fate of sex hormones in two pilot-scale municipal wastewater treatment plants:
conventional treatment. Chemosphere, 66: 1535-1544.
Fernández-López, C., Guillén-Navarro, J.M., Padilla, J.J., Parsons, J.R., 2016. Comparison of the
removal efficiencies of selected pharmaceuticals in wastewater treatment plants in the region of
Murcia, Spain.
Fick, J., Lindberg, R.H. (Umeå University), Kaj, L., Brorström-Lundén, E. (Swedish Environmental
Research Institute), 2011. Results from the Swedish National Screening Programme 2010.
Available at:
https://www.ivl.se/download/18.343dc99d14e8bb0f58b542e/1443183072893/B2014.pdf
Gros, M., Petrović M., Ginebreda, A., Barceló, D., 2010. Removal of pharmaceuticals during wastewater
treatment and environmental risk assessment using hazard indexes. Published in Environment International
36.
Kasprzyk-Hordern, B., Dinsdale, R.M., Guwy, A.J. 2009. The removal of pharmaceuticals, personal care
products, endocrine disruptors and illicit drugs during wastewater treatment and its impact on the quality of
receiving waters. Water Research, Volume 43, Issue 2, Pages 363-380,
https://doi.org/10.1016/j.watres.2008.10.047.
Kosma, C.I., Nannou, C.I., Boti, V.I., Albanis, T.A. 2019. Psychiatrics and selected metabolites in hospital
and urban wastewaters: Occurrence, removal, mass loading, seasonal influence and risk assessment. Science
of The Total Environment 659: 1473-1483. https://doi.org/10.1016/j.scitotenv.2018.12.421.
Luo, Y., Guo, W., Ngo, H. H., Nghiem, L. D., Hai, F. I., Zhang, J., Liang, S., Wang, X. C., 2014. A review
on the occurrence of micropollutants in the aquatic environment and their fate and removal during wastewater
treatment. Published in Science of the Total Environment, 473 – 474.
Magnér, J., Rosenqvist, L., Rahmber, M., Graae, L., Eliaeson, K., Örtlund, L., Fång, J., Brorström-Lundén,
E, 2016. Fate of pharmaceutical residues -in sewage treatment and on farmland fertilized with sludge.
Mailler, R., Gasperi, J., Coquet, Y., Deshayes, S., Zedek., S., Cren- Olivé, C., Cartiser, N., Eudes, V.,
Bressy, A., Caupos, E., Moilleron, R., Chebbo, G., Rocher, V. 2015. Study of a large scale powdered
activated carbon pilot: Removals of a wide range of emerging and priority micropollutants from wastewater
treatment plant effluents

136
Miehe, U., 2010. Wirksamkeit technischer Barrieren zur Entfernung von anthropogenen Spurenstoffen.
Kläranlagen und Raumfilter. von der Fakultat III - Prozesswissenschaften - der Technischen Universitat
Berlin. Genehmigte Dissertation.
Papageorgiou, M., Kosma, C., Lambropoulou, D., 2016. Seasonal occurrence, removal, mass
loading and environmental risk assessment of 55 pharmaceuticals and personal care products in a
municipal wastewater treatment plant in Central Greece.
Pereira, A., Silva., L., Laranjeiro, C., Lino, C., Pena, A., 2020. Selected pharmaceuticals in different aquatic
compartments: Part I – Source, Fate and Occurence. Published in Molecules 2020, 25(5), 1026. Available at:
https://www.mdpi.com/1420-3049/25/5/1026/htm
Radjenovic, J., Petrovic, M., Barceló, D., 2007. Analysis of pharmaceuticals in wastewater and removal using
a membrane bioreactor.
Tambosi, J. L., Yamanaka, L. Y., José, H. J., de Fátima Peralta Muniz Moreira, R., Schröder, H. F., 2010.
Recent research data on the removal of pharmaceuticals from sewage treatment plants (STP).
ter Laak, T. L., van der Aa, M., Houtman, C. J., Stoks, P. G., van Wezel, A. P., 2010. Relating environmental
concentrations of pharmaceuticals to consumption: A mass balance approach for the river Rhine. Published
in Environment International 36.
Yang, Y., Ok, Y. S., Kim, K.-H., Kwon, E. E., Tsang, Y.F., 2017. Occurrences and removal of
pharmaceuticals and personal care products (PPCPs) in drinking water and water/sewage treatment plants:
A review. Published in Science of the Total Environment, 596 – 597.
Äystö, L., Vieno, N., Fjäder, P., Mehtonen, J., Nystén, T. 2020. Pharmaceutical load to wastewater treatment
plants and their primary emission sources. Vesitalous 1/2020: 5-8. In Finnish with an abstract in English.

137
7 APIs in surface water and sediments near fish, poultry and pig farms
Fish farms
Methods
Description of the fish farms APIs were analysed from samples taken in two fish farms located in Estonia and Finland. Samples
were taken from surface water and sediments. An overview of the fish farms is shown in table 7.1.
Table 7.1. Description of the fish farms, applied pharmaceuticals and the performed sampling. The bolded pharmaceuticals
were measured in the project.
Fish
farm
Location Cultivated
species
APIs applied Sampling,
water
Sampling,
sediment
Estonian River Rainbow
trout
Florfenicol - antibiotic 1 site 1
depth in
6.12.2017
&
6.06.2018
1 site in
6.12.2017
Finnish Archipelago
Sea
Whitefish Sulfadiazine - antibiotic,
Trimethoprim -
antibiotic,
Emamectin* - anti-lice
medicine
3 sites with
2 depths in
21.8.2018
&
18.9.2018
3 sites in
17.9.2018
*Used on nearby fish farms for rainbow trout which are stored in studied fish farm and processed in nearby building from where
treated process wastewater are discharged to sea near studied fish farm.
The Estonian fish farm was located at the very beginning of Pärnu river (distance between discharge
and the river is app. 250 m, figure 7.1). The river water on the fish farm site can be influenced by
village wastewater and storm waters, as the farm is located alongside the village (400 inhabitants),
and a cattle farm (1 300 animals). The cultivated species was Rainbow trout (Oncorhynchus mykiss).
The Finnish fish farm is located in the Finnish Archipelago Sea. The site is one of several fish
farming sites scattered in the archipelago area. The selected site is located in an approx. 350 m wide
east-west strait between two islands, as presented in Figure 7.2. A small wastewater treatment plant
processing the wastewaters from the fish processing plant and ten apartments is located in the same
strait. The cultivated species during sampling was whitefish (Coregonus lavaretus).
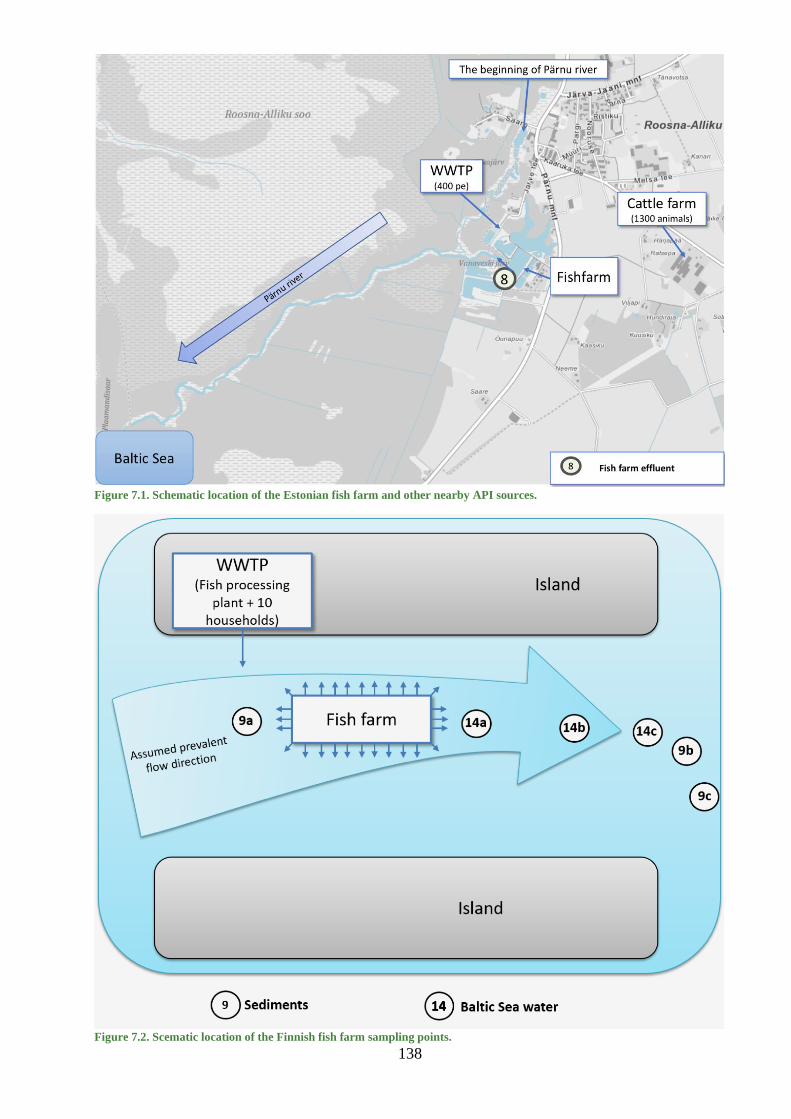
138
Figure 7.1. Schematic location of the Estonian fish farm and other nearby API sources.
Figure 7.2. Scematic location of the Finnish fish farm sampling points.
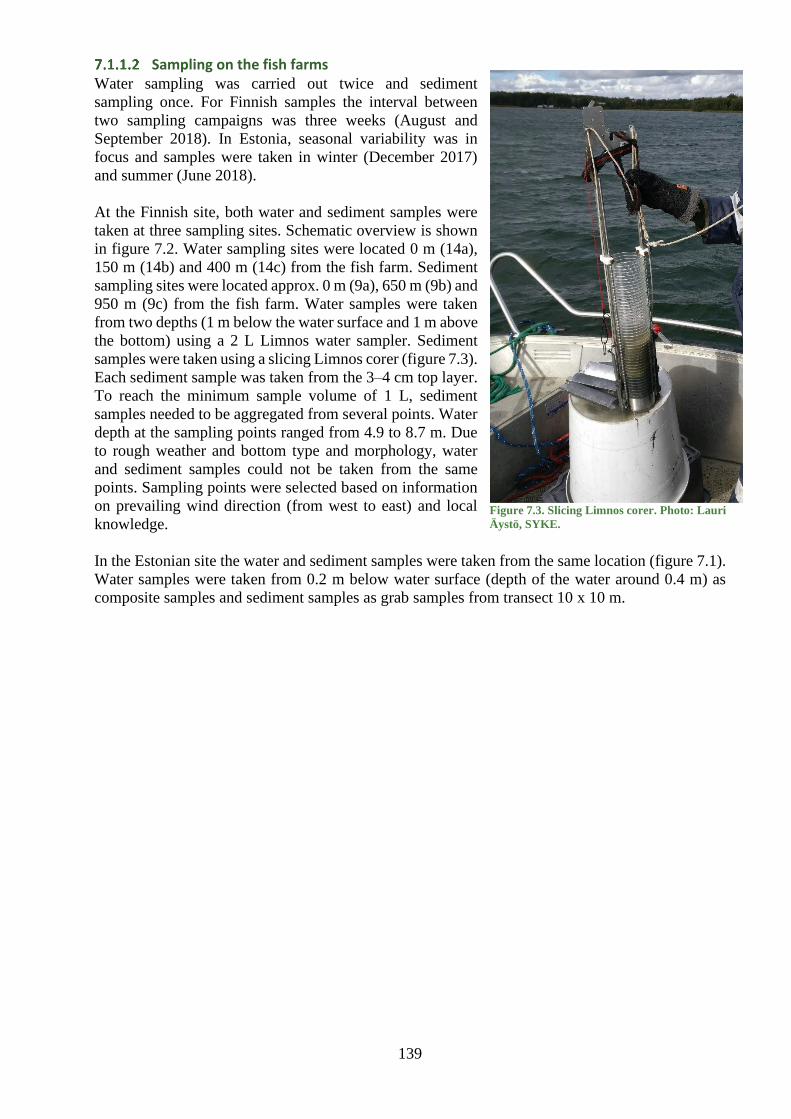
139
Sampling on the fish farms Water sampling was carried out twice and sediment
sampling once. For Finnish samples the interval between
two sampling campaigns was three weeks (August and
September 2018). In Estonia, seasonal variability was in
focus and samples were taken in winter (December 2017)
and summer (June 2018).
At the Finnish site, both water and sediment samples were
taken at three sampling sites. Schematic overview is shown
in figure 7.2. Water sampling sites were located 0 m (14a),
150 m (14b) and 400 m (14c) from the fish farm. Sediment
sampling sites were located approx. 0 m (9a), 650 m (9b) and
950 m (9c) from the fish farm. Water samples were taken
from two depths (1 m below the water surface and 1 m above
the bottom) using a 2 L Limnos water sampler. Sediment
samples were taken using a slicing Limnos corer (figure 7.3).
Each sediment sample was taken from the 3–4 cm top layer.
To reach the minimum sample volume of 1 L, sediment
samples needed to be aggregated from several points. Water
depth at the sampling points ranged from 4.9 to 8.7 m. Due
to rough weather and bottom type and morphology, water
and sediment samples could not be taken from the same
points. Sampling points were selected based on information
on prevailing wind direction (from west to east) and local
knowledge.
In the Estonian site the water and sediment samples were taken from the same location (figure 7.1).
Water samples were taken from 0.2 m below water surface (depth of the water around 0.4 m) as
composite samples and sediment samples as grab samples from transect 10 x 10 m.
Figure 7.3. Slicing Limnos corer. Photo: Lauri
Äystö, SYKE.
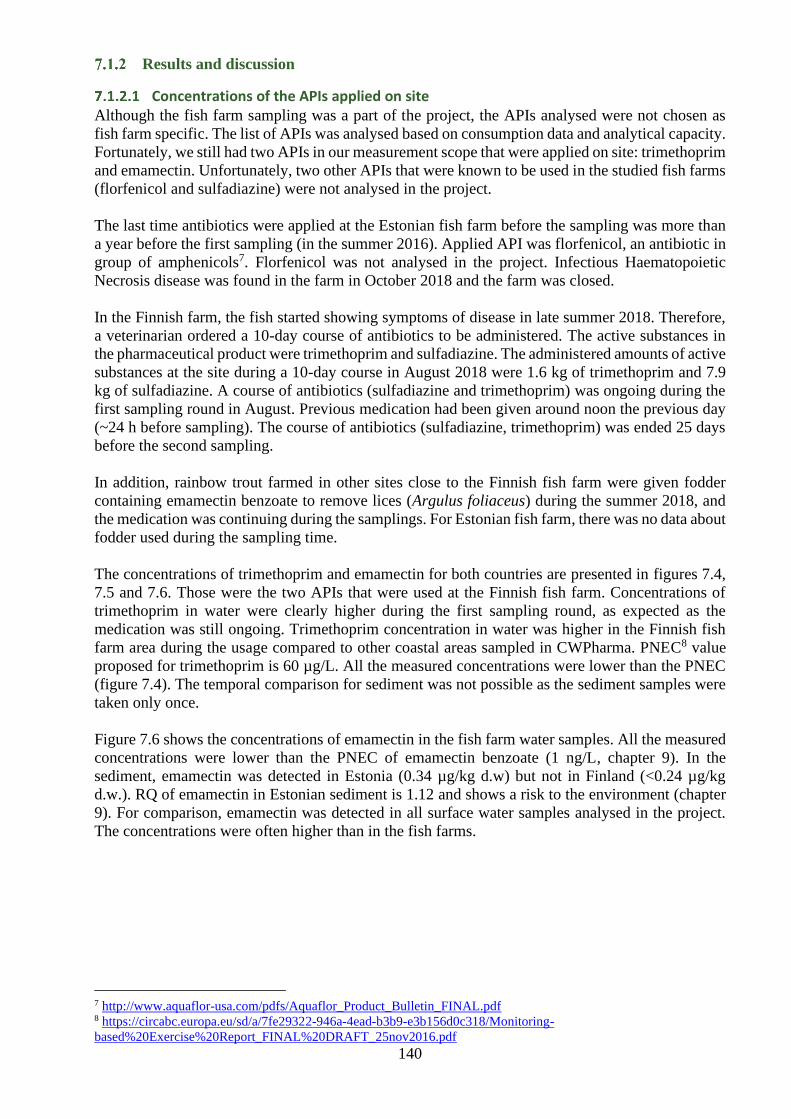
140
Results and discussion
Concentrations of the APIs applied on site Although the fish farm sampling was a part of the project, the APIs analysed were not chosen as
fish farm specific. The list of APIs was analysed based on consumption data and analytical capacity.
Fortunately, we still had two APIs in our measurement scope that were applied on site: trimethoprim
and emamectin. Unfortunately, two other APIs that were known to be used in the studied fish farms
(florfenicol and sulfadiazine) were not analysed in the project.
The last time antibiotics were applied at the Estonian fish farm before the sampling was more than
a year before the first sampling (in the summer 2016). Applied API was florfenicol, an antibiotic in
group of amphenicols7. Florfenicol was not analysed in the project. Infectious Haematopoietic
Necrosis disease was found in the farm in October 2018 and the farm was closed.
In the Finnish farm, the fish started showing symptoms of disease in late summer 2018. Therefore,
a veterinarian ordered a 10-day course of antibiotics to be administered. The active substances in
the pharmaceutical product were trimethoprim and sulfadiazine. The administered amounts of active
substances at the site during a 10-day course in August 2018 were 1.6 kg of trimethoprim and 7.9
kg of sulfadiazine. A course of antibiotics (sulfadiazine and trimethoprim) was ongoing during the
first sampling round in August. Previous medication had been given around noon the previous day
(~24 h before sampling). The course of antibiotics (sulfadiazine, trimethoprim) was ended 25 days
before the second sampling.
In addition, rainbow trout farmed in other sites close to the Finnish fish farm were given fodder
containing emamectin benzoate to remove lices (Argulus foliaceus) during the summer 2018, and
the medication was continuing during the samplings. For Estonian fish farm, there was no data about
fodder used during the sampling time.
The concentrations of trimethoprim and emamectin for both countries are presented in figures 7.4,
7.5 and 7.6. Those were the two APIs that were used at the Finnish fish farm. Concentrations of
trimethoprim in water were clearly higher during the first sampling round, as expected as the
medication was still ongoing. Trimethoprim concentration in water was higher in the Finnish fish
farm area during the usage compared to other coastal areas sampled in CWPharma. PNEC8 value
proposed for trimethoprim is 60 µg/L. All the measured concentrations were lower than the PNEC
(figure 7.4). The temporal comparison for sediment was not possible as the sediment samples were
taken only once.
Figure 7.6 shows the concentrations of emamectin in the fish farm water samples. All the measured
concentrations were lower than the PNEC of emamectin benzoate (1 ng/L, chapter 9). In the
sediment, emamectin was detected in Estonia (0.34 µg/kg d.w) but not in Finland (<0.24 µg/kg
d.w.). RQ of emamectin in Estonian sediment is 1.12 and shows a risk to the environment (chapter
9). For comparison, emamectin was detected in all surface water samples analysed in the project.
The concentrations were often higher than in the fish farms.
7 http://www.aquaflor-usa.com/pdfs/Aquaflor_Product_Bulletin_FINAL.pdf 8 https://circabc.europa.eu/sd/a/7fe29322-946a-4ead-b3b9-e3b156d0c318/Monitoring-
based%20Exercise%20Report_FINAL%20DRAFT_25nov2016.pdf

141
Figure 7.4. Trimethoprim in Finnish fish farm water sites 14a, 14b and 14c. Trimethoprim was applied to fish 24 h before
the August sampling (light green bars) and last treatment before September sampling (dark green bars) was 25 days before.
Figure 7.5. Trimethoprim in the sediments of the Estonian (EST) and Finnish (9a, 9b and 9c) fish farms (µg/kg d.w.).
0,0
0,5
1,0
1,5
2,0
2,5
3,0
3,5
4,0
21
.8.2
01
8
18
.9.2
01
8
21
.8.2
01
8
18
.9.2
01
8
21
.8.2
01
8
18
.9.2
01
8
21
.8.2
01
8
18
.9.2
01
8
21
.8.2
01
8
18
.9.2
01
8
21
.8.2
01
8
18
.9.2
01
8
1m 1m from bottom 1m 1m from bottom 1m 1m from bottom
W1 W2 W3
ng/
L
0,00
0,02
0,04
0,06
0,08
0,10
0,12
0,14
0,16
0,18
0,20
EST 9a 9b 9c
µg/
kg d
.w.

142
Figure 7.6. Emamectin concentrations in water samples (1m from the surface and 1m fromt the bottom) in the Finnish (14a,
14b and 14c) and Estonian (EST) fish farm sites.
Results of the other APIs measured in fish farm samples On the fish farms, 41 out of 64 measured APIs were detected in sediment and 32 out of 53 in water.
All raw data of API concentrations in sediments and water are presented in Annex 14 and Annex
15. Five APIs were detected in all sediment samples: fenbendazole, fexofenadine, progesterone,
risperidone and tramadol (Figure 7.7). Highest concentration in sediment was detected for
paracetamol: 520 µg/kg d.w. on the Finnish farm. Results of sediment samples from Estonian and
Finnish fish farms are shown in figure 7.8.
Two substances were detected in all the water samples, carbamazepine and caffeine. High
concentrations of caffeine show influence from other urban sources, confirming that all detected
APIs are not only emissions from fish farming. The concentrations of APIs found in water are shown
in figures 7.9–7.12. Mesalazine was detected in highest concentration, 71 ng/L, at Estonian fish
farm (Figure 7.9). Mesalazine is a human medicine used to treat inflammatory bowel disease.
On the Estonian fish farm, 27 APIs were detected in sediment and 22 APIs in water. API
concentrations in the Estonian fish farm water are shown in figure 7.9. On the Finnish fish farm, 34
APIs were detected in sediment samples and 27 APIs in water samples. APIs detected in Finnish
fish farm water samples are shown in figures 7.10, 7.11 and 7.12. There was a slight difference
between water samples taken near the bottom (1 m above the bottom) and those taken near the
surface (1 m below) at the Finnish sampling site. Six more APIs were detected from near bottom
water samples than from surface layer (candesartan, mometasone, progesterone, citalopram,
oxazepam and dipyridamole). On the other hand, fluconazole was only detected in one surface water
sample.
In the Finnish sampling site, the pharmaceutical concentrations were higher during the first sampling
round. This was expected for the substances used at the site, since active medication with antibiotic
containing trimethoprim was ongoing during the first sampling round but had ended 25 days before
the second sampling. However, the differences in concentrations applied to other substances as well.

143
The occurrence of several substances not used in the fish farming site is likely explained by the
wastewater emissions of ten households from a nearby island and other diffuse emissions from the
scattered dwellings from nearby summer cottages and permanent residential buildings.
During the first sampling round in Finland, the API sum concentrations were the highest at the
second closest sampling site (14b) but this was not the case during the second sampling, when the
API sum concentrations were quite equal at all three sites (14a-14c). This may be explained by
different weather and wind conditions during the sampling rounds which affect the water currents
and emissions from different sources to be differently directed. Secondly, September is already off-
season in the cottages, leading to less inhabitants and emissions from scattered dwellings in the area.
Altogether these issues may have caused the lower water concentrations in September compared to
August.
Figure 7.7. APIs detected in all fish farm sediment samples (μg/kg dw).
0
0,5
1
1,5
2
2,5
3
Fenbendazole Fexofenadine Progesterone Risperidone Tramadol
µg/
kg d
.w.
EST FI 9a FI 9b FI 9c
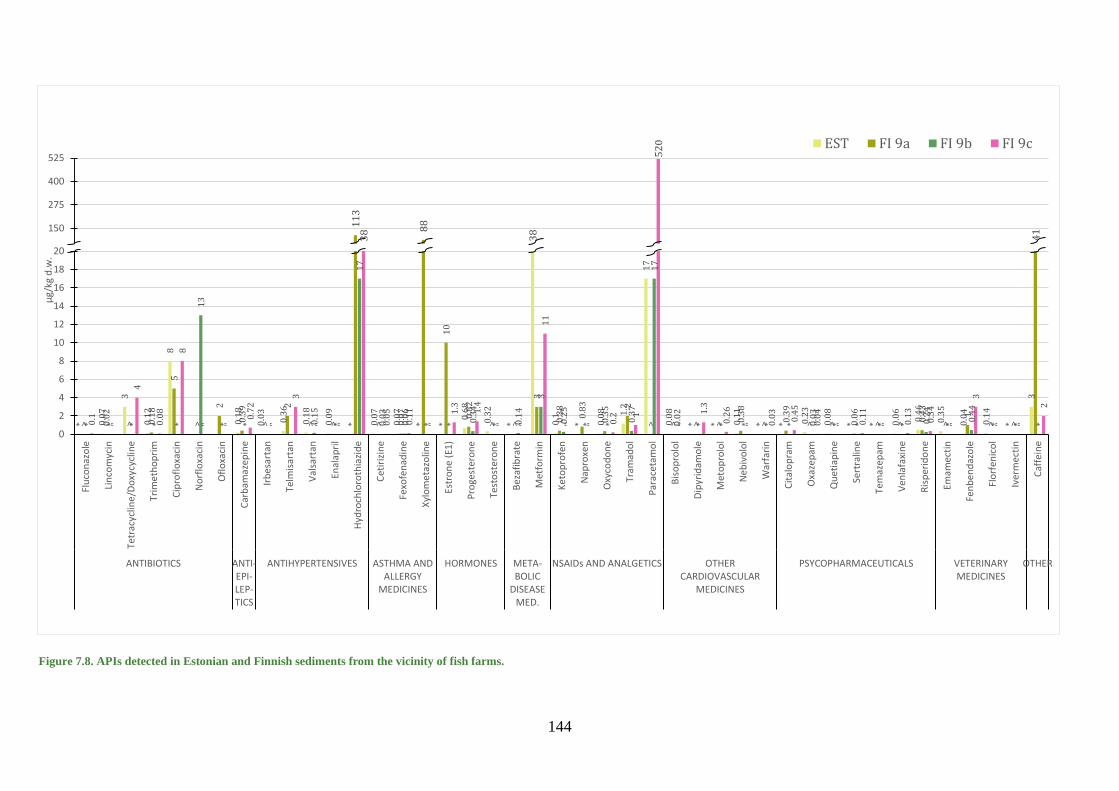
144
38
11
3
88
41
38
52
0
25
150
275
400
525EST FI 9a FI 9b FI 9c
* 0.0
7
3
0.1
2
8
0.1
8
0.0
3
0.3
6
0.1
8
0.0
9
* 0.0
7
0.0
7
* *
0.6
8
0.3
2
* 0.1
* 0.0
8 1.2
17
0.0
8
* * 0.1
1
* * 0.2
3
0.0
8
* * 0.0
6
0.4
6
0.3
5
0.0
4
0.1
4
*
3
> 0.0
2
> 0.1
8
5
>
2
0.3
9
>
2
> > > 0.0
7
10
0.8
2
> >
3
0.3
8
0.8
3
0.3
5 2
> > > > 0.3
8
> 0.3
9
> > 0.0
6
> > 0.4
3
>
1
> >* * * * *
13
* * 0.1
5
*
17
0.0
3
0.0
6
* * 0.3
4
* 0.1
4
3
0.2
5
* * 0.3
7
17
0.0
2
* * * * * 0.0
3
* * * * 0.2
4
* 0.4
4
* * *0.1
"
4
0.0
8
8
" "
0.7
2
"
3
" " 0.0
5
0.1
1
"
1.3 1.4
" "
11
" " 0.2 1
"
1.3
0.2
6
" 0.0
3
0.4
5
0.0
4
" 0.1
1
" 0.1
3
0.3
4
"
3
" "
2
0
2
4
6
8
10
12
14
16
18
20
Flu
con
azo
le
Lin
com
ycin
Tetr
acyc
line
/Do
xycy
clin
e
Trim
eth
op
rim
Cip
rofl
oxa
cin
No
rflo
xaci
n
Ofl
oxa
cin
Car
bam
azep
ine
Irb
esar
tan
Telm
isar
tan
Val
sart
an
Enal
apri
l
Hyd
roch
loro
thia
zid
e
Cet
iriz
ine
Fexo
fen
adin
e
Xyl
om
eta
zolin
e
Estr
on
e (
E1)
Pro
gest
ero
ne
Test
ost
ero
ne
Bez
afib
rate
Met
form
in
Ket
op
rofe
n
Nap
roxe
n
Oxy
cod
on
e
Tram
ado
l
Par
acet
amo
l
Bis
op
rolo
l
Dip
yrid
amo
le
Met
op
rolo
l
Neb
ivo
lol
War
fari
n
Cit
alo
pra
m
Oxa
zep
am
Qu
etia
pin
e
Sert
ralin
e
Tem
azep
am
Ven
lafa
xin
e
Ris
per
ido
ne
Emam
ecti
n
Fen
ben
daz
ole
Flo
rfen
ico
l
Iver
mec
tin
Caf
fein
e
ANTIBIOTICS ANTI-EPI-LEP-TICS
ANTIHYPERTENSIVES ASTHMA ANDALLERGY
MEDICINES
HORMONES META-BOLIC
DISEASEMED.
NSAIDs AND ANALGETICS OTHERCARDIOVASCULAR
MEDICINES
PSYCOPHARMACEUTICALS VETERINARYMEDICINES
OTHER
µg/
kg d
.w.
Figure 7.8. APIs detected in Estonian and Finnish sediments from the vicinity of fish farms.
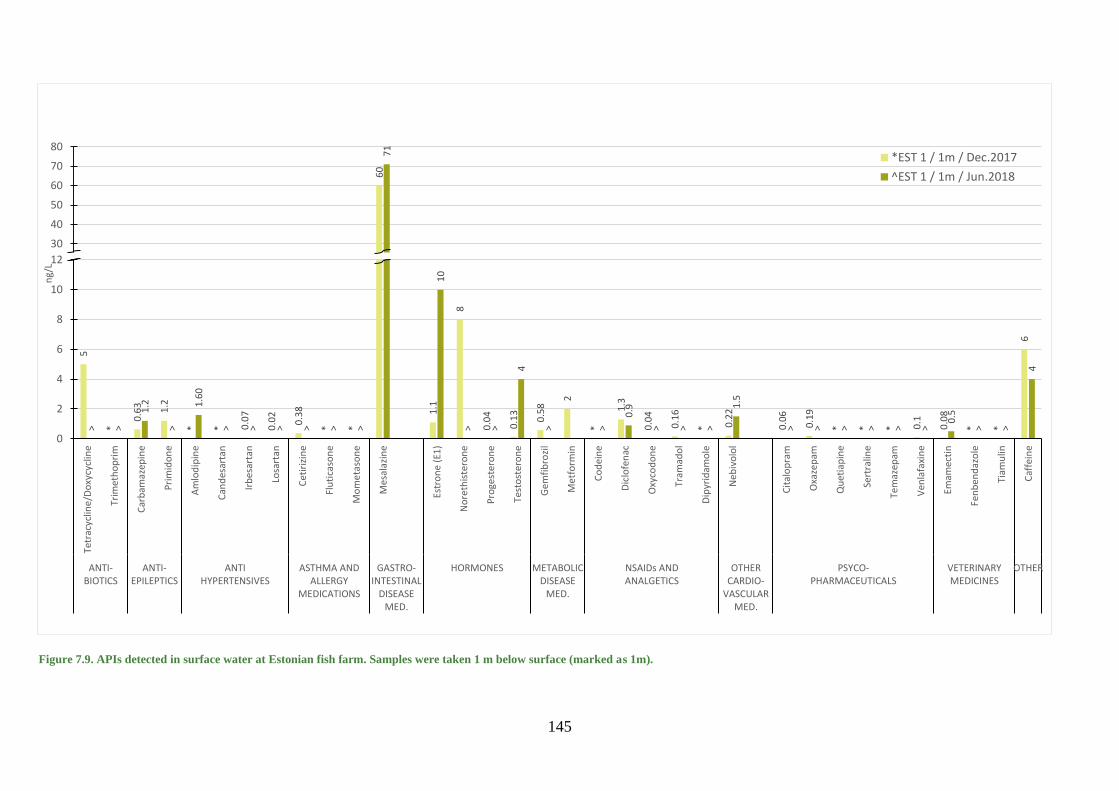
145
60
71
20
30
40
50
60
70
80*EST 1 / 1m / Dec.2017
^EST 1 / 1m / Jun.2018
5
*
0.6
3 1.2
* * 0.0
7
0.0
2
0.3
8
* *
1.1
8
0.0
4
0.1
3
0.5
8
2
*
1.3
0.0
4
0.1
6
* 0.2
2
0.0
6
0.1
9
* * * 0.1
0.0
8
* *
6
> >
1.2
>
1.6
0
> > > > > >
10
> >
4
> >
0.9
> > >
1.5
> > > > > >
0.5
> >
4
0
2
4
6
8
10
12
Tetr
acyc
line
/Do
xycy
clin
e
Trim
eth
op
rim
Car
bam
azep
ine
Pri
mid
on
e
Am
lod
ipin
e
Can
des
arta
n
Irb
esar
tan
Losa
rtan
Cet
iriz
ine
Flu
tica
son
e
Mo
me
taso
ne
Mes
alaz
ine
Estr
on
e (
E1)
No
reth
iste
ron
e
Pro
gest
ero
ne
Test
ost
ero
ne
Gem
fib
rozi
l
Met
form
in
Co
dei
ne
Dic
lofe
nac
Oxy
cod
on
e
Tram
ado
l
Dip
yrid
amo
le
Neb
ivo
lol
Cit
alo
pra
m
Oxa
zep
am
Qu
etia
pin
e
Sert
ralin
e
Tem
azep
am
Ven
lafa
xin
e
Emam
ecti
n
Fen
ben
daz
ole
Tiam
ulin
Caf
fein
e
ANTI-BIOTICS
ANTI-EPILEPTICS
ANTIHYPERTENSIVES
ASTHMA ANDALLERGY
MEDICATIONS
GASTRO-INTESTINAL
DISEASEMED.
HORMONES METABOLICDISEASE
MED.
NSAIDs ANDANALGETICS
OTHERCARDIO-
VASCULARMED.
PSYCO-PHARMACEUTICALS
VETERINARYMEDICINES
OTHER
ng/
L
Figure 7.9. APIs detected in surface water at Estonian fish farm. Samples were taken 1 m below surface (marked as 1m).
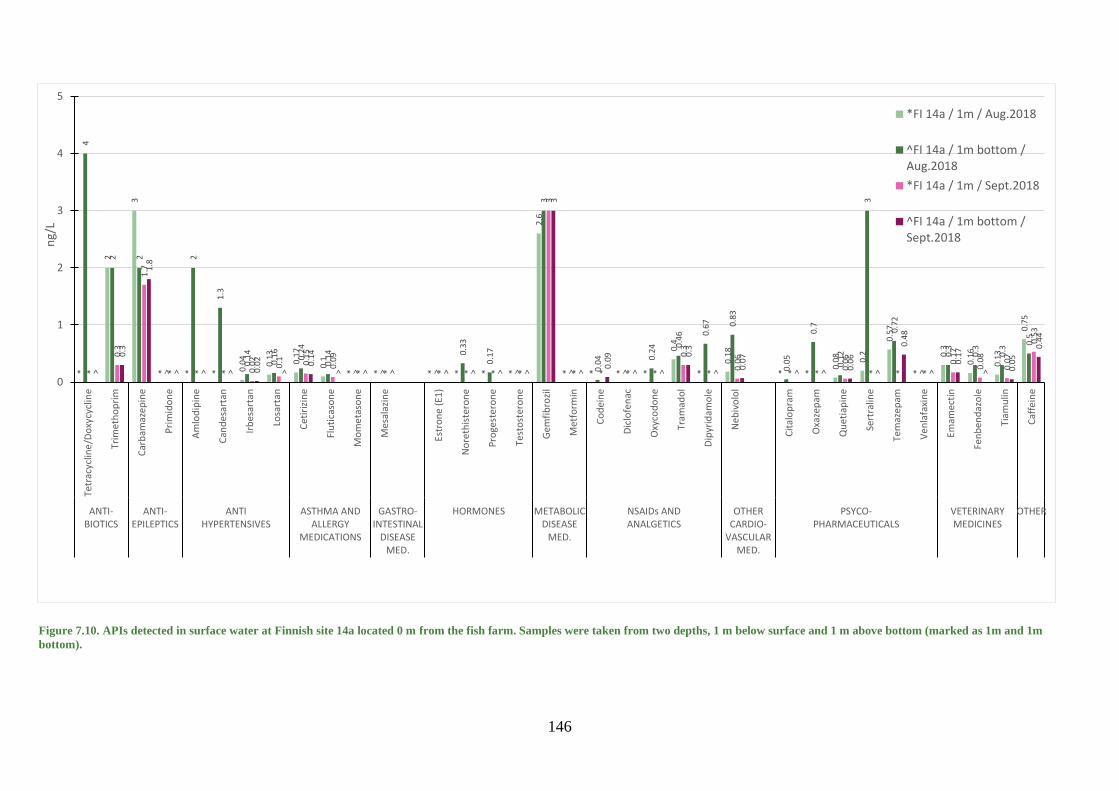
146
Figure 7.10. APIs detected in surface water at Finnish site 14a located 0 m from the fish farm. Samples were taken from two depths, 1 m below surface and 1 m above bottom (marked as 1m and 1m
bottom).
*
2
3
* * * 0.04 0.
13
0.17
0.1
* * * * * *
2.6
* * * *
0.4
*
0.18
* * 0.08 0.
2
0.5
7
*
0.3
0.16
0.13
0.7
5
4
2 2
>
2
1.3
0.14
0.16 0.
24
0.14
> > >
0.33
0.17
>
3
> 0.04
>
0.24
0.4
6 0.6
7 0.8
3
0.05
0.7
0.12
3
0.7
2
>
0.3
0.3
0.3 0.
5
*
0.3
1.7
* * * 0.02 0.
1 0.15
0.09
* * * * * *
3
* * * *
0.3
* 0.06
* * 0.06
* * *
0.17
0.08
0.07
0.5
3
>
0.3
1.8
> > > 0.02
>
0.14
> > > > > > >
3
>
0.09
> >
0.3
> 0.07
> > 0.06
>
0.4
8
>
0.17
> 0.05
0.4
4
0
1
2
3
4
5Te
trac
yclin
e/D
oxy
cycl
ine
Trim
eth
op
rim
Car
bam
azep
ine
Pri
mid
on
e
Am
lod
ipin
e
Can
des
arta
n
Irb
esar
tan
Losa
rtan
Cet
iriz
ine
Flu
tica
son
e
Mo
me
taso
ne
Mes
alaz
ine
Estr
on
e (
E1)
No
reth
iste
ron
e
Pro
gest
ero
ne
Test
ost
ero
ne
Gem
fib
rozi
l
Met
form
in
Co
dei
ne
Dic
lofe
nac
Oxy
cod
on
e
Tram
ado
l
Dip
yrid
amo
le
Neb
ivo
lol
Cit
alo
pra
m
Oxa
zep
am
Qu
etia
pin
e
Sert
ralin
e
Tem
azep
am
Ven
lafa
xin
e
Emam
ecti
n
Fen
ben
daz
ole
Tiam
ulin
Caf
fein
e
ANTI-BIOTICS
ANTI-EPILEPTICS
ANTIHYPERTENSIVES
ASTHMA ANDALLERGY
MEDICATIONS
GASTRO-INTESTINAL
DISEASEMED.
HORMONES METABOLICDISEASE
MED.
NSAIDs ANDANALGETICS
OTHERCARDIO-
VASCULARMED.
PSYCO-PHARMACEUTICALS
VETERINARYMEDICINES
OTHER
ng/
L
*FI 14a / 1m / Aug.2018
^FI 14a / 1m bottom /Aug.2018
*FI 14a / 1m / Sept.2018
^FI 14a / 1m bottom /Sept.2018
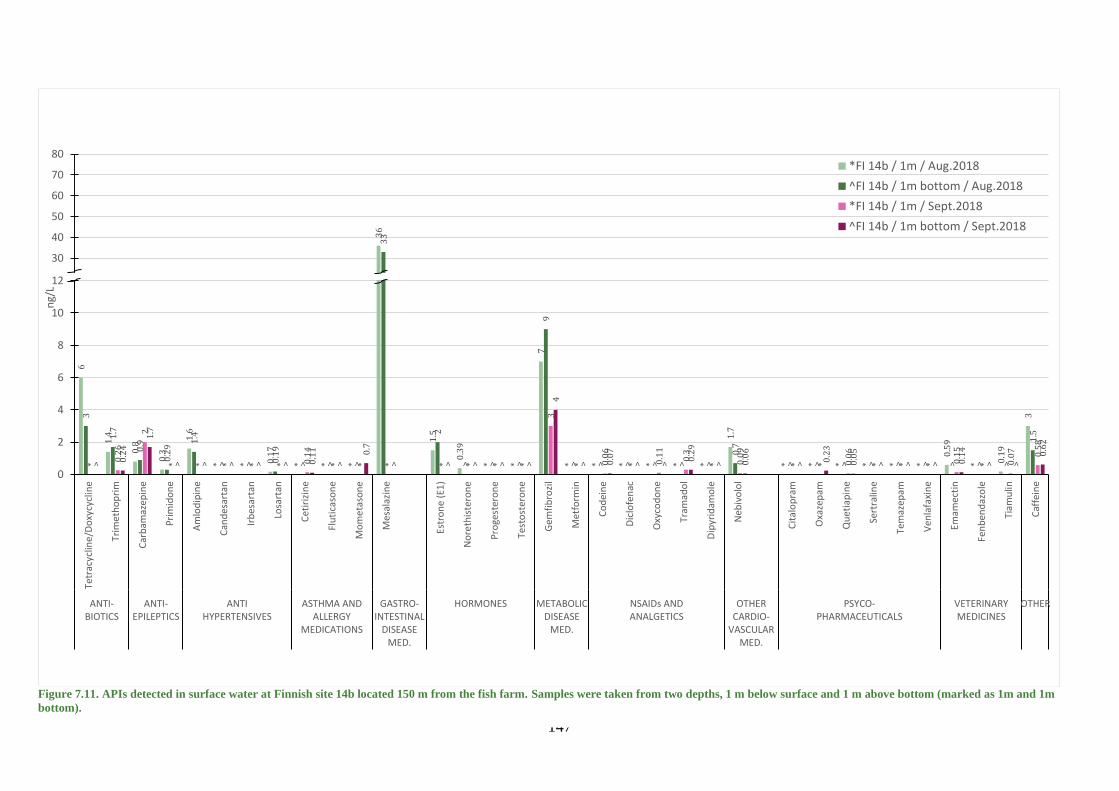
147
36
33
20
30
40
50
60
70
80*FI 14b / 1m / Aug.2018
^FI 14b / 1m bottom / Aug.2018
*FI 14b / 1m / Sept.2018
^FI 14b / 1m bottom / Sept.2018
6
1.4
0.8
0.3
1.6
* * 0.1
7
* * *
1.5
0.3
9
* *
7
* * * * * *
1.7
* * * * * *
0.5
9
* 0.1
9
33
1.7
0.9
0.2
9
1.4
> > 0.1
9
> > >
2
> > >
9
> > > > > >
0.7
> > > > > > > > >
1.5
* 0.2
6
2
* * * * * 0.1
4
* * * * * * *
3
* 0.0
6
* 0.1
1
0.3
* 0.0
9
* * 0.0
6
* * * 0.1
5
* 0.0
7 0.5
8
> 0.2
4
1.7
> > > > > 0.1
1
>
0.7
> > > > >
4
> 0.0
7
> >
0.2
9
> 0.0
6
> 0.2
3
0.0
5
> > > 0.1
4
> >
0.6
2
0
2
4
6
8
10
12
Tetr
acyc
line
/Do
xycy
clin
e
Trim
eth
op
rim
Car
bam
azep
ine
Pri
mid
on
e
Am
lod
ipin
e
Can
des
arta
n
Irb
esar
tan
Losa
rtan
Cet
iriz
ine
Flu
tica
son
e
Mo
me
taso
ne
Mes
alaz
ine
Estr
on
e (
E1)
No
reth
iste
ron
e
Pro
gest
ero
ne
Test
ost
ero
ne
Gem
fib
rozi
l
Met
form
in
Co
dei
ne
Dic
lofe
nac
Oxy
cod
on
e
Tram
ado
l
Dip
yrid
amo
le
Neb
ivo
lol
Cit
alo
pra
m
Oxa
zep
am
Qu
etia
pin
e
Sert
ralin
e
Tem
azep
am
Ven
lafa
xin
e
Emam
ecti
n
Fen
ben
daz
ole
Tiam
ulin
Caf
fein
e
ANTI-BIOTICS
ANTI-EPILEPTICS
ANTIHYPERTENSIVES
ASTHMA ANDALLERGY
MEDICATIONS
GASTRO-INTESTINAL
DISEASEMED.
HORMONES METABOLICDISEASE
MED.
NSAIDs ANDANALGETICS
OTHERCARDIO-
VASCULARMED.
PSYCO-PHARMACEUTICALS
VETERINARYMEDICINES
OTHER
ng/
L
Figure 7.11. APIs detected in surface water at Finnish site 14b located 150 m from the fish farm. Samples were taken from two depths, 1 m below surface and 1 m above bottom (marked as 1m and 1m
bottom).

148
29
20
30
40
50
60
70
80*FI 14c / 1m / Aug.2018
^FI 14c / 1m bottom / Aug.2018
*FI 14c / 1m / Sept.2018
^FI 14c / 1m bottom / Sept.2018
6
1.5
0.8
0.2
6
1.5
* * 0.1
8
* * *
1
* * * * * * * * * *
1.4
* * * * * *
0.6
1
* 0.1
5
3
>
4
2
> > > > 0.1
1
0.1
9
0.0
8
> > > > > >
4
> > > 0.0
8
0.4
> 0.1
9
0.0
4
0.5
0.1 0.2 0
.5
>
0.3
2
0.1
3
0.1
3
0.6
*
0.3
1
2
* * * 0.0
3
0.0
7
0.1
6
* * * * * * * * * * * *
0.3
1
* 0.0
9
* * 0.0
9
* * * 0.1
9
* *
1.9
> 0.2
7
1.8
> > > 0.0
1
0.0
8
0.1
5
> > > > > > >
4
> > > > 0.2
8
> > > > 0.0
5
> > > 0.1
6
> 0.0
6 0.8
0
2
4
6
8
10
12
Tetr
acyc
line
/Do
xycy
clin
e
Trim
eth
op
rim
Car
bam
azep
ine
Pri
mid
on
e
Am
lod
ipin
e
Can
des
arta
n
Irb
esar
tan
Losa
rtan
Cet
iriz
ine
Flu
tica
son
e
Mo
me
taso
ne
Mes
alaz
ine
Estr
on
e (
E1)
No
reth
iste
ron
e
Pro
gest
ero
ne
Test
ost
ero
ne
Gem
fib
rozi
l
Met
form
in
Co
dei
ne
Dic
lofe
nac
Oxy
cod
on
e
Tram
ado
l
Dip
yrid
amo
le
Neb
ivo
lol
Cit
alo
pra
m
Oxa
zep
am
Qu
etia
pin
e
Sert
ralin
e
Tem
azep
am
Ven
lafa
xin
e
Emam
ecti
n
Fen
ben
daz
ole
Tiam
ulin
Caf
fein
e
ANTI-BIOTICS
ANTI-EPILEPTICS
ANTIHYPERTENSIVES
ASTHMA ANDALLERGY
MEDICATIONS
GASTRO-INTESTINAL
DISEASEMED.
HORMONES METABOLICDISEASE
MED.
NSAIDs ANDANALGETICS
OTHERCARDIO-
VASCULARMED.
PSYCO-PHARMACEUTICALS
VETERINARYMEDICINES
OTHER
ng/
L
Figure 7.12. APIs detected in the surface water of Finnish site 14c located 400 m from the fish farm. Samples were taken from two depths, 1 m below surface and 1 m above bottom (marked as 1m and
1m bottom).
149
Conclusions
Water and sediments at two fish farms in Estonia and Finland were analysed for APIs (53 in water
and 64 in sediment). Two of the analysed APIs, trimethoprim and emamectin, were known to be
used at the Finnish fish farm, and none of them at the Estonian fish farm. Trimethoprim
concentrations were 1.4 – 3.7 ng/L in water and 0.08 – 0.18 µg/kg d.w. in sediment of the Finnish
fish farm. In the Estonian fish farm, trimethoprim was not detected (<0.17 ng/L) in the water,
whereas the concentration in sediment was 0.12 µg/kg d.w. Emamectin was detected only in the
Estonian fish farm samples at concentrations 0.08 – 0.6 ng/L in water and 0.34 µg/kg d.w. in
sediment. Trimethoprim and emamectin concentrations of the fish farm samples do not pose
environmental risks (lower than PNEC).
Our study showed the human impact is comprehensive. In natural waters it is difficult to find a place
were only fish farm impact could be studied. In our case study farms the influence from other
activities was evident, although we tried to minimize the influence when selecting the sites. The
water and sediments at the fish farms also contained other APIs, indicating influences from other
sources (e.g. WWTPs and private sewers). In total, 41 APIs were detected in fish farm sediments
and 32 in water. Two APIs were detected in all the water samples near the fish farms: carbamazepine
and caffeine. The highest concentration in water samples was detected for mesalazine (71 ng/L).
Five APIs were detected in all sediment samples near fish farms: fenbendazole, fexofenadine,
progesterone, risperidone and tramadol. The highest concentration in sediment was detected for
paracetamol (520 µg/kg d.w.). The overall concentrations and the number of detected APIs were
lower or consistent with other surface water samples of the project.

150
Pig and poultry farms
Methods
The concentrations of 55–59 APIs were analysed in the water of a watercourse near one pig and one
poultry farm in Latvia. Sampling was done according ISO standard (LVS EN ISO 5667-6:2017)
with horizontal water sampler. Surface water samplings were performed in a drainage ditch 300 m
from the pig farm at 29 November 2017 and 22 May 2018, in Vegerupe river 600 m from the poultry
farm at 28 November 2017 and 25 May 2018. The samples were taken with horizontal bathometer
0.5 m from the water surface. Four subsamples were taken for one integrated surface water sample.
The samples were collected in polyethylene bottles and kept frozen until delivery to SYKE
laboratory for analyses.
Results and discussion
The results of field measurements and observed weather conditions at sampling times are presented
in Table 7.2. APIs from each group were detected in the surface water near the pig and poultry farms
(Table 7.3). Raw results are presented in Annex 16. 24 APIs were detected in at least one sample
taken in November, and 14 APIs in May (Table 7.4 and Figure 7.13). While many API
concentrations were quantified in the range of 10 to 590 ng/L, only estrone concentration in a single
water sample (1.3 ng/L) exceed its PNEC value 0.008 ng/L. Four APIs were detected in all samples:
• Caffeine (2.2 – 590 ng/L),
• Diclofenac (NSAID and analgesic) (0.89 – 7.7 ng/L),
• Metoprolol (other cardiovascular medicine) (0.24 – 5.0 ng/L),
• Tiamulin (veterinary medicine) (1.3 – 18 ng/L).
In November 2017 the highest quantified concentrations in water were detected for caffeine 94 ng/L
and gabapentin 25 ng/L near the poultry farm and caffeine 140 ng/L and tylosin 23 ng/L near the
pig farm. Tylosin is an antibiotic used in veterinary medicine and its presence in water near farms
is expected. In May 2018, the highest quantified concentrations in water were detected for caffeine
590 ng/L near the pig farm and metformin 190 ng/L near the poultry farm. There is a wide range of
caffeine sources in water since this substance is used not only in the pharmaceutical industry but
also in the food and beverage industry. Likewise, it is difficult to identify the source of metformin
since metformin is now widely prescribed as an anti-diabetic drug and is among the most abundant
pharmaceuticals being introduced into the environment.
Eight APIs were found only in the November samples: cetirizine, citalopram, emamectin, nebivolol,
progesterone, tramadol, tylosin and xylometazoline. In November, all veterinary pharmaceuticals
(six in total) were detected: five near the pig farm and four near the poultry farm. In May, three of
the six veterenary APIs were quantified in water near the pig farm, and one near the poultry farm.
Two APIs fexofenadine (asthma and allergy medication) and toltrazuril (veterinary medicine) were
quantified only in water samples near the pig farm in November and May.
In Latvia, autumn 2017 was remarkable with heavy rains – precipitation was second highest in the
observation history. We cannot exlude that due to heavy rain and extremely high water the drainage
water from households, small family farms, pastures and allotments as well as soil leaching and
release of substances from agricultural fields can be additional sources of some pharmaceuticals in
the surface waters besides wastewaters from large pig and poultry farms.
In contrary to autumn 2017, the following spring was relatively dry and warm. Therefore, the end
of May 2018 was considered a low-flow period. The concentration of some APIs in water were
lower in May, which may be due to reduced soil leaching and vegetation. At the same time the
concentration of some APIs increased. Different physical (temperature and sunlight radiation),
chemical (oxygen presence) and biological conditions can affect substance solubility in water,

151
adsorption on suspended particles and degradation. For example, an increase in water temperature
increases the solubility of the substances and reduces sorption to particles. Also, substances can be
taken up by algae and waterweed. On the other hand, the water supply to watercourses from more
distant sources was limited due to reduced amount of drainage waters in this dry and warm spring.
According to this we assume that the sources of water pollution with specific APIs used by humans
(i.e., caffeine and metformin) were located directly at watercourses and the discharged wastewaters
were not as diluted by drainage waters as in the rainy autumn. Table 7.2. Observations and field measurements at the sampling sites near pig and poultry farm.
Observation
month Weather condition Water
temperature,
°C
Conductivity,
µS cm-1 pH O2, mg L-1
/Saturation
%
Sapling site near pig farm
November
2017
Air temperature +3°C, cloudy,
slow wind, without precipitation 5.6 668 7.79 10.3/82
May 2018 Air temperature +24°C, sunny,
slow wind, without precipitation 14.0 818 8.29 17.8/173
Sapling site near poultry farm
November
2017
Air temperature +2°C, strong
wind, rainy (long rain) 3.1 621 7.70 11.5/85
May 2018 Air temperature +24°C, sunny,
no wind, without precipitation 15.9 836 7.25 7.1/72
Table 7.3. APIs analyzed in the surface water near pig and poultry farms, and the number of detected APIs above LOQ.
API group APIs measured in water / detected APIs in bold Number of
detected APIs
in water
samples
ANTIBIOTICS Clarithromycin, fluconazole, lincomycin,
ofloxacin, sulfadiazine, trimethoprim,
tetracycline+doxycycline (SUM)
1 / 7
ANTIEPILEPTICS Carbamazepine, gabapentin, levetiracetam,
primidone
2 / 4
ANTI-
HYPERTENSIVES Amlodipine, candesartan, enalapril, eprosartan,
irbesartan, losartan, ramipril, telmisartan, valsartan
1 / 9
ASTHMA AND
ALLERGY
MEDICATIONS
Cetirizine, fexofenadine, fluticasone, mometasone
furoate, xylometazoline
3 / 6
HORMONES Estrone (E1), norethisterone, progesterone,
testosterone
2 /4
METABOLIC
DISEASE
MEDICATIONS
Atorvastatin, bezafibrate, gemfibrozil, metformin 2 / 4
NSAIDs AND
ANALGETICS1 Codeine, diclofenac, ketoprofen, naproxen,
oxycodone, tramadol
4 / 6
OTHER
CARDIOVASCULAR
MEDICINES
Atenolol, bisoprolol, dipyridamole, metoprolol,
nebivolol, sotalol, warfarin
2 / 7
PSYCOPHARMA-
CEUTICALS2 Citalopram, oxazepam, quetiapine, sertraline,
temazepam, venlafaxine
2 / 6
VETERINARY
MEDICINES Carprofen, emamectin, fenbendazole, tiamulin,
toltrazuril, tylosin
6 / 6
OTHER Caffeine 1 / 1 1. Codeine and oxycodone were not analysed in samples collected in November 2017.
2. Oxazepam and temazepam were not analysed in samples collected in November 2017.
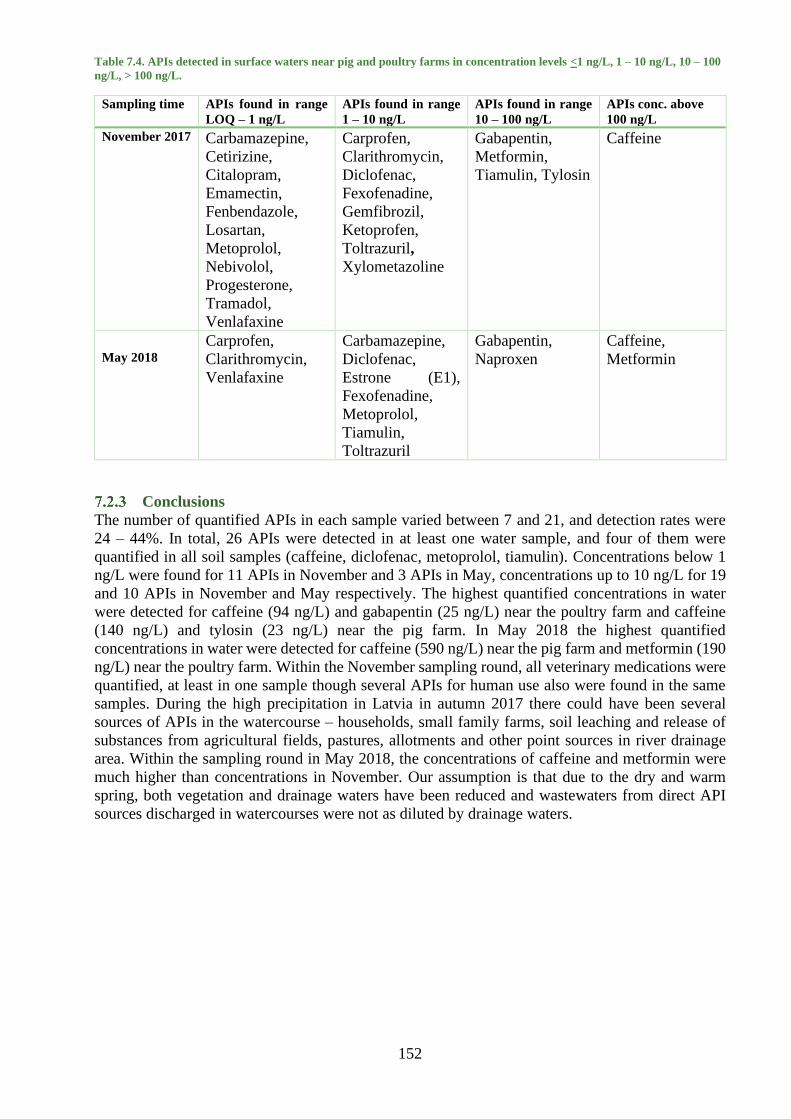
152
Table 7.4. APIs detected in surface waters near pig and poultry farms in concentration levels <1 ng/L, 1 – 10 ng/L, 10 – 100
ng/L, > 100 ng/L.
Sampling time APIs found in range
LOQ – 1 ng/L APIs found in range
1 – 10 ng/L APIs found in range
10 – 100 ng/L APIs conc. above 100 ng/L
November 2017 Carbamazepine,
Cetirizine,
Citalopram,
Emamectin,
Fenbendazole,
Losartan,
Metoprolol,
Nebivolol,
Progesterone,
Tramadol,
Venlafaxine
Carprofen,
Clarithromycin,
Diclofenac,
Fexofenadine,
Gemfibrozil,
Ketoprofen,
Toltrazuril,
Xylometazoline
Gabapentin,
Metformin,
Tiamulin, Tylosin
Caffeine
May 2018
Carprofen,
Clarithromycin,
Venlafaxine
Carbamazepine,
Diclofenac,
Estrone (E1),
Fexofenadine,
Metoprolol,
Tiamulin,
Toltrazuril
Gabapentin,
Naproxen
Caffeine,
Metformin
Conclusions
The number of quantified APIs in each sample varied between 7 and 21, and detection rates were
24 – 44%. In total, 26 APIs were detected in at least one water sample, and four of them were
quantified in all soil samples (caffeine, diclofenac, metoprolol, tiamulin). Concentrations below 1
ng/L were found for 11 APIs in November and 3 APIs in May, concentrations up to 10 ng/L for 19
and 10 APIs in November and May respectively. The highest quantified concentrations in water
were detected for caffeine (94 ng/L) and gabapentin (25 ng/L) near the poultry farm and caffeine
(140 ng/L) and tylosin (23 ng/L) near the pig farm. In May 2018 the highest quantified
concentrations in water were detected for caffeine (590 ng/L) near the pig farm and metformin (190
ng/L) near the poultry farm. Within the November sampling round, all veterinary medications were
quantified, at least in one sample though several APIs for human use also were found in the same
samples. During the high precipitation in Latvia in autumn 2017 there could have been several
sources of APIs in the watercourse – households, small family farms, soil leaching and release of
substances from agricultural fields, pastures, allotments and other point sources in river drainage
area. Within the sampling round in May 2018, the concentrations of caffeine and metformin were
much higher than concentrations in November. Our assumption is that due to the dry and warm
spring, both vegetation and drainage waters have been reduced and wastewaters from direct API
sources discharged in watercourses were not as diluted by drainage waters.
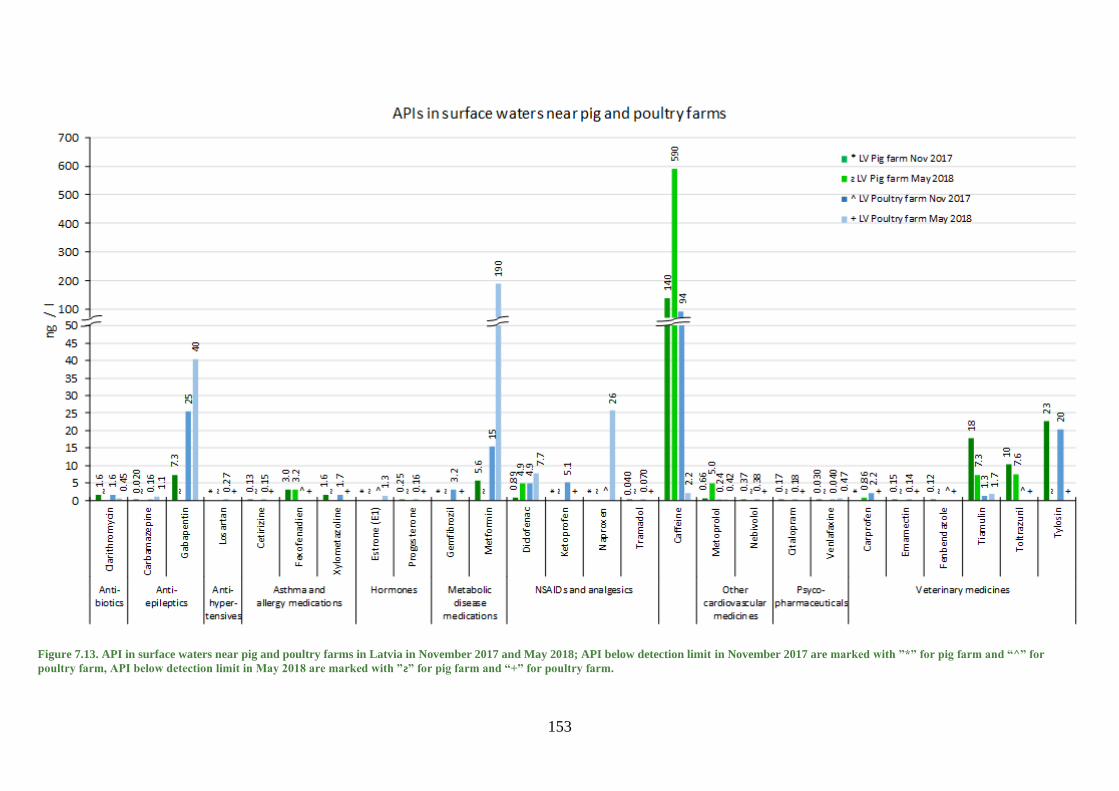
153
Figure 7.13. API in surface waters near pig and poultry farms in Latvia in November 2017 and May 2018; API below detection limit in November 2017 are marked with ”*” for pig farm and “^” for
poultry farm, API below detection limit in May 2018 are marked with ”ƨ” for pig farm and “+” for poultry farm.

154
APIs in soil fertilized with sludge or manure
Method
Estonia
Soil samples were taken according to ISO 5667-12 by Auger sampler (30 cm depth, 7 subsamples)
on 17 October 2018. During sampling, weather was sunny, without precipitation, no wind. Before
sampling, the weather was sunny and without precipitation for 6 days.
Soil structure of the site EST1 was granular, silty loam gleysols (LkG). Organic carbon content was
22 – 40%, and dry matter 78%. The field with subsurface drainage was used for pasture. Cow
manure (50 t/ha) was applied on the field most recently one month before sampling (18 September
2018). Pharmaceuticals used at the farm were antibioticstetracycline, trimethoprim, erythromycin
and tylosin tartrate.
Soil structure of the site EST2 was granular, clay loam gleysols (Gi). The organic carbon content
was 20 – 25%, and dry matter 80%. The field without subsurface drainage was used for growing
winter cereal. Dairy cattle manure was applied on the field most recently five weeks before sampling
(12 September 2018). Pharmaceuticals used at the farm were antibiotics tetracycline,
sulfamethoxazole and lincomycin hydrochloride, NSAID and analgesic ketoprofen, and hormone
progesterone.
Germany
Soil samples were taken by shovel (25 cm depth, 6 subsamples) on 24 May 2018. Weather
conditions during sampling were sunny, without precipitation, and with slow wind. Soil structure
was prismatic silty sand, dry matter 94%. Organic carbon content was not determined. The field
without subsurface drainage was used for agriculture. For agriculture rape production 7 tons/ha of
sewage sludge of a WWTP was applied on field before sowing.
Latvia
Soil samples were taken according to ISO 5667-12 by Auger sampler (15 cm depth) on 12 June
2018. Samples were taken from 10 points along a 1 km row. Weather conditions during sampling
were sunny, without precipitation, and with slow wind. In the week before sampling, small
precipitation was observed on the 5th and 11th of June (0.2 and 1.7 mm in Dobele and 0.4 and 0.5
mm in Kalnciems - towns between which the soil sampling place was located). Sampling day was
sunny. Soil structure was blocky with more clay and 84% of dry matter. Organic carbon content
was not determined. The field without subsurface drainage was used for agriculture, and manure
had been applied on this field.
Sweden
Soil samples were taken by a small shovel (app. 5 cm depth, 6 subsamples) on 29 June 2018.
Weather condition during sampling was sunny, without precipitation and no wind. Weather before
sampling was seven sunny days without precipitation. The fields SWE1 and SWE2 with subsurface
drainage were used for agriculture. Sewage sludge from WWTPs was applied on both fields two
years prior to sampling. Soil structure of SWE2 was light clay soil with 96% dry matter. Soil
structure of SWE1 was dry clay soil with 93% dry matter. Organic carbon content was not
determined.
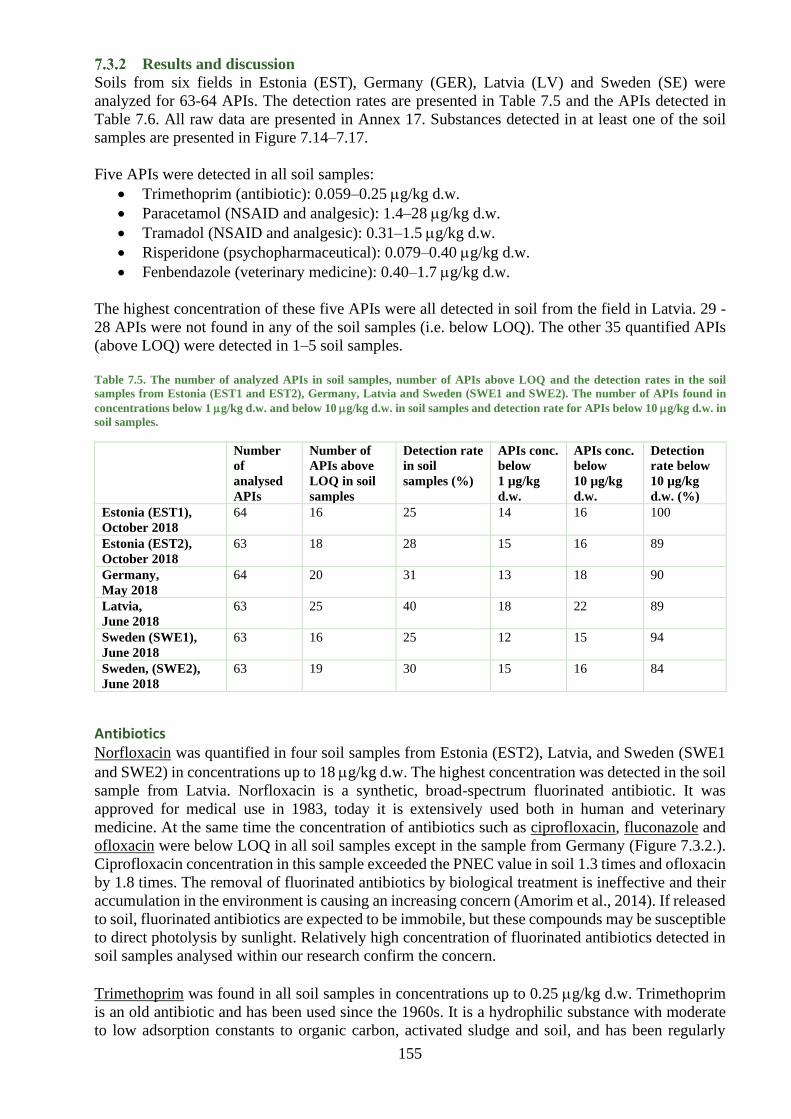
155
Results and discussion
Soils from six fields in Estonia (EST), Germany (GER), Latvia (LV) and Sweden (SE) were
analyzed for 63-64 APIs. The detection rates are presented in Table 7.5 and the APIs detected in
Table 7.6. All raw data are presented in Annex 17. Substances detected in at least one of the soil
samples are presented in Figure 7.14–7.17.
Five APIs were detected in all soil samples:
• Trimethoprim (antibiotic): 0.059–0.25 g/kg d.w.
• Paracetamol (NSAID and analgesic): 1.4–28 g/kg d.w.
• Tramadol (NSAID and analgesic): 0.31–1.5 g/kg d.w.
• Risperidone (psychopharmaceutical): 0.079–0.40 g/kg d.w.
• Fenbendazole (veterinary medicine): 0.40–1.7 g/kg d.w.
The highest concentration of these five APIs were all detected in soil from the field in Latvia. 29 -
28 APIs were not found in any of the soil samples (i.e. below LOQ). The other 35 quantified APIs
(above LOQ) were detected in 1–5 soil samples.
Table 7.5. The number of analyzed APIs in soil samples, number of APIs above LOQ and the detection rates in the soil
samples from Estonia (EST1 and EST2), Germany, Latvia and Sweden (SWE1 and SWE2). The number of APIs found in
concentrations below 1 g/kg d.w. and below 10 g/kg d.w. in soil samples and detection rate for APIs below 10 g/kg d.w. in
soil samples.
Number
of
analysed
APIs
Number of
APIs above
LOQ in soil
samples
Detection rate
in soil
samples (%)
APIs conc.
below
1 µg/kg
d.w.
APIs conc.
below
10 µg/kg
d.w.
Detection
rate below
10 µg/kg
d.w. (%)
Estonia (EST1),
October 2018
64 16 25 14 16 100
Estonia (EST2),
October 2018
63 18 28 15 16 89
Germany,
May 2018
64 20 31 13 18 90
Latvia,
June 2018
63 25 40 18 22 89
Sweden (SWE1),
June 2018
63 16 25 12 15 94
Sweden, (SWE2),
June 2018
63 19 30 15 16 84
Antibiotics Norfloxacin was quantified in four soil samples from Estonia (EST2), Latvia, and Sweden (SWE1
and SWE2) in concentrations up to 18 g/kg d.w. The highest concentration was detected in the soil
sample from Latvia. Norfloxacin is a synthetic, broad-spectrum fluorinated antibiotic. It was
approved for medical use in 1983, today it is extensively used both in human and veterinary
medicine. At the same time the concentration of antibiotics such as ciprofloxacin, fluconazole and
ofloxacin were below LOQ in all soil samples except in the sample from Germany (Figure 7.3.2.).
Ciprofloxacin concentration in this sample exceeded the PNEC value in soil 1.3 times and ofloxacin
by 1.8 times. The removal of fluorinated antibiotics by biological treatment is ineffective and their
accumulation in the environment is causing an increasing concern (Amorim et al., 2014). If released
to soil, fluorinated antibiotics are expected to be immobile, but these compounds may be susceptible
to direct photolysis by sunlight. Relatively high concentration of fluorinated antibiotics detected in
soil samples analysed within our research confirm the concern.
Trimethoprim was found in all soil samples in concentrations up to 0.25 g/kg d.w. Trimethoprim
is an old antibiotic and has been used since the 1960s. It is a hydrophilic substance with moderate
to low adsorption constants to organic carbon, activated sludge and soil, and has been regularly

156
detected in the environment. After ingestion about 40%–75% of a dose is excreted in 24 h and up
to 60% of the excreted amount is the unchanged form of trimethoprim (Straub, 2013). According to
the status report by HELCOM and UNESCO (2017) trimethoprim is a stable pharmaceutical and it
is fairly resistant to degradation during wastewater treatment in WWTP –sorption to sludge is only
45%. The half-life of trimethoprim in aquatic environment ranges from 57 to 100 days and it can be
affected by nitrifying conditions (Straub, 2013). In our research, trimethoprim was known to be used
on one farm in Estonia, and we can expect that the WWTP sludge applied on fields in Germany and
Sweden also contained trimethoprim. In fact, as trimethoprim has been used for more than 60 years,
fertilization with sludge or manure in the past can be the reason of current findings of this
pharmaceutical in all the soil samples of this study. In contrary to this assumption, some other old
and “popular” antibiotics – erythromycin, sulfamethoxazole (usually used in combination with
trimethoprim), tetracycline or doxycycline, were below LOQ in all soil samples. Different
degradation rates of the substances could result in removal of antibiotics from soil, but there is no
research data to confirm this assumption. Also, the antibiotics clarithromycin and lincomycin,
tetracycline+doxycycline (SUM) were below LOQ in all samples.
Antiepileptics The concentrations of the antiepileptics carbamazepine, levetiracetam and primidone were below
LOQ in all soil samples.
Antihypertensives Hydrochlorothiazide was quantified in four soil samples from Estonia (EST2), Germany, Latvia,
and Sweden (SWE2) in concentrations up to 110 g/kg d.w. The highest concentration was detected
in a soil sample from Latvia, but this concentration did not exceed the PNEC value for soil.
Hydrochlorothiazide concentrations in soil samples were relatively high in comparison with
concentrations of all analyzed APIs. Hydrochlorothiazide is globally the most frequently used and
relatively safe diuretic to treat hypertension and has been used clinically for more than half a century.
After ingestion, it undergoes a little metabolism and at least 61% of the oral dose is eliminated by
the kidney unchanged, via urine (O’Grady et al., 1999). Current treatment technologies are unable
to eliminate it from the wastewater and it can be considered as a concern for the aquatic environment
(Monteil et al., 2019). Due to the low biodegradation hydrochlorothiazide can be persistent pollutant
in environment. At the same time, it is sensitive to UV/VIS light (Gumieniczek et al., 2018). We
assume that hydrochlorothiazide could be exposed to the photodegradation process and could be
reduced in soil.
Telmisartan was analysed only in two soil samples from Estonia (EST1) and Germany, observed
values were 0.65 g/kg d.w. and 0.28 g/kg d.w., respectively. For other samples results of
telmisartan are not available (N/A). Valsartan concentration above LOQ was detected only in two
soil samples from Latvia and Sweden (SWE1), respectively 0.21 g/kg d.w. and 0.17 g/kg d.w.
The concentrations of amlodipine, enalapril, eprosartan, ramipril were below LOQ in all soil
samples.
Asthma and allergy medications Cetirizine was quantified in four soil samples from Estonia (EST2), Latvia, and Sweden (SWE1 and
SWE2) in concentrations up to 0.098 g/kg d.w. The highest concentration of cetirizine was
detected in soil sample from Latvia. Fexofenadine was quantified in five soil samples from Estonia
(EST2), Latvia, Germany and Sweden (SWE1 and SWE2) in concentrations up to 0.18 g/kg d.w.
and the highest concentration was detected in a soil sample from Latvia. Xylometazoline
concentrations above LOQ were detected only in two soil samples from Estonia (EST1) and
Germany, 2.3 g/kg d.w. and 7.2 g/kg d.w. respectively. The concentrations of fluticasone and
mometasone furoate were below LOQ in all samples.

157
Hormones Quantifiable values of progesterone concentration were detected only in two soil samples from
Estonia (EST1) and Latvia, respectively 0.30 g/kg d.w. and 0.22 g/kg d.w. Only in one soil
sample from Germany was estrone (E1) detected above LOQ (16 g/kg d.w.). Due to high estrone
(E1) bioconcentration in aquatic organisms its PNEC concentration in water and soil is rather low.
The PNEC value for estrone in the German soil sample was exceeded up to 160 000 times. The
concentrations of hormones such as estriol (E3) and testosterone were below LOQ. Hormone
norethisterone was analysed only in soil samples from Estonia (EST2), Latvia and Sweden (SWE 1
and SWE 2) but its concentration was below LOQ.
Metabolic disease medications Bezafibrate was quantified in four soil samples from Estonia (EST2), Latvia, and Sweden (SWE1
and SWE2). Quantified concentrations reached 0.18 g/kg d.w. and the highest concentration was
detected in two soil samples from Estonia (EST2) and Sweden (SWE2). Metformin was quantified
in five soil samples from Estonia (EST2), Germany, Latvia, and Sweden (SWE1 and SWE2) in
concentrations up to 3.1 g/kg d.w. The highest concentration was detected in a soil sample from
Germany. Relatively high concentrations of metformin were found in soil samples from Germany
and Sweden where sludge from WWTP was applied on the field and these concentrations exceeded
PNEC values for soil 10 and 4.8 times, respectively. Metformin is now widely prescribed as an anti-
diabetic drug and is among the most abundant pharmaceuticals being introduced into the
environment. Metformin is found in the wastewater and surface waters around the world, often due
to incomplete metabolism in humans and subsequent excretion. Most of the metformin is removed
during sewage treatment and may be anaerobically degraded during sludge digestion. Also, in the
environment it is transformed very slowly by photodegradation in surface waters and anaerobically
degraded in soils or in sediments (Straub et al., 2019). At the time metformin demonstrated a high
uptake by rape (Brassica napus cv. Sheik and Brassica rapa cv. Valo), (Eggen and Lillo, 2012).
The concentrations of two metabolic disease medications – gemfibrozil and simvastatin – were
below of LOQ in all samples.
NSAIDs and analgesics Quantifiable values of ketoprofen were found in five soil samples from Estonia (EST1 and EST2),
Germany and Sweden (SWE1 and SWE2). The highest quantified concentration reached 0.97 g/kg
d.w. in Estonia (EST2). All detected concentrations of ketoprofen exceeded PNEC values in soil 10
– 26 times. Oxycodone was quantified in four soil samples from Estonia (EST1 and EST2),
Germany and Latvia in concentrations up to 0.45 g/kg d.w. The highest concentration was detected
in a soil sample from Latvia. Diclofenac concentrations were below LOQ in all soil samples, except
in one sample from Estonia (0.43 g/kg d.w., EST2), which exceeded the PNEC value for soil 2.0
times. Codeine and naproxen were not detected in any soil sample.
Paracetamol was found in all soil samples and in relatively high concentrations, up to 27 g/kg d.w.
All detected concentrations of paracetamol exceeded PNEC values for soil up to 110 times. It is one
of the most commonly used medication to treat pain and fever worldwide (Kasciuškevičiūtė et al., 2018). In healthy subjects 85 to 95% of a therapeutic dose is excreted in the urine within 24 hours
as a mixture of metabolites and approximately 4% as unchanged paracetamol (Forrest et al., 1982).
According to HELCOM state report (BSAP No. 149) the calculated removal rate of paracetamol in
WWTP was more than 70%. The history of paracetamol commercial production and use started in
1950s-1960s with rapid growth in production and consumption in 1980s. Therefore, we assume that
the presence of paracetamol in all soil samples is the result of extensive use of this analgesic in the
past and present.
Tramadol was also found in all soil samples, but concentrations did not exceed the PNEC value for
soil. The commercial production of tramadol started in 1977 in Germany. Tramadol is used
primarily to treat mild to severe pain. For humans, approximately 30% of the dose is excreted in the

158
urine as unchanged drug, whereas 60% of the dose is excreted as metabolites (NIH; DailyMed).
Calculated removal rate of tramadol in WWTP is approximately 3%, so due to the low
biodegradation this compound can be considered as a concern for the aquatic environment (BSAP
No.149). Tramadol bioaccumulates in the roots and leaves of spinach from fields fertilized with
sewage sludge (Kodešová et al., 2019). It has also been shown that tramadol and its metabolites can
accumulate in the roots of the Cameroonian medicinal plant, Nauclea latifolia, near cattle pastures
(Kusari et al., 2014). Our assumption is that due to the high solubility in water and high
bioaccumulation rate in plant roots tramadol may remain in soil longer. This could be the reason of
tramadol findings in all soil samples which have been analyzed during this project.
Other cardiovascular medicines Bisoprolol was quantified in four soil samples from Estonia (EST2), Latvia, and Sweden (SWE1
and SWE2) in concentrations up to 0.049 g/kg d.w. The highest concentration was observed in soil
sample from Latvia. Metoprolol concentrations above LOQ were detected in three soil samples from
Estonia (EST1), Latvia and Sweden (SWE1). The highest concentration 0.16 g/kg d.w. of
metoprolol was detected in a soil sample from Sweden (SWE1). Measurements of nebivolol
concentrations showed that values above LOQ were detected in four soil samples from Estonia
(EST2), Germany, Latvia and Sweden (SWE2). The highest quantified concentration reached 0.41
g/kg d.w. and was detected in a soil sample from Latvia. Warfarin concentration detections above
LOQ were observed in two soil samples from Estonia (EST1) and Latvia, respectively 0.018 g/kg
d.w. and 0.048 g/kg d.w. Concentration values of three other cardiovascular medicines – atenolol,
dipyridamole, sotalol were below LOQ.
Psychopharmaceuticals Oxazepam was quantified in four soil samples from Estonia (EST1), Germany, Latvia, and Sweden
(SWE2) in concentrations up to 0.42 g/kg d.w. The highest concentration was observed in soil
sample from Latvia. Concentration values of sertraline above LOQ were found in three soil samples
from Estonia (EST1 and EST2) and Sweden (SWE2), the highest observed concentration reached
0.10 g/kg d.w. and was detected in a soil sample from Estonia (EST2). Temazepam was quantified
in three soil samples from Latvia and Sweden (SWE1 and SWE2) in concentrations up to 0.36 g/kg
d.w. The highest concentration was detected in a soil sample from Latvia. Venlafaxine was observed
in four soil samples from Estonia (EST1), Germany, Latvia and Sweden (SWE2). The highest
observed concentration reached 0.20 g/kg d.w. and was detected in soil sample from Latvia. At
the same time citalopram was detected above LOQ only in one soil sample from Latvia (0.19 g/kg
d.w.). The concentrations of other two psychopharmaceuticals – olanzapine and quetiapine were
below LOQ in all samples.
It was described before that risperidone was quantified in all soil samples in concentrations up to
0.40 g/kg d.w. It is a relatively new medication, first approved for commercial production in 1993
in United States. Risperidone is used for humans as well as animals (cats and dogs) for the same
purpose – as a nervous system agent. Calculated removal rate of risperidone in WWTP is
approximately 7%, so due to the low biodegradation this compound can be considered as a concern
for the aquatic environment (HELCOM and UNESCO 2017). Risperidone is extensively
metabolized in the liver by hydroxylation to its main pharmacoactive metabolite, 9-
hydroxyrisperidone (Asimakopoulos and Kannan, 2016) but information about its excretion is quite
poor as well as information about bioavailability and accumulation in plants from the fields fertilized
with sludge or manure. Therefore, it is difficult to explain risperidone’s presence in all the soil
samples and further understanding of the environmental fate and impacts of this compound is
needed.
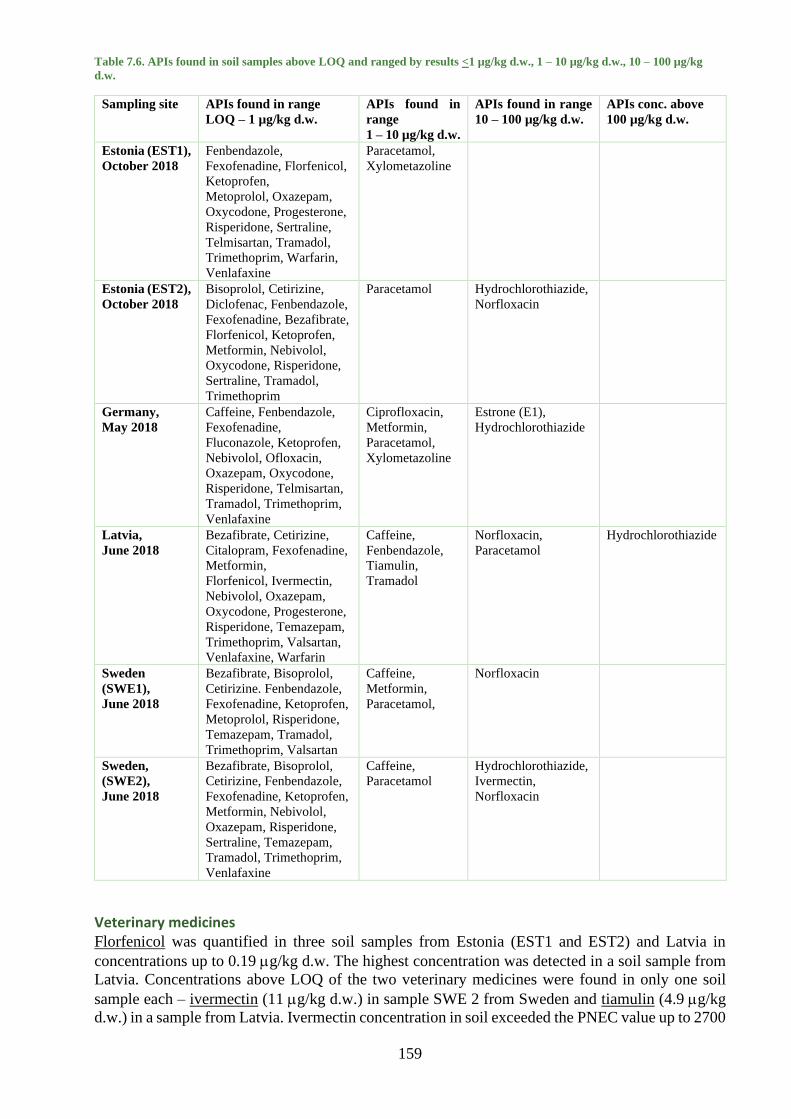
159
Table 7.6. APIs found in soil samples above LOQ and ranged by results <1 µg/kg d.w., 1 – 10 µg/kg d.w., 10 – 100 µg/kg
d.w.
Sampling site APIs found in range
LOQ – 1 µg/kg d.w.
APIs found in
range
1 – 10 µg/kg d.w.
APIs found in range
10 – 100 µg/kg d.w.
APIs conc. above
100 µg/kg d.w.
Estonia (EST1),
October 2018
Fenbendazole,
Fexofenadine, Florfenicol,
Ketoprofen,
Metoprolol, Oxazepam,
Oxycodone, Progesterone,
Risperidone, Sertraline,
Telmisartan, Tramadol,
Trimethoprim, Warfarin,
Venlafaxine
Paracetamol,
Xylometazoline
Estonia (EST2),
October 2018
Bisoprolol, Cetirizine,
Diclofenac, Fenbendazole,
Fexofenadine, Bezafibrate,
Florfenicol, Ketoprofen,
Metformin, Nebivolol,
Oxycodone, Risperidone,
Sertraline, Tramadol,
Trimethoprim
Paracetamol
Hydrochlorothiazide,
Norfloxacin
Germany,
May 2018
Caffeine, Fenbendazole,
Fexofenadine,
Fluconazole, Ketoprofen,
Nebivolol, Ofloxacin,
Oxazepam, Oxycodone,
Risperidone, Telmisartan,
Tramadol, Trimethoprim,
Venlafaxine
Ciprofloxacin,
Metformin,
Paracetamol,
Xylometazoline
Estrone (E1),
Hydrochlorothiazide
Latvia,
June 2018
Bezafibrate, Cetirizine,
Citalopram, Fexofenadine,
Metformin,
Florfenicol, Ivermectin,
Nebivolol, Oxazepam,
Oxycodone, Progesterone,
Risperidone, Temazepam,
Trimethoprim, Valsartan,
Venlafaxine, Warfarin
Caffeine,
Fenbendazole,
Tiamulin,
Tramadol
Norfloxacin,
Paracetamol
Hydrochlorothiazide
Sweden
(SWE1),
June 2018
Bezafibrate, Bisoprolol,
Cetirizine. Fenbendazole,
Fexofenadine, Ketoprofen,
Metoprolol, Risperidone,
Temazepam, Tramadol,
Trimethoprim, Valsartan
Caffeine,
Metformin,
Paracetamol,
Norfloxacin
Sweden,
(SWE2),
June 2018
Bezafibrate, Bisoprolol,
Cetirizine, Fenbendazole,
Fexofenadine, Ketoprofen,
Metformin, Nebivolol,
Oxazepam, Risperidone,
Sertraline, Temazepam,
Tramadol, Trimethoprim,
Venlafaxine
Caffeine,
Paracetamol
Hydrochlorothiazide,
Ivermectin,
Norfloxacin
Veterinary medicines Florfenicol was quantified in three soil samples from Estonia (EST1 and EST2) and Latvia in
concentrations up to 0.19 g/kg d.w. The highest concentration was detected in a soil sample from
Latvia. Concentrations above LOQ of the two veterinary medicines were found in only one soil
sample each – ivermectin (11 g/kg d.w.) in sample SWE 2 from Sweden and tiamulin (4.9 g/kg
d.w.) in a sample from Latvia. Ivermectin concentration in soil exceeded the PNEC value up to 2700

160
times. Measurements of three other veterinary medicines – emamectin, toltrazuril, tylosin were
below LOQ in all samples. Findings of fenbendazole in all the soil samples can be expected due to
the wide use of this veterinary medication as an anthelmintic agent for cattle and domestic animals
– cats and dogs. It is unlikely that there will be a decrease of fenbendazole in the environment
because of a regular use of this medication in farms and households to treat animals from numerous
helminth intestinal parasites.
Caffeine Caffeine was quantified in four soil samples from Estonia (EST1), Germany, Latvia and Sweden
(SWE1) in concentrations up to 1.3 g/kg d.w. The highest concentration was observed in a soil
sample from Sweden (SWE1).
Conclusions
Both human and veterinary APIs were detected in all the soil samples collected in the CWPharma
project. We did not find a clear difference between the soils fertilized by manure or sludge. One
potential explanation is that the residues of human and/or veterinary APIs can result from previous
soil fertilization events. Pharmaceuticals can affect the organisms at relatively low concentrations.
Due to their persistence and low degradation, fluorinated antibiotics, hydrochlorothiazide,
metformin, trimethoprim and ketoprofen can be considered as a concern for the aquatic and
terrestrial environment.
Exceedance of PNECs were often observed for paracetamol and metformin. Single exceedances of
PNECs were observed for ciprofloxacin, ofloxacin, diclofenac, estrone and the veterinary medicine
ivermectin in soil. For some APIs the environmental risk cannot be excluded because their limits of
quantification were higher than the PNECs. Our results show that more research is needed on the
fate of APIs in soil after fertilization.
Soils fertilised by manure or sewage sludge were analysed for APIs. Photo: Helene Ek Henning, CAB.

161
Figure 7.14. API in soil in two study areas of Estonia; EST 1 and EST 2. API below detection limit are marked with ”*” for EST 1 and ”^” for EST 2.
2.3
6.615 17
4.5
0
20
40
60
80
100
120
/ kg
API in soil - Estonia
*EST 1 (October 2018)
^EST 2 (October 2018)
* * * *
0.1
5
*
0.6
5
* * *
0.46
*
0.30
* * *
0.97
0.26
0.92
*
0.09
4
* 0.01
8
* 0.04
5
0.0
79
0.04
4
*
0.0
93
1.0
0.06
3
* *^ ^ ^ 0.07
4
n.a
.
^ 0.01
8
0.06
5
^ ^ ^ ^0
.18
0.5
3
0.4
3
0.40
0.06
6 0.34
0.01
2
^
0.14
^ ^ ^
0.18
0.10
^ ^
0.51
0.02
8
^ ^0.0
0.2
0.4
0.6
0.8
1.0
1.2
1.4
1.6
1.8
2.0
Cipr
oflo
xaci
n
Flu
con
azo
le
No
rflo
xaci
n
Ofl
oxac
in
Trim
etho
pri
m
Hyd
roch
loro
thia
zide
Telm
isar
tan
Va
lsa
rtan
Ceti
rizi
ne
Fexo
fen
adin
e
Xylo
met
azo
line
Ca
ffe
ine
Estr
one
(E1)
Prog
este
ron
e
Bez
afib
rate
Met
form
in
Dic
lofe
nac
Keto
pro
fen
Oxy
cod
on
e
Pa
race
tam
ol
Tra
mad
ol
Bis
op
rolo
l
Me
topr
olo
l
Ne
biv
olo
l
War
fari
n
Cit
alo
pra
m
Oxa
zepa
m
Ris
per
ido
ne
Sert
ralin
e
Tem
azep
am
Ven
lafa
xin
e
Fen
bend
azol
e
Flor
fen
icol
Iver
mec
tin
Tiam
ulin
Antibiotics Anti-hypertensives
Asthma andallergy med.
Hormones Metabolicdisease
med.
NSAIDs and analgesics Other cardiovascularmedicines
Psychopharmaceuticals Veterinarymedicines
g

162
Figure 7.15. API in soil in study area of Germany; GER 1. API below detection limit are marked with ”*”.
4.7
32
7.216
3.1
0
20
40
60
80
100
120
/ kg
API in soil - Germany
*GER 1 (May 2018)
0.007 *
0.91
0.060
0.28
* * 0.018
1.0
* * *
0.69
0.067
1.4
0.80
* *0.11
* * 0.0650.21
* * 0.080
0.46
* * *0.00.20.40.60.81.01.21.41.61.82.0
Cip
rofl
oxa
cin
Fluc
onaz
ole
No
rflo
xaci
n
Ofl
oxac
in
Trim
etho
pri
m
Hyd
roch
loro
thia
zide
Telm
isar
tan
Val
sart
an
Ceti
rizi
ne
Fexo
fen
adin
e
Xylo
met
azo
line
Caff
eine
Est
ron
e (E
1)
Prog
este
ron
e
Be
zafib
rate
Me
tfo
rmin
Dic
lofe
nac
Keto
pro
fen
Oxy
codo
ne
Pa
race
tam
ol
Tram
ado
l
Bis
opr
olol
Me
topr
olo
l
Ne
biv
olo
l
War
fari
n
Cita
lopr
am
Oxa
zep
am
Ris
per
idon
e
Sert
ralin
e
Te
ma
zep
am
Ve
nla
faxi
ne
Fen
bend
azol
e
Flor
fen
icol
Iver
mec
tin
Tiam
ulin
Antibiotics Anti-hypertensives
Asthma andallergy med.
Hormones Metabolicdisease
med.
NSAIDs and analgesics Other cardiovascularmedicines
Psychopharmaceuticals Veterinarymedicines
g

163
Figure 7.16. API in soil in study area of Latvia; LAT 1. API below detection limit are marked with ”*”.
18
110
27
4.9
0
20
40
60
80
100
120
Cipr
oflo
xaci
n
Flu
cona
zole
No
rflo
xaci
n
Oflo
xaci
n
Trim
eth
opri
m
Hyd
roch
loro
thia
zide
Te
lmis
arta
n
Val
sart
an
Cet
iriz
ine
Fexo
fena
dine
Xylo
met
azol
ine
Ca
ffe
ine
Estr
one
(E1)
Pro
gest
ero
ne
Bez
afib
rate
Met
form
in
Dic
lofe
nac
Ket
op
rofe
n
Oxy
codo
ne
Para
ceta
mo
l
Tram
ado
l
Bis
opro
lol
Met
opr
olol
Ne
biv
olo
l
War
fari
n
Cita
lopr
am
Oxa
zep
am
Ris
peri
done
Sert
ralin
e
Tem
azep
am
Ven
lafa
xine
Fen
be
nd
azo
le
Flo
rfen
icol
Iver
mec
tin
Tiam
ulin
Antibiotics Anti-hypertensives
Asthma andallergy med.
Hormones Metabolicdisease
med.
NSAIDs and analgesics Other cardiovascularmedicines
Psychopharmaceuticals Veterinarymedicines
/kg
API in soil - Latvia
*LAT 1 (June 2018)
* * *
0.25
n.a.0.21
0.100.18
*
1.1
*
0.22 0.17
0.47
* *
0.45
1.5
0.0490.14
0.41
0.0480.19
0.42 0.40
*
0.360.20
1.7
0.19*
0.00.20.40.60.81.01.21.41.61.82.0
Cip
rofl
oxa
cin
Fluc
onaz
ole
Nor
flox
acin
Ofl
oxac
in
Trim
etho
pri
m
Hyd
roch
loro
thia
zide
Telm
isar
tan
Val
sart
an
Ceti
rizi
ne
Fexo
fen
adin
e
Xylo
met
azo
line
Caff
eine
Estr
on
e (E
1)
Pro
ge
ste
ron
e
Be
zafi
bra
te
Me
tfo
rmin
Dic
lofe
nac
Keto
pro
fen
Oxy
codo
ne
Pa
race
tam
ol
Tram
adol
Bis
opr
olol
Me
topr
olo
l
Neb
ivol
ol
War
fari
n
Cita
lopr
am
Oxa
zep
am
Ris
per
idon
e
Sert
ralin
e
Te
ma
zep
am
Ve
nla
faxi
ne
Fen
be
nd
azo
le
Flor
fen
icol
Iver
mec
tin
Tia
mu
lin
Antibiotics Anti-hypertensives
Asthma andallergy med.
Hormones Metabolicdisease
med.
NSAIDs and analgesics Other cardiovascularmedicines
Psychopharmaceuticals Veterinarymedicines
g
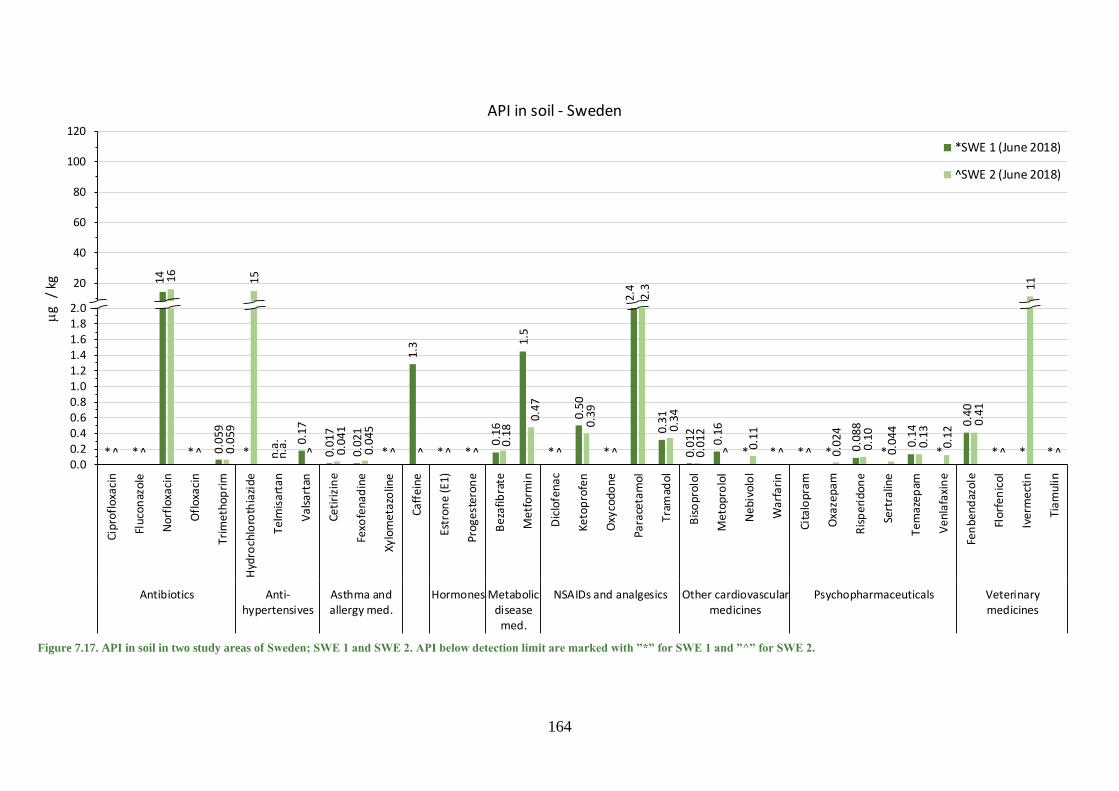
164
Figure 7.17. API in soil in two study areas of Sweden; SWE 1 and SWE 2. API below detection limit are marked with ”*” for SWE 1 and ”^” for SWE 2.
14
2.4
16 15
2.3 11
0
20
40
60
80
100
120
/ kg
API in soil - Sweden
*SWE 1 (June 2018)
^SWE 2 (June 2018)
* * * 0.05
9
* n.a. 0
.17
0.01
7
0.02
1
*
1.3
* *
0.1
6
1.5
*
0.5
0
*
0.31
0.0
12
0.16
* * * * 0.08
8
*
0.14
*
0.40
* * *^ ^ ^ 0.05
9
n.a.
^ 0.0
41
0.04
5
^ ^ ^ ^
0.18
0.4
7
^
0.39
^
0.34
0.0
12
^ 0.1
1
^ ^ 0.0
24
0.10
0.0
44
0.13
0.12
0.41
^ ^0.00.20.40.60.81.01.21.41.61.82.0
Cip
rofl
oxa
cin
Fluc
onaz
ole
Nor
flox
acin
Ofl
oxac
in
Trim
etho
pri
m
Hyd
roch
loro
thia
zide
Telm
isar
tan
Val
sart
an
Ceti
rizi
ne
Fexo
fen
adin
e
Xylo
met
azo
line
Caff
eine
Est
ron
e (
E1
)
Prog
este
ron
e
Be
zafi
bra
te
Me
tfo
rmin
Dic
lofe
nac
Keto
pro
fen
Oxy
codo
ne
Par
acet
amo
l
Tra
mad
ol
Bis
opr
olol
Me
topr
olo
l
Ne
biv
olo
l
War
fari
n
Cita
lopr
am
Oxa
zepa
m
Ris
per
idon
e
Sert
ralin
e
Te
ma
zep
am
Ve
nla
faxi
ne
Fen
be
nd
azo
le
Flor
fen
icol
Iver
mec
tin
Tia
mu
lin
Antibiotics Anti-hypertensives
Asthma andallergy med.
Hormones Metabolicdisease
med.
NSAIDs and analgesics Other cardiovascularmedicines
Psychopharmaceuticals Veterinarymedicines
g

165
References
Amorim C. L, Moreira I. S., Maia A. S., Tiritan M. E. and Castro P. M. L., 2014. Biodegradation of
ofloxacin, norfloxacin, and ciprofloxacin as single and mixed substrates by Labrys portucalensis
F11. Appl. Microbiol. Biotechnol. 98: 3181–3190.
Asimakopoulos A.G. and Kannan K., 2016. Neuropsychiatric pharmaceuticals and illicit drugs in
wastewater treatment plants: a review. Environ. Chem. 13 (4): 541-576.
https://doi.org/10.1071/EN15202
Eggen T. and Lillo C., 2012. Antidiabetic II Drug Metformin in Plants: Uptake and Translocation
to Edible Parts of Cereals, Oily Seeds, Beans, Tomato, Squash, Carrots, and Potatoes. J. Agric. Food
Chem. 60 (28): 6929-6935. https://doi.org/10.1021/jf301267c
Forrest J.A., Clements J.A., Prescott L.F., 1982. Clinical pharmacokinetics of paracetamol. Clin.
Pharmacokinet. 7 (2): 93-107.
Gumieniczek A., Galeza J., Mroczek T., Wojtanowski K., Lipska K., and Pietras R., 2018. Kinetics
and Characterization of Degradation Products of Dihydralazine and Hydrochlorothiazide in Binary
Mixture by HPLC-UV, LC-DAD and LC–MS Methods. Chromatographia. 81 (8): 1147–1162. doi:
10.1007/s10337-018-3555-8
Kasciuškevičiūtė S., Gumbrevičius G., Vendzelytė A., Ščiupokas A., Petrikonis K., Kaduševičius E., 2018. Impact of the World Health Organization Pain Treatment Guidelines and the European Medicines Agency Safety Recommendations on Nonsteroidal Anti-Inflammatory Drug Use in Lithuania: An Observational Study. Medicina 54(2), 30; https://doi.org/10.3390/medicina54020030
Kodešová R., Klement A., Golovko O., Féra M., Kočárek M., Nikodem A., Grabic R., 2019. Soil
influences on uptake and transfer of pharmaceuticals from sewage sludge amended soils to spinach.
J. Environ. Manage. 250: 109407. https://doi.org/10.1016/j.jenvman.2019.109407
Kusari S., Tatsimo S.J., Zühlke S., Talontsi F.M., Kouam S.F., Spiteller M., 2014. Tramadol – a
true natural product? Angew. Chem. Int. Ed. 53 (45): 12073-12076. doi: 10.1002/anie.201406639
Monteil H., Oturan N., Péchaud Y. and Oturan M.A., 2019. Efficient removal of diuretic
hydrochlorothiazide from water by electro-Fenton process using BDD anode: a kinetic and
degradation pathway study. Environ. Chem. 16 (8): 613-621. https://doi.org/10.1071/EN19121
O’Grady P., Yee K.F., Lins R., Mangold B., 1999. Fosinopril/hydrochlorothiazide: single dose and
steady-state pharmacokinetics and pharmacodynamics. Br. J. Clin. Pharmacol. 48: 375–381.
Straub J.O., 2013. An Environmental Risk Assessment for Human-Use Trimethoprim in European
Surface Waters. Antibiotics (Basel). 2 (1): 115–162. doi: 10.3390/antibiotics2010115
Straub J.O., Caldwell D.J., Davidson T., D'Aco V., Kappler K., Robinsone P.F., Simon-Hettich B.,
Tell J., 2019. Environmental risk assessment of metformin and its transformation product
guanylurea. I. Environmental fate. Chemosphere. 216: 844-854.
UNESCO and HELCOM, 2017. Pharmaceuticals in the aquatic environment of the Baltic Sea region
– A status report. UNESCO Emerging Pollutants in Water Series – No. 1, UNESCO Publishing,
Paris.

166
8 Linkage between API consumption and levels in WWTP influents
Materials and methods Country specific consumption data were used to predict the API load at the WWTP, which then was
compared with the measured API load based on sampling campaigns at 15 WWTPs in Estonia,
Finland, Germany, Latvia, Poland and Sweden. Within this chapter, we evaluated how well the
predicted load to the WWTP (based on the consumption data described in chapter 4) is in agreement
with the actual measured load (mload) at the WWTP influent based on the conducted sampling
campaigns (described in chapter 6). The predicted API load (pload, average API consumption per
capita) was calculated based on the following equation 1, using the averaged country specific
consumption data of the years 2015–2017, as described in chapter 4.
with
pload
= predicted specific API − load [mg
inh ∗ d]
mAPI = total quantity of consumed API [kg
a]
pop = population of specific Baltic Sea country [inh]
For validation of the predicted specific API load, the measured specific API load based on the
measured API concentration was calculated according to equation 2. According to chapter 6 the
dataset of the measured API concentration in the influent of the selected WWTPs was cleaned by
means of:
• data of samples, that were melted during delivery;
• interference for the specific API due to matrix effects.
with
mload = measured specific API − load [mg
inh ∗ d]
CAPI = API concentration measured at WWTP influent [ng
L]
Q = flow at WWTP at sampling day [L
d]
popWWTP
= real inhabitants connected to WWTP [𝑖𝑛ℎ]
To get a country specific measured API-load, the average for each API load and country was
calculated, based on the sampling campaign for each WWTP (three WWTPs per country, one
winter-sampling, one summer-sampling).
To evaluate if the measured and the predicted loads are in good argeement, the following criteria
were used:
• prediction too high: mload < 0.5 * pload
• prediction similar to measurement: 0.5 * pload ≤ mload ≤ 2 * pload
• prediction too low: mload > 2 * pload

167
Results and discussion The calculations of the predicted and measured API loads were performed for 22 of the 75 measured
APIs. The other 53 APIs were excluded in this evaluation as their consumption data were not
available in all countries or they were below LOQ at the monitored WWTPs. The selected 22 APIs
cover all API groups, except asthma medication. The determined API loads are summarized in the
following table 8.1.
Table 8.1. Compaison of predicted and measured API load for the 22 evaluated APIs
API Finland Sweden Germany Latvia Estonia
p-load m-load p-load m-loa
d p-load m-load p-load m-load p-load m-load
[mg/inh*d] [mg/inh*d] [mg/inh*d] [mg/inh*d] [mg/inh*d]
Carbamazepine 1.53 0.06 1.55 0.12 1.22 0.27 1.98 0.14 2.16 0.49
Citalopram 0.36 0.13 0.45 0.07 0.23 0.08 0.01 0.01 0.03 0.02
Codeine 0.82 0.91 0.45 0.21 0.02 0.08 0.08 0.02 0.31 0.45
Diclofenac 1.23 1.27 0.78 0.62 0.90 1.31 2.72 0.78 3.14 1.81
Erythromycin 0.02 0.06 0.15 0.20 0.49 1.07 0.06 0.06 0.00 2.67
Fluconazole 0.06 0.06 0.05 0.03 0.01 0.02 0.03 0.02 0.03 0.01
Gabapentin 4.10 5.61 4.12 10.88 2.77 2.81 2.99 1.63 1.66 1.77
Hydrochlorothiazide 1.03 1.19 0.15 1.36 1.80 1.21 0.37 0.69 0.55 1.99
Ketoprofen 0.19 0.08 0.50 0.13 0.01 0.02 0.12 0.08 0.47 0.27
Levetiracetam 3.38 2.77 2.33 1.85 4.20 3.17 0.37 0.28 0.58 0.55
Mesalacine 9.54 2.20 8.56 1.03 3.62 1.69 0.64 0.96 1.59 2.08
Metformin 74.57 39.23 31.81 22.54 54.02 30.83 40.70 9.42 47.47 15.30
Naproxen 3.86 1.15 6.05 1.69 0.57 0.19 1.06 0.21 3.95 1.21
Norethisterone 0.01 0.23 0.00 0.26 0.00 0.13 0.00 0.10 0.00 0.03
Oxazepam 0.27 0.44 0.00 0.08 0.01 0.02 0.03 0.01 0.00 0.02
Paracetamol 102.40 145.88 151.89 127.67 1.08 27.37 20.73 43.42 38.84 27.54
Sotalol 0.08 0.03 0.09 0.02 0.07 0.01 0.08 0.02 0.23 0.04
Sulfamethoxazole 0.19 0.04 0 0.04 0.56 0.05 1.43 0.07 0.85 0.07
Telmisartan 0.57 1.14 0.01 0.03 0.23 0.58 0.71 0.35 2.14 1.49
Tramadol 0.86 0.14 0.97 0.22 0.72 0.10 0.50 0.05 0.67 0.11
Trimethoprim 0.45 0.21 0.05 0.04 0.16 0.05 0.30 0.07 0.17 0.05
Venlafaxine 0.98 0.26 0.99 0.16 0.64 0.15 0.08 0.01 0.24 0.06
p-load: predicted API load based on consumption data, m-load: measured API load at WWTP influent
As an example, a detailed comparison of the measured and predicted load is presented for the four
selected APIs: carbamazepine, diclofenac, metformin, and paracetamol. APIs were selected due to
their consumption, removal in WWTPs, and occurrence in surface waters.
Carbamazepine is one of the most commonly used anti-epileptics and is also used off-label for
treatment of bipolar disorder. Carbamazepine is highly persistent and is usually not degraded in
WWTPs (Verlicchi et al. 2012). There is a lot of discussion about including carbamazepine in the
European Watch List (EU COM 2015/495). Sampling campaign within CWPharma detected
carbamazepine in inland and coastal waters in a range from < 0.005 ng/L to 920 ng/L with a median
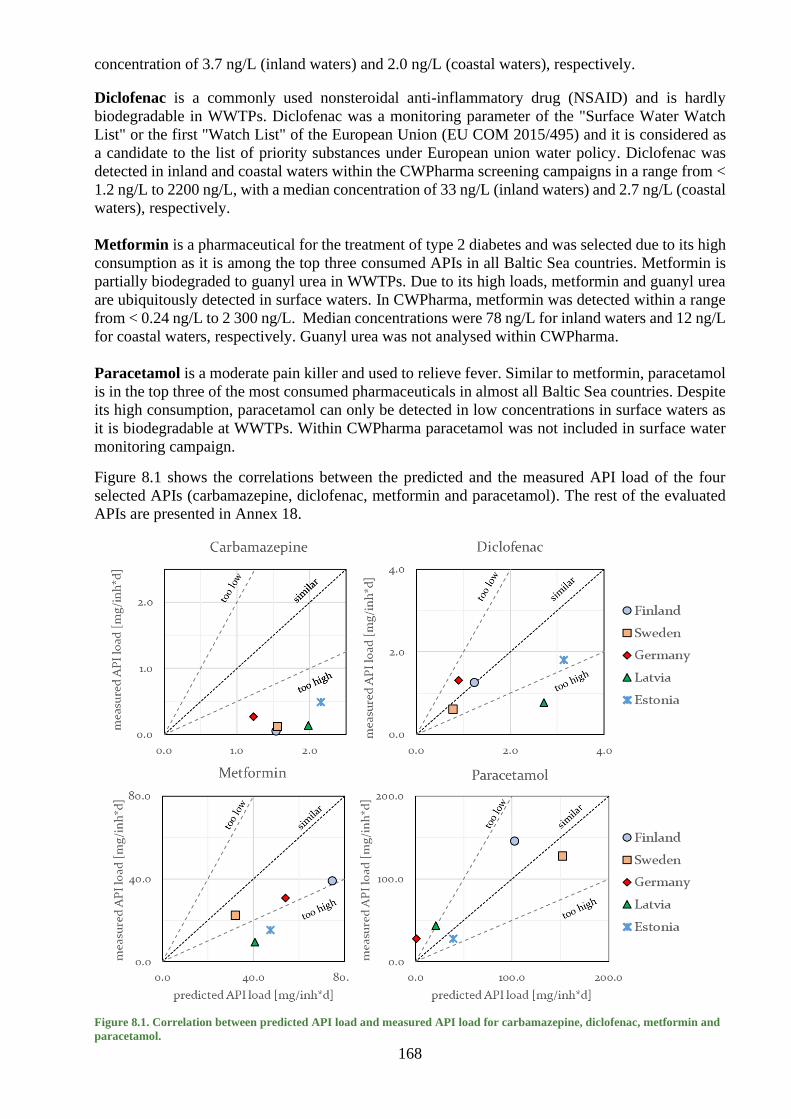
168
concentration of 3.7 ng/L (inland waters) and 2.0 ng/L (coastal waters), respectively.
Diclofenac is a commonly used nonsteroidal anti-inflammatory drug (NSAID) and is hardly
biodegradable in WWTPs. Diclofenac was a monitoring parameter of the "Surface Water Watch
List" or the first "Watch List" of the European Union (EU COM 2015/495) and it is considered as
a candidate to the list of priority substances under European union water policy. Diclofenac was
detected in inland and coastal waters within the CWPharma screening campaigns in a range from <
1.2 ng/L to 2200 ng/L, with a median concentration of 33 ng/L (inland waters) and 2.7 ng/L (coastal
waters), respectively.
Metformin is a pharmaceutical for the treatment of type 2 diabetes and was selected due to its high
consumption as it is among the top three consumed APIs in all Baltic Sea countries. Metformin is
partially biodegraded to guanyl urea in WWTPs. Due to its high loads, metformin and guanyl urea
are ubiquitously detected in surface waters. In CWPharma, metformin was detected within a range
from < 0.24 ng/L to 2 300 ng/L. Median concentrations were 78 ng/L for inland waters and 12 ng/L
for coastal waters, respectively. Guanyl urea was not analysed within CWPharma.
Paracetamol is a moderate pain killer and used to relieve fever. Similar to metformin, paracetamol
is in the top three of the most consumed pharmaceuticals in almost all Baltic Sea countries. Despite
its high consumption, paracetamol can only be detected in low concentrations in surface waters as
it is biodegradable at WWTPs. Within CWPharma paracetamol was not included in surface water
monitoring campaign.
Figure 8.1 shows the correlations between the predicted and the measured API load of the four
selected APIs (carbamazepine, diclofenac, metformin and paracetamol). The rest of the evaluated
APIs are presented in Annex 18.
Figure 8.1. Correlation between predicted API load and measured API load for carbamazepine, diclofenac, metformin and
paracetamol.

169
For carbamazepine, the predicted API load was always overestimated (prediction too high). A
possible explanation could be not considering pharmacokinetic mechanisms of action for
carbamazepine. Only 2–3% of the consumed carbamazepine is excreted by the human body in its
original form, whereas the rest is transformed into metabolites (e.g. carbamazepine-10,11 epoxide)
and thus, is not considered in this evaluation (gelbe-liste.de 2020). In the case of diclofenac,
predicted API load for Finland and Sweden is in a very good agreement with the measured API
load. Diclofenac load for Estonia and Germany is also in a good agreement, whereas for Latvia the
predicted load is too high. Even though less than 1% of the oral diclofenac intake is excreted as
unchanged (gelbe-liste.de 2020), pharmacokinetic mechanism of action is not expected to have a
similar impact on API load as it might have for carbamazepine, because a large fraction of diclofenac
is used within topical formulations (≥ 65% in Finland, see chapter 4) and can therefore be washed
off from the body as is. Prediction for metformin load was found to be in good agreement with the
measurements for Finland, Sweden and Germany, whereas prediction was too high for Latvia and
Estonia. Predicted API loads for paracetamol are in good agreement with the measured API loads,
except for Germany (prediction too low). 70% and 90% of the consumed metformin and
paracetamol, respectively, is excreted as is.
To evaluate whether pharmacokinetic mechanisms of action have an impact on the overall picture,
a simplified evaluation was performed for these four APIs by multiplying the predicted API-loads
with the factor of APIs leaving the human body as is: carbamazepine (2.5 %), diclofenac (65%,
assuming most of the topical applied diclofenac is washed off), metformin (70%), and paracetamol
(90%). All in all, agreement of predicted and measured API-load hardly changed based on the used
criteria and therefore a more detailed analysis was not conducted. However, it should be noted that
the correction of the API load prediction for carbamazepine resulted in a change from over- to an
underestimation for all countries and the absolute difference to the measured load was much lower.
Agreement of the measured and predicted API load of the 22 selected APIs is summarized in figure
8.2. 100% pharmacokinetic elimination was assumed for all evaluated APIs.
Figure 8.2: Agreement of predicted API load and measured API load based on all 22 evaluated APIs (table 8.3.1)
Finland Sweden Estonia Latvia Germany
prediction too high 10 9 9 13 9
prediction similar tomeasurement
10 8 9 7 7
prediction too low 2 5 4 2 6
0
5
10
15
20
25
nu
mb
er o
f A
PIs

170
The best agreement of the predicted and measured API load was found for Finland (45 % of all
APIs), followed by Estonia (41% of all APIs) and Sweden (36 % of all APIs), whereas worst
agreement was found for Germany and Latvia (32% of all APIs). In most cases API loads showed
an overestimation tendency for all countries. A possible explanation for this overestimation
tendency could be the quality of the used API consumption datasets. For Finland, Sweden, Latvia,
and Estonia, all prescriptions and privately sold APIs are recorded and included in the public
available datasets. In contrast, publicly available consumption data from Germany only include
prescribed pharmaceuticals from statutory health insurance (73.24 million customers) (GKV 2020).
Thus, pharmaceuticals that are sold over the counter or billed by private health insurance companies
(8.74 million customers) (PKV 2020), are not included within this dataset. In general, total amounts
of sold pharmaceuticals are provided in “defined daily dose” (DDD) per year for all countries within
CWPharma project, which results in additional uncertainties when converting it into kg API/year.
DDDs for the same API can differ for the drug’s route of administration, combination products and
formulations (e.g. for Diclofenac). This overestimation of the predicted API load might be attributed
to the following reasons:
• Not all sold or prescribed APIs have been consumed by the customer
• Regional differences in API consumption are not considered (e.g. demographics)
• Pharmacokinetic mechanisms of action are not considered in calculation.
Conclusions This study showed that the measured and predicted load are in good agreement for some APIs (e.g.
diclofenac and paracetamol) in most of the countries, whereas load prediction for other APIs (e.g.
carbamazepine) will result either in an over- or underestimation.
The best agreement of the predicted and measured API load for 22 APIs was found for Finland
(50% of all APIs), followed by Estonia (41% of all APIs) and Sweden (36 % of all APIs), whereas
worst agreement was found for Germany and Latvia (32% of all APIs). In most cases API loads
showed an overestimation tendency for all countries.
Country wise comparison of the predicted and measured API load provides a clear indication that
usage of high-quality consumption data (e.g. inclusion all sold APIs) result in a general better
agreement of the API loads. Taking into account other factors such as regional differences (e.g.
demographic) or pharmacokinetic mechanisms of action (e.g. metabolism) might also improve the
prediction of the API load. In addition, as measured API-loads are only based on two sample
campaigns in two different seasons, with only one to four WWTPs per country, the overall picture
might change with an increased database.
References
EU-COM (2015/495). DURCHFÜHRUNGSBESCHLUSS (EU) 2015/495 DER KOMMISSION
vom 20. März 2015 zur Erstellung einer Beobachtungsliste von Stoffen für eine unionsweite
Überwachung im Bereich der Wasserpolitik gemäß der Richtlinie 2008/105/EG des Europäischen
Parlaments und des Rates.
gelbe-liste.de (2020). "Carbamazepine." Retrieved 10.02.2020, 2020, from https://www.gelbe-
liste.de/wirkstoffe/Carbamazepin_967.
gelbe-liste.de (2020). "Diclofenac." Retrieved 10.02.2020, 2020, from
https://www.gelbe-liste.de/wirkstoffe/Diclofenac_277.
gelbe-liste.de (2020). "Metformin." Retrieved 10.02.2020, 2020, from
https://www.gelbe-liste.de/wirkstoffe/Metformin_21943.

171
gelbe-liste.de (2020). "Paracetamol." Retrieved 10.02.2020, 2020, from
https://www.gelbe-liste.de/wirkstoffe/Paracetamol_298.
GKV (2020). "Kennzahlen der gesetzlichen Krankenkasse." Retrieved 10.02.2020, 2020, from
https://www.gkv-
spitzenverband.de/gkv_spitzenverband/presse/zahlen_und_grafiken/zahlen_und_grafiken.jsp.
LANUV-NRW (2015). ECHO Stoffbericht -Metformin (Antidiabetikum)-, Landesamt für Natur,
Umwelt- und Verbraucherschutz Nordrhein-Westfalen
PKV (2020). "Zahlen und Fakten." Retrieved 10.02.2020, 2020, from
https://www.pkv.de/service/zahlen-und-fakten/.
Verlicchi, P., et al. (2012). "Occurrence of pharmaceutical compounds in urban wastewater:
removal, mass load and environmental risk after a secondary treatment-a review." Sci Total Environ
429: 123-155.

172
9 Environmental risk assessments of pharmaceuticals
Materials and methods
General
Environmental risk assessments of pharmaceuticals in the Baltic Sea Region were performed by
comparing measured environmental concentrations of 82 active pharmaceutical ingredients (APIs)
with calculated predicted no effect concentrations. For this purpose, we collected an extended
database on the ecotoxicity of the APIs. Sources of ecotoxicological endpoints were screened from
literature and databases. Additionally, we performed ecotoxicological tests on two APIs (nebivolol
and cetirizine) for which data were not available. Predicted no effect concentrations (PNECs) were
calculated based on collected data points, i.e. EC(LC)50-t9, NOEC-t10 and LOEC-t11. These values
were compared to the measured pharmaceuticals concentrations of the samples collected in the
CWPharma project case studies (Chapters 5-7).
Substance characteristics
Physico-chemical and biological information about the studied APIs is presented in Annex 19.
Information sources
Numerous information sources were used to generate a database on the ecotoxicity of the selected
APIs. These included in particular the databases and journals described in tables 9.1 and 9.2.
For the estimation of unknown properties of APIs (especially octanol-water partition coefficient)
EPI SUITE Software12 was used.
9 Median effect (lethal) concentrations 10 No observable effect concentration 11 Lowest observable effect concentration
12 https://www.epa.gov/tsca-screening-tools/epi-suitetm-estimation-program-interface
Table 9.1. Alphabetical list of databases used as a source of ecotoxicity endpoints.
Database Link
Agency for Toxic Substances and Disease
Registry database
http://www.atsdr.cdc.gov/toxprofiles/index.asp
Cal/Ecotox http://oehha.ca.gov/cal_ecotox/
Columbia Environmental Research Center
Acute Toxicity Database
http://www.cerc.usgs.gov/data/acute/acute.html
ECHA http://echa.europa.eu/search-for-chemicals
ECOTOX https://cfpub.epa.gov/ecotox/
EPA http://www.ipmcenters.org/ecotox/
FASS https://www.fass.se/LIF/startpage
PAN Pesticide Database http://www.pesticideinfo.org/Search_Ecotoxicity.jsp
TOXicology Data NETwork http://toxnet.nlm.nih.gov/
WikiPharma http://www.wikipharma.org/welcome.asp

173
Ecotoxicological testing
Ecotoxicological data were not found for nebivolol and cetirizine in the literature. Therefore,
ecotoxicological tests were carried out using three different trophic level bioindicators: bacteria,
algae, and crustaceans.
Bacterial bioluminescence test The purpose of this study was to determine the effects of cetirizine and nebivolol on the
bioluminescence of bacteria Aliivibrio fischeri (lyophilized luminescent marine bacteria, strain
NRRL-B 11177) using Microtox®500 system analysis (Strategic Diagnostic Ink, Newark, USA).
As the test system requires aqueous dilutions, solutions were prepared considering the internal
dilution of samples within the test.
Test conditions The study was conducted in a test room with temperature control and continuous lighting.
Incubation conditions were:
• Temperature in the test vessels: 15 ± 0.5°C,
• Temperature in Reagent Well vessel: 5.5 ± 1°C,
• Readings at times: 5, 15 and 30 minutes after sample introduction to the vessel with bacteria
• Number of replications: 2
• Number of dilutions: 5
• Dilution factor: q = 2
• Test procedure: 81.9% Basic test procedure
The bacteria preparation The bacteria used in the test were preincubated in Reconstitution Solution for about 15 minutes to
revive. Then dilutions of bacteria were made and incubated about 15–25 minutes before sample
introduction.
Test item preparation In the test procedure, the introduced sample was diluted to 81.9% of the original concentration.
Therefore, it was necessary to prepare the input concentration 18.1% higher than the wanted test
concentration (to finally have the maximum concentration of 5 mg/L for nebivolol hydrochloride
Table 9.2. Alphabetical list of science paper repositories used as a source of ecotoxicity endpoints.
Journal repository Link
ACS Publications http://pubs.acs.org/
Directory of Open Access Journals https://doaj.org/
EBSCO Information Services https://www.ebscohost.com/title-lists
Google Scholar https://scholar.google.com/
Ingenta Connect http://www.ingentaconnect.com/
Knovel Engineering Data and Technical References https://app.knovel.com/web/index.v
PubMed http://www.ncbi.nlm.nih.gov/pubmed/
ScienceDirect http://www.sciencedirect.com/
Scopus Preview https://www.scopus.com/
SpringerLink http://link.springer.com
Taylor & Francis Online http://www.tandfonline.com/
The Royal Society of Chemistry’s Journals, Books and
Databases
http://pubs.rsc.org/
Web of Science http://webofscience.com/
Wiley Online Library http://onlinelibrary.wiley.com

174
and 100 mg/L for cetirizine hydrochloride in the test). The highest concentration was prepared using
redistilled water. Then the sample was brought to the appropriate osmotic pressure with Osmotic
Adjusting Solution and next the geometric series of dilution were prepared using the Diluent
Solution according to the manufacturer’s test procedure. The tests were performed in five
concentrations:
Nebivolol hydrochloride: 5.000, 2.500, 1.250, 0.625 and 0.313 mg/L
Cetirizine hydrochloride: 100.00, 50.00, 25.00, 12.50 and 6.25 mg/L
Measurements The reaction of the bacteria on the test items was measured after 5, 15 and 30 minutes incubation in
temperature +15°C. The Diluent was used as a negative control. The results were expressed as the
percentage of bioluminescence inhibition 5, 15 and 30 minutes after sample introduction.
Additionally, the EC- 10, EC- 20, EC- 50 effects and Toxicity Unit values were calculated. The
analysis of the results was done using Microtox® Omni software.
Algal growth inhibition test The purpose of this test was to determine the effects of cetirizine and nebivolol on the growth of
algae Pseudokirchneriella subcapitata according to OECD 201. OECD medium was used as a test
medium. Toxic effects were assessed based on changes in the algae yield and growth rate under
the test conditions.
Test conditions The test was carried out in a room with controlled temperature and lighting. The test conditions
were in agreement with the OECD 201 requirements:
• Temperature in test vessels: within 23.4–23.8 ºC and did not change more than ± 2ºC during
the test.
• Medium pH: for cetirizine pH at the test initiation day was 8.12 and ranged from 7.73 to
7.83 in tested concentrations. At the end of the test pH in controls ranged from 8.13 to 8.81
and 7.83 to 8.52 in the test item solutions. The pH of medium and tested concentration did
not vary by more than 1.5 units during the test. For nebivolol pH at the test initiation day
was 8.12 and ranged from 7.81 to 7.88 in tested concentrations. At the end of the test pH in
controls ranged from 8.13 to 8.81 and 7.87 to 8.24 in the test item solutions. The pH of
medium and tested concentration did not vary by more than 1.5 units during the test.
• Lighting: continuous, cool fluorescent light, with the intensity of 7650-8480 lux for
cetirizine and 7820-8640 lux for nebivolol was used. Maximal difference in lighting
measured daily did not exceed recommended value of 15%
• Continuous shaking on orbital shaker at 100–150 rpm
• Test duration: 72 hours.
The test vessels were closed with sterile cellulose plugs, to limit evaporation and avoid cross
contamination but allowing gas exchange and incubated under the conditions described above. The
test was carried out in sterile 250-mL Erlenmayer flasks, made from class 3.3 borosilicate glass.
The pre-culture of algae inoculum in the test medium was prepared 2–4 days before the start of the
test, in order to ensure the algae were in an exponential growth phase.
Algal cell density in pre-culture inoculum was counted at the beginning of the test. The initial
volume of inoculum introduced into test vessels was calculated based on the cell density, to reach
the recommended initial number of algal cells in every flask (5 000–10 000 cells/mL). Algal culture
suspension was introduced into the test item solutions in all test vessels. In the same way control
vessels (without any test item addition) were prepared containing only OECD test medium.
Additional test vessel containing only the OECD medium to measure the temperature during the
test was prepared and incubated in parallel with other vessels.
175
The test was carried out under static conditions due to the expected stability of the test substances
in aqueous solutions.
Test item preparation
The test was carried out with five nominal concentrations of the test material:
Cetirizine: 100.0, 40.0, 16.0, 6.4, 2.6 and 1.0 mg/L
Nebivolol: 6.0, 2.4, 0.96, 0.38, 0.15 and 0.06 mg/L
Measurements The test was conducted in three replicates per each test item concentration and six replicates for
negative control. Each test vessel contained the same volume of solution (100 mL).
Pseudokirchneriella subcapitata inoculum was introduced into each vessel. Test vessels were
randomly put on orbital shakers and the position of each vessel was randomly changed daily to
reduce possible unequal lighting conditions.
A calibration curve was prepared to determine the relationship between the fluorescence of the algae
suspension and the number of algae cells. The fluorescence measurement was carried out using the
microplate reader BMG Clariostar with the following working parameters:
• time of shaking of microplates: 15 s,
• length of the excitation beam: 410 nm with a band width of about 40 nm,
• length of the emitted light 670 nm, band width 25 nm,
• orbital averaging.
Algal number was measured in each test vessel indirectly by measuring the fluorescence of the test
solutions after 24, 48 and 72 hours. On the experimental termination day additional microscopic
observation was carried out to verify any abnormal appearance of algae cells at each tested
concentration. In addition, the pH of the test and control solutions was determined at the beginning
and the end of the test. The intensity of light was also measured daily at five points on the surface
where the test vessels were placed and the temperature in the additional control vessel was recorded.
ToxRat Profesional software (version 3.2.1) was used for calculating the endpoints and analysing
biological data.
Daphnia magna immobilization test
The aim of the study was an assessment of acute toxicity of cetirizine and nebivolol to Daphnia
magna, according to OECD test guideline 202. A standard Elendt M4 medium was used as a test
medium. Toxic effects were evaluated based on the immobilisation of the test organisms. The study
was conducted in a test room with controlled temperature and lighting.
Test conditions Incubation conditions were the following for cetirizine and nebivolol:
• Temperature in the test vessels was 21.7-22.0 °C during the 48 h test,
• Medium pH 7.36 used for preparation of the test solutions, the pH values at the end of the
test were 7.47 – 7.55 (controls) and 7.41 – 7.62 (the highest concentration).
• Medium hardness: 242.35 mg/L (as CaCO3),
• Lighting: no light,
• Oxygen: the dissolved oxygen concentration at the beginning of test was 5.58 mg O2/L in
control and test vessels, after 48 hours, the oxygen concentration in the test vessels was on
average 4.81 mg O2/L (control), and 4.55 mg O2/L (the highest concentration).
• Test duration: 48 hours.

176
The test vessels were loosely covered with a pane of glass to limit evaporation and external
contamination and were incubated in accordance with the conditions described above.
The test vessels were not aerated and the daphnids were not fed during the test. Test was performed
in clean 50-mL beakers (borosilicate 3.3.).
One day before the beginning of the exposure, the adult female daphnids (after first brood) were
isolated and transferred to fresh Elendt M4 medium. Young daphnids, aged less than 24 hours at the
start of the test, were used. The neonates used in the test came from healthy parent organisms.
Test item preparation The test was performed using the following concentrations:
Cetirizine: 100, 40, 16, 6.4 and 2.6 mg/L
Nebivolol: 3, 1.5, 0.75, 0.36 and 0.19 mg/L
The test solutions were prepared in Elendt M4 medium.
Measurements Four replicates were used for the test item concentration and for the control. Control vessels
contained the same nutrient medium and number of daphnids as the test vessels but without the test
substance. Each test vessel contained the same volume of solution, approximately 40 mL, and the
same number of daphnids (five for one vessel). In total 20 daphnids were used for single test item
concentration as well as for the controls (4 vessels x 5 daphnids). Neonates of Daphnia magna were
randomly placed into the test vessels. Additional test vessel containing only the Elendt M4 medium
was prepared for temperature measurements and incubated in parallel with other vessels.
The number of the immobilised daphnids was counted, and the medium temperature was measured,
in the beginning of the test and after 24 and 48 hours of exposure.
Before starting the test, the hardness of the test medium was measured.
The pH and the dissolved oxygen content of the test solutions and control samples were measured
in the beginning and at the end of the experiment. The illumination intensity was measured on the
experiment starting day at the five points of the surface on which the test vessels were placed.
ToxRat Professional (version 3.2.1) software was used to analyse the data from the study.
Risk assessment methodology
To assess environmental risk caused by APIs in the Baltic Sea region, the risk quotient (RQ)
approach was used. Measured environmental concentrations (MEC) were compared with the
PNECs derived from the ecotoxicological studies.
1. 𝑅𝑄 =𝑀𝐸𝐶
𝑃𝑁𝐸𝐶
When RQ is equal or above 1 (that means the concentration in the environment exceeds the safe
concentration for biota) unacceptable risk is identified.
Determination of PNECwater PNECs for water were derived from the ecotoxicity data in the literature and produced within the
project. Depending on quality and quantity of ecotoxicological endpoints, an assessment factor (AF)
method or species sensitivity distributions (SSD) approach were used.
Assessment factors When limited amount of ecotoxicity data points (less than 8) was available, the PNECwater was
defined as:
2. 𝑃𝑁𝐸𝐶𝑤𝑎𝑡𝑒𝑟 =𝑙𝑜𝑤𝑒𝑠𝑡 𝐸𝐶(𝐿𝐶)50
𝐴𝐹

177
Assessment factors (AFs) vary depending on the type (acute/chronic) and number of the available
test results. The assessment factors and their criteria are presented in Table 9.3.
Species sensitivity distributions When eight or more data points were available for an API, species sensitivity distribution (SSD)
approach was used. The idea of the SSD was proposed nearly four decades ago as an
ecotoxicological tool that is useful for the derivation of environmental quality criteria and ecological
risk assessment (Posthuma at al. 2001). SSD method assumes that results of ecotoxicity tests
(usually chronic endpoints line NOEC) are subjected to statistical distribution. Different types of
distribution are assigned a priori including e.g. log-normal, Weibull and log-logistic. SSD is
therefore a statistical distribution describing the variation in the toxicity of a certain compound or
mixture among a set of species. For such constructed distribution value of 5th percentile is
calculated. This value corresponds to hazardous concentration for 5% (HC5) of species in the
ecosystem. Two approaches might then be applied to convert HC5 into PNEC value. First one is the
use of arbitrary set assessment factor ranging from 1 to 10. Second one, slightly more conservative
(that additionally take into account variability of input SSD data) is to use lower 95% confidence
interval (LCL) of HC5 as an estimate of real PNEC value. When estimating the PNECs with the
SSD method, using the LCL approach, a highly variable data set will result in a relatively
conservative PNEC. Hence, the PNECs derived from the LCL approach may lead to overestimation
of the environmental risk, especially in case of large and diverse (i.e. with high range) data set.
Chronic data were used to derive SSD for all APIs of interests under CWPharma project. If only
acute data were available, they were transformed into chronic data based on an acute-to-chronic
ratios (ACR) approach. Analysis of ACR is an important tool to derive acceptable no-effect levels
and to re-evaluate and support current risk assessment approaches. The acute endpoints were
converted into chronic ones with the following equation:
3. 𝑁𝑂𝐸𝐶 =LC(EC)50
ACR
Numerous values are assigned as ACR depending on the class of chemicals and their mode of action,
but factor of 10 is the most often used and was used for transforming acute endpoint into chronic
one.
PNECwater was defined as:
4. 𝑃𝑁𝐸𝐶𝑤𝑎𝑡𝑒𝑟 = 𝐿𝐶𝐿(𝐻𝐶5),
where LCL(HC5) is the lower confidence interval (LCL) of hazardous concentration for 5% of
species (HC5).
Table 9.3. Assessment factors used to derive PNEC.
Available data Assessment factor
Up to 8 acute test results AF=1000
Up to 2 chronic test results AF=100
At least 3 chronic test results, from 3 trophic levels AF=10
178
Hazardous concentrations (HC5) were calculated based on chronic endpoints using ssdtool13
package for language and environment for the statistical computing and graphics software R14.
Seven different distributions were fitted to data points (i.e. log-normal, log-logistic, log-Gumbel,
Gompertz, gamma, Weibull and Pareto). Based on Akaike’s Information Criterion corrected for
sample size, the best fit distribution was selected. Confidence intervals were calculated using
bootstrap methods with n=500 subsamples.
Determination of PNECsediment and PNECsoil Calculated PNECwater were used to estimate analogous values for soil and sediment compartments.
Recalculation was done based on a method for risk assessment for organic chemicals (European
Centre for Ecotoxicology and Toxicology of Chemicals, 2004) using the following equations:
1. 𝑃𝑁𝐸𝐶𝑠𝑒𝑑𝑖𝑚𝑒𝑛𝑡 = 𝑃𝑁𝐸𝐶𝑤𝑎𝑡𝑒𝑟 ∗ (0.783 + 0.0217 ∗ 𝐾𝑜𝑐),
2. where Koc is the organic-carbon partition coefficient, and𝑃𝑁𝐸𝐶𝑠𝑜𝑖𝑙 =𝐾𝑜𝑐∗𝑃𝑁𝐸𝐶𝑤𝑎𝑡𝑒𝑟
85,
where 85 is the conversion factor taking into account normalized fraction of organic carbon in soil
(0.02) and the bulk density of wet soil (1700 kg/m3).
When available, the experimental Koc values of the APIs were applied directly (or a geometric mean
if more than one Koc value was reported). If an experimental Koc was not available, EU TGD QSAR
with the following equations was used to predict the Koc value:
• For hydrophilic substances (i.e. log Kow<3)
3. 𝑙𝑜𝑔𝐾𝑂𝐶 = 0.52𝑙𝑜𝑔𝐾𝑂𝑊 + 1.02
• For hydrophobic substances (i.e. log Kow≥3)
4. 𝑙𝑜𝑔𝐾𝑂𝐶 = 0.81𝑙𝑜𝑔𝐾𝑂𝑊 + 0.1
The octanol-water and octanol-carbon partition coefficients that were applied in the PNEC
calculations are presented in Table 9.4
13 https://cran.r-project.org/web/packages/ssdtools/index.html 14 RStudio Team (2019). RStudio: Integrated Development for R. RStudio, Inc., Boston, MA URL
http://www.rstudio.com/.

179
Table 9.4. Octanol-water and octanol-carbon partition coefficients used for PNECsoil and PNECsediment calculations.
Substance API group logKow logKoc
Ciprofloxacin Antibiotics 0.28 4.78*)
Clarithromycin 3.16 2.66
Doxycycline -0.02 1.01
Erythromycin 3.06 2.79*)
Fluconazole 0.58 4.72*)
Lincomycin 0.56 1.31
Norfloxacin 0.46 4.79*)
Ofloxacin -0.39 3.31*)
Sulfadiazine -0.09 0.97
Sulfamethoxazole 0.84 1.88*)
Tetracycline -1.37 0.31
Trimethoprim 1.08 1.88*)
Carbamazepine Antiepileptics 2.45 2.51*)
Gabapentin -1.10 0.45
Levetiracetam -0.60 0.71
Primidone 0.86 1.47
Amlodipine Antihypertensives 3.00 2.53
Candesartan 6.10 5.04
Enalapril 0.07 1.06
Eprosartan 3.90 3.26
Hydrochlorothiazide -0.07 1.08*)
Irbesartan 6.00 4.96
Losartan 6.10 5.04
Ramipril 2.90 2.53
Telmisartan 6.77 2.20*)
Valsartan 3.07 2.40*)
Cetirizine Asthma and allergy medications 2.80 2.30*)
Fexofenadine 2.60 3.64*)
Fluticasone 2.69 2.42
Mometasone 2.10 2.11
Xylometazoline 3.84 4.83*)
Esomeprazole Gastrointestinal disease medications 0.60 1.33
Mesalazine 1.20 1.64
Omeprazole 2.08 2.10
Pantoprazole 2.11 2.12
17-α-ethinyl estradiol (EE2) Hormones 4.15 3.68*)
17-β-estradiol (E2) 3.40 3.52*)
Estriol (E3) 2.45 2.29
Estrone (E1) 3.13 3.04*)
Norethisterone 2.97 2.56
Progesterone 3.87 3.45*)
Testosterone 3.32 2.79
α-Estradiol 3.99 3.33
Allopurinol Metabolic disease medications -0.55 0.73
Atorvastatin 5.70 4.72

180
Substance API group logKow logKoc
Bezafibrate 4.25 2.06*)
Gemfibrozil 3.40 2.85
Metformin -1.37 1.28*)
Simvastatin 4.68 3.89
Acetylsalicylic acid NSAIDs and analgesics 1.28 1.69
Codeine 1.19 1.64
Diclofenac 4.51 2.34*)
Ibuprofen 3.97 3.32
Ketoprofen 3.12 2.45*)
Naproxen 3.18 2.45*)
Oxycodone 0.70 1.38
Paracetamol 0.46 1.32*)
Tramadol 2.07 2.79*)
Caffeine Other -0.07 2.87*)
Atenolol Other cardiovascular medicines 0.02 1.70*)
Bisoprolol 1.87 2.15*)
Dipyridamole 1.50 1.80
Furosemide 2.03 2.08
Metoprolol 1.88 1.78*)
Nebivolol 2.80 2.65*)
Sotalol 0.24 1.14
Warfarin 2.61 1.48*)
Citalopram Psychopharmaceuticals 3.50 2.96*)
Quetiapine 0.50 1.28
Olanzapine 2.90 2.53
Oxazepam 2.24 2.18
Risperidone 3.49 3.22*)
Sertraline 5.10 4.17*)
Temazepam 2.19 2.85
Venlafaxine 2.71 2.28*)
Carprofen Veterinary medicines 3.80 3.18
Emamectin benzoate 5.00 4.15
Fenbendazole 2.30 4.73*)
Florfenicol 0.36 1.26*)
Ivermectin 5.83 4.15*)
Tiamulin hydrogen fumarate 4.73 4.56*)
Toltrazuril 4.40 3.66
Tylosin 1.84 1.98 *) indicates experimental Koc used for PNECsediment and PNECsoil calculations
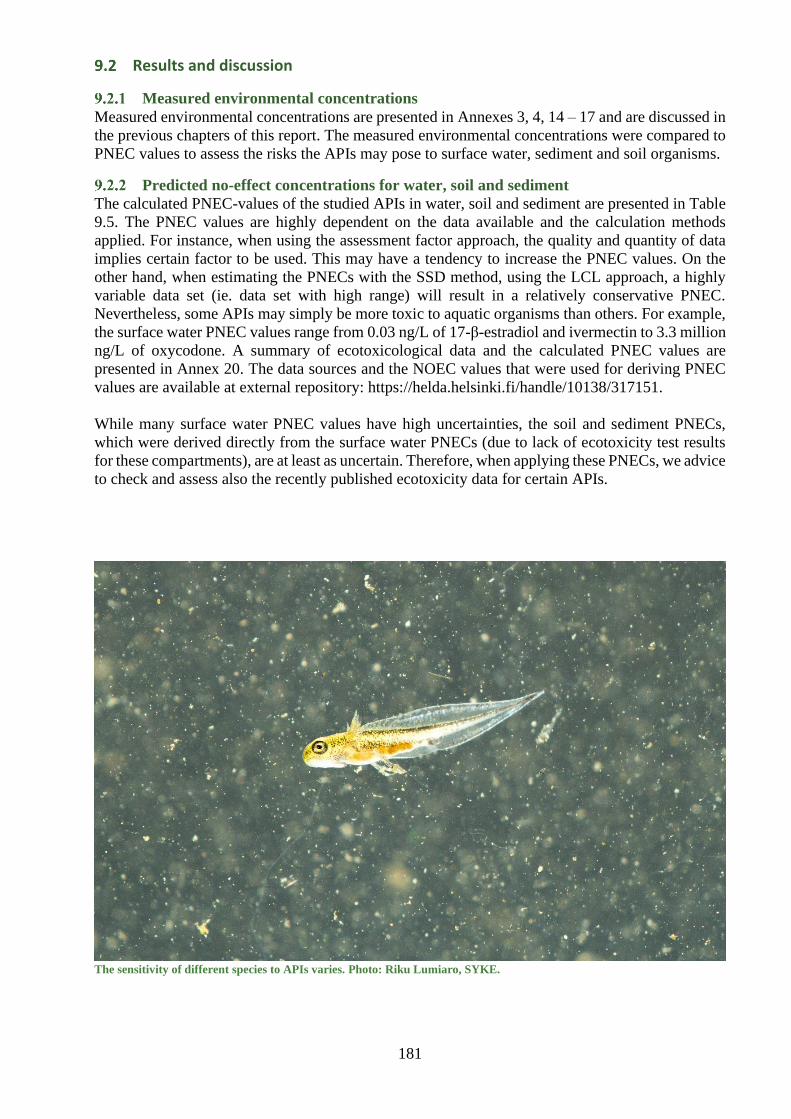
181
Results and discussion
Measured environmental concentrations
Measured environmental concentrations are presented in Annexes 3, 4, 14 – 17 and are discussed in
the previous chapters of this report. The measured environmental concentrations were compared to
PNEC values to assess the risks the APIs may pose to surface water, sediment and soil organisms.
Predicted no-effect concentrations for water, soil and sediment
The calculated PNEC-values of the studied APIs in water, soil and sediment are presented in Table
9.5. The PNEC values are highly dependent on the data available and the calculation methods
applied. For instance, when using the assessment factor approach, the quality and quantity of data
implies certain factor to be used. This may have a tendency to increase the PNEC values. On the
other hand, when estimating the PNECs with the SSD method, using the LCL approach, a highly
variable data set (ie. data set with high range) will result in a relatively conservative PNEC.
Nevertheless, some APIs may simply be more toxic to aquatic organisms than others. For example,
the surface water PNEC values range from 0.03 ng/L of 17-β-estradiol and ivermectin to 3.3 million
ng/L of oxycodone. A summary of ecotoxicological data and the calculated PNEC values are
presented in Annex 20. The data sources and the NOEC values that were used for deriving PNEC
values are available at external repository: https://helda.helsinki.fi/handle/10138/317151.
While many surface water PNEC values have high uncertainties, the soil and sediment PNECs,
which were derived directly from the surface water PNECs (due to lack of ecotoxicity test results
for these compartments), are at least as uncertain. Therefore, when applying these PNECs, we advice
to check and assess also the recently published ecotoxicity data for certain APIs.
The sensitivity of different species to APIs varies. Photo: Riku Lumiaro, SYKE.

182
Table 9.5. Predicted No Effect Concentrations for active pharmaceutical ingredients.
Substance API group Method for
deriving
PNEC
PNEC water
ng/L
PNEC sediment
g/kg dw
PNEC soil
g/kg dw
Ciprofloxacin Antibiotics SSD 5.1 6.66 3.61
Clarithromycin SSD 3.9 0.41 0.021
Doxycycline AF=1000 36.9 0.037 0.0044
Erythromycin SSD 83.5 1.18 0.61
Fluconazole SSD 15 000 17 300 9 350
Lincomycin SSD 1 290 1.58 0.31
Norfloxacin SSD 481 637 345
Ofloxacin SSD 20.4 0.93 0.49
Sulfadiazine AF=1000 135 0.13 0.015
Sulfamethoxazole SSD 43.8 0.11 0.039
Tetracycline SSD 1 730 1.43 0.042
Trimethoprim SSD 508 000 1 220 448
Carbamazepine Antiepileptics SSD 1 280 10 4.9
Gabapentin AF=1000 100 000 84.4 3.3
Levetiracetam AF=1000 100 000 89.4 6
Primidone AF=1000 100 000 142 34.4
Amlodipine Antihyper-
tensives
SSD 99.5 0.81 0.397
Candesartan AF=1000 421 1000 544
Enalapril AF=1000 44 700 46.1 5.99
Eprosartan AF=1000 100 000 4020 2 140
Hydrochloro-
thiazide
AF=10 1 000 000 1040 141
Irbesartan AF=1000 100 000 198 000 107 000
Losartan AF=100 7 800 18 600 10 100
Ramipril AF=1000 100 000 810 397
Telmisartan AF=1000 9 880 41.4 18.2
Valsartan AF=100 125 000 776 368
Cetirizine Asthma and
allergy
medications
AF=1000 78 600 403 185
Fexofenadine AF=1000 200 000 19 000 10 200
Fluticasone AF=1000 550 3.56 1.7
Mometasone AF=100 14 0.05 0.021
Xylometazoline AF=1000 2 030 2 970 1 610
Esomeprazole Gastrointestinal
disease
medications
AF=10 100 000 125 25.3
Mesalazine AF=100 911 000 1584 472
Omeprazole AF=1000 1 760 6.2 2.62
Pantoprazole AF=1000 48 000 174 74.2
17-α-ethinyl
estradiol (EE2)
Hormones SSD 0.41 0.043 0.023
17-β-estradiol (E2) SSD 0.03 0.0023 0.0013
Estriol (E3) AF=100 0.75 0.0038 0.0017
Estrone (E1) AF=100 0.008 0.0002 0.0001
Norethisterone AF=10 0.50 0.0044 0.0022
Progesterone AF=50 2 000 123 65.9
Testosterone AF=100 1 500 21.2 10.9

183
Substance API group Method for
deriving
PNEC
PNEC water
ng/L
PNEC sediment
g/kg dw
PNEC soil
g/kg dw
α-Estradiol SSD 0.85 0.04 0.021
Allopurinol Metabolic
disease
medications
AF=1000 100 000 90 6.38
Atorvastatin SSD 2 100 2 380 1 290
Bezafibrate SSD 1 260 4.13 1.7
Gemfibrozil SSD 825 13.4 6.94
Metformin AF=1000 1 350 1.61 0.30
Simvastatin AF=1000 22 800 3 870 20 90
Acetylsalicylic-
acid
NSAIDs and
analgesics
SSD 142 000 261 81.2
Codeine AF=1000 16 000 27.6 8.19
Diclofenac SSD 85.2 0.47 0.22
Ibuprofen SSD 0.12 0.0054 0.0029
Ketoprofen AF=1000 2 000 13.9 6.68
Naproxen SSD 4 980 34.3 16.5
Oxycodone AF=1 000 3 300 000 4 320 941
Paracetamol SSD 1 020 1.26 0.25
Tramadol AF=1000 170 000 2 410 1 230
Caffeine Other AF=1000 87 000 1 470 758
Atenolol Other
cardiovascular
medicines
SSD 194 000 363 115
Bisoprolol AF=1000 8 000 30.6 13.2
Dipyridamole AF=1000 2 360 5.08 1.75
Furosemide SSD 15 900 53.5 22.3
Metoprolol SSD 4 380 9.16 3.11
Nebivolol AF=1000 377 3.96 1.99
Sotalol AF=1000 300 000 326 49.3
Warfarin SSD 67 600 97.7 24.3
Citalopram Psychopharmac
euticals
SSD 15 400 317 165
Quetiapine AF=1000 10 000 12 2.24
Olanzapine SSD 1 200 9.76 4.78
Oxazepam AF=100 810 3.32 1.46
Risperidone AF=1000 5 800 216 114
Sertraline SSD 1 070 344 186
Temazepam AF=100 930 15 7.74
Venlafaxine AF=1000 3 220 15.8 7.2
Carprofen Veterinary
medicines
AF=1000 37 300 1 250 660
Emamectin
benzoate
AF=1000 1 0.31 0.17
Fenbendazole AF=100 15 17.5 9.48
Florfenicol SSD 40 900 48.3 8.84
Ivermectin AF=1000 0.03 0.0077 0.0041
Tiamulin
hydrogen
fumarate
AF=1000 165 129 69.9
Toltrazuril AF=1000 440 44.4 23.9
Tylosin AF=1000 34 0.097 0.038

184
Risk quotients
Risk quotients were calculated for each sampling point, each API and each environmental
compartment (water, sediment and soil). Risk quotients (RQs) for the substances for which
unacceptable risk was identified in at least one sample are presented in Annex 21.
The APIs for which the concentration in inland surface water, coastal water, sediment or soil
samples exceeded the PNEC in at least one sample are listed in Tables 9.6–9.11. To summarize,
exceedances of the PNECs were identified for:
Antibiotics
• Clarithromycin in inland surface waters, coastal waters and sediments.
• Ofloxacin in inland surface waters, sediments and soils.
• Tetracycline and doxycycline (sum) in one inland surface water sample and in sediments.
• Ciprofloxacin in sediments and soils.
Hormones
• Estrone in inland surface waters, coastal waters, sediments and soils.
• Norethisterone in inland surface waters, coastal waters and sediments.
NSAID and analgesics
• Diclofenac in inland surface waters, sediments and soils.
• Paracetamol in sediments and soils.
Veterinary medicines
• Emamectin in inland surface waters, coastal waters and sediments.
• Ivermectin in soils.
Metabolic disease medication
• Metformin in an inland surface water sample and in sediments and soils.
Asthma and allergy medications
• Mometasone in an inland surface water sample.
For some APIs, the limit of quantification (LOQ) was higher than the PNEC, and therefore also
some non-detects may have been above PNEC (e.g. estrone in waters, sediment and soil). In addition
to the listed APIs, the PNEC may have been exceeded for the following APIs, which were not
detected in the samples but for which the LOQ was higher than the PNEC:
• Antibiotic ciprofloxacin in coastal waters and in surface waters near fish farms.
• Antibiotics erythromycin and sulfamethoxazole, hormone estriol, veterinary medicines
ivermectin and tylosin, and asthma and allergy medicine mometasone in sediments.
• Antibiotics clarithromycin, erythromycin, doxycycline and sulfamethoxazole, veterinary
medicines emamectin and tylosin, hormones estriol and norethisterone and allergy medicine
mometasone in soils.
Another API that may pose an environmental risk is ibuprofen. Ibuprofen was not analysed in
surface waters, but it was identified to have a very low PNEC (0.12 ng/L). Ibuprofen was detected
in 40% of wastewater effluent samples with concentrations ranging from 3.7 to 44 µg/L. These
effluents would require very high dilution not to exceed the PNEC in the receiving waterbody.
Therefore, it is very probable that ibuprofen exceeds its PNEC value in inland surface waters.

185
Table 9.6. APIs exceeding the PNEC in inland surface waters.
Compound API group PNEC (ng/L) Number of samples above LOQ
exceeding PNEC
Estrone Hormone 0.008 14/55a)
Clarithromycin Antibiotic 3.9 25/55
Norethisterone Hormone 0.50 23/55
Diclofenac NSAID 85.2 19/55
Ofloxacin Antibiotic 20.4 8/55
Emamectin Veterinary 1.0 2/55b)
Sum of tetracycline and doxycycline Antibiotic 36.9
(doxycycline)
1/55
Metformin Metabolic
disease
1350 1/55
Mometasone Asthma and
allergy
14 1/55
a) 31/55 samples were non-detects, but LOQ > PNEC
b) LOQ > PNEC in two samples
Table 9.7. APIs exceeding the PNEC in Baltic Sea coastal water.
Compound API group PNEC (ng/L) Number of samples above LOQ exceeding
PNEC
Estrone Hormone 0.008 14/26a)
Emamectin Veterinary 1.0 5/26b)
Clarithromycin Antibiotic 3.9 1/26
Norethisterone Hormone 0.50 4/26
a) 12/26 samples were non-detects, but LOQ > PNEC
b) LOQ > PNEC in three samples
Table 9.8. APIs exceeding the PNEC in inland and Baltic Sea coastal sediments.
Compound API group PNEC (µg/kg
dw)
Number of samples above LOQ exceeding
PNEC
Metformin Metabolic
disease
1.6 10/10
Paracetamol NSAID 1.3 7/10
Ciprofloxacin Antibiotic 6.7 6/10
Sum of tetracycline and
doxycycline
Antibiotic 0.037
(doxycycline)
5/10a)
Estrone Hormone 0.0002 4/10b)
Norethisterone Hormone 0.0044 2/7c)
Clarithromycin Antibiotic 0.41 3/10
Emamectin Veterinary 0.31 3/10
Ofloxacin Antibiotic 0.93 2/10
Diclofenac NSAID 0.47 1/10
a) 5/10 samples non-detects, but LOQ > PNEC
b) 6/10 samples non-detects, but LOQ > PNEC
c) 5/7 samples non-detects, but LOQ > PNEC

186
Table 9.9. APIs exceeding the PNEC in soils fertilized with manure or WWTP sludge.
Compound API group PNEC
(µg/kg dw)
Number of samples above LOQ exceeding
PNEC
Paracetamol NSAID 0.25 6/6
Metformin Metabolic disease 0.30 5/6
Ivermectin Veterinary 0.004 1/6a)
Estrone Hormone 0.0001 1/6a)
Ofloxacin Antibiotic 0.49 1/6a)
Diclofenac NSAID 0.22 1/6
Ciprofloxacin Antibiotic 3.6 1/6
a) 5/6 samples non-detects, but LOQ > PNEC
Table 9.10. APIs exceeding the PNEC in surface waters near fish farms.
Compound API group PNEC (ng/L) Number of samples above LOQ
exceeding PNEC
Estrone Hormone 0.008 5/14a)
Norethisterone Hormone 0.50 1/14
a) 9/14 samples were non-detects, but LOQ > PNEC
Table 9.11. APIs exceeding the PNEC in surface waters near pig and poultry farms.
Compound API group PNEC (ng/L) Number of samples above LOQ
exceeding PNEC
Estrone Hormone 0.008 1/4a)
a) 3/4 samples were non-detects, but LOQ > PNEC
Conclusions Environmental risk assessments were carried out for 82 active pharmaceutical ingredients belonging
to different classes of medicines including antibiotics, antiepileptics, antihypertensives, asthma and
allergy medications, gastrointestinal disease medications, hormones, metabolic disease medications,
NSAIDS and analgesics, other cardiovascular medicines, psychopharmaceuticals, as well as
veterinary medications. Predicted no effect concentrations were calculated based on literature and
our own ecotoxicological studies. Risk quotients and PNECs were calculated for surface waters,
soils, and sediments. Some of the analysed APIs, especially some antibiotics and hormones, are
present at levels that may negatively affect organisms in surface water, sediment and soil. For some
of the APIs the environmental risk could not be excluded because the quantitation limits (LOQ)
were higher than the PNECs. In this study, several APIs contributed to the combined environmental
risk, although their concentrations did not exceed the PNEC. More ecotoxicological data are needed
on single APIs and their metabolities as well on mixture toxicity to assess the combined ecological
risks.
References
European Centre for Ecotoxicology and Toxicology of Chemicals. 2004. Soil and sediment risk
assessment of organic chemicals. ECETOC Technical Report 92. Brussels, Belgium.
http://www.ecetoc.org/publication/tr-092-soil-and-sediment-risk-assessment-of-organic-
chemicals/
Orias, F., Perrodin, Y. (2013) Characterisation of the Ecotoxicity of Hospital Effluents: A Review.
Science of the Total Environment, 454–455, 250–76.

187
Posthuma, L., Suter, G.W., Traas, T.P. (2001) Species Sensitivity Distributions in Ecotoxicology.
Species Sensitivity Distributions in Ecotoxicology. CRC Press.
Smit, C.E. (2015) Effecten van Drugs Op Het Waterecosysteem: Verkenning van de Ecologische
Risico’s van 10 Stoffen.
APIs are not visible but are found everywhere in the environment. Photo: Helene Ek Henning, CAB.
188
10 Overall conclusions and recommendations
Increased knowledge about usage, sources, environmental levels and risks This report increases the knowledge about the active pharmaceutical ingredients (APIs) in the Baltic
Sea Region. Sources and environmental levels of APIs were studied in selected river basin districts
in Estonia, Latvia, Finland, Germany, Poland and Sweden, and a coastal fish farm outside the case
study area in Finland. The measured environmental levels of up to 80 APIs were compared to the
predicted no-effect concentrations to assess environmental risks. This report also presents data on
human and veterinary consumption of these APIs. Major findings and remaining knowledge gaps
are highlighted below.
APIs present in all environmental samples This study showed a widespread prevalence of APIs in the environment. APIs were detected in all
the studied rivers, lakes, coastal waters, sediments and manure or sewage sludge fertilized soils. The
sum concentrations of detected APIs were 0.0018–12 µg/L in surface water, 37–188 µg/kg d.w. in
sediment and 15–166 µg/kg d.w.in soil. 8–49 out of 63 analysed APIs were detected in each surface
water sample, 13–41 out of 64 in sediment, and 18–25 out of 64 in soil.
API concentrations varied widely between the sampling occasions and locations, e.g. upstream and
downstream WWTPs. Sampling was generally performed twice, during warm and cold season, and
more data are needed to draw conclusions about the seasonal variation of the API concentrations in
the environment. Previous studies have mainly focused on APIs in surface water. This study,
however, indicated that the prevalence of APIs in sediment and soil also needs further attention.
More knowledge is needed on the plant uptake of APIs in soil and the dispersal of APIs from soil
to nearby water courses.
Some APIs frequently detected in the environment The most frequently detected APIs in surface waters were carbamazepine (antiepileptic), tramadol
and diclofenac (NSAIDs and analgesics), cetirizine (asthma and allergy medication), and
venlafaxine and citalopram (psychopharmaceuticals). Tramadol and risperidone
(psychopharmaceutical) were found in all sediment and soil samples. Other APIs that were found
in all sediment samples were metformin (metabolic disease medication), oxazepam
(psychopharmaceutical) and caffeine, whereas trimethoprim (antibiotic), paracetamol (NSAID and
analgesic) and fenbendazole (veterinary medicine) were found in all soil samples. APIs were
frequently detected in the environment due to their high usage, persistence and/or poor removal
efficiencies at WWTPs.
This study covered analyses of up to 80 APIs, representing antibiotics, antiepileptics,
antihypertensives, asthma and allergy medications, gastrointestinal disease medications, hormones,
metabolic disease medications, non-steroidal anti-inflammatory drugs (NSAIDs) and analgesics,
other cardiovascular medicines, psychopharmaceuticals and veterinary medicines. Still, there are
more than 2000 APIs used for human and veterinary consumption. Analytical methods should be
further developed to be able to make more comprehensive estimates of total API levels in the
environment, including metabolites. Measurements of APIs should be included in regular
environmental monitoring programmes, focusing on the most environmentally risky substances.
APIs present at risky levels Some of the analysed APIs, especially some antibiotics and hormones, are present at levels that may
negatively affect organisms in surface water, sediment and soil. At least one API was present at

189
concentrations which may pose environmental risk in 75% of the surface water samples. The highest
risks in surface waters were related to the hormones estrone and norethisterone, antibiotics
clarithromycin and ofloxacin, and the NSAID diclofenac. In addition, emamectin (veterinary
medicine), mometasone furoate (asthma and allergy medication) and metformin (metabolic disease
medication) were found at risky levels in some surface water samples. Ibuprofen (NSAID and
analgesic) was not analysed in surface waters, but its low PNEC-value and the observed high levels
in WWTP effluents suggest that also ibuprofen may pose an environmental risk in some surface
waters.
The APIs that most frequently exceeded their PNECs in sediments were ciprofloxacin (antibiotic),
metformin and paracetamol. In some sediment samples, risks were also observed related to
diclofenac, emamectin, estrone and norethisterone, and clarithromycin, ofloxacin and the sum
concentration of doxycycline and tetracycline. In soils, exceedance of PNECs were often observed
for paracetamol and metformin. Single exceedances of PNECs were observed for ciprofloxacin,
ofloxacin, diclofenac, estrone and the veterinary medicine ivermectin in soil. For some APIs the
environmental risk cannot be excluded because their limits of quantification were higher than the
PNECs.
This study showed that the use and dispersal of veterinary medicines is problematic and poses a risk
to the environment. APIs used for animals are dispersed to nearby watercourses via the manure-
fertilized fields. The APIs used for animals are more difficult to collect and treat compared to human
APIs that are mostly collected and treated at municipal WWTPs. It is therefore recommended to
optimize and reduce the usage of veterinary medicines. Additionally, it is recommended to
implement best practices for manure storage, treatment and application as fertilizer in regards of
decreasing the amount of APIs from veterinary use ending up on fields and in surface waters. The
use of herd treatments and broad-spectrum antibiotics should be avoided, and a strict policy for the
use of antibiotics should be implemented in the Baltic Sea member states.
Pharmaceuticals are designed to have biological effects and to be bioavailable at low doses. Low
environmental levels of APIs, such as hormones and antibiotics may therefore be problematic. The
hormone estrone is excreted naturally from humans and animals and the proportion caused by
medicinal use is not clear. Estrone is not available as human medicine in any of the countries from
which consumption data were available in this project. The widespread prevalence of antibiotics in
the environment is risky because of the development of antibiotic resistance, threatening the
effective prevention and treatment of infections caused by bacteria. Hence, measures are urgently
needed to reduce any unnecessary use and dispersal of antibiotics into the environment. Further
studies are recommended on antibiotics and the spread of antibiotic resistance genes.
The current predicted no-effect concentrations (PNECs) are based on the best available knowledge
that often is limited. More ecotoxicological data are needed to improve the environmental risk
assessment of APIs and their metabolites. In this study, several APIs contributed to the combined
environmental risk, although their concentrations did not exceed the PNEC. The sums of risk
quotients were high indicating an urgent need to decrease the loading. More knowledge on mixture
toxicity and long-term effects of exposure to APIs are needed to fully assess the combined
ecological risks. Especially, there is a lack of data on the ecotoxicological effects of APIs on the
biota in soil, sediment, and marine and brackish water like the Baltic Sea.
Improved consumption data Data on API consumption showed that the most consumed APIs (in kg) were used for pain and
fever, epilepsy, and for major public health problems such as type II diabetes, hypertension and
heart failure. Some medicines are metabolized, while others remain intact until they are excreted.
This means that large quantities of APIs are spread via the wastewater treatment plants to receiving
aquatic environments.

190
The load of APIs in wastewater influents were predicted based on the collected consumption data.
The predicted loads were then compared to the measured loads in the sixteen studied WWTPs in
Estonia, Latvia, Finland, Germany, Poland and Sweden. The measured and predicted load of APIs
in wastewater influents were in good agreement for some APIs (e.g. diclofenac and paracetamol) in
most of the countries, whereas load prediction for other APIs (e.g. carbamazepine) resulted in either
an over- or underestimation. The agreement may be improved for instance by including more
comprehensive consumption data and measurements.
It is still difficult or impossible to obtain complete consumption data of APIs in mass units. It is
recommended that public authorities in the Baltic states make drug statistics publicly available, not
only in DDD format but also in kg of API, including combination products and topical formulations.
All medicines should be included, despite of reimbursement status. Also veterinary medicines
consumption data for all APIs and especially for antibiotics, in kg of API, should be made publicly
available.
Several sources and pathways of APIs Conventional WWTPs are not designed to remove APIs from wastewater. Still, this study showed
that the concentrations of about half of the analysed APIs were lower in the effluent compared to
the influent, indicating that they are at least partly removed in the sixteen studied WWTPs. The sum
concentration of detected APIs was 53–1550 µg/L (median 300 µg/L) in influents, 14–1280 µg/L
(median 40 µg/L) in effluents and 550–11600 µg/kg d.w. (median 2440 µg/kg d.w.) in sludge. 17–
45 out of 75 analysed APIs were detected in the influent samples, 19–37 out of 75 in effluents, and
15–26 out of 31 in sludge samples.
Seventeen APIs were detected in at least 90% of influents: caffeine, codeine, diclofenac,
fluconazole, gabapentin, hydrochlorothiazide, ketoprofen, levetiracetam, mesalazine, metformin,
naproxen, oxazepam, paracetamol, sulfamethoxazole, trimethoprim, valsartan and venlafaxine. Six
of them were found in all influent samples: diclofenac, gabapentin, ketoprofen, metformin,
naproxen and trimethoprim. Paracetamol was the most abundant API in influents with the maximum
concentration of 1000 µg/L.
Fifteen APIs were detected in at least 90% of the effluents: carbamazepine, citalopram,
clarithromycin, diclofenac, erythromycin, fluconazole, hydrochlorothiazide, ketoprofen,
metoprolol, naproxen, oxazepam, sotalol, tramadol, trimethoprim and venlafaxine. Three of them
were found in all effluent samples: diclofenac, metoprolol and oxazepam. In the effluents, ibuprofen
had the highest concentration (up to 44 µg/L), followed by diclofenac (up to 38 µg/L) and caffeine
(up to 32 µg/L). Eight APIs were found in all WWTP sludge samples: diclofenac, carbamazepine,
venlafaxine, metformin, caffeine, metoprolol, citalopram and sertraline. In sludge, the most
abundant APIs were telmisartan (up to 8700 µg/kg d.w.) and ofloxacin (up to 8600 µg/kg d.w.).
Hence, this study confirmed that many APIs are incompletely removed at conventional WWTPs.
The studied APIs were mostly partitioning in effluents and less in sludge. Installment of advanced
purification techniques would therefore be reasonable, especially if the receiving waters are
sensitive.
In surface waters, the highest API concentrations were detected downstream WWTPs and during
low flow conditions. This study showed that some APIs also accumulate in coastal sediments and
pose a risk to benthic organisms. It is recommended that APIs should be monitored in WWTP
effluents, especially those API that pose environmental risks.
This study showed that the total load (in g/day) of analysed APIs from hospitals was at maximum
3% of the overall load to the WWTPs. It is therefore more cost-efficient to install advanced
treatment technologies at the WWTPs than at the hospitals. However, the hospitals may be

191
significant sources of some APIs that are predominantly used at hospitals. Also, the effluents of
manufacturing facilities of APIs contained high levels of certain APIs.
This study also showed that APIs are leaking from landfills and sludge composting sites. The sum
concentrations of detected APIs varied over the year from 3.5 to 172 µg/L in untreated leachate and
from 1.1 to 41 µg/L in treated effluents of the landfill WWTP, indicating an overall decrease of
about 35–76% during the treatment. The APIs found at highest concentrations in untreated leachates
were hydrochlorothiazide (up to 79 µg/L), paracetamol (74 µg/L) and gabapentin (7.0 µg/L),
whereas caffeine (8.8 µg/L), hydrochlorothiazide (4.4 µg/L) and erythromycin (1.8 µg/L) were
found at highest concentrations in the treated effluents. There are many landfills in the Baltic Sea
region as well as globally that have no treatment at all or limited treatment of landfill leachate.
Although the studied landfill was not a major API source compared to the municipal WWTPs in the
case study area, some landfills may be a significant source of APIs locally. Further studies of landfill
leachates are recommended, especially where household waste is or has been disposed of at landfills.
This study also covered the analyses of APIs in surface waters and sediments at Finnish and Estonian
fish farms. Temporarily elevated surface water concentrations of the antibiotic trimethoprim were
obtained near one of the fish farms after an onsite medication event. Otherwise, the number of
detected APIs and their sum concentration (0.005–0.09 µg/L) was about the same or lower in the
fish farm waters compared to other studied surface waters.
The watercourses downstream a pig farm and a poultry farm in Latvia contained 7–21 out of 59
analysed APIs. The sum concentration of the detected APIs was 0.18–0.62 µg/L, which is within
the range found in other surface water samples of the case study areas. However, the concentrations
of the veterinary medicines tiamulin and toltrazuril were higher downstream the pig farm than in
other surface water samples. Hence, this study suggests that at least some livestock farms may be
significant sources of APIs used for veterinary purposes, an issue that needs further attention.
Reducing the API emissions To summarize, this study showed a widespread prevalence of APIs in the environment. The analysed
APIs were mainly spread into the Baltic Sea environment via municipal wastewater treatment plants
(WWTPs). Other sources, such as hospitals, manufacturing facilities, landfills, fish farms, pig farms
and poultry farms, contributed to a lesser degree to the total load of APIs in the receiving waters.
Some APIs were present in environmentally risky levels, indicating an urgent need to decrease the
emissions. The combined environmental risk of the APIs, as well as the combined effects they may
have with other pollutants, is still unknown.
This report increases knowledge about the sources, environmental levels and risks of APIs in the
Baltic Sea region. The data will be further used as a basis for modelling of APIs within the Baltic
Sea region and to identify measures to reduce the emissions and environmental risks of APIs. These
results will be published in upcoming reports within the three-year project Clear Waters from
Pharmaceuticals (CWPharma) funded by the EU’s Interreg Baltic Sea Region Programme.
Recommendations • APIs should be included in regular environmental monitoring programmes, focusing on
APIs that pose environmental risks. The API list should be continuously updated as we
receive new information on environmental levels and risks.
• The analytical methods should be further refined and developed to make comprehensive
estimates of API concentrations in the environment, including metabolites.

192
• The statistics on the usage of human and veterinary medicines should be improved, by
making data publicly available in DDD format (defined daily dose) and in mass units (kg of
API) for all types of medicines.
• Further studies should be performed on the use of veterinary medicines and their dispersal
in the environment. Any unnecessary use should be restricted and best practices for manure
storage and application on agricultural fields should be implemented.
• More ecotoxicological data are needed on single APIs and their metabolities as well on
mixture toxicity to assess the combined ecological risks. Ecotoxicological studies should be
performed on different trophic levels and on different matrixes e.g. freshwater, coastal and
marine waters, sediment and soil. Also, knowledge on chronic effects from long-term
exposure to APIs should be improved.
• Further studies should be performed on the environmental levels and risks of antibiotics,
including the spread of antibiotic resistance genes.
• Emissions of APIs from landfill leachates should be further analysed, especially where
household waste is or has been disposed of at landfills.
• The emissions of environmentally risky APIs should be reduced by improved wastewater
treatment and upstream measures.
• The discharges of APIs via WWTP effluents should be followed up, focusing on APIs that
pose environmental risks. The list of environmentally risky APIs should be updated regularly
when new ecotoxicological data and risk assessments are available.

193
11 Annexes
Annex 1. Method performance of chemical analyses.
Annex 2. ATC codes and human consumption of the selected APIs.
Annex 3. Environmental levels of APIs in inland and coastal waters.
Annex 4. APIs in river and estuary sediments.
Annex 5. API concentrations in WWTP influents.
Annex 6. API concentrations in WWTP effluents.
Annex 7. Average efficiency of API treatment according to wastewater influent and effluent data.
Annex 8. APIs in WWTP sludge samples.
Annex 9. Partitioning of APIs at WWTPs.
Annex 10. API concentrations at landfill WWTP.
Annex 11. Concentration of APIs in wastewater effluents of hospitals.
Annex 12. API load from hospitals and comparison with total load to WWTPs.
Annex 13. APIs in wastewater effluents of a pharmaceutical manufacturer.
Annex 14. APIs in surface water at fishfarms.
Annex 15. APIs in sediments at fishfarms.
Annex 16. API concentrations near pig and poultry farms.
Annex 17. API concentrations in soil.
Annex 18. Predicted vs. measured API loads in WWTP influents.
Annex 19. API descriptions.
Annex 20. Predicted no-effect concentrations in surface water.
Annex 21. Risk assessments of APIs.

194
Annex 1. Method performance of chemical analyses Recovery correction method and the limit of quantification (LOQ) of the active pharmaceutical ingredients (APIs) in water samples. The APIs that were not analysed in the given matrix are marked with -.
Surface water Estuary water WTTP influent WTTP effluent
Recovery
correction
LOQ
(ng/L)
Recovery
correction
LOQ
(ng/L)
Recovery
Correction
LOQ
(ng/L)
Recovery
correction
LOQ
(ng/L)
Allopurinol - - - - STA 14 000 STA 120
Amlodipine STA 7.7 STA 0.003 STA 400 STA 110
Atenolol STA 12 STA 8.0 STA 210 STA 110
Atorvastatin 13C 15 - - 13C 10 000 13C 10 000
Bezafibrate STA 0.83 STA 0.40 STA 27 STA 13
Bisoprolol STA 0.52 STA 0.21 STA 30 STA 15
Caffeine 13C 0.75 13C 0.24 13C 17 STA 870
Candesartan STA 0.68 STA 0.22 STA 770 STA 11
Carbamazepine 13C 0.005 13C 0.034 13C 17 13C 7.7
Carprofen 13C 0.77 13C 0.58 13C 14 13C 7.1
Cetirizine STA 0.11 STA 0.028 STA 3200 STA 1200
Ciprofloxacin - - 13C 35 STA 3100 STA 1600
Citalopram+escitalopram 13C 0.058 13C 0.037 13C 2.2 13C 1.1
Clarithromycin STA 1.0 STA 0.33 STA 31 STA 16
Codeine 13C 0.070 13C 0.015 13C 42 13C 11
Diclofenac 13C 1.2 13C 0.34 13C 44 13C 22
Dipyridamole STA 1.1 STA 0.67 STA 190 STA 87
Doxycycline/ STA 5.7 STA 3.2 STA 240 STA 120
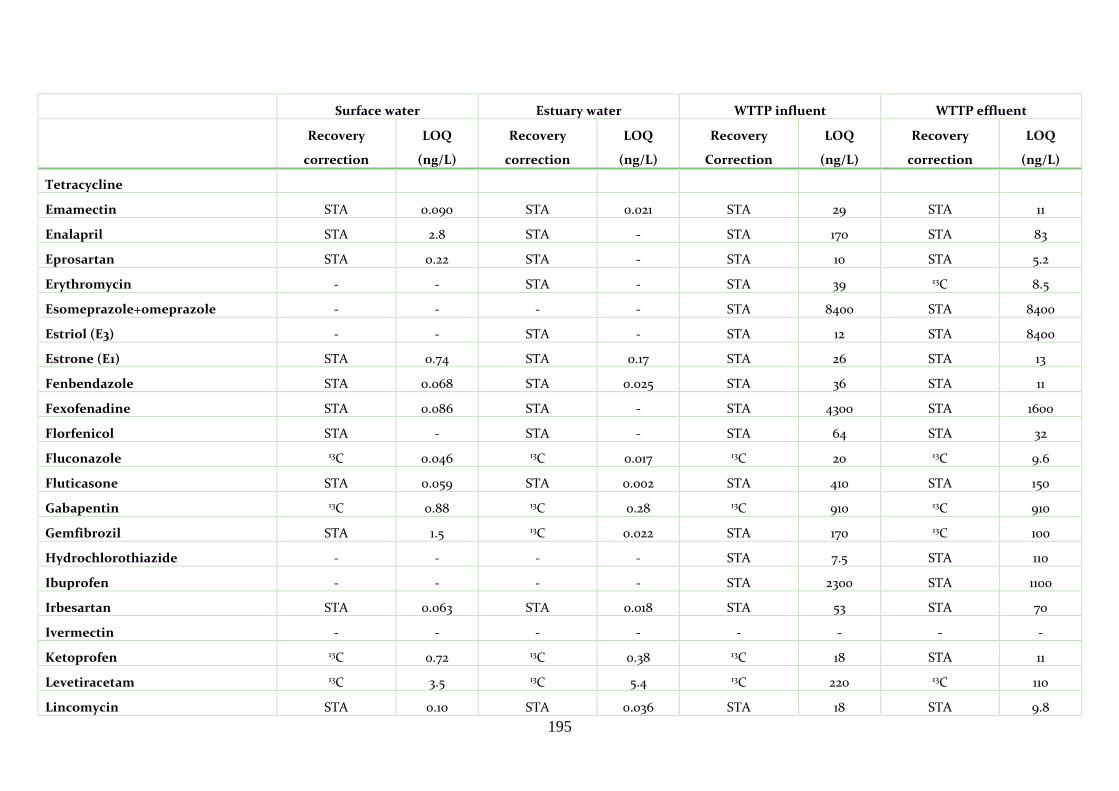
195
Surface water Estuary water WTTP influent WTTP effluent
Recovery
correction
LOQ
(ng/L)
Recovery
correction
LOQ
(ng/L)
Recovery
Correction
LOQ
(ng/L)
Recovery
correction
LOQ
(ng/L)
Tetracycline
Emamectin STA 0.090 STA 0.021 STA 29 STA 11
Enalapril STA 2.8 STA - STA 170 STA 83
Eprosartan STA 0.22 STA - STA 10 STA 5.2
Erythromycin - - STA - STA 39 13C 8.5
Esomeprazole+omeprazole - - - - STA 8400 STA 8400
Estriol (E3) - - STA - STA 12 STA 8400
Estrone (E1) STA 0.74 STA 0.17 STA 26 STA 13
Fenbendazole STA 0.068 STA 0.025 STA 36 STA 11
Fexofenadine STA 0.086 STA - STA 4300 STA 1600
Florfenicol STA - STA - STA 64 STA 32
Fluconazole 13C 0.046 13C 0.017 13C 20 13C 9.6
Fluticasone STA 0.059 STA 0.002 STA 410 STA 150
Gabapentin 13C 0.88 13C 0.28 13C 910 13C 910
Gemfibrozil STA 1.5 13C 0.022 STA 170 13C 100
Hydrochlorothiazide - - - - STA 7.5 STA 110
Ibuprofen - - - - STA 2300 STA 1100
Irbesartan STA 0.063 STA 0.018 STA 53 STA 70
Ivermectin - - - - - - - -
Ketoprofen 13C 0.72 13C 0.38 13C 18 STA 11
Levetiracetam 13C 3.5 13C 5.4 13C 220 13C 110
Lincomycin STA 0.10 STA 0.036 STA 18 STA 9.8

196
Surface water Estuary water WTTP influent WTTP effluent
Recovery
correction
LOQ
(ng/L)
Recovery
correction
LOQ
(ng/L)
Recovery
Correction
LOQ
(ng/L)
Recovery
correction
LOQ
(ng/L)
Losartan STA 0.14 STA 0.023 STA 510 STA 250
Mesalazine - - STA 0.82 STA 280 STA 63
Metformin 13C 0.24 13C 0.12 13C 250 13C 7.5
Metoprolol 13C 0.54 13C 0.35 13C 14 STA 29
Mometasone STA 1.3 STA 0.29 STA 830 STA 27
Naproxen 13C 0.57 13C 0.47 13C 11 STA 5.4
Nebivolol STA 0.052 STA 0.013 STA 970 STA 16
Norethisterone STA 0.079 STA 0.037 STA 24 STA 9.5
Norfloxacin - - - - STA 12 000 STA 12 000
Ofloxacin 13C 10 13C 4.6 13C 420 13C 210
Olanzapine - - - - STA 5.9 STA 0.96
Oxazepam 13C 0.033 13C 0.032 13C 23 13C 11
Oxycodone 13C 0.042 13C 0.027 13C 260 13C 120
Pantoprazole - - - - STA 760 STA 760
Paracetamol - - - - 13C 77 13C 77
Primidone STA 1.4 STA 0.71 STA 35 STA 18
Progesterone STA 0.086 STA 0.028 STA 31 STA 12
Quetiapine 13C 0.15 STA 0.014 STA 470 STA 120
Ramipril STA 0.72 - - STA 32 STA 16
Risperidone - - - - STA 800 STA 10
Sertraline 13C 0.041 13C 0.031 13C 20 13C 10
Simvastatin - - STA 0.020 STA 1.4 STA 1.5

197
Surface water Estuary water WTTP influent WTTP effluent
Recovery
correction
LOQ
(ng/L)
Recovery
correction
LOQ
(ng/L)
Recovery
Correction
LOQ
(ng/L)
Recovery
correction
LOQ
(ng/L)
Sotalol STA 0.89 STA 0.68 STA 15 STA 7.7
Sulfadiazine STA 17 - - STA 590 STA 300
Sulfamethoxazole - - - - 13C 42 13C 8.9
Telmisartan STA 1.4 - - STA 49 STA 11
Temazepam 13C 0.36 13C 0.34 13C 17 13C 8.3
Testosterone 13C 0.080 13C 0.047 STA 81 13C 18
Tiamulin STA 0.62 STA 0.014 STA 38 STA 19
Toltrazuril 13C 4.8 13C 3.6 13C 9000 13C 9000
Tramadol 13C 0.038 13C 0.022 13C 77 STA 38
Trimethoprim 13C 0.37 13C 0.022 13C 22 STA 11
Tylosin STA 3.7 STA 1.9 STA 320 STA 100
Valsartan STA 6.4 - - STA 300 STA 150
Warfarin 13C 0.87 13C 0.58 13C 13 STA 6.3
Venlafaxine 13C 0.034 13C 0.026 13C 20 13C 10
Xylometazoline STA 0.054 STA 0.019 STA 51 STA 26
13C = Stable isotope method. STA = Standard-addition method
.
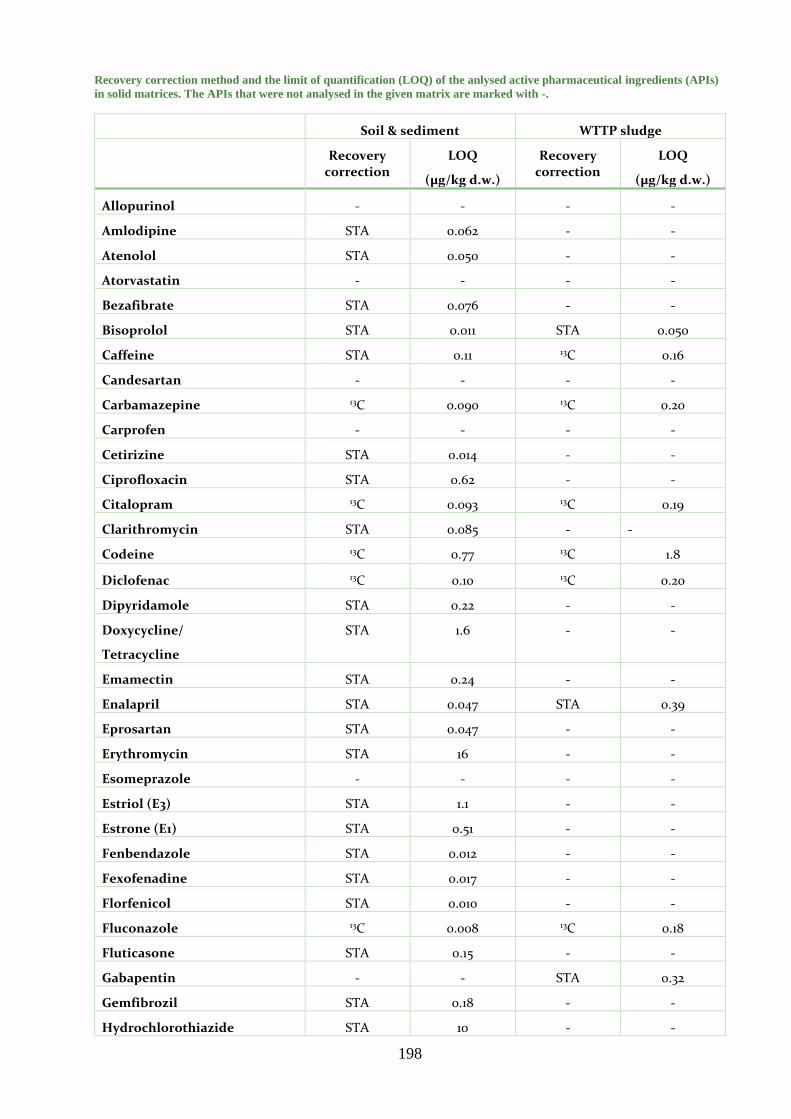
198
Recovery correction method and the limit of quantification (LOQ) of the anlysed active pharmaceutical ingredients (APIs)
in solid matrices. The APIs that were not analysed in the given matrix are marked with -.
Soil & sediment WTTP sludge
Recovery correction
LOQ
(µg/kg d.w.)
Recovery correction
LOQ
(µg/kg d.w.)
Allopurinol - - - -
Amlodipine STA 0.062 - -
Atenolol STA 0.050 - -
Atorvastatin - - - -
Bezafibrate STA 0.076 - -
Bisoprolol STA 0.011 STA 0.050
Caffeine STA 0.11 13C 0.16
Candesartan - - - -
Carbamazepine 13C 0.090 13C 0.20
Carprofen - - - -
Cetirizine STA 0.014 - -
Ciprofloxacin STA 0.62 - -
Citalopram 13C 0.093 13C 0.19
Clarithromycin STA 0.085 - -
Codeine 13C 0.77 13C 1.8
Diclofenac 13C 0.10 13C 0.20
Dipyridamole STA 0.22 - -
Doxycycline/
Tetracycline
STA 1.6 - -
Emamectin STA 0.24 - -
Enalapril STA 0.047 STA 0.39
Eprosartan STA 0.047 - -
Erythromycin STA 16 - -
Esomeprazole - - - -
Estriol (E3) STA 1.1 - -
Estrone (E1) STA 0.51 - -
Fenbendazole STA 0.012 - -
Fexofenadine STA 0.017 - -
Florfenicol STA 0.010 - -
Fluconazole 13C 0.008 13C 0.18
Fluticasone STA 0.15 - -
Gabapentin - - STA 0.32
Gemfibrozil STA 0.18 - -
Hydrochlorothiazide STA 10 - -

199
Soil & sediment WTTP sludge
Recovery correction
LOQ
(µg/kg d.w.)
Recovery correction
LOQ
(µg/kg d.w.)
Ibuprofen - - - -
Irbesartan STA 0.013 STA 0.040
Ivermectin STA 6.2 - -
Ketoprofen STA 0.059 13C 0.17
Levetiracetam 13C 0.043 13C 0.16
Lincomycin STA 0.01 STA 0.042
Losartan - - - -
Mesalazine - - - -
Metformin 13C 0.008 13C 0.014
Metoprolol STA 0.050 13C 0.20
Mometasone STA 0.75 - -
Naproxen STA 0.52 13C 1.5
Nebivolol STA 0.099 - -
Norethisterone STA 0.12 - -
Norfloxacin STA 1.5 - -
Ofloxacin 13C 0.60 13C 1.8
Olanzapine STA 1.1 STA 4.4
Oxazepam 13C 0.010 STA 0.027
Oxycodone 13C 0.065 STA 0.26
Pantoprazole - - - -
Paracetamol STA 0.25 - -
Primidone STA 0.057 STA 0.39
Progesterone STA 0.092 - -
Quetiapine STA 0.010 - -
Ramipril STA 0.052 STA 0.46
Risperidone STA 0.018 STA 0.039
Sertraline 13C 0.038 13C 0.16
Simvastatin STA 0.11 - -
Sotalol STA 0.11 - -
Sulfadiazine - - - -
Sulfamethoxazole STA 0.12 - -
Telmisartan STA 0.14 STA 1.4
Temazepam 13C 0.087 STA 0.77
Testosterone STA 0.20 - -
Tiamulin STA 0.044 - -
Toltrazuril 13C 4.4 13C 17

200
Soil & sediment WTTP sludge
Recovery correction
LOQ
(µg/kg d.w.)
Recovery correction
LOQ
(µg/kg d.w.)
Tramadol STA 0.01 STA 0.047
Trimethoprim STA 0.050 13C 0.16
Tylosin STA 3.2 STA 53
Valsartan STA 0.092 - -
Warfarin STA 0.010 - -
Venlafaxine 13C 0.044 13C 0.16
Xylometazoline STA 0.046 - -
13C = Stable isotope method. STA = Standard-addition method.
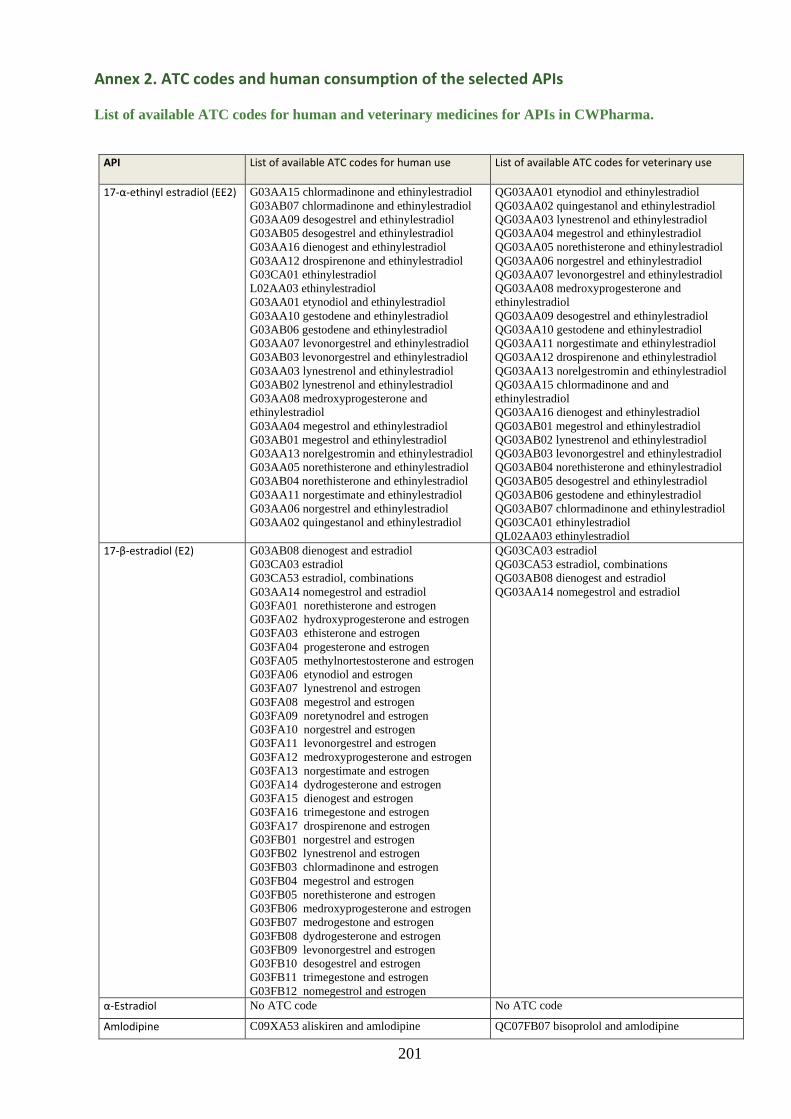
201
Annex 2. ATC codes and human consumption of the selected APIs
List of available ATC codes for human and veterinary medicines for APIs in CWPharma.
API List of available ATC codes for human use
List of available ATC codes for veterinary use
17-α-ethinyl estradiol (EE2) G03AA15 chlormadinone and ethinylestradiol
G03AB07 chlormadinone and ethinylestradiol
G03AA09 desogestrel and ethinylestradiol
G03AB05 desogestrel and ethinylestradiol
G03AA16 dienogest and ethinylestradiol
G03AA12 drospirenone and ethinylestradiol
G03CA01 ethinylestradiol
L02AA03 ethinylestradiol
G03AA01 etynodiol and ethinylestradiol
G03AA10 gestodene and ethinylestradiol
G03AB06 gestodene and ethinylestradiol
G03AA07 levonorgestrel and ethinylestradiol
G03AB03 levonorgestrel and ethinylestradiol
G03AA03 lynestrenol and ethinylestradiol
G03AB02 lynestrenol and ethinylestradiol
G03AA08 medroxyprogesterone and
ethinylestradiol
G03AA04 megestrol and ethinylestradiol
G03AB01 megestrol and ethinylestradiol
G03AA13 norelgestromin and ethinylestradiol
G03AA05 norethisterone and ethinylestradiol
G03AB04 norethisterone and ethinylestradiol
G03AA11 norgestimate and ethinylestradiol
G03AA06 norgestrel and ethinylestradiol
G03AA02 quingestanol and ethinylestradiol
QG03AA01 etynodiol and ethinylestradiol
QG03AA02 quingestanol and ethinylestradiol
QG03AA03 lynestrenol and ethinylestradiol
QG03AA04 megestrol and ethinylestradiol
QG03AA05 norethisterone and ethinylestradiol
QG03AA06 norgestrel and ethinylestradiol
QG03AA07 levonorgestrel and ethinylestradiol
QG03AA08 medroxyprogesterone and
ethinylestradiol
QG03AA09 desogestrel and ethinylestradiol
QG03AA10 gestodene and ethinylestradiol
QG03AA11 norgestimate and ethinylestradiol
QG03AA12 drospirenone and ethinylestradiol
QG03AA13 norelgestromin and ethinylestradiol
QG03AA15 chlormadinone and and
ethinylestradiol
QG03AA16 dienogest and ethinylestradiol
QG03AB01 megestrol and ethinylestradiol
QG03AB02 lynestrenol and ethinylestradiol
QG03AB03 levonorgestrel and ethinylestradiol
QG03AB04 norethisterone and ethinylestradiol
QG03AB05 desogestrel and ethinylestradiol
QG03AB06 gestodene and ethinylestradiol
QG03AB07 chlormadinone and ethinylestradiol
QG03CA01 ethinylestradiol
QL02AA03 ethinylestradiol
17-β-estradiol (E2) G03AB08 dienogest and estradiol
G03CA03 estradiol
G03CA53 estradiol, combinations
G03AA14 nomegestrol and estradiol
G03FA01 norethisterone and estrogen
G03FA02 hydroxyprogesterone and estrogen
G03FA03 ethisterone and estrogen
G03FA04 progesterone and estrogen
G03FA05 methylnortestosterone and estrogen
G03FA06 etynodiol and estrogen
G03FA07 lynestrenol and estrogen
G03FA08 megestrol and estrogen
G03FA09 noretynodrel and estrogen
G03FA10 norgestrel and estrogen
G03FA11 levonorgestrel and estrogen
G03FA12 medroxyprogesterone and estrogen
G03FA13 norgestimate and estrogen
G03FA14 dydrogesterone and estrogen
G03FA15 dienogest and estrogen
G03FA16 trimegestone and estrogen
G03FA17 drospirenone and estrogen
G03FB01 norgestrel and estrogen
G03FB02 lynestrenol and estrogen
G03FB03 chlormadinone and estrogen
G03FB04 megestrol and estrogen
G03FB05 norethisterone and estrogen
G03FB06 medroxyprogesterone and estrogen
G03FB07 medrogestone and estrogen
G03FB08 dydrogesterone and estrogen
G03FB09 levonorgestrel and estrogen
G03FB10 desogestrel and estrogen
G03FB11 trimegestone and estrogen
G03FB12 nomegestrol and estrogen
QG03CA03 estradiol
QG03CA53 estradiol, combinations
QG03AB08 dienogest and estradiol
QG03AA14 nomegestrol and estradiol
α-Estradiol No ATC code No ATC code
Amlodipine C09XA53 aliskiren and amlodipine QC07FB07 bisoprolol and amlodipine

202
API List of available ATC codes for human use
List of available ATC codes for veterinary use
C09XA54 aliskiren, amlodipine and
hydrochlorothiazide
C08CA01 amlodipine
C08GA02 amlodipine and diuretics
C10BX03 atorvastatin and amlodipine
C10BX11 atorvastatin, amlodipine and
perindopril
C07FB07 bisoprolol and amlodipine
C09DB07 candesartan and amlodipine
C09DB05 irbesartan and amlodipine
C09BB03 lisinopril and amlodipine
C09DB06 losartan and amlodipine
C07FB13 metoprolol and amlodipine
C07FB12 nebivolol and amlodipine
C09DB02 olmesartan medoxomil and
amlodipine
C09DX03 olmesartan medoxomil, amlodipine
and hydrochlorothiazide
C09BB04 perindopril and amlodipine
C09BX01 perindopril, amlodipine and
indapamide
C09BB07 ramipril and amlodipine
C09BX03 ramipril, amlodipine and
hydrochlorothiazide
C10BX09 rosuvastatin and amlodipine
C10BX07 rosuvastatin, amlodipine and lisinopril
C10BX14 rosuvastatin, amlodipine and
perindopril
C09DB04 telmisartan and amlodipine
C09DB01 valsartan and amlodipine
C09DX01 valsartan, amlodipine and
hydrochlorothiazide
QC07FB12 nebivolol and amlodipine
QC07FB13 metoprolol and amlodipine
QC08CA01 amlodipine
QC08GA02 amlodipine and diuretics
QC09BB03 lisinopril and amlodipine
QC09BB04 perindopril and amlodipine
QC09BB07 ramipril and amlodipine
QC09BX01 perindopril, amlodipine and
indapamide
QC09BX03 ramipril, amlodipine and
hydrochlorothiazide
QC09DB01 valsartan and amlodipine
QC09DB02 olmesartan medoxomil and
amlodipine
QC09DB04 telmisartan and amlodipine
QC09DB05 irbesartan and amlodipine
QC09DB06 losartan and amlodipine
QC09DB07 candesartan and amlodipine
QC09DX01 valsartan, amlodipine and
hydrochlorothiazide
QC09DX03 olmesartan medoxomil, amlodipine
and hydrochlorothiazide
QC09XA53 aliskiren and amlodipine
QC09XA54 aliskiren, amlodipine and
hydrochlorothiazide
QC10BX03 atorvastatin and amlodipine
QC10BX07 rosuvastatin, amlodipine and
lisinopril
QC10BX09 rosuvastatin and amlodipine
QC10BX11 atorvastatin, amlodipine and
perindopril
QC10BX14 rosuvastatin, amlodipine and
perindopril
Atenolol C07AB03 atenolol
C07FB03 atenolol and nifedipine
C07CB03 atenolol and other diuretics
C07CB53 atenolol and other diuretics,
combinations
C07BB03 atenolol and thiazides
C07DB01 atenolol, thiazides and other diuretics
C07AB11 s-atenolol
QC07AB03 atenolol
QC07AB11 s-atenolol
QC07BB03 atenolol and thiazides
QC07CB03 atenolol and other diuretics
QC07CB53 atenolol and other diuretics,
combinations
QC07DB01 atenolol, thiazides and other diuretics
QC07FB03 atenolol and nifedipine
Atorvastatin C10AA05 atorvastatin
C10BX08 atorvastatin and acetylsalicylic acid
C10BX03 atorvastatin and amlodipine
C10BA05 atorvastatin and ezetimibe
C10BX15 atorvastatin and perindopril
C10BX12 atorvastatin, acetylsalicylic acid and
perindopril
C10BX06 atorvastatin, acetylsalicylic acid and
ramipril
C10BX11 atorvastatin, amlodipine and
perindopril
QC10AA05 atorvastatin
QC10BA05 atorvastatin and ezetimibe
QC10BX03 atorvastatin and amlodipine
QC10BX06 atorvastatin, acetylsalicylic acid and
ramipril
QC10BX08 atorvastatin and acetylsalicylic acid
QC10BX11 atorvastatin, amlodipine and
perindopril
QC10BX12 atorvastatin, acetylsalicylic acid and
perindopril
QC10BX15 atorvastatin and perindopril
Bezafibrate C10AB02 bezafibrate QC10AB02 bezafibrate
Bisoprolol C07AB07 bisoprolol
C07FX04 bisoprolol and acetylsalicylic acid
C07FB07 bisoprolol and amlodipine
C07BB07 bisoprolol and thiazides
C09BX02 perindopril and bisoprolol
QC07AB07 bisoprolol
QC07BB07 bisoprolol and thiazides
QC07FB07 bisoprolol and amlodipine
QC07FX04 bisoprolol and acetylsalicylic acid
QC09BX02 perindopril and bisoprolol
Caffeine N06BC01 caffeine
V04CG30 caffeine and sodium benzoate
QN06BC01 caffeine
QV04CG30 caffeine and sodium benzoate
Candesartan C09CA06 candesartan
C09DB07 candesartan and amlodipine
C09DA06 candesartan and diuretics
QC09CA06 candesartan
QC09DA06 candesartan and diuretics
QC09DB07 candesartan and amlodipine
Carbamazepine N03AF01 carbamazepine QN03AF01 carbamazepine
Ciprofloxacin J01MA02 ciprofloxacin
S01AE03 ciprofloxacin
S02AA15 ciprofloxacin
S03AA07 ciprofloxacin
QJ01MA02 ciprofloxacin
QJ01RA10 ciprofloxacin and metronidazole
QJ01RA11 ciprofloxacin and tinidazole
QJ01RA12 ciprofloxacin and ornidazole

203
API List of available ATC codes for human use
List of available ATC codes for veterinary use
J01RA10 ciprofloxacin and metronidazole
J01RA12 ciprofloxacin and ornidazole
J01RA11 ciprofloxacin and tinidazole
QS01AE03 ciprofloxacin
QS02AA15 ciprofloxacin
QS03AA07 ciprofloxacin
Diclofenac D11AX18 diclofenac
M01AB05 diclofenac
M02AA15 diclofenac
S01BC03 diclofenac
S01CC01 diclofenac and antiinfectives
M01AB55 diclofenac, combinations
QM02AA15 diclofenac
QD11AX18 diclofenac
QM01AB05 diclofenac
QM01AB55 diclofenac, combinations
QS01BC03 diclofenac
QS01CC01 diclofenac and antiinfectives
Dipyridamole B01AC07 dipyridamole
B01AC30 combinations
QB01AC07 dipyridamole
QB01AC30 combinations
Doxycycline A01AB22 doxycycline
J01AA02 doxycycline
QA01AB22 doxycycline
QJ01AA02 doxycycline
Enalapril C09AA02 enalapril
C09BA02 enalapril and diuretics
C09BB02 enalapril and lercanidipine
C09BB06 enalapril and nitrendipine
QC09AA02 enalapril
QC09BA02 enalapril and diuretics
QC09BB02 enalapril and lercanidipine
QC09BB06 enalapril and nitrendipine
Erythromycin D10AF02 erythromycin
J01FA01 erythromycin
S01AA17 erythromycin
D10AF52 erythromycin, combinations
QD10AF02 erythromycin
QD10AF52 erythromycine, combinations
QJ01FA01 erythromycin
QJ51FA01 erythromycin
QJ51RF02 erythromycin, combinations with other
antibacterials
QS01AA17 erythromycin
Estriol (E3) G03CA04 estriol
G03CC06 estriol
QG03CA04 estriol
QG03CC06 estriol
Estrone (E1) G03CA07 estrone
G03CC04 estrone
Fexofenadine R06AX26 fexofenadine QR06AX26 fexofenadine
Fluconazole J01RA07 azithromycin, fluconazole and
secnidazole
D01AC15 fluconazole
J02AC01 fluconazole
QD01AC15 fluconazole
QJ01RA07 azithromycin, fluconazole and
secnidazole
QJ02AC01 fluconazole
Furosemide C03CA01 furosemide
C03CB01 furosemide and potassium
C03EB01 furosemide and potassium-sparing
agents
QC03CA01 furosemide
QC03CB01 furosemide and potassium
QC03EB01 furosemide and potassium-sparing
agents
Gemfibrozil C10AB04 gemfibrozil QC10AB04 gemfibrozil
Ibuprofen
Dexibuprofen is a
dextrorotatory enenthiomer
of ibuprofen.
N02AJ08 codeine and ibuprofen
M01AE14 dexibuprofen
C01EB16 ibuprofen
G02CC01 ibuprofen
M01AE01 ibuprofen
M02AA13 ibuprofen
R02AX02 ibuprofen
M01AE51 ibuprofen, combinations
N02AJ19 oxycodone and ibuprofen
QC01EB16 ibuprofen
QG02CC01 ibuprofen
QM01AE01 ibuprofen
QM01AE14 dexibuprofen
QM01AE51 ibuprofen, combinations
QM02AA13 ibuprofen
QN02AJ08 codeine and ibuprofen
QN02AJ19 oxycodone and ibuprofen
QR02AX02 ibuprofen
Ketoprofen
Dexketoprofen is the S(+)-
enanthiomer of ketoprofen
M01AE17 dexketoprofen
M02AA27 dexketoprofen
M01AE03 ketoprofen
M02AA10 ketoprofen
M01AE53 ketoprofen, combinations
N02AJ14 tramadol and dexketoprofen
QM01AE03 ketoprofen
QM01AE17 dexketoprofen
QM01AE53 ketoprofen, combinations
QM02AA10 ketoprofen
QM02AA27 dexketoprofen
QN02AJ14 tramadol and dexketoprofen
QN06AJ14 tramadol and dexketoprofen
Losartan C09CA01 losartan
C09DB06 losartan and amlodipine
C09DA01 losartan and diuretics
QC09CA01 losartan
QC09DA01 losartan and diuretics
QC09DB06 losartan and amlodipine
Metoprolol C07AB02 metoprolol
C07FX03 metoprolol and acetylsalicylic acid
C07FB13 metoprolol and amlodipine
C07FB02 metoprolol and felodipine
C07FX05 metoprolol and ivabradine
C07CB02 metoprolol and other diuretics
C07BB02 metoprolol and thiazides
C07BB52 metoprolol and thiazides,
combinations
QC07AB02 metoprolol
QC07BB02 metoprolol and thiazides
QC07BB52 metoprolol and thiazides,
combinations
QC07CB02 metoprolol and other diuretics
QC07FB02 metoprolol and felodipine
QC07FB13 metoprolol and amlodipine
QC07FX03 metoprolol and acetylsalicylic acid
QC07FX05 metoprolol and ivabradine

204
API List of available ATC codes for human use
List of available ATC codes for veterinary use
Naproxen G02CC02 naproxen
M01AE02 naproxen
M02AA12 naproxen
M01AE52 naproxen and esomeprazole
QG02CC02 naproxen
QM01AE02 naproxen
QM01AE52 naproxen and esomeprazole
QM01AE56 naproxen and misoprostol
QM02AA12 naproxen
Norethisterone G03AC01 norethisterone
G03DC02 norethisterone
G03FA01 norethisterone and estrogen
G03FB05 norethisterone and estrogen
G03AA05 norethisterone and ethinylestradiol
G03AB04 norethisterone and ethinylestradiol
QG03AA05 norethisterone and ethinylestradiol
QG03AB04 norethisterone and ethinylestradiol
QG03AC01 norethisterone
QG03DC02 norethisterone
QG03FA01 norethisterone and estrogen
QG03FB05 norethisterone and estrogen
Norfloxacin J01MA06 norfloxacin
S01AE02 norfloxacin
J01RA13 norfloxacin and tinidazole
QJ01MA06 norfloxacin
QJ01RA13 norfloxacin and tinidazole
QS01AE02 norfloxacin
Ofloxacin J01MA01 ofloxacin
S01AE01 ofloxacin
S02AA16 ofloxacin
J01RA09 ofloxacin and ornidazole
QJ01MA01 ofloxacin
QJ01RA09 ofloxacin and ornidazole
QS01AE01 ofloxacin
QS02AA16 ofloxacin
Paracetamol N02AJ06 codeine and paracetamol
N02AJ01 dihydrocodeine and paracetamol
N02AJ17 oxycodone and paracetamol
N02BE01 paracetamol
N02BE51 paracetamol, combinations excl.
psycholeptics
N02BE71 paracetamol, combinations with
psycholeptics
N02AJ13 tramadol and paracetamol
QN02AJ01 dihydrocodeine and paracetamol
QN02AJ06 codeine and paracetamol
QN02AJ13 tramadol and paracetamol
QN02AJ17 oxycodone and paracetamol
QN02BE01 paracetamol
QN02BE51 paracetamol, combinations excl.
psycholeptics
QN02BE71 paracetamol, combinations with
psycholeptics
QN06AJ06 codeine and paracetamol
QN06AJ13 tramadol and paracetamol
Progesterone G03DA04 progesterone
G03FA04 progesterone and estrogen
QG03DA04 progesterone
QG03FA04 progesterone and estrogen
Quetiapine N05AH04 quetiapine QN05AH04 quetiapine
Ramipril C10BX06 atorvastatin, acetylsalicylic acid and
ramipril
C09AA05 ramipril
C09BB07 ramipril and amlodipine
C09BA05 ramipril and diuretics
C09BB05 ramipril and felodipine
C09BX03 ramipril, amlodipine and
hydrochlorothiazide
C10BX04 simvastatin, acetylsalicylic acid and
Ramipril
QC10BX06 atorvastatin, acetylsalicylic acid and
ramipril
QC09AA05 ramipril
QC09BB07 ramipril and amlodipine
QC09BA05 ramipril and diuretics
QC09BB05 ramipril and felodipine
QC09BX03 ramipril, amlodipine and
hydrochlorothiazide
QC10BX04 simvastatin, acetylsalicylic acid and
Ramipril
Risperidone N05AX08 risperidone QN05AX08 risperidone
Simvastatin C10AA01 simvastatin
C10BX01 simvastatin and acetylsalicylic acid
C10BA02 simvastatin and ezetimibe
C10BA04 simvastatin and fenofibrate
C10BX04 simvastatin, acetylsalicylic acid and
ramipril
A10BH51 sitagliptin and simvastatin
QA10BH51 sitagliptin and simvastatin
QC10AA01 simvastatin
QC10BA02 simvastatin and ezetimibe
QC10BA04 simvastatin and fenofibrate
QC10BX01 simvastatin and acetylsalicylic acid
QC10BX04 simvastatin, acetylsalicylic acid and
ramipril
Sotalol C07AA07 sotalol
C07FX02 sotalol and acetylsalicylic acid
C07BA07 sotalol and thiazides
QC07AA07 sotalol
QC07BA07 sotalol and thiazides
QC07FX02 sotalol and acetylsalicylic acid
Sulfadiazine D06BA01 silver sulfadiazine
D06BA51 silver sulfadiazine, combinations
J01EC02 sulfadiazine
J01EE06 sulfadiazine and tetroxoprim
J01EE02 sulfadiazine and trimethoprim
QD06BA01 silver sulfadiazine
QD06BA51 silver sulfadiazine, combinations
QJ01EQ10 sulfadiazine
QJ01EW10 sulfadiazine and trimethoprim
QJ51RE01 sulfadiazine and trimethoprim
Sulfamethoxazole J01EC01 sulfamethoxazole
J01EE01 sulfamethoxazole and trimethoprim
QJ01EQ11 sulfamethoxazole
QJ01EW11 sulfamethoxazole and trimethoprime
Telmisartan C09CA07 telmisartan
C09DB04 telmisartan and amlodipine
C09DA07 telmisartan and diuretics
QC09CA07 telmisartan
QC09DA07 telmisartan and diuretics
QC09DB04 telmisartan and amlodipine
Testosterone G03BA03 testosterone
G03EA02 testosterone and estrogen
QG03BA03 testosterone
QG03EA02 testosterone and estrogen

205
API List of available ATC codes for human use
List of available ATC codes for veterinary use
Tetracycline A02BD08 bismuth subcitrate, tetracycline and
metronidazole
J01AA20 combinations of tetracyclines
A02BD02 lansoprazole, tetracycline and
metronidazole
A01AB13 tetracycline
D06AA04 tetracycline
J01AA07 tetracycline
S01AA09 tetracycline
S02AA08 tetracycline
S03AA02 tetracycline
J01RA08 tetracycline and oleandomycin
QA01AB13 tetracycline
QA02BD02 lansoprazole, tetracycline and
metronidazol
QA02BD08 bismuth subcitrate, tetracycline and
metronidazol
QD06AA04 tetracycline
QD06AA54 tetracycline, combinations
QG01AA90 tetracycline
QG51AA02 tetracycline
QG51AG03 tetracycline, neomycin and
sulfadimidine
QJ01AA07 tetracycline
QJ01AA20 combinations of tetracyclines
QJ01RA08 tetracycline and oleandomycin
QJ01RA90 tetracyclines, combinations with other
antibacterials
QJ51AA07 tetracycline
QS01AA09 tetracycline
QS02AA08 tetracycline
QS03AA02 tetracycline
Tramadol N02AX02 tramadol
N02AJ14 tramadol and dexketoprofen
N02AJ15 tramadol and other non-opioid
analgesics
N02AJ13 tramadol and paracetamol
QN02AJ13 tramadol and paracetamol
QN02AJ14 tramadol and dexketoprofen
QN02AJ15 tramadol and other non-opioid
analgesics
QN02AX02 tramadol
QN06AJ13 tramadol and paracetamol
QN06AJ14 tramadol and dexketoprofen
QN06AJ15 tramadol and other non-opioid
analgesics
Trimethoprim J01EE02 sulfadiazine and trimethoprim
J01EE05 sulfadimidine and trimethoprim
J01EE07 sulfamerazine and trimethoprim
J01EE01 sulfamethoxazole and trimethoprim
J01EE03 sulfametrole and trimethoprim
J01EE04 sulfamoxole and trimethoprim
J01EA01 trimethoprim
QJ01EA01 trimethoprim
QJ01EW03 sulfadimidine and trimethoprim
QJ01EW09 sulfadimethoxine and trimethoprim
QJ01EW10 sulfadiazine and trimethoprim
QJ01EW11 sulfamethoxazole and trimethoprime
QJ01EW12 sulfachlorpyridazine and trimethoprim
QJ01EW13 sulfadoxine and trimethoprim
QJ01EW14 sulfatroxazol and trimethoprim
QJ01EW15 sulfamethoxypyridazine and
trimethoprim
QJ01EW16 sulfaquinoxaline and trimethoprim
QJ01EW17 sulfamonomethoxine and
trimethoprim
QJ01EW18 sulfamerazine and trimethoprim
QJ01EW30 combinations of sulfonamides and
trimethoprim
QJ01RA02 sulfonamides, combinations with other
antibacterials excl. trimethoprim
QJ51EA01 trimethoprim
QJ51RE01 sulfadiazine and trimethoprim
Warfarin B01AA03 warfarin QB01AA03 warfarin
Venlafaxine N06AX16 venlafaxine QN06AX16 venlafaxine
Hydrochlorothiazide C03AA03 hydrochlorothiazide
C03AB03 hydrochlorothiazide and potassium
C03AX01 hydrochlorothiazide, combinations
C09BA01 captopril and diuretics
C09BA02 analapril and diuretics
C09BA03 lisinopril and diuretics
C09BA04 perindopril and diuretics
C09BA05 ramipril and diuretics
C09BA06 quinapril and diuretics
C09BA07 benazepril and diuretics
C09BA08 cilazapril and diuretics
C09BA09 fosinopril and diuretics
C09BA12 delapril and diuretics
C09BA13 moexipril and diuretics
C09BA15 zofenopril and diuretics
C07BB02 metoprolol and thiazides
C07BB03 atenolol and thiazides
QC03AA03 hydrochlorothiazide
QC03AB03 hydrochlorothiazide and potassium
QC03AX01 hydrochlorothiazide, combinations
QC03EA01 hydrochlorothiazide and potassium-
sparing agents
QC09BX03 ramipril, amlodipine and
hydrochlorothiazide
QC09DX01 valsartan, amlodipine and
hydrochlorothiazide
QC09DX03 olmesartan medoxomil, amlodipine
and hydrochlorothiazide
QC09XA52 aliskiren and hydrochlorothiazide
QC09XA54 aliskiren, amlodipine and
hydrochlorothiazide

206
API List of available ATC codes for human use
List of available ATC codes for veterinary use
C07BB04 acebutolol and thiazides
C07BB06 bevantolol and thiazides
C07BB07 bisoprolol and thiazides
C07BB12 nebivolol and thiazides
C07BB52 metoprolol and thiazides,
combinations
C09BX03 ramipril, amlodipine and
hydrochlorothiazide
C09DA01 losartan and diuretics
C09DA02 eprosartan and diuretics
C09DA03 valsartan and diuretics
C09DA04 irbesartan and diuretics
C09DA06 candesartan and diuretics
C09DA07 telmisartan and diuretics
C09DA08 olmesartan medoxomil and diuretics
C09DA09 azilsartan medoxomil and diuretics
C09DA10 fimasartan and diuretics
C09DX01 valsartan, amlodipine and
hydrochlorothiazide
C09DX03 olmesartan medoxomil, amlodipine
and hydrochlorothiazide
C03EA01 hydrochlorothiazide and potassium-
sparing agents
C09XA52 aliskiren and hydrochlorothiazide
C09XA54 aliskiren, amlodipine and
hydrochlorothiazide
Nebivolol C07AB12 nebivolol
C07FB12 nebivolol and amlodipine
C07BB12 nebivolol and thiazides
QC07AB12 nebivolol
QC07BB12 nebivolol and thiazides
QC07FB12 nebivolol and amlodipine
Olanzapine N05AH03 olanzapine QN05AH03 olanzapine
Citalopram escitalopram is s-
enanthiomer of citalopram
N06AB04 citalopram
N06AB10 escitalopram
QN06AB04 citalopram
QN06AB10 escitalopram
Sertraline N06AB06 sertraline QN06AB06 sertraline
Acetylsalisylic acid A01AD05 acetylsalicylic acid
B01AC06 acetylsalicylic acid
B01AC30 combinations
N02BA01 acetylsalicylic acid
M01BA03 acetylsalicylic acid and
corticosteroids
N02BA51 acetylsalicylic acid, combinations
excl. psycholeptics
B01AC56 acetylsalicylic acid, combinations
with proton pump inhibitors
N02BA71 acetylsalicylic acid, combinations
with psycholeptics
C10BX08 atorvastatin and acetylsalicylic acid
C10BX12 atorvastatin, acetylsalicylic acid and
perindopril
C10BX06 atorvastatin, acetylsalicylic acid and
ramipril
C07FX04 bisoprolol and acetylsalicylic acid
N02AJ07 codeine and acetylsalicylic acid
N02AJ02 dihydrocodeine and acetylsalicylic
acid
C07FX03 metoprolol and acetylsalicylic acid
N02AJ18 oxycodone and acetylsalicylic acid
C10BX02 pravastatin and acetylsalicylic acid
C10BX05 rosuvastatin and acetylsalicylic acid
C10BX01 simvastatin and acetylsalicylic acid
C10BX04 simvastatin, acetylsalicylic acid and
ramipril
C07FX02 sotalol and acetylsalicylic acid
QA01AD05 acetylsalicylic acid
QB01AC06 acetylsalicylic acid
QB01AC56 acetylsalicylic acid, combinations
with proton pump inhibitors
QC07FX02 sotalol and acetylsalicylic acid
QC07FX03 metoprolol and acetylsalicylic acid
QC07FX04 bisoprolol and acetylsalicylic acid
QC10BX01 simvastatin and acetylsalicylic acid
QC10BX02 pravastatin and acetylsalicylic acid
QC10BX04 simvastatin, acetylsalicylic acid and
ramipril
QC10BX06 atorvastatin, acetylsalicylic acid and
ramipril
QC10BX08 atorvastatin and acetylsalicylic acid
QC10BX12 atorvastatin, acetylsalicylic acid and
perindopril
QM01BA03 acetylsalicylic acid and
corticosteroids
QN02AJ02 dihydrocodeine and acetylsalicylic
acid
QN02AJ07 codeine and acetylsalicylic acid
QN02AJ18 oxycodone and acetylsalicylic acid
QN02BA01 acetylsalicylic acid
QN02BA51 acetylsalicylic acid, combinations
excl. psycholeptics
QN02BA71 acetylsalicylic acid, combinations
with psycholeptics
QN06AJ07 codeine and acetylsalicylic acid
QN06AJ18 oxycodone and acetylsalicylic acid
Omeprazole esomeprazole is s-
enanthiomer of omeprazole
A02BC05 esomeprazole
A02BD06 esomeprazole, amoxicillin and
clarithromycin
M01AE52 naproxen and esomeprazole
A02BC01 omeprazole
QA02BC01 omeprazole
QA02BC05 esomeprazole
QA02BD01 omeprazole, amoxicillin and
metronidazole

207
API List of available ATC codes for human use
List of available ATC codes for veterinary use
A02BD05 omeprazole, amoxicillin and
clarithromycin
A02BD01 omeprazole, amoxicillin and
metronidazole
QA02BD05 omeprazole, amoxicillin and
clarithromycin
QA02BD06 esomeprazole, amoxicillin and
clarithromycin
QM01AE52 naproxen and esomeprazole
Pantoprazole A02BC02 pantoprazole
A02BD04 pantoprazole, amoxicillin and
clarithromycin
A02BD11 pantoprazole, amoxicillin,
clarithromycin and metronidazole
QA02BC02 pantoprazole
QA02BD04 pantoprazole, amoxicillin and
clarithromycin
QA02BD11 pantoprazole, amoxicillin,
clarithromycin and metronidazole
Esomeprazole See omeprazole
Xylometazoline R01AA07 xylometazoline
R01AB06 xylometazoline
S01GA03 xylometazoline
S01GA53 xylometazoline, combinations
QR01AA07 xylometazoline
QR01AB06 xylometazoline
QS01GA03 xylometazoline
QS01GA53 xylometazoline, combinations
Mometasone R03AK09 formoterol and mometasone
D07AC13 mometasone
D07XC03 mometasone
R01AD09 mometasone
R03BA07 mometasone
QD07AC13 mometasone
QD07XC03 mometasone
QR01AD09 mometasone
QR03AK09 formoterol and mometasone
QR03BA07 mometasone
QS02CA91 mometasone and antiinfectives
Fluticasone D07AC17 fluticasone
R01AD08 fluticasone
R03BA05 fluticasone
R01AD12 fluticasone furoate
R03BA09 fluticasone furoate
R01AD58 fluticasone, combinations
R03AK11 formoterol and fluticasone
R03AK06 salmeterol and fluticasone
R03AK10 vilanterol and fluticasone furoate
R03AL08 vilanterol, umeclidinium bromide and
fluticasone furoate
QD07AC17 fluticasone
QR01AD08 fluticasone
QR01AD12 fluticasone furoate
QR01AD58 fluticasone, combinations
QR03AK06 salmeterol and fluticasone
QR03AK10 vilanterol and fluticasone furoate
QR03AK11 formoterol and fluticasone
QR03AL08 vilanterol, umeclidinium bromide and
fluticasone furoate
QR03BA05 fluticasone
QR03BA09 fluticasone furoate
Cetirizine levocetirizine is the r-
enanthiomer of cetirizine
R06AE07 cetirizine
R06AE09 levocetirizine
QR06AE07 cetirizine
QR06AE09 levocetirizine
Primidone N03AA03 primidone QN03AA03 primidone
Allopurinol M04AA01 allopurinol
M04AA51 allopurinol, combinations
QM04AA01 allopurinol
QM04AA51 allopurinol, combinations
Gabapentin N03AX12 gabapentin QN03AX12 gabapentin
Levetiracetam N03AX14 levetiracetam QN03AX14 levetiracetam
Mesalazin A07EC02 mesalazine QA07EC02 mesalazine
Valsartan C10BX10 rosuvastatin and valsartan
C09CA03 valsartan
C09DX02 valsartan and aliskiren
C09DB01 valsartan and amlodipine
C09DA03 valsartan and diuretics
C09DB08 valsartan and lercanidipine
C09DX04 valsartan and sacubitril
C09DX01 valsartan, amlodipine and
hydrochlorothiazide
QC09CA03 valsartan
QC09DA03 valsartan and diuretics
QC09DB01 valsartan and amlodipine
QC09DB08 valsartan and lercanidipine
QC09DX01 valsartan, amlodipine and
hydrochlorothiazide
QC09DX02 valsartan and aliskiren
QC09DX04 valsartan and sacubitril
QC10BX10 rosuvastatin and valsartan

208
API List of available ATC codes for human use
List of available ATC codes for veterinary use
Codeine R05DA04 codeine
N02AJ07 codeine and acetylsalicylic acid
N02AJ08 codeine and ibuprofen
N02AJ09 codeine and other non-opioid
analgesics
N02AJ06 codeine and paracetamol
N02AA59 codeine, combinations excl.
psycholeptics
N02AA79 codeine, combinations with
psycholeptics
R05FA01 opium derivatives and mucolytics
R05FA02 opium derivatives and expectorants
QN02AA59 codeine, combinations
QN02AA79 codeine, combinations with
psycholeptics
QN02AJ06 codeine and paracetamol
QN02AJ07 codeine and acetylsalicylic acid
QN02AJ08 codeine and ibuprofen
QN02AJ09 codeine and other non-opioid
analgesics
QN06AJ06 codeine and paracetamol
QN06AJ07 codeine and acetylsalicylic acid
QN06AJ09 codeine and other non-opioid
analgesics
QR05DA04 codeine
Irbesartan C09CA04 irbesartan
C09DB05 irbesartan and amlodipine
C09DA04 irbesartan and diuretics
QC09CA04 irbesartan
QC09DA04 irbesartan and diuretics
QC09DB05 irbesartan and amlodipine
Clarithromycin J01FA09 clarithromycin
A02BD06 esomeprazole, amoxicillin and
clarithromycin
A02BD07 lansoprazole, amoxicillin and
clarithromycin
A02BD09 lansoprazole, clarithromycin and
tinidazole
A02BD05 omeprazole, amoxicillin and
clarithromycin
A02BD04 pantoprazole, amoxicillin and
clarithromycin
A02BD11 pantoprazole, amoxicillin,
clarithromycin and metronidazole
QA02BD04 pantoprazole, amoxicillin and
clarithromycin
QA02BD05 omeprazole, amoxicillin and
clarithromycin
QA02BD06 esomeprazole, amoxicillin and
clarithromycin
QA02BD07 lansoprazole, amoxicillin and
clarithromycin
QA02BD09 lansoprazole, clarithromycin and
tinidazole
QA02BD11 pantoprazole, amoxicillin,
clarithromycin and metronidazole
QJ01FA09 clarithromycin
Eprosartan C09CA02 eprosartan
C09DA02 eprosartan and diuretics
QC09CA02 eprosartan
QC09DA02 eprosartan and diuretics
Metformin A10BA02 metformin
A10BD17 metformin and acarbose
A10BD13 metformin and alogliptin
A10BD16 metformin and canagliflozin
A10BD15 metformin and dapagliflozin
A10BD20 metformin and empagliflozin
A10BD22 metformin and evogliptin
A10BD18 metformin and gemigliptin
A10BD11 metformin and linagliptin
A10BD05 metformin and pioglitazone
A10BD14 metformin and repaglinide
A10BD03 metformin and rosiglitazone
A10BD10 metformin and saxagliptin
A10BD07 metformin and sitagliptin
A10BD02 metformin and sulfonylureas
A10BD08 metformin and vildagliptin
QA10BA02 metformin
QA10BD02 metformin and sulfonylureas
QA10BD03 metformin and rosiglitazone
QA10BD05 metformin and pioglitazone
QA10BD07 metformin and sitagliptin
QA10BD08 metformin and vildagliptin
QA10BD10 metformin and saxagliptin
QA10BD11 metformin and linagliptin
QA10BD13 metformin and alogliptin
QA10BD14 metformin and repaglinide
QA10BD15 metformin and dapagliflozin
QA10BD16 metformin and canagliflozin
QA10BD17 metformin and acarbose
QA10BD18 metformin and gemigliptin
QA10BD20 metformin and empagliflozin
QA10BD22 metformin and evogliptin
Florfenicol No ATC code QJ01BA90 florfenicol
QJ51BA90 florfenicol
Tiamulin hydrogen fumarate
No ATC code QJ01XQ01 tiamulin

209
API List of available ATC codes for human use
List of available ATC codes for veterinary use
Tylosin No ATC code QJ01FA90 tylosin
QJ51FA90 tylosin
Lincomycin J01FF02 lincomycin QJ01FF02 lincomycin
QJ01FF52 lincomycin, combinations
QJ51RF03 lincomycin, combinations with other
antibacterials
Fenbendazole P02CA06 fenbendazole QP02CA06 fenbendazole
QP52AC13 fenbendazole
Toltrazuril No ATC code QP51AJ01 toltrazuril
QP51AJ51 toltrazuril, combinations
QP52AX60 emodepside and toltrazuril
Carprofen No ATC code QM01AE91 carprofen
Emamectinbenzoate No ATC code QP54AA06 emamectin
Ivermectin D11AX22 ivermectin
P02CF01 ivermectin
QD11AX22 ivermectin
QP54AA01 ivermectin
QP54AA51 ivermectin, combinations
QS02QA03 ivermectin
Oxazepam N05BA04 oxazepam QN05BA04 oxazepam
Temazepam N05CD07 temazepam QN05CD07 temazepam
Oxycodone N02AA05 oxycodone
N02AA05 oxycodone
N02AJ18 oxycodone and acetylsalicylic acid
N02AJ19 oxycodone and ibuprofen
N02AA55 oxycodone and naloxone
N02AA56 oxycodone and naltrexone
N02AJ17 oxycodone and paracetamol
QN02AA05 oxycodone
QN02AA55 oxycodone and naloxone
QN02AA56 oxycodone and naltrexone
QN02AJ17 oxycodone and paracetamol
QN02AJ18 oxycodone and acetylsalicylic acid
QN02AJ19 oxycodone and ibuprofen
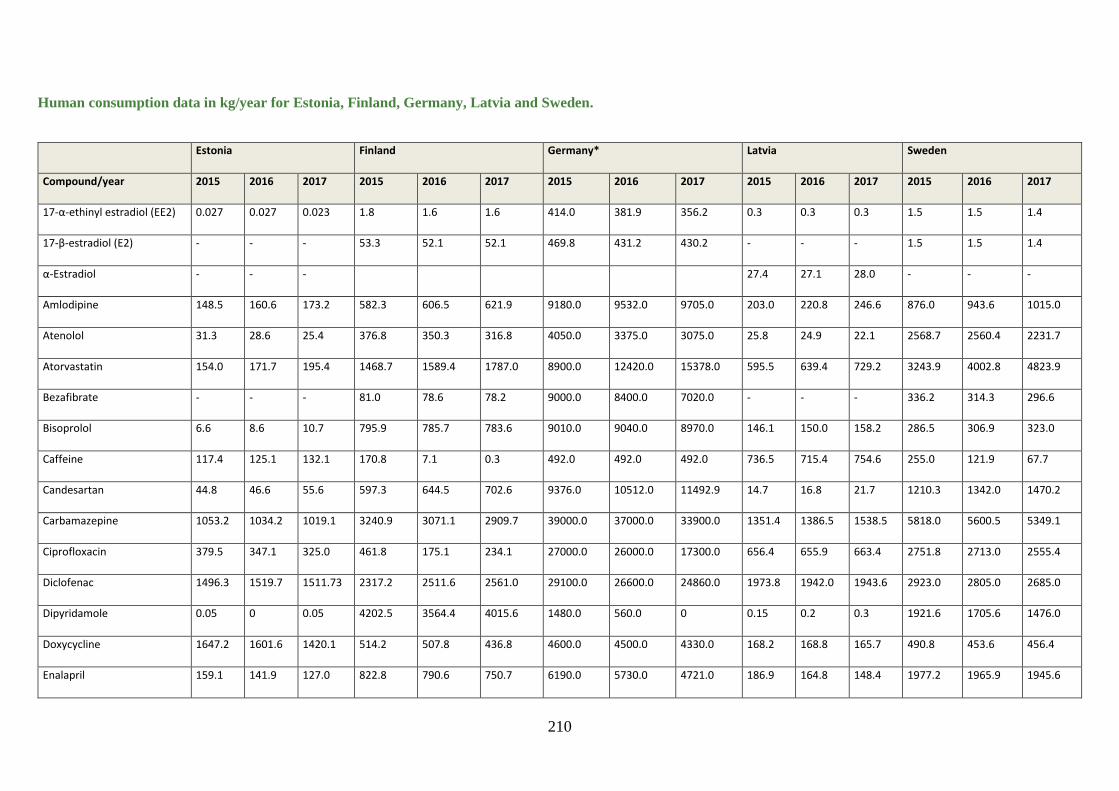
210
Human consumption data in kg/year for Estonia, Finland, Germany, Latvia and Sweden.
Estonia Finland Germany* Latvia Sweden
Compound/year 2015 2016 2017 2015 2016 2017 2015 2016 2017 2015 2016 2017 2015 2016 2017
17-α-ethinyl estradiol (EE2) 0.027 0.027 0.023 1.8 1.6 1.6 414.0 381.9 356.2 0.3 0.3 0.3 1.5 1.5 1.4
17-β-estradiol (E2) - - - 53.3 52.1 52.1 469.8 431.2 430.2 - - - 1.5 1.5 1.4
α-Estradiol - - - 27.4 27.1 28.0 - - -
Amlodipine 148.5 160.6 173.2 582.3 606.5 621.9 9180.0 9532.0 9705.0 203.0 220.8 246.6 876.0 943.6 1015.0
Atenolol 31.3 28.6 25.4 376.8 350.3 316.8 4050.0 3375.0 3075.0 25.8 24.9 22.1 2568.7 2560.4 2231.7
Atorvastatin 154.0 171.7 195.4 1468.7 1589.4 1787.0 8900.0 12420.0 15378.0 595.5 639.4 729.2 3243.9 4002.8 4823.9
Bezafibrate - - - 81.0 78.6 78.2 9000.0 8400.0 7020.0 - - - 336.2 314.3 296.6
Bisoprolol 6.6 8.6 10.7 795.9 785.7 783.6 9010.0 9040.0 8970.0 146.1 150.0 158.2 286.5 306.9 323.0
Caffeine 117.4 125.1 132.1 170.8 7.1 0.3 492.0 492.0 492.0 736.5 715.4 754.6 255.0 121.9 67.7
Candesartan 44.8 46.6 55.6 597.3 644.5 702.6 9376.0 10512.0 11492.9 14.7 16.8 21.7 1210.3 1342.0 1470.2
Carbamazepine 1053.2 1034.2 1019.1 3240.9 3071.1 2909.7 39000.0 37000.0 33900.0 1351.4 1386.5 1538.5 5818.0 5600.5 5349.1
Ciprofloxacin 379.5 347.1 325.0 461.8 175.1 234.1 27000.0 26000.0 17300.0 656.4 655.9 663.4 2751.8 2713.0 2555.4
Diclofenac 1496.3 1519.7 1511.73 2317.2 2511.6 2561.0 29100.0 26600.0 24860.0 1973.8 1942.0 1943.6 2923.0 2805.0 2685.0
Dipyridamole 0.05 0 0.05 4202.5 3564.4 4015.6 1480.0 560.0 0 0.15 0.2 0.3 1921.6 1705.6 1476.0
Doxycycline 1647.2 1601.6 1420.1 514.2 507.8 436.8 4600.0 4500.0 4330.0 168.2 168.8 165.7 490.8 453.6 456.4
Enalapril 159.1 141.9 127.0 822.8 790.6 750.7 6190.0 5730.0 4721.0 186.9 164.8 148.4 1977.2 1965.9 1945.6
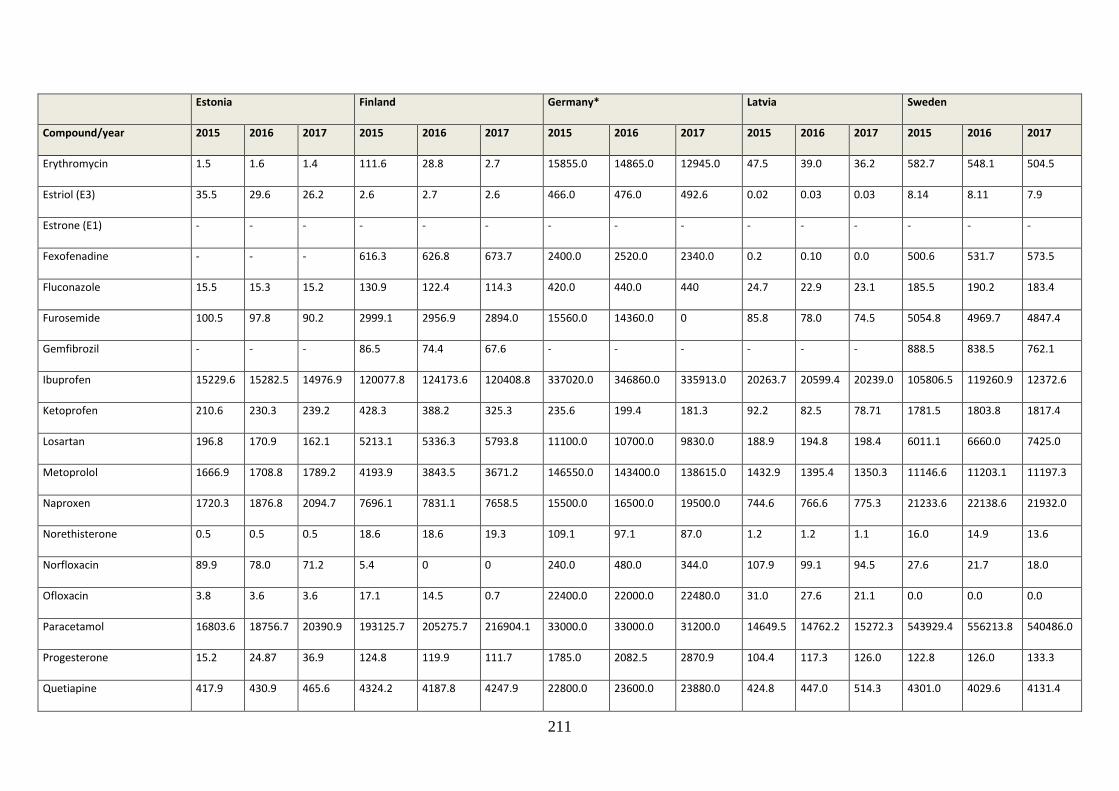
211
Estonia Finland Germany* Latvia Sweden
Compound/year 2015 2016 2017 2015 2016 2017 2015 2016 2017 2015 2016 2017 2015 2016 2017
Erythromycin 1.5 1.6 1.4 111.6 28.8 2.7 15855.0 14865.0 12945.0 47.5 39.0 36.2 582.7 548.1 504.5
Estriol (E3) 35.5 29.6 26.2 2.6 2.7 2.6 466.0 476.0 492.6 0.02 0.03 0.03 8.14 8.11 7.9
Estrone (E1) - - - - - - - - - - - - - - -
Fexofenadine - - - 616.3 626.8 673.7 2400.0 2520.0 2340.0 0.2 0.10 0.0 500.6 531.7 573.5
Fluconazole 15.5 15.3 15.2 130.9 122.4 114.3 420.0 440.0 440 24.7 22.9 23.1 185.5 190.2 183.4
Furosemide 100.5 97.8 90.2 2999.1 2956.9 2894.0 15560.0 14360.0 0 85.8 78.0 74.5 5054.8 4969.7 4847.4
Gemfibrozil - - - 86.5 74.4 67.6 - - - - - - 888.5 838.5 762.1
Ibuprofen 15229.6 15282.5 14976.9 120077.8 124173.6 120408.8 337020.0 346860.0 335913.0 20263.7 20599.4 20239.0 105806.5 119260.9 12372.6
Ketoprofen 210.6 230.3 239.2 428.3 388.2 325.3 235.6 199.4 181.3 92.2 82.5 78.71 1781.5 1803.8 1817.4
Losartan 196.8 170.9 162.1 5213.1 5336.3 5793.8 11100.0 10700.0 9830.0 188.9 194.8 198.4 6011.1 6660.0 7425.0
Metoprolol 1666.9 1708.8 1789.2 4193.9 3843.5 3671.2 146550.0 143400.0 138615.0 1432.9 1395.4 1350.3 11146.6 11203.1 11197.3
Naproxen 1720.3 1876.8 2094.7 7696.1 7831.1 7658.5 15500.0 16500.0 19500.0 744.6 766.6 775.3 21233.6 22138.6 21932.0
Norethisterone 0.5 0.5 0.5 18.6 18.6 19.3 109.1 97.1 87.0 1.2 1.2 1.1 16.0 14.9 13.6
Norfloxacin 89.9 78.0 71.2 5.4 0 0 240.0 480.0 344.0 107.9 99.1 94.5 27.6 21.7 18.0
Ofloxacin 3.8 3.6 3.6 17.1 14.5 0.7 22400.0 22000.0 22480.0 31.0 27.6 21.1 0.0 0.0 0.0
Paracetamol 16803.6 18756.7 20390.9 193125.7 205275.7 216904.1 33000.0 33000.0 31200.0 14649.5 14762.2 15272.3 543929.4 556213.8 540486.0
Progesterone 15.2 24.87 36.9 124.8 119.9 111.7 1785.0 2082.5 2870.9 104.4 117.3 126.0 122.8 126.0 133.3
Quetiapine 417.9 430.9 465.6 4324.2 4187.8 4247.9 22800.0 23600.0 23880.0 424.8 447.0 514.3 4301.0 4029.6 4131.4

212
Estonia Finland Germany* Latvia Sweden
Compound/year 2015 2016 2017 2015 2016 2017 2015 2016 2017 2015 2016 2017 2015 2016 2017
Ramipril 84.7 82.4 81.3 363.2 368.5 369.0 11550.0 11780.0 11868.8 55.9 56.0 57.1 255.3 253.0 249.6
Risperidone 1.5 1.5 1.5 19.5 18.2 17.1 185.0 185.0 185.5 3.3 3.3 3.3 15.2 15.1 14.8
Simvastatin 94.4 88.6 82.6 2673 2435.7 2327.3 41760.0 40980.0 38934.0 9.7 8.8 7.7 4505.3 4082.1 3694.8
Sotalol 121.2 109.8 97.6 186.3 176.1 143.5 2560.0 2240.0 1920.0 46.1 55.5 71.4 404.1 331.0 271.8
Sulfadiazine 63.7 90.9 90.1 384.9 397.6 363.8 3000.0 3000.0 3200.0 2.7 2.5 2.4 0.7 0.1 0.6
Sulfamethoxazole 347.4 329.6 543.7 338.6 405.3 422.3 16960.0 16480.0 16800.0 1048.0 1010.1 1016.1 0.0 0.0 0.0
Telmisartan 1055.2 1014.7 1010.0 1131.2 1132.8 1167.0 6840.0 7036.0 6832.0 498.9 486.9 543.4 51.4 52.2 52.1
Testosterone 1.68 1.84 1.91 126.8 110.3 115.2 2148.0 2376.0 2556.0 4.0 3.9 4.5 264.0 280.0 288.4
Tetracycline (lymecycline)
0.51 0.1 0.2 1268.9 1065.7 923.2 50000.0 49000.0 46000.0 1.8 2.6 2.4 304.9 (2716)
273.1 (2680)
232.5 (2659)
Tramadol 314.7 318.0 332.3 1761.4 1712.5 1700.8 22530.0 21420.0 20370.0 363.6 349.3 367.3 3933.1 3502.6 3022.1
Trimethoprim 82.3 86.2 82.1 959.7 918.6 854.1 4760.0 4640.0 4720.0 224.5 205.7 205.6 220 185 170
Warfarin 27.1 25.4 23.0 264.0 242.5 223.7 27.0 24.75 23.25 29.2 30.1 31.1 262.9 233.6 204.4
Venlafaxine 103.1 115.6 127.8 1941.8 1917.5 2028.2 18530.0 18990.0 19600.0 48.2 57.3 64.1 3415.5 3547.9 3692.1
Hydrochlorothiazide 282.8 257.2 250.7 2119.5 2049.1 2004.8 56177.5 51602.5 53757.5 269.1 259.7 265.1 551.8 552.6 549.9
Nebivolol 46.2 48.5 51.1 15.4 16.4 17.1 895.0 925.0 938.5 48.5 52.9 58.6 0.0 0.0 0.0
Olanzapine 8.7 8.9 9.4 117.9 121.7 118.3 400.0 420.0 437.0 8.4 9.8 11.1 678.2 780.9 844.5
Citalopram (Escitalopram)
14.52 14.2 13.7 482.1 (276.6)
435.5 (286.6)
399.6 (308.0)
6136.0 (863.0)
5800.0 (1035)
5500.0 (1187.0)
9.00 10.1 11.0 1396.0 (293.6)
1292.2 (333.2)
1173.1 (375.6)
Sertraline 72.4 86.7 94.8 719.1 720.1 792.5 5920.0 6670.0 7550.0 32.2 34.4 40.0 4640.2 5009.4 5330.0

213
Estonia Finland Germany* Latvia Sweden
Compound/year 2015 2016 2017 2015 2016 2017 2015 2016 2017 2015 2016 2017 2015 2016 2017
Acetylsalisylic acid 11004.3 10437.8 10175.4 28 250.4 26 696.9 24 916.4 1600666.7 1631000.0 1605566.7 10146.5 9940.5 10093.5 55604.6 52248.1 50658
Omeprazole/ esomeprazole
252.2 264.3 262.8 1357.3 1352.4 1296.8 17280.0 16380.0 14602.0 384.4 390.4 5776.5 6120.2 6400.0
Pantoprazole 140.8 172.7 196.7 2312.4 2449.8 2588.9 52240.0 55880.0 54174.0 201.8 218.0 236.2 288.0 326.2 363.1
Esomeprazole 139.2 159.9 181.7 3360.0 3620.0 3610.0 59.5 73.1 88.3 - - -
Xylometazoline 11.7 12.5 15.8 13.5 15.3 16.0 111.2 112.0 101.6 10.5 9.4 9.7 67.6 74.0 89.8
Mometasone - - - 10.6 11.0 10.8 88.9 97.3 38.7 1.5 1.7 1.9 34.2 34.7 35.1
Fluticasone 0.3 0.3 0.3 14.2 14.6 14.5
1.4 1.3 1.2 3.0 3.4 3.5
Cetirizine (Levocetirizine) ((hydroxyzine))
32.2 33.9 35.8 488.3 (49.2
478.5 (48.9)
536.1 (45.6)
132.0 (68.5)
141.0 (61.0)
155.0 (58.5)
19.1 20.8 20.7 357.0 358.6 363.6
Primidone 34.0 34.8 30.4 - - - 5462.5 5362.5 5125.0 2.5 2.6 2.5 1.9 1.9 2.1
Allopurinol 760.2 863.9 993.0 2798.2 2812.5 2821.0 133600.0 132400.0 130080.0 617.4 686.7 812.5 4453.5 4707.2 4991.4
Gabapentin 657.1 776.7 958.2 6826.0 8090.4 9709.9 82800.0 82800.0 82800.0 1806.6 2081.0 2565.0 12984.3 14851.2 16676.6
Levetiracetam 227.8 282.1 323.1 6262.5 6738.3 7292.3 117000.0 126000.0 133950.0 194.4 262.4 332.3 7518.9 8388.0 9306.8
Mesalazin 663.8 778.3 844.9 18427.2 19037.4 19857.8 106500.0 108000.0 110100.0 371.6 450.2 553.9 29443.7 30911.8 32131.4
Valsartan 346 331 317 4441.1 4527.9 4702.2 80376.0 88008.0 94112.0 314.0 335.7 357.3 1345.3 1367.5 1417.2
Codeine 121.5 144.8 176.6 1725.5 1622.8 1568.3 720.0 610.0 630.0 51.3 57.9 72.7 1750.7 1641.8 1504.3
Irbesartan 0 0 0 - - - 19950.0 19005.0 18015.0 34.3 29.6 26.3 1188 1151 1087
Clarithromycin 435.3 393.9 406.0.04 245.6 215.1 185.9 12000.0 10500.0 10500.0 444.1 435.7 469.3 630.1 638.5 615.2
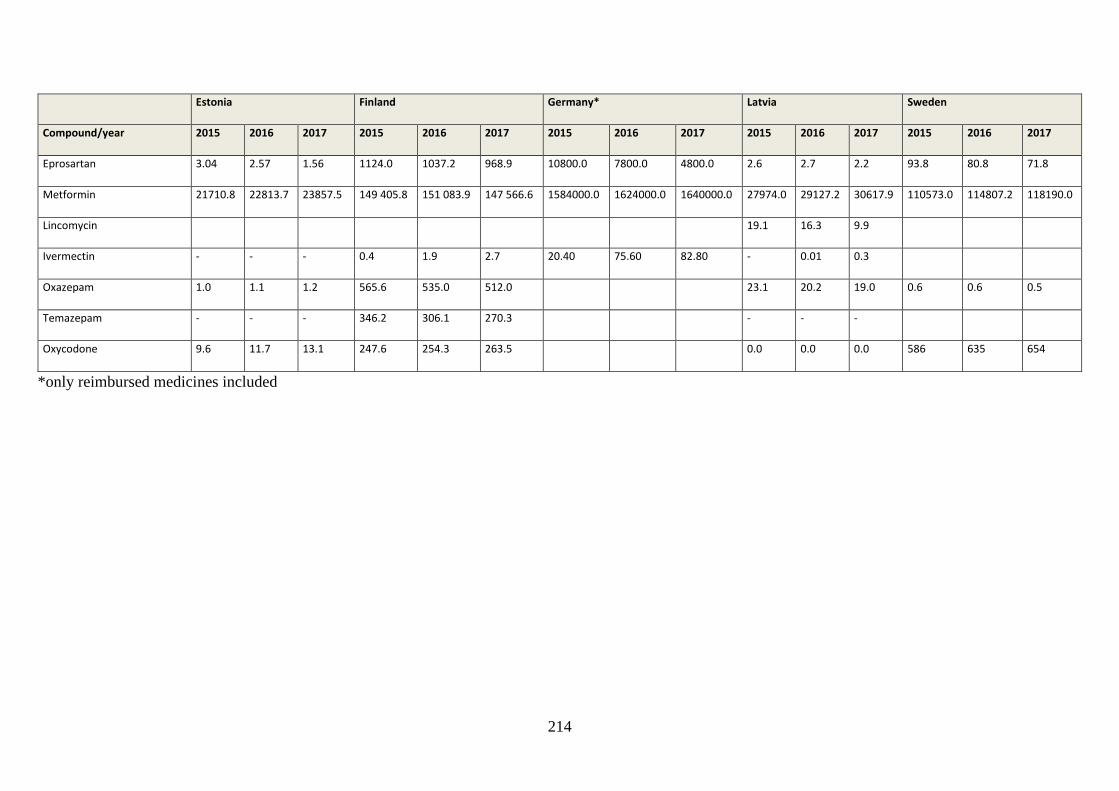
214
Estonia Finland Germany* Latvia Sweden
Compound/year 2015 2016 2017 2015 2016 2017 2015 2016 2017 2015 2016 2017 2015 2016 2017
Eprosartan 3.04 2.57 1.56 1124.0 1037.2 968.9 10800.0 7800.0 4800.0 2.6 2.7 2.2 93.8 80.8 71.8
Metformin 21710.8 22813.7 23857.5 149 405.8 151 083.9 147 566.6 1584000.0 1624000.0 1640000.0 27974.0 29127.2 30617.9 110573.0 114807.2 118190.0
Lincomycin 19.1 16.3 9.9
Ivermectin - - - 0.4 1.9 2.7 20.40 75.60 82.80 - 0.01 0.3
Oxazepam 1.0 1.1 1.2 565.6 535.0 512.0 23.1 20.2 19.0 0.6 0.6 0.5
Temazepam - - - 346.2 306.1 270.3 - - -
Oxycodone 9.6 11.7 13.1 247.6 254.3 263.5 0.0 0.0 0.0 586 635 654
*only reimbursed medicines included
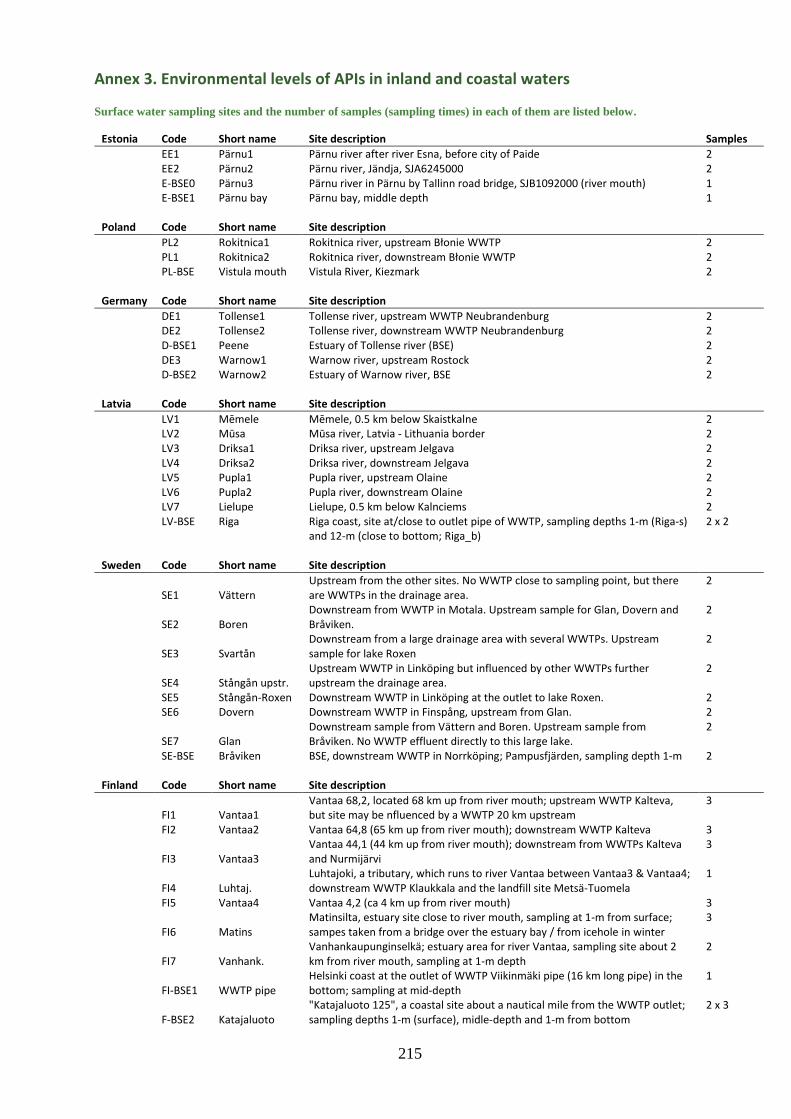
215
Annex 3. Environmental levels of APIs in inland and coastal waters Surface water sampling sites and the number of samples (sampling times) in each of them are listed below.
Estonia Code Short name Site description Samples
EE1 Pärnu1 Pärnu river after river Esna, before city of Paide 2
EE2 Pärnu2 Pärnu river, Jändja, SJA6245000 2
E-BSE0 Pärnu3 Pärnu river in Pärnu by Tallinn road bridge, SJB1092000 (river mouth) 1
E-BSE1 Pärnu bay Pärnu bay, middle depth 1
Poland Code Short name Site description
PL2 Rokitnica1 Rokitnica river, upstream Błonie WWTP 2
PL1 Rokitnica2 Rokitnica river, downstream Błonie WWTP 2
PL-BSE Vistula mouth Vistula River, Kiezmark 2
Germany Code Short name Site description
DE1 Tollense1 Tollense river, upstream WWTP Neubrandenburg 2
DE2 Tollense2 Tollense river, downstream WWTP Neubrandenburg 2
D-BSE1 Peene Estuary of Tollense river (BSE) 2
DE3 Warnow1 Warnow river, upstream Rostock 2
D-BSE2 Warnow2 Estuary of Warnow river, BSE 2
Latvia Code Short name Site description
LV1 Mēmele Mēmele, 0.5 km below Skaistkalne 2
LV2 Mūsa Mūsa river, Latvia - Lithuania border 2
LV3 Driksa1 Driksa river, upstream Jelgava 2
LV4 Driksa2 Driksa river, downstream Jelgava 2
LV5 Pupla1 Pupla river, upstream Olaine 2
LV6 Pupla2 Pupla river, downstream Olaine 2
LV7 Lielupe Lielupe, 0.5 km below Kalnciems 2 LV-BSE Riga Riga coast, site at/close to outlet pipe of WWTP, sampling depths 1-m (Riga-s)
and 12-m (close to bottom; Riga_b) 2 x 2
Sweden Code Short name Site description
SE1 Vättern Upstream from the other sites. No WWTP close to sampling point, but there are WWTPs in the drainage area.
2
SE2 Boren Downstream from WWTP in Motala. Upstream sample for Glan, Dovern and Bråviken.
2
SE3 Svartån Downstream from a large drainage area with several WWTPs. Upstream sample for lake Roxen
2
SE4 Stångån upstr. Upstream WWTP in Linköping but influenced by other WWTPs further upstream the drainage area.
2
SE5 Stångån-Roxen Downstream WWTP in Linköping at the outlet to lake Roxen. 2
SE6 Dovern Downstream WWTP in Finspång, upstream from Glan. 2
SE7 Glan Downstream sample from Vättern and Boren. Upstream sample from Bråviken. No WWTP effluent directly to this large lake.
2
SE-BSE Bråviken BSE, downstream WWTP in Norrköping; Pampusfjärden, sampling depth 1-m 2
Finland Code Short name Site description
FI1 Vantaa1 Vantaa 68,2, located 68 km up from river mouth; upstream WWTP Kalteva, but site may be nfluenced by a WWTP 20 km upstream
3
FI2 Vantaa2 Vantaa 64,8 (65 km up from river mouth); downstream WWTP Kalteva 3
FI3 Vantaa3 Vantaa 44,1 (44 km up from river mouth); downstream from WWTPs Kalteva and Nurmijärvi
3
FI4 Luhtaj. Luhtajoki, a tributary, which runs to river Vantaa between Vantaa3 & Vantaa4; downstream WWTP Klaukkala and the landfill site Metsä-Tuomela
1
FI5 Vantaa4 Vantaa 4,2 (ca 4 km up from river mouth) 3
FI6 Matins Matinsilta, estuary site close to river mouth, sampling at 1-m from surface; sampes taken from a bridge over the estuary bay / from icehole in winter
3
FI7 Vanhank. Vanhankaupunginselkä; estuary area for river Vantaa, sampling site about 2 km from river mouth, sampling at 1-m depth
2
FI-BSE1 WWTP pipe Helsinki coast at the outlet of WWTP Viikinmäki pipe (16 km long pipe) in the bottom; sampling at mid-depth
1
F-BSE2 Katajaluoto "Katajaluoto 125", a coastal site about a nautical mile from the WWTP outlet; sampling depths 1-m (surface), midle-depth and 1-m from bottom
2 x 3

216
Measured API concentrations in the 81 surface water samples are presented in the following tables.
Estonia 1/2 Site code EE1 EE1 EE2 EE2 E-BSE0 E-BSE1
Surface water type river River River river river
mouth sea
Date dd.mm.yy 6.12.17 4.6.18 6.12.17 4.6.18 13.12.17 6.6.18
N cordinates L-Est 97 58.883306 58.753609 58.389707 58.355054
E cordinates L-Est 97 25.57894 25.321941 24.496484 24.42677 API API group Unit Pärnu1 Pärnu2 Pärnu3 Pärnu bay
Amlodipine Antihypertensives ng/L <7.7 <7.7 <7.7 <7.7 <0.003 1.7 Atenolol Other cardiovascular med. ng/L <12 <12 <12 <12 <8.0 <8.0 Atorvastatin Metabolic disease med. ng/L <15 <15 <15 <15 N/A N/A Bezafibrate Metabolic disease med. ng/L <0.83 <0.83 <0.83 <0.83 <0.40 <0.40 Bisoprolol Other cardiovascular med. ng/L <0.52 <0.52 <0.52 <0.52 <0.21 <0.21 Caffeine Other ng/L 46 18 160 6.6 2.5 <0.24 Candesartan Antihypertensives ng/L <0.68 2.1 <0.68 <0.68 <0.22 <0.22 Carbamazepine Antiepileptics ng/L 1.0 3.4 2.3 26 0.56 1.2 Carprofen Veterinary medicines ng/L <0.77 <0.77 9.8 <0.77 <0.58 <0.58 Cetirizine Asthma and allergy med. ng/L 0.25 0.53 0.28 <0.11 0.04 0.2 Ciprofloxacin Antibiotics ng/L N/A N/A N/A N/A <35 <35 Citalopram Psycopharmaceuticals ng/L 0.32 <0.06 0.56 3.7 <0.04 <0.04 Clarithromycin Antibiotics ng/L 5.0 <1.0 3.5 <1.0 <0.33 <0.33 Codeine NSAIDs and analgesics ng/L N/A <0.07 N/A <0.07 0.08 <0.01 Diclofenac NSAIDs and analgesics ng/L 11 11 53 28 3.3 <0.34 Dipyridamole Other cardiovascular med. ng/L <1,1 <1.1 <1.1 <1.1 <0.67 <0.67 Emamectin Veterinary medicines ng/L 1.0 <0.09 0.42 <0.09 <0.02 1.2 Enalapril Antihypertensives ng/L <2,8 <2.8 <2.8 <2.8 N/A N/A Eprosartan Antihypertensives ng/L <0.22 <0.22 <0.22 <0.22 N/A N/A Erythromycin Antibiotics ng/L N/A N/A N/A N/A <0.92 <0.92 Estrone (E1) Hormones ng/L <0.70 <0.70 <0.70 <0.70 0.80 1.7 Fenbendazole veterinary medicines ng/L 0.13 <0.07 0.10 <0.07 <0.03 <0.03 Fexofenadine asthma and allergy med. ng/L <0.09 0.85 <0.09 0.21 N/A N/A Fluconazole Antibiotics ng/L 0.90 <0.05 <0.05 6.2 <0.25 <0.25 Fluticasone Asthma and allergy med. ng/L 0.08 <0.06 <0.06 <0.06 <0.002 <0.002 Gabapentin Antiepileptics ng/L 280 <0.88 50 <0.88 N/A N/A Gemfibrozil Metabolic disease med. ng/L 3.1 <1.5 <1.5 <1.5 0.84 <0.02 Irbesartan Antihypertensives ng/L <0.06 <0.06 <0.06 <0.06 <0.02 <0.02 Ketoprofen NSAIDs and analgesics ng/L 1.4 <0.72 2.1 <0.72 <0.38 <0.38 Levetiracetam Antiepileptics ng/L 3.9 9.5 5.3 120 <5.4 <5.4 Lincomycin Antibiotics ng/L <0.10 <0.10 <0.10 <0.10 <0.04 <0.04 Losartan Antihypertensives ng/L 0.20 <0.14 0.17 <0.14 <0.02 0.17 Mesalazine Gastrointestinal disease
m. ng/L N/A N/A N/A N/A 157 33
Metformin Metabolic disease med. ng/L 23 <0.24 83 78 87 9.1 Metoprolol Other cardiovascular med. ng/L 1.1 <0.54 6.0 6.1 <0.35 <0.35 Mometasone furoate
Asthma and allergy med. ng/L 10 28 <1.3 <1.3 <0.29 <0.29
Naproxen NSAIDs and analgesics ng/L 5.3 1.0 9.7 1.6 12 1.3 Nebivolol Other cardiovascular med. ng/L 1.3 <0.052 0.84 <0.052 0.17 1.9 Norethisterone Hormones ng/L <0.08 <0.080 1.3 0.39 <0.04 <0.04 Ofloxacin Antibiotics ng/L <10 <10 <10 <10 <4.2 <4.2 Oxazepam Psycopharmaceuticals ng/L N/A <0.033 N/A 1.2 0.11 <0.03 Oxycodone NSAIDs and analgesics ng/L N/A <0.042 N/A 2.0 <0.03 <0.03 Primidone Antiepileptics ng/L <1,4 <1.37 <1.37 <1.37 <0.71 <0.71 Progesterone Hormones ng/L 1.4 <0.086 0.11 <0.086 <0.03 <0.03 Quetiapine Psycopharmaceuticals ng/L <0.15 <0.15 <0.15 <0.15 <0.01 <0.01 Ramipril Antihypertensives ng/L <0.72 <0.72 <0.72 <0.72 N/A N/A Sertraline Psycopharmaceuticals ng/L 0.39 <0.04 0.40 5.0 <0.03 <0.03 Simvastatin Metabolic disease med. ng/L N/A N/A N/A N/A <0.02 <0.02 Sotalol Other cardiovascular med. ng/L <0.89 <0.89 <0.89 <0.89 <0.68 <0.68 Sulfadiazine Antibiotics ng/L <17 <17 <17 <17 N/A N/A Telmisartan Antihypertensives ng/L 4.3 18 4.9 9.4 N/A N/A Temazepam Psycopharmaceuticals ng/L N/A <0.36 N/A <0.36 <0.34 <0.34 Testosterone Hormones ng/L <0.08 <0.080 0.10 <0.080 <0.05 <0.05 Tetracycline / Doxycycline
Antibiotics ng/L <5.7 <5.7 <5.7 <5.7 4.9 <3.2
N/A: not analysed; Concentration lower than quantification limit (LOQ) are marked as “<” and LOQ

217
Estonia 2/2 Site code EE1 EE1 EE2 EE2 E-BSE0 E-BSE1
Surface water type river River River river river
mouth sea
Date dd.mm.yy 6.12.17 4.6.18 6.12.17 4.6.18 13.12.17 6.6.18
N cordinates L-Est 97 58.883306 58.753609 58.389707 58.355054
E cordinates L-Est 97 25.57894 25.321941 24.496484 24.42677 API API group Unit Pärnu1 Pärnu2 Pärnu3 Pärnu bay
Tiamulin Veterinary medicines ng/L 0.56 <0.079 0.45 <0.079 <0.01 0.22 Toltrazuril Veterinary medicines ng/L <4.8 <4.8 <4.8 <4.8 <3.60 <3.60 Tramadol NSAIDs and analgesics ng/L 0.39 0.93 0.60 18 0.08 <0.02 Trimethoprim Antibiotics ng/L <0.37 <0.37 0.69 1.2 <0.17 0.39 Tylosin Veterinary medicines ng/L 20 <3.7 20 <3.7 <1.9 <1.9 Valsartan Antihypertensives ng/L <6.4 <6.4 <6.4 <6.4 N/A N/A Warfarin Other cardiovascular med. ng/L <0.87 <0.87 <0.87 <0.87 <0.58 <0.58 Venlafaxine Psycopharmaceuticals ng/L 0.16 0.21 0.25 13 <0.03 <0.03 Xylometazoline Asthma and allergy medi. ng/L 1.8 <0.05 1.8 <0.05 <0.19 <0.19
Sum concentration ng/L 424 93 418 325 268 50 Number of detected / analysed APIs 28/54 12/58 28/54 18/58 14/53 11/53
N/A: not analysed; Concentration lower than quantification limit (LOQ) are marked as “<” and LOQ

218
Poland Site code PL2 PL2 PL1 PL1 PL-BSE PL-BSE
Surface water type River river river river estuary estuary
Date dd.mm.yy 29.11.17 18.7.18 29.11.17 18.7.18 21.11.17 23.7.18
N coordinates WGS84 52.195026 52.198344 54.256980 E coordinates WGS84 20.609962 20.604209 18.946839
API API group Unit Rokitnica1 Rokitnica2 Vistula mouth
Amlodipine Antihypertensives ng/L <7.7 <7.7 <7.7 <7.7 <0.003 1.8 Atenolol Other cardiovascular med. ng/L <12 <12 52 <12 <8.0 <8.0 Atorvastatin Metabolic disease med. ng/L 210 17 <15 <15 N/A N/A Bezafibrate Metabolic disease med. ng/L <0.83 <0.83 <0.83 <0.83 <0.40 <0.40 Bisoprolol Other cardiovascular med. ng/L 2.7 15 52 16 0.49 <0.21 Caffeine Other ng/L 400 41 <0.75 32 5.8 7.9 Candesartan Antihypertensives ng/L 12 <0.68 19 <0.68 1.1 <0.22 Carbamazepine Antiepileptics ng/L 35 320 920 920 9.2 60 Carprofen Veterinary medicines ng/L 2.8 1.8 8.2 2.5 <0.58 <0.58 Cetirizine Asthma and allergy med. ng/L 11 110 310 240 3.1 17 Ciprofloxacin Antibiotics ng/L N/A N/A N/A N/A <35 <35 Citalopram Psycopharmaceuticals ng/L 4.1 2.9 24 26 0.20 0.46 Clarithromycin Antibiotics ng/L 19 8.3 590 65 0.38 0.59 Codeine NSAIDs and analgesics ng/L 0.65 2.3 9.4 2.6 0.26 0.11 Diclofenac NSAIDs and analgesics ng/L 62 730 2200 2100 12 1.3 Dipyridamole Other cardiovascular med. ng/L <1.1 <1.1 <1.1 <1.1 <0.67 <0.67 Emamectin Veterinary medicines ng/L 0.54 <0.09 0.17 <0.09 <0.02 1.6 Enalapril Antihypertensives ng/L <2.8 <2.8 <2.8 <2.8 N/A N/A Eprosartan Antihypertensives ng/L <0.22 <0.22 0.23 <0.22 N/A N/A Erythromycin Antibiotics ng/L N/A N/A N/A N/A 8.4 <0.92 Estrone (E1) Hormones ng/L <0.70 2.8 <0.70 1.8 0.25 <0.17 Fenbendazole Veterinary medicines ng/L 0.23 <0.07 0.25 <0.07 <0.03 <0.03 Fexofenadine Asthma and allergy med. ng/L 21 350 340 520 N/A N/A Fluconazole Antibiotics ng/L 6.9 130 280 270 3.5 7.4 Fluticasone Asthma and allergy med. ng/L <0.06 <0.06 0.27 <0.06 0.02 <0.002 Gabapentin Antiepileptics ng/L 35 600 1900 1200 N/A N/A Gemfibrozil Metabolic disease med. ng/L <1.5 4.3 73 2.5 1.4 2.3 Irbesartan Antihypertensives ng/L 0.20 7.0 0.80 3.1 1.5 0.12 Ketoprofen NSAIDs and analgesics ng/L 12 2.4 280 3.0 0.45 3.9 Levetiracetam Antiepileptics ng/L <3.5 <3.5 60 <3.5 <5.4 <5.4 Lincomycin Antibiotics ng/L 0.24 2.6 7.0 9.4 0.55 0.57 Losartan Antihypertensives ng/L 3.5 97 110 44 0.6 0.78 Mesalazine Gastrointestinal disease m. ng/L N/A N/A N/A N/A <0.82 71 Metformin Metabolic disease medi. ng/L 220 220 290 330 11 80 Metoprolol Other cardiovascular m. ng/L 4.6 50 290 170 1.9 <0.35 Mometasone furoate
Asthma and allergy med. ng/L <1.3 <1.3 <1.3 <1.3 0.36 <0.29
Naproxen NSAIDs and analgesics ng/L 27 8.2 56 5.7 1.4 1.8 Nebivolol Other cardiovascular medi. ng/L 1.2 <0.052 2.2 0.34 0.02 1.7 Norethisterone Hormones ng/L 0.70 <0.080 <0.080 <0.080 <0.04 1.2 Ofloxacin Antibiotics ng/L 61 <10 36 <10 <4.2 <4.2 Oxazepam Psycopharmaceuticals ng/L <0.033 3.9 14 12 0.2 0.92 Oxycodone NSAIDs and analgesics ng/L 0.17 <0.042 1.2 <0.042 <0.03 <0.03 Primidone Antiepileptics ng/L 2.0 31 11 12 <0.71 1.5 Progesterone Hormones ng/L 0.89 <0.086 0.75 <0.086 <0.03 <0.03 Quetiapine Psycopharmaceuticals ng/L 1.2 <0.15 0.64 <0.15 0.2 <0.01 Ramipril Antihypertensives ng/L <0.72 18 11 3.64 N/A N/A Sertraline Psycopharmaceuticals ng/L 0.78 <0.04 5.6 5.40 0.03 <0.03 Simvastatin Metabolic disease med. ng/L N/A N/A N/A N/A 0.11 <0.02 Sotalol Other cardiovascular med. ng/L 7.3 94 190 91 2.3 1.3 Sulfadiazine Antibiotics ng/L <17 <17 <17 <17 N/A N/A Telmisartan Antihypertensives ng/L 99 1200 2800 2500 N/A N/A Temazepam Psycopharmaceuticals ng/L 1.1 7.1 12 12 <0.34 2.4 Testosterone Hormones ng/L 0.48 <0.080 0.40 <0.080 <0.05 <0.05 Tetracycline/ Doxycycline
Antibiotics ng/L <5.7 <5.7 <5.7 <5.7 <3.17 3.4
Tiamulin Veterinary medicines ng/L 0.21 <0.079 0.11 <0.079 0.01 0.52 Toltrazuril Veterinary medicines ng/L <4.8 <4.8 <4.8 <4.8 <3.60 <3.60 Tramadol NSAIDs and analgesics ng/L 10 320 550 690 3.7 8.5 Trimethoprim Antibiotics ng/L <0.37 <0.37 54 25 <0.17 0.26 Tylosin Veterinary medicines ng/L <3.7 <3.7 <3.7 <3.7 <1.9 <1.9 Valsartan Antihypertensives ng/L 40 45 30 24 N/A N/A Warfarin Other cardiovascular med. ng/L <0.87 <0.87 <0.87 1.1 <0.58 <0.58 Venlafaxine Psycopharmaceuticals ng/L 2.9 34 120 100 0.72 <0.03 Xylometazoline Asthma and allergy medi. ng/L 0.43 1.1 3.8 2.0 <0.19 <0.19
Sum concentration ng/L 1319 4477 11715 9442 71 278 Number of detected / analysed APIs 40/58 32/58 45/58 35/58 31/53 27/53
N/A: not analysed; Concentration lower than quantification limit (LOQ) are marked as “<” and LOQ
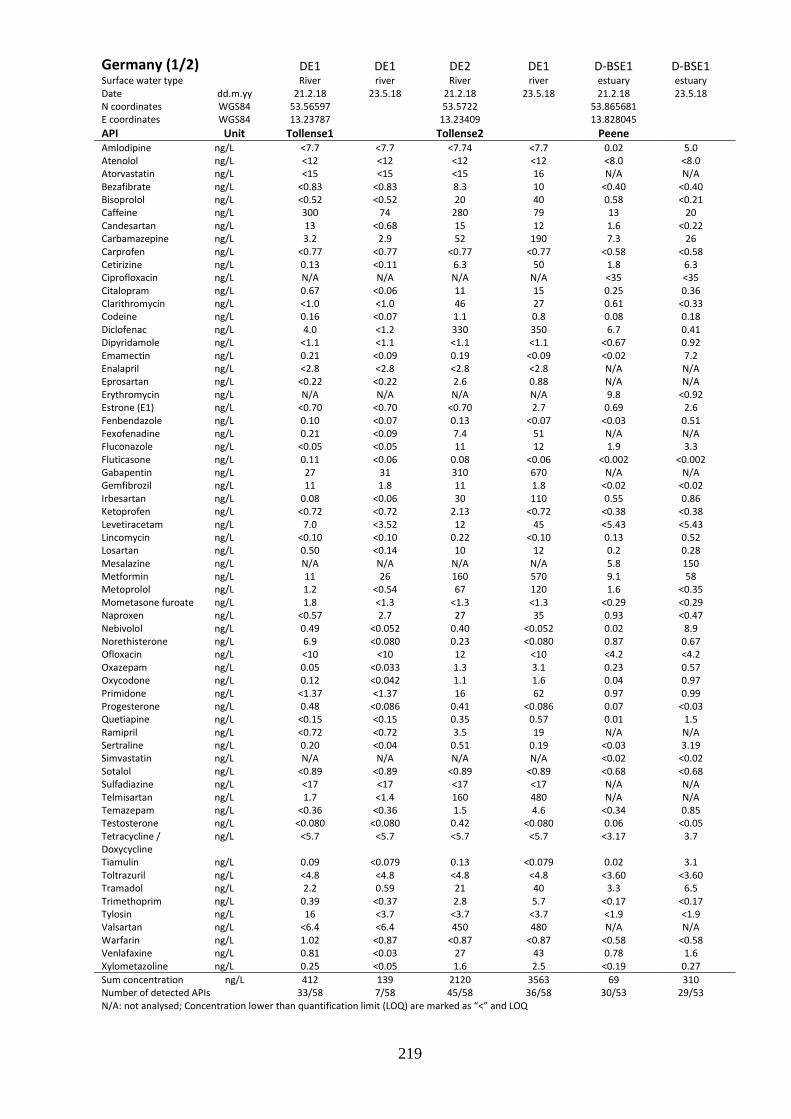
219
Germany (1/2) DE1 DE1 DE2 DE1 D-BSE1 D-BSE1 Surface water type River river River river estuary estuary Date dd.m.yy 21.2.18 23.5.18 21.2.18 23.5.18 21.2.18 23.5.18 N coordinates WGS84 53.56597 53.5722 53.865681 E coordinates WGS84 13.23787 13.23409 13.828045 API Unit Tollense1 Tollense2 Peene Amlodipine ng/L <7.7 <7.7 <7.74 <7.7 0.02 5.0 Atenolol ng/L <12 <12 <12 <12 <8.0 <8.0 Atorvastatin ng/L <15 <15 <15 16 N/A N/A Bezafibrate ng/L <0.83 <0.83 8.3 10 <0.40 <0.40 Bisoprolol ng/L <0.52 <0.52 20 40 0.58 <0.21 Caffeine ng/L 300 74 280 79 13 20 Candesartan ng/L 13 <0.68 15 12 1.6 <0.22 Carbamazepine ng/L 3.2 2.9 52 190 7.3 26 Carprofen ng/L <0.77 <0.77 <0.77 <0.77 <0.58 <0.58 Cetirizine ng/L 0.13 <0.11 6.3 50 1.8 6.3 Ciprofloxacin ng/L N/A N/A N/A N/A <35 <35 Citalopram ng/L 0.67 <0.06 11 15 0.25 0.36 Clarithromycin ng/L <1.0 <1.0 46 27 0.61 <0.33 Codeine ng/L 0.16 <0.07 1.1 0.8 0.08 0.18 Diclofenac ng/L 4.0 <1.2 330 350 6.7 0.41 Dipyridamole ng/L <1.1 <1.1 <1.1 <1.1 <0.67 0.92 Emamectin ng/L 0.21 <0.09 0.19 <0.09 <0.02 7.2 Enalapril ng/L <2.8 <2.8 <2.8 <2.8 N/A N/A Eprosartan ng/L <0.22 <0.22 2.6 0.88 N/A N/A Erythromycin ng/L N/A N/A N/A N/A 9.8 <0.92 Estrone (E1) ng/L <0.70 <0.70 <0.70 2.7 0.69 2.6 Fenbendazole ng/L 0.10 <0.07 0.13 <0.07 <0.03 0.51 Fexofenadine ng/L 0.21 <0.09 7.4 51 N/A N/A Fluconazole ng/L <0.05 <0.05 11 12 1.9 3.3 Fluticasone ng/L 0.11 <0.06 0.08 <0.06 <0.002 <0.002 Gabapentin ng/L 27 31 310 670 N/A N/A Gemfibrozil ng/L 11 1.8 11 1.8 <0.02 <0.02 Irbesartan ng/L 0.08 <0.06 30 110 0.55 0.86 Ketoprofen ng/L <0.72 <0.72 2.13 <0.72 <0.38 <0.38 Levetiracetam ng/L 7.0 <3.52 12 45 <5.43 <5.43 Lincomycin ng/L <0.10 <0.10 0.22 <0.10 0.13 0.52 Losartan ng/L 0.50 <0.14 10 12 0.2 0.28 Mesalazine ng/L N/A N/A N/A N/A 5.8 150 Metformin ng/L 11 26 160 570 9.1 58 Metoprolol ng/L 1.2 <0.54 67 120 1.6 <0.35 Mometasone furoate ng/L 1.8 <1.3 <1.3 <1.3 <0.29 <0.29 Naproxen ng/L <0.57 2.7 27 35 0.93 <0.47 Nebivolol ng/L 0.49 <0.052 0.40 <0.052 0.02 8.9 Norethisterone ng/L 6.9 <0.080 0.23 <0.080 0.87 0.67 Ofloxacin ng/L <10 <10 12 <10 <4.2 <4.2 Oxazepam ng/L 0.05 <0.033 1.3 3.1 0.23 0.57 Oxycodone ng/L 0.12 <0.042 1.1 1.6 0.04 0.97 Primidone ng/L <1.37 <1.37 16 62 0.97 0.99 Progesterone ng/L 0.48 <0.086 0.41 <0.086 0.07 <0.03 Quetiapine ng/L <0.15 <0.15 0.35 0.57 0.01 1.5 Ramipril ng/L <0.72 <0.72 3.5 19 N/A N/A Sertraline ng/L 0.20 <0.04 0.51 0.19 <0.03 3.19 Simvastatin ng/L N/A N/A N/A N/A <0.02 <0.02 Sotalol ng/L <0.89 <0.89 <0.89 <0.89 <0.68 <0.68 Sulfadiazine ng/L <17 <17 <17 <17 N/A N/A Telmisartan ng/L 1.7 <1.4 160 480 N/A N/A Temazepam ng/L <0.36 <0.36 1.5 4.6 <0.34 0.85 Testosterone ng/L <0.080 <0.080 0.42 <0.080 0.06 <0.05 Tetracycline / Doxycycline
ng/L <5.7 <5.7 <5.7 <5.7 <3.17 3.7
Tiamulin ng/L 0.09 <0.079 0.13 <0.079 0.02 3.1 Toltrazuril ng/L <4.8 <4.8 <4.8 <4.8 <3.60 <3.60 Tramadol ng/L 2.2 0.59 21 40 3.3 6.5 Trimethoprim ng/L 0.39 <0.37 2.8 5.7 <0.17 <0.17 Tylosin ng/L 16 <3.7 <3.7 <3.7 <1.9 <1.9 Valsartan ng/L <6.4 <6.4 450 480 N/A N/A Warfarin ng/L 1.02 <0.87 <0.87 <0.87 <0.58 <0.58 Venlafaxine ng/L 0.81 <0.03 27 43 0.78 1.6 Xylometazoline ng/L 0.25 <0.05 1.6 2.5 <0.19 0.27
Sum concentration ng/L 412 139 2120 3563 69 310 Number of detected APIs 33/58 7/58 45/58 36/58 30/53 29/53
N/A: not analysed; Concentration lower than quantification limit (LOQ) are marked as “<” and LOQ

220
Germany (2/2) DE3 DE3 D-BSE2 D-BSE2
Surface water type river river estuary estuary Date dd.mm.yy 22.2.18 23.5.18 22.2.18 24.5.18 N coordinates WGS84 54.09117 54.18652 E coordinates WGS84 12.15395 12.08725 API API group Unit Warnow1 Warnow2 Amlodipine Antihypertensives ng/L <7.7 <7.7 <0.003 2.7 Atenolol Other cardiovascular med. ng/L <12 <12 <8.0 <8.0 Atorvastatin Metabolic disease med. ng/L <15 <15 N/A N/A Bezafibrate Metabolic disease med. ng/L 13 <0.83 0.59 0.43 Bisoprolol Other cardiovascular m. ng/L 26 0.87 0.77 0.67 Caffeine Other ng/L 130 50 4.1 42 Candesartan Antihypertensives ng/L 15 8 1.6 <0.22 Carbamazepine Antiepileptics ng/L 52 20 1.5 5.5 Carprofen Veterinary medicines ng/L 3.7 1.5 <0.58 <0.58 Cetirizine Asthma and allergy med. ng/L 6.3 3.8 0.24 2.1 Ciprofloxacin Antibiotics ng/L N/A N/A <35 <35 Citalopram Psycopharmaceuticals ng/L 11 1.0 0.28 0.15 Clarithromycin Antibiotics ng/L 46 1.6 0.52 <0.33 Codeine NSAIDs and analgesics ng/L 1.13 <0.07 0.08 <0.01 Diclofenac NSAIDs and analgesics ng/L 490 21 4.5 0.82 Dipyridamole Other cardiovascular m. ng/L <1.1 <1.1 <0.67 <0.67 Emamectin Veterinary medicines ng/L 0.19 <0.09 <0.02 4.6 Enalapril Antihypertensives ng/L <2.8 <2.8 N/A N/A Eprosartan Antihypertensives ng/L 3.82 <0.22 N/A N/A Erythromycin Antibiotics ng/L N/A N/A 11 <0.92 Estrone (E1) Hormones ng/L <0.70 <0.70 <0.17 5.4 Fenbendazole Veterinary medicines ng/L 0.13 <0.07 <0.03 <0.03 Fexofenadine Asthma and allergy med. ng/L 7.4 1.3 N/A N/A Fluconazole Antibiotics ng/L 11 <0.05 0.25 0.30 Fluticasone Asthma and allergy med. ng/L 0.08 <0.06 <0.002 <0.002 Gabapentin Antiepileptics ng/L 450 60 N/A N/A Gemfibrozil Metabolic disease med. ng/L 11 <1.5 25 1.9 Irbesartan Antihypertensives ng/L 30 3.5 0.45 0.93 Ketoprofen NSAIDs and analgesics ng/L 2.78 <0.72 <0.38 <0.38 Levetiracetam Antiepileptics ng/L 12 5.47 <5.43 <5.43 Lincomycin Antibiotics ng/L 0.22 <0.10 0.05 <0.04 Losartan Antihypertensives ng/L 10.0 <0.14 <0.02 0.28 Mesalazine Gastrointestinal disease m. ng/L N/A N/A 2.3 100 Metformin Metabolic disease medi. ng/L 200 230 3.2 <0.12 Metoprolol Other cardiovascular m. ng/L 83 6.7 0.99 <0.35 Mometasone furoate
Asthma and allergy med. ng/L <1.3 <1.3 <0.29 <0.29
Naproxen NSAIDs and analgesics ng/L 30 <0.57 <0.47 <0.47 Nebivolol Other cardiovascular m. ng/L 0.40 0.23 0.02 4.3 Norethisterone Hormones ng/L 0.23 0.68 <0.04 <0.04 Ofloxacin Antibiotics ng/L <10 <10 <4.2 <4.2 Oxazepam Psycopharmaceuticals ng/L 1.3 0.45 0.07 <0.03 Oxycodone NSAIDs and analgesics ng/L 1.1 <0.042 0.05 <0.03 Primidone Antiepileptics ng/L 19 5.9 0.83 1.3 Progesterone Hormones ng/L 0.41 <0.086 0.04 <0.03 Quetiapine Psycopharmaceuticals ng/L 0.35 <0.15 0.01 <0.01 Ramipril Antihypertensives ng/L 4.90 <0.72 N/A N/A Sertraline Psycopharmaceuticals ng/L 0.51 0.45 <0.03 <0.03 Simvastatin Metabolic disease med. ng/L N/A N/A <0.02 <0.02 Sotalol Other cardiovascular med. ng/L <0.89 <0.89 <0.68 <0.68 Sulfadiazine Antibiotics ng/L <17 <17 N/A N/A Telmisartan Antihypertensives ng/L 160 24 N/A N/A Temazepam Psycopharmaceuticals ng/L 1.5 <0.36 <0.34 <0.34 Testosterone Hormones ng/L 0.42 <0.080 0.08 <0.05 Tetracycline / Doxycycline
Antibiotics ng/L <5.7 <5.7 <3.17 4.9
Tiamulin Veterinary medicines ng/L 0.13 <0.079 0.01 <0.01 Toltrazuril Veterinary medicines ng/L <4.8 <4.8 <3.60 <3.60 Tramadol NSAIDs and analgesics ng/L 21 6.5 0.55 1.2 Trimethoprim Antibiotics ng/L 3.5 <0.37 <0.17 <0.17 Tylosin Veterinary medicines ng/L 20 <3.7 2.38 <1.9 Valsartan Antihypertensives ng/L 510 21 N/A N/A Warfarin Other cardiovascular m. ng/L <0.87 <0.87 <0.58 <0.58 Venlafaxine Psycopharmaceuticals ng/L 27 4.2 0.47 <0.03 Xylometazoline Asthma and allergy medi. ng/L 1.6 <0.05 <0.19 <0.19
Sum concentration ng/L 2418 478 62 177 Number of detected / analysed APIs 46/58 24/58 29/53 18/53
N/A: not analysed; Concentration lower than quantification limit (LOQ) are marked as “<” and LOQ
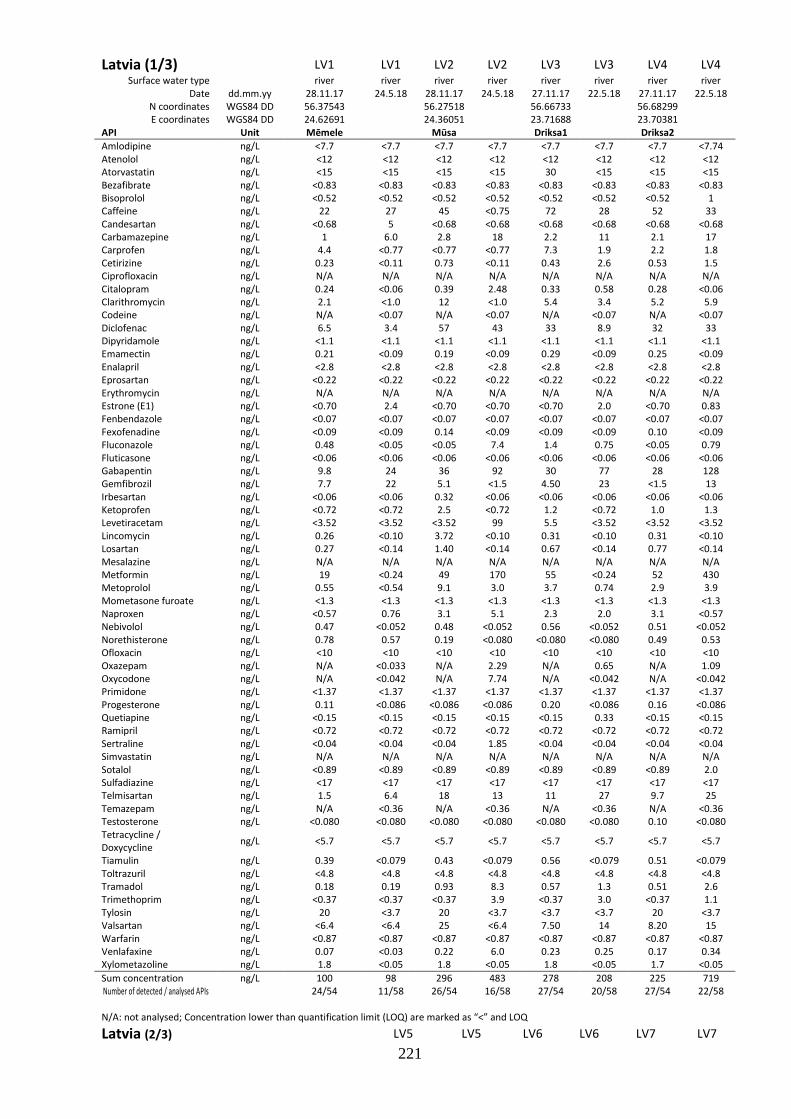
221
Latvia (1/3) LV1 LV1 LV2 LV2 LV3 LV3 LV4 LV4 Surface water type river river river river river river river river
Date dd.mm.yy 28.11.17 24.5.18 28.11.17 24.5.18 27.11.17 22.5.18 27.11.17 22.5.18 N coordinates WGS84 DD 56.37543 56.27518 56.66733 56.68299
E coordinates WGS84 DD 24.62691 24.36051 23.71688 23.70381
API Unit Mēmele Mūsa Driksa1 Driksa2
Amlodipine ng/L <7.7 <7.7 <7.7 <7.7 <7.7 <7.7 <7.7 <7.74 Atenolol ng/L <12 <12 <12 <12 <12 <12 <12 <12 Atorvastatin ng/L <15 <15 <15 <15 30 <15 <15 <15 Bezafibrate ng/L <0.83 <0.83 <0.83 <0.83 <0.83 <0.83 <0.83 <0.83 Bisoprolol ng/L <0.52 <0.52 <0.52 <0.52 <0.52 <0.52 <0.52 1 Caffeine ng/L 22 27 45 <0.75 72 28 52 33 Candesartan ng/L <0.68 5 <0.68 <0.68 <0.68 <0.68 <0.68 <0.68 Carbamazepine ng/L 1 6.0 2.8 18 2.2 11 2.1 17 Carprofen ng/L 4.4 <0.77 <0.77 <0.77 7.3 1.9 2.2 1.8 Cetirizine ng/L 0.23 <0.11 0.73 <0.11 0.43 2.6 0.53 1.5 Ciprofloxacin ng/L N/A N/A N/A N/A N/A N/A N/A N/A Citalopram ng/L 0.24 <0.06 0.39 2.48 0.33 0.58 0.28 <0.06 Clarithromycin ng/L 2.1 <1.0 12 <1.0 5.4 3.4 5.2 5.9 Codeine ng/L N/A <0.07 N/A <0.07 N/A <0.07 N/A <0.07 Diclofenac ng/L 6.5 3.4 57 43 33 8.9 32 33 Dipyridamole ng/L <1.1 <1.1 <1.1 <1.1 <1.1 <1.1 <1.1 <1.1 Emamectin ng/L 0.21 <0.09 0.19 <0.09 0.29 <0.09 0.25 <0.09 Enalapril ng/L <2.8 <2.8 <2.8 <2.8 <2.8 <2.8 <2.8 <2.8 Eprosartan ng/L <0.22 <0.22 <0.22 <0.22 <0.22 <0.22 <0.22 <0.22 Erythromycin ng/L N/A N/A N/A N/A N/A N/A N/A N/A Estrone (E1) ng/L <0.70 2.4 <0.70 <0.70 <0.70 2.0 <0.70 0.83 Fenbendazole ng/L <0.07 <0.07 <0.07 <0.07 <0.07 <0.07 <0.07 <0.07 Fexofenadine ng/L <0.09 <0.09 0.14 <0.09 <0.09 <0.09 0.10 <0.09 Fluconazole ng/L 0.48 <0.05 <0.05 7.4 1.4 0.75 <0.05 0.79 Fluticasone ng/L <0.06 <0.06 <0.06 <0.06 <0.06 <0.06 <0.06 <0.06 Gabapentin ng/L 9.8 24 36 92 30 77 28 128 Gemfibrozil ng/L 7.7 22 5.1 <1.5 4.50 23 <1.5 13 Irbesartan ng/L <0.06 <0.06 0.32 <0.06 <0.06 <0.06 <0.06 <0.06 Ketoprofen ng/L <0.72 <0.72 2.5 <0.72 1.2 <0.72 1.0 1.3 Levetiracetam ng/L <3.52 <3.52 <3.52 99 5.5 <3.52 <3.52 <3.52 Lincomycin ng/L 0.26 <0.10 3.72 <0.10 0.31 <0.10 0.31 <0.10 Losartan ng/L 0.27 <0.14 1.40 <0.14 0.67 <0.14 0.77 <0.14 Mesalazine ng/L N/A N/A N/A N/A N/A N/A N/A N/A Metformin ng/L 19 <0.24 49 170 55 <0.24 52 430 Metoprolol ng/L 0.55 <0.54 9.1 3.0 3.7 0.74 2.9 3.9 Mometasone furoate ng/L <1.3 <1.3 <1.3 <1.3 <1.3 <1.3 <1.3 <1.3 Naproxen ng/L <0.57 0.76 3.1 5.1 2.3 2.0 3.1 <0.57 Nebivolol ng/L 0.47 <0.052 0.48 <0.052 0.56 <0.052 0.51 <0.052 Norethisterone ng/L 0.78 0.57 0.19 <0.080 <0.080 <0.080 0.49 0.53 Ofloxacin ng/L <10 <10 <10 <10 <10 <10 <10 <10 Oxazepam ng/L N/A <0.033 N/A 2.29 N/A 0.65 N/A 1.09 Oxycodone ng/L N/A <0.042 N/A 7.74 N/A <0.042 N/A <0.042 Primidone ng/L <1.37 <1.37 <1.37 <1.37 <1.37 <1.37 <1.37 <1.37 Progesterone ng/L 0.11 <0.086 <0.086 <0.086 0.20 <0.086 0.16 <0.086 Quetiapine ng/L <0.15 <0.15 <0.15 <0.15 <0.15 0.33 <0.15 <0.15 Ramipril ng/L <0.72 <0.72 <0.72 <0.72 <0.72 <0.72 <0.72 <0.72 Sertraline ng/L <0.04 <0.04 <0.04 1.85 <0.04 <0.04 <0.04 <0.04 Simvastatin ng/L N/A N/A N/A N/A N/A N/A N/A N/A Sotalol ng/L <0.89 <0.89 <0.89 <0.89 <0.89 <0.89 <0.89 2.0 Sulfadiazine ng/L <17 <17 <17 <17 <17 <17 <17 <17 Telmisartan ng/L 1.5 6.4 18 13 11 27 9.7 25 Temazepam ng/L N/A <0.36 N/A <0.36 N/A <0.36 N/A <0.36 Testosterone ng/L <0.080 <0.080 <0.080 <0.080 <0.080 <0.080 0.10 <0.080 Tetracycline / Doxycycline
ng/L <5.7 <5.7 <5.7 <5.7 <5.7 <5.7 <5.7 <5.7
Tiamulin ng/L 0.39 <0.079 0.43 <0.079 0.56 <0.079 0.51 <0.079 Toltrazuril ng/L <4.8 <4.8 <4.8 <4.8 <4.8 <4.8 <4.8 <4.8 Tramadol ng/L 0.18 0.19 0.93 8.3 0.57 1.3 0.51 2.6 Trimethoprim ng/L <0.37 <0.37 <0.37 3.9 <0.37 3.0 <0.37 1.1 Tylosin ng/L 20 <3.7 20 <3.7 <3.7 <3.7 20 <3.7 Valsartan ng/L <6.4 <6.4 25 <6.4 7.50 14 8.20 15 Warfarin ng/L <0.87 <0.87 <0.87 <0.87 <0.87 <0.87 <0.87 <0.87 Venlafaxine ng/L 0.07 <0.03 0.22 6.0 0.23 0.25 0.17 0.34 Xylometazoline ng/L 1.8 <0.05 1.8 <0.05 1.8 <0.05 1.7 <0.05
Sum concentration ng/L 100 98 296 483 278 208 225 719 Number of detected / analysed APIs 24/54 11/58 26/54 16/58 27/54 20/58 27/54 22/58
N/A: not analysed; Concentration lower than quantification limit (LOQ) are marked as “<” and LOQ Latvia (2/3) LV5 LV5 LV6 LV6 LV7 LV7

222
Surface water type river river river river river river
Date dd.mm.yy 1.12.17 21.5.18 27.11.17 21.5.18 27.11.17 22.5.18
N cordinates WGS84 DD 56.77263 56.77263 56.811603
E cordinates WGS84 DD 23.91336 23.91336 23.578999
API API group unit Pupla1 Pupla2 Lielupe
Amlodipine Antihypertensives ng/L <7.7 <7.7 <7.7 <7.7 <0.038 <0.038 Atenolol Other cardiovascular
med. ng/L <12 <12 <12 <12 <0.82 <0.82
Atorvastatin Metabolic disease m. ng/L <15 <15 1100 260 N/A N/A Bezafibrate Metabolic disease m. ng/L <0.83 <0.83 <0.83 <0.83 <0.042 <0.042 Bisoprolol Other cardiovascular m. ng/L <0.52 <0.52 13 22 <0.20 <0.20 Caffeine Other ng/L 26 <0.75 37 11 0.20 2.4 Candesartan Antihypertensives ng/L <0.68 4 2 10 <0.027 <0.027 Carbamazepine Antiepileptics ng/L <0.005 0 13 110 0.08 1.7 Carprofen Veterinary medicines ng/L 9.3 3.3 <0.77 2.6 <5.4 <5.4 Cetirizine Asthma and allergy m. ng/L 0.13 <0.11 2.5 15 <0.003 0.07 Ciprofloxacin Antibiotics ng/L N/A N/A N/A N/A <3.5 <3.5 Citalopram Psycopharmaceuticals ng/L 0.22 <0.06 1.2 8.8 <0.042 <0.042 Clarithromycin Antibiotics ng/L 1.7 <1.0 28 100 0.004 0.57 Codeine NSAIDs and analgesics ng/L N/A <0.07 N/A 2.4 <0.017 0.08 Diclofenac NSAIDs and analgesics ng/L 490 300 860 1100 <0.50 7.4 Dipyridamole Other cardiovascular m. ng/L <1.1 <1.1 <1.1 <1.1 <0.78 <0.78 Emamectin Veterinary medicines ng/L 0.15 <0.09 0.14 0.37 <1.8 <1.8 Enalapril Antihypertensives ng/L <2.8 <2.8 <2.8 <2.8 N/A N/A Eprosartan Antihypertensives ng/L <0.22 <0.22 <0.22 <0.22 N/A N/A Erythromycin Antibiotics ng/L N/A N/A N/A N/A 0.13 0.10 Estrone (E1) Hormones ng/L <0.70 1.2 <0.70 <0.70 <0.91 <0.91 Fenbendazole Veterinary medicines ng/L <0.07 <0.07 <0.07 <0.07 0.15 <0.036 Fexofenadine Asthma and allergy m. ng/L <0.09 <0.09 <0.09 <0.09 N/A N/A Fluconazole Antibiotics ng/L 5.4 <0.05 7.0 12 <0.0034 <0.0034 Fluticasone Asthma and allergy m. ng/L <0.06 <0.06 <0.06 0.06 <0.019 0.13 Gabapentin Antiepileptics ng/L 3.7 <0.88 160 420 N/A N/A Gemfibrozil Metabolic disease m. ng/L 1.9 <1.5 11 7.1 0.03 <0.025 Irbesartan Antihypertensives ng/L <0.06 <0.06 0.26 <0.06 <0.25 <0.25 Ketoprofen NSAIDs and analgesics ng/L <0.72 <0.72 12 35 <0.0021 <0.0021 Levetiracetam Antiepileptics ng/L <3.52 <3.52 <3.52 50 <0.039 <0.039 Lincomycin Antibiotics ng/L <0.10 <0.10 2.1 5.3 <0.057 0.97 Losartan Antihypertensives ng/L 0.33 <0.14 6.7 2.9 <0.026 <0.026 Mesalazine Gastrointestinal disease ng/L N/A N/A N/A N/A 0.04 0.12 Metformin Metabolic disease m. ng/L 1.5 13 160 2300 <0.94 <0.94 Metoprolol Other cardiovascular m. ng/L <0.54 <0.54 43 140 <0.042 <0.042 Mometasone furoate
Asthma and allergy m. ng/L <1.3 <1.3 <1.3 <1.3 <0.0036 <0.0036
Naproxen NSAIDs and analgesics ng/L <0.57 <0.57 6.0 45 N/A N/A Nebivolol Other cardiovascular m. ng/L 0.47 <0.052 0.76 1.9 <0.50 <0.50 Norethisterone Hormones ng/L <0.080 <0.080 <0.080 <0.080 0.06 0.04 Ofloxacin Antibiotics ng/L <10 <10 19 74 <0.43 <0.43 Oxazepam Psycopharmaceuticals ng/L N/A <0.033 N/A 15 <4.6 <4.6 Oxycodone NSAIDs and analgesics ng/L N/A <0.042 N/A <0.042 <0.037 15 Primidone Antiepileptics ng/L <1.37 <1.37 <1.37 <1.37 <0.032 <0.032 Progesterone Hormones ng/L 0.21 <0.086 0.11 <0.086 <0.080 <0.080 Quetiapine Psycopharmaceuticals ng/L <0.15 <0.15 <0.15 0.46 <0.0083 <0.0083 Ramipril Antihypertensives ng/L <0.72 <0.72 <0.72 0.99 N/A N/A Sertraline Psycopharmaceuticals ng/L <0.04 <0.04 <0.04 1.1 <0.016 <0.016 Simvastatin Metabolic disease med. ng/L N/A N/A N/A N/A 0.07 0.08 Sotalol Other cardiovascular m. ng/L <0.89 <0.89 31 31 <0.0021 0.03 Sulfadiazine Antibiotics ng/L <17 <17 <17 <17 N/A N/A Telmisartan Antihypertensives ng/L <1.4 <1.4 48 230 N/A N/A Temazepam Psycopharmaceuticals ng/L N/A <0.36 N/A 1.9 <0.070 0.66 Testosterone Hormones ng/L 0.16 <0.080 0.11 <0.080 0.74 0.43 Tetracycline / Doxycycline
Antibiotics ng/L <5.7 <5.7 <5.7 <5.7 <0.055 <0.055
Tiamulin Veterinary medicines ng/L 0.43 <0.079 0.73 0.73 0.02 0.02 Toltrazuril Veterinary medicines ng/L <4.8 <4.8 <4.8 <4.8 <0.038 <0.038 Tramadol NSAIDs and analgesics ng/L 0.06 <0.038 8.6 82 0.24 2.9 Trimethoprim Antibiotics ng/L <0.37 <0.37 25 58 <0.019 <0.019 Tylosin Veterinary medicines ng/L 20 <3.7 <3.7 <3.7 <0.20 <0.20 Valsartan Antihypertensives ng/L <6.4 <6.4 <6.4 19 N/A N/A Warfarin Other cardiovascular m. ng/L <0.87 <0.87 3.4 2.5 <0.062 0.07 Venlafaxine Psycopharmaceuticals ng/L 0.32 4.5 0.51 5.1 <0.031 <0.031 Xylometazoline Asthma and allergy m. ng/L 1.6 <0.05 2.5 2.5 <0.019 0.02
Sum concentration ng/L 564 326 2604 5186 1.8 33 Number of detected / analysed APIs 20/54 7/58 32/54 39/58 12/52 20/52
N/A: not analysed; Concentration lower than quantification limit (LOQ) are marked as “<” and LOQ

223
Latvia (3/3) Site code L-BSE L-BSE L-BSEs L-BSE
Surface water type & sampling depth Sea 1-m Sea 12-m Sea 1-m Sea 12-m
Date dd.mm.yy 5.12.17 5.12.17 23.5.18 23.5.18
N cordinates WGS84 DD 57.04395 E cordinates WGS84 DD 23.96913
API API group unit Riga-s Riga-b Riga-s Riga-b
Amlodipine antihypertensives ng/L <0.038 <0.038 <0.038 <0.038 Atenolol other cardiovascular m. ng/L <0.82 <0.82 <0.82 <0.82 Atorvastatin metabolic disease m. ng/L N/A N/A N/A N/A Bezafibrate metabolic disease m. ng/L 0.11 0.06 <0.042 <0.042 Bisoprolol other cardiovascular m. ng/L <0.20 <0.20 <0.20 <0.20 Caffeine Other ng/L 0.80 0.65 0.88 0.72 Candesartan antihypertensives ng/L <0.027 <0.027 <0.027 <0.027 Carbamazepine antiepileptics ng/L 0.54 0.46 0.40 0.69 Carprofen veterinary m. ng/L <5.4 <5.4 <5.4 <5.4 Cetirizine asthma and allergy m. ng/L 0.02 0.02 0.08 0.02 Ciprofloxacin antibiotics ng/L <3.5 <3.5 <3.5 <3.5 Citalopram psycopharmaceuticals ng/L <0.042 0.05 <0.042 <0.042 Clarithromycin antibiotics ng/L 0.08 0.05 0.08 0.066 Codeine NSAIDs and analgesics ng/L 0.03 <0.017 0.11 0.12 Diclofenac NSAIDs and analgesics ng/L 0.52 0.77 0.58 1.2 Dipyridamole other cardiovascular m. ng/L <0.78 <0.78 <0.78 <0.78 Emamectin veterinary m. ng/L 2.1 <1.8 <1.8 <1.8 Enalapril antihypertensives ng/L N/A N/A N/A N/A Eprosartan antihypertensives ng/L N/A N/A N/A N/A Erythromycin antibiotics ng/L 6.2 0.06 0.13 0.09 Estrone (E1) hormones ng/L <0.91 <0.91 <0.91 <0.91 Fenbendazole veterinary m. ng/L <0.036 <0.036 <0.036 <0.036 Fexofenadine asthma and allergy m. ng/L N/A N/A N/A N/A Fluconazole antibiotics ng/L <0.0034 <0.0034 <0.0034 <0.0034 Fluticasone asthma and allergy m. ng/L 0.07 <0.019 0.30 0.18 Gabapentin antiepileptics ng/L N/A N/A N/A N/A Gemfibrozil metabolic disease m. ng/L <0.025 <0.025 <0.025 <0.025 Irbesartan antihypertensives ng/L <0.25 <0.25 <0.25 <0.25 Ketoprofen NSAIDs and analgesics ng/L <0.0021 <0.0021 <0.0021 0.01 Levetiracetam antiepileptics ng/L 0.14 <0.039 0.17 0.16 Lincomycin antibiotics ng/L 1.5 0.27 0.31 <0.057 Losartan antihypertensives ng/L <0.026 <0.026 <0.026 <0.026 Mesalazine gastrointestinal disease m. ng/L 0.11 0.07 0.07 0.09 Metformin metabolic disease m. ng/L <0.94 <0.94 <0.94 <0.94 Metoprolol other cardiovascular m. ng/L <0.042 <0.042 <0.042 <0.042 Mometasone furoate asthma and allergy m. ng/L <0.0036 0.16 0.13 0.24 Naproxen NSAIDs and analgesics ng/L N/A N/A N/A N/A Nebivolol other cardiovascular m. ng/L 0.53 <0.50 <0.50 <0.50 Norethisterone hormones ng/L 0.03 0.03 0.05 0.07 Ofloxacin antibiotics ng/L <0.43 <0.43 <0.43 <0.43 Oxazepam psycopharmaceuticals ng/L <4.6 <4.6 <4.6 <4.6 Oxycodone NSAIDs and analgesics ng/L <0.037 0.78 <0.037 <0.037 Primidone antiepileptics ng/L <0.032 <0.032 <0.032 <0.032 Progesterone hormones ng/L <0.080 <0.080 <0.080 <0.080 Quetiapine psycopharmaceuticals ng/L <0.0083 <0.0083 <0.0083 <0.0083 Ramipril antihypertensives ng/L N/A N/A N/A N/A Sertraline psycopharmaceuticals ng/L <0.016 <0.016 <0.016 <0.016 Simvastatin metabolic disease m. ng/L 0.08 0.09 0.14 0.10 Sotalol other cardiovascular m. ng/L 0.12 <0.0021 <0.0021 <0.0021 Sulfadiazine antibiotics ng/L N/A N/A N/A N/A Telmisartan antihypertensives ng/L N/A N/A N/A N/A Temazepam psycopharmaceuticals ng/L <0.070 <0.070 <0.070 <0.070 Testosterone hormones ng/L 2.2 0.19 5.8 1.6 Tetracycline/Doxycycline antibiotics ng/L <0.055 <0.055 <0.055 <0.055 Tiamulin veterinary m. ng/L 0.02 0.03 0.02 0.02 Toltrazuril veterinary m. ng/L <0.038 <0.038 <0.038 <0.038 Tramadol NSAIDs and analgesics ng/L 0.72 0.80 0.89 1.0 Trimethoprim antibiotics ng/L 0.08 0.11 <0.019 <0.019 Tylosin veterinary m. ng/L <0.20 <0.20 <0.20 <0.20 Valsartan antihypertensives ng/L N/A N/A N/A N/A Warfarin other cardiovascular m. ng/L <0.062 <0.062 <0.062 <0.062 Venlafaxine psycopharmaceuticals ng/L <0.031 <0.031 <0.031 <0.031 Xylometazoline asthma and allergy m. ng/L 0.02 <0.019 <0.019 0.01
Sum concentration ng/L 16 4.6 10 6.4 Number of detected / analysed APIs 22/52 18/52 17/52 18/52
N/A: not analysed; Concentration lower than quantification limit (LOQ) are marked as “<” and LOQ

224
Sweden (1/3) Site code SE1 SE1 SE2 SE2 Surface water type Lake lake lake Lake
Date dd.mm.yy 19.12.17 7.6.18 19.12.17 7.6.18
N cordinates WGS84 DD 58.528349 58.553747 E cordinates WGS84 DD 14.991961 15.278206
API API group unit Vättern Boren
Amlodipine antihypertensives ng/L <7.7 <7.7 <7.7 <7.7 Atenolol other cardiovascular m. ng/L <12 <12 <12 <12 Atorvastatin metabolic disease m. ng/L <15 <15 <15 <15 Bezafibrate metabolic disease m. ng/L <0.83 <0.83 <0.83 <0.83 Bisoprolol other cardiovascular m. ng/L <0.52 <0.52 <0.52 <0.52 Caffeine other ng/L 21 15 23 38 Candesartan antihypertensives ng/L <0.68 <0.68 <0.68 <0.68 Carbamazepine antiepileptics ng/L 1.1 0.8 1.8 1.5 Carprofen veterinary m. ng/L <0.77 <0.77 <0.77 1.2 Cetirizine asthma and allergy m. ng/L 0.43 <0.11 1.8 <0.11 Ciprofloxacin antibiotics ng/L N/A N/A N/A N/A Citalopram psycopharmaceuticals ng/L 0.60 5.9 0.2 10 Clarithromycin antibiotics ng/L <1.0 <1.0 1.4 <1.0 Codeine NSAIDs and analgesics ng/L 0.10 <0.07 N/A <0.07 Diclofenac NSAIDs and analgesics ng/L <1.2 <1.2 1.6 <1.2 Dipyridamole other cardiovascular m. ng/L <1.1 <1.1 <1.1 <1.1 Emamectin veterinary m. ng/L 0.33 0.43 0.10 <0.09 Enalapril antihypertensives ng/L <2.8 <2.8 <2.8 <2.8 Eprosartan antihypertensives ng/L <0.22 <0.22 <0.22 <0.22 Erythromycin antibiotics ng/L N/A N/A N/A N/A Estrone (E1) hormones ng/L <0.70 <0.70 <0.70 <0.70 Fenbendazole veterinary m. ng/L 0.22 <0.07 <0.07 <0.07 Fexofenadine asthma and allergy m. ng/L 0.13 <0.09 1.0 <0.09 Fluconazole antibiotics ng/L 0.75 1.5 1,2, <0.05 Fluticasone asthma and allergy m. ng/L 0.08 <0.06 <0.06 <0.06 Gabapentin antiepileptics ng/L 23 14 39 35 Gemfibrozil metabolic disease m. ng/L 9.3 <1.5 <1.5 <1.5 Irbesartan antihypertensives ng/L 0.08 <0.06 <0.06 <0.06 Ketoprofen NSAIDs and analgesics ng/L <0.72 <0.72 <0.72 <0.72 Levetiracetam antiepileptics ng/L <3.52 <3.52 <3.52 <3.52 Lincomycin antibiotics ng/L 0.11 <0.10 <0.10 <0.10 Losartan antihypertensives ng/L 1.5 <0.14 4.2 0.88 Mesalazine gastrointestinal disease m. ng/L N/A N/A N/A N/A Metformin metabolic disease m. ng/L 32 <0.24 33 100 Metoprolol other cardiovascular m. ng/L 0.75 <0.54 2.9 1.7 Mometasone furoate asthma and allergy m. ng/L <1.3 <1.3 <1.3 <1.3 Naproxen NSAIDs and analgesics ng/L <0.57 <0.57 2.92 <0.57 Nebivolol other cardiovascular m. ng/L 0.87 <0.052 0.27 <0.052 Norethisterone hormones ng/L 0.34 2.10 0.15 2.00 Ofloxacin antibiotics ng/L 39 15 <10 <9.96 Oxazepam psycopharmaceuticals ng/L 0.32 <0.033 N/A 0.90 Oxycodone NSAIDs and analgesics ng/L 0.10 0.77 N/A 1.6 Primidone antiepileptics ng/L <1.37 <1.37 <1.37 <1.37 Progesterone hormones ng/L 0.23 0.64 <0.086 0.34 Quetiapine psycopharmaceuticals ng/L <0.15 <0.15 <0.15 <0.15 Ramipril antihypertensives ng/L <0.72 <0.72 <0.72 <0.72 Sertraline psycopharmaceuticals ng/L 0.79 8.0 <0.04 10.0 Simvastatin metabolic disease m. ng/L N/A N/A N/A N/A Sotalol other cardiovascular m. ng/L <0.89 <0.89 <0.89 <0.89 Sulfadiazine antibiotics ng/L <17 <17 <17 <17 Telmisartan antihypertensives ng/L <1.4 <1.4 <1.4 <1.4 Temazepam psycopharmaceuticals ng/L <0.36 <0.36 N/A <0.36 Testosterone hormones ng/L 0.42 <0.080 <0.080 <0.080 Tetracycline/Doxycycline antibiotics ng/L <5.7 <5.7 <5.7 <5.7 Tiamulin veterinary m. ng/L 0.21 <0.079 0.36 <0.079 Toltrazuril veterinary m. ng/L <4.8 <4.8 <4.8 <4.8 Tramadol NSAIDs and analgesics ng/L 1.2 1.0 2.9 2.5 Trimethoprim antibiotics ng/L <0.37 1.4 <0.37 <0.37 Tylosin veterinary m. ng/L <3.7 <3.7 <3.7 <3.7 Valsartan antihypertensives ng/L <6.4 <6.4 <6.4 <6.4 Warfarin other cardiovascular m. ng/L <0.87 <0.87 <0.87 <0.87 Venlafaxine psycopharmaceuticals ng/L 0.53 1.2 0.99 2.0 Xylometazoline asthma and allergy m. ng/L 0.4 <0.054 1.7 <0.054
Sum concentration ng/L 136 68 119 208 Number of detected / analysed APIs 29/58 14/58 19/54 15/58
N/A: not analysed; Concentration lower than quantification limit (LOQ) are marked as “<” and LOQ

225
Sweden (2/3) SE3 SE3 SE4 SE4 SE5 SE5 Surface water type river river river river river River Date dd.mm.yy 19.12.17 7.6.18 19.12.17 7.6.18 19.12.17 7.6.18 N coordinates WGS84 DD 58.288652 58.421394 58.44432 E coordinates WGS84 DD 15.114039 15.631321 15.622594 API Unit Svartån Stångån upstr. Stångån-Roxen
Amlodipine ng/L 9.8 <7.7 <7.7 <7.7 <7.7 <7.7 Atenolol ng/L <12 <12 <12 <12 33 42 Atorvastatin ng/L 700 <15 <15 <15 660 300 Bezafibrate ng/L <0.83 <0.83 <0.83 <0.83 2.2 4.0 Bisoprolol ng/L <0.52 <0.52 <0.52 <0.52 1.7 <0.52 Caffeine ng/L 24 <0.75 17 68 30 160 Candesartan ng/L 16 <0.68 6.6 <0.68 1.7 12 Carbamazepine ng/L 3.7 1.9 1.1 2.4 4.8 72 Carprofen ng/L <0.77 <0.77 1.6 1.6 1.5 2.0 Cetirizine ng/L 2.3 <0.11 0.58 <0.11 6.7 1.3 Ciprofloxacin ng/L N/A N/A N/A N/A N/A N/A Citalopram ng/L 2.2 13 0.1 2.2 1.7 28 Clarithromycin ng/L 2.0 <1.0 1.3 <1.0 3.2 <1.0 Codeine ng/L 0.19 <0.07 N/A <0.07 N/A 0.29 Diclofenac ng/L 1.9 1.5 <1.2 <1.2 27 160 Dipyridamole ng/L <1.1 <1.1 <1.1 <1.1 <1.1 <1.1 Emamectin ng/L 3.2 0.38 0.31 0.45 0.17 <0.09 Enalapril ng/L <2.8 <2.8 <2.8 <2.8 <2.8 <2.8 Eprosartan ng/L <0.22 <0.22 <0.22 <0.22 0.79 <0.22 Erythromycin ng/L N/A N/A N/A N/A N/A N/A Estrone (E1) ng/L <0.70 <0.70 <0.70 <0.70 <0.70 <0.70 Fenbendazole ng/L 0.63 <0.07 <0.07 <0.07 <0.07 <0.07 Fexofenadine ng/L 0.79 <0.09 0.23 0.18 2.1 8.3 Fluconazole ng/L 0.52 <0.05 1.1 0.28 4.2 18.33 Fluticasone ng/L 0.21 <0.06 <0.06 <0.06 <0.06 <0.06 Gabapentin ng/L 160 82 50 60 130 1700 Gemfibrozil ng/L 23 <1.5 4.1 <1.5 12 <1.5 Irbesartan ng/L 0.24 <0.06 0.08 0.07 1.6 3.8 Ketoprofen ng/L <0.72 <0.72 <0.72 <0.72 4.6 8.0 Levetiracetam ng/L <3.52 <3.52 <3.52 <3.52 <3.52 14.93 Lincomycin ng/L 0.13 <0.10 0.18 <0.10 <0.10 <0.10 Losartan ng/L 9.6 1.1 0.27 <0.14 39.90 95.24 Mesalazine ng/L N/A N/A N/A N/A N/A N/A Metformin ng/L 53 180 15 <0.24 29 980 Metoprolol ng/L 5.2 3.7 0.7 1.1 18 190 Mometasone furoate ng/L <1.3 <1.3 <1.3 <1.3 <1.3 <1.3 Naproxen ng/L <0.57 <0.57 1.09 <0.57 2.39 68 Nebivolol ng/L 4.00 <0.052 0.55 <0.052 0.36 <0.052 Norethisterone ng/L 2.10 0.69 0.70 1.50 0.53 <0.080 Ofloxacin ng/L 210 <10 340 <10 46 <10 Oxazepam ng/L 1.77 1.49 N/A 0.99 N/A 44 Oxycodone ng/L 0.26 2.3 N/A 0.51 N/A 5.2 Primidone ng/L <1.37 <1.37 <1.37 <1.37 2.2 5.9 Progesterone ng/L 0.44 <0.086 0.14 <0.086 0.11 <0.086 Quetiapine ng/L 0.17 <0.15 <0.15 <0.15 <0.15 <0.15 Ramipril ng/L <0.72 <0.72 <0.72 <0.72 <0.72 <0.72 Sertraline ng/L 4.1 5.9 <0.04 2.8 0.19 19 Simvastatin ng/L N/A N/A N/A N/A N/A N/A Sotalol ng/L <0.89 <0.89 <0.89 <0.89 <0.89 1.8 Sulfadiazine ng/L <17 <17 <17 <17 <17 <17 Telmisartan ng/L <1.4 <1.4 <1.4 <1.4 <1.4 <1.4 Temazepam ng/L <0.36 <0.36 N/A 0.36 N/A 2.2 Testosterone ng/L 0.48 <0.080 0.19 <0.080 <0.080 <0.080 Tetracycline/Doxycycline ng/L <5.7 <5.7 47 <5.7 <5.7 <5.7 Tiamulin ng/L 0.69 <0.079 0.51 <0.079 0.41 <0.079 Toltrazuril ng/L <4.8 <4.8 <4.8 <4.8 <4.8 <4.8 Tramadol ng/L 4.4 4.0 0.5 1.3 6.4 110 Trimethoprim ng/L 0.91 <0.37 0.51 <0.37 1.4 <0.37 Tylosin ng/L <3.7 <3.7 <3.7 <3.7 <3.7 <3.7 Valsartan ng/L <6.4 <6.4 <6.4 <6.4 10.0 60 Warfarin ng/L <0.87 <0.87 <0.87 <0.87 <0.87 2.6 Venlafaxine ng/L 2.0 4.1 0.17 0.76 2.7 45 Xylometazoline ng/L 2.5 <0.054 1.8 <0.054 1.9 <0.054
Sum concentration ng/L 1243 302 493 144 1091 4164 Number of detected / analysed APIs 35/58 14/58 29/54 17/58 36/54 31/58
N/A: not analysed; Concentration lower than quantification limit (LOQ) are marked as “<” and LOQ

226
Sweden (3/3) SE6 SE6 SE7 SE7 SE-BSE SE-BSE Surface water type lake lake lake Lake sea sea
Date dd.mm.yy 20.12.17 7.6.18 20.12.17 7.6.18 21.12.17 11.6.18 N coordinates WGS84 DD 58.645406 58.59418 58.628369 E coordinates WGS84 DD 15.858221 16.12531 16.307817
API unit Dovern Glan Bråviken Amlodipine ng/L <7.7 <7.7 <7.7 <7.7 <7.7 <7.7 Atenolol ng/L <12 <12 <12 <12 <12.13 <12 Atorvastatin ng/L 170 <15 <15 <15 44 <15 Bezafibrate ng/L <0.83 <0.83 <0.83 <0.83 <0.83 <0.83 Bisoprolol ng/L <0.52 <0.52 <0.52 <0.52 <0.52 <0.52 Caffeine ng/L 49 33 22 55 16 140 Candesartan ng/L 2.9 9.5 <0.68 8.4 <0.68 13 Carbamazepine ng/L 0.8 3.6 3.3 4.0 1.5 5.4 Carprofen ng/L <0.77 5.7 <0.77 2.70 1.0 2.9 Cetirizine ng/L 1.2 <0.11 3.5 0.71 1.0 1.7 Ciprofloxacin ng/L N/A N/A N/A N/A N/A N/A Citalopram ng/L 0.5 5.4 0.1 1.2 0.3 1.1 Clarithromycin ng/L 1.22 <1.0 1.31 <1.0 1.37 <1.0 Codeine ng/L N/A <0.07 N/A 0.14 N/A 0.24 Diclofenac ng/L 5.2 5.8 4.4 3.4 2.8 2.1 Dipyridamole ng/L <1.1 <1.1 <1.1 <1.1 <1.1 <1.1 Emamectin ng/L 0.15 0.68 0.21 0.53 0.21 0.79 Enalapril ng/L <2.8 <2.8 <2.8 <2.8 <2.8 <2.8 Eprosartan ng/L <0.22 <0.22 <0.22 <0.22 <0.22 <0.22 Erythromycin ng/L N/A N/A N/A N/A N/A N/A Estrone (E1) ng/L <0.70 <0.70 <0.70 <0.70 <0.70 <0.70 Fenbendazole ng/L <0.07 <0.07 <0.07 <0.07 <0.07 <0.07 Fexofenadine ng/L 0.37 0.87 1.5 0.72 0.69 3.3 Fluconazole ng/L <0.05 1.3 2.5 1.2 <0.05 <0.05 Fluticasone ng/L <0.06 <0.06 <0.06 <0.06 <0.06 <0.06 Gabapentin ng/L 38 120 93 120 34 120 Gemfibrozil ng/L 13 <1.5 <1.5 <1.5 4.4 <1.5 Irbesartan ng/L 0.18 0.28 0.20 0.19 0.15 0.27 Ketoprofen ng/L 0.95 <0.72 <0.72 <0.72 <0.72 <0.72 Levetiracetam ng/L <3.52 <3.52 <3.52 <3.52 <3.52 <3.52 Lincomycin ng/L <0.10 <0.10 <0.10 <0.10 <0.10 <0.10 Losartan ng/L 10.30 5.4 3.4 1.3 4.8 1.8 Mesalazine ng/L N/A N/A N/A N/A N/A N/A Metformin ng/L 57 1300 20 400 23 230 Metoprolol ng/L 4.0 11 2.2 4.2 1.9 4.5 Mometasone furoate ng/L <1.3 <1.3 <1.3 <1.3 <1.3 <1.3 Naproxen ng/L 3.08 1.41 9.65 5.15 16 5.28 Nebivolol ng/L 0.36 0.22 0.43 <0.052 0.38 0.43 Norethisterone ng/L 0.26 <0.080 0.36 1.20 0.53 <0.080 Ofloxacin ng/L 35 <10 <10 <10 15 <10 Oxazepam ng/L N/A 3.70 N/A 2.20 N/A 2.70 Oxycodone ng/L N/A <0.042 N/A 0.18 N/A <0.042 Primidone ng/L <1.37 <1.37 1.6 1.4 <1.37 <1.37 Progesterone ng/L 0.20 <0.086 0.11 <0.086 0.11 <0.086 Quetiapine ng/L <0.15 <0.15 <0.15 <0.15 <0.15 <0.15 Ramipril ng/L <0.72 <0.72 <0.72 <0.72 <0.72 <0.72 Sertraline ng/L <0.04 8.8 <0.04 1.8 <0.04 2.8 Simvastatin ng/L N/A N/A N/A N/A N/A N/A Sotalol ng/L <0.89 <0.89 <0.89 <0.89 <0.89 <0.89 Sulfadiazine ng/L <17 <17 <17 <17 <17 <17 Telmisartan ng/L <1.4 <1.4 <1.4 <1.4 <1.4 <1.4 Temazepam ng/L N/A <0.36 N/A <0.36 N/A 0.58 Testosterone ng/L <0.080 <0.080 0.10 <0.080 0.13 <0.080 Tetracycline/Doxycycline ng/L <5.7 <5.7 <5.7 <5.7 23 <5.7 Tiamulin ng/L 0.39 0.33 0.41 0.25 0.41 <0.079 Toltrazuril ng/L <4.8 <4.8 <4.8 <4.8 <4.8 <4.8 Tramadol ng/L 1.6 5.4 3.2 5.0 1.3 4.1 Trimethoprim ng/L <0.37 <0.37 <0.37 0.38 <0.37 <0.37 Tylosin ng/L <3.7 <3.7 <3.7 <3.7 <3.7 <3.7 Valsartan ng/L <6.4 <6.4 <6.4 <6.4 <6.4 <6.4 Warfarin ng/L <0.87 <0.87 <0.87 <0.87 <0.87 <0.87 Venlafaxine ng/L 0.89 4.9 0.79 3.4 0.50 2.0 Xylometazoline ng/L 1.7 <0.054 1.9 <0.054 1.6 <0.054
Sum concentration ng/L 399 1527 176 625 196 545 Number of detected / analysed APIs 26/54 21/58 24/54 26/58 27/54 22/58
N/A: not analysed; Concentration lower than quantification limit (LOQ) are marked as “<” and LOQ
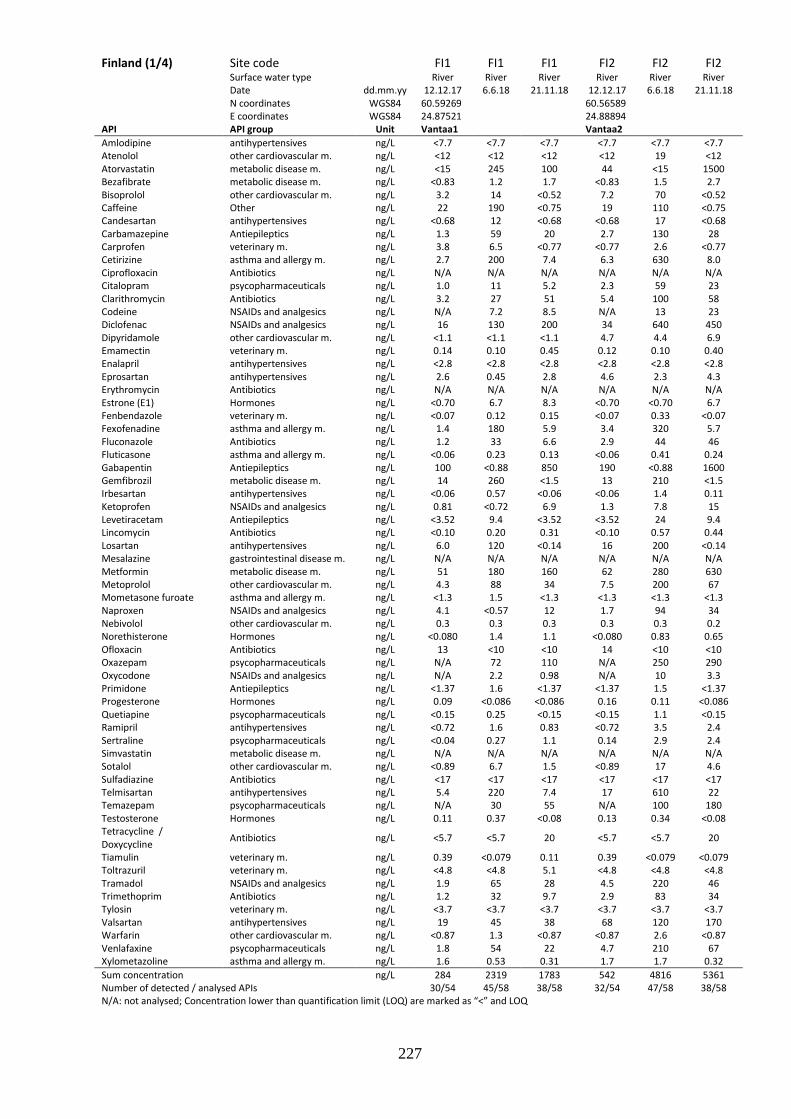
227
Finland (1/4) Site code FI1 FI1 FI1 FI2 FI2 FI2 Surface water type River River River River River River Date dd.mm.yy 12.12.17 6.6.18 21.11.18 12.12.17 6.6.18 21.11.18 N coordinates WGS84 60.59269 60.56589
E coordinates WGS84 24.87521 24.88894 API API group Unit Vantaa1 Vantaa2
Amlodipine antihypertensives ng/L <7.7 <7.7 <7.7 <7.7 <7.7 <7.7 Atenolol other cardiovascular m. ng/L <12 <12 <12 <12 19 <12 Atorvastatin metabolic disease m. ng/L <15 245 100 44 <15 1500 Bezafibrate metabolic disease m. ng/L <0.83 1.2 1.7 <0.83 1.5 2.7 Bisoprolol other cardiovascular m. ng/L 3.2 14 <0.52 7.2 70 <0.52 Caffeine Other ng/L 22 190 <0.75 19 110 <0.75 Candesartan antihypertensives ng/L <0.68 12 <0.68 <0.68 17 <0.68 Carbamazepine Antiepileptics ng/L 1.3 59 20 2.7 130 28 Carprofen veterinary m. ng/L 3.8 6.5 <0.77 <0.77 2.6 <0.77 Cetirizine asthma and allergy m. ng/L 2.7 200 7.4 6.3 630 8.0 Ciprofloxacin Antibiotics ng/L N/A N/A N/A N/A N/A N/A Citalopram psycopharmaceuticals ng/L 1.0 11 5.2 2.3 59 23 Clarithromycin Antibiotics ng/L 3.2 27 51 5.4 100 58 Codeine NSAIDs and analgesics ng/L N/A 7.2 8.5 N/A 13 23 Diclofenac NSAIDs and analgesics ng/L 16 130 200 34 640 450 Dipyridamole other cardiovascular m. ng/L <1.1 <1.1 <1.1 4.7 4.4 6.9 Emamectin veterinary m. ng/L 0.14 0.10 0.45 0.12 0.10 0.40 Enalapril antihypertensives ng/L <2.8 <2.8 <2.8 <2.8 <2.8 <2.8 Eprosartan antihypertensives ng/L 2.6 0.45 2.8 4.6 2.3 4.3 Erythromycin Antibiotics ng/L N/A N/A N/A N/A N/A N/A Estrone (E1) Hormones ng/L <0.70 6.7 8.3 <0.70 <0.70 6.7 Fenbendazole veterinary m. ng/L <0.07 0.12 0.15 <0.07 0.33 <0.07 Fexofenadine asthma and allergy m. ng/L 1.4 180 5.9 3.4 320 5.7 Fluconazole Antibiotics ng/L 1.2 33 6.6 2.9 44 46 Fluticasone asthma and allergy m. ng/L <0.06 0.23 0.13 <0.06 0.41 0.24 Gabapentin Antiepileptics ng/L 100 <0.88 850 190 <0.88 1600 Gemfibrozil metabolic disease m. ng/L 14 260 <1.5 13 210 <1.5 Irbesartan antihypertensives ng/L <0.06 0.57 <0.06 <0.06 1.4 0.11 Ketoprofen NSAIDs and analgesics ng/L 0.81 <0.72 6.9 1.3 7.8 15 Levetiracetam Antiepileptics ng/L <3.52 9.4 <3.52 <3.52 24 9.4 Lincomycin Antibiotics ng/L <0.10 0.20 0.31 <0.10 0.57 0.44 Losartan antihypertensives ng/L 6.0 120 <0.14 16 200 <0.14 Mesalazine gastrointestinal disease m. ng/L N/A N/A N/A N/A N/A N/A Metformin metabolic disease m. ng/L 51 180 160 62 280 630 Metoprolol other cardiovascular m. ng/L 4.3 88 34 7.5 200 67 Mometasone furoate asthma and allergy m. ng/L <1.3 1.5 <1.3 <1.3 <1.3 <1.3 Naproxen NSAIDs and analgesics ng/L 4.1 <0.57 12 1.7 94 34 Nebivolol other cardiovascular m. ng/L 0.3 0.3 0.3 0.3 0.3 0.2 Norethisterone Hormones ng/L <0.080 1.4 1.1 <0.080 0.83 0.65 Ofloxacin Antibiotics ng/L 13 <10 <10 14 <10 <10 Oxazepam psycopharmaceuticals ng/L N/A 72 110 N/A 250 290 Oxycodone NSAIDs and analgesics ng/L N/A 2.2 0.98 N/A 10 3.3 Primidone Antiepileptics ng/L <1.37 1.6 <1.37 <1.37 1.5 <1.37 Progesterone Hormones ng/L 0.09 <0.086 <0.086 0.16 0.11 <0.086 Quetiapine psycopharmaceuticals ng/L <0.15 0.25 <0.15 <0.15 1.1 <0.15 Ramipril antihypertensives ng/L <0.72 1.6 0.83 <0.72 3.5 2.4 Sertraline psycopharmaceuticals ng/L <0.04 0.27 1.1 0.14 2.9 2.4 Simvastatin metabolic disease m. ng/L N/A N/A N/A N/A N/A N/A Sotalol other cardiovascular m. ng/L <0.89 6.7 1.5 <0.89 17 4.6 Sulfadiazine Antibiotics ng/L <17 <17 <17 <17 <17 <17 Telmisartan antihypertensives ng/L 5.4 220 7.4 17 610 22 Temazepam psycopharmaceuticals ng/L N/A 30 55 N/A 100 180 Testosterone Hormones ng/L 0.11 0.37 <0.08 0.13 0.34 <0.08 Tetracycline / Doxycycline
Antibiotics ng/L <5.7 <5.7 20 <5.7 <5.7 20
Tiamulin veterinary m. ng/L 0.39 <0.079 0.11 0.39 <0.079 <0.079 Toltrazuril veterinary m. ng/L <4.8 <4.8 5.1 <4.8 <4.8 <4.8 Tramadol NSAIDs and analgesics ng/L 1.9 65 28 4.5 220 46 Trimethoprim Antibiotics ng/L 1.2 32 9.7 2.9 83 34 Tylosin veterinary m. ng/L <3.7 <3.7 <3.7 <3.7 <3.7 <3.7 Valsartan antihypertensives ng/L 19 45 38 68 120 170 Warfarin other cardiovascular m. ng/L <0.87 1.3 <0.87 <0.87 2.6 <0.87 Venlafaxine psycopharmaceuticals ng/L 1.8 54 22 4.7 210 67 Xylometazoline asthma and allergy m. ng/L 1.6 0.53 0.31 1.7 1.7 0.32
Sum concentration
ng/L 284 2319 1783 542 4816 5361 Number of detected / analysed APIs 30/54 45/58 38/58 32/54 47/58 38/58
N/A: not analysed; Concentration lower than quantification limit (LOQ) are marked as “<” and LOQ

228
Finland (2/4) FI3 FI3 FI3 FI4 FI5 FI5 FI5 Surface water type River River River Tributary River River River
Date dd.mm.yy 12.12.17 6.6.18 21.11.18 21.11.18 12.12.17 6.6.18 21.11.18 N coordinates WGS84 60.43332 60.36534 60.23736 E coordinates WGS84 24.85264 24.78238 024.98510
API unit Vantaa3 Luhtaj. Vantaa4 Amlodipine ng/L <7.7 <7.7 <7.7 <7.7 <7.7 <7.7 <7.7 Atenolol ng/L <12 <12 <12 <12 <12 <12 <12 Atorvastatin ng/L 35 500 920 210 42 <15 140 Bezafibrate ng/L <0.83 0.97 2.7 1.6 <0.83 <0.83 1.1 Bisoprolol ng/L 7.9 40 <0.52 <0.52 2.5 10 <0.52 Caffeine ng/L 80 78 1.7 1.2 42 86 1.8 Candesartan ng/L <0.68 17 <0.68 1.4 <0.68 <0.68 <0.68 Carbamazepine ng/L 2.6 96 32 19 1.4 22 8.8 Carprofen ng/L <0.77 6.1 <0.77 <0.77 <0.77 <0.77 <0.77 Cetirizine ng/L 6.4 330 11 3.5 2.5 100 1.9 Ciprofloxacin ng/L N/A N/A N/A N/A N/A N/A N/A Citalopram ng/L 2.0 25 19 17 0.6 2.8 3.0 Clarithromycin ng/L 5.5 68 95 36 1.9 4.2 16 Codeine ng/L N/A 9.8 18 21 N/A 1.8 5.5 Diclofenac ng/L 34 380 390 470 17 53 130 Dipyridamole ng/L 1.7 1.4 <1.1 <1.1 <1.1 <1.1 <1.1 Emamectin ng/L 0.12 0.10 0.42 0.39 0.12 <0.09 0.45 Enalapril ng/L <2.8 <2.8 <2.8 <2.8 <2.8 <2.8 <2.8 Eprosartan ng/L 4.5 0.82 4.8 1.1 1.6 0.25 0.94 Erythromycin ng/L N/A N/A N/A N/A N/A N/A N/A Estrone (E1) ng/L <0.70 6.9 10 6.0 <0.70 <0.70 5.9 Fenbendazole ng/L <0.07 0.18 <0.07 0.07 <0.07 <0.07 0.08 Fexofenadine ng/L 3.9 220 8.7 0.95 1.3 70 2.4 Fluconazole ng/L <0.05 50 12 15 0.9 7.9 <0.05 Fluticasone ng/L <0.06 0.23 0.21 0.16 <0.06 <0.06 0.13 Gabapentin ng/L 170 <0.88 1800 320 88 780 410 Gemfibrozil ng/L 12 230 7.20 8.60 9.30 29 <1.5 Irbesartan ng/L <0.06 0.92 0.06 <0.06 <0.06 <0.06 <0.06 Ketoprofen ng/L 1.3 1.9 11 4.3 <0.72 <0.72 2.4 Levetiracetam ng/L <3.52 12 26 9.1 <3.52 4.6 <3.52 Lincomycin ng/L <0.10 0.33 0.34 0.35 <0.10 <0.10 0.32 Losartan ng/L 17 120 <0.14 <0.14 7.3 11 <0.14 Mesalazine ng/L N/A N/A N/A N/A N/A N/A N/A Metformin ng/L 62 210 1300 260 39 350 340 Metoprolol ng/L 6.8 110 68 44 3.0 15 17 Mometasone furoate ng/L <1.3 <1.3 <1.3 <1.3 <1.3 <1.3 <1.3 Naproxen ng/L 2.3 56 30 21 31 6.4 14 Nebivolol ng/L 0.3 0.4 0.3 <0.05 0.4 1.3 0.3 Norethisterone ng/L <0.080 1.2 0.88 0.62 <0.080 <0.080 0.71 Ofloxacin ng/L <10 <10 <10 <10 <10 <10 <10 Oxazepam ng/L N/A 191 210 250 N/A 38 87 Oxycodone ng/L N/A 5.5 2.7 2.4 N/A 0.59 1.2 Primidone ng/L <1.37 <1.37 <1.37 <1.37 <1.37 <1.37 <1.37 Progesterone ng/L 0.12 0.09 <0.086 <0.086 <0.086 <0.086 <0.086 Quetiapine ng/L <0.15 0.22 <0.15 <0.15 <0.15 <0.15 <0.15 Ramipril ng/L <0.72 1.9 2.5 <0.72 <0.72 0.74 <0.72 Sertraline ng/L 0.06 0.55 1.7 8.6 <0.04 3.4 1.7 Simvastatin ng/L N/A N/A N/A N/A N/A N/A N/A Sotalol ng/L <0.89 12 7.9 10.0 <0.89 4.8 1.7 Sulfadiazine ng/L <17 <17 <17 <17 <17 <17 <17 Telmisartan ng/L 19 440 11 1.8 4.3 61 <1.4 Temazepam ng/L N/A 68 160 200 N/A 16 49 Testosterone ng/L <0.080 0.78 <0.08 <0.08 <0.080 <0.080 <0.08 Tetracycline/Doxycycline ng/L <5.7 <5.7 <5.7 20 <5.7 <5.7 20 Tiamulin ng/L 0.36 0.09 <0.079 <0.079 0.36 <0.079 0.15 Toltrazuril ng/L <4.8 <4.8 <4.8 <4.8 <4.8 <4.8 <4.8 Tramadol ng/L 4.5 140 68 60 2.1 24 11 Trimethoprim ng/L 2.5 41 26 19.0 1.0 9.1 5.4 Tylosin ng/L <3.7 <3.7 <3.7 <3.7 <3.7 <3.7 <3.7 Valsartan ng/L 55 73 110 110 23 66 35 Warfarin ng/L <0.87 2.0 <0.87 <0.87 <0.87 <0.87 <0.87 Venlafaxine ng/L 4.4 120 68 54 2.0 20 17 Xylometazoline ng/L 1.7 1.1 0.50 <0.05 1.6 1.6 <0.05
Sum concentration ng/L 543 3671 5438 2208 326 1801 1333 Detected / Analysed APIs 29/54 48/58 38/58 37/58 26/54 31/58 34/58
N/A: not analysed; Concentration lower than quantification limit (LOQ) are marked as “<” and LOQ

229
Finland (3/4) Site code FI6 FI6 FI6 FI7 FI7 Surface water type Estuary Estuary Estuary Estuary Estuary
Date dd.mm.yy 6.3.18 6.6.18 21.11.18 6.3.18 4.6.18
N coordinates WGS84 60.21357 60.19587 E coordinates WGS84 24.98403 24.99376 API API group unit Matins Vanhank.
Amlodipine antihypertensives ng/L 0.1 <0.003 <7.7 0.08 7.0 Atenolol other cardiovascular m. ng/L <8.0 <8.0 <12 <8.0 <8.0 Atorvastatin metabolic disease m. ng/L N/A N/A <15 N/A N/A Bezafibrate metabolic disease m. ng/L 0.54 <0.40 <0.83 0.51 <0.40 Bisoprolol other cardiovascular m. ng/L 5.1 5.3 <0.52 4.5 1.6 Caffeine Other ng/L 14 22 1.2 11 18 Candesartan antihypertensives ng/L 1.5 <0.22 <0.68 <0.22 <0.22 Carbamazepine antiepileptics ng/L 4.7 11 2.4 4.3 6.3 Carprofen veterinary m. ng/L <0.58 <0.58 <0.77 0.79 <0.58 Cetirizine asthma and allergy m. ng/L 7.4 22 5.1 8.3 10 Ciprofloxacin Antibiotics ng/L <35 <35 N/A <35 <35 Citalopram psycopharmaceuticals ng/L 0.9 0.8 0.9 0.8 0.9 Clarithromycin antibiotics ng/L 1.7 1.5 7.3 1.6 1.0 Codeine NSAIDs and analgesics ng/L 1.9 0.91 0.87 1.6 0.47 Diclofenac NSAIDs and analgesics ng/L 20 30 19 22 11 Dipyridamole other cardiovascular m. ng/L <0.67 <0.67 <1.1 <0.67 <0.67 Emamectin veterinary m. ng/L <0.02 0.18 0.48 <0.02 0.73 Enalapril antihypertensives ng/L N/A N/A <2.8 N/A N/A Eprosartan antihypertensives ng/L N/A N/A 0.24 N/A N/A Erythromycin antibiotics ng/L 9.0 <0.92 N/A 8.4 <0.92 Estrone (E1) hormones ng/L 0.37 <0.17 4.6 0.29 <0.17 Fenbendazole veterinary m. ng/L <0.03 0.06 0.20 <0.03 0.16 Fexofenadine asthma and allergy m. ng/L N/A N/A 2.20 N/A N/A Fluconazole antibiotics ng/L 2.0 3.2 <0.05 2.0 2.3 Fluticasone asthma and allergy m. ng/L 0.03 0.03 0.10 0.03 <0.002 Gabapentin antiepileptics ng/L N/A N/A 82 N/A N/A Gemfibrozil metabolic disease m. ng/L <0.02 <0.02 <1.5 2.1 7.2 Irbesartan antihypertensives ng/L 0.04 0.04 0.08 0.04 0.06 Ketoprofen NSAIDs and analgesics ng/L 1.3 <0.38 <0.72 0.95 <0.38 Levetiracetam antiepileptics ng/L <5.43 <5.43 <3.52 <5.43 6.1 Lincomycin antibiotics ng/L 0.04 <0.04 0.37 <0.04 0.12 Losartan antihypertensives ng/L 7.7 0.72 <0.14 7.4 0.06 Mesalazine gastrointestinal disease m. ng/L 3.7 190 N/A 1.8 110 Metformin metabolic disease m. ng/L 30 25 120 26 16 Metoprolol other cardiovascular m. ng/L 6.0 5.3 3.0 5.4 2.3 Mometasone furoate asthma and allergy m. ng/L <0.29 <0.29 <1.3 <0.29 <0.29 Naproxen NSAIDs and analgesics ng/L 5.3 <0.47 <0.57 5.1 0.7 Nebivolol other cardiovascular m. ng/L 0.0 0.2 0.4 0.0 1.5 Norethisterone hormones ng/L 0.19 0.27 0.45 <0.04 0.32 Ofloxacin antibiotics ng/L <4.2 <4.2 <10 <4.2 <4.2 Oxazepam psycopharmaceuticals ng/L 10 17 12 9.4 11 Oxycodone NSAIDs and analgesics ng/L 0.35 0.5 0.37 0.3 0.25 Primidone antiepileptics ng/L <0.71 <0.71 <1.37 <0.71 <0.71 Progesterone hormones ng/L <0.03 <0.03 <0.086 0.03 0.24 Quetiapine psycopharmaceuticals ng/L 0.09 0.03 0.16 0.08 0.11 Ramipril antihypertensives ng/L N/A N/A <0.72 N/A N/A Sertraline psycopharmaceuticals ng/L 0.09 <0.03 0.31 0.08 5.8 Simvastatin metabolic disease m. ng/L 0.04 <0.02 N/A <0.02 <0.02 Sotalol other cardiovascular m. ng/L 2.3 3.4 <0.89 3.1 1.3 Sulfadiazine antibiotics ng/L N/A N/A <17 N/A N/A Telmisartan antihypertensives ng/L N/A N/A 1.8 N/A N/A Temazepam psycopharmaceuticals ng/L 4.2 9.1 9.7 4.4 5.6 Testosterone hormones ng/L 0.06 <0.05 0.33 0.06 0.35 Tetracycline / Doxycycline
antibiotics ng/L <3.17 4.9 20 <3.17 11
Tiamulin veterinary m. ng/L <0.01 <0.01 0.28 <0.01 <0.01 Toltrazuril veterinary m. ng/L <3.60 <3.60 <4.8 <3.60 <3.60 Tramadol NSAIDs and analgesics ng/L 5.7 11 5.4 5.5 4.9 Trimethoprim antibiotics ng/L 2.0 3.8 0.9 2.0 2.0 Tylosin veterinary m. ng/L 2.2 <1.9 <3.7 3.5 <1.9 Valsartan antihypertensives ng/L N/A N/A 6.7 N/A N/A Warfarin other cardiovascular m. ng/L <0.58 <0.58 <0.87 <0.58 <0.58 Venlafaxine psycopharmaceuticals ng/L 5.3 9.6 3.5 4.8 3.9 Xylometazoline asthma and allergy m. ng/L <0.19 <0.19 <0.05 <0.19 <0.19
Sum concentration ng/L 155 378 312 148 244 Number of detected / analysed APIs 36/53 28/53 33/58 35/53 34/53
N/A: not analysed; Concentration lower than quantification limit (LOQ) are marked as “<” and LOQ

230
Finland (4/4) FI-BSE1 FI-BSE2 FI-BSE2 FI-BSE2 FI-BSE2 FI-BSE2 FI-BSE2 Surface water type & sampling depth
Sea 9-m
Sea 1-m
Sea 13-m
Sea 25-m
Sea 1-m
Sea 13-m
Sea 25-m
Date dd.mm.yy 4.6.18 5.3.18 5.3.18 5.3.18 4.6.18 4.6.18 4.6.18 N cordinates WGS84 DD 60.08613 60.09652 E cordinates WGS84 DD 24.91319 24.89046
API unit WWTP pipe Katajaluoto
surface middle bottom Katajaluoto
surface middle Bottom
Amlodipine ng/L <0.003 0.17 0.04 <0.003 <0.003 <0.003 <0.003 Atenolol ng/L <8.0 <8.0 <8.0 <8.0 <8.0 <8.0 <8.0 Atorvastatin ng/L N/A N/A N/A N/A N/A N/A N/A Bezafibrate ng/L 0.54 <0.40 <0.40 <0.40 <0.40 <0.40 <0.40 Bisoprolol ng/L 4.3 1.2 0.46 0.26 0.42 <0.21 <0.21 Caffeine ng/L 3.2 1.8 5.4 13 21 6.1 4.8 Candesartan ng/L 3.0 1.4 <0.22 <0.22 <0.22 <0.22 <0.22 Carbamazepine ng/L 2.8 0.64 0.6 2.6 0.87 0.96 0.89 Carprofen ng/L <0.58 <0.58 <0.58 <0.58 <0.58 <0.58 <0.58 Cetirizine ng/L 13 1.5 0.6 0.23 0.41 0.2 0.27 Ciprofloxacin ng/L <35 <35 <35 <35 <35 <35 <35 Citalopram ng/L 1.70 0.39 0.26 0.21 0.19 0.05 0.05 Clarithromycin ng/L 1.20 0.59 <0.33 <0.33 <0.33 <0.33 <0.33 Codeine ng/L 1.08 0.55 0.25 0.23 0.22 0.04 0.05 Diclofenac ng/L 35 6.3 2.6 3.0 3.0 <0.34 0.43 Dipyridamole ng/L 35 2.3 <0.67 <0.67 <0.67 <0.67 <0.67 Emamectin ng/L 0.45 <0.02 <0.02 0.23 0.4 0.32 <0.02 Enalapril ng/L N/A N/A N/A N/A N/A N/A N/A Eprosartan ng/L N/A N/A N/A N/A N/A N/A N/A Erythromycin ng/L <0.92 7.80 20 <0.92 <0.92 <0.92 <0.92 Estrone (E1) ng/L 0.51 0.6 1.0 <0.17 0.32 <0.17 0.43 Fenbendazole ng/L 0.06 <0.03 <0.03 <0.03 <0.03 <0.03 <0.03 Fexofenadine ng/L N/A N/A N/A N/A N/A N/A N/A Fluconazole ng/L 1.4 0.35 0.26 1.2 0.61 0.40 0.31 Fluticasone ng/L 0.05 0.02 <0.002 <0.002 <0.002 <0.002 <0.002 Gabapentin ng/L N/A N/A N/A N/A N/A N/A N/A Gemfibrozil ng/L 0.61 <0.02 40 <0.02 <0.02 <0.02 <0.02 Irbesartan ng/L 0.27 <0.02 <0.02 0.04 0.02 <0.02 <0.02 Ketoprofen ng/L <0.38 <0.38 <0.38 <0.38 <0.38 <0.38 <0.38 Levetiracetam ng/L 6.5 <5.43 <5.43 <5.43 <5.43 <5.43 <5.43 Lincomycin ng/L <0.04 <0.04 0.05 0.13 <0.04 <0.04 <0.04 Losartan ng/L 3.8 3.4 <0.02 0.12 0.3 0.15 0.13 Mesalazine ng/L <0.82 0.82 <0.82 58 <0.82 <0.82 29 Metformin ng/L 16 3.4 13 <0.12 18 <0.12 <0.12 Metoprolol ng/L 2.2 0.45 0.46 0.41 <0.35 <0.35 <0.35 Mometasone furoate
ng/L <0.29 <0.29 <0.29 <0.29 <0.29 <0.29 <0.29
Naproxen ng/L 0.52 0.62 0.63 2.0 2.9 <0.47 1.7 Nebivolol ng/L 0.28 0.02 0.02 0.75 0.29 0.22 0.19 Norethisterone ng/L 0.35 0.39 0.21 <0.04 <0.04 0.11 <0.04 Ofloxacin ng/L <4.2 <4.2 <4.2 <4.2 <4.2 <4.2 <4.2 Oxazepam ng/L 8.0 0.94 0.45 0.8 1.0 0.23 0.33 Oxycodone ng/L 0.25 <0.03 <0.03 0.18 0.04 0.05 <0.03 Primidone ng/L <0.71 <0.71 <0.71 0.74 <0.71 <0.71 <0.71 Progesterone ng/L <0.03 0.03 0.03 0.09 <0.03 0.03 <0.03 Quetiapine ng/L 0.14 0.39 0.06 0.17 0.01 <0.01 <0.01 Ramipril ng/L N/A N/A N/A N/A N/A N/A N/A Sertraline ng/L 0.56 0.03 <0.03 5.1 0.58 <0.03 <0.03 Simvastatin ng/L <0.02 <0.02 <0.02 <0.02 <0.02 0.14 <0.02 Sotalol ng/L 1.7 <0.68 <0.68 0.71 <0.68 <0.68 <0.68 Sulfadiazine ng/L N/A N/A N/A N/A N/A N/A N/A Telmisartan ng/L N/A N/A N/A N/A N/A N/A N/A Temazepam ng/L 3.2 0.48 <0.34 0.61 0.66 <0.34 <0.34 Testosterone ng/L <0.05 0.05 0.06 <0.05 <0.05 0.06 <0.05 Tetracycline / Doxycycline
ng/L 5.2 <3.17 <3.17 11 5.2 <3.17 4.9
Tiamulin ng/L <0.01 0.01 0.01 <0.01 <0.01 <0.01 <0.01 Toltrazuril ng/L <3.60 <3.60 4.4 <3.60 <3.60 <3.60 <3.60 Tramadol ng/L 2.9 0.31 0.24 0.64 0.69 0.15 0.12 Trimethoprim ng/L 1.5 0.28 0.26 0.34 0.26 <0.17 <0.17 Tylosin ng/L <1.9 <1.9 <1.9 <1.9 <1.9 <1.9 <1.9 Valsartan ng/L N/A N/A N/A N/A N/A N/A N/A Warfarin ng/L <0.58 <0.58 <0.58 <0.58 <0.58 <0.58 <0.58 Venlafaxine ng/L 4.8 0.6 0.35 0.59 1.2 0.15 0.14 Xylometazoline ng/L <0.19 <0.19 <0.19 <0.19 <0.19 <0.19 <0.19
Sum concentration ng/L 162 38 92 103 59 9 44 Detected / Analysed APIs 35/53 31/53 26/53 28/53 24/53 17/53 16/53
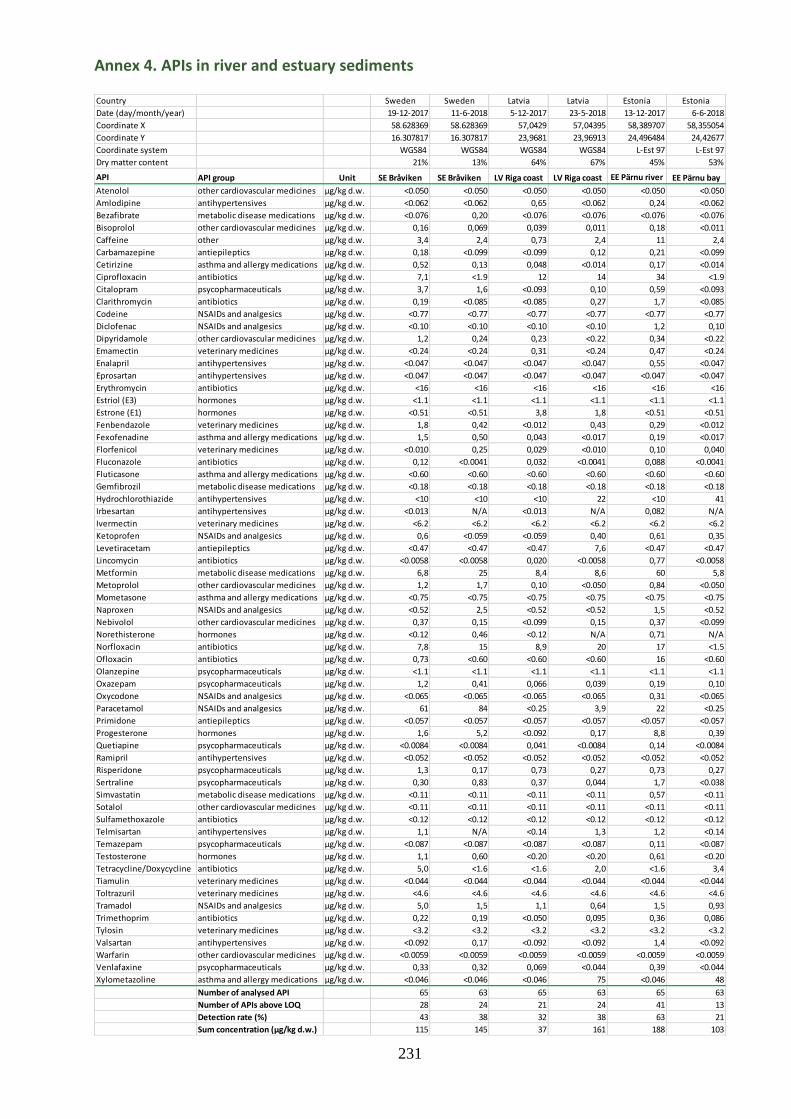
231
Annex 4. APIs in river and estuary sediments
Country Sweden Sweden Latvia Latvia Estonia Estonia
Date (day/month/year) 19-12-2017 11-6-2018 5-12-2017 23-5-2018 13-12-2017 6-6-2018
Coordinate X 58.628369 58.628369 57,0429 57,04395 58,389707 58,355054
Coordinate Y 16.307817 16.307817 23,9681 23,96913 24,496484 24,42677
Coordinate system WGS84 WGS84 WGS84 WGS84 L-Est 97 L-Est 97
Dry matter content 21% 13% 64% 67% 45% 53%
API API group Unit SE Bråviken SE Bråviken LV Riga coast LV Riga coast EE Pärnu river EE Pärnu bay
Atenolol other cardiovascular medicines µg/kg d.w. <0.050 <0.050 <0.050 <0.050 <0.050 <0.050
Amlodipine antihypertensives µg/kg d.w. <0.062 <0.062 0,65 <0.062 0,24 <0.062
Bezafibrate metabolic disease medications µg/kg d.w. <0.076 0,20 <0.076 <0.076 <0.076 <0.076
Bisoprolol other cardiovascular medicines µg/kg d.w. 0,16 0,069 0,039 0,011 0,18 <0.011
Caffeine other µg/kg d.w. 3,4 2,4 0,73 2,4 11 2,4
Carbamazepine antiepileptics µg/kg d.w. 0,18 <0.099 <0.099 0,12 0,21 <0.099
Cetirizine asthma and allergy medications µg/kg d.w. 0,52 0,13 0,048 <0.014 0,17 <0.014
Ciprofloxacin antibiotics µg/kg d.w. 7,1 <1.9 12 14 34 <1.9
Citalopram psycopharmaceuticals µg/kg d.w. 3,7 1,6 <0.093 0,10 0,59 <0.093
Clarithromycin antibiotics µg/kg d.w. 0,19 <0.085 <0.085 0,27 1,7 <0.085
Codeine NSAIDs and analgesics µg/kg d.w. <0.77 <0.77 <0.77 <0.77 <0.77 <0.77
Diclofenac NSAIDs and analgesics µg/kg d.w. <0.10 <0.10 <0.10 <0.10 1,2 0,10
Dipyridamole other cardiovascular medicines µg/kg d.w. 1,2 0,24 0,23 <0.22 0,34 <0.22
Emamectin veterinary medicines µg/kg d.w. <0.24 <0.24 0,31 <0.24 0,47 <0.24
Enalapril antihypertensives µg/kg d.w. <0.047 <0.047 <0.047 <0.047 0,55 <0.047
Eprosartan antihypertensives µg/kg d.w. <0.047 <0.047 <0.047 <0.047 <0.047 <0.047
Erythromycin antibiotics µg/kg d.w. <16 <16 <16 <16 <16 <16
Estriol (E3) hormones µg/kg d.w. <1.1 <1.1 <1.1 <1.1 <1.1 <1.1
Estrone (E1) hormones µg/kg d.w. <0.51 <0.51 3,8 1,8 <0.51 <0.51
Fenbendazole veterinary medicines µg/kg d.w. 1,8 0,42 <0.012 0,43 0,29 <0.012
Fexofenadine asthma and allergy medications µg/kg d.w. 1,5 0,50 0,043 <0.017 0,19 <0.017
Florfenicol veterinary medicines µg/kg d.w. <0.010 0,25 0,029 <0.010 0,10 0,040
Fluconazole antibiotics µg/kg d.w. 0,12 <0.0041 0,032 <0.0041 0,088 <0.0041
Fluticasone asthma and allergy medications µg/kg d.w. <0.60 <0.60 <0.60 <0.60 <0.60 <0.60
Gemfibrozil metabolic disease medications µg/kg d.w. <0.18 <0.18 <0.18 <0.18 <0.18 <0.18
Hydrochlorothiazide antihypertensives µg/kg d.w. <10 <10 <10 22 <10 41
Irbesartan antihypertensives µg/kg d.w. <0.013 N/A <0.013 N/A 0,082 N/A
Ivermectin veterinary medicines µg/kg d.w. <6.2 <6.2 <6.2 <6.2 <6.2 <6.2
Ketoprofen NSAIDs and analgesics µg/kg d.w. 0,6 <0.059 <0.059 0,40 0,61 0,35
Levetiracetam antiepileptics µg/kg d.w. <0.47 <0.47 <0.47 7,6 <0.47 <0.47
Lincomycin antibiotics µg/kg d.w. <0.0058 <0.0058 0,020 <0.0058 0,77 <0.0058
Metformin metabolic disease medications µg/kg d.w. 6,8 25 8,4 8,6 60 5,8
Metoprolol other cardiovascular medicines µg/kg d.w. 1,2 1,7 0,10 <0.050 0,84 <0.050
Mometasone asthma and allergy medications µg/kg d.w. <0.75 <0.75 <0.75 <0.75 <0.75 <0.75
Naproxen NSAIDs and analgesics µg/kg d.w. <0.52 2,5 <0.52 <0.52 1,5 <0.52
Nebivolol other cardiovascular medicines µg/kg d.w. 0,37 0,15 <0.099 0,15 0,37 <0.099
Norethisterone hormones µg/kg d.w. <0.12 0,46 <0.12 N/A 0,71 N/A
Norfloxacin antibiotics µg/kg d.w. 7,8 15 8,9 20 17 <1.5
Ofloxacin antibiotics µg/kg d.w. 0,73 <0.60 <0.60 <0.60 16 <0.60
Olanzepine psycopharmaceuticals µg/kg d.w. <1.1 <1.1 <1.1 <1.1 <1.1 <1.1
Oxazepam psycopharmaceuticals µg/kg d.w. 1,2 0,41 0,066 0,039 0,19 0,10
Oxycodone NSAIDs and analgesics µg/kg d.w. <0.065 <0.065 <0.065 <0.065 0,31 <0.065
Paracetamol NSAIDs and analgesics µg/kg d.w. 61 84 <0.25 3,9 22 <0.25
Primidone antiepileptics µg/kg d.w. <0.057 <0.057 <0.057 <0.057 <0.057 <0.057
Progesterone hormones µg/kg d.w. 1,6 5,2 <0.092 0,17 8,8 0,39
Quetiapine psycopharmaceuticals µg/kg d.w. <0.0084 <0.0084 0,041 <0.0084 0,14 <0.0084
Ramipril antihypertensives µg/kg d.w. <0.052 <0.052 <0.052 <0.052 <0.052 <0.052
Risperidone psycopharmaceuticals µg/kg d.w. 1,3 0,17 0,73 0,27 0,73 0,27
Sertraline psycopharmaceuticals µg/kg d.w. 0,30 0,83 0,37 0,044 1,7 <0.038
Simvastatin metabolic disease medications µg/kg d.w. <0.11 <0.11 <0.11 <0.11 0,57 <0.11
Sotalol other cardiovascular medicines µg/kg d.w. <0.11 <0.11 <0.11 <0.11 <0.11 <0.11
Sulfamethoxazole antibiotics µg/kg d.w. <0.12 <0.12 <0.12 <0.12 <0.12 <0.12
Telmisartan antihypertensives µg/kg d.w. 1,1 N/A <0.14 1,3 1,2 <0.14
Temazepam psycopharmaceuticals µg/kg d.w. <0.087 <0.087 <0.087 <0.087 0,11 <0.087
Testosterone hormones µg/kg d.w. 1,1 0,60 <0.20 <0.20 0,61 <0.20
Tetracycline/Doxycycline antibiotics µg/kg d.w. 5,0 <1.6 <1.6 2,0 <1.6 3,4
Tiamulin veterinary medicines µg/kg d.w. <0.044 <0.044 <0.044 <0.044 <0.044 <0.044
Toltrazuril veterinary medicines µg/kg d.w. <4.6 <4.6 <4.6 <4.6 <4.6 <4.6
Tramadol NSAIDs and analgesics µg/kg d.w. 5,0 1,5 1,1 0,64 1,5 0,93
Trimethoprim antibiotics µg/kg d.w. 0,22 0,19 <0.050 0,095 0,36 0,086
Tylosin veterinary medicines µg/kg d.w. <3.2 <3.2 <3.2 <3.2 <3.2 <3.2
Valsartan antihypertensives µg/kg d.w. <0.092 0,17 <0.092 <0.092 1,4 <0.092
Warfarin other cardiovascular medicines µg/kg d.w. <0.0059 <0.0059 <0.0059 <0.0059 <0.0059 <0.0059
Venlafaxine psycopharmaceuticals µg/kg d.w. 0,33 0,32 0,069 <0.044 0,39 <0.044
Xylometazoline asthma and allergy medications µg/kg d.w. <0.046 <0.046 <0.046 75 <0.046 48
Number of analysed API 65 63 65 63 65 63
Number of APIs above LOQ 28 24 21 24 41 13
Detection rate (%) 43 38 32 38 63 21
Sum concentration (µg/kg d.w.) 115 145 37 161 188 103

232
Annex 5. API concentrations in WWTP influents
Country Estonia Estonia Estonia Estonia Estonia Estonia
Date 06-12-2017 06-12-2017 12-12-2017 05-06-2018 05-06-2018 07-06-2018
Year 2017 2017 2017 2018 2018 2018
Month 12 12 12 6 6 6
Date 6 6 12 5 5 7
Name Türi Paide Pärnu Paide Türi Pärnu
Comments 24-h 24-h 24-h 24-h 24-h 24-h
Info
API API group Unit
Allopurinol metabolic disease medications ng/l <13718 <13718 <13718 <13718 <13718 <13718
Amlodipine antihypertensives ng/l <396 <396 <396 450 <396 <396
Atenolol other cardiovascular medicines ng/l <211 <211 <211 <211 <211 <211
Atorvastatin metabolic disease medications ng/l <10405 <10405 <10405 <10405 <10405 <10405
Bezafibrate metabolic disease medications ng/l <27 <27 <27 <27 <27 53
Bisoprolol other cardiovascular medicines ng/l <30 <30 <30 <30 <30 57
Caffeine other ng/l 249 385 253 8805 10830 3935
Candesartan antihypertensives ng/l <772 <772 <772 <772 <772 <772
Carbamazepine antiepileptics ng/l <17 <17 <17 2067 2464 1428
Carprofen veterinary medicines ng/l <14 <14 <14 <14 31 <14
Cetirizine asthma and allergy medications ng/l <3218 <3218 <3218 <3218 <3218 <3218
Ciprofloxacin antibiotics ng/l <3136 <3136 <3136 <3136 <3136 <3136
Citalopram psycopharmaceuticals ng/l 38 58 29 126 74 91
Clarithromycin antibiotics ng/l 529 1859 562 888 327 339
Codeine NSAIDs and analgesics ng/l N/A N/A N/A 2090 1608 1579
Diclofenac NSAIDs and analgesics ng/l 5407 7279 4421 8811 15730 2778
Dipyridamole other cardiovascular medicines ng/l <185 <185 <185 581 590 1796
Emamectin veterinary medicines ng/l <29 <29 <29 <29 <29 <29
Enalapril antihypertensives ng/l <167 <167 <167 <167 <167 <167
Eprosartan antihypertensives ng/l <10 <10 <10 <10 <10 162
Erythromycin antibiotics ng/l <39 <39 <39 19040 9157 1463
Esomeprazole gastrointestinal disease medications ng/l <8441 <8441 <8441 <8441 <8441 <8441
Estriol hormones ng/l <12 <12 <12 54 71 80
Estrone (E1) hormones ng/l 27 <26 296 41 59 1224
Fenbendazole veterinary medicines ng/l <36 <36 <36 <36 <36 <36
Fexofenadine asthma and allergy medications ng/l <4255 <4255 <4255 <4255 <4255 <4255
Florfenicol veterinary medicines ng/l <64 <64 <64 <64 <64 <64
Fluconazole antibiotics ng/l <20 44 48 <20 <20 57
Fluticasone asthma and allergy medications ng/l <415 <415 <415 <415 <415 607
Gabapentin antiepileptics ng/l 1667 2845 2733 5158 7954 8633
Gemfibrozil metabolic disease medications ng/l <165 <165 <165 611 <165 <165
Hydrochlorothiazide antihypertensives ng/l 2655 2152 2278 10121 21007 11860
Ibuprofen NSAIDs and analgesics ng/l <2272 <2272 2331 N/A N/A N/A
Irbesartan antihypertensives ng/l <53 <53 <53 <53 <53 <53
Ketoprofen NSAIDs and analgesics ng/l 446 491 205 2119 1927 1127
Levetiracetam antiepileptics ng/l 1074 797 734 3772 3234 3508
Lincomycin antibiotics ng/l <18 <18 <18 <18 <18 <18
Losartan antihypertensives ng/l <508 <508 <508 <508 1062 <508
Mesalazine gastrointestinal disease medications ng/l 5562 5050 4360 13052 13685 <282
Metformin metabolic disease medications ng/l 14832 26315 16703 108975 99787 93169
Metoprolol other cardiovascular medicines ng/l 791 791 571 1585 2730 1814
Mometasone furoate asthma and allergy medications ng/l <828 <828 <828 <828 <828 <828
Naproxen NSAIDs and analgesics ng/l 2679 2089 1341 5508 11789 7082
Nebivolol other cardiovascular medicines ng/l <974 <974 <974 1452 1452 1542
Norethisterone hormones ng/l <24 <24 <24 187 80 93
Norfloxacin antibiotics ng/l 13299 13365 13409 <12437 <12437 <12437
Ofloxacin antibiotics ng/l <417 <417 <417 <417 <417 <417
Olanzapine psycopharmaceuticals ng/l <5.9 <5.9 <5.9 <5.9 <5.9 <5.9
Oxazepam psycopharmaceuticals ng/l N/A N/A N/A 36 67 73
Oxycodone NSAIDs and analgesics ng/l N/A N/A N/A <263 <263 <263
Pantoprazole gastrointestinal disease medications ng/l <763 <763 <763 <763 <763 <763
Paracetamol NSAIDs and analgesics ng/l 98860 335776 145893 7573 8479 4411
Primidone antiepileptics ng/l <35 <35 <35 <35 <35 <35
Progesterone hormones ng/l <31 <31 <31 <31 33 <31
Quetiapine psycopharmaceuticals ng/l <473 <473 <473 <473 687 <473
Ramipril antihypertensives ng/l <32 <32 <32 <32 <32 <32
Risperidone psycopharmaceuticals ng/l <804 <804 <804 <804 <804 <804
Sertraline psycopharmaceuticals ng/l <20 <20 <20 45 31 49
Simvastatin metabolic disease medications ng/l <1.4 <1.4 <1.4 98 5 <1.4
Sotalol other cardiovascular medicines ng/l 70 142 124 143 151 215
Sulfadiazine antibiotics ng/l <590 <590 <590 <590 <590 <590
Sulfamethoxazole antibiotics ng/l 130 296 100 376 228 386
Telmisartan antihypertensives ng/l <49 54 <49 6851 12021 189
Temazepam psycopharmaceuticals ng/l N/A N/A N/A 30 39 30
Testosterone hormones ng/l <81 <81 <81 <81 <81 <81
Tetracycline/Doxycyclineantibiotics ng/l 260 298 404 <239 <239 <239
Tiamulin veterinary medicines ng/l <38 <38 <38 <38 <38 <38
Toltrazuril veterinary medicines ng/l <8992 <8992 <8992 <8992 <8992 <8992
Tramadol NSAIDs and analgesics ng/l <77 <77 <77 462 444 406
Trimethoprim antibiotics ng/l 123 197 103 323 158 237
Tylosin veterinary medicines ng/l <316 <316 <316 <316 <316 <316
Valsartan antihypertensives ng/l <295 743 580 465 544 1383
Warfarin other cardiovascular medicines ng/l <13 <13 <13 <13 14 14
Venlafaxine psycopharmaceuticals ng/l <20 48 43 199 189 343
Xylometazoline asthma and allergy medications ng/l <51 <51 <51 <51 <51 <51
Number of analysed API 71 71 71 74 74 74
Number of APIs above LOQ 20 23 24 35 38 37
Detection rate (%) 28 32 34 47 51 50
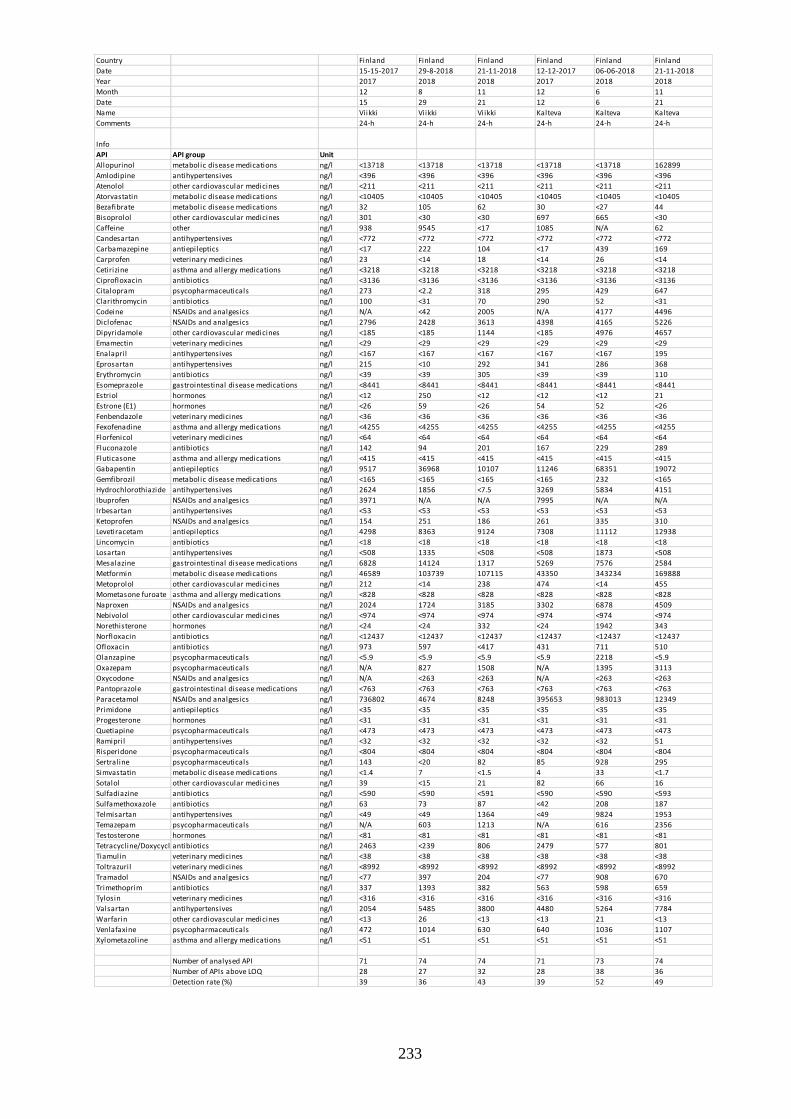
233
Country Finland Finland Finland Finland Finland Finland
Date 15-15-2017 29-8-2018 21-11-2018 12-12-2017 06-06-2018 21-11-2018
Year 2017 2018 2018 2017 2018 2018
Month 12 8 11 12 6 11
Date 15 29 21 12 6 21
Name Viikki Viikki Viikki Kalteva Kalteva Kalteva
Comments 24-h 24-h 24-h 24-h 24-h 24-h
Info
API API group Unit
Allopurinol metabolic disease medications ng/l <13718 <13718 <13718 <13718 <13718 162899
Amlodipine antihypertensives ng/l <396 <396 <396 <396 <396 <396
Atenolol other cardiovascular medicines ng/l <211 <211 <211 <211 <211 <211
Atorvastatin metabolic disease medications ng/l <10405 <10405 <10405 <10405 <10405 <10405
Bezafibrate metabolic disease medications ng/l 32 105 62 30 <27 44
Bisoprolol other cardiovascular medicines ng/l 301 <30 <30 697 665 <30
Caffeine other ng/l 938 9545 <17 1085 N/A 62
Candesartan antihypertensives ng/l <772 <772 <772 <772 <772 <772
Carbamazepine antiepileptics ng/l <17 222 104 <17 439 169
Carprofen veterinary medicines ng/l 23 <14 18 <14 26 <14
Cetirizine asthma and allergy medications ng/l <3218 <3218 <3218 <3218 <3218 <3218
Ciprofloxacin antibiotics ng/l <3136 <3136 <3136 <3136 <3136 <3136
Citalopram psycopharmaceuticals ng/l 273 <2.2 318 295 429 647
Clarithromycin antibiotics ng/l 100 <31 70 290 52 <31
Codeine NSAIDs and analgesics ng/l N/A <42 2005 N/A 4177 4496
Diclofenac NSAIDs and analgesics ng/l 2796 2428 3613 4398 4165 5226
Dipyridamole other cardiovascular medicines ng/l <185 <185 1144 <185 4976 4657
Emamectin veterinary medicines ng/l <29 <29 <29 <29 <29 <29
Enalapril antihypertensives ng/l <167 <167 <167 <167 <167 195
Eprosartan antihypertensives ng/l 215 <10 292 341 286 368
Erythromycin antibiotics ng/l <39 <39 305 <39 <39 110
Esomeprazole gastrointestinal disease medications ng/l <8441 <8441 <8441 <8441 <8441 <8441
Estriol hormones ng/l <12 250 <12 <12 <12 21
Estrone (E1) hormones ng/l <26 59 <26 54 52 <26
Fenbendazole veterinary medicines ng/l <36 <36 <36 <36 <36 <36
Fexofenadine asthma and allergy medications ng/l <4255 <4255 <4255 <4255 <4255 <4255
Florfenicol veterinary medicines ng/l <64 <64 <64 <64 <64 <64
Fluconazole antibiotics ng/l 142 94 201 167 229 289
Fluticasone asthma and allergy medications ng/l <415 <415 <415 <415 <415 <415
Gabapentin antiepileptics ng/l 9517 36968 10107 11246 68351 19072
Gemfibrozil metabolic disease medications ng/l <165 <165 <165 <165 232 <165
Hydrochlorothiazide antihypertensives ng/l 2624 1856 <7.5 3269 5834 4151
Ibuprofen NSAIDs and analgesics ng/l 3971 N/A N/A 7995 N/A N/A
Irbesartan antihypertensives ng/l <53 <53 <53 <53 <53 <53
Ketoprofen NSAIDs and analgesics ng/l 154 251 186 261 335 310
Levetiracetam antiepileptics ng/l 4298 8363 9124 7308 11112 12938
Lincomycin antibiotics ng/l <18 <18 <18 <18 <18 <18
Losartan antihypertensives ng/l <508 1335 <508 <508 1873 <508
Mesalazine gastrointestinal disease medications ng/l 6828 14124 1317 5269 7576 2584
Metformin metabolic disease medications ng/l 46589 103739 107115 43350 343234 169888
Metoprolol other cardiovascular medicines ng/l 212 <14 238 474 <14 455
Mometasone furoate asthma and allergy medications ng/l <828 <828 <828 <828 <828 <828
Naproxen NSAIDs and analgesics ng/l 2024 1724 3185 3302 6878 4509
Nebivolol other cardiovascular medicines ng/l <974 <974 <974 <974 <974 <974
Norethisterone hormones ng/l <24 <24 332 <24 1942 343
Norfloxacin antibiotics ng/l <12437 <12437 <12437 <12437 <12437 <12437
Ofloxacin antibiotics ng/l 973 597 <417 431 711 510
Olanzapine psycopharmaceuticals ng/l <5.9 <5.9 <5.9 <5.9 2218 <5.9
Oxazepam psycopharmaceuticals ng/l N/A 827 1508 N/A 1395 3113
Oxycodone NSAIDs and analgesics ng/l N/A <263 <263 N/A <263 <263
Pantoprazole gastrointestinal disease medications ng/l <763 <763 <763 <763 <763 <763
Paracetamol NSAIDs and analgesics ng/l 736802 4674 8248 395653 983013 12349
Primidone antiepileptics ng/l <35 <35 <35 <35 <35 <35
Progesterone hormones ng/l <31 <31 <31 <31 <31 <31
Quetiapine psycopharmaceuticals ng/l <473 <473 <473 <473 <473 <473
Ramipril antihypertensives ng/l <32 <32 <32 <32 <32 51
Risperidone psycopharmaceuticals ng/l <804 <804 <804 <804 <804 <804
Sertraline psycopharmaceuticals ng/l 143 <20 82 85 928 295
Simvastatin metabolic disease medications ng/l <1.4 7 <1.5 4 33 <1.7
Sotalol other cardiovascular medicines ng/l 39 <15 21 82 66 16
Sulfadiazine antibiotics ng/l <590 <590 <591 <590 <590 <593
Sulfamethoxazole antibiotics ng/l 63 73 87 <42 208 187
Telmisartan antihypertensives ng/l <49 <49 1364 <49 9824 1953
Temazepam psycopharmaceuticals ng/l N/A 603 1213 N/A 616 2356
Testosterone hormones ng/l <81 <81 <81 <81 <81 <81
Tetracycline/Doxycyclineantibiotics ng/l 2463 <239 806 2479 577 801
Tiamulin veterinary medicines ng/l <38 <38 <38 <38 <38 <38
Toltrazuril veterinary medicines ng/l <8992 <8992 <8992 <8992 <8992 <8992
Tramadol NSAIDs and analgesics ng/l <77 397 204 <77 908 670
Trimethoprim antibiotics ng/l 337 1393 382 563 598 659
Tylosin veterinary medicines ng/l <316 <316 <316 <316 <316 <316
Valsartan antihypertensives ng/l 2054 5485 3800 4480 5264 7784
Warfarin other cardiovascular medicines ng/l <13 26 <13 <13 21 <13
Venlafaxine psycopharmaceuticals ng/l 472 1014 630 640 1036 1107
Xylometazoline asthma and allergy medications ng/l <51 <51 <51 <51 <51 <51
Number of analysed API 71 74 74 71 73 74
Number of APIs above LOQ 28 27 32 28 38 36
Detection rate (%) 39 36 43 39 52 49
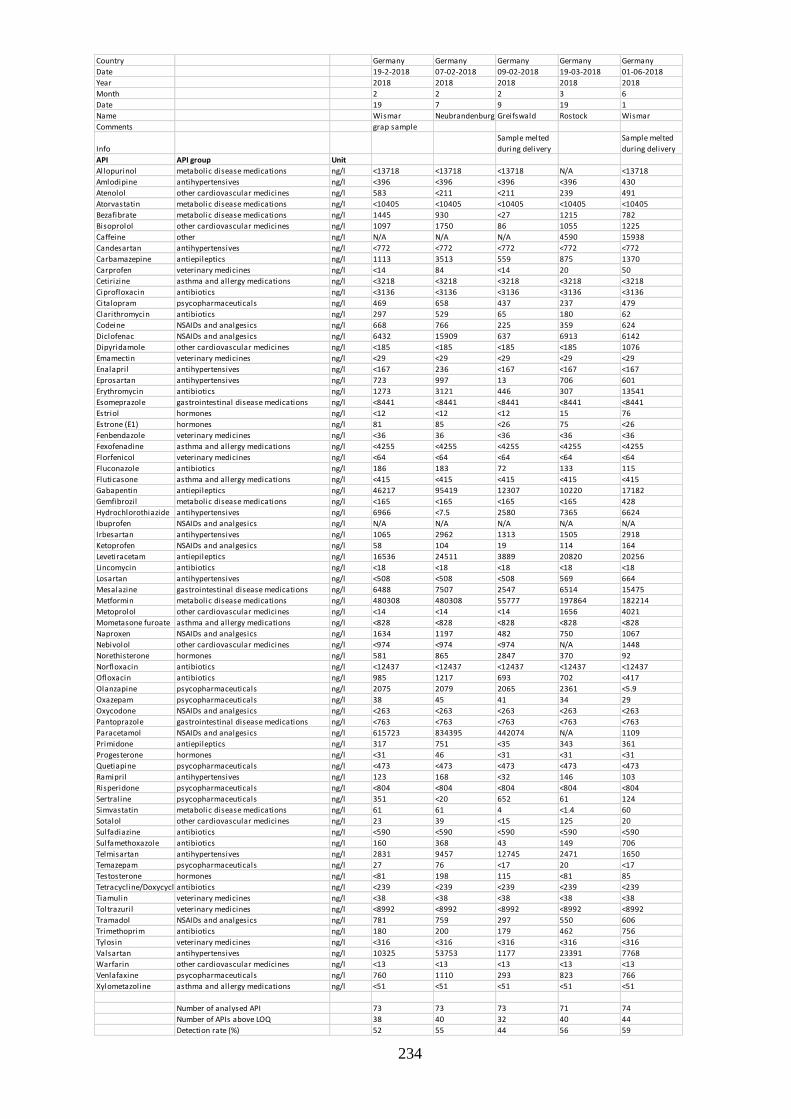
234
Country Germany Germany Germany Germany Germany
Date 19-2-2018 07-02-2018 09-02-2018 19-03-2018 01-06-2018
Year 2018 2018 2018 2018 2018
Month 2 2 2 3 6
Date 19 7 9 19 1
Name Wismar Neubrandenburg Greifswald Rostock Wismar
Comments grap sample
Info
Sample melted
during delivery
Sample melted
during delivery
API API group Unit
Allopurinol metabolic disease medications ng/l <13718 <13718 <13718 N/A <13718
Amlodipine antihypertensives ng/l <396 <396 <396 <396 430
Atenolol other cardiovascular medicines ng/l 583 <211 <211 239 491
Atorvastatin metabolic disease medications ng/l <10405 <10405 <10405 <10405 <10405
Bezafibrate metabolic disease medications ng/l 1445 930 <27 1215 782
Bisoprolol other cardiovascular medicines ng/l 1097 1750 86 1055 1225
Caffeine other ng/l N/A N/A N/A 4590 15938
Candesartan antihypertensives ng/l <772 <772 <772 <772 <772
Carbamazepine antiepileptics ng/l 1113 3513 559 875 1370
Carprofen veterinary medicines ng/l <14 84 <14 20 50
Cetirizine asthma and allergy medications ng/l <3218 <3218 <3218 <3218 <3218
Ciprofloxacin antibiotics ng/l <3136 <3136 <3136 <3136 <3136
Citalopram psycopharmaceuticals ng/l 469 658 437 237 479
Clarithromycin antibiotics ng/l 297 529 65 180 62
Codeine NSAIDs and analgesics ng/l 668 766 225 359 624
Diclofenac NSAIDs and analgesics ng/l 6432 15909 637 6913 6142
Dipyridamole other cardiovascular medicines ng/l <185 <185 <185 <185 1076
Emamectin veterinary medicines ng/l <29 <29 <29 <29 <29
Enalapril antihypertensives ng/l <167 236 <167 <167 <167
Eprosartan antihypertensives ng/l 723 997 13 706 601
Erythromycin antibiotics ng/l 1273 3121 446 307 13541
Esomeprazole gastrointestinal disease medications ng/l <8441 <8441 <8441 <8441 <8441
Estriol hormones ng/l <12 <12 <12 15 76
Estrone (E1) hormones ng/l 81 85 <26 75 <26
Fenbendazole veterinary medicines ng/l <36 36 <36 <36 <36
Fexofenadine asthma and allergy medications ng/l <4255 <4255 <4255 <4255 <4255
Florfenicol veterinary medicines ng/l <64 <64 <64 <64 <64
Fluconazole antibiotics ng/l 186 183 72 133 115
Fluticasone asthma and allergy medications ng/l <415 <415 <415 <415 <415
Gabapentin antiepileptics ng/l 46217 95419 12307 10220 17182
Gemfibrozil metabolic disease medications ng/l <165 <165 <165 <165 428
Hydrochlorothiazide antihypertensives ng/l 6966 <7.5 2580 7365 6624
Ibuprofen NSAIDs and analgesics ng/l N/A N/A N/A N/A N/A
Irbesartan antihypertensives ng/l 1065 2962 1313 1505 2918
Ketoprofen NSAIDs and analgesics ng/l 58 104 19 114 164
Levetiracetam antiepileptics ng/l 16536 24511 3889 20820 20256
Lincomycin antibiotics ng/l <18 <18 <18 <18 <18
Losartan antihypertensives ng/l <508 <508 <508 569 664
Mesalazine gastrointestinal disease medications ng/l 6488 7507 2547 6514 15475
Metformin metabolic disease medications ng/l 480308 480308 55777 197864 182214
Metoprolol other cardiovascular medicines ng/l <14 <14 <14 1656 4021
Mometasone furoate asthma and allergy medications ng/l <828 <828 <828 <828 <828
Naproxen NSAIDs and analgesics ng/l 1634 1197 482 750 1067
Nebivolol other cardiovascular medicines ng/l <974 <974 <974 N/A 1448
Norethisterone hormones ng/l 581 865 2847 370 92
Norfloxacin antibiotics ng/l <12437 <12437 <12437 <12437 <12437
Ofloxacin antibiotics ng/l 985 1217 693 702 <417
Olanzapine psycopharmaceuticals ng/l 2075 2079 2065 2361 <5.9
Oxazepam psycopharmaceuticals ng/l 38 45 41 34 29
Oxycodone NSAIDs and analgesics ng/l <263 <263 <263 <263 <263
Pantoprazole gastrointestinal disease medications ng/l <763 <763 <763 <763 <763
Paracetamol NSAIDs and analgesics ng/l 615723 834395 442074 N/A 1109
Primidone antiepileptics ng/l 317 751 <35 343 361
Progesterone hormones ng/l <31 46 <31 <31 <31
Quetiapine psycopharmaceuticals ng/l <473 <473 <473 <473 <473
Ramipril antihypertensives ng/l 123 168 <32 146 103
Risperidone psycopharmaceuticals ng/l <804 <804 <804 <804 <804
Sertraline psycopharmaceuticals ng/l 351 <20 652 61 124
Simvastatin metabolic disease medications ng/l 61 61 4 <1.4 60
Sotalol other cardiovascular medicines ng/l 23 39 <15 125 20
Sulfadiazine antibiotics ng/l <590 <590 <590 <590 <590
Sulfamethoxazole antibiotics ng/l 160 368 43 149 706
Telmisartan antihypertensives ng/l 2831 9457 12745 2471 1650
Temazepam psycopharmaceuticals ng/l 27 76 <17 20 <17
Testosterone hormones ng/l <81 198 115 <81 85
Tetracycline/Doxycyclineantibiotics ng/l <239 <239 <239 <239 <239
Tiamulin veterinary medicines ng/l <38 <38 <38 <38 <38
Toltrazuril veterinary medicines ng/l <8992 <8992 <8992 <8992 <8992
Tramadol NSAIDs and analgesics ng/l 781 759 297 550 606
Trimethoprim antibiotics ng/l 180 200 179 462 756
Tylosin veterinary medicines ng/l <316 <316 <316 <316 <316
Valsartan antihypertensives ng/l 10325 53753 1177 23391 7768
Warfarin other cardiovascular medicines ng/l <13 <13 <13 <13 <13
Venlafaxine psycopharmaceuticals ng/l 760 1110 293 823 766
Xylometazoline asthma and allergy medications ng/l <51 <51 <51 <51 <51
Number of analysed API 73 73 73 71 74
Number of APIs above LOQ 38 40 32 40 44
Detection rate (%) 52 55 44 56 59

235
Country Germany Germany Germany Germany Germany
Date 27-11-2018 03-12-2018 19-06-2018 26-06-2018 21-06-2018
Year 2018 2018 2018 2018 2018
Month 11 12 6 6 6
Date 27 3 19 26 21
Name Rostock Greifswald Neubrandenburg Greifswald Rostock
Comments
Info
Sample melted
during delivery
Sample melted
during delivery
API API group Unit
Allopurinol metabolic disease medications ng/l <13718 77402.7 <13718 <13718 <13718
Amlodipine antihypertensives ng/l <396 <396 <396 <396 452
Atenolol other cardiovascular medicines ng/l <211 <211 <211 <211 298
Atorvastatin metabolic disease medications ng/l <10405 <10405 <10405 <10405 <10405
Bezafibrate metabolic disease medications ng/l 464 301 567 468 1227
Bisoprolol other cardiovascular medicines ng/l <30 <30 1809 1617 1114
Caffeine other ng/l 1899 5200 23530 21066 19918
Candesartan antihypertensives ng/l <772 <772 <772 <772 <772
Carbamazepine antiepileptics ng/l 217 797 3377 2325 1315
Carprofen veterinary medicines ng/l <14 <14 <14 <14 39
Cetirizine asthma and allergy medications ng/l <3218 <3218 <3218 <3218 <3218
Ciprofloxacin antibiotics ng/l <3136 <3136 <3136 <3136 <3136
Citalopram psycopharmaceuticals ng/l 269 254 810 461 526
Clarithromycin antibiotics ng/l 46 214 213 434 156
Codeine NSAIDs and analgesics ng/l 430 564 473 495 485
Diclofenac NSAIDs and analgesics ng/l 5868 12159 6481 6011 4934
Dipyridamole other cardiovascular medicines ng/l <185 <185 1367 643 944
Emamectin veterinary medicines ng/l <29 <29 <29 <29 <29
Enalapril antihypertensives ng/l <167 <167 <167 <167 <167
Eprosartan antihypertensives ng/l 136 73 483 256 650
Erythromycin antibiotics ng/l 265 965 11144 12913 11257
Esomeprazole gastrointestinal disease medications ng/l <8441 <8441 <8441 <8441 <8441
Estriol hormones ng/l 16 <12 <12 36 59
Estrone (E1) hormones ng/l <26 70 50 101 83
Fenbendazole veterinary medicines ng/l <36 <36 <36 <36 <36
Fexofenadine asthma and allergy medications ng/l <4255 <4255 <4255 <4255 <4255
Florfenicol veterinary medicines ng/l <64 <64 <64 <64 <64
Fluconazole antibiotics ng/l 93 234 78 194 81
Fluticasone asthma and allergy medications ng/l <415 <415 <415 <415 <415
Gabapentin antiepileptics ng/l 12809 21155 23216 20782 13173
Gemfibrozil metabolic disease medications ng/l <165 <165 334 368 779
Hydrochlorothiazide antihypertensives ng/l 4389 1110 10986 15335 10306
Ibuprofen NSAIDs and analgesics ng/l N/A N/A N/A N/A N/A
Irbesartan antihypertensives ng/l 514 1079 4671 2456 2062
Ketoprofen NSAIDs and analgesics ng/l 53 60 106 80 154
Levetiracetam antiepileptics ng/l 12149 25651 23420 26997 22099
Lincomycin antibiotics ng/l <18 <18 <18 <18 <18
Losartan antihypertensives ng/l <508 <508 835 815 657
Mesalazine gastrointestinal disease medications ng/l 2565 3845 18353 16527 16885
Metformin metabolic disease medications ng/l 160885 199891 162964 117291 143330
Metoprolol other cardiovascular medicines ng/l 1013 1519 3311 2262 2668
Mometasone furoate asthma and allergy medications ng/l <828 <828 <828 <828 <828
Naproxen NSAIDs and analgesics ng/l 444 1382 1538 2230 1225
Nebivolol other cardiovascular medicines ng/l <974 <974 1447 1450 1464
Norethisterone hormones ng/l <24 <24 117 60 47
Norfloxacin antibiotics ng/l <12437 <12437 <12437 <12437 <12437
Ofloxacin antibiotics ng/l 503 639 3783 2116 1992
Olanzapine psycopharmaceuticals ng/l <5.9 <5.9 <5.9 <5.9 <5.9
Oxazepam psycopharmaceuticals ng/l 40 176 48 66 33
Oxycodone NSAIDs and analgesics ng/l <263 <263 <263 <263 <263
Pantoprazole gastrointestinal disease medications ng/l <763 <763 <763 <763 <763
Paracetamol NSAIDs and analgesics ng/l 2044 2734 1710 3044 1257
Primidone antiepileptics ng/l 73 146 607 385 326
Progesterone hormones ng/l <31 <31 <31 58 <31
Quetiapine psycopharmaceuticals ng/l <473 <473 <473 <473 <473
Ramipril antihypertensives ng/l 54 144 122 118 73
Risperidone psycopharmaceuticals ng/l <804 <804 <804 <804 <804
Sertraline psycopharmaceuticals ng/l 92 545 178 336 <20
Simvastatin metabolic disease medications ng/l <1.8 <1.9 92 60 93
Sotalol other cardiovascular medicines ng/l <15 <15 <15 54 106
Sulfadiazine antibiotics ng/l <594 <595 <590 <590 <590
Sulfamethoxazole antibiotics ng/l 51 159 402 126 403
Telmisartan antihypertensives ng/l 309 968 1925 914 716
Temazepam psycopharmaceuticals ng/l 53 137 60 38 24
Testosterone hormones ng/l <81 <81 82 194 143
Tetracycline/Doxycyclineantibiotics ng/l <239 284 <239 <239 <239
Tiamulin veterinary medicines ng/l <38 <38 <38 <38 <38
Toltrazuril veterinary medicines ng/l <8992 <8992 <8992 <8992 <8992
Tramadol NSAIDs and analgesics ng/l 136 369 607 964 601
Trimethoprim antibiotics ng/l 160 442 153 430 383
Tylosin veterinary medicines ng/l <316 <316 <316 <316 <316
Valsartan antihypertensives ng/l 10706 16487 30072 16507 19368
Warfarin other cardiovascular medicines ng/l <13 <13 <13 <13 <13
Venlafaxine psycopharmaceuticals ng/l 501 776 1470 1314 1131
Xylometazoline asthma and allergy medications ng/l <51 <51 61 56 <51
Number of analysed API 74 74 74 74 74
Number of APIs above LOQ 34 35 43 46 46
Detection rate (%) 46 47 58 62 62

236
Country Latvia Latvia Latvia Latvia Latvia Latvia
Date 01-12-2017 27-11-2017 07-12-2017 21-05-2018 21-05-2018 29-05-2018
Year 2017 2017 2017 2018 2018 2018
Month 12 11 12 5 5 5
Date 1 27 7 21 21 29
Name WWTP 3 WWTP 1 WWTP 2 WWTP 3 WWTP 1 WWTP 2
Comments
Info
API API group Unit
Allopurinol metabolic disease medications ng/l <13718 21752 <13718 150363 <13718 <13718
Amlodipine antihypertensives ng/l <396 <396 <396 <396 <396 <396
Atenolol other cardiovascular medicines ng/l <211 <211 <211 <211 <211 <211
Atorvastatin metabolic disease medications ng/l <10405 <10405 <10405 <10405 <10405 <10405
Bezafibrate metabolic disease medications ng/l <27 <27 <27 <27 <27 <27
Bisoprolol other cardiovascular medicines ng/l 289 417 316 420 493 386
Caffeine other ng/l <17 340 721 101 3772 2538
Candesartan antihypertensives ng/l <772 <772 <772 <772 <772 <772
Carbamazepine antiepileptics ng/l <17 <17 <17 492 1357 635
Carprofen veterinary medicines ng/l <14 25 <14 <14 <14 <14
Cetirizine asthma and allergy medications ng/l <3218 <3218 <3218 <3218 <3218 <3218
Ciprofloxacin antibiotics ng/l <3136 <3136 <3136 <3136 <3136 <3136
Citalopram psycopharmaceuticals ng/l 48 25 47 38 29 37
Clarithromycin antibiotics ng/l 521 693 878 936 845 507
Codeine NSAIDs and analgesics ng/l N/A N/A N/A 106 139 129
Diclofenac NSAIDs and analgesics ng/l 6092 3977 5346 4261 4103 4081
Dipyridamole other cardiovascular medicines ng/l <185 <185 <185 <185 <185 <185
Emamectin veterinary medicines ng/l <29 <29 <29 <29 <29 <29
Enalapril antihypertensives ng/l <167 <167 <167 <167 <167 <167
Eprosartan antihypertensives ng/l <10 <10 <10 <10 <10 <10
Erythromycin antibiotics ng/l <39 <39 <39 283 436 351
Esomeprazole gastrointestinal disease medications ng/l <8441 <8441 <8441 <8441 <8441 <8441
Estriol hormones ng/l <12 <12 <12 132 204 163
Estrone (E1) hormones ng/l 36 <26 30 <26 92 101
Fenbendazole veterinary medicines ng/l <36 <36 <36 <36 <36 <36
Fexofenadine asthma and allergy medications ng/l <4255 <4255 <4255 <4255 <4255 <4255
Florfenicol veterinary medicines ng/l <64 <64 <64 <64 <64 <64
Fluconazole antibiotics ng/l 127 55 223 60 73 136
Fluticasone asthma and allergy medications ng/l <415 <415 <415 <415 <415 <415
Gabapentin antiepileptics ng/l 6888 10008 11215 7491 12582 7488
Gemfibrozil metabolic disease medications ng/l <165 <165 <165 <165 <165 <165
Hydrochlorothiazide antihypertensives ng/l 2396 2622 1811 2998 9997 4074
Ibuprofen NSAIDs and analgesics ng/l 2587 3964 3256 N/A N/A N/A
Irbesartan antihypertensives ng/l <53 <53 <53 <53 <53 <53
Ketoprofen NSAIDs and analgesics ng/l 387 290 483 403 680 414
Levetiracetam antiepileptics ng/l <217 661 1687 1919 1804 2117
Lincomycin antibiotics ng/l <18 <18 <18 <18 <18 <18
Losartan antihypertensives ng/l <508 <508 <508 <508 <508 <508
Mesalazine gastrointestinal disease medications ng/l 2816 6266 6830 3664 5961 6439
Metformin metabolic disease medications ng/l 21924 29873 30167 92101 121479 49814
Metoprolol other cardiovascular medicines ng/l 556 431 583 421 404 388
Mometasone furoate asthma and allergy medications ng/l <828 <828 <828 <828 <828 <828
Naproxen NSAIDs and analgesics ng/l 1093 1301 1151 1010 1405 1020
Nebivolol other cardiovascular medicines ng/l <974 <974 <974 <974 <974 <974
Norethisterone hormones ng/l <24 <24 <24 463 688 637
Norfloxacin antibiotics ng/l 13360 13439 13312 <12437 <12437 <12437
Ofloxacin antibiotics ng/l 1470 <417 <417 1000 <417 <417
Olanzapine psycopharmaceuticals ng/l <5.9 <5.9 <5.9 2371 2374 2385
Oxazepam psycopharmaceuticals ng/l N/A N/A N/A 74 104 81
Oxycodone NSAIDs and analgesics ng/l N/A N/A N/A <263 <263 <263
Pantoprazole gastrointestinal disease medications ng/l <763 <763 <763 <763 <763 <763
Paracetamol NSAIDs and analgesics ng/l 272165 271908 396604 3249 <77 <77
Primidone antiepileptics ng/l <35 <35 <35 <35 <35 <35
Progesterone hormones ng/l 70 45 <31 <31 71 <31
Quetiapine psycopharmaceuticals ng/l <473 <473 <473 <473 <473 <473
Ramipril antihypertensives ng/l <32 <32 <32 <32 <32 <32
Risperidone psycopharmaceuticals ng/l <804 <804 <804 <804 <804 <804
Sertraline psycopharmaceuticals ng/l 28 <20 26 <20 <20 <20
Simvastatin metabolic disease medications ng/l <1.4 <1.4 <1.4 <1.4 <1.4 <1.4
Sotalol other cardiovascular medicines ng/l 78 109 137 109 204 80
Sulfadiazine antibiotics ng/l <590 <590 <590 <590 <590 <590
Sulfamethoxazole antibiotics ng/l 418 501 944 238 107 270
Telmisartan antihypertensives ng/l 52 <49 51 2888 3126 923
Temazepam psycopharmaceuticals ng/l N/A N/A N/A <17 19 <17
Testosterone hormones ng/l <81 <81 <81 <81 <81 <81
Tetracycline/Doxycyclineantibiotics ng/l 1064 349 411 <239 <239 <239
Tiamulin veterinary medicines ng/l <38 <38 <38 <38 <38 <38
Toltrazuril veterinary medicines ng/l <8992 <8992 <8992 <8992 <8992 <8992
Tramadol NSAIDs and analgesics ng/l <77 <77 <77 367 245 288
Trimethoprim antibiotics ng/l 661 457 562 378 269 266
Tylosin veterinary medicines ng/l <316 <316 <316 <316 <316 <316
Valsartan antihypertensives ng/l 522 646 1149 716 807 934
Warfarin other cardiovascular medicines ng/l <13 <13 <13 <13 <13 <13
Venlafaxine psycopharmaceuticals ng/l <20 30 50 <20 46 52
Xylometazoline asthma and allergy medications ng/l <51 <51 <51 <51 <51 <51
Number of analysed API 71 71 71 74 74 74
Number of APIs above LOQ 26 26 27 30 32 30
Detection rate (%) 37 37 38 41 43 41

237
Country Poland Poland Sweden Sweden Sweden Sweden Sweden Sweden
Date 29-11-2017 18-07-2018 12-2017 12-2017 12-2017 11-06-2018 15-06-2018 07-06-2018
Year 2017 2018 2017 2017 2017 2018 2018 2018
Month 11 7 12 12 12 6 6 6
Date 29 18 18 18 18 11 15 7
Name Błonie Błonie WWTP Motala Linköping Norrköping Motala Linköping Norrköping
Comments
Info
Sample melted
during delivery
API API group Unit
Allopurinol metabolic disease medications ng/l <13718 <13719 <13718 <13718 <13718 <13718 <13718 <13718
Amlodipine antihypertensives ng/l <396 <396 <396 <396 <396 <396 <396 <396
Atenolol other cardiovascular medicines ng/l <211 <211 2563 1223 1848 636 <211 259
Atorvastatin metabolic disease medications ng/l <10405 <10405 <10405 <10405 <10405 <10405 <10405 <10405
Bezafibrate metabolic disease medications ng/l <27 <27 91 213 261 N/A N/A N/A
Bisoprolol other cardiovascular medicines ng/l 242 450 56 46 90 <30 62 72
Caffeine other ng/l 597 1601 N/A N/A N/A 4345 1682 3739
Candesartan antihypertensives ng/l <772 <772 <772 <772 <772 <772 <772 <772
Carbamazepine antiepileptics ng/l 26 1573 577 1188 473 617 322 389
Carprofen veterinary medicines ng/l <14 <14 53 <14 <14 29 <14 <14
Cetirizine asthma and allergy medications ng/l <3218 <3218 <3218 <3218 <3218 <3218 <3218 <3218
Ciprofloxacin antibiotics ng/l <3136 <3136 <3136 <3136 <3136 <3136 <3136 <3136
Citalopram psycopharmaceuticals ng/l 80 58 273 280 290 <2.2 <2.2 <2.2
Clarithromycin antibiotics ng/l 719 340 37 41 <31 <31 <31 48
Codeine NSAIDs and analgesics ng/l N/A 105 1520 1004 1059 1682 667 782
Diclofenac NSAIDs and analgesics ng/l 9718 4486 3217 2542 2969 3362 1736 2704
Dipyridamole other cardiovascular medicines ng/l <185 <185 780 277 871 229 <185 <185
Emamectin veterinary medicines ng/l <29 <29 <29 <29 <29 <29 <29 <29
Enalapril antihypertensives ng/l <167 <167 188 235 237 <167 <167 <167
Eprosartan antihypertensives ng/l <10 27 15 57 21 <10 <10 <10
Erythromycin antibiotics ng/l <39 255 <39 <39 <39 491 789 1545
Esomeprazole gastrointestinal disease medications ng/l <8441 <8441 <8441 <8441 <8441 <8441 <8441 <8441
Estriol hormones ng/l <12 <12 <12 <12 <12 121 150 <12
Estrone (E1) hormones ng/l <26 121 <26 58 <26 4255 11186 11804
Fenbendazole veterinary medicines ng/l <36 <36 <36 <36 <36 <36 <36 <36
Fexofenadine asthma and allergy medications ng/l <4255 <4255 <4255 <4255 <4255 <4255 <4255 <4255
Florfenicol veterinary medicines ng/l <64 <64 <64 <64 <64 N/A N/A N/A
Fluconazole antibiotics ng/l 436 436 82 209 84 N/A N/A N/A
Fluticasone asthma and allergy medications ng/l <415 <415 <415 <415 <415 <415 <415 <415
Gabapentin antiepileptics ng/l 3314 1608 26937 21217 28656 N/A N/A N/A
Gemfibrozil metabolic disease medications ng/l <165 <165 219 254 <165 <165 <165 <165
Hydrochlorothiazide antihypertensives ng/l 2084 5549 7835 16789 6216 6120 1134 1232
Ibuprofen NSAIDs and analgesics ng/l <2272 N/A N/A N/A N/A N/A N/A N/A
Irbesartan antihypertensives ng/l <53 <53 85 165 110 64 116 111
Ketoprofen NSAIDs and analgesics ng/l 2803 2134 508 475 495 N/A N/A N/A
Levetiracetam antiepileptics ng/l 16657 6292 11322 6370 5228 N/A N/A N/A
Lincomycin antibiotics ng/l <18 22 <18 <18 <18 N/A N/A N/A
Losartan antihypertensives ng/l <508 650 2169 1595 1600 3616 2274 2502
Mesalazine gastrointestinal disease medications ng/l 12313 8508 6314 2963 5505 775 <282 <282
Metformin metabolic disease medications ng/l 65213 119869 148042 95447 130323 103601 24508 64613
Metoprolol other cardiovascular medicines ng/l 792 469 <14 <14 15 N/A N/A N/A
Mometasone furoate asthma and allergy medications ng/l <828 <828 <828 <828 <828 <828 <828 <828
Naproxen NSAIDs and analgesics ng/l 2688 2080 7570 6088 6322 N/A N/A N/A
Nebivolol other cardiovascular medicines ng/l <974 <974 <974 <974 <974 <974 <974 <974
Norethisterone hormones ng/l <24 479 1176 1727 1286 169 <24 <24
Norfloxacin antibiotics ng/l <12437 <12437 <12437 <12437 <12437 N/A N/A N/A
Ofloxacin antibiotics ng/l 1178 <417 521 543 543 N/A N/A N/A
Olanzapine psycopharmaceuticals ng/l <5.9 2418 2101 2102 2125 8 10 24
Oxazepam psycopharmaceuticals ng/l N/A <23 542 329 440 624 219 438
Oxycodone NSAIDs and analgesics ng/l N/A <263 <263 <263 <263 <263 <263 <263
Pantoprazole gastrointestinal disease medications ng/l <763 <763 <763 <763 <763 <763 <763 <763
Paracetamol NSAIDs and analgesics ng/l 178721 5803 955686 1039957 1007060 7252 7025 6836
Primidone antiepileptics ng/l <35 <35 59 <35 <35 N/A N/A N/A
Progesterone hormones ng/l <31 88 <31 32 33 <31 <31 <31
Quetiapine psycopharmaceuticals ng/l <473 <473 <473 <473 <473 <473 <473 <473
Ramipril antihypertensives ng/l <32 72 <32 <32 <32 N/A N/A N/A
Risperidone psycopharmaceuticals ng/l <804 <804 <804 <804 <804 <804 <804 <804
Sertraline psycopharmaceuticals ng/l 70 <20 384 520 377 N/A N/A N/A
Simvastatin metabolic disease medications ng/l <1.4 <1.4 3 <1.4 48 <1.4 <1.4 <1.4
Sotalol other cardiovascular medicines ng/l 48 271 88 64 52 <15 <15 <15
Sulfadiazine antibiotics ng/l <590 <590 <590 <590 <590 <590 <590 <590
Sulfamethoxazole antibiotics ng/l 61 120 <42 279 90 N/A N/A N/A
Telmisartan antihypertensives ng/l 143 3667 115 131 77 <49 <49 <49
Temazepam psycopharmaceuticals ng/l N/A <17 <17 <17 20 19 <17 <17
Testosterone hormones ng/l <81 <81 <81 93 92 <81 <81 <81
Tetracycline/Doxycyclineantibiotics ng/l 581 700 473 1208 564 245 475 296
Tiamulin veterinary medicines ng/l <38 <38 <38 <38 <38 <38 <38 <38
Toltrazuril veterinary medicines ng/l <8992 <8992 <8992 <8992 <8992 <8992 <8992 <8992
Tramadol NSAIDs and analgesics ng/l <77 806 1356 764 1029 1389 535 858
Trimethoprim antibiotics ng/l 205 115 180 220 140 N/A N/A N/A
Tylosin veterinary medicines ng/l <316 <316 <316 <316 <316 <316 <316 <316
Valsartan antihypertensives ng/l 1238 7602 345 591 511 446 332 469
Warfarin other cardiovascular medicines ng/l <13 <13 16 <13 <13 14 <13 <13
Venlafaxine psycopharmaceuticals ng/l 327 182 605 407 748 N/A N/A N/A
Xylometazoline asthma and allergy medications ng/l <51 <51 <51 <51 <51 <51 <51 <51

238
Annex 6. API concentrations in WWTP effluents
Country Estonia Estonia Estonia Estonia Estonia Estonia
Year 2017 2017 2017 2018 2018 2018
Month 12 12 12 6 6 6
Date 6 12 6 5 5 7
Name Paide Pärnu Türi Paide Türi Pärnu
Comments 24-h 24-h 24-h 24-h 24-h 24-h
Info
API API group Unit
Allopurinol metabolic disease medications ng/l <123 <123 <123 <123 <123 <123
Amlodipine antihypertensives ng/l <113 <113 <113 <113 <113 <113
Atenolol other cardiovascular medicines ng/l <106 <106 <106 <106 <106 <106
Atorvastatin metabolic disease medications ng/l <10405 <10405 <10405 <10405 <10405 <10405
Bezafibrate metabolic disease medications ng/l <13 <13 <13 <13 <13 <13
Bisoprolol other cardiovascular medicines ng/l <15 19.34412 <15 <15 24 33
Caffeine other ng/l <871 <871 <871 <871 <871 <871
Candesartan antihypertensives ng/l <11 <11 <11 <11 <11 <11
Carbamazepine antiepileptics ng/l 895 666 877 2501 1095 368
Carprofen veterinary medicines ng/l <7.1 <7.1 <7.1 <7.1 <7.1 <7.1
Cetirizine asthma and allergy medications ng/l <1204 <1204 <1204 <1204 <1204 <1204
Ciprofloxacin antibiotics ng/l <1568 <1568 <1568 <1568 <1568 <1568
Citalopram psycopharmaceuticals ng/l 72 42 70 104 57 21
Clarithromycin antibiotics ng/l 2208 405 526 618 376 63
Codeine NSAIDs and analgesics ng/l N/A N/A N/A 287 62 16
Diclofenac NSAIDs and analgesics ng/l 5419 7902 6116 38175 12592 5961
Dipyridamole other cardiovascular medicines ng/l <87 <87 <87 <87 <87 <87
Emamectin veterinary medicines ng/l <11 <11 <11 39 <11 <11
Enalapril antihypertensives ng/l <83 <83 <83 <83 <83 <83
Eprosartan antihypertensives ng/l <5.2 <5.2 <5.2 <5.2 <5.2 7.3
Erythromycin antibiotics ng/l 3500 908 1748 5740 90 151
Esomeprazole gastrointestinal disease medications ng/l <8441 <8441 <8441 <8441 <8441 <8441
Estriol (E3) hormones ng/l <8441 <8441 <8441 <8441 <8441 <8441
Estrone (E1) hormones ng/l <13 <13 <13 <13 <13 <13
Fenbendazole veterinary medicines ng/l <11 <11 <11 <11 <11 <11
Fexofenadine asthma and allergy medications ng/l <1572 <1572 <1572 <1572 <1572 <1572
Florfenicol veterinary medicines ng/l <32 <32 <32 <32 <32 <32
Fluconazole antibiotics ng/l 28 68 <9.6 16 112 <9.6
Fluticasone asthma and allergy medications ng/l <147 <147 <147 <147 <147 <147
Gabapentin antiepileptics ng/l 1203 3128 1068 0 4461 3156
Gemfibrozil metabolic disease medications ng/l <100 <100 <100 <100 <100 <100
Hydrochlorothiazide antihypertensives ng/l 1391 1039 2670 2096 4444 2019
Ibuprofen NSAIDs and analgesics ng/l 4854 4211 9461 <1136 <1136 <1136
Irbesartan antihypertensives ng/l <70 <70 <70 <70 <70 <70
Ketoprofen NSAIDs and analgesics ng/l 18 366 49 125 356 299
Levetiracetam antiepileptics ng/l <108 570 <108 171 165 <108
Lincomycin antibiotics ng/l <9.8 <9.8 <9.8 <9.8 <9.8 27
Losartan antihypertensives ng/l <254 <254 <254 270 <254 <254
Mesalazine gastrointestinal disease medications ng/l <63 85 <63 892 <63 <63
Metformin metabolic disease medications ng/l 217 <7.5 604 <7.5 <7.5 <7.5
Metoprolol other cardiovascular medicines ng/l 2433 3536 2609 7170 7265 3939
Mometasone furoate asthma and allergy medications ng/l <27 <27 <27 <27 <27 <27
Naproxen NSAIDs and analgesics ng/l <5.4 283 23 840 458 65
Nebivolol other cardiovascular medicines ng/l <16 <16 <16 34 <16 <16
Norethisterone hormones ng/l <9.5 <9.5 <9.5 <9.5 95 <9.5
Norfloxacin antibiotics ng/l 13351 13309 13317 <12437 18787 <12437
Ofloxacin antibiotics ng/l <208 <208 <208 <208 <208 <208
Olanzapine psycopharmaceuticals ng/l <0.96 <0.96 <0.96 19 382 386
Oxazepam psycopharmaceuticals ng/l N/A N/A N/A 72 59 61
Oxycodone NSAIDs and analgesics ng/l N/A N/A N/A <115 <115 <115
Pantoprazole gastrointestinal disease medications ng/l <763 <763 <763 <763 <763 <763
Paracetamol NSAIDs and analgesics ng/l 812 2501 612 <77 <77 3476
Primidone antiepileptics ng/l <18 <18 <18 <18 <18 <18
Progesterone hormones ng/l <12 <12 <12 <12 <12 <12
Quetiapine psycopharmaceuticals ng/l <116 <116 <116 <116 <116 <116
Ramipril antihypertensives ng/l <16 <16 <16 32 64 22
Risperidone psycopharmaceuticals ng/l <10 <10 <10 <10 <10 <10
Sertraline psycopharmaceuticals ng/l <10 <10 <10 16 <10 26
Simvastatin metabolic disease medications ng/l <1.5 <1.5 <1.5 <1.5 <1.5 <1.5
Sotalol other cardiovascular medicines ng/l 123 238 151 184 195 177
Sulfadiazine antibiotics ng/l <295 <295 <295 <295 <295 <295
Sulfamethoxazole antibiotics ng/l <8.9 <8.9 225 <8.9 <8.9 <8.9
Telmisartan antihypertensives ng/l 1753 813 2159 2158 4031 2178
Temazepam psycopharmaceuticals ng/l N/A N/A N/A 55 38 <8.3
Testosterone hormones ng/l <18 <18 <18 <18 <18 <18
Tetracycline/Doxycycline antibiotics ng/l 155 132 131 550 <119 135
Tiamulin veterinary medicines ng/l <19 <19 <19 <19 <19 <19
Toltrazuril veterinary medicines ng/l <8952 <8952 <8952 <8952 <8952 <8952
Tramadol NSAIDs and analgesics ng/l 175 205 182 472 306 235
Trimethoprim antibiotics ng/l 188 51 82 156 131 <11
Tylosin veterinary medicines ng/l <102 <102 124 <102 <102 139
Valsartan antihypertensives ng/l <147 322 <147 343 362 481
Warfarin other cardiovascular medicines ng/l <6.3 <6.3 <6.3 15 6.3 11
Venlafaxine psycopharmaceuticals ng/l 42 70 23 213 172 128
Xylometazoline asthma and allergy medications ng/l <26 <26 <26 27 <26 <26
Number of analysed API 71 71 71 75 75 75
Number of APIs above LOQ 20 24 22 31 27 27
Detection rate (%) 28 34 31 41 36 36
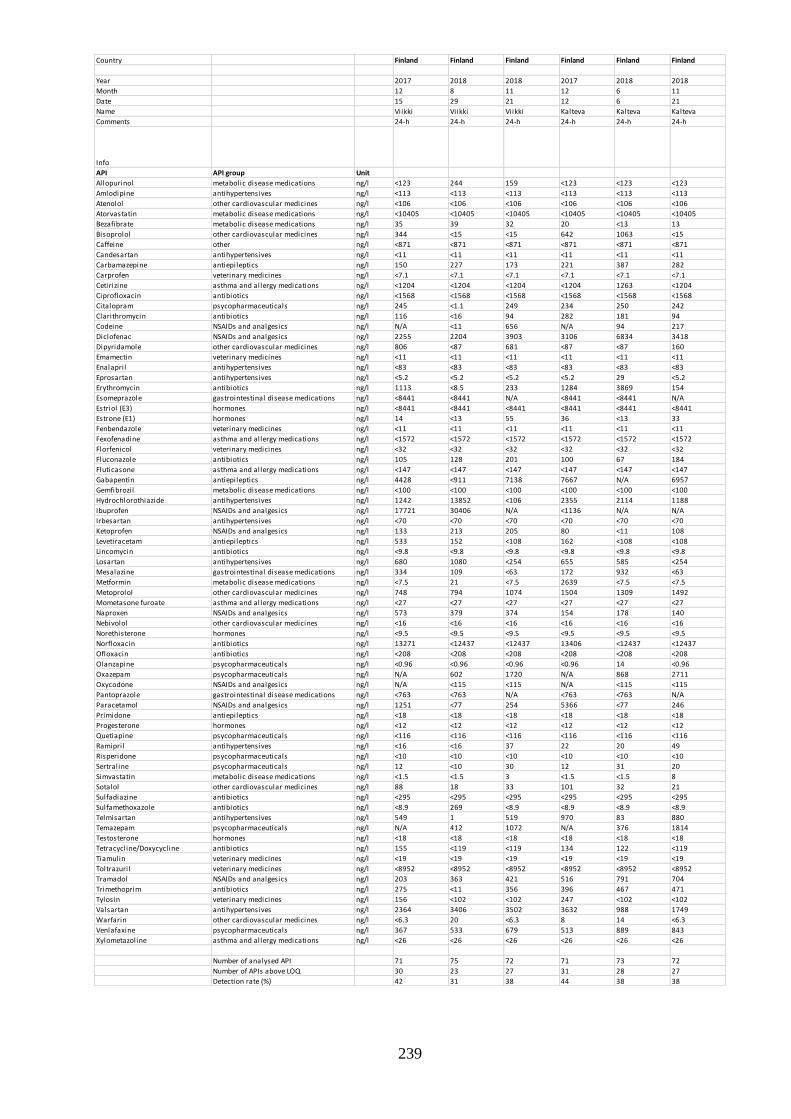
239
Country Finland Finland Finland Finland Finland Finland
Year 2017 2018 2018 2017 2018 2018
Month 12 8 11 12 6 11
Date 15 29 21 12 6 21
Name Viikki Viikki Viikki Kalteva Kalteva Kalteva
Comments 24-h 24-h 24-h 24-h 24-h 24-h
Info
API API group Unit
Allopurinol metabolic disease medications ng/l <123 244 159 <123 <123 <123
Amlodipine antihypertensives ng/l <113 <113 <113 <113 <113 <113
Atenolol other cardiovascular medicines ng/l <106 <106 <106 <106 <106 <106
Atorvastatin metabolic disease medications ng/l <10405 <10405 <10405 <10405 <10405 <10405
Bezafibrate metabolic disease medications ng/l 35 39 32 20 <13 13
Bisoprolol other cardiovascular medicines ng/l 344 <15 <15 642 1063 <15
Caffeine other ng/l <871 <871 <871 <871 <871 <871
Candesartan antihypertensives ng/l <11 <11 <11 <11 <11 <11
Carbamazepine antiepileptics ng/l 150 227 173 221 387 282
Carprofen veterinary medicines ng/l <7.1 <7.1 <7.1 <7.1 <7.1 <7.1
Cetirizine asthma and allergy medications ng/l <1204 <1204 <1204 <1204 1263 <1204
Ciprofloxacin antibiotics ng/l <1568 <1568 <1568 <1568 <1568 <1568
Citalopram psycopharmaceuticals ng/l 245 <1.1 249 234 250 242
Clarithromycin antibiotics ng/l 116 <16 94 282 181 94
Codeine NSAIDs and analgesics ng/l N/A <11 656 N/A 94 217
Diclofenac NSAIDs and analgesics ng/l 2255 2204 3903 3106 6834 3418
Dipyridamole other cardiovascular medicines ng/l 806 <87 681 <87 <87 160
Emamectin veterinary medicines ng/l <11 <11 <11 <11 <11 <11
Enalapril antihypertensives ng/l <83 <83 <83 <83 <83 <83
Eprosartan antihypertensives ng/l <5.2 <5.2 <5.2 <5.2 29 <5.2
Erythromycin antibiotics ng/l 1113 <8.5 233 1284 3869 154
Esomeprazole gastrointestinal disease medications ng/l <8441 <8441 N/A <8441 <8441 N/A
Estriol (E3) hormones ng/l <8441 <8441 <8441 <8441 <8441 <8441
Estrone (E1) hormones ng/l 14 <13 55 36 <13 33
Fenbendazole veterinary medicines ng/l <11 <11 <11 <11 <11 <11
Fexofenadine asthma and allergy medications ng/l <1572 <1572 <1572 <1572 <1572 <1572
Florfenicol veterinary medicines ng/l <32 <32 <32 <32 <32 <32
Fluconazole antibiotics ng/l 105 128 201 100 67 184
Fluticasone asthma and allergy medications ng/l <147 <147 <147 <147 <147 <147
Gabapentin antiepileptics ng/l 4428 <911 7138 7667 N/A 6957
Gemfibrozil metabolic disease medications ng/l <100 <100 <100 <100 <100 <100
Hydrochlorothiazide antihypertensives ng/l 1242 13852 <106 2355 2114 1188
Ibuprofen NSAIDs and analgesics ng/l 17721 30406 N/A <1136 N/A N/A
Irbesartan antihypertensives ng/l <70 <70 <70 <70 <70 <70
Ketoprofen NSAIDs and analgesics ng/l 133 213 205 80 <11 108
Levetiracetam antiepileptics ng/l 533 152 <108 162 <108 <108
Lincomycin antibiotics ng/l <9.8 <9.8 <9.8 <9.8 <9.8 <9.8
Losartan antihypertensives ng/l 680 1080 <254 655 585 <254
Mesalazine gastrointestinal disease medications ng/l 334 109 <63 172 932 <63
Metformin metabolic disease medications ng/l <7.5 21 <7.5 2639 <7.5 <7.5
Metoprolol other cardiovascular medicines ng/l 748 794 1074 1504 1309 1492
Mometasone furoate asthma and allergy medications ng/l <27 <27 <27 <27 <27 <27
Naproxen NSAIDs and analgesics ng/l 573 379 374 154 178 140
Nebivolol other cardiovascular medicines ng/l <16 <16 <16 <16 <16 <16
Norethisterone hormones ng/l <9.5 <9.5 <9.5 <9.5 <9.5 <9.5
Norfloxacin antibiotics ng/l 13271 <12437 <12437 13406 <12437 <12437
Ofloxacin antibiotics ng/l <208 <208 <208 <208 <208 <208
Olanzapine psycopharmaceuticals ng/l <0.96 <0.96 <0.96 <0.96 14 <0.96
Oxazepam psycopharmaceuticals ng/l N/A 602 1720 N/A 868 2711
Oxycodone NSAIDs and analgesics ng/l N/A <115 <115 N/A <115 <115
Pantoprazole gastrointestinal disease medications ng/l <763 <763 N/A <763 <763 N/A
Paracetamol NSAIDs and analgesics ng/l 1251 <77 254 5366 <77 246
Primidone antiepileptics ng/l <18 <18 <18 <18 <18 <18
Progesterone hormones ng/l <12 <12 <12 <12 <12 <12
Quetiapine psycopharmaceuticals ng/l <116 <116 <116 <116 <116 <116
Ramipril antihypertensives ng/l <16 <16 37 22 20 49
Risperidone psycopharmaceuticals ng/l <10 <10 <10 <10 <10 <10
Sertraline psycopharmaceuticals ng/l 12 <10 30 12 31 20
Simvastatin metabolic disease medications ng/l <1.5 <1.5 3 <1.5 <1.5 8
Sotalol other cardiovascular medicines ng/l 88 18 33 101 32 21
Sulfadiazine antibiotics ng/l <295 <295 <295 <295 <295 <295
Sulfamethoxazole antibiotics ng/l <8.9 269 <8.9 <8.9 <8.9 <8.9
Telmisartan antihypertensives ng/l 549 1 519 970 83 880
Temazepam psycopharmaceuticals ng/l N/A 412 1072 N/A 376 1814
Testosterone hormones ng/l <18 <18 <18 <18 <18 <18
Tetracycline/Doxycycline antibiotics ng/l 155 <119 <119 134 122 <119
Tiamulin veterinary medicines ng/l <19 <19 <19 <19 <19 <19
Toltrazuril veterinary medicines ng/l <8952 <8952 <8952 <8952 <8952 <8952
Tramadol NSAIDs and analgesics ng/l 203 363 421 516 791 704
Trimethoprim antibiotics ng/l 275 <11 356 396 467 471
Tylosin veterinary medicines ng/l 156 <102 <102 247 <102 <102
Valsartan antihypertensives ng/l 2364 3406 3502 3632 988 1749
Warfarin other cardiovascular medicines ng/l <6.3 20 <6.3 8 14 <6.3
Venlafaxine psycopharmaceuticals ng/l 367 533 679 513 889 843
Xylometazoline asthma and allergy medications ng/l <26 <26 <26 <26 <26 <26
Number of analysed API 71 75 72 71 73 72
Number of APIs above LOQ 30 23 27 31 28 27
Detection rate (%) 42 31 38 44 38 38
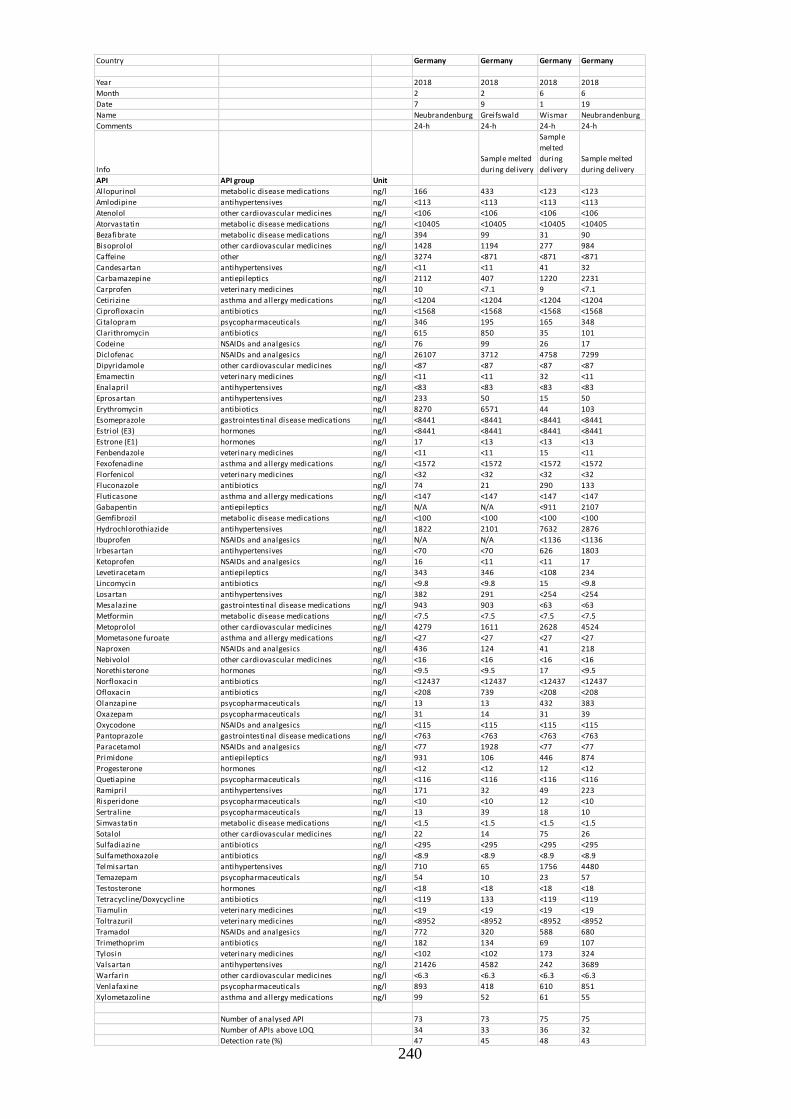
240
Country Germany Germany Germany Germany
Year 2018 2018 2018 2018
Month 2 2 6 6
Date 7 9 1 19
Name Neubrandenburg Greifswald Wismar Neubrandenburg
Comments 24-h 24-h 24-h 24-h
Info
Sample melted
during delivery
Sample
melted
during
delivery
Sample melted
during delivery
API API group Unit
Allopurinol metabolic disease medications ng/l 166 433 <123 <123
Amlodipine antihypertensives ng/l <113 <113 <113 <113
Atenolol other cardiovascular medicines ng/l <106 <106 <106 <106
Atorvastatin metabolic disease medications ng/l <10405 <10405 <10405 <10405
Bezafibrate metabolic disease medications ng/l 394 99 31 90
Bisoprolol other cardiovascular medicines ng/l 1428 1194 277 984
Caffeine other ng/l 3274 <871 <871 <871
Candesartan antihypertensives ng/l <11 <11 41 32
Carbamazepine antiepileptics ng/l 2112 407 1220 2231
Carprofen veterinary medicines ng/l 10 <7.1 9 <7.1
Cetirizine asthma and allergy medications ng/l <1204 <1204 <1204 <1204
Ciprofloxacin antibiotics ng/l <1568 <1568 <1568 <1568
Citalopram psycopharmaceuticals ng/l 346 195 165 348
Clarithromycin antibiotics ng/l 615 850 35 101
Codeine NSAIDs and analgesics ng/l 76 99 26 17
Diclofenac NSAIDs and analgesics ng/l 26107 3712 4758 7299
Dipyridamole other cardiovascular medicines ng/l <87 <87 <87 <87
Emamectin veterinary medicines ng/l <11 <11 32 <11
Enalapril antihypertensives ng/l <83 <83 <83 <83
Eprosartan antihypertensives ng/l 233 50 15 50
Erythromycin antibiotics ng/l 8270 6571 44 103
Esomeprazole gastrointestinal disease medications ng/l <8441 <8441 <8441 <8441
Estriol (E3) hormones ng/l <8441 <8441 <8441 <8441
Estrone (E1) hormones ng/l 17 <13 <13 <13
Fenbendazole veterinary medicines ng/l <11 <11 15 <11
Fexofenadine asthma and allergy medications ng/l <1572 <1572 <1572 <1572
Florfenicol veterinary medicines ng/l <32 <32 <32 <32
Fluconazole antibiotics ng/l 74 21 290 133
Fluticasone asthma and allergy medications ng/l <147 <147 <147 <147
Gabapentin antiepileptics ng/l N/A N/A <911 2107
Gemfibrozil metabolic disease medications ng/l <100 <100 <100 <100
Hydrochlorothiazide antihypertensives ng/l 1822 2101 7632 2876
Ibuprofen NSAIDs and analgesics ng/l N/A N/A <1136 <1136
Irbesartan antihypertensives ng/l <70 <70 626 1803
Ketoprofen NSAIDs and analgesics ng/l 16 <11 <11 17
Levetiracetam antiepileptics ng/l 343 346 <108 234
Lincomycin antibiotics ng/l <9.8 <9.8 15 <9.8
Losartan antihypertensives ng/l 382 291 <254 <254
Mesalazine gastrointestinal disease medications ng/l 943 903 <63 <63
Metformin metabolic disease medications ng/l <7.5 <7.5 <7.5 <7.5
Metoprolol other cardiovascular medicines ng/l 4279 1611 2628 4524
Mometasone furoate asthma and allergy medications ng/l <27 <27 <27 <27
Naproxen NSAIDs and analgesics ng/l 436 124 41 218
Nebivolol other cardiovascular medicines ng/l <16 <16 <16 <16
Norethisterone hormones ng/l <9.5 <9.5 17 <9.5
Norfloxacin antibiotics ng/l <12437 <12437 <12437 <12437
Ofloxacin antibiotics ng/l <208 739 <208 <208
Olanzapine psycopharmaceuticals ng/l 13 13 432 383
Oxazepam psycopharmaceuticals ng/l 31 14 31 39
Oxycodone NSAIDs and analgesics ng/l <115 <115 <115 <115
Pantoprazole gastrointestinal disease medications ng/l <763 <763 <763 <763
Paracetamol NSAIDs and analgesics ng/l <77 1928 <77 <77
Primidone antiepileptics ng/l 931 106 446 874
Progesterone hormones ng/l <12 <12 12 <12
Quetiapine psycopharmaceuticals ng/l <116 <116 <116 <116
Ramipril antihypertensives ng/l 171 32 49 223
Risperidone psycopharmaceuticals ng/l <10 <10 12 <10
Sertraline psycopharmaceuticals ng/l 13 39 18 10
Simvastatin metabolic disease medications ng/l <1.5 <1.5 <1.5 <1.5
Sotalol other cardiovascular medicines ng/l 22 14 75 26
Sulfadiazine antibiotics ng/l <295 <295 <295 <295
Sulfamethoxazole antibiotics ng/l <8.9 <8.9 <8.9 <8.9
Telmisartan antihypertensives ng/l 710 65 1756 4480
Temazepam psycopharmaceuticals ng/l 54 10 23 57
Testosterone hormones ng/l <18 <18 <18 <18
Tetracycline/Doxycycline antibiotics ng/l <119 133 <119 <119
Tiamulin veterinary medicines ng/l <19 <19 <19 <19
Toltrazuril veterinary medicines ng/l <8952 <8952 <8952 <8952
Tramadol NSAIDs and analgesics ng/l 772 320 588 680
Trimethoprim antibiotics ng/l 182 134 69 107
Tylosin veterinary medicines ng/l <102 <102 173 324
Valsartan antihypertensives ng/l 21426 4582 242 3689
Warfarin other cardiovascular medicines ng/l <6.3 <6.3 <6.3 <6.3
Venlafaxine psycopharmaceuticals ng/l 893 418 610 851
Xylometazoline asthma and allergy medications ng/l 99 52 61 55
Number of analysed API 73 73 75 75
Number of APIs above LOQ 34 33 36 32
Detection rate (%) 47 45 48 43

241
Country Germany Germany Germany Germany
Year 2018 2018 2018 2018
Month 6 6 11 12
Date 26 21 27 3
Name Greifswald Rostock Rostock Greifswald
Comments 24-h 24-h 24-h 24-h
Info
Sample
melted
during
delivery
API API group Unit
Allopurinol metabolic disease medications ng/l <123 <123 138 206
Amlodipine antihypertensives ng/l <113 <113 <113 <113
Atenolol other cardiovascular medicines ng/l <106 <106 <106 <106
Atorvastatin metabolic disease medications ng/l <10405 <10405 <10405 <10405
Bezafibrate metabolic disease medications ng/l 72 365 265 65
Bisoprolol other cardiovascular medicines ng/l 1128 950 <15 42
Caffeine other ng/l <871 <871 <871 <871
Candesartan antihypertensives ng/l <11 <11 <11 <11
Carbamazepine antiepileptics ng/l 1891 823 1009 902
Carprofen veterinary medicines ng/l <7.1 <7.1 <7.1 <7.1
Cetirizine asthma and allergy medications ng/l <1204 <1204 <1204 <1204
Ciprofloxacin antibiotics ng/l <1568 <1568 <1568 <1568
Citalopram psycopharmaceuticals ng/l 207 227 221 94
Clarithromycin antibiotics ng/l 239 225 86 409
Codeine NSAIDs and analgesics ng/l 17 50 62 124
Diclofenac NSAIDs and analgesics ng/l 7485 3786 6773 7011
Dipyridamole other cardiovascular medicines ng/l <87 <87 <87 <87
Emamectin veterinary medicines ng/l <11 <11 <11 <11
Enalapril antihypertensives ng/l <83 <83 <83 <83
Eprosartan antihypertensives ng/l 5 173 <5.2 <5.2
Erythromycin antibiotics ng/l 152 129 272 426
Esomeprazole gastrointestinal disease medications ng/l <8441 <8441 N/A N/A
Estriol (E3) hormones ng/l <8441 <8441 <8441 <8441
Estrone (E1) hormones ng/l <13 <13 22 47
Fenbendazole veterinary medicines ng/l <11 <11 <11 <11
Fexofenadine asthma and allergy medications ng/l <1572 <1572 <1572 <1572
Florfenicol veterinary medicines ng/l <32 <32 <32 <32
Fluconazole antibiotics ng/l 512 95 145 131
Fluticasone asthma and allergy medications ng/l <147 <147 <147 <147
Gabapentin antiepileptics ng/l 2038 <911 1002 1858
Gemfibrozil metabolic disease medications ng/l <100 <100 <100 <100
Hydrochlorothiazide antihypertensives ng/l 8992 18760 246 1562
Ibuprofen NSAIDs and analgesics ng/l <1136 <1136 N/A N/A
Irbesartan antihypertensives ng/l 1481 919 1222 858
Ketoprofen NSAIDs and analgesics ng/l 29 28 34 28
Levetiracetam antiepileptics ng/l <108 <108 <108 <108
Lincomycin antibiotics ng/l <9.8 <9.8 <9.8 <9.8
Losartan antihypertensives ng/l <254 <254 <254 <254
Mesalazine gastrointestinal disease medications ng/l <63 <63 <63 <63
Metformin metabolic disease medications ng/l <7.5 <7.5 <7.5 <7.5
Metoprolol other cardiovascular medicines ng/l 4895 2628 3980 3782
Mometasone furoate asthma and allergy medications ng/l <27 <27 <27 <27
Naproxen NSAIDs and analgesics ng/l 97 60 65 46
Nebivolol other cardiovascular medicines ng/l <16 <16 <16 <16
Norethisterone hormones ng/l <9.5 <9.5 <9.5 <9.5
Norfloxacin antibiotics ng/l <12437 <12437 <12437 <12437
Ofloxacin antibiotics ng/l <208 <208 <208 <208
Olanzapine psycopharmaceuticals ng/l 387 385 <0.96 <0.96
Oxazepam psycopharmaceuticals ng/l 54 22 69 118
Oxycodone NSAIDs and analgesics ng/l <115 <115 <115 <115
Pantoprazole gastrointestinal disease medications ng/l <763 <763 N/A N/A
Paracetamol NSAIDs and analgesics ng/l <77 <77 382 486
Primidone antiepileptics ng/l 490 302 207 143
Progesterone hormones ng/l <12 <12 <12 <12
Quetiapine psycopharmaceuticals ng/l <116 <116 <116 <116
Ramipril antihypertensives ng/l 286 89 91 112
Risperidone psycopharmaceuticals ng/l <10 <10 <10 <10
Sertraline psycopharmaceuticals ng/l 15 <10 <10 19
Simvastatin metabolic disease medications ng/l <1.5 <1.5 <1.5 <1.5
Sotalol other cardiovascular medicines ng/l 113 71 44 15
Sulfadiazine antibiotics ng/l <295 <295 <295 <295
Sulfamethoxazole antibiotics ng/l <8.9 <8.9 <8.9 <8.9
Telmisartan antihypertensives ng/l 2692 1417 638 790
Temazepam psycopharmaceuticals ng/l 33 14 92 91
Testosterone hormones ng/l <18 <18 <18 <18
Tetracycline/Doxycycline antibiotics ng/l <119 <119 <119 <119
Tiamulin veterinary medicines ng/l <19 <19 <19 <19
Toltrazuril veterinary medicines ng/l <8952 <8952 <8952 <8952
Tramadol NSAIDs and analgesics ng/l 881 399 644 699
Trimethoprim antibiotics ng/l 194 153 70 171
Tylosin veterinary medicines ng/l 353 210 <102 <102
Valsartan antihypertensives ng/l 842 5781 2217 2351
Warfarin other cardiovascular medicines ng/l <6.3 <6.3 <6.3 <6.3
Venlafaxine psycopharmaceuticals ng/l 874 623 955 557
Xylometazoline asthma and allergy medications ng/l 47 48 49 52
Number of analysed API 75 75 72 72
Number of APIs above LOQ 30 28 28 30
Detection rate (%) 40 37 39 42
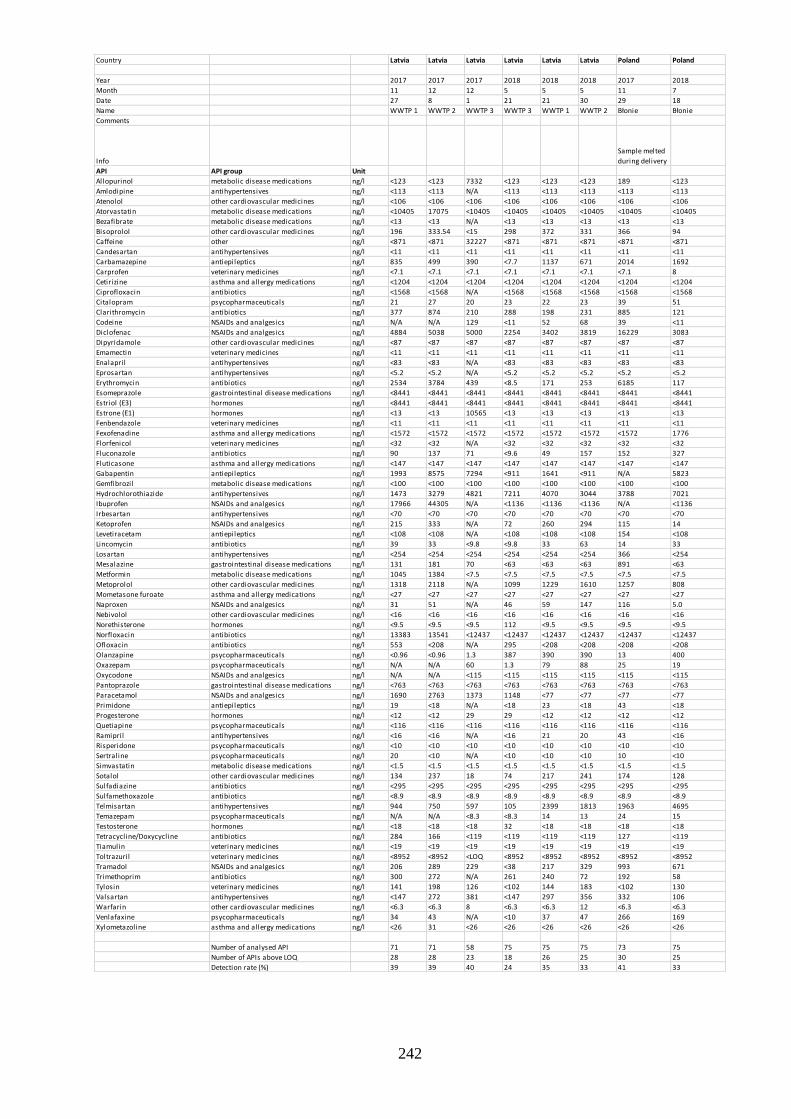
242
Country Latvia Latvia Latvia Latvia Latvia Latvia Poland Poland
Year 2017 2017 2017 2018 2018 2018 2017 2018
Month 11 12 12 5 5 5 11 7
Date 27 8 1 21 21 30 29 18
Name WWTP 1 WWTP 2 WWTP 3 WWTP 3 WWTP 1 WWTP 2 Błonie Błonie
Comments
Info
Sample melted
during delivery
API API group Unit
Allopurinol metabolic disease medications ng/l <123 <123 7332 <123 <123 <123 189 <123
Amlodipine antihypertensives ng/l <113 <113 N/A <113 <113 <113 <113 <113
Atenolol other cardiovascular medicines ng/l <106 <106 <106 <106 <106 <106 <106 <106
Atorvastatin metabolic disease medications ng/l <10405 17075 <10405 <10405 <10405 <10405 <10405 <10405
Bezafibrate metabolic disease medications ng/l <13 <13 N/A <13 <13 <13 <13 <13
Bisoprolol other cardiovascular medicines ng/l 196 333.54 <15 298 372 331 366 94
Caffeine other ng/l <871 <871 32227 <871 <871 <871 <871 <871
Candesartan antihypertensives ng/l <11 <11 <11 <11 <11 <11 <11 <11
Carbamazepine antiepileptics ng/l 835 499 390 <7.7 1137 671 2014 1692
Carprofen veterinary medicines ng/l <7.1 <7.1 <7.1 <7.1 <7.1 <7.1 <7.1 8
Cetirizine asthma and allergy medications ng/l <1204 <1204 <1204 <1204 <1204 <1204 <1204 <1204
Ciprofloxacin antibiotics ng/l <1568 <1568 N/A <1568 <1568 <1568 <1568 <1568
Citalopram psycopharmaceuticals ng/l 21 27 20 23 22 23 39 51
Clarithromycin antibiotics ng/l 377 874 210 288 198 231 885 121
Codeine NSAIDs and analgesics ng/l N/A N/A 129 <11 52 68 39 <11
Diclofenac NSAIDs and analgesics ng/l 4884 5038 5000 2254 3402 3819 16229 3083
Dipyridamole other cardiovascular medicines ng/l <87 <87 <87 <87 <87 <87 <87 <87
Emamectin veterinary medicines ng/l <11 <11 <11 <11 <11 <11 <11 <11
Enalapril antihypertensives ng/l <83 <83 N/A <83 <83 <83 <83 <83
Eprosartan antihypertensives ng/l <5.2 <5.2 N/A <5.2 <5.2 <5.2 <5.2 <5.2
Erythromycin antibiotics ng/l 2534 3784 439 <8.5 171 253 6185 117
Esomeprazole gastrointestinal disease medications ng/l <8441 <8441 <8441 <8441 <8441 <8441 <8441 <8441
Estriol (E3) hormones ng/l <8441 <8441 <8441 <8441 <8441 <8441 <8441 <8441
Estrone (E1) hormones ng/l <13 <13 10565 <13 <13 <13 <13 <13
Fenbendazole veterinary medicines ng/l <11 <11 <11 <11 <11 <11 <11 <11
Fexofenadine asthma and allergy medications ng/l <1572 <1572 <1572 <1572 <1572 <1572 <1572 1776
Florfenicol veterinary medicines ng/l <32 <32 N/A <32 <32 <32 <32 <32
Fluconazole antibiotics ng/l 90 137 71 <9.6 49 157 152 327
Fluticasone asthma and allergy medications ng/l <147 <147 <147 <147 <147 <147 <147 <147
Gabapentin antiepileptics ng/l 1993 8575 7294 <911 1641 <911 N/A 5823
Gemfibrozil metabolic disease medications ng/l <100 <100 <100 <100 <100 <100 <100 <100
Hydrochlorothiazide antihypertensives ng/l 1473 3279 4821 7211 4070 3044 3788 7021
Ibuprofen NSAIDs and analgesics ng/l 17966 44305 N/A <1136 <1136 <1136 N/A <1136
Irbesartan antihypertensives ng/l <70 <70 <70 <70 <70 <70 <70 <70
Ketoprofen NSAIDs and analgesics ng/l 215 333 N/A 72 260 294 115 14
Levetiracetam antiepileptics ng/l <108 <108 N/A <108 <108 <108 154 <108
Lincomycin antibiotics ng/l 39 33 <9.8 <9.8 33 63 14 33
Losartan antihypertensives ng/l <254 <254 <254 <254 <254 <254 366 <254
Mesalazine gastrointestinal disease medications ng/l 131 181 70 <63 <63 <63 891 <63
Metformin metabolic disease medications ng/l 1045 1384 <7.5 <7.5 <7.5 <7.5 <7.5 <7.5
Metoprolol other cardiovascular medicines ng/l 1318 2118 N/A 1099 1229 1610 1257 808
Mometasone furoate asthma and allergy medications ng/l <27 <27 <27 <27 <27 <27 <27 <27
Naproxen NSAIDs and analgesics ng/l 31 51 N/A 46 59 147 116 5.0
Nebivolol other cardiovascular medicines ng/l <16 <16 <16 <16 <16 <16 <16 <16
Norethisterone hormones ng/l <9.5 <9.5 <9.5 112 <9.5 <9.5 <9.5 <9.5
Norfloxacin antibiotics ng/l 13383 13541 <12437 <12437 <12437 <12437 <12437 <12437
Ofloxacin antibiotics ng/l 553 <208 N/A 295 <208 <208 <208 <208
Olanzapine psycopharmaceuticals ng/l <0.96 <0.96 1.3 387 390 390 13 400
Oxazepam psycopharmaceuticals ng/l N/A N/A 60 1.3 79 88 25 19
Oxycodone NSAIDs and analgesics ng/l N/A N/A <115 <115 <115 <115 <115 <115
Pantoprazole gastrointestinal disease medications ng/l <763 <763 <763 <763 <763 <763 <763 <763
Paracetamol NSAIDs and analgesics ng/l 1690 2763 1373 1148 <77 <77 <77 <77
Primidone antiepileptics ng/l 19 <18 N/A <18 23 <18 43 <18
Progesterone hormones ng/l <12 <12 29 29 <12 <12 <12 <12
Quetiapine psycopharmaceuticals ng/l <116 <116 <116 <116 <116 <116 <116 <116
Ramipril antihypertensives ng/l <16 <16 N/A <16 21 20 43 <16
Risperidone psycopharmaceuticals ng/l <10 <10 <10 <10 <10 <10 <10 <10
Sertraline psycopharmaceuticals ng/l 20 <10 N/A <10 <10 <10 10 <10
Simvastatin metabolic disease medications ng/l <1.5 <1.5 <1.5 <1.5 <1.5 <1.5 <1.5 <1.5
Sotalol other cardiovascular medicines ng/l 134 237 18 74 217 241 174 128
Sulfadiazine antibiotics ng/l <295 <295 <295 <295 <295 <295 <295 <295
Sulfamethoxazole antibiotics ng/l <8.9 <8.9 <8.9 <8.9 <8.9 <8.9 <8.9 <8.9
Telmisartan antihypertensives ng/l 944 750 597 105 2399 1813 1963 4695
Temazepam psycopharmaceuticals ng/l N/A N/A <8.3 <8.3 14 13 24 15
Testosterone hormones ng/l <18 <18 <18 32 <18 <18 <18 <18
Tetracycline/Doxycycline antibiotics ng/l 284 166 <119 <119 <119 <119 127 <119
Tiamulin veterinary medicines ng/l <19 <19 <19 <19 <19 <19 <19 <19
Toltrazuril veterinary medicines ng/l <8952 <8952 <LOQ <8952 <8952 <8952 <8952 <8952
Tramadol NSAIDs and analgesics ng/l 206 289 229 <38 217 329 993 671
Trimethoprim antibiotics ng/l 300 272 N/A 261 240 72 192 58
Tylosin veterinary medicines ng/l 141 198 126 <102 144 183 <102 130
Valsartan antihypertensives ng/l <147 272 381 <147 297 356 332 106
Warfarin other cardiovascular medicines ng/l <6.3 <6.3 8 <6.3 <6.3 12 <6.3 <6.3
Venlafaxine psycopharmaceuticals ng/l 34 43 N/A <10 37 47 266 169
Xylometazoline asthma and allergy medications ng/l <26 31 <26 <26 <26 <26 <26 <26
Number of analysed API 71 71 58 75 75 75 73 75
Number of APIs above LOQ 28 28 23 18 26 25 30 25
Detection rate (%) 39 39 40 24 35 33 41 33
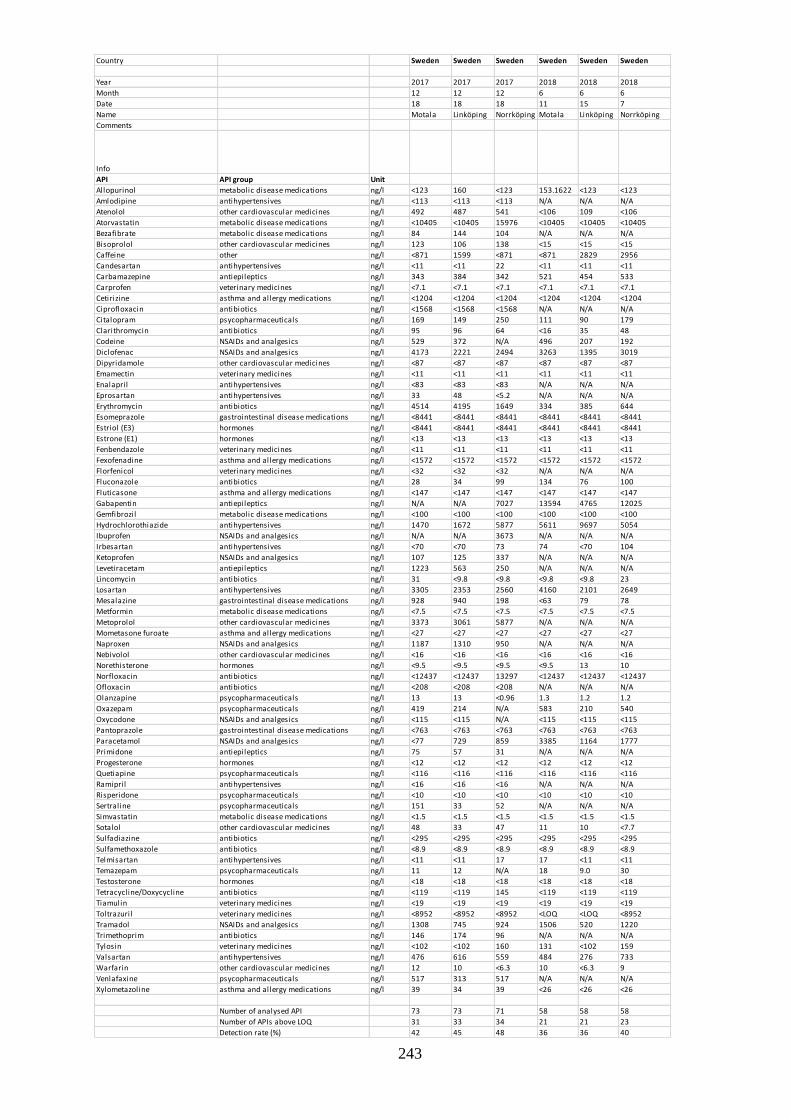
243
Country Sweden Sweden Sweden Sweden Sweden Sweden
Year 2017 2017 2017 2018 2018 2018
Month 12 12 12 6 6 6
Date 18 18 18 11 15 7
Name Motala Linköping Norrköping Motala Linköping Norrköping
Comments
Info
API API group Unit
Allopurinol metabolic disease medications ng/l <123 160 <123 153.1622 <123 <123
Amlodipine antihypertensives ng/l <113 <113 <113 N/A N/A N/A
Atenolol other cardiovascular medicines ng/l 492 487 541 <106 109 <106
Atorvastatin metabolic disease medications ng/l <10405 <10405 15976 <10405 <10405 <10405
Bezafibrate metabolic disease medications ng/l 84 144 104 N/A N/A N/A
Bisoprolol other cardiovascular medicines ng/l 123 106 138 <15 <15 <15
Caffeine other ng/l <871 1599 <871 <871 2829 2956
Candesartan antihypertensives ng/l <11 <11 22 <11 <11 <11
Carbamazepine antiepileptics ng/l 343 384 342 521 454 533
Carprofen veterinary medicines ng/l <7.1 <7.1 <7.1 <7.1 <7.1 <7.1
Cetirizine asthma and allergy medications ng/l <1204 <1204 <1204 <1204 <1204 <1204
Ciprofloxacin antibiotics ng/l <1568 <1568 <1568 N/A N/A N/A
Citalopram psycopharmaceuticals ng/l 169 149 250 111 90 179
Clarithromycin antibiotics ng/l 95 96 64 <16 35 48
Codeine NSAIDs and analgesics ng/l 529 372 N/A 496 207 192
Diclofenac NSAIDs and analgesics ng/l 4173 2221 2494 3263 1395 3019
Dipyridamole other cardiovascular medicines ng/l <87 <87 <87 <87 <87 <87
Emamectin veterinary medicines ng/l <11 <11 <11 <11 <11 <11
Enalapril antihypertensives ng/l <83 <83 <83 N/A N/A N/A
Eprosartan antihypertensives ng/l 33 48 <5.2 N/A N/A N/A
Erythromycin antibiotics ng/l 4514 4195 1649 334 385 644
Esomeprazole gastrointestinal disease medications ng/l <8441 <8441 <8441 <8441 <8441 <8441
Estriol (E3) hormones ng/l <8441 <8441 <8441 <8441 <8441 <8441
Estrone (E1) hormones ng/l <13 <13 <13 <13 <13 <13
Fenbendazole veterinary medicines ng/l <11 <11 <11 <11 <11 <11
Fexofenadine asthma and allergy medications ng/l <1572 <1572 <1572 <1572 <1572 <1572
Florfenicol veterinary medicines ng/l <32 <32 <32 N/A N/A N/A
Fluconazole antibiotics ng/l 28 34 99 134 76 100
Fluticasone asthma and allergy medications ng/l <147 <147 <147 <147 <147 <147
Gabapentin antiepileptics ng/l N/A N/A 7027 13594 4765 12025
Gemfibrozil metabolic disease medications ng/l <100 <100 <100 <100 <100 <100
Hydrochlorothiazide antihypertensives ng/l 1470 1672 5877 5611 9697 5054
Ibuprofen NSAIDs and analgesics ng/l N/A N/A 3673 N/A N/A N/A
Irbesartan antihypertensives ng/l <70 <70 73 74 <70 104
Ketoprofen NSAIDs and analgesics ng/l 107 125 337 N/A N/A N/A
Levetiracetam antiepileptics ng/l 1223 563 250 N/A N/A N/A
Lincomycin antibiotics ng/l 31 <9.8 <9.8 <9.8 <9.8 23
Losartan antihypertensives ng/l 3305 2353 2560 4160 2101 2649
Mesalazine gastrointestinal disease medications ng/l 928 940 198 <63 79 78
Metformin metabolic disease medications ng/l <7.5 <7.5 <7.5 <7.5 <7.5 <7.5
Metoprolol other cardiovascular medicines ng/l 3373 3061 5877 N/A N/A N/A
Mometasone furoate asthma and allergy medications ng/l <27 <27 <27 <27 <27 <27
Naproxen NSAIDs and analgesics ng/l 1187 1310 950 N/A N/A N/A
Nebivolol other cardiovascular medicines ng/l <16 <16 <16 <16 <16 <16
Norethisterone hormones ng/l <9.5 <9.5 <9.5 <9.5 13 10
Norfloxacin antibiotics ng/l <12437 <12437 13297 <12437 <12437 <12437
Ofloxacin antibiotics ng/l <208 <208 <208 N/A N/A N/A
Olanzapine psycopharmaceuticals ng/l 13 13 <0.96 1.3 1.2 1.2
Oxazepam psycopharmaceuticals ng/l 419 214 N/A 583 210 540
Oxycodone NSAIDs and analgesics ng/l <115 <115 N/A <115 <115 <115
Pantoprazole gastrointestinal disease medications ng/l <763 <763 <763 <763 <763 <763
Paracetamol NSAIDs and analgesics ng/l <77 729 859 3385 1164 1777
Primidone antiepileptics ng/l 75 57 31 N/A N/A N/A
Progesterone hormones ng/l <12 <12 <12 <12 <12 <12
Quetiapine psycopharmaceuticals ng/l <116 <116 <116 <116 <116 <116
Ramipril antihypertensives ng/l <16 <16 <16 N/A N/A N/A
Risperidone psycopharmaceuticals ng/l <10 <10 <10 <10 <10 <10
Sertraline psycopharmaceuticals ng/l 151 33 52 N/A N/A N/A
Simvastatin metabolic disease medications ng/l <1.5 <1.5 <1.5 <1.5 <1.5 <1.5
Sotalol other cardiovascular medicines ng/l 48 33 47 11 10 <7.7
Sulfadiazine antibiotics ng/l <295 <295 <295 <295 <295 <295
Sulfamethoxazole antibiotics ng/l <8.9 <8.9 <8.9 <8.9 <8.9 <8.9
Telmisartan antihypertensives ng/l <11 <11 17 17 <11 <11
Temazepam psycopharmaceuticals ng/l 11 12 N/A 18 9.0 30
Testosterone hormones ng/l <18 <18 <18 <18 <18 <18
Tetracycline/Doxycycline antibiotics ng/l <119 <119 145 <119 <119 <119
Tiamulin veterinary medicines ng/l <19 <19 <19 <19 <19 <19
Toltrazuril veterinary medicines ng/l <8952 <8952 <8952 <LOQ <LOQ <8952
Tramadol NSAIDs and analgesics ng/l 1308 745 924 1506 520 1220
Trimethoprim antibiotics ng/l 146 174 96 N/A N/A N/A
Tylosin veterinary medicines ng/l <102 <102 160 131 <102 159
Valsartan antihypertensives ng/l 476 616 559 484 276 733
Warfarin other cardiovascular medicines ng/l 12 10 <6.3 10 <6.3 9
Venlafaxine psycopharmaceuticals ng/l 517 313 517 N/A N/A N/A
Xylometazoline asthma and allergy medications ng/l 39 34 39 <26 <26 <26
Number of analysed API 73 73 71 58 58 58
Number of APIs above LOQ 31 33 34 21 21 23
Detection rate (%) 42 45 48 36 36 40

244
Annex 7. Average efficiency of API treatment according to wastewater influent and effluent data (%) Poland
Paide Pärnu Türi Kalteva Viikki Greifswald Neubrandenburg Rostock WWTP 1 WWTP 2 WWTP 3 Błonie WWTP Linköping Motala Norrköping
Atenolol other cardiovascular medicines 60 82 71 71
Allopurinol metabolic disease medications 100 100 99 100 100
Bezafibrate metabolic disease medications 63 82 58 43 33 8 60 49
Bisoprolol other cardiovascular medicines -26 -14 30 18 39 4 62 79 -54 17
Caffeine other 90 92 91 90 91
Carbamazepine antiepileptics -21 74 56 -27 -35 3 40 -364 16 -6 98 -8 13 28 -5 -6
Carprofen veterinary medicines 88 87 87
Citalopram psycopharmaceuticals -3 14 -29 42 16 59 47 18 20 40 49 12 47 38 14 26
Clarithromycin antibiotics 6 55 -7 3 -16 -23 -16 61 27 64 64 22
Codeine NSAIDs and analgesics 86 99 96 96 67 87 90 86 63 47 90 90 66 68 75 80
Diclofenac NSAIDs and analgesics -154 -97 3 0 7 9 -64 -15 -3 6 33 31 16 -13 2 -14
Dipyridamole other cardiovascular medicines 85 95 85 97 41 86 89 90 84
Eprosartan antihypertensives 96 96 98 95 77 96 81 16 82
Erythromycin antibiotics 70 90 99 -40 24 77 -165 -2 61 28 97 54 51 32 58 37
Estrone (E1) hormones 97 60 80 86 87 89 100 100 100 89
Fluconazole antibiotics 83 49 -3 -60 59 -56 -15 12 64 25 84 66 -18 22
Gabapentin antiepileptics 100 63 44 48 60 91 92 84 56 41 75 68
Gemfibrozil metabolic disease medications 84 84
Hydrochlorothiazide antihypertensives 57 69 39 54 -297 0 94 52 -28 -121 -27 -333 45 -152 -39
Ibuprofen NSAIDs and analgesics 86 86
Irbesartan antihypertensives 30 98 -138 -3
Ketoprofen NSAIDs and analgesics 95 -2 85 77 6 59 85 44 30 82 99 74 79 32 60
Levetiracetam antiepileptics 91 60 92 99 95 100 99 99 89 94 94 98 91 89 95 92
Losartan antihypertensives 69 19 -20 -34 -33 0
Mesalazine gastrointestinal disease medications96 98 99 94 97 99 87 98 98 98 98 99 68 89 96 95
Metformin metabolic disease medications 100 100 98 98 100 100 100 100 98 98 100 100 100 100 100 99
Metoprolol other cardiovascular medicines -280 -318 -198 -222 -302 -133 -293 -205 -289 -161 -72 -224
Naproxen NSAIDs and analgesics 92 89 98 97 79 96 64 85 97 91 95 100 78 84 85 89
Nebivolol other cardiovascular medicines 98 99 99 99 99
Norethisterone hormones 95 90 -18 98 97 84 99 99 99 76 98 99 97 99 87
Ofloxacin antibiotics 90 83 87
Olanzepine psycopharmaceuticals 99 99 84 84 84 83 94 92 97 90
Oxazepam psycopharmaceuticals 16 13 25 7 26 24 -8 98 20 15 -23 21
Paracetamol NSAIDs and analgesics 99 60 99 99 98 90 100 81 99 99 82 99 92 77 87 91
Primidone antiepileptics -13 -24 -18
Progesterone hormones 83 59 86 75
Ramipril antihypertensives -60 -1 -31
Quetiapine psycopharmaceuticals 83 83
Sertraline psycopharmaceuticals 92 77 96 89 94 61 86 85
Simvastatin metabolic disease medications 98 95 98 98 97 97
Sotalol other cardiovascular medicines -8 -37 -72 14 -127 -108 44 -15 -136 55 53 49 45 10 -18
Sulfamethoxazole antibiotics 97 94 11 95 -31 94 98 82 95 98 97 93 97 90 80
Telmisartan antihypertensives 69 -1049 66 77 62 -88 92 -107 23 -96 96 -28 92 90 79 -38
Temazepam psycopharmaceuticals 31 22 34 29 -74 8
Testosterone hormones 91 91 80 80 85
Tetracycline/Doxycycline antibiotics 90 89 89 83 90 88
Tramadol NSAIDs and analgesics -2 42 31 4 -49 -40 -2 11 -14 90 17 3 -2 -16 7
Trimethoprim antibiotics 28 73 25 27 41 58 9 56 23 62 31 50 21 19 31 37
Valsartan antihypertensives 80 65 59 10 90 60 79 63 69 99 67
Venlafaxine psycopharmaceuticals -7 63 9 19 21 31 20 -91 11 7 23 15 31 12
API
Estonia Finland Germany Latvia Sweden
AverageAPI group

245
Annex 8. APIs in WWTP sludge samples
Country
Estonia Estonia Estonia Estonia Estonia Estonia Finland Finland Finland
Date (dd-mm-yyyy)
06-12-2017 12-12-2017 06-12-2017 05-06-2018 05-06-2018 07-06-2018 15-12-2017 29-08-2018 06-06-2018
WWTP
Paide Pärnu Türi Türi Paide Pärnu Viikki Viikki Kalteva
Sludge type
dewatered dewatered dewatered dewatered dewatered dewatered treated, ready for transport
from WWTP
treated, ready for transport
from WWTP
treated sludge
Dry matter content
% 18 22 15 59 37 26 29 18 2.5
API API group Unit
Bisoprolol other cardiovascular medicines µg/kg dw 0.62 2.2 0.45 <0.099 <0.099 0.47 8.6 25 38
Caffeine other µg/kg dw 75 77 60 5.3 23 160 29 68 150
Carbamazepine antiepileptics µg/kg dw 93 89 130 17 180 63 26 46 37
Citalopram psycopharmaceuticals µg/kg dw 61 55 45 8.8 30 52 130 510 150
Codeine NSAIDs and analgesics µg/kg dw <3.7 27 23 <3.7 <3.7 <3.7 <3.7 8.4 43
Diclofenac NSAIDs and analgesics µg/kg dw 210 120 440 30 2.3 700 61 110 340
Enalapril antihypertensives µg/kg dw <0.39 1.4 <0.39 <0.39 <0.39 <0.39 <0.39 <0.39 <0.39
Fluconazole antibiotics µg/kg dw 0.49 0.31 0.15 0.22 0.21 0.93 0.81 2.1 6.2
Gabapentin antiepileptics µg/kg dw 2.3 51 <0.32 <0.32 <0.32 <0.32 <0.32 <0.32 <0.32
Irbesartan antihypertensives µg/kg dw 0.21 1.0 0.13 <0.085 <0.085 0.73 1.5 2.7 0.58
Ketoprofen NSAIDs and analgesics µg/kg dw 0.95 <0.17 1.2 0.73 <0.17 9.4 2.6 <0.17 2.3
Levetiracetam antiepileptics µg/kg dw 11 13 <0.16 <0.16 3.2 <0.16 <0.16 10 31
Lincomycin antibiotics µg/kg dw <0.042 0.24 <0.042 <0.042 <0.042 0.11 <0.042 0.28 0.18
Metformin metabolic disease medications µg/kg dw 300 120 170 9.0 8.5 510 55 57 200
Metoprolol other cardiovascular medicines µg/kg dw 44 150 67 16 110 190 30 65 42
Naproxen NSAIDs and analgesics µg/kg dw 6.0 3.7 17 <1.5 <1.5 16 <1.5 2.6 42
Ofloxacin antibiotics µg/kg dw 2.4 3.1 <1.8 8.1 2.8 <1.8 35 89 8600
Olanzapine psycopharmaceuticals µg/kg dw 5.0 7.6 <4.4 <4.4 <4.4 7.2 10 26 4.8
Oxazepam psycopharmaceuticals µg/kg dw 23 25 4.6 3.1 <0.027 21 21 140 91
Oxycodone NSAIDs and analgesics µg/kg dw <0.26 16 1.4 <0.26 2.3 100 0.89 1.4 1.0
Primidone antiepileptics µg/kg dw <0.39 <0.39 <0.39 <0.39 <0.39 <0.39 <0.39 2.4 4.4
Ramipril antihypertensives µg/kg dw <0.46 <0.46 <0.46 <0.46 <0.46 <0.46 <0.46 <0.46 <0.46
Risperidone psycopharmaceuticals µg/kg dw 1.7 3.2 <0.078 3.9 <0.078 6.0 4.6 <0.078 N/A
Sertraline psycopharmaceuticals µg/kg dw 120 100 130 29 99 920 280 720 330
Telmisartan antihypertensives µg/kg dw 8700 7100 3500 1900 4800 <1.4 450 1000 1100
Temazepam psycopharmaceuticals µg/kg dw 21 12 17 3.3 9.2 23 88 310 260
Toltrazuril veterinary medicines µg/kg dw <17 <17 <17 <17 <17 <17 <17 <17 <17
Tramadol NSAIDs and analgesics µg/kg dw 38 18 22 7.2 10 <0.047 6.2 23 44
Trimethoprim antibiotics µg/kg dw 2.4 41 1.1 <0.16 <0.16 <0.16 14 0.26 <0.16
Tylosin veterinary medicines µg/kg dw <53 <53 <53 <53 <53 <53 <53 <53 <53
Venlafaxine psycopharmaceuticals µg/kg dw 4.7 2.7 1.9 1.9 5.5 13 58 53 41 Number of analysed API 31 31 31 31 31 31 31 31 30 Number of APIs above LOQ 23 26 20 16 15 19 21 24 24 Detection rate (%)
74 84 65 52 48 61 68 77 80

246
Country
Germany Germany Germany Germany Germany Latvia Latvia Latvia Latvia
Date (dd-mm-yyyy)
26-06-2018 21-06-2018 09-02-2018 27-11-2018 03-12-2018 21-11-2017 07-12-2017 21-05-2018 12-06-2018
WWTP
Greifswald Rostock Greifswald Rostock Greifswald WWTP 1 WWTP 2 WWTP 1 WWTP 2
Sludge type
Dewatered and
digested.
Dewatered and
digested.
Dewatered and
digested.
Dewatered and
digested.
Dewatered and
digested.
No info No info No info No info
Info
Sample melted during delivery
Sample melted during delivery
Sample melted during delivery
- - - - - -
Dry matter content
% 20 26 22 23 20 19 24 19 28
API API group Unit
Bisoprolol other cardiovascular medicines µg/kg dw 70 27 48 123 82 6.8 21 15 5.3
Caffeine other µg/kg dw 53 12 16 2.2 0.59 110 31 97 15
Carbamazepine antiepileptics µg/kg dw 280 41 240 30 16 55 43 76 58
Citalopram psycopharmaceuticals µg/kg dw 140 49 170 340 450 24 34 27 55
Codeine NSAIDs and analgesics µg/kg dw <3.7 <3.7 <3.7 18 <3.7 <3.7 12 <3.7 3.8
Diclofenac NSAIDs and analgesics µg/kg dw 250 270 240 630 190 300 150 220 140
Enalapril antihypertensives µg/kg dw <0.39 <0.39 <0.39 <0.39 <0.39 <0.39 <0.39 <0.39 <0.39
Fluconazole antibiotics µg/kg dw 1.9 0.48 1.6 0.86 0.30 1.3 1.2 0.84 1.1
Gabapentin antiepileptics µg/kg dw <0.32 0.92 <0.32 <0.32 <0.32 43 36 <0.32 <0.32
Irbesartan antihypertensives µg/kg dw 40 36 51 N/A N/A 4.0 2.7 2.3 0.76
Ketoprofen NSAIDs and analgesics µg/kg dw <0.17 26 4.0 3.5 <0.17 3.4 <0.17 4.0 1.9
Levetiracetam antiepileptics µg/kg dw <0.16 <0.16 <0.16 <0.16 <0.16 <0.16 <0.16 <0.16 <0.16
Lincomycin antibiotics µg/kg dw 2.2 <0.042 0.52 0.17 <0.042 0.32 1.7 0.26 1.5
Metformin metabolic disease medications µg/kg dw 200 22 26 17 19 366 34 380 27
Metoprolol other cardiovascular medicines µg/kg dw 150 200 150 300 360 38 130 44 110
Naproxen NSAIDs and analgesics µg/kg dw 5.6 <1.5 <1.5 <1.5 11 5.0 <1.5 4.6 <1.5
Ofloxacin antibiotics µg/kg dw 180 32 <1.8 <1.8 38 <1.8 14 9.9 9.5
Olanzapine psycopharmaceuticals µg/kg dw <4.4 <4.4 14 <4.4 <4.4 6.1 4.9 14 9.9
Oxazepam psycopharmaceuticals µg/kg dw 21 2.9 3.3 22 13 68 17 26 4.2
Oxycodone NSAIDs and analgesics µg/kg dw 0.5 8.4 0.73 32 21 35 5.4 17 1.9
Primidone antiepileptics µg/kg dw <0.39 3.0 2.0 1.1 <0.39 <0.39 <0.39 <0.39 <0.39
Ramipril antihypertensives µg/kg dw <0.46 <0.46 <0.46 <0.46 <0.46 <0.46 <0.46 <0.46 <0.46
Risperidone psycopharmaceuticals µg/kg dw 6.6 0.37 3.2 4.6 3.8 0.59 3.4 2.0 1.1
Sertraline psycopharmaceuticals µg/kg dw 290 250 510 270 1100 15 71 34 66
Telmisartan antihypertensives µg/kg dw 1600 580 <1.4 N/A N/A 1900 1100 <1.4 <1.4
Temazepam psycopharmaceuticals µg/kg dw 6.3 1.9 7.5 62 36 23 11 11 23
Toltrazuril veterinary medicines µg/kg dw <17 <17 <17 <17 <17 <17 <17 <17 <17
Tramadol NSAIDs and analgesics µg/kg dw 19 21.9 12 8.2 <0.047 51 11 17 4.9
Trimethoprim antibiotics µg/kg dw <0.16 <0.16 <0.16 <0.16 <0.16 0.59 0.39 <0.16 <0.16
Tylosin veterinary medicines µg/kg dw <53 <53 <53 <53 <53 <53 <53 <53 <53
Venlafaxine psycopharmaceuticals µg/kg dw 86 130 54 98 75 9.3 7.8 3.8 5.7 Number of analysed API 31 31 31 29 29 31 31 31 31 Number of APIs above LOQ 20 21 20 19 16 23 23 21 21 Detection rate (%)
65 68 65 66 55 74 74 68 68
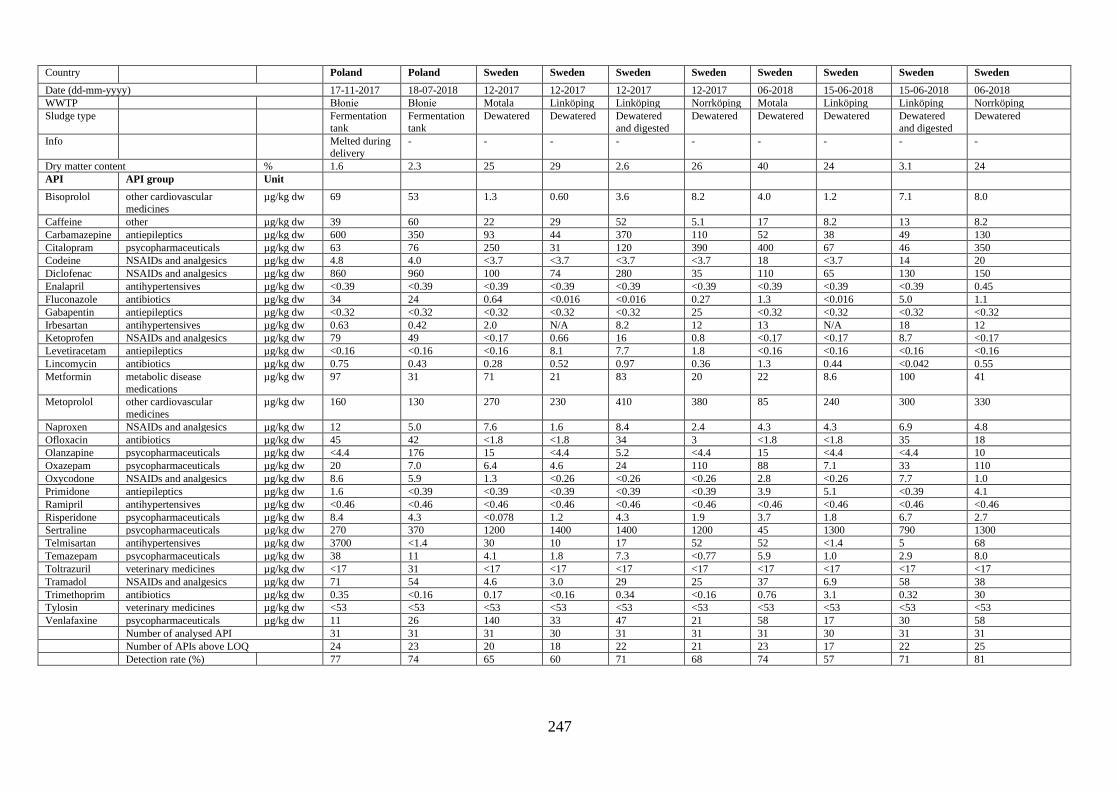
247
Country
Poland Poland Sweden Sweden Sweden Sweden Sweden Sweden Sweden Sweden
Date (dd-mm-yyyy) 17-11-2017 18-07-2018 12-2017 12-2017 12-2017 12-2017 06-2018 15-06-2018 15-06-2018 06-2018
WWTP
Błonie Błonie Motala Linköping Linköping Norrköping Motala Linköping Linköping Norrköping
Sludge type
Fermentation
tank
Fermentation
tank
Dewatered Dewatered Dewatered
and digested
Dewatered Dewatered Dewatered Dewatered
and digested
Dewatered
Info
Melted during delivery
- - - - - - - - -
Dry matter content % 1.6 2.3 25 29 2.6 26 40 24 3.1 24
API API group Unit
Bisoprolol other cardiovascular
medicines
µg/kg dw 69 53 1.3 0.60 3.6 8.2 4.0 1.2 7.1 8.0
Caffeine other µg/kg dw 39 60 22 29 52 5.1 17 8.2 13 8.2
Carbamazepine antiepileptics µg/kg dw 600 350 93 44 370 110 52 38 49 130
Citalopram psycopharmaceuticals µg/kg dw 63 76 250 31 120 390 400 67 46 350
Codeine NSAIDs and analgesics µg/kg dw 4.8 4.0 <3.7 <3.7 <3.7 <3.7 18 <3.7 14 20
Diclofenac NSAIDs and analgesics µg/kg dw 860 960 100 74 280 35 110 65 130 150
Enalapril antihypertensives µg/kg dw <0.39 <0.39 <0.39 <0.39 <0.39 <0.39 <0.39 <0.39 <0.39 0.45
Fluconazole antibiotics µg/kg dw 34 24 0.64 <0.016 <0.016 0.27 1.3 <0.016 5.0 1.1
Gabapentin antiepileptics µg/kg dw <0.32 <0.32 <0.32 <0.32 <0.32 25 <0.32 <0.32 <0.32 <0.32
Irbesartan antihypertensives µg/kg dw 0.63 0.42 2.0 N/A 8.2 12 13 N/A 18 12
Ketoprofen NSAIDs and analgesics µg/kg dw 79 49 <0.17 0.66 16 0.8 <0.17 <0.17 8.7 <0.17
Levetiracetam antiepileptics µg/kg dw <0.16 <0.16 <0.16 8.1 7.7 1.8 <0.16 <0.16 <0.16 <0.16
Lincomycin antibiotics µg/kg dw 0.75 0.43 0.28 0.52 0.97 0.36 1.3 0.44 <0.042 0.55
Metformin metabolic disease
medications
µg/kg dw 97 31 71 21 83 20 22 8.6 100 41
Metoprolol other cardiovascular
medicines
µg/kg dw 160 130 270 230 410 380 85 240 300 330
Naproxen NSAIDs and analgesics µg/kg dw 12 5.0 7.6 1.6 8.4 2.4 4.3 4.3 6.9 4.8
Ofloxacin antibiotics µg/kg dw 45 42 <1.8 <1.8 34 3 <1.8 <1.8 35 18
Olanzapine psycopharmaceuticals µg/kg dw <4.4 176 15 <4.4 5.2 <4.4 15 <4.4 <4.4 10
Oxazepam psycopharmaceuticals µg/kg dw 20 7.0 6.4 4.6 24 110 88 7.1 33 110
Oxycodone NSAIDs and analgesics µg/kg dw 8.6 5.9 1.3 <0.26 <0.26 <0.26 2.8 <0.26 7.7 1.0
Primidone antiepileptics µg/kg dw 1.6 <0.39 <0.39 <0.39 <0.39 <0.39 3.9 5.1 <0.39 4.1
Ramipril antihypertensives µg/kg dw <0.46 <0.46 <0.46 <0.46 <0.46 <0.46 <0.46 <0.46 <0.46 <0.46
Risperidone psycopharmaceuticals µg/kg dw 8.4 4.3 <0.078 1.2 4.3 1.9 3.7 1.8 6.7 2.7
Sertraline psycopharmaceuticals µg/kg dw 270 370 1200 1400 1400 1200 45 1300 790 1300
Telmisartan antihypertensives µg/kg dw 3700 <1.4 30 10 17 52 52 <1.4 5 68
Temazepam psycopharmaceuticals µg/kg dw 38 11 4.1 1.8 7.3 <0.77 5.9 1.0 2.9 8.0
Toltrazuril veterinary medicines µg/kg dw <17 31 <17 <17 <17 <17 <17 <17 <17 <17
Tramadol NSAIDs and analgesics µg/kg dw 71 54 4.6 3.0 29 25 37 6.9 58 38
Trimethoprim antibiotics µg/kg dw 0.35 <0.16 0.17 <0.16 0.34 <0.16 0.76 3.1 0.32 30
Tylosin veterinary medicines µg/kg dw <53 <53 <53 <53 <53 <53 <53 <53 <53 <53
Venlafaxine psycopharmaceuticals µg/kg dw 11 26 140 33 47 21 58 17 30 58 Number of analysed API 31 31 31 30 31 31 31 30 31 31 Number of APIs above LOQ 24 23 20 18 22 21 23 17 22 25 Detection rate (%)
77 74 65 60 71 68 74 57 71 81

248
Annex 9. Partitioning of APIs at WWTPs
Symbology in graphs:
= At least – the amount (%) partitioning in effluent or sludge, or transformed during the treatment is likely more
than the point in the graph. For example, if the concentration in influent was above LOQ, but effluent < LOQ, the
amount of API transformed during the treatment process could more than the calculated value (i.e. influent
concentration minus effluent LOQ);
= Less than – the amount (%) partitioning in effluent or sludge, or transformed during the treatment is likely less
than the point in the graph. For example, if the concentration in influent was < LOQ, but the concentration in effluent
> LOQ, the amount of API transformed during the treatment process could less than the calculated value (i.e. influent
LOQ minus effluent concentration);
= Exact value – calculation based on of detected concentrations.
0
50
100
0 1 2 3
% f
rom
inco
mm
ing
load
1 - in effluent, 2 - in sludge, 3 - lost during treatment
Bisoprolol
exact values less than at least
0
50
100
0 1 2 3
% f
rom
inco
mm
ing
load
1 - in effluent, 2 - in sludge, 3 - lost during treatment
Caffeine
exact values less than at least
0
50
100
0 1 2 3
% f
rom
inco
mm
ing
load
1 - in effuent, 2 - in sludge, 3 - lost during treatment
Carbamazepine
exact values
0
50
100
0 1 2 3
% f
rom
inco
mm
ing
load
1 - in effluent, 2 - in sludge, 3 - lost during treatment
Citalopram
exact values
0
50
100
0 1 2 3
% f
rom
inco
mm
ing
load
1 - in effluent, 2 - in sludge, 3 - lost during treatment
Codeine
exact value less than at least
0
50
100
0 1 2 3
% f
rom
inco
mm
ing
load
1 - in effluent, 2 - in sludge, 3 - lost during treatment
Diclofenac
exact value less than

249
0
50
100
0 1 2 3
% f
rom
inco
mm
ing
load
1 - in effluent, 2 - in sludge, 3 - lost during treatment
Gabapentin
exact values less than at least
0
50
100
0 1 2 3
% f
rom
inco
mm
ing
load
1 - in effluent, 2 - in sludge, 3 - lost during treatment
Irbesartan
exact values less than at least
0
50
100
0 1 2 3
% f
rom
inco
mm
ing
load
1 - in effluent, 2 - in sludge, 3 - lost during treatment
Ketoprofen
exact values less than at least
0
50
100
0 1 2 3
% f
rom
inco
mm
ing
load
1 - in effluent, 2 - in sludge, 3 - lost during treatment
Levetiracetam
exact values less than at least
0
0,2
0,4
0,6
0,8
1 2 3
% f
rom
inco
mm
ing
load
2 - in sludge
Lincomycin
at least
0
20
40
60
80
100
0 1 2 3% f
rom
inco
mm
ing
load
1 - in effluent; 2 - in sludge; 3 - lost during treatment
Metformin
exact values less than at least
0
20
40
60
80
100
0 1 2 3
% f
rom
inco
mm
ing
load
1 - in effluent, 2 - in sludge, 3 - lost during treatment
Metoprolol
exact values less than at least
0
20
40
60
80
100
0 1 2 3% f
rom
inco
mm
ing
load
1 - in effluent, 2 - in sludge, 3 - lost during treatment
Naproxen
exact values less than at least
0
50
100
0 1 2 3
% f
rom
inco
mm
ing
load
1 - in effluent, 2 - in sludge, 3 - lost during treatment
Olanzapine
exact values less than at least
0
50
100
150
0 1 2 3
% f
rom
inco
mm
ing
load
1 - in effluent, 2 - in sludge, 3 - lost during treatment
Oxazepam
exact values less than at least

250
0
20
40
60
80
100
0 1 2 3
% o
f in
com
min
g lo
ad
1 - in effluent, 2 - in sludge, 3 - lost during treatment
Ofloxacin
exact values less than at least
0
20
40
60
80
100
1 2 3
% f
rom
inco
mm
ing
load
2 - in sludge
Oxycodone
at least
0
20
40
60
80
100
0 1 2 3
% f
rom
inco
mm
ing
load
1 - in effluent, 2 - in sludge, 3 - lost during treatment
Primidone
exact values less than at least
0
20
40
60
80
100
0 1 2 3
% f
rom
inco
mm
ing
load
1 - in effluent, 2 - in sludge, 3 - lost during treatment
Ramipril
less than at least
0
20
40
60
80
100
0 1 2 3
% f
rom
inco
mm
ing
load
1 - in effluent, 2 - in sludge, 3 - lost during treatment
Risperidone
less than at least
0
20
40
60
80
100
0 1 2 3% f
rom
inco
mm
ing
load
1 - in effluent, 2 - in sludge, 3 - lost during treatment
Sertraline
exact values less than at least
0
20
40
60
80
100
0 1 2 3
% f
rom
inco
mm
ing
1 - in effluent, 2 - in sludge, 3 - lost during treatment
Telmisartan
exact values less than at least
0
20
40
60
80
100
0 1 2 3
% f
rom
inco
mm
ing
1 - in effluent, 2 - in sludge, 3 - lost during treatment
Temazepam
exact values less than at least

251
0
20
40
60
80
100
0 1 2 3
% f
rom
inco
mm
ing
load
1 - in effluent, 2 - in sludge, 3 - lost during treatment
Tramadol
exact values less than at least
0
50
100
150
0 1 2 3
% f
rom
inco
mm
ing
load
1 - in effluent, 2 - in sludge, 3 - lost during treatment
Trimethoprim
exact value less than at least
0
20
40
60
80
100
0 1 2% f
rom
inco
mm
ing
load
1 - in effluent
Tylosin
at least

252
Annex 10. API concentrations at landfill WWTP
Country
Finland Finland Finland Finland Finland Finland
Year
2018 2018 2018 2018 2018 2018
Month
3 6 11 3 6 11
Date
6 6 21 6 6 21
Comments
grab sample
grab sample
grab sample
24-h 24-h 24-h
API API group Unit Influent Effluent
Allopurinol metabolic disease medications
ng/L <14000 <14000 <14000 <120 <120 <120
Amlodipine antihypertensives ng/L <400 <400 <400 <110 <110 <110
Atenolol other cardiovascular medicines
ng/L <210 <210 <210 <110 <110 <110
Atorvastatin metabolic disease medications
ng/L <10000 <10000 <10000 <10000 <10000 <10000
Bezafibrate metabolic disease medications
ng/L <27 <27 <27 <13 <13 <13
Bisoprolol other cardiovascular medicines
ng/L <30 <30 <30 <15 <15 31
Caffeine other ng/L 21 N/A <17 <870 8800 <870
Candesartan antihypertensives ng/L <770 <770 <770 <11 <11 <11
Carbamazepine antiepileptics ng/L 250 230 43 200 215 65
Carprofen veterinary medicines ng/L <14 <14 <14 <7.1 <7.1 93
Cetirizine asthma and allergy medications
ng/L <3200 <3200 <3200 <1200 <1200 <1200
Ciprofloxacin antibiotics ng/L <3100 <3100 <3100 <1600 <1600 <1600
Citalopram psycopharmaceuticals ng/L <2.2 9.1 5.9 2.0 3.6 <1.1
Clarithromycin antibiotics ng/L <31 <31 <31 <16 <16 <16
Codeine NSAIDs and analgesics ng/L <42 <42 <42 <11 <11 <11
Diclofenac NSAIDs and analgesics ng/L 140 252 300 415 230 167
Dipyridamole other cardiovascular medicines
ng/L 571 <185 <185 <87 <87 <87
Emamectin veterinary medicines ng/L <29 <29 <29 <11 17 <11
Enalapril antihypertensives ng/L <167 <167 <167 <83 <83 <83
Eprosartan antihypertensives ng/L 20 30 <10 <5.2 <5.2 <5.2
Erythromycin antibiotics ng/L 2493 <39 <39 1833 1598 <8.5
Esomeprazole gastrointestinal disease medications
ng/L <8400 <8400 <8400 <8400 <8400 N/A
Estriol (E3) hormones ng/L 84 <12 <12 <8400 <8400 <8400
Estrone (E1) hormones ng/L 57 <26 <26 <13 <13 653
Fenbendazole veterinary medicines ng/L <36 <36 <36 <11 <11 <11
Fexofenadine asthma and allergy medications
ng/L <4300 <4300 <4300 <1600 <1600 <1600
Florfenicol veterinary medicines ng/L <64 <64 <64 <32 <32 <32
Fluconazole antibiotics ng/L 40 77 49 22 29 27
Fluticasone asthma and allergy medications
ng/L <415 <415 <415 <150 <150 <150
Gabapentin antiepileptics ng/L 1860 6960 1253 N/A N/A <910
Gemfibrozil metabolic disease medications
ng/L 302 353 <165 <100 <100 <100
Hydrochlorothiazide antihypertensives ng/L 23000 79000 <7.5 4400 3300 <100
Ibuprofen NSAIDs and analgesics ng/L N/A N/A N/A N/A N/A N/A
Irbesartan antihypertensives ng/L <53 <53 <53 <70 <70 <70
Ketoprofen NSAIDs and analgesics ng/L 1700 1400 540 13 <11 <11
Levetiracetam antiepileptics ng/L 970 760 480 <110 <110 <110
Lincomycin antibiotics ng/L <18 <18 <18 13 <9.8 <9.8
Losartan antihypertensives ng/L <510 <510 <510 <250 <250 <250
Mesalazine gastrointestinal disease medications
ng/L <280 3300 680 950 920 <63
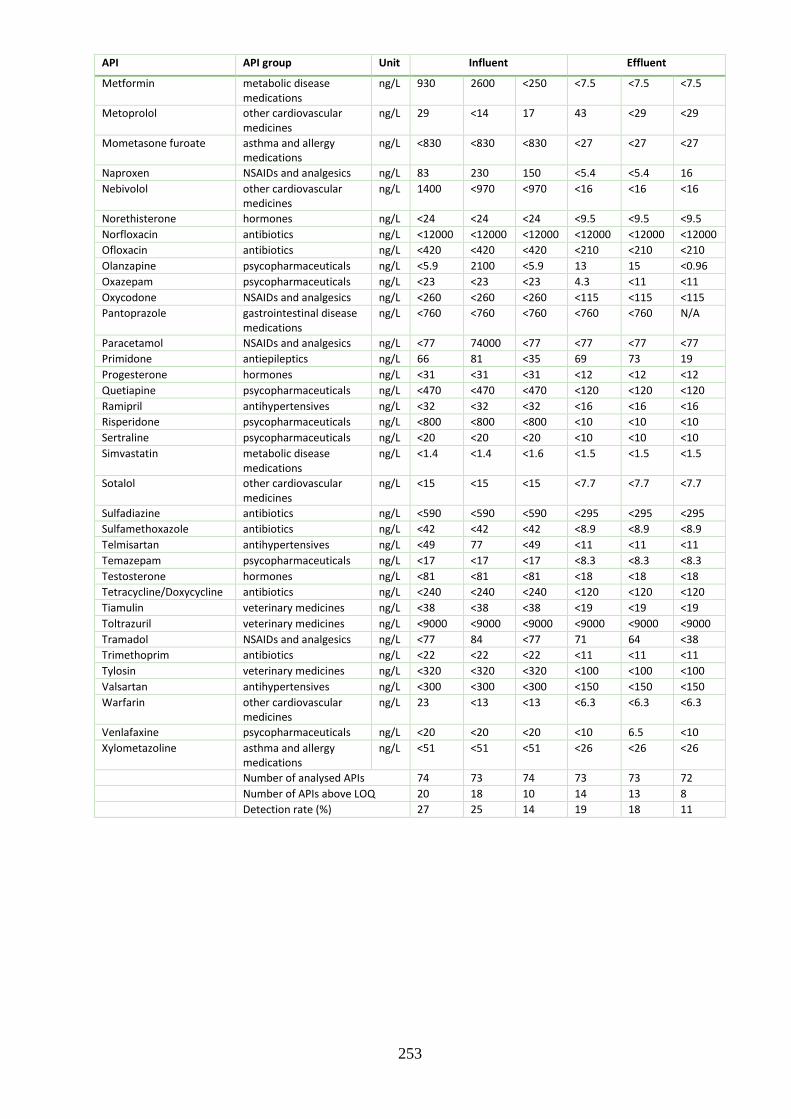
253
API API group Unit Influent Effluent
Metformin metabolic disease medications
ng/L 930 2600 <250 <7.5 <7.5 <7.5
Metoprolol other cardiovascular medicines
ng/L 29 <14 17 43 <29 <29
Mometasone furoate asthma and allergy medications
ng/L <830 <830 <830 <27 <27 <27
Naproxen NSAIDs and analgesics ng/L 83 230 150 <5.4 <5.4 16
Nebivolol other cardiovascular medicines
ng/L 1400 <970 <970 <16 <16 <16
Norethisterone hormones ng/L <24 <24 <24 <9.5 <9.5 <9.5
Norfloxacin antibiotics ng/L <12000 <12000 <12000 <12000 <12000 <12000
Ofloxacin antibiotics ng/L <420 <420 <420 <210 <210 <210
Olanzapine psycopharmaceuticals ng/L <5.9 2100 <5.9 13 15 <0.96
Oxazepam psycopharmaceuticals ng/L <23 <23 <23 4.3 <11 <11
Oxycodone NSAIDs and analgesics ng/L <260 <260 <260 <115 <115 <115
Pantoprazole gastrointestinal disease medications
ng/L <760 <760 <760 <760 <760 N/A
Paracetamol NSAIDs and analgesics ng/L <77 74000 <77 <77 <77 <77
Primidone antiepileptics ng/L 66 81 <35 69 73 19
Progesterone hormones ng/L <31 <31 <31 <12 <12 <12
Quetiapine psycopharmaceuticals ng/L <470 <470 <470 <120 <120 <120
Ramipril antihypertensives ng/L <32 <32 <32 <16 <16 <16
Risperidone psycopharmaceuticals ng/L <800 <800 <800 <10 <10 <10
Sertraline psycopharmaceuticals ng/L <20 <20 <20 <10 <10 <10
Simvastatin metabolic disease medications
ng/L <1.4 <1.4 <1.6 <1.5 <1.5 <1.5
Sotalol other cardiovascular medicines
ng/L <15 <15 <15 <7.7 <7.7 <7.7
Sulfadiazine antibiotics ng/L <590 <590 <590 <295 <295 <295
Sulfamethoxazole antibiotics ng/L <42 <42 <42 <8.9 <8.9 <8.9
Telmisartan antihypertensives ng/L <49 77 <49 <11 <11 <11
Temazepam psycopharmaceuticals ng/L <17 <17 <17 <8.3 <8.3 <8.3
Testosterone hormones ng/L <81 <81 <81 <18 <18 <18
Tetracycline/Doxycycline antibiotics ng/L <240 <240 <240 <120 <120 <120
Tiamulin veterinary medicines ng/L <38 <38 <38 <19 <19 <19
Toltrazuril veterinary medicines ng/L <9000 <9000 <9000 <9000 <9000 <9000
Tramadol NSAIDs and analgesics ng/L <77 84 <77 71 64 <38
Trimethoprim antibiotics ng/L <22 <22 <22 <11 <11 <11
Tylosin veterinary medicines ng/L <320 <320 <320 <100 <100 <100
Valsartan antihypertensives ng/L <300 <300 <300 <150 <150 <150
Warfarin other cardiovascular medicines
ng/L 23 <13 <13 <6.3 <6.3 <6.3
Venlafaxine psycopharmaceuticals ng/L <20 <20 <20 <10 6.5 <10
Xylometazoline asthma and allergy medications
ng/L <51 <51 <51 <26 <26 <26
Number of analysed APIs 74 73 74 73 73 72 Number of APIs above LOQ 20 18 10 14 13 8 Detection rate (%) 27 25 14 19 18 11

254
Annex 11. Concentration of APIs in wastewater effluents of hospitals
Country Estonia Estonia Germany Germany Sweden Sweden
Date (day/month/year) 12-12-2017 7-6-2018 19-2-2018 1-6-2018 15-6-2018 8-6-2018
API API group Unit
Pärnu
hospital
Pärnu
hospital
Wismar
hospital
Wismar
hospital
Linköping
hospital
Norrköping
hospital
Allopurinol metabolic disease medications µg/l 22 <14 <14 18 <14 <14
Amlodipine antihypertensives µg/l <0,40 0,41 <0,40 <0,40 <0,40 <0,40
Atenolol other cardiovascular medicines µg/l <0,21 <0,21 <0,21 <0,21 0,22 0,25
Atorvastatin metabolic disease medications µg/l <10 <10 <10 <10 <10 <10
Bezafibrate metabolic disease medications µg/l <0,027 <0,027 0,071 0,163 N/A N/A
Bisoprolol other cardiovascular medicines µg/l 0,038 0,052 0,82 0,064 0,078 0,146
Caffeine other µg/l 0,97 27 N/A 11 12 29
Candesartan antihypertensives µg/l <0,77 <0,77 <0,77 <0,77 <0,77 <0,77
Carbamazepine antiepileptics µg/l 0,038 0,31 0,25 0,067 2,3 0,61
Carprofen veterinary medicines µg/l <0,014 <0,014 0,026 0,042 <0,014 <0,014
Cetirizine asthma and allergy medications µg/l <3,2 <3,2 <3,2 <3,2 <3,2 <3,2
Ciprofloxacin antibiotics µg/l <3,1 14 <3,1 <3,1 <3,1 <3,1
Citalopram+escitalopram (SUM) psycopharmaceuticals µg/l 0,24 0,16 0,72 0,18 <0,0022 <0,0022
Clarithromycin antibiotics µg/l 3,5 0,21 0,34 0,31 <0,031 <0,031
Codeine NSAIDs and analgesics µg/l N/A 14 0,16 <0,042 0,79 2,4
Diclofenac NSAIDs and analgesics µg/l 9,6 3,2 0,63 0,25 0,71 1,7
Dipyridamole other cardiovascular medicines µg/l <0,19 0,52 <0,19 0,53 <0,19 <0,19
Emamectin veterinary medicines µg/l <0,029 <0,029 <0,029 <0,029 <0,029 <0,029
Enalapril antihypertensives µg/l <0,17 <0,17 <0,17 <0,17 <0,17 <0,17
Eprosartan antihypertensives µg/l <0,010 <0,010 0,17 <0,010 <0,010 <0,010
Erythromycin antibiotics µg/l <0,039 7,4 0,51 5,3 1,4 5,4
Esomeprazole gastrointestinal disease medications µg/l <8,4 <8,4 <8,4 <8,4 <8,4 <8,4
Estriol hormones µg/l <0,012 0,055 <0,012 0,029 0,248 0,266
Estrone (E1) hormones µg/l 0,054 0,088 0,081 <0,026 <0,026 9,1
Fenbendazole veterinary medicines µg/l <0,036 <0,036 <0,036 <0,036 <0,036 <0,036
Fexofenadien asthma and allergy medications µg/l <4,3 <4,3 <4,3 <4,3 <4,3 <4,3
Florfenicol veterinary medicines µg/l <0,064 <0,064 <0,064 <0,064 N/A N/A
Fluconazole antibiotics µg/l 3,2 1,8 <0,02 <0,02 N/A N/A
Fluticasone asthma and allergy medications µg/l <0,42 <0,42 <0,42 <0,42 <0,42 <0,42
Gabapentin antiepileptics µg/l 103 44 2,1 <0,91 N/A N/A
Gemfibrozil metabolic disease medications µg/l <0,17 1,3 <0,17 <0,17 <0,17 <0,17
Hydrochlorothiazide antihypertensives µg/l 2,8 16 8,3 13 1,9 2,6
Ibuprofen NSAIDs and analgesics µg/l 2,8 N/A N/A N/A N/A N/A
Irbesartan antihypertensives µg/l <0,053 <0,053 <0,053 <0,053 <0,053 <0,053
Ketoprofen NSAIDs and analgesics µg/l 4,4 4,5 <0,018 <0,018 N/A N/A
Levetiracetam antiepileptics µg/l 0,85 <0,22 22 <0,22 N/A N/A
Lincomycin antibiotics µg/l 0,065 0,13 <0,018 <0,018 N/A N/A
Losartan antihypertensives µg/l <0,51 <0,51 0,94 <0,51 1,4 1,6
Mesalazine gastrointestinal disease medications µg/l 6,1 14 11 13 0,66 2,5
Metformin metabolic disease medications µg/l 124 167 314 3,8 62 158
Metoprolol other cardiovascular medicines µg/l 2,0 2,7 <0,014 0,73 N/A N/A
Mometasone furoate asthma and allergy medications µg/l <0,83 <0,83 <0,83 <0,83 <0,83 <0,83
Naproxen NSAIDs and analgesics µg/l 6,3 54 1,0 <0,011 N/A N/A
Nebivolol other cardiovascular medicines µg/l <0,97 1,4 <0,97 1,5 <0,97 <0,97
Norethisterone hormones µg/l <0,024 0,10 0,41 0,055 <0,024 <0,024
Norfloxacin antibiotics µg/l 13 <12 <12 <12 N/A N/A
Ofloxacin antibiotics µg/l <0,42 <0,42 1,2 1,8 N/A N/A
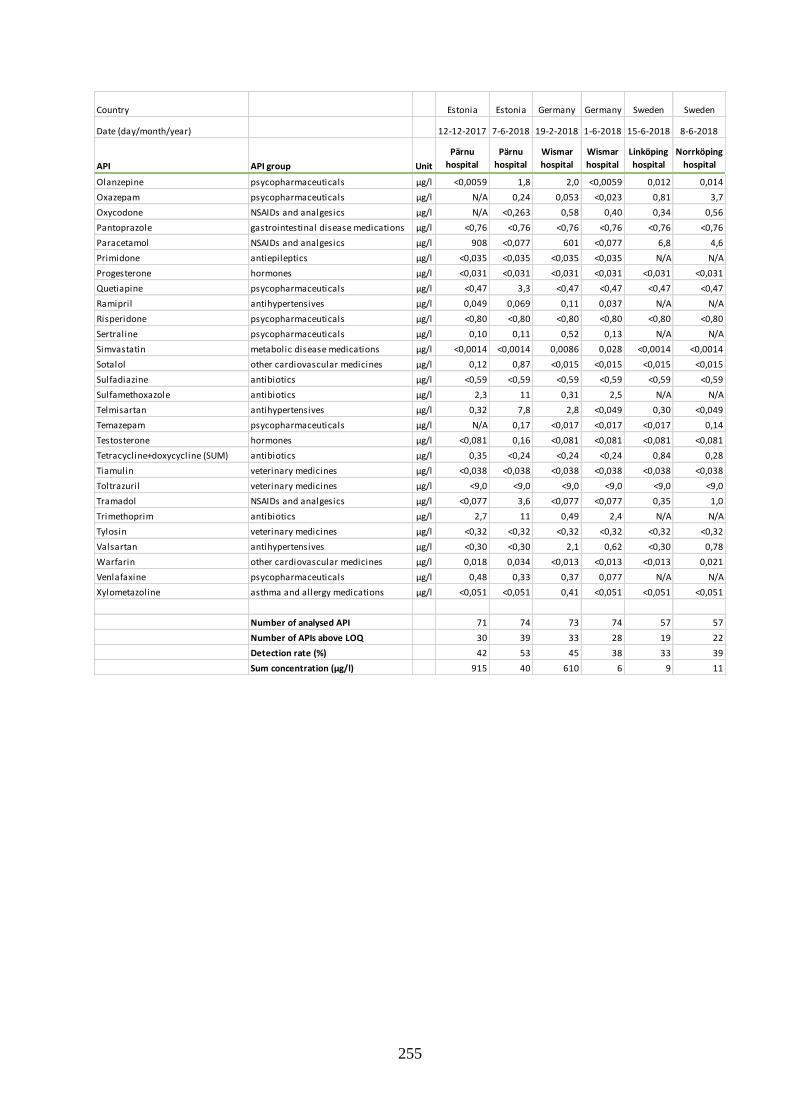
255
Country Estonia Estonia Germany Germany Sweden Sweden
Date (day/month/year) 12-12-2017 7-6-2018 19-2-2018 1-6-2018 15-6-2018 8-6-2018
API API group Unit
Pärnu
hospital
Pärnu
hospital
Wismar
hospital
Wismar
hospital
Linköping
hospital
Norrköping
hospital
Olanzepine psycopharmaceuticals µg/l <0,0059 1,8 2,0 <0,0059 0,012 0,014
Oxazepam psycopharmaceuticals µg/l N/A 0,24 0,053 <0,023 0,81 3,7
Oxycodone NSAIDs and analgesics µg/l N/A <0,263 0,58 0,40 0,34 0,56
Pantoprazole gastrointestinal disease medications µg/l <0,76 <0,76 <0,76 <0,76 <0,76 <0,76
Paracetamol NSAIDs and analgesics µg/l 908 <0,077 601 <0,077 6,8 4,6
Primidone antiepileptics µg/l <0,035 <0,035 <0,035 <0,035 N/A N/A
Progesterone hormones µg/l <0,031 <0,031 <0,031 <0,031 <0,031 <0,031
Quetiapine psycopharmaceuticals µg/l <0,47 3,3 <0,47 <0,47 <0,47 <0,47
Ramipril antihypertensives µg/l 0,049 0,069 0,11 0,037 N/A N/A
Risperidone psycopharmaceuticals µg/l <0,80 <0,80 <0,80 <0,80 <0,80 <0,80
Sertraline psycopharmaceuticals µg/l 0,10 0,11 0,52 0,13 N/A N/A
Simvastatin metabolic disease medications µg/l <0,0014 <0,0014 0,0086 0,028 <0,0014 <0,0014
Sotalol other cardiovascular medicines µg/l 0,12 0,87 <0,015 <0,015 <0,015 <0,015
Sulfadiazine antibiotics µg/l <0,59 <0,59 <0,59 <0,59 <0,59 <0,59
Sulfamethoxazole antibiotics µg/l 2,3 11 0,31 2,5 N/A N/A
Telmisartan antihypertensives µg/l 0,32 7,8 2,8 <0,049 0,30 <0,049
Temazepam psycopharmaceuticals µg/l N/A 0,17 <0,017 <0,017 <0,017 0,14
Testosterone hormones µg/l <0,081 0,16 <0,081 <0,081 <0,081 <0,081
Tetracycline+doxycycline (SUM) antibiotics µg/l 0,35 <0,24 <0,24 <0,24 0,84 0,28
Tiamulin veterinary medicines µg/l <0,038 <0,038 <0,038 <0,038 <0,038 <0,038
Toltrazuril veterinary medicines µg/l <9,0 <9,0 <9,0 <9,0 <9,0 <9,0
Tramadol NSAIDs and analgesics µg/l <0,077 3,6 <0,077 <0,077 0,35 1,0
Trimethoprim antibiotics µg/l 2,7 11 0,49 2,4 N/A N/A
Tylosin veterinary medicines µg/l <0,32 <0,32 <0,32 <0,32 <0,32 <0,32
Valsartan antihypertensives µg/l <0,30 <0,30 2,1 0,62 <0,30 0,78
Warfarin other cardiovascular medicines µg/l 0,018 0,034 <0,013 <0,013 <0,013 0,021
Venlafaxine psycopharmaceuticals µg/l 0,48 0,33 0,37 0,077 N/A N/A
Xylometazoline asthma and allergy medications µg/l <0,051 <0,051 0,41 <0,051 <0,051 <0,051
Number of analysed API 71 74 73 74 57 57
Number of APIs above LOQ 30 39 33 28 19 22
Detection rate (%) 42 53 45 38 33 39
Sum concentration (µg/l) 915 40 610 6 9 11

256
Annex 12. API load from hospitals and comparison with total load to WWTPs The tables show the load of APIs (g/day) in hospital effluents and in the connected wastewater treatment
plant, and the % of APIs from hospital effluents compared to total load of APIs in WWTP influents. APIs
below LOQ in both hospital effluents and WWTP influents are excluded. * indicates that it was not
possible to calculate the % of APIs from hospitals because the API was below LOQ in either hospital
effluents or WWTP influents.
Clarithromycin 0,029 2,9 0,97 0,023 0,64 3,6
Erythromycin 0,043 13 0,34 0,40 139 0,28
Ofloxacin 0,099 9,8 1,0 0,14 <LOQ *
Sulfamethoxazole 0,026 1,6 1,7 0,19 7,3 2,6
Trimethoprim 0,041 1,8 2,3 0,18 7,8 2,3
Carbamazepine 0,022 11 0,20 0,0050 14 0,036
Gabapentin 0,17 458 0,038 <LOQ <LOQ <LOQ
Levetiracetam 1,8 164 1,1 <LOQ <LOQ <LOQ
Eprosartan 0,014 7,2 0,20 <LOQ <LOQ <LOQ
Hydrochlorothiazide 0,70 69 1,0 0,96 68 1,4
Losartan 0,080 <LOQ * <LOQ <LOQ <LOQ
Ramipril 0,0092 1,2 0,75 0,0028 1,1 0,26
Telmisartan 0,24 28 0,84 <LOQ <LOQ <LOQ
Valsartan 0,18 102 0,18 0,047 80 0,06
Xylometazoline
asthma and
allergy med. 0,035 <LOQ * <LOQ <LOQ <LOQ
Caffeine caffeine <LOQ <LOQ <LOQ 0,83 164 0,51
Estriol <LOQ <LOQ <LOQ 0,0022 0,78 0,28
Estrone (E1) 0,0069 0,80 0,86 <LOQ <LOQ <LOQ
Norethisterone 0,035 5,8 0,60 0,0042 0,95 0,44
Mesalazine
gastrointestinal
disease
medications 0,93 64 1,4 0,95 159 0,60
Allopurinol <LOQ <LOQ <LOQ 1,3 <LOQ *
Bezafibrate 0,0060 14 0,042 0,012 8,1 0,15
Metformin 27 4756 0,56 0,28 1876 0,015
Simvastatin 0,00073 0,60 0,12 0,0021 0,62 0,34
Codeine 0,013 6,6 0,20 <LOQ <LOQ <LOQ
Diclofenac 0,054 64 0,084 0,019 63 0,029
Naproxen 0,086 16 0,53 <LOQ <LOQ <LOQ
Oxycodone 0,049 <LOQ * 0,030 <LOQ *
Paracetamol 51 6097 0,83 <LOQ <LOQ <LOQ
Bisoprolol 0,070 11 0,64 0,0048 13 0,038
Dipyridamole <LOQ <LOQ <LOQ 0,040 11 0,36
Metoprolol <LOQ <LOQ <LOQ 0,055 41 0,13
Nebivolol <LOQ <LOQ <LOQ 0,11 15 0,74
Citalopram+escitalopram (SUM) 0,061 4,6 1,3 0,013 4,9 0,27
Olanzepine 0,17 21 0,84 <LOQ <LOQ <LOQ
Oxazepam 0,0045 0,38 1,2 <LOQ <LOQ <LOQ
Sertraline 0,044 3,5 1,3 0,010 1,3 0,77
Venlafaxine 0,031 7,5 0,41 0,0058 7,9 0,07
Carprofen
veterinary
medicines 0,0022 <LOQ * 0,0031 0,52 0,60
Sum of APIs
(g/day)
Sum of APIs
(g/day)
% APIs from
hospital
Sum of APIs
(g/day)
Sum of APIs
(g/day)
% APIs from
hospital
82 11 941 0,69 6 2 686 0,21
Hospital
effluent
(m3/day)
Influent
WWTP
(m3/day)
% water flow
from
hospital
Hospital
effluent
(m3/day)
Influent
WWTP
(m3/day)
% water flow
from
hospital
84,6 9 902 0,85 75,2 10 297 0,73
other
cardiovascular
med.
psyco-
pharmaceuticals
antibiotics
antiepileptics
antihyper-tensives
hormones
metabolic disease
med.
NSAIDs and
analgesics
February 2018 June 2018
API Group of API
Wismar
hospital
(g/day)
Wismar
WWTP infl.
(g/day)
% from
Wismar
hospital
Wismar
hospital
(g/day)
Wismar
WWTP infl.
(g/day)
% from
Wismar
hospital

257
Ciprofloxacin <LOQ <LOQ <LOQ 1,1 <LOQ *
Clarithromycin 0,29 22 1,3 0,017 3,6 0,47
Erythromycin <LOQ <LOQ <LOQ 0,61 16 3,9
Fluconazole 0,27 1,9 14 0,15 0,62 24
Lincomycin 0,0054 <LOQ * 0,011 <LOQ *
Norfloxacin 1,1 528 0,21 <LOQ <LOQ <LOQ
Sulfamethoxazole 0,19 4,0 4,8 0,89 4,2 21
Tetracycline+doxycycline (SUM) 0,029 16 0,18 <LOQ <LOQ <LOQ
Trimethoprim 0,22 4,1 5,4 0,90 2,6 35
Carbamazepine 0,0032 <LOQ * 0,025 15 0,17
Gabapentin 8,6 108 8,0 3,7 93 4,0
Levetiracetam 0,07 29 0,24 <LOQ <LOQ <LOQ
Amlodipine <LOQ <LOQ <LOQ 0,034 <LOQ *
Hydrochlorothiazide 0,23 90 0,26 1,3 128 1,1
Ramipril 0,0041 <LOQ * 0,0058 <LOQ *
Telmisartan 0,026 <LOQ * 0,65 2,0 32
Caffeine caffeine 0,080 10,0 0,81 2,2 42 5,3
Estriol <LOQ <LOQ <LOQ 0,0046 0,87 0,53
Estrone (E1) 0,0045 12 0,039 0,0073 13 0,055
Norethisterone <LOQ <LOQ <LOQ 0,0085 1,0 0,86
Testosterone <LOQ <LOQ <LOQ 0,013 <LOQ *
Mesalazine
gastrointestinal
disease med. 0,51 172 0,29 1,2 <LOQ *
Allopurinol 1,8 <LOQ * <LOQ <LOQ <LOQ
Gemfibrozil <LOQ <LOQ <LOQ 0,11 <LOQ *
Metformin 10 658 1,6 14 1002 1,4
Codeine <LOQ <LOQ <LOQ 1,2 17 7,1
Diclofenac 0,80 174 0,46 0,27 30 0,90
Naproxen 0,52 53 1,0 4,5 76 5,9
Ibuprofen 0,23 92 0,25 <LOQ <LOQ <LOQ
Ketoprofen 0,36 8,1 4,5 0,37 12 3,1
Paracetamol 75 5745 1,3 <LOQ <LOQ <LOQ
Tramadol <LOQ <LOQ <LOQ 0,30 4,4 6,8
Bisoprolol 0,0031 <LOQ * 0,0043 0,62 0,70
Dipyridamole <LOQ <LOQ <LOQ 0,043 19 0,22
Metoprolol 0,17 22 0,74 0,22 20 1,1
Nebivolol <LOQ <LOQ <LOQ 0,12 17 0,72
Sotalol 0,010 4,9 0,21 0,072 2,3 3,1
Warfarin 0,0015 <LOQ * 0,0029 0,15 1,9
citalopram+escitalopram (SUM) 0,20 1,1 18 0,013 1,0 1,3
Olanzepine <LOQ <LOQ <LOQ 0,15 <LOQ *
Oxazepam <LOQ <LOQ <LOQ 0,020 0,78 2,5
Quetiapine <LOQ <LOQ <LOQ 0,27 <LOQ *
Sertraline 0,0087 <LOQ * 0,0091 0,53 1,7
Temazepam <LOQ <LOQ <LOQ 0,014 0,32 4,3
Venlafaxine 0,040 1,7 2,4 0,027 3,7 0,74
Sum of APIs
(g/day)
Sum of APIs
(g/day)
% APIs from
hospital
Sum of APIs
(g/day)
Sum of APIs
(g/day)
% APIs from
hospital
101 7 754 1,3 34 1 529 2,3
Hospital
effluent
(m3/day)
Influent
WWTP
(m3/day)
% water flow
from
hospital
Hospital
effluent
(m3/day)
Influent
WWTP
(m3/day)
% water flow
from
hospital
83 39 375 0,21 83 10 759 0,77
other
cardiovascular
med.
psyco-
pharmaceuticals
antibiotics
antiepileptics
antihyper-tensives
hormones
metabolic disease
med.
NSAIDs and
analgesics
December 2017 June 2018
API Group of API
Pärnu
hospital
(g/day)
Pärnu
WWTP infl.
(g/day)
% from
Pärnu
hospital
Pärnu
hospital
(g/day)
Pärnu
WWTP infl.
(g/day)
% from
Pärnu
hospital

258
Erythromycin 0,80 32 2,5 1,1 60 1,8
Tetracycline+doxycycline (SUM) 0,49 19 2,6 0,054 11 0,47
Hydrochlorothiazide 1,1 45 2,4 0,50 48 1,1
Losartan 0,82 91 0,90 0,31 97 0,32
Telmisartan 0,17 <LOQ * <LOQ <LOQ <LOQ
Valsartan <LOQ <LOQ <LOQ 0,15 18 0,84
Carbamazepine antiepileptics 1,3 13 10 0,12 15 0,79
Caffeine caffeine 6,6 67 9,9 5,7 144 3,9
Mesalazine
gastrointestinal
disease med. 0,38 <LOQ * 0,48 <LOQ *
Estriol 0,14 6,0 2,4 0,052 <LOQ *
Estrone (E1) <LOQ <LOQ <LOQ 1,8 456 0,39
Atenolol 0,13 <LOQ * 0,050 10 0,50
Metformin 36 981 3,7 31 2497 1,2
Codeine 0,45 27 1,7 0,47 30 1,6
Diclofenac 0,41 70 0,59 0,33 105 0,32
Oxycodone 0,20 <LOQ * 0,11 <LOQ *
Paracetamol 3,9 281 1,4 0,90 264 0,34
Tramadol 0,20 21 0,95 0,20 33 0,61
Bisoprolol 0,045 2,5 1,8 0,028 2,8 1,0
Warfarin <LOQ <LOQ <LOQ 0,0042 <LOQ <LOQ
Olanzepine 0,0068 0,40 1,7 0,0027 0,94 0,28
Oxazepam 0,47 8,8 5,3 0,72 17 4,2
Temazepam <LOQ <LOQ <LOQ 0,028 <LOQ *
Sum of APIs
(g/day)
Sum of APIs
(g/day)
% APIs from
hospital
Sum of APIs
(g/day)
Sum of APIs
(g/day)
% APIs from
hospital
54 1 665 3,2 44 3 809 1,1
Hospital
effluent
(m3/day)
Influent
WWTP
(m3/day)
% water flow
from
hospital
Hospital
effluent
(m3/day)
Influent
WWTP
(m3/day)
% water flow
from
hospital
577 40 043 1,4 195 38 650 0,50
psyco-
pharmaceuticals
antibiotics
antihyper-tensives
hormones
metabolic disease
med.
NSAIDs and
analgesics
other
cardiovascular
June 2018 June 2018
API Group of API
Linköping
hospital
(g/day)
Linköping
WWTP infl.
(g/day)
% from
Linköping
hospital
Norrköping
hospital
(g/day)
Norrköping
WWTP infl.
(g/day)
% from
Norrköping
hospital

259
Annex 13. APIs in wastewater effluents of a pharmaceutical manufacturer
Country
Latvia Latvia
Date (day/month/year)
7.12.2017 28.5.2018
API API group Unit
Allopurinol metabolic disease medications µg/L <0.12 4.8
Amlodipine antihypertensives µg/L <0.11 N/A
Atenolol other cardiovascular medicines µg/L <0.11 <0.11
Atorvastatin metabolic disease medications µg/L <10.4 <10.4
Bezafibrate metabolic disease medications µg/L <0.013 N/A
Bisoprolol other cardiovascular medicines µg/L <0.015 <0.015
Caffeine other µg/L <0.87 8.8
Candesartan antihypertensives µg/L <0.011 <0.011
Carbamazepine antiepileptics µg/L <0.008 <0.008
Carprofen veterinary medicines µg/L <0.007 <0.007
Cetirizine asthma and allergy medications µg/L <1.2 <1.2
Ciprofloxacin antibiotics µg/L <1.6 N/A
Citalopram psychopharmaceuticals µg/L 0.022 <0.001
Clarithromycin antibiotics µg/L <0.016 0.018
Codeine NSAIDs and analgesics µg/L <0.011 <0.011
Diclofenac NSAIDs and analgesics µg/L 0.042 0.022
Dipyridamole other cardiovascular medicines µg/L <0.087 <0.087
Emamectin veterinary medicines µg/L <0.011 <0.011
Enalapril antihypertensives µg/L <0.083 N/A
Eprosartan antihypertensives µg/L <0.005 N/A
Erythromycin antibiotics µg/L <0.009 <0.009
Esomeprazole gastrointestinal disease µg/L <8.4 <8.4
Estriol (E3) hormones µg/L <8.4 <8.4
Estrone (E1) hormones µg/L 0.031 5.5
Fenbendazole veterinary medicines µg/L <0.011 <0.011
Fexofenadine asthma and allergy medications µg/L <1.6 <1.6
Florfenicol veterinary medicines µg/L <0.032 N/A
Fluconazole antibiotics µg/L <0.01 <0.01
Fluticasone asthma and allergy medications µg/L <0.14 <0.14
Gabapentin antiepileptics µg/L <0.91 <0.91
Gemfibrozil metabolic disease medications µg/L <0.10 <0.10
Hydrochlorothiazide antihypertensives µg/L 6.9 1.2
Ibuprofen NSAIDs and analgesics µg/L <1.1 N/A
Irbesartan antihypertensives µg/L <0.07 <0.07
Ketoprofen NSAIDs and analgesics µg/L 0.86 N/A
Levetiracetam antiepileptics µg/L <0.11 N/A
Lincomycin antibiotics µg/L <0.01 <0.01
Losartan antihypertensives µg/L <0.25 <0.25
Mesalazine gastrointestinal disease µg/L <0.063 <0.063
Metformin metabolic disease medications µg/L <0.008 <0.008
Mometasone furotate asthma and allergy medications µg/L <0.027 <0.027
Naproxen NSAIDs and analgesics µg/L 0.069 N/A
Nebivolol other cardiovascular medicines µg/L <0.016 <0.016
Norethisterone hormones µg/L 0.018 <0.01
Norfloxacin antibiotics µg/L <12 <12
Ofloxacin antibiotics µg/L <0.21 N/A
Olanzepine psychopharmaceuticals µg/L 0.39 <0.001
Oxazepam psychopharmaceuticals µg/L <0.011 0.004
Oxycodone NSAIDs and analgesics µg/L <0.12 <0.12
Pantoprazole gastrointestinal disease µg/L <0.76 <0.76
Paracetamol NSAIDs and analgesics µg/L 4.5 16
Primidone antiepileptics µg/L <0.018 N/A
Progesterone hormones µg/L <0.012 <0.012
Quetiapine psychopharmaceuticals µg/L <0.12 <0.12
Ramipril antihypertensives µg/L <0.016 N/A
Risperidone psychopharmaceuticals µg/L <0.01 0.072

260
Sertraline psychopharmaceuticals µg/L <0.01 N/A
Simvastatin metabolic disease medications µg/L <0.002 <0.002
Sotalol other cardiovascular medicines µg/L <0.008 <0.008
Sulfadiazine antibiotics µg/L 0.58 <0.30
Sulfamethoxazole antibiotics µg/L <0.009 <0.009
Telmisartan antihypertensives µg/L 0.021 0.022
Temazepam psychopharmaceuticals µg/L <0.008 <0.008
Testosterone hormones µg/L 0.031 <0.018
Tetracycline+doxycycline antibiotics µg/L 0.20 <0.12
Tiamulin veterinary medicines µg/L <0.019 <0.019
Toltrazuril veterinary medicines µg/L <9.0 <9.0
Tramadol NSAIDs and analgesics µg/L <0.038 0.077
Trimethoprim antibiotics µg/L <0.011 N/A
Tylosin veterinary medicines µg/L <0.10 <0.10
Valsartan antihypertensives µg/L 0.59 <0.15
Venlafaxine psychopharmaceuticals µg/L 0.25 N/A
Warfarin other cardiovascular medicines µg/L 2.0 0.068
Xylometazoline asthma and allergy medications µg/L 0.028 <0.026
Number of analysed APIs
74 58
Number of APIs above LOQ
17 12 Detection rate (%)
23 21

261
Annex 14. APIs in surface water at fishfarms
Country Estonia Estonia Finland Finland Finland Finland Finland
Site
Roosna-Alliku
fish farm,
effluent
Roosna-Alliku
fish farm,
effluent
FI-14a
(surface)
FI-14a
(bottom)
FI-14b
(surface)
FI-14b
(bottom)
FI-14c
(surface)
Sampling date 6.12.2017 6.6.2018 21.8.2018 21.8.2018 21.8.2018 21.8.2018 21.8.2018
API API group Unit
Amlodipine antihypertensives ng/L <0.003 1,57 <0.003 1,79 1,57 1,37 1,49
Atenolol other cardiovascular medicines ng/L <8.00 <8.00 <8.00 <8.00 <8.00 <8.00 <8.00
Bezafibrate metabolic disease medications ng/L <0.40 <0.40 <0.40 <0.40 <0.40 <0.40 <0.40
Bisoprolol other cardiovascular medicines ng/L <0.21 <0.21 <0.21 <0.21 <0.21 <0.21 <0.21
Caffeine other ng/L 6,04 4,31 0,75 0,57 2,83 1,46 3,40
Candesartan antihypertensives ng/L <0.22 <0.22 <0.22 1,29 <0.22 <0.22 <0.22
Carbamazepine antiepileptics ng/L 0,63 1,15 2,52 2,34 0,82 0,91 0,80
Carprofen veterinary medicines ng/L <0.58 <0.58 <0.58 <0.58 <0.58 <0.58 <0.58
Cetirizine asthma and allergy medications ng/L 0,38 <0.03 0,17 0,24 <0.03 <0.03 <0.03
Ciprofloxacin antibiotics ng/L <34.8 <34.8 <34.8 <34.8 <34.8 <34.8 <34.8
Citalopram psycopharmaceuticals ng/L 0,06 <0.04 <0.04 0,05 <0.04 <0.04 <0.04
Clarithromycin antibiotics ng/L <0.33 <0.33 <0.33 <0.33 <0.33 <0.33 <0.33
Codeine NSAIDs and analgesics ng/L <0.01 <0.01 <0.01 0,04 <0.01 <0.01 <0.01
Diclofenac NSAIDs and analgesics ng/L 1,32 0,92 <0.34 <0.34 <0.34 <0.34 <0.34
Dipyridamole other cardiovascular medicines ng/L <0.67 <0.67 <0.67 0,67 <0.67 <0.67 <0.67
Emamectin veterinary medicines ng/L 0,08 0,53 0,30 0,29 0,59 <0.02 0,61
Erythromycin antibiotics ng/L <0.92 <0.92 <0.92 <0.92 <0.92 <0.92 <0.92
Estrone (E1) hormones ng/L 1,10 9,82 <0.17 <0.17 1,49 2,07 1,08
Fenbendazole veterinary medicines ng/L <0.03 <0.03 0,16 0,29 <0.03 <0.03 <0.03
Fluconazole antibiotics ng/L <0.25 <0.25 0,25 <0.25 <0.25 <0.25 <0.25
Fluticasone asthma and allergy medications ng/L <0.002 <0.002 0,10 0,14 <0.002 <0.002 <0.002
Gemfibrozil metabolic disease medications ng/L 0,58 <0.02 2,62 2,74 6,62 8,55 <0.02
Irbesartan antihypertensives ng/L 0,07 <0.02 0,04 0,14 <0.02 <0.02 <0.02
Ketoprofen NSAIDs and analgesics ng/L <0.38 <0.38 <0.38 <0.38 <0.38 <0.38 <0.39
Levetiracetam antiepileptics ng/L <5.43 <5.43 <5.43 <5.43 <5.43 <5.43 <5.43
Lincomycin antibiotics ng/L <0.04 <0.04 <0.04 <0.04 <0.04 <0.04 <0.04
Losartan antihypertensives ng/L 0,02 <0.02 0,13 0,16 0,17 0,19 0,18
Mesalazine gastrointestinal disease medications ng/L 59,76 71,40 <0.82 <0.82 35,80 32,72 28,57
Metformin metabolic disease medications ng/L 1,98 N/A <0.12 <0.12 <0.12 <0.12 <0.12
Metoprolol other cardiovascular medicines ng/L <0.35 <0.36 <0.35 <0.35 <0.35 <0.35 <0.35
Mometasone asthma and allergy medications ng/L <0.29 <0.29 <0.29 <0.29 <0.29 <0.29 <0.29
Naproxen NSAIDs and analgesics ng/L <0.47 0,14 <0.47 <0.47 <0.47 <0.47 <0.47
Nebivolol other cardiovascular medicines ng/L 0,22 1,52 0,18 0,83 1,71 0,75 1,40
Norethisterone hormones ng/L 8,12 <0.04 <0.04 0,33 0,39 <0.04 <0.04
Ofloxacin antibiotics ng/L <4.16 <4.16 <4.16 <4.16 <4.16 <4.16 <4.16
Oxazepam psycopharmaceuticals ng/L 0,19 <0.03 <0.03 0,68 <0.03 <0.03 <0.03
Oxycodone NSAIDs and analgesics ng/L 0,04 <0.03 <0.03 0,24 <0.03 <0.03 <0.03
Primidone antiepileptics ng/L 1,17 <0.71 <0.71 <0.71 0,32 0,29 0,26
Progesterone hormones ng/L 0,04 <0.03 <0.03 0,17 <0.03 <0.03 <0.03
Quetiapine psycopharmaceuticals ng/L <0.01 <0.01 0,08 0,12 <0.01 <0.01 <0.01
Sertraline psycopharmaceuticals ng/L <0.03 <0.03 0,21 2,83 <0.03 <0.03 <0.03
Simvastatin metabolic disease medications ng/L <0.02 <0.02 <0.02 <0.02 <0.02 <0.02 <0.02
Sotalol other cardiovascular medicines ng/L <0.68 <0.68 <0.68 <0.68 <0.68 <0.68 <0.68
Temazepam psycopharmaceuticals ng/L <0.34 <0.34 0,57 0,72 <0.34 <0.34 <0.34
Testosterone hormones ng/L 0,13 3,48 <0.05 <0.05 <0.05 <0.05 <0.05
Tetracycline/Doxycycline antibiotics ng/L 4,95 <3.17 <3.17 3,67 5,58 3,26 5,45
Tiamulin veterinary medicines ng/L <0.01 <0.01 0,13 0,30 0,19 <0.01 0,15
Toltrazuril veterinary medicines ng/L <3.60 <3.60 <3.60 <3.60 <3.60 <3.60 <3.60
Tramadol NSAIDs and analgesics ng/L 0,16 <0.02 0,40 0,46 <0.02 <0.02 <0.02
Trimethoprim antibiotics ng/L <0.17 <0.17 1,97 2,07 1,42 1,69 1,54
Tylosin veterinary medicines ng/L <1.91 <1.91 <1.91 <1.91 <1.91 <1.91 <1.91
Warfarin other cardiovascular medicines ng/L <0.58 <0.58 <0.58 <0.58 <0.58 <0.58 <0.58
Venlafaxine psycopharmaceuticals ng/L 0,10 <0.03 <0.35 <0.35 <0.03 <0.03 <0.03
Xylometazoline asthma and allergy medications ng/L <0.19 <0.19 <0.19 <0.19 <0.19 <0.19 <0.19
Number of analysed API 54 54 54 54 54 54 54
Number of APIs above LOQ 22 10 17 26 14 11 12
Detection rate (%) 41 19 31 48 26 20 22
Sum concentration (ng/l) 87,14 94,84 10,58 23,18 59,49 53,26 44,93

262
Country Finland Finland Finland Finland Finland Finland Finland
Site
FI-14c
(bottom)
FI-14a
(surface)
FI-14a
(bottom)
FI-14b
(surface)
FI-14b
(bottom)
FI-14c
(surface)
FI-14c
(bottom)
Sampling date 21.8.2018 18.9.2018 18.9.2018 18.9.2018 18.9.2018 18.9.2018 18.9.2018
API API group Unit
Amlodipine antihypertensives ng/L <0.003 <0.003 <0.003 <0.003 <0.003 <0.003 <0.003
Atenolol other cardiovascular medicines ng/L <8.00 <8.00 <8.00 <8.00 <8.00 <8.00 <8.00
Bezafibrate metabolic disease medications ng/L <0.40 <0.40 <0.40 <0.40 <0.40 <0.40 <0.40
Bisoprolol other cardiovascular medicines ng/L <0.21 <0.21 <0.21 <0.21 <0.21 <0.21 <0.21
Caffeine other ng/L 0,57 0,53 0,44 0,58 0,62 1,87 0,76
Candesartan antihypertensives ng/L <0.22 <0.22 <0.22 <0.22 <0.22 <0.22 <0.22
Carbamazepine antiepileptics ng/L 2,19 1,72 1,78 1,90 1,67 2,11 1,82
Carprofen veterinary medicines ng/L <0.58 <0.58 <0.58 <0.58 <0.58 <0.58 <0.58
Cetirizine asthma and allergy medications ng/L 0,19 0,15 0,14 0,14 0,11 0,16 0,15
Ciprofloxacin antibiotics ng/L <34.8 <34.8 <34.8 <34.8 <34.8 <34.8 <34.8
Citalopram psycopharmaceuticals ng/L 0,04 <0.04 <0.04 <0.04 <0.04 <0.04 <0.04
Clarithromycin antibiotics ng/L <0.33 <0.33 <0.33 <0.33 <0.33 <0.33 <0.33
Codeine NSAIDs and analgesics ng/L <0.01 <0.01 0,09 0,06 0,07 <0.01 <0.01
Diclofenac NSAIDs and analgesics ng/L <0.34 <0.34 <0.34 <0.34 <0.34 <0.34 <0.34
Dipyridamole other cardiovascular medicines ng/L <0.67 <0.67 <0.67 <0.67 <0.67 <0.67 <0.67
Emamectin veterinary medicines ng/L 0,32 0,17 0,17 0,15 0,14 0,19 0,16
Erythromycin antibiotics ng/L <0.92 <0.92 <0.92 <0.92 <0.92 <0.92 <0.92
Estrone (E1) hormones ng/L <0.17 <0.17 <0.17 <0.17 <0.17 <0.17 <0.17
Fenbendazole veterinary medicines ng/L 0,13 0,08 <0.03 <0.03 <0.03 <0.03 <0.03
Fluconazole antibiotics ng/L <0.25 <0.25 <0.25 <0.25 <0.25 <0.25 <0.25
Fluticasone asthma and allergy medications ng/L 0,08 0,09 <0.002 <0.002 <0.002 <0.002 <0.002
Gemfibrozil metabolic disease medications ng/L 3,94 3,37 3,02 2,52 3,84 <0.02 3,35
Irbesartan antihypertensives ng/L <0.02 0,02 0,02 <0.02 <0.02 0,03 0,01
Ketoprofen NSAIDs and analgesics ng/L <0.38 <0.38 <0.38 <0.38 <0.38 <0.38 <0.38
Levetiracetam antiepileptics ng/L <5.43 <5.43 <5.43 <5.43 <5.43 <5.43 <5.43
Lincomycin antibiotics ng/L <0.04 <0.04 <0.04 <0.04 <0.04 <0.04 <0.04
Losartan antihypertensives ng/L 0,11 0,10 <0.02 <0.02 <0.02 0,07 0,08
Mesalazine gastrointestinal disease medications ng/L <0.82 <0.82 <0.82 <0.82 <0.82 <0.82 <0.82
Metformin metabolic disease medications ng/L <0.12 <0.12 <0.12 <0.12 <0.12 <0.12 <0.12
Metoprolol other cardiovascular medicines ng/L <0.35 <0.35 <0.35 <0.35 <0.35 <0.35 <0.35
Mometasone asthma and allergy medications ng/L <0.29 <0.29 <0.29 <0.29 0,66 <0.29 <0.29
Naproxen NSAIDs and analgesics ng/L <0.47 <0.47 <0.47 <0.47 <0.47 <0.47 <0.47
Nebivolol other cardiovascular medicines ng/L 0,19 0,06 0,07 0,09 0,06 0,09 <0.01
Norethisterone hormones ng/L <0.04 <0.04 <0.04 <0.04 <0.04 <0.04 <0.04
Ofloxacin antibiotics ng/L <4.16 <4.16 <4.16 <4.16 <4.16 <4.16 <4.16
Oxazepam psycopharmaceuticals ng/L 0,54 <0.03 <0.03 <0.03 0,23 <0.03 <0.03
Oxycodone NSAIDs and analgesics ng/L 0,08 <0.03 <0.03 0,11 <0.03 <0.03 <0.03
Primidone antiepileptics ng/L <0.71 <0.71 <0.71 <0.71 <0.71 <0.71 <0.71
Progesterone hormones ng/L <0.03 <0.03 <0.03 <0.03 <0.03 <0.03 <0.03
Quetiapine psycopharmaceuticals ng/L 0,10 0,06 0,06 0,06 0,05 0,09 0,05
Sertraline psycopharmaceuticals ng/L 0,17 <0.03 <0.03 <0.03 <0.03 <0.03 <0.03
Simvastatin metabolic disease medications ng/L <0.02 <0.02 <0.02 <0.02 <0.02 <0.02 <0.02
Sotalol other cardiovascular medicines ng/L <0.68 <0.68 <0.68 <0.68 <0.68 <0.68 <0.68
Temazepam psycopharmaceuticals ng/L 0,51 <0.34 0,48 <0.34 <0.34 <0.34 <0.34
Testosterone hormones ng/L <0.05 <0.05 <0.05 <0.05 <0.05 <0.05 <0.05
Tetracycline/Doxycycline antibiotics ng/L <3.17 <3.17 <3.17 <3.17 <3.17 <3.17 <3.17
Tiamulin veterinary medicines ng/L 0,13 0,07 0,05 0,07 <0.01 <0.01 0,06
Toltrazuril veterinary medicines ng/L <3.60 <3.60 <3.60 <3.60 <3.60 <3.60 <3.60
Tramadol NSAIDs and analgesics ng/L 0,39 0,31 0,28 0,30 0,29 0,31 0,28
Trimethoprim antibiotics ng/L 3,73 0,30 0,26 0,26 0,24 0,31 0,27
Tylosin veterinary medicines ng/L <1.91 <1.91 <1.91 <1.91 <1.91 <1.91 <1.91
Warfarin other cardiovascular medicines ng/L <0.58 <0.58 <0.58 <0.58 <0.58 <0.58 <0.58
Venlafaxine psycopharmaceuticals ng/L <0.35 <0.35 <0.35 <0.35 <0.35 <0.35 <0.35
Xylometazoline asthma and allergy medications ng/L <0.19 <0.19 <0.19 <0.19 <0.19 <0.19 <0.19
Number of analysed API 54 54 54 54 54 54 54
Number of APIs above LOQ 18 14 13 12 12 10 11
Detection rate (%) 33 26 24 22 22 19 20
Sum concentration (ng/l) 13,40 7,04 6,88 6,23 7,98 5,23 7,00

263
Annex 15. APIs in sediments at fishfarms
Country Estonia Finland Finland Finland
Site
Roosna-Alliku
fish farmFI-9a FI-9b FI-9c
Sampling date 6.12.2017 17.9.2018 17.9.2018 17.9.2019
Dry matter content % 68,6 34,6 67,7 18,3
API API group Unit
Atenolol other cardiovascular medicines µg/kg d.w. <0.050 <0.050 <0.050 <0.050
Amlodipine antihypertensives µg/kg d.w. <0.062 <0.062 <0.062 <0.062
Bezafibrate metabolic disease medications µg/kg d.w. <0.076 <0.076 0,14 <0.076
Bisoprolol other cardiovascular medicines µg/kg d.w. 0,07 <0.011 0,02 <0.011
Caffeine other µg/kg d.w. 2,95 40,90 <0.46 1,97
Carbamazepine antiepileptics µg/kg d.w. 0,18 0,39 <0.099 0,72
Cetirizine asthma and allergy medications µg/kg d.w. 0,06 <0.014 0,03 0,05
Ciprofloxacin antibiotics µg/kg d.w. 7,86 4,79 <1.93 7,46
Citalopram psycopharmaceuticals µg/kg d.w. <0.093 0,39 <0.093 0,45
Clarithromycin antibiotics µg/kg d.w. <0.085 <0.085 <0.085 <0.085
Codeine NSAIDs and analgesics µg/kg d.w. <0.77 <0.77 <0.77 <0.77
Diclofenac NSAIDs and analgesics µg/kg d.w. <0.10 <0.10 <0.10 <0.10
Dipyridamole other cardiovascular medicines µg/kg d.w. <0.22 <0.22 <0.22 1,32
Emamectin veterinary medicines µg/kg d.w. 0,34 <0.24 <0.24 <0.24
Enalapril antihypertensives µg/kg d.w. 0,08 <0.047 <0.047 <0.047
Eprosartan antihypertensives µg/kg d.w. <0.047 <0.047 <0.047 <0.047
Erythromycin antibiotics µg/kg d.w. <16 <16 <16 <16
Estriol (E3) hormones µg/kg d.w. <1.1 <1.1 <1.1 <1.1
Estrone (E1) hormones µg/kg d.w. <0.51 9,60 <0.51 1,28
Fenbendazole veterinary medicines µg/kg d.w. 0,04 1,02 0,44 2,64
Fexofenadine asthma and allergy medications µg/kg d.w. 0,07 0,07 0,06 0,11
Florfenicol veterinary medicines µg/kg d.w. 0,13 <0.010 <0.010 <0.010
Fluconazole antibiotics µg/kg d.w. <0.0041 <0.0041 <0.0041 0,10
Fluticasone asthma and allergy medications µg/kg d.w. <0.60 <0.60 <0.60 <0.60
Gemfibrozil metabolic disease medications µg/kg d.w. <0.18 <0.18 <0.18 <0.18
Hydrochlorothiazide antihypertensives µg/kg d.w. <10 113,30 17,08 38,26
Irbesartan antihypertensives µg/kg d.w. 0,03 <0.013 N/A <0.013
Ivermectin veterinary medicines µg/kg d.w. <6.2 <6.2 <6.2 <6.2
Ketoprofen NSAIDs and analgesics µg/kg d.w. 0,09 0,38 0,25 <0.059
Levetiracetam antiepileptics µg/kg d.w. <0.47 <0.47 <0.47 <0.47
Lincomycin antibiotics µg/kg d.w. 0,07 0,02 <0.0058 <0.0058
Metformin metabolic disease medications µg/kg d.w. 37,73 2,99 3,00 11,35
Metoprolol other cardiovascular medicines µg/kg d.w. <0.050 <0.050 <0.050 0,26
Mometasone asthma and allergy medications µg/kg d.w. <0.75 <0.75 <0.75 <0.75
Naproxen NSAIDs and analgesics µg/kg d.w. <0.52 0,83 <0.52 <0.52
Nebivolol other cardiovascular medicines µg/kg d.w. 0,10 0,38 <0.099 <0.099
Norethisterone hormones µg/kg d.w. <0.12 N/A <0.12 <0.12
Norfloxacin antibiotics µg/kg d.w. <1.5 <1.5 12,74 <1.5
Ofloxacin antibiotics µg/kg d.w. <0.60 2,38 <0.60 <0.60
Olanzepine psycopharmaceuticals µg/kg d.w. <1.1 <1.1 <1.1 <1.1
Oxazepam psycopharmaceuticals µg/kg d.w. 0,23 <0.0080 0,03 0,04
Oxycodone NSAIDs and analgesics µg/kg d.w. 0,08 0,36 <0.065 0,20
Paracetamol NSAIDs and analgesics µg/kg d.w. 17,48 <0.25 17,41 517,89
Primidone antiepileptics µg/kg d.w. <0.057 <0.057 <0.057 <0.057
Progesterone hormones µg/kg d.w. 0,67 0,82 0,34 1,44
Quetiapine psycopharmaceuticals µg/kg d.w. 0,07 <0.0084 <0.0084 <0.0084
Ramipril antihypertensives µg/kg d.w. <0.052 <0.052 <0.052 <0.052
Risperidone psycopharmaceuticals µg/kg d.w. 0,46 0,43 0,24 0,34
Sertraline psycopharmaceuticals µg/kg d.w. <0.038 0,06 <0.038 0,11
Simvastatin metabolic disease medications µg/kg d.w. <0.11 <0.11 <0.11 <0.11
Sotalol other cardiovascular medicines µg/kg d.w. <0.11 <0.11 <0.11 <0.11
Sulfamethoxazole antibiotics µg/kg d.w. <0.12 <0.12 <0.12 <0.12
Telmisartan antihypertensives µg/kg d.w. 0,36 1,57 N/A 3,29
Temazepam psycopharmaceuticals µg/kg d.w. <0.087 <0.087 <0.087 <0.087
Testosterone hormones µg/kg d.w. 0,31 <0.20 <0.20 <0.20
Tetracycline/Doxycycline antibiotics µg/kg d.w. 2,65 <1.6 <1.6 3,96
Tiamulin veterinary medicines µg/kg d.w. <0.044 <0.044 <0.044 <0.044
Toltrazuril veterinary medicines µg/kg d.w. <4.6 <4.6 <4.6 <4.6
Tramadol NSAIDs and analgesics µg/kg d.w. 1,16 2,08 0,37 1,24
Trimethoprim antibiotics µg/kg d.w. 0,12 0,18 <0.050 0,08
Tylosin veterinary medicines µg/kg d.w. <3.2 <3.2 <3.2 <3.2
Valsartan antihypertensives µg/kg d.w. 0,17 <0.092 0,15 <0.092
Warfarin other cardiovascular medicines µg/kg d.w. <0.0059 <0.0059 <0.0059 0,027
Venlafaxine psycopharmaceuticals µg/kg d.w. 0,05 <0.044 <0.044 0,13
Xylometazoline asthma and allergy medications µg/kg d.w. <0.046 88,53 <0.046 <0.046
Number of analysed API 65 65 65 65
Number of APIs above LOQ 28 22 15 25
Detection rate (%) 43 34 23 38
Sum concentration (µg/kg d.w.) 73,6 271,5 52,3 594,7

264
Annex 16. API concentrations near pig and poultry farms
Country Latvia Latvia Latvia Latvia
Sample Pig farm Pg Poultry farm Py Pig farm Pg Poultry farm Py
Sampling date 29.11.2017. 28.11.2017. 22.05.2018. 25.05.2018.
API name API's group Unit
Amlodipine Antihypertensives ng/l <7.7 <7.7 <7.7 <7.7
Atenolol Other cardiovascular medicines ng/l <12 <12 <12 <12
Atorvastatin Metabolic disease medications ng/l <15 <15 <15 <15
Bezafibrate Metabolic disease medications ng/l <0.83 <0.83 <0.83 <0.83
Bisoprolol Other cardiovascular medicines ng/l <0.52 <0.52 <0.52 <0.52
Caffeine Other ng/l 140 94 590 2.2
Candesartan Antihypertensives ng/l <0.68 <0.68 <0.68 <0.68
Carbamazepine Antiepileptics ng/l 0.020 0.16 <0.005 1.1
Carprofen Veterinary medicines ng/l <0.77 2.2 0.86 <0.77
Cetirizine Asthma and allergy medications ng/l 0.13 0.15 <0.11 <0.11
Citalopram Psycopharmaceuticals ng/l 0.17 0.18 <0.060 <0.060
Clarithromycin Antibiotics ng/l 1.6 1.6 <1.0 0.45
Codeine NSAIDs and analgesics ng/l N/A N/A <0.070 <0.070
Diclofenac NSAIDs and analgesics ng/l 0.89 4.9 4.9 7.7
Dipyridamole Other cardiovascular medicines ng/l <1.1 <1.1 <1.1 <1.1
Emamectin Veterinary medicines ng/l 0.15 0.14 <0.090 <0.090
Enalapril Antihypertensives ng/l <2.8 <2.8 <2.8 <2.8
Eprosartan Antihypertensives ng/l <0.22 <0.22 <0.22 <0.22
Estrone (E1) Hormones ng/l <0.70 <0.70 <0.70 1.3
Fenbendazole Veterinary medicines ng/l 0.12 <0.070 <0.070 <0.070
Fexofenadien Asthma and allergy medications ng/l 3.0 <0.090 3.2 <0.090
Fluconazole Antibiotics ng/l <0.050 <0.050 <0.050 <0.050
Fluticasone Asthma and allergy medications ng/l <0.060 <0.060 <0.060 <0.060
Gabapentin Antiepileptics ng/l 7.3 25 <0.88 40
Gemfibrozil Metabolic disease medications ng/l <1.5 3.2 <1.5 <1.5
Irbesartan Antihypertensives ng/l <0.060 <0.060 <0.060 <0.060
Ketoprofen NSAIDs and analgesics ng/l <0.72 5.1 <0.72 <0.72
Levetiracetam Antiepileptics ng/l <3.5 <3.5 <3.5 <3.5
Lincomycin Antibiotics ng/l <0.10 <0.10 <0.10 <0.10
Losartan Antihypertensives ng/l <0.14 0.27 <0.14 <0.14
Metformin Metabolic disease medications ng/l 5.6 15 <0.24 191
Metoprolol Other cardiovascular medicines ng/l 0.66 0.24 5.0 0.42
Mometasone furoate Asthma and allergy medications ng/l <1.3 <1.3 <1.3 <1.3
Naproxen NSAIDs and analgesics ng/l <0.57 <0.57 <0.57 26
Nebivolol Other cardiovascular medicines ng/l 0.37 0.38 <0.052 <0.052
Norethisterone Hormones ng/l <0.080 <0.080 <0.080 <0.080
Ofloxacin Antibiotics ng/l <10 <10 <10 <10
Oxazepam Psycopharmaceuticals ng/l N/A N/A <0.033 <0.033
Oxycodone NSAIDs and analgesics ng/l N/A N/A <0.042 <0.042
Primidone Antiepileptics ng/l <1.4 <1.4 <1.4 <1.4
Progesterone Hormones ng/l 0.25 0.16 <0.086 <0.086
Quetiapine Psycopharmaceuticals ng/l <0.15 <0.15 <0.15 <0.15
Ramipril Antihypertensives ng/l <0.72 <0.72 <0.72 <0.72
Sertraline Psycopharmaceuticals ng/l <0.040 <0.040 <0.040 <0.040
Sotalol Other cardiovascular medicines ng/l <0.89 <0.89 <0.89 <0.89
Sulfadiazine Antibiotics ng/l <17 <17 <17 <17
Telmisartan Antihypertensives ng/l <1.4 <1.4 <1.4 <1.4
Temazepam Psycopharmaceuticals ng/l N/A N/A <0.36 <0.36
Testosterone Hormones ng/l <0.080 <0.080 <0.080 <0.080
Tetracycline/Doxycycline Antibiotics ng/l <5.7 <5.7 <5.7 <5.7
Tiamulin Veterinary medicines ng/l 18 1.3 7.3 1.7
Toltrazuril Veterinary medicines ng/l 10 <4.8 7.6 <4.8
Tramadol NSAIDs and analgesics ng/l 0.040 0.070 <0.038 <0.038
Trimethoprim Antibiotics ng/l <0.37 <0.37 <0.37 <0.37
Tylosin Veterinary medicines ng/l 23 20 <3.7 <3.7
Valsartan Antihypertensives ng/l <6.4 <6.4 <6.4 <6.4
Warfarin Other cardiovascular medicines ng/l <0.87 <0.87 <0.87 <0.87
Venlafaxine Psycopharmaceuticals ng/l 0.030 0.040 <0.030 0.47
Xylometazoline Asthma and allergy medications ng/l 1.6 1.7 <0.054 <0.054
Number of analysed API 55 55 59 59
Number of APIs above LOQ 20 20 7 11
Detection rate (%) 36 36 12 19
Sum concentration (ng/L) 212.6 176.9 618.9 272.6

265
Annex 17. API concentrations in soil
Country Germany Latvia
Date (DD.MM.YYYY) 17/10/2018 17/10/2018 24/05/2018 12/06/2018 6.2018 6.2018
Name in diagram *EST 1 ^EST 2 *DE 1 *LV 1 *SWE 1 ^SWE 2
Dry matter content % 78 80 94 84 93 96
API Group of API Unit
Amlodipine Antihypertensives µg/kg d.w. <0.062 <0.062 <0.062 <0.062 <0.062 <0.062
Atenolol Other cardiovascular medicines µg/kg d.w. <0.050 <0.050 <0.050 <0.050 <0.050 <0.050
Bezafibrate Metabolic disease medications µg/kg d.w. <0.076 0.18 <0.076 0.17 0.16 0.18
Bisoprolol Other cardiovascular medicines µg/kg d.w. <0.011 0.012 <0.011 0.049 0.012 0.012
Caffeine Other µg/kg d.w. 0.46 <0.46 1.0 1.1 1.3 <0.46
Carbamazepine Antiepileptics µg/kg d.w. <0.099 <0.099 <0.099 <0.099 <0.099 <0.099
Cetirizine Asthma and allergy medications µg/kg d.w. <0.014 0.018 <0.014 0.10 0.017 0.041
Ciprofloxacin Antibiotics µg/kg d.w. <1.9 <1.9 4.7 <1.9 <1.9 <1.9
Citalopram Psycopharmaceuticals µg/kg d.w. <0.093 <0.093 <0.093 0.19 <0.093 <0.093
Clarithromycin Antibiotics µg/kg d.w. <0.085 <0.085 <0.085 <0.085 <0.085 <0.085
Codeine NSAIDs and analgesics µg/kg d.w. <0.77 <0.77 <0.77 <0.77 <0.77 <0.77
Diclofenac NSAIDs and analgesics µg/kg d.w. <0.10 0.43 <0.10 <0.10 <0.10 <0.10
Dipyridamole Other cardiovascular medicines µg/kg d.w. <0.22 <0.22 <0.22 <0.22 <0.22 <0.22
Emamectin Veterinary medicines µg/kg d.w. <0.24 <0.24 <0.24 <0.24 <0.24 <0.24
Enalapril Antihypertensives µg/kg d.w. <0.047 <0.047 <0.047 <0.047 <0.047 <0.047
Eprosartan Antihypertensives µg/kg d.w. <0.047 <0.047 <0.047 <0.047 <0.047 <0.047
Erythromycin Antibiotics µg/kg d.w. <16 <16 <16 <16 <16 <16
Estriol (E3) Hormones µg/kg d.w. <1.1 <1.1 <1.1 <1.1 <1.1 <1.1
Estrone (E1) Hormones µg/kg d.w. <0.51 <0.51 16 <0.51 <0.51 <0.51
Fenbendazole Veterinary medicines µg/kg d.w. 1.0 0.51 0.46 1.7 0.40 0.41
Fexofenadine Asthma and allergy medications µg/kg d.w. <0.017 0.065 0.018 0.18 0.021 0.045
Florfenicol Veterinary medicines µg/kg d.w. 0.063 0.028 <0.010 0.19 <0.010 <0.010
Fluconazole Antibiotics µg/kg d.w. <0.004 <0.004 0.007 <0.004 <0.004 <0.004
Fluticasone Asthma and allergy medications µg/kg d.w. <0.60 <0.60 <0.60 <0.60 <0.60 <0.60
Gemfibrozil Metabolic disease medications µg/kg d.w. <0.18 <0.18 <0.18 <0.18 <0.18 <0.18
Hydrochlorothiazide Antihypertensives µg/kg d.w. <10 17 32 110 <10 15
Irbesartan Antihypertensives µg/kg d.w. N/A N/A N/A N/A N/A N/A
Ivermectin Veterinary medicines µg/kg d.w. <6.2 <6.2 <6.2 <6.2 <6.2 11
Ketoprofen NSAIDs and analgesics µg/kg d.w. 0.97 0.40 0.69 <0.059 0.50 0.39
Levetiracetam Antiepileptics µg/kg d.w. <0.47 <0.47 <0.47 <0.47 <0.47 <0.47
Lincomycin Antibiotics µg/kg d.w. <0.006 <0.006 <0.006 <0.006 <0.006 <0.006
Metformin Metabolic disease medications µg/kg d.w. <0.004 0.53 3.1 0.47 1.5 0.47
Metoprolol Other cardiovascular medicines µg/kg d.w. 0.094 <0.050 <0.050 0.14 0.16 <0.050
Mometasone furoate Asthma and allergy medications µg/kg d.w. <0.75 <0.75 <0.75 <0.75 <0.75 <0.75
Naproxen NSAIDs and analgesics µg/kg d.w. <0.52 <0.52 <0.52 <0.52 <0.52 <0.52
Nebivolol Other cardiovascular medicines µg/kg d.w. <0.099 0.14 0.11 0.41 <0.099 0.11
Norethisterone Hormones µg/kg d.w. N/A <0.12 N/A <0.12 <0.12 <0.12
Norfloxacin Antibiotics µg/kg d.w. <1.5 15 <1.5 18 14 16
Ofloxacin Antibiotics µg/kg d.w. <0.60 <0.60 0.91 <0.60 <0.60 <0.60
Olanzepine Psycopharmaceuticals µg/kg d.w. <1.1 <1.1 <1.1 <1.1 <1.1 <1.1
Oxazepam Psycopharmaceuticals µg/kg d.w. 0.045 <0.008 0.065 0.42 <0.008 0.024
Oxycodone NSAIDs and analgesics µg/kg d.w. 0.26 0.066 0.067 0.45 <0.065 <0.065
Paracetamol NSAIDs and analgesics µg/kg d.w. 6.6 4.5 1.4 27 2.4 2.3
Primidone Antiepileptics µg/kg d.w. <0.057 <0.057 <0.057 <0.057 <0.057 <0.057
Progesterone Hormones µg/kg d.w. 0.30 <0.092 <0.092 0.22 <0.092 <0.092
Quetiapine Psycopharmaceuticals µg/kg d.w. <0.008 <0.008 <0.008 <0.008 <0.008 <0.008
Ramipril Antihypertensives µg/kg d.w. <0.052 <0.052 <0.052 <0.052 <0.052 <0.052
Risperidone Psycopharmaceuticals µg/kg d.w. 0.079 0.18 0.21 0.40 0.088 0.096
Sertraline Psycopharmaceuticals µg/kg d.w. 0.044 0.10 <0.038 <0.038 <0.038 0.044
Simvastatin Metabolic disease medications µg/kg d.w. <0.11 <0.11 <0.11 <0.11 <0.11 <0.11
Sotalol Other cardiovascular medicines µg/kg d.w. <0.11 <0.11 <0.11 <0.11 <0.11 <0.11
Sulfamethoxazole Antibiotics µg/kg d.w. <0.12 <0.12 <0.12 <0.12 <0.12 <0.12
Telmisartan Antihypertensives µg/kg d.w. 0.65 N/A 0.28 N/A N/A N/A
Temazepam Psycopharmaceuticals µg/kg d.w. <0.087 <0.087 <0.087 0.36 0.14 0.13
Testosterone Hormones µg/kg d.w. <0.20 <0.20 <0.20 <0.20 <0.20 <0.20
Tetracycline/DoxycyclineAntibiotics µg/kg d.w. <1.6 <1.6 <1.6 <1.6 <1.6 <1.6
Tiamulin Veterinary medicines µg/kg d.w. <0.044 <0.044 <0.044 4.9 <0.044 <0.044
Toltrazuril Veterinary medicines µg/kg d.w. <4.6 <4.6 <4.6 <4.6 <4.6 <4.6
Tramadol NSAIDs and analgesics µg/kg d.w. 0.92 0.34 0.80 1.5 0.31 0.34
Trimethoprim Antibiotics µg/kg d.w. 0.15 0.074 0.060 0.25 0.059 0.059
Tylosin Veterinary medicines µg/kg d.w. <3.2 <3.2 <3.2 <3.2 <3.2 <3.2
Valsartan Antihypertensives µg/kg d.w. <0.092 <0.092 <0.092 0.21 0.17 <0.092
Venlafaxine Psycopharmaceuticals µg/kg d.w. 0.093 <0.044 0.080 0.20 <0.044 0.12
Warfarin Other cardiovascular medicines µg/kg d.w. 0.018 <0.006 <0.006 0.048 <0.006 <0.006
Xylometazoline Asthma and allergy medications µg/kg d.w. 2.3 <0.046 7.2 <0.046 <0.046 <0.046
Number of analysed API 63 63 63 63 63 63
Number of APIs above LOQ 17 18 20 24 16 19
Detection rate (%) 27 29 32 38 25 30
Sum concentration (µg/kg d.w.) 13.6 38.9 68.1 167.4 20.1 47.1
Estonia Sweden
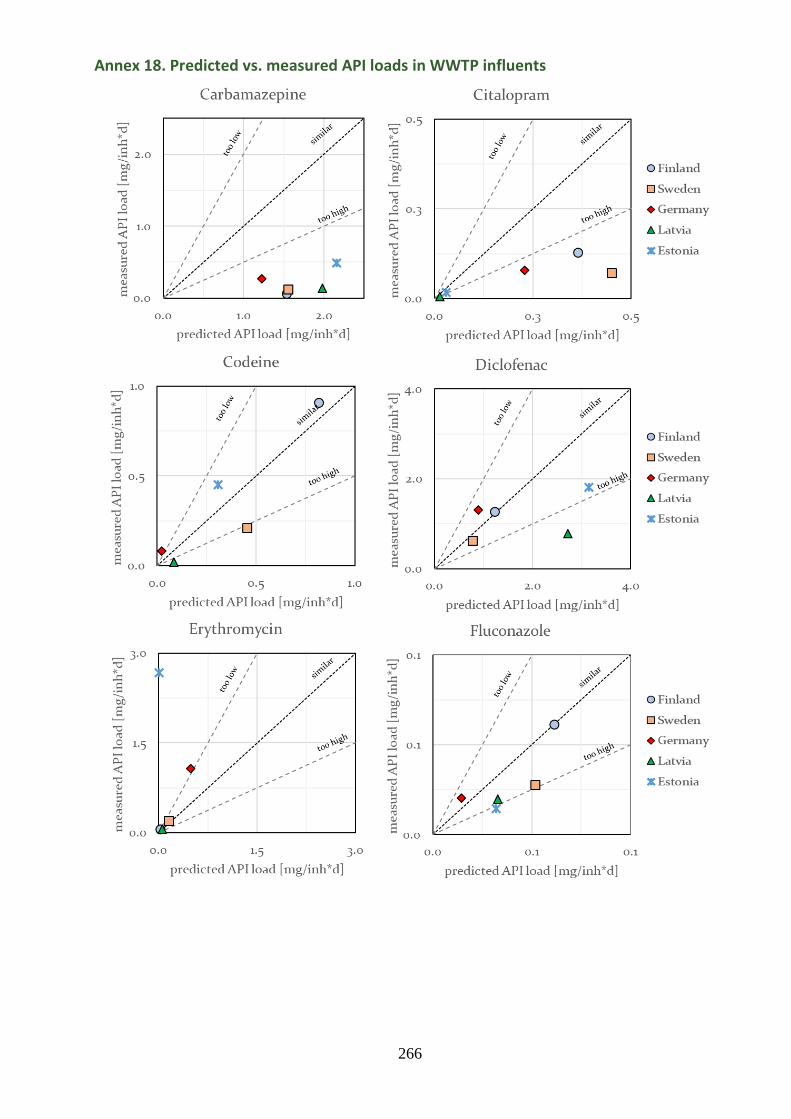
266
Annex 18. Predicted vs. measured API loads in WWTP influents

267
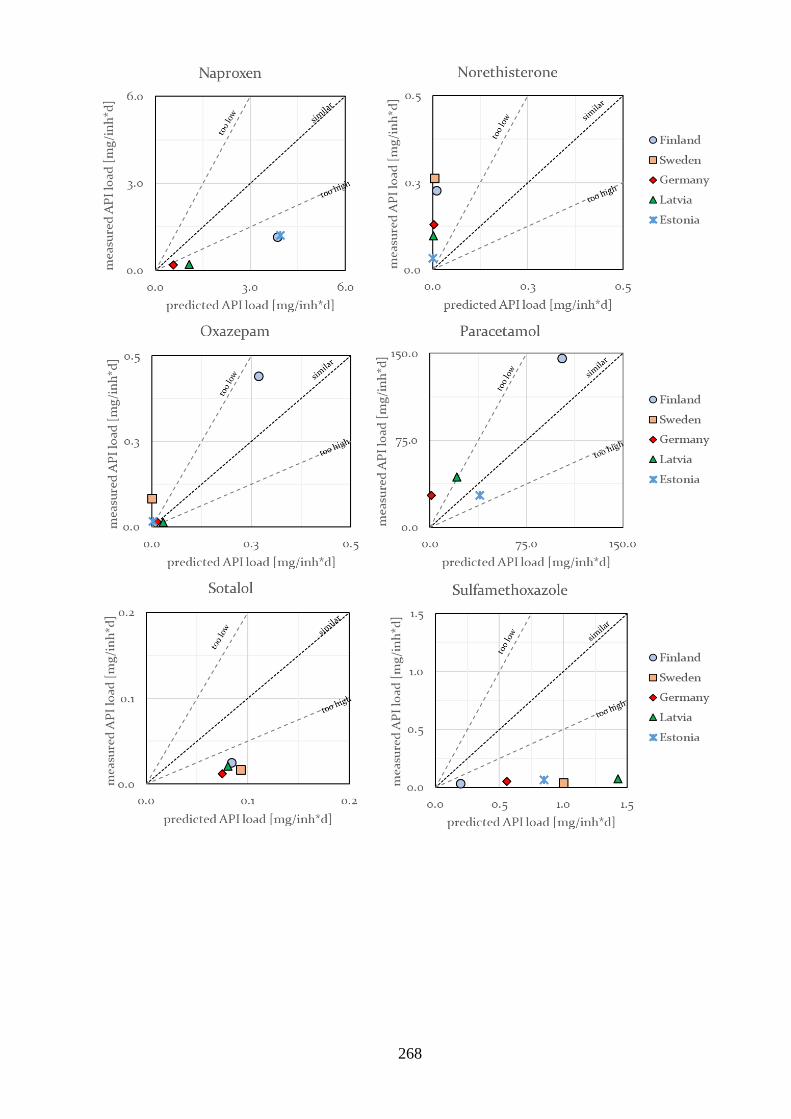
268

269

270
Annex 19. API descriptions
NSAIDs and analgesics
Codeine
CAS number 76-57-3
ATC code N02AA
ATC name (2nd level,
therapeutic subgroup) ANALGESICS (N02)
ATC name (4th level,
chemical substance)
Natural opium alkaloids (N02AA), Opioids in combination with non-
opioid analgesics (N02AJ)
Uses Relief of mild to moderately severe pain.
Mechanism of action
Codeine selectively binds to mu-opioid receptors, which are involved in
the transmission of pain throughout the body and central nervous system.
The analgesic properties of codeine are thought to arise from its
conversion to Morphine, although the exact mechanism of analgesic
action is unknown at this time.
Metabolism/Excretion
Approximately 70 to 80% of the ingested dose of codeine is metabolized
in the liver by conjugation, O-demethylation and N-demethylation.
About 90% of the total dose of codeine is excreted by the kidneys.
Approximately 10% of the drug excreted by the kidneys is
unchanged codeine.
Molecular weight 299.37
Molecular formula C18H21NO3
SMILES CN1CCC23C4C1CC5=C2C(=C(C=C5)OC)OC3C(C=C4)O
Water solubility: 0.03 M (PubMed)
Log Kow 1.19 (PubChem)
Structure
Diclofenac
CAS number 15307-86-5
ATC code M01AB05
ATC name (2nd level,
therapeutic subgroup)
ANTIINFLAMMATORY AND ANTIRHEUMATIC PRODUCTS
(M01)
ATC name (4th level,
chemical substance) Acetic acid derivatives and related substances (M01AB)
Uses Used to relieve pain, swelling (inflammation), and joint stiffness caused
by arthritis.
Mechanism of action Inhibits cyclooxygenase-1 and -2, the enzymes responsible for
production of prostaglandin (PG) G2 which is the precursor to other PGs.
Metabolism/Excretion
Undergoes oxidative metabolism to hydroxy metabolites as well as
conjugation to glucuronic acid, sulfate, and taurine in the liver.
Diclofenac is mainly eliminated via metabolism. Little or no free
unchanged diclofenac is excreted in the urine. Approximately 65% of
the dose is excreted in the urine and approximately 35% in the bile as
conjugates of unchanged diclofenac plus metabolites.

271
Molecular weight 295.017
Molecular formula C14H11Cl2NO2
SMILES C1=CC=C(C(=C1)CC(=O)O)NC2=C(C=CC=C2Cl)Cl
Water solubility: 2.37 mg/L at 25 deg C (PubChem)
Log Kow 4.51 (PubChem)
Structure
Ibuprofen
CAS number 15687-27-1
ATC code M01AE01
ATC name (2nd level,
therapeutic subgroup)
ANTIINFLAMMATORY AND ANTIRHEUMATIC PRODUCTS
(M01)
ATC name (4th level,
chemical substance) Propionic acid derivatives (M01AE)
Uses
Used to reduce fever and treat pain or inflammation caused by many
conditions such as headache, toothache, back pain, arthritis, menstrual
cramps, or minor injury.
Mechanism of action
Non-selective inhibitor of cyclooxygenase, which is an enzyme involved
in prostaglandin (mediators of pain and fever) and thromboxane
(stimulators of blood clotting) synthesis via the arachidonic acid
pathway.
Metabolism/Excretion
Metabolized and biotransformed in the liver to the formation of major
metabolites which are the hydroxylated and carboxylated derivatives.
Excreted as metabolites or their conjugates. Ibuprofen is almost
completely metabolized, with little to no unchanged drug found in
the urine. The elimination of ibuprofen is not impaired by old age or the
presence of renal impairment.
Molecular weight 206.285
Molecular formula C13H18O2
SMILES CC(C)CC1=CC=C(C=C1)C(C)C(=O)O
Water solubility: 21 mg/L (at 25 °C) (DrugBank)
Log Kow 3.97 (PubChem)
Structure
Ketoprofen
CAS number 22071-15-4
ATC code M01AE03
ATC name (2nd level,
therapeutic subgroup)
ANTIINFLAMMATORY AND ANTIRHEUMATIC PRODUCTS
(M01)
ATC name (4th level,
chemical substance) Propionic acid derivatives (M01AE)
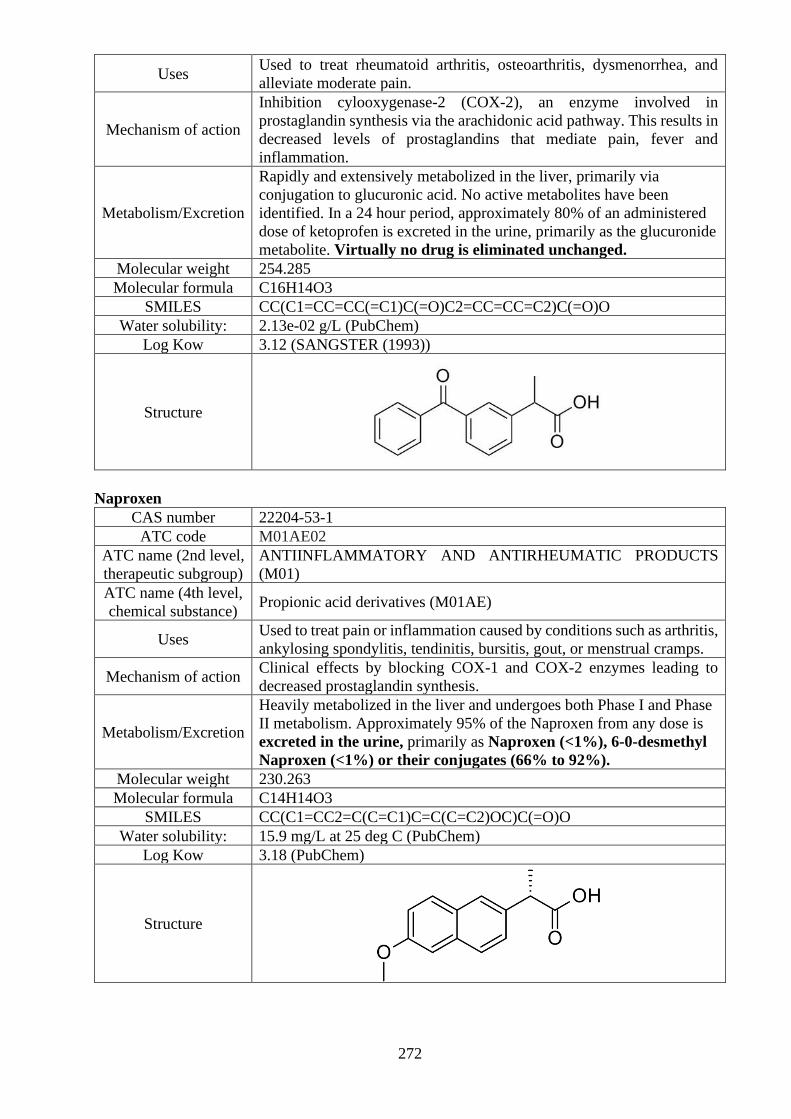
272
Uses Used to treat rheumatoid arthritis, osteoarthritis, dysmenorrhea, and
alleviate moderate pain.
Mechanism of action
Inhibition cylooxygenase-2 (COX-2), an enzyme involved in
prostaglandin synthesis via the arachidonic acid pathway. This results in
decreased levels of prostaglandins that mediate pain, fever and
inflammation.
Metabolism/Excretion
Rapidly and extensively metabolized in the liver, primarily via
conjugation to glucuronic acid. No active metabolites have been
identified. In a 24 hour period, approximately 80% of an administered
dose of ketoprofen is excreted in the urine, primarily as the glucuronide
metabolite. Virtually no drug is eliminated unchanged.
Molecular weight 254.285
Molecular formula C16H14O3
SMILES CC(C1=CC=CC(=C1)C(=O)C2=CC=CC=C2)C(=O)O
Water solubility: 2.13e-02 g/L (PubChem)
Log Kow 3.12 (SANGSTER (1993))
Structure
Naproxen
CAS number 22204-53-1
ATC code M01AE02
ATC name (2nd level,
therapeutic subgroup)
ANTIINFLAMMATORY AND ANTIRHEUMATIC PRODUCTS
(M01)
ATC name (4th level,
chemical substance) Propionic acid derivatives (M01AE)
Uses Used to treat pain or inflammation caused by conditions such as arthritis,
ankylosing spondylitis, tendinitis, bursitis, gout, or menstrual cramps.
Mechanism of action Clinical effects by blocking COX-1 and COX-2 enzymes leading to
decreased prostaglandin synthesis.
Metabolism/Excretion
Heavily metabolized in the liver and undergoes both Phase I and Phase
II metabolism. Approximately 95% of the Naproxen from any dose is
excreted in the urine, primarily as Naproxen (<1%), 6-0-desmethyl
Naproxen (<1%) or their conjugates (66% to 92%).
Molecular weight 230.263
Molecular formula C14H14O3
SMILES CC(C1=CC2=C(C=C1)C=C(C=C2)OC)C(=O)O
Water solubility: 15.9 mg/L at 25 deg C (PubChem)
Log Kow 3.18 (PubChem)
Structure

273
Oxycodone
CAS number 76-42-6
ATC code N02AA05
ATC name (2nd level,
therapeutic subgroup) ANALGESICS (N02)
ATC name (4th level,
chemical substance) Natural opium alkaloids (N02AA)
Uses Used to treat moderate to severe pain.
Mechanism of action Binding to a receptor, inhibition of adenylyl-cyclase and
hyperpolarisation of neurons, and decreased excitability.
Metabolism/Excretion
Metabolism is hepatic. Metabolized by CYP3A4 to noroxycodone and
by CYP2D6 to oxymorphone. Noroxycodone is a weaker opioid
agonist than the parent compound, but the presence of this active
metabolite increases the potential for interactions with other drugs
metabolized by the CYP3A4 pathway. Oxycodone is mainly eliminated
in the urine. Approximately 72% of an oxycodone dose is excreted in
the urine; 8% as oxycodone, 47% as oxidative metabolites and 18% as
reduced metabolites. 97% of excreted oxycodone is unconjugated. Of
the oxidative metabolites, 93% of oxymorphone is excreted in its
glucuronidated form, while noroxycodone is mostly unconjugated
when excreted. When oxymorphone is administered directly to a
subject, only 50% of the dose is excreted in the urine. 44% of the
original dose is excreted as oxymorphone-3-glucuronide with the
remaining 6% excreted as unchanged oxymorphone or as reduced
metabolites. Oxycodone and its metabolites primarily undergo urinary
excretion with less than 10% of the parent compound excreted
unchanged.
Molecular weight 315.4
Molecular formula C18H21NO4
SMILES CN1CCC23C4C(=O)CCC2(C1CC5=C3C(=C(C=C5)OC)O4)O
Water solubility: 166mg/mL (DrugBank)
Log Kow 0.66 (est) (PubChem)
Structure
Paracetamol
CAS number 103-90-2
ATC code N02BE01
ATC name (2nd level,
therapeutic subgroup) ANALGESICS (N02)
ATC name (4th level,
chemical substance) Anilides (N02BE)
Uses Used to treat many conditions such as headache, muscle aches, arthritis,
backache, toothaches, colds, and fevers.
Mechanism of action Categorized as an NSAID (a nonsteroidal anti-inflammatory drug) due
to that fact that it inhibits the cyclooxygenase (COX) pathways, and it is
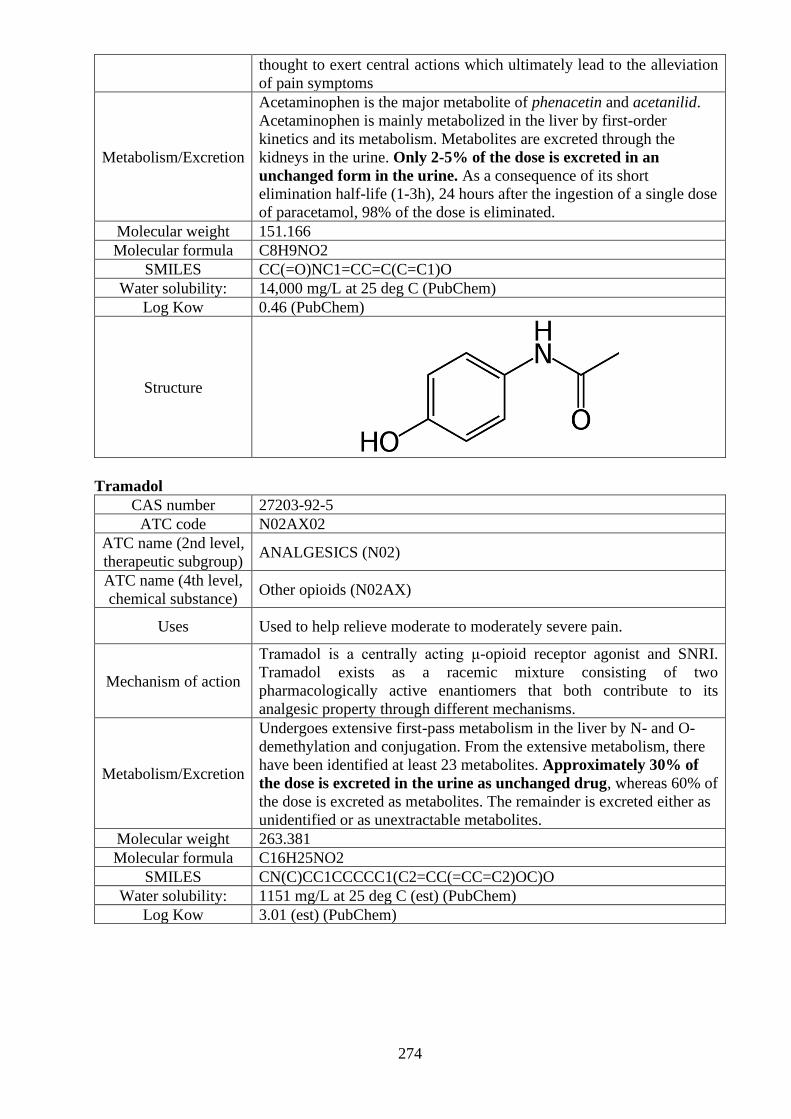
274
thought to exert central actions which ultimately lead to the alleviation
of pain symptoms
Metabolism/Excretion
Acetaminophen is the major metabolite of phenacetin and acetanilid.
Acetaminophen is mainly metabolized in the liver by first-order
kinetics and its metabolism. Metabolites are excreted through the
kidneys in the urine. Only 2-5% of the dose is excreted in an
unchanged form in the urine. As a consequence of its short
elimination half-life (1-3h), 24 hours after the ingestion of a single dose
of paracetamol, 98% of the dose is eliminated.
Molecular weight 151.166
Molecular formula C8H9NO2
SMILES CC(=O)NC1=CC=C(C=C1)O
Water solubility: 14,000 mg/L at 25 deg C (PubChem)
Log Kow 0.46 (PubChem)
Structure
Tramadol
CAS number 27203-92-5
ATC code N02AX02
ATC name (2nd level,
therapeutic subgroup) ANALGESICS (N02)
ATC name (4th level,
chemical substance) Other opioids (N02AX)
Uses Used to help relieve moderate to moderately severe pain.
Mechanism of action
Tramadol is a centrally acting μ-opioid receptor agonist and SNRI.
Tramadol exists as a racemic mixture consisting of two
pharmacologically active enantiomers that both contribute to its
analgesic property through different mechanisms.
Metabolism/Excretion
Undergoes extensive first-pass metabolism in the liver by N- and O-
demethylation and conjugation. From the extensive metabolism, there
have been identified at least 23 metabolites. Approximately 30% of
the dose is excreted in the urine as unchanged drug, whereas 60% of
the dose is excreted as metabolites. The remainder is excreted either as
unidentified or as unextractable metabolites.
Molecular weight 263.381
Molecular formula C16H25NO2
SMILES CN(C)CC1CCCCC1(C2=CC(=CC=C2)OC)O
Water solubility: 1151 mg/L at 25 deg C (est) (PubChem)
Log Kow 3.01 (est) (PubChem)

275
Structure
Antibiotics
Ciprofloxacin
CAS number 85721-33-1
ATC code J01MA02
ATC name (2nd level,
therapeutic subgroup) ANTIBACTERIALS FOR SYSTEMIC USE (J01)
ATC name (4th level,
chemical substance) Fluoroquinolones (J01MA)
Uses
An antibiotic used to treat a number of bacterial infections. This includes
bone and joint infections, intra abdominal infections, certain type of
infectious diarrhea, respiratory tract infections, skin infections, typhoid
fever, and urinary tract infections, among others.
Mechanism of action
Ciprofloxacin acts on bacterial topoisomerase II (DNA gyrase) and
topoisomerase IV. Ciprofloxacin's targeting of the alpha subunits of
DNA gyrase prevents it from supercoiling the bacterial DNA which
prevents DNA replication.
Metabolism/Excretion
Ciprofloxacin is primarily metabolized in liver by CYP1A2. Converted
into metabolites oxociprofloxacin and sulociprofloxacin and 2 minor
metabolites desethylene ciprofloxacin and formylciprofloxacin.
Approximately 40 to 50% of an orally administered dose is excreted
in the urine as unchanged drug.
Molecular weight 331.347
Molecular formula C17H18FN3O3
SMILES C1CC1N2C=C(C(=O)C3=CC(=C(C=C32)N4CCNCC4)F)C(=O)O
Water solubility: 30,000 mg/L at 20 deg C (PubChem)
Log Kow 0.28 (non-ionized) (PubChem)
Structure
Clarithromycin
CAS number 81103-11-9
ATC code J01FA01
ATC name
(2nd level,
therapeutic
subgroup)
ANTIBACTERIALS FOR SYSTEMIC USE (J01)
ATC name
(4th level, Macrolides (J01FA)
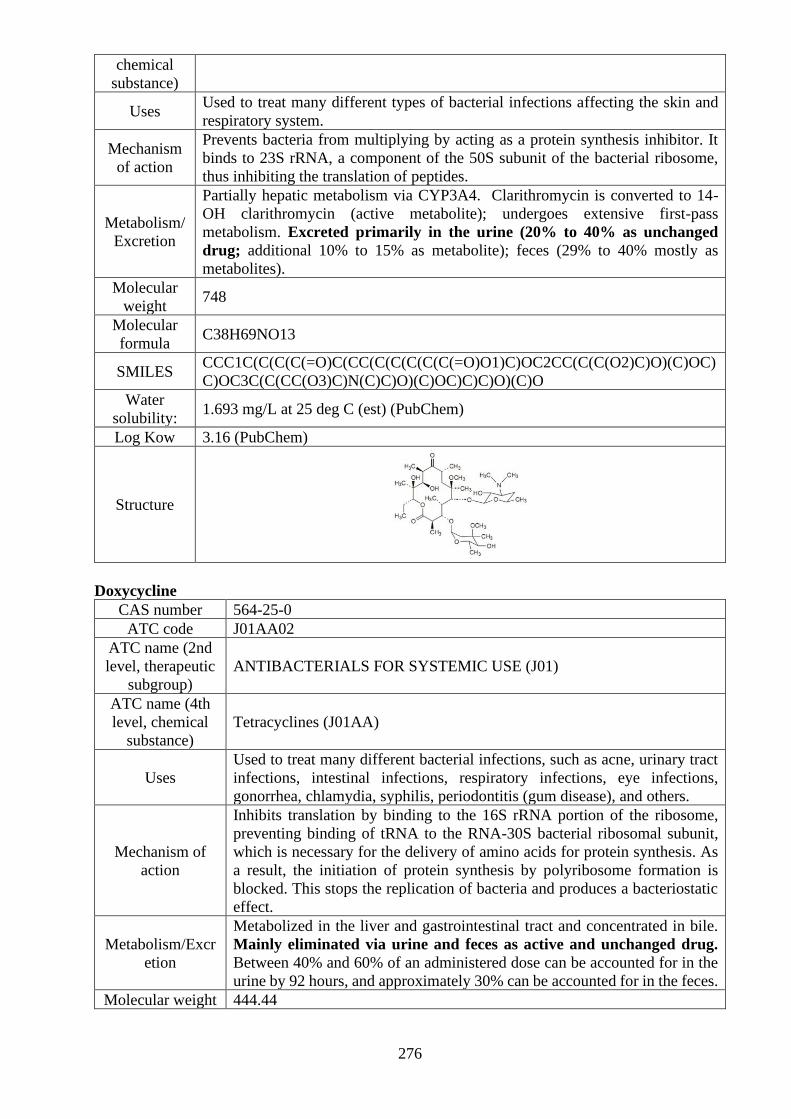
276
chemical
substance)
Uses Used to treat many different types of bacterial infections affecting the skin and
respiratory system.
Mechanism
of action
Prevents bacteria from multiplying by acting as a protein synthesis inhibitor. It
binds to 23S rRNA, a component of the 50S subunit of the bacterial ribosome,
thus inhibiting the translation of peptides.
Metabolism/
Excretion
Partially hepatic metabolism via CYP3A4. Clarithromycin is converted to 14-
OH clarithromycin (active metabolite); undergoes extensive first-pass
metabolism. Excreted primarily in the urine (20% to 40% as unchanged
drug; additional 10% to 15% as metabolite); feces (29% to 40% mostly as
metabolites).
Molecular
weight 748
Molecular
formula C38H69NO13
SMILES CCC1C(C(C(C(=O)C(CC(C(C(C(C(C(=O)O1)C)OC2CC(C(C(O2)C)O)(C)OC)
C)OC3C(C(CC(O3)C)N(C)C)O)(C)OC)C)C)O)(C)O
Water
solubility: 1.693 mg/L at 25 deg C (est) (PubChem)
Log Kow 3.16 (PubChem)
Structure
Doxycycline
CAS number 564-25-0
ATC code J01AA02
ATC name (2nd
level, therapeutic
subgroup)
ANTIBACTERIALS FOR SYSTEMIC USE (J01)
ATC name (4th
level, chemical
substance)
Tetracyclines (J01AA)
Uses
Used to treat many different bacterial infections, such as acne, urinary tract
infections, intestinal infections, respiratory infections, eye infections,
gonorrhea, chlamydia, syphilis, periodontitis (gum disease), and others.
Mechanism of
action
Inhibits translation by binding to the 16S rRNA portion of the ribosome,
preventing binding of tRNA to the RNA-30S bacterial ribosomal subunit,
which is necessary for the delivery of amino acids for protein synthesis. As
a result, the initiation of protein synthesis by polyribosome formation is
blocked. This stops the replication of bacteria and produces a bacteriostatic
effect.
Metabolism/Excr
etion
Metabolized in the liver and gastrointestinal tract and concentrated in bile.
Mainly eliminated via urine and feces as active and unchanged drug.
Between 40% and 60% of an administered dose can be accounted for in the
urine by 92 hours, and approximately 30% can be accounted for in the feces.
Molecular weight 444.44

277
Molecular
formula C22H24N2O8
SMILES CC1C2C(C3C(C(=O)C(=C(C3(C(=O)C2=C(C4=C1C=CC=C4O)O)O)O)C
(=O)N)N(C)C)O
Water solubility: 50 mg/mL (DrugBank)
Log Kow 0.63 (PubChem)
Structure
Erythromycin
CAS number 114-07-8
ATC code J01FA01
ATC name
(2nd level,
therapeutic
subgroup)
ANTIBACTERIALS FOR SYSTEMIC USE (J01)
ATC name
(4th level,
chemical
substance)
Macrolides (J01FA)
Uses
Used to treat certain infections caused by bacteria, such as infections of the
respiratory tract (bronchitis, pneumonia, Legionnaires' disease, pertussis);
diphtheria; sexually transmitted diseases, including syphilis; and ear, intestine,
gynecological, urinary tract, and skin infections. Also used to prevent recurrent
rheumatic fever.
Mechanism
of action
Erythromycin acts by inhibition of protein synthesis by binding to the 23S
ribosomal RNA molecule in the 50S subunit of ribosomes in susceptible bacterial
organisms. It stops bacterial protein synthesis by inhibiting the
transpeptidation/translocation step of protein synthesis and by inhibiting the
assembly of the 50S ribosomal subunit.
Metabolism/
Excretion
Hepatic first-pass metabolism. Erythromycin concentrates in the liver and is then
excreted in the bile. Under 5% of the orally administered dose of
erythromycin is found excreted in the urine. A high percentage of absorbed
erythromycin is not accounted for, but is likely metabolized.
Molecular
weight 733.937
Molecular
formula C37H67NO13
SMILES CCC1C(C(C(C(=O)C(CC(C(C(C(C(C(=O)O1)C)OC2CC(C(C(O2)C)O)(C)OC)
C)OC3C(C(CC(O3)C)N(C)C)O)(C)O)C)C)O)(C)O
Water
solubility: 4.2 mg/L at 25 deg C (est) (PubChem)
Log Kow 3.06 (PubChem)

278
Structure
Fluconazole
CAS number 86386-73-4
ATC code J02AC01
ATC name (2nd level,
therapeutic subgroup) ANTIMYCOTICS FOR SYSTEMIC USE (J02)
ATC name (4th level,
chemical substance) Triazole derivatives (J02AC)
Uses Used to prevent and treat a variety of fungal and yeast infections.
Mechanism of action
Fluconazole is a very selective inhibitor of fungal cytochrome P450
dependent enzyme lanosterol 14-α-demethylase. This enzyme normally
works to convert lanosterol to ergosterol, which is necessary for fungal
cell wall synthesis.
Metabolism/Excretion
Fluconazole is metabolized minimally in the liver. Fluconazole is
cleared primarily by renal excretion, with approximately 80% of the
administered dose measured in the urine as unchanged drug. About
11% of the dose is excreted in the urine as metabolites.
Molecular weight 306.277
Molecular formula C13H12F2N6O
SMILES OC(CN1C=NC=N1)(CN1C=NC=N1)C1=C(F)C=C(F)C=C1
Water solubility: 4,363 mg/L at 25 deg C (est) (PubChem)
Log Kow 0.25 at 25 deg C (est) (PubChem)
Structure
Lincomycin
CAS number 154-21-2
ATC code J01FF02
ATC name (2nd level,
therapeutic subgroup) ANTIBACTERIALS FOR SYSTEMIC USE (J01)
ATC name (4th level,
chemical substance) Lincosamides (J01FF)
Uses Used in the treatment of staphylococcal, streptococcal, and Bacteroides
fragilis infections.
Mechanism of action
Lincomycin inhibits protein synthesis in susceptible bacteria by binding
to the 50 S subunits of bacterial ribosomes and preventing peptide bond
formation upon transcription. It is usually considered bacteriostatic, but
may be bactericidal in high concentrations or when used against highly
susceptible organisms.

279
Metabolism/Excretion
Presumed hepatic, however metabolites have not been fully
characterized. Urinary excretion after this dose ranges from 1.8 to
24.8 percent (mean: 17.3 percent). Biliary excretion is also an
important route of excretion.
Molecular weight 406.538
Molecular formula C18H34N2O6S
SMILES CCCC1CC(N(C1)C)C(=O)NC(C2C(C(C(C(O2)SC)O)O)O)C(C)O
Water solubility: 927 mg/L at 25 deg C (est) (PubChem)
Log Kow 0.20 (PubChem)
Structure
Norfloxacin
CAS number 70458-96-7
ATC code J01MA06
ATC name (2nd level,
therapeutic subgroup) ANTIBACTERIALS FOR SYSTEMIC USE (J01)
ATC name (4th level,
chemical substance) Fluoroquinolones (J01MA)
Uses Used to treat different bacterial infections of the prostate or urinary tract
(bladder and kidneys). Norfloxacin is also used to treat gonorrhea.
Mechanism of action
Inhibits bacterial DNA gyrase. Norfloxacin is a broad-spectrum
antibiotic agent that is shown to be effective against various Gram-
positive and Gram-negative bacterial species.
Metabolism/Excretion
Metabolism in the liver and kidney. Norfloxacin is eliminated mainly
through renal excretion. In the first 24 hours, 33 to 48% is recovered in
the urine as norfloxacin. Six active metabolites of norfloxacin (5 to
8%) of lesser antimicrobial potency are also recovered in the urine.
The parent compound accounts for over 70% of total excretion.
Molecular weight 319.336
Molecular formula C16H18FN3O3
SMILES CCN1C=C(C(=O)C2=CC(=C(C=C21)N3CCNCC3)F)C(=O)O
Water solubility: 0.28 mg/mL at 25 deg C. Solubility in water is pH dependent,
increasing sharply at pH<5 or pH >10 (PubChem)
Log Kow 0.46 (PubChem)
Structure
Ofloxacin
CAS number 82419-36-1
ATC code J01MA01
ATC name (2nd level,
therapeutic subgroup) ANTIBACTERIALS FOR SYSTEMIC USE (J01)
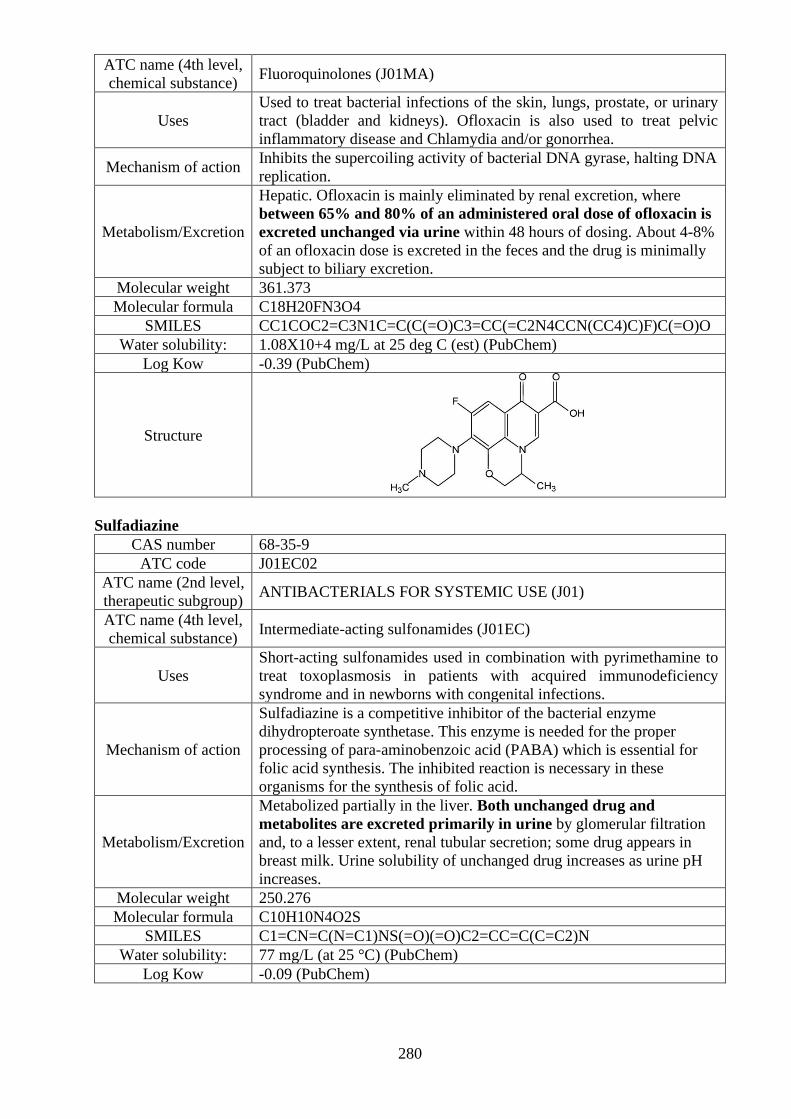
280
ATC name (4th level,
chemical substance) Fluoroquinolones (J01MA)
Uses
Used to treat bacterial infections of the skin, lungs, prostate, or urinary
tract (bladder and kidneys). Ofloxacin is also used to treat pelvic
inflammatory disease and Chlamydia and/or gonorrhea.
Mechanism of action Inhibits the supercoiling activity of bacterial DNA gyrase, halting DNA
replication.
Metabolism/Excretion
Hepatic. Ofloxacin is mainly eliminated by renal excretion, where
between 65% and 80% of an administered oral dose of ofloxacin is
excreted unchanged via urine within 48 hours of dosing. About 4-8%
of an ofloxacin dose is excreted in the feces and the drug is minimally
subject to biliary excretion.
Molecular weight 361.373
Molecular formula C18H20FN3O4
SMILES CC1COC2=C3N1C=C(C(=O)C3=CC(=C2N4CCN(CC4)C)F)C(=O)O
Water solubility: 1.08X10+4 mg/L at 25 deg C (est) (PubChem)
Log Kow -0.39 (PubChem)
Structure
Sulfadiazine
CAS number 68-35-9
ATC code J01EC02
ATC name (2nd level,
therapeutic subgroup) ANTIBACTERIALS FOR SYSTEMIC USE (J01)
ATC name (4th level,
chemical substance) Intermediate-acting sulfonamides (J01EC)
Uses
Short-acting sulfonamides used in combination with pyrimethamine to
treat toxoplasmosis in patients with acquired immunodeficiency
syndrome and in newborns with congenital infections.
Mechanism of action
Sulfadiazine is a competitive inhibitor of the bacterial enzyme
dihydropteroate synthetase. This enzyme is needed for the proper
processing of para-aminobenzoic acid (PABA) which is essential for
folic acid synthesis. The inhibited reaction is necessary in these
organisms for the synthesis of folic acid.
Metabolism/Excretion
Metabolized partially in the liver. Both unchanged drug and
metabolites are excreted primarily in urine by glomerular filtration
and, to a lesser extent, renal tubular secretion; some drug appears in
breast milk. Urine solubility of unchanged drug increases as urine pH
increases.
Molecular weight 250.276
Molecular formula C10H10N4O2S
SMILES C1=CN=C(N=C1)NS(=O)(=O)C2=CC=C(C=C2)N
Water solubility: 77 mg/L (at 25 °C) (PubChem)
Log Kow -0.09 (PubChem)

281
Structure
Sulfamethoxazole
CAS number 723-46-6
ATC code J01EC01
ATC name (2nd level,
therapeutic subgroup) ANTIBACTERIALS FOR SYSTEMIC USE (J01)
ATC name (4th level,
chemical substance) Intermediate-acting sulfonamides (J01EC)
Uses
Used to treat a wide variety of bacterial infections (such as middle ear,
urine, respiratory, and intestinal infections). It is also used to prevent and
treat a certain type of pneumonia (pneumocystis-type).
Mechanism of action
Bacteriostatic antibacterial agent that interferes with folic acid
synthesis in susceptible bacteria. Its broad spectrum of activity has
been limited by the development of resistance.
Metabolism/Excretion
The metabolism of sulfamethoxazole occurs predominately by N4-
acetylation, although the glucuronide conjugate has been identified.
About 20% of the sulfamethoxazole in the urine is unchanged
drug, about 15 to 20% is the N-glucuronide conjugate, and about 50 to
70% is the acetylated metabolite. Sulfamethoxazole is also excreted in
human milk.
Molecular weight 253.276
Molecular formula C10H11N3O3S
SMILES CC1=CC(=NO1)NS(=O)(=O)C2=CC=C(C=C2)N
Water solubility: 610 mg/L at 37 deg C (PubChem)
Log Kow 0.89 (PubChem)
Structure
Tetracycline
CAS number 60-54-8
ATC code J01AA07
ATC name (2nd
level, therapeutic
subgroup)
ANTIBACTERIALS FOR SYSTEMIC USE (J01)
ATC name (4th
level, chemical
substance)
Tetracyclines (J01AA)
Uses Used to treat a wide variety of infections, including acne.
Mechanism of
action
Exerts a bacteriostatic effect on bacteria by binding reversible to the
bacterial 30S ribosomal subunit and blocking incoming aminoacyl tRNA
from binding to the ribosome acceptor site. It also binds to some extent to

282
the bacterial 50S ribosomal subunit and may alter the cytoplasmic
membrane causing intracellular components to leak from bacterial cells.
Metabolism/Excr
etion
Metabolism is negligible. 40-55% of tetracycline is excreted from the body
primarily by the kidney, the less part is excreted by the liver followed by
reabsorption from the gastrointestinal tract. About 60% is excreted
unchanged in the urine during 24 h.
Molecular weight 444.44
Molecular
formula C22H24N2O8
SMILES CC1(C2CC3C(C(=O)C(=C(C3(C(=O)C2=C(C4=C1C=CC=C4O)O)O)O)C
(=O)N)N(C)C)O
Water solubility: 231 mg/l at 25 deg C (PubChem)
Log Kow -1.37 (PubChem)
Structure
Trimethoprim
CAS number 738-70-5
ATC code J01EA01
ATC name (2nd level,
therapeutic subgroup) ANTIBACTERIALS FOR SYSTEMIC USE (J01)
ATC name (4th level,
chemical substance)
Combinations of sulfonamides and trimethoprim, incl. Derivatives
(J01EE)
Uses
Eliminates bacteria that cause urinary tract infections. It is used in
combination with other drugs to treat certain types of pneumonia. It also
is used to treat traveler's diarrhea.
Mechanism of action
Inhibits dihydrofolate reductase. This inhibition prevents the
conversion of dihydrofolic acid (DHF) to tetrahydrofolic acid (THF) in
the thymidine synthesis pathway.
Metabolism/Excretion
Hepatic metabolism to oxide and hydroxylated metabolites. 10 to 20%
of trimethoprim is metabolized, primarily in the liver; approximately
60% to 80% of an administered dose of trimethoprim is excreted
unchanged in the urine via tubular secretion within 24 hours. The
remainder of the drug is excreted by the kidney in one of four oxide or
hydroxyl derivatives. The urinary metabolites are bacteriologically
inactive.
Molecular weight 290.323
Molecular formula C14H18N4O3
SMILES COC1=CC(=CC(=C1OC)OC)CC2=CN=C(N=C2N)N
Water solubility: 400 mg/L (at 25 °C) (PubChem)
Log Kow 0.91 (PubChem)
Structure

283
Hormones
17-α-ethinyl estradiol (EE2)
CAS number 57-63-6
ATC code G03CA01 (ethinylestradiol)
ATC name (2nd level,
therapeutic subgroup)
SEX HORMONES AND MODULATORS OF THE GENITAL
SYSTEM (G03)
ATC name (4th level,
chemical substance) Natural and semisynthetic estrogens, plain (G03CA)
Uses Used widely in birth control pills in combination with progestins.
Mechanism of action
Estrogens increase the hepatic synthesis of sex hormone binding
globulin (SHBG), thyroid-binding globulin (TBG), and other serum
proteins and suppress follicle-stimulating hormone (FSH) from the
anterior pituitary. This cascade is initiated by initially binding to the
estrogen receptors. The combination of an estrogen with a progestin
suppresses the hypothalamic-pituitary system, decreasing the secretion
of gonadotropin-releasing hormone (GnRH).
Metabolism/Excretion
Hepatic. Route of elimination not availible. The majority of estrogen
elimination occurs through the kidneys in the form of sulfate or
glucuronide conjugates.
Molecular weight 296.41
Molecular formula C20H24O2
SMILES CC12CCC3C(C1CCC2(C#C)O)CCC4=C3C=CC(=C4)O
Water solubility: 11.3 mg/L at 27 °C (DrugBank)
Log Kow 3.67 (DrugBank)
Structure
17-β-estradiol (E2)
CAS number 50-28-2
ATC code G03CA03 (estradiol)
ATC name (2nd level,
therapeutic subgroup)
SEX HORMONES AND MODULATORS OF THE GENITAL
SYSTEM (G03)
ATC name (4th level,
chemical substance) Natural and semisynthetic estrogens, plain (G03CA)
Uses
Used in hormone therapy products for managing conditions associated
with reduced estrogen production such as menopausal and peri-
menopausal symptoms as well as hypoestrogenism. It is also used in
transgender hormone therapy, as a component of oral contraceptive pills
for preventing pregnancy (most commonly as Ethinylestradiol, a
synthetic form of estradiol), and is sometimes used for the palliative
treatment of some hormone-sensitive cancers like breast and prostate
cancer.
Mechanism of action
When the estrogen receptor has bound its ligand it can enter the nucleus
of the target cell, and regulate gene transcription which leads to
formation of messenger RNA. The mRNA interacts with ribosomes to
produce specific proteins that express the effect of estradiol upon the
target cell. Estrogens increase the hepatic synthesis of sex hormone

284
binding globulin (SHBG), thyroid-binding globulin (TBG), and other
serum proteins and suppress follicle-stimulating hormone (FSH) from
the anterior pituitary.
Metabolism/Excretion
Exogenous estrogens are metabolized using the same mechanism as
endogenous estrogens. Estrogens are partially metabolized by CYP450.
Estradiol, estrone and estriol are excreted in the urine along with
glucuronide and sulfate conjugates.
Molecular weight 272.38
Molecular formula C18H24O2
SMILES CC12CCC3C(C1CCC2O)CCC4=C3C=CC(=C4)O
Water solubility: 3.90 mg/L at 27 °C (DrugBank)
Log Kow 4.01 (DrugBank)
Structure
α-Estradiol
CAS number 57-91-0
ATC code G03CA03 (estradiol)
ATC name (2nd level,
therapeutic subgroup)
SEX HORMONES AND MODULATORS OF THE GENITAL
SYSTEM (G03)
ATC name (4th level,
chemical substance) Natural and semisynthetic estrogens, plain (G03CA)
Uses Used as a medication, primarily in hormone therapy for menopausal
symptoms as well as transgender hormone replacement therapy.
Mechanism of action
Estrogen mediates its effects across the body through potent agonism of
the Estrogen Receptor (ER), which is located in various tissues including
in the breasts, uterus, ovaries, skin, prostate, bone, fat, and brain.
Estradiol binds to both subtypes of the Estrogen Receptor. When the
estrogen receptor has bound its ligand it can enter the nucleus of the
target cell, and regulate gene transcription which leads to formation of
messenger RNA. Estrogens increase the hepatic synthesis of sex
hormone binding globulin (SHBG), thyroid-binding globulin (TBG),
and other serum proteins and suppress follicle-stimulating hormone
(FSH) from the anterior pituitary.
Metabolism/Excretion
Exogenous estrogens are metabolized using the same mechanism as
endogenous estrogens. Estrogens are partially metabolized by CYP450.
Estradiol, estrone and estriol are excreted in the urine along with
glucuronide and sulfate conjugates.
Molecular weight 272.388
Molecular formula C18H24O2
SMILES CC12CCC3C(C1CCC2O)CCC4=C3C=CC(=C4)O
Water solubility: 3.6 mg/L (at 27 °C) (PubChem)
Log Kow 4.01 (PubChem)

285
Structure
Estriol (E3)
CAS number 50-27-1
ATC code G03CA04
ATC name (2nd level,
therapeutic subgroup)
SEX HORMONES AND MODULATORS OF THE GENITAL
SYSTEM (G03)
ATC name (4th level,
chemical substance) Natural and semisynthetic estrogens, plain (G03CA)
Uses Used for the treatment of post-menopausal hot flashes.
Mechanism of action
When the estrogen receptor has bound its ligand it can enter the nucleus
of the target cell, and regulate gene transcription which leads to
formation of messenger RNA. The mRNA interacts with ribosomes to
produce specific proteins that express the effect of estriol upon the target
cell. Estrogens increase the hepatic synthesis of sex hormone binding
globulin (SHBG), thyroid-binding globulin (TBG), and other serum
proteins and suppress follicle-stimulating hormone (FSH) from the
anterior pituitary.
Metabolism/Excretion
In the liver, it is non-specifically metabolized by CYP1A2, CYP3A4,
and CYP2C9 via 2-hydroxylation into 2-hydroxyestradiol, and by
CYP2C9, CYP2C19, and CYP2C8 via 17β-hydroxy dehydrogenation
into estrone, with various other CYP450 enzymes and metabolic
transformations also being involved. Estriol is excreted more than 95%
in urine.
Molecular weight 288.173
Molecular formula C18H24O3
SMILES CC12CCC3C(C1CC(C2O)O)CCC4=C3C=CC(=C4)O
Water solubility: 27.34 mg/L at 25 °C (est) (DrugBank)
Log Kow 2.45 (DrugBank)
Structure
Estrone (E1)
CAS number 53-16-7
ATC code G03CA07
ATC name (2nd level,
therapeutic subgroup)
SEX HORMONES AND MODULATORS OF THE GENITAL
SYSTEM (G03)
ATC name (4th level,
chemical substance) Natural and semisynthetic estrogens, plain (G03CA)
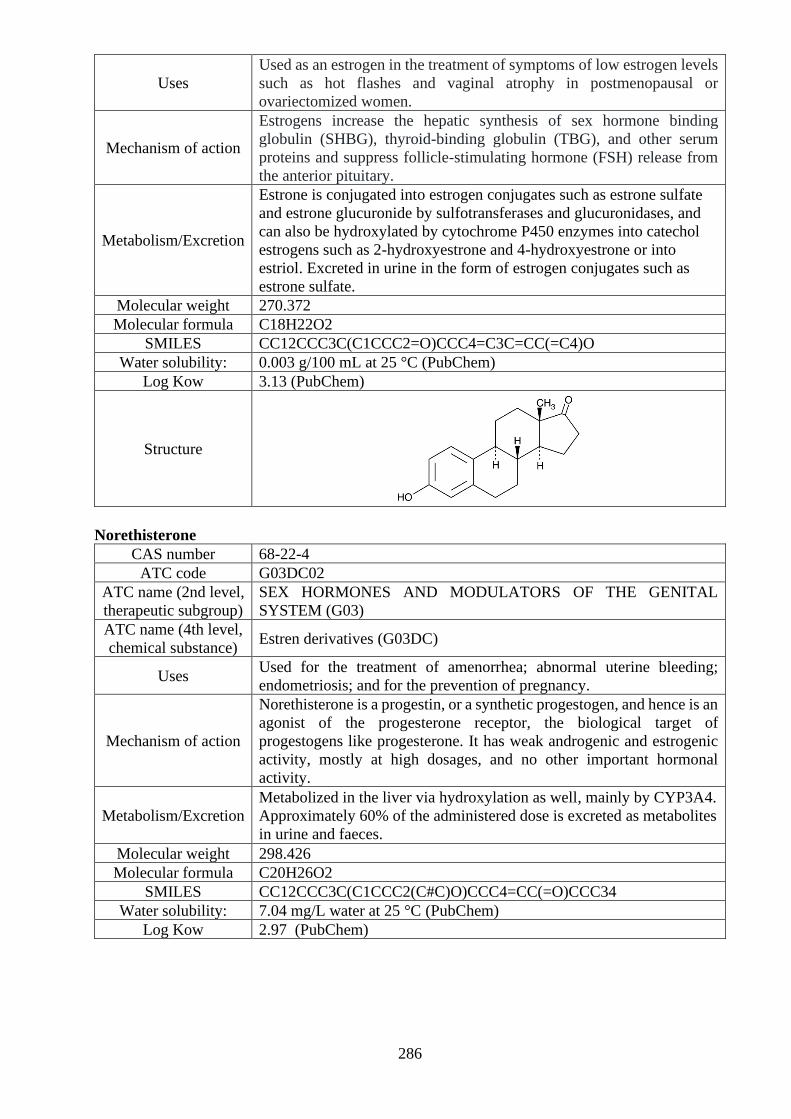
286
Uses
Used as an estrogen in the treatment of symptoms of low estrogen levels
such as hot flashes and vaginal atrophy in postmenopausal or
ovariectomized women.
Mechanism of action
Estrogens increase the hepatic synthesis of sex hormone binding
globulin (SHBG), thyroid-binding globulin (TBG), and other serum
proteins and suppress follicle-stimulating hormone (FSH) release from
the anterior pituitary.
Metabolism/Excretion
Estrone is conjugated into estrogen conjugates such as estrone sulfate
and estrone glucuronide by sulfotransferases and glucuronidases, and
can also be hydroxylated by cytochrome P450 enzymes into catechol
estrogens such as 2-hydroxyestrone and 4-hydroxyestrone or into
estriol. Excreted in urine in the form of estrogen conjugates such as
estrone sulfate.
Molecular weight 270.372
Molecular formula C18H22O2
SMILES CC12CCC3C(C1CCC2=O)CCC4=C3C=CC(=C4)O
Water solubility: 0.003 g/100 mL at 25 °C (PubChem)
Log Kow 3.13 (PubChem)
Structure
Norethisterone
CAS number 68-22-4
ATC code G03DC02
ATC name (2nd level,
therapeutic subgroup)
SEX HORMONES AND MODULATORS OF THE GENITAL
SYSTEM (G03)
ATC name (4th level,
chemical substance) Estren derivatives (G03DC)
Uses Used for the treatment of amenorrhea; abnormal uterine bleeding;
endometriosis; and for the prevention of pregnancy.
Mechanism of action
Norethisterone is a progestin, or a synthetic progestogen, and hence is an
agonist of the progesterone receptor, the biological target of
progestogens like progesterone. It has weak androgenic and estrogenic
activity, mostly at high dosages, and no other important hormonal
activity.
Metabolism/Excretion
Metabolized in the liver via hydroxylation as well, mainly by CYP3A4.
Approximately 60% of the administered dose is excreted as metabolites
in urine and faeces.
Molecular weight 298.426
Molecular formula C20H26O2
SMILES CC12CCC3C(C1CCC2(C#C)O)CCC4=CC(=O)CCC34
Water solubility: 7.04 mg/L water at 25 °C (PubChem)
Log Kow 2.97 (PubChem)
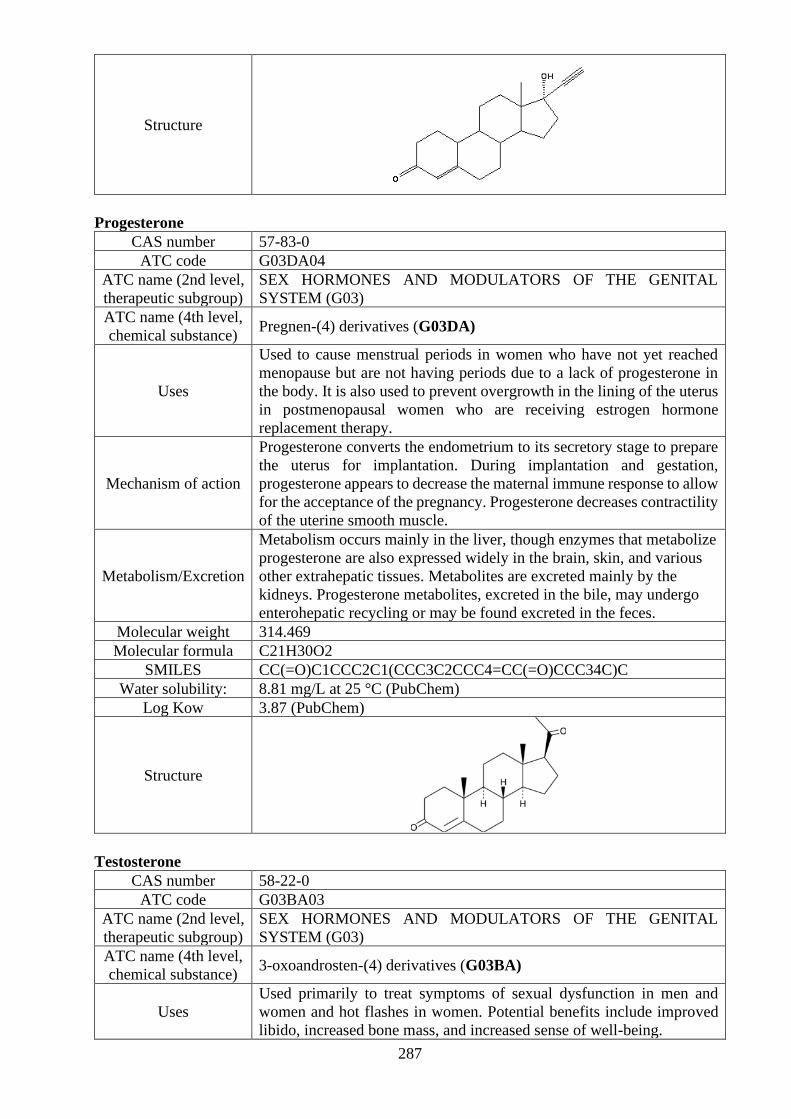
287
Structure
Progesterone
CAS number 57-83-0
ATC code G03DA04
ATC name (2nd level,
therapeutic subgroup)
SEX HORMONES AND MODULATORS OF THE GENITAL
SYSTEM (G03)
ATC name (4th level,
chemical substance) Pregnen-(4) derivatives (G03DA)
Uses
Used to cause menstrual periods in women who have not yet reached
menopause but are not having periods due to a lack of progesterone in
the body. It is also used to prevent overgrowth in the lining of the uterus
in postmenopausal women who are receiving estrogen hormone
replacement therapy.
Mechanism of action
Progesterone converts the endometrium to its secretory stage to prepare
the uterus for implantation. During implantation and gestation,
progesterone appears to decrease the maternal immune response to allow
for the acceptance of the pregnancy. Progesterone decreases contractility
of the uterine smooth muscle.
Metabolism/Excretion
Metabolism occurs mainly in the liver, though enzymes that metabolize
progesterone are also expressed widely in the brain, skin, and various
other extrahepatic tissues. Metabolites are excreted mainly by the
kidneys. Progesterone metabolites, excreted in the bile, may undergo
enterohepatic recycling or may be found excreted in the feces.
Molecular weight 314.469
Molecular formula C21H30O2
SMILES CC(=O)C1CCC2C1(CCC3C2CCC4=CC(=O)CCC34C)C
Water solubility: 8.81 mg/L at 25 °C (PubChem)
Log Kow 3.87 (PubChem)
Structure
Testosterone
CAS number 58-22-0
ATC code G03BA03
ATC name (2nd level,
therapeutic subgroup)
SEX HORMONES AND MODULATORS OF THE GENITAL
SYSTEM (G03)
ATC name (4th level,
chemical substance) 3-oxoandrosten-(4) derivatives (G03BA)
Uses
Used primarily to treat symptoms of sexual dysfunction in men and
women and hot flashes in women. Potential benefits include improved
libido, increased bone mass, and increased sense of well-being.

288
Mechanism of action
Testosterone and its androgenic metabolite, dihydrotestosterone, exert
biological effects directly through binding to the androgen receptor and
indirectly through aromatization of testosterone to estradiol, which
allows action via binding to the estrogen receptor (ER).
Metabolism/Excretion
Testosterone is metabolized to 17-keto steroids through two different
pathways. The major active metabolites are estradiol and
dihydrotestosterone (DHT). Testosterone can be hydroxylated at a
number of positions by CYP3A4, CYP2B6, CYP2C9, and CYP2C19.
Androstenedione undergoes metabolism by aromatase to form estrone,
which undergoes a reversible reaction to form estradiol. 90% of an
intramuscular dose is eliminated in urine, mainly as glucuronide and
sulfate conjugates. 6% is eliminated in feces, mostly as unconjugated
metabolites.
Molecular weight 288.431
Molecular formula C19H28O2
SMILES CC12CCC3C(C1CCC2O)CCC4=CC(=O)CCC34C
Water solubility: 23.4 mg/L at 25 °C (PubChem)
Log Kow 3.32 (PubChem)
Structure
Asthma and allergy medications
Cetirizine
CAS number 83881-51-0
ATC code R06AE07
ATC name (2nd level,
therapeutic subgroup) ANTIHISTAMINES FOR SYSTEMIC USE (R06)
ATC name (4th level,
chemical substance) Piperazine derivatives (R06AE)
Uses Used in the treatment of various allergic symptoms, such as sneezing,
coughing, nasal congestion, hives, and other symptoms.
Mechanism of action
Cetirizine, a metabolite of hydroxyzine, is an antihistamine drug. Its
main effects are achieved through selective inhibition of peripheral H1
receptors.
Metabolism/Excretion
Cetirizine is metabolized partially by oxidative O-dealkylation to a
metabolite with insignificant antihistaminic activity. Mainly eliminated
in the urine. Between 70 – 85% of an orally administered dose can be
found in the urine and 10 – 13% in the feces. About 50 or 60% of
cetirizine eliminated in the urine is unchanged.
Molecular weight 388.9
Molecular formula C21H25ClN2O3
SMILES OC(=O)COCCN1CCN(CC1)C(C1=CC=CC=C1)C1=CC=C(Cl)C=C1
Water solubility: 6.96X10+4 mg/L at 25 deg C (est) (PubChem)
Log Kow 1.70 (PubChem)

289
Structure
Fexofenadine
CAS number 83799-24-0
ATC code R06AX26
ATC name (2nd
level, therapeutic
subgroup)
ANTIHISTAMINES FOR SYSTEMIC USE (R06)
ATC name (4th
level, chemical
substance)
Other antihistamines for systemic use (R06AX)
Uses Used to relieve allergy symptoms such as watery eyes, runny nose, itching
eyes/nose, sneezing, hives, and itching.
Mechanism of
action
Competes with free histamine for binding at H1-receptors in the GI tract,
large blood vessels, and bronchial smooth muscle. This blocks the action of
endogenous histamine, which subsequently leads to temporary relief of the
negative symptoms (eg. nasal congestion, watery eyes) brought on by
histamine.
Metabolism/Exc
retion
Approximately 5% of the total dose is metabolized, by cytochrome P450
3A4 and by intestinal microflora. Most of the substance is eliminated
unchanged via the faeces (80%) and urine (11–12%).
Molecular
weight 501.288
Molecular
formula C32H39NO4
SMILES CC(C)(C1=CC=C(C=C1)C(CCCN2CCC(CC2)C(C3=CC=CC=C3)(C4=CC
=CC=C4)O)O)C(=O)O
Water solubility: 2.4X10⁻² mg/L at 25 deg C (est) (PubChem)
Log Kow 5.6 (PubChem)
Structure

290
Fluticasone
CAS number 80474-14-2
ATC code R03BA05
ATC name (2nd
level, therapeutic
subgroup)
DRUGS FOR OBSTRUCTIVE AIRWAY DISEASES (R03)
ATC name (4th
level, chemical
substance)
Glucocorticoids (R03BA)
Uses
Used to relieve seasonal and year-round allergic and non-allergic nasal
symptoms, such as stuffy/runny nose, itching, and sneezing. It can also
help relieve allergy eye symptoms such as itchy, watery eyes.
Mechanism of
action
Synthetic glucocorticoid available as 2 esters. Fluticasone furoate and
Fluticasone propionate work through an unknown mechanism to affect
the action of various cell types and mediators of inflammation.
Metabolism/Excreti
on
Cleared from hepatic metabolism by cytochrome P450 3A4. Fluticasone
propionate administered orally majority of the dose (87%-100%) is
excreted in the faeces, with up to 75% as unchanged drug, depending
on the dose administered. Between 1% and 5% of the dose is excreted as
metabolites in urine.
Molecular weight 444.509
Molecular formula C22H27F3O4S
SMILES CC1CC2C3CC(C4=CC(=O)C=CC4(C3(C(CC2(C1(C(=O)SCF)O)C)O)
F)C)F
Water solubility: 102 mg/L at 25 deg C (est) (PubChem)
Log Kow 1.40 (est) (PubChem)
Structure
Mometasone
CAS number 105102-22-5
ATC code R03BA07
ATC name (2nd
level, therapeutic
subgroup)
DRUGS FOR OBSTRUCTIVE AIRWAY DISEASES (R03)
ATC name (4th
level, chemical
substance)
Glucocorticoids (R03BA)
Uses
Used to treat skin conditions such as eczema, psoriasis, allergies, and
rash. Mometasone decreases swelling (inflammation), itching, and
redness.
Mechanism of action
Unbound corticosteroids cross cell membranes and bind with high
affinity to specific cytoplasmic receptors. Inflammation is decreased by
diminishing the release of leukocytic acid hydrolases, prevention of
macrophage accumulation at inflamed sites, interference with leukocyte
adhesion to the capillary wall, reduction of capillary membrane
permeability, reduction of complement components, inhibition of
histamine and kinin release, and interference with the formation of scar

291
tissue. The antiinflammatory actions of corticosteroids are thought to
involve phospholipase A2 inhibitory proteins, lipocortins, which control
the biosynthesis of potent mediators of inflammation such as
prostaglandins and leukotrienes.
Metabolism/Excretio
n
Hepatic. Any absorbed drug is excreted as metabolites mostly via the
bile, and to a limited extent, into the urine.
Molecular weight 427.362
Molecular formula C22H28Cl2O4
SMILES CC1CC2C3CCC4=CC(=O)C=CC4(C3(C(CC2(C1(C(=O)CCl)O)C)O)C
l)C
Water solubility: 5.23e-03 g/L (PubChem)
Log Kow 2.1 (PubChem)
Structure
Xylometazoline
CAS number 526-36-3
ATC code R01AA07
ATC name (2nd level,
therapeutic subgroup) NASAL PREPARATIONS (R01)
ATC name (4th level,
chemical substance) Sympathomimetics, plain (R01AA)
Uses Used to treat stuffy nose caused by allergies, sinus irritation, or the
common cold.
Mechanism of action
Sympathomimetic drug, which acts on alpha-adrenergic receptors in
the arterioles of the nasal mucosa. This activates the adrenal system to
yield systemic vasoconstrction. In producing vasoconstriction, the
result is a decrease in blood flow in the nasal passages and
consequently decreased nasal congestion.
Metabolism/Excretion
Imidazoline compounds undergo some hepatic metabolism but large
proportions of the ingested dose may be excreted unchanged in the
urine.
Molecular weight 244.382
Molecular formula C16H24N2
SMILES CC1=CC(=CC(=C1CC2=NCCN2)C)C(C)(C)C
Water solubility: 0.00893 mg/mL (DrugBank)
Log Kow 3.2 (PubChem)
Structure

292
Antihypertensives
Amlodipine
CAS number 88150-42-9
ATC code C08CA01
ATC name (2nd level,
therapeutic subgroup) CALCIUM CHANNEL BLOCKERS (C08)
ATC name (4th level,
chemical substance) Dihydropyridine derivatives (C08CA)
Uses Used to treat high blood pressure.
Mechanism of action
Dihydropyridine L-type calcium channel blocker that selectively inhibits
calcium influx in cardiac and vascular smooth muscle. Acting as a
vasodilator, amlodipine reduces blood pressure by relaxing the smooth
muscle in the arterial wall, decreasing total peripheral resistance.
Metabolism/Excretion
Extensively (about 90%) converted to inactive metabolites via hepatic
metabolism with 10% of the parent compound and 60% of the
metabolites excreted in urine.
Molecular weight 408.88
Molecular formula C20H25ClN2O5
SMILES CCOC(=O)C1=C(NC(=C(C1C2=CC=CC=C2Cl)C(=O)OC)C)COCCN
Water solubility: 5.3 mg/L at 25 deg C (est) (PubChem)
Log Kow 3.00 (PubChem)
Structure
Candesartan
CAS number 139481-59-7
ATC code C09CA06
ATC name (2nd
level, therapeutic
subgroup)
AGENTS ACTING ON THE RENIN-ANGIOTENSIN SYSTEM (C09)
ATC name (4th
level, chemical
substance)
Angiotensin II receptor blockers (ARBs), plain (C09CA)
Uses Used to treat high blood pressure.
Mechanism of
action
Candesartan lowers blood pressure by antagonizing the renin-angiotensin-
aldosterone system (RAAS); it competes with angiotensin II for binding to
the type-1 angiotensin II receptor (AT1) subtype and prevents the blood
pressure increasing effects of angiotensin II.
Metabolism/Excr
etion
The prodrug candesartan cilexetil undergoes rapid and complete ester
hydrolysis in the intestinal wall to form the active drug, candesartan.
Elimination of candesartan is primarily as unchanged drug in the urine and,
by the biliary route, in the feces. Minor hepatic metabolism of candesartan
(<20%) occurs by O-deethylation via cytochrome P450 2C9 to form an
inactive metabolite. Candesartan undergoes N-glucuronidation in the
tetrazole ring by uridine diphosphate glucuronosyltransferase 1A3
(UGT1A3). O-glucuronidation may also occur. 75% of candesartan is
excreted as unchanged drug in urine and feces.

293
Molecular weight 440.5
Molecular
formula C24H20N6O3
SMILES CCOC1=NC2=CC=CC(=C2N1CC3=CC=C(C=C3)C4=CC=CC=C4C5=N
NN=N5)C(=O)O
Water solubility: 1.4X10⁻¹ mg/L at 25 deg C (est) (PubChem)
Log Kow 4.79 (est) (PubChem)
Structure
Enalapril maleate salt
CAS number 75847-73-3
ATC code C09AA02
ATC name (2nd level,
therapeutic subgroup)
AGENTS ACTING ON THE RENIN–ANGIOTENSIN SYSTEM
(C09)
ATC name (4th level,
chemical substance) ACE inhibitors, plain (C09AA)
Uses
Used to treat high blood pressure in adults and children who are at least
1 month old. Enalapril is also used to treat congestive heart failure
(CHF).
Mechanism of action
The active metabolite of enalapril competitively inhibits the ACE to
hinder the production of angiotensin II, a key component of the renin-
angiotensin-aldosterone system that promotes vasoconstriction and
renal reabsorption of sodium ions in the kidneys. Ultimately, enalaprilat
works to reduce blood pressure and blood fluid volume.
Metabolism/Excretion
About 60% of the absorbed dose is extensively hydrolyzed to enalaprilat
via de-esterification mediated by hepatic esterases. Mainly eliminated
through renal excretion, where approximately 94% of the total dose is
excreted via urine or feces as either enalaprilat or unchanged parent
compound. About 61% and 33% of the total dose can be recovered in
the urine and feces, respectively. In the urine, about 40% of the
recovered dose is in the form of enalaprilat.
Molecular weight 376.2
Molecular formula C20H28N2O5
SMILES CCOC(=O)C(CCC1=CC=CC=C1)NC(C)C(=O)N2CCCC2C(=O)O
Water solubility: 1.64E+004 mg/L (PubChem)
Log Kow 0.07 at pH 4.9 (DrugBank)

294
Structure
Eprosartan
CAS number 133040-01-4
ATC code C09CA02
ATC name (2nd
level, therapeutic
subgroup)
AGENTS ACTING ON THE RENIN–ANGIOTENSIN SYSTEM (C09)
ATC name (4th
level, chemical
substance)
Angiotensin II receptor blockers (ARBs), plain (C09CA)
Uses Used to treat high blood pressure.
Mechanism of
action
Blocks the vasoconstrictor and aldosterone-secreting effects of angiotensin
II by selectively blocking the binding of angiotensin II to the AT1 receptor
found in many tissues (e.g., vascular smooth muscle, adrenal gland).
Metabolism/Excreti
on
Eprosartan is not metabolized by the cytochrome P450 system. It is
mainly eliminated as unchanged drug. Less than 2% of an oral dose is
excreted in the urine as a glucuronide.
Molecular weight 424.513
Molecular formula C23H24N2O4S
SMILES CCCCC1=NC=C(N1CC2=CC=C(C=C2)C(=O)O)C=C(CC3=CC=CS3)
C(=O)O
Water solubility: 1.9X10⁻² mg/L at 25 deg C (est) (PubChem)
Log Kow 6.37 (est) (PubChem)
Structure
Hydrochlorothiazide
CAS number 58-93-5
ATC code C03AA03
ATC name (2nd level,
therapeutic subgroup) DIURETICS (C03)
ATC name (4th level,
chemical substance) Thiazides, plain (C03AA)
Uses Used to treat high blood pressure (hypertension). Hydrochlorothiazide
is also used to treat fluid retention (edema) in people with congestive

295
heart failure, cirrhosis of the liver, or kidney disorders, or edema caused
by taking steroids or estrogen.
Mechanism of action
Hydrochlorothiazide acts on the distal convoluted tubules and inhibits
the sodium chloride co-transporter system. This action leads to a diuretic
action and loss of potassium in the urine.
Metabolism/Excretion Hydrochlorothiazide is not metabolized. Hydrochlorothiazide is
eliminated in the urine as unchanged hydrochlorothiazide.
Molecular weight 297.728
Molecular formula C7H8ClN3O4S2
SMILES C1NC2=CC(=C(C=C2S(=O)(=O)N1)S(=O)(=O)N)Cl
Water solubility: 722 mg/L at 25 deg C (PubChem)
Log Kow -0.07 (PubChem)
Structure
Irbesartan
CAS number 138402-11-6
ATC code C09CA04
ATC name (2nd
level, therapeutic
subgroup)
AGENTS ACTING ON THE RENIN–ANGIOTENSIN SYSTEM (C09)
ATC name (4th
level, chemical
substance)
Angiotensin II receptor blockers (ARBs), plain (C09CA)
Uses Used to treat high blood pressure (hypertension) and to help protect the
kidneys from damage due to diabetes.
Mechanism of
action
Irbesartan's prevention of angiotensin II binding causes vascular smooth
muscle relaxation and prevents the secretion of aldosterone, lowering blood
pressure
Metabolism/Excret
ion
Largely metabolized by glucuronidation and oxidation in the liver. 20% of
a radiolabelled oral dose of irbesartan is recovered in urine, and the rest is
recovered in the feces. <2% of the dose is recovered in urine as the
unchanged drug.
Molecular weight 428.54
Molecular formula C25H28N6O
SMILES CCCCC1=NC2(CCCC2)C(=O)N1CC3=CC=C(C=C3)C4=CC=CC=C4C5
=NNN=N5
Water solubility: 5.9X10⁻² mg/L at 25 deg C (est) (PubChem)
Log Kow 5.31 (est) (PubChem)
Structure

296
Losartan
CAS number 114798-26-4
ATC code C09CA01
ATC name (2nd
level, therapeutic
subgroup)
AGENTS ACTING ON THE RENIN–ANGIOTENSIN SYSTEM (C09)
ATC name (4th
level, chemical
substance)
Angiotensin II receptor blockers (ARBs), plain (C09CA)
Uses Used to treat high blood pressure (hypertension).
Mechanism of
action
Losartan reversibly and competitively prevents angiotensin II binding to
the AT1 receptor in tissues like vascular smooth muscle and the adrenal
gland. This causes vascular smooth muscle relaxation, lowering blood
pressure.
Metabolism/Excreti
on
Metabolized by the liver via the cytochrome P450 system. After single
doses of losartan administered orally, about 4% of the dose is excreted
unchanged in the urine and about 6% is excreted in urine as active
metabolite. Oral radiolabelled losartan is 35% recovered in urine and 60%
in feces.
Molecular weight 422.917
Molecular formula C22H23ClN6O
SMILES CCCCC1=NC(=C(N1CC2=CC=C(C=C2)C3=CC=CC=C3C4=NNN=N4
)CO)Cl
Water solubility: 8.22 mg/L at 25 deg C (est) (PubChem)
Log Kow 4.01 (est) (PubChem)
Structure
Ramipril
CAS number 87333-19-5
ATC code C09AA05
ATC name (2nd
level, therapeutic
subgroup)
AGENTS ACTING ON THE RENIN–ANGIOTENSIN SYSTEM (C09)
ATC name (4th
level, chemical
substance)
ACE inhibitors, plain (C09AA)
Uses Used to treat high blood pressure (hypertension) or congestive heart
failure, and to improve survival after a heart attack.
Mechanism of action
Angiotensin converting enzyme is a peptidyl dipeptidase that catalyzes
the conversion of angiotensin I to the vasoconstrictor substance,
angiotensin II. Angiotensin II also stimulates aldosterone secretion by
the adrenal cortex.
Metabolism/Excretio
n
Hepatic metabolism accounts for 75% of total ramipril metabolism.
25% of hepatic metabolism produces the active metabolite ramiprilat via

297
liver esterase enzymes. 100% of renal metabolism converts ramipril to
ramiprilat. Other metabolites, diketopiperazine ester, the
diketopiperazine acid, and the glucuronides of ramipril and ramiprilat,
are inactive. 60% of the parent drug and its metabolites are eliminated in
the urine with the remaining 40% eliminated in the feces. Less than 2%
is excreted in urine as unchanged drug.
Molecular weight 416.5
Molecular formula C23H32N2O5
SMILES CCOC(=O)C(CCC1=CC=CC=C1)NC(C)C(=O)N2C3CCCC3CC2C(=O
)O
Water solubility: 11.2 mg/L at 25 °C (est)
Log Kow 3.32 (est)
Structure
Telmisartan
CAS number 144701-48-4
ATC code C09CA07
ATC name (2nd
level, therapeutic
subgroup)
Agents acting on the renin–angiotensin system (C09)
ATC name (4th
level, chemical
substance)
Angiotensin II receptor blockers (ARBs), plain (C09CA)
Uses Used to treat high blood pressure (hypertension).
Mechanism of action
Interferes with the binding of angiotensin II to the angiotensin II AT1-
receptor by binding reversibly and selectively to the receptors in
vascular smooth muscle and the adrenal gland. As angiotensin II is a
vasoconstrictor, which also stimulates the synthesis and release of
aldosterone, blockage of its effects results in decreases in systemic
vascular resistance.
Metabolism/Excretio
n
Minimally metabolized by conjugation to form a pharmacologically
inactive acylglucuronide. The cytochrome P450 isoenzymes are not
involved in the metabolism of telmisartan. Eliminated unchanged in
faeces via biliary excretion (>97%); only minute amounts were
found in the urine.
Molecular weight 514.629
Molecular formula C33H30N4O2
SMILES CCCC1=NC2=C(C=C(C=C2N1CC3=CC=C(C=C3)C4=CC=CC=C4C(
=O)O)C5=NC6=CC=CC=C6N5C)C
Water solubility: 2.8X10⁻⁶ mgL at 25 deg C (est) (PubChem)
Log Kow 8.42 (est) (PubChem)

298
Structure
Valsartan
CAS number 137862-53-4
ATC code C09CA03
ATC name (2nd
level, therapeutic
subgroup)
AGENTS ACTING ON THE RENIN–ANGIOTENSIN SYSTEM (C09)
ATC name (4th
level, chemical
substance)
Angiotensin II receptor blockers (ARBs), plain (C09CA)
Uses Used to treat high blood pressure and congestive heart failure.
Mechanism of
action
Blocks the actions of angiotensin II, which include constricting blood
vessels and activating aldosterone, to reduce blood pressure. The drug
binds to angiotensin type I receptors (AT1), working as an antagonist.
Metabolism/Excret
ion
Valsartan undergoes minimal liver metabolism and is not biotransformed
to a high degree, as only approximately 20% of a single dose is recovered
as metabolites. The primary metabolite, accounting for about 9% of dose,
is valeryl 4-hydroxy valsartan. Valsartan is eliminated mostly by non-
renal routes. It is only slightly metabolized and excreted mainly
unchanged in bile (<80%) and urine (20%)
Molecular weight 435.528
Molecular formula C24H29N5O3
SMILES CCCCC(=O)N(CC1=CC=C(C=C1)C2=CC=CC=C2C3=NNN=N3)C(C(C
)C)C(=O)O
Water solubility: 1.406 mg/L at 25 °C (est) (PubChem)
Log Kow 4.00 (average value) (PubChem)
Structure

299
Metabolic disease medications
Allopurinol
CAS number 315-30-0
ATC code M04AA01
ATC name (2nd level,
therapeutic subgroup) ANTIGOUT PREPARATIONS (M04)
ATC name (4th level,
chemical substance) Preparations inhibiting uric acid production (M04AA)
Uses
Used to treat gout and certain types of kidney stones. It is also used to
prevent increased uric acid levels in patients receiving cancer
chemotherapy.
Mechanism of action
Allopurinol and its active metabolite inhibit xanthine oxidase, the
enzyme that converts hypoxanthine to xanthine and xanthine to uric
acid. The end result is decreased urine and serum uric acid
concentrations, which decreases the incidence of gout symptoms.
Metabolism/Excretion
Rapidly metabolized to oxipurinol (alloxanthine). Elimination of
allopurinol is mainly by metabolic conversion to oxipurinol by xanthine
oxidase and aldehyde oxidase, with less than 10% of the unchanged
drug excreted in the urine. About 20% of ingested allopurinol is
excreted in the feces.
Molecular weight 136.114
Molecular formula C5H4N4O
SMILES C1=C2C(=NC=NC2=O)NN1
Water solubility: Solubility in water at 37°C is 80.0 mg/dL and is greater in an alkaline
solution (DrugBank)
Log Kow -0.55 (DrugBank)
Structure
Atorvastatin
CAS number 110862-48-1
ATC code C10AA05
ATC name
(2nd level,
therapeutic
subgroup)
LIPID MODIFYING AGENTS (C10)
ATC name
(4th level,
chemical
substance)
HMG CoA reductase inhibitors (C10AA)
Uses
Used to treat high cholesterol, and to lower the risk of stroke, heart attack, or
other heart complications in people with type 2 diabetes, coronary heart disease,
or other risk factors.
Mechanism of
action
Lipid-lowering drug belonging to the statin class of medications. By inhibiting
the endogenous production of cholesterol within the liver, statins lower
abnormal cholesterol and lipid levels and ultimately reduce the risk of
cardiovascular disease. More specifically, statin medications competitively

300
inhibit the enzyme hydroxymethylglutaryl-coenzyme A (HMG-CoA)
Reductase,8 which catalyzes the conversion of HMG-CoA to mevalonic acid.
Metabolism/Ex
cretion
Extensively metabolized to its ortho- and para-hydroxylated derivatives, and to
various beta oxidation products. Less than 2% of a dose of atorvastatin is
excreted in urine following oral administration.
Molecular
weight 558.6
Molecular
formula C33H35FN2O5
SMILES CC(C)C1=C(C(=C(N1CCC(CC(CC(=O)O)O)O)C2=CC=C(C=C2)F)C3=CC
=CC=C3)C(=O)NC4=CC=CC=C4
Water
solubility: 0.00063 mg/mL (PubChem)
Log Kow 6.36 (est) (PubChem)
Structure
Bezafibrate
CAS number 41859-67-0
ATC code C10AB02
ATC name (2nd level,
therapeutic subgroup) LIPID MODIFYING AGENTS (C10)
ATC name (4th level,
chemical substance) Fibrates (C10AB)
Uses Used as a lipid-lowering agent to treat hyperlipidaemia.
Mechanism of action Antilipemic agent that lowers cholesterol and triglycerides. It decreases
low density lipoproteins and increases high density lipoproteins.
Metabolism/Excretion
Hepatic. Bezafibrate is rapidly and almost entirely eliminated via the
kidneys, some of it in metabolised form. A study in volunteers showed
that following oral administration, 95% of active 14C-labelled
bezafibrate is excreted in the urine and 3% in the faeces within 48 hours.
50% of the administered dose appears in urine as unchanged
bezafibrate, 20% in the form of glucuronides.
Molecular weight 361.8
Molecular formula C19H20ClNO4
SMILES CC(C)(C(=O)O)OC1=CC=C(C=C1)CCNC(=O)C2=CC=C(C=C2)Cl
Water solubility: 0.00155 mg/mL (DrugBank)
Log Kow
Structure

301
Gemfibrozil
CAS number 25812-30-0
ATC code C10AB04
ATC name (2nd level,
therapeutic subgroup) LIPID MODIFYING AGENTS (C10)
ATC name (4th level,
chemical substance) Fibrates (C10AB)
Uses
Used to treat very high cholesterol and triglyceride levels in people with
pancreatitis and is also used to lower the risk of stroke, heart attack, or
other heart complications in people with high cholesterol and
triglycerides who have not been helped by other treatments.
Mechanism of action
Gemfibrozil activates peroxisome proliferator-activated receptor-α
(PPARα), which alters lipid metabolism. This activation leads to
increased HDL, apo AI, apo AII, lipoprotein lipase (LPL), inhibition of
apo B synthesis, peripheral lipolysis, decreased removal of free fatty
acids by the liver, and increased clearance of apoB.
Metabolism/Excretion
Gemfibrozil undergoes hydroxylation at the 5'-methyl and 4' positions
to form the M1 and M2 metaolites respectively. Gemfibrozil also
undergoes O-glucuronidation to form gemfibrozil 1-beta glucuronide,
an inhibitor of CYP2C8. Approximately 70% of a dose of gemfibrozil
is eliminated in the urine. The majority of a dose is eliminated as a
glucuronide conjugate and <2% is eliminated as the unmetabolized
drug. 6% of a dose is eliminated in the feces.
Molecular weight 250.338
Molecular formula C15H22O3
SMILES CC1=CC(=C(C=C1)C)OCCCC(C)(C)C(=O)O
Water solubility: 11 mg/L at 25 deg C (est) (PubChem)
Log Kow 4.77 (est) (PubChem)
Structure
Metformin
CAS number 657-24-9
ATC code A10BA02
ATC name (2nd level,
therapeutic subgroup) DRUGS USED IN DIABETES (A10)
ATC name (4th level,
chemical substance) Biguanides (A10BA)
Uses
Used together with diet and exercise to improve blood sugar control in
adults with type 2 diabetes mellitus. Metformin is sometimes used
together with insulin or other medications, but it is not for treating type
1 diabetes.
Mechanism of action
Decreases hepatic glucose production, decreases intestinal absorption of
glucose, and improves insulin sensitivity by increasing peripheral
glucose uptake and utilization.
Metabolism/Excretion Metformin is not metabolized. It is cleared from the body by tubular
secretion and excreted unchanged in the urine.

302
Molecular weight 129.167
Molecular formula C4H11N5
SMILES CN(C)C(=N)N=C(N)N
Water solubility: 1.06X10+6 mg/L (miscible) at 25 °C (est) (PubChem)
Log Kow -2.64 at 25 °C (est) (PubChem)
Structure
Simvastatin
CAS number 79902-63-9
ATC code C10AA01
ATC name (2nd level,
therapeutic subgroup) LIPID MODIFYING AGENTS (C10)
ATC name (4th level,
chemical substance) HMG CoA reductase inhibitors (C10AA)
Uses
Used along with a proper diet to help lower "bad" cholesterol and fats
(such as LDL, triglycerides) and raise "good" cholesterol (HDL) in the
blood.
Mechanism of action
Simvastatin is a specific inhibitor of 3-hydroxy-3-methylglutaryl-
coenzyme A (HMG-CoA) reductase, the enzyme that catalyzes the
conversion of HMG-CoA to mevalonate, an early and rate limiting step
in the biosynthetic pathway for cholesterol.
Metabolism/Excretion
Administered as the inactive lactone derivative that is then
metabolically activated to its β-hydroxyacid form. Oxidative
metabolism in the liver is primarily mediated by CYP3A4 and
CYP3A5, with the remaining metabolism occurring through CYP2C8
and CYP2C9. Following an oral dose of 14C-labeled simvastatin in
man, 13% of the dose was excreted in urine and 60% in feces.
Molecular weight 418.574
Molecular formula C25H38O5
SMILES CCC(C)(C)C(=O)OC1CC(C=C2C1C(C(C=C2)C)CCC3CC(CC(=O)O
3)O)C
Water solubility: 3.0X10⁻² mg/L (DrugBank)
Log Kow 4.68 (DrugBank)
Structure

303
Other cardiovascular medicines
Acetylsalicylic acid
CAS number 50-78-2
ATC code B01AC06
ATC name (2nd level,
therapeutic subgroup) ANTITHROMBOTIC AGENTS (B01)
ATC name (4th level,
chemical substance) Platelet aggregation inhibitors excl. Heparin (B01AC)
Uses Used in the prevention of blood clots stroke, and myocardial infarction
(MI)
Mechanism of action
Blocks prostaglandin synthesis. It is non-selective for COX-1 and COX-
2 enzymes. Inhibition of COX-1 results in the inhibition of platelet
aggregation. The acetyl group of acetylsalicylic acid binds with a serine
residue of the cyclooxygenase-1 (COX-1) enzyme, leading to
irreversible inhibition. This stops the conversion of arachidonic acid to
thromboxane A2 (TXA2), which is a potent inducer of platelet
aggregation.
Metabolism/Excretion
Acetylsalicylic acid is hydrolyzed in the plasma to salicylic acid.
Salicylate is mainly metabolized in the liver. Elimination mainly
through the kidney, by the processes of glomerular filtration and tubular
excretion, in the form of free salicylic acid, salicyluric acid, and,
additionally, phenolic and acyl glucuronides. Salicylate can be found in
the urine soon after administration, however, the entire dose takes about
48 hours to be completely eliminated. The rate of salicylate is often
variable, ranging from 10% to 85% in the urine, and heavily depends on
urinary pH. Acidic urine generally aids in reabsorption of salicylate by
the renal tubules, while alkaline urine increases excretion.
Molecular weight 180.159
Molecular formula C9H8O4
SMILES CC(=O)OC1=CC=CC=C1C(=O)O
Water solubility: 1.19 (PubChem)
Log Kow 4,600 mg/L at 25 °C (PubChem)
Structure
Atenolol
CAS number 29122-68-7
ATC code C07AB03
ATC name (2nd level,
therapeutic subgroup) BETA BLOCKING AGENTS (C07)
ATC name (4th level,
chemical substance) Beta blocking agents, selective (C07AB)
Uses Used with or without other medications to treat high blood pressure.
Mechanism of action Selectively binds to the β1-adrenergic receptor as an antagonist.
Metabolism/Excretion Hydrophilic drug, which is predominantly eliminated via the kidneys,
only about 5% of the atenolol is metabolised by the liver. About 40%
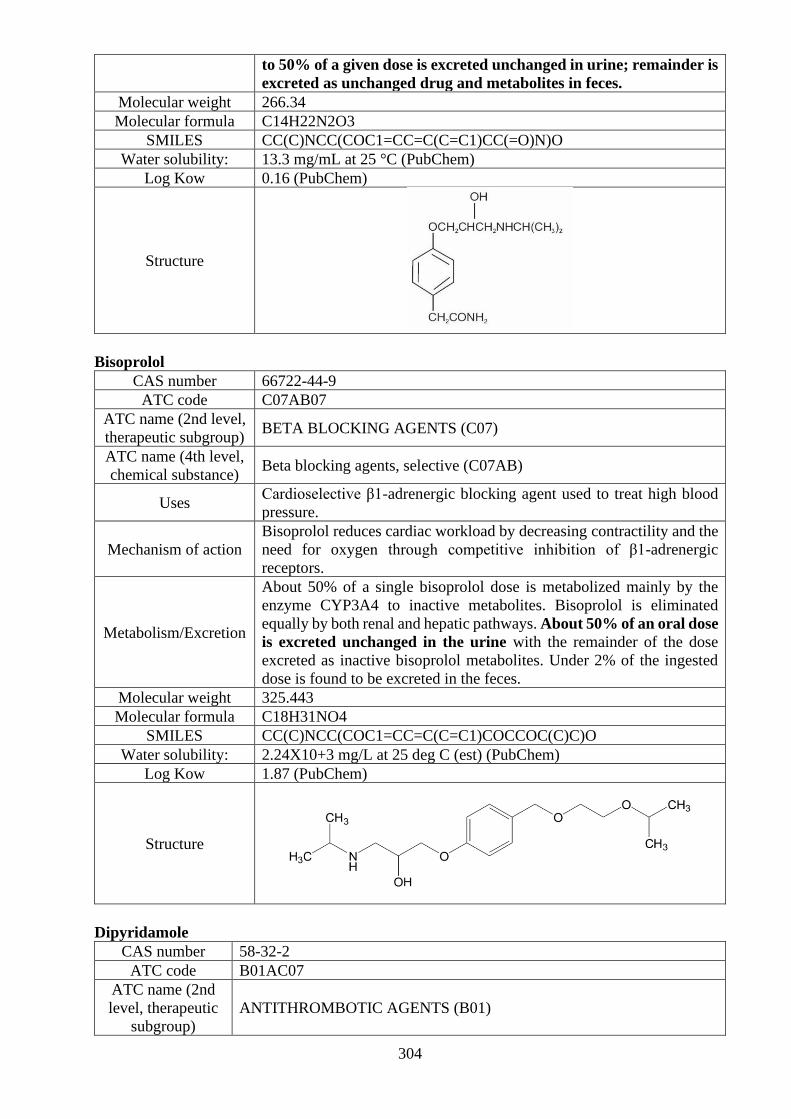
304
to 50% of a given dose is excreted unchanged in urine; remainder is
excreted as unchanged drug and metabolites in feces.
Molecular weight 266.34
Molecular formula C14H22N2O3
SMILES CC(C)NCC(COC1=CC=C(C=C1)CC(=O)N)O
Water solubility: 13.3 mg/mL at 25 °C (PubChem)
Log Kow 0.16 (PubChem)
Structure
Bisoprolol
CAS number 66722-44-9
ATC code C07AB07
ATC name (2nd level,
therapeutic subgroup) BETA BLOCKING AGENTS (C07)
ATC name (4th level,
chemical substance) Beta blocking agents, selective (C07AB)
Uses Cardioselective β1-adrenergic blocking agent used to treat high blood
pressure.
Mechanism of action
Bisoprolol reduces cardiac workload by decreasing contractility and the
need for oxygen through competitive inhibition of β1-adrenergic
receptors.
Metabolism/Excretion
About 50% of a single bisoprolol dose is metabolized mainly by the
enzyme CYP3A4 to inactive metabolites. Bisoprolol is eliminated
equally by both renal and hepatic pathways. About 50% of an oral dose
is excreted unchanged in the urine with the remainder of the dose
excreted as inactive bisoprolol metabolites. Under 2% of the ingested
dose is found to be excreted in the feces.
Molecular weight 325.443
Molecular formula C18H31NO4
SMILES CC(C)NCC(COC1=CC=C(C=C1)COCCOC(C)C)O
Water solubility: 2.24X10+3 mg/L at 25 deg C (est) (PubChem)
Log Kow 1.87 (PubChem)
Structure
Dipyridamole
CAS number 58-32-2
ATC code B01AC07
ATC name (2nd
level, therapeutic
subgroup)
ANTITHROMBOTIC AGENTS (B01)

305
ATC name (4th
level, chemical
substance)
Platelet aggregation inhibitors excl. Heparin (B01AC)
Uses Used to prevent blood clots after heart valve replacement surgery.
Mechanism of
action
Likely inhibits both adenosine deaminase and phosphodiesterase,
preventing the degradation of cAMP, an inhibitor of platelet function. This
elevation in cAMP blocks the release of arachidonic acid from membrane
phospholipids and reduces thromboxane A2 activity. Dipyridamole also
directly stimulates the release of prostacyclin, which induces adenylate
cyclase activity, thereby raising the intraplatelet concentration of cAMP and
further inhibiting platelet aggregation.
Metabolism/Excret
ion
Dipyridamole is highly protein-bound, averaging 91 to 99%. undergoes
hepatic metabolism, primarily glucuronidation, and these glucuronide
conjugates are eliminated mainly in the feces, although enterohepatic
circulation can occur. A small amount of dipyridamole and its conjugates
may be excreted in the urine.
Molecular weight 504.636
Molecular formula C24H40N8O4
SMILES C1CCN(CC1)C2=NC(=NC3=C2N=C(N=C3N4CCCCC4)N(CCO)CCO)
N(CCO)CCO
Water solubility: 10.7 ug/mL (PubChem)
Log Kow 1.5 (DrugBank)
Structure
Furosemide
CAS number 54-31-9
ATC code C03CA01
ATC name (2nd level,
therapeutic subgroup) DIURETICS (C03)
ATC name (4th level,
chemical substance) Sulfonamides, plain (C03CA)
Uses Used to treat fluid retention (edema) in people with congestive heart
failure, liver disease, or a kidney disorder such as nephrotic syndrome.
Mechanism of action
Furosemide is a loop diuretic (water pill) that prevents your body from
absorbing too much salt. This allows the salt to instead be passed in your
urine.
Metabolism/Excretion
Mainly occurs in the kidneys and in the liver to a smaller extent. The
kidneys are responsible for 85% of total furosemide total clearance,
where about 43% of the drug undergoes renal excretion. Approximately
65% of furosemide is excreted unchanged in the urine, and the
remainder is conjugated to glucuronic acid in the kidney. Two major
metabolites of furosemide are furosemide glucuronide and saluamine
(CSA). Furosemide glucuronide is an active metabolite that also
mediates a diuretic effect.
Molecular weight 330.008
Molecular formula C12H11ClN2O5S
SMILES C1=COC(=C1)CNC2=CC(=C(C=C2C(=O)O)S(=O)(=O)N)C
Water solubility: 73.1 mg/L (at 30 °C) (DrugBank)
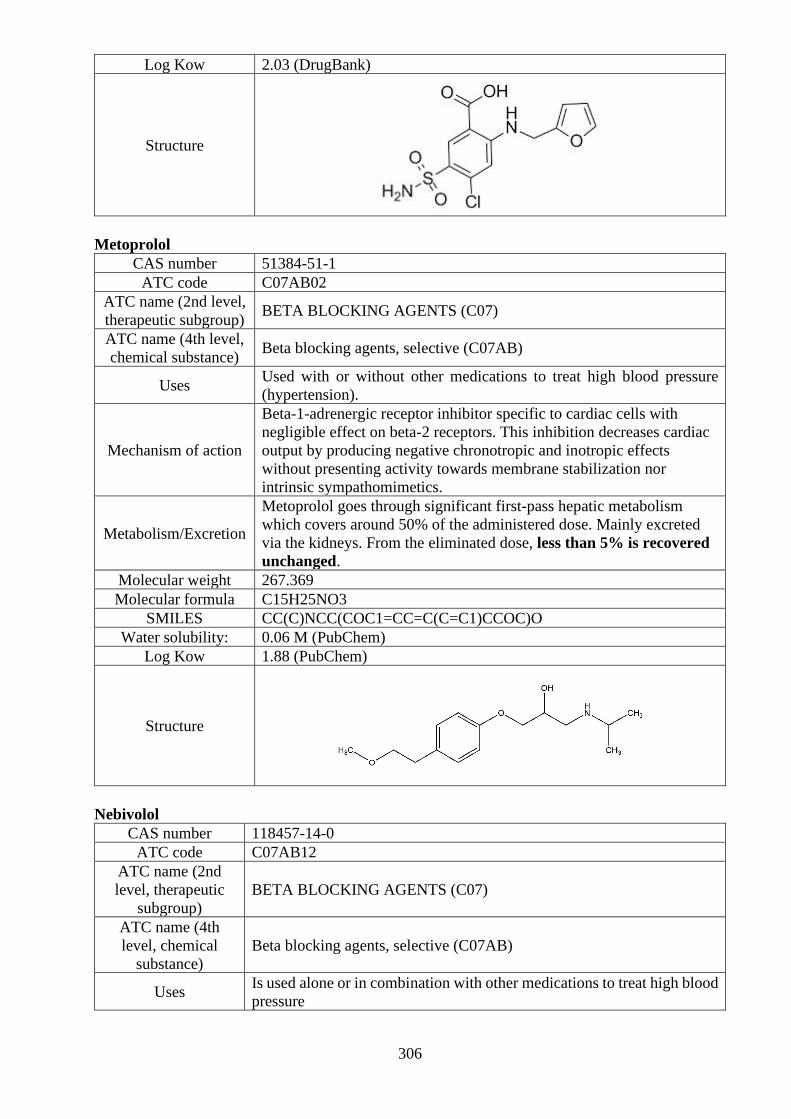
306
Log Kow 2.03 (DrugBank)
Structure
Metoprolol
CAS number 51384-51-1
ATC code C07AB02
ATC name (2nd level,
therapeutic subgroup) BETA BLOCKING AGENTS (C07)
ATC name (4th level,
chemical substance) Beta blocking agents, selective (C07AB)
Uses Used with or without other medications to treat high blood pressure
(hypertension).
Mechanism of action
Beta-1-adrenergic receptor inhibitor specific to cardiac cells with
negligible effect on beta-2 receptors. This inhibition decreases cardiac
output by producing negative chronotropic and inotropic effects
without presenting activity towards membrane stabilization nor
intrinsic sympathomimetics.
Metabolism/Excretion
Metoprolol goes through significant first-pass hepatic metabolism
which covers around 50% of the administered dose. Mainly excreted
via the kidneys. From the eliminated dose, less than 5% is recovered
unchanged.
Molecular weight 267.369
Molecular formula C15H25NO3
SMILES CC(C)NCC(COC1=CC=C(C=C1)CCOC)O
Water solubility: 0.06 M (PubChem)
Log Kow 1.88 (PubChem)
Structure
Nebivolol
CAS number 118457-14-0
ATC code C07AB12
ATC name (2nd
level, therapeutic
subgroup)
BETA BLOCKING AGENTS (C07)
ATC name (4th
level, chemical
substance)
Beta blocking agents, selective (C07AB)
Uses Is used alone or in combination with other medications to treat high blood
pressure
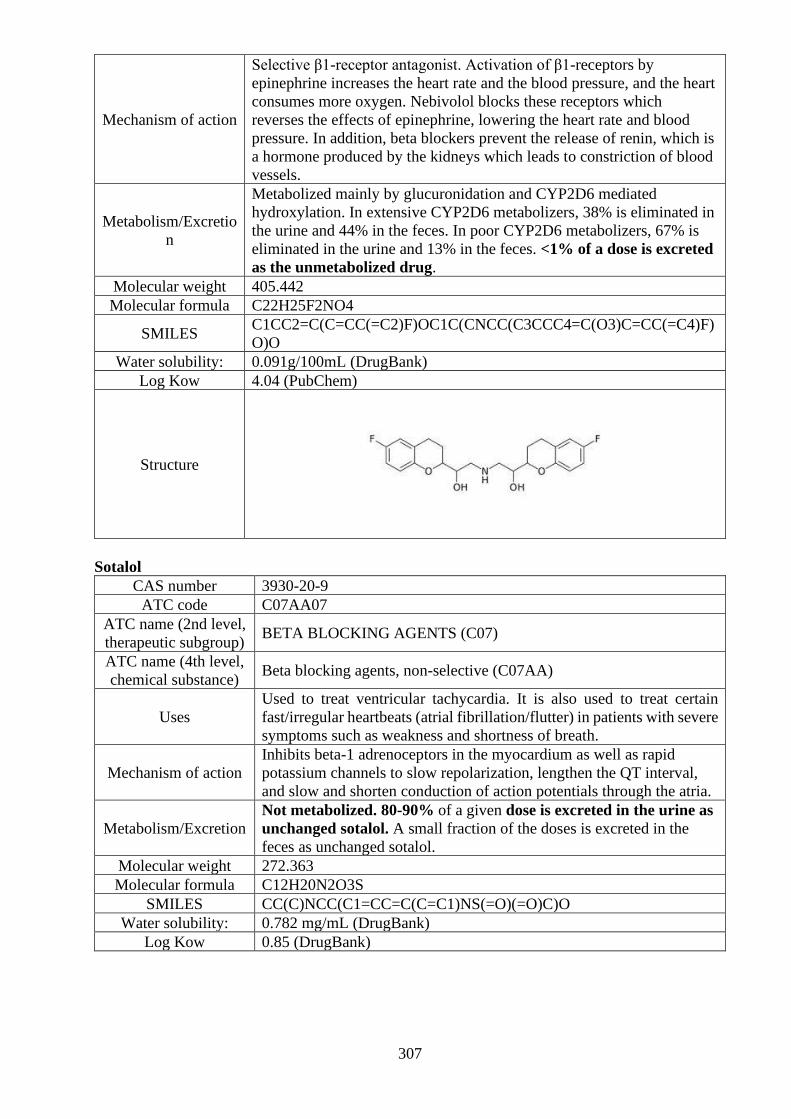
307
Mechanism of action
Selective β1-receptor antagonist. Activation of β1-receptors by
epinephrine increases the heart rate and the blood pressure, and the heart
consumes more oxygen. Nebivolol blocks these receptors which
reverses the effects of epinephrine, lowering the heart rate and blood
pressure. In addition, beta blockers prevent the release of renin, which is
a hormone produced by the kidneys which leads to constriction of blood
vessels.
Metabolism/Excretio
n
Metabolized mainly by glucuronidation and CYP2D6 mediated
hydroxylation. In extensive CYP2D6 metabolizers, 38% is eliminated in
the urine and 44% in the feces. In poor CYP2D6 metabolizers, 67% is
eliminated in the urine and 13% in the feces. <1% of a dose is excreted
as the unmetabolized drug.
Molecular weight 405.442
Molecular formula C22H25F2NO4
SMILES C1CC2=C(C=CC(=C2)F)OC1C(CNCC(C3CCC4=C(O3)C=CC(=C4)F)
O)O
Water solubility: 0.091g/100mL (DrugBank)
Log Kow 4.04 (PubChem)
Structure
Sotalol
CAS number 3930-20-9
ATC code C07AA07
ATC name (2nd level,
therapeutic subgroup) BETA BLOCKING AGENTS (C07)
ATC name (4th level,
chemical substance) Beta blocking agents, non-selective (C07AA)
Uses
Used to treat ventricular tachycardia. It is also used to treat certain
fast/irregular heartbeats (atrial fibrillation/flutter) in patients with severe
symptoms such as weakness and shortness of breath.
Mechanism of action
Inhibits beta-1 adrenoceptors in the myocardium as well as rapid
potassium channels to slow repolarization, lengthen the QT interval,
and slow and shorten conduction of action potentials through the atria.
Metabolism/Excretion
Not metabolized. 80-90% of a given dose is excreted in the urine as
unchanged sotalol. A small fraction of the doses is excreted in the
feces as unchanged sotalol.
Molecular weight 272.363
Molecular formula C12H20N2O3S
SMILES CC(C)NCC(C1=CC=C(C=C1)NS(=O)(=O)C)O
Water solubility: 0.782 mg/mL (DrugBank)
Log Kow 0.85 (DrugBank)

308
Structure
Warfarin
CAS number 81-81-2
ATC code B01AA03
ATC name (2nd level,
therapeutic subgroup) ANTITHROMBOTIC AGENTS (B01)
ATC name (4th level,
chemical substance) Vitamin K antagonists (B01AA)
Uses
Used to treat or prevent blood clots in veins or arteries, which can reduce
the risk of stroke, heart attack, or other serious conditions. Warfarin is
an anticoagulant (blood thinner).
Mechanism of action Warfarin reduces the formation of blood clots.
Metabolism/Excretion
Warfarin occurs as a pair of enantiomers that are
differentially metabolized by human cytochromes P450. The
elimination of warfarin is almost entirely by metabolism with a small
amount excreted unchanged. 80% of the total dose is excreted in the
urine with the remaining 20% appearing in the feces.
Molecular weight 308.333
Molecular formula C19H16O4
SMILES CC(=O)CC(C1=CC=CC=C1)C2=C(C3=CC=CC=C3OC2=O)O
Water solubility: 17 mg/L at 20 °C (DrugBank)
Log Kow 2.70 (DrugBank)
Structure
Antiepileptics
Carbamazepine
CAS number 298-46-4
ATC code N03AF01
ATC name (2nd level,
therapeutic subgroup) ANTIEPILEPTICS (N03)
ATC name (4th level,
chemical substance) Carboxamide derivatives (N03AF)

309
Uses Anticonvulsant drug and analgesic drug used to control seizures and to
treat pain resulting from trigeminal neuralgia.
Mechanism of action
Carbamazepine exerts its anticonvulsant activity by reducing
polysynaptic responses and blocking post-tetanic potentiation. Its
analgesic activity is not understood; however, carbamazepine is
commonly used to treat pain associated with trigeminal neuralgia.
Metabolism/Excretion
Carbamazepine can induce its own metabolism. It is metabolized in the
liver to an epoxide and several other metabolites. Carbamazepine and its
metabolites are excreted in the urine. After oral administration, 72% of
the dose is excreted in the urine and 28% is eliminated in the faeces.
Only about 1 to 3% of the drug is excreted unchanged in the urine.
Molecular weight 236.27
Molecular formula C15H12N2O
SMILES C1=CC=C2C(=C1)C=CC3=CC=CC=C3N2C(=O)N
Water solubility: 0.152 mg/mL (DrugBank)
Log Kow 2.45 (PubChem)
Structure
Gabapentin
CAS number 60142-96-3
ATC code N03AX12
ATC name (2nd level,
therapeutic subgroup) ANTIEPILEPTICS (N03)
ATC name (4th level,
chemical substance) Other antiepileptics (N03AX)
Uses
Used with other medications to prevent and control seizures. It is also
used to relieve nerve pain following shingles (a painful rash due to
herpes zoster infection) in adults.
Mechanism of action
Gabapentin was designed to mimic the neurotransmitter GABA. It does
not, however, bind to GABA receptors. Its mechanism of action as an
antiepileptic agent likely involves its inhibition of the alpha 2-delta
subunit of voltage-gated calcium channels.
Metabolism/Excretion
Gabapentin is not appreciably metabolized in humans - in humans,
metabolites account for less than 1% of an administered dose, with the
remainder being excreted as unchanged parent drug in the urine.
Molecular weight 171.24
Molecular formula C9H17NO2
SMILES C1CCC(CC1)(CC(=O)O)CN
Water solubility: 4.49X10+3 mg/L at 25 C (PubChem)
Log Kow 1.10 (PubChem)

310
Structure
Levetiracetam
CAS number 102767-28-2
ATC code N03AX14
ATC name (2nd level,
therapeutic subgroup) ANTIEPILEPTICS (N03)
ATC name (4th level,
chemical substance) Other antiepileptics (N03AX)
Uses Used in combination with other medications to treat seizure disorders
(epilepsy).
Mechanism of action Stimulation of pre-synaptic SV2A by levetiracetam may inhibit
neurotransmitter release.
Metabolism/Excretion
Levetiracetam is minimally metabolized within the body - the major
metabolic pathway appears to be the enzymatic hydrolysis of its
acetamide group which produces an inactive carboxylic acid
metabolite, L057, which accounts for approximately 24% of the total
administered dose. Approximately 66% of the administered dose of
levetiracetam is excreted in the urine as unchanged drug, while
only 0.3% of the total dose is excreted via the feces.
Molecular weight 170.212
Molecular formula C8H14N2O2
SMILES CCC(C(=O)N)N1CCCC1=O
Water solubility: 104.0 g/100 mL (PubChem)
Log Kow -0.49 (est) (PubChem)
Structure
Primidone
CAS number 125-33-7
ATC code N03AA03
ATC name (2nd level,
therapeutic subgroup) ANTIEPILEPTICS (N03)
ATC name (4th level,
chemical substance) Barbiturates and derivatives (N03AA)
Uses Used alone or with other medications for treating grand mal,
psychomotor, or focal epileptic seizures.
Mechanism of action Primidone is a GABA receptor agonist. The mechanism of Primidone's
antiepileptic action is not known.
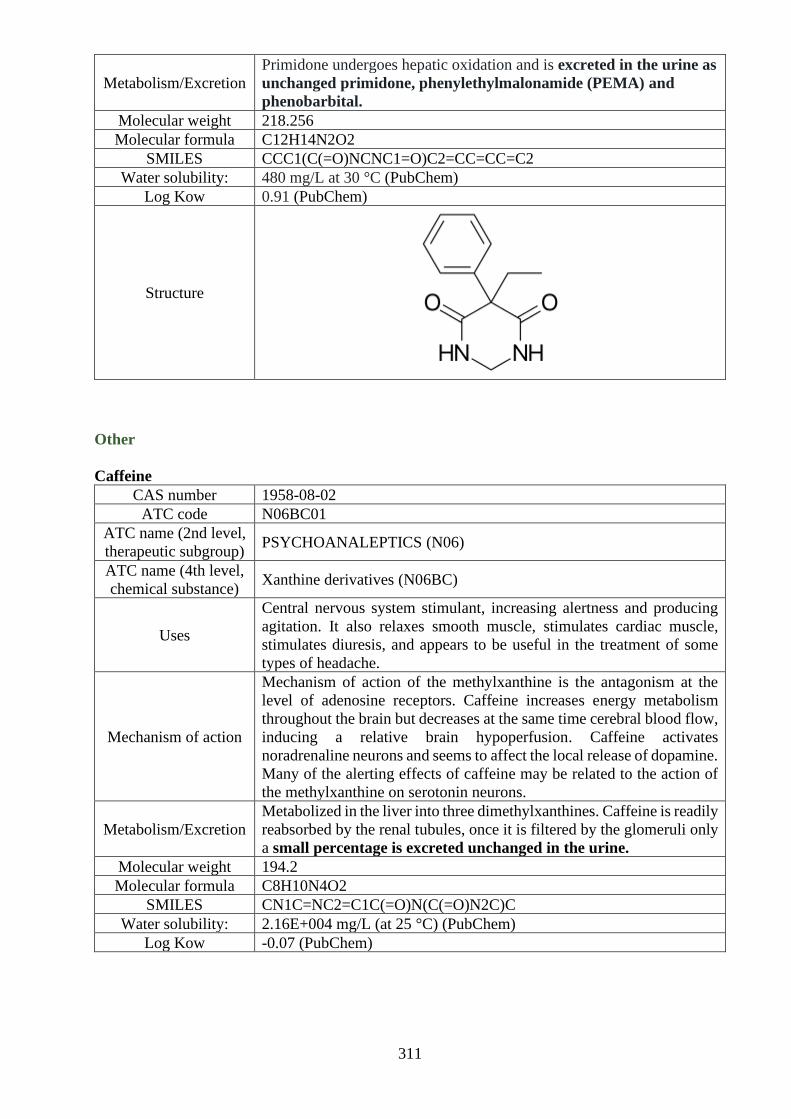
311
Metabolism/Excretion
Primidone undergoes hepatic oxidation and is excreted in the urine as
unchanged primidone, phenylethylmalonamide (PEMA) and
phenobarbital.
Molecular weight 218.256
Molecular formula C12H14N2O2
SMILES CCC1(C(=O)NCNC1=O)C2=CC=CC=C2
Water solubility: 480 mg/L at 30 °C (PubChem)
Log Kow 0.91 (PubChem)
Structure
Other
Caffeine
CAS number 1958-08-02
ATC code N06BC01
ATC name (2nd level,
therapeutic subgroup) PSYCHOANALEPTICS (N06)
ATC name (4th level,
chemical substance) Xanthine derivatives (N06BC)
Uses
Central nervous system stimulant, increasing alertness and producing
agitation. It also relaxes smooth muscle, stimulates cardiac muscle,
stimulates diuresis, and appears to be useful in the treatment of some
types of headache.
Mechanism of action
Mechanism of action of the methylxanthine is the antagonism at the
level of adenosine receptors. Caffeine increases energy metabolism
throughout the brain but decreases at the same time cerebral blood flow,
inducing a relative brain hypoperfusion. Caffeine activates
noradrenaline neurons and seems to affect the local release of dopamine.
Many of the alerting effects of caffeine may be related to the action of
the methylxanthine on serotonin neurons.
Metabolism/Excretion
Metabolized in the liver into three dimethylxanthines. Caffeine is readily
reabsorbed by the renal tubules, once it is filtered by the glomeruli only
a small percentage is excreted unchanged in the urine.
Molecular weight 194.2
Molecular formula C8H10N4O2
SMILES CN1C=NC2=C1C(=O)N(C(=O)N2C)C
Water solubility: 2.16E+004 mg/L (at 25 °C) (PubChem)
Log Kow -0.07 (PubChem)

312
Structure
Psycopharmaceuticals
Citalopram
CAS number 59729-33-8
ATC code N06AB04
ATC name (2nd level,
therapeutic subgroup) PSYCHOANALEPTICS (N06)
ATC name (4th level,
chemical substance) Selective serotonin reuptake inhibitors (N06AB)
Uses Used to treat depression.
Mechanism of action Inhibits neuronal reuptake of serotonin.
Metabolism/Excretion
Citalopram is metabolized mainly in the liver via N-demethylation to
its main metabolite, demethylcitalopram by CYP2C19 and CYP3A4.
12-23% of an oral dose of citalopram is found unchanged in the
urine, while 10% of the dose is found in the faeces.
Molecular weight 324.4
Molecular formula C20H21FN2O
SMILES CN(C)CCCC1(OCC2=C1C=CC(=C2)C#N)C1=CC=C(F)C=C1
Water solubility: 31.09 mg/L at 25 deg C (est) (PubChem)
Log Kow 3.74 (est) (PubChem)
Structure
Olanzapine
CAS number 132539-06-1
ATC code N05AH03
ATC name (2nd level,
therapeutic subgroup) PSYCHOLEPTICS (N05)
ATC name (4th level,
chemical substance) Diazepines, oxazepines, thiazepines and oxepines (N05AH)
Uses
Used to treat certain mental/mood conditions (such as schizophrenia,
bipolar disorder). It may also be used in combination with other
medication to treat depression.
Mechanism of action
The exact mechanism of action of olanzapine is not known. It may work
by blocking receptors for several neurotransmitters (chemicals that
nerves use to communicate with each other) in the brain. It binds to

313
alpha-1, dopamine, histamine H-1, muscarinic, and serotonin type 2 (5-
HT2) receptors.
Metabolism/Excretion
Greatly metabolized in the liver, which represents around 40% of the
administered dose, mainly by the activity of glucuronide enzymes and
by the CYP450 system. Mainly eliminated through metabolism and
hence, only 7% of the eliminated drug can be found as the
unchanged form. It is mainly excreted in the urine which represents
around 53% of the excreted dose followed by the feces that represent
about 30%.
Molecular weight 312.435
Molecular formula C17H20N4S
SMILES CC1=CC2=C(S1)NC3=CC=CC=C3N=C2N4CCN(CC4)C
Water solubility: 39.88 mg/L at 25 °C (est) (PubChem)
Log Kow 3.00 (PubChem)
Structure
Oxazepam
CAS number 604-75-1
ATC code N05BA04
ATC name (2nd level,
therapeutic subgroup) PSYCHOLEPTICS (N05)
ATC name (4th level,
chemical substance) Benzodiazepine derivatives (N05BA)
Uses Used to treat anxiety and also acute alcohol withdrawal.
Mechanism of action Mechanism of action appears to be via potentiation of gamma
aminobutyric acid (GABA)-receptor–mediated effects in the CNS.
Metabolism/Excretion
Oxazepam is one of the active products of metabolism from diazepam.
It is hepatically metabolized and undergoes glucuronidation. It is
metabolized in the liver to inactive metabolites. Metabolites are
excreted in urine as glucuronide conjugates.
Molecular weight 286.71
Molecular formula C15H11ClN2O2
SMILES C1=CC=C(C=C1)C2=NC(C(=O)NC3=C2C=C(C=C3)Cl)O
Water solubility: 0.02 g/L at 22 °C (PubChem)
Log Kow 2.24 at pH 7.4 (PubChem)
Structure

314
Quetiapine
CAS number 111974-69-7
ATC code N05AH04
ATC name (2nd level,
therapeutic subgroup) PSYCHOLEPTICS (N05)
ATC name (4th level,
chemical substance) Diazepines, oxazepines, thiazepines and oxepines (N05AH)
Uses
Used to treat certain mental/mood conditions (such as schizophrenia,
bipolar disorder, sudden episodes of mania or depression associated with
bipolar disorder).
Mechanism of action
Although the mechanism of action of quetiapine is not fully understood,
several proposed mechanisms exist. In schizophrenia, its actions could
occur from the antagonism of dopamine type 2 (D2) and serotonin 2A
(5HT2A) receptors. In bipolar depression and major depression,
quetiapine's actions may be attributed to the binding of this drug or its
metabolite to the norepinephrine transporter.
Metabolism/Excretion
The metabolism of quetiapine occurs mainly in the liver. Sulfoxidation
and oxidation are the main metabolic pathways of this drug. After an
oral dose of radiolabeled quetiapine, less than 1% of unchanged drug
was detected in the urine, suggesting that quetiapine is heavily
metabolized. About 73% of a dose was detected in the urine, and about
20% in the feces.
Molecular weight 383.51
Molecular formula C21H25N3O2S
SMILES C1CN(CCN1CCOCCO)C2=NC3=CC=CC=C3SC4=CC=CC=C42
Water solubility: 0.5869 mg/L at 25 °C (est) (PubChem)
Log Kow 3.17 (est) (PubChem)
Structure
Risperidone
CAS number 106266-06-2
ATC code N05AX08
ATC name (2nd level,
therapeutic subgroup) PSYCHOLEPTICS (N05)
ATC name (4th level,
chemical substance) Other antipsychotics (N05AX)
Uses
Used to treat certain mental/mood disorders (such as schizophrenia,
bipolar disorder, irritability associated with autistic disorder). This
medication can help you to think clearly and take part in everyday life.
Mechanism of action
Has a higher affinity for 5-HT2A receptors than for D2 receptors).
According to the dopamine theory of schizophrenia, the mechanism of
action of risperidone might involve a reduction of dopaminergic
neurotransmission in the mesolimbic pathway.
Metabolism/Excretion
Extensively metabolized by hepatic cytochrome P450 2D6 isozyme to
9-hydroxyrisperidone, which has approximately the same receptor
binding affinity as risperidone. Risperidone and its metabolites are
eliminated via the urine and, to a much lesser extent, via the feces.
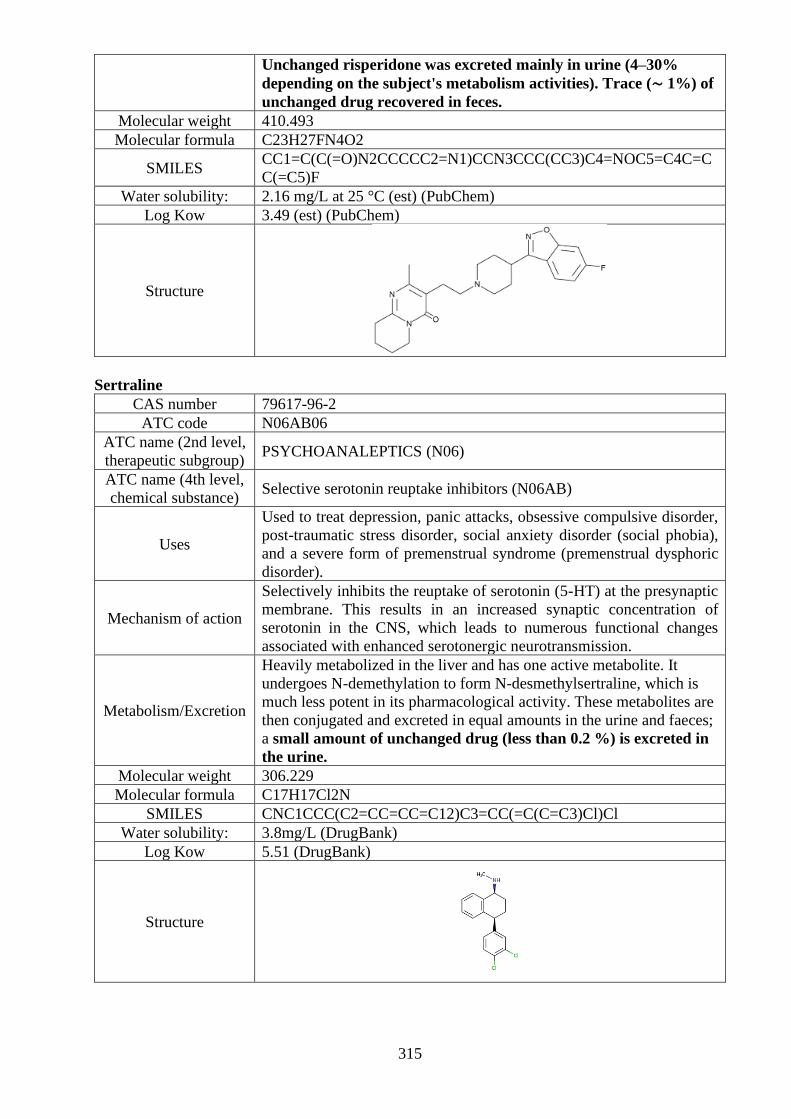
315
Unchanged risperidone was excreted mainly in urine (4–30%
depending on the subject's metabolism activities). Trace (∼ 1%) of
unchanged drug recovered in feces.
Molecular weight 410.493
Molecular formula C23H27FN4O2
SMILES CC1=C(C(=O)N2CCCCC2=N1)CCN3CCC(CC3)C4=NOC5=C4C=C
C(=C5)F
Water solubility: 2.16 mg/L at 25 °C (est) (PubChem)
Log Kow 3.49 (est) (PubChem)
Structure
Sertraline
CAS number 79617-96-2
ATC code N06AB06
ATC name (2nd level,
therapeutic subgroup) PSYCHOANALEPTICS (N06)
ATC name (4th level,
chemical substance) Selective serotonin reuptake inhibitors (N06AB)
Uses
Used to treat depression, panic attacks, obsessive compulsive disorder,
post-traumatic stress disorder, social anxiety disorder (social phobia),
and a severe form of premenstrual syndrome (premenstrual dysphoric
disorder).
Mechanism of action
Selectively inhibits the reuptake of serotonin (5-HT) at the presynaptic
membrane. This results in an increased synaptic concentration of
serotonin in the CNS, which leads to numerous functional changes
associated with enhanced serotonergic neurotransmission.
Metabolism/Excretion
Heavily metabolized in the liver and has one active metabolite. It
undergoes N-demethylation to form N-desmethylsertraline, which is
much less potent in its pharmacological activity. These metabolites are
then conjugated and excreted in equal amounts in the urine and faeces;
a small amount of unchanged drug (less than 0.2 %) is excreted in
the urine.
Molecular weight 306.229
Molecular formula C17H17Cl2N
SMILES CNC1CCC(C2=CC=CC=C12)C3=CC(=C(C=C3)Cl)Cl
Water solubility: 3.8mg/L (DrugBank)
Log Kow 5.51 (DrugBank)
Structure

316
Temazepam
CAS number 846-50-4
ATC code N05CD07
ATC name (2nd level,
therapeutic subgroup)
PSYCHOLEPTICS (N05)
ATC name (4th level,
chemical substance)
Benzodiazepine derivatives (N05CD)
Uses Used to treat insomnia symptoms, such as trouble falling asleep or
staying asleep.
Mechanism of action
Increase the effect of the neurotransmitter gamma-aminobutyric acid
(GABA) at the GABAA receptor. This causes sedation, motor
impairment, ataxia, anxiolysis, an anticonvulsant effect, muscle
relaxation, and a reinforcing effect.
Metabolism/Excretion
Principally metabolized in the liver where most of the unchanged drug
is directly conjugated to glucuronide and excreted in the urine. Less
than 5% of the drug is demethylated to oxazepam and subsequently
eliminated as the glucuronide. Glucuronides of temazepam have no
demonstrable CNS activity and it is believed that no active metabolites
are formed in general. Excreted in urine (80% to 90% as inactive
metabolites).
Molecular weight 300.74
Molecular formula C16H13ClN2O2
SMILES CN1C2=C(C=C(C=C2)Cl)C(=NC(C1=O)O)C3=CC=CC=C3
Water solubility: 164 mg/L (PubChem)
Log Kow 2.19 (PubChem)
Structure
Venlafaxine
CAS number 93413-69-5
ATC code N06AX16
ATC name (2nd level,
therapeutic subgroup) PSYCHOANALEPTICS (N06)
ATC name (4th level,
chemical substance) Other antidepressants (N06AX)
Uses
Affects chemicals in the brain that may be unbalanced in people with
depression. Venlafaxine is used to treat major depressive disorder,
anxiety and panic disorder.
Mechanism of action
Venlafaxine and its active metabolite, O-desmethylvenlafaxine (ODV),
inhibit the reuptake of both serotonin and norepinephrine with a potency
greater for the 5-HT than for the NE reuptake process.
Metabolism/Excretion
Undergoes extensive first pass metabolism in the liver to its major,
active metabolite, ODV and two minor, less active metabolites, N-
desmethylvenlafaxine and N,O-didesmethylvenlafaxine. Formation of
ODV is catalyzed by CYP450 2D6, whereas N-demethylation is
catalyzed by CYP3A4, 2C19 and 2C9. ODV possesses antidepressant
activity that is comparable to that of venlfaxine. Renal elimination of
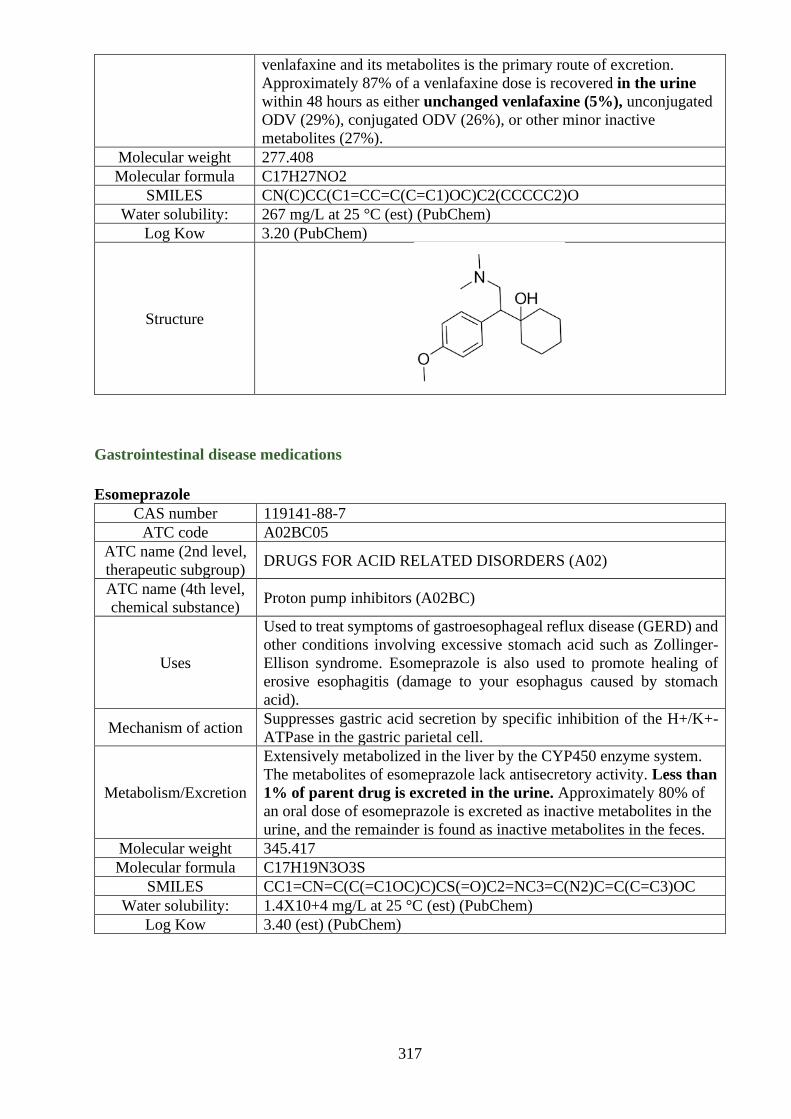
317
venlafaxine and its metabolites is the primary route of excretion.
Approximately 87% of a venlafaxine dose is recovered in the urine
within 48 hours as either unchanged venlafaxine (5%), unconjugated
ODV (29%), conjugated ODV (26%), or other minor inactive
metabolites (27%).
Molecular weight 277.408
Molecular formula C17H27NO2
SMILES CN(C)CC(C1=CC=C(C=C1)OC)C2(CCCCC2)O
Water solubility: 267 mg/L at 25 °C (est) (PubChem)
Log Kow 3.20 (PubChem)
Structure
Gastrointestinal disease medications
Esomeprazole
CAS number 119141-88-7
ATC code A02BC05
ATC name (2nd level,
therapeutic subgroup) DRUGS FOR ACID RELATED DISORDERS (A02)
ATC name (4th level,
chemical substance) Proton pump inhibitors (A02BC)
Uses
Used to treat symptoms of gastroesophageal reflux disease (GERD) and
other conditions involving excessive stomach acid such as Zollinger-
Ellison syndrome. Esomeprazole is also used to promote healing of
erosive esophagitis (damage to your esophagus caused by stomach
acid).
Mechanism of action Suppresses gastric acid secretion by specific inhibition of the H+/K+-
ATPase in the gastric parietal cell.
Metabolism/Excretion
Extensively metabolized in the liver by the CYP450 enzyme system.
The metabolites of esomeprazole lack antisecretory activity. Less than
1% of parent drug is excreted in the urine. Approximately 80% of
an oral dose of esomeprazole is excreted as inactive metabolites in the
urine, and the remainder is found as inactive metabolites in the feces.
Molecular weight 345.417
Molecular formula C17H19N3O3S
SMILES CC1=CN=C(C(=C1OC)C)CS(=O)C2=NC3=C(N2)C=C(C=C3)OC
Water solubility: 1.4X10+4 mg/L at 25 °C (est) (PubChem)
Log Kow 3.40 (est) (PubChem)

318
Structure
Omeprazole
CAS number 73590-58-6
ATC code A02BC01
ATC name (2nd level,
therapeutic subgroup) DRUGS FOR ACID RELATED DISORDERS (A02)
ATC name (4th level,
chemical substance) Proton pump inhibitors (A02BC)
Uses
Used to treat certain stomach and esophagus problems (such as acid
reflux, ulcers). It works by decreasing the amount of acid your stomach
makes. It relieves symptoms such as heartburn, difficulty swallowing,
and persistent cough.
Mechanism of action Suppresses stomach acid secretion by specific inhibition of the H+/K+-
ATPase system found at the secretory surface of gastric parietal cells.
Metabolism/Excretion
Completely metabolized by the cytochrome P450 system, mainly in
the liver. Identified metabolites are the sulfone, the sulfide, and
hydroxy-omeprazole, which exert no significant effect on acid
secretion. Most of the dose (about 77%) was eliminated in urine as at
least six different metabolites, little if any unchanged drug was
excreted in urine. The remainder of the dose was found in the feces.
This suggests significant biliary excretion of omeprazole metabolites.
Molecular weight 345.417
Molecular formula C17H19N3O3S
SMILES CC1=CN=C(C(=C1OC)C)CS(=O)C2=NC3=C(N2)C=C(C=C3)OC
Water solubility: 82.3 mg/L at 25 °C /Estimated/ (PubChem)
Log Kow 2.23 (PubChem)
Structure
Mesalazine
CAS number 89-57-6
ATC code A07EC02
ATC name (2nd level,
therapeutic subgroup)
ANTIDIARRHEALS, INTESTINAL
ANTIINFLAMMATORY/ANTIINFECTIVE AGENTS (A07)
ATC name (4th level,
chemical substance) Aminosalicylic acid and similar agents (A07EC)
Uses
Used in the treatment of ulcerative colitis, a condition characterized by
swelling and scarring of the colon and rectum. It is also used to control
the symptoms of ulcerative colitis such as stomach pain, diarrhea, and
rectal bleeding.

319
Mechanism of action Not fully understood, it is believed to possess a topical anti-
inflammatory effect on colonic epithelial cells.
Metabolism/Excretion
The primary metabolite of mesalazine (5-aminosalicylic acid) is
predominantly N-acetyl-5-aminosalicylic acid (Ac-5-ASA). This
metabolite is generated via N-acetyltransferase (NAT) activity in the
liver and intestinal mucosa cells, largely by NAT-1, in particular.
Elimination of mesalazine is mainly via the renal route following
metabolism to N-acetyl-5-aminosalicylic acid (acetylation). After the
oral administration of the extended-release formulation of mesalazine,
of the approximately 21% to 22% of the drug absorbed, less than 8%
of the dose was excreted unchanged in the urine after 24 hours,
compared with greater than 13% for N-acetyl-5-aminosalicylic acid.
Molecular weight 153.135
Molecular formula C7H7NO3
SMILES C1=CC(=C(C=C1N)C(=O)O)O
Water solubility: 122 mg/L at 25 deg C (est) (PubChem)
Log Kow 0.98 (est) (PubChem)
Structure
Pantoprazole
CAS number 102625-70-7
ATC code A02BC02
ATC name (2nd
level, therapeutic
subgroup)
DRUGS FOR ACID RELATED DISORDERS (A02)
ATC name (4th level,
chemical substance) Proton pump inhibitors (A02BC)
Uses
Used to treat erosive esophagitis (damage to the esophagus from stomach
acid caused by gastroesophageal reflux disease, or GERD) in adults and
children who are at least 5 years old.
Mechanism of action
Inhibits the final step in gastric acid production. In the gastric parietal
cell of the stomach, pantoprazole covalently binds to the H+/K+ ATP
pump to inhibit gastric acid and basal acid secretion.
Metabolism/Excretio
n
Heavily metabolized in the liver by the CYP450 system. There is no
evidence that any of the pantoprazole metabolites are
pharmacologically active. About 71% of the dose was excreted in the
urine, with 18% excreted in the feces by biliary excretion. There was
no renal excretion of unchanged pantoprazole.
Molecular weight 383.37
Molecular formula C16H15F2N3O4S
SMILES COC1=C(C(=NC=C1)CS(=O)C2=NC3=C(N2)C=C(C=C3)OC(F)F)O
C
Water solubility: 48 mg/L at 25 °C /Estimated/ (PubChem)
Log Kow 2.05 (PubChem)

320
Structure
Veterinary medicines
Carprofen
CAS number 53716-49-7
ATC code QM01AE91
ATC name (2nd level,
therapeutic subgroup)
ANTIINFLAMMATORY AND ANTIRHEUMATIC PRODUCTS
(QM01)
ATC name (4th level,
chemical substance) Propionic acid derivatives (QM01AE)
Uses Used by veterinarians as a supportive treatment for the relief of arthritic
symptoms in geriatric dogs.
Mechanism of action
Believed to be associated with the inhibition of cyclooxygenase activity.
The constitutive cyclooxygenase, COX-1, synthesizes prostaglandins
necessary for normal gastrointestinal and renal function. The inducible
cyclooxygenase, COX-2, generates prostaglandins involved in
inflammation. Inhibition of COX-1 is thought to be associated with
gastrointestinal and renal toxicity while inhibition of COX-2 provides
anti-inflammatory activity.
Metabolism/Excretion
Hepatic. Carprofen is eliminated in the dog primarily by
biotransformation in the liver followed by rapid excretion of the
resulting metabolites (the ester glucuronide of carprofen and the ether
glucuronides of 2 phenolic metabolites, 7-hydroxy carprofen and 8-
hydroxy carprofen) in the feces (70–80%) and urine (10–20%). Some
enterohepatic circulation of the drug is observed.
Molecular weight 273.716
Molecular formula C15H12ClNO2
SMILES CC(C1=CC2=C(C=C1)C3=C(N2)C=CC(=C3)Cl)C(=O)O
Water solubility: 0.00379 ng/L (PubChem)
Log Kow 3.8 (DrugBank)
Structure
Emamectin benzoate
CAS number 155569-91-8
ATC code QP54AA06
ATC name (2nd level,
therapeutic subgroup) Antiparasitic products, insecticides & repellents: Endectocides (QP54)

321
ATC name (4th level,
chemical substance) Avermectins (QP54AA)
Uses Pesticide
Mechanism of action Non-systemic, acts by causing insect paralysis by suppressing muscle
contraction. Chloride channel activator.
Metabolism/Excretion
Relatively large molecule (actually a mixture of four closely related
molecules) which is not completely absorbed on oral administration, is
poorly absorbed by the dermal administration, and rapidly eliminated in
the feces with whole-body half-lives of about 1.5 days. Thus, emamectin
benzoate will not substantially accumulate over periods of long-term
dosing. While emamectin benzoate is not extensively metabolized in
mammals, the limited information on the metabolites of emamectin
benzoate suggests that metabolism does not result in the detoxification
of emamectin benzoate. One plant metabolite of emamectin benzoate is
somewhat more toxic than emamectin benzoate itself.
Molecular weight 1008.256
Molecular formula C56H81NO15
SMILES
CCC(C)C1C(C=CC2(O1)CC3CC(O2)CC=C(C(C(C=CC=C4COC5C4
(C(C=C(C5O)C)C(=O)O3)O)C)OC6CC(C(C(O6)C)OC7CC(C(C(O7)
C)[NH2+]C)OC)OC)C)C.C1=CC=C(C=C1)C(=O)[O-]
Water solubility: 0.024 g/L at 25 °C (pH 7)
Log Kow 5.0 at pH 7
Structure
Fenbendazole
CAS number 43210-67-9
ATC code QP52AC13
ATC name (2nd level,
therapeutic subgroup) ANTHELMINTICS (QP52)
ATC name (4th level,
chemical substance) Benzimidazoles and related substances (QP52AC)
Uses
Used to treat common helminth infections, including ascarids,
hookworms, whipworms, and a single species of tapeworm, Taenia
pisiformis.
Mechanism of action
Acts by binding to tubulin, an essential structural protein of
microtubules. By blocking the microtubuless in worms the uptake of
glucose is blocked which eventually depletes glycogen reserves.
Metabolism/Excretion
Metabolized in the liver to oxfendazole, which is anthelmintic too;
oxfendazole partially gets reduced back to fenbendazole in the liver
and rumen. Also, fenbendazole itself is an active metabolite of another
anthelmintic drug, febantel. Elimination of fenbendazole is
predominantly by the faecal route.
Molecular weight 299.348

322
Molecular formula C15H13N3O2S
SMILES COC(=O)NC1=NC2=C(N1)C=C(C=C2)SC3=CC=CC=C3
Water solubility: 0.9 ug/mL (PubChem)
Log Kow 3.85 (Veterinary Substance DataBase)
Structure
Florfenicol
CAS number 73231-34-2
ATC code QJ51BA90
ATC name (2nd level,
therapeutic subgroup) ANTIBACTERIALS FOR INTRAMAMMARY USE (QJ51)
ATC name (4th level,
chemical substance) Amphenicols (QJ51BA)
Uses Used in the treatment of bovine respiratory disease (also called BRD)
and foot rot.
Mechanism of action
Bacteriostatic. Inhibits the protein synthesis of susceptible bacteria by
combining simultaneously with the 50S and 70S subunits in the
ribosome to abolish the activity of peptidyl transferase (5, 7).
Metabolism/Excretion In most species, these drugs are eliminated by renal excretion of parent
drug and by hepatic glucuronide conjugation and elimination in feces.
Molecular weight 358.205
Molecular formula C12H14Cl2FNO4S
SMILES CS(=O)(=O)C1=CC=C(C=C1)C(C(CF)NC(=O)C(Cl)Cl)O
Water solubility: 1.32 g/L at pH 7 (Aquaflor® Environmental Assessment)
Log Kow 0.37 (Aquaflor® Environmental Assessment)
Structure
Ivermectin
CAS number 70288-86-7
ATC code P02CF01
ATC name (2nd level,
therapeutic subgroup) ANTHELMINTICS (P02)
ATC name (4th level,
chemical substance) Avermectines (P02CF)
Uses
Used to treat many types of parasite infestations. This includes head lice,
scabies, river blindness (onchocerciasis), strongyloidiasis, trichuriasis,
and lymphatic filariasis.
Mechanism of action
Binds selectively and with high affinity to glutamate-gated chloride ion
channels in invertebrate muscle and nerve cells of the microfilaria.
This binding causes an increase in the permeability of the cell

323
membrane to chloride ions and results in hyperpolarization of the cell,
leading to paralysis and death of the parasite.
Metabolism/Excretion
Metabolized in the liver, and ivermectin and/or its metabolites are
excreted almost exclusively in the feces over an estimated 12 days,
with less than 1% of the administered dose excreted in the urine.
Molecular weight 875.106
Molecular formula C48H74O14
SMILES
CCC(C)C1C(CCC2(O1)CC3CC(O2)CC=C(C(C(C=CC=C4COC5C4(
C(C=C(C5O)C)C(=O)O3)O)C)OC6CC(C(C(O6)C)OC7CC(C(C(O7)C
)O)OC)OC)C)C
Water solubility: Insoluble (DrugBank)
Log Kow 5.83 (DrugBank)
Structure
Tiamulin hydrogen fumarate
CAS number 55297-96-6
ATC code QJ01XQ01
ATC name (2nd level,
therapeutic subgroup) ANTIBACTERIALS FOR SYSTEMIC USE (QJ01)
ATC name (4th level,
chemical substance) Pleuromutilins (QJ01XQ)
Uses
For treatment and prevention, when the disease is present at herd
level,of swine dysentery caused by Brachyspira hyodysenteriae
sensitive to tiamulin.The presence of disease in the herd should be
established before use.
Mechanism of action
Binds with the rRNA in the peptidyl transferase slot on the ribosome,
in which it prevents the correct positioning of the CCA ends of tRNA
for peptide transferase and subsequent protein production.
Metabolism/Excretion Following absorption, it is rapidly metabolised and excreted.
Molecular weight 609.819
Molecular formula C32H51NO8S
SMILES CCN(CC)CCSCC(=O)OC1CC(C(C(C23CCC(C1(C2C(=O)CC3)C)C)
C)O)(C)C=C.C(=CC(=O)O)C(=O)O
Water solubility: 64.9 ug/mL (PubChem)
Log Kow 4.75 (est) (PubChem)
Structure
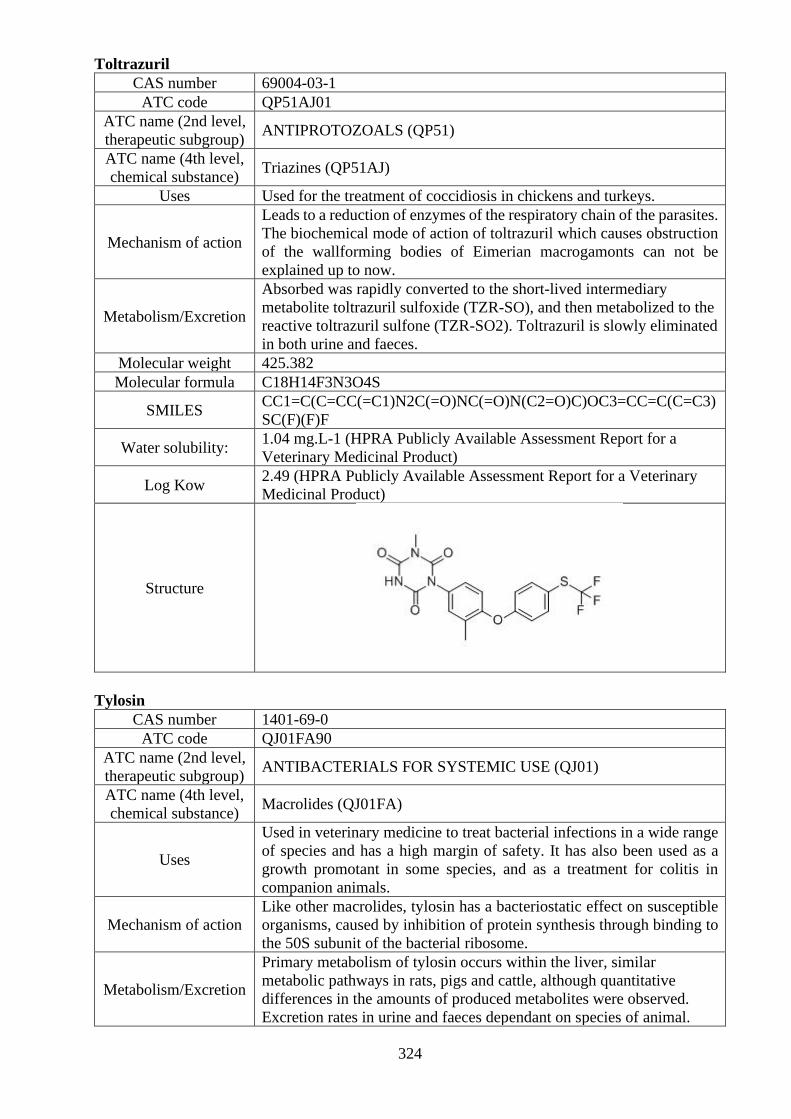
324
Toltrazuril
CAS number 69004-03-1
ATC code QP51AJ01
ATC name (2nd level,
therapeutic subgroup) ANTIPROTOZOALS (QP51)
ATC name (4th level,
chemical substance) Triazines (QP51AJ)
Uses Used for the treatment of coccidiosis in chickens and turkeys.
Mechanism of action
Leads to a reduction of enzymes of the respiratory chain of the parasites.
The biochemical mode of action of toltrazuril which causes obstruction
of the wallforming bodies of Eimerian macrogamonts can not be
explained up to now.
Metabolism/Excretion
Absorbed was rapidly converted to the short-lived intermediary
metabolite toltrazuril sulfoxide (TZR-SO), and then metabolized to the
reactive toltrazuril sulfone (TZR-SO2). Toltrazuril is slowly eliminated
in both urine and faeces.
Molecular weight 425.382
Molecular formula C18H14F3N3O4S
SMILES CC1=C(C=CC(=C1)N2C(=O)NC(=O)N(C2=O)C)OC3=CC=C(C=C3)
SC(F)(F)F
Water solubility: 1.04 mg.L-1 (HPRA Publicly Available Assessment Report for a
Veterinary Medicinal Product)
Log Kow 2.49 (HPRA Publicly Available Assessment Report for a Veterinary
Medicinal Product)
Structure
Tylosin
CAS number 1401-69-0
ATC code QJ01FA90
ATC name (2nd level,
therapeutic subgroup) ANTIBACTERIALS FOR SYSTEMIC USE (QJ01)
ATC name (4th level,
chemical substance) Macrolides (QJ01FA)
Uses
Used in veterinary medicine to treat bacterial infections in a wide range
of species and has a high margin of safety. It has also been used as a
growth promotant in some species, and as a treatment for colitis in
companion animals.
Mechanism of action
Like other macrolides, tylosin has a bacteriostatic effect on susceptible
organisms, caused by inhibition of protein synthesis through binding to
the 50S subunit of the bacterial ribosome.
Metabolism/Excretion
Primary metabolism of tylosin occurs within the liver, similar
metabolic pathways in rats, pigs and cattle, although quantitative
differences in the amounts of produced metabolites were observed.
Excretion rates in urine and faeces dependant on species of animal.

325
Molecular weight 916.112
Molecular formula C46H77NO17
SMILES
CCC1C(C=C(C=CC(=O)C(CC(C(C(C(CC(=O)O1)O)C)OC2C(C(C(C
(O2)C)OC3CC(C(C(O3)C)O)(C)O)N(C)C)O)CC=O)C)C)COC4C(C(
C(C(O4)C)O)OC)OC
Water solubility: 5 mg/mL at 25 °C (PubChem)
Log Kow 1.63 (PubChem)
Structure

326
Annex 20. Predicted no-effect concentrations in surface water
Ecotoxicological data used for deriving PNEC values are available at an external repository:
https://helda.helsinki.fi/handle/10138/317151.
Antibiotics
Ciprofloxacin
50 test results were found for ciprofloxacin in the literature. These covered acute and chronic
LC(EC)50 and NOEC values for crustacean, algae, bacteria, fish and rotifer.
PNEC was derived using species sensitivity distribution (SSD) method.
PNEC= 0.00000511 mg/L
Clarithromycin
13 test results were found for clarithromycin in the literature. These covered acute and chronic
LC(EC)50 and NOEC values for crustacean, algae, bacteria, fish, ciliate, cyanobacteria and higher
plants.
PNEC was derived using species sensitivity distribution (SSD) method.
PNEC= 0.00000391 mg/L
Doxycycline
Seven test results were found for doxycycline in literature. Higher plant and fungus EC(LC)50
values were available.
PNEC was derived using assessment factor (AF) method.
PNEC= 0.0000369 mg/L
Erythromycin
26 test results were found for erythromycin in the literature. These covered acute and chronic
LC(EC)50 and NOEC values for crustacean, algae, fish, cyanobacteria and higher plants.
PNEC was derived using species sensitivity distribution (SSD) method.
PNEC= 0.0000835 mg/L
Fluconazole
26 test results were found for fluconazole in the literature. These covered acute and chronic
LC(EC)50 and NOEC values for crustacean, algae, bacteria, fish, rotifier, cyanobacteria and higher
plants.
PNEC was derived using species sensitivity distribution (SSD) method.
PNEC= 0.0150 mg/L
Lincomycin
Ten test results were found for lincomycin in the literature. These covered acute and chronic
LC(EC)50 and NOEC values for algae, bacteria, crustacean, fish, higher plant and rotifer.
PNEC was derived using species sensitivity distribution (SSD) method.
PNEC= 0.00129 mg/L
Norfloxacin
19 test results were found in literature for norfloxacin. These covered acute and chronic algae,
bacteria, cyanobacteria and higher plant LC(EC)50 and NOEC values.
PNEC was derived using species sensitivity distribution (SSD) method.
PNEC= 0,000481 mg/L
327
Ofloxacin
23 test results were found in literature for ofloxacin. These covered acute and chronic algae, bacteria,
cyanobacteria, crustacean and higher plant LC(EC)50 and NOEC values.
PNEC was derived using species sensitivity distribution (SSD) method.
PNEC= 0,0000204 mg/L
Sulfadiazine
6 test results were found in literature for sulfadiazine. Crustacean, cyanobacteria and algae
EC(LC)50 values are available.
PNEC was derived using assessment factor (AF) method.
PNEC= 0,000135 mg/L
Sulfamethoxazole
21 test results were found in literature for sulfmetaxazole. These covered acute and chronic algae,
bacteria, cyanobacteria, crustacean, rotifier, fish, faltworm and higher plant LC(EC)50 and NOEC
values.
PNEC was derived using species sensitivity distribution (SSD) method.
PNEC= 0,0000438 mg/L
Tetracycline
8 test results were found in literature for tetracycline. These covered acute and chronic algae,
crustacean and faltworm LC(EC)50 and NOEC values.
PNEC was derived using species sensitivity distribution (SSD) method.
PNEC= 0,00173 mg/L
Trimethoprim
17 test results were found in literature for trimetoprim. These covered acute and chronic algae,
crustacean, faltworm and higher plant LC(EC)50 and NOEC values.
PNEC was derived using species sensitivity distribution (SSD) method.
PNEC= 0,508 mg/L
Antiepileptics
Carbamazepine
66 test results were found in literature for carbamazepine. These covered acute and chronic algae,
crustacean, ciliate, cyanobacteria, higher plant, fish, fungus, hydrozoa, bacteria, insects, mollusks
and rotifer LC(EC)50 and NOEC values.
PNEC was derived using species sensitivity distribution (SSD) method.
PNEC= 0,00128 mg/L
Gabapentin
4 test results were found in literature for gabapentin. Crustacean and algae EC(LC)50 values are
available.
PNEC was derived using assessment factor (AF) method.
PNEC= 0,1 mg/L
Levetiracetam
3 test results were found in literature for levetiracetam. Crustacean and algae EC(LC)50 values are
available.
PNEC was derived using assessment factor (AF) method.
PNEC= 0,1 mg/L

328
Primidone
2 test results were found in literature for primidone. Crustacean and fish EC(LC)50 values are
available.
PNEC was derived using assessment factor (AF) method.
PNEC= 0,1 mg/L
Antihypertensives
Amlodipine
19 test results were found in literature for amodipine. These covered acute and chronic algae,
crustacean, fish and hydrozoa LC(EC)50 and NOEC values.
PNEC was derived using species sensitivity distribution (SSD) method.
PNEC= 0,0000995 mg/L
Candesartan
6 test results were found in literature for candesartan. Crustacean, algae and fish LC(EC)50 values
are available.
PNEC was derived using assessment factor (AF) method.
PNEC= 0,000421 mg/L
Enalapril
7 test results were found in literature for candesartan. Crustacean, algae and fish LC(EC)50 values
are available.
PNEC was derived using assessment factor (AF) method.
PNEC= 0,044736 mg/L
Eprosartan
Single test result was found in literature for eprosartan. Algae EC50 value is available.
PNEC was derived using assessment factor (AF) method.
PNEC= 0,1 mg/L
Hydrochlorothiazide
4 test results were found in literature for hydrochlorothiazide. Crustacean, algae and fish LC(EC)50
and NOEC values are available.
PNEC was derived using assessment factor (AF) method.
PNEC= 1 mg/L
Irbesartan
4 test results were found in literature for irbesartan. Crustacean and algae LC(EC)50 values are
available.
PNEC was derived using assessment factor (AF) method.
PNEC= 0,1 mg/L
Losartan
3 test results were found in literature for losartan. Higher plant LC(EC)50 values are available.
PNEC was derived using assessment factor (AF) method.
PNEC= 0.0078 mg/L
Ramipril
FASS database PNECwater value for ramipril was directly used for further assessment.
PNEC= 0.1 mg/L
Telmisartan
Single test result was found in literature for telmisartan. Algae EC50 value is available.
329
PNEC was derived using assessment factor (AF) method.
PNEC= 0,00988 mg/L
Valsartan
6 test results were found in literature for valsartan. These covered acute and chronic crustacean,
algae and sea urchin LC(EC)50 and NOEC values.
PNEC was derived using assessment factor (AF) method.
PNEC= 0,125 mg/L
Asthma and allergy medications
Cetirizine
No literature data were found for cetirizine. Own studies were conducted with algae, bacteria and
crustacean.
PNEC was derived using assessment factor (AF) method.
PNEC= 0,07862 mg/L
Fexofenadine
Single test results were found in literature for fexofenadine. Algae EC50 value is available.
PNEC was derived using assessment factor (AF) method.
PNEC= 0,2 mg/L
Fluticasone
Single test result was found in literature for fexofenadine. Crustacean EC50 value is available.
PNEC was derived using assessment factor (AF) method.
PNEC= 0,00055 mg/L
Mometasone
FASS database PNECwater value for mometasone was directly used for further assessment.
PNEC= 0,000014 mg/L
Xylometazoline
FASS database PNECwater value for xylometazoline was directly used for further assessment.
PNEC= 0,00203 mg/L
Gastrointestinal disease medications
Esomeprazole
3 test results were found in literature for esomeprazole. Crustacean, fish and algae EC(LC)50 values
are available.
PNEC was derived using assessment factor (AF) method.
PNEC= 0,1 mg/L
Mesalazine
Single test result was found in literature for mesalazine. Fish NOEC value is available.
PNEC was derived using assessment factor (AF) method.
PNEC= 0,911 mg/L
Omeprazole
2 test results were found in literature for omeprazole. Crustacean and bacteria EC(LC)50 values are
available.
PNEC was derived using assessment factor (AF) method.
330
PNEC= 0,00176 mg/L
Pantoprazole
3 test results were found in literature for pantoprazole. Crustacean, fish and algae EC(LC)50 values
are available.
PNEC was derived using assessment factor (AF) method.
PNEC= 0,048 mg/L
Hormones
17-α-ethinyl estradiol (EE2)
76 test results were found in literature for EE2. These covered acute and chronic algae, bacteria,
ciliate, fish, crustacean, fungus, insecta and rotifier LC(EC)50 and NOEC values.
PNEC was derived using species sensitivity distribution (SSD) method.
PNEC= 0,000000408 mg/L
17-β-estradiol (E2)
76 test results were found in literature for E2. These covered acute and chronic fish, crustacean, and
fungus LC(EC)50 and NOEC values.
PNEC was derived using species sensitivity distribution (SSD) method.
PNEC= 0,0000000323 mg/L
α-Estradiol
19 test results were found in literature for -Estradiol. These covered acute and chronic fish
LC(EC)50 and NOEC values.
PNEC was derived using species sensitivity distribution (SSD) method.
PNEC= 0,000000853 mg/L
Estriol (E3)
Single test result was found in literature for E3. Fish EC50 value is available.
PNEC was derived using assessment factor (AF) method.
PNEC= 0,00000075 mg/L
Estrone (E1)
4 test results were found in literature for E1. Crustacean, and fish NOEC values are available.
PNEC was derived using assessment factor (AF) method.
PNEC= 0,000000008 mg/L
Norethisterone
6 test results were found in literature for norethisterone. Crustacean, algae, bacteria and fish
LC(EC)50 and NOEC values are available.
PNEC was derived using assessment factor (AF) method.
Progesterone
PNECwater value for progesterone (Orias & Perrodin 2013) was directly used for further assessment.
PNEC= 0.002 mg/L
Testosterone
Single test result was found in literature for testosterone. Crustacean NOEC value is available.
PNEC was derived using assessment factor (AF) method.
PNEC= 0,0015 mg/L
331
Metabolic disease medications
Allopurinol
4 test results were found in literature for allopurinol. Fish, crustacean and algae EC(LC)50 values
are available.
PNEC was derived using assessment factor (AF) method.
PNEC= 0,1 mg/L
Atorvastatin
37 test results were found in literature for atorvastatin. These covered acute and chronic crustacean,
fungus, higher plant and insecta LC(EC)50 and NOEC values.
PNEC was derived using species sensitivity distribution (SSD) method.
PNEC= 0,0021 mg/L
Bezafibrate
37 test results were found in literature for benzafibrate. These covered acute and chronic crustacean,
molusca, hydrozoa and rotifier LC(EC)50 and NOEC values.
PNEC was derived using species sensitivity distribution (SSD) method.
PNEC= 0,00126 mg/L
Gemfibrozil
23 test results were found in literature for gemfibrozil. These covered acute and chronic algae,
crustacean, fish, rotifier, hydrozoa and bacteria LC(EC)50 and NOEC values.
PNEC was derived using species sensitivity distribution (SSD) method.
PNEC= 0,000825 mg/L
Metformin
5 test results were found in literature for metformin. Crustacean, higher plant and algae EC(LC)50
values are available.
PNEC was derived using assessment factor (AF) method.
PNEC= 0,00135 mg/L
Simvastatin
Single test result was found in literature for simvastatin. Algae EC50 value is available.
PNEC was derived using assessment factor (AF) method.
PNEC= 0,0228 mg/L
NSAIDs and analgesics
Acetylsalicylic acid
11 test results were found in literature for acetylsalicylic acid. These covered mostly acute
crustacean, algae, bacteria, flatworm and rotifers LC(EC)50 values. PNEC was derived using
species sensitivity distribution (SSD) method.
PNEC= 0,142 mg/L
Codeine
3 test results were found in literature for codeine. Fish, crustacean and algae EC(LC)50 values are
available.
PNEC was derived using assessment factor (AF) method.
PNEC= 0,016 mg/L

332
Diclofenac
48 test results were found in literature for diclofenac. These covered mostly chronic crustacean,
algae, bacteria, fish, ciliate, molluscs, higher plants, cyanobacteria and rotifers NOEC values.
PNEC was derived using species sensitivity distribution (SSD) method.
PNEC= 0,0000852 mg/L
Ibuprofen
51 test results were found in literature for ibuprofen. These covered acute and chronic crustacean,
algae, bacteria, fish, ciliate, molluscs LC(EC)50 and NOEC values.
PNEC was derived using species sensitivity distribution (SSD) method.
PNEC= 0,000000118 mg/L
Ketoprofen
3 test results were found in literature for ketoprofen. Bacteria, crustacean and algae EC(LC)50
values are available.
PNEC was derived using assessment factor (AF) method.
PNEC= 0,002 mg/L
Naproxen
38 test results were found in literature for naproxen. These covered mostly chronic crustacean, algae,
bacteria, fish, insects, molluscs, higher plants, cyanobacteria and rotifers NOEC values.
PNEC was derived using species sensitivity distribution (SSD) method.
PNEC= 0,00498 mg/L
Oxycodone
3 test results were found in literature for oxycodone. Algae, crustacean and algae EC(LC)50 values
are available.
PNEC was derived using assessment factor (AF) method.
PNEC= 0,003304 mg/L
Paracetamol
50 test results were found in literature for paracetamol. These covered acute and chronic crustacean,
algae, bacteria, fish, rotifers, ciliate, molluscs, higher plants, cyanobacteria and rotifers LC(EC)50
and NOEC values.
PNEC was derived using species sensitivity distribution (SSD) method.
PNEC= 0,00102 mg/L
Tramadol
2 test results were found in literature for tramadol. Bacteria and crustacean EC(LC)50 values are
available.
PNEC was derived using assessment factor (AF) method.
PNEC= 0,17 mg/L
Other
Caffeine
ECHA registration PNECwater value for caffeine was directly used for further assessment.
PNEC= 0,087 mg/L

333
Other cardiovascular medicines
Atenolol
36 test results were found in literature for atenolol. These covered acute and chronic algae,
crustacean, fish, bacteria, higher plant and hydrozoa LC(EC)50 and NOEC values.
PNEC was derived using species sensitivity distribution (SSD) method.
PNEC= 0,194 mg/L
Bisoprolol
4 test results were found in literature for bisoprolol. Crustacean, algae and fish LC(EC)50 values
are available.
PNEC was derived using assessment factor (AF) method.
PNEC= 0,008 mg/L
Dipyridamole
3 test results were found in literature for bisoprolol. Crustacean, algae and fish LC(EC)50 values
are available.
PNEC was derived using assessment factor (AF) method.
PNEC= 0,00236 mg/L
Furosemide
8 test results were found in literature for furosemide. These covered acute and chronic crustacean,
hydrozoa, rotifer and bacteria LC(EC)50 and NOEC values.
PNEC was derived using species sensitivity distribution (SSD) method.
PNEC= 0,0159 mg/L
Metoprolol
23 test results were found in literature for metoprolol. These covered acute and chronic algae,
crustacean, fish, higher plant and bacteria LC(EC)50 and NOEC values.
PNEC was derived using species sensitivity distribution (SSD) method.
PNEC= 0,00438 mg/L
Nebivolol
No literature data were found for nebivolol. Own studies were conducted with algae, bacteria and
crustacean.
PNEC was derived using assessment factor (AF) method.
PNEC= 0,000377 mg/L
Sotalol
3 test results were found in literature for sotalol. Bacteria, crustacean and algae EC(LC)50 values
are available.
PNEC was derived using assessment factor (AF) method.
PNEC= 0,3 mg/L
Warfarin
8 test results were found in literature for warfarin. These covered acute and chronic crustacean, fish,
bacteria and rotifer LC(EC)50 and NOEC values.
PNEC was derived using species sensitivity distribution (SSD) method.
PNEC= 0,0676 mg/L
334
Psychopharmaceuticals
Citalopram
8 test results were found in literature for citaloparm. These covered acute and chronic crustacean,
and algae LC(EC)50 and NOEC values.
PNEC was derived using species sensitivity distribution (SSD) method.
PNEC= 0,0154 mg/L
Quetiapine
FASS database PNECwater value for quetiapine was directly used for further assessment.
PNEC= 0,01 mg/L
Olanzapine
8 test results were found in literature for citaloparm. These covered acute and chronic crustacean,
fish and algae LC(EC)50 and NOEC values.
PNEC was derived using species sensitivity distribution (SSD) method.
PNEC= 0,0012 mg/L
Oxazepam
For oxazepam PNECwater calculated by RIMV (Smit 2015) was directly used for further
environmental risk assessment.
PNEC= 0,00081 mg/L
Risperidone
FASS database PNECwater value for risperidone was directly used for further assessment.
PNEC= 0,0058 mg/L
Sertraline
8 test results were found in literature for sertraline. These covered acute and chronic crustacean,
fish, algae, hydrozoa and mollusc LC(EC)50 and NOEC values.
PNEC was derived using species sensitivity distribution (SSD) method.
PNEC= 0,00107 mg/L
Temazepan
For temazepan PNECwater calculated by RIMV (Smit, 2015) was directly used for further
environmental risk assessment.
PNEC= 0,00093 mg/L
Venlafaxine
3 test results were found in literature for venlafaxine. Crustacean and algae EC(LC)50 values are
available.
PNEC was derived using assessment factor (AF) method.
PNEC= 0,00322 mg/L
Veterinary medication
Carprofen
4 test results were found in literature for carprofen. Crustacean, fish and algae EC(LC)50 values are
available.
PNEC was derived using assessment factor (AF) method.
PNEC= 0,03727 mg/L
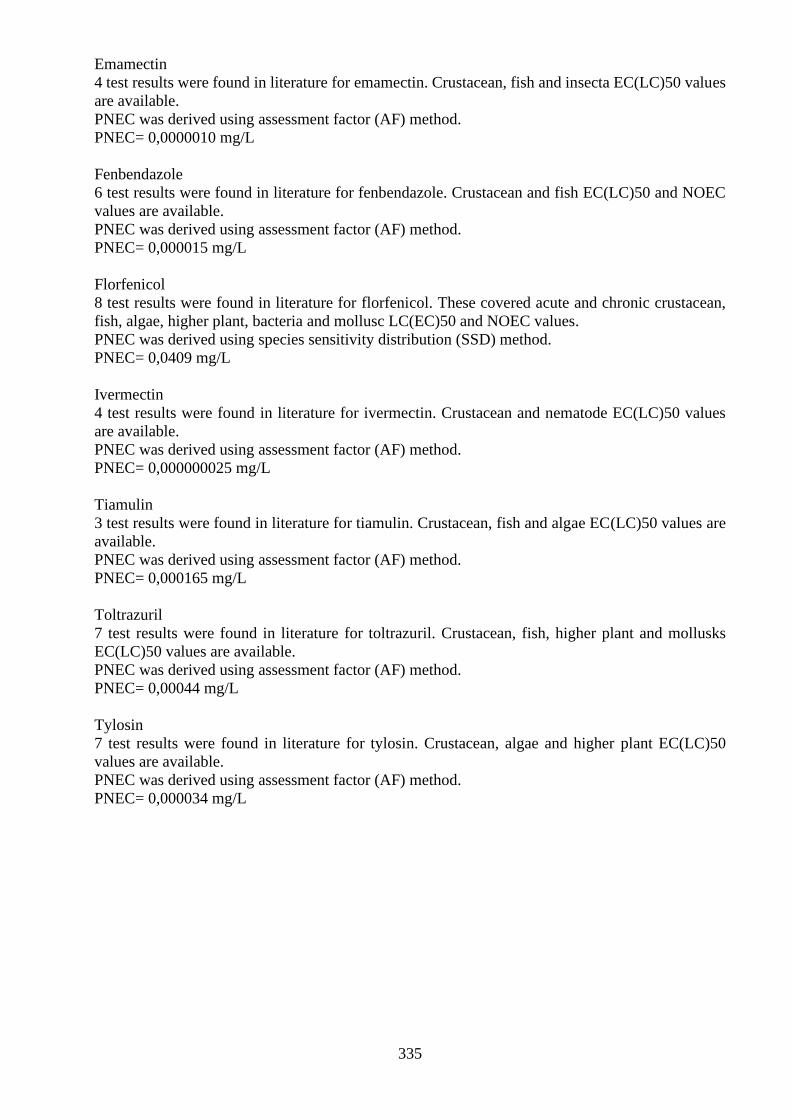
335
Emamectin
4 test results were found in literature for emamectin. Crustacean, fish and insecta EC(LC)50 values
are available.
PNEC was derived using assessment factor (AF) method.
PNEC= 0,0000010 mg/L
Fenbendazole
6 test results were found in literature for fenbendazole. Crustacean and fish EC(LC)50 and NOEC
values are available.
PNEC was derived using assessment factor (AF) method.
PNEC= 0,000015 mg/L
Florfenicol
8 test results were found in literature for florfenicol. These covered acute and chronic crustacean,
fish, algae, higher plant, bacteria and mollusc LC(EC)50 and NOEC values.
PNEC was derived using species sensitivity distribution (SSD) method.
PNEC= 0,0409 mg/L
Ivermectin
4 test results were found in literature for ivermectin. Crustacean and nematode EC(LC)50 values
are available.
PNEC was derived using assessment factor (AF) method.
PNEC= 0,000000025 mg/L
Tiamulin
3 test results were found in literature for tiamulin. Crustacean, fish and algae EC(LC)50 values are
available.
PNEC was derived using assessment factor (AF) method.
PNEC= 0,000165 mg/L
Toltrazuril
7 test results were found in literature for toltrazuril. Crustacean, fish, higher plant and mollusks
EC(LC)50 values are available.
PNEC was derived using assessment factor (AF) method.
PNEC= 0,00044 mg/L
Tylosin
7 test results were found in literature for tylosin. Crustacean, algae and higher plant EC(LC)50
values are available.
PNEC was derived using assessment factor (AF) method.
PNEC= 0,000034 mg/L

336
Annex 21. Risk assessments of APIs
Red colour indicates unacceptable risk, i.e. RQ values above 1. Green colour indicates no risk, i.e.
RQ values below 1. In some cases, the limit of quantification (LOQ) for API determination was
higher than the calculated PNEC values. In such situations, the analytical LOQ value was used as
surrogate of the measured environmental concentration (MEC) resulting in RQs above 1, signaling
that the risk cannot be excluded. In the tables below, these cases are marked with red text. Because
doxycycline and tetracycline were not distinguishable in analytical measurements worst case
scenario was applied and the lower PNEC for doxycycline was used in RQ calculations.
The colour codes used in table 9.6-9.10 are summarized below.
Colour codes:
RQ No risk: risk quotient was below 1. The API was quantified (i.e. above LOQ) and
the MEC is below PNEC.
<RQ
No risk: risk quotient was below 1, but the true RQ is even lower than presented in
tables. The API was below LOQ and the LOQ was used as MEC. LOQ was below
PNEC.
RQ Risk: risk quotient above 1. The API was quantified (i.e. above LOQ) and the
MEC is above PNEC.
<RQ
Risk cannot be excluded: risk quotient might be above 1. The API was below LOQ
and the LOQ was used as MEC. The LOQ was above PNEC. The real RQ is lower
than presented in tables.
MEC=measured environmental concentration
LOQ= limit of quantification

337
Risk assessment of APIs in inland surface waters
Sampling points at which risk was identified for at least one API measured in inland surface waters (i.e. RQ values above 1).
Sampling point Country Sampling time Clarithromycin Diclofenac Emamectin Estrone Metformin Mometasone Norethisterone Ofloxacin Tetracycline/
Doxycycline
Pärnu river, Jändja, SJA6245000 Estonia 12/2017 0.89 0.62 0.42 <87 0.061 <0.090 2.66 <0.49 <0.15
Pärnu river after river Esna, before city of Paide Estonia 12/2017 1.27 0.13 1.0 <87 0.017 0.75 <0.16 <0.49 <0.15
Pärnu river, Jändja, SJA6245000 Estonia 6/2018 <0.26 0.32 <0.090 <87 0.058 <0.090 0.78 <0.49 <0.15
Pärnu river after river Esna, before city of Paide Estonia 6/2018 <0.26 0.13 <0.090 <87 <1.78E-04 1.99 <0.16 <0.49 <0.15
Vantaa 68,2 Finland 12/2017 0.81 0.19 0.14 <87 0.038 <0.090 <0.16 0.63 <0.15
Vantaa 68,2 Finland 6/2018 6.9 1.57 0.1 834 0.14 0.11 2.78 <0.49 <0.15
Vantaa 68,2 Finland 11/2018 13 2.29 0.45 1033 0.12 <0.090 2.28 <0.49 0.53
Vantaa 64,8 Finland 12/2017 1.38 0.39 0.12 <87 0.046 <0.090 <0.16 0.69 <0.15
Vantaa 64,8 Finland 6/2018 26 7.52 0.1 <87 0.21 <0.090 1.66 <0.49 <0.15
Vantaa 64,8 Finland 11/2018 15 5.23 0.4 836 0.47 <0.090 1.31 <0.49 0.54
Vantaa 44,1 Finland 12/2017 1.41 0.4 0.12 <87 0.046 <0.090 <0.16 <0.49 <0.15
Vantaa 44,1 Finland 6/2018 17 4.49 0.1 861 0.16 <0.090 2.4 <0.49 <0.15
Vantaa 44,1 Finland 11/2018 24 4.61 0.42 1262 0.98 <0.090 1.76 <0.49 <0.15
Luhtajoki (tributary) Finland 11/2018 9.3 5.55 0.39 750 0.19 <0.090 1.23 <0.49 0.55
Vantaa 4,2 Finland 12/2017 0.49 0.2 0.12 <87 0.029 <0.090 <0.16 <0.49 <0.15
Vantaa 4,2 Finland 6/2018 1.08 0.63 <0.090 <87 0.26 <0.090 <0.16 <0.49 <0.15
Vantaa 4,2 Finland 11/2018 4.21 1.5 0.45 734 0.25 <0.090 1.41 <0.49 0.55
Tollense river, downstream WWTP Neubrandenburg Germany 2/2018 12 3.86 0.19 <87 0.12 <0.090 0.46 0.61 <0.15
Tollense river, upstream WWTP Neubrandenburg Germany 2/2018 <0.26 0.046 0.21 <87 0.008 0.13 14 <0.49 <0.15
Warnow river, upstream Rostock Germany 2/2018 12 5.78 0.19 <87 0.15 <0.090 0.45 <0.49 <0.15
Tollense river, downstream WWTP Neubrandenburg Germany 5/2018 6.98 4.06 <0.090 340 0.42 <0.090 <0.16 <0.49 <0.15
Tollense river, upstream WWTP Neubrandenburg Germany 5/2018 <0.26 <0.013 <0.090 <87 0.02 <0.090 <0.16 <0.49 <0.15
Warnow river, upstream Rostock Germany 5/2018 0.4 0.25 <0.090 <87 0.17 <0.090 1.36 <0.49 <0.15
Pupla river, downstream Olaine Latvia 11/2017 7.16 10 0.14 <87 0.12 <0.090 <0.16 0.94 <0.15
Driksa river, downstream Jelgava Latvia 11/2017 1.32 0.37 0.25 <87 0.039 <0.090 0.98 <0.49 <0.15
Pupla river, upstream Olaine Latvia 12/2017 0.43 5.7 0.15 <87 0.001 <0.090 <0.16 <0.49 <0.15
Driksa river, upstream Jelgava Latvia 11/2017 1.38 0.39 0.29 <87 0.041 <0.090 <0.16 <0.49 <0.15
Mūsa river, Latvia - Lithuania border Latvia 11/2017 3.01 0.67 0.19 <87 0.036 <0.090 0.38 <0.49 <0.15

338
Sampling point Country Sampling time Clarithromycin Diclofenac Emamectin Estrone Metformin Mometasone Norethisterone Ofloxacin Tetracycline/
Doxycycline
Mēmele, 0.5 km below Skaistkalne Latvia 11/2017 0.53 0.11 0.21 <87 0.014 <0.090 1.56 <0.49 <0.15
Pupla river, downstream Olaine Latvia 5/2018 27 13 0.37 <87 1.67 <0.090 <0.16 3.63 <0.15
Driksa river, downstream Jelgava Latvia 5/2018 1.51 0.39 <0.090 104 0.32 <0.090 1.06 <0.49 <0.15
Pupla river, upstream Olaine Latvia 5/2018 <0.26 3.57 <0.090 146 0.009 <0.090 <0.16 <0.49 <0.15
Driksa river, upstream Jelgava Latvia 5/2018 0.86 0.1 <0.090 256 <1.78E-04 <0.090 <0.16 <0.49 <0.15
Mūsa river, Latvia - Lithuania border Latvia 5/2018 <0.26 0.5 <0.090 <87 0.13 <0.090 <0.16 <0.49 <0.15
Mēmele, 0.5 km below Skaistkalne Latvia 5/2018 <0.26 0.039 <0.090 297 <1.78E-04 <0.090 1.14 <0.49 <0.15
Lielupe, 0.5 km below Kalnciems Latvia 11/2017 0.001 <0.006 <1.80 <114 <6.96E-04 <2.57E-04 0.12 <0.021 <0.001
Lielupe, 0.5 km below Kalnciems Latvia 5/2018 0.15 0.087 <1.80 <114 <6.96E-04 <2.57E-04 0.08 <0.021 <0.001
Rokitnica river, downstream Błonie WWTP Poland 11/2017 151 26 0.17 <87 0.22 <0.090 <0.16 1.79 <0.15
Rokitnica river, upstream Błonie WWTP Poland 11/2017 4.85 0.73 0.54 <87 0.16 <0.090 1.4 2.99 <0.15
Rokitnica river, downstream Błonie WWTP Poland 7/2018 17 25 <0.090 228 0.24 <0.090 <0.16 <0.49 <0.15
Rokitnica river, upstream Błonie WWTP Poland 7/2018 2.12 8.62 <0.090 352 0.16 <0.090 <0.16 <0.49 <0.15
Vättern Sweden 12/2017 <0.26 <0.013 0.33 <87 0.024 <0.090 0.68 1.93 <0.15
Boren Sweden 12/2017 0.36 0.019 0.1 <87 0.024 <0.090 0.3 <0.49 <0.15
Svartån Sweden 12/2017 0.52 0.023 3.22 <87 0.039 <0.090 4.24 10 <0.15
Stångån upstream Sweden 12/2017 0.33 <0.013 0.31 <87 0.011 <0.090 1.4 17 1.26
Stångån-Roxen Sweden 12/2017 0.82 0.32 0.17 <87 0.021 <0.090 1.06 2.28 <0.15
Dovern Sweden 12/2017 0.31 0.061 0.15 <87 0.042 <0.090 0.52 1.73 <0.15
Glan Sweden 12/2017 0.34 0.051 0.21 <87 0.015 <0.090 0.72 <0.49 <0.15
Vättern Sweden 6/2018 <0.26 <0.013 0.43 <87 <1.78E-04 <0.090 4.23 0.72 <0.15
Boren Sweden 6/2018 <0.26 <0.013 <0.090 <87 0.077 <0.090 4.05 <0.49 <0.15
Svartån Sweden 6/2018 <0.26 0.017 0.38 <87 0.13 <0.090 1.37 <0.49 <0.15
Stångån upstream Sweden 6/2018 <0.26 <0.013 0.45 <87 <1.78E-04 <0.090 2.91 <0.49 <0.15
Stångån-Roxen Sweden 6/2018 <0.26 1.85 <0.090 <87 0.72 <0.090 <0.16 <0.49 <0.15
Dovern Sweden 6/2018 <0.26 0.068 0.68 <87 0.93 <0.090 <0.16 <0.49 <0.15
Glan Sweden 6/2018 <0.26 0.04 0.53 <87 0.3 <0.090 2.44 <0.49 <0.15

339
Risk assessment of APIs in coastal surface waters
Sampling points at which risk was identified for at least one API measured in coastal waters (i.e. RQ values above 1).
Sampling point Country Sampling Ciprofloxacin Clarithromycin Emamectin Estrone Norethisterone
Pärnu river in Pärnu by Tallinn road bridge Estonia 12/2017 < 6.8 NA < 0.020 100 < 0.080
Pärnu bay Estonia 6/2018 < 6.8 NA 1.2 215 < 0.080
Katajaluoto (coast, 1-m) Finland 3/2018 < 6.8 NA < 0.020 75 0.78
Katajaluoto (coast, 13-m) Finland 3/2018 < 6.8 NA < 0.020 127 0.42
Katajaluoto (coast, 25-m) Finland 3/2018 < 6.8 NA 0.23 < 21 < 0.080
Katajaluoto (coast, 1-m) Finland 6/2018 < 6.8 NA 0.4 40 < 0.080
Katajaluoto (coast, 15-m) Finland 6/2018 < 6.8 NA 0.32 < 21 0.22
Katajaluoto (coast 23-m) Finland 6/2018 < 6.8 NA < 0.020 54 < 0.080
Helsinki coast (outlet pipe of Viikki WWTP; 9-m) Finland 6/2018 < 6.8 NA 0.45 64 0.7
Matinsilta (river mouth) Finland 3/2018 < 6.8 NA < 0.020 46 0.38
Matinsilta (river mouth) Finland 6/2018 < 6.8 NA 0.18 < 21 0.54
Matinsilta (river mouth) Finland 11/2018 NA 1.9 1.9 573 0.90
Vanhankaupunginselkä (estuary) Finland 3/2018 < 6.8 NA < 0.020 36 < 0.080
Vanhankaupunginselkä (estuary, 1-m) Finland 6/2018 < 6.8 NA 0.73 < 21 0.64
Peene, BSE Autumn Germany 2/2018 < 6.8 NA < 0.020 86 1.7
Warnow, BSE Autumn Germany 2/2018 < 6.8 NA < 0.020 < 21 < 0.080
Peene, BSE Summer Germany 5/2018 < 6.8 NA 7.2 325 1.3
Warnow, BSE Summer Germany 5/2018 < 6.8 NA 4.6 674 < 0.080
Riga coast (outlet pipe of WWTP) Latvia 12/2017 < 6.8 NA 2.1 < 114 0.06
Riga coast (outlet pipe of WWTP) Latvia 12/2017 < 6.8 NA < 1.80 < 114 0.069
Riga coast (outlet pipe of WWTP) Latvia 5/2018 < 6.8 NA < 1.80 < 114 0.093
Riga coast (outlet pipe of WWTP) Latvia 5/2018 < 6.8 NA < 1.80 < 114 0.13
Vistula River, Kiezmark Poland 11/2017 < 6.8 NA < 0.020 31 < 0.080
Vistula River, Kiezmark Poland 7/2018 < 6.8 NA 1.6 < 21 2.4
Bråviken Sweden 12/2017 NA NA 0.21 < 87 1.1
Bråviken Sweden 6/2018 NA NA 0.79 < 87 < 0.16

340
Risk assessment of APIs in sediments
Sampling points at which risk was identified for at least one API measured in sediments (i.e. RQ values above 1).
Sampling point Roosna-Alliku
fishfarm
Pärnu river in
Pärnu
by Tallinn road
bridge
Pärnu bay Fish farm ~620 m from the
fish farm
~930 m from the
fish farm
Riga coast
(outlet pipe of
WWTP)
Riga coast
(outlet pipe of
WWTP)
Bråviken Bråviken
Country Estonia Estonia Estonia Finland Finland Finland Latvia Latvia Sweden Sweden
Sampling time 12/2017 12/2017 6/2018 9/2018 9/2018 9/2018 5/2018 12/2017 12/2017 6/2018
Ciprofloxacin 1.18 5.06 <0.29 0.72 <0.29 1.12 2.07 1.75 1.07 <0.29
Clarithromycin <2.03 42 <2.03 <2.03 <2.03 <2.03 6.56 <2.03 4.57 <2.03
Diclofenac <0.21 2.6 0.21 <0.21 <0.21 <0.21 <0.21 <0.21 <0.21 <0.21
Emamectin 1.12 1.52 <0.78 <0.78 <0.78 <0.78 <0.78 1,0 <0.78 <0.78
Erythromycin <14 <14 <14 <14 <14 <14 <14 <14 <14 <14
Estriol <290 <290 <290 <290 <290 <290 <290 <290 <290 <290
Estrone <2595 <2595 <2595 48828 <2595 6496 9368 19545 <2595 <2595
Ivermectin <810 <810 <810 <810 <810 <810 <810 <810 <810 <810
Metformin 23 37 3.61 1.85 1.86 7.03 5.3 5.23 4.19 15
Mometasone <15 <15 <15 <15 <15 <15 <15 <15 <15 <15
Norethisterone <27 162 NA NA <27 <27 NA <27 <27 105
Ofloxacin <0.65 18 <0.65 2.57 <0.65 <0.65 <0.65 <0.65 0.79 <0.65
Paracetamol 14 17 <0.20 <0.20 14 410 3.07 <0.20 48 67
Sulfamethoxazole <1.13 <1.13 <1.13 <1.13 <1.13 <1.13 <1.13 <1.13 <1.13 <1.13
Tetracycline/
Doxycycline 72 <43 92 <43 <43 107 54 <43 135 <43
Tylosin <33 <33 <33 <33 <33 <33 <33 <33 <33 <33

341
Risk assessments of APIs in soil
Sampling points at which risk was identified for at least one API measured in soil (i.e. RQ values
above 1).
Sampling point EST 1 EST 2 GER 1 LAT 1 SWE 1 SWE 2
Country Estonia Estonia Germany Latvia Sweden Sweden
Sampling time 10/2018 10/2018 5/2018 6/2018 6/2018 6/2018
Ciprofloxacin <0.53 <0.53 1.3 <0.53 <0.53 <0.53
Diclofenac <0.46 2 <0.46 <0.46 <0.46 <0.46
Estrone <4900 <4900 160000 <4900 <4900 <4900
Ivermectin <1500 <1500 <1500 <1500 <1500 2700
Metformin <0.013 1.8 10 1.6 4.8 1.6
Ofloxacin <1.2 <1.2 1.8 <1.2 <1.2 <1.2
Paracetamol 26 18 5.7 110 9.7 9
Erythromycin <26 <26 <26 <26 <26 <26
Estriol <630 <630 <630 <630 <630 <630
Mometasone
furoate <35 <35 <35 <35 <35 <35
Norethisterone NA <56 NA <56 <56 <56
Sulfamethoxazole <3.1 <3.1 <3.1 <3.1 <3.1 <3.1
Tetracycline /
Doxycycline <360 <360 <360 <360 <360 <360
Tylosin <84 <84 <84 <84 <84 <84
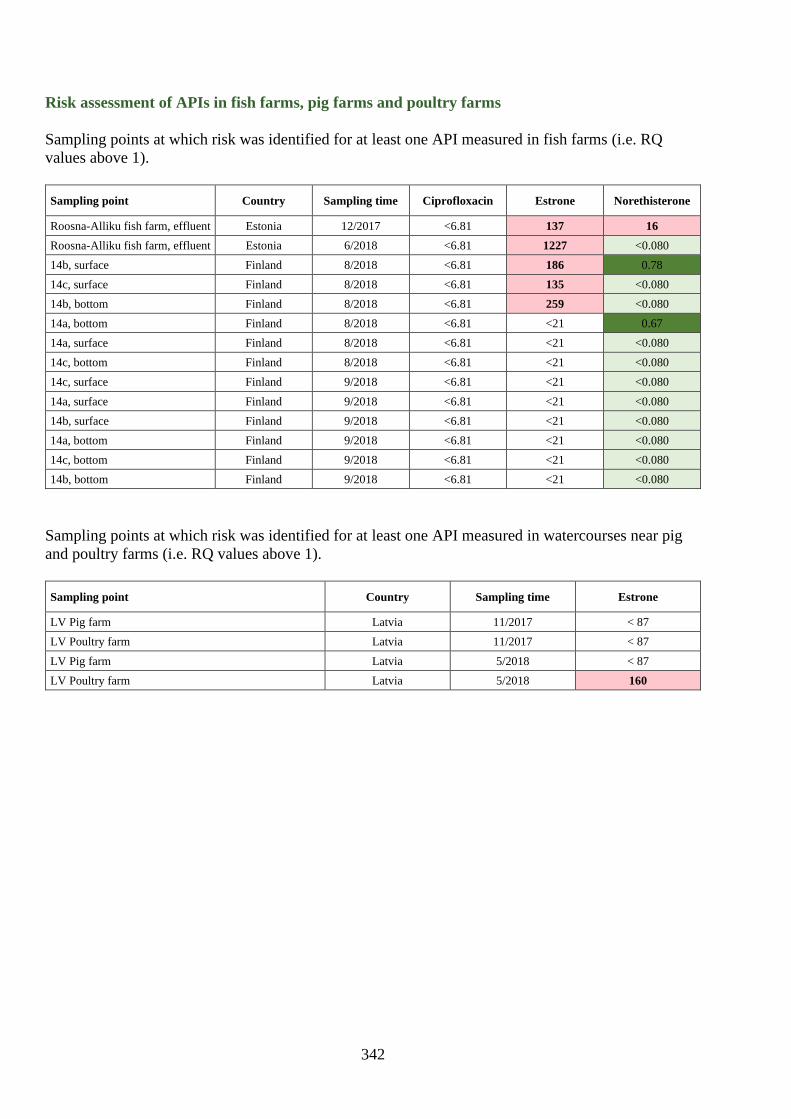
342
Risk assessment of APIs in fish farms, pig farms and poultry farms
Sampling points at which risk was identified for at least one API measured in fish farms (i.e. RQ
values above 1).
Sampling point Country Sampling time Ciprofloxacin Estrone Norethisterone
Roosna-Alliku fish farm, effluent Estonia 12/2017 <6.81 137 16
Roosna-Alliku fish farm, effluent Estonia 6/2018 <6.81 1227 <0.080
14b, surface Finland 8/2018 <6.81 186 0.78
14c, surface Finland 8/2018 <6.81 135 <0.080
14b, bottom Finland 8/2018 <6.81 259 <0.080
14a, bottom Finland 8/2018 <6.81 <21 0.67
14a, surface Finland 8/2018 <6.81 <21 <0.080
14c, bottom Finland 8/2018 <6.81 <21 <0.080
14c, surface Finland 9/2018 <6.81 <21 <0.080
14a, surface Finland 9/2018 <6.81 <21 <0.080
14b, surface Finland 9/2018 <6.81 <21 <0.080
14a, bottom Finland 9/2018 <6.81 <21 <0.080
14c, bottom Finland 9/2018 <6.81 <21 <0.080
14b, bottom Finland 9/2018 <6.81 <21 <0.080
Sampling points at which risk was identified for at least one API measured in watercourses near pig
and poultry farms (i.e. RQ values above 1).
Sampling point Country Sampling time Estrone
LV Pig farm Latvia 11/2017 < 87
LV Poultry farm Latvia 11/2017 < 87
LV Pig farm Latvia 5/2018 < 87
LV Poultry farm Latvia 5/2018 160

343
Länsstyrelsen skapar samhällsnytta genom rådgivning, samordning, tillstånd, tillsyn, prövning,
stöd och bidrag. Vi skyddar miljön, ser till att viktiga natur- och kulturvärden bevaras och skapar
förutsättningar för att utveckla landsbygden och näringslivet i länet. Vi har även samhällsviktiga
uppdrag inom bland annat krisberedskap, sociala frågor, djurskydd och samhällsplanering.
På så sätt bidrar vi till Länsstyrelsens vision om ett livskraftigt Östergötland