WORKING FOR BETTER IN THE BALTIC REGION
212
WORKING FOR BETTER Rivers IN THE BALTIC REGION The Baltic Sea Project Learners' Guide No. 4
-
Upload
khangminh22 -
Category
Documents
-
view
2 -
download
0
Transcript of WORKING FOR BETTER IN THE BALTIC REGION

WORKING FOR BETTERRiversIN THE BALTIC REGION
The Baltic Sea Project
Learners' Guide No. 4


WORKING FOR BETTER
RiversIN THE BALTIC REGION
RIVERS AS AN EDUCATIONAL CHALLENGE IN ART, SOCIAL STUDIES AND SCIENCE
¥ The Baltic Sea Project
Learners* Guide No. 4

THIS BOOK HAS BEEN PRODUCED WITHIN THE FRAMEWORK OF THE BALTIC SEA PROJECT
AS PART OF THE UNESCO ASSOCIATED SCHOOLS PROJECT
Key words: The Baltic Sea drainage area; environmental education; interdisciplinary approach Abstract: The book deals with rivers as an educationai challenge in environmental education in art, social studies and science looking for experiences with rivers and nature and for solutions to the environmental impact caused by human activities. International teacher training within the Baltic Sea Project, supported by UNESCOs Participation Programme 1998-1999, took place in Finland (1998), Lithuania (1999) and in Latvia (1999). The meetings served as forum for discussi- ons among specialists, students and teachers who contributed with their experiences and ideas.
© The Danish Ministry of education in co-operation with UNESCO Financial support from the European Commission First edition, 2000 ISBN 87-987489-1-2
Editor: Birthe Zimmermann, General co-ordinator of the Baltic Sea Project, Denmark, in co-operation with an Editorial group consisting of:Per Werge, DenmarkRisto Hamari, Leena-Riitta Salminen & Jarkko Suvikas, Finland Velga Kakse, Loreta Urtane & Andris Urtans, Latvia Ingvar Lennerstedt & Jan-Erik Wallden, Sweden Language corrections: Robert Quick, GB Main illustrator: Zane Darzina, Latvia
Cover photo: Student Rickard Nielsson, Polhemskolan, Lund, Sweden in “Kick method” action. Photo by Ingvar Lennerstedt, Lund, Sweden
Production, design & print by: Toptryk, Graasten, Denmark on Multiart Silk paper carrying the Nordic Environmental Swan logo. Colours are 100% vegetable colours.
The book can be ordered from:The Ministry of Education in Denmark,Undervisningsministeriets forlag Strandgade 100 D DK-1401 Copenhagen K Phone: +45-3392 5220 Fax: +45-3392 5219 e-mail: [email protected]
Order no: UVM-1-027
WHEN PHOTOCOPYING, PLEASE ACKNOWLEDGE THE SOURCE
Preface”01d man river.. .he just keeps rolling...”Do we take our streams and rivers for granted? We just have to take a closer look at them in order to find the answer! And that is what the teachers and students participating in the Baltic Sea Project have been doing for the last few years.
As we know rivers are much more than ”a natural stream of water of considerable volume” (Webster’s New Collegiate Dictionary). They are a source of life, not only to the marine en- vironment which they encompass but to the flora and fauna found along their banks and to nearby local inhabitants. ”Rivers are the most important freshwater resource for man.” Healthy rivers often signify healthy life and well-being. Hence, they need our constant care and protection and measures to preserve them.
As the Director-General of UNESCO, Mr. Koichiro Matsuura, recently stated ”The natural riches we daily deplete may never be reple- nished again, and the vast bodies of water we soil, while killing off countless varieties of marine life, might never more be cleansed.One of our most pressing tasks is to preserve what is most precious today while addressing the human needs of tomorrow.”
Thanks to the Baltic Sea Project, students throughout the region have been very much involved in taking a new look at nearby rivers, the quality of the water, aquatic life, the state of the surrounding environment, threats of contamination and pollution facing rivers, and conservation action. By leaming more about the many different species e.g. organisms, in- sects, plants, fish, birds, animals which depend on river quality for their existence and survi- val, students see beyond the flow of the river but become very conscious of the wealth of life it generates.
The Baltic Sea catchment area is richly end- owed with streams and rivers, a large variety of marine life, and surrounding flora and fauna. As revealed in this book, each river has common elements but each one is unique. By leaming more about our local rivers and streams and their vital bio-diversity, through dee- pening our appreciation of them and taking appropriate action to preserve them, significant contributions are made at the same time to protecting the Baltic Sea and the natural and cultural life surrounding it which is the main objective of the Baltic Sea Project. River life also depicts and reflects local culture, customs and traditions. By leaming more about rivers,
1 Water Quality Assessment, Edited by Deborah Chapman, published on behalf o f UNESCO, WHO and UNEP, 1992, page 239

one can also leam very much about the towns, villages and inhabitants along their banks.The Baltic Sea Projects aims also to promote intercultural leaming and by studying river life one can understand much about the way of life of the people.
As we know, rivers have often served as sour- ces of inspirations for composers, artists and writers and continue to do so. Portrayed through songs, music (Danube Walz by Strauss, The Rheingold Opera (Rhine) by Wagner, Moldau (Moldova River) by Czech composer Smetana, etc.), literature (e.g.Tom Sawyer by Mark Twain), paintings (Le Déjeuner ("Luncheon” on the banks of the Seine by Renoir, etc. The Thames (London) by Monet, etc.), as well as poetry as included in this book. By becoming more aware of the importance of their local rivers and streams, young people can express their appreciation through the Creative arts.
Since rivers and streams are related to so many facets of daily life and to our future wellbeing, the study of them calls for a holistic approach. This book emphasizes the contributions of subjects across the curriculum such as science, geography, mathematics, art, etc. so that young people can become more aware of the need to protect our rivers and streams, develop new skills to contribute concretely to their preser- vation, and reinforce their Creative capacity to express their ideas and feelings. This is the fourth book published in the series of the Baltic Sea Project (BSP) Leamer’s Guides. It reflects the serious and innovative work and activities underway in the many BSP schools
located throughout the Baltic Catchment Area, and it will surely be a source of inspiration and of practical use to many more.
The long preparation of such a Guide calls for much debate, concrete classroom and extra- curricular activities, a systematic exchange of ideas and results and sound co-ordination. Birthe Zimmermann (Denmark), the BSP General Co-ordinator for the past three years has played an instrumental role in ensuring the high qualitative development of the Baltic Sea Project. She is to be highly commended for steering the BSP in the right direction, for keeping it on course so that it can result in such commendable educational resource mate- rial and for ensuring the constant interaction of the unique natural and cultural dimensions of the Baltic Sea and its peoples. Like you, I am also a ”river person”. I grew up near the banks of one of the world’s largest rivers - the Mississippi (USA) and now I live about one hundred meters from another well known river, the Seine in Paris. As I cross the bridges every day, I never cease to wonder at the river’s flow, its force, its ’Tifeline”, its beauty and its fragility. Let us all commit to preserv- ing our streams and rivers, however big, how- ever small, for present and future generations.
Elizabeth Khawajkie, International Co-ordinator UNESCO Associated Schools Project NetWork (ASPnet)

Contents:PREFACE 3TO THE READER 6
SECTION 1. RIVERS AS AN EDUCATIONAL CHALLENGE IN ART 71 ENVIRONMENT AS AN EDUCATIONAL CHALLENGE IN ART 82 A HOLISTIC APPROACH 143 AESTHETICS AND ENVIRONMENT 264 VISUAL AND ENVI RON MENTAL ART 365 THE URBAN USE OF RIVERS 446 ART AND DESIGN IN ENVIRONMENTAL EDUCATION 50
QUESTIONS ON SECTION 1 57
SECTION II. RIVERS AS AN EDUCATIONAL CHALLENGE IN SOCIAL STUDIES 597 INTRODUCTION TO BALTIC RIVERS 608 IT ALL STARTS WITH THE RAIN 649 GEOGRAPHICAL MAPPING 7010 HISTORICAL MAPPING 86n CASES ON BALTIC RIVERS 92
QUESTIONS ON SECTION II 117
SECTION III. RIVERS AS AN EDUCATIONAL CHALLENGE IN SCIENCE 11912 INTRODUCTION TO SPRINGS, BROOKS AND STREAMS 12013 RIVERS AND ORGANISMS ADAPTED TO RIVERS 12214 METHODS USED FOR ESTIMATING THE WATER QUALITY OF RIVERS 150
QUESTIONS ON SECTION III 175
SECTION IV, SOLUTIONS - WORKING FOR BETTER QUALITY OF RIVERS 17715 RIVER CHANNELISATION AND RESTORATION 17816 STUDENTS" EXAMPLES 184
APPENDIXPROTOCOL TO BE USED IN THE BSP PROGRAMME "RIVERS" INDEX
192201
To the ReaderThis Leamers' Guide is the fourth in a series of jointly elaborated educational materials. Leamers Guide 1 "Working for Better Water Quality in the Baltic Sea" was first published in 1994, the second edition in 1998. Leamers' Guide 1 focuses on methodology, indicators, and on education with a specific chapter on disciplinary, interdisciplinary and problem-based leaming. Baclcground information on the vulnerable Baltic Sea provides useful information also for readers of this Leamers' Guide 4 "Working for Better Rivers in the Baltic Region". Leamers' Guide 2 "Working for Better Air Quality in the Baltic Region" was published in 1998.It deals with air pollution and education.For readers interested in "Rivers" special reference should be made to a section on "Effects of Acidification". Leamers' guide 3 "From Words to Action" (1998) has its focus point on environmen- tal education for sustainable development based on the Rio Declaration in 1992 and Agenda 21, and on a BSP students- and teachers conference in Nykoping, Sweden in 1997. Of special importance is the students' reports on how to change the attitude and make environmental education a matter of lifestyle teaching.
Rivers in the Baltic Sea drainage area have been a topic for networking BSP students and teachers for a long time. Methodology on rivers, however, has been developed and modified in almost every country, as river types, education and culture differ. A protocol has been elaborated by "Vattenriket" in Sweden during the 1990s that has served as an important tool and platform for the editorial group of this book. However, the educational approach of combining aesthetics, art and design, social stu
dies, historical and scientific aspects have been made due to numerous suggestions from students and teachers participating in parallel teacher trai- ning courses in Kotka, Finland, in November 1998, in Klaipeda, Lithuania, in April 1999 and in Ligatne, Latvia in August 1999. Through a personal relationship with nature the student reaches a level of personal appreciation that leads to engagement with nature e.g. the local river, and with increased knowledge and understanding the student may influence authorities and decision makers and thus help solve environmental problems, caus- ed by other decisions made by other decision makers at another time. "Working for Better Rivers in the Baltic Region" is divided into four main sections accordingly. The first section deals with environment as a challenge in art, the second provides baclcground information on how rivers devel- op and on different types of rivers, the third section focuses on life in rivers and on different methodology. The fourth section calls for ideas for action and solutions, when problems have been an estab- lished faet. It has not been the intention to make one joint method for investigating rivers in the entire region, the aim however, has been to make one joint protocol (Appendix 1) that can provide the basics for comparisons on rivers in the Baltic Sea region.Many people have helped in the process with their time, ideas, suggestions, illustrations, photos and knowledge. We thank you all! A special thanks to Anna-Maj B. Påhlsson, Lund and Jan Herrmann, Kalmar, Sweden, for comments on Index methods.
Birthe Zimmermann, General co-ordinator of the Baltic Sea Project, May 2000

Section I.RIVERS AS AN EDUCATIONAL CHALLENGE IN ART
Chapter 1: Environment as an Educational Challenge in Art 8Rivers as a Theme in Art Education 10Aims and Objectives 11On Tasks 12
Chapter 2: A Holistic Approach 14Sharpening the Multisense Perceptions 14Rivers in Mental images, as Visions and Models 16Rivers and Human Activities 16Log driver Films - Romantic Portrayal o f Work 18Boats, Art and Innovation 25
Chapter 3: Aesthetics and Environment 26Universal Symbolic Meanings of the River 28Symbolic Signs of the River 29Northern Myths abou t Rivers 30Myths and Heroes 32
C hapter 4: Visual and Environmental Art 36About the Nature o f Flowing Water 37Rivers in the Visual Art 38Environmental Art as a Branch of the Visual Art 40The Kyml River and Art 42
C hapter 5: The Urban Use o f Rivers 44Flowing Water in Architecture and Urban Planning 44Rivers and Cities 46Sources 48
C hapter 6: Art and Design in Environmental Education 50Suggestions - to be further e laborated locally 52Latvian Foik Song 53River Svir, a Russian Legend 55
Questions on Section I 57
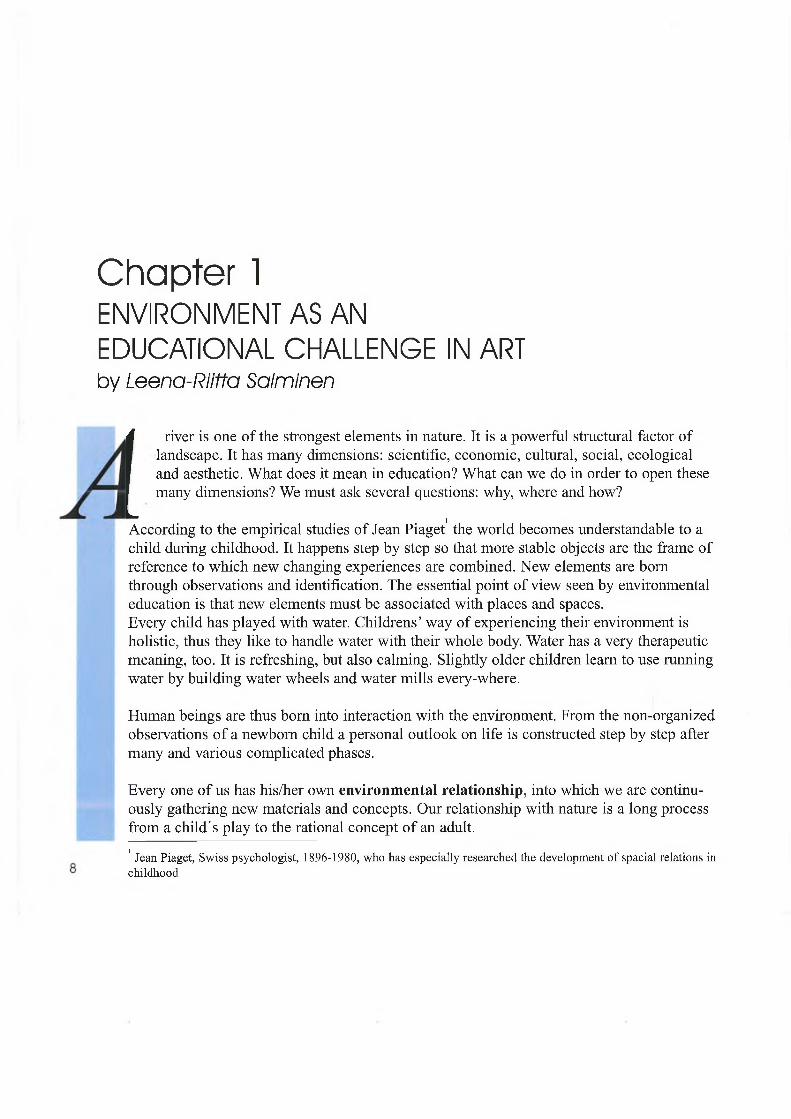
Chapter 1ENVIRONMENT AS AN EDUCATIONAL CHALLENGE IN ARTby Leena-Riiffo Solminen
(river is one of the strongest elements in nature. It is a powerful structural factor of landscape. It has many dimensions: scientific, economic, cultural, social, ecological and aesthetic. What does it mean in education? What can we do in order to open these many dimensions? We must ask several questions: why, where and how?
1According to the empirical studies of Jean Piaget the world becomes understandable to a child during childhood. It happens step by step so that more stable objects are the frame of reference to which new changing experiences are combined. New elements are bom through observations and identification. The essential point of view seen by environmental education is that new elements must be associated with places and spaces.Every child has played with water. Childrens’ way of experiencing their environment is holistic, thus they like to handle water with their whole body. Water has a very therapeutic meaning, too. It is refreshing, but also calming. Slightly older children leam to use running water by building water wheels and water mills every-where.
Human beings are thus bom into interaction with the environment. From the non-organized observations of a newbom child a personal outlook on life is constructed step by step after many and various complicated phases.
Every one of us has his/her own environmental relationship, into which we are continu- ously gathering new materials and concepts. Our relationship with nature is a long process from a child's play to the rational concept of an adult.1 Jean Piaget, Swiss psychologist, 1896-1980, who has especially researched the development o f spacial relations in childhood

On the other hand, the outlook on life of young people is influenced by the commercia- lisation of life. The mainstream culture doesn't necessarily include conscious searching for experiences of nature, or at least they are not an absolutely natural part of the modem life- style.Experiences of nature are often paid commodi- ties. Holidays in Lapland or on the seashore are “arranged” trips.A rational modem city-dweller may regard nature as romantic or as fashionably “green”, but he/she doesn't identify its role as a basic source of life.
So, special activities are demanded in order to find our way to nature.
Ecological crises have forced us to recognise that activities and attitudes to nature must be understood with a greater responsibility and that ways of life must be changed to meet the demands of ecological reality. Luckily, many young people recognise that environmental issues are uppermost in their minds and they want to influence them.
In Western art philosophy the relationship between art and nature is a central theme.
1.1) ” My Own Relationship with Nature ” Painting by Minna Herrala, 17 years old, a pupil o f Langinkosld Upper Secondary School, Finland

RIVERS AS A THEME IN ART EDUCATION
In environmental education through art theaim is a personal, concrete experience and work. In Creative work one is always searching for new links between the already identified and something new. At best it means succeed- ing through a continuation of a child’s way of organising the world through play.
Leonardo da Vinci said that we gain knowledge only by studying nature.
We can address a river with all five senses. From a distance we can hear the water flowing, and feel its humidity. Often water smells fresh or - due to human activities - unpleasant. We can also admire the movement of water, its streaming, waving, glittering and gleaming.
Working with the river theme provides oppor- tunities for us to reflect on our relationship with time.When working on a slow, quiet, Creative pro- cess, we have the opportunity to deepen our feeling for nature and to find a contemplative concentration.
The feeling of sacredness in our relationship with nature is also a response to one's spiritual longing for balance and a deeper aim in life. The experience of being a part of the greater processes of nature is meaningful and opens up new dimensions.
In art education the process of learning is much more im portant than the final artwork. Even at the beginning of the process you must be aware of how to go further, of how to reach your goals. The social dynamics of a group and the wholeness of the process must thus be imagined early on. Receptivity and a willingness to be open have to be consi- dered by both teachers and pupils.
The environment is formed in active, Creative interaction in which physical, psychological and social aspects come together.
The environment is examined in all its aspects. Nature is the starting point, but related to it includes artefacts and the phenomenon ofhuman culture. Lilce Leonardo da Vinci, art educators believe that combining art and science is possible, and even necessary, in order to understand the wholeness.
The starting point is phenomenal, the appreci- ation of our own experiences, the expression of feelings and the subjective process of vari- ous aspects.Positive experiences are often of an aesthetic character. Meanings and values of the environment are then seen as personally important and worthy of active involvement.
1.2) “Approaching the river”, Korkeakoskifishing area on the Kymi riverbank. Photographed by a group working with ecological history at Langinkoski Upper Secondary School

Through art we can promote the appreciation of nature or reveal a conflict. Can we appeal to a person through feelings and images in order to change attitudes to the environment and so make the world better? An art educator’s answer is positive.
Many developers of environmental education think that one’s own active involvement in the environment is essential for leaming and changing attitudes. One must start from one’s own immediate surroundings.
From the point of view of art education, it is not just a matter of protecting the environment on its own. A more sustainable view of deve- lopment must be aimed at for the future to create a new balance. It means creating better surroundings, objects and ways of living. But it is very important to create positive, real life visions.
We also need to design something new in order to change our lifestyle. We will not suc- ceed by employing restrictions or prohibitive laws. Instead, we need joy, dignity and a new responsibility in order to see the benefits of a sustainable lifestyle.
One can talk about the aesthetics of simplicityand naturalness. It means that we reuse materi-als, realise the beauty of everyday life andreplace quantity by quality.
AIMS AND OBJECTIVES
- to ensure an artistic share in the multi- disciplinary wholeness;
- to integrate ecological conception with cultural ecological conception;
- to use an artistic-aesthetic leaming process:• observation-interpretation-evaluation• experiential leaming• leaming by doing;
- to understand that observation is leamed and incorporated with culture;
- to find new ways and models of observation through a r t , and new ways to classify and construct one's own relationship with the theme;
- to nurture feelings and subjective processes;- to understand that one can change the
future, not only protect the former cultural heritage and nature;
- to visualize intellectual and cognitive con- ceptions.
Meelcer 19942;Art and ecology have fundamental factors in common. They can offer tools to end the long battle between thinking and intuition, science and art and perhaps also between mankind and nature.
2 Joseph W. Meeker was one o f those who wanted to combine art and science. His work ”The Comedy of Survival” was published in 1974 in New York.

ON TASKS
1. Tasks which sharpen and make observations more sensitive:
• colour, form, size, motion, hard-soft, natural-man made, living-lifeless.
2. Tasks which give expression to the processes of the river.
• flowing of water: rapids- quiet water;• variations of day and night
and throughout the year;• changes of light;• weather changes: winds, rain,
snow and ice.
4. Tasks which test the scale and limits of the river:
• practical uses of the river- as a source of energy and livelihood;
• the river as a cultural environment- as a traffic route, as a location for settlement and other forms of construction,as a milieu.
• rivers and industry;• the future of the river.
3. Tasks which challenge the pattems and conventions of viewing the river:
• the river as a factor of identity;■ the river as a landmark;• mythical meanings, beliefs and symbols
of the river;• the river in the arts, as a source of
inspiration.
Tools:painting, drawing, photography, video, digital pictures, performance, drama, multiartistic projects, exhibitions, workshops, excursions, environmental and natural art materials.

1.3) The Langinkoski rapids in winter on the River KymiDigital photograph by Simo Koho, a 15 year-old pupil from Langinkoski Lower Secondary School, Kotka, Finland

Chapter 2A HOUSTIC APPROACHSHARPENING THE MULTISENSE PERCEPTIONS by Leena-Riitta Salminen and Jarkko Suvikas
nstead of leaming in a classroom, the project should be talcen outdoors. It is very important to emphasise concentration and to create situations which promote one’s own personal experience. The aim is to approach the river theme using all five senses.
According to an agreed plan, the first study location on the river is visited and visual and verbal observations talcen. These sites should be chosen by the teacher, preferably after consultation with the pupils. Maps may be used to help. One must also take notes on the vocal landscape and malce observations on the sense of smell. Tactile sensations should also be included through touching.
An essential part of the process is recordings of feelings, thoughts and associations. It is also important to report on the messages from your own body.
The exercise should continue by marking one of the observation sites so that one can find it later. Of course it must be done without damaging nature. The purpose is to come back to the spot later, perhaps at regular intervals in order to record how the observations change. It is also necessary to talk about the influence of one's personal state of mind.
Furthermore, it's possible to deepen one's empathy with the river by coming back at dif- ferent times of the day and even in different seasons. The wholeness being achieved by lin- king scientific and cultural historical aspects together. The experience of the environment can now reach new, perhaps surprising dimensions.

2.1) Young picture maker Suvi Eerola workingwith her material Photo: LR Salminen
Tasks
1. To paint different light and movement con- ditions of the river (rapids, quiet waters, normal flow etc.) and try to find the right shades of colours for the motions of run- ning water. Use large paper and paint with your whole body, so you will feel more deeply the essential nature of your river.
2. Take your camera and search for a series of pictures along the riverside to support your painting. You must first concentrate on your subject, and if possible, make notes on your feelings and thoughts. If you use a video camera, you can record sounds too. If you use a digital camera, your series of pictures may be presented on your home pages.Or you can exhibit your publications on the river theme.
2.2) “Riverbank” Cut in linoleum by Suvi Eerola, a 17 year-old pupil from Langinkoski Upper Secondaiy School
3. You can find poems inspired by rivers or write them yourself.In a team you can put together a little book and illustrate it with your own pictures.
2.3) At an international BSP teachers' training in Kotka in 1998 all participants modelled clay figures which were somehow linked with the river theme. Photo: LR Salminen
' Linoleum is a hard material in which you can’t carve an exact picture. It is, however, very suitable for emotional expres- sions in which the feeling is the main factor.

RIVERS IN MENTAL IMAGES, AS VISIONS AND MODELS
The leaming process begins by studying what had happened earlier to the area. The point of view may be historical, scientific or it may simply follow the river from its beginnings to the present. In addition to the facts, one may enliven the theme by interviewing those peop- le to whom the river has been or is personally very important.
It is very important to discuss how the river has influenced one's lifestyle. The one who is a professional fisherman clearly sees the river differently from a farmer or someone who has his/her summer cottage on the riverside. Also, unpleasant information and experiences must be included. This process doesn't need to be linear. It may integrate several of these approaches together. Elements that surprise the participants are welcome.
As we know, river landscapes have inspired many artists. It is interesting to study which kinds of paintings, literary or musical works were inspired by the river. Local area organisations may have old photos. It's also useful to ask experts outside school to share their inte- rests.
But it is necessary to create something of your own. It may be a poem, drawing, paint- ing, model or object. Or it can be a drama depicting life on the riverside, video or multi- media presentation. Expressions of feelings must be encouraged along with knowledge.
Right from the beginning notes must be made of the process. The whole leaming experience may be made up from mental maps or codes of relationships between different aspects and on links between different factors.
It's very important to verbalise the experience in groups. Communication between an indivi- dual and a community clearly opens doors for new visions and forms of experience and it strengthens feelings of togethemess.Finally it is necessary to discuss what should be done for the future of the river. To involve new generations requires understanding one's responsibility on a larger scale.
The results of the work are worth publishing in the home pages of the school or in the local media, or at least in the school's own news.An exhibition open to the public serves the same purpose.
RIVERS AND HUMAN ACTIVITIES
The idea is to make various types of report in which one is studying the relationship between people and the river.There may be many aspects e.g. the river as a source of livelihood, the river as a resource for industry and the river as an artistic starting point.

THE RIVER AS A SOURCE OF LIVELIHOOD
It's very interesting to see which kind of struc- tures were created by human activities. The starting point may be a hunting culture. It may be studied experimentally on the bank, by researching different ways of fishing and by trying to obtain nourishment in this way.
A good procedure is to fish and then handle the fish, which may be quite strange for students today. A fish is also a veiy elegant and dynamic, aesthetic object as an inhabitant of
2.4) Whitefish dam. Photographed by Risto Hamari
water whose colours and forms have develop- ed during a long evolution.Functional and constructional logic are thus combined in fishing trips.
The second phase is to consider agricultural factors. The original idea was to live in secure places and very often living by the riverside. Land had to be tamed for human needs. It is very interesting to visit a farm, to see the rhythms of the landscape, to record the loca- tion of buildings and the whole way of life. From the aesthetic point of view, one can also study agricultural tools and other objects used in different periods.
THE RIVER CREATES COMMUNITIES
The river provides a habitat for plants, animals and people. Culturally it may be seen as a real and symbolic mother stream for all communi- ties that were born on the riverside.
The river has fed both in a material and spiritual way, first individual inhabitants living near the banks, then villages, then factory are- as and eventually cities. This feature is com- mon to all rivers in the BSP region.
The River Kymi in Finland became an impor- tant resource for industrialisation. As elsewhe- re, whole communities grew up around factories that had a very clearly organised system of dwellings, some services and even leisure facilities. Often the buildings were of a

consistent style. The location of the house revealed in which position of the hierarchical system the dweller was placed.
It is very interesting to notice that exotic features were sometimes incorporated into buil- dings by workers who came from abroad to work in the factories. They were often highly specialised professional workers.
A world famous example of a modem commu- nity built up around a sulphate cellulose facto- ry is Al var Aalto's Sunila in the delta of the Kymi River. It was planned in the 1930’s and offers a fine example of good architecture even today.
2.5) Foreign features in the Karhula factory area; houses covered by shingle, built at the end o f the 19th century.Photographed by Leena-Riitta Salminen
TaskTo study the structure of a community created by a factory. You can survey buildings of vari- ous types and functions, and imagine everyday life and leisure time of the inhabitants since the first decades of the process. Use photo- graphs, drawings, paintings or video.
LOG-DRIVER FILMS 5 - ROMANTIC PORTRAYAL OF WORK by Jarkko Suvikas
Log driver films represent an interesting genre in the history of Finnish film making. Log driver films can be seen in a way as Finnish westerns. They often consist of wild nature, untamed river, freedom and hardworking people but unfortunately the life of good and honest people is made harder by bandits and crooks. Even though the actual portrayal of work is not the main theme in these films, these log driver films have been very popular for understandable reasons. They have represented return to the roots to an era when nature was unspoiled and love was real and uncomplicated. Log driver films were particu- larly popular at the time when Finnish people started to break their bonds to nature and environment, and when they started to flock to towns. In industrial towns people lost their fascination to work and their freedom to work when and how they wanted, and those things were replaced by busy schedules and stamping a timecard. Log driver films made workers to forget their miserable life: inadequate nourish- ment, low wages, humble accommodations and a constant worry of future since there were few jobs for life.
The log driver films romanticise the early industrialisation of Finland at the end of the 19th century. This time in the Finnish economy was largely dependent on forests - Finland’s green gold. The value of forests rose incredib- ly during a short period of time, and wood industry pro vided plenty of jobs to the ever-
Alvar Aalto (1898-1976) famous Finnish architect, pioneer o f functionalism;
the function of the building is the most important basis o f planning. Finnish titles are freely translated

growing Finnish population which was bound by class society. Log driver films were in faet shot at the same time as American westerns and a log driver was in a way a some kind of cowboy of his time - he was free and he was not bound by social constraints. The surrounding society of the films was strictly guided by certain rules and taboos: money talked and made the world go round in patriarchal rural communities where mansion owners and lum- ber company managers were big shots.The peasants had their own roles below the decision malcers and between those two social groups there was an easy-going and relaxed log-driver - a symbol of a real macho man.
The very first Finnish log-driver film ”Kosken- laskijan morsian” (“The Log driver’s Bride”) was directed by the director of Suomi Filmi Oy Erldci Karu in 1923 and it was based on Våino Kataja’s classic novel. The rapids shown in this film as in many films to come were found from the spring-heads of the Kymi river in Mankala. The Mankala rapids (Tolp- pakoski rapid, Våhåkåyrå rapid and Isokåyrå rapid) had become quite a significant tourist attraction and fishing resort at the tum of the century. After having tested shooting rapids in Mankala with a tarboat bought from Vaala the Finnish Association of Tourism started to orga- nise rapid shooting excursions for tourists in Mankala since the summer of 1909. After nearly 300 successful rapid shooting excursions unfortunate accidents toolc place in Mankala in 1911 and 1912 where altogether four lives were lost. Due to these incidents the rapid shooting in Mankala was banned. However the Mankala rapids were understandably a
brilliant setting for Finnish log-driver films and they provided a sense of drama and dan- ger to film-making. At the age of silent film the audience had to, however, resort to their own imagination in order to hear the roar of the rapids. Even though the Mankala rapids are not situated in central location, they were however hamessed and in the summer of 1947 the construction worlc of the hydroelectric po- wer station began. After 1947 the log-driver films were shot in different locations, for example in the Pemoo rapids of the Kymi river and Pamilo rapids in Ilomantsi.
The film ”Koskenlaskijan morsian” (“The Log driver’s Bride”) in 1923 was a breakthrough for Erkki Karu as a Finnish director. The re- views were incredibly good and the critics saw the film to be the best success of Finnish film- making and ”even an accomplishment compa- red to foreign art films”. When the film had its premiere in Kinopalatsi in Helsinki, even the prime minister of Finland Kyosti Kallio and many diplomats were present. Karu’s film was also an economic success. In faet it made more money than the previous films of Suomi Filmi Oy altogether. The rights of the film were sold to both to Scandinavia and some countries of Central Europe and the export of Finnish film- making had begun. Mr. Karu continued with the log-driver theme in his first soundtrack ”Tukkipojan morsian” (The Log-man’s Bride”)in 1931. Even though this film was supposed to be a talkie, the use of sound was a relative concept in the film. Namely the first line of the film was said only after eight minutes and even after that the flow of lines was not staggering.

2.6) Courtsey: The movie Kuningasjåtkå (The King Lumberjack, 1997)
The hero of the film played by Urho Somersalmi was a modem man: at the end of the film after having tumed out to be a weal- thy man and not a real log-driver, he goes to piclc up his fiancee with his car. His intelligence and wit as of course his muscles malce him a hero compared to the other log-drivers. He is able to control his rivals due to his patience and peaceful arrogance but he is lilce any young man in that respect that he falls in love at first sight. The director Erklci Kam was able to capture the magic of Finnish summer while shooting this film: joyful parties, bonfires on the beach, intensive drinking and of course the Midsummer play essential parts in this film.
The prototype of Finnish log-driver films ”Laulu tulipunaisesta kukasta” (“The Song of the Buming red Flower”) (1938) was based on Johannes Linnankoski’s novel. The novel had already been filmed twice in Sweden in 1919 and 1934. The first Finnish version from 1938 was filmed by Theodor Tugai alca Teuvo Tulio who became later well-known for his pathetic and melodramatic films.The second Finnish version was directed by Mikko Niskanen in the 1970’s. Mr. Tulio was quite fascinated by the rapid shooting scenes and intensive love scenes in Mr. Linnankoski’s novel and he paid extra attention to those in his film.
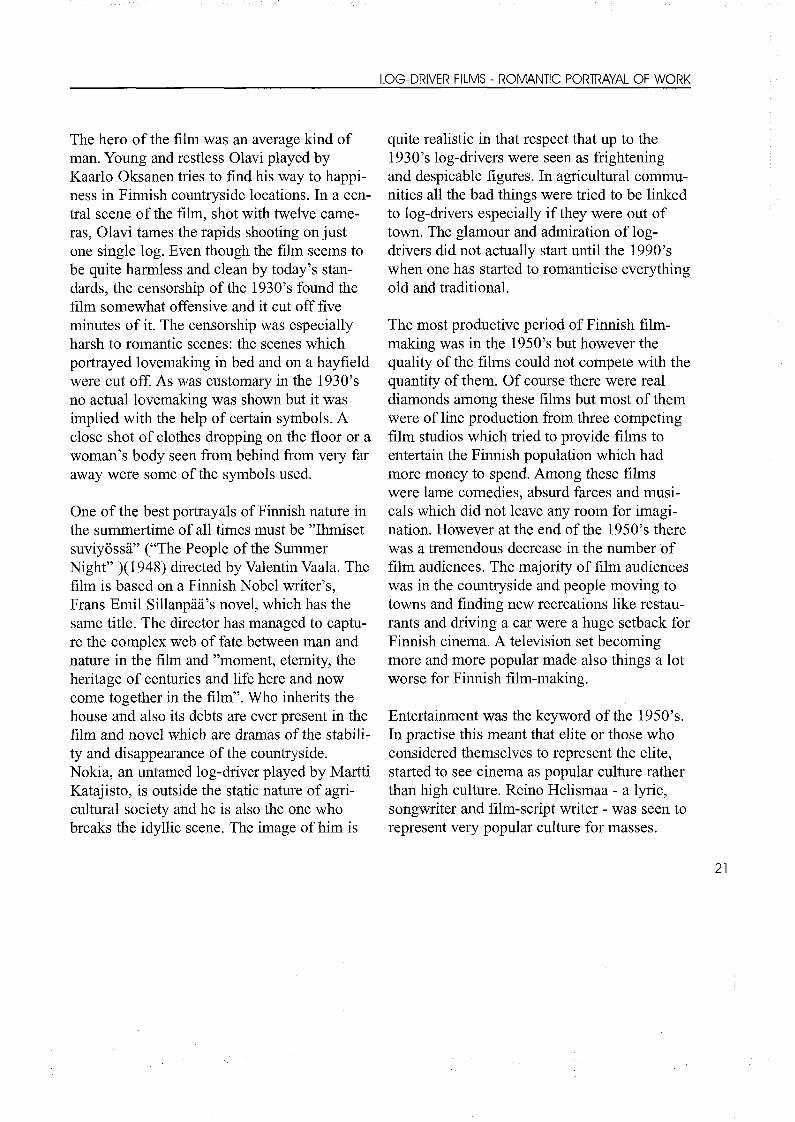
The hero of the film was an average kind of man. Young and restless Olavi played by Kaarlo Oksanen tries to find his way to happi- ness in Finnish countryside locations. In a central scene of the film, shot with twelve came- ras, Olavi tames the rapids shooting on just one single log. Even though the film seems to be quite harmless and clean by today’s standards, the censorship of the 1930’s found the film somewhat offensive and it cut off five minutes of it. The censorship was especially harsh to romantic scenes: the scenes which portrayed lovemaldng in bed and on a hayfield were cut off. As was customary in the 1930’s no actual lovemaking was shown but it was implied with the help of certain symbols. A close shot of clothes dropping on the floor or a woman’s body seen from behind from very far away were some of the symbols used.
One of the best portrayals of Finnish nature in the summertime of all times must be ’Thmiset suviyosså” (“The People of the Summer Night” )(1948) directed by Valentin Vaala. The film is based on a Finnish Nobel writer’s,Frans Emil Sillanpåå’s novel, which has the same title. The director has managed to captu- re the complex web of fate between man and nature in the film and ”moment, etemity, the heritage of centuries and life here and now come together in the film”. Who inherits the house and also its debts are ever present in the film and novel which are dramas of the stabili- ty and disappearance of the countryside.Nokia, an untamed log-driver played by Martti Katajisto, is outside the static nature of agri- cultural society and he is also the one who breaks the idyllic scene. The image of him is
quite realistic in that respect that up to the 1930’s log-drivers were seen as frightening and despicable figures. In agricultural commu- nities all the bad things were tried to be linked to log-drivers especially if they were out of town. The glamour and admiration of logdrivers did not actually start until the 1990’s when one has started to romanticise everything old and traditional.
The most productive period of Finnish film- making was in the 1950’s but however the quality of the films could not compete with the quantity of them. Of course there were real diamonds among these films but most of them were of line production from three competing film studios which tried to provide films to entertain the Finnish population which had more money to spend. Among these films were lame comedies, absurd farces and musicals which did not leave any room for imagi- nation. However at the end of the 1950’s there was a tremendous decrease in the number of film audiences. The majority of film audiences was in the countryside and people moving to towns and finding new recreations like restaurants and driving a car were a huge setback for Finnish cinema. A television set becoming more and more popular made also things a lot worse for Finnish film-making.
Entertainment was the key word of the 1950’s. In practise this meant that elite or those who considered themselves to represent the elite, started to see cinema as popular culture rather than high culture. Reino Helismaa - a lyric, songwriter and film-script writer - was seen to represent very popular culture for masses.

Together with Toivo Kårlci, Tapio Rautavaara, Jorma Ikavallco and Esa Palcarinen Reino Helismaa were like a plague to prestigious film and music critics. Helismaa and the popular culture of the time called as ”Rillumarei” have not been appreciated until in recent years.
Log-floater films were an essential part of the entertainment in the 1950’s and they were always obvious box office hits. Reino Helismaa wrote about half a dozen comedy manuscripts linked to this theme and it was generally Armand Lohikosld who directed these films. Helismaa’s manuscripts to films ”Rovaniemen markkinoilla” (“At the Marketplace in Roivaniemi”) (1951) and its sequel ”Hei rillumarei” (“Hello, Hurray“) (1954) were not actual log-floater films but they were linked to the same theme by por- traying honest but freespirited lumberjaclcs.In the film ”Hei rillumarei” three rednecks played by Palcarinen, Helismaa and Ilcåvalko travel to Helsinki, where their humour was especially despised, and in the film the satire towards better people has its climax moment when Severi Suhonen played by Palcarinen goes to the opera. The whole so called high culture was greatly criticized in this absurd but partly witty film.Also a film called ”Me tulemme taas”(“Here We Come Again”)(1953) directed by Armand Lohikosld portrayed wellbuilt and handsome Tapio Rautavaara, the Olympic gold-winner of javelin, playing a log-floater.A film called ”Kaksi vanhaa tuklcijåtkåå” (“Two Old Log-floaters”) (1954) is the best of the log-floater films to which Mr. Helismaa has provided the manuscript. In faet, this film
is quite good by any standards. In this film directed by Ossi Elstelå one looks back to good old values and good old world.A self-made man played by Ossi Elstelå gets tired of superficial and shallow thinlcing and behaviour in high society and he disguises himself as a log-floater and goes back to his old job. In the log-floating nostalgia talces him over but he also manages to correct some inju- stices in the log-floating site before the happy ending. The daughter of the self-made man is played by Anneli Sauli and the log-floater who falls in love with him is played by Olavi Virta. Also this film is based on a song by Reino Helismaa - a song which is a beautiful and melancholic waltz of two old logfloaters.
The log-floater film genre had its comeback in the 1990’s. In 1998 came out ”Kuningasjåtlcå” (“The Lumberjaclc King”) directed by Markku Polonen who had placed his earlier films also to Finnish agricultural settings.The events of the film talce place in the 1950’s when a widower with a 10-year-old son has to work in a log-floating site during a summer. The son is first ashamed of his clumsy father who succeeds at nothing but end’s well, all’s well. At the end of the film the father is finally a man and a full member of the log-floaters’ group.”Lilce the river, the complex plot talces the father and the son from plight to peace and the final test is the merciless waterfall which almost lcills the son but at the last moment the father ma-nages to save him”.Mr. Polonen paid extra attention to nostalgia in this film and nostalgia seems to be an essential factor in all his films.

”Mr. Polonen has found a current of Nostalgia which he exploits when directing his films.Mr. Polonen knows how to direct films but too much is always too much”.A Finnish film critic Peter von Bagh states in his book ”Suomalaisen elokuvan lcultainen kir- ja” (1992) that the log-floater theme was exploited to its end already in the 1950’s. However in his opinion the mediocre directors of the 1950’s got more out of the theme than the most brilliant directors of today ever would because the Finnish soul has wandered off from that environment.
Quite correctly Mr. von Bagh is looking forward to seeing a log-floater film where myth and reality would be in balance. Who would direct the real working conditions of log-floaters, the cold weather, the humble lod- gings and a vicious circle of diseases and sicknesses. But still we need those films and their shades of colour. Log-driver films were ecology long before ecology. We need the con- cept of freedom, the concrete change of sea- sons, clean and clear waters and the challenge of the forests - pathetic pictures of the kind faces of our native country.
2.7) Courtsey: The movie Kuningasjåtkå (The King Lumberjack, 1997)

HOW TO WATCH AND ANALYSE FINNISH LOG DRIVER FILMS
The Finnish television is in the habit of showing Finnish log driver films once in a while. In addition, it is also possible to borrow log driver film classics from libraries if one wants to show them to one’s students. Also film and material departments of different citi- es have various log driver films which can be used in film education needs.
FILM ANALYSIS
While watching log driver films the studentscan study and pay attention to the followingissues:
- what trend of style does the film represent?
- is the outloolc of the film believable?
- what is man’s relation to nature in the film?
- what kind of symbols and symbolism has the director resorted to?
- what is the acting like?
- how do the main characters relate to each other?
- assessing and evaluating the staging
- an analysis of the plot
- does the film contain ethical dilemmas and lessons?
- does the film have a particular message or theme?
- how has the film been constructed on a technical level?
BOATS, ART AND INNOVATION
BOATS, ART AND INNOVATION by Leena-Riitta Salminen
The first people who moved to the region of the Baltic Sea after the Glacial Periods used some kind of boat. You can find some references to them in rock paintings and drawings. Besides the bow, the only man-made object was the boat. Unfortunately, there are no references to boats from the Stone, Bronze or Iron Ages. So there is a gap of 6, 000 years in history.
There is some evidence that the first boats could have been made from leather. But at least on the rapids of rivers leather as a materi- al would not have been durable enough.
Natural waterways are very varied: small ponds may occur in the wildemess; there are also brooks and rivers, lakes and a rugged sea- shore. That is why the history of boats is so complex. In the beginning it seems most likely that the first boats were powered by paddling. Later, as the boats became bigger and heavier, they needed to be rowed as we do today.
Fishermen followed the rhythm of the seasons. Spawning fish determined the places to fish.At the beginning of the summer they would fish for salmon in rivers, near dams. In mid summer they had to go fishing farther afield, to the sea. As fishing was too difficult in the winter, they had to do something else instead.
The first boats were made from one stock and were very stiff troughs. At the next stage the trough was made wider. The whole form could
be bound by root strings. Later they leamed to add side panels. Finally, the boats were con- structed out of five parts altogether.
In different parts of the region, there were distinct features in the shapes of the boats. For example, there were specific models for lakes and seas. But it is a very interesting question that if rivers with rapids and streams and quiet waters had such special demands, why river boats tend to be so much more similar. A river boat had to be narrow and light at least, becau- se it sometimes had to be carried across dry land.
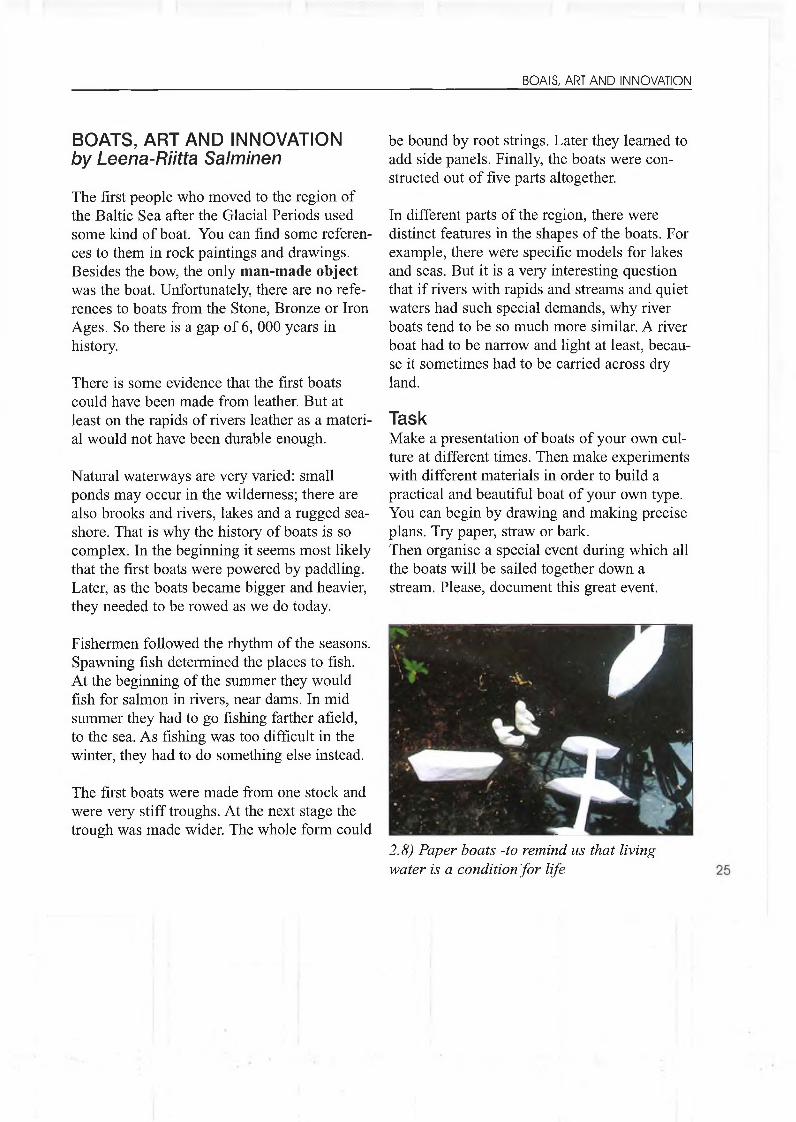
TaskMake a presentation of boats of your own culture at different times. Then make experiments with different materials in order to build a practical and beautiful boat of your own type. You can begin by drawing and making precise plans. Try paper, straw or bark.Then organise a special event during which all the boats will be sailed together down a stream. Please, document this great event.
2.8) Paper boats -to remind us that living water is a condition for life

Chapter 3AESTHETICS AND ENVIRONMENTby Leena-Riitta Salminen
rhe idea that a human being can be taught by art is not new. As early as 1795 Friedrich von Schiller discussed the question of the moral growth of man in his book ”On the Aesthetic Education of Man”. According to his conception, politically well run society and intellectually high-class thinking can only be achieved “by cultivating the character”. Fle said “the instruments used are fme arts, because they offer models of beauty and perfection which are inspiring and develop our character”.
He also brought the term ”das Spieltrieb” into use, which is the nucleus of art and aesthetics. In a romantic way he thought that art develops our sensitivity of feelings, and besides, it improves morality and the sense of human understanding.
In many theories aesthetic experience is a strong and natural human need.The central figure of Western philosophy, Ludvig Wittgenstein (1889-1951) declares in his book Tractatus Logico-Philosophus (1922), that ethics and aesthetics belong together.
When examining the aesthetic character of the environment, one cannot ignore ecological and ethical points of view. Aesthetic experience is thus a wholeness into which everyone brings his knowledge, basic values and personality.
Consciousness of aesthetics can be developed by providing information about the mecha- nisms of nature, natural science and the various periods of culture.
6 Friedrich von Schiller (1759-1805), German writer and poet, philosopher o f art and value

The beginning of the 1960s can be regarded as a tuming point in environmental aesthetics. Desultory writings of the issue can be found before it, but the real start was given by R.W: Hepbum and Harold Osbome .In 1962 Osbome published an article “The Use of Nature in Art ” in which he considered why environmental critics had such low status and why the environment was so little taught.
Aesthetics of nature can be divided into aesthetics of nature and aesthetics of landscape. The object of the former is nature as a whole or wild nature. The latter is much wider ranging in also taking into consideration the achievements of man, including city or urban culture, as well. Architecture and environmental art are incorporated into the latter too. So, the environment is seen as a very wide con- cept, supported by science in different forms.
3.1) “A romantic river: early spring, youth and dreams”. Photograph by Katja Suortti, (15) at Langinkoski Lower Secondary School in a course o f art education
1 R.W. Hepbum was one o f first among those who wanted to combine aesthetics and the environment. His work Contemporary Aesthetics and the Neglect o f Natural Beauty was published in London 1966
8 Harold Osbome was his contemporary and had similar thoughts about m an’s relationship with nature.

UNIVERSAL SYMBOLIC MEANINGS OF THE RIVER
In universal mythology the river theme is very old. In symbolic meaning it differs from the sea. The water in the river never stays still but is always moving and flowing, representing power and changing of times.
The great cultures of the world were bom about 3 000 years ago. The Huang Ho, Ganges, Indus, Eufrates, Tigris and the Nile were their mother streams.
Water is also central in many creation myths in which a “great flood” is a common theme.
Our Western culture has its roots in Greece. There they had many river gods: Achelos, Skamandros and Kephissos. In ancient Rome, the River Tiber was honoured as Father Tiberinus and it was said to be the father of all rivers. In Christian religion, the water in bap- tism symbolizes the River Jordan where Saint John baptized Jesus.
Every culture in the BSP region has also inherited something from the old cultural traditions and partly created its own symbolic meanings.
3.2) Two rivers (the Eufrates and the Tigris) in 3.3) God o f rivers, Tiberius. the rural landscape. Carving in a silver bowl Vincent Cartaris book, Venice 1647 in Maikopi, Kaukasus, about 1800 B. C.

SYMBOLIC SIGNS OF THE RIVER
For mystics during the Middle Ages the four elements, already identified by the Greek phi- losopher Empedokles (about 490-430 B.C), were given symbolic signs.
Fire was described as a triangle resting on one side. It symbolized fire flaming strongly upwards. The warmth of fire was said to be dry warmth and it was associated with the choleric temperament type.
The opposite of fire, water, was described as quite an opposite figure: a triangle balancing on its point. The character of water was humid coldness. It was associated with the phleg- matic temperament type.
The same basic figures were also the signs of air and earth but with a hook figure added. Air was associated with the sanguine and earth with the melancholic temperament.
Another system of signs was based on a round figure in which fire was an empty circle. A cir- cle with a straight horizontal line symbolized water.
Air was a diamond in the middle of a circle and earth a circle with a cross inside. The cross was derived from the myths about the four rivers of Paradise.
3.4) Two medieval systems o f signs: fire, water, air, earth

NORTHERN MYTHS ABOUT RIVERS
In northem mythology, the father of the uni- verse is Odin. He is the strongest and the oldest of all gods in the North. But before him there was an emptiness, Ginnungagap, which was waiting for fulfilment. The fierce reign of Muspell was bom in the South, and the icy Niefelheim was bom in the North. To the north was bom icy Niefelheim. In the middle of the emptiness the air became warmer as the heat streaming from Muspell met with the coldness of Niefelheim. Ice began to melt and as drops fell down, the giant Ymir was bom.
And the tale continues: when Ymir was slee- ping, he began to sweat copiously. A male and a female body started to grow from his left armpit. Another man was bom from his feet. After that a cow, Audhumla, was bom from the melting earth. Four rivers spouted from the cow's udder and they nourished Ymir. Again we meet the same myth of four rivers, but now it was mille instead of water.
The cow Audhumla licked salty ice. A whole man, Odin's grandfather was bom from ice over three days.
The icy Giant Ymir was very brutal and cruel. Odin and his brothers Vili and Ve hated him so much that they finally killed him. Ymir's flesh was given the form of earth by Odin and his brothers. The bones were given the forms of stones and rocks. Of the flood they made rivers, lakes and seas around the earth.
The skull of Ymir gave form for heaven and it was held up by four dwarfs. The dwarfs were given the names of the four points of the com- pass. The reign of gods became Åsgård and if you wanted to go there, you had to wallc through a fiery rainbow.
Tasks
To research the myths related to a river of your own culture. They can be illustrated by visual means or they can be presented by means of drama.
It's also interesting to discuss how these myths have survived.
Can they be recognized in your feasts or even in everyday life?

3.5) “Bones were given the forms o f stones and rocks.The flood made rivers, lakes and seas around the earth ”A pencil drawing by Johanna Kukkola, (18) Langinkoski Upper Secondary School.She illustrated this northern myth in a course o f art education

MYTHS AND HEROES
Finland's national epic story Kalevala was published 1835. At that time Finland had been part of Russia since 1809. It was however a grand duchy i.e. it had some special rights but, naturally, no independence. Kalevala described the heroes and the heroic history of the past. Artists were interested in these themes and their aim was to fmd the origin of the Finnish landscape, lifestyle and culture. Perhaps even more they wanted to create a new art in which a strong national feeling encouraged Finns to demand a more independent status from Russia.
3.7) “Maiden o f Air ” Drawing by Alcseli Gallen-Kallela 1890
Robert Wilhelm Ekman (1808-1873) painted several mythical themes. The most famous and the strongest hero of Kalevala is Våinåmoinen. Traditionally, he is also known as the god of water. According to Robert Wilhelm Ekman, he looked like an oldish man and his symbol was a Finnish musical instrument, a kantele, with five strings. By the way, it was told that Våinåmoinen often liked to drink a lot of ale. So, the heroes apparently also had human features.
9
Akseli-Gallen Kallela was very interested in mythical figures. One of the first ones was the Maiden of Air in 1890. A beautiful, young woman was swimming in a rapid. The drawing was full of power and optimism, which was a symbol of the new patriotic feeling.
3.6) “Våinåmoinen ” Drawing by Robert Wilhelm Ekman 1860
Akseli-Gallen Kallela (1865-1931), master of so-called Golden Age in Finnish Art, created national style, where Kalevala themes and modem European stylistic features were meeting. He was painter, graphic artist, but planned also fumiture and posters.

Alcseli Gallen- Kallela painted the river theme many times. As mention- ed above, Finnish artists wanted to discover the heroic past of Finns and the original way of life. Many of them travelled to Carelia and to the deep wildemess of Central Finland.
The young artist and his newly mar- ried wife lived among poor people in the region where Kalevala songs and poems were collected. You can see thatVåinåmoinen is in the picture, though only in the form of the five strings of his kantele. The artist wanted to paint theMåntykoslci rapid as a free, heroic drama of the original Finnish nature.
3.8) “Mdntykoski Rapid” Oil painting, 1892 by Akseli Gallen-Kallela. The strings o f Våinåmoinen can be seen as five lines across the painting

3.9) ‘‘Mother o f Lemminkainen ” Painting by Akseli Gallen-Kallela 1897
One of the most famous paintings of Akseli Gallen-Kallela is the Mother of Lemmin- kåinen. At the same time the great Finnish composer Jean Sibelius was fmishing his Lemminkainen series.
Lemminkainen was a kind of black hero, a bad boy, very naughty and often in big trouble.
He got his punishment and was thrown into the Tuonela River that is a symbol of the realm of Death.
But according to the painter, the mother of Lemminkainen loved her son so much that she collected the broken parts of her son and gave him life again.

3.10) Mother o f Lemminkåinen in the modern environment. Post-modern visualisation by Johanna Kukkola (18) Langinkoski Upper Secondary School
By the river you can see many symbols: the skull, the flowers of death and the Swan of death. The bees are carrying the rays of life.
The struggle of the mother is seen on her face. The model of the mother was the painter's own mother who was a very elever and civili- zed woman.
Nowadays this really is one of the national masterpieces in Finland, and it reminds us of the historical and cultural struggle for our independence.
Chapter 4VISUAL AND ENVIRONMENTAL ARTby Leena-Riitta Salminen
characteristic of environmental art is that it breaks traditional boundaries. It is separate from the old basic explanations. Environmental art is rejected by galleries: the conception of space, time, motion, light, colour and etemity of art has to be re-evaluated.
Very strong ecological questions are related to environmental art. Art will then reason what its relationship is with community, decision making and economics. The former mission given by art history has then to be pushed aside and new approaches used.
Environmental artists have created and incorporated new elements into urban living environments, by which one can address modem urban citizens.Many new methods are used as a means: events, improvizations, exhibitions, etc. through which one can fmd new dimensions of urbanism. Sometimes these means are very shocking and radical.Their aim is to challenge conventional ways of thinking.
The growth of innovations has also nourished art by providing new materials and technical means with the support of scientific thinking.
Perhaps the most fascinating questions can be found in art that has been made in nature.

ABOUT THE NATURE OF FLOWING WATER
Flowing water is always in motion and is very dynamic. You cannot see clearly distinguishab- le boundaries in water. Water has its invisible connections to the wholeness. Daylight and darkness offer quite different perspectives to a river. The sound of flowing water that you cannot see in the dark, may touch our primitive powers, like our fear of the un-known.
What about the rhythm of the seasons? Running water differs from the frozen river in shifting from quiet water in midsummer to the stormy foam of autumn.
The boundary of water and the ground joins and separates two elements.Streams of water, ice and snow connect life and death, creation and destruction. The melting of ice in spring, tuming winter to spring combines the cold darkness and continuity of life with the miracle of rebirth in nature.
4.1) “I am listening to the water under ice”
4.2) “Angels in the snow” Photos by pupils from Langinkoski Upper Secondary School. Rivers are frozen in the BSP region during winter, but it is still possible to hear the sounds o f running water and play winter games on the ice.
In flowing water you can see the great processes of nature: rain, freezing and thawing. It is also associated with time: water keeps coming and going away; seasons and times of the day have their own flow pattems. “You can step into the same river only once”, said the old philosopher Heracleitos (bom about 540 B.C.) in Greece thousands of years ago.
TasksYou can collect a series of pictures of a river in different seasons and at different times of the day. You can use photographs or video or traditional ways of drawing and painting. If this is not possible, you can look for ready- made material in books and papers and make a collection to create a montage. Especially try to find different atmospheres and light conditi- ons. You can also record the aural landscape by recording it and combining it with these pictures.

RIVERS IN THE VISUAL ARTS
I shall show you same examples of how a river and art meet visually. We shall go through historical periods and my point of view is how the relationship between nature and human beings has changed. The other point of view is a mythical motif in art combined with the river.
My area is visual arts, but I think it might be possible to find similar approaches in literature and music. Similar connections can also be made within different cultures, too.
PREHISTORICAL PERIODThe oldest pictures found in Finland are rock paintings. Excellent paintings can be found about 90 km from Kotka, at Verla, in the Kymi river valley. At that time the river flowed from north to south.
vertical cliff faces close to the water’s edge. Red ochre does not fade when exposed to sun- light, which explains why the rock paintings have survived to the present time.They are also protected by a film of silicone dioxide absorbed from the rock.
Most Finnish rock paintings date from the Comb-Ceramic culture ca 4200-2000 B.C., our richest Stone Age period. The rock paintings illustrate the shamanistic religious system which for long dominated in the northem regions. Expectations, hopes and beliefs related to hunting, magic, totemism, cosmology and the fertility cult are expressed through the animals pictured. The artists might well have been shamans who, among other things (like hea- ling and acting as a priest) were traditionally employed to guarantee their tribes' hunting luck.
The rock painting at Verla is the largest of its kind in the Kymi valleys and ranks among the most notable Finnish examples of rock art. Of altogether 48 rock paintings found in Finland no less than 15 are located in the northem Kymi valley. This painting is made on the
The rock painting at Verla is six metres long and about 1.6 metres high. One can make out the outline of 8 elks, 3 human beings and an angular figure as well as some figures dama- ged beyond recognition.
4.3) Verla rock painting, 4200-2000 B. C.

VISUAL AND ENVIRONMENTAL ART
The style is unusually expressive compared with other paintings in the Kymi valley. They may thus well belong to the oldest period of our rock art. The human figure on the right is also among the most unique-looking figures preserved. It represents a specific Finnish ring- headed type.The man wearing attire on his head and stand- ing on the back of an elk represents a typical shaman. The angular figure between the man and the moose may be a snake, a typical sha- manistic symbol.
An excellent example from that period is the painting in Pyhtåå stone church dating from about the 1450’s, on the Kymi riverside , about 20 km from Kotka. Saint Christopher is car- rying Baby Christ on his shoulder and he is greeting the visitor just opposite the door. People believed that St.C. protected them from sudden death. In Finland, Saint Christopher was thus painted as a giant who was carrying Baby Christ over the river. In folklore he is called “the oldest of the river” or “the being of the rapids”.
MIDDLE AGESThe Christian religion brought its own picto- rial themes, but it is very important to notice that religious themes and symbols were presented side by side with magic figures.
Churches in the Middle Ages were often located along river banks because the people nearby often had to go to church in order to hear God’s words, and again the rivers were excellent waterways.
4.4)Saint Christopher carrying Baby Christ. Wall painting in Pyhtåå church
IDEAL LANDSCAPESDuring the romantic period, European painters travelled to study art in Paris. Finnish painters first studied in Diisseldorf, then later in Paris.
4.5) Kyrdskoski Rapid. Oil painting by Werner Holmberg 1854

It is very interesting that the main themes were often domestic landscapes which were painted abroad on the basis of slcetches.
However, some artists, Werner Holmberg (1830-1860) for instance, painted absolute masterpieces. His goal was to find an ideal, beautiful Finnish landscape. The Kyroskoski River and the rapids theme were seen as an impressive drama of nature.
ENVIRONMENTAL ART AS A BRANCH OF THE VISUAL ARTS
4.6) Sculpture in the park at Pratolino. Ginvanni di Bolngna_______
FAMOUS ENVIRONMENTAL ARTISTS
A kind of predecessor for environmental artists was Giovanni da Bologna (1529- 1608) who was said to be the most famous sculptor after Michelangelo.
He was perhaps the first artist to create art straight from nature. Grand Duke Francesco the First began to build the famous villa Pratolino. As normal in the Renaissance, science and art worlced together. There were mechanical statues and water organs played sweet classical tones in the parks of Pratolino. Giovanni da Bologna planned an oval water pool with a gigantic figure of rock, briclcs and plaster. It symbolized the river Nile. The giant, over 10 metres tall, had a fish in his hand and the water ran from his mouth.
Modem artist Klaus Rinke (bom 1935) was a pioneer of working with water. He organized demonstrations in which he brought water into art exhibitions. In one exhibition people couldn't get into the rooms without walking over vessels filled with water. Or he pumped water from a nearby river through the rooms of the art exhibition. Once he brought water into 12 cities from the River Rhine, and presented the occasion as a primitive ritual.In another work of art Klaus Rinke wallced to the mountains of Scotland. He then followed a river from its sources up in the mountains to the sea. He made a series of photographs about his visits called “Between Sweet and Salty Water”.

Richard Long (bom 1945) said that art museums were graveyards of art. Therefore he wan- ted to work far from cities and main routes.In one of his best known works he also follow- ed a river from source to mouth. But he com- bined a text by James Joyce with it. So he formed a triangle between a river, a wanderer and a writer.
In another work he measured precisely the length of the River Avon, the river on who’s banks he was bom. Then, by canoe he took a trip of the same length on another river. So he transferred his original perception of the River Avon to another stream and gave quite a new meaning to another place.
Two of the most famous environmental artists are the married couple Christo (bom 1935) and Jeanne Claude (bom 1939). They have been very productive and have worked all over the world. At least twice they have worked with the river theme. An excellent example is The Bridge Pont Neuf over the Seine. It was wrapped with 440 000 square feet of woven polyamide fabric and 42 900 feet of rope.They expressed the problem of hiding: that if you cover something, it will totally change. At the same time it will become much more exci- ting.
The same method was used in Arkansas on the River Colorado, 1993. It was covered with a long fabric, but not hidden totally. Whereas natural rivers have heaven as a roof, in this case, a new flat space was created over the river.
Rnvri ron mental artists have representatives in all the BSP countries and it is nowadays an essential part of the postmodem art style.
Tasks
1. You can plan your work on environmental art alone or as a team. Use the space over a river in a new way. You may emphasize the distance between the two shores. It may be a landmark that arouses interest, or calls forth enthusiasm or feelings.
2. Or you can study the motions and surface tension of the water. Then you can tum those observations into another material language (e.g. sand, fabric, clay etc.) and then move it into another place, possibly an unfamiliar one.
3. You can also search for memories or ideas from your own mind or perhaps from your album of family photographs in which a river had a significant role. You must have a lively relationship with this subject and strong feelings. Then repeat the same mes- sage in quite a new way using different ways of visualizing

4.7) “The Kymi River.” Painting by Victor Westerholm, 1902
THE KYMI RIVER AND ART
Let us now return to the Kymi. Some years later Victor Westerholm (1860 - 1919) traveled to the Kymi, and for a very similar reason to that of Akseli Gallen-Kallela; he wanted to paint a great river but not so darkly as Akseli Gallen-Kallela's Mother of Lemminkainen.
The river inspired him as an element of nature and by strong feelings of power.But however, we can find another distinctive approach: water power as a source of genuine Finnish energy: the national context again.

Many other painters have illustrated the River Kymi, but nobody as brilliantly as Victor Westerholm. If we see the river as a source of livelihood, we should remember the fine painting by Gunnar Bemdtson (1854 - 1895), pain- ted as early as 1892. It’s called Salmon Fishing at Langinltoski. The painting is not so much romantic, but a realistic illustration of hard work. The rapids are only the powerful baclcground.
4.8) “Salmon Fishing at Langinkoski ” Painting by Gunnar Berndtson, 1892 using different ways o f visualizing.

Chapter 5THE URBAN USE OF RIVERSFLOWING WATER SN ARCHITECTURE AND URBAN PLÅNNING by Leena-Riitta Salminen
m 7 rom the earliest days people leamed to use flowing water. Egyptians used the River m J Nile in order to improve their material livelihood by building a network of channels for
m irrigation. The Romans built up an enormous system of aqueducts. Also in old eastemcultures in India and China flowing, living water was used as a tool for rulers to control the lives and improve the material welfare of their subjects.
In Japanese garden art they brought elements of flowing water into their gardens in the form of sensui. On dry land they built artificial miniature rapids using stones, raked sand, flowing water and ponds.
One of the most impressive examples of European garden art is the gardens and parks of big palaces. We can admire them in Versailles and much nearer in Drottningholm in Stockholm. In the French type of garden one of the basic elements is the expressly stylized river landscape. In Italian garden art a stylized mountain stream is used as a water element.
In any case, water has become a very important enlivening element of an urban milieu and its planning.One of the most popular examples is the theme of a fountain, used in parks and green areas throughout history. Flowing water has been made into a visual expression in which the motions of water play the main role. Often additional effects are used to make an impressi- on e.g. serpentines, mist, colouring and various lighting effects. The wetness of water is an impressive experience.

5.1) The Drottningholm Park, 17th century
But the theme of flowing water has also inspired planners of single buildings. Perhaps the most famous example is Kaufmann House by a pioneer of modem architecture, Frank Lloyd Wright10.
The name of the house is “Falling Water” and it is situated in Bear Run, Pennsylvania.It was partly built on a waterfall during 1936/7.Flowing water falls down under the building forming an element that connects nature and the building in a totally new way.
5.2) “The Falling Water House ” House in ________________________ Bear Run/ architect Frank Lloyd Wright10 Frank Lloyd Wright (1869-1959), American architect, representative of modem architecture

RIVERS AND CITIES
In most countries in the BSP region the Capital cities grew up on the banks of rivers.In Finland the first capital Turku and then Helsinki, the capital since 1812, were establis- hed on the deltas of rivers. But also the most important industrial and commercial cities ori- ginated of rivers. Rivers connected the inland agricultural areas with the cities that offered work and a way of life for new inhabitants. At the same time, the river opened up new routes to the rest of the world by sea.
Industrialisation began to hamess natural water courses and it finally changed the relationship between the river and people. On a lar- ger scale, it led to the concentration of population in towns and cities on river banks. Often industry was the heart of these densely built- up areas. This is a general European feature of development and can be seen everywhere.
How these industrial and commercial areas developed in terms of architecture and cultural history, are extremely interesting issues, but ones that it is not possible to pursue here. But however, the theme of flowing water has a very central role.
In a cultural sense, the river is thus a stream of life. Unfortunately, people haven't always honoured it but have threatened its survival by their shortsighted policy and greed.
Tasks
1. To malce a report on the use of flowing water in parks and open spaces in your home village/city. Plan some other ways of using it to enliven your environment.
2. To make plans for your own school as well. Create cosy and beautiful common outdoor spaces with water and plants. Ask if your school or community can help you to rea- lise the best plan. Or you can do it your- selves.
3. To make a visual and written report on how the banks of your home river have developed through the centuries or decades. Use books, museums, interviews and exhibitions in order to provide a realistic idea.
4. Think of what has to be done to improve the aesthetic conditions of the riverside. Remember to adopt a human scale, to con- sider social advantages, and to plan places where you can be alone and together. Use all your imagination. Avoid rejecting even the silliest ideas.
Give time fo r this process, do not hurry!
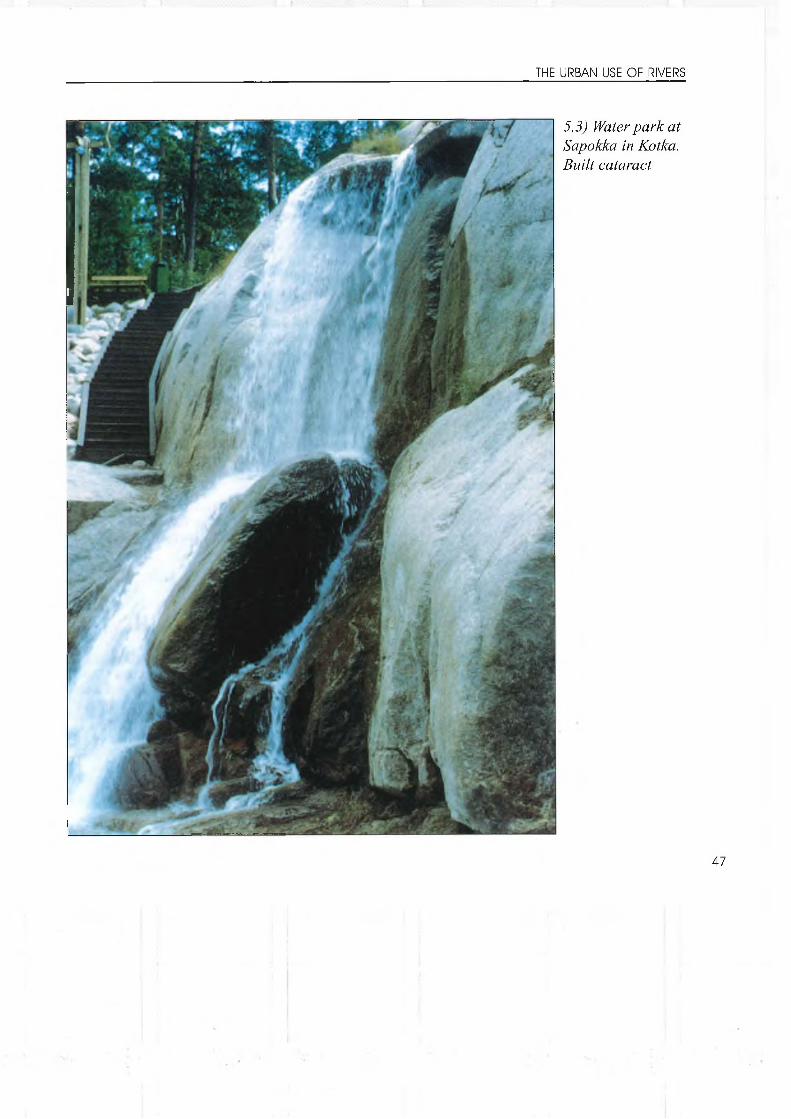
5.3) Water park at Sapokka in Kotka. BuHt cataract

List of sources:
PICTURES:1.1. M y ow n relationship w ith nature1.2. A pproaching the river1.3. Langinlcoski rapid in w inter2.1. L inoleum carving2.2. Riverbank2.3. BSP teachers m aldng clay figures2.4. W hitefish dam2.5. K arhula factory area2.6. K uningasjåtkå2.7. Kuningasjatlcå2.8. Paper boats3.1. Rom antic river3.2. Two rivers in rural landscape3.3. G od o f rivers3.4. Two m edieval systems o f signs3.5. Bones w ere given fo rm s...3.6. V åinåm oinen3.7. M aiden o f A ir3.8. Rapid M åntykoski3.9. M other o f Lemminlcåinen
3.10. M other o f Lem m inkåinen in m odem environm ent
4.1. I am listening to the water under the ice4.2. A ngels in the snow4.3. Verla rock painting4.4. Saint Chrostophorus carrying the Baby4.5. K yroskosi rapid4.6. Sculpture in park o f Pratolino4.7. Kym i River4.8. Salm on fishing at Langinkoski5.1. Park o f D rottningholm5.2. H ouse o f Falling Water5.3. W ater park o f SapoMca
LITERATURE:- Arkio, Leena-K alevi Poyklco (Ed.):
Taidehistoria ja ym paristotutkim us (Art H istory and Environm ent Research) Helsinki 1971
- Biederm ann, H ans : Suuri Symbolikirja (Great book o f Sym bols), edited by Pentti Lem piåinen Juval996
- Gronholm, Inari ( ed.): Kuvien maailma (World of Pictures) Helsinki 1995
- Haapala, Arto-Pulliainen Ukri: Taide ja kauneus (Art and Beauty) Johdatus estetiikkaan (Introduction to Aesthetics) Helsinki 1998
- Kinnunen, Aame-Sepånmaa, Yrjo (ed,): Ymparistoestetiikka ( Environment Aesthetics) Manttå 1981
- Koch Rudolf: Merkkien kirja (Das Zeichenbuch), Keuruu 1984
- Levanto Yrjånå : Tåydellinen torso Kirjoitulcsia lcuvataiteesta 1976-1990 Helsinki 1990
- Mantere, Meri-Helga (Ed.): Maan lcuva (Picture of Earth) Kirjoitulcsia taiteeseen perustuvasta ymparis- tolcasvatuksesta Helsinki 1995
- Paavilainen, Maija ( ed.): Vesi (Water) Helsinki 1990- Philip N e il: Suuri Myyttikirja (Great book of Myths)
Singapore 1996- Piironen Liisa ( ed.): Power of Images, INSEA
Helsinki 1992- Sepånmaa Yrjo: Alligaattorin hymy (Smile of an
Alligator) Ympåristoestetiilcan uusi aalto (New Wave of Environmental Aesthetics) Jyvåskyla 1994
- Sepånmaa Yrjo : The Beauty of Environment Helsinki 1986
- Markku Vallconen, Olli Vallconen (ed.):Suomen Taide ( Art of Finland) Porvoo 1984
- Villcuna Janne : Finska Båtar fran forhistorisk tid Helsinki 1994
FILM SOURCES:- Bagh Peter von, Suom alaisen elokuvan kultainen
kirja. K euruu 1992.- Uusitalo Kari, Elåviksi syntyneet lcuvat - suomalaisen
elokuvan m ykkåvuodet 1896-1930. H elsinki 1972.- Uusitalo K ari, H ei rillum arei - suom alaisen elokuvan
m im m iteollisuusvuodet 1949-1955. Vammala 1978.- Uusitalo K ari, Lavean tien sanlcarit - suomalainen
elolcuva 1931-1939. K euruu 1975.- Uusitalo K ari, Ruutia, riitoja, raklcautta - suomalaisen
elokuvan sotavuodet 1940-1948. Vammala 1977.- Uusitalo Kari, Suom en Hollywood on kuollut.
Hyvinlcåå 1982.

Polish rivers:by student Ludmila Marjanska, Glogow, Poland
POLISH RIVERSWe start seeing a country outside a country.From the distance I can see more and more clearly It is heart shaped It is the branches of the rivers that help us survive the sight of Naples:Narew the bride married to Bug rural Wkra, and Latin sounding, sleeping Liwiec.The largest and smallest, flooded on the meadows flowering with cowslips, sorrels and mulleins washing the shores, dangerous in spring, caught in concrete bed and generously gifting the yellow sand Streams, where trout shine like silver, and waters where salmon mates.At the banks of those rivers willow figures remain in melancholy. \nd that is what you miss in Paris.
by Ludmila Marjanska

Chapter 6ART AND DESIGN IN ENVIRONMENTAL EDUCATIONSuggestions - to be further elaborated locally by Søren Møller
■ Environmental thinking and approach• Alternative process and• Untraditional thinkingcan very well co-function in everyday teaching situations at all levels, in all countries, in big and small cities and villages.
Intentions: Common, shared intentions for art work.For everyone involved, pupils, teachers and the audience, they must be:• Positive and giving• Trans-bordering• Food for thought
Didactics: Suggested as a frame:• Introduction made by the teacher• Presentation of the task• Division into groups• Discussion• Practical work• Presentation and exhibition• Discussion on achievements
ntroduction• Green consciousness

ART AND DESIGN IN ENVIRONMENTAL EDUCATION
6.1)Teachers at work:From The international BSP- teacher’s training course in Klaipeda, Lithuania on April 24th - 27th 1999. Photos: Søren Møller
Tasks/ Solutions: All tasks are to be made as• Slcetches• A model■ Documentation either photographic or as a
video• As inexpensive as possible; recycling mate-
rials to be recommended
Teacher’s role as inspiration: The teacher has to inspire each group by• Surprises• Provocation• Untraditional compositions and angles
Continuation: The teacher can urge the work to continue by• Showing photos• Showing slides• Using overheads• Using videos
Means:• “Sell the idea” shortly and precisely
tell the time allowed for the work• Don’t give any direct solutions - You as the
teacher do not know the answer to your own question, and you want to gain somet- hing personally from the surprising results at the presentation.
THE TASK GIVEN WAS AS FOLLOWS:“Bridging the gap”:“Fantasy” is on the left bank, and “Imagine” on the right. Between them runs the river.Enable people to cross from “Fantasy” to “Imagine” or opposite by building a bridge.Do not make it an ordinary bridge which is often a straight line from one point to another point- make it imaginative and wonderful to cross either way.

10 Suggestions on TASKS to be further elaborated locally...
1. To cross a river or a stream, not rationally, but in a slow, entertaining way.
2. The farmer’s cows have to cross the high- way to get to the field. The stable is on one side of the new double-laned high- way, the field is on the other side. Traffic is heavy. Give suggestions to the farmer. Remember: Happy cows give more milk! Make it funny!
3. You have been thrown out of your home and have to find a new place to stay. At the river there is a big tree with its branches overhanging the water. Make your own home in the tree and add possibilities for good experiences in nature and for physical exercise. Find the actual tree that is suitable.
4. Your town is situated by the river. The town is fed up with cars. The may or has visited Venice, and he asks for fancy suggestions how to change the town into a water-town: Canals are to be dug out, lakes to be created together with fountains and waterfalls. With the city map as starting point you are to see it all from above, and come with more detailed suggestions.
5. Make a means of transport with pedals that can satisfy all your and your family’s and friends’ need for transportation and freight: On land, on water - and in the air?
6. Your town wants to attract more birds: Both migrating and non-migrating species. Transform the town into an Eldorado for birds where man and beast can live side by side excitingly.
Concrete suggestions with a starting point in a city map.
7. Your region needs a new guide to present the surrounding nature in the most sufficient manner. Find at least 10 locations that must be visited, state why, state the proper time and make a pamphlet with the recommended route. Add actual times for: Sunrise; Sunset; Water level; light; Sound; Smells; Temperature; Means of transport: On foot or by bike.
8. Cars are... cars. They don’t look nice, neither on the roads, nor in nature or towns. Suggest how to paint, decorate, plant, refumish a series of the most repu- table cars into environmentally correct, beautiful and funny experiences.
9. Asphalt roads are rarely good nature experiences. They take up too much space in towns: remove the asphalt and make a plan for planting to replace all roads in your town. Make an alternative transport possibility that fulfils the need of the town without any asphalt roads. Explain what species of plants, trees ... and state rea- sons why.
10. People in the town by the river want to make it an experience for the people sail- ing (rowing, canoeing) by to pass through the town. Suggest how facades facing the river can be changed or made as an experience. On the reverse people passing by also want to make it an experience for the townspeople to remember when they pass: How can they remodel, paint, culture their ships so that everybody gets into high spirits.

At r i _’lL
STRAUJA, STRAUJA UPE TECEJ'
Latviesu tautasdziesma-rotala
m— i— i— ........ .......... ^ g — ii y.... »i
1 -jJ ■ ■■■gj'' M... . ~~ —tS
1.Strauja,strauja u-pe te -ce j1, s tra u ja ^ tra u ja upe te -c é f
gar b rå -f iS a nam durvTmi, gar brå- IT-sa namduryTm.
2. Nedrlksteju pari jati — Baidås manis kumelinis.
3. Jåj, brållti, drosi pari, Nesllks tavis kumelinis.
4. Apakså ir baltas smiltis, Virsu skaidrais udentinis.
5. Zobens grieza baltu smilti, Odens skalo kumelinu.
STRAUJA STRAUJA...(LATVIAN FOLK SONG)
1) Swiftly, swiftly the river flows Along my brother’s house
2) Did not dare ride across the horse is scared
3) Ride across and don’t be scared You will safely get across
4) At the river bottom white sand Pure water flows on top
5) Sward will cut white sand Water will flush your horse

Wi A 1" 1 * 3 Ru j r (
6.2)
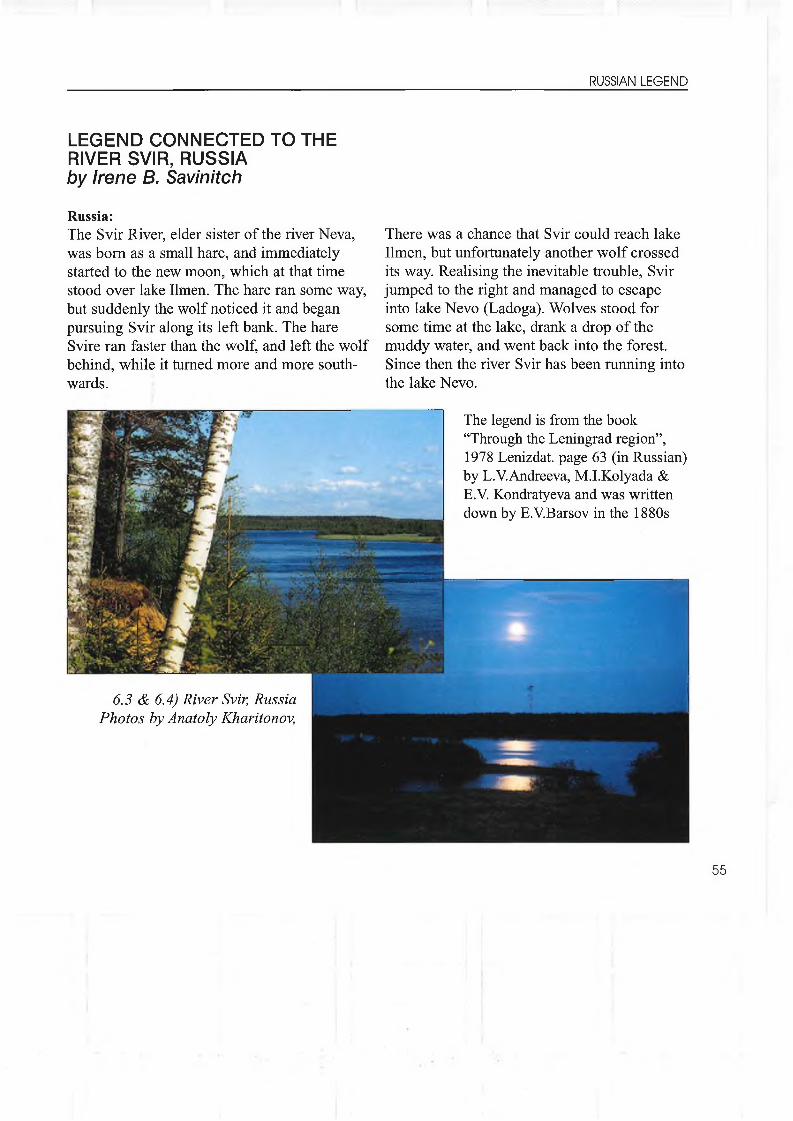
LEGEND CONNECTED TO THE RIVER SVIR, RUSSIA by Irene B. Savinitch
Russia:The Svir River, elder sister of the river Neva, was bom as a small hare, and immediately started to the new moon, which at that time stood over lake Ilmen. The hare ran some way, but suddenly the wolf noticed it and began pursuing Svir along its left bank. The hare Svire ran faster than the wolf, and left the wolf behind, while it tumed more and more south- wards.
There was a chance that Svir could reach lake Ilmen, but unfortunately another wolf crossed its way. Realising the inevitable trouble, Svir jumped to the right and managed to escape into lake Nevo (Ladoga). Wolves stood for some time at the lake, drank a drop of the muddy water, and went back into the forest. Since then the river Svir has been running into the lake Nevo.
The legend is from the book “Through the Leningrad region”, 1978 Lenizdat. page 63 (in Russian) by L.V.Andreeva, M.I.Kolyada & E.V. Kondratyeva and was written down by E.V.Barsov in the 1880s
6.3 & 6.4) River Svir, Russia Photos by Anatoly Kharitonov,

6.5) Lithuanian students performing at Vytautas Didysis Gymnasium for international BSP teachers attending the Rivers Course in Klaipeda, Lithuania, April 1999Photo: Birthe Zimmermann

QUESTIONSto section I
• Study picture 1.1 (page 19 : What does Minna Herrala express in her drawing “ My own relationship with nature"? Describe possible experiences or relations expressed, and compare with your own personal relationship with nature.
• Comment upon Meeker’s quotation on page 11: What fundamental factors have art and ecology in common?What tools can they offer?
• Study photo 1.3 (page 13): What senses does the photo appeal to? What is the vocal message that the river tells you?
• Why is one’s own active involvement in environmental aspects essential for learning and for changing the attitudes?
• Regard picture 3,4 (page 29):What modern symbols would you make for fire - water - air - earth?
• What is river empathy?
• Find examples from your country of life at the river being romanticised as in Finnish logdriver films
• When studying the sculpture in fig. 4.6 (page 40) : What national artist in your country would define himself an environmental artist?
• Frank Lloyd Wright's house “Falling Water" (fig. 5.2 on page 45) would create great conflicts in most countries if suggested or built to-day: Why? How have rivers been protected from similar artist provocation in your country?

7.1) The river Salaca in Latvia: The velocity o f the river Salaca at this point is rather low, enabling the river to deposit fine particles, thus creating a braided channel (see page 78). Photo: A. Kharitonov at the BSP Rivers course in Ligatne, Latvia, August 1999

Section II.RIVERS AS AN EDUCATIONAL CHALLENGE IN SOCIAL STUDIES
C hapter 7: Introduction to Baltic Rivers 60C hapter 8: It all Starts with the Rain 64
Studying Models of the Water Cycle on Land 64The Role o f Climate, Soil and Vegetation 65The Role o f Human Production and Settlement 67The River as Result - a Model for Rivers in the Baltic Area, 68
C hapter 9: G eographical M apping of a River SystemM apping the Topographical Drainage Basin 70The Shaping of the Drainage Basin by G lacial Erosion 72How the Runoff of Water Formed the Landscape 76How Humans Influence Watercourses 81Actual Stage and Modification 84
C hapter 10: Historical M apping o f RiversM apping the Historical Runoff o f the River - How to Find Sources? 86Settlements along the River through Ages 88Material Remains from former Production and Use o f the River 88Use o f the River for Trade and Transport 88Recent Use and Future of the River 90
C hapter 11: Educational Experiences: Cases on Baltic RiversRiver Nivaa, Denmark, an Interdisciplinary A pproach 92The River Kymi, Finland 98Rivers as Means for Transport o f Logs, Finland 102Rivers and Sawmills 108River Gauja, what makes it? Latvia 113River Oder, Poland 116
Questions on Section II 117

Chapter 7INTRODUCTION TO BALTIC RIVERSRiver types and sizes - a presentation by Per Werge
he Baltic Sea with a water surface of 415.000 km2 and a total water volume of 22.000 Ion3 receives yearly 660 km3 of water from precipitation (rain and snow). About 225 km3 of the precipitation falls directly into the sea, while about 435 km3 is
brought into the sea by approximately 200 rivers from the surrounding catchment area - an important contribution.
The catchment area, or drainage basin, covers about 1,6 million km2 i.e. 15% of Europe, with about 10% of its population. With a variation in precipitation from 400 mm in the most northem region to 800-900 mm in the south-west and a regional average of 500-600 mm the precipitation is relatively low compared to many other regions of Europe.
Simultaneously the evaporation is low due to the long winter season, about 2/3 of the precipitation evaporates in the southem parts and 1/3 in the north.
In addition the shape of the Baltic drainage basin as a former glacial basin surrounded by the Scandinavian mountains to the north, the Sudetes, Beskydi and Carpathian Mountains to the south and terminal moraines to the east and west has a limited area. This means that the rivers leading to the Baltic Sea generally are small or medium sized streams both in length and water discharge compared to other European rivers and especially to the greater rivers of the world.

7.2) The most important rivers in the Baltic drainage basin and their catchment areas.The largest Baltic river is the Russian River Neva, which is the 7th largest in Europe with a drainage area o f281.000 km2.The Wisla in Poland is the 9th largest with a catchment area o f 194.000 km2.Between Europe's top 31 rivers with a catchment area larger than 50.000 km2 we also find:the Oder (D,PL) as no.13, the Neman (LT,BY) as no.15, t he Dvina (LV,BY,RU) no.18 and the Finnish River Kemijoki as no.31.
Table 1:The major Baltic rivers within each country
River Country Catchment area in
1000 km2
Neva Russia 220Finland 61,1
Wisla PolandSlovakia,
191,8
Ukraine, Belarus 2,2Oder Poland 114,2
Germany e.10Czech Republic 4,7
Neman Belarus 45,5Lithuania 46,6Russia and Poland 6
Dvina Russia 35,7Belarus 25,8Latvia 23,6Lithuania 3
Kemijoki Finland 51,1Kymijoki Finland 37,2Narva Estonia 17
Russia e.30Tome Ålv Sweden e.20(Tomionjoki) Finland e.20Ångermanålven Sweden 30,6Dalålven Sweden 29Kokemåenjoki Finland 27Lielupe (Venta) Latvia 8,8
Lithuania 5,2Gauja Latvia 7,9Påmu Estonia 6,9Gudenå Denmark 2,6
Source: European Environment Agency, Copenhagen 1994 (e: estimation)

CLASSIFICATION
Within the Baltic drainage area the geological and geomorphological conditions vary consi- derably from the northem and southem moun- tainous divides to the central morainic plains and hills.According to the geological setting the area should be recognised as three or four geological regions, each providing important conditions for the evolution of the regional streams and rivers.These geological and geomorphological subregions are further described in chapter 10. "Mapping the topographical drainage basin". Also the climatic types of the region are key factors determining the conditions of the rivers, especially their vegetation zones and related biological life.Investigations by several geologists, climatolo- gists and biologists have developed a tradition for a biogeographical classification of the Nordic rivers that may be useful for river studies in the entire Baltic region.
THE FOUR BIOGEOGRAPHICAL GROUPS OF RIVERS ARE:
1. Low-gradient streams in former deciduous forests in a warm temperate rainy climate with low flow in summer
2. Low-gradient streams in mixed coniferous forests in a cold temperate climate with an even, all year round runoff
3. High-gradient streams in the coniferous and deciduous forests in a cold, snowy climate with low flow in winter
7.3) Map of the four groups of Baltic rivers (from Robert C.Petersen et al., Amsterdam 1995).The 5"' group has no attention fo r the Baltic area
1) TEMPERATE CONTINENTIAL
2) BOREO-NEMORAL
3) BOREAL
4) ARCTIC
5) TEMPERATE ATLANTIC
4. Streams of the alpine and arctic vegetation zones with an arctic climate and maximum runoff in midsummer.The four groups of rivers are further described and explained in Section III "River Typology" (page 122)

7.5) Students gidded by Risto Hamari,
Langinkoski lukio investigate the Kymi River in Finland regularly on field courses.
Photo: Risto Hamari
7.4) The River Gudenå, Denmark has its spring only a short distance from River Skjernå, the latter running to the wadden sea/ North Sea and the former to the Baltic Sea Drainage area.Photo: Birthe Zimmermann
7.6) The Vistula river south o f Gdansk in April 2000 with the water level reaching peak level. Photo: Birthe Zimmermann
7.7) The river Amata, Lat\>ia, in August 1999 was investigated by BSP teachers. Photo: A. Kharitonow

Chapter 8IT ALL STARTS WITH THE RAIN - AN INTRODUCTIONStudying models of the water cycie on land by Per Werge
r å 1 he water cycle as shown in figure 8.1 is basically the way nature produces rivers. This# cycle is called the hydrological circle and connects ocean, atmosphere and land with a
m steady flow of fresh water from the ocean to the land. Without this supply of fresh water all land would be dry and without life, a desert. 2/3rds of the Earth' surface is covered with water. In total 1.348.000.000 km3 of water lie in the oceans i.e. 97,3 % of all water.

This water is saline and cannot be used by most plants or animals. By the energy of the sun, both as heat and wind, about 425.000 km3 of the water evaporates into the atmosphere, cools by ascent and condenses to form clouds and later precipitation (hail, snow, rain etc.). Through precipitation most of this water retums directly to the ocean. This circulation is fairly rapid. The water and water vapour in the atmosphere are replaced about 40 times a year. Only 40.000 km3 of the water is brought by the wind to the land. The model shows how this small amount of fresh water from the open sea provides the basic input to the water cycle on land. Without it the land would dry out by the steady runoff back to the ocean. This runoff is a combination of groundwater flow,
of throughflow (percolation) in the soil and of overland and streamflow to the ocean. On land there is a supplementary water circulation, based on evaporation from the surface of rivers and lakes, from land, vegetation and animals plus transpiration from plants - together termed evapotranspiration.About 2/3rds of the rain and snow on land thus derives from evapotranspiration.
THE ROLE OF CLIMATE, SOIL AND VEGETATION:
Climate, soil and vegetation play a major role in the water cycle on land and the nature of the surface runoff - the rivers.
8.2) The river as part o f the water circle in a humid temperate environment

The model shown (Figure 8.2) gives an idea of how these three basic natural conditions influence the river landscape.In the arctic mountainous areas of the Baltic drainage basin the water resource is stored as ice or snow during the winter. In summer mineral particles are washed out by the overland flow of meltwater and transported by their gravity downslope until they are deposited according to the size of the particles. Coarse materials like boulders are deposited first, progressively followed by gravel, sand and mud as slopes decrease.Due to the low temperatures evaporation is low, and the stony soil is frozen for a part of the year. Thus the water must run off as overland flow until the meltwater streams deliver the alluvial material to the unfrozen environ- ments nearer the sea. By this stage the meltwater already forms clear river forms, first straight runs and later braided streams, a network of many smaller branches woven together, in ever shifting positions caused by the deposition. Due to the former glacial erosion the lower areas with the old glacial deposits contain many basins adding numerous lakes and bogs to the water course.
In the non-polar environment i.e. the humid temperate areas (fig. 8.2) which constitute most of the Baltic area the underlying rock of chalk, limestone, sandstone or in some places even granite is permeable and is reached by percolating water. The rock is then called an aquifer. Much water percolates straight through the soil to fill the pores and cracks of the aquifer as groundwater.
Depending on the capacity of the groundwater reservoir, the permeability of the rock and the amount of percolating water the aquifer will accumulate water and the water table will rise. The groundwater storage is directly related to the above mentioned soil moisture storage.Saturation of the groundwater storage will cause the outflow of surplus water to the more or less saturated soil and, through groundwater flow and soil throughflow eventually to the rivers.The flow through the aquifer and soil is very slow compared to surface runoff. The typical situation in humid temperate areas is a fairly constant supply to the groundwater storage by rainfall all the year round, whereas the loss of water to the rivers from groundwater and soil- water is controlled by evaporation and transpiration from plants in the growing season.In many areas the combined evapotranspiration causes a variation in the groundwater table on 1-2 metres throughout the year.The vegetation also provides a means of recir- culation of precipitation that never falls on the ground. Part of the rain and snow is caught by plants before it can reach the ground. This is called interception. In mature woodlands and plantations with many layers of leaves this storage can be considerable and much of it evaporates directly from the leaves.By transpiration from plants the vegetation contributes to the water cycle by drawing up water from the soil pores. In dry summer conditions transpiration may deplete the soil moisture faster than it will be replaced by rainfall.

THE ROLE OF HUMAN PRO- DUCTION AND SETTLEMENT
The use o f water in agriculture, manufacturing industry and households has increased to such an extent that restrictions are necessary for the use of drinldng water in many countries. Compared to the amount of water in the water cycle - for the Baltic Area this is 400-800 litres of water delivered per m2 during the year - the pumping of water brings only about 30 litres of this water into use (Denmark). Evapotranspiration is estimated to recycle 340-420 litres per m2, leaving a balance of about 200 litres per m2 around many big cities. In the surrounding area of these cities the water supply may take about 100 litres per m2, and in the process lower the water table by 5- 10 metres locally (Danish figures). The local pumping of ground water and evapotranspiration thus leaves only about 100 litres per m2 or
less for surface ranoff into rivers and to reple- nish the ground water storage. During the growing season this is insufficient, and the rivers suffer reduced flows.In some areas the streamflow during the summer more or less equates to the discharge of effluent from the sewage treatment plants to the river.The river is in this case no longer a simple channel for natural water flow as part of the hydrological cycle. In this sense the river system represents part of an artificial water cycle connected to the general hydrology as a whole. This artificial cycle not only influences the water level of the reservoirs in the system, but changes the entire ecosystem by adding foreign nutrients, chemicals and biocides to the reservoirs, lalces and rivers. By enforced water pumping in areas near the shore the water circulation may even be mixed with brackish or saline water.
GROUND WATER SEWAGE SALTWATER
8.3) The human impact on the water cycle
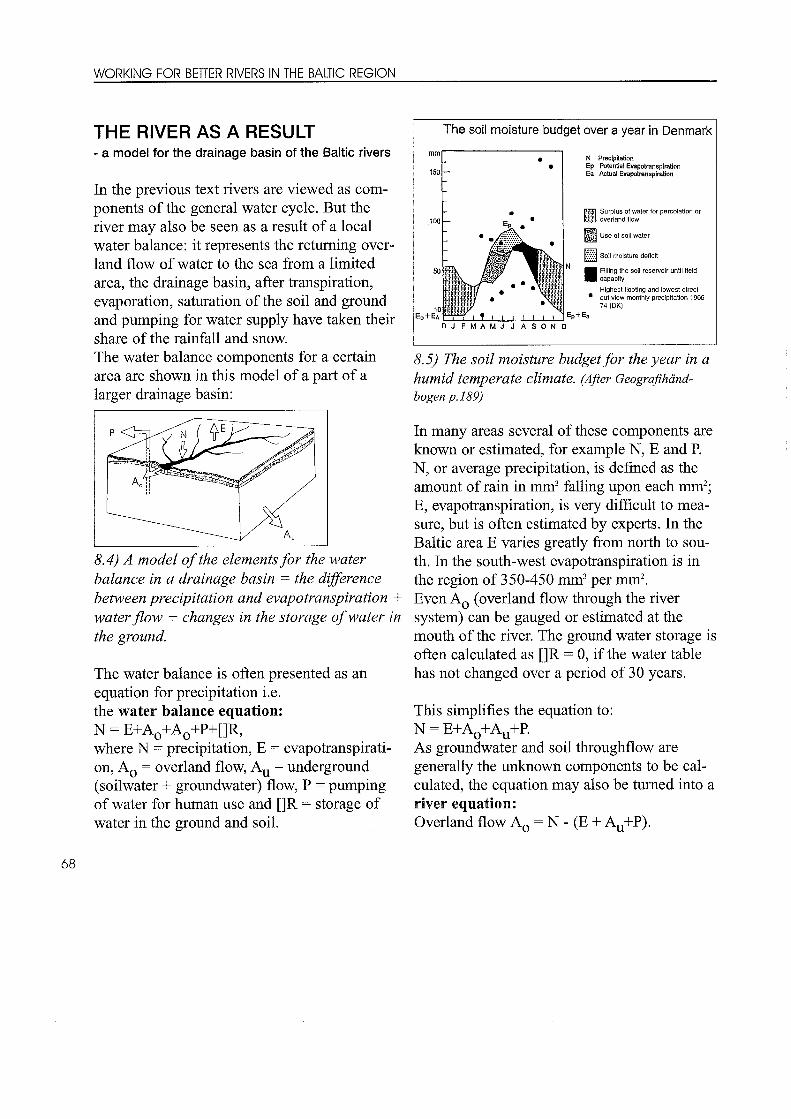
THE RIVER AS A RESULT- a model for the drainage basin of the Baltic rivers
In the previous text rivers are viewed as com- ponents of the general water cycle. But the river may also be seen as a result of a local water balance: it represents the retuming overland flow of water to the sea from a limited area, the drainage basin, after transpiration, evaporation, saturation of the soil and ground and pumping for water supply have taken their share of the rainfall and snow.The water balance components for a certain area are shown in this model of a part of a larger drainage basin:
In many areas several of these components are known or estimated, for example N, E and P. N, or average precipitation, is defmed as the amount of rain in mm3 falling upon each mm2; E, evapotranspiration, is very difficult to mea- sure, but is often estimated by experts. In the Baltic area E varies greatly from north to South. In the south-west evapotranspiration is in the region of 350-450 mm3 per mm2.Even A0 (overland flow through the river system) can be gauged or estimated at the mouth of the river. The ground water storage is often calculated as []R = 0, if the water table has not changed over a period of 30 years.
This simplifies the equation to:N = E+AQ+AU+P.As groundwater and soil throughflow are generally the unknown components to be calculated, the equation may also be tumed into a river equation:Overland flow A0 = N - (E + Au+P).
balance in a drainage basin = the difference between precipitation and evapotranspiration + water flow + changes in the storage o f water in the ground.
The water balance is often presented as an equation for precipitation i.e. the water balance equation:N = E+A0+A0+P+[]R, where N = precipitation, E = evapotranspiration, A0 = overland flow, Au = underground (soilwater + groundwater) flow, P = pumping of water for human use and []R = storage of water in the ground and soil.
The soil moisture budget over a year in Denmark
N PrecipitationEp Potential EvapotranspirationEa Actual Evapotranspiration
filjjjn Surplus of water for percolation or lliliiil overland flow
Råra Use of soil water
Soil moisture deficit
■ Filling the soil reservoir until field capaciiy
Highest flooting and lowest direct • out view monthly precipitation 1965-
74 (DK)
D J F M A M J J A
8.5) The soil moisture budget for the year in a humid temperate climate. (After Geografihåndbogen p.189)

Generally the annual precipitation in most humid temperate areas is 200-300 mm higher than the evapotranspiration. During the growing season and especially in dry summers the net balance between soil throughflow to the rivers and pumping for water supply will be negative. A soil moisture deficit is built up. But due to the slow throughflow in deep soils and permeable aquifers the soil and ground water reservoirs will normally supply enough water to keep most rivers running as permanent streams even in the driest years.Another important variation from the simple flow model is brought about by uneven precipitation. The general pattem of flow in a river system, the combination of groundwater flow, throughflow and overland flow, is called the hydrograph. While a dry season may suspend the overland flow and perhaps the soil throughflow, a wet season and especially sudden and stormy rain may exceed the permeability rate of the soil by saturating it.
A surplus of water will travel directly to the river as overland flow and appear as a sudden peak in the hydrograph. If the permeability of the soil or the river channel is further limited by human activities, e.g. cementing of the banks, sudden rain storms may cause flooding.
It is obvious that the arctic river of Upper Scandinavia has virtually no runoff except after the thawing of the snow, while the European mainland river has a much less shif- ting flow regime, though with maxima during winter and after the spring thaw, when evaporation is lowest. 8.6) THE RIVER HYDROGRAPH
(the flow regime during a year) for the fourBaltic river groups (see page 62)
Chapter 9GEOGRAPHICAL MAPPING OF A RIVER SYSTEMMapping the topographical drainage system by Per Werge
r t 1 he first task to perform when carrying out a geographical study of a river would K normally be to map the river as part of a whole drainage system separated from other
m systems.The river system is the channel network that is formed in the drainage basin.The boundaries of this drainage basin are represented in mountains by the most significant ridges, and in glacial landscapes mostly by hills bordering the basin.This border is referred to as the drainage divide or watershed.
The definition of a single drainage basin should be the catchment area, composed of a network of sub-surface and surface pipes and channels transporting all soil water and overland flow from the precipitation within the area bounded by the watershed by gravity to the sea.
In this respect the Baltic drainage basin is not a single system, but a collection of river systems all delivering their water to the Baltic Sea (See figure 9.1).
The Danish Straits might be viewed as three rivers leading all Baltic water to the ocean- or the Kattegat might be viewed as the final common channel for all Baltic runoff water.

9.1) THE BALTIC DRAINAGE BASIN
The drainage basin o f the Baltic Sea includes six entire countries together with regions o f 8 other countries including Belarus, Ukraine, Slovakia, the Czech Republic and Norway - the last five countries are by tradition not included in the main co-operative network and infrastructure o f the Baltic Sea.
The overland flow never just runs directly off the bare surface. Most precipitation within a drainage basin is intercepted by vegetation or absorbed by the soil, or evaporated. Overland flow first appears when - in humid regions - the soil is saturated with water. When this water moves, it begins at a certain velocity to concentrate into subsurface soil pipes and to move soil particles These pipes represent the forerunners of brooks.
Depending on the amount of water, the slope of the terrain and the vegetation cover the transport of soil particles accelerates, and small rills in the surface occur, converging and diverging until a certain distance from the divide. From this distance the rills converge into larger channels, as shown in figure 9.2. Once established the channels tend to stabilise the flow and grow more and more permanent.
9.2) A network o f small subsurface pipes converge to form surface rills and then into larger rills which establish the flow pattern.

As the ranning water flows downslope from the watershed the streams deepen their chan- nels by erosion, join other streams and eventu- ally become a single, large trunk river.In order to make this pattem of rivers within a single drainage basin more visible and ame- nable to monitoring, measurement and map- ping a simple classification system was adopt- ed in the 1930s:
9.3) How to organise the streams in the system after order
Each stream segment is numbered according to its position between the source and the mouth. The streams of the first order will be found near the divide as very small broolcs. Streams of the second order have only these first order broolcs as tributaries, and third-order streams receive water only from second-order streams and so on. Mapping a river networlc or drainage basin according to this classification produces a basis for further analysis, both geomorphological (how the surface was chan- ged by the water at each level of the system) and biological (which biotypes are related at the level of each river system).The mapping should be related to the standard, published topographical maps of the area.
THE SHAPING OF THE DRAINAGE BASIN by glacial erosion
How the glaciers transformed the former tecto- nic landscape by erosion into subregions of different character, soil and drainage capacity. In most parts of the world, even in mountains, the surface consists of materials from the Earth's younger geological periods, in volcanic and coastal areas sometimes less than 100 years old. In general the oldest bedrock has been eroded over the last 200 million years or so and covered by younger formations, in the form of sediments in the sea or erosion materials from mountains raised or upfolded by immense tectonic forces.
9.4) The geological structure o f Northern Europe
In contrast very old bedroclc appears as mountains and shields in the tectonically stable northem part of the Baltic drainage basin, the Fennoscandinavian Shield covering Sweden and Finland. This geological basement is visible as crystalline rock at or near the surface
/ / '.// / i
I'en.MuS ICc in d iiiii l.ih li-
- - s .
C a le c lM i |Bejipfcfoi' ’AT vi \
V. Easfeuropear Table
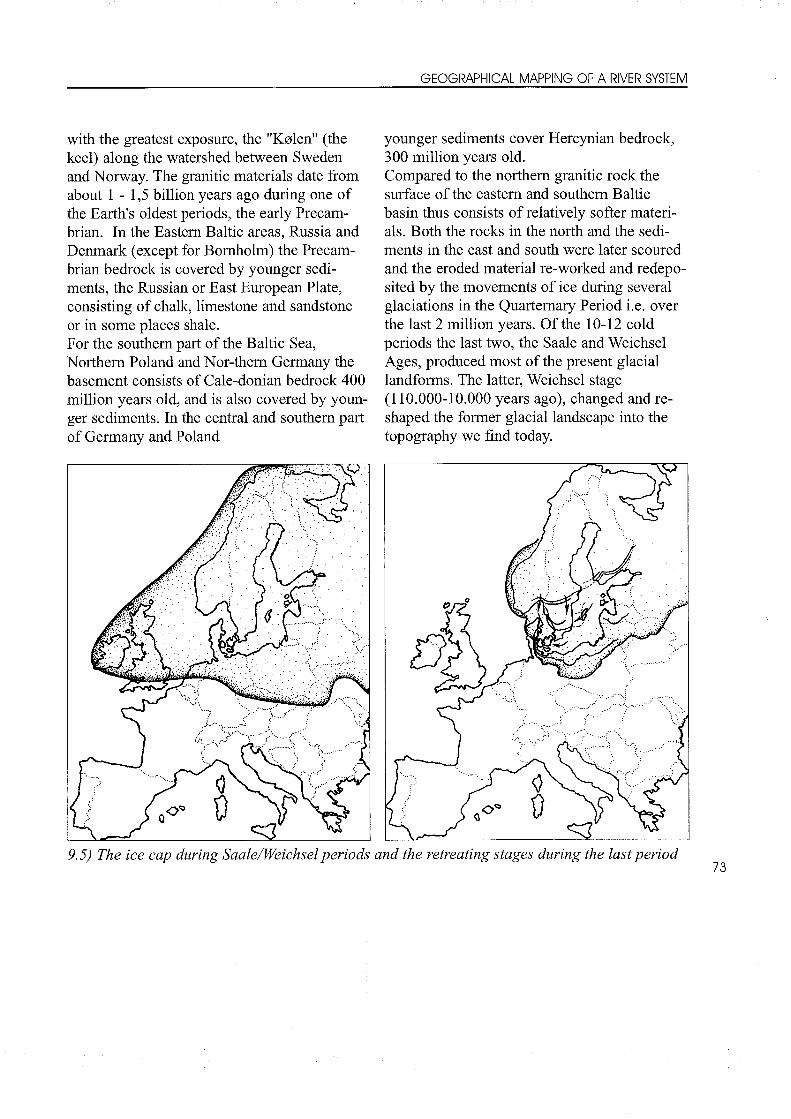
with the greatest exposure, the "Kølen" (the lceel) along the watershed between Sweden and Norway. The granitic materials date from about 1-1 ,5 billion years ago during one of the Earth's oldest periods, the early Precam- brian. In the Eastem Baltic areas, Russia and Denmark (except for Bornholm) the Precam- brian bedrock is covered by younger sediments, the Russian or East European Plate, consisting of chalk, limestone and sandstone or in some places shale.For the southem part of the Baltic Sea, Northern Poland and Nor-them Germany the basement consists of Cale-donian bedrock 400 million years old, and is also covered by younger sediments. In the central and southem part of Germany and Poland
younger sediments cover Hercynian bedrock, 300 million years old.Compared to the northem granitic rock the surface of the eastem and southem Baltic basin thus consists of relatively softer materials. Both the rocks in the north and the sediments in the east and south were later scoured and the eroded material re-worlced and redepo- sited by the movements of ice during several glaciations in the Quartemary Period i.e. over the last 2 million years. Of the 10-12 cold periods the last two, the Saale and Weichsel Ages, produced most of the present glacial landforms. The latter, Weichsel stage (110 .000-10.000 years ago), changed and re- shaped the former glacial landscape into the topography we find today.
9.5) The ice cap during Saale/Weichsel periods and the retreating stages during the last period

To imagine how this landscape was formed it must be considered how plastic thick ice is. First, a growing cover of snow is converted into fim by pressure melting. Later this tums to ice which then begins to deform under its own weight. On a slope or forced by the weight of continuous snowfall the ice cap starts moving under the influence of gravity. As long as the ground creates friction or is relatively warm the ice slides over the bed on melt-water carrying stones and other debris that scours and abrades the bedrock. Colder conditions and increasing ice thickness cause more abrasion until a limit is reached when very thick ice stops moving and sliding over the floor altogether and starts intemal plastic flow.The base of the glacier sticks to the floor while the upper part and surface move on.
9.6) The Nordie ice cap during the ice age, 3,8 lan at its thickest, but still with some peaks "Nunatak" above the ice
As such a thick ice cap, like the inland ice of Greenland, the Scandinavian ice cover in the Weichsel period just overwhelmed the area and remained relatively stationary.
At its thickest the Scandinavian ice cap reached 3,8 km and its remarkable weight depres- sed the land by nearly 300 metres in the Bothnian Bay, 150 m. in an arc connecting
Oslo-Stockholm-Tampere and 50 m in an arc from Murmansk to Tallinn, Rristiansstad and Frederikshavn.Abrasion then does not occur until warmer conditions return and the ice begins to melt again. This means that the greatest erosion takes place near to the spreading ice margin, where the ice is thinner and less plastic and melt-water lubricates its movement over the bed. This faet is worth remembering.It explains two important types of glacial landscapes: first the U-shaped valleys and rounded cirques in the rocky mountains, overlooked by crests and pyramidal peaks ("nunataks") that remained ice-free near the root of the glaciers' initial and final stages. It was during the first and last periods of the ice age that most erosion took place here.Secondly the valley landscape formed near the ice margin, eroded and reshaped on the surface of the older sediments and moraines as broad valleys and fjords along the Baltic coasts. The glaciers mainly followed already existing troughs and valleys from the former periods of water runoff, i.e. valleys from the Tertiary Age (in German: Urstromtåler) such as the Elbe Valley, the Wisla Valley north of Warsaw and the Nemunas Valley in Lithuania.In some places chalk and limestone deposits have been held and raised in a vertical position by the ice - as the cliffs of the islands Riigen and Møn show.A third main type of glacial landscape is represented by the hilly deposits of material brought by the ice from the eroded areas and just left (deposited) along the former ice- channel as lateral moraines and as terminal moraines after it melted.

9.7) The ice margin with deposits o f a different kind
* 5 5 1c
Especially in the lowlands and during the last period of the ice age the balance between the energy for ice movement, and for erosion and transport of debris materials has been a delica- te and dynamic one over long periods. The pattem of deposition of debris has changed with new erosion, and in regions with highly permeable soil the melting water drained into the ground leaving glacial debris as streamli- ned hills called drumlins. During warmer periods the melting ice created a great deal of surface water, some of which filled icy ponds and deposited debris (till). Some water drained to the floor of the ice channel as subglacial streams eroding subglacial gorges (tunnel valleys) in the bed, or in other placecs depositing a ridge, or eslcer of gravel and stones (in Danish: "ås"). Generally most deposition occurred during the melting (ablation) periods when the ice movement stopped. Material was left as moraine and melt-water washed out debris (stones, gravel and sand) from the ice forming
ever shifting braided streams that left sorted deposits on an outwash plain. These outwash plains, in common with morai- nic plains and hills from the innumerab- le stages where gla- ciers were stalled during the long melting period of the ice, now fill the lower parts of the Baltic drainage basin, where most people
now live and the rivers run. During the peri- glacial and postglacial periods that followed the Weichsel Age the Baltic Basin contained huge lakes or waters open to the sea e.g. by 8000 BC the Baltic Ice Lake had formed, by 7500-7000 BC this had been replaced by the Yoldia Sea, by 6500 BC it had given way to the Ancylus Lake and finally by 5000-2000 BC to the Littorina Sea. (Mapped in Leamers Guide no. 1 "Working for better Water Quality in the Baltic Sea", p.31) These waters were made up of the meltwater from the Nordic glaciers, filling the lowland that was still depressed by the weight of the ice. During the last 12.000 years the land slowly recovered its isostatic equilibrium in a series of steps, a few metres at a time. Each rise was followed by renewed periods of marine erosion, crea- ting new cliffs and Coastal plains behind new coastlines. These cliffs, plains and former shorelines are now located on elevated land often far from the present coast.

HOW THE RUNOFF OF WATER FORMED THE LANDSCAPE
The character and forms of water erosion In brief the Ice Age was the making of the Nordic and Baltic landscapes as we know them today. As described above this landscape, as well as being formed by glacial erosion has also been continuously reshaped and remodel- led mainly by melt-water and later water movements. The entire glacial melt-water system is shown as a model below.During more recent times overland flow as brooks, rivers and lakes continued to form the landscape. However, since the end of the Weichsel Age, lakes and Coastal formations have also added interesting landforms to those produced by rivers. In contrast to rivers lakes are just waterfilled topographical depressions
in the surface. The effect of a lake on surface runoff is mainly to absorb both the velocity (speed of flow) and the volume of water and eroded material. At the inflow end the water current rapidly slows down and the transported material begins to deposit in the lake. At the outflow the water is released more slowly and more evenly compared to runoff from rivers without associated lakes. The lakes also functi- on as reservoirs connecting groundwater, soil water and overland flow and are, depending on the climate, subject to evaporation too. This means that fluctuations in water runoff are smoothed by its passage through lalces.The sediments deposited in the lakes and the sea is further replaced and reworked by the movements in the sea. Wave energy, bed topo- graphy and other natural conditions continue to influence the river basin near the coastline.
Glacialprocesses
Periglacialprocesses
Meltwatererosion
GroundwaterRainfallTributariesMeltwater
The meltwater systeminputs outputs
Landscape features
Meltwater channels
marginalsubglacialproglacialoverflow
Outwash plains Valley trains EskersKames - terraces
Temporary Permanent Relict lakes features
strandlines lake floor deposits
Major influences
9.8) The meltwater system

THE RIVER ITSELF
The river itself - as a product of the water cycle - generally reflects the volume of the precipitation within its topographical watershed. The gravity of this water is the source of energy that enables the river to work on the surface of its drainage basin. Over time this work shapes the terrain of the basin into a more or less concave long profile. The rivers erode and transport all materials from higher altitudes to lower until, as a result, the landscape eventually becomes a flat plain. This process seldom occurs as an unbroken cycle because tectonic forces e.g. uplift, subsidence or crustal compression affect the landscape, thus allowing the cycle of erosion to start again. Every fluvial landscape is likely to exhibit a very complex evolution as a result of exposure to such processes. In order to try to understand the basic fluvial erosion processes we can employ the following model of river valley evolution.Near the head of a river every stream is relatively small and incapable of transporting the larger particles of debris until more headwa- ters and brooks merge and add more energy to the work.From this stage, often involving third order streams, there will be a surplus of erosive energy that can excavate sharp and steep slop- es and which is sufficient to transport even relatively large stones. The later "cut and fill" of debris is achieved according to a scale for particle size. Whereas the available energy for the transport of debris on steep gradients by the higher water velocity has the capacity for transporting coarse materials, on lower gradi
ents with lower velocity, but increased water volume, these may be deposited and a larger load of finer gravel and sand transported.
This energy transformation gives the river its typical concave long profile: steeper in the upper reaches, moderate in the middle section and approaching the horizontal in the lower reaches. Simultaneously erosion forms typical cross sectional profiles for both the river chan- nel and its valley i.e. V-shaped in the upper reaches, U-shaped in the middle reaches and a wide channel on the floodplain. Important components in this process are the difference in altitude from spring source to sea mouth (the gradient), the character of the bedrock (roughness) to absorb the stream energy by fri- ction and erosion, and the volume of water to transport and deposit the eroded load of materials along the lower sections of the river.
The stream energy is often measured as the water transport Q in m3/sec: Q = A x V m3/sec where A is the cross section in m2 and V the velocity in m/sec.
9.9) How to measure the cross section and the velocit. Velocity is difficult to measure correct- ly and should be estimated after a number o f floating tests

The velocity is controlled by friction. It is low- est around the channel perimeter where it is influenced by the roughness of the bed i.e. the rougher the slower. Even friction with the air means that the highest velocity not will be measured at the surface of the water, but just below the surface towards the centre of the river. The average velocity is found 0,6 of the distance from surface to bed:
9.10) Flow, gradient and shape o f the water course. The gradient may be estimated by use o f detailed mops.
According to the energy (gravity) components mentioned above i.e. gradient, velocity and volume, the river takes one of three basic forms of which the first form is rare:
gy correspond - a stream ajfected only by natural forces will always tend to meander with a specific wavelength according to the natural conditions i.e. bedrock, climate related water runoff, gradient etc.
1 . a single straight channel2 . a single meandering channel and3. a braided channel, interrupted by islands. The three forms correspond with the way rivers erode their terrain:On steep slopes the water velocity and power is high and may move small as well as larger particles. The most difficult to move are boul- ders, cobbles etc. These materials are therefo- re, as mentioned above, not transported further than the gradient will permit, and they often cover the river bed as a protection for the sediment below. On more moderate slopes the river meanders. The connection of more tributaries add more volume and therefore more energy to the flow, while the load of particles consumes energy. Thus there develops in this section, often referred to as "the mature river" a dynamic equilibrium between deposition and new erosion of the former deposited sediments and of the valley slopes, that may widen the valley. Still, the velocity is sufficient to carry away finer particles like clay and silt by suspension, and the river bed is composed of the heavier sand, gravel and cobbles.On the floodplain the meandering river by its nature has a relatively longer channel, compa- red to the local gradient. Due to the lower velocity the river tends to deposit still finer particles, filling the floodplain with barriers of deposition, which in tum forces the river to erode new channels through them, leaving some as islands between numerous channels. This is referred to as a braided channel.A delta has the final form of a braided channel (page 58). Here the velocity drops to zero as the river enters the sea and even clay particles and fine sand will be deposited.

WHY DOES A RIVER NATURALLY MEANDER?
Every river has a channel plan or geometry, reflecting the amount of water, the channel slope, type of bedrock etc. within its water- shed. The river develops its specific geometry based upon these components. The roughness of the river bed creates friction and turbulence, starts the meandering process (the winding) of the river and the forming of pools and riffles.The energy minus the loss by friction (delivered as heat) is used for the transport of particles and thus there is a basic transport of material from the upper, steeper section of the river to the lower and gentler gradient sections,- or as it is often misleadingly called: from the young stage to the mature stage of the river. Features of both stages are generally present and active throughout the whole river.
Due to centrifugal forces water in a winding path is thrown outwards to the concave bank of the river causing erosion. The materials eroded will be deposited in areas with lower velocity (less energy for transport), i.e. among the coarse particles in the bottom of the channel and on the inside of the bends of the channel as point bar deposition.
This pattem of transport is complementary to the channel plan created by deposition associ- ated with a geometrical (sinuous) meandering. What is eroded from the outside bank of the bend will be deposited in the low energy zone of the next convex bank. The river thus represents a dynamic equilibrium: if after increased
rainfall a stream breaks its banks or levees and cuts through the neck of the meander, the resulting shorter channel will steepen the gradient and both erosion and later deposition will increase until a new equilibrium is reached.The transition from meandering to braided stream may occur where gradients become steeper and materials are relatively coarse or where the debris load is deposited on gentler gradients.Braided channels include shifting islands of gravel and sand waiting to be transported during periods of high water or reshaped by low water. At low flow the meandering river may take the form of a braided stream within the overall river channel. In reality it is very difficult to identify the precise equilibrium of the entire river system as it shapes the degra- ding landscape into steep and mature valleys and old river plains because the climatic components may vary enormously from year to year. If the valleys really are in a state of dynamic equilibrium they may perform the roles of both cutting and filling of sediments in both wet and dry periods. The river needs a valley broad enough to contain high storm floods. During drier periods the river bed is a site of deposition, after which the material may be removed by the next flood. Living next to a river one is unlikely to observe exactly the same river bed over a period of a lifetime.If the ground level is uplifted or removed by tectonic forces - or the climate changes - the river begins to create a new equilibrium, a new river geometry, due to the impact of the new components. These effects can be observed as river terraces both in the long profile and as terraces on the valley sides.

In conclusion:there are 3 traditional river sections. Following tradition the overall summary of these complicated conditions for river forms identifies three main types of river landscapes or sections, shown in the model below
STFFP GRADIFNT '
CHANNEL SHAPE U MODERATE GRADIENT
GRAVEL AND PEBBLES
CHANNEL SHAPE LOW GRADIENT
GRAVEL AND SILT
a) UPPER RIVER REACHThe well-defined V-shaped valley of the upper reaches, with the river bed covered in pebbles and boulders
b) MIDDLE RIVER REACHthe meandering U-shaped valley of the middle reaches, with the bed covered with pebbles and gravel,
c) LOWER RIVER REACHthe wide meander loops and braided streams of the lower reaches, with the bed covered with gravel and silt.
9.12) The three typical reaches for a river

HOW HUMANS INFLUENCE WATERCOURSES
i.e. the changes to rivers and streams by society - a cultural geographical approach
Since the first human settlements we must consider changes to river and river environ- ments as a part or element of human activities: people catch animals and gather plants from the wild and begin to use nature as a resource and a location for production and infrastructure to an ever increasing extent. From the earliest cultures civilisation involved the alteration of rivers on different scales, from the very local mooring of boats to simple post or pile bridges to modem multipurpose dams. A local example is the hydroelectric power stations on the Kymi River (Finland), which both control the river flow for floating logs and produce electricity. On a world scale the planned Yangtse River dam system in China will be larger than any existing dam.
The basic means of regulating rivers take the following three forms: dams, canals and pipelines of all scales and sizes:
1. Dams for water supply and fishing ponds, irrigation, energy production and for floating of timber.
2. Canals for regulation of water runoff, drainage and irrigation and for traffic and transport.
3. Pipelines for drainage and runoff control in intensively cultivated and urban areas as well as for water supply.
Every change or regulation of the river system is a modification of the natural dynamic equil- ibrium. The river will begin to readjust itself by using a proportion of its energy in new erosion and deposition until a new balance is atta- ined.A dam will collect all debris eroded upstream which will be deposited in the dam reservoir and release the clear water with enhanced erosional power causing scouring below the dam - and greater deposition downstream in the channel leading to an increased danger of flooding.Roads and railways partly routed on dams across the river valley may bring about the same effect.
9.13) A long profile o f a river with a dam, the river deposits debris from the upper reaehes in the artificial lake and causes new erosion and deposition below the dam.
Many rivers have been canalised in order to maintain a more navigable channel close to harbours or towns. Such canalisation is normally created by building artificial levées, dikes or concrete revetments that separate the river from its floodplain.

This work must cause damage. In the canali- sed sections the river can neither erode nor deposit on its natural floodplain and utilises all its energy in wearing away the dilces and revet- ments. This forces the inhabitants to raise the dikes every year in order to compensate for the raised river surface. The water level is raised by the deposition of sediments on the canal bed.
9.14) The elevated river bed between dikes in the Wisla delta in Poland
Many of these regulations have created increa- sed risk of flooding, reduced water resources for irrigation and water supply, made rivers unnavigable, lowered the ground water level, allowing salination, encouraged renewed erosion etc. etc. These adverse consequences may reflect peoples' lack of understanding of the river system. While people tend to plan their needs for, say 10-15 years ahead, the river is likely to talce much longer to adjust to irregu- larities before a new equilibrium can be rea- ched. This might take as much as 100 years judging by experiences from the river Rhine which has been straightened by the cutting-off of meanders since the early 19th Century.
The floodings of the Rhine and Oder valleys in the 1990s show that large scale impacts may occur long after the transformation of the rivers was completed.
Drainage and water supply through canals and pipelines supplied with pumped ground water from wells have been in use since anci- ent times. However they seem to be the most influential alteration to the water cycle on land now and in the future while demand for arable land and water supply try to keep step with the growing urban populations. The first stage in agricultural development has often been to clear forests for creating fields. The roots of the trees are important not only for bringing soil water to the tree itself, but also for their effect of allowing percolating rainwater to dra- in into the subsoil.Clear cutting of trees increases overland flow many times and thus significantly decreases the storage water in the ground.The later drainage of fields immediately con- tributed to further transfer of the water to canals and pipelines as surface runoff. Over a long period of time this has converted even more of the precipitation to overland flow that passes rapidly through the modified motor- way-like rivers to the sea.The urbanisation process has had a similar effect but on a much greater scale: the surfaces of the buildings (roof and walls) and of streets, squares and courtyards (pavements) are made of impermeable materials that are served by a network of drainage and sewage pipes, all as straight and smooth as possible to keep the urban settlement dry.

9.15) Three steps o f modification o f the river course, from a natural environment through a cultivatedfield to a townscape

The final effect of human modification has been to rapidly speed up the passage of water over land by depriving the ground of even more storage water and conducting it through increased surface runoff to the sea. By this process the natural water cycle on land is partly destroyed allowing less water to transpire from vegetation to contribute to the local humidity.
The environment is becoming progressively drier as a result.Applied to the growing population in urban areas this trend must reach a point where the demand for fresh water is in direct conflict with the control of water runoff. Thus water demand will be the crucial resource need for future populations not only in arid regions but also in the Baltic region.
ACTUAL STAGE AND MODIFICATION OF THE RIVER
The condition of the river today, its function or malfunction in the water cycle now.Plans and perspectives for a restoration of a natural river course .
In this chapter we will shortly try to summari- se and produce a typology of rivers according to their recent use. This is not the place to present a complete model of the trends in the use of nature and the landscape by modem society. In brief, however, we may conclude that decisions about the use of natural resources is made by fewer and fewer people both in
primary production (mining, agriculture, fishing) and in secondary production (industry and craft).This is most commonly achieved through computerised and automatic tools, but also by the capacity of bigger and bigger machines. The locations of these processes are thus becoming increasingly separated from peoples' lives in the urban areas. Here people handle the products via the tertiary (service) sector and design the products of tomorrow via the quartemary (research, information, education) sector.This fundamental division of labour is the most significant factor in modem life in the industrialised countries, because it means a separation of most human life from the natural life of the environment itself. When society considers nature it will be as a resource or site (location for urbanisation). Through this process the environment is threatened with consi- derable change.
When people react to the growing urbanisation and computerisation of their work and cultural life and try to recognise or rediscover nature, it will mostly be as visitors or tourists, who can now only use the environment as a recreatio- nalreserve.
This is the reason why the already long experience of changing the rivers into canals, pipelines etc. has brought a growing knowledge and consciousness of how industrialisation and urbanisation change the environment and may cause an irreversible demise of all sorts of natural resources: air, water, bio-types, biodiversity, natural beauty.
And this is why the recent period of transformation of rivers and river landscapes represents a largely inappropriate model for the future continuous and extended use of water reserves and for the restoration of reserves and riverscapes destroyed by former use or regulation.
In tum extreme precipitation may cause floo- ding when the water volume exceeds the capa- city of the artificially engineered river channel to cope as discussed in the previous chapter.
RIVERS AS WASTE WATER AND STORM DRAINAGE CHANNELS
Up to this point of the discussion the use of water resources for industrial and other urban purposes and the return to the river of waste water has not been talcen in account.
These questions will be the subject of biologi- cal analyses in the following section (section III, Science), but their influence on the spatial and dynamic river regime has added important impacts on the dynamic equilibrium of the river.Most influential from a dynamic point of view is the pumping of ground water.This, together with increased irrigation means a remarkable lowering of the ground water reserve in all urban areas.
The relationship between the river's discharge and the ground water storage in the aquifer is partly disturbed. In many industrial and urban regions the water in the rivers mainly consists of the retumed, used waste water and only during periods of heavy rain e.g. storms and depressions (cyclones etc.) does the water level exceed the volume of waste water.
RIVER USE TO DAY
As a consequence of the great and conflicting demands for water and river environments from growing populations we may add a number of new types of river control to those already proposed.
So as well as:1 . drainage pipelines2 . canals3. water reservoirs (for irrigation, water
supply and energy production)4. fishing ponds
- we can add the following "modem" facilities:
5. recreational canals6. nature reserves7. green buffer zones (for nutrient overflow
from fields and communities)8. restoration of the former natural channel
shape and river ponds to slow down the water runoff

Chapter 10HISTORICAL MAPPING OF RIVERSMapping the Historical Runoff of the River - How do we Find Sources? by Per Werge
rhe history of a river reflects the regional history; the region may be defined as the drainage area of a river. The river region in this sense is an area normally different from other functional regions. It is not an administrative or political region or a natural legion representing unique natural characteristics.
The neighbouring river or water course may exhibit the same characteristic life and deve- lopment as the chosen stream, except where nature, technology or political circumstances produce exceptional conditions.This faet defines the form of the historical research of a river:The mapping should reproduce the local development and life as a part of the overall "Great History", i.e. taking into account the economic, social, political and technological aspects that the general historical process generates.On the other hand the "Great History" consists of a complex of many local developments within the surrounding economical and political frameworlc, of many variations of the "small history", of which many are often disregarded or overlooked by the normally very national historiography.As pointed out by various regional history writers the populations and industries in certain regions have been or are more closely dependent on another (foreign) regional population and economy than on their official political and national unit - in terms of economy and culture.Thus the region may have specialised in a specific form of production or trade, which has been common especially in border and coastal regions or along strategic and commercially important transport routes - such as rivers.

This faet gives direction and form to the des- cription of the overall historical mapping of the river.The mapping must be based on local discove- ries and sources to document what exactly happened and provided the living along its course. And these sources should be organised to reflect the main periods of the general history as proposed in the following model of the historical developments of natural and social forms of life, settlement and production in the Baltic region.The model might at the same time be useful as a programme for the research of the river history. Having considered the natural conditions for river development - and still regar- ding them as responses to human activity - the researcher should look for the remains of settlements and of production and trade from the chosen period(s) of the "Great History".For this purpose these periods are viewed as the main steps in the economical-technological process. This perspective should help the researcher to avoid very local interests from taking over the picture of what happened in the region during a certain period.
The change of rivers and river cultures in the Baltic drainage basin th rough the timesA generaiized strucfure o f o research covering a ll postglacial
Ages o f the regions developm ent
The neolithic settlem ents by the rivers
Medievals 17-18.
Iron Age - Century Industrial a ndAbsolutism = agricultural
m ents v------------------ reforming19.Century
T iPaleolithic settiements along the rivers
Culturalprocesses
i ^
J l
The shape of the landscape by the ice
C onditions for organic life an d agriculture
Decline of the craft during the 2 . industrial w ave 1900- 1950
N oturo l processes
M oulding of rivers, lakes, straits and fjords
Conditions for marine life and fishing
Climatechanges
Riverforms
Coastalform ations
Environm ent as product
T he change of th e p opulations into suburban com m uters of th e boom ing 1950-70es
Breaking th e Cold W ar super- struc- turesl980- 2010 by foundation of a new European subregion: T he Baltic B anana?
So, what and where to search?
More specifically: what sources should be searched for documentation on the three basic elements of every social community i.e. the settlement's everyday living activities, its production and the distribution and transport of its products.
Figure 10.1 (above) illustrates how the living in every individual region must be a product of the human utilisation of nature according to the main historical evolution of technology and politics.After this development nature is not just nature any more, but environment.

SETTLEMENTS ALONG THE RIVER THROUGH THE AGES
Former settlements in the riverscape may be indicated by preserved foundations, waste tips, burials, buildings and other material remains. They should be researched by observation and through maps, and furthermore from local inhabitants who can reveal the former use of the river and area. Maps and individuals may be found in the same place as deeds and docu- ments for copyhold and property, namely in local archives and museums, church registers, libraries, public institutions and administrations.For later periods, the present day and the future: The buildings and infrastructure should be studied as a whole, along with maps, plans, paintings, photos, films and literature. The mass media may provide even more documen- tation on the development of occupation and settlement.Interviewing key people and eye witnesses who lived in the area is another useful and active method, which can add important per- spectives to the research. However, the information from different sources should be cross referenced to achieve more objective data.In some cases useful information may have been presented by institutions or private people on the Internet. Basically this Information should be treated as for all other data i.e. regarded as sources to be compared with and evaluated in relation to other sources.The overwhelming problem of Internet information will be to find useful sources and to sort out the serious and valuable sources from all the private, commercial or political uses.
MATERIAL REMAINS FROM THE FORMER PRODUCTION - and use of the river
Signs of human use of the river for production through time are generally from finds of specialised tools and industries, remains of buildings and fields for production and power, man-made modification of the river for sailing and fishing and dams, ditches and canals for irrigation and power.Again visits to and research in archives and libraries etc. for maps and documents are necessary, as well as the further methods mentioned above.
USE OF THE RIVER FOR TRADE AND TRANSPORT
Trade and transport are physically and logical- ly closely related to each other.This means that signs of infrastructure i.e. remains of transport technology (means of transport) and transport structures (harbours, roads, bridges) outside the confines of the individual farm or village indicate trade. Similar are other indications lilce finds or uses of goods and products produced elsewhere. This part of the research must be done on location as well as in archives etc.(See above).

Sources and documentation on the changing landscape
Geography:The nature is near collapse after ruthless exploitation on soil and forest through the 16.- 20. Centuries:A new policy must save the nature and stimulate organisation andrationalisation o f the agriculture industrialisation and urbanisation
M aps and
engravings Photos o f
terrains Foundations
Infrastructure Technology
Painfings
Laws and regulafions, deeds and accounts fo r forests, waterm ills, m anufacturing industry, agriculture and fishing and hunting. M arke t fo r natura l goods Production calendars Diaries and le tters . Literature
History:Is it the
developm ent o f technology,
mainly mining, industrialization
andinfrastructure
that threatens the natural
resources and beauty outside
the industrial and urban
centres
Policy and consciousness:G row ing awareness by the citizens and the politica l elite o f the value o f the landscape and nature beside the econom ical dem and fo r production: A need fo r sustainability
Figure 10.2 (above) shows a model for primary written sources suitable as documentation on how a regional landscape changes through the political and economical process o f buil- ding the society. The model does not mention the most commonly used recent sources o f information: the mass media and information technology networks. No doubt these sources should be taken in account as easily accessible informants, but as second hand or third hand
sources they must i f possible be examined and evaluated by comparison to first hand sources. For rivers as historical objects the most commonly used sources are official documents, maps and material remains o f their use and management.In chapter 11 the model in figure 10.2 is shown in a more extended version, as it has been used in relation to the small Danish river Nivaa.

RECENT USE AND FUTURE OF THE RIVER - its position in the planning of the region
Investigation of a recent stream or river may sometimes cause a shift from pure "scientific" and historical research to a form of prelimina- ry political spadework. The investigator determines the hydrological, biological, chemical and physical-geographical state of the water- course - and begins to react critically to this man-made situation. S/he then continues by setting up political demands directed towards the authorities and land owners, maybe for- ming an active lobby for the restoration of a natural river environment. There is nothing scientifically wrong with such an approach as long as the investigations use scientific methods and the purpose of the work is to keep or restore the watercourse to a natural environment, suitable as a sustainable habitat and water source for subsequent generations of plants, animals and humans.Environmentalists in several countries have already produced purpose built handbooks for river investigators based on this view and on the intention of creating a river-protection movement by changing students and local environmentalists into individual "stream keepers". These stream-keepers work locally by "adopting a stream".Through the publication of their investigations they put pressure on all the relevant govem- ment agencies. In most industrialised countries, and among them the North European Countries, the biological and chemical state of the water courses and resources are by now so heavily threatened from chemicals and
nutrients that authorities on their own, or in co-operation with environmental NGOs (non- Govemmental organisations), have in many places worked on projects for bringing the state of local waters back to a natural balance by creating nature reserves, river parks and reproducing former wetlands and moors with meandering streams and open lakes.The way to get involved in this subject might be to investigate the public and (if possible) private planning of projects, especially public regional planning. In many states this planning implies the legal restrictions and guidelines for the optimal future development of the settlement, infrastructure and environment. If the regional planning has no environmental priori- ties for the water resources, it might be appropriate to produce and publish well docu- mented river investigations to inform the planning authorities.
Suggested reading:
"DEN JYSKE HISTORIKER " no.68 1994, especially the theme on "The region within an historical approach ”, notice especially the contributions by Poul Holm on coastal cul- tures, Perry Anderson on the Modern Region Phenomenon in Western Europe and Carl- Hans Hauptmeyer on regional history in Germany as it is used as an interdisciplinary and inter-regional tool to avoid very narrow "Heimat-studies

SOURCES AND LITERATURE
IN SECTION II:
• David Burtenshaw:"Geography", Longman Revision Guides, Longman Group Ltd, UK 1990.
• "DEN JYSKE HISTORIKER" no.68University of Aarhus 1994, especially •
"The region within an historical approach".
• "Diercke Weltatlas", Westermann,Braunschweig 1988/1996
pp.27,58-59,65,87.
• "Geografisk Orientering" no.6, 1997, especially "rivers",Geografforlaget, Brenderup DK.
• Brita Pilegaard Hansen et al.: "Geografihåndbogen", G.E.C.Gad,Copenhagen DK 1991/1999.
• "Gyldendals nye Atlas",Copenhagen DK 1994 p.21.
• Torben P.Jensen et al.: "Geografi - natur - kultur - mennesker",Geografforlaget, Brenderup DK 1992.
• Kristensen, Peter and Hans Ole Hansen: "European Rivers and Lakes",European Environment Agency, Copenhagen 1994.
"Monitor 1988", National Swedish Environmental Protection Board,Solna, Sweden 1988.
• Robert C. Petersen Jr., Gisli Mår Gislason and Lena B-M.Vought:"Rivers of the Nordic countries" in C.E.Cushing, K.W.Cummins and G.W.Minshall (ed):"River and stream ecosystems", Elsevier, Amsterdam 1995 p.295-341.
"Streamkeepers Field Guide".Adopt-A-Stream Foundation 1991/1996/1999, Everett WA, USA. (ISBN 0-9652109-0-1).
• Wienberg Rasmussen et al.: "Geologi", Jul.Gjellerup, Copenhagen DK 1968/1974
• Brian Knapp: "Systematic geography", Unwin Hyman Ltd, London UK 1986/1989.

Chapter 11EDUCATIONAL EXPERIENCES - CASES ON BALTIC RIVERSThe River Nivaa, Den mark by Per Werge
rhe research model shown is based on an interdisciplinary case study involving geography, history and language (Danish and English integrated together).
A model for a regional historical study of a river is demonstrated through a number of research approaches for the river Nivå. The small river system of the Nivaa, covering a catchment area of about 120 km2 25-35 km north of Copenhagen in Denmarlc, has been used as a study focus by various groups of students from Rungsted Gymnasium, BSP local upper secondaiy school, both as a biotop and as a natural and cultural river region.The intention was, through investigations, tests and documentation over a number of years, to let the students reconstruct and show the long development and change of this river and its catchment area by nature and by humans as a consequence of their building of society.Each group was given, depending on their subject interest, the opportunity of choos- ing a limited period and thus focus on a specific problem, a historical event, thelife of the population or other topics as , , n . r r7/f0 r ■ r^ ^ 1 11.1) A map from 1768 snowing the position ofshown on page 87. u . , , / ,7r HirschoLm Lastle

TITLES OF THE PROJECT:
• The history of a Danish river region.• Rural 18th Century Hørsholm in trans
formation into a playground for princes.
Pages 94-95 present periods of well known and documented development of the Nivaa drainage area and its three central urban areas: the town of Hørsholm founded in 1744, the old industrial site of Usserød with a series of watermills, and the fishing hamlet of Rungsted on the coast of the Øresund. Pages 94-95 demonstrate how different approaches to a certain period (18th Century) in this area can provide a number of topics and ways into a dramatic period of change in this river region. The 18th century was a period of experimen- tal commercial and agrarian reforms in order to produce a higher revenue for the land owner of the area, the King (the Queen) of Denmark. As a monument to this effort the Royal Castle of the district, Hirscholm Castle in Hørsholm, was rebuilt and extended several times in order to give Denmark "a Nordic Versailles".
Also by order of the Queen even a market town was founded adj acent to the castle - with little success. On the contrary the life of the Queen's successor, the illegitimate child of the Queen and her lover, the Kings private doctor, the politically progressive Struensee, produced probably the greatest scandal of all contempor- ary scandals (!) at the Danish Court.Soon afterwards Struensee was executed by beheading and the Queen exiled. After this event the castle of Hirscholm stood empty and was later cleared and the property sold into private ownership.
The following pages 95-97 provide ideas on how to search for documentation on two of the processes of change which characterised the region during the chosen period: the agrarian reform and the change of the environment (landscape and townscape).Yet the chosen period is very well illuminated through documents in local and State archives, and through material remains and structures in the surrounding land and riverscape.It is obvious that in this case we can easily see the "regional history" in the context of the "Great History" - During the 18th. C. Hørsholm headed an experimentarium for socio-economic and physical planning of the Danish Absolute State.But any other period will act in a similar way with more or less easy access to knowledge on the physical and social life and change of the region.
11.2) Copperplate o f Hirscholm Castle by year 1746 - in its full extension as "A Nordic Versailles"

n .3) |\|jvq drainage basin through the agesCommunifyfoundationsIron Age Shifting culti vation
"Torp" and "rød"setllements
-500
-M-500
Villages, the first towns
1000
-H- i i i i i l1100
—I—1200
Concentration of land, The Crown gets Hørningshoim
1300
Hørsholm used as "pantry"- entailed
estate under Copenhagen
Castle or Kronborg
1400
Noture Beech forest, dense wood
types
Cultivated land grows
Forest area increases according to the agricultural
1 8.Century Hørsholm
Life at Court: Customs and standards, ideas and
aesthetics, view of the nature y
Citizen life/N
/T h e Forest Law 1805, consider- ations for the environment and natural resources
/T he '*Castle
'Hirschholm CastleX [ pulledrebuild (3.castle) \ down1733-36, pulled ' \1 8 1 0 ,down and the4.castle plus
Sophienberg build1737-44. Founda-tion of Hørsholm /
V Town and Kings / °\ roads /
Clearing of forest, foun- dation of pares, roads, canals and ponds regu- late the landscape
j Single farms /replaced in the
' landscape, area exchange and
clearings. Drainage of bogs y
for farmland
The Struensee-scandaleA the political environment I
The economy of State and estate: Agrarian reforms in Hørsholm 1759-61 • for all the country 1766-1788
Life of the peasants, work, nature-use and conceptions in the 1700-years

Communityfoundations
Building of 1.castle "The white house" during 16.C, farmed out, overtaken by the Queen 1658
The Crown takes the property of the Church, founda- tion of water miils
1500 1600
The red House (2.castle) is built 1664
1700
Hirschholm Castle rebuild (3.castle) 1733-36 , pulled down and the 4.castle plus Sophienberg are build 1737-44 Hørsholm Town and Kings roads 1800
The Manufacturcastle ing industry,demol- mills, harbour,ished railway,1810 urbanisation
1900
Suburbs, shopping centers, country houses, sporte stadions, coastal- and bathing resorts, sewage and waste treating systems, motorways 2000
Game preserves and fishing ponds, river- regulations
Nature types
Forest protection for game parks
Forest clearing, foundations of pares, roads, canals and ponds regu- lates the terrain
Single farms moved to the countryside Drainage of
moors for culti- vation
Farmed forest and land.
Urban landscape
Cultivated wood, open farmland, reforested areas, Garden city and pares, research pares, dense towns, beaches for bathing
11.5)
Geography:U p-dating o f the culture landscape in the 1700-years: N ew organisation and ra tiona lisation o f the agricu ltu ra l production, com parisons o f the two production systems in an environm ental perspective
The subjects entrances to (e.g.) the agrarian reforms
O.1800
The economy of State and estate: Agrarian reforms in Hørsholm 1759-61 - for all the country 1766-1788
History:M erkantilis tic po licy as background fo r a huge econom ica l and socia l reform :The peasants transformation from serfs to freeholders and o f the m anor from feudalism to capita lism
Danish-English:Life and consciousness o f the peasantry in the transition from appendix to the land into an econom ical, lega l and po litica l ind ipendent ind iv idua l
Life of the peasants, work, nature-use and conceptions in the 1700-years

11.6)
The subjects entrances to (e.g.) the bourgeoisie and urban life
Geography:Town-planning in the 1700-years: Theory and aestethics o f the town, its structure and function in a new age, the system o f traffic networks
f Establishment of the citizens as a social class and a public audience: The Danish Theatre, romanticism in painting
^Citizen life, ^ norms for provinces and capital, nature view
History:Merkantilistic and
colony policy as background for the
economic growth and blooming
commerce: Business and
buildings o f the citizens in the
transition from feudalism to
capitalism
Danish-English:Life and consciousness o f the Citizen in the transition from dependence o f the Prince into an economical, legal and political indipendent individual, the new opinion leader
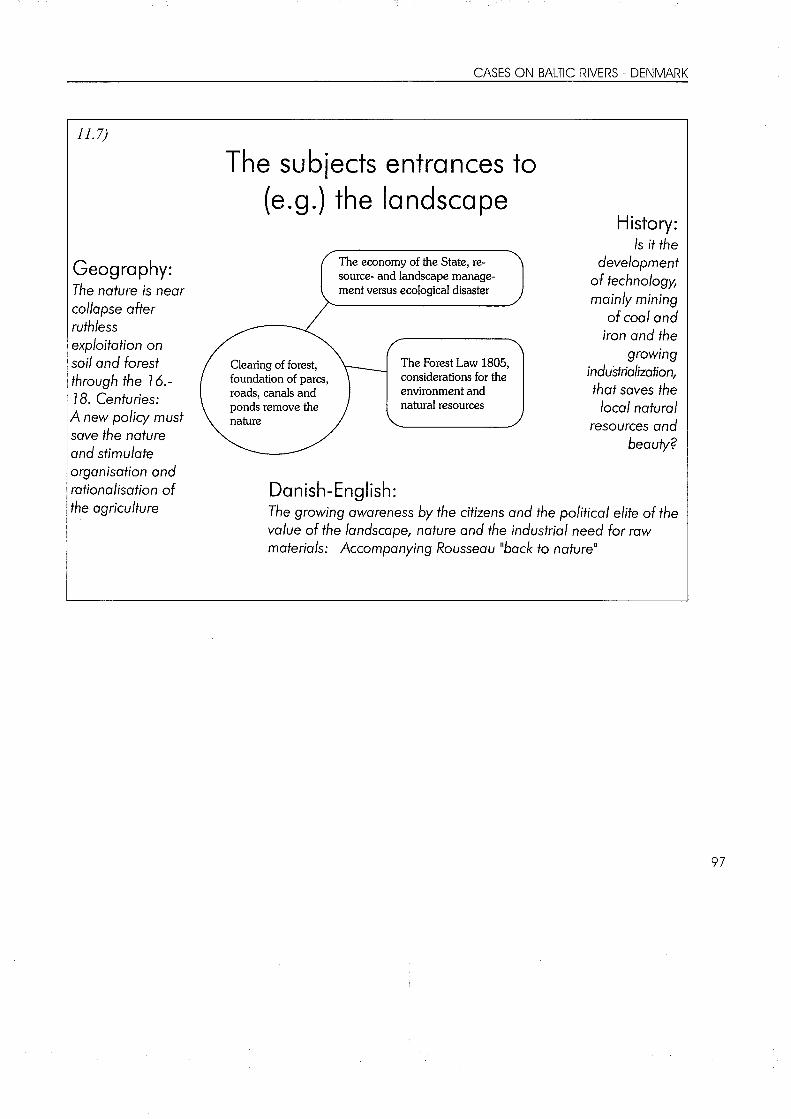
11.7)
Geography:The nature is near collapse after ruthless exploitation on soil and forest through the 16.- 18. Centuries:
A new policy must save the nature and stimulate organisation and rationalisation o f the agriculture
The subjects entrances to (e.g.) the landscape
The economy of the State, re- source- and landscape management versus ecological disaster
The Forest Law 1805, considerations for the environment and natural resources
History:Is it the
development o f technology, mainly mining
o fco a l and iron and the
growing industrialization, that saves the
local natural resources and
beauty?
Dcmish-English:The growing awareness by the citizens and the political elite o f the value o f the landscape, nature and the industrial need for raw materials: Accompanying Rousseau "back to nature"

THE RIVER KYMI, FINLAND by Risto Hamari
The river Kymi runs to the Baltic in the south- eastem part of Finland. The drainage basin of the river is one of biggest in Finland, altoget- her 37.210 square kilometres. There are rivers, lakes, straits and ponds within the drainage basin until the waters come to lake Påijånne, also one of the biggest in Finland. From Påijånne water flows through two huge end moraines, the Salpausselkå, and south of Salpausselkå the river is finally called the river Kymi. During the history of the river there has been different episodes and growing influence of man. Shortly mentioned the phases are the prehistorical, the preindustrial and the modem industrial eras.
HOW TO BRING THE RIVER KYMI INTO EDUCATION?
There are several interesting ways to use a river as an example in environmental education. The river Kymi is no exception to that. All levels of environmental approach support the leaming:
Rivers at the Local level* Easy to reach* Brings leaming from classroom to nature* Connects practice to theory* Helps to act locally (and think globally)* Promotes interdisciplinary leaming
Rivers at the regional level* Common and familiar interest for leamers
in the region* Gives new aspects* Widens the perspective* Motivates for co-operation
Rivers at the global level* A possibility to share results* Brings the problems in global perspective* Promotes new skills in co-operation* Leads to the use of modem media* Gives you new friends
THE PHASES OF THE RIVER KYMI IN FINLAND: PREHISTORY
The area around the place that is nowadays known as the valley of the river Kymi was inhabited - as strange as it may sound - before the river was even bom! Of course there is a natural explanation for this. When the Glacier time ended large areas were covered with meltwater. During those days the city of Kotka of today was far out in the sea.
11.8) Rock carving (see also page 38, section I ) showing traces o f early inhabitants by the river Kymi

The highest hills were small islands and the seashore was more than thirty kilometres north of what it is to-day. Fish and good game brought the first people here. They were stone age representatives of Komsa and Suomusjårvi cultures living by hunting and fishing. They left some marks of their presence. Floors of huts, megalite burial places or village areas can be found as a witness of the original inha- bitants.There was and still is a marked land uplift in Finland after the glaciers melted. In the centre of glaciation the land lifted more rapidly than in the periphery. At first the rivers starting from central Finland ran to the north-west. There was no river Kymi at all. Slowly the direction grew shallower and finally the waters broke their way to the south-east. The river Kymi emerged some 6000 years ago by break- ing the Salpausselkå ridge and flowed to the Gulf of Finland. Although the geographical change meant a natural catastrophe, it soon tumed out to be a blessing for the stone age man in the area. Salmon, white fish and other fishes found their way to the big river and the possibilities to survive increased significantly for the local people.During the stone age and the following bronze age people lived as part of the surrounding nature. Little by little the possibilities to use natural resources improved and man's usage of resources increased. Hunting and fishing was supplemented by farming. Man's influence and negative impact on nature was very little, fort- unately, because the era was the longest in the history of the river Kymi.
PREINDUSTRIAL TIME
In the middle ages more interest was paid to the river itself. People living along the riverside tumed from fishermen to active users of the river itself. The new innovation came from Sweden. It was the water mill. Using the ener-gy of water in the river the first small mills started to mill flour for farmers. At first the mills were established along the small byrivers. Speed of the current was too heavy in the main stream and flooding destroyed the machinery easily. Near Langinkoski there were several flourmills already in 1550 and later on more of them were built along the Kymi river. There were other activities, too: The clay banks of the river served another purpose: Making tiles for better houses. The production of the tiles was so active that the surplus was transported to Stockholm or to Tallinn. In order to manage with the transportation there was also a big shipyard already in use in 1560 in Helilå, on the estuary of the river Kymi.The shipyard used timber and gave income to the local landowners and worlc for the phea- sants. The forests near the river were valuable also in another aspect. Timber from pine trees was used in purpose to produce tar. During that time tar was the most valuable article and highly valued in the marlcet. It was used to make any kind of wooden material resistant, but especially it was used to protect boats and vessels. Tar was also used as a medicine. It was only natural that there were several places along the river where they produced tar. Other trees were used to produce coal for warming the houses but even more as an energy source in smithies. Because they produced a lot of

charcoal in the area, some iron works were founded, one of them still exists as a museum in Ruotsinpyhtåå, near Kotka.As soon as technology advanced enough the first saw mills appeared on the banks of the river. The start was hard for them. Flooding and ice in winter time often damaged the mills. The saw blades made by village smiths were rough. You hardly got three boards from one big log. Most of the wood was lost in the process. The first real environmental threat was the total loss of forests because there were several different interest to use them. It meant that the foundation of the sawmills was strictly regulated. They were almost denied when the new innovation - thin saw blade - was inven- ted. When they changed the regulations to be more liberal there was a sudden rise in activity in the county of Kymi. Hamina was during that time the most important export harbour. In 1738 export of timber from Hamina was big- ger than from any other harbour by the Baltic Sea. The age of sawmills in river Kymi is dis- cussed in details on pages 108-112.
WHEN ENVIRONMENT BECAMEÅ PROBLEM!
The activities prepared the river region of Kymi for the industrial revolution. Steam sawmills accelerated the production of board which was a popular article all over the Europe as a building material.The large drainage basin of the Kymi river made log floating possible even for hundreds of kilometres to the estuary.There the logs were loaded unto ships for
11.9) Industrial waste water with cellulose fibres leads to aesthetic and environmental problems. Photo: Risto Hameri 1978
export. It gave enormous possibilities for the region. The industrial revolution in Finland started in the county of Kymi and especially in Kotka, first with the sawmills and board production but very soon also with pulp and paper production. It led to extremely rapid economi- cal growth but with it the environmental problems appeared also. At first nobody paid any notice or people were too eager to fight for better economical standards of living.All through the 18th century hectic building of pulp and paper plants took place. Soon the region was the top area of forest industry in Finland. During 1900 the paper mills grew

bigger and bigger. A lot of world records in the production was achieved but slowly the negative results in nature were obvious.
The handling of wood in chemical processes produced a lot of waste water with the same chemicals as used in the processes or new ones bom in the chemical reactions during the process. At first all of these went to the river untreated because it was generally believed that the river diluted the components, and took them to the sea, where they finally were sup- posed to "vanish". Acids used in the process, compounds with heavy metals, and chlorine compounds were washed into the river. And not only chemicals. Tiny cellulose fibres were not captured during the paper production.Huge amount of small fibres went through the process and went to the river with the waste water. They floated in the water and spread diffusely all over the river bottom in slowly flowing reaches. Now there are areas where even in the 1970s and 1980s one could find more than 5 meters thick sediments of fibres mixed with clay (fig 35). The fibre rich sediments hindered the growth of isoetid plants and all the other small bottom plants which almost disappeared from Kymijoki. Some plants survived in or near the rapids if they could adapt to the swift stream. Soft, organic bottoms used a lot of dissolved oxygen when the bacteria were active and abundant.During some decades in 1950-1970, the worst time in the history of the river, the bottoms were anaerobic without any life of macro- organisms. Sometimes there where accidents during the process of pulp production. It might happen that a lot of acid or basic waste got
11.10) Cellulose fibres pile up on the river banks o f the river Kymi. Photo: R. Hameri 1988
into the river killing fishes and other animals. The situation seemed to be unhealthy even for man. Finally in 1962 Finland got a strict law for water protection. Soon after that the first water purification plants were built and nowa- days every municipality and papermill are obliged to have a functioning water purification station. It means that the situation is much better now than three decades earlier. But the situation is not good. Soft bottoms with fibre are still abundant. It makes the litoral biotopes very hostile for macro-flora. Small plants can- not colonise the bottom and the big ones, if they manage to do so, are in danger of being washed away with the stream.
In the sediments there are still a lot of hazard- ous chemicals. Newly puplished doctoral theses by Kari-Matti Yuori, an eco-toxicolo- gist, showed that the bottom fauna of several rapids in the river Kymi was malformed and there were also negative behavioural changes in the animals. This is one good example of bio-indication.New but discouraging information conceming bottom analyses of the river show that after a fire in one of the chemical plants along the river a lot of dioxines and furanes were wash- ed into the river decades ago. Although they are now in the sediment buried into it, there is a possibility that they could be mobilised by the bottom animals and get to the fish and finally to fish eaters. All this means that even though we are now in much better situation, we still have a huge demand ahead us to make the river Kymi better for the next generation.
KYMI RIVER AS A MEANS OF TRANSPORTING LOGS by Jarkko Suvikas
Still in the 18th century at the time of sawmil- ls people used to take the wood they needed from forests nearby and log driving was needed only rarely. A great amount of logs was talcen by sleighs to sawmills which started to operate again in the spring-time once the ice- bloclcs were gone. At the age of steam-mills since the 1860's the need of wood multiplied tremendously. For example the surroundings of the Kymi River soon became empty of big logs which were used as raw material at the mills. On the other hand the slow-growing
forests in Salpausselkå area in southem Finland could not pro vide adequate material for Finnish lumber industry. The untouched forests of northem and eastem Finland started to look appealing. At the end of the 19th century the zero limit of forests was already in northem and eastem Karelia. The low price level of wood, inexpensive labour costs and free means of transportation i.e. rivers made it possible to transport wood throughout Finland. Before wood was transported from northem Karelia to Kotka it had to be inspected by representatives of lumber companies. First forests were bought at bargain prices but at the beginning of the 20th century peasants started to know what their forests were worth. After having marked the bought area of forest the representatives of lumber companies marked the trees which were to be cut down. Only strong and tall trees were accepted. It was easy to find big and strong trees because the area had not been touched earlier and it had never seen a saw nor an axe before. When one marked the trees, one used to leave a blaze of the lumber company at the height of the human chest and a blaze on the base which signified the places where the trees were to be cut down no matter how much snow there was. The lumber companies did not want to waste any pre- cious material.A representative of the lumber company started well in advance to organise how the log dri- ving and living on the logging camp should go. There was plenty of workforce to choose from because extra population living in the countryside needed money quite badly.The trees were cut down either with a partner using a cross-cut saw or alone using frame
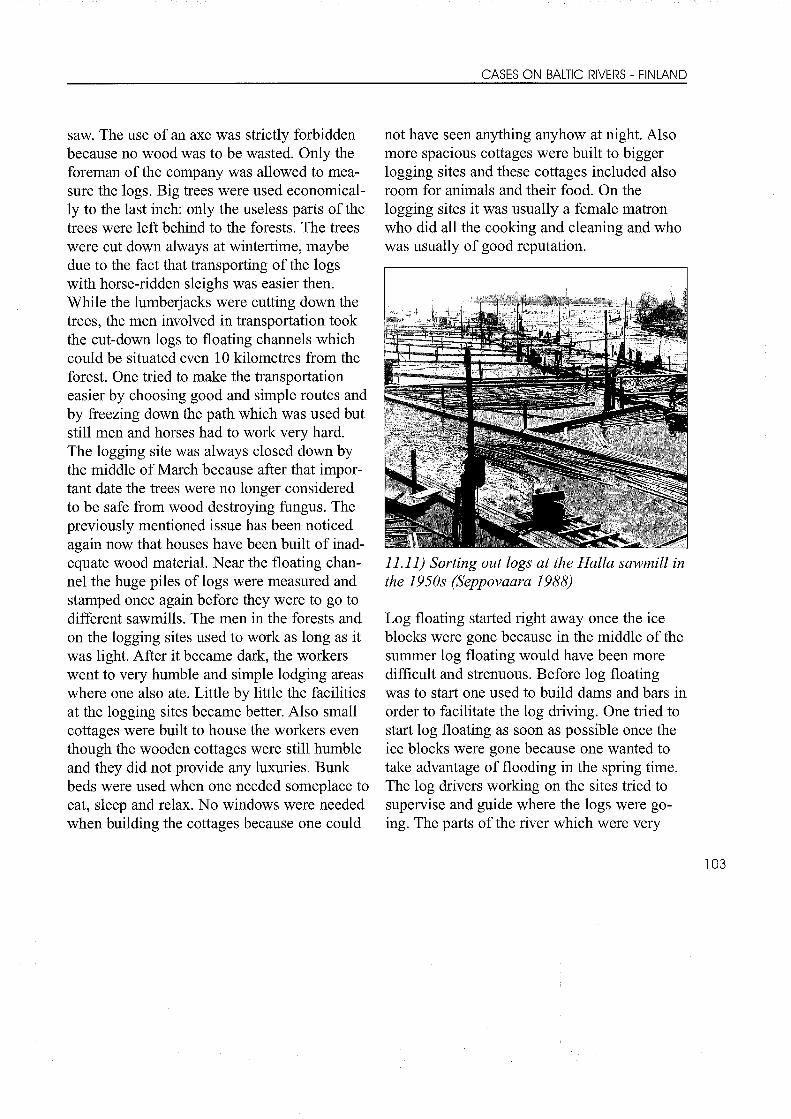
saw. The use of an axe was strietly forbidden because no wood was to be wasted. Only the foreman of the company was allowed to mea- sure the logs. Big trees were used economical- ly to the last inch: only the useless parts of the trees were left behind to the forests. The trees were cut down always at wintertime, maybe due to the faet that transporting of the logs with horse-ridden sleighs was easier then. While the lumberjacks were cutting down the trees, the men involved in transportation took the cut-down logs to floating channels which could be situated even 10 kilometres from the forest. One tried to make the transportation easier by choosing good and simple routes and by freezing down the path which was used but still men and horses had to work very hard.The logging site was always closed down by the middle of March because after that impor- tant date the trees were no longer considered to be safe from wood destroying fungus. The previously mentioned issue has been noticed again now that houses have been built of inad- equate wood material. Near the floating channel the huge piles of logs were measured and stamped once again before they were to go to different sawmills. The men in the forests and on the logging sites used to work as long as it was light. After it became dark, the workers went to very humble and simple lodging areas where one also ate. Little by little the facilities at the logging sites became better. Also small cottages were built to house the workers even though the wooden cottages were still humble and they did not provide any luxuries. Bunk beds were used when one needed someplace to eat, sleep and relax. No windows were needed when building the cottages because one could
not have seen anything anyhow at night. Also more spacious cottages were built to bigger logging sites and these cottages included also room for animals and their food. On the logging sites it was usually a female matron who did all the cooking and cleaning and who was usually of good reputation.
11.11) Sorting out logs at the Halla sawmill in the 1950s (Seppovaara 1988)
Log floating started right away once the ice blocks were gone because in the middle of the summer log floating would have been more difficult and strenuous. Before log floating was to start one used to build dams and bars in order to facilitate the log driving. One tried to start log floating as soon as possible once the ice blocks were gone because one wanted to talce advantage of flooding in the spring time. The log drivers working on the sites tried to supervise and guide where the logs were go- ing. The parts of the river which were very

demanding for log floating had been modified by human labour and the extremely difficult sections of river, which were only one meter wide, were supervised by an extremely slcilful log driver. At the tum of the century before telephone became more common, communica- tion presented various problems at the log flo- ating sites. In addition to resorting to shouting as hard as one could, various flag signals and of course messenger boys were also used while informing of the present situation and the developments on the log floating site. After the difficult brook sections the work became easier as the brook tumed into a river. As the floating channels became better, the work was also less strenuous. The most difficult rapids and sections of the river had also been modified in order to facilitate the log driving. As the log drivers' group advanced, the part of the group that was furthest behind also made sure that no wood was left behind and the rivers and creelcs remained untouched. The log drivers' work was very hard because the level of water diminished all the time. Once one arriv- ed to lalces, for example Lake Pie-linen or Lake Saimaa, the separate logs were unified to form a big circle-formed raft. At the beginning of the log floating era the sections of water where water did not flow very well a special method of advancing was used. While using this special method one had to pay special attention to wind and be very careful: losing control of the raft and its direction was a con- stant threat. Depending on the length of the joumey the log drivers had to stay even several days on the raft with their horses. At the end of the 19th century the steam tug boats and other vessels of the lumber companies, which
became more and more common, facilitated of course this time-consuming and strenuous job enormously.Once one arrived to river stretches the joumey of the logs advanced either as bundles of logs or separate logs. At some point one arrived fmally to sorting locations which were situated in different locations for example in Ristisaari in northem Karelia. Based on the company blazes the logs were separated to different piles. It was only then that the company blazes of the logs counted. The next stage was to organise the logs to bundles of 80-100 logs. Once one wanted to continue one's joumey, the logs were once again unified into a raft in such a mann er that there were about 200 or 300 bundles to each and every tug boat or other equivalent vessel.
11.12) Floating Channel at Kyminsuu.
From then onwards the joumey continued sou- thwards. Once in a while one came across with very narrow patches of water where one had to separate the log raft into smaller pieces. One tended to use a special path from Vuolcsi to Påijånne. That patch of water consisted of

rapids, peaceful parts of river and sections of lakes. Once one came nearer the Kymi rivers and Kotka, the sections of water were all downhill.Kotka and the delta of the Kymi river had become the most prominent centre of sawmills at the end of the 19th century. The attempts to liberalise economy had made all this possible: steam sawmills were permitted in 1857, the limitations of sawing quotas came to an end in 1861 and the freedom of trade was accepted in 1879. All of these reforms had come into existence in most parts of Europe almost 100 years earlier. The steam sawmills were no longer dependent upon rapids and thus they could be placed near harbours where ships were loaded and unloaded. The fear that raw material, i.e. wood, would come to an end diminish- ed and disappeared as one started to cut down new areas of forest. The freedom of trade law liberated the market forces and since the city of Kotka had the best opportunities to form a prosperous harbour location in the Baltic area, there was nothing to stop Kotka from becom- ing the biggest industrial centre in Kymi river area.By 1875 nine saw mills altogether had started their operation in Kotka area.If Kotka was the biggest sawmill centre in Finland, then also the Kymi river was the most important floating charm el in Finland. The very first logs came via Korkeakoski rapids to Kotka in autumn 1870. Some of the most demanding rapids, i.e. Anjalankoski and Ahvenkoski, were modified and facilitated using human labour. The logs that had left from more northem parts of the country came to the upper course of the Kymi river to
Mattila generally in September. The log floating society operated in Mattila accepted the logs and checked the company blazes on the logs before transporting the logs to Kotka.The logs that were checked and accepted in September were sawed the very same year, whereas the logs that came in October were left to wait for the upcoming log floating in spring. The joumey of the logs down the Kymi river went relatively smoothly because the flow in the river was adequate. On their way the logs passed several industrial locations via special log floating canals. In faet, part of the wood material was separated and taken to factories and sawmills located besides the river but still the most important place of sorting out the logs was situated at the mouth of the river.Especially at the beginning log floating caused a great number of complaints due to environmental damages. First placing bars in order to facilitate the log driving was used only rarely. In faet there were many stretches of water where there were not any bars whatsoever. At the particular stretches of water the logs tend- ed to go towards shores and the fishing grounds.Documented complaints conceming the impeding of fishing due to log floating have been found even from the 17th century. Documents also show that fishing became qui- te a bit more demanding in the Korkeakoski rapids due to log floating in the 1770's. The trash and sawdust originating from the sawmills presented also an environmental problem that was seen to hinder the spawning salmon rising upwards in the narrow streams. In faet, even log floating and the industry of the areas

of the Kymi river collided and conflicted with eaeh other. The industry of Kuusanlcoski was the first party to claim compensation due to damages and troubles caused by log floating. When logs were stuck and blocking the river, they caused floods and on the other hand they also caused the fall of water level.Also trash originating from log floating was a nuisance to the environment and also factories built near shore were vulnerable to log floating.At the time of log floating the factories near the shore had to organise 24-hour duty in order to see that there were not any problems and they even had to prepare themselves to use dynamite in order to clear the blockades. In clear cases compensations were paid by the log floating companies first approximately but later even boards and commissions were estab- lished to investigate the damages caused by log floating.Sorting out logs at the mouth of Kymi river was an impressive site which gathered labour force all around southem Finland for the hec- tic months of summer and autumn. There are two different rumours of the reputation of the worlcforce but mainly the workers were honest and hardworking people. However among the workers were also some occasional people who strengthened the image of log-floaters as rootless and untamed people. For those out of town lodging and dining barracks had been built to the sites. The workers worked very hard even at night helped by great outdoor lamps and the blazes that had been stamped in the northem forests were extremely important when sorting out the logs.The logs of different companies went to diffe
rent areas and for the very last time tugboats came to take the log rafts to different sawmills where the logs were later piled up. Most logs were sawed generally a year after they had been cut down.
Sources:
Lahonkoski (ed.): "Tukkimetsiå ja hoyrylaivoja". Imatra 1987.Pååskynen: "Kymin uittoyhdistys 1873-1973". Heinola 1974.Seppovaara: "Kymijold". Kouvola 1988.

HOW TO STUDY THE HISTORY OF LOG FLOATING
INTERVIEWSLog floating on an extensive scale did not come to an end in Finland until the 1960's and 1970's so it is relatively easy to find people to interview, the following items and details can for example be asked:- working methods- housing conditions- salary and wage level- nourishment- working conditions
PHOTOGRAPHY - HOW THE RIVER SCENE HAS CHANGED Photos taken of log floating have been collect- ed in great amounts by different provincial and city archives. An interesting way to take ad- vantage of these photos is to locate the place or the part of the river that the photo represents and then to shoot it again by camera. When one compares the old and the new photo, one may be able to see how the effects of log floating have disappeared.
RESORTING TO RESEARCH MATERIAL AND LITERATUREThere is plenty of literature conceming log floating available. Familiarising oneself with literature one can find out the following things:- special vocabulary and jargon linked to log
floating and logging sites- different occupational groups involved in
log floating- the regional and social background of the
log floaters- how the rapids were modified- tugboats and other vessels of the era- the environmental effects of log floating
and quarrels caused by log floating
CREATING A BOARDGAME You can create a board-game where the purpose is to get the logs from say northem Karelia to Kotka using log floating as a means of transportation. The principle is the same as in many board-games: one throws the dice and one tries to advance on the board. If the raft breaks down or you lose your money in a card-game, you lose your tum.
Use your imagination!

11.13) The Finnish sawmill industry in 1907: Water and steam mills (from Ahvenainen 1984)
RIVERS AND SAWMILLSby Jarkko Suvikas
Rivers made the early period of Finnish wood- working industry, namely the period of sawmills, possible. The very first sawmills came to existence along Finnish rivers in the 16th century. The Finnish rivers from north to south provided excellent opportunities for exploiting water power. The first Swedish sawmill was founded by Vadstena monastery in 1447. Naantali monastery in Finland, which was under Vadstena monastery's rule, was the first place where a sawmill was to be establis- hed in Finland. Gustav Wasa, Swedish king (1523-1560), who "saw many lovely currents in Finland", is well-known for his economic aspirations. Under his and his sons' govem-
ment's rule royal sawmills were founded so many and so close to each other that one did not need to travel many days to see a sawmill in southem Finland.The Kymenkartano sawmill situated in Korkeakoski was a model example of the royal sawmills of its era. The sawmill situated in Korkeakoski with its dams and buildings was constructed as peasants' labour work services in 1563-1565. The site was supervised by Gustav Wasa's main building engineer Paavali Koberg who was a man behind many deman- ding construction developments. The machine- ry of Korkeakoski sawmill was one of the very first to have been built in Finland and the iron parts were hammered by a Finnish blaclcsmith living in Pyhtåå. However, the production figures of the sawmill were modest. Out of the logs brought in by the peasants in a way to pay their taxes only 1440 boards or 120 dozens were made during its first year of operation. Despite of modest figures the sawmill in Korkeakoski was considered to be one of the most important sawmills in Finland at the time.The material, i.e. wood, of all the royal sawmills was collected in the form of regular and additional taxes made payable in logs. When acquiring the logs one tried to follow a schedule of taking tums so that different villages should provide wood in different years so that the forests in some particular village would not be all cut down.The logs had to be big and strong because the ready sawed goods were also big and strong. Generally two different products were manufa- ctured at the sawmills: planks and boards. The width of both products was approximately 12

inches and the diameter of the boards was 1.5 inches and of the planks 3 inches. This meant in practice that a log that was about 4 meters tall could provide either two planks or four boards. In order to use the logs in an economic manner the men sawing the logs had to be ex- tremely competent and skilful and the logs had to be the right size. The capacity of the sawmills was dependent on the water and ice situation. There were great yearly variations in production figures and only rarely was the capacity of the sawmill in full use.Sawmills were small miracles at the time and people came to admire them even quite far away. Before one could establish a sawmill, one had to find a good location. If the location was excellent, it solved both the energy and transportation problems. In practise this meant that sawmills were mostly founded in inhabit- ed areas. In order to build a sawmill one usual- ly needed to build dam constructions, too. However, building dams caused problems with flooding which in return caused major dis- agreements and arguments.From the dam water was directed to the driv- ing wheel either by a channel or by using the flow of water as source of energy. In the first alternative the power of energy was regulated using a hatch in the beginning of the channel as a facilitating instrument. A waterwheel, which was about one meter wide, solved the energy problem and the waterwheel was made of both wood and iron. By using crank axle and axis of rotation the water power was directed to the blade which was generally made out of iron. Since the 17th century the serration of the saws were improved by adding steel to their manufacture. In any case the
blades were very big and clumsy and some of them weighed even 50 kg. It is therefore quite understandable that the sawing yield with this kind of equipment was not smooth and meti- culous. In faet, Finnish wood and wooden products had a bad reputation on foreign marlcets for a long time. Long and strenuous exporta- tion from the sawmills to export harbours also made things worse whereas quality of the products was concemed.In the beginning of the sawing the logs were placed on special sawing levels. After this the log was placed to a sawing piston where the log was forced towards the blade of the saw. The blade went through the log as jerlcs and after the log had gone through the blade, the piston was pulled backwards and the log was placed to it again. Wedges were also placed in order to facilitate the sawing procedures.Axes and hammers were also resorted to at this phase of sawing. All in all, the logs were big and strong and sawing took a lot of time. At the beginning of the 16th century Finnish wood was exported to Baltic countries and regions especially as wooden dishes.The major export countries and cities were Baltic countries, Sweden and the Hanseatic towns situated on the Southern coast of the Baltic. At that time barrels and scoops were used both in transportation and storage and wooden products became all the time more and more important articles of export in the 16th century. At the end of the 16th century Turku, Rauma and Pori were the most important export harbours of wood and wooden products, and the biggest shipper was the harbour of Pori which exported on average 2800 boards between 1594-1597. According to log-

books the most important export destinations were Stralsund, Liibeclt and Danzig.Some of the sawmills founded by the Crown in the 16th century continued their business even in the 17th century but little by little private citizens and companies started to run the sawmills. According to the political policies started by Gustav II Adolf the economic aspirations started by the state were given to nobles and mansions. Whereas fmancial politics was concemed, one started to move towards the age of Mercantilism which continued in Finland until the mid 19th century. Mercantilism meant prescribing and patronis- ing in the economic policy. People were worri- ed whether forests would run out, which partly hindered the development of sawmill industry. Forests were, however, used for many different purposes. They provided material for con- structing and heating houses and they were also used for hunting. When one wanted to gather berries and mushrooms, one headed towards forests, and bum-beat has had its long traditions and importance for long especially in eastem Finland. In addition, forests were also used as hiding places. Even in the 16th century one started to regulate and prescribe the use of forests in Germany and similar thoughts and ideas spread quickly to Sweden- Finland.On the other hand the needs of mining and metal industry were placed ahead of those of sawmill industry: mining and metal industry needed plenty of wood and logs for their needs.It has been estimated that there were about 200 sawmills in Finland at the end of the 17th century and the yearly production capacity of
these sawmills was approximately 14,000 dozens. The sawmills under the mansions' rule in southem Finland mainly manufactured wood for their own needs and the sawmill was in operation as long as the constmction site needed wood. However the situation was com- pletely different in Ostrobothnia where logs were sawed for storage because their demand was so great. A new era started in the export of wood at the end of the 18th century and Finnish wood products were exported also out- side Scandinavia. However the main export article of Finland was still tar which was exported using Dutch vessels.The first major era of water-driven sawmills was in Finland since the mid 18th century to the end of the 18th century. The sawmill industry bloomed ironically due to a war in 1700- 1721. During the war a lot of immigrants, who moved to Southeastem Finland, Hamina and Viipuri, brought a great variety of technical inventions and solutions with them. The new bourgeoisie immigrated from Ingermanland and the Baltic countries started to establish so- called thinbladed sawmills. If the sawmill had been built to a location where the current was strong, it was possible to use the sawmill throughout the year. However in the worst possible case it was possible to operate the sawmill only for a couple of months due to lack of water and the freezing of water. In 1745 it was estimated that the sawmill in Pitkåkoski rapids in Miehikkålå was in operation from 12 to 16 weeks and 7500-8000 logs were needed. The sawing quantity was depen- dent on seasons and individual days. In the springtime it was possible to saw more than in other seasons due to abundance of water and

light and then it was customary to work 24 hours a day. However, artificial lighting was not approved because it might have led to a fire.When the sawmills started to manufacture material for commerce and export rather than for their own needs, it all made the sawing more professional. The thin-bladed saws need- ed skilful and competent workers and it was also necessary to make sure that the sawmills were profit-making companies. The workers started to specialise in different tasks. When in the 16th and 17th centuries there were only a couple of occupational groups working in the sawmills, in the 18th century almost double or treble occupational groups were needed. However, the sawmills did not provide work all year round but those working in the sawmills made extra money farming or raising cattle. Some of the workers got extra money from log-floating or acquiring the logs.
11.14) The mechanism o f a one-circle sawmill (from Ahvenainen 1984)
The rise of the sawmill industry in the 18th century would not have been possible without an increase in demand. An escalation in world
trade and an aspiration to build more war and commercial vessels reflected also Finland. The domination of power on the world's seas also changed and around 1760 England was for the first time a bigger buyer of Finnish wood and wood products than the Netherlands.The second and the last major era of water- driven sawmills was between 1830-1860. During that era the production figures and the number of sawmills increased and due to new methods it was possible to saw more than ever before. At the same time the ownership of the sawmills also changed. When still in the 18th century there had been many sawmill owners living in the same town, at the mid 19th century there were fewer and fewer owners. The water-driven sawmills which were situated by the rapids in the countryside were purchased by the bourgeoisie living in the Coastal areas and many sawmills were owned by fewer people in towns. Commercial houses were established to export towns and these commercial houses were clearly above the rest of the bourgeoisie as major shippers of saw material. The bonds of Mercantilism were not broken in Finland until in the 1860's when economic liberalism reached Finland. At that time sawing quotas were abolished and market forces and investment markets were freed. Due to all of these changes sawmill industry became the biggest export industry in Finland until the 1930's. Whereas sawmills were con- cemed a new source of energy, a steam engine, started to replace rapids as the major source of energy slowly but surely. However until the First World War sawmills continued to be in practice and the change took place first in those areas where transportation from sawmil-

ls to ships was difficult. The steam sawmills could be placed near harbours and they were not dependent on water level nor on the ice situation. The steam sawmills were much more productive.As the production figures rose, the demand of labour force also rose. At the end of the 1870's obtaining nearly 6 million logs demanded 1,5 million worlcdays and nearly 15,000 workers but at the beginning of the century cutting wood and transporting it supplied work for 50,000 people and before the World War II even for 70,000 men.Pori, Kotka and the area of Viipuri became the three great sawmill areas in Finland. Finland, whose population had almost trebled to three million inhabitants in the 19th century, was no longer able to provide a living to all its inhabitants by means of traditional agriculture.
A majority of the population living in the countryside had come down in the social lad- der. At the time they were not however re- ferred to as unemployed people but as surplus population. The evergrowing sawmill areas were a blessing in disguise because they were able to provide jobs to peasants who did not have any permanent jobs. All in all, Finland started to make its living out of forests.
Sources:
Ahvenainen Jorma, Suomen sahateollisuuden historia. Porvoo 1984.KansaAhti, S ahan vålceå. Kotka 1987. Korhonen Martti, Kymi - Virta-Kartano-Pitåjå. Hamina 1984.Reuna Risto, Puutyolåisten historia I. Helsinki 1984.
11.15) Sorting logs 1952-54(Source: the regional museum o f Kymenlaakso county)

THE RIVER GAUJA, LATVIA: by Sanita Soldre, student at Vecpiebalga Regional country gymnasium, Latvia
Man's usage of the river changes the landscape, and: Where is the source of the river?
"The river Gauja runs near my native home. Many folksongs, tales and myths are connect- ed to this longest, fastest flowing and most beautiful river in Latvia! Every bend of Gauja shows a different characteristics - some bends have very deep whirlpools, at others you may easily ford the river. The forests along its banks emerge snowy white during spring due to the blossoms of the wild cherries ripening in the autumn into somewhat bitter and almost blackcherry fruits, most attractive to the birds. Butterflies and blue dragonflies accompany the angler whose steps widen the path year after year as he approaches the river to catch fish, the gifts of the river. And its strong stream cools everyone in the sweltering summer day. In winter the thin ice and snow calm Gauja's restless water.The river Gauja makes Sigulda a popular pla- ce. Gauja at Sigulda calls many tourists who appreciate the primeval hollows, holes, sand- stone precipices and who has not been to Sigulda? If you ask elderly people about Gauja National Park they all call Sigulda nature's sanctuary. Others enjoy the castle, the old town, the baloon festival, or even bungi- jumping above the river! The river Gauja is a mystery symbol. Nobody has revealed its con- cealed secrets, nobody knows what is hidden in its depths!"
WHERE DOES THE RIVER GAUJA BEGIN, WHERE IS ITS SOURCE? by Klavs Zommers
The river Gauja has its source near Vecpie-bal- ga. The exact spot of its origin was still debated in the 1980s as its history is as fol- lows: Until 1830 there were five lakes and no connection between lake Inesis, lake Alauksts and lake Tauns. The water from lake Alauksts ran to the Baltic Sea from point 1 (next pages). This point was considered the beginning of river Gauja and the water flowed through lake Laidzis (point 2) and west- northwest. In the 1830s a mill was built on the river Orizare (Point 4). To provide enough water for the mill two canals were dug (points 5 and 6) and the lakes Alauksts and Inesis were connected.Now these canals have changed their beds, and we call them rivers. From lake Inesis water ran to the river Daugava through a system of small and bigger rivers. After the construction of the canals the quantity of the water taken to the sea by the Gaujina "the Little Gauja" decreas- ed, and in dry summers it was reduced to no flow at all. Most of the year water from the lake Alauksts runs to the Riga Gulf by two big Latvian rivers, the Daugava and the Gauja.In the period between the 1960s and the 1970s the area around the upper Gauja was drained. As a result of the draining the lake Laidzis changed from lake into a wetland area. To-day the slopes of Elka Hill (point 7) is referred to as the source/spring of the river Gauja. We hope in the future to study man's use of the rivers and streams and the history of the mills (Little HES), and ponds.
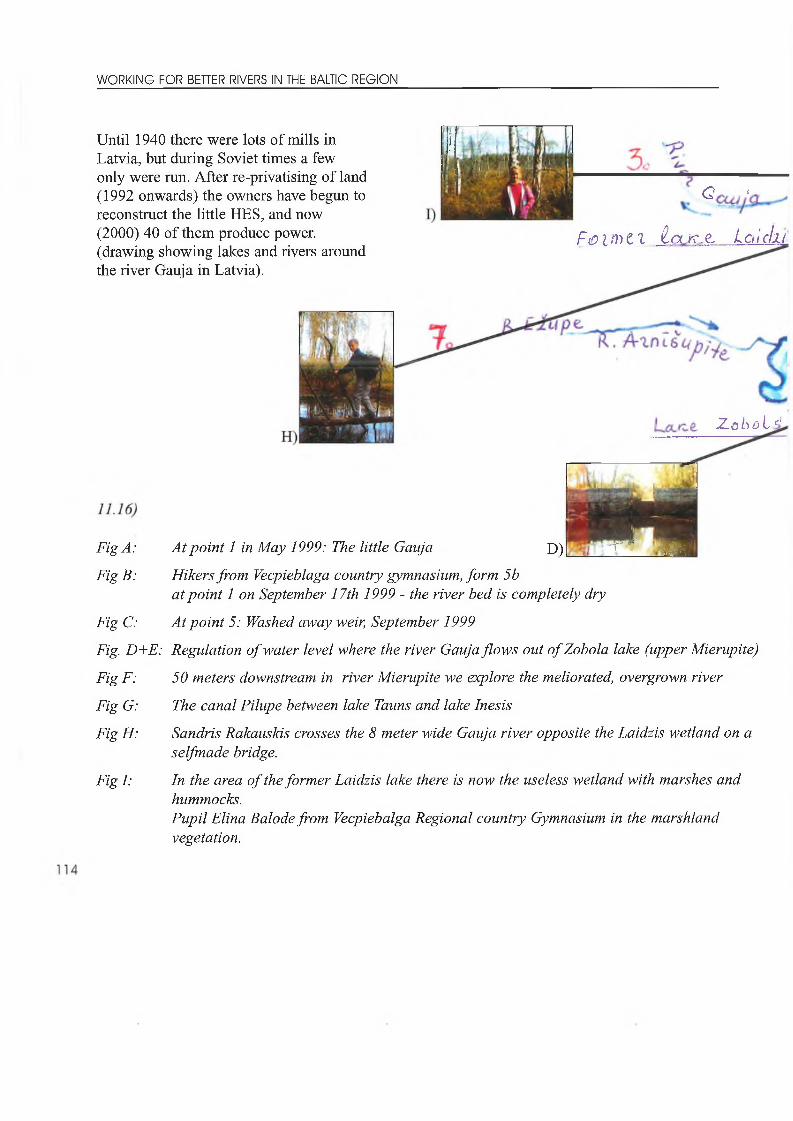
Until 1940 there were lots of mills in Latvia, but during Soviet times a few only were run. After re-privatising of land (1992 onwards) the owners have begun to reconstruct the little HES, and now (2000) 40 of them produce power. (drawing showing lakes and rivers around the river Gauja in Latvia).
Z .o b o L e'
<2 ■
F<o i m il J fø K-.e, La icln
FigA:
FigB:
Fig C:
Fig. D+E:
Fig F :
Fig G:
FigH:
Figl:
At point 1 in May 1999: The little Gauja D)| 't" ~'ff j | 3
Hikers from Vecpieblaga countiy gymnasium, form 5bat point 1 on September 17th 1999 - the river bed is completely dry
At point 5: Washed away weir, September 1999
Regidation o f water level where the river Gauja flows out ofZobola lake (upper Mierupite)
50 meters downstream in river Mierupite we explore the meliorated, overgrown river
The canal Pilupe between lake Tauns and lake Inesis
Sandris Rakauslds crosses the 8 meter wide Gauja river opposite the Laidzis wetland on a selfmade bridge.
In the area o f the former Laidzis lake there is now the useless wetland with marshes and hummocks.Pupil Elina Balode from Veepiebalga Regional countiy Gymnasium in the marshland vegetation.

A ic t U K . s t ^ f
L a .K t

THE ODRA RIVER, POLAND by Danuta Madroszkiewicz
The river Odra has its spring in the Odreski mountains in the East Sudeties.The name of the river is connected with the river's history and people living on its banks. The first inhabitants were the Slavs and they gave names to many places along the Odra river, names that have been preserved to our time.Major cities are situated along its banks e.g Raciborz, Opole, Brzeg Dolny, Wroclaw, Glogow, Nowa Sol and its main port Szczecin.
The river from 1945 became mainly Polish again and serves as borderline between Poland and the Czech Republic, and between Poland and Germany before it runs to the Baltic Sea. The Odra river is a river not very rich in water, and thus in the summer and autumn it suffers from low water levels. However, spring floods are becoming frequent. The river is used for hydro-electrical purposes and seven water power stations are situated along its stretch, the biggest of these in Brzeg Dolny.
11.18) The river Odra passing through Glogow - spring flood
The river is navigable along its 643 km stretch, and the first historical record of its navigability was made in the XII century.
Fishes such as salmon, Salmo salar and the cornmon Atlantic sturgeon, Acipenser sturio used to live here, but because of river contami- nation they have disappeared.
So environmental protection and water pollution decrease is to be worked for!
11.17) Low water levels occur in summer and autumn

QUESTIONSto section II
• Why is the river gradient a very important • factor?
• How can man influence the water cycle ?
• Find a map of your local river.Try to organise it according to "structure of a • river network" (page 72 fig, 9.3)
• What purposes does man have to influence upon river courses in general, and in your local area?
How can sources be found if you want to study your local river and the changes of its use with a time dimension and a historical perspective?
What causes floodings?
Discuss what you consider to be a “natural stream”

12.1) Bro ok.Photo: Risto Hamari

Section III.RIVERS AS AN EDUCATIONAL CHALLENGE IN SCIENCE
Chapter 12: Introduction to Springs, Brooks and Streams 120
Chapter 13: Rivers and Organisms A dapted to RiversGeneral Description of Rivers and Organisms 122Higher Water Plants 128Benthlc Animals in Rivers 132Fishes 135M ammals 142Birds 146
Chapter 14: Methods Used for Estimating the Water Quality of RiversPhysical and C hem ica l Methods 150Investigation of the Aquatic Vegetation 159Water Quality by Index Methods 163
• The Trent Method 164■ M acro Index 166• The Saprobity Index 168■ Water Quality Estimation M ethodology in Latvia 171
Questions on Section III 175
Chapter 12:RIVERS AS AN EDUCATIONAL CHALLENGE IN SCIENCEIntroduction to Springs, Brooks and Streams by Risto Hamari
w 7 very river starts with a spring somewhere in the upper reach. Small streams have their L -V origin in springs and finally several streams unite together - and you have a river.
m , But sometimes springs and brooks exist as single small scale ecosystems without any straight connection to other water bodies. Springs can present themselves as small ponds or swampy areas with special plant and animal species adapted to spring ecosystem.
Some springs get their water from deeper layers. Normally the temperature of this ground water is the same as the annual mean temperature of the region. In northem parts of the Baltic area it means temperatures near zero degrees. In southem Finland the temperature of spring water is +4 degrees and in southem Poland near +12. The water is cool during the summer and it doesn't freeze during the winter. It is flowing and therefore there are more electrolytes for plants to use than in stagnant water.The vegetation in springs is luxuriant and the plants are typical ones which favour eutrofic places. There are also plant species which can be found almost only in springs.Common species in or near springs are Carex paniculata, Stellaria alsine and Epilobium alsinifolium. Originally the common Tussilago farfara also grows in springs. Some mosses grow typically in springs. Philonotis and Calliergon are two of the common spring genera. Since the temperature of the water is the same through the year and the water is rich in oxygen the springs are also favoured by amphibians. In northem part of the Baltic drainage basin it is normal that frogs spend the winter time in springs avoiding this way freezing to death. In summertime Amphibians also find springs favourable because some mosqitoes live in spring water and fullfill their metamorphosis there.

In the clear water of a spring or a springy pond you might find also the common newt (Triturus vulgaris). There are also springs in which the temperature of the water varies according to the temperature in the air. The water to these springs derives near the surface and in dry seasons they might totally dry out. Even when the bed is dry the vegetation shows that there has been water at least part of the year. Comarum palustre, Equisetum palustre are all signs of that. It is quite normal and even the most frequent situation that springs are something between these two special forms of springs. In most springs the temperature of the water varies according to the temperature of the air, not being exactly the same. Despite of that the nature of the spring flora and fauna shows the above descriped qualities and could be considered as a living part of the spring ecosystem.Brooks might be independent units as well as the springs. They might arise of course from a spring but also from wetland like marsh, bog or simply from wet slope. There are brooks and streams in which there is water through out the year but also ones with water only on certain seasons or times. Very often in northem areas there are swift streams in spring time when the snow smelts. Later on in summer they slowly dry out. First diminishing to tiny brooks and finally only to wet brook beds in the ground with water pools only in deeper places if even there. But you may recognise the run of the brook from the vegetation. The above mentioned herbs are common as well as Glyceria fluitans, Juncus ejfusus and Calla palustris. Even bushes like willows are growing along the brook and sometimes there
are large assosiations of Filipendula ulmaria or Calamagrostis purpurea. Brooks and streams show all the hydrological elements of rivers in a small scale. There are swift flowing strips and slowly flowing strips. There are rapids and tiny falls; erosion and accumulation can be easily seen along the course of a brook. If the brook is permanent a rich fauna lives in it. A lot of invertebrates live in or near the water. Some fishes favour brooks eating these small animals. Small fishes like bullhead (Cottus gobio) and stone loach (Noemacheilus barbatulus) are true brook dwellers, but you might also find local populations of brown trout (Salmo trutta Mfario) or dace (Leuciscus leuciscus). Also water shrew (Neomys fodiens) and water mole (Arvicola terrestris) are living near brooks and if there is enough water even otter (Lutra lutra) lives in streams nesting in the bank of the stream.
12.2) The plant Sparganium is adapted to life in the currents- Photo: Risto Hamari

Chapter 13 RIVERS AND ORGANISMS ADAPTEDTO RIVERS General Description of Rivers and Organisms
by Risto Hamari, Ingvar Lennerstedt, Loreta Urtane and Andris Urtans
E
ach of the rivers we meet in the Baltic and all over the World has its own features and identity. To describe and compare rivers and their features, people have invented seve- ral descriptive systems or River Typologies for better understanding of what they are
studying. Such an approach was based on their particular interests e.g. fishery, water sup- ply, wastewater drainage, water tourism etc. There are several general principles common to all typologies.
Generally (See section II) the typical river is often described as originating in mountainous areas from springs or glaciers. In the Baltic region the highest point for a rain drop to join the stream and start its joumey to the Baltic is close to the 2000 metre contour, but in the southem part of the Baltic it is much more usual that rivers originate at altitudes of less than few hundred metres.On visiting your local river it is extremely important to know the factors which defme river appearance.Geology and geomorphology play an important role in forming the landscape and control- ling water resources. According to the geology, the Baltic Sea catchment can be divided into two regions.The first includes the southem part of the Baltic from Russia in the south east to Denmark and the southem tip of Sweden in the south west and consists of glacial morainic deposits. The second geological region embraces the rest of Sweden as well Finland and consists of ancient Archean crystalline rocks, the so called Fennoscandinavian shield (Section II, Page 72), which slopes gently towards the south east.

Climate is another important factor affecting water flow and vegetation along the water- courses. There are marked climatic contrasts between the different parts of the Baltic catchment. Thus the difference in average mid- winter temperatures between the Swedish- Finnnish border area and Denmark is almost 15°C.As a result of widely differing climates, the various parts of the Baltic have different types of vegetation. This in tum has resulted in a wide range of conditions both for fauna and for human land use. Denmark, in the far south and the west coast of Sweden, Northem and the North East part of Germany and Poland as well part of Lithuania belongs to the nemoral vegetation zone which consists primarily of the Central European deciduous forest region. The original trees here are beech, oak, elm, ash and certain other broad-leaved species. Norway spruce has never spread as far south as this without human help. To the north of the nemoral zone is the boreo-nemoral zone, who- se original vegetation is dominated by mixed forest consisting of both coniferous and deciduous trees as we can observe in parts of Lithuania, Latvia, Estonia and Russia.The northem limit of the oak, Crossing the southem part of Finland, marks the transition to the boreal zone, i.e. the large northem coniferous forest region that embraces the major parts of Finland and Sweden.Thus according to the geology and biogeogra- phy, the Baltic rivers can be further divided into three groups (see also Section II, page 62).
These groups are:
Group 1. Low-gradient streams in former deciduous forests, now used with different intensities of agriculture, which overlap the nemoral vegetation zone. Stream water che- mistry tends to be eutrophic with high levels of most nutrients. This pro vides considerable potential for the growth of macrophyte stands, sometimes even clogging the waterways.
Group 2. Low-gradient streams in mixed coniferous forests dominated by pine (Pinus sylvestris) and spruce (Picea abies), heavily interspersed with lakes and wetlands, which overlap the boreo-nemoral vegetation zone. These include rivers from central Sweden up to the Dal alven river, the lake region in south eastem Finland as well as rivers found in Russia, Estonia and part of Latvia. For this group altemating slow and fast flowing river stretches are typical. A wide spectmm of agri- cultural activities is recorded from the almost virgin state to the most intensively used and altered landscape.
Group 3. High-gradient streams in the coniferous and deciduous forests of the boreal vegetation zone where pine (Pinus sylvestris) and spruce (Picea abies) dominate the landscape. The gradient of rivers tends to be higher compared to the previous two groups. Because of the physically harsh stream channel environment within the group, the macrophyte stands are less frequent and abundant and therefore play a particularly important role as microhabitats for stream organisms.

Due to the aetivities of the last glaciation, the Baltic catchment can be regarded as a young landscape on an ancient foundation with much variation of river longitudinal profiles and gradients and braiding is rare. Therefore for the Baltic rivers a typology of river stretches seems to be more applicable.Different river stretches were first of all noti- ced by fishermen, who according to their cat- ches identified a zonation of rivers based on the presence of typical fish species i.e. on bio- logical grounds.According to the "slope rule" i.e. th a t" in a given bio-geographical area, rivers or stretches of rivers of like breadth, depth and slope, have more or less defmed biological characteristics and very similar fish populations " - 4 zones were described i.e. - trout, grayling, barbel and bream zones. Later it was discovered that these zones overlap as fish do not follow human prescriptions, but still this approach suits our interests quite well.
The Trout Region(The upper river/High order river)The clear water runs fast. Big stones are typical on the bottom. The water flow transports the finer material away, particularly during periods of heavy rain and snow melt. River banks are frequently dominated by woods. Leaves,twigs and needles fall into the river and are the main sources of energy for water ani- mals. Typical inhabitants of such river zones are trout Salmo trutta, minnow Phoxinus phox- inus and bullhead Cottus gobio.Fish are mostly small and are collectively called brook fish.
The grayling region(The middle river/mid order river)The water flows less fast. Stones and pebbles dominate on the bottom. The water colour is clear or somewhat brownish due to the occur- rence of humic substances. The organic partic- les in the water are smaller and mostly covered with bacterial aggregates and fungal threads. Other invertebrates are adapted to live on these fine organic particles which they catch by filtering the running water. Stones may be covered by microscopic layers of algae that can be scraped off by other invertebrates. There are different forms of adaptation and the number of species is greater than in the trout region. Other, somewhat bigger fish species live in this river zone. Typical species are grayling, Thymallus thymallus and chub, Leuciscus cephalus.
The barbel region (The upper lowland river/ upper low-order river)The water flow is slow. The water is often col- oured slightly brownish by humic substances or yellow-green by planlctonic algae. Water plants become common. The river channel meanders where water erodes the outer part of the bend and sediments are deposited on the inside of the bend. Much sunlight penetrates the water and promotes the growth of plankto- nic algae. Typical fish species in the upper lowland region are barbel, Barbus barbus, asp, Aspius aspius and orfe, Leuciscus idus.
The bream zone (The lower lowland river/lower low order river)The river has increased breadth and a much greater discharge as it flows over its flood

TROUT, Salmo trutfa
BARBEL,Barbus barbus t
PHYTOPLANKTON
GRAZERS
COLLECTORS SHREDDERS PREDATORS GRAZERS
MOSSES ALGAE
MACROPHYTES
COLLECTORSPREDATORS
BREAM, ^ Abramis * brama
**>
13.1) River zones according to typical Fish Species
MACROPHYTES

plain. The colour of the water is the same as in as in barbel zone. There are abundant macrophyte growths and there are many similarities with lakes and ponds. Typical fish for this zone are bream, Abramis brama and tench, Tinca tinca.Rivers originating in flat lowland landscapes may lack the trout, grayling and barbel zones .
The occurrence of fish species in the relevant zones are shown in the table on fig. 13.1 page 139.
With increasing knowledge about rivers it appears that the major factors of ecological significance which exhibit a progressive biological change along the length of river are: current velocity, substratum, flow, temperature, dissolved oxygen, dissolved nutrients and water hardness. Many of these factors are interdependent. Thus water velocity is depen- dent on gradient and the cross section of the bed and the bed form, whilst bed form is dependent chiefly on water velocity. Furthermore the exposure to the air is obvi- ously related to the width... flow rate determines turbulence and river bed type, whilst depth determines the rate of oxygen diffusion to the bed. Width is dependent on the volume of water available having due regard to bed sha- pe. Flow rate also has an effect on the rate of oxygenation in that turbulence influences oxygen transfer. Such interdependence of physical factors leads us to the basic principle of Biotypological classification which states that: "Widely separated streams and rivers having very similar non-biological features will usual- ly have parallel and ecologically similar fau
nas". It appears that rivers are dynamic systems and through their flow they can be thought of as progressing from youth to old age or, in other words like all of us they are bom and grow older. As a result the River Continuum Concept (RCC, Vannote et al.1980) was introduced. It introduced the idea that a continuous gradient of physical conditions exists from the headwaters to the mouths of the rivers, and that the structural and functi- onal characteristics of the biological communi- ties conform to the dynamic physical conditions of a given river reach. Furthermore, that downstream communities of organisms can adjust to the inefficiencies of the organic matter decomposition processes upstream.Our interests are also well suited by a geo- morphological approach in which rivers can generally be described as consisting of three major river reaches - upper, middle and lower. Upper reaches originate from a variety of sources - snow melt, or ground water that sur- faces as a spring. They have fairly steep gradients, typically narrow, "V" shaped valleys and boulder-strewn riverbeds give them a stair-step appearance. Cobbles and gravel fill in around the boulders to cover the streambed. Nutrition sources mostly originate outside the river and consist of leaves, needles and woody branches. Cold and turbulent water flow makes such river stretches sparsely inhabited. They are fol- lowed by middle reaches with meandering or braided channels that are mainly characteristic of foothill river and stream courses. The gradient of such rivers has decreased and valleys have widened into a "U" shape with signs of some lateral erosion. The most characteristic features are sequences of pool- riffle systems

and a tendency to meander. The river bed is composed mostly of gravel and cobbles. There is shrubby macrophyte vegetation in isolated river stretches. The river becomes adult. Typical lower reaches are characterised by big arching meanders, side channels and ox-bows, coastal wetlands and rich riparian vegetation located on a flat flood plain in a broad valley. The river bed consists of sand, gravel and mud. Deposition processes are evident with sand bars, shoals and banks along the river.The headwaters or spring zone where the stream originates are generally considered as a young stage, while the lower stretches near the river mouth, where it empties into another water body, are usually regarded as mature. Likewise the groups of water organisms will dominate and replace each other along the river course. This sequence of replacement is generally shown in fig 13.1.In upper river reaches where there are food deficiencies in benthic communities, mainly grazers dominate with a less significant pres- ence of collectors and predators.In the middle reaches of different rivers collectors, shredders, predators and grazers are represented with varying numbers which are dependent on the availability and characteri- stics of the available nutrition. The lower reaches display the greater numbers of organisms per sq.metre with collectors and predators playing the most important role. Rivers do not always follow the normal longitudinal cross section and it quite frequently happens that a river or stream may differ significantly from this ideal. Thus, an apparently normal senile river as observed on a map, on Crossing some geological structures may suddenly develop a
very steep gradient rather resembling the char- acteristics of foothill river and stream courses with riffle-pool sequences. It is worth mentio- ning that from the geological point of view, the geomorphology of the southem part of the Baltic is regarded as being rather young and rivers found here are still carving their longitudinal profiles through the sediments left by the last deglaciations. And in many cases such rivers join other rivers or fall into the Baltic with the steepest stretches in their lower reaches. Such stretches always display diverse plant and animal communities. And, as many of them are still not recognised by scientists they are waiting for you to discover!
Channels.Intensification of agriculture brought about large- scale clearance of forests and drainage of land to drain the "excess" water by the quickest route to the sea. In all Baltic countries agricultural areas were covered with dense "networks" of channels and dykes. Some of them are filled with water permanently, some only during snow melt and periods of rainfall. Nevertheless all artificial watercourses are alive and have their own flora and fauna. Sometimes only seasonal channels and dykes have a specific fauna that is tolerant of water and oxygen deficiency. Such artificial watercourses are still disregarded and under-investi- gated by scientists and surely can tell us many interesting stories about how Nature "greens" human constructions.

13.2) River flora

HIGHER WATER PLANTS IN RIVERS11 by Risto HamariSpecies mentioned in the protocol (apendix 1) are underlined.Acorus calamus Agrostis stolonifera Alisma lanceolata A. plantago-aquatica Alopegurus aequalisA. geniculatus Berula erecta Bidens cernua B radiataB. tripartita Butomus umbellatus Calamagrostis canescensC. purpurea C. stricta Calla palustris Callitriche cophocarpa C. hamulataC. palustris Caltha palustris Cardamine amara Carex acuta C. aquatilis C. canescens C. elata C. gracilis C. lasiocarpa C. nigra C. oederi C. riparia C. rostrata C. vesicaria Catabrosa aquatica Ceratophyllum demersum Cicuta virosa Cladium mariscus Elatine hydropiper Eleocharis acicularis
E. palustris Elodea canadensis Eriophorum angusti- foliumEquisetum fluviatile Galium palustre Glyceria fluitans G. maxima Hippuris vulgaris Hottonia palustris Hydrocharis morsus- ranaeHydrocotyle vulgaris Iris pseudacorus Isoetes echinospora I. lacustrisJuncus alpino ar ticulatus Juncus conglomeratus Juncus effusus J. filiformis J. supinus Leersia oryzoides Lemna gibba L. minor L. trisulca Litorella uniflora Lobelia dortmanna Lycopus europaeus Lysimachia thyrsiflora L.vulgaris Lythrum salicaria Mentha aquatica Menyanthes trifoliata Montia fontana Myosotis laxa M. scorpioides Myosoton aquaticum
Myriophyllum alterni- florum M. spicatum M. verticillatum Nasturtium microphyllum Nuphar lutea N. pumila Nvmphaea alba Oenanthe aquatica O. fistulosa Pedicidaris palustris Peucedanum palustre Persicaria amphibia P. hydropiper Phalaris arundinacea Phragmites australis Polvlogonum amphibium Potamogeton alpinus P. berchtoldii P. crispus P. compressus P. filiformis P. friesii P. gramineus P. lucens P. natans P. obtusifolius P. pectinatus P. perfoliatus P. polygonifolius P. praelongus P. pusillus P. rutilusPotentilla palustris Ranunculus flammula R. circinatus R. lingua
R. peltatus EE R. penicillatus R. repens R. reptans R. sceleratus R. trichophyllus Rorippa amphibia R. nasturtium-aquaticum Rumex aquaticus R. hydrolapathum R. hydropiper Sagittaria natans S. sagittifolia Schoenoplectus lacustris Scholochloa festucacea Scirpus sylvaticus Scutellaria galericulata Sium latifolium Sparganium emersum S. erectum S. glomeratum S. gramineum S. natansSpirodela polyrhiza Startiotes aloides Subularia aquatica Tvpha aneustifolia T. latifolia Utricularia australis U. intermedia U. minor U. vulgaris Veronica anagallis- aquatica V. beccabunga V. scutellata
11 The latin names of species have been written according to the most recent Field Flora o f Finland (1998) and follow the rales o f the International Code of Botanical Nomenclature. (W. Greuter &al., 1994).
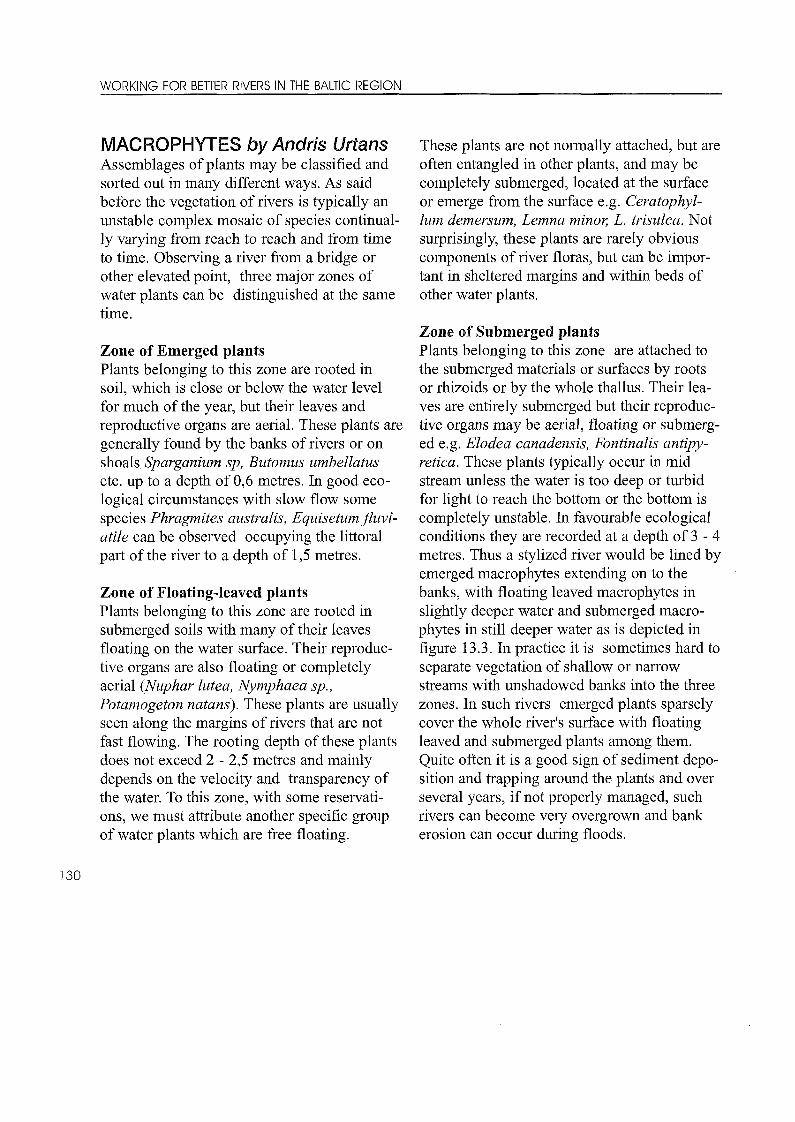
MACROPHYTES by Andris UrtansAssemblages of plants may be classified and sorted out in many different ways. As said before the vegetation of rivers is typically an unstable complex mosaic of species continual- ly varying from reach to reach and from time to time. Observing a river from a bridge or other elevated point, three major zones of water plants can be distinguished at the same time.
Zone of Emerged plants Plants belonging to this zone are rooted in soil, which is close or below the water level for much of the year, but their leaves and reproductive organs are aerial. These plants are generally found by the banks of rivers or on shoals Sporganium sp, Butomus umbellatus etc. up to a depth of 0,6 metres. In good ecological circumstances with slow flow some species Phragmites australis, Equisetum fluvi- atile can be observed occupying the littoral part of the river to a depth of 1,5 metres.
Zone of Floating-leaved plantsPlants belonging to this zone are rooted in submerged soils with many of their leaves floating on the water surface. Their reproductive organs are also floating or completely aerial (Nuphar lutea, Nymphaea sp., Potamogeton natans). These plants are usually seen along the margins of rivers that are not fast flowing. The rooting depth of these plants does not exceed 2 - 2,5 metres and mainly depends on the velocity and transparency of the water. To this zone, with some reservations, we must attribute another specific group of water plants which are free floating.
These plants are not normally attached, but are often entangled in other plants, and may be completely submerged, located at the surface or emerge from the surface e.g. Ceratophyl- lum demersum, Lemna minor, L. trisulca. Not surprisingly, these plants are rarely obvious components of river floras, but can be important in sheltered margins and within beds of other water plants.
Zone of Submerged plants Plants belonging to this zone are attached to the submerged materials or surfaces by roots or rhizoids or by the whole thallus. Their leaves are entirely submerged but their reproductive organs may be aerial, floating or submerged e.g. Elodea canadensis, Fontinalis antipy- retica. These plants typically occur in mid stream unless the water is too deep or turbid for light to reach the bottom or the bottom is completely unstable. In favourable ecological conditions they are recorded at a depth of 3 - 4 metres. Thus a stylized river would be lined by emerged macrophytes extending on to the banks, with floating leaved macrophytes in slightly deeper water and submerged macrophytes in still deeper water as is depicted in figure 13.3. In practice it is sometimes hard to separate vegetation of shallow or narrow streams with unshadowed banks into the three zones. In such rivers emerged plants sparsely cover the whole river's surface with floating leaved and submerged plants among them. Quite often it is a good sign of sediment deposition and trapping around the plants and over several years, if not properly managed, such rivers can become very overgrown and bank erosion can occur during floods.

EMERGED FREEFLOATING + FLOATING LEAVED EMERGED PLANTS + SUBMERGED PLANTS PLANTS
-------- ——---- ^ --------------— ------ ---------------—--------------—— — —►

BENTHIC ANIMALS IN RIVERS By Loreta Urtane
Water as a living medium for water invertebratesOxygen is the limiting factor for all living organisms. Animals living in water have ad- justed themselves to aquatic conditions during many generations and millions of years. The water medium has become their microcosmos as they search for food or hide themselves from predators.Unlike terrestrial organisms they can breathe in water. In many cases their adjustment to living in water is striking and has determined their behaviour.Thus some of them obtain oxygen by absorb- ing the dissolved oxygen in the water through their gills or skin while some of them gain oxygen directly from the air through special openings called stigma. Some of them like the dragonfly nymph have combined locomotion with respiration. The nymph sucks water into its abdomen which contains gills, and then after taking in dissolved oxygen, it squirts water out like a rocket thus propelling itself forward.Snails collect atmospheric air in hollows under their shells, but water spiders construct a nest anchored among water plants which is filled with air brought there attached to the hair covering their bodies. Water bugs lift themselves up to the surface and then, respiring through their abdomenal openings collect air here or under their wings.According to their food preferences macroin- vertebrates comprise four functional trophic groups i.e.
■ Grazers and scrapers - herbivores feeding on attached algae
• Shredders - large particle feeding detritivores
• Collectors - both suspension (filter) and deposit (surface) fine particle feeding detritivores
• Predators - camivores
Those who live in mudIn slow and calmly flowing rivers there is less oxygen compared to swift flowing ones. This is due to lesser aeration and oxygen absorption from the air. Secondly, with the increasing instability of the deposited mud, more and more micro-organisms inhabit such places. Micro-organisms help decompose muds but utilize much oxygen in the process.
Chironomidae J/Decomposition is accelerated by the help of midges (Chironomidae) which are one of the most widespread freshwater groups. With their rapid growth rate and high abundance they may cover the whole surface of the river bed giving the appearance of a moving red carpet. Sometimes in muds one can observe the nymphs of water bugs in small numbers.Due to low oxygen saturation muddy bottoms are favourable for only a few species.
Those who live among the waterplantsSlow flowing rivers are characterised by abun- dant macrophyte growth with twisting floating leaves of arrowheads and bur-reeds, submerged pondweeds as well as yellow and

white water lilies dominating in the slackest water. Here one can fmd excellent hiding pla- ces, as well as the abundance of different forms of nutrition. Attached to the different substrates leeches wait for prey. A variety of bug larvae can be found here. Here one can find Chironomids that have bored into water plant stems to suck their juice.
Within the plant growth we can find abundant groups of Asellus aquaticus feed- ing on dead plants and organisms. The latter may be so occupied with eating that they ignore what is going on around them.
Asellus aquaticus Caddis fly larvae living among plants construct their cases from plant materials. Some larvae do not make cases, but construct fine nets between plant stems in which they catch tiny Crustaceans and Rotatoria.
Among the roots of water plants burrowing mayflies and alderflies, Sialis species constantly search for prey at the same time trying to hide themselves from the fish gliding between plants. For the patient observer
Sialis sp. water plant habitats are a captive world of discovery where the gover- ning rule above all is "eat or be eaten".
Those who live in sandy habitatsRivers with sandy beds seem lifeless due to the constantly moving upper part of the sub- strate. Here one can survive only by burrowing into the sand itself. Here you can find
Chironomids. The most interesting living organisms patiently bring with them cases made of fine sand like caddis flies,Leptocerus. Other caddis Plsldium sp, flies e.g. Molanna angusta- ta like prisoners slowly cross the sandy surface pulling heavy cases with anchor like lateral processes which help them to avoid being was- hed downstream. Sieving sand you can quite often find another typical dweller of such habitats, the oval pea-mussel, Pisidium sp.
Who lives in stony stretches?Such habitats often display fast moving water falling over the stones and crushing everything in its way. But at the same time such extreme places are stocked and saturated with specific organisms which either hide themselves under the stones in so called dead zone, or being flattened can withstand strong currents. Many of them have special adaptations like a strong muscle foot like Ancyllus fluviatilis and Acroloxus lacustris. Leeches anchor themselves with suckers and water sponges firmly cement themselves to the stones with perfect disguise. Some caddis flies make their cases from stones and for safety also anchor them to the boulders with special filaments.Sometimes when they are taken out of the water they instinctively even try to glue themselves to the fingers of the investigator. Questions can be raised as to why all these creatures have chosen to live under such extreme conditions. And here the answer is quite straightforward i.e. if not dragged away, you can just sit and simply wait like in a café

while the current serves you bypassing drifting organic particles or careless invertebrates, according to your food preferences.
Water Invertebrates and pollutionDifferent invertebrates react to different factors caused by organic pollution and depletion of oxygen is undoubtedly the main factor involv- ed. In some cases whole orders react characteristically in a similar way e.g. the Plecoptera (Stoneflies) are all intolerant of organic pollution. In other orders differences exist at the species level.Platyhelmintes (Planarians) are mostly intolerant of any organic pollution.Annelida.Most of the true worms, Oligochaeta arefavoured by organic pollution and are often the
dominant invertebratesin severely pollutedconditions. Tubifexworms can be found in
, similar situations.Oligochaeta T , A x ,6 Leeches. Most leaches
are tolerant of organic pollution, most beingable to withstand anaerobic conditions for along time.The major factor determining the distribution of leeches is probably the availability of their host prey. Thus Pisciola geometra is a fish parasite and hence is found only in waters sup- porting fish. Glossiphonia complanata which feeds predominantly on snails, Helobdella stagnalis, feeding on Asellus aquaticus and Erpobdella octoculata, feeding on oligochaeta and chironomid larvae are all therefore associated with organically enriched waters in which their respective food organism occurs.
Crustacea. There are two most commonly occuring benthic cru- staceans - Gammarus pulex and Asellus aquaticus in watercourses Gammarus pulex around the Baltic. They occur in quite different waters. Gammarus pulex is intolerant of low oxygen concentrations and cannot withstand organic pollution. On the contrary, Asellus aquaticus is quite tolerant of low oxygen conditions and can achieve high abundan- ce in polluted waters.Ephemeroptera - Mayflies are also a group intolerant of organic pollution. Baetis rhodani is an exception in being quite tolerant of organic enrichment.Odonata - Dragonflies and Damsel fli es are found in slower flowing stretches and are able to withstand low oxygen conditions. Trichoptera- Caddis flies are generally intolerant of organic pollution. The cased caddises as well as the genus Ryacophila are even more sensitive to organic pollution. Other orders of insects such as Hemiptera (bugs), Coleoptera (Beetles) and Diptera (True flies) have a wide range of degrees of tolerance specific for each species. Tubifera tenax (the rat-tailed maggot) and the air breathing Syrphidae are two of the most tolerant invertebrates to be found in sep- tic sludges. They do not occur in rivers, being restricted to the river margins due to the length of their respiratory siphons.Mollusca - the air breathing pulmonate Gastropoda like Lymnaea peregera and Physa sp. are generally more tolerant of low oxygen conditions than the gill-breathing proso- branchs.

FISHES by Ingvar Lennerstedt
Do you know which fish inhabit your stream or river?There are probably more species than you think. In summer when paddling among the rocks you may have seen small fish suddenly disappearing in front of your feet. They were probably minnows or one of the other small river fish species. The fish would have been afraid of being caught.Or you may actually have caught one of them in a net during your BSP river studies. These fish feed on the small invertebrates that live among the rocks. Further out in the river there are fish that rise to talce their food from the water surface. They may be trout or grayling. These fish sometimes live on insects that fall on the water surface, food that has come from the surrounding habitats.When fly-fishing we use this habit of certain fish species to feed on the water surface. The success of fly-fishing depends upon the quali- ties of the artificial fly, and each angler thinlcs s/he knows the best way to tie a fly. This is a vital part of the sport.Big fish like salmon prefer to eat other fish and, of course, mussels, crustaceans, and other invertebrates as well. When salmon hunt fish
they may be caught by trolling-spoons drawn through the water. Salmon fishing is often regarded as the highest, and the most exciting form of fresh water fishing.These three examples each show a different way that fish employ to obtain their food in running water: i.e. by eating invertebrates in the water, by eating insects from the water sur
face, and by eating other fish smaller than themselves.Before we get into a more detailed description of the fish species in the four different stages of the river we shall concentrate on the salmon and the eel, two spectacular species making long-distance migrations. But they are not the only fish that travel up and down the river.
MIGRATORY FISH
SALMON, Salmo salar is the biggest fish species living in running water. However, in a river there may not be enough food for indivi- dual fish to grow very big. Salmon have solved the problem by migrating to the Baltic Sea to find food. They may spend 1 -4 years at sea. First they feed on crustaceans and small fish close to the coast. Later when they grow big- ger they move out to the open sea to live on herrings and similar fish; they may travel hundreds of kilometres around the Baltic Sea. Normally salmon will return to their native river after 4 years. They find their way to the river mouth and swim powerfully against the current and over rapids and falls; they may jump vertically up to 4 m. to negotiate falls. Impressive! They can then try to find the place where they were bom.How salmon find their way to their native rivers is not fully understood. But they have a well-developed sense of smell and probably find their way by recognising the characteristic smells in the water. Which substances they use are unclear. One hypothesis suggests that the salmon living in the river produce pheromones and the salmon in the sea recognise the phero-

mones from their relatives in the river. The hypothesis is fascinating but has yet to been proved. Pheromones are very common in the animal world, so why not? A second hypothesis involves celestial navigation. Navigation by the stars may be especially important in the open sea.After spawning in the upper river, the salmon are exhausted. Most of them die. Some will return to the sea, but only a small fraction, about 5%, will spawn a second time. The dead salmon provide food for other fish or inverte- brates. Altematively bacteria and fungi may decompose the fish remnants. Important nutri- ents such as nitrogen and phosphorus will be released. These nutrients may add to the pro- ductivity of the river ecosystem. By dying the salmon may substantially improve the nutrient conditions of the river to the benefit of their offspring! In effect these nutrients will have come from the sea.
EELS, Anguilla anguilla are examples of the opposite kind of behaviour. They spawn in the sea and
swim to rivers and lalces to live and grow. You are probably familiar with the fascinating life cycle of the eel. The eels spawn in the Sargasso Sea in the western Atlantic. The young flattened larvae first drift passively in the sea currents towards Europe and North America. They are called leptocephalus, meaning narrow-headed.The leptocephalus larvae have long, thin teeth that they use to feed on micro-plankton. After 2-3 years and at about 7 cm in length they
reach European coastal waters. They change their appearance through metamorphosis and become active swimmers. They gain a new set of teeth. They are now called elvers and live in coastal waters. After another 5-6 years they may have reached the northem part of the Baltic Sea.Then the eels enter a river to reach a lake.Now they have a yellow-green back and a yel- low belly; they are called yellow eels. Neither sluices, dams, nor rapids will prevent the eels from finding their way upstream. They may avoid obstacles by moving in the surrounding grass using a snake-like motion.They may stay in fresh water for 5-25 years, depending on the temperature and the amount of available food. They are largely noctumal and eat a wide variety of food types.The sex of growing eels is complicated.A small fraction, about 10%, are preliminary females, the others have undetermined sex and are referred to as juvenile hermaphrodites. How the eventual sex is decided is unclear. Perhaps the outcome is influenced by environmental factors of some kind.When fully-grown and sexually determined they change appearance once again through a second metamorphosis. The eyes grow larger and they are grey/black on the back and their sides become silver/white.They are now called silver eels. The intestine is reduced and they stop feeding. The sex organs are not fully developed, but the fish have a good deal of fat and other nutrients in their bodies to sustain them on their long jour- ney and later reproduction. In the autumn the silver eels swim downstream to the sea and find their way back to the Sargasso Sea.

On arrival they dive to 500-700 m depth to spawn in the dark or in extremely dim light. They have retinal pigment in their eyes, similar to that found in deep-sea fish.
So when you meet an eel in your river you should treat it with reverence, as it may be an old dignity, a visitor from the Sargasso Sea!
Silver eel
Leptocephalus larva stages
m
p j -----
13.4) Migration o f eels
Elver
Yellow eel
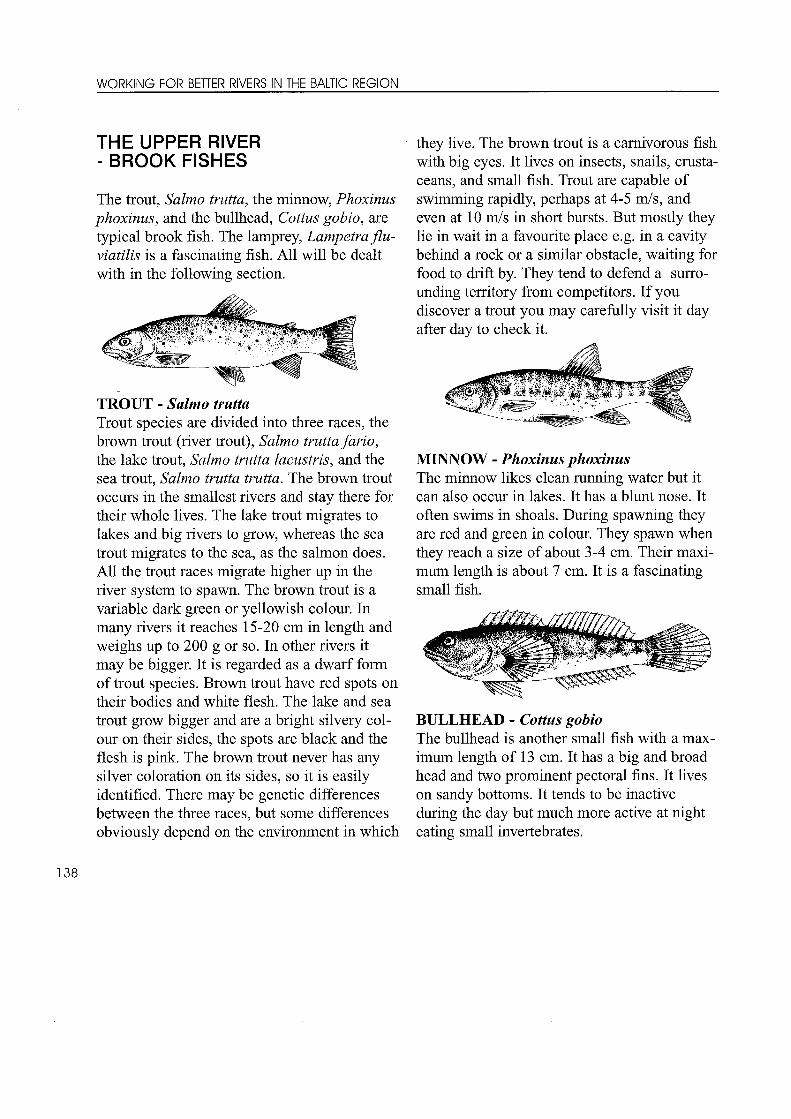
THE UPPER RIVER - BROOK FISHES
The trout, Salmo trutta, the minnow, Phoxinus phoxinus, and the bullhead, Cottus gobio, are typical brook fish. The lamprey, Lampetra flu- viatilis is a fascinating fish. All will be dealt with in the following section.
TROUT - Salmo truttaTrout species are divided into three races, the brown trout (river trout), Salmo trutta fario, the lake trout, Salmo trutta lacustris, and the sea trout, Salmo trutta trutta. The brown trout occurs in the smallest rivers and stay there for their whole lives. The lake trout migrates to lakes and big rivers to grow, whereas the sea trout migrates to the sea, as the salmon does. All the trout races migrate higher up in the river system to spawn. The brown trout is a variable dark green or yellowish colour. In many rivers it reaches 15-20 cm in length and weighs up to 200 g or so. In other rivers it may be bigger. It is regarded as a dwarf form of trout species. Brown trout have red spots on their bodies and white flesh. The lake and sea trout grow bigger and are a bright silvery colour on their sides, the spots are black and the flesh is pink. The brown trout never has any silver coloration on its sides, so it is easily identified. There may be genetic differences between the three races, but some differences obviously depend on the environment in which
they live. The brown trout is a camivorous fish with big eyes. It lives on insects, snails, crustaceans, and small fish. Trout are capable of swimming rapidly, perhaps at 4-5 m/s, and even at 10 m/s in short bursts. But mostly they lie in wait in a favourite place e.g. in a cavity behind a rock or a similar obstacle, waiting for food to drift by. They tend to defend a surro- unding territory from competitors. If you discover a trout you may carefully visit it day after day to check it.
MINNOW - Phoxinus phoxinusThe minnow likes clean running water but it can also occur in lakes. It has a blunt nose. It often swims in shoals. During spawning they are red and green in colour. They spawn when they reach a size of about 3-4 cm. Their maxi- mum length is about 7 cm. It is a fascinating small fish.
BULLHEAD - Cottus gobioThe bullhead is another small fish with a max- imum length of 13 cm. It has a big and broad head and two prominent pectoral fins. It lives on sandy bottoms. It tends to be inactive during the day but much more active at night eating small invertebrates.

Table 2: Fishes in rivers of the Baltic Sea region compiled by Andris Urtans
Species
Biogeographic zones
Trout Greyling Barbel Bream
Cottus gobio
Salmo trutta fario
Phoxinus phoxinus
Neamacheilus barbatulus
Thymallys thymallus
Leuciscus leuciscus
Leuciscus cephalus
Alburnoides bipunctatus
Gobio gobio
Gasterosteus aculeatus
Rutilus rutilus
Esox lucius
Alburnus alburnus
Perca fluviatilis
Stizostedion lucioperca
Cobitis taenia —<| -C
—<
—<
—C —* —<
—< —<
Cyprinus carpio
Carassius auratus
Scardinius erythrophthalmus
Blicca bjoerkna
Abram is brama
Rhodeus amarus
Pungitius pungitiuis
Lota lota
Tinca tinca
Gymnocephalus cernuus
Lepomis gibbosus -<—cM icropterus salmoides
M isgurnus fossilis
Anguilla anguilla
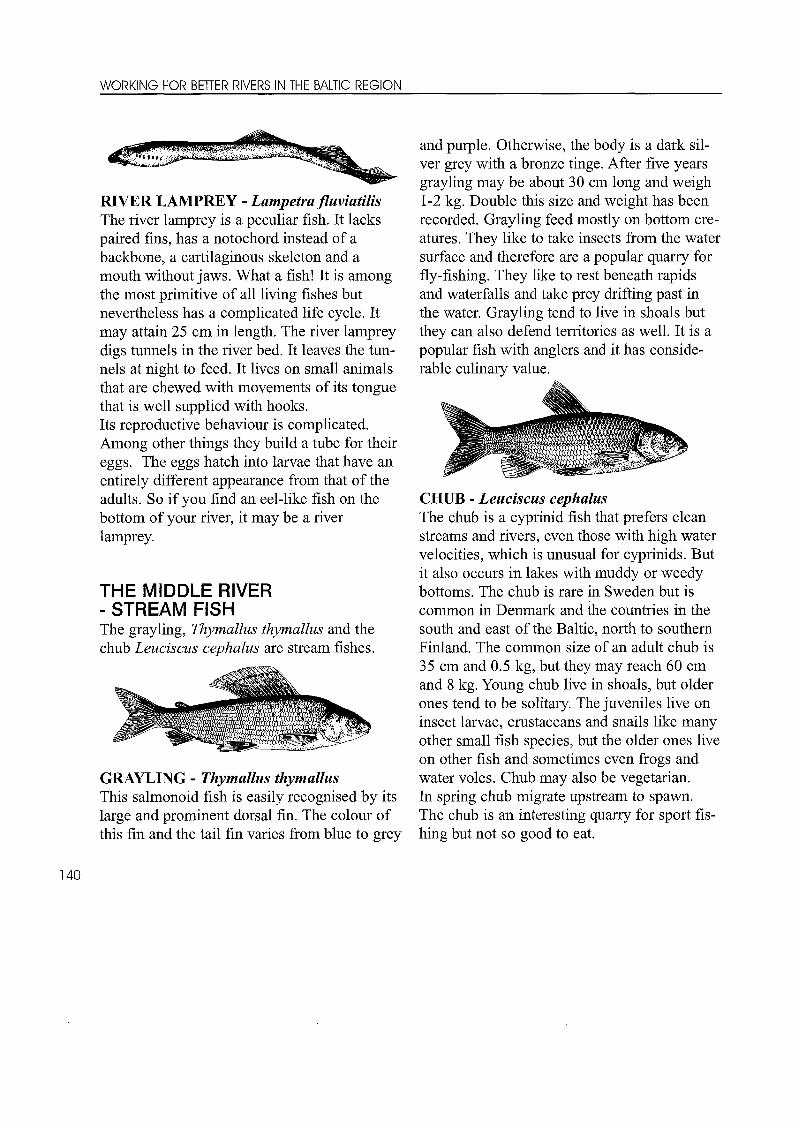
RIVER LAMPREY - Lampetra fluviatilisThe river lamprey is a peculiar fish. It lacks paired fms, has a notochord instead of a backbone, a cartilaginous skeleton and a mouth without jaws. What a fish! It is among the most primitive of all living fishes but nevertheless has a complicated life cycle. It may attain 25 cm in length. The river lamprey digs tunnels in the river bed. It leaves the tunnels at night to feed. It lives on small animals that are chewed with movements of its tongue that is well supplied with hooks.Its reproductive behaviour is complicated. Among other things they build a tube for their eggs. The eggs hatch into larvae that have an entirely different appearance from that of the adults. So if you find an eel-like fish on the bottom of your river, it may be a river lamprey.
THE MIDDLE RIVER - STREAM FISHThe grayling, Thymallus thymallus and the chub Leuciscus cephalus are stream fishes.
GRAYLING - Thymallus thymallusThis salmonoid fish is easily recognised by its large and prominent dorsal fin. The colour of this fin and the tail fin varies from blue to grey
and purple. Otherwise, the body is a dark silver grey with a bronze tinge. After five years grayling may be about 30 cm long and weigh 1-2 kg. Double this size and weight has been recorded. Grayling feed mostly on bottom cre- atures. They like to take insects from the water surface and therefore are a popular quarry for fly-fishing. They like to rest beneath rapids and waterfalls and take prey drifting past in the water. Grayling tend to live in shoals but they can also defend territories as well. It is a popular fish with anglers and it has conside- rable culinary value.
CHUB - Leuciscus cephalusThe chub is a cyprinid fish that prefers clean streams and rivers, even those with high water velocities, which is unusual for cyprinids. But it also occurs in lakes with muddy or weedy bottoms. The chub is rare in Sweden but is common in Denmark and the countries in the south and east of the Baltic, north to southem Finland. The common size of an adult chub is 35 cm and 0.5 kg, but they may reach 60 cm and 8 kg. Young chub live in shoals, but older ones tend to be solitary. The juveniles live on insect larvae, crustaceans and snails like many other small fish species, but the older ones live on other fish and sometimes even frogs and water voles. Chub may also be vegetarian.In spring chub migrate upstream to spawn.The chub is an interesting quarry for sport fis- hing but not so good to eat.

THE LOWLAND RIVER - LOWLAND AND LAKE FISH
Typical fish in the upper lowland river are the barbel, Barbus barbus, and the orfe, Leuciscus idus. In the lower lowland river there are a lot of different lake fish. The bream, Abramis brama is chosen as an example.
ate rapids and falls, as salmon do.The behaviour of orfe is in many ways similar to that of grayling. They take insects from the water surface when they can and they live in scattered shoals. But unlike grayling they pre- fer lowland rivers. At two years of age orfe may reach 15 cm; and at 7 years old about 30- 40 cm and 1-2 kg. The species has some eco- nomic importance.
BARBEL - Barbus barbusThe barbel lives in clear running water in the lowland river. The species is recognised by the barbs on its lower jaw. The barbel is typically found in the rivers south of the Baltic Sea.It is a bottom-living fish that is capable of speeds of up to 30 m/s in short bursts. It lives in the big lowland rivers where it feeds on a range of different water animals, plants and detri- tus.
ORFE - Leuciscus idusThe orfe is a cyprinid fish, the different species of which are difficult to identify as they are so similar. Orfe live mainly in clean water streams. But they may sometimes occur in lakes and in braclcish water along the coasts of the Baltic Sea as well. They move upstream to spawn, where they may have to leap to negoti-
BREAM - Abramis bramaThe bream is also a cyprinid fish and is generally well known. It lives in lowland rivers, but also in lakes and brackish waters along the coasts. It is a good example of a lake fish that can also live in rivers. Juvenile bream feed on planktonic crustaceans and the bigger ones on bottom living insects, molluscs etc; but they can also eat vascular plants and detritus particles. During feeding they form their mouth into a funnel to suck in the bottom material, sort out the edible things, and blow the inedible material out through their mouth or gill slits. On quiet evenings and nights it may be possible to hear bream feeding in shallow water by a curious smacking sound! In some areas of Finland and Eastem Europe the bream still has an economic importance. However, after feeding on detritus bream are likely to have an unpleasant muddy taste. So for commercial fishing they must be caught from firm- bottomed waters.

MAMMALS By Andris Urtans
Many birds and mammals are recorded as living on the margins of streams and rivers, however only a few species actually live in water.Among the birds truly aquatic species, in the sense that they explore the water column or the benthic habitats of streams and rivers, are dippers and several ducks.Among mammals there are only a few specialists, who spend an extensive part of their lives in slow-flowing rivers. The most well known species in the Baltic are beavers and otters.
A NATURAL HISTORY OF OTTERS, Lutra lutra L and Beavers, Castor fiber
OTTERSLutra lutra L.
In the past the European otter was common in most inland waters and along the coasts of Europe. Like beavers otters were hunted for their far and since the 19th century became
quite rare in the Baltic as a whole.During the 1950s, the otter population in Europe suddenly began to decline. Many different explanations for the decline were sugge- sted including habitat destruction during river maintanance and the indirect or direct influen- ces of eutrophication, acidification and toxic chemicals. Nowadays more and more records suggest that polychlorinated biphenyls (PCBs), discovered in 1966 as by-products of the plastics industry would be the main reason for such a decline. Stream acidification from acid rain causes a reduction in the prey available to otters.Because of their sensitivity to environmental stress, otters can be considered as biological indicators of the quality of a wetland habitati.e. otter pres^nce indicating good environmental conditions. Hence the disappearance of otters in many Baltic regions reflects quite precisely the scale of environmental damage to which many wetlands have been exposed during the last few decades.Otters live in fresh, brackish, and even salt- water habitats of rivers, streams, lakes, canals, open marshes and coasts. They have been observed in mountain areas up to 2800 m.They are mostly active at night, which makes them difficult to study.With its webbed feet, long streamlined body, and its rudder -like tail, the otter is well adapt- ed to its semi-aquatic lifestyle. Otters hunt their prey by sight during short dives, using their whiskers to locate fish in murky water. Otters can achieve a top speed of 12 km/hr and can stay under water for up to 40 seconds, although a period of about 15 seconds is more typical. The average length and weight ratio of

otters is 1 m/6 kg for females and 1,2 m/8 kg for males respectively.Today there are many attempts to reintroduce the otter - an undertaking that can be success- ful only if the quality of the habitat has been improved accordingly.
HabitatOtters live in all wetlands, including rivers, lakes, streams, ditches, dykes, marshes and reedbeds but for successful survival they need up to 30 holts (dens) or resting sites within their home range. Typical holts are found in such places as large cavities in bankside tree roots, particularly those of oak, ash and black alder, as well as in dense, impenetrable shrubs and thickets. Rock cavities, peat burrows, reed and sedge beds and old culverts are also used.
Home rangeAn adult otter has a home range (territorry) where it hunts, rests and breeds. It varies in size and reaches up to 40 km of riverbank. In its home range an otter requires:A good food supply Clean unpolluted water Secure resting places or holt (den) sites Undisturbed sites for breeding.
DietOtters are camivores at the top of the food chain. Its favourite food is fish, but being opportunistic, it eats whatever species is easie- st to catch and amphibians, molluscs and cru- staceans also form an important part of their diet. Adult otters eat around 1 kg of food a day.
BreedingThe bitch chooses the most secure holt in her home range in which to give birth. It is vital that there is no disturbance, especially from humans and their dogs during this stage. Cubs usually number between one and four and stay with their mothers for 12 to 18 months. The male plays no role in bringing up the family.
Studying ottersDirect observation of otters is difficult and they are often confused with mink which is smaller (cat sized), darker, more inquisitive and easier to see. The best clues to an otter presence are sprains (droppings), footprints and runs. Spraints are black and tar-like when fresh. They are spiky and contain individual fish bones and scales and have a characteristi- cally "fishy" smell that is not unpleasant. Spraints are usually found in prominent places such as on boulders and bank side ledges.They are used by otters to mark their territori- es. (Mink scats tend to be twisted and smell very unpleasant). Otter footprints are 45 to 73 mm across and may show five toes.
Problems for ottersBesides chemical contamination with PCBs the management of rivers for flood reduction has involved straightening and deepening of river channels and removal of bankside trees and thickets. This along with the drainage of wetlands for agriculture has reduced the amo- unt of bankside cover and feeding sites available for otters as well for other wildlife. Numbers of otters (Otter population) in Sweden are estimated at 500-1000 specimens, in Latvia more than 4000 specimens.

BEAVERSCastor fiber L.
The European beaver used to be widespread in Europe, but due to hunting (noble fur as well as beaver oil, Casteorum used in medicine) they disappeared during the 19th century from almost the whole of the Baltic region. (The last beavers in Sweden were killed in 1871, in Latvia in 1873.). Only several hundred esca- ped in Norway. From there in 1922 they were reintroduced to Sweden and in 1927 to Latvia. Later Canadian beavers were introduced in several countries (Poland, Finland,) so creating a mixed population.It has been estimated that in prehistoric times in some forested areas beavers were the major element in establishing a landscape mosaic by creating ponds and opening the forest canopy. Their influence in some places can still be tra- ced in the distribution of fens and peat areas. The beaver is one of the largest rodents, its adult weight being about 20 kg and its body length lm. Beavers' back feet have skin betw
een the toes, their front feet have five fingers with large nails for handling and digging and their hairless flat tail is used for steering and paddling.In rivers they build dams as much as 20 m long and sometimes even 3 m high. They fell trees with a stem diameter of up to 40 cm, and build highly developed beaver lodges of branches and twigs, packed with mud and stones. The lodges often have several rooms used for different purposes such as sleeping, eating etc. The entrance tunnel is submerged and the lod- ge is therefore safe from predators. Air channels at the top ensure a good inner climate. Beavers are territorial and live in small family groups consisting of parents and offspring from the last two years. The European beaver normally has 2 - 4 offspring, whereas the Canadian beaver normally has 4-5. At the age of 2-3 years the young ones leave their home range and establish their own family groups
DietBeavers feed mainly on the fresh bark, twigs, leaves and buds of different plants.
ProblemsBeavers play a contradictory role in today's Baltic landscape. Due to the cessation of agricultural activities and abandonment of rural areas in the southem and eastem part of the Baltic they are quickly occupying abandoned areas, flooding vast forest territories and destroying former drainage systems.At the same time they are rare in the rest of the Baltic.

Country Species Numbers Reintroduced
Sweden Castor fiber 100000-200000 1922
Finland Mixed 6000 1937
Poland Mixed 5000-10000 ? 1940s
Estonia Castor fiber 4000 1957
Latvia Castor fiber 100000 1927
Lithuania Mixed ? 14000 1947-59
Germany Castor fiber 3300-4200
Denmark Castor fiber 18 1999
Table 3: populations o f beavers in the Baltic region
EUROPEAN MINKLutreola lutreola
America, numbers of European Mink Lutreola lutreola have drastically decreased during the last few decades.
Mustela vison
Length of body 32 - 40 cm, tail 12-19 cm. Found in the vicinity of rivers and streams with thick herbaceous vegetation along the banks. A noctumal animal it conceals itself in holes in the banks of watercourses by day. Feeds on smaller aquatic vertebrates and invertebrates. Mates in March or April and produ- ces 2 - 7 young in May or June.Due to competition and interbreeding with related mink Mustela vison, a native of North
The related mink Mustela vison, a native of North America, has a similar lifestyle although it has a less specialised diet. Now introduced into Europe, there is some evidence of competition.

BIRDS by Johannes Bang
All birds are dependent on water, but very few birds are totally dependant on rivers and streams. Two species of birds will be describ- ed that take all their food in rivers and steams, and build their nests in the riverbank or close by. The birds are dependent of the quality of water in the rivers. If the water is polluted some of the prey fish and invertebrates die or disappear. The same results from low transpa- rency, which prevents the birds from finding food. Consequently is not enough to protect the bird through legislation. If the habitat is not protected also, the birds cannot survive.
The Natural History of the Kingfisher
Alcedo atthis
In the Baltic area the kingfisher can be found in the southem Finland, in the Baltic states, Poland, Germany, Denmark and southem Sweden. Always close to water in rivers, streams, and lakes. In the winter time it can be found in lakes, ponds and sometimes along the coastlines of salt and brackish waters.The kingfisher is about sparrow size with beautiful colours in greenish-blue and with a long and strong bill and very small legs. If you look at a picture of this beautiful bird you might imagine that it is easily seen, but this is not the case. Most important is to become familiar with the special voice, its scream, which can often be heard when it is flying.The flight is very fast, so often what you experience is a scream, a blue light, and the bird has disappeared further up- or downstream. If you get to know a stream with kingfishers, you may be fortunate enough to find the poles or dead branches where it frequently sits.If cautious you will have a good chance of being able to admire the beautiful colours.

The kingfisher feeds on small fish, which it normally lures from the observation pole or directly when flying in a quick dive. Sometimes there might be conflicts with owners of fishponds where small trouts are raised. Such a place with a lot of small fish will attract the kingfisher, as birds always go for the best hunting grounds.
In the breeding season the kingfisher will try to find a place where it can dig a hole about one meter into the bank.This can only be done if the bank consists of sand or gravel. The entrance of the nest is often well hidden behind grass, roots or branches overhanging the river bank. At the end of the nest hole the 5-8 ball shaped white eggs can be found on a layer of fish skeletons and pellets. When 3-4 weeks old the young king- fishers leave the nest hole and sit on a branch waiting for the parent birds to feed them fish. The adults will place a dead fish on the water below the young kingfisher, and this way they train catching food.
In the autumn the youngsters leave the breeding territory and fly around in order to find a place to spend the winter. Therefore kingfis- hers from autumn till spring may be observed at lakes, ponds and even seashores. If the winter is severe and the lakes and streams have an ice-cover, many kingfishers starve and even- tually die and it might talce some years before the population recovers.
The Natural History of the Dipper
The Dipper, Cinclus cinclus
The dipper can be found in Sweden, northem Finland and along the coast of the Baltic states

and Poland. In Denmark it only breeds regu- larly on the island of Bornholm, however, in some years in other parts of the country as well. During the breeding season the dipper is strictly connected to streams and rivers, but outside the breeding season it may also be observed at lakes. During the autumn and win- ter the dipper migrates to milder areas west and south west of the breeding place and it can even cross the Baltic Sea from Sweden to Poland. In severe winters it might be forced to migrate even further south.In shape, size and colour the dipper is veiy much like the female blackbird Turdus merula, but both male and female dippers have a white spot on the breast. The dipper also has a white nictitating membrane which can be seen without difficulty when it stands on a stone. Dippers can only be observed along running waters during the breeding season, whereas during migration it can be found along lake shores and in ponds.
Though the dipper has brown colours it is much easier to observe than the kingfisher, when it sits on a stone, a log or at the bank of the streams. From time to time the dipper will dive into the water, and swim below the water upstream while searching for food. The food mainly consists of invertebrates. Normally it dives from its sitting stone, but sometimes it dives when flying. The bird dives under the water, comes to the surface, and it is even able to take off from the surface of a fast running stream.
It is not only in the breeding season that the dipper defends its territory. Like the related wren Troglodytes troglodytes it has a winter song to mark its territory. If another dipper enters the territory it will be met with a threatening position and if it is not enough to scare the intrader off, a fight might take place.
Though the territory is well defended during the daytime, many dippers may sleep together under a bridge, and here they accept one another. The next moming they fly back to their territories along the stream.
In the breeding season they find a stream with rocks where the nest can be built close to the stream. Examples have been given even of the dipper nesting behind a waterfall, and also nestboxes placed under a bridge might suit the dipper.The nest is very similar to that of the wren: Round with a hole on one side.The 4-6 eggs are white, and after hatching the young dippers will stay in the nest for about three weeks.The young ones stay in the territory till the beginning of the autumn.
NESTBOXESshould have the following measures: 20 x 20 x 20 cm the hole: 8 x 8 cm.


Chapter 14METHODS USED FOR ESTIMATING THE WATER QUALITY IN RIVERSPhysical and Chemical Methods by Velga Kakse
remperature
The water temperature of a river is very important for water quality. Many of the physical. biological and chemical characteristics of a river are directly affected by
temperature.
One of the most serious ways that humans change the temperature of rivers is through ther- mal pollution. People also affect water temperature by cutting down trees that help shade the river, exposing the water to direct sunlight.
As water temperature rises, the rate of photosynthesis and plant growth also increases. More plants grow and die, bacteria that consume oxygen decompose them.The metabolic rate of organisms also rises with increasing water temperatures, resulting in an even greater oxygen demand.
The life cycles of aquatic insects tend to speed up in warm water.
Animals that feed on these insects can be negatively affected, particularly birds that depend on insects emerging at key periods during their migratory flights.
Most aquatic organisms have adapted to survive within a range of water temperatures.
Temperature also affect aquatic life's sensitivity to toxic wastes, parasites and disease.

Procedures:1. The temperature test compares the diffe
rence in water temperature between two different stream sites. Select two stream sites to test for which the physical conditions, current speed, amount of sunlight reaching the water, and the depth of the stream are as similar as possible.One of the sites should be the monitoring site in which you are running all of your tests. The second site should be about two kilometres upstream.
2. The same thermometer should be used to measure the water temperature at both sites.
3. Rubber gloves should be wom.4. Keep the thermometer in the water until a
constant reading is obtained (approximately two minutes).
5. Record your measurement in degrees Celsius on the data sheet.
6. Repeat the test as soon as possible approximately 1 - 2 km upstream.
7. Subtract the upstream temperature from the temperature downstream using the following equation:
TurbidityTurbidity is a measure of the relative clarity of water. Turbidity increases as a result of su- spended solids in water that reduce the transmission of light. Suspended solids are varied, ranging from clay, silt, and plankton, to industrial wastes and sewage.Turbidity may be the result of soil erosion, waste discharge, urban runoff, or the presence of excess nutrients that result in algal growth. Turbidity may affect the colour of the water, from nearly white to red-brown, as well as green from algal blooms.At higher levels of turbidity, water loses its ability to support a diversity of aquatic organisms. Water becomes warmer as suspended particles absorb heat from sunlight, causing oxygen levels to fall. Less light penetrating the water decreases photosynthesis, causing further drops in oxygen levels. The combinati- on of warmer water, less light, and oxygen depletion makes it impossible for some forms of aquatic life to survive. In addition, suspended solids may clog fish gills, reduce growth rates, decrease resistance to disease, and pre- vent egg and larval development.
Temperature downstream minus the temperature upstream = temperature difference
Temperature ( A°C)4 (excellent) 0 - 23 (good) 2 ,2 -52 (fair) 5,1 - 10,01 (poor) 10 <
Methods for measuring turbidityTurbidity can be measured by a specialised instrument called a turbidimeter, which measu- res the amount of light scattered through a sample of collected water. Turbidity can be measured by a Secchi Disk or by a "turbidity tube". The "turbidity tube" is easier to use and more precise than the Secchi Disk. The turbidity tube consists of a transparent, calibrated tube with a small black cross on the bottom.

Procedures:1. Collect a small bucketful of stream water to
sample, being careful not to disturb the sediments on the stream bottom.
2. Shake the sample vigorously before exami- nation.
3. Hold the tube over a white surface such as a sheet of paper out of direct sunlight. Gradually pour the water sample into the tube while looking vertically down into the tube.
4. Stop pouring when the black cross on the bottom of the tube is just visible.
5. Note the reading from the scale on the side of the tube.
When using the Secchi disk, it is important to make sure the disk travels vertically through the water. If the current moves the disk too much, testing should be moved to a spot where the current is less strong, or weights could be added to the apparatus.
1. Lower the Secchi disk from a bridge, boat or dock into the water until it disappears. Note the number of metres/ centimetres on the chain or rope.
2. Drop the disk even further, and the raise it until you can see the disk again. Note the number of metres/ centimetres on the chain.
3. Add the results of step 1 and 2 and divide by two. This is the turbidity level.
excellent >91,5 cm good 30,5 cm - 91,5 cm fair 5 cm - 30,5 cm poor < 5 cm
Dissolved oxygen (DO)The presence of oxygen in water is an indicati- on of good water quality, and the absence of oxygen is a signal of severe pollution. Aquatic animals need oxygen to survive. Fish and some aquatic insects have gills to extract oxygen from water. Some aquatic organisms, like pike and trout, require medium to high levels of dissolved oxygen to live. Other animals, like carp and catfish, flourish in water of low dissolved oxygen. Water of consistently high levels of dissolved oxygen is usually conside- red healthy and capable of supporting more stable ecosystems consisting of different kinds of aquatic organisms. Generally, rivers with a constant DO saturation value of 90 percent or above are considered healthy, unless the waters are supersaturated due to cultural eutrop- hication. Rivers below 90 % saturation may have large amounts of oxygen - demanding materials (organic wastes).
N.B. For more accurate data use correction table next page. For non-standard pressure you

must correct the dissolved oxygen measure- ment for the effects of atmospheric pressure. Multiply your dissolved oxygen measurement by the appropriate correction factor.
Correction table for DO measurementsAtmospheric Correction factorpressure, kPa103,0 1,02101,3 1,0099,0 0,9897,0 0,9695,0 0,9493,0 0,9291,0 0,90
Methods for measuring dissolved oxygenThere are many alternatives for DO analysis. DO data can be obtained by using kits distri- buted by a number of different chemical com- panies or by the electrometric method using a membrane electrode. The iodometric method is a titremetric procedure based on the oxidising property of DO. We will describe the iodometric method.
Reagents:- Manganous sulphate solution:
Dissolve 364 g MnSO^.. H2O in distilled water, filter and dilute to 1 L.
- Alkaline iodide-azide solution:Dissolve 500 g NaOH and 135 g Nal in distilled water and dilute to 1 L. To this solution add 10 g NaNg dissolved in 40 mL distilled water.
- Sulphuric acid: concentrated.- Starch solution: Dissolve 2 g soluble starch
and 0,2 g salicylic acid in 100 mL hot distilled water.
- Sodium thiosulphate titrant:Dissolve 6,205 g ^ 2 8 2 0 3 . 5H2O in distilled water. Add 1,5 mL 6N NaOH or0,4 g solid NaOH and dilute to 1000 mL.
Procedures:1. To the sample collected in a 250 or 300
mL bottle, add 1 mL M11SO4 solution.2. To this add 1 mL alkaline iodide- azide
reagent.3. Stopper carefully, to avoid trapping air
bubbles and mix by inverting the stoppered bottle several times.
4. A precipitate or floc will form. Allow this floc to settle to about half the bottle volume.
5. When floc has settled, add 1 mL conc.h 2s o 4
6. Restopper the bottle and mix by inverting several times until all of the floc has dissolved into the sample.
7. Titrate with 0,0021 M ^ 2 8 2 0 3 solution to get a pale straw colour.
8. Add a few drops of the starch solution, which will tum the sample blue.
9. Continue titration with ^ 2 8 2 0 3 until the blue colour tums clear.
10. 1 mL of 0,0021 M ^ 2 8 2 0 3 = 1 mg dissolved oxygen/L
Dissolved oxygen, mg/L (20° C)Good - 8,0 - 9,0Slightly polluted - 6,7 - 8,0Moderately polluted - 4,5 - 6,7Heavily polluted - < 4,5Gravely polluted - < 4,0

Biochemical Oxygen Demand (BOD 5-days )The biochemical oxygen demand (BOD5) determination is an empirical test in which standardized laboratory procedures are used to determine the relative oxygen requirements of polluted waters.The test measures the oxygen required for the biochemical degradation of organic material and the oxygen used to oxidise inorganic material such as sulphides and ferrous iron. It also may measure the oxygen used to oxidise reduced forms of nitrogen.When organic matter decomposes, organic matter is broken down and oxidised by micro- organisms. BOD is a measure of the quantity of oxygen used by micro-organisms in the aerobic oxidation of organic matter.When aquatic plants die, aerobic bacteria feed upon them. In this process, organic matter is broken down and oxidised. Decaying aquatic plants and their decomposers (aerobic bacteria) demand oxygen during plant decompositi- on. Nutrient input into the river from nitrates and phosphates will stimulate plant growth. Therefore, nutrients can be a major force in high biochemical oxygen demand of rivers. Impounded river reaches also collect organic wastes from upriver that settle in quieter water. The bacteria that feed on this organic waste consume oxygen. In impounded and polluted rivers, aerobic bacteria, robbing other aquatic organisms of the dissolved oxygen they need to live consume much of the available dissolved oxygen. Organisms that are more tolerant of lower dissolved oxygen such as carp, midge larvae and sewage worms may become more numerous. Other organisms that are intolerant
of low dissolved oxygen levels, such as caddis fly larvae, mayfly numphs, and stonefly nym- phs, will not survive in this water. In waters of high BOD a low diversity of aquatic organisms will replace the ecologically stable and complex relationships present in waters contai- ning a high diversity of organisms.
Reagents(See dissolved oxygen)
Procedure:1. Fill two glass-stoppered dissolved oxygen
(DO) bottles (one clear and one wrapped in black tape) with sample water, holding them for two to three minutes between the surface and the river bottom. If sampling by hand, remember to use gloves.
2. Prepare the clear sample bottle according to the directions for the DO test. Determine the DO value for this sample in mg/L. Record on the data sheets.
3. Place the black sample bottle in the dark, and incubate for five days at 20 C.
4. After five days, determine the level of DO in mg/L of this sample by repeating the DO testing procedure.
5. Determine the BOD level. BOD = mg/L DO (original sample) minus the mg/L DO (after incubation).
Biochemical Oxygen Demand (mg/L)4 (Excellent) < 2 mg/L3 (Good) 2 - 4 mg/L2 (Fair) 4.1 -10 mg/L1 (Poor) >10 mg/L
BOD can also be made over 7 days (BOD7)

AlkalinityAlkalinity is significant in many uses and treatments of natural water and waste water. Because the alkalinity of many surface waters is primarily a function of carbonate, bicarbo- nate and hydroxide content, is talcen as an indication of concentration of these con- stituents.
ReagentsHydrochloric acid, HC1, 0,1 NSodium carbonate solution, Na2CC>3, 0,1 NMethyl orange indicator solution, 0,1%
Procedure1. To 15 mL 0,1 N Na2CC>3 solution add 85
mL distilled water, add a few drops of the0,1% methyl orange indicator solution, mix and titrate with the HC1 solution until colour tums from yellow to pink.
2. Calculate the concentration of the HC1 er V l = C2'V2 , wherecj - normality of the IS^CC^V - volume of the Na2CC>3 C2 - normality of the HC1 V2 - volume of the HC1.
3. To 100 mL of the water sample add a few drops of the methyl orange indicator soluti on and titrate with the HC1 solution until the colour changes from yellow to pink
4. Calculate HCO3' concentration x:61 • V r N- 1000x = ------ i-------------
V2Where:
V I -volume of the HC1. mL N - normality of the HC1V2 - volume of the water sample, mL
pHWater contains both H+ ions and OH" ions. Pure, deionized water contains equal number of H+ and OH" and is considered neutral (pH 7).If the sample being measured has more H+ than OH" ions, it is considered acidic and has a pH of less than 7.If the sample contains more OH" ions than H+ ions, it is considered basic, with pH greater than 7.
The pH of natural water is usually between 6,5 and 8,5.Changes in the pH value of water are impor- tant to many organisms.Most organisms have adapted to life in water of a specific pH (table 4) and may die if the pH changes even slightly.
Methods for measuring pH1. Electronic pocket-sized electronic pH
meters use for testing pH.2. Using pH test papers.
Procedures1. Dip the pH paper into the water sample for
about 15 seconds or until a colour change occurs.
2. Compare the colour from the stick to the comparison sheet included with the pH papers.

0 1 2 3 4 5 6 7 8 9 10 11 12 13 14
Bacteria
Plants (algae, rooted, etc.) Moss [Carp, roach, grayling, some insects
Perch, pike
Snails, calms, mussels
MayflyStonefly
Table 4. p H ranges that support aquatic life (see also Learners ’ Guide 2 page 34)
PhosphatePhosphorous is usually present in natural waters as phosphate P 0 4^'. Total phosphates include organic phosphorus and inorganic phosphate. Organic phosphate is a part of living plants and animals, their by-products and their remains. Inorganic phosphates include the ions H2 PO4 ' , and P0 4 ^ ' bonded to soil particles and phosphates present in laundry detergents. Phosphorus is an essential element for life. It is a plant nutrient nee- ded for growth and a fundamental element in the metabolic reactions of plants and animals. In most waters phosphorus functions as a growth-limiting factor because it is present in very low concentrations. This scarcity o f phosphorus can be explained by its attraction to organic matter and soil particles. Algae and larger aquatic plants rapidly take up any unat- tached or free phosphorus, in the form of inorganic phosphates, because algae only require small amounts of phosphorus to live. Excess phosphorus causes extensive algal growth
called "algal blooms". Algal blooms colour the water a pea soup green and are a classic symptom of cultural eutrophication.Water in advanced stages of cultural eutrophication can become anaerobic (without oxygen). Anaerobic conditions usually occur near the lake or impoundment bottom and produce gases like hydrogen sulphide which foul the shoreline with a "rotten egg" smell.Because phosphorus may occur in combinati- on with organic matter, a digestion method to determine total phosphorus must be able to oxidise organic matter effectively to release phosphorus as orthophosphate.
Reagents:Sulphuric acid solution; add 300 mL conc. H2 SO4 to approximately 600 mL distilled water and dilute to IL with distilled water. Ammonium persulphate: ( ^ 1 1 4 ) 2 8 2 0 3 solid. Sodium hydroxide: NaOH, IN.
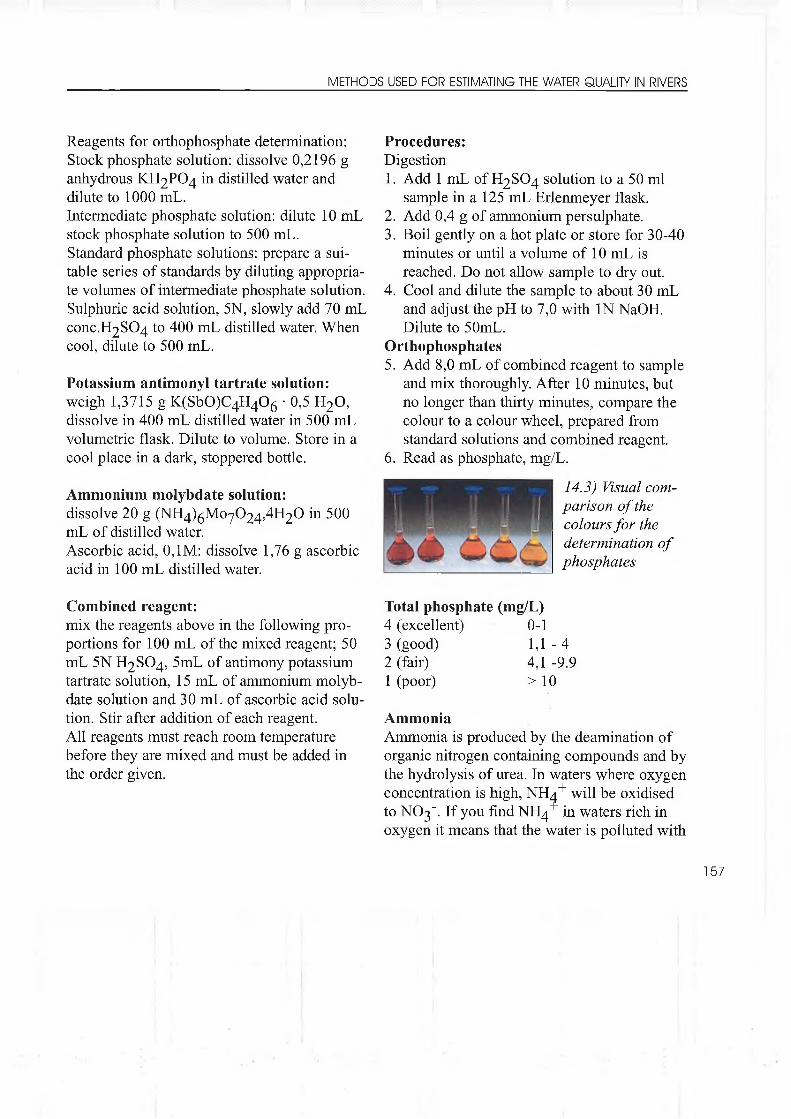
Reagents for orthophosphate determination: Stock phosphate solution: dissolve 0,2196 g anhydrous KH2PO4 in distilled water and dilute to 1000 mL.Intermediate phosphate solution: dilute 10 mL stock phosphate solution to 500 mL.Standard phosphate solutions: prepare a sui- table series of standards by diluting appropria- te volumes of intermediate phosphate solution. Sulphuric acid solution, 5N, slowly add 70 mL conc.H2S04 to 400 mL distilled water. When cool, dilute to 500 mL.
Potassium antimonyl tartrate solution:weigh 1,3715 g K(Sb0)C4H40 6 • 0,5 H20, dissolve in 400 mL distilled water in 500 mL volumetric flask. Dilute to volume. Store in a cool place in a dark, stoppered bottle.
Ammonium molybdate solution:dissolve 20 g (N H ^gM oyC ^^E ^O in 500 mL of distilled water.Ascorbic acid, 0,1M: dissolve 1,76 g ascorbic acid in 100 mL distilled water.
Combined reagent:mix the reagents above in the following proportions for 100 mL of the mixed reagent; 50 mL 5N H2SO4, 5mL of antimony potassium tartrate solution, 15 mL of ammonium molybdate solution and 30 mL of ascorbic acid solution. Stir after addition of each reagent.All reagents must reach room temperature before they are mixed and must be added in the order given.
Procedures:Digestion1. Add 1 mL of H2SO4 solution to a 50 ml
sample in a 125 mL Erlenmeyer flask.2. Add 0,4 g of ammonium persulphate.3. Boil gently on a hot plate or store for 30-40
minutes or until a volume of 10 mL is reached. Do not allow sample to dry out.
4. Cool and dilute the sample to about 30 mL and adjust the pH to 7,0 with IN NaOH. Dilute to 50mL.
Orthophosphates5. Add 8,0 mL of combined reagent to sample
and mix thoroughly. After 10 minutes, but no longer than thirty minutes, compare the colour to a colour wheel, prepared from standard solutions and combined reagent.
6. Read as phosphate, mg/L.
14.3) Visual com- parison o f the colours for the determination o f phosphates
Total phosphate (mg/L)4 (excellent) 0-13 (good) 1,1 - 42 (fair) 4,1 -9.91 (poor) > 10
AmmoniaAmmonia is produced by the deamination of organic nitrogen containing compounds and by the hydrolysis of urea. In waters where oxygen concentration is high, NH4"1" will be oxidised to NO3". If you find NH4"1" in waters rich in oxygen it means that the water is polluted with

nia are often hazardeous and harmful to the environment and methods such as the Nessler method should be avoided. Ammonium can be determined by using a spectrophotometer as well as by using sticks.
NitratesNitrogen is an essential plant nutrient required by all plants and animals for building protein. In aquatic ecosystems nitrogen is present in many different forms.Blue-green algae are able to use the molecular form of nitrogen (N2) and biologically convert it to usable forms of nitrogen for aquatic plant growth such as ammonia (NH3) and nitrates (NO3-).Because nitrogen, as ammonia and nitrates, acts as a plant nutrient, it also causes eutrophi- cation. Eutrophication causes more plant growth and decay, which in tum stimulates a biochemical oxygen demand. However, unlike phosphorus, nitrogen rarely limits plant growth, so plants are not as sensitive to increa- ses in ammonia and nitrates levels.Sewage is the main source of nitrates added by people to rivers.Other important sources of nitrates in water are fertilisers.Water containing high nitrate levels can cause a serious condition called methemoglobine- mia.
Procedure.Nitrate test strips, similar to those used for pH are used for measurement.The strips are swirled in water, removed and compared with a colour code, and read in milligrams per litre.
Nitrates (mg/L)4 (excellent) 0-13 (good) 1.1-32 (fair) 3,1 -51 (poor) > 5
NitritesNitrite is an intermediate oxidation state of nitrogen, formed both in the oxidation of ammonia to nitrate and in the reduction of nitrate. Such oxidation and reduction may occur in waste water treatment plants, water distribution systems and natural waters.Nitrite is the actual etiologic agent of methem- oglobinemia. Nitrous acid, which is formed from nitrite in acidic solution, can react with secondary amines to form nitrosamines, many of which are known carcinogens.
Discussion questions:1. What impact does pH have on water
quality?2. What factors influence BOD?3. If the temperature difference was great,
what possible effects might thermal pollution have?
4. If you found high levels of nitrates, what are the possible sources?
5. What factors might contribute to turbidity levels?
6. How might turbidity affect dissolved oxygen concentration?
7. What might explain a high phosphate level in river water?

INVESTIGATION OF THE AQUATIC VEGETATION by Andris Urtans
All higher aquatic plants and those of the lower groups visible without magnifying lenses are defmed as macrophytes.Principally they consists of aquatic vascular flowering plants, aquatic mosses, liverworts, fems and macroalgae.By studying the aquatic vegetation in water- courses we can obtain detailed information not only dealing with the State of the watercourse but the recent changes to it as well. Macrophytes are recorded taking up passing nutrients not only through their roots, but also through their leaves and even stems. In con- trast to many aquatic animals, who can escape dangerous substances in water by flowing or creeping away, macrophytes have to withstand all kinds of changes.The macrophyte vegetation changes when the environment surrounding it changes but more slowly than microscopic phytoplankton and water animals do. In this way macrophytes reflect the changes that have taken place during a longer period of time.Many macrophytes have definite tolerance threshold to pollution. Therefore waterplant stands and their State can tell us a lot about a given watercourse.
Vegetation MappingBy visiting a watercourse several times and mapping macrophytes you can leam what has happened to the river since the previous visit. It can be done in several way s.
In smaller and shallower watercourses it can be done following the watercourse along the bank and making a scaled sketch of the river. In the sketch the boundaries of emergent and submerged vegetation is recorded. It can be done without wading into the water.In deeper and wider rivers observation and mapping of macrophytes can be done using a boat. In both cases submerged vegetation can be measured and investigated by using a rake with slightly bent rake tines and a long (2 - 3 m) handle. Mark the handle so it can be used to measure the depth of the given watercourse as well.To determine submerged vegetation in clear water you can use a viewing box (usually a plastic or wooden box with a watertight glass or plastic lens).In slow flowing rivers during summer time one can use a snorkel, which enables plants to be observed in their native environment. Sometimes to describe the distribution of macrophytes in a watercourse it is useful to make a sketch of the vegetation across the river. To make such a sketch of the vegetation profile pull a marked string across the river and then describe the macrophytes in each metre, at the same time taking a record of the depth. In deeper watercourses such descriptive profiles can be done attaching the end of the marked string to the pole at the deepest point, where the vegetation disappears.Then using the boat follow the profile and describe the vegetation as you did in the shallow water.

Recording of MacrophytesThe easiest way is to record macrophytes right where they are growing, but this is not always possible. Talten out of the water submerged and floating-leaved water plants quickly lose water from their tissues and shrink as they dry out, in the process making their recording more complicated.To keep the natural shape of macrophytes, shake off excess water and put them away in plastic bags and investigate some hours later in a school lab where you can use different identi- fication books.Do not postpone it to the next day.
Macrophytes will quickly start to decay.To describe the composition of river vegetation one has to record their occurrence in 2 x 2 m^ or 10 x 10 m^ plots.
Sometimes in narrow watercourses it is impos- sible due to the very sparse occurrence of simple plants or their patches.In such cases it is best to record all the plant species you find in a 100 metre long stretch of the river.
Vegetation Co verageIn many cases vegetation cover in a watercourse indicates the content of nutrients in water and sediments.Coverage of vegetation can be estimated visually.To do it, roughly divide the river into 10 metre wide sections and make an approximate esti- mate of the coverage of all the emerged, submerged and floating-leaved water plants you can observe in the given section.Add it up and try to express the water plant coverage as a percentage.This method is rather rough, but can provide you with important information. It is observed that plant coverage above 30% starts to clog the natural flow of watercourses and creates obstacles for river maintenance.
Observation points (stations)The best places for arranging permanent observation stations are bridges Crossing the rivers. Elevated river banks are also excellent observation points. From here you can clearly observe several tens of metres of river flow and the associated vegetation zones. To be sure that your chosen river stretch is typical of the given watercourse, it is advisable to make a preliminary survey of a 100 - 200 metre long stretch.
Always follow the safety code. It is not recom- mended to wade in water alone or make fun by jumping in the river from the bank!

TABLE 5: IDENTIFICATION OF PLANTS
Plants with fully or partly immersed leaves
Freely floating plants _________ i______
Leaves and stem togehterLeaves oval,
whole or divided
------------------------ !Leaves and stems of plants emerges from the water
Leaves prolonged, linear, barrel like
Leaves and stem separately
23.
Lemna Spirodela Lemna Hydrocharis Sium Alisma Butomus Sparga- Typha Typha Juncus minor polyrhiza trisulca morsus-r. latifolium plantago- umbella- nium latifolia angustifolia efffusus
aquatica tus
Equisetum Acoruscalamus
Leaves narrow, fine Leaves broad Floating leaves ribbon like
hyllum hyllum culus getonpectina-
tus
lutea haeaalba
geton canadensis geton perfoliatusnafans lucens
niummin.
emersum sagittifolia

TABLE 6: IDENTIFICATION OF GROUPS OF BENTHIC ANIMALS
Have not Legs
V S Å /Falsø Legs
Shell consist of 2 parts
1 Tail appendages
BodyProlonged
COURTSEY Bernu Vides skola. 1997

WATER QUALITY BY INDEX METHODS by Ingvar Lennerstedt
The Protoeol records the findings of the investigation in the form of primary material. The Protoeol and how to handle it is described in appendix 1 .
Page 1 deals with general information,page 2 with animals,page 3 with plants, andpage 4 with physical and chemicalparameters.
The student group working with the protoeol is encouraged to carry out an evaluation of the findings, noted in last section of protoeol (91, 92, 93, 94).The purpose is to stimulate ideas about how the conditions may be improved where they live and by actions of the students themselves.
Evaluations of river studies often end with a numerical value of water quality. It is easy then to compare values from different parts of the same river and between different rivers. There are several methods available to arrive at such a numerical value of water quality.
This chapter describes the Trent Index, the Macro Index and the Saprobity Indexmethods for water quality evaluation. To apply any of these methods you need some experience and training in species identification.
The Trent and Macro Index methods arevarieties of the same basic idea. They use cert- ain animals as indicators of water quality.The task is to look for those animals, which relies on considerable skill in species or genus determination.
The Saprobity Index method means a mathematical calculation of water quality based on extensive scientific research.The animals in the river need to be collected systematically and quantitatively. Each animal is given a value and the water quality calcu- lated by a mathematical formula.Many authors have raised objections to this method on the grounds that so many factors influence the occurrence of animals that it is impossible to determine a reliable value for each species. Even the basic approach has been questioned.If you want to estimate water quality according to any of the methods, we propose you contact a local environmental authority or scientific centre doing such examination and obtain more detailed information on the method.The result of water quality estimation may be noted in the Protoeol (90).
Remember, it is your evaluation of the find- ings expressed in words that is the important issue and the most interesting for other students to read (91, 92, 93, 94).

Trent Index Method
The Trent Index method is based on the observation that the macroinvertebrate groups Plecoptera, Ephemeroptera, Trichoptera, Gammarus, Asellus, red chironomides and Tubificidae disappear in this order as the nutrient level of a river rises. These animals are used as indicators of water quality.F.S. Woodiwiss developed the Trent Index method in 1964 from a study of the Trent River in Britain. It is widely used in European countries, and it has been modified several times. In Denmark the version used is called the Macro Index Method, as described on pages 166-167. Here we report on a version of the Trent Index used in Sweden and presented in 1995 to a BSP teachers training course by N. Jansson, Linkoping, Sweden.There are some more sophisticated versions of the Trent Index method in use in Swedish aut- horities and companies monitoring water quality in rivers.
The first step is to calculate a sensitivity figure. This may be done according to the River Protocol. You take the number of clean water animal species (protocol, space 51) and sub- tract the number of polluted water species (52), to amve at the sensitivity figure (54).The second step is to determine the water quality on a 7-point scale, Table 8. For this purpose, you use the schedule in Table 7.
The working procedure is as follows.Table 7 has four columns with sensitivity figures <1, 1-3, 4-9, and >9. You find the column that fits your findings and then deter
mine the appropriate category. To do this, the animals have to be identified according to species, which should be done in the laboratory with the help of species examination keys.This may be a difficult task for inexperienced students. The animals are classified into 5 categories i.e. the five rows in Table 7.
Category 1 comprises animals that live in very clean water. If two or more of the mentioned species are found you follow the top row and depending on the sensitivity figure you choose class 3, 2, or 1.If only one species is found you follow the bottom row to reach classes 4,3, or 2.If no Category 1 species is present you should go straight to Category 2, comprising animals that can live in slightly eutrophicated water.If none of the species in Category 2 is present you go to Category 3.If the objections are valid, you choose Category 4.
You go down the table and stop at the category that best fits your findings and read off the appropriate water quality class.
If you use the Trent Index Method you should record the water quality value at (92) in the Protocol.
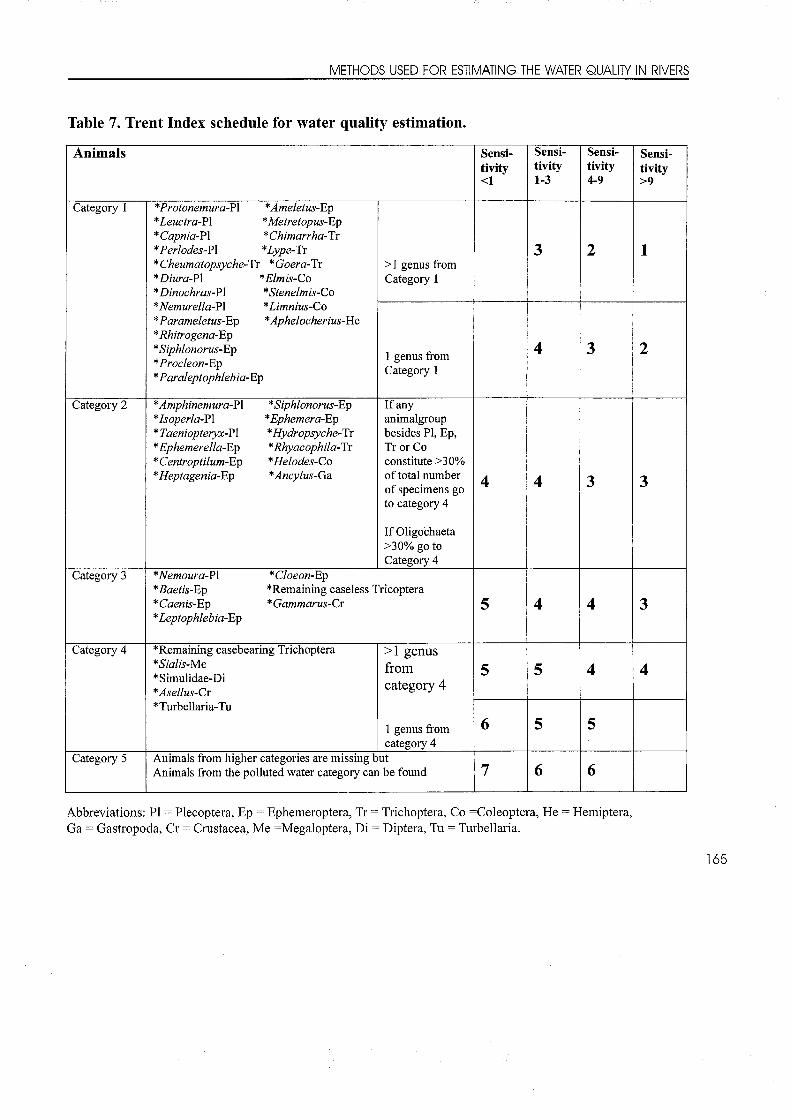
Table 7. Trent Index schedule for water quality estimation.
Animals Sensi-tivity<1
Sensi-tivity1-3
Sensi-tivity4-9
Sensi-tivity>9
Category 1 *Protonemura- PI *Ameletus-Ep *Leuctra-PI *Metretopus-Ep *Capnia- PI * Chimarrha-Tv *Perlodes-P\ *Lype-Tr* Cheumaiopsyche-Tr *Goera-Tr *Diura- PI *Elmis- Co *Dinochras-PI *Stenelmis-Co *Nemurella-P\ *Limnius-Co* Parameletus-Ep *Aphelocherius-He* Rhitrogena-Ep* Siphlonorus-Ep *Procleon-Ep *Paraleptophlebia-Ep
> 1 genus from Category 1
3 2 1
1 genus from Category 1
4 3 2
Category 2 *Amphinemura-P\ * Siphlonorus-Ep* Isoperla-P\ *Ephemera-Ep* Taeniopteryx-PI *Hydropsyche-Tr* Ephemerella- Ep * Rhyacophila-T r* Centr optilum-Ep * Helodes-Co* Heptagenia- Ep *Ancylus-G'&
If anyanimalgroup besides PI, Ep, Tr or Co constitute >30% of total number of specimens go to category 4
If Oligochaeta >30% go to Category 4
4 4 3 3
Category 3 *Nemoura-P\ *Cloeon-Ep *Baetis-Ep *Remaining caseless Tricoptera *Caenis-Ep * Gammarus-Cr *Leptophleb rø-Ep
5 4 4 3
Category 4 *Remaining casebearing Trichoptera*Sialis-Me*Simulidae-Di* Asellus-Cr*Turbellaria-Tu
>1 genus fromcategory 4
1 genus from category 4
5 5 4 4
6 5 5
Category 5 Animals from higher categories are missing but Animals from the polluted water category can be found 7 6 6
Abbreviations: PI = Plecoptera, Ep = Ephem eroptera, Tr = Trichoptera, Co =Coleoptera, He = Hemiptera, Ga = G astropoda, Cr = Crastacea, M e =M egaloptera, Di = Diptera, Tu = Turbellaria.

Macro Index methodThis method is based on indicator animals like the Trent Index method.The Macro Method was developed in Denmark by Andersen et al (1984) and has been used in Danish schools. This presentation is based on Abrahamsen (1994).
Table 9 is a schedule for the calculation of the Macro Index. It ends with 11 water quality categories. Compared with the Trent method, the columns with diversity values replace the columns with sensitivity values, and the rows with key groups replace those with categories. The working procedure is similar.The animals are collected and classified into groups as is done in the River Protocol (49).To get a diversity figure you count the number of animal groups recorded.You exclude groups marked with an asterisk as these animals are also counted in other boxes. The maximum diversity figure is 19.Note that this diversity figure is not the same as that recorded at (55) that refers to the total number or species or genera.
The diversity figure is incorporated into Tab le 8. There are five columns with diversity figures: 0-1, 2-5, 6-10, 11-16, and 17-.You need to find the column that fits your diversity figure.The schedule has 7 Key Groups, shown as rows 1-7.The first key group is plecopterans. If you have caught some plecopterans you use this key group. If no plecopterans are present you should go on to Key Group 2, which deals with ephemeropterans.
If there are no ephemeropterans you go to Key Group 3 dealing with trichopterans. You conti- nue down the table until you find the relevant key group.
Assume that you have found plecopterans in the samples and arrived at Key Group 1.Then you have to decide how many plecop- teran species there are and especially of at least one of the two species Nemoura cinerea and Leuctra fusca, which live in slightly eutrophic water. In practise it is a difficult task to differentiate these species from related species. This has to be done in the laboratory with the help of books with examination keys, and it needs considerable experience.If there is more than one species and no Nemoura cinerea and Leuctra fusca, you use the top row; depending on the diversity figure, you look for the appropriate Index Number 7, 8, 9, 10.
If there is only one species and no Nemoura cinerea and Leuctra fusca, you use the middle row and choose one of the index numbers 6, 7, 8, or 9.If you have found Nemoura cinerea and Leuctra fusca but no other plecopterans you should follow the arrow and go down to Key Group 3 on the bottom row.If you end on Key Group 2, ephemeropterans, the procedure is the same. You have to look for Baetis rhodani and Cloeon dipterum, both of which are difficult to identify.There are three rows to choose between. Working through the schedule you end up with one of 11 water quality categories: 10-9-8-7-6- 5-4-3-2-1-0-00.

Table 9. Macro Index schedule for estimation of index number.
Key group NormalMethod
QuickM ethod Diversity figure
0-1 2-5 6-10 11-16 1 7 -
1. Plecoptera>1 species
7 8 9 10
1 species □ - 6 7 8 9
Nemoura cinerea Leuctra fusca □ C h
- - - - -
2. Ephemeroptera>1 species - 6 7 8 9
1 species □ - 5 6 7 8
Baetis rodhani Cloeon dipterum □ D i
- - - - -
3. Trichoptera >1 species - 5 6 7 8
1 species □ □ -4 4 5 6 7
4. GammarusNo animal above present 3 4 5 6 7
5. AsellusNo animal above present 2 3 4 5 6
6. Red Chironomus 1 2 3 4No animal above present
Tubifex 1 2 3 - -
7. Eristalis No animal above present 0 1 2 - -
No living invertebrates 00 - - - -
Note (i). I f tw o boxes in Key Group 1, Plecoptera, are ticked, go to tw o boxes in Key Group 3, Trichoptera Note (ii). I f two boxes in Key Group 3, Ephem eroptera are ticked, go to two boxes in Key Group 3, Trichoptera.

Category 5 is in the middle of the scale.Water in categories 00, 0, 1 and 2 is heavily polluted by human activities; these classes are very rare in natural rivers, even in nutrient rich catchment areas.
To avoid the difficult identification of species, there is a quick method, also shown in the schedule of Table 8.The quick method is particularly suitable for polluted water.If the water is eutrophic many species of plecopterans, ephemeropterans, and trichopterans disappear. Therefore you can look for signs of eutrophication.The signs are listed in Table 9 as 7 boxes. You study the river and record how many boxes apply to the river conditions. If, for example, you have found plecopterans and ticlced one box, you would use the middle row of Key Group 1.If you find plecopterans and have ticked two or more boxes you should follow the arrow down to Key Group 3.If you use the Macro Index method you should note the result at (92) in the Protocol.
Table 9. Boxes indicating eutrophication
□ Outlets of wastewater from the community□ Bottom vegetation missing□ Luxuriant emergent vegetation□ Water colour strongly green□ Reduced oxygen content in water□ Muddy water, or unnatural smells□ Bottom with black sediments, or tufts of
fungus on the bottom.
Saprobity Index methodThe Trent and Macro methods use animal species as indicators of water quality.The Saprobity method adopts a different approach. It focuses on the amount o f organic material and nutrient salts, the Saprobity, the basic conditions for life in the water. It presup- poses that saprobity can be expressed on a mathematical scale, as shown around the circle in Figure 14.4. Every species has a saprobity value on this scale. The Saprobity Index of a water is calculated in a mathematical way from the occurrence and abundance of species, the formula being shown below.The Saprobity method has been developed over many decades of scientific research.V. Slådecek in 1973 proposed the introduction of saprobity values of species. Since then the scientific basis has been revised several times and the method modified accordingly.The method has been extensively used in different central and eastem European countries.
The idea of the Saprobity method is graphical- ly shown as a circle, Figure 14.4. Water is di- vided into four categories (L, E, T, and C). Each category occupies lA of the circle. The limnosaprobic category (L) represents the surface water of rivers and lakes. The eusaprobic category (E) deals with wastewater with microbial life but polluted by domestic or industrial activities. The toxic sector (T) com- prises wastewater that has no microbial activi- ty due to toxic or radioactive substances. The catharobic sector (C) represents pure ground water. The left half of the circle shows different types of natural waters, the right half wastewaters.

The upper half shows waters with living processes, the lower half waters without life.The natural waters area (L) has five sections, xenosaprobic (x) for spring water, oligosapro- bic (o) for clean water, betasaprobic (b) and alfasaprobic (a) for water with more organic material, and finally polysaprobic (p) for water rich in organic material. The bioactive waste water (E) has four sections, dominated by cili- ates (i), zooflagellates (m), bacteriae (h) and spores and cysts (u).As scientific knowledge has advanced, however, many scientists no longer agree with this way of looking at life in water.
One important factor in the saprobity system is the amount of organic material. It is determined by measuring the biological oxygen demand over a period of 5 days, BOD5. A second factor is the content of oxygen, O2 . Both factors are important in the saprobity concept. They are shown in Figure 14.4 as arrows with values noted on the graphs.The arrows run in opposite directions. When oxygen content decreases, the organic content increases, but there is no inverse relationship as may be deduced from the figure.The basic idea of the Saprobic method is that the degree of saprobity can be expressed by a mathematical value. Slådecelc proposed a scale from -0.5 to 8.5, shown around the circumfe- rence of the circle in Figure 14.4.The idea is that each species has a saprobity value, a mathematical figure.Many scientists claim that it is impossible to determine a reliable saprobity value. Conditions in nature are so variable and con- trolled by so many factors that it is practically
impossible to arrive at a single value for each species. When studying a river, the sampled animals are identified according to species or genus. In a particular river, there may be many different animal and plant species, each with a Saprobity value. If there are many individuals of a particular species, it indicates a better water quality than if only one individual is present. Therefore, the sampling of animals must be carried out in a quantitatively reliable way. And it has to be repeated in different micro-habitats of each river section. This is a difficult task for inexperienced students.Now we tum to the calculation of the Saprobity Index. It is calculated using the following mat-hematical formula. It is a simplifi- ed version of the more scientific ones in use.
Saprobity ^ sum 0f a |j sp ecjes products (v x n) Index num ber o f all individuals (N)
S = Saprobity Index,v = the scientifically determined saprobity
value of the species, n = number of individuals of that species, and N = total number of individuals in the investi-
gated area.
The Saprobity Index may be used to describe the degree of pollution of a river. H. Liebmann (1962) proposed four pollution zones, which have been widely used: I, II, III, and IV.These zones are not based on raw saprobity figures, but on a derived Saprobity Index. Liebmann's pollution zones are shown outside the circle in Figure 14.4. Table 10 also descri- bes the degree of pollution in words.

Table 10: Degree o f pollution
Saprobity Pollution WaterIndex Zone Quality
0.0- 1 .5 I Clean1.5-2.5 II Clean to slightly polluted2.5-3.5 III Polluted3.5-4.0 IV Heavily polluted
14.4) Circular diagram summarising the theory o f the Saprobic Method.For explanations, see text (After Abrahams en 1994).
References• Abrahamsen, S.E. (1994.) Biologiske
ferskvandsundersogelser. Teknisk forlag, Copenhagen.
• Andersen M.M., Rigét F.F. and Sparholt H. (1984) A modification of the Trent index for use in Denmark. - Water Res. Vol 18, No 2, sid. 145-151.
• Jansson N (1995) A modification of M.M. Andersen et al's. new index (a modification of the Trent index) presented on a BSP River Course for teachers in Motala Sweden.
• Liebmann, H. (1962). Handbuch der Frischwasser- und Abwasserbiologie. Miinchen.
• Slådecek, V. (1973). System of water quality from the biological point of view. - Arch. Hydrobiol., Beitr. Ergebn. Limnologie (Stuttgart) 7, p.1-128.
• Woodiwiss F. S. (1964) The biological system of stream classification used by the Trent River Board. - Chem. Ind. 83,No 1, sid. 443-447.

WATER QUALITY ESTIMATION METHODOLOGY IN LATVIA by Loreta Urtane
Every aquatic organism can serve as an indi- cator. If we know at least roughly its environmental requirements we are able to assess the water quality according to its presence and, in some cases, even according to its absence. Because there are no single species on a habitat the composition of the community gives a complex of information about properties of the surrounding water: planktonic community about the water, benthic and littoral ones about the conditions on the bottom and near the shoreline. The more species within the community under examination, the more precise is the resulting classification. Saprobity is the state of water quality with respect to the content of putrescible organic material, as reflect- ed by the species composi-tion of the community. Thus saprobity is a biocoenotical expres- sion ofBO D 5. A community indicates the saprobic level (=state, degree, zone) prevailing over a period of time sufficient for its develop- ment. Saprobity is indicated by the communi- ties of organisms which reflect the amount of putrescible organic matter and the intensity of its decomposition.The saprobity index "S" was introduced by Pantle and Buck (1955) in order to replace the subjective estimation by an objective calcula- tion and has the following formula:
S - Saprobity Index (River Quality level)
s - Numerical value of each species
H - Class of the organism number in the sample
This method is based on the assumption that each river water quality level has its numerical value, so too each organism in accordance with its preference to live in clean or polluted waters, is given a defmite numerical value. Students can fmd the numerical value of a defmite species in a table.The primary goal of the saprobiological ana- lysis is the quick classification of the community under examination. A skilled biologist is able to predict for example the BOD5 value within a few minutes whereas the chemist must wait 5 days.The extended saprobic index "S" forms a universal scale of water quality providing a classification for the practical use of water.
Eutrophication means the increase of growth of algae and other aquatic plants as a consequ- ence of increased input of mineral nutrients (mainly P, N, C, K, Ca). Every aquatic organism can serve as an indicator.If we know at least roughly its environmental requirements we are able to assess the water quality according to its presence and, in some cases, even according to its absence. Because there are no single species in a habitat the composition of the community gives a complex of information about the properties of the surrounding water: the planktonic community about the water and the benthic and littoral ones about the conditions on the bottom and near the shoreline respectively.Both sources of information may not agree. The more species within the community under examination, the more precise is the resulting classification.
S um (s x H )
S = -

SamplingTo carry out the sampling the student stands in the water facing upstream. To sample all organisms contained in the upper layer of the bottom, the bottom must be disturbed.
14.5) In weedy places the net must be directed from the bottom upwards along the stems o f water plants thus sampling organisms living between or attached to the water plants.
14.6) Then with the help o f a net produce a gliding movement along the surface o f the river bottom. In this way you collect benthic organisms together with different items found on the bottom - organic and wooden debris, as well as mineral gravel and sand particles.
2
This method requires a fixed area - usually lm . In this way comparison between samples can be made.

Processing of the sampleThe net sample is transferred to a plastic tub, in which some river water has been added beforehand. Then with tweezers pick out all organisms and transfer them to a bottle half filled with water.
When all organisms from the tub are collected, students can start to identify organisms and evaluate water quality. It can be done in the school lab or on the river bank. To do this, animals from the bottle are transferred back to the tube. From the tube organisms are picked out and transferred to smaller tubs in
such a way that in each of them only organisms belonging to the same group of organisms/ species are collected.Working at the river it is not necessary to transfer organisms from the tub to the bottle. Organisms belonging to the same group/species are directly transferred to the smaller tubs.
14.8)Grupa Suga Skaits Skaita
klase HAtzlm e
Sj
A tzlm es reizinåjums
ar skaita klasi (SjxH)
Matoms - Gordius aauaticus 0,8Strautenes - PlecoDtera Visas suaas t.OMakstenes - Trichoptera Rhyacophvla sp. 0,85
Aaraylea so. 1,4Anabolia so. 2,0Goera sp. 1,5Halesus sp. 1,0Hydropsyche sp. 1,75Leptocerus sp. 1,7Limnophilus so. 1,55Molanna anqustata 1,0Myslacides sd . 2,1Oxyethira sp. 1,3Polycentroous sd. 1,65Stenophylax sp. 1,25Citas makstenu suqas 1,5
Spares - Odonata Strautu zilspåres - Aprion sp. 1.1Smaraqdspåres - Cordulia sp. 1,55Dréspares - Aeshna sp. 2,0Upiu spares - Gomphus sd. 2,5Citas SDåru suaas 2,0
Mazsaru tårpi - Oligochaeta Naididae 2,0Stobrintårpi - Tubificidae 3,8
D§les - Hirudinea Rlkldéle - Erpobdella niaricolis 2,25Rikldéle - Erpobdella octaculata 3,0Parastå qiiemidéle - Glossiphonia complanata 2,5Plakandéle - Glossiphonia heteroclita 2,4Parastå iokldele - Haemoois sanpuisuqa 1,7Punktotå olåtndéle - Helobdella staanalis 2,8Zivju déle - Piscicola aeometra 2,0
Planårijas - Turbellaria Baltå planårija - Dendrocoelum lacteum 2,0Tumåå duqéziia - Duaesia luoubns 1,6Niknå olanåriia - Planaria torva 2.2
IdentificationStudents using an identification scheme (14.8) identify organisms belonging to the bigger groups.
Practical calculation of River Water Quality involves some students using a Work sheet. The Work Sheet is filled in step by step at the same time that Water Quality is determined.

Calculation of W ater Quality
The steps to fill in the Work Sheet are as follows:
1 . step - determine the number of individuals of each species/organism group in Im^, i.e. the number of organisms from the tub must be written in the 1. column
2. step - obtain class H of the organism number in the sample for each species/ groups of organisms, i.e. one must fill in the 2. column, using the table "Classes of Organism Number"
3. step - obtain the sum of all organism number classes, i.e. add them all up
4. step - multiply the respective class of the organism number with the appropriate numerical value of each species and fill in the 4. column
5. step - add together all the multiplied values obtained in the 4.step
6. step - divide the sum of column 4 by the sum of column 2.
Table 11. Number classes of Organisms
Number o f organisms Class o f the organism number - H
1 - 4 organisms 1
5 - 3 4 organisms 2
3 5 - 4 9 organisms 3
50 - 94 organisms 5
95 -1 4 9 organisms 7
More than 150 9
Table 12. Estimation of W ater Quality
Numerical Value of Water Quality
Degree of River Water Quality
O 0 1 t/l Clean
1,5 -2 ,5 Clean to slightly polluted
2 ,5 -3 ,5 Polluted
3 ,5 -4 ,0 Heavily polluted
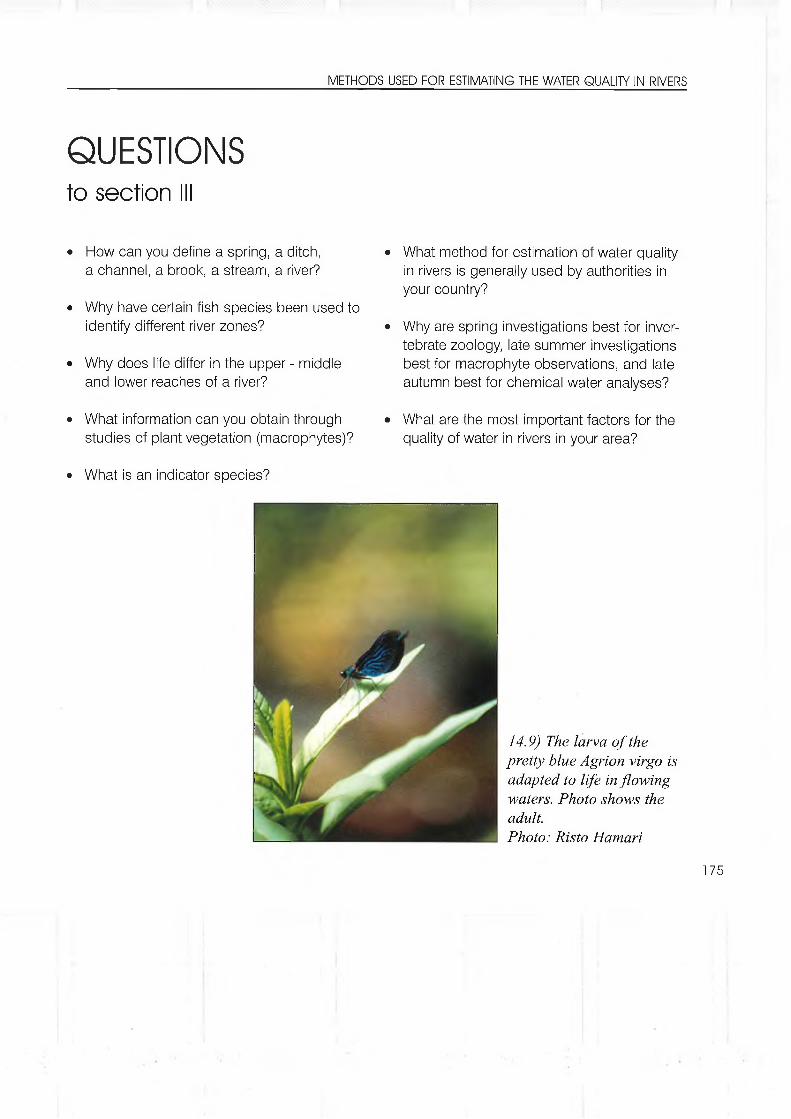
QUESTIONSto section III
• How can you define a spring, a ditch, a channel, a brook, a stream, a river?
• Why have certain fish species been used to identify different river zones?
• Why does life differ in the upper - middle and lower reaches of a river?
• What information can you obtain through studies of plant vegetation (macrophytes)?
• What is an indicator species?
• What method for estimation of water quality in rivers is generally used by authorities in your country?
• Why are spring investigations best for inver- tebrate zoology, late summer investigations best for macrophyte observations, and late autumn best for chemical water analyses?
• What are the most important factors for the quality of water in rivers in your area?
14.9) The larva o f the pretty blue Agrion virgo is adapted to life in flowing waters. Photo shows the adult.Photo: Risto Hamari

15.1) Wetlands help reduce the amount o f nitrogen outlets to rivers, streams and eventually coastal waters and the Baltic Sea from diffuse sources.Due to anaerobic conditions in wetland soil types, meadows etc. NO j (nitrate) will be reduced to gaseous by bacteria and the gas is then emitted to the atmosphere.Removed nitrogen thus cannot serve as nutrients to enrich the growth o f phyplankton, epiphytes and macrophytes.
The river Gramå, Denmark, September 1998. Photo: Birthe Zimmermann

Section IV.WORKING FOR BETTER QUALITY OF RIVERS IN THE BALTIC SEA REGION
Chapter 15: River Channelisation and Restoration 1 78How to A ffect the Future of the Local River Env. 182
C hapter 16: Students' ExamplesSweden: Fontinalis and Heavy Metals 184Poland: The Iron Bridge 186Poland: Slepiutka Stream in Katowice 187Lithuania: The Smeltaite River Park 188
Appendix: Protoeol to be used in the BSP program m e "Rivers" 191Index 201
Chapter 15:RIVER CHANNELISATION AND RESTORATION- Reasons and Methods by Andris Urtans
'T' hy do we need to restore rivers and streams?' People have always tried to hamess rivers to serve their own needs. Unfortunately in
many cases it was done ignoring the integrity of the rivers and many of them have become artificial channels with unstable and unfavourable living conditions.
During the last two hundred years throughout the Baltic the river systems have been dramatically altered by human action.The changes have been brought about directly by dams and reservoirs and channelisation, and indirectly by land-use developments throughout the drainage basins.
This has led to the loss of many common and widespread species.Now it is widely accepted that restoration of degraded streams must be based on an holistic approach which considers the whole catchment. In the same time one must understand that rivers have undergone such dramatic changes that restoration of stream habitats towards pristine conditions is in most cases a utopian view.
On the other hand rivers still are the most efficient natural domestic waste water treatment plants. Thus successful stream restoration has to be based on an understanding of the processes in watercourses as well as in the adj acent terrestrial (riparian) part and the river. Restoration has to be looked at as an art to find the compromise between biodiversity and human needs.

River channelisation has led to the reduced contact between the stream and its surrounding environment with the following effects:
• A change in channel stability. After channelisation (channel straightening, deepening and creation of steep slopes) streams are hydrodynamically unstable and they make attempts to recreate a more stable form by eroding banks. Instability is aggravatedby the removal of riparian vegetation. As a result, bank erosion, sediment transport and often deposition increases in the channel.
• Significantly reduced nutrient retention capabilities and reduction in water transit time through the river. This has led tostreams becoming little more than transport ditches in terms of their nutrient dynamics with decreased self cleansing capacity and directly increased transport of nitrogen and phosphorus to the sea.
• Changes in the stream hydrograph.Greater peak discharges have often resulted from installation of more efficient drainage infrastructures, particularly tile-drain net- works connected to deep, straightened and monotonous channels with the following reduction of surface and subsurface water storage areas. As a result of drainage, most surface runoff enters streams directly without passing through a riparian buffer strip. This reduces groundwater recharge
• An increase in light penetration to the stream. With the removal of trees and bushes along the stream, aquatic macro
phyte production is enhanced. Macrophyte growth in tum, slows water flow, increasing sedimentation. Streams may therefore have to be dredged more often to prevent flooding.
• A depletion of flora and fauna around and within the stream. Drainage and channelisation allow riparian areas to be con- verted to farmland destroying marginal wet- land areas. Benthic stream habitats are simplified and repeatedly disturbed by silta- tion and subsequent dredging.
TechniquesThere are several importnat techniques for restoring and maintaining the biodiversity and multifunctionality of rivers. These techniques include:• Installation of buffer strips• Environmentally sensitive maintenance of
rivers.• In-channel modifications• Remeandering of straightened streams.
Such activities and combinations of techniques have been effectively carried out in more than 200 project schemes in South Jutland, Denmark, as well as in Sweden and Germany. Schemes for the installation of effective buffer strips have been developed in Estonia.There are several successful projects of river restoration in Lithuania and Latvia as well. Each technique is intended to reach particular goals and is briefly described below.
Installation of Buffer stripsOne of the most significant features of the riparian zone is its capability of reducing the input of nutrients entering the river by surface and subsurface flow. There is fairly consistent evidence that both phosphorus and nitrogen is very effectively removed by small but appropriate ly managed buffer zones only 10 metres in width.The reintroduction of trees and bushes along stream banks can be an additional and valu- able technique in river restoration to increase biodiversity in both the river and riparian zones.This is due to the faet that woody vegetation can stabilise stream banks, provide habitats for fish and aquatic invertebrates amongst their roots, shade the river itself, as well as provid- ing additional space (microhabitats) for terrestrial plants and animals.
Environmentally sensitive maintenance of riversEnvironmentally sensitive maintenance of rivers may include activities such as the following:
• Aquatic plant - macrophyte cutting is acceptable only when necessary and with local variations, but in straightened streams macrophyte cutting must be sinuous with some vegetation left along the banks. Macrophyte cutting is allowed with minimum sediment disturbance to keep the aquatic benthic community intact.
• Cutting of the bank vegetation is allowed only when necessary.
• During dredging or maintenance of rivers gravel and stones must not be removed from the streams.
• Overhanging banks, roots etc, are to be maintained if possible.
IN-CHANNEL MODIFICATIONS
Side slope reductionOne of the main problems in channelized streams is bank failure along channel sides as a major source of stream sediment. Sedimentation can be so great, that such water courses have to be dredged every few years to maintain flood capacity. In such streams the benthic animal community becomes quickly suffocated and buried in sediments.At the same time dredging drastically - up to 60% ,decreases the number of benthic fauna species compared with the previous state of the river. Thus streams become biologically more and more impoverished. To decrease sedimentation processes, the reduction of the steep banks of channelised streams and stabilising them with vegetation are of the highest importance.
Riffle-pool sequencesIn natural streams riffles and pools occur at more or less regular intervals, thus providing aquatic communities with a variety of microhabitats. Installation of riffle-pool sequences increases the physical complexity of streams.It is proved that even placement of several stones in appropriate stream conditions signifi- cantly increases the diversity of the given river stretch.

Remeandering of straightened streams.In natural streams meanders prolong the con- tact of passing water for benthic communities which filter, sediment and transform organic matter in such a way that they can act as self purification units whose efficiency is directly connected with the treating and cleansing period. It is evident that in straightened streams this period is extremely short. Reconstruction of meanders is not always easy, particularly since the original straighte- ning of channels was often accompanied by channel deepening.Re-meandering of streams requires expert advice dealing with hydrology and geomor- phology in order to create a system which is appropriate for the hydrological regime and substrate type found in the river.
Riparian buffer zones.In recent decades more and more surprising information is obtained dealing with the extremely important role of the terrestrial area adjacent to the river channel.Rivers and their hanks create multifunctional and mutually interacting systems with the river as a medium for aquatic life and the river edge as a medium for terrestrial plants and animals. The meeting zone where aquatic media and terrestrial media met each other is called the Riparian zone. This zone is extremely important especially in areas in which intensive agri- culture is carried out.The vegetation located in riparian zones affe- cts the health of the catchment environment in a variety of ways. Riparian vegetation provides food for animals and other organisms living in and near the water. This food mainly occurs in
the form of falling leaves, branches and logs. Insects attracted to the riparian zones become part of the food supply when they fall into the water or lay their eggs there. Many animals depend upon logs and branches as a source of shelter. These large forms of debris also affect the flow and thus provide better living conditions for some animals. Overhanging trees provide shade that lowers water temperatures and prevents an imbalance in the amount of plant growth. The riparian vegetation also protects banks from erosion. Plants have the ability to absorb nutrients and pollutants. Thus they act as a buffer and a filter to reduce the amount of pollutants entering the water
Most essential functions of the riparian zone are:• They protect banks of water bodies from
erosion,• They absorb and filter polluted surface and
subsurface flow from intensively managed adj acent agricultural fields. They can reduce sediment-bound phosphorus and nitrogen to streams by 80-87% and ground water nitrate inputs by more than 90%.
• They deter intensive growth of aquatic macrophytes through canopy shading,
• They create microclimates.• They create shelter for many terrestrial
animals.• They are the main food suppliers in the
upper reaches of rivers.• They create more connectivity in land
scapes by providing migration corridors and ecological "stepping stones" for animals which have adapted themselves to intensively used agricultural areas.

HOW TO AFFECT THE FUTURE OF THE LOCAL RIVER ENVIRONMENT by Leena-Riitta Salminen
In law, communities have to manage their environments through the planning process. The first and the most general level is the county plan, which offers only political and strategic priorities for development.In every municipality there has to be a master plan, which outlines the features of development planned for the various functional areas: for dwelling, services, refreshment areas, green areas, traffic and areas for recreation. The most important is the town plan, which is more detailed and outlines the exact character for each different part of the town, even down to individual homes and sites.In some municipalities they also have a special environmental plan, which refers to all the green areas.A Finnish example: Kotlca's environmental plan (fig 15.1) shows which areas must be pro- tected on the banks of the Kymi river, e.g. where fishing is allowed, where you can or cannot build etc.But the most important faet, again ordered by law, is that in planning the future of the region or town, everyone has his/her right to contri- bute to the planning process.
So, you must be aware of what kind of plans your region or home town has.And when new ones are under consideration, you must be ready to express your opinions. You can also make attempts to change the already existing plan.So, visit municipal planning offices or ask them to come to school to explain the new plans. Also leam to read the symbols and colours used in the plans.You can also make observations about local decision making by reading newspapers, but an even better way is to go courageously into the open meetings of the local council.And again record what you see and hear and think.
15.1) opposite pagePart o f Kotka's environmental plan showing the Kymi riverside
Explanation o f colours: blue: protected areas light yellow: important area for landscape, must be open dark yellow: must be protected fo r agri- culturelight green: field area, but i f needed, can be woodedgreen: fo r an environmentally important wooded area

1:1370876:15
1:1U7,
13:0 ' jlfcolansaarl J
15.1) Part o f Kotka 's environmental plan showing the Kymi river- side

Chapter 16STUDENTS1 EXAMPLESSWEDEN: FONTINALIS SP. FOR INVESTIGATING HEAVY METALS By Lars Davidson and Susanne Mellvig
tried method to investigate the heavy metal contamination in water systems is to analyse the metal content of water moss, Fontinalis sp.Background values that could be considered normal are published by the Swedish Environmental Protection Agency (in "Bedomnings-grunder for sjoar och vattendrag").
Thus it is possible to evaluate heavy metal contamination from naturally growing water moss in a given stream.
The difficult part is the analysis itself. It is quite unlilcely that a school would have labora- tory capacity to reliably analyse the heavy metal content in Fontinalis. It has to be carried out in a certified laboratory to a rather high cost.But Fontinalis does not grow in all waters where you want to analyse for heavy metals. Therefore a method is developed where you plant documented clean water moss for a certain time and thereby can estimate the degree of pollution.
In co-operation with institutions that could fund the laboratory costs it is possible for a school to take part in a heavy metal monitoring project and thereby contribute to reliable results. The important taslc of collecting samples for analysis and the task of planting Fontinalis samples for absorption of heavy metals is very suitable for the environmental supervisors in the school.

With fmancial support from the Environment and Planning Administration in Nacka we car- ried through the above tasks in the following way at Nacka Gymnasium:
1. We explored our neighbour lake system for Fontinalis. After that we decided the sampling sites for naturally occurring water moss as well as the sites for planting Fontinalis in plastic net baskets.
2. The net baskets were made from plastic nets sewn together with cotton thread. The material should absolutely not be contami- nated with metals of any sort. The size of the baskets was about 30 times 30 cm.
3. The Fontinalis to be planted should be picked at a place with very low metal levels or upstream at a spot where little pollution has occurred. The moss should be wet and fresh when it is put in the baskets. Then it is put in its site to stay there for at least three weeks absorbing the metals of the water. About 300 grams of moss is a suit- able amount.
4. If you suspect heavy metal pollution at some point of your water system you should plan one sample upstream and one downstream of that point.
5. The samples, about 300 grams of moss, are harvested and put in plastic bags. The sites are documented and the samples transported to the laboratory without delay.
6. Some weeks later you can study the laboratory protocols together with your students and evaluate the results. In this you should consider such factors as the mineral content of the ground and its weathering properties. High metal content does not necessarily mean pollution.
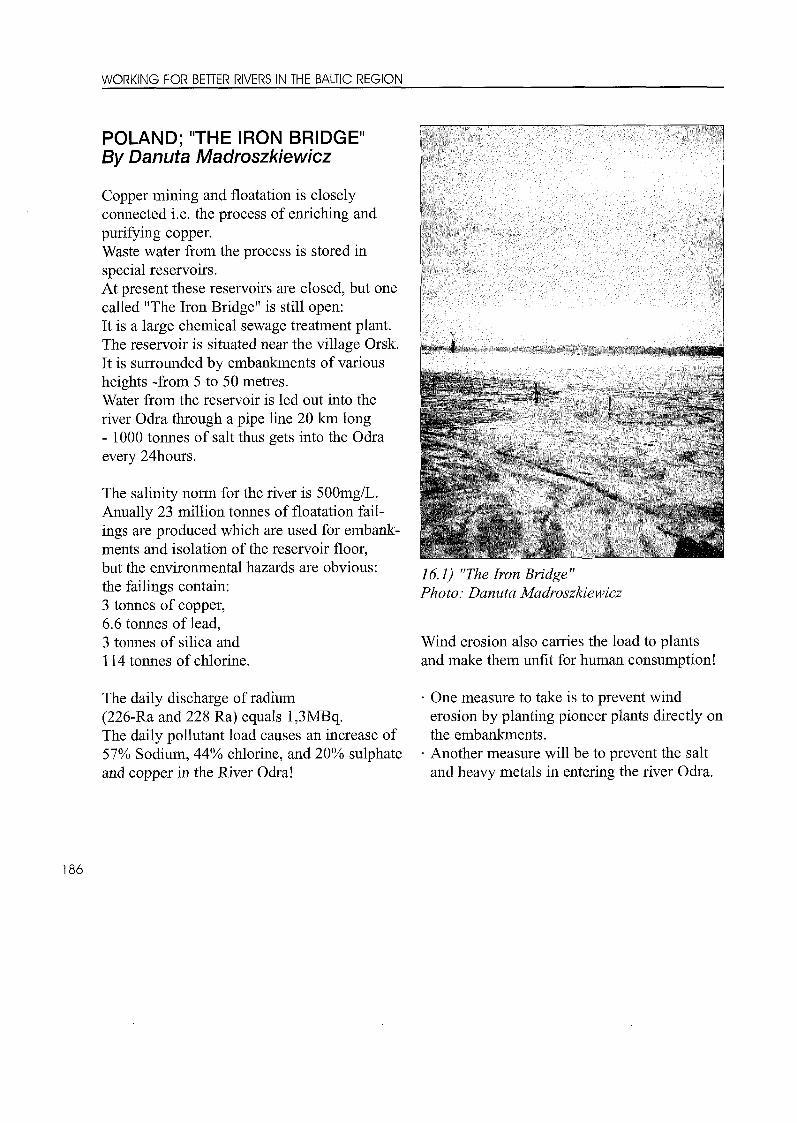
POLAND; "THE IRON BRIDGE" By Danuta Madroszkiewicz
Copper mining and floatation is closely connected i.e. the process of enriching and purifying copper.Waste water from the process is stored in special reservoirs.At present these reservoirs are closed, but one called "The Iron Bridge" is still open:It is a large chemical sewage treatment plant. The reservoir is situated near the village Orsk. It is surrounded by embankments of various heights -from 5 to 50 metres.Water from the reservoir is led out into the river Odra through a pipe line 20 km long- 1000 tonnes of salt thus gets into the Odra every 24hours.
The salinity norm for the river is 500mg/L. Anually 23 million tonnes of floatation fail- ings are produced which are used for embankments and isolation of the reservoir floor, but the environmental hazards are obvious: the failings contain:3 tonnes of copper,6.6 tonnes of lead,3 tonnes of silica and 114 tonnes of chlorine.
16.1) "The Iron Bridge "Photo: Danuta Madroszldewicz
Wind erosion also carries the load to plants and make them unfit for human consumption!
The daily discharge of radium (226-Ra and 228 Ra) equals l,3MBq.The daily pollutant load causes an increase of 57% Sodium, 44% chlorine, and 20% sulphate and copper in the River Odra!
One measure to take is to prevent wind erosion by planting pioneer plants directly on the embankments.Another measure will be to prevent the salt and heavy metals in entering the river Odra.

POLAND. SLEPIUOTKA STREAM IN KATOWICE byJolanta Mol
After investigations on nutrients, oxygen and temperature made regularly every week through 1999 we conclude:Slepiuotka stream deserves a complex restoration program.
This programme should include:- elimination of illegal sanitary connection to
storm sewer network- protection and restoration of vegetation in
the riparian area- reduction of storm water impact to stream
habitat (dry and wet ponds, created wet- lands, and storm water management system including reducing of impervious areas in the valley and watershed)
- establishing urban stream buffer zone, including valley slopes
- restoring habitat diversity in the channel (i.e. stone clusters, checkdams, wing deflectors, riffles and ponds) and on the streambanks (live fascines, livestakes). Naturalists and hydrologists from Central Mining Institute (Katowice) and Silesian University initiated a program entitled "A project study for Slepiotka Stream Restoration" in co-operation with the local authorities. The investigations include:
- water quality and flows- channel geometry- biodiversity of riparian area- inventory of illegal and illicite sanitary
connections (fmished)- proposal of protected zone and buffer zone
(nearly fmished).
16.2) Students working at Slepiuotka Stream in Katowice, Poland. Photo: Jolanta Mol
In Poland there is no experience in urban stream restoration, so we look abroad for methods and suggestions for solutions.
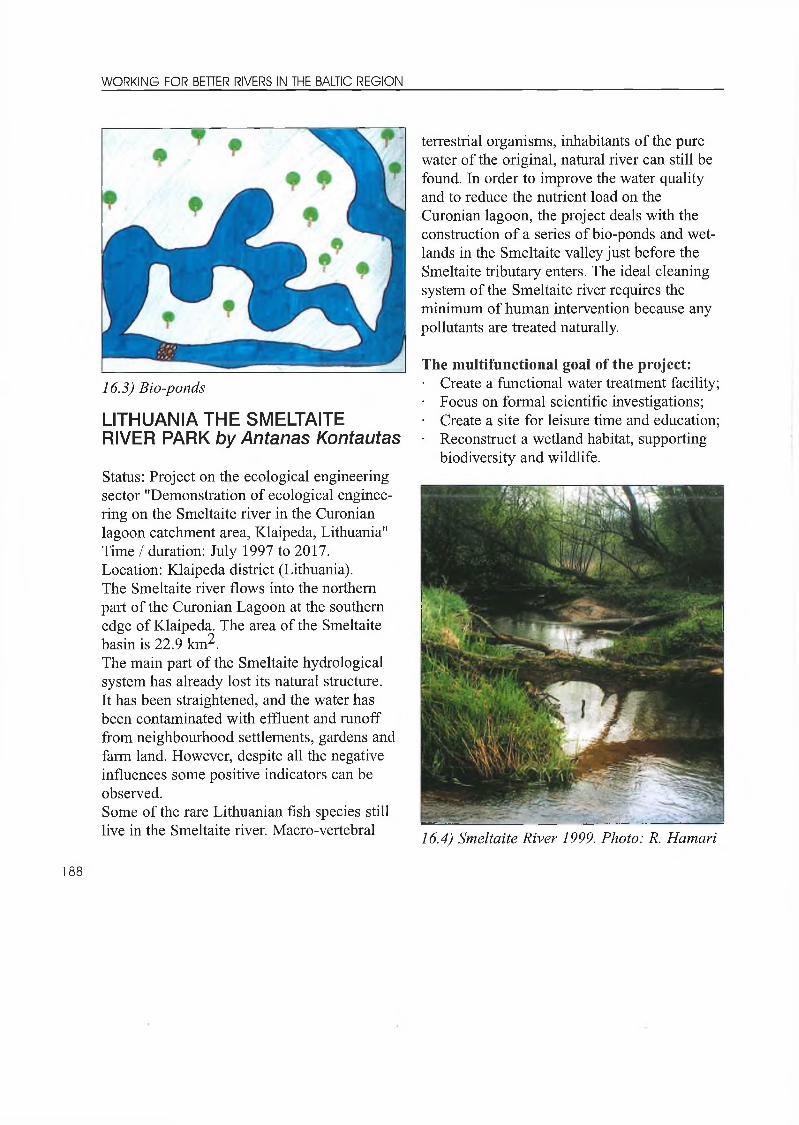
16.3) Bio-ponds
LITHUANIA THE SMELTAITE RIVER PARK byAntanas Kontautas
Status: Project on the ecological engineering sector "Demonstration of ecological engineering on the Smeltaite river in the Curonian lagoon catchment area, Klaipeda, Lithuania" Time / duration: July 1997 to 2017.Location: Klaipeda district (Lithuania).The Smeltaite river flows into the northem part of the Curonian Lagoon at the southem edge of Klaipeda. The area of the Smeltaite basin is 22.9 km^.The main part of the Smeltaite hydrological system has already lost its natural structure.It has been straightened, and the water has been contaminated with effluent and runoff from neighbourhood settlements, gardens and farm land. However, despite all the negative influences some positive indicators can be observed.Some of the rare Lithuanian fish species still live in the Smeltaite river. Macro-vertebral
terrestrial organisms, inhabitants of the pure water of the original, natural river can still be found. In order to improve the water quality and to reduce the nutrient load on the Curonian lagoon, the project deals with the construction of a series of bio-ponds and wet- lands in the Smeltaite valley just before the Smeltaite tributary enters. The ideal cleaning system of the Smeltaite river requires the minimum of human intervention because any pollutants are treated naturally.
The multifunctional goal of the project:• Create a functional water treatment facility;• Focus on formal scientific investigations;• Create a site for leisure time and education;• Reconstruct a wetland habitat, supporting
biodiversity and wildlife.
16.4) Smeltaite River 1999. Photo: R. Hamari

Background informationIn 1991 the members of the Ecological Club ZVEJONÉ and Klaipeda University began to work on the Project. An Analysis of Systems was undertaken. Centre scientists began the Smeltaite river reconstruction and maintenance work. Due to habitat destruction many suitable sites for spawning have disappeared and artificial spawning sites for trout and sea-trout have been established. The programme of restoration for the Smeltaite river ecosystem was carri- ed out by the Stensund Ecological Centre (Sweden), the Tartu University Ecological Centre (Estonia) and the Geography Institute (Lithuania) in 1992-1994. Restoration of the river delta started in 1996 and a system of small biological lakes was established. It slows the river flow and creates favourable conditions for natural water cleaning processes. Investigation of the living conditions for the different species of flora and fauna in the system of biological lalces has also been started.
ImplementationThe establishment of the system of six Smeltaite River biological lakes and a marsh was completed in the summer of 1998. The system achieved a reduction in the contamina- tion of the water reservoirs. Information displays provided data on the purposes of the biological water storage lakes and on water treatment plants in the region, directions for observing water flora and fauna and ways of investigating the level of water contamination. Currently the educational part of the project is being prepared by Klaipeda University and Environmental Club Zvejone.
16.5) Smeltaite River biological lakes.Photo: Risto Hamari
ResultsBio-diversity is increasing and water quality is improving. Club Zvejone raised awareness of environmental education by organising excursions for teachers to the Smeltaite river park and provided information about the park in the local press.

RIVER DANE NORTH-EAST OF KLAIPEDA - A BIG PROBLEM! By Karolina Trilikauskaiti student at Klaipeda Vytautas Gymnasium
There are a lot of polluted reservoirs in Klaipeda, and the biggest one is the River Dane: For several decades now effluent from industrial establishments has entered the river. In 1993 - 1994 industrial pollution was prohi- bited, but other chemical substances e.g. nitrates and phospherous, sewage and waste water from the streets still run into the river.People are indifferent to the problem, and this ignorance is a threat to the River Dane. Specialists from the Klaipeda Health Authority even point out that swimming in the river is NOT recommended.The water has an unpleasant smell, the colour of the water is green, it contains phospate and nitrate and only verylittle oxygen, and thus has a very poor water quality unsuited to most living organisms.The municipality of Klaipeda is working with that of Karlskrona, Sweden on a programme to decrease the pollution.The students from our school are studying the pollution by investigating the fauna and flora and measuring the physical and chemical pro- perties of the water. Through our studies we hope we may be able to help the River Dane to improve its water quality. It is a big underta- king involving a great deal of hard work, and like all people who live near the river we have a responsibility to take care of it.If the River Dane is made cleaner, our city of Klaipeda will be nice and cosy, too!
SOLUTIONS: by Ingvar Lennerstedt
What society can do:• arrange more wetlands and dams• Increase meandering in rivers• build rapids• Define "crop-breeding free zones" along
river banks• Facilitate ecological farming
What you, the students can do:■ Plant trees and bushes along rivers■ Buy ecological goods• Discuss river problems with the responsible
authorities• Reduce road transport/ travel collectively■ study life cicles - e.g. usage of water and
energy in households and industries
Please add to the list...
Both the large and small environmental steps outlined in this book should be taken both locally and intemationally. You, students invol- ved in the BSP programme, have the important task of studying the conditions, thinking about how to act, and fmally teaching other people how to respond.
Good luck with your work!
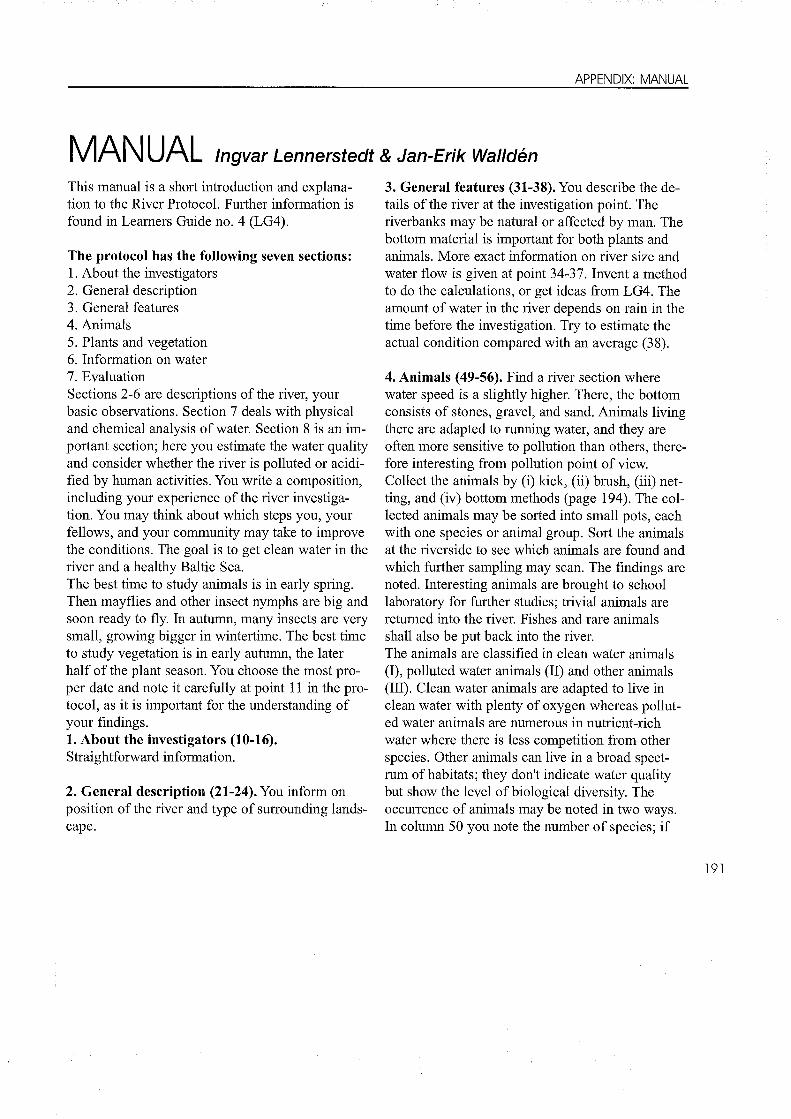
MANUAL Ingvar Lennerstedt & Jan-Erik WalldénThis manual is a short introduction and explana- tion to the River Protocol. Further information is found in Leamers Guide no. 4 (LG4).
The protocol has the folio wing seven sections:1. About the investigators2. General description3. General features4. Animals5. Plants and vegetation6. Information on water7. EvaluationSections 2-6 are descriptions of the river, your basic observations. Section 7 deals with physical and chemical analysis of water. Section 8 is an important section; here you estimate the water quality and consider whether the river is polluted or acidi- fied by human activities. You write a composition, including your experience of the river investiga- tion. You may think about which steps you, your fellows, and your community may take to improve the conditions. The goal is to get clean water in the river and a healthy Baltic Sea.The best time to study animals is in early spring. Then mayflies and other insect nymphs are big and soon ready to fly. In autumn, many insects are very small, growing bigger in wint.ert.ime. The best time to study vegetation is in early autumn, the later half of the plant season. You choose the most proper date and note it carefully at point 11 in the protocol, as it is important for the understanding of your findings.1. About the investigators (10-16).Straightforward information.
2. General description (21-24). You inform on position of the river and type of surrounding landscape.
3. General features (31-38). You describe the de- tails of the river at the investigation point. The riverbanks may be natural or affected by man. The bottom material is important for both plants and animals. More exact information on river size and water flow is given at point 34-37. Invent a method to do the calculations, or get ideas from LG4. The amount of water in the river depends on rain in the time before the investigation. Try to estimate the actual condition compared with an average (38).
4. Animals (49-56). Find a river section where water speed is a slightly higher. There, the bottom consists of stones, gravel, and sand. Animals living there are adapted to running water, and they are often more sensitive to pollution than others, there- fore interesting from pollution point of view. Collect the animals by (i) kick, (ii) brush, (iii) netting, and (iv) bottom methods (page 194). The collected animals may be sorted into small pots, each with one species or animal group. Sort the animals at the riverside to see which animals are found and which further sampling may scan. The findings are noted. Interesting animals are brought to school laboratory for further studies; trivial animals are retumed into the river. Fishes and rare animals shall also be put back into the river.The animals are classified in clean water animals(I), polluted water animals (II) and other animals (III). Clean water animals are adapted to live in clean water with plenty of oxygen whereas polluted water animals are numerous in nutrient-rich water where there is less competition from other species. Other animals can live in a broad spect- rum of habitats; they don't indicate water quality but show the level of biological diversity. The occurrence of animals may be noted in two ways. In column 50 you note the number of species; if

two animals have different morphology they be- long to different species, the name of the species name is not necessary to get. In column 49 you note how abundant the animals of the group is ir- respective of species (++/+/0, see instructions). The sensitivity figure (54) is the number of clean water species (51) subtracted by the number of polluted water species (52). The higher figure, the better is the water quality. The animal diversity figure is the total number of species found in the river. You reach diversity figure by adding sum I (51), sum II (52) and sum III (53) Low diversity figure may indicate nutrient-poor, polluted or acidified water. The animal society (56) is calcu- lated trom the Figure 1. You decide which is the dominant animal group and reach one of seven socie-ties. This is a very rough method.Points 54, 55 and 56 are expressions of the water quality. These figures, together with information on plant diversity (64,65), give you good opportu- nity to compare with other BSP River studies.
.. .
l fJ» |
r*
8 o j . (S
Caddie flies Mayflies
■ v / GnmiA lus \ /
/ \ \/
Eristalis
XSoproby class I II m IV
------------- ► ------------- ► -----------► -------------------- ►1 2 3 4 5 6 7
Eutrofic ClosS-------------------------- ► ------------------- ► ----------------------------- ►
To * 9 * 8 * 7 * 6 * 5~ * 4 * 3* 2 * 1 * 0 *Makroindex
Figure 1. Graphic method for pollution class estimation.
5. Plants and vegetation (60-66). They are divid- ed into four categories. Emergent plants (I) grow
above the water surface. Floating-leaved plants (II) have roots in bottom and leaves floating on water surface. Free-floating plants (III) have root hang- ing freely in water, not anchored to bottom; they may aggregate in calm river sections. Submerged- floating plants (IV) are anchored to bottom and have leaves below water surface. Occurrence of plants is noted on a 3-graded scale (++/+/0). Number of groups is counted, plant diversity (64). Some plant species prefer clean water whereas others are numerous in eutrophic water. Plant species, however, cannot be used as water quality indicators as in the same way as animals. Vegetation, estimate roughly the amount of vegetation in the river (65). The structure of bottom material is crucial for vegetation. The information adds facts to the general description in section 2 and 3. The vegetation close to the river adds to the conditions for the life in the river (66).
6. Information on water (70-82) deals with physical and chemical parameters, described in LG4. Smell, colour, turbidity, water temperature, and pH (70-74) may be estimated or measured at the river; the remaining parameters on nutrients, oxygen and alkalinity (75-82) may be determined in laboratory. There are a lot of parameters mentioned in this protoeol; very few BSP schools do all of them. Even just a few records are valuable. Smell (70). Most river water has no particular smell or a natural smell of organic material. You shall note if there is any bad smell of hydrogen sulphide (anoxic condition) petrol or other hydrocarbons or chemicals (severe pollution).Colour (71) depends on particles or plankton algae in the water. Plankton algae give water a yellow- green colour; humus substances from marshes and bogs give a brown colour.Turbidity (72) depends mainly on occurrence of small mineral particles as clay. They may come from erosion of riverbanks or surface erosion on

agricultural fields when heavy rains cause a lot of surface water running off directly into the river. Temperature (73) depends on season and mostly follows the air temperature, compare! It tells you how far the autumn or spring has advanced in the water. If turbidity is high, heavy sunshine may raise water temperature a little. pH (74) is a measure on the amount of hydrogen ions in the water, the acidity. It depends on the conditions in the soil of the catchments area. The pH level in water affects many living processes in animals and plants. When pH level drops many animals and plants cannot live any longer, eggs and young larvae often being very sensitive. The pH figure may be translated into the following words: >6,8 - near neutral, 6.8-6.5 - wealdy acid, 6.5-6.2 - moderately acid, 6.2-5,6 - acid <5.6 - strongly acid. Acidification of soils, lakes and rivers is a big problem in many parts of the Baltic region, particularly in Finland and Sweden. Phosphorous and nitrogen (75-79) in nutrient salts regulate the growth of macro plants and algae. When agriculture and municipality increase the output of these nutrients into the river the vegetation increases, the process of eutrophication. This is a second big problem in many parts of the Baltic region. Phosphorus in river occurs (i) as phosphate ions solved in the water, easily available to macro plants and algae, (ii) as phosphate ions bound to the surface of small mineral particles, difficult for plants to take up, and (iii) as part of small organic particles, detritus, this phosphorous being available only after decomposition by microbes. The simplest methods give the amount of free phosphate ions (75). By boiling with an oxidative substance the total phosphorous may be estimated (76). Mostly there is a relation between free phosphate and total phosphorous, so free phosphate may tell a little about the total phosphorous as well. Nitrogen occurs (i) as nitrate ions, (ii) as ammonia ions, and (iii) as part of detritus and other organic
particles. Nitrogen salts do not bind to the surface of mineral particles. Nitrate ions (77) and ammonia ions (78) may be determined in several ways. The total nitrogen (78) is determined after treating the water sample with a strongly reductive agent in strongly acid solution, a complicated task.Oxygen (80) may be determined in different ways. Oxygen is necessary for the life of most microbes, plants and animals. When organic particles are numerous, microbes consume oxygen and the content decreases. BOD (81), biochemical oxygen demand, is a measure on the amount of organic material in the water. A water sample is put in a bottle with clean water saturated with oxygen. After 5 or 7 days at constant temperature the drop in oxygen is measured.Allcalinity (82) is a measure on the ability of the water to neutralize acid substances, to resist acidification. This neutralising process without signifi- cant pH change is called buffering. The buffering substances in river water are hydrocarbonate, organic anions, and humus substances. The allcalinity is determined by titration or some quick methods.
7. Evaluation (90-93). The water quality (90) may be estimated according to Trent, Macro, or Saprobic methods, described in LG4. It needs some skill in species determination. Doing it or not, you may examine your fmdings, compare them with studies you have made earlier and with information from local authority and arrive at an opinion whether the water of the river is polluted by nutrients (91) or acid substances (92) from human activities. You may write down your arguments (93) and other experiences of river investi- gation (94). And fmally, think about the basic item of the study: "How can we get or maintain clean water in the river, and how can we improve the water in the Baltic Sea?"
We look forward to hear from you. Good luck!

COLLECTION METHODS by Ingvar Lennerstedt
B egin the study by finding a river stretch where the w ater speed is slightly higher. There the bottom consists o f stones, grave, and sand and the animals living there are adapted to stream ing water. These animals are the m ost interesting from a pollution point o f view.I f possible, avoid stretches w ith stagnant water because m any river animals avoid such water.
The collected animals may be sorted into small pots. Each pot shall contain specimens of one ani- mal group or one species. Don't collect too many animals of one species, as the task is to record the number of species. We propose that the sorting be made immediately at the river side to see which animals are found and which may be sought for by further collection. The findings are noted according to the protocol. Interesting animals are brought to the school laboratory for further studies; trivial animals are let go back to the river. Rare animals and fishes are also put back into the river.
FOUR METHODS MAY BE USED.1. Kick method. Stand in the watercourse with your back or side towards the current. Hold a col- lecting-net with a flat-bottom ring pressed against the bottom, the opening shall be against the current. Move one foot by small kicks through the bottom material 1-2 dm before the net entrance. The effect of this kicking is that many animals living on or between the stones let the grasp and drift with the water to a new place to avoid the danger they are subdued to. After collecting in one place you move the net a little distance upstream and repeat the procedure. Note that the water is actually going through the net, that the net is not clogged with material. Then empty the net content into a pan or a small tank.Use a soft tweezers to remove the animals that are still clinging to the net or the rim. Note that some
animals may be very small, less than 5 mm. They may unveil their existence by small movements.Be observant and have patience.
2. Brush method. Take stones by hand from the river bottom. Use a dishwashing brush and brush off the animals sitting on the stones into a pan.Do the same with pieces of wood and other things you find in the river. Collect the animals as described above. If the water is too deep to reach the stones by hand you may practice the following way. Collect some stones and put them in a rough net bag intended for potatoes or similar, tie the bag to a rope, sink the bag down into the river and anchored the rope to the shore. This may be done some days in advance. At the time of collection you carefully pull up the net. Keep a collecting net downstream the stones in the net bag to collect animals that may drift away. Brush the surface of the stones, bring the material into a pan and collect the animals.
3. Netting method. Use a water net or a sieve and run it through the vegetation in upstream direction. Empty the sieve content in a small tank and collect the animals. This is the traditional way of collecting water animals.
4. Bottom method. In bottom with fine material there are animals digging close to the surface. These animals are collected with a bottom sampler or a metallic sieve (mesh 0.5 mm). If the water is shallow it is possible to put the sieve to the bottom and use a spade to bring bottom material into the sieve. The material consists of clay, silt and animals. Note the smell, if any. The fine material is removed by moving the sieve on the water surface; the animals will remain in the sieve and are sorted out into the pots.
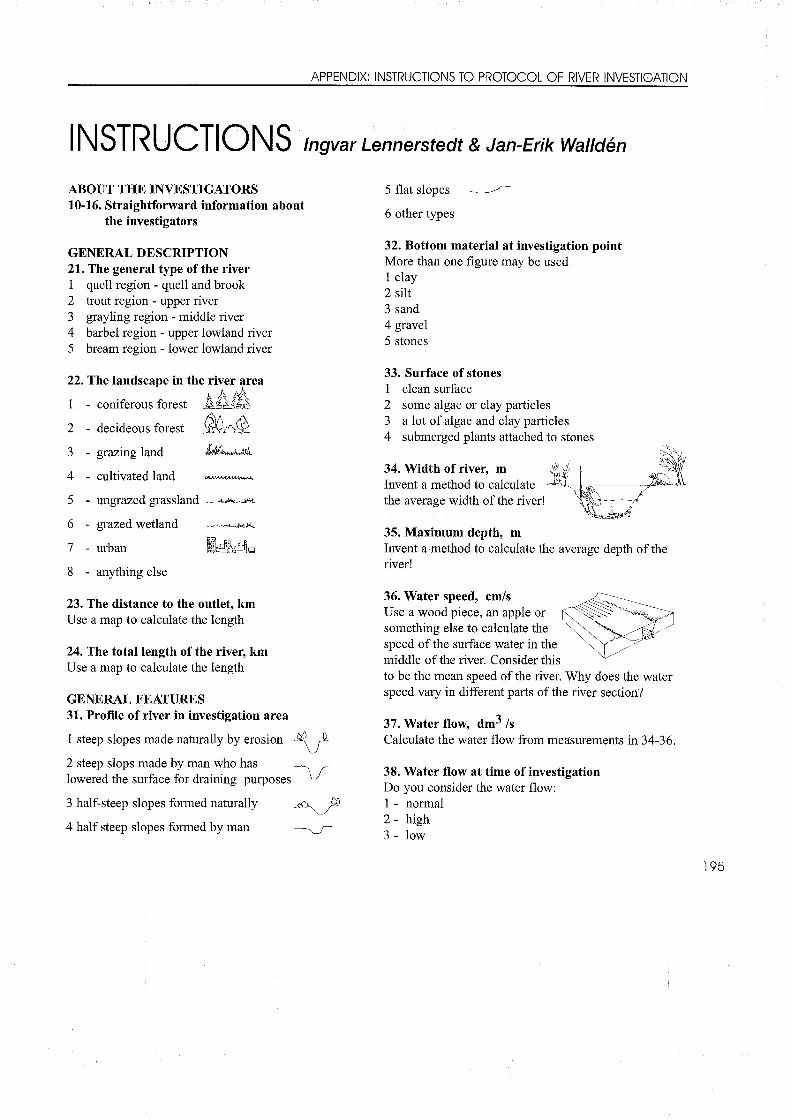
INSTRUCTIONS Ingvar Lennerstedt & Jan-Erik Walldén
ABOUT THE INVESTIGATORS 10-16. Straightforward information about
the investigators
GENERAL DESCRIPTION21. The general type of the river1 quell region - quell and brook2 trout region - upper river3 grayling region - middle river4 barbel region - upper lowland river5 bream region - lower lowland river
22. The landscape in the river area
1 - coniferous forest
2 - decideous forest
3 - grazing land
4 - cultivated land iWWWUIWMWM
5 - ungrazed grassland
6 - grazed w etland
7 - urban
8 - anything else
23. The distance to the outlet, kmUse a m ap to calculate the length
24. The total length of the river, kmUse a m ap to calculate the length
GENERAL FEATURES31. Profile of river in investigation area
1 steep slopes m ade naturally by erosion
2 steep slops m ade by m an who has lowered the surface for draining purposes
3 half-steep slopes form ed naturally
4 half steep slopes form ed by m an
5 flat slopes ------
6 other types
32. Bottom material at investigation pointM ore than one figure m ay be used1 clay2 silt3 sand4 gravel5 stones
33. Surface of stones1 clean surface2 som e algae or clay particles3 a lo t o f algae and clay particles4 subm erged plants attached to stones
34. Width of river, mInvent a m ethod to calculate the average w idth o f the river!
35. Maximum depth, mInvent a m ethod to calculate the average depth o f the river!
36. Water speed, cm/sU se a w ood piece, an apple or som ething else to calculate the speed o f the surface w ater in the m iddle o f the river. Consider this to be the m ean speed o f the river. W hy does the w ater speed vary in different parts o f the river section?
37. Water flow, dm /sCalculate the w ater flow from m easurem ents in 34-36.
38. Water flow at time of investigationDo you consider the water flow:1 - norm al2 - high3 - low

ANIMALSHow to collect and evaluate the animals are described in L eam ers’ Guide 4.
49. Abundance is noted++ for plenty o f specim ens,+ for one or a few specim ens, and0 for not found.
50 Note(1) num ber o f species for Trent method,(2) x for occurrence, M acro method, and(3) num ber o f specim ens per square meter,
Saprobie method.
51. Clean Water speciesCount Clean w ater species in colum n 50, note the sum in (51)
52. Polluted water speciesCount Polluted w ater species in colum n 50, note the sum in (52)
53. Remaining speciesCount the rem aining species in colum n 50, note the sum in (53)
54. Sensitivity Calculationsum I - sum II
55. Diversity Calculationsum I + sum II + sum III. Exclude shadowed boxes w hen calculations o f M acro index.
56. Pollution classEstim ate the pollution class, use figure 1 (below), note class 1, 2, 3, 4, 5, 6 ,or 7.
Saproby class I
Eutroflc Class
lo * <rMakroindex
I I I I I IV
4 5
7 6 5 4 3 2 1 0
Figure 1. Graphic method for pollution class estimation.

PLANTS
60. Emerged plant speciesC ount the num ber o f em erged plant species, sum I
61. Floating-leaved plant speciesC ount the num ber o f floating-leaved plant species, sum II
62. Free-floating plant speciesCount the num ber o f free-floating plant species, sum III
63 Submerged-floating plant speciesC ount the num ber o f subm erged-floating plant species, sum IV
64. Plant diversity Calculationsum I + 11+ III + IV
VEGETATION
70. Amount of emergent vegetation1 - no2 - scattered3 - rich
Amount of floating-leaved vegetation1 - no2 - scattered3 - rich
Amount of submerged vegetation1 - no2 - scattered3 - rich
71. Vegetation on shores within 10 meters from water1. - no particular river vegetation,
all sunshine falls on water2. - scattered bushes or trees shadowing the water3. - a hedge o f bushes and tress on one side giving
shadow some tim e o f the day4. - hedges o f bushes or tress on both sides,
water heavily shadowed
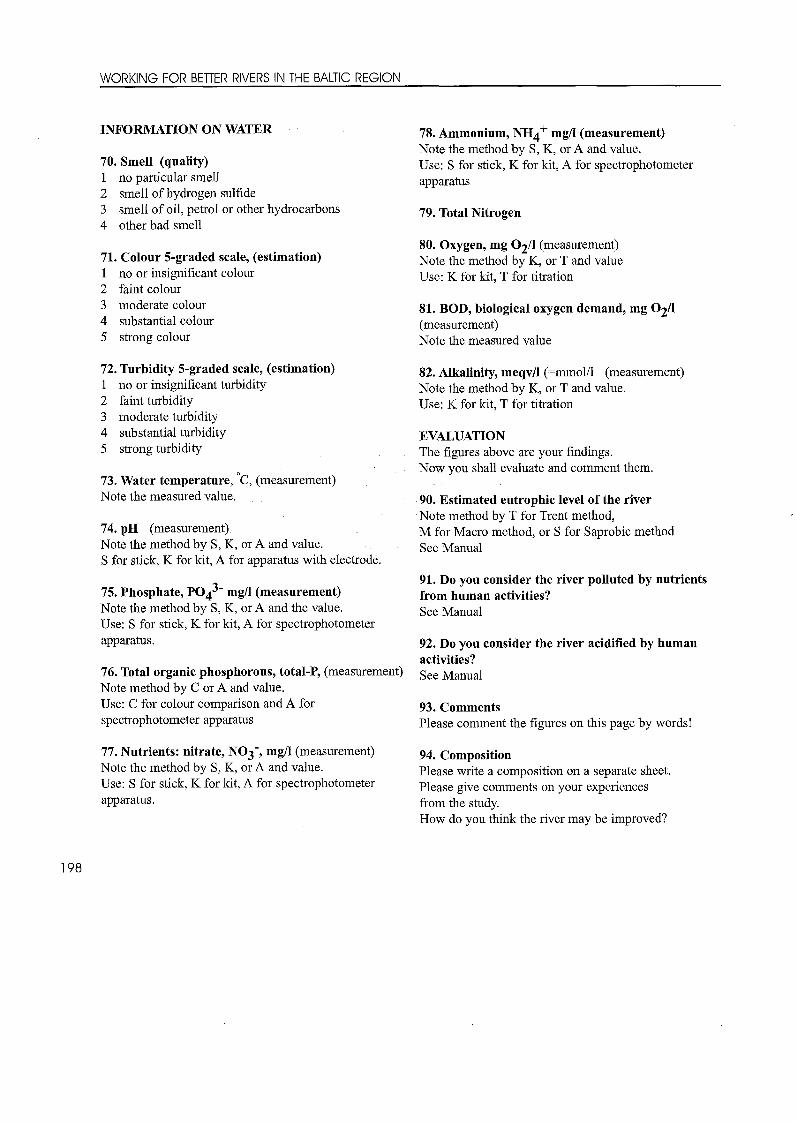
INFORMATION ON WATER
70. Smell (quality)1 no particular smell2 sm ell o f hydrogen sulfide3 sm ell o f oil, petrol or other hydrocarbons4 other bad smell
71. Colour 5-graded scale, (estimation)1 no or insignificant colour2 faint colour3 m oderate colour4 substantial colour5 strong colour
72. Turbidity 5-graded scale, (estimation)1 no or insignificant turbidity2 faint turbidity3 m oderate turbidity4 substantial turbidity5 strong turbidity
73. Water temperature, °C, (measurem ent)N ote the m easured value.
74. pH (measurement).N ote the m ethod by S, K, or A and value.S for stick, K for kit, A for apparatus w ith electrode.
75. Phosphate, PO ^' mg/l (measurement)N ote the m ethod by S, K, or A and the value.Use: S for stick, K for kit, A for spectrophotom eter apparatus.
76. Total organic phosphorous, total-P, (measurement) Note m ethod by C or A and value.Use: C for colour com parison and A for spectrophotom eter apparatus
77. Nutrients: nitrate, NO^', mg/l (measurement)N ote the m ethod by S, K, or A and value.Use: S for stick, K for kit, A for spectrophotom eter apparatus.
78. Ammonium, NH4 + mg/I (measurement)N ote the m ethod by S, K, or A and value.Use: S for stick, K for kit, A for spectrophotom eter apparatus
79. Total Nitrogen
80. Oxygen, mg O2 /I (measurement)N ote the m ethod by K, or T and value Use: K for ldt, T for titration
81. BOD, biological oxygen demand, mg O2 /I(measurement)N ote the m easured value
82. Alkalinity, meqv/1 (=m m ol/l (measurement) N ote the m ethod b y K, or T and value.Use: K for kit, T for titration
EVALUATIONThe figures above are your findings.N ow you shall evaluate and com m ent them.
90. Estimated eutrophic level of the riverN ote m ethod by T for Trent method,M for M acro m ethod, or S for Saprobic m ethod See M anual
91. Do you consider the river polluted by nutrients from human activities?See M anual
92. Do you consider the river acidified by human activities?See M anual
93. CommentsPlease com m ent the figures on this page by words!
94. CompositionPlease write a com position on a separate sheet.P lease give com ments on your experiences from the study.How do you think the river m ay be improved?

The Baltic Sea ProjectProtocol of river investigation
About the investigators
10. Name of River
11. Date of investigation
12. Name of class/group
13. Name of school
14. Address of School
15. E-mail /fax
16. Name of teacher
General description
21. General type of the river _________
22. Landscape in the river area _________
23. Distance to the outlet, km _________
24. Total length of the river, km _________
Please draw a map of the river showing the investigation area and a major city for reference of position. Scale: 1 cm = 1 km And please enclose a photo of your river.
General features
31. Profile of the river
32. Bottom material
33. Surface of stones
34. Width of river, m
35. Maximum depth, m
36. Water speed, cm/s
37. Water flow, dm3/s
38. Water flow at time of investigation
Send the protocol to programcoordinator Jan-Erik Walldén, Polhemskolan i Lund, Box 4047, S-22721 Lund, Sweden.

Animals49 49 49
Ciean Water I so **i*n Polluted water II so + +/+ /0 Other animals III 50 ++m°Plecoptera Asellus Coleoptera
Ephemeroptera Sialis Hemiptera
Trichoptera Sphaerium
©Odonata
Ancylus Lymnaea Diptera
-dnnnE E 3nnø>
Gammarus
M
Chironomus, red Culicidae
Aphelocheirus
♦Oligochaeta Chironomidae
51. Sum I
Eristalis Bivalvia
52. Sum II
Hirudinea
Turbellaria
54. Sensitivity l-ll=
Gastropoda
55.Animal diversity l+ ll+ lll=
except shadowed boxes
Arachnida
56. Pollution class
Hydrozoa
53. Sum III

Plants
Emergent I ++/+/Q Floating-leaved IISubmerged-floating
++/+/0 plants IV ++/+/0
Alismataceae Potamogetonaceae HydrocharitaceaeElodea
Butomaceae Nymphaeaceaef f
Callitrichaceae
Carex sp lå I I Polygonaceae Potamogetonacea
Equisetaceae Haloragidacea i61. Sum II
Phragmithes and other Poaceae Ranunculus sp
Free-floating plants III
Apiaceae Hydrocharitaceae Fontinalis sp
Mentha aquatica Ceratophyllaceae
63. Sum IV
Sparganiaceae Lemnaceae 64. plantdiversity l+ll+lll+IV=
t ! )\Typhaceae Lentibulariaceae
65. Amount of vegatation in water
Emergent Floatingleaved
Sub-meraed
Juncus sp
60. Sum
62. Sum III66. Vegetation on shores within 10 meters from water

r
Information on Water
70. Smell
71. Color
72. Turbidity
73. Water temperature
74. pH
75. Phosphate P043’ (mg/l)
76. Total Organic Phosphorus (mg/l)
77. Nitrate, N03' (mg/l)
78. Ammonium, NH4+
79. Total nitrogen, N, mg/l
80. Oxygen, mg Oz/l
81. BOD, biochemical oxygen demand
82. Alkalinity, mmol/l
Other observations: mammals, birds,fishes, flowers etc.
Evaluation
90. Estimated water quality of the river
91. Do you consider the river polluted by nutrients from human activities?
92. Do you consider the river acidified by human activities?
93. Please comment the figures on this page by words below!
94. Write a composition on a separate sheet. Please give comments on your experiences from the study.How do you think the river may be improved?
We look forward to get your protocol

ACKNOWLEDGEMENTSPHOTOS:Cover, page 149 Ingvar Lennerstedt Page 13 Simo KohoPages 15, 18, 25, 37 Leena-Riitta SalminenPages 17, 63, 98, 100, 101, 118, 121, 128, 175Risto HamariPage 27 Katja SuottiPage 51 Søren MøllerPages 55, 58, 63, 128 Anatoly KharitonovPages 56, 63, 176 Birthe ZimmermannPages 114, 115 Klavs ZommersPages 116, 186 Danuta MadroszkiewiczPage 157 Velga KaksePage 187 Jolanta Mol
DRAWINGS:Page 9 Minna HerralaPage 15 Suvi EerolaPages 31, 35 Johanna KukkolaPages 62, 64, 65, 67, 68, 71, 73, 74, 75, 77, 78, 80,81, 82, 83, 118, 136, 137, 138, 139, 140, 141, 142,144, 145, 146, 147, 161, 172, 173, 194, ZaneDarzinaPages 69, 76, 87, 89, 94, 95, 96, 97 Per Werge Pages 125, 131, Zane Darzina & Loreta Urtane Pages 132, 133, 134, 162, Loreta Urtane Pages 152, Velga Kakse Pages 165, 167, 170 Ingvar Lennerstedt Pages 192, 196, Ingvar Lennerstedt,Jan-Erik Walldén & Loreta Urtane Pages 199, 200, 201, 202, Zane Darzina,Ingvar Lennerstedt, Loreta Urtane, Jan-Erik Walldén
AUTHORS AND CONTRIBUTORS
Elizabeth Khawajkie UNESCO ASPnet7 Place de Fontenoy F-75352 Paris 07 SR France
Jolanta Guza, Director Children's Environmental School 16, Gertrudes iela,LV-1050 Riga, Latvia
Zane Darzina, designerNorthern Vidzeme Biosphere ReserveRiga Str, 10aLV-1043 Salacgriva, Latvia
Chapters 1, 2, 3, 4, 5, 15:Leena-Riitta Salminen, teacher Langinkosken lukio Allintie 20FIN-48220 Kotka, Finland
Chapters 2,11 :Jarkko Suvikas, teacher Langinkosken lukio Allintie 20FIN-48220 Kotka, Finland
Chapter 5:Ludmila Marjanska, student Glogow, Poland
TRANSLATION:Roger Quick,Luton Sixth Form College, The Geography department Bradgers Hill Road Bedfordshire LU2 7EW Great Britain
Chapters 11,12,13:Risto Hamari, principal Langinkosken lukio Allintie 20FIN-48220 Kotka, Finland

Chapter 6;Søren Møller, artist and teacher Amtsgymnasiet i Sønderborg Grundtvigs Alle 86 DK-6400 Sønderborg, Denmark
Irene B, Savinitch, teacher University of St. Petersburg, Russia
Chapters 7, 8, 9, 10,11:Per Werge, teacherManenvej 14ADK-3460 Birkerød, Denmark
Chapter 11:Klavs Zommers, teacher Vecpiebalga Country Gymnasium LV-4122 Cesu Rajons, Latvia
Sanita Soldre, student Vecpiebalga Country Gymnasium LV-4122 Cesu Rajons, Latvia
Chapters 11,16:Danuta Madroszkiewicz, teacher III L.O. im Bohaterow Westerplatte ul. Obozowa 3 PL-67-200 Glogow, Poland
Chapters 13,14, Appendix 1:Ingvar Lennerstedt, BSP ressource person Småskolevågen 1 S-22467 Lund, Sweden
Chapter 13,14,15:Loreta Urtane, environmental consultant Carl Bro Ltd.Peldu Str. 26/28 LV-1050 Riga, Latvia
Andris Urtans, deputy director and hydrobiologist Northern Vidzeme Biosphere Reserve Riga Str. 10aLV-1043 Salacgriva, Latvia
Chapter 13:Johannes Bang, BSP national co-ordinatorMinistry of EducationH.C. Andersens Boulevard 43,DK-1553 Copenhagen V, Denmark
Chapter 14:Velga Kakse, BSP national co-ordinatorMinistry of EducationValnu iela 2LV-1050 Riga, Latvia
Chapter 16:Environmental Club Zvejoné/Lithuanian Green Movement Mr Antanas Kontautas Taikos 42-3LT-5802 Klaipeda, Lithuania
Lars Davidsson, teacher Nacka Gymnasium Griffelvågen 17 S-13140 Nacka, Sweden
Susanne Mellvig, teacher Nacka Gymnasium Griffelvågen 17 S-13140 Nacka, Sweden
Jolanta Mol, teacherII L.O. im M. Konopnickiej GlowackiegoPL-40-052 Katowice, Poland
Karolina Trilikauskaiti, student Vytautas Didysis GymnaisumS. Daukanto 31 LT- 5800 Klaipeda, Lithuania
Appendix:Jan-Erik Walldén Polhemskolan i Lund Box 4047S-22721 Lund, Sweden

INDEXAAbrasion 72 Acidification 6, 142 Adaptation 124, 133 Aesthetics 6, 11, 26, 27, 48 Alkalinity 155, 194 Ammonia 156, 157, 158 Ancyllus 133Art 4, 6, 8-12, 19, 25-27, 32, 36-44, 50 Artificial lake 81 Asellus 133, 134, 162, 164 Aquifer 65, 66, 85
BBacteria 101, 136, 154, 176 Baetis 134, 166 Barbel 124-126,141,192 Barrel 109Bedrock 72-74, 77-79 Beaver 144 Beetle 162Benthic animals 132,162 Biochemical oxygen demand 152, 154, 158Bio-indication 100Boards 98, 106, 108-109BOD5 152, 169, 171Bottom 53, 79, 101-102, 124, 130, 140-141, 151-156, 164-168, 171-172, 192Brackish 67,141-142,146Braided channel 58, 78Bream 124-126, 141Brook 104, 118, 121, 124, 138, 175, 192Bullhead 121, 124, 138Butomus 129-130, 161
CCanal 82, 114Catchmentarea 3-4, 60-61, 70, 92, 188 Ceratophyllum 129Channel 58, 67-70, 74-81, 85, 103-105,109, 123-124, 175, 179-181, 187Channelisation 177-179Charcoal 98Chironomidae 132Chlorine 101,186Chub 124, 140Cobble 76, 78, 126-127Coleoptera 134, 165Collector 125, 127, 132Coniferous forest 123,192Communication 16, 104
Communities 17, 19, 21, 85, 126-127,171, 180-182Consciousness 26, 50, 84Cross-cut saw 102Crustacea 134, 165Current 23, 76, 99, 110, 126, 134-135,151-152
DDam 17, 48, 81, 109 Debris 74-75, 77, 79, 81, 172, 181 Deciduous forest 123 Delta 18, 78, 82, 105, 189 Denmark 4, 61, 63, 67, 73, 92-97, 122- 123, 140, 146, 148, 164, 166, 170, 176 Deposition 66, 75, 78-79, 81-82, 127, 130, 179Design 6 ,11, 50-54, 84 Dioxine 102 Dipper 147-148 Diptera 143, 165Dissolved Oxygen 101, 126, 132, 152- 154Diversity 3, 151, 154, 166, 180, 187,189, 193 Dragonfly 132Drainage basin 60-62, 66, 68, 70-72, 75,77, 98, 100, 120
EEconomic liberalism 111 Eel 135-137, 140 Elodea 129-130,161 Elver 137Emerged plants 130 ,161 ,197 Empathy 14, 57Environment 3, 6,8-14, 23, 26, 35, 46,61, 65-66, 83-84, 87, 90, 93, 100, 106, 123, 138, 158-159, 179, 181-182, 185 Environmental art 27, 36-43 Environmental education 1, 6, 8, 10-11, 50-53, 98, 189Environmental relationship 8 Ephemeroptera 134, 164-165, 167 Equilibrium 75, 78-79, 81-82, 85 Equisetum 121,128-130,161 Erosion 66, 72-82, 121, 126, 130, 151, 179, 186, 192 Esker 75Estonia 61, 123, 179, 189 Estuary 99-100Evaporation 60, 65-66, 68-69, 76
Evapotranspiration 64-65, 67-69
FFinland 6, 9, 13, 17-19, 32-33, 35, 38-39, 46, 48, 61, 63, 72, 81, 99-108, 110- 112, 120-123, 129, 140-147 Floating-leaved plants 130, 161, 197 Flies 133-134, 162 Flooding 69, 81-85, 99-100, 103, 109, 144, 179Floodplain 77-78, 81-82Flow 3-4, 14, 19, 37, 62-71, 76-79, 81-82, 104-105, 109, 113, 123-126, 130,160, 179-181, 189, 192 Fontinalis 130,160,184-187 Freefloating 131 Fungus 103, 168 Furanes 102 Frame saw 102
GGammarus 134, 162, 164 Gastropoda 134, 164 Geomorphological 62, 72, 126 Germany 61, 73, 90, 110, 116, 123, 146, 179Glacial erosion 66, 72, 76 G lac iertim e 98Gradient 62, 77-80, 117, 123, 126-127 Gravel 66, 75, 77-79, 80, 126-127, 147,172, 180, 192Grayling 124-126,135,140-141,192 ' Grazers 125, 127, 132 Groundwater 64-69, 76, 179
HHarbour 100, 105, 109 Fleavy metals 101,184-186 Helobdella 134 Hemiptera 134, 165 Heroes 32 Hydrograph 69 ,179 Hydrology 67, 181
IIdentification of animals 162 Identification of plants 161 Imagination 19, 21, 46, 107 Indicator 155 ,166 ,171 ,175 Industrialisation 17, 18, 46, 84, 89 Innovation 25, 99-100 Interception 66

Irrigation 44, 81-82, 85, 88 Isoetid plants 101
KKingfisher 146-148Kymi river 18-19, 38, 42, 63, 81, 99, 100, 102, 105-106, 182
LLand uplift 99Latvia 6, 58, 61, 63, 113-115, 123, 143-144, 171, 179Leaches 134, 162Legend 55Lemna 128-130,161Leptocerus 133Levées 81Lithuania 6, 51, 56, 61, 74, 123, 179,188-189Logdriver 57Log-floater 22-23Logging site 103Lumberjack 20-23Lumber company 19 ,102Lymnaea 134
MMacrophytes 125, 130, 159, 160, 175- 176, 181Macro-organisms 101 Mayflies 133,162,191 Meandering process 79 Methodology 6, 717 Meltwater system 76 Mercantilism 110-111 Middle reach 7 7 ,80 126-127 Minnow 124, 135, 138 Mink 143, 145 Moisture budget 68 Mollusca 134 Morainic 62, 75, 122 Myth 23, 30-31
NNature 2, 6, 8-11, 14-15, 18, 21, 24-27,33, 36-38, 40, 42, 45, 52, 57, 64-65, 78,81, 84-87, 90, 92, 98-101, 113, 121, 127, 169Nitrate 154, 158, 190 Nuphar 128-130, 161 Nymphaea 128-130
OOrfe 124, 141 O ligochaeta 134 Otters 142-143
PPaper 2, 15, 25, 100-101, 152, 155 PCBs 142-143 pH 155-158,192-193,196 Phosphate 156-158, 193, 196 Phragmites 129-130 Pisidium 133 Plank 108-109Plecoptera 134, 164-165, 167Pools 79, 121, 180Poland 49, 61, 73, 82, 116, 120, 123,144, 146, 148, 186-187Pollution 3, 6, 116, 134, 150, 152, 169,170, 184-185, 190-192, 195Potamogeton 129-130Predators 125, 127, 132, 144Pulp 100-101
RRaft 104, 107Rain 12, 37, 60, 64-69, 85, 122, 124,142, 191Rapid 12-13, 15, 19, 21, 25, 39, 40, 43- 44, 101-102, 104-107, 110-111, 121, 135-136, 140, 190Restoration 84-85, 90, 178-180, 187, 189Riffle 78, 126-127, 180 River equation 68 River lamprey 140 River zone 124-125,175 Rock art 38-39Runoff 62, 64-70, 74, 76, 78, 81-82, 84- 86, 151, 179, 188Russla 32, 53, 55, 61, 73, 122-123, 201
SSagittaria 128-129, 161 Saline 65, 67Salmon 25, 43, 49, 99, 105, 116, 135- 136, 141Sand 41, 44, 49, 53, 66, 75, 77-79, 127, 133, 147, 172, 191, 194 Sawmill 103,105,108-112 Scoops 109 Scraper 132Sediment 78, 102, 130, 179-181 Sensitivity 26, 142, 150, 164, 166, 192, 195Settlement 12, 67, 82, 87-88, 90Shipyard 99Shredder 125, 127, 132Sialis 133, 162Smithies 99Sollwater 68Sparganium 121,129-130
Spawning 25, 105, 136, 138, 189Stoneflies 134, 162Stones 30-31, 44, 74-75, 77, 124, 133,144, 180-181, 191, 194Stream 3, 17, 25, 41, 44, 46, 52, 65, 72,77-79, 86, 90-91, 99, 101, 113, 117, 121-127, 130, 135, 140, 142, 146, 148, 151-152, 170, 175, 178-180, 184, 187Sturgeon 116Submerged plants 130-131,194Sustainable lifestyle 11Sweden 6, 20, 61, 72-73, 91, 99, 109-110, 122-123, 140, 143-148, 164, 170,179, 184, 189-190, 193Symbolic sign 29Syrphidae 134
TTar 99, 110, 143Tectonic forces 72, 77, 79Temperature 52, 120-121, 126, 136, 150-151, 157-158, 187, 192-193, 196Throughflow 65-66, 68-69Tiles 99Timber 81,99-100Topographical 62, 70, 76-77Townscape 83, 93Transpiration 65-66, 68Transport 57, 71, 75, 77, 79, 81, 86, 102,179, 185, 190Trent index 163-166,170Trout 49, 121, 124-126, 135, 138, 152,189, 194Tubifera 134Tug boat 104Turbidity 151-152, 158, 192-193, 196
UUpper reach 120 Urbanisation 82, 84, 89
VVelocity 58, 71, 77-79, 126, 130 Vegetation mapping 159
WWater cycle 64-68, 77, 82, 84 Water mill 99Water Quality 3, 6, 75, 150, 152, 163- 169, 171-175, 187-193 Watershed 70, 72-73, 77, 187 Waterwheel 109Waste water 85, 100-101, 155, 158, 169, 178, 186, 190 Weichsel period 74 White fish 99


The Baltic Sea Project
Rivers drain into the vulnerable Baltic Sea even from countries not belonging to the nine
riparian member states in the Baltic Sea Project within the U N ESCO ASPnet.Rivers have always been of greatest importance for man, for transport, for energy, for fishes
and food, for getting rid of wastes, for relaxation and recreational purposes.Water is thus an essential resource.
The book deals with aesthetics, environmental education as a challenge in art, social studies and science. It provides information on how rivers are formed - “It all starts with the rain”.
The water cycle and man's influence on the water cycle is treated in a special chapter. Another presents the natural history of specific organisms adapted to rivers,
and one chapter is devoted to the question of nature restoration. The importance of environmental education for sustainable development is included in the holistic
approach meant for interdisciplinary project work and problem based leaming amongBSP students and teachers.
What does the river tell me? How are rivers formed and what is in faet a river?These questions and others on environmental river education as a challenge have been dealt
with in this Leamers Guide "Working for Better Rivers in the Baltic Sea Region".The book is the fourth in a series of Leamers' Guides to further the main objectives of the BSP.
The authors are teachers from upper secondary level with experiences in a wide variety of subjects e.g. art, biology, chemistry, design, film, geography, history, social science
and who have been active within the UNESCO Baltic Sea Project.The authors have elaborated the book in close dialogue with experts, colleagues and students
participating in parallel international teacher training courses in different parts of the Baltic Sea Region. The intention was to try out methods, to develop ideas jointly and to
foster new ideas. Also BSP students have contributed with their suggestions and ideas on how to act and help solve the problems when man's activities in, on or by rivers makes
environment become a problem.
I l l l l U N D E R N I N G S
M I N I S T E R I E T