THE BALTIC ECOMUSSEL PROJECT
403
THE BALTIC ECOMUSSEL PROJECT Final report November 2003
-
Upload
khangminh22 -
Category
Documents
-
view
0 -
download
0
Transcript of THE BALTIC ECOMUSSEL PROJECT
THE BALTIC ECOMUSSEL
PROJECT
Final report
November 2003
List of Contents
A Project Description
B Word from the Project Leader
C Summary and Conclusions
1. Environmental Aspects of Mussel Farming
1.1 Methodology for monitoring and evaluation
- Introduction to mussel farming: Why mussel farms?- Ecological and physical aspects affecting mussel farming- How to assess potential sites for mussel farming – Case study in Hanko, Finland- Environmental consequences of mussel farms – Case study in Kumlinge, Åland- Ecosystem services- Perspectives
1.2 Synergy between mussel growing and other Marine use areas – wind farms, fishery, ornithology and evaluation
1.3 Results of pilot studies on protein, lipid and heavy metals in Mytilus edulis in the Kurzeme coastal zone of the open Baltic Sea
1.4 Risk assessment of environmental factors influencing potential Mytilus spp. cultivation on the coastal zone of the Baltic Sea in the Kurzeme region
2. Socio Economic Studies
2.1 Mussel farming in the Baltic Sea – good for economy, good for ecology and good for the local community?
2.2 Microeconomic modelling of Labour Market as applied on Mussel Farming
2.3 Social Aspects of mussel Farming
3. Technical and Financial Studies, Reports and Plans
3.1 Technical Studies and Reports
3.1.1 Growing Techniques for mussels Mytilus edulis3.1.2 Mussel Farming Equipment and Costs
3.2 End Use of Blue Mussels
3.3 Examples of Business Plans
3.3.1. Sweden3.3.1.1 Annex Sweden3.3.2. Finland3.3.2.1 Annex Finland3.3.3. Latvia3.3.3.1 Annex LatviaAnnex NPL Mussel toolkit (Excel File outside this PDF)
3.4. Other information
3.4.1. Mussel Growing Restrictions in the Open Baltic Sea at the Kurzeme Coast3.4.2. Compendium on establishment of a mussel farm from the point of view of laws and regulations in Latvia
3.5 Study Visits, Examples of Blue Mussel Farms
3.5.1 Study Visit to Aland and Finland3.5.2 Study Visit to Sweden and Denmark3.5.3 Study Visit to Canada3.5.4 Study Visit to Scotland
Disclaimer: The contents of the document reflect the authors’ views. The Managing Authority of the Central Baltic INTERREG IV A Programme cannot be held liable for information published by the project partners.
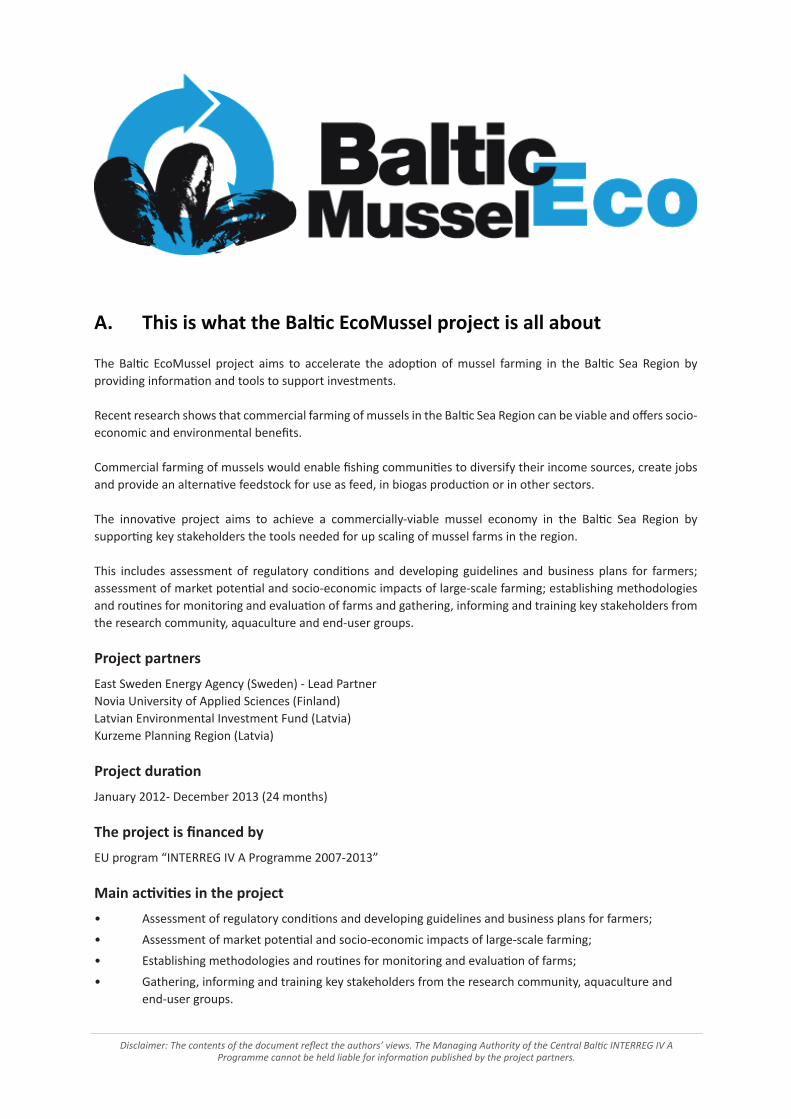
A. This is what the Baltic EcoMussel project is all about
The Baltic EcoMussel project aims to accelerate the adoption of mussel farming in the Baltic Sea Region by providing information and tools to support investments.
Recent research shows that commercial farming of mussels in the Baltic Sea Region can be viable and offers socio-economic and environmental benefits.
Commercial farming of mussels would enable fishing communities to diversify their income sources, create jobs and provide an alternative feedstock for use as feed, in biogas production or in other sectors. The innovative project aims to achieve a commercially-viable mussel economy in the Baltic Sea Region by supporting key stakeholders the tools needed for up scaling of mussel farms in the region.
This includes assessment of regulatory conditions and developing guidelines and business plans for farmers; assessment of market potential and socio-economic impacts of large-scale farming; establishing methodologies and routines for monitoring and evaluation of farms and gathering, informing and training key stakeholders from the research community, aquaculture and end-user groups.
Project partners
East Sweden Energy Agency (Sweden) - Lead Partner Novia University of Applied Sciences (Finland) Latvian Environmental Investment Fund (Latvia) Kurzeme Planning Region (Latvia)
Project duration
January 2012- December 2013 (24 months)
The project is financed by
EU program “INTERREG IV A Programme 2007-2013”
Main activities in the project
• Assessment of regulatory conditions and developing guidelines and business plans for farmers;
• Assessment of market potential and socio-economic impacts of large-scale farming;
• Establishing methodologies and routines for monitoring and evaluation of farms;
• Gathering, informing and training key stakeholders from the research community, aquaculture and end-user groups.
Disclaimer: The contents of the document reflect the authors’ views. The Managing Authority of the Central Baltic INTERREG IV A Programme cannot be held liable for information published by the project partners.
B. A Word from the Project Leader The Baltic EcoMussel project aims to support the development of commercial mussel farms in order to strengthen fishery as an industry, the countryside and the labour markets in the Baltic Sea Region. The project also indirectly aims to reduce nitrogen and phosphorous in the Baltic Sea, thus creating a cleaner sea.
Mussels are farmed in many countries within the EU. In Sweden, farms are mainly found on the west coast. Lately, a number of pilot projects have studied whether or not commercial mussel farming is possible in the Baltic Sea. Baltic EcoMussel has shown positive results indicating that there is a potential for establishing mussel farms and thus creating labour opportunities in coastal areas as well as favourable environmental and socio-economic effects. The project is targeted at being the opening of a commercial development of mussel farms in the Baltic Sea.
The Baltic EcoMussel project contributes to the achievement of the Swedish part of the European Union Baltic Sea strategy, EUSBSR, targets. The project has created tools for stakeholders to influence the development in the entire Baltic Sea area.
The project has also defined a number of strategic analyses to secure that commercialisation of mussel farms can be done in an effective and sustainable manner; assessing rules and regulations, the development of guide lines and business plans for mussel farmers, assessment of market potential and socio-economic effects of mussel farming on a large scale.
Furthermore, the project works with the implementation of methods and routines to monitor and evaluate farms as well as defining, informing and training selected key stakeholders in science, aqua agriculture and end user groups. The development of end use areas has been an important task within the project.
The project supports the development of the entire business chain from mussel farms to the final, commercial product. The target is to achieve this through local participation and international cooperation.
To reach these targets, a strong and professional partner organization has been formed within the project. Which has been coordinated by East Sweden Energy Agency in cooperation with Novia University of Applied Sciences In Finland, Latvian Environmental Investment Fund and Kurzeme Planning Region in Latvia.
Facts have been gathered from the Swedish west coast, Canada, Scotland and Denmark as well as from some other countries experienced in commercial mussel farming. The results of the project will be presented at a conference in Riga on November 26-27 and then spread throughout the entire Baltic Sea Region and elsewhere.New programmes for cooperation supported by the EU structural funds are now being created leaning on the EU2020-targets for a smart, environmental and economical sustainable Baltic Sea area. With the work already done on mussels in the Baltic Sea, a platform has now been created which makes it possible to further develop and coordinate new, innovative and environmentally positive projects.Mussels contribute to saving the Baltic Sea environment. Also, when harvested, mussels support the development of innovative business solutions providing new labour opportunities in coastal and farmland areas.
Carl Hamilton
Project Leader Baltic EcoMussel
C. Summary and conclusions
by E. Diaz & P. Kraufvelin
The project Baltic EcoMussel assessed and considered the environmental and socio-economic realities of three regions in the Baltic Sea to establish mussel farm activities, the east coast of Sweden, the open coast in Latvia, and at the entrance of the Gulf of Finland in Finland.
The project Baltic EcoMussel met contrasting public opinions; for example some people were against mussel farms considering it a non-reliable business, based on the fact that blue mussels exhibit a slow growth rate in the Baltic proper, and partially because they chose to ignore any possibilities of mussel cultivation in a non-optimal environment for mussels before having the concept tested.
Thus, our first goal has been to inform people about blue mussel aquaculture in the Baltic Sea region.
The second goal of the project was to prove that mussel aquaculture is feasible in the three target regions of the Baltic Sea (see above).
This goal was accomplished, and additionally we made new findings relevant for this industry:1. Mussels grow considerable faster on the cultivation ropes than on natural substrates on the sea floor2. 40 tons of mussel cultivation do not harm the marine ecosystem3. Proven recruitment of mussels at open coasts, e.g. the coast of Liepaja, Latvia.
Additionally, as a third goal, we wanted to identify investment costs for a mussel farm installation for each one of the study locations. We identified the necessary investments and costs taken as a reference a production of 80-100 tons of mussels every second year within a water area of 1 hectare.
These investments could be subsidized by municipalities, regional development programs and EU development programs or by the private sector.
The identification of end-uses for harvested mussels was our fourth goal. We suggest that mussels should be used in restaurants, which might be promoted as a local and organic culinary delicatessen from the Baltic region. Other end-uses for mussels include: fertilizers for agriculture and as fish and chicken food. Additionally, we highlight the indirect positive environmental consequence of mussel farming at local scales. This is taking place through the recycling of nutrients.
Nitrogen and phosphorus from agriculture, municipalities and industries are taken up by the mussel tissues from the sea in situ (one of the few available in site methods for removal of nutrients already present in the sea) and when harvesting, N and P and carbon (C) are eliminated from the water and returned to land.
During the active filtration process of the mussels, the waters also become clearer which may benefit submerged macrophytes and natural fish stocks.
The next steps would be to test the equipment/methods/concepts in the regions at industrial scales and attract interest in developing this industry further. In synthesis, the investment of mussel industry in the Baltic region means investment in a green economic activity and in a greener future, implying cleaning and clearing the sea.

1.
Environmental Aspects of Mussel Farming
1.1Methodology for monitoring and evaluation
Eliecer Diaz and Patrik Kraufvelin
2
Methodology for monitoring and evaluation
Eutrophication of sea areas, especially at coastal zones, is an issue of high concern for the economy of the Baltic countries. The principal problems with excessive nutrients in the water are present in increased frequencies of plankton and filamentous algal blooms, which in the end increases the turbidity of the water inhibiting the growth of other important species of macroalgae like bladder-wrack, and at the same time inducing the extra consumption of oxygen from the waters when the algae are broken down.
Economic activities in marine environments are determined by the capacity of the ecosystem to provide goods and services to humans. This ecological feature of the ecosystem is a prerequisite that needs to be assessed before starting an economic activity. Here, the results are provided from a tested methodology meant to help stakeholders in the implementation of mussel farms in the Baltic Sea as an economically sustainable activity to remove nutrients of the Baltic Sea. Mussel farming can be an alternative/extra source of income to small-scale fishery whose activity is seriously threatened by overfishing and pollution (also with nutrient pollution). A synthesis of the natural aspects which need to be considered before engaging in this activity is provided here.
Disclaimer: The contents of the document reflect the authors’ views. The Managing Authority of the Central Baltic INTERREG IV A Programme cannot be held liable for information published by the project partners.
3
INDEX
I. Introduction to mussel farming: Why mussel farms?
II. Ecological and physical aspects affecting mussel farming
III. How to assess potential sites for mussel farming
Study case: monitoring environmental features for mussels in Hanko, and their effects on mussel recruitment and growth
a. Environmental factors predicting best mussel recruitment
b. Environmental factors predicting mussel growth.
c. Growth monitoring
IV. Environmental consequences of mussel farms
Study case. Environmental consequences of the mussel farm in Kumlinge, Åland.
Methodology
Results
Discussion
Conclusions
References
4
I. Introduction to mussel farming: Why mussel farms?
Fish stocks show serious signals of declining in the world and in the Baltic Sea due to overfishing and failed fishing policies. Similarly, marine coastal areas where much local fishing activities take place are suffering from severe degradation due to the release of fertilizers from agricultural activities and pollution from other industrial activities (HELCOM 2013). The Baltic Sea is a species-poor, semi-enclosed brackish water system with lower salinities than the sea. The most prominent species exploited in the fishing industry are cod (Gadus morhua), herring (Clupea harengus) and sprat (Sprattus sprattus) costituing 80% of the total fish biomass caught (Elmgren1984; Thurow 1984). According to the Baltic Marine Environment Protection Commission, HELCOM, the highest catches were recorded during 1996-98, when total landings peaked around 1,100,000 tons; from that point, the annual level of total catch varies around 700,000 tons and have started to further decline, since the fish populations do not tend to increase anymore. Studies suggest that these species have not exhibited their typical high abundances in about 10-20 years.
Researchers also suggest that the additive effect of nutrient emissions from agricultural activities plus an increased fishing effort due to new technologies (which make fishing more efficient) causes unpredictability in the estimations of catches of commercial fish. This has changed the perception of fishermen towards their own activity; they are now considering fishing as not reliable economical activity in the long term. The declines of industrial and small-scaled fisheries have mainly negative consequences on the economy of the Baltic countries at small and large scales. Therefore, efforts towards the diversification of new sustainable fishing activities are fundamental to maintain socio-economic standards and well-being in the society. For example, economic activities that combine aquaculture, restoration of ecosystems and/or tourism need to be further explored. Here, focus lies on mussel farming as an economical activity showing these features, counteracting the effects of decreased fisheries and helping to remove nutrients from the Baltic Sea (restoration), while consequently improving the water clarity (transparency) at the coastal areas.
5
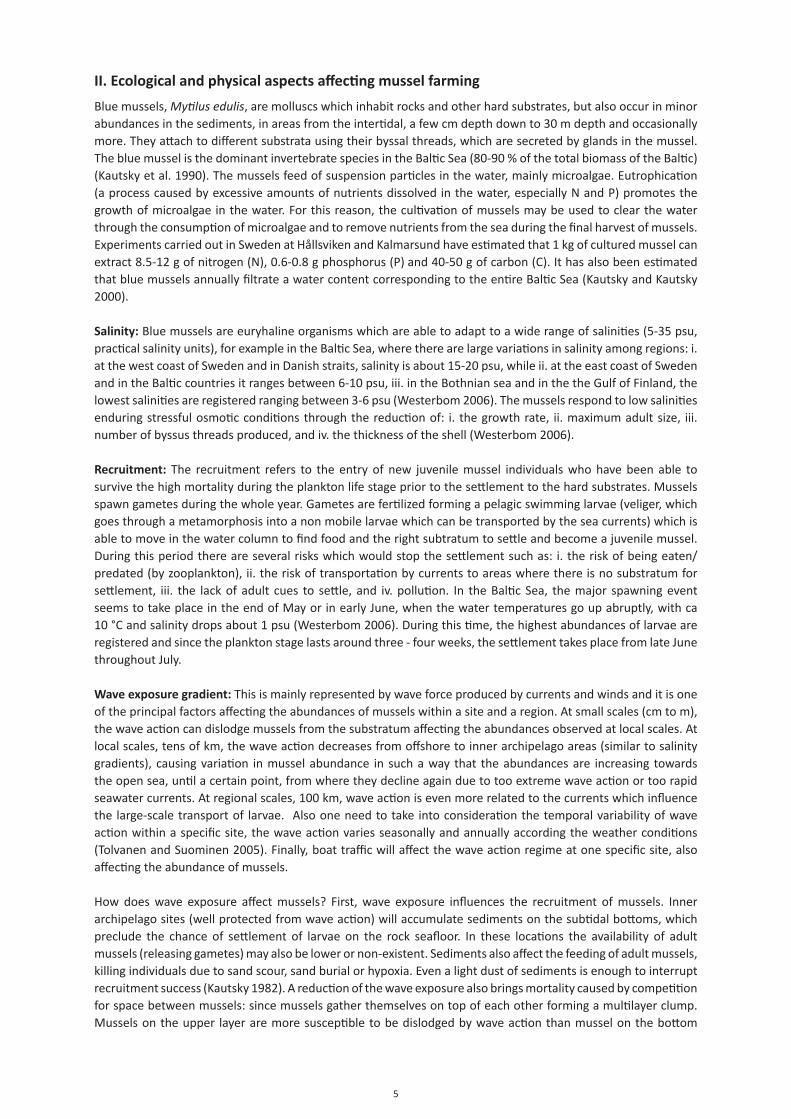
II. Ecological and physical aspects affecting mussel farming
Blue mussels, Mytilus edulis, are molluscs which inhabit rocks and other hard substrates, but also occur in minor abundances in the sediments, in areas from the intertidal, a few cm depth down to 30 m depth and occasionally more. They attach to different substrata using their byssal threads, which are secreted by glands in the mussel. The blue mussel is the dominant invertebrate species in the Baltic Sea (80-90 % of the total biomass of the Baltic) (Kautsky et al. 1990). The mussels feed of suspension particles in the water, mainly microalgae. Eutrophication (a process caused by excessive amounts of nutrients dissolved in the water, especially N and P) promotes the growth of microalgae in the water. For this reason, the cultivation of mussels may be used to clear the water through the consumption of microalgae and to remove nutrients from the sea during the final harvest of mussels. Experiments carried out in Sweden at Hållsviken and Kalmarsund have estimated that 1 kg of cultured mussel can extract 8.5-12 g of nitrogen (N), 0.6-0.8 g phosphorus (P) and 40-50 g of carbon (C). It has also been estimated that blue mussels annually filtrate a water content corresponding to the entire Baltic Sea (Kautsky and Kautsky 2000).
Salinity: Blue mussels are euryhaline organisms which are able to adapt to a wide range of salinities (5-35 psu, practical salinity units), for example in the Baltic Sea, where there are large variations in salinity among regions: i. at the west coast of Sweden and in Danish straits, salinity is about 15-20 psu, while ii. at the east coast of Sweden and in the Baltic countries it ranges between 6-10 psu, iii. in the Bothnian sea and in the the Gulf of Finland, the lowest salinities are registered ranging between 3-6 psu (Westerbom 2006). The mussels respond to low salinities enduring stressful osmotic conditions through the reduction of: i. the growth rate, ii. maximum adult size, iii. number of byssus threads produced, and iv. the thickness of the shell (Westerbom 2006).
Recruitment: The recruitment refers to the entry of new juvenile mussel individuals who have been able to survive the high mortality during the plankton life stage prior to the settlement to the hard substrates. Mussels spawn gametes during the whole year. Gametes are fertilized forming a pelagic swimming larvae (veliger, which goes through a metamorphosis into a non mobile larvae which can be transported by the sea currents) which is able to move in the water column to find food and the right subtratum to settle and become a juvenile mussel. During this period there are several risks which would stop the settlement such as: i. the risk of being eaten/predated (by zooplankton), ii. the risk of transportation by currents to areas where there is no substratum for settlement, iii. the lack of adult cues to settle, and iv. pollution. In the Baltic Sea, the major spawning event seems to take place in the end of May or in early June, when the water temperatures go up abruptly, with ca 10 °C and salinity drops about 1 psu (Westerbom 2006). During this time, the highest abundances of larvae are registered and since the plankton stage lasts around three - four weeks, the settlement takes place from late June throughout July.
Wave exposure gradient: This is mainly represented by wave force produced by currents and winds and it is one of the principal factors affecting the abundances of mussels within a site and a region. At small scales (cm to m), the wave action can dislodge mussels from the substratum affecting the abundances observed at local scales. At local scales, tens of km, the wave action decreases from offshore to inner archipelago areas (similar to salinity gradients), causing variation in mussel abundance in such a way that the abundances are increasing towards the open sea, until a certain point, from where they decline again due to too extreme wave action or too rapid seawater currents. At regional scales, 100 km, wave action is even more related to the currents which influence the large-scale transport of larvae. Also one need to take into consideration the temporal variability of wave action within a specific site, the wave action varies seasonally and annually according the weather conditions (Tolvanen and Suominen 2005). Finally, boat traffic will affect the wave action regime at one specific site, also affecting the abundance of mussels.
How does wave exposure affect mussels? First, wave exposure influences the recruitment of mussels. Inner archipelago sites (well protected from wave action) will accumulate sediments on the subtidal bottoms, which preclude the chance of settlement of larvae on the rock seafloor. In these locations the availability of adult mussels (releasing gametes) may also be lower or non-existent. Sediments also affect the feeding of adult mussels, killing individuals due to sand scour, sand burial or hypoxia. Even a light dust of sediments is enough to interrupt recruitment success (Kautsky 1982). A reduction of the wave exposure also brings mortality caused by competition for space between mussels: since mussels gather themselves on top of each other forming a multilayer clump. Mussels on the upper layer are more susceptible to be dislodged by wave action than mussel on the bottom
6
layers (Zardi et al. 2006). In contrast, an increase in wave action will directly increase mortality of dislodgement. Therefore, the determination of the optimal wave exposure, where mussels exhibit higher abundances of recruits and adults is crucial to decide potential sites for mussel farms. Finally, the wave action will affect the availability of food (microalgae) for the mussels and this can be studied by measurements of chlorophyll-a levels in the water.
Depth: It has been thoroughly documented that especially non-motile aquatic invertebrate species exhibit fixed positions at specific depths. This phenomenon is called “zonation” and is produced by different causes: predation, competition, wave action, light regime, etc. M. edulis position ranges from 0-30 m of depth, but its maximum abundance is found between 6-8 m, gradually declining towards deeper waters. In waters shallower than 6 m, M. edulis competes for space with the macroalgae bladder-wrack, Fucus vesiculosus, and other filamentous algal species which limit its recruitment. At these shallower depths, M. edulis is also affected by strong wave action and ice scouring during winter (Westerbom 2006). The water depth also affects the availability of food for the mussles and generally there are more food in shallow surface waters than deeper down in the water mass. Setting the mussel farm below the surface can help to prevent the destruction of the mussel farm during the winter due to ice. Ice it has recognized one of the most dramatic problems related to mussel farm activities (Lindahl 2012).
Predators: There are two major predation sources for mussels in the Baltic Sea to take into consideration, fish and birds. For example the roach is the main important blue mussel feeder even in poor blue mussel environments (Lappalainen et al. 2004). The second main predator of mussel is the eider duck, Somateria mollissima, which can cause a major change in the abundance of blue mussels. It has been estimated that these birds are able to consume between 0.5-2.5 kg of mussels per day (shell included) (Hariö and Öst 2002). Therefore, implementation of nets to stop the predation of eider may be necessary, the effect of roach on the mussel farm nets needs to be assessed.
The recognition of recruitment peaks along the summer season (and also year-to-year differences) at local scales is essential a priori knowledge to start the set up of mussel farms. Similarly, the optimal level of wave and current exposure as well as which depths are the best ones for recruitment and growth are another crucial aspects that need to be taken into account to obtain the best economical profits.
7
III. How to assess a potential site for mussel farming?
1. Study case: monitoring environmental features for blue mussels in Hanko, and their effects on recruitment and growth.
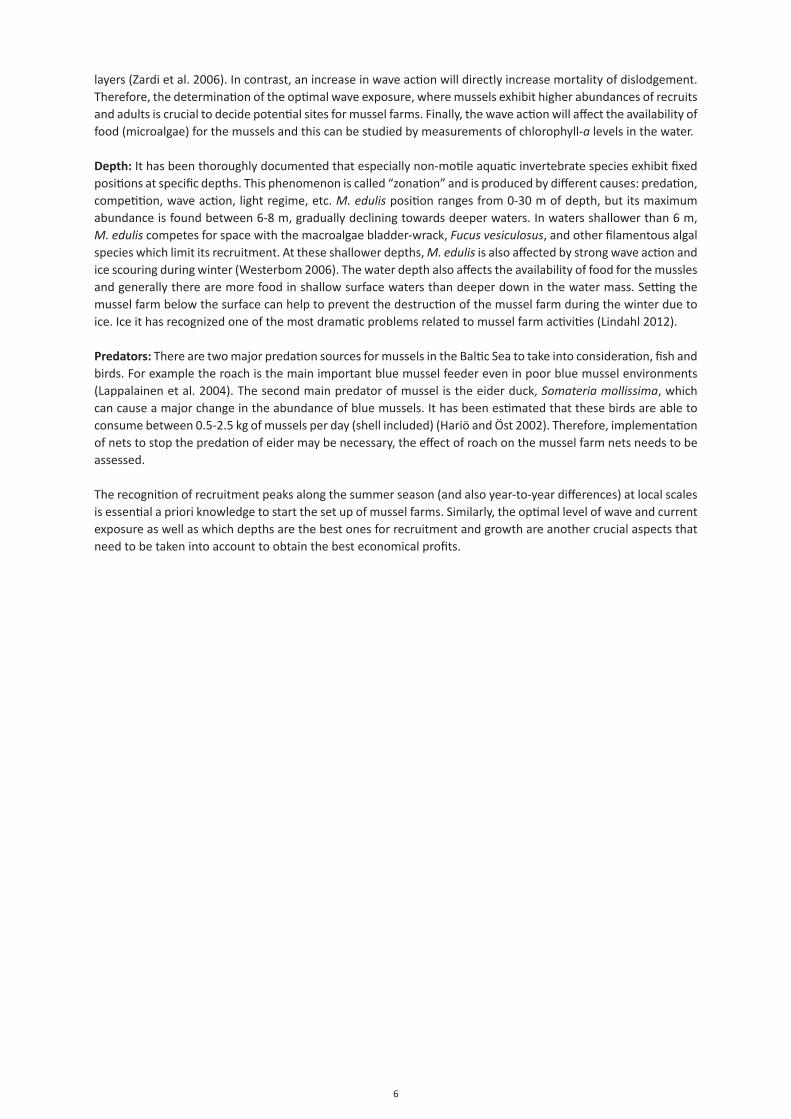
Taking into consideration the factors on the section II (wave exposure, depth, food (chlorophyll-a concentration), and recruitment), a pilot experiment was designed. The experiment was located at the very entrance of Gulf of Finland in the southeastern part of the Archipelago Sea (Fig. 1). Nine sites were chosen divided in three levels of wave exposure: three sites were located at high wave exposures, three at moderate exposures, and three at sheltered areas (low exposure). In each site, three experimental units were attached to the bottom (Fig. 2). This experimental unit allowed repeated tests of recruit density (abundance of mussels) at three depths: 2 m, 4 m and 6 m below the surface. The experimental design comprises, n = 27 experimental units, N = 81 samples per time = 9 sites x 3 experimental units x 3 depths). At every depth on each experimental unit, three short ropes were attached (= individual samples).
Figure 1. Map showing the area on the western side of the Hanko peninsula, where 9 sites where chosen to monitor which conditions are optimal for setting up mussel farms. The nine sites were distributed homogeneously along a gradient of wave exposure, where three sites were located at the most exposed places, three sites located at more moderate places and finally three sites were located at sheltered places.
8
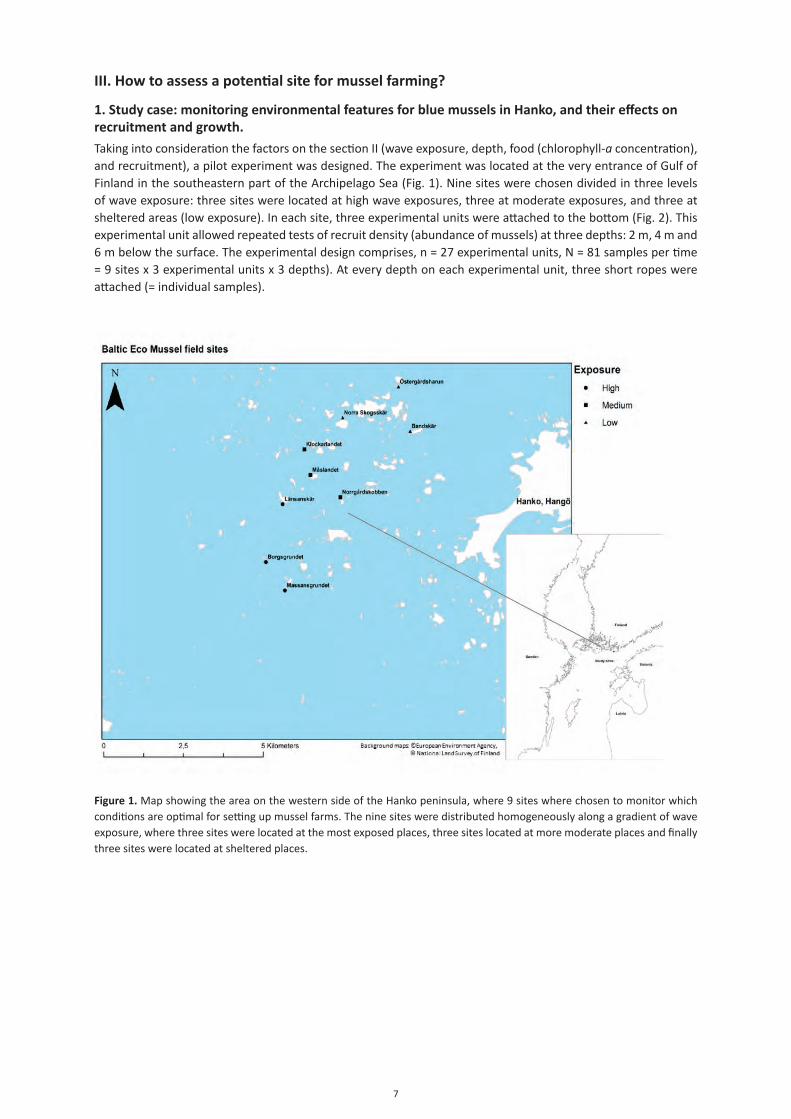
Figure 2. The scheme of one experimental unit used to assess the wave exposure and depths where mussels recruit better and grow faster. Three experimental units where set up in each of the 9 locations.
Environmental monitoring. Two water samples (1 liter per bottle) were taking using a “Limnos” sampler at two depths, 2 and 6 m. Three estimations of light penetration using Secchi disc method were also made. The water collected served to estimate: i. the concentration of nutrients (total N, Nitrogen, and total P, Phosphorous), ii. amount of food and visibility through the estimation of chlorophyll-a concentration, iii. oxygen concentration and iv. salinity. Nutrients and chlorophyll-a estimations were made at Tvärminne Zoological station using spectrophotometers within 24 h after the sampling. Three sampling were made at July 26th, Aug 13th and October 22nd 2012.
Recruitment analyses. On October 22nd 2012, the first sampling to detect recruitment was taken. This sampling comprised the extraction of three ropes from each depth from three different experimental units (n = 9 per site, N = 81).
Growth monitoring. On 13th May and 25th June 2013. One rope per location was taken at different depth, this allowed us to observe the period when mussels exhibit better growth: winter or spring.
2. Results
Monitoring Environmental conditions (July - October)
Water transparency and concentration of Chlorophyll-a. The water conditions at the experimental site were homogeneous and fairly healthy. For example, there were no signs of hypoxia or anoxia during the samplings, since the oxygen levels were in the range between 95-120% of saturation. It was observed that the oxygen in the surface water was slightly higher than deeper down, especially in July-August.
The salinity did neither show any variability along the wave exposure gradient nor with depth. The average salinity was 6 psu, which coincide with the normal range expected for the region (Westerbom 2006).
The water transparency examined using the Secchi depths showed expected decrease in water transparency towards sheltered sites (1-2 m of greater visibility in the most exposed sites compared to the most sheltered sites), and also a temporal increase towards winter months. The Secchi depth was consistent with the concentration of chlorophyll-a in the water. For example, the poorest water transparency was observed in sheltered places, where the higher concentration of chlorophyll-a concentration was found (two-way RM-ANOVA, p < 0.05 for Secchi depth and Chlorophyll-a analyses).
9
The factor Time * Exposure * Depth (p < 0.05), identified stratification between water layers of 2 and 6 m, with higher chlorophyll-a concentrations in exposed and moderately exposed sites at 2 m than at 6 m during July. In August and October, there was no stratification, and chlorophyll-a tended to decrease towards winter months. The maximum concentration of chlorophyll-a observed in the experimental site was 2.8 ± 1.26 µ/l.
Nutrients.
Total amount of Phosphorus. P-concentration at the experimental site was on average 21.9 ± 4.5 µg/l. The total amount of phosphorous varied according to the depth, where at 6 m the concentration was higher than at 2 m (two-way RM-ANOVA, p < 0.05). There was also temporal variability in the concentration of P, exhibiting higher values in October than in July and August (which did not show differences). The “Time and “Exposure” factors in the ANOVA showed that P-concentration increased significantly with respect to the other groups in October at the sheltered sites the, while “Time and Depth” factors showed that in July, there was significantly higher P-concentration at 6 m than in the rest of the groups.
Total amount of Nitrogen. The average concentration of N in the locations was 333 ± 22.67 µg/l. A similar trend as for the P-concentration was observed for the N-concentration in relation to wave exposure as higher N was observed at the sheltered site, but in terms of depth the trend was the opposite to P, since the N-concentrations were higher at 6 m. Finally, the temporal term in two-way RM-ANOVA denoted that in August there is higher levels of N dissolved in the water.
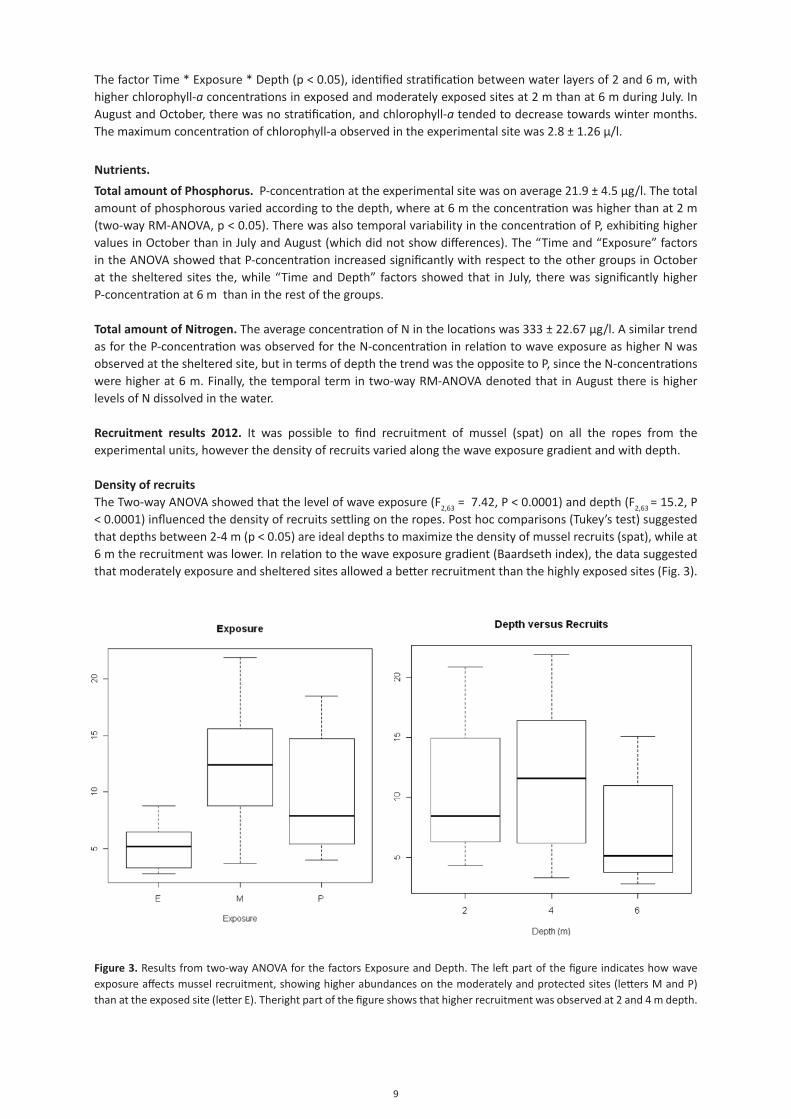
Recruitment results 2012. It was possible to find recruitment of mussel (spat) on all the ropes from the experimental units, however the density of recruits varied along the wave exposure gradient and with depth.
Density of recruitsThe Two-way ANOVA showed that the level of wave exposure (F2,63 = 7.42, P < 0.0001) and depth (F2,63 = 15.2, P < 0.0001) influenced the density of recruits settling on the ropes. Post hoc comparisons (Tukey’s test) suggested that depths between 2-4 m (p < 0.05) are ideal depths to maximize the density of mussel recruits (spat), while at 6 m the recruitment was lower. In relation to the wave exposure gradient (Baardseth index), the data suggested that moderately exposure and sheltered sites allowed a better recruitment than the highly exposed sites (Fig. 3).
Figure 3. Results from two-way ANOVA for the factors Exposure and Depth. The left part of the figure indicates how wave exposure affects mussel recruitment, showing higher abundances on the moderately and protected sites (letters M and P) than at the exposed site (letter E). Theright part of the figure shows that higher recruitment was observed at 2 and 4 m depth.

10
Size of recruits
The mean (± SD) size of recruits was 2.28 ± 0.5 mm in October 2013. A two-way ANOVA was run with the factors Exposure and Depth. Significant main effects for Exposure (F2,60= 29.34, P < 0.0001) suggested that at protected sites, recruits grow better than at moderately and highly wave exposed sites (Tukey’s test, p < 0.05). In terms of depth (F2,60= 6.3735, P < 0.0001), the recruits from 2 and 4 m had the same size, but both were larger than those found at 6 m depths (Tukey’s test p < 0.05) Fig 4 and 5.
Figure 4. Results two-way ANOVA, A. Showing that sheltered sites (P) exhibit larger sizes of mussel recruits than at exposed (E) and moderately exposed sites (M). The second part of the figure (B) shows that at 6 m depth, recruits tend to be smaller
than at 2 and 4 m depth.
Environmental factors
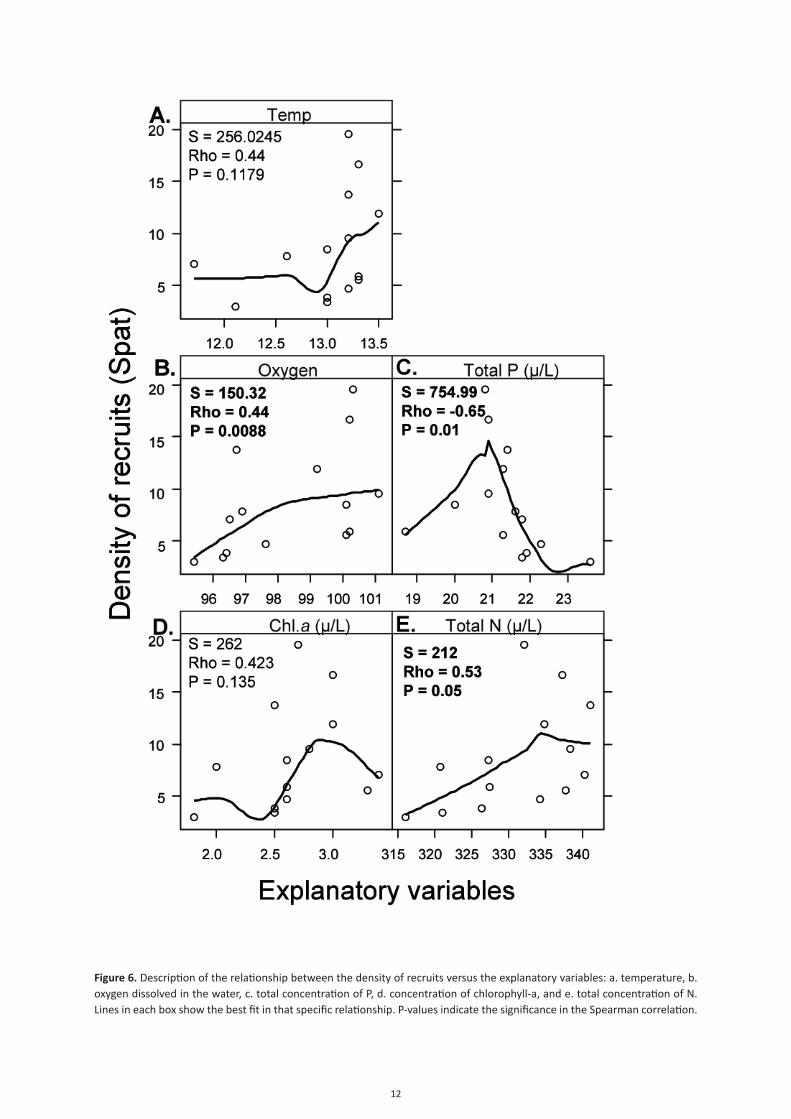
Other important environmental factors affecting recruitmentDespite wave exposure and depth being the most important factors affecting the recruitment of mussels, other factors can modulate the recruitment intensity such as concentration of chlorophyll-a, total concentration of phosphorus P and nitrogen N, oxygen concentration, temperature and salinity (the latter at larger scales than the ones examined here). Data, showed high non-linearity between the predictor variables and the density of recruits, but some significant relationships could be identified:- Recruitment is enhanced when the oxygen concentration increases in the water (Fig 6B)- Recruitment is enhanced when the total P decreases in the water (Fig 6C).- Recruitment is enhanced by increased N-concentrations in the water (Fig 6E). Although the origin of N and P was ignored, it might be possible that total N increases the amount of nutrients necessary for the growth of several groups of essential microalgae for the diet of the mussel. In contrast the excess of P, which is mainly related to organic waste, which can increase also cyanobacterial blooms and reduce the oxygen in the water provoking a disruption in the recruitment of blue mussels.
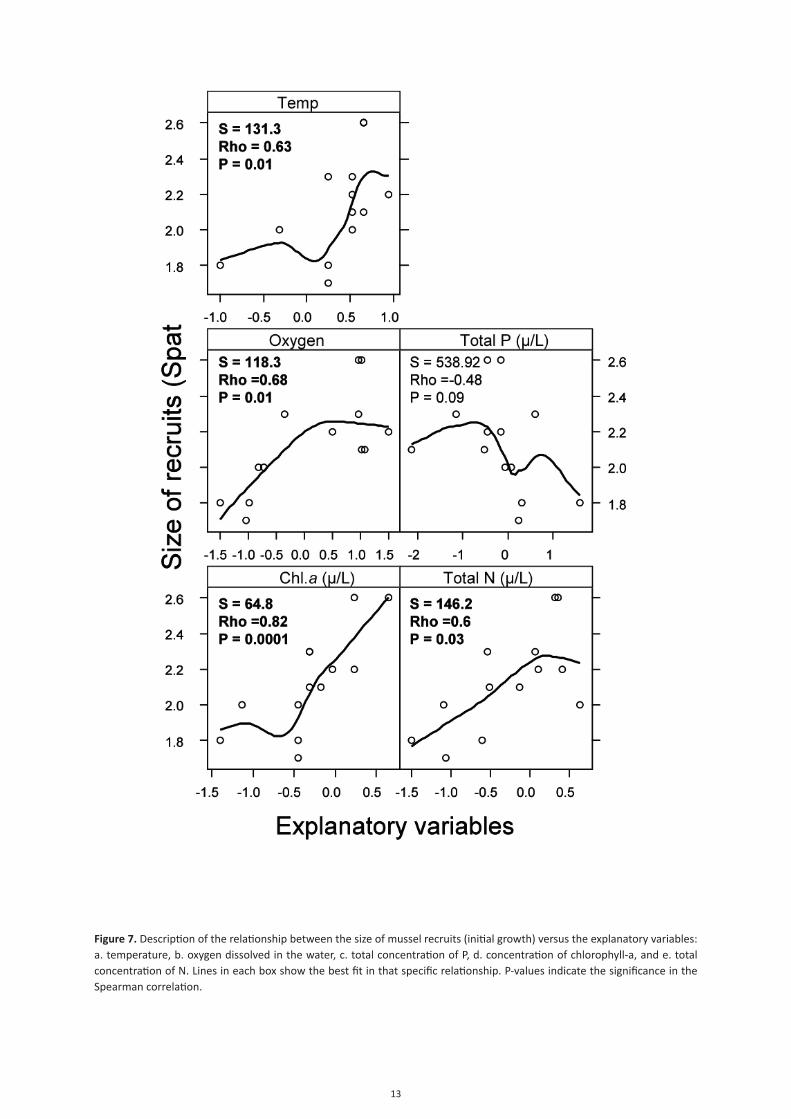
Environmental factors affecting the size (initial growth) of the blue mussel recruitsBesides wave exposure and depth, data showed significant statistical trends: i. an enhanced mussel growth can be obtained by increasing the concentration of chlorophyll-a, temperature, oxygen, and at the same time decreasing the concentration of P (Fig 7).
Growth
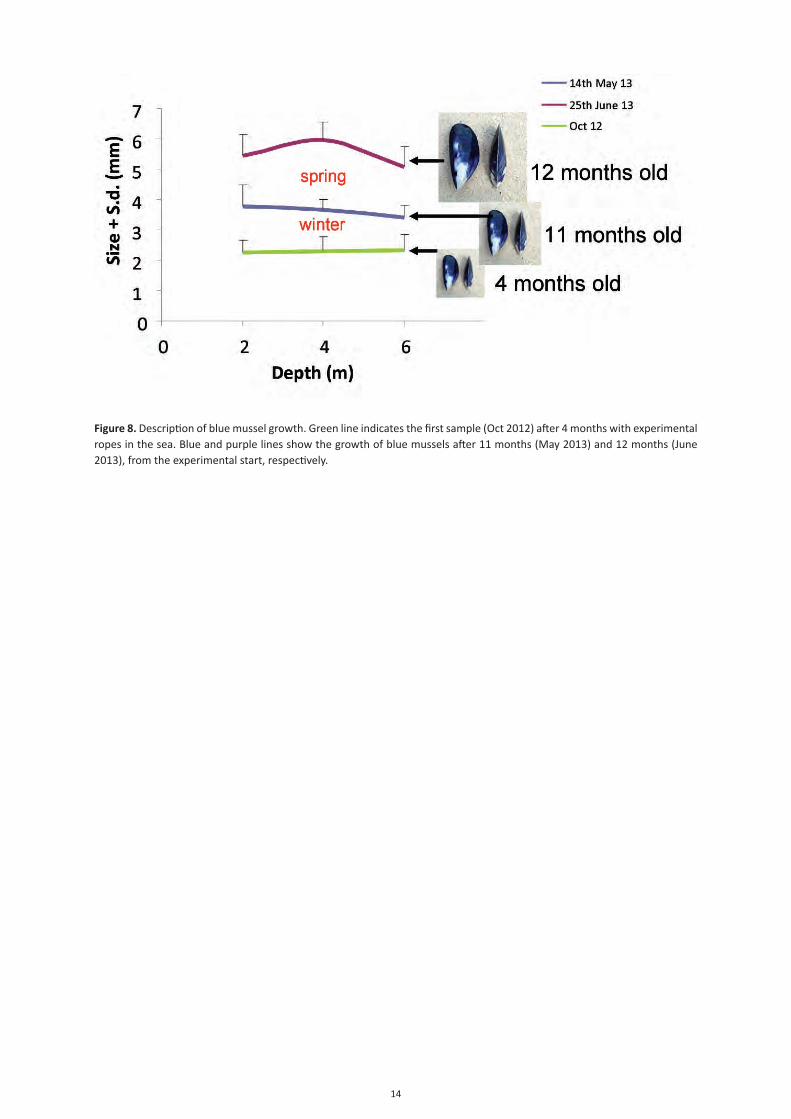
The ropes were set in the beginning of June 2012, after 4 months (October 2012) the mussels on the ropes measured on average 0.23 ± 0.05 cm, but scarce growth was observed after 11 months, the mussel reaching the size 0.48 ± 0.19 cm in May 2013, finally after 12 months from initiation of the experiment, the mussels reached as size of 0.66 ± 0.04 cm to June 2013 (Fig. 8). The growth thus mainly seems to take place from May on, when the concentration of chlorophyll-a and water temperature increases. In contrast, in winter blue mussels seem to growth at a slower rate.
11
3. Conclusions and recommendations from this part
With the available data this far, it can be concluded that mussel farms should be located in places ranging from moderately wave-exposed to semi-sheltered sites (Baardseth index of 1-2, with minimal traffic on the surroundings). The optimal depth where the nets or ropes should be submerged are 2-4 m, in order to gather enough recruits as also has been recommended in several method manuals, one of them the New Zealand method used in Scotland. These conditions together warrant better recruitment in terms of both recruit abundance and size, perhaps due to the higher food availability (higher concentrations of chlorophyll-a). Nevertheless, the optimal conditions can change over summer months when other species (mainly filamentous algae) start to grow on the ropes and to compete with the mussels. It is also highly recommended to avoid sites with bad water circulation or near sewagea which can concentrate large amount of phosphorus, the concentration of this may reduce drastically the recruitment. The data suggests also the growth is higher when there is a combination of high temp (over 15 ºC) and oversaturated oxygen concentrations and sufficient amount of food represented with concentration of chl-a.
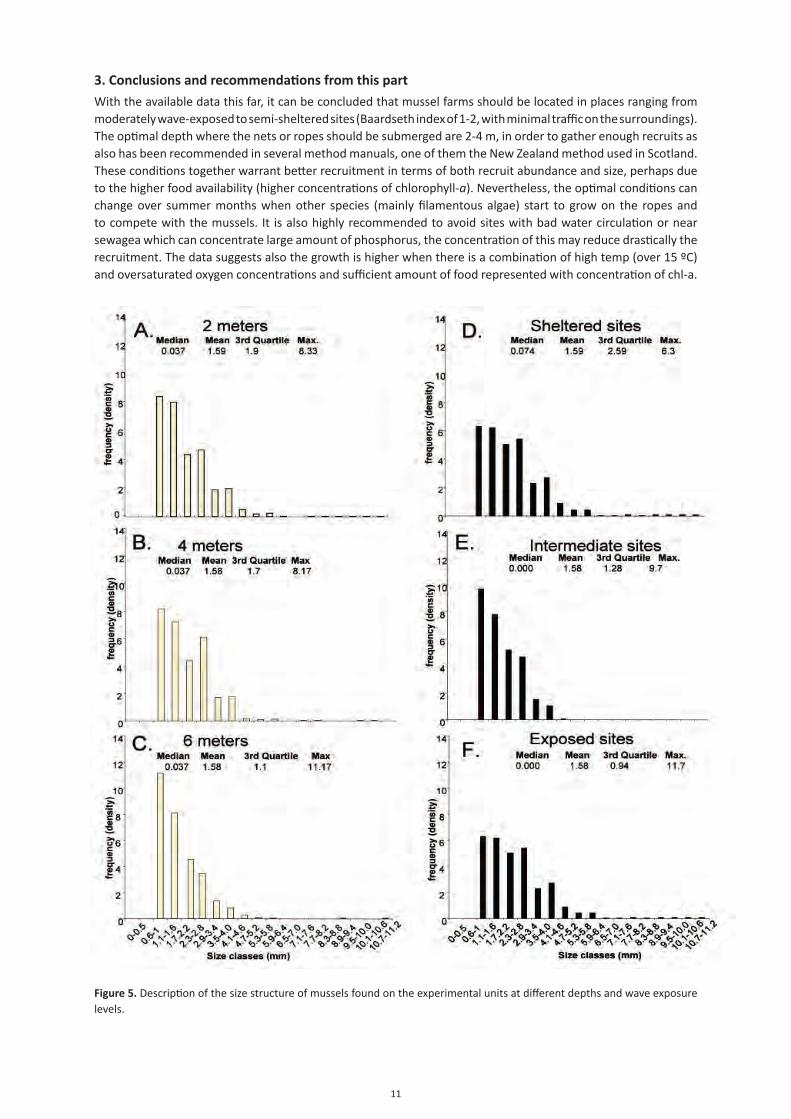
Figure 5. Description of the size structure of mussels found on the experimental units at different depths and wave exposure levels.
12
Figure 6. Description of the relationship between the density of recruits versus the explanatory variables: a. temperature, b. oxygen dissolved in the water, c. total concentration of P, d. concentration of chlorophyll-a, and e. total concentration of N. Lines in each box show the best fit in that specific relationship. P-values indicate the significance in the Spearman correlation.
13
Figure 7. Description of the relationship between the size of mussel recruits (initial growth) versus the explanatory variables: a. temperature, b. oxygen dissolved in the water, c. total concentration of P, d. concentration of chlorophyll-a, and e. total concentration of N. Lines in each box show the best fit in that specific relationship. P-values indicate the significance in the Spearman correlation.
14
Figure 8. Description of blue mussel growth. Green line indicates the first sample (Oct 2012) after 4 months with experimental ropes in the sea. Blue and purple lines show the growth of blue mussels after 11 months (May 2013) and 12 months (June 2013), from the experimental start, respectively.
15
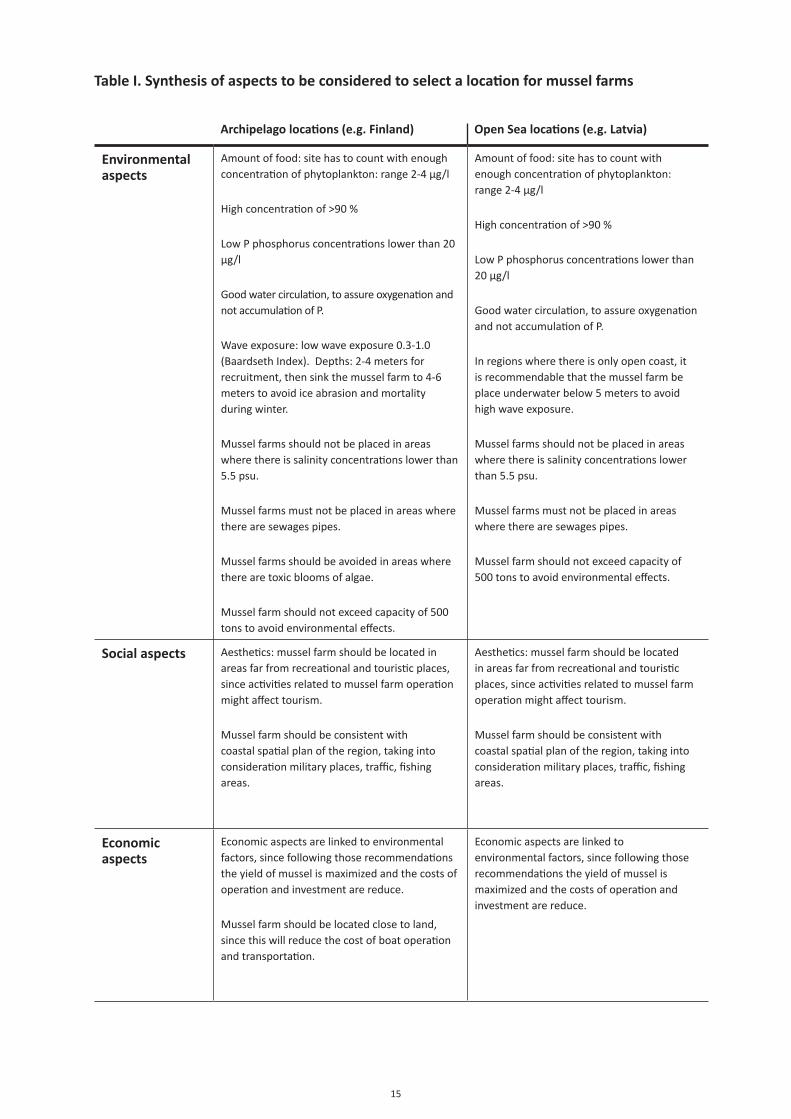
Table I. Synthesis of aspects to be considered to select a location for mussel farms
Archipelago locations (e.g. Finland) Open Sea locations (e.g. Latvia)
Environmental aspects
Amount of food: site has to count with enough concentration of phytoplankton: range 2-4 µg/l
High concentration of >90 %
Low P phosphorus concentrations lower than 20 µg/l
Good water circulation, to assure oxygenation and not accumulation of P.
Wave exposure: low wave exposure 0.3-1.0 (Baardseth Index). Depths: 2-4 meters for recruitment, then sink the mussel farm to 4-6 meters to avoid ice abrasion and mortality during winter.
Mussel farms should not be placed in areas where there is salinity concentrations lower than 5.5 psu.
Mussel farms must not be placed in areas where there are sewages pipes.
Mussel farms should be avoided in areas where there are toxic blooms of algae.
Mussel farm should not exceed capacity of 500 tons to avoid environmental effects.
Amount of food: site has to count with enough concentration of phytoplankton: range 2-4 µg/l
High concentration of >90 %
Low P phosphorus concentrations lower than 20 µg/l
Good water circulation, to assure oxygenation and not accumulation of P.
In regions where there is only open coast, it is recommendable that the mussel farm be place underwater below 5 meters to avoid high wave exposure.
Mussel farms should not be placed in areas where there is salinity concentrations lower than 5.5 psu.
Mussel farms must not be placed in areas where there are sewages pipes.
Mussel farm should not exceed capacity of 500 tons to avoid environmental effects.
Social aspects Aesthetics: mussel farm should be located in areas far from recreational and touristic places, since activities related to mussel farm operation might affect tourism.
Mussel farm should be consistent with coastal spatial plan of the region, taking into consideration military places, traffic, fishing areas.
Aesthetics: mussel farm should be located in areas far from recreational and touristic places, since activities related to mussel farm operation might affect tourism.
Mussel farm should be consistent with coastal spatial plan of the region, taking into consideration military places, traffic, fishing areas.
Economic aspects
Economic aspects are linked to environmental factors, since following those recommendations the yield of mussel is maximized and the costs of operation and investment are reduce.
Mussel farm should be located close to land, since this will reduce the cost of boat operation and transportation.
Economic aspects are linked to environmental factors, since following those recommendations the yield of mussel is maximized and the costs of operation and investment are reduce.
16
IV. Environmental consequences of mussel farms
1. Study case: Environmental consequences of the mussel farm in Kumlinge, Åland.
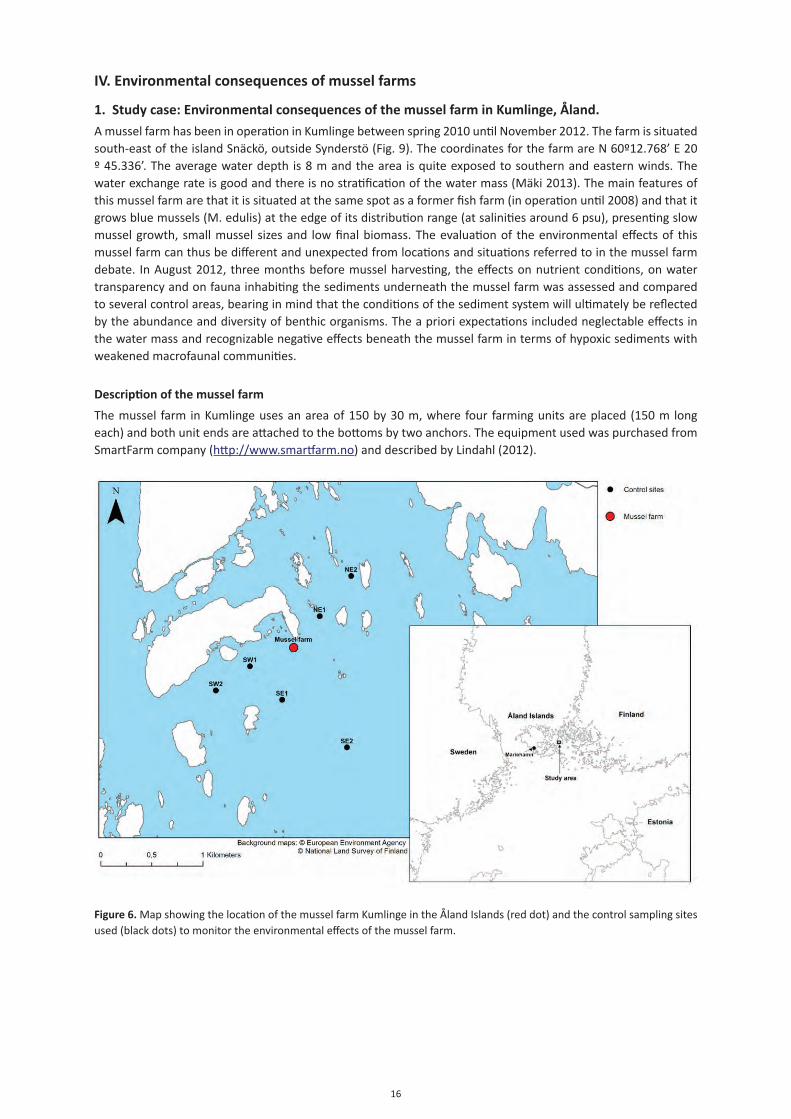
A mussel farm has been in operation in Kumlinge between spring 2010 until November 2012. The farm is situated south-east of the island Snäckö, outside Synderstö (Fig. 9). The coordinates for the farm are N 60º12.768’ E 20 º 45.336’. The average water depth is 8 m and the area is quite exposed to southern and eastern winds. The water exchange rate is good and there is no stratification of the water mass (Mäki 2013). The main features of this mussel farm are that it is situated at the same spot as a former fish farm (in operation until 2008) and that it grows blue mussels (M. edulis) at the edge of its distribution range (at salinities around 6 psu), presenting slow mussel growth, small mussel sizes and low final biomass. The evaluation of the environmental effects of this mussel farm can thus be different and unexpected from locations and situations referred to in the mussel farm debate. In August 2012, three months before mussel harvesting, the effects on nutrient conditions, on water transparency and on fauna inhabiting the sediments underneath the mussel farm was assessed and compared to several control areas, bearing in mind that the conditions of the sediment system will ultimately be reflected by the abundance and diversity of benthic organisms. The a priori expectations included neglectable effects in the water mass and recognizable negative effects beneath the mussel farm in terms of hypoxic sediments with weakened macrofaunal communities.
Description of the mussel farm
The mussel farm in Kumlinge uses an area of 150 by 30 m, where four farming units are placed (150 m long each) and both unit ends are attached to the bottoms by two anchors. The equipment used was purchased from SmartFarm company (http://www.smartfarm.no) and described by Lindahl (2012).
Figure 6. Map showing the location of the mussel farm Kumlinge in the Åland Islands (red dot) and the control sampling sites used (black dots) to monitor the environmental effects of the mussel farm.
17
Methodology
To measure the environmental impacts of this mussel farm, the area was visited during 23-24 August 2012 and water samples were taken with a Ruttner sampler and hydrographical variables (temperature, salinity, oxygen saturation, total-P, total-N, and chlorophyll-a) were registered twice at 2 and 6 m depth at each of seven stations, all with 8 m as the total water depth. The secchi depth was also taken at each station. One sampling station was placed beneath the mussel farm and the other stations were 500 and 1000 m away from the farm into three directions: SW, SE and NE (Fig. 9). Furthermore, the organic content (as loss of ignition) and zoobenthos from four sediment samples taken by a Van Veen grab (inner surface = 250 cm2) from each of three stations (beneath the mussel farm and 500 m to the SW and 500 m to the SE) was examined. The zoobenthos was sieved using a 0.5 mm mesh and fauna samples were stored in 70% ethanol until the animals were sorted and counted in the laboratory by use of a dissecting microscope. Organisms were identified to species level (exceptions: Chironomidae, Oligochaeta and Hydrobia).
Differences in water and sediment quality as well as univariate measures for zoobenthos were analysed statistically using one-way or two-way ANOVA after checking for normality and homogeneity of variances (and using appropriate data transformations if the assumptions were violated). Differences in species composition using non-parametric multivariate techniques available in the PRIMER statistical package (Clarke 1993), i.e. NMDS-ordination, ANOSIM and SIMPER on square-root transformed data in order to balance the influence between more dominant and more rare species.
Results
Does the mussel farm affect the water quality in the area?
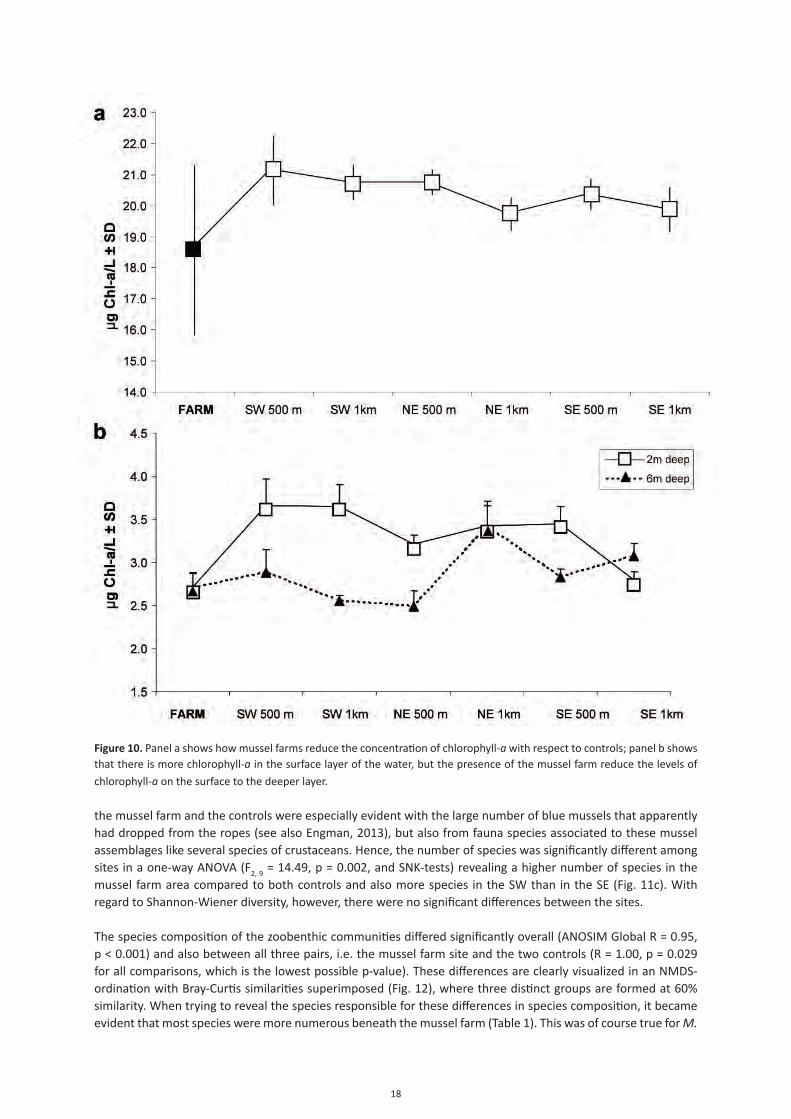
In some aspects, water quality differed significantly between the mussel farm (M) and the six control sites 500 – 1000 m to the SW, SE and NE of the farm, but not for all investigated variables. For total-P, there were significant overall differences (F = 2.94, p = 0.045*, df = 6, 14) at 2 m depth and pair-wise SNK-test demonstrated that these differences were due to lower values in the farming area (17.17 µg/l) compared to the control sites (20.07 – 21.30 µg/l) (Fig. 10a). At 6 m depth, there were no significant differences in total-P.
Clearing the water?
The Secchi depth also seemed to be bigger at the mussel farm (6.1 m) compared to the control areas (4.5–5.3 m) indicating differences in water transparency/clarity (no statistical tests performed). The differences in water transparency were, however, also documented by chlorophyll-a values, where a two-way ANOVA demonstrated a significant interaction between Site and Depth (F = 8.10, p < 0.001, df = 6, 22) and SNK-tests reveal that the chlorophyll-a levels were clearly lower at 2 m depth at the mussel farm compared to all control sites (Fig. 10b), while at 6 m depth, chlorophyll-a was only lower at the mussel farm compared to the SE and NE sites at 1000 m distance. With regard to the other hydrographical variables, there were no significant differences for total-N, oxygen concentration, salinity and temperature between the mussel farm and the surrounding control sites (data not shown).
Effects on the fauna inhabiting the sea floor (soft sediments) Accumulation of organic material under the farm compared to the controls
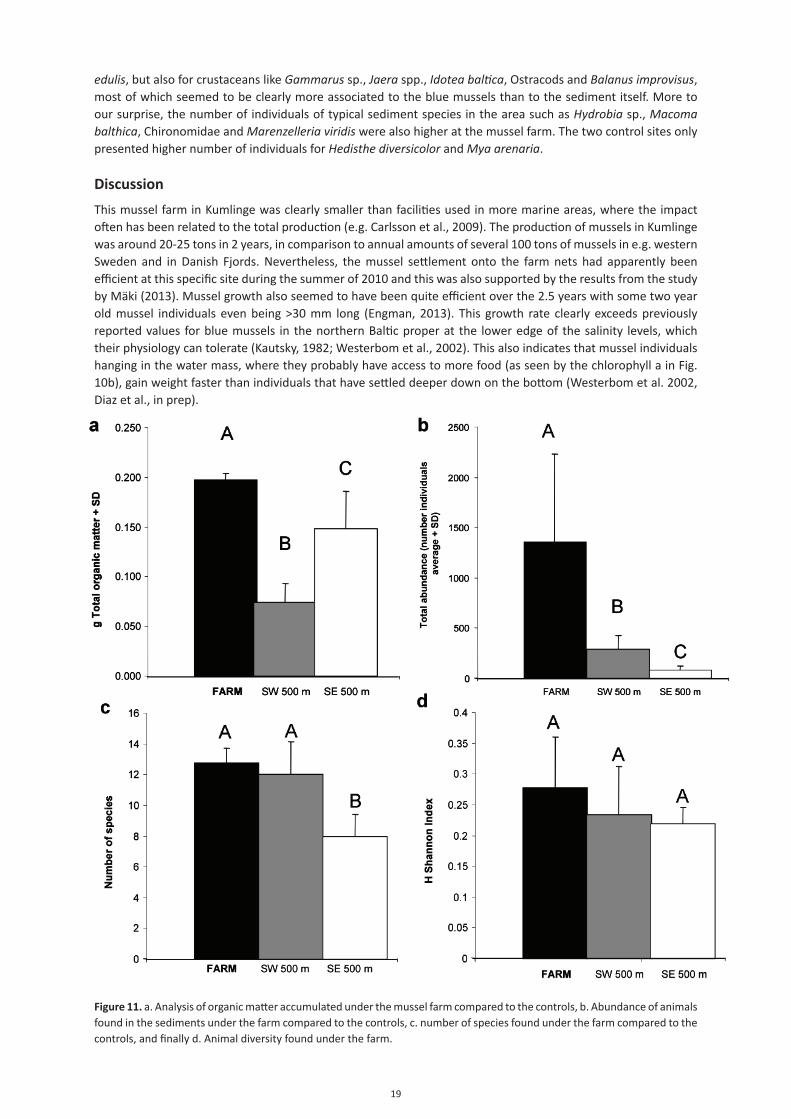
The sediments appeared to be well-aerated by visual inspections in connection with the sampling and there were no differences in oxygen saturation at 6-8 m depth (values always > 90%). Sediment organic content (in percentage) differed, however, significantly between the three sites examined in a one-way ANOVA (F2, 6 = 55.32, p < 0.001), i.e. over the farm area and the two controls 500 m to the SW and to the SE. Pair-wise SNK-tests showed that the organic content was significantly higher within the farm area compared to the control 500 m to the SW, but there were no differences between the farm area and the control 500 m to the SE (Fig. 11a).
Total abundance was higher beneath the mussel farm compared to the two control sites.
With regard to fauna inhabiting the sediment or living on the surface of it, there were clear differences between the mussel farm site and the two controls 500 m to the SW and to the SE. Total abundance was higher beneath the mussel farm compared to the two control sites (F2, 9 = 18.58, p < 0.001, and SNK-tests), but also higher in the SW than in the SE (Fig. 11b). The differences between
18
Figure 10. Panel a shows how mussel farms reduce the concentration of chlorophyll-a with respect to controls; panel b shows that there is more chlorophyll-a in the surface layer of the water, but the presence of the mussel farm reduce the levels of
chlorophyll-a on the surface to the deeper layer.
the mussel farm and the controls were especially evident with the large number of blue mussels that apparently had dropped from the ropes (see also Engman, 2013), but also from fauna species associated to these mussel assemblages like several species of crustaceans. Hence, the number of species was significantly different among sites in a one-way ANOVA (F2, 9 = 14.49, p = 0.002, and SNK-tests) revealing a higher number of species in the mussel farm area compared to both controls and also more species in the SW than in the SE (Fig. 11c). With regard to Shannon-Wiener diversity, however, there were no significant differences between the sites.
The species composition of the zoobenthic communities differed significantly overall (ANOSIM Global R = 0.95, p < 0.001) and also between all three pairs, i.e. the mussel farm site and the two controls (R = 1.00, p = 0.029 for all comparisons, which is the lowest possible p-value). These differences are clearly visualized in an NMDS-ordination with Bray-Curtis similarities superimposed (Fig. 12), where three distinct groups are formed at 60% similarity. When trying to reveal the species responsible for these differences in species composition, it became evident that most species were more numerous beneath the mussel farm (Table 1). This was of course true for M.
19
edulis, but also for crustaceans like Gammarus sp., Jaera spp., Idotea baltica, Ostracods and Balanus improvisus, most of which seemed to be clearly more associated to the blue mussels than to the sediment itself. More to our surprise, the number of individuals of typical sediment species in the area such as Hydrobia sp., Macoma balthica, Chironomidae and Marenzelleria viridis were also higher at the mussel farm. The two control sites only presented higher number of individuals for Hedisthe diversicolor and Mya arenaria.
Discussion
This mussel farm in Kumlinge was clearly smaller than facilities used in more marine areas, where the impact often has been related to the total production (e.g. Carlsson et al., 2009). The production of mussels in Kumlinge was around 20-25 tons in 2 years, in comparison to annual amounts of several 100 tons of mussels in e.g. western Sweden and in Danish Fjords. Nevertheless, the mussel settlement onto the farm nets had apparently been efficient at this specific site during the summer of 2010 and this was also supported by the results from the study by Mäki (2013). Mussel growth also seemed to have been quite efficient over the 2.5 years with some two year old mussel individuals even being >30 mm long (Engman, 2013). This growth rate clearly exceeds previously reported values for blue mussels in the northern Baltic proper at the lower edge of the salinity levels, which their physiology can tolerate (Kautsky, 1982; Westerbom et al., 2002). This also indicates that mussel individuals hanging in the water mass, where they probably have access to more food (as seen by the chlorophyll a in Fig. 10b), gain weight faster than individuals that have settled deeper down on the bottom (Westerbom et al. 2002, Diaz et al., in prep).
Figure 11. a. Analysis of organic matter accumulated under the mussel farm compared to the controls, b. Abundance of animals found in the sediments under the farm compared to the controls, c. number of species found under the farm compared to the controls, and finally d. Animal diversity found under the farm.
20
None of the a priori negative expectations about the environmental effects of mussel farming, and also the ones predicted by Stadmark and Conley (2011, 2012), were fulfilled. On the contrary, potential improvements in some environmental variables related to the presence of this mussel far were foundm, at least at this specific time. The P-concentrations were lower at the farming site indicating nutrient uptake by the mussels and there were improved water transparency and lower chlorophyll-a levels close to the mussel farm indicating effective mussel filter-feeding of plankton. A reduction in total-P will also decrease blooms of green annual filamentous and sheet-like macroalgae (e.g. Kraufvelin et al., 2010) and harmful bluegreen algae (e.g. Paerl and Otten, 2013). Clear waters in the close vicinity of a mussel farm may stimulate photosynthetic production in the area of generally more “desired” species such as seagrass and bladder-wrack, thanks to the increased depth penetration of light (Kautsky et al., 1986; Torn et al., 2006; Petersen et al., 2012) and this may further serve to improve local oxygen conditions. An improved water transparency around the farm has also repeatedly been observed in connection with plankton blooms in the spring and summer in 2011 and 2012 (Engman, 2013).
With regard to the analyses of sediments and their infauna, no signs of hypoxic or anoxic “dead” bottoms could be observed nor a lack of biota beneath the current mussel farm (the former fish farm). This conformed to a temporal pattern of repeated visual inspections under the fish/mussel farm, where the bottoms were judged as recovered already in the summer of 2009 by lack of hydrogen sulfide smell in the sediments and presence of fauna (T. Engman, personal communication). This system therefore seems to be more resilient than predictions brought forward in the mussel farm debate. Similarly, we could during our visit discard anoxia under the mussel farm, because the sediments appeared to be well-aerated by visual inspections in connection with the sampling and we saw no differences in water dissolved oxygen saturation at 6-8 m depth (values always > 90%).
The sediment organic content (in percentage) differed significantly between the three sites being higher within the farm area compared to the control 500 m to the SW, but there were no differences compared to the control 500 m to the SE (Fig 11a). This was the only potentially negative environmental impact that was found at this mussel farm and it could be due to an accumulation of organic matter from a larger area to just one place as was predicted by Stadmark and Conley (2012). On the other hand, it could partly be a carry-over effect due to the “historical” fish farming activities (with a yearly production of rainbow trout around 40-50 tons), which took place until 2008 in the area. This because some traces can be long lasting after pollution abatement from fish farming (see e.g. Kraufvelin et al., 2001; Villnäs et al., 2011). However, the equally high values at the SE control (as the ones underneath the farm) speak against the mussel farm accumulating considerable amounts of organic matter and the levels found are indeed innocuous compared to those reported from other locations around the Åland Islands and in the Archipelago Sea (e.g. Kraufvelin et al., 2001, 2011; Villnäs et al., 2011). However, if the mussel farm production is dramatically increased, the organic matter could increase to harmful amounts.
In terms of the fauna, it was observed that the mussel farm increased species richness and total abundance (number of individuals) of sediment macrofauna. This is partly explained by the presence of M. edulis clumps originating from the mussel ropes and falling onto the sediments underneath the mussel farm. These clumps serve as shelter for several invertebrates and are imposing the distinct species composition beneath the farm and the deviations from the controls. At the same time, they are increasing the richness and abundance of species at the mussel farm site which can be seen as a positive effect on local biodiversity (Norling and Kautsky, 2008) with capability of attracting fish and birds as well as other components of the aquatic food web. It should also be mentioned that we still got both blue mussels and equal amounts of sediment in the samples taken beneath the mussel farm (not only blue mussels with dead understory layers/matrix) as in the control areas and the sediment contained living sediment fauna communities and we saw no signs of hypoxia or weakened communities. Finally, it must be pointed out that a community similar to the one associated to the blue mussels on the bottom also exists on the ropes, which in parallel is further increasing the biodiversity of the area (Norling and Kautsky, 2007, 2008; Koivisto et al., 2011, Koivisto and Westerbom, 2012). These associated algal-animal assemblages may in addition serve as a positive by-catch of nutrients when the mussels later are being harvested.
Despite the encouraging results of this environmental study, we caution against drawing too far-reaching conclusions with regard to the effects of mussel farming due to a number of reasons: 1) there were certain restrictions within the study design, 2) the studied mussel farm was smaller than those referred to in the debate, 3) the background knowledge with regard to the efficiency of mussel farms for combating eutrophication in the Baltic at larger scales is still relatively premature. Due to spatial-temporal restrictions in lacking more sampling occasions in time and more than one farming facility, our data is not totally conclusive with regard to actual
21
causality issues. In order to deal with such issues, we would need to apply BACI-type (BACI = Before-After-Control-Impact) designs (see Stewart-Oaten et al., 1986, 1992; Underwood, 1996). In this specific case in Kumlinge, a BACI design was not possible due to several reasons. Among these, there were no before data available and there was a lack of funding and expertise for carrying out unconfounded examination when the mussel farm was started up. Furthermore, it must be pointed out that the true risks of mussel farms altering nutrient biogeochemical cycles and contributing to the general eutrophication of the Baltic Sea by this activity and the release of pseudofeces (Stadmark and Conley 2011, 2012) are still not known. Albeit, at this small farming unit, we saw no signs of hypoxia and the amount of pseudofeces may have been relatively small or effectively diluted. Nevertheless, if present, such negative effects could partly outweigh the expected positive impact of harvesting nutrients together with the mussels. Due to this, it is crucial to repeat this study in mussel farms of different sizes and compare results from different locations in the Baltic Sea, especially because of the variability in the salinity, which seems to be the major factor affecting the growth and recruitment of mussels (Westerbom et al. 2002). This should be done in close connection with the examination of the water exchange rate, because this is not only a proxy for good settlement and growth of mussels, this is also essential for minimizing the possible negative environmental impacts. While doing this, the need for well-designed environmental monitoring programs running alongside mussel farming activities should neither be forgotten.
To summarize: since it is likely that mussel farming activities will increase also in the Baltic proper in the future, this study has its true value in demonstrating no negative impacts, in setting baselines for future effect studies and in bringing forward sustainability in any attempt to perform nutrient bioextraction. We are also fully aware of that our contribution to the debate was only a “one time – one place“ shot, but it did still take place at the maximum presence of farmed mussels in the area (a few months before final harvesting) and it was at the only mussel farming site in the Baltic proper to date, so there were no chances of replication/repetition. Finally, it can also be stressed that this was the first time when local farming site data were brought into the debate, which until now only has been based on arguments, expectations and fears derived from sites outside the Baltic proper and from the general perception of the critical environmental conditions of the Baltic Sea as a whole.
22
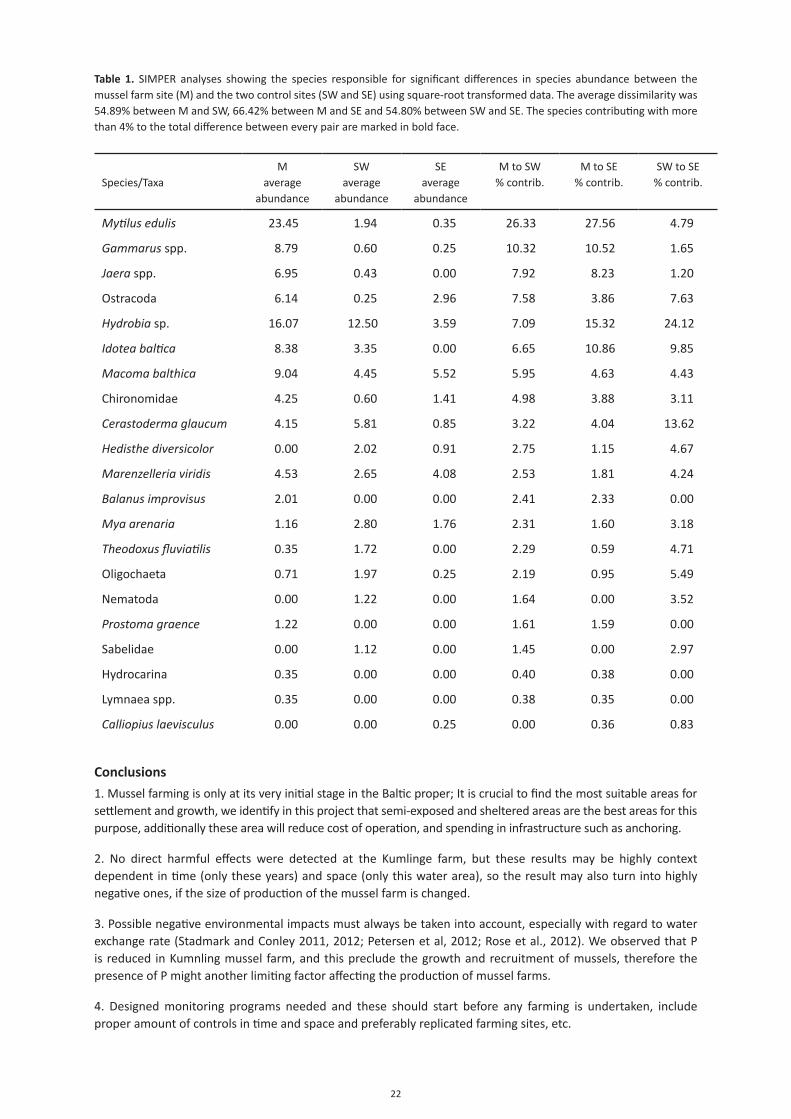
Table 1. SIMPER analyses showing the species responsible for significant differences in species abundance between the mussel farm site (M) and the two control sites (SW and SE) using square-root transformed data. The average dissimilarity was 54.89% between M and SW, 66.42% between M and SE and 54.80% between SW and SE. The species contributing with more than 4% to the total difference between every pair are marked in bold face.
Species/TaxaM
average abundance
SW average
abundance
SE average
abundance
M to SW % contrib.
M to SE % contrib.
SW to SE % contrib.
Mytilus edulis 23.45 1.94 0.35 26.33 27.56 4.79
Gammarus spp. 8.79 0.60 0.25 10.32 10.52 1.65
Jaera spp. 6.95 0.43 0.00 7.92 8.23 1.20
Ostracoda 6.14 0.25 2.96 7.58 3.86 7.63
Hydrobia sp. 16.07 12.50 3.59 7.09 15.32 24.12
Idotea baltica 8.38 3.35 0.00 6.65 10.86 9.85
Macoma balthica 9.04 4.45 5.52 5.95 4.63 4.43
Chironomidae 4.25 0.60 1.41 4.98 3.88 3.11
Cerastoderma glaucum 4.15 5.81 0.85 3.22 4.04 13.62
Hedisthe diversicolor 0.00 2.02 0.91 2.75 1.15 4.67
Marenzelleria viridis 4.53 2.65 4.08 2.53 1.81 4.24
Balanus improvisus 2.01 0.00 0.00 2.41 2.33 0.00
Mya arenaria 1.16 2.80 1.76 2.31 1.60 3.18
Theodoxus fluviatilis 0.35 1.72 0.00 2.29 0.59 4.71
Oligochaeta 0.71 1.97 0.25 2.19 0.95 5.49
Nematoda 0.00 1.22 0.00 1.64 0.00 3.52
Prostoma graence 1.22 0.00 0.00 1.61 1.59 0.00
Sabelidae 0.00 1.12 0.00 1.45 0.00 2.97
Hydrocarina 0.35 0.00 0.00 0.40 0.38 0.00
Lymnaea spp. 0.35 0.00 0.00 0.38 0.35 0.00
Calliopius laevisculus 0.00 0.00 0.25 0.00 0.36 0.83
Conclusions
1. Mussel farming is only at its very initial stage in the Baltic proper; It is crucial to find the most suitable areas for settlement and growth, we identify in this project that semi-exposed and sheltered areas are the best areas for this purpose, additionally these area will reduce cost of operation, and spending in infrastructure such as anchoring.
2. No direct harmful effects were detected at the Kumlinge farm, but these results may be highly context dependent in time (only these years) and space (only this water area), so the result may also turn into highly negative ones, if the size of production of the mussel farm is changed.
3. Possible negative environmental impacts must always be taken into account, especially with regard to water exchange rate (Stadmark and Conley 2011, 2012; Petersen et al, 2012; Rose et al., 2012). We observed that P is reduced in Kumnling mussel farm, and this preclude the growth and recruitment of mussels, therefore the presence of P might another limiting factor affecting the production of mussel farms.
4. Designed monitoring programs needed and these should start before any farming is undertaken, include proper amount of controls in time and space and preferably replicated farming sites, etc.
23
V. Ecosystem services of mussel farms
1. Positive effects. The obvious and direct benefit of mussel farms is their contribution as an environmental tool for extracting nutrients (nitrogen and phosphorus) from the sea. It has been estimated that the harvesting of 1 kg of alive mussels remove between 8.5-12 g of Nitrogen and 0.6-0.8 g of Phosphorous. As a consequence of this, mussel farms in coastal areas improve the water transparency, which can promote tourist activities in local areas.
Business opportunity. It is possible to tag localities where there are important discharges of nutrients by agricultural farms. It is possible to move mussel farm units containing the biomass necessary to reduce the nutrient discharges to these coastal localities. This would imply the incorporation of “aquaculture farms business” providing services for growing mussels, transport of mussels and harvesting. The formation of these commercial enterprises, depends on the market economy and also the country regulation quotas to eliminate nutrients from the sea (Lindahl et al. 2005).
Costs. It has been calculated that 262.000 USD are necessary to remove 28 ton Nitrogen, as an extra cost of transport and processing the mussels.
USD
Quota cost for remove 28 tonnes of NSalaries for 5 employees (each 36600)Income tax (33% of income)Employee tax (32% of income)Total taxDifference between
1470001830006039058560118950
Table taken from Lindahl et al. 2005
2. Negative effects. There are several business risks that needs to be considered in mussel farming. Some of them are related to the effects on the environment and other related to the risk on theconsumers of mussels after harvesting.
a. Environmental issues. The first negative effect is the deposition of organic matter below the rearing structures – deposits can result in an increase of several centimetres of sediment a year, inducing changes in sediment composition and benthic community structures (animals inhabiting those sediments), due to lack of oxygen. This effect in the long term will induce the decay of biodiversity associated to mussel beds including small invertebrates, fish and birds.
Short scale solution. Similarly to rotation used in the agriculture, it is possible to move mussel farms units at scales of 500-1000 m every year to avoid accumulation of sediments in specific places and promote the recovery of disturbed areas. The cost of rotation needs to be calculated.
b. Consumer issues. One of the target of mussel farming is the food industry, mussels can be directly consumed if they reach a size larger than 2 cm, e.g. in the west coast of Sweden or Norway. Indirectly, mussel meat can be used in the feeding of hen and fish through pellets (Lindahl et al. 2005). In the Baltic, the major risk is the presence of toxic blooms of algae, which can induce several gastrointestinal problems for humans. These algae are filtered and incorporated to the tissues by the mussels. These blooms are unpredictable in time. Similarly, the filtration of heavy metals (Lehtonen et al. 2006) seems to be an imminent risk for the human population. These effects/risks need to be reassessed in this project, for example comparing level of toxins in the environment respect to the harvested mussels. This will incorporated in our experiment during next year when we get adult mussels. One alternative solution is the production of BIOGAS, this is in progress for next report.
V. Perspectives
The main economical issue in mussel farming seems to be related to the persuasion the ministries of agriculture and European commission that mussel farming is a feasible and a cost-effect tool to remediate eutrophication. With these report we have proved that mussel farms of 100 tons can improve environmental quality of the ecosystem, but we ignore the effects when the mussel farm is scaled to larger sizes. We have found optimal conditions for recruitment of mussels in term of exposure and depth, now next report will focus on the survival of adults in the same sites in Hanko.

24
ReferencesCarlsson MS, Holmer M, Petersen JK (2009) Seasonal and spatial variation of benthic impacts of mussel long-line farming in a eutrophicated Danish fjord, Limfjorden. J Shellfish Res 28:791-801
Clarke KR (1993) Non-parametric multivariate analyses of changes in community structure. Austral J Ecol 18:117-143
Elmgren R (1984) Trophic dynamics in the enclosed, brackish Baltic Sea. Rapp. P.-v. Reun. Cons. int. Explor. Mer. 183: 152–169
Engman T (2013) Möjligheter och förutsättningar för storskalig musselodling på Åland. Del 2 inom Fas III, Odling och skörd. Ålands Landskapsregering, 24 pp (in Swedish)
Hario M, Öst M (2002) Does heavy investment in foraging implicate low food acquisition for female Common Eiders Somateria mollisima? Ornis Fennica 79: 111-120
HELCOM 2013 http://www.itameriportaali.fi/en/tietoa/veden_liikkeet/en_GB/hydrografia/
Kautsky N (1982) Growth and size structure in a Baltic Mytilus edulis population. Mar Biol 68:117-133
Kautsky N, Kautsky H, Kautsky U, Wärn M (1986) Decreased depth penetration of Fucus vesiculosus L. since the 1940s indicates eutrophication of the Baltic Sea. Mar Ecol Prog Ser 28:1-8
Kautsky L, Kautsky N (2000) Baltic Sea, including Bothnian Sea and Bothnian Bay. In Sheppard, CRC (ed) Seas at the millenium: an environmental evaluation. Elsecier Science Ltd. Chapter 8, pp 1-14
Kautsky N, Johannesson K, Tedengren M (1990) Genotypic and phenotypic differences between Baltic and North Sea populations of Mytilus edulis evaluated through reciprocal transplantations. I. growth and morphology. Mar Ecol Prog Ser 59: 203-210
Koivisto M, Westerbom M, Riihimäki A (2011) Succession-driven facilitation of macrofaunal communities in sublittoral blue mussel habitats. Mar Biol 158:945-954
Koivisto M, Westerbom M (2012) Invertebrate communities associated with blue mussel beds in a patchy environment: a landscape ecology approach, Mar Ecol Prog Ser 471:101-110
Kraufvelin P, Sinisalo B, Leppäkoski E, Mattila J, Bonsdorff E (2001) Changes in zoobenthic community structure after pollution abatement from fish farms in the Archipelago Sea (N Baltic Sea). Mar Environ Res 51:229-245
Kraufvelin P, Lindholm A, Pedersen MF, Kirkerud LA, Bonsdorff E (2010) Biomass, diversity and production of rocky shore macroalgae at two nutrient enrichment and wave action levels. Mar Biol 157:29-47
Kraufvelin P, Perus J, Bonsdorff E (2011) Scale-dependent distribution of soft-bottom infauna and possible structuring forces in low diversity systems. Mar Ecol Prog Ser 426:13-28
Lappalainen A, Westerbom M, Vesala S (2004) Blue Mussels (Mytilus edulis) in the diet of roach (Rutilus rutilus) in outer archipelago areas of the western Gulf of Finland, Baltic Sea. Hydrobiologia 514: 87-92
Lehtonen KK, Liniö S, Schneider R, Leivuori M (2006) Biomarkers of polluton effects in the bivalves Mytilus edulis and Macoma balthica collected from the southern coast of Finland (Baltic Sea). Mar Ecol Prog Ser 322: 155-168
Lindahl O (2012) Mussel farming as an environmental measure in the Baltic. Final Report BalticSea2020, 18 pp
Lindahl O, Kollberg S (2009) Can the EU Agri-Environmental aid program be extended into the coastal zone to combat eutrophication? Hydrobiologia 629: 59–64
Lindahl O, Hart R, Hernorth B. Kollberg S, Loo L, Olrog L, Rehnstam-Holm A, Sevensson J, Svensson S, Syversen U (2005) Improving marine water quality by mussel farming: a profitable solution for Swedish society. Ambio 34: 131-138
25
Mäki T (2013) Kolonisering och dynamik av pionjärsamhällen på hårda underlag i den Åländska skärgården med speciell betoning på blåmusslan, Mytilus edulis. MSc-thesis, Åbo Akademi University, 88 pp. (in Swedish with abstract in English)
Norling P, Kautsky N (2007) Structural and functional effects of Mytilus edulis on diversity of associated species and ecosystem functioning. Mar Ecol Prog Ser 351:163-175
Norling P, Kautsky N (2008) Patches of the mussel Mytilus sp. are islands of high biodiversity in subtital sediment habitats in the Baltic Sea. Aquat Biol 4:75-87
Paerl HW, Otten TG (2013) Harmful cyanobacterial blooms: causes, consequences and controls. Microb Ecol 65:995-1010
Petersen JK, Timmermann K, Carlsson M, Holmer M, Maar M, Lindahl O (2012) Mussel farming can be used as mitigation tool – a reply. Mar Pollut Bull 64:452-454
Rose J, Ferreira JG, Stephenson K, Bricker SB, Tedesco M, Wikfors GH (2012) Comment on Stadmark and Conley. Mar Pollut Bull 64:449-451
Stadmark J, Conley DJ (2011) Mussel farming as a nutrient reduction measure in the Baltic Sea: consideration of nutrient biogeochemical cycles. Mar Pollut Bull 62:1385-1388
Stadmark J, Conley DJ (2012) Response to Rose et al. and Petersen et al. Mar Pollut Bull 64:455-456
Stewart-Oaten A, Murdoch WW, Parker KR (1986) Environmental impact assessment: “pseudoreplication” in time? Ecology 67:929-940
Stewart-Oaten A, Bence JR, Osenberg CW (1992) Assessing effects of unreplicated perturbations: No simple solution. Ecology 73:1396-1404
Tolvanen H, Suominen T (2005) Quantification of openness and wave activity in archipelago environments. Estuar Coast Shelf Sci 64: 436-446
Torn K, Krause-Jensen D, Martin G (2006) Present and past depth distribution of bladder-wrack (Fucus vesiculosus) in the Baltic Sea. Aquat Bot 84:53-62
Underwood AJ (1996) On beyond BACI: Sampling designs that might reliably detect environmental disturbances. In: Schmitt RJ, Osenberg CW (Eds), Detecting Ecological Impacts: Concepts and Applications in Coastal Habitats. Academic Press, San Diego, pp. 151-175
Villnäs A, Perus J, Bonsdorff E (2011) Structural and functional shifts in zoobenthos induced by organic enrichment – implications for community recovery potential. J Sea Res 65:8-18
Westerbom M (2006) Population dynamics of blue mussels in a variable environment at the edge of their range. PhD-thesis, University of Helsinki
Westerbom M, Kilpi M, Mustonen O (2002) Blue mussels, Mytilus edulis, at the edge of the range: population structure, growth and biomass along a salinity gradient in the north-eastern Baltic Sea. Mar Biol 140:991-999
Zardi G, Nicastro K, Porri F, McQuaid CD (2006) Sand stress as a non-determinant of habitat segregation of indigeneous (Perna perna) and invasive (Mytilus galloprovincialis) mussels in South Africa. Mar Biol 148: 1031-1038.
1.2Synergy between mussel growing and other
marine use areas – wind farms, fishery, ornithology and evaluation
Author:Ieva Bārda, MSc.
Latvian Institute of Aquatic Ecology
2
Contents Contents ............................................................................................................................2
1. Synergy with wind farms ...............................................................................................3
2. Synergy with ornithology ...............................................................................................6
3. Synergy with fisheries ...................................................................................................8
4. References .................................................................................................................12
Disclaimer: The contents of the document reflect the authors’ views. The Managing Authority of the Central Baltic INTERREG IV A Programme cannot be held liable for information published by the project partners.
3
1. Synergy with wind farms
All Baltic Sea countries are generating electricity from the wind to a greater or lesser extent. Wind energy potential is highly regarded around the world as to further technological development in the near future; it is also cost-competitive with traditional fossil fuel used for energy. The sea has a number of advantages compared to the land: wind resources are significantly larger and more stable, and relatively unlimited free space where it is possible to install wind turbines in large numbers. However, the installation of wind turbines in the sea is more expensive and more difficult than on land [1].
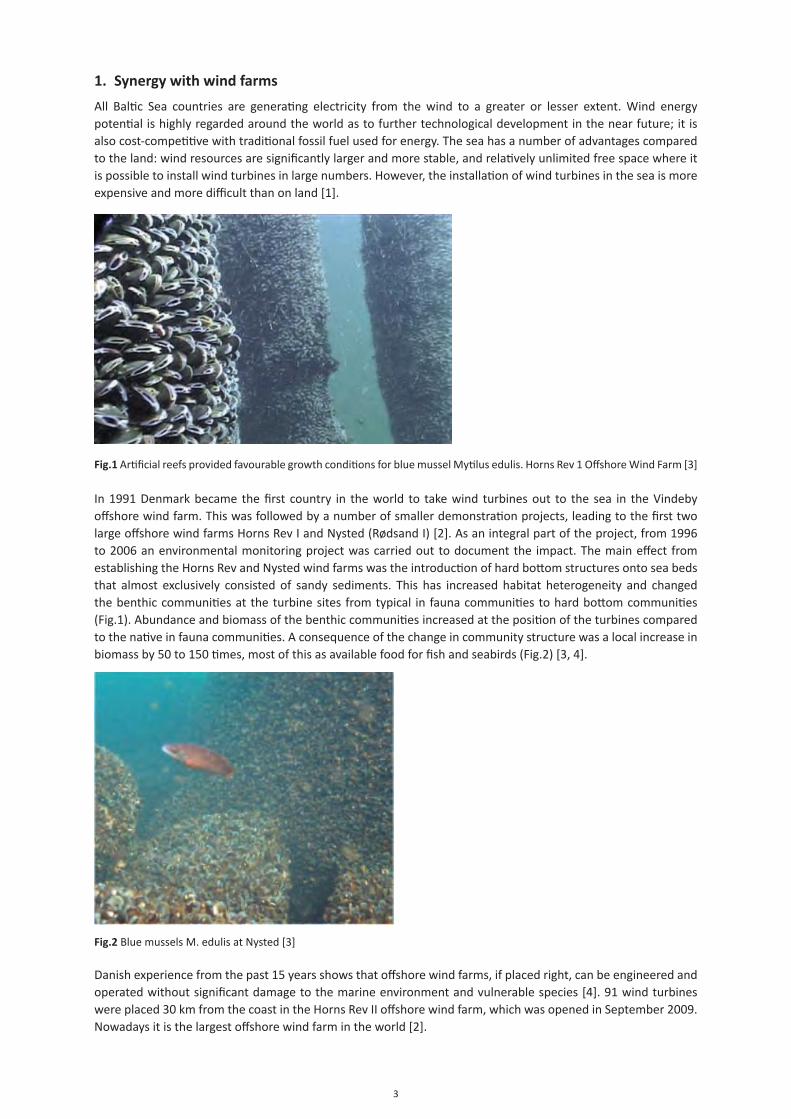
Fig.1 Artificial reefs provided favourable growth conditions for blue mussel Mytilus edulis. Horns Rev 1 Offshore Wind Farm [3]
In 1991 Denmark became the first country in the world to take wind turbines out to the sea in the Vindeby offshore wind farm. This was followed by a number of smaller demonstration projects, leading to the first two large offshore wind farms Horns Rev I and Nysted (Rødsand I) [2]. As an integral part of the project, from 1996 to 2006 an environmental monitoring project was carried out to document the impact. The main effect from establishing the Horns Rev and Nysted wind farms was the introduction of hard bottom structures onto sea beds that almost exclusively consisted of sandy sediments. This has increased habitat heterogeneity and changed the benthic communities at the turbine sites from typical in fauna communities to hard bottom communities (Fig.1). Abundance and biomass of the benthic communities increased at the position of the turbines compared to the native in fauna communities. A consequence of the change in community structure was a local increase in biomass by 50 to 150 times, most of this as available food for fish and seabirds (Fig.2) [3, 4].
Fig.2 Blue mussels M. edulis at Nysted [3]
Danish experience from the past 15 years shows that offshore wind farms, if placed right, can be engineered and operated without significant damage to the marine environment and vulnerable species [4]. 91 wind turbines were placed 30 km from the coast in the Horns Rev II offshore wind farm, which was opened in September 2009. Nowadays it is the largest offshore wind farm in the world [2].
4
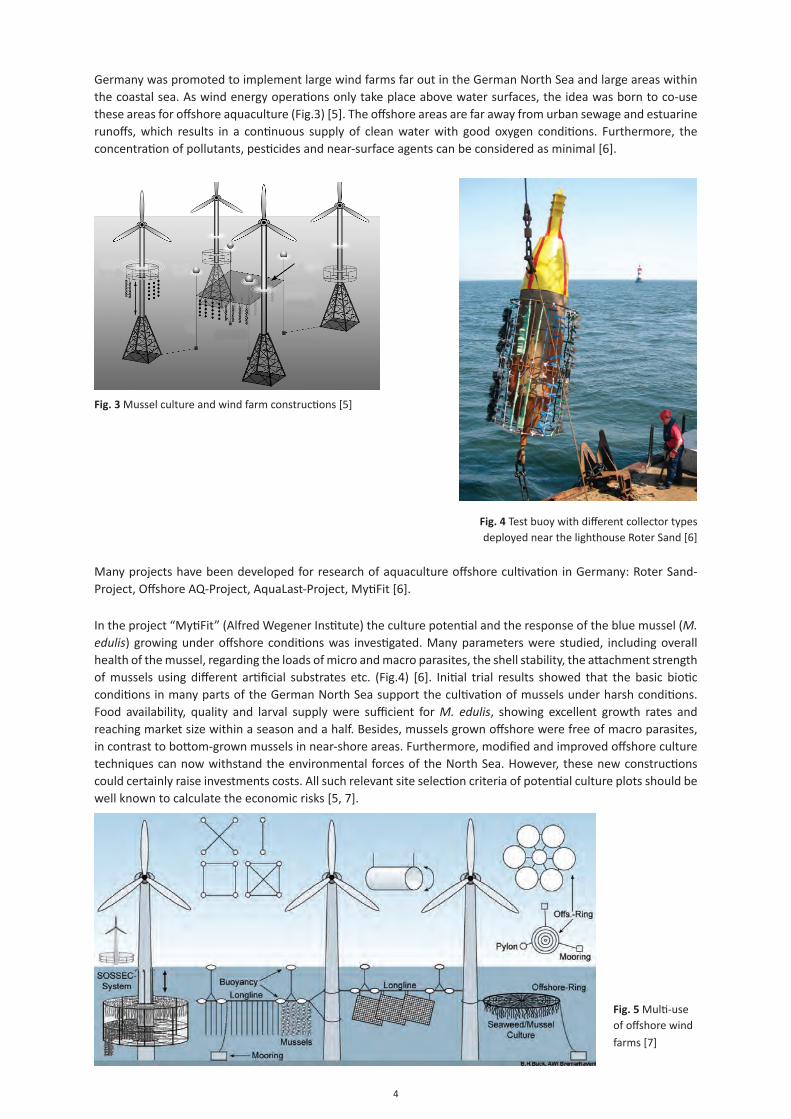
Germany was promoted to implement large wind farms far out in the German North Sea and large areas within the coastal sea. As wind energy operations only take place above water surfaces, the idea was born to co-use these areas for offshore aquaculture (Fig.3) [5]. The offshore areas are far away from urban sewage and estuarine runoffs, which results in a continuous supply of clean water with good oxygen conditions. Furthermore, the concentration of pollutants, pesticides and near-surface agents can be considered as minimal [6].
Fig. 3 Mussel culture and wind farm constructions [5]
Fig. 4 Test buoy with different collector types deployed near the lighthouse Roter Sand [6]
Many projects have been developed for research of aquaculture offshore cultivation in Germany: Roter Sand-Project, Offshore AQ-Project, AquaLast-Project, MytiFit [6].
In the project “MytiFit” (Alfred Wegener Institute) the culture potential and the response of the blue mussel (M. edulis) growing under offshore conditions was investigated. Many parameters were studied, including overall health of the mussel, regarding the loads of micro and macro parasites, the shell stability, the attachment strength of mussels using different artificial substrates etc. (Fig.4) [6]. Initial trial results showed that the basic biotic conditions in many parts of the German North Sea support the cultivation of mussels under harsh conditions. Food availability, quality and larval supply were sufficient for M. edulis, showing excellent growth rates and reaching market size within a season and a half. Besides, mussels grown offshore were free of macro parasites, in contrast to bottom-grown mussels in near-shore areas. Furthermore, modified and improved offshore culture techniques can now withstand the environmental forces of the North Sea. However, these new constructions could certainly raise investments costs. All such relevant site selection criteria of potential culture plots should be well known to calculate the economic risks [5, 7].
Fig. 5 Multi-use of offshore wind
farms [7]
5
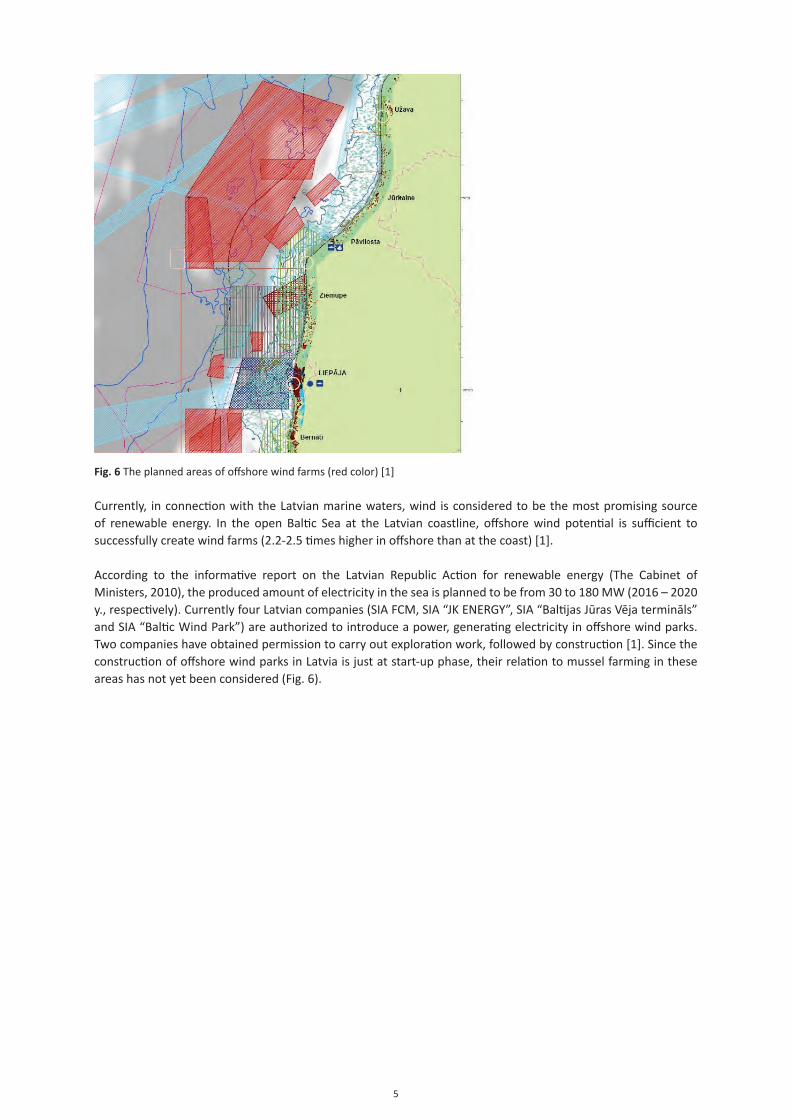
Fig. 6 The planned areas of offshore wind farms (red color) [1]
Currently, in connection with the Latvian marine waters, wind is considered to be the most promising source of renewable energy. In the open Baltic Sea at the Latvian coastline, offshore wind potential is sufficient to successfully create wind farms (2.2-2.5 times higher in offshore than at the coast) [1].
According to the informative report on the Latvian Republic Action for renewable energy (The Cabinet of Ministers, 2010), the produced amount of electricity in the sea is planned to be from 30 to 180 MW (2016 – 2020 y., respectively). Currently four Latvian companies (SIA FCM, SIA “JK ENERGY”, SIA “Baltijas Jūras Vēja termināls” and SIA “Baltic Wind Park”) are authorized to introduce a power, generating electricity in offshore wind parks. Two companies have obtained permission to carry out exploration work, followed by construction [1]. Since the construction of offshore wind parks in Latvia is just at start-up phase, their relation to mussel farming in these areas has not yet been considered (Fig. 6).
6
2. Synergy with ornithology
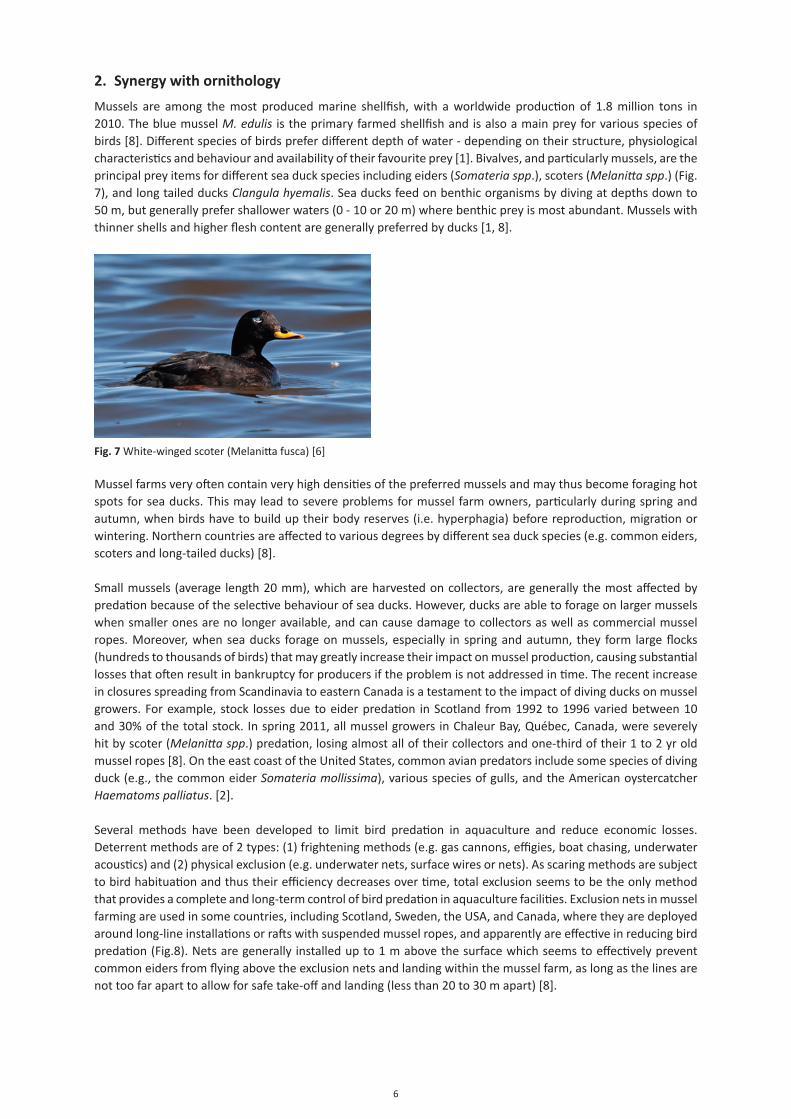
Mussels are among the most produced marine shellfish, with a worldwide production of 1.8 million tons in 2010. The blue mussel M. edulis is the primary farmed shellfish and is also a main prey for various species of birds [8]. Different species of birds prefer different depth of water - depending on their structure, physiological characteristics and behaviour and availability of their favourite prey [1]. Bivalves, and particularly mussels, are the principal prey items for different sea duck species including eiders (Somateria spp.), scoters (Melanitta spp.) (Fig. 7), and long tailed ducks Clangula hyemalis. Sea ducks feed on benthic organisms by diving at depths down to 50 m, but generally prefer shallower waters (0 - 10 or 20 m) where benthic prey is most abundant. Mussels with thinner shells and higher flesh content are generally preferred by ducks [1, 8].
Fig. 7 White-winged scoter (Melanitta fusca) [6]
Mussel farms very often contain very high densities of the preferred mussels and may thus become foraging hot spots for sea ducks. This may lead to severe problems for mussel farm owners, particularly during spring and autumn, when birds have to build up their body reserves (i.e. hyperphagia) before reproduction, migration or wintering. Northern countries are affected to various degrees by different sea duck species (e.g. common eiders, scoters and long-tailed ducks) [8].
Small mussels (average length 20 mm), which are harvested on collectors, are generally the most affected by predation because of the selective behaviour of sea ducks. However, ducks are able to forage on larger mussels when smaller ones are no longer available, and can cause damage to collectors as well as commercial mussel ropes. Moreover, when sea ducks forage on mussels, especially in spring and autumn, they form large flocks (hundreds to thousands of birds) that may greatly increase their impact on mussel production, causing substantial losses that often result in bankruptcy for producers if the problem is not addressed in time. The recent increase in closures spreading from Scandinavia to eastern Canada is a testament to the impact of diving ducks on mussel growers. For example, stock losses due to eider predation in Scotland from 1992 to 1996 varied between 10 and 30% of the total stock. In spring 2011, all mussel growers in Chaleur Bay, Québec, Canada, were severely hit by scoter (Melanitta spp.) predation, losing almost all of their collectors and one-third of their 1 to 2 yr old mussel ropes [8]. On the east coast of the United States, common avian predators include some species of diving duck (e.g., the common eider Somateria mollissima), various species of gulls, and the American oystercatcher Haematoms palliatus. [2].
Several methods have been developed to limit bird predation in aquaculture and reduce economic losses. Deterrent methods are of 2 types: (1) frightening methods (e.g. gas cannons, effigies, boat chasing, underwater acoustics) and (2) physical exclusion (e.g. underwater nets, surface wires or nets). As scaring methods are subject to bird habituation and thus their efficiency decreases over time, total exclusion seems to be the only method that provides a complete and long-term control of bird predation in aquaculture facilities. Exclusion nets in mussel farming are used in some countries, including Scotland, Sweden, the USA, and Canada, where they are deployed around long-line installations or rafts with suspended mussel ropes, and apparently are effective in reducing bird predation (Fig.8). Nets are generally installed up to 1 m above the surface which seems to effectively prevent common eiders from flying above the exclusion nets and landing within the mussel farm, as long as the lines are not too far apart to allow for safe take-off and landing (less than 20 to 30 m apart) [8].
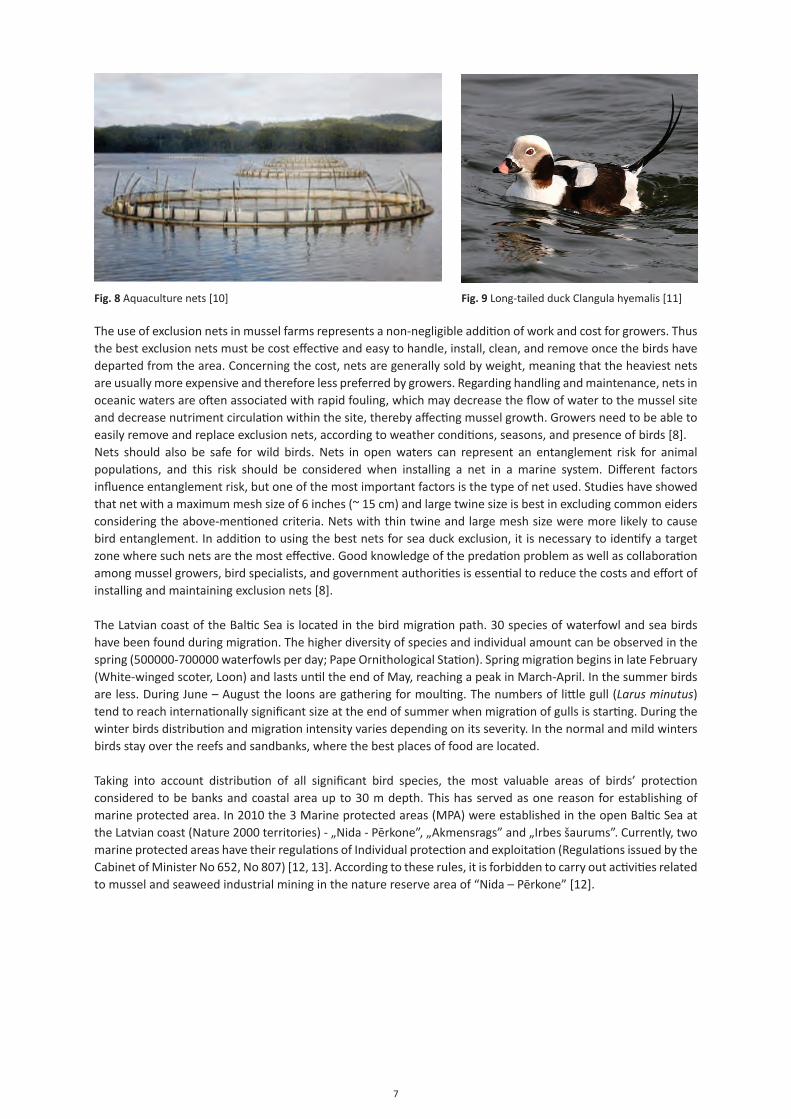
7
Fig. 8 Aquaculture nets [10] Fig. 9 Long-tailed duck Clangula hyemalis [11]
The use of exclusion nets in mussel farms represents a non-negligible addition of work and cost for growers. Thus the best exclusion nets must be cost effective and easy to handle, install, clean, and remove once the birds have departed from the area. Concerning the cost, nets are generally sold by weight, meaning that the heaviest nets are usually more expensive and therefore less preferred by growers. Regarding handling and maintenance, nets in oceanic waters are often associated with rapid fouling, which may decrease the flow of water to the mussel site and decrease nutriment circulation within the site, thereby affecting mussel growth. Growers need to be able to easily remove and replace exclusion nets, according to weather conditions, seasons, and presence of birds [8]. Nets should also be safe for wild birds. Nets in open waters can represent an entanglement risk for animal populations, and this risk should be considered when installing a net in a marine system. Different factors influence entanglement risk, but one of the most important factors is the type of net used. Studies have showed that net with a maximum mesh size of 6 inches (~ 15 cm) and large twine size is best in excluding common eiders considering the above-mentioned criteria. Nets with thin twine and large mesh size were more likely to cause bird entanglement. In addition to using the best nets for sea duck exclusion, it is necessary to identify a target zone where such nets are the most effective. Good knowledge of the predation problem as well as collaboration among mussel growers, bird specialists, and government authorities is essential to reduce the costs and effort of installing and maintaining exclusion nets [8].
The Latvian coast of the Baltic Sea is located in the bird migration path. 30 species of waterfowl and sea birds have been found during migration. The higher diversity of species and individual amount can be observed in the spring (500000-700000 waterfowls per day; Pape Ornithological Station). Spring migration begins in late February (White-winged scoter, Loon) and lasts until the end of May, reaching a peak in March-April. In the summer birds are less. During June – August the loons are gathering for moulting. The numbers of little gull (Larus minutus) tend to reach internationally significant size at the end of summer when migration of gulls is starting. During the winter birds distribution and migration intensity varies depending on its severity. In the normal and mild winters birds stay over the reefs and sandbanks, where the best places of food are located.
Taking into account distribution of all significant bird species, the most valuable areas of birds’ protection considered to be banks and coastal area up to 30 m depth. This has served as one reason for establishing of marine protected area. In 2010 the 3 Marine protected areas (MPA) were established in the open Baltic Sea at the Latvian coast (Nature 2000 territories) - „Nida - Pērkone”, „Akmensrags” and „Irbes šaurums”. Currently, two marine protected areas have their regulations of Individual protection and exploitation (Regulations issued by the Cabinet of Minister No 652, No 807) [12, 13]. According to these rules, it is forbidden to carry out activities related to mussel and seaweed industrial mining in the nature reserve area of “Nida – Pērkone” [12].
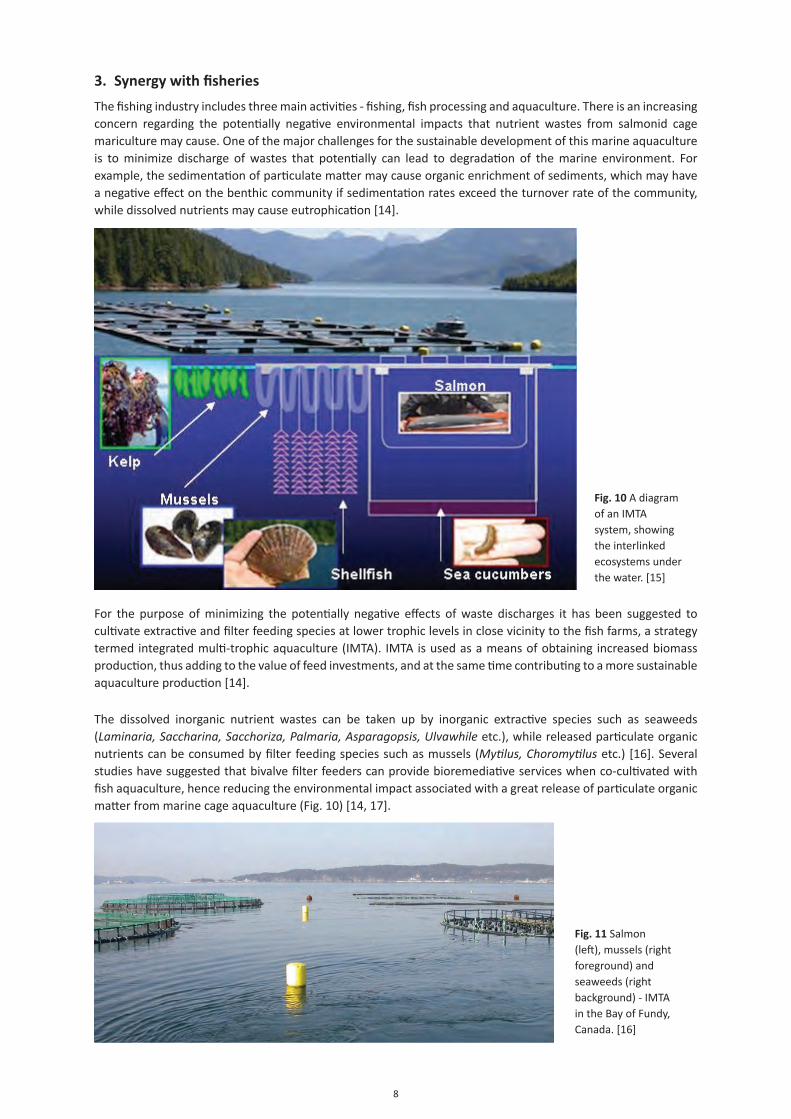
8
3. Synergy with fisheries
The fishing industry includes three main activities - fishing, fish processing and aquaculture. There is an increasing concern regarding the potentially negative environmental impacts that nutrient wastes from salmonid cage mariculture may cause. One of the major challenges for the sustainable development of this marine aquaculture is to minimize discharge of wastes that potentially can lead to degradation of the marine environment. For example, the sedimentation of particulate matter may cause organic enrichment of sediments, which may have a negative effect on the benthic community if sedimentation rates exceed the turnover rate of the community, while dissolved nutrients may cause eutrophication [14].
Fig. 10 A diagram of an IMTA system, showing the interlinked ecosystems under the water. [15]
For the purpose of minimizing the potentially negative effects of waste discharges it has been suggested to cultivate extractive and filter feeding species at lower trophic levels in close vicinity to the fish farms, a strategy termed integrated multi-trophic aquaculture (IMTA). IMTA is used as a means of obtaining increased biomass production, thus adding to the value of feed investments, and at the same time contributing to a more sustainable aquaculture production [14].
The dissolved inorganic nutrient wastes can be taken up by inorganic extractive species such as seaweeds (Laminaria, Saccharina, Sacchoriza, Palmaria, Asparagopsis, Ulvawhile etc.), while released particulate organic nutrients can be consumed by filter feeding species such as mussels (Mytilus, Choromytilus etc.) [16]. Several studies have suggested that bivalve filter feeders can provide bioremediative services when co-cultivated with fish aquaculture, hence reducing the environmental impact associated with a great release of particulate organic matter from marine cage aquaculture (Fig. 10) [14, 17].
Fig. 11 Salmon (left), mussels (right foreground) and seaweeds (right background) - IMTA in the Bay of Fundy, Canada. [16]
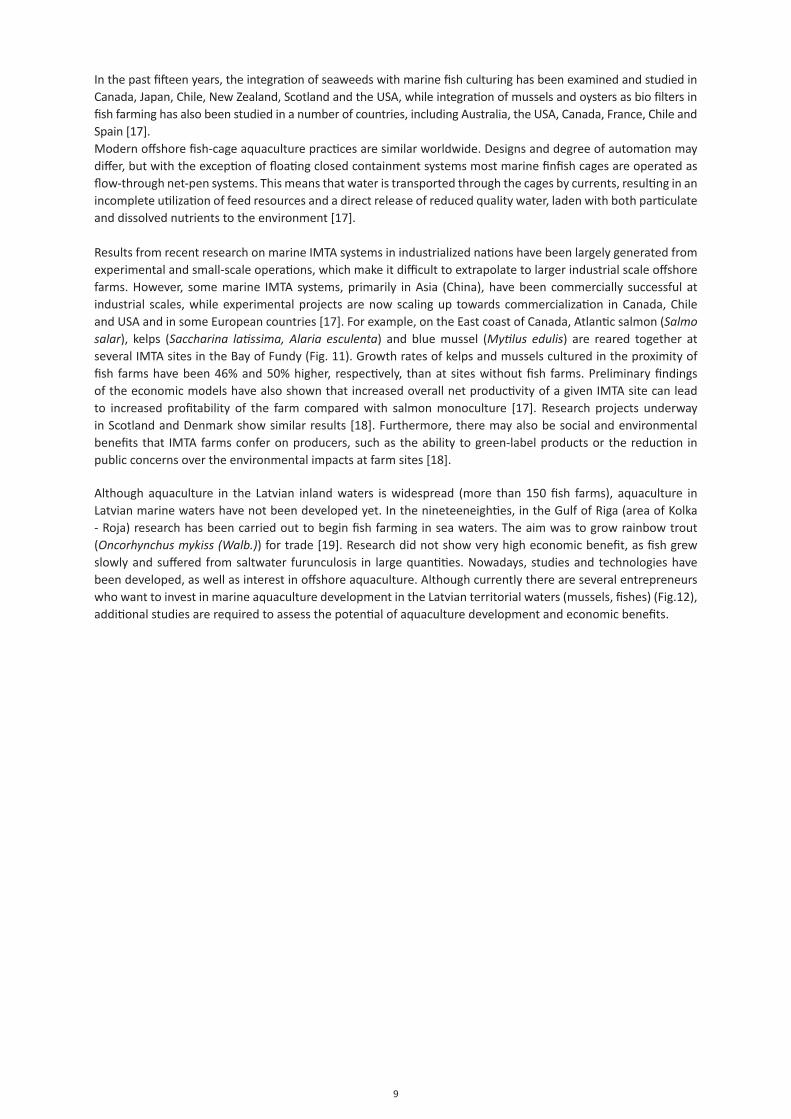
9
In the past fifteen years, the integration of seaweeds with marine fish culturing has been examined and studied in Canada, Japan, Chile, New Zealand, Scotland and the USA, while integration of mussels and oysters as bio filters in fish farming has also been studied in a number of countries, including Australia, the USA, Canada, France, Chile and Spain [17].Modern offshore fish-cage aquaculture practices are similar worldwide. Designs and degree of automation may differ, but with the exception of floating closed containment systems most marine finfish cages are operated as flow-through net-pen systems. This means that water is transported through the cages by currents, resulting in an incomplete utilization of feed resources and a direct release of reduced quality water, laden with both particulate and dissolved nutrients to the environment [17].
Results from recent research on marine IMTA systems in industrialized nations have been largely generated from experimental and small-scale operations, which make it difficult to extrapolate to larger industrial scale offshore farms. However, some marine IMTA systems, primarily in Asia (China), have been commercially successful at industrial scales, while experimental projects are now scaling up towards commercialization in Canada, Chile and USA and in some European countries [17]. For example, on the East coast of Canada, Atlantic salmon (Salmo salar), kelps (Saccharina latissima, Alaria esculenta) and blue mussel (Mytilus edulis) are reared together at several IMTA sites in the Bay of Fundy (Fig. 11). Growth rates of kelps and mussels cultured in the proximity of fish farms have been 46% and 50% higher, respectively, than at sites without fish farms. Preliminary findings of the economic models have also shown that increased overall net productivity of a given IMTA site can lead to increased profitability of the farm compared with salmon monoculture [17]. Research projects underway in Scotland and Denmark show similar results [18]. Furthermore, there may also be social and environmental benefits that IMTA farms confer on producers, such as the ability to green-label products or the reduction in public concerns over the environmental impacts at farm sites [18].
Although aquaculture in the Latvian inland waters is widespread (more than 150 fish farms), aquaculture in Latvian marine waters have not been developed yet. In the nineteeneighties, in the Gulf of Riga (area of Kolka - Roja) research has been carried out to begin fish farming in sea waters. The aim was to grow rainbow trout (Oncorhynchus mykiss (Walb.)) for trade [19]. Research did not show very high economic benefit, as fish grew slowly and suffered from saltwater furunculosis in large quantities. Nowadays, studies and technologies have been developed, as well as interest in offshore aquaculture. Although currently there are several entrepreneurs who want to invest in marine aquaculture development in the Latvian territorial waters (mussels, fishes) (Fig.12), additional studies are required to assess the potential of aquaculture development and economic benefits.
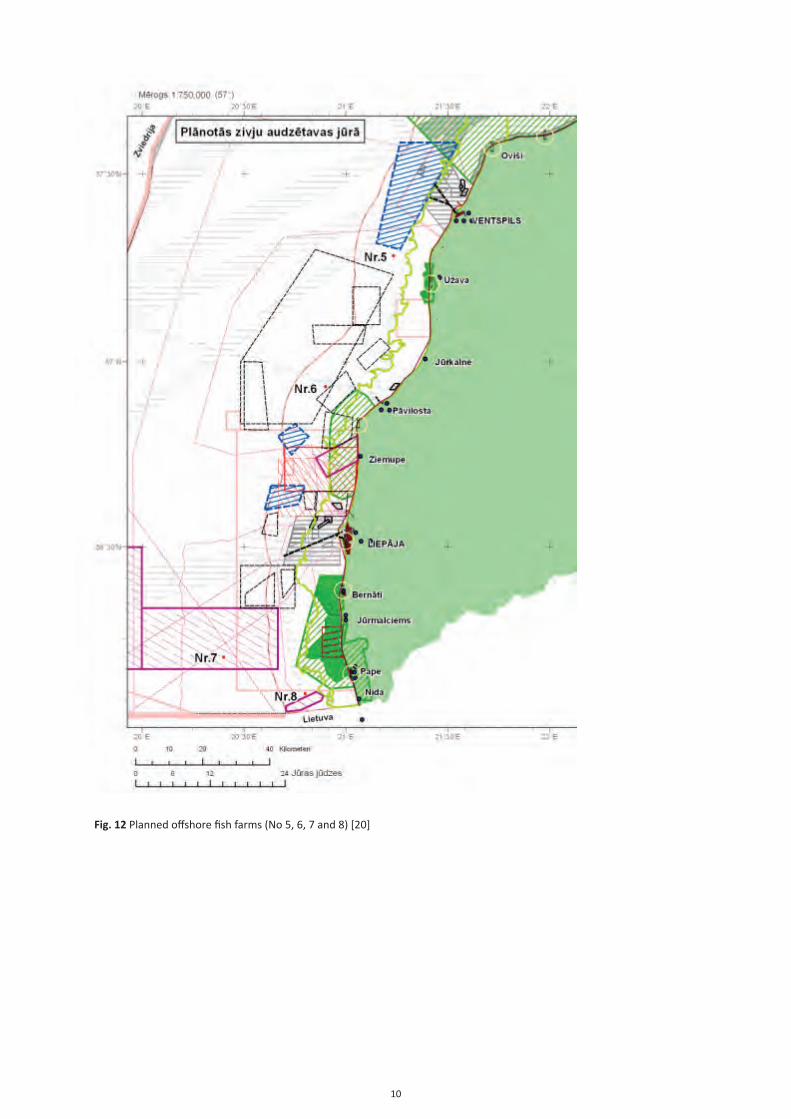
10
Fig. 12 Planned offshore fish farms (No 5, 6, 7 and 8) [20]
11
4. References
5. Ruskule A., Veidemane K. Baltijas jūras Kurzemes piekrastes jūras telpiskā plānojuma pilotprojekts. BaltSeaPlan Report 17. Baltijas Vides forums, 2012. 105 lpp.
6. Wind turbines in Denmark. Danish energy agency. November, 2009 p.32
7. HORNS REV 2 OFFSHORE WIND FARM Environmental Impact Assessment. Summary of the EIA-report, October 2006, p.18
8. Danish Offshore Wind – Key Environmental Issues. Danish energy authority [Online]. http://188.64.159.37/graphics/Publikationer/Havvindmoeller/kap01.htm
9. Brenner M., Buck B.H., Köhler A. New concept combines offshore wind farms, mussel cultivation. Global aquaculture alliance. January/February, 2007. p. 79-81
10. Health of offshore cultivated blue mussels. Project “MytiFit”. Alfred Wegener Institute. [Online]. http://www.awi.de/en/research/new_technologies/marine_aquaculture_maritime_technologies_and_iczm/projects/marine_aquaculture_projects/mytifit/
11. Brenner M., Buck B.H., Köhler A. Blue mussel culture: does offshore cultivation lead to increasing product quality? AQUA 2006, 9-13 May 2006, Fortezza da Basso Convention Centre, Florence (Italy)
12. Varennes E., Hanssen S.A., Bonardelli J., Guillemette M., 2013. Sea duck predation in mussel farms: the best nets for excluding common eiders safely and efficiently. Aquaculture environment interactions. Vol. 4: 31–39
13. http://www.ornitofaunistika.com/lvp/lvp_melfus.htm
14. http://www.commercialnetmakers.com.au/aquaculture-nets-perth.html
15. http://www.ornitofaunistika.com/lvp/lvp_clahye.htm
16. Aizsargājamās jūras teritorijas “Nida – Pērkone” individuālie aizsardzības un izmantošanas noteikumi (Ministru Kabineta noteikumi Nr.652). http://likumi.lv/doc.php?id=234988#position=400
17. Aizsargājamās jūras teritorijas “Irbes šaurums” individuālie aizsardzības un izmantošanas noteikumi (Ministru Kabineta noteikumi Nr.807). http://likumi.lv/doc.php?id=238305
18. Handå A., Min H., Wang X., Broch O. J., Reitan K.I., Reinertsen H., Olsen Y., 2012. Incorporation of fish feed and growth of blue mussels (Mytilus edulis) in close proximity to salmon (Salmo salar) aquaculture: Implications for integrated multi-trophic aquaculture in Norwegian coastal waters. Aquaculture. 356–357 (2012) 328–341
19. Bocking E., 2009. Can salmon farming be sustainable? [Online] http://www.theecologist.org/News/news_analysis/340409/can_salmon_farming_be_sustainable.html
20. Barrington K., Chopin T., Robinson, S. 2009. Integrated multi-trophic aquaculture (IMTA) in marine temperate waters. In D. Soto (ed.). Integrated mariculture: a global review. FAO Fisheries and Aquaculture Technical Paper. No. 529. Rome, FAO. pp. 7–46.
21. Troell M., Joyce A., Chopin T., Neori A., Buschmann A. H., Fang J.G., 2009. Ecological engineering in aquaculture — Potential for integrated multi-trophic aquaculture (IMTA) in marine offshore systems. Aquaculture 297 (2009) 1–9
22. Stenton-Dozey J., 2007. Marine aquaculture. Finding hidden treasure in aquaculture waste. Water & Atmosphere 15 (4).
23. Mitāns A. Zivkopības stāvoklis Latvijā. Latvijas zivsaimniecības gadagrāmata 1996/97. 180. – 187. lpp.
24. Plānotās zivju audzētavas jūrā. Latvijas Jūras administrācija, 2013.
12
Synergies between mussel farming and other industries/activitiesAs a whole, the mussel industry can provide many new employment opportunities apart from the farming itself and this thanks to the many different synergies occurring. Although the labour effect from one mussel farm is limited, synergy effects can be achieved through ‘clustering’ of activities within related industries and new innovation in the sector, but this is of course depending on with path is chosen for the end-use of the mussels.
While setting up the farm, there are effects on farm equipment (like ropes, anchors, buoys) and regarding transportation of equipment between farms/harbours and industries, etc.
During the operation of the farm, synergies may occur with environmental authorities or research institutes with regard to studying the effectiveness of the mussel farm in reducing nutrients and not causing any harm itself like hypoxia beneath the farm (Kraufvelin and Díaz unpubl.). Also, while in operation, the mussel farm would cause synergies with fisheries and recreational activities by providing cleaner (more transparent water), improving photosynthetic activities of desired species as bladder-wrack and eelgrass deeper down in the water and consequently better conditions for fish production and thus for fisheries (Petersen et al. 2012). While the farms are in operation, there may also be additional synergies with the tourism area through arrangement of guided study visits to mussel farms and possibility for mussel tasting. On the Åland Islands, finally, it has also been suggested to use mussel farms in close connection with fish farms for in situ nutrient reduction from fish aquaculture activities imposing another set of potential synergies, this time with fish farming.
During harvesting, there are synergies with transportation of the harvested product (the blue mussels) between the farm and the harbour on the sea and from the harbour to end-users on land.
Depending on end-use, there are many more synergies. If the mussels are used as feed, there are synergies between mussel meal industrial plants, food suppliers in related industries such as the local salmon, chicken feed / poultry (Jönsson 2009), and pork farms. If the mussels are used for biogas production, further synergies may occur in energy plants. If the mussels are used as fertilizers, synergies occur with fertilizer production industries and with agriculture. If the mussels are used for human consumption, finally, there would be synergies with restaurants and maybe health authorities for monitoring of pollutants in mussels and their suitability as a food source.
All these activities may have multiple socioeconomic impacts on the community. The adapted approach towards the socioeconomic impacts has therefore a dual connotation, as the analysis include a combination of the possible economic benefits for the community and the ecological benefits derived from the effects of nutrient removal in the local coastal waters.
References
Jönsson L (2009) Mussel meal in poultry diets – with focus on organic production. Doctoral thesis, Swedish University of Agricultural Sciences, Uppsala. 57 pp.
Kraufvelin P, Díaz ER (2013) A small mussel farm in the Baltic proper was beneficial to the surrounding environment (Submitted manuscript)
Petersen JK, Timmermann K, Carlsson M, Holmer M, Maar M, Lindahl O (2012) Mussel farming can be used as mitigation tool – a reply. Mar Pollut Bull 64:452-454
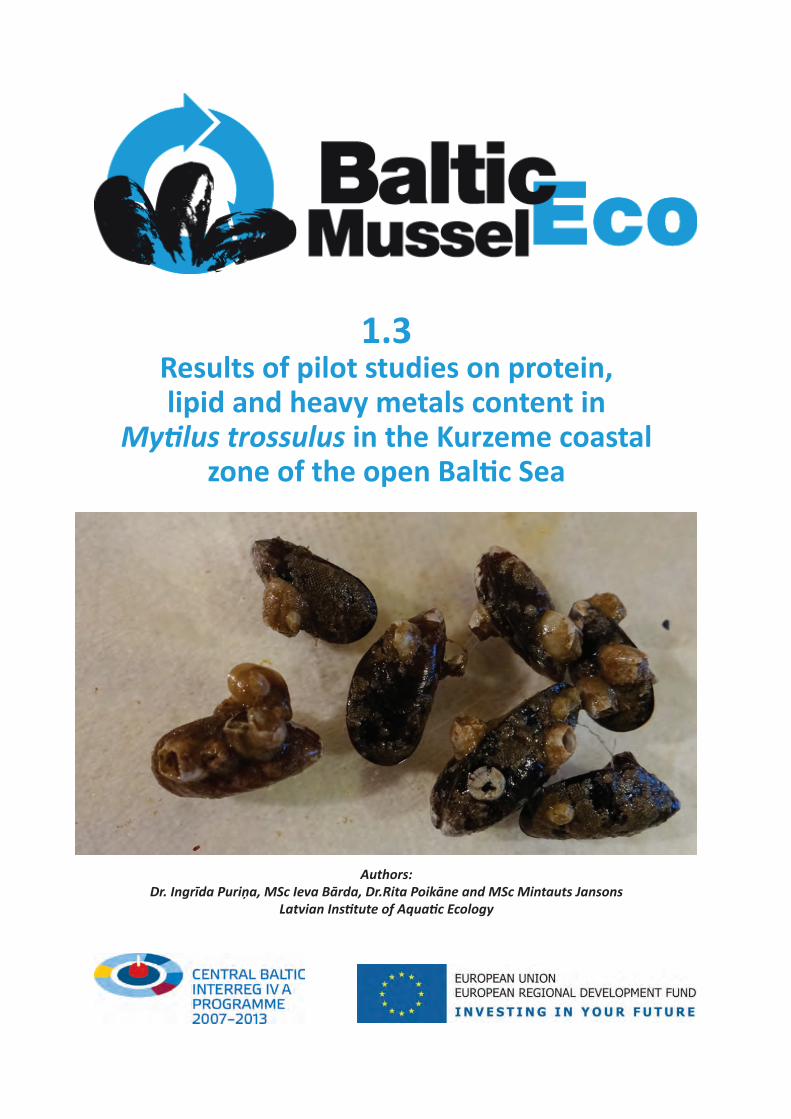
1.3Results of pilot studies on protein, lipid and heavy metals content in
Mytilus trossulus in the Kurzeme coastal zone of the open Baltic Sea
Authors:Dr. Ingrīda Puriņa, MSc Ieva Bārda, Dr.Rita Poikāne and MSc Mintauts Jansons
Latvian Institute of Aquatic Ecology
2
Introduction
The quality requisites of bivalve molluscs are primarily dependent on the quality of the aquatic environment, assuring a healthy product and a safe consumption. Water, protein, lipid, mineral and glycogen contents of the meat, together with other minor components contribute to the nutritional value and organoleptic characteristics of mussels. It is known that water temperature, food availability and reproductive cycle of animals may influence the meat yield and biochemical composition of mussels (Fernandez-Reiriz et al., 1996; Okumus & Stirling, 1998). Besides their nutritional value molluscs are universally accepted as bioindicators of marine environmental pollution (Rainbow and Phillips, 1993). Mussels are able to accumulate heavy metals and lipophilic organic contaminants such as PAHs or PCBs in the soft tissues decreasing their nutritional value significantly (Capuzzo and Leavitt, 1988; Fernández-Reiriz et al., 1996; Ferreira and Vale, 1998).
Disclaimer: The contents of the document reflect the authors’ views. The Managing Authority of the Central Baltic INTERREG IV A Programme cannot be held liable for information published by the project partners.
3
Materials and Methods
a. Collection of organisms
Mussels Mytilus trossulus were collected on 27-28 June 2013 in Pāvilosta, Liepāja and Jūrmalciems at 20m depth by scuba diving. In each location 3 replicate samples were collected 10-20 m apart from each other. M.trossulus were collected from large boulders (>30cm). After 24h of depuration in sea water at 4°C molluscs were sorted. Molluscs from size class 20±5mm were opened, whole soft tissues (including mantle) collected for lipids, proteins and heavy metals analysis. Samples were frozen and kept at -20°C till analysis. 20-30 shells were cleaned from fouling (barnacles, hydroids, bryozoans), frozen and kept at -20°C till analysis. One extra shell sample was kept with fouling organisms, to estimate the differences in chemical content.
The visual differences between molluscs from 3 main sampling sites were observed. In Pāvilosta molluscs tended to have larger size differences from 5-35mm, while in other stations size ranges were 5-25mm. Molluscs from Pāvilosta sorted out for the analysis of heavy metals tended to have higher average shell size.
b. Analysis of protein content
Frozen samples were homogenized with UltraTurrax at 24000 rot/min for 1min. 1g wet weight of molluscs was diluted with phosphate homogenization buffer 100mM, pH 7.4 at ratio 1: 40, well mixed and centrifuged at 10000 x g for 20 min. Supernatant was collected and mixed with Bradford reagent. Absorption was measured at 595nm (according to Bradford, 1976). BSA (bovine serum albumine) was used as protein standard.
c. Analysis of lipid content
Frozen samples were homogenized with UltraTurrax at 24000 rot/min for 1min. 2g wet weight were diluted by propan-2-ol and cyclohexane, homogenized in Ultra-Turrax (24000 rot/min for 30 sec). Deionized water was added to samples and samples were repeatedly homogenized. Samples were centrifuged at 450 x g for 5min and upper cyclohexane fraction was collected in 30ml centrifugation beaker. Samples were washed with additional cyclohexane/propan-2-ol mixture, centrifuged, and again separated. Cyclohexane fraction containing lipids was evaporated in nitrogen stream and then dried in hot (60°C) sand bath. Lipid content was measured gravimetrically (Smedes, 1999).
d. Analysis of heavy metals
For analysis of heavy metals whole molluscs were freeze-dried and homogenized using IKA analytic mill A11 basic. Aliquots of about 500mg dried sample material were digested using a CEM high- pressure microwave reaction system MARS 5 according to EPA method 3051A. Lead, cadmium and nickel concentrations were determined using a Varian SpectrAA -880Z atomic absorption spectrometer equipped with GTA-100 Zeeman graphite tube atomizer. Zinc, copper, magnesium, manganese and ferrum were determined by flame atomic absorption on a Varian SpectrAA -880. Mercury was determined with cold vapour atomic absorption spectroscopy using a Varian SpectrAA -880 equipped with vapour generation accessory VGA-77.
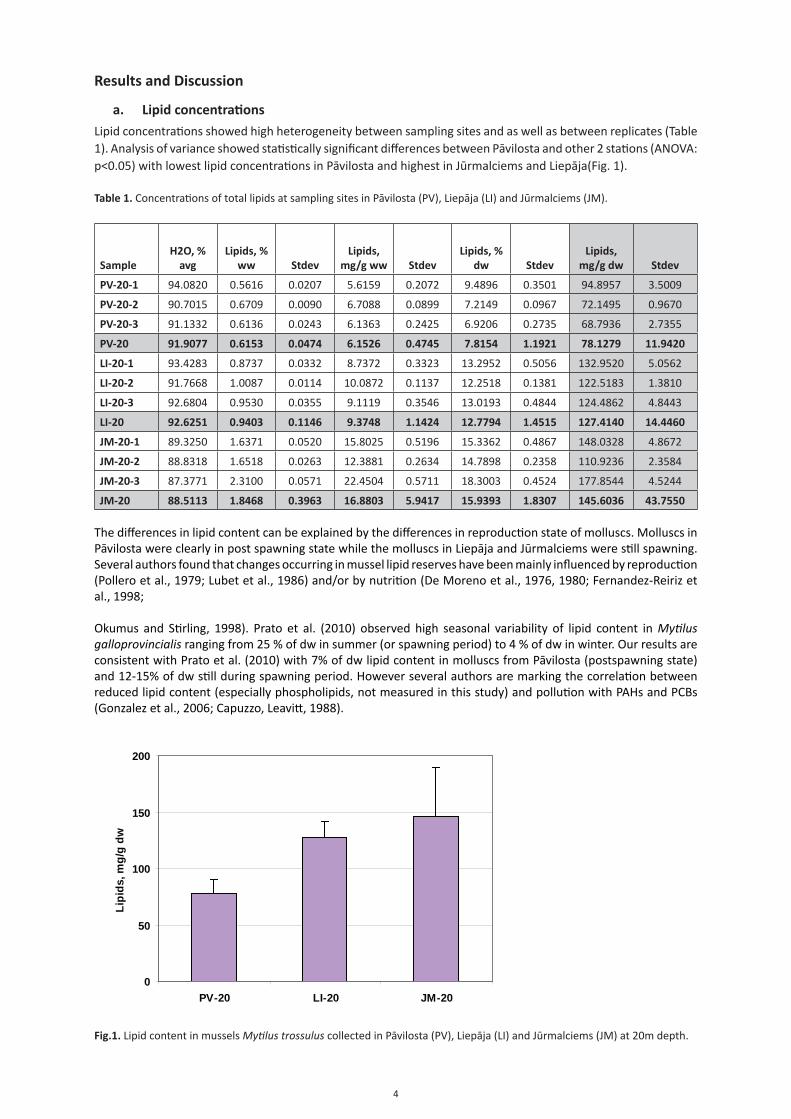
4
Results and Discussion
a. Lipid concentrations
Lipid concentrations showed high heterogeneity between sampling sites and as well as between replicates (Table 1). Analysis of variance showed statistically significant differences between Pāvilosta and other 2 stations (ANOVA: p<0.05) with lowest lipid concentrations in Pāvilosta and highest in Jūrmalciems and Liepāja(Fig. 1).
Table 1. Concentrations of total lipids at sampling sites in Pāvilosta (PV), Liepāja (LI) and Jūrmalciems (JM).
SampleH2O, %
avgLipids, %
ww StdevLipids,
mg/g ww StdevLipids, %
dw StdevLipids,
mg/g dw Stdev
PV-20-1 94.0820 0.5616 0.0207 5.6159 0.2072 9.4896 0.3501 94.8957 3.5009
PV-20-2 90.7015 0.6709 0.0090 6.7088 0.0899 7.2149 0.0967 72.1495 0.9670
PV-20-3 91.1332 0.6136 0.0243 6.1363 0.2425 6.9206 0.2735 68.7936 2.7355
PV-20 91.9077 0.6153 0.0474 6.1526 0.4745 7.8154 1.1921 78.1279 11.9420
LI-20-1 93.4283 0.8737 0.0332 8.7372 0.3323 13.2952 0.5056 132.9520 5.0562
LI-20-2 91.7668 1.0087 0.0114 10.0872 0.1137 12.2518 0.1381 122.5183 1.3810
LI-20-3 92.6804 0.9530 0.0355 9.1119 0.3546 13.0193 0.4844 124.4862 4.8443
LI-20 92.6251 0.9403 0.1146 9.3748 1.1424 12.7794 1.4515 127.4140 14.4460
JM-20-1 89.3250 1.6371 0.0520 15.8025 0.5196 15.3362 0.4867 148.0328 4.8672
JM-20-2 88.8318 1.6518 0.0263 12.3881 0.2634 14.7898 0.2358 110.9236 2.3584
JM-20-3 87.3771 2.3100 0.0571 22.4504 0.5711 18.3003 0.4524 177.8544 4.5244
JM-20 88.5113 1.8468 0.3963 16.8803 5.9417 15.9393 1.8307 145.6036 43.7550
The differences in lipid content can be explained by the differences in reproduction state of molluscs. Molluscs in Pāvilosta were clearly in post spawning state while the molluscs in Liepāja and Jūrmalciems were still spawning. Several authors found that changes occurring in mussel lipid reserves have been mainly influenced by reproduction (Pollero et al., 1979; Lubet et al., 1986) and/or by nutrition (De Moreno et al., 1976, 1980; Fernandez-Reiriz et al., 1998;
Okumus and Stirling, 1998). Prato et al. (2010) observed high seasonal variability of lipid content in Mytilus galloprovincialis ranging from 25 % of dw in summer (or spawning period) to 4 % of dw in winter. Our results are consistent with Prato et al. (2010) with 7% of dw lipid content in molluscs from Pāvilosta (postspawning state) and 12-15% of dw still during spawning period. However several authors are marking the correlation between reduced lipid content (especially phospholipids, not measured in this study) and pollution with PAHs and PCBs (Gonzalez et al., 2006; Capuzzo, Leavitt, 1988).
0
50
100
150
200
PV-20 LI-20 JM-20
Lipi
ds, m
g/g
dw
Fig.1. Lipid content in mussels Mytilus trossulus collected in Pāvilosta (PV), Liepāja (LI) and Jūrmalciems (JM) at 20m depth.
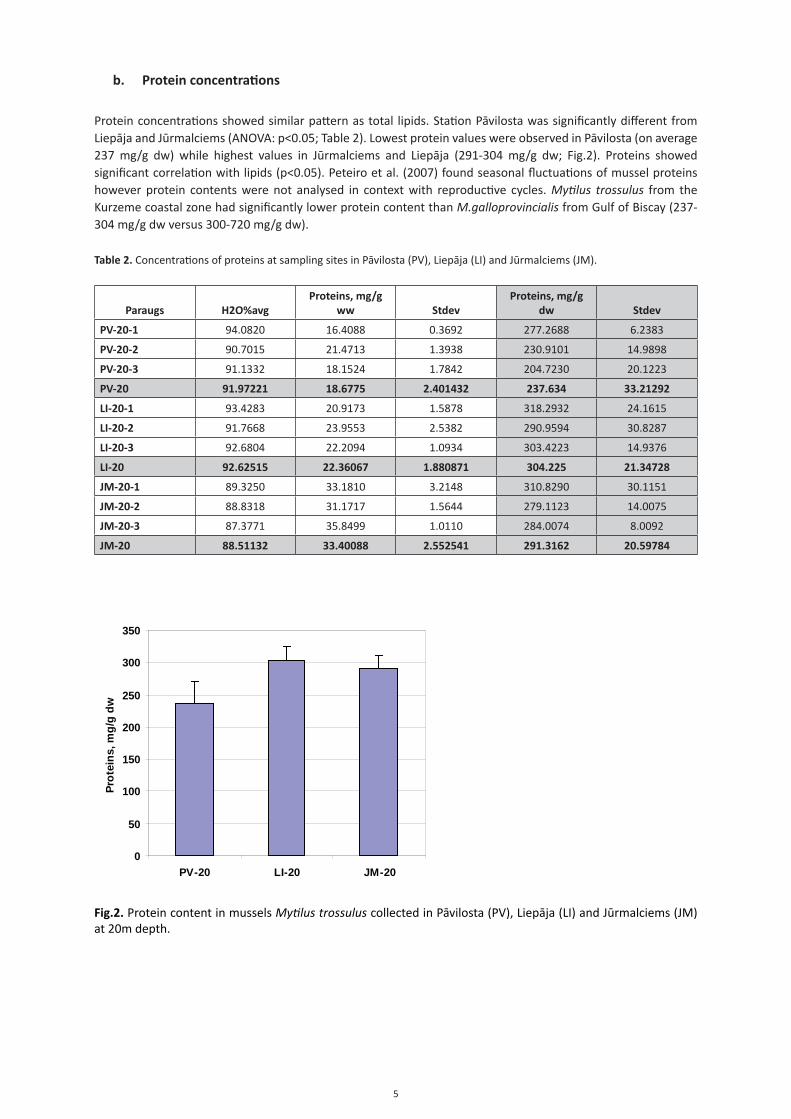
5
b. Protein concentrations
Protein concentrations showed similar pattern as total lipids. Station Pāvilosta was significantly different from Liepāja and Jūrmalciems (ANOVA: p<0.05; Table 2). Lowest protein values were observed in Pāvilosta (on average 237 mg/g dw) while highest values in Jūrmalciems and Liepāja (291-304 mg/g dw; Fig.2). Proteins showed significant correlation with lipids (p<0.05). Peteiro et al. (2007) found seasonal fluctuations of mussel proteins however protein contents were not analysed in context with reproductive cycles. Mytilus trossulus from the Kurzeme coastal zone had significantly lower protein content than M.galloprovincialis from Gulf of Biscay (237-304 mg/g dw versus 300-720 mg/g dw).
Table 2. Concentrations of proteins at sampling sites in Pāvilosta (PV), Liepāja (LI) and Jūrmalciems (JM).
Paraugs H2O%avgProteins, mg/g
ww StdevProteins, mg/g
dw Stdev
PV-20-1 94.0820 16.4088 0.3692 277.2688 6.2383
PV-20-2 90.7015 21.4713 1.3938 230.9101 14.9898
PV-20-3 91.1332 18.1524 1.7842 204.7230 20.1223
PV-20 91.97221 18.6775 2.401432 237.634 33.21292
LI-20-1 93.4283 20.9173 1.5878 318.2932 24.1615
LI-20-2 91.7668 23.9553 2.5382 290.9594 30.8287
LI-20-3 92.6804 22.2094 1.0934 303.4223 14.9376
LI-20 92.62515 22.36067 1.880871 304.225 21.34728
JM-20-1 89.3250 33.1810 3.2148 310.8290 30.1151
JM-20-2 88.8318 31.1717 1.5644 279.1123 14.0075
JM-20-3 87.3771 35.8499 1.0110 284.0074 8.0092
JM-20 88.51132 33.40088 2.552541 291.3162 20.59784
Fig.2. Protein content in mussels Mytilus trossulus collected in Pāvilosta (PV), Liepāja (LI) and Jūrmalciems (JM) at 20m depth.
0
50
100
150
200
250
300
350
PV-20 LI-20 JM-20
Prot
eins
, mg/
g dw
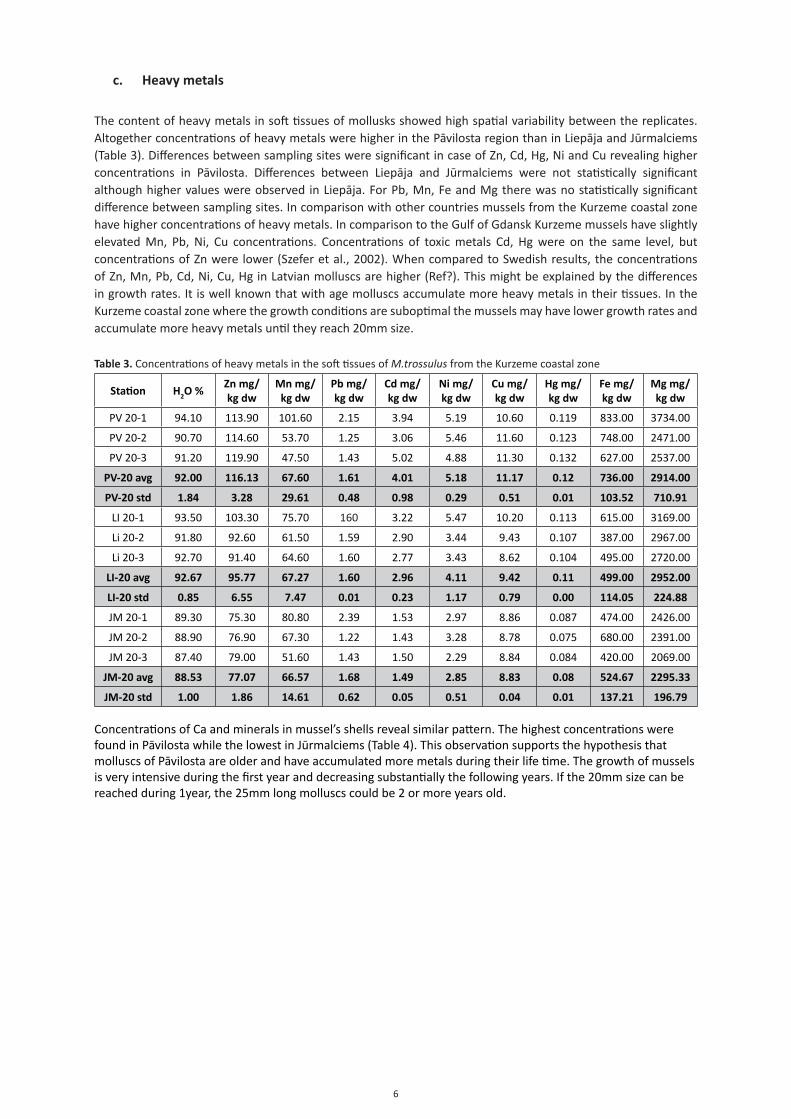
6
c. Heavy metals
The content of heavy metals in soft tissues of mollusks showed high spatial variability between the replicates. Altogether concentrations of heavy metals were higher in the Pāvilosta region than in Liepāja and Jūrmalciems (Table 3). Differences between sampling sites were significant in case of Zn, Cd, Hg, Ni and Cu revealing higher concentrations in Pāvilosta. Differences between Liepāja and Jūrmalciems were not statistically significant although higher values were observed in Liepāja. For Pb, Mn, Fe and Mg there was no statistically significant difference between sampling sites. In comparison with other countries mussels from the Kurzeme coastal zone have higher concentrations of heavy metals. In comparison to the Gulf of Gdansk Kurzeme mussels have slightly elevated Mn, Pb, Ni, Cu concentrations. Concentrations of toxic metals Cd, Hg were on the same level, but concentrations of Zn were lower (Szefer et al., 2002). When compared to Swedish results, the concentrations of Zn, Mn, Pb, Cd, Ni, Cu, Hg in Latvian molluscs are higher (Ref?). This might be explained by the differences in growth rates. It is well known that with age molluscs accumulate more heavy metals in their tissues. In the Kurzeme coastal zone where the growth conditions are suboptimal the mussels may have lower growth rates and accumulate more heavy metals until they reach 20mm size.
Table 3. Concentrations of heavy metals in the soft tissues of M.trossulus from the Kurzeme coastal zone
Station H2O %Zn mg/kg dw
Mn mg/kg dw
Pb mg/kg dw
Cd mg/kg dw
Ni mg/kg dw
Cu mg/kg dw
Hg mg/kg dw
Fe mg/kg dw
Mg mg/kg dw
PV 20-1 94.10 113.90 101.60 2.15 3.94 5.19 10.60 0.119 833.00 3734.00
PV 20-2 90.70 114.60 53.70 1.25 3.06 5.46 11.60 0.123 748.00 2471.00
PV 20-3 91.20 119.90 47.50 1.43 5.02 4.88 11.30 0.132 627.00 2537.00
PV-20 avg 92.00 116.13 67.60 1.61 4.01 5.18 11.17 0.12 736.00 2914.00
PV-20 std 1.84 3.28 29.61 0.48 0.98 0.29 0.51 0.01 103.52 710.91
LI 20-1 93.50 103.30 75.70 160 3.22 5.47 10.20 0.113 615.00 3169.00
Li 20-2 91.80 92.60 61.50 1.59 2.90 3.44 9.43 0.107 387.00 2967.00
Li 20-3 92.70 91.40 64.60 1.60 2.77 3.43 8.62 0.104 495.00 2720.00
LI-20 avg 92.67 95.77 67.27 1.60 2.96 4.11 9.42 0.11 499.00 2952.00
LI-20 std 0.85 6.55 7.47 0.01 0.23 1.17 0.79 0.00 114.05 224.88
JM 20-1 89.30 75.30 80.80 2.39 1.53 2.97 8.86 0.087 474.00 2426.00
JM 20-2 88.90 76.90 67.30 1.22 1.43 3.28 8.78 0.075 680.00 2391.00
JM 20-3 87.40 79.00 51.60 1.43 1.50 2.29 8.84 0.084 420.00 2069.00
JM-20 avg 88.53 77.07 66.57 1.68 1.49 2.85 8.83 0.08 524.67 2295.33
JM-20 std 1.00 1.86 14.61 0.62 0.05 0.51 0.04 0.01 137.21 196.79
Concentrations of Ca and minerals in mussel’s shells reveal similar pattern. The highest concentrations were found in Pāvilosta while the lowest in Jūrmalciems (Table 4). This observation supports the hypothesis that molluscs of Pāvilosta are older and have accumulated more metals during their life time. The growth of mussels is very intensive during the first year and decreasing substantially the following years. If the 20mm size can be reached during 1year, the 25mm long molluscs could be 2 or more years old.
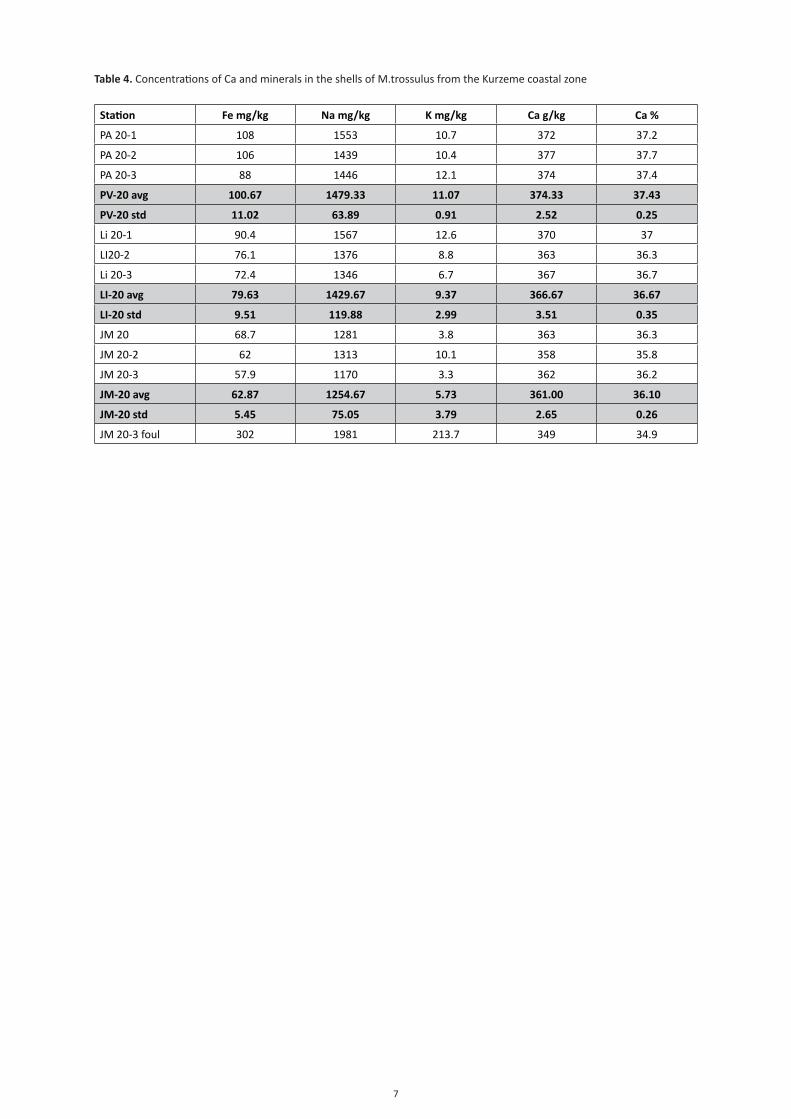
7
Table 4. Concentrations of Ca and minerals in the shells of M.trossulus from the Kurzeme coastal zone
Station Fe mg/kg Na mg/kg K mg/kg Ca g/kg Ca %
PA 20-1 108 1553 10.7 372 37.2
PA 20-2 106 1439 10.4 377 37.7
PA 20-3 88 1446 12.1 374 37.4
PV-20 avg 100.67 1479.33 11.07 374.33 37.43
PV-20 std 11.02 63.89 0.91 2.52 0.25
Li 20-1 90.4 1567 12.6 370 37
LI20-2 76.1 1376 8.8 363 36.3
Li 20-3 72.4 1346 6.7 367 36.7
LI-20 avg 79.63 1429.67 9.37 366.67 36.67
LI-20 std 9.51 119.88 2.99 3.51 0.35
JM 20 68.7 1281 3.8 363 36.3
JM 20-2 62 1313 10.1 358 35.8
JM 20-3 57.9 1170 3.3 362 36.2
JM-20 avg 62.87 1254.67 5.73 361.00 36.10
JM-20 std 5.45 75.05 3.79 2.65 0.26
JM 20-3 foul 302 1981 213.7 349 34.9

8
Conclusion
The molluscs have seasonal changes in lipid and protein content with lower values directly after spawning period. Older mussels invest more energy reserves in spawning as a result decreasing more substantially the body weight in the post spawning period. Older mussels accumulate more heavy metals and minerals in the body tissues and shells during lifetime. For the potential mussel farming it would be necessary to collect the mussels of known age, to assure the health and nutritional value of animals. Bigger and older animals might increase the risk of contamination with heavy metals of consumers (humans or animals).
9
References
1. Beninger, P. G., & Lucas, A. (1984). Seasonal variations in condition, reproductive activity, and gross biochemical composition of two species of adult clam reared in a common habitat: Tapes decussates L. (Jeffreys) and Tapes philippinarum (Adams & Reeve). Journal of Experimental Marine Biology and Ecology, 79(1), 19–37.
2. Capuzzo, J.M., Leavitt, D.F., 1988. Lipid composition of the digestive glands of Mytilus edulis and Carcinus maenas in response to pollutant gradients. Mar.Ecol. Prog. Ser. 46, 139–145.
3. Fernández-Reiriz, M.J., Labarta, U., Babarro, J.M.F., 1996. Comparative allometries in growth and chemical composition of mussel (Mytilus galloprovincialis Lmk.) cultured in two zones in the Ría de Sada (Galicia, NW Spain). J. Shellfish Res. 15, 349–353.
4. Fernandez-Reiriz, M.J., Labarta, U., Albentosa, M., Perez-Camacho, A., 1998. Effect of microalgal diet and commercial wheatgerm flours on the lipid profile of Ruditapes decussatus spat. Comp. Biochem. Physiol. 119B, 369–377.
5. Ferreira, A.M., Vale, C., 1998. PCB accumulation and alterations of lipids in two length classes of the oyster Crassostrea angulata and of the clam Ruditapes decussates. Mar. Environ. Res. 45, 259–268.
6. González, J.J., Viñas, L., Franco, M.A., Fumiga, J., Soriano, J.A., Grueiro, G., Muniategui, S., López-Mahía, P., Prada, D., Bayona, J.M., Alzaga, R., Albaigés, J., 2006. Spatial and temporal distribution of dissolved/dispersed aromatic hydrocarbons in seawater in the area affected by the Prestige oil spill. Mar. Pollut. Bull. 53, 250–259.
7. Lubet, P., Brichon, G., Besnard, J.Y., Zwingelstein, G., 1986. Sexual differences in the composition and metabolism of lipids in the mantle of the mussel Mytilus galloprovincialis Lmk (Mollusca: Bivalvia). Comp. Biochem. Physiol. 84B, 279–285.
8. Okumus, I., & Stirling, H. P. (1998). Seasonal variations in the meat weight, Condition Index and biochemical composition of mussels (Mytilus edulis L.) in suspended culture in two Scottish sea lochs. Aquaculture, 159(3–4), 249–261.
9. Pollero, R. J., Re´ , M. E., & Brenner, R. R. (1979). Seasonal changes of the lipids of the mollusc Chlamys tehuelcha. Comparative Biochemistry and Physiology, 64A(2), 257–263.

1.4Risk assessment of environmental factors
influencing potential Mytilus spp. cultivation on the coastal zone of the Baltic Sea in the
Kurzeme region
Author:Dr Ingrīda Puriņa
Latvian Institute of Aquatic Ecology
2
Content
1. Characterization of the study area .............................................................................. 3
2. Hydrological factors ................................................................................................... 4
2.1 Wind and waves exposure ................................................................................. 4
2.2 Currents ............................................................................................................ 6
2.3 Ice conditions .................................................................................................... 6
2.4 Temperature, salinity and oxygen conditions ..................................................... 6
3. Hydrochemical factors: ............................................................................................... 8
3.1 Nutrients ........................................................................................................... 8
3.2 Pollutants .......................................................................................................... 8
4. Biotic factors ............................................................................................................ 11
4.1 Food availability .............................................................................................. 11
4.2 Species competition ........................................................................................ 12
4.3 Benthic feeders ............................................................................................... 12
4.4 Parasites and diseases ..................................................................................... 13
5. Internal factors ......................................................................................................... 13
6. Conclusions .............................................................................................................. 14
7. List of references ...................................................................................................... 15
Disclaimer: The contents of the document reflect the authors’ views. The Managing Authority of the Central Baltic INTERREG IV A Programme cannot be held liable for information published by the project partners.
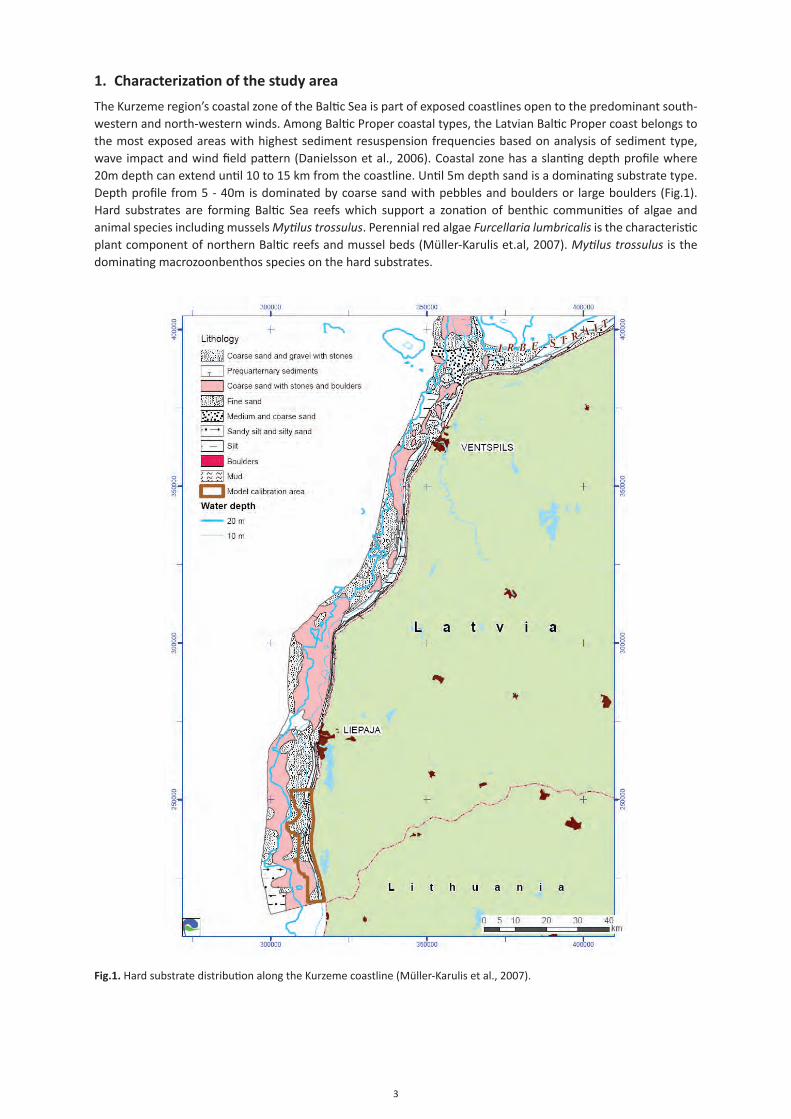
3
1. Characterization of the study area
The Kurzeme region’s coastal zone of the Baltic Sea is part of exposed coastlines open to the predominant south-western and north-western winds. Among Baltic Proper coastal types, the Latvian Baltic Proper coast belongs to the most exposed areas with highest sediment resuspension frequencies based on analysis of sediment type, wave impact and wind field pattern (Danielsson et al., 2006). Coastal zone has a slanting depth profile where 20m depth can extend until 10 to 15 km from the coastline. Until 5m depth sand is a dominating substrate type. Depth profile from 5 - 40m is dominated by coarse sand with pebbles and boulders or large boulders (Fig.1). Hard substrates are forming Baltic Sea reefs which support a zonation of benthic communities of algae and animal species including mussels Mytilus trossulus. Perennial red algae Furcellaria lumbricalis is the characteristic plant component of northern Baltic reefs and mussel beds (Müller-Karulis et.al, 2007). Mytilus trossulus is the dominating macrozoonbenthos species on the hard substrates.
Fig.1. Hard substrate distribution along the Kurzeme coastline (Müller-Karulis et al., 2007).
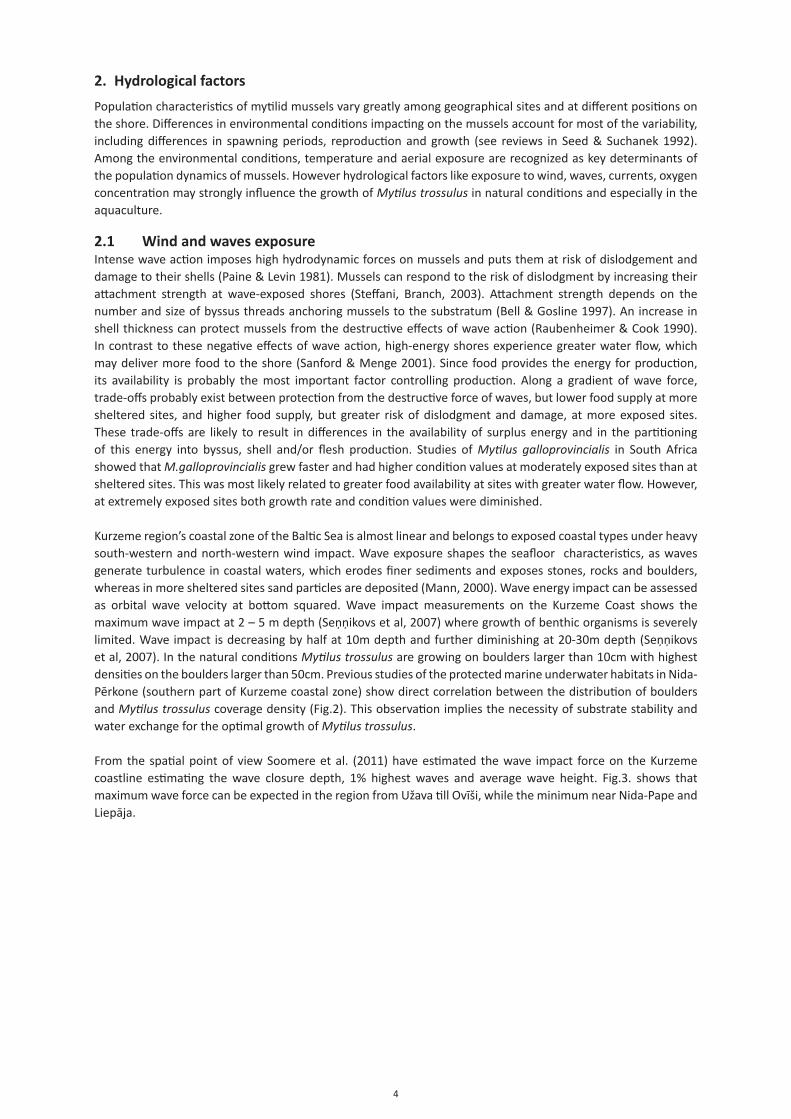
4
2. Hydrological factors
Population characteristics of mytilid mussels vary greatly among geographical sites and at different positions on the shore. Differences in environmental conditions impacting on the mussels account for most of the variability, including differences in spawning periods, reproduction and growth (see reviews in Seed & Suchanek 1992). Among the environmental conditions, temperature and aerial exposure are recognized as key determinants of the population dynamics of mussels. However hydrological factors like exposure to wind, waves, currents, oxygen concentration may strongly influence the growth of Mytilus trossulus in natural conditions and especially in the aquaculture.
2.1 Wind and waves exposureIntense wave action imposes high hydrodynamic forces on mussels and puts them at risk of dislodgement and damage to their shells (Paine & Levin 1981). Mussels can respond to the risk of dislodgment by increasing their attachment strength at wave-exposed shores (Steffani, Branch, 2003). Attachment strength depends on the number and size of byssus threads anchoring mussels to the substratum (Bell & Gosline 1997). An increase in shell thickness can protect mussels from the destructive effects of wave action (Raubenheimer & Cook 1990). In contrast to these negative effects of wave action, high-energy shores experience greater water flow, which may deliver more food to the shore (Sanford & Menge 2001). Since food provides the energy for production, its availability is probably the most important factor controlling production. Along a gradient of wave force, trade-offs probably exist between protection from the destructive force of waves, but lower food supply at more sheltered sites, and higher food supply, but greater risk of dislodgment and damage, at more exposed sites. These trade-offs are likely to result in differences in the availability of surplus energy and in the partitioning of this energy into byssus, shell and/or flesh production. Studies of Mytilus galloprovincialis in South Africa showed that M.galloprovincialis grew faster and had higher condition values at moderately exposed sites than at sheltered sites. This was most likely related to greater food availability at sites with greater water flow. However, at extremely exposed sites both growth rate and condition values were diminished.
Kurzeme region’s coastal zone of the Baltic Sea is almost linear and belongs to exposed coastal types under heavy south-western and north-western wind impact. Wave exposure shapes the seafloor characteristics, as waves generate turbulence in coastal waters, which erodes finer sediments and exposes stones, rocks and boulders, whereas in more sheltered sites sand particles are deposited (Mann, 2000). Wave energy impact can be assessed as orbital wave velocity at bottom squared. Wave impact measurements on the Kurzeme Coast shows the maximum wave impact at 2 – 5 m depth (Seņņikovs et al, 2007) where growth of benthic organisms is severely limited. Wave impact is decreasing by half at 10m depth and further diminishing at 20-30m depth (Seņņikovs et al, 2007). In the natural conditions Mytilus trossulus are growing on boulders larger than 10cm with highest densities on the boulders larger than 50cm. Previous studies of the protected marine underwater habitats in Nida-Pērkone (southern part of Kurzeme coastal zone) show direct correlation between the distribution of boulders and Mytilus trossulus coverage density (Fig.2). This observation implies the necessity of substrate stability and water exchange for the optimal growth of Mytilus trossulus.
From the spatial point of view Soomere et al. (2011) have estimated the wave impact force on the Kurzeme coastline estimating the wave closure depth, 1% highest waves and average wave height. Fig.3. shows that maximum wave force can be expected in the region from Užava till Ovīši, while the minimum near Nida-Pape and Liepāja.
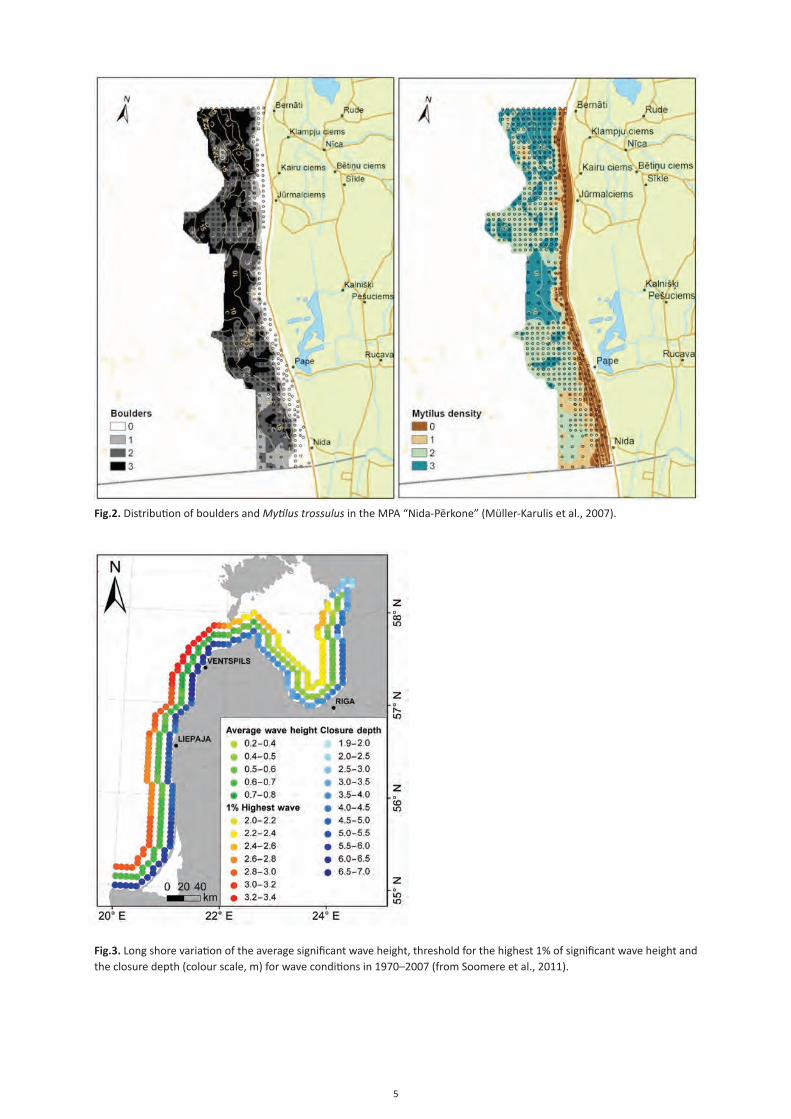
5
Fig.2. Distribution of boulders and Mytilus trossulus in the MPA “Nida-Pērkone” (Müller-Karulis et al., 2007).
Fig.3. Long shore variation of the average significant wave height, threshold for the highest 1% of significant wave height and the closure depth (colour scale, m) for wave conditions in 1970–2007 (from Soomere et al., 2011).
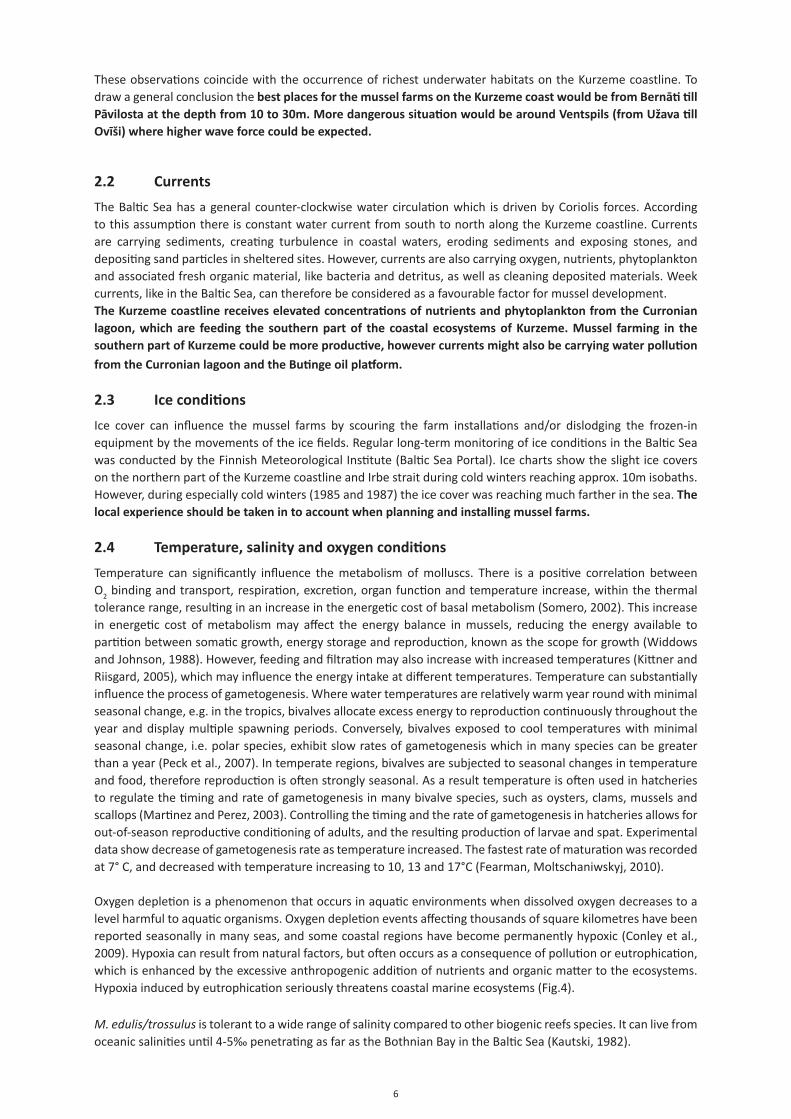
6
These observations coincide with the occurrence of richest underwater habitats on the Kurzeme coastline. To draw a general conclusion the best places for the mussel farms on the Kurzeme coast would be from Bernāti till Pāvilosta at the depth from 10 to 30m. More dangerous situation would be around Ventspils (from Užava till Ovīši) where higher wave force could be expected.
2.2 Currents
The Baltic Sea has a general counter-clockwise water circulation which is driven by Coriolis forces. According to this assumption there is constant water current from south to north along the Kurzeme coastline. Currents are carrying sediments, creating turbulence in coastal waters, eroding sediments and exposing stones, and depositing sand particles in sheltered sites. However, currents are also carrying oxygen, nutrients, phytoplankton and associated fresh organic material, like bacteria and detritus, as well as cleaning deposited materials. Week currents, like in the Baltic Sea, can therefore be considered as a favourable factor for mussel development. The Kurzeme coastline receives elevated concentrations of nutrients and phytoplankton from the Curronian lagoon, which are feeding the southern part of the coastal ecosystems of Kurzeme. Mussel farming in the southern part of Kurzeme could be more productive, however currents might also be carrying water pollution
from the Curronian lagoon and the Butinge oil platform.
2.3 Ice conditions
Ice cover can influence the mussel farms by scouring the farm installations and/or dislodging the frozen-in equipment by the movements of the ice fields. Regular long-term monitoring of ice conditions in the Baltic Sea was conducted by the Finnish Meteorological Institute (Baltic Sea Portal). Ice charts show the slight ice covers on the northern part of the Kurzeme coastline and Irbe strait during cold winters reaching approx. 10m isobaths. However, during especially cold winters (1985 and 1987) the ice cover was reaching much farther in the sea. The local experience should be taken in to account when planning and installing mussel farms.
2.4 Temperature, salinity and oxygen conditions
Temperature can significantly influence the metabolism of molluscs. There is a positive correlation between O2 binding and transport, respiration, excretion, organ function and temperature increase, within the thermal tolerance range, resulting in an increase in the energetic cost of basal metabolism (Somero, 2002). This increase in energetic cost of metabolism may affect the energy balance in mussels, reducing the energy available to partition between somatic growth, energy storage and reproduction, known as the scope for growth (Widdows and Johnson, 1988). However, feeding and filtration may also increase with increased temperatures (Kittner and Riisgard, 2005), which may influence the energy intake at different temperatures. Temperature can substantially influence the process of gametogenesis. Where water temperatures are relatively warm year round with minimal seasonal change, e.g. in the tropics, bivalves allocate excess energy to reproduction continuously throughout the year and display multiple spawning periods. Conversely, bivalves exposed to cool temperatures with minimal seasonal change, i.e. polar species, exhibit slow rates of gametogenesis which in many species can be greater than a year (Peck et al., 2007). In temperate regions, bivalves are subjected to seasonal changes in temperature and food, therefore reproduction is often strongly seasonal. As a result temperature is often used in hatcheries to regulate the timing and rate of gametogenesis in many bivalve species, such as oysters, clams, mussels and scallops (Martinez and Perez, 2003). Controlling the timing and the rate of gametogenesis in hatcheries allows for out-of-season reproductive conditioning of adults, and the resulting production of larvae and spat. Experimental data show decrease of gametogenesis rate as temperature increased. The fastest rate of maturation was recorded at 7° C, and decreased with temperature increasing to 10, 13 and 17°C (Fearman, Moltschaniwskyj, 2010).
Oxygen depletion is a phenomenon that occurs in aquatic environments when dissolved oxygen decreases to a level harmful to aquatic organisms. Oxygen depletion events affecting thousands of square kilometres have been reported seasonally in many seas, and some coastal regions have become permanently hypoxic (Conley et al., 2009). Hypoxia can result from natural factors, but often occurs as a consequence of pollution or eutrophication, which is enhanced by the excessive anthropogenic addition of nutrients and organic matter to the ecosystems. Hypoxia induced by eutrophication seriously threatens coastal marine ecosystems (Fig.4).
M. edulis/trossulus is tolerant to a wide range of salinity compared to other biogenic reefs species. It can live from oceanic salinities until 4-5‰ penetrating as far as the Bothnian Bay in the Baltic Sea (Kautski, 1982).
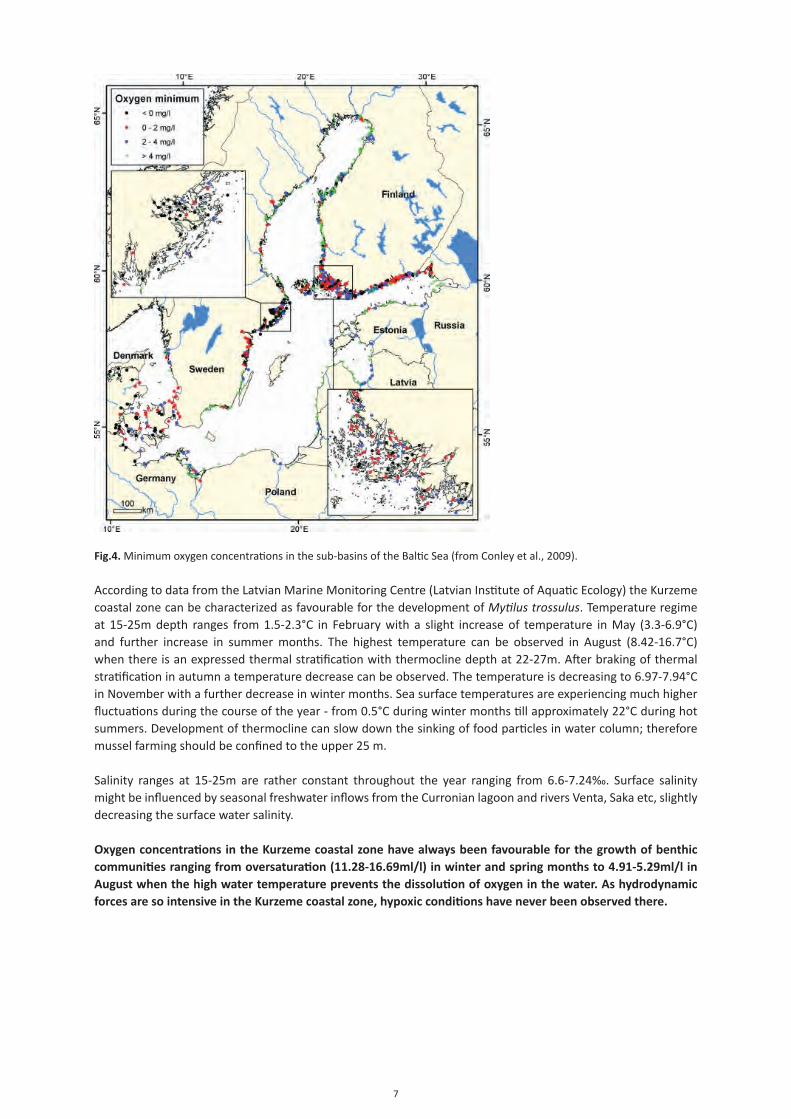
7
Fig.4. Minimum oxygen concentrations in the sub-basins of the Baltic Sea (from Conley et al., 2009).
According to data from the Latvian Marine Monitoring Centre (Latvian Institute of Aquatic Ecology) the Kurzeme coastal zone can be characterized as favourable for the development of Mytilus trossulus. Temperature regime at 15-25m depth ranges from 1.5-2.3°C in February with a slight increase of temperature in May (3.3-6.9°C) and further increase in summer months. The highest temperature can be observed in August (8.42-16.7°C) when there is an expressed thermal stratification with thermocline depth at 22-27m. After braking of thermal stratification in autumn a temperature decrease can be observed. The temperature is decreasing to 6.97-7.94°C in November with a further decrease in winter months. Sea surface temperatures are experiencing much higher fluctuations during the course of the year - from 0.5°C during winter months till approximately 22°C during hot summers. Development of thermocline can slow down the sinking of food particles in water column; therefore mussel farming should be confined to the upper 25 m.
Salinity ranges at 15-25m are rather constant throughout the year ranging from 6.6-7.24‰. Surface salinity might be influenced by seasonal freshwater inflows from the Curronian lagoon and rivers Venta, Saka etc, slightly decreasing the surface water salinity.
Oxygen concentrations in the Kurzeme coastal zone have always been favourable for the growth of benthic communities ranging from oversaturation (11.28-16.69ml/l) in winter and spring months to 4.91-5.29ml/l in August when the high water temperature prevents the dissolution of oxygen in the water. As hydrodynamic forces are so intensive in the Kurzeme coastal zone, hypoxic conditions have never been observed there.
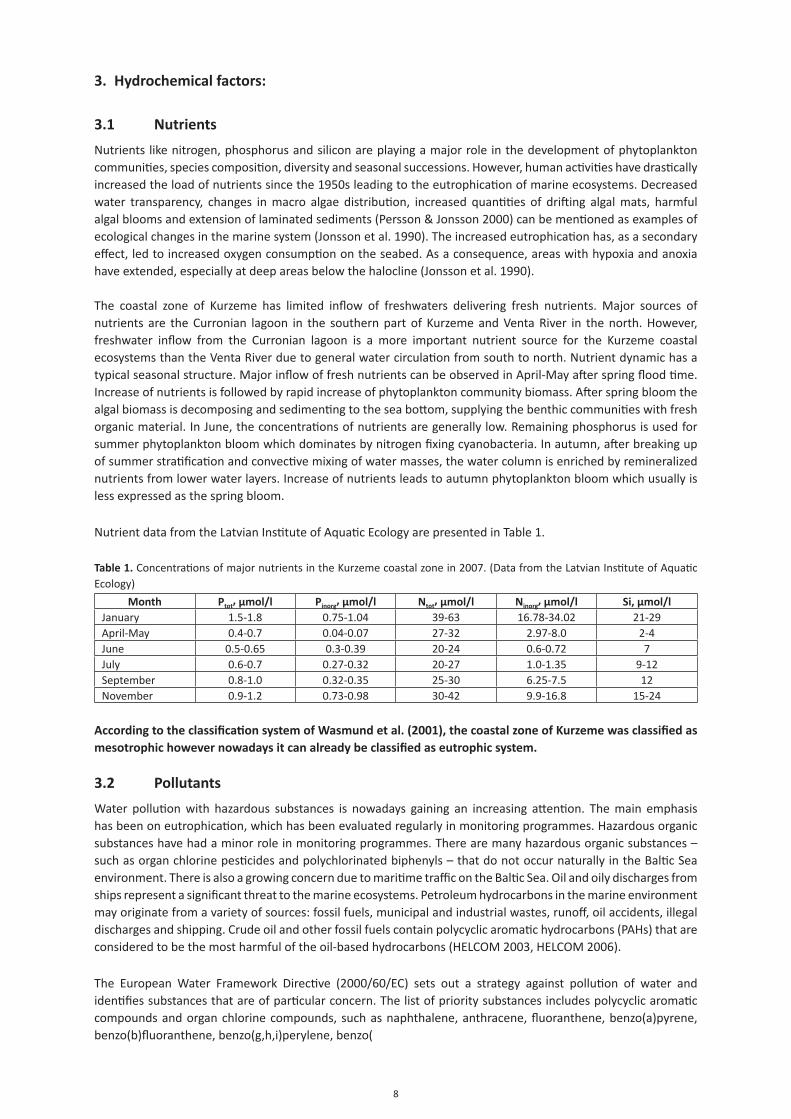
8
3. Hydrochemical factors:
3.1 Nutrients
Nutrients like nitrogen, phosphorus and silicon are playing a major role in the development of phytoplankton communities, species composition, diversity and seasonal successions. However, human activities have drastically increased the load of nutrients since the 1950s leading to the eutrophication of marine ecosystems. Decreased water transparency, changes in macro algae distribution, increased quantities of drifting algal mats, harmful algal blooms and extension of laminated sediments (Persson & Jonsson 2000) can be mentioned as examples of ecological changes in the marine system (Jonsson et al. 1990). The increased eutrophication has, as a secondary effect, led to increased oxygen consumption on the seabed. As a consequence, areas with hypoxia and anoxia have extended, especially at deep areas below the halocline (Jonsson et al. 1990).
The coastal zone of Kurzeme has limited inflow of freshwaters delivering fresh nutrients. Major sources of nutrients are the Curronian lagoon in the southern part of Kurzeme and Venta River in the north. However, freshwater inflow from the Curronian lagoon is a more important nutrient source for the Kurzeme coastal ecosystems than the Venta River due to general water circulation from south to north. Nutrient dynamic has a typical seasonal structure. Major inflow of fresh nutrients can be observed in April-May after spring flood time. Increase of nutrients is followed by rapid increase of phytoplankton community biomass. After spring bloom the algal biomass is decomposing and sedimenting to the sea bottom, supplying the benthic communities with fresh organic material. In June, the concentrations of nutrients are generally low. Remaining phosphorus is used for summer phytoplankton bloom which dominates by nitrogen fixing cyanobacteria. In autumn, after breaking up of summer stratification and convective mixing of water masses, the water column is enriched by remineralized nutrients from lower water layers. Increase of nutrients leads to autumn phytoplankton bloom which usually is less expressed as the spring bloom.
Nutrient data from the Latvian Institute of Aquatic Ecology are presented in Table 1.
Table 1. Concentrations of major nutrients in the Kurzeme coastal zone in 2007. (Data from the Latvian Institute of Aquatic Ecology)
Month Ptot, μmol/l Pinorg, μmol/l Ntot, μmol/l Ninorg, μmol/l Si, μmol/lJanuary 1.5-1.8 0.75-1.04 39-63 16.78-34.02 21-29April-May 0.4-0.7 0.04-0.07 27-32 2.97-8.0 2-4June 0.5-0.65 0.3-0.39 20-24 0.6-0.72 7July 0.6-0.7 0.27-0.32 20-27 1.0-1.35 9-12September 0.8-1.0 0.32-0.35 25-30 6.25-7.5 12November 0.9-1.2 0.73-0.98 30-42 9.9-16.8 15-24
According to the classification system of Wasmund et al. (2001), the coastal zone of Kurzeme was classified as mesotrophic however nowadays it can already be classified as eutrophic system.
3.2 Pollutants
Water pollution with hazardous substances is nowadays gaining an increasing attention. The main emphasis has been on eutrophication, which has been evaluated regularly in monitoring programmes. Hazardous organic substances have had a minor role in monitoring programmes. There are many hazardous organic substances – such as organ chlorine pesticides and polychlorinated biphenyls – that do not occur naturally in the Baltic Sea environment. There is also a growing concern due to maritime traffic on the Baltic Sea. Oil and oily discharges from ships represent a significant threat to the marine ecosystems. Petroleum hydrocarbons in the marine environment may originate from a variety of sources: fossil fuels, municipal and industrial wastes, runoff, oil accidents, illegal discharges and shipping. Crude oil and other fossil fuels contain polycyclic aromatic hydrocarbons (PAHs) that are considered to be the most harmful of the oil-based hydrocarbons (HELCOM 2003, HELCOM 2006).
The European Water Framework Directive (2000/60/EC) sets out a strategy against pollution of water and identifies substances that are of particular concern. The list of priority substances includes polycyclic aromatic compounds and organ chlorine compounds, such as naphthalene, anthracene, fluoranthene, benzo(a)pyrene, benzo(b)fluoranthene, benzo(g,h,i)perylene, benzo(
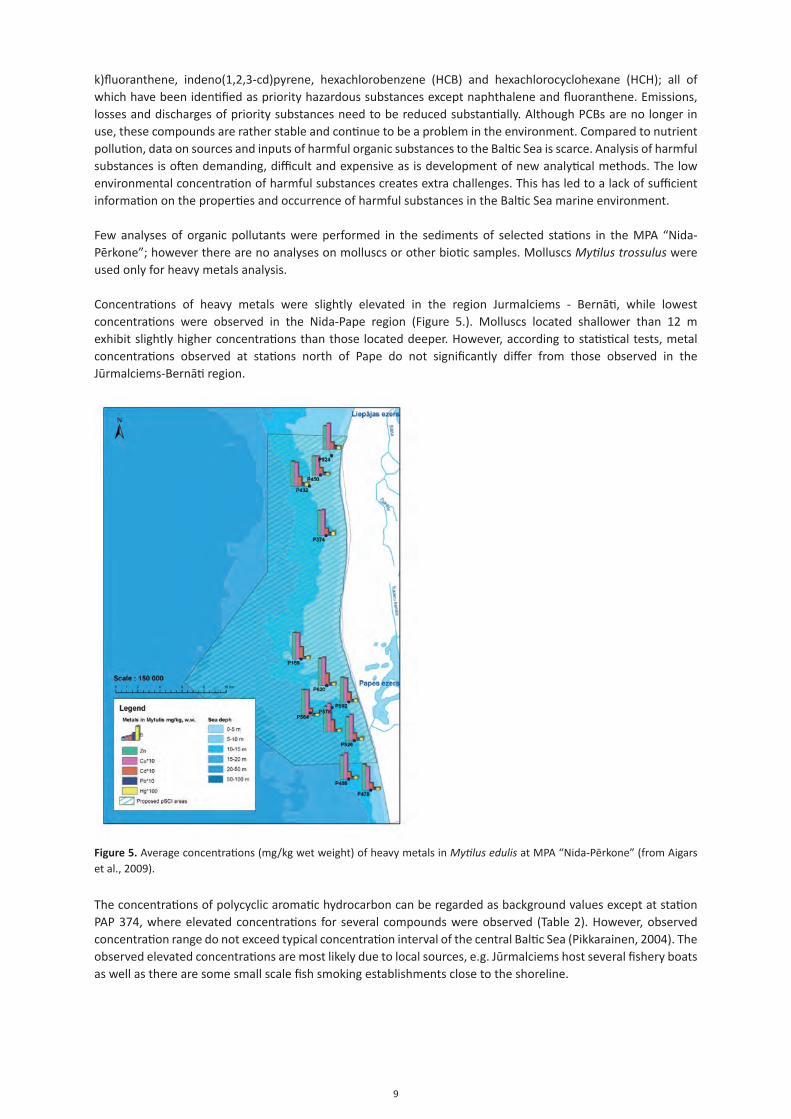
9
k)fluoranthene, indeno(1,2,3-cd)pyrene, hexachlorobenzene (HCB) and hexachlorocyclohexane (HCH); all of which have been identified as priority hazardous substances except naphthalene and fluoranthene. Emissions, losses and discharges of priority substances need to be reduced substantially. Although PCBs are no longer in use, these compounds are rather stable and continue to be a problem in the environment. Compared to nutrient pollution, data on sources and inputs of harmful organic substances to the Baltic Sea is scarce. Analysis of harmful substances is often demanding, difficult and expensive as is development of new analytical methods. The low environmental concentration of harmful substances creates extra challenges. This has led to a lack of sufficient information on the properties and occurrence of harmful substances in the Baltic Sea marine environment.
Few analyses of organic pollutants were performed in the sediments of selected stations in the MPA “Nida-Pērkone”; however there are no analyses on molluscs or other biotic samples. Molluscs Mytilus trossulus were used only for heavy metals analysis.
Concentrations of heavy metals were slightly elevated in the region Jurmalciems - Bernāti, while lowest concentrations were observed in the Nida-Pape region (Figure 5.). Molluscs located shallower than 12 m exhibit slightly higher concentrations than those located deeper. However, according to statistical tests, metal concentrations observed at stations north of Pape do not significantly differ from those observed in the Jūrmalciems-Bernāti region.
Figure 5. Average concentrations (mg/kg wet weight) of heavy metals in Mytilus edulis at MPA “Nida-Pērkone” (from Aigars et al., 2009).
The concentrations of polycyclic aromatic hydrocarbon can be regarded as background values except at station PAP 374, where elevated concentrations for several compounds were observed (Table 2). However, observed concentration range do not exceed typical concentration interval of the central Baltic Sea (Pikkarainen, 2004). The observed elevated concentrations are most likely due to local sources, e.g. Jūrmalciems host several fishery boats as well as there are some small scale fish smoking establishments close to the shoreline.
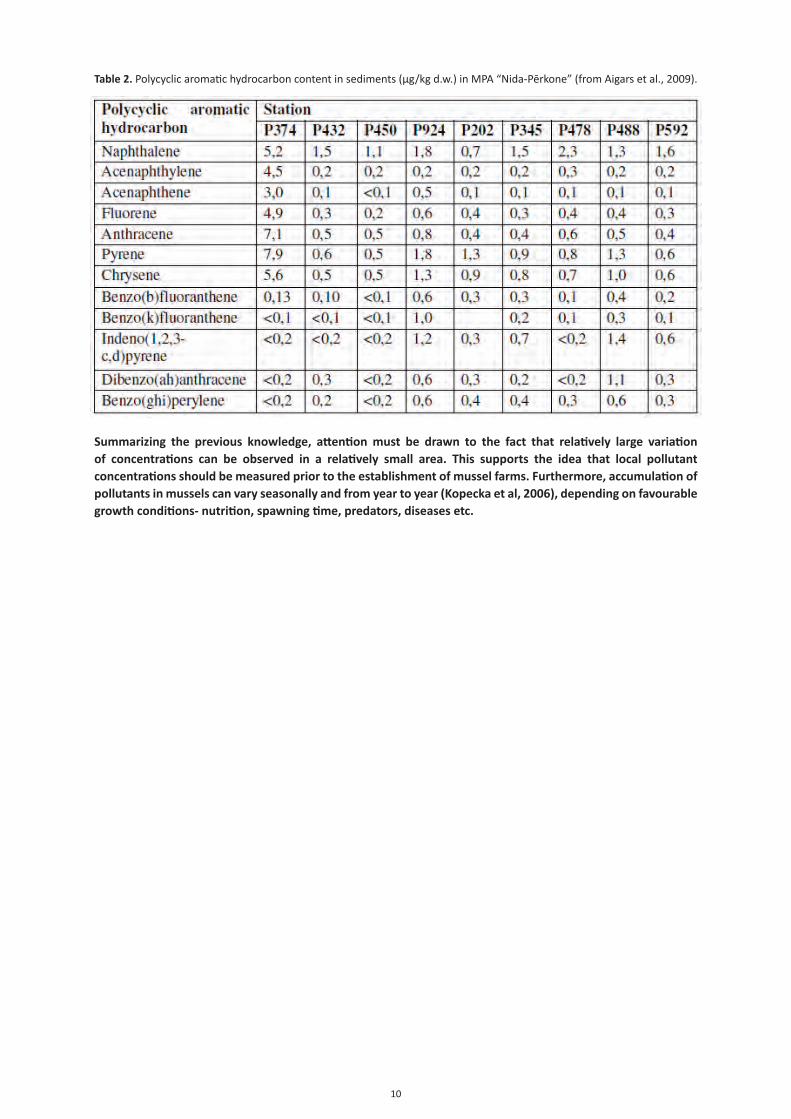
10
Table 2. Polycyclic aromatic hydrocarbon content in sediments (μg/kg d.w.) in MPA “Nida-Pērkone” (from Aigars et al., 2009).
Summarizing the previous knowledge, attention must be drawn to the fact that relatively large variation of concentrations can be observed in a relatively small area. This supports the idea that local pollutant concentrations should be measured prior to the establishment of mussel farms. Furthermore, accumulation of pollutants in mussels can vary seasonally and from year to year (Kopecka et al, 2006), depending on favourable growth conditions- nutrition, spawning time, predators, diseases etc.
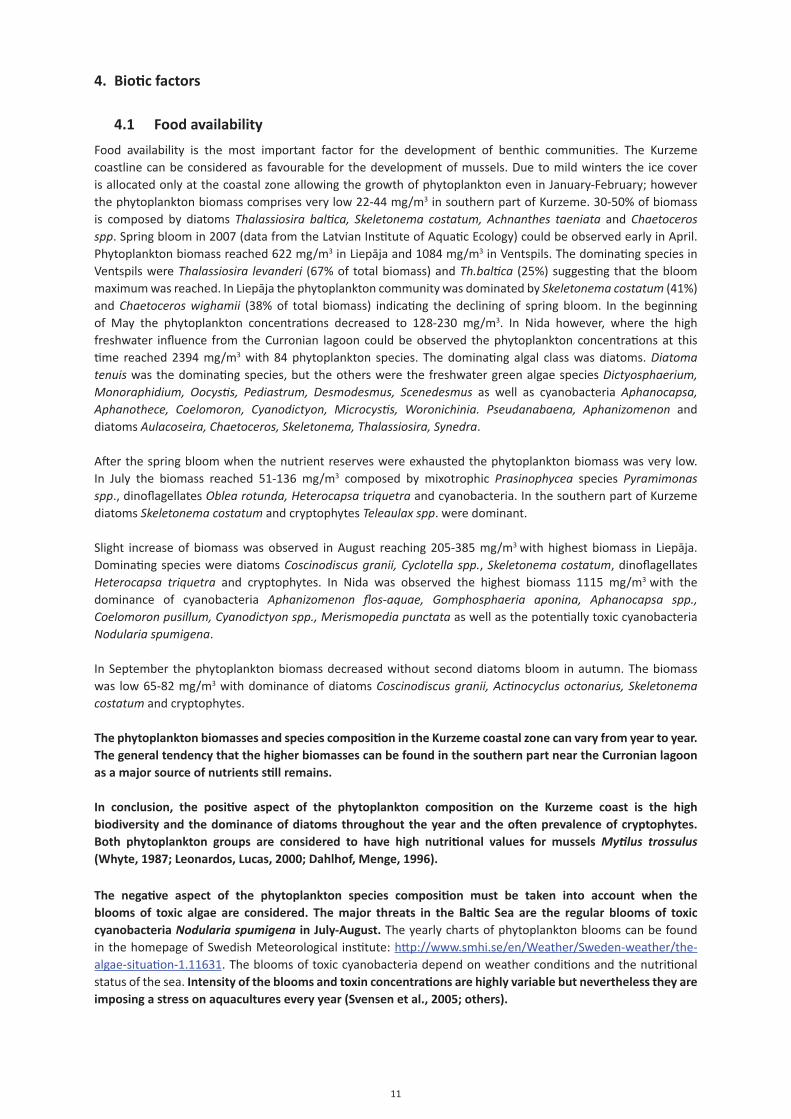
11
4. Biotic factors
4.1 Food availability
Food availability is the most important factor for the development of benthic communities. The Kurzeme coastline can be considered as favourable for the development of mussels. Due to mild winters the ice cover is allocated only at the coastal zone allowing the growth of phytoplankton even in January-February; however the phytoplankton biomass comprises very low 22-44 mg/m3 in southern part of Kurzeme. 30-50% of biomass is composed by diatoms Thalassiosira baltica, Skeletonema costatum, Achnanthes taeniata and Chaetoceros spp. Spring bloom in 2007 (data from the Latvian Institute of Aquatic Ecology) could be observed early in April. Phytoplankton biomass reached 622 mg/m3 in Liepāja and 1084 mg/m3 in Ventspils. The dominating species in Ventspils were Thalassiosira levanderi (67% of total biomass) and Th.baltica (25%) suggesting that the bloom maximum was reached. In Liepāja the phytoplankton community was dominated by Skeletonema costatum (41%) and Chaetoceros wighamii (38% of total biomass) indicating the declining of spring bloom. In the beginning of May the phytoplankton concentrations decreased to 128-230 mg/m3. In Nida however, where the high freshwater influence from the Curronian lagoon could be observed the phytoplankton concentrations at this time reached 2394 mg/m3 with 84 phytoplankton species. The dominating algal class was diatoms. Diatoma tenuis was the dominating species, but the others were the freshwater green algae species Dictyosphaerium, Monoraphidium, Oocystis, Pediastrum, Desmodesmus, Scenedesmus as well as cyanobacteria Aphanocapsa, Aphanothece, Coelomoron, Cyanodictyon, Microcystis, Woronichinia. Pseudanabaena, Aphanizomenon and diatoms Aulacoseira, Chaetoceros, Skeletonema, Thalassiosira, Synedra.
After the spring bloom when the nutrient reserves were exhausted the phytoplankton biomass was very low. In July the biomass reached 51-136 mg/m3 composed by mixotrophic Prasinophycea species Pyramimonas spp., dinoflagellates Oblea rotunda, Heterocapsa triquetra and cyanobacteria. In the southern part of Kurzeme diatoms Skeletonema costatum and cryptophytes Teleaulax spp. were dominant.
Slight increase of biomass was observed in August reaching 205-385 mg/m3 with highest biomass in Liepāja. Dominating species were diatoms Coscinodiscus granii, Cyclotella spp., Skeletonema costatum, dinoflagellates Heterocapsa triquetra and cryptophytes. In Nida was observed the highest biomass 1115 mg/m3 with the dominance of cyanobacteria Aphanizomenon flos-aquae, Gomphosphaeria aponina, Aphanocapsa spp., Coelomoron pusillum, Cyanodictyon spp., Merismopedia punctata as well as the potentially toxic cyanobacteria Nodularia spumigena.
In September the phytoplankton biomass decreased without second diatoms bloom in autumn. The biomass was low 65-82 mg/m3 with dominance of diatoms Coscinodiscus granii, Actinocyclus octonarius, Skeletonema costatum and cryptophytes.
The phytoplankton biomasses and species composition in the Kurzeme coastal zone can vary from year to year. The general tendency that the higher biomasses can be found in the southern part near the Curronian lagoon as a major source of nutrients still remains.
In conclusion, the positive aspect of the phytoplankton composition on the Kurzeme coast is the high biodiversity and the dominance of diatoms throughout the year and the often prevalence of cryptophytes. Both phytoplankton groups are considered to have high nutritional values for mussels Mytilus trossulus (Whyte, 1987; Leonardos, Lucas, 2000; Dahlhof, Menge, 1996).
The negative aspect of the phytoplankton species composition must be taken into account when the blooms of toxic algae are considered. The major threats in the Baltic Sea are the regular blooms of toxic cyanobacteria Nodularia spumigena in July-August. The yearly charts of phytoplankton blooms can be found in the homepage of Swedish Meteorological institute: http://www.smhi.se/en/Weather/Sweden-weather/the-algae-situation-1.11631. The blooms of toxic cyanobacteria depend on weather conditions and the nutritional status of the sea. Intensity of the blooms and toxin concentrations are highly variable but nevertheless they are imposing a stress on aquacultures every year (Svensen et al., 2005; others).
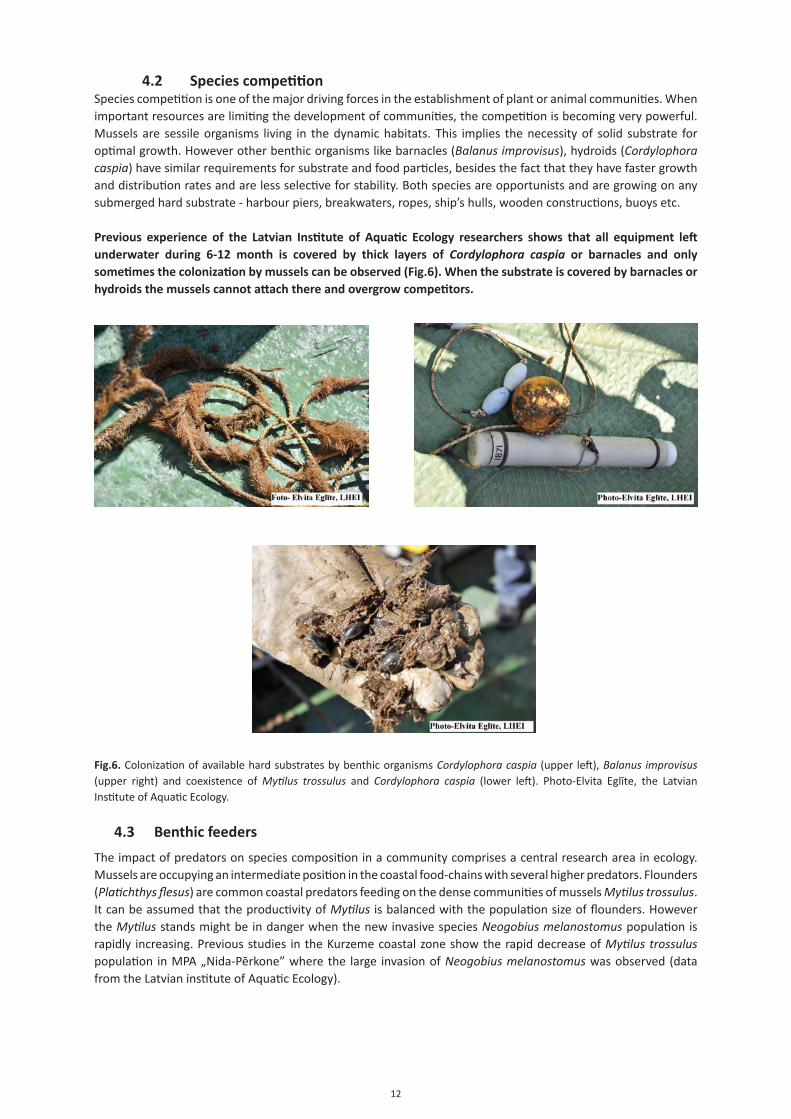
12
4.2 Species competitionSpecies competition is one of the major driving forces in the establishment of plant or animal communities. When important resources are limiting the development of communities, the competition is becoming very powerful. Mussels are sessile organisms living in the dynamic habitats. This implies the necessity of solid substrate for optimal growth. However other benthic organisms like barnacles (Balanus improvisus), hydroids (Cordylophora caspia) have similar requirements for substrate and food particles, besides the fact that they have faster growth and distribution rates and are less selective for stability. Both species are opportunists and are growing on any submerged hard substrate - harbour piers, breakwaters, ropes, ship’s hulls, wooden constructions, buoys etc.
Previous experience of the Latvian Institute of Aquatic Ecology researchers shows that all equipment left underwater during 6-12 month is covered by thick layers of Cordylophora caspia or barnacles and only sometimes the colonization by mussels can be observed (Fig.6). When the substrate is covered by barnacles or hydroids the mussels cannot attach there and overgrow competitors.
Fig.6. Colonization of available hard substrates by benthic organisms Cordylophora caspia (upper left), Balanus improvisus (upper right) and coexistence of Mytilus trossulus and Cordylophora caspia (lower left). Photo-Elvita Eglīte, the Latvian Institute of Aquatic Ecology.
4.3 Benthic feeders
The impact of predators on species composition in a community comprises a central research area in ecology. Mussels are occupying an intermediate position in the coastal food-chains with several higher predators. Flounders (Platichthys flesus) are common coastal predators feeding on the dense communities of mussels Mytilus trossulus. It can be assumed that the productivity of Mytilus is balanced with the population size of flounders. However the Mytilus stands might be in danger when the new invasive species Neogobius melanostomus population is rapidly increasing. Previous studies in the Kurzeme coastal zone show the rapid decrease of Mytilus trossulus population in MPA „Nida-Pērkone” where the large invasion of Neogobius melanostomus was observed (data from the Latvian institute of Aquatic Ecology).
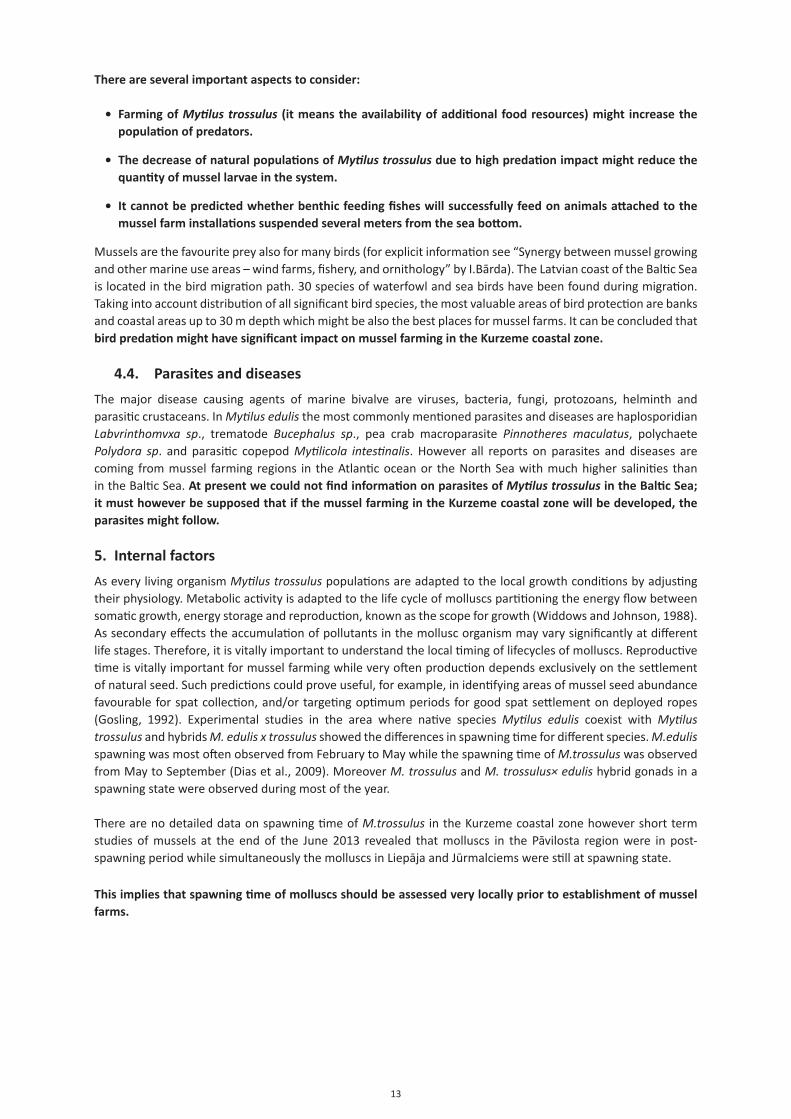
13
There are several important aspects to consider:
• Farming of Mytilus trossulus (it means the availability of additional food resources) might increase the population of predators.
• The decrease of natural populations of Mytilus trossulus due to high predation impact might reduce the quantity of mussel larvae in the system.
• It cannot be predicted whether benthic feeding fishes will successfully feed on animals attached to the mussel farm installations suspended several meters from the sea bottom.
Mussels are the favourite prey also for many birds (for explicit information see “Synergy between mussel growing and other marine use areas – wind farms, fishery, and ornithology” by I.Bārda). The Latvian coast of the Baltic Sea is located in the bird migration path. 30 species of waterfowl and sea birds have been found during migration. Taking into account distribution of all significant bird species, the most valuable areas of bird protection are banks and coastal areas up to 30 m depth which might be also the best places for mussel farms. It can be concluded that bird predation might have significant impact on mussel farming in the Kurzeme coastal zone.
4.4. Parasites and diseases
The major disease causing agents of marine bivalve are viruses, bacteria, fungi, protozoans, helminth and parasitic crustaceans. In Mytilus edulis the most commonly mentioned parasites and diseases are haplosporidian Labvrinthomvxa sp., trematode Bucephalus sp., pea crab macroparasite Pinnotheres maculatus, polychaete Polydora sp. and parasitic copepod Mytilicola intestinalis. However all reports on parasites and diseases are coming from mussel farming regions in the Atlantic ocean or the North Sea with much higher salinities than in the Baltic Sea. At present we could not find information on parasites of Mytilus trossulus in the Baltic Sea; it must however be supposed that if the mussel farming in the Kurzeme coastal zone will be developed, the parasites might follow.
5. Internal factors
As every living organism Mytilus trossulus populations are adapted to the local growth conditions by adjusting their physiology. Metabolic activity is adapted to the life cycle of molluscs partitioning the energy flow between somatic growth, energy storage and reproduction, known as the scope for growth (Widdows and Johnson, 1988). As secondary effects the accumulation of pollutants in the mollusc organism may vary significantly at different life stages. Therefore, it is vitally important to understand the local timing of lifecycles of molluscs. Reproductive time is vitally important for mussel farming while very often production depends exclusively on the settlement of natural seed. Such predictions could prove useful, for example, in identifying areas of mussel seed abundance favourable for spat collection, and/or targeting optimum periods for good spat settlement on deployed ropes (Gosling, 1992). Experimental studies in the area where native species Mytilus edulis coexist with Mytilus trossulus and hybrids M. edulis x trossulus showed the differences in spawning time for different species. M.edulis spawning was most often observed from February to May while the spawning time of M.trossulus was observed from May to September (Dias et al., 2009). Moreover M. trossulus and M. trossulus× edulis hybrid gonads in a spawning state were observed during most of the year.
There are no detailed data on spawning time of M.trossulus in the Kurzeme coastal zone however short term studies of mussels at the end of the June 2013 revealed that molluscs in the Pāvilosta region were in post-spawning period while simultaneously the molluscs in Liepāja and Jūrmalciems were still at spawning state.
This implies that spawning time of molluscs should be assessed very locally prior to establishment of mussel farms.
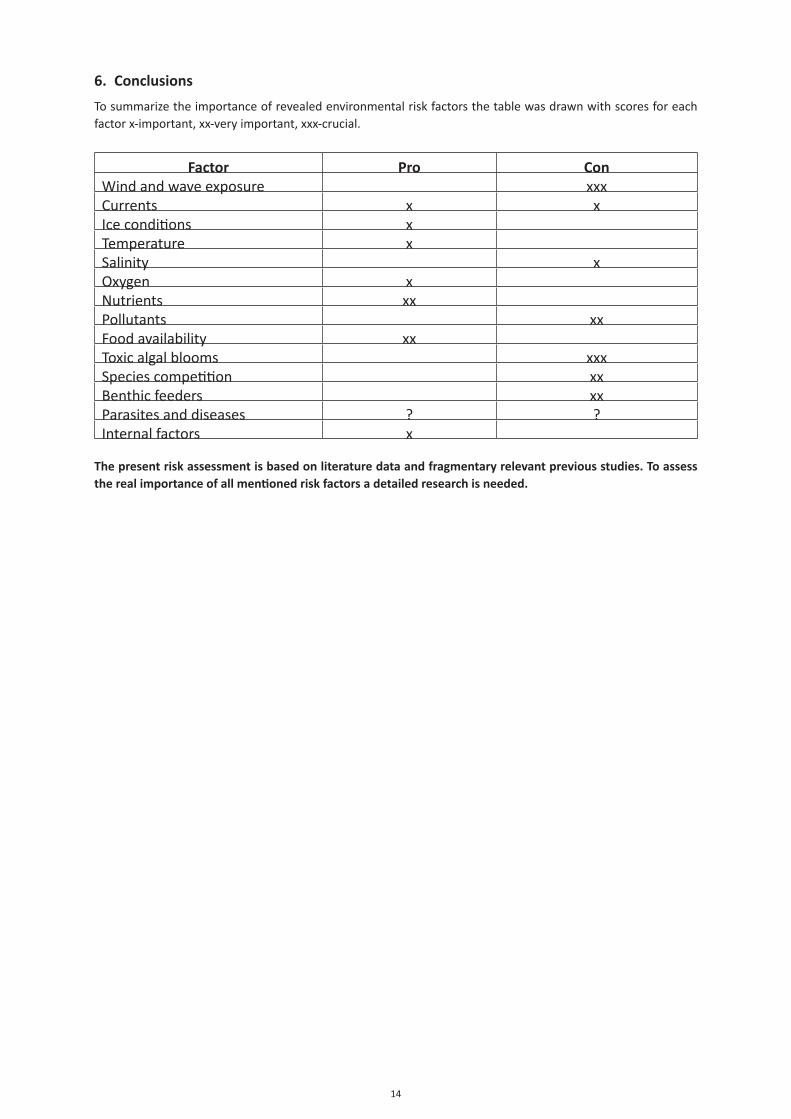
14
6. Conclusions
To summarize the importance of revealed environmental risk factors the table was drawn with scores for each factor x-important, xx-very important, xxx-crucial.
Factor Pro ConWind and wave exposure xxxCurrents x xIce conditions xTemperature xSalinity xOxygen xNutrients xxPollutants xxFood availability xxToxic algal blooms xxxSpecies competition xxBenthic feeders xxParasites and diseases ? ?Internal factors x
The present risk assessment is based on literature data and fragmentary relevant previous studies. To assess the real importance of all mentioned risk factors a detailed research is needed.
15
7. List of references
1. Aigars J., Garnaga G., Martin G., 2009. Action C4 – Assessment of the impact of transboundary and local pollution on habitats and species of community importance. Final report. LIFE Nature project “Marine Protected Areas in the Eastern Baltic Sea” Reference number: LIFE 05 NAT/LV/000100. http://www.balticseaportal.net/media/upload/File/Deliverables/Action%20reports/C4_final_report.pdf
2. Bell EC, Gosline JM (1997) Strategies for life in flow: tenacity, morphometry, and probability of dislodgment of two Mytilus species. Marine Ecology Progress Series, 159:197–208.
3. Conley, D.J., Bjorck, S., Bonsdorff, E., Carstensen, J., Destouni, G., Gustafsson, B.G., Hietanen, S., Kortekaas, M., Kuosa, H., Meier, H.E., Muller-Karulis, B., Nordberg, K., Norkko, A., Nurnberg, G., Pitkanen, H., Rabalais, N.N., Rosenberg, R., Savchuk, O.P., Slomp, C.P., Voss, M., Wulff, F., Zillen, L., 2009. Hypoxia-related processes in the Baltic Sea. Environ. Sci. Technol. 43, 3412-3420.
4. Danielsson, Å., Jönsson, A., Rahm, L. 2006. Resuspension patterns in the Baltic proper.
5. Journal of Sea Research, doi:10.1017/jseares.2006.07.005
6. Fearman J., Moltschaniwskyj N.A., 2010. Warmer temperatures reduce rates of gametogenesis in temperate mussels, Mytilus galloprovincialis. Aquaculture, 305, 20–25.
7. HELCOM 2003: The Baltic Marine Environment 1999–2002. – Baltic Sea Environ. Proceedings 87. – 48 p.
8. HELCOM, 2006. Illegal discharges of oil in the Baltic Sea during 2005. – HELCOM Indicator Fact Sheets 2006. Online. [2 July 2007], http://www.helcom.fi/environment2/ifs/en_GB/cover/.
9. Jonsson, P., Carman, R. & Wulff, F. 1990. Laminated sediments in the Baltic - a tool for evaluating nutrient mass balances. Ambio 19, 152-158.
10. Kautsky, N. 1982. Growth and size structure in a Baltic Mytilus edulis population. Marine Biology, 68, 117-133.
11. Kittner, C., Riisgard,H.U.,2005. Effect of temperature on filtration rate in the mussel Mytilus edulis: no evidence for temperature compensation. Marine Ecology Progress Series, 305, 147–152.
12. Kopecka, J., Lehtonen, K.K., Barsˇien_e, J., Broeg K., Vuorinen P.J., Gercken, J., Pempkowiak, J., 2006. Measurements of biomarker levels in flounder (Platichthys flesus) and blue mussel (Mytilus trossulus) from the Gulf of Gdansk (Southern Baltic). Marine Pollution Bulletin 53, 406–421.
13. Leonardos N., Lucas A.N., 2000. The nutritional value of algae grown under different culture conditions for Mytilus edulis L. larvae. Aquaculture, vol. 182, 3–4, 301–315.
14. Mann, K.H. 2000. Ecology of Coastal Waters. Blackwell Science, 406 pp.
15. Martinez, G., Perez, H., 2003. Effect of different temperature regimes on reproductive conditioning in the scallop Argopecten purpuratus. Aquaculture 228, 153–167.
16. Müller-Karulis B., Jermakovs V., Aigars J., 2007. The modelling of Furcellaria lumbricalis habitats along the Latvian coast. BALANCE Report No. 23, 1-25.
17. Paine R.T., Levin S.A., 1981. Intertidal landscapes: disturbance and the dynamics of pattern. Ecological Monographs, 51:145–178.
18. Peck, L.S., Powell, D.K., Tyler, P.A., 2007. Very slow development in two Antarctic bivalve molluscs, the infaunal clam Laternula elliptica and the scallop Adamussium colbecki. Marine Biology 150, 1191–1197.
19. Persson, J. & Jonsson, P. 2000. Historical development of laminated sediments - an approach to detect soft sediment ecosystem changes in the Baltic Sea. Marine Pollution Bulletin 40, 122-134.
16
20. Pikkarainen, A.-L. 2004: Polycyclic aromatic hydrocarbons in Baltic Sea sediments. – Polycyclic Aromatic Compounds 24: 667–679.
21. Raubenheimer D, Cook P (1990) Effects of exposure to wave action on allocation of resources to shell and meat growth by the subtidal mussel, Mytilus galloprovincialis. J Shellfish Res 9: 87–93.
22. Sanford E., Menge B.A., 2001. Spatial and temporal variation in barnacle growth in a coastal upwelling system. Marine Ecology Progress Series, 209: 143–157.
23. Seed R., Suchanek T.H., 1992. Population and community ecology of Mytilus. In: Gosling E (ed) The mussel Mytilus: ecology, physiology, genetics and culture. Elsevier, p 87–169.
24. Seņņikovs J., Valainis A., Muller-Karulis B., Ranka M., 2007. Modeling wave impact on coastal habitats along the Latvian Baltic Proper coast. BALANCE Project Report, 1-39.
25. Somero, G.N., 2002. Thermal physiology and vertical zonation of intertidal animals: optima, limits and costs of living. Integrative and Comparative Biology 42, 780–789.
26. Soomere T., Viška M., Lapinskis J., Räämeta A., 2011. Linking wave loads with the intensity of erosion along the coasts of Latvia Estonian Journal of Engineering, 17, 4, 359–374, doi: 10.3176/eng.2011.4.06.
27. Steffani C.N., Branch G.M., 2003. Growth rate, condition, and shell shape of Mytilus galloprovincialis: responses to wave exposure. Marine Ecology Progress Series, Vol. 246: 197–209
28. Svensen C., Strogyloudi E., Wexels Riser C., Dahlmann J., Legrand C., Wassmann P., Graneli E., Pagou K., 2005. Reduction of cyanobacterial toxins through coprophagy in Mytilus edulis. Harmful Algae 4, 329–336.
29. The Baltic Sea Portal, http://www.itameriportaali.fi/en/tietoa/jaa/jaatalvi/en_GB/jaatalvi/
30. Whyte J.N.C., 1987. Biochemical composition and energy content of six species of phytoplankton used in mariculture of bivalves. Aquaculture, vol. 60, 3–4, 231-241.
31. Widdows, J., Johnson, D., 1988. Physiological energetics of Mytilus edulis — scope for growth. Marine Ecology Progress Series 46, 113–121.
2.
Socio Economic Studies
2.1Mussel farming in the Baltic Sea
– Good for economy, good for ecology and good for the local community?
Eliecer Díaz, Maria Ehrnström, Zaiga Ozolina and Patrik Kraufvelin
2
Background
Today, the Baltic Sea faces many challenges in connection with the shortfall of traditional fishing activities in coastal communities while also restoring the fragile brackish waters, suffering from decades of serious environmental degradation. Just as in other European coastal communities, the decreasing availability of fish stock has left geographically remote small-scale fishing villages in a vulnerable position in terms of employment (Pita et al. 2010). The situation is worsened by the fact that aquaculture, which has been an important alternative for livelihood throughout the Baltic Sea region, is haltering or even in decline (Aquabest 2012). This decline is not due to a decrease in demand for seafood, quite the contrary, but to ‘the difficulty of reconciling environmental policy with a viable aquaculture economy’ (Aquabest 2012).
In fact, the continuing eutrophication of coastal waters in the Baltic Sea, not only from aquaculture but also from many other human activities, is a serious environmental threat to the whole region, and calls for urgent action to ‘avoid an irreversible disaster’ (HELCOM, 2007). On a global scale, concerns have also been raised that the aquaculture industry is currently threatening the world’s wild fish stock as it is relying heavily on wild fish to feed the farmed fish (Naylor et al. 2000). Thus, there is not only a demand for alternative means of livelihood in the Baltic Sea coastal areas but also an increasing and urgent demand for alternative and more sustainable fish feed in the aquaculture industry, to meet sustainability goals and decrease the nuisance of eutrophication.
Mussel farming could provide a series of benefits and realistic solutions to many of these challenges. Lindahl and Kollberg (2009) point out that mussel farms not only improve coastal water quality, but they also provide new jobs and produce healthy marine food, while recycling nutrients from sea to land. It is under these premises that the Baltic EcoMussel project is being developed. The project explores how mussel farming could contribute both to increased ecological and economic benefits in different regions around the Baltic Sea.
To explore the socioeconomic impacts, the focus of the project lies on three specific regions: SW Nyland, Finland; Östergötland, Sweden and Kurzeme region, western Latvia. Due to the different conditions in different locations of the Baltic Sea, the size of the farm and the harvest from a farm will differ depending on where it is located. A mussel farm in the Gulf of Finland will require three times the area to harvest the same amount as a farm located in Kattegat next to Denmark. These differences are of importance when analyzing the area needed for each farm. However, in this study we consider the harvest size of 100-200 tons per year as being large scale, and adapt required areas according to this measure (WP4 for rationale).
For these communities we consider demographic statistics on the regional migration flows in recent years (inbound/outbound), as well as the availability of specialized work force or training needs to create a specialized in these regions. Based on these statistics we can make projections regarding the effects of mussel farming and related industries on the local community development. The selected regions also play a decisive role in determining the cost of labour and thus an important part of the cost-benefit analysis of the business plan included in the project.
Disclaimer: The contents of the document reflect the authors’ views. The Managing Authority of the Central Baltic INTERREG IV A Programme cannot be held liable for information published by the project partners.
3
Mussels as an alternative to subsistence in remote coastal communitiesThere are considerable benefits of mussel farming on complementary employment and increased income levels for fishermen in these communities. Today, rural coastal and island communities face challenges, due to the global shortfall of fishing activity and the scarcity of alternative employment opportunities (Pita et al. 2010). Furthermore, the remoteness of these places leaves inhabitants with limited possibilities to commute to economic centers on a day-to-day basis. Finding alternative means for subsistence, often called ‘employment diversification in fishing communities’ (Pita et al, 2010), without harming the environment is important in order to keep remote coastal communities vibrant and alive not only in the short term, but also long term, providing future generations the environmental conditions of sustainable subsistence opportunities in these localities. Such incentives would provide residents the possibility to generate an income in these areas without having to commute to distant economic centers. Nonetheless, previous employment initiatives such as the salmon industry have left an ecological footprint that is neither beneficial for the quality of the water nor positively received by neighboring residents. Mussel farming provides an interesting opportunity to combine local job creation with purifying the sea waters from the effects of on-going eutrophication processes. Hitherto, mussel farming is the only realistic, i.e. in situ operational, way of removing (through harvesting) nutrients already present in the sea.
Mussel farming could not only offer this very much needed employment diversification for local fishermen, but it could also alleviate eutrophication as mussel farms have been recognized as a possible measure to improve coastal water quality (Lindahl and Kollberg, 2009). To explore such benefits, a key component of the Baltic EcoMussel project is to identify potential socio-economic impacts of large-scale mussel farming in the Baltic Sea Region, including effects on the local labour market. Mussel farming in itself does not necessarily contribute to high employment rates, as the farming activity does not require daily work input. At its best, mussel farming can create an additional income for traditional fishermen or fish farmers, providing them an incentive to stay active within the aquaculture sector. Due to natural condition limitations (6 psu salinity in the Gulf of Finland), the definition of large-scale mussel farming in the Baltic Sea may differ to the concept of large-scale farming in other locations with other conditions. Here, we consider that the maximum size of one mussel farm can produce 100 tons of mussels in 2.5 years, with a minimal distance of at least 1 km to other farms. The farm in itself requires 1-2 fulltime workers at the initial start-up phase and the harvesting phase, and during the rest of the time the farm would require 1-2 part-time workers for maintenance tasks.
It is still important to note that as a whole, the mussel industry can provide new employment opportunities. Although the labour effect from one mussel farm is limited, synergy effects can be achieved through linking multiple farms in one region. Such ‘clustering’ of activities allows for related industries and new innovation in the sector to take place. Consequently, in this project, we take a broader approach to the socioeconomic effects of mussel-farming in the Baltic Sea. We consider the effects on employment creation in related industrial activities as well as the effects on the actual supply chain of the mussel farm. This approach allows us to explore the effects on farm equipment, transportation, specialized harvesting jobs, mussel meal industrial plants as well as the benefits from inserting mussel meal as food supply in related industries such as the local salmon, poultry, and pork farms. All these activities may have multiple socioeconomic impacts on the community. The adapted approach towards the socioeconomic impacts has a dual connotation, as the analysis include a combination of the economic benefits for the community and the ecological benefits derived from the effects of nutrient removal in the local coastal waters.Based on findings from a Baltic EcoMussel field trip, successful experience in Denmark shows that there are potential benefits for fish farmers with mussel farming as a supplementary activity. Furthermore, the initial stage of mussel farming requires the input of expert knowledge. In Denmark this knowledge has been acquired from Canada. Initiating mussel farming on larger scale in the Baltic Sea, it would be of benefit to train such consultants locally for the entire Baltic Region, and thus providing additional job opportunities locally.
4
Mussels as a clean-up alternative to haul eutrophication in the Baltic Sea: Nutrient trading concept
A pattern of hauling nutrients from rural to urban areas prevails in the Baltic Sea, which has received around 20 million tons and 2 million tons of N and P, respectively in the last 50 years (Conley 2012). This massive load of nutrients has decreased the resilience and productivity in about 60000 km2. This has affected economies through reduction of oxygen in the sea bottom and consequently also on the availability of wild fish. The cleaning characteristics of mussel farms could be used as a mitigation tool of this eutrophication process. The needed initial investments in mussel farms could be supported by subsidies in the EU-agro environmental aid program, which currently is directed towards methods in agriculture that decrease nutrient release from farmland to environment. There are different types of subsidies to combat eutrophication, such as the “basic environmental subsidy”, and “special agro-environmental subsidies such as organic farming, wetland construction, traditional rural biotopes, and heritage breed. It has been calculated that 1 hectare of mussel farm removes 25 times more nutrients (N and P) than a single hectare of wetland (Lindahl and Kollberg 2009). One project objective of Baltic EcoMussel is to explore whether it is possible to incorporate the use of mussel farms in the “EU - Agro environmental program”. The operating scheme of mussel farms could be based in the association and application for funding of 5 land farmers which should receive form EU a subsidy for the implementation and maintenance of a mussel farm of 1 hectare for at least 10 years. This idea can be implemented regionally and around the Baltic countries.
Another important aspect of the benefits of mussel farms in combating eutrophication is how to serve as a bridge between responsible aquaculture and local community stakeholder acceptance. A recent study among stakeholders and their attitudes towards aquaculture around the Baltic Sea found that a properly managed growth of aquaculture is considered a necessary and responsible way to meet future global food needs (Aquabest 2012). However, as Aquaculture in its current form is contributing to the nutrient load and the eutrophication process, its activities do face obstacles related to sustainability. Mussel farm have been described as “the engine of an Agro-Agua recycling system of nutrients from sea to land” (Lindahl and Kollberg, 2009). Thus, mussel farming could provide a natural mitigation process of potential harms of increased aquaculture in the Baltic Sea. Hence, within the parameters of the Baltic EcoMussel project, we investigate whether the mussels can play a pivotal role in developing a “properly managed” and “responsible” aquaculture in the Baltic Sea that does not cause increased stress on an already heavily burdened ecosystem. According to Lindahl and Kollberg (2009), the optimal effect of mussel farms in this respect, is achieved when all mussels are farmed and brought back to land as nutrients for human consumption or as feed or organic fertilizers.
End uses and closing the nutrient loop
While achieving increased mitigation against the on-going eutrophication in the Baltic Sea, finding an end-use for the farmed mussels is decisive for a long term profitable mussel industry in the region. The end use of the mussels plays also an important role in defining the socio-economic impacts of such an industry. Whether used in human consumption or as bioenergy, the final use will determine the type of processing facilities needed as well as the amount of job creation within that industry. The Baltic EcoMussel project will explore different end-use possibilities, and their labour market effects.
Highest profits could be achieved if the end use is directed towards human consumption and particularly gastronomic uses in restaurants. However, due to their small size, the mussels from the Baltic provide limited possibilities for gastronomic use and direct human consumption (albeit still possible). Nevertheless, as fish and poultry feed, the mussels could still be used in the food industry, achieving higher profitability than in other industries such as fertilizers or bio-energy use. In fact, recent large-scale experiments, replacing fish meal with mussel meal as chicken feed, indicate that mussel meal could very well replace the need of fish meal in the poultry and egg production (Jönsson, 2007). Mussel meal could also replace the use of soy or fish meal in fish farms, thus decreasing the nutrient load in the sea by closing the loop between nutrient loading fish farms and nutrient cleaning mussel farms.
An additional positive effect of mussel meal could be its nutritional benefits. The mussel flesh contains some essential amino-acids in high quantities in comparison with other products. This may improve the quality of the salmon/pork/poultry when mussel meal is used instead of for example soy. The converting process of mussels into meal is based on a lactic fermentation process (fragment proteins into amino-acid) and then a chemical

5
process which converts the mussel meal into pellets with specific concentrations to respective animal diets. Based on experience in Denmark, such a process provides jobs for two persons when the production process is stable.
We should also incorporate the extraction of Omega-3; It has been said that Perna canaliculus, the New Zealand green-lipped mussel, has the highest concentration of the essencial fatty acid Omega-3 fatty acids among animals producing it. Omega-3 products are very popular, since it can be used in clinical treatments to improve rheumatoid arthritis, ulcerative colitis; and in combination with drugs, improve the skin lesions. In various animal models, Omega-3 fatty acids decrease the number and size of tumours. Studies with nonhuman primates and human newborns indicate that DHA is essential for the normal functional development of the retina and brain, particularly in premature infants. Because Omega-3 fatty acids are essential in growth and development throughout the life cycle, they should be included in the diets of all humans (Simopoulos 1991). Finally, it is used in combination with other treatments to improve the condition in patients suffering from depression. Due to their high level of omega-3 fatty acids (see above), mussels could also have an important role to play in food supplement industry where the demand for omega-3 fatty acids is on the increase.
The synergy effects from mussel farming in the Baltic Sea and innovative end-uses deserve further exploration. Not only does the presence of mussels have a positive effect on other industries such as fish farming, providing cleaner water, improving photosynthetic activities of desired species as bladder-wrack and eelgrass deeper down in the water and consequently better conditions for fisheries and fish aquaculture (Petersen et al. 2012), but the mussel itself has also attributes that can decrease toxic loads in currently non-related industries. For example, the adhesive material in the mussel may function as a biodegradable substitute to current chemical adhesive substances. The shells could be used as non-toxic isolation in building material. And finally, as the mussels bind phosphorus and nitrogen, the use of these could come to substitute current chemical fertilizers in different plant growing processes. All these synergy effects need further research, but they provide a promising starting point to further develop industries related to mussel farms in the Baltic Sea.
Aesthetic concerns
The aesthetic impact of mussel farming is two-folded. First, the Baltic Sea presents serious negative effects on the aesthetics (and thus tourist attractions) due to the abundant presence of algae during the peak season for tourism. Mussel farms, due to the registered cleaning ability could improve water quality and thus also the overall aesthetics of the nearby waters. However, overexploitation of mussel farming would impact the landscape with the presence of visible parts of the farms above the sea level. This could also impact the mobility of those who are accustomed to travel freely in these waters. Still, by the use of suitable locations, which are not threatened by weather conditions nor affecting neighboring residents, the mussel farms could give a considerable upswing for the community by improved water quality and mitigated effects of the fish farming industries.
Public Services demands
Finally, what effects would mussel farming and the related industries have on the demand for public services? Here, the demand depends on the scale of industry development, as well as the final destination of the processed mussels. Depending on the chosen techniques for the mussel farms, it might be necessary to develop infrastructure that supports the relocation of harvesting equipment (big machines with transport load on local roads). Whether the farms are located on remote islands may impose demands on public ferries during harvesting time. However, such infrastructural demands arise periodically during harvesting time and when well-planned should not disturb other local community activities. Other demands may include monitoring of water quality and prevention of plagues, administered by authority institutions. The exact need for public services will be determined based on interviews with representatives with mussel farms in other locations around the world.
6
References
Aquabest (2012) Stakeholder’s Attitudes to the Development of Aquaculture in the Baltic Sea Region
HELCOM (2007) HELCOM Baltic Sea Action Plan. HELCOM. Ministerial Meeting, Krakow, Poland, 15 Nov 2007. Available at: http://www.helcom.fi/BSAP/en_GB/intro/
Naylor RL, Goldburg RJ, Primavera JH et al. (2000) Effect of aquaculture on world fish supplies. Nature 405:1017-1024
Lindahl O, Kollberg S (2009) Can the EU agri-environmental aid program be extended into the coastal zone to combat eutrophication? Hydrobiologia 629: 59-64
Jönsson L (2007) Foderförsök med värphöns och kyckling. In Muslingemel i stedet for fiskemel i økologiske foder till æglæggende høns, kylling och andre husdyr. TemaNord 2007: 540 (in Swedish)
Petersen JK, Timmermann K, Carlsson M, Holmer M, Maar M, Lindahl O (2012) Mussel farming can be used as mitigation tool – a reply. Mar Pollut Bull 64:452-454
Pita C, Dickey H, Pierce G et al. (2010) Willingness for mobility amongst European fishermen. J Rural Stud 26:308-319
Simopoulos A (1991) Omega-3 fatty acids in health and disease and in growth and development. Am J Clin Nutr 54: 438-463
2.2Microeconomic modelling of labour market
as applied on mussel farming
Patrik Kraufvelin and Eliecer Díaz
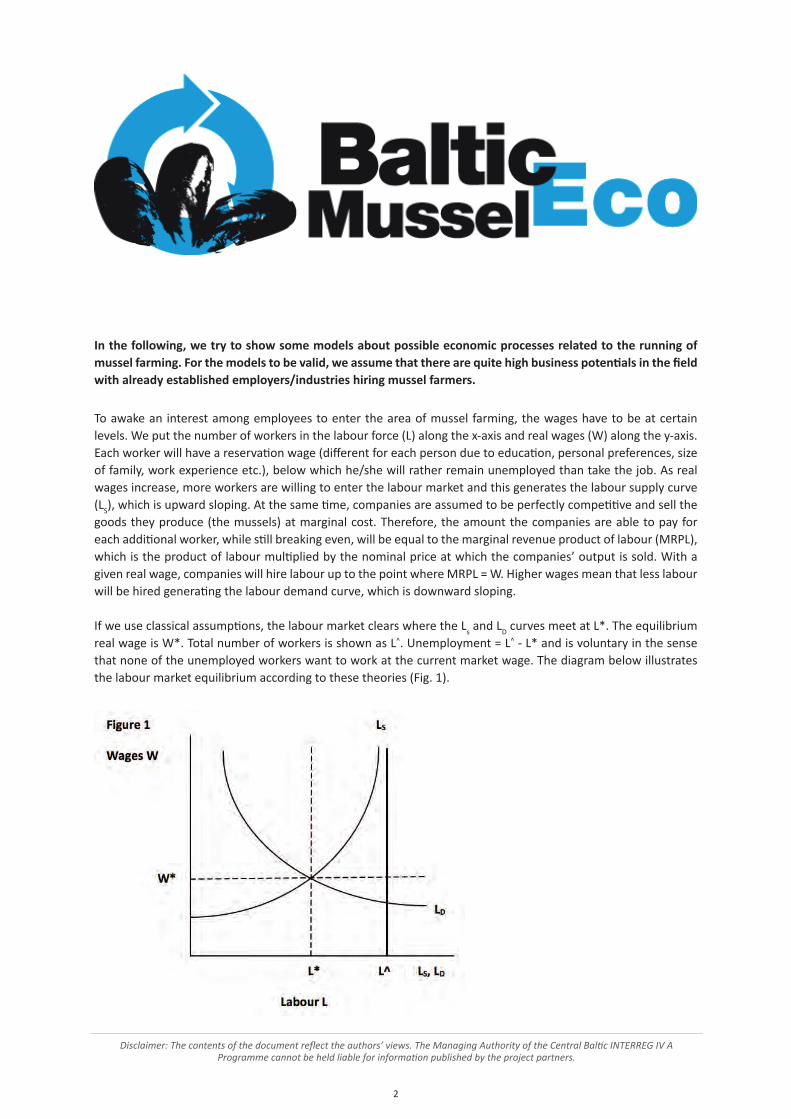
2
In the following, we try to show some models about possible economic processes related to the running of mussel farming. For the models to be valid, we assume that there are quite high business potentials in the field with already established employers/industries hiring mussel farmers.
To awake an interest among employees to enter the area of mussel farming, the wages have to be at certain levels. We put the number of workers in the labour force (L) along the x-axis and real wages (W) along the y-axis. Each worker will have a reservation wage (different for each person due to education, personal preferences, size of family, work experience etc.), below which he/she will rather remain unemployed than take the job. As real wages increase, more workers are willing to enter the labour market and this generates the labour supply curve (LS), which is upward sloping. At the same time, companies are assumed to be perfectly competitive and sell the goods they produce (the mussels) at marginal cost. Therefore, the amount the companies are able to pay for each additional worker, while still breaking even, will be equal to the marginal revenue product of labour (MRPL), which is the product of labour multiplied by the nominal price at which the companies’ output is sold. With a given real wage, companies will hire labour up to the point where MRPL = W. Higher wages mean that less labour will be hired generating the labour demand curve, which is downward sloping.
If we use classical assumptions, the labour market clears where the Ls and LD curves meet at L*. The equilibrium real wage is W*. Total number of workers is shown as L^. Unemployment = L^ - L* and is voluntary in the sense that none of the unemployed workers want to work at the current market wage. The diagram below illustrates the labour market equilibrium according to these theories (Fig. 1).
Disclaimer: The contents of the document reflect the authors’ views. The Managing Authority of the Central Baltic INTERREG IV A Programme cannot be held liable for information published by the project partners.
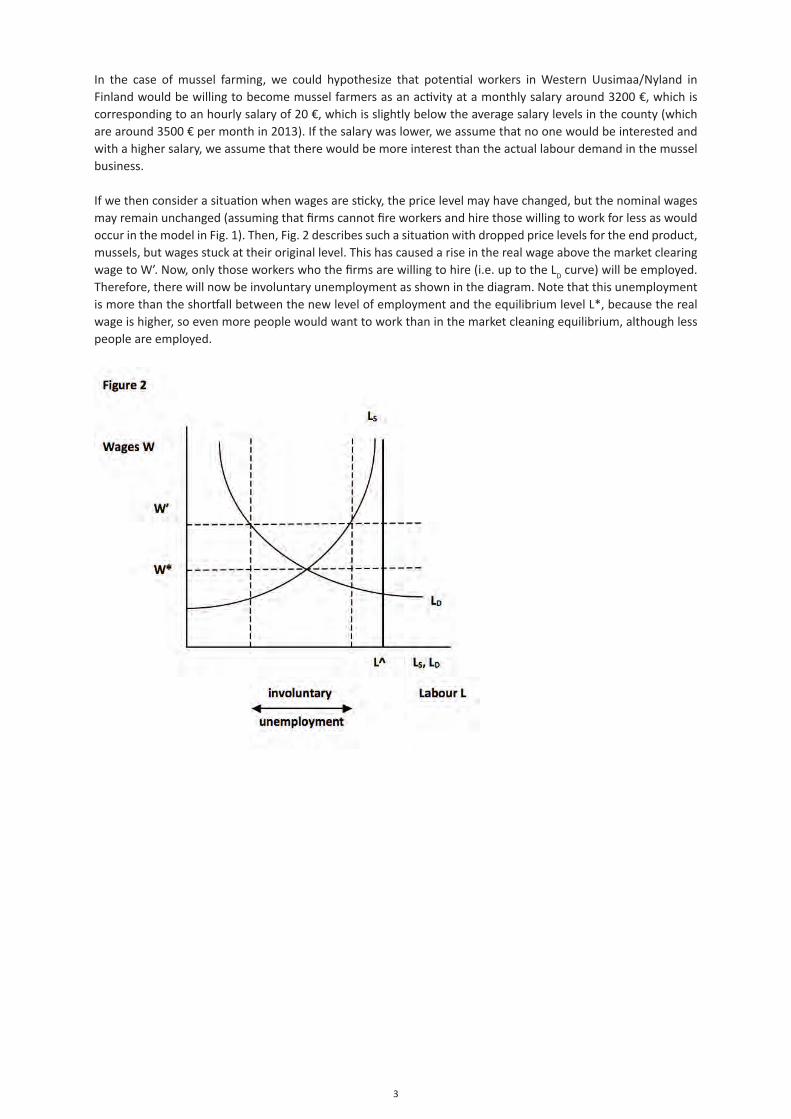
3
In the case of mussel farming, we could hypothesize that potential workers in Western Uusimaa/Nyland in Finland would be willing to become mussel farmers as an activity at a monthly salary around 3200 €, which is corresponding to an hourly salary of 20 €, which is slightly below the average salary levels in the county (which are around 3500 € per month in 2013). If the salary was lower, we assume that no one would be interested and with a higher salary, we assume that there would be more interest than the actual labour demand in the mussel business.
If we then consider a situation when wages are sticky, the price level may have changed, but the nominal wages may remain unchanged (assuming that firms cannot fire workers and hire those willing to work for less as would occur in the model in Fig. 1). Then, Fig. 2 describes such a situation with dropped price levels for the end product, mussels, but wages stuck at their original level. This has caused a rise in the real wage above the market clearing wage to W’. Now, only those workers who the firms are willing to hire (i.e. up to the LD curve) will be employed. Therefore, there will now be involuntary unemployment as shown in the diagram. Note that this unemployment is more than the shortfall between the new level of employment and the equilibrium level L*, because the real wage is higher, so even more people would want to work than in the market cleaning equilibrium, although less people are employed.

4
Within mussel farming, this would constitute a situation, where the salaries are stuck at 3200 € month, while they should be at only 2200 € per month for the firms to break even. At the same time there is a will among new workers to enter the mussel business, since they wrongly believe that the wages are fairly good and the market feasible.
The reason why employment can deviate from the equilibrium level can also be explained by the model in Fig. 3, where workers have misperceived the price level on the mussels. We assume that firms know the actual price level, whereas workers do not have the same information and base their views on previously formed expectations. In this case, if nominal wages and prices drop so that real wages remain constant, workers may remain unaware of price levels also dropping and may think that their real wages have dropped. This has the same effect as if the Ls curve would be shifted upwards to LS’ in Fig. 3. Since the labour demand curve remains fixed, this will result in a higher real wage and a lower level of employment than in the classical case (Fig. 1). The extra unemployment could possibly be classified as involuntary, because all those willing to work in the mussel industry at the market wage are able to do so. However, when they understand that the price level has dropped they will retrospectively realize that they should have been willing to work at a lower nominal wage.

2.3Social aspects of mussel farming
Patrik Kraufvelin and Eliecer Díaz
2
Introduction
To draw a picture of the social aspects of mussel farming, we interviewed three representatives for fishing organisations, we sent out questionnaires to fishermen and to people working in the tourism area and we also interviewed ordinary people in the streets in both Ekenäs and Hanko, using questionnaires specifically designed for each group. Thus, four types of questionnaires were applied, one was distributed to people that we met on the streets in the region (Appendix 1), one was sent out to tourism organisations (Appendix 2), one to fishermen (Appendix 3) and one for the representatives of the fishing organisations (Appendix 4). Altogether, we conducted 61 questionnaires out of which 40 were answered by private persons, 11 by tourism organisations, 7 by fishermen and 3 by representatives for fishing organisations. We chose to focus on Hanko and Ekenäs (Raseborg), because this was the part of the region, where mussel farming would be most efficient due to salinity conditions which are decreasing to too low levels further east into the Gulf of Finland (Westerbom 2006) and also further north to the Gulf of Bothnia. We want to point out, however, that similar possibilities for mussel farming would possibly also occur further west from our study area, i.e. in the outer sea areas of Kimitoön and Pargas in Åboland (SW Finland) as well as on the Åland islands, i.e. in areas with seawater salinities of 6 psu (practical salinity units) or more.
Finally, using the results from interviews, some local community background data and mussel farming expectations, we make a hypothetical diagnosis of the societal impact of mussel farming in the region.
Disclaimer: The contents of the document reflect the authors’ views. The Managing Authority of the Central Baltic INTERREG IV A Programme cannot be held liable for information published by the project partners.
3
General trends and environmental awareness
Ordinary people interviewed in Ekenäs (Raseborg)
The questionnaires with ordinary people in Ekenäs were answered in July 2013. In total, 30 persons were interviewed in Ekenäs and these persons were representing the following occupations: students (8), teachers (3), retired (2), engineers (2), administrators (2), social workers (2), sales manager/director (2), pilot (1), gardener (1), nurse (1), tourism officer (1), chef (1), vice president of industrial company (1), economist (1), food marketing specialist (1) and no occupation (1). The age range of the interviewed people was between 16 and 70 years old and the age distribution was quite even with the median age of the interviewed being slightly above 40 years. Out of the interviewed people, 70% were living in Ekenäs, 27% were there on vacation and 3% were there due to their work.
When these persons were asked if they were concerned about eutrophication in the Baltic Sea (pollution of excessive nutrients as N and P), 93% said that they were concerned about eutrophication, 3% said no and 3% did not know (Fig. 1a). In a chi-square goodness-of-fit test, this was a significant result (chi-square = 22.53, p ≤ 0.0001***) meaning that people in Ekenäs are concerned about eutrophication. When asked if they would be prepared to pay for cleaner water at their shore (cabin house), 77% said yes, 17% said no and 6% said maybe (Fig. 1b), which also was significant (chi-square = 25.8, p ≤ 0.0001***) meaning that people in general were willing to pay. When asked how much they would be prepared to pay (choosing between <100 €, 100-300 € and >300 € per year), 66% of those who were willing to pay said <100 € per year, 30% said 100-300 € per year and only 4% said >300 € per year (Fig. 1c), which was significant in favour of the lowest sum suggested ((chi-square = 15.68, p ≤ 0.0001***). Finally, the persons were asked if the money that they were willing to pay should go to pay investment for mussel farming and 52% said yes, 16% said partly to mussel farming or not only to mussels, whereas 20% answered no and 12% had no opinion about the topic (Fig. 1d). This result was not statistically significant (chi-square = 1.96, p = 0.16 ns) meaning that people were not certain in their opinion.
Summarizing the results from Ekenäs, the people interviewed were representing a quite wide range of occupation and age, with an even age distribution of people living in or being on vacation in Ekenäs. A vast majority of the ones interviewed was concerned about eutrophication in the Baltic Sea. A clear majority (77%) was also prepared to pay for cleaner water at their shore, but most of these persons were willing to pay less than 100 € per year, although one third was still willing to pay 100-300 € per year or even more. With regard to the question about whether this money should go to mussel farming, a slight majority was in favour of that, although one third of the people willing to pay answered no or was hesitant and there were no statistically significant differences among the preferred alternatives.
Ordinary people interviewed in Hanko
The questionnaires with ordinary people in Hanko were answered in July 2013. In total, 10 persons were interviewed and these persons were representing the following occupations: students (2), quality inspector (1), air hostess (1), retired (1), dentist (1), guide (1), navigator (1) and no occupation (2). The age range of the interviewed people was between 21 and 74 years old and the age distribution was a bit skewed towards older groups with the average age being 48.5 years. Out of the interviewed people, 80% were living in Hanko and 20% were there on vacation. When asked if they were concerned about eutrophication in the Baltic Sea, 70% said yes and 30% said no (Fig. 2a), which did not show any statistically significant differences (chi-square = 1.6, p = 0.2 ns). When asked if they would be prepared to pay for cleaner water at their shore, 70% said yes, 20% said maybe and 10% said no (Fig. 2b), which was a significant result at the 0.05 level (chi-square = 6.2, p = 0.045*) meaning that people in general were willing to pay. When asked how much they would be prepared to pay, 67% of those willing to pay said <100 € per year and 33% said 100-300 € per (Fig. 2c) which also shows a significant difference in favour of the lowest sum (chi-square = 6, p = 0.049*). Finally, when asked if this money should go to pay investment for mussel farming, 67% said yes and 33% said no (Fig. 2d), which showed no significant difference among the groups (chi-square = 1, p = 0.32 ns).
Summarizing the results from Hanko, the people interviewed were representing a quite wide range of occupation and age, with a bit older age distribution than in Ekenäs and with people living in or being on vacation in Hanko. Out of these people, two thirds were concerned about eutrophication, but one third was not. Two thirds were
4
also prepared to pay for cleaner water at their shore, but most of these persons were again willing to pay less than 100 € per year, although one third was still willing to pay 100-300 € per year. With regard to the question about whether this money should go to mussel farming, two thirds were again in favour of that, although one third of the people willing to pay answered no and the distribution of the answers were not significantly different.
Interviewed tourism organisations in Ekenäs and in Hanko
A total number of five tourism organisations were interviewed in Ekenäs. Only a small part of the representatives for tourism organisations (20%) in Ekenäs did feel that algal blooms / eutrophication impact tourism in the region, mainly in the form that people do not want to swim. Anyway, the majority (60%) was convinced that cleaner water can, in one way or another, attract more tourists and they also believed that access to the water is a very important (60%) or an important (40%) aspect in tourism. The opinions about aesthetics differed broadly (the concept of aesthetics used in this study refers to maintaining clear waters and coastal areas free from pollution and even though we explained the meaning as how we saw it, all organisations did not seem to become fully clear about what we were referring to) and probably therefore, a whole range of answers from not important (20%), of little importance (40%), important (20%) to very important (20%) was achieved. When asked about mussel farms as tourist attractions, the tourism organisations saw potentials of mussel farms mostly as a food culinary for tasting (80%) or not at all (20%), although one respondent (20%) also saw potentials in boat tours to mussel farms. Finally, the tourism organisations were asked if they or hotels should pay a fee for mussel farm investments and 60% said no and 40% said yes, among the latter one organisation was in favour of paying less than 100 € per year and the other was positive of paying 100-300€ per year.
A total number of six tourism organisations were interviewed in Hanko. Here, the representatives for tourism organisations (67%) did clearly feel that algal blooms and eutrophication impact tourism in the region, mainly in the form that people do not want to swim (66%), but also in the form that algal blooms may be toxic for humans (33%). A vast majority (83%) was convinced that cleaner water would attract more tourists and 83% also believed that access to the water is a very important aspect in tourism and the rest, or 17%, thought that it is an important aspect, the latter was a statistically significant observation (chi-square = 11.33, p = 0.01**), i.e. the only one in the analyses of the responses from tourism organisations. The opinions about aesthetics differed again broadly and a range of answers from not important (33%) to important (33%) and very important (33%) was encountered. The tourism organisations in Hanko saw potentials of mussel farms mostly as food culinary for tasting (100%), but also for boat tours to mussel farms (67%). Finally, the tourism organisations were asked if they or hotels should pay a fee for mussel farm investment and 67% said yes and 16% said maybe and 16% said no. Among the ones accepting payment, 60% was in favour of paying 100-300 € per year and 40% wanted to pay less than 100 € per year.
Summarising the results from the interviews of tourism organisations in Ekenäs and Hanko, the worries about eutrophication and the interest in mussel farms appeared to be less in Ekenäs than in Hanko. Also the willingness to pay differed, with more willingness in Hanko than in Ekenäs.
Other important points brought forward by tourism organisations follow below. Algae have not been considered a major problem in the region itself. However, towards the end of the summer, those traveling by boat have had problems further out in the sea as the algae do disturb the tourism when children and dogs cannot swim in the sea during algal blooms. There are also esthetical damages by algae. Clean water is generally considered as very important for the tourism business. Also, the beach area in Ekenäs has received positive feedback for its cleanliness and the company (Sommaröstrand) is actively working for a cleaner environment. Further, access to a clean sea is very important for the tourism industry. The respondents answered that without clean water, the tourism industry would suffer. Also the esthetics of the water is of importance. Finally, it is considered important that the location of the mussel farms do not disturb the different tourism entrepreneurs and to avoid problems, it would be advisable to include tourism entrepreneurs in the planning of the exact location of the farms. Synergies could also be found between mussel farming and tourism, for example by organizing boat trips out to the mussel farms.
5
Interviews with fishermen
Within the project, we sent out 50 interview letters to local fishermen, but we received only seven replies, but two of these persons replying just told us that they had retired. Therefore, with n = 5, it is hard to draw many conclusions. Out of the five fishermen replying, however, three (60%) were considering to continue fishing up to 5 years from now and one (20%) was considering to continue fishing over more than 10 years from now. None of them through their vocation as fishermen has a future. The incomes are too low and the seals are eating fish from and destroying their equipment. Two of the respondents (40%) were already partly retired (no alternative sources of income) and the two (40%) had other jobs to have more income (hairdresser, restaurant owner). The message from the fishermen is the same: fishing is not profitable any longer. Of the five fishermen two (40%) had considered abandoning their job during the past two years.
Two fishermen (40%) could consider starting up a mussel farm under the conditions described in the questionnaire, but the other three (60%) could not consider that. The fishermen felt that long term jobs, economic buoyancy and profits would be the most important aspects to attract fishermen’s interest into starting up mussel farming and one of these fishermen also felt that sufficient buyers and market plans would be important. All fishermen thought that it was hard to estimate a realistic economical compensation in euro for starting up mussel farming activities, but for fishermen to start a mussel farm, the most important aspect to take into consideration would be the profitability of the farm. None of the fishermen would today be willing to start a farm because they were afraid that the equipment would be too expensive and it would not be possible to sell the mussels to a profitable price. There are serious questions about who would be the buyer of the mussels. The estimated pay they would expect from maintaining a fishing farm ranged from 500-1000 €/month for the start up phase (50 h of work), 100 € for the maintenance phase (5 h of monthly work), and 1500 € for the harvesting phase (70 h of work).
Thus, the main conclusion we can make from these interviews (and also from the low response rate of only 14% or the questionnaires sent out) is that the fishermen do not seem to be very interested in starting up mussel farms, but this can also be the consequence of not having enough information about mussel farms and their potential.
6
Interview with two representatives for different fishermen’s organisations and one representative for recreational fisheries
Two persons represented fishermen’s organisations in southern Finland. One of these persons was interviewed in connection with the Stakeholder’s meeting arranged at Novia University of Applied Sciences in Raseborg in June 19th 2013 and the other kindly replied to our request over e-mail.
The fishermen’s representative attending the meeting, thought that the meeting was very good and he was positive with regard to development of mussel farming in Finland and could consider to manage a mussel farm for a small subsidy (depending on the work effort), but could not say if he felt that mussel farming technology could be affordable and neither if mussel farms should be run as cooperatives by several fishermen. He further thought that the existing regulation in Finland does not encourage the use of sea resources sufficiently. Among the listed statements, he agreed that “Mussel farming is a possibility to reduce eutrophication in the Baltic Sea” and “Before approving mussel farming in Finnish territories, targeted research and pilot projects are needed” and disagreed with “Aquaculture is sufficiently developed in Finland and it is not necessary” and “Mussel farming would cause negative impact for fishing and tourism”. For the three remaining statements (Appendix 4), he neither agreed nor disagreed. When asked to prioritize measures to be taken in order to develop mussel farming in Finland, he listed the statement in the following order (1 = most important, 6 = least important): 1) Practical trials / pilot farms in the sea, 2) Establishment of small mussel farms to assess potential end uses such as fertilizers, chicken feed, fish meal, 3) Scientific research on the ecology of mussels, 4) Joining forces of potential mussel farmers, establishing mussel farm organisations for cooperation and development of projects, 5) Establishing regulations for sea aquaculture, 6) Environmental impact assessment for farms of commercial size in the sea. Finally, when asked about what institutions that should take the leading role in development of mussel farming in Finland, he thought that State environmental institutes (SYKE, Metsähallitus), coastal municipalities and scientific institutions would be the most appropriate ones. He was not in favour of syndicates and specific interest organisations (fishermen, land farmers and federations) taking the lead role.
The fishermen’s representative interviewed over e-mail was positive with regard to development of mussel farming in Finland, thought that mussel farming equipment would be affordable and could consider to manage a mussel farm for a small subsidy, although he thought that it would be important to run a mussel farm as a cooperative by several fishermen. He further thought that the existing regulation in Finland does not encourage the use of sea resources sufficiently. Among the listed statements, he agreed on “Development of aquaculture in the sea would give possibilities for jobs and increase income especially along the coast”, “Mussel farming is a possibility to reduce eutrophication in the Baltic Sea”, “Mussel farming would provide both environmental and economic benefits” and “Before approving mussel farming in Finnish territories, targeted research and pilot projects are needed” and disagreed with “Aquaculture is sufficiently developed in Finland and it is not necessary”, “Mussel farming in Finland is not possible” and “Mussel farming would cause negative impact for fishing and tourism” (Appendix 4). When asked to prioritize measures to be taken in order to develop mussel farming in Finland, he listed the statement in the following order (1 = most important, 6 = least important): 1) Practical trials / pilot farms in the sea, 2) Establishment of small mussel farms to assess potential end uses such as fertilizers, chicken feed, fish meel, 3) Environmental impact assessment for farms of commercial size in the sea, 4) Joining forces of potential mussel farmers, establishing mussel farm organisations for cooperation and development of projects, 5) Scientific research on the ecology of mussels, and 6) Establishing regulations for sea aquaculture. Finally, when asked about what institutions that should take the leading role in development of mussel farming in Finland, he thought that interest organisations should the lead role.
Finally, we also interviewed one person active within recreational fishing. This person felt that the water areas are already considered quite clean and that clean water is a way of attracting fishing tourists particularly from Russia. The person also thought that the water quality is more of a problem in Hanko than in Ekenäs. The recreational fishing representative underlined the importance of engaging in dialogue with a broad base of stakeholders before setting the location of mussel farms. Recreational fishing is dependent on access to water and it is important that the farms do not disturb their activities.
7
How do mussel farms affect society?
Synthesizing the responses from ordinary people, tourism organisations, fishermen and the representatives for the fishermen’s organisations, there seem to be a general concern about eutrophication in the Baltic Sea and that mussel farming combating eutrophication could be a thing worth testing. Some additional benefits by mussel farming activities were also recognised by some tourism organisations such as trips to mussel farms and mussel tasting activities. In addition to this, we should also bring forward possible increased attractiveness of the sea as a tourist destination and increased amounts of vegetated bottoms thanks to mussel farms improving water transparency (Lindahl 2012, Petersen et al. 2012) and also the possibilities for improved yield of traditional fishing thanks to mussels cleaning sea areas. People and organisations were also to a certain degree willing to pay (mostly <100 € per year) for various measures, but surprisingly often for mussel farming, specifically.
Socio-economic impacts: target groups
In addition to the viewpoints referred to above from the questionnaires/interviews, mussel farms also have other socio-economic impacts. First, there could be clear benefits for municipalities in saving investments in bigger water treatment plants (Järnefors et al. 2006, Gren et al. 2008) thanks to the mussels taking care of part of the water cleaning. The society would further benefit from increased tax incomes (Salary Income tax, VAT, tax on profits) and a decreased unemployment, not to forget possibilities for new employment opportunities in related fields (see below). Mussel farmers may get access to ”Emission rights” which can create increased incomes and possibilities of profits and they may also get State/EU financed subsidies during the startup stage. Other possibly affected society compartments are: civil organisations (environmental and other), environmental NGOs with special attention to Baltic Sea, water protection organisations, state authorities, research institutes and laboratories and others that monitors water quality and toxicity in mussels. Finally, farmers and others (like industries) that emit nitrates/phosphates to the Baltic Sea may also be affected, e.g. if an ”emission rights” system is developed, then they may have to pay (according to polluters pay principle), which would lead to additional costs for these industries and farmers depending on how the system is designed. On the other hand, animal farmers may also benefit from mussel farming thanks to the potential interest in mussels as animal feed, particularly in case this food can be categorized as ecological and local. Fish farmers may also benefit from the use of mussels as fish farm feed. Not only would this be a way of closing the nutrient loop in fish farms (avoiding additional nutrient load to the Baltic) there would neither be the problem of dioxins as in herring feed and there would be better omega 3/6 ratios and more natural food origin than soya feed. Finally, the fish farmers could get access to local food and decrease the dependency on imported resources.
Economic crisis: unemployment situation in Raseborg and Hanko
The most recent data on unemployment from June 2013 (ELY-centralen i Nyland), tell that Hanko with 12.3% (528 persons) unemployed has the highest unemployment rate in the entire region (Uusimaa/Nyland). Also, Raseborg with 9.9% (1347 persons) is above the average rate which is 9.2%. Looking at employment in various sectors, the number of people unemployed within the agricultural, forestry and fishery sector in Uusimaa/Nyland increased with 67 persons (10.8%) from 621 to 688 from May to June 2013, which is indicating that every new job created in this sector would be welcome. In the summary of the questionnaire replies it should also be taken into consideration that the aspect of job creation was never brought forward in the questionnaires and despite this we encountered many positive views on mussel farming. If also possible job opportunities had been mentioned in the interviews, the responses to mussel farming might even have become more positive, because Western Uusimaa/Nyland is a region which recently has lost many working opportunities and many people are facing unemployment.
8
Hypothetical diagnosis of the societal impact of mussel farming in the region
In the following, we are basing our calculations on hypothetical initiation of ten mussel farms (each producing 100 tons of blue mussels after two farming years, i.e. every second year) in the sea area around the Hanko peninsula. Farming for two years, compared to 2.5 years in the Kumlinge case (Engman 2013), i.e. farming only until mid- or late June during the second growth year, could be justified by at least two strong arguments. First, during the second year, many mussels fall off (Engman 2013) unless socking is used and the problems and costs associated with this could then be avoided. Second, in order to start a new colonization for the next two-year period, the equipment need to be out in the sea already by the end of June. Harvesting in November, after 2.5 years, would mean that harvesting could only be done every third year, since then the farmer would have to wait for eight months for the next year’s recruitment.
The working time for constructing and placing out the equipment, for maintenance of the farm and for harvesting of the mussels has been calculated to sum-up to one half of a full-time person per farm = five persons for the ten mussel farms (Table 1). In addition to this, one to two more persons may be needed temporarily for practical assistance and safety or even more persons, if a spin-off industry dealing with mussel meal (or other end products) will be generated (but these costs are not included in the calculations). The estimated costs for establishing and maintaining farms of a size of 100 ton per 2 years, i.e. sizes relevant for the local conditions outside Hanko, thus sum up to 93560 (Table 1) for the first full cycle. Imagining that the equipment can be re-used over several farming cycles, the costs for subsequent farming periods may be reduced by 46.5% to 43560 € per farm and cycle.
If we bring in possible alternative payers, like EU, the national government, local governments (municipalities), ordinary people through donations and tourism organisations, the Polluters pay principle (farmers or industries), the picture may look even better from the mussel farmer’s perspective. The question is then: What kind of compensation should a mussel farmer receive for starting up a farm?
If we are comparing with rules for fishermen subsidies, up to 40% of equipment costs could be subsidized, which with the equipment costs calculated above would mean 20000 € per 100 ton farm (if the equipment costs are around 50000 €). Additionally, when looking at the potential willingness of people of Raseborg and Hanko to pay, possible additional local support could raise to 100000 € from residents in Hanko (4292 inhabitants x 50 € x 0.47, i.e. 47% of the working population was willing to pay a yearly sum, here standardized to 50€, for cleaner waters and approved mussel farming as a measure) and to 270000 € from residents in Raseborg (13653 inhabitants x 50 € x 0.4, i.e. 40% were willing to pay a yearly sum which could go to mussel farming) and then we are neglecting possible payment from tourism organisations and local companies. Already with such a local support, potentially summing up to 370000 € per year (740000 € per 2-year farming cycle), it would be possible to start up regional mussel farming activities almost at the described intensity or at least eight farms, producing almost a total amount of 1000 ton mussels per 2-year cycle, even without the EU subsidies, and there would still be pay back to the region as the taxes the mussel farmers are paying for their work efforts and for their equipment, fuel, etc. + the value of the end product, i.e. the farmed mussels for use as feed, fertilizers, biogas or even food. In addition to this, together with the 1000 tons of harvested mussels, a quite considerable amount of N (8500 kg) and P (600 kg) would be removed from the sea contributing to a improved local environmental conditions. Also, while actively being filter feeding in the water during the production stage, the mussels have also contributed to a better water transparency, with further positive environmental effects. The possible negative effects are expected to be minor of mussel farms of this size, if the farms only are placed out where the water exchange rate is rapid and effective (Kraufvelin and Díaz, unpubl.), and this prerequisite should also come naturally from choosing the optimal recruitment areas (Díaz et al. unpubl.). Finally, the mussel farming activities could also be used within the tourism area, e.g. by arranging guided boat trips for demonstrating environmental measures in practice and also offering mussel tasting.
9
References
ELY-centralen i Nyland (2013) Sysselsättningsöversikt, juni 2013. 5 pp (In Swedish)
Engman T (2013) Möjligheter och förutsättningar för storskalig musselodling på Åland. Del 2 inom Fas III, Odling och skörd. Ålands Landskapsregering, 24 pp (in Swedish)
Gren IM, Jonzon Y, Lindqvist M (2008). Costs of nutrient reductions to the Baltic Sea. Swedish University of Agricultural Sciences (SLU), Uppsala, 64 pp.
Järnefors C, Bourghardt C, Sandén, Romelsjö H, Thorbäck J (2006) Musslan – i naturens tjänst. Analys av musselodling som alternativ till konventionell kväverening. Göteborgs Universitet (In Swedish)
Kraufvelin P, Díaz ER (2013) A small mussel farm in the Baltic proper was beneficial to the surrounding environment (Submitted manuscript)
Lindahl O (2012) Mussel farming as an environmental measure in the Baltic. Final Report BalticSea2020, 18 pp
Petersen JK, Timmermann K, Carlsson M, Holmer M, Maar M, Lindahl O (2012) Mussel farming can be used as mitigation tool – a reply. Mar Pollut Bull 64:452-454
Westerbom M (2006) Population dynamics of blue mussels in a variable environment at the edge of their range. PhD-thesis, University of Helsinki
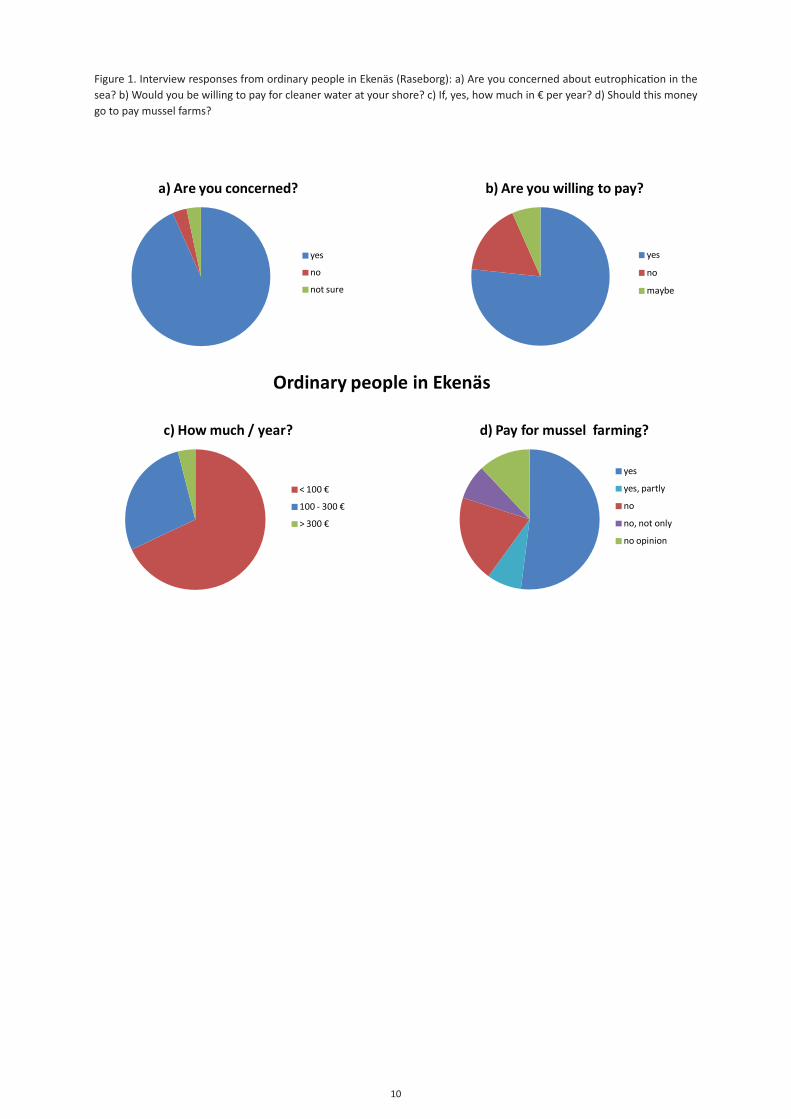
10
Figure 1. Interview responses from ordinary people in Ekenäs (Raseborg): a) Are you concerned about eutrophication in the sea? b) Would you be willing to pay for cleaner water at your shore? c) If, yes, how much in € per year? d) Should this money go to pay mussel farms?
a) Are you concerned?
yes
no
not sure
b) Are you willing to pay?
yes
no
maybe
c) How much / year?
< 100 €
100 - 300 €
> 300 €
d) Pay for mussel farming?
yes
yes, partly
no
no, not only
no opinion
Ordinary people in Ekenäs
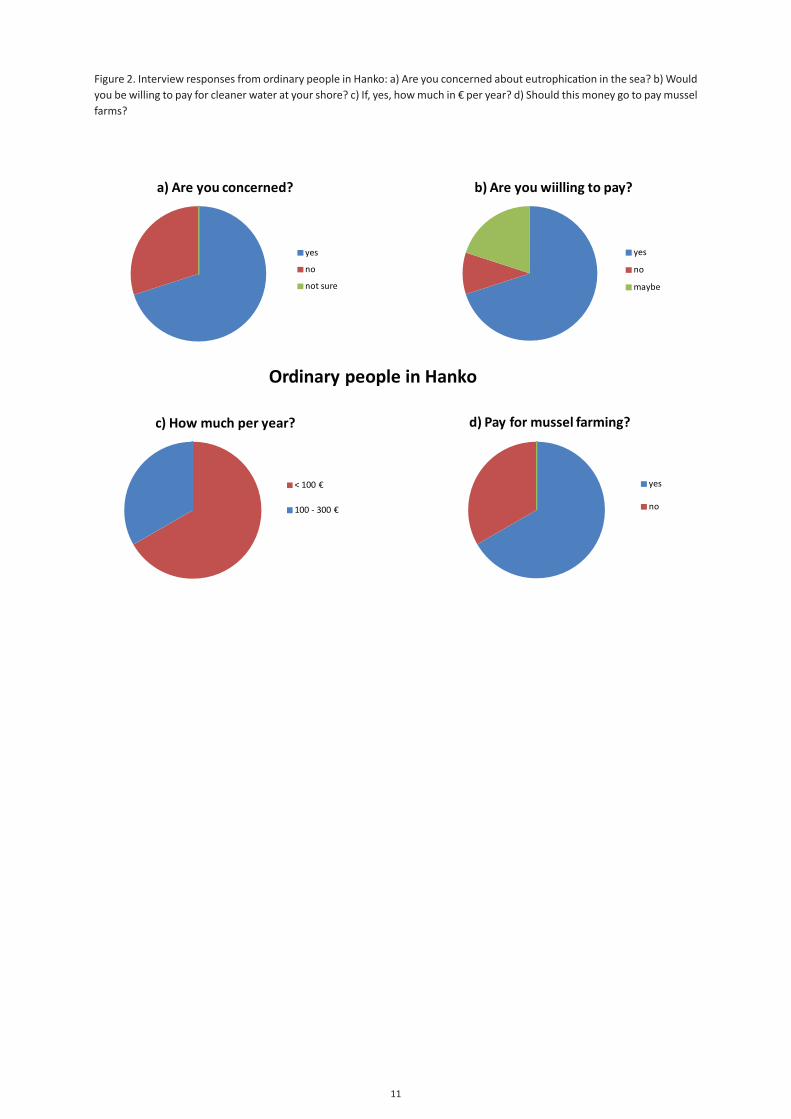
11
Figure 2. Interview responses from ordinary people in Hanko: a) Are you concerned about eutrophication in the sea? b) Would you be willing to pay for cleaner water at your shore? c) If, yes, how much in € per year? d) Should this money go to pay mussel farms?
Ordinary people in Hanko
a) Are you concerned?
yes
no
not sure
b) Are you wiilling to pay?
yes
no
maybe
c) How much per year?
< 100 €
100 - 300 €
d) Pay for mussel farming?
yes
no
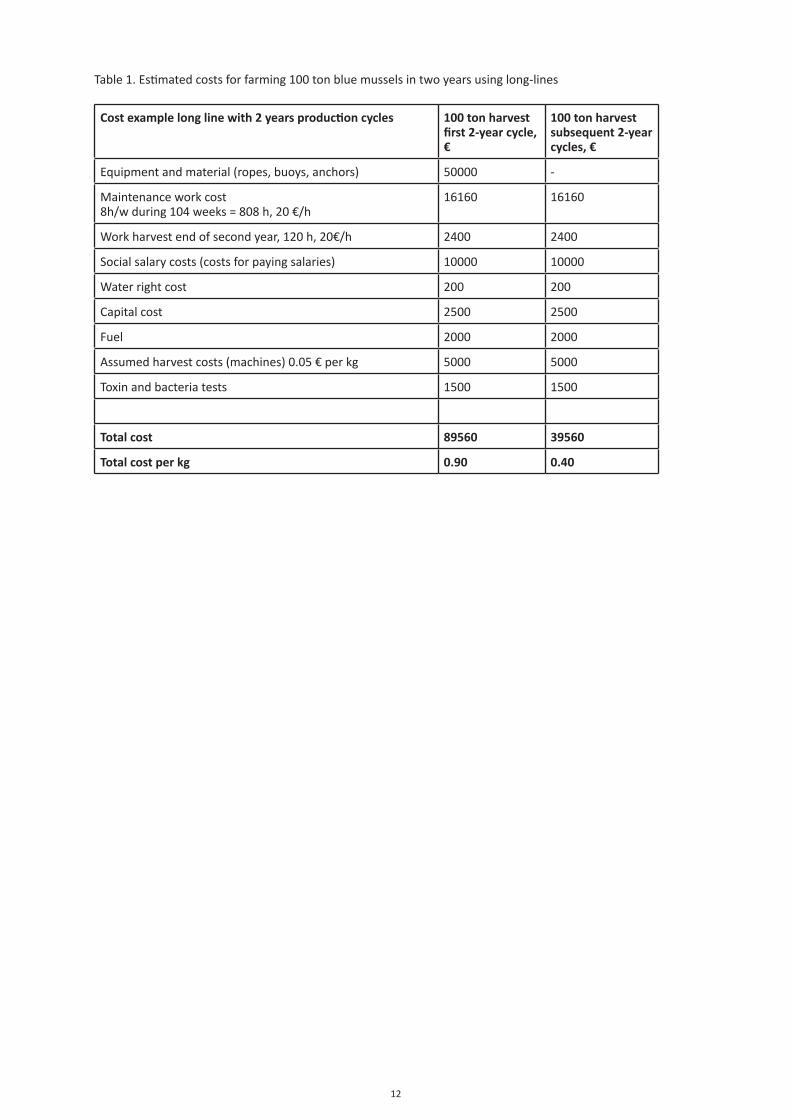
12
Table 1. Estimated costs for farming 100 ton blue mussels in two years using long-lines
Cost example long line with 2 years production cycles 100 ton harvest first 2-year cycle, €
100 ton harvest subsequent 2-year cycles, €
Equipment and material (ropes, buoys, anchors) 50000 -
Maintenance work cost8h/w during 104 weeks = 808 h, 20 €/h
16160 16160
Work harvest end of second year, 120 h, 20€/h 2400 2400
Social salary costs (costs for paying salaries) 10000 10000
Water right cost 200 200
Capital cost 2500 2500
Fuel 2000 2000
Assumed harvest costs (machines) 0.05 € per kg 5000 5000
Toxin and bacteria tests 1500 1500
Total cost 89560 39560
Total cost per kg 0.90 0.40
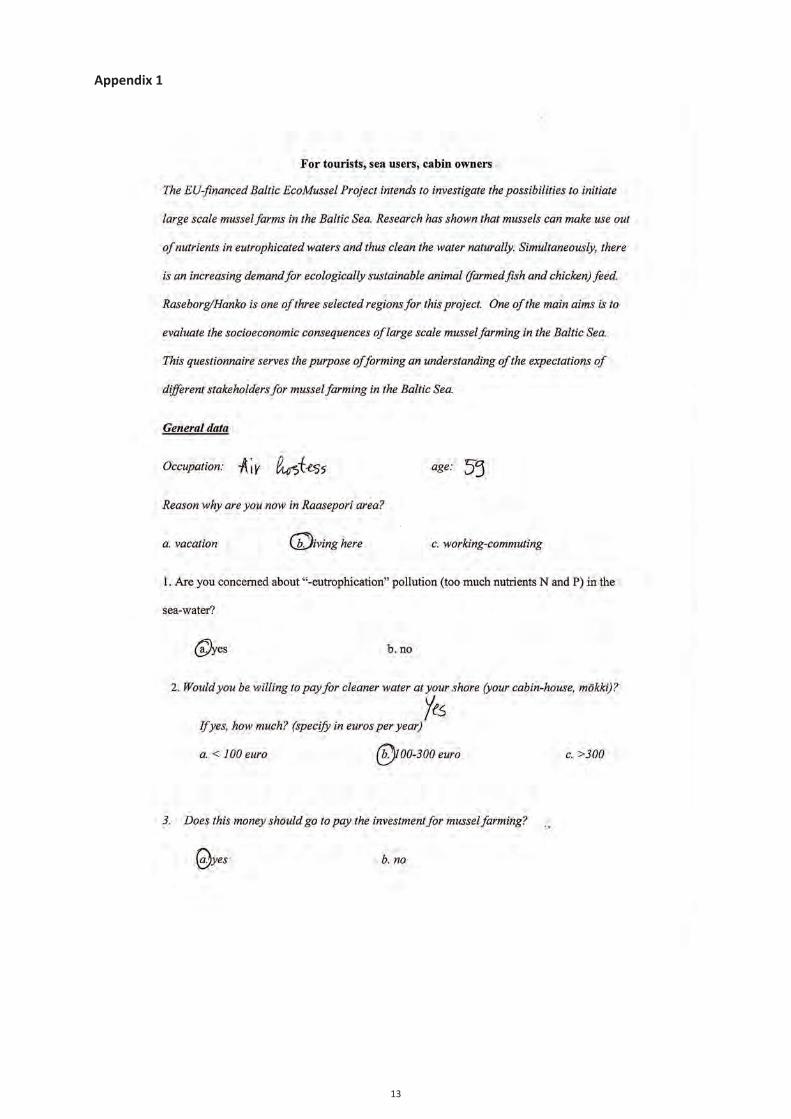
13
Appendix 1
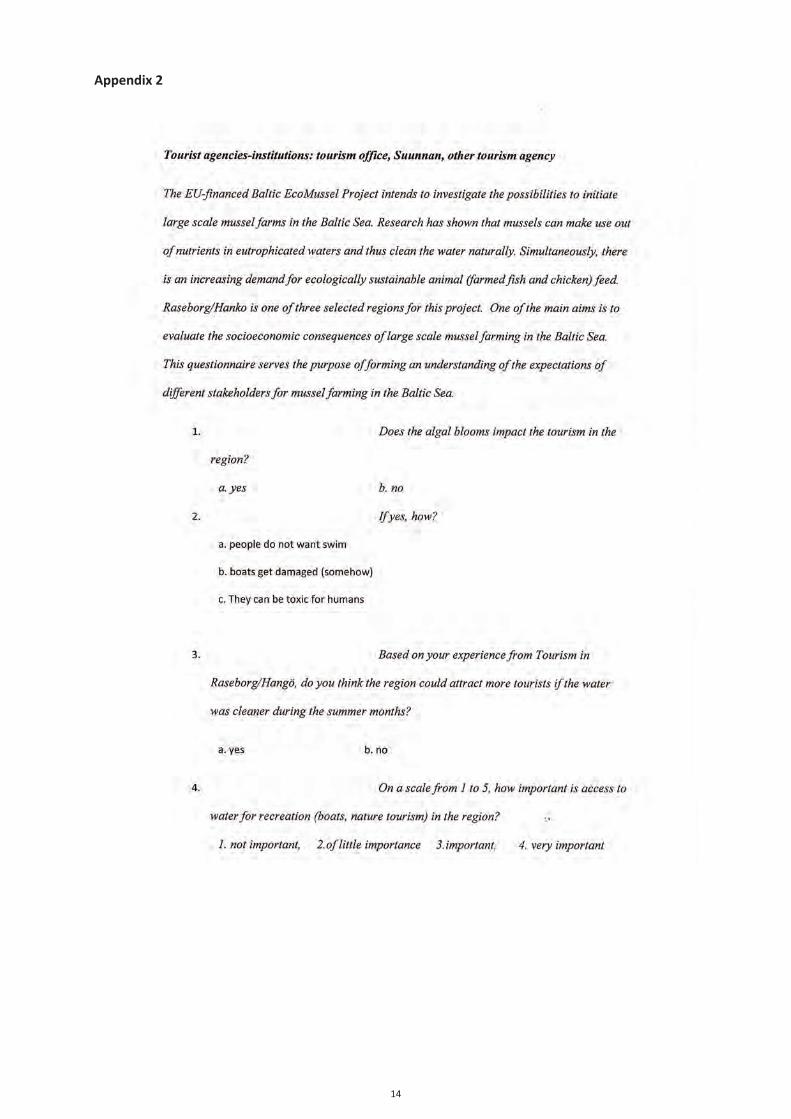
14
Appendix 2
15
16
Appendix 3
Questionnaire to fishermen in Raseborg/Hanko:
The EU-financed Baltic EcoMussel Project intends to investigate the possibilities to initiate large scale mussel farms in the Baltic Sea. Research has shown that mussels can make use out of nutrients in eutrophicated waters and thus clean the water naturally. Simultaneously, there is an increasing demand for ecologically sustainable animal (farmed fish and chicken) feed. Raseborg/Hanko is one of three selected regions for this project. One of the main aims is to evaluate the socioeconomic consequences of large scale mussel farming in the Baltic Sea. This questionnaire serves the purpose of forming an understanding of the expectations of different stakeholders for mussel farming in the Baltic Sea.
Currently we are working on an analysis of investment costs to be able to do a profitability analysis of mussel farming in the Baltic Sea. To finalize such an analysis, we also need the input from professional fishermen based on your realities and expectations with regard to mussel farming. We hope you can take the time to answer the questions below related to the mapping of mussel farms in the Baltic Sea.
1. What are your expectations of the future as a professional fisherman?
2. Does your job as a fisherman bring you enough income to feel that this is a profession you can continue with in the future?
3. Do you have alternative sources of income?
4. If yes, how much time do you use for fishing in relation to your other activities?
5. Have you during the past two years considered abandoning your job as a fisherman.
6. If yes, have the reasons been economic?
7. Under the conditions explained in the project description above, would you consider starting a mussel farm?
8. What aspects should one consider to attract fishermen to start mussel farming?
9. What would you expect as a realistic compensation for a mussel farm (estimate in euro/month)
a. During the initial stage (50 h)
b. During the growing stage (5 h)
c. During harvesting (4 persons, 70h during 2 days)
10. Does this initiative give rise to any questions that have not been dealt with above or do you want to add something of importance for when elaborating a mussel farm strategy in the Baltic Sea?

17
Appendix 4
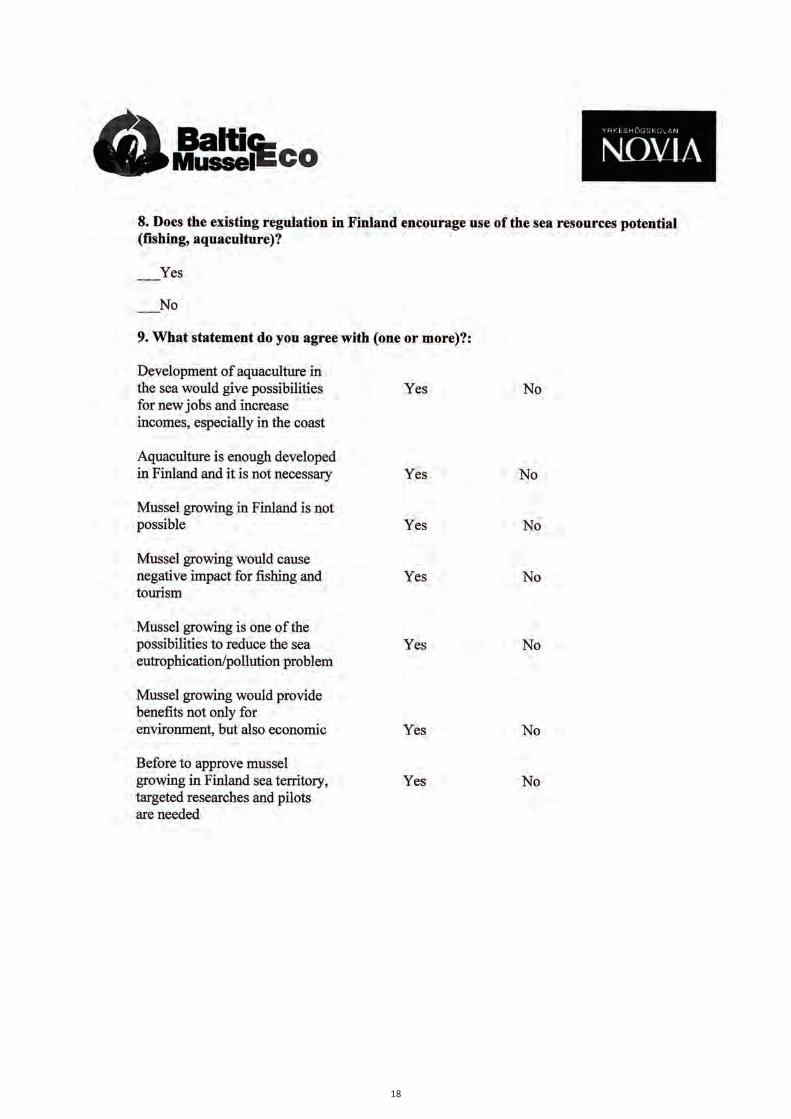
18

19

3.
Technical and Financial Studies, Reports and Plans

3.1
Technical Studies and Reports
3.1.1Growing techniques for mussels
Mytilus trossulus
2
Contents
1 Introduction ........................................................................................................................... 3
2 Cultivationonbottom ............................................................................................................ 4
3 Cultivation-offbottom .......................................................................................................... 6
3.1Cultivationonstakes(‘bouchot’) ....................................................................................63.2Cultivationonlong-lines .................................................................................................83.3Cultivationontrestles ...................................................................................................133.4Cultivationonraft .........................................................................................................14
4 Conclusion ........................................................................................................................... 15
5 Mapofsalinity ..................................................................................................................... 16
6 References ........................................................................................................................... 17
Disclaimer: The contents of the document reflect the authors’ views. The Managing Authority of the Central Baltic INTERREG IV A Programme cannot be held liable for information published by the project partners.
3
1. IntroductionThere are hundreds of species of mussel but only about a dozen or so are fished commercially and most of these are in the genus Mytilus. [23] Mytilus edulis has been harvested for centuries. Blue mussel shells have been found in kitchen middens dated 6000 B.C.
Until the 19th century, blue mussels were harvested from wild beds in most European countries for food, fish bait and as a fertilizer. The initial step for mussel aquaculture was based upon storage and relaying fishery products.[3]
Mussel growing methods were established based on historical, geographical, physical and other aspects. There are several growing techniques for mussel and different authors use different names for mussel farming. In this document the author will review several methods:
• On bottom
• Off bottom
• On stakes
• On longlines
• Ropes/Sock
• Nets
• On raft
• On trestles.
Based on place, species, weather conditions, techniques, cultural aspects and historical experience the farmer chooses a method for mussel growing.
To understand differences between these methods, the information will be analysed as follows.
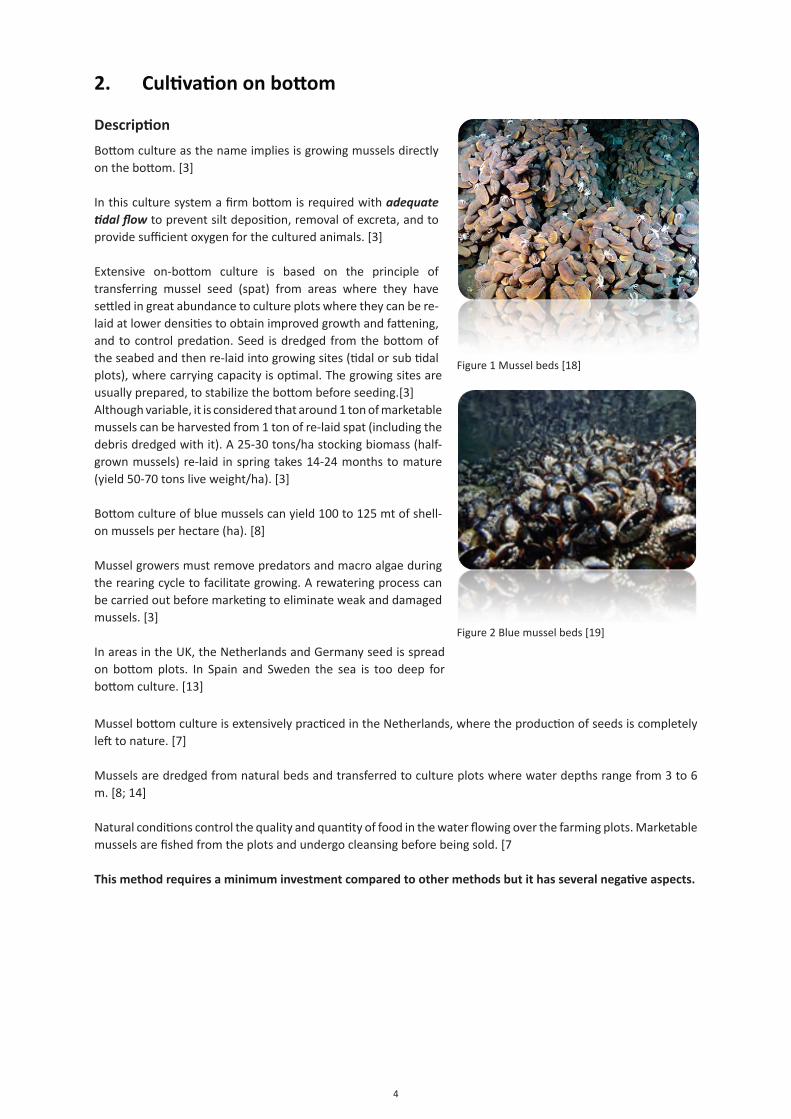
4
2. Cultivationonbottom
Description
Bottom culture as the name implies is growing mussels directly on the bottom. [3]
In this culture system a firm bottom is required with adequate tidal flow to prevent silt deposition, removal of excreta, and to provide sufficient oxygen for the cultured animals. [3]
Extensive on-bottom culture is based on the principle of transferring mussel seed (spat) from areas where they have settled in great abundance to culture plots where they can be re-laid at lower densities to obtain improved growth and fattening, and to control predation. Seed is dredged from the bottom of the seabed and then re-laid into growing sites (tidal or sub tidal plots), where carrying capacity is optimal. The growing sites are usually prepared, to stabilize the bottom before seeding.[3]Although variable, it is considered that around 1 ton of marketable mussels can be harvested from 1 ton of re-laid spat (including the debris dredged with it). A 25-30 tons/ha stocking biomass (half-grown mussels) re-laid in spring takes 14-24 months to mature (yield 50-70 tons live weight/ha). [3]
Bottom culture of blue mussels can yield 100 to 125 mt of shell-on mussels per hectare (ha). [8]
Mussel growers must remove predators and macro algae during the rearing cycle to facilitate growing. A rewatering process can be carried out before marketing to eliminate weak and damaged mussels. [3]
In areas in the UK, the Netherlands and Germany seed is spread on bottom plots. In Spain and Sweden the sea is too deep for bottom culture. [13]
Figure 1 Mussel beds [18]
Figure 2 Blue mussel beds [19]
Mussel bottom culture is extensively practiced in the Netherlands, where the production of seeds is completely left to nature. [7]
Mussels are dredged from natural beds and transferred to culture plots where water depths range from 3 to 6 m. [8; 14]
Natural conditions control the quality and quantity of food in the water flowing over the farming plots. Marketable mussels are fished from the plots and undergo cleansing before being sold. [7
Thismethodrequiresaminimuminvestmentcomparedtoothermethodsbutithasseveralnegativeaspects.
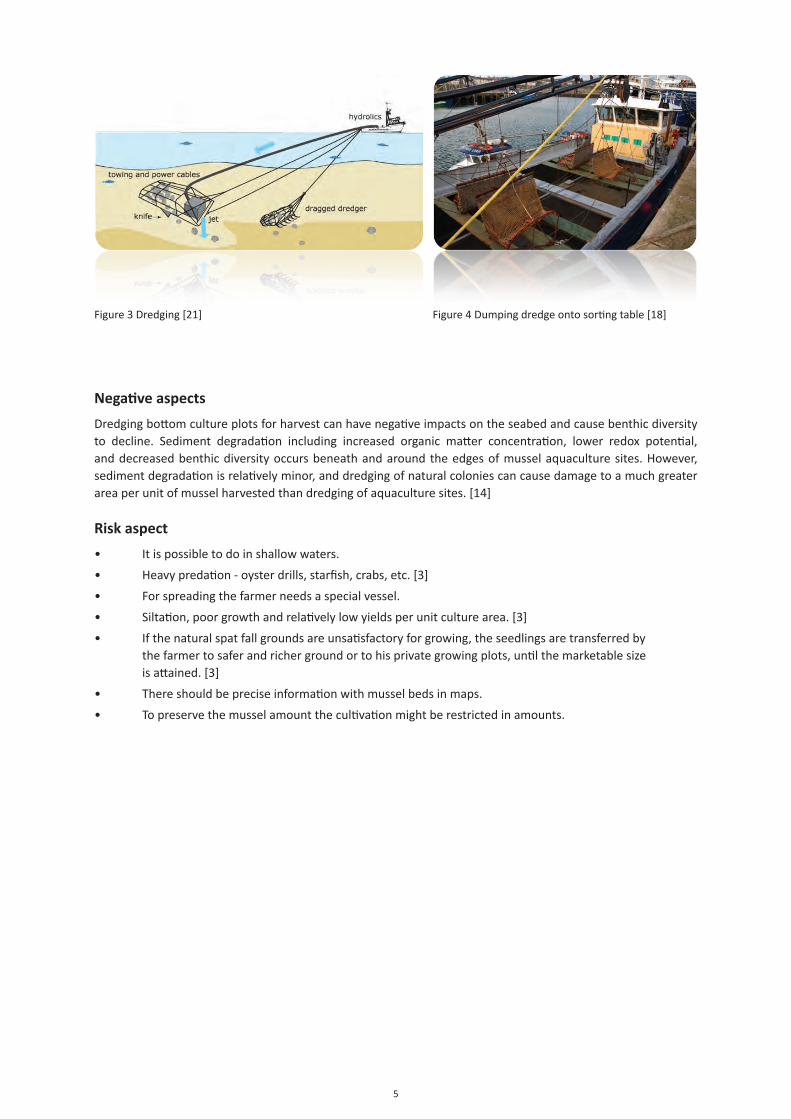
5
Negativeaspects
Dredging bottom culture plots for harvest can have negative impacts on the seabed and cause benthic diversity to decline. Sediment degradation including increased organic matter concentration, lower redox potential, and decreased benthic diversity occurs beneath and around the edges of mussel aquaculture sites. However, sediment degradation is relatively minor, and dredging of natural colonies can cause damage to a much greater area per unit of mussel harvested than dredging of aquaculture sites. [14]
Riskaspect
• It is possible to do in shallow waters.
• Heavy predation - oyster drills, starfish, crabs, etc. [3]
• For spreading the farmer needs a special vessel.
• Siltation, poor growth and relatively low yields per unit culture area. [3]
• If the natural spat fall grounds are unsatisfactory for growing, the seedlings are transferred by the farmer to safer and richer ground or to his private growing plots, until the marketable size is attained. [3]
• There should be precise information with mussel beds in maps.
• To preserve the mussel amount the cultivation might be restricted in amounts.
Figure 3 Dredging [21] Figure 4 Dumping dredge onto sorting table [18]
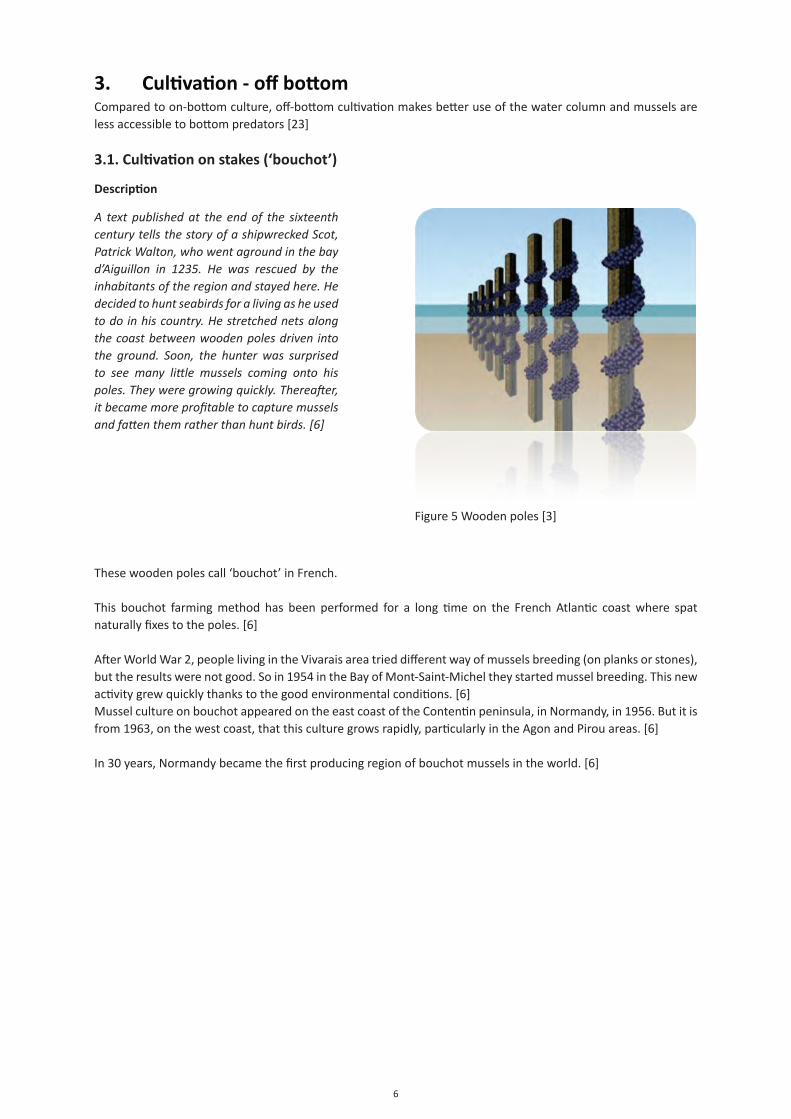
6
3. Cultivation-offbottomCompared to on-bottom culture, off-bottom cultivation makes better use of the water column and mussels are less accessible to bottom predators [23]
3.1.Cultivationonstakes(‘bouchot’)
Description
These wooden poles call ‘bouchot’ in French. This bouchot farming method has been performed for a long time on the French Atlantic coast where spat naturally fixes to the poles. [6]
After World War 2, people living in the Vivarais area tried different way of mussels breeding (on planks or stones), but the results were not good. So in 1954 in the Bay of Mont-Saint-Michel they started mussel breeding. This new activity grew quickly thanks to the good environmental conditions. [6]Mussel culture on bouchot appeared on the east coast of the Contentin peninsula, in Normandy, in 1956. But it is from 1963, on the west coast, that this culture grows rapidly, particularly in the Agon and Pirou areas. [6]
In 30 years, Normandy became the first producing region of bouchot mussels in the world. [6]
A text published at the end of the sixteenth century tells the story of a shipwrecked Scot, Patrick Walton, who went aground in the bay d’Aiguillon in 1235. He was rescued by the inhabitants of the region and stayed here. He decided to hunt seabirds for a living as he used to do in his country. He stretched nets along the coast between wooden poles driven into the ground. Soon, the hunter was surprised to see many little mussels coming onto his poles. They were growing quickly. Thereafter, it became more profitable to capture mussels and fatten them rather than hunt birds. [6]
Figure 5 Wooden poles [3]
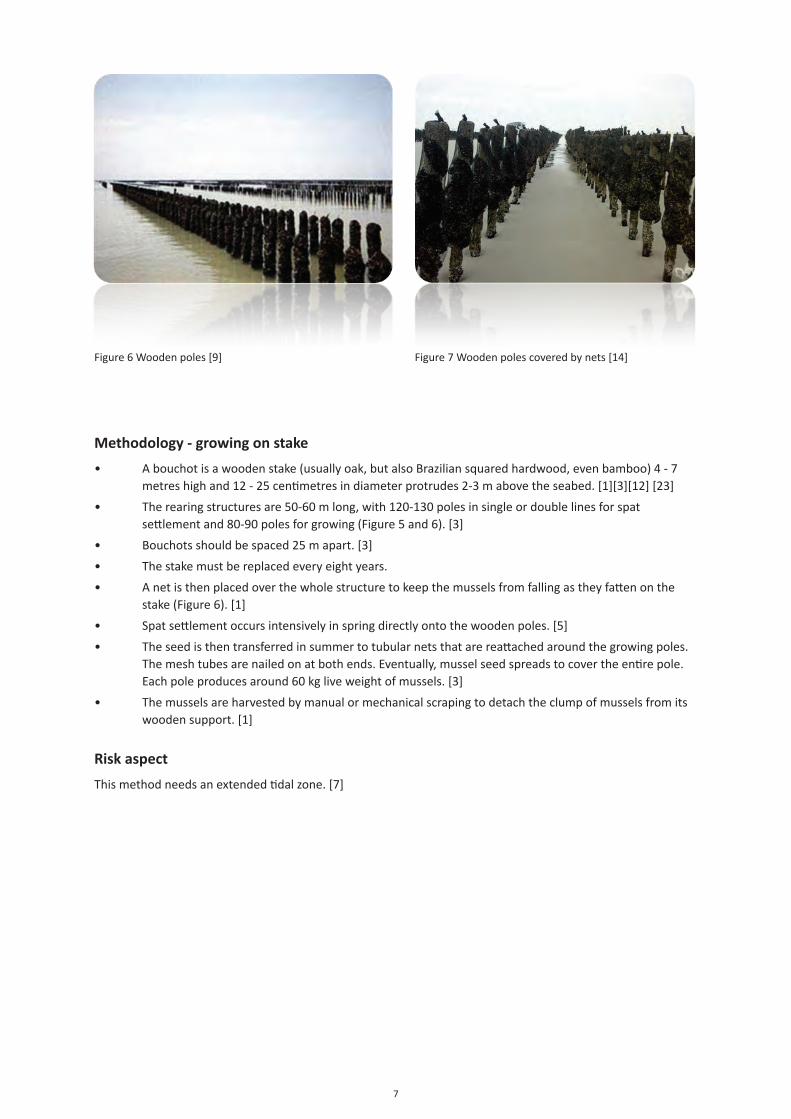
7
Methodology-growingonstake
• A bouchot is a wooden stake (usually oak, but also Brazilian squared hardwood, even bamboo) 4 - 7 metres high and 12 - 25 centimetres in diameter protrudes 2-3 m above the seabed. [1][3][12] [23]
• The rearing structures are 50-60 m long, with 120-130 poles in single or double lines for spat settlement and 80-90 poles for growing (Figure 5 and 6). [3]
• Bouchots should be spaced 25 m apart. [3]
• The stake must be replaced every eight years.
• A net is then placed over the whole structure to keep the mussels from falling as they fatten on the stake (Figure 6). [1]
• Spat settlement occurs intensively in spring directly onto the wooden poles. [5]
• The seed is then transferred in summer to tubular nets that are reattached around the growing poles. The mesh tubes are nailed on at both ends. Eventually, mussel seed spreads to cover the entire pole. Each pole produces around 60 kg live weight of mussels. [3]
• The mussels are harvested by manual or mechanical scraping to detach the clump of mussels from its wooden support. [1]
Riskaspect
This method needs an extended tidal zone. [7]
Figure 6 Wooden poles [9] Figure 7 Wooden poles covered by nets [14]
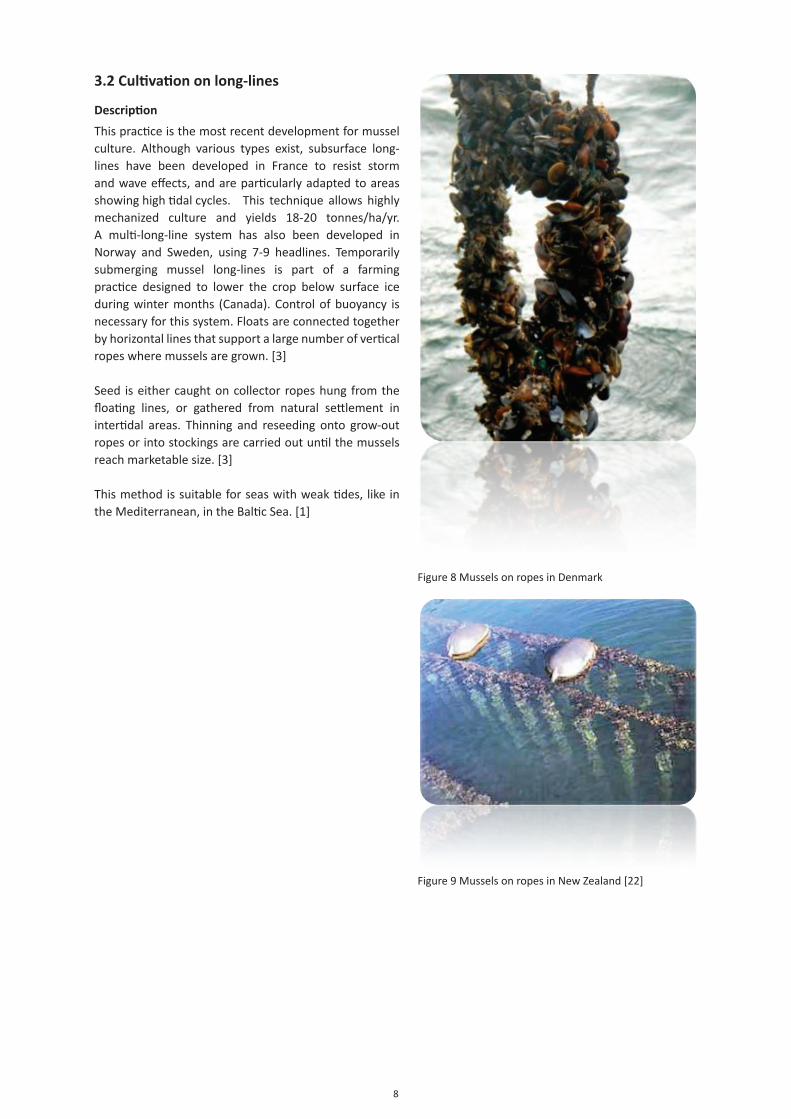
8
3.2Cultivationonlong-lines
Description
This practice is the most recent development for mussel culture. Although various types exist, subsurface long-lines have been developed in France to resist storm and wave effects, and are particularly adapted to areas showing high tidal cycles. This technique allows highly mechanized culture and yields 18-20 tonnes/ha/yr. A multi-long-line system has also been developed in Norway and Sweden, using 7-9 headlines. Temporarily submerging mussel long-lines is part of a farming practice designed to lower the crop below surface ice during winter months (Canada). Control of buoyancy is necessary for this system. Floats are connected together by horizontal lines that support a large number of vertical ropes where mussels are grown. [3]
Seed is either caught on collector ropes hung from the floating lines, or gathered from natural settlement in intertidal areas. Thinning and reseeding onto grow-out ropes or into stockings are carried out until the mussels reach marketable size. [3]
This method is suitable for seas with weak tides, like in the Mediterranean, in the Baltic Sea. [1]
Figure 8 Mussels on ropes in Denmark
Figure 9 Mussels on ropes in New Zealand [22]
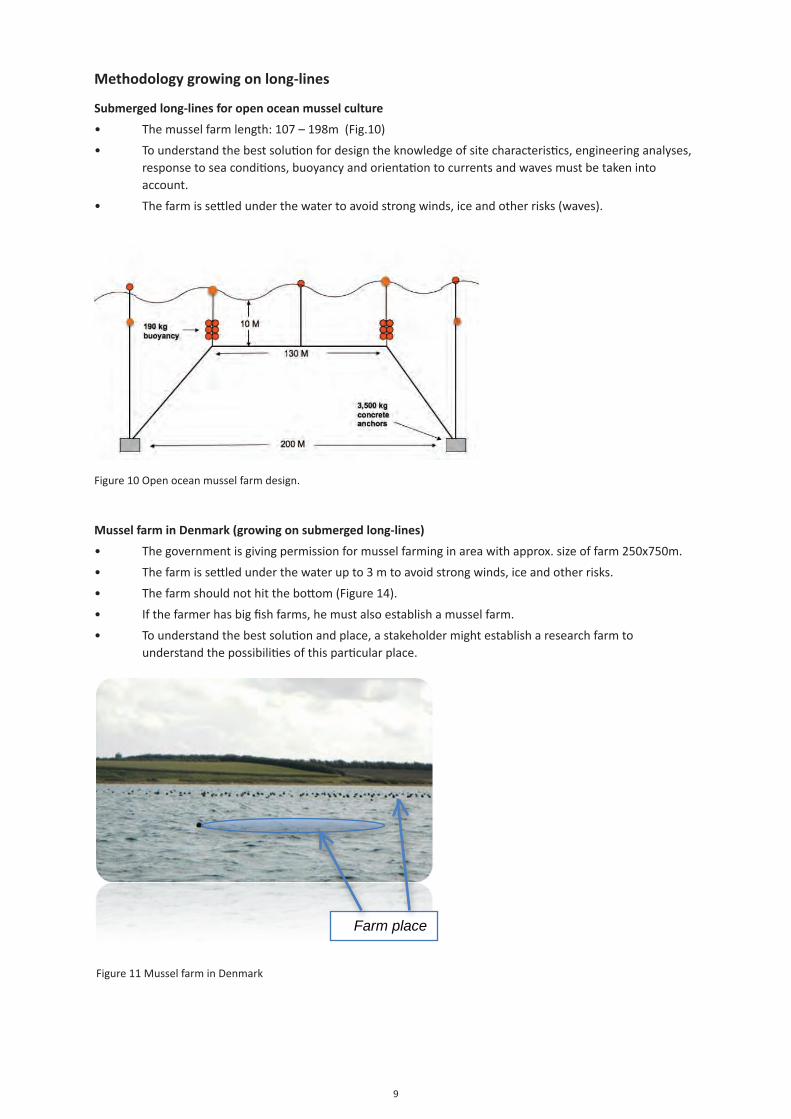
9
Methodologygrowingonlong-lines
Submergedlong-linesforopenoceanmusselculture
• The mussel farm length: 107 – 198m (Fig.10)
• To understand the best solution for design the knowledge of site characteristics, engineering analyses, response to sea conditions, buoyancy and orientation to currents and waves must be taken into account.
• The farm is settled under the water to avoid strong winds, ice and other risks (waves).
MusselfarminDenmark(growingonsubmergedlong-lines)
• The government is giving permission for mussel farming in area with approx. size of farm 250x750m.
• The farm is settled under the water up to 3 m to avoid strong winds, ice and other risks.
• The farm should not hit the bottom (Figure 14).
• If the farmer has big fish farms, he must also establish a mussel farm.
• To understand the best solution and place, a stakeholder might establish a research farm to understand the possibilities of this particular place.
Figure 10 Open ocean mussel farm design.
Figure 11 Mussel farm in Denmark
Farm place

10
200m 200m 200m
750m
250m
Figure 12 Example of long-line culture on ropes. View from the top on mussel farm.
Visualisationofsuggestedanchorpositions
Figure 13 Example of long-line culture on rope. View from the side. [10]
In Denmark the farmer drills the bottom to secure anchors. The anchors are more stable when the drilling is done in winter through the ice. Also to keep ropes stable, the farmer adds small weight on ropes before establishing the farm.
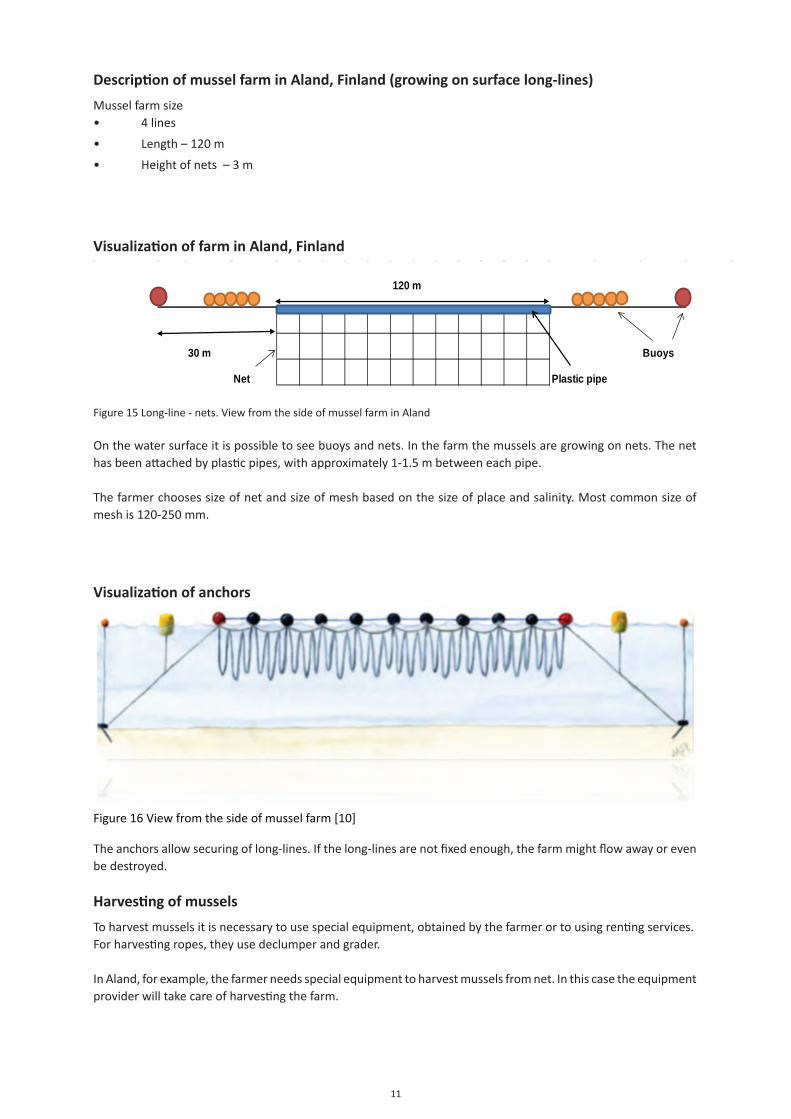
11
DescriptionofmusselfarminAland,Finland(growingonsurfacelong-lines)
Mussel farm size• 4 lines
• Length – 120 m
• Height of nets – 3 m
VisualizationoffarminAland,Finland
120 m
30 m Buoys
Net Plastic pipe
Figure 15 Long-line - nets. View from the side of mussel farm in Aland
On the water surface it is possible to see buoys and nets. In the farm the mussels are growing on nets. The net has been attached by plastic pipes, with approximately 1-1.5 m between each pipe.
The farmer chooses size of net and size of mesh based on the size of place and salinity. Most common size of mesh is 120-250 mm.
Visualizationofanchors
Figure 16 View from the side of mussel farm [10]
The anchors allow securing of long-lines. If the long-lines are not fixed enough, the farm might flow away or even be destroyed.
Harvestingofmussels
To harvest mussels it is necessary to use special equipment, obtained by the farmer or to using renting services.For harvesting ropes, they use declumper and grader.
In Aland, for example, the farmer needs special equipment to harvest mussels from net. In this case the equipment provider will take care of harvesting the farm.
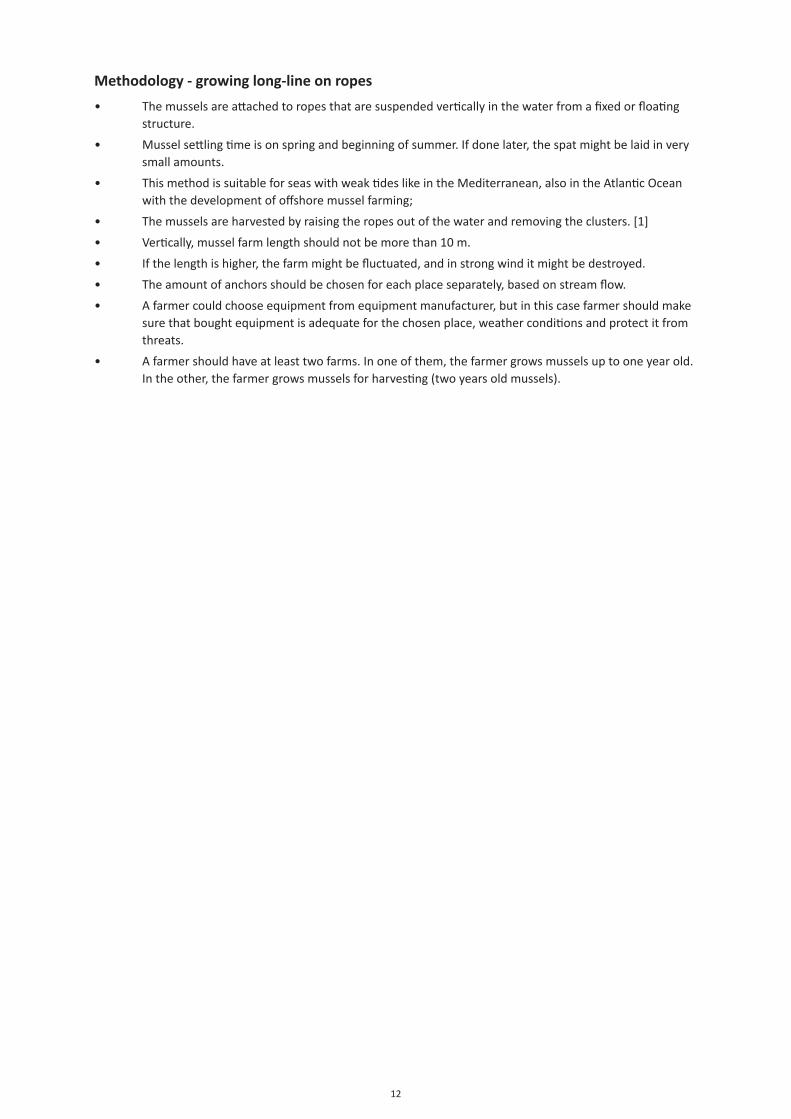
12
Methodology-growinglong-lineonropes
• The mussels are attached to ropes that are suspended vertically in the water from a fixed or floating structure.
• Mussel settling time is on spring and beginning of summer. If done later, the spat might be laid in very small amounts.
• This method is suitable for seas with weak tides like in the Mediterranean, also in the Atlantic Ocean with the development of offshore mussel farming;
• The mussels are harvested by raising the ropes out of the water and removing the clusters. [1]
• Vertically, mussel farm length should not be more than 10 m.
• If the length is higher, the farm might be fluctuated, and in strong wind it might be destroyed.
• The amount of anchors should be chosen for each place separately, based on stream flow.
• A farmer could choose equipment from equipment manufacturer, but in this case farmer should make sure that bought equipment is adequate for the chosen place, weather conditions and protect it from threats.
• A farmer should have at least two farms. In one of them, the farmer grows mussels up to one year old. In the other, the farmer grows mussels for harvesting (two years old mussels).
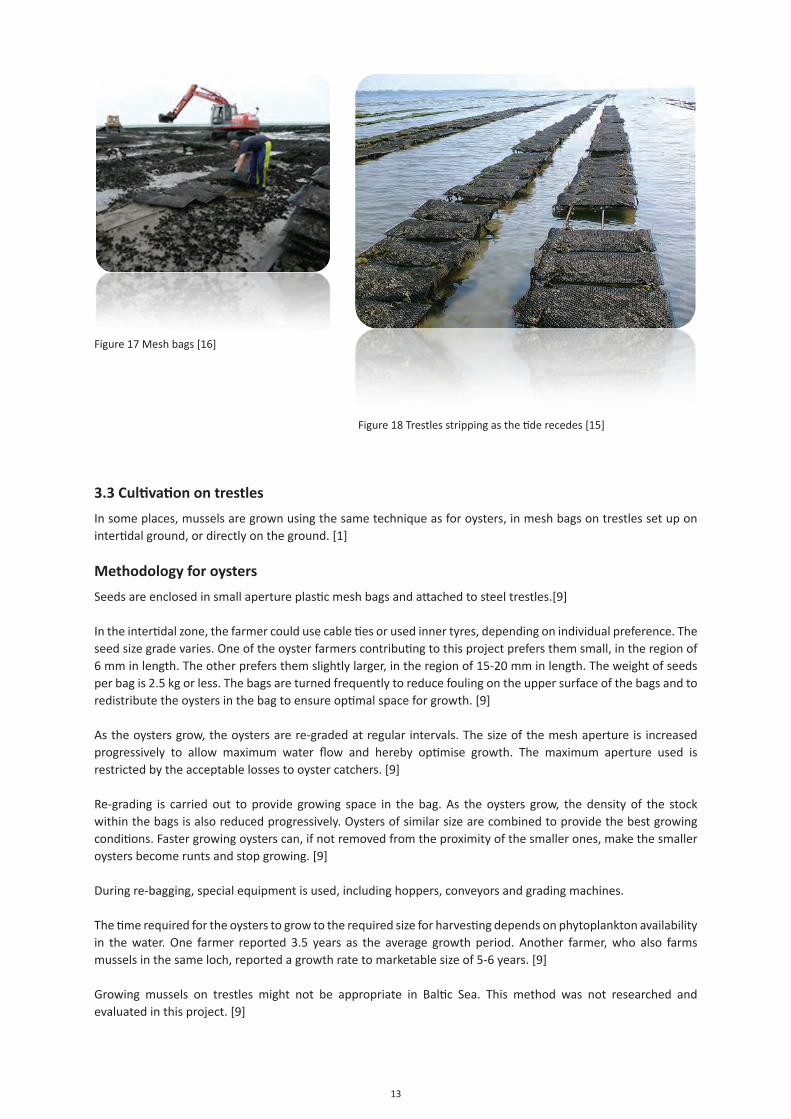
13
3.3Cultivationontrestles
In some places, mussels are grown using the same technique as for oysters, in mesh bags on trestles set up on intertidal ground, or directly on the ground. [1]
Methodologyforoysters
Seeds are enclosed in small aperture plastic mesh bags and attached to steel trestles.[9]
In the intertidal zone, the farmer could use cable ties or used inner tyres, depending on individual preference. The seed size grade varies. One of the oyster farmers contributing to this project prefers them small, in the region of 6 mm in length. The other prefers them slightly larger, in the region of 15-20 mm in length. The weight of seeds per bag is 2.5 kg or less. The bags are turned frequently to reduce fouling on the upper surface of the bags and to redistribute the oysters in the bag to ensure optimal space for growth. [9]
As the oysters grow, the oysters are re-graded at regular intervals. The size of the mesh aperture is increased progressively to allow maximum water flow and hereby optimise growth. The maximum aperture used is restricted by the acceptable losses to oyster catchers. [9]
Re-grading is carried out to provide growing space in the bag. As the oysters grow, the density of the stock within the bags is also reduced progressively. Oysters of similar size are combined to provide the best growing conditions. Faster growing oysters can, if not removed from the proximity of the smaller ones, make the smaller oysters become runts and stop growing. [9]
During re-bagging, special equipment is used, including hoppers, conveyors and grading machines. The time required for the oysters to grow to the required size for harvesting depends on phytoplankton availability in the water. One farmer reported 3.5 years as the average growth period. Another farmer, who also farms mussels in the same loch, reported a growth rate to marketable size of 5-6 years. [9]
Growing mussels on trestles might not be appropriate in Baltic Sea. This method was not researched and evaluated in this project. [9]
Figure 17 Mesh bags [16]
Figure 18 Trestles stripping as the tide recedes [15]
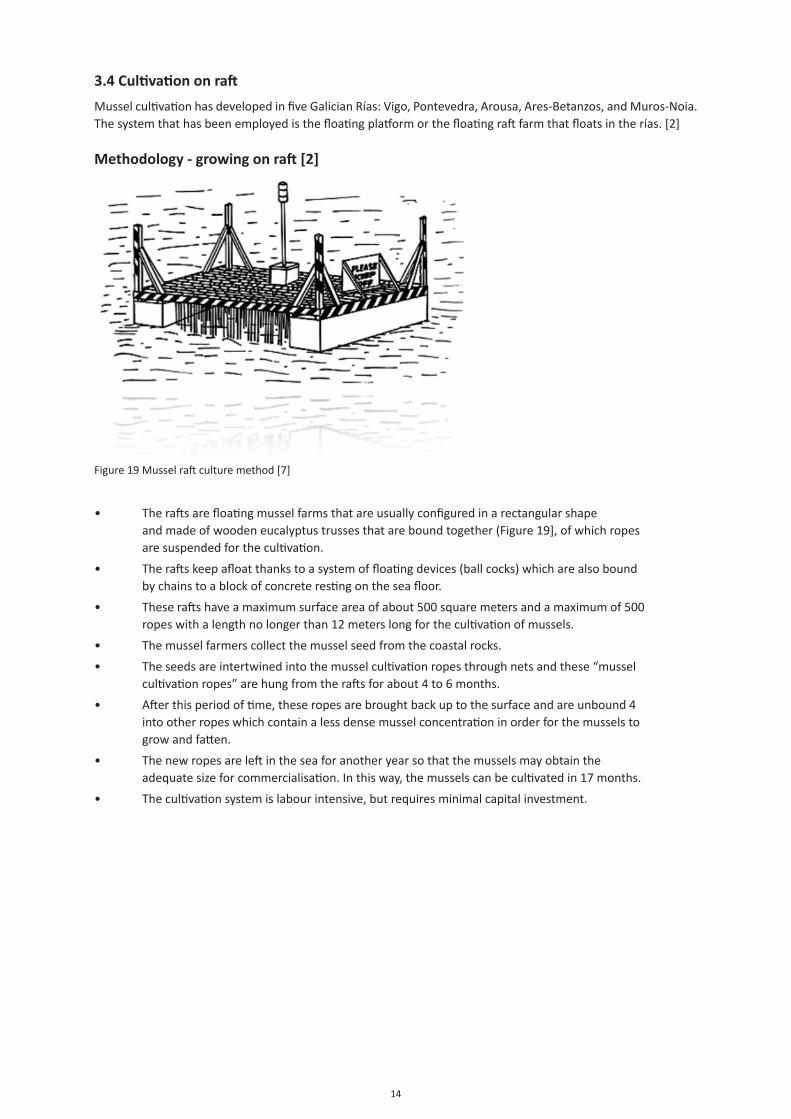
14
3.4Cultivationonraft
Mussel cultivation has developed in five Galician Rías: Vigo, Pontevedra, Arousa, Ares-Betanzos, and Muros-Noia. The system that has been employed is the floating platform or the floating raft farm that floats in the rías. [2]
Methodology-growingonraft[2]
• The rafts are floating mussel farms that are usually configured in a rectangular shape and made of wooden eucalyptus trusses that are bound together (Figure 19], of which ropes are suspended for the cultivation.
• The rafts keep afloat thanks to a system of floating devices (ball cocks) which are also bound by chains to a block of concrete resting on the sea floor.
• These rafts have a maximum surface area of about 500 square meters and a maximum of 500 ropes with a length no longer than 12 meters long for the cultivation of mussels.
• The mussel farmers collect the mussel seed from the coastal rocks.
• The seeds are intertwined into the mussel cultivation ropes through nets and these “mussel cultivation ropes” are hung from the rafts for about 4 to 6 months.
• After this period of time, these ropes are brought back up to the surface and are unbound 4 into other ropes which contain a less dense mussel concentration in order for the mussels to grow and fatten.
• The new ropes are left in the sea for another year so that the mussels may obtain the adequate size for commercialisation. In this way, the mussels can be cultivated in 17 months.
• The cultivation system is labour intensive, but requires minimal capital investment.
Figure 19 Mussel raft culture method [7]
15
4. ConclusionMussel farm should be established in places where it is:• Possible to shelter from strong winds;
• Less ice possibilities;
• Water condition is appropriate for mussel farming;
• A benthic structure is appropriate for molluscs;
• etc.
The farmer should analyse the current situation regularly. As ships are travelling all over the world, ships’ ballast water might contain invasive species which might quickly adapt in a new place. This specie might endanger a farm.
Also birds, like some ducks, might eat all mussels in one farm within one week.
In these cases, a farmer-to-be should evaluate this threat and choose the best solution to protect his farm.
On-bottom as well as of-bottom mussel growing (stakes, trestles and rafts) might not be appropriate on the Latvian costs of the Baltic Sea due to lack of tides and environmental conditions (ice, strong winds, open coastline). The most appropriate method for mussel growing might be submerged long-lines.

16
5. Mapofsalinity
Figure 20 Map and data from Helcom [5]
17
6. References1. Blue mussels and Mediterranean mussels [Online] Available from: http://ec.europa.eu/fisheries/marine_species/ farmed_fish_and_shellfish/mussels/index_en.htm [Accessed: 5 April 2013] [20]
2. CABALLERO, G., GARZA M.D., VARELA M. (2008), The governance of mussel production in Galicia, An institutional analysis [Online], Available from: http://www.univ-brest.fr/gdr-amure/eafe/eafe_conf/2008/Caballero.pdf [Accessed: 5 April 2013]
3. GOULLETqUER P., (2004-2013), Cultured Aquatic Species Information Programme. Mytilus edulis. Cultured Aquatic Species Information Programme [Online], FAO Fisheries and Aquaculture Department [online]. Rome. Updated 1 January 2004. Available from: http://www.fao.org/fishery/culturedspecies/Mytilus_edulis/en [Accessed 5 April 2013] [5]
4. GATES G.P. The Secret Life of Mussels [Online] Available from: http://www.greensisland.com/SecretLifeofMussels. html [Accessed 5 April 2013] [6]
5. HELCOM (2012), [Online], [Accessed 5 April 2013]:
• Available from: http://www.helcom.fi/environment/indicators2002/oxygen/en_GB/figure2/?u4.
highlight=salinity[7]
• Available from: http://www.helcom.fi/environment2/nature/en_GB/facts/
6. IRISH HERAULT (2012), The Irishman who invented mussel farming [Online], October 6, 2012. Available from: http://irishherault.wordpress.com/2012/10/06/bouchot-moules-mussels-irish/[3] [Accessed 5 April 2013]
7. LOVATELLI A., BAyLON C.B., GARRIDO-HANDOG L., AyPA, S. M., LIO-PO G. (1990), Selected papers on mollusc culture [Online], UNDP/FAO Regional seafarming development and demonstration project (RAS/90/002) National Inland Fisheries Institute Kasetsart University Campus Bangkhen, Bangkok, Thailand, Available from: http://www. fao.org/docrep/field/003/AB737E/AB737E04.htm (Accessed October 10, 2012) [24]
8. MCNIVIN A.A. & Associates (2006), Farmed Mussels, Final report, [Online] Seafood Watch Seafood Report, Monterey Bay Aquarium Available from http://www.montereybayaquarium.org/cr/cr_seafoodwatch/content/ media/MBA_SeafoodWatch_FarmedMussels.pdf [Accessed 5 April 2013] [8]
9. MEyHOFF J. F., Carbon Footprint Of Scottish Suspended Mussels And Intertidal Oysters [Online], 2012 Available from http://www.sarf.org.uk/cms-assets/documents/43896-326804.sarf078.pdf [Accessed 5 April 2013] [10]
10. PETERSEN, J.K., MAAR M., HOLMER M. Muslinger som virkemiddel - Et pilotstudie [Online], 2010, By- og landskabstyrelsen, Miljpministeriet, Available from lhttp://www.skaldyrcenter.dk/files/Muslinger%20som%20 virkemiddel_rapport.pdf [Accessed 5 April 2013] [11]
11. PLEINE MER, Available from Available from http://www.pleinemer.com/bouchot-en.htm [Accessed 5 April 2013] [9]
12. Publication of an application for registration pursuant to Article 8(2) of Council Regulation (EC) No 509/2006 on agricultural products and foodstuffs as traditional specialities guaranteed, [Online], Official Journal C 239, 09/08/2012 P. 0013 – 0020, (October 10, 2012) [2] [Accessed: 5 April 2013]
13. Shellfish Farming Overview [Online], Project BLUE SEED, Available from http://www.blueseedproject.com/index. php/44/shellfish-farming/ [Accessed 5 April 2013] [12]
14. TUCKER C.S., HARGREAVES J.A. Environmental Best Management for Aquaculture 2008 Blackwell Publishing. [Online], Available from http://books.google.lv/ p. 438-439) [Accessed 5 April 2013]

18
15. Photo: CANTWELL E., [Online], Available from http://ringcowaterford.blogspot.com/2007/12/oyster-farming-in- ring.html#!/2007/12/oyster-farming-in-ring.html\ [Accessed 5 April 2013]
16. Photo: FliCkR/PALIMBIZ, [Online], Available from http://www.flickr.com/photos/palimbiz/6065817607/ [Accessed 5 April 2013] [14]
17. Photo: KAy P., [Online], Available from http://www.naturalengland.org.uk/ourwork/marine/mpa/mcz/features/ habitats/bluemusselbeds.aspx [Accessed 5 April 2013]
18. Photo: MONTEREy FISH MARKET, [Online], Available from http://www.montereyfish.com/pages/methods/dredge. html [Accessed 5 April 2013]
19. Photo: MONTEREy FISH MARKET, [Online], Available from http://www.geograph.ie/photo/360536 [Accessed 5 April 2013] Available from http://teacheratsea.files.wordpress.com/2012/07/dump-dredge.jpg [Accessed 5 April 2013] šo [22] aizvietot
20. Photo: MORECAMBE BAy OySTERS, [Online], Available from http://morecambebayoysters.co.uk/oysters/?page_ id=22 [Accessed 5 April 2013] [16]
21. Photo: NOAA OCEAN ExPLORER [Online], Available from http://oceanexplorer.noaa.gov/explorations/04fire/logs/ april11/media/mussel_mound.html [Accessed 5 April 2013]
22. Photo: SEA PRODUCT NEW ZEALAND LIMITED [Online], Available from http://home.xtra.co.nz/hosts/seapro/ information.html [Accessed 5 April 2013]
23. Gosling E. Bivalve Molluscs; Biology, Ecology and Culture, 443 p. Blackwell Publishing
24. Langan R., Mussel longline design and installation. 2011 Mussel Farming Workshop [Online] http://www.mbl.edu/ mrc/offshore-mussel-farming-workshop/
3.1.2Mussel farming equipment and costs
2
Contents
1 Mussel farm in Denmark [1] ..................................................................................................6
1.1 Canadian line ..............................................................................................................................6
1.2 Seed collectors line ................................................................................................................... 12
1.3 Swedish line .............................................................................................................................. 13
1.4 Other costs ............................................................................................................................... 14
1.5 Income ...................................................................................................................................... 18
1.6 Calculation of profit/loss ........................................................................................................... 19
2 Mussel farm Finland [2] ......................................................................................................20
3 Harvested amount of mussel ..............................................................................................23
4 Mussel farm in Sweden .......................................................................................................26
5 Advisable investment costs for mussel farm in the Baltic Sea ..............................................29
6 Comparing of costs .............................................................................................................32
7 References ..........................................................................................................................33
Disclaimer: The contents of the document reflect the authors’ views. The Managing Authority of the Central Baltic INTERREG IV A Programme cannot be held liable for information published by the project partners.

3
Figures and tablesFigure 1; Visualisation of Canadian line. View from the side [1] ........................................................................... 6
Figure 2; Screw anchor held by dr. J.K.Petersen .................................................................................................... 7
Figure 3; Cement anchors, photo from forums.sailinganarchy.com ...................................................................... 8
Figure 4; Long-line floats, photo from www.jjchicolino.es .................................................................................... 9
Figure 5; Mussel floats .......................................................................................................................................... 9
Figure 6; Ropes .................................................................................................................................................... 10
Figure 7; Open water crop rope .......................................................................................................................... 10
Figure 8; Aqualoop Crop Rope ............................................................................................................................. 10
Figure 9; Hatchery rope ....................................................................................................................................... 11
Figure 10; Different type of ropes ....................................................................................................................... 11
Figure 11; Seed collectors’ line. [1] ..................................................................................................................... 12
Figure 12; Visualisation of Swedish lines [1] ....................................................................................................... 13
Figure 13; Isothermical bins for live holding, photo from www.cocci.org.uk ...................................................... 14
Figure 14; Truck electronic pallet, photo from www.cocci.org.uk ....................................................................... 14
Figure 15; Socking table ...................................................................................................................................... 15
Figure 16; Socking process, photo ....................................................................................................................... 15
Figure 17; Declumping and grading, photo has been taken in Canada, PEI ........................................................ 16
Figure 18; Declumper, photo has been taken in Canada, St.John’s ..................................................................... 16
Figure 19; Visualisation of Aland farm ................................................................................................................. 20
Figure 20; Aland farm .......................................................................................................................................... 20
Figure 21; Salinity, mussel amount, harvesting period ........................................................................................ 23
Figure 22; Visualisation of Sweden farm ............................................................................................................. 26
Figure 23; Visualization of Canadian line for mussel farming .............................................................................. 29
4
Table 1; Investment cost for one Canadian line..................................................................................................... 7
Table 2; Investment cost for one Seed collectors line ......................................................................................... 12
Table 3; Investment cost for one Swedish line .................................................................................................... 13
Table 4; Other equipment cost ............................................................................................................................ 14
Table 5; Labour costs for establishing a farm ...................................................................................................... 17
Table 6; Investment cost ...................................................................................................................................... 17
Table 7; Maintenance cost ................................................................................................................................... 17
Table 8; Labour cost ............................................................................................................................................. 18
Table 9; Incomes .................................................................................................................................................. 18
Table 10; Profit/loss statement ........................................................................................................................... 19
Table 11; Investment cost .................................................................................................................................... 21
Table 12; Other costs ........................................................................................................................................... 21
Table 13; Profit/loss statement ........................................................................................................................... 22
Table 14; Equipment ............................................................................................................................................ 26
Table 15; Maintenance costs ............................................................................................................................... 27
Table 16; Harvesting costs ................................................................................................................................... 27
Table 17; Augment cost ....................................................................................................................................... 27
Table 18; Annual cost .......................................................................................................................................... 27
Table 19; Profit/loss statement ........................................................................................................................... 28
Table 20; Numbers comparing two farms ........................................................................................................... 32

5
Abbreviation
DSC Danish Shellfish Center
DKK Danish crone
EUR euro
ha hectare
m meter
mm millimetre
mln million
qty quantity
UK United Kingdom
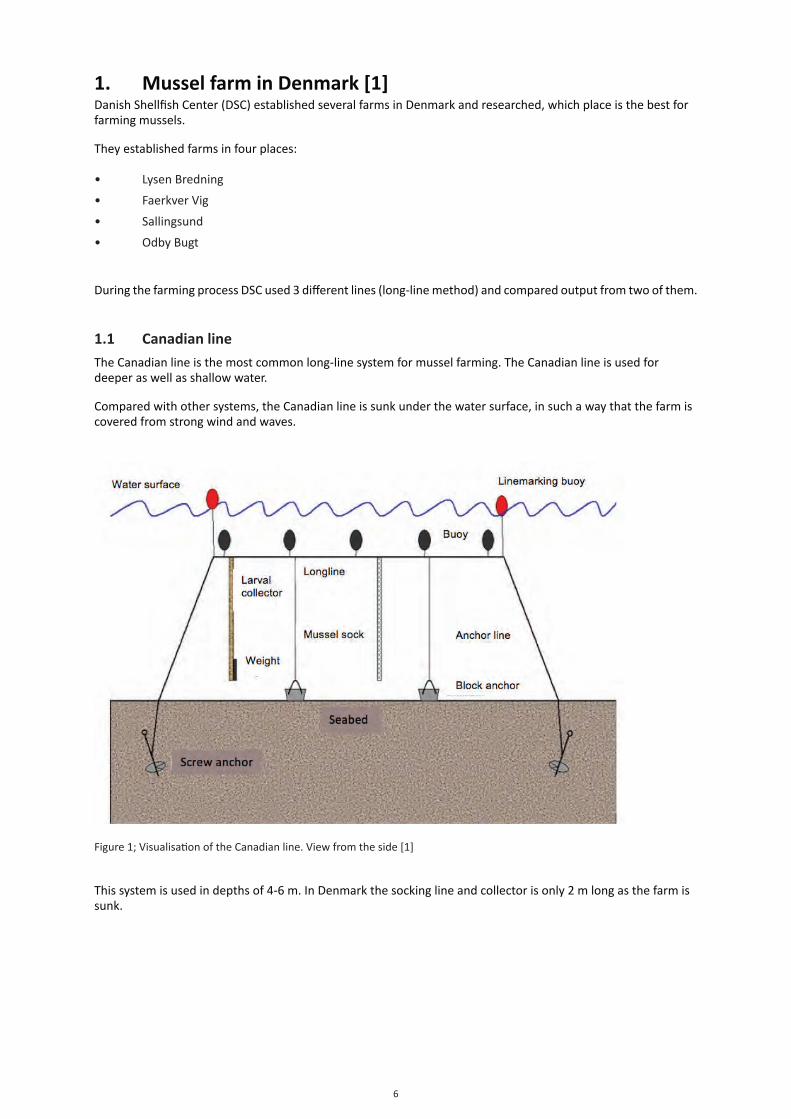
6
1. Mussel farm in Denmark [1]Danish Shellfish Center (DSC) established several farms in Denmark and researched, which place is the best for farming mussels.
They established farms in four places:
• Lysen Bredning
• Faerkver Vig
• Sallingsund
• Odby Bugt
During the farming process DSC used 3 different lines (long-line method) and compared output from two of them.
1.1 Canadian lineThe Canadian line is the most common long-line system for mussel farming. The Canadian line is used for deeper as well as shallow water.
Compared with other systems, the Canadian line is sunk under the water surface, in such a way that the farm is covered from strong wind and waves.
Figure 1; Visualisation of the Canadian line. View from the side [1]
This system is used in depths of 4-6 m. In Denmark the socking line and collector is only 2 m long as the farm is sunk.
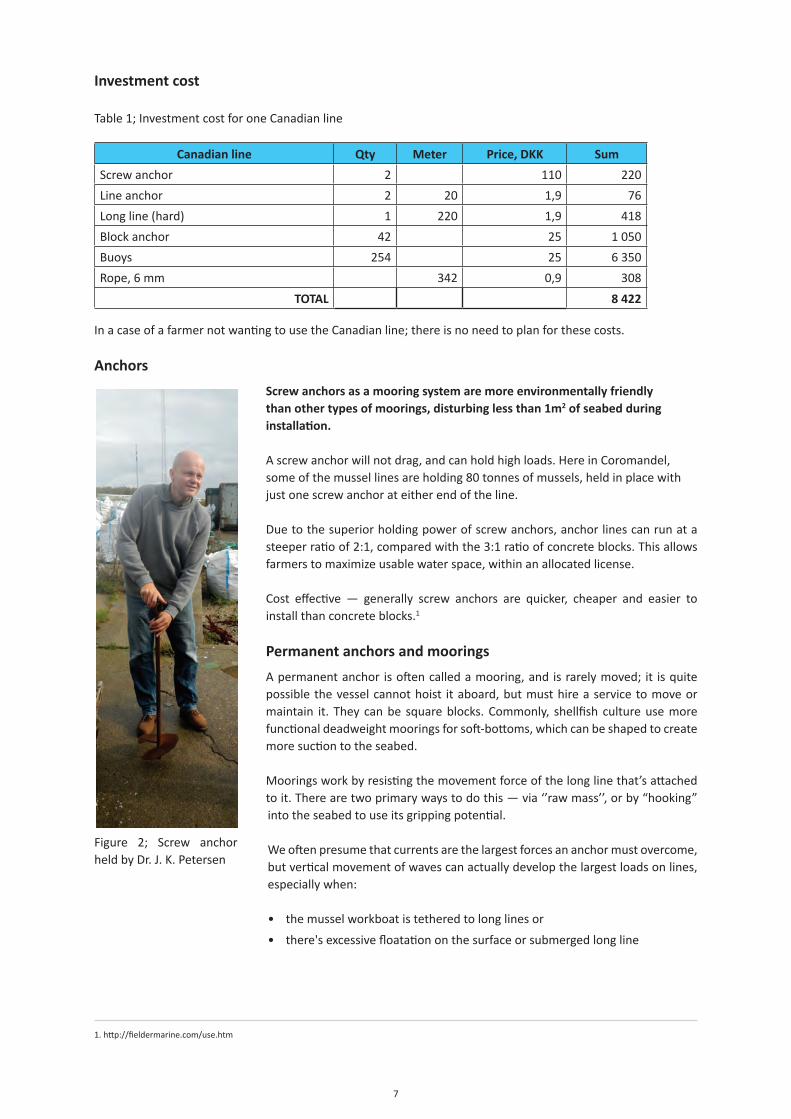
7
Investment cost
Table 1; Investment cost for one Canadian line
Canadian line Qty Meter Price, DKK Sum
Screw anchor 2 110 220
Line anchor 2 20 1,9 76
Long line (hard) 1 220 1,9 418
Block anchor 42 25 1 050
Buoys 254 25 6 350
Rope, 6 mm 342 0,9 308
TOTAL 8 422
In a case of a farmer not wanting to use the Canadian line; there is no need to plan for these costs.
Anchors
Screw anchors as a mooring system are more environmentally friendly than other types of moorings, disturbing less than 1m2 of seabed during installation. A screw anchor will not drag, and can hold high loads. Here in Coromandel, some of the mussel lines are holding 80 tonnes of mussels, held in place with just one screw anchor at either end of the line.
Due to the superior holding power of screw anchors, anchor lines can run at a steeper ratio of 2:1, compared with the 3:1 ratio of concrete blocks. This allows farmers to maximize usable water space, within an allocated license. Cost effective — generally screw anchors are quicker, cheaper and easier to install than concrete blocks.1
Permanent anchors and moorings
A permanent anchor is often called a mooring, and is rarely moved; it is quite possible the vessel cannot hoist it aboard, but must hire a service to move or maintain it. They can be square blocks. Commonly, shellfish culture use more functional deadweight moorings for soft-bottoms, which can be shaped to create more suction to the seabed.
Moorings work by resisting the movement force of the long line that’s attached to it. There are two primary ways to do this — via ‘’raw mass’’, or by “hooking” into the seabed to use its gripping potential.
We often presume that currents are the largest forces an anchor must overcome, but vertical movement of waves can actually develop the largest loads on lines, especially when:
• the mussel workboat is tethered to long lines or
• there's excessive floatation on the surface or submerged long line
Figure 2; Screw anchor held by Dr. J. K. Petersen
1. http://fieldermarine.com/use.htm
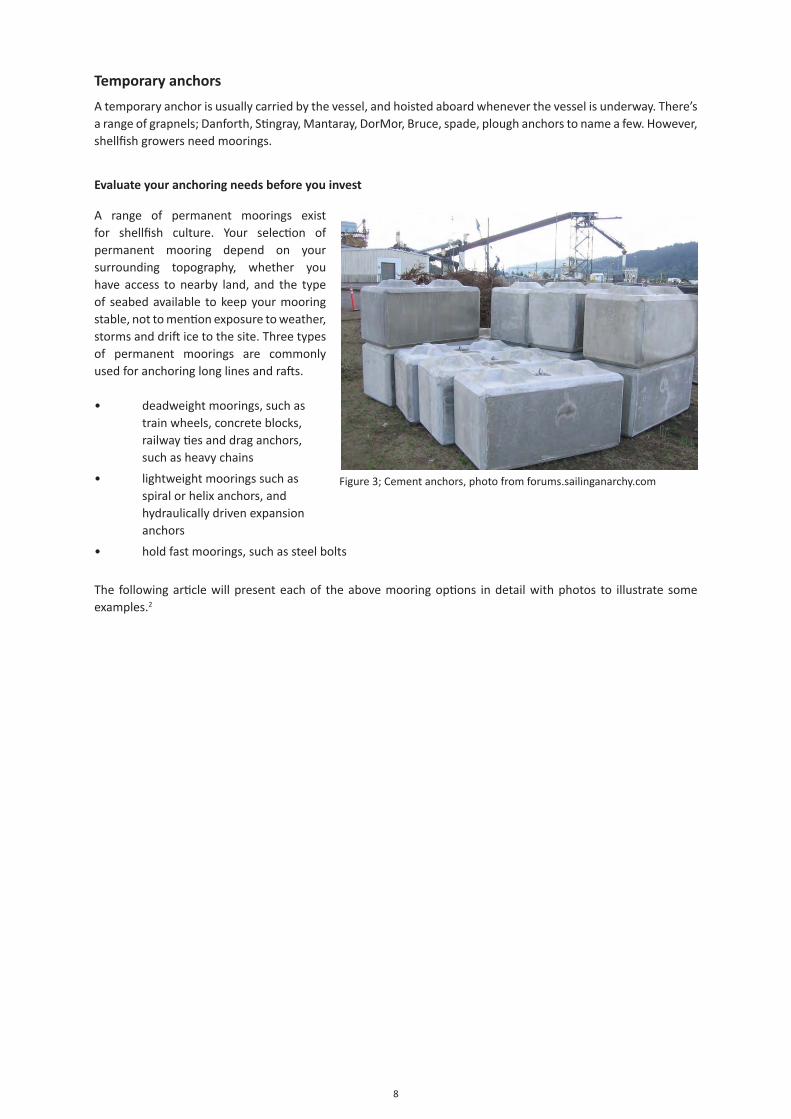
8
Temporary anchors
A temporary anchor is usually carried by the vessel, and hoisted aboard whenever the vessel is underway. There’s a range of grapnels; Danforth, Stingray, Mantaray, DorMor, Bruce, spade, plough anchors to name a few. However, shellfish growers need moorings.
Evaluate your anchoring needs before you invest
A range of permanent moorings exist for shellfish culture. Your selection of permanent mooring depend on your surrounding topography, whether you have access to nearby land, and the type of seabed available to keep your mooring stable, not to mention exposure to weather, storms and drift ice to the site. Three types of permanent moorings are commonly used for anchoring long lines and rafts.
• deadweight moorings, such as train wheels, concrete blocks, railway ties and drag anchors, such as heavy chains
• lightweight moorings such as spiral or helix anchors, and hydraulically driven expansion anchors
• hold fast moorings, such as steel bolts
The following article will present each of the above mooring options in detail with photos to illustrate some examples.2
Figure 3; Cement anchors, photo from forums.sailinganarchy.com

9
FLOATS AND BUOYS
Made with blow moulding method, they are equipped with valves for inflating air. These used floats come from mussel farms in the open sea, where they can no longer be used as they lose air and do not hold the pressure. The floats can find another use where it is not required that the float goes completely underwater, such as lagoons, protected farms, farms “biventia” type.3
JFC Manufacturing Co Ltd offers their produced floats, which “increases yields, reduced crop losses, and maximised profits of mussel farmers throughout Ireland, UK, Netherlands, France and Bulgaria. JFC mussel floats are ideal for inshore and offshore locations, are proven in the most exposed conditions of the Atlantic Ocean, and can significantly improve the profitability of mussel farming enterprises”.4
They suggest to use floats which sink under the water surface with increases of mussel weight. Video is available in www.jfcmarine.com/MusselsFloats.html
Figure 4; Long-line floats, photo from www.jjchicolino.es
2. http://www.musseltalk.com/index.php?option=com_k2&view=item&id=5:anchors-moorings-part-1-deadweight-moorings&Itemid=35&lang=en 3. http://www.cocci.org.uk/page.aspx?pagina=3&contenuto=38 4. http://www.jfcmarine.com/MusselsFloats.html 5. http://www.jfcmarine.com/MusselsFloats.html
Figure; Mussel floats5
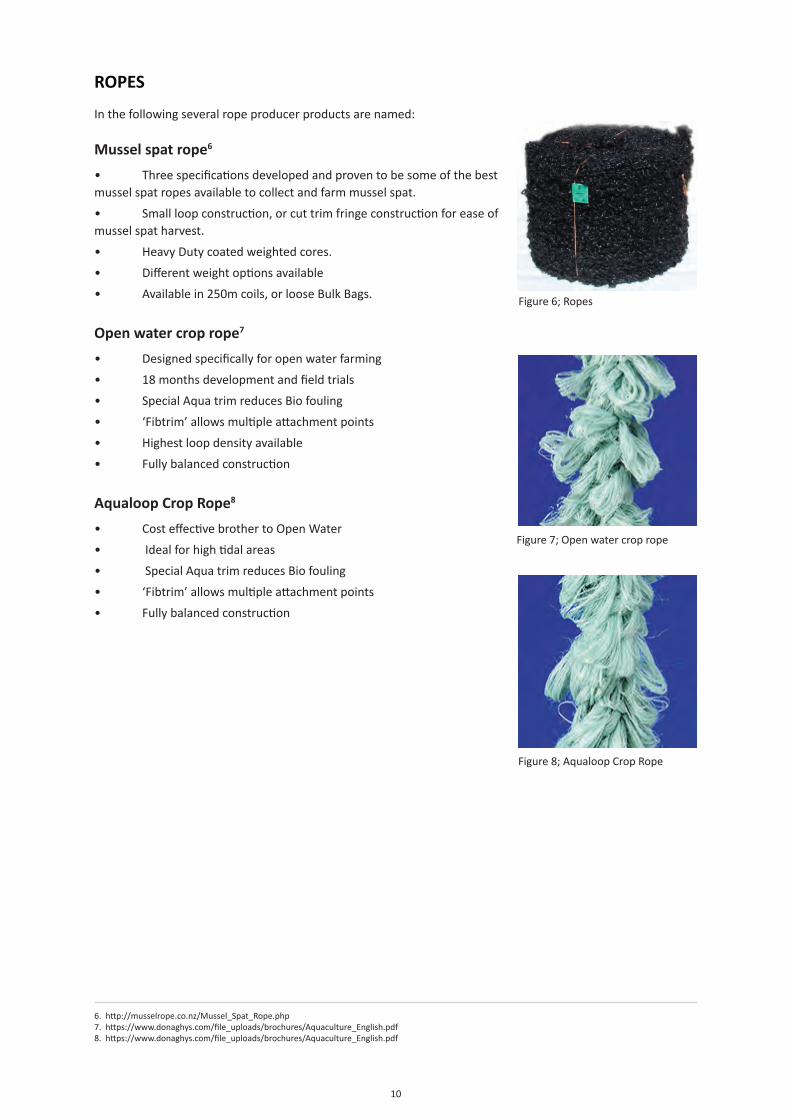
10
ROPES
In the following several rope producer products are named:
Mussel spat rope6
• Three specifications developed and proven to be some of the best mussel spat ropes available to collect and farm mussel spat.
• Small loop construction, or cut trim fringe construction for ease of mussel spat harvest.
• Heavy Duty coated weighted cores.
• Different weight options available
• Available in 250m coils, or loose Bulk Bags.
Open water crop rope7 • Designed specifically for open water farming
• 18 months development and field trials
• Special Aqua trim reduces Bio fouling
• ‘Fibtrim’ allows multiple attachment points
• Highest loop density available
• Fully balanced construction
Aqualoop Crop Rope8
• Cost effective brother to Open Water
• Ideal for high tidal areas
• Special Aqua trim reduces Bio fouling
• ‘Fibtrim’ allows multiple attachment points
• Fully balanced construction
Figure 6; Ropes
Figure 7; Open water crop rope
Figure 8; Aqualoop Crop Rope
6. http://musselrope.co.nz/Mussel_Spat_Rope.php7. https://www.donaghys.com/file_uploads/brochures/Aquaculture_English.pdf8. https://www.donaghys.com/file_uploads/brochures/Aquaculture_English.pdf
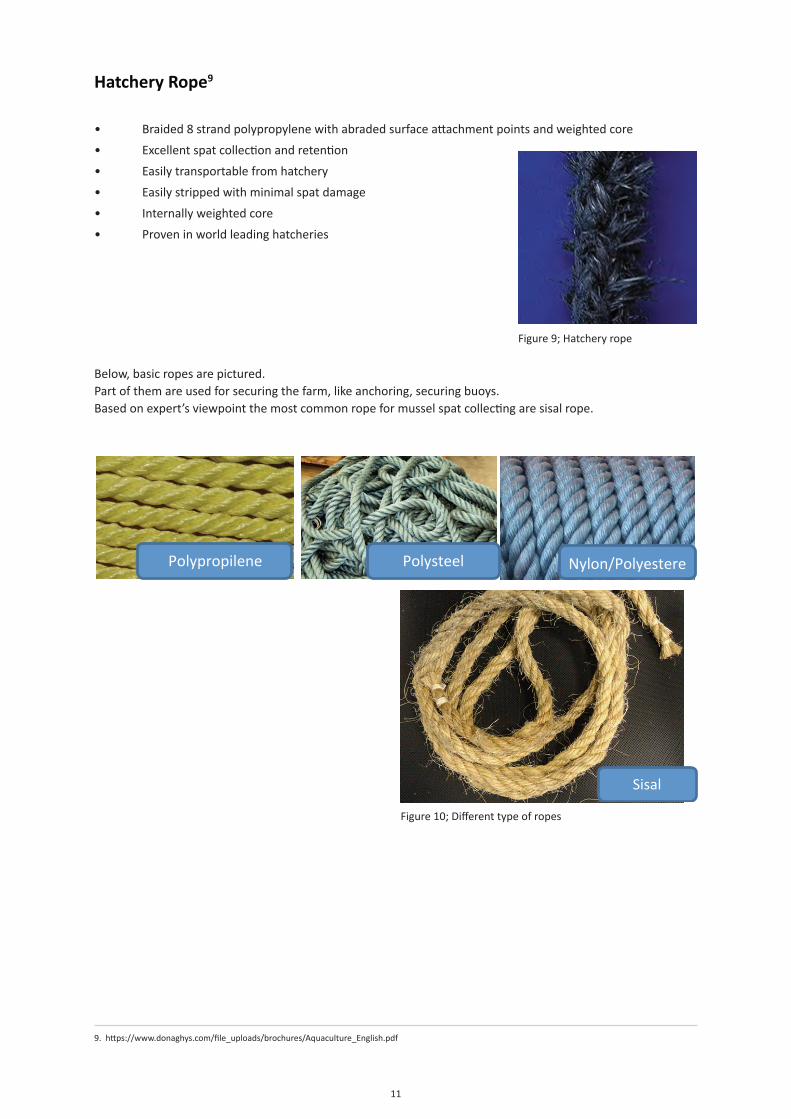
11
Hatchery Rope9
• Braided 8 strand polypropylene with abraded surface attachment points and weighted core
• Excellent spat collection and retention
• Easily transportable from hatchery
• Easily stripped with minimal spat damage
• Internally weighted core
• Proven in world leading hatcheries
Below, basic ropes are pictured.Part of them are used for securing the farm, like anchoring, securing buoys.Based on expert’s viewpoint the most common rope for mussel spat collecting are sisal rope.
Figure 9; Hatchery rope
Polypropilene Polysteel Nylon/Polyestere
Sisal
Figure 10; Different type of ropes
9. https://www.donaghys.com/file_uploads/brochures/Aquaculture_English.pdf
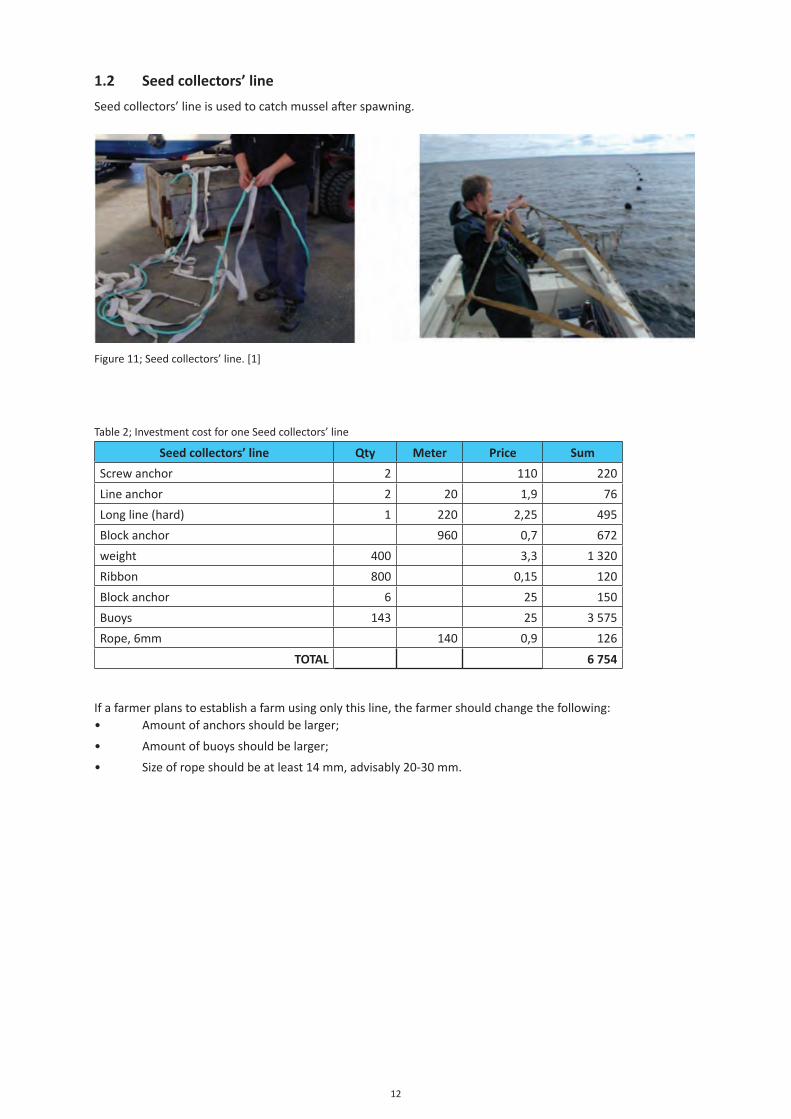
12
1.2 Seed collectors’ line
Seed collectors’ line is used to catch mussel after spawning.
Figure 11; Seed collectors’ line. [1]
Table 2; Investment cost for one Seed collectors’ line
Seed collectors’ line Qty Meter Price Sum
Screw anchor 2 110 220
Line anchor 2 20 1,9 76
Long line (hard) 1 220 2,25 495
Block anchor 960 0,7 672
weight 400 3,3 1 320
Ribbon 800 0,15 120
Block anchor 6 25 150
Buoys 143 25 3 575
Rope, 6mm 140 0,9 126
TOTAL 6 754
If a farmer plans to establish a farm using only this line, the farmer should change the following:• Amount of anchors should be larger;
• Amount of buoys should be larger;
• Size of rope should be at least 14 mm, advisably 20-30 mm.
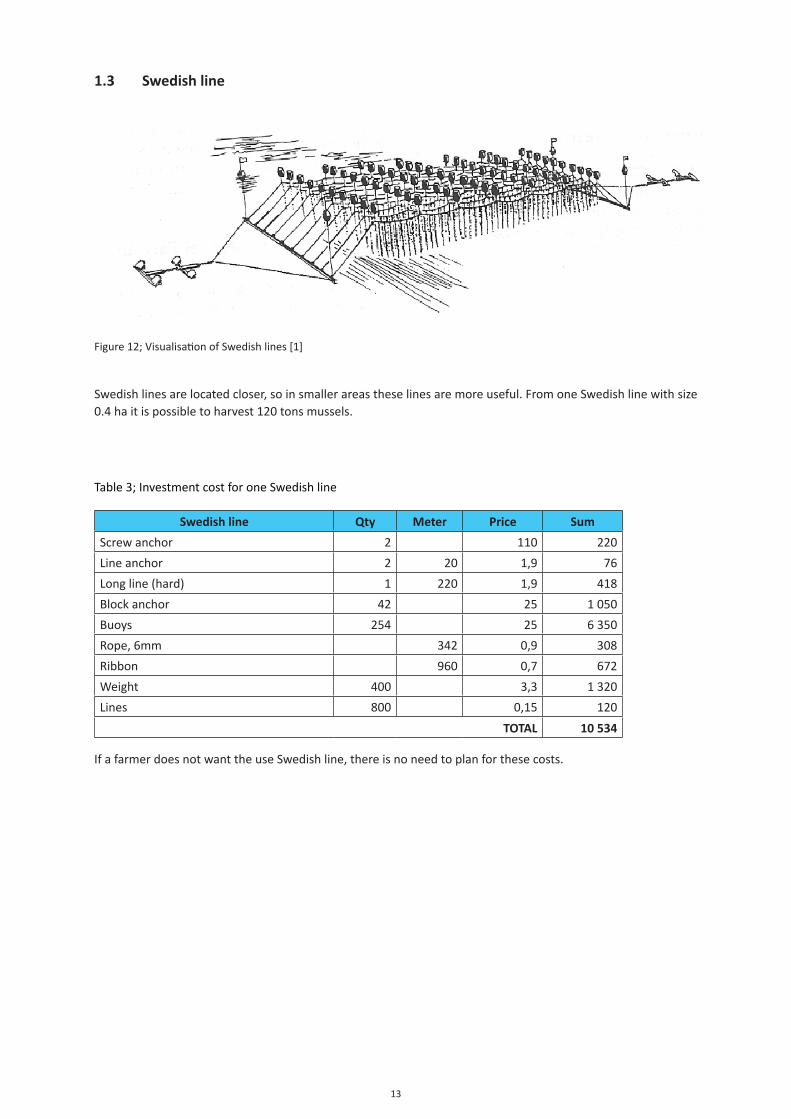
13
1.3 Swedish line
Figure 12; Visualisation of Swedish lines [1]
Swedish lines are located closer, so in smaller areas these lines are more useful. From one Swedish line with size 0.4 ha it is possible to harvest 120 tons mussels.
Table 3; Investment cost for one Swedish line
Swedish line Qty Meter Price Sum
Screw anchor 2 110 220
Line anchor 2 20 1,9 76
Long line (hard) 1 220 1,9 418
Block anchor 42 25 1 050
Buoys 254 25 6 350
Rope, 6mm 342 0,9 308
Ribbon 960 0,7 672
Weight 400 3,3 1 320
Lines 800 0,15 120
TOTAL 10 534
If a farmer does not want the use Swedish line, there is no need to plan for these costs.
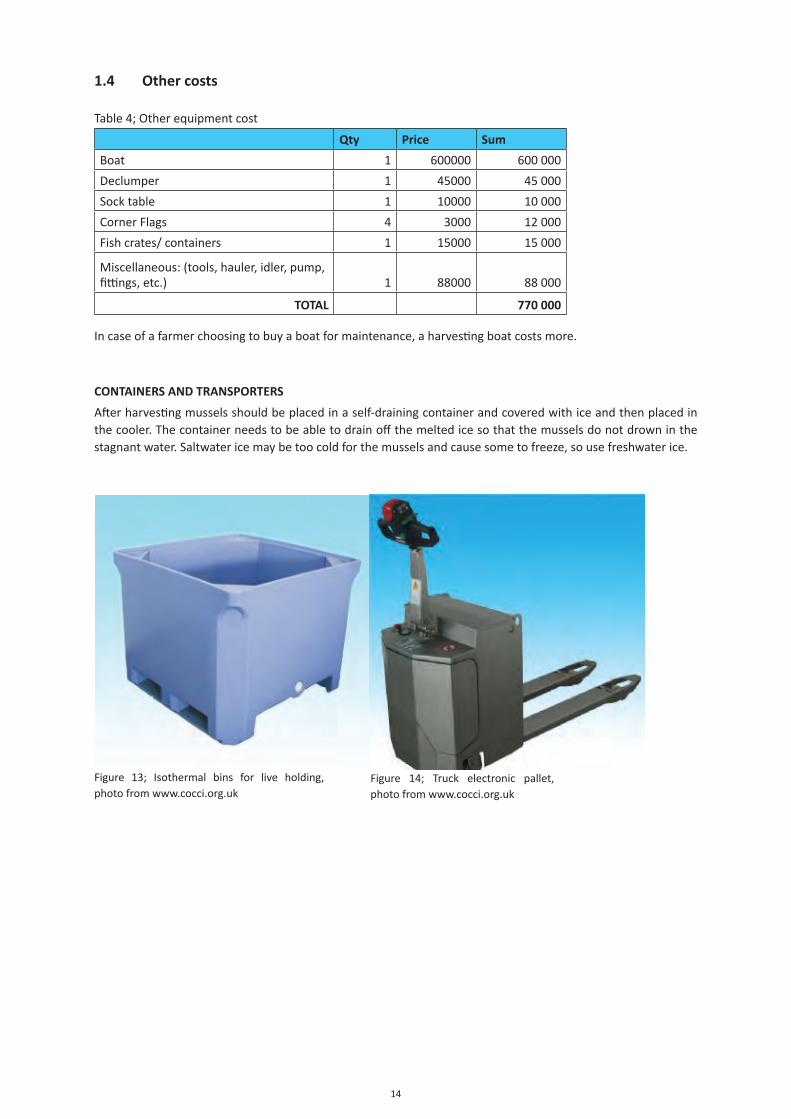
14
1.4 Other costs
Table 4; Other equipment cost
Qty Price Sum
Boat 1 600000 600 000
Declumper 1 45000 45 000
Sock table 1 10000 10 000
Corner Flags 4 3000 12 000
Fish crates/ containers 1 15000 15 000
Miscellaneous: (tools, hauler, idler, pump, fittings, etc.) 1 88000 88 000
TOTAL 770 000
In case of a farmer choosing to buy a boat for maintenance, a harvesting boat costs more.
CONTAINERS AND TRANSPORTERS
After harvesting mussels should be placed in a self-draining container and covered with ice and then placed in the cooler. The container needs to be able to drain off the melted ice so that the mussels do not drown in the stagnant water. Saltwater ice may be too cold for the mussels and cause some to freeze, so use freshwater ice.
Figure 13; Isothermal bins for live holding, photo from www.cocci.org.uk
Figure 14; Truck electronic pallet, photo from www.cocci.org.uk

15
SOCKING TABLE10
Socking mussels can be used to sock flex mesh, Fukui/Tipper, plastic, or Irish socking.
Socking is rucked on to the ABS tubes, usually 250’ at a time. A knot is tied at the end of the sock seed is dumped into the hopper, which are fed into the socking via the ABS tubes. Once the desired sock length is achieved a knot is tied and the process is repeated.
SEED COLLECTING
Seed is usually collected in the upper reaches of inlets or rivers where shallow water depths limit grow-out operations.
Seed collectors are made primarily from two metre lengths of used 12-18 mm polypropylene rope. Collectors are attached to the backline 30-50 mm apart and weighted to keep them suspended vertically in the water column. The mussel larvae settle on these collectors and grow rapidly, reaching sizes of 10 to 25 mm by fall. Care must be taken to provide adequate flotation of long lines to avoid mortality of seed by predators or fall-off during storm events.
Figure 15; Socking table11
Figure 16; Socking process, the photo has been taken in Canada, St.John’s
10. http://www.fukuina.com/shellfish/high_speed_socking_table.htm11. http://www.fukuina.com/shellfish/high_speed_socking_table.htm
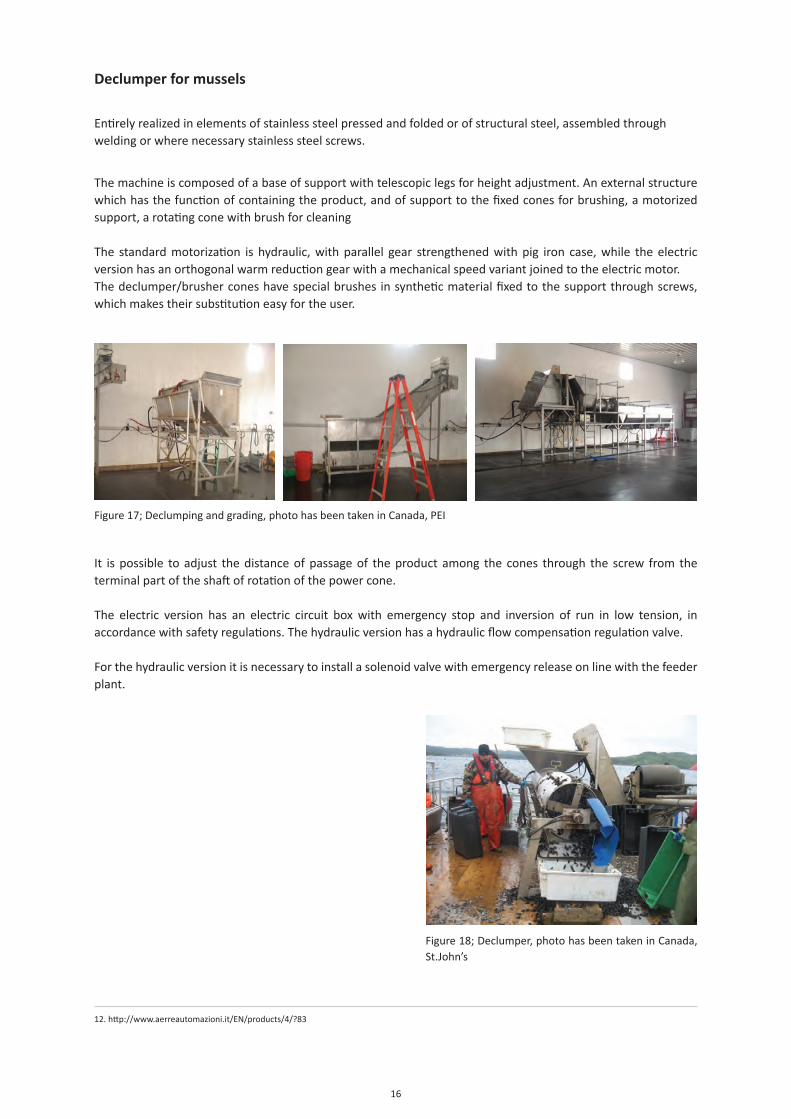
16
Declumper for mussels
Entirely realized in elements of stainless steel pressed and folded or of structural steel, assembled through welding or where necessary stainless steel screws.
The machine is composed of a base of support with telescopic legs for height adjustment. An external structure which has the function of containing the product, and of support to the fixed cones for brushing, a motorized support, a rotating cone with brush for cleaning The standard motorization is hydraulic, with parallel gear strengthened with pig iron case, while the electric version has an orthogonal warm reduction gear with a mechanical speed variant joined to the electric motor.The declumper/brusher cones have special brushes in synthetic material fixed to the support through screws, which makes their substitution easy for the user.
It is possible to adjust the distance of passage of the product among the cones through the screw from the terminal part of the shaft of rotation of the power cone.
The electric version has an electric circuit box with emergency stop and inversion of run in low tension, in accordance with safety regulations. The hydraulic version has a hydraulic flow compensation regulation valve.
For the hydraulic version it is necessary to install a solenoid valve with emergency release on line with the feeder plant.
Figure 17; Declumping and grading, photo has been taken in Canada, PEI
Figure 18; Declumper, photo has been taken in Canada, St.John’s
12. http://www.aerreautomazioni.it/EN/products/4/?83
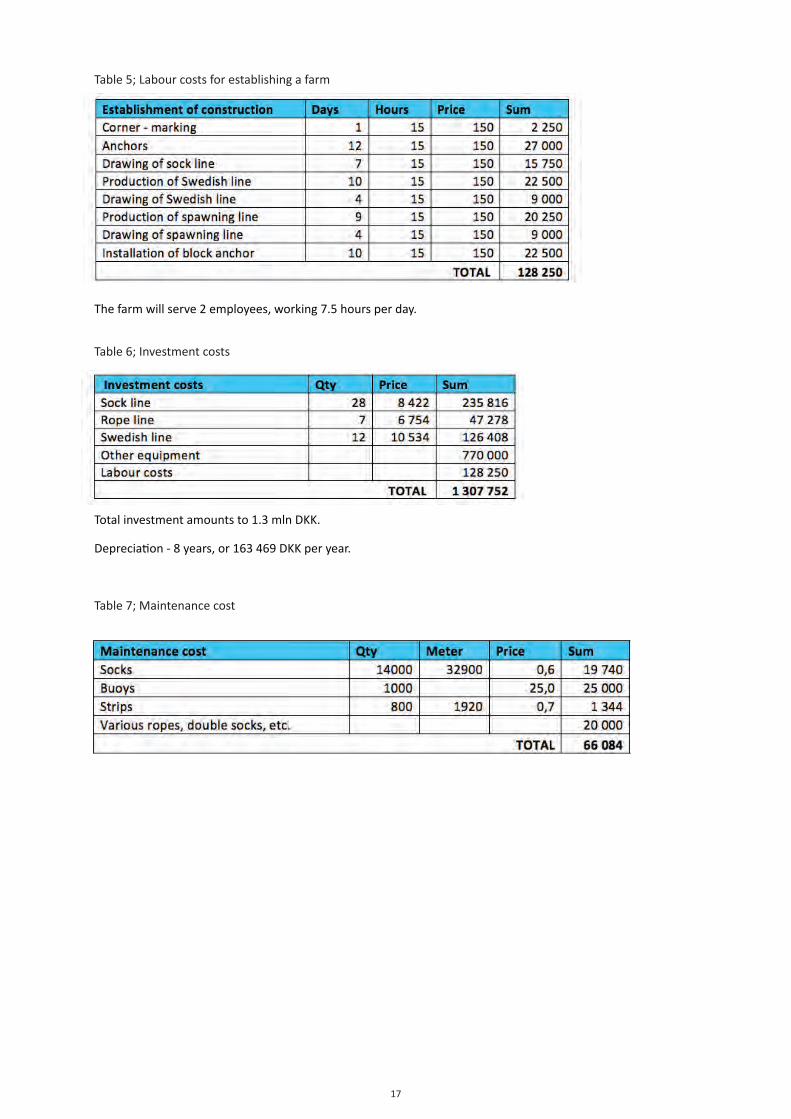
17
Table 5; Labour costs for establishing a farm
The farm will serve 2 employees, working 7.5 hours per day.
Table 6; Investment costs
Total investment amounts to 1.3 mln DKK.
Depreciation - 8 years, or 163 469 DKK per year.
Table 7; Maintenance cost
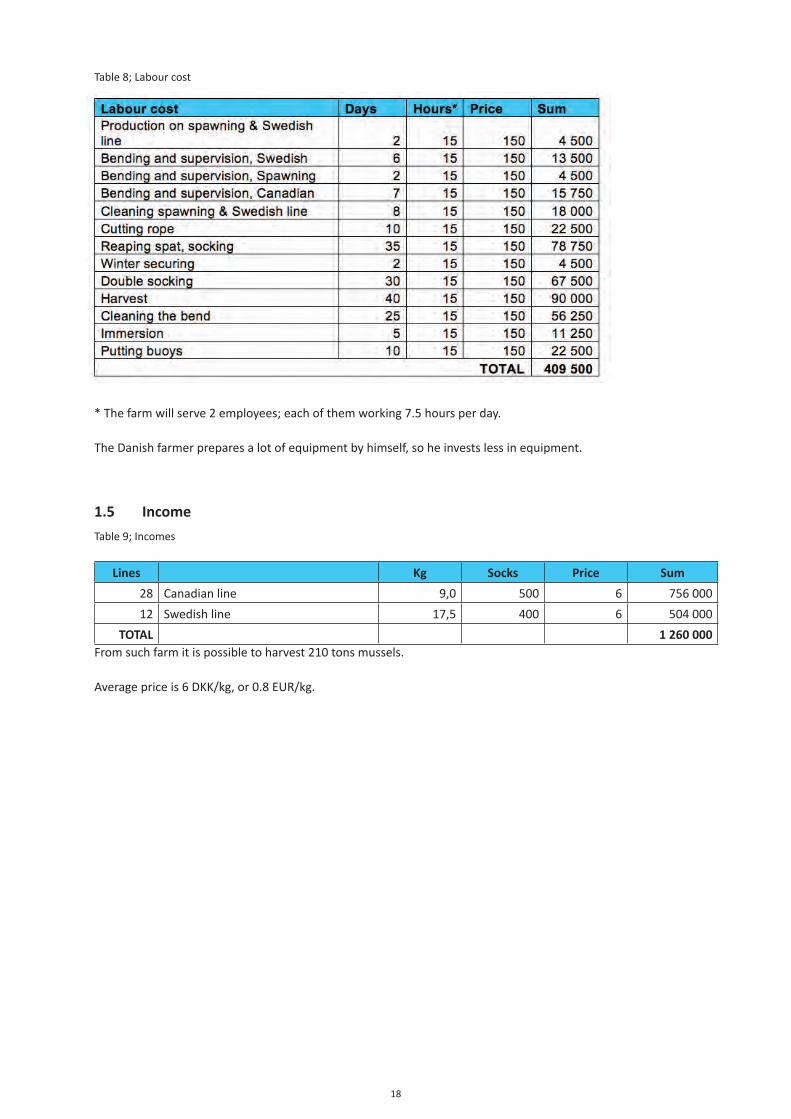
18
Table 8; Labour cost
* The farm will serve 2 employees; each of them working 7.5 hours per day.
The Danish farmer prepares a lot of equipment by himself, so he invests less in equipment.
1.5 Income
Table 9; Incomes
Lines Kg Socks Price Sum
28 Canadian line 9,0 500 6 756 000
12 Swedish line 17,5 400 6 504 000
TOTAL 1 260 000From such farm it is possible to harvest 210 tons mussels.
Average price is 6 DKK/kg, or 0.8 EUR/kg.
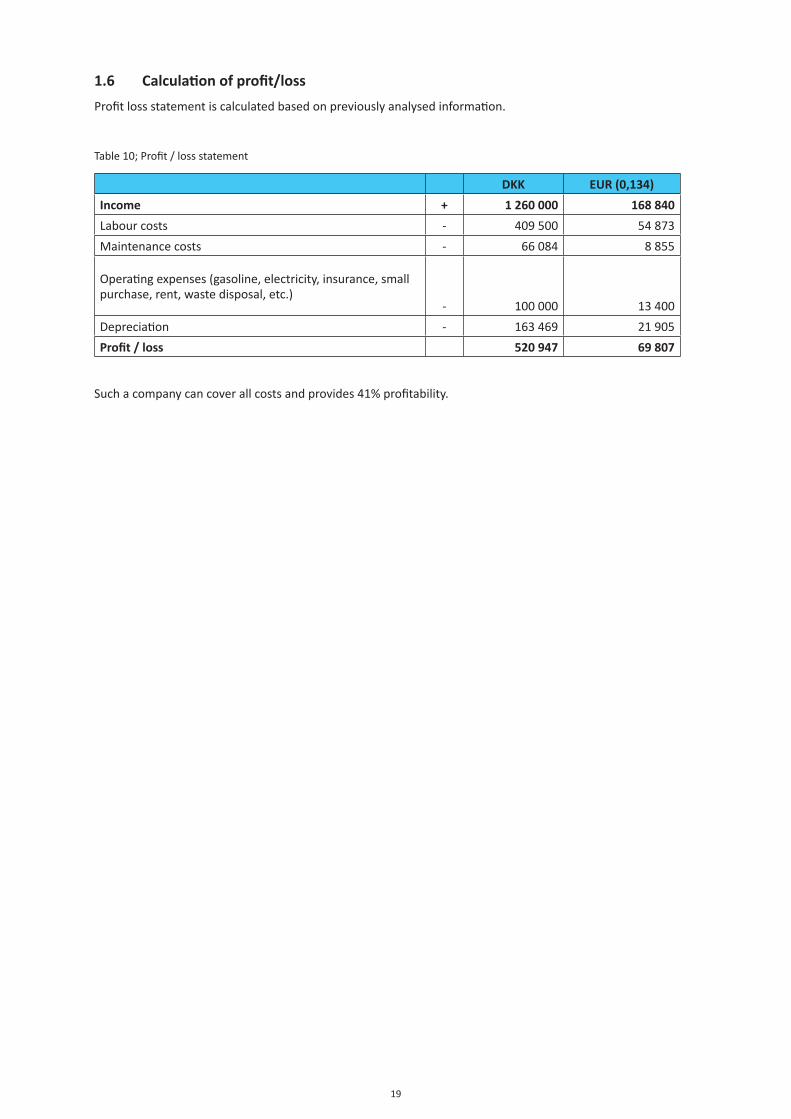
19
1.6 Calculation of profit/loss
Profit loss statement is calculated based on previously analysed information.
Table 10; Profit / loss statement
DKK EUR (0,134)
Income + 1 260 000 168 840
Labour costs - 409 500 54 873
Maintenance costs - 66 084 8 855
Operating expenses (gasoline, electricity, insurance, small purchase, rent, waste disposal, etc.)
- 100 000 13 400
Depreciation - 163 469 21 905
Profit / loss 520 947 69 807
Such a company can cover all costs and provides 41% profitability.
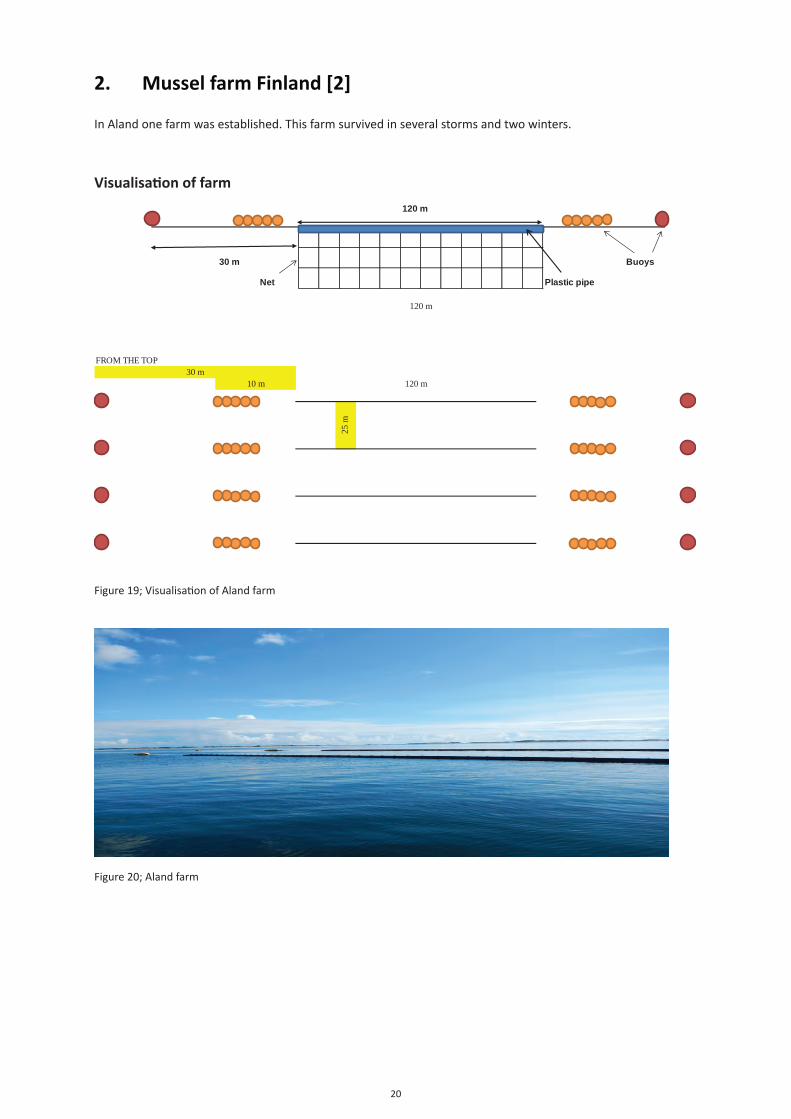
20
2. Mussel farm Finland [2]
In Aland one farm was established. This farm survived in several storms and two winters.
Visualisation of farm
Figure 19; Visualisation of Aland farm
Figure 20; Aland farm
120 m
30 m Buoys
Net Plastic pipe
120 m
FROM THE TOP
10 m 120 m
25 m
30 m
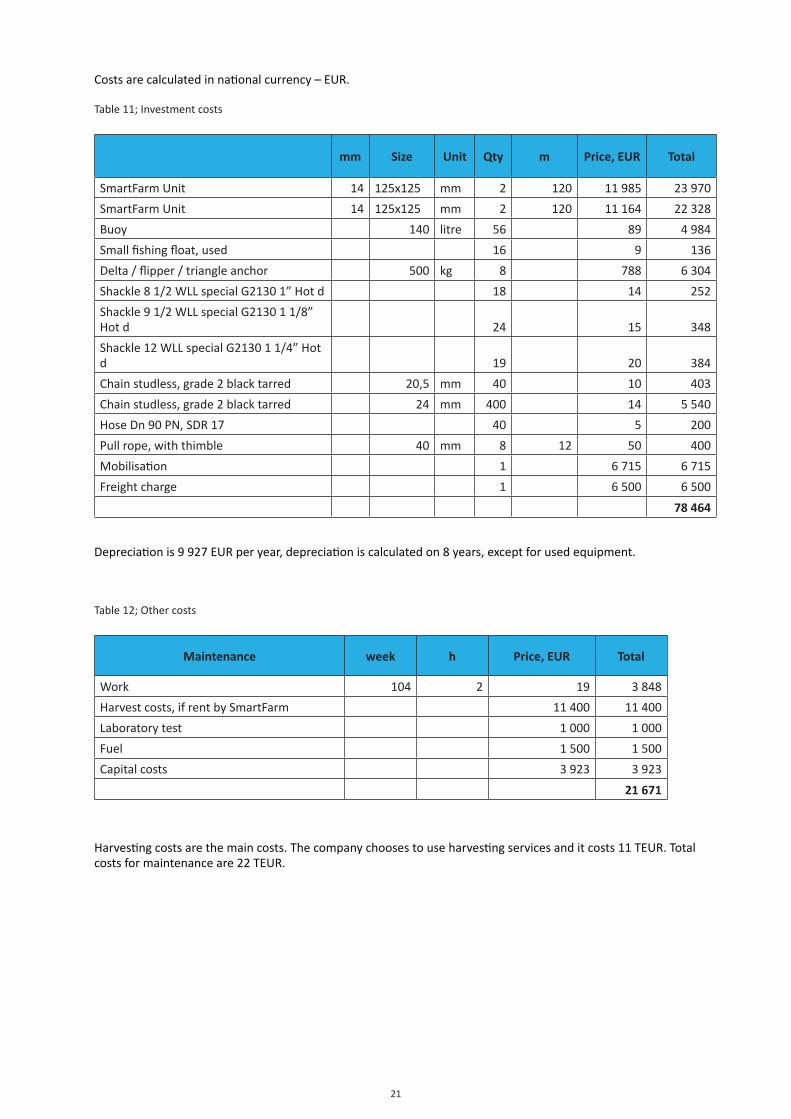
21
Costs are calculated in national currency – EUR.
Table 11; Investment costs
mm Size Unit Qty m Price, EUR Total
SmartFarm Unit 14 125x125 mm 2 120 11 985 23 970
SmartFarm Unit 14 125x125 mm 2 120 11 164 22 328
Buoy 140 litre 56 89 4 984
Small fishing float, used 16 9 136
Delta / flipper / triangle anchor 500 kg 8 788 6 304
Shackle 8 1/2 WLL special G2130 1” Hot d 18 14 252
Shackle 9 1/2 WLL special G2130 1 1/8” Hot d 24 15 348
Shackle 12 WLL special G2130 1 1/4” Hot d 19 20 384
Chain studless, grade 2 black tarred 20,5 mm 40 10 403
Chain studless, grade 2 black tarred 24 mm 400 14 5 540
Hose Dn 90 PN, SDR 17 40 5 200
Pull rope, with thimble 40 mm 8 12 50 400
Mobilisation 1 6 715 6 715
Freight charge 1 6 500 6 500
78 464
Depreciation is 9 927 EUR per year, depreciation is calculated on 8 years, except for used equipment.
Table 12; Other costs
Maintenance week h Price, EUR Total
Work 104 2 19 3 848
Harvest costs, if rent by SmartFarm 11 400 11 400
Laboratory test 1 000 1 000
Fuel 1 500 1 500
Capital costs 3 923 3 923
21 671
Harvesting costs are the main costs. The company chooses to use harvesting services and it costs 11 TEUR. Total costs for maintenance are 22 TEUR.
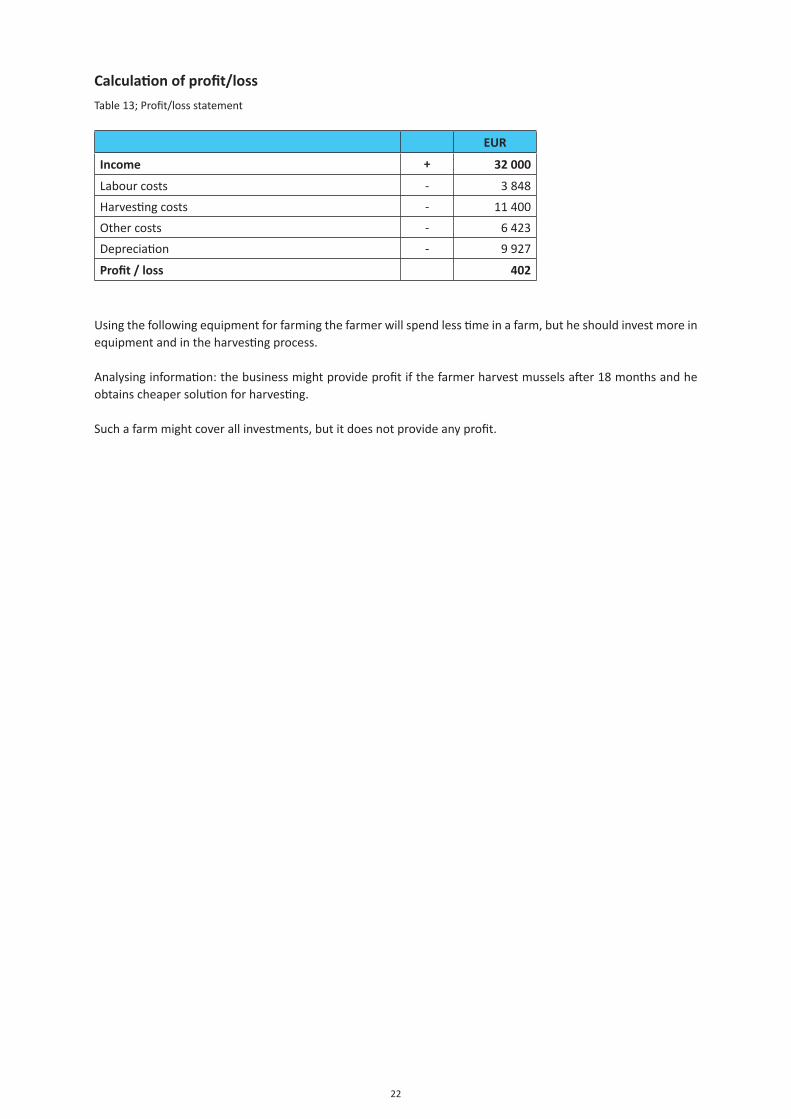
22
Calculation of profit/loss
Table 13; Profit/loss statement
EUR
Income + 32 000
Labour costs - 3 848
Harvesting costs - 11 400
Other costs - 6 423
Depreciation - 9 927
Profit / loss 402
Using the following equipment for farming the farmer will spend less time in a farm, but he should invest more in equipment and in the harvesting process.
Analysing information: the business might provide profit if the farmer harvest mussels after 18 months and he obtains cheaper solution for harvesting.
Such a farm might cover all investments, but it does not provide any profit.
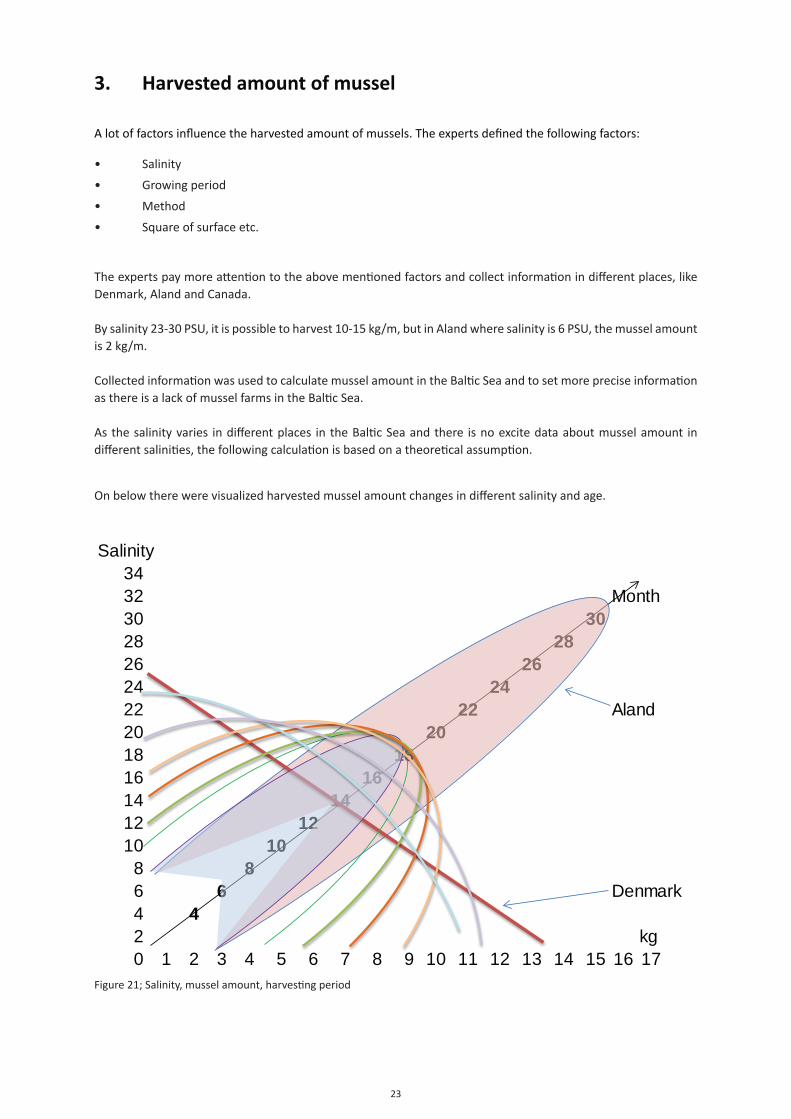
23
3. Harvested amount of mussel
A lot of factors influence the harvested amount of mussels. The experts defined the following factors:
• Salinity
• Growing period
• Method
• Square of surface etc.
The experts pay more attention to the above mentioned factors and collect information in different places, like Denmark, Aland and Canada.
By salinity 23-30 PSU, it is possible to harvest 10-15 kg/m, but in Aland where salinity is 6 PSU, the mussel amount is 2 kg/m.
Collected information was used to calculate mussel amount in the Baltic Sea and to set more precise information as there is a lack of mussel farms in the Baltic Sea. As the salinity varies in different places in the Baltic Sea and there is no excite data about mussel amount in different salinities, the following calculation is based on a theoretical assumption.
On below there were visualized harvested mussel amount changes in different salinity and age.
Salinity3432 Month30 3028 2826 2624 2422 22 Aland20 2018 1816 1614 1412 1210 10
8 86 6 Denmark4 42 kg0 1 2 3 4 5 6 7 8 9 10 11 12 13 14 15 16 17
Figure 21; Salinity, mussel amount, harvesting period
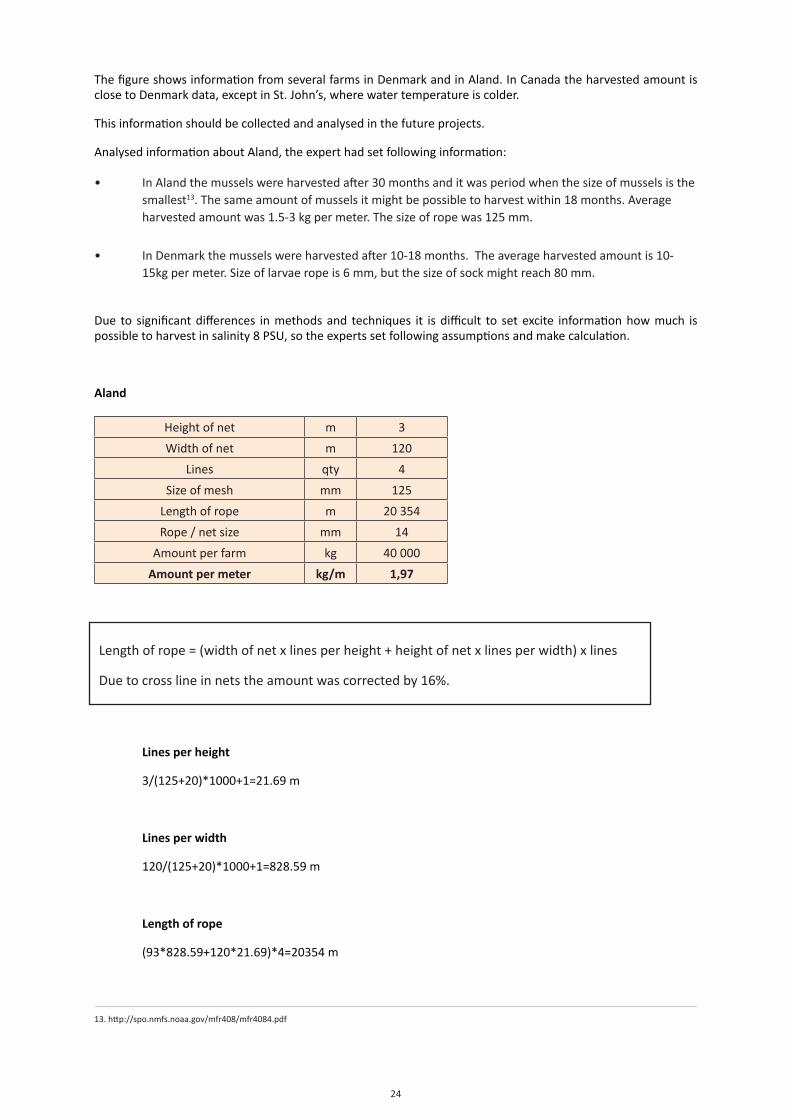
24
The figure shows information from several farms in Denmark and in Aland. In Canada the harvested amount is close to Denmark data, except in St. John’s, where water temperature is colder.
This information should be collected and analysed in the future projects.
Analysed information about Aland, the expert had set following information:
• In Aland the mussels were harvested after 30 months and it was period when the size of mussels is the smallest13. The same amount of mussels it might be possible to harvest within 18 months. Average harvested amount was 1.5-3 kg per meter. The size of rope was 125 mm.
• In Denmark the mussels were harvested after 10-18 months. The average harvested amount is 10- 15kg per meter. Size of larvae rope is 6 mm, but the size of sock might reach 80 mm.
Due to significant differences in methods and techniques it is difficult to set excite information how much is possible to harvest in salinity 8 PSU, so the experts set following assumptions and make calculation.
Aland
Height of net m 3
Width of net m 120
Lines qty 4
Size of mesh mm 125
Length of rope m 20 354
Rope / net size mm 14
Amount per farm kg 40 000
Amount per meter kg/m 1,97
Lines per height
3/(125+20)*1000+1=21.69 m
Lines per width
120/(125+20)*1000+1=828.59 m
Length of rope
(93*828.59+120*21.69)*4=20354 m
Length of rope = (width of net x lines per height + height of net x lines per width) x lines
Due to cross line in nets the amount was corrected by 16%.
13. http://spo.nmfs.noaa.gov/mfr408/mfr4084.pdf

25
If the 2 kg/m amount is possible to harvest from 14 mm rope than on 30 mm rope is possible to harvest twice more or 4.2 kg/m.
As the experts obtained information based on one farm data, the information might have to be corrected, collecting information from other farms.
The mussel amount in salinity 8 PSU was calculated based on Denmark and Aland farms information.
In chapter 1.5, it was mentioned that Danes harvested 9 kg/m from Canadian line and 17.5 kg/m from Swedish line.
For collecting seed they use 6 mm rope but after seed harvesting they sock mussels in ropes with size up to 80 mm.
The Canadians also mentioned that for seed collecting it is necessary to have a smaller amount of water area than for socking.
So based on expert viewpoint the Danes might harvest for 30-50% less from 6 mm rope and it is 4.5-6.3 kg/m.
So on rope 14 mm they might grow and harvest 10-15 kg/m; that amount was mentioned by DSC and also in Canada that Danes harvest 10-15 kg/m.2
Based on project experts viewpoint it is possible to harvest 3.2 kg in salinity 8 PSU.
(8-6) x (15-2) / (28-6) + 2=3.2
PSU kg/m
Denmark 28 15
Aland 6 2
Sweden 8 3,2
This amount, 3.2 kg/m on the rope 14 mm, will be used for future calculation.
40000/20354=1.97 kg/m
Amount per meter= Harvested amount
Length of rope
13. Study report
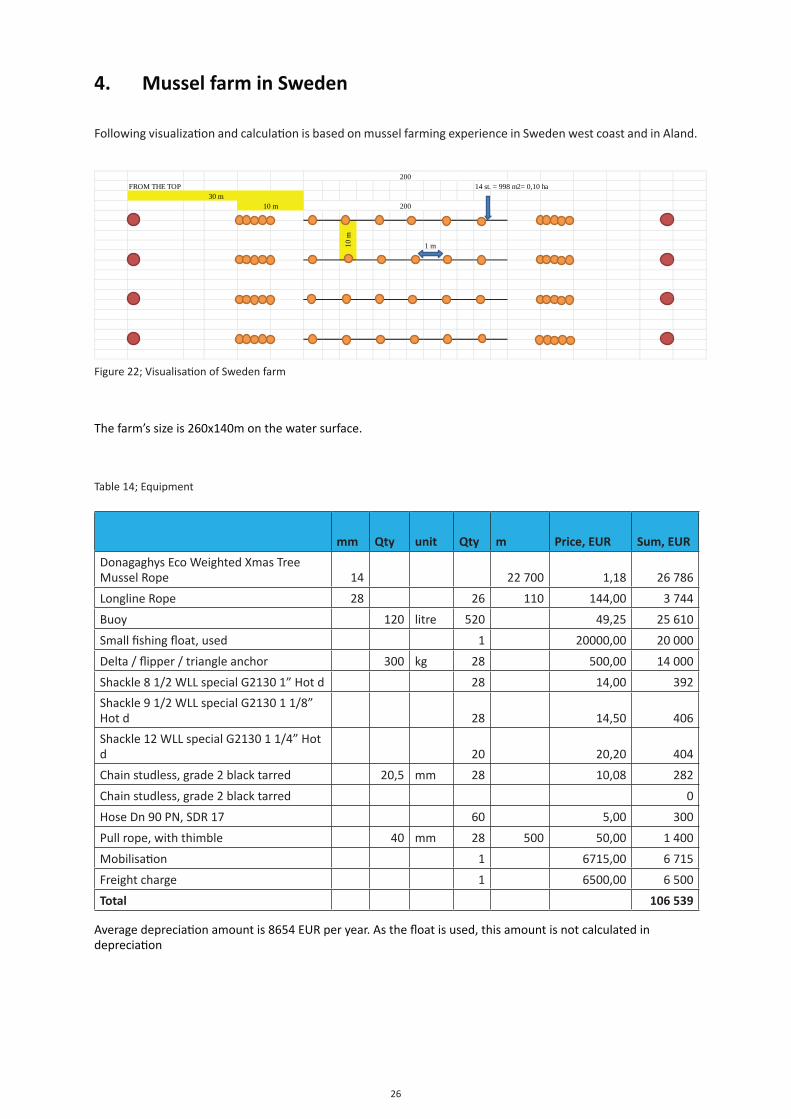
26
4. Mussel farm in Sweden
Following visualization and calculation is based on mussel farming experience in Sweden west coast and in Aland.
FROM THE TOP 14 st. = 998 m2= 0,10 ha
1 m
10 m 200
10 m
200
30 m
Figure 22; Visualisation of Sweden farm
The farm’s size is 260x140m on the water surface.
Table 14; Equipment
mm Qty unit Qty m Price, EUR Sum, EUR
Donagaghys Eco Weighted Xmas Tree Mussel Rope 14 22 700 1,18 26 786
Longline Rope 28 26 110 144,00 3 744
Buoy 120 litre 520 49,25 25 610
Small fishing float, used 1 20000,00 20 000
Delta / flipper / triangle anchor 300 kg 28 500,00 14 000
Shackle 8 1/2 WLL special G2130 1” Hot d 28 14,00 392
Shackle 9 1/2 WLL special G2130 1 1/8” Hot d 28 14,50 406
Shackle 12 WLL special G2130 1 1/4” Hot d 20 20,20 404
Chain studless, grade 2 black tarred 20,5 mm 28 10,08 282
Chain studless, grade 2 black tarred 0
Hose Dn 90 PN, SDR 17 60 5,00 300
Pull rope, with thimble 40 mm 28 500 50,00 1 400
Mobilisation 1 6715,00 6 715
Freight charge 1 6500,00 6 500
Total 106 539
Average depreciation amount is 8654 EUR per year. As the float is used, this amount is not calculated in depreciation
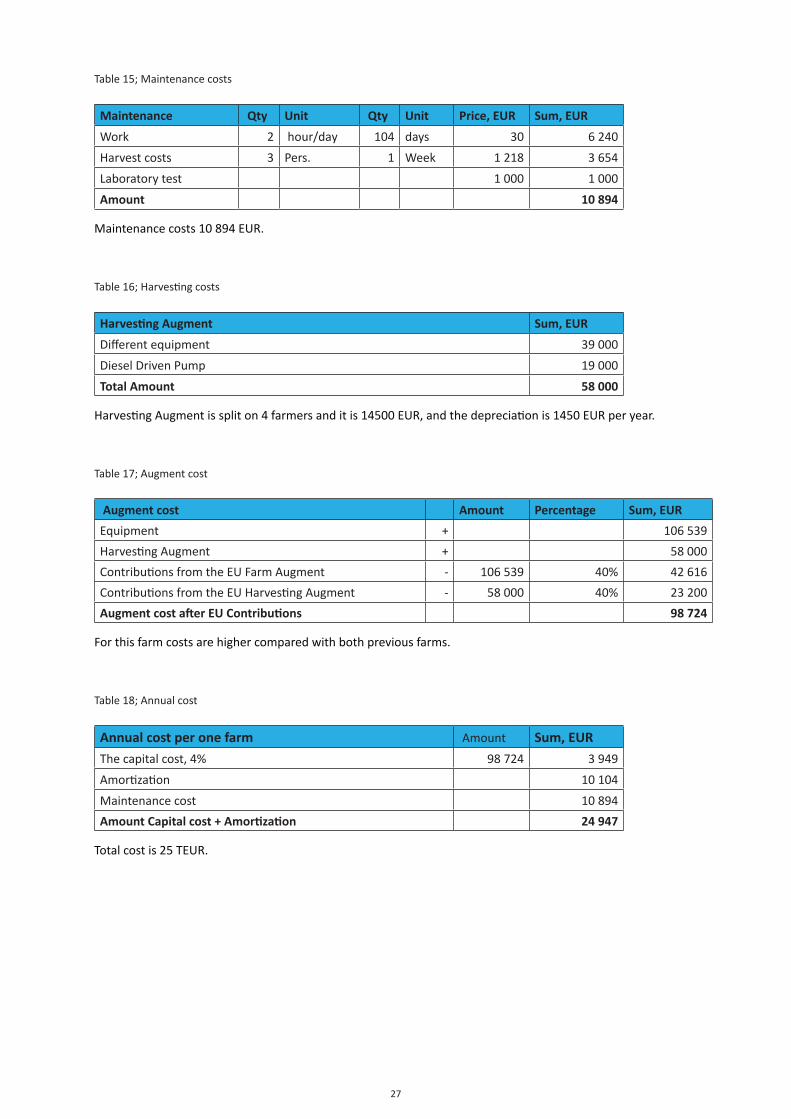
27
Table 15; Maintenance costs
Maintenance Qty Unit Qty Unit Price, EUR Sum, EUR
Work 2 hour/day 104 days 30 6 240
Harvest costs 3 Pers. 1 Week 1 218 3 654
Laboratory test 1 000 1 000
Amount 10 894
Maintenance costs 10 894 EUR.
Table 16; Harvesting costs
Harvesting Augment Sum, EUR
Different equipment 39 000
Diesel Driven Pump 19 000
Total Amount 58 000
Harvesting Augment is split on 4 farmers and it is 14500 EUR, and the depreciation is 1450 EUR per year.
Table 17; Augment cost
Augment cost Amount Percentage Sum, EUR
Equipment + 106 539
Harvesting Augment + 58 000
Contributions from the EU Farm Augment - 106 539 40% 42 616
Contributions from the EU Harvesting Augment - 58 000 40% 23 200
Augment cost after EU Contributions 98 724
For this farm costs are higher compared with both previous farms.
Table 18; Annual cost
Annual cost per one farm Amount Sum, EURThe capital cost, 4% 98 724 3 949
Amortization 10 104
Maintenance cost 10 894
Amount Capital cost + Amortization 24 947
Total cost is 25 TEUR.
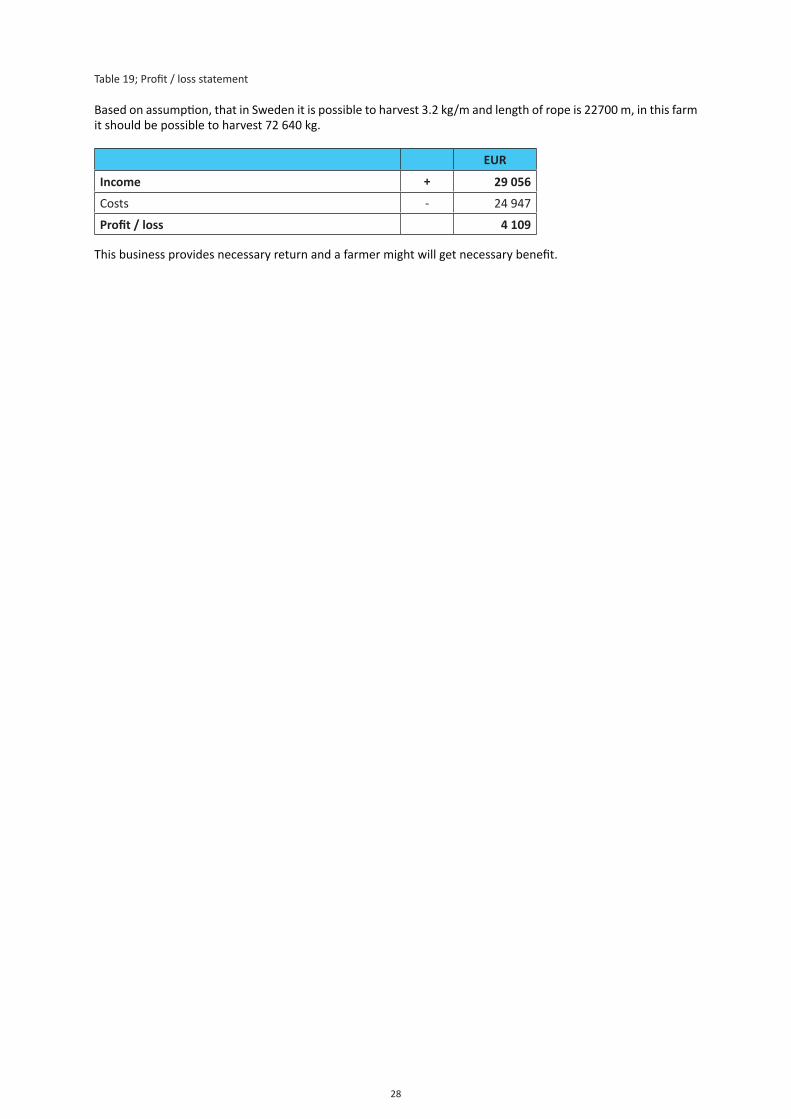
28
Table 19; Profit / loss statement
Based on assumption, that in Sweden it is possible to harvest 3.2 kg/m and length of rope is 22700 m, in this farm it should be possible to harvest 72 640 kg.
EUR
Income + 29 056
Costs - 24 947
Profit / loss 4 109
This business provides necessary return and a farmer might will get necessary benefit.
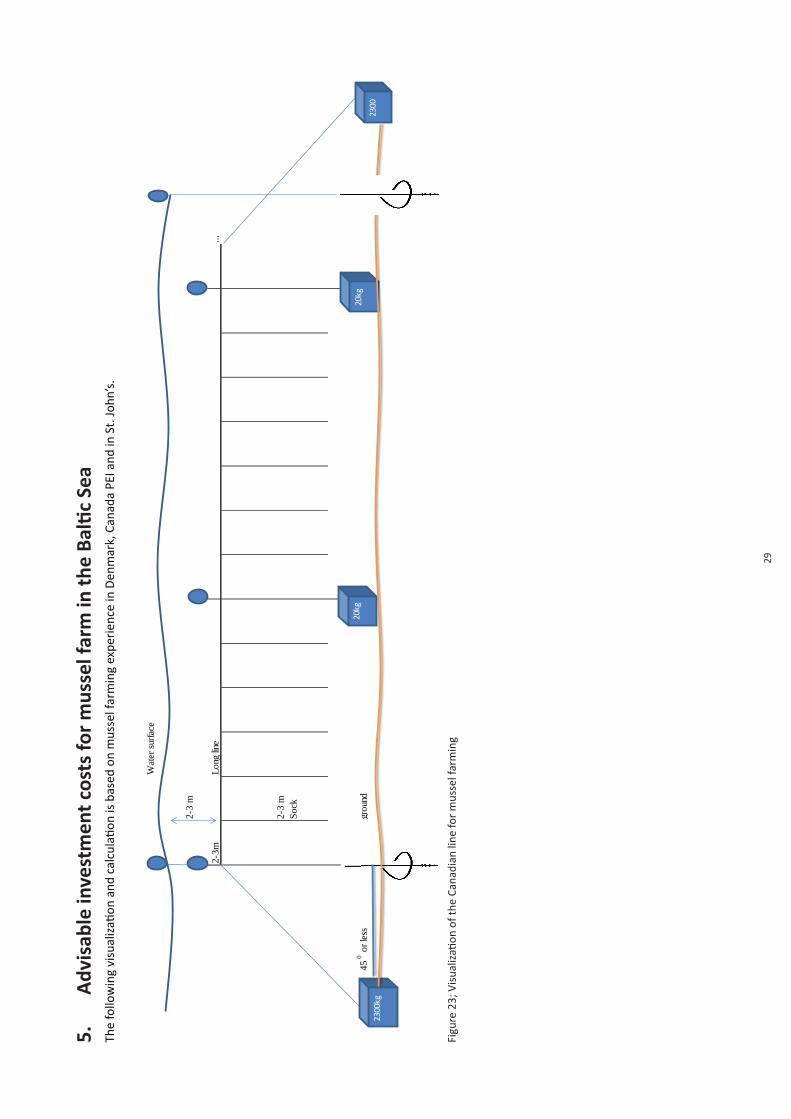
29
5.
Adv
isab
le in
vest
men
t cos
ts fo
r m
usse
l far
m in
the
Balti
c Se
aTh
e fo
llow
ing
visu
aliz
ation
and
cal
cula
tion
is b
ased
on
mus
sel f
arm
ing
expe
rien
ce in
Den
mar
k, C
anad
a PE
I and
in S
t. Jo
hn’s
.
Figu
re 2
3; V
isua
lizati
on o
f the
Can
adia
n lin
e fo
r m
usse
l far
min
g
Wat
er su
rface
2-3
m
2-3m
Long
line
...
2-3
mSo
ck
45 0
or le
ssgr
ound
2300
kg
20kg
20kg
2300
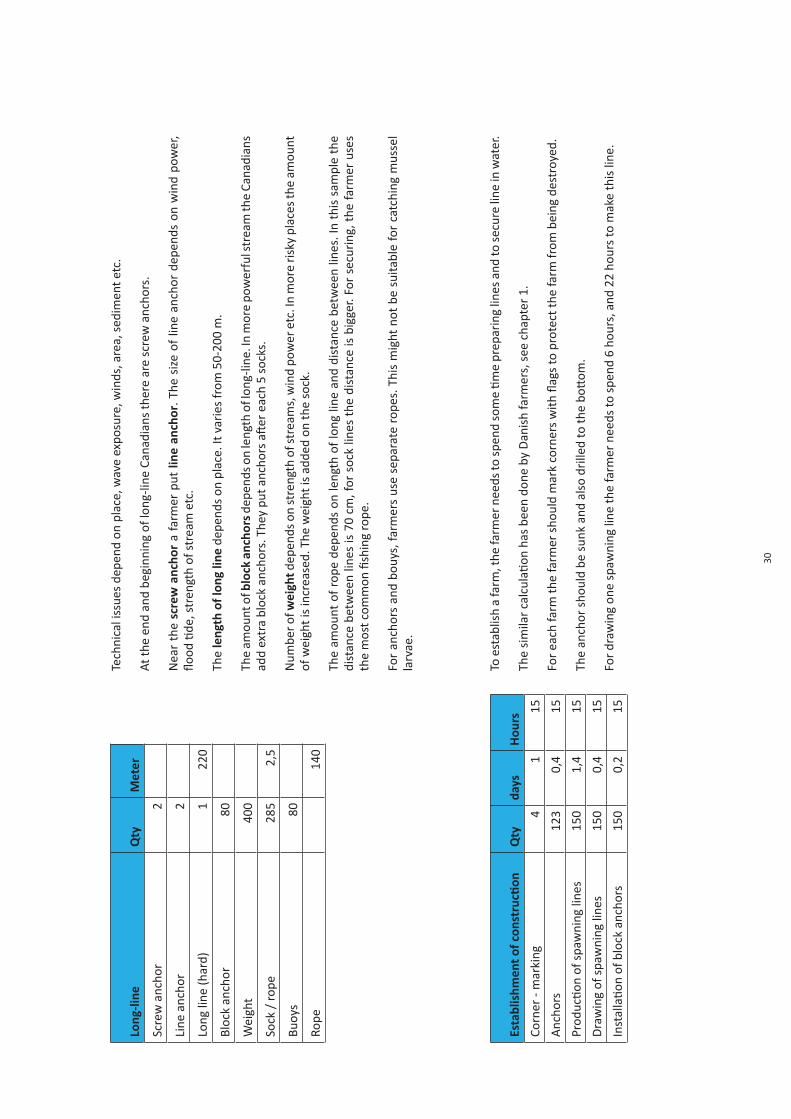
30
Long
-line
Qty
Met
er
Scre
w a
ncho
r2
Line
anc
hor
2
Long
line
(har
d)1
220
Bloc
k an
chor
80
Wei
ght
400
Sock
/ ro
pe28
52,
5
Buoy
s80
Rope
14
0
Esta
blis
hmen
t of
con
stru
ction
Qty
days
Hou
rs
Corn
er -
mar
king
41
15
Anc
hors
123
0,4
15
Prod
uctio
n of
spa
wni
ng li
nes
150
1,4
15
Dra
win
g of
spa
wni
ng li
nes
150
0,4
15
Inst
alla
tion
of b
lock
anc
hors
15
00,
215
To e
stab
lish
a fa
rm, t
he fa
rmer
nee
ds to
spe
nd s
ome
time
prep
arin
g lin
es a
nd to
sec
ure
line
in w
ater
.
The
sim
ilar
calc
ulati
on h
as b
een
done
by
Dan
ish
farm
ers,
see
cha
pter
1.
For
each
farm
the
farm
er s
houl
d m
ark
corn
ers
with
flag
s to
pro
tect
the
farm
from
bei
ng d
estr
oyed
.
The
anch
or s
houl
d be
sun
k an
d al
so d
rille
d to
the
bott
om.
For
draw
ing
one
spaw
ning
line
the
farm
er n
eeds
to s
pend
6 h
ours
, and
22
hour
s to
mak
e th
is li
ne.
Tech
nica
l iss
ues
depe
nd o
n pl
ace,
wav
e ex
posu
re, w
inds
, are
a, s
edim
ent e
tc.
At th
e en
d an
d be
ginn
ing
of lo
ng-li
ne C
anad
ians
ther
e ar
e sc
rew
anc
hors
.
Nea
r th
e sc
rew
anc
hor
a fa
rmer
put
line
anc
hor.
The
siz
e of
line
anc
hor
depe
nds
on w
ind
pow
er,
flood
tide
, str
engt
h of
str
eam
etc
.
The
leng
th o
f lon
g lin
e de
pend
s on
pla
ce. I
t var
ies
from
50-
200
m.
The
amou
nt o
f blo
ck a
ncho
rs d
epen
ds o
n le
ngth
of l
ong-
line.
In m
ore
pow
erfu
l str
eam
the
Cana
dian
s ad
d ex
tra
bloc
k an
chor
s. T
hey
put a
ncho
rs a
fter
eac
h 5
sock
s.
Num
ber o
f wei
ght d
epen
ds o
n st
reng
th o
f str
eam
s, w
ind
pow
er e
tc. I
n m
ore
risk
y pl
aces
the
amou
nt
of w
eigh
t is
incr
ease
d. T
he w
eigh
t is
adde
d on
the
sock
.
The
amou
nt o
f rop
e de
pend
s on
leng
th o
f lon
g lin
e an
d di
stan
ce b
etw
een
lines
. In
this
sam
ple
the
dist
ance
bet
wee
n lin
es is
70
cm, f
or s
ock
lines
the
dis
tanc
e is
big
ger.
For
secu
ring
, the
farm
er u
ses
the
mos
t com
mon
fish
ing
rope
.
For
anch
ors
and
bouy
s, fa
rmer
s us
e se
para
te r
opes
. Thi
s m
ight
not
be
suita
ble
for
catc
hing
mus
sel
larv
ae.
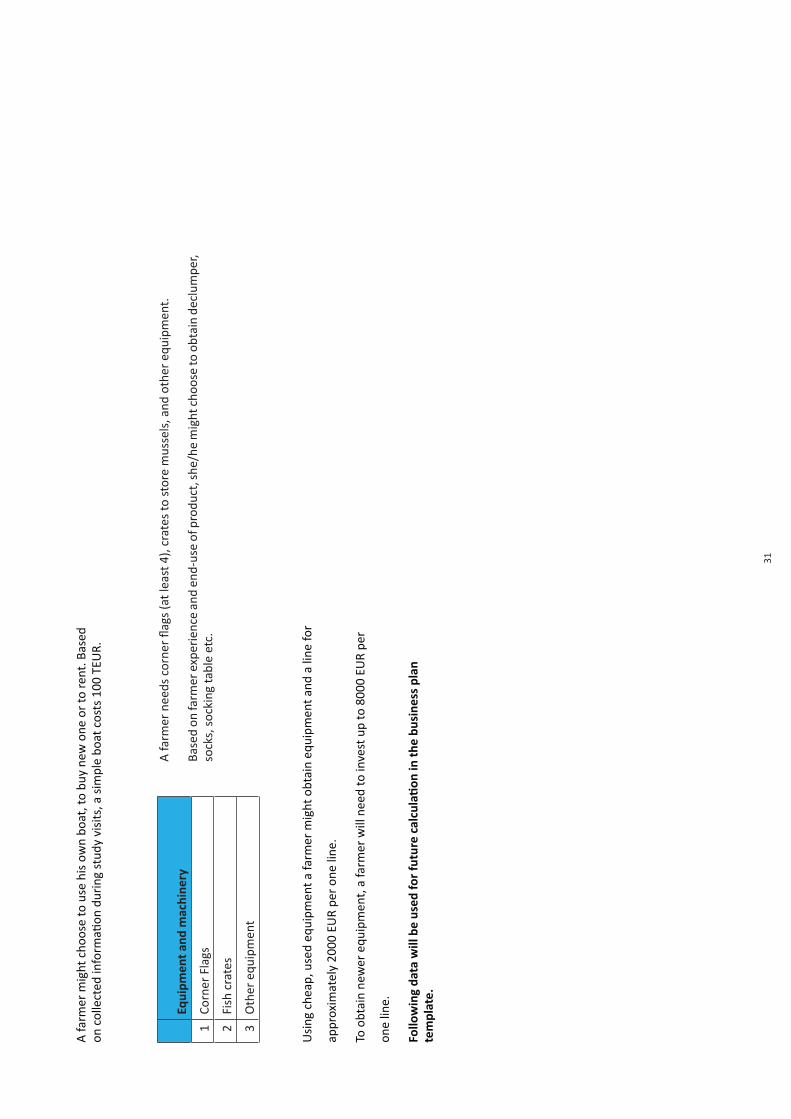
31
A fa
rmer
mig
ht c
hoos
e to
use
his
ow
n bo
at, t
o bu
y ne
w o
ne o
r to
rent
. Bas
ed
on c
olle
cted
info
rmati
on d
urin
g st
udy
visi
ts, a
sim
ple
boat
cos
ts 1
00 T
EUR.
Eq
uipm
ent a
nd m
achi
nery
1Co
rner
Fla
gs
2Fi
sh c
rate
s
3O
ther
equ
ipm
ent
Usi
ng c
heap
, use
d eq
uipm
ent a
farm
er m
ight
obt
ain
equi
pmen
t and
a li
ne fo
r
appr
oxim
atel
y 20
00 E
UR
per
one
line.
To o
btai
n ne
wer
equ
ipm
ent,
a fa
rmer
will
nee
d to
inve
st u
p to
800
0 EU
R pe
r
one
line.
Fo
llow
ing
data
will
be
used
for
futu
re c
alcu
lati
on in
the
busi
ness
pla
n te
mpl
ate.
A fa
rmer
nee
ds c
orne
r fla
gs (a
t lea
st 4
), cr
ates
to s
tore
mus
sels
, and
oth
er e
quip
men
t.
Base
d on
farm
er e
xper
ienc
e an
d en
d-us
e of
pro
duct
, she
/he
mig
ht c
hoos
e to
obt
ain
decl
umpe
r, so
cks,
soc
king
tabl
e et
c.
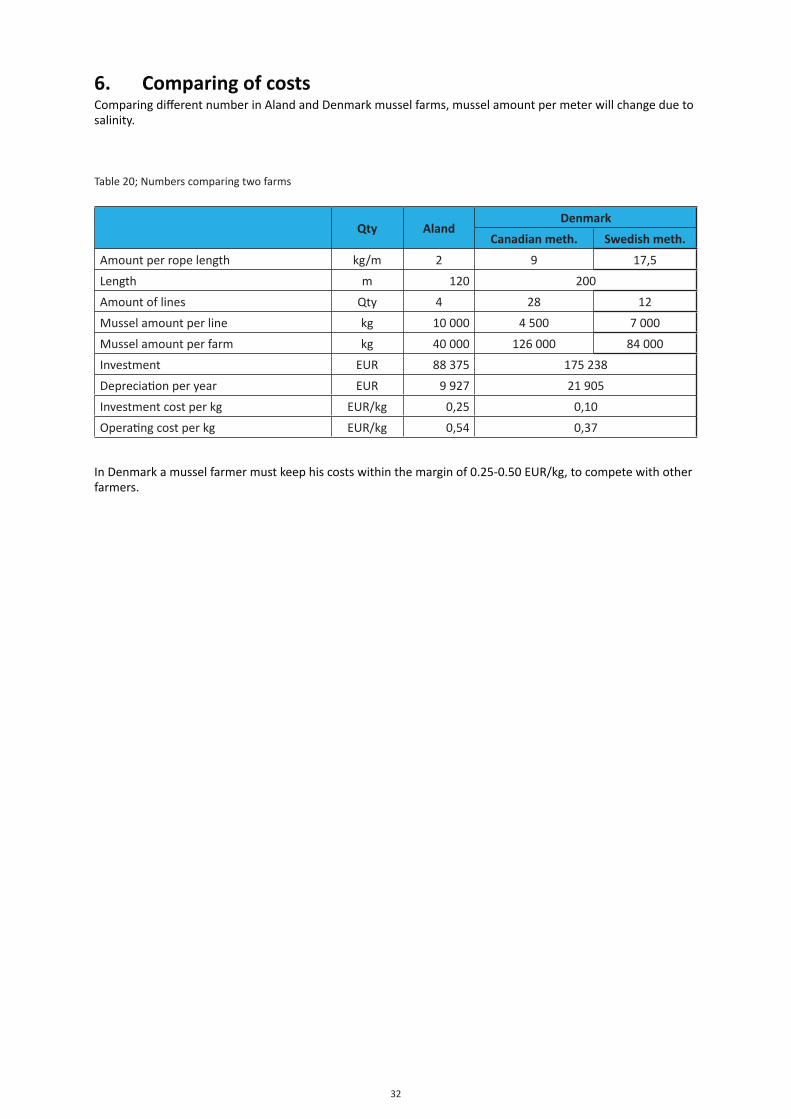
32
6. Comparing of costsComparing different number in Aland and Denmark mussel farms, mussel amount per meter will change due to salinity.
Table 20; Numbers comparing two farms
Qty AlandDenmark
Canadian meth. Swedish meth.
Amount per rope length kg/m 2 9 17,5
Length m 120 200
Amount of lines Qty 4 28 12
Mussel amount per line kg 10 000 4 500 7 000
Mussel amount per farm kg 40 000 126 000 84 000
Investment EUR 88 375 175 238
Depreciation per year EUR 9 927 21 905
Investment cost per kg EUR/kg 0,25 0,10
Operating cost per kg EUR/kg 0,54 0,37
In Denmark a mussel farmer must keep his costs within the margin of 0.25-0.50 EUR/kg, to compete with other farmers.
33
7. References1. Petersen J.K. and Tørring D. BLÅMUSLINGEPROJEKT FASE II (2008), Dansk Skaldyrcenter [Online], Available from: http://www.skaldyrcenter.dk/files/Bl%c3%83%c2%a5muslinge%20fase%20II%20rapport%20(ny%20version).pdf [Accessed: 5 April 2013].
2. LindqVist M. Economic conditions for large-scale mussel farming in Åland (2013), [Accessed: 22 March 2013 from M.Lindqvist].
3. SLABYJ BOHDAN M., CREAMER DONN L., and TRUE RUTH H. Seasonal Effect on Yield, Proximate Composition, and Quality of Blue Mussel, Mytilus edulis, Meats Obtained From Cultivated and Natural Stock (1978); Available from: http://spo.nmfs.noaa.gov/mfr408/mfr4084.pdf [Accessed: 5 April 2013].
4. Project Baltic EcoMussel study report (2012)
Internet recourses for photos;
1. http://fieldermarine.com/use.htm
2. http://www.musseltalk.com/index.php?option=com_k2&view=item&id=5:anchors-moorings-part-1-deadweight-moorings&Itemid=35&lang=en
3. http://www.cocci.org.uk/page.aspx?pagina=3&contenuto=38
4. http://www.jfcmarine.com/MusselsFloats.html
5. http://musselrope.co.nz/Mussel_Spat_Rope.php
6. https://www.donaghys.com/file_uploads/brochures/Aquaculture_English.pdf
7. http://www.fukuina.com/shellfish/high_speed_socking_table.htm
8. http://www.aerreautomazioni.it/EN/products/4/?83
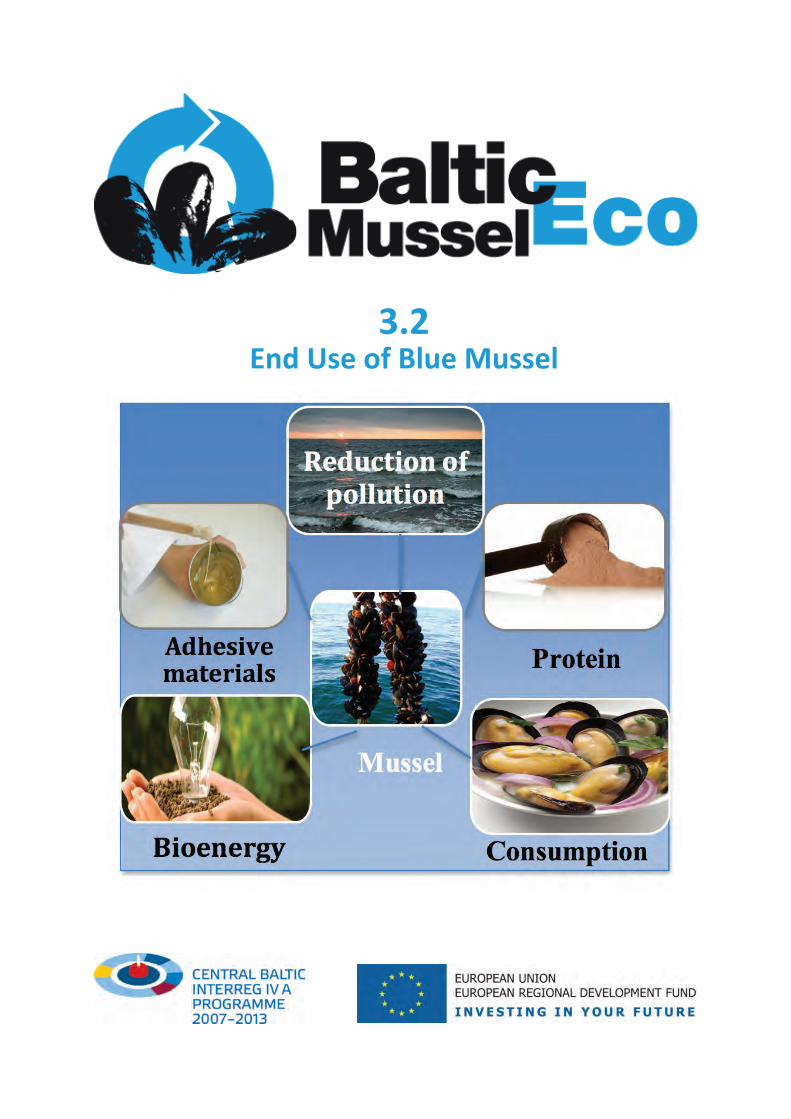
3.2End Use of Blue Mussel
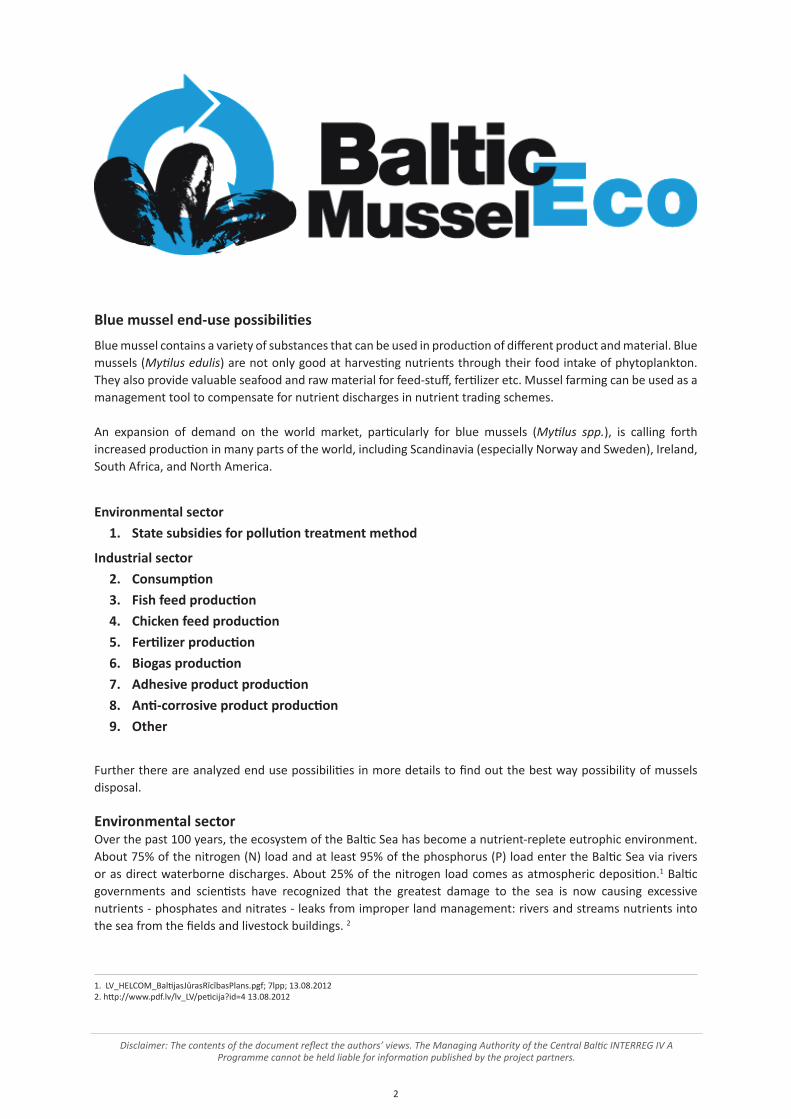
2
Blue mussel end-use possibilities
Blue mussel contains a variety of substances that can be used in production of different product and material. Blue mussels (Mytilus edulis) are not only good at harvesting nutrients through their food intake of phytoplankton. They also provide valuable seafood and raw material for feed-stuff, fertilizer etc. Mussel farming can be used as a management tool to compensate for nutrient discharges in nutrient trading schemes.
An expansion of demand on the world market, particularly for blue mussels (Mytilus spp.), is calling forth increased production in many parts of the world, including Scandinavia (especially Norway and Sweden), Ireland, South Africa, and North America.
Environmental sector
1. State subsidies for pollution treatment method
Industrial sector
2. Consumption
3. Fish feed production
4. Chicken feed production
5. Fertilizer production
6. Biogas production
7. Adhesive product production
8. Anti-corrosive product production
9. Other
Further there are analyzed end use possibilities in more details to find out the best way possibility of mussels disposal.
Environmental sectorOver the past 100 years, the ecosystem of the Baltic Sea has become a nutrient-replete eutrophic environment. About 75% of the nitrogen (N) load and at least 95% of the phosphorus (P) load enter the Baltic Sea via rivers or as direct waterborne discharges. About 25% of the nitrogen load comes as atmospheric deposition.1 Baltic governments and scientists have recognized that the greatest damage to the sea is now causing excessive nutrients - phosphates and nitrates - leaks from improper land management: rivers and streams nutrients into the sea from the fields and livestock buildings. 2
1. LV_HELCOM_BaltijasJūrasRīcībasPlans.pgf; 7lpp; 13.08.20122. http://www.pdf.lv/lv_LV/peticija?id=4 13.08.2012
Disclaimer: The contents of the document reflect the authors’ views. The Managing Authority of the Central Baltic INTERREG IV A Programme cannot be held liable for information published by the project partners.
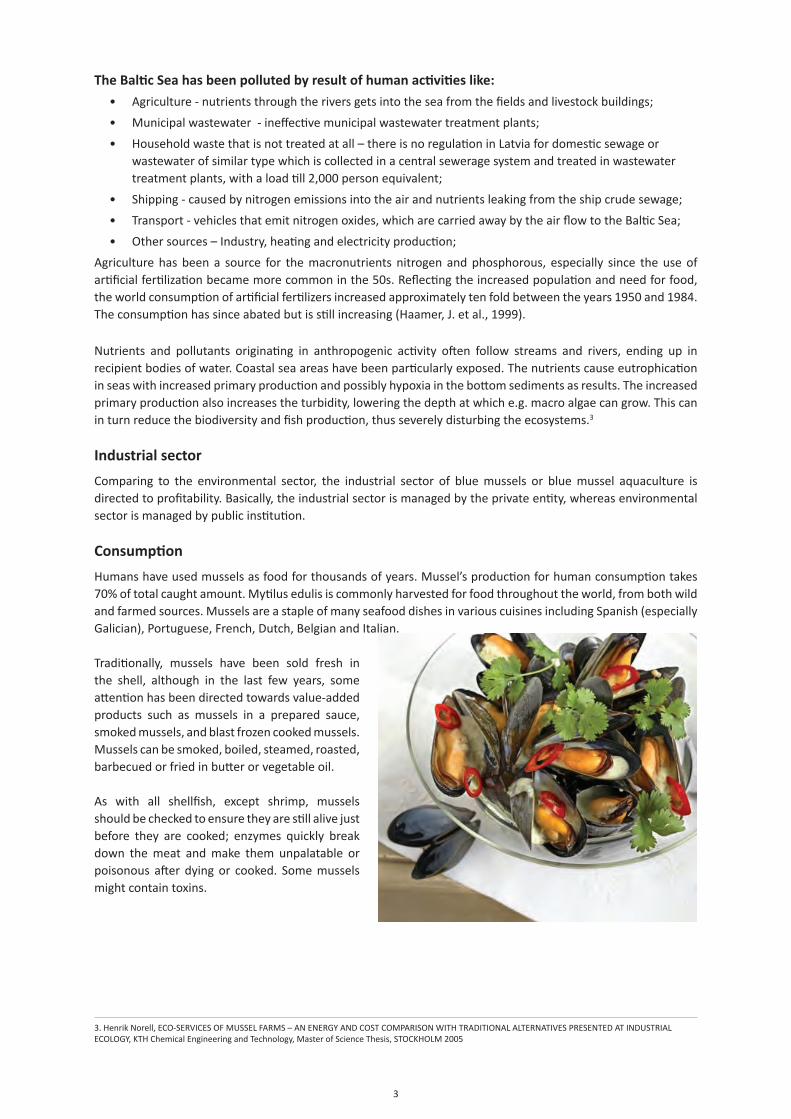
3
The Baltic Sea has been polluted by result of human activities like:
• Agriculture - nutrients through the rivers gets into the sea from the fields and livestock buildings;
• Municipal wastewater - ineffective municipal wastewater treatment plants;
• Household waste that is not treated at all – there is no regulation in Latvia for domestic sewage or wastewater of similar type which is collected in a central sewerage system and treated in wastewater treatment plants, with a load till 2,000 person equivalent;
• Shipping - caused by nitrogen emissions into the air and nutrients leaking from the ship crude sewage;
• Transport - vehicles that emit nitrogen oxides, which are carried away by the air flow to the Baltic Sea;
• Other sources – Industry, heating and electricity production;
Agriculture has been a source for the macronutrients nitrogen and phosphorous, especially since the use of artificial fertilization became more common in the 50s. Reflecting the increased population and need for food, the world consumption of artificial fertilizers increased approximately ten fold between the years 1950 and 1984. The consumption has since abated but is still increasing (Haamer, J. et al., 1999).
Nutrients and pollutants originating in anthropogenic activity often follow streams and rivers, ending up in recipient bodies of water. Coastal sea areas have been particularly exposed. The nutrients cause eutrophication in seas with increased primary production and possibly hypoxia in the bottom sediments as results. The increased primary production also increases the turbidity, lowering the depth at which e.g. macro algae can grow. This can in turn reduce the biodiversity and fish production, thus severely disturbing the ecosystems.3
Industrial sector
Comparing to the environmental sector, the industrial sector of blue mussels or blue mussel aquaculture is directed to profitability. Basically, the industrial sector is managed by the private entity, whereas environmental sector is managed by public institution.
Consumption
Humans have used mussels as food for thousands of years. Mussel’s production for human consumption takes 70% of total caught amount. Mytilus edulis is commonly harvested for food throughout the world, from both wild and farmed sources. Mussels are a staple of many seafood dishes in various cuisines including Spanish (especially Galician), Portuguese, French, Dutch, Belgian and Italian.
Traditionally, mussels have been sold fresh in the shell, although in the last few years, some attention has been directed towards value-added products such as mussels in a prepared sauce, smoked mussels, and blast frozen cooked mussels. Mussels can be smoked, boiled, steamed, roasted, barbecued or fried in butter or vegetable oil.
As with all shellfish, except shrimp, mussels should be checked to ensure they are still alive just before they are cooked; enzymes quickly break down the meat and make them unpalatable or poisonous after dying or cooked. Some mussels might contain toxins.
3. Henrik Norell, ECO-SERVICES OF MUSSEL FARMS – AN ENERGY AND COST COMPARISON WITH TRADITIONAL ALTERNATIVES PRESENTED AT INDUSTRIAL ECOLOGY, KTH Chemical Engineering and Technology, Master of Science Thesis, STOCKHOLM 2005
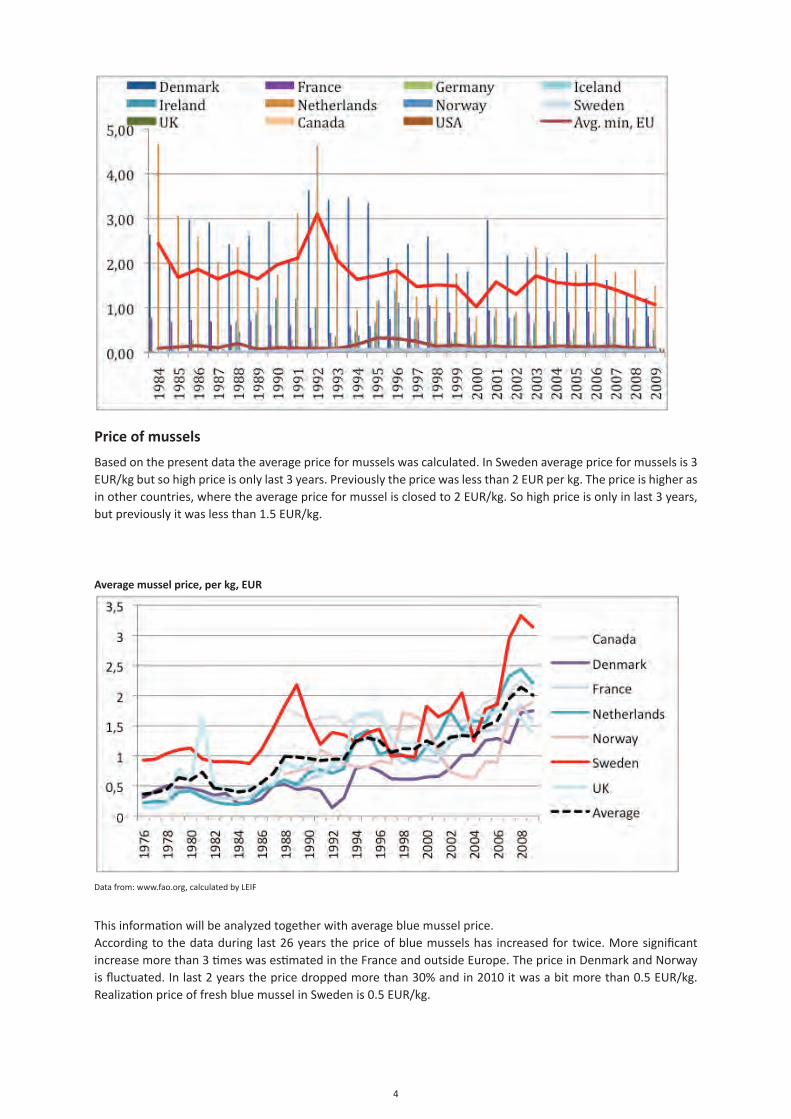
4
Price of mussels
Based on the present data the average price for mussels was calculated. In Sweden average price for mussels is 3 EUR/kg but so high price is only last 3 years. Previously the price was less than 2 EUR per kg. The price is higher as in other countries, where the average price for mussel is closed to 2 EUR/kg. So high price is only in last 3 years, but previously it was less than 1.5 EUR/kg.
Average mussel price, per kg, EUR
Data from: www.fao.org, calculated by LEIF
This information will be analyzed together with average blue mussel price.According to the data during last 26 years the price of blue mussels has increased for twice. More significant increase more than 3 times was estimated in the France and outside Europe. The price in Denmark and Norway is fluctuated. In last 2 years the price dropped more than 30% and in 2010 it was a bit more than 0.5 EUR/kg. Realization price of fresh blue mussel in Sweden is 0.5 EUR/kg.
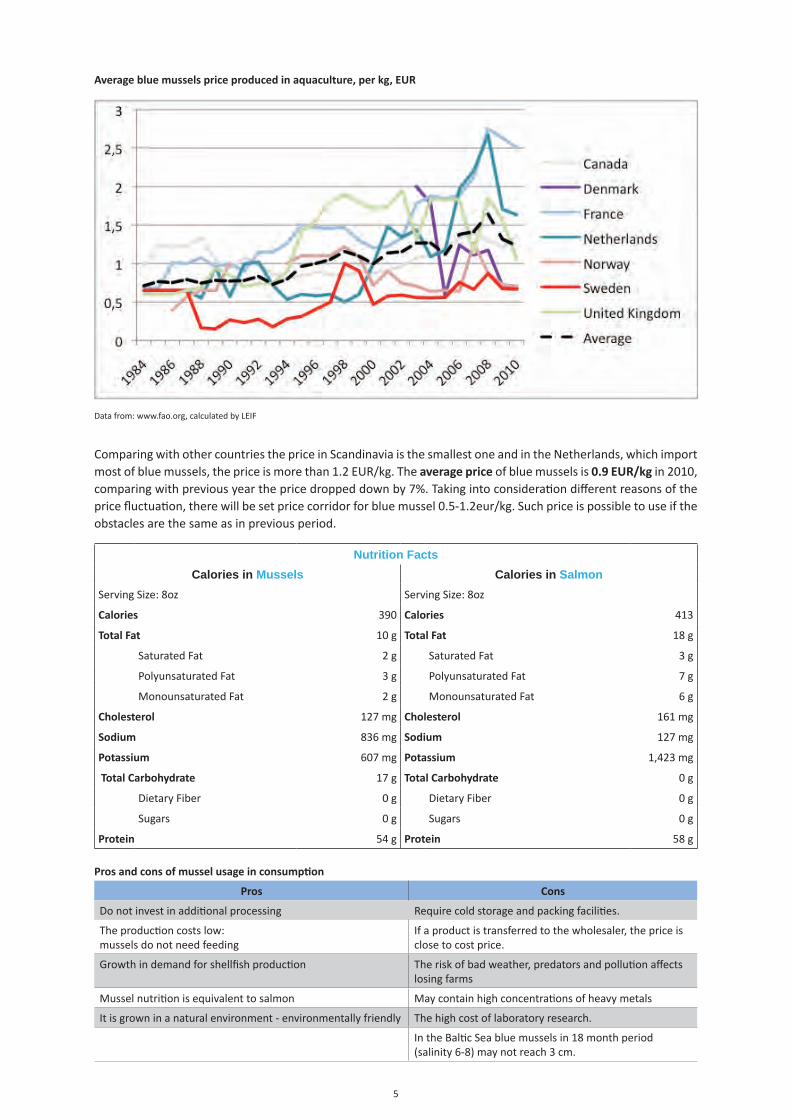
5
Average blue mussels price produced in aquaculture, per kg, EUR
Data from: www.fao.org, calculated by LEIF
Comparing with other countries the price in Scandinavia is the smallest one and in the Netherlands, which import most of blue mussels, the price is more than 1.2 EUR/kg. The average price of blue mussels is 0.9 EUR/kg in 2010, comparing with previous year the price dropped down by 7%. Taking into consideration different reasons of the price fluctuation, there will be set price corridor for blue mussel 0.5-1.2eur/kg. Such price is possible to use if the obstacles are the same as in previous period.
Nutrition FactsCalories in Mussels Calories in Salmon
Serving Size: 8oz Serving Size: 8oz
Calories 390 Calories 413
Total Fat 10 g Total Fat 18 g
Saturated Fat 2 g Saturated Fat 3 g
Polyunsaturated Fat 3 g Polyunsaturated Fat 7 g
Monounsaturated Fat 2 g Monounsaturated Fat 6 g
Cholesterol 127 mg Cholesterol 161 mg
Sodium 836 mg Sodium 127 mg
Potassium 607 mg Potassium 1,423 mg
Total Carbohydrate 17 g Total Carbohydrate 0 g
Dietary Fiber 0 g Dietary Fiber 0 g
Sugars 0 g Sugars 0 g
Protein 54 g Protein 58 g
Pros and cons of mussel usage in consumption
Pros Cons
Do not invest in additional processing Require cold storage and packing facilities.
The production costs low:mussels do not need feeding
If a product is transferred to the wholesaler, the price is close to cost price.
Growth in demand for shellfish production The risk of bad weather, predators and pollution affects losing farms
Mussel nutrition is equivalent to salmon May contain high concentrations of heavy metals
It is grown in a natural environment - environmentally friendly The high cost of laboratory research.
In the Baltic Sea blue mussels in 18 month period (salinity 6-8) may not reach 3 cm.
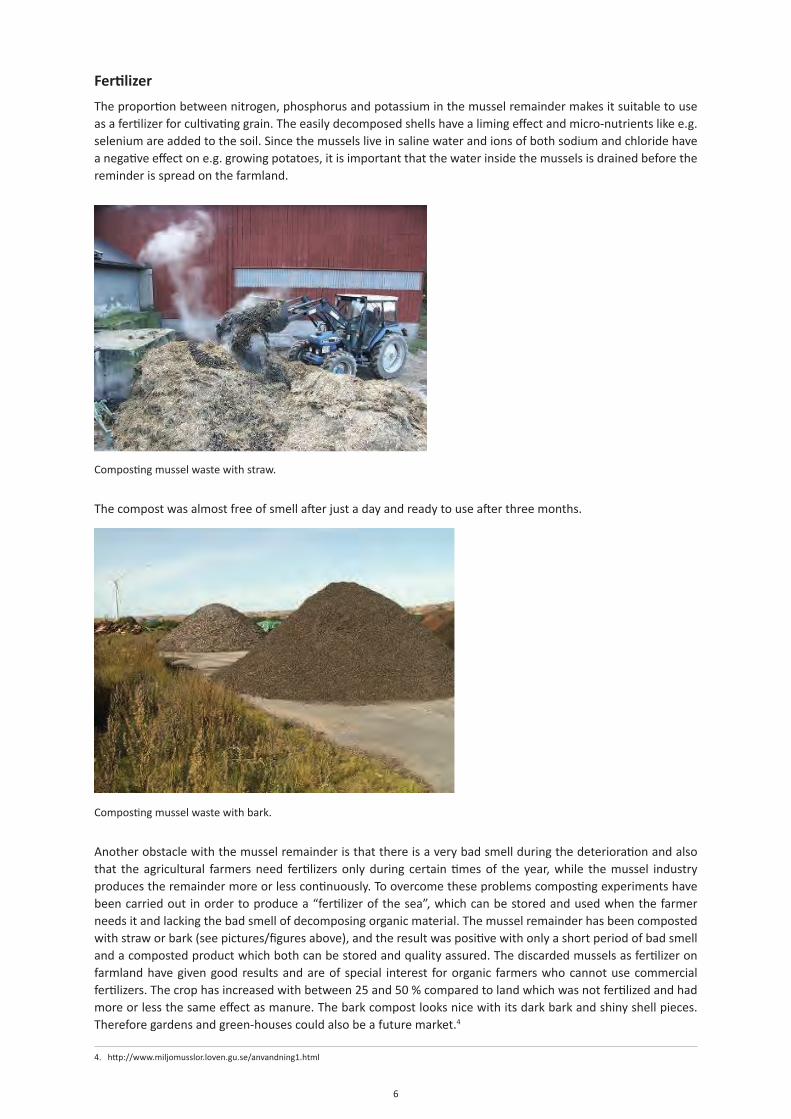
6
Fertilizer
The proportion between nitrogen, phosphorus and potassium in the mussel remainder makes it suitable to use as a fertilizer for cultivating grain. The easily decomposed shells have a liming effect and micro-nutrients like e.g. selenium are added to the soil. Since the mussels live in saline water and ions of both sodium and chloride have a negative effect on e.g. growing potatoes, it is important that the water inside the mussels is drained before the reminder is spread on the farmland.
Composting mussel waste with straw.
The compost was almost free of smell after just a day and ready to use after three months.
Composting mussel waste with bark.
Another obstacle with the mussel remainder is that there is a very bad smell during the deterioration and also that the agricultural farmers need fertilizers only during certain times of the year, while the mussel industry produces the remainder more or less continuously. To overcome these problems composting experiments have been carried out in order to produce a “fertilizer of the sea”, which can be stored and used when the farmer needs it and lacking the bad smell of decomposing organic material. The mussel remainder has been composted with straw or bark (see pictures/figures above), and the result was positive with only a short period of bad smell and a composted product which both can be stored and quality assured. The discarded mussels as fertilizer on farmland have given good results and are of special interest for organic farmers who cannot use commercial fertilizers. The crop has increased with between 25 and 50 % compared to land which was not fertilized and had more or less the same effect as manure. The bark compost looks nice with its dark bark and shiny shell pieces. Therefore gardens and green-houses could also be a future market.4
4. http://www.miljomusslor.loven.gu.se/anvandning1.html
7
Anti-corrosive product
Protein from Swedish blue mussels and cerium from China are constituents of an environmentally friendly alternative to current anti-corrosion methods.
The fact is the adhesive blue mussel protein can prevent corrosion in stainless steel. Researchers at the Royal Institute of Technology (KTH) in Stockholm have used this knowledge to develop an anticorrosive agent for carbon steel. The assignment to develop a new anti-corrosive product came from Biopolymer Products, which saw the possibilities for commercializing the research results. The assignment to develop a new anti-corrosive product came from Biopolymer Products, which saw the possibilities for commercializing the research results.
Adhesive
Using reverse-genetics molecular biology techniques, researchers at the Idaho National Laboratory (INL) have replicated the genetic machinery used by the blue mussel, Mytilus edulis, to produce the adhesive anchors and threads.
The INL technology makes it possible to produce adhesives that mimic those of the mussel – they are very strong, unaffected by water and bind to a variety of surfaces such as glass, ceramic, wood, rock, concrete, plastic (even Teflon) and biological substrates including skin, muscle, bone and other tissues. This is the only adhesive that can be applied underwater, is impervious to turbulent forces and is environmentally safe. There are no current conventional glues that come close.5
This breakthrough provides a new route to large-scale production of these adhesive proteins, providing a “green” alternative to often toxic and expensive commercial adhesives used in everyday products from plywood to automobiles.6
The INL blue mussel adhesive is the only adhesive that bonds underwater, is impervious to water and turbulent forces and is environmentally safe, opening new applications in military, marine, and construction industries. Because it is biocompatible and moisture-proof, it can be used in a variety of biomedical and surgical applications as well.
Mussels like to position themselves in the fastest moving water and have adapted perfectly to their habitat by secreting quick-setting adhesive anchors and strong tethers (called byssal structures) from a foot organ in their shells. So far, scientists have identified nine protein components in the byssi. The proteins have specialized functions as primers, surface bonding promoters, adhesives, and catalysts (initiating an epoxy-like polymerization process).
In fact, blue mussel adhesive compares well to epoxies and is as strong as most cyanoacrylate “superglues” on the market, with holding powers of up to 1,000 psi. Tested underwater, there is nothing that compares. When applied to wet surfaces, INL blue mussel adhesive is 10 to 100 times stronger than anything commercially available.7
Industries of realization
Adhesive is a valuable asset to the military (for easy attachment of underwater surveillance, measurement and ordnance devices) and to a wide range of industries and biomedical applications. All can benefit from an environmentally safe, biocompatible, strong, inexpensive alternative to the conventional adhesives available today. There are no conventional glues that can be applied in an aqueous environment and are impervious to water and turbulent forces. The INL developed blue mussel adhesives bind to glass, ceramics, concrete, metals, wood, plastics (including Teflon), and biological substrates (including human and animal skin, muscle, and other tissues).
Applications include:
• Underwater adhesives
• Construction and specialty adhesives
• Biomedical adhesives
• Adhesives for joining hard-to-bond materials8
5. http://techportal.eere.energy.gov/technology.do/techID=562 6. http://techportal.eere.energy.gov/technology.do/techID=562 ; 09.08.2012 7. http://techportal.eere.energy.gov/technology.do/techID=562 8. http://techportal.eere.energy.gov/technology.do/techID=562
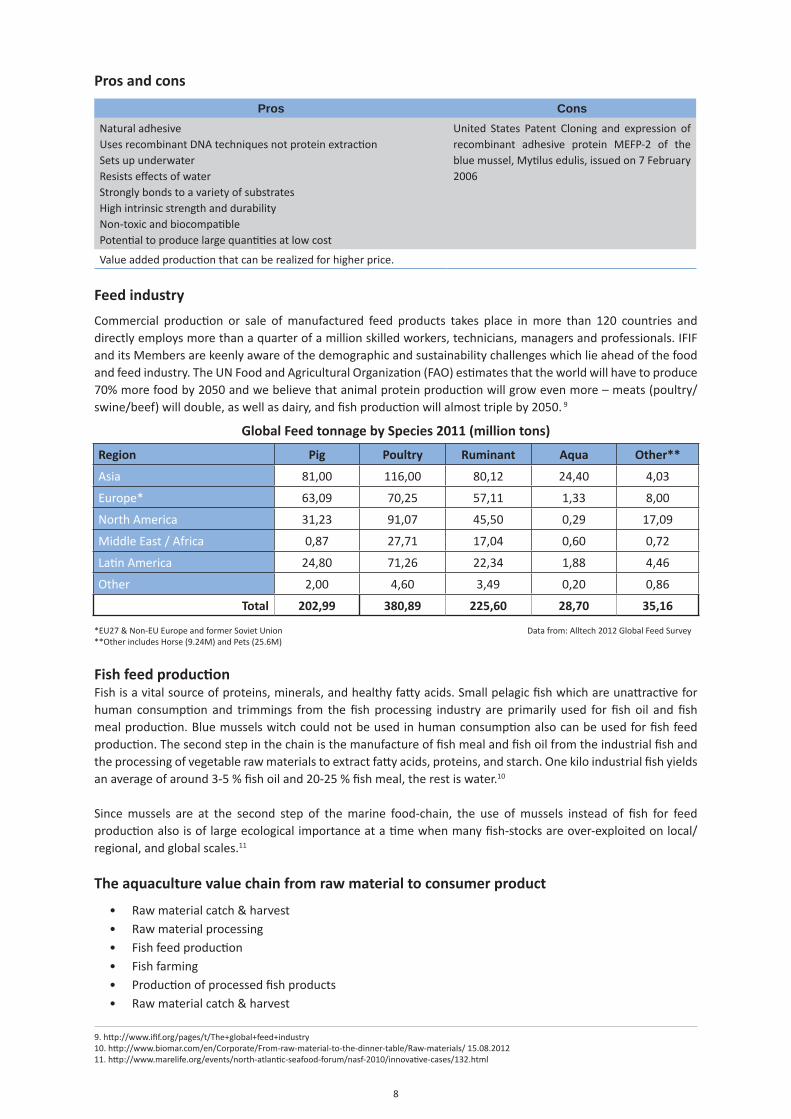
8
Pros and cons
Pros ConsNatural adhesiveUses recombinant DNA techniques not protein extraction Sets up underwaterResists effects of waterStrongly bonds to a variety of substratesHigh intrinsic strength and durabilityNon-toxic and biocompatiblePotential to produce large quantities at low cost
United States Patent Cloning and expression of recombinant adhesive protein MEFP-2 of the blue mussel, Mytilus edulis, issued on 7 February 2006
Value added production that can be realized for higher price.
Feed industry
Commercial production or sale of manufactured feed products takes place in more than 120 countries and directly employs more than a quarter of a million skilled workers, technicians, managers and professionals. IFIF and its Members are keenly aware of the demographic and sustainability challenges which lie ahead of the food and feed industry. The UN Food and Agricultural Organization (FAO) estimates that the world will have to produce 70% more food by 2050 and we believe that animal protein production will grow even more – meats (poultry/swine/beef) will double, as well as dairy, and fish production will almost triple by 2050. 9
Global Feed tonnage by Species 2011 (million tons)
Region Pig Poultry Ruminant Aqua Other**
Asia 81,00 116,00 80,12 24,40 4,03
Europe* 63,09 70,25 57,11 1,33 8,00
North America 31,23 91,07 45,50 0,29 17,09
Middle East / Africa 0,87 27,71 17,04 0,60 0,72
Latin America 24,80 71,26 22,34 1,88 4,46
Other 2,00 4,60 3,49 0,20 0,86
Total 202,99 380,89 225,60 28,70 35,16
*EU27 & Non-EU Europe and former Soviet Union Data from: Alltech 2012 Global Feed Survey**Other includes Horse (9.24M) and Pets (25.6M)
Fish feed productionFish is a vital source of proteins, minerals, and healthy fatty acids. Small pelagic fish which are unattractive for human consumption and trimmings from the fish processing industry are primarily used for fish oil and fish meal production. Blue mussels witch could not be used in human consumption also can be used for fish feed production. The second step in the chain is the manufacture of fish meal and fish oil from the industrial fish and the processing of vegetable raw materials to extract fatty acids, proteins, and starch. One kilo industrial fish yields an average of around 3-5 % fish oil and 20-25 % fish meal, the rest is water.10
Since mussels are at the second step of the marine food-chain, the use of mussels instead of fish for feed production also is of large ecological importance at a time when many fish-stocks are over-exploited on local/regional, and global scales.11
The aquaculture value chain from raw material to consumer product
• Raw material catch & harvest• Raw material processing• Fish feed production• Fish farming• Production of processed fish products• Raw material catch & harvest
9. http://www.ifif.org/pages/t/The+global+feed+industry10. http://www.biomar.com/en/Corporate/From-raw-material-to-the-dinner-table/Raw-materials/ 15.08.201211. http://www.marelife.org/events/north-atlantic-seafood-forum/nasf-2010/innovative-cases/132.html
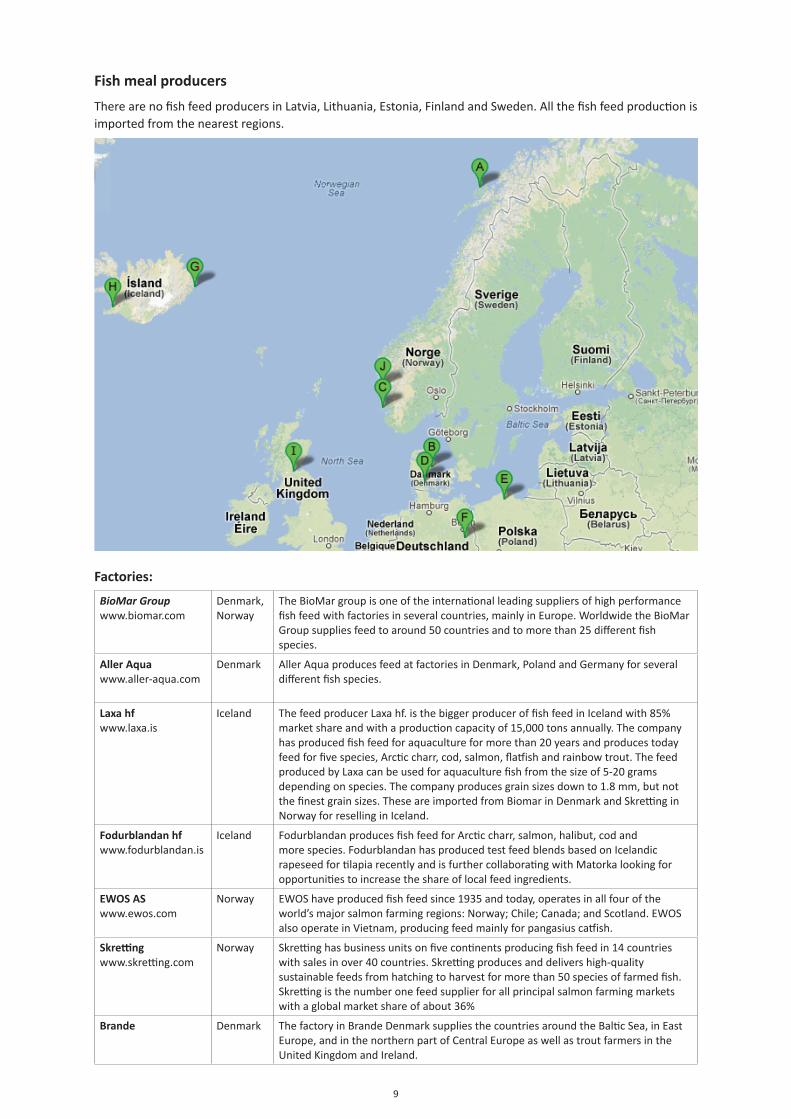
9
Fish meal producers
There are no fish feed producers in Latvia, Lithuania, Estonia, Finland and Sweden. All the fish feed production is imported from the nearest regions.
Factories:
BioMar Group www.biomar.com
Denmark, Norway
The BioMar group is one of the international leading suppliers of high performance fish feed with factories in several countries, mainly in Europe. Worldwide the BioMar Group supplies feed to around 50 countries and to more than 25 different fish species.
Aller Aquawww.aller-aqua.com
Denmark Aller Aqua produces feed at factories in Denmark, Poland and Germany for several different fish species.
Laxa hfwww.laxa.is
Iceland The feed producer Laxa hf. is the bigger producer of fish feed in Iceland with 85% market share and with a production capacity of 15,000 tons annually. The company has produced fish feed for aquaculture for more than 20 years and produces today feed for five species, Arctic charr, cod, salmon, flatfish and rainbow trout. The feed produced by Laxa can be used for aquaculture fish from the size of 5-20 grams depending on species. The company produces grain sizes down to 1.8 mm, but not the finest grain sizes. These are imported from Biomar in Denmark and Skretting in Norway for reselling in Iceland.
Fodurblandan hfwww.fodurblandan.is
Iceland Fodurblandan produces fish feed for Arctic charr, salmon, halibut, cod and more species. Fodurblandan has produced test feed blends based on Icelandic rapeseed for tilapia recently and is further collaborating with Matorka looking for opportunities to increase the share of local feed ingredients.
EWOS ASwww.ewos.com
Norway EWOS have produced fish feed since 1935 and today, operates in all four of the world’s major salmon farming regions: Norway; Chile; Canada; and Scotland. EWOS also operate in Vietnam, producing feed mainly for pangasius catfish.
Skrettingwww.skretting.com
Norway Skretting has business units on five continents producing fish feed in 14 countries with sales in over 40 countries. Skretting produces and delivers high-quality sustainable feeds from hatching to harvest for more than 50 species of farmed fish.Skretting is the number one feed supplier for all principal salmon farming markets with a global market share of about 36%
Brande Denmark The factory in Brande Denmark supplies the countries around the Baltic Sea, in East Europe, and in the northern part of Central Europe as well as trout farmers in the United Kingdom and Ireland.
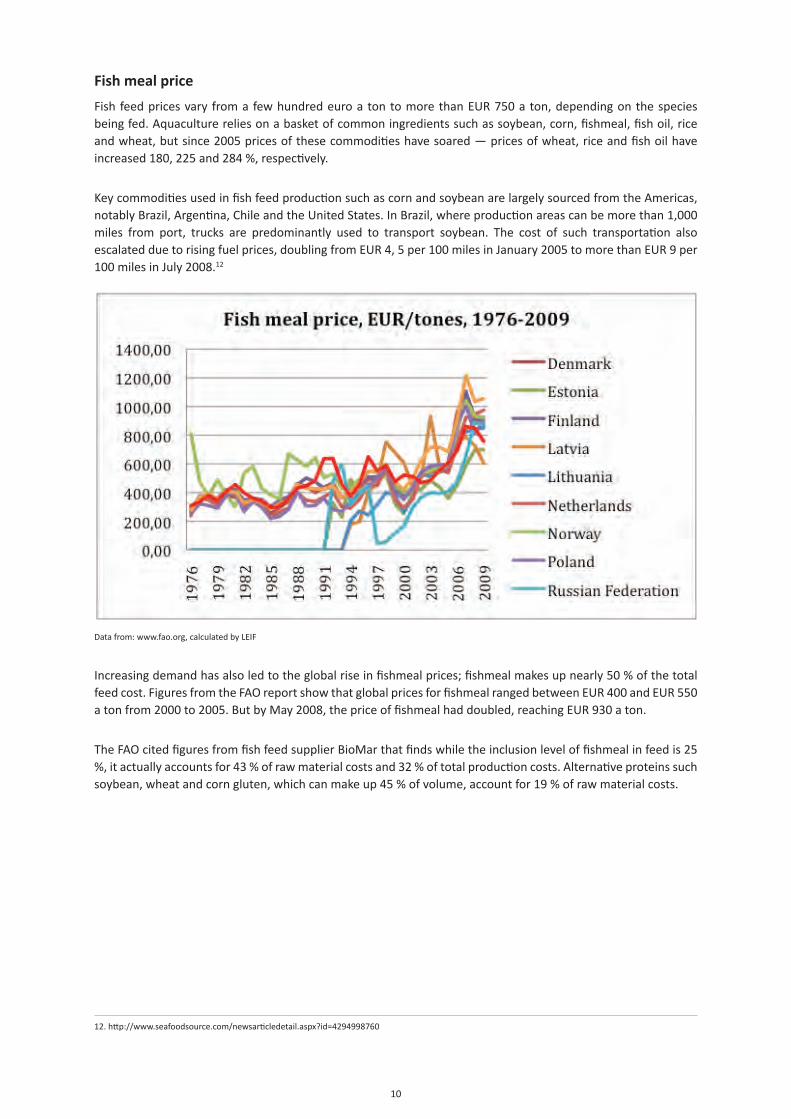
10
Fish meal price
Fish feed prices vary from a few hundred euro a ton to more than EUR 750 a ton, depending on the species being fed. Aquaculture relies on a basket of common ingredients such as soybean, corn, fishmeal, fish oil, rice and wheat, but since 2005 prices of these commodities have soared — prices of wheat, rice and fish oil have increased 180, 225 and 284 %, respectively.
Key commodities used in fish feed production such as corn and soybean are largely sourced from the Americas, notably Brazil, Argentina, Chile and the United States. In Brazil, where production areas can be more than 1,000 miles from port, trucks are predominantly used to transport soybean. The cost of such transportation also escalated due to rising fuel prices, doubling from EUR 4, 5 per 100 miles in January 2005 to more than EUR 9 per 100 miles in July 2008.12
Data from: www.fao.org, calculated by LEIF
Increasing demand has also led to the global rise in fishmeal prices; fishmeal makes up nearly 50 % of the total feed cost. Figures from the FAO report show that global prices for fishmeal ranged between EUR 400 and EUR 550 a ton from 2000 to 2005. But by May 2008, the price of fishmeal had doubled, reaching EUR 930 a ton.
The FAO cited figures from fish feed supplier BioMar that finds while the inclusion level of fishmeal in feed is 25 %, it actually accounts for 43 % of raw material costs and 32 % of total production costs. Alternative proteins such soybean, wheat and corn gluten, which can make up 45 % of volume, account for 19 % of raw material costs.
12. http://www.seafoodsource.com/newsarticledetail.aspx?id=4294998760
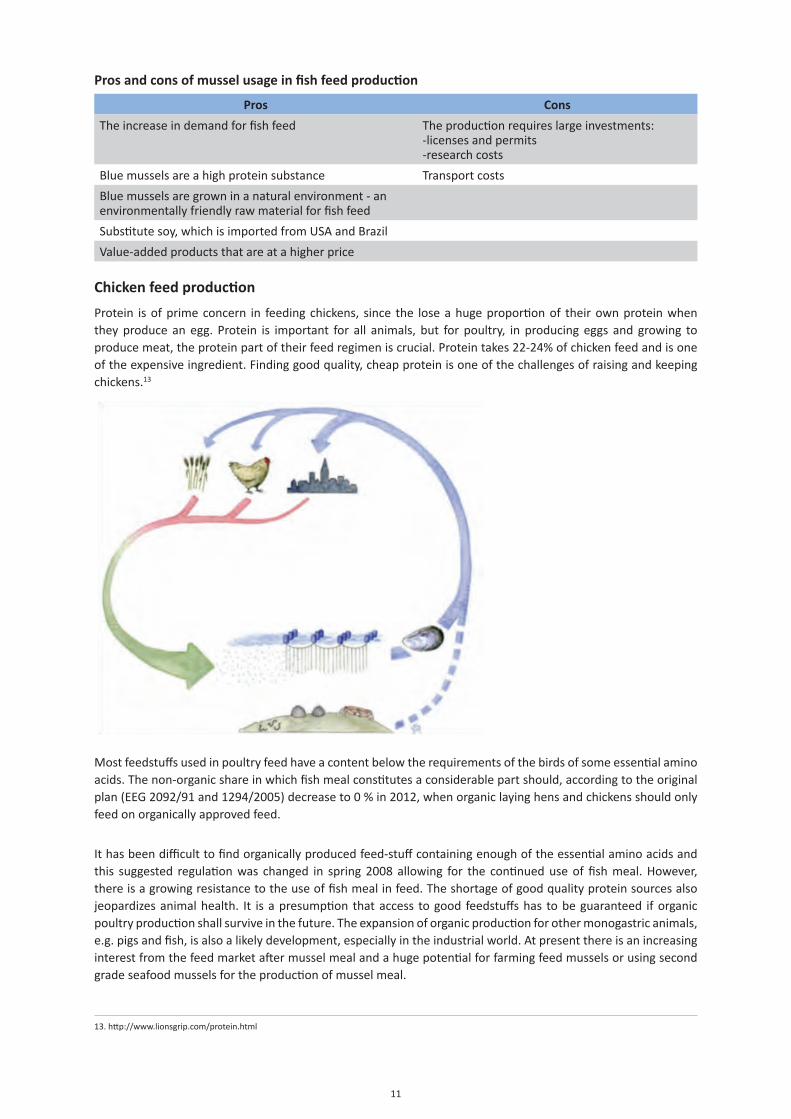
11
Pros and cons of mussel usage in fish feed production
Pros Cons
The increase in demand for fish feed The production requires large investments:-licenses and permits-research costs
Blue mussels are a high protein substance Transport costs
Blue mussels are grown in a natural environment - an environmentally friendly raw material for fish feed
Substitute soy, which is imported from USA and Brazil
Value-added products that are at a higher price
Chicken feed production
Protein is of prime concern in feeding chickens, since the lose a huge proportion of their own protein when they produce an egg. Protein is important for all animals, but for poultry, in producing eggs and growing to produce meat, the protein part of their feed regimen is crucial. Protein takes 22-24% of chicken feed and is one of the expensive ingredient. Finding good quality, cheap protein is one of the challenges of raising and keeping chickens.13
Most feedstuffs used in poultry feed have a content below the requirements of the birds of some essential amino acids. The non-organic share in which fish meal constitutes a considerable part should, according to the original plan (EEG 2092/91 and 1294/2005) decrease to 0 % in 2012, when organic laying hens and chickens should only feed on organically approved feed.
It has been difficult to find organically produced feed-stuff containing enough of the essential amino acids and this suggested regulation was changed in spring 2008 allowing for the continued use of fish meal. However, there is a growing resistance to the use of fish meal in feed. The shortage of good quality protein sources also jeopardizes animal health. It is a presumption that access to good feedstuffs has to be guaranteed if organic poultry production shall survive in the future. The expansion of organic production for other monogastric animals, e.g. pigs and fish, is also a likely development, especially in the industrial world. At present there is an increasing interest from the feed market after mussel meal and a huge potential for farming feed mussels or using second grade seafood mussels for the production of mussel meal.
13 http://www.lionsgrip.com/protein.html
13. http://www.lionsgrip.com/protein.html
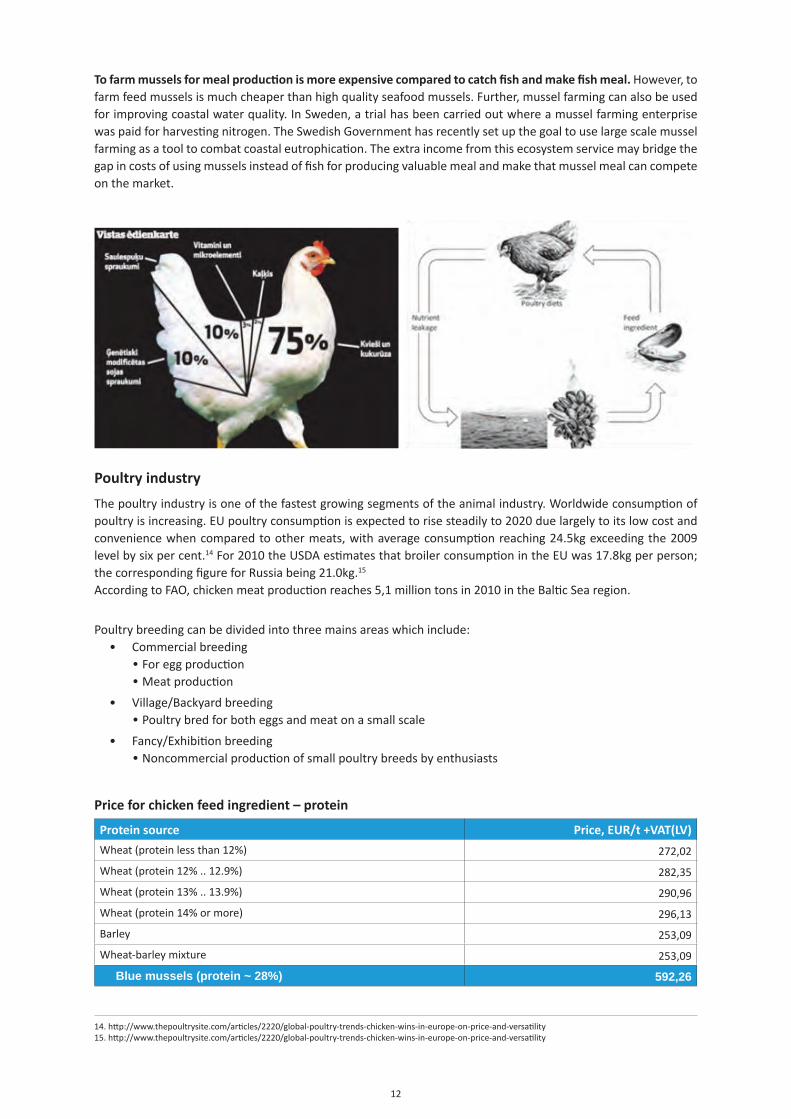
12
To farm mussels for meal production is more expensive compared to catch fish and make fish meal. However, to farm feed mussels is much cheaper than high quality seafood mussels. Further, mussel farming can also be used for improving coastal water quality. In Sweden, a trial has been carried out where a mussel farming enterprise was paid for harvesting nitrogen. The Swedish Government has recently set up the goal to use large scale mussel farming as a tool to combat coastal eutrophication. The extra income from this ecosystem service may bridge the gap in costs of using mussels instead of fish for producing valuable meal and make that mussel meal can compete on the market.
Poultry industry
The poultry industry is one of the fastest growing segments of the animal industry. Worldwide consumption of poultry is increasing. EU poultry consumption is expected to rise steadily to 2020 due largely to its low cost and convenience when compared to other meats, with average consumption reaching 24.5kg exceeding the 2009 level by six per cent.14 For 2010 the USDA estimates that broiler consumption in the EU was 17.8kg per person; the corresponding figure for Russia being 21.0kg.15
According to FAO, chicken meat production reaches 5,1 million tons in 2010 in the Baltic Sea region.
Poultry breeding can be divided into three mains areas which include:• Commercial breeding •For egg production •Meat production
• Village/Backyard breeding •Poultry bred for both eggs and meat on a small scale
• Fancy/Exhibition breeding •Noncommercial production of small poultry breeds by enthusiasts
Price for chicken feed ingredient – protein
Protein source Price, EUR/t +VAT(LV)
Wheat (protein less than 12%) 272,02
Wheat (protein 12% .. 12.9%) 282,35
Wheat (protein 13% .. 13.9%) 290,96
Wheat (protein 14% or more) 296,13
Barley 253,09
Wheat-barley mixture 253,09
Blue mussels (protein ~ 28%) 592,26
14. http://www.thepoultrysite.com/articles/2220/global-poultry-trends-chicken-wins-in-europe-on-price-and-versatility15. http://www.thepoultrysite.com/articles/2220/global-poultry-trends-chicken-wins-in-europe-on-price-and-versatility
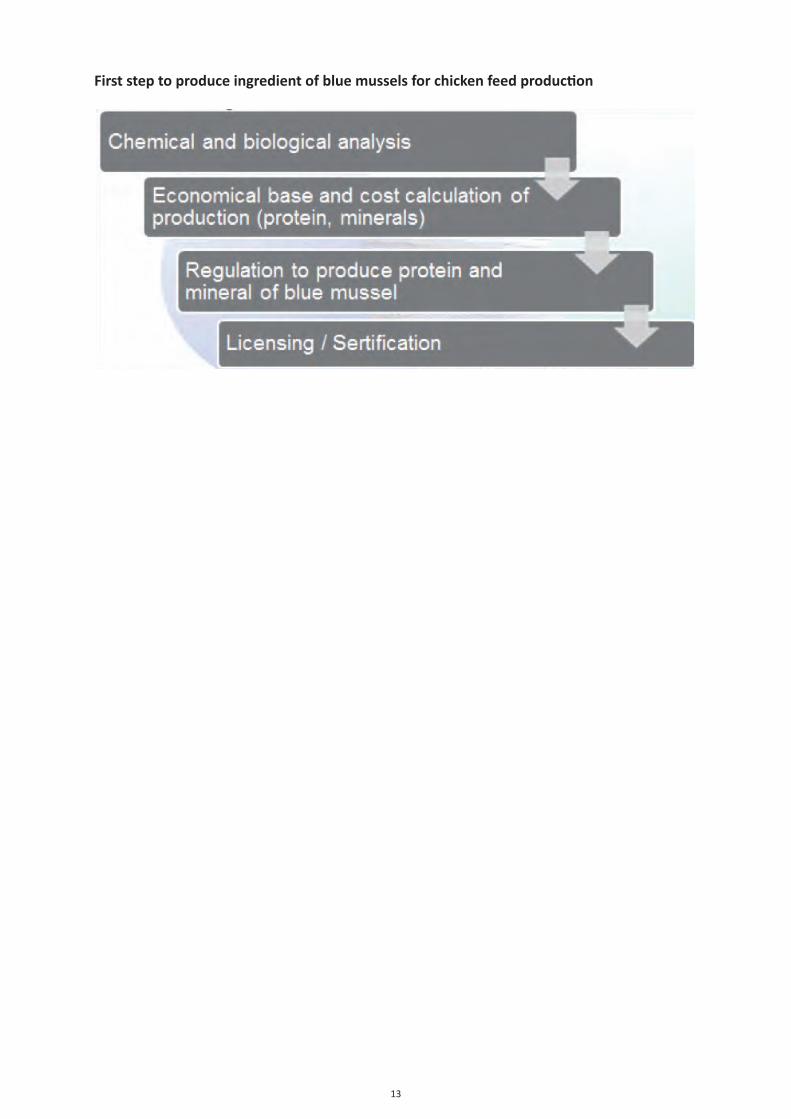
13
First step to produce ingredient of blue mussels for chicken feed production

3.3
Examples of Business Plans

3.3.1Baltic Ecomussel
Business PlanSweden
2
Abbreviations
B.C. before century
cm centimetre
CV curriculumvitae
EBITDA EarningsBeforeInterest,Taxes,DepreciationandAmortization
ERDF EuropeanRegionalDevelopmentFund
EXW Ex-Works(atradetermrequiringthesellertodelivergoodsathisorherown placeofbusiness.)Allothertransportationcostsandrisksareassumedbythe buyer)
FAO FoodandAgricultureorganizationoftheUnitedNations
g gram
kg kilogram
GDP grossdomesticproduct
IRR internalrateofreturn
LEIF LatvianEnvironmentalInvestmentFund
M million
MEUR millioneuros
MIRR modifiedinternalrateofreturn
mth month
NPV Netpresentvalue
Qty quantity
T thousand
t ton
TEUR thousandeuros
WACC weightedaveragecostofcapital
Y year
Disclaimer: The contents of the document reflect the authors’ views. The Managing Authority of the Central Baltic INTERREG IV A Programme cannot be held liable for information published by the project partners.
3
Index1. Generalinformationaboutthecompany......................................................................................... 6
1.1. Generalinformationaboutthecompany......................................................................................... 6
1.2. TheBalticEcoMusselLtd.objectives................................................................................................ 6
2. PROjECT IMPLEMENTATION 7
2.1. Projectobjective............................................................................................................................... 7
2.2. Projectimplementationcapacity...................................................................................................... 7
Managementstaffprofile................................................................................................................. 7
2.3. Product............................................................................................................................................. 8
2.4. Strategicsegmentation..................................................................................................................... 9
2.5. FinancialResources......................................................................................................................... 10
2.6. Investmentplan.............................................................................................................................. 10
2.7. Projectimplementationtimetable.................................................................................................. 14
3. MARkET ANALySIS .......................................................................................................................15
3.1. Sectoroverview-fisheryandaquaculture..................................................................................... 15
3.2. BluemusselfisheryinSweden....................................................................................................... 20
3.3. Prognosisofmusselvolume........................................................................................................... 26
3.4. Competitors.................................................................................................................................... 27
3.5. Financialindicatorsofindustry....................................................................................................... 28
4. RISk EVALUATION AND ANALySIS OF TEChNICAL ASPECTS .......................................................37
5. SWOT ............................................................................................................................................40
6. FINANCIAL BASIS OF ThE PROjECT .............................................................................................41
6.1. RevenuePlan.................................................................................................................................. 41
6.2. CostsPlan....................................................................................................................................... 42
6.3. ProfitandLossStatement............................................................................................................... 44
6.4. Riskanalysis.................................................................................................................................... 44
6.5. Cashflow........................................................................................................................................ 45
6.6. Balanceforecast.............................................................................................................................. 46
6.7. Projectprofitabilitycalculation....................................................................................................... 48
6.8. Sensitivityanalysis.......................................................................................................................... 48
4
Figure1;MusselsoftheBalticSea.................................................................................................................. 8
Figure2;Musseloutlets.................................................................................................................................. 9
Figure3;WorldGDP(1984-2012)andfisherytradeandproduction(1984-2009),trillionEUR................. 16
Figure4;GlobalfisheryproductioninthecaptureandaquacultureMt,
1950-2010andaverageconsumptionpercapitakg..................................................................................... 17
Figure5;Shareofglobalcommoditytradeandproductionbygroups(inEUR),1976-2009........................ 18
Figure6;Shareofglobalcommoditytradeandproductionbygroups(intons),1976-2009........................ 18
Figure7;Fisheryandmusselsproductionandtradeintheworld(Mtons),1950-2010.............................. 19
Figure8;Fishingofbluemusselintheworld1950-2010(tons)................................................................... 20
Figure9;CaughtamountofbluemusselsinSweden(tons),1976-2009...................................................... 21
Figure10;MusseltradeinSweden(tons),1976-2009.................................................................................. 22
Figure11;Overallconsumptionofmussels(Mkg)andpercapitainSweden(kg),1976-2009.................... 23
Figure11;Averagemusselprice,perkg,EUR............................................................................................... 23
Figure12;Averagebluemusselspriceproducedinaquaculture,perkg,EUR............................................. 24
Figure13;Prognosisofmusselsvolume,Mtons1950-2040........................................................................ 25
Figure14;Themainmarketplayers.............................................................................................................. 26
5
Table1;Structureoffinancialresources....................................................................................................... 10
Table2;Investmentplan-boat..................................................................................................................... 10
Table3;Investmentplan-equipment........................................................................................................... 11
Table4;Investmentplan-long-line.............................................................................................................. 12
Table5;Investmentplan-labourcosts......................................................................................................... 13
Table6;Timetableofforfarmestablishment............................................................................................... 14
Table7;Financialdata,balance..................................................................................................................... 28
Table8;Financialdata,profitandlossstatement......................................................................................... 29
Table9;Financialindicators2007-2011ofSnadderogSnaskum.................................................................. 29
Table10;Generalcharacteristicsoffinancialindicators............................................................................... 31
Table11;Financialdata,balance................................................................................................................... 32
Table12;Financialdata,profitandlossstatement....................................................................................... 32
Table13;Financialindicators2008-2011ofFiskebäcksSeafoodAB............................................................. 33
Table14;Mainfinancialdatain2011............................................................................................................ 35
Table15;Thegeneralcharacteristicsoffinancialindicatorsofthese4companies...................................... 35
Table16;Revenue......................................................................................................................................... 41
Table17;Productioncosts............................................................................................................................. 42
Table18;Calculationofsalaries.................................................................................................................... 42
Table19;Profitandlossstatement............................................................................................................... 44
Table20;Calculationofriskrate................................................................................................................... 44
Table21;Financialplan................................................................................................................................. 45
Table22;Cashflowforecast.......................................................................................................................... 46
Table23;Balanceforecast............................................................................................................................. 47
Table24;Calculationofmainfinancialindicators......................................................................................... 47
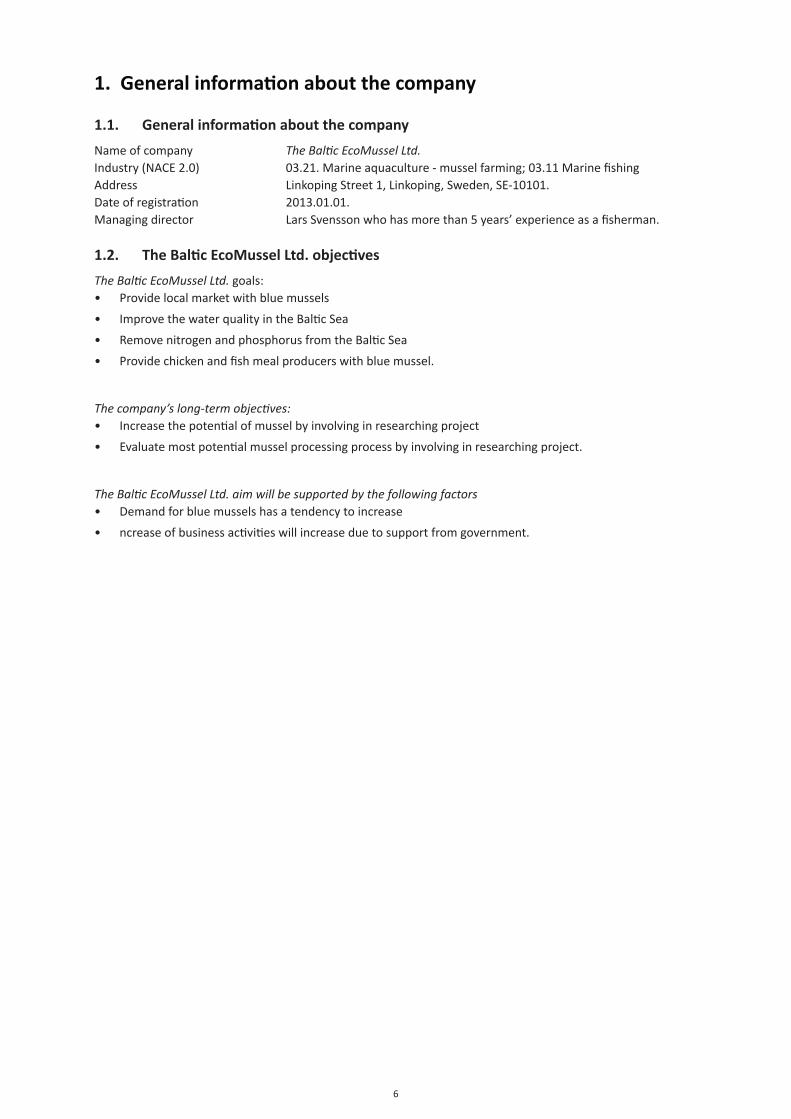
6
1. General information about the company
1.1. General information about the companyNameofcompany The Baltic EcoMussel Ltd.Industry(NACE2.0) 03.21.Marineaquaculture-musselfarming;03.11MarinefishingAddress LinkopingStreet1,Linkoping,Sweden,SE-10101.Dateofregistration 2013.01.01.Managingdirector LarsSvenssonwhohasmorethan5years’experienceasafisherman.
1.2. The Baltic EcoMussel Ltd. objectivesThe Baltic EcoMussel Ltd.goals:• Providelocalmarketwithbluemussels
• ImprovethewaterqualityintheBalticSea
• RemovenitrogenandphosphorusfromtheBalticSea
• Providechickenandfishmealproducerswithbluemussel.
The company’s long-term objectives:• Increasethepotentialofmusselbyinvolvinginresearchingproject
• Evaluatemostpotentialmusselprocessingprocessbyinvolvinginresearchingproject.
The Baltic EcoMussel Ltd. aim will be supported by the following factors• Demandforbluemusselshasatendencytoincrease
• ncreaseofbusinessactivitieswillincreaseduetosupportfromgovernment.
7
2. Project implementation
2.1. Project objectiveInordertoimprovethesectordevelopment:• EstablishingamusselfarminSweden
• ReducingpollutionintheBalticSea
Also themussels reducenitrogenandphosphorus inwater, thuspurifieswater in theBalticSeaandprovidebetterconditionsforfish.
• Providinglocalmarketwithmussels;
• IncreasingproductionquantitiesforlocalproducerlocatedaroundtheBalticSea;
Alsoseveralindustries,likefishandchickenmealproducers,feelthelackofresourcesandduetothisreasontheamountofimportedmusselincreasesandcarbondioxinpollutionincreases,too.
• Increasingofemploymentinthefisherysector.
AccordingtotheEuropeanactsthecatchquantityoffishisreduced.Thisreductioninfluencesemploymentinregions.Sothemanagershouldnotinvolveotherpersonsfromotherfieldandtheirexperienceworkingintheseawillreducesomerisksandincreasesuccessofbusiness.Overall, themussel farming has a lot of environmental and economic benefits looking on the Baltic Sea insustainablemanner.
2.2. Project implementation capacity
Management staff profileTheBalticEcoMusselLtd.ismanagedbyafishermanwhohasmorethan5years’experienceofworkingintheBalticSea.
AdetailedLarsSvenssonCVisattachedinannex.
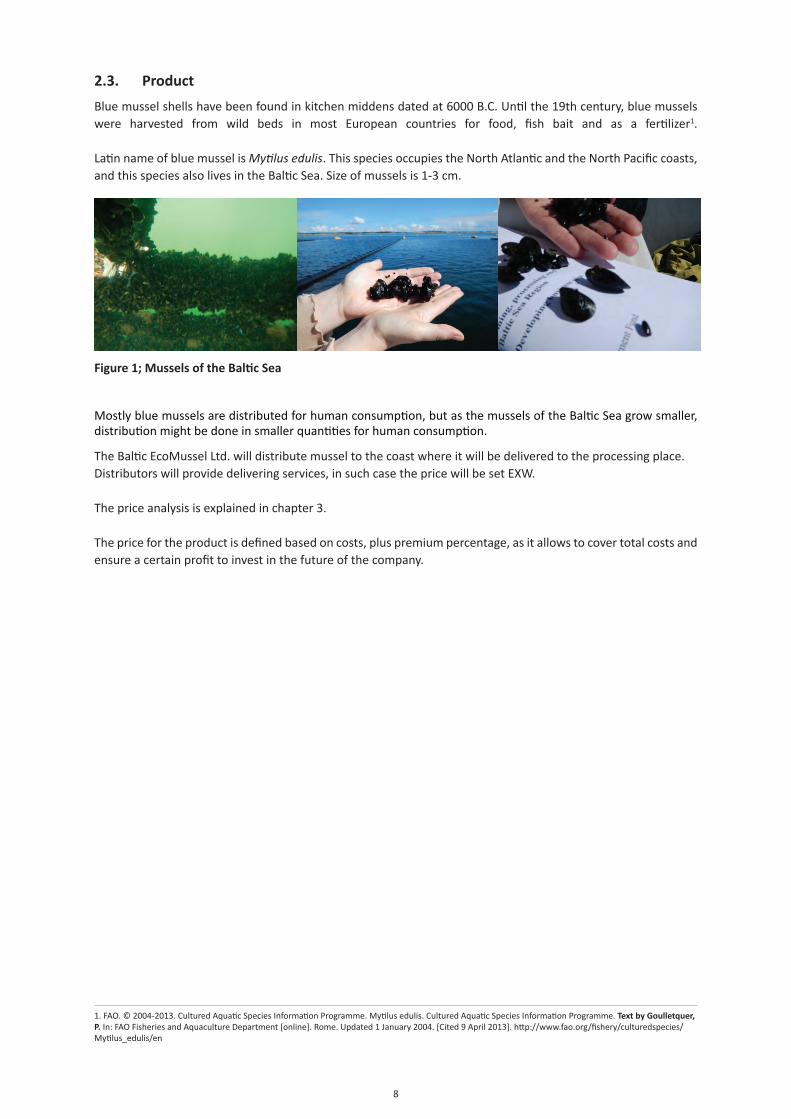
8
2.3. ProductBluemusselshellshavebeenfoundinkitchenmiddensdatedat6000B.C.Untilthe19thcentury,bluemusselswere harvested from wild beds in most European countries for food, fish bait and as a fertilizer1.
LatinnameofbluemusselisMytilus edulis.ThisspeciesoccupiestheNorthAtlanticandtheNorthPacificcoasts,andthisspeciesalsolivesintheBalticSea.Sizeofmusselsis1-3cm.
Mostlybluemusselsaredistributedforhumanconsumption,butasthemusselsoftheBalticSeagrowsmaller,distributionmightbedoneinsmallerquantitiesforhumanconsumption.
TheBalticEcoMusselLtd.willdistributemusseltothecoastwhereitwillbedeliveredtotheprocessingplace.Distributorswillprovidedeliveringservices,insuchcasethepricewillbesetEXW.
Thepriceanalysisisexplainedinchapter3.
Thepricefortheproductisdefinedbasedoncosts,pluspremiumpercentage,asitallowstocovertotalcostsandensureacertainprofittoinvestinthefutureofthecompany.
1
Figure 1; Mussels of the Baltic Sea
1.FAO.©2004-2013.CulturedAquaticSpeciesInformationProgramme.Mytilusedulis.CulturedAquaticSpeciesInformationProgramme.Text by Goulletquer, P.In:FAOFisheriesandAquacultureDepartment[online].Rome.Updated1January2004.[Cited9April2013].http://www.fao.org/fishery/culturedspecies/Mytilus_edulis/en
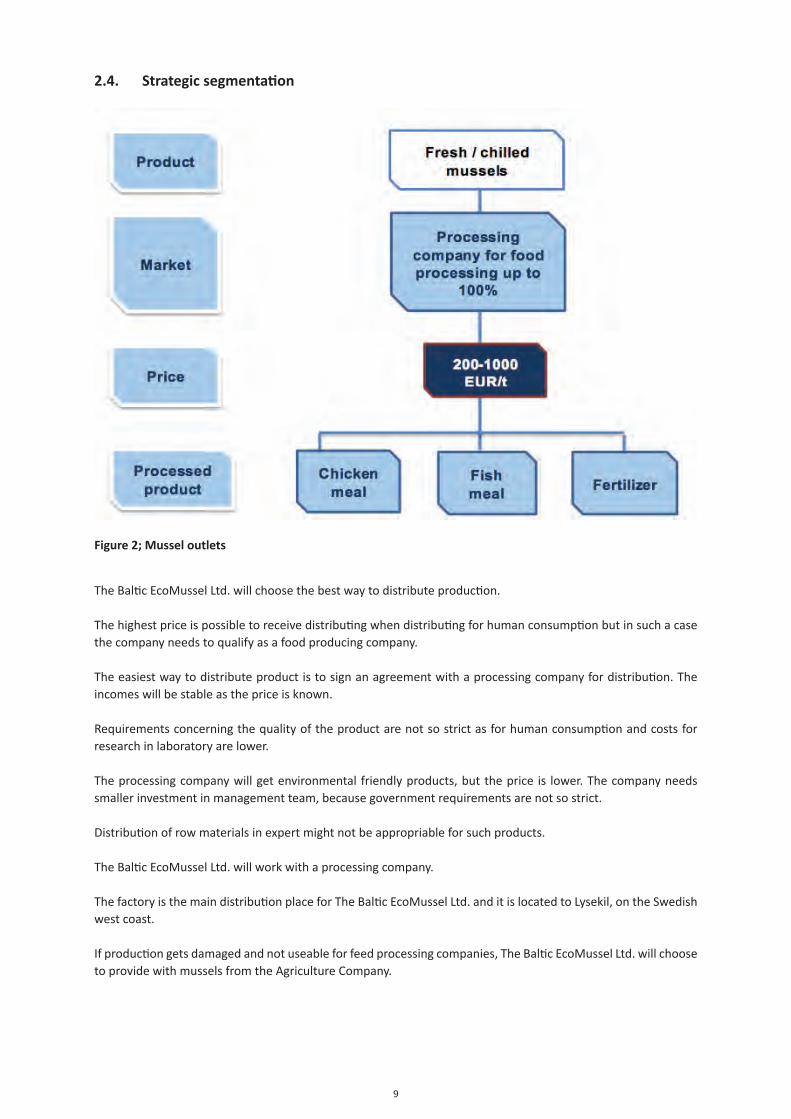
9
2.4. Strategic segmentation
TheBalticEcoMusselLtd.willchoosethebestwaytodistributeproduction.
Thehighestpriceispossibletoreceivedistributingwhendistributingforhumanconsumptionbutinsuchacasethecompanyneedstoqualifyasafoodproducingcompany.
Theeasiestwaytodistributeproductistosignanagreementwithaprocessingcompanyfordistribution.Theincomeswillbestableasthepriceisknown.
Requirementsconcerningthequalityoftheproductarenotsostrictasforhumanconsumptionandcostsforresearchinlaboratoryarelower.
Theprocessingcompanywillgetenvironmental friendlyproducts,buttheprice is lower.Thecompanyneedssmallerinvestmentinmanagementteam,becausegovernmentrequirementsarenotsostrict.
Distributionofrowmaterialsinexpertmightnotbeappropriableforsuchproducts.
TheBalticEcoMusselLtd.willworkwithaprocessingcompany.
ThefactoryisthemaindistributionplaceforTheBalticEcoMusselLtd.anditislocatedtoLysekil,ontheSwedishwestcoast.
Ifproductiongetsdamagedandnotuseableforfeedprocessingcompanies,TheBalticEcoMusselLtd.willchoosetoprovidewithmusselsfromtheAgricultureCompany.
Figure 2; Mussel outlets
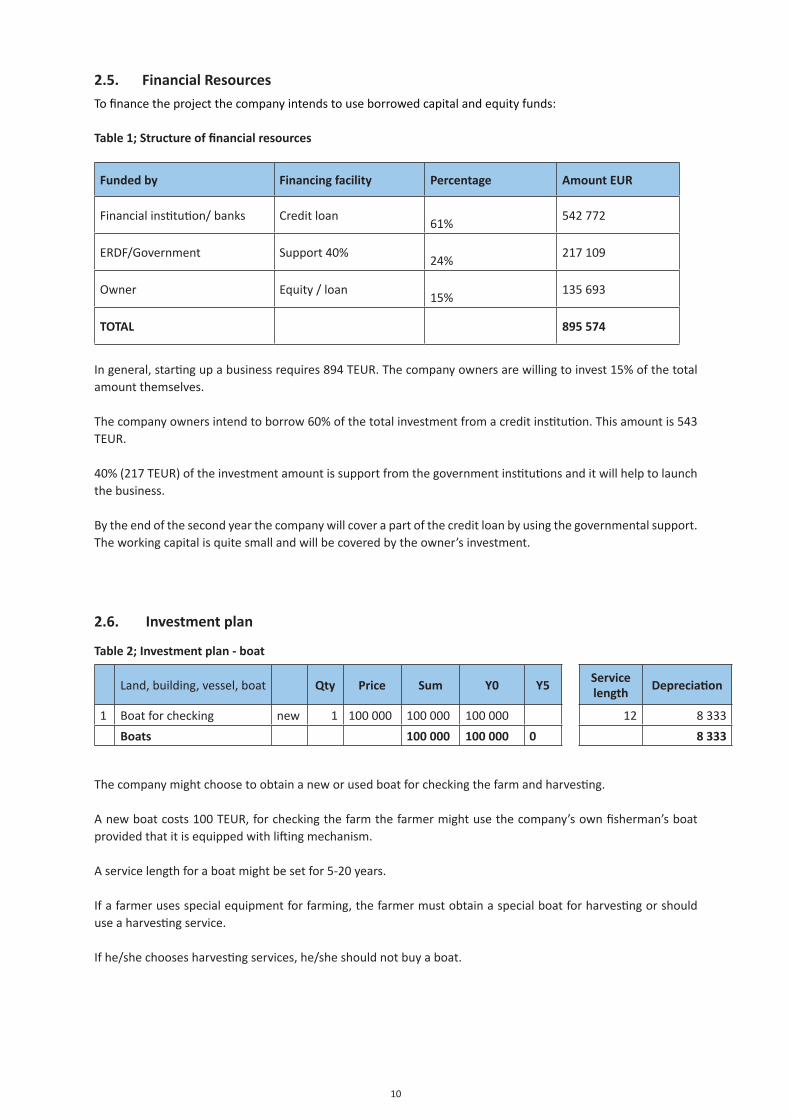
10
2.5. Financial ResourcesTofinancetheprojectthecompanyintendstouseborrowedcapitalandequityfunds:
Table 1; Structure of financial resources
Funded by Financing facility Percentage Amount EUR
Financialinstitution/banks Creditloan61%
542772
ERDF/Government Support40%24%
217 109
Owner Equity/loan15%
135693
TOTAL 895 574
Ingeneral,startingupabusinessrequires894TEUR.Thecompanyownersarewillingtoinvest15%ofthetotalamountthemselves.
Thecompanyownersintendtoborrow60%ofthetotalinvestmentfromacreditinstitution.Thisamountis543TEUR.
40%(217TEUR)oftheinvestmentamountissupportfromthegovernmentinstitutionsanditwillhelptolaunchthebusiness.
Bytheendofthesecondyearthecompanywillcoverapartofthecreditloanbyusingthegovernmentalsupport.Theworkingcapitalisquitesmallandwillbecoveredbytheowner’sinvestment.
2.6. Investment plan
Table 2; Investment plan - boat
Land,building,vessel,boat Qty Price Sum Y0 Y5 Service length Depreciation
1 Boatforchecking new 1 100 000 100 000 100 000 12 8 333
Boats 100 000 100 000 0 8 333
Thecompanymightchoosetoobtainaneworusedboatforcheckingthefarmandharvesting.
Anewboatcosts100TEUR,forcheckingthefarmthefarmermightusethecompany’sownfisherman’sboatprovidedthatitisequippedwithliftingmechanism.
Aservicelengthforaboatmightbesetfor5-20years. Ifafarmerusesspecialequipmentforfarming,thefarmermustobtainaspecialboatforharvestingorshoulduseaharvestingservice.
Ifhe/shechoosesharvestingservices,he/sheshouldnotbuyaboat.
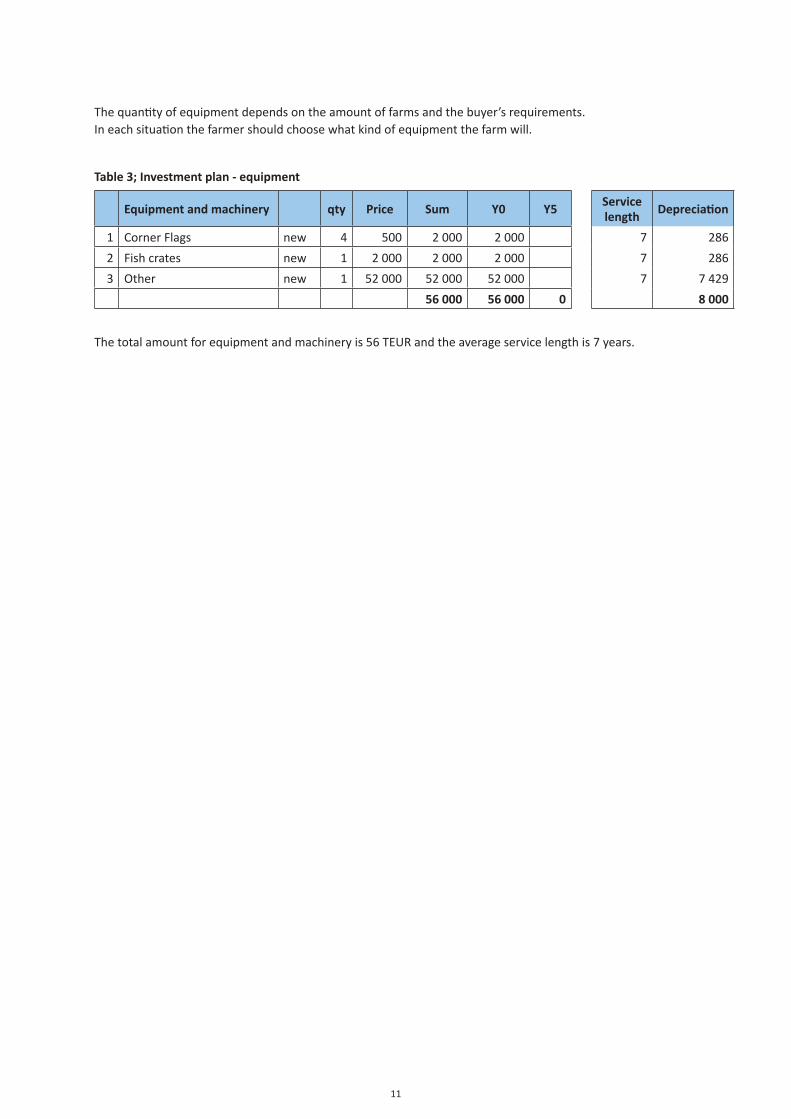
11
Thequantityofequipmentdependsontheamountoffarmsandthebuyer’srequirements.Ineachsituationthefarmershouldchoosewhatkindofequipmentthefarmwill.
Table 3; Investment plan - equipment
Equipment and machinery qty Price Sum Y0 Y5 Service length Depreciation
1 CornerFlags new 4 500 2 000 2 000 7 286
2 Fishcrates new 1 2 000 2 000 2 000 7 286
3 Other new 1 52000 52000 52000 7 7429
56 000 56 000 0 8 000
Thetotalamountforequipmentandmachineryis56TEURandtheaverageservicelengthis7years.
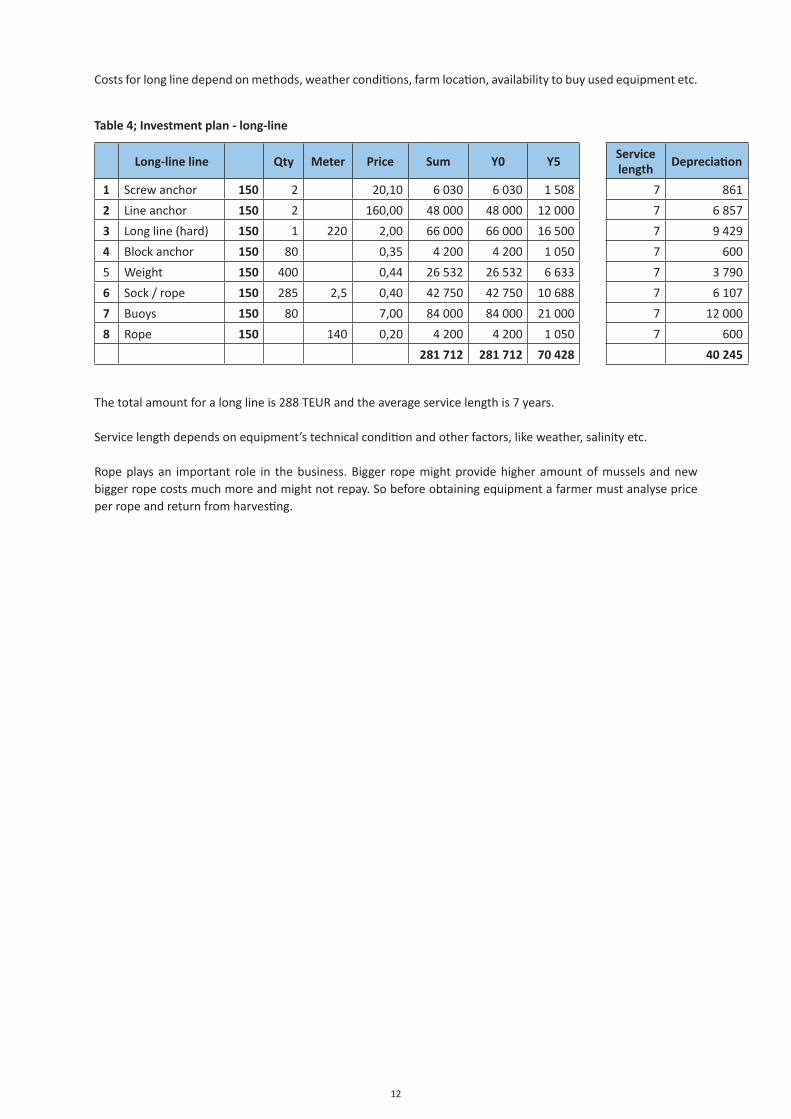
12
Costsforlonglinedependonmethods,weatherconditions,farmlocation,availabilitytobuyusedequipmentetc.
Table 4; Investment plan - long-line
Long-line line Qty Meter Price Sum Y0 Y5 Service length Depreciation
1 Screwanchor 150 2 20,10 6 030 6 030 1508 7 861
2 Lineanchor 150 2 160,00 48000 48000 12 000 7 6857
3 Longline(hard) 150 1 220 2,00 66 000 66 000 16500 7 9429
4 Blockanchor 150 80 0,35 4200 4200 1050 7 600
5 Weight 150 400 0,44 26532 26532 6 633 7 3 790
6 Sock/rope 150 285 2,5 0,40 42750 42750 10 688 7 6 107
7 Buoys 150 80 7,00 84000 84000 21 000 7 12 000
8 Rope 150 140 0,20 4200 4200 1050 7 600
281 712 281 712 70 428 7 40 245
Thetotalamountforalonglineis288TEURandtheaverageservicelengthis7years.
Servicelengthdependsonequipment’stechnicalconditionandotherfactors,likeweather,salinityetc.
Ropeplaysan important role in thebusiness.Bigger ropemightprovidehigheramountofmusselsandnewbiggerropecostsmuchmoreandmightnotrepay.Sobeforeobtainingequipmentafarmermustanalysepriceperropeandreturnfromharvesting.
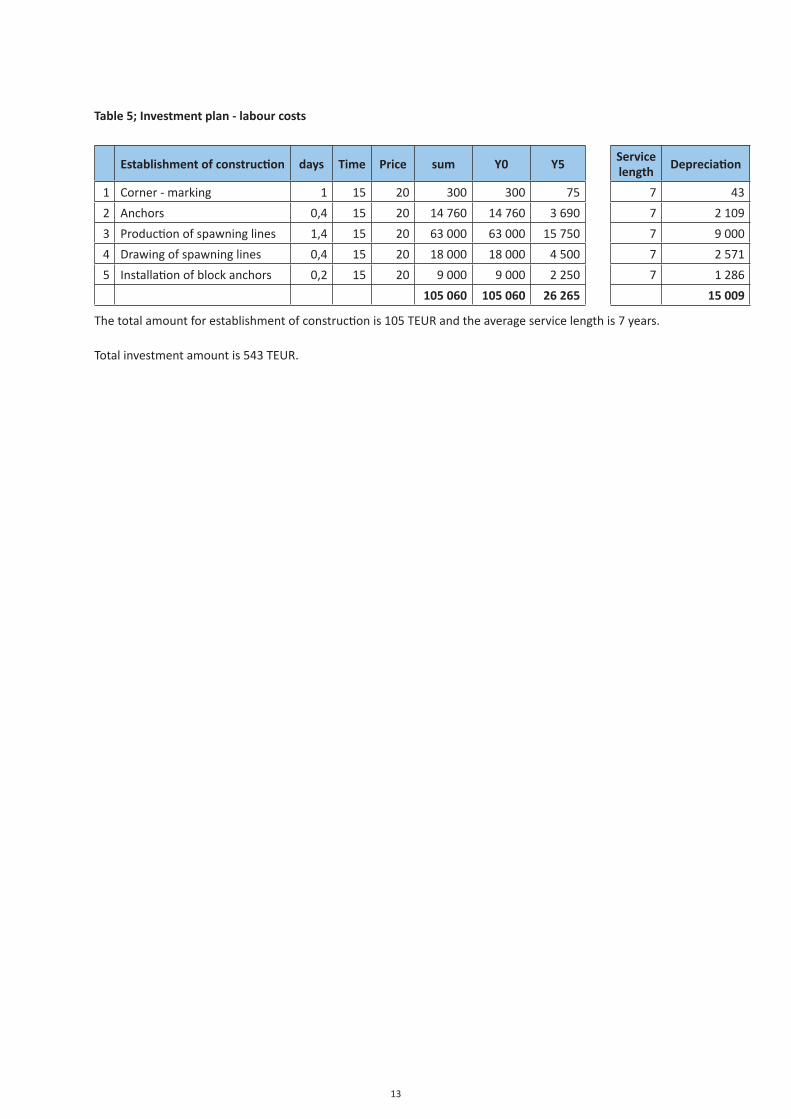
13
Table 5; Investment plan - labour costs
Establishment of construction days Time Price sum Y0 Y5 Service length Depreciation
1 Corner-marking 1 15 20 300 300 75 7 43
2 Anchors 0,4 15 20 14760 14760 3 690 7 2 109
3 Productionofspawninglines 1,4 15 20 63 000 63 000 15750 7 9 000
4 Drawingofspawninglines 0,4 15 20 18 000 18 000 4500 7 2571
5 Installationofblockanchors 0,2 15 20 9 000 9 000 2250 7 1 286
105 060 105 060 26 265 15 009
Thetotalamountforestablishmentofconstructionis105TEURandtheaverageservicelengthis7years.
Totalinvestmentamountis543TEUR.
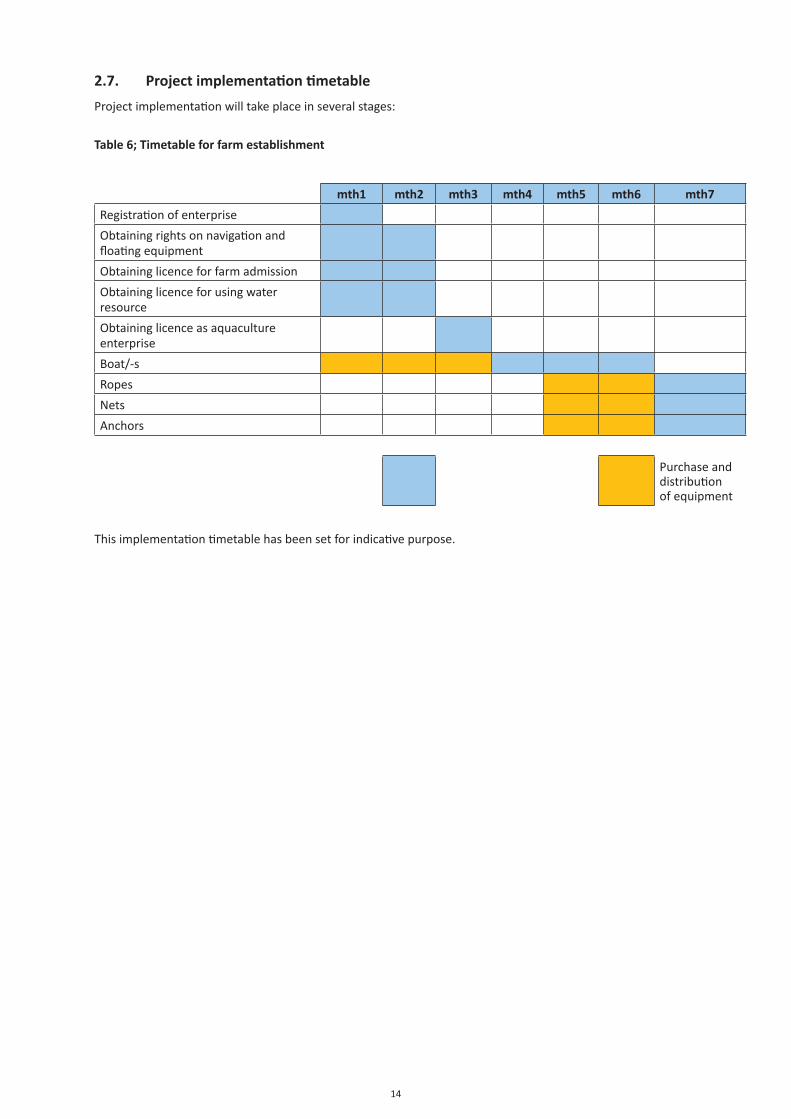
14
2.7. Project implementation timetableProjectimplementationwilltakeplaceinseveralstages:
Table 6; Timetable for farm establishment
mth1 mth2 mth3 mth4 mth5 mth6 mth7Registrationofenterprise
Obtainingrightsonnavigationandfloatingequipment
Obtaininglicenceforfarmadmission
Obtaininglicenceforusingwaterresource
Obtaininglicenceasaquacultureenterprise
Boat/-s
Ropes
Nets
Anchors
Purchaseanddistributionofequipment
Thisimplementationtimetablehasbeensetforindicativepurpose.
15
3. Market Analysis
3.1. Sector overview - fishery and aquaculture
Introduction of industry analysisAgriculturehasasignificant influenceonpeople’s life,andthissector is responsible for foodprovision in theworld.Still,anumberofpeopleleadtheirlivesufferingfromhunger.Duetothis,theimportanceofagricultureincreases.
Notwithstanding,theagriculturesectordoesn’tincludesuchareasasfisheryorforestry;thesesectorsarehighlyimportantinoverallfoodprovidingindustries.
Keywords:
• Aquaculture:
• Thefarmingofaquaticorganismsincludingfish,molluscs,crustaceansandaquaticplantswithsomesortofinterventionintherearingprocesstoenhanceproduction,suchasregularstocking,feeding,protectionfrompredators,etc.Farmingalsoimpliesindividualorcorporateownershipofthestockbeingcultivated.
• Forstatisticalpurposes,aquaticorganismswhichareharvestedbyanindividualorcorporatebody,whichhasownedthemthroughouttheirrearingperiod,contributetoaquaculture.
• Fishery:
• Generally,afisheryisanactivityleadingtoharvestingoffish.Itmayinvolvecaptureofwildfishorgrowingoffishthroughaquaculture.
• Aunitdeterminedbyanauthorityorotherentitythatisengagedinraisingand/orharvestingfish.Typically,theunitisdefinedintermsofsomeorallofthefollowing:peopleinvolved,speciesortypeoffish,areaofwaterorseabed,methodoffishing,classofboatsandpurposeoftheactivities.2
Aquacultureisprobablythefastestgrowingfood-producingsectortoday.
Manyresourcesusedinaquaculturesuchaswater,land,seed,broodstockandfeedingredientsareofteninshortsupply.Thisissobecausetheseresources-orfactorsofproduction-arealsocommonlyusedinagriculture,anactivitywithwhichaquacultureisoftenintegrated,particularly inAsia. Ithappensthatthiscompetitionturnsinto,or isseenas,aconflictbetweenusergroups. Inmostcountriestheseconflictsaresettledinthemarketplace.Buyersand sellers set thepriceand therebydetermine theuse.Thus resourcemanagement is clearlyneeded.
The sector’s use of natural resourcesmust ensure long term sustainability, which generallymeans avoidingadverse effects on the environment. However, information on expected or potential environmental impactsof aquaculture is often incomplete. The use of selected management approaches and the application of aprecautionaryapproachbybothfarmmanagementandbyregulatoryorganizationscanhelptoavoidmakingdecisionsbasedonincompleteknowledge.
Animportantaspectinthiscontextistheneedforeffectivecontrolsoffishhealthmanagement,asdiseaseshavebecomeaprimaryconstraintforthegrowthofaquaculture.Intensiveculturepractices,withpoorlycontrolleduseoffeedandproductionofwaste,haveadverselyaffectedlocalenvironments. Accordingto informationfromtheFoodandAgricultureorganizationof theUnitedNations (hereinafter-FAO)thelivelihoodofover500millionpeopleindevelopingcountriesdirectlyorindirectlydependsonfisheriesandaquaculture. Due to several reasons, such as thewillingness to increase one’s ownwelfare, it increases theoverfishingandreducesfishstocks.
2.www.fao.org
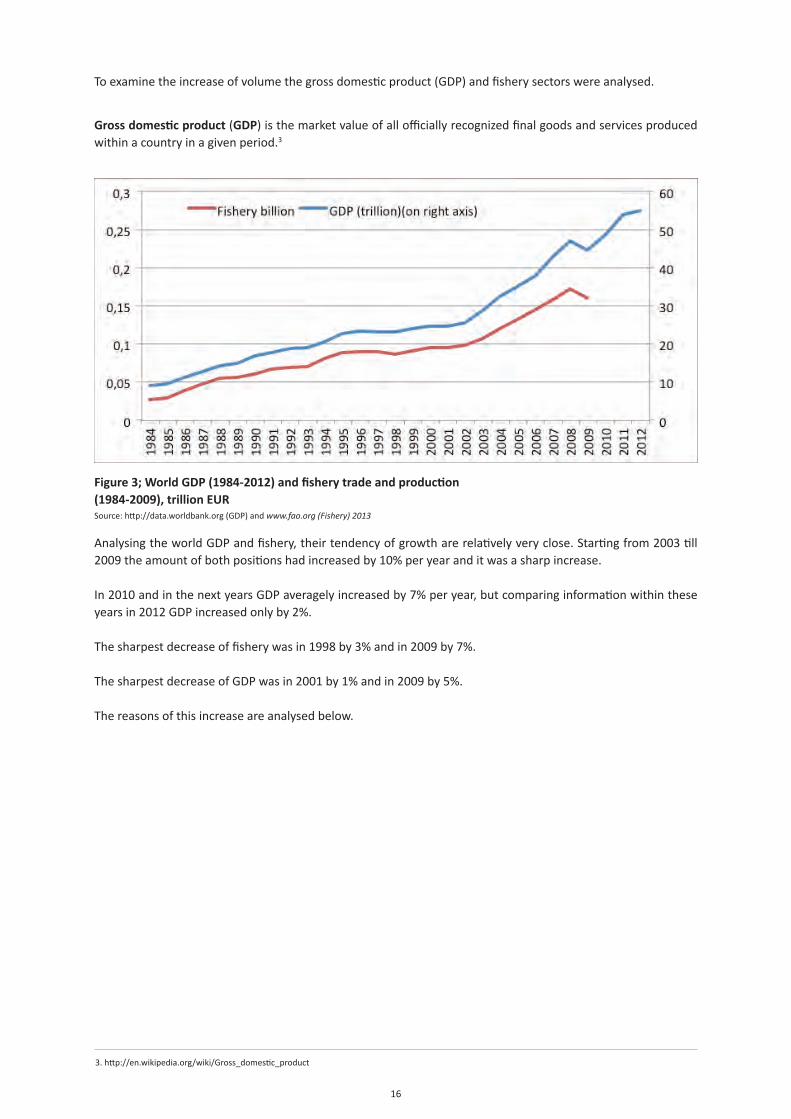
16
Toexaminetheincreaseofvolumethegrossdomesticproduct(GDP)andfisherysectorswereanalysed.
Gross domestic product(GDP)isthemarketvalueofallofficiallyrecognizedfinalgoodsandservicesproducedwithinacountryinagivenperiod.3
Figure 3; World GDP (1984-2012) and fishery trade and production (1984-2009), trillion EURSource:http://data.worldbank.org(GDP)andwww.fao.org (Fishery) 2013
AnalysingtheworldGDPandfishery,theirtendencyofgrowtharerelativelyveryclose.Startingfrom2003till2009theamountofbothpositionshadincreasedby10%peryearanditwasasharpincrease.
In2010andinthenextyearsGDPaveragelyincreasedby7%peryear,butcomparinginformationwithintheseyearsin2012GDPincreasedonlyby2%.
Thesharpestdecreaseoffisherywasin1998by3%andin2009by7%.
ThesharpestdecreaseofGDPwasin2001by1%andin2009by5%.
Thereasonsofthisincreaseareanalysedbelow.
3.http://en.wikipedia.org/wiki/Gross_domestic_product
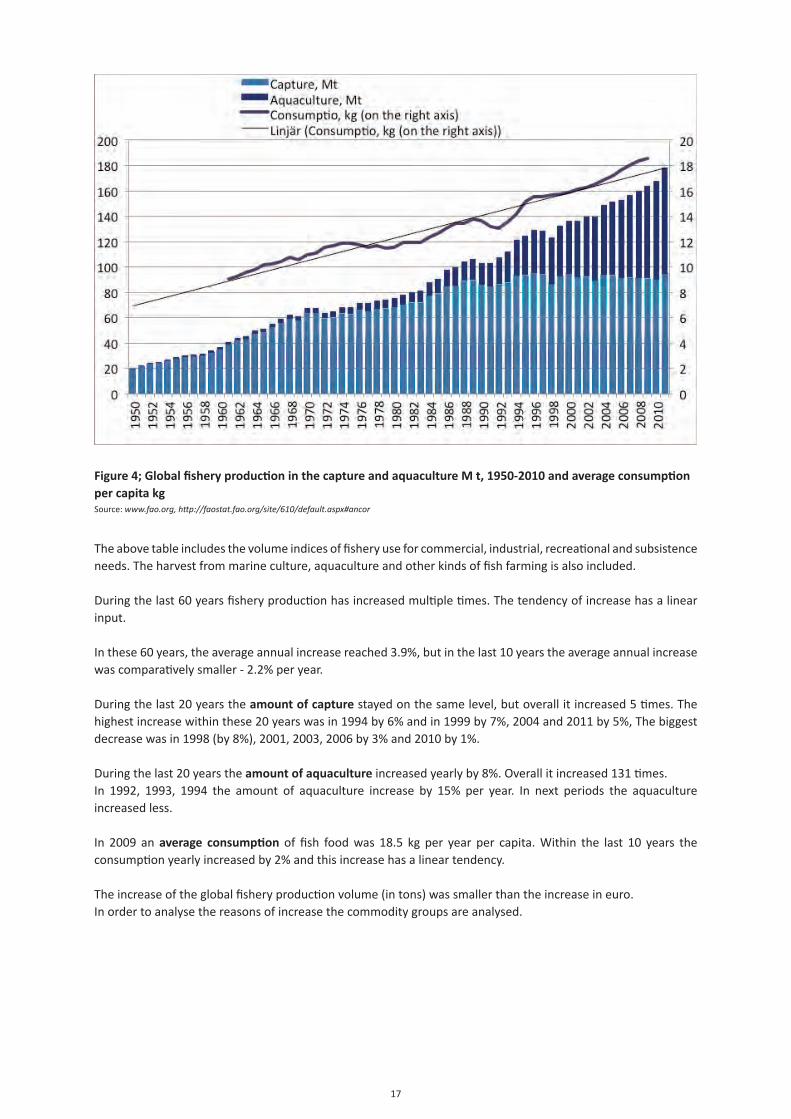
17
Figure 4; Global fishery production in the capture and aquaculture M t, 1950-2010 and average consumption per capita kgSource:www.fao.org, http://faostat.fao.org/site/610/default.aspx#ancor
Theabovetableincludesthevolumeindicesoffisheryuseforcommercial,industrial,recreationalandsubsistenceneeds.Theharvestfrommarineculture,aquacultureandotherkindsoffishfarmingisalsoincluded.
Duringthelast60yearsfisheryproductionhasincreasedmultipletimes.Thetendencyofincreasehasalinearinput.
Inthese60years,theaverageannualincreasereached3.9%,butinthelast10yearstheaverageannualincreasewascomparativelysmaller-2.2%peryear.
Duringthelast20yearstheamount of capturestayedonthesamelevel,butoverallitincreased5times.Thehighestincreasewithinthese20yearswasin1994by6%andin1999by7%,2004and2011by5%,Thebiggestdecreasewasin1998(by8%),2001,2003,2006by3%and2010by1%.
Duringthelast20yearstheamount of aquacultureincreasedyearlyby8%.Overallitincreased131times.In 1992, 1993, 1994 the amount of aquaculture increase by 15% per year. In next periods the aquacultureincreasedless.
In 2009 anaverage consumption of fish foodwas 18.5 kg per year per capita.Within the last 10 years theconsumptionyearlyincreasedby2%andthisincreasehasalineartendency.
Theincreaseoftheglobalfisheryproductionvolume(intons)wassmallerthantheincreaseineuro.Inordertoanalysethereasonsofincreasethecommoditygroupsareanalysed.
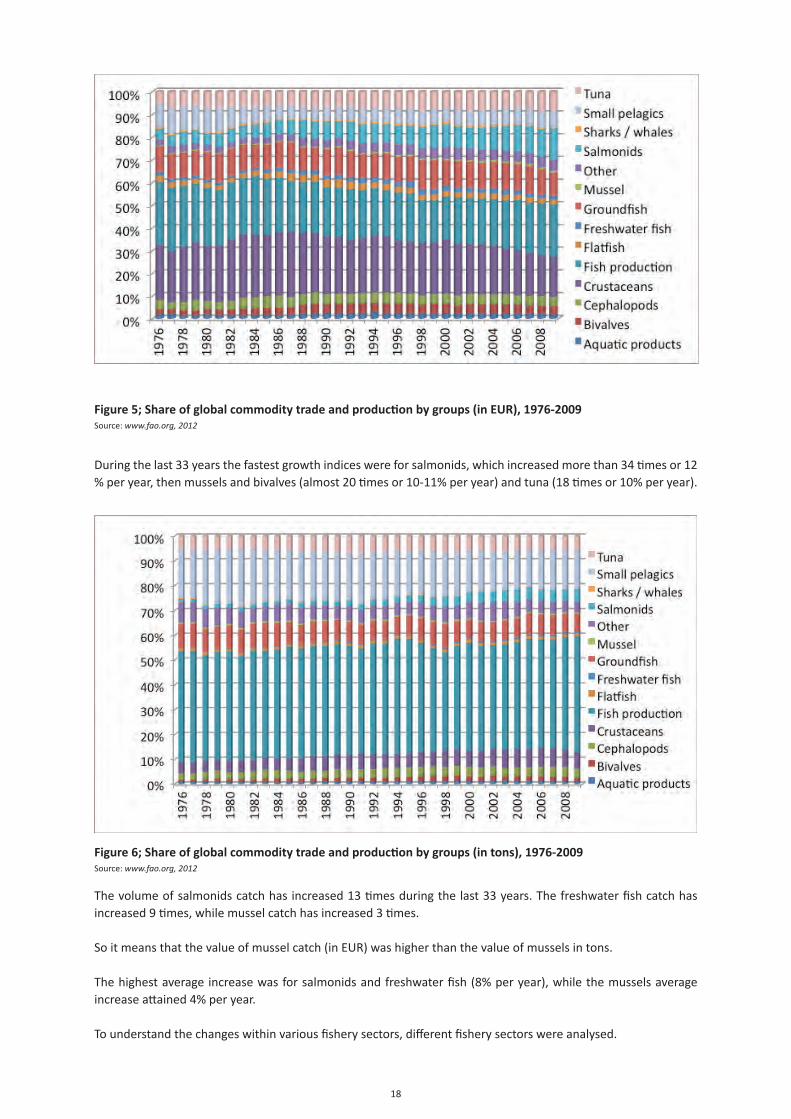
18
Figure 5; Share of global commodity trade and production by groups (in EUR), 1976-2009Source:www.fao.org, 2012
Duringthelast33yearsthefastestgrowthindiceswereforsalmonids,whichincreasedmorethan34timesor12%peryear,thenmusselsandbivalves(almost20timesor10-11%peryear)andtuna(18timesor10%peryear).
Figure 6; Share of global commodity trade and production by groups (in tons), 1976-2009Source:www.fao.org, 2012
Thevolumeofsalmonidscatchhasincreased13timesduringthelast33years.Thefreshwaterfishcatchhasincreased9times,whilemusselcatchhasincreased3times.
Soitmeansthatthevalueofmusselcatch(inEUR)washigherthanthevalueofmusselsintons.
Thehighestaverageincreasewasforsalmonidsandfreshwaterfish(8%peryear),whilethemusselsaverageincreaseattained4%peryear.
Tounderstandthechangeswithinvariousfisherysectors,differentfisherysectorswereanalysed.
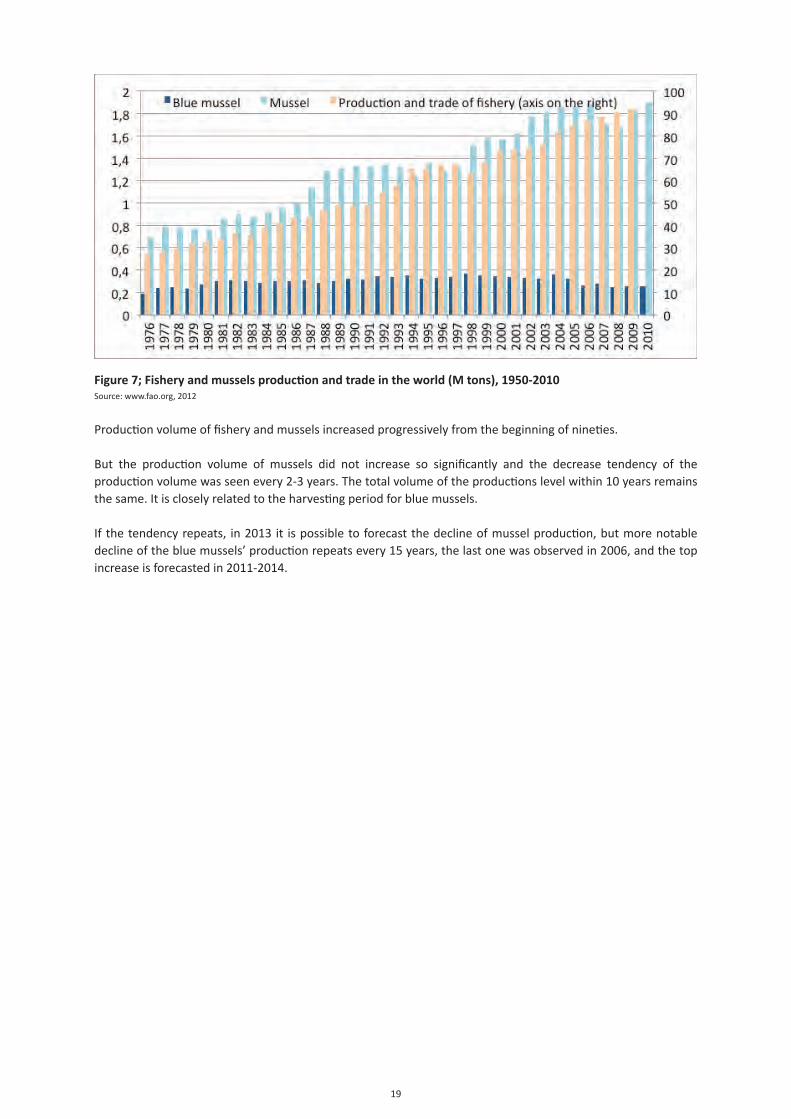
19
Figure 7; Fishery and mussels production and trade in the world (M tons), 1950-2010Source:www.fao.org,2012
Productionvolumeoffisheryandmusselsincreasedprogressivelyfromthebeginningofnineties.
But the production volume of mussels did not increase so significantly and the decrease tendency of theproductionvolumewasseenevery2-3years.Thetotalvolumeoftheproductionslevelwithin10yearsremainsthesame.Itiscloselyrelatedtotheharvestingperiodforbluemussels.
Ifthetendencyrepeats, in2013 it ispossibletoforecastthedeclineofmusselproduction,butmorenotabledeclineofthebluemussels’productionrepeatsevery15years,thelastonewasobservedin2006,andthetopincreaseisforecastedin2011-2014.
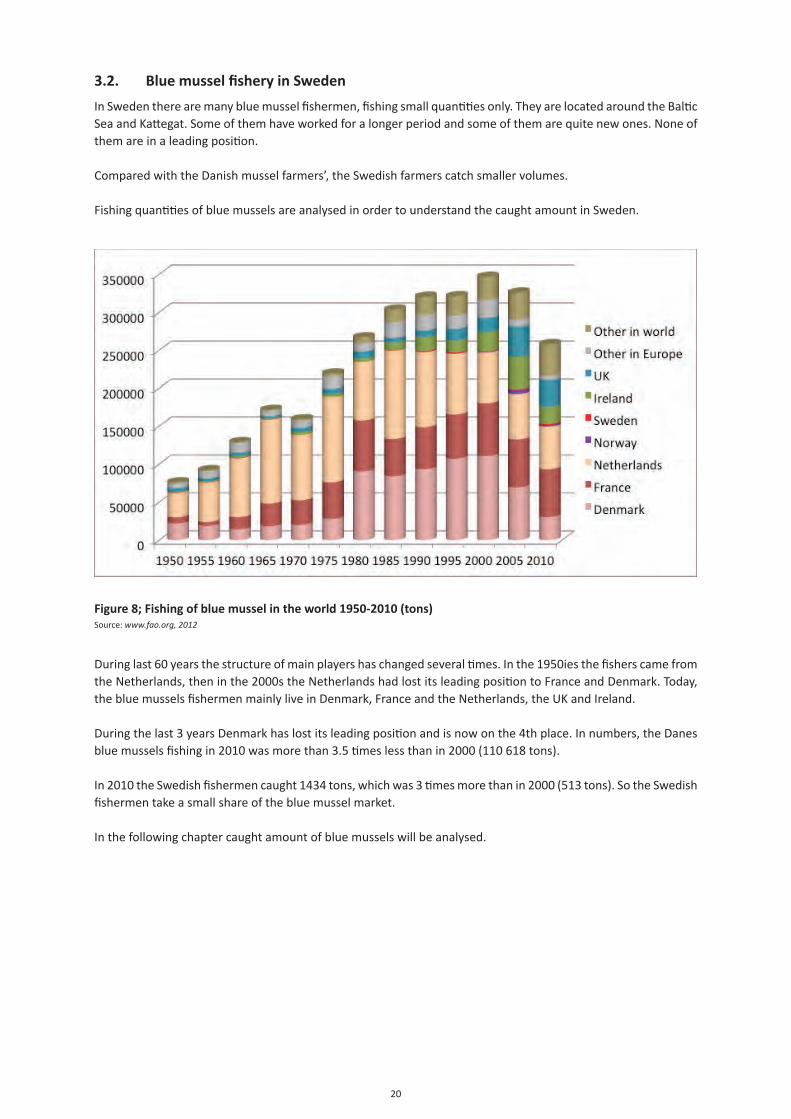
20
3.2. Blue mussel fishery in SwedenInSwedentherearemanybluemusselfishermen,fishingsmallquantitiesonly.TheyarelocatedaroundtheBalticSeaandKattegat.Someofthemhaveworkedforalongerperiodandsomeofthemarequitenewones.Noneofthemareinaleadingposition.
ComparedwiththeDanishmusselfarmers’,theSwedishfarmerscatchsmallervolumes.
FishingquantitiesofbluemusselsareanalysedinordertounderstandthecaughtamountinSweden.
Figure 8; Fishing of blue mussel in the world 1950-2010 (tons)Source:www.fao.org, 2012
Duringlast60yearsthestructureofmainplayershaschangedseveraltimes.Inthe1950iesthefisherscamefromtheNetherlands,theninthe2000stheNetherlandshadlostitsleadingpositiontoFranceandDenmark.Today,thebluemusselsfishermenmainlyliveinDenmark,FranceandtheNetherlands,theUKandIreland. Duringthelast3yearsDenmarkhaslostitsleadingpositionandisnowonthe4thplace.Innumbers,theDanesbluemusselsfishingin2010wasmorethan3.5timeslessthanin2000(110618tons).
In2010theSwedishfishermencaught1434tons,whichwas3timesmorethanin2000(513tons).SotheSwedishfishermentakeasmallshareofthebluemusselmarket.
Inthefollowingchaptercaughtamountofbluemusselswillbeanalysed.
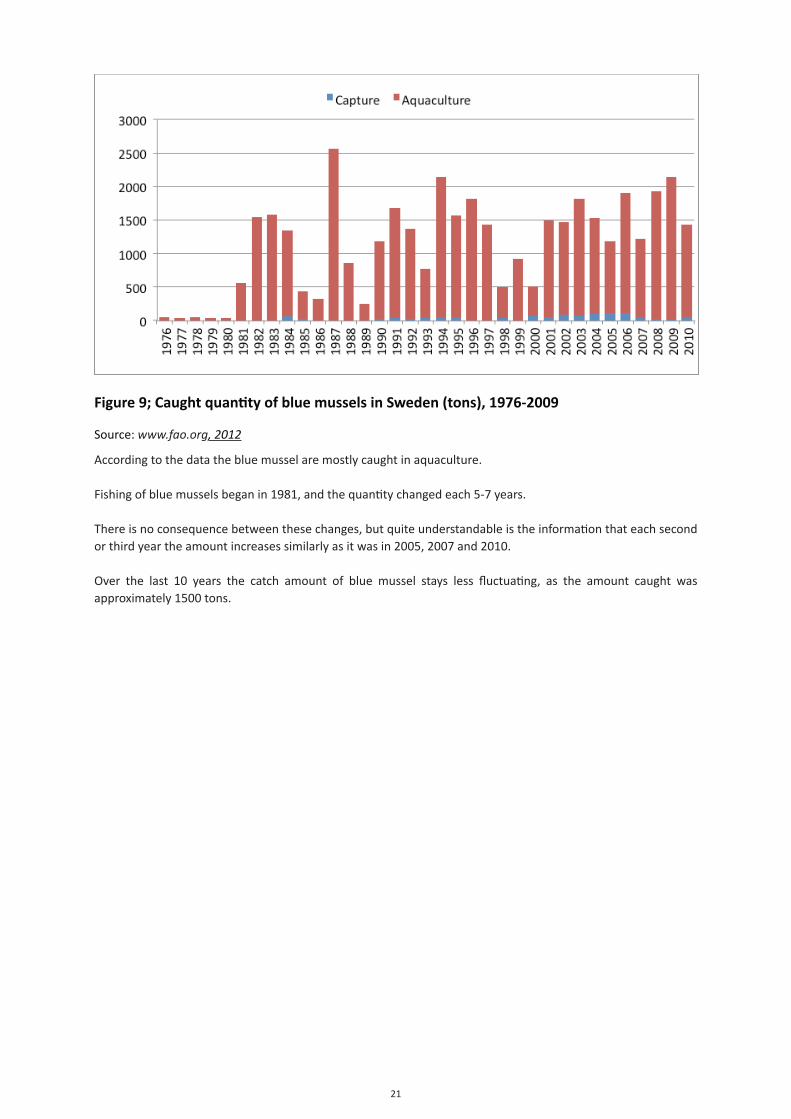
21
Figure 9; Caught quantity of blue mussels in Sweden (tons), 1976-2009
Source:www.fao.org, 2012
Accordingtothedatathebluemusselaremostlycaughtinaquaculture.
Fishingofbluemusselsbeganin1981,andthequantitychangedeach5-7years.
Thereisnoconsequencebetweenthesechanges,butquiteunderstandableistheinformationthateachsecondorthirdyeartheamountincreasessimilarlyasitwasin2005,2007and2010.
Over the last 10 years the catch amount of blue mussel stays less fluctuating, as the amount caught wasapproximately1500tons.
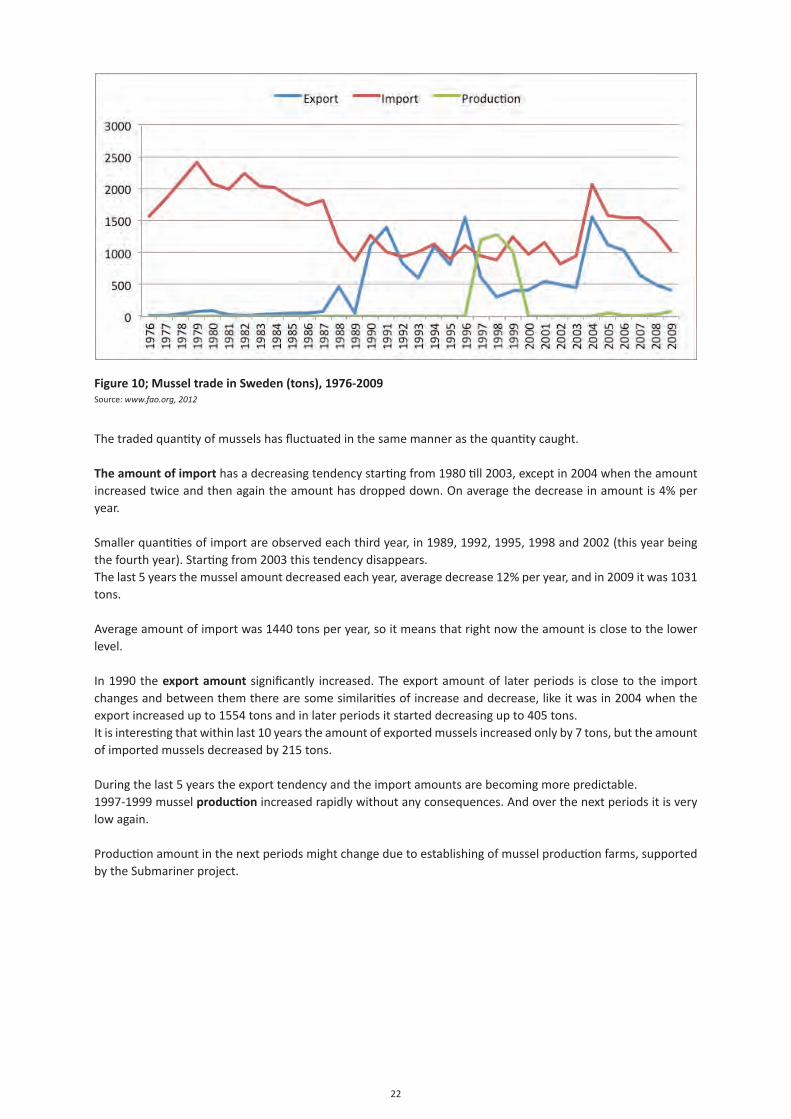
22
Figure 10; Mussel trade in Sweden (tons), 1976-2009Source:www.fao.org, 2012
Thetradedquantityofmusselshasfluctuatedinthesamemannerasthequantitycaught.
The amount of import hasadecreasingtendencystartingfrom1980till2003,exceptin2004whentheamountincreasedtwiceandthenagaintheamounthasdroppeddown.Onaveragethedecreaseinamountis4%peryear.
Smallerquantitiesofimportareobservedeachthirdyear,in1989,1992,1995,1998and2002(thisyearbeingthefourthyear).Startingfrom2003thistendencydisappears.Thelast5yearsthemusselamountdecreasedeachyear,averagedecrease12%peryear,andin2009itwas1031tons.
Averageamountofimportwas1440tonsperyear,soitmeansthatrightnowtheamountisclosetothelowerlevel.
In1990theexport amount significantly increased.Theexportamountof laterperiods isclosetothe importchangesandbetweenthemtherearesomesimilaritiesofincreaseanddecrease,likeitwasin2004whentheexportincreasedupto1554tonsandinlaterperiodsitstarteddecreasingupto405tons.Itisinterestingthatwithinlast10yearstheamountofexportedmusselsincreasedonlyby7tons,buttheamountofimportedmusselsdecreasedby215tons.
Duringthelast5yearstheexporttendencyandtheimportamountsarebecomingmorepredictable.1997-1999musselproductionincreasedrapidlywithoutanyconsequences.Andoverthenextperiodsitisverylowagain.
Productionamountinthenextperiodsmightchangeduetoestablishingofmusselproductionfarms,supportedbytheSubmarinerproject.
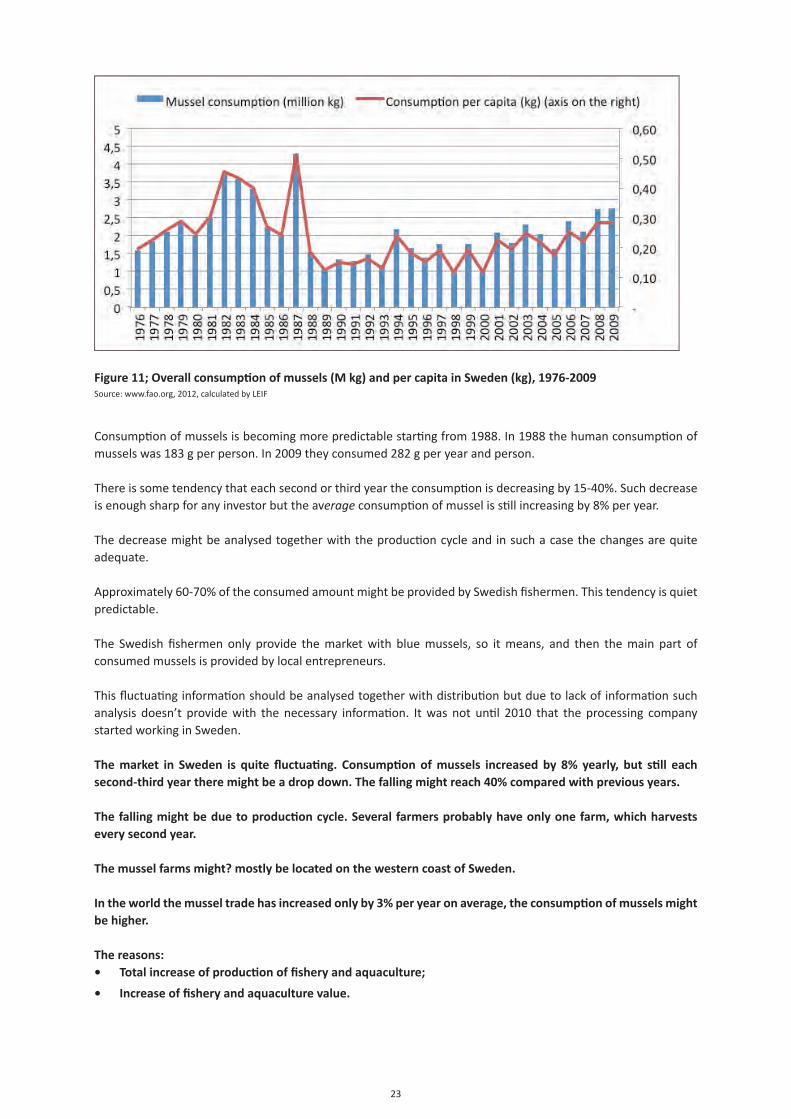
23
Figure 11; Overall consumption of mussels (M kg) and per capita in Sweden (kg), 1976-2009Source:www.fao.org,2012,calculatedbyLEIF
Consumptionofmusselsisbecomingmorepredictablestartingfrom1988.In1988thehumanconsumptionofmusselswas183gperperson.In2009theyconsumed282gperyearandperson.
Thereissometendencythateachsecondorthirdyeartheconsumptionisdecreasingby15-40%.Suchdecreaseisenoughsharpforanyinvestorbuttheaverageconsumptionofmusselisstillincreasingby8%peryear.
Thedecreasemightbeanalysedtogetherwiththeproductioncycleandinsuchacasethechangesarequiteadequate.
Approximately60-70%oftheconsumedamountmightbeprovidedbySwedishfishermen.Thistendencyisquietpredictable. The Swedish fishermen only provide themarketwith bluemussels, so itmeans, and then themain part ofconsumedmusselsisprovidedbylocalentrepreneurs.
Thisfluctuatinginformationshouldbeanalysedtogetherwithdistributionbutduetolackofinformationsuchanalysis doesn’t providewith the necessary information. Itwas not until 2010 that the processing companystartedworkinginSweden.
The market in Sweden is quite fluctuating. Consumption of mussels increased by 8% yearly, but still each second-third year there might be a drop down. The falling might reach 40% compared with previous years.
The falling might be due to production cycle. Several farmers probably have only one farm, which harvests every second year.
The mussel farms might? mostly be located on the western coast of Sweden.
In the world the mussel trade has increased only by 3% per year on average, the consumption of mussels might be higher.
The reasons:• Total increase of production of fishery and aquaculture;
• Increase of fishery and aquaculture value.
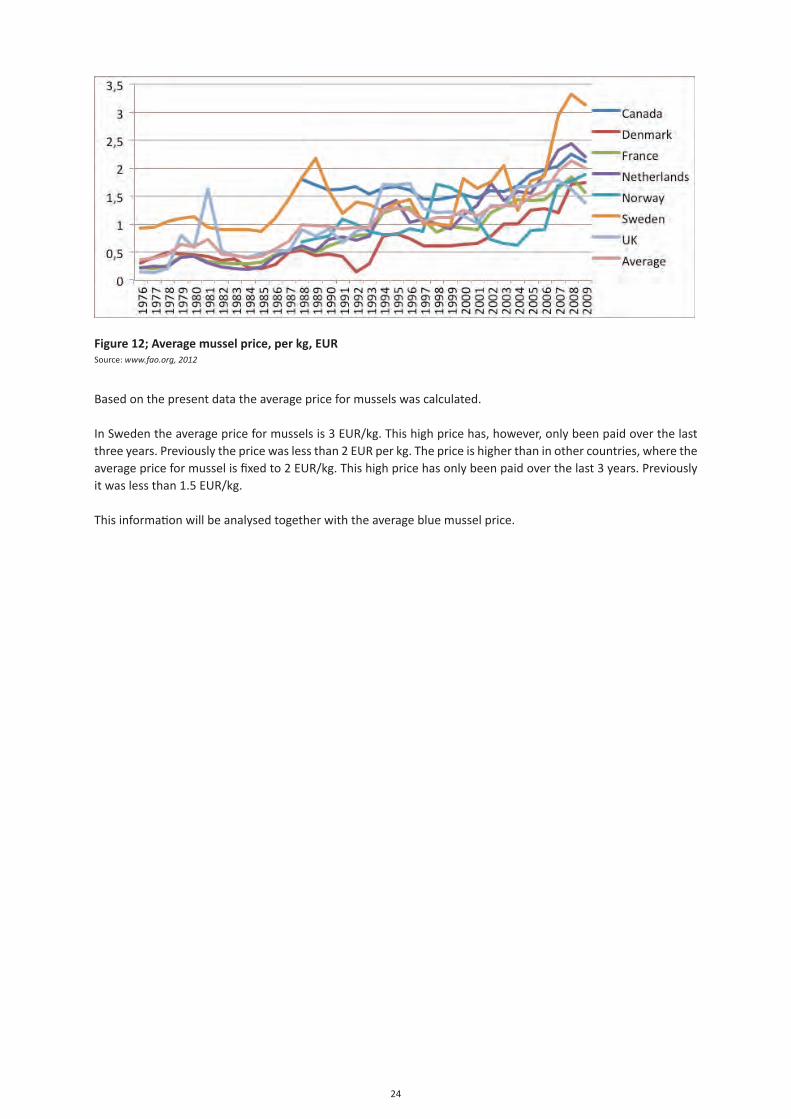
24
Figure 12; Average mussel price, per kg, EURSource:www.fao.org, 2012
Basedonthepresentdatatheaveragepriceformusselswascalculated.
InSwedentheaveragepriceformusselsis3EUR/kg.Thishighpricehas,however,onlybeenpaidoverthelastthreeyears.Previouslythepricewaslessthan2EURperkg.Thepriceishigherthaninothercountries,wheretheaveragepriceformusselisfixedto2EUR/kg.Thishighpricehasonlybeenpaidoverthelast3years.Previouslyitwaslessthan1.5EUR/kg.
Thisinformationwillbeanalysedtogetherwiththeaveragebluemusselprice.
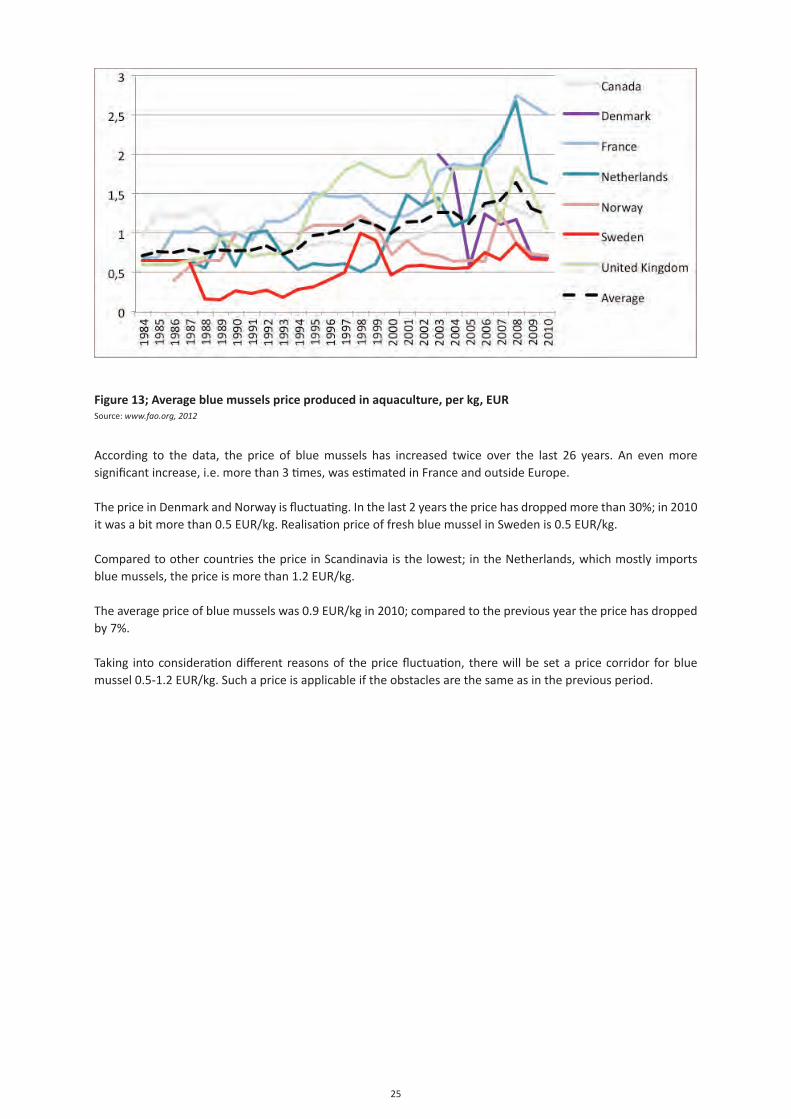
25
Figure 13; Average blue mussels price produced in aquaculture, per kg, EURSource:www.fao.org, 2012
According to the data, the price of bluemussels has increased twice over the last 26 years. An evenmoresignificantincrease,i.e.morethan3times,wasestimatedinFranceandoutsideEurope.
ThepriceinDenmarkandNorwayisfluctuating.Inthelast2yearsthepricehasdroppedmorethan30%;in2010itwasabitmorethan0.5EUR/kg.RealisationpriceoffreshbluemusselinSwedenis0.5EUR/kg.
ComparedtoothercountriesthepriceinScandinaviaisthelowest;intheNetherlands,whichmostlyimportsbluemussels,thepriceismorethan1.2EUR/kg.
Theaveragepriceofbluemusselswas0.9EUR/kgin2010;comparedtothepreviousyearthepricehasdroppedby7%. Taking intoconsiderationdifferent reasonsof thepricefluctuation, therewillbesetapricecorridor forbluemussel0.5-1.2EUR/kg.Suchapriceisapplicableiftheobstaclesarethesameasinthepreviousperiod.
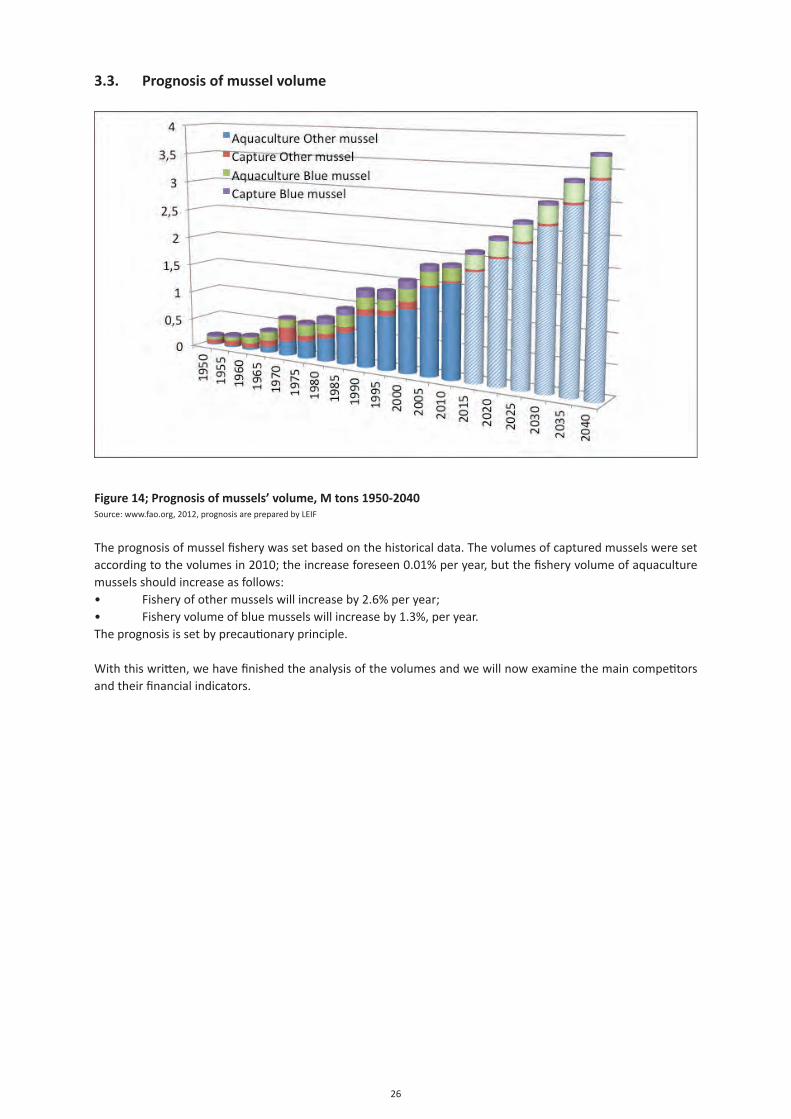
26
3.3. Prognosis of mussel volume
Figure 14; Prognosis of mussels’ volume, M tons 1950-2040Source:www.fao.org,2012,prognosisarepreparedbyLEIF
Theprognosisofmusselfisherywassetbasedonthehistoricaldata.Thevolumesofcapturedmusselsweresetaccordingtothevolumesin2010;theincreaseforeseen0.01%peryear,butthefisheryvolumeofaquaculturemusselsshouldincreaseasfollows:• Fisheryofothermusselswillincreaseby2.6%peryear;• Fisheryvolumeofbluemusselswillincreaseby1.3%,peryear.Theprognosisissetbyprecautionaryprinciple.
Withthiswritten,wehavefinishedtheanalysisofthevolumesandwewillnowexaminethemaincompetitorsandtheirfinancialindicators.
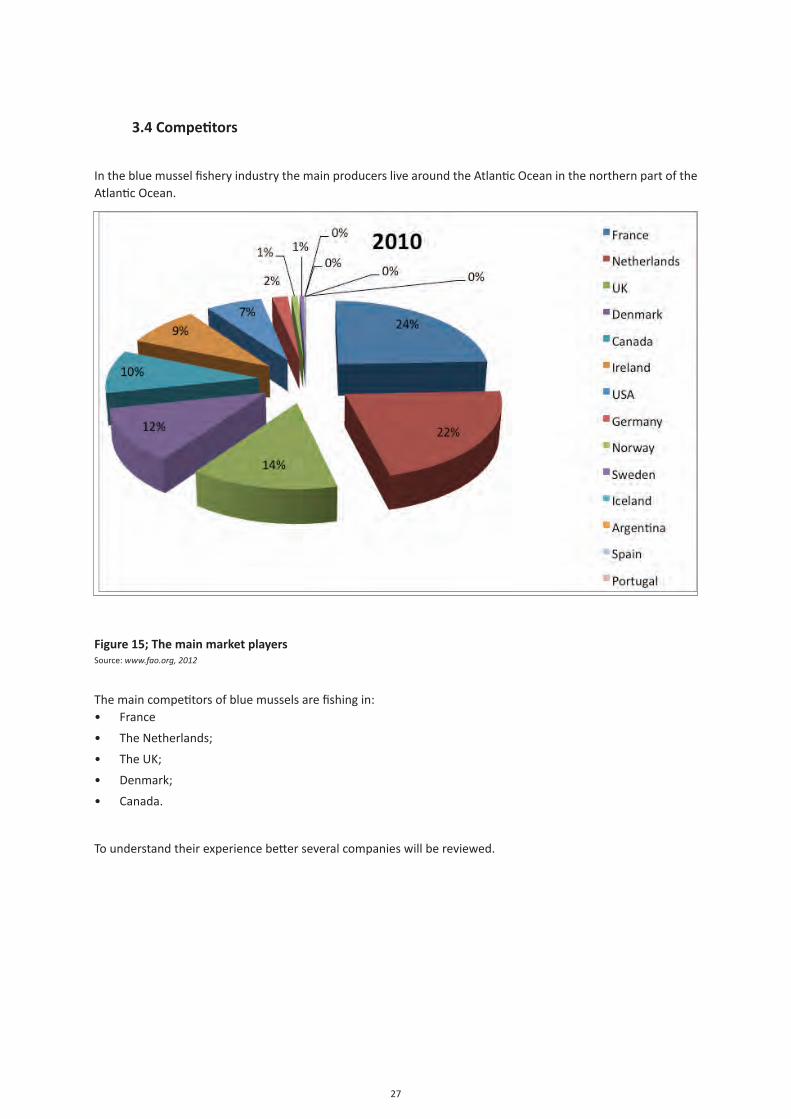
27
3.4 Competitors
InthebluemusselfisheryindustrythemainproducerslivearoundtheAtlanticOceaninthenorthernpartoftheAtlanticOcean.
Figure 15; The main market playersSource:www.fao.org, 2012
Themaincompetitorsofbluemusselsarefishingin:• France
• TheNetherlands;
• TheUK;
• Denmark;
• Canada.
Tounderstandtheirexperiencebetterseveralcompanieswillbereviewed.
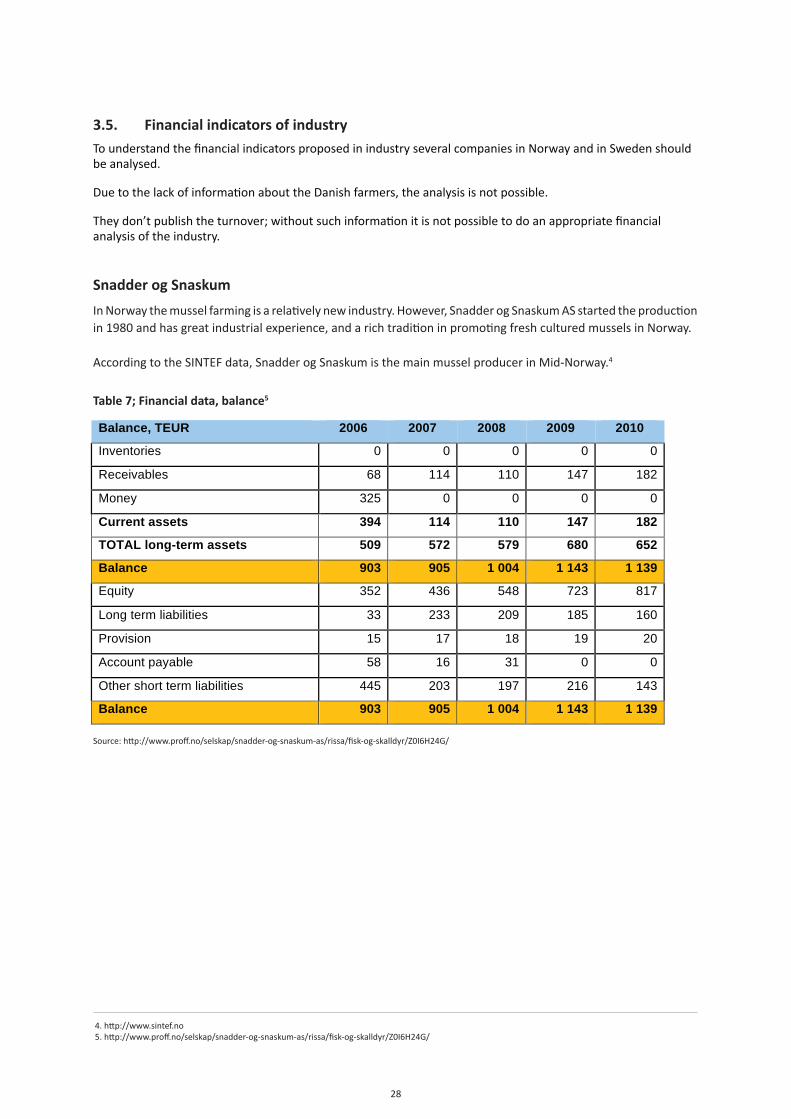
28
3.5. Financial indicators of industryTounderstandthefinancialindicatorsproposedinindustryseveralcompaniesinNorwayandinSwedenshouldbeanalysed.
DuetothelackofinformationabouttheDanishfarmers,theanalysisisnotpossible.
Theydon’tpublishtheturnover;withoutsuchinformationitisnotpossibletodoanappropriatefinancialanalysisoftheindustry.
Snadder og SnaskumInNorwaythemusselfarmingisarelativelynewindustry.However,SnadderogSnaskumASstartedtheproductionin1980andhasgreatindustrialexperience,andarichtraditioninpromotingfreshculturedmusselsinNorway.
AccordingtotheSINTEFdata,SnadderogSnaskumisthemainmusselproducerinMid-Norway.4
Table 7; Financial data, balance5
Source:http://www.proff.no/selskap/snadder-og-snaskum-as/rissa/fisk-og-skalldyr/Z0I6H24G/
4.http://www.sintef.no5.http://www.proff.no/selskap/snadder-og-snaskum-as/rissa/fisk-og-skalldyr/Z0I6H24G/
30
3.5. Financial indicators of industry To understand the financial indicators proposed in industry several companies in Norway and in Sweden should be analysed. Due to the lack of information about the Danish farmers, the analysis is not possible. They don't publish the turnover; without such information it is not possible to do an appropriate financial analysis of the industry. Snadder og Snaskum In Norway the mussel farming is a relatively new industry. However, Snadder og Snaskum AS started the production in 1980 and has great industrial experience, and a rich tradition in promoting fresh cultured mussels in Norway. According to the SINTEF data, Snadder og Snaskum is the main mussel producer in Mid-Norway.4
Table 7; Financial data, balance5
Balance, TEUR 2006 2007 2008 2009 2010
Inventories 0 0 0 0 0
Receivables 68 114 110 147 182
Money 325 0 0 0 0
Current assets 394 114 110 147 182
TOTAL long-term assets 509 572 579 680 652
Balance 903 905 1 004 1 143 1 139
Equity 352 436 548 723 817
Long term liabilities 33 233 209 185 160
Provision 15 17 18 19 20
Account payable 58 16 31 0 0
Other short term liabilities 445 203 197 216 143
Balance 903 905 1 004 1 143 1 139
Source: http://www.proff.no/selskap/snadder-og-snaskum-as/rissa/fisk-og-skalldyr/Z0I6H24G/
4 http://www.sintef.no/ 5 http://www.proff.no/selskap/snadder-og-snaskum-as/rissa/fisk-og-skalldyr/Z0I6H24G/
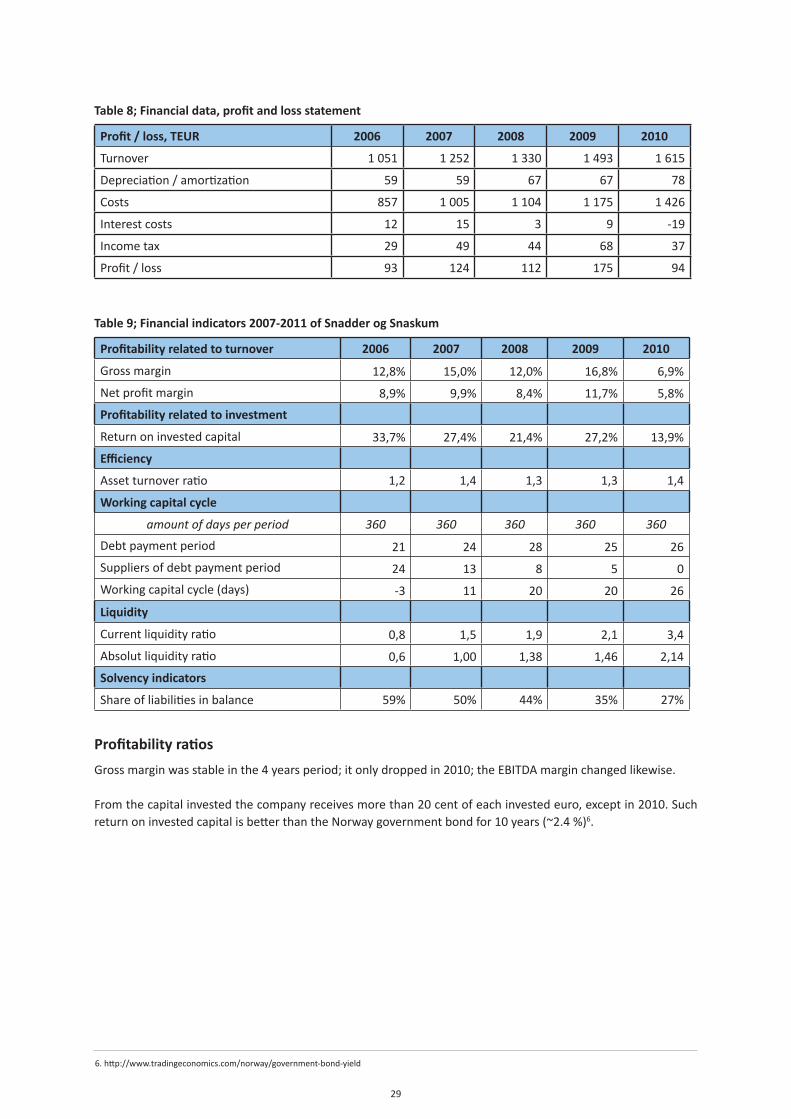
29
Table 8; Financial data, profit and loss statement
Profit / loss, TEUR 2006 2007 2008 2009 2010
Turnover 1051 1252 1 330 1493 1615
Depreciation/amortization 59 59 67 67 78
Costs 857 1005 1104 1175 1426
Interestcosts 12 15 3 9 -19
Incometax 29 49 44 68 37
Profit/loss 93 124 112 175 94
Table 9; Financial indicators 2007-2011 of Snadder og Snaskum
Profitability related to turnover 2006 2007 2008 2009 2010
Grossmargin 12,8% 15,0% 12,0% 16,8% 6,9%
Netprofitmargin 8,9% 9,9% 8,4% 11,7% 5,8%
Profitability related to investment
Returnoninvestedcapital 33,7% 27,4% 21,4% 27,2% 13,9%
Efficiency
Assetturnoverratio 1,2 1,4 1,3 1,3 1,4
Working capital cycle
amount of days per period 360 360 360 360 360
Debtpaymentperiod 21 24 28 25 26
Suppliersofdebtpaymentperiod 24 13 8 5 0
Workingcapitalcycle(days) -3 11 20 20 26
Liquidity
Currentliquidityratio 0,8 1,5 1,9 2,1 3,4
Absolutliquidityratio 0,6 1,00 1,38 1,46 2,14
Solvency indicators
Shareofliabilitiesinbalance 59% 50% 44% 35% 27%
Profitability ratiosGrossmarginwasstableinthe4yearsperiod;itonlydroppedin2010;theEBITDAmarginchangedlikewise.
Fromthecapitalinvestedthecompanyreceivesmorethan20centofeachinvestedeuro,exceptin2010.SuchreturnoninvestedcapitalisbetterthantheNorwaygovernmentbondfor10years(~2.4%)6.
6.http://www.tradingeconomics.com/norway/government-bond-yield
30
Efficiency ratiosWithin5years,thecompanyassetscyclewasenoughstable1.3timeayear.Theindicatorshowsthespecificsoftheindustry.
Working capital cycleDuringthelast5yearsthetradereceivableswere21-28days.
Thecompanydoesnothaveinventories,sothestockpaymentperiodwouldnotbecalculated.
Suppliersofdebtpaymentperiodduring the last5yearsdecreased from24days in2006 to0days in2010.Suchchangesinfluencedtheworkingcapitalcycle.Ifin2006theworkingcapitalcyclewasnegative,in2010itincreasedupto26days.Butthecompanyisstillworkinginastablesituationandcancoveritsworkingcapital.
Liquidity ratiosAsthecompanydoesnothavestocks,thecompany’stotalandcurrentliquidityratioisonthesamelevel.Duringthelast5yearsthisratiohasbecomemorestableandreaches3in2010.
Absoluteliquidityalsorosefrom0.6in2008to2.1in2010.Theabsoluteliquidityishigherthannecessary,sothecompanymightmanageitscashflowtoinvestfreeresourcesmorepragmaticincasethecompanydoesnotkeepthemforsomeotherpurpose.
Solvency ratiosTheaverageshareofcreditorshasdecreasedfrom50%intheyear2006to27%intheyear2010.Comparingtheoverallinformation,thecompanyisworkingonaveragelowfinancialrisk.
Other main producers of blue mussels in Mid-Norway - financial indicatorsAnalysing20NorwegiancompaniesinAugust2012,whicharethemainproducersofbluemusselsinMid-Norwayin2007:• 7ofthemareinactive,
• 9ofthemareworkingwithaloss;
• 4areactiveandinthepreviousperiodshaveworkedwithaprofit.
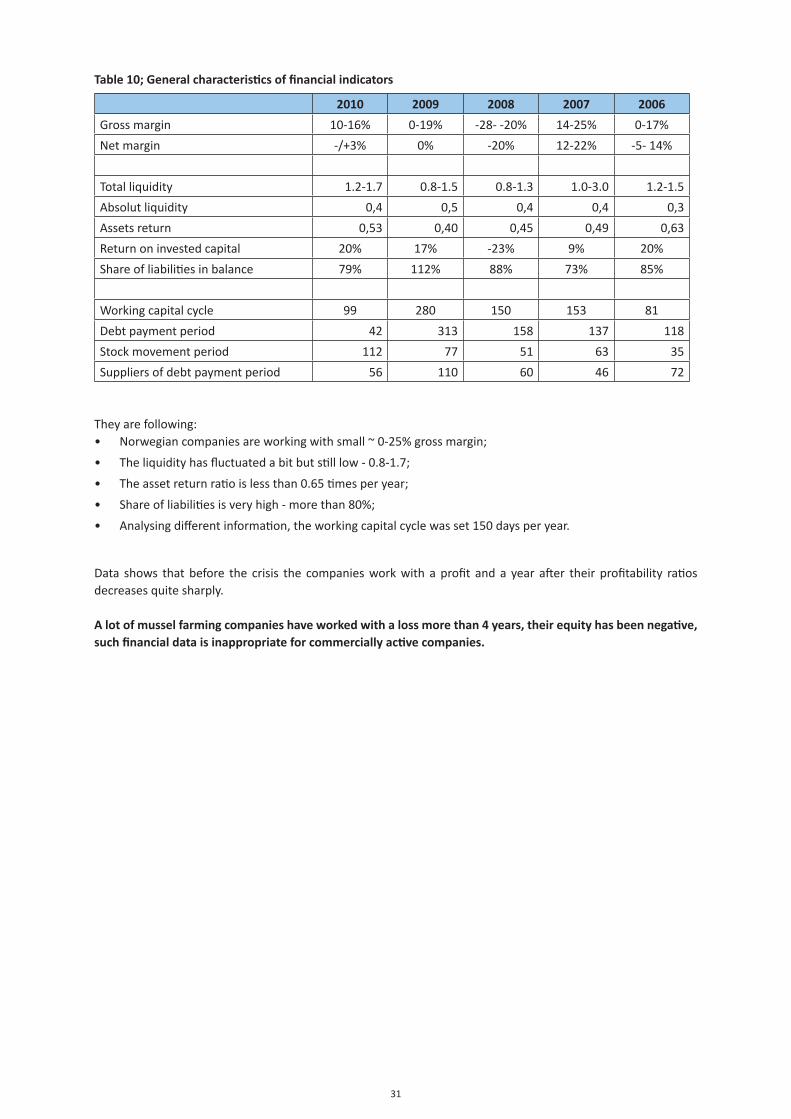
31
Table 10; General characteristics of financial indicators
2010 2009 2008 2007 2006Grossmargin 10-16% 0-19% -28--20% 14-25% 0-17%
Netmargin -/+3% 0% -20% 12-22% -5-14%
Totalliquidity 1.2-1.7 0.8-1.5 0.8-1.3 1.0-3.0 1.2-1.5
Absolutliquidity 0,4 0,5 0,4 0,4 0,3
Assetsreturn 0,53 0,40 0,45 0,49 0,63
Returnoninvestedcapital 20% 17% -23% 9% 20%
Shareofliabilitiesinbalance 79% 112% 88% 73% 85%
Workingcapitalcycle 99 280 150 153 81
Debtpaymentperiod 42 313 158 137 118
Stockmovementperiod 112 77 51 63 35
Suppliersofdebtpaymentperiod 56 110 60 46 72
Theyarefollowing:• Norwegiancompaniesareworkingwithsmall~0-25%grossmargin;
• Theliquidityhasfluctuatedabitbutstilllow-0.8-1.7;
• Theassetreturnratioislessthan0.65timesperyear;
• Shareofliabilitiesisveryhigh-morethan80%;
• Analysingdifferentinformation,theworkingcapitalcyclewasset150daysperyear.
Data shows thatbefore the crisis the companiesworkwith aprofit anda year after their profitability ratiosdecreasesquitesharply.
A lot of mussel farming companies have worked with a loss more than 4 years, their equity has been negative, such financial data is inappropriate for commercially active companies.
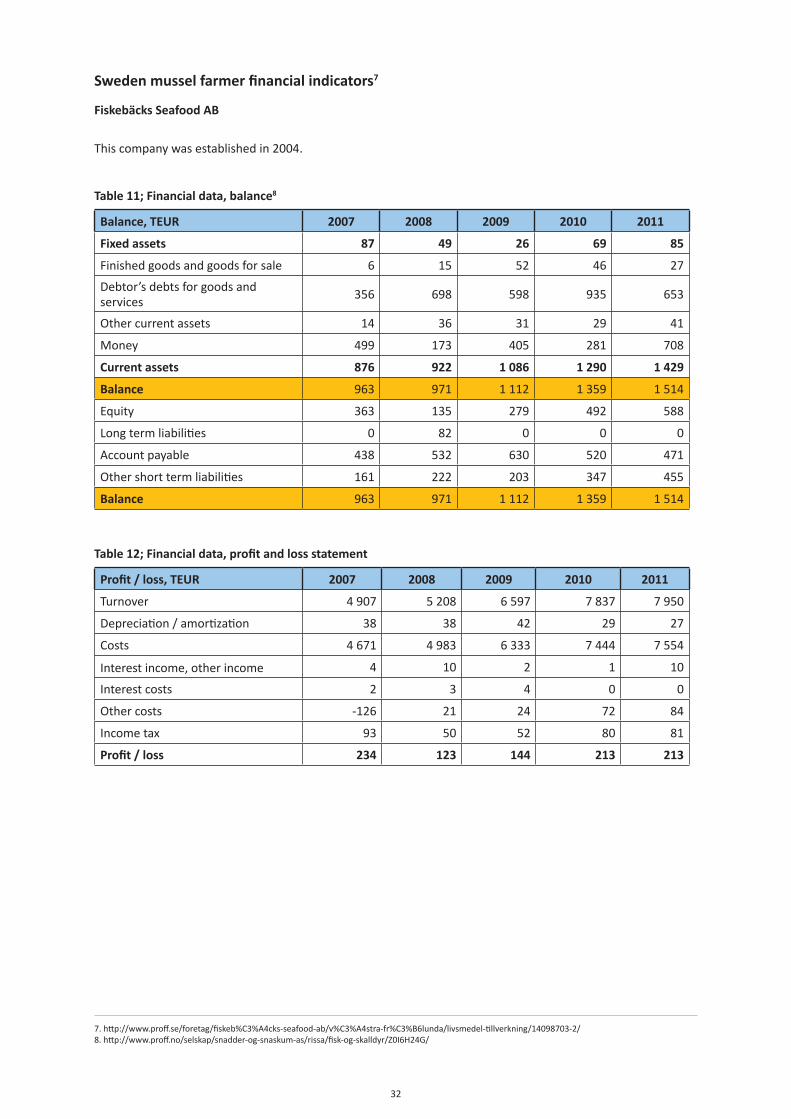
32
Sweden mussel farmer financial indicators7
Fiskebäcks Seafood AB
Thiscompanywasestablishedin2004.
Table 11; Financial data, balance8
Balance, TEUR 2007 2008 2009 2010 2011
Fixed assets 87 49 26 69 85
Finishedgoodsandgoodsforsale 6 15 52 46 27
Debtor’sdebtsforgoodsandservices
356 698 598 935 653
Othercurrentassets 14 36 31 29 41
Money 499 173 405 281 708
Current assets 876 922 1 086 1 290 1 429
Balance 963 971 1 112 1359 1514
Equity 363 135 279 492 588
Longtermliabilities 0 82 0 0 0
Accountpayable 438 532 630 520 471
Othershorttermliabilities 161 222 203 347 455
Balance 963 971 1 112 1359 1514
Table 12; Financial data, profit and loss statement
Profit / loss, TEUR 2007 2008 2009 2010 2011
Turnover 4907 5208 6597 7 837 7950
Depreciation/amortization 38 38 42 29 27
Costs 4671 4983 6 333 7444 7554
Interestincome,otherincome 4 10 2 1 10
Interestcosts 2 3 4 0 0
Othercosts -126 21 24 72 84
Incometax 93 50 52 80 81
Profit / loss 234 123 144 213 213
7.http://www.proff.se/foretag/fiskeb%C3%A4cks-seafood-ab/v%C3%A4stra-fr%C3%B6lunda/livsmedel-tillverkning/14098703-2/8.http://www.proff.no/selskap/snadder-og-snaskum-as/rissa/fisk-og-skalldyr/Z0I6H24G/
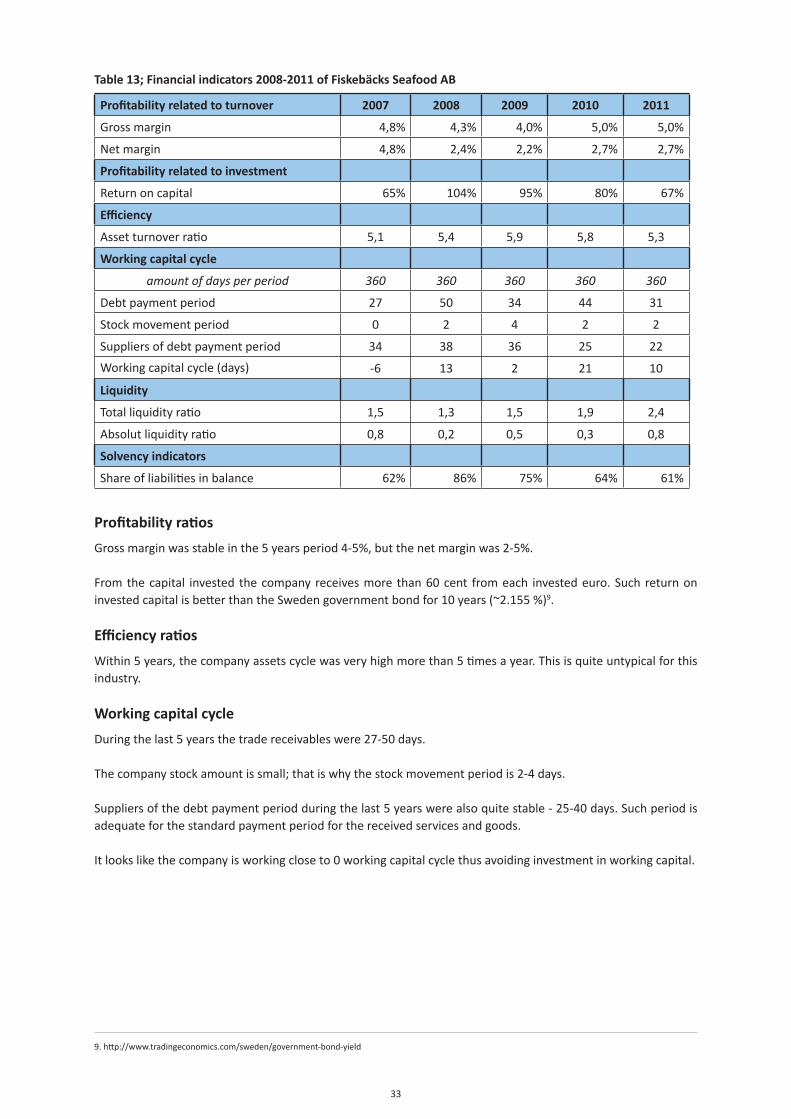
33
Table 13; Financial indicators 2008-2011 of Fiskebäcks Seafood AB
Profitability related to turnover 2007 2008 2009 2010 2011
Grossmargin 4,8% 4,3% 4,0% 5,0% 5,0%
Netmargin 4,8% 2,4% 2,2% 2,7% 2,7%
Profitability related to investment
Returnoncapital 65% 104% 95% 80% 67%
Efficiency
Assetturnoverratio 5,1 5,4 5,9 5,8 5,3
Working capital cycle
amount of days per period 360 360 360 360 360
Debtpaymentperiod 27 50 34 44 31
Stockmovementperiod 0 2 4 2 2
Suppliersofdebtpaymentperiod 34 38 36 25 22
Workingcapitalcycle(days) -6 13 2 21 10
Liquidity
Totalliquidityratio 1,5 1,3 1,5 1,9 2,4
Absolutliquidityratio 0,8 0,2 0,5 0,3 0,8
Solvency indicators
Shareofliabilitiesinbalance 62% 86% 75% 64% 61%
Profitability ratiosGrossmarginwasstableinthe5yearsperiod4-5%,butthenetmarginwas2-5%.
Fromthecapital invested thecompanyreceivesmore than60cent fromeach investedeuro.Such returnoninvestedcapitalisbetterthantheSwedengovernmentbondfor10years(~2.155%)9.
Efficiency ratiosWithin5years,thecompanyassetscyclewasveryhighmorethan5timesayear.Thisisquiteuntypicalforthisindustry.
Working capital cycleDuringthelast5yearsthetradereceivableswere27-50days.
Thecompanystockamountissmall;thatiswhythestockmovementperiodis2-4days.
Suppliersofthedebtpaymentperiodduringthelast5yearswerealsoquitestable-25-40days.Suchperiodisadequateforthestandardpaymentperiodforthereceivedservicesandgoods.
Itlookslikethecompanyisworkingcloseto0workingcapitalcyclethusavoidinginvestmentinworkingcapital.
9.http://www.tradingeconomics.com/sweden/government-bond-yield
34
Liquidity ratiosThecompany’stotalliquidityratioincreasedupto2.4.
Absoluteliquidityalsoarosefrom0,2intheyear2008to0,8intheyear2011.TheabsoluteliquidityishigherasitisnecessaryanditisthesameasforSnadderogSnaskum.
Solvency ratiosTheaverageshareofcreditorsishigherthan50%.Withinthelast4yearsithasdecreasedfrom86%to61%in2011butstilltheshareofcreditorsishigh.
Comparingtheoverallinformation,thecompanyisworkingonaveragelowfinancialriskanditisthesameasforthepreviouscompany.
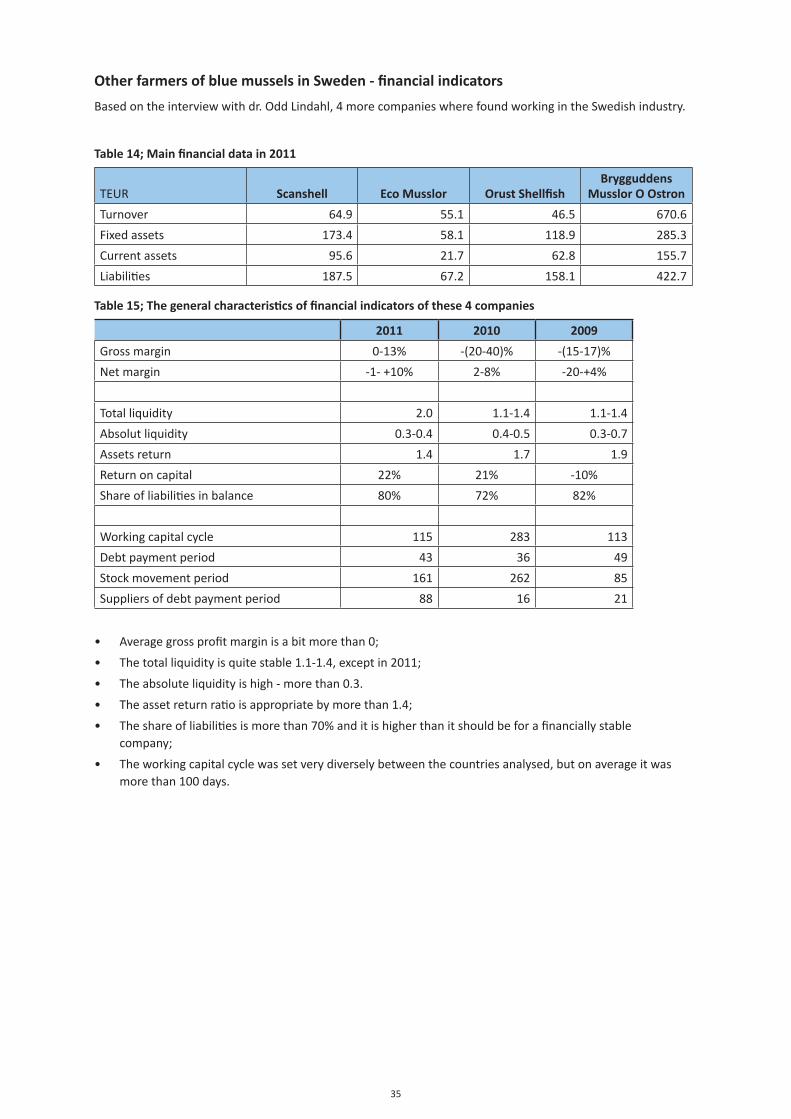
35
Other farmers of blue mussels in Sweden - financial indicatorsBasedontheinterviewwithdr.OddLindahl,4morecompanieswherefoundworkingintheSwedishindustry.
Table 14; Main financial data in 2011
TEUR Scanshell Eco Musslor Orust ShellfishBrygguddens
Musslor O OstronTurnover 64.9 55.1 46.5 670.6
Fixedassets 173.4 58.1 118.9 285.3
Currentassets 95.6 21.7 62.8 155.7
Liabilities 187.5 67.2 158.1 422.7
Table 15; The general characteristics of financial indicators of these 4 companies
2011 2010 2009Grossmargin 0-13% -(20-40)% -(15-17)%
Netmargin -1-+10% 2-8% -20-+4%
Totalliquidity 2.0 1.1-1.4 1.1-1.4
Absolutliquidity 0.3-0.4 0.4-0.5 0.3-0.7
Assetsreturn 1.4 1.7 1.9
Returnoncapital 22% 21% -10%
Shareofliabilitiesinbalance 80% 72% 82%
Workingcapitalcycle 115 283 113
Debtpaymentperiod 43 36 49
Stockmovementperiod 161 262 85
Suppliersofdebtpaymentperiod 88 16 21
• Averagegrossprofitmarginisabitmorethan0;
• Thetotalliquidityisquitestable1.1-1.4,exceptin2011;
• Theabsoluteliquidityishigh-morethan0.3.
• Theassetreturnratioisappropriatebymorethan1.4;
• Theshareofliabilitiesismorethan70%anditishigherthanitshouldbeforafinanciallystable company;
• Theworkingcapitalcyclewassetverydiverselybetweenthecountriesanalysed,butonaverageitwas morethan100days.
36
Severalcompaniesworkashortperiod;inseveralcompaniesthegrossprofitwasnegativein2010.Duetohighdepreciationamountthenetprofitiscloseto0.
Reviewing the information, the expert suggests applying the following financial indicators:
• Totalliquidityratioshouldbeatleast 1.2
• Assetreturn 0.2-1.4
• Shareofliabilitiesmightbe 70%
• Grossprofit– positive
• Workingcapitalmightfluctuate:
• Forasmallercompanyismorethan 110days
• Forabiggercompanyis 30days
37
4. Risk evaluation and analysis of technical aspects
Anumberofsignificantrisksaredistributed,whichmayadverselyaffectbusinessdevelopmentandimplementationprocess.
Technological and environmental risk• Weather – very high.Ice,strongwind,wavesandevensomeanimalsarethemainenemiesformusselfarmers.Theymightdestroyfarmfasterthananythingelse.
Thefarmermightavoidtheoccurrenceofriskchoosingthemostappropriateequipment,usingotherfarmer’sexperience.
Thefarmersneedtoimprovetheirexperienceparticipatinginevents,seminars,conferencesetc.
• Technology risk – moderate.
Evenchoosingthebestandthemostexpensiveriskmightnothelpthefarmertoreceivetheaverageamount.
Eachfarmermustpayattentiontotwoaspects:
• Farmingprocess–whenallequipmentshouldbesetuponthehighestlevelatalocation.
• Harvestingprocess–usingspecialequipment,thefarmerhastochoosespecialequipment andprobablyaboatforharvesting.Alsointheharvestingprocessitmighthavetobedone onthehighestlevel,becausebyusinginappropriateequipmentthefarmercanlosealotof musselswhichareattachedbyropes/nets.
• Environment risk - low.
Themusselsreducetheamountofnitratesandphosphorus;alsothepresenceofsomeheavymetalsinwater.Themusselfarmmightbecomparedwiththewatertreatmentfactory.
Themusseleffectonthewaterisverygood.Technological and environmental risks are assessed as moderate.
Risk management Thecompanystructureissimpleandadequateformusselfarming.
Employedpersonnelwillnotrequirespecialknowledge,howeveritwouldbeabenefit,ifthemanagingdirectorhadadegreeinmarinebiology,engineeringormaritimeaffairs.
Thestaffshouldhaveanadequatetrainingsothattheirtechnicalandprofessionalskillsareappropriate.Management risk - moderately low.
38
Economic RiskEconomicrisksincludethefollowingfactors:
• Industry risk - very low.
Theindustryhasthepotentialtodevelopandgrowsignificantly.AccordingtotheEuropeanCommissionregulationandseveralinternationaldocuments,inthenearfuturethemusselfarmingmighthaveagrowingdemand.Theincrease indemandmightbe influencedbydevelopingnew industries, likeproductionofadhesivematerials,productionofbuildingmaterialsusingmusselshellsetc.
Ifthelegislationischangedinordertoallowreducetheheatingperiodofmussels,themusselconsumptionwillincreaseinfoodindustry.
Besides,comparingthemusselfarmingwithwatertreatmentfacilities,thecostsandbenefitsaresimilar.
• Revenue stability risk - moderate.
The revenue stabilitymayhavean impacton substituteproductsentry into themarket, customers’financialdeterioration,costincreaseinrawmaterialsandotherfactors.
Thesubstituteproductsdon’tinfluencethefarmingofthebluemusselmarket,becauseeachcountrydecidesitsownwayhowtogetenergy-thewind,theflowrate,waterorsolar,withoutcompetingwitheachother.
TodayaroundtheBalticSeathecompetitionisnotsevere;thecompaniesincreasetheircompetencediscussingorexchanginginformation.Outsidetheaforesaidareathecompetenceisseriousenough.
Thepriceissetonaveragelylowlevel.
Therawmaterialcostschangeduetoseveralfactors;however,theamountofcostsforrawmaterialstakesasmallpartincomparisonwithothercosts.
• Customer risk - high.
Thecompanysellsproductstoseveralcompanies,thusthecompanydoesnotdependononecustomer.
• Supplier risk - moderately low.
Thecompanywillpurchaserawmaterialsfromanumberofsuppliers,sotheywon’tmakedependencesolelyononesupplier.
• Company size risk - moderately low.
ThecompanywillbebigenoughintheBalticSearegionarea.Thecompanymightinfluencethemarkettendency.DuetowatersalinityintheBalticSea,exceptinKattegat,thesaleswillbesmallerwhilecomparingthecompaniesarefarminginmoresalinewater.
Economic risk – moderately low.
Financial riskFinancialriskforanewentityishigherthanforanexistingandviablebusinessonewouldhave.
Manybanksorotherfinanciersdon’tsupportthefisheryindustry.Thefinancingdependsonthewillingnesstoinvestfromtheprivatefinanciersorownercredithistoryinfinancialsector.Financial risk – high.
39
Political riskRisksareassociatedwiththealterationsinlegislation,whichinthiscasehasonlypositiveimpactonthecompany’sfuturedevelopment.
Severalpoliticiansmighthaveapositiveinfluencethepossibilitiesofobtainingpermissionformusselfarming.Thisindustryreceivesanegativeresonanceduetoweatherconditions.Atthebeginningof2012severalmusselfarmsweredestroyedbystrongwindandices.ThesefarmswereaidedbyEUsupport.
Swedishscientistspublicisedresultsprovingthatmusselcantreatthewaterandthemusselfarmingiscomparablewithawatertreatmentfacilities.
Severalcountriessuggesttosupportthemusselfarmingfromagricultureastheagricultureisaseriouspolluterofwaters.Incasethissuggestiondevelops,themusselfarmingmightattractwiderinterestfrompoliticians.
Political risk – moderately high.
Mussel farming will operate on the average risk conditions.
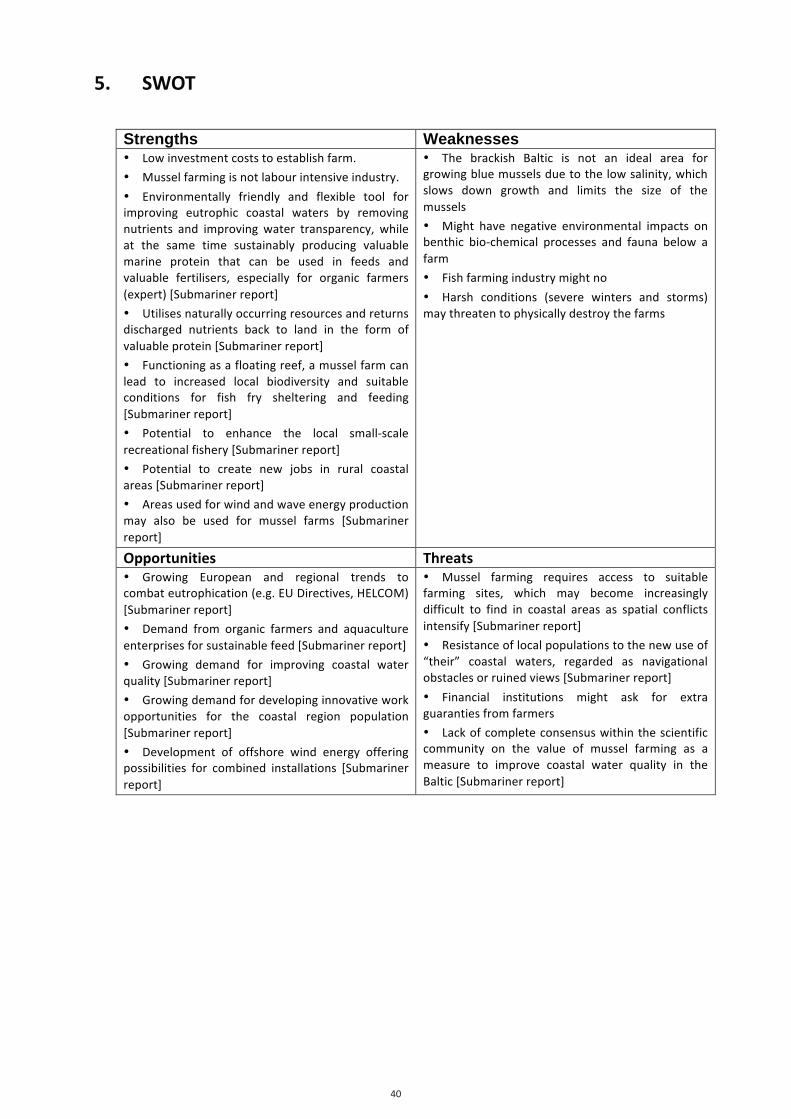
40
5. SWOT
42
5. SWOT Strengths Weaknesses • Low investment costs to establish farm.
• Mussel farming is not labour intensive industry.
• Environmentally friendly and flexible tool for improving eutrophic coastal waters by removing nutrients and improving water transparency, while at the same time sustainably producing valuable marine protein that can be used in feeds and valuable fertilisers, especially for organic farmers (expert) [Submariner report]
• Utilises naturally occurring resources and returns discharged nutrients back to land in the form of valuable protein [Submariner report]
• Functioning as a floating reef, a mussel farm can lead to increased local biodiversity and suitable conditions for fish fry sheltering and feeding [Submariner report]
• Potential to enhance the local small-‐scale recreational fishery [Submariner report]
• Potential to create new jobs in rural coastal areas [Submariner report]
• Areas used for wind and wave energy production may also be used for mussel farms [Submariner report]
• The brackish Baltic is not an ideal area for growing blue mussels due to the low salinity, which slows down growth and limits the size of the mussels
• Might have negative environmental impacts on benthic bio-‐chemical processes and fauna below a farm
• Fish farming industry might no
• Harsh conditions (severe winters and storms) may threaten to physically destroy the farms
Opportunities Threats • Growing European and regional trends to combat eutrophication (e.g. EU Directives, HELCOM) [Submariner report]
• Demand from organic farmers and aquaculture enterprises for sustainable feed [Submariner report]
• Growing demand for improving coastal water quality [Submariner report]
• Growing demand for developing innovative work opportunities for the coastal region population [Submariner report]
• Development of offshore wind energy offering possibilities for combined installations [Submariner report]
• Mussel farming requires access to suitable farming sites, which may become increasingly difficult to find in coastal areas as spatial conflicts intensify [Submariner report]
• Resistance of local populations to the new use of “their” coastal waters, regarded as navigational obstacles or ruined views [Submariner report]
• Financial institutions might ask for extra guaranties from farmers
• Lack of complete consensus within the scientific community on the value of mussel farming as a measure to improve coastal water quality in the Baltic [Submariner report]
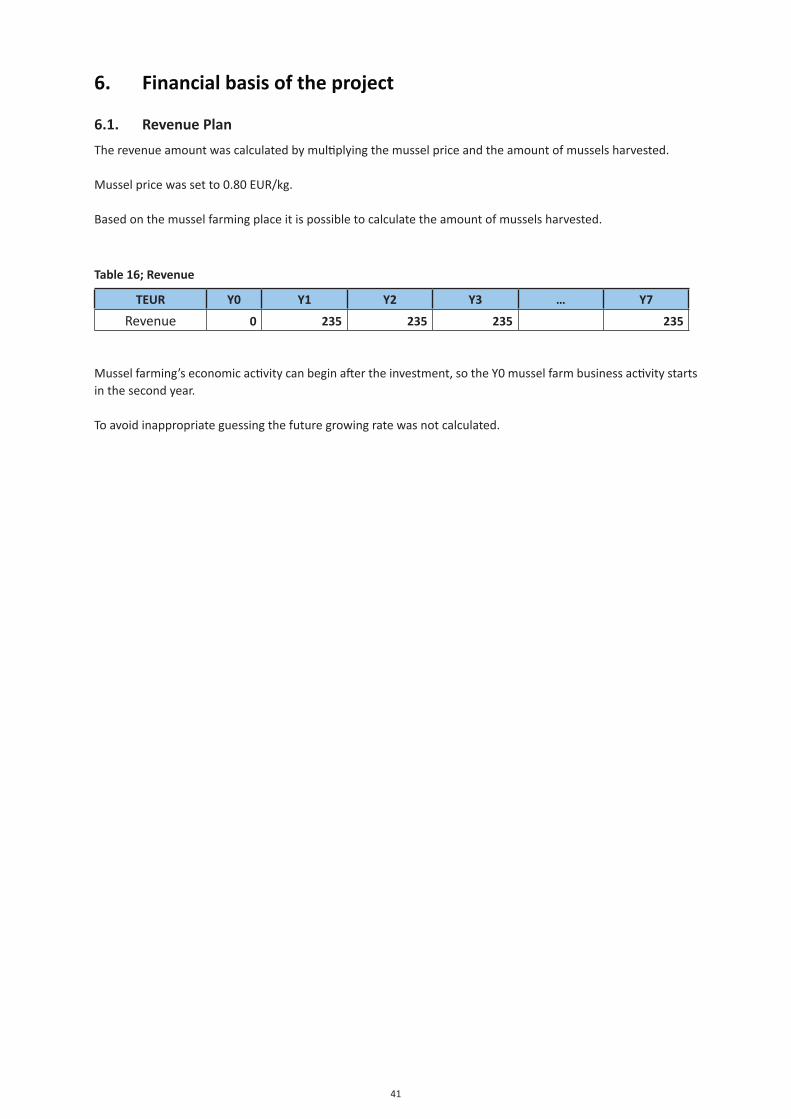
41
6. Financial basis of the project
6.1. Revenue PlanTherevenueamountwascalculatedbymultiplyingthemusselpriceandtheamountofmusselsharvested.
Musselpricewassetto0.80EUR/kg.
Basedonthemusselfarmingplaceitispossibletocalculatetheamountofmusselsharvested.
Table 16; Revenue
TEUR Y0 Y1 Y2 Y3 … y7
Revenue 0 235 235 235 235
Musselfarming’seconomicactivitycanbeginaftertheinvestment,sotheY0musselfarmbusinessactivitystartsinthesecondyear.
Toavoidinappropriateguessingthefuturegrowingratewasnotcalculated.
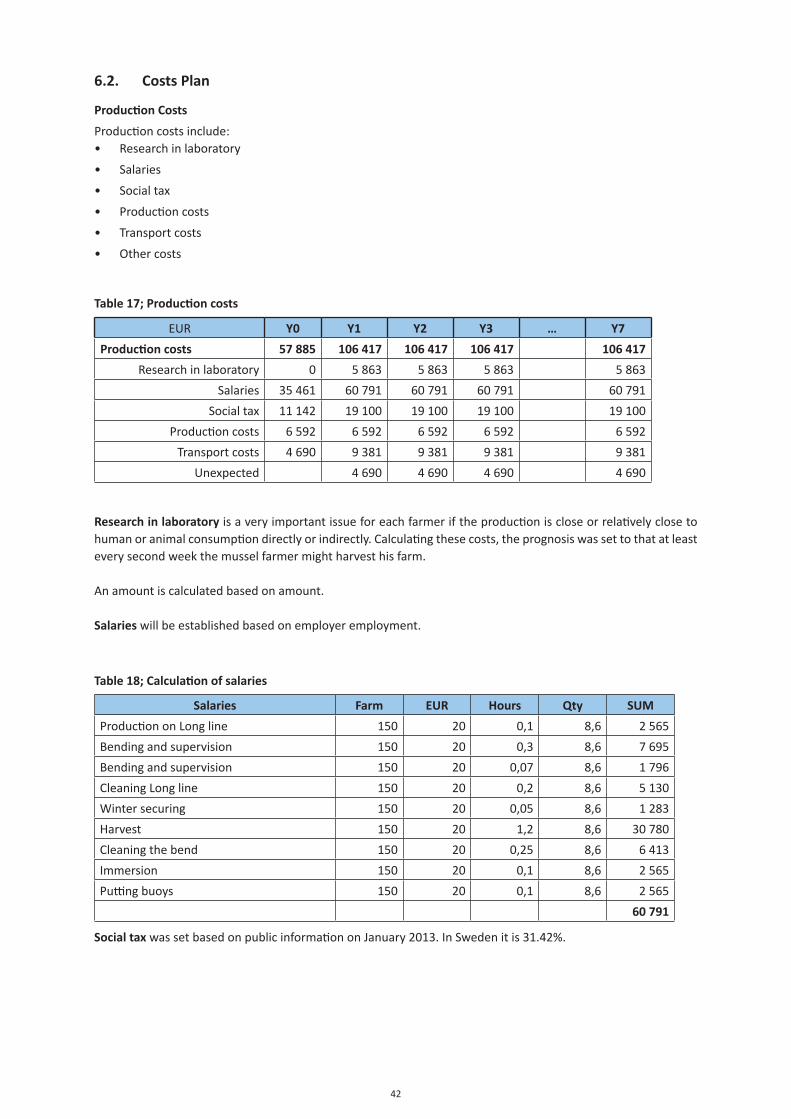
42
6.2. Costs Plan
Production Costs
Productioncostsinclude:• Researchinlaboratory
• Salaries
• Socialtax
• Productioncosts
• Transportcosts
• Othercosts
Table 17; Production costs
EUR Y0 Y1 Y2 Y3 … y7Production costs 57 885 106 417 106 417 106 417 106 417
Researchinlaboratory 0 5863 5863 5863 5863
Salaries 35461 60 791 60 791 60 791 60 791
Socialtax 11142 19 100 19 100 19 100 19 100
Productioncosts 6592 6592 6592 6592 6592
Transportcosts 4690 9 381 9 381 9 381 9 381
Unexpected 4690 4690 4690 4690
Research in laboratory isaveryimportantissueforeachfarmeriftheproductioniscloseorrelativelyclosetohumanoranimalconsumptiondirectlyorindirectly.Calculatingthesecosts,theprognosiswassettothatatleasteverysecondweekthemusselfarmermightharvesthisfarm.
Anamountiscalculatedbasedonamount.
Salarieswillbeestablishedbasedonemployeremployment.
Table 18; Calculation of salaries
Salaries Farm EUR hours Qty SUMProductiononLongline 150 20 0,1 8,6 2565
Bendingandsupervision 150 20 0,3 8,6 7695
Bendingandsupervision 150 20 0,07 8,6 1 796
CleaningLongline 150 20 0,2 8,6 5130
Wintersecuring 150 20 0,05 8,6 1 283
Harvest 150 20 1,2 8,6 30 780
Cleaningthebend 150 20 0,25 8,6 6413
Immersion 150 20 0,1 8,6 2565
Puttingbuoys 150 20 0,1 8,6 2565
60 791
Social taxwassetbasedonpublicinformationonJanuary2013.InSwedenitis31.42%.
43
Production costs consistofdifferentmaterialcosts,like:• Buoys
Toestablishafarmandtoprovidemaintenanceitisnecessarytobuy1000buoysinprice3.4EUR.• Lines
Toestablishafarmandtoprovidemaintenanceitisnecessarytoinvest192EUR.• Various ropes, double socks, etc.
Thesecostsare3000EUR.
Transport costsarecalculatedto4%oftheturnover.
Unexpected costsarecalculatedto2%oftheturnover.
Administrative costsAdministrativecostsarecalculatedto8TEURinY0,andinnextyearsitwillbe12TEUR.
Interest costsInterestcostsarecalculatedbasedonthecreditamountandthecreditpaymentperiod.Interestrateis5%.Suchrateishighercomparedtobankloansinterestrate,andsmallerusingriskcapital.10
Other incomesOtherincomesarecalculatedforusingtheEUsupportanddepreciated.Itisincludedinabalance.
Income taxItiscalculatedbasedontaxrateinSweden(26.3%).
10.http://www.riksbank.se/en/Interest-and-exchange-rates/search-interest-rates-exchange-rates/?g2-SECBLENDEFF=on&g98-EUDP6MEUR=on&from=2013-01-07&to=2013-08-05&f=Quarter&cAverage=Average&s=Comma(1.75+0.53=2.28%)http://www.tradingeconomics.com/finland/lending-interest-rate-percent-wb-data.html

44
6.3. Profit and Loss Statement
Table 19; Profit and loss statement
TEUR Y0 Y1 Y2 Y3 Y4 Y5 Y6 y7Turnover 0 235 235 235 235 235 235 235Productioncosts 58 106 106 106 106 106 106 106
Administrativecosts 8 12 12 12 12 12 12 12
EBITDA -66 116 116 116 116 116 116 116Depreciation 18 72 72 72 72 72 72 70
Interestcost 27 22 15 11 8 5 3 2
Otherincomes,supportfromgovernment 29 29 29 29 29 29 29
Incometax 0 0 8 9 10 10 11 12
Net profit -111 51 51 53 56 58 59 61
Thefirstyearthecompanyhadalossof107TEUR;themaincostpositionsareproduction,administrationandinterestcosts.Withinthefirst2yearsthecompanyneedstopayattentiononcostandincomeamount.Toprovidestableincomethecompanywillconcludeafuturecontractformusselselling.
6.4. Risk analysisIndrawingupfinancialflows,many factorsare taken intoaccount,but for informationtobemorereliableanumberofmethodstoverifytheiraccuracyareused.ThediscountratevaluewascalculatedonWACCmethodasfollows:
Table 20; Calculation of risk rate
Risk Rate Information grounds
Risk-freeinterestrate 2.155% 8-yeargovernmentbondrate11
MarketPremium 5.80 Damodarandatabase12
Betaindustry 1.29 Damodarandatabase13
TOTAL 9.64%
Calculatingthenetpresentvalue(NPV)oftheprojectcost-effectivenessthediscountrate9.64%isused.
11.http://www.investing.com/rates-bonds/sweden-government-bonds?maturity_from=130&maturity_to=29012.http://pages.stern.nyu.edu/~adamodar/13.http://pages.stern.nyu.edu/~adamodar/
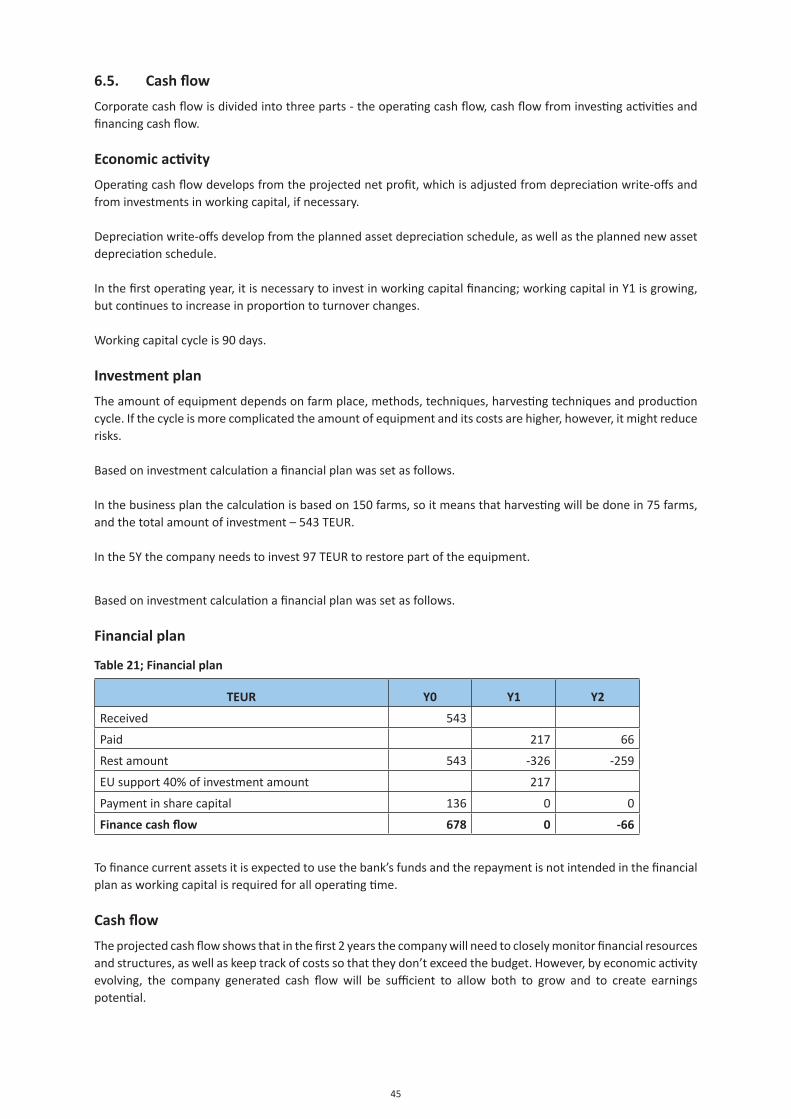
45
6.5. Cash flowCorporatecashflowisdividedintothreeparts-theoperatingcashflow,cashflowfrominvestingactivitiesandfinancingcashflow.
Economic activityOperatingcashflowdevelopsfromtheprojectednetprofit,whichisadjustedfromdepreciationwrite-offsandfrominvestmentsinworkingcapital,ifnecessary.
Depreciationwrite-offsdevelopfromtheplannedassetdepreciationschedule,aswellastheplannednewassetdepreciationschedule.
Inthefirstoperatingyear,itisnecessarytoinvestinworkingcapitalfinancing;workingcapitalinY1isgrowing,butcontinuestoincreaseinproportiontoturnoverchanges.
Workingcapitalcycleis90days.
Investment planTheamountofequipmentdependsonfarmplace,methods,techniques,harvestingtechniquesandproductioncycle.Ifthecycleismorecomplicatedtheamountofequipmentanditscostsarehigher,however,itmightreducerisks.
Basedoninvestmentcalculationafinancialplanwassetasfollows.
Inthebusinessplanthecalculationisbasedon150farms,soitmeansthatharvestingwillbedonein75farms,andthetotalamountofinvestment–543TEUR.
Inthe5Ythecompanyneedstoinvest97TEURtorestorepartoftheequipment.
Basedoninvestmentcalculationafinancialplanwassetasfollows.
Financial plan
Table 21; Financial plan
TEUR Y0 Y1 Y2
Received 543
Paid 217 66
Restamount 543 -326 -259
EUsupport40%ofinvestmentamount 217
Paymentinsharecapital 136 0 0
Finance cash flow 678 0 -66
Tofinancecurrentassetsitisexpectedtousethebank’sfundsandtherepaymentisnotintendedinthefinancialplanasworkingcapitalisrequiredforalloperatingtime.
Cash flowTheprojectedcashflowshowsthatinthefirst2yearsthecompanywillneedtocloselymonitorfinancialresourcesandstructures,aswellaskeeptrackofcostssothattheydon’texceedthebudget.However,byeconomicactivityevolving, the company generated cash flowwill be sufficient to allow both to grow and to create earningspotential.
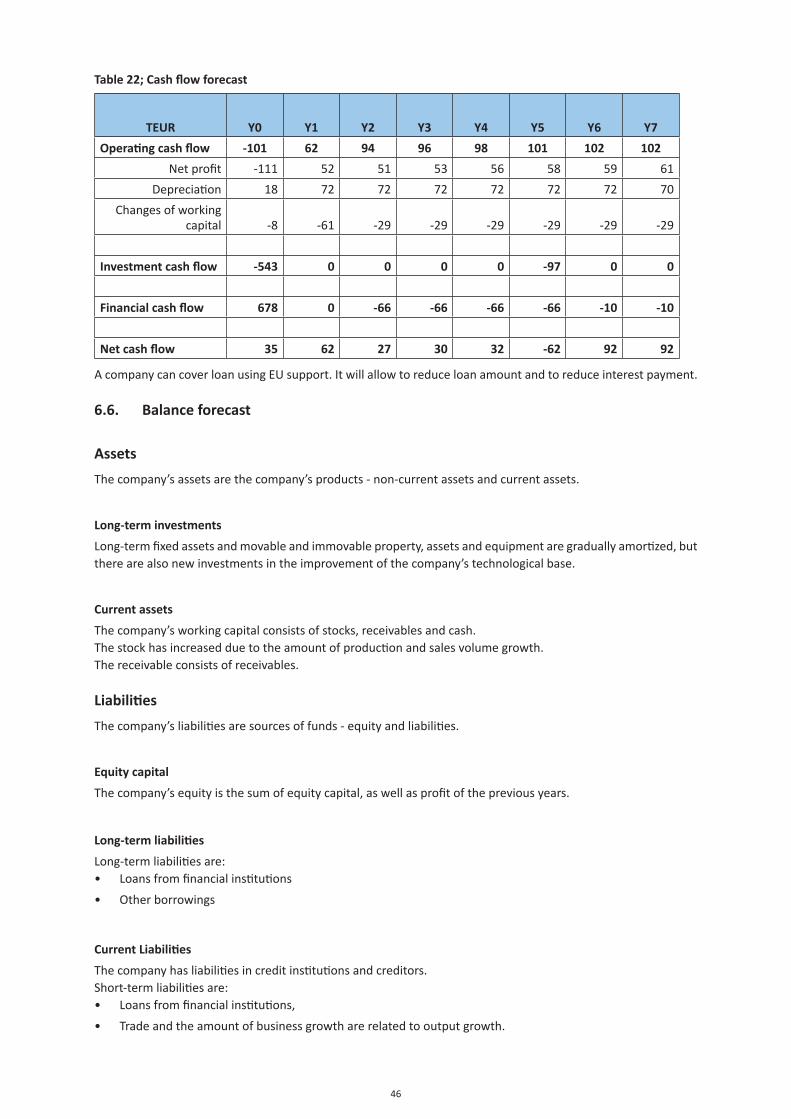
46
Table 22; Cash flow forecast
TEUR Y0 Y1 Y2 Y3 Y4 Y5 Y6 y7Operating cash flow -101 62 94 96 98 101 102 102
Netprofit -111 52 51 53 56 58 59 61
Depreciation 18 72 72 72 72 72 72 70
Changesofworkingcapital -8 -61 -29 -29 -29 -29 -29 -29
Investment cash flow -543 0 0 0 0 -97 0 0
Financial cash flow 678 0 -66 -66 -66 -66 -10 -10
Net cash flow 35 62 27 30 32 -62 92 92
AcompanycancoverloanusingEUsupport.Itwillallowtoreduceloanamountandtoreduceinterestpayment.
6.6. Balance forecast
AssetsThecompany’sassetsarethecompany’sproducts-non-currentassetsandcurrentassets.
Long-term investments
Long-termfixedassetsandmovableandimmovableproperty,assetsandequipmentaregraduallyamortized,buttherearealsonewinvestmentsintheimprovementofthecompany’stechnologicalbase.
Current assets
Thecompany’sworkingcapitalconsistsofstocks,receivablesandcash.Thestockhasincreasedduetotheamountofproductionandsalesvolumegrowth.Thereceivableconsistsofreceivables.
LiabilitiesThecompany’sliabilitiesaresourcesoffunds-equityandliabilities.
Equity capital
Thecompany’sequityisthesumofequitycapital,aswellasprofitofthepreviousyears.
Long-term liabilities
Long-termliabilitiesare:• Loansfromfinancialinstitutions
• Otherborrowings
Current Liabilities
Thecompanyhasliabilitiesincreditinstitutionsandcreditors.Short-termliabilitiesare:• Loansfromfinancialinstitutions,
• Tradeandtheamountofbusinessgrowtharerelatedtooutputgrowth.

47
Balance
Table 23; Balance forecast, TEURPrognosis of balance Y0 Y1 Y2 Y3 Y4 Y5 Y6 Y7
Inventory 14 27 27 27 27 27 27 27Receivables 0 26 26 26 26 26 26 26Cash and cash equivalents 35 96 123 153 185 123 216 308Current assets 49 149 176 206 238 176 268 361Property, vessel, land 98 90 81 73 65 56 48 40Equipment 54 46 38 30 22 14 6 0Other equipment 372 317 262 207 152 193 138 83Tangible assets 524 453 381 310 238 263 192 122Balance 573 602 557 516 476 439 460 483Current loans 0 10 10 10 10 10 10 10Accounts payable 6 12 12 12 12 12 12 12Deferred incomes 0 29 29 29 29 29 29 3Current liabilities 6 50 50 50 50 50 50 25Loans from credit institutions 100 90 80 70 60 50 40 30Other loans 442 225 169 113 56 0 0 0Deferred incomes 0 160 131 102 74 45 17 13Long term liabilities 542 475 380 285 190 95 57 43Fixed capital 136 136 136 136 136 136 136 136Previously profit / loss -111 -59 -9 44 100 158 218Current year profit / loss -111 52 51 53 56 58 59 61Total equity 25 76 127 180 236 294 353 414Balance 573 602 557 516 476 439 460 483
Table 24; Calculation of main financial indicators
Y1 Y2 Y3 Y4 Y5 Y6 y7Assetreturn 0,39 0,42 0,45 0,49 0,53 0,51 0,49
Shareofequity 0,13 0,23 0,35 0,49 0,67 0,77 0,86
Totalliquidity 2,95 3,49 4,08 4,72 3,49 5,32 14,33
EBITDAmargin 50% 50% 50% 50% 50% 50% 50%
Loans/EBITDA 2,72 2,14 1,57 1,00 0,43 0,34 0,26
Shareofliabilities 0,87 0,77 0,65 0,51 0,33 0,23 0,14
Workingcapitalindays 90 90 90 90 90 90 90
Performingfinancialforecasting,thefollowingfactorsweretakenintoaccount:• EBITDAprofitmarginissethigherthan40%.
• Liquidityratio-thefirstyeardoesnothighmorethan2.
• Equityshareofthebalancesheetisappropriatelyhigherthan0.2.andthatisamoderatebusinessrisk.
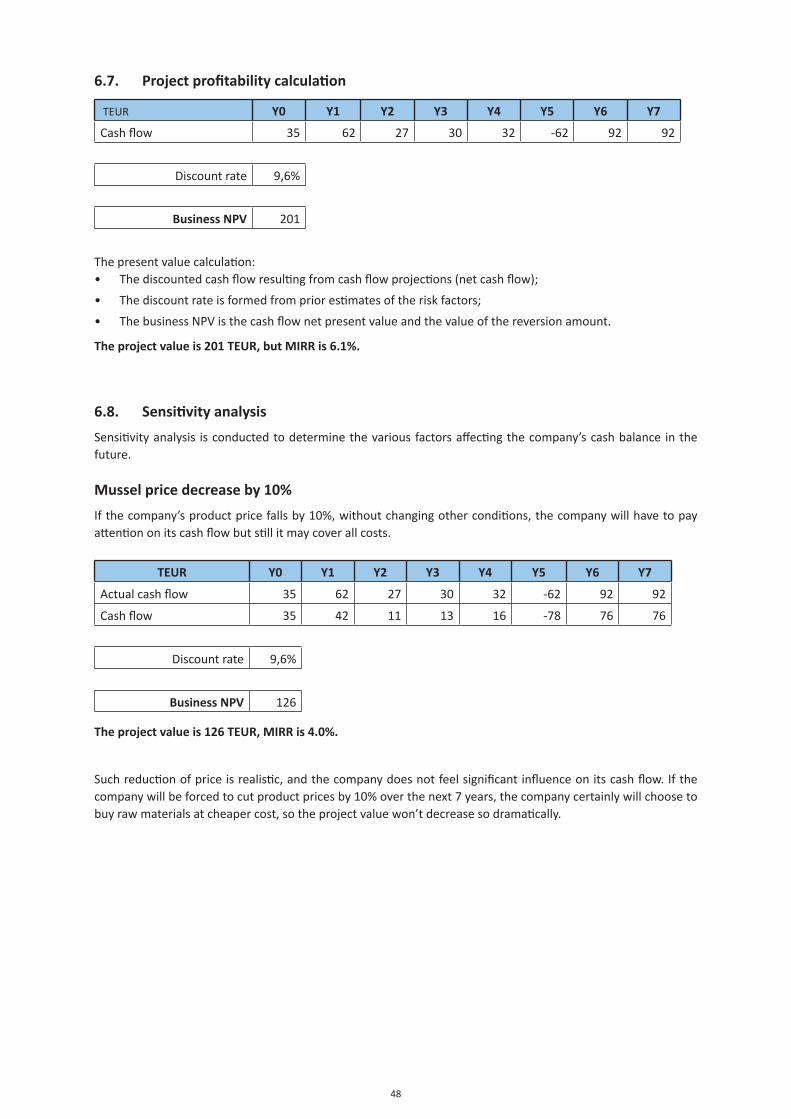
48
6.7. Project profitability calculation
TEUR Y0 Y1 Y2 Y3 Y4 Y5 Y6 y7
Cashflow 35 62 27 30 32 -62 92 92
Discountrate 9,6%
Business NPV 201
Thepresentvaluecalculation:• Thediscountedcashflowresultingfromcashflowprojections(netcashflow);
• Thediscountrateisformedfrompriorestimatesoftheriskfactors;
• ThebusinessNPVisthecashflownetpresentvalueandthevalueofthereversionamount.
The project value is 201 TEUR, but MIRR is 6.1%.
6.8. Sensitivity analysisSensitivityanalysis isconductedtodeterminethevariousfactorsaffectingthecompany’scashbalance inthefuture.
Mussel price decrease by 10%Ifthecompany’sproductpricefallsby10%,withoutchangingotherconditions,thecompanywillhavetopayattentiononitscashflowbutstillitmaycoverallcosts.
TEUR Y0 Y1 Y2 Y3 Y4 Y5 Y6 y7
Actualcashflow 35 62 27 30 32 -62 92 92
Cashflow 35 42 11 13 16 -78 76 76
Discountrate 9,6%
Business NPV 126
The project value is 126 TEUR, MIRR is 4.0%.
Suchreductionofpriceisrealistic,andthecompanydoesnotfeelsignificantinfluenceonitscashflow.Ifthecompanywillbeforcedtocutproductpricesby10%overthenext7years,thecompanycertainlywillchoosetobuyrawmaterialsatcheapercost,sotheprojectvaluewon’tdecreasesodramatically.
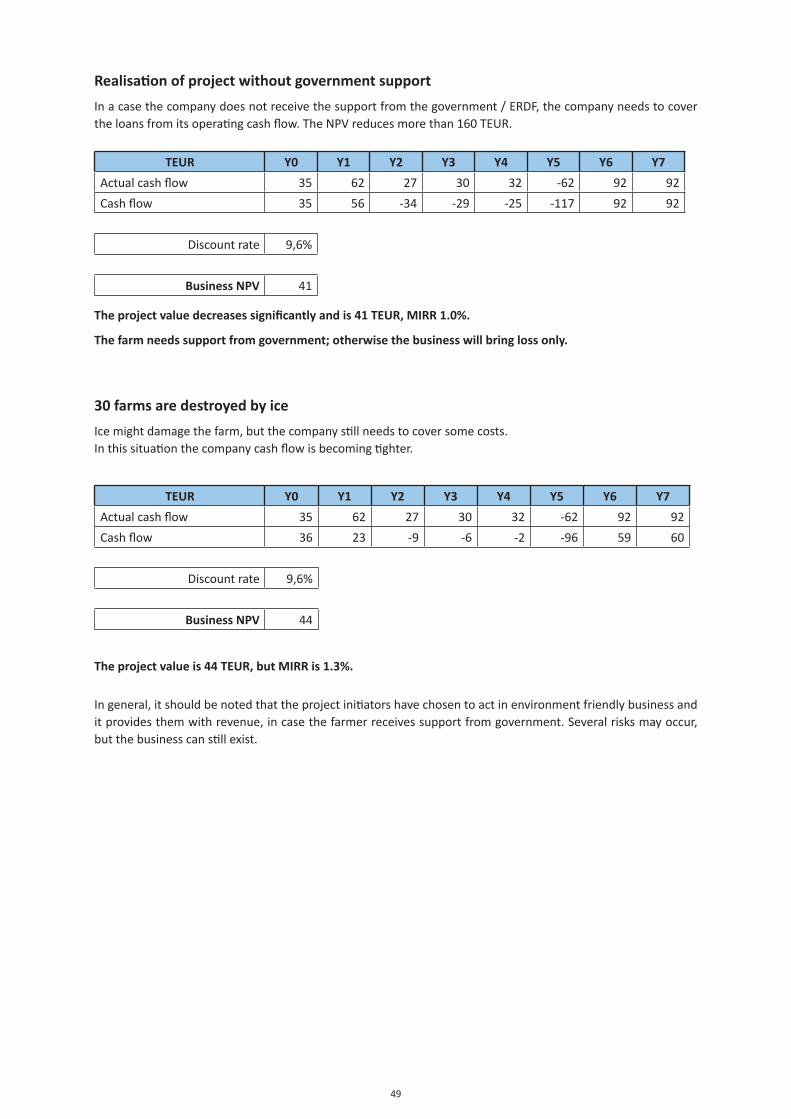
49
Realisation of project without government supportInacasethecompanydoesnotreceivethesupportfromthegovernment/ERDF,thecompanyneedstocovertheloansfromitsoperatingcashflow.TheNPVreducesmorethan160TEUR.
TEUR Y0 Y1 Y2 Y3 Y4 Y5 Y6 y7Actualcashflow 35 62 27 30 32 -62 92 92
Cashflow 35 56 -34 -29 -25 -117 92 92
Discountrate 9,6%
Business NPV 41
The project value decreases significantly and is 41 TEUR, MIRR 1.0%.
The farm needs support from government; otherwise the business will bring loss only.
30 farms are destroyed by ice Icemightdamagethefarm,butthecompanystillneedstocoversomecosts.Inthissituationthecompanycashflowisbecomingtighter.
TEUR Y0 Y1 Y2 Y3 Y4 Y5 Y6 y7Actualcashflow 35 62 27 30 32 -62 92 92
Cashflow 36 23 -9 -6 -2 -96 59 60
Discountrate 9,6%
Business NPV 44
The project value is 44 TEUR, but MIRR is 1.3%.
Ingeneral,itshouldbenotedthattheprojectinitiatorshavechosentoactinenvironmentfriendlybusinessanditprovidesthemwithrevenue,incasethefarmerreceivessupportfromgovernment.Severalrisksmayoccur,butthebusinesscanstillexist.

1
3.3.1.1Business Plan
Sweden Annex

2
Annex
Main indicators
24
150
EUR 0,80
50%
40%
EUR 20,00
NPV IRR MIRR201 1,50% 6,06%
Year Current asse ts
Tangible assets
Current liabilities Equity Long te rm
liabilitiesY0 0 -66 -111 Y0 49 525 6 25 543 574Y1 235 116 51 Y1 149 453 50 76 476 602Y2 235 116 51 Y2 176 382 50 127 380 558Y3 235 116 53 Y3 206 310 50 180 285 516Y4 235 116 56 Y4 238 239 50 236 190 476Y5 235 116 58 Y5 176 264 50 294 95 439Y6 235 116 59 Y6 268 192 50 353 57 460Y7 235 116 61 Y7 360 122 25 414 43 483
49,51%Net profitability
26,12%
ActiveYear T urnover EBIT DA Net profit
Passive
Rope, mm
Support, %
Salary (h)
Prognosis of profit / loss Prognosis of balance
Balance
Mussel harvesting places, %
Price
Lines
EBIT DA profitability
Indicators to change
Main financial data
Disclaimer: The contents of the document reflect the authors’ views. The Managing Authority of the Central Baltic INTERREG IV A Programme cannot be held liable for information published by the project partners.
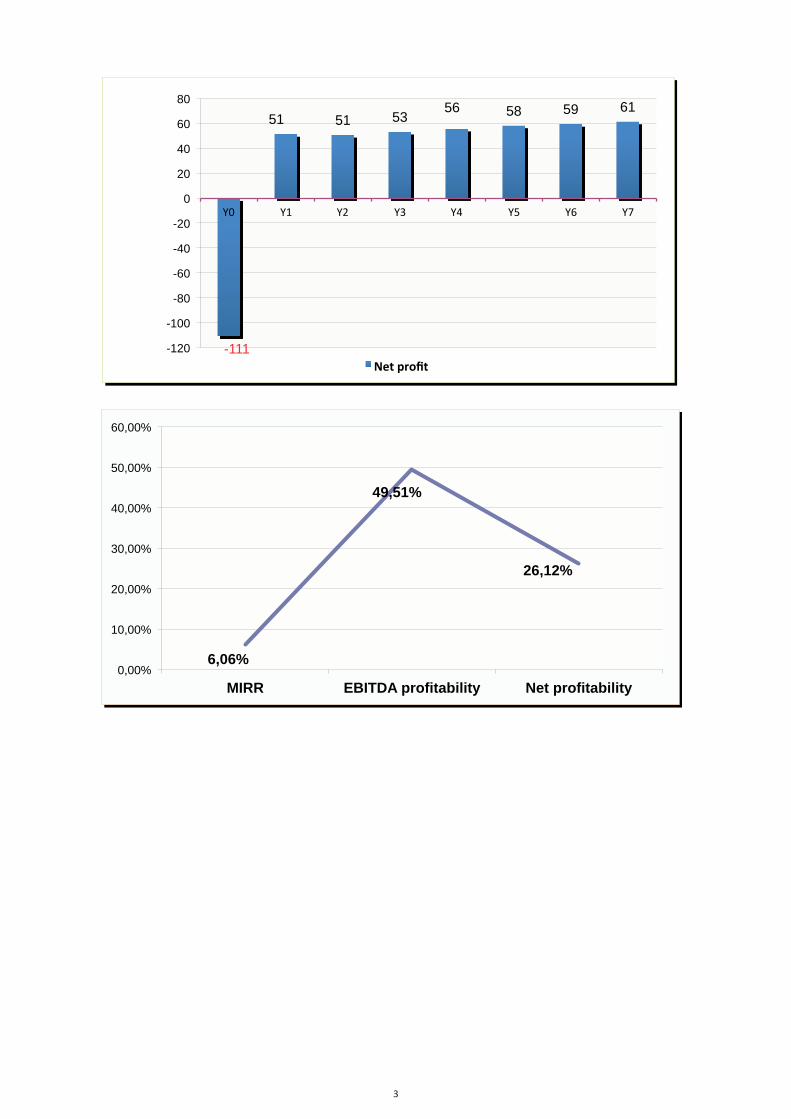
3
-111
51 51 53 56 58 59 61
-120
-100
-80
-60
-40
-20
0
20
40
60
80
Y0 Y1 Y2 Y3 Y4 Y5 Y6 Y7
Net profit
Y7
6,06%
49,51%
26,12%
0,00%
10,00%
20,00%
30,00%
40,00%
50,00%
60,00%
MIRR EBITDA profitability Net profitability
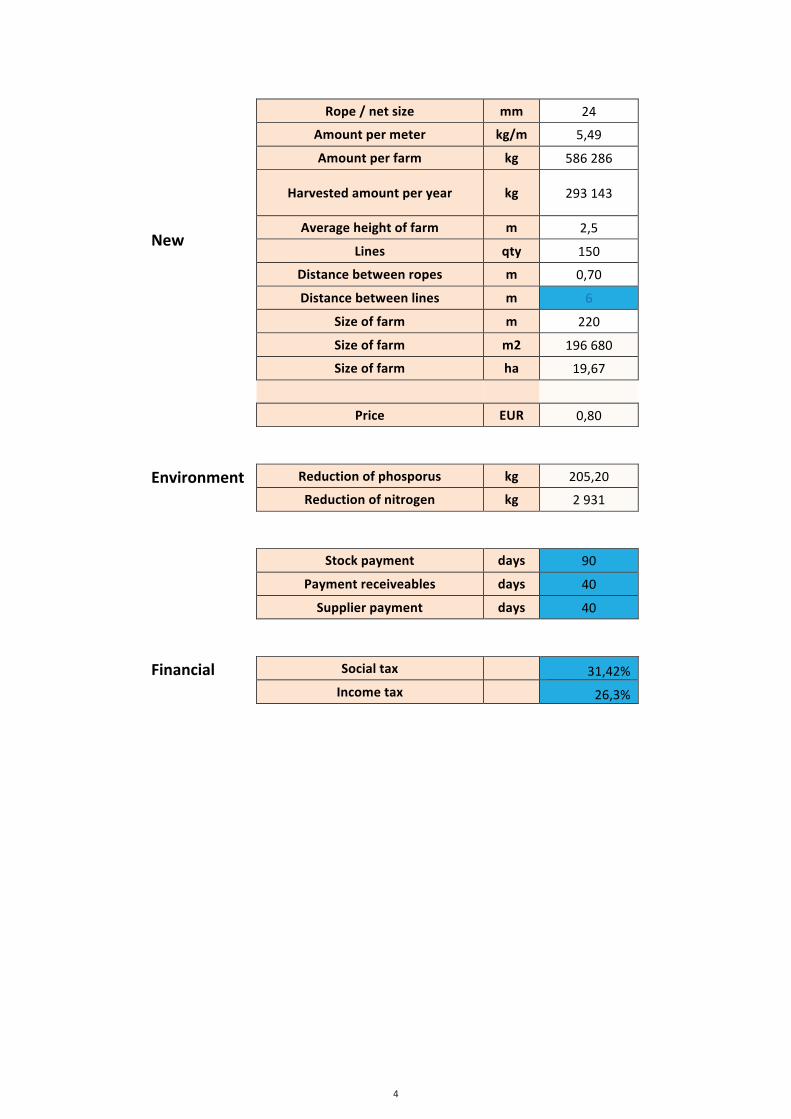
4
New
Rope / net size mm 24
Amount per meter kg/m 5,49
Amount per farm kg 586 286
Harvested amount per year kg 293 143
Average height of farm m 2,5
Lines qty 150
Distance between ropes m 0,70
Distance between lines m 6
Size of farm m 220
Size of farm m2 196 680
Size of farm ha 19,67
Price EUR 0,80
Environment Reduction of phosporus kg 205,20
Reduction of nitrogen kg 2 931
Stock payment days 90
Payment receiveables days 40
Supplier payment days 40
Financial Social tax 31,42%
Income tax 26,3%
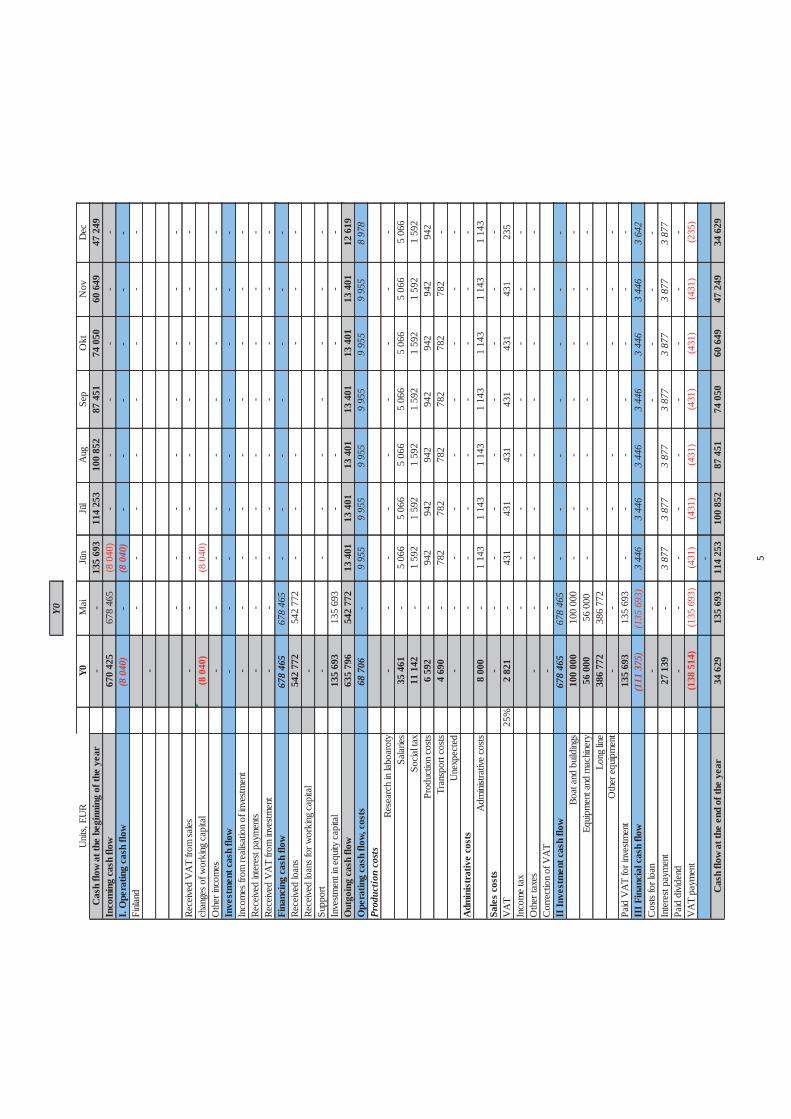
5
Y0
Y0M
aiJū
nJū
lA
ugSe
pO
ktN
ovD
ec-
-13
5 69
311
4 25
310
0 85
287
451
74 0
5060
649
47 2
4967
0 42
567
8 46
5(8
040
)-
--
--
-(8
040
)-
(8 0
40)
--
--
--
--
--
--
--
-
--
--
--
--
Rece
ived
VA
T fro
m sa
les-
--
--
--
--
chan
ges o
f wor
king
cap
ital
(8 0
40)
(8 0
40)
--
--
--
--
-In
vest
men
t cas
h flo
w-
--
--
--
--
--
--
--
--
-Re
ceive
d int
eres
t pay
men
ts-
--
--
--
--
--
--
--
--
-67
8 46
567
8 46
5-
--
--
--
Rece
ived
loan
s54
2 77
254
2 77
2-
--
--
-Re
ceive
d lo
ans f
or w
orki
ng c
apita
l- -
--
--
--
-In
vestm
ent i
n eq
uity
capi
tal
135
693
135
693
--
--
-63
5 79
654
2 77
213
401
13 4
0113
401
13 4
0113
401
13 4
0112
619
68 7
06-
9 95
59
955
9 95
59
955
9 95
59
955
8 97
8
--
--
--
--
-35
461
-5
066
5 06
65
066
5 06
65
066
5 06
65
066
11 1
42-
1 59
21
592
1 59
21
592
1 59
21
592
1 59
26
592
-94
294
294
294
294
294
294
24
690
-78
278
278
278
278
278
2-
--
--
--
--
--
--
--
--
-8
000
-1
143
1 14
31
143
1 14
31
143
1 14
31
143
--
--
--
--
-25
%2
821
-43
143
143
143
143
143
123
5-
--
--
--
--
--
--
--
--
Cor
rect
ion
of V
AT
--
II In
vest
men
t cas
h flo
w67
8 46
567
8 46
5-
--
--
--
Boat
and
buil
ding
s10
0 00
010
0 00
0-
--
--
--
Equip
men
t and
mac
hiner
y56
000
56 0
00-
--
--
--
386
772
386
772
--
--
--
-13
5 69
313
5 69
3-
--
--
--
III F
inan
cial
cas
h flo
w(1
11 3
75)
(135
693
)3
446
3 44
63
446
3 44
63
446
3 44
63
642
Cos
ts fo
r loa
n-
--
--
-In
tere
st pa
ymen
t27
139
-3
877
3 87
73
877
3 87
73
877
3 87
73
877
Paid
divi
dend
--
--
--
--
-(1
38 5
14)
(135
693
)(4
31)
(431
)(4
31)
(431
)(4
31)
(431
)(2
35)
-34
629
135
693
114
253
100
852
87 4
5174
050
60 6
4947
249
34 6
29
Paid
VA
T fo
r inv
estm
ent
VA
TIn
com
e ta
x
Fina
ncin
g ca
sh fl
ow
Out
goin
g ca
sh fl
ow
Prod
uctio
n co
sts
Oth
er e
quip
men
t
Adm
inistr
ative
cos
ts
Tran
spor
t cos
tsU
nexp
ecte
d
Rece
ived
VA
T fro
m in
vestm
ent
VA
T pa
ymen
t
Cas
h flo
w at
the
end
of th
e ye
ar
Oth
er ta
xes
Long
line
Supp
ort
Rese
arch
in la
boar
oty
Salar
ies
Inco
mes
from
reali
satio
n of
inve
stmen
t Socia
l tax
Sale
s co
sts
Adm
inis
trat
ive
cost
s
Unit
s, EU
RC
ash
flow
at th
e be
ginn
ing
of th
e ye
ar
Ope
ratin
g ca
sh fl
ow, c
osts
Prod
uctio
n co
sts
Oth
er in
com
es
Inco
min
g ca
sh fl
owI.
Ope
ratin
g ca
sh fl
owFi
nland
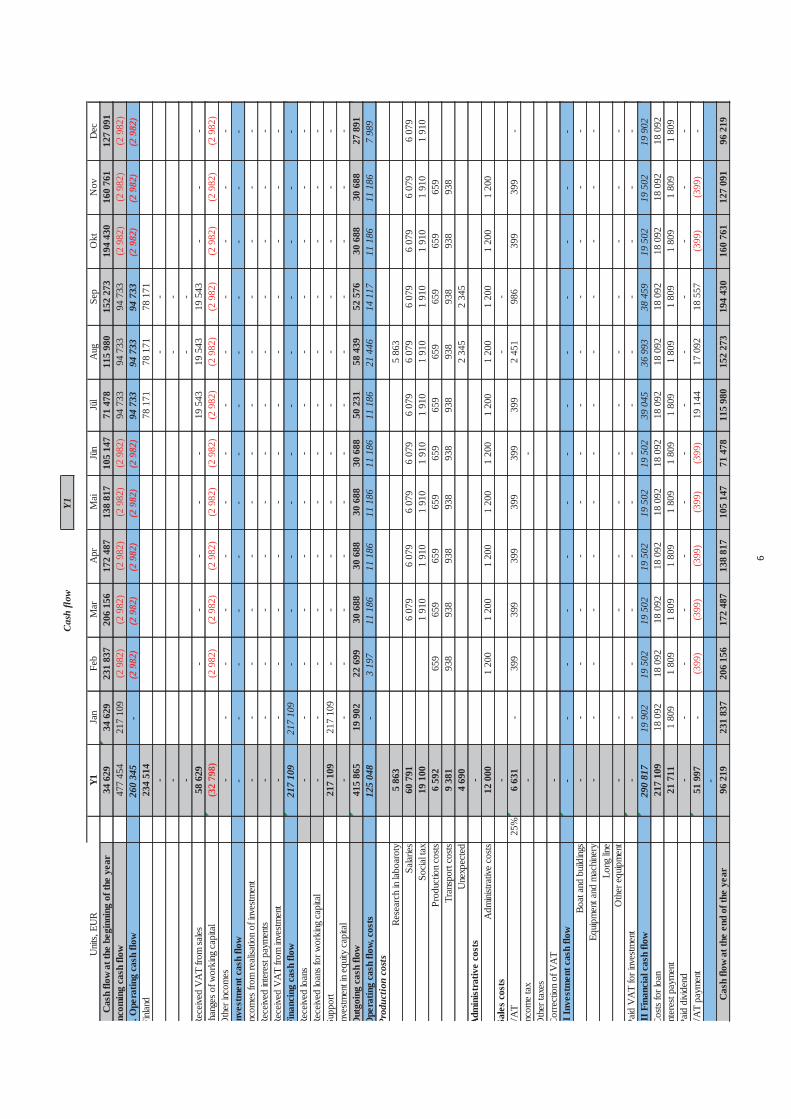
6
Y1
Y1Ja
nFe
bM
arA
prM
aiJū
nJū
lA
ugSe
pO
ktN
ovD
ec34
629
34 6
2923
1 83
720
6 15
617
2 48
713
8 81
710
5 14
771
478
115
980
152
273
194
430
160
761
127
091
477
454
217
109
(2 9
82)
(2 9
82)
(2 9
82)
(2 9
82)
(2 9
82)
94 7
3394
733
94 7
33(2
982
)(2
982
)(2
982
)26
0 34
5-
(2 9
82)
(2 9
82)
(2 9
82)
(2 9
82)
(2 9
82)
94 7
3394
733
94 7
33(2
982
)(2
982
)(2
982
)23
4 51
478
171
78 1
7178
171
--
--
--
--
-Re
ceive
d V
AT
from
sales
58 6
29-
--
--
19 5
4319
543
19 5
43-
--
chan
ges o
f wor
king
cap
ital
(32
798)
(2 9
82)
(2 9
82)
(2 9
82)
(2 9
82)
(2 9
82)
(2 9
82)
(2 9
82)
(2 9
82)
(2 9
82)
(2 9
82)
(2 9
82)
--
--
--
--
--
--
-In
vest
men
t cas
h flo
w-
--
--
--
--
--
--
--
--
--
--
--
--
-Re
ceive
d int
eres
t pay
men
ts-
--
--
--
--
--
--
--
--
--
--
--
--
-21
7 10
921
7 10
9-
--
--
--
--
--
Rece
ived
loan
s-
--
--
--
--
--
--
Rece
ived
loan
s for
wor
king
cap
ital
--
--
--
--
--
--
-21
7 10
921
7 10
9-
--
--
--
--
--
Inve
stmen
t in
equit
y ca
pita
l-
--
--
--
--
--
--
415
865
19 9
0222
699
30 6
8830
688
30 6
8830
688
50 2
3158
439
52 5
7630
688
30 6
8827
891
125
048
-3
197
11 1
8611
186
11 1
8611
186
11 1
8621
446
14 1
1711
186
11 1
867
989
5 86
35
863
60 7
916
079
6 07
96
079
6 07
96
079
6 07
96
079
6 07
96
079
6 07
919
100
1 91
01
910
1 91
01
910
1 91
01
910
1 91
01
910
1 91
01
910
6 59
265
965
965
965
965
965
965
965
965
965
99
381
938
938
938
938
938
938
938
938
938
938
4 69
02
345
2 34
5-
12 0
001
200
1 20
01
200
1 20
01
200
1 20
01
200
1 20
01
200
1 20
0-
--
25%
6 63
1-
399
399
399
399
399
399
2 45
198
639
939
9-
--
Cor
rect
ion
of V
AT
-II
Inve
stm
ent c
ash
flow
--
--
--
--
--
--
-Bo
at a
nd b
uildi
ngs
--
--
--
--
--
--
-Eq
uipm
ent a
nd m
achin
ery
--
--
--
--
--
--
-
--
--
--
--
--
--
--
--
--
--
--
--
-II
I Fin
anci
al c
ash
flow
290
817
19 9
0219
502
19 5
0219
502
19 5
0219
502
39 0
4536
993
38 4
5919
502
19 5
0219
902
Cos
ts fo
r loa
n21
7 10
918
092
18 0
9218
092
18 0
9218
092
18 0
9218
092
18 0
9218
092
18 0
9218
092
18 0
92In
tere
st pa
ymen
t21
711
1 80
91
809
1 80
91
809
1 80
91
809
1 80
91
809
1 80
91
809
1 80
91
809
Paid
divi
dend
--
--
--
--
--
--
-51
997
-(3
99)
(399
)(3
99)
(399
)(3
99)
19 1
4417
092
18 5
57(3
99)
(399
)-
-96
219
231
837
206
156
172
487
138
817
105
147
71 4
7811
5 98
015
2 27
319
4 43
016
0 76
112
7 09
196
219
Paid
VA
T fo
r inv
estm
ent
VA
TIn
com
e ta
x
Fina
ncin
g ca
sh fl
ow
Out
goin
g ca
sh fl
ow
Prod
uctio
n co
sts
Oth
er e
quip
men
t
Adm
inistr
ative
cos
ts
Tran
spor
t cos
tsU
nexp
ecte
d
Rece
ived
VA
T fro
m in
vestm
ent
VA
T pa
ymen
t
Cas
h flo
w at
the
end
of th
e ye
ar
Oth
er ta
xes
Long
line
Cas
h flo
w
Supp
ort
Rese
arch
in la
boar
oty
Salar
ies
Inco
mes
from
reali
satio
n of
inve
stmen
t Socia
l tax
Sale
s co
sts
Adm
inis
trat
ive
cost
s
Unit
s, EU
RC
ash
flow
at th
e be
ginn
ing
of th
e ye
ar
Ope
ratin
g ca
sh fl
ow, c
osts
Prod
uctio
n co
sts
Oth
er in
com
es
Inco
min
g ca
sh fl
owI.
Ope
ratin
g ca
sh fl
owFi
nland

7
Cas
h flo
wY2
Y2Ja
nFe
bM
arA
prM
aiJū
nJū
lA
ugSe
pO
ktN
ovD
ec96
219
96 2
1995
000
84 9
4766
904
48 8
6130
818
4 91
565
044
116
964
174
748
156
705
138
663
293
143
--
--
--
97 7
1497
714
97 7
14-
--
293
143
--
--
--
97 7
1497
714
97 7
14-
--
234
514
78 1
7178
171
78 1
71-
--
--
--
--
--
Rece
ived
VA
T fro
m sa
les58
629
--
--
-19
543
19 5
4319
543
--
-ch
ange
s of w
orki
ng c
apita
l-
--
--
--
--
--
--
--
--
--
--
--
--
-In
vest
men
t cas
h flo
w-
--
--
--
--
--
--
--
--
--
--
--
--
-Re
ceive
d int
eres
t pay
men
ts-
--
--
--
--
--
--
--
--
--
--
--
--
--
--
--
--
--
--
--
Rece
ived
loan
s-
--
--
--
--
--
--
Rece
ived
loan
s for
wor
king
cap
ital
- --
--
--
--
--
--
Inve
stmen
t in
equit
y ca
pita
l-
--
--
--
--
--
-26
5 94
41
219
10 0
5418
043
18 0
4318
043
25 9
0337
586
45 7
9439
931
18 0
4318
043
15 2
4513
2 90
9-
3 19
711
186
11 1
8611
186
19 0
4611
186
21 4
4614
117
11 1
8611
186
7 98
9
5 86
35
863
60 7
916
079
6 07
96
079
6 07
96
079
6 07
96
079
6 07
96
079
6 07
919
100
1 91
01
910
1 91
01
910
1 91
01
910
1 91
01
910
1 91
01
910
6 59
265
965
965
965
965
965
965
965
965
965
99
381
938
938
938
938
938
938
938
938
938
938
4 69
02
345
2 34
5-
12 0
001
200
1 20
01
200
1 20
01
200
1 20
01
200
1 20
01
200
1 20
0-
-25
%6
631
-39
939
939
939
939
939
92
451
986
399
399
-7
861
7 86
1-
--
--
--
--
--
-C
orre
ctio
n of
VA
T-
--
--
--
--
--
--
II In
vest
men
t cas
h flo
w-
--
--
--
--
--
--
Boat
and
buil
ding
s-
--
--
--
--
--
--
Equip
men
t and
mac
hiner
y-
--
--
--
--
--
--
--
--
--
--
--
--
--
--
--
--
--
--
--
III F
inan
cial
cas
h flo
w13
3 03
61
219
6 85
76
857
6 85
76
857
6 85
726
400
24 3
4825
814
6 85
76
857
7 25
6C
osts
for l
oan
66 4
166
038
6 03
86
038
6 03
86
038
6 03
86
038
6 03
86
038
6 03
86
038
Inte
rest
paym
ent
14 6
231
219
1 21
91
219
1 21
91
219
1 21
91
219
1 21
91
219
1 21
91
219
1 21
9Pa
id d
ivide
nd-
--
--
--
--
--
--
51 9
97-
(399
)(3
99)
(399
)(3
99)
(399
)19
144
17 0
9218
557
(399
)(3
99)
--
123
417
95 0
0084
947
66 9
0448
861
30 8
184
915
65 0
4411
6 96
417
4 74
815
6 70
513
8 66
312
3 41
7
Paid
VA
T fo
r inv
estm
ent
VA
TIn
com
e ta
x
Fina
ncin
g ca
sh fl
ow
Out
goin
g ca
sh fl
ow
Prod
uctio
n co
sts
Oth
er e
quip
men
t
Adm
inistr
ative
cos
ts
Tran
spor
t cos
tsU
nexp
ecte
d
Rece
ived
VA
T fro
m in
vestm
ent
VA
T pa
ymen
t
Cas
h flo
w at
the
end
of th
e ye
ar
Oth
er ta
xes
Long
line
Supp
ort
Rese
arch
in la
boar
oty
Salar
ies
Inco
mes
from
reali
satio
n of
inve
stmen
t Socia
l tax
Sale
s co
sts
Adm
inis
trat
ive
cost
s
Unit
s, EU
RC
ash
flow
at th
e be
ginn
ing
of th
e ye
ar
Ope
ratin
g ca
sh fl
ow, c
osts
Prod
uctio
n co
sts
Oth
er in
com
es
Inco
min
g ca
sh fl
owI.
Ope
ratin
g ca
sh fl
owFi
nland
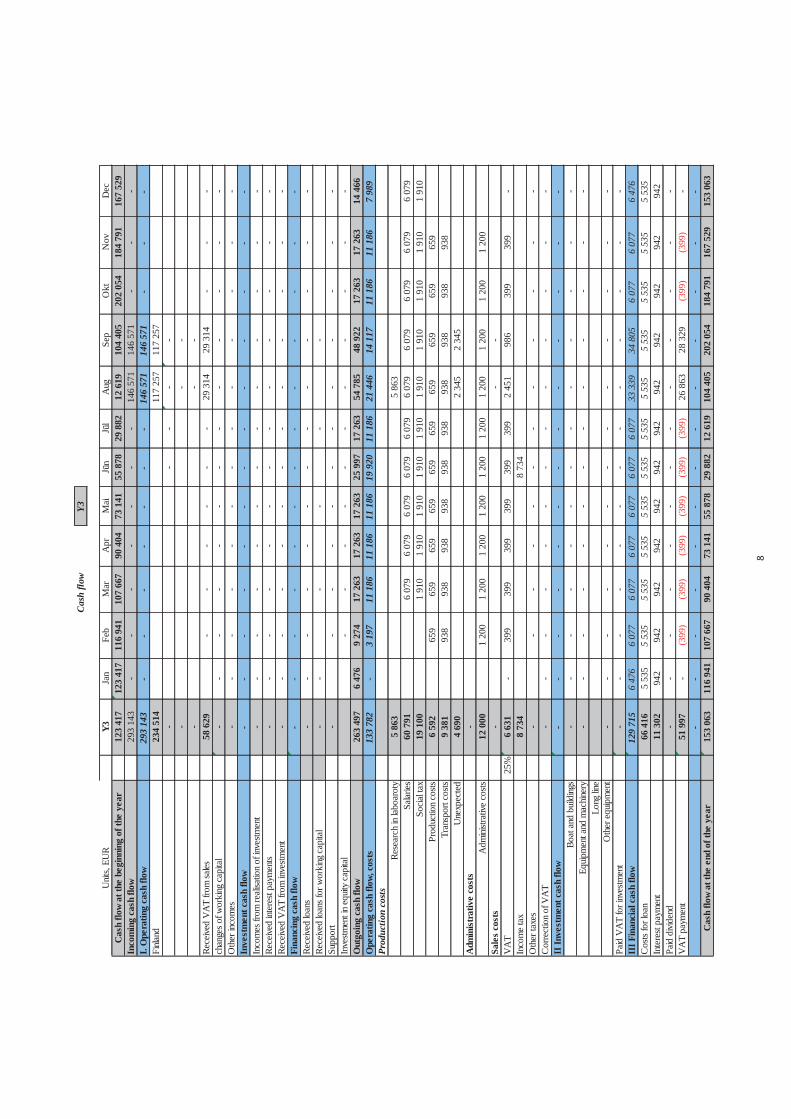
8
Y3
Y3Ja
nFe
bM
arA
prM
aiJū
nJū
lA
ugSe
pO
ktN
ovD
ec12
3 41
712
3 41
711
6 94
110
7 66
790
404
73 1
4155
878
29 8
8212
619
104
405
202
054
184
791
167
529
293
143
--
--
--
-14
6 57
114
6 57
1-
--
293
143
--
--
--
-14
6 57
114
6 57
1-
--
234
514
117
257
117
257
--
--
--
--
--
-Re
ceive
d V
AT
from
sales
58 6
29-
--
--
-29
314
29 3
14-
--
chan
ges o
f wor
king
cap
ital
--
--
--
--
--
--
--
--
--
--
--
--
--
Inve
stm
ent c
ash
flow
--
--
--
--
--
--
--
--
--
--
--
--
--
Rece
ived
inter
est p
aym
ents
--
--
--
--
--
--
--
--
--
--
--
--
--
--
--
--
--
--
--
-Re
ceive
d lo
ans
--
--
--
--
--
--
-Re
ceive
d lo
ans f
or w
orki
ng c
apita
l-
--
--
--
--
--
--
--
--
-In
vestm
ent i
n eq
uity
capi
tal
--
--
--
--
--
-26
3 49
76
476
9 27
417
263
17 2
6317
263
25 9
9717
263
54 7
8548
922
17 2
6317
263
14 4
6613
3 78
2-
3 19
711
186
11 1
8611
186
19 9
2011
186
21 4
4614
117
11 1
8611
186
7 98
9
5 86
35
863
60 7
916
079
6 07
96
079
6 07
96
079
6 07
96
079
6 07
96
079
6 07
919
100
1 91
01
910
1 91
01
910
1 91
01
910
1 91
01
910
1 91
01
910
6 59
265
965
965
965
965
965
965
965
965
965
99
381
938
938
938
938
938
938
938
938
938
938
4 69
02
345
2 34
5-
12 0
001
200
1 20
01
200
1 20
01
200
1 20
01
200
1 20
01
200
1 20
0-
--
25%
6 63
1-
399
399
399
399
399
399
2 45
198
639
939
9-
8 73
48
734
--
--
--
--
--
--
Cor
rect
ion
of V
AT
--
--
--
--
--
--
-II
Inve
stm
ent c
ash
flow
--
--
--
--
--
--
-Bo
at a
nd b
uildi
ngs
--
--
--
--
--
--
-Eq
uipm
ent a
nd m
achin
ery
--
--
--
--
--
--
-
--
--
--
--
--
--
--
--
--
--
--
--
--
III F
inan
cial
cas
h flo
w12
9 71
56
476
6 07
76
077
6 07
76
077
6 07
76
077
33 3
3934
805
6 07
76
077
6 47
6C
osts
for l
oan
66 4
165
535
5 53
55
535
5 53
55
535
5 53
55
535
5 53
55
535
5 53
55
535
5 53
5In
tere
st pa
ymen
t11
302
942
942
942
942
942
942
942
942
942
942
942
942
Paid
divi
dend
--
--
--
--
--
--
-51
997
-(3
99)
(399
)(3
99)
(399
)(3
99)
(399
)26
863
28 3
29(3
99)
(399
)-
--
--
--
--
--
--
-15
3 06
311
6 94
110
7 66
790
404
73 1
4155
878
29 8
8212
619
104
405
202
054
184
791
167
529
153
063
Paid
VA
T fo
r inv
estm
ent
VA
TIn
com
e ta
x
Fina
ncin
g ca
sh fl
ow
Out
goin
g ca
sh fl
ow
Prod
uctio
n co
sts
Oth
er e
quip
men
t
Adm
inistr
ative
cos
ts
Tran
spor
t cos
tsU
nexp
ecte
d
Rece
ived
VA
T fro
m in
vestm
ent
Cas
h flo
w
VA
T pa
ymen
t
Cas
h flo
w at
the
end
of th
e ye
ar
Oth
er ta
xes
Long
line
Supp
ort
Rese
arch
in la
boar
oty
Salar
ies
Inco
mes
from
reali
satio
n of
inve
stmen
t Socia
l tax
Sale
s co
sts
Adm
inis
trat
ive
cost
s
Unit
s, EU
RC
ash
flow
at th
e be
ginn
ing
of th
e ye
ar
Ope
ratin
g ca
sh fl
ow, c
osts
Prod
uctio
n co
sts
Oth
er in
com
es
Inco
min
g ca
sh fl
owI.
Ope
ratin
g ca
sh fl
owFi
nland
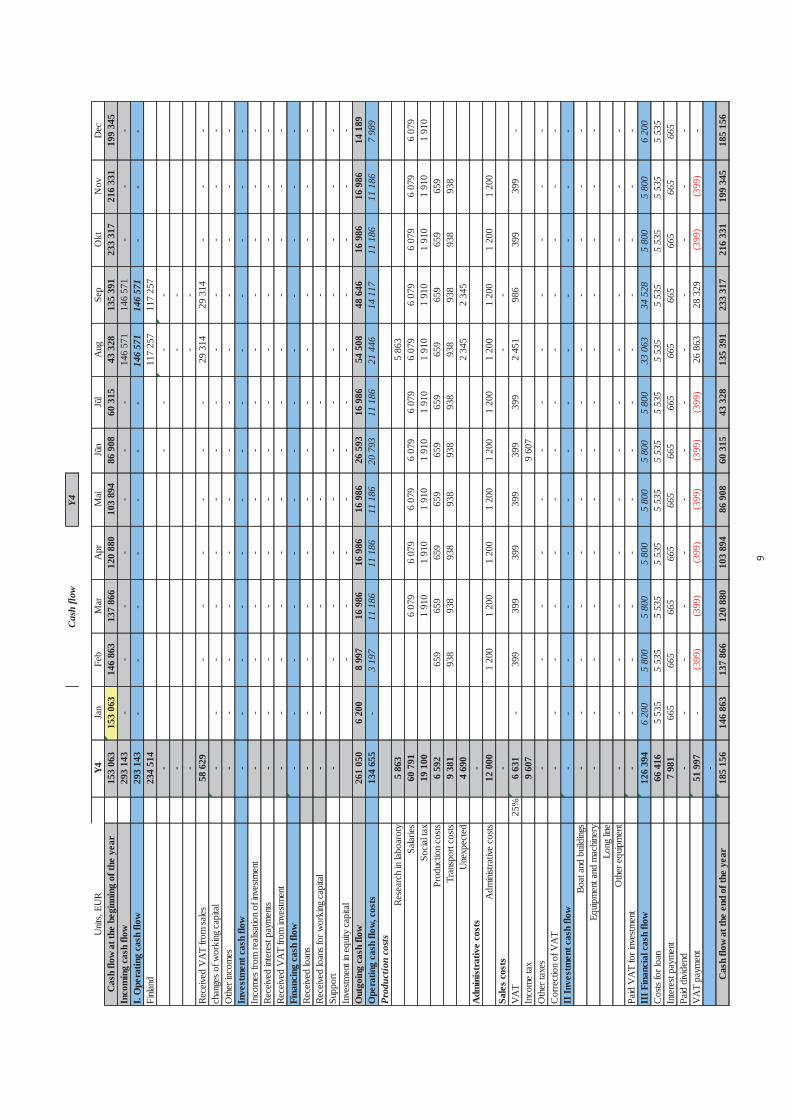
9
Y4
Y4Ja
nFe
bM
arA
prM
aiJū
nJū
lA
ugSe
pO
ktN
ovD
ec15
3 06
315
3 06
314
6 86
313
7 86
612
0 88
010
3 89
486
908
60 3
1543
328
135
391
233
317
216
331
199
345
293
143
--
--
--
-14
6 57
114
6 57
1-
--
293
143
--
--
--
-14
6 57
114
6 57
1-
--
234
514
117
257
117
257
--
--
--
--
--
-Re
ceive
d V
AT
from
sales
58 6
29-
--
--
-29
314
29 3
14-
--
chan
ges o
f wor
king
cap
ital
--
--
--
--
--
--
--
--
--
--
--
--
--
Inve
stm
ent c
ash
flow
--
--
--
--
--
--
--
--
--
--
--
--
--
Rece
ived
inter
est p
aym
ents
--
--
--
--
--
--
--
--
--
--
--
--
--
--
--
--
--
--
--
-Re
ceive
d lo
ans
--
--
--
--
--
--
-Re
ceive
d lo
ans f
or w
orki
ng c
apita
l-
--
--
--
--
--
--
--
--
-In
vestm
ent i
n eq
uity
capi
tal
--
--
--
--
--
-26
1 05
06
200
8 99
716
986
16 9
8616
986
26 5
9316
986
54 5
0848
646
16 9
8616
986
14 1
8913
4 65
5-
3 19
711
186
11 1
8611
186
20 7
9311
186
21 4
4614
117
11 1
8611
186
7 98
9
5 86
35
863
60 7
916
079
6 07
96
079
6 07
96
079
6 07
96
079
6 07
96
079
6 07
919
100
1 91
01
910
1 91
01
910
1 91
01
910
1 91
01
910
1 91
01
910
6 59
265
965
965
965
965
965
965
965
965
965
99
381
938
938
938
938
938
938
938
938
938
938
4 69
02
345
2 34
5-
12 0
001
200
1 20
01
200
1 20
01
200
1 20
01
200
1 20
01
200
1 20
0-
--
25%
6 63
1-
399
399
399
399
399
399
2 45
198
639
939
9-
9 60
79
607
--
--
--
--
--
--
Cor
rect
ion
of V
AT
--
--
--
--
--
--
-II
Inve
stm
ent c
ash
flow
--
--
--
--
--
--
-Bo
at a
nd b
uildi
ngs
--
--
--
--
--
--
-Eq
uipm
ent a
nd m
achin
ery
--
--
--
--
--
--
-
--
--
--
--
--
--
--
--
--
--
--
--
--
III F
inan
cial
cas
h flo
w12
6 39
46
200
5 80
05
800
5 80
05
800
5 80
05
800
33 0
6334
528
5 80
05
800
6 20
0C
osts
for l
oan
66 4
165
535
5 53
55
535
5 53
55
535
5 53
55
535
5 53
55
535
5 53
55
535
5 53
5In
tere
st pa
ymen
t7
981
665
665
665
665
665
665
665
665
665
665
665
665
Paid
divi
dend
--
--
--
--
--
--
-51
997
-(3
99)
(399
)(3
99)
(399
)(3
99)
(399
)26
863
28 3
29(3
99)
(399
)-
-18
5 15
614
6 86
313
7 86
612
0 88
010
3 89
486
908
60 3
1543
328
135
391
233
317
216
331
199
345
185
156
Paid
VA
T fo
r inv
estm
ent
VA
TIn
com
e ta
x
Fina
ncin
g ca
sh fl
ow
Out
goin
g ca
sh fl
ow
Prod
uctio
n co
sts
Oth
er e
quip
men
t
Adm
inistr
ative
cos
ts
Tran
spor
t cos
tsU
nexp
ecte
d
Rece
ived
VA
T fro
m in
vestm
ent
Cas
h flo
w
VA
T pa
ymen
t
Cas
h flo
w at
the
end
of th
e ye
ar
Oth
er ta
xes
Long
line
Supp
ort
Rese
arch
in la
boar
oty
Salar
ies
Inco
mes
from
reali
satio
n of
inve
stmen
t Socia
l tax
Sale
s co
sts
Adm
inis
trat
ive
cost
s
Unit
s, EU
RC
ash
flow
at th
e be
ginn
ing
of th
e ye
ar
Ope
ratin
g ca
sh fl
ow, c
osts
Prod
uctio
n co
sts
Oth
er in
com
es
Inco
min
g ca
sh fl
owI.
Ope
ratin
g ca
sh fl
owFi
nland

3.3.2Baltic Ecomussel
Business PlanFinland
2013

2
Disclaimer: The contents of the document reflect the authors’ views. The Managing Authority of the Central Baltic INTERREG IV A Programme cannot be held liable for information published by the project partners.
2
Abbreviation B.C. before century
cm centimetre
CV curriculum vitae
EBITDA Earnings Before Interest, Taxes, Depreciation and Amortization
ERDF European Regional Development Fund
EXW Ex-‐Works (a trade term requiring the seller to deliver goods at his or her own place of business. All other transportation costs and risks are assumed by the buyer)
FAO Food and Agriculture organization of the United Nations
g gram
kg kilogram
GDP gross domestic product
IRR internal rate of return
LEIF Latvian Environmental Investment Fund
M million
MEUR million euros
MIRR modified internal rate of return
mth month
NPV Net present value
Qty quantity
T thousand
t ton
TEUR thousand euros
Y year
Abbreviations
3
3
Index
1. GENERAL INFORMATION ABOUT THE COMPANY..............................................................................6
1.1. General information about the company ......................................................................................... 6 1.2. The Finland Mussel Farm objectives................................................................................................. 6
2. PROJECT IMPLEMENTATION.............................................................................................................7
2.1. Project objective ............................................................................................................................... 7 2.2. Project implementation capacity...................................................................................................... 7 2.3. Product ............................................................................................................................................. 8 2.4. Strategic segmentation..................................................................................................................... 9 2.5. Financial Resources......................................................................................................................... 10 2.6. Investment plan .............................................................................................................................. 11 2.7. Project implementation timetable ................................................................................................. 14
3. MARKET ANALYSIS .........................................................................................................................15
3.1. Sector overview -‐ fishery and aquaculture ..................................................................................... 15 3.2. Blue mussel fishery in Finland......................................................................................................... 20 3.3. Prognosis of mussels volume.......................................................................................................... 24 3.4. Competitors .................................................................................................................................... 25 3.5. Financial indicators of industry ....................................................................................................... 26
4. RISK EVALUATION AND ANALYSIS OF TECHNICAL ASPECTS.............................................................35
5. SWOT.............................................................................................................................................38
6. FINANCIAL BASIS OF THE PROJECT..................................................................................................39
6.1. Revenue forecast ............................................................................................................................ 39 6.2. Costs plan forecast.......................................................................................................................... 40 6.3. Profit and Loss Statement............................................................................................................... 42 6.4. Risk analysis .................................................................................................................................... 42 6.5. Cash flow forecast........................................................................................................................... 42 6.6. Balance forecast.............................................................................................................................. 45 6.7. Project profitability calculation....................................................................................................... 47 6.8. Sensitivity analysis .......................................................................................................................... 47
4
4
Table of contents
Table 1. Structure of financial resources ......................................................................................................... 10
Table 2; Investment plan -‐ boat....................................................................................................................... 11
Table 3; Investment plan -‐ equipment ............................................................................................................ 11
Table 4; Investment plan -‐ long-‐line ................................................................................................................ 12
Table 5; Investment plan -‐ labour costs .......................................................................................................... 13
Table 6; Timetable of for farm establishment ................................................................................................. 14
Table 7; Financial data, balance ...................................................................................................................... 26
Table 8; Financial data, profit and loss statement........................................................................................... 27
Table 9; Financial indicators 2007-‐2011 of Snadder og Snaskum ................................................................... 27
Table 10; General characteristics of financial indicators ................................................................................. 29
Table 11; Financial data, balance .................................................................................................................... 30
Table 12; Financial data, profit and loss statement......................................................................................... 30
Table 13; Financial indicators 2008-‐2011 of Fiskebäcks Seafood AB .............................................................. 31
Table 14; Main financial data in 2011 ............................................................................................................. 33
Table 15; The general characteristics of financial indicators of these 4 companies ....................................... 33
Table 16; Revenue ........................................................................................................................................... 39
Table 17; Production costs .............................................................................................................................. 40
Table 18; Calculation of salaries ...................................................................................................................... 40
Table 19; Profit and loss statement................................................................................................................. 42
Table 20; Calculation of risk rate ..................................................................................................................... 42
Table 21; Financial plan ................................................................................................................................... 43
Table 22; Cash flow forecast............................................................................................................................ 44
Table 23; Balance forecast............................................................................................................................... 46
Table 24; Calculation of main financial indicators ........................................................................................... 46
5
5
Figure 1. Mussels of the Baltic Sea .................................................................................................................... 8
Figure 2. Mussel outlets .................................................................................................................................... 9
Figure 3. World GDP (1984-‐2012) and fishery trade and production (1984-‐2009), trillion EUR ................... 16
Figure 4. Global fishery production in the capture and aquaculture M t, 1950-‐2010 and average
consumption per capita kg .............................................................................................................................. 17
Figure 5. Share of global commodity trade and production by groups (in EUR), 1976-‐2009.......................... 18
Figure 6. Share of global commodity trade and production by groups (in tons), 1976-‐2009 ......................... 18
Figure 7. Fishery and mussels production and trade in the world (M tons), 1950-‐2010................................. 19
Figure 8. Fishing of blue mussel in the world 1950-‐2010 (tons)...................................................................... 20
Figure 9. Mussel trade in Finland (tons), 1988-‐2009....................................................................................... 21
Figure 10. Consumption of mussels (g) and GDP per capita (EUR) in Finland, 1988-‐2009.............................. 21
Figure 11. Average mussel price, per kg, EUR ................................................................................................. 22
Figure 12. Average blue mussels price produced in aquaculture, per kg, EUR ............................................... 23
Figure 13. Prognosis of mussels volume, M tons 1950-‐2040 .......................................................................... 24
Figure 14. The main market players ................................................................................................................ 25
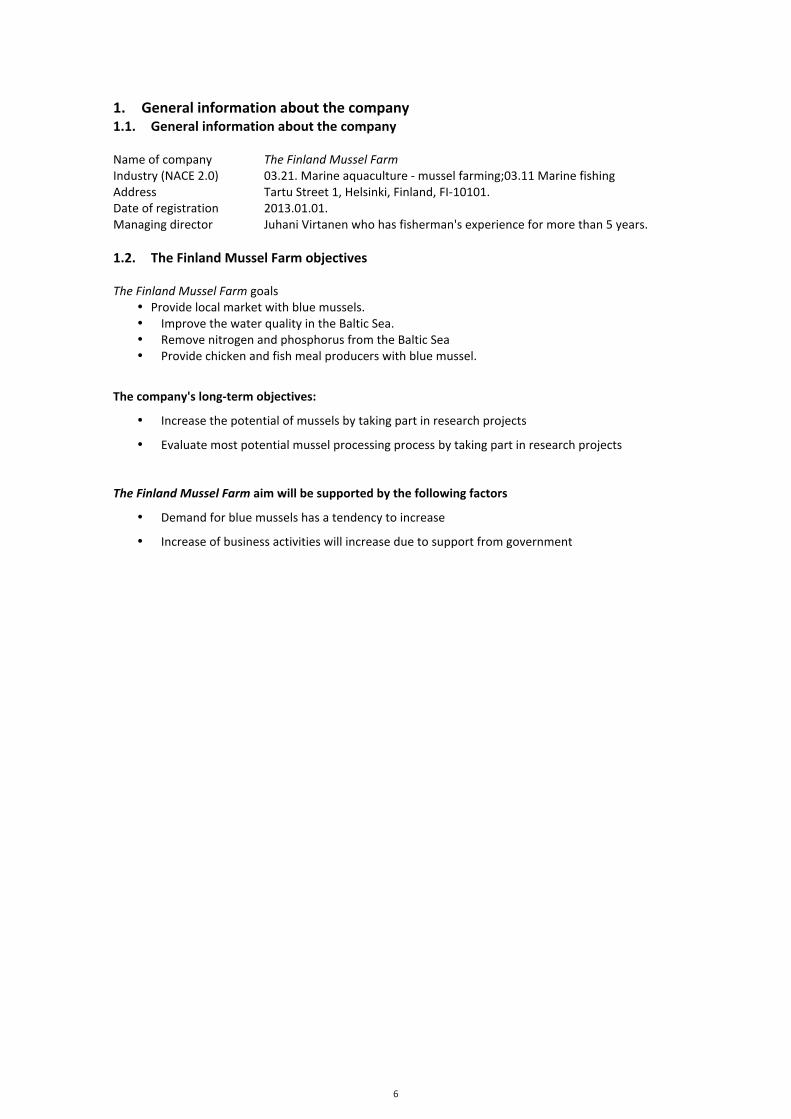
6
6
1. General information about the company 1.1. General information about the company Name of company The Finland Mussel Farm Industry (NACE 2.0) 03.21. Marine aquaculture -‐ mussel farming;03.11 Marine fishing Address Tartu Street 1, Helsinki, Finland, FI-‐10101. Date of registration 2013.01.01. Managing director Juhani Virtanen who has fisherman's experience for more than 5 years. 1.2. The Finland Mussel Farm objectives The Finland Mussel Farm goals
• Provide local market with blue mussels. • Improve the water quality in the Baltic Sea. • Remove nitrogen and phosphorus from the Baltic Sea • Provide chicken and fish meal producers with blue mussel.
The company's long-‐term objectives:
• Increase the potential of mussels by taking part in research projects
• Evaluate most potential mussel processing process by taking part in research projects
The Finland Mussel Farm aim will be supported by the following factors
• Demand for blue mussels has a tendency to increase
• Increase of business activities will increase due to support from government
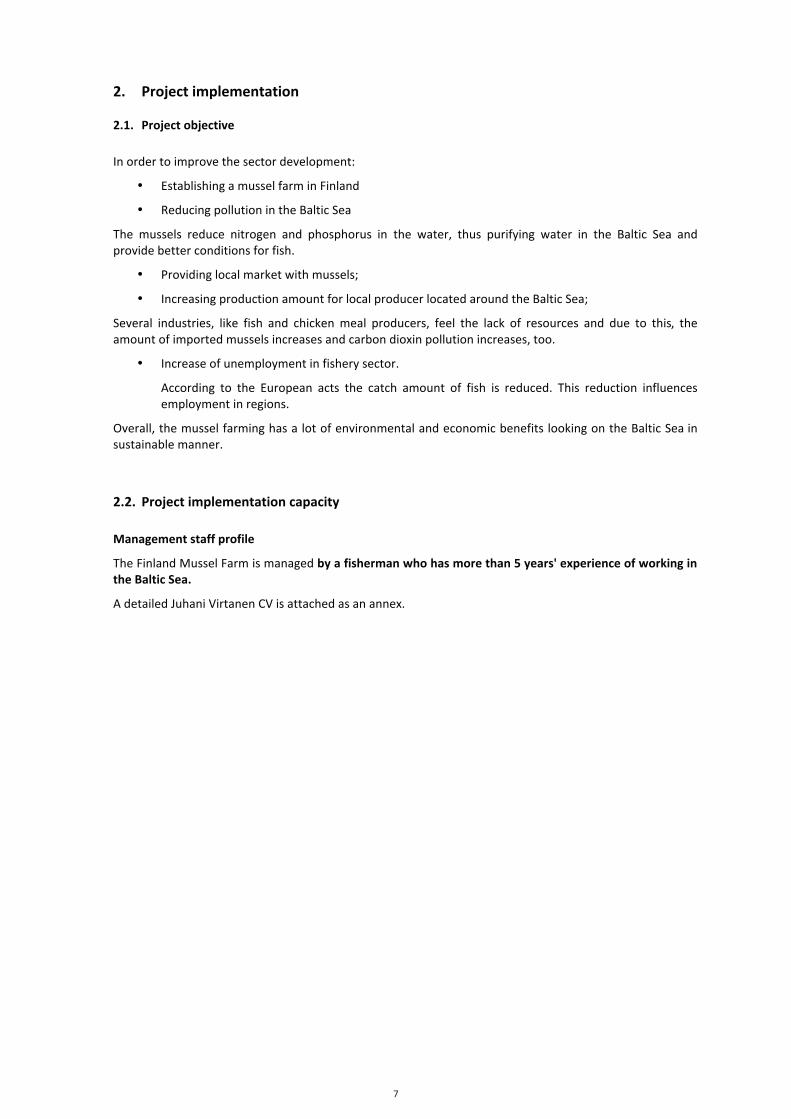
7
7
2. Project implementation
2.1. Project objective
In order to improve the sector development:
• Establishing a mussel farm in Finland
• Reducing pollution in the Baltic Sea
The mussels reduce nitrogen and phosphorus in the water, thus purifying water in the Baltic Sea and provide better conditions for fish.
• Providing local market with mussels;
• Increasing production amount for local producer located around the Baltic Sea;
Several industries, like fish and chicken meal producers, feel the lack of resources and due to this, the amount of imported mussels increases and carbon dioxin pollution increases, too.
• Increase of unemployment in fishery sector.
According to the European acts the catch amount of fish is reduced. This reduction influences employment in regions.
Overall, the mussel farming has a lot of environmental and economic benefits looking on the Baltic Sea in sustainable manner.
2.2. Project implementation capacity Management staff profile
The Finland Mussel Farm is managed by a fisherman who has more than 5 years' experience of working in the Baltic Sea.
A detailed Juhani Virtanen CV is attached as an annex.
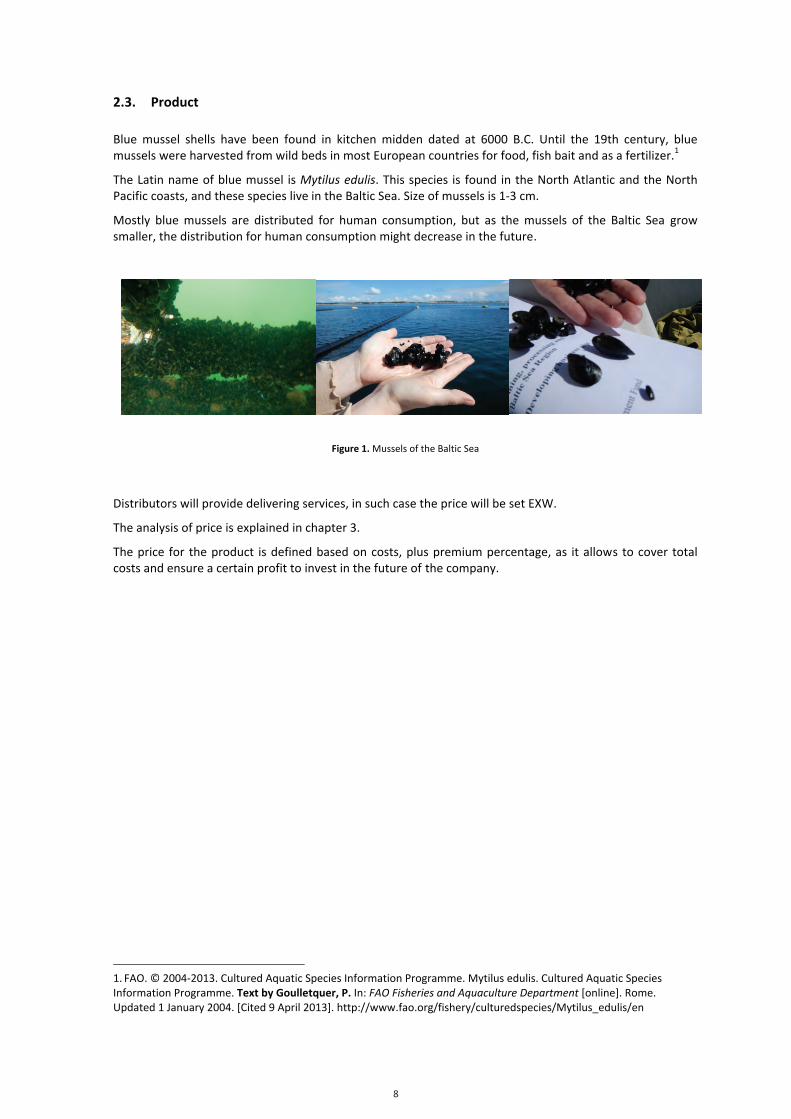
8
8
2.3. Product Blue mussel shells have been found in kitchen midden dated at 6000 B.C. Until the 19th century, blue mussels were harvested from wild beds in most European countries for food, fish bait and as a fertilizer.1
The Latin name of blue mussel is Mytilus edulis. This species is found in the North Atlantic and the North Pacific coasts, and these species live in the Baltic Sea. Size of mussels is 1-‐3 cm.
Mostly blue mussels are distributed for human consumption, but as the mussels of the Baltic Sea grow smaller, the distribution for human consumption might decrease in the future.
Figure 1. Mussels of the Baltic Sea
Distributors will provide delivering services, in such case the price will be set EXW.
The analysis of price is explained in chapter 3.
The price for the product is defined based on costs, plus premium percentage, as it allows to cover total costs and ensure a certain profit to invest in the future of the company.
1. FAO. © 2004-‐2013. Cultured Aquatic Species Information Programme. Mytilus edulis. Cultured Aquatic Species Information Programme. Text by Goulletquer, P. In: FAO Fisheries and Aquaculture Department [online]. Rome. Updated 1 January 2004. [Cited 9 April 2013]. http://www.fao.org/fishery/culturedspecies/Mytilus_edulis/en
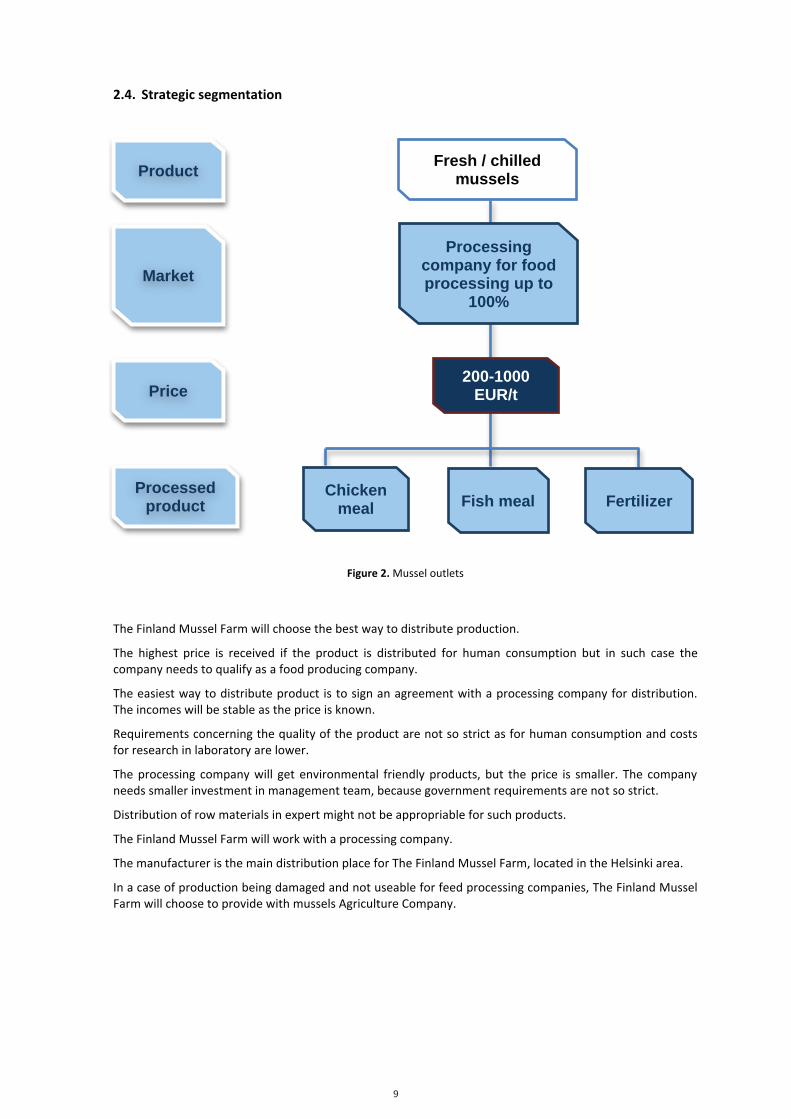
9
9
2.4. Strategic segmentation
Figure 2. Mussel outlets
The Finland Mussel Farm will choose the best way to distribute production.
The highest price is received if the product is distributed for human consumption but in such case the company needs to qualify as a food producing company.
The easiest way to distribute product is to sign an agreement with a processing company for distribution. The incomes will be stable as the price is known.
Requirements concerning the quality of the product are not so strict as for human consumption and costs for research in laboratory are lower.
The processing company will get environmental friendly products, but the price is smaller. The company needs smaller investment in management team, because government requirements are not so strict.
Distribution of row materials in expert might not be appropriable for such products.
The Finland Mussel Farm will work with a processing company.
The manufacturer is the main distribution place for The Finland Mussel Farm, located in the Helsinki area.
In a case of production being damaged and not useable for feed processing companies, The Finland Mussel Farm will choose to provide with mussels Agriculture Company.
Fresh / chilled mussels
200-1000 EUR/t
Processing company for food processing up to
100%
Chicken meal Fish meal Fertilizer
Product
Market
Price
Processed product
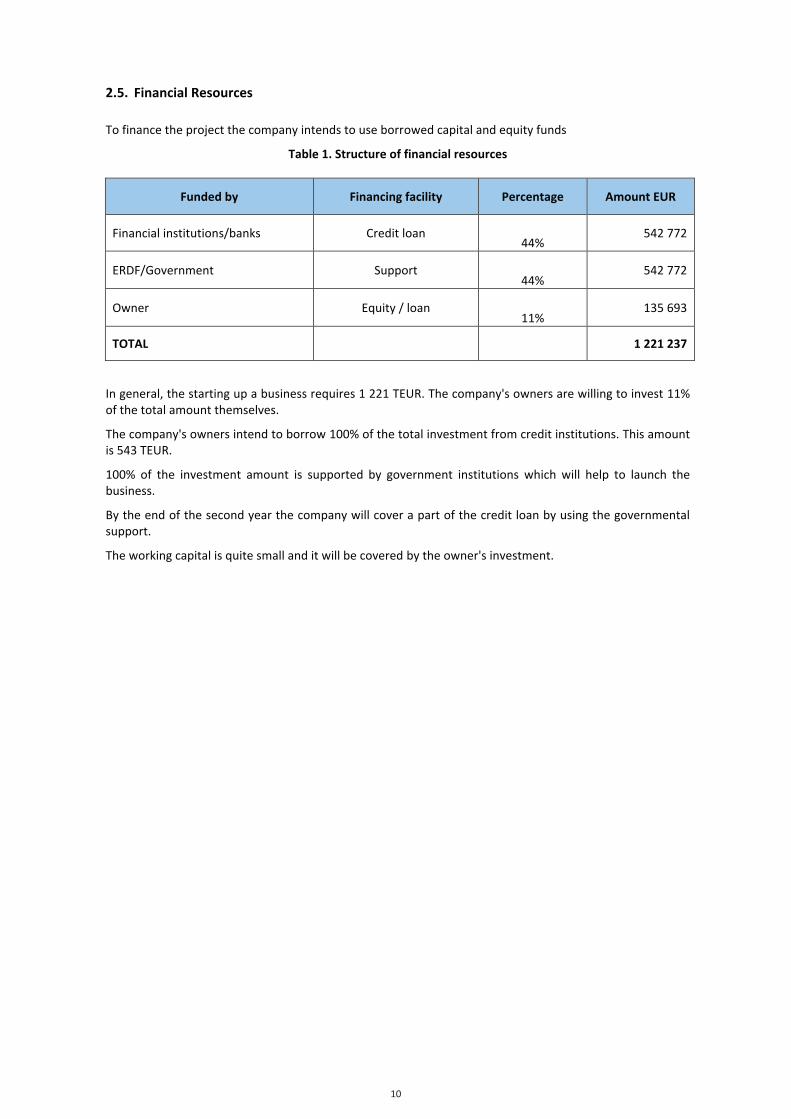
10
10
2.5. Financial Resources To finance the project the company intends to use borrowed capital and equity funds
Table 1. Structure of financial resources
Funded by Financing facility Percentage Amount EUR
Financial institutions/banks Credit loan 44%
542 772
ERDF/Government Support 44%
542 772
Owner Equity / loan 11%
135 693
TOTAL
1 221 237
In general, the starting up a business requires 1 221 TEUR. The company's owners are willing to invest 11% of the total amount themselves.
The company's owners intend to borrow 100% of the total investment from credit institutions. This amount is 543 TEUR.
100% of the investment amount is supported by government institutions which will help to launch the business.
By the end of the second year the company will cover a part of the credit loan by using the governmental support.
The working capital is quite small and it will be covered by the owner's investment.
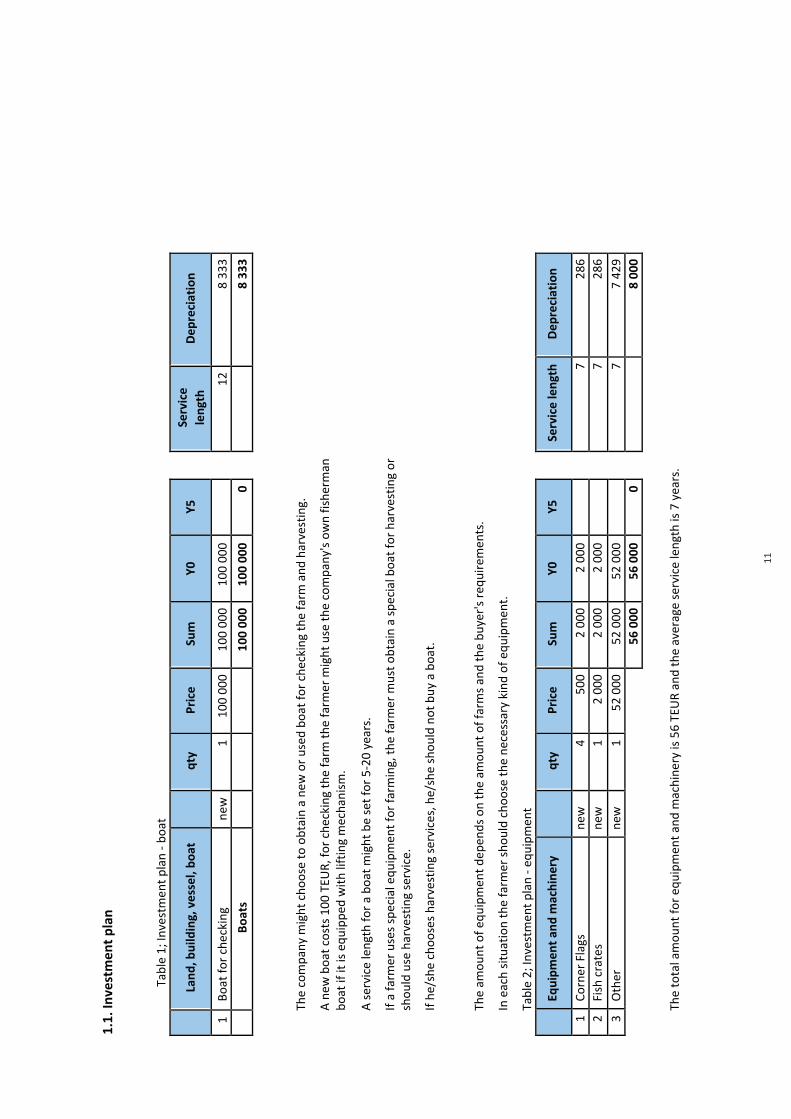
11
1.1.
Investmen
t plan
Ta
ble 1; In
vestmen
t plan -‐ b
oat
Land
, building, vessel, bo
at
qty
Price
Sum
Y0
Y5
Service
length
Dep
reciation
1 Bo
at fo
r ch
ecking
ne
w
1 10
0 00
0 10
0 00
0 10
0 00
0
12
8 33
3
Bo
ats
10
0 00
0 10
0 00
0 0
8 33
3
The co
mpa
ny m
ight cho
ose to obtain a ne
w or us
ed boa
t for che
cking the farm
and
harve
sting.
A new
boa
t cos
ts 100
TEU
R, fo
r ch
ecking
the farm
the farm
er m
ight use th
e co
mpa
ny's own fis
herm
an
boat if it is equ
ippe
d with
lifting mec
hanism
.
A service
leng
th fo
r a bo
at m
ight be set for 5-‐20 ye
ars.
If a farm
er uses sp
ecial e
quipmen
t for fa
rming, th
e farm
er m
ust o
btain a sp
ecial b
oat for harve
sting or
shou
ld use harve
sting service.
If he
/she
cho
oses harve
sting services, h
e/sh
e sh
ould not buy
a boa
t.
The am
ount of e
quipmen
t dep
ends
on the am
ount of farms an
d the bu
yer's
req
uiremen
ts.
In each situation the farm
er sho
uld ch
oose th
e ne
cessary kind
of e
quipmen
t.
Table 2; In
vestmen
t plan -‐ e
quipmen
t
Eq
uipm
ent an
d machine
ry
qty
Price
Sum
Y0
Y5
Service length
Dep
reciation
1 Co
rner Flags
new
4 50
0 2 00
0 2 00
0
7
286
2
Fish
crates
new
1 2 00
0 2 00
0 2 00
0
7
286
3
Other
new
1 52
000
52
000
52
000
7
7 42
9
56
000
56
000
0
8 00
0
The total a
mou
nt fo
r eq
uipm
ent a
nd m
achine
ry is 56 TE
UR an
d the av
erag
e service leng
th is 7 yea
rs.
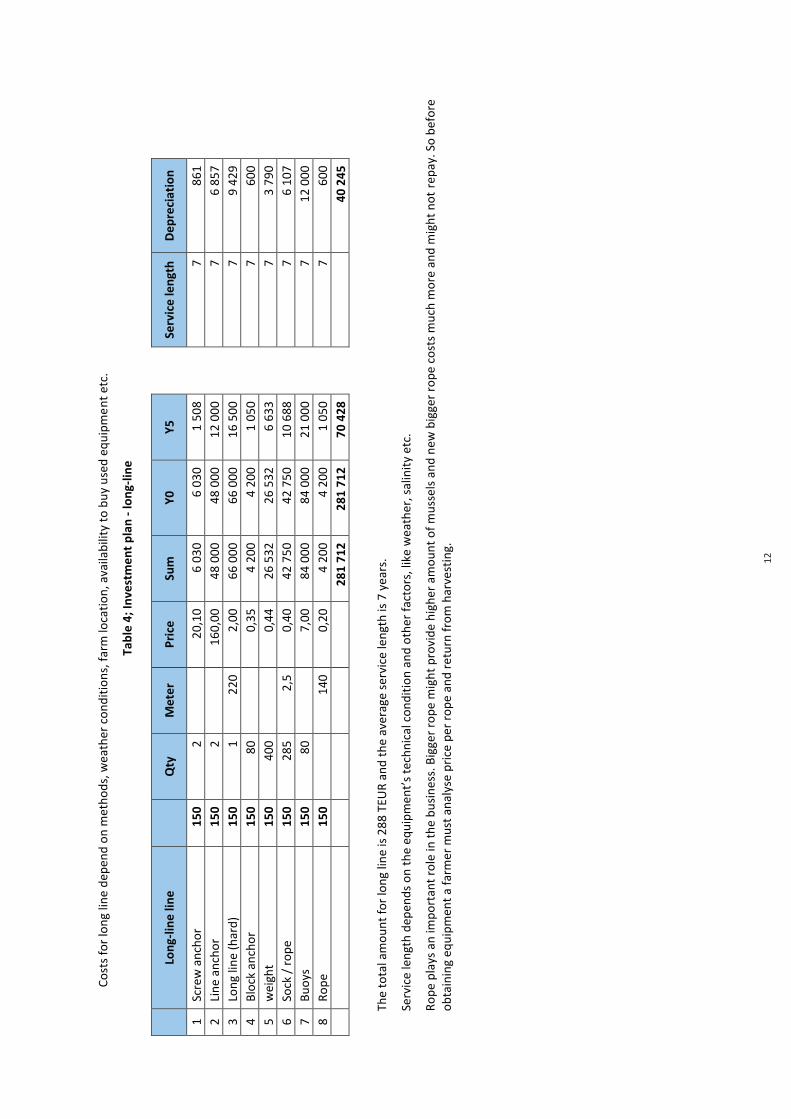
12
12
Costs for long line depend on
metho
ds, w
eather con
ditio
ns, farm locatio
n, availability to buy used equipm
ent e
tc.
Table 4; Investment plan -‐ long-‐line
Long-‐line line
Qty
Meter
Price
Sum
Y0
Y5
Service length
Depreciation
1
Screw ancho
r 150
2
20,10
6 030
6 030
1 508
7
861
2
Line ancho
r 150
2
160,00
48 000
48 000
12 000
7
6 857
3
Long line (h
ard)
150
1 220
2,00
66 000
66 000
16 500
7
9 429
4
Block anchor
150
80
0,35
4 200
4 200
1 050
7
600
5
weight
150
400
0,44
26 532
26 532
6 633
7
3 790
6
Sock / rop
e 150
285
2,5
0,40
42 750
42 750
10 688
7
6 107
7
Buoys
150
80
7,00
84 000
84 000
21 000
7
12 000
8
Rope
150
140
0,20
4 200
4 200
1 050
7
600
281 712
281 712
70 428
7
40 245
The total amou
nt fo
r long line is 288 TEU
R and the average service length is 7 years.
Service length depends on the equipm
ent’s technical con
ditio
n and other factors, like weather, salinity etc.
Rope plays an impo
rtant role in th
e bu
siness. Bigger rope might provide higher am
ount of m
ussels and
new
bigger rope costs much more and might not repay. So before
obtaining equipm
ent a farm
er must analyse price per rop
e and return from
harvesting.
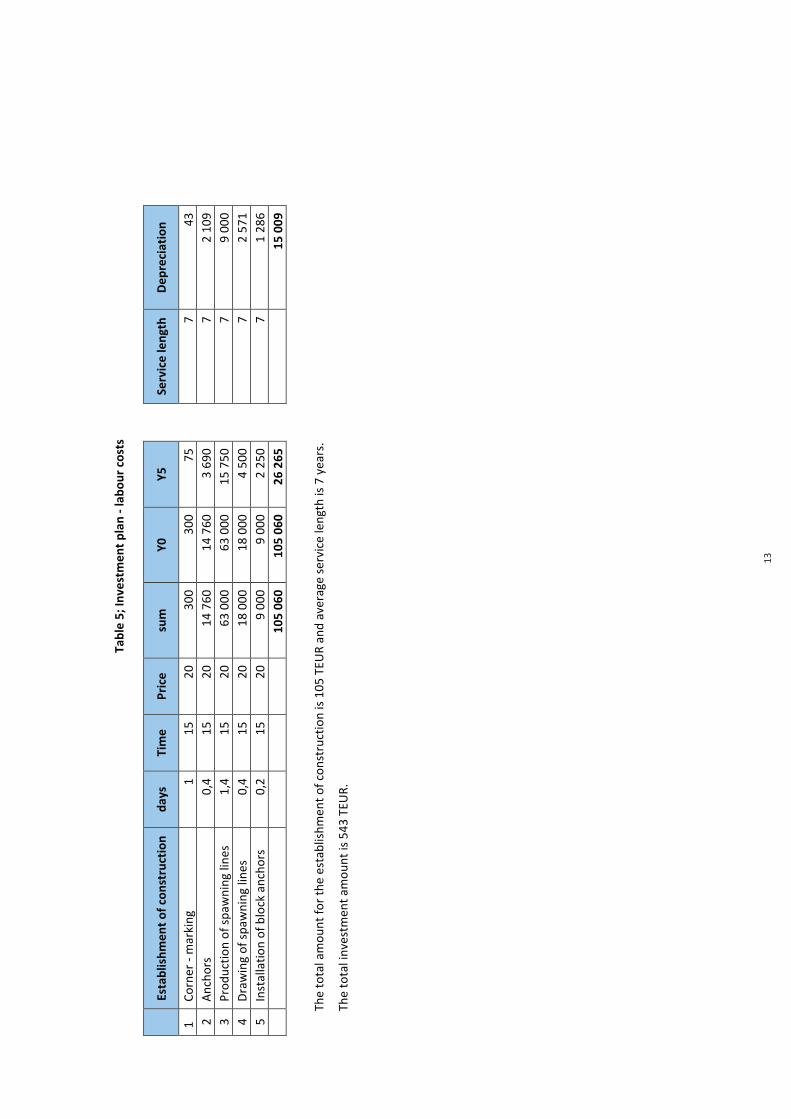
13
13
Table 5; Investment plan -‐ labo
ur costs
Establishm
ent of con
struction
days
Time
Price
sum
Y0
Y5
Service length
Depreciation
1
Corner -‐ marking
1 15
20
300
300
75
7
43
2
Ancho
rs
0,4
15
20
14 760
14 760
3 690
7
2 109
3
Prod
uctio
n of spawning lines
1,4
15
20
63 000
63 000
15 750
7
9 000
4
Drawing of spawning lines
0,4
15
20
18 000
18 000
4 500
7
2 571
5
Installatio
n of block ancho
rs
0,2
15
20
9 000
9 000
2 250
7
1 286
105 060
105 060
26 265
15 009
The total amou
nt fo
r the establishm
ent o
f con
struction is 105 TEU
R and average service length is 7 years.
The total investm
ent amou
nt is 543 TEU
R.

14
14
2.7.
Project implem
entation
timetable
Project implem
entatio
n will take place in several stages:
Table 6; Timetable of for farm
establishm
ent
mth1
mth2
mth3
mth4
mth5
mth6
mth7
Registratio
n of enterprise
Obtaining rights on
navigation and flo
ating
equipm
ent
Obtaining licence for farm
adm
ission
Obtaining licence for using water resou
rce
Obtaining licence as aqu
aculture enterprise
Boat/-‐s
Ropes
Nets
Ancho
rs
Purchase and
distribution of equ
ipment
This im
plem
entatio
n tim
etable has been set for indicative pu
rpose.
15
15
3. Market Analysis
3.1. Sector overview -‐ fishery and aquaculture
Introduction of industry analysis
Agriculture has a significant influence on people's life, and this sector is responsible for food provision in the world. Still, a number of people lead their live suffering from hunger. Due to this, the importance of agriculture increases.
Notwithstanding, the agriculture sector doesn't include such areas as fishery or forestry; these sectors are highly important in overall food providing industries.
Key words:
• Aquaculture: o The farming of aquatic organisms including fish, molluscs, crustaceans and aquatic plants
with some sort of intervention in the rearing process to enhance production, such as regular stocking, feeding, protection from predators, etc. Farming also implies individual or corporate ownership of the stock being cultivated.
o For statistical purposes, aquatic organisms which are harvested by an individual or corporate body, which has owned them throughout their rearing period, contribute to aquaculture.
• Fishery: o Generally, a fishery is an activity leading to harvesting of fish. It may involve capture of
wild fish or growing of fish through aquaculture. o A unit determined by an authority or other entity that is engaged in raising and/or
harvesting fish. Typically, the unit is defined in terms of some or all of the following: people involved, species or type of fish, area of water or seabed, method of fishing, class of boats and purpose of the activities.2
Aquaculture is probably the fastest growing food-‐producing sector today.
Many resources used in aquaculture such as water, land, seed, brood stock and feed ingredients are often in short supply. This is so because these resources -‐ or factors of production -‐ are also commonly used in agriculture, an activity with which aquaculture is often integrated, particularly in Asia. It happens that this competition turns into, or is seen as, a conflict between user groups. In most countries these conflicts are settled in the market place. Buyers and sellers set the price and thereby determine the use. Thus resource management is clearly needed.
The sector's use of natural resources must ensure long term sustainability, which generally means avoiding adverse effects on the environment. However, information on expected or potential environmental impacts of aquaculture is often incomplete. The use of selected management approaches and the application of a precautionary approach by both farm management and by regulatory organizations can help to avoid making decisions based on incomplete knowledge.
An important aspect in this context is the need for effective controls of fish health management, as diseases have become a primary constraint for the growth of aquaculture. Intensive culture practices, with poorly controlled use of feed and production of waste, have adversely affected local environments.
According to information from the Food and Agriculture organization of the United Nations (hereinafter-‐FAO) the livelihood of over 500 million people in developing countries directly or indirectly depends on fisheries and aquaculture. Due to several reasons, such as the willingness to increase one's own welfare, it increases the overfishing and reduces fish stocks.
To examine the increase of volume the gross domestic product (GDP) and fishery sectors were analysed.
2. www.fao.org
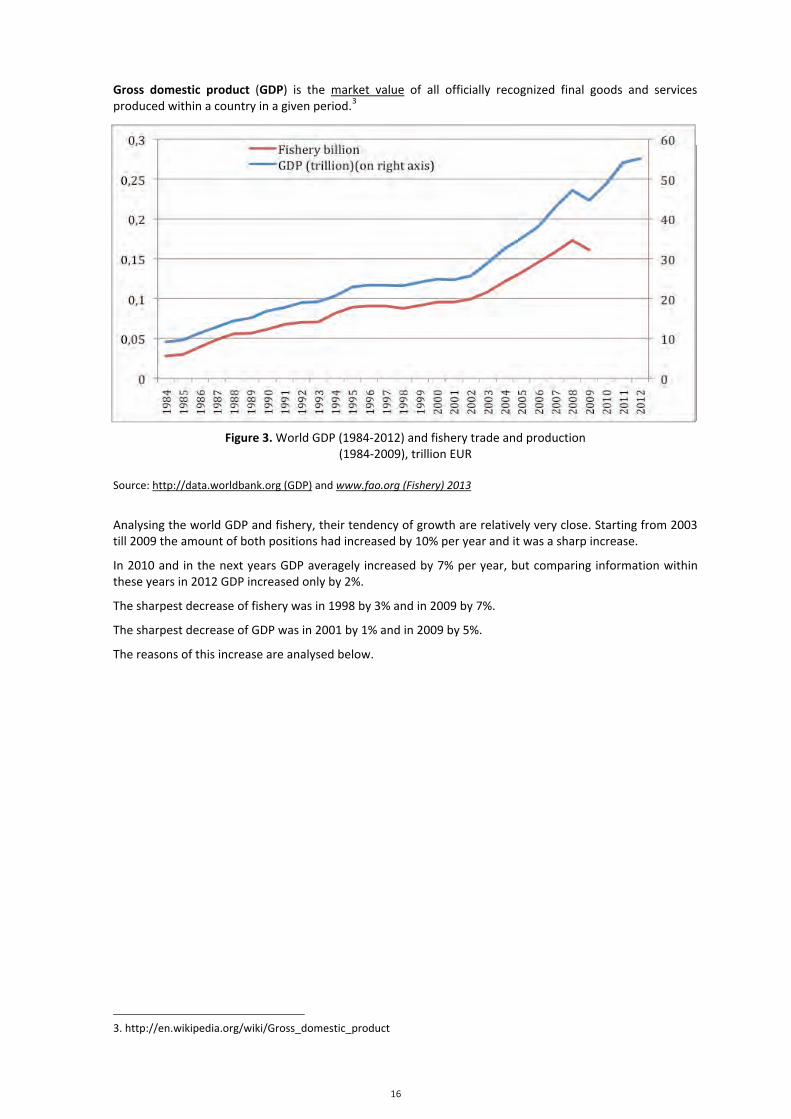
16
16
Gross domestic product (GDP) is the market value of all officially recognized final goods and services produced within a country in a given period.3
Figure 3. World GDP (1984-‐2012) and fishery trade and production (1984-‐2009), trillion EUR
Source: http://data.worldbank.org (GDP) and www.fao.org (Fishery) 2013
Analysing the world GDP and fishery, their tendency of growth are relatively very close. Starting from 2003 till 2009 the amount of both positions had increased by 10% per year and it was a sharp increase.
In 2010 and in the next years GDP averagely increased by 7% per year, but comparing information within these years in 2012 GDP increased only by 2%.
The sharpest decrease of fishery was in 1998 by 3% and in 2009 by 7%.
The sharpest decrease of GDP was in 2001 by 1% and in 2009 by 5%.
The reasons of this increase are analysed below.
3. http://en.wikipedia.org/wiki/Gross_domestic_product
0
10
20
30
40
50
60
0
0,05
0,1
0,15
0,2
0,25
0,3 19
8 4 198 5 198 6 198 7 198 8 198 9 199 0 199 1 199 2 199 3 199 4 199 5 199 6 199 7 199 8 199 9 200 0 200 1 200 2 200 3 200 4 200 5 200 6 200 7 200 8 200 9 201 0 201 1 201 2
Fishery billion GDP (trillion)(on right axis)
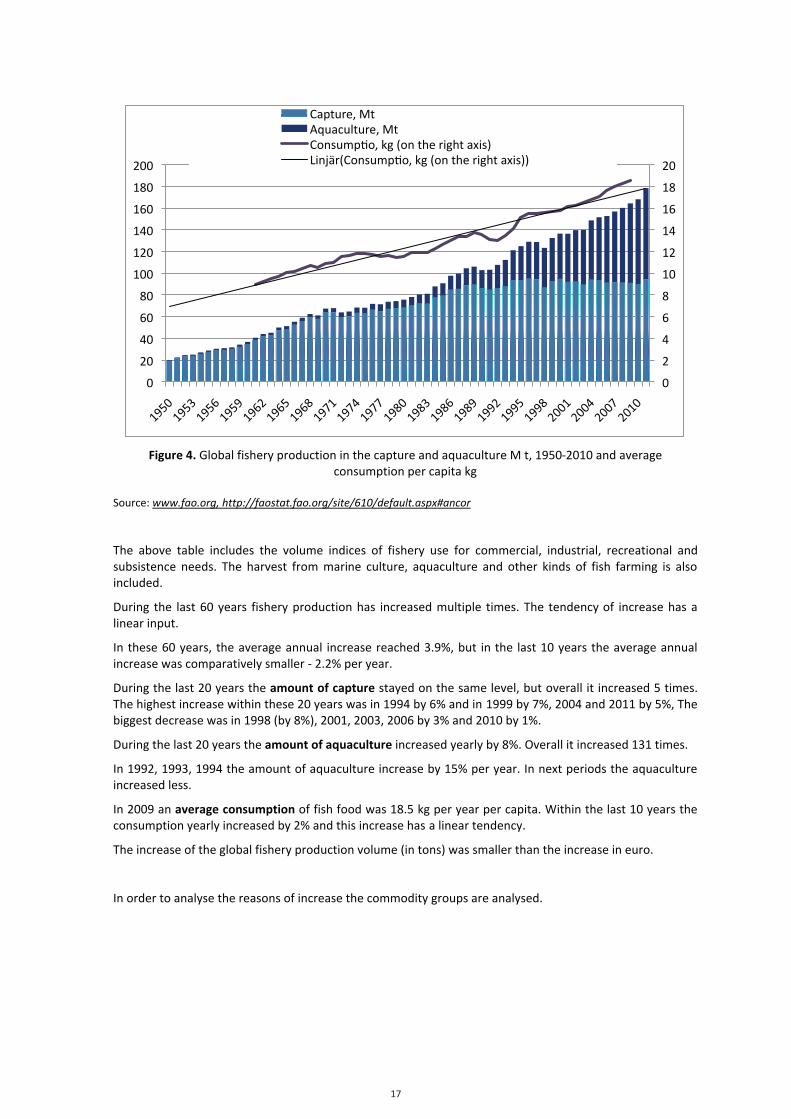
17
17
Figure 4. Global fishery production in the capture and aquaculture M t, 1950-‐2010 and average consumption per capita kg
Source: www.fao.org, http://faostat.fao.org/site/610/default.aspx#ancor
The above table includes the volume indices of fishery use for commercial, industrial, recreational and subsistence needs. The harvest from marine culture, aquaculture and other kinds of fish farming is also included.
During the last 60 years fishery production has increased multiple times. The tendency of increase has a linear input.
In these 60 years, the average annual increase reached 3.9%, but in the last 10 years the average annual increase was comparatively smaller -‐ 2.2% per year.
During the last 20 years the amount of capture stayed on the same level, but overall it increased 5 times. The highest increase within these 20 years was in 1994 by 6% and in 1999 by 7%, 2004 and 2011 by 5%, The biggest decrease was in 1998 (by 8%), 2001, 2003, 2006 by 3% and 2010 by 1%.
During the last 20 years the amount of aquaculture increased yearly by 8%. Overall it increased 131 times.
In 1992, 1993, 1994 the amount of aquaculture increase by 15% per year. In next periods the aquaculture increased less.
In 2009 an average consumption of fish food was 18.5 kg per year per capita. Within the last 10 years the consumption yearly increased by 2% and this increase has a linear tendency.
The increase of the global fishery production volume (in tons) was smaller than the increase in euro.
In order to analyse the reasons of increase the commodity groups are analysed.
0
2
4
6
8
10
12
14
16
18
20
0
20
40
60
80
100
120
140
160
180
200
Capture, Mt Aquaculture, Mt Consumpco, kg (on the right axis) Linjär(Consumpco, kg (on the right axis))
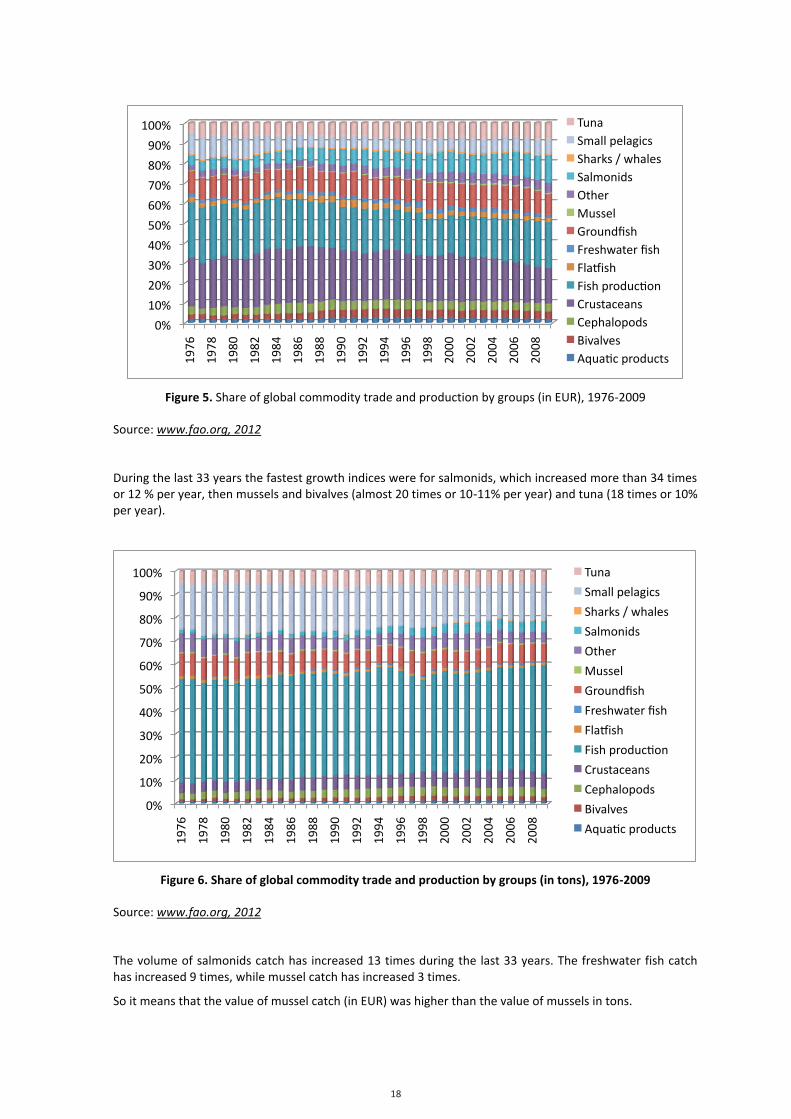
18
18
Figure 5. Share of global commodity trade and production by groups (in EUR), 1976-‐2009
Source: www.fao.org, 2012
During the last 33 years the fastest growth indices were for salmonids, which increased more than 34 times or 12 % per year, then mussels and bivalves (almost 20 times or 10-‐11% per year) and tuna (18 times or 10% per year).
Figure 6. Share of global commodity trade and production by groups (in tons), 1976-‐2009
Source: www.fao.org, 2012
The volume of salmonids catch has increased 13 times during the last 33 years. The freshwater fish catch has increased 9 times, while mussel catch has increased 3 times.
So it means that the value of mussel catch (in EUR) was higher than the value of mussels in tons.
0%
10%
20%
30%
40%
50%
60%
70%
80%
90%
100%
1976
1978
1980
1982
1984
1986
1988
1990
1992
1994
1996
1998
2000
2002
2004
2006
2008
Tuna Small pelagics Sharks / whales Salmonids Other Mussel Groundfish Freshwater fish Flahish Fish produccon Crustaceans Cephalopods Bivalves Aquacc products
0%
10%
20%
30%
40%
50%
60%
70%
80%
90%
100%
1976
1978
1980
1982
1984
1986
1988
1990
1992
1994
1996
1998
2000
2002
2004
2006
2008
Tuna
Small pelagics
Sharks / whales
Salmonids
Other
Mussel
Groundfish
Freshwater fish
Flahish
Fish produccon
Crustaceans
Cephalopods
Bivalves
Aquacc products
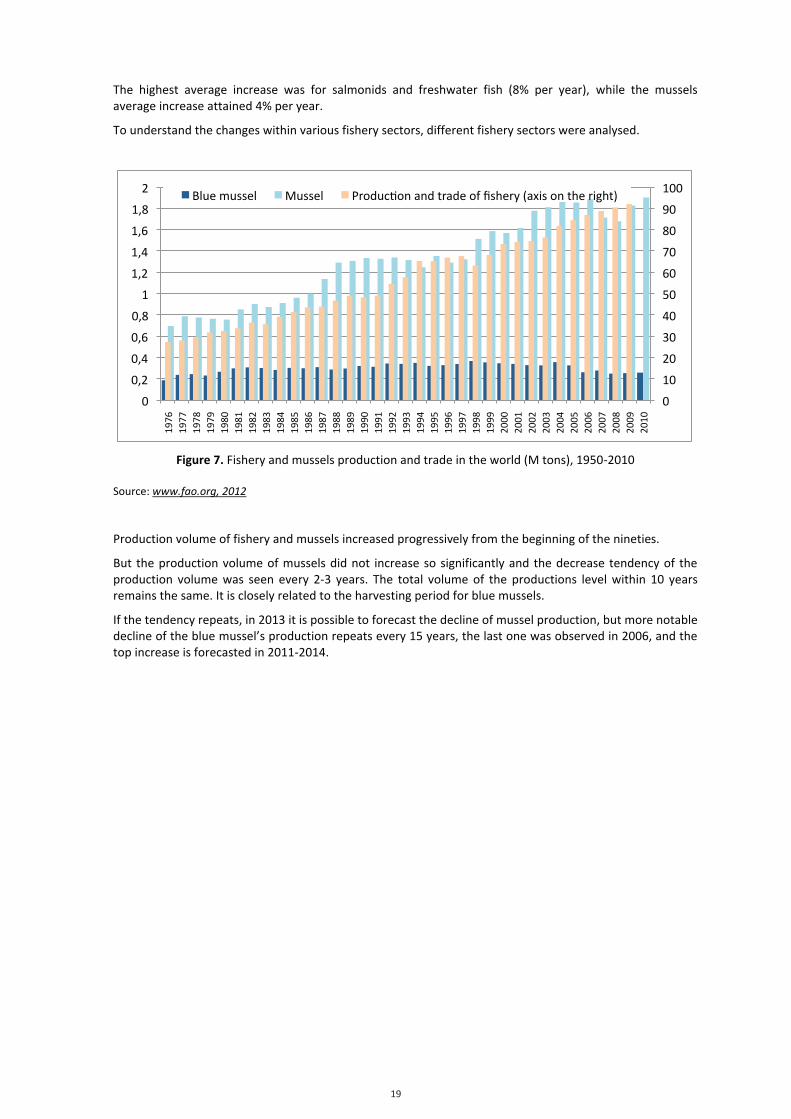
19
19
The highest average increase was for salmonids and freshwater fish (8% per year), while the mussels average increase attained 4% per year.
To understand the changes within various fishery sectors, different fishery sectors were analysed.
Figure 7. Fishery and mussels production and trade in the world (M tons), 1950-‐2010
Source: www.fao.org, 2012
Production volume of fishery and mussels increased progressively from the beginning of the nineties.
But the production volume of mussels did not increase so significantly and the decrease tendency of the production volume was seen every 2-‐3 years. The total volume of the productions level within 10 years remains the same. It is closely related to the harvesting period for blue mussels.
If the tendency repeats, in 2013 it is possible to forecast the decline of mussel production, but more notable decline of the blue mussel’s production repeats every 15 years, the last one was observed in 2006, and the top increase is forecasted in 2011-‐2014.
0
10
20
30
40
50
60
70
80
90
100
0
0,2
0,4
0,6
0,8
1
1,2
1,4
1,6
1,8
2
1976
19
77
1978
19
79
1980
19
81
1982
19
83
1984
19
85
1986
19
87
1988
19
89
1990
19
91
1992
19
93
1994
19
95
1996
19
97
1998
19
99
2000
20
01
2002
20
03
2004
20
05
2006
20
07
2008
20
09
2010
Blue mussel Mussel Produccon and trade of fishery (axis on the right)
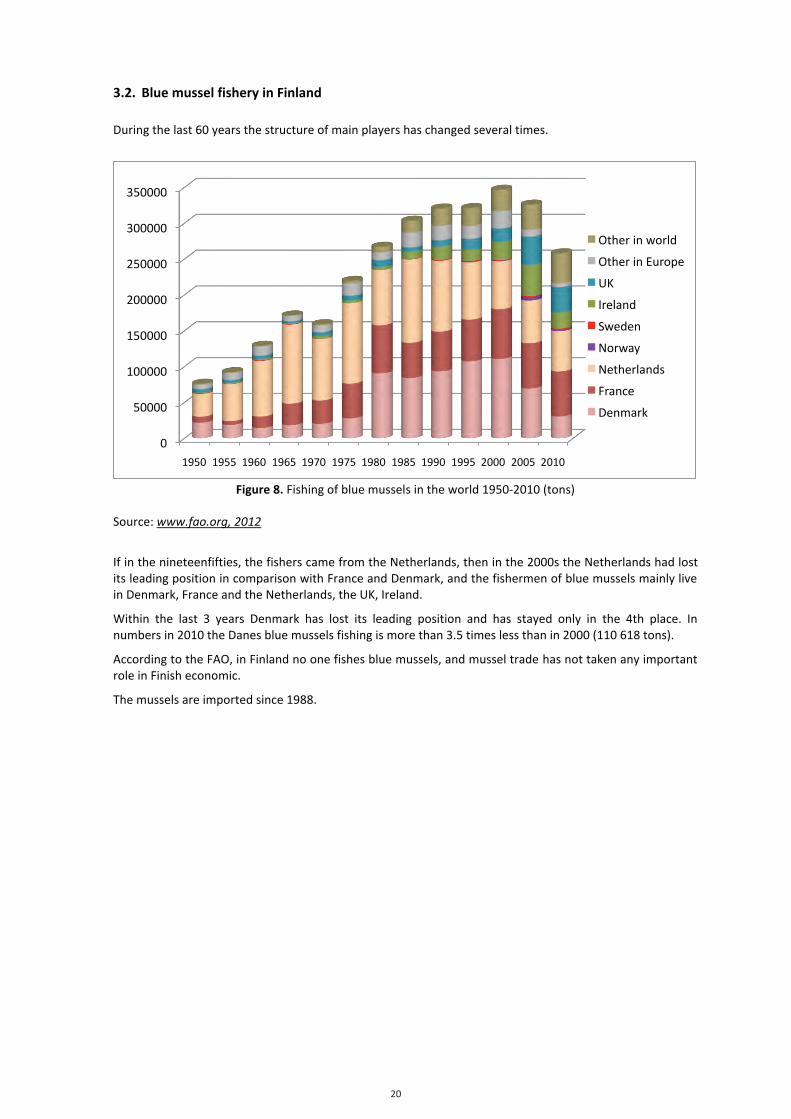
20
20
3.2. Blue mussel fishery in Finland
During the last 60 years the structure of main players has changed several times.
Figure 8. Fishing of blue mussels in the world 1950-‐2010 (tons)
Source: www.fao.org, 2012
If in the nineteenfifties, the fishers came from the Netherlands, then in the 2000s the Netherlands had lost its leading position in comparison with France and Denmark, and the fishermen of blue mussels mainly live in Denmark, France and the Netherlands, the UK, Ireland.
Within the last 3 years Denmark has lost its leading position and has stayed only in the 4th place. In numbers in 2010 the Danes blue mussels fishing is more than 3.5 times less than in 2000 (110 618 tons).
According to the FAO, in Finland no one fishes blue mussels, and mussel trade has not taken any important role in Finish economic.
The mussels are imported since 1988.
0
50000
100000
150000
200000
250000
300000
350000
1950 1955 1960 1965 1970 1975 1980 1985 1990 1995 2000 2005 2010
Other in world
Other in Europe
UK
Ireland
Sweden
Norway
Netherlands
France
Denmark
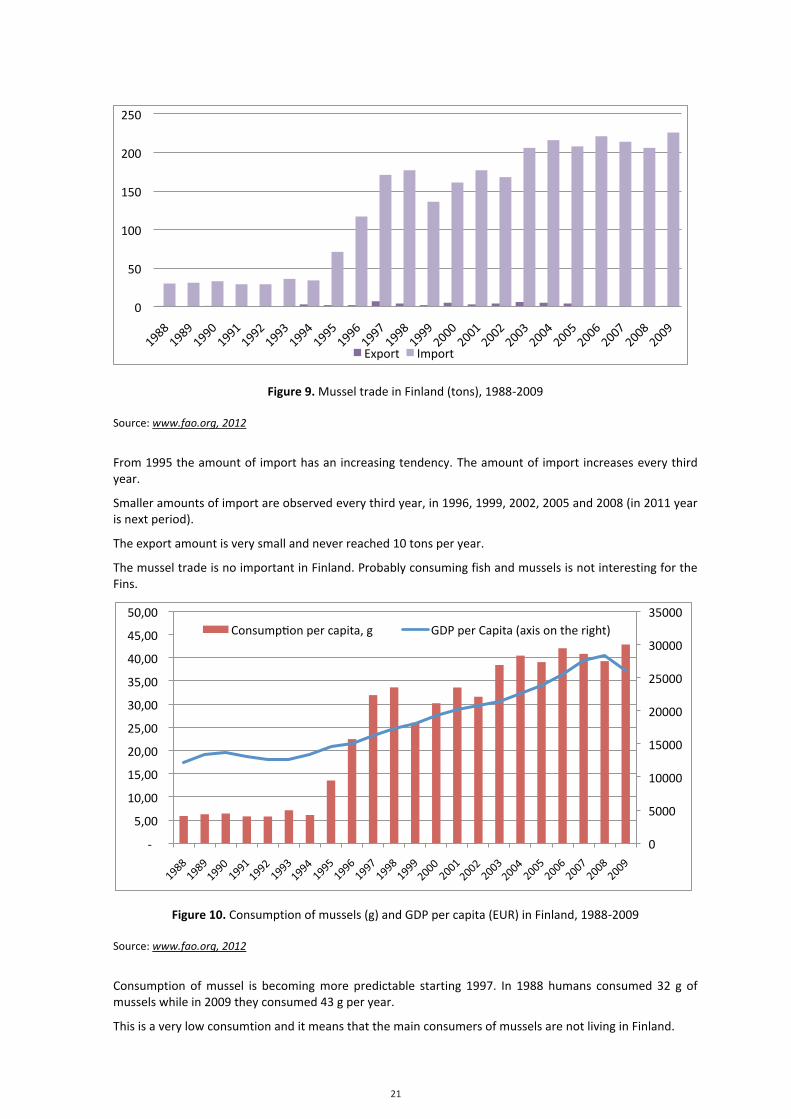
21
21
Figure 9. Mussel trade in Finland (tons), 1988-‐2009
Source: www.fao.org, 2012
From 1995 the amount of import has an increasing tendency. The amount of import increases every third year.
Smaller amounts of import are observed every third year, in 1996, 1999, 2002, 2005 and 2008 (in 2011 year is next period).
The export amount is very small and never reached 10 tons per year.
The mussel trade is no important in Finland. Probably consuming fish and mussels is not interesting for the Fins.
Figure 10. Consumption of mussels (g) and GDP per capita (EUR) in Finland, 1988-‐2009
Source: www.fao.org, 2012
Consumption of mussel is becoming more predictable starting 1997. In 1988 humans consumed 32 g of mussels while in 2009 they consumed 43 g per year.
This is a very low consumtion and it means that the main consumers of mussels are not living in Finland.
0
50
100
150
200
250
Export Import
0
5000
10000
15000
20000
25000
30000
35000
-‐
5,00
10,00
15,00
20,00
25,00
30,00
35,00
40,00
45,00
50,00 Consumpcon per capita, g GDP per Capita (axis on the right)
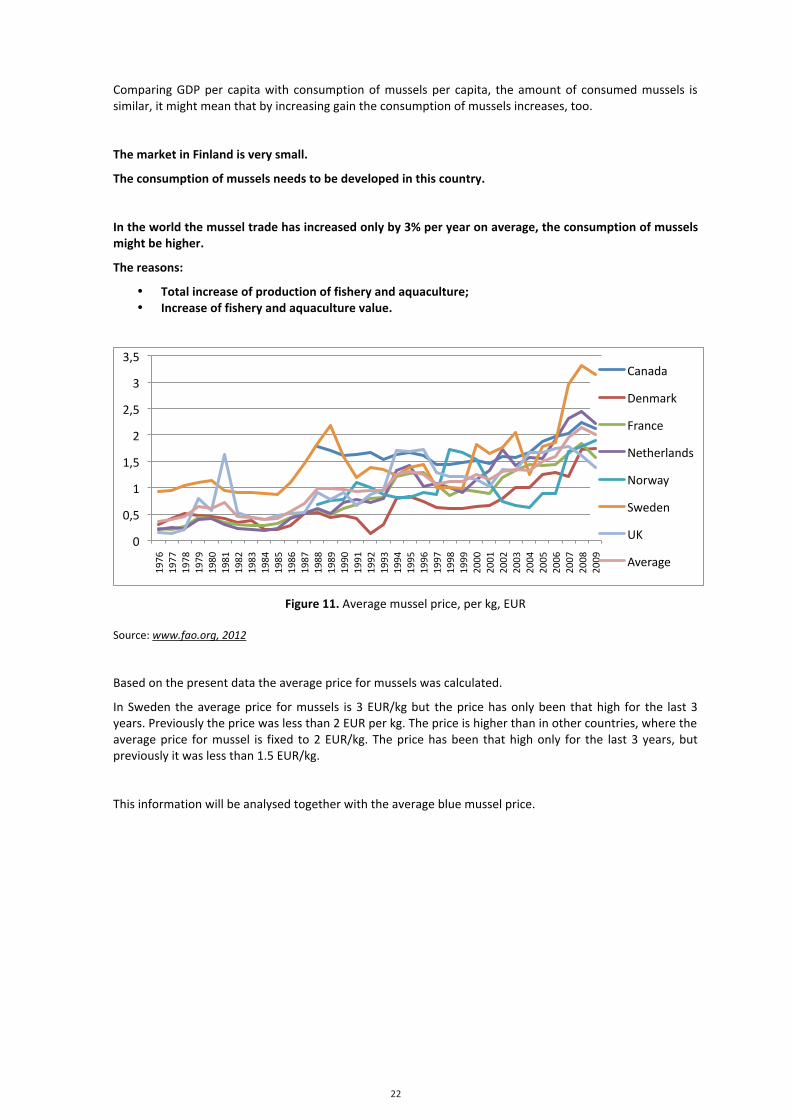
22
22
Comparing GDP per capita with consumption of mussels per capita, the amount of consumed mussels is similar, it might mean that by increasing gain the consumption of mussels increases, too.
The market in Finland is very small.
The consumption of mussels needs to be developed in this country.
In the world the mussel trade has increased only by 3% per year on average, the consumption of mussels might be higher.
The reasons:
• Total increase of production of fishery and aquaculture; • Increase of fishery and aquaculture value.
Figure 11. Average mussel price, per kg, EUR
Source: www.fao.org, 2012
Based on the present data the average price for mussels was calculated.
In Sweden the average price for mussels is 3 EUR/kg but the price has only been that high for the last 3 years. Previously the price was less than 2 EUR per kg. The price is higher than in other countries, where the average price for mussel is fixed to 2 EUR/kg. The price has been that high only for the last 3 years, but previously it was less than 1.5 EUR/kg.
This information will be analysed together with the average blue mussel price.
0
0,5
1
1,5
2
2,5
3
3,5
1976
19
77
1978
19
79
1980
19
81
1982
19
83
1984
19
85
1986
19
87
1988
19
89
1990
19
91
1992
19
93
1994
19
95
1996
19
97
1998
19
99
2000
20
01
2002
20
03
2004
20
05
2006
20
07
2008
20
09
Canada
Denmark
France
Netherlands
Norway
Sweden
UK
Average
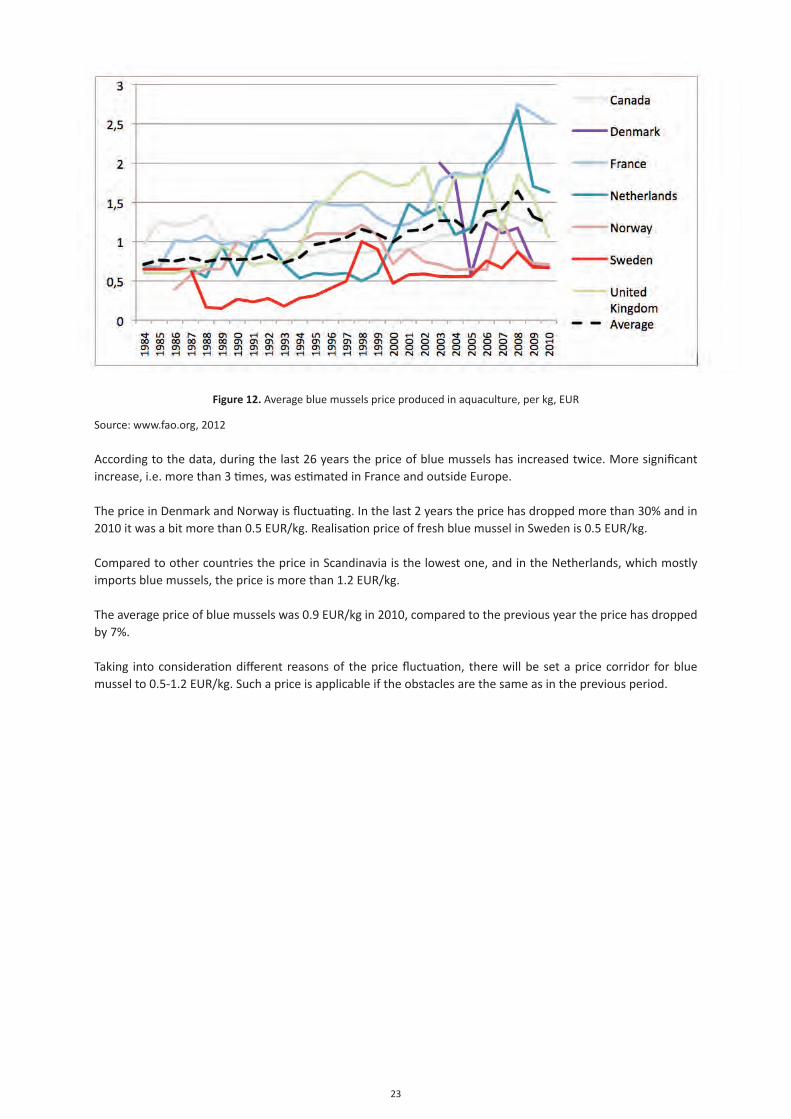
23
Figure 12. Average blue mussels price produced in aquaculture, per kg, EUR
Source: www.fao.org, 2012
According to the data, during the last 26 years the price of blue mussels has increased twice. More significant increase, i.e. more than 3 times, was estimated in France and outside Europe.
The price in Denmark and Norway is fluctuating. In the last 2 years the price has dropped more than 30% and in 2010 it was a bit more than 0.5 EUR/kg. Realisation price of fresh blue mussel in Sweden is 0.5 EUR/kg.
Compared to other countries the price in Scandinavia is the lowest one, and in the Netherlands, which mostly imports blue mussels, the price is more than 1.2 EUR/kg.
The average price of blue mussels was 0.9 EUR/kg in 2010, compared to the previous year the price has dropped by 7%.
Taking into consideration different reasons of the price fluctuation, there will be set a price corridor for blue mussel to 0.5-1.2 EUR/kg. Such a price is applicable if the obstacles are the same as in the previous period.
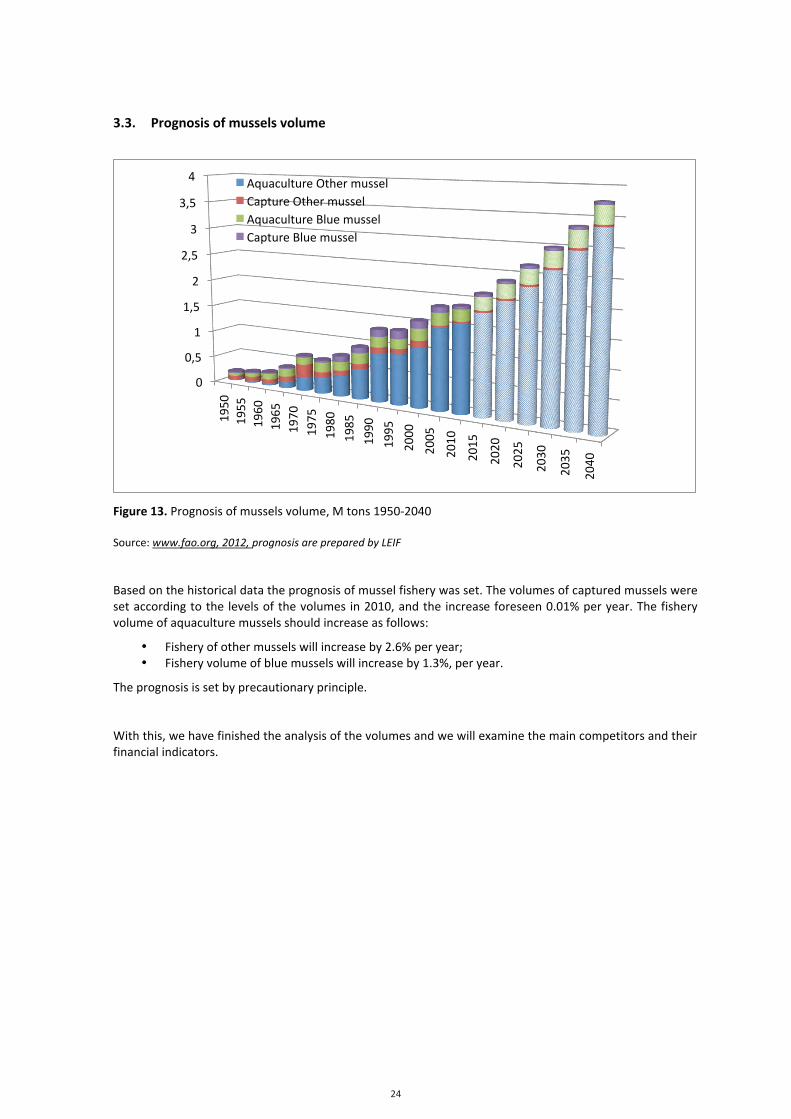
24
24
3.3. Prognosis of mussels volume
Figure 13. Prognosis of mussels volume, M tons 1950-‐2040
Source: www.fao.org, 2012, prognosis are prepared by LEIF
Based on the historical data the prognosis of mussel fishery was set. The volumes of captured mussels were set according to the levels of the volumes in 2010, and the increase foreseen 0.01% per year. The fishery volume of aquaculture mussels should increase as follows:
• Fishery of other mussels will increase by 2.6% per year; • Fishery volume of blue mussels will increase by 1.3%, per year.
The prognosis is set by precautionary principle.
With this, we have finished the analysis of the volumes and we will examine the main competitors and their financial indicators.
0
0,5
1
1,5
2
2,5
3
3,5
4
1950
19
55
1960
19
65
1970
19
75
1980
19
85
1990
1995
2000
2005
2010
2015
2020
2025
2030
2035
2040
Aquaculture Other mussel Capture Other mussel Aquaculture Blue mussel Capture Blue mussel
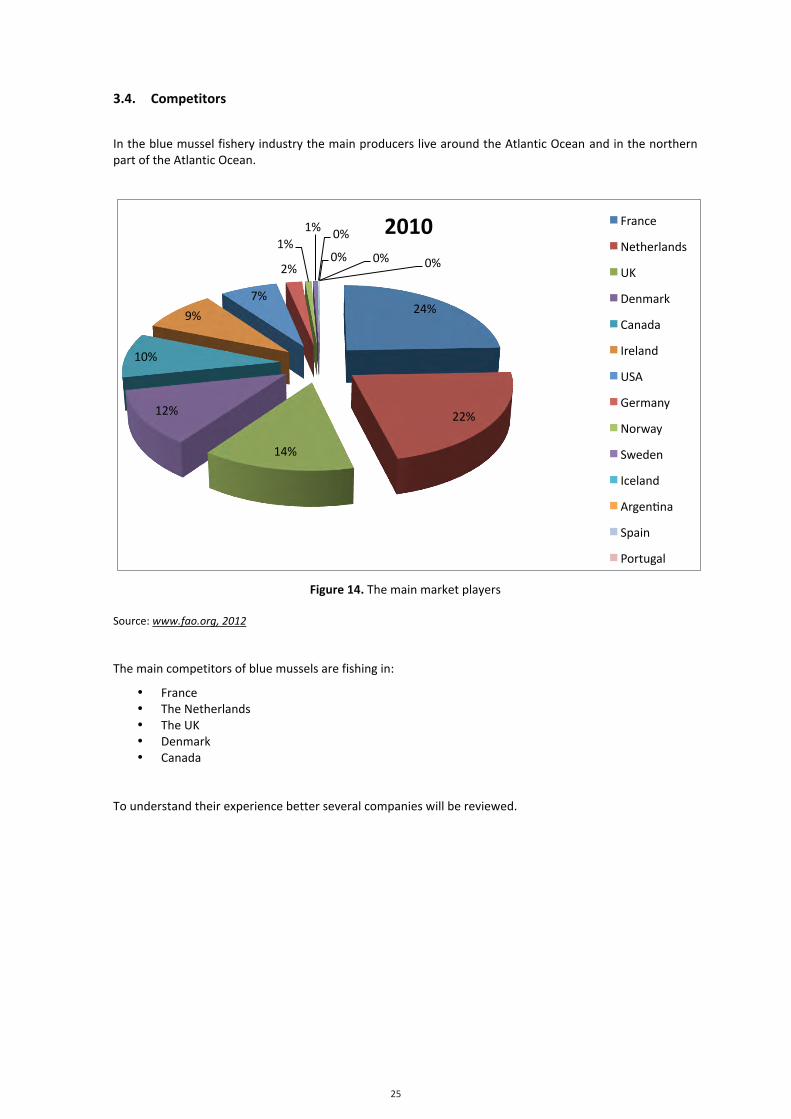
25
25
3.4. Competitors
In the blue mussel fishery industry the main producers live around the Atlantic Ocean and in the northern part of the Atlantic Ocean.
Figure 14. The main market players
Source: www.fao.org, 2012
The main competitors of blue mussels are fishing in:
• France • The Netherlands • The UK • Denmark • Canada
To understand their experience better several companies will be reviewed.
24%
22%
14%
12%
10%
9%
7%
2%
1% 1% 0%
0% 0% 0%
2010 France
Netherlands
UK
Denmark
Canada
Ireland
USA
Germany
Norway
Sweden
Iceland
Argencna
Spain
Portugal
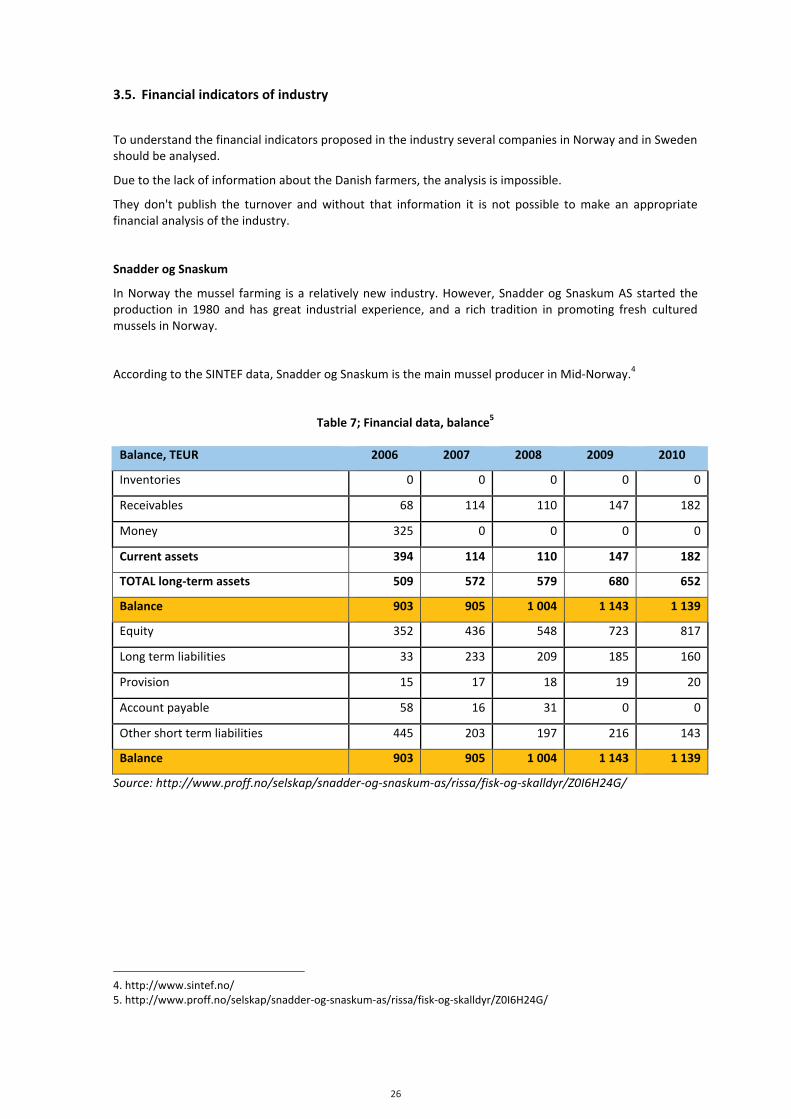
26
26
3.5. Financial indicators of industry
To understand the financial indicators proposed in the industry several companies in Norway and in Sweden should be analysed.
Due to the lack of information about the Danish farmers, the analysis is impossible.
They don't publish the turnover and without that information it is not possible to make an appropriate financial analysis of the industry.
Snadder og Snaskum
In Norway the mussel farming is a relatively new industry. However, Snadder og Snaskum AS started the production in 1980 and has great industrial experience, and a rich tradition in promoting fresh cultured mussels in Norway.
According to the SINTEF data, Snadder og Snaskum is the main mussel producer in Mid-‐Norway.4
Table 7; Financial data, balance5
Balance, TEUR 2006 2007 2008 2009 2010
Inventories 0 0 0 0 0
Receivables 68 114 110 147 182
Money 325 0 0 0 0
Current assets 394 114 110 147 182
TOTAL long-‐term assets 509 572 579 680 652
Balance 903 905 1 004 1 143 1 139
Equity 352 436 548 723 817
Long term liabilities 33 233 209 185 160
Provision 15 17 18 19 20
Account payable 58 16 31 0 0
Other short term liabilities 445 203 197 216 143
Balance 903 905 1 004 1 143 1 139
Source: http://www.proff.no/selskap/snadder-‐og-‐snaskum-‐as/rissa/fisk-‐og-‐skalldyr/Z0I6H24G/
4. http://www.sintef.no/ 5. http://www.proff.no/selskap/snadder-‐og-‐snaskum-‐as/rissa/fisk-‐og-‐skalldyr/Z0I6H24G/
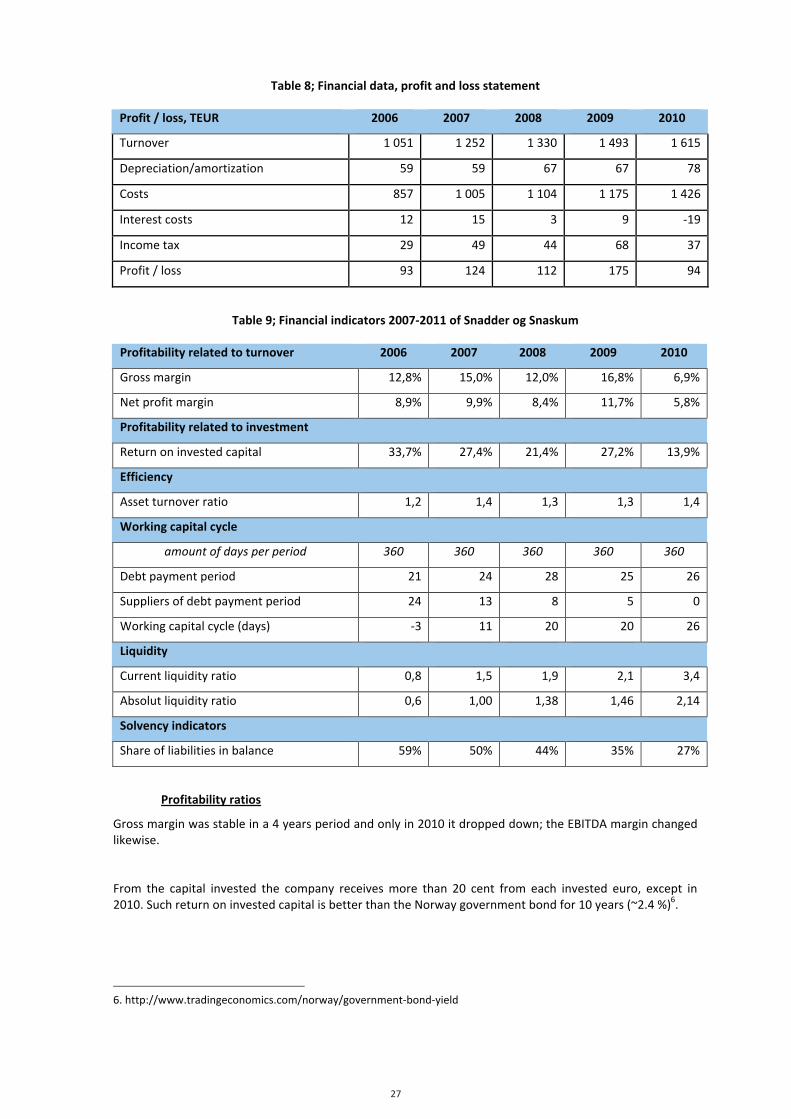
27
27
Table 8; Financial data, profit and loss statement
Profit / loss, TEUR 2006 2007 2008 2009 2010
Turnover 1 051 1 252 1 330 1 493 1 615
Depreciation/amortization 59 59 67 67 78
Costs 857 1 005 1 104 1 175 1 426
Interest costs 12 15 3 9 -‐19
Income tax 29 49 44 68 37
Profit / loss 93 124 112 175 94
Table 9; Financial indicators 2007-‐2011 of Snadder og Snaskum
Profitability related to turnover 2006 2007 2008 2009 2010
Gross margin 12,8% 15,0% 12,0% 16,8% 6,9%
Net profit margin 8,9% 9,9% 8,4% 11,7% 5,8%
Profitability related to investment
Return on invested capital 33,7% 27,4% 21,4% 27,2% 13,9%
Efficiency
Asset turnover ratio 1,2 1,4 1,3 1,3 1,4
Working capital cycle
amount of days per period 360 360 360 360 360
Debt payment period 21 24 28 25 26
Suppliers of debt payment period 24 13 8 5 0
Working capital cycle (days) -‐3 11 20 20 26
Liquidity
Current liquidity ratio 0,8 1,5 1,9 2,1 3,4
Absolut liquidity ratio 0,6 1,00 1,38 1,46 2,14
Solvency indicators
Share of liabilities in balance 59% 50% 44% 35% 27%
Profitability ratios
Gross margin was stable in a 4 years period and only in 2010 it dropped down; the EBITDA margin changed likewise.
From the capital invested the company receives more than 20 cent from each invested euro, except in 2010. Such return on invested capital is better than the Norway government bond for 10 years (~2.4 %)6.
6. http://www.tradingeconomics.com/norway/government-‐bond-‐yield
28
28
Efficiency ratios Within 5 years, the company assets cycle was enough stable 1.3 time a year. The indicator shows the specifics of the industry.
Working capital cycle
During the last 5 years the trade receivables were 21-‐28 days.
The company does not have inventories, so the stock payment period would not be calculated.
Suppliers of debt payment period during the last 5 years decreased from 24 days in 2006 up to 0 days in 2010. Such changes influenced the working capital cycle. If in 2006 the working capital cycle was negative, in 2010 it increased up to 26 days. But still the company is working in a stable situation and it can cover its working capital.
Liquidity ratios
As the company does not have stocks, the company's total and current liquidity ratio is on the same level. During last 5 years this ratio has become more stable and reached 3 in 2010.
Absolute liquidity also arise from 0,6 in the year 2008 to 2.1 in the year 2010. The absolute liquidity is higher as it is necessary, so the company might manage its cash flow to invest free resources more pragmatic in case the company does not keep them for some purpose.
Solvency ratios
The average share of creditors has decreased from 50% in the year 2006 to 27% in the year 2010.
Comparing the overall information, the company is working on average low financial risk.
Other main producers of blue mussels in Mid-‐Norway financial indicators
Analysing 20 Norwegian companies in August 2012, which are the main producers of blue mussels in Mid-‐Norway in 2007:
• 7 of them are inactive, • 9 of them are working with a loss; • 4 of are active and in the previous periods have worked with a profit.
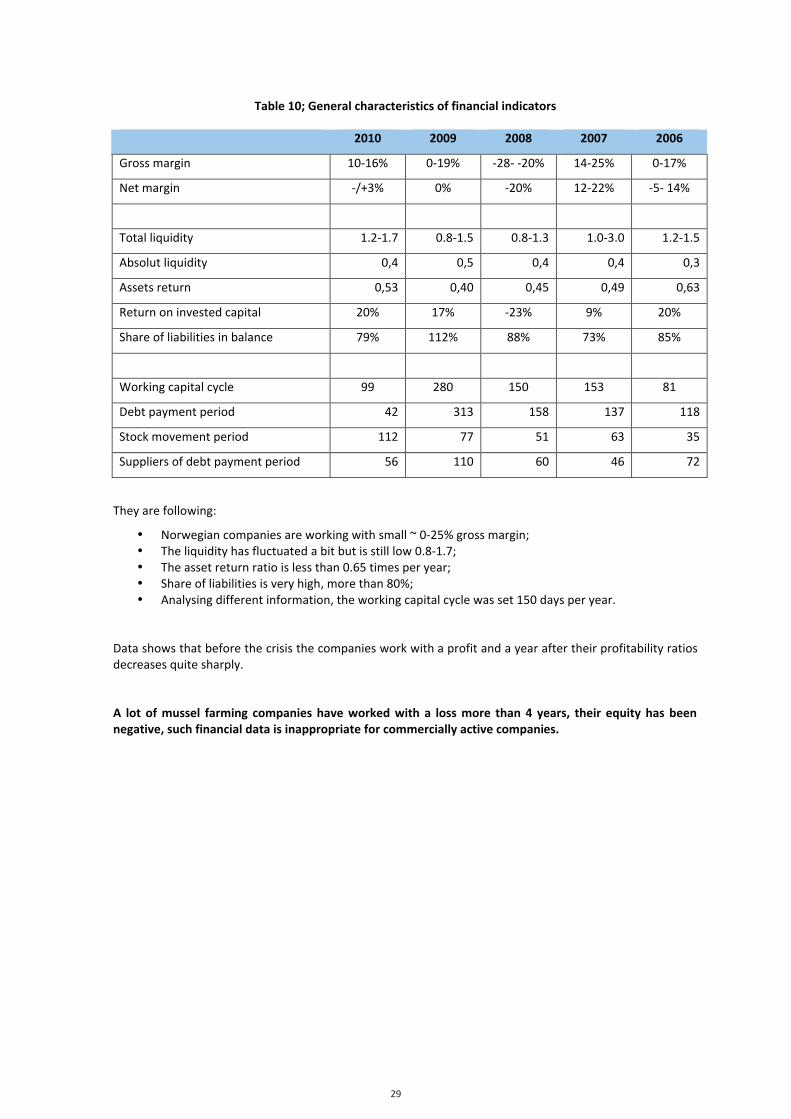
29
29
Table 10; General characteristics of financial indicators
2010 2009 2008 2007 2006
Gross margin 10-‐16% 0-‐19% -‐28-‐ -‐20% 14-‐25% 0-‐17%
Net margin -‐/+3% 0% -‐20% 12-‐22% -‐5-‐ 14%
Total liquidity 1.2-‐1.7 0.8-‐1.5 0.8-‐1.3 1.0-‐3.0 1.2-‐1.5
Absolut liquidity 0,4 0,5 0,4 0,4 0,3
Assets return 0,53 0,40 0,45 0,49 0,63
Return on invested capital 20% 17% -‐23% 9% 20%
Share of liabilities in balance 79% 112% 88% 73% 85%
Working capital cycle 99 280 150 153 81
Debt payment period 42 313 158 137 118
Stock movement period 112 77 51 63 35
Suppliers of debt payment period 56 110 60 46 72
They are following:
• Norwegian companies are working with small ~ 0-‐25% gross margin; • The liquidity has fluctuated a bit but is still low 0.8-‐1.7; • The asset return ratio is less than 0.65 times per year; • Share of liabilities is very high, more than 80%; • Analysing different information, the working capital cycle was set 150 days per year.
Data shows that before the crisis the companies work with a profit and a year after their profitability ratios decreases quite sharply.
A lot of mussel farming companies have worked with a loss more than 4 years, their equity has been negative, such financial data is inappropriate for commercially active companies.
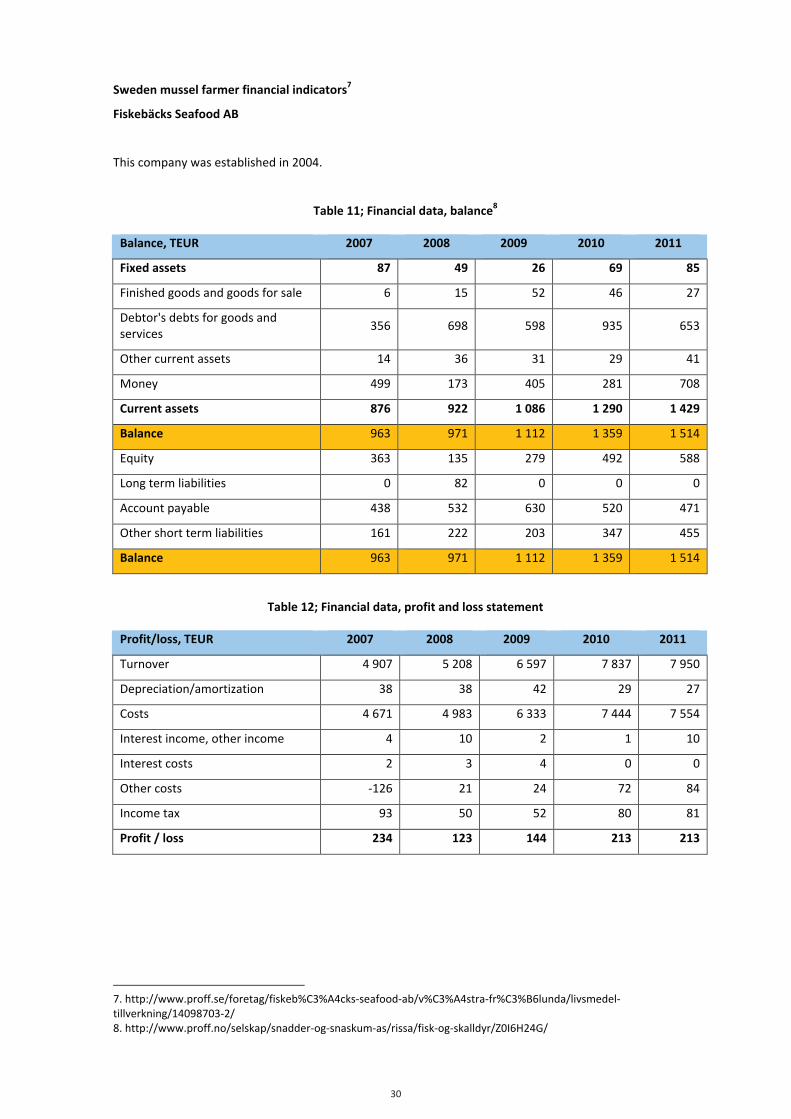
30
30
Sweden mussel farmer financial indicators7
Fiskebäcks Seafood AB
This company was established in 2004.
Table 11; Financial data, balance8
Balance, TEUR 2007 2008 2009 2010 2011
Fixed assets 87 49 26 69 85
Finished goods and goods for sale 6 15 52 46 27
Debtor's debts for goods and services
356 698 598 935 653
Other current assets 14 36 31 29 41
Money 499 173 405 281 708
Current assets 876 922 1 086 1 290 1 429
Balance 963 971 1 112 1 359 1 514
Equity 363 135 279 492 588
Long term liabilities 0 82 0 0 0
Account payable 438 532 630 520 471
Other short term liabilities 161 222 203 347 455
Balance 963 971 1 112 1 359 1 514
Table 12; Financial data, profit and loss statement
Profit/loss, TEUR 2007 2008 2009 2010 2011
Turnover 4 907 5 208 6 597 7 837 7 950
Depreciation/amortization 38 38 42 29 27
Costs 4 671 4 983 6 333 7 444 7 554
Interest income, other income 4 10 2 1 10
Interest costs 2 3 4 0 0
Other costs -‐126 21 24 72 84
Income tax 93 50 52 80 81
Profit / loss 234 123 144 213 213
7. http://www.proff.se/foretag/fiskeb%C3%A4cks-‐seafood-‐ab/v%C3%A4stra-‐fr%C3%B6lunda/livsmedel-‐tillverkning/14098703-‐2/ 8. http://www.proff.no/selskap/snadder-‐og-‐snaskum-‐as/rissa/fisk-‐og-‐skalldyr/Z0I6H24G/
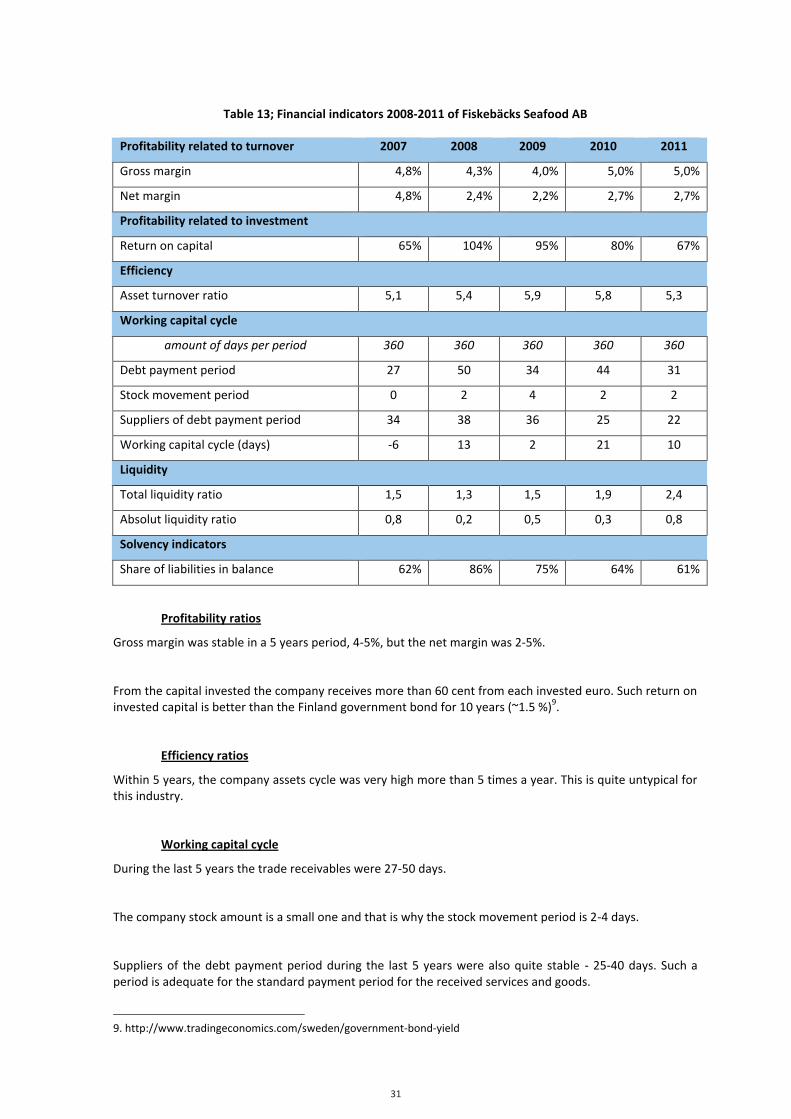
31
31
Table 13; Financial indicators 2008-‐2011 of Fiskebäcks Seafood AB
Profitability related to turnover 2007 2008 2009 2010 2011
Gross margin 4,8% 4,3% 4,0% 5,0% 5,0%
Net margin 4,8% 2,4% 2,2% 2,7% 2,7%
Profitability related to investment
Return on capital 65% 104% 95% 80% 67%
Efficiency
Asset turnover ratio 5,1 5,4 5,9 5,8 5,3
Working capital cycle
amount of days per period 360 360 360 360 360
Debt payment period 27 50 34 44 31
Stock movement period 0 2 4 2 2
Suppliers of debt payment period 34 38 36 25 22
Working capital cycle (days) -‐6 13 2 21 10
Liquidity
Total liquidity ratio 1,5 1,3 1,5 1,9 2,4
Absolut liquidity ratio 0,8 0,2 0,5 0,3 0,8
Solvency indicators
Share of liabilities in balance 62% 86% 75% 64% 61%
Profitability ratios
Gross margin was stable in a 5 years period, 4-‐5%, but the net margin was 2-‐5%.
From the capital invested the company receives more than 60 cent from each invested euro. Such return on invested capital is better than the Finland government bond for 10 years (~1.5 %)9.
Efficiency ratios
Within 5 years, the company assets cycle was very high more than 5 times a year. This is quite untypical for this industry.
Working capital cycle
During the last 5 years the trade receivables were 27-‐50 days.
The company stock amount is a small one and that is why the stock movement period is 2-‐4 days.
Suppliers of the debt payment period during the last 5 years were also quite stable -‐ 25-‐40 days. Such a period is adequate for the standard payment period for the received services and goods.
9. http://www.tradingeconomics.com/sweden/government-‐bond-‐yield
32
32
It looks like the company is working close to 0 working capital cycle thus avoiding investment in working capital.
Liquidity ratios
The company's total liquidity ratio increased up to 2.4.
Absolute liquidity also arose from 0,2 in the year 2008 to 0,8 in the year 2011. The absolute liquidity is higher than what is necessary and it is the same as for Snadder og Snaskum.
Solvency ratios
The average share of creditors is higher than 50%. Within last 4 years it has decreased from 86% to 61% in 2011 but still the share of creditors is high.
Comparing the overall information, the company is working on average low financial risk and it is the same as for the previous company.
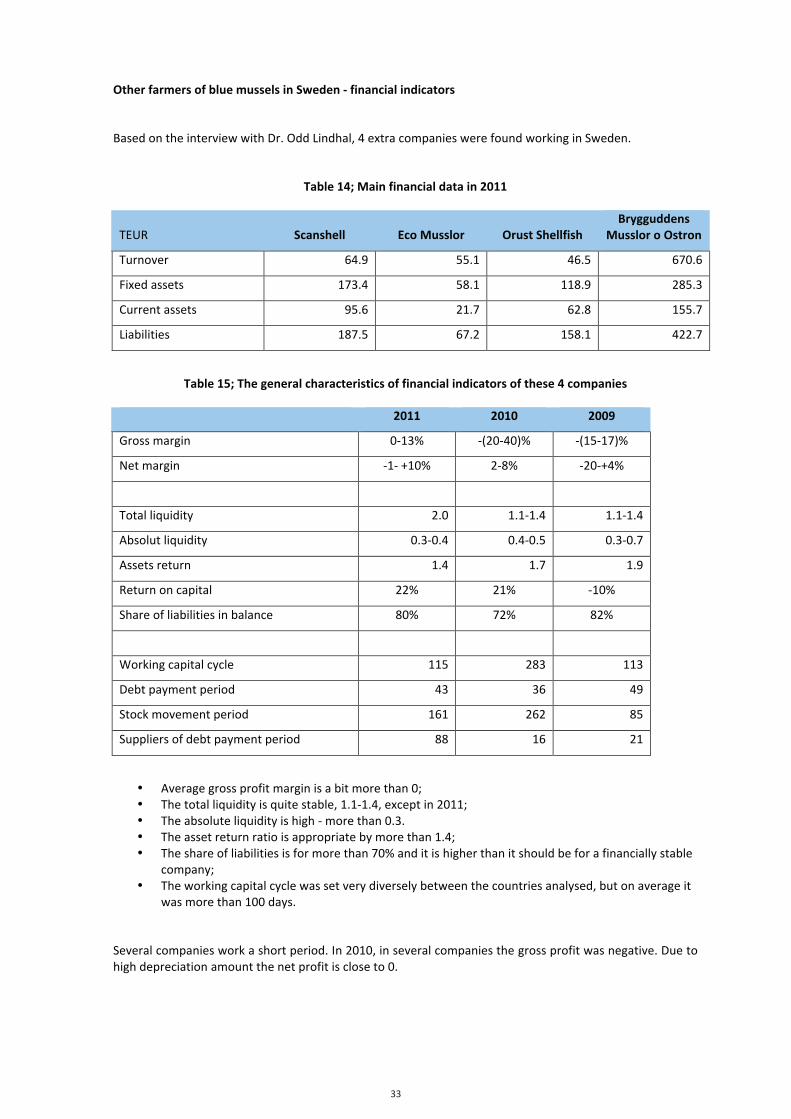
33
33
Other farmers of blue mussels in Sweden -‐ financial indicators
Based on the interview with Dr. Odd Lindhal, 4 extra companies were found working in Sweden.
Table 14; Main financial data in 2011
TEUR Scanshell Eco Musslor Orust Shellfish Brygguddens
Musslor o Ostron
Turnover 64.9 55.1 46.5 670.6
Fixed assets 173.4 58.1 118.9 285.3
Current assets 95.6 21.7 62.8 155.7
Liabilities 187.5 67.2 158.1 422.7
Table 15; The general characteristics of financial indicators of these 4 companies
2011 2010 2009
Gross margin 0-‐13% -‐(20-‐40)% -‐(15-‐17)%
Net margin -‐1-‐ +10% 2-‐8% -‐20-‐+4%
Total liquidity 2.0 1.1-‐1.4 1.1-‐1.4
Absolut liquidity 0.3-‐0.4 0.4-‐0.5 0.3-‐0.7
Assets return 1.4 1.7 1.9
Return on capital 22% 21% -‐10%
Share of liabilities in balance 80% 72% 82%
Working capital cycle 115 283 113
Debt payment period 43 36 49
Stock movement period 161 262 85
Suppliers of debt payment period 88 16 21
• Average gross profit margin is a bit more than 0; • The total liquidity is quite stable, 1.1-‐1.4, except in 2011; • The absolute liquidity is high -‐ more than 0.3. • The asset return ratio is appropriate by more than 1.4; • The share of liabilities is for more than 70% and it is higher than it should be for a financially stable
company; • The working capital cycle was set very diversely between the countries analysed, but on average it
was more than 100 days.
Several companies work a short period. In 2010, in several companies the gross profit was negative. Due to high depreciation amount the net profit is close to 0.
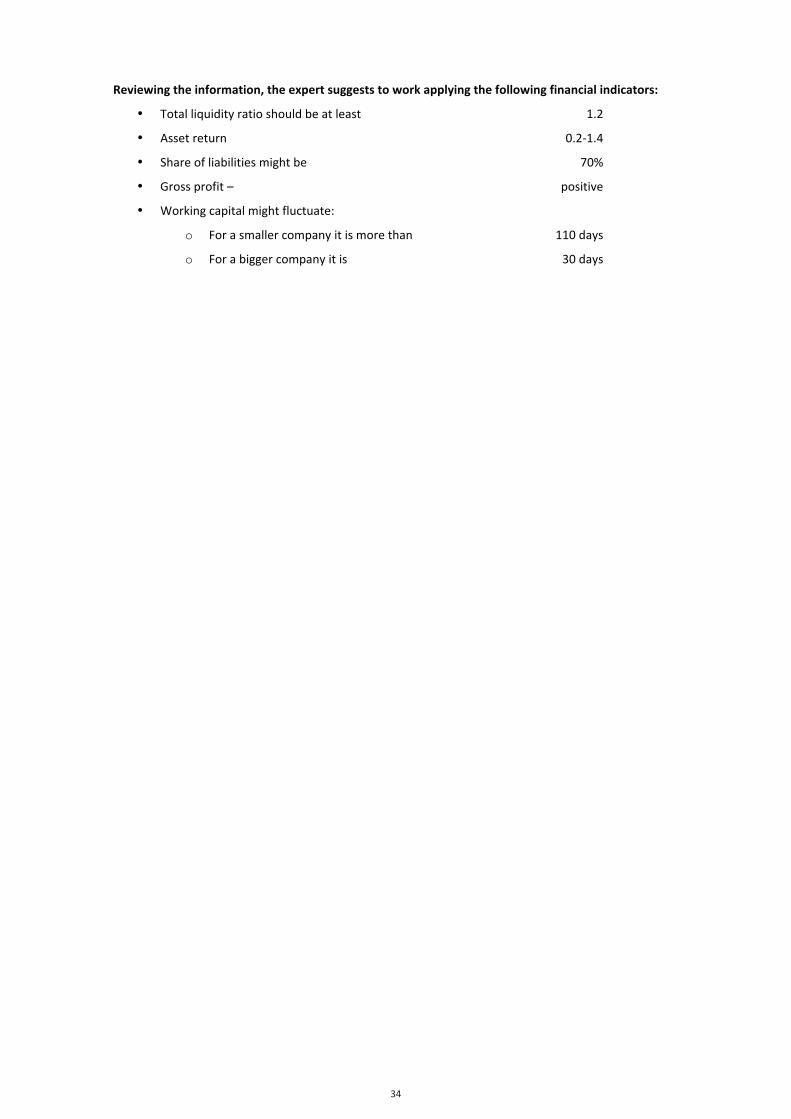
34
34
Reviewing the information, the expert suggests to work applying the following financial indicators:
• Total liquidity ratio should be at least 1.2
• Asset return 0.2-‐1.4
• Share of liabilities might be 70%
• Gross profit – positive
• Working capital might fluctuate:
o For a smaller company it is more than 110 days
o For a bigger company it is 30 days
35
35
4. Risk evaluation and analysis of technical aspects
A number of significant risks are distributed, which may adversely affect business development and implementation process.
Technological and environmental risk
• Weather – very high.
Ice, strong wind, waves and even some animals are the main enemies for mussel farmers. They might destroy farm faster than anything else.
The farmer might avoid the occurrence of risk choosing the most appropriate equipment, using other farmer's experience.
The farmers need to improve their experience participating in events, seminars, conferences etc.
• Technology risk – moderate.
Even choosing the best and the most expensive risk might not help the farmer to receive the average amount.
Each farmer must pay attention to two aspects:
• Farming process – when all equipment should be set up on the highest level at a location.
• Harvesting process – using special equipment, the farmer has to choose special equipment and probably a boat for harvesting. Also in the harvesting process it might have to be done on the highest level, because by using inappropriate equipment the farmer can lose a lot of mussels which are attached by ropes/nets.
• Environment risk -‐ low.
The mussels reduce the amount of nitrates and phosphorus; also the presence of some heavy metals in water. The mussel farm might be compared with the water treatment factory.
The mussel effect on the water is very good.
Technological and environmental risks are assessed as moderate.
Risk management
The company structure is simple and adequate for mussel farming.
Employed personnel will not require special knowledge, however it would be a benefit, if the managing director had a degree in marine biology, engineering or maritime affairs.
The staff should have an adequate training so that their technical and professional skills are appropriate.
Management risk -‐ moderately low.
36
36
Economic Risk
Economic risks include the following factors:
• Industry risk -‐ very low.
The industry has the potential to develop and grow significantly. According to the European Commission regulation and several international documents, in the near future the mussel farming might have a growing demand. The increase in demand might be influenced by developing new industries, like production of adhesive materials, production of building materials using mussel shells etc.
If the legislation is changed in order to allow reduction of the heating period of mussels, the mussel consumption will increase in food industry.
Besides, comparing the mussel farming with water treatment facilities, the costs and benefits are similar.
• Revenue stability risk -‐ moderate.
The revenue stability may have an impact on substitute products entry into the market, customers' financial deterioration, cost increase in raw materials and other factors.
The substitute products don’t influence the farming of the blue mussel market, because each country decides its own way to get energy -‐ wind, the flow rate, water or solar, without competing with each other.
Today around the Baltic Sea the competition is not severe; the companies increase their competence discussing or exchanging information. Outside the aforesaid area the competence is serious enough.
The price is set on averagely low level.
The raw material costs change due to several factors; however, the amount of costs for raw materials takes a small part in comparison with other costs.
• Customer risk -‐ high.
The company sells products to several companies, thus the company does not depend on one customer.
• Supplier risk -‐ moderately low.
The company will purchase raw materials from a number of suppliers, so they won’t make dependence solely on one supplier.
• Company size risk -‐ moderately low.
The company will be big enough in the Baltic Sea region area. The company might influence the market tendency. Due to water salinity in the Baltic Sea, except in Kattegat, the sales will be smaller while comparing the companies are farming in more saline water.
Economic risk – moderately low.
Financial risk
The financial risk for a new entity is higher than for an existing and viable business.
Many banks or other financiers don't support the fishery industry. The financing depends on the willingness to invest from the private financiers or owner credit history in the financial sector.
Financial risk – high.
37
37
Political risk
Risks are associated with the alterations in legislation, which in this case has only positive impact on the company's future development.
Several politicians might have a positive influence on the possibilities of obtaining permission for mussel farming.
This industry receives a negative resonance due to weather conditions. At the beginning of 2012 several mussel farms were destroyed by strong wind and ices. These farms were aided by EU support.
Swedish scientists publicised results proving that mussel can treat the water and the mussel farming is comparable with a water treatment facilities.
Several countries suggest to support the mussel farming from agriculture as the agriculture is a serious polluter of waters. In case this suggestion develops, the mussel farming might attract wider interest from politicians.
Political risk – moderately high.
Mussel farming will operate on the average risk conditions.
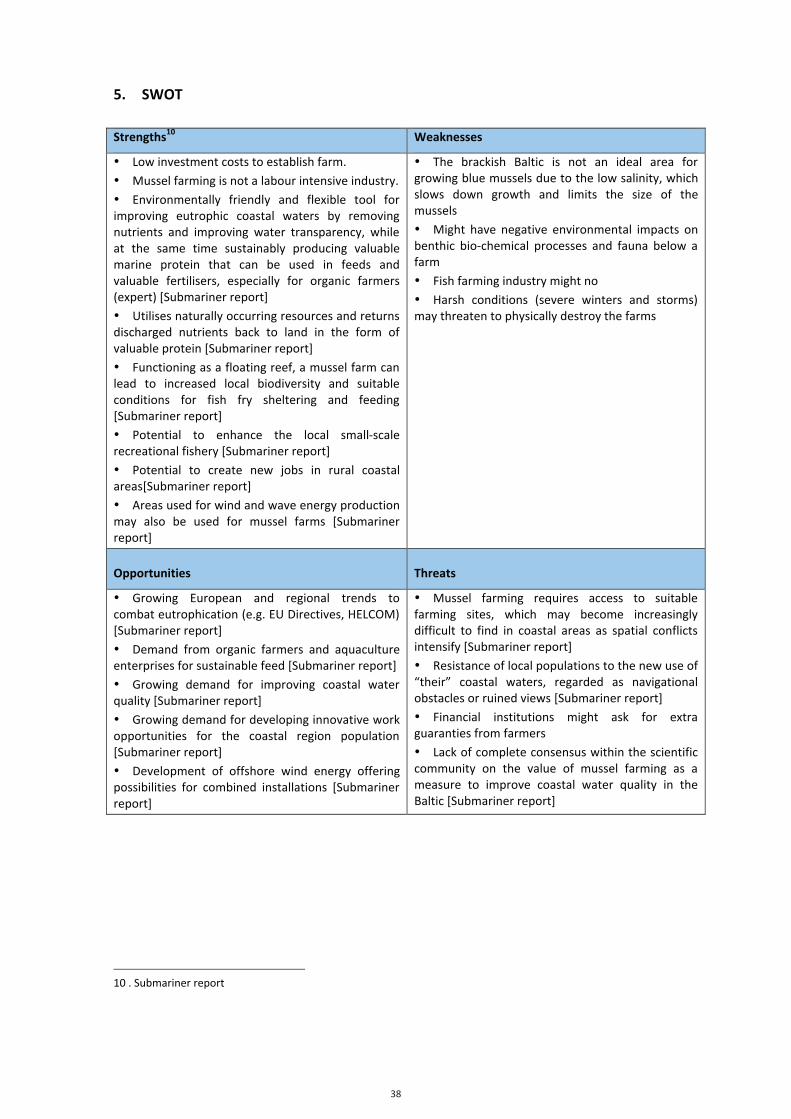
38
38
5. SWOT
Strengths10 Weaknesses
• Low investment costs to establish farm. • Mussel farming is not a labour intensive industry. • Environmentally friendly and flexible tool for improving eutrophic coastal waters by removing nutrients and improving water transparency, while at the same time sustainably producing valuable marine protein that can be used in feeds and valuable fertilisers, especially for organic farmers (expert) [Submariner report] • Utilises naturally occurring resources and returns discharged nutrients back to land in the form of valuable protein [Submariner report] • Functioning as a floating reef, a mussel farm can lead to increased local biodiversity and suitable conditions for fish fry sheltering and feeding [Submariner report] • Potential to enhance the local small-‐scale recreational fishery [Submariner report] • Potential to create new jobs in rural coastal areas[Submariner report] • Areas used for wind and wave energy production may also be used for mussel farms [Submariner report]
• The brackish Baltic is not an ideal area for growing blue mussels due to the low salinity, which slows down growth and limits the size of the mussels • Might have negative environmental impacts on benthic bio-‐chemical processes and fauna below a farm • Fish farming industry might no • Harsh conditions (severe winters and storms) may threaten to physically destroy the farms
Opportunities Threats
• Growing European and regional trends to combat eutrophication (e.g. EU Directives, HELCOM) [Submariner report] • Demand from organic farmers and aquaculture enterprises for sustainable feed [Submariner report] • Growing demand for improving coastal water quality [Submariner report] • Growing demand for developing innovative work opportunities for the coastal region population [Submariner report] • Development of offshore wind energy offering possibilities for combined installations [Submariner report]
• Mussel farming requires access to suitable farming sites, which may become increasingly difficult to find in coastal areas as spatial conflicts intensify [Submariner report] • Resistance of local populations to the new use of “their” coastal waters, regarded as navigational obstacles or ruined views [Submariner report] • Financial institutions might ask for extra guaranties from farmers • Lack of complete consensus within the scientific community on the value of mussel farming as a measure to improve coastal water quality in the Baltic [Submariner report]
10 . Submariner report
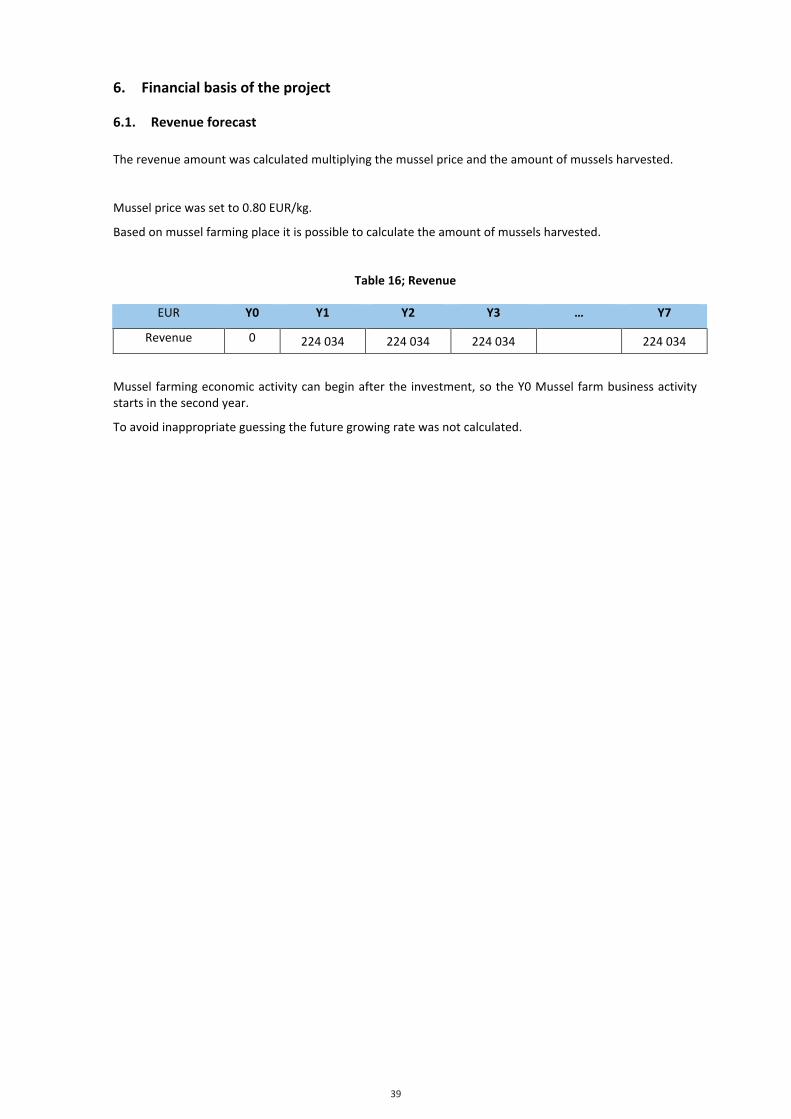
39
39
6. Financial basis of the project
6.1. Revenue forecast The revenue amount was calculated multiplying the mussel price and the amount of mussels harvested.
Mussel price was set to 0.80 EUR/kg.
Based on mussel farming place it is possible to calculate the amount of mussels harvested.
Table 16; Revenue
EUR Y0 Y1 Y2 Y3 … Y7
Revenue 0 224 034 224 034 224 034 224 034
Mussel farming economic activity can begin after the investment, so the Y0 Mussel farm business activity starts in the second year.
To avoid inappropriate guessing the future growing rate was not calculated.
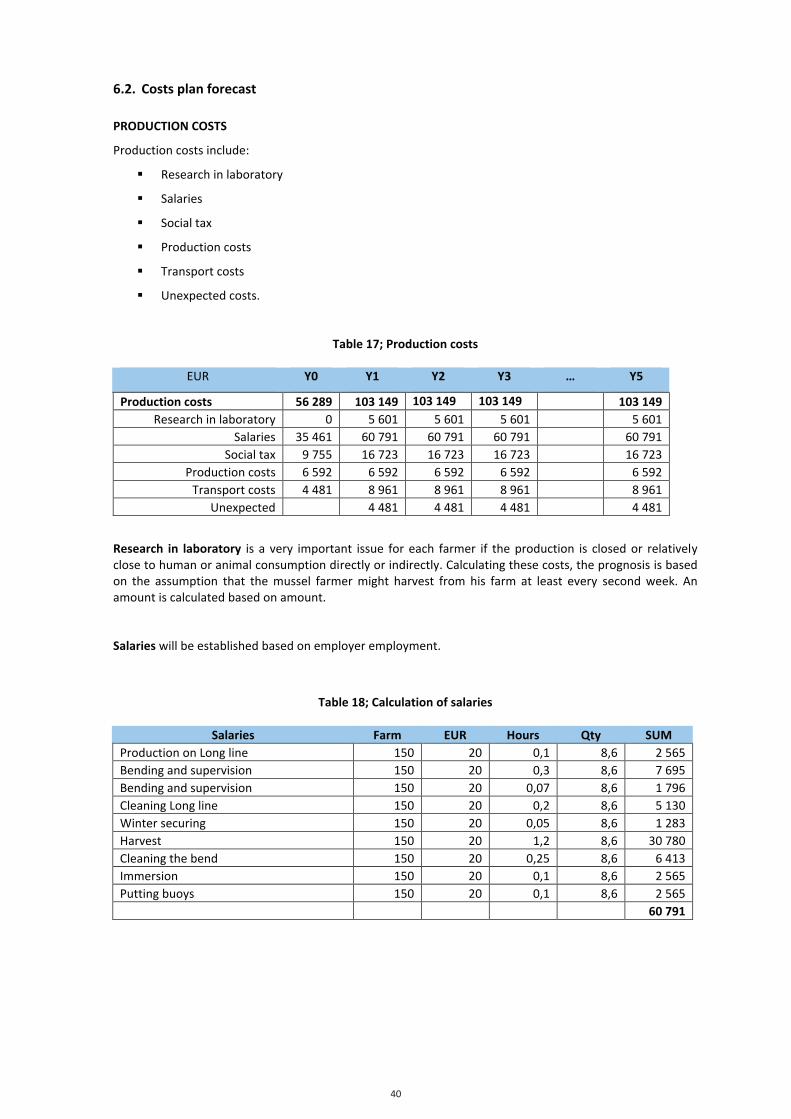
40
40
6.2. Costs plan forecast PRODUCTION COSTS
Production costs include:
§ Research in laboratory
§ Salaries
§ Social tax
§ Production costs
§ Transport costs
§ Unexpected costs.
Table 17; Production costs
EUR Y0 Y1 Y2 Y3 … Y5
Production costs 56 289 103 149 103 149 103 149 103 149 Research in laboratory 0 5 601 5 601 5 601 5 601
Salaries 35 461 60 791 60 791 60 791 60 791 Social tax 9 755 16 723 16 723 16 723 16 723
Production costs 6 592 6 592 6 592 6 592 6 592 Transport costs 4 481 8 961 8 961 8 961 8 961
Unexpected 4 481 4 481 4 481 4 481
Research in laboratory is a very important issue for each farmer if the production is closed or relatively close to human or animal consumption directly or indirectly. Calculating these costs, the prognosis is based on the assumption that the mussel farmer might harvest from his farm at least every second week. An amount is calculated based on amount.
Salaries will be established based on employer employment.
Table 18; Calculation of salaries
Salaries Farm EUR Hours Qty SUM Production on Long line 150 20 0,1 8,6 2 565 Bending and supervision 150 20 0,3 8,6 7 695 Bending and supervision 150 20 0,07 8,6 1 796 Cleaning Long line 150 20 0,2 8,6 5 130 Winter securing 150 20 0,05 8,6 1 283 Harvest 150 20 1,2 8,6 30 780 Cleaning the bend 150 20 0,25 8,6 6 413 Immersion 150 20 0,1 8,6 2 565 Putting buoys 150 20 0,1 8,6 2 565 60 791
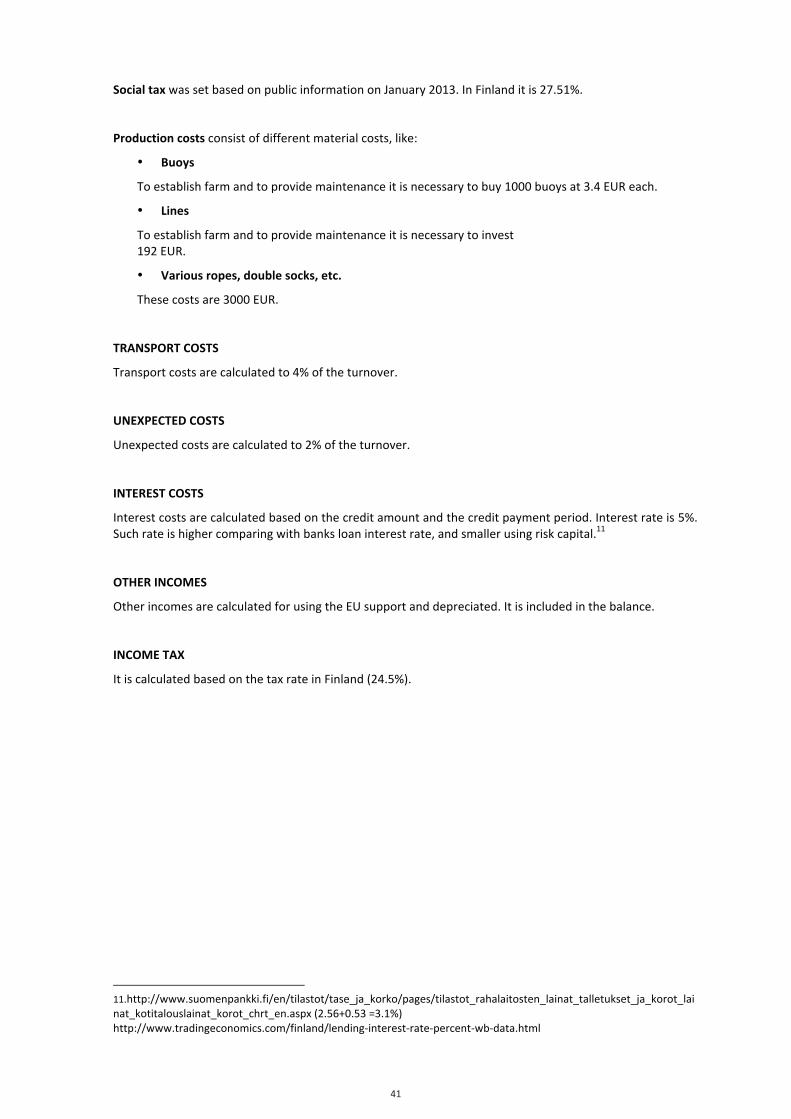
41
41
Social tax was set based on public information on January 2013. In Finland it is 27.51%.
Production costs consist of different material costs, like:
• Buoys
To establish farm and to provide maintenance it is necessary to buy 1000 buoys at 3.4 EUR each.
• Lines
To establish farm and to provide maintenance it is necessary to invest 192 EUR.
• Various ropes, double socks, etc.
These costs are 3000 EUR.
TRANSPORT COSTS
Transport costs are calculated to 4% of the turnover.
UNEXPECTED COSTS
Unexpected costs are calculated to 2% of the turnover.
INTEREST COSTS
Interest costs are calculated based on the credit amount and the credit payment period. Interest rate is 5%. Such rate is higher comparing with banks loan interest rate, and smaller using risk capital.11
OTHER INCOMES
Other incomes are calculated for using the EU support and depreciated. It is included in the balance.
INCOME TAX
It is calculated based on the tax rate in Finland (24.5%).
11.http://www.suomenpankki.fi/en/tilastot/tase_ja_korko/pages/tilastot_rahalaitosten_lainat_talletukset_ja_korot_lainat_kotitalouslainat_korot_chrt_en.aspx (2.56+0.53 =3.1%) http://www.tradingeconomics.com/finland/lending-‐interest-‐rate-‐percent-‐wb-‐data.html
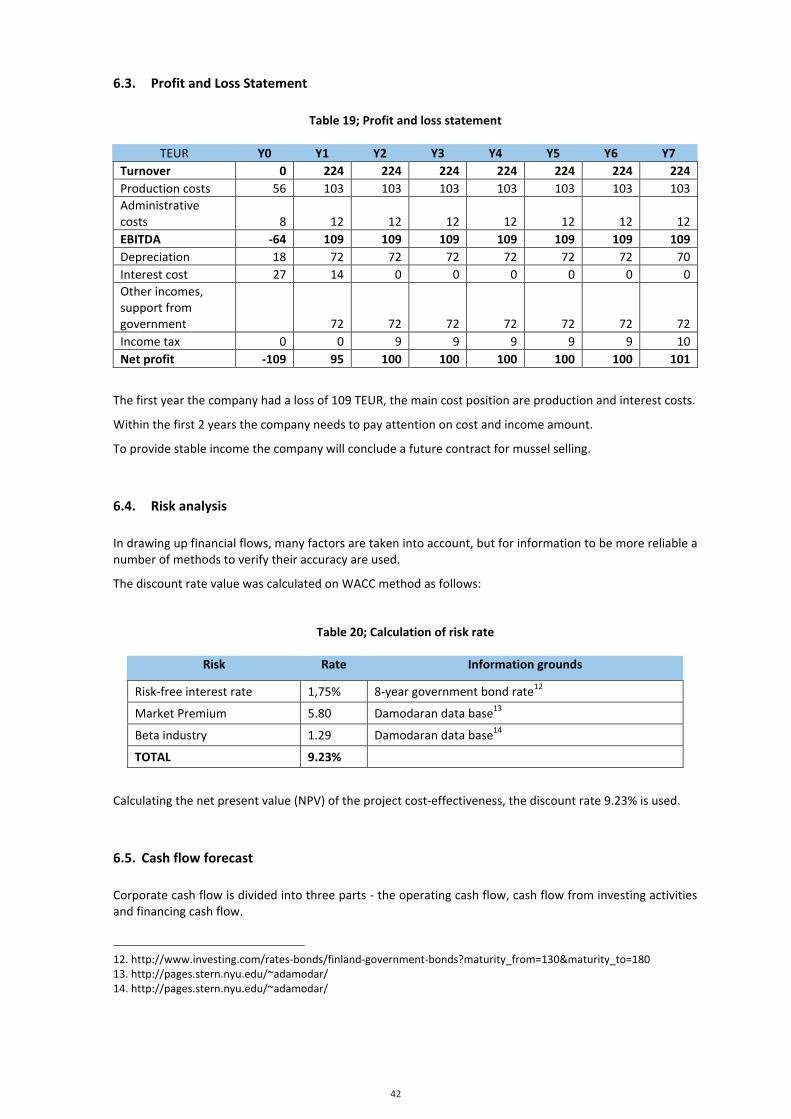
42
42
6.3. Profit and Loss Statement
Table 19; Profit and loss statement
TEUR Y0 Y1 Y2 Y3 Y4 Y5 Y6 Y7 Turnover 0 224 224 224 224 224 224 224 Production costs 56 103 103 103 103 103 103 103 Administrative costs 8 12 12 12 12 12 12 12 EBITDA -‐64 109 109 109 109 109 109 109 Depreciation 18 72 72 72 72 72 72 70 Interest cost 27 14 0 0 0 0 0 0 Other incomes, support from government 72 72 72 72 72 72 72 Income tax 0 0 9 9 9 9 9 10 Net profit -‐109 95 100 100 100 100 100 101
The first year the company had a loss of 109 TEUR, the main cost position are production and interest costs.
Within the first 2 years the company needs to pay attention on cost and income amount.
To provide stable income the company will conclude a future contract for mussel selling.
6.4. Risk analysis In drawing up financial flows, many factors are taken into account, but for information to be more reliable a number of methods to verify their accuracy are used.
The discount rate value was calculated on WACC method as follows:
Table 20; Calculation of risk rate
Risk Rate Information grounds
Risk-‐free interest rate 1,75% 8-‐year government bond rate12
Market Premium 5.80 Damodaran data base13
Beta industry 1.29 Damodaran data base14
TOTAL 9.23%
Calculating the net present value (NPV) of the project cost-‐effectiveness, the discount rate 9.23% is used.
6.5. Cash flow forecast Corporate cash flow is divided into three parts -‐ the operating cash flow, cash flow from investing activities and financing cash flow.
12. http://www.investing.com/rates-‐bonds/finland-‐government-‐bonds?maturity_from=130&maturity_to=180 13. http://pages.stern.nyu.edu/~adamodar/ 14. http://pages.stern.nyu.edu/~adamodar/
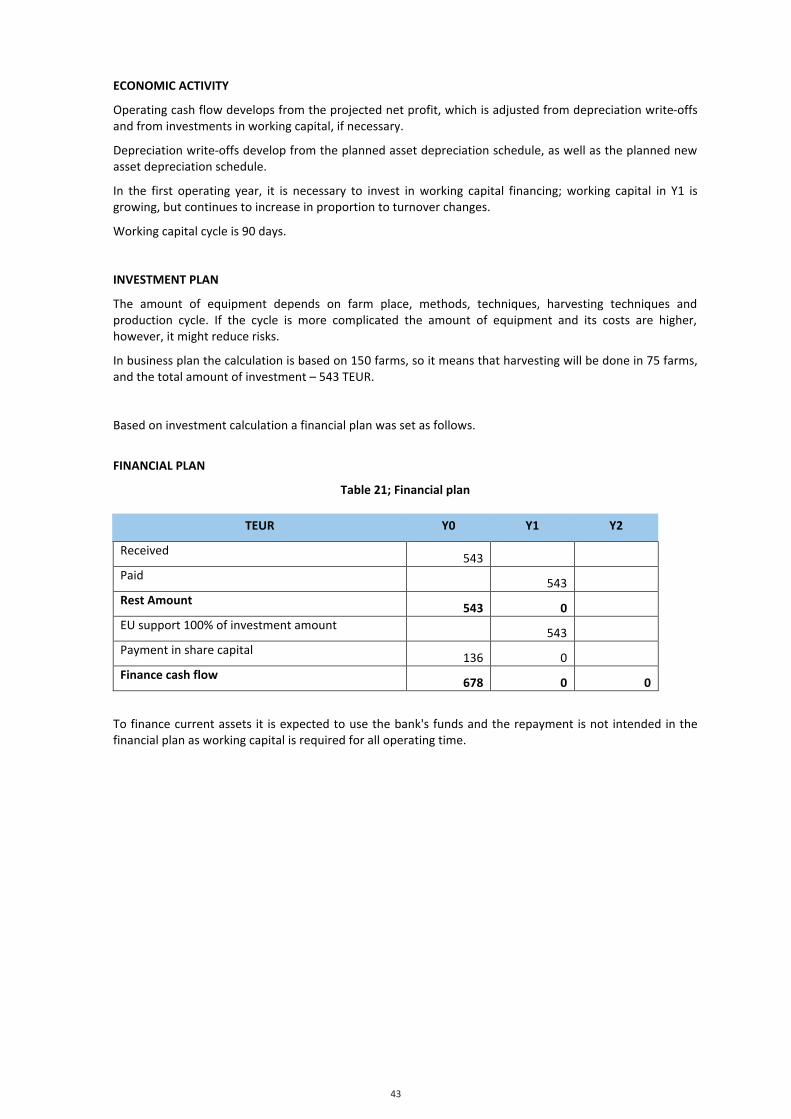
43
43
ECONOMIC ACTIVITY
Operating cash flow develops from the projected net profit, which is adjusted from depreciation write-‐offs and from investments in working capital, if necessary.
Depreciation write-‐offs develop from the planned asset depreciation schedule, as well as the planned new asset depreciation schedule.
In the first operating year, it is necessary to invest in working capital financing; working capital in Y1 is growing, but continues to increase in proportion to turnover changes.
Working capital cycle is 90 days.
INVESTMENT PLAN
The amount of equipment depends on farm place, methods, techniques, harvesting techniques and production cycle. If the cycle is more complicated the amount of equipment and its costs are higher, however, it might reduce risks.
In business plan the calculation is based on 150 farms, so it means that harvesting will be done in 75 farms, and the total amount of investment – 543 TEUR.
Based on investment calculation a financial plan was set as follows.
FINANCIAL PLAN
Table 21; Financial plan
TEUR Y0 Y1 Y2
Received 543
Paid 543
Rest Amount 543 0
EU support 100% of investment amount 543
Payment in share capital 136 0
Finance cash flow 678 0 0
To finance current assets it is expected to use the bank's funds and the repayment is not intended in the financial plan as working capital is required for all operating time.
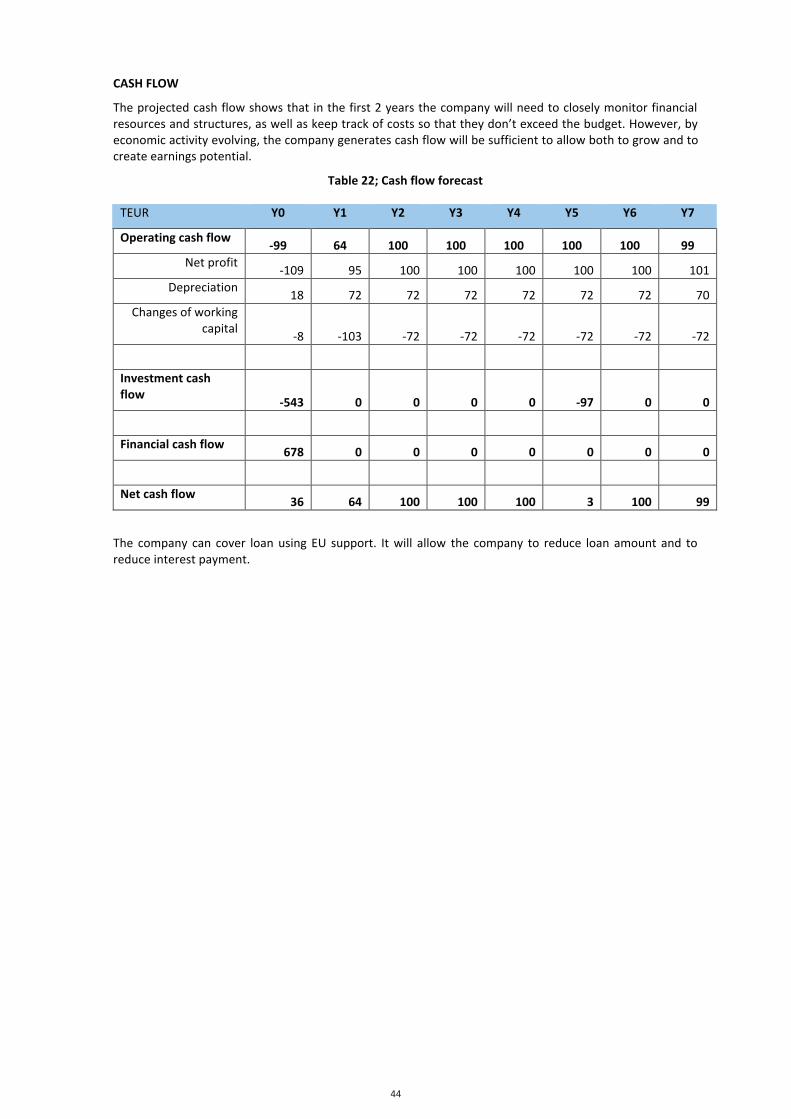
44
44
CASH FLOW
The projected cash flow shows that in the first 2 years the company will need to closely monitor financial resources and structures, as well as keep track of costs so that they don’t exceed the budget. However, by economic activity evolving, the company generates cash flow will be sufficient to allow both to grow and to create earnings potential.
Table 22; Cash flow forecast
TEUR Y0 Y1 Y2 Y3 Y4 Y5 Y6 Y7
Operating cash flow -‐99 64 100 100 100 100 100 99
Net profit -‐109 95 100 100 100 100 100 101
Depreciation 18 72 72 72 72 72 72 70
Changes of working capital
-‐8 -‐103 -‐72 -‐72 -‐72 -‐72 -‐72 -‐72
Investment cash flow
-‐543 0 0 0 0 -‐97 0 0
Financial cash flow
678 0 0 0 0 0 0 0
Net cash flow
36 64 100 100 100 3 100 99
The company can cover loan using EU support. It will allow the company to reduce loan amount and to reduce interest payment.
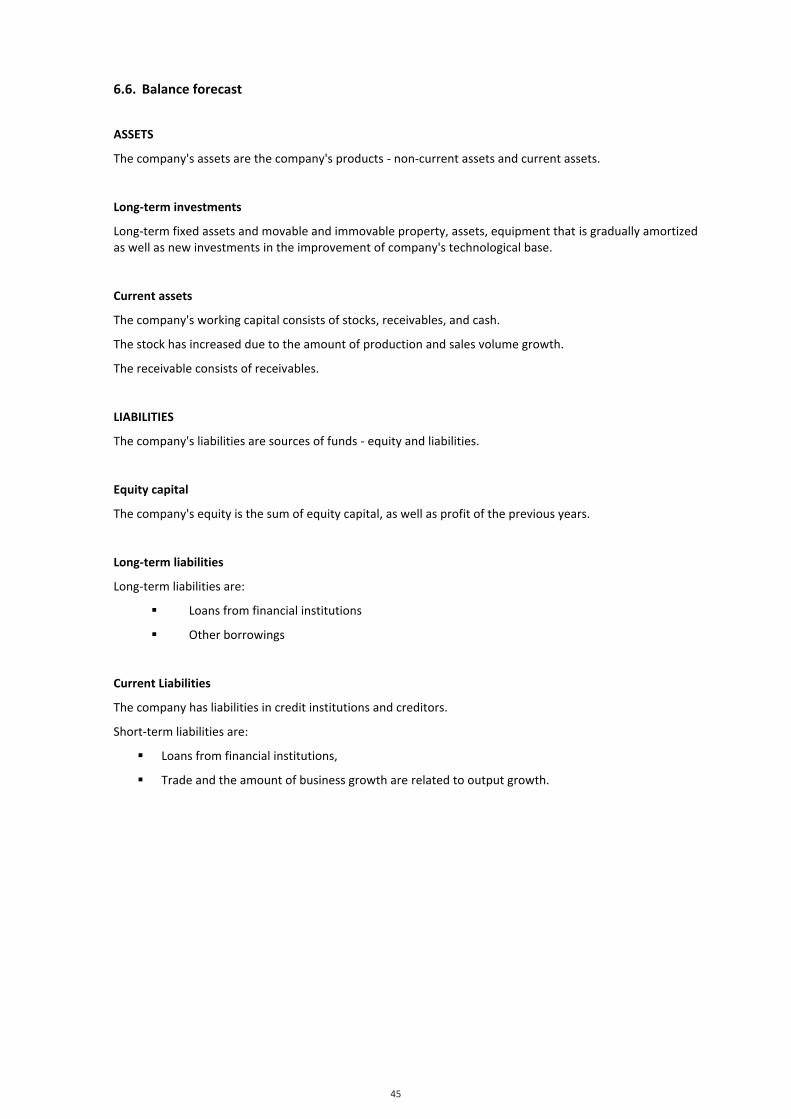
45
45
6.6. Balance forecast
ASSETS
The company's assets are the company's products -‐ non-‐current assets and current assets.
Long-‐term investments
Long-‐term fixed assets and movable and immovable property, assets, equipment that is gradually amortized as well as new investments in the improvement of company's technological base.
Current assets
The company's working capital consists of stocks, receivables, and cash.
The stock has increased due to the amount of production and sales volume growth.
The receivable consists of receivables.
LIABILITIES
The company's liabilities are sources of funds -‐ equity and liabilities.
Equity capital
The company's equity is the sum of equity capital, as well as profit of the previous years.
Long-‐term liabilities
Long-‐term liabilities are:
§ Loans from financial institutions
§ Other borrowings
Current Liabilities
The company has liabilities in credit institutions and creditors.
Short-‐term liabilities are:
§ Loans from financial institutions,
§ Trade and the amount of business growth are related to output growth.
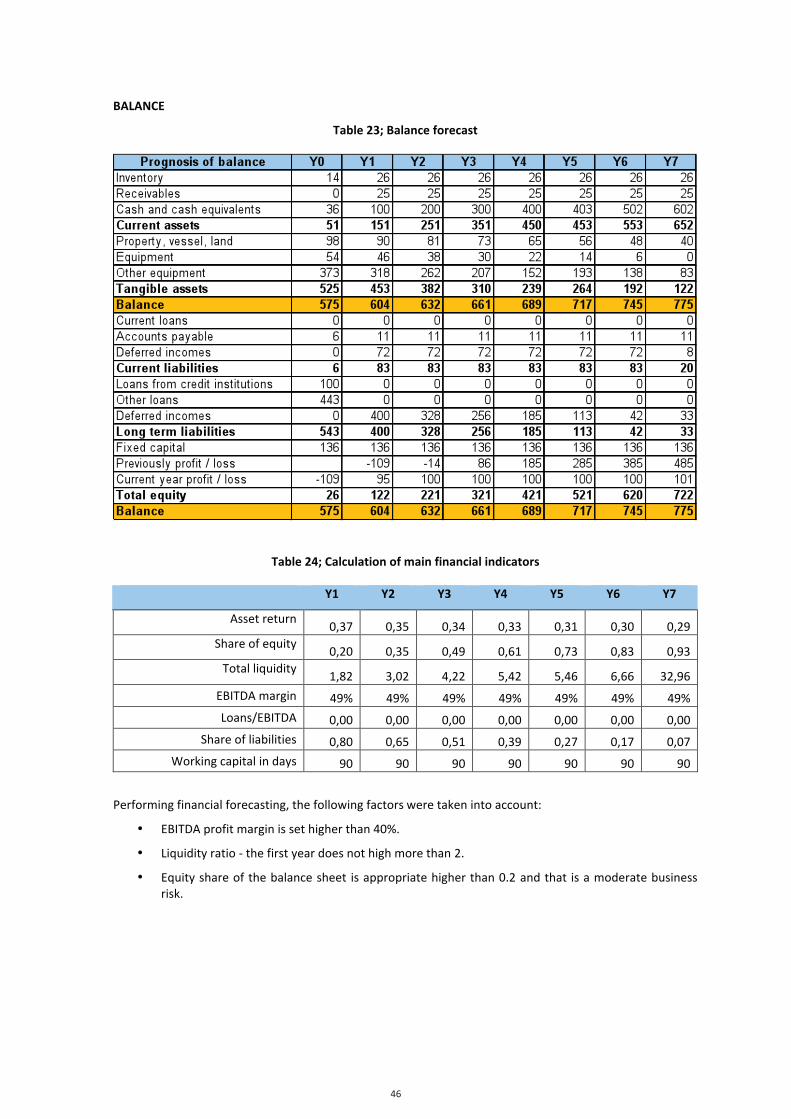
46
46
BALANCE
Table 23; Balance forecast
Table 24; Calculation of main financial indicators
Y1 Y2 Y3 Y4 Y5 Y6 Y7
Asset return 0,37 0,35 0,34 0,33 0,31 0,30 0,29
Share of equity 0,20 0,35 0,49 0,61 0,73 0,83 0,93
Total liquidity 1,82 3,02 4,22 5,42 5,46 6,66 32,96
EBITDA margin 49% 49% 49% 49% 49% 49% 49%
Loans/EBITDA 0,00 0,00 0,00 0,00 0,00 0,00 0,00
Share of liabilities 0,80 0,65 0,51 0,39 0,27 0,17 0,07
Working capital in days 90 90 90 90 90 90 90
Performing financial forecasting, the following factors were taken into account:
• EBITDA profit margin is set higher than 40%.
• Liquidity ratio -‐ the first year does not high more than 2.
• Equity share of the balance sheet is appropriate higher than 0.2 and that is a moderate business risk.
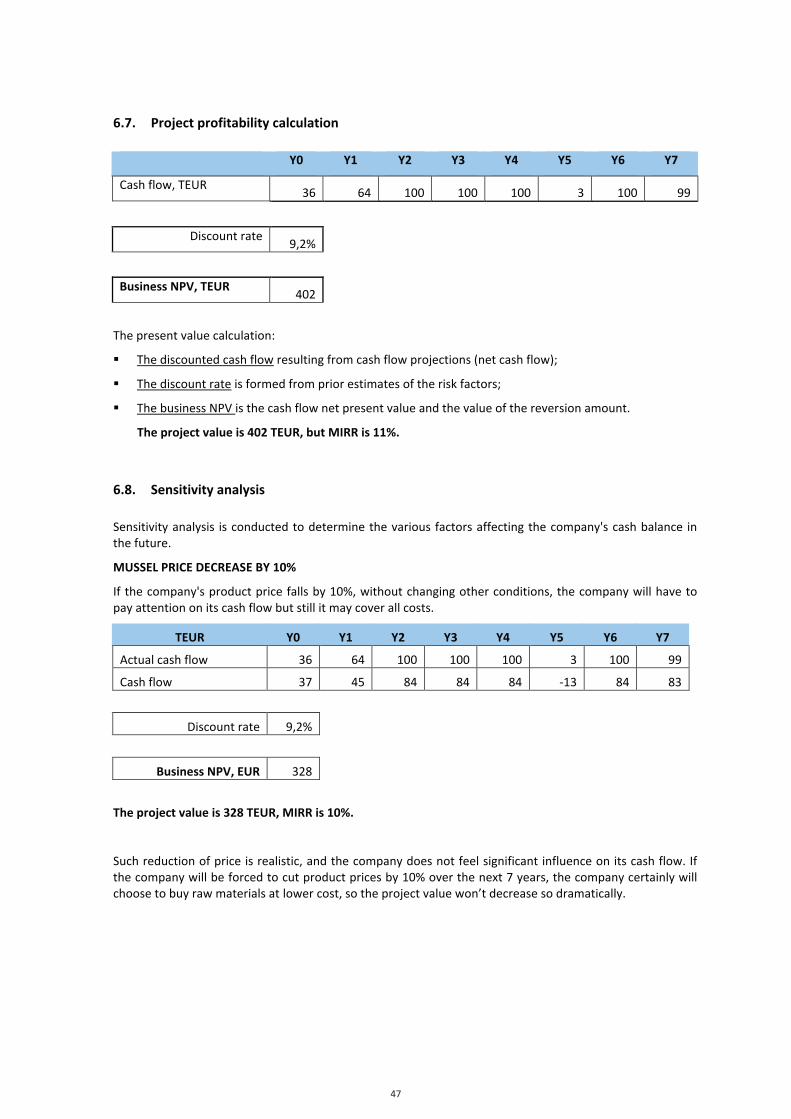
47
47
6.7. Project profitability calculation Y0 Y1 Y2 Y3 Y4 Y5 Y6 Y7
Cash flow, TEUR 36 64 100 100 100 3 100 99
Discount rate 9,2%
Business NPV, TEUR 402
The present value calculation:
§ The discounted cash flow resulting from cash flow projections (net cash flow);
§ The discount rate is formed from prior estimates of the risk factors;
§ The business NPV is the cash flow net present value and the value of the reversion amount.
The project value is 402 TEUR, but MIRR is 11%.
6.8. Sensitivity analysis Sensitivity analysis is conducted to determine the various factors affecting the company's cash balance in the future.
MUSSEL PRICE DECREASE BY 10%
If the company's product price falls by 10%, without changing other conditions, the company will have to pay attention on its cash flow but still it may cover all costs.
TEUR Y0 Y1 Y2 Y3 Y4 Y5 Y6 Y7
Actual cash flow 36 64 100 100 100 3 100 99
Cash flow 37 45 84 84 84 -‐13 84 83
Discount rate 9,2%
Business NPV, EUR 328
The project value is 328 TEUR, MIRR is 10%.
Such reduction of price is realistic, and the company does not feel significant influence on its cash flow. If the company will be forced to cut product prices by 10% over the next 7 years, the company certainly will choose to buy raw materials at lower cost, so the project value won’t decrease so dramatically.
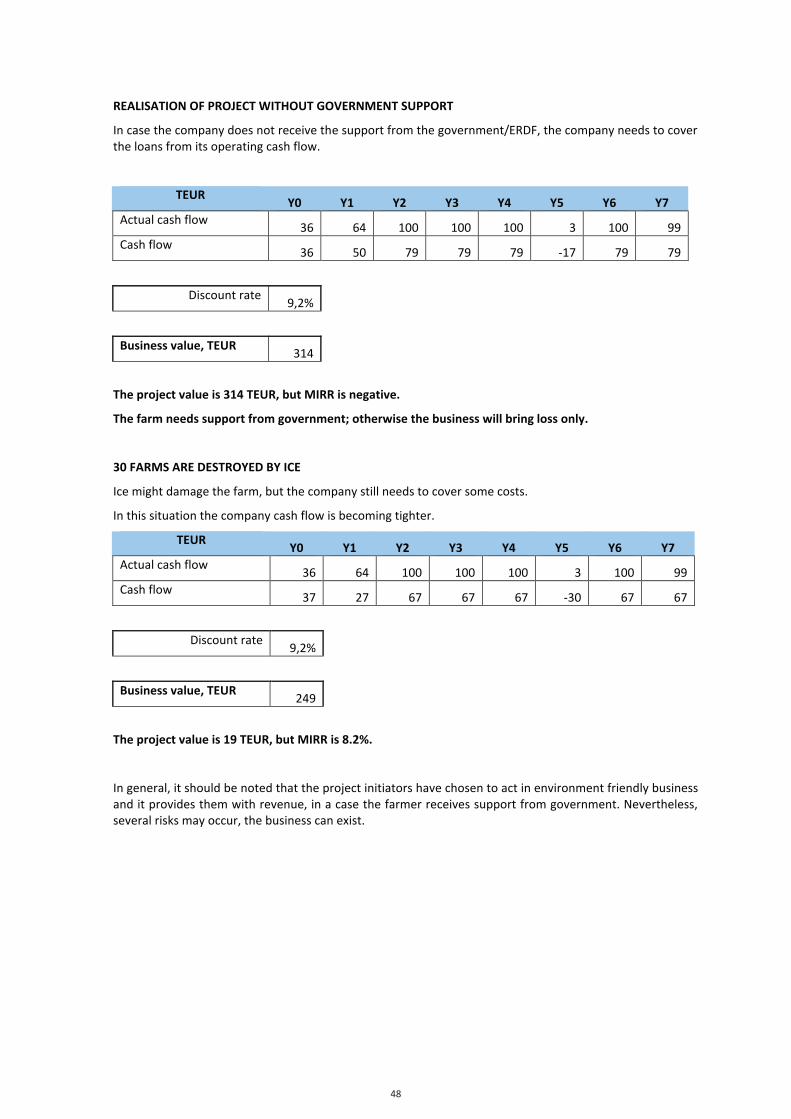
48
48
REALISATION OF PROJECT WITHOUT GOVERNMENT SUPPORT
In case the company does not receive the support from the government/ERDF, the company needs to cover the loans from its operating cash flow.
TEUR Y0 Y1 Y2 Y3 Y4 Y5 Y6 Y7
Actual cash flow 36 64 100 100 100 3 100 99
Cash flow 36 50 79 79 79 -‐17 79 79
Discount rate 9,2%
Business value, TEUR 314
The project value is 314 TEUR, but MIRR is negative.
The farm needs support from government; otherwise the business will bring loss only.
30 FARMS ARE DESTROYED BY ICE
Ice might damage the farm, but the company still needs to cover some costs.
In this situation the company cash flow is becoming tighter.
TEUR Y0 Y1 Y2 Y3 Y4 Y5 Y6 Y7
Actual cash flow 36 64 100 100 100 3 100 99
Cash flow 37 27 67 67 67 -‐30 67 67
Discount rate 9,2%
Business value, TEUR 249
The project value is 19 TEUR, but MIRR is 8.2%.
In general, it should be noted that the project initiators have chosen to act in environment friendly business and it provides them with revenue, in a case the farmer receives support from government. Nevertheless, several risks may occur, the business can exist.
1
3.3.2.1Business Plan
Finland Annex
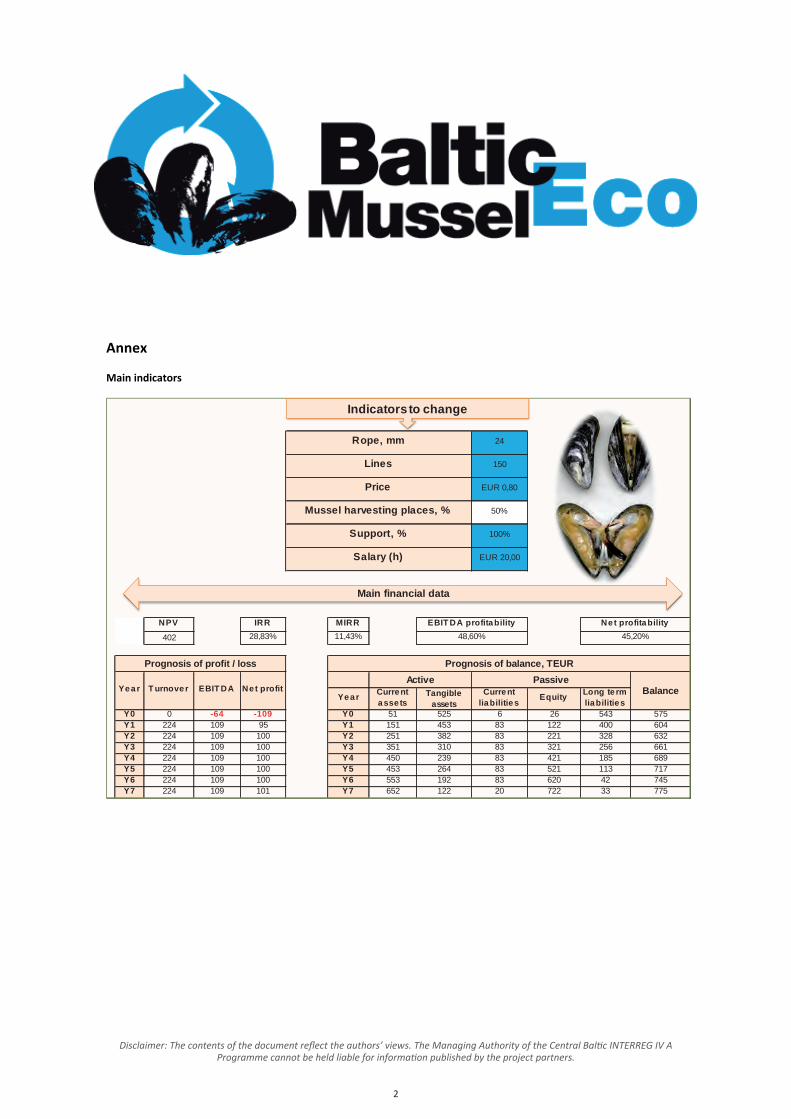
2
Annex Main indicators
24
150
EUR 0,80
50%
100%
EUR 20,00
NPV IRR MIRR402 28,83% 11,43%
Year Current asse ts
Tangible assets
Current liabilities Equity Long te rm
liabilitiesY0 0 -64 -109 Y0 51 525 6 26 543 575Y1 224 109 95 Y1 151 453 83 122 400 604Y2 224 109 100 Y2 251 382 83 221 328 632Y3 224 109 100 Y3 351 310 83 321 256 661Y4 224 109 100 Y4 450 239 83 421 185 689Y5 224 109 100 Y5 453 264 83 521 113 717Y6 224 109 100 Y6 553 192 83 620 42 745Y7 224 109 101 Y7 652 122 20 722 33 775
48,60%Net profitability
45,20%
ActiveYear T urnover EBIT DA Net profit
Passive
Rope, mm
Support, %
Salary (h)
Prognosis of profit / loss Prognosis of balance, TEUR
Balance
Mussel harvesting places, %
Price
Lines
EBIT DA profitability
Indicators to change
Main financial data
Disclaimer: The contents of the document reflect the authors’ views. The Managing Authority of the Central Baltic INTERREG IV A Programme cannot be held liable for information published by the project partners.
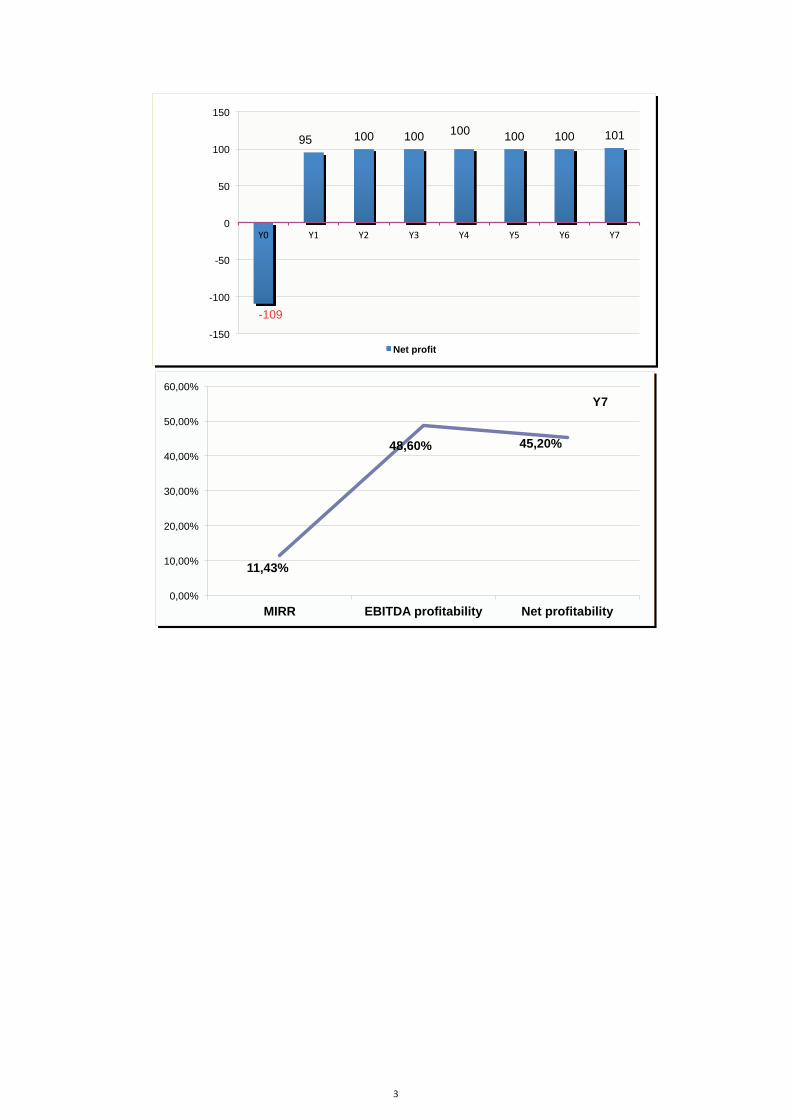
3
0 0
-109
95 100 100 100 100 100 101
-150
-100
-50
0
50
100
150
Y0 Y1 Y2 Y3 Y4 Y5 Y6 Y7
Net profit
11,43%
48,60% 45,20%
0,00%
10,00%
20,00%
30,00%
40,00%
50,00%
60,00%
MIRR EBITDA profitability Net profitability
Y7
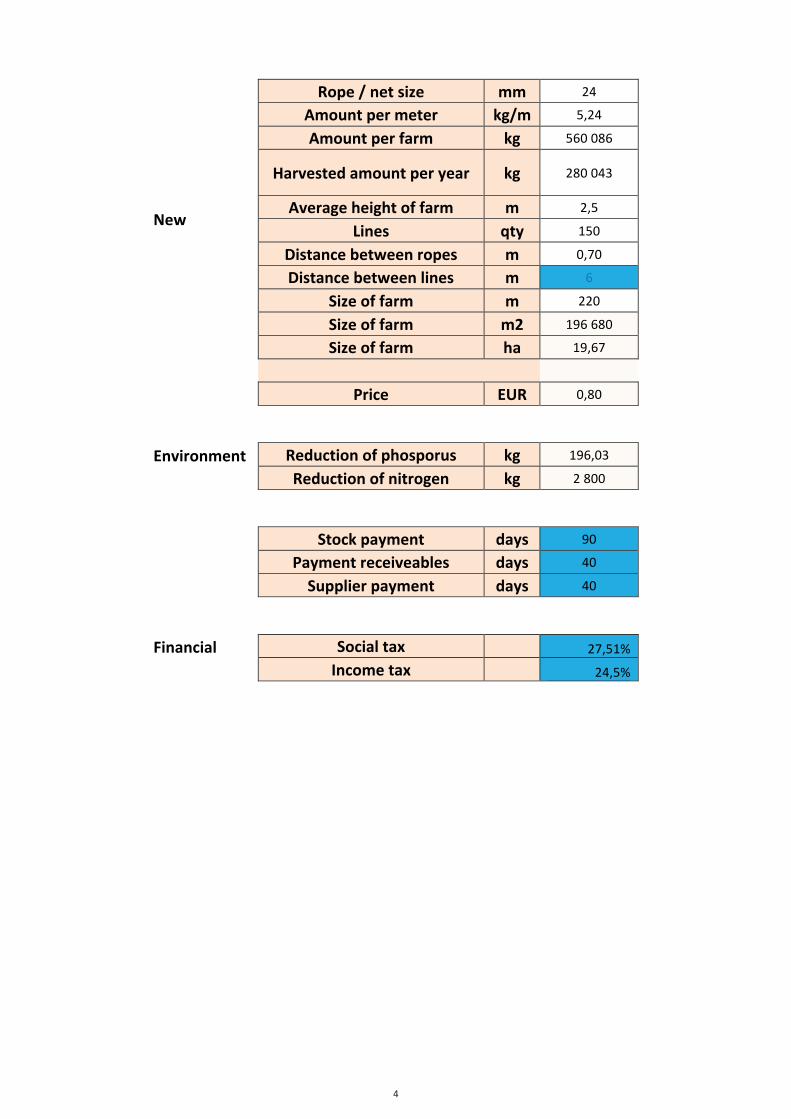
4
New
Rope / net size mm 24
Amount per meter kg/m 5,24
Amount per farm kg 560 086
Harvested amount per year kg 280 043
Average height of farm m 2,5
Lines qty 150
Distance between ropes m 0,70
Distance between lines m 6
Size of farm m 220
Size of farm m2 196 680
Size of farm ha 19,67
Price EUR 0,80
Environment Reduction of phosporus kg 196,03
Reduction of nitrogen kg 2 800
Stock payment days 90
Payment receiveables days 40
Supplier payment days 40
Financial Social tax 27,51%
Income tax 24,5%
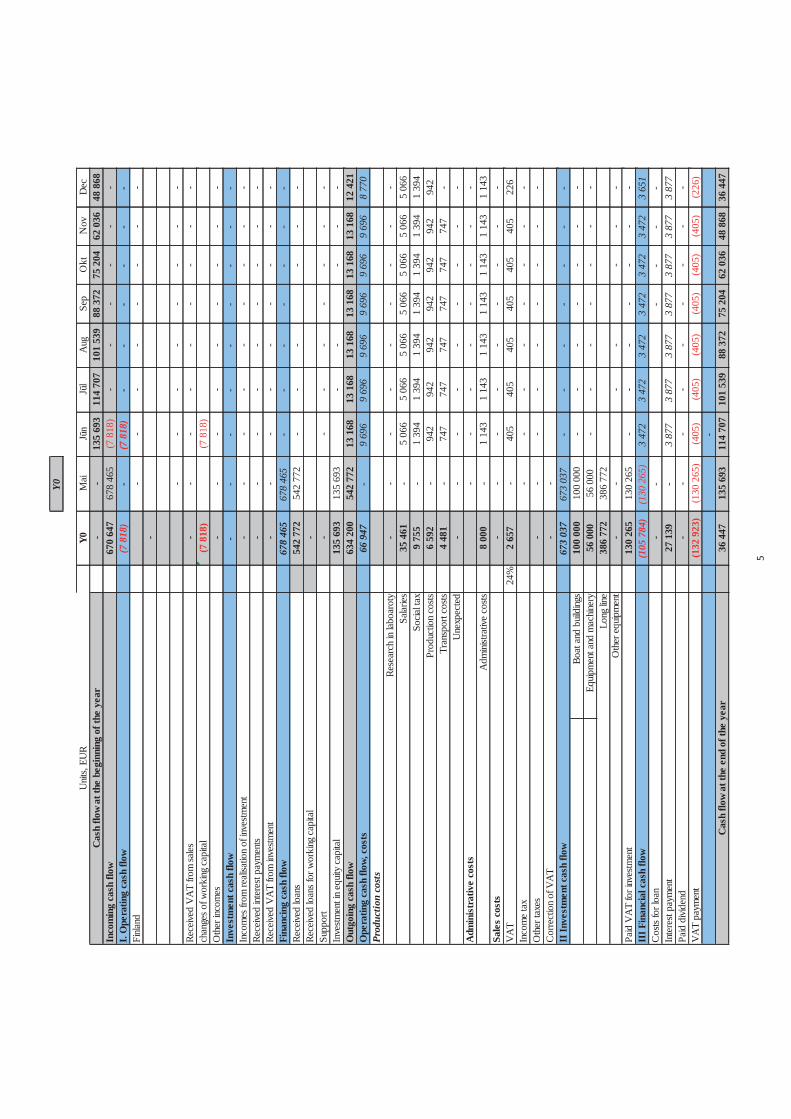
5
Y0
Y0M
aiJū
nJū
lA
ugSe
pO
ktN
ovD
ec-
-13
5 69
311
4 70
710
1 53
988
372
75 2
0462
036
48 8
6867
0 64
767
8 46
5(7
818
)-
--
--
-(7
818
)-
(7 8
18)
--
--
--
--
--
--
--
-
--
--
--
--
Rece
ived
VA
T fro
m sa
les-
--
--
--
--
chan
ges o
f wor
king
cap
ital
(7 8
18)
(7 8
18)
--
--
--
--
-In
vest
men
t cas
h flo
w-
--
--
--
--
--
--
--
--
-Re
ceive
d int
eres
t pay
men
ts-
--
--
--
--
--
--
--
--
-67
8 46
567
8 46
5-
--
--
--
Rece
ived
loan
s54
2 77
254
2 77
2-
--
--
-Re
ceive
d lo
ans f
or w
orki
ng c
apita
l- -
--
--
--
-In
vestm
ent i
n eq
uity
capi
tal
135
693
135
693
--
--
-63
4 20
054
2 77
213
168
13 1
6813
168
13 1
6813
168
13 1
6812
421
66 9
47-
9 69
69
696
9 69
69
696
9 69
69
696
8 77
0
--
--
--
--
-35
461
-5
066
5 06
65
066
5 06
65
066
5 06
65
066
9 75
5-
1 39
41
394
1 39
41
394
1 39
41
394
1 39
46
592
-94
294
294
294
294
294
294
24
481
-74
774
774
774
774
774
7-
--
--
--
--
--
--
--
--
-8
000
-1
143
1 14
31
143
1 14
31
143
1 14
31
143
--
--
--
--
-24
%2
657
-40
540
540
540
540
540
522
6-
--
--
--
--
--
--
--
--
Cor
rect
ion
of V
AT
--
II In
vest
men
t cas
h flo
w67
3 03
767
3 03
7-
--
--
--
Boat
and
buil
ding
s10
0 00
010
0 00
0-
--
--
--
Equip
men
t and
mac
hiner
y56
000
56 0
00-
--
--
--
386
772
386
772
--
--
--
-13
0 26
513
0 26
5-
--
--
--
III F
inan
cial
cas
h flo
w(1
05 7
84)
(130
265
)3
472
3 47
23
472
3 47
23
472
3 47
23
651
Cos
ts fo
r loa
n-
--
--
-In
tere
st pa
ymen
t27
139
-3
877
3 87
73
877
3 87
73
877
3 87
73
877
Paid
divi
dend
--
--
--
--
-(1
32 9
23)
(130
265
)(4
05)
(405
)(4
05)
(405
)(4
05)
(405
)(2
26)
-36
447
135
693
114
707
101
539
88 3
7275
204
62 0
3648
868
36 4
47
Paid
VA
T fo
r inv
estm
ent
VA
TIn
com
e ta
x
Fina
ncin
g ca
sh fl
ow
Out
goin
g ca
sh fl
ow
Prod
uctio
n co
sts
Oth
er e
quip
men
t
Adm
inistr
ative
cos
ts
Tran
spor
t cos
tsU
nexp
ecte
d
Rece
ived
VA
T fro
m in
vestm
ent
VA
T pa
ymen
t
Cas
h flo
w at
the
end
of th
e ye
ar
Oth
er ta
xes
Long
line
Supp
ort
Rese
arch
in la
boar
oty
Salar
ies
Inco
mes
from
reali
satio
n of
inve
stmen
t
Socia
l tax
Sale
s co
sts
Adm
inis
trat
ive
cost
s
Unit
s, EU
RC
ash
flow
at th
e be
ginn
ing
of th
e ye
ar
Ope
ratin
g ca
sh fl
ow, c
osts
Prod
uctio
n co
sts
Oth
er in
com
es
Inco
min
g ca
sh fl
owI.
Ope
ratin
g ca
sh fl
owFi
nland
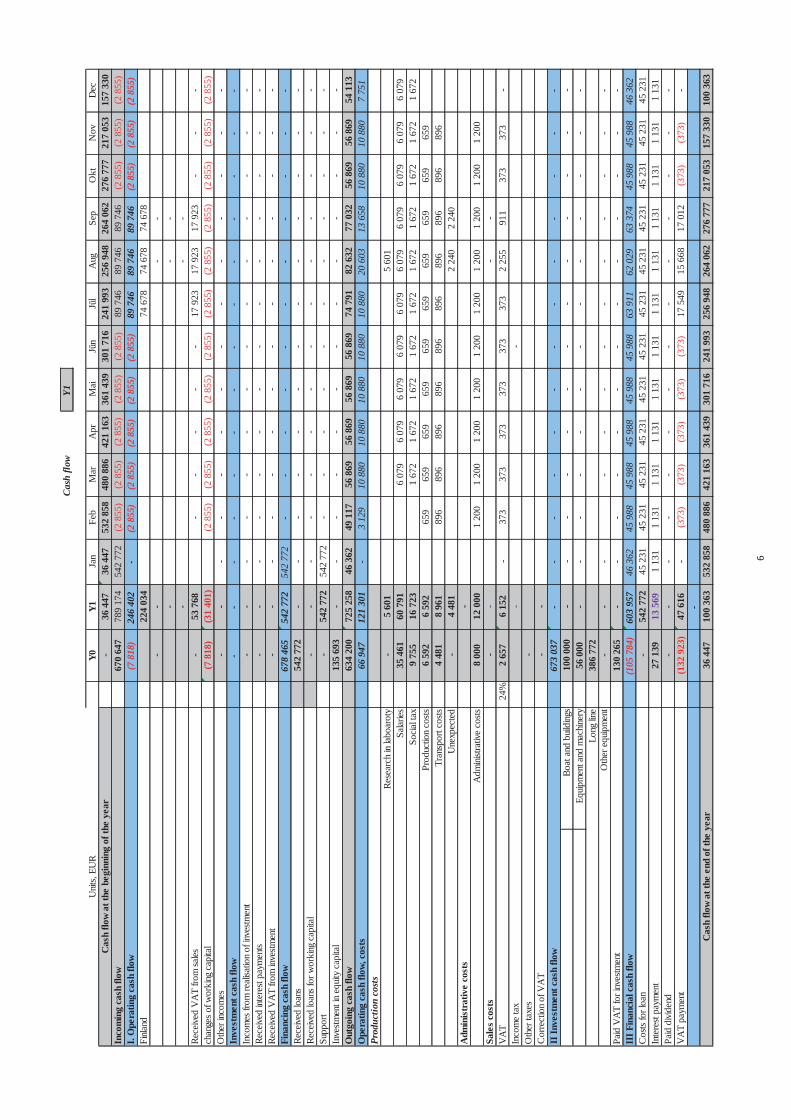
6
Y1
Y0Y1
Jan
Feb
Mar
Apr
Mai
Jūn
Jūl
Aug
Sep
Okt
Nov
Dec
-36
447
36 4
4753
2 85
848
0 88
642
1 16
336
1 43
930
1 71
624
1 99
325
6 94
826
4 06
227
6 77
721
7 05
315
7 33
067
0 64
778
9 17
454
2 77
2(2
855
)(2
855
)(2
855
)(2
855
)(2
855
)89
746
89 7
4689
746
(2 8
55)
(2 8
55)
(2 8
55)
(7 8
18)
246
402
-(2
855
)(2
855
)(2
855
)(2
855
)(2
855
)89
746
89 7
4689
746
(2 8
55)
(2 8
55)
(2 8
55)
224
034
74 6
7874
678
74 6
78-
--
--
--
--
-Re
ceive
d V
AT
from
sales
-53
768
--
--
-17
923
17 9
2317
923
--
-ch
ange
s of w
orki
ng c
apita
l(7
818
)(3
1 40
1)(2
855
)(2
855
)(2
855
)(2
855
)(2
855
)(2
855
)(2
855
)(2
855
)(2
855
)(2
855
)(2
855
)-
--
--
--
--
--
--
-In
vest
men
t cas
h flo
w-
--
--
--
--
--
--
--
--
--
--
--
--
--
-Re
ceive
d int
eres
t pay
men
ts-
--
--
--
--
--
--
--
--
--
--
--
--
--
-67
8 46
554
2 77
254
2 77
2-
--
--
--
--
--
Rece
ived
loan
s54
2 77
2-
--
--
--
--
--
--
Rece
ived
loan
s for
wor
king
cap
ital
--
--
--
--
--
--
--
-54
2 77
254
2 77
2-
--
--
--
--
--
Inve
stmen
t in
equit
y ca
pita
l13
5 69
3-
--
--
--
--
--
--
634
200
725
258
46 3
6249
117
56 8
6956
869
56 8
6956
869
74 7
9182
632
77 0
3256
869
56 8
6954
113
66 9
4712
1 30
1-
3 12
910
880
10 8
8010
880
10 8
8010
880
20 6
0313
658
10 8
8010
880
7 75
1
-5
601
5 60
135
461
60 7
916
079
6 07
96
079
6 07
96
079
6 07
96
079
6 07
96
079
6 07
99
755
16 7
231
672
1 67
21
672
1 67
21
672
1 67
21
672
1 67
21
672
1 67
26
592
6 59
265
965
965
965
965
965
965
965
965
965
94
481
8 96
189
689
689
689
689
689
689
689
689
689
6-
4 48
12
240
2 24
0-
8 00
012
000
1 20
01
200
1 20
01
200
1 20
01
200
1 20
01
200
1 20
01
200
--
--
24%
2 65
76
152
-37
337
337
337
337
337
32
255
911
373
373
--
--
Cor
rect
ion
of V
AT
--
II In
vest
men
t cas
h flo
w67
3 03
7-
--
--
--
--
--
--
Boat
and
buil
ding
s10
0 00
0-
--
--
--
--
--
--
Equip
men
t and
mac
hiner
y56
000
--
--
--
--
--
--
-38
6 77
2-
--
--
--
--
--
--
130
265
--
--
--
--
--
--
-II
I Fin
anci
al c
ash
flow
(105
784
)60
3 95
746
362
45 9
8845
988
45 9
8845
988
45 9
8863
911
62 0
2963
374
45 9
8845
988
46 3
62C
osts
for l
oan
-54
2 77
245
231
45 2
3145
231
45 2
3145
231
45 2
3145
231
45 2
3145
231
45 2
3145
231
45 2
31In
tere
st pa
ymen
t27
139
13 5
691
131
1 13
11
131
1 13
11
131
1 13
11
131
1 13
11
131
1 13
11
131
1 13
1Pa
id d
ivide
nd-
--
--
--
--
--
--
-(1
32 9
23)
47 6
16-
(373
)(3
73)
(373
)(3
73)
(373
)17
549
15 6
6817
012
(373
)(3
73)
--
36 4
4710
0 36
353
2 85
848
0 88
642
1 16
336
1 43
930
1 71
624
1 99
325
6 94
826
4 06
227
6 77
721
7 05
315
7 33
010
0 36
3
Paid
VA
T fo
r inv
estm
ent
VA
TIn
com
e ta
x
Fina
ncin
g ca
sh fl
ow
Out
goin
g ca
sh fl
ow
Prod
uctio
n co
sts
Oth
er e
quip
men
t
Adm
inistr
ative
cos
ts
Tran
spor
t cos
tsU
nexp
ecte
d
Rece
ived
VA
T fro
m in
vestm
ent
VA
T pa
ymen
t
Cas
h flo
w at
the
end
of th
e ye
ar
Oth
er ta
xes
Long
line
Cas
h flo
w
Supp
ort
Rese
arch
in la
boar
oty
Salar
ies
Inco
mes
from
reali
satio
n of
inve
stmen
t
Socia
l tax
Sale
s co
sts
Adm
inis
trat
ive
cost
s
Unit
s, EU
RC
ash
flow
at th
e be
ginn
ing
of th
e ye
ar
Ope
ratin
g ca
sh fl
ow, c
osts
Prod
uctio
n co
sts
Oth
er in
com
es
Inco
min
g ca
sh fl
owI.
Ope
ratin
g ca
sh fl
owFi
nland
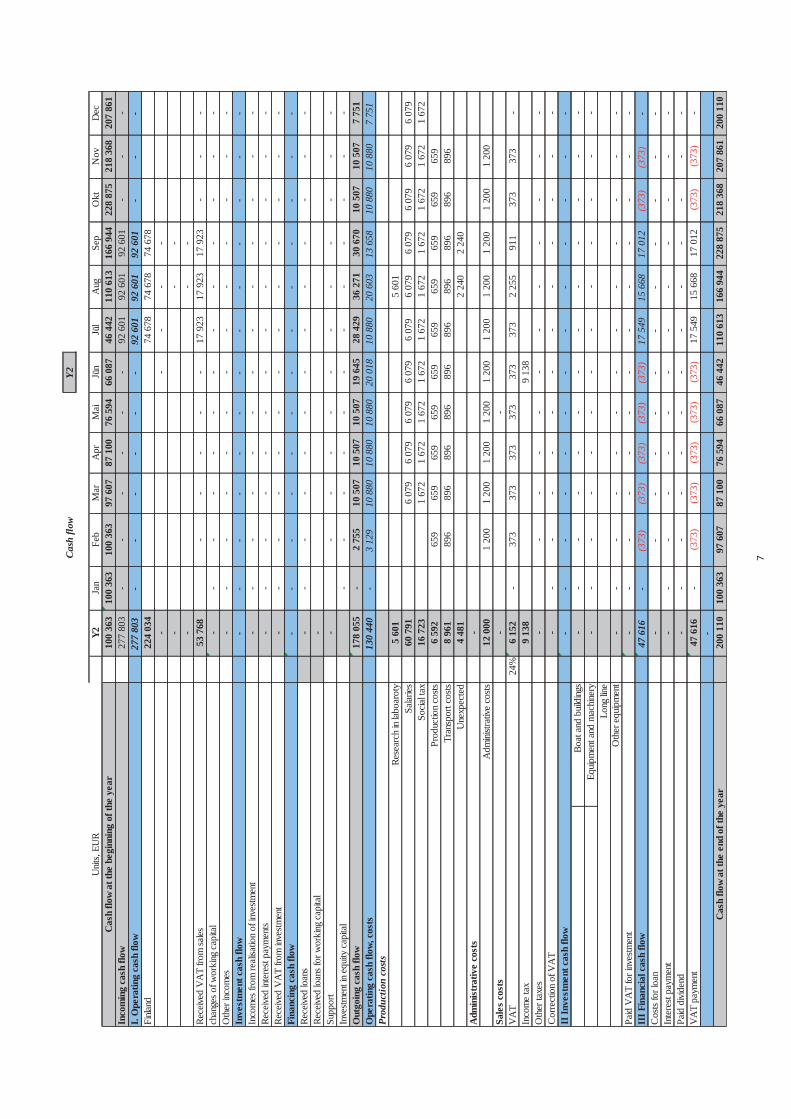
7
Cas
h flo
wY2
Y2Ja
nFe
bM
arA
prM
aiJū
nJū
lA
ugSe
pO
ktN
ovD
ec10
0 36
310
0 36
310
0 36
397
607
87 1
0076
594
66 0
8746
442
110
613
166
944
228
875
218
368
207
861
277
803
--
--
--
92 6
0192
601
92 6
01-
--
277
803
--
--
--
92 6
0192
601
92 6
01-
--
224
034
74 6
7874
678
74 6
78-
--
--
--
--
--
Rece
ived
VA
T fro
m sa
les53
768
--
--
-17
923
17 9
2317
923
--
-ch
ange
s of w
orki
ng c
apita
l-
--
--
--
--
--
--
--
--
--
--
--
--
-In
vest
men
t cas
h flo
w-
--
--
--
--
--
--
--
--
--
--
--
--
-Re
ceive
d int
eres
t pay
men
ts-
--
--
--
--
--
--
--
--
--
--
--
--
--
--
--
--
--
--
--
Rece
ived
loan
s-
--
--
--
--
--
--
Rece
ived
loan
s for
wor
king
cap
ital
- --
--
--
--
--
--
Inve
stmen
t in
equit
y ca
pita
l-
--
--
--
--
--
-17
8 05
5-
2 75
510
507
10 5
0710
507
19 6
4528
429
36 2
7130
670
10 5
0710
507
7 75
113
0 44
0-
3 12
910
880
10 8
8010
880
20 0
1810
880
20 6
0313
658
10 8
8010
880
7 75
1
5 60
15
601
60 7
916
079
6 07
96
079
6 07
96
079
6 07
96
079
6 07
96
079
6 07
916
723
1 67
21
672
1 67
21
672
1 67
21
672
1 67
21
672
1 67
21
672
6 59
265
965
965
965
965
965
965
965
965
965
98
961
896
896
896
896
896
896
896
896
896
896
4 48
12
240
2 24
0-
12 0
001
200
1 20
01
200
1 20
01
200
1 20
01
200
1 20
01
200
1 20
0-
-24
%6
152
-37
337
337
337
337
337
32
255
911
373
373
-9
138
9 13
8-
--
--
--
--
--
-C
orre
ctio
n of
VA
T-
--
--
--
--
--
--
II In
vest
men
t cas
h flo
w-
--
--
--
--
--
--
Boat
and
buil
ding
s-
--
--
--
--
--
--
Equip
men
t and
mac
hiner
y-
--
--
--
--
--
--
--
--
--
--
--
--
--
--
--
--
--
--
--
III F
inan
cial
cas
h flo
w47
616
-(3
73)
(373
)(3
73)
(373
)(3
73)
17 5
4915
668
17 0
12(3
73)
(373
)-
Cos
ts fo
r loa
n-
--
--
--
--
--
-In
tere
st pa
ymen
t-
--
--
--
--
--
--
Paid
divi
dend
--
--
--
--
--
--
-47
616
-(3
73)
(373
)(3
73)
(373
)(3
73)
17 5
4915
668
17 0
12(3
73)
(373
)-
-20
0 11
010
0 36
397
607
87 1
0076
594
66 0
8746
442
110
613
166
944
228
875
218
368
207
861
200
110
Paid
VA
T fo
r inv
estm
ent
VA
TIn
com
e ta
x
Fina
ncin
g ca
sh fl
ow
Out
goin
g ca
sh fl
ow
Prod
uctio
n co
sts
Oth
er e
quip
men
t
Adm
inistr
ative
cos
ts
Tran
spor
t cos
tsU
nexp
ecte
d
Rece
ived
VA
T fro
m in
vestm
ent
VA
T pa
ymen
t
Cas
h flo
w at
the
end
of th
e ye
ar
Oth
er ta
xes
Long
line
Supp
ort
Rese
arch
in la
boar
oty
Salar
ies
Inco
mes
from
reali
satio
n of
inve
stmen
t
Socia
l tax
Sale
s co
sts
Adm
inis
trat
ive
cost
s
Unit
s, EU
RC
ash
flow
at th
e be
ginn
ing
of th
e ye
ar
Ope
ratin
g ca
sh fl
ow, c
osts
Prod
uctio
n co
sts
Oth
er in
com
es
Inco
min
g ca
sh fl
owI.
Ope
ratin
g ca
sh fl
owFi
nland
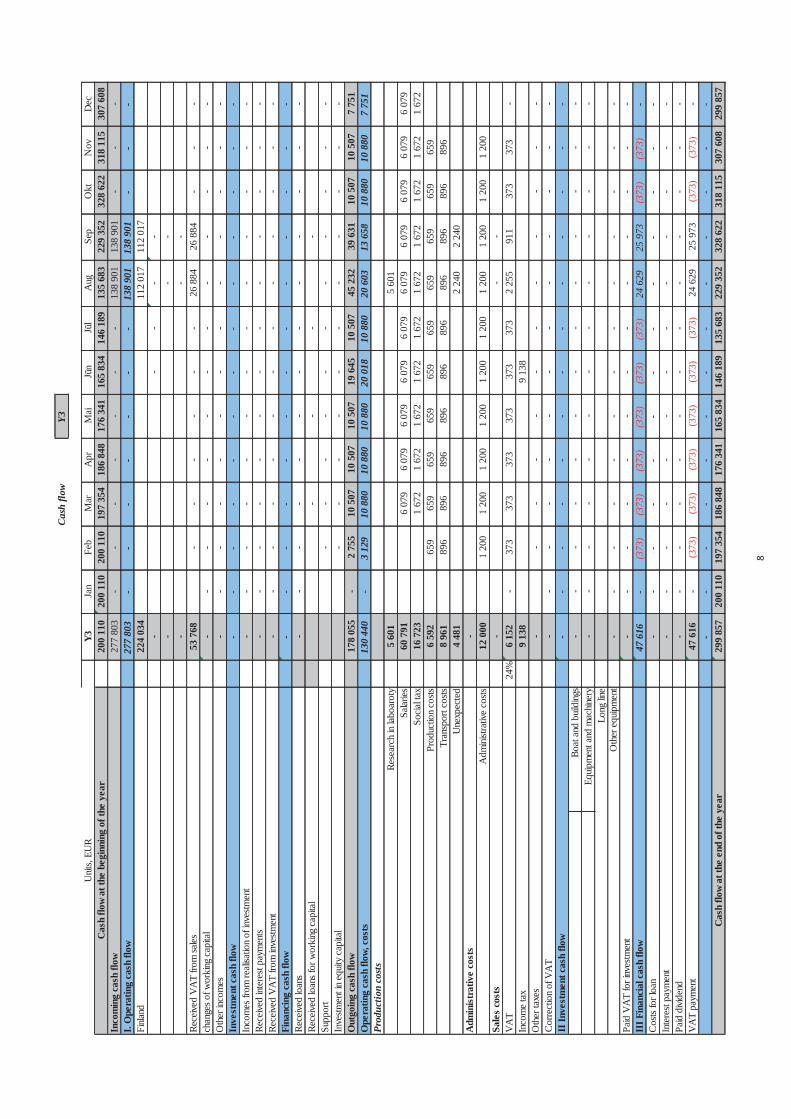
8
Y3
Y3Ja
nFe
bM
arA
prM
aiJū
nJū
lA
ugSe
pO
ktN
ovD
ec20
0 11
020
0 11
020
0 11
019
7 35
418
6 84
817
6 34
116
5 83
414
6 18
913
5 68
322
9 35
232
8 62
231
8 11
530
7 60
827
7 80
3-
--
--
--
138
901
138
901
--
-27
7 80
3-
--
--
--
138
901
138
901
--
-22
4 03
411
2 01
711
2 01
7-
--
--
--
--
--
Rece
ived
VA
T fro
m sa
les53
768
--
--
--
26 8
8426
884
--
-ch
ange
s of w
orki
ng c
apita
l-
--
--
--
--
--
--
--
--
--
--
--
--
-In
vest
men
t cas
h flo
w-
--
--
--
--
--
--
--
--
--
--
--
--
-Re
ceive
d int
eres
t pay
men
ts-
--
--
--
--
--
--
--
--
--
--
--
--
--
--
--
--
--
--
--
Rece
ived
loan
s-
--
--
--
--
--
--
Rece
ived
loan
s for
wor
king
cap
ital
--
--
--
--
--
--
--
-In
vestm
ent i
n eq
uity
capi
tal
--
--
--
--
--
-17
8 05
5-
2 75
510
507
10 5
0710
507
19 6
4510
507
45 2
3239
631
10 5
0710
507
7 75
113
0 44
0-
3 12
910
880
10 8
8010
880
20 0
1810
880
20 6
0313
658
10 8
8010
880
7 75
1
5 60
15
601
60 7
916
079
6 07
96
079
6 07
96
079
6 07
96
079
6 07
96
079
6 07
916
723
1 67
21
672
1 67
21
672
1 67
21
672
1 67
21
672
1 67
21
672
6 59
265
965
965
965
965
965
965
965
965
965
98
961
896
896
896
896
896
896
896
896
896
896
4 48
12
240
2 24
0-
12 0
001
200
1 20
01
200
1 20
01
200
1 20
01
200
1 20
01
200
1 20
0-
--
24%
6 15
2-
373
373
373
373
373
373
2 25
591
137
337
3-
9 13
89
138
--
--
--
--
--
--
Cor
rect
ion
of V
AT
--
--
--
--
--
--
-II
Inve
stm
ent c
ash
flow
--
--
--
--
--
--
-Bo
at a
nd b
uildi
ngs
--
--
--
--
--
--
-Eq
uipm
ent a
nd m
achin
ery
--
--
--
--
--
--
-
--
--
--
--
--
--
--
--
--
--
--
--
--
III F
inan
cial
cas
h flo
w47
616
-(3
73)
(373
)(3
73)
(373
)(3
73)
(373
)24
629
25 9
73(3
73)
(373
)-
Cos
ts fo
r loa
n-
--
--
--
--
--
--
Inte
rest
paym
ent
--
--
--
--
--
--
-Pa
id d
ivide
nd-
--
--
--
--
--
--
47 6
16-
(373
)(3
73)
(373
)(3
73)
(373
)(3
73)
24 6
2925
973
(373
)(3
73)
--
--
--
--
--
--
--
299
857
200
110
197
354
186
848
176
341
165
834
146
189
135
683
229
352
328
622
318
115
307
608
299
857
Paid
VA
T fo
r inv
estm
ent
VA
TIn
com
e ta
x
Fina
ncin
g ca
sh fl
ow
Out
goin
g ca
sh fl
ow
Prod
uctio
n co
sts
Oth
er e
quip
men
t
Adm
inistr
ative
cos
ts
Tran
spor
t cos
tsU
nexp
ecte
d
Rece
ived
VA
T fro
m in
vestm
ent
Cas
h flo
w
VA
T pa
ymen
t
Cas
h flo
w at
the
end
of th
e ye
ar
Oth
er ta
xes
Long
line
Supp
ort
Rese
arch
in la
boar
oty
Salar
ies
Inco
mes
from
reali
satio
n of
inve
stmen
t
Socia
l tax
Sale
s co
sts
Adm
inis
trat
ive
cost
s
Unit
s, EU
RC
ash
flow
at th
e be
ginn
ing
of th
e ye
ar
Ope
ratin
g ca
sh fl
ow, c
osts
Prod
uctio
n co
sts
Oth
er in
com
es
Inco
min
g ca
sh fl
owI.
Ope
ratin
g ca
sh fl
owFi
nland
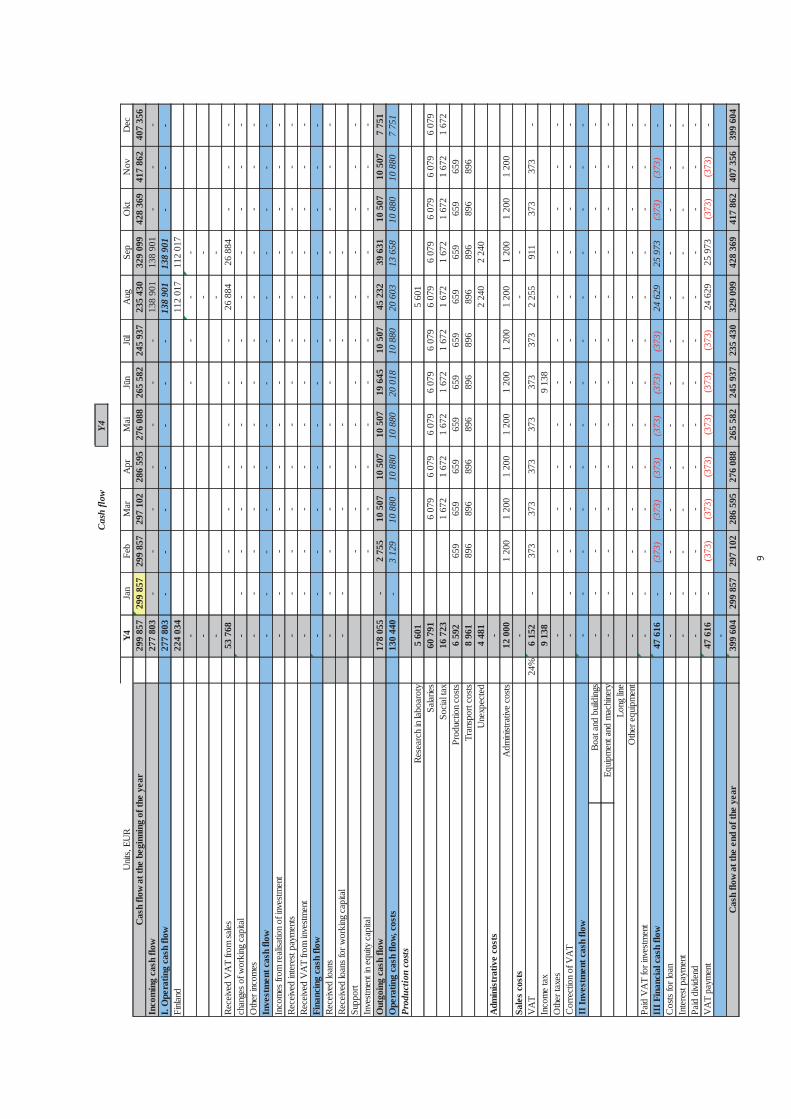
9
Y4
Y4Ja
nFe
bM
arA
prM
aiJū
nJū
lA
ugSe
pO
ktN
ovD
ec29
9 85
729
9 85
729
9 85
729
7 10
228
6 59
527
6 08
826
5 58
224
5 93
723
5 43
032
9 09
942
8 36
941
7 86
240
7 35
627
7 80
3-
--
--
--
138
901
138
901
--
-27
7 80
3-
--
--
--
138
901
138
901
--
-22
4 03
411
2 01
711
2 01
7-
--
--
--
--
--
Rece
ived
VA
T fro
m sa
les53
768
--
--
--
26 8
8426
884
--
-ch
ange
s of w
orki
ng c
apita
l-
--
--
--
--
--
--
--
--
--
--
--
--
-In
vest
men
t cas
h flo
w-
--
--
--
--
--
--
--
--
--
--
--
--
-Re
ceive
d int
eres
t pay
men
ts-
--
--
--
--
--
--
--
--
--
--
--
--
--
--
--
--
--
--
--
Rece
ived
loan
s-
--
--
--
--
--
--
Rece
ived
loan
s for
wor
king
cap
ital
--
--
--
--
--
--
--
--
-In
vestm
ent i
n eq
uity
capi
tal
--
--
--
--
--
-17
8 05
5-
2 75
510
507
10 5
0710
507
19 6
4510
507
45 2
3239
631
10 5
0710
507
7 75
113
0 44
0-
3 12
910
880
10 8
8010
880
20 0
1810
880
20 6
0313
658
10 8
8010
880
7 75
1
5 60
15
601
60 7
916
079
6 07
96
079
6 07
96
079
6 07
96
079
6 07
96
079
6 07
916
723
1 67
21
672
1 67
21
672
1 67
21
672
1 67
21
672
1 67
21
672
6 59
265
965
965
965
965
965
965
965
965
965
98
961
896
896
896
896
896
896
896
896
896
896
4 48
12
240
2 24
0-
12 0
001
200
1 20
01
200
1 20
01
200
1 20
01
200
1 20
01
200
1 20
0-
--
24%
6 15
2-
373
373
373
373
373
373
2 25
591
137
337
3-
9 13
89
138
--
--
--
--
--
--
Cor
rect
ion
of V
AT
--
--
--
--
--
--
-II
Inve
stm
ent c
ash
flow
--
--
--
--
--
--
-Bo
at a
nd b
uildi
ngs
--
--
--
--
--
--
-Eq
uipm
ent a
nd m
achin
ery
--
--
--
--
--
--
-
--
--
--
--
--
--
--
--
--
--
--
--
--
III F
inan
cial
cas
h flo
w47
616
-(3
73)
(373
)(3
73)
(373
)(3
73)
(373
)24
629
25 9
73(3
73)
(373
)-
Cos
ts fo
r loa
n-
--
--
--
--
--
--
Inte
rest
paym
ent
--
--
--
--
--
--
-Pa
id d
ivide
nd-
--
--
--
--
--
--
47 6
16-
(373
)(3
73)
(373
)(3
73)
(373
)(3
73)
24 6
2925
973
(373
)(3
73)
--
399
604
299
857
297
102
286
595
276
088
265
582
245
937
235
430
329
099
428
369
417
862
407
356
399
604
Paid
VA
T fo
r inv
estm
ent
VA
TIn
com
e ta
x
Fina
ncin
g ca
sh fl
ow
Out
goin
g ca
sh fl
ow
Prod
uctio
n co
sts
Oth
er e
quip
men
t
Adm
inistr
ative
cos
ts
Tran
spor
t cos
tsU
nexp
ecte
d
Rece
ived
VA
T fro
m in
vestm
ent
Cas
h flo
w
VA
T pa
ymen
t
Cas
h flo
w at
the
end
of th
e ye
ar
Oth
er ta
xes
Long
line
Supp
ort
Rese
arch
in la
boar
oty
Salar
ies
Inco
mes
from
reali
satio
n of
inve
stmen
t
Socia
l tax
Sale
s co
sts
Adm
inis
trat
ive
cost
s
Unit
s, EU
RC
ash
flow
at th
e be
ginn
ing
of th
e ye
ar
Ope
ratin
g ca
sh fl
ow, c
osts
Prod
uctio
n co
sts
Oth
er in
com
es
Inco
min
g ca
sh fl
owI.
Ope
ratin
g ca
sh fl
owFi
nland

3.3.3Baltic Ecomussel
Business PlanLatvia
2013
2
Disclaimer: The contents of the document reflect the authors’ views. The Managing Authority of the Central Baltic INTERREG IV A Programme cannot be held liable for information published by the project partners.
2
Abbreviation
B.C. before century
cm centimetre
CV curriculum vitae
EBITDA Earnings Before Interest, Taxes, Depreciation and Amortization
ERDF European Regional Development Fund
EXW Ex-‐Works (a trade term requiring the seller to deliver goods at his or her own place of business. All other transportation costs and risks are assumed by the buyer)
FAO Food and Agriculture organization of the United Nations
g gram
kg kilogram
GDP gross domestic product
IRR internal rate of return
LEIF Latvian Environmental Investment Fund
M million
MEUR million euros
MIRR modified internal rate of return
mth month
NPV Net present value
Qty quantity
T thousand
t ton
TEUR thousand euros
Y year
Abbreviations
3
3
Index
1. GENERAL INFORMATION ABOUT THE COMPANY .............................................................................6
1.1. General information about the company ......................................................................................... 6 1.2. Baltic EcoMussel Ltd. objectives ....................................................................................................... 6
2. PROJECT IMPLEMENTATION.............................................................................................................7
2.1. Project objective ............................................................................................................................... 7 2.2. Project implementation capacity...................................................................................................... 7 2.3. Product ............................................................................................................................................. 8 2.4. Strategic segmentation..................................................................................................................... 9 2.5. Financial Resources......................................................................................................................... 10 2.6. Investment plan .............................................................................................................................. 11 2.7. Project implementation timetable ................................................................................................. 15
3. MARKET ANALYSIS .........................................................................................................................16
3.1. Sector overview -‐ fishery and aquaculture ..................................................................................... 16 3.2. Blue mussel fishery in Latvia ........................................................................................................... 21 3.3. Prognosis of mussels volume.......................................................................................................... 24 3.4. Competitors .................................................................................................................................... 25 3.5. Financial indicators of industry ....................................................................................................... 26
4. RISK EVALUATION AND ANALYSIS OF TECHNICAL ASPECTS.............................................................33
5. SWOT.............................................................................................................................................35
6. FINANCIAL BASIS OF THE PROJECT .................................................................................................36
6.1. Revenue Plan .................................................................................................................................. 36 6.2. Costs Plan........................................................................................................................................ 36 6.3. Profit and Loss Statement............................................................................................................... 38 6.4. Risk analysis .................................................................................................................................... 38 6.5. Cash flow......................................................................................................................................... 38 6.6. Balance forecast.............................................................................................................................. 40 6.7. Project profitability calculation....................................................................................................... 42 6.8. Sensitivity analysis .......................................................................................................................... 43
4
4
FIGURES
Figure 1; Mussels of the Baltic Sea ...............................................................................................................8
Figure 2; Mussel outlets ...............................................................................................................................9
Figure 3; Structure of financial resources...................................................................................................10
Figure 4; World GDP (1984-‐2012) and fishery trade and production (1984-‐2009), trillion EUR ...............17
Figure 5; Global fishery production in the capture and aquaculture M t, 1950-‐2010 and average
consumption per capita kg .........................................................................................................................18
Figure 6; Share of global commodity trade and production by groups (in EUR), 1976-‐2009 .....................19
Figure 7; Share of global commodity trade and production by groups (in tons), 1976-‐2009.....................19
Figure 8; Fishery and mussels production and trade in the world (M tons), 1950-‐2010............................20
Figure 9; Fishing of blue mussel in the world 1950-‐2010 (tons).................................................................22
Figure 10; Average mussel price, per kg, EUR ............................................................................................23
Figure 11; Average blue mussels price produced in aquaculture, per kg, EUR ..........................................23
Figure 12; Prognosis of mussels volume, M tons 1950-‐2040 .....................................................................24
Figure 13; The main market players ...........................................................................................................25
5
5
TABLES
Table 1; Investment plan -‐ boat...............................................................................................................11
Table 2; Equipment..................................................................................................................................12
Table 3; Spawling line ..............................................................................................................................13
Table 4; Investment plan -‐ labour costs...................................................................................................14
Table 5; Timetable of for farm establishment .........................................................................................15
Table 6; Financial data, balance...............................................................................................................26
Table 7; Financial data, profit and loss statement...................................................................................27
Table 8; Financial indicators 2007-‐2011 of Snadder og Snaskum............................................................27
Table 9; General characteristics of financial indicators ...........................................................................28
Table 10; Financial data, balance.............................................................................................................29
Table 11; Financial data, profit and loss statement.................................................................................29
Table 12; Financial indicators 2008-‐2011 of Fiskebäcks Seafood AB.......................................................30
Table 13; Main financial data in 2011......................................................................................................31
Table 14; The general characteristics of financial indicators of these 4 companies................................31
Table 15; Turnover...................................................................................................................................36
Table 16; Production costs ......................................................................................................................36
Table 17; Calculation of salaries ..............................................................................................................36
Table 18; Profit and loss statement.........................................................................................................38
Table 19; Calculation of risk rate .............................................................................................................38
Table 20; Financial plan ...........................................................................................................................39
Table 21; Cash flow forecast....................................................................................................................40
Table 22; Balance forecast.......................................................................................................................41
Table 23; Calculation of main financial indicators ...................................................................................41
6
6
1. General information about the company
1.1. General information about the company Name of company Baltic EcoMussel Ltd.
Industry (NACE 2.0) 03.21. Marine aquaculture -‐ mussel farming; 03.11 Marine fishing
Address Liepaja, Graudu street 1.
Date of registration 2013.01.01.
Managing director Jānis Bērziņš who has fisherman's experience more than 5 years.
1.2. Baltic EcoMussel Ltd. objectives Baltic EcoMussel Ltd. goals:
• Provide local market with blue mussels
• Improve the water quality in the Baltic Sea
• Remove nitrogen and phosphorus from the Baltic Sea
• Provide chicken and fish meal producers with blue mussel.
The company's long-‐term objectives:
• Increase the potential of mussel by involving in researching project
• Evaluate most potential mussel processing process by involving in researching project.
Baltic EcoMussel Ltd. aim will be supported by the following factors
• Demand for blue mussels has a tendency to increase
• Increase of business activities will increase due to support from government.
7
7
2. Project implementation
2.1. Project objective In order to improve the sector development:
• Establishing a mussel farm in Latvia;
• Reducing pollution in the Baltic Sea.
Also the mussels reduce nitrogen and phosphorus in water, thus purify water in the Baltic Sea and provide better conditions for fish.
• Providing local market with mussels (fish feed, fertilizers, pharmacy and less human consumption);
• Increasing production amount for local producer located around the Baltic Sea.
Also several industries, like fish and chicken meal producers, feel the lack of resources and due to this reason the amount of imported mussel increases and carbon dioxin pollution increases, too.
• Increasing of employment in fishery sector.
According to the European acts the catch amount of fishes are reduced. This reduction influences employment in regions. So the manager should not involve other persons from other field and their experience working in the sea will reduce some risks and increase success of business.
Overall, the mussel farming has a lot of environmental and economic benefits looking on the Baltic Sea in sustainable manner.
2.2. Project implementation capacity Management staff profile
Baltic EcoMussel Ltd. is managed by the fisherman who has more than 5 years' experience of working in the
Baltic Sea.
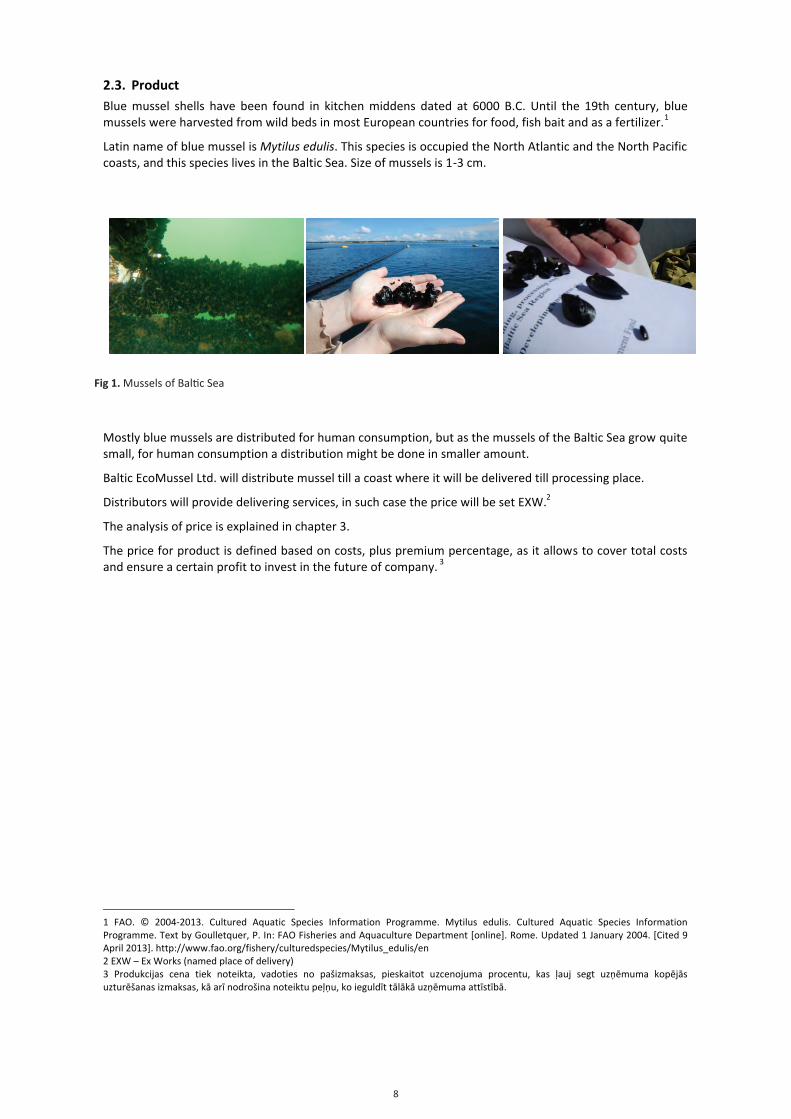
8
8
2.3. Product Blue mussel shells have been found in kitchen middens dated at 6000 B.C. Until the 19th century, blue mussels were harvested from wild beds in most European countries for food, fish bait and as a fertilizer.1
Latin name of blue mussel is Mytilus edulis. This species is occupied the North Atlantic and the North Pacific coasts, and this species lives in the Baltic Sea. Size of mussels is 1-‐3 cm.
Mostly blue mussels are distributed for human consumption, but as the mussels of the Baltic Sea grow quite small, for human consumption a distribution might be done in smaller amount.
Baltic EcoMussel Ltd. will distribute mussel till a coast where it will be delivered till processing place.
Distributors will provide delivering services, in such case the price will be set EXW.2
The analysis of price is explained in chapter 3.
The price for product is defined based on costs, plus premium percentage, as it allows to cover total costs and ensure a certain profit to invest in the future of company. 3
1 FAO. © 2004-‐2013. Cultured Aquatic Species Information Programme. Mytilus edulis. Cultured Aquatic Species Information Programme. Text by Goulletquer, P. In: FAO Fisheries and Aquaculture Department [online]. Rome. Updated 1 January 2004. [Cited 9 April 2013]. http://www.fao.org/fishery/culturedspecies/Mytilus_edulis/en 2 EXW – Ex Works (named place of delivery) 3 Produkcijas cena tiek noteikta, vadoties no pašizmaksas, pieskaitot uzcenojuma procentu, kas ļauj segt uzņēmuma kopējās uzturēšanas izmaksas, kā arī nodrošina noteiktu peļņu, ko ieguldīt tālākā uzņēmuma attīstībā.
Figure 1; Mussels of the Baltic Sea
Fig 1. Mussels of Baltic Sea
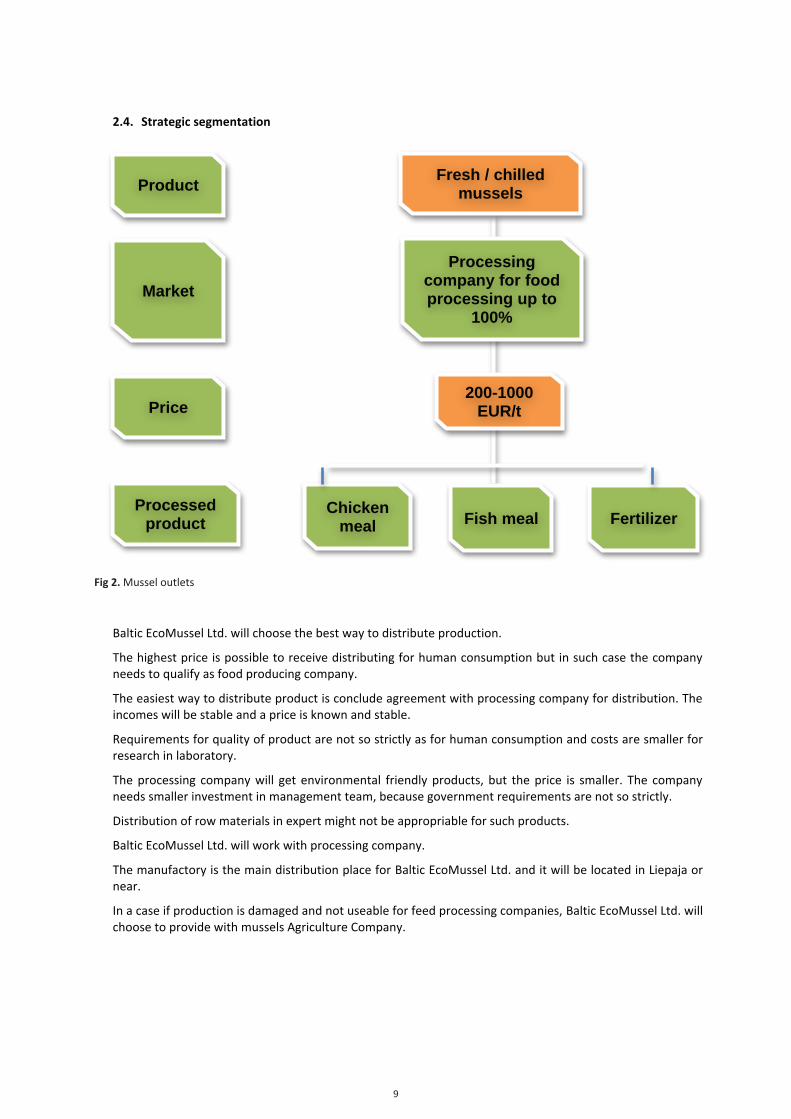
9
9
2.4. Strategic segmentation
Baltic EcoMussel Ltd. will choose the best way to distribute production.
The highest price is possible to receive distributing for human consumption but in such case the company needs to qualify as food producing company.
The easiest way to distribute product is conclude agreement with processing company for distribution. The incomes will be stable and a price is known and stable.
Requirements for quality of product are not so strictly as for human consumption and costs are smaller for research in laboratory.
The processing company will get environmental friendly products, but the price is smaller. The company needs smaller investment in management team, because government requirements are not so strictly.
Distribution of row materials in expert might not be appropriable for such products.
Baltic EcoMussel Ltd. will work with processing company.
The manufactory is the main distribution place for Baltic EcoMussel Ltd. and it will be located in Liepaja or near.
In a case if production is damaged and not useable for feed processing companies, Baltic EcoMussel Ltd. will choose to provide with mussels Agriculture Company.
Fresh / chilled mussels
200-1000 EUR/t
Processing company for food processing up to
100%
Chicken meal Fish meal Fertilizer
Product
Market
Price
Processed product
Figure 2; Mussel outlets
Fig 2. Mussel outlets
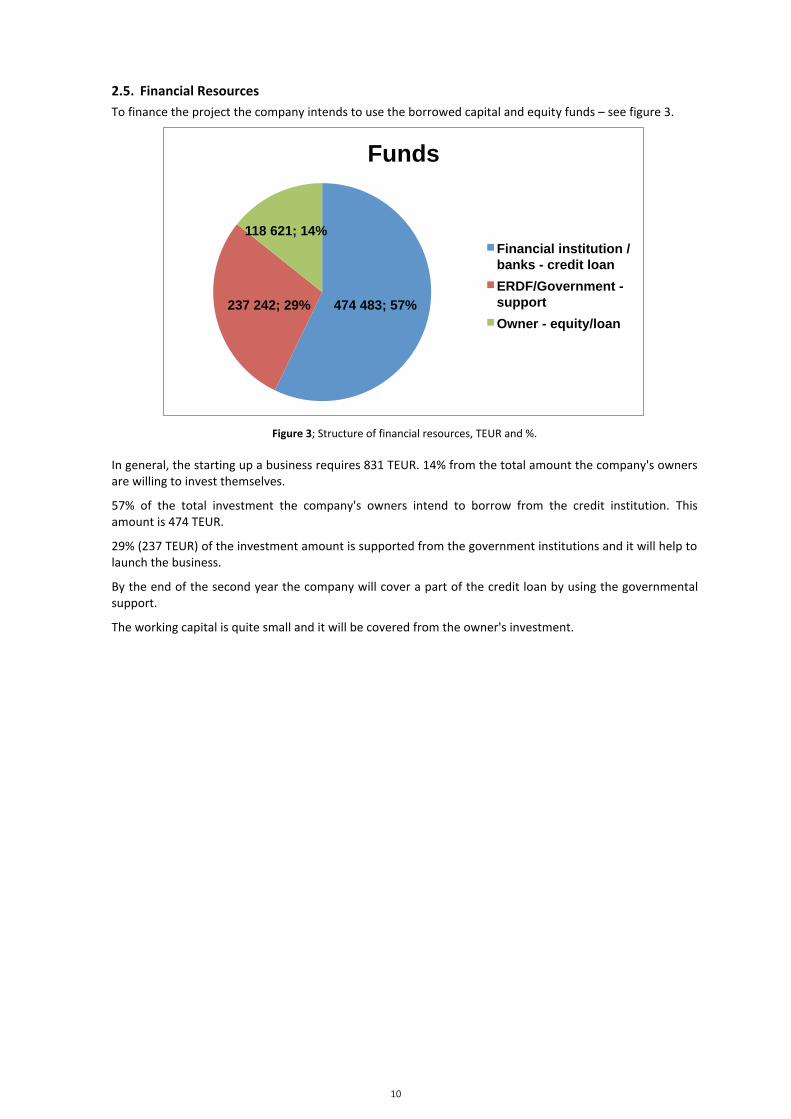
10
10
2.5. Financial Resources To finance the project the company intends to use the borrowed capital and equity funds – see figure 3.
Figure 3; Structure of financial resources, TEUR and %.
In general, the starting up a business requires 831 TEUR. 14% from the total amount the company's owners are willing to invest themselves.
57% of the total investment the company's owners intend to borrow from the credit institution. This amount is 474 TEUR.
29% (237 TEUR) of the investment amount is supported from the government institutions and it will help to launch the business.
By the end of the second year the company will cover a part of the credit loan by using the governmental support.
The working capital is quite small and it will be covered from the owner's investment.
474 483; 57% 237 242; 29%
118 621; 14%
Funds
Financial institution / banks - credit loan ERDF/Government - support Owner - equity/loan

11
11
2.6.
Inv
estm
ent p
lan
Tabl
e 1;
Inve
stm
ent pl
an -‐
boat
La
nd, b
uild
ing,
ves
sel,
boat
qty
Price
Sum
Y0
Y5
Serv
ice
leng
th
Dep
reciat
ion
1 Bo
at fo
r checking
new
1 100 000
100 000
100 000
12
8 333
Bo
ats
10
0 00
0 10
0 00
0 0
8 33
3 The company might cho
ose to obtain new or used boat for checking the farm
and
harvesting.
A new
boat costs 100 TEU
R, fo
r checking th
e farm
the farm
er might use th
e company's own fisherm
an boat in a case if it is equipped
with
lifting mechanism
.
A service length fo
r a bo
at is set fo
r 5-‐20 years.
If a farm
er uses special equipment for farm
ing, th
e farm
er must o
btain a special boat for harvesting or sho
uld uses harvesting service.
If he/she cho
oses harvesting services, he / she shou
ld not buy a boat.
The total investm
ent w
ould be 100 TEUR. A service length fo
r building is set fo
r 20 years.
There could be som
e difficultie
s to get credit financing fo
r a new boat for start-‐up projects, but it is still accessible if businessman has
another stable business to cover extra costs fo
r blue mussel farming (unexpected expenses).
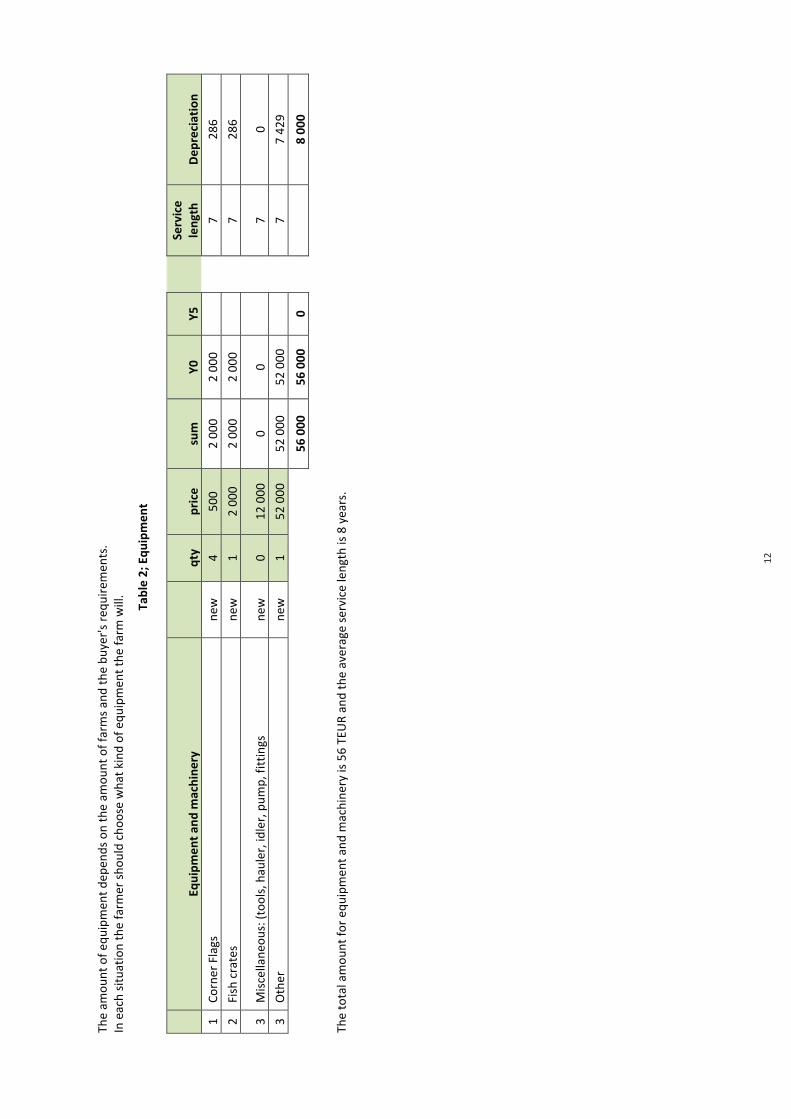
12
12
The am
ount of equipment d
epends on the am
ount of farms and the buyer's requirements.
In each situation the farm
er sho
uld choo
se what kind of equ
ipment the farm
will.
Tabl
e 2;
Equ
ipm
ent
Eq
uipm
ent an
d m
achi
nery
qty
price
sum
Y0
Y5
Serv
ice
leng
th
Dep
reciat
ion
1 Co
rner Flags
new
4 500
2 000
2 000
7 286
2 Fish crates
new
1 2 000
2 000
2 000
7 286
3 Miscellaneou
s: (too
ls, hauler, idler, pum
p, fittings
new
0 12 000
0 0
7 0
3 Other
new
1 52 000
52 000
52 000
7 7 429
56
000
56
000
0
8 00
0 The total amou
nt fo
r equipm
ent and machinery is 56 TEUR and the average service length is 8 years.
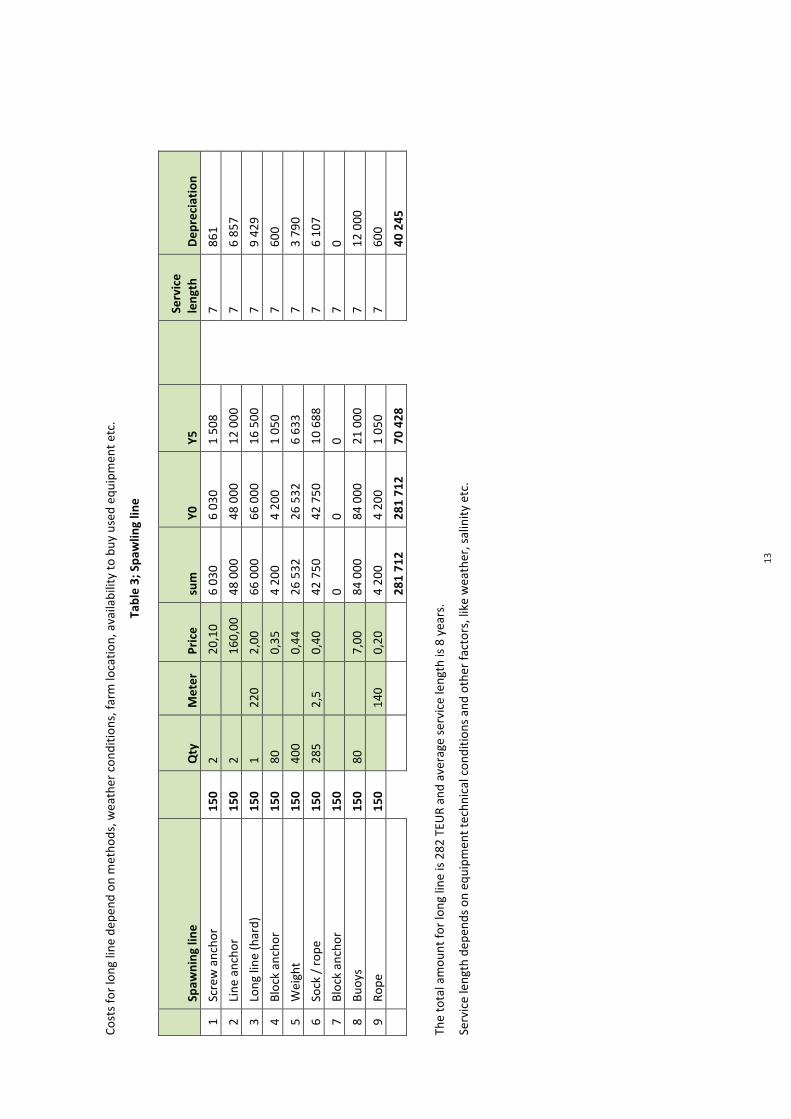
13
13
Costs for long line depend on
metho
ds, w
eather con
ditio
ns, farm locatio
n, availability to buy used equipm
ent e
tc.
Tabl
e 3;
Spa
wlin
g lin
e
Sp
awni
ng li
ne
Qty
M
eter
Pr
ice
sum
Y0
Y5
Serv
ice
leng
th
Dep
reciat
ion
1
Screw ancho
r 15
0 2
20,10
6 030
6 030
1 508
7
861
2
Line ancho
r 15
0 2
160,00
48 000
48 000
12 000
7
6 857
3
Long line (h
ard)
150
1 220
2,00
66 000
66 000
16 500
7
9 429
4
Block anchor
150
80
0,35
4 200
4 200
1 050
7
600
5
Weight
150
400
0,44
26 532
26 532
6 633
7
3 790
6
Sock / rop
e 15
0 285
2,5
0,40
42 750
42 750
10 688
7
6 107
7
Block anchor
150
0
0 0
7
0
8
Buoys
150
80
7,00
84 000
84 000
21 000
7
12 000
9
Rope
150
140
0,20
4 200
4 200
1 050
7
600
281
712
281
712
70 4
28
7
40 2
45
The total amou
nt fo
r long line is 282 TEU
R and average service length is 8 years.
Service length depends on equipm
ent technical con
ditio
ns and other factors, like weather, salinity etc.
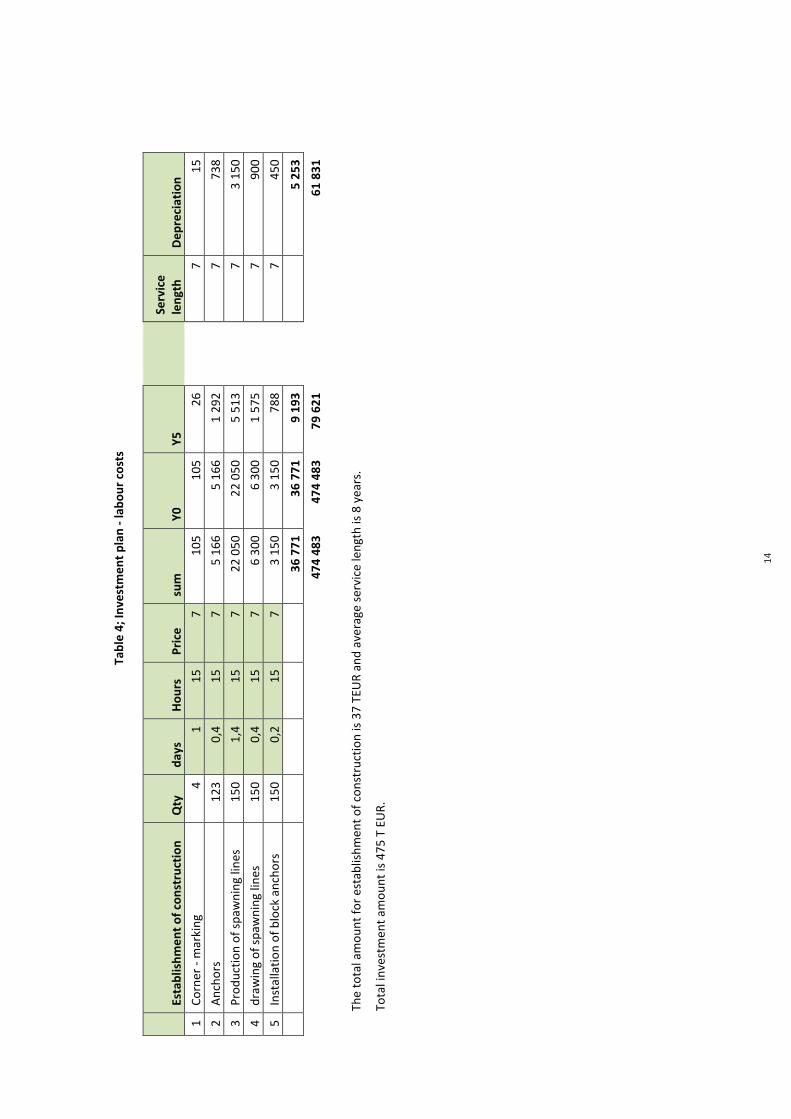
14
14
Ta
ble
4; In
vest
men
t pl
an -‐
labo
ur cos
ts
Es
tabl
ishm
ent of
con
stru
ctio
n Qty
da
ys
Hou
rs
Price
sum
Y0
Y5
Serv
ice
leng
th
Dep
reciat
ion
1 Co
rner -‐ marking
4 1
15
7 105
105
26
7
15
2 Ancho
rs
123
0,4
15
7 5 166
5 166
1 292
7
738
3 Prod
uctio
n of spawning lines
150
1,4
15
7 22 050
22 050
5 513
7
3 150
4 draw
ing of spawning lines
150
0,4
15
7 6 300
6 300
1 575
7
900
5 Installatio
n of block ancho
rs
150
0,2
15
7 3 150
3 150
788
7
450
36 7
71
36 7
71
9 19
3
5
253
474
483
474
483
79 6
21
61 8
31
The total amou
nt fo
r establishm
ent o
f con
struction is 37 TEUR and average service length is 8 years.
Total investm
ent amou
nt is 475 T EUR.
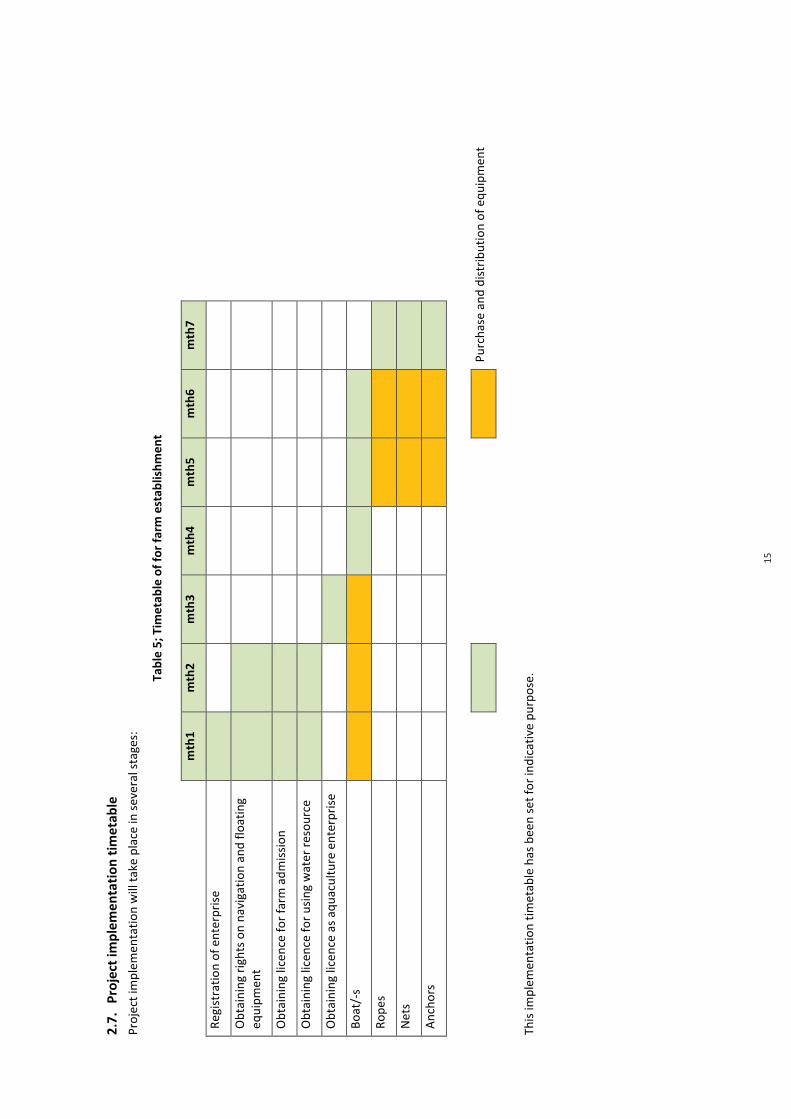
15
15
2.7.
Pro
ject
impl
emen
tation
tim
etab
le
Project implem
entatio
n will take place in several stages:
Tabl
e 5;
Tim
etab
le o
f for
farm
est
ablis
hmen
t
m
th1
mth
2 m
th3
mth
4 m
th5
mth
6 m
th7
Registratio
n of enterprise
Obtaining rights on
navigation and flo
ating
equipm
ent
Obtaining licence for farm
adm
ission
Obtaining licence for using water resou
rce
Obtaining licence as aqu
aculture enterprise
Boat/-‐s
Ropes
Nets
Ancho
rs
Purchase and
distribution of equ
ipment
This im
plem
entatio
n tim
etable has been set for indicative purpose.
16
16
3. Market Analysis
3.1. Sector overview -‐ fishery and aquaculture Introduction of industry analysis
Agriculture has significant influence on people's life, and this sector is responsible for food provision in the world. Still, today a number of people lead their live suffering from hunger. Due to this reason the importance of agriculture increases.
Notwithstanding, the agriculture sector doesn't include such areas as fishery, forestry, these sectors are highly important in overall food providing industries.
Key words:
• Aquaculture: o The farming of aquatic organisms including fish, molluscs, crustaceans and aquatic plants with
some sort of intervention in the rearing process to enhance production, such as regular stocking, feeding, protection from predators, etc. Farming also implies individual or corporate ownership of the stock being cultivated.
o For statistical purposes, aquatic organisms which are harvested by an individual or corporate body, which has owned them throughout their rearing period, contribute to aquaculture.
• Fishery: o Generally, a fishery is an activity leading to harvesting of fish. It may involve capture of wild
fish or rising of fish through aquaculture. o A unit determined by an authority or other entity that is engaged in raising and/or harvesting
fish. Typically, the unit is defined in terms of some or all of the following: involved people, species or type of fish, area of water or seabed, method of fishing, class of boats and purpose of the activities.4
Aquaculture is probably the fastest growing food-‐producing sector.
Many resources used in aquaculture such as water, land, seed, broodstock and feed ingredients are often in short supply. This is so because these resources -‐ or factors of production -‐ are also commonly used in agriculture, an activity with which aquaculture is often integrated, particularly in Asia. It happens that this competition turns into, or is seen as a conflict between user groups. In most countries these conflicts are settled in the market place. Buyers and sellers set the price and thereby determine the use. Thus resource management is clearly needed.
The sector's use of natural resources must ensure long term sustainability, which generally means avoiding adverse effects on the environment. However, information on expected or potential environmental impacts of aquaculture is often incomplete. The use of selected management approaches and the application of a precautionary approach by both farm management and by regulatory organizations can help to avoid making decisions based on incomplete knowledge.
An important aspect in this context is the need for effective controls of fish health management as diseases have become a primary constraint for the growth of aquaculture. Intensive culture practices, with poorly controlled use of feed and production of waste, have adversely affected local environments.
According to the Food and Agriculture organization of the United Nations (hereinafter-‐FAO) information in developing countries the livelihood of over 500 million people directly or indirectly depends on fisheries and aquaculture. Due to several reasons, such as the willingness to increase one's own welfare, it increases the overfishing and reduces fish stocks.
To examine the increase of volume the gross domestic product (GDP) and fishery sectors were analysed.
Gross domestic product (GDP) is the market value of all officially recognized final goods and services produced within a country in a given period.5
4 www.fao.org 5 http://en.wikipedia.org/wiki/Gross_domestic_product
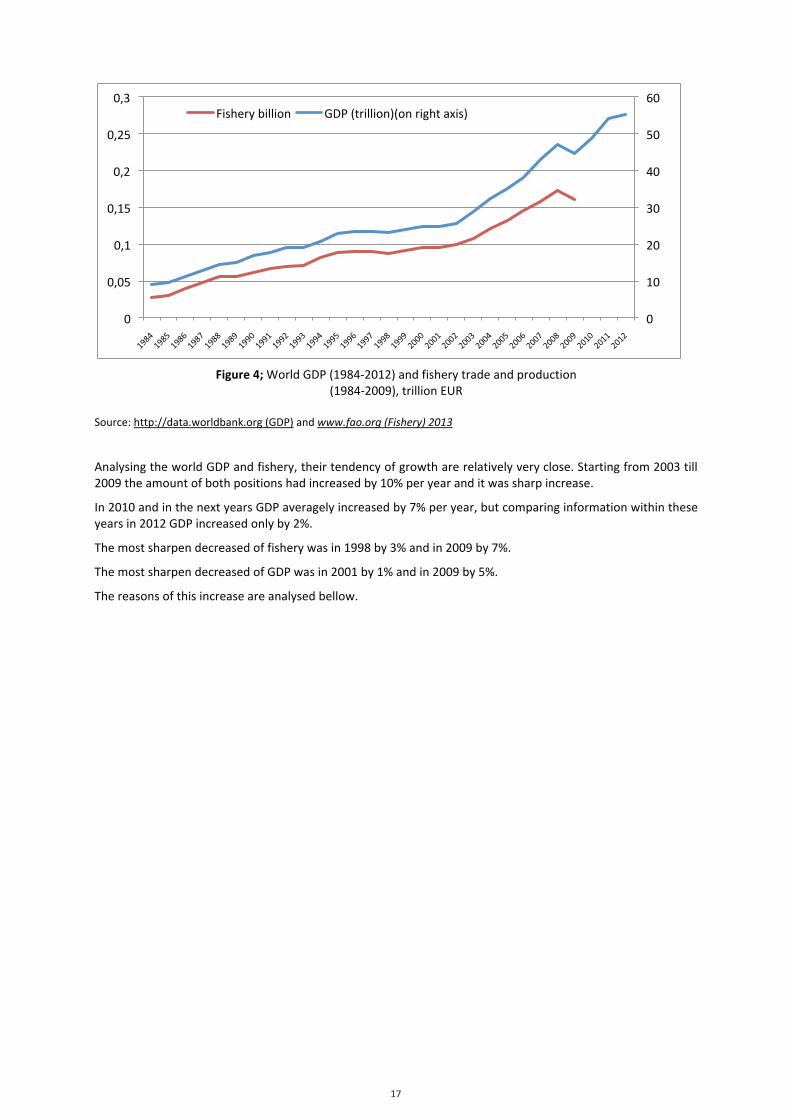
17
17
Figure 4; World GDP (1984-‐2012) and fishery trade and production (1984-‐2009), trillion EUR
Source: http://data.worldbank.org (GDP) and www.fao.org (Fishery) 2013 Analysing the world GDP and fishery, their tendency of growth are relatively very close. Starting from 2003 till 2009 the amount of both positions had increased by 10% per year and it was sharp increase.
In 2010 and in the next years GDP averagely increased by 7% per year, but comparing information within these years in 2012 GDP increased only by 2%.
The most sharpen decreased of fishery was in 1998 by 3% and in 2009 by 7%.
The most sharpen decreased of GDP was in 2001 by 1% and in 2009 by 5%.
The reasons of this increase are analysed bellow.
0
10
20
30
40
50
60
0
0,05
0,1
0,15
0,2
0,25
0,3 Fishery billion GDP (trillion)(on right axis)
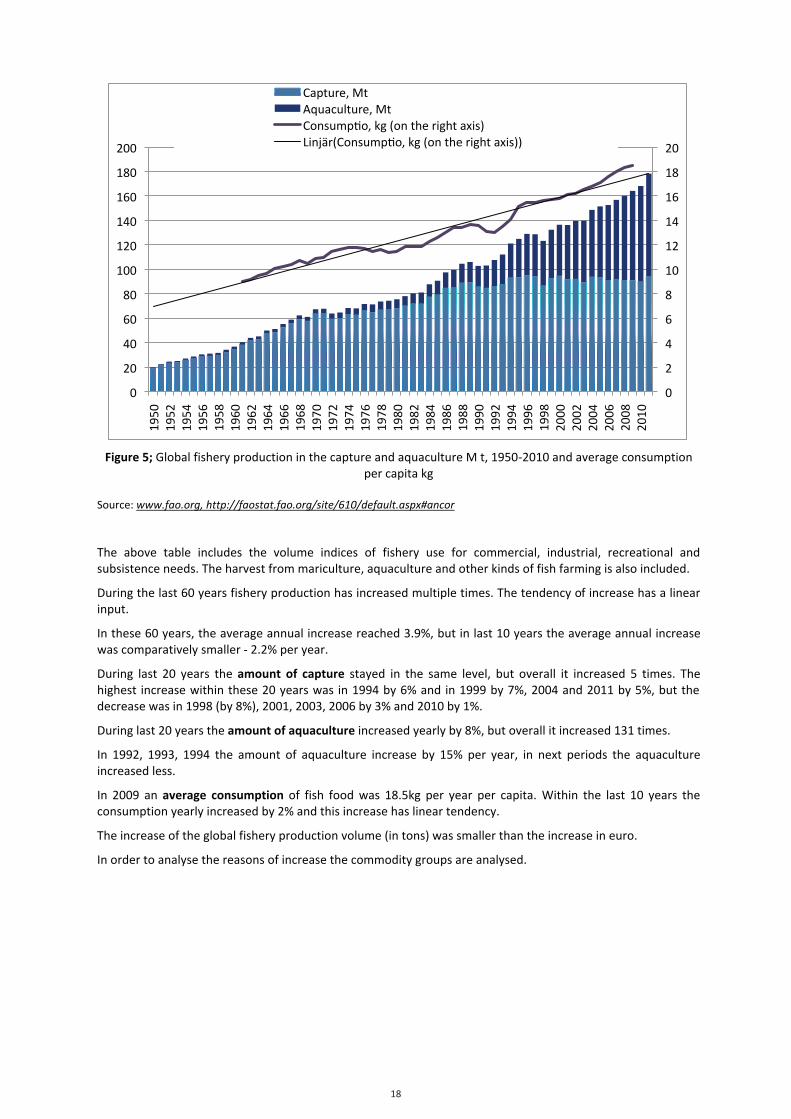
18
18
Figure 5; Global fishery production in the capture and aquaculture M t, 1950-‐2010 and average consumption per capita kg
Source: www.fao.org, http://faostat.fao.org/site/610/default.aspx#ancor
The above table includes the volume indices of fishery use for commercial, industrial, recreational and subsistence needs. The harvest from mariculture, aquaculture and other kinds of fish farming is also included.
During the last 60 years fishery production has increased multiple times. The tendency of increase has a linear input.
In these 60 years, the average annual increase reached 3.9%, but in last 10 years the average annual increase was comparatively smaller -‐ 2.2% per year.
During last 20 years the amount of capture stayed in the same level, but overall it increased 5 times. The highest increase within these 20 years was in 1994 by 6% and in 1999 by 7%, 2004 and 2011 by 5%, but the decrease was in 1998 (by 8%), 2001, 2003, 2006 by 3% and 2010 by 1%.
During last 20 years the amount of aquaculture increased yearly by 8%, but overall it increased 131 times.
In 1992, 1993, 1994 the amount of aquaculture increase by 15% per year, in next periods the aquaculture increased less.
In 2009 an average consumption of fish food was 18.5kg per year per capita. Within the last 10 years the consumption yearly increased by 2% and this increase has linear tendency.
The increase of the global fishery production volume (in tons) was smaller than the increase in euro.
In order to analyse the reasons of increase the commodity groups are analysed.
0
2
4
6
8
10
12
14
16
18
20
0
20
40
60
80
100
120
140
160
180
200 19
50
1952
19
54
1956
19
58
1960
19
62
1964
19
66
1968
19
70
1972
19
74
1976
19
78
1980
19
82
1984
19
86
1988
19
90
1992
19
94
1996
19
98
2000
20
02
2004
20
06
2008
20
10
Capture, Mt Aquaculture, Mt Consumpao, kg (on the right axis) Linjär(Consumpao, kg (on the right axis))
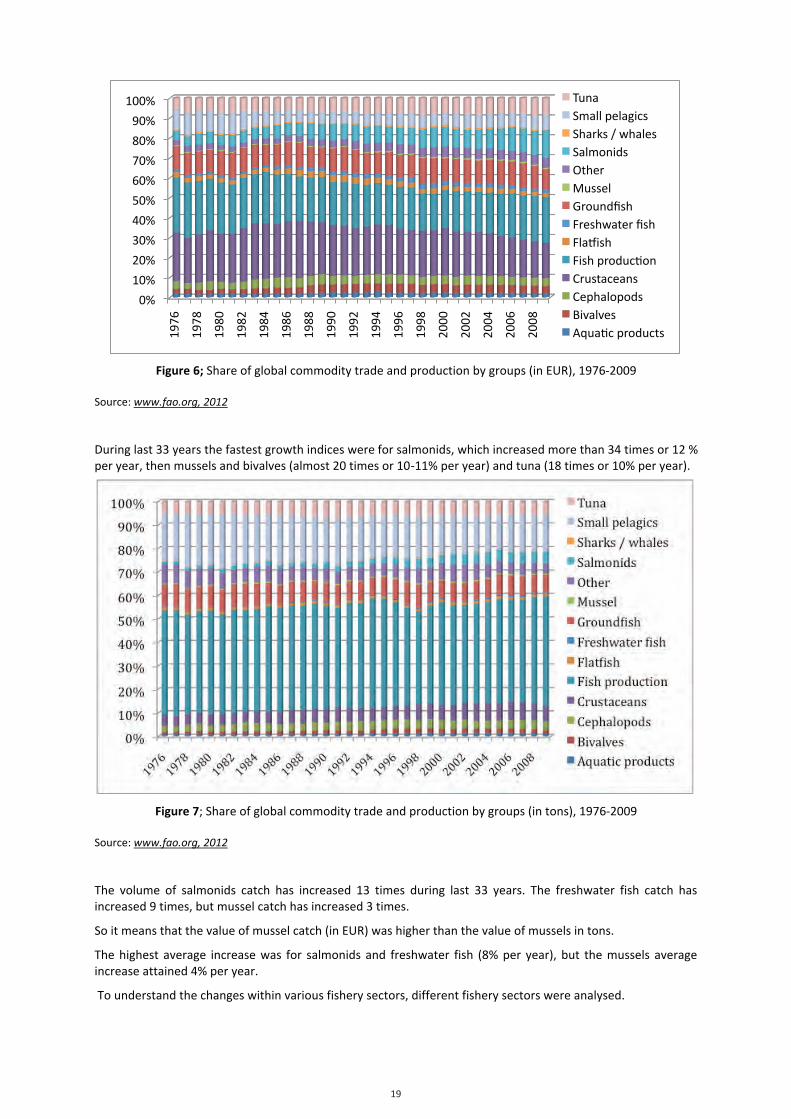
19
19
Figure 6; Share of global commodity trade and production by groups (in EUR), 1976-‐2009
Source: www.fao.org, 2012
During last 33 years the fastest growth indices were for salmonids, which increased more than 34 times or 12 % per year, then mussels and bivalves (almost 20 times or 10-‐11% per year) and tuna (18 times or 10% per year).
Figure 7; Share of global commodity trade and production by groups (in tons), 1976-‐2009
Source: www.fao.org, 2012
The volume of salmonids catch has increased 13 times during last 33 years. The freshwater fish catch has increased 9 times, but mussel catch has increased 3 times.
So it means that the value of mussel catch (in EUR) was higher than the value of mussels in tons.
The highest average increase was for salmonids and freshwater fish (8% per year), but the mussels average increase attained 4% per year.
To understand the changes within various fishery sectors, different fishery sectors were analysed.
0%
10%
20%
30%
40%
50%
60%
70%
80%
90%
100%
1976
1978
1980
1982
1984
1986
1988
1990
1992
1994
1996
1998
2000
2002
2004
2006
2008
Tuna Small pelagics Sharks / whales Salmonids Other Mussel Groundfish Freshwater fish Flagish Fish producaon Crustaceans Cephalopods Bivalves Aquaac products
0%
10%
20%
30%
40%
50%
60%
70%
80%
90%
100%
197 6 197 8 198 0 198 2 198 4 198 6 198 8 199 0 199 2 199 4 199 6 199 8 200 0 200 2 200 4 200 6 200 8
Tuna
Small pelagics
Sharks / whales
Salmonids
Other
Mussel
Groundfish
Freshwater fish
Flagish
Fish producaon
Crustaceans
Cephalopods
Bivalves
Aquaac products
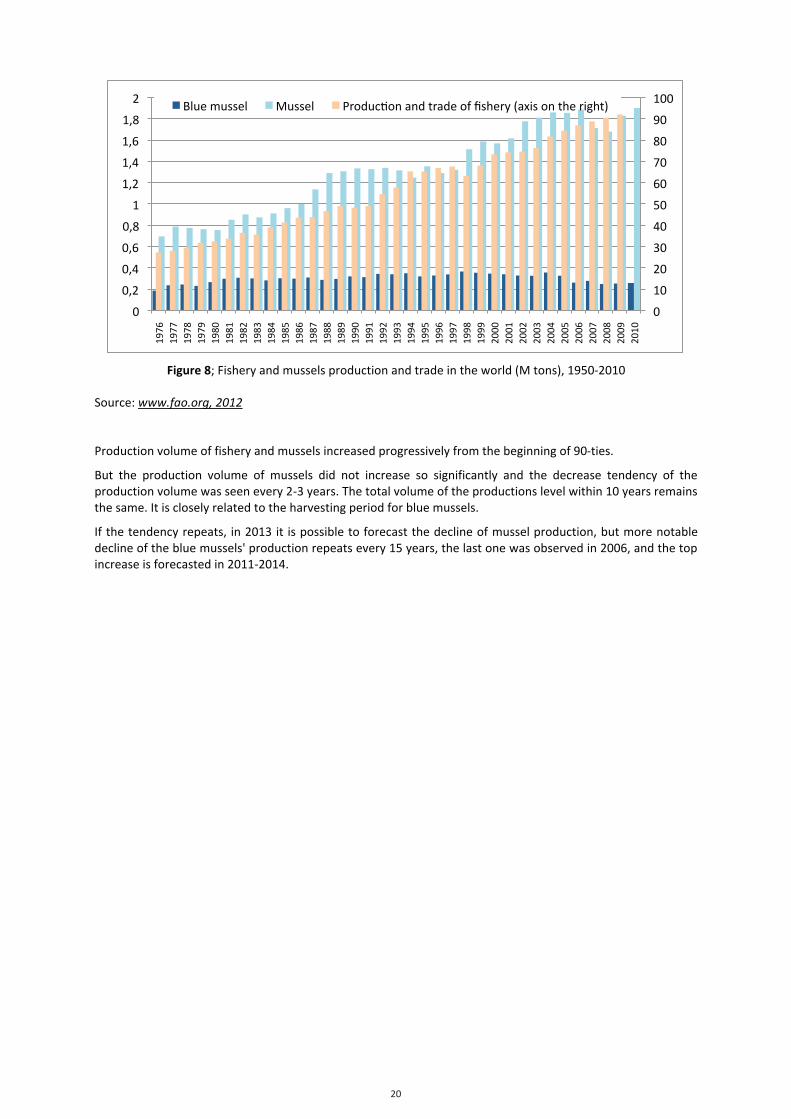
20
20
Figure 8; Fishery and mussels production and trade in the world (M tons), 1950-‐2010
Source: www.fao.org, 2012
Production volume of fishery and mussels increased progressively from the beginning of 90-‐ties.
But the production volume of mussels did not increase so significantly and the decrease tendency of the production volume was seen every 2-‐3 years. The total volume of the productions level within 10 years remains the same. It is closely related to the harvesting period for blue mussels.
If the tendency repeats, in 2013 it is possible to forecast the decline of mussel production, but more notable decline of the blue mussels' production repeats every 15 years, the last one was observed in 2006, and the top increase is forecasted in 2011-‐2014.
0
10
20
30
40
50
60
70
80
90
100
0
0,2
0,4
0,6
0,8
1
1,2
1,4
1,6
1,8
2
1976
19
77
1978
19
79
1980
19
81
1982
19
83
1984
19
85
1986
19
87
1988
19
89
1990
19
91
1992
19
93
1994
19
95
1996
19
97
1998
19
99
2000
20
01
2002
20
03
2004
20
05
2006
20
07
2008
20
09
2010
Blue mussel Mussel Producaon and trade of fishery (axis on the right)

21
21
3.2. Blue mussel fishery in Latvia
Mussel cultivation in the Baltic Sea is not very widespread. The local focus is on using mussels for human consumption, whereas within the last years in other areas of the Baltic Sea first small-‐scale pilot plants for eutrophication abatement have been implemented. The knowledge about impacts of mussel farming in the Baltic Sea on the ecosystem and the influences on socio-‐economy is limited; experiences from other mussel farming areas in northern Europe can be used initially. In Latvia there are many small fishermen but almost no one is related to business of blue mussels. They are located at coast of Baltic Sea. Some of them have worked for a longer period but some of them are quite new ones, but blue mussel production as a business is just as a pilot-‐project and a challenge for local fishermen. So, now we can say that none of them are in a leading position.
Latvian blue mussel farming business is not developed, but other countries have been set up several experimental farms in the Baltic Sea. However, in order to successfully deal with the mussel business, it is important to check sea salinity which in the Latvian case is almost insufficient. Mussels are grown in salty seas, where they can reach 7 cm, but in low salinity, we can grow only 1-‐2 cm high, so it can be said that environmental conditions are inappropriate. Also one of the problems is the pollution of the Gulf of Riga. As the Swedish coast and on the Åland Islands are open seas and less polluted than the Gulf of Riga, then, compared to Latvia, there may develop a blue mussel farming. The potential shellfish growing areas, mainly in Latvian can be considered an open coastline. One of the initiatives that focus on the cultivation of mussels in the Baltic Sea is known as the Baltic Sea in 2020, and its goal is to develop mussel cultivation rather than a cheap and effective way to protect the environment and improve water quality, and to explore the potential uses of mussels feed or as fertilizer in organic farming. It is almost impossible to compare the volumes with the Danish or Swedish mussel farmers', because of small volumes.
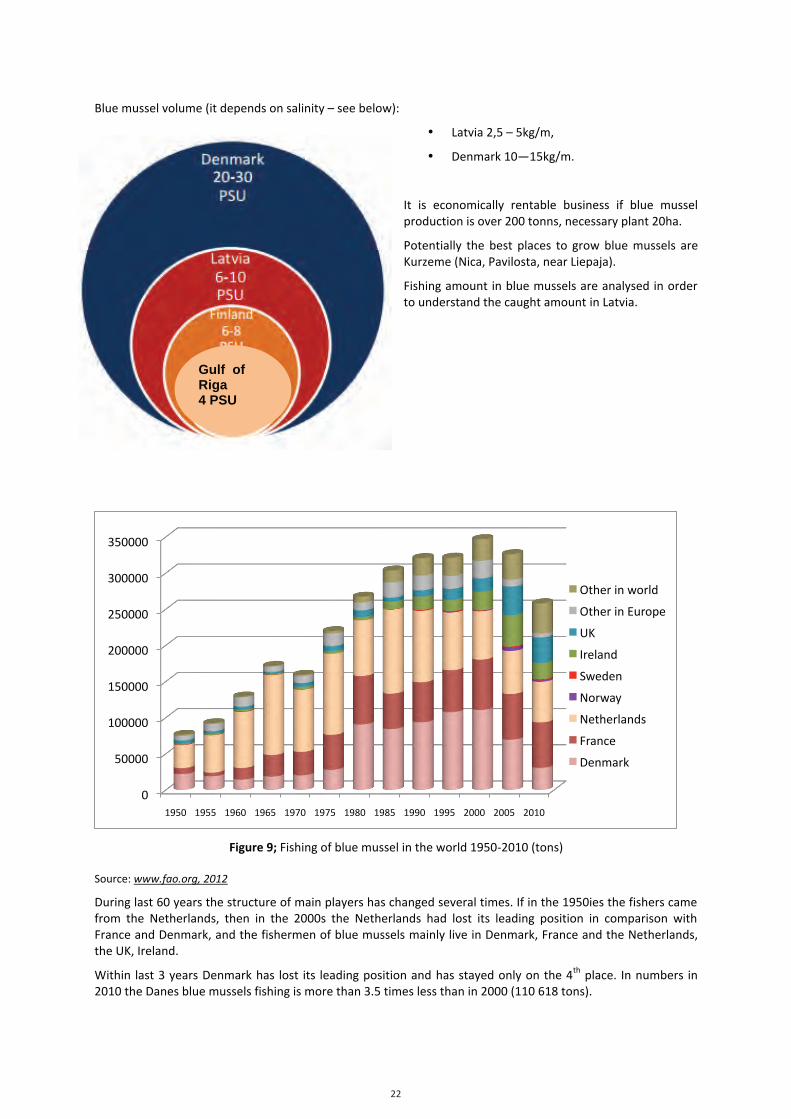
22
22
Gulf of Riga 4 PSU
Blue mussel volume (it depends on salinity – see below):
• Latvia 2,5 – 5kg/m,
• Denmark 10—15kg/m.
It is economically rentable business if blue mussel production is over 200 tonns, necessary plant 20ha.
Potentially the best places to grow blue mussels are Kurzeme (Nica, Pavilosta, near Liepaja).
Fishing amount in blue mussels are analysed in order to understand the caught amount in Latvia.
Figure 9; Fishing of blue mussel in the world 1950-‐2010 (tons)
Source: www.fao.org, 2012
During last 60 years the structure of main players has changed several times. If in the 1950ies the fishers came from the Netherlands, then in the 2000s the Netherlands had lost its leading position in comparison with France and Denmark, and the fishermen of blue mussels mainly live in Denmark, France and the Netherlands, the UK, Ireland.
Within last 3 years Denmark has lost its leading position and has stayed only on the 4th place. In numbers in 2010 the Danes blue mussels fishing is more than 3.5 times less than in 2000 (110 618 tons).
0
50000
100000
150000
200000
250000
300000
350000
1950 1955 1960 1965 1970 1975 1980 1985 1990 1995 2000 2005 2010
Other in world
Other in Europe
UK
Ireland
Sweden
Norway
Netherlands
France
Denmark
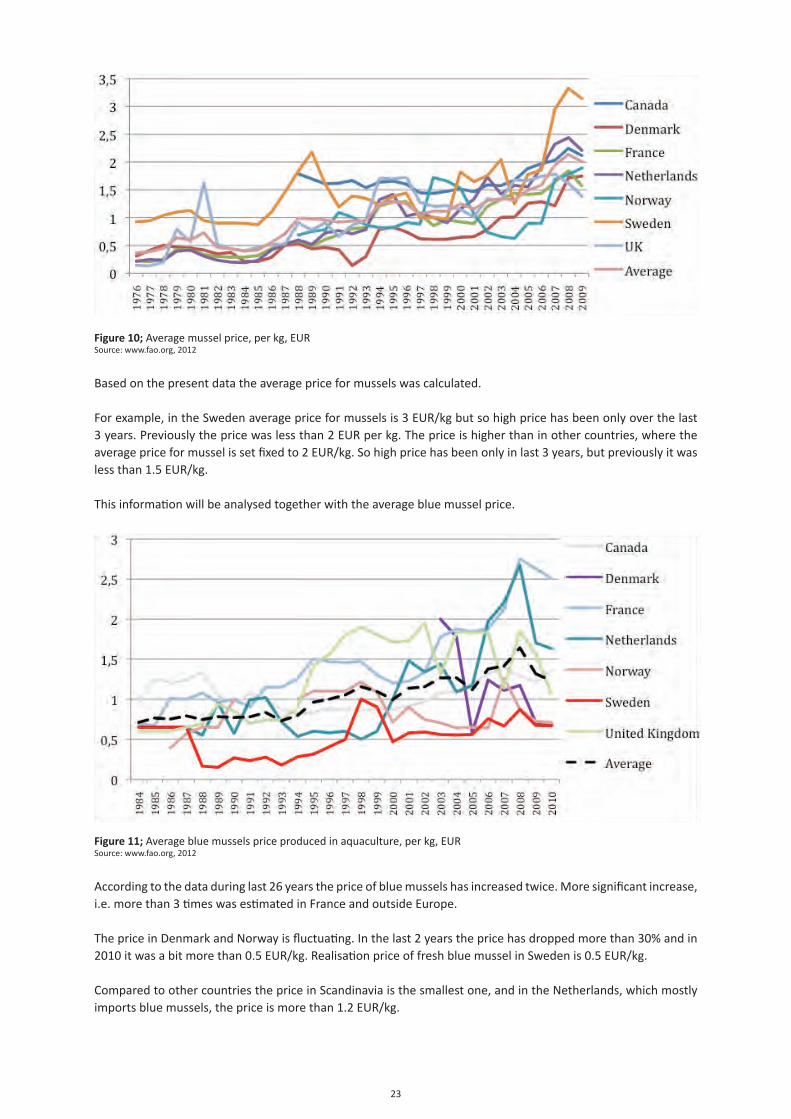
23
Figure 10; Average mussel price, per kg, EURSource: www.fao.org, 2012
Based on the present data the average price for mussels was calculated.
For example, in the Sweden average price for mussels is 3 EUR/kg but so high price has been only over the last 3 years. Previously the price was less than 2 EUR per kg. The price is higher than in other countries, where the average price for mussel is set fixed to 2 EUR/kg. So high price has been only in last 3 years, but previously it was less than 1.5 EUR/kg.
This information will be analysed together with the average blue mussel price.
Figure 11; Average blue mussels price produced in aquaculture, per kg, EURSource: www.fao.org, 2012
According to the data during last 26 years the price of blue mussels has increased twice. More significant increase, i.e. more than 3 times was estimated in France and outside Europe.
The price in Denmark and Norway is fluctuating. In the last 2 years the price has dropped more than 30% and in 2010 it was a bit more than 0.5 EUR/kg. Realisation price of fresh blue mussel in Sweden is 0.5 EUR/kg.
Compared to other countries the price in Scandinavia is the smallest one, and in the Netherlands, which mostly imports blue mussels, the price is more than 1.2 EUR/kg.
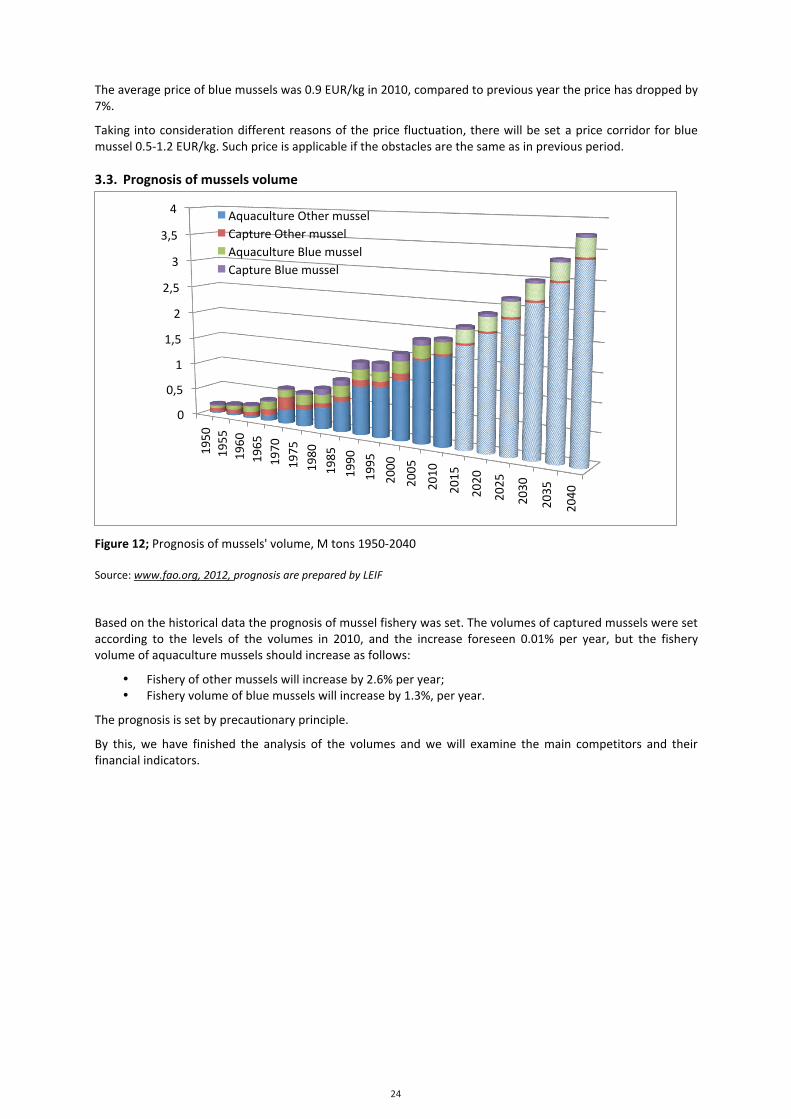
24
24
The average price of blue mussels was 0.9 EUR/kg in 2010, compared to previous year the price has dropped by 7%.
Taking into consideration different reasons of the price fluctuation, there will be set a price corridor for blue mussel 0.5-‐1.2 EUR/kg. Such price is applicable if the obstacles are the same as in previous period.
3.3. Prognosis of mussels volume
Figure 12; Prognosis of mussels' volume, M tons 1950-‐2040
Source: www.fao.org, 2012, prognosis are prepared by LEIF
Based on the historical data the prognosis of mussel fishery was set. The volumes of captured mussels were set according to the levels of the volumes in 2010, and the increase foreseen 0.01% per year, but the fishery volume of aquaculture mussels should increase as follows:
• Fishery of other mussels will increase by 2.6% per year; • Fishery volume of blue mussels will increase by 1.3%, per year.
The prognosis is set by precautionary principle.
By this, we have finished the analysis of the volumes and we will examine the main competitors and their financial indicators.
0
0,5
1
1,5
2
2,5
3
3,5
4 19
50
1955
19
60
1965
19
70
1975
19
80
1985
1990
1995
2000
2005
2010
2015
2020
2025
2030
2035
2040
Aquaculture Other mussel Capture Other mussel Aquaculture Blue mussel Capture Blue mussel
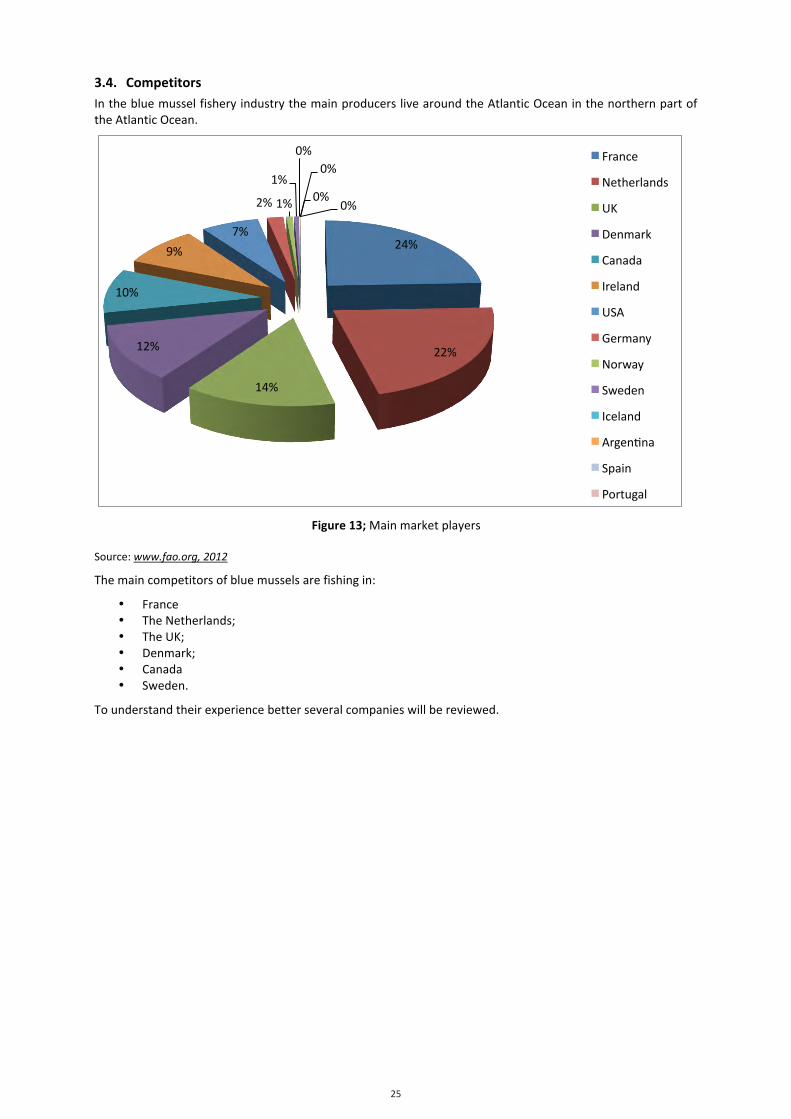
25
25
3.4. Competitors In the blue mussel fishery industry the main producers live around the Atlantic Ocean in the northern part of the Atlantic Ocean.
Figure 13; Main market players
Source: www.fao.org, 2012
The main competitors of blue mussels are fishing in:
• France • The Netherlands; • The UK; • Denmark; • Canada • Sweden.
To understand their experience better several companies will be reviewed.
24%
22%
14%
12%
10%
9%
7%
2% 1%
1%
0% 0%
0% 0%
France
Netherlands
UK
Denmark
Canada
Ireland
USA
Germany
Norway
Sweden
Iceland
Argenana
Spain
Portugal
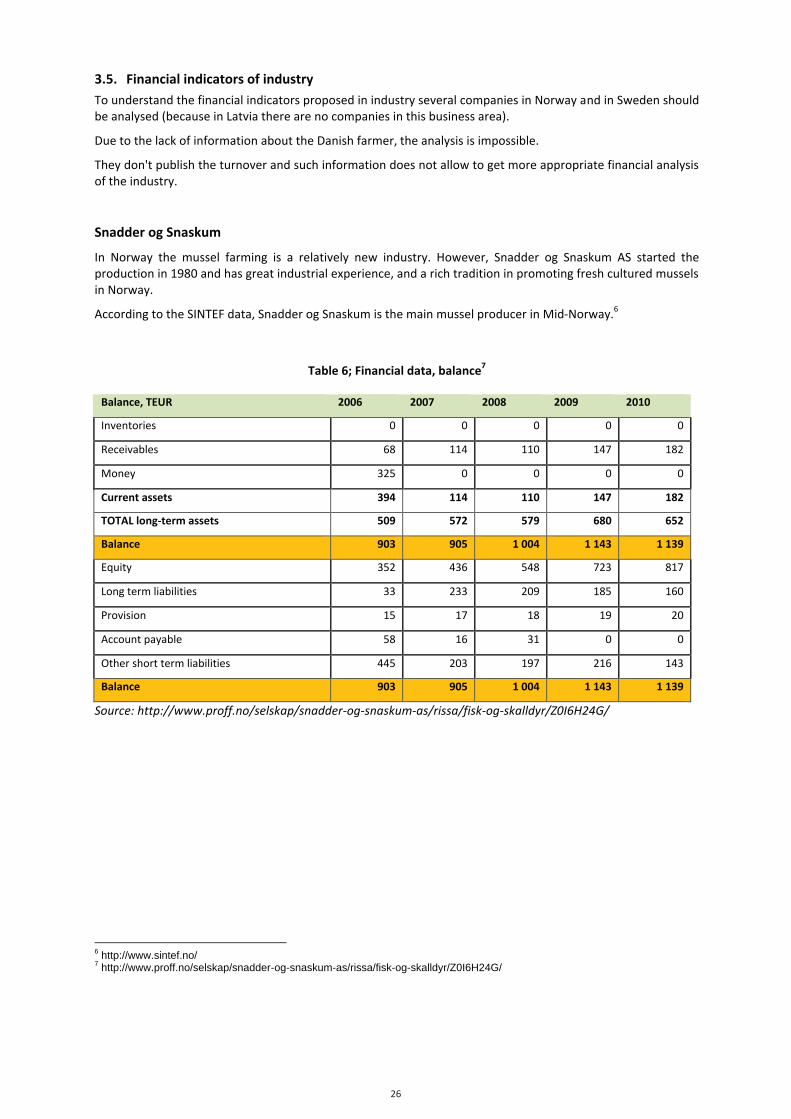
26
26
3.5. Financial indicators of industry To understand the financial indicators proposed in industry several companies in Norway and in Sweden should be analysed (because in Latvia there are no companies in this business area).
Due to the lack of information about the Danish farmer, the analysis is impossible.
They don't publish the turnover and such information does not allow to get more appropriate financial analysis of the industry.
Snadder og Snaskum
In Norway the mussel farming is a relatively new industry. However, Snadder og Snaskum AS started the production in 1980 and has great industrial experience, and a rich tradition in promoting fresh cultured mussels in Norway.
According to the SINTEF data, Snadder og Snaskum is the main mussel producer in Mid-‐Norway.6
Table 6; Financial data, balance7
Balance, TEUR 2006 2007 2008 2009 2010
Inventories 0 0 0 0 0
Receivables 68 114 110 147 182
Money 325 0 0 0 0
Current assets 394 114 110 147 182
TOTAL long-‐term assets 509 572 579 680 652
Balance 903 905 1 004 1 143 1 139
Equity 352 436 548 723 817
Long term liabilities 33 233 209 185 160
Provision 15 17 18 19 20
Account payable 58 16 31 0 0
Other short term liabilities 445 203 197 216 143
Balance 903 905 1 004 1 143 1 139
Source: http://www.proff.no/selskap/snadder-‐og-‐snaskum-‐as/rissa/fisk-‐og-‐skalldyr/Z0I6H24G/
6 http://www.sintef.no/ 7 http://www.proff.no/selskap/snadder-og-snaskum-as/rissa/fisk-og-skalldyr/Z0I6H24G/
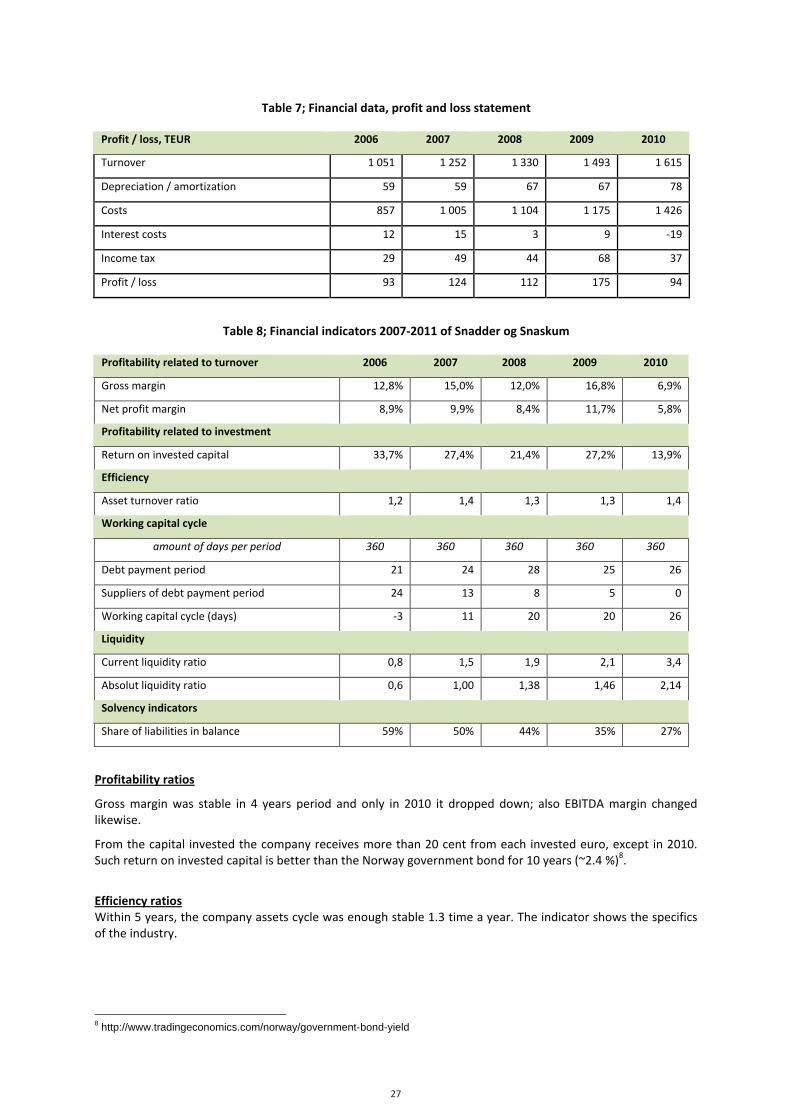
27
27
Table 7; Financial data, profit and loss statement
Profit / loss, TEUR 2006 2007 2008 2009 2010
Turnover 1 051 1 252 1 330 1 493 1 615
Depreciation / amortization 59 59 67 67 78
Costs 857 1 005 1 104 1 175 1 426
Interest costs 12 15 3 9 -‐19
Income tax 29 49 44 68 37
Profit / loss 93 124 112 175 94
Table 8; Financial indicators 2007-‐2011 of Snadder og Snaskum
Profitability related to turnover 2006 2007 2008 2009 2010
Gross margin 12,8% 15,0% 12,0% 16,8% 6,9%
Net profit margin 8,9% 9,9% 8,4% 11,7% 5,8%
Profitability related to investment
Return on invested capital 33,7% 27,4% 21,4% 27,2% 13,9%
Efficiency
Asset turnover ratio 1,2 1,4 1,3 1,3 1,4
Working capital cycle
amount of days per period 360 360 360 360 360
Debt payment period 21 24 28 25 26
Suppliers of debt payment period 24 13 8 5 0
Working capital cycle (days) -‐3 11 20 20 26
Liquidity
Current liquidity ratio 0,8 1,5 1,9 2,1 3,4
Absolut liquidity ratio 0,6 1,00 1,38 1,46 2,14
Solvency indicators
Share of liabilities in balance 59% 50% 44% 35% 27%
Profitability ratios
Gross margin was stable in 4 years period and only in 2010 it dropped down; also EBITDA margin changed likewise.
From the capital invested the company receives more than 20 cent from each invested euro, except in 2010. Such return on invested capital is better than the Norway government bond for 10 years (~2.4 %)8.
Efficiency ratios Within 5 years, the company assets cycle was enough stable 1.3 time a year. The indicator shows the specifics of the industry.
8 http://www.tradingeconomics.com/norway/government-bond-yield
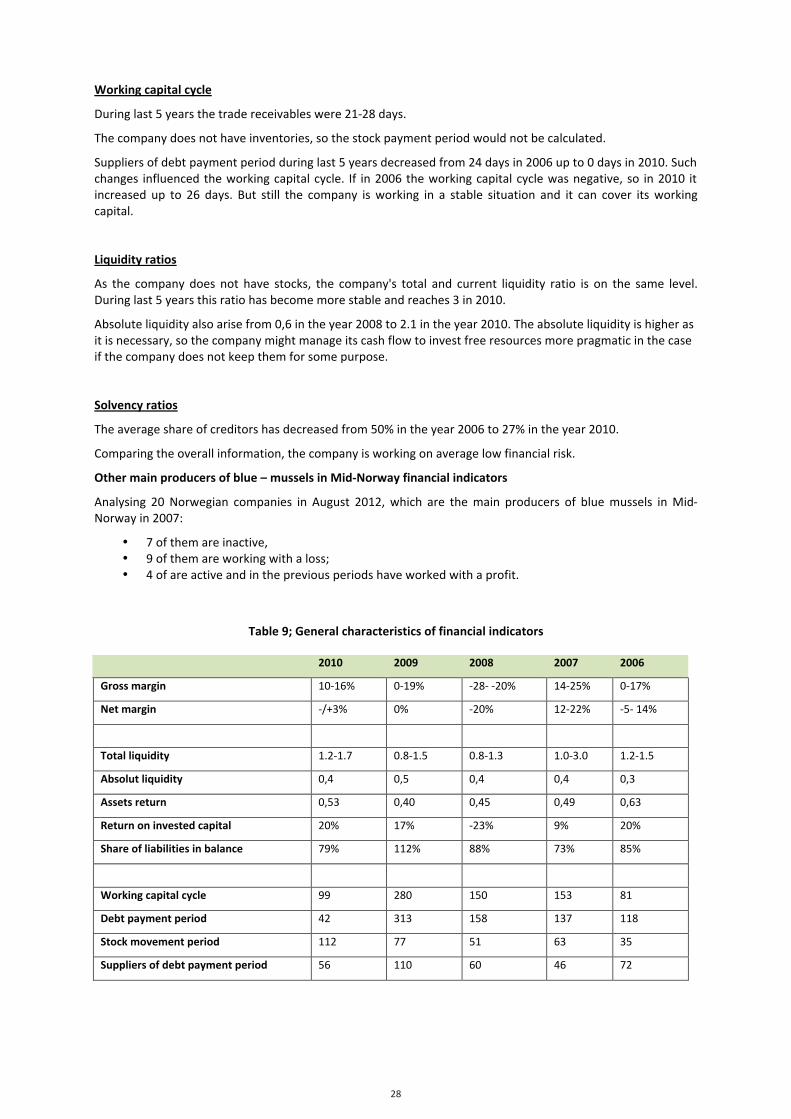
28
28
Working capital cycle
During last 5 years the trade receivables were 21-‐28 days.
The company does not have inventories, so the stock payment period would not be calculated.
Suppliers of debt payment period during last 5 years decreased from 24 days in 2006 up to 0 days in 2010. Such changes influenced the working capital cycle. If in 2006 the working capital cycle was negative, so in 2010 it increased up to 26 days. But still the company is working in a stable situation and it can cover its working capital.
Liquidity ratios
As the company does not have stocks, the company's total and current liquidity ratio is on the same level. During last 5 years this ratio has become more stable and reaches 3 in 2010.
Absolute liquidity also arise from 0,6 in the year 2008 to 2.1 in the year 2010. The absolute liquidity is higher as it is necessary, so the company might manage its cash flow to invest free resources more pragmatic in the case if the company does not keep them for some purpose.
Solvency ratios
The average share of creditors has decreased from 50% in the year 2006 to 27% in the year 2010.
Comparing the overall information, the company is working on average low financial risk.
Other main producers of blue – mussels in Mid-‐Norway financial indicators
Analysing 20 Norwegian companies in August 2012, which are the main producers of blue mussels in Mid-‐Norway in 2007:
• 7 of them are inactive, • 9 of them are working with a loss; • 4 of are active and in the previous periods have worked with a profit.
Table 9; General characteristics of financial indicators
2010 2009 2008 2007 2006
Gross margin 10-‐16% 0-‐19% -‐28-‐ -‐20% 14-‐25% 0-‐17%
Net margin -‐/+3% 0% -‐20% 12-‐22% -‐5-‐ 14%
Total liquidity 1.2-‐1.7 0.8-‐1.5 0.8-‐1.3 1.0-‐3.0 1.2-‐1.5
Absolut liquidity 0,4 0,5 0,4 0,4 0,3
Assets return 0,53 0,40 0,45 0,49 0,63
Return on invested capital 20% 17% -‐23% 9% 20%
Share of liabilities in balance 79% 112% 88% 73% 85%
Working capital cycle 99 280 150 153 81
Debt payment period 42 313 158 137 118
Stock movement period 112 77 51 63 35
Suppliers of debt payment period 56 110 60 46 72
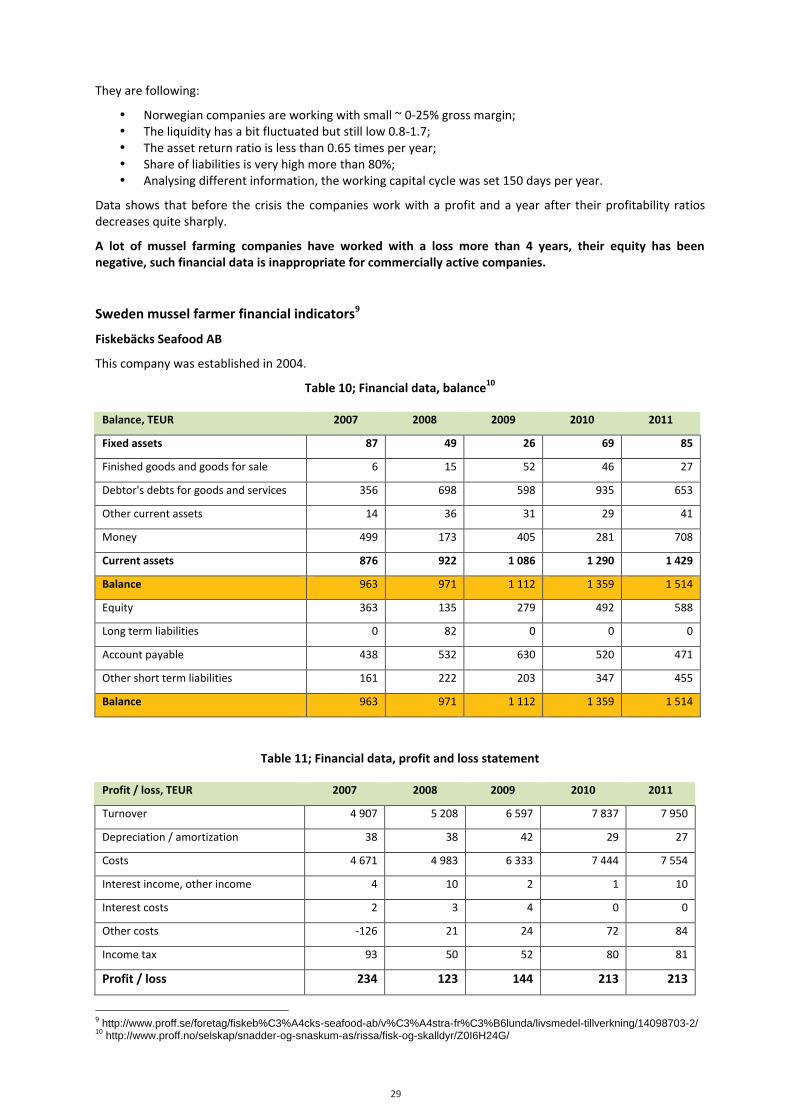
29
29
They are following:
• Norwegian companies are working with small ~ 0-‐25% gross margin; • The liquidity has a bit fluctuated but still low 0.8-‐1.7; • The asset return ratio is less than 0.65 times per year; • Share of liabilities is very high more than 80%; • Analysing different information, the working capital cycle was set 150 days per year.
Data shows that before the crisis the companies work with a profit and a year after their profitability ratios decreases quite sharply.
A lot of mussel farming companies have worked with a loss more than 4 years, their equity has been negative, such financial data is inappropriate for commercially active companies.
Sweden mussel farmer financial indicators9
Fiskebäcks Seafood AB
This company was established in 2004.
Table 10; Financial data, balance10
Balance, TEUR 2007 2008 2009 2010 2011
Fixed assets 87 49 26 69 85
Finished goods and goods for sale 6 15 52 46 27
Debtor's debts for goods and services 356 698 598 935 653
Other current assets 14 36 31 29 41
Money 499 173 405 281 708
Current assets 876 922 1 086 1 290 1 429
Balance 963 971 1 112 1 359 1 514
Equity 363 135 279 492 588
Long term liabilities 0 82 0 0 0
Account payable 438 532 630 520 471
Other short term liabilities 161 222 203 347 455
Balance 963 971 1 112 1 359 1 514
Table 11; Financial data, profit and loss statement
Profit / loss, TEUR 2007 2008 2009 2010 2011
Turnover 4 907 5 208 6 597 7 837 7 950
Depreciation / amortization 38 38 42 29 27
Costs 4 671 4 983 6 333 7 444 7 554
Interest income, other income 4 10 2 1 10
Interest costs 2 3 4 0 0
Other costs -‐126 21 24 72 84
Income tax 93 50 52 80 81
Profit / loss 234 123 144 213 213
9 http://www.proff.se/foretag/fiskeb%C3%A4cks-seafood-ab/v%C3%A4stra-fr%C3%B6lunda/livsmedel-tillverkning/14098703-2/ 10 http://www.proff.no/selskap/snadder-og-snaskum-as/rissa/fisk-og-skalldyr/Z0I6H24G/
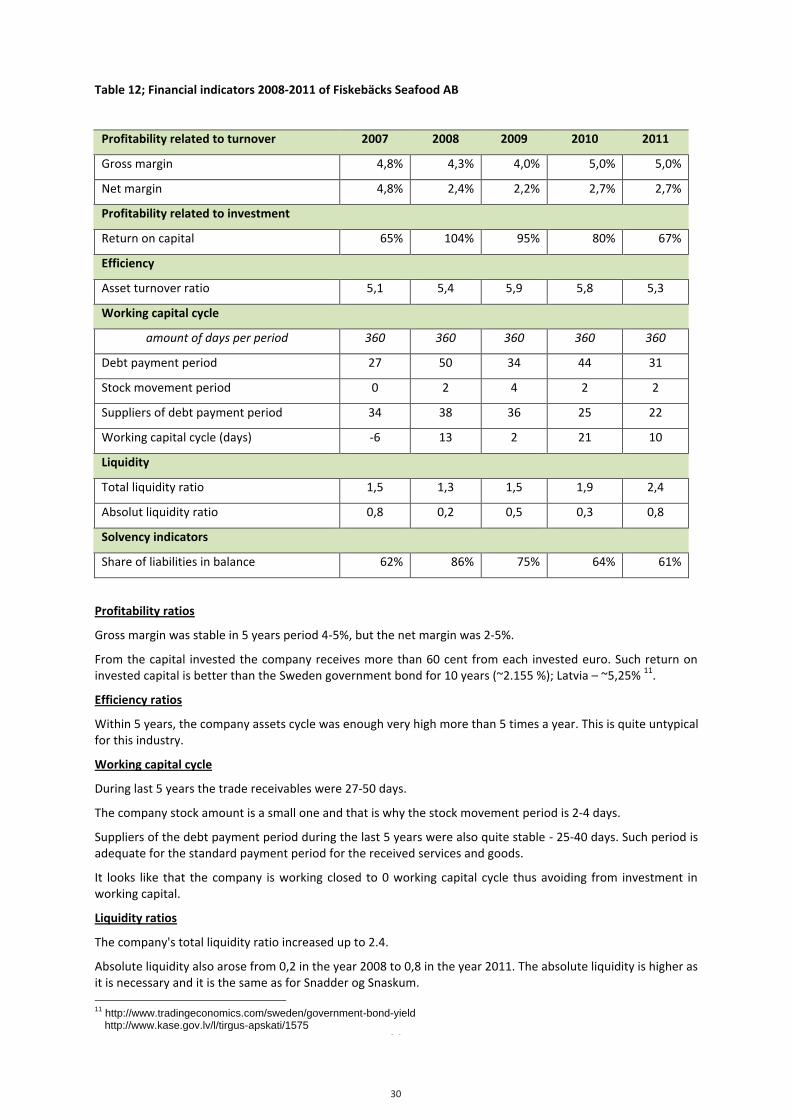
30
30
Table 12; Financial indicators 2008-‐2011 of Fiskebäcks Seafood AB
Profitability related to turnover 2007 2008 2009 2010 2011
Gross margin 4,8% 4,3% 4,0% 5,0% 5,0%
Net margin 4,8% 2,4% 2,2% 2,7% 2,7%
Profitability related to investment
Return on capital 65% 104% 95% 80% 67%
Efficiency
Asset turnover ratio 5,1 5,4 5,9 5,8 5,3
Working capital cycle
amount of days per period 360 360 360 360 360
Debt payment period 27 50 34 44 31
Stock movement period 0 2 4 2 2
Suppliers of debt payment period 34 38 36 25 22
Working capital cycle (days) -‐6 13 2 21 10
Liquidity
Total liquidity ratio 1,5 1,3 1,5 1,9 2,4
Absolut liquidity ratio 0,8 0,2 0,5 0,3 0,8
Solvency indicators
Share of liabilities in balance 62% 86% 75% 64% 61%
Profitability ratios
Gross margin was stable in 5 years period 4-‐5%, but the net margin was 2-‐5%.
From the capital invested the company receives more than 60 cent from each invested euro. Such return on invested capital is better than the Sweden government bond for 10 years (~2.155 %); Latvia – ~5,25% 11.
Efficiency ratios
Within 5 years, the company assets cycle was enough very high more than 5 times a year. This is quite untypical for this industry.
Working capital cycle
During last 5 years the trade receivables were 27-‐50 days.
The company stock amount is a small one and that is why the stock movement period is 2-‐4 days.
Suppliers of the debt payment period during the last 5 years were also quite stable -‐ 25-‐40 days. Such period is adequate for the standard payment period for the received services and goods.
It looks like that the company is working closed to 0 working capital cycle thus avoiding from investment in working capital.
Liquidity ratios
The company's total liquidity ratio increased up to 2.4.
Absolute liquidity also arose from 0,2 in the year 2008 to 0,8 in the year 2011. The absolute liquidity is higher as it is necessary and it is the same as for Snadder og Snaskum. 11 http://www.tradingeconomics.com/sweden/government-bond-yield http://www.kase.gov.lv/l/tirgus-apskati/1575
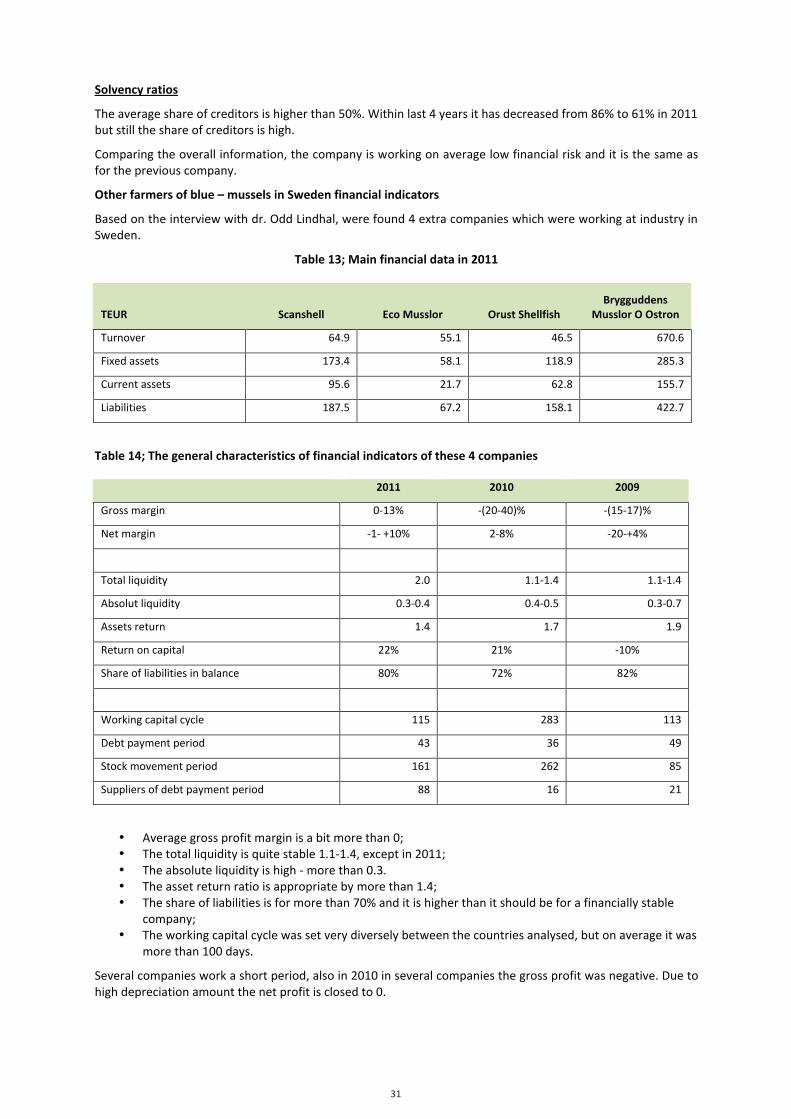
31
31
Solvency ratios
The average share of creditors is higher than 50%. Within last 4 years it has decreased from 86% to 61% in 2011 but still the share of creditors is high.
Comparing the overall information, the company is working on average low financial risk and it is the same as for the previous company.
Other farmers of blue – mussels in Sweden financial indicators
Based on the interview with dr. Odd Lindhal, were found 4 extra companies which were working at industry in Sweden.
Table 13; Main financial data in 2011
TEUR Scanshell Eco Musslor Orust Shellfish Brygguddens
Musslor O Ostron
Turnover 64.9 55.1 46.5 670.6
Fixed assets 173.4 58.1 118.9 285.3
Current assets 95.6 21.7 62.8 155.7
Liabilities 187.5 67.2 158.1 422.7
Table 14; The general characteristics of financial indicators of these 4 companies
2011 2010 2009
Gross margin 0-‐13% -‐(20-‐40)% -‐(15-‐17)%
Net margin -‐1-‐ +10% 2-‐8% -‐20-‐+4%
Total liquidity 2.0 1.1-‐1.4 1.1-‐1.4
Absolut liquidity 0.3-‐0.4 0.4-‐0.5 0.3-‐0.7
Assets return 1.4 1.7 1.9
Return on capital 22% 21% -‐10%
Share of liabilities in balance 80% 72% 82%
Working capital cycle 115 283 113
Debt payment period 43 36 49
Stock movement period 161 262 85
Suppliers of debt payment period 88 16 21
• Average gross profit margin is a bit more than 0; • The total liquidity is quite stable 1.1-‐1.4, except in 2011; • The absolute liquidity is high -‐ more than 0.3. • The asset return ratio is appropriate by more than 1.4; • The share of liabilities is for more than 70% and it is higher than it should be for a financially stable
company; • The working capital cycle was set very diversely between the countries analysed, but on average it was
more than 100 days.
Several companies work a short period, also in 2010 in several companies the gross profit was negative. Due to high depreciation amount the net profit is closed to 0.
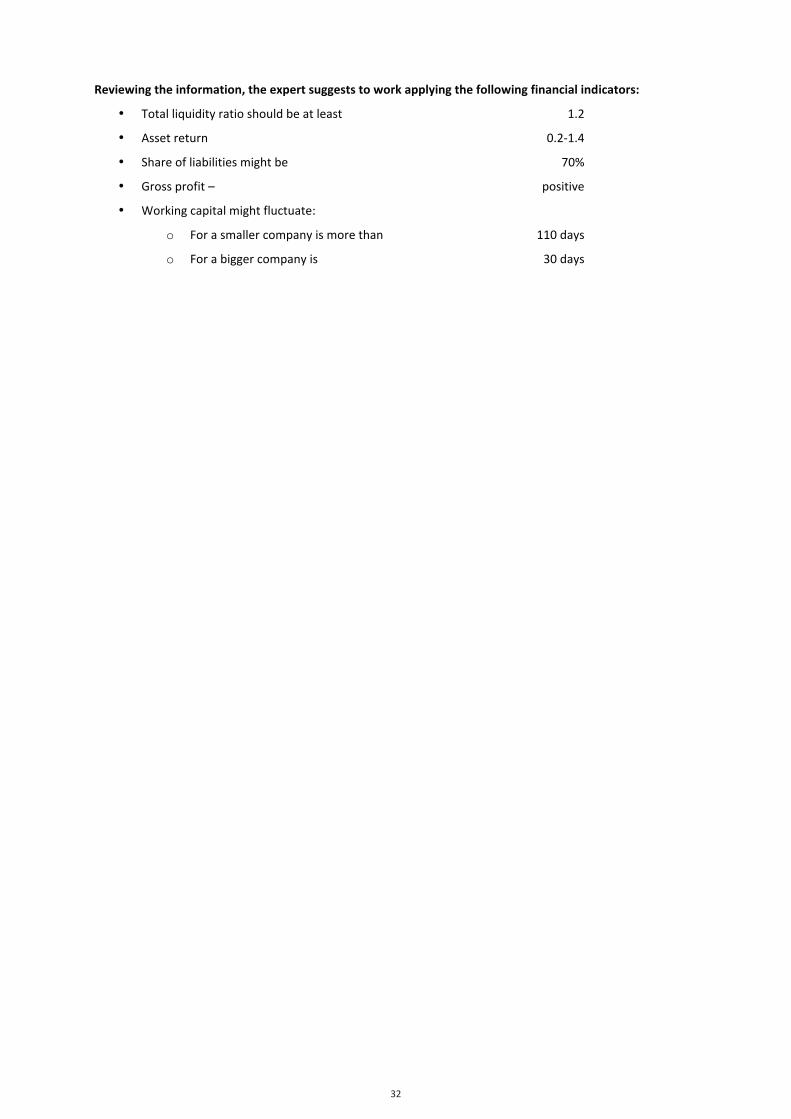
32
32
Reviewing the information, the expert suggests to work applying the following financial indicators:
• Total liquidity ratio should be at least 1.2
• Asset return 0.2-‐1.4
• Share of liabilities might be 70%
• Gross profit – positive
• Working capital might fluctuate:
o For a smaller company is more than 110 days
o For a bigger company is 30 days
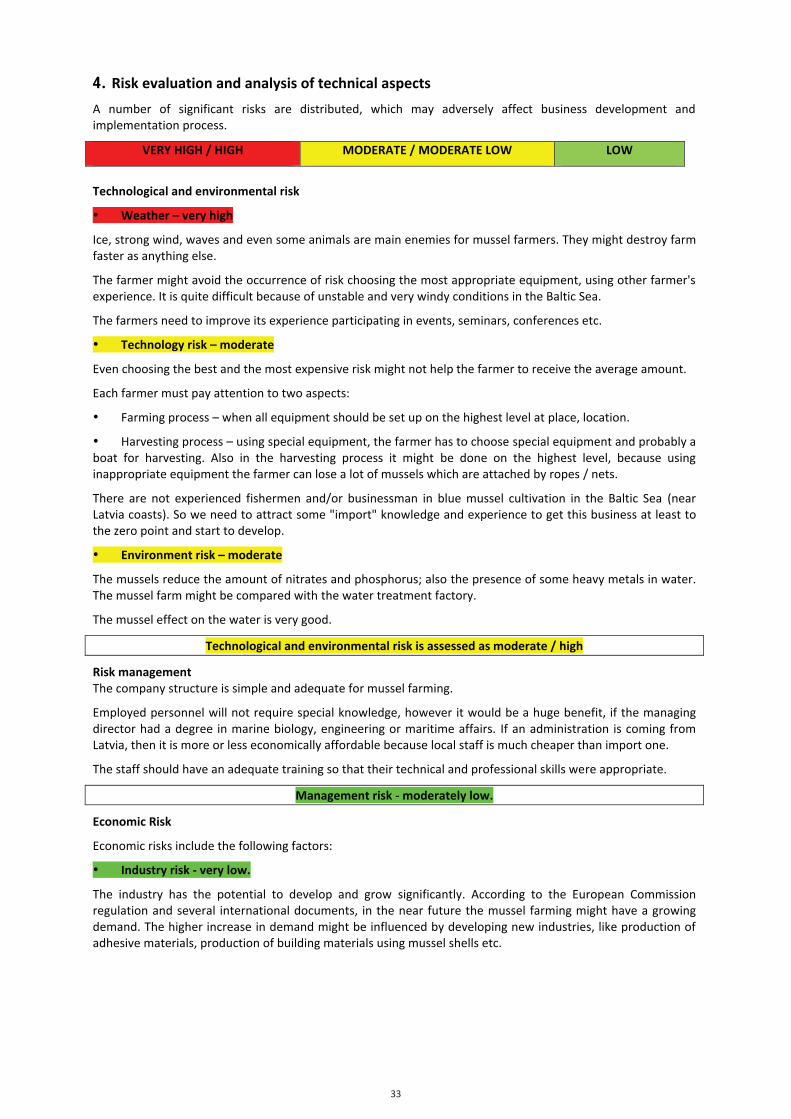
33
33
4. Risk evaluation and analysis of technical aspects
A number of significant risks are distributed, which may adversely affect business development and implementation process.
VERY HIGH / HIGH MODERATE / MODERATE LOW LOW
Technological and environmental risk
• Weather – very high
Ice, strong wind, waves and even some animals are main enemies for mussel farmers. They might destroy farm faster as anything else.
The farmer might avoid the occurrence of risk choosing the most appropriate equipment, using other farmer's experience. It is quite difficult because of unstable and very windy conditions in the Baltic Sea.
The farmers need to improve its experience participating in events, seminars, conferences etc.
• Technology risk – moderate
Even choosing the best and the most expensive risk might not help the farmer to receive the average amount.
Each farmer must pay attention to two aspects:
• Farming process – when all equipment should be set up on the highest level at place, location.
• Harvesting process – using special equipment, the farmer has to choose special equipment and probably a boat for harvesting. Also in the harvesting process it might be done on the highest level, because using inappropriate equipment the farmer can lose a lot of mussels which are attached by ropes / nets.
There are not experienced fishermen and/or businessman in blue mussel cultivation in the Baltic Sea (near Latvia coasts). So we need to attract some "import" knowledge and experience to get this business at least to the zero point and start to develop.
• Environment risk – moderate
The mussels reduce the amount of nitrates and phosphorus; also the presence of some heavy metals in water. The mussel farm might be compared with the water treatment factory.
The mussel effect on the water is very good.
Technological and environmental risk is assessed as moderate / high
Risk management The company structure is simple and adequate for mussel farming.
Employed personnel will not require special knowledge, however it would be a huge benefit, if the managing director had a degree in marine biology, engineering or maritime affairs. If an administration is coming from Latvia, then it is more or less economically affordable because local staff is much cheaper than import one.
The staff should have an adequate training so that their technical and professional skills were appropriate.
Management risk -‐ moderately low.
Economic Risk
Economic risks include the following factors:
• Industry risk -‐ very low.
The industry has the potential to develop and grow significantly. According to the European Commission regulation and several international documents, in the near future the mussel farming might have a growing demand. The higher increase in demand might be influenced by developing new industries, like production of adhesive materials, production of building materials using mussel shells etc.
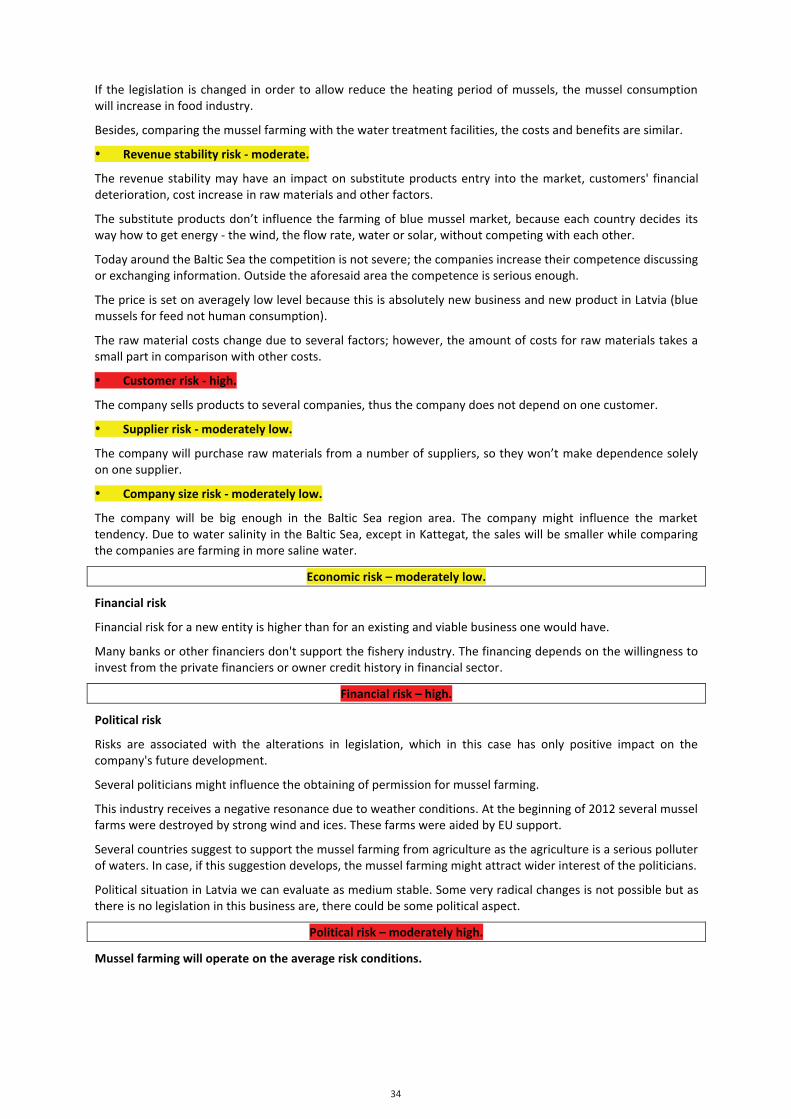
34
34
If the legislation is changed in order to allow reduce the heating period of mussels, the mussel consumption will increase in food industry.
Besides, comparing the mussel farming with the water treatment facilities, the costs and benefits are similar.
• Revenue stability risk -‐ moderate.
The revenue stability may have an impact on substitute products entry into the market, customers' financial deterioration, cost increase in raw materials and other factors.
The substitute products don’t influence the farming of blue mussel market, because each country decides its way how to get energy -‐ the wind, the flow rate, water or solar, without competing with each other.
Today around the Baltic Sea the competition is not severe; the companies increase their competence discussing or exchanging information. Outside the aforesaid area the competence is serious enough.
The price is set on averagely low level because this is absolutely new business and new product in Latvia (blue mussels for feed not human consumption).
The raw material costs change due to several factors; however, the amount of costs for raw materials takes a small part in comparison with other costs.
• Customer risk -‐ high.
The company sells products to several companies, thus the company does not depend on one customer.
• Supplier risk -‐ moderately low.
The company will purchase raw materials from a number of suppliers, so they won’t make dependence solely on one supplier.
• Company size risk -‐ moderately low.
The company will be big enough in the Baltic Sea region area. The company might influence the market tendency. Due to water salinity in the Baltic Sea, except in Kattegat, the sales will be smaller while comparing the companies are farming in more saline water.
Economic risk – moderately low.
Financial risk
Financial risk for a new entity is higher than for an existing and viable business one would have.
Many banks or other financiers don't support the fishery industry. The financing depends on the willingness to invest from the private financiers or owner credit history in financial sector.
Financial risk – high.
Political risk
Risks are associated with the alterations in legislation, which in this case has only positive impact on the company's future development.
Several politicians might influence the obtaining of permission for mussel farming.
This industry receives a negative resonance due to weather conditions. At the beginning of 2012 several mussel farms were destroyed by strong wind and ices. These farms were aided by EU support.
Several countries suggest to support the mussel farming from agriculture as the agriculture is a serious polluter of waters. In case, if this suggestion develops, the mussel farming might attract wider interest of the politicians.
Political situation in Latvia we can evaluate as medium stable. Some very radical changes is not possible but as there is no legislation in this business are, there could be some political aspect.
Political risk – moderately high.
Mussel farming will operate on the average risk conditions.

35
35
5. SWOT
Strengths12 Weaknesses
• Farming if not labour intensive industry. • Environmentally friendly and flexible tool for improving eutrophic coastal waters by removing nutrients and improving water transparency, while at the same time sustainably producing valuable marine protein that can be used in feeds and valuable fertilisers, especially for organic farmers (expert) • Utilises naturally occurring resources and returns discharged nutrients back to land in the form of valuable protein • Functioning as a floating reef, a mussel farm can lead to increased local biodiversity and suitable conditions for fish fry sheltering and feeding • Potential to enhance the local small-‐scale recreational fishery • Potential to create new jobs in rural coastal areas • Areas used for wind and wave energy production may also be used for mussel farms
• The brackish Baltic is not an ideal area for growing blue mussels due to the low salinity, which slows down growth and limits the size of the mussels • Might have negative environmental impacts on benthic bio-‐chemical processes and fauna below a farm • Mussel farming for environmental measures in the Baltic will be dependent on the mussel farmers being compensated for the ecosystem service provided • Harsh conditions (severe winters and storms) may threaten to physically destroys the farms • Sea salinity (insufficient)
Opportunities Threats
• More or less low investment costs to establish farm • Growing European and regional trends to combat eutrophication (e.g. EU Directives, HELCO M) • Demand from organic farmers and aquaculture enterprises for sustainable feed • Growing demand for improving coastal water quality • Growing demand for developing innovative work opportunities for the coastal region population • Development of offshore wind energy offering possibilities for combined installations • Option to develop second business
• Mussel farming requires access to suitable farming sites, which may become increasingly difficult to find in coastal areas as spatial conflicts intensify • Resistance of local populations to the new use of “their” coastal waters, regarded as navigational obstacles or ruined views • Lack of complete consensus within the scientific community on the value of mussel farming as a measure to improve coastal water quality in the Baltic • Lack of experience of blue mussel cultivation in Latvia.
12 Submariner report

36
36
6. Financial basis of the project
6.1. Revenue Plan The revenue amount was calculated multiplying the mussel price and the amount of mussels harvested.
Mussel price was set in amount 0.60 EUR/kg.
Based on mussel farming place it is possible to calculate the amount of mussels harvested.
Table 15; Turnover
Y0 Y1 Y2 Y3 Y4 Y5 Y6 Y7 Y8 Y9 Y10 Y11 Turnover T EUR 0 147 147 147 147 147 147 147 147 147 147 147
Mussel farming economic activity can begin after the investment, so the Y0 Mussel farm business activity starts in the second year.
To avoid inappropriate guessing the future growing rate was not calculated.
6.2. Costs Plan PRODUCTION COSTS
Production costs include:
§ Research in laboratory
§ Salaries
§ Social tax
§ Production costs
§ Transport costs
§ Other costs
Table 16; Production costs
T EUR Y0 Y1 Y2 Y3 Y4 Y5
Production costs 25 47 47 47 47 47 Research in laboaroty 0 4 886 4 886 4 886 4 886 4 886 Salaries 12 411 21 277 21 277 21 277 21 277 21 277 Social tax 2 990 5 126 5 126 5 126 5 126 5 126 Production costs 6 592 6 592 6 592 6 592 6 592 6 592 Transport costs 2 931 5 863 5 863 5 863 5 863 5 863 Unexpected 2 931 2 931 2 931 2 931 2 931
Research in laboratory is very important issue for each farmer if the production is closed or relatively close to human or animal consumption directly or indirectly. Calculated these costs, the prognosis was set that each second week mussel farmer might harvest from its farm at least.
An amount is calculated based on amount.
Salaries will be established based on employer employment.
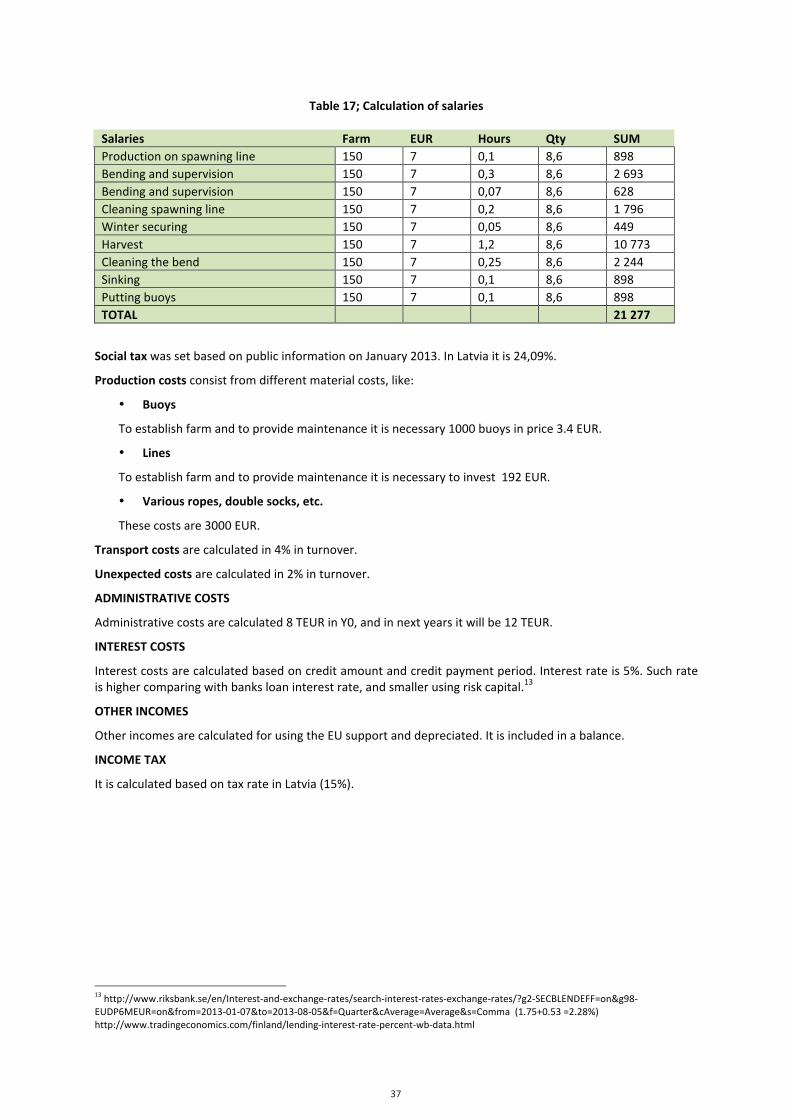
37
37
Table 17; Calculation of salaries
Salaries Farm EUR Hours Qty SUM Production on spawning line 150 7 0,1 8,6 898 Bending and supervision 150 7 0,3 8,6 2 693 Bending and supervision 150 7 0,07 8,6 628 Cleaning spawning line 150 7 0,2 8,6 1 796 Winter securing 150 7 0,05 8,6 449 Harvest 150 7 1,2 8,6 10 773 Cleaning the bend 150 7 0,25 8,6 2 244 Sinking 150 7 0,1 8,6 898 Putting buoys 150 7 0,1 8,6 898 TOTAL 21 277
Social tax was set based on public information on January 2013. In Latvia it is 24,09%.
Production costs consist from different material costs, like:
• Buoys
To establish farm and to provide maintenance it is necessary 1000 buoys in price 3.4 EUR.
• Lines
To establish farm and to provide maintenance it is necessary to invest 192 EUR.
• Various ropes, double socks, etc.
These costs are 3000 EUR.
Transport costs are calculated in 4% in turnover.
Unexpected costs are calculated in 2% in turnover.
ADMINISTRATIVE COSTS
Administrative costs are calculated 8 TEUR in Y0, and in next years it will be 12 TEUR.
INTEREST COSTS
Interest costs are calculated based on credit amount and credit payment period. Interest rate is 5%. Such rate is higher comparing with banks loan interest rate, and smaller using risk capital.13
OTHER INCOMES
Other incomes are calculated for using the EU support and depreciated. It is included in a balance.
INCOME TAX
It is calculated based on tax rate in Latvia (15%).
13 http://www.riksbank.se/en/Interest-‐and-‐exchange-‐rates/search-‐interest-‐rates-‐exchange-‐rates/?g2-‐SECBLENDEFF=on&g98-‐EUDP6MEUR=on&from=2013-‐01-‐07&to=2013-‐08-‐05&f=Quarter&cAverage=Average&s=Comma (1.75+0.53 =2.28%) http://www.tradingeconomics.com/finland/lending-‐interest-‐rate-‐percent-‐wb-‐data.html
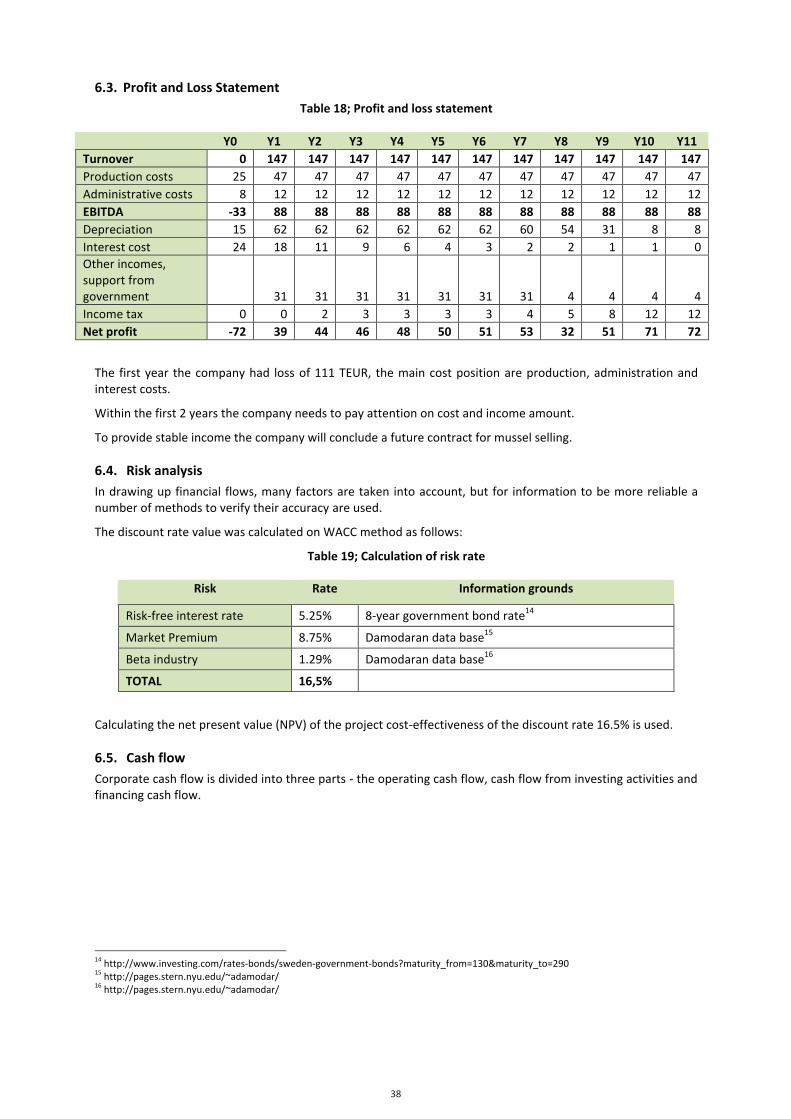
38
38
6.3. Profit and Loss Statement Table 18; Profit and loss statement
Y0 Y1 Y2 Y3 Y4 Y5 Y6 Y7 Y8 Y9 Y10 Y11 Turnover 0 147 147 147 147 147 147 147 147 147 147 147 Production costs 25 47 47 47 47 47 47 47 47 47 47 47 Administrative costs 8 12 12 12 12 12 12 12 12 12 12 12 EBITDA -‐33 88 88 88 88 88 88 88 88 88 88 88 Depreciation 15 62 62 62 62 62 62 60 54 31 8 8 Interest cost 24 18 11 9 6 4 3 2 2 1 1 0 Other incomes, support from government 31 31 31 31 31 31 31 4 4 4 4 Income tax 0 0 2 3 3 3 3 4 5 8 12 12 Net profit -‐72 39 44 46 48 50 51 53 32 51 71 72
The first year the company had loss of 111 TEUR, the main cost position are production, administration and interest costs.
Within the first 2 years the company needs to pay attention on cost and income amount.
To provide stable income the company will conclude a future contract for mussel selling.
6.4. Risk analysis In drawing up financial flows, many factors are taken into account, but for information to be more reliable a number of methods to verify their accuracy are used.
The discount rate value was calculated on WACC method as follows:
Table 19; Calculation of risk rate
Risk Rate Information grounds
Risk-‐free interest rate 5.25% 8-‐year government bond rate14
Market Premium 8.75% Damodaran data base15
Beta industry 1.29% Damodaran data base16
TOTAL 16,5%
Calculating the net present value (NPV) of the project cost-‐effectiveness of the discount rate 16.5% is used.
6.5. Cash flow Corporate cash flow is divided into three parts -‐ the operating cash flow, cash flow from investing activities and financing cash flow.
14 http://www.investing.com/rates-‐bonds/sweden-‐government-‐bonds?maturity_from=130&maturity_to=290 15 http://pages.stern.nyu.edu/~adamodar/ 16 http://pages.stern.nyu.edu/~adamodar/
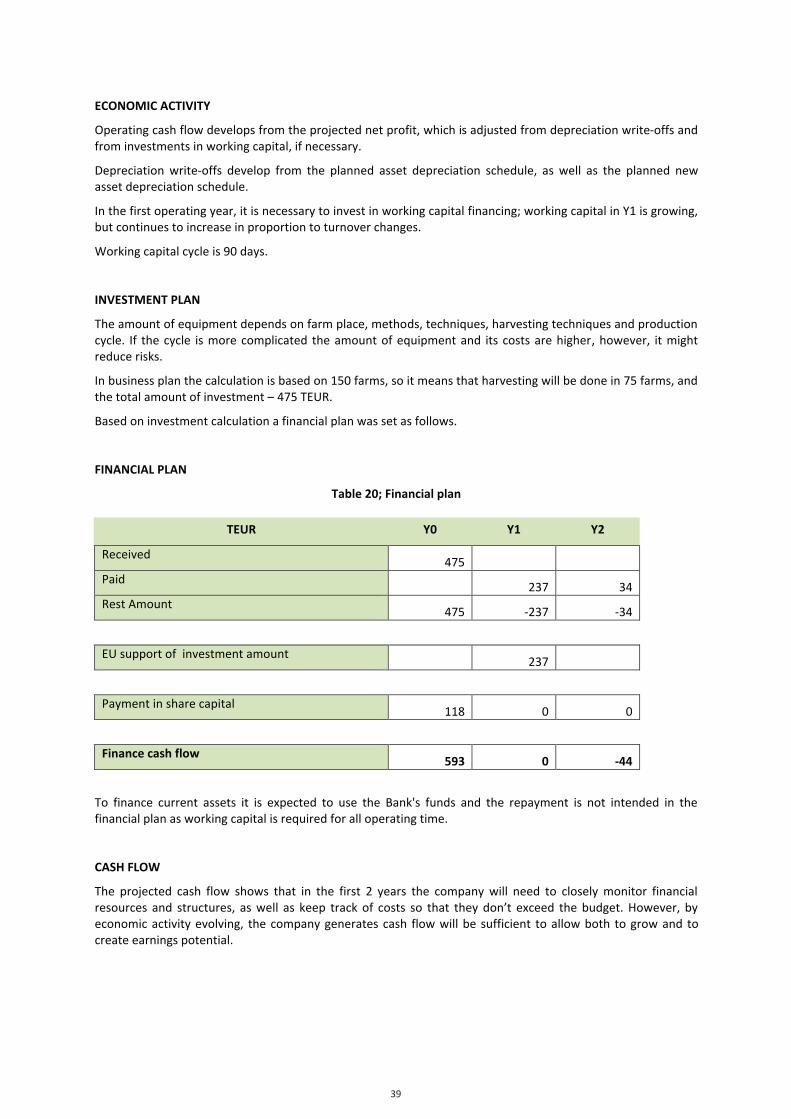
39
39
ECONOMIC ACTIVITY
Operating cash flow develops from the projected net profit, which is adjusted from depreciation write-‐offs and from investments in working capital, if necessary.
Depreciation write-‐offs develop from the planned asset depreciation schedule, as well as the planned new asset depreciation schedule.
In the first operating year, it is necessary to invest in working capital financing; working capital in Y1 is growing, but continues to increase in proportion to turnover changes.
Working capital cycle is 90 days.
INVESTMENT PLAN
The amount of equipment depends on farm place, methods, techniques, harvesting techniques and production cycle. If the cycle is more complicated the amount of equipment and its costs are higher, however, it might reduce risks.
In business plan the calculation is based on 150 farms, so it means that harvesting will be done in 75 farms, and the total amount of investment – 475 TEUR.
Based on investment calculation a financial plan was set as follows.
FINANCIAL PLAN
Table 20; Financial plan
TEUR Y0 Y1 Y2
Received 475
Paid 237 34
Rest Amount 475 -‐237 -‐34
EU support of investment amount 237
Payment in share capital 118 0 0
Finance cash flow 593 0 -‐44
To finance current assets it is expected to use the Bank's funds and the repayment is not intended in the financial plan as working capital is required for all operating time.
CASH FLOW
The projected cash flow shows that in the first 2 years the company will need to closely monitor financial resources and structures, as well as keep track of costs so that they don’t exceed the budget. However, by economic activity evolving, the company generates cash flow will be sufficient to allow both to grow and to create earnings potential.
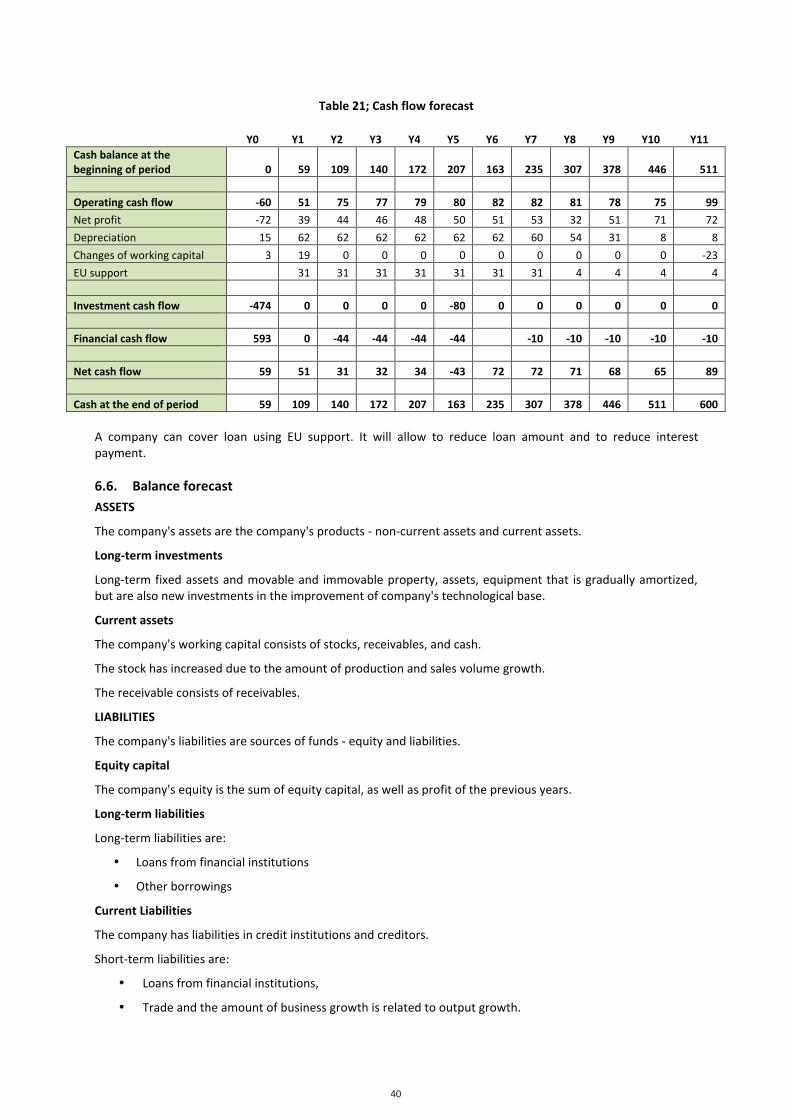
40
40
Table 21; Cash flow forecast
Y0 Y1 Y2 Y3 Y4 Y5 Y6 Y7 Y8 Y9 Y10 Y11 Cash balance at the beginning of period 0 59 109 140 172 207 163 235 307 378 446 511
Operating cash flow -‐60 51 75 77 79 80 82 82 81 78 75 99
Net profit -‐72 39 44 46 48 50 51 53 32 51 71 72
Depreciation 15 62 62 62 62 62 62 60 54 31 8 8
Changes of working capital 3 19 0 0 0 0 0 0 0 0 0 -‐23
EU support 31 31 31 31 31 31 31 4 4 4 4
Investment cash flow -‐474 0 0 0 0 -‐80 0 0 0 0 0 0
Financial cash flow 593 0 -‐44 -‐44 -‐44 -‐44 -‐10 -‐10 -‐10 -‐10 -‐10
Net cash flow 59 51 31 32 34 -‐43 72 72 71 68 65 89
Cash at the end of period 59 109 140 172 207 163 235 307 378 446 511 600 A company can cover loan using EU support. It will allow to reduce loan amount and to reduce interest payment.
6.6. Balance forecast ASSETS
The company's assets are the company's products -‐ non-‐current assets and current assets.
Long-‐term investments
Long-‐term fixed assets and movable and immovable property, assets, equipment that is gradually amortized, but are also new investments in the improvement of company's technological base.
Current assets
The company's working capital consists of stocks, receivables, and cash.
The stock has increased due to the amount of production and sales volume growth.
The receivable consists of receivables.
LIABILITIES
The company's liabilities are sources of funds -‐ equity and liabilities.
Equity capital
The company's equity is the sum of equity capital, as well as profit of the previous years.
Long-‐term liabilities
Long-‐term liabilities are:
• Loans from financial institutions
• Other borrowings
Current Liabilities
The company has liabilities in credit institutions and creditors.
Short-‐term liabilities are:
• Loans from financial institutions,
• Trade and the amount of business growth is related to output growth.
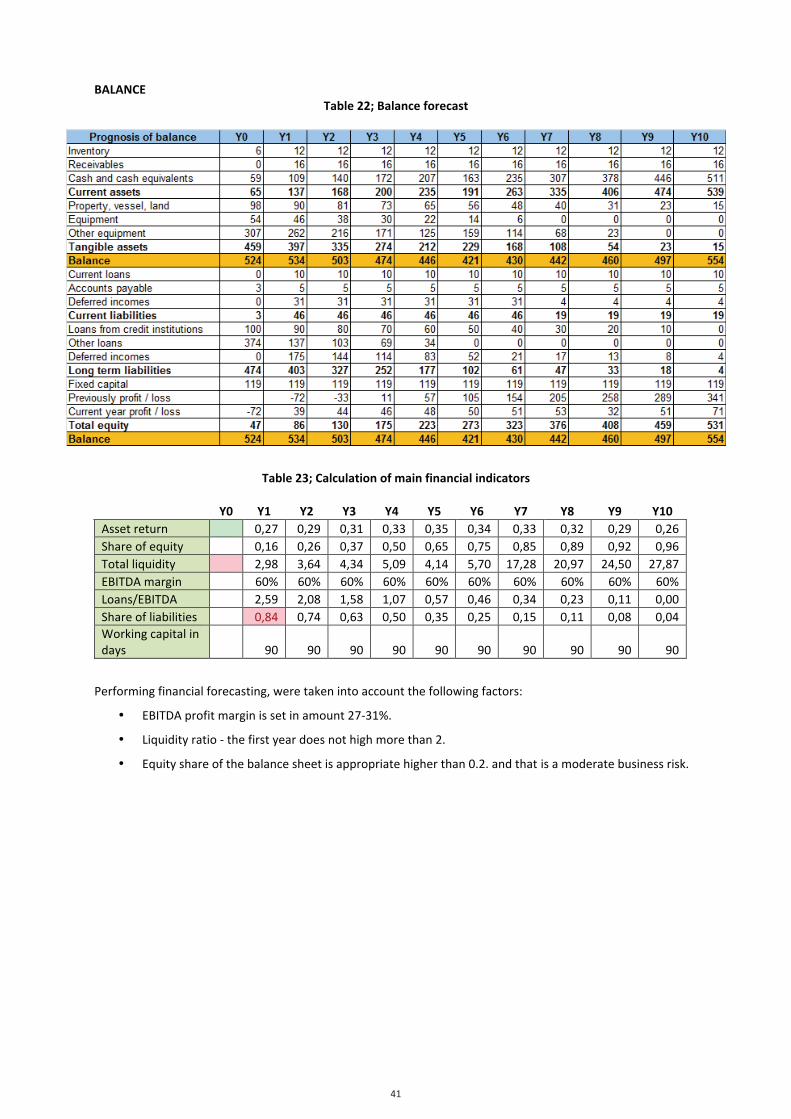
41
41
BALANCE Table 22; Balance forecast
Table 23; Calculation of main financial indicators
Y0 Y1 Y2 Y3 Y4 Y5 Y6 Y7 Y8 Y9 Y10 Asset return 0,27 0,29 0,31 0,33 0,35 0,34 0,33 0,32 0,29 0,26 Share of equity 0,16 0,26 0,37 0,50 0,65 0,75 0,85 0,89 0,92 0,96 Total liquidity 2,98 3,64 4,34 5,09 4,14 5,70 17,28 20,97 24,50 27,87 EBITDA margin 60% 60% 60% 60% 60% 60% 60% 60% 60% 60% Loans/EBITDA 2,59 2,08 1,58 1,07 0,57 0,46 0,34 0,23 0,11 0,00 Share of liabilities 0,84 0,74 0,63 0,50 0,35 0,25 0,15 0,11 0,08 0,04 Working capital in days 90 90 90 90 90 90 90 90 90 90
Performing financial forecasting, were taken into account the following factors:
• EBITDA profit margin is set in amount 27-‐31%.
• Liquidity ratio -‐ the first year does not high more than 2.
• Equity share of the balance sheet is appropriate higher than 0.2. and that is a moderate business risk.

42
42
6.7. Project profitability calculation Y0 Y1 Y2 Y3 Y4 Y5 Y6 Y7 Discounted cash flow 59 51 31 32 34 -‐43 72 72
Discount rate 16,5%
Business NPV, EUR 169
The present value calculation:
§ The discounted cash flow resulting from cash flow projections (net cash flow);
§ The discount rate is formed from prior estimates of the risk factors;
§ The business NPV is the cash flow net present value and the value of the reversion amount.
The project value is 169 TEUR, but MIRR is 6.92%.
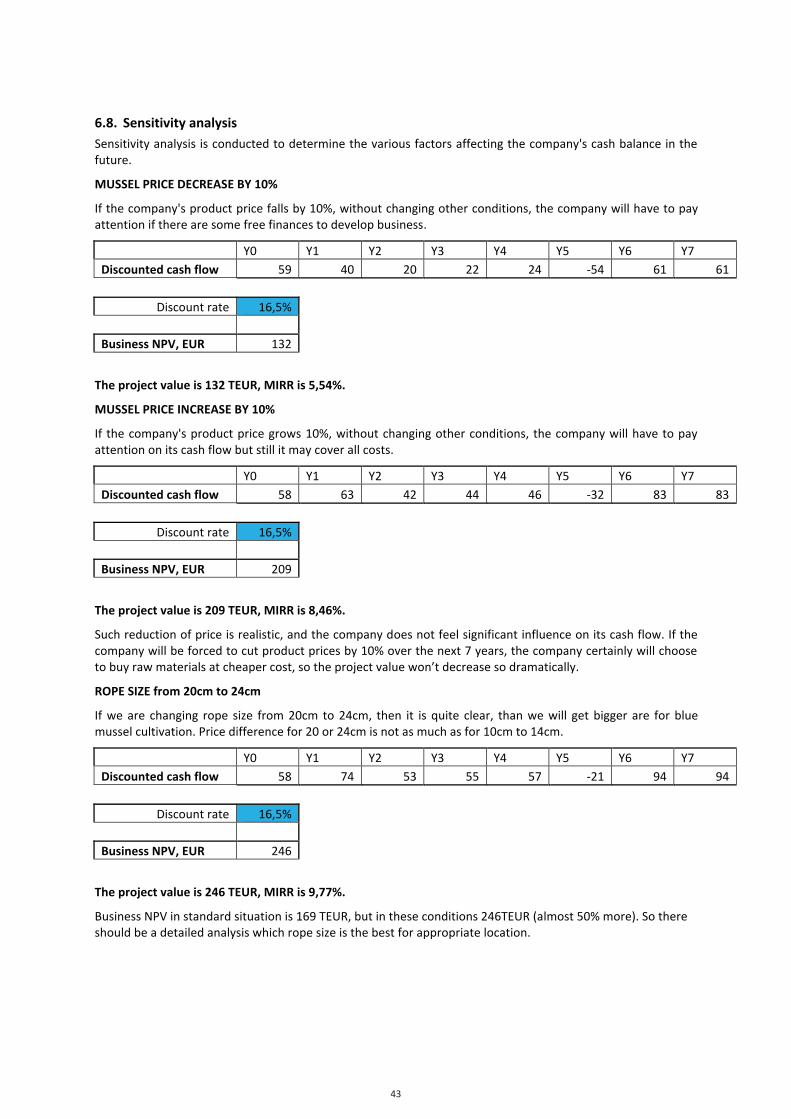
43
43
6.8. Sensitivity analysis Sensitivity analysis is conducted to determine the various factors affecting the company's cash balance in the future.
MUSSEL PRICE DECREASE BY 10%
If the company's product price falls by 10%, without changing other conditions, the company will have to pay attention if there are some free finances to develop business.
Y0 Y1 Y2 Y3 Y4 Y5 Y6 Y7 Discounted cash flow 59 40 20 22 24 -‐54 61 61
Discount rate 16,5%
Business NPV, EUR 132
The project value is 132 TEUR, MIRR is 5,54%.
MUSSEL PRICE INCREASE BY 10%
If the company's product price grows 10%, without changing other conditions, the company will have to pay attention on its cash flow but still it may cover all costs.
Y0 Y1 Y2 Y3 Y4 Y5 Y6 Y7 Discounted cash flow 58 63 42 44 46 -‐32 83 83
Discount rate 16,5%
Business NPV, EUR 209
The project value is 209 TEUR, MIRR is 8,46%.
Such reduction of price is realistic, and the company does not feel significant influence on its cash flow. If the company will be forced to cut product prices by 10% over the next 7 years, the company certainly will choose to buy raw materials at cheaper cost, so the project value won’t decrease so dramatically.
ROPE SIZE from 20cm to 24cm
If we are changing rope size from 20cm to 24cm, then it is quite clear, than we will get bigger are for blue mussel cultivation. Price difference for 20 or 24cm is not as much as for 10cm to 14cm.
Y0 Y1 Y2 Y3 Y4 Y5 Y6 Y7 Discounted cash flow 58 74 53 55 57 -‐21 94 94
Discount rate 16,5%
Business NPV, EUR 246
The project value is 246 TEUR, MIRR is 9,77%.
Business NPV in standard situation is 169 TEUR, but in these conditions 246TEUR (almost 50% more). So there should be a detailed analysis which rope size is the best for appropriate location.
3.3.3.1Business Plan
Latvia Annex

2
Disclaimer: The contents of the document reflect the authors’ views. The Managing Authority of the Central Baltic INTERREG IV A Programme cannot be held liable for information published by the project partners.
ANNEX MAIN IDICATORS
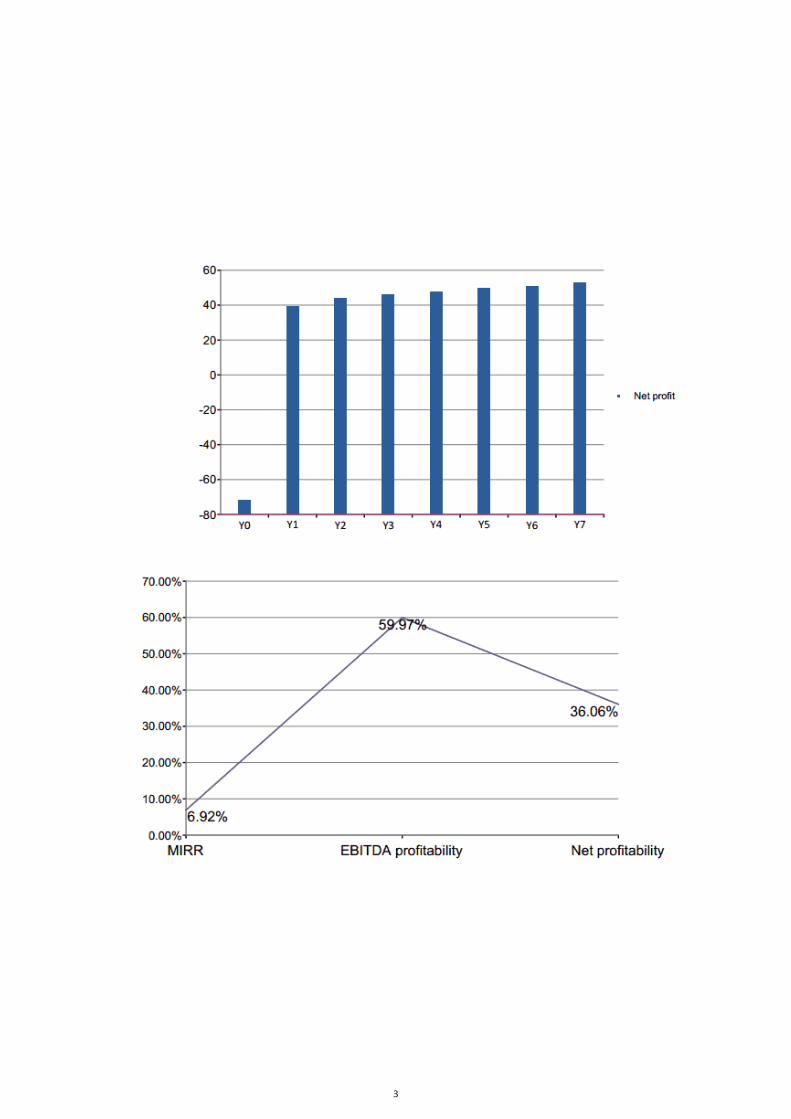
3
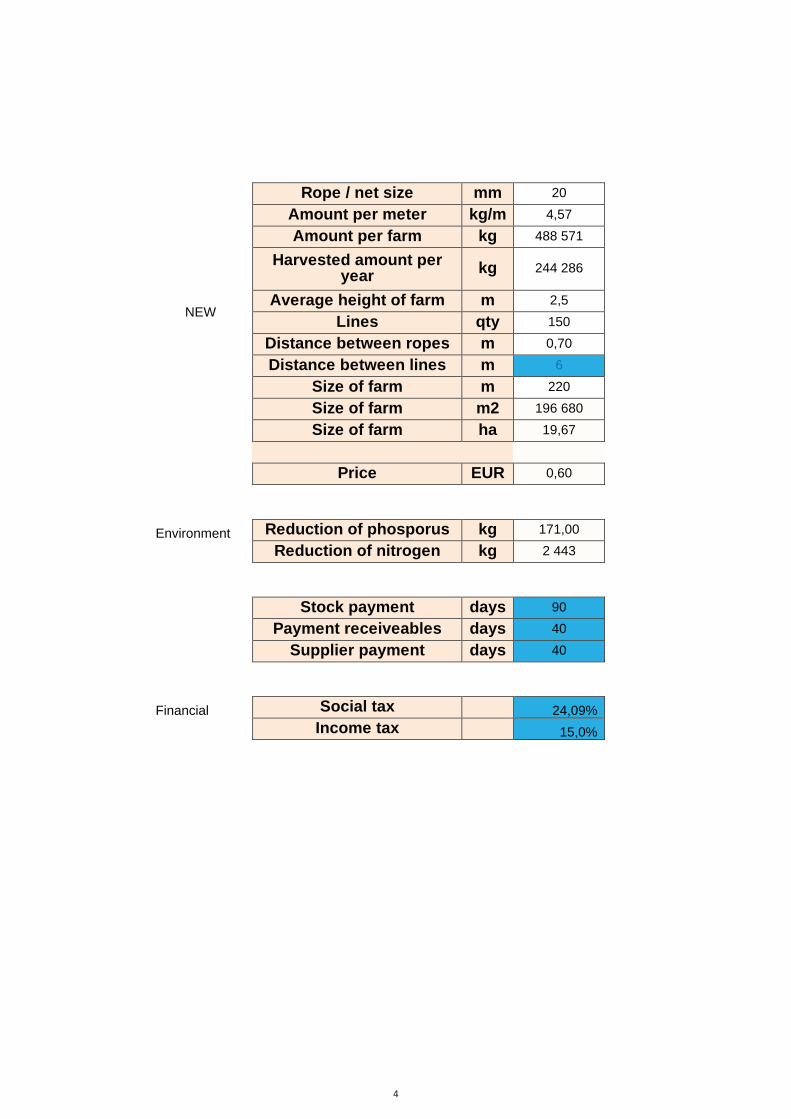
4
Rope / net size mm 20
Amount per meter kg/m 4,57 Amount per farm kg 488 571
Harvested amount per year kg 244 286
Average height of farm m 2,5 Lines qty 150
Distance between ropes m 0,70 Distance between lines m 6
Size of farm m 220 Size of farm m2 196 680
NEW
Size of farm ha 19,67 Price EUR 0,60
Environment Reduction of phosporus kg 171,00
Reduction of nitrogen kg 2 443 Stock payment days 90
Payment receiveables days 40
Supplier payment days 40 Financial Social tax 24,09% Income tax 15,0%
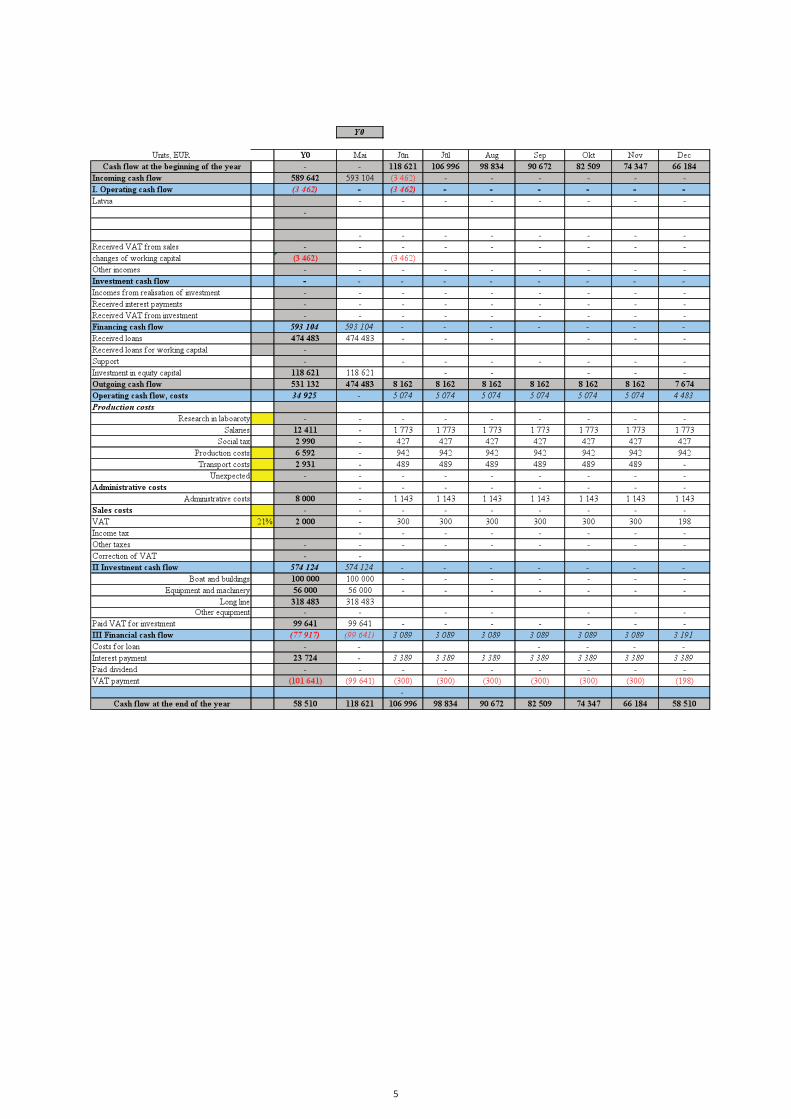
5
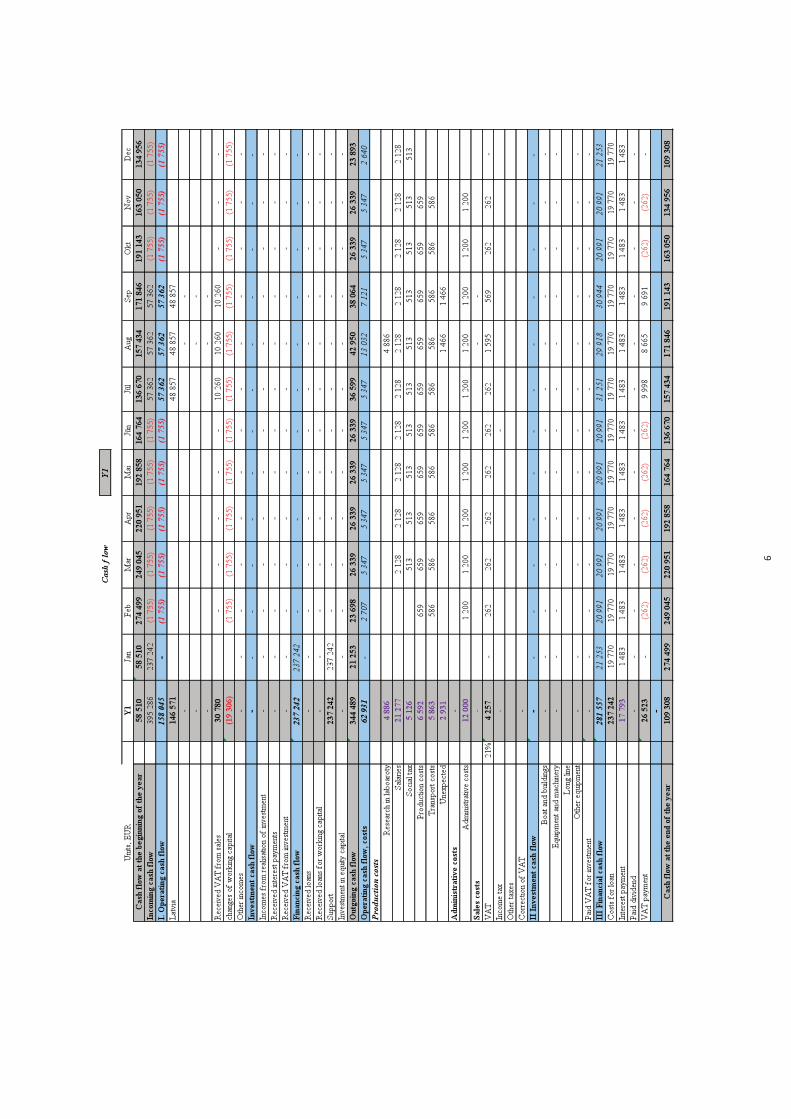
6
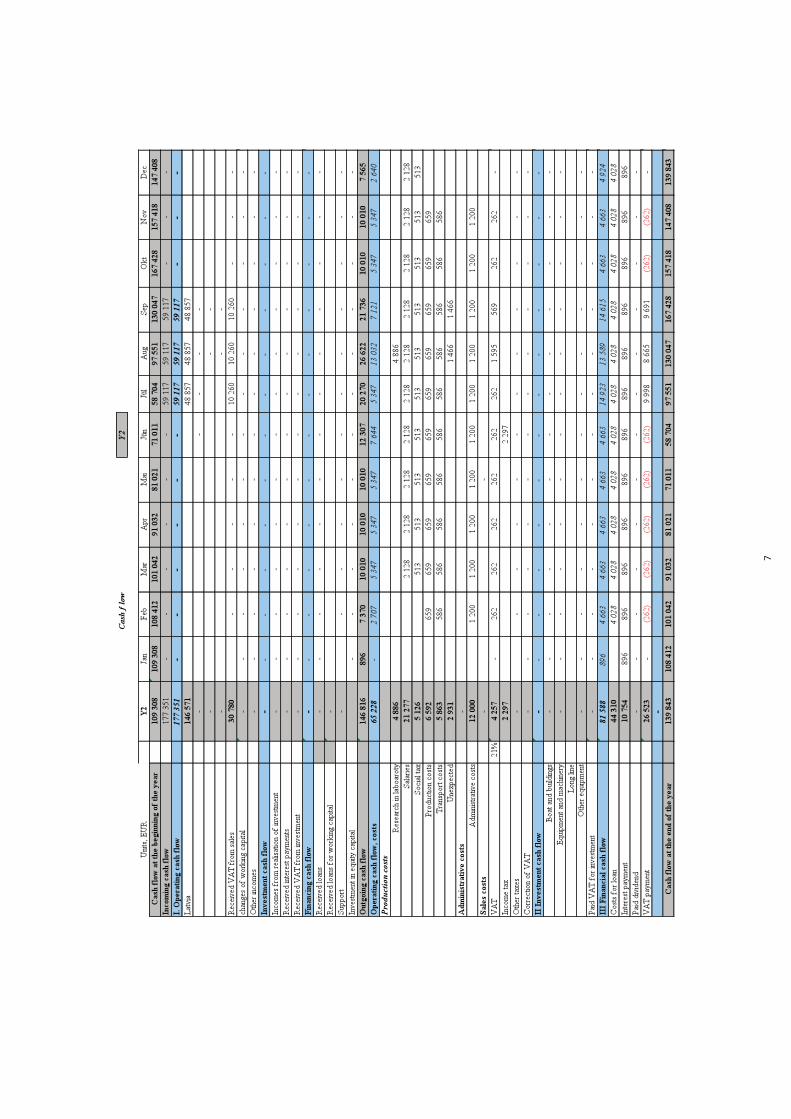
7
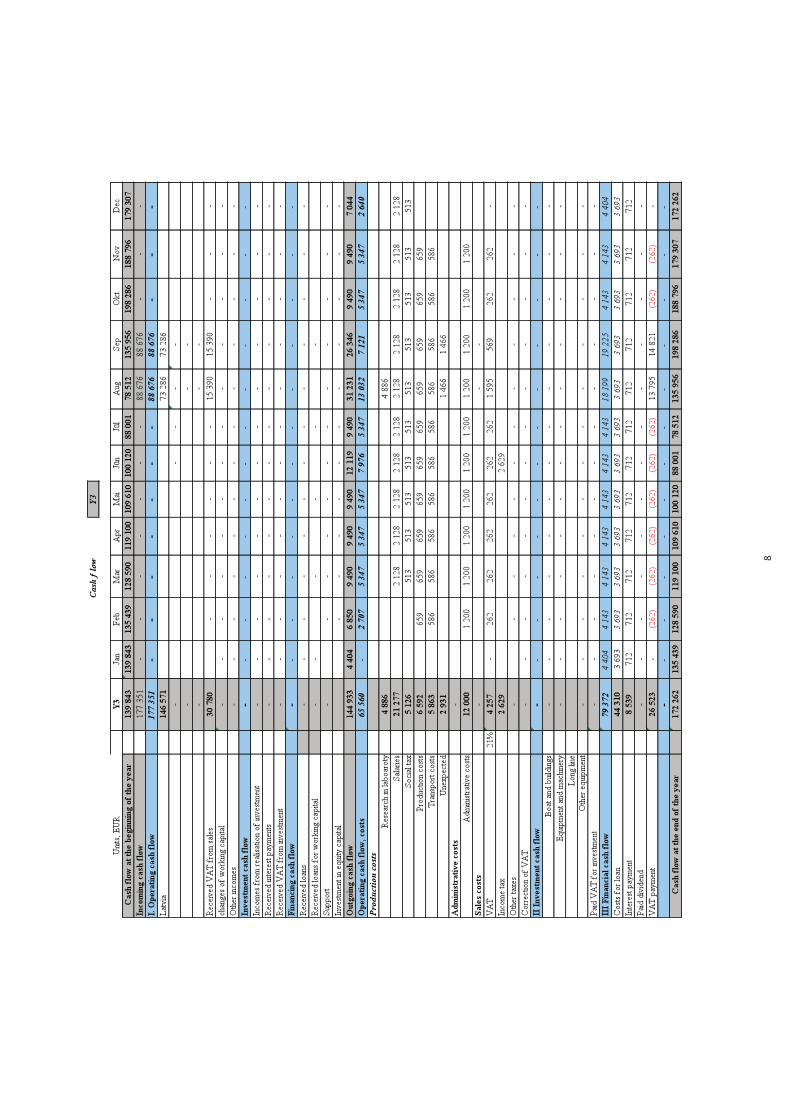
8
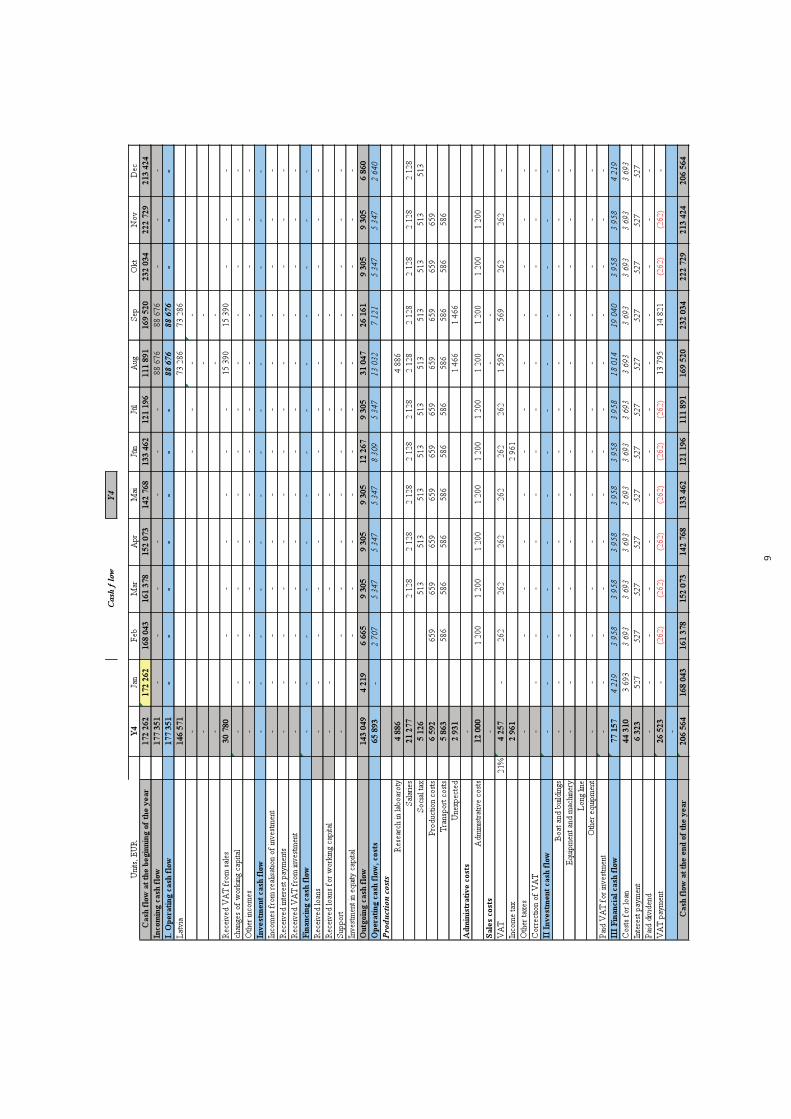
9

3.4
Other Information
3.4.1Mussel growing restrictions in the open
Baltic Sea at Kurzeme coast
Author:MSc. Ieva Bārda
Latvian Institute of Aquatic Ecology
2
Contents
Content ........................................................................................................................... 2
1. Restriction in the open Baltic Sea at the Latvian coast ................................................ 3
1.1 Fisheries .............................................................................................................. 3
1.2 Maritime traffic and transportation, port activities .............................................. 4
1.3 Production of hydrocarbons................................................................................. 6
1.4 Military defence and security .............................................................................. 7
1.5 Marine protected areas ....................................................................................... 7
2. References ................................................................................................................. 9
Disclaimer: The contents of the document reflect the authors’ views. The Managing Authority of the Central Baltic INTERREG IV A Programme cannot be held liable for information published by the project partners.
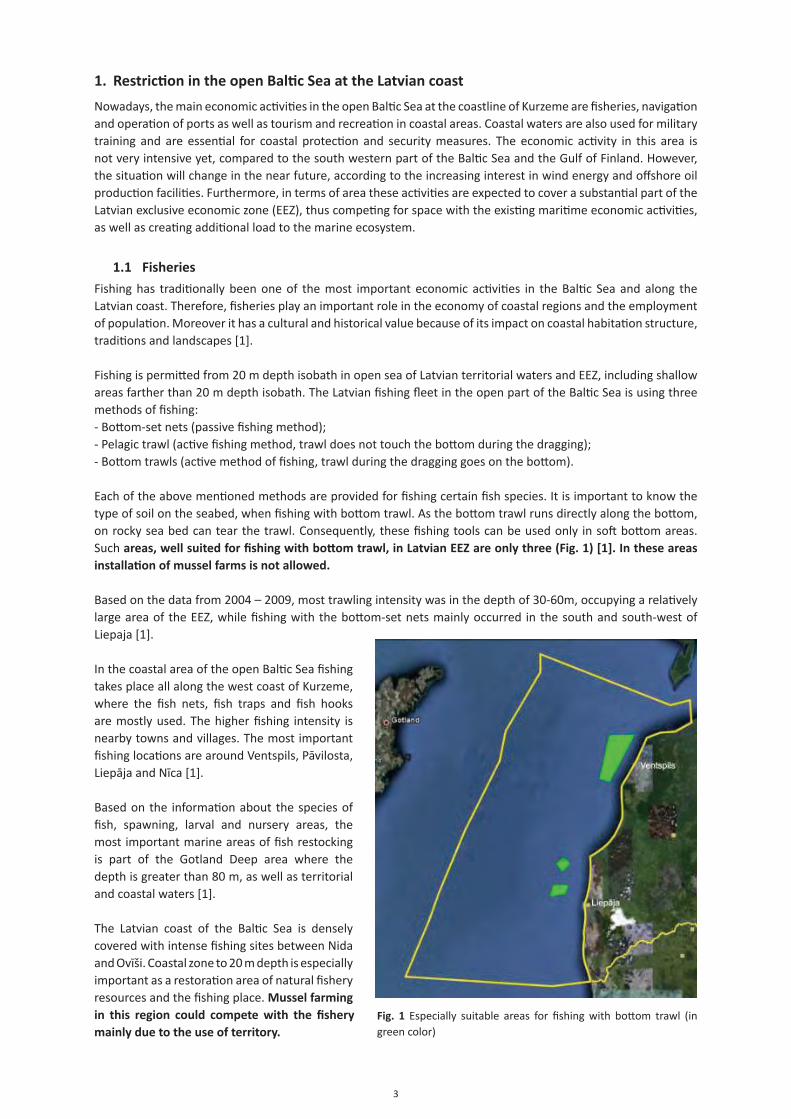
3
1. Restriction in the open Baltic Sea at the Latvian coast
Nowadays, the main economic activities in the open Baltic Sea at the coastline of Kurzeme are fisheries, navigation and operation of ports as well as tourism and recreation in coastal areas. Coastal waters are also used for military training and are essential for coastal protection and security measures. The economic activity in this area is not very intensive yet, compared to the south western part of the Baltic Sea and the Gulf of Finland. However, the situation will change in the near future, according to the increasing interest in wind energy and offshore oil production facilities. Furthermore, in terms of area these activities are expected to cover a substantial part of the Latvian exclusive economic zone (EEZ), thus competing for space with the existing maritime economic activities, as well as creating additional load to the marine ecosystem.
1.1 Fisheries
Fishing has traditionally been one of the most important economic activities in the Baltic Sea and along the Latvian coast. Therefore, fisheries play an important role in the economy of coastal regions and the employment of population. Moreover it has a cultural and historical value because of its impact on coastal habitation structure, traditions and landscapes [1].
Fishing is permitted from 20 m depth isobath in open sea of Latvian territorial waters and EEZ, including shallow areas farther than 20 m depth isobath. The Latvian fishing fleet in the open part of the Baltic Sea is using three methods of fishing:- Bottom-set nets (passive fishing method);- Pelagic trawl (active fishing method, trawl does not touch the bottom during the dragging);- Bottom trawls (active method of fishing, trawl during the dragging goes on the bottom).
Each of the above mentioned methods are provided for fishing certain fish species. It is important to know the type of soil on the seabed, when fishing with bottom trawl. As the bottom trawl runs directly along the bottom, on rocky sea bed can tear the trawl. Consequently, these fishing tools can be used only in soft bottom areas. Such areas, well suited for fishing with bottom trawl, in Latvian EEZ are only three (Fig. 1) [1]. In these areas installation of mussel farms is not allowed.
Based on the data from 2004 – 2009, most trawling intensity was in the depth of 30-60m, occupying a relatively large area of the EEZ, while fishing with the bottom-set nets mainly occurred in the south and south-west of Liepaja [1].
In the coastal area of the open Baltic Sea fishing takes place all along the west coast of Kurzeme, where the fish nets, fish traps and fish hooks are mostly used. The higher fishing intensity is nearby towns and villages. The most important fishing locations are around Ventspils, Pāvilosta, Liepāja and Nīca [1].
Based on the information about the species of fish, spawning, larval and nursery areas, the most important marine areas of fish restocking is part of the Gotland Deep area where the depth is greater than 80 m, as well as territorial and coastal waters [1].
The Latvian coast of the Baltic Sea is densely covered with intense fishing sites between Nida and Ovīši. Coastal zone to 20 m depth is especially important as a restoration area of natural fishery resources and the fishing place. Mussel farming in this region could compete with the fishery mainly due to the use of territory.
Fig. 1 Especially suitable areas for fishing with bottom trawl (in green color)
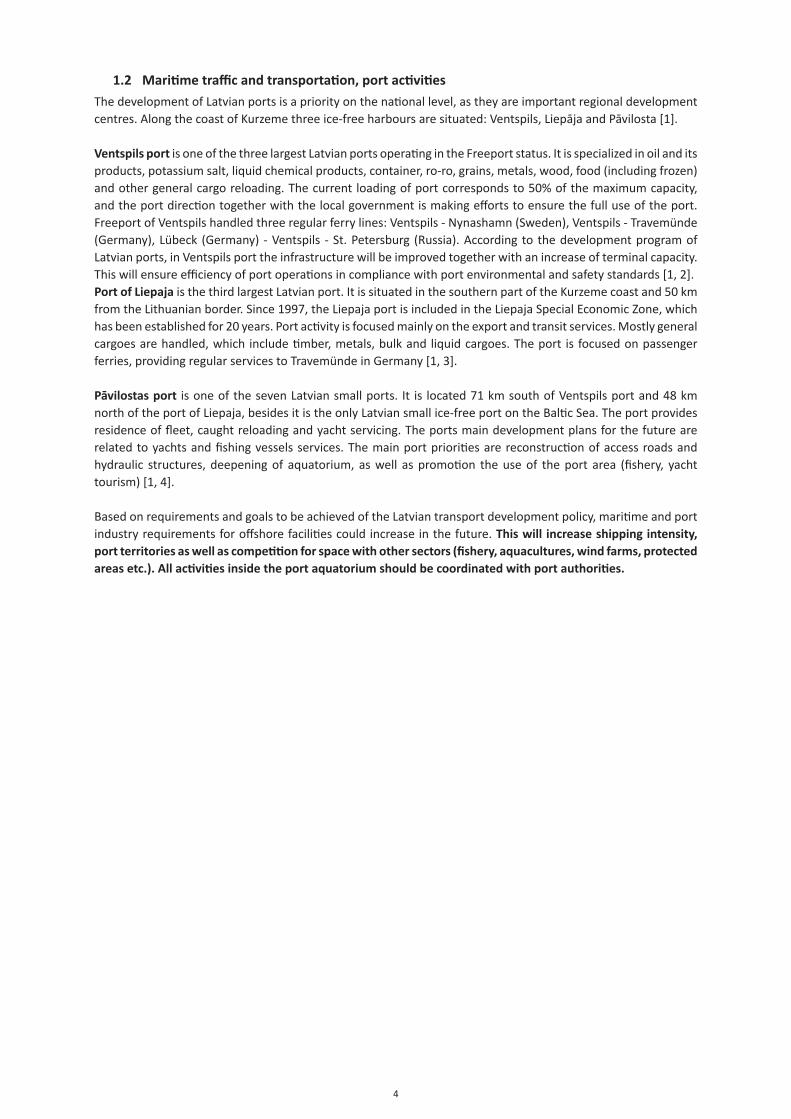
4
1.2 Maritime traffic and transportation, port activities
The development of Latvian ports is a priority on the national level, as they are important regional development centres. Along the coast of Kurzeme three ice-free harbours are situated: Ventspils, Liepāja and Pāvilosta [1].
Ventspils port is one of the three largest Latvian ports operating in the Freeport status. It is specialized in oil and its products, potassium salt, liquid chemical products, container, ro-ro, grains, metals, wood, food (including frozen) and other general cargo reloading. The current loading of port corresponds to 50% of the maximum capacity, and the port direction together with the local government is making efforts to ensure the full use of the port. Freeport of Ventspils handled three regular ferry lines: Ventspils - Nynashamn (Sweden), Ventspils - Travemünde (Germany), Lübeck (Germany) - Ventspils - St. Petersburg (Russia). According to the development program of Latvian ports, in Ventspils port the infrastructure will be improved together with an increase of terminal capacity. This will ensure efficiency of port operations in compliance with port environmental and safety standards [1, 2].Port of Liepaja is the third largest Latvian port. It is situated in the southern part of the Kurzeme coast and 50 km from the Lithuanian border. Since 1997, the Liepaja port is included in the Liepaja Special Economic Zone, which has been established for 20 years. Port activity is focused mainly on the export and transit services. Mostly general cargoes are handled, which include timber, metals, bulk and liquid cargoes. The port is focused on passenger ferries, providing regular services to Travemünde in Germany [1, 3].
Pāvilostas port is one of the seven Latvian small ports. It is located 71 km south of Ventspils port and 48 km north of the port of Liepaja, besides it is the only Latvian small ice-free port on the Baltic Sea. The port provides residence of fleet, caught reloading and yacht servicing. The ports main development plans for the future are related to yachts and fishing vessels services. The main port priorities are reconstruction of access roads and hydraulic structures, deepening of aquatorium, as well as promotion the use of the port area (fishery, yacht tourism) [1, 4].
Based on requirements and goals to be achieved of the Latvian transport development policy, maritime and port industry requirements for offshore facilities could increase in the future. This will increase shipping intensity, port territories as well as competition for space with other sectors (fishery, aquacultures, wind farms, protected areas etc.). All activities inside the port aquatorium should be coordinated with port authorities.
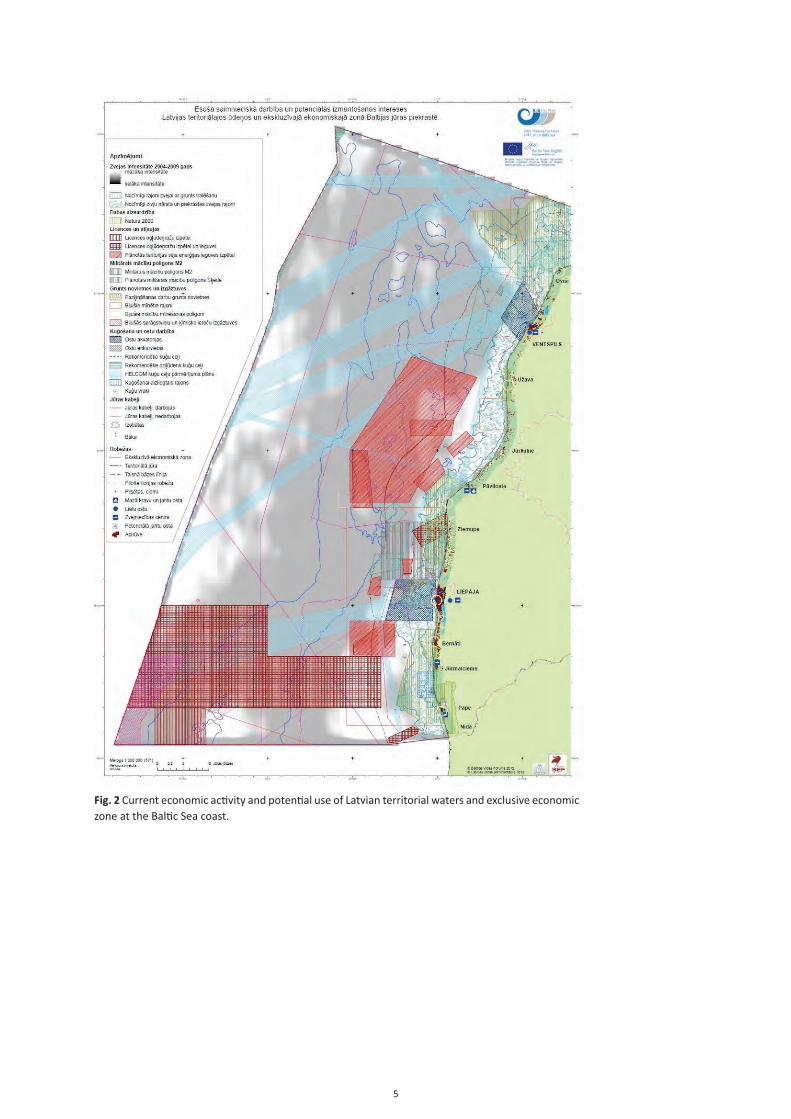
5
Fig. 2 Current economic activity and potential use of Latvian territorial waters and exclusive economic zone at the Baltic Sea coast.
6
1.3 Production of hydrocarbons
The potential oil fields in the Latvian maritime waters are located in ~21.5 thousand km2 large area and it measured volume are ~360 million barrels. The largest deposits are concentrated to the offshore of the south-west area. Around 50 local elevations have been discovered there. 20 of them have been found to be promising for oil production. Oil-bearing rock layers are located within 650 to 1900 m depth, but productive horizon embeds 1200-1900 m below the sea level [1].
Geological and economic estimates indicate that oil production will be feasible in a number of large oil deposits, while the rest of the field could be opened only after the establishment of appropriate large deposits. It is estimated that the potential oil resources in Latvian marine waters could make 40-60 million m3. Currently these resources are considered as economically disadvantageous. However, their role in the future is likely to increase as large and easily exploitable oil resource in the world are more and more scarce, while oil exploration and extraction technologies are developing.
In July 2004 the two licenses were issued to Odin Energi AS (Denmark) for hydrocarbon exploration and production in the Baltic Sea at Latvian EEZ (south of Liepaja). In 2008 the Balin Energy Ltd., owned by the Polish oil company PKN Orlen and Kuwait Energy, took over one of Odin Energi licenses [1].
In May 2013 the oil exploration borehole was set up by the Balin Energy (Fig. 3), but at the end of month the drilling was completed, reaching the depth of 1460 m below sea level. The selected reservoir was drilled through the hole, but only water was found and no hydrocarbons. The bore was securely closed [5].
Areas of interest for hydrocarbon production often conform to territories with intensive fishing, as well as potentially sites of wind farm construction (Fig. 2) and aquaculture (Fig. 12 in Synergy with fishery). As previously mentioned, it is theoretically possible to have hydrocarbon generation and production of wind parks on the same site. However, the standard practice is to allow only one of these activities in any given area [1].
The oil rig usually occupies a relatively small area of the total territory of the deposit and is installed in the most cost efficient place. Security zone determines at least in 500 m radius, where other activities are not permitted. Still, in the rest of the license area other economic activities are allowed. However, it should be noted that there is a high environmental risk in the sites of hydrocarbon production, and even a small accident can cause huge damage to the marine environment [1].
Fig. 3 Oil exploration in the open Baltic Sea at Kurzeme coast by Balin Energy. Photo I. Puriņa
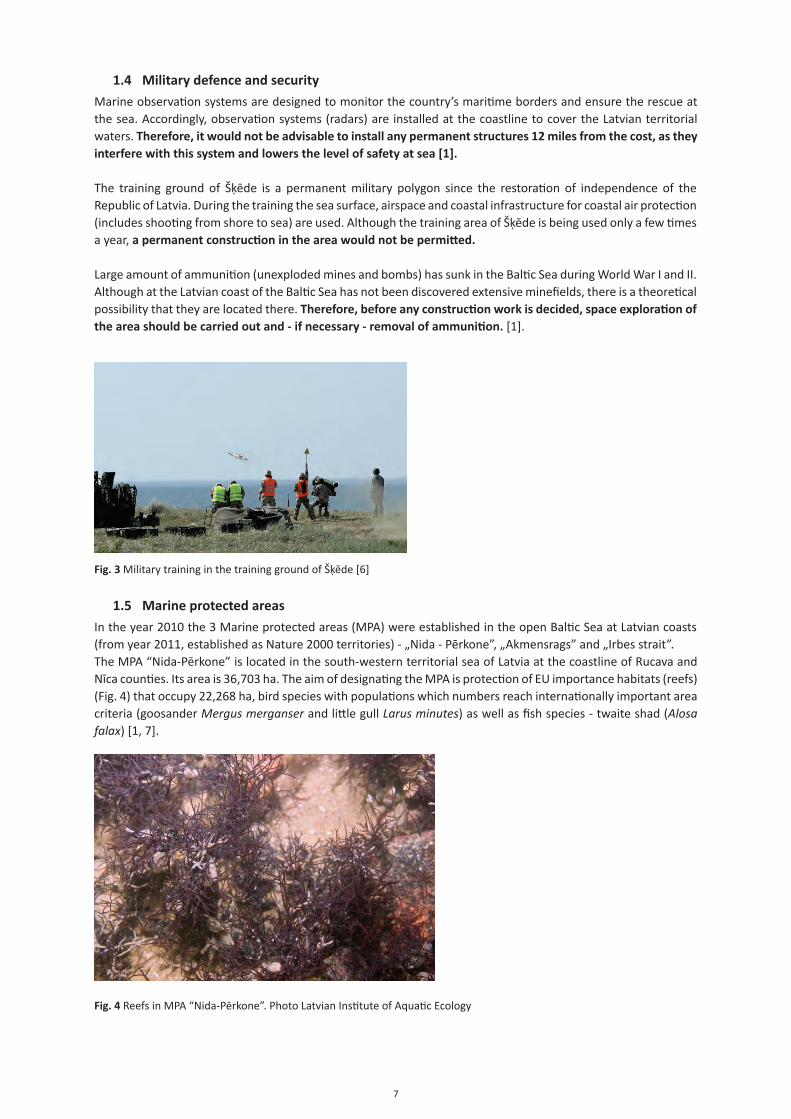
7
1.4 Military defence and security
Marine observation systems are designed to monitor the country’s maritime borders and ensure the rescue at the sea. Accordingly, observation systems (radars) are installed at the coastline to cover the Latvian territorial waters. Therefore, it would not be advisable to install any permanent structures 12 miles from the cost, as they interfere with this system and lowers the level of safety at sea [1].
The training ground of Šķēde is a permanent military polygon since the restoration of independence of the Republic of Latvia. During the training the sea surface, airspace and coastal infrastructure for coastal air protection (includes shooting from shore to sea) are used. Although the training area of Šķēde is being used only a few times a year, a permanent construction in the area would not be permitted.
Large amount of ammunition (unexploded mines and bombs) has sunk in the Baltic Sea during World War I and II. Although at the Latvian coast of the Baltic Sea has not been discovered extensive minefields, there is a theoretical possibility that they are located there. Therefore, before any construction work is decided, space exploration of the area should be carried out and - if necessary - removal of ammunition. [1].
Fig. 3 Military training in the training ground of Šķēde [6]
1.5 Marine protected areas
In the year 2010 the 3 Marine protected areas (MPA) were established in the open Baltic Sea at Latvian coasts (from year 2011, established as Nature 2000 territories) - „Nida - Pērkone”, „Akmensrags” and „Irbes strait”. The MPA “Nida-Pērkone” is located in the south-western territorial sea of Latvia at the coastline of Rucava and Nīca counties. Its area is 36,703 ha. The aim of designating the MPA is protection of EU importance habitats (reefs) (Fig. 4) that occupy 22,268 ha, bird species with populations which numbers reach internationally important area criteria (goosander Mergus merganser and little gull Larus minutes) as well as fish species - twaite shad (Alosa falax) [1, 7].
Fig. 4 Reefs in MPA “Nida-Pērkone”. Photo Latvian Institute of Aquatic Ecology
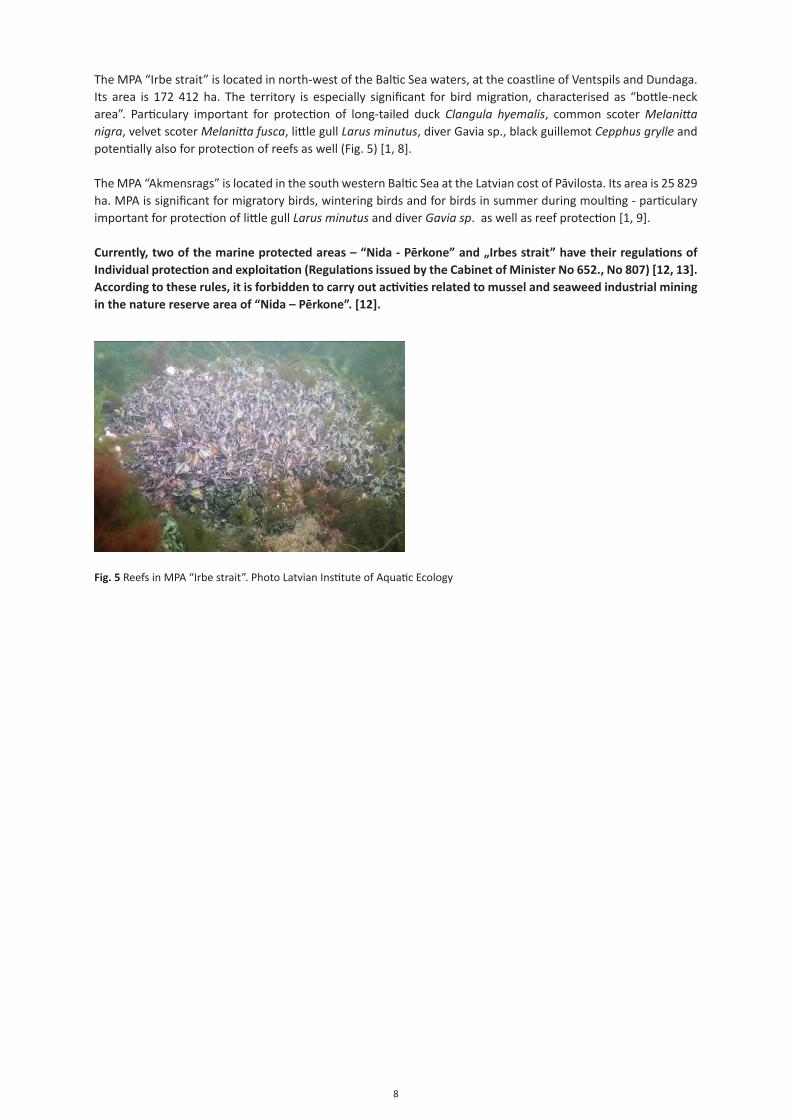
8
The MPA “Irbe strait” is located in north-west of the Baltic Sea waters, at the coastline of Ventspils and Dundaga. Its area is 172 412 ha. The territory is especially significant for bird migration, characterised as “bottle-neck area”. Particulary important for protection of long-tailed duck Clangula hyemalis, common scoter Melanitta nigra, velvet scoter Melanitta fusca, little gull Larus minutus, diver Gavia sp., black guillemot Cepphus grylle and potentially also for protection of reefs as well (Fig. 5) [1, 8].
The MPA “Akmensrags” is located in the south western Baltic Sea at the Latvian cost of Pāvilosta. Its area is 25 829 ha. MPA is significant for migratory birds, wintering birds and for birds in summer during moulting - particulary important for protection of little gull Larus minutus and diver Gavia sp. as well as reef protection [1, 9].
Currently, two of the marine protected areas – “Nida - Pērkone” and „Irbes strait” have their regulations of Individual protection and exploitation (Regulations issued by the Cabinet of Minister No 652., No 807) [12, 13]. According to these rules, it is forbidden to carry out activities related to mussel and seaweed industrial mining in the nature reserve area of “Nida – Pērkone”. [12].
Fig. 5 Reefs in MPA “Irbe strait”. Photo Latvian Institute of Aquatic Ecology
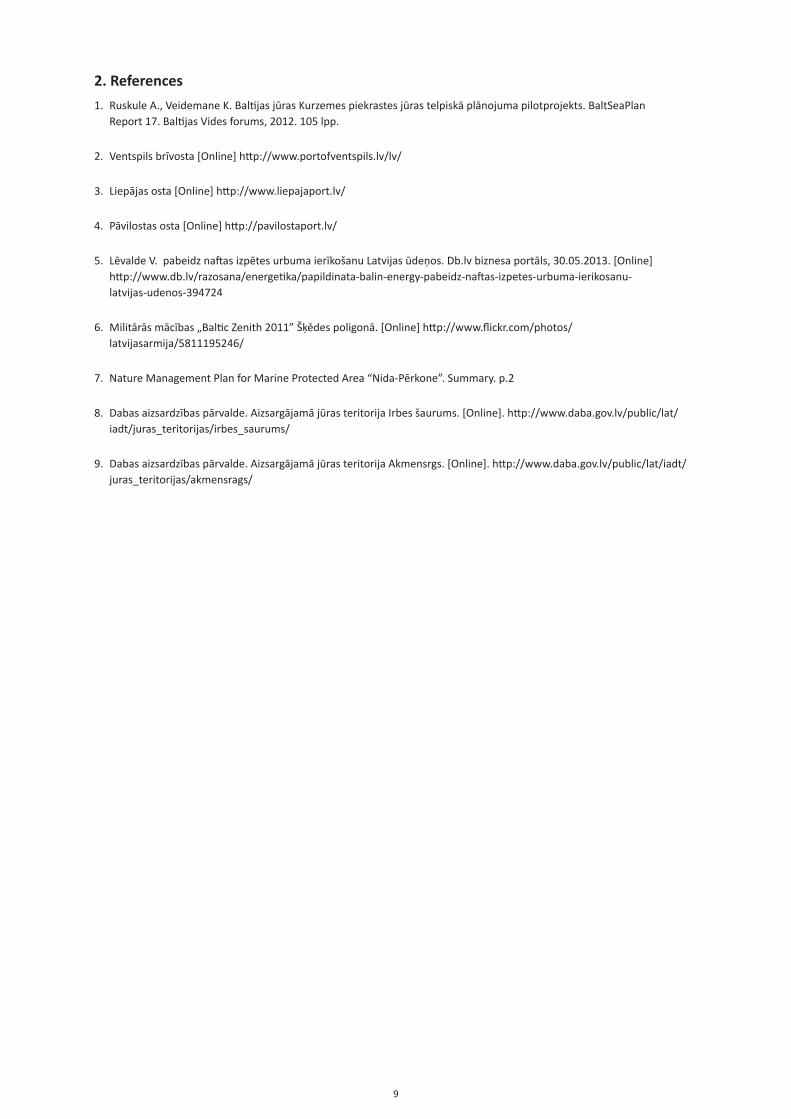
9
2. References
1. Ruskule A., Veidemane K. Baltijas jūras Kurzemes piekrastes jūras telpiskā plānojuma pilotprojekts. BaltSeaPlan Report 17. Baltijas Vides forums, 2012. 105 lpp.
2. Ventspils brīvosta [Online] http://www.portofventspils.lv/lv/
3. Liepājas osta [Online] http://www.liepajaport.lv/
4. Pāvilostas osta [Online] http://pavilostaport.lv/
5. Lēvalde V. pabeidz naftas izpētes urbuma ierīkošanu Latvijas ūdeņos. Db.lv biznesa portāls, 30.05.2013. [Online] http://www.db.lv/razosana/energetika/papildinata-balin-energy-pabeidz-naftas-izpetes-urbuma-ierikosanu- latvijas-udenos-394724
6. Militārās mācības „Baltic Zenith 2011” Šķēdes poligonā. [Online] http://www.flickr.com/photos/ latvijasarmija/5811195246/
7. Nature Management Plan for Marine Protected Area “Nida-Pērkone”. Summary. p.2
8. Dabas aizsardzības pārvalde. Aizsargājamā jūras teritorija Irbes šaurums. [Online]. http://www.daba.gov.lv/public/lat/ iadt/juras_teritorijas/irbes_saurums/
9. Dabas aizsardzības pārvalde. Aizsargājamā jūras teritorija Akmensrgs. [Online]. http://www.daba.gov.lv/public/lat/iadt/ juras_teritorijas/akmensrags/

3.4.2Compendium
on Establishment of a Mussel Farm from the Point of View of Laws
and Regulations in Latvia
2
Disclaimer: The contents of the document reflect the authors’ views. The Managing Authority of the Central Baltic INTERREG IV A Programme cannot be held liable for information published by the project partners.
INTRODUCTION
This compendium has been prepared according to task of the project “Baltic EcoMussel “Commercial farming, processing and use of mussels in the Baltic Sea Region” to assess the Latvian law and regulatory frameworks that the potential mussel farm developers should take into account when initiating economic activities at sea, as well as give recommendations for reduction of bureaucratic processes.
Currently there are no Intensive mussel cultivation farms (hereinafter - Mussel farm) in Latvian offshore seawaters where mussels would be cultivated for commercial purposes. There are no other aquaculture facilities located in Latvian offshore seawaters, so there are no practical examples on the basis of which to assess the institutional burden of establishment and operation of a mussel farm and their impact on the cost and time position.
Compendium contains chapters on:
1. Place in the sea from the legal points of view
2. Property rights for establishment of a mussel farm;
3. Process of acquiring licence for sea area;
4. Environmental Impact Assessment;
5. Agreements / licences / registration
One of the major factors hindering the possibility of establishing a mussel farm at sea is that at the beginning of 2013 there is no Marine Spatial Plan developed in Latvia that would harmonize the interests of different sectors (fisheries, environmental protection, shipping, public safety, etc.) in these areas. According to the Section 3 of transitional provisions of Spatial Development Planning Law, development of marine spatial plan is expected to start no later than by January 1, 2014.
As a result of the planning, areas available for fishery, including aquaculture activities, will be marked in the plan and the procedures for starting the particular business in the area will be set.1
Is is not planned to include sites of mussel farms as a separate use of the sea in the Marine spatial plan, as mussel farming is seen as a form of aquaculture in the fishery sector.
Currently, when a private entity wishes to exercise its rights for business or research Latvian maritime waters, the particular project is individually examined by the Cabinet of Ministers by adopting a corresponding order2, prescribed for in Section 19(2)4 of the Marine Environment Protection and Management Law and Section 22(5) of the Law on Environmental Impact Assessment.
1. Aquaculture multi-annual strategic guidelines for 2014 to 20202. Aquaculture multi-annual strategic guidelines for 2014 to 2020
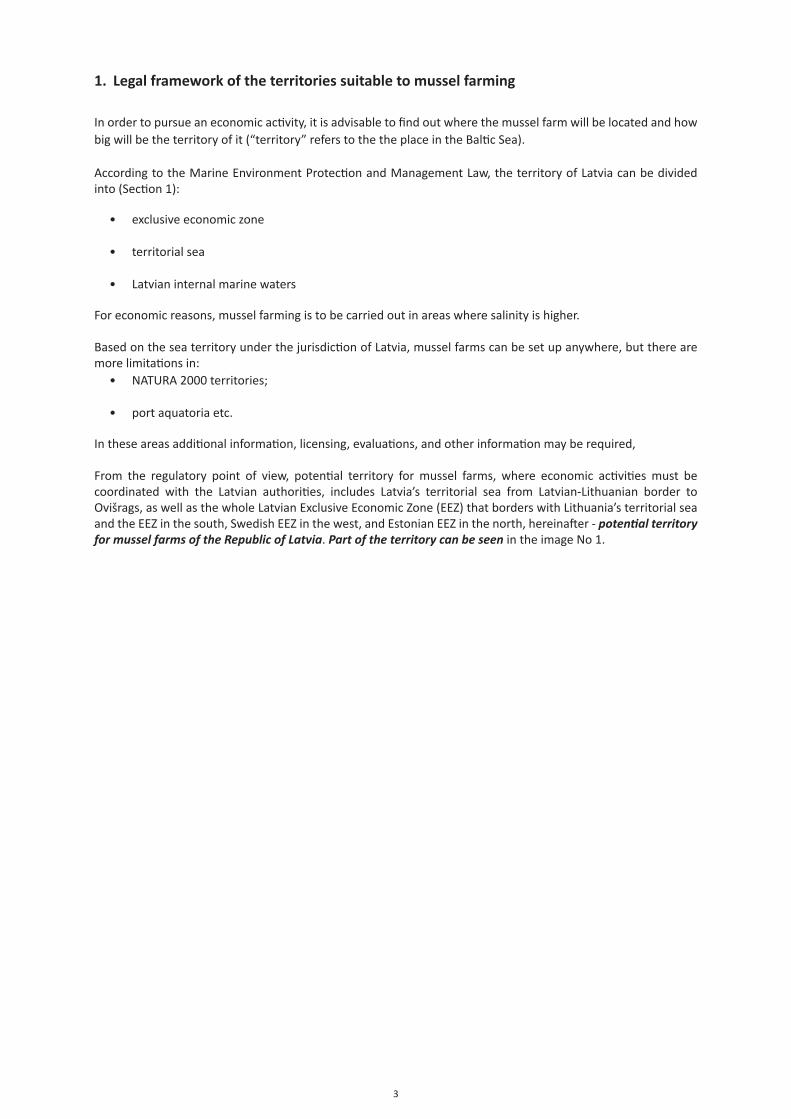
3
1. Legal framework of the territories suitable to mussel farming
In order to pursue an economic activity, it is advisable to find out where the mussel farm will be located and how big will be the territory of it (“territory” refers to the the place in the Baltic Sea).
According to the Marine Environment Protection and Management Law, the territory of Latvia can be divided into (Section 1):
• exclusive economic zone
• territorial sea
• Latvian internal marine waters
For economic reasons, mussel farming is to be carried out in areas where salinity is higher.
Based on the sea territory under the jurisdiction of Latvia, mussel farms can be set up anywhere, but there are more limitations in:
• NATURA 2000 territories;
• port aquatoria etc.
In these areas additional information, licensing, evaluations, and other information may be required,
From the regulatory point of view, potential territory for mussel farms, where economic activities must be coordinated with the Latvian authorities, includes Latvia’s territorial sea from Latvian-Lithuanian border to Ovišrags, as well as the whole Latvian Exclusive Economic Zone (EEZ) that borders with Lithuania’s territorial sea and the EEZ in the south, Swedish EEZ in the west, and Estonian EEZ in the north, hereinafter - potential territory for mussel farms of the Republic of Latvia. Part of the territory can be seen in the image No 1.
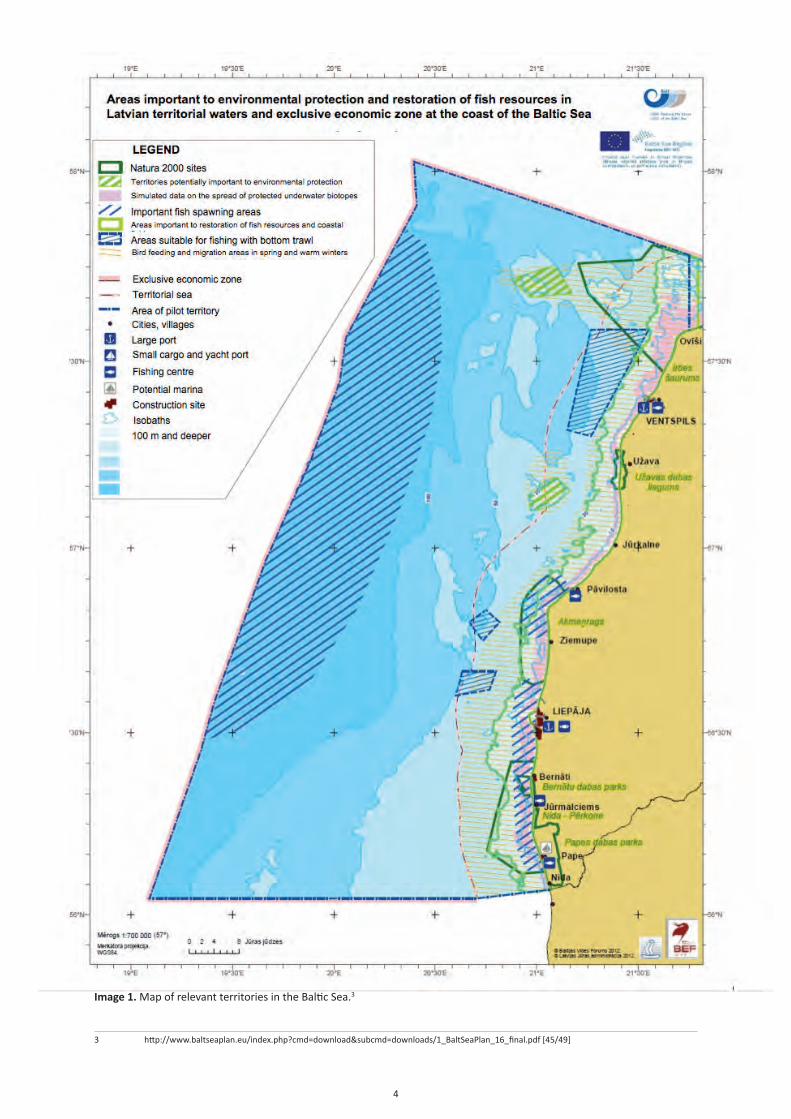
4
Image 1. Map of relevant territories in the Baltic Sea.3
3 http://www.baltseaplan.eu/index.php?cmd=download&subcmd=downloads/1_BaltSeaPlan_16_final.pdf [45/49]
5
2. Authorities involved in the mussel farm coordination processes
Establishment of mussel farm at the sea requires coordination with and licences from the following authorities:
• Fishery department of the Ministry of Agriculture - issues related to carrying out aquaculture activities at sea.
• Environment State Bureau – Environmental Impact Assessment
• Ministry of Environmental Protection and Regional Development -
- Spatial Planning Department; - on including mussel farm in the Marine spatial plan
- Department of Nature Protection; - on influence of the mussel farm on nature protection.
- Department of Environmental Protection; - on influence of the mussel farm on environmental protection.
• Latvian Maritime Administration - development and operation of navigation measures, technical requirements for establishment of a mussel farm;
• State Environmental Service - environmental protection and use of natural resources;
• Ministry of Transport - order for the use of waters and safety at sea;
• Nature Conservation Agency
• Institute of Food Safety, Animal Health and Environment “BIOR”
State authorities controlling the activities of mussel farms:
• Food and Veterinary Service - monitoring and control includes regular inspections, visits, audits and, where appropriate, sampling in each aquaculture business, taking into account the risks that may arise in relation to infection of aquaculture animals with infectious diseases;
• State Environmental Service in cooperation with National Armed Forces and Border Guard – controls the use of the sea and protection of marine environment in accordance with laws and regulations on environmental protection, fishery, maritime administration and maritime security, as well as border guard;
• Rural Support Service - compliance of economic activities with the operational programme.
6
3. Laws and regulations regulating the establishment of mussel farms
According to the Section 19(1) of the Marine Environment Protection and Management Law, a public person and private person shall use the sea in compliance with:
• regulatory enactments regulating the relevant type of activity;
• Marine Environment Protection and Management Law;
• Maritime spatial planning;
• Environment protection principles;
• Public interests.
There is a possibility that the representatives of public authorities may base their information on the following laws and regulations:
• 15.11.2011. Regulations No 200 of the Cabinet of Ministers “Order for accepting the planned activities”
• Fishery Law – sets out the necessary agreements with BIOR and Nature Conservation Agency for establishment of mussel farms;
• Veterinary Medicine Law - defines aquaculture animals and sets the rules on by-products;
• Law on Environmental Impact Assessment – prescribes that prior to acquiring a licence, it is necessary to carry out the Environmental Impact Assessment.
• 25.01.2011. Regulations No 83 of the Cabinet of Ministers “Order for assessment of the impact of the planned activity on the environment”
• 09.10.2007. Regulations No 689 of the Cabinet of Ministers “Regulations regarding the stamp duty on the preliminary assessment of impact of the planned activity on the environment”
• Maritime Administration and Marine Safety Law – sets the framework of institutional competence in maritime affairs and ensuring the maritime security;
• 19.12.2006. Regulations No 1024 of the Cabinet of Ministers “Regulations regarding the technical requirements for navigation measures” - prescribes the navigation means necessary to farms;
• 19.12.2006. Regulations No 1032 of the Cabinet of Ministers “Order for ensuring operation of navigation measures”
• United Nations Convention on the Law of the Sea of 1982, Chapter V – on economic activities;
• Law On Ports – in the economic activity is carried out in port territory.
More information on laws and regulations regulating establishment of mussel farms is included in the table of Chapter 1 of Statement “On laws and regulations that directly or indirectly affect cultivation and production of mussels (Latin - Mytilus edulis, Mytilus trossulus) in the territory of Latvia (the Baltic Sea and / or the Gulf of Riga), and their sale in the territory of Latvia”.
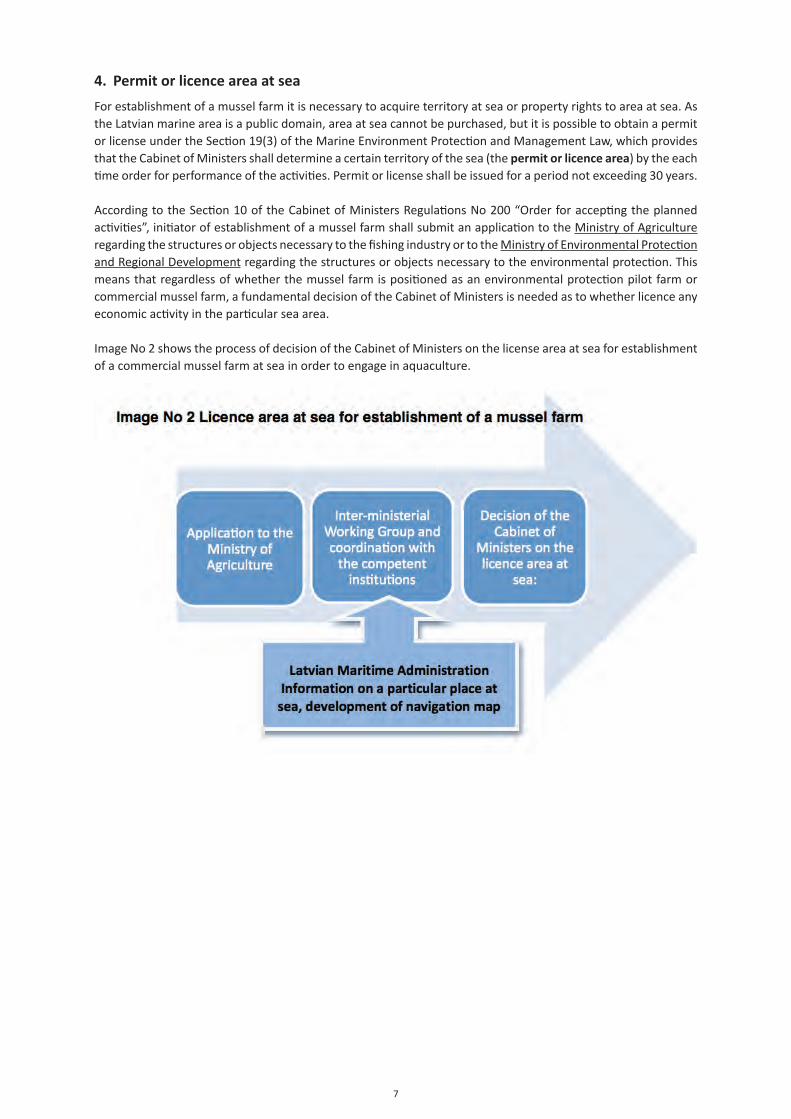
7
4. Permit or licence area at sea
For establishment of a mussel farm it is necessary to acquire territory at sea or property rights to area at sea. As the Latvian marine area is a public domain, area at sea cannot be purchased, but it is possible to obtain a permit or license under the Section 19(3) of the Marine Environment Protection and Management Law, which provides that the Cabinet of Ministers shall determine a certain territory of the sea (the permit or licence area) by the each time order for performance of the activities. Permit or license shall be issued for a period not exceeding 30 years.
According to the Section 10 of the Cabinet of Ministers Regulations No 200 “Order for accepting the planned activities”, initiator of establishment of a mussel farm shall submit an application to the Ministry of Agriculture regarding the structures or objects necessary to the fishing industry or to the Ministry of Environmental Protection and Regional Development regarding the structures or objects necessary to the environmental protection. This means that regardless of whether the mussel farm is positioned as an environmental protection pilot farm or commercial mussel farm, a fundamental decision of the Cabinet of Ministers is needed as to whether licence any economic activity in the particular sea area.
Image No 2 shows the process of decision of the Cabinet of Ministers on the license area at sea for establishment of a commercial mussel farm at sea in order to engage in aquaculture.
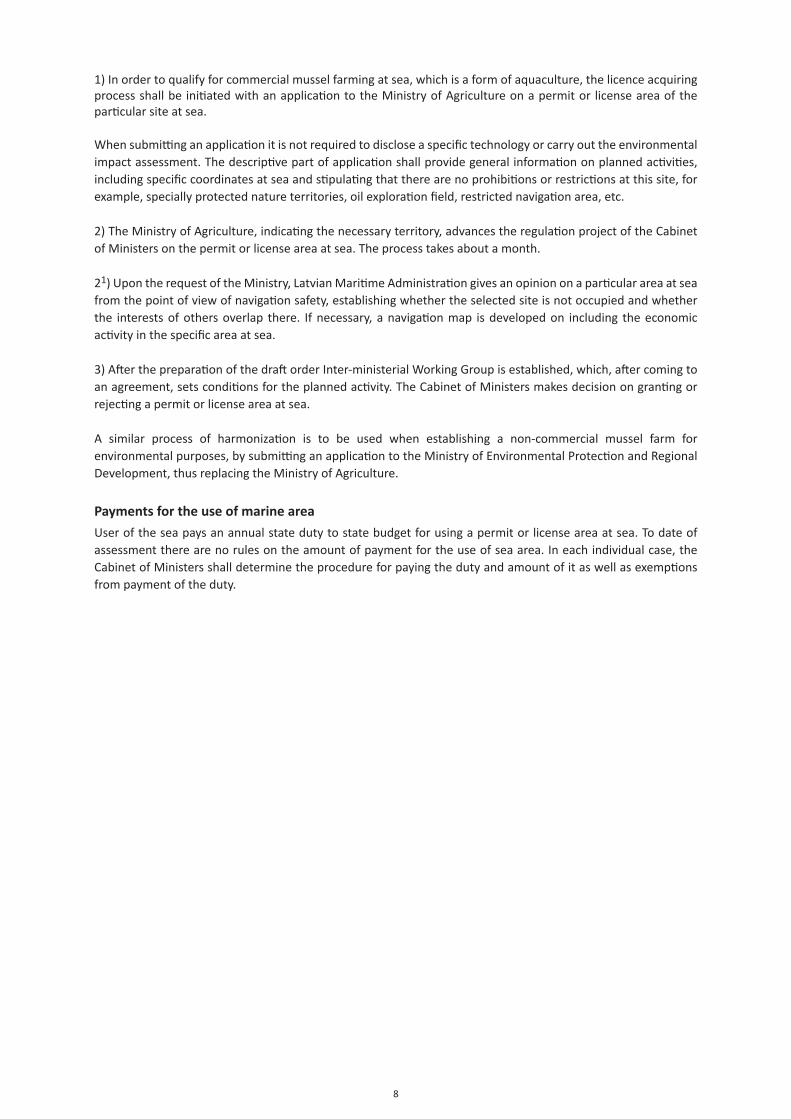
8
1) In order to qualify for commercial mussel farming at sea, which is a form of aquaculture, the licence acquiring process shall be initiated with an application to the Ministry of Agriculture on a permit or license area of the particular site at sea.
When submitting an application it is not required to disclose a specific technology or carry out the environmental impact assessment. The descriptive part of application shall provide general information on planned activities, including specific coordinates at sea and stipulating that there are no prohibitions or restrictions at this site, for example, specially protected nature territories, oil exploration field, restricted navigation area, etc.
2) The Ministry of Agriculture, indicating the necessary territory, advances the regulation project of the Cabinet of Ministers on the permit or license area at sea. The process takes about a month.
21) Upon the request of the Ministry, Latvian Maritime Administration gives an opinion on a particular area at sea from the point of view of navigation safety, establishing whether the selected site is not occupied and whether the interests of others overlap there. If necessary, a navigation map is developed on including the economic activity in the specific area at sea.
3) After the preparation of the draft order Inter-ministerial Working Group is established, which, after coming to an agreement, sets conditions for the planned activity. The Cabinet of Ministers makes decision on granting or rejecting a permit or license area at sea.
A similar process of harmonization is to be used when establishing a non-commercial mussel farm for environmental purposes, by submitting an application to the Ministry of Environmental Protection and Regional Development, thus replacing the Ministry of Agriculture.
Payments for the use of marine area
User of the sea pays an annual state duty to state budget for using a permit or license area at sea. To date of assessment there are no rules on the amount of payment for the use of sea area. In each individual case, the Cabinet of Ministers shall determine the procedure for paying the duty and amount of it as well as exemptions from payment of the duty.
9
5. Licence for establishment of a mussel farm in permit or licence area at sea
Paragraph 8 of transitional provisions of Marine Environment Protection and Management Law prescribes that until the date of entry into force of the marine spatial plan, if other regulations do not prescribe otherwise, the Cabinet of Ministers makes a decision on admissibility of activities mentioned in Section 19(2)4 of this Law in the permit or license area at Latvian territorial sea and the exclusive economic zone, taking into account the provisions of Section 14 of this Law. See Image No 3
1) After the Cabinet of Ministers makes a decision on the permit or licence area at sea Cabinet of Ministers prepares a draft order and develops a tender regulation for carrying out economic activity in the particular territory (Regulations of the Cabinet of Ministers). Development of the rules of tender may take 3-4 months.
2) After the approval of regulations of the Cabinet of Ministers a tender is organized – submission of applications, evaluation and award of contract. The applicant must comply with the tender requirements, and competition might be between a more economically attractive type of activity (e.g. wind farms), and the activity must not jeopardize the existing activities at sea, such as waterways, pipelines and other infrastructure facilities, near which the establishment of a mussel farm should not be planned.
6) If the winner is an initiator of establishment of a mussel farm, necessary approvals from the competent authorities shall be received after notification on tender results in order to receive permit of the Cabinet of Ministers for starting the activities:
• Opinion of the Environment State Bureau on mussel farm’s environmental impact assessment;
• Latvian Maritime Administration’s agreement on placement and visual design of navigation measures for establishment of a mussel farm and including it in Navigation maps;
10
Agreements on hydraulic structure projects with the Latvian Maritime Administration. Fee for this service is applied in accordance with the Regulations No 1074“Noteikumi par valsts akciju sabiedrības “Latvijas Jūras administrācija” valsts pārvaldes uzdevumu ietvaros sniegto maksas pakalpojumu cenrādi” of the Cabinet of Ministers from December 22, 2008 prescribing that the fee for preparation of Latvian Maritime Administration official’s opinion and issue of a written statement is LVL 40.
• The agreement with the Nature Conservation Agency and the Institute of Food Safety, Animal Health and Environment “BIOR” on the impact of mussel farm on specially protected nature territories and Natura 2000 sites and their impact on the issue of species conservation.
• Food and Veterinary Service – to start an aquaculture business in addition to a variety of general permits it is necessary to carry out business registration or receive approval of the Food and Veterinary Service, responsible for supervision of all animal diseases (including food security and safety) and control of companies in this field.
• From the point of view of Animal Protection Law it is necessary to define mussels as either farm animal or wildlife. In classical aquaculture, legally acquired product (fish) is introduced in a closed environment where they are fed, while in the mussel farming, animals spawn and grow themselves. In case the mussels will be covered by wildlife regulatory standards, they will be different from farm animal regulations and killing will not apply to wildlife, as it is prohibited in all forms. Non-game wildlife production could be related to mussels. Because of the definition, several initiatives have not been implemented due to this law.
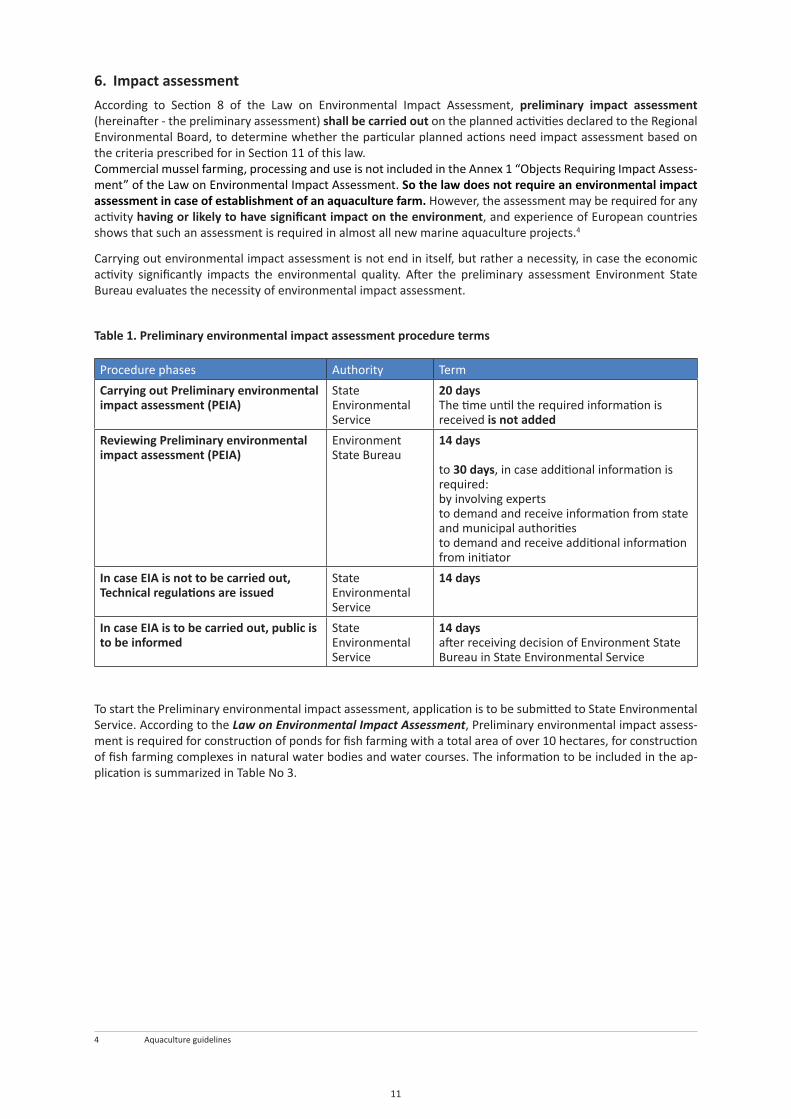
11
6. Impact assessment
According to Section 8 of the Law on Environmental Impact Assessment, preliminary impact assessment (hereinafter - the preliminary assessment) shall be carried out on the planned activities declared to the Regional Environmental Board, to determine whether the particular planned actions need impact assessment based on the criteria prescribed for in Section 11 of this law.Commercial mussel farming, processing and use is not included in the Annex 1 “Objects Requiring Impact Assess-ment” of the Law on Environmental Impact Assessment. So the law does not require an environmental impact assessment in case of establishment of an aquaculture farm. However, the assessment may be required for any activity having or likely to have significant impact on the environment, and experience of European countries shows that such an assessment is required in almost all new marine aquaculture projects.4
Carrying out environmental impact assessment is not end in itself, but rather a necessity, in case the economic activity significantly impacts the environmental quality. After the preliminary assessment Environment State Bureau evaluates the necessity of environmental impact assessment.
Table 1. Preliminary environmental impact assessment procedure terms
Procedure phases Authority Term
Carrying out Preliminary environmental impact assessment (PEIA)
State Environmental Service
20 daysThe time until the required information is received is not added
Reviewing Preliminary environmental impact assessment (PEIA)
Environment State Bureau
14 days
to 30 days, in case additional information is required:by involving expertsto demand and receive information from state and municipal authoritiesto demand and receive additional information from initiator
In case EIA is not to be carried out, Technical regulations are issued
State Environmental Service
14 days
In case EIA is to be carried out, public is to be informed
State Environmental Service
14 daysafter receiving decision of Environment State Bureau in State Environmental Service
To start the Preliminary environmental impact assessment, application is to be submitted to State Environmental Service. According to the Law on Environmental Impact Assessment, Preliminary environmental impact assess-ment is required for construction of ponds for fish farming with a total area of over 10 hectares, for construction of fish farming complexes in natural water bodies and water courses. The information to be included in the ap-plication is summarized in Table No 3.
4 Aquaculture guidelines
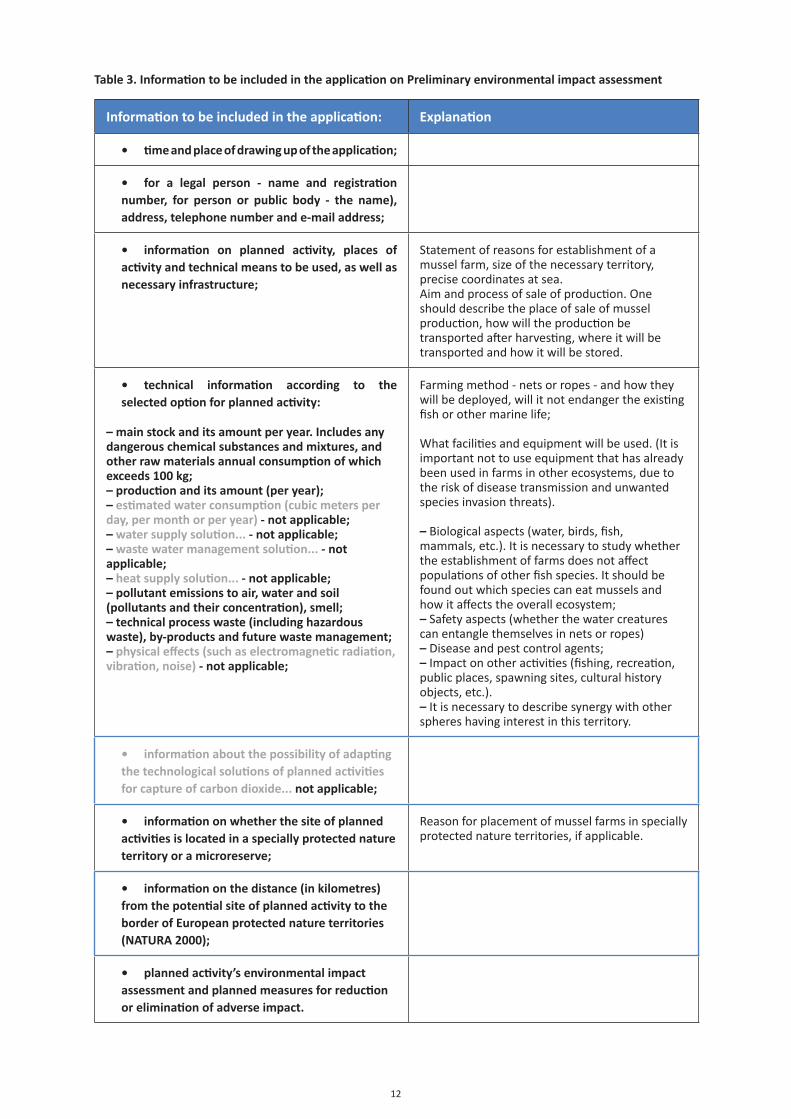
12
Table 3. Information to be included in the application on Preliminary environmental impact assessment
Information to be included in the application: Explanation
• time and place of drawing up of the application;
• for a legal person - name and registration number, for person or public body - the name), address, telephone number and e-mail address;
• information on planned activity, places of activity and technical means to be used, as well as necessary infrastructure;
Statement of reasons for establishment of a mussel farm, size of the necessary territory, precise coordinates at sea.Aim and process of sale of production. One should describe the place of sale of mussel production, how will the production be transported after harvesting, where it will be transported and how it will be stored.
• technical information according to the selected option for planned activity:
– main stock and its amount per year. Includes any dangerous chemical substances and mixtures, and other raw materials annual consumption of which exceeds 100 kg;– production and its amount (per year);– estimated water consumption (cubic meters per day, per month or per year) - not applicable; – water supply solution... - not applicable;– waste water management solution... - not applicable;– heat supply solution... - not applicable;– pollutant emissions to air, water and soil (pollutants and their concentration), smell;– technical process waste (including hazardous waste), by-products and future waste management;– physical effects (such as electromagnetic radiation, vibration, noise) - not applicable;
Farming method - nets or ropes - and how they will be deployed, will it not endanger the existing fish or other marine life;
What facilities and equipment will be used. (It is important not to use equipment that has already been used in farms in other ecosystems, due to the risk of disease transmission and unwanted species invasion threats).
– Biological aspects (water, birds, fish, mammals, etc.). It is necessary to study whether the establishment of farms does not affect populations of other fish species. It should be found out which species can eat mussels and how it affects the overall ecosystem;– Safety aspects (whether the water creatures can entangle themselves in nets or ropes)– Disease and pest control agents;– Impact on other activities (fishing, recreation, public places, spawning sites, cultural history objects, etc.).– It is necessary to describe synergy with other spheres having interest in this territory.
• information about the possibility of adapting the technological solutions of planned activities for capture of carbon dioxide... not applicable;
• information on whether the site of planned activities is located in a specially protected nature territory or a microreserve;
Reason for placement of mussel farms in specially protected nature territories, if applicable.
• information on the distance (in kilometres) from the potential site of planned activity to the border of European protected nature territories (NATURA 2000);
• planned activity’s environmental impact assessment and planned measures for reduction or elimination of adverse impact.
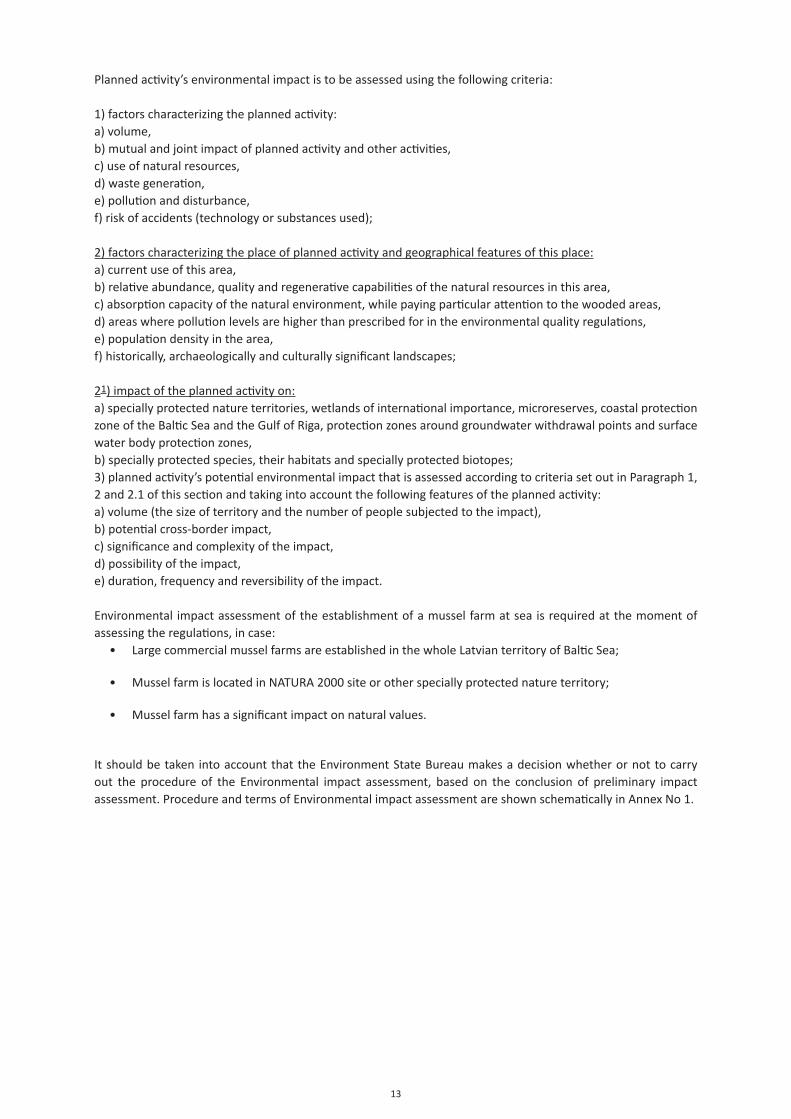
13
Planned activity’s environmental impact is to be assessed using the following criteria:
1) factors characterizing the planned activity:a) volume,b) mutual and joint impact of planned activity and other activities,c) use of natural resources,d) waste generation,e) pollution and disturbance,f) risk of accidents (technology or substances used);
2) factors characterizing the place of planned activity and geographical features of this place:a) current use of this area,b) relative abundance, quality and regenerative capabilities of the natural resources in this area,c) absorption capacity of the natural environment, while paying particular attention to the wooded areas,d) areas where pollution levels are higher than prescribed for in the environmental quality regulations,e) population density in the area,f) historically, archaeologically and culturally significant landscapes;
21) impact of the planned activity on:a) specially protected nature territories, wetlands of international importance, microreserves, coastal protection zone of the Baltic Sea and the Gulf of Riga, protection zones around groundwater withdrawal points and surface water body protection zones,b) specially protected species, their habitats and specially protected biotopes;3) planned activity’s potential environmental impact that is assessed according to criteria set out in Paragraph 1, 2 and 2.1 of this section and taking into account the following features of the planned activity:a) volume (the size of territory and the number of people subjected to the impact),b) potential cross-border impact,c) significance and complexity of the impact,d) possibility of the impact,e) duration, frequency and reversibility of the impact.
Environmental impact assessment of the establishment of a mussel farm at sea is required at the moment of assessing the regulations, in case:
• Large commercial mussel farms are established in the whole Latvian territory of Baltic Sea;
• Mussel farm is located in NATURA 2000 site or other specially protected nature territory;
• Mussel farm has a significant impact on natural values.
It should be taken into account that the Environment State Bureau makes a decision whether or not to carry out the procedure of the Environmental impact assessment, based on the conclusion of preliminary impact assessment. Procedure and terms of Environmental impact assessment are shown schematically in Annex No 1.

14
Conclusions
• Lack of experience – there are no similar examples of carrying out economic activities at sea that would require establishment of stationary structures or objects. So there is no clear understanding of the adaptation of existing regulations to the situation at sea.
• Lack of Marine spatial planning – spatial planning is the bases for receiving permit for economic activity in the given area that determines what activities are allowed there. Since there is no MSP yet that prescribes for harmonization of the interests of the various stakeholders, it is not clear how much space and in what areas will be provided for aquaculture, including mussel farm. See more in Chapter 2 of the Statement.
• Property rights – sea water and its resources belongs to the state and individual or legal person cannot purchase space at sea. To acquire the right to carry out economic activities at sea, it is required to obtain permission of the Cabinet of Ministers on the licence area at sea, on the basis of which a lease agreement could be concluded for use of a particular area. See image No 4. Permit or license shall be issued for a period not exceeding 30 years.
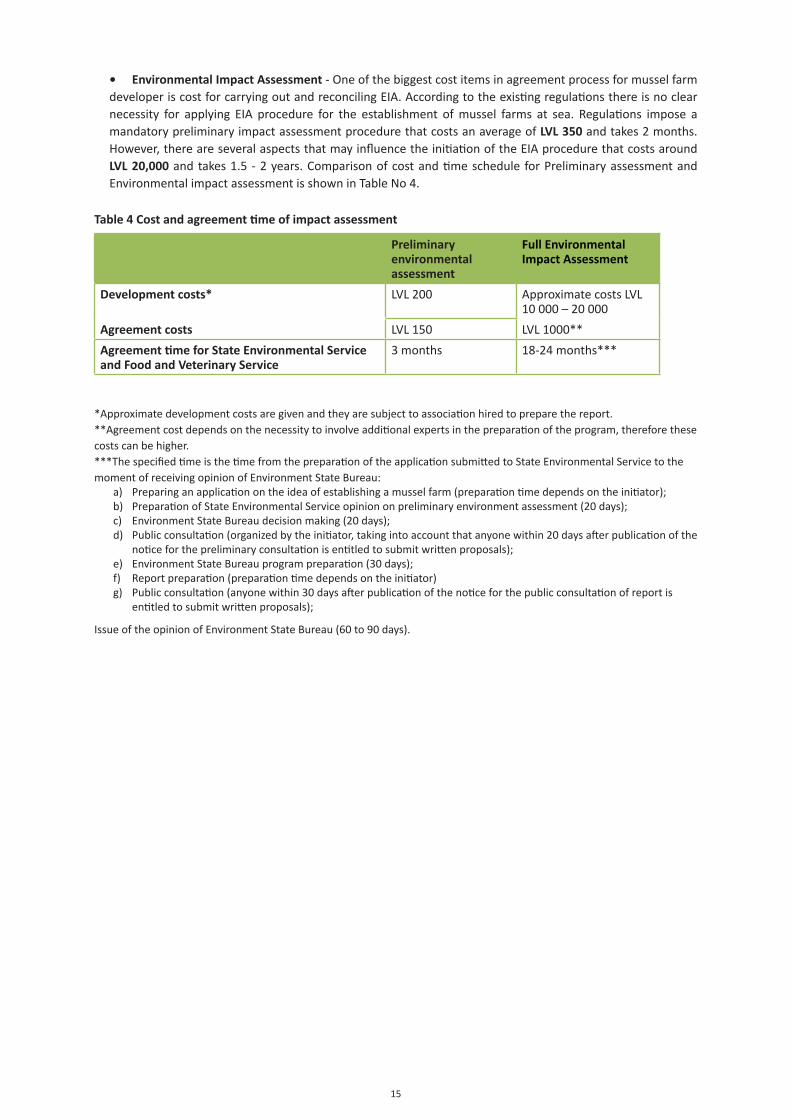
15
• Environmental Impact Assessment - One of the biggest cost items in agreement process for mussel farm developer is cost for carrying out and reconciling EIA. According to the existing regulations there is no clear necessity for applying EIA procedure for the establishment of mussel farms at sea. Regulations impose a mandatory preliminary impact assessment procedure that costs an average of LVL 350 and takes 2 months. However, there are several aspects that may influence the initiation of the EIA procedure that costs around LVL 20,000 and takes 1.5 - 2 years. Comparison of cost and time schedule for Preliminary assessment and Environmental impact assessment is shown in Table No 4.
Table 4 Cost and agreement time of impact assessment
Preliminary environmental assessment
Full Environmental Impact Assessment
Development costs* LVL 200 Approximate costs LVL 10 000 – 20 000
Agreement costs LVL 150 LVL 1000**
Agreement time for State Environmental Service and Food and Veterinary Service
3 months 18-24 months***
*Approximate development costs are given and they are subject to association hired to prepare the report. **Agreement cost depends on the necessity to involve additional experts in the preparation of the program, therefore these costs can be higher.***The specified time is the time from the preparation of the application submitted to State Environmental Service to the moment of receiving opinion of Environment State Bureau:
a) Preparing an application on the idea of establishing a mussel farm (preparation time depends on the initiator); b) Preparation of State Environmental Service opinion on preliminary environment assessment (20 days);c) Environment State Bureau decision making (20 days);d) Public consultation (organized by the initiator, taking into account that anyone within 20 days after publication of the
notice for the preliminary consultation is entitled to submit written proposals);e) Environment State Bureau program preparation (30 days); f) Report preparation (preparation time depends on the initiator)g) Public consultation (anyone within 30 days after publication of the notice for the public consultation of report is
entitled to submit written proposals);
Issue of the opinion of Environment State Bureau (60 to 90 days).
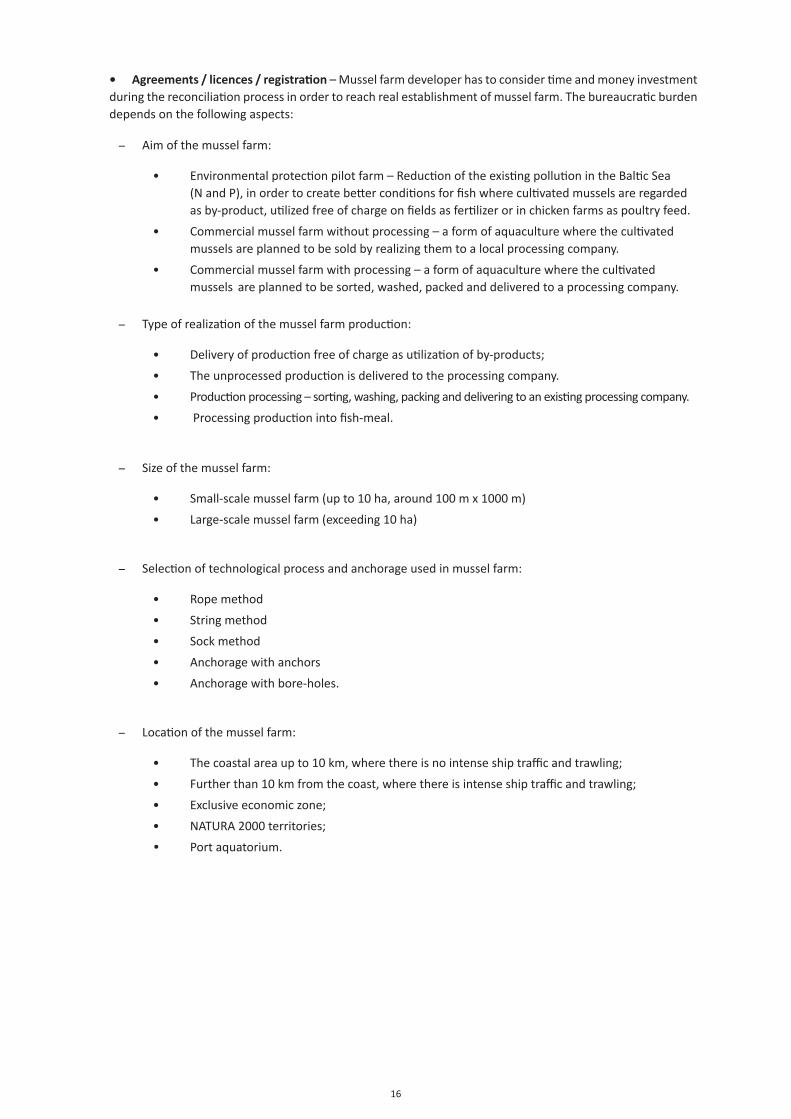
16
• Agreements / licences / registration – Mussel farm developer has to consider time and money investment during the reconciliation process in order to reach real establishment of mussel farm. The bureaucratic burden depends on the following aspects:
- Aim of the mussel farm:
• Environmental protection pilot farm – Reduction of the existing pollution in the Baltic Sea (N and P), in order to create better conditions for fish where cultivated mussels are regarded as by-product, utilized free of charge on fields as fertilizer or in chicken farms as poultry feed.
• Commercial mussel farm without processing – a form of aquaculture where the cultivated mussels are planned to be sold by realizing them to a local processing company.
• Commercial mussel farm with processing – a form of aquaculture where the cultivated mussels are planned to be sorted, washed, packed and delivered to a processing company.
- Type of realization of the mussel farm production:
• Delivery of production free of charge as utilization of by-products;
• The unprocessed production is delivered to the processing company.
• Production processing – sorting, washing, packing and delivering to an existing processing company.
• Processing production into fish-meal.
- Size of the mussel farm:
• Small-scale mussel farm (up to 10 ha, around 100 m x 1000 m)
• Large-scale mussel farm (exceeding 10 ha)
- Selection of technological process and anchorage used in mussel farm:
• Rope method
• String method
• Sock method
• Anchorage with anchors
• Anchorage with bore-holes.
- Location of the mussel farm:
• The coastal area up to 10 km, where there is no intense ship traffic and trawling;
• Further than 10 km from the coast, where there is intense ship traffic and trawling;
• Exclusive economic zone;
• NATURA 2000 territories;
• Port aquatorium.
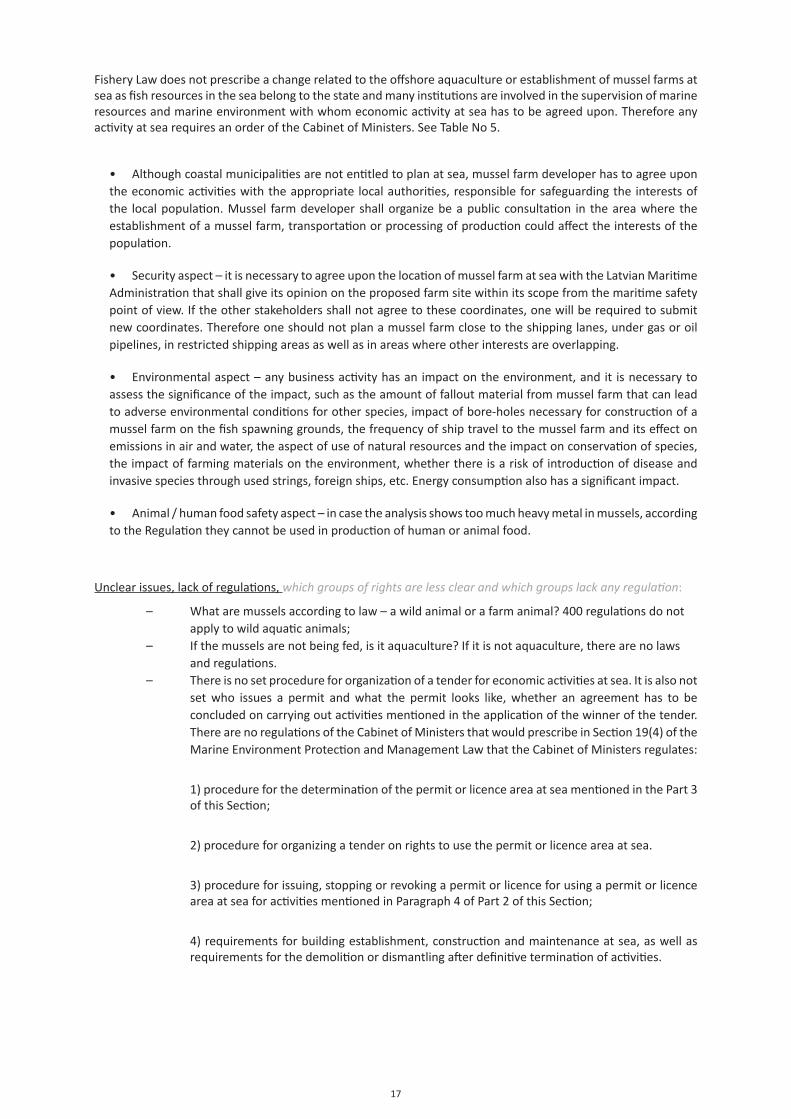
17
Fishery Law does not prescribe a change related to the offshore aquaculture or establishment of mussel farms at sea as fish resources in the sea belong to the state and many institutions are involved in the supervision of marine resources and marine environment with whom economic activity at sea has to be agreed upon. Therefore any activity at sea requires an order of the Cabinet of Ministers. See Table No 5.
• Although coastal municipalities are not entitled to plan at sea, mussel farm developer has to agree upon the economic activities with the appropriate local authorities, responsible for safeguarding the interests of the local population. Mussel farm developer shall organize be a public consultation in the area where the establishment of a mussel farm, transportation or processing of production could affect the interests of the population.
• Security aspect – it is necessary to agree upon the location of mussel farm at sea with the Latvian Maritime Administration that shall give its opinion on the proposed farm site within its scope from the maritime safety point of view. If the other stakeholders shall not agree to these coordinates, one will be required to submit new coordinates. Therefore one should not plan a mussel farm close to the shipping lanes, under gas or oil pipelines, in restricted shipping areas as well as in areas where other interests are overlapping.
• Environmental aspect – any business activity has an impact on the environment, and it is necessary to assess the significance of the impact, such as the amount of fallout material from mussel farm that can lead to adverse environmental conditions for other species, impact of bore-holes necessary for construction of a mussel farm on the fish spawning grounds, the frequency of ship travel to the mussel farm and its effect on emissions in air and water, the aspect of use of natural resources and the impact on conservation of species, the impact of farming materials on the environment, whether there is a risk of introduction of disease and invasive species through used strings, foreign ships, etc. Energy consumption also has a significant impact.
• Animal / human food safety aspect – in case the analysis shows too much heavy metal in mussels, according to the Regulation they cannot be used in production of human or animal food.
Unclear issues, lack of regulations, which groups of rights are less clear and which groups lack any regulation:
– What are mussels according to law – a wild animal or a farm animal? 400 regulations do not apply to wild aquatic animals;
– If the mussels are not being fed, is it aquaculture? If it is not aquaculture, there are no laws and regulations.
– There is no set procedure for organization of a tender for economic activities at sea. It is also not set who issues a permit and what the permit looks like, whether an agreement has to be concluded on carrying out activities mentioned in the application of the winner of the tender. There are no regulations of the Cabinet of Ministers that would prescribe in Section 19(4) of the Marine Environment Protection and Management Law that the Cabinet of Ministers regulates:
1) procedure for the determination of the permit or licence area at sea mentioned in the Part 3 of this Section;
2) procedure for organizing a tender on rights to use the permit or licence area at sea.
3) procedure for issuing, stopping or revoking a permit or licence for using a permit or licence area at sea for activities mentioned in Paragraph 4 of Part 2 of this Section;
4) requirements for building establishment, construction and maintenance at sea, as well as requirements for the demolition or dismantling after definitive termination of activities.
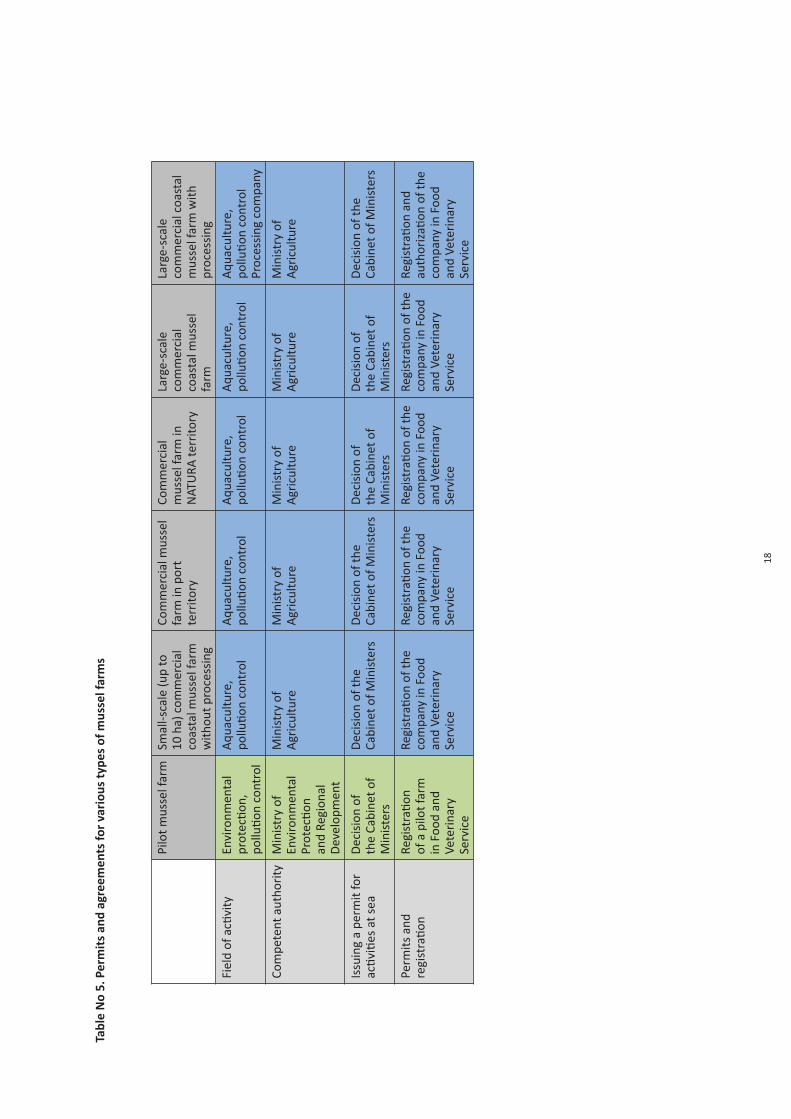
18
Tabl
e N
o 5.
Per
mit
s an
d ag
reem
ents
for
vari
ous
type
s of
mus
sel f
arm
s
Pilo
t mus
sel f
arm
Smal
l-sca
le (u
p to
10
ha)
com
mer
cial
co
asta
l mus
sel f
arm
w
ithou
t pro
cess
ing
Com
mer
cial
mus
sel
farm
in p
ort
terr
itory
Com
mer
cial
m
usse
l far
m in
N
ATU
RA te
rrito
ry
Larg
e-sc
ale
com
mer
cial
co
asta
l mus
sel
farm
Larg
e-sc
ale
com
mer
cial
coa
stal
m
usse
l far
m w
ith
proc
essi
ng
Fiel
d of
acti
vity
Envi
ronm
enta
l pr
otec
tion,
po
llutio
n co
ntro
l
Aqu
acul
ture
, po
llutio
n co
ntro
lA
quac
ultu
re,
pollu
tion
cont
rol
Aqu
acul
ture
, po
llutio
n co
ntro
lA
quac
ultu
re,
pollu
tion
cont
rol
Aqu
acul
ture
, po
llutio
n co
ntro
lPr
oces
sing
com
pany
Com
pete
nt a
utho
rity
Min
istr
y of
En
viro
nmen
tal
Prot
ectio
n an
d Re
gion
al
Dev
elop
men
t
Min
istr
y of
A
gric
ultu
reM
inis
try
of
Agr
icul
ture
Min
istr
y of
A
gric
ultu
reM
inis
try
of
Agr
icul
ture
Min
istr
y of
A
gric
ultu
re
Issu
ing
a pe
rmit
for
activ
ities
at s
eaD
ecis
ion
of
the
Cabi
net o
f M
inis
ters
Dec
isio
n of
the
Cabi
net o
f Min
iste
rsD
ecis
ion
of th
e Ca
bine
t of M
inis
ters
Dec
isio
n of
th
e Ca
bine
t of
Min
iste
rs
Dec
isio
n of
th
e Ca
bine
t of
Min
iste
rs
Dec
isio
n of
the
Cabi
net o
f Min
iste
rs
Perm
its a
nd
regi
stra
tion
Regi
stra
tion
of a
pilo
t far
m
in F
ood
and
Vete
rina
ry
Serv
ice
Regi
stra
tion
of th
e co
mpa
ny in
Foo
d an
d Ve
teri
nary
Se
rvic
e
Regi
stra
tion
of th
e co
mpa
ny in
Foo
d an
d Ve
teri
nary
Se
rvic
e
Regi
stra
tion
of th
e co
mpa
ny in
Foo
d an
d Ve
teri
nary
Se
rvic
e
Regi
stra
tion
of th
e co
mpa
ny in
Foo
d an
d Ve
teri
nary
Se
rvic
e
Regi
stra
tion
and
auth
oriz
ation
of t
he
com
pany
in F
ood
and
Vete
rina
ry
Serv
ice
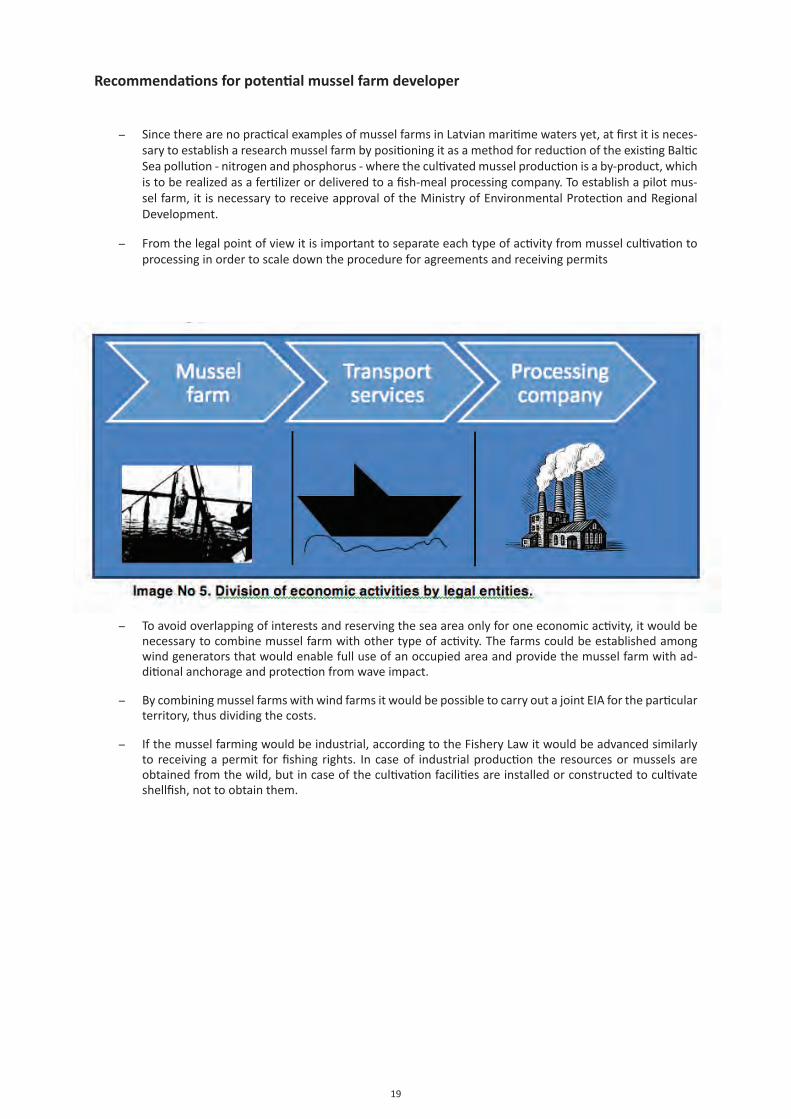
19
Recommendations for potential mussel farm developer
- Since there are no practical examples of mussel farms in Latvian maritime waters yet, at first it is neces-sary to establish a research mussel farm by positioning it as a method for reduction of the existing Baltic Sea pollution - nitrogen and phosphorus - where the cultivated mussel production is a by-product, which is to be realized as a fertilizer or delivered to a fish-meal processing company. To establish a pilot mus-sel farm, it is necessary to receive approval of the Ministry of Environmental Protection and Regional Development.
- From the legal point of view it is important to separate each type of activity from mussel cultivation to processing in order to scale down the procedure for agreements and receiving permits
- To avoid overlapping of interests and reserving the sea area only for one economic activity, it would be necessary to combine mussel farm with other type of activity. The farms could be established among wind generators that would enable full use of an occupied area and provide the mussel farm with ad-ditional anchorage and protection from wave impact.
- By combining mussel farms with wind farms it would be possible to carry out a joint EIA for the particular territory, thus dividing the costs.
- If the mussel farming would be industrial, according to the Fishery Law it would be advanced similarly to receiving a permit for fishing rights. In case of industrial production the resources or mussels are obtained from the wild, but in case of the cultivation facilities are installed or constructed to cultivate shellfish, not to obtain them.
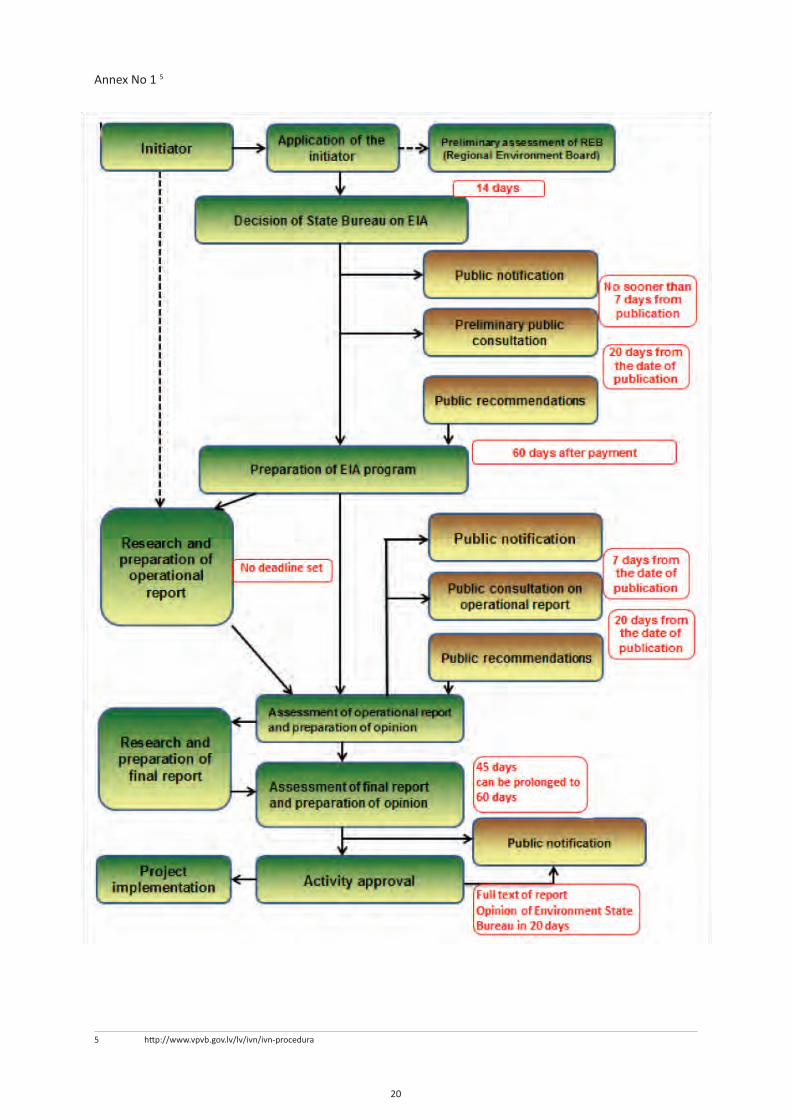
20
Annex No 1 5
5 http://www.vpvb.gov.lv/lv/ivn/ivn-procedura
3.5
Study Visits Examples of
Blue Mussel Farms
3.5.1Study Visit to Aland and Finland
Prepared on September 21, 2012
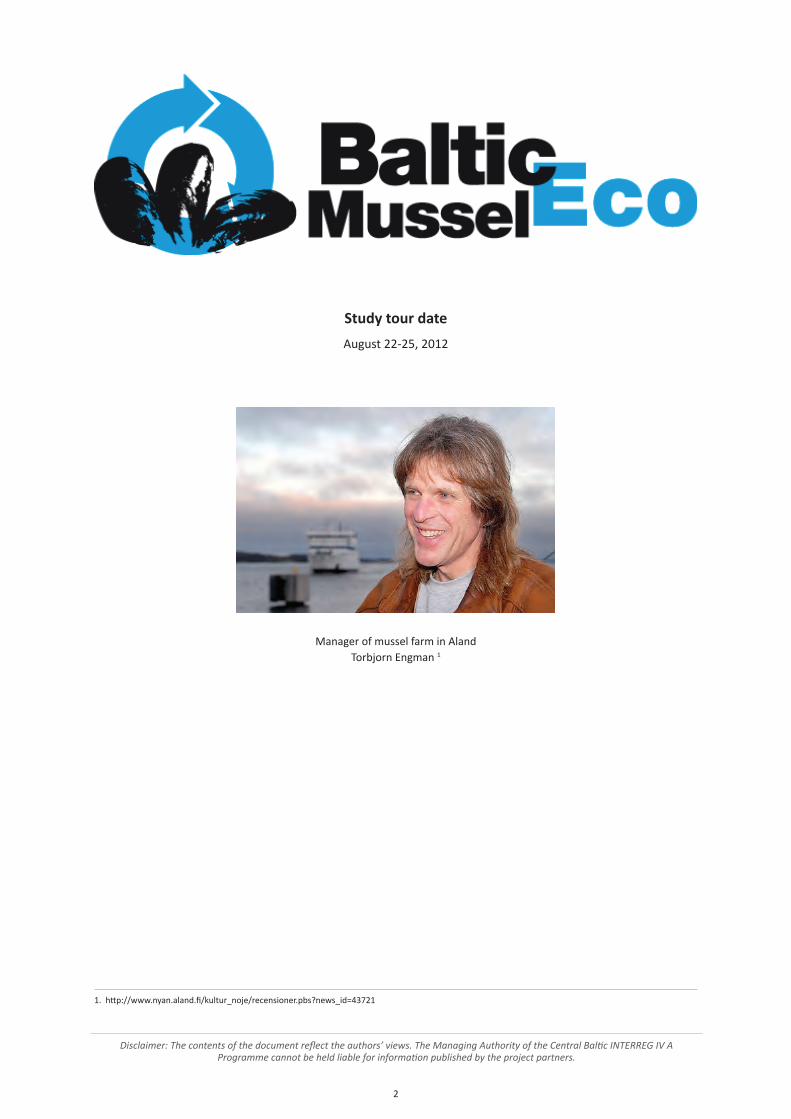
2
Study tour date
August 22-25, 2012
Manager of mussel farm in AlandTorbjorn Engman 1
1. http://www.nyan.aland.fi/kultur_noje/recensioner.pbs?news_id=43721
Disclaimer: The contents of the document reflect the authors’ views. The Managing Authority of the Central Baltic INTERREG IV A Programme cannot be held liable for information published by the project partners.
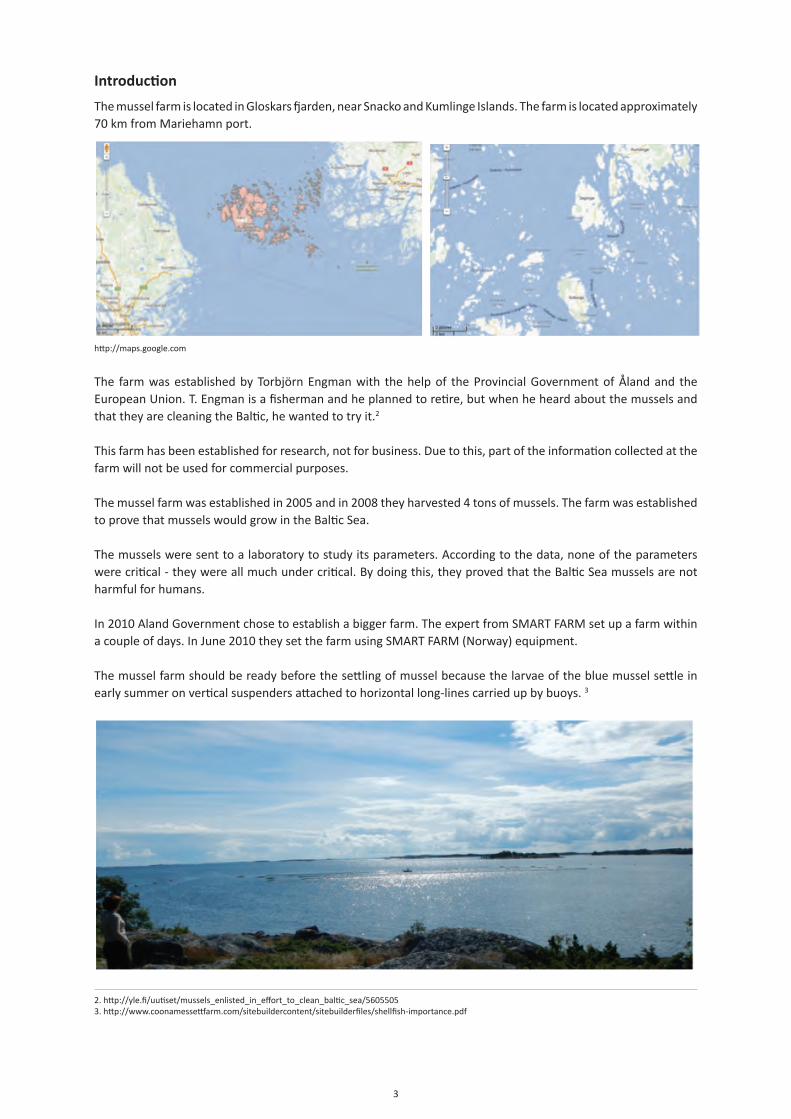
3
Introduction
The mussel farm is located in Gloskars fjarden, near Snacko and Kumlinge Islands. The farm is located approximately 70 km from Mariehamn port.
http://maps.google.com
The farm was established by Torbjörn Engman with the help of the Provincial Government of Åland and the European Union. T. Engman is a fisherman and he planned to retire, but when he heard about the mussels and that they are cleaning the Baltic, he wanted to try it.2
This farm has been established for research, not for business. Due to this, part of the information collected at the farm will not be used for commercial purposes.
The mussel farm was established in 2005 and in 2008 they harvested 4 tons of mussels. The farm was established to prove that mussels would grow in the Baltic Sea.
The mussels were sent to a laboratory to study its parameters. According to the data, none of the parameters were critical - they were all much under critical. By doing this, they proved that the Baltic Sea mussels are not harmful for humans.
In 2010 Aland Government chose to establish a bigger farm. The expert from SMART FARM set up a farm within a couple of days. In June 2010 they set the farm using SMART FARM (Norway) equipment.
The mussel farm should be ready before the settling of mussel because the larvae of the blue mussel settle in early summer on vertical suspenders attached to horizontal long-lines carried up by buoys. 3
2 3
2. http://yle.fi/uutiset/mussels_enlisted_in_effort_to_clean_baltic_sea/56055053. http://www.coonamessettfarm.com/sitebuildercontent/sitebuilderfiles/shellfish-importance.pdf
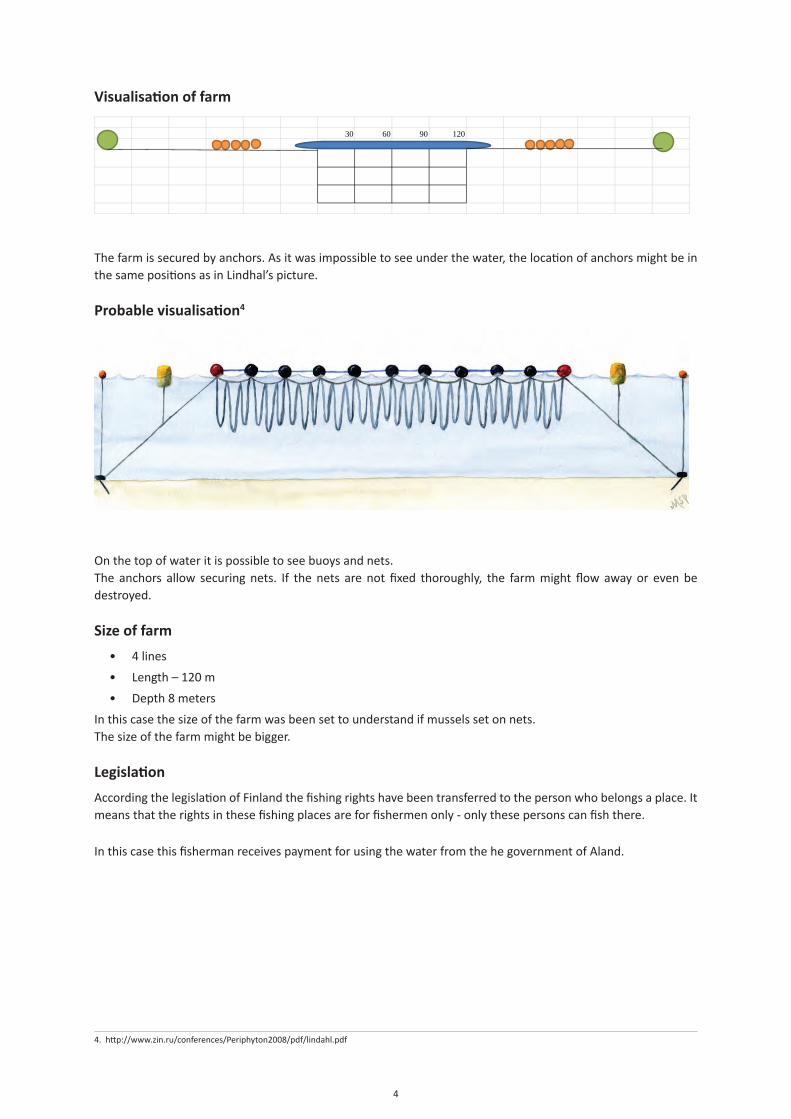
4
Visualisation of farm
30 60 90 120
The farm is secured by anchors. As it was impossible to see under the water, the location of anchors might be in the same positions as in Lindhal’s picture.
Probable visualisation4
On the top of water it is possible to see buoys and nets.The anchors allow securing nets. If the nets are not fixed thoroughly, the farm might flow away or even be destroyed.
Size of farm
• 4 lines
• Length – 120 m
• Depth 8 meters
In this case the size of the farm was been set to understand if mussels set on nets. The size of the farm might be bigger.
Legislation
According the legislation of Finland the fishing rights have been transferred to the person who belongs a place. It means that the rights in these fishing places are for fishermen only - only these persons can fish there.
In this case this fisherman receives payment for using the water from the he government of Aland.
4. http://www.zin.ru/conferences/Periphyton2008/pdf/lindahl.pdf
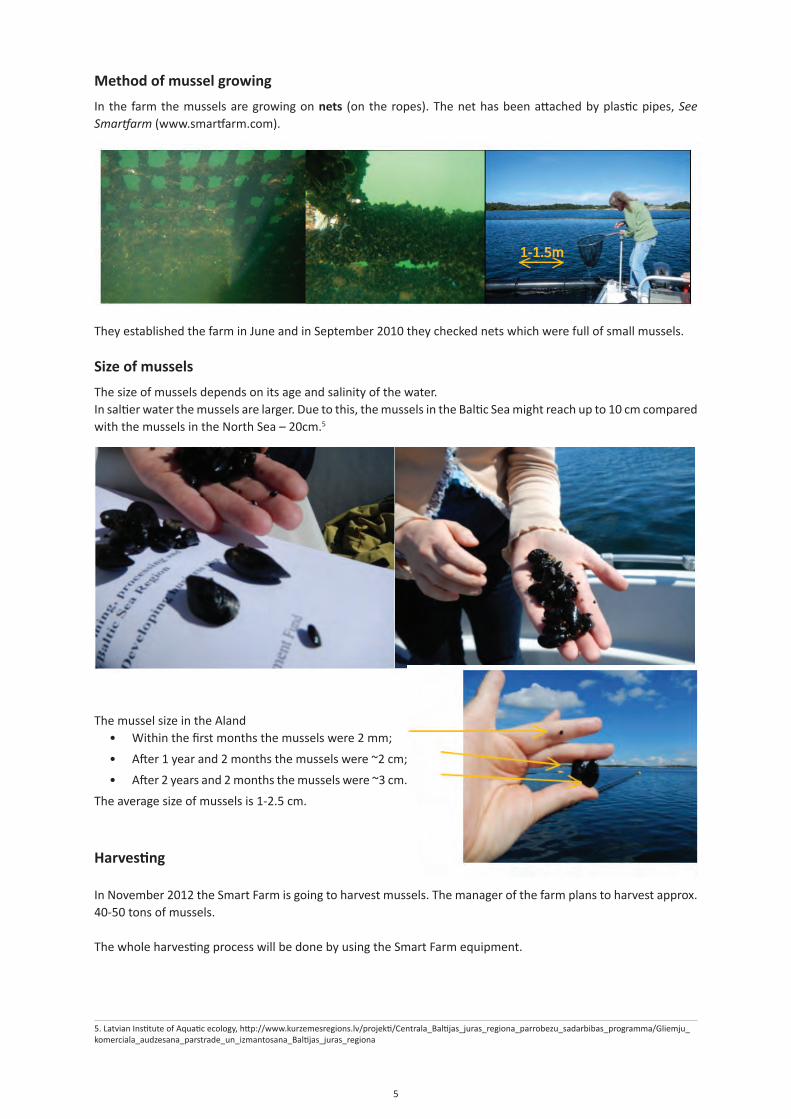
5
Method of mussel growing
In the farm the mussels are growing on nets (on the ropes). The net has been attached by plastic pipes, See Smartfarm (www.smartfarm.com).
They established the farm in June and in September 2010 they checked nets which were full of small mussels.
Size of mussels
The size of mussels depends on its age and salinity of the water.In saltier water the mussels are larger. Due to this, the mussels in the Baltic Sea might reach up to 10 cm compared with the mussels in the North Sea – 20cm.5
The mussel size in the Aland• Within the first months the mussels were 2 mm;
• After 1 year and 2 months the mussels were ~2 cm;
• After 2 years and 2 months the mussels were ~3 cm.
The average size of mussels is 1-2.5 cm.
Harvesting
In November 2012 the Smart Farm is going to harvest mussels. The manager of the farm plans to harvest approx. 40-50 tons of mussels.
The whole harvesting process will be done by using the Smart Farm equipment.
5. Latvian Institute of Aquatic ecology, http://www.kurzemesregions.lv/projekti/Centrala_Baltijas_juras_regiona_parrobezu_sadarbibas_programma/Gliemju_komerciala_audzesana_parstrade_un_izmantosana_Baltijas_juras_regiona
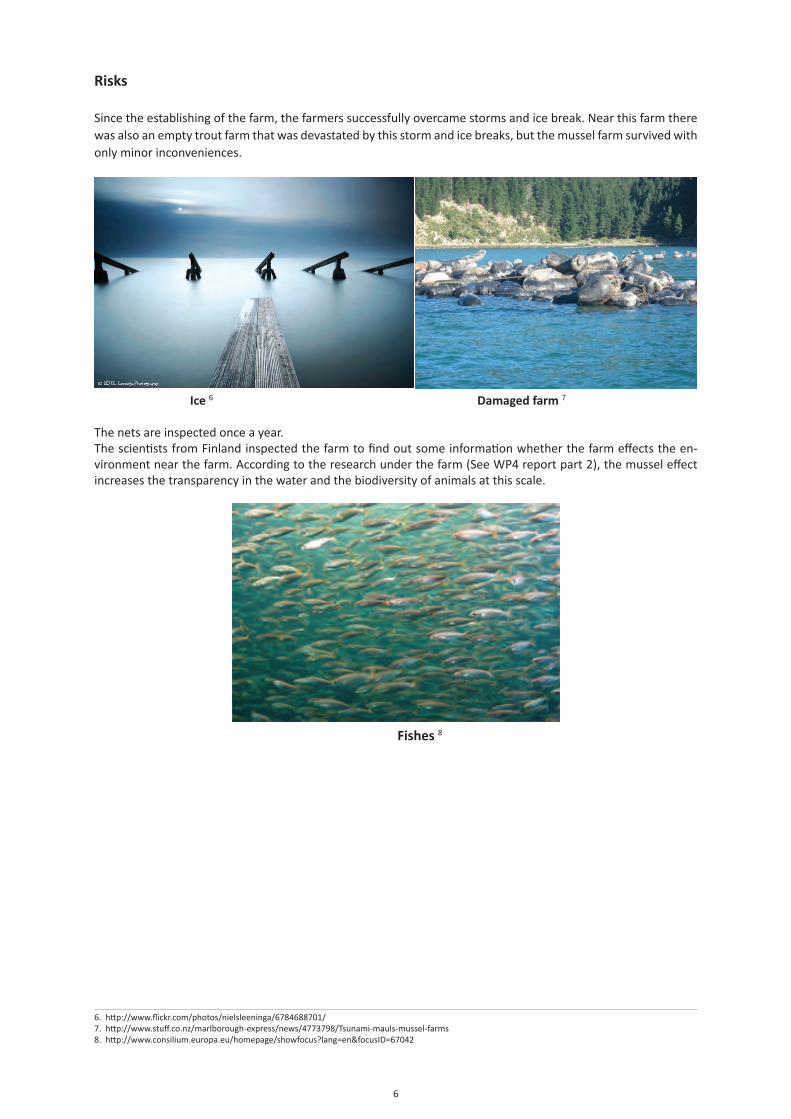
6
Risks
Since the establishing of the farm, the farmers successfully overcame storms and ice break. Near this farm there was also an empty trout farm that was devastated by this storm and ice breaks, but the mussel farm survived with only minor inconveniences.
Ice 6 Damaged farm 7
The nets are inspected once a year.The scientists from Finland inspected the farm to find out some information whether the farm effects the en-vironment near the farm. According to the research under the farm (See WP4 report part 2), the mussel effect increases the transparency in the water and the biodiversity of animals at this scale.
Fishes 8
6. http://www.flickr.com/photos/nielsleeninga/6784688701/7. http://www.stuff.co.nz/marlborough-express/news/4773798/Tsunami-mauls-mussel-farms8. http://www.consilium.europa.eu/homepage/showfocus?lang=en&focusID=67042
7
Financial parameters
Incomes:• 45 tons;
• Actual price is unknown yet (3 EUR).
Costs:• 1 fisherman, part time employed (monthly);
• Fuel (monthly)
• Diving services (yearly)
• Administrative costs (monthly)
Equipment• Nets
• Anchors
• Plastic pipes
• Boat
Investment amount 84 T EUR.The services length of the equipment is about 10-20 years. The use of metallic equipment might be shorter as the salinity influences the metal (corrosion), but he pipes might be used for 20 years.
For harvesting it is necessary to have a crane, a refrigerator and a ship.
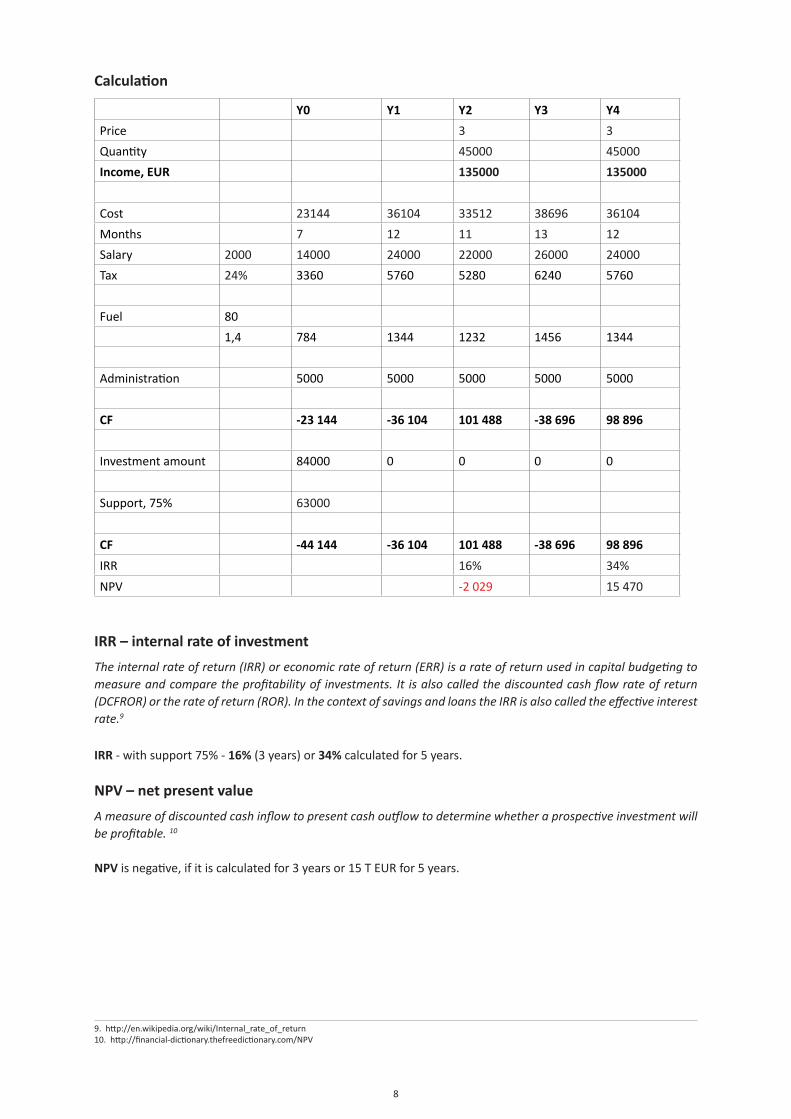
8
Calculation
Y0 Y1 Y2 Y3 Y4
Price 3 3
Quantity 45000 45000
Income, EUR 135000 135000
Cost 23144 36104 33512 38696 36104
Months 7 12 11 13 12
Salary 2000 14000 24000 22000 26000 24000
Tax 24% 3360 5760 5280 6240 5760
Fuel 80
1,4 784 1344 1232 1456 1344
Administration 5000 5000 5000 5000 5000
CF -23 144 -36 104 101 488 -38 696 98 896
Investment amount 84000 0 0 0 0
Support, 75% 63000
CF -44 144 -36 104 101 488 -38 696 98 896
IRR 16% 34%
NPV -2 029 15 470
IRR – internal rate of investment
The internal rate of return (IRR) or economic rate of return (ERR) is a rate of return used in capital budgeting to measure and compare the profitability of investments. It is also called the discounted cash flow rate of return (DCFROR) or the rate of return (ROR). In the context of savings and loans the IRR is also called the effective interest rate.9
IRR - with support 75% - 16% (3 years) or 34% calculated for 5 years.
NPV – net present value
A measure of discounted cash inflow to present cash outflow to determine whether a prospective investment will be profitable. 10
NPV is negative, if it is calculated for 3 years or 15 T EUR for 5 years.
9. http://en.wikipedia.org/wiki/Internal_rate_of_return10. http://financial-dictionary.thefreedictionary.com/NPV
9
Conclusion
The first – Establish the pilot farm in your country
It will provide you with the information on:• Mussel places in the region;
• Information of mussel chemical conditions, e.g. whether or not the mussels are useful for human consumption
• Possibility to use different methods to understand which one is the best for your region
• Risk factors e.g. will your farm successfully survive during ice, storms and strong wind seasons etc.
• What kind of enemies might influence your farm, like sea birds, fishes, cormorants etc?
Size of mussels
Before the study tour we got different information about the size of the Baltic mussel. When visiting the farm we got precise information on its size within 2 years. Their size was 2-3 cm.
Settling time
The mussels settle in the beginning of summer. If the farmer can’t establish the farm during this period, the year might be considered as lost.
Amount per m2
During this study tour we didn’t get the potential quantity of mussel grown within one square meter. The main problem is that that farm was not prepared as an enterprise.
During the next study tour we need to calculate the quantity based on salinity in the North Sea and extrapolate these data based on salinity in the Baltic Sea.
Legislation
In Finland the fishing rights have been designed for fishermen. So the fisherman might choose the type of fishing, fishing gear and fishing methods.
3.5.2Study Visit to Sweden and Denmark
Prepared on October 21, 2012
2
Study tour date
October 1-3, 2012, Sweden and Denmark
SWEDEN
Disclaimer: The contents of the document reflect the authors’ views. The Managing Authority of the Central Baltic INTERREG IV A Programme cannot be held liable for information published by the project partners.
3
Introduction
In October 2012, the Project partners visited Mr Odd Lindahl, Phd, Biological Oceanographer and Marine Ecologist employed by the Royal Swedish Academy of Sciences, Kristineberg. Presently working for the Swedish Rural Economy and Agricultural Societies, Lindahl has made research of mussels for several years, and is a project expert of the SUBMARINER project.
The visited pilot project is carrying out research on mussel meal production. It was established with support from the EU, within the SUBMARINER and AQUABEST projects, as well as from the government and the local municipality.
The production site is quite a small one, established in 2010. Approximately 1 tons of mussels can be processed per day making products for several purposes; for research, development as well as for commercial needs.Second class mussels are used as a raw material transported to this production site and are heated on rotary dryer up to 90 ̊C according to a newly developed process technique. During this process the mussel shell opens. They obtain several ranges of products – mussel flesh and mussel shell or mussel shell with flesh.
Shells MIX Flesh
Within the project, several experiments have been made to find out if it is possible to get mussel flesh without shell using different methods. The research is going on. Obtained mussel flesh and shell mixtures can be used for chicken, fish, pig or other animal farming. All feeds contain both protein (e.g. mussel meal) and calcium in varying amounts. Mussel shells can serve as a calcium source but it still remains to be researched how to produce the correct mixture of protein and calcium for different purposes. This work was under progress at the pilot project facility.
Processing
For heating they use wood chips, which are automatically and continuously supplemented. The boiler house has a recirculation system.Mussels are heated up to 85˚-90˚C to kill all bacteria. The heat consumption is low due to the recirculation that has been provided by equipment provided by the Swedish company Torkapparater AB.
A chimney was extended by 6 meters, as a smell arises during processing, and both employees and local residents were complaining about it. Currently, the smell is spread at 18 m height which has put on end to all complaints.
Mussels are supplied once a week; production processing takes place the whole year, expect during summer. Of 1 ton live fresh mussel, roughly 50 kg will become dry mussel meal and 400 – 500 kg dry mussel shells.
Specification
Spring mussels are tastier (on production sent mussels which are cough in spring before spawning). Research done on mussels produced in Åland farms showed that mussels have less protein and they are more fragile compared with Danish mussels. Due to this reason they are not useful for pigs.
In places, where mussels do not grow in sufficient quantities, farmers grow mussels artificially and relocate them from one place to another.
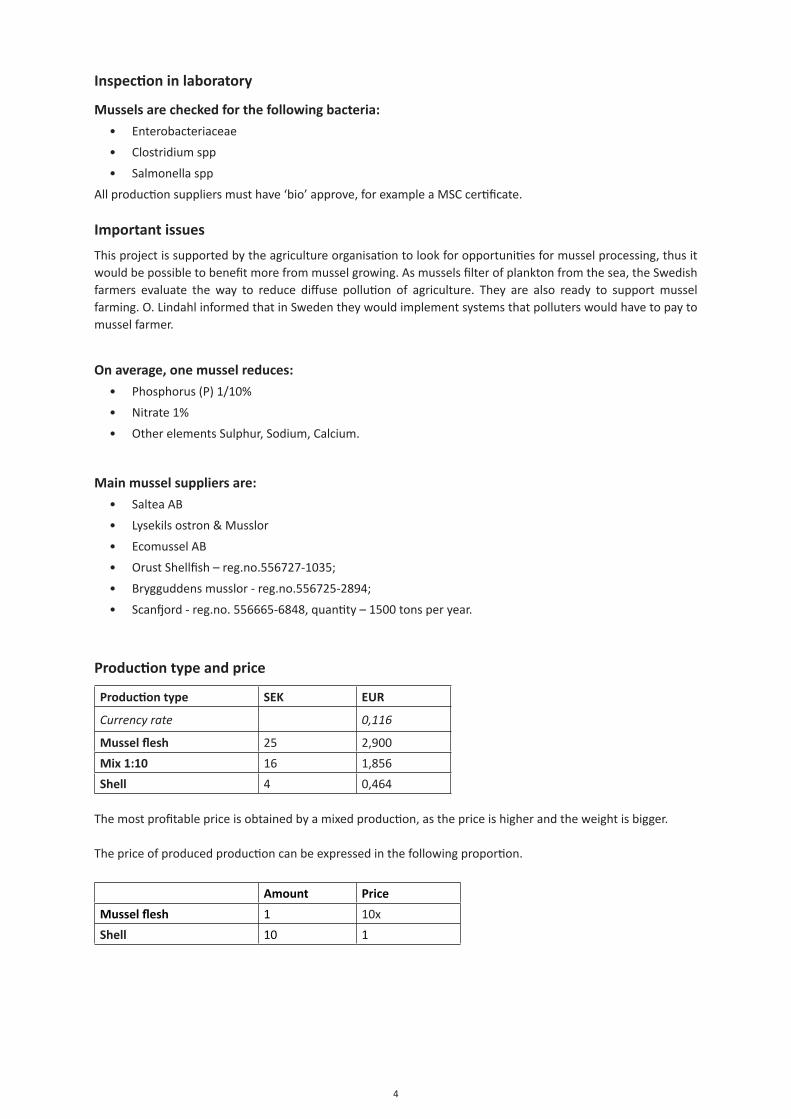
4
Inspection in laboratory
Mussels are checked for the following bacteria:
• Enterobacteriaceae
• Clostridium spp
• Salmonella spp
All production suppliers must have ‘bio’ approve, for example a MSC certificate.
Important issues
This project is supported by the agriculture organisation to look for opportunities for mussel processing, thus it would be possible to benefit more from mussel growing. As mussels filter of plankton from the sea, the Swedish farmers evaluate the way to reduce diffuse pollution of agriculture. They are also ready to support mussel farming. O. Lindahl informed that in Sweden they would implement systems that polluters would have to pay to mussel farmer.
On average, one mussel reduces:
• Phosphorus (P) 1/10%
• Nitrate 1%
• Other elements Sulphur, Sodium, Calcium.
Main mussel suppliers are:
• Saltea AB
• Lysekils ostron & Musslor
• Ecomussel AB
• Orust Shellfish – reg.no.556727-1035;
• Brygguddens musslor - reg.no.556725-2894;
• Scanfjord - reg.no. 556665-6848, quantity – 1500 tons per year.
Production type and price
Production type SEK EUR
Currency rate 0,116
Mussel flesh 25 2,900
Mix 1:10 16 1,856
Shell 4 0,464
The most profitable price is obtained by a mixed production, as the price is higher and the weight is bigger.
The price of produced production can be expressed in the following proportion.
Amount Price
Mussel flesh 1 10x
Shell 10 1
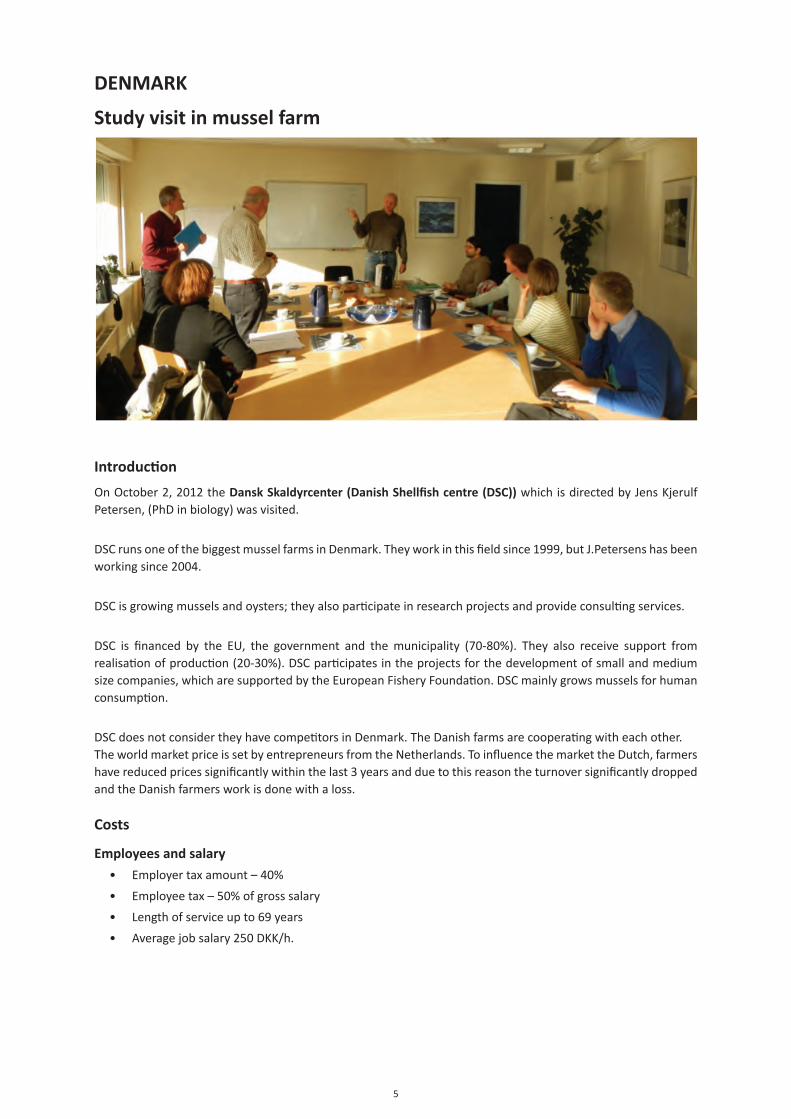
5
DENMARK
Study visit in mussel farm
Introduction
On October 2, 2012 the Dansk Skaldyrcenter (Danish Shellfish centre (DSC)) which is directed by Jens Kjerulf Petersen, (PhD in biology) was visited.
DSC runs one of the biggest mussel farms in Denmark. They work in this field since 1999, but J.Petersens has been working since 2004.
DSC is growing mussels and oysters; they also participate in research projects and provide consulting services.
DSC is financed by the EU, the government and the municipality (70-80%). They also receive support from realisation of production (20-30%). DSC participates in the projects for the development of small and medium size companies, which are supported by the European Fishery Foundation. DSC mainly grows mussels for human consumption.
DSC does not consider they have competitors in Denmark. The Danish farms are cooperating with each other.The world market price is set by entrepreneurs from the Netherlands. To influence the market the Dutch, farmers have reduced prices significantly within the last 3 years and due to this reason the turnover significantly dropped and the Danish farmers work is done with a loss.
Costs
Employees and salary
• Employer tax amount – 40%
• Employee tax – 50% of gross salary
• Length of service up to 69 years
• Average job salary 250 DKK/h.
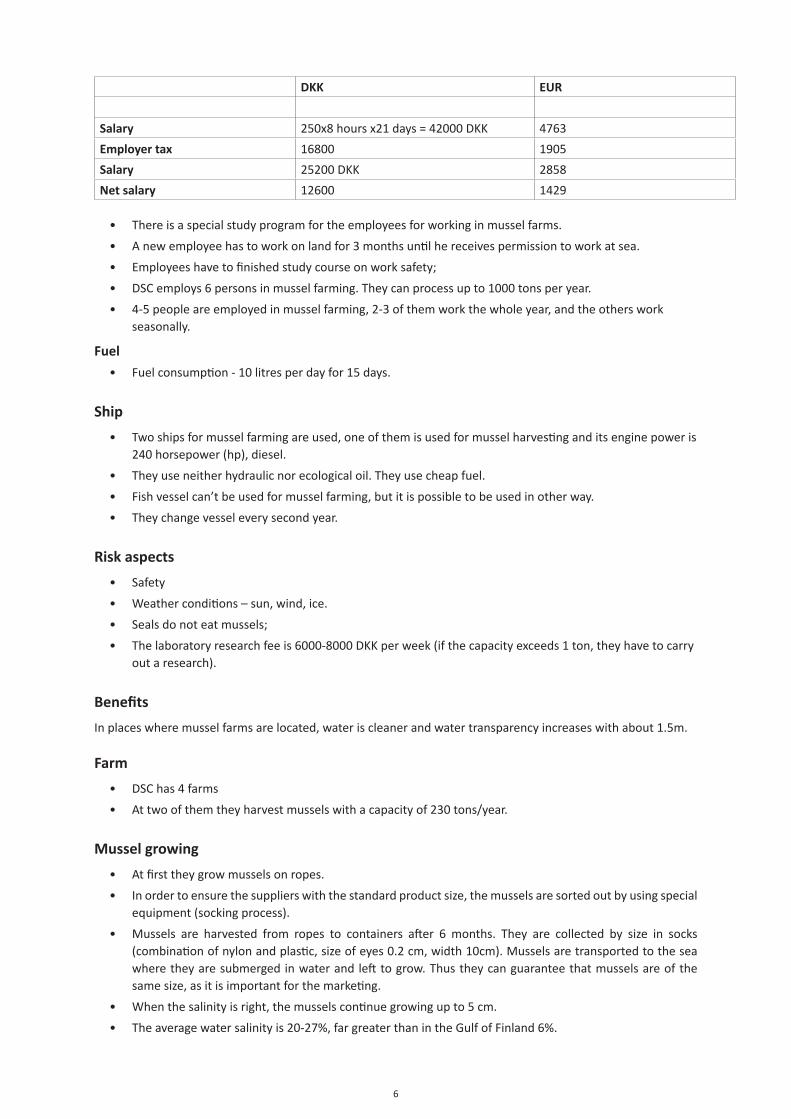
6
DKK EUR
Salary 250x8 hours x21 days = 42000 DKK 4763
Employer tax 16800 1905
Salary 25200 DKK 2858
Net salary 12600 1429
• There is a special study program for the employees for working in mussel farms.
• A new employee has to work on land for 3 months until he receives permission to work at sea.
• Employees have to finished study course on work safety;
• DSC employs 6 persons in mussel farming. They can process up to 1000 tons per year.
• 4-5 people are employed in mussel farming, 2-3 of them work the whole year, and the others work seasonally.
Fuel
• Fuel consumption - 10 litres per day for 15 days.
Ship
• Two ships for mussel farming are used, one of them is used for mussel harvesting and its engine power is 240 horsepower (hp), diesel.
• They use neither hydraulic nor ecological oil. They use cheap fuel.
• Fish vessel can’t be used for mussel farming, but it is possible to be used in other way.
• They change vessel every second year.
Risk aspects
• Safety
• Weather conditions – sun, wind, ice.
• Seals do not eat mussels;
• The laboratory research fee is 6000-8000 DKK per week (if the capacity exceeds 1 ton, they have to carry out a research).
Benefits
In places where mussel farms are located, water is cleaner and water transparency increases with about 1.5m.
Farm
• DSC has 4 farms
• At two of them they harvest mussels with a capacity of 230 tons/year.
Mussel growing
• At first they grow mussels on ropes.
• In order to ensure the suppliers with the standard product size, the mussels are sorted out by using special equipment (socking process).
• Mussels are harvested from ropes to containers after 6 months. They are collected by size in socks (combination of nylon and plastic, size of eyes 0.2 cm, width 10cm). Mussels are transported to the sea where they are submerged in water and left to grow. Thus they can guarantee that mussels are of the same size, as it is important for the marketing.
• When the salinity is right, the mussels continue growing up to 5 cm.
• The average water salinity is 20-27%, far greater than in the Gulf of Finland 6%.
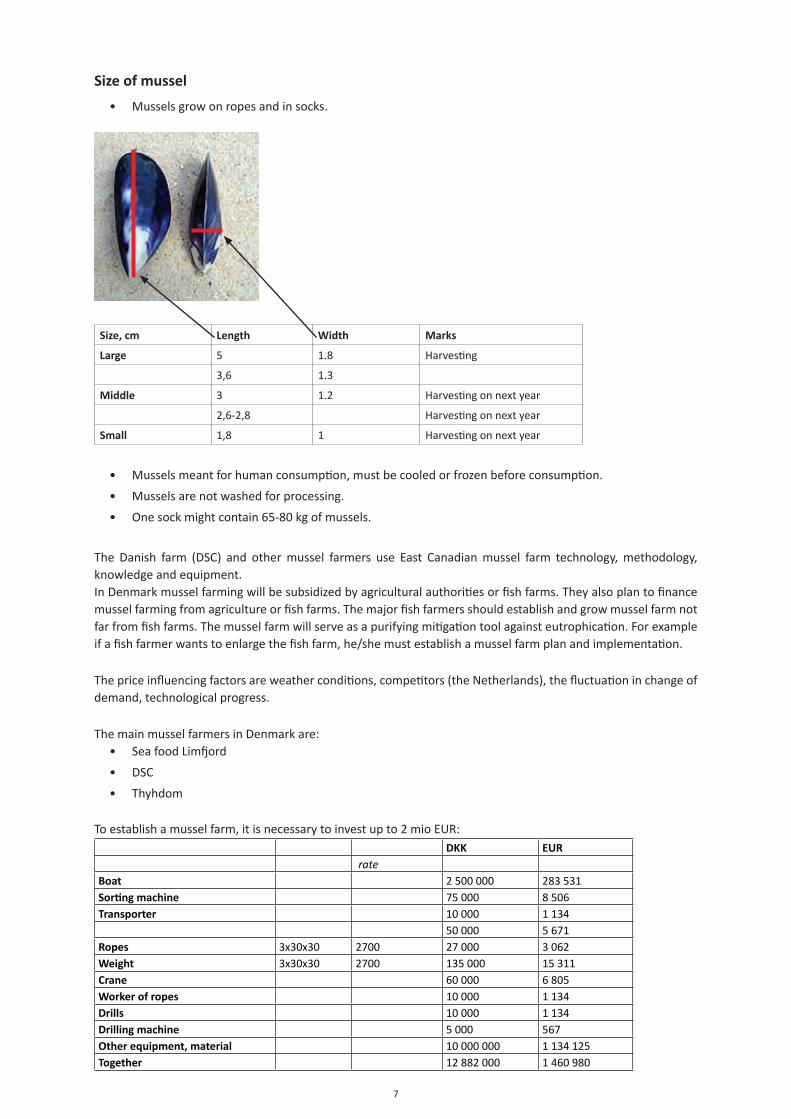
7
Size of mussel
• Mussels grow on ropes and in socks.
Size, cm Length Width Marks
Large 5 1.8 Harvesting
3,6 1.3
Middle 3 1.2 Harvesting on next year
2,6-2,8 Harvesting on next year
Small 1,8 1 Harvesting on next year
• Mussels meant for human consumption, must be cooled or frozen before consumption.
• Mussels are not washed for processing.
• One sock might contain 65-80 kg of mussels.
The Danish farm (DSC) and other mussel farmers use East Canadian mussel farm technology, methodology, knowledge and equipment.In Denmark mussel farming will be subsidized by agricultural authorities or fish farms. They also plan to finance mussel farming from agriculture or fish farms. The major fish farmers should establish and grow mussel farm not far from fish farms. The mussel farm will serve as a purifying mitigation tool against eutrophication. For example if a fish farmer wants to enlarge the fish farm, he/she must establish a mussel farm plan and implementation.
The price influencing factors are weather conditions, competitors (the Netherlands), the fluctuation in change of demand, technological progress.
The main mussel farmers in Denmark are:• Sea food Limfjord
• DSC
• Thyhdom
To establish a mussel farm, it is necessary to invest up to 2 mio EUR: DKK EUR rate Boat 2 500 000 283 531Sorting machine 75 000 8 506Transporter 10 000 1 134
50 000 5 671Ropes 3x30x30 2700 27 000 3 062Weight 3x30x30 2700 135 000 15 311Crane 60 000 6 805Worker of ropes 10 000 1 134Drills 10 000 1 134Drilling machine 5 000 567Other equipment, material 10 000 000 1 134 125Together 12 882 000 1 460 980

8
DSC faced the following problems:• Size of farm might be of 250x750m in one region. Within a period they receive permission to grow mussels in 4 places;
200m 200m 200m
250m
750m
• It takes 6 months to get permission but the main problem was getting permission on a boat (the water belongs to the government and fisher should buy fishing rights).
• When buyers from the Netherlands reduce mussel price, a lot of mussel farmers are forced to leave the market because of dumping.
• It was necessary to set the fishing place for mussels. To avoid damages, they were forced to establish the mussel farms away from shipping routes.
Necessary equipment to establish a mussel farm• For fastening they use anchors which can be handmade. They use 20l plastic buckets filled with cement and 2cm thick ropes are submerged there. When the cement is hardened, the bucket is removed, thus obtaining 15-25kg of anchor.
• Such cement blocks are used for strengthening/anchor of ropes.
• To build a farm 10-30 cement blocks are needed. The block quantity depends on farm location, powerful water flow and wind
• The service length of anchors is approx. 10 years and the ropes are the first to decompose.
• Ideal height of a mussel farm is 5-10 m. If it is higher, the farm might fluctuate in storm to much so it might be destroyed. On such case it is necessary to use more anchors.
• In winter they do some drilling works through the ice. On ice surface the drilled anchor is more stable and might be preserved longer.
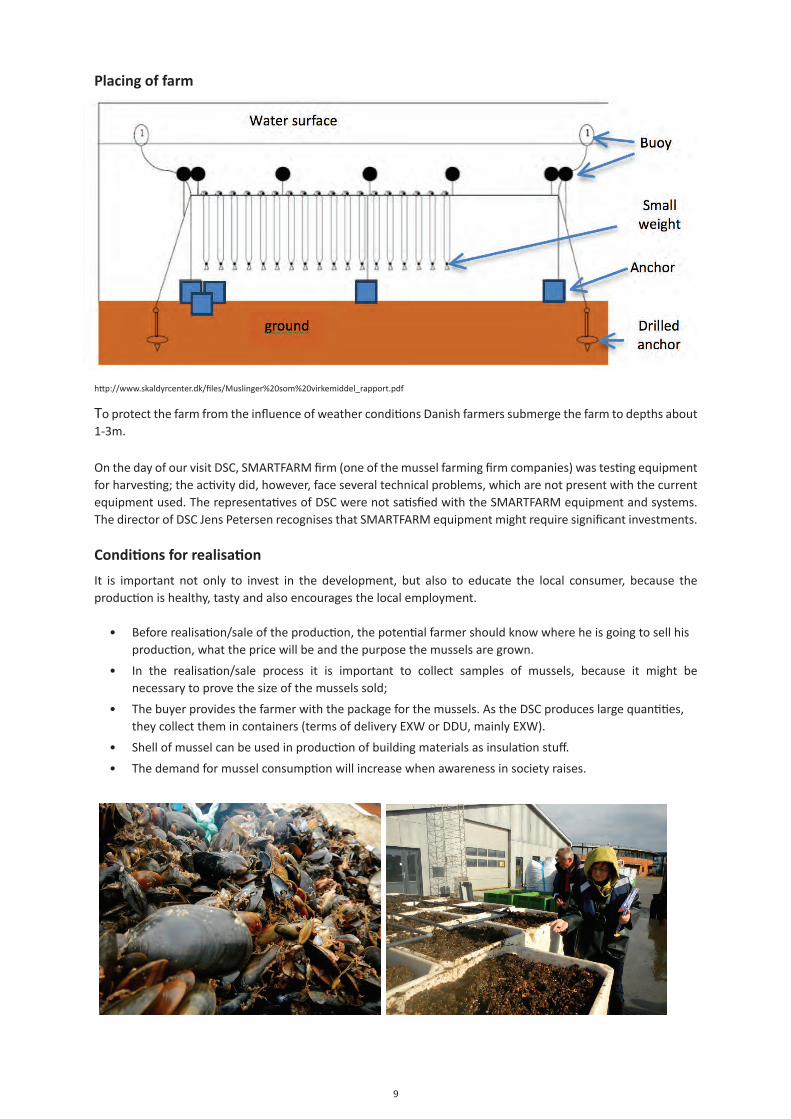
9
Placing of farm
http://www.skaldyrcenter.dk/files/Muslinger%20som%20virkemiddel_rapport.pdf
To protect the farm from the influence of weather conditions Danish farmers submerge the farm to depths about 1-3m.
On the day of our visit DSC, SMARTFARM firm (one of the mussel farming firm companies) was testing equipment for harvesting; the activity did, however, face several technical problems, which are not present with the current equipment used. The representatives of DSC were not satisfied with the SMARTFARM equipment and systems. The director of DSC Jens Petersen recognises that SMARTFARM equipment might require significant investments.
Conditions for realisation
It is important not only to invest in the development, but also to educate the local consumer, because the production is healthy, tasty and also encourages the local employment.
• Before realisation/sale of the production, the potential farmer should know where he is going to sell his production, what the price will be and the purpose the mussels are grown.
• In the realisation/sale process it is important to collect samples of mussels, because it might be necessary to prove the size of the mussels sold;
• The buyer provides the farmer with the package for the mussels. As the DSC produces large quantities, they collect them in containers (terms of delivery EXW or DDU, mainly EXW).
• Shell of mussel can be used in production of building materials as insulation stuff.
• The demand for mussel consumption will increase when awareness in society raises.
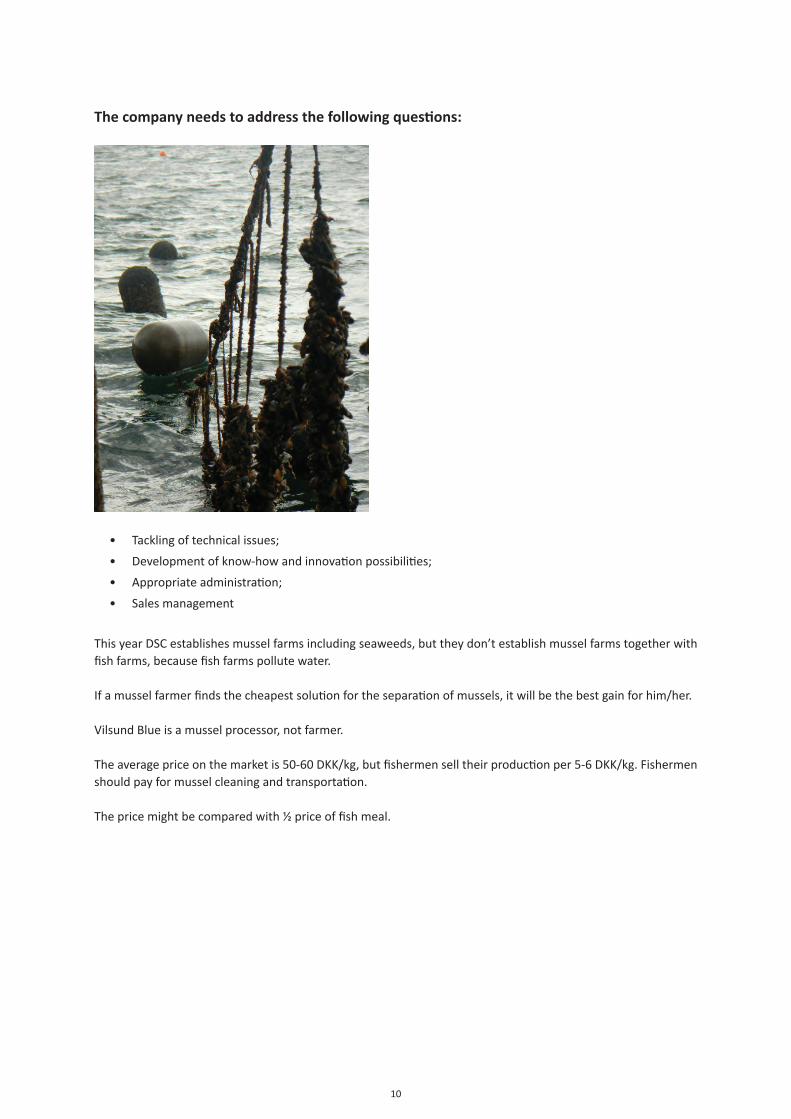
10
The company needs to address the following questions:
• Tackling of technical issues;
• Development of know-how and innovation possibilities;
• Appropriate administration;
• Sales management
This year DSC establishes mussel farms including seaweeds, but they don’t establish mussel farms together with fish farms, because fish farms pollute water.
If a mussel farmer finds the cheapest solution for the separation of mussels, it will be the best gain for him/her.
Vilsund Blue is a mussel processor, not farmer.
The average price on the market is 50-60 DKK/kg, but fishermen sell their production per 5-6 DKK/kg. Fishermen should pay for mussel cleaning and transportation.
The price might be compared with ½ price of fish meal.
11
Study visit in processing company
We visited European Protein AS. This company processes production and due to the fermentation process they get several protein types. In 2007 they started the fermentation and later produced liquid for pig farms.
In 2009 they started to process the food remnants, producing 55 mio tons. Today they can produce 150 000 tons protein per year, but in the USA 500 000 tons per year.
In the processing, Lacto bacter is used, a bacteria that uses lactic fermentation to break proteins into amino acids. Today soya is the main protein source in Europe constituting 80% of the total quantity. This production is imported from the USA due to the lack of protein.
Shortcomings in the potential processing of mussels using lactic fermentation
In the protein production process the food should be boiled 60 minutes, if it is meant for pigs or fish. Due to this reason the mussel consumption constitutes restrictions as it is a fish product. Compared with human consumption the food should be prepared within 3 minutes. Such strange difference reduces competitiveness of the mussel product.
During processing, European protein reduces the pH level up to 4; under this level most of the bacteria die.
If it was possible to change the EU regulations, so that mussels would be exposed for a long term heating treatment, the company would be ready to buy mussels. The future price might be 70-90% of fish meal price. The product should be sold to the fermentation plants in a liquid state. This raises several questions about the potential contamination with other bacteria. The production might consist of sea stars and algae, as well as other sea products.
• If the production of mussels is locally harvested in the Baltic Sea, the local economy will attract investors
• CO2 pollution will reduce due to use of the local production (transportation distance is smaller)
• The import of soya might be reduced
• Consumption of GMO will decrease in the EU.
3.5.3Study Visit to Canada
Prepared June 25, 2013
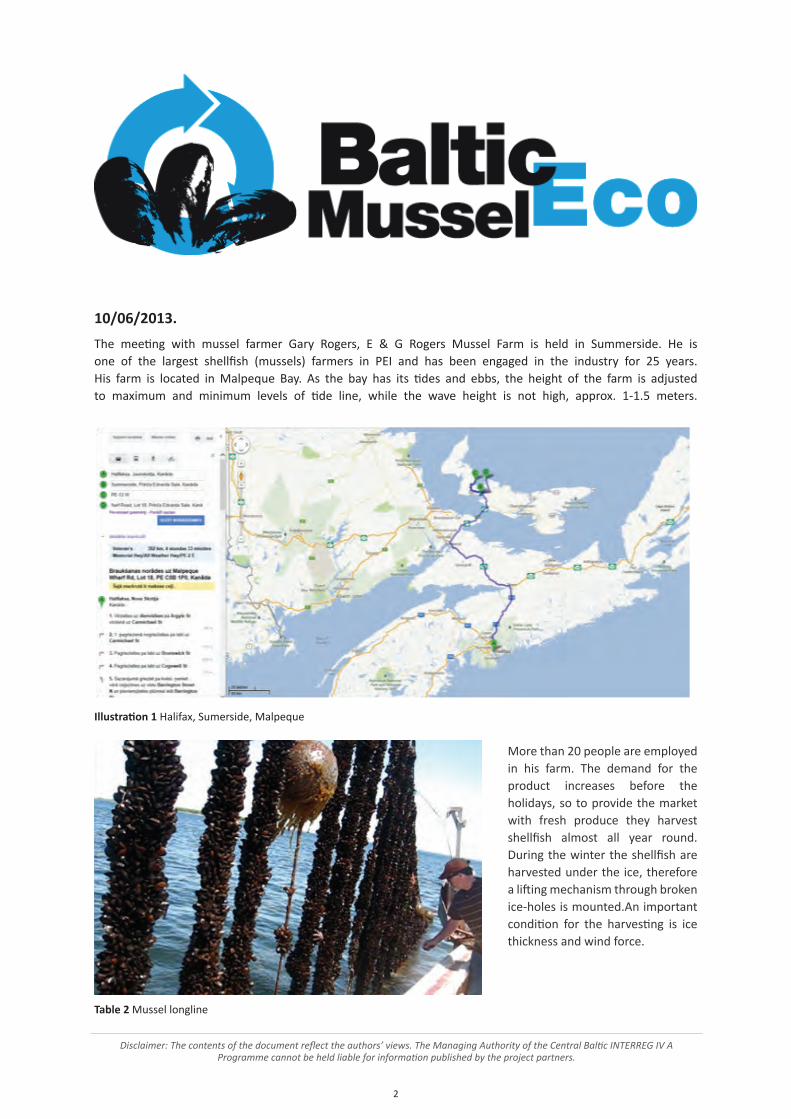
2
10/06/2013.
The meeting with mussel farmer Gary Rogers, E & G Rogers Mussel Farm is held in Summerside. He is one of the largest shellfish (mussels) farmers in PEI and has been engaged in the industry for 25 years. His farm is located in Malpeque Bay. As the bay has its tides and ebbs, the height of the farm is adjusted to maximum and minimum levels of tide line, while the wave height is not high, approx. 1-1.5 meters.
Illustration 1 Halifax, Sumerside, Malpeque
More than 20 people are employed in his farm. The demand for the product increases before the holidays, so to provide the market with fresh produce they harvest shellfish almost all year round. During the winter the shellfish are harvested under the ice, therefore a lifting mechanism through broken ice-holes is mounted.An important condition for the harvesting is ice thickness and wind force.
Table 2 Mussel longline
Disclaimer: The contents of the document reflect the authors’ views. The Managing Authority of the Central Baltic INTERREG IV A Programme cannot be held liable for information published by the project partners.
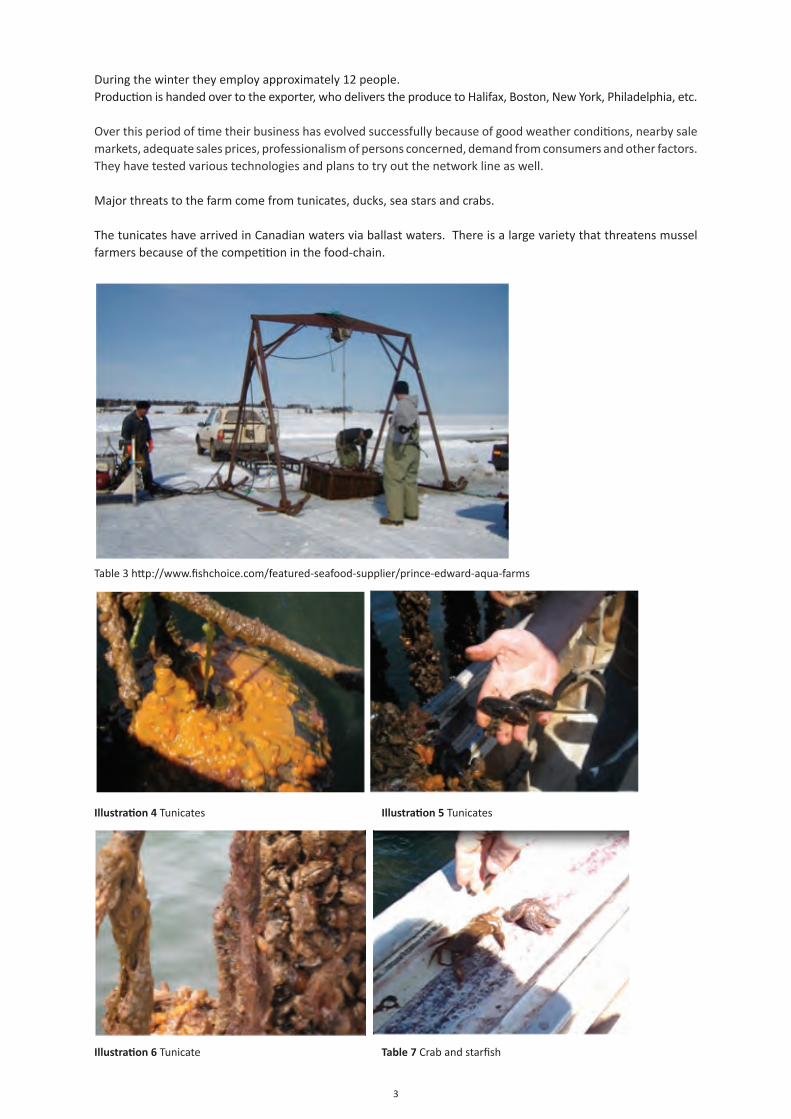
3
During the winter they employ approximately 12 people.Production is handed over to the exporter, who delivers the produce to Halifax, Boston, New York, Philadelphia, etc.
Over this period of time their business has evolved successfully because of good weather conditions, nearby sale markets, adequate sales prices, professionalism of persons concerned, demand from consumers and other factors. They have tested various technologies and plans to try out the network line as well.
Major threats to the farm come from tunicates, ducks, sea stars and crabs.
The tunicates have arrived in Canadian waters via ballast waters. There is a large variety that threatens mussel farmers because of the competition in the food-chain.
Table 3 http://www.fishchoice.com/featured-seafood-supplier/prince-edward-aqua-farms
Illustration 4 Tunicates Illustration 5 Tunicates
Illustration 6 Tunicate Table 7 Crab and starfish
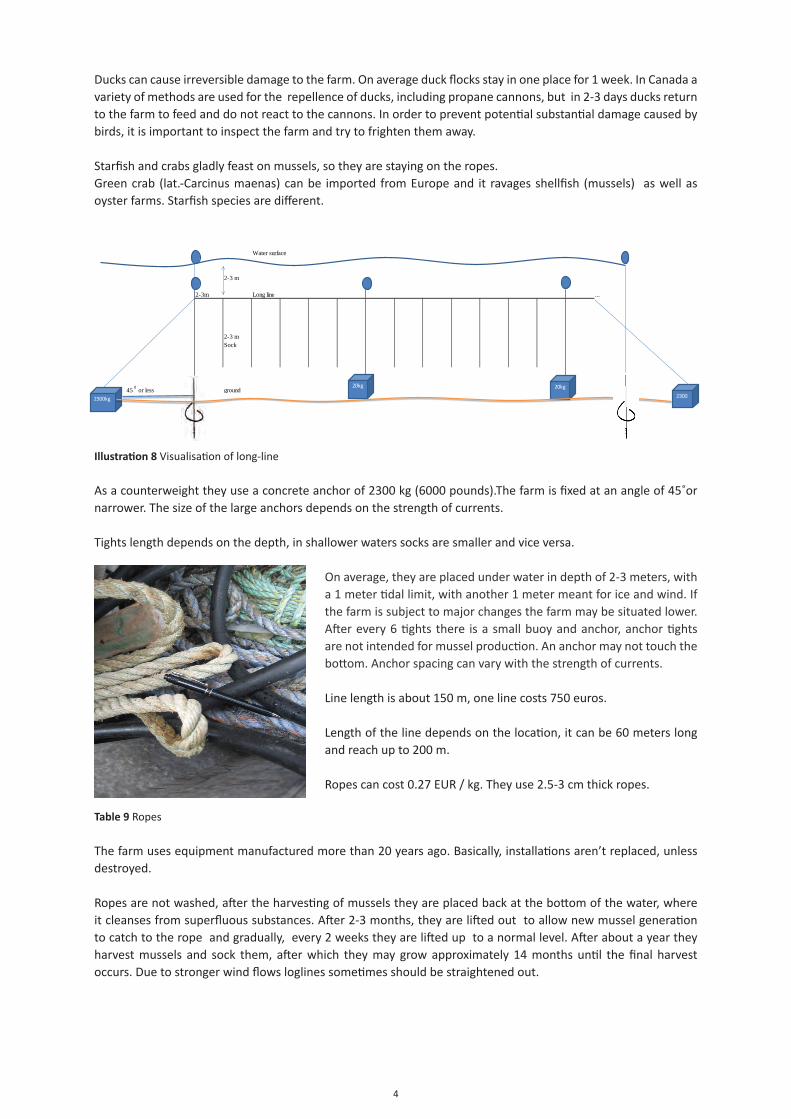
4
Ducks can cause irreversible damage to the farm. On average duck flocks stay in one place for 1 week. In Canada a variety of methods are used for the repellence of ducks, including propane cannons, but in 2-3 days ducks return to the farm to feed and do not react to the cannons. In order to prevent potential substantial damage caused by birds, it is important to inspect the farm and try to frighten them away.
Starfish and crabs gladly feast on mussels, so they are staying on the ropes.Green crab (lat.-Carcinus maenas) can be imported from Europe and it ravages shellfish (mussels) as well as oyster farms. Starfish species are different.
Illustration 8 Visualisation of long-line
As a counterweight they use a concrete anchor of 2300 kg (6000 pounds).The farm is fixed at an angle of 45˚or narrower. The size of the large anchors depends on the strength of currents.
Tights length depends on the depth, in shallower waters socks are smaller and vice versa. On average, they are placed under water in depth of 2-3 meters, with a 1 meter tidal limit, with another 1 meter meant for ice and wind. If the farm is subject to major changes the farm may be situated lower. After every 6 tights there is a small buoy and anchor, anchor tights are not intended for mussel production. An anchor may not touch the bottom. Anchor spacing can vary with the strength of currents.
Line length is about 150 m, one line costs 750 euros.
Length of the line depends on the location, it can be 60 meters long and reach up to 200 m.
Ropes can cost 0.27 EUR / kg. They use 2.5-3 cm thick ropes.
Table 9 Ropes
The farm uses equipment manufactured more than 20 years ago. Basically, installations aren’t replaced, unless destroyed.
Ropes are not washed, after the harvesting of mussels they are placed back at the bottom of the water, where it cleanses from superfluous substances. After 2-3 months, they are lifted out to allow new mussel generation to catch to the rope and gradually, every 2 weeks they are lifted up to a normal level. After about a year they harvest mussels and sock them, after which they may grow approximately 14 months until the final harvest occurs. Due to stronger wind flows loglines sometimes should be straightened out.
Water surface
2-3 m
2-3m Long line ...
2-3 mSock
45 0 or less ground2300kg
20kg 20kg
2300
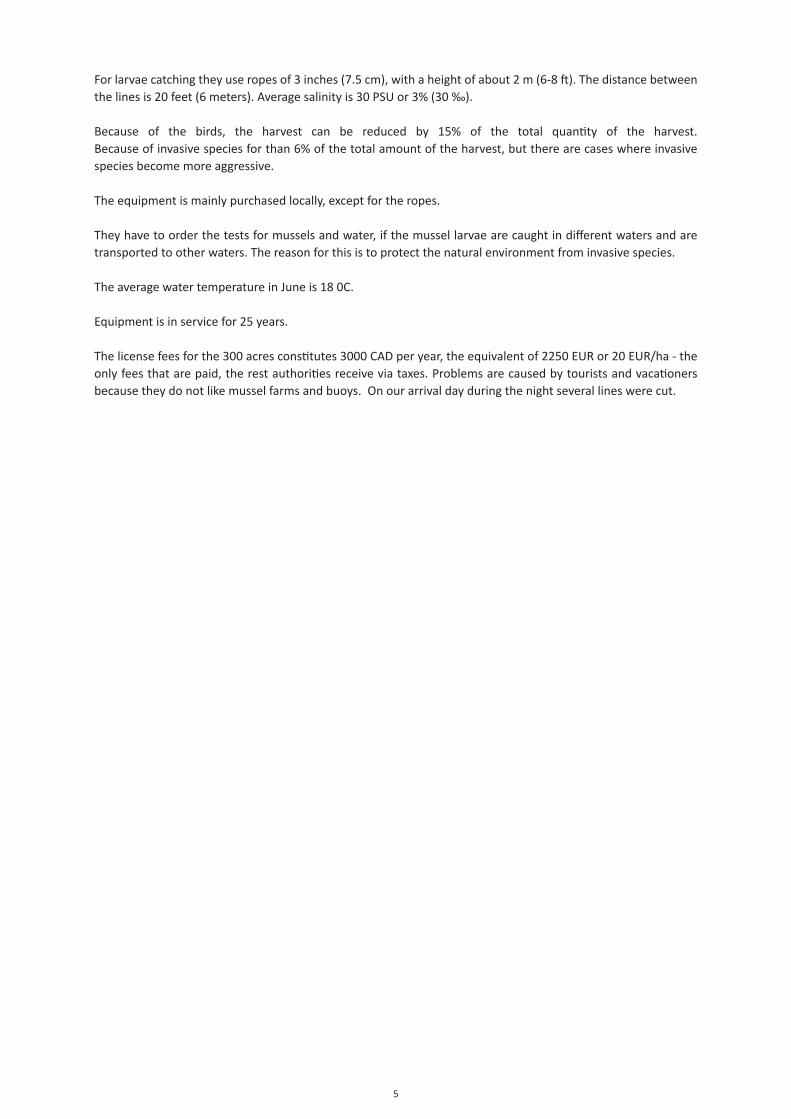
5
For larvae catching they use ropes of 3 inches (7.5 cm), with a height of about 2 m (6-8 ft). The distance between the lines is 20 feet (6 meters). Average salinity is 30 PSU or 3% (30 ‰).
Because of the birds, the harvest can be reduced by 15% of the total quantity of the harvest. Because of invasive species for than 6% of the total amount of the harvest, but there are cases where invasive species become more aggressive. The equipment is mainly purchased locally, except for the ropes. They have to order the tests for mussels and water, if the mussel larvae are caught in different waters and are transported to other waters. The reason for this is to protect the natural environment from invasive species.
The average water temperature in June is 18 0C.
Equipment is in service for 25 years.
The license fees for the 300 acres constitutes 3000 CAD per year, the equivalent of 2250 EUR or 20 EUR/ha - the only fees that are paid, the rest authorities receive via taxes. Problems are caused by tourists and vacationers because they do not like mussel farms and buoys. On our arrival day during the night several lines were cut.
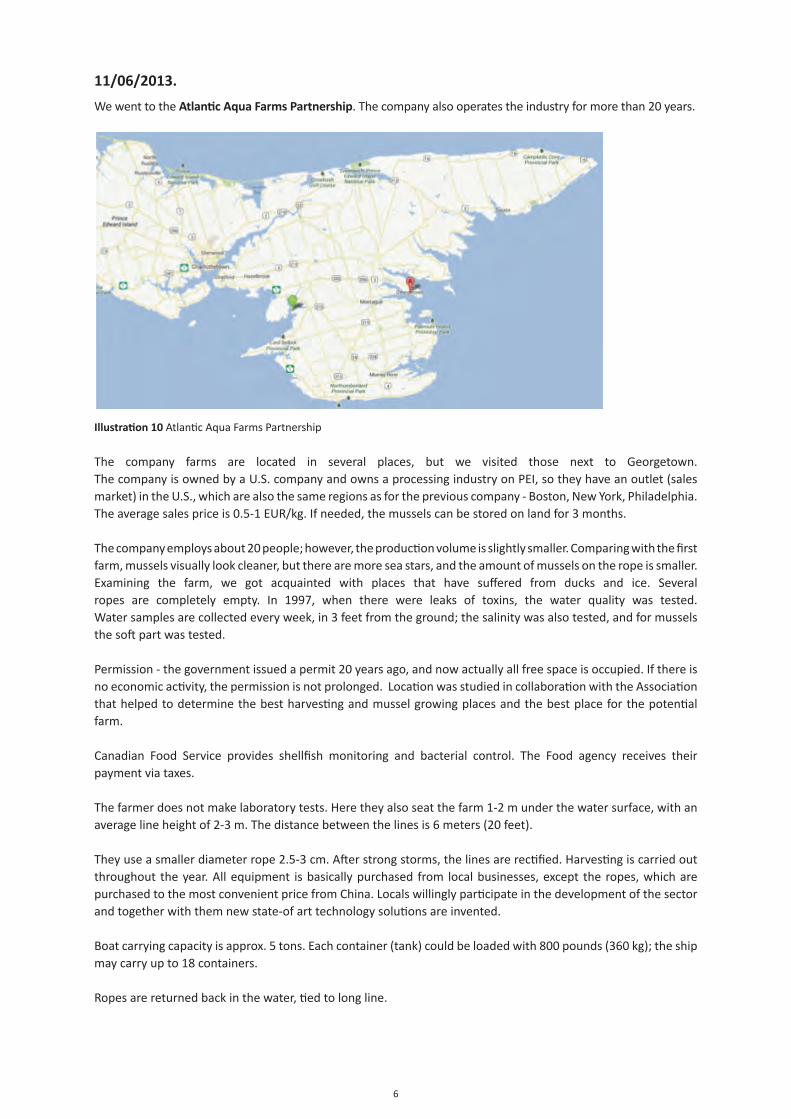
6
11/06/2013.
We went to the Atlantic Aqua Farms Partnership. The company also operates the industry for more than 20 years.
Illustration 10 Atlantic Aqua Farms Partnership
The company farms are located in several places, but we visited those next to Georgetown. The company is owned by a U.S. company and owns a processing industry on PEI, so they have an outlet (sales market) in the U.S., which are also the same regions as for the previous company - Boston, New York, Philadelphia.The average sales price is 0.5-1 EUR/kg. If needed, the mussels can be stored on land for 3 months.
The company employs about 20 people; however, the production volume is slightly smaller. Comparing with the first farm, mussels visually look cleaner, but there are more sea stars, and the amount of mussels on the rope is smaller. Examining the farm, we got acquainted with places that have suffered from ducks and ice. Several ropes are completely empty. In 1997, when there were leaks of toxins, the water quality was tested. Water samples are collected every week, in 3 feet from the ground; the salinity was also tested, and for mussels the soft part was tested.
Permission - the government issued a permit 20 years ago, and now actually all free space is occupied. If there is no economic activity, the permission is not prolonged. Location was studied in collaboration with the Association that helped to determine the best harvesting and mussel growing places and the best place for the potential farm. Canadian Food Service provides shellfish monitoring and bacterial control. The Food agency receives their payment via taxes.
The farmer does not make laboratory tests. Here they also seat the farm 1-2 m under the water surface, with an average line height of 2-3 m. The distance between the lines is 6 meters (20 feet).
They use a smaller diameter rope 2.5-3 cm. After strong storms, the lines are rectified. Harvesting is carried out throughout the year. All equipment is basically purchased from local businesses, except the ropes, which are purchased to the most convenient price from China. Locals willingly participate in the development of the sector and together with them new state-of art technology solutions are invented. Boat carrying capacity is approx. 5 tons. Each container (tank) could be loaded with 800 pounds (360 kg); the ship may carry up to 18 containers. Ropes are returned back in the water, tied to long line.
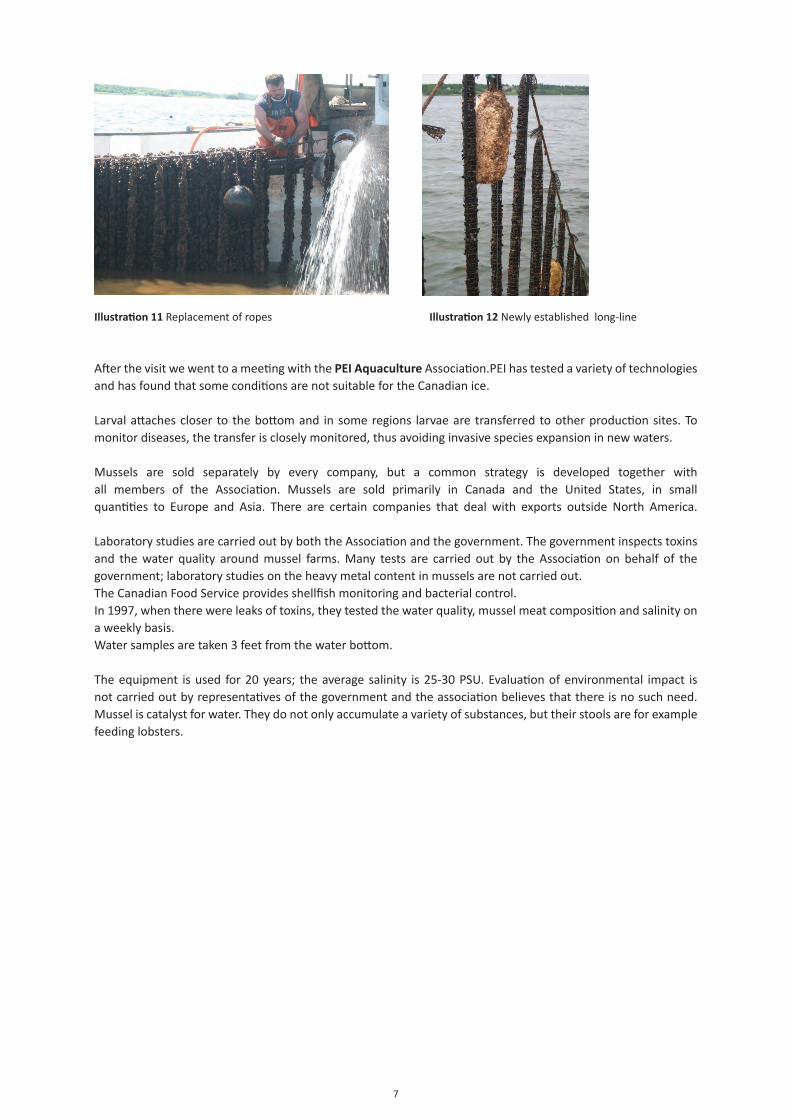
7
Illustration 11 Replacement of ropes Illustration 12 Newly established long-line
After the visit we went to a meeting with the PEI Aquaculture Association.PEI has tested a variety of technologies and has found that some conditions are not suitable for the Canadian ice. Larval attaches closer to the bottom and in some regions larvae are transferred to other production sites. To monitor diseases, the transfer is closely monitored, thus avoiding invasive species expansion in new waters. Mussels are sold separately by every company, but a common strategy is developed together with all members of the Association. Mussels are sold primarily in Canada and the United States, in small quantities to Europe and Asia. There are certain companies that deal with exports outside North America.
Laboratory studies are carried out by both the Association and the government. The government inspects toxins and the water quality around mussel farms. Many tests are carried out by the Association on behalf of the government; laboratory studies on the heavy metal content in mussels are not carried out.The Canadian Food Service provides shellfish monitoring and bacterial control.In 1997, when there were leaks of toxins, they tested the water quality, mussel meat composition and salinity on a weekly basis.Water samples are taken 3 feet from the water bottom. The equipment is used for 20 years; the average salinity is 25-30 PSU. Evaluation of environmental impact is not carried out by representatives of the government and the association believes that there is no such need. Mussel is catalyst for water. They do not only accumulate a variety of substances, but their stools are for example feeding lobsters.
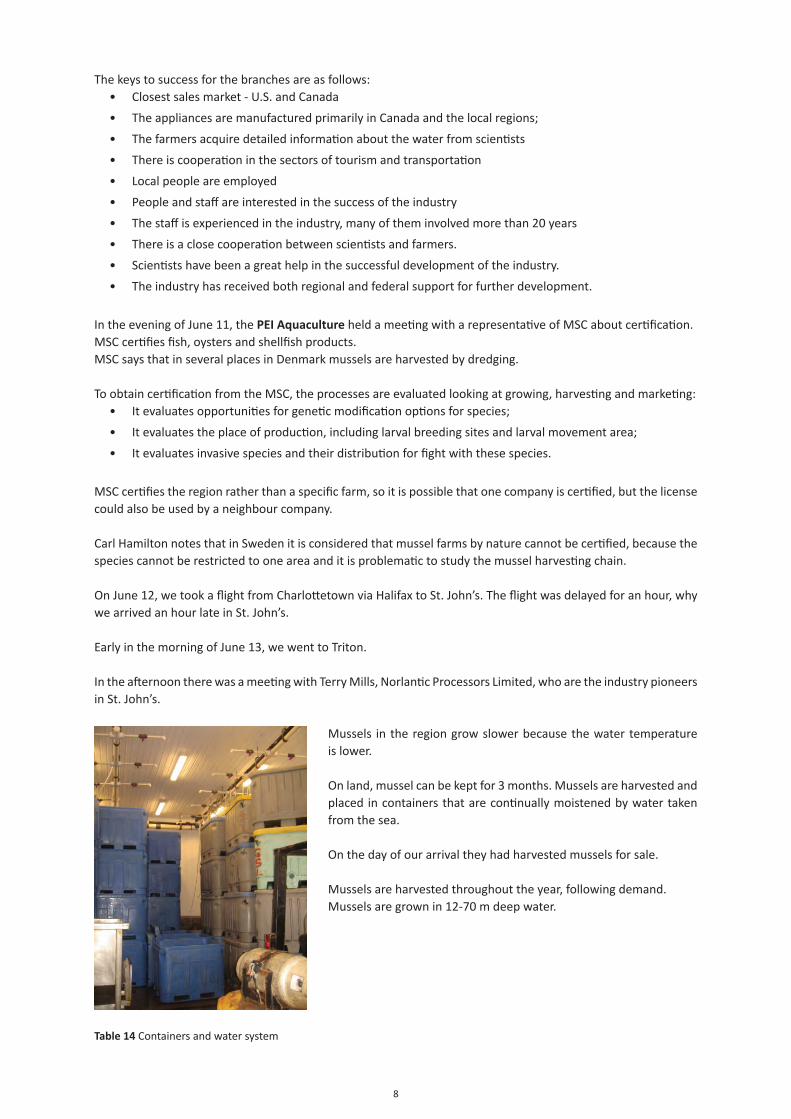
8
The keys to success for the branches are as follows:• Closest sales market - U.S. and Canada
• The appliances are manufactured primarily in Canada and the local regions;
• The farmers acquire detailed information about the water from scientists
• There is cooperation in the sectors of tourism and transportation
• Local people are employed
• People and staff are interested in the success of the industry
• The staff is experienced in the industry, many of them involved more than 20 years
• There is a close cooperation between scientists and farmers.
• Scientists have been a great help in the successful development of the industry.
• The industry has received both regional and federal support for further development.
In the evening of June 11, the PEI Aquaculture held a meeting with a representative of MSC about certification.MSC certifies fish, oysters and shellfish products.MSC says that in several places in Denmark mussels are harvested by dredging. To obtain certification from the MSC, the processes are evaluated looking at growing, harvesting and marketing:
• It evaluates opportunities for genetic modification options for species;
• It evaluates the place of production, including larval breeding sites and larval movement area;
• It evaluates invasive species and their distribution for fight with these species.
MSC certifies the region rather than a specific farm, so it is possible that one company is certified, but the license could also be used by a neighbour company. Carl Hamilton notes that in Sweden it is considered that mussel farms by nature cannot be certified, because the species cannot be restricted to one area and it is problematic to study the mussel harvesting chain. On June 12, we took a flight from Charlottetown via Halifax to St. John’s. The flight was delayed for an hour, why we arrived an hour late in St. John’s.
Early in the morning of June 13, we went to Triton.
In the afternoon there was a meeting with Terry Mills, Norlantic Processors Limited, who are the industry pioneers in St. John’s.
Mussels in the region grow slower because the water temperature is lower.
On land, mussel can be kept for 3 months. Mussels are harvested and placed in containers that are continually moistened by water taken from the sea.
On the day of our arrival they had harvested mussels for sale.
Mussels are harvested throughout the year, following demand.Mussels are grown in 12-70 m deep water.
Table 14 Containers and water system
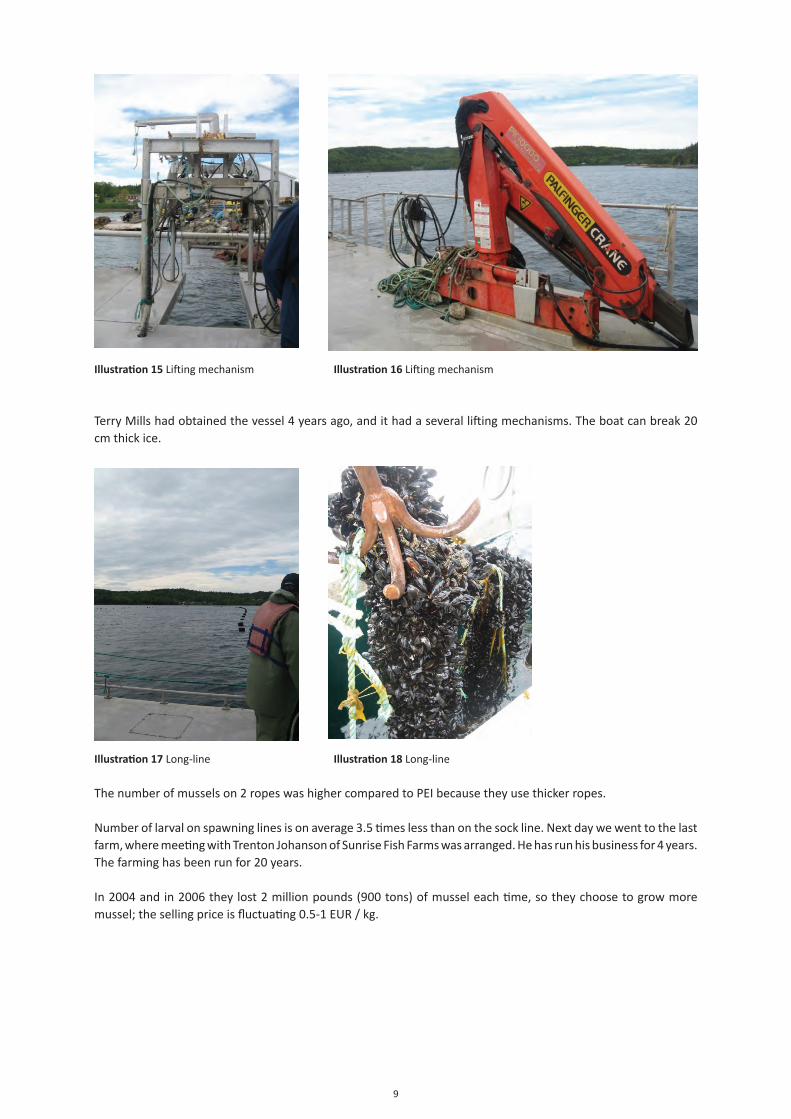
9
Illustration 15 Lifting mechanism Illustration 16 Lifting mechanism
Terry Mills had obtained the vessel 4 years ago, and it had a several lifting mechanisms. The boat can break 20 cm thick ice.
Illustration 17 Long-line Illustration 18 Long-line
The number of mussels on 2 ropes was higher compared to PEI because they use thicker ropes.
Number of larval on spawning lines is on average 3.5 times less than on the sock line. Next day we went to the last farm, where meeting with Trenton Johanson of Sunrise Fish Farms was arranged. He has run his business for 4 years. The farming has been run for 20 years. In 2004 and in 2006 they lost 2 million pounds (900 tons) of mussel each time, so they choose to grow more mussel; the selling price is fluctuating 0.5-1 EUR / kg.
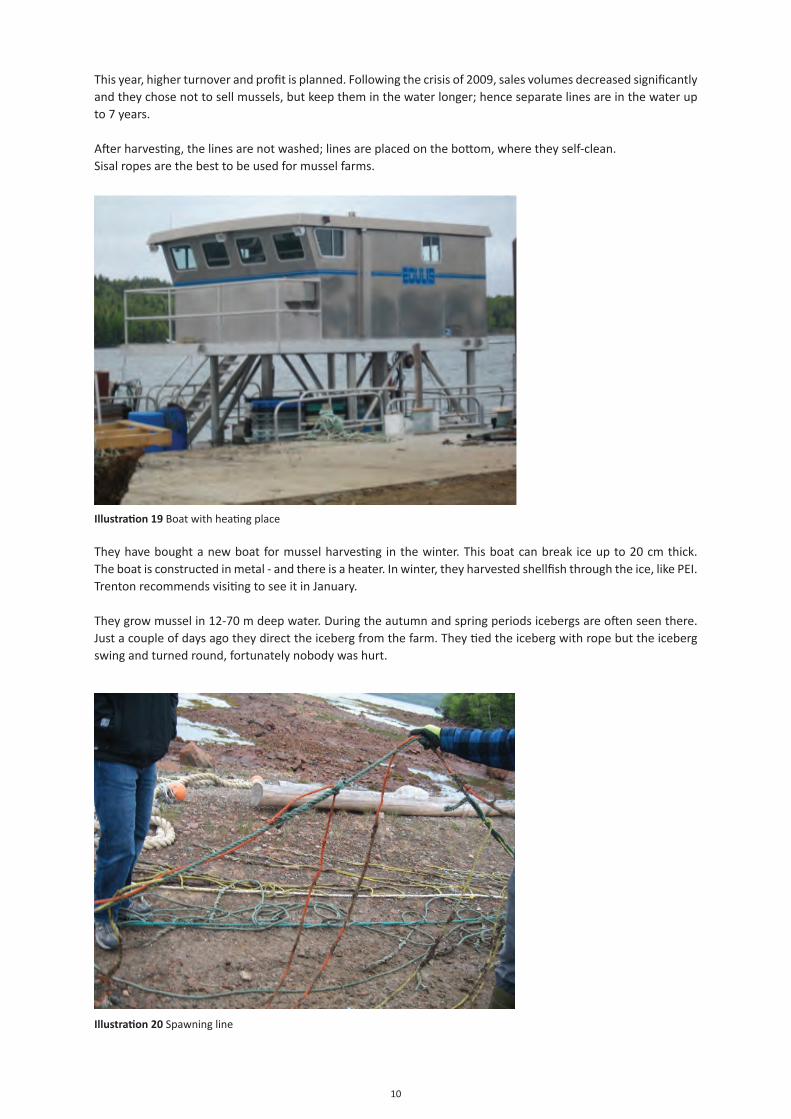
10
This year, higher turnover and profit is planned. Following the crisis of 2009, sales volumes decreased significantly and they chose not to sell mussels, but keep them in the water longer; hence separate lines are in the water up to 7 years.
After harvesting, the lines are not washed; lines are placed on the bottom, where they self-clean.Sisal ropes are the best to be used for mussel farms.
Illustration 19 Boat with heating place
They have bought a new boat for mussel harvesting in the winter. This boat can break ice up to 20 cm thick. The boat is constructed in metal - and there is a heater. In winter, they harvested shellfish through the ice, like PEI. Trenton recommends visiting to see it in January. They grow mussel in 12-70 m deep water. During the autumn and spring periods icebergs are often seen there. Just a couple of days ago they direct the iceberg from the farm. They tied the iceberg with rope but the iceberg swing and turned round, fortunately nobody was hurt.
Illustration 20 Spawning line
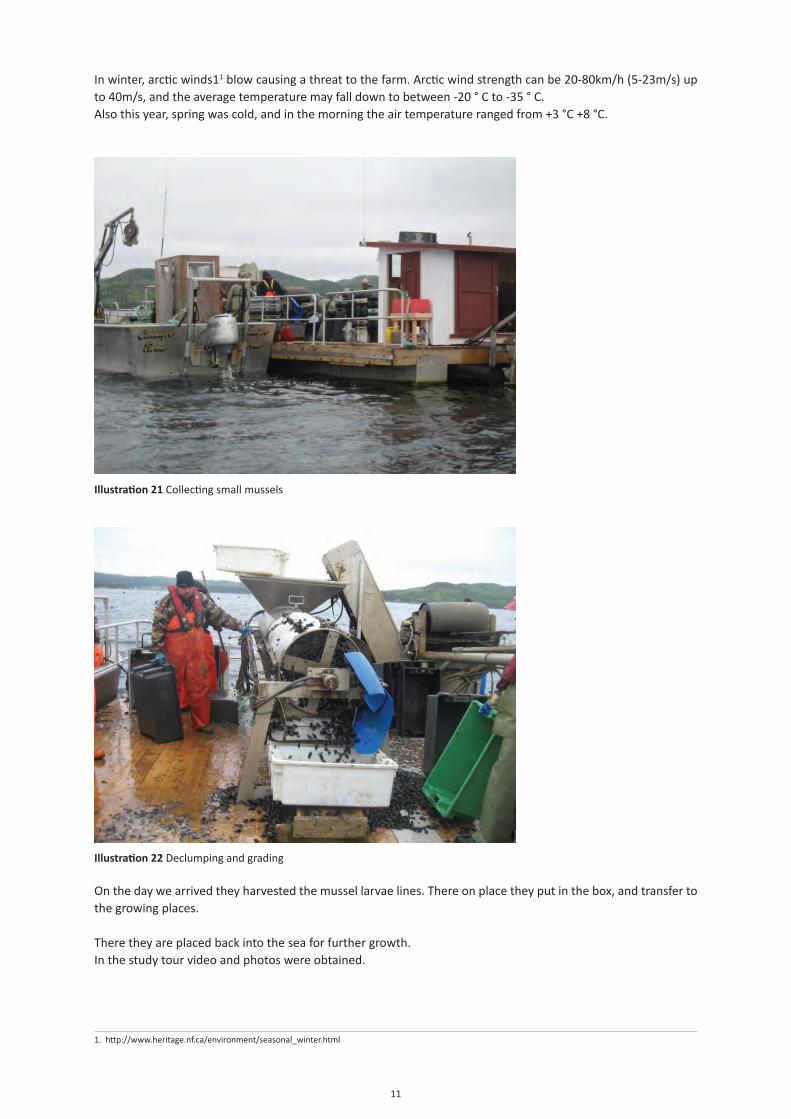
11
In winter, arctic winds11 blow causing a threat to the farm. Arctic wind strength can be 20-80km/h (5-23m/s) up to 40m/s, and the average temperature may fall down to between -20 ° C to -35 ° C.Also this year, spring was cold, and in the morning the air temperature ranged from +3 °C +8 °C.
Illustration 21 Collecting small mussels
Illustration 22 Declumping and grading
On the day we arrived they harvested the mussel larvae lines. There on place they put in the box, and transfer to the growing places. There they are placed back into the sea for further growth.In the study tour video and photos were obtained.
1. http://www.heritage.nf.ca/environment/seasonal_winter.html

3.5.4 Study Visit to Scotland
2
Study Visit to Inverlussa Mussel Farm, Isle Mull Scotland. 6th and 7th June 2013
Objective.
1. Motivation
A crucial aspect in optimizing mussel farming is the adaptation of different technologies such as “culture nets”, “harvesting machinery” and “anchoring devices” to differences in coastal environments where mussels grow.
In the Baltic region, there are two main providers for mussel farm equipment: SmartFarm (Norway) and Kingfisher (Sweden). Both companies are limited in their experience using mussel equipment in the Baltic proper, like in the Gulf of Finland and at the open coast of Latvia. These locations belong to the project region presenting two problematic scenarios for stakeholders interested in mussel farming, and our project has the obligation to inform and advise about them. The scenarios are: (1) in the Gulf of Finland the recruitment and growth of mussels is reduced by the low salinity and high eutrophication. (2) Areas of the open coast of Latvia are deep and exposed to high wave action reducing the mussel attachment to the substratum. Moreover the greatest difference in depths along the Latvian coast respect the rest of the Baltic regions, makes setting up mussel farms more challenging and complex.
One example on the consequences of using uniform technology in the heterogonous localities in the Baltic Region is the example of Kumlinge, Åland in Nov. 2012 (Engman, T. com. Pers.). One of the firms (SmartFarm) installed mesh nets developed for the coast of Norway the result were losses in the mussel biomass mainly during harvesting which was ultimately caused because their harvesting machinery need to be adapted to shallow depths, narrow and enclosed areas where the mussel farm was located. Similarly, the cultivation nets were not optimal to maximize the farm was located. Additionally, it is well known in the ecologic literature that on the surface (0-2 m of depth) mussels compete with barnacles and algae, moreover in winter a considerable lost mussel biomass is expected due to the ice. Similar results and problems were reported by Odd Lindahl (2012) for the east coast of Sweden. Nevertheless, the principal problem was first ice, breaking the installations, and secondly, there was not harvesting technology available.
Therefore, a global assessment of technologies used in different regions and locations is therefore essential to optimize the efficiency of mussel farms and to prevent further losses.
2. Study site details and research topics:
Technique: The farm to be visited is located in Loch Spelve, in the South East corner of the isle of Mull, Scotland, UK. In 2012 this company produced 550-600 tons of mussels, five times more than we expected in the Baltic region, which anyway it is a low production in comparison to Canada, Holland or Denmark. Loch Spelve is
Disclaimer: The contents of the document reflect the authors’ views. The Managing Authority of the Central Baltic INTERREG IV A Programme cannot be held liable for information published by the project partners.
3
considered to be especially suitable for rope grown mussel cultivation, which is quite unique and different from those offered on the Baltic Sea market. The Loch’s remote location, with virtually no human habitation around its shores and the mix of fresh (from the mountains) and sea water creates similar conditions to the Gulf of Finland. Furthermore, the depths along this coast resemble those known from the coast of Latvia. These two features make this farm an exceptionally well suited study site.
The techniques used in Loch Spelve might be useful for areas with low recruitment and growth rates such as the Gulf of Finland. This technique might be efficient in East coast of Sweden, Åland, and Gulf of Finland. However its suitability for open coasts where strong water movement might cause dislodging of mussels from ropes, scenario that resembles the Latvian coast, will be assessed.
3. Specific aspects
Ecosystem impacts information: one of the most important points in our project is to promote mussel farming activities in a sustainable way. We assessed and concluded that 40-80 tons of mussels can have a positive effect on the waters and soft sediment ecosystem, increasing the diversity, water transparency and reducing the amount of total phosphate. We do not know the effects that 500-600 tons might have on the sediments and the water quality. Therefore, if available, we will gather information about soft sediment ecosystems and the environmental impacts of the mussel farm.
Anchoring: Differences in anchoring with be assessed for different locations, for example areas protected from wave action will require lighter anchoring than location with a higher wave exposure. Additionally, different in substrata requires different anchoring. We will assess the substrata and ways and the cost of implying anchoring of the mussel farms. Harvesting: We will evaluate the techniques used for mussel farm harvesting, taking into consideration the cost (incl. personnel).
RESULTS
1. Physical and oceanographic conditions considered to set the mussel farm at Isle of Mull.
The mussel farm location was chosen by the founder Douglas Wilson of the farm during the 80’s decade. He was a fishermen interested in parallel sources of income, then he provided some ropes to be colonized by mussels. The success of the small scale experience drove him to invest more and more in larger units.
Nevertheless, the mussel farm location seemed to be chosen by intuition of a man who has worked in the sea all his life, the location seems to be adequate with respect to physiological conditions required for mussel cultivation:
1. Salinity:
29-35%
2. Wave exposure:
Very low wave exposure, since the farm is located in a closed bay, where there is no influence by the wind or waves, but with a good water circulation.
3. Depth:
The total depth of the sites varied between 12 m, while the ropes were submerges from 1-8 m, because they noticed below 12 m the growth is slower.
4. Water circulation:
On average 1 m/s which is equivalent to all the places were commonly mussel farms are located in the world.
4
5. Pollution and threats.
a. Anoxic or hypoxic bottoms:
One of the most debated aspects about mussel farms in the world is the accumulation of organic matter underneath of the mussel farm caused by their faeces elimination. Inverlussa mussel farm have yearly controls and certification from a state environmental organization “Seastandards” which have not detected any sign of hypoxia underneath the farm.
Nevertheless there is no regulation about this issue, in case signs of anoxia are detected.
b. Red tides:
This seems to be the major problem threatening the mussel farms in Scotland. Red tides are fast reproduction of micro-algae, caused mainly to an abrupt increase in the water temperatures and an improvement in the light conditions. Red tides are common in spring and summer time, and for this reason water samples are taken 3 times a week by a biochemist. The algae causing threats to human health are: Dinophysis spp, Pseudonitzchia spp and Alexandrium spp.
The consequences of this contamination on humans are the total paralysis of the body as well as severe memory loss and even in some case the death.
c. Ice:
The bay never gets totally frozen during winter, although during November and December the water lower its temperature, the ropes are protected against ices because they remain underwater.
d. Other health problems:
The presence of the bacteria E. coli can be a threat for human health affecting the production; the causes of this contamination are produced by presence of animals in the storage rooms when the mussels are harvested. Additionally, on the harvesting boat, mussels can remain in containers for more than 10 h at environmental temperatures inducing the decomposition of the tissues. The consequences of this contamination are the withdrawal of mussel products from the markets where they are commercialized. This contamination is considered serious.
e. Biological problems with predation:
Eider ducks can eat about 500 mussels per day, so they are listed the first risk factor. Sea-squirts, tube worms and barnacles do not kill the mussel but can affect significantly the mussel growth.
6. Technology and operation
a. Infrastructure
Mussel farms comprise different lines, each line comprises different mussel units. 1 line mussel farm contains (fig 1):-10 km new Zealand mussel rope (fig. 2)-40-60 floats-2 Anchors (1 tonne each)-3 boats: a. small 3 m (small crane), b. medium size boat (10 m) small crane, and c. larger boat (20 m) with a larger crane.-Seeding or socking machine-1 declumper-1 truck
Technique used: New Zealand technique. This technique comprises a sequence of hanging ropes units. Each unit comprises a 2 floating devices, and 2 ropes (21 m each): 10 m deep in one direction downward, 1 m separation and 10 m upwards. The version of this technique comprises the use of continues ropes and “pigs”(holders of rope) at each unit.
5
b. Temporal pattern of processing.
The operation of mussel farm can be divided in different stages:
1. Seeding. April (spring) setting up the ropes and units. Ropes must remain rolled near the surface to maximize the spat (mussel larvae) catch, after 2 months the ropes are unrolled and the growing.
1.1. Inspection. Every week mussel ropes are lifted and visually inspected to determine if they have growth enough and remove few predators. A small boat is used for inspection.
2. Socking: after 10 months (February), mussels are removed from the ropes using a boat (20 m long), equipped with a crane, able to lift up 100 kg. The crane lift the rope, the rope is cutted off the line and put into a mussel declumper.
3. Harvesting: after 6 months (September) from socking stage, mussels can be harvested, using the larger boat, equipped with a crane. The harvesting process last about 2 full days, and 2 temporal workers can be hired.
4. Reseeding. Immediately after the harvesting, ropes without mussels, they remain rolled until next spring.
7. Investment, costs and production
It was said during the interview that the investment costs are around £25000The operation costs were not revealed to us, nevertheless one can observe there are2 people hired permanent in the farm: the manager and an assistant.1 Biochemist in charge of monitoring the water quality of the sea is hired per hour.2 extra people are paid per hour during harvesting for about 1 week. Price of mussels in the Scottish markets 1 pound the Kg
Annual production.
The annual production can vary from 60 tons to 550 tons = 550000 pounds a yearThe mussels are ready to be sold when they reach a size of 5 cm.
8. Social Perspectives
Mussels Mytilus edulis are totally sold for human consumption, they go to supermarkets, restaurants. 1 mussel farm provides 2 permanent job for rural people, additionally 3 part time jobs.
Mussel farmers see future in their activities, but other stakeholders in the region such as fisher ecologists from Scottish Association of Marine Science forecast the collapse of mussel farming in a few years, the arguments were not clear.
9. Discussion The location of Inverlussa farm it is coherent with all the location of mussel farm in the world, this is sheltered places but with exchange of water (see report Canada and Denmark). The technique used to cultivate mussel farms is the New Zealand method, comprising ropes which increased the surface of attachment of larvae. The mussel farm units are divided in several independent segments, where the rope hangs, blocks with the mussel farm are not connected by same rope as in the Canadian method/Danish methodology, which can be inefficient since more time in harvesting is invested. Therefore, we recommend the use of a continues line, instead the block separation.
The risk observed were similar to those might occur in the Baltic Region, for example in the Baltic proper predation by eider ducks might be significant once the mussel farm is extablished, similarly predation by fish needs to be considered.
Red tides and bacterial infection is also another important potential problem which can affect the production of mussels for human consumptions, we recommend to follow the same protocols of monitoring used in the Scotland.
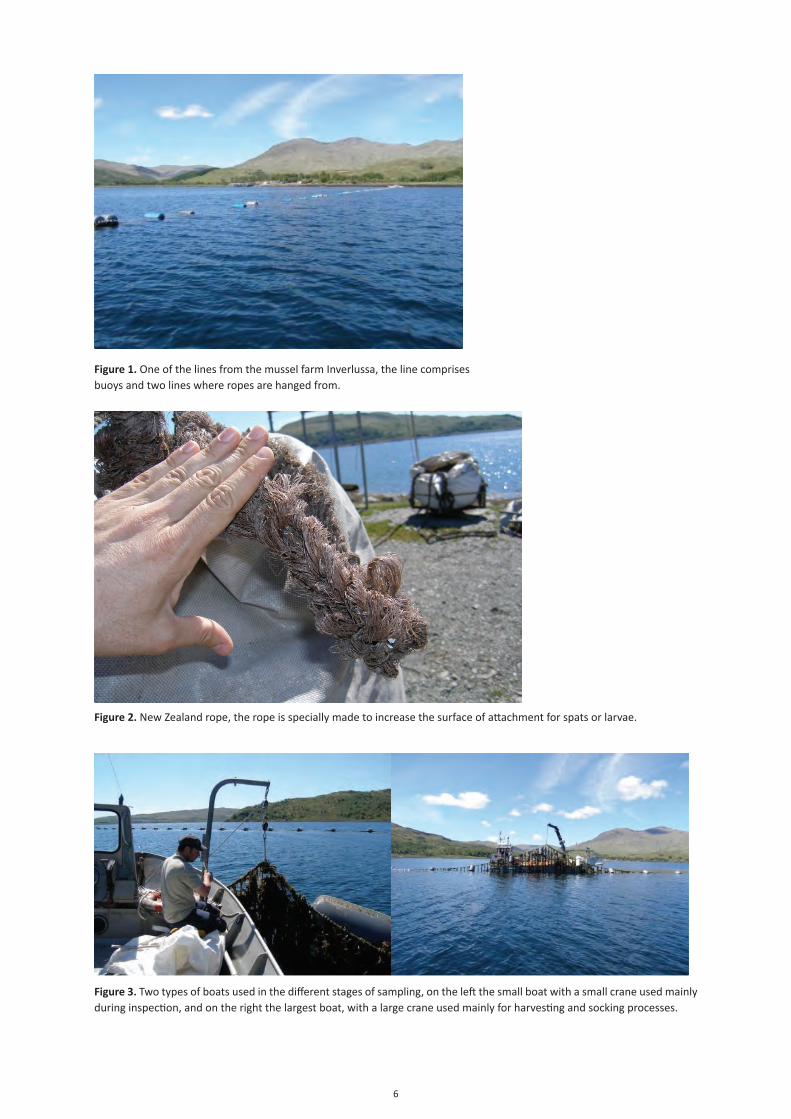
6
Figure 1. One of the lines from the mussel farm Inverlussa, the line comprises buoys and two lines where ropes are hanged from.
Figure 2. New Zealand rope, the rope is specially made to increase the surface of attachment for spats or larvae.
Figure 3. Two types of boats used in the different stages of sampling, on the left the small boat with a small crane used mainly during inspection, and on the right the largest boat, with a large crane used mainly for harvesting and socking processes.