Working Group on Methods of Fish Stock Assessments ... - ICES
Upload
khangminh22Category
view
1download
0
CONSEI L P E R M A N E N T I N T E R N A T I O N A L POUR
L ' E X P L O R A T I O N DE LA MER
C H A R L O T T E N L U N D SLOT. — D AN E M A R K
RAPPORTSET
PROCÈS-VERBAUX DES RÉUNIO NSVOLUME CVI
F L U C T U A T I O N S I N T H E B A L T I C S T O C K OF S A L M O N
( 1 9 2 1 — 1 9 3 5 )
BY
T. H. JÄRVI
EN COMMISSION CHEZ
A N D R . F R E D . H Ø S T & F I L S
COPENHAGUE
Prix : Kr. 6,00.
7-iu v. lyae. M ai 1938.
h t t p s : / / d o i . o r g / 1 0 . 1 7 8 9 5 / i c e s . p u b . 9 2 0 9
F L U C T U A T I O N S I N T H E B A L T I C S T O C K OF S A L M O N
( 1 9 2 1 — 1 9 3 5 )
BY
T. H. JÄRVI

C O N T E N T S
page
F orew ord ............................................................................................................................................................................................ 5
I. Catch Fluctuations in Baltic Salmon Fishing during the Period 1920—35.1. Salmon Catches obtained in Finland according to Statistical In form ation ............................................ 62. Statistical Information on Catches of Salmon prepared in other Countries bordering the Baltic 143. Comparative Survey of Catch Years...................................................................................................................... 16
II. Year and Life-Cycle Classes in Finnish Catches of Salmon.1. Introduction...................................................................................................................................................................... 222. Survey of Fishing Methods employed at Grounds supplying S am ples.............................. 223. Grouping of Salmon into Life-Cycle C lasses...................................................................................................... 344. The most important Life-Cycle Classes........................................................................ 35
A. Smolt A ge.............................................. 35B. First Migratory Period................................................................................................... 37C. Previously Spawned Salmon................................................................................................................................. 46
5. Age of Salmon................................................................................................................................................................. 596. Year-Classes...................................................................................................................................................................... 66
III. Length and Weight of Salmon.1. Length and Weight M easurements.............................................................................................. 712. Certain Weight-Class S ta tis t ic s ................................................................................................................................ 72
IV. Surveys and Summaries.1. The Importance of different Year-Classes in Baltic Salmon Fishing during 1921— 1935................. 892. Factors influencing the Abundance of the Year-Classes............................................................................... 933. Final S u r v e y ................................................................................................................................................................... 101
Appendix: Representation of the Sexes in the different Life-Cycle Groups................................................ 102
References................................................... 103

- 5 —
Foreword.
In undertaking the task, the results of which are described in this publication, my intention was
to investigate as thoroughly as possible the fluctuation phenomena appearing in salmon fishing, and the causes of same. With this aim in view it was necessary, of course, first of all to determine the relative individual abundance of the different year-classes forming the stock of salmon in the Baltic during the period appointed for investigation.
I have been cognizant of the fact that complete success in this aim would be open to question, as the material used for the basis of the investigation has been obtained only from Finnish salmon rivers or their neighbouring grounds at sea, i. e., from a fairly restricted area of the Baltic. The stock of salmon in the Baltic, taken as a whole, is formed in the rivers emptying their waters into the various regions of this sea. The extensive geographical divergence in the breeding grounds of the salmon is certain to have an influence on the yield, neutralising the effects of climatic conditions on the original individual abundance of the year-classes born in different localities, as there can be, and are, very great variations in the climate of different regions. Should the salmon, however, return to their own rivers to spawn, a theory given general support, the effect of climatic conditions prevailing during the breeding season on the different year-classes should make its appearance on the salmon reaching their ascending and spawning age.
There are several reasons for supporting the assumption that the salmon rivers of northern Finland and Sweden at present represent the largest breeding grounds of the stock of salmon in the Baltic, taken as a whole, or of the different stocks of salmon — if that originating in each river is treated separately — and that they also contribute the largest portion to each migrating shoal of salmon in the Baltic.
The most delicate period of the breeding season of individual salmon lasts throughout the winter. In Finland this is of long duration — several months — particularly in the northern river region. During its course both the height of the water in the rivers and the frost conditions may fluctuate considerably over the same year, not to mention over several years. At
first thought it appears probable, therefore, that these conditions have a decisive influence on the original abundance of individuals in the year-class. The effects of these factors, in so far as they can be judged from the catch of salmon in Finland, will be seen from my investigation.
The quantity of fish that have spawned can also be taken as a factor influencing the abundance of the individuals of the year-class being bred. On the basis of my experiences of other species of fish I considered this as a factor, but nevertheless probably of only secondary importance.
The results of my investigations will be found to cover a wider field if they can be combined with corresponding investigations made concurrently in other Baltic countries. As investigations of this type are now being made, I consider that the material provided from Finland will shed a strong light on Baltic salmon conditions prevailing during later years.
My investigations, as they are given here, were planned so long ago as 1917, and at the end of the fishing season that year I obtained a large collection of scale specimens from the Oulu River. My original plan to make my investigations in the Oulu River was prompted on the one hand by the fact that the International Council for the Exploration of the Sea had decided that the salmon of the Oulu River must be specially investigated (see H e n k i n g and Sa n d m a n , 1913), and on the other, by the existence of detailed information on the salmon catches from the Oulu River dating from 1863.
The exceptional conditions prevailing in Finland in 1918 and other circumstances prevented me from carrying out my scheme. This period was followed by a complete revolution in fishing conditions in the Oulu River: the local salmon weirs used for centuries (Raatinpato weir at the Merikoski Rapids near the city of Oulu, and the Muhos weir in the parish of Muhos) had been abandoned, while the fishing rights also changed hands. An interval thus began during which I was able to obtain only a few scale specimens

— 6 -
from the river for investigation purposes. Only since1925 have I succeeded in obtaining suitable specimens from the Oulu River.
Some time previously, i. e. 1920, I had been able to organize collections of scale specimens and accompanying measurements in both arms of the Kymi River at Langinkoski Rapids and Ahvenkoski Rapids— but since 1924 only from the eastern arm, then, however, both from Langinkoski Rapids and from Ränninkoski and Siikasaari fisheries situated above the rapids. Since August 1931 the spawning of salmon in the western arm — the Ahvenkoski Rapids — has entirely stopped and with it the salmon fishing, as the stream was then closed by the dam built in connection with the power station.
In 1922 the Kemi River was included among the rivers under investigation, when specimens were collected from the Korva, or Kilo, weir.
In 1925 a change was made at all these sites where specimens were collected and where formerly so-called random tests had been made, in that from then on scale specimens were taken from every individual salmon caught at the collecting stations. Unfortunately this rule was not very strictly observed during the first few years.
In 1925 collecting work was also begun in the Koke- mäki River at Lukkarinsanta above the town of Pori.
Collecting work in the Tornio River was begun in 1930.
In 1931 a change was made in collecting specimens from the Kemi River, owing to the difficulties created by timber floating at the Korva weir, difficulties which finally led to the complete cessation of fishing there ; specimens from then on being taken principally from catches of salmon made in the sea at the mouth of the river (Valkeasaari fishing grounds).
In addition to the above-mentioned specimens, I have had small specimen collections from the Kemi River (75 specimens) dating from 1915 and from the
Kokemäki River (68 specimens) dating from 1915— 17. These of course could not be used for investigating the composition of the stock, but they nevertheless provide some sort of estimation of the age and growth of the salmon caught.
It will be clear from the above that my material has been collected by other persons and I am extremely grateful to many collectors for their interest and labours on my behalf.
The following persons have either undertaken the collecting of specimens over long periods or have supplied me with the largest collections:
Oulu River: L a u r i Sa a e e l a (1917), J. K a i p o x e n (1922— 35) and J a a k k o K u r t t i (1934— 35).
Kemi River: Y r j ö V u o t i (1922— 32), O l l i K i l p e l ä (1932— 35) and V. A l a r u i k k a (1932— 35), together with M a t t i R a n t a p ö r h ö l ä (1929, 1931— 35) from the sea, outside the mouth of the Kemi River.
Tornio River: P e n t t i , H u l d a , and T u o m a s
P e l t t a r i (1930— 35).Kokemäki River: F r e d . T ä h t i n e n (1925— 29,
1934— 35) and L a u r i L e i n o (1930— 32).Kymi River: K. A h o l a (1920— 24), J . L e i k a s and
E. L e i s t i (1925— 35), and Y. V i l k m a n (1920— 23).The task of drawing up the tables in connection
with my investigation has been undertaken by Misses T o i n i M u r o m a and H e l m a St e n b o r g , the former handling the biological, and the latter the catch statistics. Mr. O iv a J o n a s s o n has assisted in preparing and interpreting the scales : he has also been responsible for taking the necessary photographs.
I would like to take this opportunity of expressing my sincere thanks to all who have given their assistance.
No figure illustrating salmon scales has been included in this paper, as selected samples have been published separately two years ago in the present series of publications (Rapp, et Proc.-Verb., Vol. XCVII).
I. Catch Fluctuations in Baltic Salmon Fishing during the Period 1920—1935.
1. S a lm on C atches obtained in F in land according to S ta t is t ica l In form ation .F is h in g c e n tr e s . From ancient times the main
Finnish salmon fishing centre has been the northern region of the Gulf of Bothnia1) — the so-called Both- nian Bay costal area — stretching from Oulu to Tornio. The determining factor in this is provided by the many rivers of considerable size which enter the sea along this coast, and which with the melting of the winter snows develop into torrents. In former days fishing was principally confined to the lower reaches of rivers : nowadays it is practised at sea in the neigh
1) The waters of the Baltic Sea north of Aland, the Gulf of Bothnia (Pohjanlahti), are composed of two parts: the southern, the Bothnian Sea (Selkämeri) and the northern, the Bothnian Bay (Perämeri).
bourhood of the estuaries. I shall call this large salmon fishing centre the Bothnian Bay salmon area.
There are comparatively few areas along the coast of the Bothnian Bay and the Bothnian Sea starting southwards from the Oulu area — which also includes the neighbouring waters of Hailuoto — where the salmon approach the shores in shoals of any size. Of these places, on moving southward, can be mentioned the Kokkola and Pietarsaari area, certain parts of Merenkurkku, such as Klubbhällan, and the Kaskinen area. All these areas may be considered as intermediary stations separating the salmon region of the Bothnian Bay from that of southern Finland.
There are two southern Finland salmon regions. The first of these belongs to the Gulf of Bothnia area. The centre of this region used to be the Kokemäki

— 7 —
Table i . Yield and E xp ort of S a lm on from Fin land in 1920— 1935.1)
(Total Quantity, Catch from Sea and River).
Yield in thousands of kilogrammes Percentage of Total Yield Export (net)3;
Year Whole Country Bothnian Bay Whole Country Bothnian Bay Total Quant. Fresh Fish
T otalGull of Gulf of B oth- Fin-
n ia landSea R ive r Sea R iver T otal
Gulf of Gulf of B o th- I'iri-
n ia landSea River Sea R iver T otal 1000
kg/ 0 1000
kg
19-20.. 301-3 243-9 57-4 200-5 100-8 130-7 84-9 215-6 80-9 19-1 66-5 33-5 43-4 28-2 71-6 42-1 6-01921.. 3713 325 2 46-1 244-7 126-6 176-9 114-5 2914 87-6 12-4 65-9 34-1 47-6 30-8 78-4 279-9 75-4 216-4 58-31922.. 301-2 250-1 51-1 194-7 106-5 121-1 96-1 217-2 83-0 17-0 64-6 35-4 40-2 31-9 72-1 293-4 97-4 228-6 75-91923.. 353-8 294-7 59-1 183-6 170-2 103-1 156-0 259-1 83-3 16-7 51-9 48-1 29-1 44-1 73-2 150-6 42-6 106-9 30-21924.. 297-62) 261-6 36-0 155-0 142-6 89-2 126-1 215-3 87-9 12-1 52-1 47-9 30-0 42-3 72-3 69-7 23-4 50-4 16-91925.. 218-0 187-9 30-1 156-3 61-7 82-6 52-2 134-8 86-2 13-8 71-7 28-3 37-9 23-9 61-8 145-2 66-6 123-3 56-61926.. 191-9 163-0 28-9 142-6 49-3 82-1 38-0 120-1 84-9 15-1 74-3 25-7 42-8 19-8 62-6 109-9 57-3 98-0 51-11927.. 159-8 1324 27-4 111-5 48-3 52-3 32-7 85-0 82-9 17-1 69-8 30-2 32-7 20-5 53-2 100-5 62-9 92-4 57-81928.. 178-5 139 3 39-2 131-4 47-1 61-3 32-6 93 9 78-0 22-0 73-6 26-4 34-3 18-3 52-6 88-2 49-4 84-5 47-31929.. 181-9 146-9 35-0 135-4 46-5 70-2 38-2 108-4 80-8 19-2 74-4 25-6 38-6 21-0 59-6 55-2 30-3 53-0 29-11930.. 207-3 180-5 26-8 156-9 50-4 100-4 38-6 139-0 87-1 12-9 75-7 24-3 48-4 18-6 67-0 124-8 60-2 119-3 57-51931.. 260-9 213-2 47-7 216-7 44-2 144-5 36-3 180-8 81-7 18-3 83-1 16-9 55-4 13-9 69-3 119-9 46-0 117-2 44-91932.. 264-8 201-9 62-9 222-3 42-5 124-0 34-7 158-7 76-2 23-8 84-0 16-0 46-8 13-1 59-9 146-9 55-5 146-5 55-31933.. 250-8 223-5 27-3 158-5 92-3 108-5 77-3 185-8 89-1 10-9 63-2 36-8 43-3 30-8 74-1 141-1 56-3 137-4 54-81934.. 265-6 233-S 31-8 199-3 66-3 127-5 58-6 1861 88-0 12-0 75-0 25-0 48-0 22-1 70-1 145-8 54-9 144-6 54-41935.. 298-2 221-9 76-3 237-2 61-0 107-7 53-2 160-9 74-4 25-6 79-5 20-5 36-1 17-8 53-9 137-8 46-2 133-6 44-8
Mean . 256-4 213-7 42-7 177-9 78-5 105-1 66-9 172-0 83-3 16-7 69-4 30-6 41-0 26-1 67-1 140-6 54-8 123-5 48-2
x) The w ate rs of th e B altic n o rth of Å land, i .e . , th e Gulf of B o thn ia (P oh jan lah ti , B o ttn iska viken) are composed of tw o p a r ts ; th e southern , th e B o th n ian Sea (Selkäm eri, B o tten h av e t) and th e no rth e rn , th e B o thn ian B ay (P eräm eri, B o ttenv iken).
2) The figures for 1924— 1927 differ from earlier figures, e. g ., tho se in th e “ B ulletin S ta t is tiq u e” — owing to th e fac t th a t these included th e catch (local) f rom Ladoga, w hich is now om itted .
8) Includes also exports of salm on from Ladoga, a n d is th u s com parative ly high.
River, distinguished by its numerous rapids, but nowadays this river has been utilised for industrial and power-providing purposes and is fast losing its importance as a salmon river.
The second of these regions comprises the Gulf of Finland, the eastern part in particular. The principal salmon rivers of this region are, on the Finnish side, the Kymi River (but only its eastern arm, as since1931 the western arm has been dammed), and on the Esthonian side the Narva River. Apart from these certain Russian salmon rivers (e. g. the Luuka River) are of some importance as spawning rivers for this salmon region.
S t a t i s t i c a l in fo r m a t io n on Finnish catches of salmon is not of the best — on the contrary. Apart from the fact that a considerable portion of the basic information is inaccurate, the statistics of catches are complicated by the inclusion of sea trout, and by the fact that the information is published separately as catches from sea and fresh water. The statistics on salmon and sea trout caught at sea can be employed to a certain extent, but it is impossible without going back to the original sources to separate accurately the fresh water catches from, first of all, the “Bothnian Bay” region ( = Oulu administrative district) where large numbers of lake salmon are also obtained from fresh water, or from the Viipuri admini
strative district which contains not only the Kymi River, but also Lake Ladoga and the Vuoksi River, with their large catches of salmon.
Table 1 gives the official statistics of Finnish catches of salmon (and sea trout) for the years 1920— 35. They are given as (a) the total catch from the whole country, sea and river; (b) the catch divided into the yields from sea and river fishing; and (c) the catch divided into the yields from the Gulf of Bothnia and the Gulf of Finland with their respective rivers. The boundary of the Turku and Uusimaa administrative districts, which ends at the sea slightly to the west of the city of Hanko, has here been selected as the boundary between the Gulf of Bothnia and Gulf of Finland regions. The catches of salmon from the Bothnian Bay — the largest salmon region — have been treated separately as they appear as catches originating in the Oulu administrative district region.
As the information on river-fishing in Finland also includes the trout species obtained in fresh water I have used these figures fairly freely. I have assumed that (a), the amounts of salmon given for the inland waterways of the administrative districts of Uusimaa, Turku and Pori and Vaasa can be regarded as representing salmon and I have taken these into consideration, and that (b), the statistics compiled from the Oulu administrative district, must also be

Table 2. C atches of S a lm on at the m o s t im p o rta n t F ish in g A reas in 1921— 1935in thousands of kilogrammes and in percentages of regional value in Table 1.
Year
Gulf of Bothnia
Bothnian Bay
Northern Salmon Area (Oulu Administrative District)
- V. >'’’ : ° s , : =«■;
Bothnian Sea
•an 0 ? H«
& ’Sc& § §S Jcç’3w
OKO 303B 5
£ '51 '5 °
1
= s 1i .2 > sc > o Si ° .a< <
11-2i l lSB =
► i 5<
ao2ai3w
OCM
2
S
"oHaw&>
<
OS*.— o oo« 0-S 3 ° «
!>
-
• >
O iS<*H .2 °o P o~~ "a
>
1921.. 53-4 81-2 48-0 1-5 30-0 20-0 8-9 1-0 1-4 245-4 84-2 7-3 8-2 4-6 0-8 13-6 266-3 81-9 15-0 32-51922.. 77-3 22-3 35-0 2-0 321 13-5 6-0 0-8 2-0 191-0 87-9 4-8 7-8 6-4 0-8 15-0 210-8 84-3 13-1 25-61923.. 29-5 122-5 30-0 1-2 18-0 15-0 3-9 0-9 2-4 223-4 86-2 4-0 8-0 9-3 0-9 18-2 245-6 83-3 13-4 22-71924.. 30-0 91-2 20-0 1-0 17-0 10-0 6-9 0-9 2-6 179-6 83-4 3-4 8-6 18-1 0-8 27-5 210-5 80-5 12-0 33-31925.. 13-4 25-5 25-0 11 13-4 11-2 8-7 0-6 1-4 100-3 74-4 11-6 5-3 19-0 0-8 25-1 137-0 72-9 10-8 35-91926.. 8-3 4-8 20-0 4-0 12-9 10-5 5-0 1-4 1-7 68-6 57-1 10-9 6-8 9-4 0-8 17-0 96-5 59-2 14-7 50-91927.. 10-0 8-1 20-0 3-6 3-6 10-0 5-2 1-0 1-6 63-1 74-2 9-3 8-0 7-8 2-9 18-7 91-1 68-8 12-8 46-71928.. 16-1 20-2 20-0 3-6 5-4 9-0 7-2 10 1-0 83-5 88-9 8-8 8-2 9-4 1-3 18-9 111-2 79-8 11-3 28-81929.. 17-1 15-4 27-0 4-0 5-0 7-5 5-8 0-8 5-4 88-0 81-2 7-3 8-2 9-2 0-9 18-3 113-6 77-3 14-5 41-41930.. 16-0 120 25-0 6-0 32-2 8-0 6-6 0-8 3-3 109-9 79-1 6-0 6-3 10-4 1-0 17-7 133-6 74-0 15-0 56-01931.. 38-4 19-8 55 0 8-0 8-8 6 0 9-6 1-5 1-6 148-7 82-2 5-3 2-7 7-4 1-0 111 165-1 77-4 16-5 34-61932.. 35-3 15-5 50-0 7-5 15-7 7-0 12-3 2-3 0-7 146-3 92-2 7-1 1-5 13-0 0-5 15-0 168-4 83-4 20-8 33-11933.. 39-4 13-2 64-0 8-0 7-9 6-0 17-9 1-9 1-8 160-1 86-2 5-3 2-4 8-0 0-5 10-9 176-3 78-9 22-4 82-11934.. 561 310 35-0 8-5 8-0 7-0 18-1 3-6 2-3 169-6 91-1 5-2 4-2 10-8 0-6 15-6 190-4 81-4 20-4 64-21935.. 38-0 251 25-0 7-0 4-9 6-5 16-8 4-2 2 0 129-5 80-5 6-6 2-8 6-0 0-4 9-2 145-3 65-5 9-9 13-0
Mean . 31-9 33-9 330 4-5 14-3 9-8 9-3 1-5 2-1 140-5 81-7 6-9 5-9 9-9 0-9 16-8 164-1 76-8 14-8 34-7
Total
o 23 .S <Tl H f i t
Gulf of Finland
In Table 2, the catch of Salmon, in sea and river, is
A. Gulf of B o th n ia : B o th n ia n Bay.1. N o r th e rn Salm on a re a ( = Oulu administrative
district).Tornio region: Alatornio (sea), K arunk i and Ylitornio
(river).Kemi region: Town of Kemi + district (sea), Tervola
and Kovaniemi (river).Simo region: Simo parish (sea).Kuivaniemi: parish of this name (sea).I i region: Ii (sea), Pudasjärvi and Taivalkoski (river).Haukipudas: (sea and river).Oulu region: Oulu (sea), Oulujoki, Muhos and Utajärvi
(river).Hailuoio: Oulunsalo, Hailuoto and Lumijoki (sea).
taken into consideration, nevertheless with the subtraction of 10 tons per annum. I have nevertheless (owing to the salmon of the Yuoksi and Lake Ladoga) omitted (c), the statistics on the inland waterways and rivers flowing into the eastern part of the Gulf of Finland from the Viipuri administrative district. In order to facilitate making comparisons I have calculated the percentage figures in addition to the figures indicating the amounts. According to the statistics thus derived, wThich are based on estimates, an average annual catch of 256 tons of salmon was obtained during
mpiled from regions divided as set out below:
Raahe: Siikajoki, Saloinen, Pyhäjoki, Kalajoki and Pattijoki (sea).
2. V aasa a d m in is t r a t iv e d i s t r i c t : Himanka, Loh- taja, Kälviä, Kokkola, Luoto, Pietarsaari, Uusikaarlepyv (sea).
B. Gulf of B o th n ia : B o th n ia n Sea:Kaskinen region: Kaskinen, Kristiina (sea).Pori region: Ahlainen, Noormarkku, Pori, Ulvila and
Nakkila (sea and river).Rauma region: Rauma.
C. G ulf of F in la n d :Kymi region: Kymi (sea and river), Pyhtää (sea), Veh-
kalahti (sea and river).
the years 1920—35 in Finland. Of this the major portion — 83-3% — was obtained from the Gulf of Bothnia and the rivers entering it. Of this percentage 67 °/0 fell to the northern part of the Bothnian Bay (Oulu administrative district), so that only about 16% remained to the other areas of the Gulf of Bothnia. Compared with this the percentage of salmon caught in the Gulf of Finland and the rivers entering it is of only secondary importance — 16-7 °/0. According to these statistics the mean annual yield is divided between sea and river fishing, the former amounting

— 9 —
Trrrol
wnrrru
i/nrriki
OIJLUUiktfrriinl
llacLesk.
Fig. 1. Northern Region of Bothnian Bay, Salmon Areas:—1. Tornio, 2. Kemi, 3. Simo and Kuivaniemi, 4. Ii-Haukipudas, 6. Oulu, 6. Raahe.
On the Swedish side: 7. Norrbotten, 8. Västerbotten.
to about 70°/o (69-4), and the latter to about 30% (30-6). I will not touch on the annual fluctuations appearing in the statistics.
I have utilised various sources in order to check the accuracy of the statistics given in Table 1.
For purposes of comparison I have first of all included in the table the figures indicating the quantity of salmon exported. A considerable portion of salmon caught in the Bothnian Bay finds a market abroad. These statistics have been obtained from accurate sources, as exporters of the fish have supplied the information on net weights of exported salmon. The export statistics of sea salmon are excessive, however, as they include fish obtained from Lake Ladoga. According to these statistics the annual export of
salmon averages 48-2% of the yield. Exports of salted salmon are so small that the total annual exports of salmon amount to no more than 54-8% of the yield. The export percentages of the yield indicate that the fluctuations in the annual catch are not exact, as is only to be expected when one knows the methods employed in obtaining the original information. For example the estimate of the 1922 catch is too low as otherwise the export percentage of the total yield would have amounted to no less than 97-4%. This percentage is excessive, even though these exports include those of fish caught in Lake Ladoga. As, on the other hand, the export percentage of the 1924 yield is 23-4 and of the 1929 yield 30-3, it would appear, in spite of commercial fluctuations and the
— 10 —
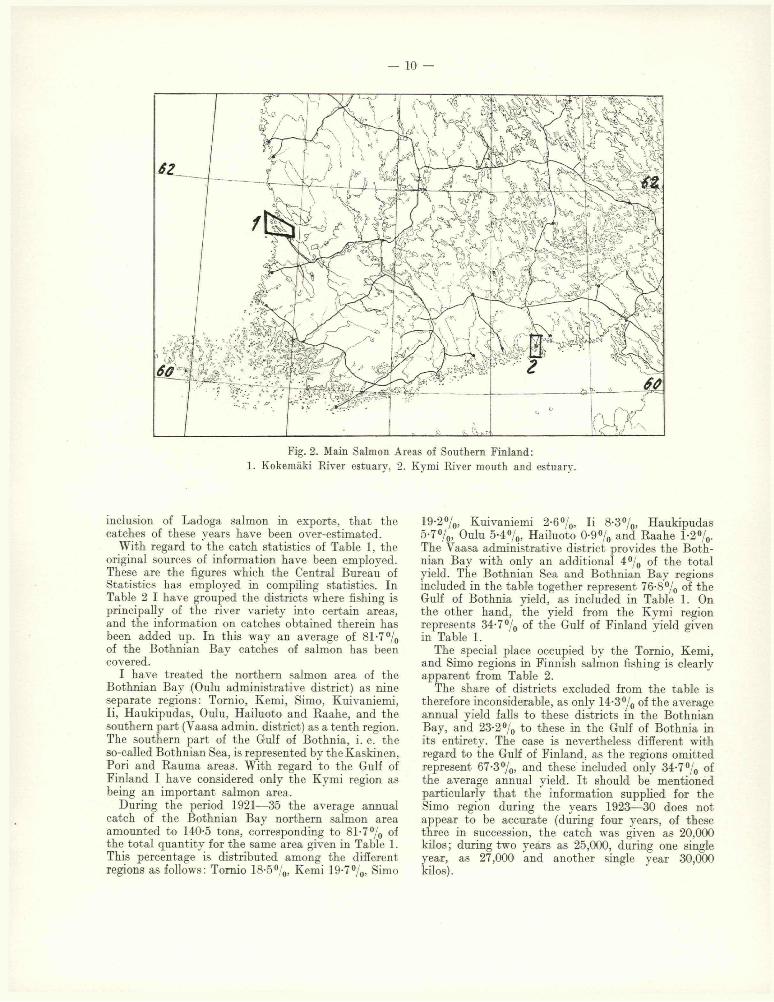
Fig. 2. Main Salmon Areas of Southern Finland:1. Kokemäki River estuary, 2. Kymi River mouth and estuary.
inclusion of Ladoga salmon in exports, that the catches of these years have been over-estimated.
With regard to the catch statistics of Table 1, the original sources of information have been employed. These are the figures which the Central Bureau of Statistics has employed in compiling statistics. In Table 2 I have grouped the districts where fishing is principally of the river variety into certain areas, and the information on catches obtained therein has been added up. In this way an average of 81-7°/o of the Bothnian Bay catches of salmon has been covered.
I have treated the northern salmon area of the Bothnian Bay (Oulu administrative district) as nine separate regions: Tornio, Kemi, Simo, Kuivaniemi, Ii, Haukipudas, Oulu, Hailuoto and Raahe, and the southern part (Vaasa admin, district) as a tenth region. The southern part of the Gulf of Bothnia, i. e. the so-called Bothnian Sea, is represented by the Kaskinen, Pori and Rauma areas. With regard to the Gulf of Finland I have considered only the Kymi region as being an important salmon area.
During the period 1921— 35 the average annual catch of the Bothnian Bay northern salmon area amounted to 140-5 tons, corresponding to 81-7 °/0 of the total quantity for the same area given in Table 1. This percentage is distributed among the different regions as follows: Tornio 18-5°/0, Kemi 19-7%, Simo
19-2°/0, Kuivaniemi 2-6%, Ii 8-3%, Haukipudas5-7°/0, Oulu 5-4°/(,, Hailuoto 0-9% and Raahe 1-2%. The Vaasa administrative district provides the Bothnian Bay with only an additional 4°/0 of the total yield. The Bothnian Sea and Bothnian Bay regions included in the table together represent 76-8% of the Gulf of Bothnia yield, as included in Table 1. On the other hand, the yield from the Kymi region represents 34-7 °/0 of the Gulf of Finland yield given in Table 1.
The special place occupied by the Tornio, Kemi, and Simo regions in Finnish salmon fishing is clearly apparent from Table 2.
The share of districts excluded from the table is therefore inconsiderable, as only 14-3% of the average annual yield falls to these districts in the Bothnian Bay, and 23-2% to these in the Gulf of Bothnia in its entirety. The case is nevertheless different with regard to the Gulf of Finland, as the regions omitted represent 67-3%> and these included only 34-7% of the average annual yield. It should be mentioned particularly that the information supplied for the Simo region during the years 1923— 30 does not appear to be accurate (during four years, of these three in succession, the catch was given as 20,000 kilos; during two years as 25,000, during one single year, as 27,000 and another single year 30,000 kilos).
— 11 —
The information on the Bothnian Bay catch for1926 and the Gulf of Finland catch for 1933 is also probably far from accurate (the share of the Kymi region in each case is given as 82°/0).
As the special statistics under discussion — Table 3— give the number as well as the weight in kilogrammes, the mean weight of the fish obtained can be calculated — see Table 4.
A source for controlling general statistics of catches is provided by the statistics of Tables 3 and 4 ; I shall call these the special statistics.
The Finnish state owns many outstanding salmon fishing grounds, particularly in the Bothnian Bay salmon area. The state does not interest itself in fishing, however, but the grounds are let for a certain period of the year. The hire of the fishing grounds is subjected to supply of data on catches. The special statistics thus obtained have been at my disposal and in part I have determined their particulars. These statistics of state-owned salmon fishing grounds contain daily reports on the number of fish obtained and the total weight divided into five different size classes: less than 3 kilos, 3-5— 7, 7-5— 13, 13-5—19, and above 19 kilos in weight.
These statistics have been put into table form on the basis of areas as follows:
1. T orn io area: embraces the Kiviranta and Sumi- saari weirs in the Tornio River, and the island waters at the mouth of the river lying within the parish of Alatornio.2. K em i area: embraces the Muurola, Köngäs, and Korva weirs in the Kemi River (the Korva weirs were used for the last time in 1932, and for only a short period at the beginning of the preceding fishing season), and the sea outside the estuary (some of the fishing grounds only, not including the Valkeakari fishing grounds).3. S im o area: embraces the most important salmon fishing grounds of the sea area belonging to the Maksniemi and Simo villages, and of the waters beyond them. The area also includes the sea fishing grounds of the parish of Kuivaniemi situated a little to the south.4. I i — H a u k ip u d a s area: embraces the sea of the mouths of the Ii and Haukipudas Rivers.5. O ulu area: The combined catches of the fishing grounds of the Pyhäkoski Rapids in the Oulu River.
A more detailed list of fishing grounds included is given in connection with the table (Table 3).
The above-mentioned separate statistics of catches of salmon obtained from state-owned fishing grounds— Table 3 — may be taken in the main as being fairly accurate. This table represents on an average about 51 °/0 of the yield from the Bothnian Bay, 41% of that from the Gulf of Bothnia, and 34% of the yield of the entire country, according to the figures given in the basic table, i. e. Table 1. The table shows, nevertheless, that the “representation” has fluctuated considerably over the years, being in some years (1923, 1924 and 1931) relatively low (30—35%), but rising in others up to 40—48%.
I have used yet another source of comparison with regard to the catches of 1921— 23. The State Railways have kindly supplied me with detailed statistics of the quantities of fresh salmon transported from the various stations and halts in the Bothnian Bay northern salmon area, i. e. those stations to the north of Oulu, during the open-water period of these years as well as the total quantities of salted salmon all the year round. These statistics have been incorporated in Table 5, in that the various stations have been combined to correspond to the Tornio, Kemi, Simo, Ii, and Haukipudas-Oulu salmon regions, i. e. the same regions that appear in the special statistics. With regard to these statistics, supplied by the State Railways, it should be noted that the values represent the gross amounts of fish transported. A comparison of the railways statistics with export statistics shows that as regards certain years (1921, 1922 and 1923)
t i
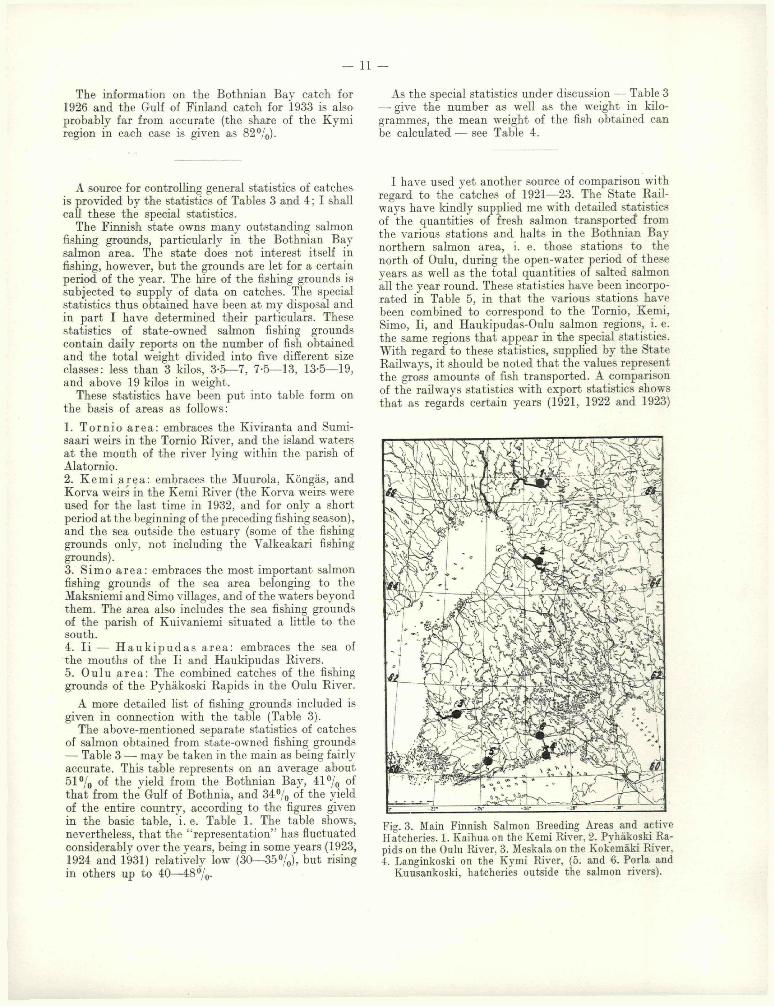
Fig. 3. Main Finnish Salmon Breeding Areas and active Hatcheries. 1. Kaihua on the Kemi River, 2. Pyhäkoski Rapids on the Oulu River, 3. Meskala on the Kokemäki River, 4. Langinkoski on the Kymi River, (6. and 6. Porla and
Kuusankoski, hatcheries outside the salmon rivers).

— 12 —
Table 3. S ta tis t ic s of C atches of S a lm on from certain F ish in g G rounds in the northern S a lm on Areaof the B othnian B ay in 1921— 1935.
Year .
Catch in thousands of kilogrammes in Percentage Number of Salmon (in Areas)
To
rnio
Reg
ion
Kem
iR
egio
n
Sim
oR
egio
n
Ii—
Ha
uk
ip
ud
as
Reg
ion
Ou
luR
egio
n
To
tal
of
tota
l Y
ield
; of
Wh
ole
C
ou
ntr
y
of
Gul
f of
B
oth
nia
Y
ield
of
Bo
thn
ian
B
ay
Yie
ld
1
To
rnio
Reg
ion
Kem
iR
egio
n
2.2G
li—
Ha
uk
ip
ud
as
Reg
ion _ a
•H 2. 3 "5b
°& To
tal
1921........ 34-7 56-9 (58-61)) — 7-5 (157-7) 42-5 48-5 54-1 3981 5559 715 (10255)1922........ 39-6 35-8 (4641)) 184 6-9 (146-8) 48-7 58-7 67-6 4020 3350 — 1817 604 (9791)1923........ 18-7 19-3 25-6 10-6 4-5 78-7 22-2 26-7 30-4 2037 1980 3143 1222 370 87521924........ 15-2 14-9 22-9 51 7-0 65-1 21-9 24-9 30-2 1416 1394 2502 554 658 65241925........ 7-5 16-2 31-6 74 7-5 69-9 32-1 37-2 51-9 829 1759 5291 1209 697 97851926........ 8-0 7-3 27-8 10-0 3-9 570 29-7 35-0 47-5 1179 1009 5945 1632 514 102791927........ 15-3 13-8 (18-22)) 144 11-7 73-4 45-9 554 86-4 1911 1766 (23132)) 1720 1230 89401928........ 20-7 10-7 45-0 11-0 5-1 82-5 46-2 59-2 97-0 3347 1360 5993 1355 459 125141929........ 18-7 13-0 28-7 7-3 4-0 71-7 39-4 48-8 764 2018 1381 3449 839 337 80241930........ 15-2 16-5 38-0 6-9 6-3 82-9 40-0 45-9 76-5 1766 1831 5243 1040 566 104461931........ 11-1 3-2 354 84 5-7 63-5 24-3 29-8 35-1 1336 366 4897 1051 484 81341932........ 7-5 8-0 41-3 54 11-8 73 7 27-8 36-5 46-4 929 780 4660 567 1079 80151933........ 10-4 3-6 37-9 16-6 15-2 83-7 334 374 45-0 1719 536 5566 2186 1311 113181934........ 271 141 36-6 19-4 16-0 113-2 42-6 48-4 60-8 3354 1535 5274 2490 1614 142671935........ 10-6 11-6 28-1 14-9 13-0 78-2 26-2 35-2 48-6 1473 1315 4156 1904 1084 9932
Mean . . . . 174 16-3 34-8 11-0 8-4 87-2 34-0 40-8 50-7 2088 1728 4495 1399 781 9798
*) According to H allw ay T ra n sp o rt S ta tis tic s 50 °/0. a) M aksniem i ca tch om itted , n o t available.
The statistics given in Tables 3 and 4 have been compiled from information obtained from the following fishing grounds:—
Tornio region.Sea
Herakarinkrunni . . . . 1922—35H u itu r i ...................... 1922—25In a k a ri....................... 1922—28; 1934—35Pensaskari................. 1922—28; 1933—35
W eirs.Kiviranta and Sumi-
saari.................... 1921—35
Kemi region.
Sea.1921—30; 1933—35 1922; 1928—32 1921—351921—26; 1928—30; 19331921—26; 1928—30; 1935 1927—35
Weirs.Korva (K ilo) 1921—32K öngäs v 1921—35Muurola....................... 1921—32; 1934—35
Simo region, Maksniemi.Sea.
Haikara...................... 1923—26; 1929—30; 1932—34Halttari...................... 1923—25; 1928—35Junno ......................... 1928—31; 1933—35K arvo ........................ 1923—26; 1928—30; 1932Leuka ......................... 1923—26; 1928—34Röyttä........................ 1923—26; 1928—35Virtaniemi................. 1928; 1931Ykskivi...................... 1924; 1928—30; 1933—35Ykskuusi.................... 1923—26; 1928—34
Also some small fishing places during single years.
Simonicmi region.
Sea.Aapeli........................ 1923—24Haarakuusi................ 1923—25; 1928—35Hevosenkenkä 1923; 1929—33Hunskeri..................... 1923—35Härkönen (Härkä-
letto) .................. 1923; 1926—29; 1933; 1935Kantalannokka 1923; 1924; 1928Kekosenniemi 1923—24 ; 1926—30 ; 1932—33 ; 1935K lapu ......................... 1928—35Knihtilänranta 1923—24Koivuluoto................. 1923—35Korkiakari................ 1924; 1926—35
Ajoksenkrunni..........In a k a r i .......................K allio .........................Murhaniemi..............Pihlajakari................S a rv i..........................

- 13 -
Leipäre.............. .. 1925—35Lettojuoni.............. . . 1923; 1930; 1932; 1935Maakarvo.............. .. 1925—29; 1931—32; 1935M aalahti................ .. 1923—26M aijankari............ . . 1928—34Maisterin m atala.. .. 1924; 1934—35Montaja.................. . . 1923—35M öyly.................... .. 1923; 1926—35Pappilannokka .. 1924—26Peräjuoni.............. . . 1923—35Pihlajakari............ . . 1923—26; 1928—34Pikkukalla............ . . 1928; 1930—35Plassi...................... . . 1923—24; 1926; 1928—35Rajaletto................ .. 1923—25Selkäkari................ .. 1923—35S yvänsija........... . . 1923—25:1927:1929—30 ; 1934—!Tiuranen ................ .. 1923—35Vatunki.................. .. 1923—35Verkko matala .. 1923—24V irtaniem i............ . . 1929; 1931
Also some small fishing places during single years.
Kuivaniemi region.
Sea.Aaponmatala . . . . . . . 1934—35Hietakalla.......... . . . . 1925—35H ijanjuoni........ . . . . 1933—34Häskeri.............. . . . . 1923—30; 1932—35Isom atala.......... . . . . 1932—34Kokko................ . . . . 1925; 1927—35Kaakkurinniemi. . . . . 1923—35Koivuluoto........ . . . . 1923—25; 1927—35K rassi................ . . . . 1923—25; 1927—35Kuivamatala . .. . . . . 1923—27; 1929; 1931; 1933—35Kyytika.ri.......... . . . . 1923—35Käpsänkallio . .. . . . . 1924—35Lahdenmatala .. . . . . 1924—30; 1932—35Liippo................ . . . . 1925—35Nikannenä ........ . . . . 1925—31 ; 1933—35Onsajanmatala.. . . . . 1923—35Oriniemi............ . . . . 1923—35Rah tu n e n .......... . . . . 1923—30; 1932—35R a u m a.............. . . . . 1924—35Rintamatala. . . . . . . . 1925—26; 1932—33; 1935Röyskerinkalla.. . . . . 1924—26; 1929—35Samuli................ . . . . 1924—25; 1927—28; 1930—35Siikamatala . . . . . . . . 1925; 1933—34Ulkomatala........ . . . . 1925; 1927—28; 1933—35Vanhamatala . . . . 1923; 1926—28; 1930; 1932—35
Also some small fishing grounds during single years.
K ntu le tto .................. 1923; 1924—25; 1927; 1930; 1933Laitakari.................... 1923; 1925—31; 1933—35L ounaletto ................ 1929—31; 1933—35Lännensija................ 1923; 1929—31; 1933—34Maakaapri.................. 1923—29; 1931; 1933—35Maaklaama................ 1927; 1929—30; 1933—35M ajava...................... 1923; 1929Mustakivi.................. 1923; 1925—29; 1931; 1933—35Nokkaletto................ 1933—35Nälli............................ 1929; 1934—35Papinkari.................. 1923; 1931; 1933—35Petäjäluoto................ 1923—34Peura.......................... 1933—35Pihlajakari................ 1933—35Pikkueteläsija 1924; 1933P itk ä k a r i................... 1923; 1933—35Praava........................ 1933—35Pöydänpäänletto . . . . 1923—27 ; 1929—31 ; 1933—35R öyttä........................ 1923; 1933Syvänjuoni................. 1923; 1930—31; 1933—35Tukkikari.................. 1923—25; 1927; 1933—35Ulkokaapri................ 1923—29; 1931; 1933—35Ulkoklaam a.............. 1923; 1933—35Ulkoletto.................... 1923; 1928—30; 1933—35Ulkovalkama 1923; 1929—30; 1933—34V anham antti 1923—24; 1934
W eirs.Venäjänkari, Haukka
and I l l i .............. 1922—35
Also some fishing places during single years.
Haukipudas region.
Hoikkahiue................ 1923—35Konikari.................... 1923—33; 1935K ropsu ...................... 1923—33; 1935Pensaskari................. 1923—35
Oulu River region.
Pyhäkosken apa ja t.. 1921—34M aija la ...................... 1925—27; 1933—34Varvikko.................... 1922; 1924
Kokemäki ltiver region.
Lukkarinsanta 1921—35
Ii region.
g ea Kymi River region.
Antinmatala.............. 1923—25; 1927—31; 1933—35 Langinkoski............... 1921—35Keskiletto.................. 1923; 1925; 1927; 1929; 1933—35 Ränninkoski and Sii-K utinkalla................ 1923; 1931; 1933—35 kasaarenkoski... 1921—35

— 14 —
Table 4. N u m b er and A verage W eight of S a lm on cau gh t at certa in F ish in g G roun ds of the B othnianB ay, n orthern S a lm o n A rea.
Year
------------
Number
Tornio Kemi Simo Ii-Haukip. Oulu
Total
Southern Finland
K ivi-ra n ta
Sumi-saari
Alator-nio (Sea)i
K orvaK öngäsM uurola
OffK em i
Maks-niem i(Sea)
Simon-kylä(Sea)
K u iv a niem i(Sea)
Ii(Sea)
H au k ipudas
OuluR iver
K oke-mäki
K ym iR iver T otal
1921........ 2318 1663 4989 570 715 (10,255) 267 596 8631922........ 1497 2114 409 2908 442 — — — 1817 — 604 (9,791) 329 1149 14781923........ 1117 448 472 1279 701 1196 1797 150 1162 60 1 370 8,752 409 1038 14471924........ 925 251 240 1054 340 815 1346 341 496 58 658 6,524 319 621 9401925........ 336 75 418 1384 375 1712 2531 1048 1108 101 697 9,785 591 518 11091926........ 722 37 420 604 405 1251 3296 1398 1540 92 514 10,279 434 725 11591927........ 1238 97 576 1050 716 — 1573 740 1660 60 1230 8,940 205 813 10181928........ 2320 577 450 788 572 1954 2804 1235 1275 80 459 12,514 106 596 7021929........ 1620 193 205 830 551 1308 1489 652 780 59 337 8,024 102 423 5251930........ 1149 158 459 1164 667 2471 1895 877 975 65 566 10,446 122 261 3831931........ 937 118 281 252 114 2068 2141 688 989 62 484 8,134 28 431 4591932........ 345 152 432 642 138 2025 1935 700 470 97 1079 8,015 76 585 6611933........ 581 476 662 154 382 2109 2098 1359 2114 72 1311 11,318 167 119 2861934........ 2014 285 1055 923 612 1897 2044 1333 2427 63 1614 14,267 175 247 4221935........ 714 189 570 771 544 1490 1646 1020 1825 79 1084 9,932 188 269 457
Mean. . . . 1189 456 475 1253 475 1691 2046 888 1331 73 781 9,798 235 559 794
Year Average Weight in Kilogrammes
1921........ 8-5 9-0 10-3 9-3 _ 10-4 9-7 11-1 6-2 7-71922........ 10-4 9-5 9-8 10-9 9-0 — — — 10-0 — 11-4 10-3 7-6 7-2 7-31923........ 8-8 9-6 9-8 10-4 8-5 7-8 8-4 7-8 8-8 7-0 12-1 9-0 — 8-4 8-41924........ 11-0 11-2 9-3 11-4 8-4 8-4 9-8 8-2 9-2 8-3 10-7 10-0 — 9-0 9-01925........ 11-4 10-2 6-9 9-2 9-2 4-9 7-1 5-0 6-0 5-1 10-8 7-1 10-5 8-7 9-61926........ 6-8 7-5 6-7 7-5 6-9 — 4-8 5-7 6-2 5-1 7-7 5-6 10-8 5-6 7-61927........ 7-9 7-7 8-5 8-4 7-0 — 7-9 7-7 8-4 7-9 9-5 8-2 10-8 7-4 8-11928........ 5-6 6-0 9-2 8-7 6-9 7-5 7-6 7-4 8-2 7-5 11-1 8-5 10-7 8-1 8-51929........ 9-3 8-7 10-0 10-6 7-7 8-9 8-4 7-1 8-9 7-0 11-8 10-3 11-0 8-6 9-11930........ 8-7 8-3 8-4 9-9 7-5 7-3 7-4 6-9 6-7 6-7 11-2 9-3 11-0 9-9 10-31931........ 7-4 8-9 10-9 8-9 8-0 7-2 7-3 7-3 7-8 5-8 11-8 7-8 12-4 6-8 7-11932........ 7-5 6-9 8-9 10-3 10-1 9-6 8-4 7-8 9-4 7-5 10-9 9-2 11-4 7-3 7-81933........ 5-9 4-4 7-3 4-4 7-7 7-8 5-8 6-9 7-6 7-4 11-6 7-4 10-3 10-5 10-41934........ 7-7 6-6 9-2 9-8 8-3 6-8 6-6 7-7 7-8 7-9 9-9 7-9 10-3 9-9 10-11935........ 6-3 5-0 91 9-3 8-2 7-3 6-4 6-5 1 7-9 6-5 12-0 7-9 10-4 10-0 10-1
they correspond fairly closely, particularly in respect of fresh salmon (most of the salted salmon is consumed in Finland). A comparison with the catch statistics of Table 1, on the other hand, does not produce equally good results. It would appear, therefore, that the catch statistics for 1923 were estimated at an excessive figure. I would also point out that the transport statistics further illustrate the tremendous importance of the Kemi and Simo salmon regions to the yield of Finnish salmon as it stands at present.
The above comparative survey of the various statistics shows that it is impossible to obtain accurate information on catches of salmon in Finland during
different years, but that by balancing the sources of information against one another it is possible to evolve very true, if occasionally somewhat generalised, results.
2. S ta tis t ica l In form ation on C atches of S a lm on prepared in other C ountries b ord erin g the Baltic.
I will give a fairly detailed account of the statistics of catches of salmon compiled in S w e d e n — Tables6— 7. The reason for this is partly to show the varying importance of different regions as salmon-fishing centres along the extensive sea-board of Sweden,

— 15 —
Tbrnto
.. *
l/oc/keaJcarr'Z 4
o~
Fig. 4. Outlets of Tornio and Kemi Rivers, and the Archipelago at the Estuary. 1. Sumisaari weir in the Tornio River, 2. Kiviranta weir in the Tornio River, 3. Korva weir in the Kemi River, 4. Centre of the Valkeasaari fishing grounds, 5. Maksniemi region in Simo Parish, 6. and 7. Röyttä and Halttari, the best salmon fishing sites in Finland.
particularly the Gulf of Bothnia, and partly to show the simultaneous or intermittent fluctuation phenomena in the various parts of this coast, and in order that comparisons in this respect might be made between the catches of salmon obtained from the northern Finnish and northern Swedish areas. In addition, the Swedish statistics of river catches often include information on the number of salmon. The Swedish figures on the average weight of salmon during different years thus derived can be compared with the corresponding Finnish figures, and shed light on the stages of development occurring in the fluctuation phenomena.
I have grouped the Swedish catch statistics into two different series: the first embracing the coast of the Gulf of Bothnia and the second the Baltic proper.
The boundary is not, however, absolutely in its actual position, i. e. the Åland Sea, as the Stockholm administrative district in its entirety has been included in the Gulf of Bothnia area. The catch of salmon obtained in Sweden is divided on the average between the two areas: in that the Gulf of Bothnia area represents 53% and the Baltic area 47%. The total Swedish catch of salmon appears to be about double the Finnish, as is true also of the two coasts.
If on the basis of these statistics we seek the centres of the Swedish salmon fishing, we shall find that as in Finland the most important of these are situated in the Gulf of Bothnia area, to the north and west of the Bothnian Bay. The average annual catch of the Norbotten administrative district represents 55%, and that of the Västerbotten administrative district

— 16 —
T ab le 5. Q uantities (g ro ss ) of S a lm on con veyed by ra ilw ays b etw een O ulu— T ornio—
R ovaniem i in 1921— 1923.
Thousands of Kilos
Percentage
1921 1922 1923 1921 1922 1923
Fresh Salmon1. Tornio ................ 0-4 6-1 4-3 0-2 2-0 3-62. Kaakamo,
Laurila-Muurola,Lautiosaari,Kemi 69-6 98-2 32-0 27-3 32-3 26-8
3. Maksniemi, Viantie, Simo . . . 111 1 77-7 31-5 43 7 25-5 26-3
4. Kuivaniemi, Olhava .............. 5-7 8-5 2-2 2-2 2-8 1-8
5. I i ......................... 48-3 94-2 21 1 19-0 30-9 17-76. Haukipudas,Oulu 19-4 19-7 28-5 7-6 6-5 23-8
T o ta l... 254 5 304-4 119-6 100-0 100-0 100-0
Salted Salmon1. Tornio................ 38-7 10-8 8-5 19-6 5-0 4-62. Kaakamo,
Laurila-Muurola,Lautiosaari.Kemi 83-2 98 3 93 5 42 0 45-6 50-5
3. Maksniemi, Viantie, Simo. .. 6-2 15-0 7-2 3-1 7-0 3-9
4. Kuivaniemi, Olhava .............. 23-8 17-4 17-0 12-0 8-1 9-2
5. I i ......................... 34-9 62-4 47-8 17-6 29-0 25-86. Haukipudas,Oulu 11-2 11-4 11 1 5-7 5-3 6-0
Total. . . 198-0 215-3 185-1 100-0 100-0 100-0
Fresli and Salted Salmon
1. Tornio................ 39-1 16-9 12-8 8-6 3-3 4-22. Kaakamo,
Laurila-Muurola, Lautiosaari,Kemi 152-8 196 5 125 5 338 37 8 41 2
3. Maksniemi, Viantie, Simo. . . 117-3 92-7 38-7 25-9 17-8 12-7
4. Kuivaniemi, Olhava .............. 29-5 25-9 19-2 6-5 5-0 6-3
5. I i ......................... 83-2 156-6 68-9 18-4 30 1 22-66. Haukipudas, Oulu 30-6 31-1 39-6 6-8 6-0 13-0
Total Fresh and S a lted ................. 452-5 519-7 304-7 100-0 100-0 100-0
50°/o w eigh t..........According to Export
Statistics (Table 1) Yield (Table 1) . . . .
226 3 259 9 152-4
279-9 293-4 150-6 291-4 217-2 259-1
I
Table 6 (according to Alm, partly) and Table 7 (according to Bull, of Swedish Statist. Bureau): see p p . 18— 19.
17% — a total of 7*2% of the total annual catch of the Swedish Gulf of Bothnia area. The Blekinge administrative district appears to be the principal centre of the Baltic proper, followed by the Kalmar administrative district, according to the mean annual catch during the period 1918— 1935.
Of the D a n is h catches of salmon only those obtained in the Bornholm area have been included in Table 8, while the G erm an yield is given in the same table by dividing the coast into three different fishing areas.
The P o lis h salmon statistics are of a special type and extremely valuable, for they give the large salmon and mielnica separately, as well as the number of all salmon caught since 1931. I have included these statistics in detail — Table 9 — owing to their great importance and special features.
The E s th o n ia n catch statistics (Table 10) date from 1928 (no previous information compiled).
As a summary I have drawn up Table 10, in which the catch statistics from the various countries are grouped according to the different areas of the Baltic, i. e. the B a l t i c p ro p er , th e G u lf of B o th n ia an d th e G u lf of F in la n d . The last-named area does not contain information on U.S.S.R. catches, but in any case the stock of salmon in the Gulf of Finland is of only secondary importance in this investigation. In addition, the stock of salmon in the Gulf of Finland, judging by various factors, is probably not in such close and direct relation to the shoals of salmon in the Baltic proper, as are the shoals migrating from and back to the Gulf of Bothnia.
It is interesting to examine the total yield of salmon from the Baltic (with its gulfs) from Table 10. According to this table it has fluctuated during the period 1928— 1935 between about 950,000 and almost 1,400,000 kilos (in 1932). As mentioned previously the table does not include salmon obtained from the U.S.S.R. areas, and there are other reasons for assuming that the figures given above should be treated as minimum statistics. If we were to take the mean weight of salmon obtained from all the different sources as 5 kilos, the yield of Baltic salmon would amount annually to about 190— 280 thousand individuals; this calculation, of course, is made only for the purpose of giving a general illustration of the situation.
3. C om p arative S urvey of Catch Y ears.
On seeking the phases of the fluctuation phenomena from Tables 1— 10 described above, we find the following :
A. T he m a x im u m c a tc h y e a r s occurred:a. G u lf of B o th n ia : 1921 and 1934 both in Finnish and Swedish territory.
The maximum in the former case is clearly apparent in the statistics of both countries; in the latter it appears to be weaker on the Finnish side, although
- 17 -
T ab le 8. C atches of S a lm on from the B a ltic prop er in 1918— 1935 (in thousands of kilos).
Year
Sweden Denmark Germany Polanc Latvia
TotalGoth-land
Sea
K alm ar
Sea
Blekinge
Sea M är- n in i
K ri-stans-s tadSea
Mal-mö-husSea
T otalB ornholm
Sea
W es tera
B altic
P om m ernand
Biigen
E astP russia T otal
LargeSalm on
Miel-nica Total Sea
1918.. 1-6 23-3 4-7 13-1 2-2 0-9 45 8 19 5 169-01919.. 26-8 14-4 39-8 11-0 9-7 4-9 106-6 72-0 _ _ _ 108-0 _ _ _ _1920.. 34-8 17-2 73-6 23-8 16-0 7-7 173-1 84-0 — _ _ 68-0 _ _ _1921.. 27-4 18-5 77-9 18-6 16-2 3-0 161-6 79-0 — — — 43 0 12-8 _ 12-8 _ _1922.. 15-3 121 46-6 20-8 5-4 2-6 102-8 43-0 — — — 105-0 186-4 53 6 240-0 , _ _1923.. 5-9 30-7 40-0 22-9 7-7 4-0 111-2 39-0 — — — 93-0 82-0 4 7 86-7 _ _1924.. 3-5 26-5 39-2 8-9 3-7 1-2 83-0 15 0 — — — 64-0 67-0 3-7 70-7 65-6 _1925.. 3-9 30-6 21-7 5-4 — 1-1 62 7 36-0 — — 43-3 68-0 28-3 (>■5 34-8 63-5 _1926.. 4-3 35-0 45-8 5-4 6-2 7-5 104-2 42-0 10-4 71-0 76-8 158-2 87-2 28-0 115-2 72-7 492-31927.. 25-6 73-0 41-5 9-5 5-9 2-5 158-0 67-0 5-8 43-0 157-0 205-8 134-5 38-8 173-3 87-9 692-01928.. 11-9 58-2 62-5 — 7-1 6-7 146-4 43-0 5-4 231-1 108-3 3448 228-5 306 2591 88-7 882-01929.. 16-7 43-0 24-5 4-9 4-6 6-1 99-8 24-0 3-1 137-1 50-7 190-9 121-7 103 132-0 j 139 9 586-61930.. 10-3 32-4 36-6 4-6 6-4 3-2 93-5 40-0 3-5 54-9 89-1 147-5 214-6 211 235-7 118-6 635-31931.. 7-4 331 178-8 4-9 12-1 14-6 2509 60-0 14-9 112-2 56-6 183-7 65-2 129 78-1 57-0 629-71932.. 7-9 60-2 133-5 — 21-2 5-1 227 9 157 0 4-1 111-0 163-2 278 3 58-0 25 6 83-6 86-5 833 31933.. 26-5 22-8 80-3 2-7 33-0 13-0 178-3 125-0 4-4 35-7 119-1 159-2 87-4 132 100-6 128-1 691-21934.. 31-3 35-4 67-6 1-8 24-7 6-8 167-6 50-0 4-5 30-0 161-4 195-9 60-9 3 6 64-5 114-5 592-51935.. 49-6 28-9 75-3 — 12-9 2-8 169-5 64-0 3-5 49-6 66-8 119-9 62-1 3 4 65-5 69-0 487-9
Mean . 17-3 33 1 60-6 10-6 11-5 5-2 135-7 58-9 6-0 87-6 99-3 150-1 99-8 18-3 116-8 91-0 652-3
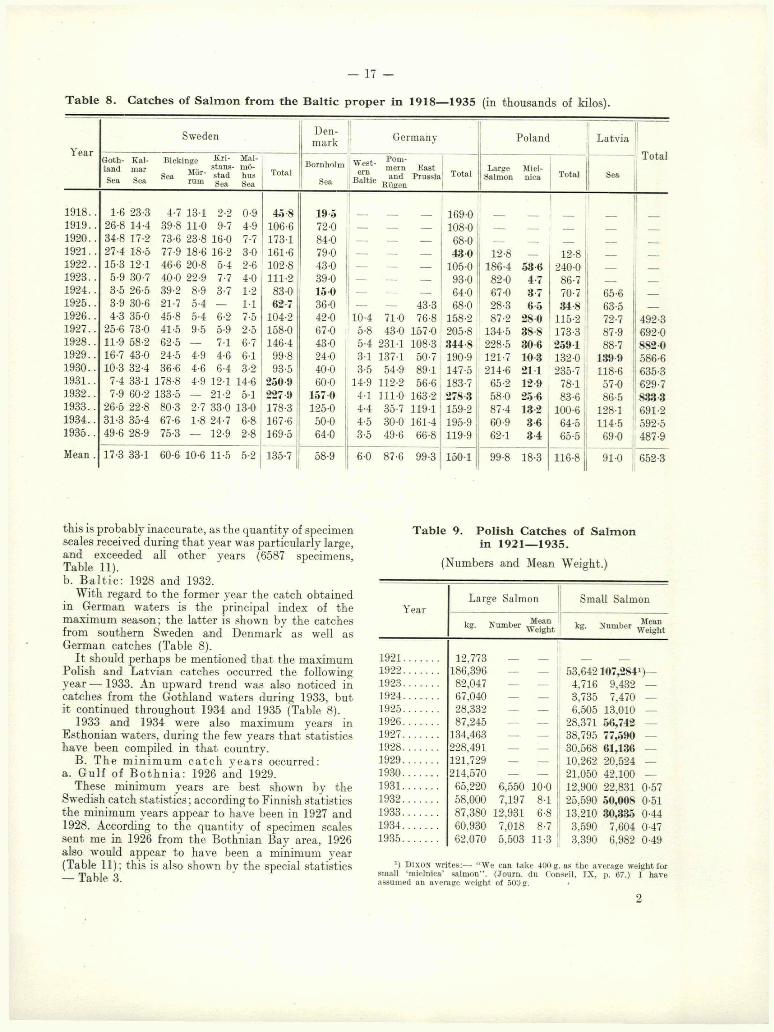
this is probably inaccurate, as the quantity of specimen scales received during that year was particularly large, and exceeded all other years (6587 specimens, Table 11).b. B a lt ic : 1928 and 1932.
With regard to the former year the catch obtained in German waters is the principal index of the maximum season; the latter is shown by the catches from southern Sweden and Denmark as well as German catches (Table 8).
It should perhaps be mentioned that the maximum Polish and Latvian catches occurred the following yea r— 1933. An upward trend was also noticed in catches from the Gothland waters during 1933, but it continued throughout 1934 and 1935 (Table 8).
1933 and 1934 were also maximum years in Esthonian waters, during the few years that statistics have been compiled in that country.
B. The m in im u m c a tc h y e a r s occurred:a. G u lf of B o th n ia : 1926 and 1929.
These minimum years are best shown by the Swedish catch statistics; according'to Finnish statistics the minimum years appear to have been in 1927 and 1928. According to the quantity of specimen scales sent me in 1926 from the Bothnian Bay area, 1926 also would appear to have been a minimum year (Table 11): this is also shown by the special statistics— Table 3.
Table 9. P o lish C atches of S a lm on in 1921— 1935.
(Numbers and Mean Weight.)
YearLarge Salmon Small Salmon
kg. N um ber MeanW eight kg. N u m b e r ^
1921............ 12.7731922............ 186,396 — — 53,642107,284')—1923............ 82,047 — — 4.716 9,432 —1924............ 67,040 — — 3,735 7,470 —1925............ 28,332 — — 6,505 13,010 —1926............ 87,245 — — 28,371 56,742 —1927............ 134,463 — — 38,795 77,590 —1928............ 228,491 — — 30,568 61,136 —1929............ 121,729 — — 10,262 20,524 —1930............ 214,570 — — 21,050 42,100 —1931............ 65,220 6,550 10-0 12,900 22,831 0-571932............ 58,000 7,197 8-1 25,590 50,008 0-511933............ 87,380 12,931 6-8 13,210 30,335 0-441934............ 60,930 7,018 8-7 3,590 7,604 0-471935............ 62,070 5,503 11-3 3,390 6,982 0-49
*) D i x o n w rite s:— “ We can ta k e 400 g. as th e average w eight for sm all ‘m ielnica’ sa lm on” . (Jo iirn . du Conseil, IX , p. 67.) I have assum ed an average w eigh t of 500 g.
2

— 18 —
T ab le 6. S w e d ish C atches of S a lm o n in Gulf
YearNorrbotten Västerbotten
Sea Torne K alix Lule Sea Skellefte Urne
1920............ 115-3 32-0 19-4 57-2 223 9 20-9 6-3 10-0 37-2
1921............ 1762 55-3 17-7 57-8 307 0 43-6 5-1 12-7 61-4
1922............ 137-2 41-4 15-9 38-5 233 0 24-3 6-1 16-4 46-8
1923............ 101-4 23-6 12-6 39-3 176-9 34-1 4-7 16-7 55-5
1924............ 69-6 16-5 12-0 21-0 119-1 20-9 3-0 13-2 37-1
1925............ 37-0 6-3 — — 43-3 15-9 5-8 9-3 31-0
1926............ 33 8 6-8 — — 40-6 19-8 2-1 10-1 32-0
1927............ 69-3 .— . — — 69-3 35-9 3-2 20-7 59-8
1928............ 68-9 — — — 68-9 28-8 2-4 15-6 46-8
1929............ 48-1 — — — 48-1 16-4 — 10-4 26-8
1930............ 64-5 — — — 64-5 22-1 — 9-6 31-7
1931............ 79-0 — — — 79-0 20-8 3-0 2-6 26-4
1932............ 77-0 — — — 77-0 21-7 3-8 1-3 26-8
1933............ 84-5 — — — 84-5 20-8 3-1 1-2 25-1
1934............ 180-8 — 15-2 10-1 2061 27-9 8-5 3-7 40-1
1935............ 145-4 16-5 10-2 20-1 192-2 23-9 5-1 3-2 32-2
Mean. . . 93-0 24-8 14-7 34-9 127-1 24-9 4-4 9-8 38-5
T ab le 7. Catch of S a lm o n from certa in S w ed ish
Thousands of Kilos
T orne K alix Lule Skellefte U m eÅnger-
m an Inda l L junge L jusne D al M örrum T orne K alix Lule Skellefti
1920 ......................................... 32-0 19-4 57-2 6-3 10-0 20-7 11-5 0-9 10-4 2-2 23-3 2612 5578 5991921 ........................... 55-3 17-7 57-8 5-1 12-7 23-3 20-0 3-3 14-0 4-3 18-6 — — 5765 535
1922 ......................................... 41-4 15-9 38-5 6-1 16-4 18-6 16-1 1-8 14-8 6-5 20-7 4365 — 3538 6151923 ......................................... 23-6 12-6 39-3 4-7 16-7 17-4 23-2 3-7 21-1 7-4 22-9 2348 — 3659 5051924 ......................................... 16-4 12-0 21-0 3-0 13-2 12-3 15-7 1-5 13-9 3-6 (11-0)
(7-2)1'655 — — 308
1925 ......................................... 5-8 9-3 14-0 15-8 2-0 12-2 2-4 ------ — — 4961926 ......................................... 2-1 10-1 6-8 5-5 1-1 10-7 ____ ------ — — —
1927 ......................................... _ _ 3-2 20-7 13-1 11-7 1-9 14-2 5-4 ------ ------- — — —
1928 ......................................... _ 2-4 15-6 8-6 8-8 1-7 11-4 2-4 ------ ------ — — 247
1929 ......................................... _ 2-0 10-4 5-0 4-8 0-9 12-2 2-3 4-9 ------ — — 1981930 ......................................... _ ?,?, 9-5 7-9 fi-8 1-0 11-2 1-8 — ------ — — 2631931 ............................... _ 3-9 2-6 6-5 7-7 0-8 7-8 2-3 2-4 ------ — — 2771932 ................................... 3-8 1-3 8-1 11-8 2-1 7-9 1-9 2-5 ------ — — 3891933 ......................................... 3-1 1-2 15-5 15-3 3-7 5-9 2-9 2-7 ____ — — 3111934 ......................................... 15-2 1-01 8-5 3-7 17-0 18-6 3-4 5-3 2-5 1-8 ------ 1834 1227 7771935 ......................................... 16-5 10-2 20-1 5-1 3-2 19-8 18-1 2-4 9-4 2-4 — • 2090 1125 1886 561
M ean... 30-9 14-7 34-9 4-1 9-8 13-4 13-2 2-0 11-4 3-4 10-7 — — 434
b. B a lt ic : According to the statistics given in Table C. G ood and bad sa lm o n y e a r s are grouped so 10, 1924 and 1925 were minimum years. German and that before and after the maximum years there areDanish catches were at their minimum figure in 1924, good years, and correspondingly before and after thesouthern Swedish and Polish in 1925 (Table 8). minimum years bad years. Only a few' intermediary
During earlier years the minimum periods in years therefore had average catches. The foregoingrespect of the southern parts of the Baltic were 1918 refers to the fact that in salmon fishing there arein Denmark a n d southern Sweden, and 1921 in Germany. certain factors that have a stabilising influence on

- 19 —
of B othnia A reas in 1920— 1935 (in thousands of kilos).
Västernorrland Gävleborg Uppsala—StockholmTotal
Percentage
Sea Anger-m an Inda l L jung Sea L jusne Sea Dal N orr-
b o ttenVaster-b o tten
V. N orr- land
G ävleborg
U ppsa la-Stockh.
15-5 21-6 8-6 0-9 46-6 8-4 10-4 18-8 2-2 2-2 4-4 830 9 67-7 11-2 14-1 5-7 1-311-0 23-3 16-9 3-3 54-5 9-3 14-0 23-3 3-1 4-3 7-4 453 6 67-7 13-5 12-0 5-2 1-610-1 18-6 16-0 1-8 46-5 111 14-8 25-9 2-5 6-5 9-0 3612 64-5 12-9 12-9 7-2 2-516-9 17-4 23-2 3-7 61-2 131 21-2 34-3 3-8 7-4 112 339-1 52-2 16-4 18-0 10-1 3-38-0 12-3 15-7 1-5 37-5 4-7 14-0 18-7 3-5 3-6 7-1 219-5 54-3 16-9 17-1 8-5 3-28-4 140 15-8 2-0 40-2 4-0 12-2 16-2 3-3 — 3-3 134-0 32-3 23-1 30-0 12-1 2-58-8 6-8 15-6 1-7 32-9 5-2 11-1 16-3 3-1 — 3-1 124-9 32-5 25-6 26-3 13-1 2-5
12-7 13-1 11-7 2-0 39-5 5-4 14-2 19-6 3-8 7-7 11-5 199-7 34-7 29-9 19-8 9-8 5-813-9 8-6 8-8 1-7 330 6-7 11-4 18-1 3-2 3-1 6-3 173-1 39-8 27-1 19-1 10-4 3-66-2 5-0 4-8 0-9 16-9 3-6 12-2 15-8 2-8 3-1 5-9 1135 42-4 23-6 14-9 13-9 5-28-2 7-9 6-8 1-0 23-9 4-1 11-2 15-3 2-7 2-7 5-4 140-8 45-8 22-5 17-0 10-9 3-8
10-8 6-5 7-7 0-8 25-8 4-4 7-8 12-2 2-2 3-2 5-4 148-8 53-1 17-8 17-3 8-2 3-6100 8-1 11-8 2-1 32-0 8-1 7-9 16-0 2-9 4-1 7-0 158-8 48-5 16-9 20-1 10-1 4-49-4 15-5 15-3 3-6 43-8 7-7 5-9 13-6 3-5 2-9 6-4 173-4 48-7 14-5 25-3 7-8 3-7
10-6 17-0 18-6 3-4 49-6 9-2 5-3 14-5 2-9 2-4 5-3 315 6 65-3 12-7 15-7 4-6 1-713-7 16 3 18-1 2-4 50-5 8-6 9-4 18-0 2-8 2-4 5-2 298-1 j 64-5 10-8 16-9 6-0 1-8
10-9 13-3 13-5 2-1 39-7 7-1 11-4 18-5 3-0 4-0 6-5 230-3 55-2 16-7 17-2 8-0 2-8
S a lm on R iv ers in N u m b e rs and K ilo g ra m m e s.
Number Average Weight in Kilos
UmeAnger-
m an Inda l Ljunge Ljusne Dal M örrum T orne K alix Lule Skellefte U me Anger-m an Inda l L junge L jusne D al M örrum
L300 1941 1255 93 443 2910 7-4 10-3 10-5 7-7 10-7 9-2 9-4 5-0 8-0L326 2300 2077 314 — 613 2495 — 10-0 9-5 9-6 10-1 9-6 10-4 _ 7-0 7-41710 1670 1648 185 — 974 2607 9-5 — 10-9 9-9 9-6 11-2 9-8 9-5 _ 6-7 8-0[790 1698 2456 401 — 1144 2793 10-0 — 10-8 9-4 9-3 10-2 9-4 9-2 _ 6-4 8-2[519 1105 1504 163 — 582 1379 9-9 — — 9-6 8-7 11-2 10-5 8-9 _ 6-2[109 1485 1795 195 — 335 900 — — — 11-6 8-4 9-4 8-8 10-2 _ 7-1— 610 646 101 — — — — — — — _ 11-1 8-6 10-4 _ _ _— 1301 1271 198 1479 894 — — — — — — 10-1 9-8 9-8 9-6 6-1 _— 804 920 182 1180 358 — — — — 9-9 _ 10-7 9-6 9-1 9-7 6-6 _— 473 568 101 1260 334 595 — — — 10-0 — 10-6 8-5 9-2 9-6 6-8 8-2.059 747 692 122 1104 278 — — — — 8-5 9-0 10-6 9-9 8-2 10-1 6-6 _294 634 926 90 834 520 267 — — — 10-6 8-9 10-2 8-3 9-2 9-4 4-5 9-1148 770 1254 219 857 280 274 — — — 9-8 8-9 10-6 9-4 9-6 9-2 6-7 9-1166 1463 1640 331 580 405 277 — — — 10-1 7-1 10-6 9-3 11-1 10-3 7-1 9-9439 1598 2040 277 558 412 238 - 8-3 8-2 10-9 8-4 10-7 9-1 12-1 9-5 6-0 7-6357 2015 1974 247 954 350 7-9 9-1 10*7 9-1 9-0 9-8 9-2 9-7 9-9 6-9 —
935 1288 1417 201 978 528 1340 1
the divergencies appearing in the individual abundance of the various year-classes.
During the period 1920— 1935 the years 1920, 1922 and 1923 were probably good salmon years as regards the G u lf of B o th n ia . Of these the first preceded and the second two followed the maximum year of 1921. It. can also be assumed that the years 1931— 1933
as an average preceded the maximum year of 1934.The weak period was therefore 1925— 1930, with
its two minimum years — 1926 and 1928.With regard to the B a l t ic p ro p er it would appear
— if we exclude the minimum years 1918 and 1920— that there were no bad salmon years other than the minimum years of 1924 and 1925. The maximum
2 *
- 20 -
Table 10. C atches of S a lm on from the B altic (inc lu d in g G ulfs) in 1920— 1935(in thousands of kilos).
Year
1920.1921.1922.1923.1924.1925.1926.1927.1928.1929.1930.1931.1932.1933.1934.1935.
Gulf of Bothnia Baltic
Sweden F in landSweden Germ any
To ta l an d an d L a tv ia D enm ark P oland
330 ■ 453 361' 339 219' 134 124 199 173 113 140 148 158 173 315 298
243-9 325 2 250-1 294-7 261-6 187-9 1630 1324 139-3 146-9 180-5 213-2 201-9 223-5 233-S 221-9
Mean . . . 230-3 213-7
See “ N o te to T ab le 10” on p . 21.
574-8778-8611-3633-8481-1321-9287-9332-1312-42604321-3362-0360-7396-95494520-0
444-1
257-1240-6145-8 150-298-098-7
146-2 225-0 189-4 123-8 133-5 310-9 3849 303-3 217-6 233-5
55-8 345-0 179-7 134-7 102 8 273-4 379-1 603 9 322-9 383-2 261-8 361 9259-8260-4 185-4
65-663-572-787-988-7
189 9 118-6
57-0 86-5
128 1 114-5 69-0
203-7 274-0 91-0
Gulf of Finland
F in la n d E sthon ia
257 1 296-4 490-8 329-9 298 3 265 0 492-3 692-0 882-0 586-6 635-3 629-7 833 3 691-2 592-5 487-9
528-8
57-446-1 51-1 59-1 36-030-1 28-9 27-4 39-2 35-0 26-847-7 62-9 27-331-8 76-3
57-566-295-099-11)
124-6141-0147-6119-8
42-7 106-4 149-7
96-7101-2121-8146-8187-5168-3179-4196-1
Total
1291-1948-2
1078-41138-51381-51256-41321-31204-0
1202-4
T ab le 11. N u m b e r
\ ear
River Areas
Ann
ual
Spe
cim
ens
Tot
alBothnian Bay Area Southern Area Tornio River
To
rnio
Riv
er *s u
«
Ou
luR
iver
To
tal
Ko
kem
äki
i R
ive
r
Ky
mi
Riv
er
Kiv
ira
nta
Su
mis
aari
1920........ 52 52 238 2901921........ — — 69 69 — 328 397 — —
1922........ — 152 25 177 — 227 404 — —
1923........ — 70 110 180 — 148 328 — —
1924........ — 75 73 148 — 144 292 — —
1925........ — 424 257 681 232 355 1268 — —
1926........ — 220 259 479 418 721 1618 — —
1927........ — 171 679 850 195 811 1856 — —
1928........ — 322 394 716 100 594 1410 — —
1929........ — 587 317 904 95 422 1421 — —
1930........ 483 594 471 1548 120 260 1928 352 131
1931........ 1032 210 482 1724 28 428 2180 920 112
1932........ 498 989 924 2411 83 588 3082 405 93
1933........ 1055 1542 1014 3611 — 117 3728 579 476
1934........ 2237 2502 1369 6108 162 317 6587 1954 283
.1935........ 887 1695 1084 3666 172 262 4100 710 177
Total. . . 6192 9553 7579 23324 1605 5960 30889 4920 1272
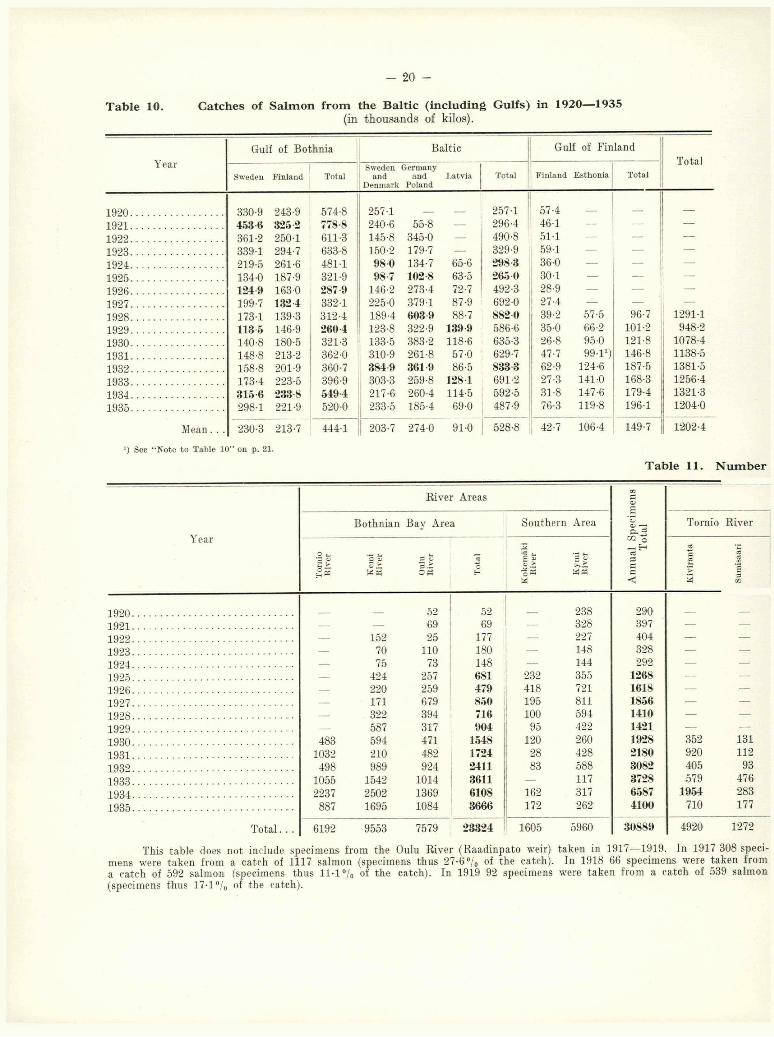
This table does not include specimens from the Oulu River (Raadinpato weir) taken in 1917—1919. In 1917 308 specimens were taken from a catch of 1117 salmon (specimens thus 27-6 °/0 of the catch). In 1918 66 specimens were taken from a catch of 592 salmon ("specimens thus 11-1 °/0 of the catch). In 1919 92 specimens were taken from a catch of 539 salmon (specimens thus 17-1 °/0 of the catch).

— 21 —
years of 1928 and 1932 appear to have been linked by good intervening years. The sudden drop in the1934 and 1935 special Polish mielnica statistics
Note to Table 10.I have combined the Esthonian catches of salmon in
their entirety with those of the Gulf of Finland district, although since 1931 that part obtained from the western Esthonian provinces, i. e., Lääne, Saare and Pärnumaa provinces, could be separated. The statistics available per province are as follows (in thousands of kilogrammes):
Viru Harju Lääne Saare Pärnu Baltic
1931. . 29-4 29-3 58-7 35-9 2-5 2 0 40-41932. . 59-2 38-9 98-1 18-7 3-3 4-5 26-21933.. 92-5 37-9 130-4 0-8 0-4 9-4 10-61934. . 91-0 28-5 119-5 0-9 0-9 26-9 28-91935. . 78-7 190 97-7 0-4 0-8 20-9 22-1
According to the statistics the Esthonian catches of salmon are principally derived from the Gulf of Finland area. The statistics have been kindly supplied by Mr. J. K o d r e s , Inspector of Fisheries.
nevertheless hints at a new depression of some importance.
I should mention further in making this survey that, as shown by Table 10, the maximum year of1932 in the Baltic proper was followed two years later by a maximum period in the Gulf of Bothnia, or rather, the Bothnian Bay; and that the minimum year of 1924 in the Baltic proper was followed two years later by a minimum year in the Bothnian Bay. The minimum year of 1925 in the Baltic proper was followed two years later — according to Finnish statistics — by a minimum year in the Bothnian Bay. On the other hand, the maximum year of 1928 in the Baltic proper was followed by no corresponding maximum year in the Bothnian Bay — at least, not in 1930, as might have been expected on the basis of former experiences.
With regard to salmon fishing in the Gulf of Finland, I am unable as yet to refer to the fluctuation phenomenon owing to the insufficiency of the statistics.
For the time being I will conclude my survey based on statistics of catches, but will revert to the subject after dealing with the biological analysis of the composition of year-classes and life-cycles of salmon caught in Finnish waters, provided by the specimen scales and their measurements which I have collected.
of S p ec im en s in vestigated .
Fishing GroundsPercentages of Numbers
Kemi River Oulu River Kymi River from special Statistics
Ko
rva
Kö
ng
äs is031
Val
kea
ko
ski
(Sea
)
Py
häk
osk
iK
apid
s
Mai
jala
Var
vik
ko
Ah
ven
ko
ski
and
Kän
nin
- k
osk
i
Lan
gin
ko
ski
Rap
ids
To
rnio
Riv
er
Kem
iR
iver
Ou
luR
iver
ss :2 *•*2 © ® £ so ̂ K
ym
iR
ive
r
_ _ _ _ 52 _ 106 132 _ _ _ _ _ •
— — — — 69 — 123 205 — — 9-7 - 55-0152 — — — 25 — 108 119 — 4-5 4-1 - 19-870 — — — 110 — 39 109 — 3-5 29-7 - 14-375 — — — 73 — — 144 — 5-4 11-1 - 23-2
424 — — — 257 — 145 210 — 24-1 36-9 39-3 68-5220 — — — 173 86 271 450 ;- 21-8 50-4 96-3 99-4171 — — — 488 191 , 322 489 - 9-7 55-2 95-1 99-8
64 — 258 — 394 — 247 347 - 23-7 85-8 94-3 99-7370 — — 217 317 — 127 295 - 42-5 94-1 93-1 99-8594 — — — 471 — 107 153 27-3 32-4 83-2 98-4 99-6
22 — — 188 482 — 128 300 77-2 57-4 99-6 100-0 99-3186 65 27 711 924 — 190 398 53-6 126-81) 85-6 109*2 100-0— 142 73 1327 1014 _ 96 21 70-9 323-31) 77-3 — 98-3— 408 378 1710 1172 197 111 206 66-7 163-01) 84-8 92-6 128-38)— 167 508 1020 809 275 78 184 60-2 128-91) 100-0 91-5 97-4
2348 782 1244 5179 6830 749 2198 3762 — — — — —
l ) P ercentage figures exceeding 100 are due to th e fac t th a t no special s ta tis tic s are o b ta ined from th e catches of th e V alkeakari salm on fishing grounds nor in general from those of o th e r fishing grounds a t th e m o u th of th e K em i river, un less th e num bers derived from scale specimens be ta k en in to account, w hich is n o t th e case.
*) P ercentage figures exceeding 100 are caused by certain samples ta k en from ou ts ide th e m ou th of th e river,
— 22 -
II. Year and Life-Cycle Classes in Finnish Catches of Salmon.
1. In troduction .The biological analysis of salmon which is presented
in this work is founded, as mentioned before, on measurements and weighings carried out at certain fishing grounds, combined with the collecting of scale specimens. With the exception of the Valkeakari fishing grounds at the mouth of the Kemi River, all these fishing grounds are hired out by the state and have contributed information for the “special statistics” , i. e. those given in Table 3. The salmon
I have given my results in two series of tables, of which one •— Tables 12— 18 — shows the figures in respect of the age and life-cycle classes (as numbers and percentages) given by specimens collected from various areas, each year separately. The second series— Tables 19—26 — is intended to provide a comparative survey of the duration of the smolt-age and migratory period as well as of the number of salmon which have ascended the rivers previously at the various salmon areas. This series also includes the
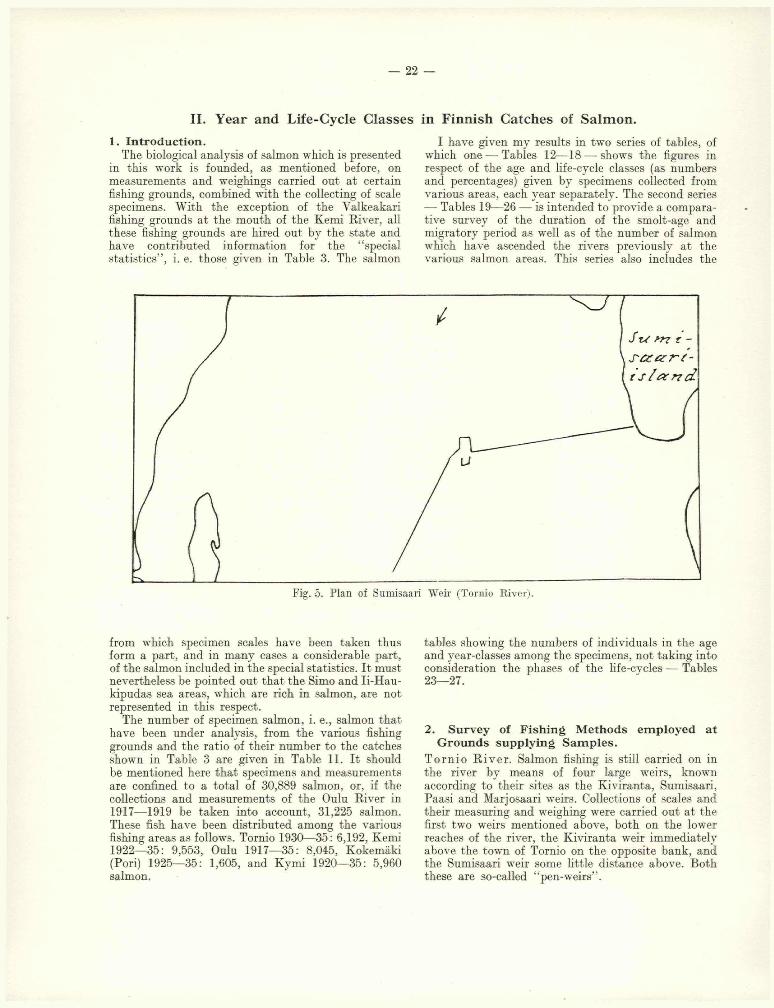
Fig. 5. Plan of Sumisaari Weir (Tornio River).
from which specimen scales have been taken thus form a part, and in many cases a considerable part, of the salmon included in the special statistics. It must nevertheless be pointed out that the Simo and Ii-Hau- kipudas sea areas, which are rich in salmon, are not represented in this respect.
The number of specimen salmon, i. e., salmon that have been under analysis, from the various fishing grounds and the ratio of their number to the catches shown in Table 3 are given in Table 11. It should be mentioned here that specimens and measurements are confined to a total of 30,889 salmon, or, if the collections and measurements of the Oulu River in 1917— 1919 be taken into account, 31,225 salmon. These fish have been distributed among the various fishing areas as follows. Tornio 1930—35: 6,192, Kemi1922— 35: 9,553, Oulu 1917— 35: 8,045, Kokemäki (Pori) 1925— 35: 1,605, and Kymi 1920—35: 5,960 salmon.
tables showing the numbers of individuals in the age and year-classes among the specimens, not taking into consideration the phases of the life-cycles — Tables 23— 27.
2. S urvey of F ish in g M ethod s em p loyed at G rounds su p p ly in g S a m p les .
T orn io R iv er . Salmon fishing is still carried on in the river by means of four large weirs, known according to their sites as the Kiviranta, Sumisaari, Paasi and Marjosaari weirs. Collections of scales and their measuring and weighing were carried out at the first two weirs mentioned above, both on the lower reaches of the river, the Kiviranta weir immediately above the town of Tornio on the opposite bank, and the Sumisaari weir some little distance above. Both these are so-called "pen-weirs” .
— 23 —
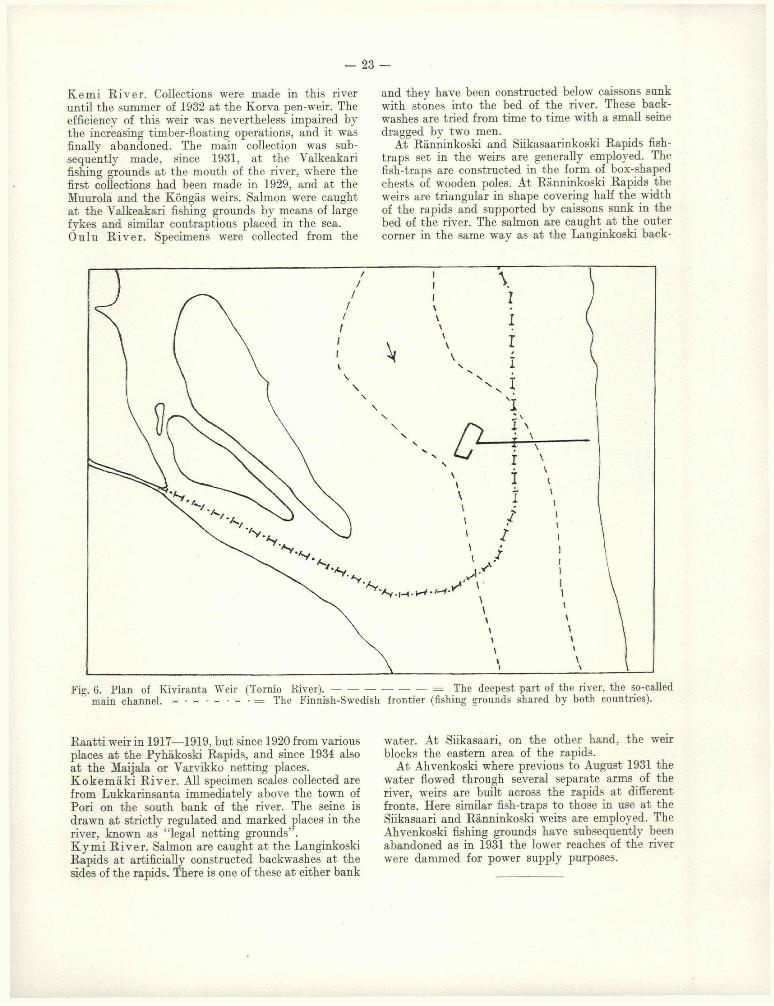
K e m i K iver . Collections were made in this river until the summer of 1932 at the Korva pen-weir. The efficiency of this weir was nevertheless impaired by the increasing timber-floating operations, and it was finally abandoned. The main collection was subsequently made, since 1931, at the Yalkeakari fishing grounds at the mouth of the river, where the first collections had been made in 1929, and at the Muurola and the Köngäs weirs. Salmon were caught at the Valkeakari fishing grounds by means of large fykes and similar contraptions placed in the sea. O ulu R iv er . Specimens were collected from the
and they have been constructed below caissons sunk with stones into the bed of the river. These backwashes are tried from time to time with a small seine dragged by two men.
At Ränninkoski and Siikasaarinkoski Rapids fish- traps set in the weirs are generally employed. The fish-traps are constructed in the form of box-shaped chests of wooden poles. At Ränninkoski Rapids the weirs are triangular in shape covering half the width of the rapids and supported by caissons sunk in the bed of the river. The salmon are caught at the outer corner in the same way as at the Langinkoski back-
‘Ay .(_<•
Fig. 6. Plan of Kiviranta Weir (Tornio River). — = The deepest part of the river, the so-calledmain channel. « • h • h • « ■ = The Finnish-Swedish frontier (fishing grounds shared by both countries).
Raatti weir in 1917— 1919, but since 1920 from various places at the Pyhäkoski Rapids, and since 1934 also at the Maijala or Varvikko netting places. K o k e m ä k i R iv er . All specimen scales collected are from Lukkarinsanta immediately above the town of Pori on the south bank of the river. The seine is drawn at strictly regulated and marked places in the river, known as “legal netting grounds” .K y m i R iv er . Salmon are caught at the Langinkoski Rapids at artificially constructed backwashes at the sides of the rapids. There is one of these at either bank
water. At Siikasaari, on the other hand, the weir blocks the eastern area of the rapids.
At Ahvenkoski where previous to August 1931 the water flowed through several separate arms of the river, weirs are built across the rapids at different fronts. Here similar fish-traps to those in use at the Siikasaari and Ränninkoski weirs are employed. The Ahvenkoski fishing grounds have subsequently been abandoned as in 1931 the lower reaches of the river were dammed for power supply purposes.

— 24 —
Fig. 7. A few minutes Rest at a Corner of the Kiviranta Weir after hauling in the Seine.
eh m i Stttr re —* • / / t2 r? £ ?
Fig. 8. Plan of the Muurola Weir (Kemi River).
— 25 —
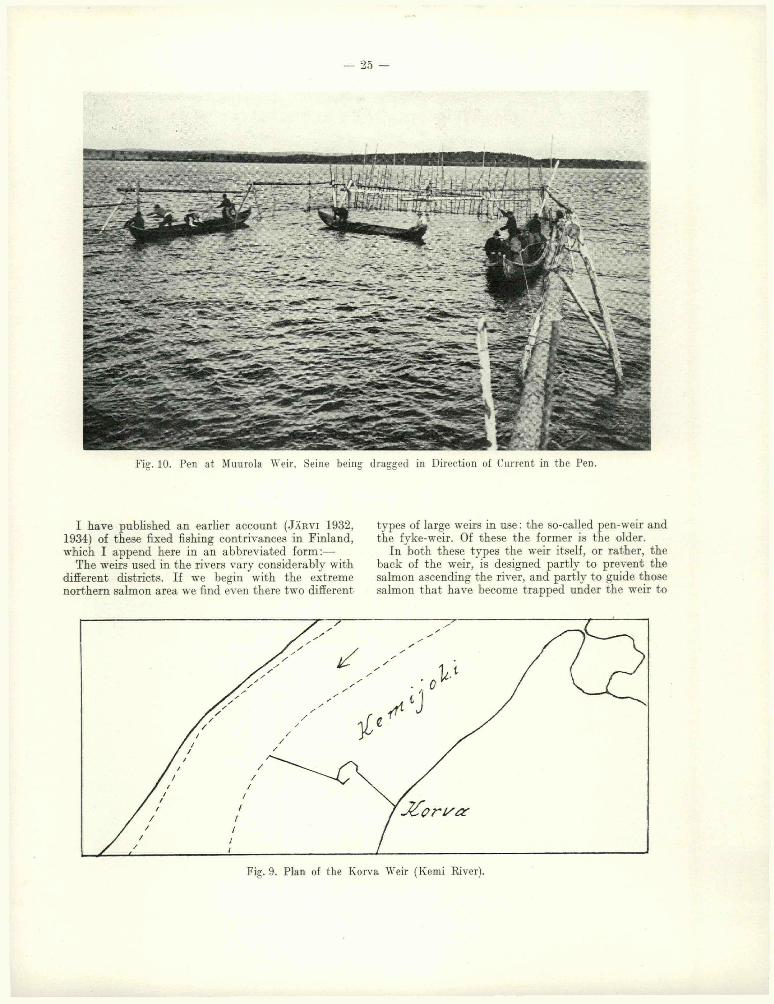
Fig. 10. Pen at Muurola Weir, Seine being dragged in Direction of Current in the Pen.
I have published an earlier account ( J ä r v i 1932, 1934) of these fixed fishing contrivances in Finland, which I append here in an abbreviated form:—
The weirs used in the rivers vary considerably with different districts. If we begin with the extreme northern salmon area we find even there two different
types of large weirs in use : the so-called pen-weir and the fyke-weir. Of these the former is the older.
In both these types the weir itself, or rather, the back of the weir, is designed partly to prevent the salmon ascending the river, and partly to guide those salmon that have become trapped under the weir to
Fig. 9. Plan of the Korva Weir (Kemi River).

- 26 —
Fig. 11. Lifting the Seine and opposed Seine at the lower edge of the Muurola Weir Pen
Fig. 12. The Korva Weir and Pen (Kemi River). Photographed from the upper corner of the pen.

— 27 —
Fig. 13. Lifting the Catch at the lower side of the Korva Weir Pen.
a certain point or points where they can be caught. In the pen-weirs the ascending salmon have to enter the so-called pen, and in other weirs the fyke or other catching apparatus placed in the weir. The pen is a fairly large fence placed in a suitable, i. e. a deep and fairly rapid part of the river. The salmon guided by the wings of the weir enter the pen via the entrances,
but once in the pen in their efforts to ascend the river they can no longer find the outlet. The position of the pen in the weir is of very great importance. It is essential that the flow of the current through the entrance to the pen be sufficiently strong so that it is easily perceptible to the fish as it approaches the entrance. It often happens that the parts of the weir
Pie ftnscxa n -
Fig. 14 a. Plan of the Köngäs Fyke-Weir (Kemi River).

— 28 —
Fie. 14b. Köngäs Fyke-Weir at the Point where the Kemi River branches. Small Bank Weir in Foreground.
Fig. 15. Part of the Pyhäkoski Rapids in Oulu River. On the left side a fishing site with Weirs.

— 29 -
Fig. 16. Part of the Niskakoski Rapids in Oulu River.
Fig. 17. Leppiniemi Fishing Site on the Pyhäkoski Rapids (Oulu River).

— 30 —
a r r r z r s r k ø f k i
Fig. 18. Plan of Riinninkoski Fishing Grounds in Kvmi River.
connected to the upper edge of the pen must be altered and rearranged so that suitable currents enter the pen which can act as an artificial back-wash, forming a resting-place for the fish. The lifting of the salmon from the pens, of which, by the way, there is only one per weir, is done with a certain kind of drift-net (seine), a so-called “kulle”. This “kulle” is a large-meshed, but strong, net, the bottom edge of which is formed by an iron chain. It is thrown in at the upper end of the pen and drawn across the current to the lower end. At this end there is another net along the wall of the pen. The seine drives the salmon before it into this other net. The seine and the net are then lifted together into the boat from the lower end of the pen. The salmon thus obtained are caught between the two nets.
In the fyke-weirs, the salmon ascend through the openings in the walls of the weir to the fykes situated at the back of the openings, or they are forced backwards into net bags, placed down stream. The water presses against them in these bags and hinders their movements.
The weirs of northern Finland are always rebuilt every year and are supported by stakes. This is the only possibility in rivers where the spring floods drive all obstacles from their path on the breaking-up of the ice. The stakes are driven into the bed of the river obliquely against the current, and are supported by other stakes slanting in the opposite direction, thus forming a kind of trestle resembling a slightly concave bridge of long thin saplings. Large stones are then placed on the bridge to provide the weir with sufficient strength to resist the current. The wall of the weir itself is closed in different ways, depending on the strength of the current, either by poles made from small pine trees and bound closely together or
by placing young fir shoots into the river upside down (e. g. Korva weir). In the slowest currents and streams (Muurola and Muhos weirs) string, wide-meshed nets are, or were, used.
Only three pen weirs are in use at present —• the Kiviranta and Sumisaari weirs, which I have mentioned before, situated close to each other near the mouth of the Tornio River, and the Muurola weir at Rovaniemi, more than 120 km. from the mouth of the Kemi River. At the beginning of the century there were still seven pen-weirs in use along the Tornio River, but these were discontinued in 1920. At this time there were also five pen-weirs in the Kemi River ; the last but one, the Korva weir, being used for the last time in the summer of 1932.
At present there are two fyke-weirs employed in the Tornio River (Paasi and Marjosaari), one in the Kemi River (Köngäs) and three in the Ii River (Illinkoski, Venäjänkari and Haukka). The Raati and Muhos weirs in the Oulu River were used for the last time in the summer of 1919.
In addition to these large weirs, small, so-called shore-weirs are used particularly in the Tornio and Kemi Rivers. These are short weirs usually built only for the spring floods at different points along the rapids. They usually consist of a bridge laid across trestles and weighed with stones, and a wall of young fir shoots. There are generally two or three openings in the wall; the trap is a fyke.
Since the large weirs in the Oulu River were abandoned salmon fishing in that river, subsequent to 1920, has been carried out principally at six points along the Pyhäkoski Rapids ; of these the best-known is Leppiniemi. These fishing grounds are formed from artificial backwaters. A fairly short bridge weir is built over a row of trestles from the side of the river; a weir wall is made supported by the foremost row of trestles. The purpose of this wall is to regulate the quantity of water flowing under the weir, as the flow must be even and attract the salmon. A special platform is constructed on the back row of trestles, for the seine which, when necessary, can be quickly thrown into the water. The fishing itself is as follows:— during the summer season the fishermen take turns in sitting all hours of the day and night on the high banks of the river above the fishing grounds, watching for changes in the flow of the river. On noting a change in the flow the watcher knows that a salmon in the foam of the rapids has come under the weir; the net is then cast from the platform as quickly as possible and drawn to the bank below the weir.
It is probable that since the years 1914— 1917 no salmon weirs have been constructed in the Kokemäki River, although at the beginning of the century several different types of weirs were still in use in the lower reaches of the river. Fishing in this river is done with a seine at carefully specified places where no more than half the width of the river may be covered.
The fixed salmon fishing apparatus employed in the Kymi River are unusual in that they are built
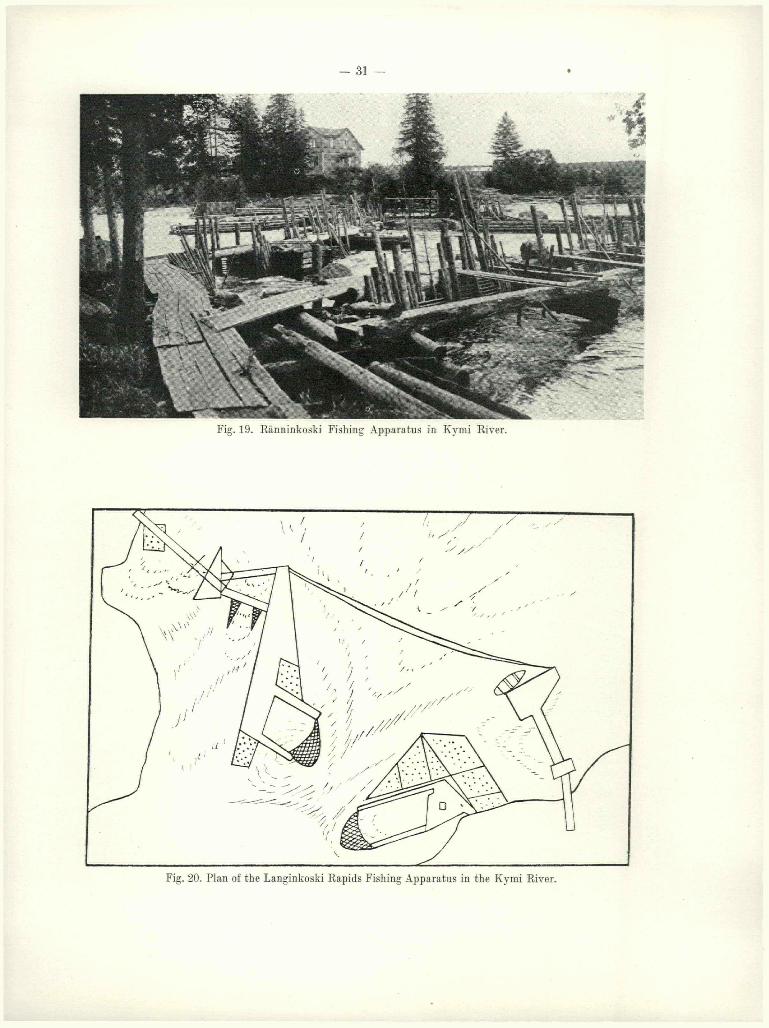
- 31 —
Fig. 19. Ränninkoski Fishing Apparatus in Kymi River.
Fig. 20. Plan of the Langinkoski Rapids Fishing Apparatus in the Kymi River.

— 32
Fig. 21. Fishing with Salmon-fishing Apparatus on the left side of the Rapids.
Fig. 22. Fish Trap at Siikasaari Rapids (Kymi River).

— 33 —
Fig. 23. Large Fvke-Net for Sea Fishing (Kemi, Valkeakari).
on permanent caissons sunk in the river, i. e., usually triangular (but sometimes square) frames of beams are sunk in the river and extend for some distance above the surface of the water. These frames are then filled with large stones. These caissons are strong enough to withstand the pressure of the drifting ice and can be used for a long time. The fixed fishing contrivances in these parts are either enclosures supported by one caisson, or large weir “yards” supported by several caissons placed in rows. Of this latter type two are at present in use — the Siikasaari and Ränninkoski weirs already referred to. The small artificial enclosures situated on either bank of the Langinkoski Rapids are both of the former type.
In former times salmon fishing a t sea was practised on a very small scale in Finland, but since the latter half of the 19th century it has developed and improved considerably. The development in salmon fishing at sea has been influenced largely by technical improvements in catching methods. Nowadays salmon are caught at sea almost entirely by means of large fyke-
nets usually placed one after the other in so-called “designs”.
The most important centres of salmon fishing by the above means are the estuaries of the Tornio and Kemi Rivers, then the fishing waters of Maksniemi, and finally Simoniemi. The importance of the Maksniemi grounds is due to their favourable position in relation to the mouth of the Kemi River. A long cape stretching far out into the sea acts as a collector of salmon which have arrived at the shores to the south of the Kemi River too early. The best known of the Maksniemi fishing places are the so-called Röyttä and Halttari grounds.
Salmon fishing of any importance off the shores of the Gulf of Finland is only that done with large fyke-nets at the estuary of the Kymi River. The catch at other places is small, although some salmon fishing is practised at other parts of the eastern end of the Gulf of Finland.
During winter salmon are caught from only two very restricted areas in Finland — outside the towns of Pori and Kaskinen — both on the coast of the Bothnian Sea and at no great distance from each other.
3

- 34 -
Fig. 24. Large Fyke-Net during Low Water (Jakobstad, Öregrund).
3. G roup in g of S a lm o n in to L ife-C ycle C lasses .
The division of salmon into life-cycle classes begins immediately on the individuals of a certain year-class starting their migration, as the departure from the breeding rivers is made at different ages. Subsequently the number of life-cycle classes grows considerably, as the salmon remain for different periods on their first migration and ascend and spawn for the first time — if their life-time is sufficient — at different ages. As in addition to this there are a certain number of salmon attempting to spawn for the second, third and fourth time, the number of the life-cycle classes finally becomes fairly considerable.
In marking the life-cycle classes I have used the abbreviated number and letter markings fixed by the Salmon and Trout Committee of the International Council for the Exploration of the Sea at the meeting held in Gdynia in 1933 (Rapp, et Proc.-Verb., Vol. XCI). With regard to the special terms, I have used those given on p. 12 of a list published by the present author in collaboration with M r. W. J. M. M e x z i e s in 1936 (Rapp, et Proc.-Verb., Vol. XCVII).
In order to determine the ratio between the various migratory periods and the age of the salmon, I have appended the following table, which will provide a general illustration of these ratios as regards certain of the more common life-cycle classes.
R atios betw een the Life-C ycle C lasses , the A ge and the A scen d in g Y ears.
Description Age Ascending Year
a. F ir s t t im e a sc e n d in g :3.1 + 4 years the fifth3.2 + 5 years the sixth3.3 and 3.3 + 6 years the seventh3.4 and 3.4 + 7 years the eighth3.5 8 years the ninth
b. S e c o n d t im e a sc e n d in g :3.1 +G 1 6 years the seventh3 .1 + G2 7 years the eighth3 .2 + G1 7 years the eighth3.3 G1 8 years the ninth3.4 G1 9 years the tenth
c. T h ird t im e a sc e n d in g :3.1 + G1G1 8 years the ninth3.1 + G2G1 9 years the tenth3.2 + G1G1 9 years the tenth3.3G1G1 10 years the eleventh3.4G1G1 11 years the twelfth
d. F o u r th t im e a sc e n d in g :3.3G1G1G1 12 years the thirteenth3.4G1G1 G1 13 years the fourteenth
When smolt-age is 2. or 4., the Age and Ascending Year will be one year less or more, respectively.
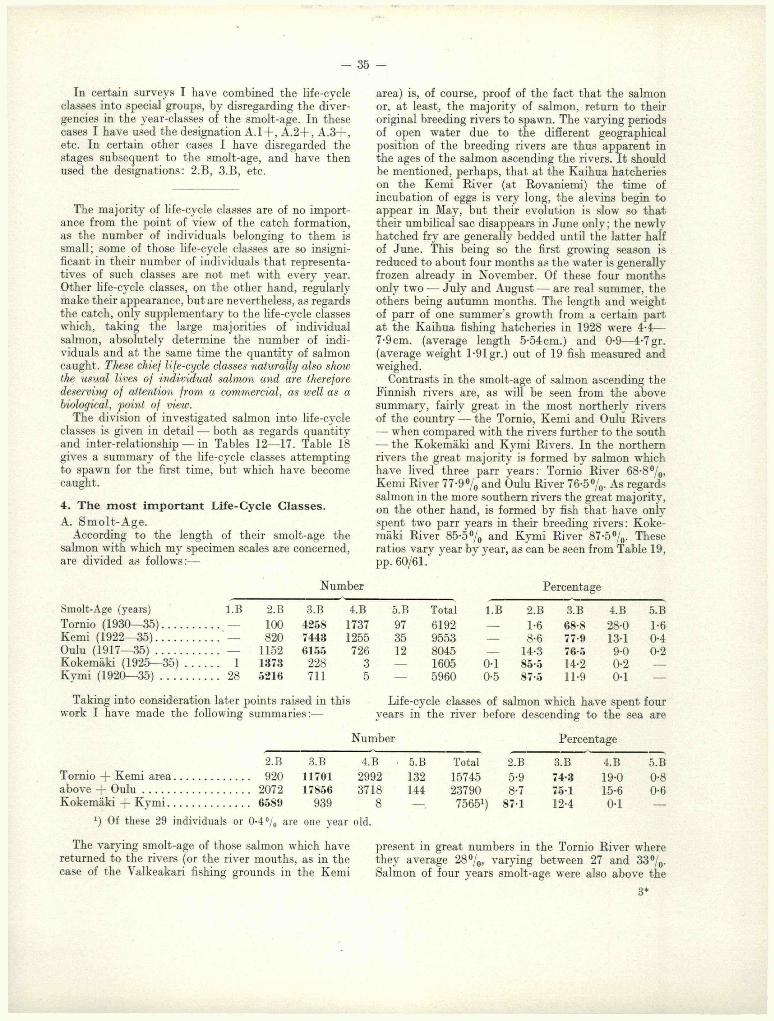
- 35 —
In certain surveys I have combined the life-cycle area) is, of course, proof of the fact that the salmonclasses into special groups, by disregarding the diver- or, at least, the majority of salmon, return to theirgencies in the year-classes of the smolt-age. In these original breeding rivers to spawn. The varying periodscases I have used the designation A. 1 + , A.2 + , A .3 + , of open water due to the different geographicaletc. In certain other cases I have disregarded the position of the breeding rivers are thus apparent instages subsequent to the smolt-age, and have then the ages of the salmon ascending the rivers. It shouldused the designations: 2.B, 3.B, etc. be mentioned, perhaps, that at the Kaihua hatcheries
on the Kemi River (at Rovaniemi) the time of incubation of eggs is very long, the alevins begin to
The majority of life-cycle classes are of no import- appear in May, but their evolution is slow so thatance from the point of view of the catch formation, their umbilical sac disappears in June only; the newlyas the number of individuals belonging to them is hatched fry are generally bedded until the latter halfsmall; some of those life-cycle classes are so insigni- of June. This being so the first growing season isficant in their number of individuals that representa- reduced to about four months as the water is generallytives of such classes are not met with every year. frozen already in November. Of these four monthsOther life-cycle classes, on the other hand, regularly only two — July and August -— are real summer, themake their appearance, but are nevertheless, as regards others being autumn months. The length and weightthe catch, only supplementary to the life-cycle classes of parr of one summer’s growth from a certain partwhich, taking the large majorities of individual at the Kaihua fishing hatcheries in 1928 were 4-4—salmon, absolutely determine the number of indi- 7-9cm. (average length 5-54cm.) and 0-9— 4-7 gr.viduals and at the same time the quantity of salmon (average weight 1-91 gr.) out of 19 fish measured andcaught. These chief life-cycle classes naturally also show weighed.the usual lives of individual salmon and are therefore Contrasts in the smolt-age of salmon ascending thedeserving of attention from a commercial, as well as a Finnish rivers are, as will be seen from the abovebiological, 'point of view. summary, fairly great in the most northerly rivers
The division of investigated salmon into life-cycle of the country — the Tornio, Kemi and Oulu Riversclasses is given in detail — both as regards quantity — when compared with the rivers further to the southand inter-relationship — in Tables 12— 17. Table 18 — the Kokemäki and Kymi Rivers. In the northerngives a summary of the life-cycle classes attempting rivers the great majority is formed by salmon whichto spawn for the first time, but which have become have lived three parr years: Tornio River 68-8%,caught. Kemi River 77-9% and Oulu River 76-5°/o. As regards
salmon in the more southern rivers the great majority,4. The m o st im p ortan t Life-Cycle C lasses. on the other hand, is formed by fish that have onlyA. S m o lt-A g e . spent two parr years in their breeding rivers: Koke-
According to the length of their smolt-age the mäki River 85-5°/o and Kymi River 87-5 °/0. Thesesalmon with which my specimen scales are concerned, ratios vary year by year, as can be seen from Table 19,are divided as follows:— pp. 60/61.
Number Percentage
Smolt-Age (years) l.B 2.B 3.B 4.B 5.B Total l.B 2.B 3.B 4.B 5.BTornio (1930—35).................... — 100 4258 1737 97 6192 — 1-6 68-8 28-0 1-6Kemi (1922—35)...................... — 820 7443 1255 35 9553 — 8-6 77-9 13-1 0-4Oulu (1917—3 5 ) ...................... — 1152 6155 726 12 8045 — 14-3 76-5 9-0 0-2Kokemäki (1925— 3 5 ) ............ 1 1373 228 3 — 1605 0-1 85-5 14-2 0-2 —Kymi (1920—3 5 ) ..................... 28 5216 711 5 — 5960 0-5 87-5 11-9 0-1
Taking into consideration later points raised in this Life-cycle classes of salmon which have spent fourwork I have made the following summaries:— years in the river before descending to the sea are
Number Percentage
2.B 3.B 4.B • 5.B Total Z B 3.B 4.B 5.BTornio + Kemi area........................... 920 11701 2992 132 15745 5-9 74-3 19-0 0-8above + O u lu ...................................... 2072 17856 3718 144 23790 8-7 75-1 15-6 0-6Kokemäki + K ym i............................. 6589 939 8 — 75651) 87-1 12-4 0-1 —
*) Of these 29 individuals or 0-4 °/0 are one year old.
The varying smolt-age of those salmon which have present in great numbers in the Tornio River wherereturned to the rivers (or the river mouths, as in the they average 28%, varying between 27 and 33%.case of the Valkeakari fishing grounds in the Kemi Salmon of four years smolt-age were also above the
3*
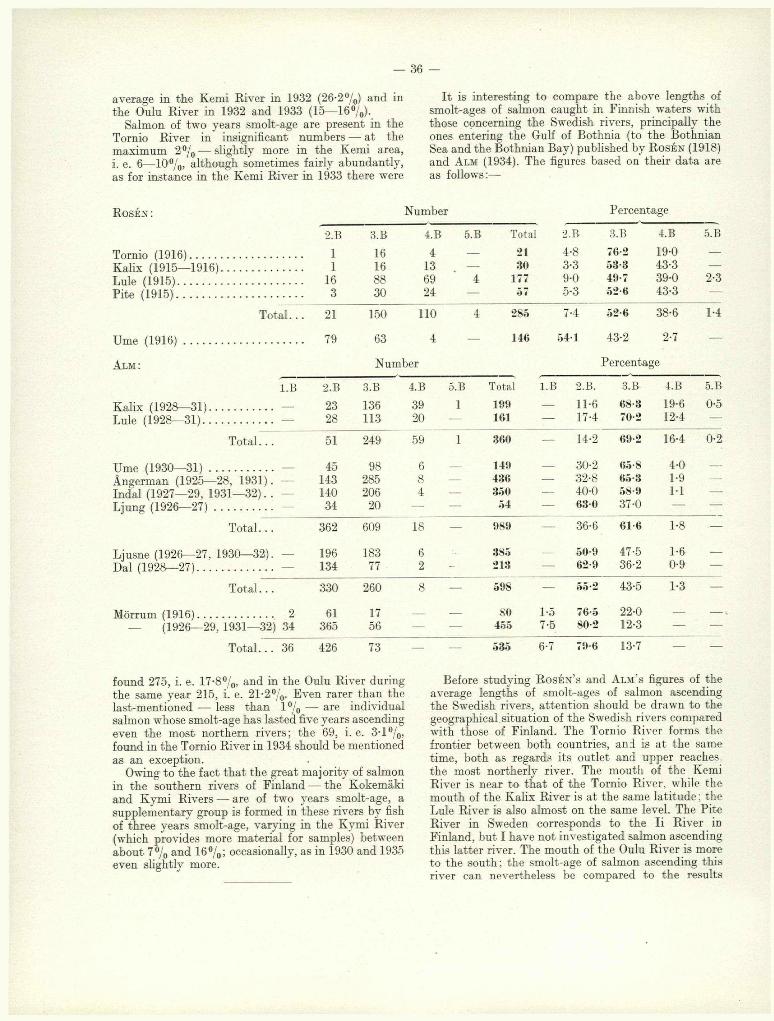
— 36 —
average in the Kemi River in 1932 (26-2 °/0) and in the Oulu River in 1932 and 1933 (15— 16%).
Salmon of two years smolt-age are present in the Tornio River in insignificant numbers — at the maximum 2% — slightly more in the Kemi area, i. e. 6— 10%, although sometimes fairly abundantly, as for instance in the Kemi River in 1933 there were
It is interesting to compare the above lengths of smolt-ages of salmon caught in Finnish waters with those concerning the Swedish rivers, principally the ones entering the Gulf of Bothnia (to the Bothnian Sea and the Bothnian Bay) published by R o s é n (1918) and A lm (1934). The figures based on their data are as follows:—
R o s é n : Number Percentage
Tornio (1916).............................Kalix (1915— 1916)..................Lule (1915).................................Pite (1915)..................................
2.B
11
163
3.B
16168830
4.B
4136924
5.B
4
Total
2130
17757
2.B
4-8 3-3 9-05-3
3.B
76-253-349-752-6
4.B
19-043-339-043-3
5.B
2-3
Total. . . 21 150 110 4 285 7-4 52-6 38-6 1-4
Ume (1 9 1 6 )................................ 79 63 4 — 146 54-1 43-2 2-7 —
A l m : Number Percentage
l.B 2.B 3.B 4.B 5.B Total l.B 2.B. 3.B 4.B 5.B
Kalix (1928— 31)...................... — 23 136 39 1 199 — 11-6 68-3 19-6 0-5
Lule (1928— 31)......................... — 28 113 20 — 161 — 17-4 70-2 12-4 ---
Total. . . 51 249 59 1 360 — 14-2 69-2 16-4 0-2
Ume (1930— 3 1 ) ....................... __ 45 98 6 — 149 — 30-2 65-8 4-0 —
Ångerman (1925— 28, 1931). — 143 285 8 — 436 — 32-8 65-3 1-9 —Indal (1927— 29, 1931— 32). . — 140 206 4 — 350 — 40-0 58-9 11 —Ljung (1926— 2 7 ) ..................... — 34 20 — — 54 — 63-0 37-0 — —
Total. . . 362 609 18 — 989 — 36-6 61-6 1-8 —
Ljusne (1926— 27, 1930— 32). __ 196 183 6 385 — 50-9 47-5 1-6 —
Dal (1928— 27)........................... — 134 77 2 - 213 — 62-9 36-2 0-9 —
Total. . . 330 260 8 — 598 — 55-2 43-5 1-3 —
Mörrum (1916)........................... 2 61 17 — — 80 1-5 76-5 22-0 — —— (1926— 29, 1931—32) 34 365 56 — — 455 7-5 80-2 12-3 — —
T ota l.. . 36 426 73 — — 535 6-7 79-6 13-7 — —
found 275, i. e. 17-8%, and in the Oulu River during the same year 215, i. e. 21-2%. Even rarer than the last-mentioned — less than 1% — are individual salmon whose smolt-age has lasted five years ascending even the most northern rivers; the 69, i. e. 3-1%, found in the Tornio River in 1934 should be mentioned as an exception.
Owing to the fact that the great majority of salmon in the southern rivers of Finland — the Kokemäki and Kymi Rivers — are of two years smolt-age, a supplementary group is formed in these rivers by fish of three years smolt-age, varying in the Kymi River (which provides more material for samples) between about 7% and 16%; occasionally, as in 1930 and 1935 even slightly more.
Before studying R o s é n ’s and A l m ’s figures of the average lengths of smolt-ages of salmon ascending the Swedish rivers, attention should be drawn to the geographical situation of the Swedish rivers compared with those of Finland. The Tornio River forms the frontier between both countries, and is at the same time, both as regards its outlet and upper reaches, the most northerly river. The mouth of the Komi River is near to that of the Tornio River, while the mouth of the Kalix River is at the same latitude; the Lule River is also almost on the same level. The Pite River in Sweden corresponds to the Ii River in Finland, but I have not investigated salmon ascending this latter river. The mouth of the Oulu River is more to the south; the smolt-age of salmon ascending this river can nevertheless be compared to the results

— 37 —
obtained from the Pite River. The Ume River flows into Merenkurkku (Quarken). There is no corresponding river on the Finnish side. This is also the case with the Ångerman, Indal and Lungan Rivers. The Kokemäki River in the south of Finland enters the Bothnian Sea at the same latitude as the Ljusne River in Sweden, while the Dal River in the latter country flows into the sea much more to the south. The Mörrum and Kymi Rivers can hardly be compared with one another, as the former enters the western arm of the Baltic far from the other rivers mentioned above.
A comparison of R o s é n ’s and A l m ’s figures on the length of smolt-ages with those which I obtained from samples collected in the Bothnian Bay northern salmon area, will show noticeable divergencies. R o s e n ’s four-year-smolt ascending the Kalix and Lule Rivers predominate to a greater extent than my observations concerning the Tornio and Kemi Rivers. Two-year-smolt ages in A l m ’s figures, on the other hand, are present in greater numbers than was found to be the case in this investigation. It is probable that these divergencies have been brought about to a certain degree by the phenomenon of fluctuation, so that too much weight should not be attached to them. A s regards the Kokemäki and Kymi Rivers the two- year-smolt predominate to a greater extent (85—87 °/0) than in the Ljung, Lusne and Dal Rivers (51— 63%).
If we combine the various observations on the above lengths of smolt-ages according to the different sea areas (the Ume River is taken as belonging to the Bothnian Sea) we get:—
Data which can be used for purposes of comparison as regards the length of smolt-ages have also been published on the southern parts of the Baltic. D i x o n (1931, 1934) has investigated salmon from the Gulf of Danzig and neighbouring waters (464 fish), W i l l e r and Q u e d n a u (1934) the coast of East Prussia outside Kuhrische Nährung (Neukuhren, 1127 fish).
Their results are as shown on page 38, top.An examination of these figures indicating the
smolt-ages of salmon caught in the southern areas of the Baltic shows that the division of the fish into the various smolt-age classes most nearly corresponds to the figures for Bothnian Bay salmon, as in the majority of cases (63-9%) the smolt-age has been three years. This fact has also been observed by D i x o n , W i l l e r and Q u e d n a u , who have expressed the opinion that for the main part salmon caught in the southern parts of the Baltic have originated in the northern areas.
The smolt-age of the salmon indeed demonstrates very clearly the great importance of the rivers flowing into the most northerly part of the Gulf of Bothnia — the Bothnian Bay — in maintaining the stock of salmon in the southern as well as the northern parts of the Baltic.
The varying composition of smolt-ages obtained by D i x o n in 1928 and 1933 with different fishing appliances — net and hook — is unexpected, although it probably should not be afforded too much attention at present as the divergencies are based on insufficient data, and may therefore be purely circumstantial.
B o th n ia n B ay: Number Percentage
2.B 3.B 4.B 5.B Total 2.B 3.B 4.B 5.B
F in land ................................................. 2072 17856 3718 144 23790 8-7 75-1 15-6 0-6S w ed en ................................................. 72 399 169 5 645 11-2 61-9 26-2 0-7
Total. . . 2144 18255 3887 149 24435
COOO l> 15-9 0-6
B o th n ia n Sea: l.B l.BF in land ...................................... ] 1373 228 3 __ 1605 0-1 85-5 14-2 9-0 ---S w ed en ...................................... - 771 932 30 — 1733 — 44-5 53-8 1-7 ---
T ota l.. . 1 2144 1160 33 — 3338 0-02 64-2 34-8 1-0 ---
The figures in the above table representing Bothnian Bay salmon are naturally based — owing to the great disparity in the data — on observations published in this paper. According to the table the difference between the length of smolt-ages in the Bothnian Bay and the Bothnian Sea is considerable. Three-year- smolt-ages are in maj ority by almost three-fourths in the Bothnian Bay. As regards salmon ascending the rivers from the Bothnian Sea, salmon of two-year- smolt-age easily predominate on the Finnish side, whereas on the Swedish side there is almost a corresponding minority (44-5%), salmon of three-year- smolt-age just predominating — 53-8 %.
B. F ir s t M ig ra to ry P er iod .It is known that usually the first migratory period
of salmon is of longer duration than subsequent migrations, and it is probable that these first migrations cover a greater distance than later ones.
According to the data which I have collected the salmon returning to the Finnish salmon areas for the first time have spent the following different periods on migration ( + indicates the summer of ascent and the figure the preceding complete migratory years). Salmon arrive at the Finnish salmon areas generally during June and July.
(See page 38, middle.)

— 38 —
D i x o n : Series A: Salmon caught with drift-net:Number Percentage
1928........................................ . . . 14 69 17 — 100 14-0 690 17-0 ---1931........................................ 9 123 44 — 176 5-0 700 25-0 ---1932........................................ . . . 13 46 30 1 90 15-0 51 0 33-1 1-01933........................................ . . . 6 75 16 1 98 6-0 770 16-0 1-0
Combined . . . 42 313 107 2 464 9-0 67-5 23-1 0-4
D i x o n : Series B: Salmon caught with hooks :1928........................................ . . . 12 14 4 — 30 40-0 4 7 0 13-0 —1933........................................ . . . 26 41 — — 67 39-0 610 — —
Combined . . . 38 55 4 97 39-0 5 7 0 4-0 —
W i l l e r and Q u e d n a u :
1928/29 .................................. . . . 8 55 32 1 96 8-3 57-3 33-3 1-11929/30 .................................. . . . 49 213 81 5 348 14-1 61-2 23-3 1-41930/31 .................................. . . . 45 442 190 6 683 6-6 64-7 27-8 0-9
Com bined... 102 710 303 12 1127 9-0 6 3 0 26-9 1-1
2.B 3.B 4.B 5.B 2.B 3.B. 4.B 5.B
All observations (D i x o n , W i l l e r and Q u e d n a u ):
1928—3 1 ................................................. 182 1078 414 14 1688 10-8 63» 24-5 0-8
Tornio (1930— 35)Kemi (1922— 35).........Oulu (1917— 3 5 ) .........Kokemäki (1925—35) Kymi (1920— 35)
TornioK e m i.........Oulu...........Kokemäki. K ym i.........
A .+ A.1+ A.2+ A.34- A.4+ A.5+ A.6+ Total TotalSpecimens
Number of Individuals
9 1578 2397 1803 192 22 — 6001 619211 443 2515 5266 699 75 — 9009 96154 393 1036 5045 1126 79 2 7685 8045
— 4 107 975 256 10 — 1352 1605— 510 1834 2637 402 6 — 5389 5960
or in Percentage0-1 25-5 38*7 29-1 3-1 0-4 — 96-90-1 4-6 26-2 54-8 7-2 0-8 — 93-70-05 4-9 12-9 62-7 14-0 1-0 0-02 95-5— 0-2 6-7 60-7 15-9 0-7 — 84-2— 8-0 30-8 44-2 6-7 0-1 — 90-4
The above figures provide a basis for the following table of the Bothnian Bay northern salmon area (i. e., the combined Tornio, Kemi and Oulu areas), and of the salmon rivers of southern Finland (Kokemäki and Kymi Rivers):—
The figures for the various fishing grounds in the Kymi River go to show the similarity or divergence between the catches at different fishing grounds in the same river:
(See page 39.)
Southern Finnish Rivers.
Bothnian Bay a r e a ..........Southern Finnish Rivers.
A .+ A.1+ A.2+ A.3+ A.4+ A.5+ A.6-+- Total
Number of Individuals
24 2414 5948 12114 2017 156 2 22695— 514 1941 3612 658 16 — 6741
or in Percentage
0-1 10-1 24-9 50-8 8-5 0-6 0-01 95-0— 6-8 25-7 47-7 8-7 0-2 — 89-1
TotalSpecimens
238527565

- 39 -
Ahvenkoski Rapids (1920— 2 3 ) ................................. 43Ränninkoski Rapids (1920— 3 5 ) ................................. 134Langinkoski Rapids (1920— 35)................................... 333
T o ta l... 510
Ahvenkoski...........................................................................11*4Ränninkoski......................................................................... 7-4Langinkoski.................................................. 8-9
Several noteworthy facts may be decided from the above surveys. First of all, that very rarely are salmon that have ascended after having spent their first, migratory year obtained at the main Finnish salmon- fishing grounds. A few of these, however, have made their appearance at, for instance, the mouth of the Kemi River (Yalkeakari fishing ground, 11 salmon), and have ascended to the lower end of the lower reaches of the Tornio River (Kiviranta weir, 9 salmon).I am nevertheless aware that these small salmon are still caught — unfortunately this is still allowed by law — at the eastern end of the Gulf of Finland, although in small quantities. My detailed investigations have not yet included this area, but the above is shown by the fact that marked salmon have been caught there while still at this stage.
On the other hand, the life-cycle class that spends its second summer on migration, regularly makes its appearance to ascend the rivers.
These small salmon — which have their own particular name in several languages (Finnish “Kossi" English “Grilse”) — generally ascend the Finnish rivers in August, certain individuals making their appearance already in July. The share of this life-cycle group : A.l-f- (owing to the variations in the smolt-age there are naturally several life-cycle classes) in the catches is small during normal salmon years, both as regards its individual numbers and its percentage of the whole catch, as the fish belonging to this group are generally of light weight — an average of about 1-5 kg. A peculiarity will be seen, however, from my summary, in that during the years 1930— 1935 the A.l-f- group, or the so-called grilse, ascended the lower reaches of the Tornio River in very large numbers —- no less than 25-5% of the entire individual number of salmon caught — whereas the proportion of this same migratory group in other areas, among others the nearby Kemi area, was extremely small (4—5%).I am unable to provide an absolutely satisfactory explanation of these variations in percentage: the explanation nevertheless lies partly in the fact that the collecting of samples of these small salmon in neither the Kemi nor the Oulu Rivers was, despite my instructions, anything like so carefully made as that of the larger salmon (collectors have advised me of this in certain years). The disparity in the percentages — on the one hand 25 and on the other only
A.l-f- A. 2~\~ A.3+ A.4+ A.5-{-
Number of Individuals
125 168 4609 815 102
1100 1654 296 6
Total TotalSpecimens
340 3761660 18223389 3762
1834
33-233-229-2
2637 402 6
or in Percentage
44-7 1-144-7 5-6 . —44-0 7-9 0-1
5389
90-491-1 90-1
5960
4 or 5 — is nevertheless so great that it may have been caused by peculiar ecological conditions. The disproportion between the percentages may be ascribable also to the fact that salmon fishing in the Tornio River (at the Kiviranta weir) is carried on for a much longer period (up to the end of August) than, for example, in the estuary of the Kemi River. In any case, the proportion of this life-cycle class (A .1+) to the Kemi area catch does not alter, if the catches of. the same years that are available as regards the Tornio River, are taken into consideration. In the specimens from the Kemi area for 1930— 1935 the migratory group A .l—)- is represented by a total of 346 fish, i. e., 4-6°/o of the total — 7,532.
It appears from the numbers of the general summary that the principal factor in the catches from the Kemi, Oulu, Kokemäki and even the Kymi River has been the life-cycle group: A .3 + , which, on having spent three years on migration, endeavours to ascend the rivers. The share of this life-cycle group in forming the catches was (according to specimens):— Kemi 54-8, Oulu 62-7, Kokemäki 60-7 and Kymi area 44-3%, i. e. either above or just below 50°/0. If we examine— from Table 20 — the share of the group under discussion in catches for the various years, we find the following: the group played the most important part in forming the catches (data considered only since 1925) as follows: Kemi area 1935: 68-5%; Oulu area 1927: 85-1% and 1932: 75-8°/o; Kokemäki River 1930: 78-3% and 1934: 80-3%: Kymi River 1927 and 1934: 61— 68%. It has been at its lowest in the Kemi area 1925 (22-5%) and 1926 (28-2%), Oulu River 1926 (42-1%), Kokemäki River 1928 (43%), and Kymi River 1926 (16— 17%). The above variations, often considerable, are naturally in the main attributable to the fluctuation phenomenon, although other reasons have possibly had some bearing on the matter.
This life-cycle group (A.3 + ) was exceptional during the years 1930— 35 in the Tornio area, where its mean proportion did not rise higher than 29-1%. The maximum occurred there in 1934 (37-2%) and its minimum the year before that, 1933 (15-2%). In the Tornio area during the period in question this group has only been present as a fairly large complementary group in the catch.
The main complementary group in catches obtained

- 40 -
Table 12. D iv ision of S a lm on in to Life-Cycle C lassesaccording to specimen scales.
Number
T ornio River.
Percentageco i o o rH 03 CO lO 1 >o o i—l IN
8) I Life-Cycle Class CO03 COC5 CO03 CO03 CO03 CO05 O CTD CO 03 CO03 COOS CO03o rH
3 2 .1 + ........................ 1 9 — 4 3 4 21 0-2 0-9 —
4 2 .2 + ........................ —. 2 4 — 8 2 16 — 0-2 0-83 -1 + ........................ 55 65 163 236 149 328 996 11-4 6-3 32-74 + .......................... . — — — — 4 — 4 — — —
5 2.3............................ 3 4 3 14 10 15 49 0-6 0-4 0-63 .2 + ........................ 80 331 61 337 570 151 1530 16-6 32-0 12-34 .1 + ........................ . 41 35 26 188 159 46 495 8-5 3-4 5-25 - + .......................... . — — — — 5 — 5 — — —
6 2.4........................... . 1 — — 2 3 1 7 0-2 __ __3.3............................ 131 207 78 87 750 186 1489 271 20-0 15-74 .2 + ........................ 59 250 56 68 346 49 828 12-3 24-2 11-25 .1 + ........................ . 6 — 1 8 49 2 66 1-2 — 0-2
7 2.5............................ 1 13.4............................ . 44 40 18 20 16 9 147 9-1 3-9 3-64.3.............................. 24 31 60 57 73 67 312 5-0 3-0 12-15 .2 + ........................ 3 3 — — 15 2 23 0-6 0-3 —
8 3.6............................ 4 8 2 1 4 1 20 0-8 0-8 0-44.4.............................. 11 7 5 7 7 1 38 2-3 0-7 105-3.............................. — 1 - 2 — — 3 — 0-1 —
9 4-5........................... . — 1 — — — — 1 — 0-1 —
Total... 463 994 477 1031 2171 865 6001 95 9 963 95-8
Previously spawned:o n ce .......................... . 19 34 20 23 61 21 178 3-9 3-3 4-0twice.......................... 1 4 1 — 3 1 10 0-2 0-4 0-2three times . . . . . . . . . . — — — 1 2 — 3 — — —
Total... 20 38 21 24 66 22 191 41 3 7 4 2Specimens. . . 483 1032 498 1055 2237 887 6192
COCO
TfCO
>oCO
1 ia O CO
03 03 03 CO 03rH rH T—1 03 rH
rH
0-4 0-1 0-5 0 3
— 0-3 0-2 0 222-4 6-7 37-0 161— 0-2 — 01
1-3 0-4 1-7 0-831-9 25-5 17-0 24 717-8 7 1 5-2 8-0— 0-2 — 01
0-2 01 0-1 018-2 33-5 21-0 2326-4 15-5 5-5 1340-8 2-2 0-2 11
0-1 0 021-9 0-7 1-0 2 45-4 3-3 7-6 5 0— 0-7 0-2 0 4
0-1 0-2 0-1 0 30-7 0-3 0-1 0 60-2 — — 0 05
— — — 0 02
97-7 97 0 97 5 96-9
2-2
0-1
2-80-10-1
2-40-1
2 9 0-2 0 05
2 3 3 0 2 5 3 1
in Finnish salmon waters is nevertheless the life-cycle group: A.2-|-, the salmon of which on spending two years at sea return to the rivers during the third summer. This group is also that which formed the majority, as regards numbers, of the 1930— 35 catch in the Tornio area. Nevertheless the group has not formed an absolute majority even in the Tornio area except in 1931 when the percentage was 56-7. In other years it has fluctuated, being, for example, 23°/0 in 1935 and 42% in 1934. In the Kemi area this group achieved an absolute majority in 1933, 53%; t i e minimum there being in 1929, 6-8%, and the mean percentage amounting to 26-2. The proportion of this group is even smaller in the Oulu River, averaging12-9%. The maximum (since 1925) was in 1931: 23-2%, and the minimum in 1927 and 1929: 4-3 and 4-1%. The group reached its maximum in the Kokemäki River in 1935: 16-3% (the catch in 1931 was too small to be taken into consideration), while the mean there has been only 6-7%. The figures for the Kymi River show the following :— an almost absolute
majority occurred at the Langinkoski Rapids in 1920: 50% (Ahvenkoski only 38-7% during the same year) and in 1926: 54% ; Ränninkoski Rapids in 1926: 65-5%, combined 62-4%; Ränninkoski Rapids in 1931: 53-9%, Langinkoski Rapids during the same year only 43-6% (combined 50-1%); Langinkoski Rapids in 1932: 55-5%, Ränninkoski Rapids during the same year: 58-4% (combined 56-5%). This group has also been least important in 1923 at the Langinkoski Rapids: 2-8%, Ahvenkoski Rapids: 5-1%; in1924 at the Langinkoski Rapids: 6-3%, and in 1930 at the Langinkoski Rapids: 5-9%, whereas at the Ränninkoski Rapids: 15-9%.
Another, although less important, complementary group is formed by the classes that have spent four full years on their first migration, and thus arrived at the spawning rivers only during their fifth migratory summer. The mean proportion of this life-cycle group in catches of salmon varies (according to specimens) between 16 and 3%. As this group is only a relatively small proportion of salmon arriving at the Tornio
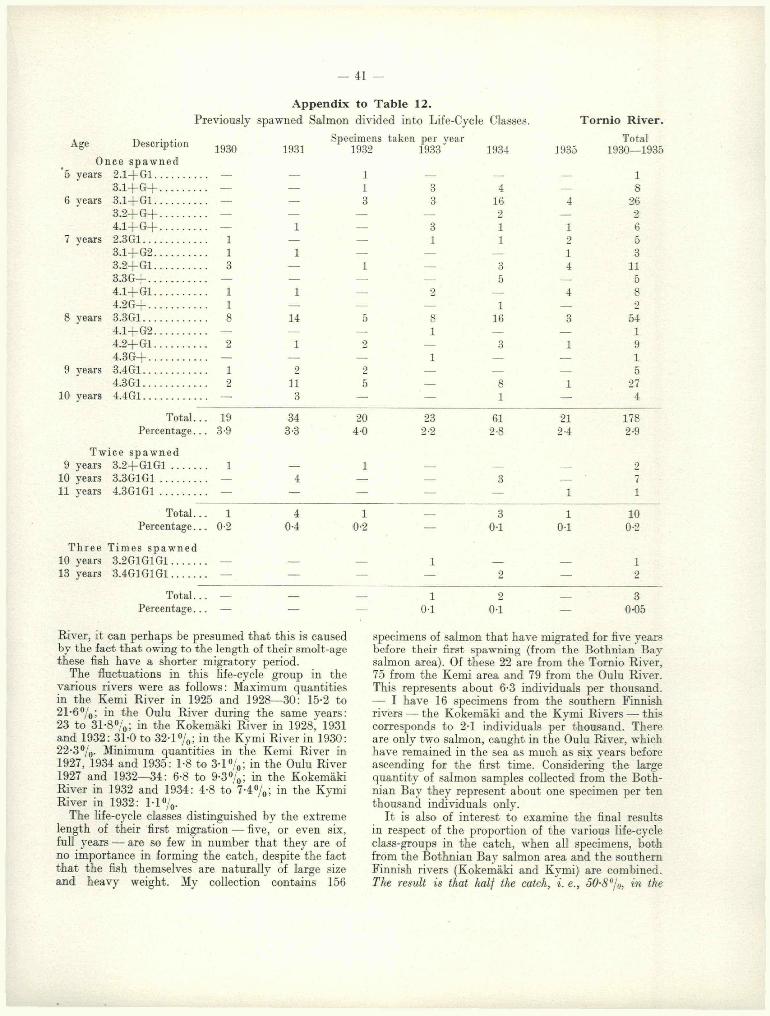
— 41 -
A ppendix to T ab le 12.
Previously spawned Salmon divided into Life-Cycle Classes.
*«> 1930 1931 “" i S “ S ”" ,934Once spawned
5 years 2.1-J-G1............ — — 13 .1 + G + ................ — — 1 3 4
6 years 3.1-)- G1............ -— — 3 3 163 .2 + G + ........... — — — — 24 .1 + G + ........... — 1 — 3 1
7 years 2.3G1................. 1 — — 1 13.1+G 2............. 1 1 —3.2+G 1............. 3 — 1 — 33 .3G +.................... _ _ _ _ _ 54.1+G 1............. 1 1 — 2 —4.2G +............... 1 — — _ 1
8 years 3.3G1................. 8 14 5 8 164.1+G 2............. _ _ — 1 —4.2+G 1.................. 2 1 2 — 34.3G +............... — — — 1
9 years 3.4G1...................... 1 2 24.3G1................. 2 11 5 — 8
10 years 4.4G1................. — 3 — — 1
Total... 19 34 20 23 61Percentage.. . 3-9 3-3 4-0 2-2 2-8
Twice spawned9 years 3.2+G 1G 1...... 1 — 1 — _
10 years 3.3G1G1.......... — 4 — — 311 years 4.3G1G1 . . . . . _ — — — — —
Total... 1 4 1 — 3
Percentage... 0-2 0-4 0-2 — 01
Three Times spawned10 years 3.2G1G1G1...... — — — 1 —13 years 3.4G1G1G1...... — — — — 2
Total... — — — 1 2Percentage... — — — 0-1 0-1
1935
Tornio River.
Total 1930—1935
212-4
10-1
26265 3
116 8 2
541915
27
1782-9
100-2
30-05
River, it can perhaps be presumed that this is caused by the fact that owing to the length of their smolt-age these fish have a shorter migratory period.
The fluctuations in this life-cycle group in the various rivers were as follows: Maximum quantities in the Kemi River in 1925 and 1928—30: 15-2 to 21 -6%; in the Oulu River during the same years: 23 to 31-8%; in the Kokemäki River in 1928, 1931 and 1932: 31-0 to 32-1 °/0; in the Kymi River in 1930: 22-3 %. Minimum quantities in the Kemi River in 1927, 1934 and 1935: 1-8 to 3-1 °/0; in the Oulu River 1927 and 1932—34: 6-8 to 9*3°/0 ; in the Kokemäki River in 1932 and 1934: 4-8 to 7-4°/0; in the Kymi River in 1932: 1-1%.
The life-cycle classes distinguished by the extreme length of their first migration — five, or even six, full years — are so few in number that they are of no importance in forming the catch, despite the fact that the fish themselves are naturally of large size and heavy weight. My collection contains 156
specimens of salmon that have migrated for five years before their first spawning (from the Bothnian Bay salmon area). Of these 22 are from the Tornio River, 75 from the Kemi area and 79 from the Oulu River. This represents about 6-3 individuals per thousand.— I have 16 specimens from the southern Finnish rivers — the Kokemäki and the Kymi Rivers — this corresponds to 2-1 individuals per thousand. There are only two salmon, caught in the Oulu River, which have remained in the sea as much as six years before ascending for the first time. Considering the large quantity of salmon samples collected from the Bothnian Bay they represent about one specimen per ten thousand individuals only.
It is also of interest to examine the final results in respect of the proportion of the various life-cycle class-groups in the catch, when all specimens, both from the Bothnian Bay salmon area and the southern Finnish rivers (Kokemäki and Kymi) are combined. The result is that half the catch, i. e., 50-8 v/0, in the
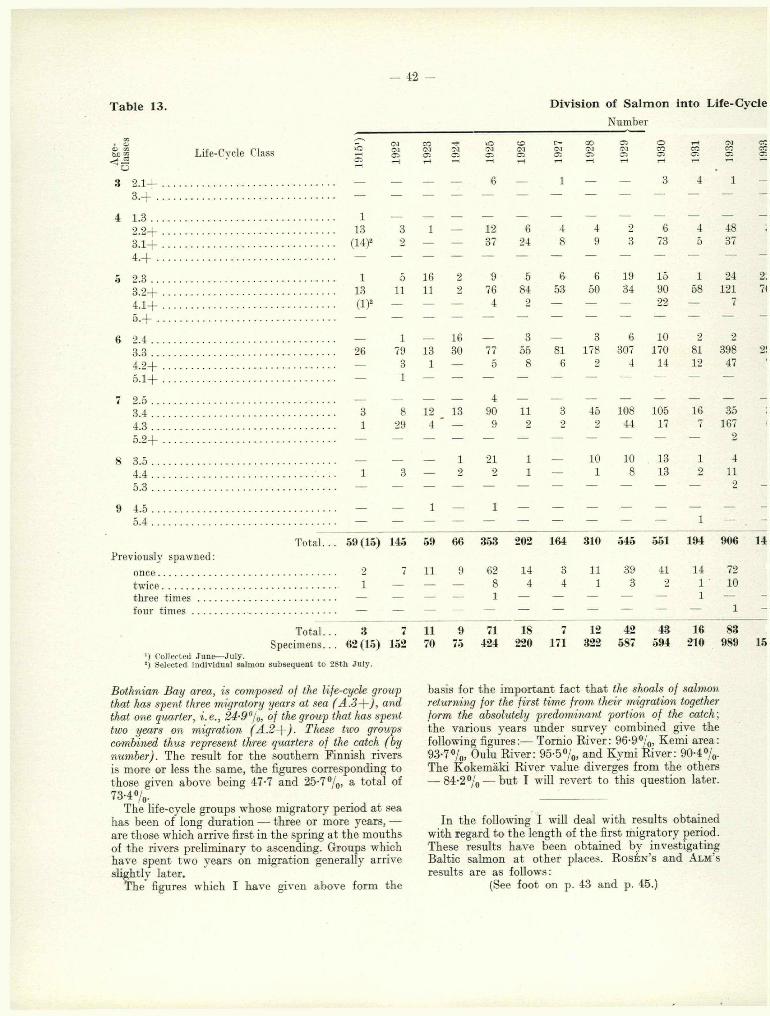
- 42 -
Table 13.
CO I o< CJ CO
bX) to Life-Cycle Class
2.1+ 3 + .
1.3 .. 2.2+ 3 J + 4 .+ .
2.3 .. 3.2+ 4.1+ 5 + .
6 2.4 .. 3.3 .. 4.2+ 5.1+
2.5 .. 3.4 .. 4.3 .. 5.2+
3.5 .4.4 ,5.3 ,
4.55.4 ,
Total.Previously spawned:
once............twice...........three times four times .
D iv ision of S a lm on into Life-Cycle
Number
CMCiCOCQo
00
Total...Specimens...
x) Collected Ju n e— Ju ly .2) Selected ind iv idual salm on subsequ en t to 28 th Ju ly .
Bothnian B ay area, is composed of the life-cycle group that has spent three migratory years at sea ( A. 3 and that one quarter, i.e., 24-9°/0, of the group that has spent two years on migration (A .2-\-). These two groups combined thus represent three quarters of the catch (by number). The result for the southern Finnish rivers is more or less the same, the figures corresponding to those given above being 47-7 and 25-7%, a total of 73-4 %:
The life-cycle groups whose migratory period at sea has been of long duration — three or more years, — are those which arrive first in the spring at the mouths of the rivers preliminary to ascending. Groups which have spent two years on migration generally arrive slightly later.
The figures which I have given above form the
113 3 1 — 12 6 4 4 2 6 4 48
(14)® 2 — — 37 24 8 9 3 73 5 37
1 5 16 2 9 5 6 6 19 15 1 2413 11 11 2 76 84 53 50 34 90 58 121
(I)2 — — — 4 2 — — — 22 — 7
1 16 3 3 6 10 2 226 79 13 30 77 55 81 178 307 170 81 398— 3
11 — 5 8 6 2 4 14 12 47
43 8 12 13 90 11 3 45 108 105 16 351 29 4 — 9 2 2 2 44 17 7 167
2
_ __ __ 1 21 1 __ 10 10 13 1 41 3 --- 2 2 1 — 1 8 13 2 11
2
1 11 —
59(15) 145 59 66 858 202 164 310 545 551 194 906
2 7 11 9 62 14 3 11 39 41 14 721 __ — — 8 4 4 1 3 2 1 10
1 —1
3 7 11 9 71 18 7 12 42 43 16 836*2(15) 152 7« 75 424 220 171 322 587 594 210 989
basis for the important fact that the shoals of salmon returning for the first time from their migration together form the absolutely predominant portion of the catch ; the various years under survey combined give the following figures:— Tornio River: 96-9°/o, Kemi area: 93-7% , Oulu River: 95-5% , and Kymi River: 9 0 4 % . The Kokemäki River value diverges from the others— 84-2°/o ■— but I will revert to this question later.
In the following I will deal with results obtained with regard to the length of the first migratory period. These results have been obtained by investigating Baltic salmon at other places. R o s e n ’s and A l m ’s results are as follows:
(See foot on p. 43 and p. 45.)
2 ;7(

C la sses according to specimen scales.
41
19110
1
3631642
9
161513165
9
241782
36
1514
142292
2
3831
781
146
1873
31
lO CO 1—I o Ci tHT—I
201
1167339
1
5141918
879
704138421
12
568610
9
6660
3
01
lO T—iCi
1-6
43
Percentage
oCO05
1-4 0-6 — 0-5 1-9 0-1 —
21-0 2-0 14 — 2-8 2-7 2-3 1-2 0-3 1-0 1-91-1 8-7 10-9 4-6 2-8 0-5 12-3 2-4
1-6 3-3 22-9 2-7 2 1 2-3 3-5 1-9 3-2 2-5 0-521-0 7-2 15-7 2-7 18-0 38-2 31-0 15-5 5-8 15-2 27-6
_ 0-9 0-9 — — — 3-7 —
0-7 21-3 — 1-3 — 0-9 1-0 1-7 1-042-0 52-0 18-6 40-0 18-3 25-0 47-4 55-4 52-3 28-6 38-5
1-2 3-6 3-5 0-6 0-7 2-4 5-72-0 1-40-7 —
0'94-8 5-3 17-2 17-3 21-2 5-0 1-8 14 0 184 17-6 7-61-6 19-1 5-7
1-6 2-0
2-1 0-9 1-2 0-6 7-5 2-9 3-3
1-32-7
5-00-5
0-50-5
3 1 0-3
1-714
2-2•2-2
1 4 — 0-2 — — —
0-510
4-93-7
2412-20-7
0-240-34-8
3-516-9
0-2
041-10-2
K em i River.
1-90-2
14-745-8
0-5
0-51944-90-1
2-14-00-1
010-5
0-844
1-704
6-604
041-63-10-1
0-10-2
iOCO05
0-2 0-050-03 —
0-90-8
003 —
14 8412-6 17-2
0-1
0-6 0-2 60-5 49-0
4-60-05
012-7
11-00-2
0-204
0-5 — — — —
0 2 0 01
0011-83 5001
5-3 19 90 901
0 7 430
4 401
015 96 3 01
0-70 60 03
0 02001
2373 1620 9024 95-2 954 843 88-0 83 3 91-8 95 9 963 92-8 92-8 924 91 6 94-8 94 8 95 6 93 7
119 69 545 3-2 4-6 15-7 12-0 14-6 64 1-8 34 6-7 6-9 6-6 7-3 4-7 4-8 4-1 5-79 5 56 1-6 — — — 1-9 1-8 2-3 0-3 0-5 0-3 0-5 1-0 0-5 04 0-3 0 61 1 4
1 — —--- 0-2 --- --- ---
— —0-5
04 —0 03 0-05 004
001
129 75 606 4-8 46 15-7 12 0 167 8-2 41 3 7 7 2 7 2 7-6 8 4 5 2 52 4 4 6 32502 1695 9630
R o s e n ’s Results (1918):
Tornio (1916).........Kalix (1915, 1916)
Ume (1916— 1917)
Number
T o ta l. .
Percentage
A. 14- A.2+ A.3+ A.4+ Total A.1+ A.2+ A.3+ A. 4 +
— 9 11 1 21 — 42-9 52 4 4-7. 5 16 8 1 30 16-6 53 3 26-6 3-3. 21 63 71 22 177 11-9 35-6 40 1 124
2 17 34 5 58 3 4 29-3 58-6 8-6
. 28 105 124 29 286 9-8 36-7 43 3 10-1
. 3 29 114 1 147 2-0 19-7 77-5 0-7
. 31 134 238 30 433 7-2 30-9 55-0 6-9
A comparison of A lm ’s percentage figures given on p. 45 with the proportion of the various life-cycle
groups yielded by Finnish specimens shows that the figures for the Kalix and Lule Rivers are connected

— 44 —
K em i River.
Age Description
Once spawned5 vears 2 .1+ G 1............
3 .1 + G + ..........6 years 2 .1 + G 2 ............
2 .2 + G 1 ............2 .3 G + ..............3 .1 + G 1 ............3 .2 + G + ..........
7 years 2 .1 + G 3............2.3G1................3 .1 + G 2............3 .2 + G I ............3 .3 G + ..............4 .1+ G 1............4 .2 + G + ..........
8 years 2.3G2................2.4G1................3 .1 + G 3............3 .2 + G 2 ............3 .3 + G I ............3 .4 G + ..............4 .1 + G 2 ............4 .2 + G I ............4 .3 G + ..............
9 years 3.4G1................4 .1+ G 3............4.3G1.................4 .4 G + ..............5 .2 + G I ............
10 years 4.4G1................
A ppendix to T ab le 13.
Specimens taken per year
rH O lO!N05
00tM05
05CM05
oCO05
iOCO05
1 —
1
5
- - - _1
111
1—
2 1
— 2 8 7 34 13 115 23 25 7 28
1 2 12 61
1 3 2 3— 2 4 10
6 8 13 167 2 8 31 1 1 1
1 — 2
3 —
1
21113
— 1113
511
3
320
1
1 9 11 — —
1
Percentage..
Twice spawned7 years 2 .2 + G 1 G + ...8 years 2.2+G1G1___9 vears 2.3G1G1..........
3.1+G2G1___3.2+G1G1.. . .
10 years 3.3G1G1..........4.2+G1G1.. . .
11 years 3.4G1G1..........4.3G1G1..........
Total... 1 — — — 4 1
Three Times spawned11 years 3.1+G2G1G1........12 years 3.3G1G1G1............
Total... — — — 1 — — — — 1 — — 1
Four Times sp aw n ed 2) 10 years 4 .1+G +G +G +G 1
T o ta l
23 65 1
2411
2220602043 164 4
24522
111130
126213
. . 1
.. 1-67
4-610
14-39
12-062
14-614
6-43
1-811
3-439
6-741
6-914
6-6697-0
563-6
1164-6
694-0
5211)5-4
13
11
1 21
- 1 3 6
11
13
1
. . — — — — 8 1 — 21
1 1 62
4 5 313
- — — — — 31
— — — — — 2 — —15
541)(0-7%)
4(0-04»/.)
1(0-01 Vo)
1) D escending specim ens (kelts) n o t included: once spaw ned, 24 specim ens; tw ice spaw ned, 2 specim ens; see A pp. (B) to T ables 13, 14 a n d 16, p . 57.2) U nique ind iv idual of its type , ob ta ined from V alkeakari, J u n e 9t.h, 1932. See J ärvi a n d Me n z ie s , 1936, p. 40-—41 (Fig. 48— 50). Age open to
investigation .
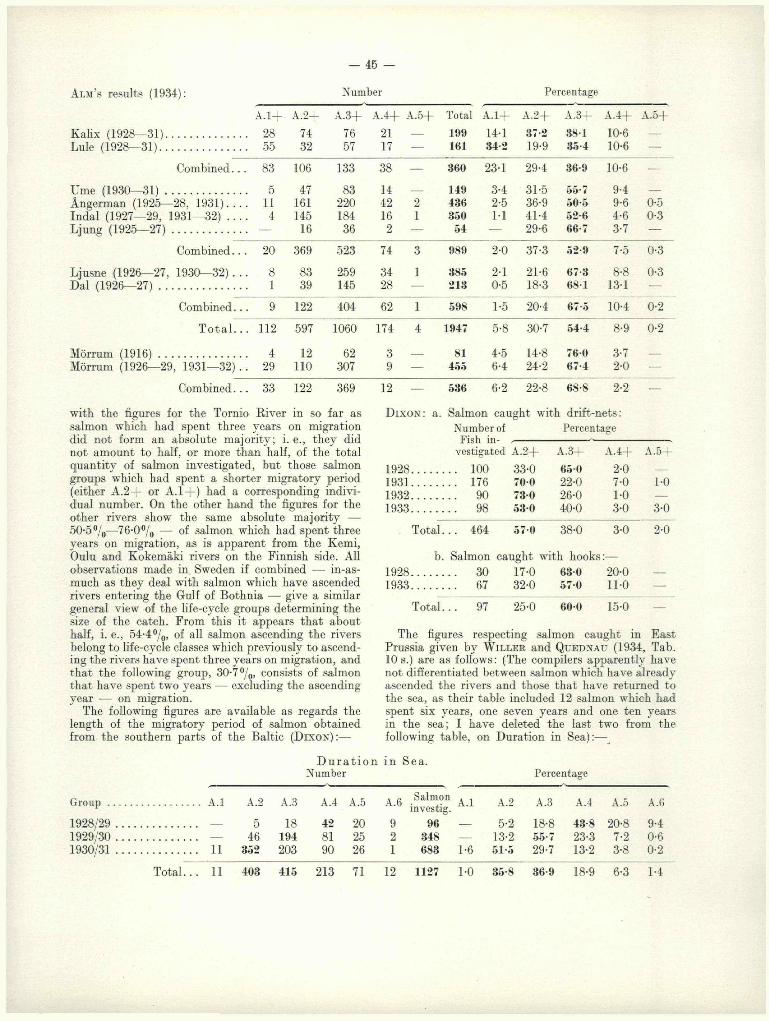
— 45 —
Alm’s results (1934): Number Percentage
A.1+ A .2+ A.3+ A.4+ A .5+ Total A.1+ A.2+ A .3+ A.4+ A .5+
Kalix (1928— 31)........................... 28 74 76 21 — 199 14-1 37-2 38 1 10-6 —Lule (1928— 31)............................. 55 32 57 17 — 161 34-2 19-9 35-4 10-6 —
Combined. . 83 106 133 38 — 360 23-1 29-4 36-9 10-6 —
Ume (1930—3 1 ) ........................... 5 47 83 14 — 149 3-4 31-5 65*7 9-4 —Ångerman (1925— 28, 1 9 3 1 ).. . 11 161 220 42 2 436 2-5 36-9 50-5 9-6 0-5Indal (1927—29, 1931—32) . . . 4 145 184 16 1 350 1-1 41-4 52 6 4-6 0-3Ljung (1925—2 7 ) ........................ — 16 36 2 — 54 — 29-6 66-7 3-7 —
Combined.. 20 369 523 74 3 989 2-0 37-3 52-9 7-5 0-3
Ljusne (1926— 27, 1930—32). . 8 83 259 34 1 385 2-1 21-6 67-3 8-8 0-3Dal (1926— 2 7 ) ............................. 1 39 145 28 — 213 0-5 18-3 68 1 13-1 —
Combined.. 9 122 404 62 1 598 1-5 20-4 67-5 10-4 0-2
T o t a l . . 112 597 1060 174 4 1947 5-8 30-7 54-4 8-9 0-2
Mörrum (1 9 1 6 ) ............................. 4 12 62 3 __ 81 4-5 14-8 760 3-7 —Mörrum (1926— 29, 1931—32). 29 110 307 9 — 455 6-4 24-2 67-4 2-0 —
Combined.. 33 122 369 12 — 536 6-2 22-8 68-8 2-2 —
with the figures for the Tornio River in so far as salmon which had spent three years on migration did not form an absolute majority; i. e., they did not amount to half, or more than half, of the total quantity of salmon investigated, but those salmon groups which had spent a shorter migratory period (either A.2-)- or A .1 + ) had a corresponding individual number. On the other hand the figures for the other rivers show the same absolute majority — 5O 5°/0— 76-0% — of salmon which had spent three years on migration, as is apparent from the Kemi, Oulu and Kokemäki rivers on the Finnish side. All observations made in Sweden if combined — in-as- much as they deal with salmon which have ascended rivers entering the Gulf of Bothnia — give a similar general view of the life-cycle groups determining the size of the catch. From this it appears that about half, i. e., 54-4°/o, of all salmon ascending the rivers belong to life-cycle classes which previously to ascending the rivers have spent three years on migration, and that the following group, 30-7 °/0, consists of salmon that have spent two years — excluding the ascending year — on migration.
The following figures are available as regards the length of the migratory period of salmon obtained from the southern parts of the Baltic (D i x o n ) :—
D i x o n : a. Salmon caught with drift-nets: Number of Percentage
Fish in- -------------------- ------------vestigated A.2 + A.3-)- A.4 +
1928................ 100 33-0 «5-0 2-0193 1 ................ 176 70-0 22-0 7-0193 2 ................... 90 73-0 26-0 1-0193 3 ................... 98 53-0 40-0 3-0
T o ta l. . . 464 57-0 38-0 3-0
b. Salmon caught with hooks:—1928................... 30 17-0 63-0 20-01933................... 67 32-0 5 7 0 11-0
A.5 +
1-0
3-0
2-0
T o ta l.. 97 25-0 60 0 15-0
The figures respecting salmon caught in East Prussia given by W i l l e r and Qu e d n a u (1934, Tab. 10 s.) are as follows: (The compilers apparently have not differentiated between salmon which have already ascended the rivers and those that have returned to the sea, as their table included 12 salmon which had spent six years, one seven years and one ten years in the sea; I have deleted the last two from the following table, on Duration in Sea):—
D u r a t i o n in Sea. Number Percentage
Group . .
1928/291929/301930/31
A.l A.2 A.3 A.4 A.5 A.6 Salmoninvestig. A.l A.2 A.3 A.4 A.5 A.6
— 5 18 42 20 9 96 — 5-2 18-8 43-8 20-8 9-4— 46 194 81 25 2 348 — 13-2 55-7 23-3 7-2 0-611 352 203 90 26 1 683 1-6 51-5 29-7 13-2 3-8 0-2
T o ta l. . . 11 403 415 213 71 12 1127 1-0 35-8 36-9 18-9 6-3 1-4
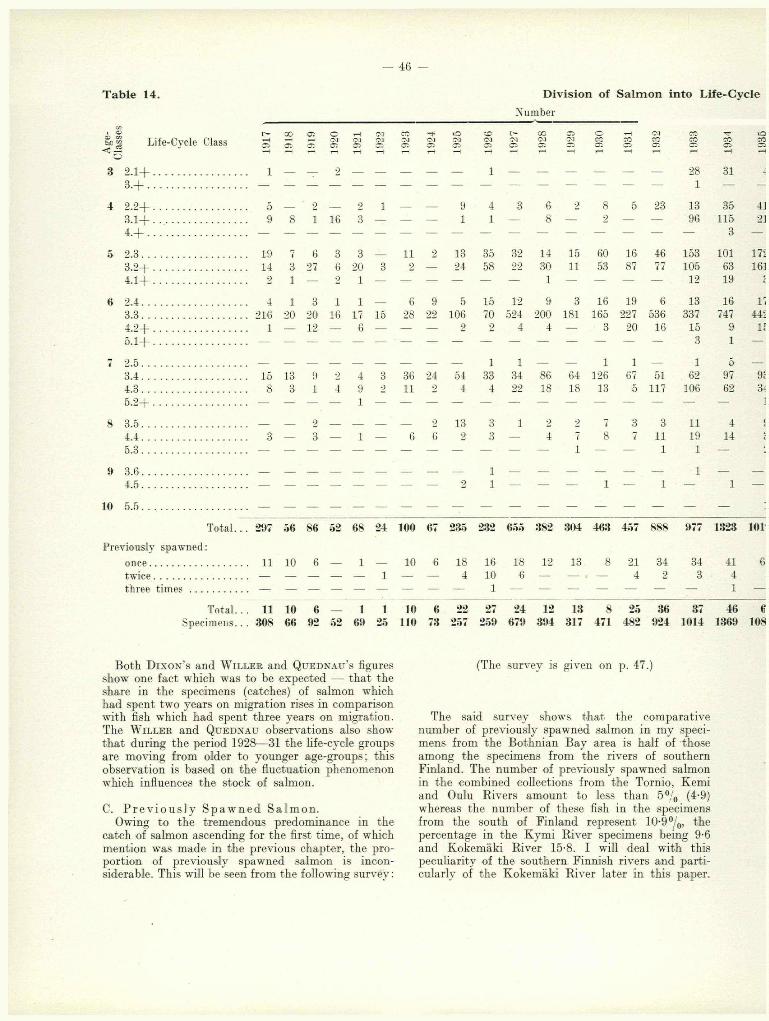
— 46 -
Table 14. D iv ision of S a lm on into Life-Cycle
Number
So 1 L ife -C v o le Classt'ai
00
19
19 o
2?t-H<M 03
CO
19
24
19
25
19
26
19
27 00
<NrH 1
92
9
19
30 rH
COC5t-H 1
93
2
19
33
19
34
19
35
8 2 . 1 + ......................................... . 1 — — 2 — ---- ---- ---- — 1 — — — — — — 28 31 4
3 + ............................................ __ __ __ __ __ __ __ ---- __ ---- --- ---- ---- 1 ---- __
4 2 . 2 + ......................................... 5 0, 2 1 9 4 3 fi 2 8 5 23 13 35 41
3 . 1 + ......................................... 9 8 1 16 3 1 1 8 __ 2 96 115 21
4 + ............................................ 3
5 2 . 3 .............................................. . 19 7 6 3 3 __ 11 2 13 35 32 14 15 60 16 46 153 101 17S
3 . 2 + ......................................... . 14 3 27 6 20 3 2 — 2 4 58 22 30 11 53 87 77 105 63 16]
4 . 1 + ......................................... 2 1 — 2 1 1 12 19 «
6 2 . 4 .............................................. . 4 1 3 1 1 __ 6 9 5 15 12 9 3 16 19 6 13 16 l i
3 . 3 .............................................. . 216 20 20 16 17 15 28 22 106 70 5 2 4 20 0 181 1 6 5 227 53 6 33 7 747 44-
4 - 2 + ......................................... 1 — 12 — 6 — — — 2 2 4 4 — 3 20 16 15 9 I f
5 . 1 + ......................................... 3 1 —
7 2 . 5 .............................................. __ __ __ __ __ __ __ — — 1 1 — — 1 1 — 1 5 —
3 . 4 .............................................. . 15 13 9 2 4 3 36 24 54 33 34 86 64 126 67 51 62 97 9J
4.3................................... . 8 3 1 4 9 2 11 2 4 4 22 18 18 13 5 117 106 62 3^
5 .2 + .................... 1 ]
8 3 . 5 ...................... __ __ 2 __ __ __ __ 2 13 3 1 2 2 7 3 3 11 4 Ç
4 . 4 ...................... . 3 — 3 — 1 — 6 G 2 3 — 4 7 8 7 11 19 14 £5 . 3 ...................... 1 1 1 —
9 3 . 6 ...................... 1 1
4 . 5 ...................... . — — — — — — — — 2 1 — — — 1 — 1 — 1 ---
10 5 . 5 ......................
T o t a l . . . 29 7 56 86 52 68 24 100 <>7 235 232 655 382 304 463 457 888 977 1323 101
P r e v io u s ly s p a w n e d :
o n c e ..................... . 11 10 6 — 1 — 10 6 18 16 18 12 13 8 21 34 34 41 6
t w i c e .................... . — — — — — 1 — — 4 10 6 — — « — 4 2 3 4three times .................. 1 1 —
T o t a l . . . 11 10 6 — 1 1 10 6 22 27 24 12 13 8 25 36 37 46 6Specimens.. . SOS 66 92 52 69 25 110 78 2 5 7 259 679 394 317 471 482 924 1014 1369 108
Both D i x o n ’s and W i l l e r and Qu e d n a u ’s figures show one fact which was to be expected — that the share in the specimens (catches) of salmon which had spent two years on migration rises in comparison with fish which had spent three years on migration. The W i l l e r and Q u e d n a u observations also show that during the period 1928— 31 the life-cycle groups are moving from older to younger age-groups; this observation is based on the fluctuation phenomenon which influences the stock of salmon.
C. P r e v i o u s l y S p a w n e d S a lm o n .Owing to the tremendous predominance in the
catch of salmon ascending for the first time, of which mention was made in the previous chapter, the proportion of previously spawned salmon is inconsiderable. This will be seen from the following survey:
(The survey is given on p. 47.)
The said survey shows that the comparative number of previously spawned salmon in my specimens from the Bothnian Bay area is half of those among the specimens from the rivers of southern Finland. The number of previously spawned salmon in the combined collections from the Tornio, Kemi and Oulu Rivers amount to less than 5% (4-9) whereas the number of these fish in the specimens from the south of Finland represent 10-9 °/0, the percentage in the Kymi River specimens being 9-6 and Kokemäki River 15-8. I will deal with this peculiarity of the southern Finnish rivers and particularly of the Kokemäki River later in this paper.
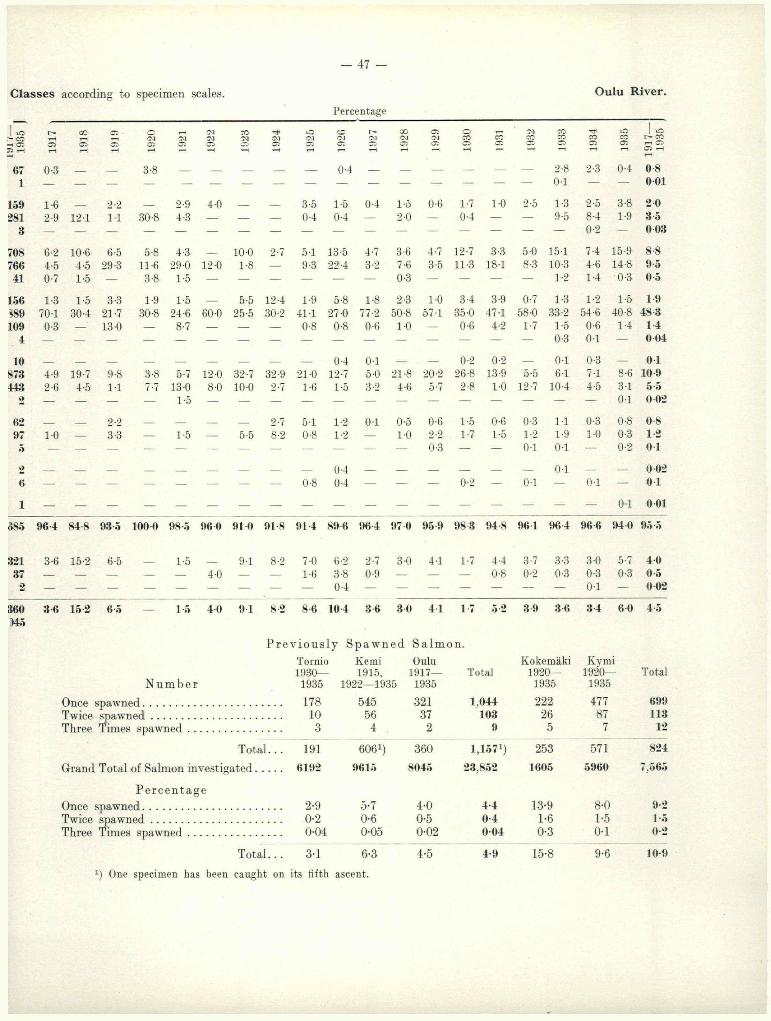
— 47 —
C lasses according to specimen scales. Oulu R iver.
Percentage
1 to > CO -H Ci 75 r-H ■H
T—1C5tH 19
18
1919 <NCTi 1921
1922
1923
1924
1925
1926 o-OJ
1928 œwcr: 1930
1931
1932
1933
1934
1935
1917
—19
35
671
0-3 — — 3-8 — — — — — 0-4 — — — — — — 2-8 2-3 0-4 0-8001
159281
3
1-62-9 121
2-211 30-8
2-94-3
4-0 ——
3-50-4
1-50-4
0-4 1-52-0
0-6 1-70-4
1-0 2-5 1-39-5
2-58-40-2
3-81-9
2 03-5003
70876641
6-24-50-7
10-64-51-5
6-529-3
5-811-6
3-8
4-329-0
1-512-0
10-01-8
2-7 5-19-3
13-522-4
4-73-2
3-67-60-3
4-73-5
12-711-3
3-318-1
5-08-3
15-110-3
1-2
7-44-61-4
15-914-80-3
8-8 9 5 0-5
156389109
4
1-370-10-3
1-530-4
3-321-713-0
1-930-8
1-524-6
8-760-0
5-525-5
12-430-2
1-94M0-8
5-827-0
0-8
1-877-20-6
2-350-8
1-0
1-057-1
3-435-00-6
3-9 47-1
4-2
0-7 58-0
1-7
1-333-2
1-50-3
1-254-6
0-60-1
1-540-8
1-4
19 48 3
1 4 0 04
10873443
2
4-92-6
19-74-5
9-81-1
3-87-7
5-713-0
12 0 8-0
32-710-0
32-92-7
21-01-6
0-4 12-7
1-5
0-15-03-2
21-84-6
20-25-7
0-226-8
2-8
0-213-9
1-05-5
12-7
0-16-1
10-4
0-37-14-5
8-63-1
01 10 95-5
6297
51-0
— 2-23-3
---1-5
---5-5
2-78-2
5-10-8
1-21-2
0-1 0-61-0
0-62-20-3
1-51-7
0-61-5
0-31-2 0-1
1-11-90-1
0-31-0
0-80-30-2
0-81 201
26 __ __ _ __ __ _ _ _ 0-8
0-40-4 __ __ __ 0-2 __ 0-1
0-10-1 —
0 02 0 1
1 0-1 0 01
885 964 84-8 93 5 100 0 98-5 96 0 91 0 91 -8 91 4 89-6 96 4 97 0 95 9 98 3 94 8 961 96 4 96 6 94 0 95-5
321
372
3-6 15-2 6-5—
1-54-0
9-1 8-2 7-01-6
6-23-80-4
2-70-9
3-0 4-1 1-7 4-40-8
3-70-2
3-3
0-3
3-0
0-3
0-1
5-70-3
4 0 0 5 0 02
360 3 6 15 2 6-5 — 1 -5 4 0 91 8-2 8-6 10 4 3 6 3 0 4 1 17 5 2 3 9 3 6 8 4 6 0 4 5Ï45
P r e v i o u s l y S p a w n e d S a lm o n .
Tornio Kemi Oulu Kokemäki Kymi1930— 1915, 1917— Total 1920— 1920— Total
N u m b e r 1935 1922—1935 1935 1935 1935
Once spawned................................................. 178 545 321 1,044 222 477 699Twice sp aw n ed .............................................. 10 56 37 103 26 87 113Three Times spawned................................. 3 4 2 9 5 7 12
T ota l.. 191 6061) 360 M 5 7 1) 253 571 824
Grand Total of Salmon investigated. . . . . 6192 9615 8045 23,852 1605 5960 7,565
P e r c e n ta g eOnce spawned................................................. 2-9 5-7 4-0 4-4 13-9 8-0 9-2Twice spaw ned............................................ 0-2 0-6 0-5 0 4 1-6 1-5 1 -5Three Times spaw ned................................. 0-04 0-05 0-02 004 0-3 0-1 0-2
T ota l.. 3-1 6-3 4-5 4-9 15-8 9-6 10-9
*) One specimen has been caught on its fifth ascent.
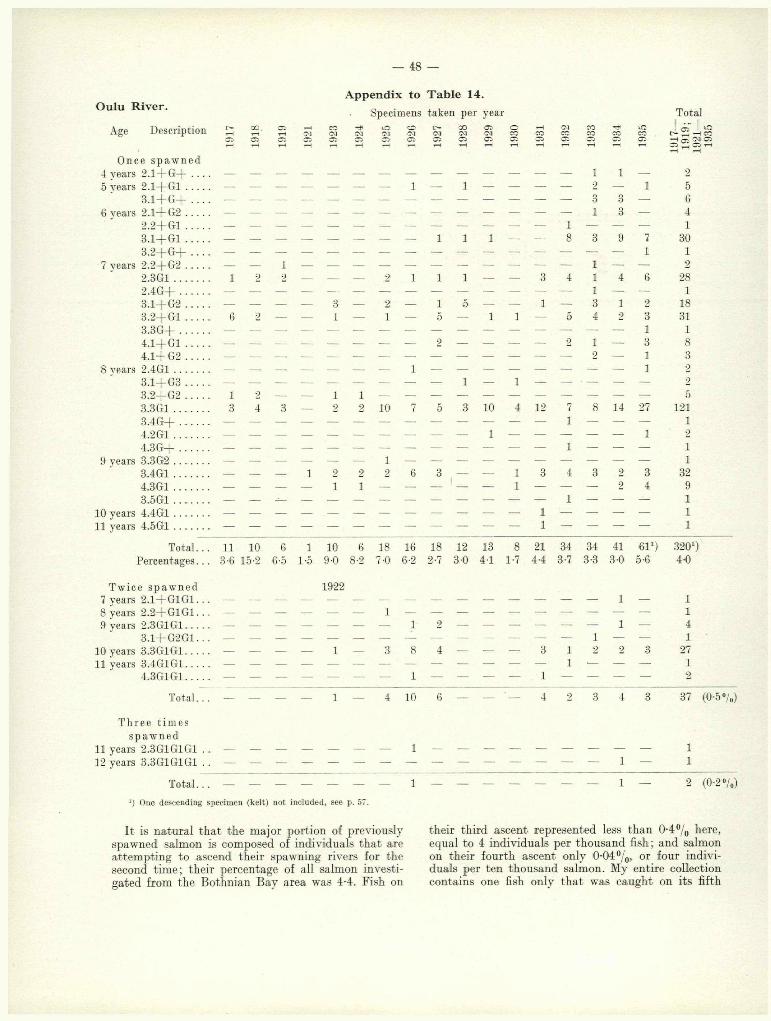
— 48 —
Oulu River.
Age Description
A ppendix to T ab le 14.
Specimens taken per year TotalCO.rH05
05 y—t05
CM05
o05
oCO05
CMCO05
CO i&CO CO CO05 05 05
Once4 years 25 years 2
36 years 2
233
7 years 2223334 4. 2 3 3.3, 34, 4. 3.3.4.3.4. 4.
8 years
9 years
10 years11 years
spaw ned •1+G-f- . . . ,1+G l . . . . .1—I- Gr—|— . • • ,l-f-G2 ,2+G l 1+G1 . . . . 2 + G + . . . -2+G2 . . . ..3G1..........4 G + ........1+G2 . . . .
.2+G l . . . .3 G + .........1+G l . . . . 1+G2 . . . .
.4G1..........1 + G 3 . . . .2+G23G 1..........4 G + ........2G 1..........3 G + ........3G2..........4G 1..........3G 1..........5G 1..........4G 1..........5G1..........
T ota l... Percentages. . .
Twice spaw ned7 years 2.1+G1G18 years 2.2+G1G19 years 2.3G1G1. .
3.1+G2G110 years 3.3G1G1..11 years 3.4G1G1..
4.3G1G1..
1 1 _ _ _12
L1 5
3 3 — 61 3 — 4
— — — — — — — — — — — — — i — — — 11 1 1 — ' — 8 3 9 7 30
1 11 1 2
1 2 2 — — — 2 1 1 1 — — 3 4 1 4 6 28— — — — — — — — — — — — — — 1 — — 1— — — — 3 — 2 — 1 5 — — 1 — 3 1 2 18
6 2 — — 1 — 1 — 5 — 1 1 — 5 4 2 3 311 1
— — — — — — — — 9 — — — — 2 1 — 3 82 — 1 3
— — — — — — — 1 — — — — — — — — 1 2— — — — — — — — — 1 — 1 — — • — — — 2
1 2 — — 1 1 — — — — — — — — — — — 03 4 3 — 2 2 10 7 5 3 10 4 12 7 8 14 27 121
1 11 1 2
1 11 1
— — — 1 2 2 2 6 3 — — 1 3 4 3 2 3 32— — — — 1 1 — — — — — 1 — — — 2 4 9
1 11 11 1
11 10 6 1 10 6 18 16 18 12 13 8 21 34 34 41 61l) 3201)3-6 15-2 6-5 1-5 9-0 8-2 7-0 6-2 2-7 3 0 4*1 1-7 4-4 3-7 3-3 3-0 5-6 4-0
Total
192 2_ _ _ _ _ _ i _
_ _ _ _ _ _ 1 — — — — — — — — — —
— — — — —- — — — — — — — — — 1 — —
— — — — 1 — 3 8 4 — — — 3 1 2 2 3_ _ _ _ _ _ _ _ _ _ _ _ _ i _ _ _
_ _ _ _ _ _ _ 1 — — — — i _ _ _ _
- - - - - - 1 — 4 10 6 — — — 4 2 3 4 3
1141
2712
T hree tim es spaw ned
11 years 2.3G1G1G1 — 112 years 3.3G1G1G1 — — — — — — — — — — — 1 —
Total. . . — — — — — — — 1 — — — — — — — 1 —
‘) One descending specim en (kelt) n o t inc luded , see p. 57.
37 (0-5V.)
2 (0-2»/o)
It is natural that the major portion of previously spawned salmon is composed of individuals that are attempting to ascend their spawning rivers for the second time; their percentage of all salmon investigated from the Bothnian Bay area was 4-4. Fish on
their third ascent represented less than 0-4 °/0 here, equal to 4 individuals per thousand fish; and salmon on their fourth ascent only 0-04%, or four individuals per ten thousand salmon. My entire collection contains one fish only that was caught on its fifth

- 49 -
T able 15. D iv is ion of S a lm on in to Life-Cycle C la sse saccording to specimen scales.
Number
K okem äki R iver.
Percentage
• I Life-Cycle g ® 5Class « « «
3 2.1+
CO 05 O tH 03 ^<M 03 CO CO CO CO05 05 05 05 05 05
VO I xO CO »OCO 05 03 05tH 05 -H
COCM05
CO
05
05CM05
co ioco05 03 05tH 05 rH
Total
1 — — 0-4 0-2 — — — — — 01
01
4 1 . 3 ........... 1 1 0-2
2 . 2 + . . . . . 8 17 3 3 5 — 5 6 9 20 76 3-4 4-1 1-5 3-0 5-3 — 17-8 7-2 5-6 11-63 . 1 + . . . . . — 1 — — — — 1 — — — 2 — 0-2 — — — — 3-6 — — —
5 2 . 3 ........... . . 117 22 7 8 8 3 0 3 6 88 2 3 4 11 8 98 838 50-4 54-3 4 5 1 30-0 37-9 73-2 7-1 41-0 72-8 57 03 . 2 + . . . . . 4 5 3 1 1 2 1 3 3 8 31 1-7 1-2 1-5 1-0 1-0 1-7 3-6 3-6 1-9 4-6
6 2 . 4 ........... . . 50 65 22 23 11 11 7 2 11 18 220 21-6 15-6 11-3 23 0 11-6 9-2 25-0 2 -4 6-8 1 0-53 . 3 ........... . . 31 14 12 13 12 6 1 19 12 14 134 13-4 3-3 6-1 13-0 12-7 5-0 3-6 22-9 7-4 8-1
7 2 . 5 ........... .. — 2 2 1 1 — 1 — 1 2 10 — 0-5 1-0 1-0 1-0 ____ 3-6 ____ 0-6 1-23 . 4 ........... . . 1 12 2 5 7 2 2 2 1 1 35 0-4 2-9 1-0 5-0 7-4 1-7 7-1 2-4 0-6 0-64 . 3 ........... . . — — — — 1 — — 1 — — 2 — — — — 1-0 — — 1-2 — —
8 4 . 4 ........... . . — — — 1 — — — — — — 1 — — — 1-0 — — — — — —
212 .345 132 77 74 109 20 67 155 161 1352 918 82 5 67 7 77 0 77 9 90 8 71 4 80 7 95 7 93 6 84-2
Previously spawned:
on ce ................ 19 64 62twice............three times .
TotalSpecimens
11 —
14 17 9 7 14 5 11 2227 4 2 — 1 2 — 262 -------1 1 — — 5
8-3 15-3 31'8 14-0 17-9 7-5 25-0 16-9 3-1 6-4 13-90-4 2-0 0-5 7-0 4-2 1-7 — 1-2 1-2 — 1-6— 0-2 — 2 0 — — 3-6 1-2 — — 0 3
20 73 63 23 21 11 8 16 7 11 253 8 7 17 5 32 3 23 0 221 9 2 28 6 19 3 4 3 6 4 15 8232 418 195 100 95 120 28 83 162 172 1605
Age Description
Once spawned4 years 2 .1 + G + ............6 years 2.1-f-G2................
7 years
8 years
9 years
2.2+G1. 2.3G1. . . 3.2+G l. 2.4G1. . . 3.3G1. . . 3.4G1...
Total... Percentage..
Twice spawned9 years 2.3G1G1..................
3.2G1G1....................10 vears 2.4G1G1....................
3.3G1G1....................
Total. . .
Three tim es spawned11 vears 2.3G1G1G1................
1925 1926
i
A ppendix to Tab le 15.
Specimens taken per year. 1927 1928 1929 1930 1931 1932 1933 1934
K okem äki River.
1935 Total
32
13
1
150
1101
11
42 8 141
22
i6 13
— 14
119
j.
59
161a
110
62
42
1
223
— 1 — — —V
27152
198-3
6415-3
6231-8
1414-0
1717-9
97-5 :
725-0
1416-9 —
53-1
116-4
22213-8
1 6 1 21
3 — — 1 — 1 — 151
— 2 — 4 12
— — 1 —
28
1 8 1 7 4 2 — 1 — 2 — 26 (1-6%)
_ 1 _ 2 _ _ 1 1 . _ _ _ 5
5 (0-3°/„)
4

— 50 -
T ab le 16.
O Ö3 biD 2« 6
Life-Cycle Class
1.1+ ,
1.2+ 2.1+ .
1.3 .. 2.2+ 3 .1+
1 .4 ..2.3 .. 3.2+
2.4 .. 3.3 ..
7 2.5 . 3.4 . 4.3 .
8 3.5 .
D iv is ion of S a lm o n in to Life-Cycle
Number
oj mCN <M05 05
OJ05
00(M05
oCO05
CO CO05 02
18 47 — — 2 1 72 15 10 11 7 58 30
_ __ 3 __ __ __ __ 1 5 — — _ — — —
61 40 26 3 8 29 228 110 65 38 7 121 189 3 •2;
7 9 3 3 2 1 9 2 __ ■
35 64 47 85 66 54 58 291 170 166 63 30 112 14 13i5 5 — — 1 8 15 26 7 7 2 10 32 1 1
1 8 5 8 26 37 15 12 32 29 37 8 5 — i:4 13 4 4 4 14 13 10 26 7 19 10 7 3
1 1 — •2 — —— 5 1 — 1 1 1 — 4 6 4 6 — — —
T otal.. . 182 184 86 101 108 144 413 468 323 268 140 255 .379 21Previously spawned:
once......................................... — 16 32 5 32 62 24 15 19 21 12 37 10 —tw ice....................................... — 5 1 3 4 4 13 6 3 5 1 8 8 —three t im e s ........................... . — — — — — — — — 2 1 — — 1 —
Specimens. . . — 21 33 8 36 66 37 21 24 27 13 45 19 —Total.. . 132 205 119 109 144 210 450 489 347 295 153 300 398 21Catch.. . — 269 832 839 454 324 450 490 347 295 153 302 398 23
19
12(
’) Few salm on w ere ob ta in ed from L anginkoski R ap id s in 1933. This is not, however, due to a bad salm on year. On th e con trary th e sum m er was d id n o t rise to seines, as K oivukoski R ap ids were th e n u n d er construc tion . A t th e beginning of Septem ber th e w ate r was l x/2 m. below th e level of th e previo '
K ym i R iver. L an gin kosk i RapidsA ppendix to Table 16.
Age Description 1921 1922 1923 1924 1925Specimens taken per
1926 1927 1928 1929year
1930 1931 1932 1933 1934 1935Total
1921—1935Once s pawned
4 years 2 .1 + G + ___ __ __ __ __ __ 2 __ — —. — __')
— ;-- 2
5 years 2 .1 + G 1 ........ 4 — --- 2 — 3 4 — — — 2 3 --- — --- 182 .2 + G + . . . . 1 i 2
6 years 2 .1 + G 2 ........ 2 — --- — — — — — 1 — — — --- — --- 32 .2 + G 1 ........ — 13 --- 12 3 1 3 7 8 2 1 — --- 4 --- 543 .1 + G 1 ........ 2 — --- 3 — — — — — — — — --- — --- 5
7 years 2 .2 + G 2 ........ — — --- 1 — — — — — — — — --- — --- 12.3G1............ 6 15 5 13 55 14 4 9 9 9 29 4 --- 2 9 1833 .2 + G 1 ........ — 1 — — 2 — 2 — 3 — — — — 1 — 9
8 years 2.4G1............ — — — — 1 1 — 1 — 1 — — --- — — 43.3G1............ 2 3 — 1 1 2 2 1 — — 5 3 --- — 1 21
9 years 3.4G1............ 1 1
T ota l... 16 32 5 32 62 24 15 19 21 12 37 10 --- 7 11 303Percentages. . . 7-8 26-9 4*6 22-2 29-5 5-3 31 5-5 7-1 7-8 12-3 2-5 — 3-4 6-0 8-1
*) No scales collected.
ascent. This fish was obtained in the estuary of the Kemi River (Valkeakari waters) on June 9th 1932, and is a male, 124cm. in length and 19-0kg. in weight. A photograph of one of its scales is published on
pp. 40— 41, Fig. 48— 50 of the guide compiled by W. M. M en zies and the author (1936). As mentioned in this guide (p. 8) the scales of this fish were exceptional in so far as the deformation usually present

— 51 -
C lasses according to specimen scales. K ym i R iver: L anginkosk i.
Percentage
19
35 1 oO COoa oO 1—<
1
0M011
92
1
19
22
19
23
19
24
19
25
19
26
19
27
1928
(
19
29
19
30
19
31
19
32
19
33
19
34
19
35
19
20
—
19
35
— 3 0-80 1
a0 1
11 2 8 9 13-6 2 3 0 — --- 1-4 0-5 16-0 3-1 2-9 3-7 4-6 19-3 7-5 — 3-4 6-0 7-7
— 9 — — 2-5 --- — — — 0-2 1-4 __ __ __ _0-2
18 9 6 7 46-2 19-5 21-9 2-8 5-6 13-8 50-7 22-5 18-7 12-9 4-6 40-4 47-5 14-3 10-2 9-8 2 5 72 41 5-3 — — — — — 2 0 0-6 0-9 0-7 0-7 3-0 0-5 — 1-5 1-1 1 1
— 2 — — — 0-9 — — — — __ 0-3 __ __ _0 1
81 1 4 7 2 26-5 31-2 39-5 78-0 45-8 25-7 13 0 59-5 4 9-0 56-4 41-1 10 -0 28-2 66-6 66-0 44-0 3 9 11 131 3-8 2-4 — — 0-7 3-8 3-3 5-3 2-0 2-4 1 3 3-3 8-0 4-8 5-3 0-5 3 5
26 2 6 2 0-8 3-9 4-2 7-3 1 8-0 17-6 3-3 2-5 9-2 9-8 24-2 2-7 1-3 6-3 14-1 7 029 17 1 3-0 6-4 3-4 3-6 2-8 6-7 2-9 2-0 7-5 2-4 12-4 3-3 1-7 14-3 1-9 15-8 4 -5
— o __ __ 0-5 0 13 32 — 2-4 0-8 — 0-7 0-5 0-2 — 1-2 2-0 2-6 2-0 --- --- 1-6 0-8
--- 0-5 --- — — 0 11 --- --- — — — — 0-2 — — — — — — --- — — 0 0 3
171 3 3 8 9 1000 8 9-8 72 3 926 75 0 6 8 -6 91 -8 95-7 9 3 1 9 0 9 91 5 8 5 0 9 5 2 1000 9 5 1 9 2 9 9 0 1
11 3 0 3 — 7-8 26-9 4-6 22-2 29-5 5-3 3 4 5-5 7-1 7-8 12-3 2-5 3-4 6-0 8-11 6 4 — 2-4 0-8 2-8 2-8 1-9 2-9 1-2 0-9 1-7 0-7 2-7 2-0 — 1-0 0-6 1 71 6 — — — — — — — — 0-5 0-3 — — 0-3 — 0-5 0-5 0 1
IS 3 7 3 — 10 2 27 7 74 2 5 0 3 1 4 8-2 4 3 6 9 9 1 8-5 15 0 4-8 — 4 9 7 1 9-9
188 —
in qUe8ti° n ' hC Water WaS extreffiely ,ow a t ^ « o s k i R ap id s and th e salm on
Ae-e Dpscrintinn Specimens taken per year Totalge escript 011 1921 1922 1923 1924 1925 1926 1927 1928 1929 1930 1931 1932 1933 1934 1935 1921-1935
Twice spawned7 years 2.1+G1G1.. . — — — — x 18 years 2.1-)-G2Gl.. . — — 1 — — — _ __ __ __ __ __ __ __ __
2.2+G1G1... — — — 2 2
Total... 5 1 3 4 4 13 6 3 5 1 8 8 — 2
Three tim es sp aw n ed 1)
10 years 2.2G1G1G1 ... — — _ — — 1 _ _11 years 2.3G1G1G1 . . _ _ _ _ _ _ _ \ i _ _ _ _ 1
129 years 2.3G1G1........ 3 1 2 2 2 4 5 3 3 1 7 7 — 1 1 42
3.2+G 1G1... — — — — — 1 — — _ _ _ _ _ _ _ _ i10 years 2.4G1G1........ — — — — — \ j ̂ 3
3.3G1G1.............. 2 — — — — — 1 _ ] _ _ _ _ _ _
64 (1-7%)
— 11 4
Total... _ _ _ _ _ _ _ ! i _ _ x _ x j 5(0-1%)
') One descending salm on (kelt) n o t inc luded, see p . 57.
in scales of previously spawned salmon had not once spread to the inner edge of the scale, but only made its appearance on the outer edge. From this the conclusion — always, of course, uncertain to some extent — was drawn that this salmon had probably not made complete ascents, i .e . , those lasting the
whole winter, but only shorter trips. This fish had apparently happened to make these ascents in successive years. If we do not assume this the fish would have been of an absolutely exceptional age.
The relative quantity of previously spawned salmon also reflects the changes due to the phenomenon of
4*

- 52 —
Table 17 A. D iv is ion of S a lm on in to Life-Cycle C lassesaccording to specimen scales. K ym i R iver: A hvenk osk i.
3 2 .1 + . . . 2 34 1 ' —4 1 .3 . . . . . — 1 1 —
2 .2 + . . . 29 16 47 13 .1 + . . . 3 2 — —-
5 2 .3 . . . . . 46 33 22 323 .2 + . . . 12 16 3 14 .1 + . . . — 1 — —
6 2 .4 . . . . . — • 2 — 13 .3 . . . . . 3 6 23 3
4 .2 + . . . — 1 — —7 3 .4 . . . . . — 1 — ---
Total. . . 94 111 97 38Previously spawned:
once . . . . 10 11 10 1twice.. . . 2 1 1 —
Total. . . 12 12 11 1Specimens. . . 106 123 108 39
A pp en dix to T able 17 A.A hvenkoski R apids. o tH CO 1 CO(M 03 O 0-1
05T—i T—I t-H 05 r-f
Once spawned:6 years 2.1+G 1.......... 3 6 -- -- 86 years 2.1+G 2.......... — 3 -- -- 3
2 .2 + G1 2 — 3 1 63.1+G1 . . . 1 — — -- 1
7 years 2.3G1.............. 1 1 6 -- 88 years 3.3G1.............. 3 1 1 -- 59 years 3.3G2.............. — 1 — -- 1
Total. . . 10 11 10 1 32 (8-5%)Percentages. . . 9-4 9-0 9-3 2-6
Twice spawned:8 years 2.2+G1G1 . . . — 1 — — 1
9 vears 2.3G1G1........ 2 — — — 23.2G1G1 — — 1 — 1
Total. .. 2 1 1 — 4 (1.1 °/o)
fluctuation. During the declining fishing seasons the relative quantity of re-ascending individuals naturally increases, reaching its maximum during bad salmon years, whereas during good seasons the number of previously spawned salmon sinks to a minimum. If we take into account the specimens gathered since 1925, we find that that year was a maximum year for previously spawned salmon in the Kemi River — in all 16-7% of all salmon investigated, fish ascending for the second time amounting to 14-6 %. The corresponding maximum in the Oulu River specimens was in 1926 : re-ascending salmon amounting to 10-4 °/0; the number of salmon on their
1 CO O 03
oOJ 03
19
22 CO
0305
1 CO O 03 03 0503 05
05 tH05tH T—1 T—I 05 tH
rH
37 1-9 27-6 0-9 --- 9 92 — 0-8 0-9 --- 0 5
93 27-4 13-0 43-5 2-6 24-75 2-8 1-6 — — 13
132 42-6 26-9 20-4 82-0 35131 11-3 12-2 2-8 2-6 8-2
1 — 0-8 — — 0 3
3 __ 1-6 — 2-6 0-83 4 2-8 4-1 21-3 7-6 9 0
1 — 0-8 — — 0 31 — 0-8 — — 0 3
340 88-7 902 89-8 97 4 904
32 9-4 9-0 9-3 2-6 8-54 1-9 0-8 0-9 — 1 1
36 113 9-8 10 2 2 6 9 6376
third ascent was particularly high (3-8%), corresponding to 10 out of the 259 specimens (total catch 312 salmon). Re-ascending salmon just touched their minimum in the Kemi River specimens in 1928 3-7% or 12 out of 322 specimens; and in the Oulu River in 1930 1-7% or 8 out of 471 specimens.
I have already observed that specimens from the salmon rivers of southern Finland do not produce the same results as regards the number of re-ascending salmon compared with the specimens from the Both- nian Bay salmon area. The former ratios are twice those of the latter. This is the case with salmon ascending the Kymi River, but also, and, indeed, particularly, the Kokemäki River (Lukkarinsanta fishing ground).
The Kymi River figures of the proportion of previously spawned salmon compared with the total salmon caught must be considered as more normal than those of the Kokemäki River: Re-ascending salmon reached a maximum in comparative quantities also at the Kymi River fishing grounds in 1924 and 1925 — Langinkoski Rapids 1924, 25-0°/o (36 out of 144 specimens) and 1925, 31-4% (66 out of 210 specimens); Ränninkoski Rapids 1925, 22-8°/0 (33 out of 145 specimens). Re-ascending salmon were at a minimum at Langinkoski Rapids in 1927, 1932 and 1934 — 4-3 °/0— 4-9 %; at Ränninkoski Rapids in 1927 and 1932 — 3-7% and 5-8% (the percentage in 1934 was 10-8).
Compared with salmon ascending for the first time the number of previously spawned fish was very high for several years in the Kokemäki River specimens: 1926, 17-5% (73 specimens); 1927, 32-3°/0 (63 specimens); 1928, 23-0% (23 specimens); 1929, 22-1% (21 specimens); 1931, 28-6% (8 specimens); 1932,

— 53 —
19-3% (16 specimens). Only in 1925, 1930, 1934 and 1935 did the percentage of previously spawned salmon fall below 10% (varying from 4-3% in 1934 to 9-2% in 1932). I am of the opinion that the reason for the above must be sought in the following conditions : The relative abundance of re-ascending salmon during the period 1925— 35 is due not only to the depreciation in the yield caused by the phenomenon of fluctuation, but also to the fact that this salmon river during the period under discussion was, so to speak, on its last legs as a salmon river. Industry has conquered this river to such an extent that its importance as a breeding ground for new generations of salmon is coming to an end. This is the reason for the sudden and rapid decline in the catches and at the same time, for the relative abun
dance of previously ascended and spawned salmon in the specimens.
The migratory period which is spent by salmon that have once ascended the river and then after spawning have returned to the sea before re-ascending, I have called the intermediate migratory 'period. The length of the intermediate migratory period of salmon among my specimens which have ascended the rivers on more than one occasion is shown in the following groupings (the variations in smolt-age have not been taken into consideration in these; if information on this point is required it can be found in the Appendices Tables to 12— 17).
Salmon caught on their second or third ascent may be grouped according to their intermediate migratory period as follows:
In the river: Tornio Kemi Oulu Kokemäki Kymi TotalGroup :A . 1 + G + ........................................................ 14 3 8 1 2 28A .1+G 1 + ........................................................ 35 30 43 — 48 156A .1+ G 2 .............................................................. 4 28 25 5 16 78A .1 + G 3 ............................................................. — 6 2 — — 8
T o ta l.................... 53 67 78 6 66 270Per mille of Grand Total........................... 8-6 7-0 9-7 3-7 11-1
Group :A . 2 + G + . . . ................................................. 4 4 1 — 2 11A .2+G 1 .......................................................... 20 77 34 11 98 240A .2 + G 2 .......................................................... — 4 7 — 3 14A .2 + G 3 .......................................................... — — — — — 0
T o ta l...................... 24 85 42 11 103 265Per mille of Grand Total........................... 3-9 8-8 5-2 6-9 17-3
Group :A .3 ( + ) G + ...................................................... 6 31 2 — 2 41A .3(+ )G 1........................................................ 86 292 158 176 296 1008A.3G2 .......................... — 1 1 — 1 3A .3 G 3 ............ — — — — — 0
T o ta l ..................................................................................... 9 2 3 2 4 161 176 2 9 9 1 0 5 2
Per mille of Grand Total............................ 14-9 33-7 20-0 109-7 50-2
Group :A .4 G + ..................................................... — 4 2 — — 6A .4 G 1 _____________________ ___________ 9 39 35 29 9 121A .4 G 2 ....................................... — — — — — 0
T o ta l................................................................. 9 43 37 29 9 127Per mille of Grand Total......................... 1-5 4-5 4-6 18-1 1-5
Group :A .5 G 1 .............................................................. — — 2 — — 2
Group :A .1+G 1G 1...................................................... — — 1 — 1 2A .1+G 2G 1...................................................... — 1 1 — 1 3
T o ta l................................................................... — 1 2 — 2Per mille of Grand T o t a l — 0-1 0-2 —• 0-3

— 54 —
In the river: Tornio Kemi Oulu Kokemäki Kymi TotalGroup :A .2 + G 1 G + ................................ .................. — 1 — — — 1A .2+G 1G 1.................................. .................. 2 9 1 1 22 35
T o ta l............................................. 9 10 1 1 22 36Per mille of Grand Total. . . .................. 0-3 1-0 0-1 0-6 3-7 —
Group :A.3G1G1...................................... .................. 8 42 33 23 60 166Per mille of Grand Total. . . .................. 1-3 4-4 4-1 14-3 10-1 —
Group :A.4G1G1...................................... .................. — 1 1 2 3 7Per mille of Grand Total. . . .................. — 0-1 0-1 1-2 0-5 —
So-called descending salmon, caught during return journey after spawning:
Group :A . l + G ........................................ .................... — 3 — — — 3A .2 + G ......................................... .................... — 3 — — — 3A .3 G ............................................. .................... — 18 1 — — 19A .4 G ............................................. .................... — 1 —- — — 1A.3G1G......................................... .................... — 3 — — — 3A.G 1G 1G .................................... .................... — — — — 1 1
T o ta l............................................. __ 28 1 — 1 30Per mille of Grand Total. . . .................... — 2-8 0-1 — 0-2 —
The following list comprises 1981 individuals of refer to this total, 30 of which (or l-5°/o) were caughtpreviously spawned salmon; the percentages given on the down journey after spawning:
Second Third Fourth AscentNo. 7o No. °/o No. 7 .
A . 1 + G + .............. 28 1-41 A .1+G 1G 1___ 2 0-10 — . — —A .1 + G 1 ( + ) .......... 156 7-88 — — — — — —A .1 + G 2 ................ 78 3-94 A .1+G 2G 1___ 3 0-15 A.1+G2G1G1 . . . . . 1 0-05A .1 + G 3 ................ 8 0-40 — — — — — . —
T otal.. . 270 13-63 5 0-25 1 0-05
A . 2 + G + .............. 11 0-56 A .2 + G 1 G + .. . 1 0-05 ____ ____ ____
A .2 + G 1 ................ 240 12-11 A .2+G 1G 1. . . . . 35 1-77 A.2+G1G1G1 . . . . . 3 0-15A .2 + G 2 ................ 14 0-71 — — — — — —
Total. . . 265 13-38 36 1-82 3 0-15
A .3 G + .................. 41 2-07 ____ — * ____ — — —
A .3 G 1 ..................... 1008 50-89 A.3G1G1........... . 166 8-38 A.3G 1G1G1......... . . 14 0-71A .3 G 2 ..................... 3 0-15 — — — — — —
Total. . , 1052 53-11 166 8-38 14 0-71
A .4 G + .................. 6 0-3 ____ — _ — — —
A .4 G 1 .................... 121 6-11 A.4G1G1........... 7 0-35 A.4G1G1G1......... 2 0-10
Total. . . 127 6-41 7 0 35 2 010
A .5 G 1 ........................................... 2 0-1 — — — — — —
Grand T ota l.. . 1716 86-63 20 1-01

— 55 —
With 1 specimen ascending for the 5th time: A .1 + G + G + G + G + (0-01%) and 30 ascending salmon (1-5%), the total of 1981 previous spawners has been reached.
It will be seen from these tables first of all — and this, by the way, is quite natural — that salmon which have ascended several times have generally originated in the life-cycle groups which, during the first ascent of the salmon, form the majority, i. e., are either predominant or are large complementary groups.
The tables show, for example, that the life-cycle group: A.3G1, is represented among the re-ascending salmon to the amount of 50-9%, and the groups: A .3G +, A.3G1 and A.3G2 by a total of 53-1%. This is in absolute conformity with the part played by the group A.3 in the specimens in their entirety; the share of the A.3 group in the Bothnian Bay specimens being 50% and in the specimens from southern Finnish rivers 42%. Correspondingly, the groups: A .2+ G and A . l+ G occupy the position of complementary groups among the re-ascending salmon, although their percentage is fairly small —13-4 and 13-6 — i. e., 27% combined. These main groups together represent 77-9% of the re-ascending salmon.
The corresponding life-cycle groups of salmon which have ascended a third or fourth time also make their appearance in a predominating or major supplementary status. With regard to the former, the predominating position is held by the A.3G1G1 group (166 specimens, 8-4%), the latter, by the A.3G1G1G1 group (14 specimens, 0-71 %)• The group A.2+G1G1 occupies the position of a supplementary group among the salmon ascending for the third time (36 specimens, 1-8%).
With regard to the length of the intermediate migratory period, it can be observed that with the great majority (89-3%), of all re-ascending salmon, it has lasted a full year, i. e., the re-ascent of the rivers occurs during the second summer after the return to the sea.
There are, nevertheless, individuals which have made their re-ascent after two full years on their intermediate migration, but there are only 78 specimens (or 3-9%) of this type. There are also even rarer individuals — only 8 specimens in all, corresponding to 0-4% of re-ascending salmon — which have spent three years before ascending a second time. I t is, nevertheless, noteworthy that all have originally made their first ascent as members of the group i. e., while in their grilse stage andthus still young. This phenomenon is also repeated among those fish that have spent two years on their first intermediate migration. Of these, only three specimens have originated in the group A.3, and 14 in the group A .2 + , but of those ascending at an early age, 78 specimens originated in the group A .1 + . It would therefore appear justified to state that salmon making their first ascent as grilse, are more liable than other salmon to spend a year longer on their intermediate migration. This, however, with regard to
salmon making their first ascent when older and weightier, occurs on very rare occasions only.
The surveys also show that there are certain re- ascending salmon which have spent only about half a year on their intermediate migration (marked -j~).
With regard to salmon included in this group, it should be mentioned that there has never been any definite knowledge as to whether the salmon should really have been included amongst those which have spent a full year on migration, i. e., G1 instead of G + . This group namely includes salmon in the scales of which the spawning mark is surrounded only by a “narrow” new area of growth, whereas in other fish it is wide and complete, clearly showing the summer and winter growth. Under these circumstances, I have considered it possible that the salmon included in this group have returned to the sea during the breeding autumn, and that, during the winter and spring seasons, they have become so strong and grown to such an extent that they have again ascended during the next summer season. They would thus have actually spent a longer period in the sea than that designated by the sign + , namely the preceding winter. Those salmon, on the other hand, that have spent more than a year on migration must be assumed, for the main part, to have remained in the river for the winter after spawning, and returned to the sea only during the spring floods. It should be mentioned also that there may be some uncertainty in distinguishing fish that have spent half a year, from those that have spent a full year, on their intermediate migration.
In support of the above statements on the periods of descent of kelts (spent), I would like to refer to the fact that my specimens, particularly those collected from the estuary of the Kemi Biver, also contain salmon that have just made their descent, and also to the indications given by certain marking results (see Jäkvi 1931). In these recently descended salmon, the inner edges of the scales terminate at the so-called spawning mark, without there being any indication in the scales of re-growth subsequent to absorption; in addition to this, the fish are very light in proportion to their length. Salmon of this type were represented by 26 specimens of salmon of one ascent in the Kemi River specimens for 1915— 35, corresponding to 0-3%, and of two ascents by 3 specimens. In the Oulu River specimens, they are represented by one salmon of one ascent, and in the Kymi River specimens by one fish of three ascents — in other words, very small quantities when the number of specimens is considered (see p. 57).
The following figures in respect of quantities of previously spawned salmon are given by R osén (1918, p. 39) and Alm (1934, p. 13) :
Of 163 salmon caught in 1915 in the Lule River, R osén found 5 specimens on their second ascent, corresponding roughly to 5% . 58 salmon caught the same year in the Pite River included 8 specimens
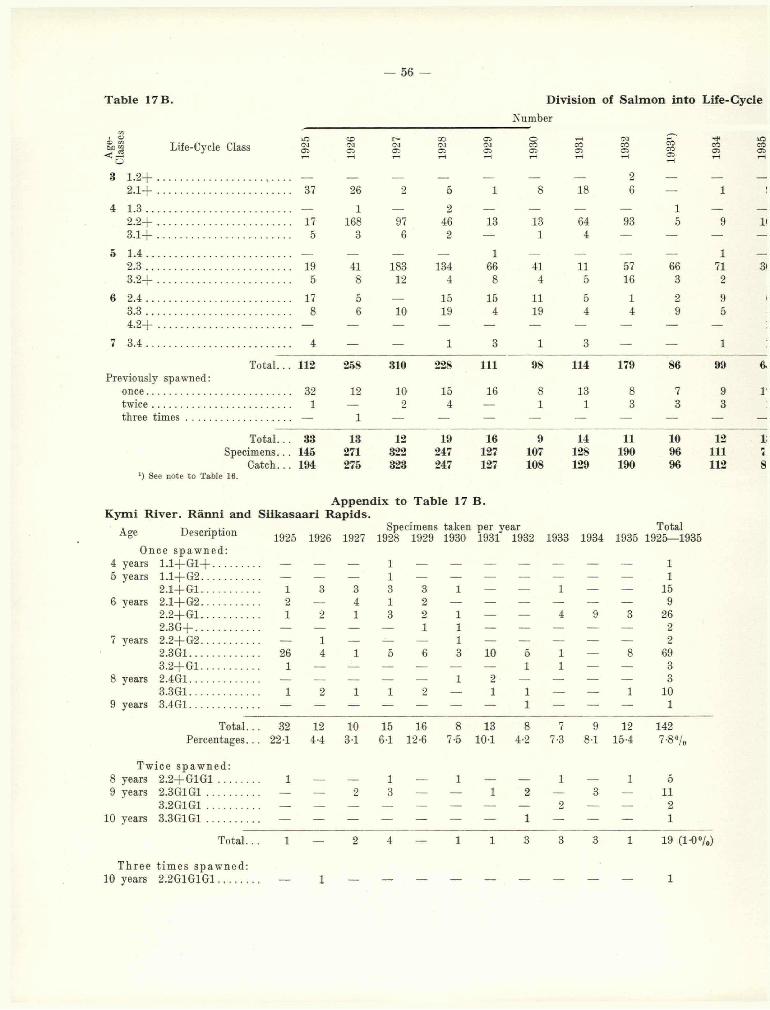
— 56
T able 17 B. D iv is ion of S a lm on in to Life-Cycle
Number
a?m g Life-Cycle Class
lO<M03rH 1926
1927
1928
1929
1930
1931
1932 COCO03rH 1934
3 1 . 2 + ......................................... ----- — — — — — — 2 ----- —
2 . 1 + ......................................... . . . 37 26 2 5 1 8 18 6 — 1
4 1 .3 ............................................. — 1 — 2 — — — — 1 —
2 . 2 + ......................................... . . . 17 168 97 46 13 13 64 93 5 93 . 1 + ......................................... . . . 5 3 6 2 — 1 4 — — —
5 1 .4 ............................................. — — — — 1 — — — — 12 .3 ............................................. . . . 19 41 183 134 66 41 11 57 66 713 . 2 + ......................................... . . . 5 8 12 4 8 4 5 16 3 2
6 2 .4 ............................................. . . . 17 5 — 15 15 11 5 1 2 93 .3 ............................................. . . . 8 6 10 19 4 19 4 4 9 54.2+
3.4 .. 3 — —
' ) See n o te to Table 16.
A ppendix to T able 17 B. K ym i R iver. R änni and S iik asaari R apids.
Age Description Specimens taken per year Total
Once spawned:4 years 1 .1 + G 1 + .. . .5 years 1.1+G2..........
2.1+G 1..........6 years 2.1+G 2..........
2.2+ G1......2.3G +............
7 years 2 .2 + G2..........2.3G1..............3 .2 + G1..........
8 years 2.4G1..............3.3G1..............
9 years 3.4G1..............
1925 1926 1927 1928 1929 1930 1931 1932 1933 1934 1935 1925—1935
261
10
21
1
11
159
2622
6933
101
T ota l.. 32 12 10 15 16 8 13 8 7 9 12 142Percentages.. . 22-1 4-4 31 6-1 12-6 7-5 10-1 4-2 7-3 8-1 15-4 7-8%
Twice spawned:8 years 2 .2+G 1G 1............ 1 — — 1 — 1 — — 1 — 1 59 years 2.3G1G1................ — — 2 3 — — 1 2 — 3 — 11
3.2G1G1................ — — — — — — — — 2 — — 210 years 3.3G1G1................ — — — — — — — 1 — — — 1
T ota l.. . 1 —
Three t i mes spawned :10 years 2.2G1G1G1.............. — 1
4 — 19 (1-0%)
lOCO05
T ota l.. . 112 258 310 228 111 98 114 179 86 99 6.Previously spawned:
once...................... . 32 12 10 15 16 8 13 8 7 9 rtw ice..................... 1 — 2 4 — 1 1 3 3 3three t im e s ......... . — 1
T ota l.. 33 13 12 19 16 9 14 11 10 12 l;
Specimens.. . 145 271 322 247 127 107 128 190 96 111 p4
Catch.. . 194 275 323 247 127 108 129 190 96 112 8

— 57 —
C lasses according to specimen scales. K ym i R iver: S iik asaari and R änn in kosk i.
Percentage
19
25
- s
1935
1925 CO
<N0 3 19
27
1928
1929
1930
1931 o a
CO0 5tH 19
33
1934
1935 1 vO
lO CO ™ 0 3 0 3 i—1 rH
0 16 2
z
113 25-5 9-6 0-6 2-0 0 - 8 7-5 14-11-0
3-2 — 0-9 11-5
4535
2111-7
3-4
0-4 62-0
1-1
30-11-9
0-8
18-60-8
10-2 12-2
0-950-0
3-149-0
1-0
5-2 8-1 12-8
0-2 29 4
11
2
71971
13-23-4
15-13-0
56-93-7
54-31-6
0-8
52-06-3
38-33-7
8-6
3-930-0
8-468-8
31
0-9 64-0
1-8
38-55-1
0 139 5
3 9
8692
1
11-75-5
1-8
2-2 316-1
7-711-8
3-110-317-8
3-931
0-52-1
2-1
9-48 - 1
4-57-75-11-3
4 7 5 0 0 1
14 2-8 — — 0-4 2-4 0-9 2-4 — — 0-9 1-3 0-8
1660 77-2 95-2 963 923 87-4 91-6 891 94-2 89-6 89-2 83 3 911
14219
1
22-1
0-74-4
0-4
310-6
6-1
1-6
12-6 7-50-9
10-1
0-8
4-21-6
7-33-1
8-1
2-715-41-3
7-81 00 1
162 22-8 4-8 37 7-7 12 6 8-4 109 5-8 10 4 10-8 16 7 8-918221882
A ppendix (B) to T ab les 13, 14 and 16: D escen d in g S a lm on (K elts).
Age Description
K em i R iver.
Once spawned:
1915 1923Specimens taken per year1928 1932 1933 1934 1935
Total...
Twice spawned:9 years 3.3G1G...........................................
O ulu R iver.Once spawned:
7 years 3.3G.................................................
K ym i R iver. L an gin kosk i R apids.
Three tim es spawned:10 years 2.3G1G1G......................................
16
1
Total1915—1935
5 years 2.2 - G ........................ .................... — — — — 1 — — 1
3 . 1 - G........................ .................... — — — — 3 — — 36 years 2.3G............................ .................. — — — 1 1 1 — 37 years 3.3G............................ .................. 1 — — 1 8 1 — 11
4.2G............................ .................. — — — 1 — — — 1
8 years 3.4G............................ .................... — 1 1
4.3G............................ .................. — — — — 3 1 — 4
24 (0-3°/.)

- 58 —
T able 18.
Smolt-Age
2 21 3........................... 996 4........................... 495 5........................... 66
Total.. . 1.578 Others1) . ..
R iver- and Sea-Life.. C om b in ations of T ab les 12— 17.
T ornio R iver (1930—1935)
A .1+ A.2+
161530828
23
23î)7
In Sea A .3+ A.4+
Number 49 7
1439 147312 38
3
1803 10 2
A.5+ Total A .l-f A.2+
1
201
0441321074
92
5992200
0-3 16-18-01-1
0-224-713-40-4
38-7
In Sea A .3+ A. 44-
Percentage 0-8 0-1
23-2 2-45-0 0-60-05
291 31
A. 5 +
0-020-3002
0 3
Total
1-5 06-7 27 0
15
96-832
20339
8712
1671918421
9
5144138
6103
70568
601
K em i R iver (1915—1935)
0-2 3-5 0-9 0-1
t
669
77870291180
'ö
1-819-94-40-1
5-3 43-0
6-3 0-03
0-75-90-60-01
0 1
0-70-02
8-1730123
0 2
Total. . .. 458 2515 5265 699 75 9012 4-8 26 1 54-7 7 2 0-8 936Others2) . . 618 6 4
Oulu R iver (1917—1935)>> 67 159 708 156 10 1100 0-8 2-0 8-8 1-9 0-1 1373 281 766 3889 873 62 5871 3-5 9-5 48-3 10-9 0-8 7304 41 109 443 97 6 696 0-5 1-4 5-5 1-2 0 1 8-75, 4 2 5 — 1 12 0-04 0-02 0-1 — 0-01 0 1
Total... 393 1036 5045 1126 79 7679 4 9 12 9 62 7 140 1 0 95 5Others3) . . 366 4-5
K okem äki R iver (1925—-1935)2 2 76 838 2 2 0 10 1146 0-1 4-7 52-2 13-7 0-6 7143 2 31 134 35 — 202 0-1 1-9 8-4 2-2 — 12 64 --- — 2 1 — 3 — — 0-1 0-1
—0 2
Total... 4 107 974 256 10 1351 0 2 6-7 60 7 160 0 6 84-2Others4) . . 254 15 8
K ym i R iver : L an gin kosk i R apids (1920--1925)
1 3 2 9 2 — 16 0-1 0-1 0-2 0 1 — 0 4•> 289 967 1472 262 5 2995 7-7 25-7 39-1 7-0 0-1 79-63 41 131 171 32 1 376 1-1 3-5 4-5 0-8 0-03 1004 . — - 2 — — 2 — — 0 1 — — 0 1
Total... 333 1100 1654 296 6 3389 8-8 29-2 44 0 7 9 0 2 901Others . . . . 373 9 9
K ym i R iver: A hvenk oski, S iik asaari and R änn in kosk i R apids (1920—1935)
1........................... — 2 6 2 — 10 — 0 1 0-3 0-1 2........................... 150 628 851 89 — 1718 6-8 28-6 38-7 4-0 3........................... 26 102 126 15 — 269 1-2 4-6 5-7 0-7 4........................... 1 2 — — — 3 005 0 1
T ota l... 177 734 983 106 — 2000 8 1 33 4 44 7 4 8Others. . . 198
1) om itted from ta b le : life-classes 4 + (4 spec.) and 5 + (5 spec.) »“) also life-classes 3 + (1 spec.), 4 + (1 spec.), 5 + (9 spec.), an d 1.3 (1 spec.) I . add ition Drevlonslv snaw nedd) also life-classes 3 + (1 spec.), 4 + (3 spec.), an d 3.6 (2 spec.) ( ad d itio n all prev iouslj spaw ned.*) also life-class 1.3 (1 spec.) J
0 5 78-2 12-2
0 1
91 09 0
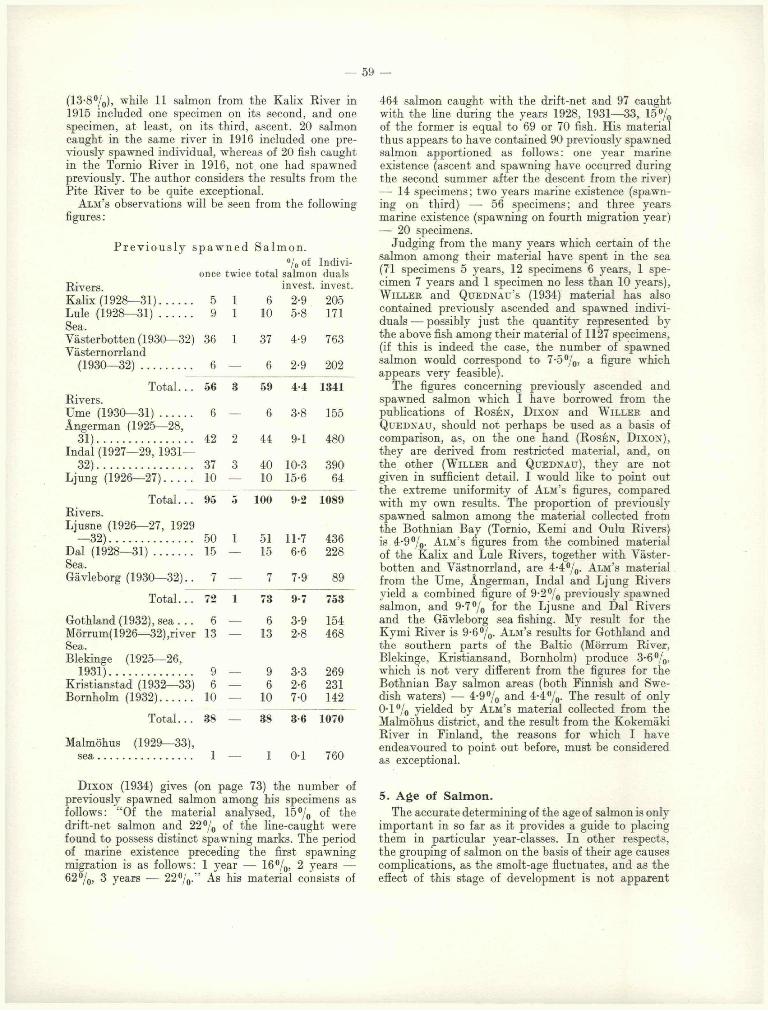
— 59 —
(13-8%), while 11 salmon from the Kalix River in 1915 included one specimen on its second, and one specimen, at least, on its third, ascent. 2 0 salmon caught in the same river in 1916 included one previously spawned individual, whereas of 2 0 fish caught in the Tornio River in 1916, not one had spawned previously. The author considers the results from the Pite River to be quite exceptional.
A l m ’s o b se rv a tio n s w ill be seen f ro m t h e fo llo w in g figu res :
P r e v i o u s l y s p a w n e d S a lm o n .
Rivers.Kalix (1928— 31)Lule (1928— 31)Sea.Västerbotten (1930—32) Västernorrland
(1930— 3 2 ) ..................
once twice
5 1 9 1
36 I
6 —
7o oftotal salmon
invest.6 2-9
10 5-8
37 4-9
6 2-9
Individualsinvest.205171
763
2 0 2
Total. . .Rivers.
56 3 59 4-4 1341
Ume (1930—31) Ångerman (1925— 28,
6 — 6 3-8 155
31)..................................Indal (1927— 29, 1931—
42 2 44 9-1 480
3 2).................................. 37 3 40 10-3 390Ljung (1926— 27).......... 1 0 — 1 0 15-6 64
Total. . .Rivers.Ljusne (1926—27, 1929
95 5 1 0 0 9-2 1089
— 32)............................. 50 1 51 11-7 436Dal (1928— 3 1 ) .............Sea.
15 — 15 6 -6 228
Gävleborg (1930— 32).. 7 — 7 7-9 89
Total. . . 72 1 73 9-7 753
Gothland (1932), sea . . . 6 — 6 3-9 154Mörrum( 1926—32),river Sea.Blekinge (1925— 26,
13 13 2 -8 468
1931)............................. 9 — 9 3-3 269Kristianstad (1932—33) 6 — 6 2 - 6 231Bornholm (1932)........... 1 0 — 1 0 7-0 142
T ota l.. .
Malmöhus (1929— 33),
38 38 3 6 1070
se a ................................. 1 — 1 0-1 760
464 salmon caught with the drift-net and 97 caught with the line during the years 1928, 1931— 33, 15% of the former is equal to 69 or 70 fish. His material thus appears to have contained 90 previously spawned salmon apportioned as follows : one year marine existence (ascent and spawning have occurred during the second summer after the descent from the river)— 14 specimens; two years marine existence (spawning on third) — 56 specimens; and three years marine existence (spawning on fourth migration year)— 2 0 specimens.
Judging from the many years which certain of the salmon among their material have spent in the sea (71 specimens 5 years, 12 specimens 6 years, 1 specimen 7 years and 1 specimen no less than 10 years), W i l l e r and Q u e d n a u ’s (1934) material has also contained previously ascended and spawned individuals — possibly just the quantity represented by the above fish among their material of 1127 specimens, (if this is indeed the case, the number of spawned salmon would correspond to 7-5%, a figure which appears very feasible).
The figures concerning previously ascended and spawned salmon which I have borrowed from the publications of R o s é n , D i x o n and W i l l e r and Q u e d n a u , should not perhaps be used as a basis of comparison, as, on the one hand ( R o s é n , D ix o n ) , they are derived from restricted material, and, on the other ( W i l l e r and Q u e d n a u ) , they are not given in sufficient detail. I would like to point out the extreme uniformity of A lm ’s figures, compared with my own results. The proportion of previously spawned salmon among the material collected from the Bothnian Bay (Tornio, Kemi and Oulu Rivers) is 4-9%. A lm ’s figures from the combined material of the Kalix and Lule Rivers, together with Väster- botten and Västnorrland, are 4-4%. A lm ’s material from the Ume, Ångerman, Indal and Ljung Rivers yield a combined figure of 9-2 % previously spawned salmon, and 9-7% for the Ljusne and Dal Rivers and the Gävleborg sea fishing. My result for the Kymi River is 9-6%. A lm ’s results for Gothland and the southern parts of the Baltic (Mörrum River, Blekinge, Kristiansand, Bornholm) produce 3-6%, which is not very different from the figures for the Bothnian Bay salmon areas (both Finnish and Swedish waters) — 4-9% and 4-4%. The result of only 0-1% yielded by A lm ’s material collected from the Malmöhus district, and the result from the Kokemäki River in Finland, the reasons for which I have endeavoured to point out before, must be considered as exceptional.
D i x o n (1934) gives (on page 73) the number of previously spawned salmon among his specimens as 5. A ge of S a lm on .follows: “Of the material analysed, 15% of the The accurate determining of the age of salmon is onlydrift-net salmon and 2 2 % of the line-caught were important in so far as it provides a guide to placingfound to possess distinct spawning marks. The period them in particular year-classes. In other respects,of marine existence preceding the first spawning the grouping of salmon on the basis of their age causesmigration is as follows: 1 year — 16%, 2 years — complications, as the smolt-age fluctuates, and as the62%, 3 years — 22% .” As his material consists of effect of this stage of development is not apparent
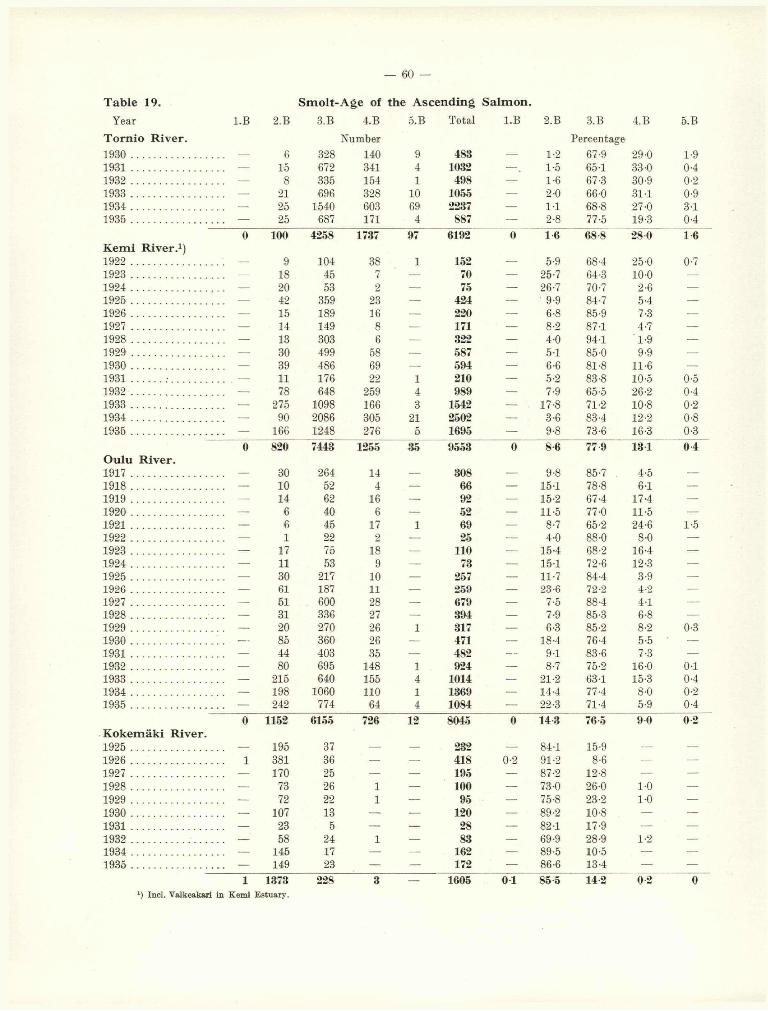
— 60 —
T able 19. S m o lt-A g e of the A scen d in g S alm on .
Year l.B 2.B 3.B 4.B 5.B Total l.B 2.B 3.B 4.B 5.B
T ornio R iver. Number Percentage1930 ............................... — 6 328 140 9 483 — 1-2 67-9 29-0 1-91931 ............................... — 15 672 341 4 1032 — . 1-5 65-1 33 0 0-41932 ............................... — 8 335 154 1 498 — 1-6 67-3 30-9 0-2
1933 ............................... — 21 696 328 10 1055 — 2-0 66-0 31 1 0-91934 ............................... — 25 1540 603 69 2237 — 1 1 68-8 27-0 3-11935 ............................... . — 25 687 171 4 887 — 2-8 77-5 19-3 0-4
0 100 4258 1737 97 6192 0 1 6 68-8 28 0 1 6K em i R iver.1)1922 ............................... — 9 104 38 1 152 — 5-9 68-4 25-0 0-71923 ............................... — 18 45 7 — 70 — 25-7 64-3 10-0 —
1924 ............................... — 2 0 53 2 — 75 — 26-7 70-7 2-6 —1925 ............................... — 42 359 23 — 424 — 9-9 84-7 5-4 —1926 ............................... — 15 189 16 — 220 — 6-8 85-9 7-3 —1927 ............................... — 14 149 8 — 171 — 8-2 87-1 4-7 —1928 ............................... — 13 303 6 — 322 — 4-0 94-1 1-9 —1929 ............................... — 30 499 58 — 587 — 5-1 85-0 9-9 —1930 ............................... — 39 486 69 —- 594 — 6-6 81-8 11-6 —1931.......... : .................. — 11 176 22 1 210 — 5-2 83-8 10-5 0-51932 ............................... — 78 648 259 4 989 — 7-9 65-5 26-2 0-41933 ............................... — 275 1098 166 3 1542 — 17-8 71-2 1 0-8 0-2
1934 ............................... 90 2086 305 21 2502 — 3-6 83-4 12-2 0-8
1935 ............................... . — 166 1248 276 5 1695 — 9-8 73-6 16-3 0-3
0 820 7443 1255 35 9553 0 8-6 77 9 131 0 4Oulu R iver.1917............................... — 30 264 14 — 308 — 9-8 85-7 4-5 —1918............................... — 10 52 4 — 66 — 15-1 78-8 6-1 —
1919 ............................... — 14 62 16 — 92 — 15-2 67-4 17-4 —1920 ............................... — 6 40 6 — 52 — 11-5 77-0 11-5 —1921 ............................... — 6 45 17 1 69 — 8-7 65-2 24-6 1-51922 ............................... — 1 22 2 — 25 — 4-0 88-0 8-0 —1923 ............................... — 17 75 18 — 110 — 15-4 68-2 16-4 —1924 ............................... — 11 53 9 — 73 — 151 72-6 12'3 —1925 ............................... — 30 217 10 — 257 — 11-7 84-4 3-9 —1926 ............................... — 61 187 11 — 259 — 23-6 72-2 4-2 —1927 ............................... — 51 600 28 — 679 — 7-5 88-4 4-1 —1928 ............................... — 31 336 27 — 394 — 7-9 86-3 6-8 —1929 ............................... — 20 270 26 1 317 — 6-3 85-2 8-2 0-31930 ............................... — 85 360 26 — 471 — 18-4 76-4 5-5 —1931............................... — 44 403 35 — 482 — 9-1 83-6 7-3 —1932 ............................... — 80 695 148 1 924 — 8-7 75-2 16-0 0-1
1933 ............................... — 215 640 155 4 1014 — 21-2 63-1 15-3 0-41934 ............................... — 198 1060 11 0 1 1369 — 14-4 77-4 8-0 0-2
1935 ............................... . — 242 774 64 4 1084 — 22-3 71-4 5-9 0-4
0 1152 6155 726 12 8045 0 143 765 9 0 0-2K okem äki R iver.1925 ............................... — 195 37 — — 232 — 84-1 15-9 — —1926 ............................... . 1 381 36 — — 418 0-2 91-2 8-6 — —1927 ............................... — 170 25 — — 195 — 87-2 12-8 — —1928 ............................... — 73 26 1 — 100 — 73-0 26-0 1-0 —1929 ............................... — 72 22 1 — 95 — 75-8 23-2 1-0 —1930 ............................... — 107 13 — — 120 — 89-2 10-8 — —
1931............................... — 23 5 — — 28 — 82-1 17-9 — —1932 ............................... — 58 24 1 — 83 — 69-9 28-9 1-2 —1934 ............................... — 145 17 — — 162 — 89-5 10-5 — —1935 ............................... . — 149 23 — — 172 — 86-6 13-4 — —
1 1373 228 3l ) Incl. V alkeakari in K em i E stu a ry .
1605 0 1 855 142 0 2 0

— 61 —
T ab le 19 (continued).
Year l.B 2.B 3.B 4.B 5.B Total l.B 2.B 3.B 4.B 5.B
K ym i R iver.
1920 .......................... 1 199 38Number
238 0-4 83-6
Percentage
16-01921.......................... . . . 3 169 54 2 — 328 0-9 82-0 16-5 0-6 —1922 .......................... . . . 4 186 37 — — 227 1-8 81-9 16-3 — —1923 .......................... . . . 1 139 8 — — 148 0-7 93-9 5-4 — —1924 .......................... . . . — 134 10 — — 144 — 93-1 6-9 — —1926 .......................... . . . — 305 50 — — 355 — 85-9 14-1 — —1926 .......................... . . . 2 657 62 — — 721 0-3 91-1 8-6 — —1927 ............................ 1 737 73 — — 811 0-1 90-9 9-0 — —1928 .......................... . . . 9 517 68 — — 594 1-5 87-0 11-5 — —1929 .......................... . . . 2 377 43 — — 422 0-5 89-3 10-2 — —1930 .......................... . . . — 209 51 — — 260 — 80-4 19-6 — —1931.......................... . . . 1 370 57 — — 428 0-2 86-5 13-3 — —
1932 .......................... 2 516 68 2 — 588 0-3 87-8 11-6 0-3 —1933 .......................... . . . 1 97 19 — — 117 0-9 82-9 16-2 — —1934 .......................... 1 289 27 — — 317 0-3 91-2 8-5 — —
1936 .......................... . . . — 215 46 1 — 262 — 82-1 17-5 0-4 —
28 5216 711 5 0 5960 0-5 87-5 11 9 0 1 0
T ab le 20. The Life-C ycle C la sses of the A scen d in g Salm on.
First time ascending Previously spawned
Areas and Catch Years A
.1+
A.2
+ M< <
i£5<
œ<
"sioEh A
.1+ ■ f M iQ
5 < < <CD
Tot
al
once
twic
e COGj
CO Tot
al
once
twic
e
3 ti
mes
Tot
al
cOj
’S
Cat
ch
T ornio R iver. Individuals Percentage Individuals Percentage CO
1930 ................ 103 142 158 56 4 — 463 21-4 29-4 32-7 11-6 0-8 — 95 9 19 1 — 20 3-9 0-2 — 41 483 —
1931 ................ 109 586 243 47 9 — 994 10-6 56-8 23-5 4-5 0-9 — 963 34 4 — 38 3-3 0-4 — 3 7 1032 —
1932 ................ 190 121 141 23 2 — 477 38-2 24-3 28-3 4-6 0-4 — 95-8 20 1 — 21 4-0 0-2 — 4 2 498 —
1933 ................ 436 405 160 29 1 — 1031 41-3 38-4 15-2 2-7 0-1 — 97 7 23 — 1 24 2-2 — 0-1 2 3 1055 —
19341) .............. 360 939 833 26 4 — 2171 16-1 42 0 37-2 1 1 0*2 — 97-0 61 3 2 66 2-8 0-1 0-1 3 0 2237 —
1935 ................ 380 204 268 11 2 — 865 42-9 23-0 30-2 1-2 0-2 — 97 5 21 1 — 22 2-4 0-1 — 2 5 887 —
Total... 1578 2397 1803 192 22 — 6001 25-5 38-7 29 1 3 1 0-4 — 96-9 178 10 3 191 2-9 0 2 0 04 3 1 6192
K em i
1915 .
R iver.
26 29 4 59 41-9 46-8 6-5 — 952 2 1 3 3-2 1-6 4-8 621922 . 3 17 113 12 — — 145 2-0 11-2 74-3 7-9 — 954 7 — — 7 4-6 — — 4 6 152 1414'1923 . — 13 33 12 1 — 59 — 18-6 47-1 17-2 1-4 — 843 11 — — 11 15-7 — — 15 7 70 4591924 . — 2 32 31 1 — 66 — 2-7 42-7 41-3 1-3 — 88-0 9 — — 9 12-0 — — 1 2 0 75 6161925 . 47 93 95 92 26 — 353 11-1 21-9 22-5 21-7 6-1 — 833 62 8 1 71 14-6 1-9 0-2 16 7 424 8521926 . 26 98 62 15 1 — 202 11-8 44-5 28-2 6-8 0-5 — 91-8 14 4 — 18 6-4 1-8 — 8-2 220 2521927 . 9 63 89 3 — — 164 5-3 36-8 52-0 1-8 — — 95 9 3 4 — 7 1-8 2-3 — 41 171 37419282) 9 56 186 49 10 — 310 2-8 17-4 57-8 15-2 3-1 — 963 11 1 — 12 3-4 0-3 — 3 7 322 7519293) 3 40 370 122 10 — 545 0-5 6-8 63-0 20-8 1-7 — 92-8 39 3 — 42 6-7 0-5 — 7 2 587 3731930 . 98 110 202 128 13 — 551 16-5 18-5 34-0 21-6 2-2 — 92 8 41 2 — 43 6-9 0-3 — 7 2 594 —
1931 . 9 74 89 21 1 — 194 4-3 35-2 42-4 10-0 0-5 — 92 4 14 1 1 16 6-6 0-5 0-5 7-6 210 —
19324) 45 218 591 48 4 — 906 4-6 22-0 59-6 4-9 0-4 — 915 72 in — 83 7-4 1-0 — 8-5 989 —
1933 . 11 815 587 47 2 — 1462 0-7 52-9 38-1 3-0 0-1 94-8 72 8 — 80 4-7 0-5 — 5-2 1542 —
19345) 165 502 1627 63 5 — 2373 6-6 20-1 65-0 2-5 0-2 94-8 119 9 1 129 4-8 0-4 0-03 5 2 2502 —
1935 . 18 388 1161 52 1 — 1620 1-1 22-9 68-5 3-1 0-05 — 95 -6 69 5 1 75 4-1 0-3 0-05 4 4 1695 —
Total. . . 443 2515 5266 699 75 ---- 9009 4 6 26 2 54 8 7 2 0-8 — 93 7 545 56 4 606 5-7 0 6 0 04 6 3 9615
x) The specimens also con tain 9 ind iv iduals from life-class A .+ , w hich a re included in th e to ta l .2) Of th e K orva ca tch (75 ind .) 64 are recorded in co lum n “ Specim ens” , th e rem ain ing 258 are from K aihua .3) Of th e K orva ca tch (373 ind .) 370 are recorded in colum n “ Specim ens” , th e rem ain ing 217 from V alkeakari.4) Column “ Specim ens” also contains one ind . from th e age-class 4.2G1G1G1G1, which is inc luded in th e to ta l.5) Column “ Specim ens” also con tains 11 ind. from life-class A. + , which are inc luded in th e to ta l.6) Catch in th e years 1922— 28 from K orw a W eir only.
(continued on p. 62).
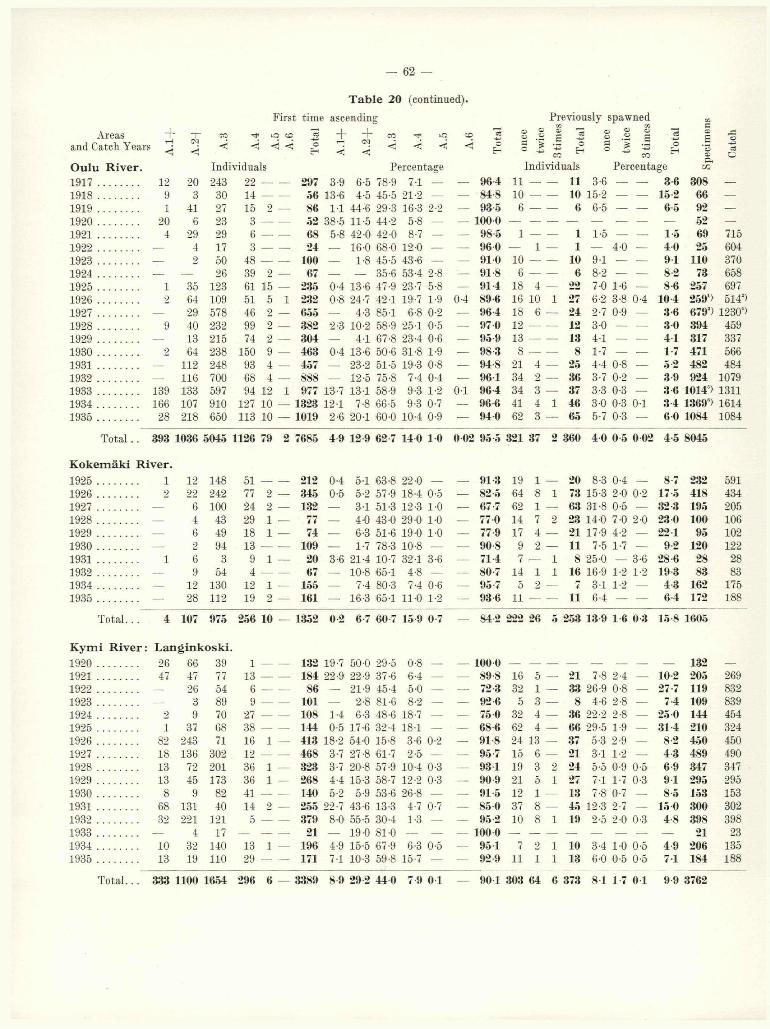
— 62 —
T ab le 20 (continued).
First time ascending Previously spawned «
Areas + + era - * i o œ j + + c o - * i o = c 3 £ .2 £ 3 § . 2 « 3 S ’»and Catch Years 2 J ^ £ o | S 5 o J '-0 c2 '3 te
O ulu R iver.1917.............. 12 2 0
Individuals 243 22 — 297 3-9
Percentage
6-5 78-9 7-1 — 96-4Individuals
1 1 ------- 11 3-6Percentage -------- 3 6
&co
3081918.............. 9 3 30 14 — — 56 13-6 4-5 45-5 21-2 — — 84-8 10 — — 10 15-2 — — 15 2 66 —1919.............. 1 41 27 15 2 — 86 1-1 44-6 29-3 16-3 2-2 — 935 6 — — 6 6-5 — — 6-5 92 —1920 .............. 20 6 23 3 — — 52 38-5 11-5 44-2 5-8 — — 1000 — — — — — — — — 52 —
1921.............. 4 29 29 6 — — 68 5-8 42-0 42-0 8-7 — — 98-5 1 — — 1 1-5 — — 1-5 69 7151922 .............. — 4 17 3 — — 24 — 16-0 68-0 1 2 0 — — 96 0 — 1 — 1 — 4-0 — 4 0 25 6041923 .............. — 2 50 48 — — 100 — 1-8 45-5 43-6 — — 91-0 10 — — 10 9-1 — — 9-1 110 3701924 .............. — — 26 39 2 — 67 — — 35-6 53-4 2-8 :— 918 6 — — 6 8-2 — — 8-2 73 6581925 .............. 1 35 123 61 15 — 235 0-4 13-6 47-9 23-7 5-8 — 914 18 4 — 22 7-0 1-6 — 8-6 257 6971926 .............. 2 64 109 51 5 1 232 0-8 24-7 42-1 19-7 1-9 0-4 89-6 16 10 1 27 6-2 3-8 0-4 104 259’) 514”)1927 .............. — 29 578 46 2 — 655 — 4-3 85-1 6-8 0-2 — 964 18 6 — 24 2-7 0-9 — 3 6 679“) 1230')1928 .............. 9 40 232 99 2 — 382 2-3 10-2 58-9 251 0-5 — 97-0 12 — — 12 3-0 — — 3 0 394 4591929 .............. — 13 215 74 2 — 304 — 4-1 67-8 23-4 0-6 — 95 9 13 — — 13 4-1 — — 41 317 3371930 .............. 2 64 238 150 9 — 463 0-4 13-6 50-6 31-8 1-9 — 983 8 — — 8 1-7 — — 17 471 5661931.............. — 11 2 248 93 4 — 457 — 23-2 51-5 19-3 0-8 — 94-8 21 4 — 25 4-4 0-8 — 5 2 482 4841932 .............. — 116 700 68 4 — 888 — 12-6 75-8 7-4 0-4 — 961 34 2 — 36 3-7 0-2 — 3 9 924 10791933 .............. 139 133 597 94 12 1 977 13-7 13-1 58-9 9-3 1-2 0-1 964 34 3 — 37 3-3 0-3 — 3-6 1014s) 13111934 .............. 166 107 910 127 10 — 1323 12-1 7-8 6 6 '5 9-3 0-7 — 96 6 41 4 1 46 3-0 0-3 0-1 3-4 1369*) 16141935 .............. 28 218 650 113 in — 1019 2-6 20-1 60 0 10-4 0-9 — 940 62 3 — 65 5-7 0-3 — 6 0 1084 1084
Total. . 393 1036 5045 1126 79 2 7685 4 9 12 9 62 7 140 1 0 0 02 95 5 321 37 2 360 4-0 0 5 0 02 4 5 8045
K okem äki R iver.
1925 .............. 1 12 148 51 212 0-4 5-1 63-8 22 0 — 913 19 1 20 8-3 0-4 8-7 232 5911926 ............ 9 22 242 77 2 — 345 0-5 5-2 57-9 18-4 0-5 — 82-5 64 8 1 73 15-3 2-0 0-2 17 5 418 4341927 ............ — 6 10 0 24 2 — 132 — 3-1 51-3 12-3 1-0 — 67-7 62 1 — 63 31-8 0-6 — 32 3 195 2051928 ............ — 4 43 29 1 — 77 — 4-0 43-0 29-0 1-0 — 77 0 14 7 2 23 14-0 7-0 2-0 23 0 100 1061929 ............ — 6 49 18 1 — 74 — 6-3 51-6 19-0 1-0 — 77 9 17 4 — 21 17-9 4-2 — 22 1 95 1 02
1930 ............ — 2 94 13 — — 109 — 1-7 78-3 10-8 — — 90-8 9 2 — 11 7-5 1-7 — 9 2 120 122
1931............ 1 6 3 9 1 — 20 3-6 21-4 10-7 32-1 3-6 714 7 .— 1 8 25-0 — 3-6 28-6 28 281932 ............ — 9 54 4 — — 67 — 10-8 65-1 4-8 - 80-7 14 1 1 16 16-9 1-2 1-2 19 3 83 831934 ............ — 12 130 12 1 — 155 — 7-4 80-3 7-4 0-6 — 957 5 2 — 7 3-1 1-2 — 4 3 162 1751935 ............ . — 28 11 2 19 2 — 161 — 16-3 65-1 11-0 1-2 — 93 6 11 — — 11 6-4 — — 6 4 172 1 88
Total.. 4 107 975 256 10 — 1352 0-2 6 7 60 7 159 0-7 — 84-2 222 26 5 253 13 9 1 6 0 3 15 8 1605
K ym i R iver: L anginkosk i.1920 .............. 26 66 39 1 132 19-7 50-0 29-5 0-8 — 100 0 — — — — — — — — 132 —1921.............. 47 47 77 13 ------- 184 22-9 22-9 37-6 6-4 — — 89-8 16 5 — 21 7-8 2-4 — 10 2 205 2691922 .............. — 26 54 6 86 — 21-9 45-4 5-0 — — 723 32 1 — 33 26-9 0-8 — 27 7 119 8321923 .............. — 3 89 9 ------- 101 — 2-8 81-6 8-2 — — 92 6 5 3 — 8 4-6 2-8 — 7 4 109 8391924 .............. 0 9 70 27 ------- 108 1-4 6-3 48-6 18-7 — — 75 0 32 4 — 36 22-2 2-8 — 25 0 144 4541925 .............. 1 37 68 38 ------- 144 0-5 17-6 32-4 18-1 — 68 6 62 4 — 66 29-5 1-9 — 314 210 3241926 .............. 82 243 71 16 1 — 413 18-2 54-0 15-8 3-6 0-2 — 91-8 24 13 — 37 5-3 2-9 — 8-2 450 4501927 .............. 18 136 302 12 468 3-7 27-8 61 7 2-5 — - 95 7 15 6 — 21 3-1 1-2 — 4 3 489 4901928 .............. 13 72 201 36 1 — 323 3-7 20-8 57-9 10-4 0-3 — 931 19 3 2 24 5-5 0-9 0-5 6 9 347 3471929 .............. 13 45 173 36 1 — 268 4-4 15-3 58-7 12-2 0-3 — 909 21 5 1 27 7-1 1-7 0-3 91 295 2951930 .............. 8 9 82 41 ------- 140 5-2 5-9 53-6 26-8 — — 915 12 1 — 13 7-8 0-7 — 8-5 153 1531931.............. 68 131 40 14 2 — 255 22-7 43-6 13-3 4-7 0-7 - 85-0 37 8 — 45 12-3 2-7 — 15 0 300 3021932 .............. 32 221 121 5 379 8-0 55-5 30-4 1-3 — — 95 2 10 8 1 19 2-5 2-0 0-3 4-8 398 3981933 .............., — 4 17 — 21 - 19-0 81-0 — — — 100 0 — — — — — — — — 21 231934 .............. 10 32 140 13 1 — 196 4-9 15-5 67-9 6-3 0-5 95 1 7 2 1 10 3-4 1-0 0-5 4 9 206 1351935 .............. 13 19 11 0 29 171 7-1 10-3 59-8 15-7 — — 92 9 11 1 1 13 6-0 0-5 0-5 7-1 184 18 8
Total... 333 1100 1654 296 6 — 3389 8 9 29 2 440 7 9 01 901 303 64 6 373 8-1 17 0 1 9 9 3762

— 63 —
T able 20 (continued).
First time ascending Previously spawnedAreas + + CO lO + + co_ -t* 10 CO c3 £ £ 2 « g £ I "3 <3J
and Catch YearsO'!■< < O
H < < < H CO§ ■% .g -s0 -5 *» HCO "o
O00
A hvenk osk i. Individuals Percentage Individuals PercentagecuOD
1920 .................. 5 41 48 — — --- 94 4-7 38-7 45-3 - — 88-7 10 2 — 12 9 .4 1 .9 __ 11.3 îoe —1921.................. 37 32 39 3 — --- 111 30-1 26-0 31-7 2-4 — — 90-2 11 1 — 12 9-0 0-8 - 9-8 123 —1922 ................... 1 50 46 — --- 97 0-9 46-3 42-6 - — 89-8 10 1 — 11 9-3 0-9 — 10 2 108 _1923 ................... — 2 35 1 — — 38 — 51 89-7 2-6 — — 97 4 1 ------- I 2 - 6 -------- 2-6 39
Total.. 43 125 168 4 — — 340 114 332 447 11 90 4 32 4 36 8-5 1 1 — 9 6 376
R änn in k osk i and S iik asaarenk osk i.
19% . 42 22 27 21 — — 112 28-9 15-2 18-6 14-5 - 77-2 32 1 — 33 22-1 0-7 __ 22-8 145 19419*6 . 29 176 48 5 — - 258 10-7 65-0 17-7 1-8 - 95 2 12 — 1 13 4.4 — 0-4 4-8 271 2751927 8 109 193 — — 310 2-5 33-9 59-9 — — 96 3 10 2 — 12 31 0-6 — 37 322 3231998 7 50 155 16 - __ 228 2-8 20-2 62-8 6-5 - — 923 15 4 — 19 6-1 1-6 — 7-7 247 2471999 1 21 70 19 — 111 0-8 16-5 55-1 15-0 - 87-4 16 — — 16 12-6 — — 12 6 127 1271930 9 17 60 12 — — 98 8-4 15-9 56 1 11-2 - 91 6 8 1 — 9 7-5 0-9 — 8-4 107 1081931 29 69 15 8 — 114 17-2 53-9 11-7 6-3 — 891 13 1 — 14 10-1 0-8 — 109 128 1291933 6 111 61 1 - 179 3-2 58-4 32-1 0-5 - — 942 8 3 — 11 4-2 1-6 — 5-8 190 1901933 . — 8 76 2 _ — 86 — 8-3 79-2 2-1 — — 89-6 7 3 — 10 7-3 3-1 — 10 4 96 961934 1 11 76 11 — 99 0-9 9-9 68-5 9-9 — 89-2 9 3 — 12 8-1 2-7 — 108 111 1121935 9 15 34 7 — — 65 11-5 19-2 43-6 9-0 - 833 12 1 — 13 15-4 1-3 — 167 78 81
Total.. . 134 609 815 102 — — 1660 7 4 33 4 44 7 5-6 — 911 142 19 1 162 7 8 1 0 01 8-9 1822
1) P y h äk o sk i K ap ids 173, M aijala 86 ind.2) » „ 312, „ 202 ,,3) „ » 488, „ 191 „4) „ f f 841, „ 389 „8) One ind . from th e class A .+ included, which is also inc luded in th e final to ta ls .•) T hree ind . from th e class A .+ included, w hich are also included in th e final to ta ls .
later ■— at least only to a very insignificant extent — in the size, weight and commercial value of the salmon. These facts, actually, are most closely dependent on the life-cycle group to which the salmon belong during their marine existence. In spite of this, I have prepared a table — No. 21 — concerning the age of salmon among my material. I have put them into two main groups : those ascending for the first time, and previously spawned salmon. The result is as follows:
(See p. 64).
Table 21 shows that the mean age of salmon ascending for the first time among my specimens was as follows: Tornio River 5-4 years (excluding year of ascent), Kemi area 5-8, Oulu River 5-9, Kokemäki River 5-3, and Kymi River only 4-7 years. The lower mean age of the Kymi River salmon is due principally to a shorter smolt-age. Taking the mean age of previously spaw’ned salmon re-ascending, even more uniform figures are obtained: Tornio River 7-6, Kemi area 7-9, Oulu River 7-8, Kokemäki River 7-4 and Kymi River 7-1 years. The comparative high mean age (despite their short smolt-age) of salmon from the last-named river is derived mainly from the relative
large number of salmon which have ascended twice before.
There are, of course, annual fluctuations in the mean ages, due to variations in the formation of the stock. The lowest figures for salmon ascending for the first time were noted in the following years :— Tornio River 1933 and 1935 (both 5-1 years); Kemi area 1933 (5-4 years) and 1927 (5-5 years); Oulu River 1920 (5-2 years) and 1933—35 (5-7 years) ; Kokemäki River 1934 and 1935 (5-1 years), and Kymi River 1931 (4-2 years). The highest mean ages among salmon on their first ascent were:— Tornio River 1930 (5-7 years); Kemi River 1928 and 1929 (6-0 and6-2 years); Oulu River 1925, 1927—32 (6-0— 6-2 years); Kokemäki River 1928 (5-6 years), and Kymi River 1924 and 1930 (5-2 years). The lowTest mean ages among previously spawned salmon occurred in the Kokemäki River in 1935 (6 -8 years) and the Kymi River 1920— 22 (6 -8 years) and 1924 (6-7 years). The highest mean ages among previously spawned salmon occurred in the Tornio River 1931 (8 - 6 years); Kemi River 1925 and 1926 (8 - 6 years), and 1931 (8-5 years); Oulu River (since 1925) 1926 (8-9 years) and 1931 (8-5 years); Kokemäki River 1928 (8-4 years), and Kymi River 1932 (7-9 years).
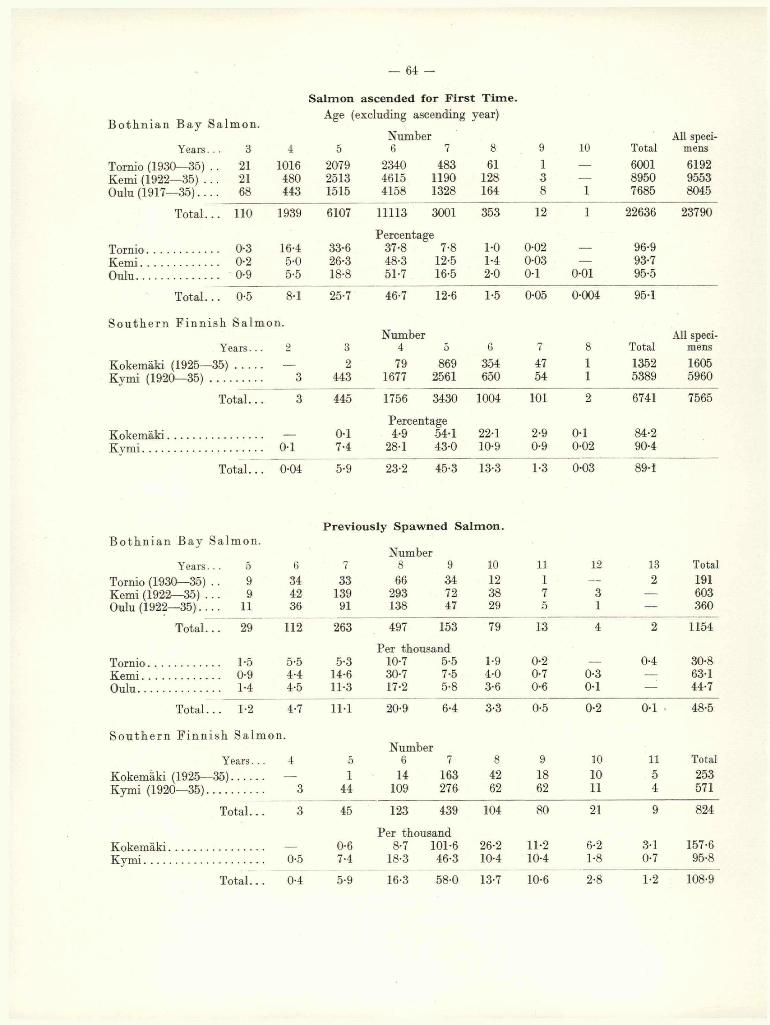
— 64 -
S alm on ascended for F ir s t T im e .
B o t h n ia n B a y
Years
S a lm o n .
3 4
Age (excluding ascending year)
Number5 6 7 8 9 10 Total
All specimens
Tornio (1930—35) Kemi (1922— 35) . Oulu (1917— 3 5 ) ..
. . 21
. . 21
. . 6 8
1016480443
207925131515
234046154158
48311901328
61128164
1
38 1
600189507685
619295538045
Total. . . 1 1 0 1939 6107 11113 3001 353 1 2 1 22636 23790
Tornio.....................K em i.......................Oulu.........................
0-3 0 - 2
. . 0-9
16-45-05-5
33-626-318-8
Percentage 37-8 7-8 48-3 12-5 51-7 16-5
1-0
1-42 - 0
0 - 0 2
0-030 -1 0 -0 1
96-993-795-5
Total. . . 0-5 8-1 25-7 46-7 1 2 -6 1-5 0-05 0-004 95-1
S o u t h e r n F in n i s h S a lm o n .
Years. .. 2 3Number
4 5 6 7 8 TotalAll speci
mens
Kokemäki (1925— Kymi (1920— 35)
-35)3
2
44379
1677869
2561354650
4754
1
1
13525389
16055960
Total. . . 3 445 1756 3430 1004 1 0 1 2 6741 7565
Kokem äki..............K ym i....................... 0 -1
0 -1
7-4
Percentage 4-9 54-1
28-1 43-022 -1
10-92-90-9
0 -1
0 - 0 2
84-290-4
T o ta l. . . 0-04 5-9 23-2 45-3 13-3 1-3 0-03 89-1
B o t h n ia n B a y
YearsTornio (1930— 35) Kemi (1922— 35) . Oulu (1922— 3 5 )..
S a lm o n .
599
11
6
344236
P rev iou sly Spaw ned S a lm on .
Number 7 8 9 10
33 6 6 34 12 139 293 72 38 91 138 47 29
11
1
75
12
31
132
Total191603360
Total. . . 29 1 1 2 263 497 153 79 13 4 2 1154
Per thousandTornio..................... . . 1-5 5-5 5-3 10-7 5-5 1-9 0 - 2 — 0-4 30-8K em i....................... . . 0-9 4-4 14-6 30-7 7-5 4-0 0-7 0-3 — 63-1Oulu......................... . . 1-4 4-5 11-3 17-2 5-8 3-6 0 - 6 0 -1 — 44-7
Total., . . 1-2 4-7 11-1 20-9 6-4 3-3 0-5 0 - 2 0 -1 48-5
S o u t h e r n F in n is h S a lm o n.Number
Years... 4 5 6 7 8 9 10 11 Total
Kokemäki (1925—-35)........... — 1 14 163 42 18 1 0 5 253Kymi (1920— 35). 3 44 109 276 62 62 11 4 571
T ota l.. . 3 45 123 439 104 80 2 1 9 824
Per thousandKokemäki.............. — 0 -6 8-7 101-6 26-2 1 1 -2 6 -2 3-1 157-6K ym i...................... 0-5 7-4 18-3 46-3 10-4 10-4 1 -8 0-7 95-8
Total. . . 0-4 5-9 16-3 58-0 13-7 1 0 - 6 2 -8 1 -2 108-9
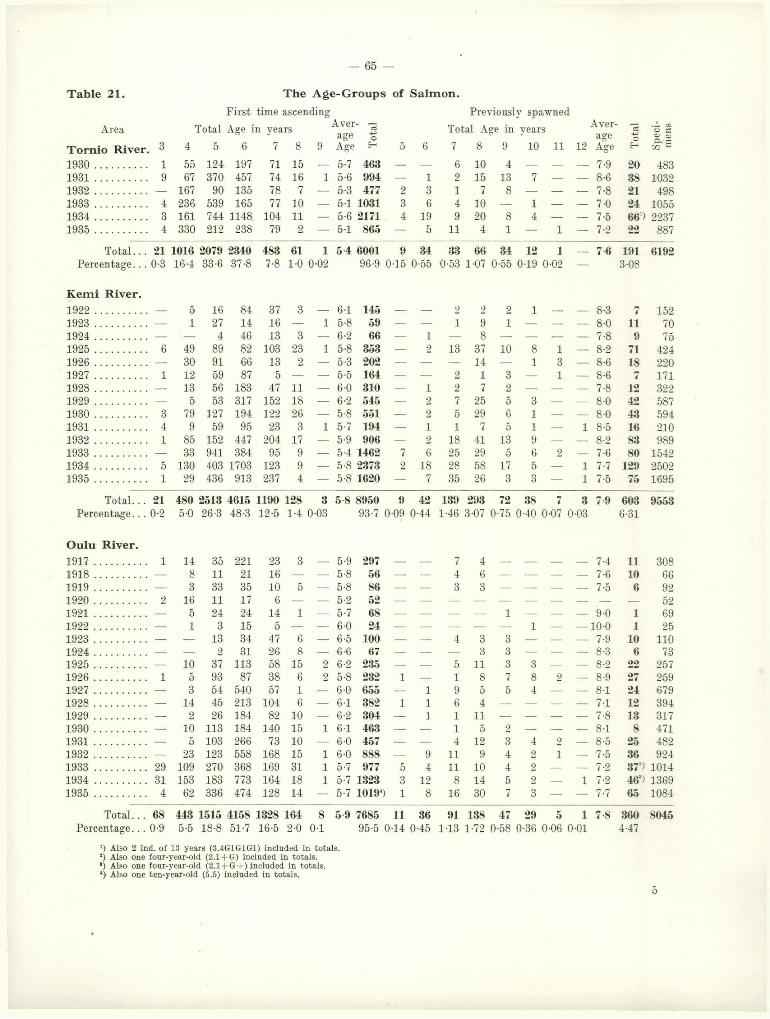
— 65 —
T ab le 21. T h e A ge-G rou p s of S a lm on .
First time ascending Previously spawned
Area Total Age in years Average
ao
Total Age in years Average
ÜSO
Spe
ci
men
s
T ornio R iver. 3 4 5 6 7 8 9 Age E—1 5 6 7 8 9 10 11 12 Age E-h
1930 .................. 1 55 124 197 71 15 — 5-7 463 — — 6 10 4 — — — 7-9 20 4831931 .................. 9 67 370 457 74 16 1 5-6 994 — 1 2 15 13 7 — — 8-6 38 10321932 .................. — 167 90 135 78 7 — 5-3 477 2 3 1 7 8 — — — 7-8 21 4981933 .................. 4 236 539 165 77 10 — 5-1 1031 3 6 4 10 — 1 — — 7-0 24 10551934 .................. 3 161 744 1148. 104 11 — 5-6 2171 4 19 9 20 8 4 — — 7-5 66') 22371935 .................. 4 330 212 238 79 2 — 5-1 865 — 5 11 4 1 — 1 — 7-2 22 887
Total.. . 21 1016 2079 2340 483 61 1 5 4 6001 9 34 33 66 34 12 1 __ 7 6 191 6192Percentage.. . 0-3 16-4 33-6 37-8 7-8 1-0 0-02 96-9 0-15 0-55 0-53 1-07 0-55 0-19 0-02 — 3-08
K em i R iver.
1922 ................ — 5 16 84 37 3 — 6-1 145 — — 2 2 2 1 — — 8-3 7 1521923 ................ . — 1 27 14 16 — 1 5-8 59 — — 1 9 1 — — — 8-0 11 701924 ................ . — — 4 46 13 3 — 6-2 66 — 1 — 8 — — — — 7-8 9 751925 ................ 6 49 89 82 103 23 1 5-8 353 — 2 13 37 10 8 1 — 8-2 71 4241926 ................ . — 30 91 66 13 2 — 5-3 202 — — — 14 — 1 3 — 8-6 18 2201927 ................ 1 12 59 87 5 — — 5-5 164 — — 2 1 3 — 1 — 8-6 7 1711928 ................ . — 13 56 183 47 11 — 6-0 310 — 1 2 7 2 — — — 7-8 12 3221929 ................ . — 5 53 317 152 18 — 6-2 545 — 2 7 25 5 3 — — 8-0 42 5871930 ................ 3 79 127 194 122 26 — 5-8 551 — 2 5 29 6 1 — — 8-0 43 5941931 ................ 4 9 59 95 23 3 1 5-7 194 — 1 1 7 5 1 — 1 8-5 16 2101932 ................ 1 85 152 447 204 17 — 5-9 906 — 2 18 41 13 9 — — 8-2 83 9891933 ................ . — 33 941 384 95 9 — 5-4 1462 7 6 25 29 5 6 2 — 7-6 80 15421934 ................ 5 130 403 1703 123 9 — 5-8 2373 2 18 28 58 17 5 — 1 7-7 129 25021935 ................ 1 29 436 913 237 4 — 5-8 1620 — 7 35 26 3 3 — 1 7-5 75 1695
T o ta l.. . 21 480 2513 4615 1190 128 3 5-8 8950 9 42 139 293 72 38 7 3 7-9 603 9553Percentage.. . 0-2 5-0 26-3 48-3 12-5 1-4 0 03 93-7 0-09 0-44 1-46 3-07 0-75 0-40 0-07 0-03 6-31
O ulu R iver.
1917 ................ 1 14 35 221 23 3 — 5-9 297 — — 7 4 — — — — 7-4 11 3081918 ................ . — 8 11 21 16 — — 5-8 56 — — 4 6 — — — — 7-6 10 661919 ................ . — 3 33 35 10 5 — 5-8 86 — — 3 3 — - — — 7-5 6 921920 ................ P, 16 11 17 6 — — 5-2 52 — — — — — — — — — — 521921 ................ . — 5 24 24 14 1 — 5-7 68 — — — — 1 — — — 9-0 1 691922 ................ . — 1 3 15 5 — — 6-0 24 — — — — — 1 — — 10-0 1 251923 ................ . — — 13 34 47 6 — 6-5 100 — — 4 3 3 - — — 7-9 10 1101924 ................ . — — 2 31 26 8 — 6-6 67 — — — 3 3 — — — 8-3 6 731925 ................ . — 10 37 113 58 15 2 6-2 235 — — 5 11 3 3 — — 8-2 22 2571926 ................ 1 5 93 87 38 6 2 5-8 232 1 — 1 8 7 8 2 — 8-9 27 2591927 ................ . — 3 54 540 57 1 — 6-0 655 — 1 9 5 5 4 — — 8-1 24 6791928 ................ — 14 45 213 104 6 — 6-1 382 1 1 6 4 — — — — 7-1 12 3941929 ................ . — 2 26 184 82 10 — 6-2 304 — 1 1 11 — — — — 7-8 13 3171930 ................ . — 10 113 184 140 15 1 6-1 463 — — 1 5 2 — — — 8-1 8 4711931................ . — 5 103 266 73 10 — 6-0 457 — — 4 12 3 4 2 — 8-5 25 4821932 ................ . — 23 123 558 168 15 1 6-0 888 — 9 11 9 4 2 1 — 7-5 36 9241933 ................ 39 109 270 368 169 31 1 5-7 977 5 4 11 10 4 2 — — 7-2 37*) 10141934 ................ 31 153 183 773 164 18 1 5-7 1323 3 12 8 14 5 2 — 1 7-2 46s) 13691935 ................ 4 62 336 474 128 14 — 5-7 1019*) 1 8 16 30 7 3 — — 7-7 65 1084
T o ta l... 68 443 1515 4158 1328 164 8 5 9 7685 11 36 91 138 47 29 5 1 7 8 360 8045Percentage... 0-9 5-5 18-8 51-7 16-5 2-0 0-1 95-5 0-14 0-46 1-13 1-72 0-58 0-36 0-06 0-01 4-47
*) Also 2 ind . of 13 years (3.4G1G1G1) inc luded in to ta ls .2) Also one four-year-o ld (2 .1+ G) included in to ta ls .*) Also one four-year-old (2 .1+ G + ) inc luded in to ta ls .4) Also one ten -year-o ld (5.5) inc luded in to ta ls .
5

— 66 —
Area
K ok em äki R iver.
T ab le 21 (continued).
First time ascending
Total Age in years 5age 04 5 6 7 8 9 Age ^ 5 6
Previously spawned
Total Age in years
7 8 9 10 1 12
AverageAge
1925 ................ 1 8 12 1 81 1 __ — 5-3 212 — 5 13 1 1 — — — 6-9 20 2321926 ................ 1 19 232 79 14 — — 5-2 345 1 1 51 11 6 2 1 — 7-4 73 4181927 ................ — 3 91 34 4 — — 5-3 132 — 2 42 16 3 — — — 7-3 63 1951928 ................ — 3 31 36 6 1 — 5-6 77 — — 8 6 3 4 2 — 8-4 23 1 0 0
1929 ................ — 5 37 23 9 — — 5-5 74 — — 15 2 3 1 — — 7-5 21 951930 ................ — — 90 17 2 — — 5-2 109 — 2 2 5 — 2 — — 7-8 11 1 2 0
1931................ — 6 3 8 3 — — 5-4 20 — 1 6 — — — 1 — 7-4 8 281932 ................. — 6 37 21 3 — — 5-3 67 — — 13 1 1 — 1 — 7-4 16 831934 ................ — 9 121 23 2 — — 5-1 155 — 1 4 - 1 1 — — 7-6 7 1621935 ................. — 2 0 106 32 3 — — 5-1 161 — 2 9 — — — — — 6-8 11 172
Total.. » 79 869 354 47 1 — 5 3 1352 1 14 163 42 18 10 5 — 7-4 253 1605Percentage.. 0 1 4-9 54-1 22-1 2-9 0-1 — 84-2 0-06 0-87 10-16 2-62 1-12 0-62 0-31 — 15-76
K ym i R iver.
1920 ................. 1 20 1 0 0 97 8 — — 4-4 226 — 3 3 1 3 2 — — 6-8 12 2381921................ — 83 59 118 29 6 — 4-4 295 — 9 7 7 4 4 2 — 6-8 33 3281922 ................ — 1 77 72 32 1 — 4-8 183 — — 16 22 4 2 — — 6-8 44 2271923 ................ — — 4 119 16 — — 5-1 139 — — 1 5 1 2 — — 7-4 9 1481924 ................ — 2 8 67 30 1 — 5-2 108 — 2 15 14 3 2 — — 6-7 36 1441925 ................. — 38 51 86 76 5 — 4-8 256 — 1 6 84 6 2 — — 7-0 99 3551926 ................ 1 98 409 1 2 2 39 1 1 4-2 671 2 6 3 19 13 6 1 — 7 1 50 7211927 ................ — 17 217 512 32 — — 4-7 778 — 7 8 7 3 7 1 — 6-9 33 8111928 ................ — 15 123 315 92 6 — 4-9 551 1 5 11 14 4 6 1 1 7-0 43 5941929 ................ — 12 53 249 55 1 0 — 5-0 379 — 3 14 18 2 3 2 1 7-0 43 4221930 ................ —. 15 22 11 0 8 6 5 — 5-2 238 — 1 4 13 3 1 — — 7-0 22 2601931................ 1 76 198 56 27 11 — 4-2 369 — 2 1 40 8 8 — — 7-3 59 4281932 ................ — 38 284 217 17 2 — 4-4 558 — 3 — 10 4 10 3 — 7-9 30 5881933 ................ —. — 9 84 14 — — 5-0 107 — 1 4 2 1 2 — — 6-9 10 1171934 ................ — 8 33 221 31 2 — 5-0 295 — — 13 3 — 4 1 1 7-1 22 3171935 ................ — 2 0 30 116 6 6 4 — 5 0 236 — 1 3 17 3 1 — 1 7-2 26 262
Total.. Percentage..
30-1
443 16777-4 28-1
256143-0
65010-9
54 10-9 0-02
4 7 5389 3 4490-4 0-05 0-74
109 276 62 62 111-83 4-63 1-04 1-04 0-18
40-07
7 1 5719-58
5960
The age of most salmon on their first ascent in the Bothnian Bay salmon area is 6 years ; these represent 46-7% the entire material for this area (including previously spawned individuals). In the southern Finland area, principally among those ascending the Kymi River, the majority — 45-3% — is formed by younger fish •—- 5 years old. I give these figures separately from my general survey.
6 . Y ear-C lasses .
Year-classes of individuals that have reached the right age for catching are the main factor for obtaining good catches of salmon. This, of course, is true of all fishing. Adverse weather conditions or other natural factors •— excessive flooding of the rivers, for example— must affect fishing during the very best salmon seasons, while the inefficiency of the fishermen may prevent the proper utilisation of the facilities proffered. But these factors are only of secondary importance, as neither the utmost professional skill, nor the best possible weather conditions can create a good fishing
season when the year-classes of the right age for catching do not form a sufficiently abundant stock owing to a weak or wasted renewal. In surveying matters from this point of view a good knowledge of conditions operating among the stock of salmon is a factor of major importance — at least I consider this to be the case in the future, in respect of those engaged in fishing as well as the fishery authorities, for example. For this reason, as mentioned earlier in this paper, I have endeavoured to shed light on conditions among the Baltic stock of salmon due to the varying individual abundance of the year-classes.
The division of the specimens in my material into the different year-classes is shown in Tables 22— 26, in which the different river areas are separated. The combined result yielded by the material collected since 1925 is as follows (1925 was chosen as the starting point, as subsequent to that year every fish caught at the grounds from which material has been collected, has been examined, with very few, and thus insignificant, exceptions):—
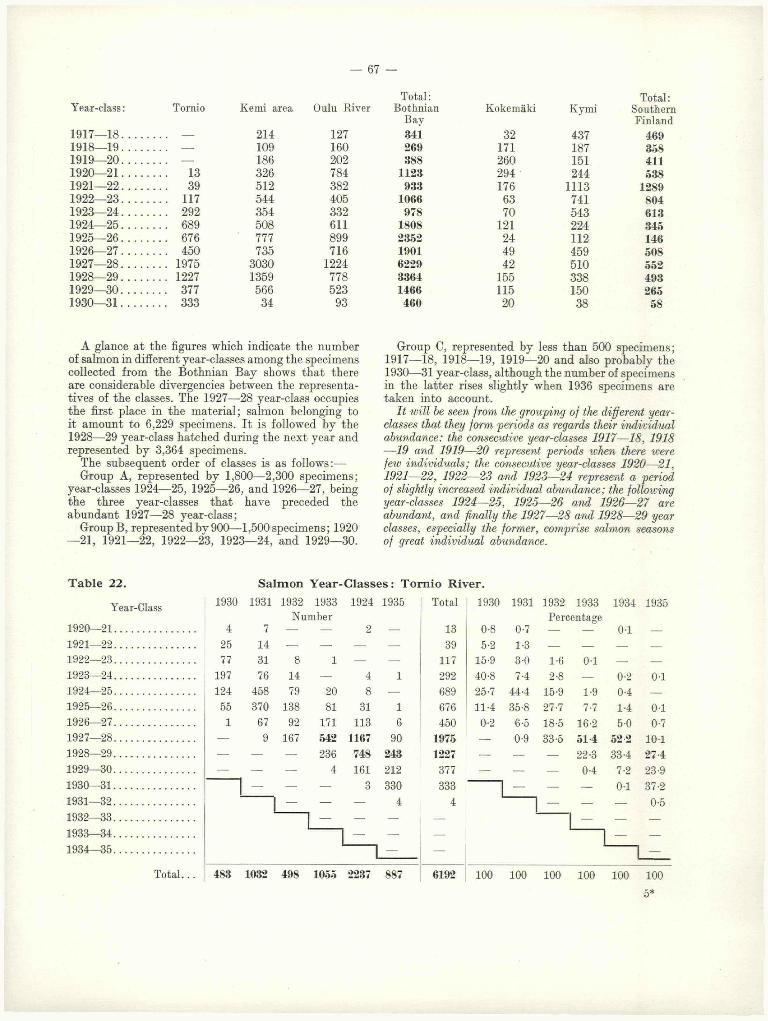
— 67 —
Year-class: Tornio Kemi area Oulu River
1917— 1 8 ................ — 214 1271918— 1 9 ................ — 109 1601919— 2 0 ................ — 186 2021920— 2 1 ................ 13 326 7841921— 22. . . ......... 39 512 3821922— 2 3 ................ 117 544 4051923— 2 4 ................ 292 354 3321924— 2 5 ................ 689 508 6111925— 2 6 ................ 676 777 8991926— 2 7 ................ 450 735 7161927—2 8 ................ 1975 3030 12241928— 2 9 ................ 1227 1359 7781929— 3 0 ................ 377 566 5231930— 3 1 ................ 333 34 93
Total : Total:Bothnian Kokemäki Kymi Southern
Bay Finland341 32 437 469269 171 187 358388 260 151 411
1123 294 244 538933 176 1113 1289
1066 63 741 804978 70 543 613
1808 121 224 3452352 24 112 1461901 49 459 5086229 42 510 5523364 155 338 4931466 115 150 265460 2 0 38 58
A glance at the figures which indicate the number of salmon in different year-classes among the specimens collected from the Bothnian Bay shows that there are considerable divergencies between the representatives of the classes. The 1927—28 year-class occupies the first place in the material; salmon belonging to it amount to 6,229 specimens. It is followed by the1928— 29 year-class hatched during the next year and represented by 3,364 specimens.
The subsequent order of classes is as follows:— Group A, represented by 1,800— 2,300 specimens;
year-classes 1924— 25, 1925— 26, and 1926—27, being the three year-classes that have preceded the abundant 1927—28 year-class;
Group B, represented by 900— 1,500 specimens; 1920 — 21, 1921— 22, 1922—23, 1923— 24, and 1929—30.
Group C, represented by less than 500 specimens; 1917— 18, 1918— 19, 1919— 20 and also probably the1930—31 year-class, although the number of specimens in the latter rises slightly when 1936 specimens are taken into account.
I t will be seen from the grouping of the different year- classes that they form periods as regards their individual abundance: the consecutive year-classes 1917— 18, 1918 —19 and 1919—20 represent periods when there were feiv individuals; the consecutive year-classes 1920— 21,1921— 22, 1922—23 and 1923—24 represent a period of slightly increased individual abundance; the folloiving year-classes 1924— 25, 1925—26 and 1926—27 are abundant, and finally the 1927—28 and 1928—29 year classes, especially the former, comprise salmon seasons of great individual abundance.
T ab le 22. S a lm on Y ear-C lasses : T orn io R iver.
Year-Class 1930 1931 1932 1933 1924 1935 Total 1930 1931 1932 1933 1934 1935Number Percentage
1920—2 1 . . . . 4 7 — — 2 — 13 0-8 0-7 — — 0 1 —1921—2 2 . . . . 25 14 — — — — 39 5-2 1-3 — — — —1922—2 3 . . . . 77 31 8 1 — — 117 15-9 3-0 1-6 0-1 — —1923—2 4 . . . . 197 76 14 — 4 1 292 40-8 7-4 2-8 — 0-2 0-1
1924—2 5 . . . . 124 458 79 20 8 — 689 25-7 44-4 15-9 1-9 0-4 —1925—2 6 . . . . 55 370 138 81 31 1 676 11-4 35-8 27-7 7-7 1-4 0-1
1926—2 7 . . . . 1 67 92 171 113 6 450 0-2 6-5 18-5 16-2 5-0 0-71927—2 8 . . . . — 9 167 542 1167 90 1975 — 0-9 33-5 514 52 2 1 0 1
1928—2 9 . . . . — — — 236 748 243 1227 — — — 22-3 33-4 27 41929—3 0 . . . . — — — 4 161 21 2 377 — — — 0-4 7-2 23-91930—3 1 . . . . — — — 3 330 333 — — — 0-1 37-21931—3 2 . . . . — — — 4 4 — — — 0-51932—3 3 . . . . — — — — — — —1933—34 — — — — —1934—35
1 — ---1 —
Total... 483 1032 498 1055 2237 887 6192 1 00 10 0 1 0 0 1 00 1 0 0 1 0 0

— 68
T ab le 23.
1911—12.1912—13.
Year-Class1922 1923 1924 1925 1926 1927 1928 1929
Number
S a lm o n Y ea r-C la sses :
1930 1931 1932 1933
1913—14........................... ........ : .......... 5 2 — 1
1914—15........................... ..................... 39 9 — 8 3
1915—16........................... .................... 84 17 11 11 1 1
1916—17........................... ..................... 16 14 13 60 — —
1917 18........................... ..................... 5 27 47 116 16 3
1918 19........................... ..................... — 1 4 84 13 1 2 3 — 1
1919—20........................... ..................... — — — 89 66 7 18 5 1 —
1920—21........................... ..................... — — — 49 91 87 49 43 6 1
1921 22........................... ..................... — — — 6 30 59 184 159 55 6 10
132
61922 23........................... — — — --- 12 56 319 127 10
1923—24...........................1 -
— --- 1 13 53 196 24 57 5
1924—25........................... — --- — — 5 127 96 2 22 38
1925 26........................... --- — — — 79 59 449 1 2 0
1926—27........................... I — — 3 9 152 390
1927—28........................... — — — 4 85 948
1928—29........................... — — — 1 33
1929 30........................... — — — —
1930—31.1931—32.1932—33.1933—34.1934—35.
Total. 152 70 424 220 171 322 587 594 210 989 1542
The scale specimens collected from the salmon of southern Finland do not provide such a clear picture of the various periods. The Kokemäki River specimens are perhaps too restricted in quantity to be used as a basis for this type of survey, as salmon fishing in that river, as mentioned earlier, is on the decline. My material compiled from the Kymi River salmon has also been affected by certain exceptional conditions in 1933 and 1934. I have noted, for example, that 1934 was a particularly good salmon year also at the estuary of the Kymi River as in other parts of Finland (The two leading fish firms in the town of Kotka bought 20,000kg. of salmon that year). This exception was not visible in the catches at the fishing grounds (Langinkoski and Ränninkoski Rapids) in the Kymi River. In 1933 and 1934 the river above these rapids was dammed owing to building work, and the water was consequently low enough to hamper fishing.
According to scale specimens collected from the Kymi River, it would appear that the individual abundance or shortage of the year-classes does not correspond with the periods occurring in the Bothnian
Bay area. According to the Kymi River specimens, 1921— 22 was an abundant year-class and provided scale specimens of 1113 salmon. The second place is occupied by the following year-class, 1922— 23, with 741 specimens. The subsequent order is 1923— 24 (543 specimens), 1927— 28 (510), 1926— 27 (459), and 1917— 18 (437 specimens). Taking into account my statements in connection with the Kymi River 1934- catch, the 1928— 29 year-class should probably be included in this same group, although it is represented by 338 salmon only. The following year-classes have been weakly represented: 1918— 19, 1919— 20 and 1920— 21 (represented by between 151 and 244 individuals), 1924—25 and 1925— 26 (224 and 112 individuals), and 1929—30 (150 individuals).
I will interrupt my remarks on the varying individual abundance of the different year-classes, and will revert to the same question in another connection.

— 69 —
K em i River.
1934 1935 Total 1922 1923 1924 1925 1926 1927 1928 1929 1930 1931 1932 1933 1934 1935
1 0-7Percentage
2 1-38 3-3 2-9 — 0 -2:
59 25-6 12-8 — 1-9 1-4125 55-3 24-3 14-7 2-6 0-4 0-6
103 10-5 20-0 17-3 14-2 — —214 3-3 38-6 62-7 27-3 7-3 1-7109 — 1-4 5-3 19-8 5-9 0-6 0-6 0-5 — 0-5186 — — — 21-0 30 0 4-1 5-6 0-9 0-2 —326 — — — 11-6 41-4 50-9 15-2 7-3 1-0 0-5
1 512 — — — 1*4 13-6 34-5 57-2 27-1 9-2 2-8 1-0 0-1 0-03— 1 544 — — — — 7-0 17-4 54-3 21-4 4-8 1-3 0-4 — 0-05
5 — 354 — — — 0-6 4-0 9-0 33 0 11-4 5-8 0-3 0-2 —17 3 508 — — — — 0-9 21-4 45-7 22-5 2-5 0-7 0-2
67 3 777 — — — — 13-3 28-1 45-4 7-8 2-7 0-2
151 30 735 — — — 0-5 4-3 15-4 25-3 6-0 1-8
1721 272 3030 — — — 1-9 8-6 615 6 8 -8 16-0405 920 1359 — — — 0-1 2 1 16-2 54-3130 436 566 — — — — 5-2 25-7
5 29 34- — — 0-2 1-7
— 1 1 — — — 0-05
~ — — —
~ --- — —
! -- —
2502 1695 9553 100 100 100 100 100 100 100 100 100 100 100 100 100 100
T able 25.
Year-Class
S a lm on Y ear-C lasses : K okem äki R iver.
OS 05 OS 05
Number1914—15 . . — 1
1915—16 . . 1 2
1916—17 . . 1 6 — 2
1917—18 . . 14 11 3 41918—19 . . 86 65 16 3 1
1919—20 . . 121 80 46 7 31920—21 . . 8 233 36 14 2
1921—22 . 1 19 91 36 241922—23 . . — 1 3 31 231923—24 . . — — — 3 371924—25 . . — — — — 51925—26 . —- — — —1926—27 . — — —1927—28 .. — —1928—29 .. —1929—30 ..1930—31 ..
Total. . 232 418 195 100 95
CM05
o(Mo s
1 —
3 0-4 9 0-4
32 6-0171 371
m 52 2 294 3-5
I) Hi
6 3724 12
9 106
GO03OS
OSOl05oCO05
<MCOOS
Percentage
83 162 172 1605 100 100
— 2-0
1-5 4-08-2 3-0 1-0
23-6 7-0 3-2 1-7 3 6
18-5 14-0 2 1 — — 1-2
46-7 36-0 25-3 4-2 — —
1-5 31 0 24-2 3-3 — 1-2
— 3-0 38-9 15-8 321 1-2 0-6
— — 5-3 75 0 321 19-3 0-6
— — — — 10-7 25-3 —
— — — — 21-5 44-6 3-7
— — — — 7-2 14-8 7-0
— — — — 74-7 19-8
— — — 5-6 61 6
— — — 11-6
1 0 0 1 0 0 1 0 0 10 0 1 0 0 1 0 0 10 0 10 0

— 70 —
T ab le 24.0 0 o s
Year-Class: T—10 5
i-H0 5
t-H0 5
tH tH iH
1908—09
1909—1 0 ........
7. 30 6
1910—11.......... . 22 1 20 8
1911—12.......... . 35 21 13
1912—13.......... . 14 11 35
1913—14.......... 1 8 33
1914—15.......... . — — 3
1915—16.......... . — — —1916—17.......... . — — —
1917—18.......... — —
S a lm o n Y ear-C lasses:
o(MCS
1918—19.1919—20.1920—21.1921—22.1922—23.
1923—24.1924—25.1925—26.1926—27.1927—28.1928—29.1929—30.1930—31.1931—32.1932—33.1933—34.1934—35.
6
1711
162
1
1
142424
5
CMOS
lO<NOS
Number
— 35 9 3
15 51 11
3 34 26
1 13 312
35
2663
1133710
CD r - COCM 0 3 CM0 5 0 5 0 5
914398794
51
OS O 1-1O ] CO COOS OS OS
cvi coCO COo s OS
T o ta l... 308 6 6 0 2 52 69 110 73 257 259
456
66 10 — — 2
541 1 1 0 21 3 4 1
54 214 83 2 0 3 2 —
3 46 185 141 22 5 2
— 14 26 184 77 24 5— — 2 113 266 179 41— — — 10 103 567 180
— — — — 5 123 372
- — — — 23 275
— — — 1 10
1 — — — 29
1 - — —
— ——
679 394 317 471 482 924 1014
In the above chapters I have endeavoured to illustrate the distribution of the salmon shoals in Finnish waters into different life-cycle classes during the period when I have taken measurements and weighings and collected scale specimens. In particular I would like to draw the attention of the reader to the figures which are obtained by combining all the observations of the years in question. This, in my opinion, will
remove the particular fluctuations which are influenced by the different numbers of individuals in the year-classes if only a few years are taken into account. As my material in its entirety represents a fairly large number of salmon, I consider that my observations on the life-cycle classes will shed light on the normal course of life of the salmon stock in the Baltic as a whole.
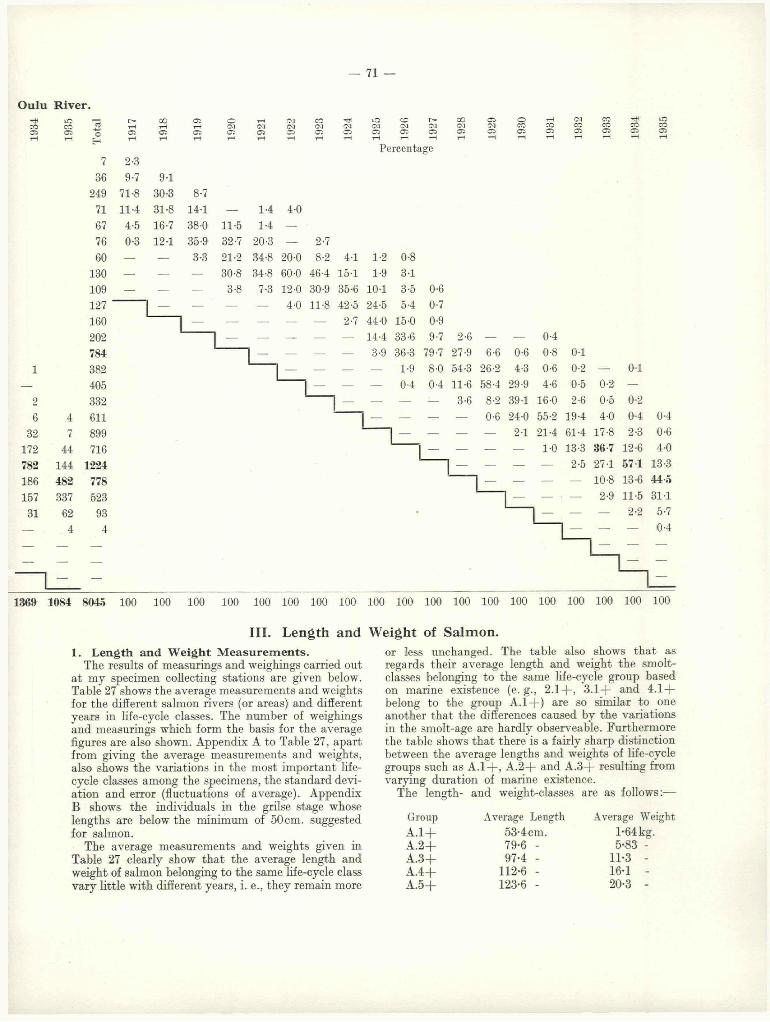
71 —
O ulu R iver.-rHCO05
2
6
32172782
186157
31
lOCO05
47
44
144482
33762
4
00tH05
05 i—H 05
O? I 05
-sH0305
0305
CO0305
05 O rH03 CO CO05 05 05
736
24971677660
130109127160202784382405
332611899716
1224778523
934
2-3
9'7
71-8
11-4
4-5
0-3
Percentage
9-130-3 8-731-8 14-1 — 1-4 4-016-7 38-0 11-5 1-4 —12-1 35-9 32-7 20-3 — 2-7— 3-3 21-2 34-8 2 0 0 8-2 4-1 1-2 0-8
— — 30-8 34-8 60-0 46-4 15-1 1-9 3-1— — 3-8 7-3 12 0 30-9 35-6 10-1 3-5 0-6
— — — — 4-0 11-8 42-5 24-5 5-4 0-7
— — — — — 2-7 44-0 15-0 0-9
— — — — — 14-4 33-6 9-7 2-6 —
— — — — 3-9 36-3 79-7 27-9 6-6
— — — — 1-9 8-0 54-3 26-2
— — — 0-4 0-4 11-6 58-4
— -— — ■— 3-6 8-2
— — — — 0-6
0-64-3
29-9
— 2 1
0-40-8
0-64-6
16-055-221-4
COCO02
0-1
0-20-52-6
19-461-4
1-0 13-3 2-5
»OCO CO05 05
— 01
0-2 —
0-5
4-0 17-8
867
27-1
10-8
2-9
0-20-42-3
12-6
571
0-40-64-0
13-313-6 44-5
11-5 31-1 2-2 5-7— 0-4
1369 1084 8045 100 100 100 100 100 100 100 100 100 100 100 100 100 100 100 100 100 100 100
III. Length and Weight of Salmon.1. Length and W eight M easu rem en ts.
The results of measurings and weighings carried out at my specimen collecting stations are given below. Table 27 shows the average measurements and weights for the different salmon rivers (or areas) and different years in life-cycle classes. The number of weighings and measurings which form the basis for the average figures are also shown. Appendix A to Table 27, apart from giving the average measurements and weights, also shows the variations in the most important lifecycle classes among the specimens, the standard deviation and error (fluctuations of average). Appendix B shows the individuals in the grilse stage whose lengths are below the minimum of 50 cm. suggested for salmon.
The average measurements and weights given in Table 27 clearly show that the average length and weight of salmon belonging to the same life-cycle class vary little with different years, i. e., they remain more
or less unchanged. The table also shows that as regards their average length and weight the smolt- classes belonging to the same life-cycle group based on marine existence (e. g., 2 .1 + , 3.1 + and 4.1 + belong to the group A .1 + ) are so similar to one another that the differences caused by the variations in the smolt-age are hardly observeable. Furthermore the table shows that there is a fairly sharp distinction between the average lengths and weights of life-cycle groups such as A .1 + , A .2 + and A .3 + resulting from varying duration of marine existence.
The length- and weight-classes are as follows:—
Group Average Length Average Weight
A.1 + 53-4 cm. 1-64 kg.A.2 + 79-6 - 5-83 -A .3 + 97-4 - 11-3 -A .4 + 1 1 2 - 6 - 16-1 -A .5 + 123-6 - 20-3 -

— 72 —
T ab le 26. S a lm on Y ear -C lasses:
Year-Class 1920 1921 1922 1923 1924 1925 1926 1927Number
1928 1929 1930 1931 1932 1933
1910—11................. 2 2
1911—12................. 3 4
1912—13................. 1 4 2
1913—14................ . 11 13 4 2
1914—15................. . 1 0 0 36 23 1 2
1915—16................. . 1 0 0 127 48 5 3 2 1
1916—17................. . 20 59 72 17 15 6 6 1 1
1917—18................ 1 83 77 119 45 89 14 7 1 1
1918—19................ . — — 1 4 69 82 2 0 3 6 2
1919—20................ . — — ' — — 8 87 42 7 4 31920—21................ — — — 2 51 128 40 2 0 2 1
1921—22................. — — — 38 411 519 103 28 3 8 31922—23................ — — — 98 217 320 69 18 8 10 —1923—24................. — — 1 17 124 252 90 51 4 2
1924—25................ — — — 15 53 111 28 12 1
1925—26.................. — — — 12 22 58 17 2
1926—27..................1 - ,
— — 15 198 2 2 0 181927—28.................. 1 — — — 76 284 851928—29................ — . — 1 38 91929—30................... — — — —1930—31.................. — — —1931—3 2 ..................... ................ — —1932—3 3 ..................... 1 —1933—3 4 .....................1934—3 5 .....................
Total... 238 328 227 148 144 355 721 811 594 422 260 428 588 117
2. C ertain W eigh t-C lass S ta tis t ic s .At the outset of the investigations, it appeared that
there was very little hope of obtaining scale specimens from any large number of salmon, and I did not know how to carry out the work on age determinations even if the collection of scale specimens should be extensive. Under these circumstances I assumed that the catch statistics, divided into weight-classes, might perhaps provide a suitable basis for determining the different year-classes, of individual abundance, if the figures obtained from the statistics were converted along the lines suggested by scale investigations. Table 28 gives the original statistics and Table 29 is an attempt to convert weight-classes into probable age-groups.
The statistics given in Table 28 embrace the data obtained from the fishing grounds mentioned in the appendix to Tables 3 and 4, grouped as in the tables.
In considering the weight-classes I had to rely, more or less, on estimates; the data on lengths and weights shown in Table 27 were not then available. The division is as follows : first group : fish below 3 kg.
(grilse), second group : 3-5— 7kg. (small salmon), third :7-5— 13kg.; fourth: 13-5— 19kg., and fifth: (and last group): salmon weighing above 19kg.
As is usual with statistics, particular attention must be paid to the original sources of information, although in several cases this is difficult to control with sufficient exactitude. With regard to later statements based on these statistics, I very much doubt whether sufficient care was devoted in compiling the original data to following the medium, and at the same time to the most important life-cycle classes; a certain amount of generalisation has been necessary, particularly in areas (such as the Simo) where the number of fish was so large that even the sorting was a race against time. From personal experience I know that our fishermen usually just divide the salmon up into “big” and “small” when the catch is brought to the bank, and then weigh the two groups as a whole with a decimal balance after the salmon have been counted. As far as I have noticed, the division into “big” and “small” has been done from a commercial, more than a statistical, point of view. I am compelled to make
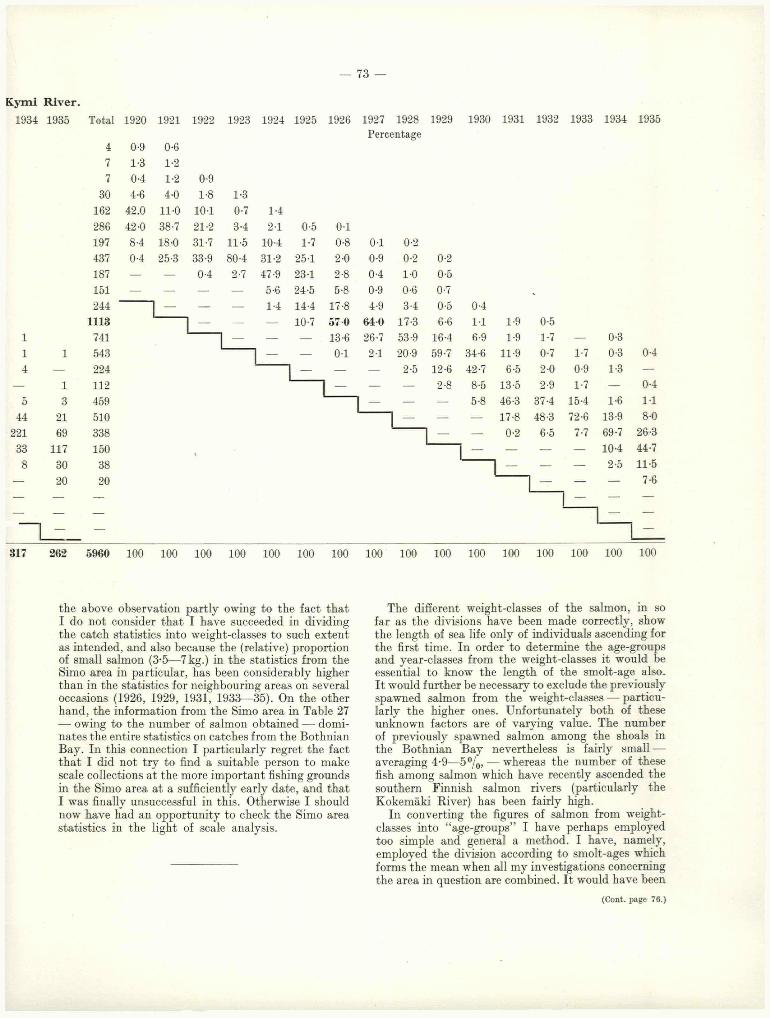
73 —
Kymi River.
1934 1935 Total 1920 1921 1922 1923 1924 1925 1926 1927 1928 1929 1930 1931 1932 1933 1934 1935
4 0-9 0-6
Percentage
7 1-3 1-2
7 0-4 1-2 0-9
30 4-6 4-0 1-8 1-3162 42.0 11-0 10-1 0-7 1-4286 42-0 38-7 21-2 3-4 2 1 0-5 0 1
197 8-4 18-0 31-7 11-5 10-4 1-7 0-8 0 1 0-2
437 0-4 25-3 33-9 80-4 31-2 25-1 2-0 0-9 0-2 0-2
187 — — 0-4 2-7 47-9 23-1 2-8 0-4 1-0 0-5151 — — — — 5-6 24-5 5-8 0-9 0-6 0-7 .
244 — — — 1-4 14-4 17-8 4-9 3-4 0-5 0-41113 — — — 10-7 57 0 640 17-3 6-6 1 1 1-9 0-5
0-31 741 — — — 13-6 26-7 53-9 16-4 6-9 1-9 1-7 —0-41 1 543 — — 0 1 2-1 20-9 59-7 34-6 11-9 0-7 1-7 0-3
4 — 224- — — 2-5 12-6 42-7 6-5 2-0 0-9 1-3 —
— 1 1 12 — — — 2-8 8-5 13-5 2-9 1-7 — 0-4
5 3 459 — — — 5-8 46-3 37-4 15-4 1-6 1-1
44 21 510 1 - — — 17-8 48-3 72-6 13-9 8-0
221 69 338 — — 0-2 6-5 7-7 69-7 26-3
33 117 150 , 1 - — — — 10-4 44-7
8 30 38 — — — 2-5 11-5
— 20 20 — — — 7-6
— — — — — —
— — — — —
H — — —
817 262 5960 10 0 1 0 0 1 00 10 0 10 0 1 0 0 10 0 1 00 10 0 1 0 0 1 0 0 10 0 10 0 10 0 1 00 1 0 0
the above observation partly owing to the fact that I do not consider that I have succeeded in dividing the catch statistics into weight-classes to such extent as intended, and also because the (relative) proportion of small salmon (3-5— 7 kg.) in the statistics from the Simo area in particular, has been considerably higher than in the statistics for neighbouring areas on several occasions (1926, 1929, 1931, 1933—35). On the other hand, the information from the Simo area in Table 27— owing to the number of salmon obtained — dominates the entire statistics on catches from the Bothnian Bay. In this connection I particularly regret the fact that I did not try to find a suitable person to make scale collections at the more important fishing grounds in the Simo area at a sufficiently early date, and that I was finally unsuccessful in this. Otherwise I should now have had an opportunity to check the Simo area statistics in the light of scale analysis.
The différé tit weight-classes of the salmon, in so far as the divisions have been made correctly, show the length of sea life only of individuals ascending for the first time. In order to determine the age-groups and year-classes from the weight-classes it would be essential to know the length of the smolt-age also. It would further be necessary to exclude the previously spawned salmon from the weight-classes — particularly the higher ones. Unfortunately both of these unknown factors are of varying value. The number of previously spawned salmon among the shoals in the Bothnian Bay nevertheless is fairly small — averaging 4-9—5% , — whereas the number of these fish among salmon which have recently ascended the southern Finnish salmon rivers (particularly the Kokemäki Biver) has been fairly high.
In converting the figures of salmon from weight- classes into “age-groups” I have perhaps employed too simple and general a method. I have, namely, employed the division according to smolt-ages which forms the mean when all my investigations concerning the area in question are combined. It would have been
(Cont. page 76.)
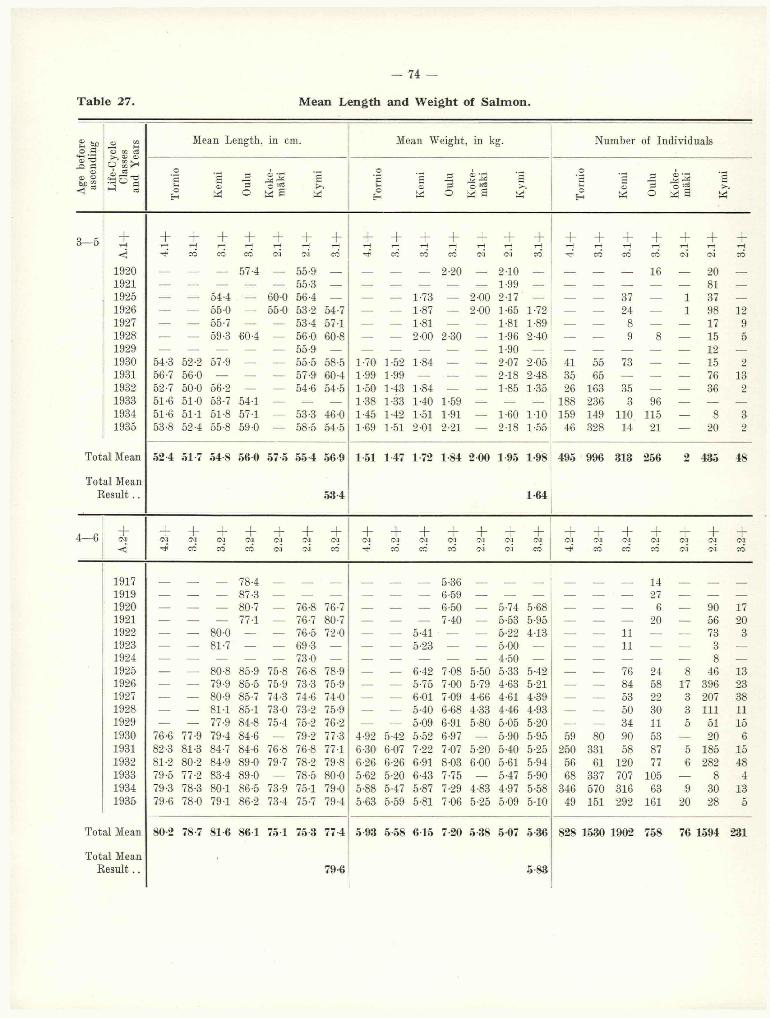
- 74 —
T ab le 27. M ean Length and W eight of S a lm on .
Ï M 05 F° Mean Length, in cm. Mean Weight in kg. Number of IndividualsO Ö Ö CO c3“3 TS .a c © a> « So “
oÎS O g ^ §
OJ-o 05
w oOW 6 «
o'Ëo£-<
05W
s
5
05 *r|
w a
©£05
oow a
B>>«
3—5 +rH +T—j +rH + T—H +rH +rH +rH + + +rH + i“1+rH +rH + + i—i +rH + T—I +rH +rH +rH +rH +rH
< T* CO CO CO OJ Cvi CO -rr CO CO CO 03 oi erf Th CO erf CO Cvi 03 erf
1920 --- --- --- 57-4 --- 55-9 — — --- — 2 -20 --- 2-10 — --- — --- 16 — 20 —1921 --- --- --- — --- 55-3 — — --- — — --- 1-99 — --- — --- — — 81 —1925 --- --- 54-4 — 60-0 56-4 — — --- 1-73 — 2-00 247 .— --- — 37 — 1 37 —1926 --- --- 55 0 — 55 0 53-2 54-7 — --- 1-87 — 2-00 1-65 1-72 --- — 24 — 1 98 121927 --- --- 55-7 — — 53-4 57-1 — --- 1-81 — — 1-81 1-89 --- — 8 — — 17 91928 --- --- 59-3 60-4 — 56-0 60-8 — --- 2 00 2-30 — 1-96 240 --- — 9 8 — 15 51929 --- --- — — — 55-9 — — --- — — — 1-90 — --- — — — — 12 —1930 54-3 52-2 57-9 — — 55-5 58-5 1-70 1-52 1-84 — — 2-07 2-05 41 55 73 — — 15 21931 56-7 56-0 — — — 57-9 60-4 1-99 1-99 — — — 2-18 248 35 65 — — — 76 131932 52-7 50-0 56-2 — — 54-6 54-5 1-50 1-43 1-84 — — 1-85 1-35 26 163 35 —. — 36 21933 51-6 51 0 53-7 54-1 — — — 1-38 1-33 140 1-59 — — —. 188 236 3 96 — — —1934 51-6 51-1 51-8 57-1 — 53-3 46-0 1 45 1-42 1-51 1-91 — 1-60 140 159 149 110 115 — 8 31935 53-8 5 24 55-8 59-0 — 58-5 54-5 1-69 1-51 2-01 2-21 —• 2-18 1-55 46 328 14 21 — 20 2
Total Mean 5 2 4 51-7 548 560 57*6 554 56 9 151 147 1 72 1-84 2 0 0 195 1-98 495 99G 313 256 2 485 48
Total MeanResult.. 534 1-64
4—6 +03 +CM +03 +03
+ + +03 +03 +oa +03 +03
+03 +O) +ca +03 +CM +03 +03 +03 +03 +03 +03< CO CO CO oi oi co" ■*? co’ erf erf oj 03 erf CO erf erf 03 03 erf
1917 78-4 5-36 141919 --- — — 87-3 — — --- — — — 6-69 — --- — --- — — 27 --- --- —1920 --- — — 80-7 — 76-8 76-7 — — — 6-50 — 5-74 5-68 --- — — 6 --- 90 171921 --- — — 77-1 — 76-7 80-7 — — — 740 — 5-53 5-95 --- — — 20 --- 56 201922 --- — 80-0 — — 76-5 72-0 — — 541 — — 5-22 443 --- — 11 — --- 73 31923 --- — 81-7 — — 69-3 — — — 5-23 — — 5-00 — --- — 11 — --- 3 —1924 --- — _ — — 73-0 — — — — — — 4-50 — --- — __ __ --- 8 __1925 --- — 80-8 85-9 75-8 76-8 78-9 — — 642 7-08 5-50 5-33 542 --- — 76 24 8 46 131926 --- — 79-9 85-5 75*9 73-3 75-9 — — 5-75 7-00 5-79 4-63 5-21 --- — 84 58 17 396 231927 --- — 80-9 85-7 74-3 74-6 74-0 — — 6-01 7-09 4-66 4-61 4-39 --- — 53 22 3 207 381928 --- — 81-1 85-1 73-0 73-2 75-9 — — 540 6-68 4-33 446 4-93 --- — 50 30 3 111 111929 --- — 77-9 84-8 75-4 75-2 76-2 — — 5-09 6-91 5-80 6-05 5-20 --- — 34 11 5 51 151930 76-6 77-9 79-4 84-6 — 79-2 77-3 4-92 5-42 5-52 6-97 — 5-90 5-95 59 80 90 53 — 20 61931 82-3 81-3 84-7 84-6 76-8 76-8 77-1 6-30 6-07 7-22 7-07 5-20 540 5-25 250 331 58 87 5 185 151932 81-2 80-2 84-9 89-0 79-7 78-2 79-8 6-26 6-26 6-91 8-03 6-00 5-61 5-94 56 61 120 77 6 282 481933 79-5 77-2 83-4 89-0 — 78-5 80-0 5-62 5-20 643 7-75 — 547 5-90 68 337 707 105 — 8 41934 79-3 78-3 80-1 86-5 73-9 75-1 79-0 5-88 5-47 5-87 7-29 4-83 4-97 5-58 346 570 316 63 9 30 131935 79-6 78-0 79-1 86-2 73-4 75-7 79-4 5-63 5-59 5-81 7-06 5-25 5-09 540 49 151 292 161 20 28 5
Total Mean 80*2 78-7 816 861 751 75 3 774 5 93 5-58 615 7 20 5 38 5 07 536 828 1530 1902 758 76 1594 231
Total MeanResult.. 79« 5 83

— 75 —
T ab le 27 (continued).
£ M5 c £ SÜ M !iMean Length, in cm. Mean Weight in k 3- Number of Individuals
o rC
£ © <£> O
“ s
Tor
nio
Kem
i
Oul
u
Kok
e-m
äki
Kym
i
Tor
nio
Kem
i
Oul
u
Kok
e-m
äki
Kvm
i
Tor
nio
Kem
i
Oul
u
Kok
e-m
äki
Kym
i
CO CO CO CO CO CO CO CO CO CO CO CO CO CO CO CO CO CO CO CO CO CO5— 7 <3 CO CO CO Cd CO CO CO CO IM <M CO CO CO CO CT IM CO
1917 —
191819191920 -- — — 104-2 -- 91-2 91-6 — — — 13-5 -- 9-4 9-6 -- — — 16 -- 80 7
1921 -- — — 103-5 -- 98-7 99-0 — — — 11-9 -- 11-3 12-2 -- — — 17 -- 97 18
1922 -- — 103-0 103-6 -- 92-2 101-8 — — 13-1 12-1 -- 9-4 11-1 -- — 79 15 -- 69 27
1923 -- — 102-5 101-7 — 90-7 99-0 — — 10-6 11-5 -- 8-9 11-4 -- — 13 28 -- 117 7
1924 -- — 98-9 103-5 -- 86-1 94-3 — — 11-3 11-8 -- 7-6 9-8 -- — 30 22 66 4
1925 __ — 100-2 102-5 94-7 91-3 93-1 — — 12-3 12-1 10-2 9-0 9-1 -- — 77 106 .117 73 22
1926 -- — 101-2 102-7 94-2 93-1 93-5 — — 12-1 12-0 10-1 9-5 9-7 -- — 55 70 227 99 19
1927 -- — 99-6 103-4 92-5 91-5 95-7 — — 11-6 12-3 9-7 8-7 9-6 -- — 81 524 88 474 20
1928 -- — 100-0 103-7 94-0 91-1 92-8 — — 9-4 11-8 10-0 8-6 9-1 — — 178 200 30 304 4b
1929 -- — 97-6 100-5 94-1 91-2 93-1 — — 10-2 11-4 9-8 8-8 9-0 -- — 307 181 36 232 11
1930 99-7 97-5 98-5 103-6 94-4 94-5 94-9 11-6 11-1 11-3 12-4 10-5 9-9 10-3 24 131 170 165 88 104 38
1931 97-5 99-4 99-7 102-3 97-0 94-8 95-1 10-7 11-7 11-2 11-8 10-5 10-0 9-9 31 207 81 227 2 41 14
1932 101-7 100-8 103-2 104-4 97-9 95-5 95-5 12-5 12-5 12-2 12-4 11-3 10-3 9-9 60 78 398 536 34 169 11
1933 101-8 101-0 103-0 104-6 — 98-0 101-1 13-2 12-4 12-4 12-8 — 11-1 12-2 57 87 299 337 — 80 12
1934 99-2 99-9 82-3 105-0 92-6 94-9 100-2 11-8 12-3 11-3 13-0 10-8 10-2 11-9 73 750 1513 747 118 207 y
1935 101-8 100-2 99-6 104-7 93-9 95-4 97-3 12-9 12-3 11-4 12-8 10-7 10-5 10-9 67 186 831 442 98 111 33
Total Mean
Total Mean R esult..
1006 99-8 93-8 103-8 940 92-8 95-9
97-4
123 121 114 124 103 9-4 101
113
312 1439 4112 3889 838 2323 297
Û o 'S! rH Tt< ■̂ 1<1 CO CO CO <N IN CO CO CO CO CM <N CO CO CO co <M (M CO
19171918191919201921 --- — — 121-0 --- 112-1 115-5 — — — 16-5 --- 16-3 18-7 --- — — 4 --- 10 61922 --- — 111-4 118-7 --- 111-4 — — — 16-8 18-8 --- 16-2 — ---* — 8 3 --- 5 —1923 --- — 118-5 114-4 --- 106-9 — — — 16-4 15-8 --- 13-8 — --- — 12 36 — 9 —1924 --- — 110-2 114-3 --- 107-0 — — — 15-1 15-6 --- 13-9 — --- — 13 24 --- 26 —1925 --- — 111-3 115-6 106-2 104-5 105-6 — — 16-5 17-2 14-2 13-3 12-4 — — 90 54 50 54 51926 --- — 114-6 115-6 111-2 108-3 — — — 17-4 17-3 16-0 14-7 — --- — 11 33 66 20 —1927 --- — 119-4 115-3 109-8 110-3 — — — 19-6 17-4 15-9 14-6 — --- — 3 34 22 12 —1928 -- — 112-1 113-7 107-1 106-5 112-4 — — 15-2 15-7 13-4 13-5 15-6 --- — 45 86 23 47 51929 -- — 112-6 113-3 106-1 106-4 104-4 — — 15-7 16-0 14-5 13-6 12-7 --- — 108 64 11 44 91930 106-0 109-6 111-1 113-1 109-2 108-8 107-6 13-7 15-1 16-3 16-3 15-0 14-1 13-4 11 44 105 126 11 48 51931 114-2 114-5 110-6 115-7 115-4 110-6 109-3 17-4 17-5 16-1 16-7 17-1 14-9 14-3 7 40 16 67 7 13 91932 110-4 113-0 113-9 117-9 114-0 113-8 — 16-2 17-6 16-7 17-1 16-8 16-6 — 5 18 35 51 2 6 —1933 115-4 117-4 117-1 117-1 — 114-5 — 17-1 19-2 18-6 17-9 — 15-9 — 7 20 32 62 — 2 —1934 117-3 114-3 113-1 115-6 111-0 112-8 117-0 18-7 17-3 16-3 17-3 16-3 16-3 17-4 7 16 41 97 11 22 11935 117-0 114-0 114-2 117-6 110-6 112-1 113-8 19-0 18-0 17-2 17-9 17-2 16-3 16-6 1 9 46 93 18 32 4
Total Mean
Total Mean R esult..
112 2 113 2 112 6 115 3 109 2 1082 109-5
1126
164 170 162 16-8 153 142 14 7
161
38 147 565 873 220 350 44
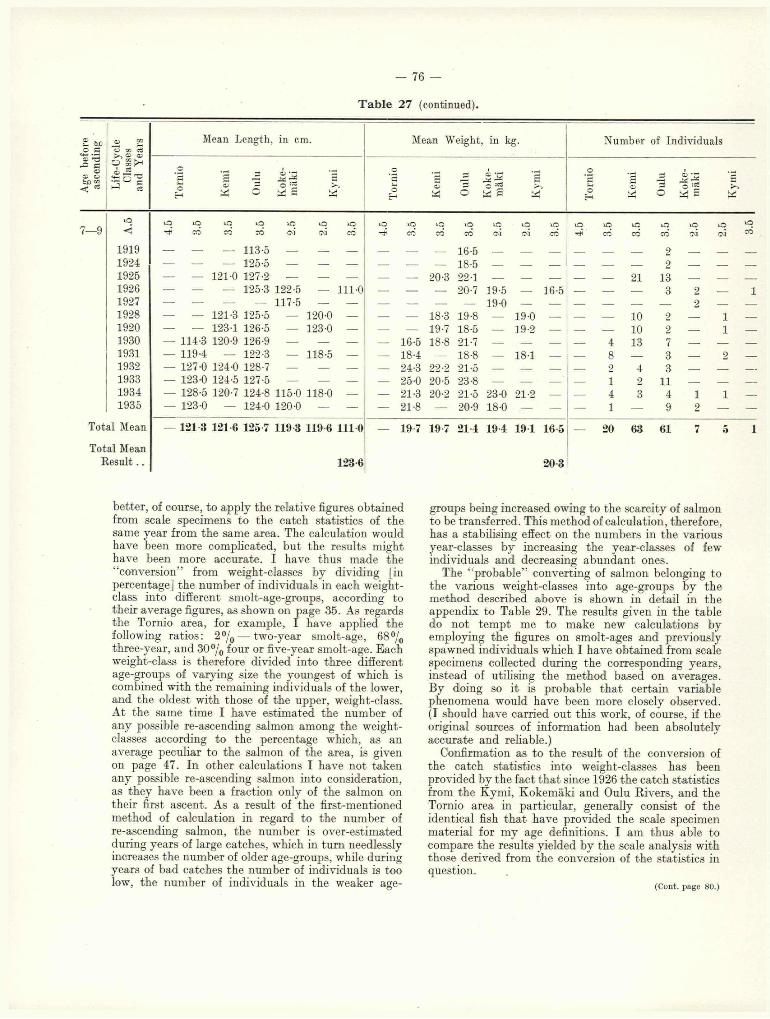
- 76 —
T able 27 (continued).
2 u> o s
Lif
e-C
ycle
C
lass
es
and
Yea
rs Mean Length, in cm. Mean Weight in kg. Number of Individuals
© r3
© © © fcJD 2
<sT
orni
o
Kem
i
Oul
u
Ko
ke
mäk
i
Tor
nio
Kem
i
Oul
u
Ko
ke
mäk
i
Kv
mi
Tor
nio
Kem
i
Oul
u
Ko
ke
mäk
i
Ky
mi
7—9iQ IQ IQ O O o o O lO iO iO iO iQ lO to lO o■< -rJH CO CO CO CM CO CO CO CO 03 CO CO CO CO <M <M CO
1919 — — — 113-5 -1924 — 125-51925 — — 121-0 127-2 --- --- — — — 20-3 22-1 --- --- — — --- 21 13 __ __ __1926 — 125-3 122-5 --- 111-0 — — — ‘20-7 19-5 --- 16-5 — --- — 3 2 __ 11927 — — — — 117-5 --- — — — — — 19-0 --- — — --- __ __ 2 __ __1928 — — 121-3 125-5 — 120-0 — — — 18-3 19-8 — 19-0 — — --- 10 2 __ 1 __1920 — — 123-1 126-5 — 123-0 — — — 19-7 18-5 — 19-2 — — --- 10 2 — 1 —1930 — 114-3 120-9 126-9 — — — 16-5 18-8 21-7 — — — — 4 13 7 __ __ __1931 — 119-4 — 122-3 — 118-5 — — 18-4 — 18-8 — 18-1 — — 8 __ 3 __ 2 __1932 — 127-0 124-0 128-7 — — — — 24-3 22-2 21-5 — — — — 2 4 3 __ __ __1933 — 123-0 124-5 127-5 — — — 25-0 20-5 23-8 — — — — 1 2 11 __ __ __1934 — 128-5 120-7 124-8 115-0 118-0 — — 21-3 20-2 21-5 23-0 21-2 — — 4 3 4 1 1 —1935 — 123-0 — 124-0 120-0 — — — 21-8 — 20-9 18-0 — — — 1 — 9 2 — —
Total Mean
Total Mean Result..
— 121 3 121 6 125 7 119 3 119 6 111 0
123-6
197 19-7 214 194 191 16-5
203
2 0 63 61 7 5 1
better, of course, to apply the relative figures obtained from scale specimens to the catch statistics of the same year from the same area. The calculation would have been more complicated, but the results might have been more accurate. I have thus made the “conversion” from weight-classes by dividing [in percentage] the number of individuals in each weight- class into different smolt-age-groups, according to their average figures, as shown on page 35. As regards the Tornio area, for example, I have applied the following ratios: 2 ° / 0 — two-year smolt-age, 6 8 % three-year, and 30°/0 four or five-year smolt-age. Each weight-class is therefore divided into three different age-groups of varying size the youngest of which is combined with the remaining individuals of the lower, and the oldest with those of the upper, weight-class. At the same time I have estimated the number of any possible re-ascending salmon among the weight- classes according to the percentage which, as an average peculiar to the salmon of the area, is given on page 47. In other calculations I have not taken any possible re-ascending salmon into consideration, as they have been a fraction only of the salmon on their first ascent. As a result of the first-mentioned method of calculation in regard to the number of re-ascending salmon, the number is over-estimated during years of large catches, which in turn needlessly increases the number of older age-groups, while during years of bad catches the number of individuals is too low, the number of individuals in the weaker age-
groups being increased owing to the scarcity of salmon to be transferred. This method of calculation, therefore, has a stabilising effect on the numbers in the various year-classes by increasing the year-classes of few individuals and decreasing abundant ones.
The ‘‘probable” converting of salmon belonging to the various weight-classes into age-groups by the method described above is shown in detail in the appendix to Table 29. The results given in the table do not tempt me to make new calculations by employing the figures on smolt-ages and previously spawned individuals which I have obtained from scale specimens collected during the corresponding years, instead of utilising the method based on averages. By doing so it is probable that certain variable phenomena would have been more closely observed. (I should have carried out this work, of course, if the original sources of information had been absolutely accurate and reliable.)
Confirmation as to the result of the conversion of the catch statistics into weight-classes has been provided by the fact that since 1926 the catch statistics from the Kymi, Kokemäki and Oulu Rivers, and the Tornio area in particular, generally consist of the identical fish that have provided the scale specimen material for my age definitions. I am thus able to compare the results yielded by the scale analysis with those derived from the conversion of the statistics in question.
(Cont. page 80.)

— 77 —
M ea n s a n d S t a n d a r d D e v i a t i o n s c
T ornio R iver: K iviranta.Year Ind. Mean Stand. Dev.
3.4 1930........... 30 109-43 ± 0-8966 ±4-9106193 1 ............. 33 114-27 ± 0-8274 ± 4-7533
4.3 1931............ 25 98-20 ± 0-9448 ± 4-7244193 2 ............. 22 (J 102-41 ± 1-4988 ± 7-0301
3 1 $ 100-03 ± 1-0206 ± 5-6824193 3 ............. 31 102-00 ± 0-9327 ±5-1930193 4 ............. 20 (J 102-10 ± 1-4780 ± 6-6098
4 4 $ 97-64 ± 0-8406 ± 5-5759193 5 ............. 21 (J 105-33 ± 1-0697 ± 4-9024
3 4 $ 98-32 ± 0-7068 ±4-1214
3.3 1930............ 100 97-72 ± 0-3834 ± 3-8343193 1 ............. 171 99-34 ± 0-4245 ±5-5516193 2 ............. 60 100-17 ± 0-7554 ±5-8513193 3 ............. 20 <J 102-75 ±1-1487 ±5-1369
3 8 $ 99-37 ± 0-9225 ± 5-6865193 4 ............. 228 <? 102-70 ± 0-3779 ± 5-7068
443$ 97-91 ± 0-2504 ± 5-2693193 5 ............. 60 (J 103-18 ± 0-7640 ±5-9176
103 $ 98-22 ± 0-4466 ± 4-5325
4 .2 + 1930............ 38 77-18 ± 0-7479 ± 4-6105193 1 ............. 233 82-24 ± 0-3004 ± 4-5852193 2 ............. 45 80-16 ± 1-0550 ± 7-0771193 3 ............. 48 78-94 ± 0-8510 ± 5-8959193 4 ............. 70 c? 80-59 ± 0-7060 ± 5-9096
239 $ 78-62 ± 0-3086 ± 4-7705193 5 ............. 42 79-50 ± 1-1000 ±7-1289
3 .2 + 1930............ 62 78-39 ± 0-6497 ±5-1157193 1 ............. 306 81-39 ± 0-2680 ± 4-6885193 2 ............. 45 79-49 ± 1-0393 ±6-9717193 3 ............. 42 (? 78-33 ±1-2111 ± 7-8489
162$ 76-36 ± 0-5531 ± 7-0396193 4 ............. 149 (J 79-13 ± 0-4387 ± 5-3548
342$ 77-42 ±0-2847 ± 5-2659193 5 ............. 37 cJ 78 62 ± 1-0887 ± 6-6226
8 7 $ 77-24 ±0-6156 ± 5-7420
5 .1 + 1934............. 40 50-48 ±0-8161 ±5-1618
4 .1 + 1930............ 28 54-36 ± 0-6231 ± 3-2970193 1 ............. 30 56-67 ± 0-8580 ± 4-6994193 2 .......... 20 53-50 ±1-3182 ± 5-8949193 3 ............. 54 (J 52-74 ± 0-3948 ± 2-9009
2 3 $ 51-39 ± 0-7499 ± 3-5965193 4 ............. 47 c? 53-17 ± 0 -7123 ± 4-8830
6 1 $ 51-41 ± 0-6376 ± 4-97991 9 3 5 .. ......... 33 53-27 ± 0-7339 ±4-2161
3 .1 + 1930............ 49 52-14 ± 0-5061 ± 3-5429193 1 ............. 60 56-42 ±0-6152 ± 4-7652193 2 ............. 65 (J 50-85 ± 0-6772 ± 5-4604
5 2 $ 49-79 ± 0-6757 ± 4-8725
)pendix A.
th e P r in c ip a l S iz e -M e a s u r e m e n ts .
Year Ind. Mean Stand. Dev.1933 • 57 cJ 52-58 ± 0-4224 ± 3-1894
3 0 $ 52-13 ± 0-6142 ± 3-36401934 ■ 56 52-14 ± 0-4707 ± 3-5226
4 1 $ 50-66 ± 0-8210 ± 5-25711935 . 139 <? 53-17 ± 0-3228 ± 3-8055
107$ 51-07 ± 0-3550 ± 3-6717
Tornio R iver: S u m isaar i.
4.3 1933 26 101-54 ± 1-3158 ± 6-7094
3.3 1930 31 96-84 ± 1-0323 ± 5-74771931 36 99-50 ± 1-3897 ± 8-33831933 29 101-90 ± 1-1947 ± 6-43401934 . 26 $ 104-81 ± 1-3889 ± 7-0818
4 5 $ 102-42 ± 0-8407 ± 5-63931935 23 101-13 ± 1-9124 ± 9-1713
4.2+ 1930 21 75-67 ± 1-0781 ± 4-94051933 20 80-80 ± 1-2661 ± 5-66221934 34 81-50 ± 1-0598 ± 6-1799
3.2+ 1931 25 80-28 ± 1-2477 ± 6-23871933 ,. 63 3 80-00 ± 0-9970 ± 7-9142
70 $ 76-10 ± 0-8500 ± 7-11201934 71 80-93 ± 0-6495 ± 5-47281935 27 79-52 ± 1-5048 ± 7-8190
4.1+ 1933 108 51-03 ± 0-4552 ± 4-73061934 30 50-90 ± 0-8542 ± 4-6787
3.1 + 1932 23 51-87 ±1-1590 ± 5-55841933 137 49-98 ± 0-3837 ± 4-49121934 36 50-89 ± 0-7090 ± 4-25401935 ,. 39 3 52-49 ± 0-7509 ± 4-6894
4 3 $ 53-05 ± 0-6914 ± 4-5338
K em i R iver.
3.5 1925 21 121-00 ± 0-9851 ± 4-5145
3.4 1925 • 60 c? 113-75 ± 0-4712 ± 3-64983 0 $ 106-50 ± 0-9150 ± 5-0117
1928 45 112-10 ± 0-6200 ± 4-15931929 . 78 <? 115-23 ± 0-5102 ± 4-5062
26$ 108-50 ± 0-9251 ± 4-71701930 . 65 cJ 113-48 ± 0-5172 ± 4-1695
4 0 $ 107-28 ± 0-7432 ± 4-70071932 35 113-93 ± 0-7014 ± 4-14981933 32 117-07 ± 0-9056 ± 5-12301934 41 113-10 ± 0-6192 ± 3-96511935 46 114-20 ± 0-6823 ± 4-6278
4.3 1922 29 103-43 ± 0-8098 ± 4-36141929 44 96-25 ± 0-8583 ± 5-69341932 . 60 S 105-92 ± 0-6046 ± 4-6837
107$ 99-90 ± 0-5380 ± 5-56551933 61 101-70 ± 0-8923 ± 6-9696

— 78 —
T ab le 27, A pp en dix A (continued).
Year Ind Mean Stand. Dev.1934 78 98-86 ± 0-6411 ± 5-66281935 60 3 103-09 ± 0-7127 ± 5-5204
127 ? 97-51 ± 0-4593 ± 5-1764
1915 26 102-81 ± 1-1754 ± 5-99341922......... 3 108-55 ± 0-8969 ± 4-2068
57 ? 100-82 ± 0-6332 ± 4-78061924 30 98-93 ± 0-9369 ± 5-13181925......... 21 <5 102-71 ± 0-9360 ± 4-2896
56 ? 99-21 ± 0-4494 ± 3-36351926 , 55 101-18 ± 0-6123 db 4-54121927 81 99-61 ± 0-4925 ± 4-43311928 57 3 101-51 ± 1-0992 ± 8-2994
121 ? 99-24 ± 0-3469 ± 3-81601929 307 97-62 ± 0-2575 ± 4-51241930 36 S 103-69 ± 0-5891 ± 3-5350
134 ? 97-16 ± 0-2644 ± 3-06101931 , , 29 â 102-17 ± 1-0662 ± 5-7420
52 ? 98-27 ± 0-6232 ± 4-49401932 104 s 107-38 ± 0-4669 ± 4-7616
294 ? 101-70 ± 0-2702 ± 4-63391933 67 s 106-43 ± 0-7678 ± 6-2850
232 ? 102-03 ± 0-3673 ± 5-59551934 407 c? 103-86 ± 0-2652 ± 5-3504
1106 9 98-56 ± 0-1583 ± 5-26771935 212 3 103-96 ± 0-3567 ± 5-1942
619 ? 98-08 ± 0-1855 ± 4-6140
1932 24 99-63 ± 1-0387 ± 5-08871933 61 3 106-03 ± 0-7463 ± 5-8295
166 ? 102-83 ± 0-3644 ± 4-69531934 36 99-92 ± 0-7487 ± 4-49241935 29 3 104-31 ± 1-2958 ± 6-9783
113 ? 98-95 ± 0-4600 ± 4-8900
1932 47 85-09 ± 0-9031 ± 6-19131933 76 83-93 ± 0-6212 ± 5-41591934 27 3 79-78 ± 1-3387 ± 6-9564
138 $ 80-02 ± 0-4891 ± 5-74641935 78 78-21 ± 0-5977 ± 5-2788
1925 28 3 82-89 ± 1-0907 ± 5-771948 ? 79-60 ± 0-6228 ± 4-3150
1926 84 79-92 ± 0-5884 ± 5-39281927 22 3 84-77 ± 0-9337 ± 4-3795
31 $ 78-12 ± 0-8321 ± 4-63351928 25 3 82-96 ± 0-8207 -j- 4-1035
25 $ 79-20 ± 1-0461 ± 5-23071929 34 77-88 ± 0-8481 ± 4-94581930 25 3 81-88 ± 0-8641 ± 4-3204
65 9 78-38 ± 0-4583 ± 3-69531931 58 84-67 ± 0-7043 ± 5-36431932 27 c? 91-11 ± 0-6663 ± 3-4624
94 $ 83-11 ± 0-5391 ± 5-22761933 143 3 85-87 ± 0-5142 ± 6-1501
564 $ 82-79 ± 0-2523 ± 5-99361934 64 c? 82-23 ± 0-7344 ± 5-8758
252 ? 79-61 ± 0-3308 ± 5-2513
Year Ind. Mean Stand. Dev.1935 • 50 S 81-58 ± 0-6319 ± 4-4681
242 $ 78-64 ± 0-3334 ± 5-1858
2.2+ 1932 48 86-31 ± 0-8287 ± 5-74161933 30 81-23 ± 1-1876 ± 6-5049
4 .1+ 1930 22 58-73 ± 0-8109 ± 3-80361934 42 51-24 ± 0-6673 ± 4-3248
3 .1+ 1925 37 54-51 ± 0-5587 d= 3-39861926 24 55-00 ± 0-6640 ± 3-25321930 73 57-93 ± 0-4224 ± 3-60911932 37 56-00 ± 0-7460 ± 4-53811934 11 0 51-75 ± 0-3902 ± 4-0934
O ulu R iver.
3.4 1923 36 114-36 ± 0-8390 ± 5-03411924 24 114-25 ± 1-1369 d b 5-56961925 54 115-57 ± 0-8062 ± 5-92461926 33 115-57 ± 1-1579 ± 6-65211927 34 115-26 ± 0-7571 ± 4-41491928 • 3 1 S 118-23 ± 0-8947 d b 4-9818
55$ 111-18 ± 0-6459 ± 4-79061929 64 113-25 ± 0-7477 ± 5-98171930 • 30 3 117-43 ± 0-9401 d b 5-1493
96$ 111-80 ± 0-4134 ± 4-05121931 . 3 1 3 119-19 ± 0-9197 ± 5-1207
36$ 112-61 ± 0-9046 ± 5-42781932 • 22 3 120-41 ± 0-6575 ± 3-0844
29$ 116-07 ± 0-9492 ± 5-11201933 . 34 3 119-03 ± 0-8579 ± 5-0028
28$ 114-79 ± 0-6743 ± 3-56831934 . 44 <? 117-50 ± 0-6244 ± 4-1423
53$ 114-06 ± 0-4753 ± 3-46091935 . 63 119-59 ± 0-6589 ± 5-2298
30$ 113-57 ± 0-7013 ± 3-8440
4.3 1927 22 101-50 ± 1-7041 ± 7-99291932.......... 117 103-88 ± 0-4609 ± 4-98581933 106 105-05 ± 0-5517 d b 5-68081934 62 105-95 ± 0-6772 d b 5-33261935 34 105-38 ± 0-6759 ± 3-9411
3.3 1917 • 34 c? 104-97 ± 1-0510 ± 6-1285182 $ 100-95 ± 0 -2 8 1 6 ± 3-7997
1918 20 104-40 ± 1-1233 ± 5-02391919 2 0 99-95 ± 1-0111 ± 4-52191923 28 101-71 ± 1-0582 ± 5-59941924 22 103-45 ± 1-0923 ± 5-12371925 106 102-51 ± 0-5552 ± 5-71611926 70 102-67 ± 0-6585 ± 5-50921927 - 36 3 107-91 ± 0-8911 ± 5-3468
488$ 103-06 ± 0-2158 ± 4-76891928 . 35 3 108-14 ± 0-8761 ± 5-1833
165$ 102-13 ± 0-3572 ± 4-58871929 181 100-49 ± 0-3945 ± 5-30741930 . 28 <? 108-68 ± 0-7727 ± 4-0885
137 $ 102-53 ± 0-3989 ± 4-6690

— 79 —
T ab le 27, A pp en dix A (continued).
Year Ind. Mean Stand. Dev.1931 . 29 (J 104-10 ± 1-3438 ± 7-2367
198$ 102-01 ± 0-3791 ± 5-33431932 • 56 <? 107-66 ± 0-7810 ± 5-8441
480$ 103-99 ± 0-2292 ± 5-02221933 • 43 <? 109-65 ± 0-8378 ± 5-4938
294$ 103-90 ± 0-2959 ± 5-07421934 . 103 (J 109-56 ± 0-5438 ± 5-5193
644$ 104-24 ± 0-1942 ± 4-92931935 • 41 (J 110-12 ± 0-9153 ± 5-8610
401$ 104-18 ± 0-2292 ± 4-5907
2.3 1926 35 102-25 ± 0-9218 ± 5-45321927 32 101-56 ± 0-8615 ± 4-87331930 60 102-47 + 0-6278 ± 4-86271932 46 103-89 ± 0-7234 ± 4-91351933 153 106-05 ± 0-3627 ± 4-48641934 101 104-44 ± 0-5061 ± 5-08581935 172 104-40 ± 0-3709 ± 4-8647
4 .2+ 1931 20 83-50 ± 1-2777 ± 5-7140
3.2+ 1919 27 87-30 ± 1-0616 ± 5-51621921 20 77-10 ± 2-9987 ± 13-41041925 24 85-87 ± 0-9671 ± 4-73831926 58 85-48 ± 0-7017 ± 5-34441927.......... 85-72 ± 1-0109 ± 4-74151928 30 85-13 ± 0-8904 ± 4-87681930 . 22 (J 85-23 ± 1-3650 ± 6-4025
31$ 84-19 ± 1-1188 ± 6-22921931 87 84-62 ± 0-5627 ± 5-24851932 • 25 (J 89-64 ± 1-0475 ± 5-2374
52$ 88-65 ± 0-7571 ± 5-45971933 . 26 c? 89-50 ± 1-3046 ± 6-6521
79$ 88-84 ± 0-6066 ± 5-39131934 63 86-51 ± 0-5934 ± 4-71001935 • 33 c? 86-18 ± 1-1514 ± 6-6148
128$ 86-14 ± 0-4454 ± 5-0401
2 .2+ 1932 23 88-39 ± 0-9910 ± 4-75261934 35 83-06 ± 1-1449 ± 6-77361935 41 86-98 ± 0-8990 ± 5-7565
3.1+ 1933 96 54-11 ± 0-5643 ± 5-52911934........... 115 57-06 ± 0-4751 ± 5-09531935 21 59-00 ± 1-3965 ± 6-3994
2.1+ 1933.......... 28 52-93 ± 0-7708 ± 4-07861934 31 56-87 ± 0-7367 ± 4-1017
K okem äki R iver.
2.4 1925 50 106-22 ± 0-9876 ± 6-98371926 65 111-21 ± 0-6830 ± 5-50681927 22 109-82 ± 1-3432 ± 6-30011928 23 107-13 ± 1-7866 ± 8-5684
3.3 1925 31 93-06 ± 1-3593 ± 7-5688
Year Ind. Mean Stand. Dev.1925 .. 63 <J 95-73 ± 0-9141 ± 7-2555
54$ 93-56 ± 0-6877 ± 5-05351926 .. 108 <? 94-99 ± 0-6896 ± 7-1668
119$ 93-42 ± 0-6076 ± 6-62821927 . 35 <? 92-91 ± 1-2652 ± 7-4853
53$ 92-15 ± 0-9447 ± 6-87741928 30 93-97 ± 1-3795 ± 7-55601929 36 94-11 ± 1-3722 ± 9-43331930 . 32 (J 94-56 ± 1-2740 ± 7-2067
56$ 94-38 ± 0-8851 ± 6-62371932 34 97-94 ± 1-2691 ± 7-40021934 . 57 <? 96-40 ± 0-8240 ± 6-2209
118$ 88-97 ± 0-7356 ± 5-74541935 . 41 c? 97-34 ± 0-8614 ± 5-5155
57$ 91-39 ± 0-8254 ± 6-2314
1935 20 73-35 ± 1-7209 ± 7-6959
li R iver.
1924 26 107-04 ± 1-0844 ± 5-52951925 54 104-50 ± 0-7089 ± 5-20951926 20 108-30 ± 1-5566 ± 6-96131928 47 106-43 ± 0-9859 ± 6-75921929 44 106-41 ± 1 -1 0 0 0 ± 7-29661930 48 108-79 ± 0-7845 ± 5-43531934 22 112-77 ± 1-0737 ± 5-03601935 32 112-09 ± 1-0802 ± 6-1103
1922 27 101-81 ± 1-6039 ± 8-33401925 22 93-14 ± 1-6852 ± 7-90451927 20 95-65 ± 1-5657 ± 7-00201928 45 92-77 ± 0-9421 ± 6-31461930 38 94-92 ± 0-9020 ± 5-56031935 33 97-30 ± 1-2019 ± 6-9042
1920 • 2 0 <? 96-35 ± 1-7525 ± 7-837660$ 89-43 ± 0-5214 ± 4-0392
1921 . 37 <? 104-24 ± 1-3071 ± 7-950660$ 95-32 ± 0-6153 ± 4-7660
1922.......... . 26 c? 94-80 ± 1-2067 ± 6-153043$ 90-69 + 0-6674 ± 4-3763
1923 . 29 J 97-72 ± 1-1311 ± 6-09128 8 $ 88-44 ± 0-4853 ± 4-5527
1924 66 86-09 ± 0-5252 ± 4-26661925 73 91-27 ± 0-7047 ± 6-02131926.......... 99 93-12 ± 0-7048 ± 7-01271927.......... 474 91-54 ± 0-3136 ± 6-82851928.......... 304 91-11 ± 0-3642 ± 6-35111929........... 232 91-20 ± 0-3653 ± 5-56341930 . 23 c? 100-82 ± 1-0376 ± 4-9762
81$ 92-70 ± 0-4256 ± 3-83021931 41 94-76 ± 0-8676 ± 5-55531932 . 65 cJ 100-75 ± 0-5645 ± 4-5513
104$ 92-17 ± 0-4146 ± 4-22791933 . 30 c? 103-93 ± 0-9900 ± 5-4223
50$ 94-50 ± 0-5982 ± 4-22971934 207 94-93 ± 0-4559 ± 6-5596

— 80 —
T ab le 27, A pp en dix A (continued).
Year Ind. Mean Stand. Dev.
1935 . 24 (J 100-25 ± 0-8922 ± 4-370887 $ 94 00 ± 0-6003 ± 5-5997
3.2+ 1921 2 0 80-70 ± 1-7651 ± 7-89371926 ........ 23 75-87 ± 1-3178 ± 6-31971927.......... 38 73-97 ± 0-7449 ± 4-59191932 48 79-81 ± 0-6143 ± 4-2561
2 .2+ 1920 ........ 90 76-80 ± 0-4910 ± 4-65761921 56 76-73 ± 0-9012 ± 6-74431922 73 76-53 ± 0-6522 ± 5-57211925.......... 46 76-80 ± 0-9952 ± 6-74951926 396 73-30 ± 0-3116 ± 6-19981927 207 74-58 ± 0-3873 ± 5-57271928 111 73-23 ± 0-5232 ± 5-51181929 51 75-18 ± 0-7516 ± 5-36761930 ........ 2 0 79-20 ± 1-3903 ± 6-2177
Year Ind. Mean Stand. Dev.1931 . 34 80-12 ± 0-7019 ± 4-0927
151 $ 76-03 ± 0-3552 ± 4-36491932 , . 40<? 84-60 ± 0-7104 ± 4-4933
242 ? 77-09 ± 0-2884 ± 4-48741934 30 75-14 ± 0-8482 ± 4-64551935 28 75-68 ± 1-0089 ± 5-3387
,1+ 1920 20 55-95 ± 0-9123 ± 4-08011921 . 37 (J 54-81 ± 0-6750 ± 4-1058
44$ 54-73 ± 0-6101 ± 4-04681925 38 56-50 ± 0-8525 ± 5-25531926 98 53-28 ± 0-4005 ± 3-96451931 . 2 2 <? 57-86 ± 0-6244 ± 2-9289
54$ 57-91 ± 0-5438 ± 3-99601932 36 54-64 ± 0-8288 ± 4-97291935 20 58-55 ± 0-8499 ± 3-8010
I have obtained a good, or fairly satisfactory, result on rare occasions only which I give in age-group percentages of catch statistics (A series) on the one hand, and of scale specimen analysis (B series) on the other.
ASe a (Years) 4 5 6 7
Tornio.
8 > 8Numbe
of salrao
1930 A: 0-3 B: 0-2
11-6
11-426-025-7
35-040-8
19-815-9
6-2
5-21-1
0-8
1766\483/
1931 A: 0-2 B: 0-9
8-96-5
34-235-8
33-044-4
16-37-4
6-2
3-02-0
1-31336\10321
1935 A: 0-7 B: 0-5
22-737-2
24-123-9
28-427-4
17-210-1
5-80-7
1-1
0-2
1473»887/
Kem i.
1926 A: 0-6 B: —
9-613-6
44-941-4
29-730-0
8-55-9
4-77-3
2-0
1-8
1009\2 2 0 /
1927 A: 1-0 B: 0-6
11-37-0
31-834-5
40-750-9
9-04-1
4-30-6
1-92-3
1766\171/
1930 A: 1-3 B: 0-5
12-713-3
20-921-4
42-233-0
15-821-4
5-29-2
1-91-2
1831\594/
1932 A: 0-1 B: 0-1
2-48-6
2 0-0
15-452-445-4
17-622-5
5-45-8
2-1
2-37809891)
1934 A: 0-2 B: 0-2
4-05-2
24-216-2
52-868-8
12-56-0
4-42-7
1-90-9
1535 2502 *)
1935 A: 0-5 B: 0-1
6-2
1-726-525-7
47-454-3
12-716-0
4-81-8
1-90-4
131516951)
*) T h e specim ens also inc lude salm on ob ta ined from th e K em i R ive r es tua ry (Valkeakari).
1925 A 2-0 11-3 14-5Oulu.
38-3 26-0 6-3 1-6 697\B — 3-9 14-4 44-0 24-5 10-1 3-1 257/
1928 A 1-3 7-9 15-0 46-4 22-0 5-9 1-5 459\B — 3-6 11-6 54-3 27-9 2-6 — 394/
1929 A 0-6 2-7 11-6 53-1 24-6 5-9 1-5 337 \B — 0-6 8-2 58-4 26-2 6-6 — 317/
1931 A — 0-4 12-0 53-3 26-9 6-2 1 -2 484\B — 1-0 214 55-2 16-0 4-6 1-8 482/
1926 A 2-8 8-7K okem äki.
48-6 22-1 12-2 5-1 0-5 4341B 0-2 4-6 55-8 19-1 15-6 2-6 2-1 418/
1927 A 2-0 11-2 48-3 19-0 13-6 5-4 0-5 2051B — 1-5 46-7 18-5 23-6 8-2 1-5 195/
1931 A — 21-4 17-9 32-1 25-0 3-6 — 281B — 21-5 10-7 32-1 32-1 — 3-6 28/
1932 A — 7-9 43-4 34-2 11-9 2-6 — 76)B — 7-2 44-6 25-3 19-3 1-2 2-4 83/
K ym i.1926 A 15-7 53-6 18-2 2-1 6-9 3-2 0-3 725\
B 13-7 57-0 17-8 5-8 2-8 2-0 0-9 721/
1931 A 18-8 41-3 21-6 7-7 7-4 3-0 0-2 431 \B 18-0 46-3 13-5 6-5 11-9 1-9 1-9 428/
1932 A 5-1 50-3 29-6 4-8 6-8 34 0-3 585)B 6-5 48-3 374 2-9 2-0 0-7 2-2 588/
1935 A 7-4 17-5 40-9 21-6 8-9 3-3 04 269\B 7-6 11-5 44-7 26-3 8-0 14 0-8 262/
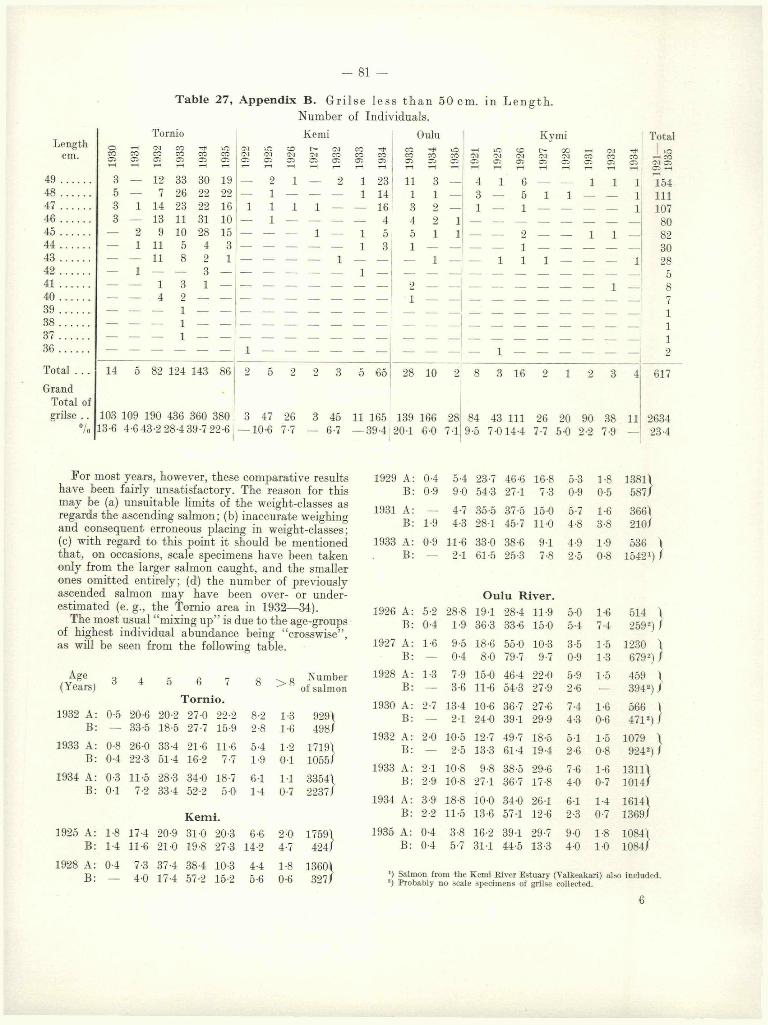
- 81 —
Lengthcm.
49 . .48 . .47 . .46 . .45 . .44 ..43 . .42 ..41 . .40 ..39 . .38 ..37 . .36 . .
Total . .
Grand Total of grilse . .
°// o
T a b le 27, A p p e n d ix B . G r i l s e l e s s t h a n 50 cm. in L e n g t h .
Number of Individuals.
— 1
TornioCM CO - fCO CO CO0 3 0 3 0 3”- —112 33 30
7 26 2214 23 2213 11 319 10 28
11 5 411 8 2
1 3 1
KemilOCMCi Ci
2 1 —
1 — —
1 1 1
1 — —
1
CM CO ^CO CO COüj uj 05
1 23 1 14- 16
— 4
1 — —
1 - 1 — —
1 — —
Oulu
11 1
345 1
1
Kvi
4 1 6 — —3 — 5 1 1 1 — 1 — —
2 -
1 —
1 1 1
1 — —
14 5 82 124 143 86
103 109 190 436 360 380 13-6 4-6 43-2 28-4 39-7 22-6
5 65
3 47 26 3 45 11 165-1 0 -6 7-7 — 6-7 - 3 9 - 4
28 10
139 166 20-1 6-0
287-1
1
-t*c oC2
— 1 1
— — 1
8 3 16
84 43 111 26 9-5 7-014-4 7-7
Total
154111107
80823028
5
205-0
909.9
387-9
11
617
263423-4
For most years, however, these comparative results have been fairly unsatisfactory. The reason for this may be (a) unsuitable limits of the weight-classes as regards the ascending salmon; (b) inaccurate weighing and consequent erroneous placing in weight-classes; (c) with regard to this point it should be mentioned that, on occasions, scale specimens have been taken only from the larger salmon caught, and the smaller ones omitted entirely; (d) the number of previously ascended salmon may have been over- or underestimated (e. g., the Tornio area in 1932—34).
The most usual “mixing up” is due to the age-groups of highest individual abundance being “crosswise”, as will be seen from the following table.
Age(Years) 3 4 5 6 7
T o rn io .
8 > 8 Number of salmon
1932 A: B:
0-5 20-633-5
20-218-5
27-027-7
22-215-9
8-22-8
1-31-6
929)498/
1933 A: B:
0-80-4
26-022-3
33-451-4
21-616-2
11-67-7
5-41-9
1-20-1
171911055/
1934 A: B:
0-30-1
11-57-2
28-333-4
34-052-2
18-75-0
6-11-4
1-10-7
3354/2237/
K em i.1925 A:
B:1-81-4
17-411-6
20-921-0
31-019-8
20-327-3
6-614-2
2-04-7
1759V424/
1928 A: B:
0-4 7-34-0
37-417-4
38-457-2
10-315-2
4-45-6
1-80-6
1360) 327 /
1929 A: 0-4 5-4 23-7 46-6 16-8 5-3 1-8 1381)B: 0-9 9-0 54-3 27-1 7-3 0-9 0-5 587/
1931 A: — 4-7 35-5 37-5 15-0 5-7 1-6 366)B: 1-9 4-3 28-1 45-7 11-0 4-8 3-8 210/
1933 A: 0-9 11-6 33-0 38-6 9-1 4-9 1-9 536 1B: — 2-1 61-5 25-3 7-8 2-5 0-8 15421) /
1926 A 5-2 28-8
O u lu R iv er.
19-1 28-4 11-9 5-0 1-6 514 )1! 0-4 1-9 36-3 33-6 15-0 5-4 7-4 2592) /
1927 A 1-6 9-5 18-6 55-0 10-3 3-5 1-5 1230 /B 0-4 8-0 79-7 9-7 0-9 1-3 6792) /
1928 A 1-3 7-9 15-0 46-4 22-0 5-9 1-5 459 1I! — 3-6 11-6 54-3 27-9 2-6 — 3942) /
1930 A 2-7 13-4 10-6 36-7 27-6 7-4 1-6 566 \B — 2-1 24-0 39-1 29-9 4-3 0-6 4712) /
1932 A 2-0 10-5 12-7 49-7 18-5 5-1 1-5 1079 \i; — 2-5 13-3 61-4 19-4 2-6 0-8 9242) /
1933 A 2-1 10-8 9-8 38-5 29-6 7-6 1-6 1311/B 2-9 10-8 27-1 36-7 17-8 4-0 0-7 1014/
1934 A 3-9 18-8 10-0 34-0 26-1 6-1 1-4 1614/B 2-2 11-5 13-6 57-1 12-6 2-3 0-7 1369/
1935 A 0-4 3-8 16-2 39-1 29-7 9-0 1-8 1084)B 0-4 5-7 31-1 44-5 13-3 4-0 1-0 1084/
*) Salm on from th e K em i R iver E s tu a ry (Valkeakari) also included. 2) P robab ly no scale specimens of grilse collected.
6

82
Age(Years) 3 4 5 6 7
K okem äki.
8 > 8o
1925 A 1-2 14-6 56-7 16-4 7-6 3-2 0-3B 0-4 3-5 52-2 37-1 6 0 0-4 0-4
1928 A 2-8 8-5 47-1 23-6 12-3 5-7 —
B — 3 0 31-0 36-0 14-0 7-0 9-0
1929 A — 14-7 50-0 18-6 10-8 5-9 —
B — 5-3 38-9 24-2 25-3 2-1 4-2
1930 A 0-8 9-0 59-0 14-8 11-5 4-9 —
B — — 75-0 15-8 3-3 4-2 1-7
1934 A 4-0 13-2 49-7 20-0 91 4-0 —
B — 5-6 74-7 14-8 3-7 — 1-2
1935 A 3-7 19-1 44-2 20-2 9-6 3-2 —
B 11-6 61-6 19-8 7-0
K ym i.
1921 A 32-9 27-3 22-7 6-4 7-4 3-0 0-3B 25-3 18-0 38-7 11-0 4 0 1-2 1-8
1922 A 10-3 39-2 35-8 4-6 6-7 3 1 0-3B 0-4 33-9 31-7 21-2 10-1 1-8 0-9
1923 A 1-4 27-2 52-9 8-4 6-7 3-0 0-4B — 2-7 804 11-5 3-4 0-7 1-3
1924 A 1-8 24-5 50-6 12-4 7-4 3-0 0-3B 1-4 5-6 47-9 31-2 10-4 2-1 1-4
Number of salmon
591» 2321
106\ 100/
102» 951
122\ 120/175\ 162/
188) 172/
5961328/
11491227/
10381148/
621\144/
1925 A 14-9 18-9 43-0 12-4 7-5 2-9 0-4 518\B 10-7 14-4 24-5 23-1 25-1 1-7 0-5 355/
1927 A 3-6 45-9 36-5 4-0 7-4 2-5 0-1 813\B 2-1 26-7 64-0 4-9 0-9 0-4 1-0 811/
1928 A 3-5 38-3 40-6 7-2 7-1 3-0 0-3 596\B 2-5 20-9 53-9 17-3 3-4 0-6 1-4 594/
1929 A 31 28-4 48-2 9-7 7-3 3-1 0-2 423\B 2-8 12-6 59-7 16-4 6-6 0-5 1-4 422/
1930 A 4-6 6-1 65-1 13-0 7-3 3-5 0-4 261\B 5-8 8-5 42-7 34-6 6-9 1-1 0-4 260/
1933 A 0-8 9-3 51-3 19-3 14-3 5-0 — 1191B — 7-7 72-6 15-4 1-7 0-9 1-7 117/
1934 A 4-9 15-8 50-2 17-4 8-1 3-2 0-4 247»B 2-5 10-4 69-7 13-9 1-6 ’ — 1-9 317/
It can be assumed with fairly good reason that the above statistics of catches of salmon from the Bothnian Bay northern salmon area (also Kokemäki and Kymi Rivers) for the years 1921— 35, divided into weight- classes, give no clear, but a somewhat unreliable, view of the age-groups of the salmon. I have nevertheless converted the age-group percentages into year-class numbers, and have obtained the results given below.
Tornio Kemi
(A) (B) (A) (B)
1913/14 ................... 1273 — 13161914/15 ................... 3881 — 30571915/16 ................... 3302 — 3743 1254)1916/17 ................... 1767 — 2162 1034)1917/18 ................... 1274 — 1762 2141918/19 ................... 737 — 1069 1091919/20 ................... 1299 — 950 1861920/21 ................... 2075 — 1728 3261921/22 ................... 1991 — 1547 5121922/23 ................... 2715 [117]1) 1684 5441923/24 ................... 1726 [292] 1324 3541924/25 ................... 1299 689 791 5081925/26 ................... 1333 676 919 7771926/27 ................... 1397 450 658 7351927/28 ................... 2164 1975 1173 30303)1928/29 ................... 1821 1227 1057 13593)1929/30 ................... 753 377 415 566
Total . . . 30807 5803 25355 9448
Simo Ii and Haukipudas Oulu Total
(A) (A) (A) (B) (A) (B) (C)__ --- [150] — 2739 — —--- [232] 507 — 7677 — 7767[542] [1411] 612 1304) 9610 — 9925
[2 1 1 1 ] 1059 516 1094) 7615 — 78092739 846 669 1274) 7290 — 74662 2 2 0 564 495 1604) 5085 — 50373036 8 8 6 419 2 0 2 4) 6590 — 640167002) 2352 984 784 138392) 1 1 1 0 13S202)5569 1608 735 382 11450 894 112734932 1090 594 405 11015 1066 109963968 784 509 332 8311 978 85114438 842 655 611 8025 1808 79795910 1233 1177 899 10572 2352 105673866 1430 1179 716 8530 1901 87244871 2371 1 1 1 2 1224 11691 6229 120264315 1719 749 778 9661 3364 99661981 749 506 523 4404 1466 4487
57198 19176 11568 7382 144104 21168 142754
*) D o n o t inc lude salm on caugh t p rev ious to 1930.2) T he figure would be still h igher b u t for th e omission of th e M aksniem i d a ta for 1927, w hen th e salm on of th e 1920/21 year-class were
in th e cycle 3.3( + ).3) Also inc lude salm on from es tu a ry of K em i R ive r (Valkeakari).4) Scale specim ens ta k e n from only sm all num b er of fish.

— 83 -
This table dealing with salmon from the Bothnian Bay salmon area gives in the (A)-column the number of individuals belonging to the different year-classes, according to the converted age-group division of Table 28, and in the (B)-column the salmon belonging to the scale specimens, also in year-classes. (A)-column thus gives the salmon taking into consideration the assumed number of previously spawned individuals, while the (C)-column assumes all the salmon to be ascending to the spawning waters for the first time.
The picture given by the columns (A) and (C) of this table varies considerably from that yielded by the scale analysis, i. e., the (B)-column. The table nevertheless provides one or two points that should be mentioned specially, although no great value should be attributed as proof to the table.
The first point is: that the scale specimens from small numbers of fish selected from large catches are insufficient to provide an explanation of the individual abundance of the year-classes, especially while they are young, as the collector has been compelled to devote more attention to the large than to the small fish. Under these circumstances the scale specimens which were collected for my investigations prior to 1925 are not very representative. Despite their incompleteness, my calculations based on weight- classes for this period — 1921— 24 — provide a better illustration.
Another fact produced by the table is that collecting- stations must be numerous and distant from one another. It is to be regretted that no scale specimen collecting base has existed in the Simo area, for example. Among other things, the scale specimens have shown that the 1927—28 year-class has been best represented. It also appears abundant (although occupying but second place) in columns (A) and (C) of the table under discussion, but is appreciably smaller than in the (B)-column. This is principally due (apart from a partial levelling for the benefit of the following year-class) to the fact that representatives of this year-class in the Simo fishing area are not abundant according to weight-class statistics. This, of course, may be due to errors in weighing. Other factors may possibly have influenced this result: climatic conditions (wind etc.) may have caused decreased fishing in the Simo area in 1934, and this indeed is very probably the case, as the fish caught in this area in 1934 do not indicate a rise on the previous year. During this year the 1927—28 year- class was at its most important spawning age, i. e., in the cycle 3.3. As the year-class was caught to a limited extent only in the Simo area while in this
cycle, it has naturally followed that the proportion of this year-class has been higher in other fishing areas.
The probability of the above explanation is strengthened by the observation that the year-class 1920— 21, which was only weakly represented in the scale specimens collected in 1926 and 1927, reaches a higher individual figure in the combined summary [(A) and (C)-columns] on the basis of the Simo catch. It would therefore appear that in both these cases the weather conditions prevailing during the fishing season have had a marked influence on the distribution of the catch in different areas.
It should be mentioned that the weakest individual year-class is 1918— 19 in columns (A) and (C) of the table.
I will add to this chapter a survey of the results yielded by the statistics divided into weight-classes, and the grouping of salmon from the Kokemäki and Kymi Rivers into year-classes, although with the exception of 1921— 24 they are of little importance, as the scale analysis of subsequent years has taken into account practically all individual salmon caught. [(A) and (B)-columns have the same significance as in the preceding table.]
K o k e m ä ki K y m iYear-class (A) (B) (A) (B)1914/15........... . 106 — 148 1621915/16........... . 182 — 279 2861916/17........... . 194 — 725 1971917/18........... . 414 — 1337 437 2)1918/19........... . 462 171 850 1871919/20........... . 619 260 484 1511920/21 ........... . 370 294 330 244J1921/22 ........... . 186 176 847 111311922/23 ........... . 119 63 804 7411923/24 ........... . 91 70 545 5431924/25 ........... . 113 121 391 2241925/26 ........... . 63 24 176 112 3)1926/27 ........... . 90 49 415 4591927/28 ........... . 159 42 *) 503 5101928/29 ........... . 137 155 223 3381929/30 ........... . 114 115 150 150J
T o ta l .. . 3419 1540 8207 5854
*) Scale specimens are en tirely m issing from th e yea r 1933 w hen th e year-class 1927/28 w as in th e cycle 2.3.
a) Scale specimens from some of th e fish only,3) Scale specimens from aJl salm on; add itiona l specimens from sea
in 1934 caused th e increase in th e year-class 1928/29.
6*
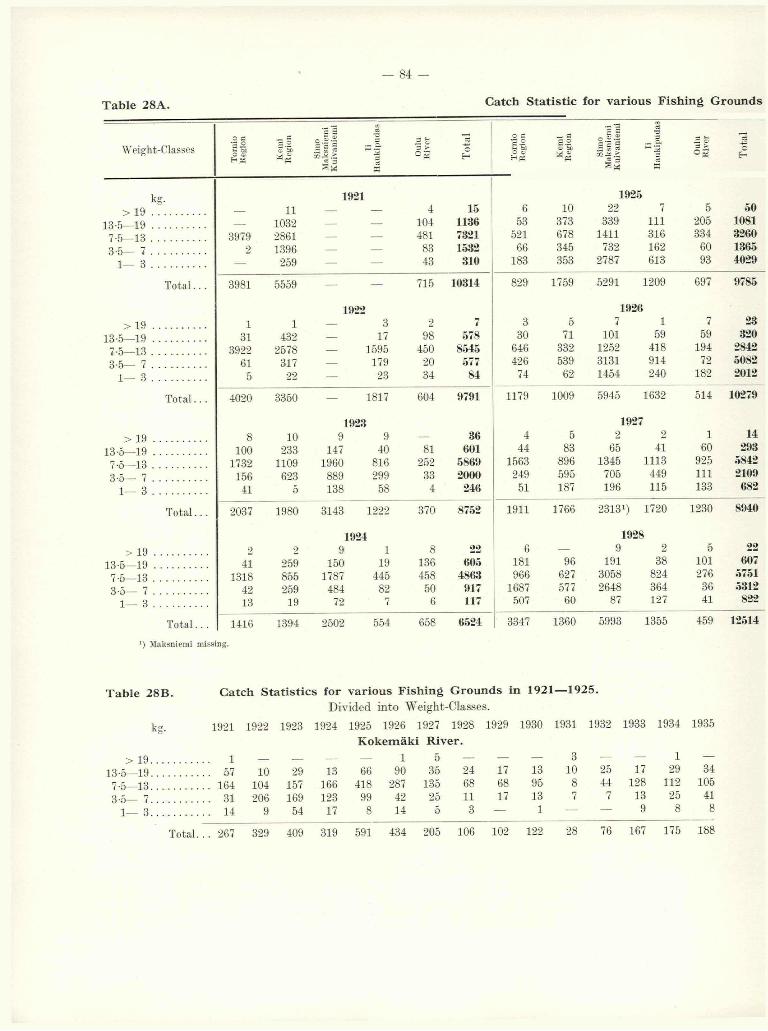
84 -
T ab le 28A . Catch S ta t is t ic for variou s F ish in g G rounds
Weight-Classes
To
rnio
Reg
ion
Kem
iR
egio
n
Sim
oM
aksn
iem
iK
uiv
anie
mi DC_£C
Ou
luR
ive
r
To
tal
To
rnio
Reg
ion
Kem
iR
egio
n i l l.s s «CO —ö > C3 —
Ha
uk
ipu
da
s
Ou
luR
ive
r
To
tal
k> 19
13-5—19 7-5— 13 3-5— 7 .
1— 3 .
rr3*
39792
u103228611396259
19-21— 4
104481
8343
15113673211532310
653
52166
183
10373678345353
192522
3391411
7322787
7111316162613
5205334
6093
501081326013654029
T o ta l. . . 3981 5559
1922
—- 715 10314 829 1759 5291
1926
1209 697 9785
> 19 . 1 1 — 3 2 7 3 5 7 1 7 23
13-5—19 . 31 432 — 17 98 578 30 71 101 59 59 320
7-5—13 . 3922 2578 — 1595 450 8545 646 332 1252 418 194 2842
3-5— 7 . 61 317 __ 179 20 577 426 539 3131 914 72 5082
1— 3 . 5 22 — 23 34 84 74 62 1454 240 182 2012
T o ta l. . . 4020 3350
1923
1817 604 9791 1179 1009 5945
1927
1632 514 10279
> 19 . 8 10 9 9 — 36 4 5 2 2 1 14
13-5—19 . 100 233 147 40 81 601 44 83 65 41 60 293
7-5—13 . 1732 1109 1960 816 252 5869 1563 896 1345 1113 925 5842
3-5— 7 . 156 623 889 299 33 2000 249 595 705 449 111 2109
1— 3 . 41 5 138 58 4 246 51 187 196 115 133 6S2
T o ta l. . . 2037 1980 3143
1924
1222 370 8752 1911 1766 23131)
1928
1720 1230 8940
> 19 . 9 2 9 1 8 22 6 — 9 2 5 22
13-5—19 . 41 259 150 19 136 605 181 96 191 38 101 607
7-5— 13 . 1318 855 1787 445 458 4863 966 627 3058 824 276 5751
3-5— 7 . 42 259 484 82 50 917 1687 577 2648 364 36 5312
1— 3 . 13 19 72 7 6 117 507 60 87 127 41 822
T o ta l.. . 1416 1394 2502 554 658 6524 3347 1360 5993 1355 459 12514
*) M aksniem i missing.
T ab le 28B . Catch S ta t is t ic s for various F ish in g G rounds in 1921— 1925.Divided into Weight-Classes.
kg. 1921 1922 1923 1924 1925 1926 1927 1928
K okem äki R iver.
1929 1930 1931 1932 1933 1934 1935
> 1 9 ................... 1 — . — .— — 1 5 — — — 3 — — 1 —
13-6— 19................... .. 57 10 29 13 66 90 35 24 17 13 10 25 17 29 34
7-5—13................... .. 164 104 157 166 418 287 135 68 68 95 8 44 128 112 105
3-5— 7 ................... .. 31 206 169 123 99 42 25 11 17 13 7 7 13 25 41
1— 3 ................... ,. 14 9 54 17 8 14 5 3 1 — — 9 8 8
T o ta l . ,.. 267 329 409 319 591 434 205 106 11)2 122 28 76 167 175 188

in 1921— 1925. Divided into Weight-Classes.
— 85 -
To
rnio
Reg
ion
Kem
iR
egio
n
Sim
oM
aksn
iem
iK
uiv
anie
mi
IiH
au
kip
ud
as
3 **
° £ Tot
al
To
rnio
Reg
ion ._ e
S ® « Er
Sim
oM
aksn
iem
iK
uiv
anie
mi
IiH
au
kip
ud
as
Ou
luR
ive
r
Tot
al
1929 193315 i 10 3 3 32 12 2 23 8 23 68
237 183 225 57 81 783 162 29 174 109 440 9141156 814 1849 520 235 4574 350 258 2101 942 635 4286
547 326 1259 198 8 2338 553 190 2687 1013 31 447463 57 106 61 10 297 642 57 581 114 182 1576
2018 1381 3449 839 337 8024 1719 536 5566 2186 1311 11.318
1930 193411 1 11 — 11 34 20 2 14 2 2 40
216 236 258 89 176 975 403 100 180 108 487 1278722 994 2391 387 262 4756 1271 1038 2121 1401 693 6524533 341 1147 182 19 2222 1127 358 2493 607 35 4620284 259 1436 382 98 2459 533 37 466 372 397 1805
1766 1831 5243 1040 566 10446 3354 1535 5274 2490 1614 14267
1931 193514 1 15 4 2 36 11 5 4 2 41 63
150 49 120 34 132 485 158 103 136 123 361 881424 164 2208 510 336 3642 527 789 1735 1070 519 4640591 147 2309 396 14 3457 294 354 1377 316 135 2476157 5 245 107 — 514 483 64 904 393 28 1872
1336 366 4897 1051 484 8134 1473 1315 4156 1904 1084 9932
19329 3 10 2 8 32
170 102 446 20 179 917329 524 2796 394 719 4762145 143 952 92 27 1359276 8 456 59 146 945
929 780 4660 567 1079 8015
T able 28B (continued).
kg- 1921 1922 1923 1924 1925 1926 1927 1928 1929 1930 1931 1932 1933 1934 1935
K ym i R iver.> 19 1 — — — 1 — 1 — — — 1 1
13-5—19 40 34 44 67 52 23 12 31 28 21 36 25 2 2 36 567-5—13 177 488 659 381 279 147 349 285 245 210 113 197 84 154 1393-5— 7 155 493 318 170 100 425 419 256 134 16 190 329 12 42 50
1— 3 223 134 17 13 87 129 33 24 15 14 92 34 1 14 23
Total. . . 596 1149 1038 621 518 725 813 596 423 261 431 585 119 247 269
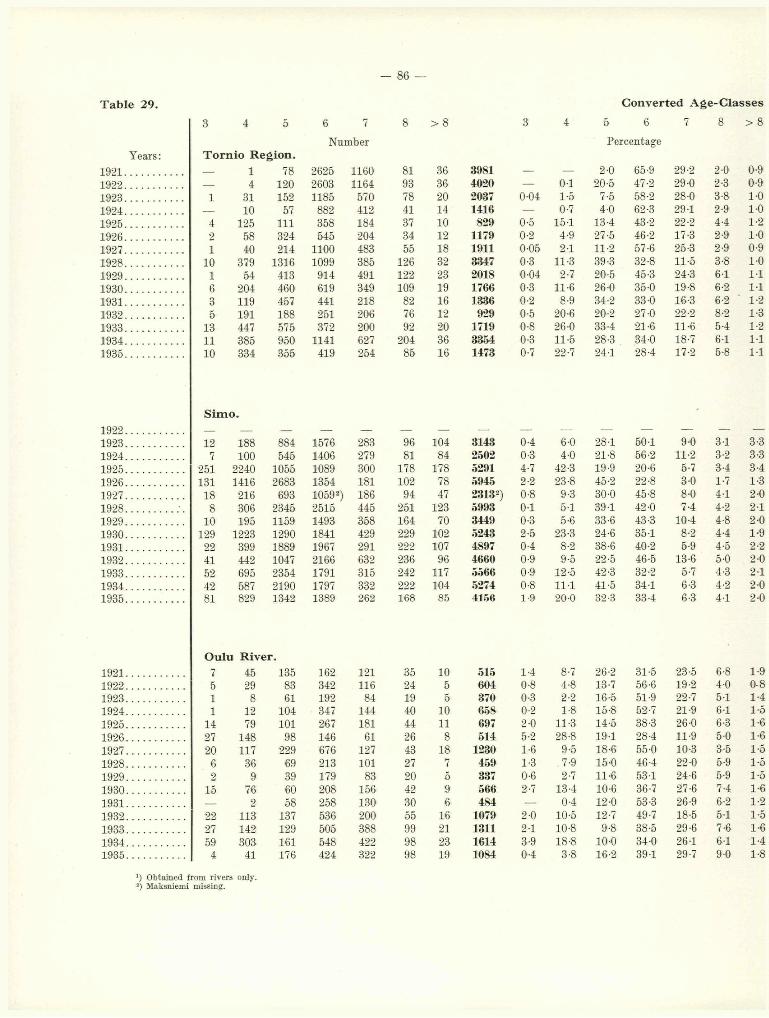
- 86 —
T able 29. C onverted A g e-C la sse s
3 4 5 6 7 8 > 8 3 4 5 6 7 8 > 8
Number PercentageYears: T orn io R egion .
1921.................... — 1 78 2625 1160 81 36 3981 — — 2-0 65-9 29-2 2-0 0-91922..................... — 4 120 2603 1164 93 36 402« — 0-1 20-5 47-2 29-0 2-3 0-91923..................... 1 31 152 1185 570 78 20 2037 0-04 1-5 7-5 58-2 28-0 3-8 1-01924.................... — 10 57 882 412 41 14 1416 — 0-7 4-0 62-3 29-1 2-9 1-01925..................... 4 125 111 358 184 37 10 829 0-5 15-1 13-4 43-2 22-2 4-4 1-21926..................... 2 58 324 545 204 34 12 1179 0-2 4-9 27-5 46-2 17-3 2-9 1-01927..................... 1 40 214 1100 483 55 18 1911 0-05 2-1 11-2 57-6 25-3 2-9 0-91928..................... 10 379 1316 1099 385 126 32 3347 0-3 11-3 39-3 32-8 11-5 3-8 1-01929..................... 1 54 413 914 491 122 23 2018 0-04 2-7 20-5 45-3 24-3 6-1 1-11930..................... 6 204 460 619 349 109 19 1766 0-3 11-6 26-0 35-0 19-8 6-2 1-11931..................... 3 119 457 441 218 82 16 1336 0-2 8-9 34-2 33 0 16-3 6-2 1-21932..................... 5 191 188 251 206 76 12 929 0-5 20-6 20-2 27-0 22-2 8-2 1-31933..................... 13 447 575 372 200 92 20 1719 0-8 26-0 33-4 21-6 11-6 5-4 1-21934..................... 11 385 950 1141 627 204 36 3354 0-3 11-5 28-3 34-0 18-7 6-1 1-11935..................... 10 334 355 419 254 85 16 1473 0-7 22-7 24-1 28-4 17-2 5-8 1-1
S im o .
192 2 ..................192 3 .................. 12 188 884 1576 283 96 104 3143 0-4 6-0 28-1 501 9-0 3-1 3-31924..................... 7 100 545 1406 279 81 84 2502 0-3 4-0 21-8 56-2 11-2 3-2 3-31925..................... 251 2240 1055 1089 300 178 178 5291 4-7 42-3 19-9 20-6 5-7 3-4 3-41926..................... 131 1416 2683 1354 181 102 78 5945 2-2 23-8 45-2 22-8 3-0 1-7 1-31927..................... 18 216 693 10593) 186 94 47 23132) 0-8 9-3 30-0 45-8 8-0 4-1 2-01928................ .'. 8 306 2345 2515 445 251 123 5993 0-1 5-1 39-1 42-0 7-4 4-2 2-11929..................... 10 195 1159 1493 358 164 70 3449 0-3 5-6 33-6 43-3 10-4 4-8 2-01930.................... 129 1223 1290 1841 429 229 102 5243 2-5 23-3 24-6 351 8-2 4-4 1-91931..................... 22 399 1889 1967 291 222 107 4897 0-4 8-2 38-6 40-2 5-9 4-5 2-21932..................... 41 442 1047 2166 632 236 96 4660 0-9 9-5 22-5 46-5 13-6 5-0 2-01933..................... 52 695 2354 1791 315 242 117 5566 0-9 12-5 42-3 32-2 5-7 4-3 2-11934..................... 42 587 2190 1797 332 222 104 5274 0-8 11-1 41-5 34-1 6-3 4-2 2-01935..................... 81 829 1342 1389 262 168 85 4156 1-9 20 0 32-3 33-4 6-3 4-1 2-0
Oulu R iver.
1921..................... 7 45 135 162 121 35 10 515 1-4 8-7 26-2 31-5 23-5 6-8 1-91922..................... 5 29 83 342 116 24 5 604 0-8 4-8 13-7 56-6 19-2 4-0 0-81923..................... 1 8 61 192 84 19 5 370 0-3 2-2 16-5 51-9 22-7 5-1 1-41924..................... 1 12 104 347 144 40 10 658 0-2 1-8 15-8 52-7 21-9 6-1 1-51925..................... 14 79 101 267 181 44 11 697 2-0 11-3 14-5 38-3 26-0 6-3 1-61926..................... 27 148 98 146 61 26 8 514 5-2 28-8 19-1 28-4 11-9 5-0 1-61927..................... 20 117 229 676 127 43 18 1230 1-6 9-5 18-6 55 0 10-3 3-5 1-51928..................... 6 36 69 213 101 27 7 459 1-3 7-9 15-0 46-4 22-0 5-9 1-51929..................... 2 9 39 179 83 20 5 337 0-6 2-7 11-6 531 24-6 5-9 1-51930..................... 15 76 60 208 156 42 9 566 2-7 13-4 10-6 36-7 27-6 7-4 1-61931..................... — 2 58 258 130 30 6 484 — 0-4 120 53-3 26-9 6-2 1-21932..................... 22 113 137 536 200 55 16 1079 2-0 10-5 12-7 49-7 18-5 5-1 1-51933..................... 27 142 129 505 388 99 21 1311 2-1 10-8 9-8 38-5 29-6 7-6 1-61934.................... 59 303 161 548 422 98 23 1614 3-9 18-8 10-0 34-0 26-1 6-1 1-41935..................... 4 41 176 424 322 98 19 1084 0-4 3-8 16-2 39-1 29-7 9-0 1-8
*) O btained from riv e rs only. 2) M aksniem i missing.

(from Table 28 m aterial; see
3 4 5 6
explanation, p.
7 8
88).
> 8
- 87
3 4 5 6 7 8 > 8
23 328 1357
Number
2304 1103 334 110 5559 0-4 5-9
Percentage
24-4 41-5
K em i R egion.
19-8 6-0 2-02 46 468 1968 627 174 65 3350 0-1 1-4 14-0 58-7 18-7 5-2 1-9
— 60 578 896 302 105 39 1980 — 3-0 29-2 45-3 15-2 5-3 2-02 38 275 677 300 81 21 1394 0-2 2-7 19-7 48-6 21-5 5-8 1-5
32 306 368 545 357 116 35 1759 1-8 17-4 20-9 31-0 20-3 6-6 2-06 97 453 300 86 47 20 1009 0-6 9-6 44-9 29-7 8-5 4-7 2-0
17 200 561 719 159 76 34 1766 1-0 11-3 31-8 40-7 9-0 4-3 1-95 99 508 523 140 60 25 1360 0-4 7-3 37-4 38-4 10-3 4-4 1-85 74 328 644 232 73 25 1381 0-4 5-4 23-7 46-6 16-8 5-3 1-8
23 233 382 773 289 96 35 1831 1-3 12-7 20-9 42-2 15-8 5-2 1-9— 17 130 137 55 21 6 366 — 4-7 35-5 37-5 15-0 5-7 1-6
1 19 156 409 137 42 16 780 0-1 2-4 20-0 32-4 17-6 5-4 2-15 62 177 207 49 26 10 536') 0-9 11-6 33-0 38-6 9 1 4-9 1-93 61 371 810 192 68 30 1535 0-2 4-0 24-2 52-8 12-5 4-4 1-96 82 349 623 167 63 25 1315 0-5 6-2 26-5 47-4 12-7 4-8 1-9
2 34 287 1269 220 4 1 1817 0-1 1-9 15-8
Ii and H aukipudas.
69-8 12-1 0-2 0 15 72 314 680 138 12 1 1222 0-4 5-9 25-7 55-6 11-3 1-0 011 12 105 360 73 3 — 554 0-2 2-2 18-9 65-0 13-2 0-5 —
55 493 234 278 129 19 1 1209 4-5 40-8 19-3 23-0 10-7 1-6 0-122 269 782 450 100 9 — 1632 1-3 16-5 47-9 27-6 6-1 0-6 —
10 131 465 930 177 7 — 1720 0-6 7-6 27-0 54-1 10-3 0-4. —
11 132 375 693 137 7 — 1355 0-8 9-7 27-7 51-2 10-1 0-5 —
5 66 209 436 113 9 1 839 0-6 7-8 24-9 52 0 13-5 11 0-134 314 227 334 119 12 — 1040 3-3 30-2 21-8 32-1 11-4 1-2 —
10 119 369 452 93 7 1 1051 1-0 11-3 351 43-0 8-8 0-7 015 54 116 321 66 5 — 567 0-9 9-5 20-5 56-6 11-6 0-9 —
10 180 890 877 208 20 1 2186 0-5 8-2 40-7 40-1 9-5 0-9 0-134 345 647 1182 266 16 — 2490 1-4 13-9 26-0 47-4 10-7 • 0-6 —
35 335 394 887 235 18 — 1904 1-8 17-6 20-7 46-6 12-4 0-9 —
28 370 1858 5838 2024 193 3 10314 0-3 3-6 18-0
Bothnian56-6
Bay (Summary).
19-6 1-98 115 1215 6553 1802 97 1 9791 0-1 1-2 124 66-9 18-4 1-0 —
22 365 2067 4776 1393 123 6 8752 0-3 4-2 23-6 54-6 15-9 1 4 0-110 170 1145 3848 1234 113 4 6524 0-2 2-6 17-6 59-0 18-9 1-7 0-1
362 3145 1962 2760 1338 210 8 9785 3-7 32 1 20-1 28-2 13-7 2-1 0-1181 1966 4390 2973 697 68 4 10279 1-8 191 42-7 28-9 6-8 0-7 —61 702 2217 4744 1156 58 2 8940 0-7 7-9 24-8 53-1 12-9 0-6 —
74 1094 4634 5218 1377 113 4 12514 0-6 8-7 37-0 41-7 11-0 0-9 —27 433 2213 3875 1322 149 5 8024 0-3 54 27-6 48-3 16-5 1-9 0-1
221 2044 2488 4011 1495 182 5 10446 2-1 19-6 23-8 38-4 14-3 1-7 —
46 697 3003 3328 950 104 6 8134 0-6 8-6 36-9 40-9 11-7 1-3 0-185 831 1599 3871 1453 171 5 8015 1-1 104 20-0 48-3 18-1 2-1 0-1
142 1585 3993 4012 1378 197 11 11318 1-3 14-0 35-3 35-4 12-2 1-7 0-1162 1770 4341 5747 2007 234 6 14267 1-1 124 30-4 40-3 14-1 1-6 —
168 1627 2575 3955 1409 188 10 9932 1-7 164 25-9 39-8 14-2 1-9 0-1

— 8 8 —
Table 2'
Years: 3 4
K okem äki
5
R iver.
6 7
Number
8 > 8 3 4 5 6
Percentage
7 8 >
1921..................... 12 29 128 63 24 10 1 267 4-5 10-9 47-9 23-6 9-0 3-7 0-1922..................... 8 178 90 12 28 12 1 329 2-4 54-1 27-4 3-6 8-5 3-6 0-:1923..................... 46 153 133 33 29 14 1 409 11-2 37-4 32-5 8-1 7 1 3-4 0-:1924..................... 15 108 140 23 21 11 1 319 4-7 33-9 43-9 7-2 6-6 3-4 0 -:1925..................... 7 86 335 97 45 19 2 591 1-2 14-6 56-7 16-4 7-6 3-2 0-i1926..................... 12 38 211 96 53 22 2 434 2-8 8-7 48-6 22-1 12-2 5-1 0-J1927..................... 4 23 99 39 28 11 1 205 2-0 11-2 48-3 19-0 13-6 5-4 0-11928..................... 3 9 50 25 13 6 — 106 2-8 8-5 47-1 23-6 12-3 5-7 —
1929..................... — 15 5.1 19 11 6 — 102 — 14-7 50-0 18-6 10-8 5-9 -
1930..................... 1 11 72 18 14 6 — 122 0-8 9-0 59-0 14-8 11-5 4-9 —
1931.................... — 6 5 9 7 1 — 28 — 21-4 17-9 32-1 25-0 3-6 —
1932..................... — 6 33 26 9 2 — 76 — 7-9 43-4 34-2 11-9 2-6 —
1933..................... 8 12 100 28 14 5 — 167 4-7 7-2 59-9 16-8 8-4 3-0 —
1934..................... 7 23 87 35 16 7 — 175 4-0 13-2 49-7 20-0 9-1 4-0 —
1935..................... 7 36 83 38 18 6 — 188 3-7 19-1 44-2 20-2 9-6 3-2 -
E xp lan ation of T ab le 29.The figures appearing in this table are derived from the
statistics contained in Table 28 in the following manner:—1. Tornio. Each weight-class is converted into age-
groups by assuming that the salmon, according to its smolt-age, is divided into 2% two-year-olds, 68% three- year-olds and 30°/o older salmon (four and five-year-olds). Salmon which had spawned previously are assumed to constitute 3°/o of the total catch of each year; their number, if similarly divided into the percentages on the basis of their assumed smolt-age, is taken from the third weight-class and transferred to the next but one age-group. (It is assumed, therefore, that the salmon do not ascend the rivers during the year immediately following the spawning year, but a year later).
2. Kemi. The conversion into age-groups of salmon belonging to different weight-classes is made by assuming the smolt-age to be two years in 9 % of the total, three years in 78°/o and four (or five) years in 13%. Salmon which spawned in previous years are calculated at 6% of the total annual catch of salmon. These salmon— divided into the above percentages on the basis of the assumed smolt-age — are taken from the third (7-5—13kg.) and fourth (13-5—19 kg.) weight-classes and transferred into the next but one age-groups. The transfer is made by taking % of the quantity to be transferred from the third, and % from the fourth, weight-class.
3. Simo. The conversion of the statistics contained in Table 28 into age-groups has been made by employing the same ratios as those used in converting the Kemi statistics, except for the fact that the quantity of salmon which had spawned in previous years is calculated to be only 3% of the total.
4. Ii and Haukipudas. In making the conversion, the smolt-age has been estimated at two years in 9%, three
years in 78% and four (or more) years in 13%, i. e., on the same basis as that used for the Kemi and Simo statistics. As the statistics embrace comparatively small numbers the assumption in respect of salmon which spawned in previous years might be disregarded.
5. Oulu. In making the conversion the smolt-age has been estimated at two years in 15%, three years in 75% and four years in 10%. Salmon which had spawned in previous years have been estimated at 5% of the total. On this basis % of the salmon to be transferred to older age-groups were taken from the third, and 1/1 from the fourth, weight-class.
6. Bothnia» Bay salmon region. The information from the Tornio, Kemi, Simo, Ii. Haukipudas and Oulu River regions in Table 28 has been combined and the conversion made by assuming the following division of smolt-age:— two years in 9% , three years in 75%, and older salmon in 16%. It has been assumed that there were no salmon which had spawned in previous years.
7. Kokemäki. The weight-classes in Table 28 have been converted by assuming the smolt-age to be two years in 86%, and three years in 14%. The salmon which had spawned previously have been calculated for the years 1921—25 and 1932—35 at 10% of the total number of salmon; for the years 1926—31 at 15%. Of the estimated number of salmon which had spawned previously % have been transferred from the third weight-class — divided into proportions according to smolt-age — and the remainder — divided in the same ratios — from the fourth weight-class.
8. Kymi. In making the conversion the smolt-age has been assumed at two years in 88% and at three years in 12%. Of the total amount 10% has been transferred— as salmon of earlier spawning years — to the higher age-groups in a manner similar to tha t described above.

— 89 —
(continued).
3 4 5 6 7 8 > 8 3 4 5 6 7 8 > 8
Number PercentageK ym i River.
196 163 135 38 44 18 2 596 32-9 27-3 22-7 6-4 7-4 3-0 0-3118 450 412 53 77 36 3 1149 10-3 39-2 35-8 4-6 6-7 31 0-3
15 282 549 87 70 31 4 1038 1-4 27-2 52-9 8-4 6-7 3 0 0-411 152 314 77 46 19 2 621 1-8 24-5 50-6 12-4 7-4 3 0 0-377 98 223 64 39 15 2 518 14-9 18-9 43 0 12-4 7-5 2-9 0-4
114 389 132 15 50 23 2 725 15-7 53-6 18-2 2 1 6-9 3-2 0-329 373 297 33 60 20 1 813 3-6 45-9 36-5 4-0 7-4 2-5 0-1
21 228 242 43 42 18 2 596 3-5 38-3 40-6 7-2 7-1 3 0 0-313 12 0 204 41 31 13 1 423 31 28-4 48-2 9-7 7-3 31 0-2
12 16 170 34 19 9 1 261 4-6 6-1 65-1 13-0 7-3 3-5 0-481 178 93 33 32 13 1 431 18-8 41-3 21-6 7-7 7-4 30 0-2
30 294 173 28 40 18 2 585 5-1 50-3 29-6 4-8 6-8 31 0-31 11 61 23 17 6 — 119 0-8 9-3 51-3 19-3 14-3 5-0 —
12 39 124 43 20 8 1 247 4-9 15-8 50-2 17-4 8-1 3-2 0-420 47 11 0 58 24 9 1 269 7-4 17-5 40-9 21-6 8-9 3-3 0-4
IV. Surveys and Summaries.1. The Im portan ce of d ifferent Y ear-C lasses
in B altic S a lm on F ish in g d uring 1921— 35.The proportion of certain year-classes in the catches
of salmon from the Baltic area varies to such an extent that a more detailed explanation will probably be of value.
Year-Class 19*27/28. As shown by Table 10, and as mentioned on page 16, the 1934-fishing season was extremely good, both in Finnish and Swedish waters. The abundant catches of this season are shown, for example, by the fact that no less than 6,229 scale specimens were received from the different fishing grounds of the Tornio, Kemi and Oulu Rivers. This number is almost twice that of the following year, three times that of 1931—33, and almost six times that of other years, 1925— 1928. I must point out, however, according to the statistics given in the previous chapter, that no exceptionally large catches were obtained from the Simo fishing area in 1934, although these were considered to be quite good (according to special statistics, 5,274 specimens: Maksniemi area 1,897, Simo village area 2,044 and Kuivaniemi area 1,333 specimens; see Tables 4 and 28 A).
An analysis of the specimen scales shows that this good year 1934 was due 'principally to the 1927/28 year- class, which at the time was more or less in the 3 .3 (+ ) life-cycle stage, a stage that amounted to 750 specimens among those sent from the Tornio River, 1,513 among Kemi and Valkeakari, 747 specimens among the Oulu River specimens — a total of 3,010 specimens, i. e. 48-3%.
This year-class was also present at other life-cycle stages, principally as 4 .2 + , but also as 5 .1 + and 2 .4 + . The former — the 4 .2 + life-cycle class — was represented from the Tornio River by 346 specimens,
Kemi (and Valkeakari) by 165 specimens, and the Oulu River by 9 specimens — a total of 520 ; the latter two by 49 + 3 specimens from the Tornio River collection, 9 + 16 from that of the Kemi, and 1 + 16 from the Oulu collection — a total of 94 specimens, corresponding to 9-9% of the total scale specimens. A few representatives of this same year-class were present among the re-ascending salmon, thus 19 in the Tornio River, 17 in the Kemi River and 12 in the Oulu River. More than half of the specimen scales of 1934 (3,672) — 59-0°/0 — were representatives of the 1927/28 year-class.
The following major groups in the 1934 catches were salmon of the following year-class — 1928/29. 748 specimens in the Tornio River (majority in the lifecycle class 3 .2 + ); 405 in the Kemi area (majority 3 .2 + ); and 186 in the Oulu River (both 2 .3 + and 3 .2 + ); this represents a total of 1,339 specimens of the 1928/29 year-class, or 21-4 ° /0 of the 1934 specimens.
The year-classes 1926/27 and 1929/30, the former as eldest, and the latter as youngest (grilse), are represented fairly uniformly in the 1934 specimens, by 436 of the former and 448 of the latter; combined they represent 10-9. The remainder of the 1934 specimens, i. e. 8 -6 °/0, is made up of representatives of other year-classes.
The year-class that played such an important part (58-9°/0) in the large catches of 1934 was represented among the catches of the preceding and subsequent years — 1933 and 1935 — as follows, according to scale specimens.
The 1927/28 year-class predominated in both the Tornio River and Kemi area specimens in 1933. Its percentage from the Tornio River was 51-4 (542 out of 1,055), and in the Kemi area no less than 61-5

- 90 -
(948 out of 1,542). Judging from the Oulu River specimens, this year-class appeared as a supplementary group in 1933, amounting to 27-1 % (275 out of 1,014 specimens).
The 1927/28 year-class had already lost its importance in the 1935 catches. It was represented in the Tornio River by 10-1 ° /0 (90 specimens), Kemi area by 16% (272 specimens) and Oulu River by 13-3% (144 specimens).
This year-class is thus represented in the 1933—35 specimens by 5,895 specimens (1933 1,765, 1934 3,624 and 1935 506). As the total number of specimens collected during this period was 11,494, the 1927/28 year-class represented 51-3°/0 of all three catch-years.
The 1927/28 year-class, the majority of which in the spring of 1934 belonged to the 3.3 life-cycle class, had belonged two years previously (spring 1932) to the 3.1 life-cycle class. This fact caused me to evolve the following.
From Table 10 we note the fact — described in detail on page 21 ■— that in the southern Baltic yield of salmon the year 1932 was the last maximum year noted with a total catch of 833 tons. There is probably reason to suppose that a considerable part of that catch was composed of weighty salmon. The Polish statistics (see Table 9) nevertheless show that in 1932 there were also large quantities of mielnica, i. e., salmon in the A .l life-cycle class. The quantity of mielnica caught in Poland that year was very large— 50,000. A study of the table shows that afterwards their number fell sharply, being still about 30,000 in 1933, but decreasing to some 7— 7-5 thousand in 1934 and 1935.
The age of smolt obtained in 1932 in Polish and German waters is not known, but to my mind it is probable that three years has predominated. If this was the case, then the 1927/28 year-class that played such an important part in the catches of salmon in northern Finnish and Swedish waters during 1933 and 1934, has also constituted the major part of the catch of mielnica in the southern areas of the Baltic in 1932. Correspondingly the poor mielnica years in the Polish waters in 1934 and 1935 should indicate poor catches of salmon in the Bothnian Bay area. As far as Finland is concerned, at least, such forecasts have been completely realized especially in 1937, which fact should be mentioned here as preliminary information.
The Year-('lasses 1914/15 and 1915/16. Table 10 shows that the years 1921/22 were very good salmon years in the Gulf of Bothnia and the Bothnian Bay. I have specimen scales from the Oulu and Kymi Rivers only for this period, but these specimens are so few that it is impossible to use them as a basis for any definite conclusion. The only source of information (apart from those shown in Tables 1 and 10) from the Finnish side are the special statistics in Tables 3 and 4. The good catches of these years are shown by
the following figures (a) salmon caught in the Tornio area: 3981 in 1921, 4020 in 1922, but in 1923 only 2037, (b) Kemi area: 5559 in 1921, 3350 in 1922, but in 1923 only 1980 fish.
If we assume that the year-classes forming the 1921/22 catches have joined the same life-cycle class in the Bothnian Bay as the representatives of the 1927/28 year-class in 1933 and i934, the salmon of that time have then belonged to the 1914/15 and 1915/16 year-classes; they have been in the mielnica stage in the springs of 1919 and 1920.
Year-Class 1920/21. The abundance of this year- class is show'n first of all by the statistics according to weight-classes, given in Table 28 and, after a conversion into age and year-classes, in Table 29. The year-class 1920/21 then shows an individual quantity of almost 14,000, i.e., a greater quantity than that of any other year-class recorded in these tables (also nearly 2,000 more than the 1927/28 year-class, the abundance and special position of which have already been proved by the scale specimens). The great importance of the 1920/21 year-class in the formation of the catch is shown in particular by the catches of 1926 and 1927 in the Simo area (Maksniemi, Simoniemi and Kuivaniemi), and the Ii and Haukipudas waters.
This year-class also shows an obvious improvement on its predecessor in the Oulu River samples. It has been represented by 784 fish among the specimens from that river; of these 541 were caught in 1927, representing 79-7 °/0, and 94 in 1926, but even then representing 36-3 °/0, as the preceding year-class (1919/20) was weakly represented (32-6% only). The 1928 specimens still contained 110 fish belonging to the 1920/21 year-class, representing about 28%.
My specimens from the Kemi River for 1926 and1927 were very few — owing to the failure of the fishing at the Korva weir — consisting of 220 and 171 specimens respectively — but of these 41-4% and 50-9% belonged to the 1920/21 year-class. No specimens were collected from the Tornio River at this time.
I will add, finally, that the principal life-cycle class of the 1920/21 year-class (3.3-f-) made its ascent in the summer of 1927, when the 1927/28 year-class was born; these two abundant year-classes — 1920/21 and 1927/28 — are thus closely connected, the latter extensively originating from the former one.
Year-Classes 1928/29 and 1929/30. The 1928/29 year-class may also be considered as being fairly abundant, as a total of 3364 representatives were traced in the specimens from the Bothnian Bay salmon area. This exceeds any other year-class with the exception of 1927/28.
We have already discussed the importance of the 1928/29 year-class (as a supplementary group) in the 1934-catches on page 89. Salmon of this year-class were represented in the 1934-specimens from the Tornio, Kemi and Oulu River regions by a total of 1559 fish — 21-4%. It is true that this percentage is
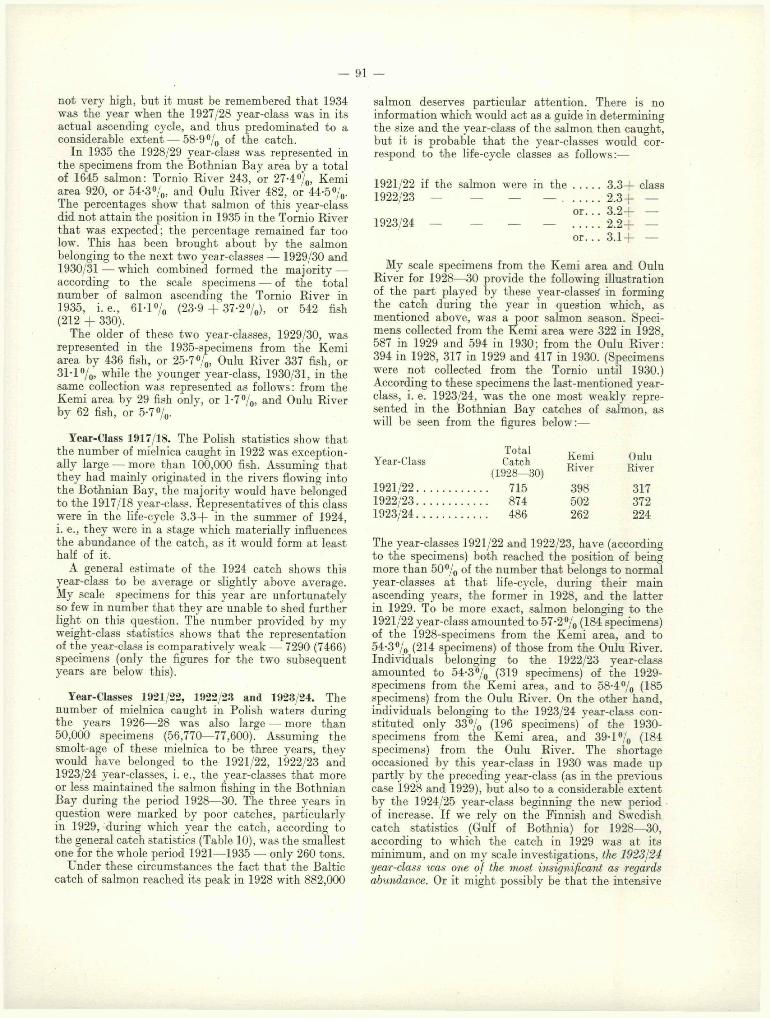
— 91 —
not very high, but it must be remembered that 1934 was the year when the 1927/28 year-class was in its actual ascending cycle, and thus predominated to a considerable extent — 58-9% of the catch.
In 1935 the 1928/29 year-class was represented in the specimens from the Bothnian Bay area by a total of 1645 salmon: Tornio River 243, or 27-4%, Kemi area 920, or 54-3%, and Oulu River 482, or 44-5 %. The percentages show that salmon of this year-class did not attain the position in 1935 in the Tornio River that was expected; the percentage remained far too low. This has been brought about by the salmon belonging to the next two year-classes — 1929/30 and 1930/31 — which combined formed the majority — according to the scale specimens — of the total number of salmon ascending the Tornio River in 1935, i .e . , 61-1% (23-9 + 37-2%), or 542 fish (212 + 330).
The older of these two year-classes, 1929/30, was represented in the 1935-specimens from the Kemi area by 436 fish, or 25-7%, Oulu River 337 fish, or 31-1%. while the younger year-class, 1930/31, in the same collection was represented as follows: from the Kemi area by 29 fish only, or 1-7%, and Oulu River by 62 fish, or 5-7%.
Year-C’lass 1917/18. The Polish statistics show that the number of mielnica caught in 1922 was exceptionally large — more than 100,000 fish. Assuming that they had mainly originated in the rivers flowing into the Bothnian Bay, the majority would have belonged to the 1917/18 year-class. Representatives of this class were in the life-cycle 3 .3 + in the summer of 1924,i. e., they were in a stage which materially influences the abundance of the catch, as it would form at least half of it.
A general estimate of the 1924 catch shows this year-class to be average or slightly above average. My scale specimens for this year are unfortunately so few in number that they are unable to shed further light on this question. The number provided by my weight-class statistics shows that the representation of the year-class is comparatively weak — 7290 (7466) specimens (only the figures for the two subsequent years are below this).
Year-Classes 1921/22, 1922/23 and 1923/24. Thenumber of mielnica caught in Polish waters during the years 1926— 28 was also large — more than 50,000 specimens (56,770— 77,600). Assuming the smolt-age of these mielnica to be three years, they would have belonged to the 1921/22, 1922/23 and 1923/24 year-classes, i. e., the year-classes that more or less maintained the salmon fishing in the Bothnian Bay during the period 1928—30. The three years in question were marked by poor catches, particularly in 1929, during which year the catch, according to the general catch statistics (Table 10), was the smallest one for the whole period 1921— 1935 — only 260 tons.
Under these circumstances the fact that the Baltic catch of salmon reached its peak in 1928 with 882,000
salmon deserves particular attention. There is no information which would act as a guide in determining the size and the year-class of the salmon then caught, but it is probable that the year-classes would correspond to the life-cycle classes as follows:—
1921/22 if the salmon were in t h e .........3 .3 + class1922/23 — — — — ............. 2 .3 + —
o r . . . 3 .2 + —1923/24 — — — — ... 2 .2 + —
o r . . . 3 .1 + —
My scale specimens from the Kemi area and Oulu River for 1928— 30 provide the following illustration of the part played by these year-classed in forming the catch during the year in question which, as mentioned above, was a poor salmon season. Specimens collected from the Kemi area were 322 in 1928, 587 in 1929 and 594 in 1930; from the Oulu River: 394 in 1928, 317 in 1929 and 417 in 1930. (Specimens were not collected from the Tornio until 1930.) According to these specimens the last-mentioned year- class, i. e. 1923/24, was the one most weakly represented in the Bothnian Bay catches of salmon, as will be seen from the figures below:—
TotalYear-Class Catch
(1928—30)1921/22............................. 7151922/23............................. 8741923/24............................. 486
The year-classes 1921/22 and 1922/23, have (according to the specimens) both reached the position of being more than 50% of the number that belongs to normal year-classes at that life-cycle, during their main ascending years, the former in 1928, and the latter in 1929. To be more exact, salmon belonging to the 1921/22 year-class amounted to 57-2% (184 specimens) of the 1928-specimens from the Kemi area, and to 54-3 % (214 specimens) of those from the Oulu River. Individuals belonging to the 1922/23 year-class amounted to 54-3% (319 specimens) of the 1929- specimens from the Kemi area, and to 58-4% (185 specimens) from the Oulu River. On the other hand, individuals belonging to the 1923/24 year-class constituted only 33% (196 specimens) of the 1930- specimens from the Kemi area, and 39-1% (184 specimens) from the Oulu River. The shortage occasioned by this year-class in 1930 was made up partly by the preceding year-class (as in the previous case 1928 and 1929), but also to a considerable extent by the 1924/25 year-class beginning the new period of increase. If we rely on the Finnish and Swedish catch statistics (Gulf of Bothnia) for 1928—30, according to which the catch in 1929 was at its minimum, and on my scale investigations, the 1923/24 year-class was one of the most insignificant as regards abundance. Or it might possibly be that the intensive
Kemi OuluRiver River
398 317502 372262 224
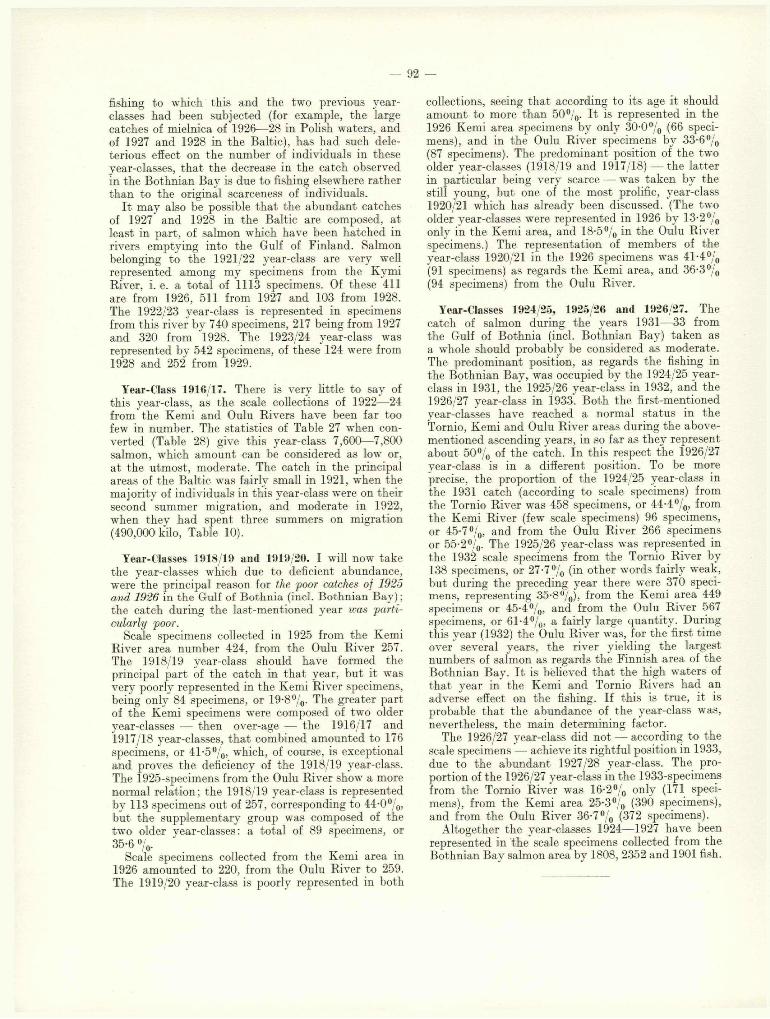
92 —
fishing to which this and the two previous year-classes had been subjected (for example, the largecatches of mielnica of 1926—28 in Polish waters, and of 1927 and 1928 in the Baltic), has had such deleterious effect on the number of individuals in theseyear-classes, that the decrease in the catch observed in the Bothnian Bay is due to fishing elsewhere rather than to the original scarceness of individuals.
It may also be possible that the abundant catches of 1927 and 1928 in the Baltic are composed, at least in part, of salmon which have been hatched in rivers emptying into the Gulf of Finland. Salmon belonging to the 1921/22 year-class are very well represented among my specimens from the Kymi River, i. e. a total of 1113 specimens. Of these 411 are from 1926, 511 from 1927 and 103 from 1928. The 1922/23 year-class is represented in specimens from this river by 740 specimens, 217 being from 1927 and 320 from 1928. The 1923/24 year-class was represented by 542 specimens, of these 124 were from 1928 and 252 from 1929.
Year-Class 1916/17. There is very little to say of this year-class, as the scale collections of 1922— 24 from the Kemi and Oulu Rivers have been far too few in number. The statistics of Table 27 when converted (Table 28) give this year-class 7,600— 7,800 salmon, which amount can be considered as low or, at the utmost, moderate. The catch in the principal areas of the Baltic was fairly small in 1921, when the majority of individuals in this year-class were on their second summer migration, and moderate in 1922, when they had spent three summers on migration (490,000 kilo, Table 10).
Year-CIasses 1918/19 and 1919/20. I will now take the year-classes which due to deficient abundance, were the principal reason for the poor catches of 1925 and 1926 in the Gulf of Bothnia (incl. Bothnian Bay) ; the catch during the last-mentioned year was particularly poor.
Scale specimens collected in 1925 from the Kemi River area number 424, from the Oulu River 257. The 1918/19 year-class should have formed the principal part of the catch in that year, but it was very poorly represented in the Kemi River specimens, being only 84 specimens, or 19-8%. The greater part of the Kemi specimens were composed of two older year-classes — then over-age — the 1916/17 and 1917/18 year-classes, that combined amounted to 176 specimens, or 41-5%, which, of course, is exceptional and proves the deficiency of the 1918/19 year-class. The 1925-specimens from the Oulu River show a more normal relation; the 1918/19 year-class is represented by 113 specimens out of 257, corresponding to 44-0%, but the supplementary group was composed of the two older year-classes: a total of 89 specimens, or 35-6%.
Scale specimens collected from the Kemi area in 1926 amounted to 220, from the Oulu River to 259. The 1919/20 year-class is poorly represented in both
collections, seeing that according to its age it should amount to more than 50%. It is represented in the 1926 Kemi area specimens by only 30-0% ( 6 6 specimens), and in the Oulu River specimens by 33-6% (87 specimens). The predominant position of the two older year-classes (1918/19 and 1917/18)— the latter in particular being very scarce — was taken by the still young, but one of the most prolific, year-class 1920/21 which has already been discussed. (The two older year-classes were represented in 1926 by 13-2% only in the Kemi area, and 18-5% in the Oulu River specimens.) The representation of members of the year-class 1920/21 in the 1926 specimens was 41-4% (91 specimens) as regards the Kemi area, and 36-3% (94 specimens) from the Oulu River.
Year-CIasses 1924/25, 1925/26 and 1926/27. Thecatch of salmon during the years 1931— 33 from the Gulf of Bothnia (incl. Bothnian Bay) taken as a whole should probably be considered as moderate. The predominant position, as regards the fishing in the Bothnian Bay, was occupied by the 1924/25 year- class in 1931, the 1925/26 year-class in 1932, and the 1926/27 year-class in 1933. Both the first-mentioned year-classes have reached a normal status in the Tornio, Kemi and Oulu River areas during the above- mentioned ascending years, in so far as they represent about 50% of the catch. In this respect the 1926/27 year-class is in a different position. To be more precise, the proportion of the 1924/25 year-class in the 1931 catch (according to scale specimens) from the Tornio River was 458 specimens, or 44-4%, from the Kemi River (few scale specimens) 96 specimens, or 45-7%, and from the Oulu River 266 specimens or 55-2%. The 1925/26 year-class was represented in the 1932 scale specimens from the Tornio River by 138 specimens, or 27-7% (in other words fairly weak, but during the preceding year there were 370 specimens, representing 35-8%), from the Kemi area 449 specimens or 45-4%, and from the Oulu River 567 specimens, or 61-4%, a fairly large quantity. During this year (1932) the Oulu River was, for the first time over several years, the river yielding the largest numbers of salmon as regards the Finnish area of the Bothnian Bay. It is believed that the high waters of that year in the Kemi and Tornio Rivers had an adverse effect on the fishing. If this is true, it is probable that the abundance of the year-class was, nevertheless, the main determining factor.
The 1926/27 year-class did not — according to the scale specimens — achieve its rightful position in 1933, due to the abundant 1927/28 year-class. The proportion of the 1926/27 year-class in the 1933-specimens from the Tornio River was 16-2% only (171 specimens), from the Kemi area 25-3% (390 specimens), and from the Oulu River 36-7% (372 specimens).
Altogether the year-classes 1924— 1927 have been represented in the scale specimens collected from the Bothnian Bay salmon area by 1808, 2352 and 1901 fish.

— 93 —
The above explanation of the varying abundance of the year-classes has not taken into account specimens from the salmon rivers of southern Finland. To judge from the specimens obtained from the salmon waters of the Kymi River, the 1921/22 year-class has played the most important part among the salmon ascending that river since the year 1925, i. e., 1113 specimens. It has been followed by the individually abundant year-classes 1922/23 and 1923/24, there being 741 specimens from the former, and 543 from the latter. The year-classes 1924/25, and particularly 1925/26, are but weakly represented, — 224 and 112 specimens. Compared to these the year-classes 1926/27, 1927/28 and 1928/29 have been abundant, recording 459, 510 and 338 specimens respectively. The importance of the 1927/28 year-class, which was particularly abundant in the Bothnian Bay, in the 1933 and 1934- catches of the southern Finnish salmon area is difficult to judge in detail from the scale specimens. This is due to the fact that during the years in question the eastern arm of the Kymi River was dammed for building operations, thus occasioning exceptional conditions as regards the height of the water and the yield from fishing. According to available information the salmon fishing in the sea at the estuary of the Kymi River was extremely good during these years.
With regard to year-classes ascending the Kymi River prior to 1925, my scale specimens are not sufficiently representative, as they were taken from a portion only of the catch. It appears nevertheless that the 1917/18 year-class was abundant here, being represented as “grilse” as early as 1921 by 25-3 % (83 out of 328 specimens), in 1922 as small salmon by 33-9% (77 out of 227 specimens), in 1923 as large salmon by 80-4°/o (119 out of 148 specimens), in 1924 by 31-2% (45 out of 144 specimens), and even in 1925 by 25-1% (89 out of 355 specimens). This represents a total of 413 specimens out of 1202, and corresponds to 34-4° / 0 over a period of 5 years. The following year- classes — 1918/19, 1919/20 and 1920/21 — appear to have been but weakly represented in the Kymi River, the scale specimens amounting to only 187, 151 and 244, although collections were made during the period 1924— 1928, when specimens were taken from practically every salmon caught, at most collecting- stations, although not from every one.
The material from the Kokemäki River is fairly small, and consequently not very illustrating. From the point of view of greatest individual abundance the 1919/20, 1920/21 and 1922/23 year-classes appear to occupy the leading positions. The total representation of these year-classes in the material has been 260, 293 and 176 specimens. The 1925/26 and 1926/27 year-classes are very insignificantly represented, both by less than 50 specimens. The year-classes 1927/28, 1928/29 and 1929/30 have been more abundant. No collection of scale specimens was made during the most important year of ascent of the first-named year- class into the Kokemäki River (1933), but the total catch that year rose from the 76 specimens of the previous year (1932) to 167 specimens. The 1928/29
and 1929/30 year-classes were represented in the 1934 and 1935 catches — which totalled 363 specimens — by 42-1 ° /0 (154 specimens) and 31-7°/o (115 specimens).
Starting from (a) the catch statistics of the years 1921—35 for the different countries interested in Baltic fishing, (b) the results of my scale collections, and (c) in special cases the statistics from the Finnish coasts divided into weight-classes, I have endeavoured to estimate the importance of fifteen different year- classes in Baltic salmon fishing. The result can be given as follows, divided into three main groups only as this is but an attempt to give the main features :
A : Superior year-classes:1914/15, 1915/16, 1920/21, 1927/28, and, perhaps, 1928/29.
B: Moderate year-classes:1916/17, 1917/18 (possibly midway between A. and B.), 1921/22, 1922/23, 1924/25, 1925/26 and 1926/27.
C: Poor year-classes:1918/19, 1919/20 and 1923/24.
2. F actors in fluencing the A bundance of theY ear-C Iasses.
In the preceding chapter I have endeavoured to estimate the relative abundance of the year-classes hatched during the period 1914— 1929 — although from a general point of view only. Having grouped the year-classes into three different classes on this basis, I will attempt in the following to describe the conditions under which these year-classes have been hatched, and which have influenced their varying abundance. The main factors in this have been the conditions prevailing during the spawning and the subsequent period when the fertilised spawn has been motionless in the bed of the river, developing into fry. As this stage is of long duration — the whole of the winter — external conditions have obviously fluctuated. In cases where an unsuccessful year-class has occurred despite apparently favourable external conditions, the failure may be ascribed to the fact that the number of spawning pairs was insufficient in the river.
As the ascent of the salmon, particularly as regards rivers of the Bothnian Bay, appears to be affected by the high water during the early spring floods, permitting large numbers of salmon to pass the lower reaches of the river without being caught (due to fishing difficulties), the result is that in such years larger numbers of salmon reach the headwaters of the river than is the case with weak spring floods. The strength and the volume of the spring floods thus influencing the number of spawning individuals in the headwaters of the river, I am recording below the high-water mark of the spring floods in the Tornio,
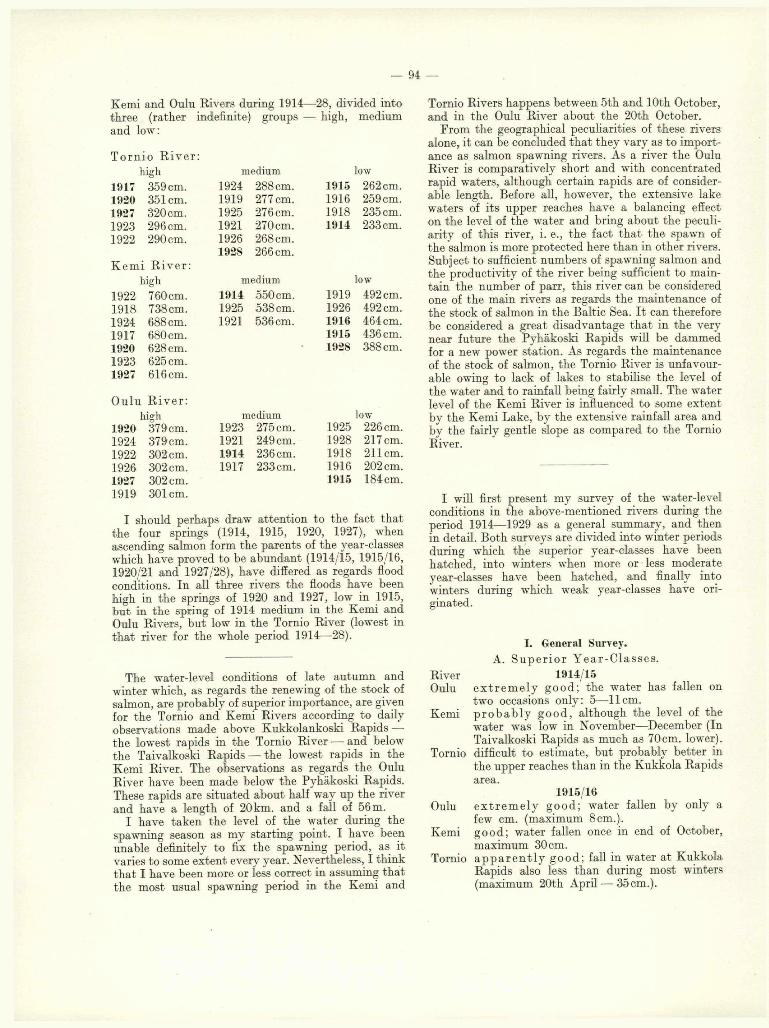
— 94
Kemi and Oulu Rivers during 1914— 28, divided into three (rather indefinite) groups — high, medium and low:
T o r n io R iv er :high medium low
1917 359 cm. 1924 288 cm. 1915 262 cm.1920 351 cm. 1919 277 cm. 1916 259 cm.1927 320 cm. 1925 276 cm. 1918 235 cm.1923 296 cm. 1921 270cm. 1914 233 cm.1922 290 cm. 1926 268 cm.
1928 266 cm.K e m i R iv er :
high medium low
1922 760 cm. 1914 550cm. 1919 492cm.1918 738 cm. 1925 538 cm. 1926 492 cm.1924 6 8 8 cm. 1921 536 cm. 1916 464cm.1917 680 cm. 1915 436 cm.1920 628 cm. 1928 388 cm.1923 625 cm.1927 616cm.
O ulu R iv er :high medium low
1920 379 cm. 1923 275 cm. 1925 226 cm.1924 379 cm. 1921 249 cm. 1928 217 cm.1922 302 cm. 1914 236 cm. 1918 2 1 1 cm.1926 302 cm. 1917 233 cm. 1916 2 0 2 cm.1927 302 cm. 1915 184 cm.1919 301cm.
I should perhaps draw attention to the fact that the four springs (1914, 1915, 1920, 1927), when ascending salmon form the parents of the year-classes which have proved to be abundant (1914/15, 1915/16, 1920/21 and 1927/28), have differed as regards flood conditions. In all three rivers the floods have been high in the springs of 1920 and 1927, low in 1915, but in the spring of 1914 medium in the Kemi and Oulu Rivers, but low in the Tornio River (lowest in that river for the whole period 1914— 28).
The water-level conditions of late autumn and winter which, as regards the renewing of the stock of salmon, are probably of superior importance, are given for the Tornio and Kemi Rivers according to daily observations made above Kukkolankoski Rapids — the lowest rapids in the Tornio River — and below the Taivalkoski Rapids — the lowest rapids in the Kemi River. The observations as regards the Oulu River have been made below the Pyhäkoski Rapids. These rapids are situated about half way up the river and have a length of 20 km. and a fall of 56 m.
I have taken the level of the water during the spawning season as my starting point. I have been unable definitely to fix the spawning period, as it varies to some extent every year. Nevertheless, I think that I have been more or less correct in assuming that the most usual spawning period in the Kemi and
Tornio Rivers happens between 5th and 10th October, and in the Oulu River about the 20th October.
From the geographical peculiarities of these rivers alone, it can be concluded that they vary as to importance as salmon spawning rivers. As a river the Oulu River is comparatively short and with concentrated rapid waters, although certain rapids are of considerable length. Before all, however, the extensive lake waters of its upper reaches have a balancing effect on the level of the water and bring about the peculiarity of this river, i. e., the fact that the spawn of the salmon is more protected here than in other rivers. Subject to sufficient numbers of spawning salmon and the productivity of the river being sufficient to maintain the number of parr, this river can be considered one of the main rivers as regards the maintenance of the stock of salmon in the Baltic Sea. It can therefore be considered a great disadvantage that in the very near future the Pyhäkoski Rapids will be dammed for a new power station. As regards the maintenance of the stock of salmon, the Tornio River is unfavourable owing to lack of lakes to stabilise the level of the water and to rainfall being fairly small. The water level of the Kemi River is influenced to some extent by the Kemi Lake, by the extensive rainfall area and by the fairly gentle slope as compared to the Tornio River.
I will first present my survey of the water-level conditions in the above-mentioned rivers during the period 1914— 1929 as a general summary, and then in detail. Both surveys are divided into winter periods during which the superior year-classes have been hatched, into winters when more or less moderate year-classes have been hatched, and finally into winters during which weak year-classes have originated.
I. General Surrey.A. S u p e r io r Y ea r -C Ia sse s .
River 1914/15Oulu e x t r e m e ly good ; the water has fallen on
two occasions only: 5— 1 1 cm.Kemi p r o b a b ly g o o d , although the level of the
water was low in November—December (In Taivalkoski Rapids as much as 70cm. lower).
Tornio difficult to estimate, but probably better in the upper reaches than in the Kukkola Rapids area.
1915/16Oulu e x t r e m e ly good ; water fallen by only a
few cm. (maximum 8 cm.).Kemi good ; water fallen once in end of October,
maximum 30 cm.Tornio a p p a r e n t ly good ; fall in water at Kukkola
Rapids also less than during most winters (maximum 20th April — 35 cm.).
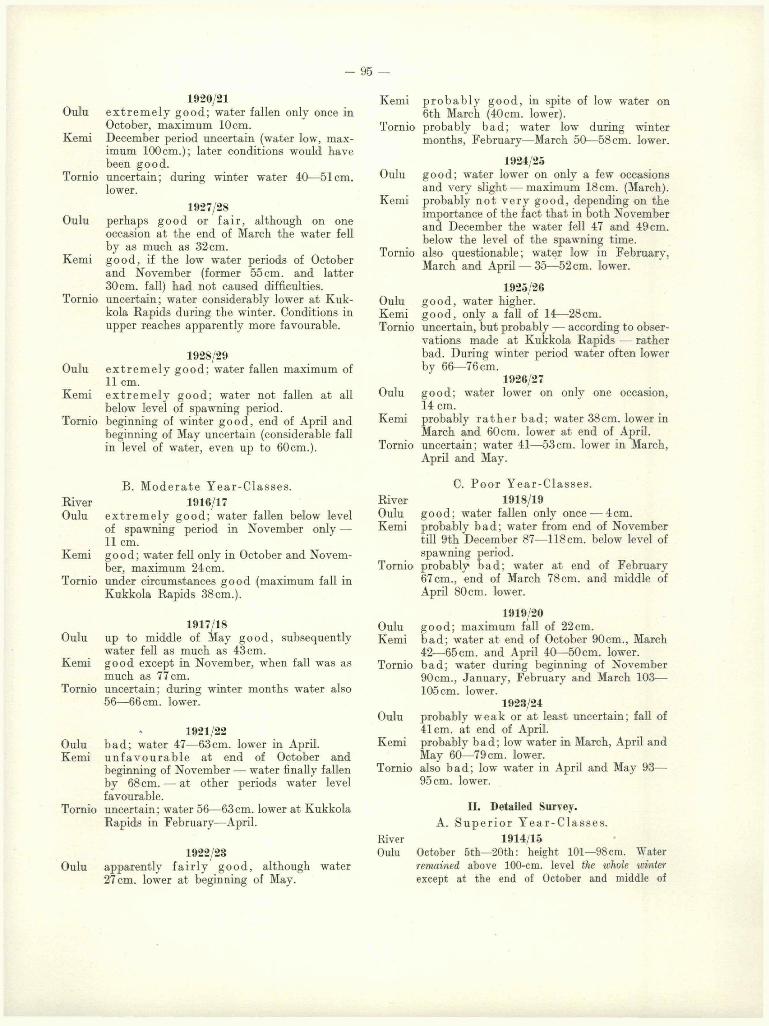
- 95 —
Oulu
Kemi
Tornio
Oulu
Kemi
Tornio
Oulu
Kemi
Tornio
RiverOulu
Kemi
Tornio
Oulu
Kemi
Tornio
OuluKemi
Tornio
Oulu
1920/21e x t r e m e ly good ; water fallen only once in October, maximum 10cm.December period uncertain (water low, maximum 1 0 0 cm.); later conditions would have been good.uncertain; during winter water 40— 51cm. lower.
1927/28perhaps g o o d or fa ir , although on one occasion at the end of March the water fell by as much as 32 cm.g o o d , if the low water periods of October and November (former 55 cm. and latter 30 cm. fall) had not caused difficulties, uncertain; water considerably lower at Kukkola Rapids during the winter. Conditions in upper reaches apparently more favourable.
1928/29e x t r e m e ly good ; water fallen maximum of11 cm.e x t r e m e ly good ; water not fallen at all below level of spawning period, beginning of winter g o o d , end of April and beginning of May uncertain (considerable fall in level of water, even up to 60cm.).
B. M o d er a te Y ea r -C Ia sses .1916/17
e x t r e m e ly good ; water fallen below level of spawning period in November only —11 cm.good ; water fell only in October and November, maximum 24 cm.under circumstances g o o d (maximum fall in Kukkola Rapids 38cm.).
1917/18up to middle of May g o o d , subsequently water fell as much as 43 cm. g o o d except in November, when fall was as much as 77 cm.uncertain; during winter months water also56—66 cm. lower.
1921/22bad; water 47— 63cm. lower in April, u n fa v o u r a b le at end of October and beginning of November — water finally fallen by 6 8 cm. — at other periods water level favourable.uncertain; water 56— 63cm. lower at Kukkola Rapids in February— April.
1922/23apparently fa ir ly g o o d , although water 27cm. lower at beginning of May.
Kemi p r o b a b ly g o o d , in spite of low water on 6 th March (40cm. lower).
Tornio probably bad; water low during winter months, February— March 50— 58 cm. lower.
1 9 2 4 / 2 5
Oulu good ; water lower on only a few occasions and very slight — maximum 18cm. (March).
Kemi probably n o t v e r y g o o d , depending on the importance of the fact that in both November and December the water fell 47 and 49 cm. below the level of the spawning time.
Tornio also questionable; water low in February, March and April — 35—52cm. lower.
1925/26Oulu g o o d , water higher.Kemi g o o d , only a fall of 14— 28cm.Tornio uncertain, but probably — according to obser
vations made at Kukkola Rapids — rather bad. During winter period water often lower by 66—76 cm.
1926/27Oulu good ; water lower on only one occasion,
14 cm.Kemi probably r a th e r bad; water 38cm. lower in
March and 60cm. lower at end of April.Tornio uncertain; water 41—53cm. lower in March,
April and May.
C. P o o r Y ea r -C Ia sse s .River 1918/19Oulu good ; water fallen only once — 4 cm.Kemi probably bad; water from end of November
till 9th December 87— 118 cm. below level of spawning period.
Tornio probably bad; water at end of February 67cm., end of March 78cm. and middle of April 80 cm. lower.
1919/20Oulu good ; maximum fall of 22cm.Kemi bad; water at end of October 90cm., March
42—65 cm. and April 40—50 cm. lower.Tornio bad; water during beginning of November
90cm., January, February and March 103— 105cm. lower.
1923/24Oulu probably w eak or at least uncertain; fall of
41cm. at end of April.Kemi probably bad; low water in March, April and
May 60—79 cm. lower.Tornio also bad; low water in April and May 93—
95 cm. lower.
II. Detailed Survey.A. S u p e r io r Y e a r -C I a s s e s .
River 1914/15Oulu October 5th—20th: height 101—98 cm. Water
remained above 1 0 0 -cm. level the whole winter except at the end of October and middle of

- 96 —
November, when the water fell from 5cm. and 1 1 cm.; the latter low water lasted for one day only.
Kemi October 5th—20th: height 178—150 cm. Level of water during spawning period can be estimated at 160cm. Water gradually fell to 90cm. (November 7th), corresponding to a fall of 70 cm. Water rose on December 12th above the 160-cm. level and remained above this level the whole winter (even at low water the level kept above 190cm.).
Tornio October 5th—20th: height 108—89 cm. We can thus assume that the level of the water at Kukkola Rapids was about 100 cm. during the spawning. But as the water level fell quickly, being 11 cm. on October 31st, and only 15—22 cm. on November 6 th—9th, it is probable that a relatively lower level prevailed in the upper reaches of the river even during the spawning. On one occasion only during the winter (December 14th—15th) did the water rise to above the 1 0 0 -cm. level, otherwise it remained between 83 and 53 cm., falling at the end of March and beginning of April to 43—46 cm. height. The level of the water during the winter— as far as the Kukkola Rapids are concerned — was therefore continuously 17—57 cm. lower than the level of the spawning period.
1915/16Oulu October 5th—20th: height 80—65cm., but the
water continued to fall, reaching its minimum— 61 cm. — on the 26th. If we assume the level of the water to have been 65cm. during the spawning period, the low water fell by only a few centimetres (maximum 8 cm.) below that level during the middle of April.
Kemi October 5th—20th: level 126—138 cm. The low water fell by 30cm., i. e. to 108cm., at the end of October, but remained from November 4th above the 138-cm. level throughout the winter (it was generally considerably above this level, i. e. 40— 1 1 2 cm., if we take the low water of each month separately).
Tornio October 5th—20th: height 72—62cm. The water fell considerably at the end of the month, reaching its lowest point — possibly owing to the packing of the ice — on November 3rd, 22 cm., but rising again to above 72 cm. on the 26th, only to fall once more below this level on December 18th. During January, February and March the water remained at 46—59cm., or 27—14cm. below the 73cm.-level; in April it fell 35cm. below this level (20th April). Conditions in the upper reaches of the river were probably favourable as in the autumn of 1914. This can be assumed from the falling of the level in the Kukkola Rapids during the latter half of October.
1920/21Oulu October 5th—20th: height 103—98cm., falling
from this level by 10 cm. on October 22nd, thus being 88 cm. The water was above this level during
the whole winter, and dating from November 11th, above the 1 0 0 -cm. level.
Kemi October 5th—20th: height 225—172 cm., falling to 132 cm. on November 9th. The level of the water during the spawning period should probably be assumed at about 200cm. The water remained below this level up to January 19th, being low particularly in December — only 144—100 cm. (maximum difference thus a whole metre). Dating from January 19th the level of the water was above 200cm., except at the end of March and beginning of April, when the low water fell some 7 cm.
Tornio October 5th—20th: height 112—93cm., the level falling to 73 cm. on the 28th. If the level of the water during the spawning period is taken as 100 cm., the level of the water during the whole of the winter — excluding the high water of December — was below this level; the low water as follows: November 50cm., December 33cm., January 24cm., February 43cm., March 44cm. and April 51cm.
1927/28Oulu October 5th—20th: height 148—129 cm., falling
after this by 18cm. (28th). If the spawning occurred while the level of the water was 130cm., the level has then fallen below this by 18cm. in October and by the end of February, while during March it was as much as 32cm. below. The rise began again on April 4th, without reaching the 130-cm. level before April 25th.
Kemi October 5th—10th: height 194—232 cm. (October maximum), on 11th—20th 230—178 cm. If the spawning had occurred while the water was at the 230-cm. level, the water would not have fallen by more than 55 cm. in October, and by 30cm. in November (1st), and by 10cm. only in March— April.
Tornio October 5th—10th: height 116—150 cm., 11th— 17th: 152—105cm., and 18th—27th: 97—46cm. During the period subsequent to the spawning a powerful fall of about one metre thus occurred in the Kukkola Rapids, which presupposes that the water in the upper parts of the river was at a comparatively low level during the spawning. The high water only exceeded thel00-cm. level in January and December, the level at other periods being between 48 and 89 cm., in other words still a metre lower than the level of October 11th.
1928/29Oulu October 5th—20th: height 126—112cm.; if the
spawning has occurred at this time the level of the water has been more than 126 cm. the whole of the winter, except during May, when on one occasion (5th) it fell by 11cm., i.e . to 115cm.
Kemi October 5th—24th: height 173—124 cm., but rose from November 5th (on that date 130cm. height). If the spawning occurred while the level was 125— 130 cm., the water was above this level the whole of
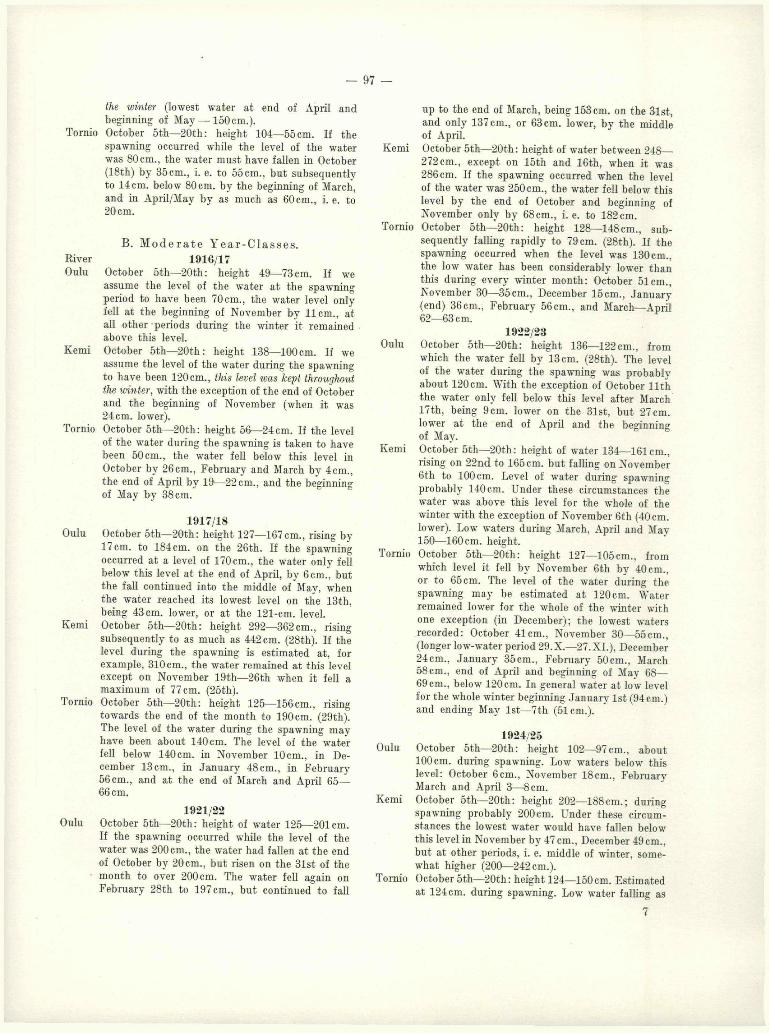
— 97 —
the winter (lowest water at end of April and beginning of May — 150 cm.).
Tornio October 6 th—20th: height 104—56 cm. If thespawning occurred while the level of the water was 80cm., the water must have fallen in October (18th) by 35cm., i. e. to 55cm., but subsequently to 14 cm. below 80 cm. by the beginning of March,and in April/May by as much as 60cm., i. e. to2 0 cm.
B. M o d e r a t e Y e a r -C I a s s e s .River 1916/17Oulu October 5th—20th: height 49—73 cm. If we
assume the level of the water at the spawning period to have been 70cm., the water level only fell at the beginning of November by 1 1 cm., at all other periods during the winter it remained above this level.
Kemi October 5th—20th : height 138—100 cm. If we assume the level of the water during the spawning to have been 1 2 0 cm., this level was kept throughout the winter, with the exception of the end of October and the beginning of November (when it was 24 cm. lower).
Tornio October 5th—20th: height 56—24 cm. If the level of the water during the spawning is taken to have been 50 cm., the water fell below this level in October by 26cm., February and March by 4cm., the end of April by 19—22 cm., and the beginning of May by 38 cm.
1917/18Oulu October 5th—20th: height 127—167 cm., rising by
17 cm. to 184 cm. on the 26th. If the spawning occurred at a level of 170cm., the water only fell below this level at the end of April, by 6 cm., but the fall continued into the middle of May, w'hen the water reached its lowest level on the 13th, being 43 cm. lower, or at the 121-cm. level.
Kemi October 6 th—20th: height 292—362 cm., rising subsequently to as much as 442 cm. (28th). If the level during the spawning is estimated at, for example, 310 cm., the water remained at this level except on November 19th—26th when it fell a maximum of 77 cm. (25th).
Tornio October 5th—20th: height 125—156cm., rising towards the end of the month to 190 cm. (29th). The level of the water during the spawning may have been about 140 cm. The level of the water fell below 140cm. in November 10cm., in December 13cm., in January 48cm., in February 56cm., and at the end of March and April 65—66 cm.
1921/22Oulu October 5th—20th: height of water 125—201cm.
If the spawning occurred while the level of the water was 2 0 0 cm., the water had fallen at the end of October by 20cm., but risen on the 31st of the month to over 200 cm. The water fell again on February 28th to 197 cm., but continued to fall
up to the end of March, being 153cm. on the 3lst, and only 137 cm., or 63cm. lower, by the middle of April.
Kemi October 5th—20th: height of water between 248— 272cm., except on 15th and 16th, when it was 286 cm. If the spawning occurred when the level of the water was 250cm., the water fell below this level by the end of October and beginning of November only by 6 8 cm., i.e . to 182cm.
Tornio October 5th—20th: height 128—148 cm., subsequently falling rapidly to 79 cm. (28th). If the spawning occurred when the level was 130cm., the low water has been considerably lower than this during every winter month: October 61cm., November 30—35cm., December 15cm., January (end) 36cm., February 6 6 cm., and March—April 62—63 cm.
1922/23Oulu October 5th—20th: height 136—122cm., from
which the water fell by 13 cm. (28th). The levelof the water during the spawning was probablyabout 120 cm. With the exception of October 11th the water only fell below this level after March 17th, being 9 cm. lower on the 31st, but 27 cm. lower at the end of April and the beginning of May.
Kemi October 5th—20th: height of water 134—161cm., rising on 22nd to 165 cm. but falling on November 6 th to 100 cm. Level of water during spawning probably 140cm. Under these circumstances the water was above this level for the whole of the winter with the exception of November 6 th (40cm. lower). Low waters during March, April and May 150—160cm. height.
Tornio October 5th—20th: height 127—105cm., fromwhich level it fell by November 6 th by 40cm., or to 65 cm. The level of the water during the spawning may be estimated at 120 cm. Water remained lower for the whole of the winter with one exception (in December); the lowest waters recorded: October 41cm., November 30—55cm., (longer low-water period 29.X.—27.XL), December 24cm., January 35cm., February 50cm., March 58cm., end of April and beginning of May 68—69cm., below 120cm. In general water at low levelfor the whole winter beginning January 1st (94cm.) and ending May 1st—7th (51cm.).
1924/25Oulu October 5th—20th: height 102—97 cm., about
100 cm. during spawning. Low waters below this level: October 6 cm., November 18cm., February March and April 3— 8 cm.
Kemi October 5th—20th: height 202—188 cm.; during spawning probably 200cm. Under these circumstances the lowest water would have fallen below this level in November by 47 cm., December 49cm., but at other periods, i. e. middle of winter, somewhat higher (200—242 cm.).
Tornio October 6 th—20th: height 124—150cm. Estimated at 124 cm. during spawning. Low water falling as

— 98 -
follows: November 12 cm., December 24 cm.,January 28cm., February 35cm., March and April 52 cm. lower (even high water in March 36 cm. lower).
1925/26Oulu October 5th—20th: height 71—64cm. Level
during spawning 64 cm. Subsequently the water was above this level for the whole of the winter by a minimum of 54cm. and a maximum of 83 cm.
Kemi October 5th—20th: height 184—140cm., from which level the water then fell by 8 cm. (25th). If the level during the spawning was 160 cm., the level has been below this by 28cm. in October/ November, and by 14 cm. in March/April.
Tornio October 5th—20th: height 125—68cm., from which level water fell to 43 cm. on 23rd. Level of water during spawning possibly 1 2 0 cm., but farther up the river relatively lower, as it has been followed by a fall of 76 cm. Water had been considerably lower during the whole of the winter— except high water in December. Low-water seasons as follows: October 76cm., November 6 6 cm., December 22cm., January 53cm., February 63 cm., March and April 6 6 cm.
1926/27Oulu October 5th—20th: height 106—120cm. Level
during spawning can be estimated at 115cm. The water did not fall below this level except on October 30th, by 14 cm. At all other periods the water was as much as 10 2 cm. above and at least 9cm. higher, i. e. 124cm. (25th April).
Kemi October 5th—20th: height 172—246cm. Level during spawning about 180cm. (9th). Water fallen below this in October (28th) by 40cm., and then only at the end of March by 38cm. and at the end of April by 60 cm.
Tornio October 5th—20th: height 104—172 cm. (172 cm. on 16th). Level during spawning estimated at about 105 cm. The low-water seasons during the winter have been below this level as follows: October 15cm., November 34cm., January 23cm., February 27 cm., March 41cm., April and May 49—53 cm.
C. P o o r Y e a r -C I a s s e s .
River 1918/19Oulu October 5th—20th: height 140—150cm., rising at
the end of the month by 10 cm. Water fallen below 150cm. only once in April and then by only 4cm. (13th).
Kemi October 5th—20th: height 182—268 cm., and rose by a further 7cm., i.e . to 275cm., on 22nd. If level during spawning is assumed to have been 230 cm., the water fell below this level on November 18th, 87 cm. on the 24th and no less than 118cm. on December 6 th below the level, i. e. at a height of 112 cm. Water was at 230 cm. or higher from December 9th to April 5th; below this during the middle of April, minimum height 218cm.
Tornio October 5th—20th: height 148—135 cm. If the
level was 140cm., for example, during the spawning, the high water during the whole of the winter was below this level, with the exception of November 20th—22nd, and December 15th and 16th when it was 9 cm. higher, or at more or less the same level (142 cm.). The water fell in October by 35 cm., reaching the lowest point — 58cm.— on November 26th. At the end of February it was 67 cm. lower, at the end of March 78cm. lower, and during the middle of April 80cm. lower, or at a height of 60 cm.
1919/20Oulu October 5th—20th: height 129—166 cm. Level
during spawning can be assumed at 150cm. (20th); water thereafter was higher and fell to the same level only at the beginning of March, being below the level until April 4th, a maximum of 22cm. (March 24th and 28th).
Kemi October 5th—14th: height 301—268cm., afterwhich a slight fall occurred to 190cm. (31st). Ifthe level during the spawning is estimated at 280cm. (October 12th) the water subsequently fell by no less than 90 cm., rising to above 280cm. only on November 11th. The water subsequently fell below this level in December by 10cm., in January by 29cm., February by 40cm., being 42—65cm. lower in March, and 52—40cm. lower at the beginning of April.
Tornio October 5th—20th: height of water 170—120 cm. Fall continued up to November 3rd, when the level was only 81 cm. The spawning, if carried out on about the 5th, occurred during high water which was followed by a direct fall of 90 cm. Even the high water during the winter did not on a single occasion approach that level (on December 12th it was 123cm., or 57cm. lower; the highest water in January was 89 cm., in February 99 cm. lower). The low waters of January, February and March were 103—105 cm. lower, or at a level of 65—67 cm.
1923/24Oulu October 5th—20th: height 165—198 cm., but
continued to rise up to 242 cm. (26th). If the level during the spawning is estimated at 2 0 0 cm., the water fell below this level about the middle of March, a maximum of 26cm., continued to fall up to the 30th of April, so that on the 29th and 30th the level was 159 cm., or 41cm. lower.
Kemi October 5th—20th: height 278—288cm., so that the level during the spawning was about 280 cm. The water fell below this level by a maximum of 45 cm. at the beginning of November, by a maximum of 30cm. in February, 60cm. in March (at the end), 79 cm. at the end of April, and 60 cm. during the first days of May.
Tornio October 5th—20th: height 190—152cm. Level during spawning can be taken as 170 cm. Water fallen below this level in November by 63 cm., in December by 58cm., January 54cm., February 8 8 cm., end of March and beginning of April and May 93—95cm.

— 99 —
A study of the above survey will show that even water conditions favourable to the hatching of the salmon occurred in all three rivers (Oulu, Kemi and Tornio Rivers) during the winter of 1915/16, when one year-class proving to be of high abundance was hatched. This was also the case with the Oulu River, and probably the Kemi River in the winter of 1914/15.
Water-level conditions during the winter of 1920/21 were favourable in the Oulu River only. There is no absolutely reliable information on the conditions in the Kemi River for this winter, but since it produced a fairly rich year-class it may be assumed that the great fall in the level of the water during December had no lasting effect. Another explanation may be, that high floods in all the rivers in the spring of 1920, brought the salmon in such numbers for the autumn spawning that the damage caused by the low water of December did not become disastrous.
The water-level conditions during the winter of 1927/28 were probably at their best in the Kemi River, while hardly at their best in the Oulu River. The great density of the year-class then developing can partly be explained by the fact that there were floods in all the rivers during the spring of 1927.
The water conditions in all three rivers in the winter of 1928/29 were superior to those of the previous year: they were particularly good as far as the Oulu and Kemi Rivers were concerned. As, however, the year- class then hatched did not appear to have created a record as regards abundance, it may be assumed that this was due to the low floods of the spring of1928 (in the Tornio River between medium and low, in the Oulu River low, and in the Kemi River the lowest of the whole period — 1914— 1928). It is probable that there were sufficient pairs of spawning salmon for the achievement of much greater possibilities.
This will suffice for the conditions in rivers flowing into the Bothnian Bay during the years when the superior year-classes were hatched.
With regard to the moderate year-classes I have observed that the two first year-classes, 1916/17 and 1917/18, particularly the former, might possibly have been midway between superior and moderate. In any event, the level of the water during the winter of 1916/17 was extremely favourable in all three rivers, even in the Tornio River, and the conditions cannot be considered bad during the winter of 1917/18. There was nevertheless a flood of very low water in all these rivers during the spring of 1916. The level of the flood water in the spring of 1917, on the other hand, was extremely high, particularly in the Tornio River, but also in the Kemi River (fairly low in the Oulu River). The weakness of the year-classes hatched during these winters — despite the good conditions — was probably influenced by the war-time shortage of food. This led to fishing during the spawning period, first of all illegally, and then from September 1917 to December 1st 1919, legally, in so far as seines could be drawn throughout the year in the upper waters of the Tornio and Kemi Rivers (in the Lapland district), and fishing
with rod and line was allowed along the entire length of the rivers.
The water-level appears to have been unfavourable during the hatching of the 1921/22 year-class. The spring flood of 1921 was of medium height. The 1922/23 year-class, on the other hand, was hatched under more favourable circumstances, the spring floods of 1922 also having been higher.
During the hatching of the 1924/25 and 1925/26 year-classes the water-level conditions were favourable in the Oulu and Kemi Rivers; the spring floods were of medium height more or less. As, however, these year-classes did not become abundant, it may be assumed that too few individuals took part in the spawning.
During the hatching of the 1926/27 year-class the water , level conditions were good in the Oulu River, but fairly bad in the Kemi River (as usual, it is rather difficult to make any definite statement about conditions in the Tornio River). The 1926 spring floods were high in the Oulu River, moderate in the Tornio River, and low in the Kemi River.
I have only placed three year-classes as definitely poor.
During the hatching of the 1918/19 and 1919/20 year-classes the water-level conditions were good in the Oulu River — that is, during these winters — but bad in the Kemi and Tornio Rivers. The spring flood of 1918 was high in the Kemi River, but low in the Oulu and Tornio Rivers; in 1919 high in the Oulu River, moderate in the Tornio River, but low in the Kemi River. The deficiency of both these year-classes also may be partly due to the excessive fishing of those years.
The water-level conditions in the winter of 1923/24 were unfavourable in all three rivers, as there were considerable falls in the level during the winter. The1923 spring floods were high in the Tornio and Kemi Rivers, and moderate in the Oulu River.
The conditions prevailing in the salmon rivers flowing into the Bothnian Bay during the winters 1916/17, 1917/18, 1918/19 and 1919/20 appear to my mind to indicate that there was not always a sufficient number of salmon during the spawning, and that deficiencies may have occurred in this respect also.
I have pointed out in the preceding chapter that, according to the scale specimens which I have obtained from the Kymi River since the year 1925, the 1921/22 year-class has been the one best represented (1113 specimens). This agrees fairly well with the conditions prevailing in the lower reaches of the Kymi River during the winter of 1921/22 (the only place where the salmon are able to spawn). Assuming that the spawning has occurred during the beginning of November, the water has been below the level of that period on two occasions only — 13 and 15cm.
According to the specimens, however, the following year-class, 1922/23, has also appeared to be fairly rich, but there is some uncertainty as to the level of
7*

— 100 —
the water during the winter if the spawning occurred during the first days of November 1922, when the level of the water in the river was comparatively high (200 cm.). According to the information which I have received, the spawning period in the Kymi River also has been abnormal, and under these circumstances it may be that I have wrongly estimated the spawning period (only 7 salmon — 5 of them females — were obtained that autumn from the hatchery in the Langinkoski Rapids, probably owing to the high level of the water).
The 1923/24 year-class has proved to be medium as regards its number of individuals. This agrees with the level of the water during the winter — there was a drop of 32 cm. in April.
The 1924/25 year-class was weak. This is also consistent with the water-level conditions of the winter. The level in the lower part of the Kymi River during the middle of March was as much as 41— 49 cm. below that of November (beginning).
The 1925/26 year-class appears to have had even fewer individuals, according to the specimens, so that it must be considered as very weak (a total of only 112 specimens). This also appears to be due to the winter water-level conditions: the level of the water in the lower reaches of the Kymi was 50— 67 cm. lower in February, March and April than it was at the beginning of November.
The 1926/27 and 1927/28 year-classes can be considered as fair, with regard to their abundance. The former was hatched during the favourable winter, with regard to the water-level conditions (only small fluctuations in the level of the water), and the latter probably under unfavourable conditions (great fluctuations), but it is also possible that the spawning did not occur at the time supposed (as also may be true of the 1922/23 year-class).
The 1928/29 year-class should probably be considered weak — the winter conditions were also bad.
The 1917/18 year-class has been one of the most prominent of the year-classes, representatives of which ascended the Kymi River in 1921— 1924 and formed the catch. This is shown first of all by the fact that it was represented by 427 specimens among the 1926 scale specimens. This year-class was hatched under favourable conditions, as far as the level of the water is concerned. The spawning took place at such low water that the level was higher for the whole of the winter. The 1918/19 year-class also was hatched under similar circumstances, but is only weakly represented among my specimens (only 187 specimens), see p. 93. Is this because there were too few fish spawning?
The 1919/20 and 1920/21 year-classes are also weakly represented in the specimens for the years1924 and 1928. It is difficult to form an opinion of the conditions prevailing during the preceding winter, while conditions were probably bad during the latter.
I will add a short survey of the water-level conditions in the Kymi River during the period 1914/15 to 1928/29, and of the heights of the spring floods.
1914/15. November 1st—10th: height 48—26cm. If we assume that the spawning took place while the water was at a height of 40cm., the water fell to 8 cm. on the 25th, at other periods the level has been below 40cm. as follows: December 10cm., January 4cm., April 9cm.
1915/16. November 1st—10th: height 80—57cm. If the level of the water was 60 cm. during the spawning it had fallen by the end of March by 11cm., but had been higher at all other periods.
1916/17. November 1st—10th: height 99—123 cm. If the spawning occurred at a height of 1 2 0 cm., the water had fallen below this level in November (3rd) 6 cm., February 2cm., March 21cm., and April 35 cm.
1917/18. November 1st—10th: height 79—91cm. If the level of the water during the spawning was 90 cm. the water remained above this level the whole winter (lowest water in December: 15cm., in January: 35cm., later 47—73cm. higher).
1918/19. November 1st—10th: height 94—112 cm. If the spawning took place at a level of 1 1 0 cm., the water remained above this level /or the n'hole of the winter (minimum 6 cm. in March).
1919/20. November 1st—10th: height 110—77 cm. If the spawning took place at a level of 80cm., the water remained above this level for the whole of the winter, although by no more than 4 cm. during the low waters of January, February and March. If the spawning occurred at 100cm., the water during the above-mentioned months was 16cm. lower, and if at 1 1 0 cm., 26cm. lower.
1920/21. November 1st—10th: height 96—91cm. Spawning apparently occurred at 90cm. Water fallen below this level in November by 22 cm., December by 40cm., January/February by 42 cm., beginning of March by 36cm.
1921/22. November 1st—10th: height 57—52cm. Ifspawning occurred at 55cm., the low water seasons were below this level only in November by 15cm., December by 13cm., all other periods above the level.
1022/23. Novemberlst—10th:height202—197cm.Height at spawning probably 200cm. Water fallen below this level: November 5cm., January 13cm., February 10cm., end of March 61cm., middle of April 78cm., and 54cm. up to the beginning of May.
.1923/24. Novemberlst—10th:height208—226cm.Height at spawning can be estimated at 220 cm. Water fell below this level on March 18th, being 15 cm. lower on the 23rd and 24th, and even 32cm. lower on April 26th.
1924/25. November 1st—10th: height 208—203 cm.Spawning level probably 205 cm. Water fell below this level by 6 cm. in November, 9 cm. in December, 18cm. in January, 19cm. in February, from middle of March onwards a maximum of 41—49 cm.
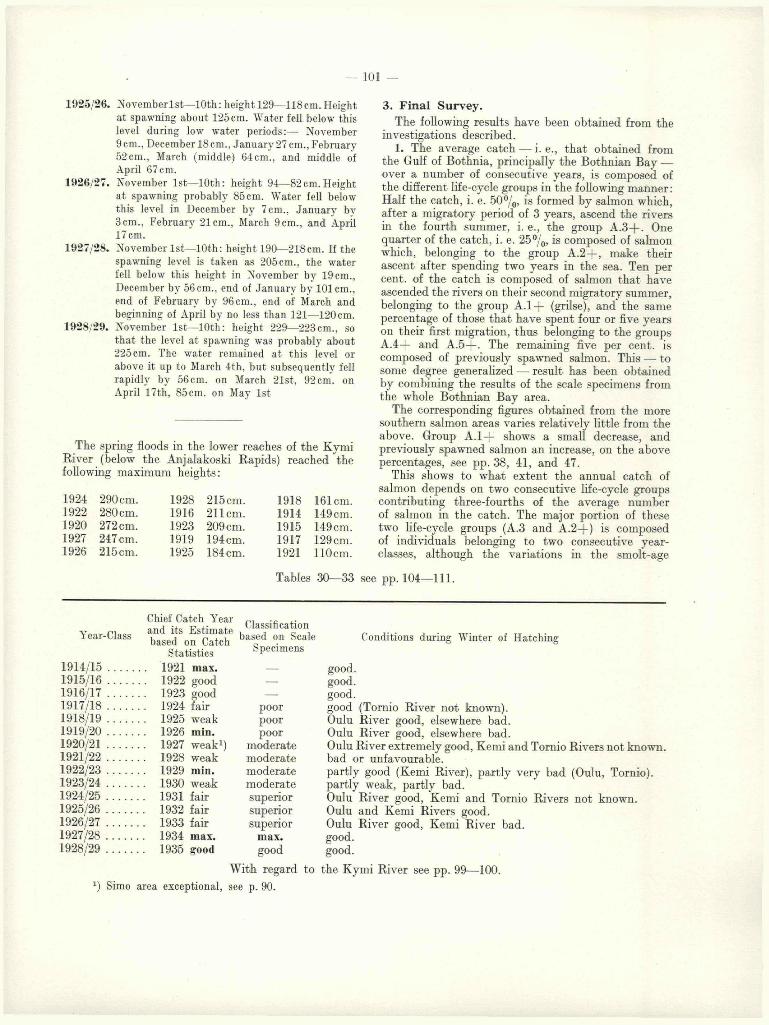
101 —
1925/2«. Novemberlst—10th: height 129—118cm. Height at spawning about 125 cm. Water fell below this level during low water periods:— November 9 cm., December 18 cm., January 27 cm., February 52cm., March (middle) 64cm., and middle of April 67 cm.
1926/27. November 1st—10th: height 94—82cm.Height at spawning probably 85cm. Water fell below this level in December by 7 cm., January by 3cm., February 21cm., March 9cm., and April 17 cm.
1927/28. November 1st—10th: height 190—218cm. If the spawning level is taken as 205cm., the water fell below this height in November by 19 cm., December by 56cm., end of January by 101cm., end of February by 96cm., end of March and beginning of April by no less than 121—120 cm.
1928/29. November 1st—10th: height 229—223cm., so that the level at spawning was probably about 225cm. The water remained at this level or above it up to March 4th, but subsequently fell rapidly by 56cm. on March 21st, 92 cm. on April 17th, 85cm. on May 1st
The spring floods in the lower reaches of the Kymi River (below the Anjalakoski Rapids) reached the following maximum heights:
1924 290 cm. 1928 215 cm. 1918 161cm.1922 280 cm. 1916 2 1 1 cm. 1914 149 cm.1920 272cm. 1923 209 cm. 1915 149 cm.1927 247 cm. 1919 194cm. 1917 129 cm.1926 215cm. 1925 184cm. 1921 1 1 0 cm.
3. F in al Survey.
The following results have been obtained from the investigations described.
1. The average catch — i. e., that obtained from the Gulf of Bothnia, principally the Bothnian Bay — over a number of consecutive years, is composed of the different life-cycle groups in the following manner : Half the catch, i. e. 50°/0, is formed by salmon which, after a migratory period of 3 years, ascend the rivers in the fourth summer, i. e., the group A .3 + . One quarter of the catch, i. e. 25°/0, is composed of salmon which, belonging to the group A .2 + , make their ascent after spending two years in the sea. Ten per cent, of the catch is composed of salmon that have ascended the rivers on their second migratory summer, belonging to the group A . l - f (grilse), and the same percentage of those that have spent four or five years on their first migration, thus belonging to the groups A.4 + and A .5+ - The remaining five per cent, is composed of previously spawned salmon. This-— to some degree generalized — result has been obtained by combining the results of the scale specimens from the whole Bothnian Bay area.
The corresponding figures obtained from the more southern salmon areas varies relatively little from the above. Group A .1 + shows a small decrease, and previously spawned salmon an increase, on the above percentages, see pp. 38, 41, and 47.
This shows to what extent the annual catch of salmon depends on two consecutive life-cycle groups contributing three-fourths of the average number of salmon in the catch. The major portion of these two life-cycle groups (A.3 and A.2 + ) is composed of individuals belonging to two consecutive year- classes, although the variations in the smolt-age
Tables 30—33 see pp. 104— 111.
Chief Catch Year Qiassißcation
Year-Class ^asedSon^atcff *)ase<̂ on Scale Conditions during Winter of HatchingStatistics Specimens
1 9 1 4 /15 ............. 1921 max. — good.1915/16 ............. 1922 good — good.1916/17 ............. 1923 good — good.1917/18 ............. 1924 fair poor good (Tornio River not known).1918/19 ............. 1925 weak poor Oulu River good, elsewhere bad.1919/20 ............. 1926 min. poor Oulu River good, elsewhere bad.1920/21 ............. 1927 weak1) moderate Oulu River extremely good, Kemi and Tornio Rivers not known.1921/22 ............. 1928 weak moderate bad or unfavourable.1922/23 ............. 1929 min. moderate partly good (Kemi River), partly very bad (Oulu, Tornio).1923/24 ............. 1930 weak moderate partly weak, partly bad.1924/25 ............. 1931 fair superior Oulu River good, Kemi and Tornio Rivers not known.1925/26 ............. 1932 fair superior Oulu and Kemi Rivers good.1926/27 ............. 1933 fair superior Oulu River good, Kemi River bad.1927/28 ............. 1934 max. max. good.1928/29 ............. 1935 good good good.
With regard to the Kymi River see pp. 99— 100.
*■) Simo area exceptional, see p. 90.

— 102 -
bring additions of individuals from the neighbouring year-classes — above and below. The variation in the smolt-age thus to some extent has a stabilising eSect on the abundance of the different life-cycle groups, and therefore on the catch years.
2 . The catch obtained in 1921— 35 is composed of year-classes of which the first (rather important) was hatched in the winter of 1914/15, and the last (also rather important) during the winter of 1928/29. The representatives of each of these year-classes have returned to the Bothnian Bay area as a major group on their seventh year, belonging to the life-cycle class 3 .3 (+ ). The relative abundance of the year-classes is thus shown most clearly by the catch seven summers after the hatching of the year-class. The table on p. 101 shows the catch years in question at their year-classes, and the estimate of the catches from the Gulf of Bothnia during those years.
3. The table also includes the result of the mutual individual abundance of the year-classes which I have obtained from the scale specimens, grouped as follows:— first, maximum quantity (6229 specimens) and second largest quantity, extremely good (3364 specimens), then: superior (1800— 2300 specimens), moderate (900— 1500 specimens), and poor (below 500 specimens). A comparison between the estimates
of the catch years shows a fair degree of conformity. (The 1920/21 year-class is an exception both as regards the total estimate of the year-class and the scale specimens. This year-class has yielded a maximum result in certain fishing areas — Simo area, see p. 90).
4. The table also includes the so-called conditions of the year-classes. These signify the water-level conditions during the winter when individuals belonging to the year-class were but fertilised eggs on the bed of the river. Conditions have been taken as good when the level of the water has not fallen during the whole of the winter, or has fallen only slightly below the level at which the spawning is believed to have occurred. Conditions have been taken as bad when large falls in the level of the water have been observed. The rivers in question are the Oulu, Kemi and Tornio Rivers. The good and bad conditions correspond fairly well to the estimates given to the chief catch years that coincide with each year-class. There are certain divergencies such as, for example, the 1917/18 and 1918/19 year-classes. It is possible that the increased fishing due to post-war food shortage decreased the numbers of spawning salmon. This same factor may probably also have affected the abundance of other year-classes.
APPENDIX.
Representation of the Sexes in the different Life-Cycle Groups.
I have given another result provided by my investigations in Table 34, pp. 112— 114. It gives the sex representation in the different life-cycle groups, as they appear in collecting the material (this fact has not been taken into account in every case — it particularly concerns salmon in the grilse stage).
The table shows the sex determination of 28,727 salmon. Of this number 9,054 were male, and 19,682 female, corresponding to 31-5% and 68-5%. As 94-4° /0 of the male and 93-9° / 0 of the female salmon have been on their first ascent, their percentages remain more or less unchanged, i. e. 31-6 and 68-4%. The great preponderance of the females is noticeable in the life-cycles A.2 + and A.3(-(-), i. e., in the lifecycles which form the main groups among individuals ascending to spawn. The relative number of females is more or less the same in each of these life-cycle groups — 75-5°/o in the former, and 76-2% in the
latter. Males form the majority in salmon ascending in the grilse stage, as well as among those which ascend for the first time later on in life after migrations of 4 or 5 years. (As the sex of only part of salmon in the grilse stage has been determined, the percentage of males to females has remained smaller than it should have been).
Female salmon have also formed the majority among the previously spawned and reascending individuals — according to the statistics given in the table. They represent 70-3% (1054 specimens) of salmon on their second ascent, and 72-4°/0 (142 specimens) of salmon on their third ascent. The relations have changed in the opposite direction as regards salmon making more numerous ascents:57-9°/o male and 42-1 ° / 0 female, but it should be pointed out that the material contained only a very small number of fish (1 1 males and 8 females).

— 103 —
References.
A l m , G u n n a r , 1919. Morrumsåns lax och laxöring. Meddel. Kungl. Lantbruksstyrelsen, No. 216. Stockholm.
— 1924. Laxen och laxfiskets växlingar i Mörrumsan och andra Östersjöälvar. Meddel. Kungl. Lantbruks- styrelsen, No. 252. Stockholm.
— 1928. The Salmon in the Baltic Area of Sweden. Cons, p. l’Explor. de la Mer, Rapp, et Proc.-Verb., Vol. XLVIII.
— 1934. Salmon in the Baltic Precincts. Cons. p. l’Explor. de la Mer, Rapp, et Proc.-Verb., Vol. XCII.
B o r o w i k , J ö z e f , 1930. Dziesiec lat Polskiego Rvbo- lowstwa morskiego (1920—1930). Tablice statystyczne. — Wydawnictwa morskiego instytutu rybackiego. Gdynia.
D a h l , K n u t , 1910. Alder og vekst hos lax og örret. Fiskeriinsp. Indber. Christiania.
D i x o n , B o r i s , 1931. The Age and Growth of Salmon caught in the Polish Baltic. Journ. du Conseil, Vol. VI, No. 3.
— 1934. The Age and Growth of Salmon caught in the Polish Baltic in the Years 1931—33. Journ. du Conseil. Vol. IX, No. 1.
Fiskeriberetning for Aaret 1918—for Aaret 1935. Köben- havn 1919—1936.
H e n k i n g , H . , 1913. Die Lachsfrage im Ostseegebiet. Tätigkeitsbericht, unter Beifügung von Spezialarbeiten der Kommissionsmitglieder A . C. J o h a n s e n und J. A l b . S a n d m a n . Cons. p. l’Explor. de la Mer, Rapp, et Proc.-Verb., Vol. XVI.
— 1916. Die Lachsfrage im Ostseegebiet. II. Tätigkeitsbericht. Teil 1. Cons. p. l’Explor. de la Mer, Rapp, et Proc.-Verb., Vol. XXIII.
— 1929. Untersuchungen an Salmoniden mit besonderer Berücksichtigung der Art- und Rassefragen. Teil 1. Cons. p. l’Explor. de la Mer, Rapp, et Proc.-Verb., Vol. LXI.
— 1929. Die Ostseefischerei. Handb. d. Seefisch. Nordeuropas, Bd. V, H. 3. Stuttgart.
— 1931. Untersuchungen an Salmoniden mit besonderer Berücksichtigung der Art- und Rassefragen. Teil II. Cons. p. l’Explor. de la Mer, Rapp, et Proc.-Verb., Vol. LXXIII.
H e s s l e , C h r . , 1923. Några iakttagelser rörande blanklaxen vid Gotland. Svensk Fiskeritidskrift.
H u n t s m a n , A. G., 1937. Fluctuations in Abundance of North American Atlantic Salmon. Cons. p. l’Explor. de la Mer, Rapp, et Proc.-Verb., Vol. CI, IV.
J a c o b s e n , J . P. and J o h a n s e n , A. C., 1921. On the causes of the fluctuations in the yield of some of our fisheries. I. The Salmon and Seatrout. Medd. Komm. Danmarks Fisk.- og Havunders., Ser. Fiskeri, Bd. VI.
Jahresberichte über die Deutsche Fischerei, 1927—35. Berlin 1928—36.
J ä r v i , T. H., 1931. Märkta laxar. En översikt av resul- taten inom Östersjöomrädet. Fiskeritidskr. för Finland. No. 5—9. Helsingfors.
— 1932. Suomen merikalastus ja jokipyynti. Helsinki.— 1934. Märkta laxar. Ibid. No. 3. Helsingfors.
J ä r v i , T. H., 1934. Die Seefischerei von Finnland. Handb. der Seefisch. Nordeuropas, Bd. VIII, H. 4. Stuttgart.
— 1934. Angaben über das Alter der in Finnland gefangenen Lachse vor der Auswanderung, nebst einigen Bemerkungen über ihre Wanderungen. Cons, p. l’Explor. de la Mer, Rapp, et Proc.-Verb., XCI.
— 1934. Die Fischzucht zur Unterstützung des Lachsbestandes. Die bisherigen Erfahrungen in Finnland. Ibidem.
— and M e n z i e s , W. J . M., 1936. The Interpretation of the Zones on Scales of Salmon, Sea Trout and Brown Trout. Cons. p. l’Explor. de la Mer, Rapp, et Proc.- Verb., XCVII.
M e n z i e s , W. J . M . 1936 see J ä r v i .N o r d q v i s t , Osc., 1906. Laxens uppstigande i Finlands
och norra Sveriges älvar, statistiskt bidrag till laxens biologie. Fennia 22.
—- 1924. Times of Entering of the Atlantic Salmon in the Rivers. Cons. Perm. Internat, p. l’Explor. de la Mer, Rapp. et Proc.-Verb., Vol. XXXII.
Polskie rybalowstwo morskie. V. (1931—32) a. VI (1933— 1935). Wydawnictwa morskiego urzedu rybackiego. Gdynia 1933, 1936.
P o u l s e n , E r i k M., 1935. Recent Investigations into the Stock of Salmon and Sea Trout in the River Gudenaa. Report Danish Biol. Stat., XL.
P r y c e - T a n n a t t , T. E., 1936. Laws and Regulations in Summary concerning Salmon and Trout Fisheries. Cons. p. l’Explor. de la Mer, Rapp, et Proc.-Verb., Vol. XCVI.
Q u e d n a u , W . , 1932. Untersuchungen über den Lachs (Salmo salar L.) II. Die Angelhakenmethode bei der Erforschung der Lachswanderungen und ihre bisherigen Ergebnisse. Zeitschr. für Fisherei. Bd. XXX, H. 4. 1931 a. 1934 see W i l l e r and Q u e d n a u .
Report of the Meeting of Salmon and Trout Experts in Poland — October 1933. Cons. p. l’Explor. de la Mer, Rapp, et Proc.-Verb., XCI. 1934.
R o s é n , N i l s , 1918. Undersökningar över laxen och lax- fisket i Norrbottens län. (On the Salmon and Salmon- Fisheries in Norrbotten). Meddel. Kungl. Lantbruksstyrelsen, No. 208. Stockholm.
— 1918. Om laxen och laxfisket i Västerbottens län. (English Summary). Ibid., No. 214.
S c h e u r i n g , U., 1929. Die Wanderungen der Fische. Ergebnisse der Biologie. Bd. V.
S i e d l e c k i , M., 1932. Remarks on the Programme of Work of the Salmon and Trout Committee. Cons. p. l’Explor. de la Mer, Rapp, et Proc.-Verb., Vol. LXXXI.
— 1936. Fluctuations in the Number of Individuals belonging to different Age-Groups in the Catches of European Salmon (Salmo Salar L.). Cons. p. l’Explor. de la Mer, Rapp, et Proc.-Verb., Vol. CI, III, No. 9.
Sveriges offisiella statistik: Fiske 1920—1935.W i l l e r und Q u e d n a u , 1931, XI. Untersuchungen über
den Lachs (Salmo salar L.) I. Zeitschr. für Fischerei, Bd. XXIX.
— 1934. Untersuchungen über den Lachs. III. Ibid. Bd. XXXII. 1934.
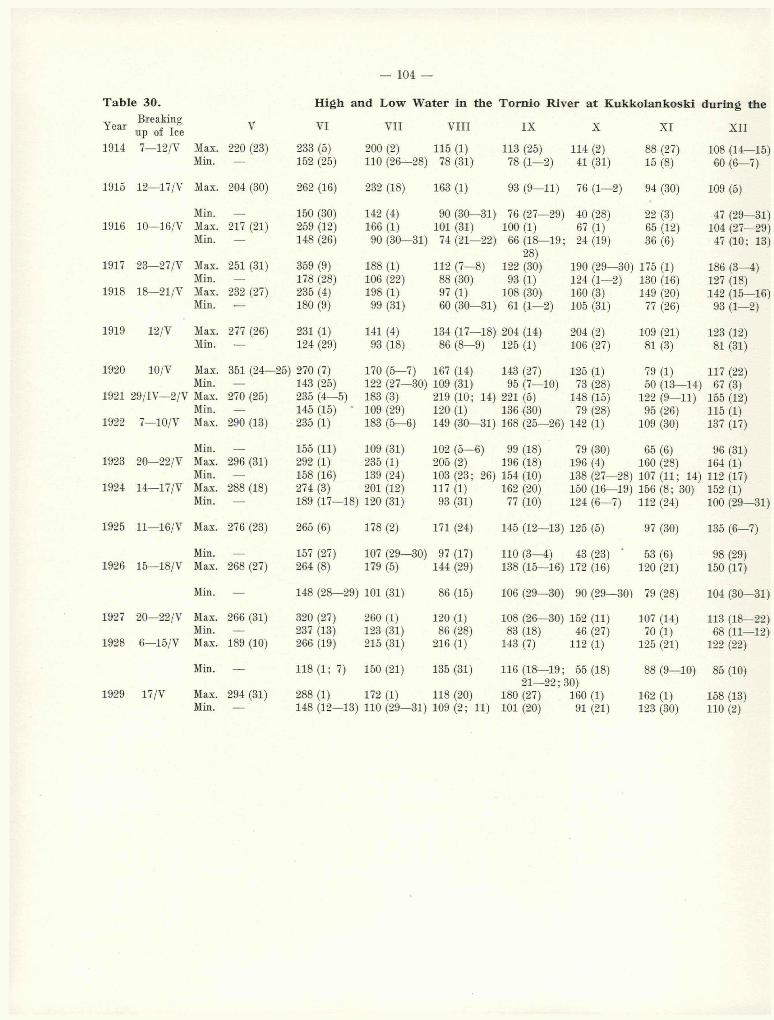
— 104 —
T ab le 30.
Breaking up of Ice
H igh and L ow W ater in the T ornio R iver at K ukkolankosk i during the
Year
1914 7—12/V Max.Min.
1915 12—17/V Max.
Min.1916 10—16/V Max.
Min.
1917 23—27/V Max.Min.
1918 18—21/V Max.Min.
1919 12/V Max.Min.
1920 10/V Max.Min.
1921 29/IV—2/V Max.Min.
1922 7—10/V Max.
Min.1923 20—22/V Max.
Min.1924 14—17/V Max.
Min.
1925 11—16/V Max.
Min.1926 15—18/V Max.
Min.
1927 20—22/V Max.Min.
1928 6—15/V Max.
Min.
1929 17/V Max.Min.
204 (30)
277 (26)
351 (24—
270 (25)
290 (13)
VI VII \ 'III IX X XI XII
233 (5) 2 0 0 (2 ) 115 (1 ) 113 (25) 114 (2 ) 88 (27) 108 (14--15)152 (25) 11 0 (26--28) 78 (31) 78 (1- 2 ) 41 (31) 15 (8 ) 60 (6- 7)
262 (16) 232 (18) 163 (1 ) 93 (9-11) 76 (1 - 2 ) 94 (30) 109 (5)
150 (30) 142 (4) 90 (30--31) 76 (27—29) 40 (28) 22 (3) 47 (29--31)259 (1 2 ) 166 (1 ) 101 (31) 10 0 (1 ) 67 (1 ) 65 (1 2 ) 104 (27--29)148 (26) 90 (30—31) 74 (2 1 - - 2 2 ) 66 (18—19; 24 (19) 36 (6 ) 47 (1 0 ; 13)
28)359 (9) 188 (1 ) 112 ( 7 - 8 ) 12 2 (30) 190 (29--30) 175 (1 ) 186 ( 3 - 4)178 (28) 106 (2 2 ) 88 (30) 93 (1 ) 124 (1- 2 ) 130 (16) 127 (18)235 (4) 198 (1 ) 97 (1 ) 108 (30) 160 (3) 149 (2 0 ) 142 (15--16)180 0 ) 99 (31) 60 (30—31) 61 (1- 2 ) 105 (31) 77 (26) 93 (1- 2 )
231 (1 ) 141 (4) 134 (17--18) 204 (14) 204 (2 ) 109 (2 1 ) 123 (1 2 )124 (29) 93 (18) 86 (8 -9 ) 125 (1 ) 106 (27) 81 (3) 81 (31)
270 (7) 170 ( 5 - 7) 167 (14) 143 (27) 125 (1 ) 79 (1 ) 117 (2 2 )143 (25) 122 (27--30) 109 (31) 95 (7-10) 73 (28) 50 (13--14) 67 (3)235 (4 - i5) 183 (3) 219 (1 0 ; 14) 2 21 (5) 148 (15) 122 (9 -:11) 155 (1 2 )145 (15) 109 (29) 12 0 (1 ) 136 (30) 79 (28) 95 (26) 115 (1 )235 (1 ) 183 (5-18) 149 (30--31) 168 (25—26) 142 (1 ) 109 (30) 137 (17)
155 (1 1 ) 109 (31) 102 (5 -6 ) 99 (18) 79 (30) 65 (6 ) 96 (31)292 (1 ) 235 (1 ) 205 (2 ) 196 (18) 196 (4) 160 (28) 164 (1 )158 (16) 139 (24) 103 (23; 26) 154 (1 0 ) 138 (27--28) 107 (H; 14) 1 12 (17)274 (3) 201 (1 2 ) 117 (1 ) 162 (2 0 ) 150 (16--19) 156 (8 ; 30) 152 (1 )189 (17—-18) 12 0 (31) 93 (31) 77 (1 0 ) 124 (6 - 7) 112 (24) 1 00 (29--31)
265 (6 ) 178 (2 ) 171 (24) 145 (12—13) 125 (5) 97 (30) 135 (6- 7)
157 (27) 107 (29--30) 97 (17) 1 10 (3 -4 ) 43 (23) • 53 (6 ) 98 (29)264 (8 ) 179 (5) 144 (29) 138 (15—16) 172 (16) 1 20 (2 1 ) 150 (17)
00rH (28--29) 101 (31) 86 (15) 106 (29—30) 90 (29—-30) 79 (28) 104 (30--31)
320 (27) 260 (1 ) 1 20 (1 ) 108 (26—30) 152 (1 1 ) 107 (14) 113 (18-- 2 2 )237 (13) 123 (31) 86 (28) 83 (18) 46 (27) 70 (1 ) 68 (11 - - 1 2 )266 (19) 215 (31) 216 (1 ) 143 (7) 112 (1 ) 125 (2 1 ) 122 (2 2 )
118 <i; 7) 150 (2 1 ) 135 (31) 116 (18—19; 55 (18) 88 (9 -:L0 ) 85 (1 0 )21—22; 30)
288 (i) 172 (1 ) 118 (2 0 ) 180 (27) 160 (1 ) 162 (1 ) 158 (13)148 (1 2 - -13) 1 10 (29--31) 109 (2 ; :11) 101 (2 0 ) 91 (2 1 ) 123 (30) 11 0 (2 )
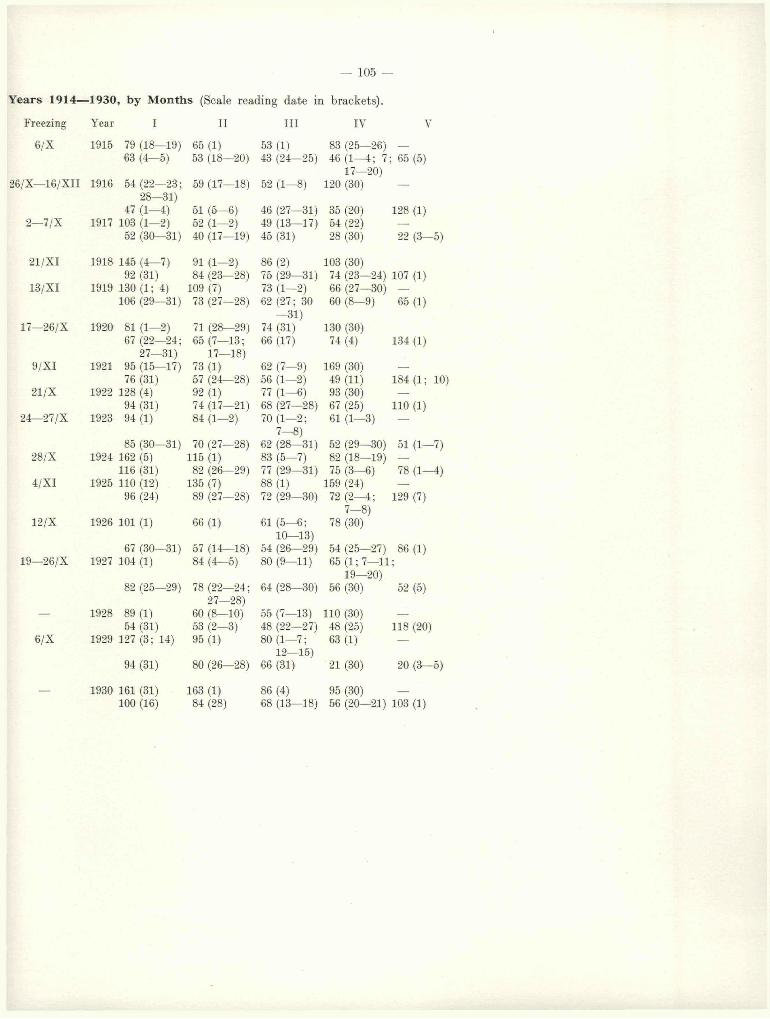
- 105 -
Years 1914— 1930, by M on ths (Scale reading date in brackets).
Freezing Year I II III IV V
6 /X 1915 79 (18—19) 65 (1) 53 (1) 83 (25—26) —
63 (4—5) 53 (18—20) 43 (24—25) 46 (1—4; 7 17—20)
; 65 (5)
26/X—16/XII 1916 54 (22—23; 28—31)
59 (17—18) 52 (1—8) 120 (30) ---
47 (1—4) 51 (5—6) 46 (27—31) 35 (20) 128 (1 )2—7/X 1917 103 (1—2) 52 (1 -2 ) 49 (13—17) 54 (22) —
52 (30—31) 40 (17—19) 45 (31) 28 (30) 22 (3—5)
21/XI 1918 145 (4—7) 91 (1—2) 8 6 (2 ) 103 (30)92 (31) 84 (23—28) 75 (29—31) 74 (23—24) 107 (1)
13/XI 1919 130 (1 ; 4) 109 (7) 73 (1—2) 6 6 (27—30) —106 (29—31) 73 (27—28) 62 (27; 30
- 3 1 )60 (8—9) 65 (1)
17—26/X 1920 81 (1—2) 71 (28—29) 74 (31) 130 (30)67 (22—24;
27—31)65 (7—13;
17—18)6 6 (17) 74 (4) 134 (1)
9/XI 1921 95 (15—17) 73 (1) 62 (7—9) 169 (30) —
76 (31) 57 (24—28) 56 (1—2) 49 (11) 184(1; 10)21 /X 1922 128 (4) 92 (1) 77 (1—6) 93 (30) —
94 (31) 74 (17—21) 6 8 (27—28) 67 (25) 1 1 0 (1 )24—27/X 1923 94 (1) 84 (1—2) 70 (1—2;
7—8)61 (1—3) -
85 (30—31) 70 (27—28) 62 (28—31) 52 (29—30) 51 (1 -7 )28/X 1924 162 (5) 115 (1) 83 (5—7) 82 (18—19) —
116 (31) 82 (26—29) 77 (29—31) 75 (3—6) 78 (1—4)4/XI 1925 110 (12) 135 (7) 8 8 (1 ) 159 (24) —
96 (24) 89 (27—28) 72 (29—30) 72 (2—4; 7 - 8 )
129 (7)
12/X 1926 101 (1) 6 6 (1 ) 61 (5—6; 10—13)
78 (30)
67 (30—31) 57 (14—18) 54 (26—29) 54 (25—27) 86 (1 )19—26/X 1927 104 (1) 84 (4—5) 80 (9—11) 65 (1 ; 7—11 ;
19—20)82 (25—29) 78 (22—24;
27—28)64 (28—30) 56 (30) 52 (5)
— 1928 89 (1) 60 (8—1 0 ) 55 (7—13) 110 (30) —54 (31) 53 (2—3) 48 (22—27) 48 (25) 118 (2 0 )
6 /X 1929 127 (3; 14) 95 (1) 80 (1—7; 12—15)
63 (1) -
94 (31) 80 (26—28) 6 6 (31) 21 (30) 20 (3—5)
— 1930 161 (31) 163 (1) 8 6 (4) 95 (30) —
1 0 0 (16) 84 (28) 6 8 (13—18) 56 (20—21) 103 (1)
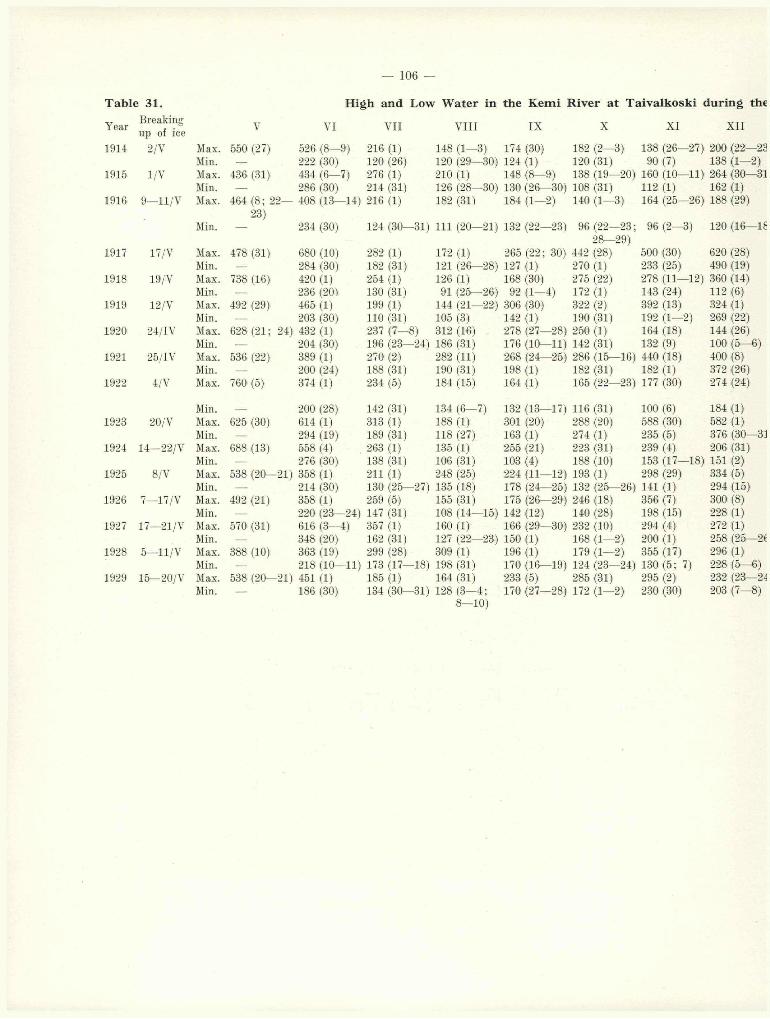
- 106 -
T ab le 31. H igh and Low W ater in the K em i R iver at T a iva lk osk i during the
YearBreaking
V VI VIIup of ice1914 2/V Max. 550 (27) 526 (8—9) 216 (1 )
Min. — 222 (30) 1 2 0 (26)1915 1/V Max. 436 (31) 434 (6—7) 276 (1)
Min. — 286 (30) 214 (31)1916 9—11/V Max. 464 (8 ; 22— 408 (13—14) 216 (1 )
23)Min. — 234 (30) 124 (30--31)
1917 17/V Max. 478 (31) 680 (1 0 ) 282 (1 )Min. — 284 (30) 182 (31)
1918 19/V Max. 738 (16) 420 (1) 254 (1)Min. — 236 (20) 130 (31)
1919 12/V Max. 492 (29) 465 (1) 199 (1)Min. — 203 (30) 110 (31)
1920 24/IV Max. 628 (21: 24) 432 (1) 237 (7—8 )Min. — 204 (30) 196 (23--24)
1921 25/IV Max. 536 (22) 389 (1) 270 (2)Min. — 200 (24) 188 (31)
1922 4/V Max. 760 (5) 374 (1) 234 (5)
Min. — 2 0 0 (28) 142 (31)1923 20/V Max. 625 (30) 614 (1) 313 (1)
Min. — 294 (19) 189 (31)1924 14—22/V Max. 6 8 8 (13) 558 (4) 263 (1)
Min. — 276 (30) 138 (31)1925 8 /V Max. 538 (20—21) 358 (1) 21 1 (1 )
Min. — 214 (30) 130 (25—-27)1926 7—17/V Max. 492 (21) 358 (1) 259 (5)
Min. — 220 (23—24) 147 (31)1927 17—21/V Max. 570 (31) 616 (3—4) 357 (1)
Min. — 348 (20) 162 (31)1928 5—11/V Max. 388 (10) 363 (19) 299 (28)
Min. — 218 (10—1 1 ) 173 (17--18)1929 15—20/V Max. 538 (20—21) 451 (1) 185 (1)
Min. — 186 (30) 134 (30--31)
VIII IX X XI XII
148 (1 -3 ) 174 (30) 182 (2 -3 ) 138 (26--27) 20 0 (22—2312 0 (29—30) 124 (1 ) 12 0 (31) 90 (7) 138 (1- 2 )21 0 (1 ) 148 (8 -9 ) 138 (19—20) 160 (1 0 - - 1 1 ) 264 (30—31126 (28—30) 130 (26—30) 108 (31) 112 (1 ) 162 (1 )182 (31) 184 (1- 2 ) 140 (1 -3 ) 164 (25--26) 188 (29)
111 (2 0 - 2 1 ) 132 (22—23) 96 (22—23;28—29)
96 (2 - 3) 12 0 (16—IS
172 (1 ) 265 (22; 30) 442 (28) 500 (30) 620 (28)121 (26—28) 127 (1 ) 270 (1 ) 233 (25) 490 (19)126 (1 ) 168 (30) 275 (2 2 ) 278 (1 1- - 1 2 ) 360 (14)91 (25—26) 92 (1 -4 ) 172 (1 ) 143 (24) 11 2 (6 )
144 (2 1 —2 2 ) 306 (30) 322 (2 ) 392 (13) 324 (1 )105 (3) 142 (1 ) 190 (31) 192 (1- 2 ) 269 (2 2 )312 (16) 278 (27—28) 250 (1 ) 164 (18) 144 (26)186 (31) 176 (1 0- 1 1 ) 142 (31) 132 (9) 100 (5 -6 )282 (1 1 ) 268 (24—25) 286 (15—16) 440 (18) 400 (8 )190 (31) 198 (1 ) 182 (31) 182 (1 ) 372 (26)184 (15) 164 (1 ) 165 (22—23) 177 (30) 274 (24)
134 (6 -7 ) 132 (13-17) 116 (31) 100 (6 ) 184 (1 )188 (1 ) 301 (2 0 ) 288 (2 0 ) 588 (30) 582 (1 )118 (27) 163 (1 ) 274 (1 ) 235 (5) 376 (30—31135 (1 ) 255 (2 1 ) 223 (31) 239 (4) 206 (31)106 (31) 103 (4) 188 (1 0 ) 153 (17--18) 151 (2 )248 (25) 224 (1 1 - 1 2 ) 193 (1 ) 298 (29) 334 (5)135 (18) 178 (24—25) 132 (25—26) 141 (1 ) 294 (15)155 (31) 175 (26—29) 246 (18) 356 (7) 300 (8 )108 (14—15) 142 (1 2 ) 140 (28) 198 (15) 228 (1 )160 (1 ) 166 (29—30) 232 (1 0 ) 294 (4) 272 (1 )127 (22-23) 150 (1 ) 168 (1- 2 ) 2 0 0 (1 ) 258 (25—2(309 (1 ) 196 (1 ) 179 (1 - 2 ) 355 (17) 296 (1 )198 (31) 170 (16—19) 124 (23—24) 130 (5; 17) 228 (5 -6 )164 (31) 233 (5) 285 (31) 295 (2 ) 232 (23—24128 (3 -4 ;
8 —1 0 )170 (27—28) 172 (1 - 2 ) 230 (30) 203 (7 -8 )
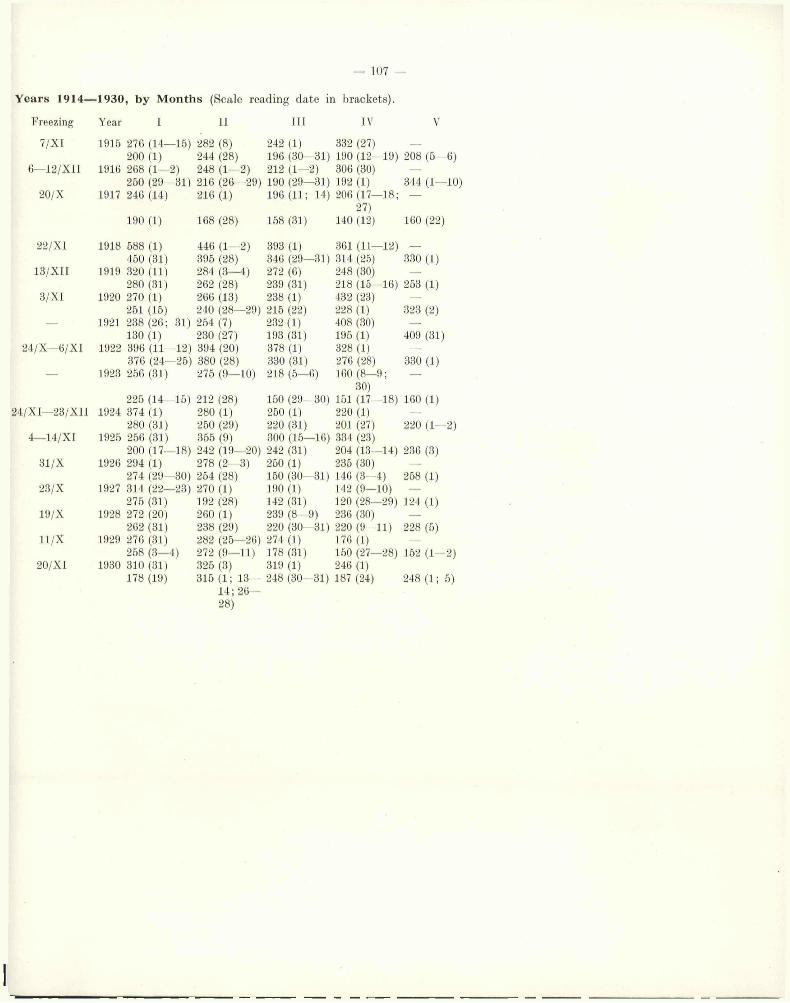
— 107 -
Y ears 1914— 1930, b y M on th s (Scale reading date in brackets).
Freezing Year I II III IV V
7/X1 1915 276 (14—15) 282 (8 ) 242 (1) 332 (27) —
2 0 0 (1 ) 244 (28) 196 (30—31) 190 (12—19) 208 (5—6)6—12/XII 1916 268 (1—2) 248 (1—2) 2 1 2 (1—2 ) 306 (30) — •
260 (29—31) 216 (26—29) 190 (29—31) 192 (1) 344 (1—10)2 0 / X 1917 246 (14) 216 (1 ) 196(11; 14) 206 (17—18; —
190 (1) 168 (28) 158 (31)27)
140 (12) 160 (2 2 )
22/XI 1918 588 (1) 446 (1—2) 393 (1) 361 (11—12) —
450 (31) 396 (28) 346 (29—31) 314 (25) 330 (1)13/X1I 1919 320 (11) 284 (3—4) 272 (6 ) 248 (30) —
280 (31) 262 (28) 239 (31) 218 (15—16) 253 (1)3/X1 1920 270 (1) 266 (13) 238 (1) 432 (23) —
261 (16) 240 (28—29) 215 (22) 228 (1 ) 323 (2)— 1921 238 (26; 31) 254 (7) 232 (1) 408 (30) —
130 (1) 230 (27) 193 (31) 195 (1) 409 (31)24/X—6/X I 1922 396 (11—12) 394 (20) 378 (1) 328 (1) —
376 (24—25) 380 (28) 330 (31) 276 (28) 330 (1)— 1923 256 (31) 275 (9—10) 218 (5—6) 160 (8—9; —
30)225 (14—15) 2 1 2 (28) 160 (29—30) 151 (17—18) 160 (1)
24/XI—23/XII 1924 374 (1) 280 (1 ) 250 (1) 2 2 0 (1 ) —
280 (31) 250 (29) 220 (31) 201 (27) 2 2 0 (1—2 )4—14/XI 1925 266 (31) 355 (9) 300 (16—16) 334 (23)
200 (17—18) 242 (19—20) 242 (31) 204 (13—14) 236 (3)31/X 1926 294 (1) 278 (2—3) 260 (1 ) 236 (30) —
274 (29 30) 254 (28) 150 (30—31) 146 (3—4) 258 (1)23/X 1927 314 (22—23) 270 (1) 190 (1) 142 (9—10) —
276 (31) 192 (28) 142 (31) 120 (28—29) 124 (1)19/X 1928 272 (20) 260 (1 ) 239 (8—9) 236 (30) —
262 (31) 238 (29) 220 (30—31) 220 (9—11) 228 (5)11/X 1929 276 (31) 282 (25—26) 274 (1) 176 (1) —
258 (3—4) 272 (9—11) 178 (31) 150 (27—28) 152 (1—2)20/XI 1930 310 (31) 325 (3) 319 (1) 246 (1)
178 (19) 315 (1 ; 13— 248 (30—31) 187 (24) 248 (1 ; 5)14; 26—
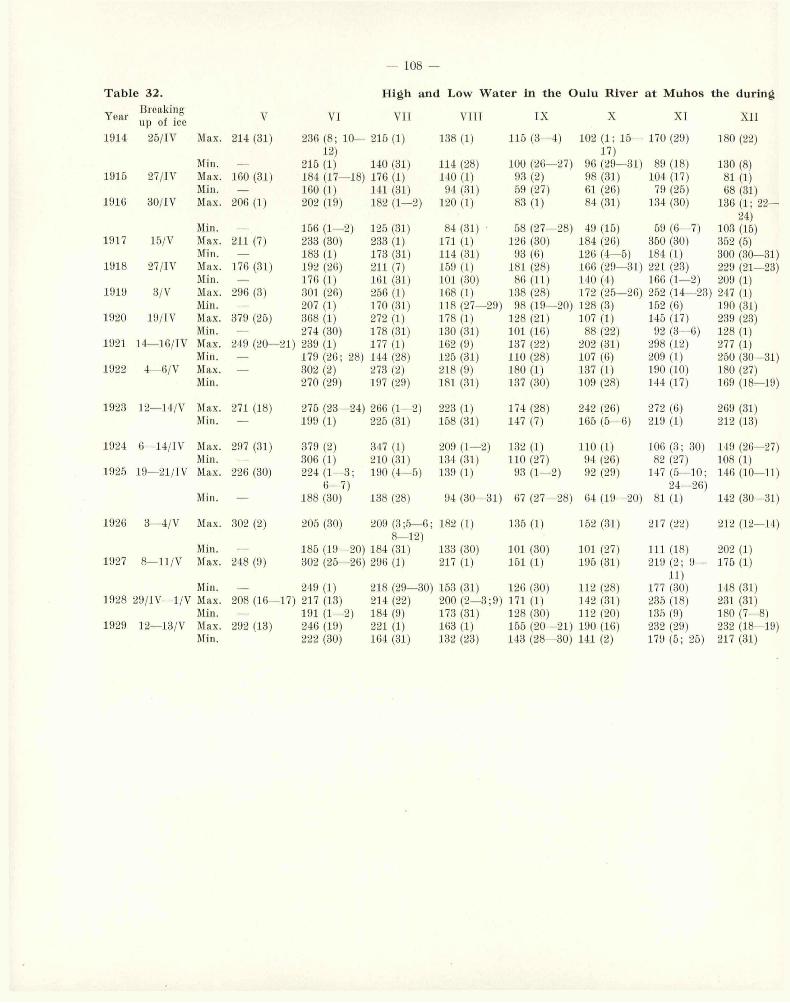
108 —
T a b le 32. H igh and Low W ater in the O ulu R iver a t M uhos the during
YearBreaking up of ice V VI VII VIII IX X XI XII
1914 25/IV Max. 214 (31) 236 (8 ; 10— 215 (1) 138 (1) 115 (3—4) 1 0 2 (1 ; 16— 170 (29) 180 (2 2 )1 2) 17)
Min. — 215 (1) 140 (31) 114 (28) 1 0 0 (26--27) 96 (29—31) 89 (18) 130 (8 )1915 27/IV Max. 160 (31) 184 (17—18) 176 (1) 140 (1) 93 (2) 98 (31) 104 (17) 81 (1 )
Min. — 160 (1 ) 141 (31) 94 (31) 59 (27) 61 (26) 79 (25) 6 8 (31)1916 30/IV Max. 206 (1 ) 202 (19) 182 (I—2 ) 1 2 0 (1 ) 83 (1) 84 (31) 134 (30) 136 (1 ; 22—
Min. — 156 (1—2 ) 125 (31) 84 (31) 58 (27—-28) 49 (15) 59 (6—7) 103zt)(16)
1917 15/V Max. 211 (7) 233 (30) 233 (1) 171 (1) 126 (30) 184 (26) 350 (30) 352 (5)Min. — 183 (1) 173 (31) 114 (31) 93 (6 ) 126 (4—5) 184 (1) 300 (30—-31)
1918 27/IV Max. 176 (31) 192 (26) 211 (7) 159 (1) 181 (28) 166 (29—31) 221 (23) 229 (2 1—-23)Min. —• 176 (1) 161 (31) 101 (30) 8 6 (1 1 ) 140 (4) 166 (1—2 ) 209 (1 )
1919 3/V Max. 296 (3) 301 (26) 256 (1) 168 (1 ) 138 (28) 172 (25—26) 252 (14—23) 247 (1 )Min. — 207 (1) 170 (31) 118 (27--29) 98 (19-- 2 0 ) 128 (3) 152 (6 ) 190 (31)
1920 19/IV Max. 379 (25) 368 (1) 272 (1) .178 (1) 128 (2 1 ) 107 (1) 145 (17) 239 (23)Min. — 274 (30) 178 (31) 130 (31) 10 1 (16) 8 8 (2 2 ) 92 (3—6) 128 (1 )
1921 14—16/IV Max. 249 (20--21) 239 (1) 177 (1) 162 (9) 137 (22) 202 (31) 298 (12) 277 (1 )Min. — 179 (26; 28) 144 (28) 125 (31) 1 1 0 (28) 107 (6 ) 209 (1) 250 (30—-31)
1922 4—6 /V Max. — 302 (2) 273 (2) 218 (9) 180 (1 ) 137 (1) 190 (10) 180 (27)Min. 270 (29) 197 (29) 181 (31) 137 (30) 109 (28) 144 (17) 169 (18--19)
1923 12—14/V Max. 271 (18) 275 (23—24) 266 (1—2 ) 223 (1) 174 (28) 242 (26) 272 (6 ) 269 (31)Min. —• 199 (1) 225 (31) 158 (31) 147 (7) 165 (5—6) 219 (1) 21 2 (13)
1924 6—14/IV Max. 297 (31) 379 (2) 347 (1) 209 (1— !) 132 (1) .110 (1 ) 106 (3; 30) 149 (26--27)Min. — 306 (1) 210 (31) 134 (31) 110 (27) 94 (26) 82 (27) 108 (1 )
.1925 19—21/IV Max. 226 (30) 224 (1—3; 190 (4—5) 139 (1) 93 (1— 2) 92 (29) 147 (5—10; 146 (1 0 —- 11)6—7) 24—26)
Min. —• 188 (30) 138 (28) 94 (30--31) 67 (27--28) 64 (19—20) 81 (1 ) 142 (30--31)
1926 3—4/V Max. 302 (2) 205 (30) 209 (3;6—6 ; 182 (1 ) 135 (1) 152 (31) 217 (22) 21 2 (1 2—-14)8 —1 2 )
Min. — 185 (19—20) 184 (31) 133 (30) 101 (30) 101 (27) 1 11 (18) 202 (1 )1927 8—11/V Max. 248 (9) 302 (25—26) 296 (1) 217 (1) 151 (1 ) 195 (31) 219 (2; 9—
11 ^175 (1 )
Min. — 249 (1) 218 (29—30) 163 (31) 126 (30) 112 (28)l i )
177 (30) 148 (31)1928 29/IV—1/V Max. 208 (16--17) 217 (13) 214 (22) 200 (2—3; 9) 171 (1) 142 (31) 235 (18) 231 (31)
Min. — 191 (1—2) 184 (9) 173 (31) 128 (30) 1 1 2 (2 0 ) 135 (9) 180 (7—18)1929 12—13/V Max. 292 (13) 246 (19) 2 21 (1 ) 163 (1) 155 (20-- 2 1 ) 190 (16) 232 (29) 232 (18--19)
Min. 222 (30) 164 (31) 132 (23) 143 (28—-30) 141 (2) 179 (5; 25) 217 (31)

— 109 -
Y ears 1914— 1930, by M onths (Scale reading date in brackets).
Freezing Year I II III IV V
25/XI 1915 171 (2—3) 165 (1—6) 157 (1) 220 (27) —
165 (29—31) 157 (28) 142 (31) 138 (11-- 1 2 ) 106 (1 1 )6 / XI 1916 6 8 (1—7) 64 (1—7) 62 (1—14) 306 (27) —
64 (29—31) 62 (17—29) 59 (28—31) 57 (12--19) 112 (7)19/XII 1917 137 (3) 122 (1—3) 116 (1—4) 2 02 (26) —
122 (30—31) 116 (28) 108 (29—31) 1 02 (2 1 ) 151 (25; 27)25/XI 1918 — 278 (1) 251 (1) 235 (1) —
— 251 (28) 236 (30—31) 164 (30) 127 (13)9/XII 1919 226 (6 ) 2 0 0 (1 ) 176 (1) 233 (29) —
201 (31) 178 (28) 161 (31) 146 (13) 178 (19)16/XI 1920 189 (1—7) 183 (1—2) 154 (1) 368 (18--19) —
183 (30—31) 155 (29) 128 (24—28) 143 (1) 266 (1 ; 4—5)12/XI—21/XII 1921 234 (10) 195 (1—2) 167 (1) 247 (14) —
190 (1—3) 169 (28) 115 (22—23) 1 2 0 (2 ) 187 (1)29/X—8/XI 1922 249 (1) 234 (1) 195 (1) 287 (30)
228 (26—27) 197 (28) 153 (31) 137 (22) —
21/XI 1923 176 (1) 146 (1) 132 (1) 11 0 (1 ) —
148 (31) 133 (28) 111 (26; 29 94 (30) 93 (2—3)- 3 1 )
26/XII 1924 273 (4) 228 (1 ) 209 (1) 173 (1) —
229 (31) 210 (25—26; 174 (31) 159 (29--30) 160 (1—2 )29)
29/XI 1925 142 (5—7) 117 (1) 101 (6 —8 ) 249 (19) — -
118 (31) 97 (27) 94 (31) 92 (3) 136 (1)9/XI ' 1926 144 (3—4) 141 (10—13) 140 (1) 287 (30) —
138 (15) 135 (22—23) 124 (29; 31) 118 (8 ; 2 1 — 12 2 (1 0—1 1 )2 2 )
29/X—28/XI 1927 2 1 0 (1—2 ) 192 (1) 178 (5—6) 153 (1) —
193 (31) 177 (28) 154 (31) 124 (25) 127 (1)29/X—2/XII 1928 147 (1—2) 130 (1) 1 12 (1 ) 288 (29) —
131 (26—31) 112 (29) 99 (29—31) 98 (1—;3) 132 (8—9)6 /XI 1929 254 (13) 2 0 2 (1 ) 198 (3) 173 (1)
202 (31) 198 (27—28) 174 (31) 151 (19--30) 115 (5)14/XI—16/XII 1930 340 (31) 343 (2—3) 268 (1 ) 197 (1) —
211 (3—5; 269 (28) 202 (31) 1 2 2 (2 1 ) 138 (8—9)15)

— 110
T able 3 3 . H igh and Low W ater in the K ym i R iver a t A njala d uring the
YearBreaking
V VI VIIup of ice
1914 15—21/IV Max. 136 (30) 149 (15; 17 145 (1)- 1 9 )
Min. — 130 (1) 114 (26)1915 21—23/IV Max. 127 (29) 149 (21; 23; 149 (1—3)
30)Min. — 127 (1) 128 (25)
1916 16—24/IV Max. 196 (29) 211 (29) 209 (1)Min. — 190 (1) 177 (30)
1917 24/IV—4/V Max. 125 (29) 129 (16; 30) 129 (2)Min. — 114 (3) 101 (29)
1918 11—22/IV Max. 170 (1) 161 (1—3) 148 (1—4)Min. — 147 (30) 125 (31)
1919 20/IV Max. 195 (27; 29) 194 (1; 9) 194 (5)
Min. — 181 (23; 29) 173 (29; 31)1920 30/III-13/IV Max. 264 (31) 272 (9) 257 (1)
Min. — 257 (30) 209 (31)
1921 1—2/IV Max. 117 (12) 1 1 0 (2 ) 89 (1)Min. — 90 (30) 80 (13—14)
1922 — Max. 232 (31) 280 (30) 283 (5—8)Min. — 233 (1) 269 (30—31)
1923 — Max. 179 (22; 28 209 (28; 29) 214 (24—26)—29; 31)
Min. .— 179 (1) 199 (4—5)
1924 ___ Max. 258 (30—31) 290 (17; 30) 300 (18—19;2 1 )
Min. — 259 (1) 288 (31)
1925 8 /IV Max. 176 (5; 10; 184 (27—29) 176(1; 3—7;29) 1 0 ; 1 2 )
Min. — 176 (8 ; 15; 141 (29—31)25—26)
1926 28/IV Max. 206 (26) 215 (22) 213 (1)
Min. - 203 (1). 175 (24)1927 — Max. 215 (30) 247 (28—30) 256 (7—9;
11 ; 13—15)Min. — 2 1 0 (2 ) 249 (1 ; 29—
31)1928 23/IV Max. 188 (30—31) 215 (26—27) 218 (2)
Min. — 190 (1—2) 206 (24)1929 21/IV Max. 188 (31) 215 (3) 206 (15)
Min. — 188 (1 ) 187 (30—31)
VIII IX X XI XII
116 (1 ) 83 (4) 70 (1) 49 (18) 74 (31)
64 (30) 48 (27) 37 (25) 8 (23) 30 (14)133 (2) 1 1 0 (8 ) 100 (9) 108 (15) 116 (30)
97 (29) 88 (26) 71 (31) 54 (27) 80 (25)177 (1) 150 (1) 111 (1 2 ) 134 (13) 157 (30)148 (20) 103 (30) 96 (22) 99 (1) 114 (3)101 (1 ) 75 (25) 89 (27) 118 (30) 161 (25; 27'67 (26; 30 45 (9) 45 (1) 79 (4; 11) 105 (4)
- 3 1 ) 1 2 2 (1 ) 92 (1) 94 (30—31) 123 (29—30) 164 (13—IS91 (28—30) 73 (27—28) 78 (1) 94 (1—3) 130 (1)
173 (1) 141 (1) 117 (16) 133 (22) 123 (31)
134 (31) 105 (25) 105 (4; 19) 77 (9) 91 (2)208 (1 ) 171 (1—2) 136 (1) 96 (1) 6 8 (1 )
172 (29; 31) 136 (30) 92 (31) 6 8 (30) 50 (27—28
82 (1—2 ) 59 (1) 49 (31) 57 (6 )30)
66 (27)59 (31) 39 (30) 36 (4—5) 40 (20—21) 42 (18)
268 (1—2 ) 251 (1) 227 (1) 213 (29—30) 235 (31)252 (30—31) 227 (30) 205 (31) 195 (13—15) 212 (2—3)209 (1 ; 4) 184 (11—12) 207 (31) 266 (27) 312 (29—31
181 (30—31) 174 (21—22) 182 (1 ; 8 —9) 208 (1 ) 260 (5—6)
288 (1 ) 250 (1) 215 (1 ) 208 (1—4) 202 (2; 4—5
251 (31) 217 (29—30) 206 (28) 199 (19)8—9)
194 (15—16
147 (18) 130 (28) 149 (10) 133 (30)2 1 )
159 (1)
117 (29) 100 (24) 111 (2 ) 114 (24) 107 (17)
182 (2 ) 140 (1) 106 (1 ) 112 (14) 125 (24)
143 (31) 99 (25) 91 (7; 30) 82 (5; 8 ) 78 (13)254 (1; 6 ) 224 (1) 209 (6 ) 232 (22—23) 198 (29)
224 (31) 200 (19—20) 174 (30) 186 (30) 149 (16)
212 (13) 225 (25) 230 (24—25) 246 (30) 280 (17)198 (31) 198 (13—14) 2 0 0 (8 ) 233 (10) 244 (24)187 (2—3) 168 (10; 23; 2 0 0 (16) 223 (30) 243 (16)
157 (31)26—27)
152 (5) 163 (1) 195 (3) 222 (1—2; 7
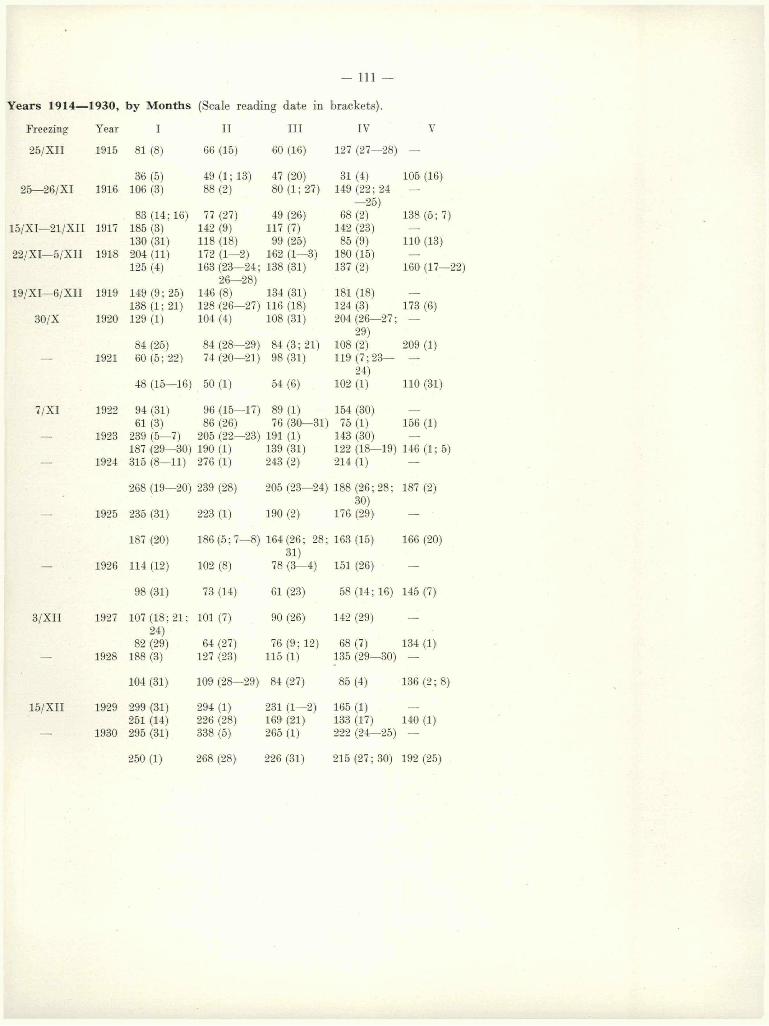
- I l l —
Years 1914— 1930, by M onths (Scale reading date in brackets).
Freezing Year I II III IV V
25/XII 1915 81 (8 ) 66 (15) 60 (16) 127 (27—28) —
36 (5) 49 (1; 13) 47 (20) 31 (4) 105 (16)26—26/XI 1916 106 (3) 8 8 (2 ) 80 (1; 27) 149 (22; 24 —
- 2 5 )83 (14; 16) 77 (27) 49 (26) 68 (2 ) 138 (5; 7)
15/XI—21/XII 1917 185 (3) 142 (9) 117 (7) 142 (23) —130 (31) 118 (18) 99 (25) 85 (9) 110 (13)
22/XI—5/XII 1918 204 (11) 172 (1—2) 162 (1—3) 180 (15) —125 (4) 163 (23—24; 138 (31) 137 (2) 160 (17—22)
26—28)19/XI—6/XII 1919 149 (9; 25) 146 (8 ) 134 (31) 181 (18) —
138 (1; 21) 128 (26—27) 116 (18) 124 (3) 173 (6 )30/X 1920 129 (1) 104 (4) 108 (31) 204 (26—27 ; —
29)84 (25) 84 (28—29) 84 (3; 21) 108 (2 ) 209 (1)
— 1921 60 (5; 22) 74 (20—21) 98 (31) 119 (7 ; 23— —24)
48 (15—16) 50 (1) 54 (6 ) 10 2 (1 ) 110 (31)
7/XI 1922 94 (31) 96 (15—17) 89 (1) 154 (30) —
61 (3) 8 6 (26) 76 (30—31) 75 (1) 156 (1)— 1923 239 (5—7) 205 (22—23) 191 (1) 143 (30) —
187 (29—30) 190 (1) 139 (31) 122 (18—19) 146 (1 ; 5)— 1924 315 (8—11) 276 (1) 243 (2) 214 (1) —
268 (19—20) 239 (28) 205 (23—24) 188 (26; 28; 187 (2)30)
— 1925 235 (31) 223 (1) 190 (2) 176 (29) —
187 (20) 186 (5; 7—8) 164(26; 28; 163 (15) 166 (2 0 )31)
— 1926 114 (12) 10 2 (8 ) 78 (3—4) 151 (26) —
98 (31) 73 (14) 61 (23) 58 (14; 16) 145 (7)
3/XII 1927 107 (18; 21; 101 (7) 90 (26) 142 (29) —
24)82 (29) 64 (27) 76 (9; 12) 68 (7) 134 (1)
— 1928 188 (3) 127 (23) 115 (1) 135 (29—30) —
104 (31) 109 (28—29) 84 (27) 85 (4) 136 (2; 8 )
15/XII 1929 299 (31) 294 (1) 231 (1—2) 165 (1) —
251 (14) 226 (28) 169 (21) 133 (17) 140 (1)— 1930 295 (31) 338 (5) 265 (1 ) 222 (24—25) —
250 (1) 268 (28) 226 (31) 215 (27 ; 30) 192 (25)

— 112 —
A p p en d ix : T ab le 34. R ep resen tation of the S e x e s in the different L ife-C ycle-G roup s.
A. Salmon which have not spawned previously.
SS S 9 <$<$ 9 ? < ? < ? ? $ < ? < ? ? ? c?c? 9 9 <S<3 9 9Districts: 2.1-)- 3 .1+ 4.1—j— 5.1-)- A.l-)- Percentage
Tornio....................... 9 4 522 361 258 180 22 33 811 578 584 41-6K em i......................... 19 1 268 55 61 25 9 3 357 84 81 0 19 0Oulu........................... 44 8 178 34 27 4 3 — 252 46 84-6 154Kokemäki................. 1 1 — 2 — — — — 1 3 - —K ym i......................... 139 222 11 38 — 1 — — 150 261 36-5 63-5
Total... 212 236 979 490 346 210 34 36 1571 972 61 8 38 2
2.2+ 3 .2+ 4 .2+ 5.2+ A .2+ PercentageTornio....................... 5 9 366 850 147 445 6 15 524 1319 284 71-6K em i......................... 63 91 433 1472 61 360 — 9 557 1932 224 77-6Oulu........................... 46 113 196 570 21 8 8 — 2 263 773 254 74-6Kokemäki................ 22 54 11 20 — — — — 33 74 30-8 69-2K ym i......................... 280 950 36 158 1 1 — — 317 1109 22-2 77-8
Total... 416 1217 1042 3070 230 894 6 26 1694 5207 24 5 75-5
2.3 3.3 4.3 5.3 A.3(+) PercentageTornio....................... 14 33 409 851 115 170 — 2 538 1056 33-8 66-2K em i......................... 123 389 1036 3049 169 437 1 2 1329 3877 25-5 74-5Oulu........................... 82 626 463 3426 50 393 — 5 595 4450 11-8 88-2Kokemäki................ 376 463 56 78 2 — — — 434 541 44-5 55-5K ym i......................... 543 1226 96 149 1 1 — — 640 1376 31-7 68-3
Total... 1138 2737 2060 7553 337 1001 1 9 3536 11300 23-8 76 2
2.4 3.4 4.4 5.4 A.4(+) PercentageTornio....................... 6 1 92 22 20 11 — — 118 34 77-6 224K em i......................... 47 23 414 147 49 8 1 — 511 178 74-2 25-8Oulu........................... 71 85 366 507 39 58 — — 476 650 42-3 57-7Kokemäki................ 165 55 28 7 — 1 — — 193 63 754 24-6K ym i......................... 233 55 32 4 — — — — 265 59 81-8 18-2
Total... 522 219 932 687 108 78 1 — 1563 984 61 4 38 6
2.5 3.5 4.5 5.5 A.5(+) PercentageTornio....................... 1 — 13 2 — — — — 14 2 87-5 12-5K em i......................... 7 — 65 1 2 — — — 74 1 98-7 1-3Oulu........................... 9 1 54 8 4 2 1 — 6 8 11 86-1 13-9Kokemäki................. 9 1 — — — — — — 9 1 90-0 10-0K ym i......................... 4 — 1 — — — — — 5 — 1000
Total... 30 2 133 11 6 2 1 — 170 15 91 9 81
All ascending for the first tim e... 8534 18478 31-6 684
B. Salmon which have spawned on<2.1+G 1+
Tornio........ ................... 1
K em i.......... ...................... — 2
Oulu............. ..................... 3 2Kokemäki ..................... — —K ym i.......... ...................... 19 11
T ota l... 23 15
previously.
3 .1+G 1+ 4.1+G 1+
18 7 6 1
17 7 2 325 5 7 —
2 4 — —
62 23 15 4
A .1+G 1+ Percentage25 8 75-8 24-219 12 61-3 38-735 7 83-3 16-7
21 15 58-3 41-7
100 42 704 29 6

— 113 —
T ab le 34 (continued).
f t S 3 9? <J5 ft <?<? ft <?<? f tDistricts : 2 ,.1+G2 3.1+G2 4.1+G2 A.1+G2 Percentage
Tornio............................ . — — 1 l 1 — 2 1 66-7 33-3K em i............................... . 4 2 11 9 2 — 17 11 60-7 39-3Oulu................................. . — 4 12 6 2 1 14 11 56-0 44-0Kokemäki...................... . 4 1 — — — — 4 1 80-0 20-0K vm i............................... 7 — — — — — 7 — 100-0
Total.. . 15 7 24 16 5 1 44 24 64 7 35 3
2.1+G3 3 .1 + G3 4 .1 + G3 A.1+G3 PercentageK em i.............................. 1 — 4 — 1 — 6 — 1 0 0 —Oulu................................. . — — 2 — — 2 — 10 0
Total.. 1 — 6 — 1 — 8 — 1 0 0
2 .2+ G1 3 .2 + G1 4 .2 + G1 A.2+G1 PercentageTornio............................. . — — 4 7 3 4 7 11 38-9 61-1K em i.............................. . — 5 7 53 1 1 0 + 1 *) 8 69 10-4 89-6Oulu................................. . — 1 13 18 — 2 13 21 38-2 61-8Kokemäki...................... 4 5 — 2 — — 4 7 36-4 63-6K vm i............................... 13 57 3 6 — — 16 62 20-5 79-5
Total.. . 17 6 8 27 85 4 17 48 170 22-0 78-0
2.2+G2
Kemi Oulu. . Kymi
Tornio . .. Kemi . . . .Oulu........Kokemäki Kymi . . . .
3 .2+ G245
A.2+G2
Total. . .
2.3G1 3.3G1235
6347
3182398
168
933
6
31208114
726
4.3G1
1 163 23
9
12 1
A.3G1 12 4939 24911 14671 10552 194
KemiOulu.Kymi
Total.. .
2.4G1 3.4G1 4.4G1Tornio............................... — — 1 2K em i................................. 3 3 14 17Oulu................................... — 2 6 26Kokemäki........................ 17 10 — 2K ym i................................. 2 5 1 1
Percentage
10085-7 14-3
100
92 3 7-7
Percentage19-7 13-5
7-0 40-3 211
80-386-593-059-778-9
Total. . . 120 310 61 386 4 47 185 743 19 9 80-1
2.3G2 3.3G2 • — A.3G2 Percentage— 1
1
1—
1
1
1
1 0 0
1 0 0
1 0 0
33 3 6 6 7
Total... 20 48
A.4G1 Percentage1 2 3 40-0 60-02 18 22 45-0 55-01 6 29 17-1 82-9
— 17 12 58-6 41-4— 3 6 33-3 66-7
4 46 72 39 0 610
Oulu.
') This one is 5.2 + <31 .
3.5G1 4.5G1 A.5G1 Percentage1 — I — 2 — 100
All ascending for the second time: 446 1054 29-7 70-3
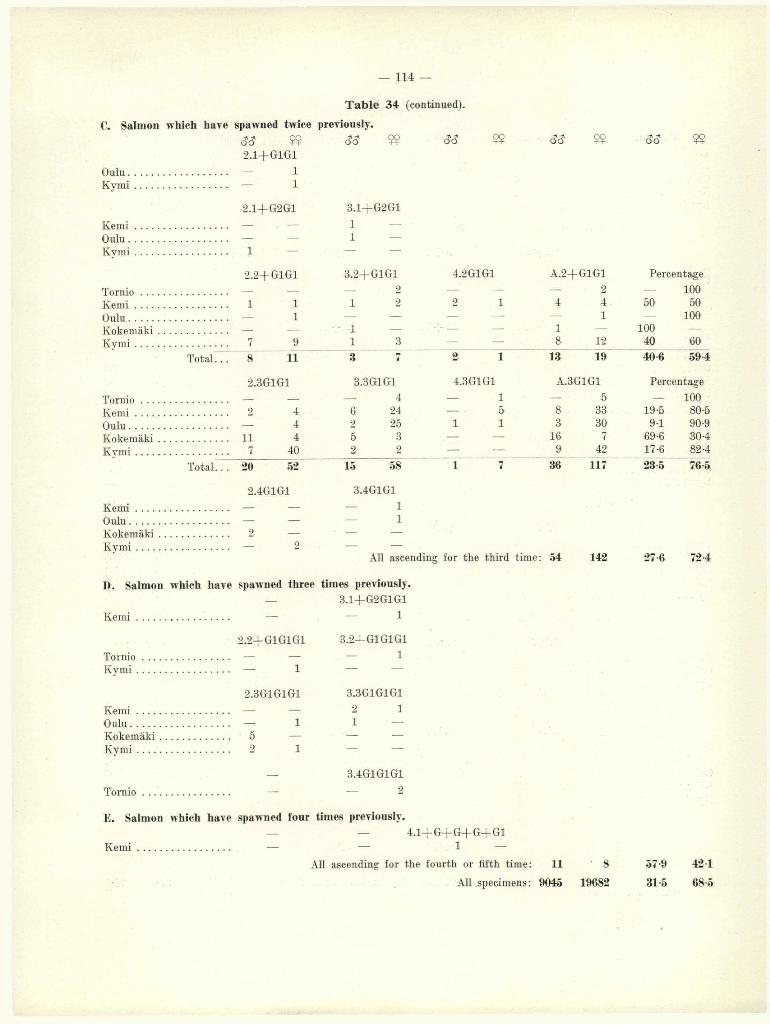
— 114 —
T able 34 (continued).
C. Salmon which have spawned twice previously.S3 9? SS 99 SS 99 SS 99 SS 992.1+G1G1
Oulu................................... — 1K ym i................................. — 1
2.1+G2G1 3.1+G2G1
K em i................................. — — 1Oulu................................... — — 1K ym i................................. 1
2.2+G1G1 3.2+G1G1 4.2G1G1 A.2+G1G1 Percentage
Tornio............................... — — — 2 — — — 2 — 100K em i................................. 1 1 1 2 2 1 4 4 50 50Oulu................................... — 1 — — — — — 1 — 100Kokemäki......................... — — 1 — 4 — 1 100K vm i................................. 7 9 1 3 — — 8 12 40 60
Total... 8 “ 11 3 T 2 Ï 13 l F 40 6 594
2.3G1G1 3.3G1G1 4.3G1G1 A.3G1G1 Percentage
Tornio............................... — — — 4 — 1 — 5 — 100Kemi ....................... 2 4 6 24 — 5 8 33 19-5 80-6Oulu................................... — 4 2 25 1 1 3 30 9-1 90-9Kokemäki......................... 11 4 5 3 — — 16 7 69-6 30-4Kymi .............. 7 40 2 2 — — 9 42 17*6 82*4
Total... 20 52 15 58 1 7 36 117 23-5 76-5
2.4G1G1 3.4G1G1
K em i................................. — — — 1Oulu................................... — — — 1Kokemäki......................... 2 — — —K ym i................................. — 2 — —
All ascending for the third time: 54 142 27-6 72-4
1). Salmon which have spawned three times previously.— 3.1+G2G1G1
K em i................................. — — 1
2.2+G1G1G1 3.2+G1G1G1
Tornio............................... — — — 1K ym i................................. — 1 —
2.3G1G1G1 3.3G1G1G1
K em i................................. — — 2 1Oulu................................... — 1 1Kokemäki......................... 5 — — —K ym i................................. 2 1
— 3.4G1G1G1
Tornio............................... — — 2
E. Salmon which have spawned (our times previously.— — 4.1+G +G +G +G 1
Kemi ............................. — — 1 —
All ascending for the fourth or fifth time: 11 8 57-9 42-1
All specimens: 9045 19682 31-5 68-5
Copyright © 2022 FDOKUMEN