Extensive gas bubble release in Norwegian spring spawning ... - ICES
24
"Not to be cited without reference to the author" International Council for the Exploration of the Sea CM J998/J:20 Variation in the Pattern ofFish Aggregation Extensive gas bubble release in Norwegian spring spawning herring (Clupea harengus) during predator avoidance Leif N 0t1:estad Abstract Events of extensive gas bubble releases in overwintering Norwegian spring spawning herring (Clupea harengus) were repeatedly observed acoustically and visually in Vestfjorden, northern Norway, during attacks from killer whales (Orcinus orca) and saithe (Pollachius virens). Gas bubble production was so extensive that large areas of the sea surface were sometimes covered with white foam after an event. Gas bubbles were visually observed to come from the swimbladder of individual herring swimming very close to the surface. Acoustically, gas bubbles could be identified on the echo sounder as strong echoes covering the upper 0-30 m of the water column. Schools of herring were forced from 30-100 m depth up to the surface by predatory killer whales and saithe. I suggest that herring expel gas near the surface as·a concequence of the rapid change in depth, and that gas bubble release may confuse and deflect both visually and acoustically oriented predators due to increased scattering of light, reduced range of visi9n, and confusing effects of the reflection energy of the bubbles and the fish. Such events may have considerable effect on the target strength and estimated stock during acoustic surveys.
-
Upload
khangminh22 -
Category
Documents
-
view
2 -
download
0
Transcript of Extensive gas bubble release in Norwegian spring spawning ... - ICES
"Not to be cited without reference to the author"
International Council for the
Exploration of the Sea
CM J998/J:20 Variation in the
Pattern ofFish Aggregation
Extensive gas bubble release in Norwegian spring spawning herring
(Clupea harengus) during predator avoidance
Leif N 0t1:estad
Abstract
Events of extensive gas bubble releases in overwintering Norwegian spring spawning
herring (Clupea harengus) were repeatedly observed acoustically and visually in
Vestfjorden, northern Norway, during attacks from killer whales (Orcinus orca) and
saithe (Pollachius virens). Gas bubble production was so extensive that large areas of
the sea surface were sometimes covered with white foam after an event. Gas bubbles
were visually observed to come from the swimbladder of individual herring
swimming very close to the surface. Acoustically, gas bubbles could be identified on
the echo sounder as strong echoes covering the upper 0-30 m of the water column.
Schools of herring were forced from 30-100 m depth up to the surface by predatory
killer whales and saithe. I suggest that herring expel gas near the surface as·a
concequence of the rapid change in depth, and that gas bubble release may confuse
and deflect both visually and acoustically oriented predators due to increased
scattering of light, reduced range of visi9n, and confusing effects of the reflection
energy of the bubbles and the fish. Such events may have considerable effect on the
target strength and estimated stock ~izes during acoustic surveys.
2
Key words: gas bubbles, herring, killer whales, target strength, saithe
LeifN0ttestad: Department of Fisheries and Marine Biology, University of Bergen,
N-5020 Bergen, Norway, [tel: (+ 47) 55 584489, fax: (+ 4755584450) E-mail:
Leif.N [email protected].
Introduction
Pacific herring (Ciupea pallasi) have been observed to release gas bubbles during diel
vertical migration (Thorne and Thomas, 1990). Also, gas bubble release has been
reported in herring (Ciupea harengus) in the Baltic in response to midwater trawling
(Suuronen et ai., 1997). Although fishermen along the coast of Norway have seen this
feature in Norwegian spring spawning herring (Ciupea harengus) and even use the
word 'mesking' for this type of behaviour, documentation has so far been limited for
this stock.
Clupeoids are physostomous fish with an open swimbladder, i.e. have a pneumatic
duct leading from the posterior end of the stomach to the swimbladder in addition to
an anal duct from the swimbladder to the vent (Blaxter et ai., 1979). The lack of a
buoyancy function is presumably linked to the advantages of making rapid vertical
movements in response to predators (Blaxter, 1985). The hydrostatic function of the
g~ bladder is limited to the near-surface in clupeoids according to Blaxter and Hunter
(1982), Herring may swallow air at the surface and pass it into the swimbladder via
the pneumatic duct (Brawn, 1962; Blaxter and Batty, 1984). The volume of gas in the
swimbladder is likely to vary in response to the changes in ambient pressure (depth)
2

3
according to Boyle's law (Ona, 1984; 1990). Laboratory studies by Blaxter and Batty
(1984) indicate that herring may not be able to secrete gas into the swimbladder like
physoclist fish and may always be negatively buoyant (Brawn 1962; Blaxter and
Batty, 1984; Ona, 1984; 1990).
Overwintering Norwegian spring spawning herring in northern Norway make die!
vertical migrations between 400 m depth during daytime up to 50 m depth at night
(Huse and Ona, 1996). During this period they hardly eat (Slotte, 1996) and stay
normally in deep schools or dense layers during daytime presumably to avoid visually
oriented predators (Huse and Ona, 1996). Despite the fact that herring prefer to stay in
deep waters during daytime, predators are capable of herding schools of herring into
dense balls (Similli and Ugarte, 1993; Similii et al., 1996) and forcing them into
shallower areas and sometimes all the way to the surface (Sirnilii and Ugarte, 1993).
During such events the release of bubbles has been noticed. Inshore, their main
predators are killer whales (Orcinus orca), saithe (Pollachius virens) and cod (Gadus
morhua) (Huse and Ona, 1996; Similii 1997).
The aim of this study was to collect direct observations on gas bubble production in
herring and to reveal the physiological and behavioural significance and implications
of this behaviour. Alternative hypothesis to existing theory are presented.
Material and Methods
Herring schools in Vestfjorden, Ofotijorden and Tysfjorden were observed
acoustically by the 16 m long (20 BRT) RN "Fjordfangst" during daytime (07:00-
3
---------------------.--------
4
18:00) in the period 7-20 November. Due to its small size, the vessel is very
convenient to study herring school dynamics within the Vestfjorden system.
The research vessel was equipped with a FURUNO CH-12 multibeam sonar (ISO
kHz) and a PC based SIMRAD EY-500 echosounder (38 kHz) connected to an echo
integrator. The echosounder has similar functions to the SIMRAD EK-500 with the
Bergen Echo Integrator system (Knutsen, 1990). Instruments were calibrated
according to the standard target method (Foote et al., 1987). Echosounder signal were
printed and ping-to-ping data were regularly stored on optical disk. Herring schools
were first recorded on the sonar, and lengthwise and crosswise extent (Misund, 1990)
of the school projection were measured by a ruler directly on the monitor screen.
School area, vertical extent, school volume, transect length, fish density and school
biomass were calculated using equations from lohannesson and Losse (1977) and
Misund (1990; 1991; 1993).
Calculations were corrected for beam width and pulse length (Misund,1993).
Horizontal dimensions were corrected by taking into account the school depth and the
nominal beam angle of the transducer (McLennan and Simmonds, 1992).
The sonar which is commenly used in commercial fisheries may operate as an omni
sonar sending and receiving acoustic signals from 3600, although ping interval is then
quite low. We applied a 90° sector width, during operation. The vessel passed over the
school with an average speed of 5 knots and the echosounder with echo-integrator
recorded vertical extension and deptll'oftheschool. To record the behaviour and
4
5
dynamics of a herring school an attampt was made to position the vessel directly
above it during oehavioura1 recordings, using the presence and location of gas
bubbles, predators (sea birds, killer whales) and of stunned and dead herring as
guidance. During daytime visual observations were made by several persons. The
behaviour of individual herring at the surface was also noted in the daytime. Vessel
avoidance, where natural fish behaviour may be influenced by the presence of a
research ship, i.e. sudden change in swimming speed or direction, was not observed in
this study (see Olsen 1979) .. The engine was always put in neutral position during
predator-prey interactions as long as the ship were situated above the school. While
the observations were made the estimated horizontal movement of the schools was
less than 50 m according to the GlobalPositioning System.
Target strength (TS) were use~ to distinguish a school from bottom signals and
between herring, saithe and killer whales. Echo intensity of the gas bubbles and their
contribution from the gas bubbles were calculated by echo-integrating those areas or
water layers with extensive gas bubble release, where no herring were present.
Target strength (TS) of herring from fish length (L) was calculated as TSdupeoid = 20
log L - 71.9 after Foote (1987), based on sub-samples from 400 individuals of herring
taken from commercial purse seine catches in the same area. Stunned and dead
herring near the surface were caught with a landing net. Also, predatory fish were
caught when herring were under attack, by using five different baits attached on a 1. 0
mm fishing line. Catches consisted entirely of saithe. Length and weight were
measured and stomach samples from both herring and saithe were analysed.
5
6
Detailed infonnation was. collected on some of the schooling events taking place close
to surface by day. It was possible to track the school visually by spotting the wake of
frightened herring being herded in schools of considerable size.
Results
Three case studies of rapid vertical migration followed by gas bubble release are
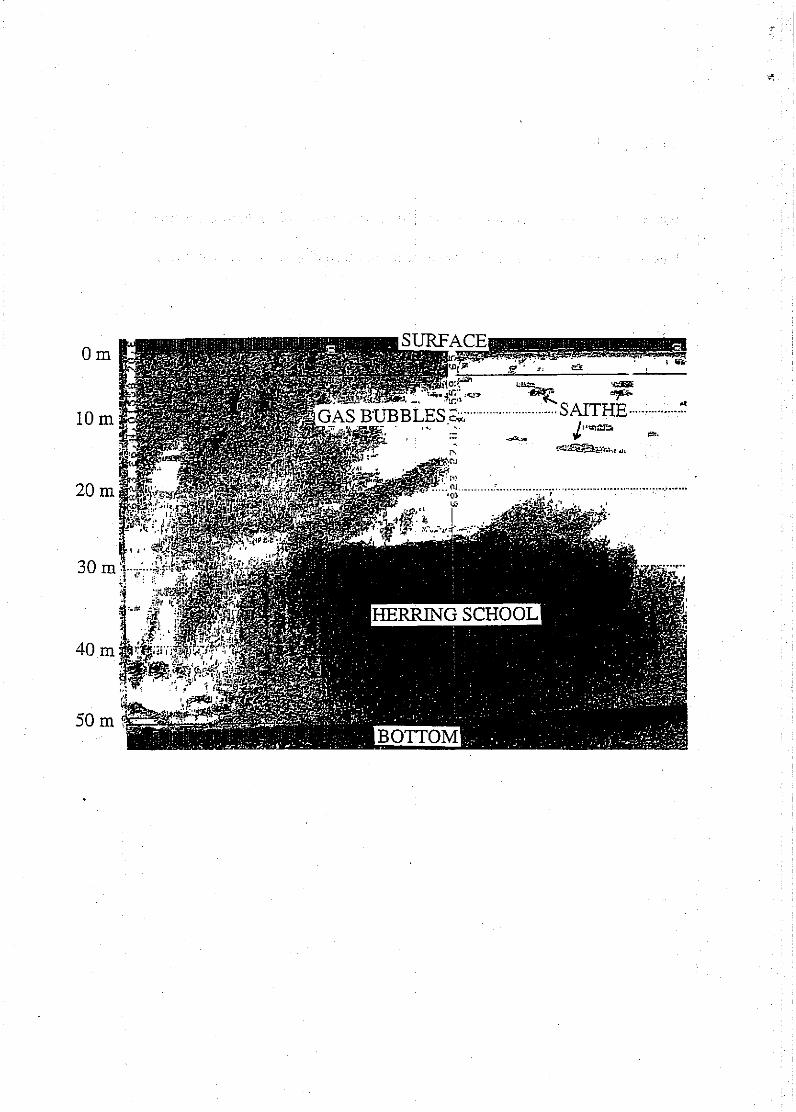
reported here (figure la-c). School A (figure la) is placed very densely close to the
bottom at 65 to 80 m depth, up to 30 m depth. The bottom is irregular but can easily
be distinguisheq from the school on the echogram. The herring school were attacked
by both six killer whales and a shoal of saithe. Gas bubbles are shown in figure la
from the surface down to 30 mdepth with medium density. The school had dived to
deeper waters from approximately 10m down to 40 m after predator attack.
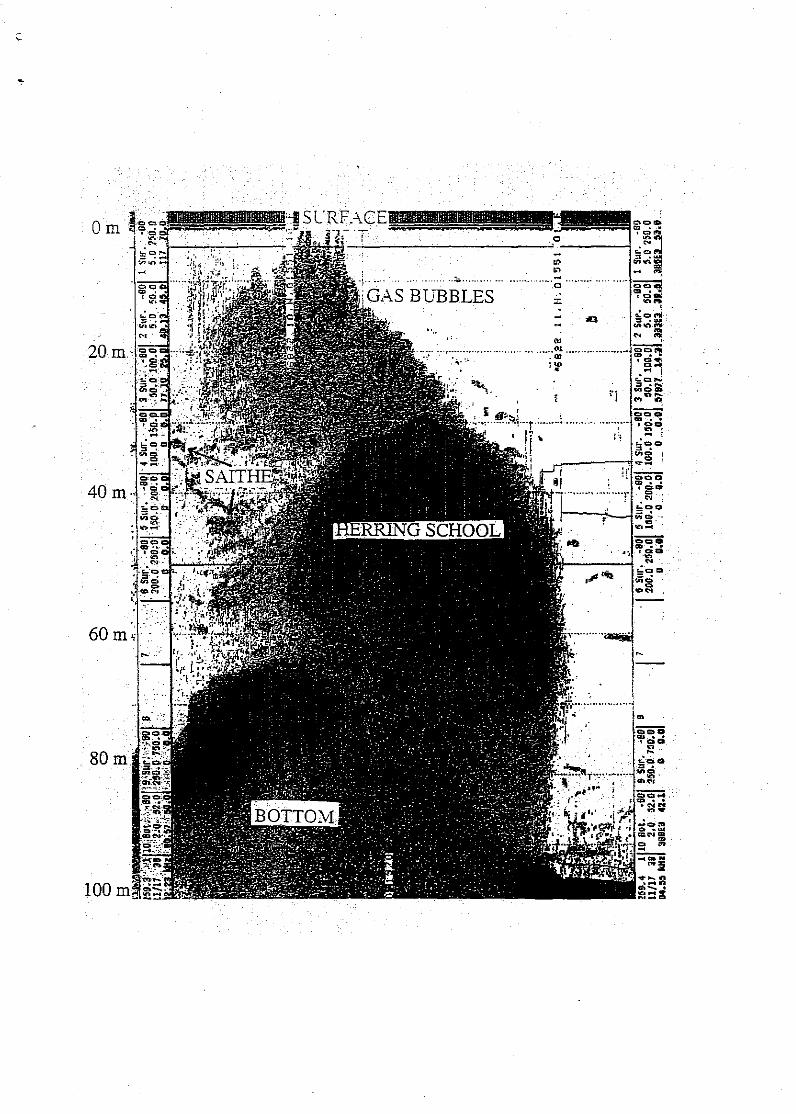
School B (figure Ib) is inseperable from the bottom at 50 m depth and extends up to
27 m depth. Air bubbles are seen as quite strong acoustic signals from the upper left
comer at the surface, down toa more scattered and distributed layer at 25 m depth.
This situation was recorded when the school had just dived from the surface layers. It
was not possible to determine the shoal size and density of saithe. The saithe were too
mixed with the herring.
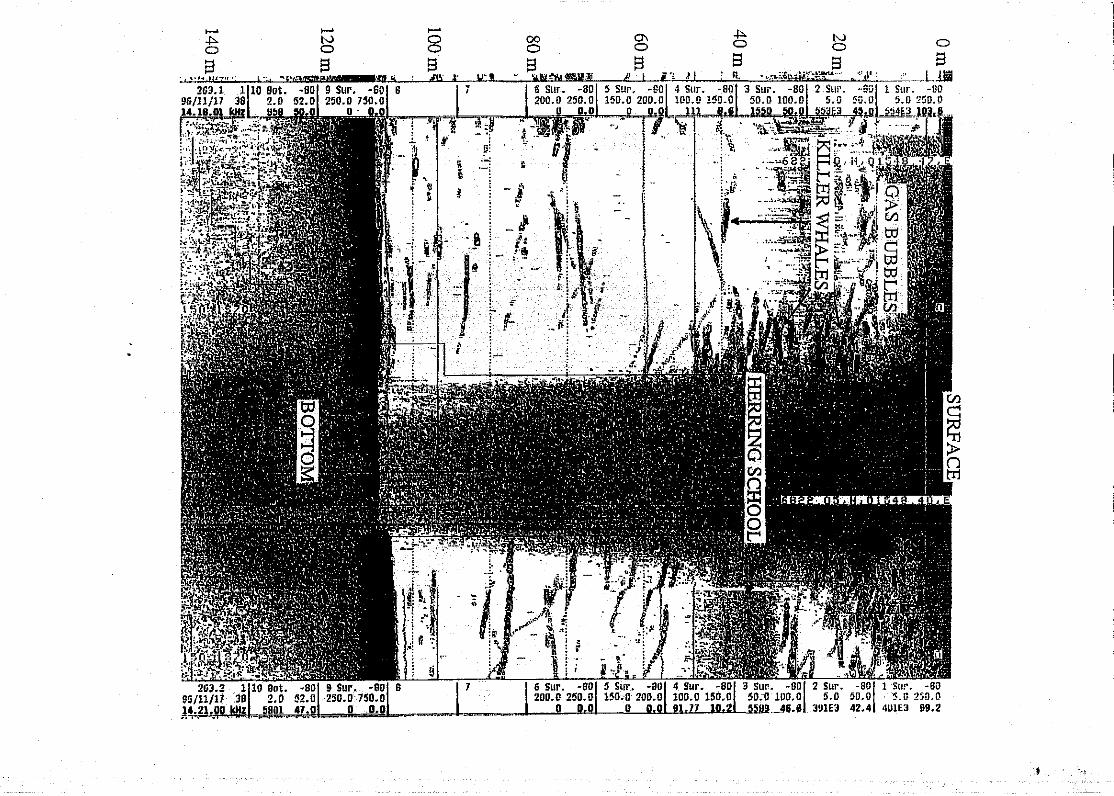
SchoolC was observed at the surface down to approximately 80 m during a predator"
preyinteraction with a shoal ofsaithe and eight killer whales (figure Ic). The latter.
are visible as elongated, strong echoes of variable density encircling the school.
Measurements of high density of some visible tracks in combination with parallel
6
:;
7
visual observation provided an opportunity to test the acoustic signals from killer
whales qualitatively. After some experience, they are quite easy to distinguish from
other echoes in the water column, because they are large (3-6 m) and killer whales
have lungs which reflect very strong echoes. The bottom at 110 m depth was
relatively flat. However, at the surface it is more difficult to distinguish herring from
gas bubbles. Gas bubbles are seen from 0-10 m. The echogram was taken
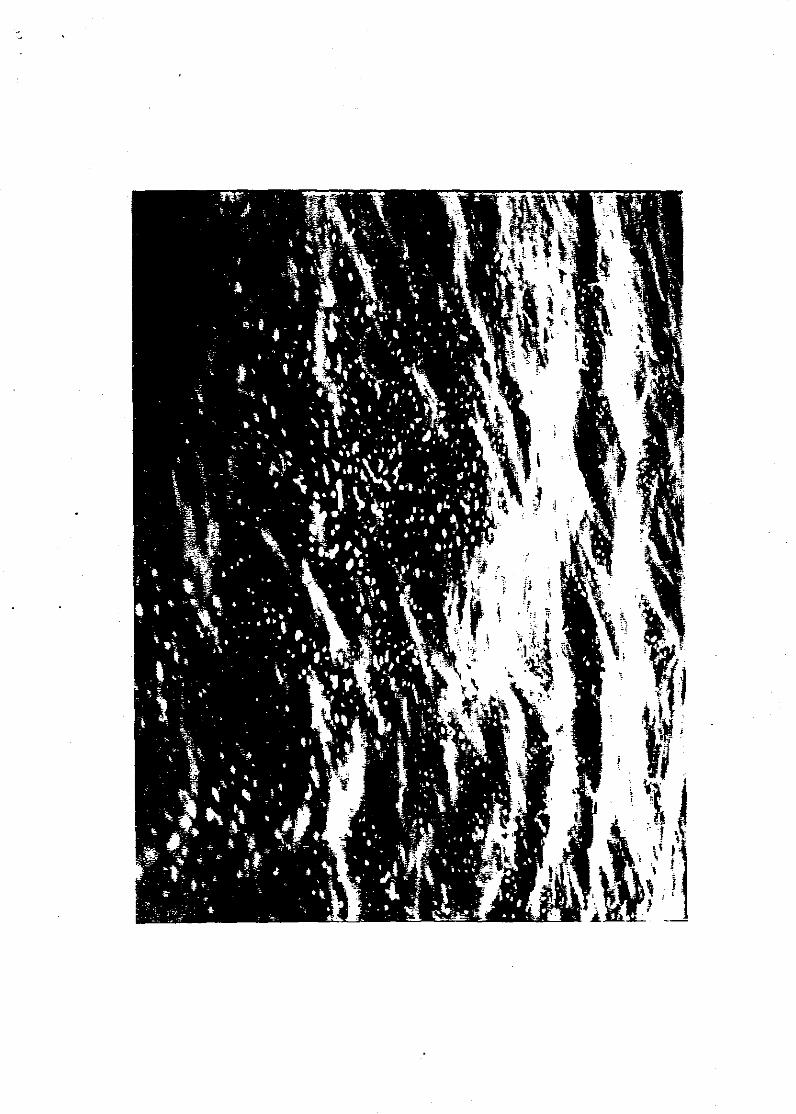
simultaneously with the photograph of the foam at the surface (figure 2). Some
minutes later the school dived to deep water. The killer whales appearently stopped
feeding and moved off at high speed.
A common feature of the results is that all schools appears to have been under
predator attack either from pods of killer whales and/or shoals of Atlantic saithe.
Hundreds of herring were seen releasing gas bubbles close to surface only a few
metres from the research vessel. Highly visible foam (figure 2) covered some 50 m' of
the water surface around the ship. Although not examined chemically, the origin was
most probably accumulated gas bubbles released from herring near the surface with a
possibly addition of some gas release by attacking killer whales. The predator-prey
interactions attracted hundreds of sea gulls such as herring gulls (Larus foscus),
common gulls (Larus canus), great black back gulls (Larus marinus) and lesser black
backed gulls (Larus argentatus) and some adult white tailed eagles (Haliaeetus
albicilla). Stomach samples from saithe (n = 68) showed that 85% of the individuals
had recently been eating one or more herring confirming that predator-prey
interactions were actually taking place. Herring caught from the observed schools (n =
24) and herring (n = 400) sub-sampled from commercial catches had no prey in their
7
8
stomachs, confirming that their behaviour was not affected by feeding. Extensive
analysis of stomach analysis have previously shown that herring hardly eat during the
winter (Slotte 1996), The main prey for herring, Calanus finmarchicus, winter at great
depths, thus .being unavailable for herring. During all three events, gas bubbles in the
surface waters Were seen from the ship, although with various intensity. Although
herring were seen under the surface, there was no evidence of gulping air from the
surface. Stunned. and dead herring were floating at the surface, and some herring had
bite marks that appears to be consistant with the distance between teeth in adult killer
whales, suggesting that killer whales were actually chasing herring.
Table 1 provides relevant data on herring school dimension, biomass and gas bubble
release. Although average herring. densities were not particularly high, densities up to
20-30 fish m-' were measured in some parts of the schools.
Discussion
The study confirmed that on particular occations extensive gas bubbles may be
released by herring and the available evidence suggests that this behaviour is strongly
related to predator-prey interactions. Thome and Thomas (1990) put forward two
alternative hypotheses to explain the source of the gas, since herring are considered
not to have the physiological mechanisms to secrete gas (Brawn, 1962; Blaxter and
Batty, 1984; Ona, 1984; 1990). A fIrst hypothesis was that gas is formed during
fermentation in the gut, while asecond possibility is that herring may gulp air at the
surface prior to descent. Neither of these hypotheses is supported by the present
observations. Since herring do not feed during the overwintering period (Dommasnes
8
9
et al., 1994; Huse and Ona, 1996; Slotte, 1996), fermentation in the gut can be
rejected as a possible explanation in this study, and visual observations did not
indicate that herring came right up to the surface to gulp air, even though herring
swallowing air at the surface have been observed in laboratory experiments (Blaxter
and Batty, 1984). The fish stay normally deep (> 50 - 1 DDm ) during at least some
time of the overwintering p.eriod (Huse and Ona, 1996), which would provide little
opportunity to exchange gas at the surface. Moreover, such behaviour would cause
serious risk because of predation by the numerous seabirds in the area.
An alternative hypothesis must be put forward to explain the observations in
Norwegian spring -spawning herring. I suggest that herring may be able to secrete gas
from the blood system into the swimbladder. Although gas for physostome
swimbladder inflation or deflation is generally con~idered to be insignificant (Moyle
and Cech, 1988), the situation may be-different during rapid upward swimming when
an overpressure of gas in the blood may be formed.
Saithe are members of the gadoid family and are therefore as physoclists (Gunderson
1993) not able to release gas. Therefore, they cannot be held responsible for the gas
bubble production observed during this study. Still, a fraction of the gas bubbles may
have come from killer whales releasing gas from their blowhole. However, the type of
gas bubbles produced by killer whales are very different from those coming from
herring (SirniHi and Ugarte, 1993) and can easily be confirmed. Killer whales produce
large bubbles with low frequency. Bubbles produced by herring are small « 1 cm)
and they may be released more or less continously as long as individuals in the school
9
-------- - - ----- -
10
may have some gas left in the swimbladder. Since each school was tracked for an
extended period of time (25, 32 and 39 min, for schools A, B and Crespectively), it
seems most likely that the herring schools were forced by predators from deeper areas
near the bottom to surface waters, where they expelled the gas, followed by a rapid
downward escape.
Rapid downward swimming appears to be a commen and efficient anti-predator
reaction in herring schools (Blaxter, 1985). In addition, an active release of gas
bubbles may effectively contribute to predator avoidance by scattering the light and
thereby reduce the visible range of predators especially near the surface during
daytime when light conditions are good. Marine mammals use gas bubbles to increase·
their hunting efficiency on various schooling fish species (Sharpe and Dill, 1997).
However, the results obtained here indicate that pelagic physostomous species may
use gas bubbles in the opposite way as part of a tactical anti-predator repertoire. It has
been suggested that gas bubbles may also ·confuse the biological sonar of killer whales
(Barrett-Lennard et al., 1997) by dispersion and scattering of the sound.
There were no· opportunities to examine stomach samples from killer whales, and we
did not obtain direct observations of killer whales actually catching fish. However,
herring represent the main prey for the killer whale population in northern Norway
and they follow the herring stock all year around (SimiHiet al., 1996). Therefore it
seems likely that they were mainly feeding on herring also during our study, even
thoughsaithe may also have been eaten. Density offish in schools is around one fish
per cube of body length (Pitcher and Partridge 1979; Misund 1991). The high density
10
II
values on 'adult herring in our study indicate that the herring were under predator
attack.
The dimensions of the herring schools attacked suggest that only relatively small
sized (4.5 - 18 tonnes) and dense (2.6 - 5.2 ind*m') schools in shallow water (50 - 110
m) were pursued. Most herring appears to stay in the deep layers covering huge areas
up to several kilometers during overwintering (Vab0 and N0ttestad 1997), and the
bottom depth within most of the Vestfjorden system which ranges mostly between
300 down to 900 m depth (R.0ttingen et al., 1994). Thus, it would seem that only a
relative small component of the stock suffers from predator attacks.
If herring are able to expel gas over short time intervals then abrupt changes in target
strength might be expected. Due to the low specific acoustic impedance of gas
compared to fish flesh and bones, the swimbladder is the primary organ responsible
for the reflected energy from a'fish (Foote, 1980; 1985; Furusawa, 1988) Therefore,
any change in its size should affect target strength. Moreover, rapid vertical
swimming has a significant effect on the tilt angle, thus reducing the dorsal aspect
target strength of the recorded fish (Huse and Qna, 1996). Since acoustic population
estimates of herring are made in these wintering areas, ecological interactions as
shown in this study may affect in situ acoustic measurements, and should be taken
into account during the surveys.
11
12
Acknowldegements
I would like to thank skipper Paul Jm-gensen for excellent manouvering on board RN
"Fjordfangst" and invaluable technical assistance from Bjorn Totland and Roger
Larsen. Geir Huse, Anders Ferno, Ole Arve Misund, Egil Ona and Tony Pitcher .are
thanked for valuable criticism and suggestions to the manuscript. Comments be two
reviewers greatly improved the quality of the manuscript. The Research Council in
Norway are thanked for financial support.
References
Barrett-Lennard, L.G., Ford, JX.B.,.and Heise, K.A. 1997. The mixed blessing of
echolocation: Differences in sonar use by fish-eating and mammal-eating killer
whales. Animal Behaviour 51:553-565.
Blaxter, J.H.S. 1985. The herring: A successful species? Canadian Journal of Fisheries
and Aquatic Science, 42 (Suppl. 1):21-30.
Blaxter, J.H.S., and Batty, R.S.;1984. The herring swimbladder: loss and gain of gas.
Journal of theMarine Biological Association of the United Kingdom, 64:441-
459.
Blaxter, lH.S., and Hunter, J.R. 1982. The biology of clupeids. Advances in Marine.
Biology, 20:1-223.
12
.• 13
Blaxter, J.H.S., Denton, E.J., and Gray, J.A.B. 1979. The herring swimbladder as a
gas reservoir for the acoustico-Iateralis system Journal of the Marine Biological
Assocition of the United Kingdom, 59:1-10.
Brawn, V.M. 1962. Physical properties and hydrostatic function of the swimbladder
of herring (Clupea harengus 1.) Journal of the Fisheries Research Board of
Canada, 19 (4): 635-655.
Foote, K.G. 1980. Importance of the swimbladder in acoustic scattering by fish: a
comparison of gadoid and mackerel target strengths. Journal of Acoustic Society
of America, 67: 2084-2089.
Foote, K.G. 1985. Effect of swimming on fish target strength. ICES CM 19851B:29
(mimeo).
Foote, K. G. 1987. Fish target strengths for use in echo integrator surveys. Journal of
the Acoustical Society of America, 82(3): 981-987.
Foote, K. G., Knutsen, H. P., Vestnes, G., MacLennan, D. N., and Simmonds, E. J.
1987. Calibration of acoustic instruments for fish density estimation: a practical
guide. ICES Cooperative Research Report, 144:69 pp.
Fillusawa, M. 1988. Prolate spheroidal models for predicting general trends offish
target strength. Journal of the Acoustical Society of Japan, (E) 9:13-24.
13
----------~-,---
14
Gunderson, D.R. 1993 .. Surveys of Fisheries Resources. John Wiley & Sons Inc. New
York. 248 pp.
Huse, 1., and Dna, E. 1996. Tilt angle distribution and swimming speed of
overwintering Norwegian spring spawning herring. ICES Journal of Marine
Science, 53:863-873.
Johannesson, K.A., and Losse, G.F. 1977. Methodology of acoustic estimations of .
fish abundance in some UNDPIF AO Resource survey Projects. Rapport et
Proces-Verbaux des Reunions du Conseil International pour l'Exploration de la
Mer, 170:296-318.
Knutsen, H. P. 1990. The Bergen Echo Integrator: an introduction. Journal du Conseil
International pour l'Exp1oration de la Mer, 47:167-174.
MacLennan, D.N., and Simmonds, E.J. 1992. Fisheries acoustics. Chapman and Hall,
London, pp. 325.
Misund, O.A. 1990. Sonar observations of schooling herring. School dimensions,
swimming behaviour, and avoidance of vessel and purse seine.- Rapports et
Proces-Verbaux des Reunions du Conseil International pour l'Exploration de la
Mer, 189: 135-146.
14
15
Misund, O.A. 1991. Swimming behaviour of schools related to fish capture and
acousticabundanceestirnation. Ph.D. Thesis, 132 pp.
Misund, O.A. 1993. Dynamics of moving masses; variability in packing density,
shape and size among pelagic schools. ICES Journal of Marine Science, 49:325-
334.
Moyle, P.B. and Cech, JJ.Jr. 1988. Fishes: An Introduction to Ichthyology. Prentice
Hall, Englewood Cliffs, New Jersey. 559 p.
Olsen, K. 1979. Observed avoidance behaviour in herring in relation to passage of an
echo survey vessel. ICES eM 19931818.
Ona, E. 1984. In situ observations of swimbladder compression in herring. ICES CM
198418: 18. (mimeo).
Ona, E. 1990. Physiological factors causing natural variations in acoustic target
strength offish. Journal of the Marine Biological Association of the United
Kingdom, 70: 107-127.
Pitcher, TJ., and Partridge, B.L. 1979. Fish school density and volume. Marine
Biology. 54:383-94.
. .
15
16
Sharpe, F .A. and Dill, L.M. 1997. The behaviour of Pacific herring schools in
repsonse go artificial hurnpback whale bubbles. Canadian Journal of Zoology
75 :725-730.
Similli, T., Ugarte, E 1993; Surface and underwater observations of cooperatively
feeding killer whales in northern Norway. Canadian Journal of Zoology,
71:1494-1499.
Similii, T., Holst, 1. C., and Christensen, I. 1996. Occurrence and diet of killer whales
in northern Norway; seasonal patterns relative to the distribution and abundance
of Norwegian spring-spawning herring. Canadian Journal of Fisheries and
Aquatic Science, 53: 769-779.
Simila;T. 1997. Behavioural ecology of killer whales in northern Norway. PhD
thesis. Norwegian College of Fisheries Science, University of Troms0, Norway.
Suuronen, P., Lehtonen, E., and Wallace, J. 1997. Avoidance and escape behaviour by
herring encountering midwatertrawls.Fisheries Research 29: 13-24.
Thome, R.E., and Thomas, G.L. 1990. Acoustic observations of gas bubble release by
Pacific herring (Clupeaharengus pallasl). Canadian Journal of Fisheries and
Aquatic Science, 47:1920-1928.
16
,'''''
17
Vab0, R., N0tlestad, L. 1997. An individual based model offish school behaviour:
predicting antipredator tactics as observed in nature. Fisheries Oceanography
6:3,155-171.
17
. __ ._-_._-_ .... _-_._----
18
Figure legends:
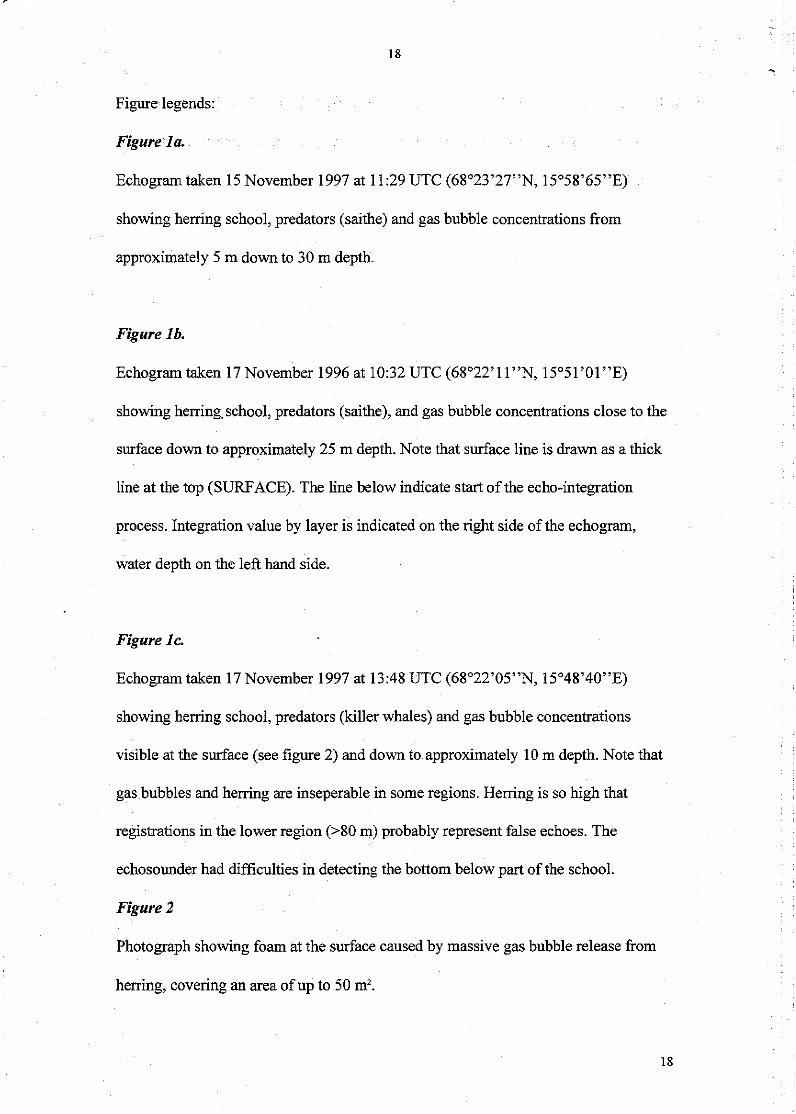
Figurela.
Echogram taken IS November 1997 at 11:29 UTC (68°23'27"N, 15°58'65"E)
showing herring school, predators (saithe) and gas bubble concentrations from
approximately 5 m down to 30 m depth,
Figure lb.
Echogram taken 17 November 1996 at 10:32 UTC (68°22'11 "N, 15°51 '01 "E)
showing herring,school, predators (saithe), and gas bubble concentrations close to the
surface down to approximately 25 m depth. Note that surface line is drawn as a thick
line at the top (SURF ACE). The line below indicate start of the echo-integration
process. Integration value by layer is indicated on the right side of the echogram,
water depth on the left hand side.
Figure Ie.
Echogram taken 17 November 1997 at 13:48 UTC (68°22'OS"N, Is0 48'40"E)
showing herring school, predators (killer whales) and gas bubble concentrations
visible at the surface (see figure 2) and down to approximately 10m depth. Note that
gas bubbles and herring are inseperable in some regions. Herring is so high that
registrations in the lower region (>80 m) probably represent false echoes. The
echosounder had difficulties in detecting the bottom below part of the school.
Figure 2
Photograph showing foam at the surface caused by massive gas bubble release from
herring, covering an area of up to 50 m'.
18
"
19
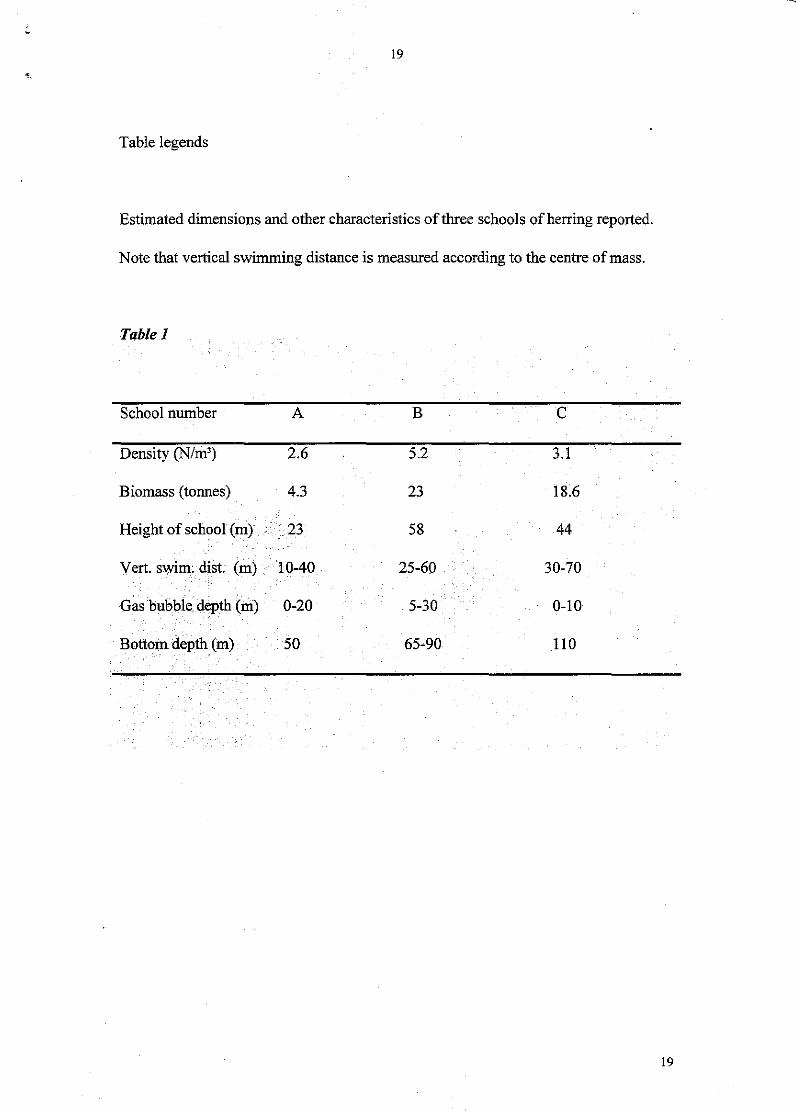
Table legends
Estimated dimensions and other characteristics of three schools of herring reported.
Note that vertical swimming distance is measured according to the centre of mass.
Table 1
School number A B C
Density (N/m') 2.6 5.2 3.1
Biomass (tonnes) 4.3 23 18.6
Height of school (m) ·23 58 44
Vert. swim. dist. (m) 10-40 25-60 30-70
Gas bubble depth (m) 0-20 5-30 0-10
Bottom. depth (m) 50 65-90 110
19
'~
am
10m-",.
20m
40m
Sam,
Om
100
.. : .... GAS BUBBLES
'" " ·;:;··· .... ·····.·· .. I=~
'"
.. ... , ........................ -....... :: ..... ················:1 ijl'~",,!
,. l~
.....
.p.. 00 Cl\ .p.. N
~ i -.J
')" I ii _.
J; -I' ~:~ r"'" ,.-:: I -- -. d\ .. :· :.. ~ ;P t '
8: f.l b t ; ,--
• -'f