Contents - ICES
496
ICES | WGEEL 2020 | I Contents 1 Summary of national and international stock status indicators.................................................... 1 1.1 Escapement biomass and mortality rates........................................................................ 1 1.2 Recruitment time-series .................................................................................................. 2 2 Overview of the national stock and its management.................................................................. 14 2.1 Describe the eel stock and its management .................................................................. 14 2.2 Significant changes since last report .............................................................................. 14 3 Impacts on the national stock ..................................................................................................... 16 3.1 Fisheries ......................................................................................................................... 16 3.1.1 Glass eel fisheries........................................................................................................... 16 3.1.2 Yellow eel fisheries ........................................................................................................ 16 3.1.3 Silver eel fisheries .......................................................................................................... 19 3.2 Restocking ...................................................................................................................... 19 3.2.1 Amount stocked ............................................................................................................. 19 3.3 Aquaculture ................................................................................................................... 25 3.4 Entrainment ................................................................................................................... 25 3.5 Habitat Quantity and Quality ......................................................................................... 25 3.6 Other impacts ................................................................................................................ 25 4 National stock assessment .......................................................................................................... 26 4.1 Description of Method ................................................................................................... 26 4.1.1 Data collection ............................................................................................................... 26 4.1.2 Analysis .......................................................................................................................... 26 4.1.3 Reporting ....................................................................................................................... 27 4.1.4 Data quality issues and how they are being addressed ................................................. 27 4.2 Trends in Assessment results ......................................................................................... 28 5 Other data collection for eel ....................................................................................................... 30 5.1 Yellow eel abundance surveys ....................................................................................... 30 5.2 Silver eel escapement surveys ....................................................................................... 35 5.3 Life-history parameters.................................................................................................. 37 5.4 Diseases, Parasites and Pathogens or Contaminants .................................................... 38 6 New information ......................................................................................................................... 41 7 References ................................................................................................................................... 45
-
Upload
khangminh22 -
Category
Documents
-
view
0 -
download
0
Transcript of Contents - ICES

ICES | WGEEL 2020 | I
Contents
1 Summary of national and international stock status indicators.................................................... 1 1.1 Escapement biomass and mortality rates ........................................................................ 1 1.2 Recruitment time-series .................................................................................................. 2
2 Overview of the national stock and its management.................................................................. 14 2.1 Describe the eel stock and its management .................................................................. 14 2.2 Significant changes since last report .............................................................................. 14
3 Impacts on the national stock ..................................................................................................... 16 3.1 Fisheries ......................................................................................................................... 16 3.1.1 Glass eel fisheries ........................................................................................................... 16 3.1.2 Yellow eel fisheries ........................................................................................................ 16 3.1.3 Silver eel fisheries .......................................................................................................... 19 3.2 Restocking ...................................................................................................................... 19 3.2.1 Amount stocked ............................................................................................................. 19 3.3 Aquaculture ................................................................................................................... 25 3.4 Entrainment ................................................................................................................... 25 3.5 Habitat Quantity and Quality ......................................................................................... 25 3.6 Other impacts ................................................................................................................ 25
4 National stock assessment .......................................................................................................... 26 4.1 Description of Method ................................................................................................... 26 4.1.1 Data collection ............................................................................................................... 26 4.1.2 Analysis .......................................................................................................................... 26 4.1.3 Reporting ....................................................................................................................... 27 4.1.4 Data quality issues and how they are being addressed ................................................. 27 4.2 Trends in Assessment results ......................................................................................... 28
5 Other data collection for eel ....................................................................................................... 30 5.1 Yellow eel abundance surveys ....................................................................................... 30 5.2 Silver eel escapement surveys ....................................................................................... 35 5.3 Life-history parameters .................................................................................................. 37 5.4 Diseases, Parasites and Pathogens or Contaminants .................................................... 38
6 New information ......................................................................................................................... 41 7 References ................................................................................................................................... 45
II | ICES SCIENTIFIC REPORTS 2:85 | ICES
Report on the eel stock, fishery and other impacts in Belgium, 2019–2020
Authors Claude Belpaire, Research Institute for Nature and Forest (INBO), Dwersbos 28, 1630 Linkebeek, Belgium. [email protected]
Jan Breine, Research Institute for Nature and Forest (INBO), Dwersbos 28, 1630 Linkebeek, Bel-gium
Jeroen Van Wichelen, Research Institute for Nature and Forest (INBO), Havenlaan 88/73, 1000 Brussel, Belgium
Ine Pauwels, Research Institute for Nature and Forest (INBO), Havenlaan 88/73, 1000 Brussel, Belgium
Raf Baeyens, Research Institute for Nature and Forest (INBO), Havenlaan 88/73, 1000 Brussel, Belgium
Johan Coeck, Research Institute for Nature and Forest (INBO), Havenlaan 88/73, 1000 Brussel, Belgium
Billy Nzau Matondo, Laboratoire de Démographie des Poissons et Hydroécologie, Unité de Biologie du Comportement, Institut de Zoologie, UR FOCUS, Université de Liège, Quai van Beneden 22, 4020 Liège, Belgium
Michael Ovidio, Laboratoire de Démographie des Poissons et Hydroécologie, Unité de Biologie du Comportement, Institut de Zoologie, UR FOCUS, Université de Liège, Quai van Beneden 22, 4020 Liège, Belgium
Jenna Vergeynst, Department of Data Analysis and Mathematical Modelling, Universiteit Gent, Coupure Links 653, 9000 Gent, Belgium
Pieterjan Verhelst, Ghent University, Marine Biology, Krijgslaan 281, 9000 Ghent (Belgium)
Jens De Meyer, Ghent University, Evolutionary Morphology of Vertebrates and Zoology Mu-seum, K.L. Ledeganckstraat 35, 9000 Gent (Belgium)
Dominique Adriaens, Ghent University, Evolutionary Morphology of Vertebrates and Zoology Museum, K.L. Ledeganckstraat 35, 9000 Gent (Belgium)
Lies Teunen, University of Antwerp, Systemic Physiological and Ecotoxicological Research group, (SPHERE) Groenenborgerlaan 171, 2020 Antwerp, Belgium
Lieven Bervoets, University of Antwerp, Systemic Physiological and Ecotoxicological Research group, (SPHERE) Groenenborgerlaan 171, 2020 Antwerp, Belgium
Damien Sony, Profish Technology, Chemin des Pêcheurs 114, 5100 Jambes, Belgium
Xavier Rollin, Direction de la nature et des espaces verts (DNEV), Département de la Nature et des Forêts (DNF), Direction générale opérationnelle de l’Agriculture, des Ressources Naturelles et de l’Environnement (DGARNE), Service Public de Wallonie (SPW), avenue Prince de Liège 7, 5100 Jambes (Namur), Belgium.
Frédéric Dumonceau, Service de la pêche, Direction de la chasse et de la pêche (DCP), Départe-ment de la Nature et des Forêts (DNF), Direction générale opérationnelle de l’Agriculture, des

ICES | WGEEL 2020 | III
Ressources Naturelles et de l’Environnement (DGARNE), Service Public de Wallonie (SPW), av-enue Prince de Liège 7, 5100 Jambes (Namur), Belgium.
Kristof Vlietinck, Agency for Nature and Forests, Koning Albert II-laan 20/bus 8, 1000 Brussels, Belgium.
Reporting Period: This report was completed in September 2020, and contains data up to 2020. Some 2020 data are provisional.

ICES | WGEEL 2020 | 1
1 Summary of national and international stock status indicators
1.1 Escapement biomass and mortality rates
The table below (Table 1) presents the most recent data of escapement biomass and mortality rates. It presents the data included in the Belgian Progress Report 2018. There are no new stock indicators compared to the 2018 WGEEL Belgian Country Report (Belpaire et al., 2018).
For the contribution of Flanders to the Scheldt and Meuse RBD, new data were made available for the 2018-Belgian EMP progress report (data from the period 2015–2017). For the contribution of Wallonia to the Scheldt and Meuse RBD no new data are available for the 2018-Belgian EMP progress report: for this reason the data from the previous report (data from the period 2011–2014, reported in the 2015-Belgian EMP progress report) were used for Wallonia and added to the new data of Flanders for the Scheldt and Meuse RBD.
Table 1. Stock indicators of silver eel escapement, biomass and mortality rates, and assessed habitat area.
Year EMU_code Assessed
Area
(ha)
B0 (kg) Bcurr (kg) Bbest (kg) Bcurr/B0 (%) ∑F ∑H ∑A
2015–2017 BE_Sche 20888* 207123 23429 27109 11.3 2260 1420 3680
2015–2017 BE_Meus 5205* 32157 2331 17949 7.2 518 15100 15618
Key: EMU_code = Eel Management Unit code; B0 = the amount of silver eel biomass that would have existed if no anthropogenic influences had impacted the stock (kg); Bcurr = the amount of silver eel biomass that currently escapes to the sea to spawn (in the assessment year) (kg); Bbest = the amount of silver eel biomass that would have existed if no anthropogenic influences had impacted the current stock (kg); ∑F = mortality due to fishing, summed over the age groups in the stock (rate); ∑H = anthropogenic mortality excluding the fishery, summed over the age groups in the stock (rate); ∑A = all anthropogenic mortality summed over the age groups in the stock (rate); Assessed area (ha) = combined area total (ha) of transitional and inland waters.
*Areas according to 2015 Belgian EMP Progress Report.
2 | ICES SCIENTIFIC REPORTS 2:85 | ICES
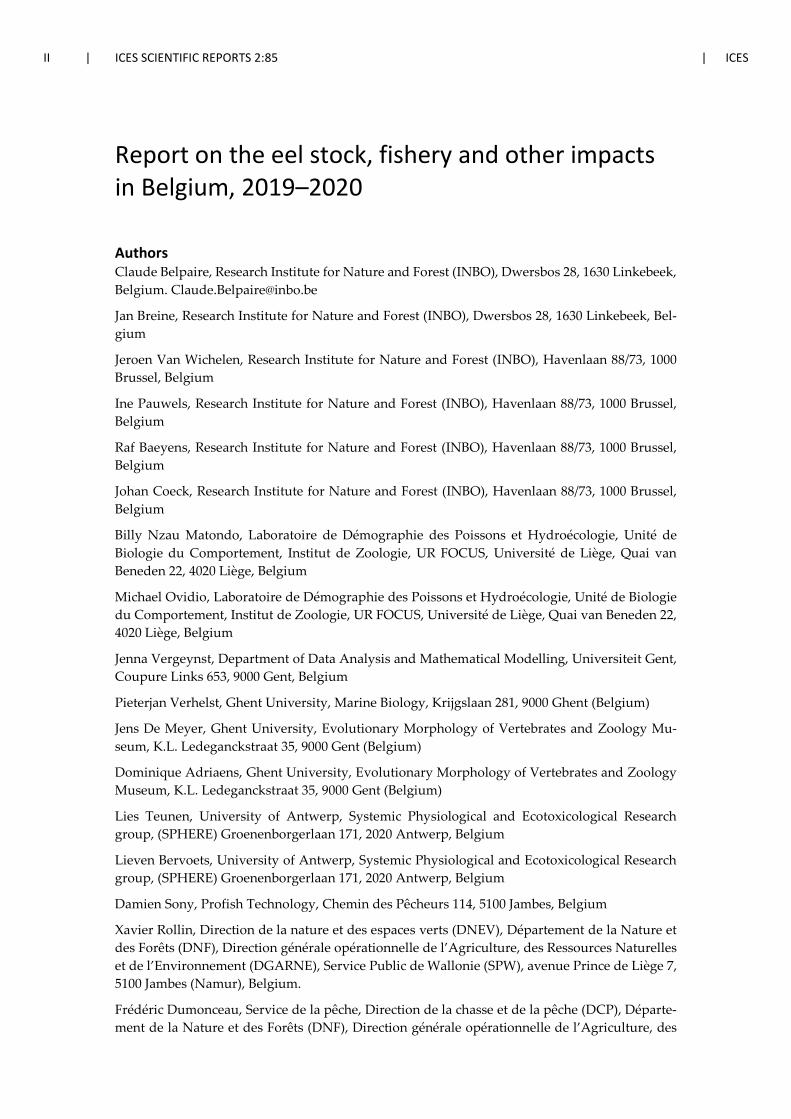
Figure 1. Precautionary Diagram for Belgium.
1.2 Recruitment time-series
The WGEEL uses these time-series data to calculate the Recruitment Indices, relative to the ref-erence period of 1960–1979, and the results form the basis of the annual Single Stock Advice reported to the EU Commission. These recruitment indices are also used by the EU CITES Scien-tific Review Group in their annual review of the Non-Detriment Finding position.
Belgium submits yearly the data of the glass eel recruitment series at Nieuwpoort (river Yser), and the ascending yellow eels at Lixhe on the River Meuse. Since a few years ago a new perma-nent monitoring station to estimate glass eel recruitment in Flanders is available at the Veurne-Ambacht pumping station.
Glass eel recruitment at Nieuwpoort at the mouth of River Yser (Yser ba-sin)
In Belgium, both commercial and recreational glass eel fisheries are forbidden by law. Fisheries on glass eel are carried out by the Flemish government. Former years, when recruitment was high, glass eels were used exclusively for restocking in inland waters in Flanders. Nowadays, the glass eel caught during this monitoring are returned to the river.
Long-term time-series on glass eel recruitment are available for the Nieuwpoort station at the mouth of the river Yser. Recently new initiatives have been started to monitor glass eel recruit-ment in the Scheldt basin (see below).
For extensive description of the glass eel fisheries on the river Yser see Belpaire (2002, 2006).
Figures 2A–D and Tables 2–3 present the time-series of the total annual catches of the dipnet fisheries in the Nieuwpoort ship lock and give the maximum day catch per season. Since the last report the figure has been updated with data for 2020.
Hereunder the results of the monitoring are briefly described, per year.
Fishing effort in 2006 was half of normal, with 130 dipnet hauls during only 13 fishing nights between March 3rd, and June 6th. Catches of the year 2006 were extremely low and close to zero.

ICES | WGEEL 2020 | 3
In fact only 65 g (or 265 individuals) were caught. Maximum day catch was 14 g. These catches are the lowest record since the start of the monitoring (1964).
In 2007, fishing effort was again normal, with 262 dipnet hauls during 18 fishing nights between February 22nd, and May 28th. Catches were relatively good (compared to former years 2001–2006) and amounted 2214 g (or 6466 individuals). Maximum day catch was 485 g. However this 2007 catch represents only 0.4% of the mean catch in the period 1966–1979 (mean = 511 kg per annum, min. 252–max. 946 kg).
In 2008, fishing effort was normal with 240 dipnet hauls over 17 fishing nights. Fishing was car-ried out between February 16th and May 2nd. Total captured biomass of glass eel amounted 964.5 g (or 3129 individuals), which represents 50% of the catches of 2007. Maximum day catch was 262 g.
In 2009, fishing effort was normal with 260 dipnet hauls over 20 fishing nights. The fishing was carried out between and February 20th and May 6th. Total captured biomass of glass eel amounted 969 g (or 2534 individuals), which is similar to the catches of 2008). Maximum day catch was 274 g.
In 2010, fishing effort was normal with 265 dipnet hauls over 19 fishing nights. The fishing was carried out between and February 26th and May 26th. Total captured biomass of glass eel amounted 318 g (or 840 individuals). Maximum day catch was 100 g. Both total captured bio-mass, and maximal day catch is about at one third of the quantities recorded in 2008 and 2009. Hence, glass eel recruitment at the Yser in 2010 was at very low level. The 2010 catch represents only 0.06% of the mean catch in the period 1966–1979 (mean = 511 kg per annum, min. 252–max. 946 kg).
In 2011, fishing effort was normal with 300 dipnet hauls over 20 fishing nights. The fishing was carried out between and February 16th and April 30th. Compared to 2010, the number of hauls was ca. 15% higher, but the fishing period stopped earlier, due to extremely low catches during April. Total captured biomass of glass eel amounted 412.7 g (or 1067 individuals). Maximum day catch was 67 g. Total captured biomass is similar as the very low catches in 2010. Maximal day catch is even lower than data for the four previous years (2007–2010). Overall, the quantity re-ported for the Yser station should be regarded as very low, comparable to the 2010 record. The 2011 catch represents only 0.08% of the mean catch in the period 1966–1979 (mean = 511 kg per annum, min. 252–max. 946 kg).
In 2012, fishing effort was higher than previous years with 425 dipnet hauls over 23 fishing nights. The fishing was carried out between and March 2nd and May 1st. Compared to 2010, the number of hauls was 42% higher. Total captured biomass of glass eel amounted 2407.7 g (or 7189 individuals). Maximum day catch was 350 g. Both, the total captured biomass and the maximum day catch are ca. six times higher than in 2010. Overall, the quantity reported in 2012 for the Yser station increased significantly compared to previous years and is similar to the 2007 catches. Still, the 2012 catch represents only 0.47% of the mean catch in the period 1966–1979 (mean = 511 kg per annum, min. 252–max. 946 kg).
In 2013, fishing effort included 410 dipnet hauls over 23 fishing nights. The fishing was carried out between 20 February and 6 May. Total captured biomass of glass eel amounted 2578.7 g (or 7368 individuals). Maximum day catch was 686 g. So compared to 2012, similar fishing effort (number of hauls), and similar year catches, but higher maximum day catch.
In 2014, fishing effort included 460 dipnet hauls over 23 fishing nights. The fishing was carried out between 24 February and 25 April. Total captured biomass of glass eel amounted 6717 g (or 17 815 individuals). Maximum day catch was 770 g. So compared to 2013, same number of fish-

4 | ICES SCIENTIFIC REPORTS 2:85 | ICES
ing nights, but 12% more hauls (increased fishing effort in number of hauls), and a 2.6 fold in-crease of the total year catches. Maximum day catch increased with 12% compared to the 2013 value.
In 2015, fishing effort was somewhat reduced compared to previous years, with 355 dipnet hauls over 19 fishing nights. The fishing was carried out between 16 February and 29 April. Total cap-tured biomass of glass eel amounted 2489 g (or 6753 individuals). Maximum day catch was 487 g. So compared to 2014, 17% less fishing nights and 23% less hauls, and a decrease in total year catch of 63%. Compared to 2012 and 2013 total catch was similar in 2015, but considering the reduced fishing effort, the CPUE (catch per haul) was between 11 and 23% higher. Maximum day catch was between the levels of 2012 and 2013 (Figures 3A–D, and Table 4).
In 2016, fishing effort included 195 dipnet hauls over 11 fishing nights. The fishing was carried out between 2 February and 6 March. Total captured biomass of glass eel amounted 1023 g (or 2301 individuals). Maximum day catch was 208g. However, after 6 March, glass eel sampling had to be cancelled due to technical problems at the sluices. As such, only 11 fishing days took place, resulting in a low total catch (Table 3). The catch per unit of effort (CPUE) was lower in 2016 compared to the two previous years (Table 4). However, since sampling was cancelled early in the glass eel season, the peak had probably yet to come. Therefore, the CPUE values might be underestimations. For purposes of international stock assessment, considering the technical problems and absence of catch data during the main migration period, the 2016 data of the Yser glass eel recruitment series should be considered as not representative and are reported as “non-available”.
In 2017, fishing effort was rather low compared to previous years, with 270 dipnet hauls over 18 fishing nights. The fishing was carried out between 10 February and 21 April. Total captured biomass of glass eel amounted 1697 g (or 4924 individuals). Maximum day catch was 607 g. So compared to 2014, 22% less fishing nights and 41% less hauls, and a decrease in total year catch of 75%. Compared to 2012, 2013 and 2015 total catch was reduced with ca 32% in 2017, but con-sidering the reduced fishing effort, the CPUE (mean catch per haul) was 6,3 g per haul which is similar as in the period 2012–2016 (with the exception of 2014 where a significant higher CPUE was recorded. Maximum day catch was within the range recorded in the 2012–2016 period.
In 2018, fishing effort was rather high compared to the two previous years, with 340 dipnet hauls over 22 fishing nights. The fishing was carried out between 24 February and 27 April. From 11 March 2018 on, for a period of ca. 10 days, monitoring was not possible. Sea sluices had to be kept closed due to flooding conditions. Normal values should therefore be somewhat higher than reported. However, we advise to keep the reported values for use in international analysis. But, we should consider this important note in the discussions on the local trend. Total captured biomass of glass eel amounted 1749 g (or 4928 individuals). This is within the range reported for the five previous years. Note however that the number of fishing and catching days is higher than in previous years (22 nights). Maximum day catch was 230 g, which is low compared to two previous years. CPUE (mean catch per haul) was 5.1 g per haul which is similar as in the period 2012–2017 (with the exception of 2014 where a significant higher CPUE was recorded) (Figures 3A–D, and Tables 4–5).
In 2019, fishing effort was somewhat lower than 2018, but higher compared to 2016 and 2017, with 325 dipnet hauls over 22 fishing nights. The fishing was carried out between 18 February and 29 April. Total captured biomass of glass eel amounted 2415 g (or 7213 individuals). This is within the range reported for the five previous years. Maximum day catch was 545 g, which is also within the range of previous years. CPUE (mean catch per haul) was 7.4 g per haul which is quite high compared to the period 2012–2018 (with the exception of 2014 where a significant higher CPUE was recorded) (Figures 3A–D, and Tables 4–5).
ICES | WGEEL 2020 | 5
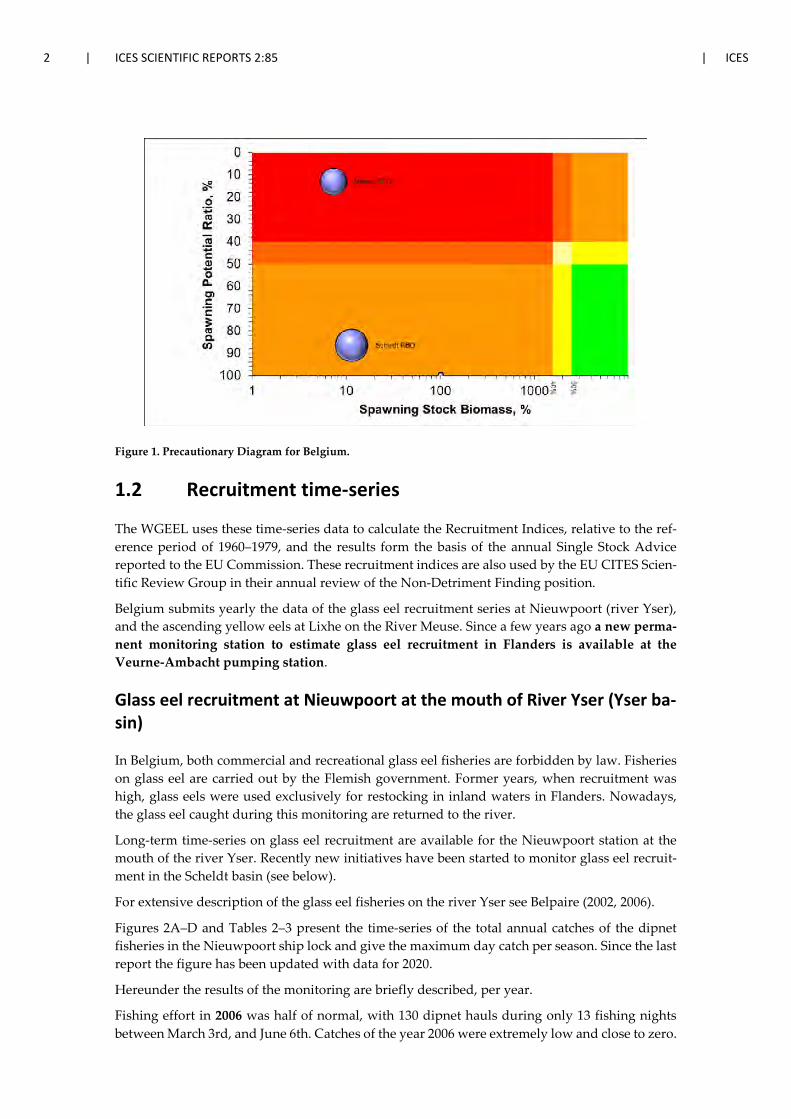
In 2020, monitoring started on 3 February and stopped on 5 March. On 6 March there was a malfunction at the sluice, after that water level was too high to perform the monitoring and on 19 March monitoring was not allowed any more due to Covid 19. Fishing effort was thus much lower than during other years, and fishing was only performed during start of the sea-son. Fishing effort was 190 hauls during 12 fishing days. Total captured biomass of glass eel amounted 605 g (or 1497 individuals). Maximum day catch was 174 g. Considering the very low fishing effort and the temporal bias in fishing, comparison of the 2020 data with recruit-ment data of previous years is not appropriate. Due to technical problems at the sluice and to COVID-19 measures, the 2020 data of the Yser glass eel recruitment series are incomplete and not representative, and should not be used for statistical purposes, nor for international stock assessment and should be treated as “NON-AVAILABLE” for international assessments.
6 | ICES SCIENTIFIC REPORTS 2:85 | ICES
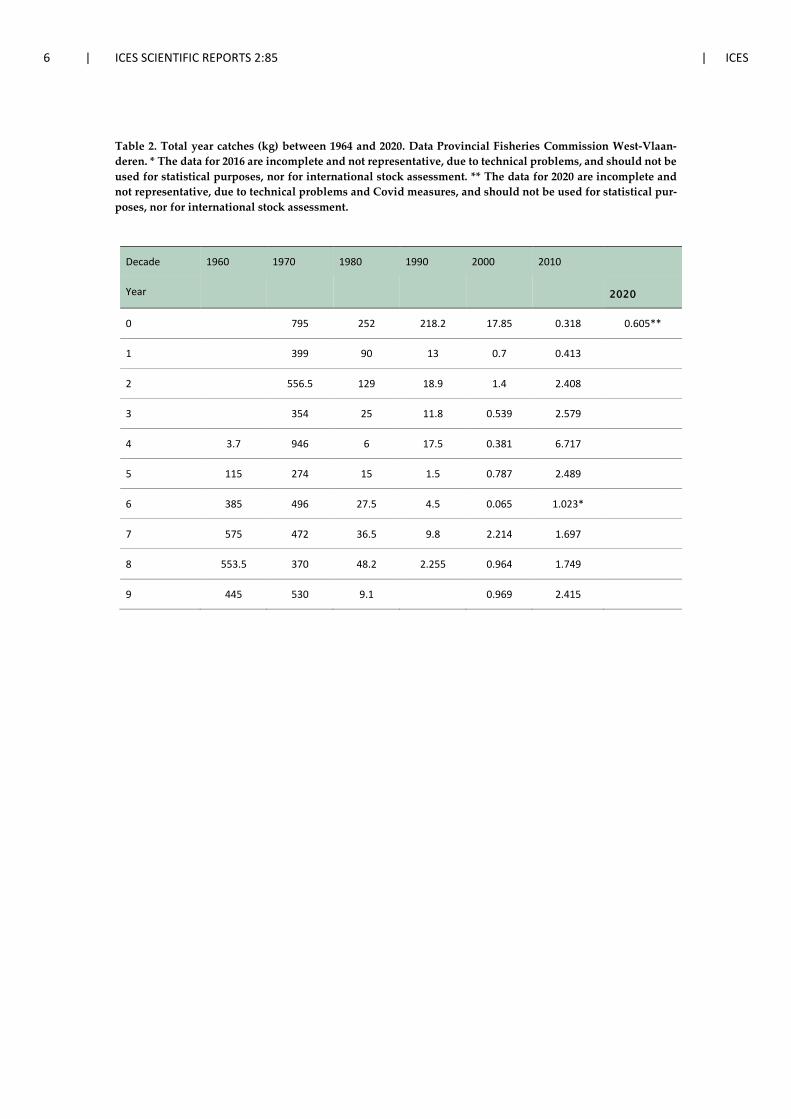
Table 2. Total year catches (kg) between 1964 and 2020. Data Provincial Fisheries Commission West-Vlaan-deren. * The data for 2016 are incomplete and not representative, due to technical problems, and should not be used for statistical purposes, nor for international stock assessment. ** The data for 2020 are incomplete and not representative, due to technical problems and Covid measures, and should not be used for statistical pur-poses, nor for international stock assessment.
Decade 1960 1970 1980 1990 2000 2010
Year 2020
0 795 252 218.2 17.85 0.318 0.605**
1 399 90 13 0.7 0.413
2 556.5 129 18.9 1.4 2.408
3 354 25 11.8 0.539 2.579
4 3.7 946 6 17.5 0.381 6.717
5 115 274 15 1.5 0.787 2.489
6 385 496 27.5 4.5 0.065 1.023*
7 575 472 36.5 9.8 2.214 1.697
8 553.5 370 48.2 2.255 0.964 1.749
9 445 530 9.1 0.969 2.415

ICES | WGEEL 2020 | 7
Figure 2A. Annual variation in glass eel catches at river Yser using the dipnet catches in the ship lock at Nieu-wpoort (total year catches and maximum day catch per season), data for the period 1964–2018. * The data for 2016 are incomplete and not representative, due to technical problems at the sluices, and should not be used for statistical purposes, nor for international stock assessment. ** The data for 2020 are incomplete and not representative, due to technical problems and Covid measures, and should not be used for statistical purposes, nor for international stock assessment.
Figure 2B. Annual variation in glass eel catches at river Yser using the dipnet catches in the ship lock at Nieu-wpoort (total year catches and maximum day catch per season), data for the period 2000–2018. * The data for 2016 are incomplete and not representative, due to technical problems at the sluices, and should not be used for statistical purposes, nor for international stock assessment. ** The data for 2020 are incomplete and not representative, due to technical problems and Covid measures, and should not be used for statistical purposes, nor for international stock assessment.
8 | ICES SCIENTIFIC REPORTS 2:85 | ICES
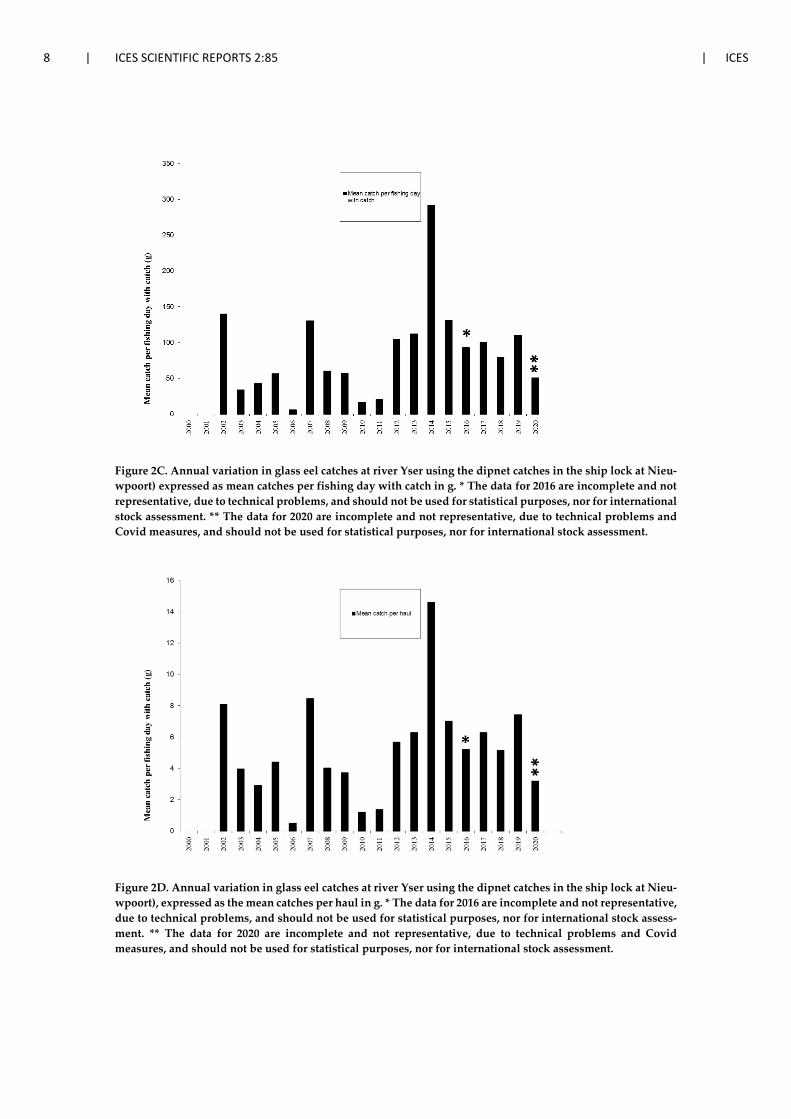
Figure 2C. Annual variation in glass eel catches at river Yser using the dipnet catches in the ship lock at Nieu-wpoort) expressed as mean catches per fishing day with catch in g. * The data for 2016 are incomplete and not representative, due to technical problems, and should not be used for statistical purposes, nor for international stock assessment. ** The data for 2020 are incomplete and not representative, due to technical problems and Covid measures, and should not be used for statistical purposes, nor for international stock assessment.
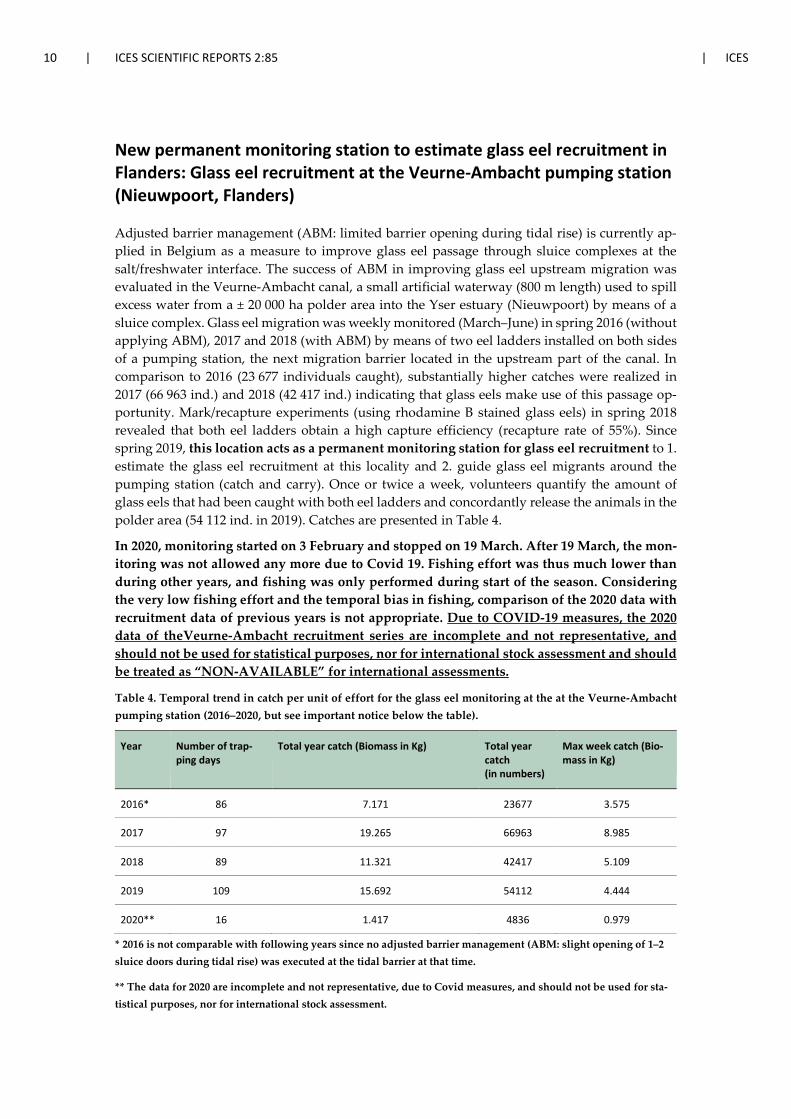
Figure 2D. Annual variation in glass eel catches at river Yser using the dipnet catches in the ship lock at Nieu-wpoort), expressed as the mean catches per haul in g. * The data for 2016 are incomplete and not representative, due to technical problems, and should not be used for statistical purposes, nor for international stock assess-ment. ** The data for 2020 are incomplete and not representative, due to technical problems and Covid measures, and should not be used for statistical purposes, nor for international stock assessment.

ICES | WGEEL 2020 | 9
Table 3. Temporal trend in catch per unit of effort for the governmental glass eel monitoring by dipnet hauls at the sluices in Nieuwpoort (River Yzer, 2002–2017). CPUE values are expressed as Kg glass eel caught per fishing day with catch and as Kg glass eel per haul. * The data for 2016 are incomplete and not representative, due to technical problems, and should not be used for statistical purposes, nor for international stock assess-ment. ** The data for 2020 are incomplete and not representative, due to technical problems and Covid measures, and should not be used for statistical purposes, nor for international stock assessment.
Year Total year catch
Max day-catch
Total year catch/Number of fishing days with catch (Kg/day)
Total year catch/Number of hauls per season (Kg/haul)
2002 1.4 0.46 0.140 0.0081
2003 0.539 0.179 0.034 0.004
2004 0.381 0.144 0.042 0.0029
2005 0.787 0.209 0.056 0.0044
2006 0.065 0.014 0.006 0.0005
2007 2.214 0.485 0.130 0.0085
2008 0.964 0.262 0.060 0.004
2009 0.969 0.274 0.057 0.0037
2010 0.318 0.1 0.017 0.0012
2011 0.412 0.067 0.021 0.0014
2012 2.407 0.35 0.105 0.0057
2013 2.578 0.686 0.112 0.0063
2014 6.717 0.77 0.292 0.0146
2015 2.489 0.487 0.131 0.0070
2016* 1.023* 0.208* 0.093* 0.0052*
2017 1.697 0.607 0.100 0.0063
2018 1.749 0.230 0.080 0.0051
2019 2.415 0.545 0.110 0.0074
2020** 0.605 0.174 0.050 0.0032
10 | ICES SCIENTIFIC REPORTS 2:85 | ICES
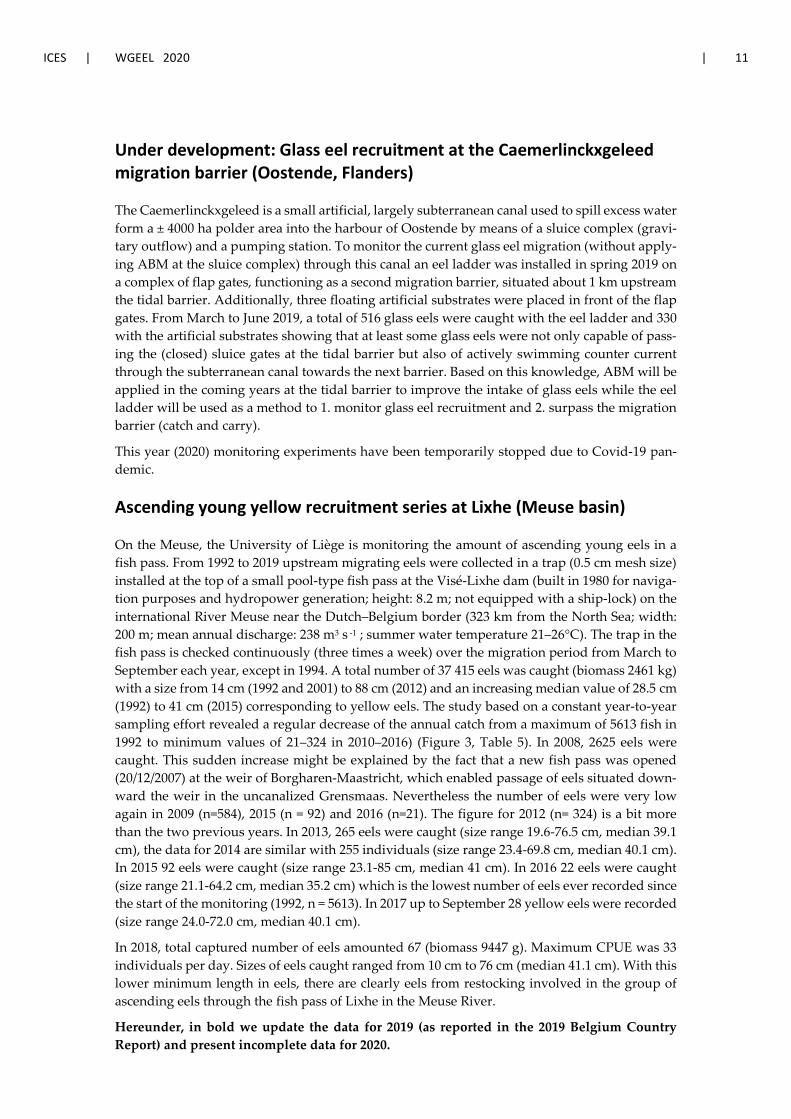
New permanent monitoring station to estimate glass eel recruitment in Flanders: Glass eel recruitment at the Veurne-Ambacht pumping station (Nieuwpoort, Flanders)
Adjusted barrier management (ABM: limited barrier opening during tidal rise) is currently ap-plied in Belgium as a measure to improve glass eel passage through sluice complexes at the salt/freshwater interface. The success of ABM in improving glass eel upstream migration was evaluated in the Veurne-Ambacht canal, a small artificial waterway (800 m length) used to spill excess water from a ± 20 000 ha polder area into the Yser estuary (Nieuwpoort) by means of a sluice complex. Glass eel migration was weekly monitored (March–June) in spring 2016 (without applying ABM), 2017 and 2018 (with ABM) by means of two eel ladders installed on both sides of a pumping station, the next migration barrier located in the upstream part of the canal. In comparison to 2016 (23 677 individuals caught), substantially higher catches were realized in 2017 (66 963 ind.) and 2018 (42 417 ind.) indicating that glass eels make use of this passage op-portunity. Mark/recapture experiments (using rhodamine B stained glass eels) in spring 2018 revealed that both eel ladders obtain a high capture efficiency (recapture rate of 55%). Since spring 2019, this location acts as a permanent monitoring station for glass eel recruitment to 1. estimate the glass eel recruitment at this locality and 2. guide glass eel migrants around the pumping station (catch and carry). Once or twice a week, volunteers quantify the amount of glass eels that had been caught with both eel ladders and concordantly release the animals in the polder area (54 112 ind. in 2019). Catches are presented in Table 4.
In 2020, monitoring started on 3 February and stopped on 19 March. After 19 March, the mon-itoring was not allowed any more due to Covid 19. Fishing effort was thus much lower than during other years, and fishing was only performed during start of the season. Considering the very low fishing effort and the temporal bias in fishing, comparison of the 2020 data with recruitment data of previous years is not appropriate. Due to COVID-19 measures, the 2020 data of theVeurne-Ambacht recruitment series are incomplete and not representative, and should not be used for statistical purposes, nor for international stock assessment and should be treated as “NON-AVAILABLE” for international assessments.
Table 4. Temporal trend in catch per unit of effort for the glass eel monitoring at the at the Veurne-Ambacht pumping station (2016–2020, but see important notice below the table).
Year Number of trap-ping days
Total year catch (Biomass in Kg) Total year catch (in numbers)
Max week catch (Bio-mass in Kg)
2016* 86 7.171 23677 3.575
2017 97 19.265 66963 8.985
2018 89 11.321 42417 5.109
2019 109 15.692 54112 4.444
2020** 16 1.417 4836 0.979
* 2016 is not comparable with following years since no adjusted barrier management (ABM: slight opening of 1–2 sluice doors during tidal rise) was executed at the tidal barrier at that time.
** The data for 2020 are incomplete and not representative, due to Covid measures, and should not be used for sta-tistical purposes, nor for international stock assessment.
ICES | WGEEL 2020 | 11
Under development: Glass eel recruitment at the Caemerlinckxgeleed migration barrier (Oostende, Flanders)
The Caemerlinckxgeleed is a small artificial, largely subterranean canal used to spill excess water form a ± 4000 ha polder area into the harbour of Oostende by means of a sluice complex (gravi-tary outflow) and a pumping station. To monitor the current glass eel migration (without apply-ing ABM at the sluice complex) through this canal an eel ladder was installed in spring 2019 on a complex of flap gates, functioning as a second migration barrier, situated about 1 km upstream the tidal barrier. Additionally, three floating artificial substrates were placed in front of the flap gates. From March to June 2019, a total of 516 glass eels were caught with the eel ladder and 330 with the artificial substrates showing that at least some glass eels were not only capable of pass-ing the (closed) sluice gates at the tidal barrier but also of actively swimming counter current through the subterranean canal towards the next barrier. Based on this knowledge, ABM will be applied in the coming years at the tidal barrier to improve the intake of glass eels while the eel ladder will be used as a method to 1. monitor glass eel recruitment and 2. surpass the migration barrier (catch and carry).
This year (2020) monitoring experiments have been temporarily stopped due to Covid-19 pan-demic.
Ascending young yellow recruitment series at Lixhe (Meuse basin)
On the Meuse, the University of Liège is monitoring the amount of ascending young eels in a fish pass. From 1992 to 2019 upstream migrating eels were collected in a trap (0.5 cm mesh size) installed at the top of a small pool-type fish pass at the Visé-Lixhe dam (built in 1980 for naviga-tion purposes and hydropower generation; height: 8.2 m; not equipped with a ship-lock) on the international River Meuse near the Dutch–Belgium border (323 km from the North Sea; width: 200 m; mean annual discharge: 238 m3 s -1 ; summer water temperature 21–26°C). The trap in the fish pass is checked continuously (three times a week) over the migration period from March to September each year, except in 1994. A total number of 37 415 eels was caught (biomass 2461 kg) with a size from 14 cm (1992 and 2001) to 88 cm (2012) and an increasing median value of 28.5 cm (1992) to 41 cm (2015) corresponding to yellow eels. The study based on a constant year-to-year sampling effort revealed a regular decrease of the annual catch from a maximum of 5613 fish in 1992 to minimum values of 21–324 in 2010–2016) (Figure 3, Table 5). In 2008, 2625 eels were caught. This sudden increase might be explained by the fact that a new fish pass was opened (20/12/2007) at the weir of Borgharen-Maastricht, which enabled passage of eels situated down-ward the weir in the uncanalized Grensmaas. Nevertheless the number of eels were very low again in 2009 (n=584), 2015 (n = 92) and 2016 (n=21). The figure for 2012 (n= 324) is a bit more than the two previous years. In 2013, 265 eels were caught (size range 19.6-76.5 cm, median 39.1 cm), the data for 2014 are similar with 255 individuals (size range 23.4-69.8 cm, median 40.1 cm). In 2015 92 eels were caught (size range 23.1-85 cm, median 41 cm). In 2016 22 eels were caught (size range 21.1-64.2 cm, median 35.2 cm) which is the lowest number of eels ever recorded since the start of the monitoring (1992, n = 5613). In 2017 up to September 28 yellow eels were recorded (size range 24.0-72.0 cm, median 40.1 cm).
In 2018, total captured number of eels amounted 67 (biomass 9447 g). Maximum CPUE was 33 individuals per day. Sizes of eels caught ranged from 10 cm to 76 cm (median 41.1 cm). With this lower minimum length in eels, there are clearly eels from restocking involved in the group of ascending eels through the fish pass of Lixhe in the Meuse River.
Hereunder, in bold we update the data for 2019 (as reported in the 2019 Belgium Country Report) and present incomplete data for 2020.

12 | ICES SCIENTIFIC REPORTS 2:85 | ICES
In 2019, 118 eels (biomass 24 779 g) were caught (size range 12.2–100.0 cm, median 29.1 cm). Maximum CPUE was 42 individuals per day. This number includes wild and stocked eels since the Belgian Meuse, downstream of Lixhe, was stocked in 2018.
In 2020, up to 17 August, 84 eels were caught (biomass 2352.2 g). Sizes of eels caught ranged from 12.4 cm to 67.3 cm (median 22.8 cm). Maximum CPUE was 40 individuals per day. This observed number of eels caught has been impacted by the Covid-19 pandemic. Due to Covid, the monitoring of the fish pass started late (from June 10, 2020). The reported number of eels includes both wild and restocked eels. On 9 March 2018, the Belgian Meuse was restocked with a great quantity of imported glass eels (110 kg, 70 sites). This figure for 2020 may be incomplete. While the 2020 data may be underestimated due to Covid, they may be used in the international analysis (considering mentioning there may be underestimation).
The decreasing trend in the recruitment of young eels in this part of the Meuse was particularly marked from 2004 onwards. The University of Liège (Nzau Matondo et al., 2015a, 2017; Nzau Matondo and Ovidio 2016) is continuing a research program financed by EFF-EU to monitor the status of ascending yellow eel stocks at Lixhe since 1992, to follow the dynamic of upstream movements of these eels in the upper parts of the Belgian Meuse River basin and to carry out for scientific purposes the restocking to enhance the local eel stocks. A fish pass located at the en-trance of Belgium from the Dutch Meuse is regularly monitored. Since 2010, each yellow eel caught in this fish pass has been tagged and its upstream migration is monitored using fixed RFID detection stations placed in fish passes located upstream in the Meuse and in the lower reaches of the Ourthe (main tributary of the Meuse) (Nzau Matondo and Ovidio 2018).
Restocking using the imported glass eels has been conducted in 2013 and 2017 thanks to FEAMP (50% UE and 50% SPW financing) projects and the population dynamics of young eel recruits are currently being monitored by electrofishing and RFID mobile telemetry in the restocked streams. A 4-year study on the behaviour and life history of eels from restocking made in 2013 was published (Nzau Matondo et al., 2019). See under Section 6 for more details on this paper.
Figure 3. Variation in the number of ascending young yellow eels trapped at the fish trap of the Visé-Lixhe dam between 1992 and 2020. Data from University of Liège (Nzau Matondo et al., 2015; Nzau Matondo and Ovidio, 2016). * Data for 2020 (n=84) include wild and stocked eels, and may be incomplete.

ICES | WGEEL 2020 | 13
Table 5. Variation in the number of ascending young yellow eels trapped at the fish trap of the Visé-Lixhe dam between 1992 and 2020. Data from University of Liège (in Philippart and Rimbaud (2005), Philippart et al., 2006, Nzau Matondo et al., 2015; Nzau Matondo and Ovidio, 2016). * Data for 2020 (n=84) include wild and stocked eels, and may be incomplete.
DECADE
Year 1990 2000 2010 2020
0 3365 249 84*
1 2915 208
2 5613 1790 324
3 1842 265
4 423 255
5 4240 758 92
6 575 22
7 2709 731 28
8 3061 2625 67
9 4664 584 118
14 | ICES SCIENTIFIC REPORTS 2:85 | ICES
2 Overview of the national stock and its management
2.1 Describe the eel stock and its management
Four international RBDs are partly lying on Belgian territory: the Scheldt (Schelde/Escaut), the Meuse (Maas/Meuse), the Rhine (Rijn/Rhin) and the Seine. For description of the river basins in Belgium see the 2006 Country Report (Belpaire et al., 2006). All RBDs are part of the NORTH SEA ICES ecoregion.
In response to the Council Regulation CE 1100/2007, Belgium has provided a single Eel Manage-ment Plan (EMP), encompassing the two major river basin districts (RBD) present on its territory: the Scheldt and the Meuse RBD.
Given the fact that the Belgian territory is mostly covered by two internationals RBDs, namely the Scheldt and Meuse, the Belgian Eel Management Plan was prepared jointly by the three Re-gional entities, each respectively providing the overview, data and measures focusing on its larger RBDs. The Belgian EMP thus focuses on the Flemish, Brussels and Walloon portions of the Schelde/Escaut RBD, and the Walloon and Flemish portions of the Meuse/Maas RBD.
The three Belgian authorities (Flanders, Wallonia or Brussels Regions) are responsible for the implementation and evaluation of the proposed EMP measures on their respective territory.
In the next years, all eel-related measures proposed in the Belgian EMP will be fine-tuned ac-cording to the existing WFD management plans and implemented in such manner by the respon-sible regional authorities.
The Belgian EMP has been approved by the European Commission on January 5th, 2010, in line with the Eel Regulation.
In June 2012, Belgium submitted the first report in line with Article 9 of the eel Regulation 1100/2007 (Vlietinck et al., 2012). This report outline focuses on the monitoring, effectiveness and outcome of the Belgian Eel Management Plan.
The second Belgian Progress Report in line with Article 9 of the eel Regulation 1100/2007, was submitted in June 2015 (Vlietinck and Rollin, 2015).
The third Belgian Progress Report in line with Article 9 of the eel Regulation 1100/2007, was submitted in June 2018.
A general overview of specific actions and approaches to assessing the status of eel, to quantify-ing the human impacts by fisheries and other human impacts, has been presented in the last Belgian country report, see Section 2.1 (Belpaire et al., 2018).
2.2 Significant changes since last report
No significant changes since the last country report. But, see Section 2.2 of the last Belgian coun-try report (Belpaire et al., 2019), apart from following action.
Evaluation of small-scale Adjusted barrier management (ABM) to improve glass eel migration at the tidal barrier (Maertensas) of the Noordede (Oostende, Flanders)
The Noordede is a heavily modified waterway currently used to drain ± 5200 ha polder area in the vicinity of Oostende. About 3 km inland, it contains a tidal barrier (Maertensas), preventing free fish migration. This barrier consists of a sluice complex with seven gravitary outflow chan-nels that are only opened to spill excess polder water at low tide into the harbour of Oostende.
ICES | WGEEL 2020 | 15
This complex was refurbished and automatized in 2017 at which time the outflow channel bor-dering the right riverbank was established as a fish-migration-channel where a small-scale ABM is applied during the glass eel season. Around equal water level (+/- 20 cm) between the sea and the polder area, the sluice door of this channel is temporally opened (20 cm) for about 30 minutes allowing the in- and outflow of water and biota. Due to the specific polder water level manage-ment, this time window is situated close to ebb tide and occurs twice each tidal cycle, during tidal rise and during tidal fall. The success of this mitigation measure was evaluated in spring 2019. The glass eel intake was quantified during ten selected tidal cycles, both under day- and night-time conditions, using a fykenet that filtered the complete inflow of the fish-migration-channel. The results show that glass eels mainly make use of this passage opportunity during tidal rise (12 283 ind. caught), the majority (98%) during nighttime. In contrast and counterintu-itive to common knowledge, also 570 individuals passed the barrier during tidal fall, again mainly during nighttime (70%). These results indicate that even short time passage windows located early during tidal rise might substantially increase glass eel intake at tidal migration bar-riers.
There was no further information available compared to last year’s report.
16 | ICES SCIENTIFIC REPORTS 2:85 | ICES
3 Impacts on the national stock
3.1 Fisheries
3.1.1 Glass eel fisheries
There are no commercial glass eel fisheries. A recent feasibility study to assess the possibilities for commercial glass eel fisheries on the River Yser, did not indicate significant potential (Pau-wels et al., 2016).
There are no recreational glass eel fisheries.
3.1.2 Yellow eel fisheries
There is no commercial fishery for yellow eel in inland waters in Belgium. Commercial fisheries for yellow eel in coastal waters or the sea are negligibly small.
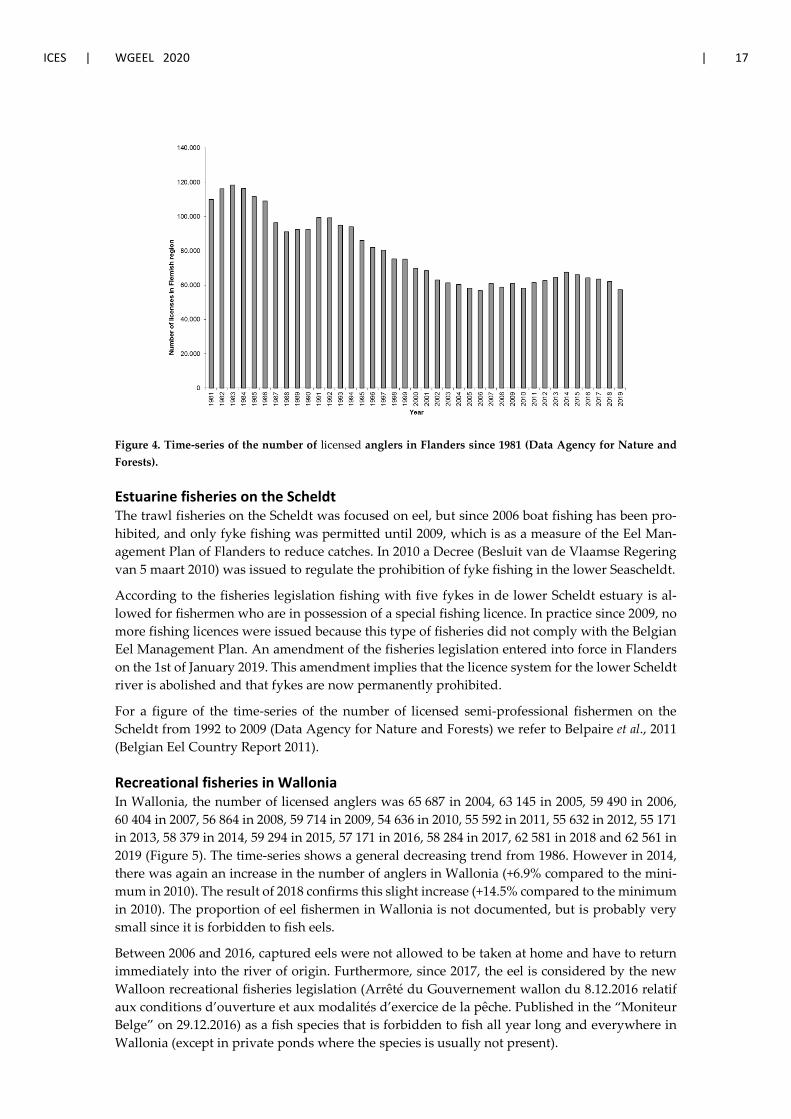
Recreational fisheries in Flanders The number of licensed anglers was 60 520 in 2004, 58 347 in 2005, 56 789 in 2006, 61 043 in 2007, 58 788 in 2008, 60 956 in 2009, 58 338 in 2010, 61 519 in 2011, 62 574 in 2012, 64 643 in 2013, 67 554 in 2014, 66 105 in 2015, 64 336 in 2016, 63 545 in 2017, 62 143 in 2018 and 57 388 in 2019. The time-series shows a general decreasing trend from 1983 (Figure 4), till 2006. However in 2007 there was again an increase in the number of Flemish anglers until 2014 when the number of anglers was 19% higher than in 2006. Since 2015, numbers are slightly decreasing again.
Only eels above the size limit of 30 cm are allowed to be taken home (since 2013). In 2013, a new legislation on river fisheries went into force (Agentschap Natuur en Bos, 2013). An amendment of the fisheries legislation entered into force in Flanders on the 1st of January 2019. Since then, the total number of eels that an angler can keep in Flanders has been reduced from five to three. There is no indication to what extent this new bag limit will have an impact on the total recreational biomass of eel retrieved by recreational fisheries.
An inquiry among Flemish fishermen was organized in 2016 (Agentschap Natuur en Bos, 2016). 10 000 fishermen were contacted, and the inquiry got a response of 28.8%. Data refer to the year 2015. The results indicated that 7% of the Flemish recreational fishermen prefer eel fishing. This is identical as in previous inquiry.
73% of the recreational fishermen fishing with a rod on eel, indicated that they take home their catch for consumption (despite advice not to do this due to contamination and associated human health risks). Eels are the second highest ranked species (after pikeperch) with respect of amounts taken home for consumption. It was estimated that over Flanders 29 523 kg of eels are retrieved annually from Flemish public water bodies to take home for consumption (as assessed for the year 2015, for a total of 66 105 recreational fishermen). This estimation is 12.1% lower than in 2008, when the retrieved yield was estimated at 33 600 kg of eels (Agentschap Natuur en Bos, 2016).
ICES | WGEEL 2020 | 17
Figure 4. Time-series of the number of licensed anglers in Flanders since 1981 (Data Agency for Nature and Forests).
Estuarine fisheries on the Scheldt The trawl fisheries on the Scheldt was focused on eel, but since 2006 boat fishing has been pro-hibited, and only fyke fishing was permitted until 2009, which is as a measure of the Eel Man-agement Plan of Flanders to reduce catches. In 2010 a Decree (Besluit van de Vlaamse Regering van 5 maart 2010) was issued to regulate the prohibition of fyke fishing in the lower Seascheldt.
According to the fisheries legislation fishing with five fykes in de lower Scheldt estuary is al-lowed for fishermen who are in possession of a special fishing licence. In practice since 2009, no more fishing licences were issued because this type of fisheries did not comply with the Belgian Eel Management Plan. An amendment of the fisheries legislation entered into force in Flanders on the 1st of January 2019. This amendment implies that the licence system for the lower Scheldt river is abolished and that fykes are now permanently prohibited.
For a figure of the time-series of the number of licensed semi-professional fishermen on the Scheldt from 1992 to 2009 (Data Agency for Nature and Forests) we refer to Belpaire et al., 2011 (Belgian Eel Country Report 2011).
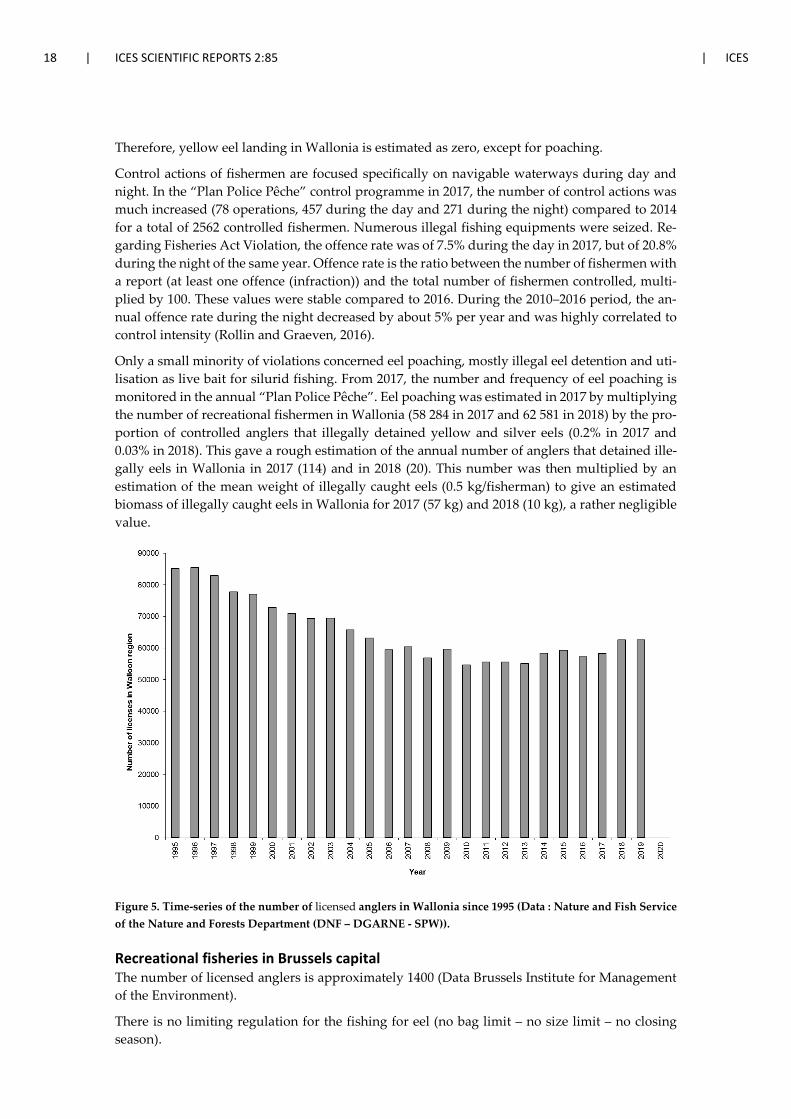
Recreational fisheries in Wallonia In Wallonia, the number of licensed anglers was 65 687 in 2004, 63 145 in 2005, 59 490 in 2006, 60 404 in 2007, 56 864 in 2008, 59 714 in 2009, 54 636 in 2010, 55 592 in 2011, 55 632 in 2012, 55 171 in 2013, 58 379 in 2014, 59 294 in 2015, 57 171 in 2016, 58 284 in 2017, 62 581 in 2018 and 62 561 in 2019 (Figure 5). The time-series shows a general decreasing trend from 1986. However in 2014, there was again an increase in the number of anglers in Wallonia (+6.9% compared to the mini-mum in 2010). The result of 2018 confirms this slight increase (+14.5% compared to the minimum in 2010). The proportion of eel fishermen in Wallonia is not documented, but is probably very small since it is forbidden to fish eels.
Between 2006 and 2016, captured eels were not allowed to be taken at home and have to return immediately into the river of origin. Furthermore, since 2017, the eel is considered by the new Walloon recreational fisheries legislation (Arrêté du Gouvernement wallon du 8.12.2016 relatif aux conditions d’ouverture et aux modalités d’exercice de la pêche. Published in the “Moniteur Belge” on 29.12.2016) as a fish species that is forbidden to fish all year long and everywhere in Wallonia (except in private ponds where the species is usually not present).
18 | ICES SCIENTIFIC REPORTS 2:85 | ICES
Therefore, yellow eel landing in Wallonia is estimated as zero, except for poaching.
Control actions of fishermen are focused specifically on navigable waterways during day and night. In the “Plan Police Pêche” control programme in 2017, the number of control actions was much increased (78 operations, 457 during the day and 271 during the night) compared to 2014 for a total of 2562 controlled fishermen. Numerous illegal fishing equipments were seized. Re-garding Fisheries Act Violation, the offence rate was of 7.5% during the day in 2017, but of 20.8% during the night of the same year. Offence rate is the ratio between the number of fishermen with a report (at least one offence (infraction)) and the total number of fishermen controlled, multi-plied by 100. These values were stable compared to 2016. During the 2010–2016 period, the an-nual offence rate during the night decreased by about 5% per year and was highly correlated to control intensity (Rollin and Graeven, 2016).
Only a small minority of violations concerned eel poaching, mostly illegal eel detention and uti-lisation as live bait for silurid fishing. From 2017, the number and frequency of eel poaching is monitored in the annual “Plan Police Pêche”. Eel poaching was estimated in 2017 by multiplying the number of recreational fishermen in Wallonia (58 284 in 2017 and 62 581 in 2018) by the pro-portion of controlled anglers that illegally detained yellow and silver eels (0.2% in 2017 and 0.03% in 2018). This gave a rough estimation of the annual number of anglers that detained ille-gally eels in Wallonia in 2017 (114) and in 2018 (20). This number was then multiplied by an estimation of the mean weight of illegally caught eels (0.5 kg/fisherman) to give an estimated biomass of illegally caught eels in Wallonia for 2017 (57 kg) and 2018 (10 kg), a rather negligible value.
Figure 5. Time-series of the number of licensed anglers in Wallonia since 1995 (Data : Nature and Fish Service of the Nature and Forests Department (DNF – DGARNE - SPW)).
Recreational fisheries in Brussels capital The number of licensed anglers is approximately 1400 (Data Brussels Institute for Management of the Environment).
There is no limiting regulation for the fishing for eel (no bag limit – no size limit – no closing season).
ICES | WGEEL 2020 | 19
3.1.3 Silver eel fisheries
Commercial There is no commercial fishery for silver eel in inland waters in Belgium. Commercial fisheries for silver eel in coastal waters or the sea are negligibly small.
Recreational No time-series available. Due to the specific behaviour of silver eel, catches of silver eel by rec-reational anglers are considered low.
3.2 Restocking
3.2.1 Amount stocked
Restocking data per management unit are not available.
All glass eel used for the Flemish and Walloon restocking programs are purchased from foreign sources (usually UK or France). There are no quarantine procedures. Nowadays, no bootlace eels, nor ongrown cultured eels are restocked.
Stocking in Flanders Glass eel and young yellow eels were used for restocking inland waters by governmental fish stock managers. The origin of the glass eel used for restocking from 1964 onwards was the glass eel catching station at Nieuwpoort on river Yser. However, due to the low catches after 1980 and the shortage of glass eel from local origin, foreign glass eel was imported mostly from UK or France.
Also young yellow eels were restocked; the origin was mainly the Netherlands. Restocking with yellow eels was stopped after 2000 when it became evident that also yellow eels used for restock-ing contained high levels of contaminants (Belpaire and Coussement, 2000). So only glass eel is stocked from 2000 on (Figure 6). Glass eel restocking is proposed as a management measure in the EMP for Flanders.
In some years, the glass eel restocking could not be done each year due to the high market prices. Only in 2003 and 2006 respectively 108 and 110 kg of glass eel were stocked in Flanders (Figure 6 and Table 6). In 2008, 117 kg of glass eel from U.K. origin (rivers Parrett, Taw and Severn) was stocked in Flemish water bodies. In 2009, 152 kg of glass eel originating from France (Gironde) was stocked in Flanders. In 2010 (April 20th, 2010) 143 kg has been stocked in Flanders. The glass eel was originating from France (area 20–50 km south of Saint-Nazaire, small rivers nearby the villages of Pornic, Le Collet and Bouin). A certificate of veterinary control and a CITES certificate were delivered.
In 2011 (21 April 2011) 120 kg has been stocked in Flemish waters. The glass eel was originating from France (Bretagne and Honfleur). A certificate of veterinary control and a CITES certificate were delivered.
In 2012, 156 kg has been stocked in Flemish waters. The glass eel was supplied from the Nether-lands but was originating from France.
In 2013, 140 kg has been stocked in Flemish waters. The glass eel was supplied via a French compagny (SAS Anguilla, Charron, France).

20 | ICES SCIENTIFIC REPORTS 2:85 | ICES
In 2014, the lower market price allowed a higher quantity of glass eel to be stocked. 500 kg has been stocked in Flemish waters. The glass eel was supplied via a French company (Aguirrebar-rena, France).
In 2015, Flanders ordered 335 kg glass eel for stocking in Flemish waters (price 190 €/kg). How-ever, the supplier was not able to supply the glass eel. Apparently, due to shortness of glass eel, suppliers prioritize fulfillment of their orders towards the more lucrative orders (e.g. by the aq-uaculture sector). As a result, no glass eel could be stocked in Flanders in 2015.
In 2016, Flanders purchased 385 kg glass eel for stocking in Flemish waters (price 180 €/kg). These glass eel were stocked on March 18th, 2016. Origin of the glass eel was France (sarl Foucher-Maury).
In 2017, Flanders bought 225 kg glass eel for stocking in Flemish waters (price 233.33 €/kg, with-out taxes). These glass eel were stocked on March 29th, 2017. Origin of the glass eel was France (sarl Foucher-Maury).
In 2018, Flanders bought 280 kg glass eel for stocking in Flemish waters (price 265 €/kg, without taxes). These glass eel were stocked on March 14th, 2018. Origin of the glass eel was France (SAS Foucher-Maury).
In 2019, Flanders bought 300 kg glass eel for stocking in Flemish waters (price 180 €/kg, without taxes). These glass eel were stocked on February, 26th, 2019. Origin of the glass eel was France (EURL AGUIRREBARRENA, St Vincent de Tyrosse, France).
In 2020, Flanders bought 300 kg glass eel for stocking in Flemish waters (price 185 €/kg, with-out taxes). These glass eel were stocked on March, 11th, 2019. Origin of the glass eel was France (EURL AGUIRREBARRENA, Zac Casablanca, 5 rue de la Cotterie – 40230, St Vincent de Ty-rosse, France).
The cost of the glass eel per kg (including transport but without taxes) is presented in Table 7.
Glass eel restocking activities in Flanders are not taking account of the variation in eel quality of the restocking sites.
ICES | WGEEL 2020 | 21
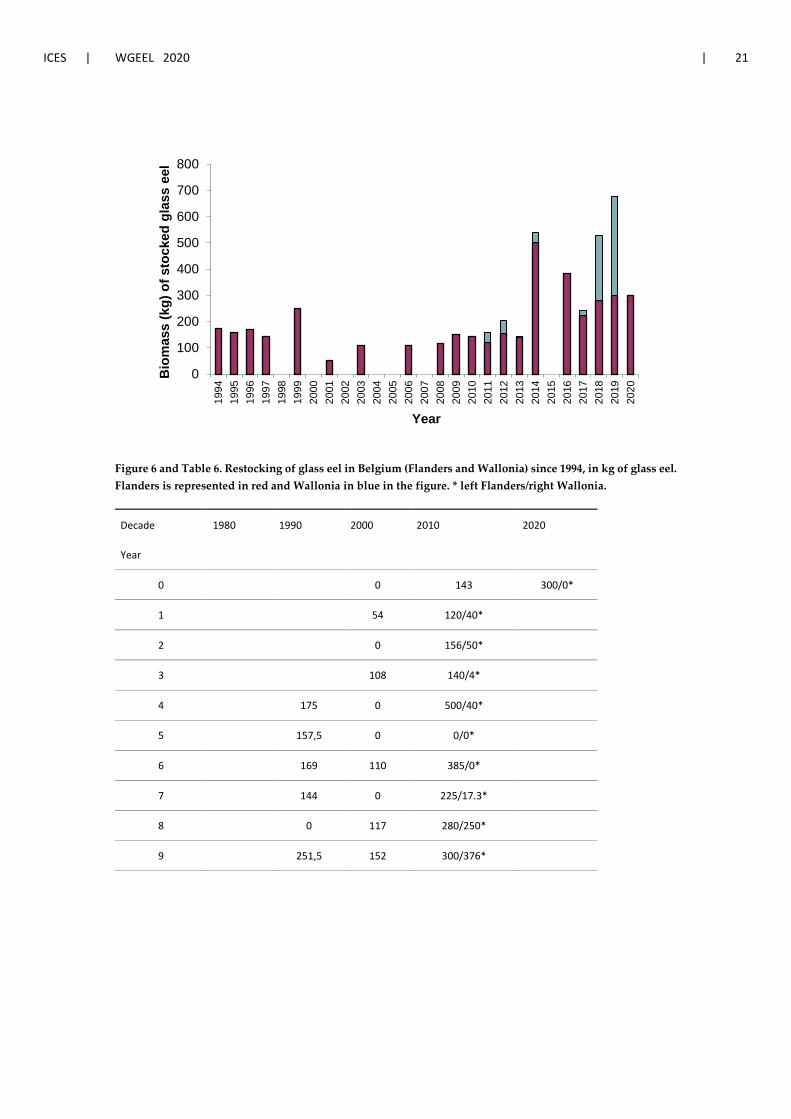
Figure 6 and Table 6. Restocking of glass eel in Belgium (Flanders and Wallonia) since 1994, in kg of glass eel. Flanders is represented in red and Wallonia in blue in the figure. * left Flanders/right Wallonia.
Decade 1980 1990 2000 2010 2020
Year
0
0 143 300/0*
1
54 120/40*
2
0 156/50*
3
108 140/4*
4
175 0 500/40*
5
157,5 0 0/0*
6
169 110 385/0*
7
144 0 225/17.3*
8
0 117 280/250*
9
251,5 152 300/376*
0
100
200
300
400
500
600
700
800
1994
1995
1996
1997
1998
1999
2000
2001
2002
2003
2004
2005
2006
2007
2008
2009
2010
2011
2012
2013
2014
2015
2016
2017
2018
2019
2020
Bio
mas
s (k
g) o
f sto
cked
gla
ss e
el
Year
22 | ICES SCIENTIFIC REPORTS 2:85 | ICES
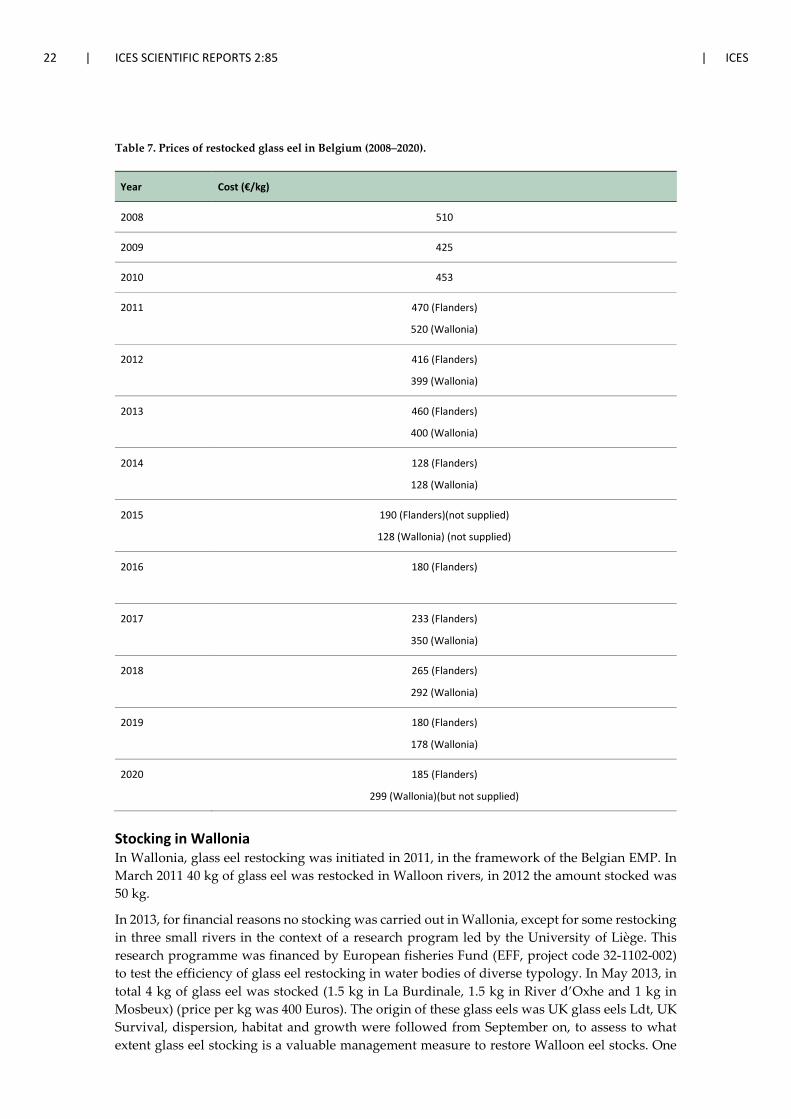
Table 7. Prices of restocked glass eel in Belgium (2008–2020).
Year Cost (€/kg)
2008 510
2009 425
2010 453
2011 470 (Flanders)
520 (Wallonia)
2012 416 (Flanders)
399 (Wallonia)
2013 460 (Flanders)
400 (Wallonia)
2014 128 (Flanders)
128 (Wallonia)
2015 190 (Flanders)(not supplied)
128 (Wallonia) (not supplied)
2016 180 (Flanders)
2017 233 (Flanders)
350 (Wallonia)
2018 265 (Flanders)
292 (Wallonia)
2019 180 (Flanders)
178 (Wallonia)
2020 185 (Flanders)
299 (Wallonia)(but not supplied)
Stocking in Wallonia In Wallonia, glass eel restocking was initiated in 2011, in the framework of the Belgian EMP. In March 2011 40 kg of glass eel was restocked in Walloon rivers, in 2012 the amount stocked was 50 kg.
In 2013, for financial reasons no stocking was carried out in Wallonia, except for some restocking in three small rivers in the context of a research program led by the University of Liège. This research programme was financed by European fisheries Fund (EFF, project code 32-1102-002) to test the efficiency of glass eel restocking in water bodies of diverse typology. In May 2013, in total 4 kg of glass eel was stocked (1.5 kg in La Burdinale, 1.5 kg in River d’Oxhe and 1 kg in Mosbeux) (price per kg was 400 Euros). The origin of these glass eels was UK glass eels Ldt, UK Survival, dispersion, habitat and growth were followed from September on, to assess to what extent glass eel stocking is a valuable management measure to restore Walloon eel stocks. One
ICES | WGEEL 2020 | 23
year after stocking, elvers were found up and downstream the unique point of the glass eels release and in the complete transversal section of these streams, with preference for the sheltered microhabitats located near the banks where water velocity and depth are low (Ovidio et al., 2015). Higher recruitment success of glass eels was observed in the Mosbeux because of its high carry-ing capacity. Recently, the mark–recapture method using the Jolly-Seber model estimated the recruitment success at 658 young eels (density 11.1 eels/m², minimal survival 15.8%) two after stocking in Mosbeux. The young eels are monitoring two times a month in Mosbeux and Vesdre using a mobile detection RFID station to study their space use and seasonal movement.
In 2014, 501 kg glass eel were ordered from a French company (Aguirrebarrena, France) with EFF 50% co-funding. Unhappily, the French supplier was unable to supply the ordered quantity and only 40 kg were restocked in 2014. Therefore, the Walloon region accepted to delay the de-livery of the remaining 461 kg glass eel in 2015. However, the French supplier was again “una-ble” to supply the ordered glass eel. The higher prices for glass eel in 2015 probably explain this situation. The French supplier was excluded from the Walloon market for three years (between 2016 and 2018), but no glass eel stocking could take place in 2015.
In 2016, no glass eels stocking was carried out in Wallonia for financial reasons. In 2017, no glass eels stocking was carried out in Wallonia because of a (new) delivery default of a French supplier (OP Estuaires).
In 2017, in the context of a survey on the effectiveness of glass eel restocking in Wallonia, the University of Liège stocked 17.3 kg of glass eel (n=76370) imported from a French company (Gur-ruchaga Maree, France) in 6 rivers (Hoegne, Wayai, Winamplanche, Berwinne, Gueule and Oxhe). Glass eels were released in 43 sites (Hoëgne: 3.9 kg at six sites; Wayai: 3.6 kg at ten sites; Winamplanche: 0.6 kg at five sites; Berwinne: 4.0 kg at eleven sites; Gueule: 4.3 kg at ten sites and Oxhe: 1 kg at one site). These rivers were both hydromorphologically and physicochemically different. Assessments conducted after restocking in ten release sites (1–2 sites/river) during au-tumn each year revealed n = 323 individuals in 2017 and n = 464 individuals in 2018 that were captured and pit-tagged. Density of recruited young eels varied between sites and was higher in more eutrophic site with bottom substrate offering good burial and water pH slightly alkaline.
In 2018, Wallonia bought 250 kg glass eel for stocking in Walloon waters (price 291.65 €/kg, with-out taxes). These glass eels were stocked on March 9th, 2018 at 256 sites, in the Belgian Meuse (110 kg, 70 sites), the Ourthe-Amblève-Aisne river system (86 kg, 83 sites), the Lesse (20 kg, 20 sites), the Sambre (13 kg, 43 sites), the Mehaigne (4 kg, eight sites) and different Walloon tribu-taries of the Scheldt (16 kg, 22 sites in rivers Dendre, Senne, Dyle, Deux Gettes and Scheldt). Origin of the glass eel was France (SAS Foucher-Maury). A certificate of veterinary control was delivered (absence of Pseudodactylogyrus, Ichthyophtirius multifiliis, Anguillicola crassus). Survival at reception was very good (maximum 0.5% mortality at stocking site).
In 2019, Wallonia bought 376 kg glass eel for stocking in Walloon waters (price 178 €/kg, without taxes). These glass eels were stocked on March 13th, 2019 in 228 sites, in the Belgian Meuse (100 kg, 78 sites), the Ourthe-Amblève-Aisne river system (156 kg, 74 sites), the Lesse-Lhomme river system (56 kg, 28 sites), the Sambre (24 kg, 24 sites), the Semois (20 kg, 12 sites) and different Walloon tributaries of the Scheldt (19 kg, 12 sites in rivers Dendre and Scheldt-Lys). Origin of the glass eel was France (SAS Foucher-Maury). A certificate of veterinary control was delivered (absence of Pseudodactylogyrus, Ichthyophtirius multifiliis, Anguillicola crassus). Survival at recep-tion was very good (maximum 1% mortality at stocking site).
In 2020, Wallonia ordered on 12 March 2020 to an eel trading company (UK Glass Eels Ldt, Gloucester, UK) 220 kg glass eel for stocking in Walloon waters (price 299 €/kg, without taxes). However, the supplier was not able to provide the glass eel due to the lockdown as a measure for the Covid-19 pandemic. As a result, no glass eel could be stocked in Wallonia in 2019 but this order remains valid, probably for 2021.
24 | ICES SCIENTIFIC REPORTS 2:85 | ICES
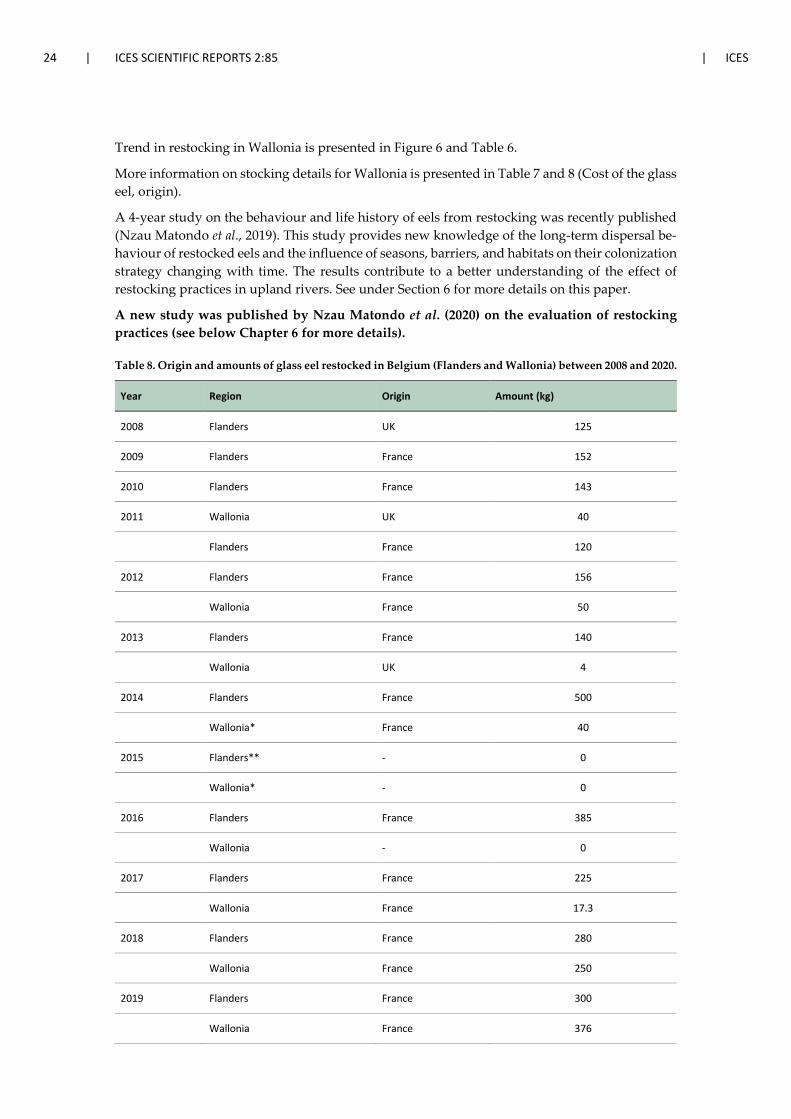
Trend in restocking in Wallonia is presented in Figure 6 and Table 6.
More information on stocking details for Wallonia is presented in Table 7 and 8 (Cost of the glass eel, origin).
A 4-year study on the behaviour and life history of eels from restocking was recently published (Nzau Matondo et al., 2019). This study provides new knowledge of the long-term dispersal be-haviour of restocked eels and the influence of seasons, barriers, and habitats on their colonization strategy changing with time. The results contribute to a better understanding of the effect of restocking practices in upland rivers. See under Section 6 for more details on this paper.
A new study was published by Nzau Matondo et al. (2020) on the evaluation of restocking practices (see below Chapter 6 for more details).
Table 8. Origin and amounts of glass eel restocked in Belgium (Flanders and Wallonia) between 2008 and 2020.
Year Region Origin Amount (kg)
2008 Flanders UK 125
2009 Flanders France 152
2010 Flanders France 143
2011 Wallonia UK 40
Flanders France 120
2012 Flanders France 156
Wallonia France 50
2013 Flanders France 140
Wallonia UK 4
2014 Flanders France 500
Wallonia* France 40
2015 Flanders** - 0
Wallonia* - 0
2016 Flanders France 385
Wallonia - 0
2017 Flanders France 225
Wallonia France 17.3
2018 Flanders France 280
Wallonia France 250
2019 Flanders France 300
Wallonia France 376
ICES | WGEEL 2020 | 25
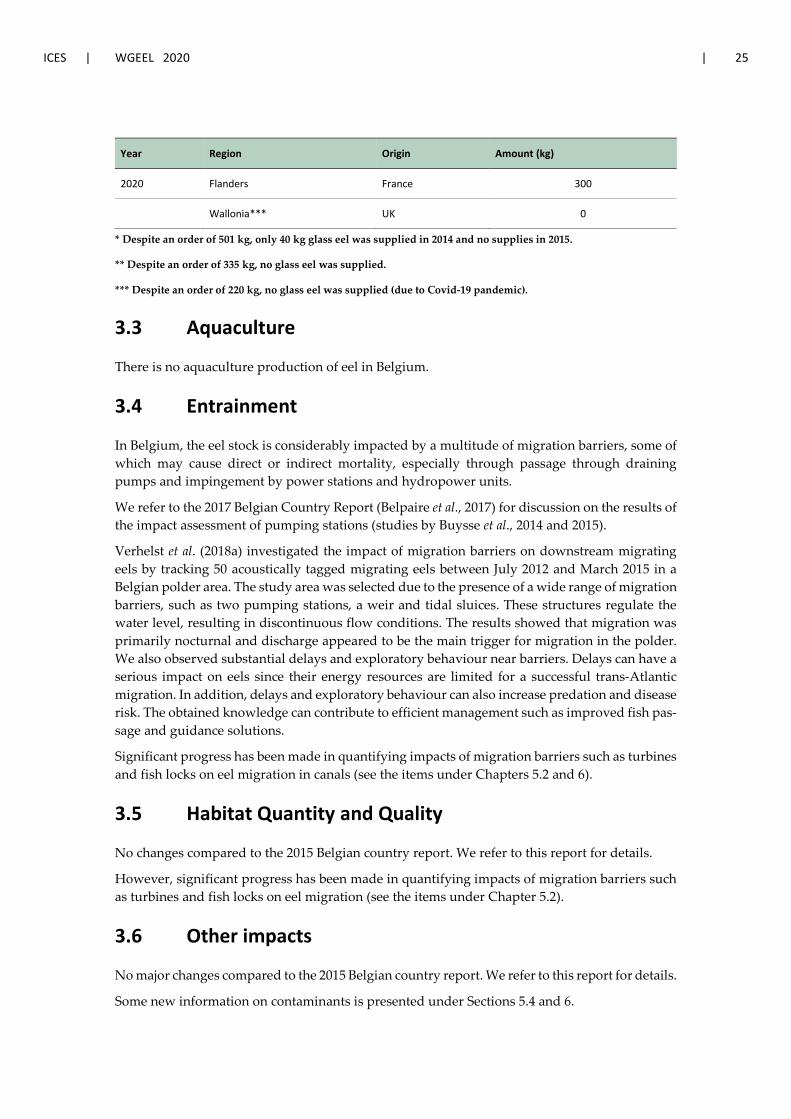
Year Region Origin Amount (kg)
2020 Flanders France 300
Wallonia*** UK 0
* Despite an order of 501 kg, only 40 kg glass eel was supplied in 2014 and no supplies in 2015.
** Despite an order of 335 kg, no glass eel was supplied.
*** Despite an order of 220 kg, no glass eel was supplied (due to Covid-19 pandemic).
3.3 Aquaculture
There is no aquaculture production of eel in Belgium.
3.4 Entrainment
In Belgium, the eel stock is considerably impacted by a multitude of migration barriers, some of which may cause direct or indirect mortality, especially through passage through draining pumps and impingement by power stations and hydropower units.
We refer to the 2017 Belgian Country Report (Belpaire et al., 2017) for discussion on the results of the impact assessment of pumping stations (studies by Buysse et al., 2014 and 2015).
Verhelst et al. (2018a) investigated the impact of migration barriers on downstream migrating eels by tracking 50 acoustically tagged migrating eels between July 2012 and March 2015 in a Belgian polder area. The study area was selected due to the presence of a wide range of migration barriers, such as two pumping stations, a weir and tidal sluices. These structures regulate the water level, resulting in discontinuous flow conditions. The results showed that migration was primarily nocturnal and discharge appeared to be the main trigger for migration in the polder. We also observed substantial delays and exploratory behaviour near barriers. Delays can have a serious impact on eels since their energy resources are limited for a successful trans-Atlantic migration. In addition, delays and exploratory behaviour can also increase predation and disease risk. The obtained knowledge can contribute to efficient management such as improved fish pas-sage and guidance solutions.
Significant progress has been made in quantifying impacts of migration barriers such as turbines and fish locks on eel migration in canals (see the items under Chapters 5.2 and 6).
3.5 Habitat Quantity and Quality
No changes compared to the 2015 Belgian country report. We refer to this report for details.
However, significant progress has been made in quantifying impacts of migration barriers such as turbines and fish locks on eel migration (see the items under Chapter 5.2).
3.6 Other impacts
No major changes compared to the 2015 Belgian country report. We refer to this report for details.
Some new information on contaminants is presented under Sections 5.4 and 6.
26 | ICES SCIENTIFIC REPORTS 2:85 | ICES
4 National stock assessment
4.1 Description of Method
The latest data regarding national stock assessment refer to the silver eel escapement assessment for the progress report 2018 of the EU Regulation as described in Belpaire et al. (2018) and the 2018 Belgian Eel Progress Tables.
We refer to these documents for detailed information.
4.1.1 Data collection
Flanders (Belpaire et al., 2018) In Flanders, the quantification of the migration of silver eel is based on model calculations. For this purpose, the total number of yellow eels per stratum River Type * River Basin is calculated on the basis of the estimated density of yellow eel (using electrofishing data) and the surface area of water courses in the eel management plan, including corrections for various factors of natural and anthropogenic mortality. The 2018 reporting is based on data collected between 1 January 2015 and 31 December 2017.
The data are supplied by Flanders’ Freshwater Fish Monitoring Network and other monitoring programs carried out by INBO’s MHAF team (“Monitoring en Herstel Aquatische Fauna”).
Flanders recently started with monitoring the silver eel migration at one site (see also Section 5.2), which enables preliminary comparison of the two evaluation methods. A first analysis on a limited set of data from this test area (Polder Noordwatering Veurne) clearly shows the potential and added value of a combined approach with both model-based estimates and follow-up and quantification of direct monitoring of the silver eel. A SWOT analysis of both methods analysed the advantages and disadvantages and potentials of both methods. The silver eel production figures obtained by the two different methods confirmed each other, but the error margins in both calculations are very significant. However, this type of approach requires a specific plan-based approach with a statistically based experimental design. We recommend to further explore the comparison between the two methods through field experiments and a targeted pilot plan.
Wallonia No new assessment available since the study of de Canet et al. (2014) in Vlietinck and Rollin (2015), except the estimation of caught eels related to poaching (see Section 3.1.2).
Based on a constant year-to-year sampling effort, a non-selective cone-trap pool retaining eels in a fish pass build in the Belgian Meuse river at Lixhe is scientifically and homogeneously moni-tored since 1992 to assessing the abundance of the ascending yellow eels from the Dutch Meuse. Scientific data processing make it possible to establish the trend of incoming stocks of wild eels in the Belgian Meuse (see Section 1.2 Time-series of recruitment).
4.1.2 Analysis
Flanders (Belpaire et al., 2018) The method for calculating the silver eel escapement rate was adjusted from the calculation mod-els used in the previous reports (Stevens en Coeck, 2013, Belpaire et al., 2015). In this new model,
ICES | WGEEL 2020 | 27
conversion of catch data to expected number per ha have been optimized, and the mortality fig-ures from recreational fisheries and cormorants have been calculated in a different way. Mortal-ities due to pumps and turbines were now integrated over the stratum River Basin on the basis of a different allocation key (in casu the proportion of the basin drained by pumps)). For cases without CPUE data within the stratum River Type * River Basin, a zero-inflated negative binomial model was used to estimate the number of eels per hectare. Furthermore, the fresh, brackish and salt tidal waters (types Mlz and O1) were considered together as one river type. The R script developed during the previous report was further adapted according to the refinement of the calculation model. The changes in the calculation model are considered to have a significant in-fluence on the results.
Wallonia The analysis used in the ascending yellow eel assessment for the period 1992–2018 for the Belgian Meuse at Lixhe in Wallonia has been reported in Nzau Matondo and Ovidio (2016), Nzau Ma-tondo et al. (2014, 2015, 2017) and Benitez et al. (2019). By monitoring a fish pass over 26 years, the number of ascending yellow eels has drastically declined (nearly 4% per year since 1992; abundance of eels in 2018 was 1.2% of the historical level in 1992). Similarly, the migration flux of ascending yellow eels estimated using mark-recapture method also dropped significantly (stock in 2013 was 0.5% in biomass and 1.6% in numbers of the historical level in 1993). In 2013, the silver eel production in the Meuse at Lixhe was estimated at 0.54% in numbers and 0.64% in biomass of ascending yellow eel stock using the DemCam model.
4.1.3 Reporting
Flanders The silver eel escapement assessment for the period 2015–2017 for Flanders has been reported in Belpaire et al. (2018).
Wallonia The ascending yellow eel assessment for the period 1992–2018 for the Belgian Meuse at Lixhe in Wallonia has been reported in Nzau Matondo and Ovidio (2016), Nzau Matondo et al. (2015, 2017) and Benitez et al. (2019). The results are reported every year to European Commission through the regional and national reports.
4.1.4 Data quality issues and how they are being addressed
Flanders (Belpaire et al., 2018) Despite these improvements (see Section 4.1.2), serious concern remains on the representative-ness of the results, as the model strongly suffers from insufficient data and for some strata data with insufficient representativeness.
The calculation model generated production figures for the canals and tidal waters. However, it is very likely that the results for these two types are highly underestimated, due to insufficient and low quality data. Here, we recommend applying specific methods for the evaluation of the yellow eel stock or for the production and escapement ratio of silver eels in these waters (con-sidering their large ratio in the total area of the eel management area).
A number of other recommendations / action points were formulated, in response to the large uncertainties and error margins inherently linked to the chosen reporting strategy.
28 | ICES SCIENTIFIC REPORTS 2:85 | ICES
Wallonia See the detailed discussion about the accuracy of the models used by de Canet et al. (2014) in the mid-term report of Vlietinck and Rollin (2015).
Based on a constant year-to-year sampling effort, a non-selective cone-trap pool retaining eels in a fish pass build in the Belgian Meuse river at Lixhe is scientifically and homogeneously moni-tored since 1992 to assessing the abundance of the ascending yellow eels from the Dutch Meuse. Scientific data processing makes it possible to establish the trend of incoming stocks of wild eels in the Belgian Meuse. However, the representativeness of the results remains a major concern, as the estimation model only concerns the migratory fraction of yellow eels over part of the Meuse without the Albert Canal (Nzau Matondo et al., 2015). It suffers greatly from a lack of annual data for both resident yellow eels and silver eels.
For the stocked eels, we use the Jolly-Seber method for assessing the stocks and survivals (Nzau Matondo et al., 2020). This method is based on the capture histories of the tagged individuals for modelling effective demographic parameters of eels. As this model requires multiple time-spaced electrofishing sessions before providing a stock history associated with each electrofish-ing session, it is not easy to implement on a large hydrographic network.
4.2 Trends in Assessment results
Flanders (Belpaire et al., 2018)
The current figures for silver eel escapement estimated with the new calculation model based on the data collected between 2015 and 2017 are 11,5% for the EMU Scheldt and 18,3% for the EMU Maas. These are the same for the EMU Scheldt as those reported in 2015, but are significantly better for EMU Maas than the figures reported in 2015. Given the use of a new calculation model, no statement can be made about the evolution of the stocks. The improvement in EMU Maas is mainly due to the application of the new calculation model.
However, on the basis of a trend analysis in which the new 2018 calculation model was applied to the data of the last two periods, the population seems to stagnate (in terms of silver eel pro-duction). Where a slight improvement for the EMU Maas is noticeable, the escapement figures for the EMU Scheldt remain at the same level (very slight decrease). The expected positive effects of the recovery measures implemented in Flanders are therefore not clearly visible in the pro-duction figures. Additional measures will have to be taken in order to achieve the objectives of the Eel Regulation (40% escapement). The introduction of a catch-and-release obligation for the recreational fisheries would contribute to an increase of about 10% of the current escapement figures.
Wallonia
The estimation of caught eels related to poaching (see Section 3.1.2) seems negligible (57 kg in 2017) compared to other pressures of anthropogenic origin on yellow and silver eels populations in Wallonia.
In the Belgian Meuse river at Lixhe ascending yellow eels are monitored (Nzau Matondo and Ovidio, 2016; Nzau Matondo et al., 2017; Benitez et al., 2019) in the old fish pass of Lixhe. For a trend analysis of incoming stocks of wild eels in the Belgian Meuse, see Section 1.2 (Recruitment time-series). Decreasing numbers of ascending yellow eels were described, as well as the fre-quency of catches, body size and the influence of environmental factors on upstream movement of the eels. In 2018, the number of ascending yellow eels reached 1.2% of the record level of 1992.

ICES | WGEEL 2020 | 29
With the weekly survival probabilities estimated greater than 95% using the best-selected Jolly-Seber model, the imported glass eels unmistakably survive in well selected upland rivers (Nzau Matondo et al., 2020). Restocking may represent a beneficial management option for enhancing the local stocks in inland waters.
30 | ICES SCIENTIFIC REPORTS 2:85 | ICES
5 Other data collection for eel
5.1 Yellow eel abundance surveys
Trend analysis of eel catches in the Flemish Fish Monitoring Network
Flanders runs a fish monitoring programme for the water Framework Directive. See 2016 country report (Belpaire et al., 2016b) for a preliminary assessment of electrofishing and fyke-fishing data from the Flemish Fish Monitoring Network showing temporal trends in eel presence and abun-dance (INBO data) over the periods 1994–2000, 2001–2005, 2006–2009 and 2010–2012. 303 loca-tions on running waters were assessed in each of the four periods.
The most recent analysis of electrofishing and fyke-fishing data has been performed in the frame-work of the 2018 progress report for the EU Eel Regulation (Belpaire et al., 2018). The evaluation of the silver eel escapement is based on modelling the yellow eel abundance data. See Section 4.1 for more details.
Estuarine fish monitoring by fykes
A fish monitoring network by INBO has been put in place to monitor fish stock in the Scheldt estuary using paired fykenets (Figure 7). Campaigns take place in spring and autumn, and also in summer from 2009 onwards. At each site, two paired fykes were positioned at low tide and emptied daily; they were placed for two successive days. Data from each survey per site were standardized as number of fish per fyke per day. Figures (Figures 8–10) below show the time trend of eel catches in six locations along the Scheldt (Zandvliet, Antwerpen, Steendorp, Kastel, Appels and Overbeke) (Data Jan Breine, INBO; Breine and Van Thuyne, 2015; Breine et al., 2019b). Data are presented until autumn 2019.
Compared to last year’s report the fall data for 2019 have now been included, and some sum-mer 2019 data have been updated. Due to Covid-19 issues, data processing and reporting for the spring and summer campaign 2020 were delayed and data were not yet available.
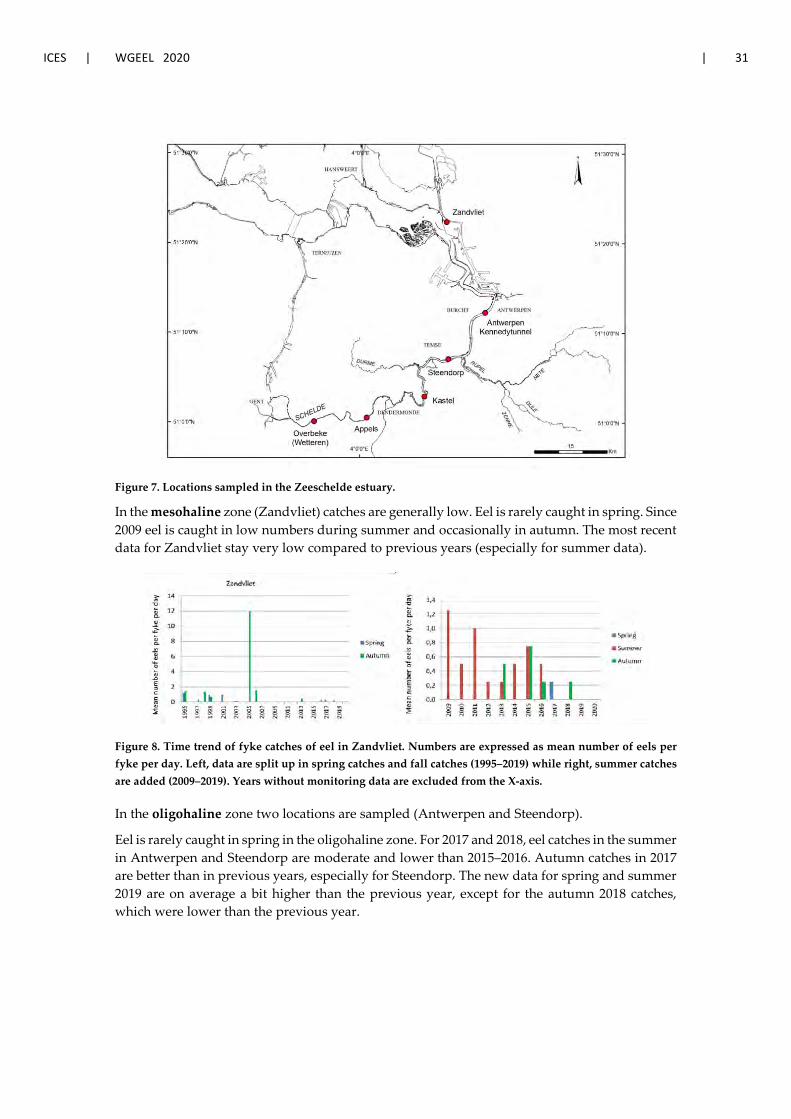
ICES | WGEEL 2020 | 31
Figure 7. Locations sampled in the Zeeschelde estuary.
In the mesohaline zone (Zandvliet) catches are generally low. Eel is rarely caught in spring. Since 2009 eel is caught in low numbers during summer and occasionally in autumn. The most recent data for Zandvliet stay very low compared to previous years (especially for summer data).
Figure 8. Time trend of fyke catches of eel in Zandvliet. Numbers are expressed as mean number of eels per fyke per day. Left, data are split up in spring catches and fall catches (1995–2019) while right, summer catches are added (2009–2019). Years without monitoring data are excluded from the X-axis.
In the oligohaline zone two locations are sampled (Antwerpen and Steendorp).
Eel is rarely caught in spring in the oligohaline zone. For 2017 and 2018, eel catches in the summer in Antwerpen and Steendorp are moderate and lower than 2015–2016. Autumn catches in 2017 are better than in previous years, especially for Steendorp. The new data for spring and summer 2019 are on average a bit higher than the previous year, except for the autumn 2018 catches, which were lower than the previous year.
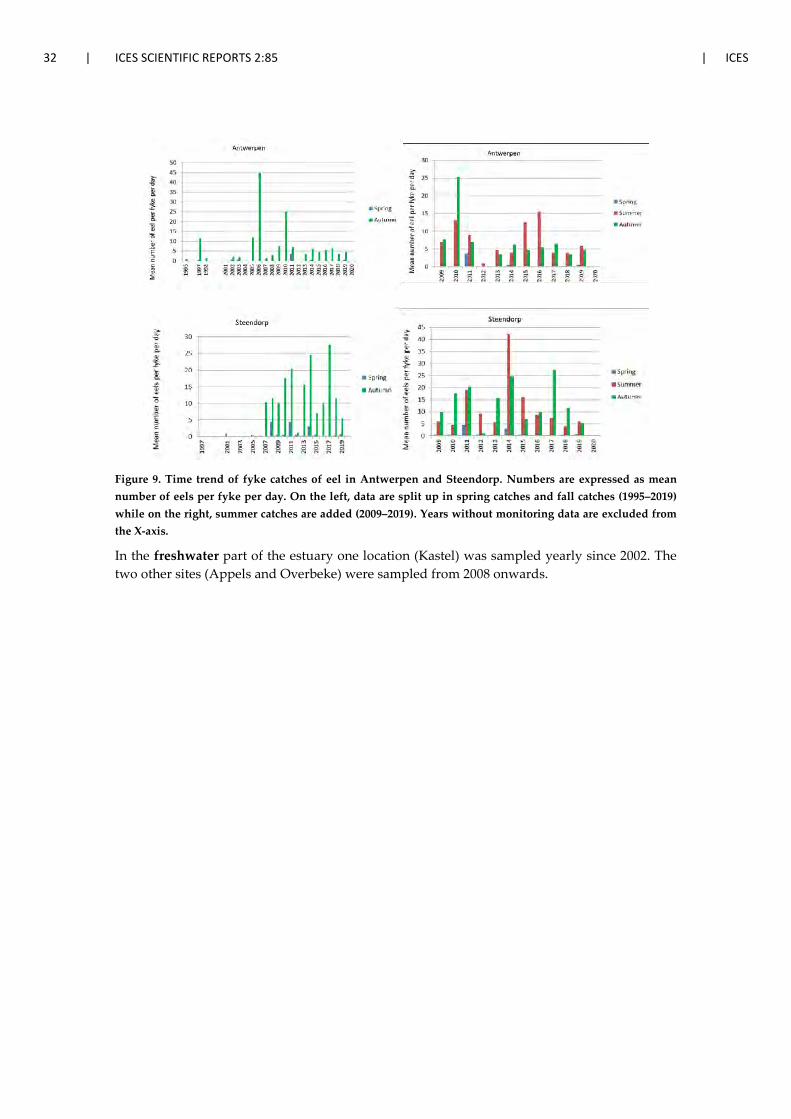
32 | ICES SCIENTIFIC REPORTS 2:85 | ICES
Figure 9. Time trend of fyke catches of eel in Antwerpen and Steendorp. Numbers are expressed as mean number of eels per fyke per day. On the left, data are split up in spring catches and fall catches (1995–2019) while on the right, summer catches are added (2009–2019). Years without monitoring data are excluded from the X-axis.
In the freshwater part of the estuary one location (Kastel) was sampled yearly since 2002. The two other sites (Appels and Overbeke) were sampled from 2008 onwards.
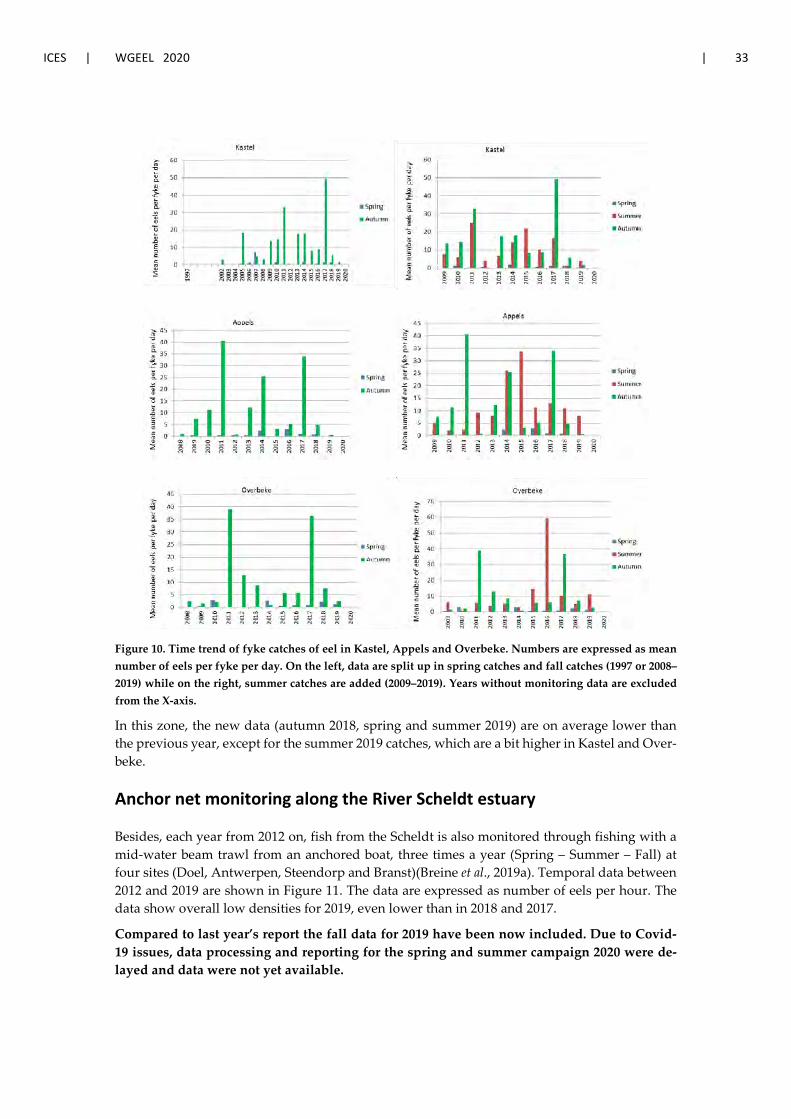
ICES | WGEEL 2020 | 33
Figure 10. Time trend of fyke catches of eel in Kastel, Appels and Overbeke. Numbers are expressed as mean number of eels per fyke per day. On the left, data are split up in spring catches and fall catches (1997 or 2008–2019) while on the right, summer catches are added (2009–2019). Years without monitoring data are excluded from the X-axis.
In this zone, the new data (autumn 2018, spring and summer 2019) are on average lower than the previous year, except for the summer 2019 catches, which are a bit higher in Kastel and Over-beke.
Anchor net monitoring along the River Scheldt estuary
Besides, each year from 2012 on, fish from the Scheldt is also monitored through fishing with a mid-water beam trawl from an anchored boat, three times a year (Spring – Summer – Fall) at four sites (Doel, Antwerpen, Steendorp and Branst)(Breine et al., 2019a). Temporal data between 2012 and 2019 are shown in Figure 11. The data are expressed as number of eels per hour. The data show overall low densities for 2019, even lower than in 2018 and 2017.
Compared to last year’s report the fall data for 2019 have been now included. Due to Covid-19 issues, data processing and reporting for the spring and summer campaign 2020 were de-layed and data were not yet available.
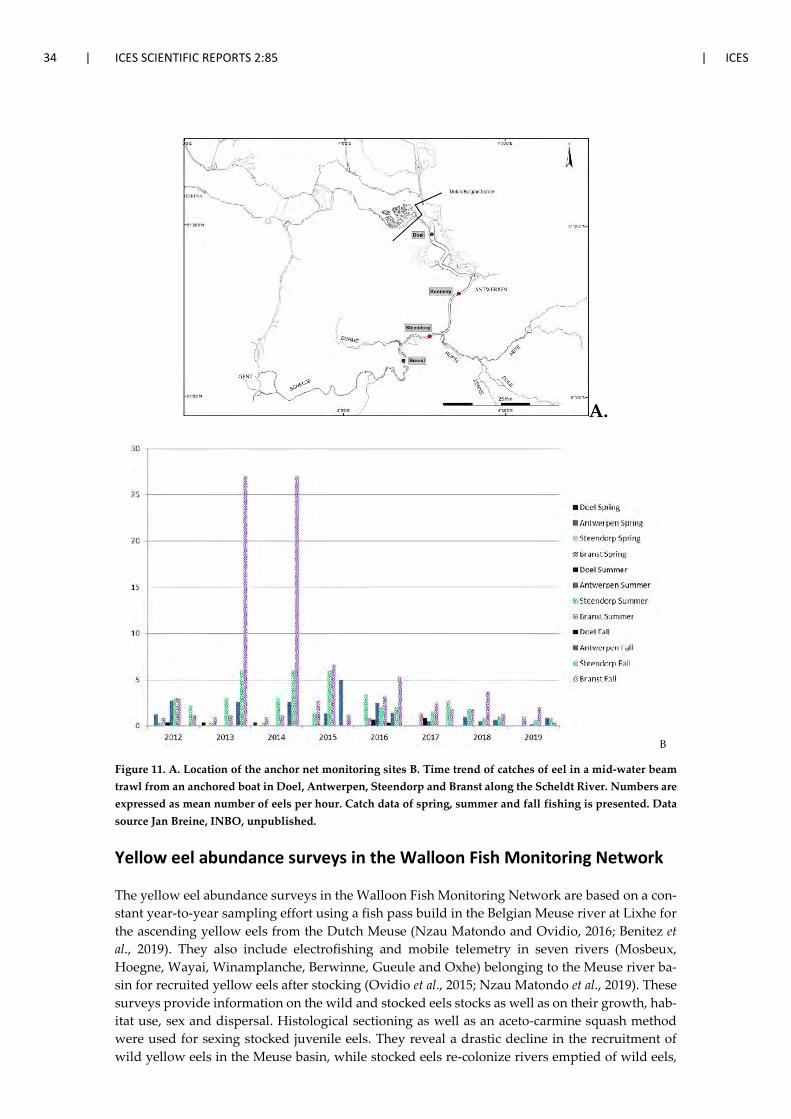
34 | ICES SCIENTIFIC REPORTS 2:85 | ICES
A.
B
Figure 11. A. Location of the anchor net monitoring sites B. Time trend of catches of eel in a mid-water beam trawl from an anchored boat in Doel, Antwerpen, Steendorp and Branst along the Scheldt River. Numbers are expressed as mean number of eels per hour. Catch data of spring, summer and fall fishing is presented. Data source Jan Breine, INBO, unpublished.
Yellow eel abundance surveys in the Walloon Fish Monitoring Network
The yellow eel abundance surveys in the Walloon Fish Monitoring Network are based on a con-stant year-to-year sampling effort using a fish pass build in the Belgian Meuse river at Lixhe for the ascending yellow eels from the Dutch Meuse (Nzau Matondo and Ovidio, 2016; Benitez et al., 2019). They also include electrofishing and mobile telemetry in seven rivers (Mosbeux, Hoegne, Wayai, Winamplanche, Berwinne, Gueule and Oxhe) belonging to the Meuse river ba-sin for recruited yellow eels after stocking (Ovidio et al., 2015; Nzau Matondo et al., 2019). These surveys provide information on the wild and stocked eels stocks as well as on their growth, hab-itat use, sex and dispersal. Histological sectioning as well as an aceto-carmine squash method were used for sexing stocked juvenile eels. They reveal a drastic decline in the recruitment of wild yellow eels in the Meuse basin, while stocked eels re-colonize rivers emptied of wild eels,
ICES | WGEEL 2020 | 35
therefore enhancing the local stock of eels. Sex of stocked eels was observed predominantly fe-male.
5.2 Silver eel escapement surveys
Development of a new permanent monitoring station to estimate silver eel escapement in Flanders
Silver eel escapement from the polder area was estimated at the Veurne-Ambacht pumping sta-tion in autumn 2017 and 2018. The Veurne-Ambacht canal, a small artificial waterway (800 m length) used to spill excess water from a ± 20 000 ha polder area into the Yser estuary (Nieu-wpoort) by means of a sluice complex. From September until December/January silver eels were caught with fykenets placed permanently in two out of four (2017) or all (2018) gravitary outflow canals from the pumping station until the migration seized at lower (< 4°C) water temperatures. The monitoring campaign from 2017 (half of the passage ways blocked by nets) yielded 450 eels (440 silver eels, 10% males). The 2018 campaign, with all four passage ways blocked by nets, obtained 1163 eels (1132 silver eels, 9.5% males). The 2018 value corresponds to only 9.6% of the expected natural silver eel escapement which matches remarkably well with a modelled estimate (9.46%) based on electric fishery data (2015–2017) of the same area. Migration peaks were obvi-ously triggered by heavy rain events when there is need to drain excess polder water into the estuary and water in the polder area starts to flow.
No escapement data were collected during fall 2019 and 2020. However, Flanders fisheries man-agement services will further investigate the feasibility to develop this site as station to periodi-cally estimate silver eel escapement.
Pop-off data storage tags to reveal marine migration routes of European eel
See under Section 6 for details or preliminary results.
Meta-analysis on European silver eel migration
See under Section 6 for details or preliminary results.
Silver eel migration from the Baltic Sea into the North Sea
See under Section 6 for details or preliminary results.
Silver eel tagging experiments in the Albert Canal (Flanders)
Last year we reported on results of tagging and migration studies at the Albert Canal connecting the Meuse River to the Scheldt Estuary, see Belgian country report 2018 and 2019 (Belpaire et al., 2018; 2019). More results are available now:
Silver eel tracking Silver eel downstream migration through the Albert canal was investigated using acoustic te-lemetry in previous research (Verhelst et al., 2018; Vergeynst et al., 2019), as mentioned in the Belgian eel country report 2019 (See under Section 6 of last year’s report for the abstracts). Ver-helst et al. (2018) observed that only one third of the downstream migrating tracked silver eels

36 | ICES SCIENTIFIC REPORTS 2:85 | ICES
reached the sea and that they migrated downstream through the shipping canal at a very slow pace. Vergeynst et al. (2019) found how eels passed the ship lock complex and how they were delayed. To understand the role of flow in passage success, Vergeynst et al. (2020) recently com-pared the eels’ passage routes and movement behaviour with the flow field, which was modelled with a Computational Fluid Dynamics model. Beside the behaviour in close proximity to the ship locks, the authors also investigated eel behaviour in the entire canal pond upstream. They found that in this highly regulated environment, where canal ponds are like water tanks with only small temporary flow outlets at the ship lock complexes, successful downstream migration depends on a complex interplay of intrinsic behaviour and environmental flow conditions. Even if a fish finds these outlets, timing and luck are detrimental factors in its passage success, only to arrive again in another canal pound that lacks cues to the downstream direction most of the time. Successful passage does not guarantee further migration success, because the route through the lock filling system is potentially harmful (Vergeynst et al., 2020). The study also revealed that 9% (five out of 58 eels that were detected near the ship lock complex, out of 64 tagged eels released further upstream) of the eels passed the complex via the hydropower plant that is installed in a by-pass channel of the ship lock complex. The harmfulness of the hydropower turbines was in-vestigated in another study (next paragraph).
Eel mortality rate at the hydropower plant of Ham (Kwaadmechelen)
Three of the six ship lock complexes on the Albert canal are equipped with a hydropower plant, generating electricity with three 10 m head Archimedes hydrodynamic screws. Pauwels et al. (n.d.) assessed the rate of eel injury and mortality, and the physical conditions during down-stream passage of these Archimedes hydrodynamic screws. The injury and mortality rates were investigated with life fish experiments with hatched eels, bream and roach. The averaged mor-tality rate of eels after forced screw passage was 3%. (This was far lower than the observed mor-tality rates for the two other investigated species: bream and roach.) The mortality rate is the average over the three rotational speeds of the screw, being 33, 40 and 48 Hz, and three repeating tests per rotational speed. The highest mortality rate observed over all tests performed was 8%, at 48 Hz. Apart from 2% of all recovered eels (dead and alive), dead eels were not externally injured. Internal injuries were not assessed. On average 11% of recovered eels were alive and suffered scratches over less than 25% of their body. Another 15% was alive but contused, and on average 2% was alive but scratched over almost half of their body. If we can assume that these scratches and contusions prevent successful downstream migration and reproduction, then this means that around 17% of all tested eels were lost from the population due to passage of this Archimedes hydrodynamic screw (Pauwels et al., (n.d.); Baeyens et al., 2019). Assuming that on average 9% of all silver eels which try to pass downstream near the ship lock complexes on the Albert canal pass via the hydropower plant, that around 17% of them are killed or severely in-jured and that this happens at every of three ship lock complexes being equipped with a hydro-power plant, means that 4,5% of all silver eels migrating downstream through the Albert canal are lost from the population due to passage of the hydropower stations.
Assessment of the silver eel escapement in Flanders
Belpaire et al. (2018) estimated the biomass of silver eels escaping from Flanders in the framework of the 2018 progress report for the EU Regulation. See for more details Chapter 4.
ICES | WGEEL 2020 | 37
Silver eel tagging in the River Meuse
An ongoing LIFE16 NAT/BE/000807 “Life4Fish” European Project is studying the downstream migration behaviour of Silver eel in the Meuse between Namur and Lixhe using acoustic telem-etry. The aim of the project conducted by Luminus in collaboration with the University of Liege, the University of Namur, EDF RandD and Profish Technology is to analyse the behaviour of the silver eel when facing the different hydropower stations of the Meuse in order to mitigations measures to improve eel survival and meet the requirements of the permits.
The project started in 2017 and will be spread until 2022. The steps of the project can be summa-rized as follow:
1. Update the stock estimation of silver eels and its sanitary state that will migrate through the six HPP concerned by the project (UNAMUR).
2. Conduct a public tender to select fish behavioural barriers that can be used at a pilot scale to increase eel passage over spillways (Luminus).
3. Develop an eel migration model able to be run as an alarm system directly by operators, to stop turbine production during the main peaks of eel run (EDF RandD).
4. Measure the efficiency of the pilot measures that will be tested using telemetry study, in comparison with the reference state already obtained during a first telemetry survey in 2017–2018 (Profish).
5. Select the best solutions observed and deployed them among the entire river stretch con-cerned in order to reach a survival rate higher than 80% for the entire eel stock passing through the 6 HPP (all partners).
6. Perform a final telemetry study to verify that the eel protection target has been achieved (Profish).
Not mentioned in these actions, ULIEGE is also involved in development of surface bypass de-sign and adapted spillage mainly targeting salmon smolts, by the use of hydraulic numerical and physical (small scale) models.
In mid-2020, the project just finished the pilot test of mitigation measures on different sites. In Namur HPP, an electrical fish fence has been tested; in Andenne HPP, the eel prediction model associated with turbine shutdown has been tested (Teichert et al., 2020); in Ivoz-Ramet HPP, a bubble curtain has been tested.
The reports of efficiency are being under analysis and are not yet available, but two years of telemetry (2017–2018 N = 150; 2019–2020 N = 140) brought lot of new insights relative to the silver eel migration in the Meuse. The concerned reports are being validated by the partners and will be published soon on a new web platform that will be dedicated to the LIFE4FISH project.
5.3 Life-history parameters
All eel which are caught by INBO during the Flemish fish Monitoring Network are measured and weighed, and after validation entered in a database. All data are available at https://vis.inbo.be/.
Belpaire et al. (2018) calculated the length–weight relationship in Flanders for 7093 eels captured through electrofishing and fyke fishing in Flanders in the period 2015–2017 (see also Belgian Country Report 2018 for a figure).
38 | ICES SCIENTIFIC REPORTS 2:85 | ICES
5.4 Diseases, Parasites and Pathogens or Contaminants
Diseases and parasites
With respect to diseases and parasites no new information is available (But see Bourillon et al., 2020, Chapter 6). We refer to the 2015 country report (Belpaire et al., 2016a) for the latest infor-mation.
Contaminants
Contaminants in silver eel A paper was published reviewing the impact of chemical pollution on Atlantic eels, including a discussion on research needs, and implications for management (Belpaire et al., 2019, see Section 6 for the abstract).
Belgium cooperated to the paper of Bourillon et al. (2020) where 482 silver eels from 12 catch-ments across Europe were analysed for three aspects of eel quality: muscular lipid content (N=169 eels), infection with Anguillicola crassus (N=482), and contamination by persistent organic pollutants (POPs, N = 169) and trace elements. Eels from Belgian river Scheldt were most im-pacted by agricultural and construction activities, PCBs, coal burning, and land use. See chapter 6 for more details on the paper.
Measuring contaminants in eel for implementation of the Water Framework Di-rective Here, we summarize the results of the general findings and trends of a four-year monitoring campaign (2015–2018) set up to fulfil the requirements of the Water Framework Directive (Biota Monitoring Flanders (Belgium)) (Teunen et al., 2020).
Surface waters and aquatic ecosystems are under constant pressure of chemical pollution, mainly of anthropogenic origin. Chemical pollutants in the environment may, in high concentrations, be harmful to aquatic ecosystems, causing habitat loss and a decrease in biodiversity. Additionally, they may be toxic to humans. The European Water Framework Directive forces member states to monitor pollutants in surface waters and defined environmental standards (EQS) for a number of priority compounds. These EQS were created in order to protect the environment against det-rimental effects of pollution. Most chemical pollutants can be measured in water or sediment samples. A set of strong hydrophobic/lipophilic components are, however, difficult to measure in water due to their poor solubility. Additionally, they are strongly bio accumulative. Via bio magnification very high concentrations can be reached in higher trophic levels. Accordingly, the European Commission created environmental standards for biota (biota EQS) for eleven priority compounds and their derivatives (Directive 2013/39/EG). Depending on the compound, they need to be measured in fish and/or fresh water bivalves.
During biota monitoring field studies conducted between 2015 and 2018, the bioaccumulation of hexachlorobenzene (HCBz), hexachlorobutadiene (HCBd), mercury (Hg), brominated dif-enylethers (PBDE), hexabromo-cyclododecane (HBCD), perfluoro-octanesulfonate (PFOS), dico-fol, heptachlor and heptachlorepoxide, and dioxins and dioxin-like compounds in muscle tissue of European perch (Perca fluviatilis) and eel (Anguilla anguilla), collected at 44 sampling locations in Flanders was measured. Additionally, PCBs were measured in these samples. PAHs were measured in bivalves.
PBDE (97%) and mercury (100%; Figure 12) exceeded their respective biota EQS in almost all sample locations. Furthermore, many exceedances were recorded for PFOS (76%) and dioxins in
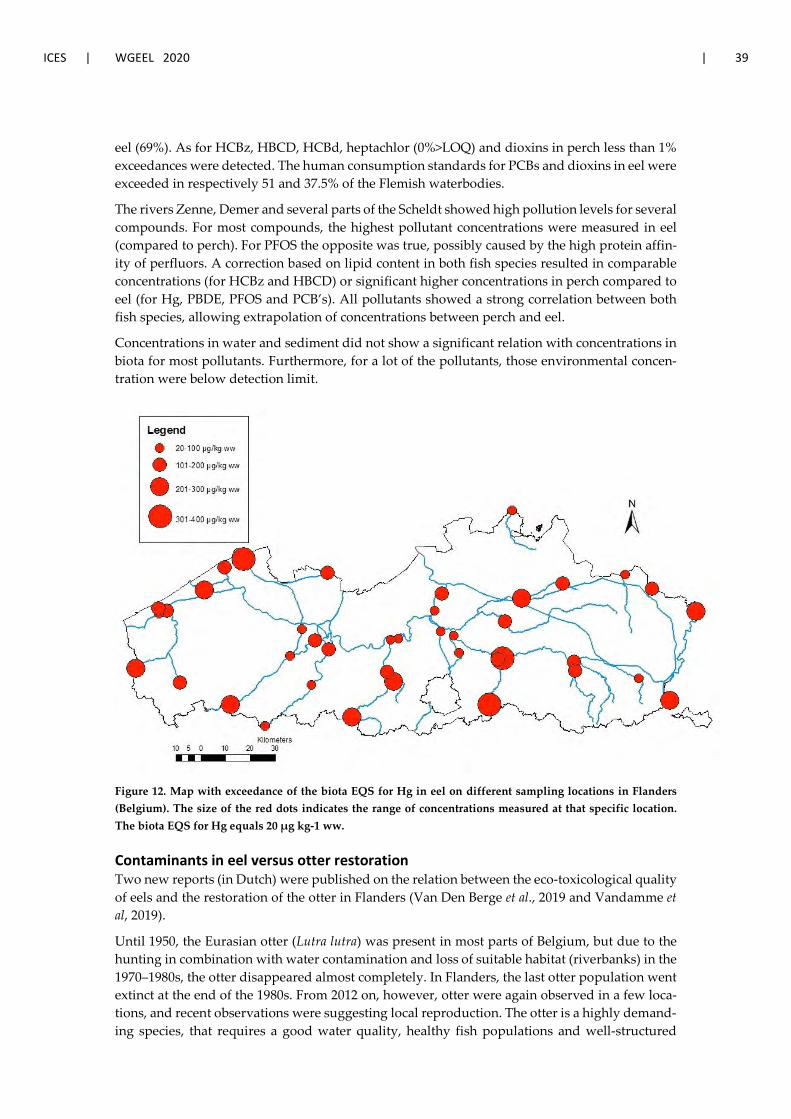
ICES | WGEEL 2020 | 39
eel (69%). As for HCBz, HBCD, HCBd, heptachlor (0%>LOQ) and dioxins in perch less than 1% exceedances were detected. The human consumption standards for PCBs and dioxins in eel were exceeded in respectively 51 and 37.5% of the Flemish waterbodies.
The rivers Zenne, Demer and several parts of the Scheldt showed high pollution levels for several compounds. For most compounds, the highest pollutant concentrations were measured in eel (compared to perch). For PFOS the opposite was true, possibly caused by the high protein affin-ity of perfluors. A correction based on lipid content in both fish species resulted in comparable concentrations (for HCBz and HBCD) or significant higher concentrations in perch compared to eel (for Hg, PBDE, PFOS and PCB’s). All pollutants showed a strong correlation between both fish species, allowing extrapolation of concentrations between perch and eel.
Concentrations in water and sediment did not show a significant relation with concentrations in biota for most pollutants. Furthermore, for a lot of the pollutants, those environmental concen-tration were below detection limit.
Figure 12. Map with exceedance of the biota EQS for Hg in eel on different sampling locations in Flanders (Belgium). The size of the red dots indicates the range of concentrations measured at that specific location. The biota EQS for Hg equals 20 µg kg-1 ww.
Contaminants in eel versus otter restoration Two new reports (in Dutch) were published on the relation between the eco-toxicological quality of eels and the restoration of the otter in Flanders (Van Den Berge et al., 2019 and Vandamme et al, 2019).
Until 1950, the Eurasian otter (Lutra lutra) was present in most parts of Belgium, but due to the hunting in combination with water contamination and loss of suitable habitat (riverbanks) in the 1970–1980s, the otter disappeared almost completely. In Flanders, the last otter population went extinct at the end of the 1980s. From 2012 on, however, otter were again observed in a few loca-tions, and recent observations were suggesting local reproduction. The otter is a highly demand-ing species, that requires a good water quality, healthy fish populations and well-structured

40 | ICES SCIENTIFIC REPORTS 2:85 | ICES
riverbanks. The study suggested that high concentrations of bio-accumulating contaminants pre-sent in food organisms like eel, such as PCB’s, dieldrin and mercury, however, hamper the con-servation or recovery of Eurasian otter populations. Areas with high concentrations of these pol-lutants in fish are incapable of supporting a sustainable otter population (Van Den Berge et al., 2019).
In another more area-specific study, assessing the eco-toxicological burden of eel and other prey fish in the focus area of the existing otter population, revealed that the current levels of mercury and PCBs in prey fish (and especially in eel) seem to stand in the way of the development of a sustainable otter population for the time being (Vandamme et al., 2019).
ICES | WGEEL 2020 | 41
6 New information
New papers published
New paper. De Meyer, J., P. Verhelst, and D. Adriaens. 2020. 'Saving the European eel: How morphological research can help in effective conservation management', Integrative and comparative biology. Doi: 10.1093/icb/icaa004
Understanding the European eel’s morphology can play an important role in function of man-agement measures, as functional morphological studies provide useful insights on how species perform behaviours that are vital for survival, such as feeding and locomotion. In addition, they allow us to evaluate how environmental changes can affect or limit such crucial behaviours. Consequently, when making conservation decisions, functional morphology represents an im-portant component that should be taken into account. Hence, in this paper, an overview is given of studies on the eel’s morphology that demonstrate both its relation with ecology and behav-iour, but are also relevant for developing and installing specific management measures.
New paper. Steendam, C., Verhelst, P., Van Wassenbergh, S. and De Meyer, J. 2020. Burrowing behaviour of the European eel (Anguilla anguilla): effects of life stage. Journal of Fish Biology (in press)
Even though the European eel is known to be a burrowing species, little is known about this behaviour. Simultaneously, insights in the burrowing behaviour, such as substrate preference and burrowing performance, might provide useful information for conservation. In this study, substrate preference and burrowing performance was evaluated in three life stages: glass, elver and yellow eel, with the latter stage being subdivided in three size classes. Glass and elver eels prefer coarse gravel (diam. > 8 mm) over fine gravel (1–2 mm) and sand, as they can swim through the gaps between the grains. For actual burrowing behaviour, eels of all life stages pre-ferred fine gravel over sandy substrates. Accordingly, burrowing efficiency was also highest in these fine gravel substrates (lower burrowing duration, less and/or lower frequency of body movements), indicating that eels chose the substrate that is most efficient for burrowing. In ad-dition, burrowing performance increased with body size as well, with glass eels requiring more body undulations than yellow eels. Surprisingly, this increase in performance does not corrobo-rate with the urge to hide, as this decreased with body size; glass and elver eels always hid into the substrate, whereas yellow eels showed less burrowing activity with increasing body size. This study thus provides novel information about the eel’s behaviour and possible habitat use, which can contribute in developing more efficient conservation measures.
New paper. Baan J, De Meyer J, De Kegel B, Adriaens D. From yellow to silver: Transforming cranial mor-phology in European eel (Anguilla anguilla). J. Anat. 2020; 00:1–9. https://doi.org/10.1111/joa.13259
Upon migration towards the Sargasso Sea, the European eel undergoes a final transformation from yellow to silver eel, a process known as silvering. This process goes along with drastic changes, such as an increase of eye size, an elongation of the pectoral fins and a thickening of the skin. However, what changes take place in the cranial musculoskeletal system has not been eval-uated yet. With 3D-reconstructions, we evaluated whether and how the system changes from yellow to silver eel, with eye size being used as a proxy for the silver stage. We show that size-corrected muscle volumes increase during silvering, associated with an increase in bite force, although these trends are insignificant. A significant increase was, however, found in the respir-atory muscle sizes. A better performing respiratory system could be beneficial during the eel’s long migration, which can include deep and potentially oxygen-poor environments. Finally, we observe that the overall skull dimensions and especially orbit size increase during silvering as

42 | ICES SCIENTIFIC REPORTS 2:85 | ICES
well, which might be necessary to accommodate the larger eyes. In addition, we compared arti-ficially matured eels with wild silver eels, with the latter having a narrower, less tall skull as well as smaller jaw muscles, which could be a side-effect of the hormonal injections of the artificially matured eels or be part of the natural maturation process as the wild silver eels had a lower eye index than the artificially matured eels.
New paper. Billy Nzau Matondo, Jean -Philippe Benitez, Arnaud Dierckx , Xavier Rollin and Michaël Ovidio, 2020. An Evaluation of Restocking Practice and Demographic Stock Assessment Methods for Cryptic Juvenile European Eel in Upland Rivers. Sustainability 12, 1124; doi:10.3390/su12031124.
Restocking of the critically endangered European eel Anguilla anguilla is widespread, but it is rarely scientifically evaluated. Methods used to assess its associated performance by estimating the survival rate and implement restocking for maximum recruitment in rivers have not yet been investigated. Based on two glass eel restocking events using a single release site/point and mul-tiple sites per river performed in upland rivers (>340 km from the North Sea), the recruitment success of stocked eels was scientifically evaluated during a 3-year study using multiple capture-mark–recapture methods and mobile telemetry. We compared the observed data with the data estimated from the Telemetry, De Lury and Jolly-Seber stock assessment methods. For recruit-ment data, Telemetry was very close to Jolly-Seber, an appropriate stock assessment method for open populations. Using the best model of Jolly-Seber, survival probability was higher (>95%) in both restocking practices, but recruitment yields were higher and densities of stocked eels were lower in multiple sites compared to a single site. Our results suggest that Telemetry can help to rapidly assess cryptic juvenile eel stocks with good accuracy under a limited number of capture-mark–recapture sessions. Artificial dispersal of glass eels on several productive habitats/sites per river appears to be the better-suited practice for restocking.
New paper. Jenna Vergeynst, Ine Pauwels, Raf Baeyens, Ans Mouton, Tom De Mulder, Ingmar Nopens, 2020. Shipping canals on the downstream migration route of European eel (Anguilla anguilla): Oppor-tunity or bottleneck? Ecology of Freshwater Fish https://doi.org/10.1111/eff.12565
Migrating fish species are worldwide in decline due to several global changes and threats. Among these causes are manmade structures blocking their freshwater migration routes. Ship-ping canals with navigation locks play a dual role in this. These canals can serve as an important migration route, offering a short cut between freshwater and the sea. In contrast, the navigation locks may act as barriers to migration, causing delays and migration failures. To better under-stand these issues for downstream migrating fish, we studied the behaviour of European eels (Anguilla anguilla) in the Albert Canal at two scales. The mid-scale contained a 27 km canal pound confined by two navigation lock complexes, in which we released and tracked 86 silver eels. The small scale was a 200 × 150 m area just in front of the most downstream complex of the canal pound, where we analysed the behaviour of 33 eels in relation to the flow field resulting from a computational fluid dynamics (CFD) model. This paper discusses the factors influencing fish behaviour, and the relation between these behaviours on both scales. On the mid-scale, migra-tion efficiency resulted from a combination of intrinsic behaviour and flow in the canal pound. Also on the small scale, intrinsic behaviour influenced the success to pass the navigation lock. Increasing the flow would create more attraction and passage opportunities and hence facilitate migration through shipping canals, but only if this flow guides the fish through safe passage routes.
ICES | WGEEL 2020 | 43
New paper. Bastien Bourillon, Anthony Acou, Thomas Trancart, Claude Belpaire, Adrian Covaci, Paco Bustamante, Elisabeth Faliex, Elsa Amilhat, Govindan Malarvannan, Laure Virag, Kim Aarestrup, Lieven Bervoets, Catherine Boisneau, Clarisse Boulenger, Paddy Gargan, Gustavo Becerra-Jurado, Javier Lobón-Cerviá, Gregory E. Maes, Michael Ingemann Pedersen, Russell Poole, Niklas Sjöberg, Håkan Wickström, Alan Walker, David Righton, Éric Feunteun, 2020. Assessment of the quality of European silver eels and tentative approach to trace the origin of contaminants – A European overview. Science of the Total Environment, 743, 140675. https://doi.org/10.1016/j.scitotenv.2020.140675.
The European eel is critically endangered. Although the quality of silver eels is essential for their reproduction, little is known about the effects of multiple contaminants on the spawning migra-tion and the European eel management plan does not take this into account. To address this knowledge gap,we sampled 482 silver eels from 12 catchments across Europe and developed methods to assess three aspects of eel quality: muscular lipid content (N=169 eels), infection with Anguillicola crassus (N=482), and contamination by persistent organic pollutants (POPs, N = 169) and trace elements (TEs, N = 75).We developed a standardized eel quality risks index (EQR) using these aspects for the subsample of 75 female eels. Among 169 eels, 33% seem to have enough muscular lipids content to reach the Sargasso Sea to reproduce. Among 482 silver eels, 93% were infected by A. crassus at least once during their lifetime. All contaminants were above the limit of quantification, except the 1,2 bis (2,4,6-tribromophenoxy)ethane (BTBPE), Ag and V. The contamination by POPs was heterogeneous between catchments while TEs were relatively homogeneous, suggesting a multiscale adaptation of management plans. The EQR revealed that eels from Warwickshire were most impacted by brominated flame-retardants and agricultural contaminants, those from Scheldt were most impacted by agricultural and construction activi-ties, PCBs, coal burning, and land use, while Frémur eels were best characterized by lower lipid contents and high parasitic and BTBPE levels. There was a positive correlation between EQR and a human footprint index highlighting the capacity of silver eels for biomonitoring human activ-ities and the potential impact on the suitability of the aquatic environment for eel population health. EQR therefore represents a step forward in the standardization and mapping of eel qual-ity risks, which will help identify priorities and strategies for restocking freshwater ecosystems.
Ongoing or new projects
Meta-analysis on European silver eel migration
All over Europe, telemetry studies have and are been conducted to reveal migration routes and the migration behaviour of seaward migrating silver eels. The rationale behind these studies can be fundamental insight, but often involve applied research related to habitat restoration and overcoming migration barriers. In this pan-European study, we brought together telemetry data on European silver eels from 19 projects/locations and nine countries (number of projects/loca-tions between brackets per country): Belgium (five), Denmark (one), France (three), Germany (one), Lithuania (one), Norway (one), Portugal (one), The Netherlands (three) and the UK (three). This was done under the framework of the European Tracking Network (ETN, http://www.lifewatch.be/etn/). The ETN aims at delivering multiple benefits for the scien-tific community: (1) detecting animals on telemetry networks beyond a specific research area (especially when acoustic telemetry is involved), (2) a proper tool to manage and analyse your data and (3) creating a scientific social network of telemetry scientists. Bringing together silver eel telemetry data from freshwater and transitional systems all over Europe allows to conduct a meta-analysis on the migration behaviour. In this meta-analysis, the migration speeds will be linked with spatio-temporal resolutions and biometric measurements (e.g. size and sex) to reveal important insights in how the migration is orchestrated in relation to the spawning period. Fur-thermore, comparing migration speeds between systems with different anthropogenic stressors can reveal their relative impacts on the migration behaviour and speed. The results of this study
44 | ICES SCIENTIFIC REPORTS 2:85 | ICES
not only contribute to the fundamental knowledge of the species, but will aid conservation through translation into management.
Pop-off data storage tags to reveal marine migration routes of European eel (update of 2019 report) The migration routes of European eel have mainly been deduced and studied in freshwater and estuarine systems, yet, their routes in marine environments remain elusive. Nonetheless, im-proving our knowledge on that front could reveal important aspects of the life cycle since the largest part of their migration is fulfilled in the marine environment. Tracking silver eels from the Southern North Sea into the Atlantic will expose how eels handle the dynamic hydrology of the English Channel. For instance, if eels apply selective tidal stream transport as they do in estuaries or already start with diel vertical migration. Data is obtained via the tagging of eels with pop-off data storage tags in the Veurne-Ambacht Canal (Nieuwpoort, Belgium) and the Rivers Elbe and Eider (Germany) with an additional two datasets from pop-off satellite archival tags from the River Eider. In Belgium, 102 eels have been tagged in 2018, another 60 in 2019 and this year 70 more will be tagged. In Germany 82 eels were tagged in 2011 and 2012. This study is a collaboration between Ghent University (Belgium), Centre for Environment, Fisheries and Aq-uaculture Science (UK), Flanders Marine Institute (Belgium), the Research Institute for Nature and Forest (Belgium), Swedish University of Agricultural Sciences (Sweden), Institute of Inland Fisheries Potsdam Sacrow (Germany) and the Thünen Institute of Fisheries Ecology (Germany).
Silver eel migration from the Baltic Sea into the North Sea DTU Denmark (Professor Kim Aarestrup and Dr Martin Lykke Kristensen) and Ghent Univer-sity have tagged 70 silver eels with acoustic transmitters and pop-off data storage tags in 2019 to identify the migration routes and behaviour of eels migrating from the Baltic Sea into the North Sea. Not only will the results illustrate how the eels change behaviour when moving from the relative shallow, hydrologically low-dynamic Baltic Sea into the deeper waters along the coast of southern Sweden and Norway, information may be revealed on the capture rate by commer-cial fishing. Additionally, since eels were single (either acoustic or pop-off data storage tag) or double tagged (acoustic and pop-off data storage tag) a comparative study can be conducted on the effect of external pop-off data storage tag attachment on the progression speed by the eels.
ICES | WGEEL 2020 | 45
7 References
Agentschap voor Natuur en Bos, 2013. Officieuze coördinatie van de visserijreglementering. 19 April 2013.
Agentschap voor Natuur en Bos, 2016. Enquête bij hengelaars op openbaar water. 11 april 2016. ANB-VF/2015/4. M.A.S. – Market Analysis and Synthesis, 63p.
Baan, J., J. De Meyer, B. De Kegel, and D. Adriaens. 2020. 'From yellow to silver: Transforming cranial morphology in European eel (Anguilla anguilla)', J Anat.
Baeyens, R. and, I. S. Pauwels, D. Buysse, A. M. Mouton, I. Vergeynst, J. Papadopoulos, N. De Maerteleire, S. Pieters, E. Gelaude, K. Robberechts, P. Verhelst, L. Vermeersch, S., Vandamme, and J. Coeck, 2019. Monitoring van de effecten van de pompinstallatie en waterkrachtcentrale te Ham op het visbestand in het Albertkanaal. Brussels, Belgium.
Belpaire, C. 2002. Monitoring of glass eel recruitment in Belgium. In: Dekker W. (Ed.) Monitoring of glass eel recruitment. Netherlands Institute of Fisheries research, report C007/02-WD, Volume 2B, pp. 169–180.
Belpaire, C. 2006. Report on the eel stock and fishery in Belgium 2005. In FAO European Inland Fisheries Advisory Commission; International Council for the Exploration of the Sea. Report of the 2006 session of the Joint EIFAC/ICES Working Group on Eels. Rome, 23–27 January 2006. EIFAC Occasional Paper. No. 38, ICES CM 2006/ACFM:16. Rome, FAO/Copenhagen, ICES. 2006. 352p., 217–241.
Belpaire, C. and Coussement, M. 2000. Nota omtrent het uitzetten van paling in de Vlaamse openbare waters. [Note on the restocking of glass eel in Flandrian public waters]. Advice for the High Fisheries Council (March 20, 2000). Institute for Forestry and Game Management, Vlaamse Vereniging van Hengelsport Verbonden, IBW.Wb.V.ADV.2000.070 (in Dutch).
Belpaire, C., Adriaens, D., Breine, J., Buysse, D., Geeraerts, C., Ide, C., Lebel, A., Philippart, J.C., Stevens, M., Rollin, X., Vlietinck, K. 2011. Report on the eel stock and fishery in Belgium 2010/'11. 44 pages.
Belpaire C., Verschelde P., Maes Y., Stevens M., Van Thuyne G., Breine J., Coeck J. 2015. Berekening van het ontsnappingspercentage van zilverpaling ten behoeve van de 2015 rapportage voor de Palingverordening. Rapporten van het Instituut voor Natuur- en Bosonderzoek 2015 (INBO.R.2015.9679951). Instituut voor Natuur- en Bosonderzoek, Brussel.
Belpaire, C., Breine, J., Buysse, D., Van Wichelen, J., Coeck, J., Ovidio, M., Nzau Matondo, B., De Meyer, J., Bouilliart, M., Adriaens, D., Verhelst, P., Roland, K., Kestemont, P., Bervoets, L., Darchambeau, F., Rol-lin, X., Vlietinck, K. 2016a. Report on the eel stock and fishery in Belgium 2014/’15. In: ICES. 2016. Report of the Joint EIFAAC/ICES/GFCM Working Group on Eel (WGEEL), 24 November–2 December 2015, Antalya, Turkey. ICES CM 2015/ACOM:18. 130 pp.
Belpaire, C., Van Thuyne, G., Breine, J., Buysse, D., Van Wichelen, J., Coeck, J., Ovidio, M., Nzau Matondo, B., De Meyer, J., Bouilliart, M., Adriaens, D., Verhelst, P., Rees J.F., Rollin, X., Vlietinck, K. 2016b. Report on the eel stock, fishery and other impacts, in: Belgium, 2016. In: ICES. 2016. Report of the Working Group on Eels (WGEEL), 15–22 September 2016, Cordoba, Spain. ICES CM 2016/ACOM:19. 107 pp.
Belpaire C., Verschelde P., Maes Y., Van Thuyne G., Van Wichelen J., Buysse D., Breine J., Verreycken H. 2018. Berekening van het ontsnappingspercentage van zilverpaling ten behoeve van de 2018 rapportage voor de Palingverordening. Rapporten van het Instituut voor Natuur- en Bosonderzoek 2018 (65). Instituut voor Natuur- en Bosonderzoek, Brussel. DOI: doi.org/10.21436/inbor.14744967.
Belpaire, C., Breine, J., Van Wichelen, Pauwels, I., Nzau Matondo, B., Ovidio, M., De Meyer, J., Vergeynst, J., Verhelst, P., Adriaens, D., Teunen, L., Bervoets, L., Rollin, X., Vlietinck, K. 2018. Report on the eel stock, fishery and other impacts, in: Belgium, 2018. In: ICES. 2018. Report of the Joint EI-FAAC/ICES/GFCM Working Group on Eels (WGEEL), 5–12 September 2018, Gdańsk, Poland. ICES CM 2018/ACOM:15. 152 pp.
46 | ICES SCIENTIFIC REPORTS 2:85 | ICES
Belpaire, C., Hodson, P., Pierron, F., Freese, M. 2019. Impact of chemical pollution on Atlantic eels: Facts, research needs, and implications for management. Current Opinion in Environmental Science and Health 11: 26–36.
Belpaire, C., Breine, J., Van Wichelen, Nzau Matondo, B., Ovidio, M., Vergeynst, J., Verhelst, P., Teunen, L., Bervoets, L., Rollin, X., Vlietinck, K. 2019. Report on the eel stock, fishery and other impacts, in Belgium, 2019. In: ICES. 2019. Joint EIFAAC/ICES/GFCM Working Group on Eels (WGEEL). ICES Scientific Re-ports. 1:50. 177 pp. http://doi.org/10.17895/ices.pub.5545.
Benitez, J.P., Dierckx, A., Nzau Matondo, B., Philippart, J.C., Mandiki, R., Erraud, A., Kestemont, P., Ovidio, M. 2019. Rapport final annuel 2019 au Service Public de Wallonie (DGARNE/DNF-SP) de la Subvention 2018–2019 relative au suivi scientifique de la réhabilitation du saumon atlantique dans le bassin de la Meuse. Université de Liège et Université de Namur, 159 pages.
Bourillon, B., Anthony Acou, Thomas Trancart, Claude Belpaire, Adrian Covaci, Paco Bustamante, Elisa-beth Faliex, Elsa Amilhat, Govindan Malarvannan, Laure Virag, Kim Aarestrup, Lieven Bervoets, Ca-therine Boisneau, Clarisse Boulenger, Paddy Gargan, Gustavo Becerra-Jurado, Javier Lobón-Cerviá, Gregory E. Maes, Michael Ingemann Pedersen, Russell Poole, Niklas Sjöberg, Håkan Wickström, Alan Walker, David Righton, Éric Feunteun. 2020. Assessment of the quality of European silver eels and tentative approach to trace the origin of contaminants – A European overview. Science of The Total Environment, 743, 140675. https://doi.org/10.1016/j.scitotenv.2020.140675.
Breine, J., L. Galle, I. Lambeens, Y. Maes, T. Terrie en G. Van Thuyne. 2019a. Monitoring van de visgemeenschap in het Zeeschelde-estuarium. Ankerkuilcampagnes 2018. Rapporten van het Instituut voor Natuur- en Bosonderzoek 2019 (7). 68pp.
Breine, J., L. Galle, I. Lambeens, Y. Maes, T. Terrie and G. Van Thuyne. 2019b. Opvolgen van het visbestand in het Zeeschelde-estuarium. Viscampagnes 2018. Rapporten van het Instituut voor Natuur- en Bosonderzoek 2019 (27). 81 pp.
Breine, J., Van Thuyne, G. 2015. Opvolging van het visbestand in de Zeeschelde: Viscampagnes 2014. INBO.R.2015.6977363. Rapporten van het Instituut voor Natuur- en Bosonderzoek 2015. 65 pp.
Buysse, D., Mouton, A.M., Bayens, R., Coeck, J. 2015. Evaluation of downstream migration actions for eel at an Archimedes screw pump pumping station. Fisheries Management and Ecology 22, 286–294.
Buysse, D., Mouton, A.M., Stevens, M., Van den Neucker, T., Coeck, J. 2014. Mortality of European eel after downstream migration through two types of pumping stations. Fisheries Management and Ecology, 21, 13–21 online doi: 10.1111/fme.12046.
de Canet, L., Briand, C., Beaulaton, L., Roland, K., Kestemont, P. 2014. Eel density analysis (EDA 2.0), Silver eel (Anguilla anguilla) escapement in the Meuse basin (DRAFT). Draft Report Université de Namur, EPTB-Vilaine, ONEMA.
De Meyer, J., P. Verhelst, and D. Adriaens. 2020. 'Saving the European eel: How morphological research can help in effective conservation management', Integrative and comparative biology.
Eel Management Plan for Belgium 2009. 172 pages.
Nzau Matondo B., Ovidio M. 2018. Decreased stock entering the Belgian Meuse is associated with the loss of colonisation behaviour in yellow-phase European eels. Aquatic Living Resources 2018, 31, 7. https://doi.org/10.1051/alr/2017047.
Nzau Matondo, B., Benitez, J-P., Dierckx, A., Philippart, J-C., Ovidio, M. 2014. Arrival of European eel in Belgian part of the Meuse: who and how are they? Proceedings of the 10th International Conference on Ecohydraulics, Trondheim, Norway http://hdl.handle.net/2268/170392.
Nzau Matondo, B., J. P. Benitez, A. Dierckx, J. C. Philippart, M. Ovidio. 2017. Assessment of the entering stock, migration dynamics and fish pass fidelity of European eel in the Belgian Meuse River. River Res. Applic. 33:292–301. DOI: 10.1002/rra.
Nzau Matondo, B., Ovidio, M. 2016. Dynamics of upstream movements of the European eel Anguilla an-guilla in an inland area of the River Meuse over the last 20 years Environ Biol Fish (2016) 99:223–235 DOI 10.1007/s10641-016-0469-x.
ICES | WGEEL 2020 | 47
Nzau Matondo, B., Philippart, J.C., Dierckx, A., Benitez, J.P, Rimbaud, G. and Ovidio, M. 2015. Estimation de l’abondance du stock des anguilles recrutées par migration de remontée dans la Meuse en Wallonie et réalisation des essais de repeuplement en juvéniles. Rapport final du projet financé par le Fonds européen pour la Pêche (Code projet: 32-1102-002) et Service Public de Wallonie, Département de la Nature et des Forêts. Laboratoire de Démographie des Poissons et d’Hydroécologie de l’Université de Liège, 135 pages.
Nzau Matondo, B., Seleck E., Dierckx, A. Benitez, J. P., Rollin, X., Ovidio, M. 2019. What happens to glass eels after restocking in upland rivers? A long-term study on their dispersal and behavioural traits. Aquatic Conservation: Marine and Freshwater Ecosystems 29:374–388.
Nzau Matondo, Benitez, J. P., Dierckx, A., Rollin, X., Ovidio, M. 2020. An evaluation of restocking practice and demographic stock assessment methods for cryptic juvenile European eel in upland rivers. Sus-tainibility 12, 1124; DOI : 10.3390/su12031124.
Ovidio, M., Tarrago-Bès, F., Nzau Matondo, B. 2015. Short-term responses of glass eels transported from UK to small Belgian streams. Ann. Limnol. - Int. J. Lim. 51:219–226. DOI : 10.1051/limn/2015016.
Pauwels, I. S., R. Baeyens, G. Toming, M. Schneider, D. Buysse, J. Coeck, and J. A. Tuhtan. No date. Multi-species assessment of injury, mortality and physical conditions during downstream passage through a large Archimedes hydrodynamic screw (Albert canal, Belgium). Sustainability.
Pauwels, I., Van Wichelen, J., Vandamme, L., Vught, I., Van Thuyne, G., Auwerx, J., Baeyens, R., De Marteleire, N., Gelaude, E., Picavet, B., Pieters, S., Robberechts, K., Belpaire, C., Coeck, J. 2016. Wetenschappelijke onderbouwing en ondersteuning van het visserijbeleid en het visstandbeheer - onderzoeksprogramma visserij 2015: eindrapport. Rapporten van het Instituut voor Natuur- en Bosonderzoek 2016. Instituut voor Natuur- en Bosonderzoek, Brussel.
Philippart, J.C., Rimbaud G. 2005. L’efficacité de la nouvelle grande échelle à poissons du barrage de Visé-Lixhe sur la Meuse. Eléments du suivi scientifique 1999–2004. [Efficiency of the new large fish pass at the Visé-Lixhe dam on the river Meuse. Follow-up 1999–2004]. Draft report: 50 years of Fonds Piscicole.
Philippart, J-C. 2006. L’érosion de la biodiversité: les poissons. Dossier Scientifique réalisé dans le cadre de l’éla-boration du rapport analytique 2006–2007 sur l’état de l’environnement Wallon. Université de Liège. 306 pp.
Rollin, X., Graeven, C. 2016. Bilan du Plan Police Pêche en Wallonie : Période 2010–2015. Rapport interne du Département Nature et Forêt, DGO3, Service Public de Wallonie, 18 p.
Steendam, C., Verhelst, P., Van Wassenbergh, S. and De Meyer, J. 2020. Burrowing behavior of the European eel (Anguilla anguilla): effects of life stage. Journal of Fish Biology. In press.
Stevens M., Coeck M. 2013. Berekening van het ontsnappingspercentage van zilverpaling in Vlaanderen. Wetenschappelijke ondersteuning voor de eerste rapportering over de opvolging van het palingbeheerplan. Rapporten van het Instituut voor Natuur- en Bosonderzoek 2013 (18). Instituut voor Natuur- en Bosonderzoek, Brussel.
Teichert, N.; Tétard, S.; Trancart, T.; Feunteun, E.; Acou, A.; De Oliveira, E. 2020. Resolving the trade-off between silver eel escapement and hydropower generation with simple decision rules for turbine shut-down. Journal of Environmental Management 261, 110212.
Teunen L., Belpaire C., Dardenne F., Blust R., Covaci A. en Bervoets L. 2020. Veldstudies naar monitoring van biota in het kader van de rapportage van de chemische toestand voor de Kaderrichtlijn Water 2015–2018 (algemene trends en relaties). Universiteit Antwerpen (UA) in samenwerking met het Instituut voor Natuur- en Bosonderzoek (INBO), in opdracht van de Vlaamse Milieumaatschappij (VMM). Antwerpen, België, 99 blz.
Van Den Berge K., Belpaire C., Maes D., Van Thuyne G., Gouwy J., Geeraerts C., Pauwels I., De Bruyn L., Vandamme L. 2019. Onderzoek naar habitatkwaliteit voor de otter in België; Potentieel leefgebied voor de otter in Vlaanderen. Rapporten van het Instituut voor Natuur- en Bosonderzoek 2019 (58). Instituut voor Natuur- en Bosonderzoek, Brussel. DOI: doi.org/10.21436/inbor.17664371.
Vandamme L., Belpaire C., Gelaude E., Gouwy J., Robberechts K., Van Thuyne G., Galle L., Maes Y., Lambeens I., Terrie T., Breine J., Bervoets L., Teunen L., Malarvannan G., Covaci A., Van Den Berge K.
48 | ICES SCIENTIFIC REPORTS 2:85 | ICES
2019. Onderzoek naar potentieel habitat voor de otter in de Benedenschelde; 2019. Habitatkwaliteit en knelpunten gedetailleerd in kaart. Rapporten van het Instituut voor Natuur- en Bosonderzoek 2019 (59). Instituut voor Natuur- en Bosonderzoek, Brussel. DOI: doi.org/10.21436/inbor.17665371.
Vergeynst, J., I. Pauwels, R. Baeyens, J. Coeck, I. Nopens, T. De Mulder, and A. Mouton. 2019. The impact of intermediate-head navigation locks on downstream fish passage. River Research and Applications 35: 224–235.
Vergeynst, J., I. Pauwels, R. Baeyens, A. Mouton, T. De Mulder, and I. Nopens. 2020. Shipping canals on the downstream migration route of European eel (Anguilla anguilla): Opportunity or bottleneck? Ecol-ogy of Freshwater Fish 1–15.
Verhelst, P., Baeyens, R., Reubens, J., Benitez, J.-P., Coeck, J., Goethals, P., Ovidio, M., Vergeynst, J., Moens, T., Mouton, A. 2018. European silver eel (Anguilla anguilla L.) migration behaviour in a highly regulated shipping canal. Fisheries Research 206, 176–184.
Verhelst, P., Bruneel, S., Reubens, J., Coeck, J., Goethals, P., Oldoni, D., Moens, T., Mouton, A. 2018. Selective tidal stream transport in silver European eel (Anguilla anguilla L.) – Migration behaviour in a dynamic estuary. Estuarine, Coastal and Shelf Science 213, 260–268.
Verhelst, P., Buysse, D., Reubens, J., Pauwels, I., Aelterman, B., Van Hoey, S., Goethals, P., Coeck, J., Moens, T., Mouton, A. 2018a. Downstream Migration of European Eel (Anguilla anguilla L.) in an Anthropogenically Regulated Freshwater System : Implications for Management. Fisheries Research 199: 252–262.
Verhelst, P., R. Baeyens, J. Reubens, J. P. Benitez, J. Coeck, P. Goethals, M. Ovidio, J. Vergeynst, T. Moens, and A. Mouton. 2018. European silver eel (Anguilla anguilla L.) migration behaviour in a highly regu-lated shipping canal. Fisheries Research Elsevier 206: 176–184, https://doi.org/10.1016/j.fishres.2018.05.013.
Vlietinck, K. et al. 2012. Nature and Forest Agency, Groupe de travail pour l’anguille européenne coordonné par le Service de la pêche du Service public de Wallonie. Council Regulation (EC) No 1100/2007 of 18 September 2007 establishing measures for the recovery of the stock of European eel. Eel Management Plan for Belgium. First report to be submitted in line with Article 9 of the eel Regulation 1100/2007. June 2012.
Vlietinck, K., Rollin, X. 2015. Council Regulation (EC) No 1100/2007 of 18 September 2007 establishing measures for the recovery of the stock of European eel. Eel Management Plan for Belgium. Second report to be submitted in line with Article 9 of the eel Regulation 1100/2007. Nature and Forest Agency, Nature and Forest Department (SPW). June 2015.
ICES | WGEEL 2020 | I
Contents
Report on the eel stock, fishery and other impacts, in: Denmark 2019/2020 ........................................... ii Authors .......................................................................................................................................... ii
1 Summary of national and international stock status indicators.................................................... 1 1.1 Escapement, biomass and mortality rates ....................................................................... 1 1.2 Recruitment time-series .................................................................................................. 1 1.2.1 Yellow eel recruitment ..................................................................................................... 1 Hellebaekken ................................................................................................................................. 3 1.2.2 Glass eel recruitment ....................................................................................................... 3
2 Overview of the stock and its management .................................................................................. 7 2.1 Describe the eel stock and its management .................................................................... 7 2.2 Significant changes since last report ................................................................................ 7
3 Impacts on the stock ..................................................................................................................... 8 3.1 Fisheries ........................................................................................................................... 8 3.1.1 Glass eel fisheries ............................................................................................................. 8 3.1.2 Yellow eel fisheries .......................................................................................................... 8 3.1.3 Silver eel fisheries ............................................................................................................ 8 3.2 Silver eel landings ............................................................................................................ 8 3.2.1.1 Commercial ...................................................................................................................... 8 3.2.2 Recreational ................................................................................................................... 10 3.2.2.1 Freshwater ..................................................................................................................... 10 3.2.2.2 Marine ............................................................................................................................ 10 3.3 Restocking ...................................................................................................................... 11 3.4 Aquaculture ................................................................................................................... 12 3.5 Entrainment ................................................................................................................... 14 3.5.1 Hydropower ................................................................................................................... 14 3.5.2 Trout farms (aquaculture) .............................................................................................. 14 3.6 Habitat Quantity and Quality ......................................................................................... 15 3.7 Other impacts ................................................................................................................ 15
4 National stock assessment .......................................................................................................... 16 4.1 Description of Method ................................................................................................... 16 4.1.1 Data collection ............................................................................................................... 16 4.1.1.1 Analysis .......................................................................................................................... 16 4.1.2 Reporting ....................................................................................................................... 16 4.2 Trends in Assessment results ......................................................................................... 16 4.2.1 Stock indicators .............................................................................................................. 16
5 Other data collection ................................................................................................................... 18 5.1 Recruitment time-series ................................................................................................ 18 5.2 Yellow eel abundance surveys ....................................................................................... 18 5.3 Silver eel escapement surveys ....................................................................................... 18 5.4 Parasites & Pathogens ................................................................................................... 18 Parasites and pathogens ............................................................................................................. 18 5.5 Contaminants ................................................................................................................. 18 5.6 Predators ....................................................................................................................... 18 Cormorants .................................................................................................................................. 18
6 New Information ......................................................................................................................... 20 6.1 New studies ................................................................................................................... 20 6.2 New papers .................................................................................................................... 21
7 References ................................................................................................................................... 22
ii | ICES SCIENTIFIC REPORTS 2: 85 | ICES
Report on the eel stock, fishery and other impacts, in: Denmark 2019/2020
Note to the reader - this document accompanies a series of spreadsheet tables that provide the bulk of the data in a format most suitable for the working practices of the WGEEL. Summaries of these data are provided in this document.
Authors Michael Ingemann Pedersen, Technical University of Denmark, National Institute of Aquatic Resources, DTU-Aqua, Vejlsøvej 39, DK-8600 Silkeborg, Denmark. Direct +45 89213128 [email protected]
Martin Lykke Kristensen, Technical University of Denmark, National Institute of Aquatic Resources, DTU-Aqua, Vejlsøvej 39, DK-8600 Silkeborg, Denmark. +45 89213100 [email protected]
Reporting Period: This report was completed in September 2020 and contains data up to 2019 and some provisional data for 2020.
Acknowledgments:
Mads Christoffersen, Technical University of Denmark, provided data for the recruitment-mon-itoring site Hellebaekken. Gudenaacentralen collected and provided recruitment data from Tange Hydropower dam. Hartevaerket collected and provided recruitment data from Harte Hy-dropower dam.
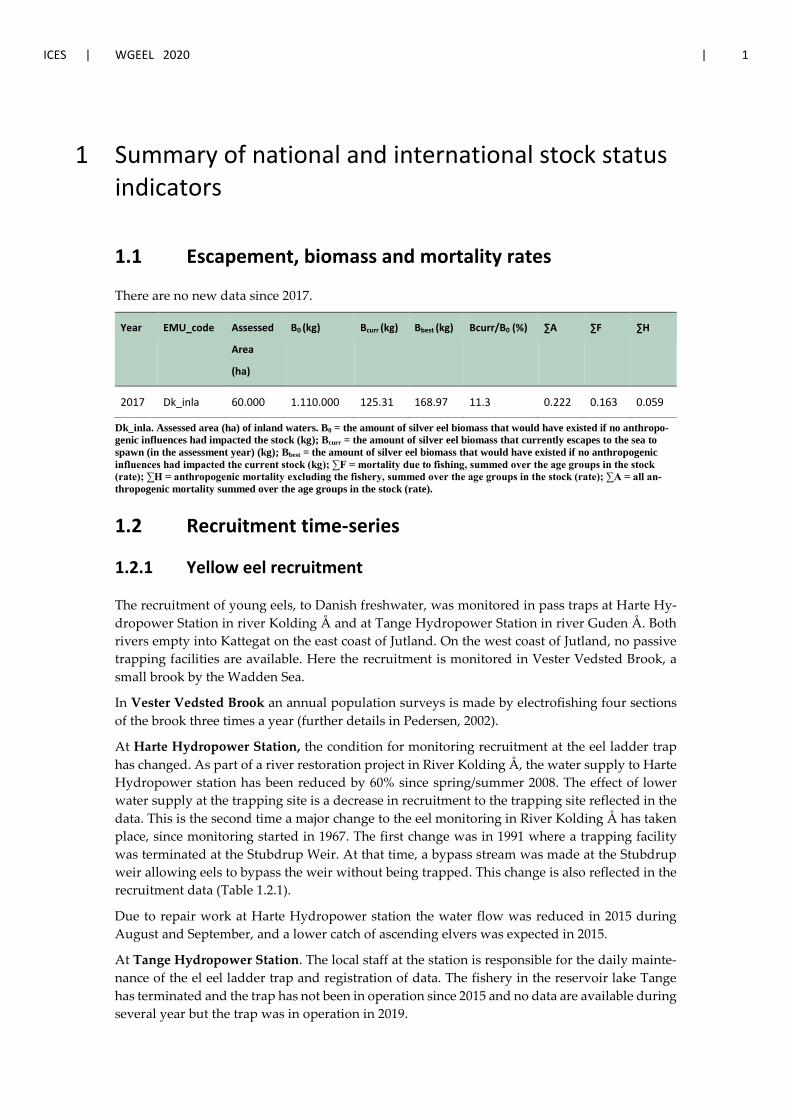
ICES | WGEEL 2020 | 1
1 Summary of national and international stock status indicators
1.1 Escapement, biomass and mortality rates
There are no new data since 2017.
Year EMU_code Assessed
Area
(ha)
B0 (kg) Bcurr (kg) Bbest (kg) Bcurr/B0 (%) ∑A ∑F ∑H
2017 Dk_inla 60.000 1.110.000 125.31 168.97 11.3 0.222 0.163 0.059
Dk_inla. Assessed area (ha) of inland waters. B0 = the amount of silver eel biomass that would have existed if no anthropo-genic influences had impacted the stock (kg); Bcurr = the amount of silver eel biomass that currently escapes to the sea to spawn (in the assessment year) (kg); Bbest = the amount of silver eel biomass that would have existed if no anthropogenic influences had impacted the current stock (kg); ∑F = mortality due to fishing, summed over the age groups in the stock (rate); ∑H = anthropogenic mortality excluding the fishery, summed over the age groups in the stock (rate); ∑A = all an-thropogenic mortality summed over the age groups in the stock (rate).
1.2 Recruitment time-series
1.2.1 Yellow eel recruitment
The recruitment of young eels, to Danish freshwater, was monitored in pass traps at Harte Hy-dropower Station in river Kolding Å and at Tange Hydropower Station in river Guden Å. Both rivers empty into Kattegat on the east coast of Jutland. On the west coast of Jutland, no passive trapping facilities are available. Here the recruitment is monitored in Vester Vedsted Brook, a small brook by the Wadden Sea.
In Vester Vedsted Brook an annual population surveys is made by electrofishing four sections of the brook three times a year (further details in Pedersen, 2002).
At Harte Hydropower Station, the condition for monitoring recruitment at the eel ladder trap has changed. As part of a river restoration project in River Kolding Å, the water supply to Harte Hydropower station has been reduced by 60% since spring/summer 2008. The effect of lower water supply at the trapping site is a decrease in recruitment to the trapping site reflected in the data. This is the second time a major change to the eel monitoring in River Kolding Å has taken place, since monitoring started in 1967. The first change was in 1991 where a trapping facility was terminated at the Stubdrup Weir. At that time, a bypass stream was made at the Stubdrup weir allowing eels to bypass the weir without being trapped. This change is also reflected in the recruitment data (Table 1.2.1).
Due to repair work at Harte Hydropower station the water flow was reduced in 2015 during August and September, and a lower catch of ascending elvers was expected in 2015.
At Tange Hydropower Station. The local staff at the station is responsible for the daily mainte-nance of the el eel ladder trap and registration of data. The fishery in the reservoir lake Tange has terminated and the trap has not been in operation since 2015 and no data are available during several year but the trap was in operation in 2019.
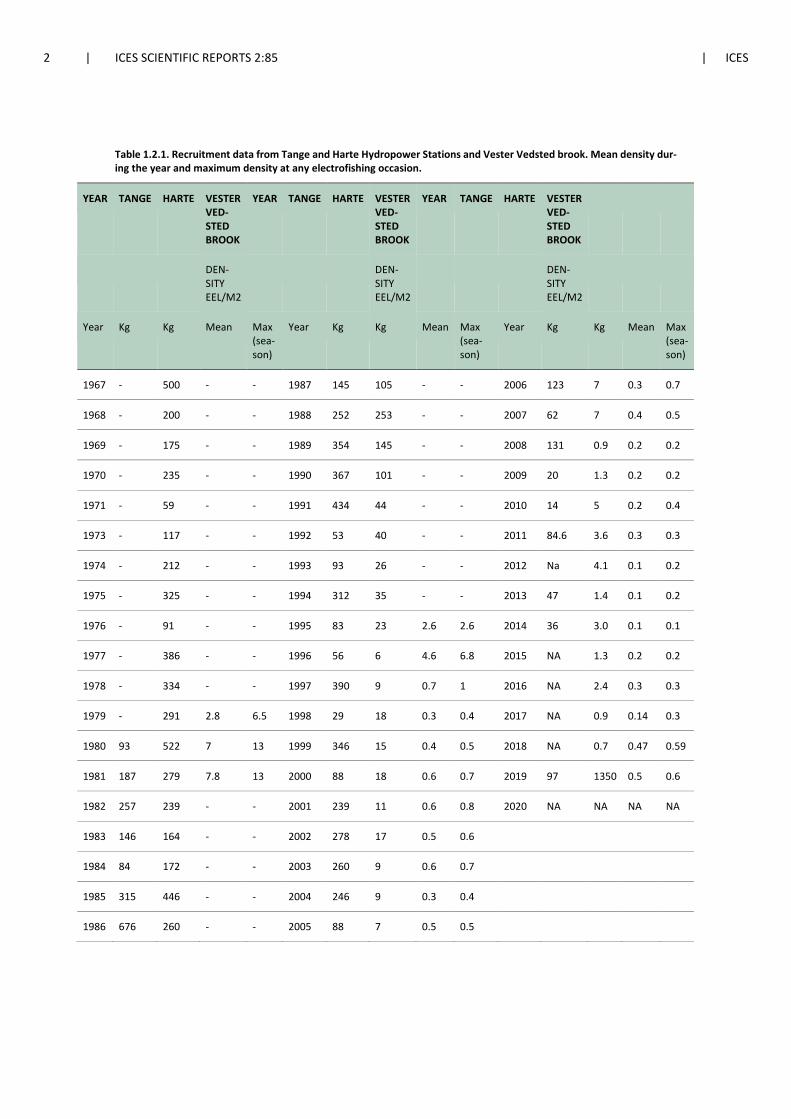
2 | ICES SCIENTIFIC REPORTS 2:85 | ICES
Table 1.2.1. Recruitment data from Tange and Harte Hydropower Stations and Vester Vedsted brook. Mean density dur-ing the year and maximum density at any electrofishing occasion.
YEAR TANGE HARTE VESTER VED-STED BROOK
YEAR TANGE HARTE VESTER VED-STED BROOK
YEAR TANGE HARTE VESTER VED-STED BROOK
DEN-SITY EEL/M2
DEN-SITY EEL/M2
DEN-SITY EEL/M2
Year Kg Kg Mean Max (sea-son)
Year Kg Kg Mean Max (sea-son)
Year Kg Kg Mean Max (sea-son)
1967 - 500 - - 1987 145 105 - - 2006 123 7 0.3 0.7
1968 - 200 - - 1988 252 253 - - 2007 62 7 0.4 0.5
1969 - 175 - - 1989 354 145 - - 2008 131 0.9 0.2 0.2
1970 - 235 - - 1990 367 101 - - 2009 20 1.3 0.2 0.2
1971 - 59 - - 1991 434 44 - - 2010 14 5 0.2 0.4
1973 - 117 - - 1992 53 40 - - 2011 84.6 3.6 0.3 0.3
1974 - 212 - - 1993 93 26 - - 2012 Na 4.1 0.1 0.2
1975 - 325 - - 1994 312 35 - - 2013 47 1.4 0.1 0.2
1976 - 91 - - 1995 83 23 2.6 2.6 2014 36 3.0 0.1 0.1
1977 - 386 - - 1996 56 6 4.6 6.8 2015 NA 1.3 0.2 0.2
1978 - 334 - - 1997 390 9 0.7 1 2016 NA 2.4 0.3 0.3
1979 - 291 2.8 6.5 1998 29 18 0.3 0.4 2017 NA 0.9 0.14 0.3
1980 93 522 7 13 1999 346 15 0.4 0.5 2018 NA 0.7 0.47 0.59
1981 187 279 7.8 13 2000 88 18 0.6 0.7 2019 97 1350 0.5 0.6
1982 257 239 - - 2001 239 11 0.6 0.8 2020 NA NA NA NA
1983 146 164 - - 2002 278 17 0.5 0.6
1984 84 172 - - 2003 260 9 0.6 0.7
1985 315 446 - - 2004 246 9 0.3 0.4
1986 676 260 - - 2005 88 7 0.5 0.5
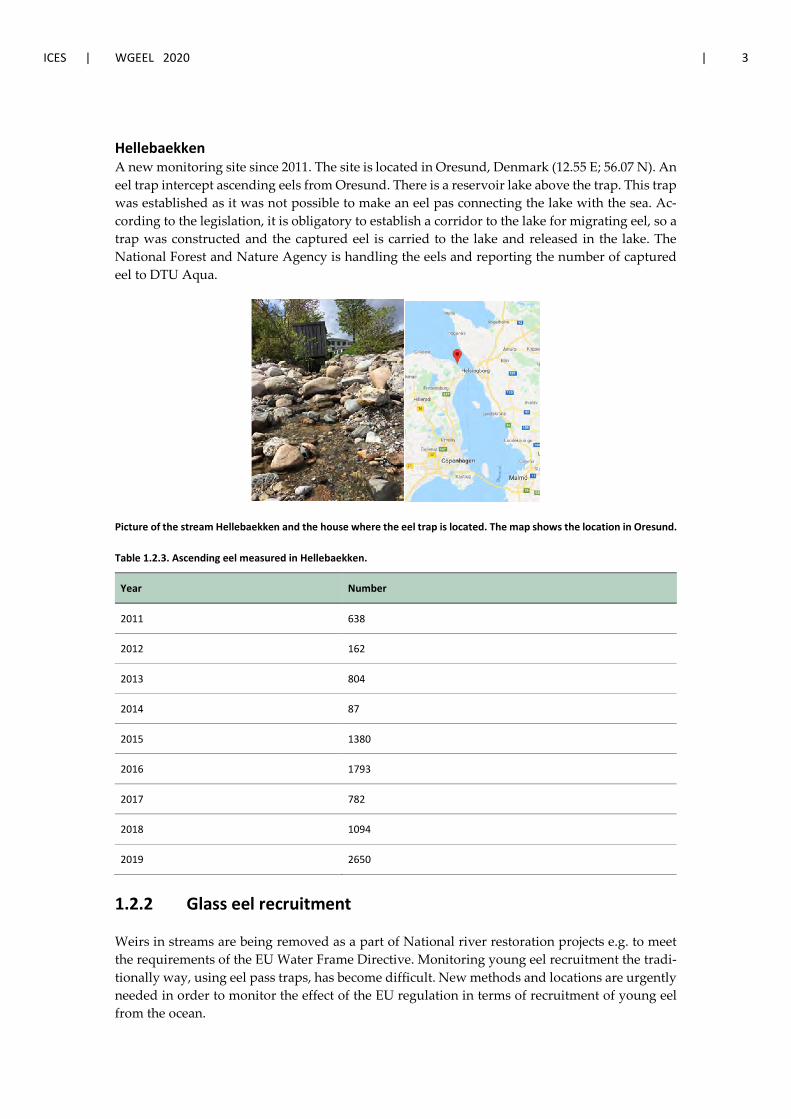
ICES | WGEEL 2020 | 3
Hellebaekken A new monitoring site since 2011. The site is located in Oresund, Denmark (12.55 E; 56.07 N). An eel trap intercept ascending eels from Oresund. There is a reservoir lake above the trap. This trap was established as it was not possible to make an eel pas connecting the lake with the sea. Ac-cording to the legislation, it is obligatory to establish a corridor to the lake for migrating eel, so a trap was constructed and the captured eel is carried to the lake and released in the lake. The National Forest and Nature Agency is handling the eels and reporting the number of captured eel to DTU Aqua.
Picture of the stream Hellebaekken and the house where the eel trap is located. The map shows the location in Oresund.
Table 1.2.3. Ascending eel measured in Hellebaekken.
Year Number
2011 638
2012 162
2013 804
2014 87
2015 1380
2016 1793
2017 782
2018 1094
2019 2650
1.2.2 Glass eel recruitment
Weirs in streams are being removed as a part of National river restoration projects e.g. to meet the requirements of the EU Water Frame Directive. Monitoring young eel recruitment the tradi-tionally way, using eel pass traps, has become difficult. New methods and locations are urgently needed in order to monitor the effect of the EU regulation in terms of recruitment of young eel from the ocean.
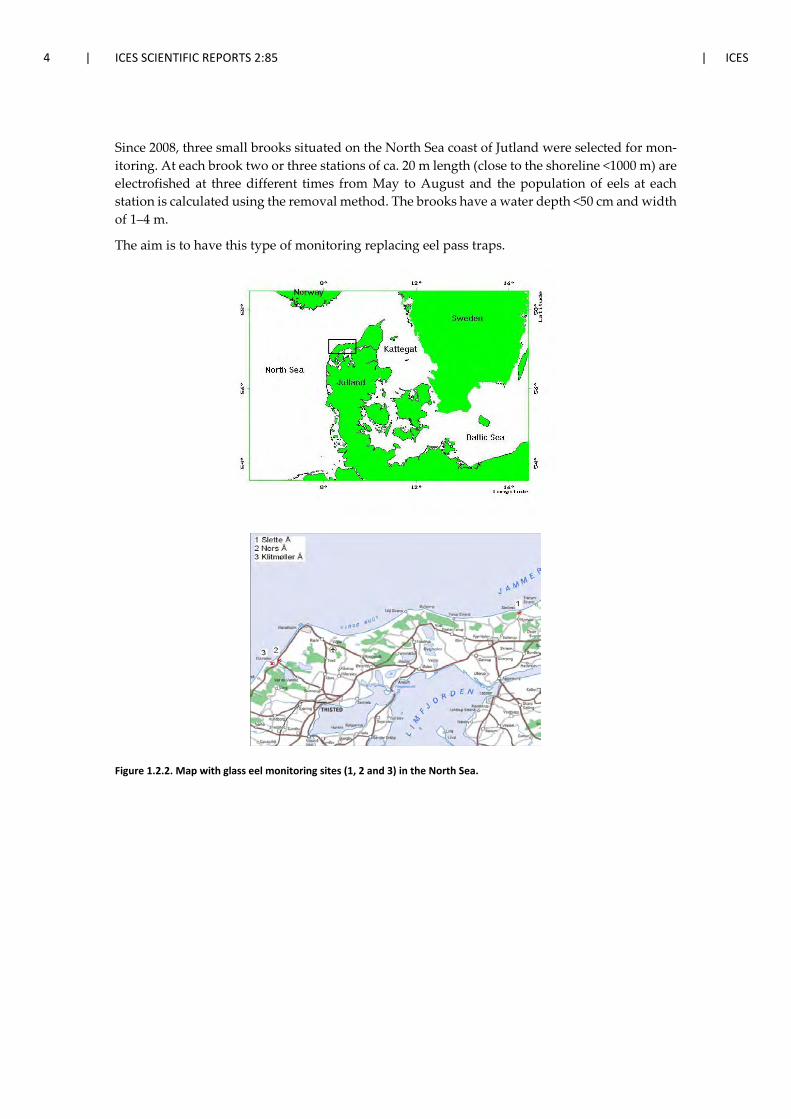
4 | ICES SCIENTIFIC REPORTS 2:85 | ICES
Since 2008, three small brooks situated on the North Sea coast of Jutland were selected for mon-itoring. At each brook two or three stations of ca. 20 m length (close to the shoreline <1000 m) are electrofished at three different times from May to August and the population of eels at each station is calculated using the removal method. The brooks have a water depth <50 cm and width of 1–4 m.
The aim is to have this type of monitoring replacing eel pass traps.
Figure 1.2.2. Map with glass eel monitoring sites (1, 2 and 3) in the North Sea.
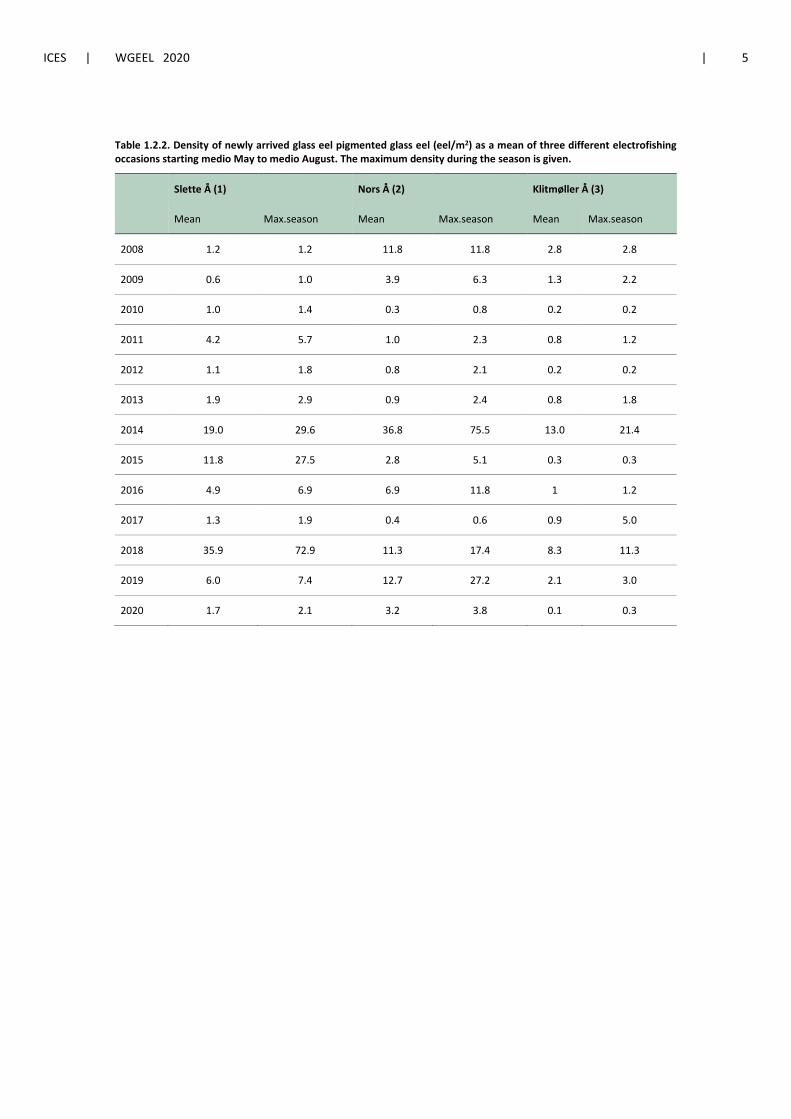
ICES | WGEEL 2020 | 5
Table 1.2.2. Density of newly arrived glass eel pigmented glass eel (eel/m2) as a mean of three different electrofishing occasions starting medio May to medio August. The maximum density during the season is given.
Slette Å (1) Nors Å (2) Klitmøller Å (3)
Mean Max.season Mean Max.season Mean Max.season
2008 1.2 1.2 11.8 11.8 2.8 2.8
2009 0.6 1.0 3.9 6.3 1.3 2.2
2010 1.0 1.4 0.3 0.8 0.2 0.2
2011 4.2 5.7 1.0 2.3 0.8 1.2
2012 1.1 1.8 0.8 2.1 0.2 0.2
2013 1.9 2.9 0.9 2.4 0.8 1.8
2014 19.0 29.6 36.8 75.5 13.0 21.4
2015 11.8 27.5 2.8 5.1 0.3 0.3
2016 4.9 6.9 6.9 11.8 1 1.2
2017 1.3 1.9 0.4 0.6 0.9 5.0
2018 35.9 72.9 11.3 17.4 8.3 11.3
2019 6.0 7.4 12.7 27.2 2.1 3.0
2020 1.7 2.1 3.2 3.8 0.1 0.3

6 | ICES SCIENTIFIC REPORTS 2:85 | ICES
Figure 1.2.3. Monitoring data. Density of newly arrived glass eel pigmented glass eel (eel/m2) as a mean of three different electrofishing occasions starting mid-May to mid-August.
Slette Å. Monitoring glass eel recruitment by electrofishing. Photo by Jan Skriver.
0
5
10
15
20
25
30
35
40
2008 2010 2012 2014 2016 2018 2020
Glass eel/m2
Slette Å
Nors Å
Klitmøller Å
ICES | WGEEL 2020 | 7
2 Overview of the stock and its management
2.1 Describe the eel stock and its management
From 1st July 2009, the eel is managed according to the EU regulation, aiming at 40% (relative to the pristine) silver eel escapement in freshwater and 50% effort reduction in the marine waters. The Danish territory is managed as one freshwater EMU excluding two small transboundary river basins named Kruså and Vidå shared with Germany. Intermediate and coastal waters to-gether with community waters constitute the entire marine area.
From 1st July 2009, professional fishing operations are based on licences. The professional fish-ermen in saline areas are given a licence permitting the use of a limited number of gear in order to meet the 50% effort reduction following the EU eel regulation. Recreational fishermen operat-ing in the marine are permitted to use six fykenets or six hook lines but in a reduced period of the year. Fishing is closed from the 10th of May to 31 July in order to reduce effort by 50%.
In freshwater a few professional fishermen have a licence permitting the use of a limited number of gears. For landowners and recreational fishermen the open fishing season has been limited to a period of 2.5 month (1 August and fishing is closed from 16 October–31 July.
The escapement target of 40% in freshwater has been calculated to be achieved after ca. 85 years if a total ban on freshwater fisheries will commence. Licences are provisionally issued until 31st December every year and have to be renewed. The Ministry of Food, Agriculture and Fisheries may implement further reductions pending the development in the eel stock.
The EU commission has enforced a closing period for commercial and recreational eel fisheries from 1 December 2019 until 1 March 2020.
2.2 Significant changes since last report
There are no significant changes in eel management since the last country report.
8 | ICES SCIENTIFIC REPORTS 2:85 | ICES
3 Impacts on the stock
3.1 Fisheries
3.1.1 Glass eel fisheries
No data; glass eel fishery is forbidden.
3.1.2 Yellow eel fisheries
The commercial time-series on Silver eel landing are shown below see Table 3.3.1.1 (Freshwater) and 3.3.1.2 (Marine) and recreational see Table 3.3.2.1
3.1.3 Silver eel fisheries
The commercial time-series on Yellow eel landing are shown below see Table 3.3.1.1 (Freshwater) and Table 3.3.1.2 (Marine).
3.2 Silver eel landings
3.2.1.1 Commercial Data on separate landings of yellow and silver eel in fresh and salt water are given below. Data origin is landing reports by commercial fishers reported to the ministry. From mid-2009 landings were only reported from those having a licence to fish for eel.

ICES | WGEEL 2020 | 9
Table 3.3.1.1. Freshwater landings (ton) of yellow and silver eels.
Year Silver Yellow Total Year Silver Yellow Total Year Silver Yellow Total
1960 - - 214 1981 - - 140 2002 5 27 27
1961 - - 235 1982 - - 163 2003 2 21 24
1962 - - 215 1983 - - 116 2004 4 12 15
1963 - - 238 1984 - - 126 2005 3 10 14
1964 - - 223 1985 - - 111 2006 7 8 14
1965 - - 205 1986 - - 120 2007 5 6 11
1966 - - 211 1987 - - 90 2008 5 4 9
1967 - - 243 1988 - - 119 2009 8 5 13
1968 - - 258 1989 - - 114 2010 10 3 13
1969 - - 254 1990 - - 107 2011 11 4 15
1970 - - 249 1991 - - 99 2012 9 4 13
1971 - - 183 1992 - - 109 2013 10 3 13
1972 - - 200 1993 - - 57 2014 12 3 15
1973 - - 201 1994 - - 60 2015 9 6 15
1974 - - 163 1995 - - 52 2016 10 3 13
1975 - - 260 1996 - - 34 2017 12 5 16
1976 - - 178 1997 - - 39 2018 6.5 5 11.5
1977 - - 179 1998 - - 40 2019 5.9 4.0 9.9
1978 - - 157 1999 - - 30 2020 NA NA NA
1979 - - 78 2000 4 24 28 2021
1980 - - 147 2001 2 34 36 2020
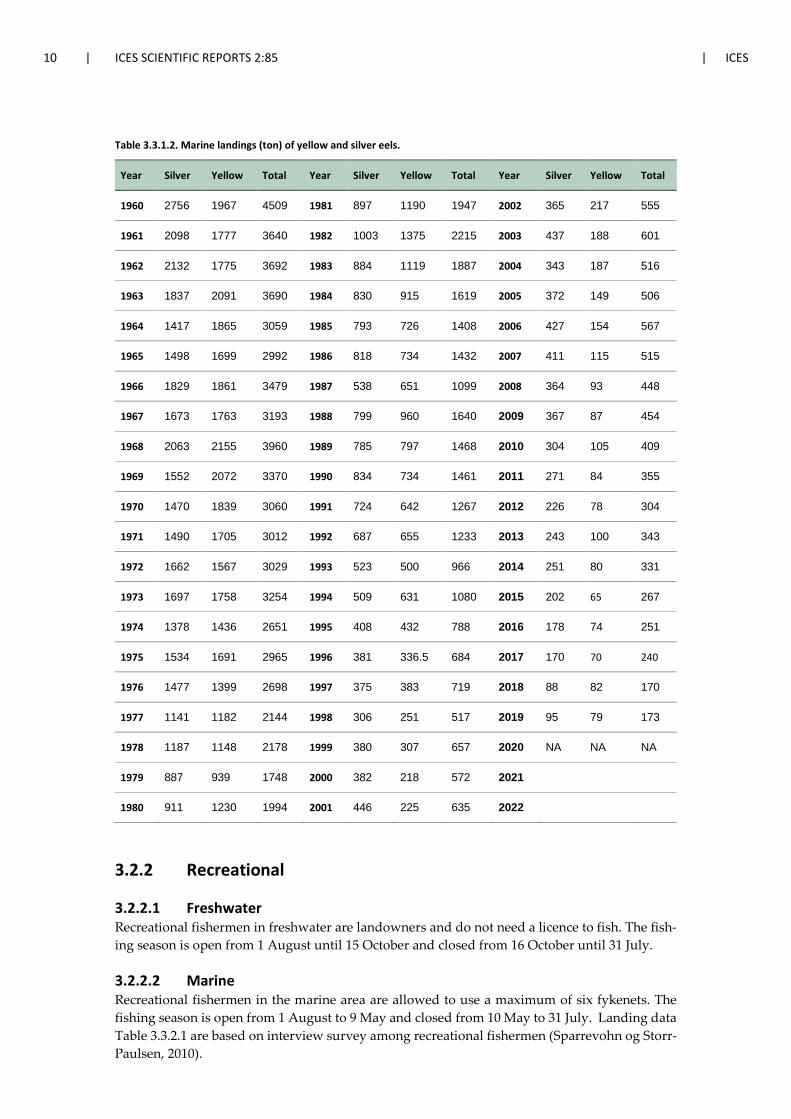
10 | ICES SCIENTIFIC REPORTS 2:85 | ICES
Table 3.3.1.2. Marine landings (ton) of yellow and silver eels.
Year Silver Yellow Total Year Silver Yellow Total Year Silver Yellow Total
1960 2756 1967 4509 1981 897 1190 1947 2002 365 217 555
1961 2098 1777 3640 1982 1003 1375 2215 2003 437 188 601
1962 2132 1775 3692 1983 884 1119 1887 2004 343 187 516
1963 1837 2091 3690 1984 830 915 1619 2005 372 149 506
1964 1417 1865 3059 1985 793 726 1408 2006 427 154 567
1965 1498 1699 2992 1986 818 734 1432 2007 411 115 515
1966 1829 1861 3479 1987 538 651 1099 2008 364 93 448
1967 1673 1763 3193 1988 799 960 1640 2009 367 87 454
1968 2063 2155 3960 1989 785 797 1468 2010 304 105 409
1969 1552 2072 3370 1990 834 734 1461 2011 271 84 355
1970 1470 1839 3060 1991 724 642 1267 2012 226 78 304
1971 1490 1705 3012 1992 687 655 1233 2013 243 100 343
1972 1662 1567 3029 1993 523 500 966 2014 251 80 331
1973 1697 1758 3254 1994 509 631 1080 2015 202 65 267
1974 1378 1436 2651 1995 408 432 788 2016 178 74 251
1975 1534 1691 2965 1996 381 336.5 684 2017 170 70 240
1976 1477 1399 2698 1997 375 383 719 2018 88 82 170
1977 1141 1182 2144 1998 306 251 517 2019 95 79 173
1978 1187 1148 2178 1999 380 307 657 2020 NA NA NA
1979 887 939 1748 2000 382 218 572 2021
1980 911 1230 1994 2001 446 225 635 2022
3.2.2 Recreational
3.2.2.1 Freshwater Recreational fishermen in freshwater are landowners and do not need a licence to fish. The fish-ing season is open from 1 August until 15 October and closed from 16 October until 31 July.
3.2.2.2 Marine Recreational fishermen in the marine area are allowed to use a maximum of six fykenets. The fishing season is open from 1 August to 9 May and closed from 10 May to 31 July. Landing data Table 3.3.2.1 are based on interview survey among recreational fishermen (Sparrevohn og Storr-Paulsen, 2010).
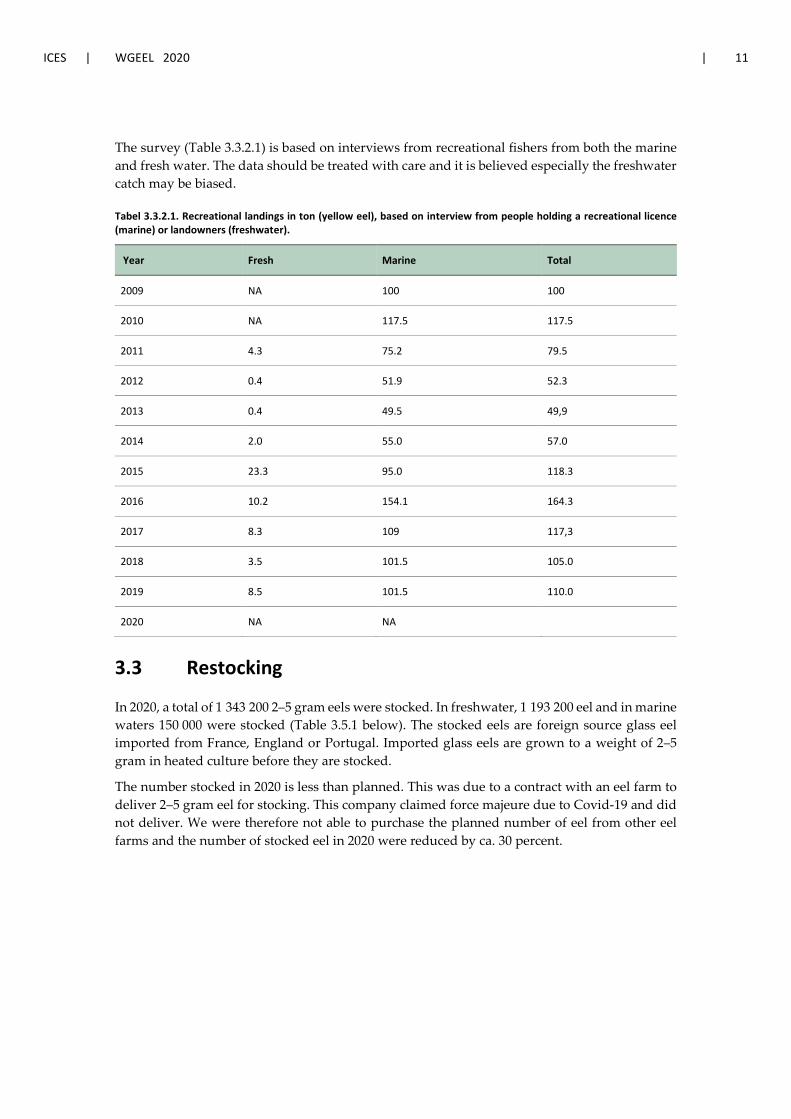
ICES | WGEEL 2020 | 11
The survey (Table 3.3.2.1) is based on interviews from recreational fishers from both the marine and fresh water. The data should be treated with care and it is believed especially the freshwater catch may be biased.
Tabel 3.3.2.1. Recreational landings in ton (yellow eel), based on interview from people holding a recreational licence (marine) or landowners (freshwater).
Year Fresh Marine Total
2009 NA 100 100
2010 NA 117.5 117.5
2011 4.3 75.2 79.5
2012 0.4 51.9 52.3
2013 0.4 49.5 49,9
2014 2.0 55.0 57.0
2015 23.3 95.0 118.3
2016 10.2 154.1 164.3
2017 8.3 109 117,3
2018 3.5 101.5 105.0
2019 8.5 101.5 110.0
2020 NA NA
3.3 Restocking
In 2020, a total of 1 343 200 2–5 gram eels were stocked. In freshwater, 1 193 200 eel and in marine waters 150 000 were stocked (Table 3.5.1 below). The stocked eels are foreign source glass eel imported from France, England or Portugal. Imported glass eels are grown to a weight of 2–5 gram in heated culture before they are stocked.
The number stocked in 2020 is less than planned. This was due to a contract with an eel farm to deliver 2–5 gram eel for stocking. This company claimed force majeure due to Covid-19 and did not deliver. We were therefore not able to purchase the planned number of eel from other eel farms and the number of stocked eel in 2020 were reduced by ca. 30 percent.
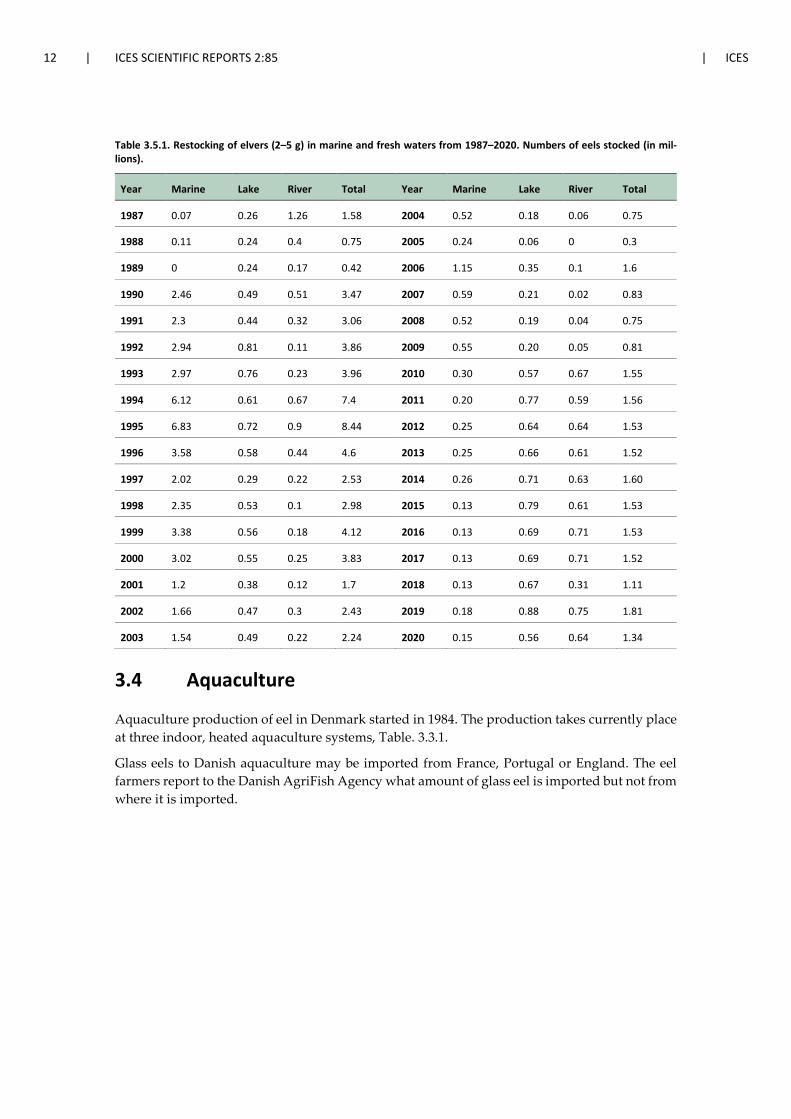
12 | ICES SCIENTIFIC REPORTS 2:85 | ICES
Table 3.5.1. Restocking of elvers (2–5 g) in marine and fresh waters from 1987–2020. Numbers of eels stocked (in mil-lions).
Year Marine Lake River Total Year Marine Lake River Total
1987 0.07 0.26 1.26 1.58 2004 0.52 0.18 0.06 0.75
1988 0.11 0.24 0.4 0.75 2005 0.24 0.06 0 0.3
1989 0 0.24 0.17 0.42 2006 1.15 0.35 0.1 1.6
1990 2.46 0.49 0.51 3.47 2007 0.59 0.21 0.02 0.83
1991 2.3 0.44 0.32 3.06 2008 0.52 0.19 0.04 0.75
1992 2.94 0.81 0.11 3.86 2009 0.55 0.20 0.05 0.81
1993 2.97 0.76 0.23 3.96 2010 0.30 0.57 0.67 1.55
1994 6.12 0.61 0.67 7.4 2011 0.20 0.77 0.59 1.56
1995 6.83 0.72 0.9 8.44 2012 0.25 0.64 0.64 1.53
1996 3.58 0.58 0.44 4.6 2013 0.25 0.66 0.61 1.52
1997 2.02 0.29 0.22 2.53 2014 0.26 0.71 0.63 1.60
1998 2.35 0.53 0.1 2.98 2015 0.13 0.79 0.61 1.53
1999 3.38 0.56 0.18 4.12 2016 0.13 0.69 0.71 1.53
2000 3.02 0.55 0.25 3.83 2017 0.13 0.69 0.71 1.52
2001 1.2 0.38 0.12 1.7 2018 0.13 0.67 0.31 1.11
2002 1.66 0.47 0.3 2.43 2019 0.18 0.88 0.75 1.81
2003 1.54 0.49 0.22 2.24 2020 0.15 0.56 0.64 1.34
3.4 Aquaculture
Aquaculture production of eel in Denmark started in 1984. The production takes currently place at three indoor, heated aquaculture systems, Table. 3.3.1.
Glass eels to Danish aquaculture may be imported from France, Portugal or England. The eel farmers report to the Danish AgriFish Agency what amount of glass eel is imported but not from where it is imported.
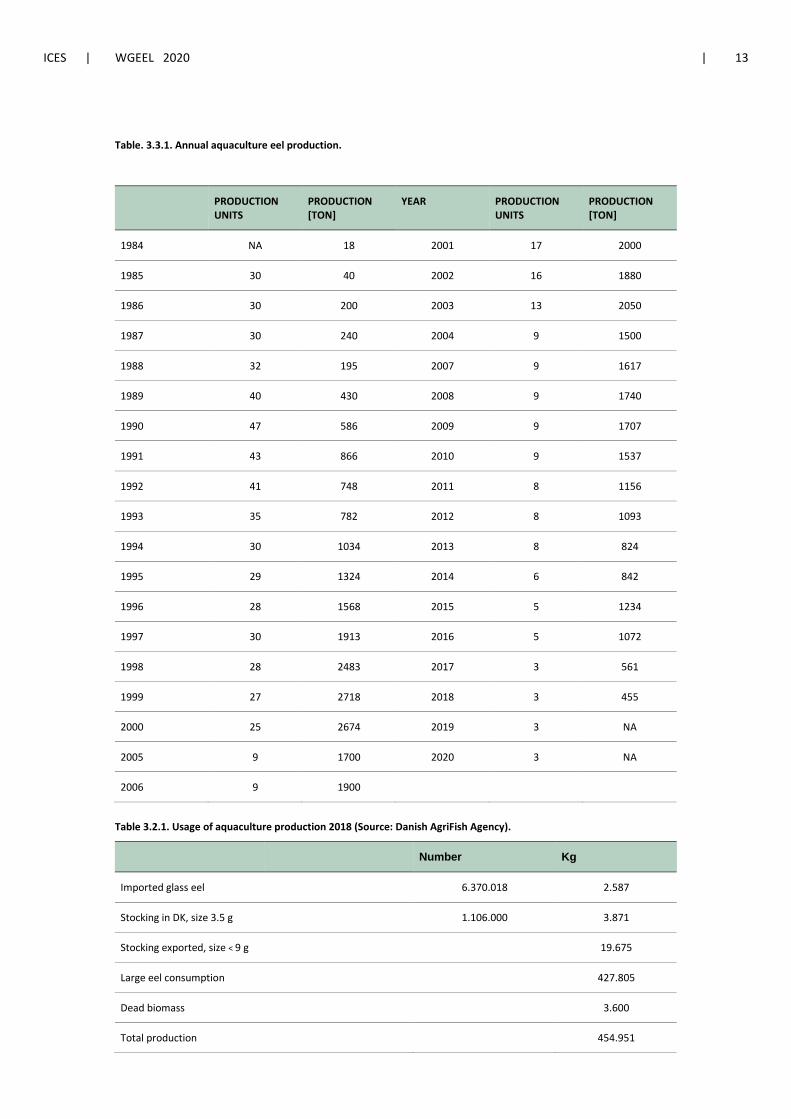
ICES | WGEEL 2020 | 13
Table. 3.3.1. Annual aquaculture eel production.
PRODUCTION UNITS
PRODUCTION [TON]
YEAR PRODUCTION UNITS
PRODUCTION [TON]
1984 NA 18 2001 17 2000
1985 30 40 2002 16 1880
1986 30 200 2003 13 2050
1987 30 240 2004 9 1500
1988 32 195 2007 9 1617
1989 40 430 2008 9 1740
1990 47 586 2009 9 1707
1991 43 866 2010 9 1537
1992 41 748 2011 8 1156
1993 35 782 2012 8 1093
1994 30 1034 2013 8 824
1995 29 1324 2014 6 842
1996 28 1568 2015 5 1234
1997 30 1913 2016 5 1072
1998 28 2483 2017 3 561
1999 27 2718 2018 3 455
2000 25 2674 2019 3 NA
2005 9 1700 2020 3 NA
2006 9 1900
Table 3.2.1. Usage of aquaculture production 2018 (Source: Danish AgriFish Agency).
Number Kg
Imported glass eel 6.370.018 2.587
Stocking in DK, size 3.5 g 1.106.000 3.871
Stocking exported, size < 9 g 19.675
Large eel consumption 427.805
Dead biomass
3.600
Total production
454.951
14 | ICES SCIENTIFIC REPORTS 2:85 | ICES
The import and export data Table 3.2.1 are reported by the eel farmers to the Danish AgriFish Agency. The different categories (import, stocking) are reported in kg and in numbers. The cat-egories stocking export, consumption and dead biomass is reported in kg. Life mortality from the glass eel stage to the stocked eel stage or the consumption stage is the same level, approxi-mately 5–15 %. It should be noted that the number of glass eel imported to the farm is not neces-sarily comparable to the number of eel from the farm the same year. The retention time of eel in the farm differs by eel stage, e.g. eel for stocking is 3–8 month and eel for consumption is 18 months or more.
3.5 Entrainment
3.5.1 Hydropower
In 2006, there were 43–61 hydroelectric power units in operation in Denmark. Since then several hydropower units have been closed down (e.g. Vilholdt, Karlsgårdeværket, Harteværket, Hol-stebro vandkraft, etc). There are no exact data on the number and the capasity of hydroelectric power units at present.
We have measured a loss of silver eel between 0 and 58% at two particular hydropower plants. Measured using telemetry. At Tange Hydropower plant there is a significant bypass problem for eels, we have measured a loss of at least 58% (Pedersen et al., 2011). At Vestbirk hydropower, the fish bypass (1/4 of the water discharge) in combination with 10 mm screens work well and the loss is close to zero. (Pedersen and Jepsen, 2012).
We have no data for other hydropower plants.
3.5.2 Trout farms (aquaculture)
Research in relation to weirs of trout farms have been conducted in connection with three trout farms in River Kongeåen and River Mattrup Å. The conclusion from these studies was that delay of eel migration due to low discharge was observed in some years and the eels bypass the screens that were supposed to prevent eels and other species to enter the trout farm.
Danish trout farms are often located on the banks of rivers depending on water intake from the rivers. To guide the river water into the trout farm, a weir is built in the river. Less than 250 trout farms use “flow through” river water and approximately ten have systems for recirculation of water. To prevent fish from entering the trout farms a screen with a maximum 6 mm bar distance is obligatory at the point of the water inflow and a maximum 10 mm bar distance at the point of outflow.
Two studies have been conducted. The first study was at Brejnholt trout farm in River Mattrup Å. Here no mortality was observed but migration delay of silver eels at the weir varied with water discharge. The second study was in River Kongeå, here two trout farms are situated on the bank of the river at Vejen and Jedsted. Both trout farms have 6 mm bar distance at the water intake. At Vejen fish farm, several fish entered the fish farm despite the 6 mm bar screen which seems not correctly installed or damaged. At Jedsted, no fish entered the fish farm and the screen was working well. If the screen at Vejen fish farm is fixed properly, eels would not be able to enter the fish farm. However, it is quite difficult to see by eye if there is any such problem at other comparable fish farms unless the place where the screen is mounted, is dried out.
The conclusion from these studies is that migrating silver eels is likely to have migration delay at weirs, which may depend on the hydrological conditions (water discharge) at some weirs and at others, the screens may be incorrect mounted, causing eels to be trapped at the trout farm. No
ICES | WGEEL 2020 | 15
mortality was observed but delay at weirs is likely to cause higher mortality from predators (Pedersen and Jepsen, 2012).
3.6 Habitat Quantity and Quality
The spatial distribution of weirs in relation to hydropower and “flow through trout farms” are geographically limited to Jutland. No updated data on quantity and quality are available since 2006.
It was assumed that 10 ton of eel would die in connection with these weirs throughout the Danish inland waters!
3.7 Other impacts
Covid-19 affected the number of eel stocked this year see section restocking Section 3.3.
16 | ICES SCIENTIFIC REPORTS 2:85 | ICES
4 National stock assessment
4.1 Description of Method
4.1.1 Data collection
1. Commercial fishermen are obliged to report through logbooks to the Ministry of Fisher-ies. Landings in weight are separated in yellow and silver eel landings.
2. Recreational fisheries catch are collected through yearly interview surveys. 3. Recruitment data are monitored in freshwater using eel pass traps and electrofishing sur-
veys. 4. Silver eel escapements from all 887 Danish river systems are surveyed using three index
river systems. Two river systems with a silver eel trap and one river system with a com-mercial fisherman (Ribe Å).
4.1.1.1 Analysis At River Ribe Å, we use tag–recapture to estimate escapement (Petersen estimate, Ricker 1981). The depletion method was used (Bohlin et al., 1989) when river population estimates are made by electrofishing.
4.1.2 Reporting
Collected data are published in national reports or international journals, WGEEL CR reports or Eel management progress reports to the EU- commission.
4.2 Trends in Assessment results
4.2.1 Stock indicators
Data from index river systems are used to calculate the total silver eel escapement from the Dan-ish freshwater territory. The count was repeated every third year. The National Institute of Aquatic Resources (DTU Aqua) has succeeded in estimating and counting escaping silver eels from River Ribe Å, upper part of River Gudenå and Lake Vester Vandet, see below.
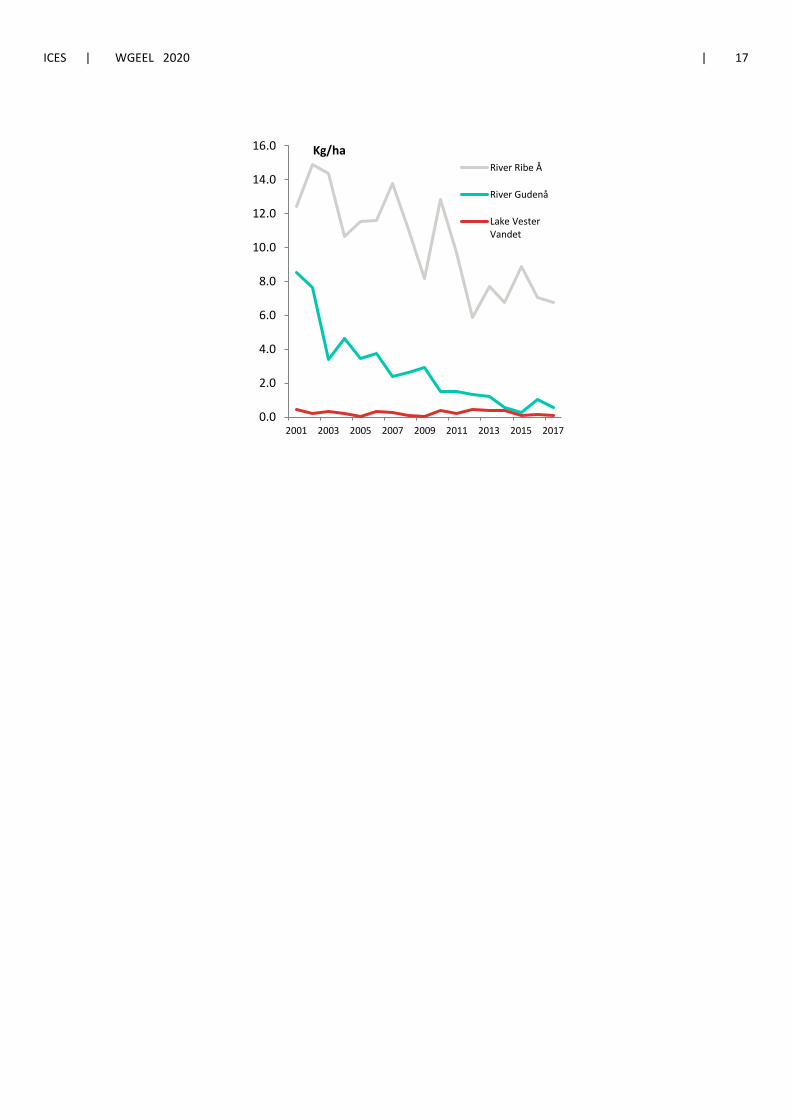
ICES | WGEEL 2020 | 17
0.0
2.0
4.0
6.0
8.0
10.0
12.0
14.0
16.0
2001 2003 2005 2007 2009 2011 2013 2015 2017
Kg/ha River Ribe Å
River Gudenå
Lake VesterVandet
18 | ICES SCIENTIFIC REPORTS 2:85 | ICES
5 Other data collection
5.1 Recruitment time-series
Glass eel surveys are described in Section 1 of this country report.
5.2 Yellow eel abundance surveys
The monitoring in Vester Vedsted may be recognized both as a yellow eel abundance survey as well as recruitment survey. No other surveys are available!
5.3 Silver eel escapement surveys
Described in Section 4 of this country report.
5.4 Parasites & Pathogens
Parasites and pathogens
The swimbladder parasite Anguillicola crassus is widely distributed throughout both brackish and freshwaters in Denmark. Monitoring of Anguillicola parasites takes place on a yearly basis at three locations since 1987. The number of Anguillicola infected eels (prevalence) is relatively constant during 1987–2018 at all three locations.
Table 11.2. Anguillicola monitoring data.
Location Salinity ppt Coordinates Year Total Infected Prevalence Intensity
N N % n
Isefjord 18 55.50N;11.50E 2018 95 24 25.3 1.2
Ringk. Fjord 5–10 55.55N;08.20E 2018 92 68 73.9 6.4
Arresø 0 55.59N;11.57E 2018 106 51 48.1 2.3
5.5 Contaminants
No new data available.
5.6 Predators
Cormorants
Cormorants are possibly the only important predator of eel due to the large number of nesting birds; predation is expected to be largest in the vicinity of the colonies, but birds migrating through Denmark may have significant impact during the fall.
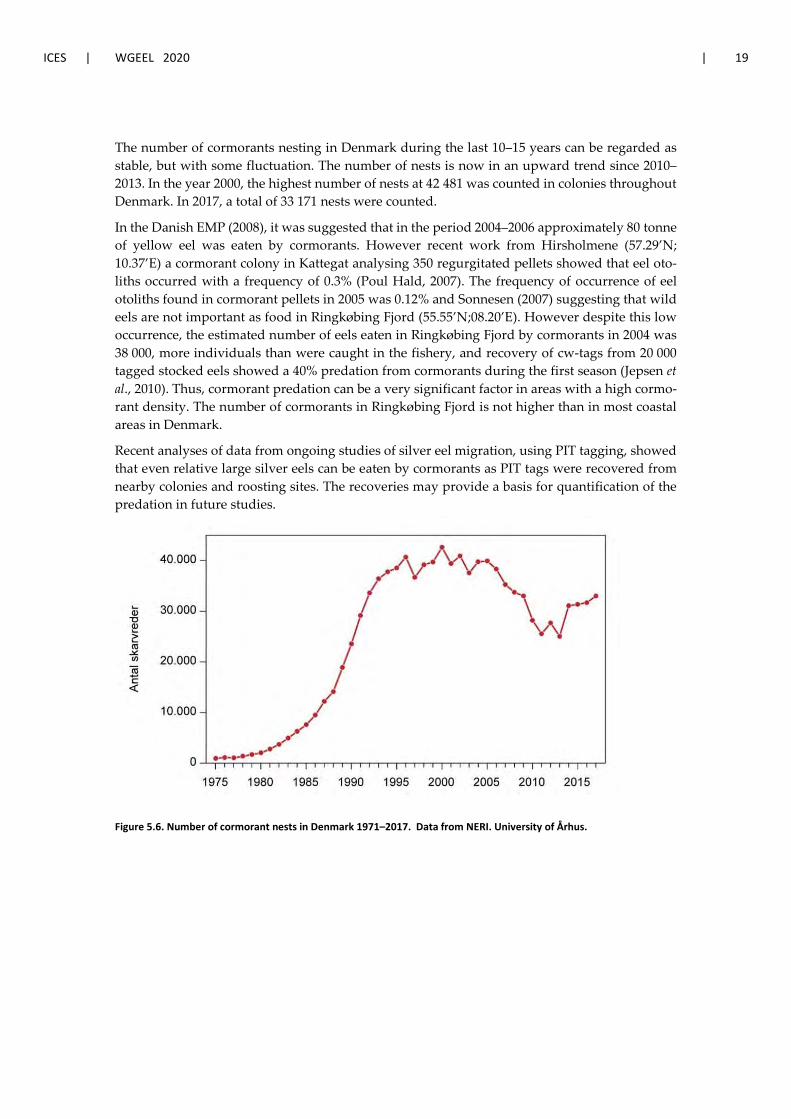
ICES | WGEEL 2020 | 19
The number of cormorants nesting in Denmark during the last 10–15 years can be regarded as stable, but with some fluctuation. The number of nests is now in an upward trend since 2010–2013. In the year 2000, the highest number of nests at 42 481 was counted in colonies throughout Denmark. In 2017, a total of 33 171 nests were counted.
In the Danish EMP (2008), it was suggested that in the period 2004–2006 approximately 80 tonne of yellow eel was eaten by cormorants. However recent work from Hirsholmene (57.29’N; 10.37’E) a cormorant colony in Kattegat analysing 350 regurgitated pellets showed that eel oto-liths occurred with a frequency of 0.3% (Poul Hald, 2007). The frequency of occurrence of eel otoliths found in cormorant pellets in 2005 was 0.12% and Sonnesen (2007) suggesting that wild eels are not important as food in Ringkøbing Fjord (55.55’N;08.20’E). However despite this low occurrence, the estimated number of eels eaten in Ringkøbing Fjord by cormorants in 2004 was 38 000, more individuals than were caught in the fishery, and recovery of cw-tags from 20 000 tagged stocked eels showed a 40% predation from cormorants during the first season (Jepsen et al., 2010). Thus, cormorant predation can be a very significant factor in areas with a high cormo-rant density. The number of cormorants in Ringkøbing Fjord is not higher than in most coastal areas in Denmark.
Recent analyses of data from ongoing studies of silver eel migration, using PIT tagging, showed that even relative large silver eels can be eaten by cormorants as PIT tags were recovered from nearby colonies and roosting sites. The recoveries may provide a basis for quantification of the predation in future studies.
Figure 5.6. Number of cormorant nests in Denmark 1971–2017. Data from NERI. University of Århus.
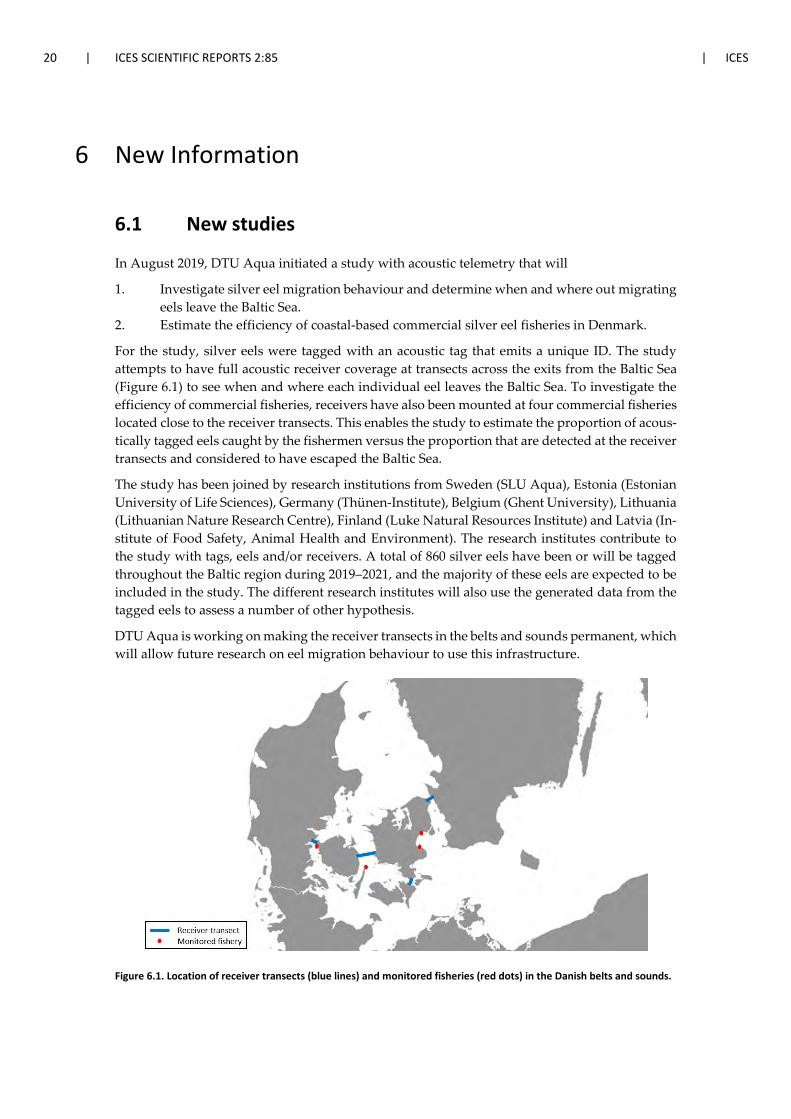
20 | ICES SCIENTIFIC REPORTS 2:85 | ICES
6 New Information
6.1 New studies
In August 2019, DTU Aqua initiated a study with acoustic telemetry that will
1. Investigate silver eel migration behaviour and determine when and where out migrating eels leave the Baltic Sea.
2. Estimate the efficiency of coastal-based commercial silver eel fisheries in Denmark.
For the study, silver eels were tagged with an acoustic tag that emits a unique ID. The study attempts to have full acoustic receiver coverage at transects across the exits from the Baltic Sea (Figure 6.1) to see when and where each individual eel leaves the Baltic Sea. To investigate the efficiency of commercial fisheries, receivers have also been mounted at four commercial fisheries located close to the receiver transects. This enables the study to estimate the proportion of acous-tically tagged eels caught by the fishermen versus the proportion that are detected at the receiver transects and considered to have escaped the Baltic Sea.
The study has been joined by research institutions from Sweden (SLU Aqua), Estonia (Estonian University of Life Sciences), Germany (Thünen-Institute), Belgium (Ghent University), Lithuania (Lithuanian Nature Research Centre), Finland (Luke Natural Resources Institute) and Latvia (In-stitute of Food Safety, Animal Health and Environment). The research institutes contribute to the study with tags, eels and/or receivers. A total of 860 silver eels have been or will be tagged throughout the Baltic region during 2019–2021, and the majority of these eels are expected to be included in the study. The different research institutes will also use the generated data from the tagged eels to assess a number of other hypothesis.
DTU Aqua is working on making the receiver transects in the belts and sounds permanent, which will allow future research on eel migration behaviour to use this infrastructure.
Figure 6.1. Location of receiver transects (blue lines) and monitored fisheries (red dots) in the Danish belts and sounds.
ICES | WGEEL 2020 | 21
6.2 New papers
Christoffersen, M., Svendsen, J.C., Kuhn, J.A., Nielsen, A., Martjanova, A., Støttrup, J.G. 2018. Benthic habitat selection in juvenile European eel Anguilla anguilla: implications for coastal habitat manage-ment and restoration. Journal of Fish Biology, Volume 93, pages 996–999.
The critically endangered European eel Anguilla anguilla is dependent on suitable habitat quali-ties over a vast geographic area. Even though a significant proportion of the population never enters freshwater, the preferred benthic habitat is largely unknown in the marine environment. Examining substratum selection in A. anguilla reveals that elvers prefer coarse gravel, suggesting that conservation efforts may benefit from targeting this type of substratum in marine coastal areas.
Pedersen M. I. Jepsen N. Rasmussen G. 2017. Survival and growth compared between wild and farmed eel stocked in freshwater ponds. Fisheries Research, Volume 194, October 2017, pages 112–116.
To evaluate the efficiency of eel stocking, we compared the survival and growth of wild eels (2–5 g) with that of “farmed” eels (3–6 g). Wild eels were caught in a river and farmed eels came from a farm, where wild imported glass eels are cultured. Two experiments of 5–12 month du-ration were conducted in a series of shallow, open ponds of approximately 200 m2. Wild and farmed eels were batch tagged, mixed and released in the ponds at an initial density of 0.5 indi-vidual /m2. Survival was rather high (34–88%) with variations between ponds. No significant difference in survival was found between wild and farmed during the first five months in both experiments. Growth rates were significantly higher for farmed eels compared to wild eels in both experiments. The results show that farmed eels performed better than wild eels. In regions with low recruitment, the eel population may be increased by importing glass eels, stocked di-rectly or stocked as on-grown farmed eel. The optimal size for stocking (between glass- and 3 g eels) may be determined through future studies.
Pedersen M.I. and G. H. Rasmussen. 2018. Fisheries regulation on European eel (Anguilla anguilla) for 2018; how big is the effect? Journal of fisheries Research. Vol 2 p 17–18.
The EU Council of Ministers decided in December 2017 to implement a limitation on commercial marine catches on eels exceeding 12 cm in length for 2018. We aimed to evaluate the effect of the fishing limitation using data on actual and potential silver eel escapement (stock indicators). The data suggest that fisheries exploitation of adult eels in the marine areas has relatively little effect on the biomass of silver eel that potentially can escape to the spawning grounds in the Sargasso Sea. The 2018 fishing regulation for the marine commercial fisheries increases migrating of silver eels towards the spawning grounds in the Sargasso Sea, from expected 10 000 t to 10 200 t, equiv-alent to a 2% increase. Other anthropogenic mortality and predation may be far more important than landings of all life stages and account for 49% of the total loss.

22 | ICES SCIENTIFIC REPORTS 2:85 | ICES
7 References
Danish EMP. 2008. Danish Eel Management Plan December 2008. In accordance with COUNCIL REGU-LATION (EC) No 1100/2007 of 18 September 2007.
Hald, P. 2007. Skarvernes Fødevalg ved Hirsholmene i årene 2001–2003. http://www.sns.dk/pub-likat/2001/hirsholmen_skarv_2001_2003.pdf
Jepsen N., R. Klenke, P., Sonnesen, and T. Bregnballe. 2010. The use of coded wire tags to estimate cormorant predation on fish stocks in an estuary. Marine end freshwater Research. Volume 61, Issue 3, pp. 320–329.
Pedersen M.I. 2002. Monitoring of glass eel recruitment in Denmark. In: Dekker W. (ed) 2002, Monitoring of glass eel recruitment. Netherlands Institute of Fisheries Research, report C007/02-WD, 256 pp. ISBN 90-74549-06-3.
Pedersen, M.I., J.S. Mikkelsen. 2011. Udvandring af blankål fra Ribe Å i 2010. DTU Aqua-rapport nr. 241-2011, 10 p.
Pedersen M. I., N. Jepsen, K. Aarestrup, A. Koed, S. Pedersen and F. Økland. 2011. Loss of European silver eel passing a hydropower station. J. Appl. Ichthyol. 28, 189–193.
Pedersen M. I., N. Jepsen. 2012. Passage for ål ved dambrug og kraftværk i Gudenåen og Kongeåen. DTU Aqua-rapport nr. 259-2012.
Pedersen, M. I., Rasmussen, G.H. 2015. Yield per recruit from two different sizes of stocked eel (Anguilla anguilla) in brackish Roskilde Fjord. ICES Journal of Marine Science 73: 158–164.
Pedersen M.I. Jepsen N. Rasmussen G. 2017. Survival and growth compared between wild and farmed eel stocked in freshwater ponds. Fisheries Research, Volume 194, October 2017, pages 112–116.
Sonnesen, P. 2007. Skarvens prædation omkring Ringkøbing Fjord – en undersøgelse af sammenhænge mellem fødevalg og fiskebestandenes sammensætning. DTU Aqua Specialerapport pp. 76 + bilag.
Sparrevohn C. R. og M. Storr-Paulsen. 2010. DTU Aqua-rapport nr. 217-2010. Åle- og torskefangst ved rekreativt fiskeri i Danmark.

ICES | WGEEL 2020 | I
Contents
Report on the eel stock, fishery and other impacts, in ESTONIA ................................................................ ii Authors .......................................................................................................................................... ii
1 Summary of national and international stock status indicators.................................................... 3 1.1 Escapement biomass and mortality rates ........................................................................ 3 1.2 Recruitment time-series .................................................................................................. 3
2 Overview of the national stock and its management.................................................................... 4 2.1 Describe the eel stock and its management .................................................................... 4 2.2 Significant changes since last report ................................................................................ 5
3 Impacts on the national stock ....................................................................................................... 6 3.1 Fisheries ........................................................................................................................... 6 3.1.1 Glass eel fisheries ............................................................................................................. 8 3.1.2 Yellow eel fisheries .......................................................................................................... 8 3.1.3 Silver eel fisheries ............................................................................................................ 8 3.2 Restocking ........................................................................................................................ 8 3.3 Aquaculture ................................................................................................................... 10 3.4 Entrainment ................................................................................................................... 10 3.5 Habitat Quantity and Quality ......................................................................................... 10 3.6 Other impacts ................................................................................................................ 11
4 National stock assessment .......................................................................................................... 12 4.1 Description of Method ................................................................................................... 12 4.1.1 Data collection ............................................................................................................... 12 4.1.2 Analysis .......................................................................................................................... 12 4.1.3 Reporting ....................................................................................................................... 13 4.1.4 Data quality issues and how they are being addressed ................................................. 13 4.2 Trends in Assessment results ......................................................................................... 13
5 Other data collection for eel ....................................................................................................... 15 5.1 Yellow eel abundance surveys ....................................................................................... 15 5.2 Silver eel escapement surveys ....................................................................................... 15 5.3 Life-history parameters .................................................................................................. 15 5.4 Diseases, Parasites & Pathogens or Contaminants ........................................................ 18
6 New Information ......................................................................................................................... 19 7 References ................................................................................................................................... 20
II | ICES SCIENTIFIC REPORTS 2:85 | ICES
Report on the eel stock, fishery and other impacts, in ESTONIA
Authors Priit Bernotas*, Paul Teesalu, Maidu Silm
Estonian University of Life Sciences, Chair of Hydrobiology and Fisheries
[email protected], [email protected], [email protected] +37256501622*
Reporting Period: This report was completed in September 2020, and contains data up to 2019
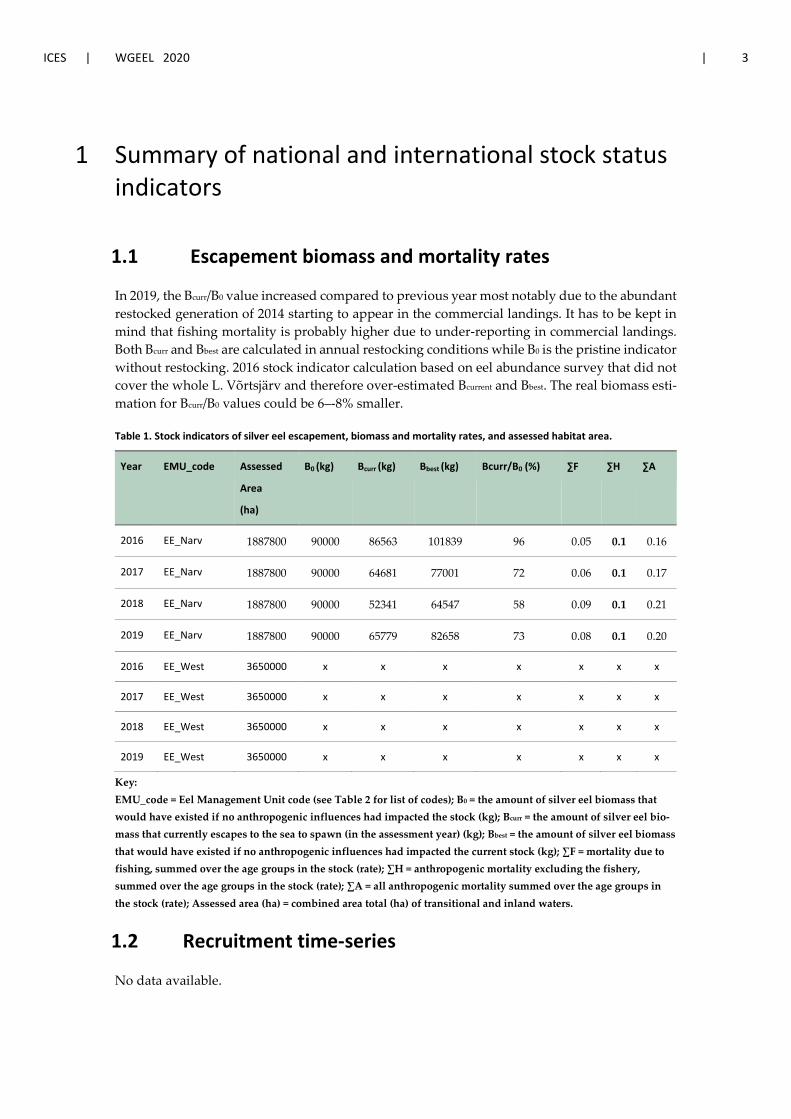
ICES | WGEEL 2020 | 3
1 Summary of national and international stock status indicators
1.1 Escapement biomass and mortality rates
In 2019, the Bcurr/B0 value increased compared to previous year most notably due to the abundant restocked generation of 2014 starting to appear in the commercial landings. It has to be kept in mind that fishing mortality is probably higher due to under-reporting in commercial landings. Both Bcurr and Bbest are calculated in annual restocking conditions while B0 is the pristine indicator without restocking. 2016 stock indicator calculation based on eel abundance survey that did not cover the whole L. Võrtsjärv and therefore over-estimated Bcurrent and Bbest. The real biomass esti-mation for Bcurr/B0 values could be 6–-8% smaller.
Table 1. Stock indicators of silver eel escapement, biomass and mortality rates, and assessed habitat area.
Year EMU_code Assessed
Area
(ha)
B0 (kg) Bcurr (kg) Bbest (kg) Bcurr/B0 (%) ∑F ∑H ∑A
2016 EE_Narv 1887800 90000 86563 101839 96 0.05 0.1 0.16
2017 EE_Narv 1887800 90000 64681 77001 72 0.06 0.1 0.17
2018 EE_Narv 1887800 90000 52341 64547 58 0.09 0.1 0.21
2019 EE_Narv 1887800 90000 65779 82658 73 0.08 0.1 0.20
2016 EE_West 3650000 x x x x x x x
2017 EE_West 3650000 x x x x x x x
2018 EE_West 3650000 x x x x x x x
2019 EE_West 3650000 x x x x x x x
Key: EMU_code = Eel Management Unit code (see Table 2 for list of codes); B0 = the amount of silver eel biomass that would have existed if no anthropogenic influences had impacted the stock (kg); Bcurr = the amount of silver eel bio-mass that currently escapes to the sea to spawn (in the assessment year) (kg); Bbest = the amount of silver eel biomass that would have existed if no anthropogenic influences had impacted the current stock (kg); ∑F = mortality due to fishing, summed over the age groups in the stock (rate); ∑H = anthropogenic mortality excluding the fishery, summed over the age groups in the stock (rate); ∑A = all anthropogenic mortality summed over the age groups in the stock (rate); Assessed area (ha) = combined area total (ha) of transitional and inland waters.
1.2 Recruitment time-series
No data available.
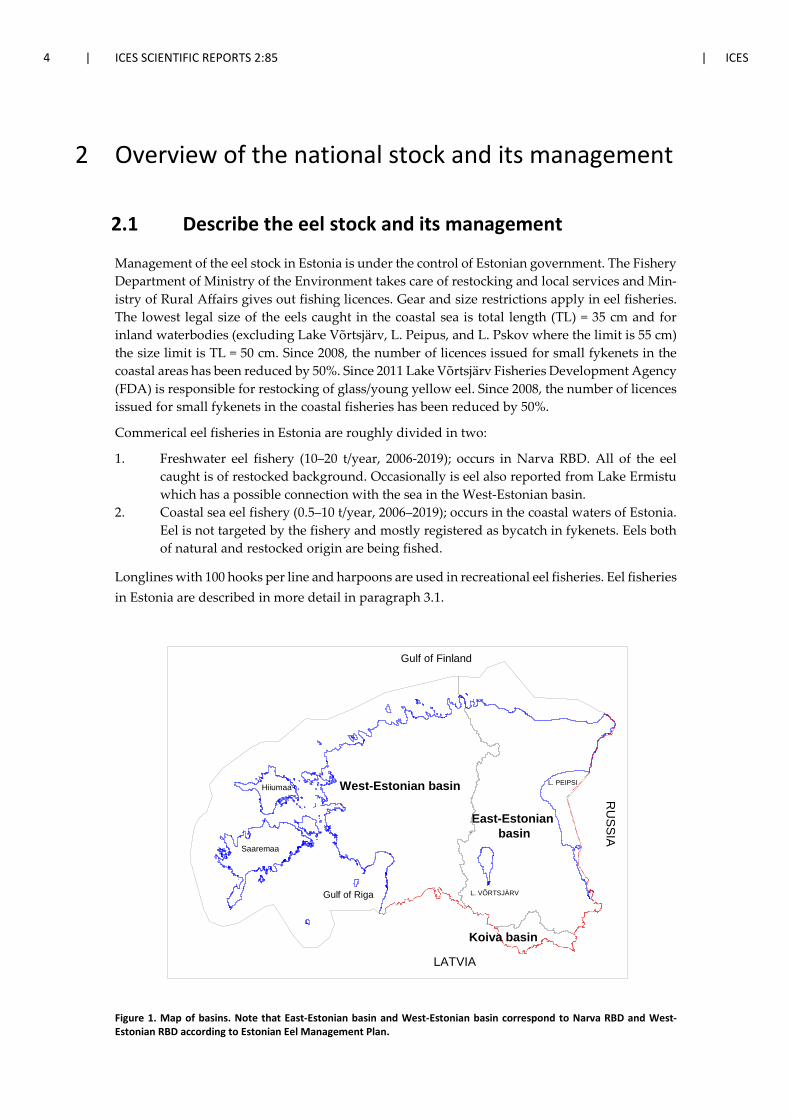
4 | ICES SCIENTIFIC REPORTS 2:85 | ICES
2 Overview of the national stock and its management
2.1 Describe the eel stock and its management
Management of the eel stock in Estonia is under the control of Estonian government. The Fishery Department of Ministry of the Environment takes care of restocking and local services and Min-istry of Rural Affairs gives out fishing licences. Gear and size restrictions apply in eel fisheries. The lowest legal size of the eels caught in the coastal sea is total length (TL) = 35 cm and for inland waterbodies (excluding Lake Võrtsjärv, L. Peipus, and L. Pskov where the limit is 55 cm) the size limit is TL = 50 cm. Since 2008, the number of licences issued for small fykenets in the coastal areas has been reduced by 50%. Since 2011 Lake Võrtsjärv Fisheries Development Agency (FDA) is responsible for restocking of glass/young yellow eel. Since 2008, the number of licences issued for small fykenets in the coastal fisheries has been reduced by 50%.
Commerical eel fisheries in Estonia are roughly divided in two:
1. Freshwater eel fishery (10–20 t/year, 2006-2019); occurs in Narva RBD. All of the eel caught is of restocked background. Occasionally is eel also reported from Lake Ermistu which has a possible connection with the sea in the West-Estonian basin.
2. Coastal sea eel fishery (0.5–10 t/year, 2006–2019); occurs in the coastal waters of Estonia. Eel is not targeted by the fishery and mostly registered as bycatch in fykenets. Eels both of natural and restocked origin are being fished.
Longlines with 100 hooks per line and harpoons are used in recreational eel fisheries. Eel fisheries in Estonia are described in more detail in paragraph 3.1.
Figure 1. Map of basins. Note that East-Estonian basin and West-Estonian basin correspond to Narva RBD and West-Estonian RBD according to Estonian Eel Management Plan.
West-Estonian basin
East-Estonianbasin
Koiva basin
RU
SSIA
L. PEIPSI
L. VÕRTSJÄRV
Gulf of Finland
LATVIA
Saaremaa
Hiiumaa
Gulf of Riga
ICES | WGEEL 2020 | 5
According to ordinance of government (RT I 2004, 48, 339) and Water Framework Directive the territory of Estonia is divided into three basins (Figure 1) and nine subbasins. Basins and sub-basins are not directly connected to one river, as in European scale Estonian rivers are very small, except River Narva and its watershed area (1/3 of territory of Estonia and shared with Russia and Latvia). Other more important rivers are River Pärnu, River Kasari and River Gauja, last of which is shared with Latvia (not incl. to the EMP).
Estonia submitted its national Eel Management Plan (EMP) in accordance to the Regulation EC No 1100/2007 establishing measures for the recovery of the stock of European eel on 31st of De-cember 2008 and this plan was approved by the European Commission on 30th of November 2009 (Report of…, 2015).
2.2 Significant changes since last report
Updated values for ∑H and ∑A. See paragraphs 1.1 and 3.4 for details.
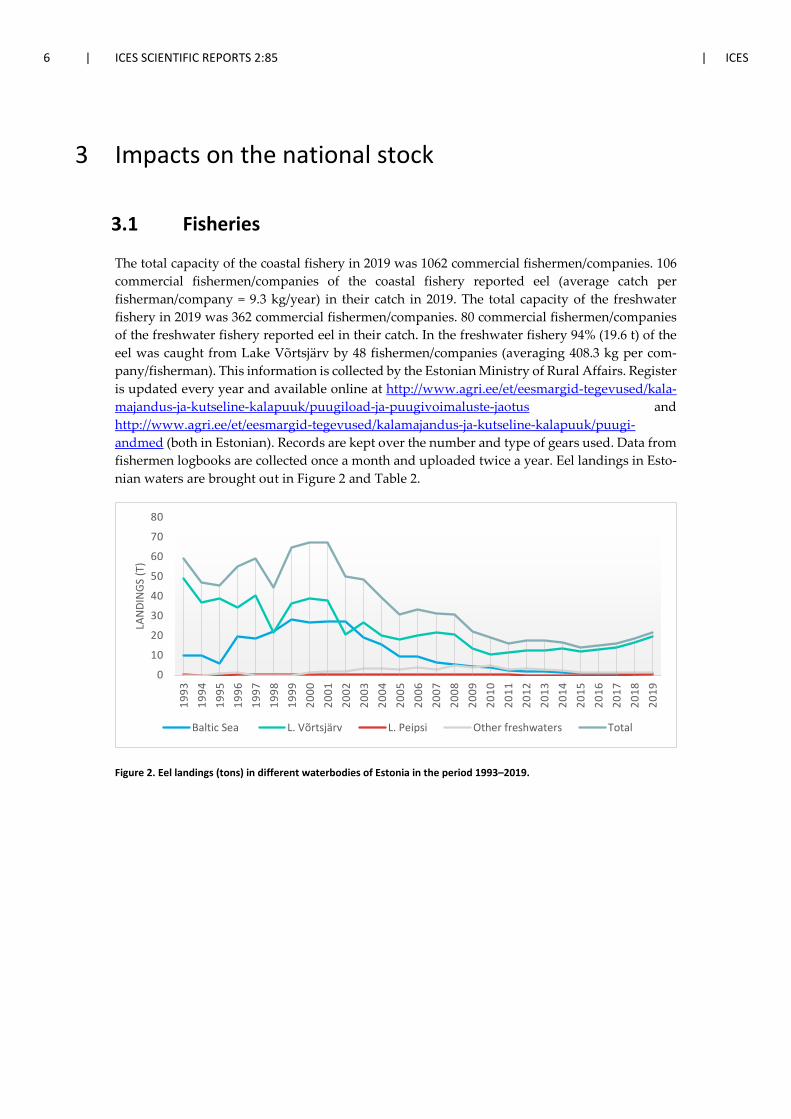
6 | ICES SCIENTIFIC REPORTS 2:85 | ICES
3 Impacts on the national stock
3.1 Fisheries
The total capacity of the coastal fishery in 2019 was 1062 commercial fishermen/companies. 106 commercial fishermen/companies of the coastal fishery reported eel (average catch per fisherman/company = 9.3 kg/year) in their catch in 2019. The total capacity of the freshwater fishery in 2019 was 362 commercial fishermen/companies. 80 commercial fishermen/companies of the freshwater fishery reported eel in their catch. In the freshwater fishery 94% (19.6 t) of the eel was caught from Lake Võrtsjärv by 48 fishermen/companies (averaging 408.3 kg per com-pany/fisherman). This information is collected by the Estonian Ministry of Rural Affairs. Register is updated every year and available online at http://www.agri.ee/et/eesmargid-tegevused/kala-majandus-ja-kutseline-kalapuuk/puugiload-ja-puugivoimaluste-jaotus and http://www.agri.ee/et/eesmargid-tegevused/kalamajandus-ja-kutseline-kalapuuk/puugi-andmed (both in Estonian). Records are kept over the number and type of gears used. Data from fishermen logbooks are collected once a month and uploaded twice a year. Eel landings in Esto-nian waters are brought out in Figure 2 and Table 2.
Figure 2. Eel landings (tons) in different waterbodies of Estonia in the period 1993–2019.
0
10
20
30
40
50
60
70
80
1993
1994
1995
1996
1997
1998
1999
2000
2001
2002
2003
2004
2005
2006
2007
2008
2009
2010
2011
2012
2013
2014
2015
2016
2017
2018
2019
LAN
DIN
GS (T
)
Baltic Sea L. Võrtsjärv L. Peipsi Other freshwaters Total
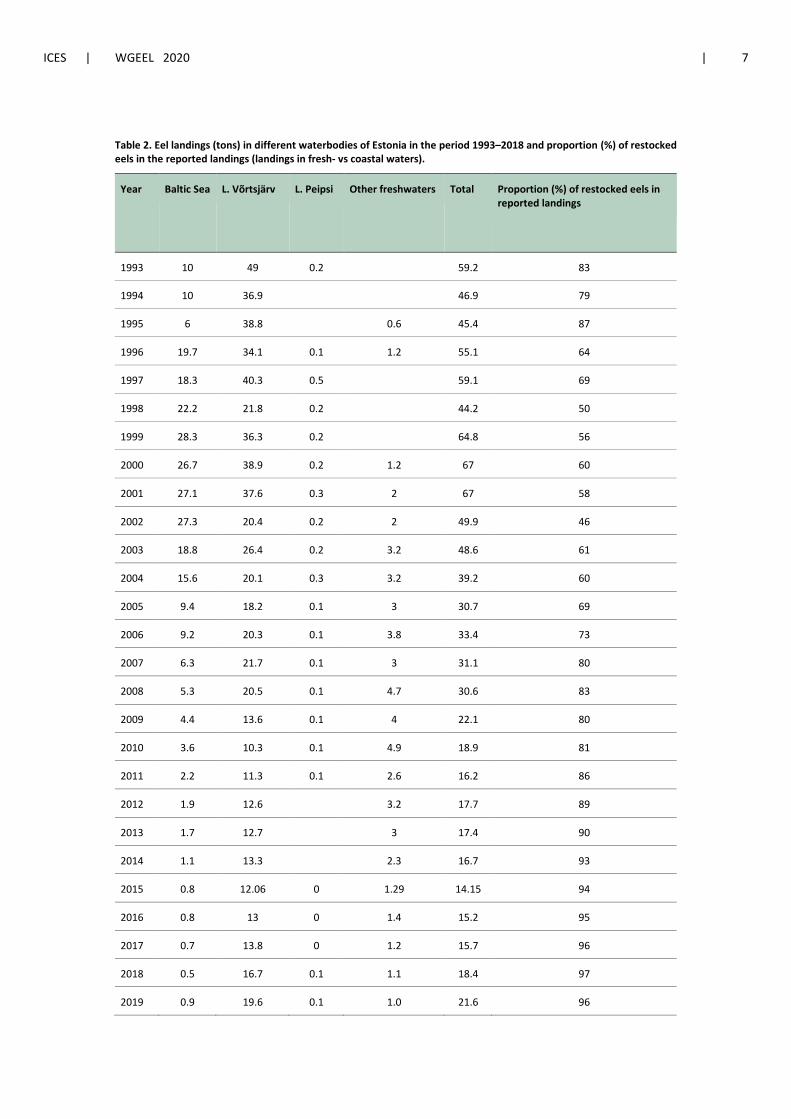
ICES | WGEEL 2020 | 7
Table 2. Eel landings (tons) in different waterbodies of Estonia in the period 1993–2018 and proportion (%) of restocked eels in the reported landings (landings in fresh- vs coastal waters).
Year Baltic Sea L. Võrtsjärv L. Peipsi Other freshwaters Total Proportion (%) of restocked eels in reported landings
1993 10 49 0.2
59.2 83
1994 10 36.9
46.9 79
1995 6 38.8
0.6 45.4 87
1996 19.7 34.1 0.1 1.2 55.1 64
1997 18.3 40.3 0.5
59.1 69
1998 22.2 21.8 0.2
44.2 50
1999 28.3 36.3 0.2
64.8 56
2000 26.7 38.9 0.2 1.2 67 60
2001 27.1 37.6 0.3 2 67 58
2002 27.3 20.4 0.2 2 49.9 46
2003 18.8 26.4 0.2 3.2 48.6 61
2004 15.6 20.1 0.3 3.2 39.2 60
2005 9.4 18.2 0.1 3 30.7 69
2006 9.2 20.3 0.1 3.8 33.4 73
2007 6.3 21.7 0.1 3 31.1 80
2008 5.3 20.5 0.1 4.7 30.6 83
2009 4.4 13.6 0.1 4 22.1 80
2010 3.6 10.3 0.1 4.9 18.9 81
2011 2.2 11.3 0.1 2.6 16.2 86
2012 1.9 12.6
3.2 17.7 89
2013 1.7 12.7
3 17.4 90
2014 1.1 13.3
2.3 16.7 93
2015 0.8 12.06 0 1.29 14.15 94
2016 0.8 13 0 1.4 15.2 95
2017 0.7 13.8 0 1.2 15.7 96
2018 0.5 16.7 0.1 1.1 18.4 97
2019 0.9 19.6 0.1 1.0 21.6 96
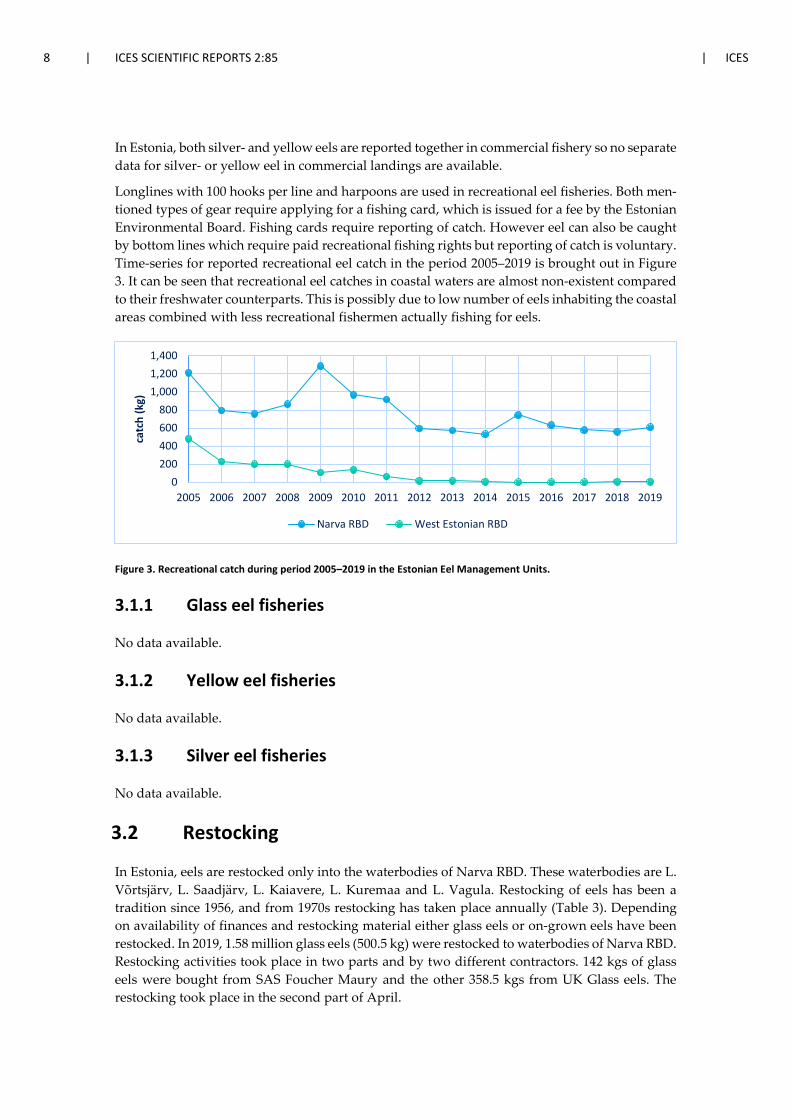
8 | ICES SCIENTIFIC REPORTS 2:85 | ICES
In Estonia, both silver- and yellow eels are reported together in commercial fishery so no separate data for silver- or yellow eel in commercial landings are available.
Longlines with 100 hooks per line and harpoons are used in recreational eel fisheries. Both men-tioned types of gear require applying for a fishing card, which is issued for a fee by the Estonian Environmental Board. Fishing cards require reporting of catch. However eel can also be caught by bottom lines which require paid recreational fishing rights but reporting of catch is voluntary. Time-series for reported recreational eel catch in the period 2005–2019 is brought out in Figure 3. It can be seen that recreational eel catches in coastal waters are almost non-existent compared to their freshwater counterparts. This is possibly due to low number of eels inhabiting the coastal areas combined with less recreational fishermen actually fishing for eels.
Figure 3. Recreational catch during period 2005–2019 in the Estonian Eel Management Units.
3.1.1 Glass eel fisheries
No data available.
3.1.2 Yellow eel fisheries
No data available.
3.1.3 Silver eel fisheries
No data available.
3.2 Restocking
In Estonia, eels are restocked only into the waterbodies of Narva RBD. These waterbodies are L. Võrtsjärv, L. Saadjärv, L. Kaiavere, L. Kuremaa and L. Vagula. Restocking of eels has been a tradition since 1956, and from 1970s restocking has taken place annually (Table 3). Depending on availability of finances and restocking material either glass eels or on-grown eels have been restocked. In 2019, 1.58 million glass eels (500.5 kg) were restocked to waterbodies of Narva RBD. Restocking activities took place in two parts and by two different contractors. 142 kgs of glass eels were bought from SAS Foucher Maury and the other 358.5 kgs from UK Glass eels. The restocking took place in the second part of April.
0200400600800
1,0001,2001,400
2005 2006 2007 2008 2009 2010 2011 2012 2013 2014 2015 2016 2017 2018 2019
catc
h (k
g)
Narva RBD West Estonian RBD
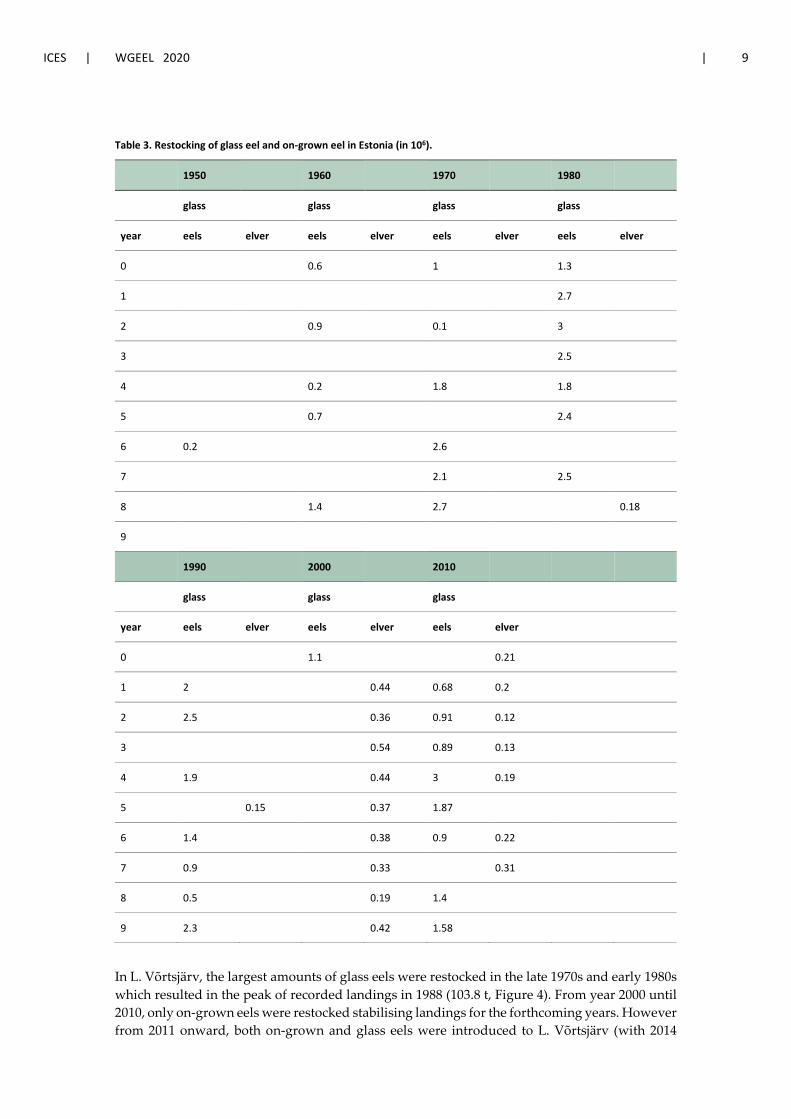
ICES | WGEEL 2020 | 9
Table 3. Restocking of glass eel and on-grown eel in Estonia (in 106).
1950
1960
1970
1980
glass
glass
glass
glass
year eels elver eels elver eels elver eels elver
0
0.6
1
1.3
1
2.7
2
0.9
0.1
3
3
2.5
4
0.2
1.8
1.8
5
0.7
2.4
6 0.2
2.6
7
2.1
2.5
8
1.4
2.7
0.18
9
1990
2000
2010
glass
glass
glass
year eels elver eels elver eels elver
0
1.1
0.21
1 2
0.44 0.68 0.2
2 2.5
0.36 0.91 0.12
3
0.54 0.89 0.13
4 1.9
0.44 3 0.19
5
0.15
0.37 1.87
6 1.4
0.38 0.9 0.22
7 0.9
0.33
0.31
8 0.5
0.19 1.4
9 2.3
0.42 1.58
In L. Võrtsjärv, the largest amounts of glass eels were restocked in the late 1970s and early 1980s which resulted in the peak of recorded landings in 1988 (103.8 t, Figure 4). From year 2000 until 2010, only on-grown eels were restocked stabilising landings for the forthcoming years. However from 2011 onward, both on-grown and glass eels were introduced to L. Võrtsjärv (with 2014
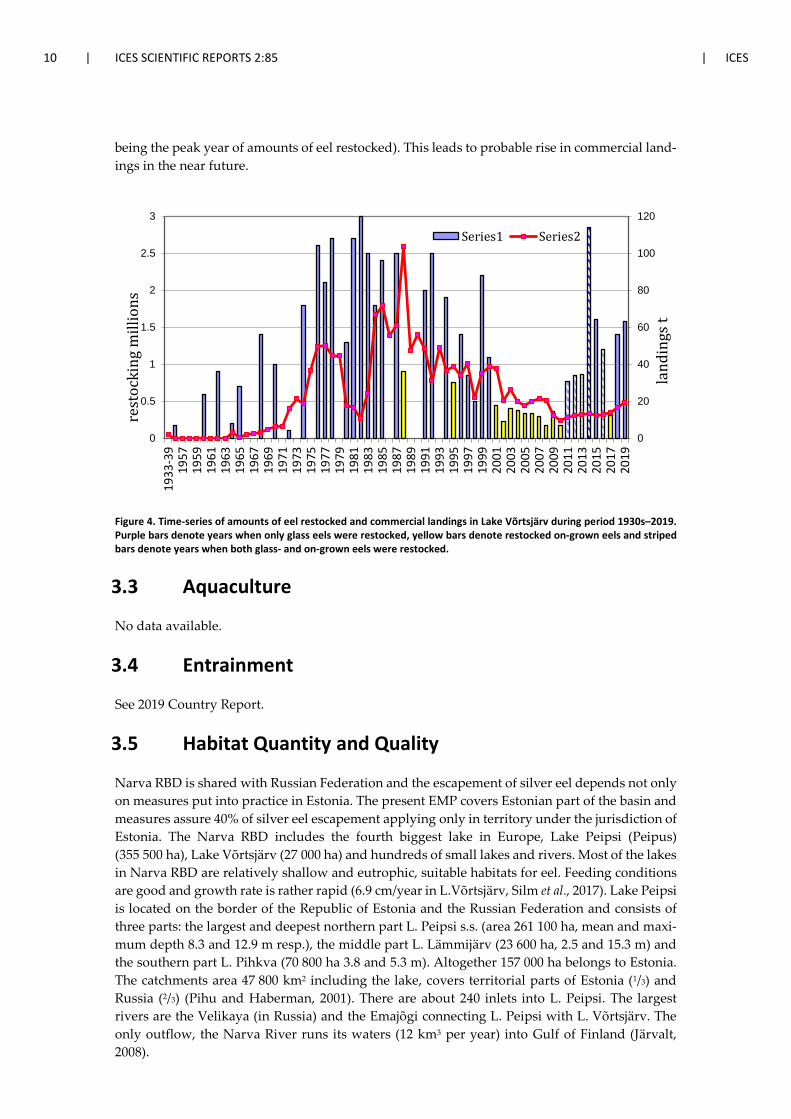
10 | ICES SCIENTIFIC REPORTS 2:85 | ICES
being the peak year of amounts of eel restocked). This leads to probable rise in commercial land-ings in the near future.
Figure 4. Time-series of amounts of eel restocked and commercial landings in Lake Võrtsjärv during period 1930s–2019. Purple bars denote years when only glass eels were restocked, yellow bars denote restocked on-grown eels and striped bars denote years when both glass- and on-grown eels were restocked.
3.3 Aquaculture
No data available.
3.4 Entrainment
See 2019 Country Report.
3.5 Habitat Quantity and Quality
Narva RBD is shared with Russian Federation and the escapement of silver eel depends not only on measures put into practice in Estonia. The present EMP covers Estonian part of the basin and measures assure 40% of silver eel escapement applying only in territory under the jurisdiction of Estonia. The Narva RBD includes the fourth biggest lake in Europe, Lake Peipsi (Peipus) (355 500 ha), Lake Võrtsjärv (27 000 ha) and hundreds of small lakes and rivers. Most of the lakes in Narva RBD are relatively shallow and eutrophic, suitable habitats for eel. Feeding conditions are good and growth rate is rather rapid (6.9 cm/year in L.Võrtsjärv, Silm et al., 2017). Lake Peipsi is located on the border of the Republic of Estonia and the Russian Federation and consists of three parts: the largest and deepest northern part L. Peipsi s.s. (area 261 100 ha, mean and maxi-mum depth 8.3 and 12.9 m resp.), the middle part L. Lämmijärv (23 600 ha, 2.5 and 15.3 m) and the southern part L. Pihkva (70 800 ha 3.8 and 5.3 m). Altogether 157 000 ha belongs to Estonia. The catchments area 47 800 km2 including the lake, covers territorial parts of Estonia (1/3) and Russia (2/3) (Pihu and Haberman, 2001). There are about 240 inlets into L. Peipsi. The largest rivers are the Velikaya (in Russia) and the Emajõgi connecting L. Peipsi with L. Võrtsjärv. The only outflow, the Narva River runs its waters (12 km3 per year) into Gulf of Finland (Järvalt, 2008).
0
20
40
60
80
100
120
0
0.5
1
1.5
2
2.5
3
1933
-39
1957
1959
1961
1963
1965
1967
1969
1971
1973
1975
1977
1979
1981
1983
1985
1987
1989
1991
1993
1995
1997
1999
2001
2003
2005
2007
2009
2011
2013
2015
2017
2019
land
ings
t
rest
ocki
ng m
illio
ns
Series1 Series2

ICES | WGEEL 2020 | 11
The second large lake in this basin is Võrtsjärv, very shallow and turbid lake with a surface area of about 27 000 ha and mean and maximum depths of 2.8 m and 6.0 m, respectively. Its drainage basin (310 400 ha, incl. 10 300 ha in Latvia) is situated in the Central Estonia. Small lakes where eel fishery take place in the basin, are L. Saadjärv (707 ha), L. Kuremaa (497 ha) and L. Kaiavere (250 ha) in Vooremaa district and L. Vagula (519 ha) in South Estonia (Järvalt, 2008).
3.6 Other impacts
No data available.
12 | ICES SCIENTIFIC REPORTS 2:85 | ICES
4 National stock assessment
4.1 Description of Method
4.1.1 Data collection
Data are collected by regular fykenets and an enclosure fykenet system in Narva RBD.
Data are collected annually during the fishing season (May–September). 100–200 specimens are collected from commercial fishermen to measure length and weight. Up to three regular fykenets (mouth opening 1–3 m, mesh size in the codend > 18 mm) set in different locations in L. Võrtsjärv are used for collecting scientific samples.
Enclosure fykenet system was used on the small lakes of Narva RBD in 2018. The methodology was modified after Ubl and Dorow (2015). A random fishing area was selected taking the depth (as the leader nets of the system are 1.8 m high, the sampling spot should not be very deep) into account. The system was set for one week per sampling spot. Samples were collected twice a week. All eels caught were measured and weighted. Sex and silvering stage was determined. Also the occurrence of parasites and the type of food ingested was recorded. From a select sam-ple, otoliths were extracted for age reading and possible micro-chemical analyses. Samples were taken from May until the middle of October 2018.
Collected otoliths were etched and stained with 1% HCl acid and neutral red solution according to the Swedish method (ICES, 2009).
West Estonian RBD: University of Tartu was responsible for the scientific monitoring of eel. Small fykenets were used for annual monitoring. Six monitoring areas in the coastal waters have been surveyed since 1998. The gear is 55 cm high with a semi-circular opening and a leader or wing that is 5 m long. Fykes are made of 17 mm mesh in the arm and 10-mm in the codend. Mostly yellow eel were caught using this gear. Catch per unit of effort (cpue) data were presented as an average number of eels caught per fyke/day by study years and monitoring areas (Bernotas et al., 2016).
Length and weight along with the CPUE of small fykenets. Otoliths are collected for age reading and micro-chemical analyses.
4.1.2 Analysis
Enclosure fykenet system (Ubl and Dorow, 2015) was used to determine approximate number of eels per hectare in L. Võrtsjärv in 2016–2017. Escaping silver eel biomass was calculated using these variables:
N – number of eels in lake according to enclosure fykenet catches
Ni – number of i-age group eels in the lake
F – commercial fishing mortality for given year
Fi – commercial fishing mortality of i-age group eels for given year
Pi – proportion of i-age group eels in commercial landings (%)
NRi – corrected number on i-age group eels in commercial landings according to enclosure fykenet data
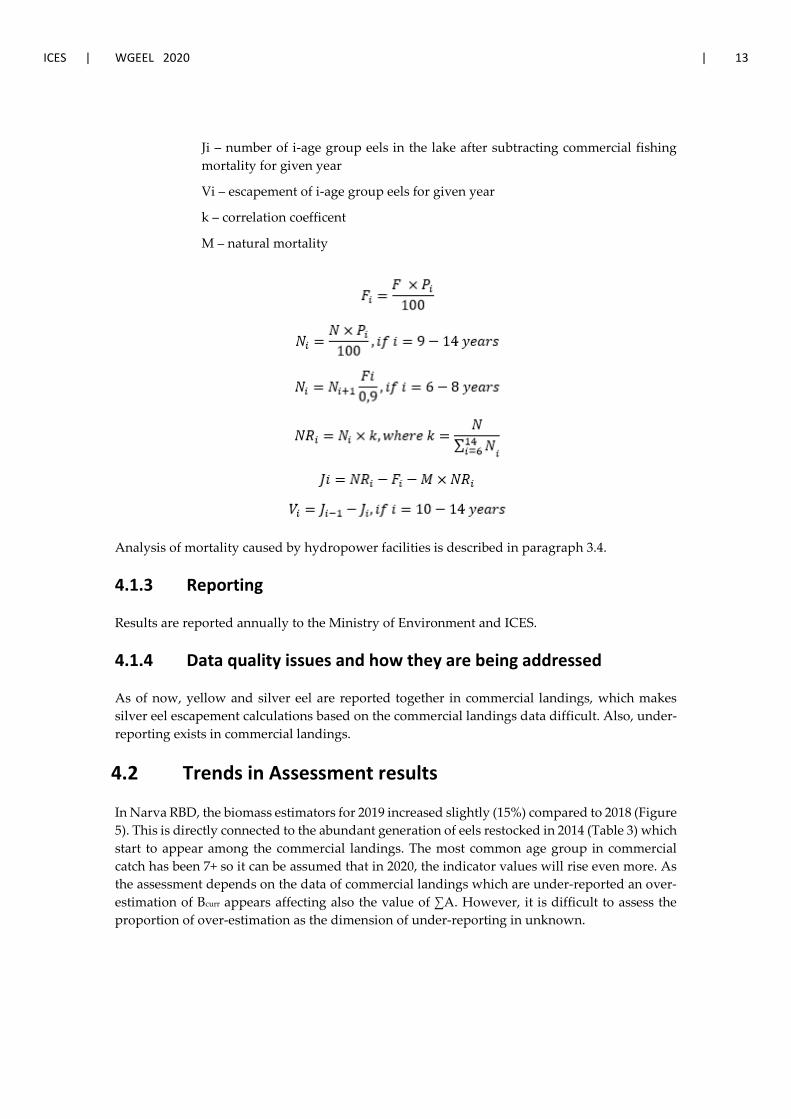
ICES | WGEEL 2020 | 13
Ji – number of i-age group eels in the lake after subtracting commercial fishing mortality for given year
Vi – escapement of i-age group eels for given year
k – correlation coefficent
M – natural mortality
Analysis of mortality caused by hydropower facilities is described in paragraph 3.4.
4.1.3 Reporting
Results are reported annually to the Ministry of Environment and ICES.
4.1.4 Data quality issues and how they are being addressed
As of now, yellow and silver eel are reported together in commercial landings, which makes silver eel escapement calculations based on the commercial landings data difficult. Also, under-reporting exists in commercial landings.
4.2 Trends in Assessment results
In Narva RBD, the biomass estimators for 2019 increased slightly (15%) compared to 2018 (Figure 5). This is directly connected to the abundant generation of eels restocked in 2014 (Table 3) which start to appear among the commercial landings. The most common age group in commercial catch has been 7+ so it can be assumed that in 2020, the indicator values will rise even more. As the assessment depends on the data of commercial landings which are under-reported an over-estimation of Bcurr appears affecting also the value of ∑A. However, it is difficult to assess the proportion of over-estimation as the dimension of under-reporting in unknown.
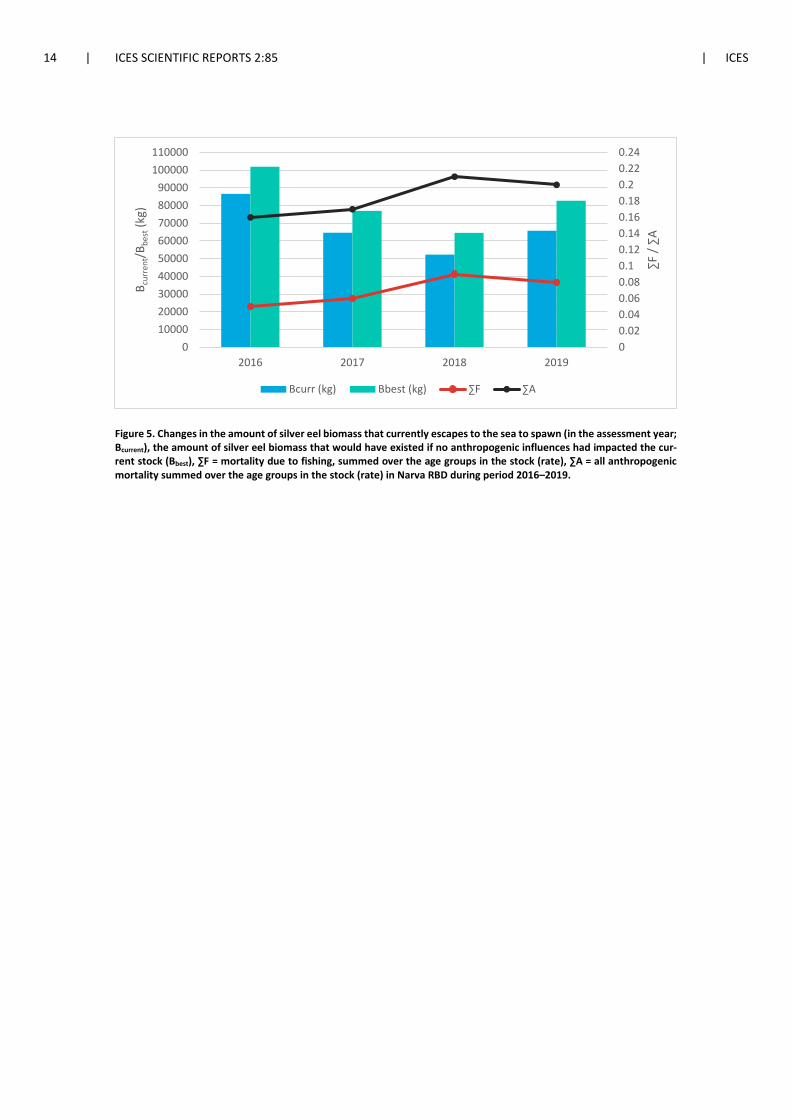
14 | ICES SCIENTIFIC REPORTS 2:85 | ICES
Figure 5. Changes in the amount of silver eel biomass that currently escapes to the sea to spawn (in the assessment year; Bcurrent), the amount of silver eel biomass that would have existed if no anthropogenic influences had impacted the cur-rent stock (Bbest), ∑F = mortality due to fishing, summed over the age groups in the stock (rate), ∑A = all anthropogenic mortality summed over the age groups in the stock (rate) in Narva RBD during period 2016–2019.
00.020.040.060.080.10.120.140.160.180.20.220.24
0100002000030000400005000060000700008000090000
100000110000
2016 2017 2018 2019
∑F/ ∑
A
B cur
rent
/Bbe
st(k
g)
Bcurr (kg) Bbest (kg) ∑F ∑A
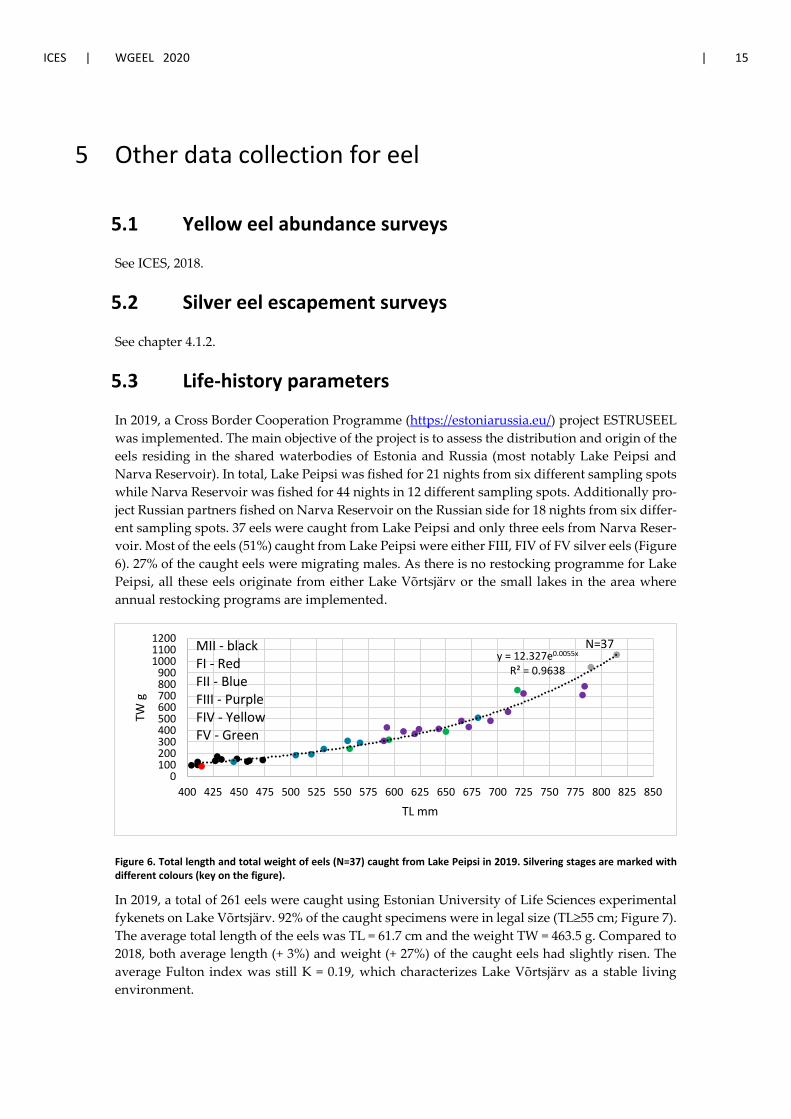
ICES | WGEEL 2020 | 15
5 Other data collection for eel
5.1 Yellow eel abundance surveys
See ICES, 2018.
5.2 Silver eel escapement surveys
See chapter 4.1.2.
5.3 Life-history parameters
In 2019, a Cross Border Cooperation Programme (https://estoniarussia.eu/) project ESTRUSEEL was implemented. The main objective of the project is to assess the distribution and origin of the eels residing in the shared waterbodies of Estonia and Russia (most notably Lake Peipsi and Narva Reservoir). In total, Lake Peipsi was fished for 21 nights from six different sampling spots while Narva Reservoir was fished for 44 nights in 12 different sampling spots. Additionally pro-ject Russian partners fished on Narva Reservoir on the Russian side for 18 nights from six differ-ent sampling spots. 37 eels were caught from Lake Peipsi and only three eels from Narva Reser-voir. Most of the eels (51%) caught from Lake Peipsi were either FIII, FIV of FV silver eels (Figure 6). 27% of the caught eels were migrating males. As there is no restocking programme for Lake Peipsi, all these eels originate from either Lake Võrtsjärv or the small lakes in the area where annual restocking programs are implemented.
Figure 6. Total length and total weight of eels (N=37) caught from Lake Peipsi in 2019. Silvering stages are marked with different colours (key on the figure).
In 2019, a total of 261 eels were caught using Estonian University of Life Sciences experimental fykenets on Lake Võrtsjärv. 92% of the caught specimens were in legal size (TL≥55 cm; Figure 7). The average total length of the eels was TL = 61.7 cm and the weight TW = 463.5 g. Compared to 2018, both average length (+ 3%) and weight (+ 27%) of the caught eels had slightly risen. The average Fulton index was still K = 0.19, which characterizes Lake Võrtsjärv as a stable living environment.
y = 12.327e0.0055x
R² = 0.9638
0100200300400500600700800900
100011001200
400 425 450 475 500 525 550 575 600 625 650 675 700 725 750 775 800 825 850
TW g
TL mm
N=37MII - blackFI - RedFII - BlueFIII - PurpleFIV - YellowFV - Green
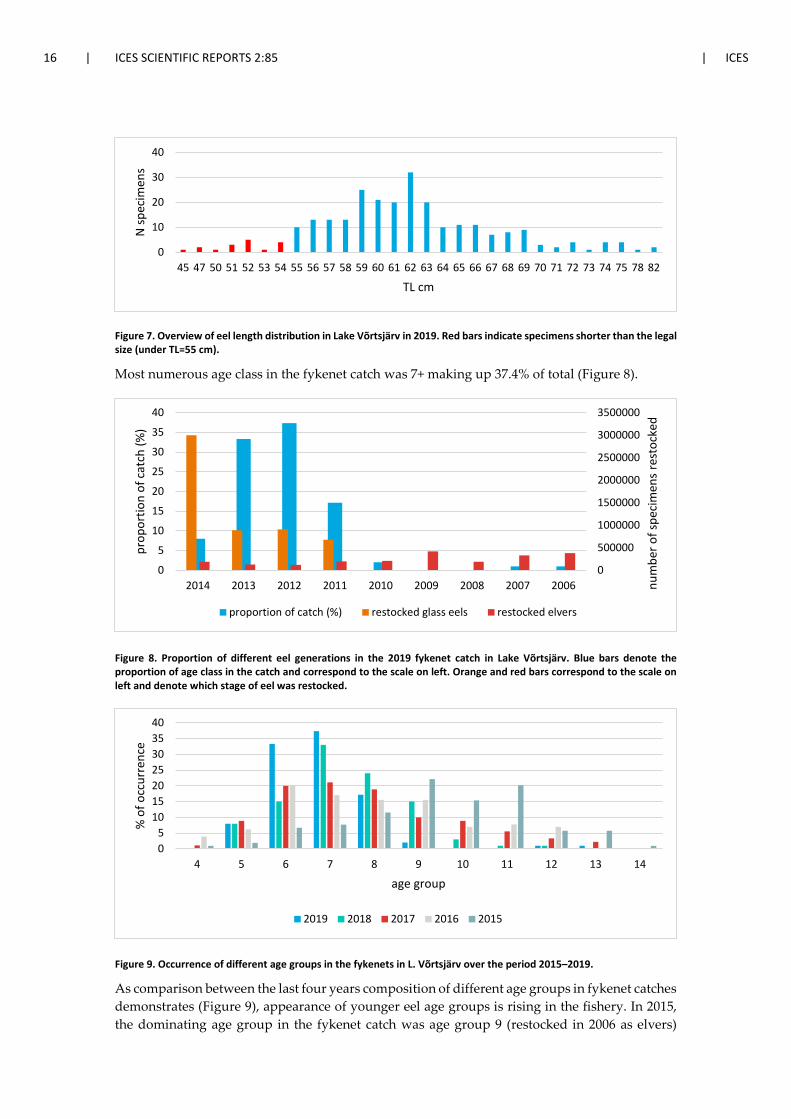
16 | ICES SCIENTIFIC REPORTS 2:85 | ICES
Figure 7. Overview of eel length distribution in Lake Võrtsjärv in 2019. Red bars indicate specimens shorter than the legal size (under TL=55 cm).
Most numerous age class in the fykenet catch was 7+ making up 37.4% of total (Figure 8).
Figure 8. Proportion of different eel generations in the 2019 fykenet catch in Lake Võrtsjärv. Blue bars denote the proportion of age class in the catch and correspond to the scale on left. Orange and red bars correspond to the scale on left and denote which stage of eel was restocked.
Figure 9. Occurrence of different age groups in the fykenets in L. Võrtsjärv over the period 2015–2019.
As comparison between the last four years composition of different age groups in fykenet catches demonstrates (Figure 9), appearance of younger eel age groups is rising in the fishery. In 2015, the dominating age group in the fykenet catch was age group 9 (restocked in 2006 as elvers)
0
10
20
30
40
45 47 50 51 52 53 54 55 56 57 58 59 60 61 62 63 64 65 66 67 68 69 70 71 72 73 74 75 78 82
N sp
ecim
ens
TL cm
0
500000
1000000
1500000
2000000
2500000
3000000
3500000
0
5
10
15
20
25
30
35
40
2014 2013 2012 2011 2010 2009 2008 2007 2006 num
ber o
f spe
cim
ens
rest
ocke
d
prop
ortio
n of
cat
ch (%
)
proportion of catch (%) restocked glass eels restocked elvers
05
10152025303540
4 5 6 7 8 9 10 11 12 13 14
% o
f occ
urre
nce
age group
2019 2018 2017 2016 2015
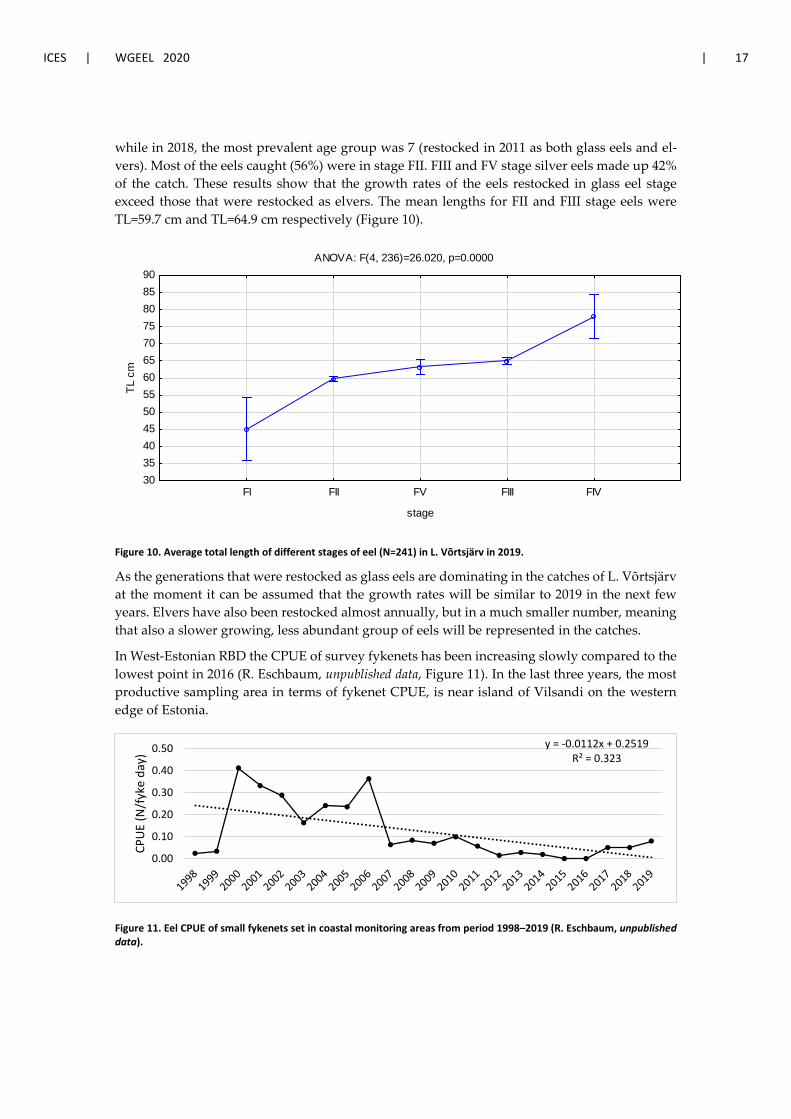
ICES | WGEEL 2020 | 17
while in 2018, the most prevalent age group was 7 (restocked in 2011 as both glass eels and el-vers). Most of the eels caught (56%) were in stage FII. FIII and FV stage silver eels made up 42% of the catch. These results show that the growth rates of the eels restocked in glass eel stage exceed those that were restocked as elvers. The mean lengths for FII and FIII stage eels were TL=59.7 cm and TL=64.9 cm respectively (Figure 10).
ANOVA: F(4, 236)=26.020, p=0.0000
FI FII FV FIII FIV
stage
30354045505560657075808590
TL c
m
Figure 10. Average total length of different stages of eel (N=241) in L. Võrtsjärv in 2019.
As the generations that were restocked as glass eels are dominating in the catches of L. Võrtsjärv at the moment it can be assumed that the growth rates will be similar to 2019 in the next few years. Elvers have also been restocked almost annually, but in a much smaller number, meaning that also a slower growing, less abundant group of eels will be represented in the catches.
In West-Estonian RBD the CPUE of survey fykenets has been increasing slowly compared to the lowest point in 2016 (R. Eschbaum, unpublished data, Figure 11). In the last three years, the most productive sampling area in terms of fykenet CPUE, is near island of Vilsandi on the western edge of Estonia.
Figure 11. Eel CPUE of small fykenets set in coastal monitoring areas from period 1998–2019 (R. Eschbaum, unpublished data).
y = -0.0112x + 0.2519R² = 0.323
0.00
0.10
0.20
0.30
0.40
0.50
CPU
E (N
/fyk
e da
y)

18 | ICES SCIENTIFIC REPORTS 2:85 | ICES
5.4 Diseases, Parasites & Pathogens or Contaminants
43 % (N = 49) of the analysed eels (N = 113) in L. Võrtsjärv were infected with the parasite An-guillicoloides crassus. The average intensity of infection was ten parasites per fish, which is 40% higher than observed in 2018. There is a direct relationship between feeding activity and infec-tion potential, as more active individuals are more successful in finding food and, as a result, may be more likely infected (Lefebvre et al., 2013). It is known that fish restocked as glass eels grow faster than on-grown individuals in the first years due to better adaptation to natural food (Roslender, 2019; Simon and Dörner, 2014). As the proportion of glass eels in the yield has in-creased year by year, the number of infected individuals and the intensity of infection may also increase in the future. The samples collected from L. Peipsi showed that 60% of the eels were infected with A. Crassus with the average intensity of infection being three parasites per eel.

ICES | WGEEL 2020 | 19
6 New Information
In early 2020, a paper on eel restocking and environmental factors was published (How do envi-ronmental factors affect the yield of European eel (Anguilla anguilla) in a restocked population?). In this study, we used a machine learning method followed by generalized linear model to ana-lyse long time eel restocking, commercial fishery and environmental data from Lake Võrtsjärv, Estonia, to detect whether significant relationships exist within these data. It was found that en-vironmental parameters can have an effect on the commercial eel yield both retrospectively and during the particular fishing year. Considering that seven year old eel was the most common age group in commercial catch, we introduced a seven year gap between eel restocking and yield to study the most important abiotic and biotic factors during the first year of eel restocking that have an effect on the yield. According to our results, cyanobacterial biomass and summer water temperature during the year of restocking had the strongest negative impact on the yield seven years after, while the number of restocked individuals and copepod biomass had a positive ef-fect. During particular fishing year, however, the yield was most notably positively affected by total phosphorous concentration, number of individuals restocked seven years before and met-azooplankton biomass in the lake.
20 | ICES SCIENTIFIC REPORTS 2:85 | ICES
7 References
Bernotas, P., Vetemaa, M., Saks, L., Eschbaum, R., Verliin, A., and Järvalt, A. 2016. Dynamics of European eel landings and stocks in the coastal waters of Estonia. ICES Journal of Marine Science: Journal Du Conseil . http://doi.org/10.1093/icesjms/fsv245
ICES. 2009. Workshop on Age Reading of European and American Eel (WKAREA), 20–24 April 2009, Bor-deaux, France. ICES CM 2009\ACOM: 48. 66 pp.
ICES. 2018. Report of the Joint EIFAAC/ICES/GFCM Working Group on Eels (WGEEL), 5–12 September 2018, Gdańsk, Poland. ICES CM 2018/ACOM:15. 152 pp. Annex “Report on the eel stock, fishery and other impacts, in: Estonia 2018.”
Järvalt, A. 2008. Eel management plan. Report. 26 pp. Ministry of Environment. http://www.en-vir.ee/sites/default/files/elfinder/article_files/kavajaheakskiitmiseotsus03.12.2009.pdf
Lefebvre, F., Fazio, G., Mounaix, B., Crivelli, A.J. 2013. Is the continental life of the European eel Anguilla anguilla affected by the parasitic invader Anguillicoloides crassus? Proc. R. Soc. B Biol. Sci. 280. https://doi.org/10.1098/rspb.2012.2916.
Pihu, E. and Haberman, J. (Editors.) 2001. Lake Peipsi – Flora and Fauna. Institute of Zoology and Botany. Tartu, Sulemees publishers.
Report of the implementation of Estonian National Eel Management Plan. 2015. Estonian Ministry of the Environment. Report. Tallinn 2015. 25pp.
Roslender, K. 2019. Proportion and morphological features of male eels (Anguilla anguilla) in restocked pop-ulation (Bachelor thesis). Retrieved from Estonian University of Life Sciences Library. (http://hdl.han-dle.net/10492/4992)
Silm, M; Bernotas, P; Haldna, M; Järvalt, A; Nõges, T. 2017. Age and growth of European eel, Anguilla an-guilla (Linnaeus, 1758), in Estonian lakes. Journal of Applied Ichthyology, 33 (2), 236−241.jai.13314.
Simon, J., Dörner, H. 2014. Survival and growth of European eels stocked as glass- and farm-sourced eels in five lakes in the first years after stocking. Ecol. Freshw. Fish 23, 40–48. https://doi.org/10.1111/eff.12050.
Ubl, C. and Dorow, M. 2015. A novel enclosure approach to assessing yellow eel (Anguilla anguilla) density in non-tidal coastal waters. Fisheries Research 161, 57–63. http://dx.doi.org/10.1016/j.fishres.2014.06.009.
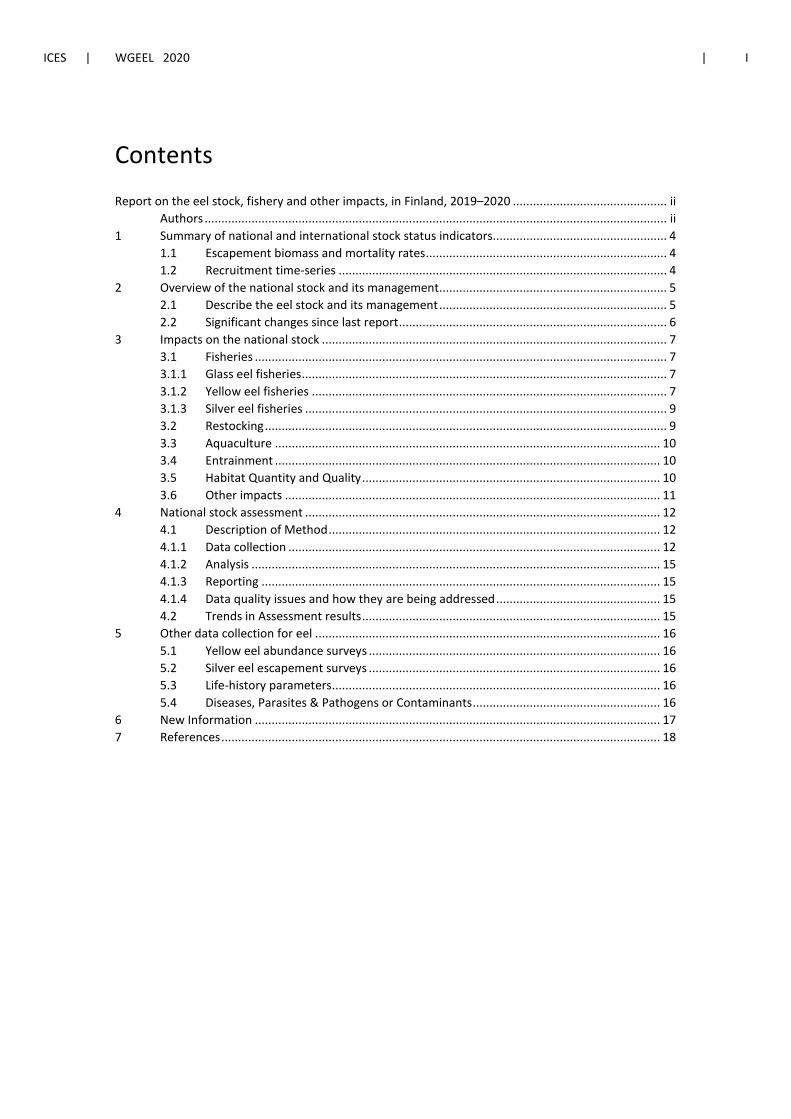
ICES | WGEEL 2020 | I
Contents
Report on the eel stock, fishery and other impacts, in Finland, 2019–2020 .............................................. ii Authors .......................................................................................................................................... ii
1 Summary of national and international stock status indicators.................................................... 4 1.1 Escapement biomass and mortality rates ........................................................................ 4 1.2 Recruitment time-series .................................................................................................. 4
2 Overview of the national stock and its management.................................................................... 5 2.1 Describe the eel stock and its management .................................................................... 5 2.2 Significant changes since last report ................................................................................ 6
3 Impacts on the national stock ....................................................................................................... 7 3.1 Fisheries ........................................................................................................................... 7 3.1.1 Glass eel fisheries ............................................................................................................. 7 3.1.2 Yellow eel fisheries .......................................................................................................... 7 3.1.3 Silver eel fisheries ............................................................................................................ 9 3.2 Restocking ........................................................................................................................ 9 3.3 Aquaculture ................................................................................................................... 10 3.4 Entrainment ................................................................................................................... 10 3.5 Habitat Quantity and Quality ......................................................................................... 10 3.6 Other impacts ................................................................................................................ 11
4 National stock assessment .......................................................................................................... 12 4.1 Description of Method ................................................................................................... 12 4.1.1 Data collection ............................................................................................................... 12 4.1.2 Analysis .......................................................................................................................... 15 4.1.3 Reporting ....................................................................................................................... 15 4.1.4 Data quality issues and how they are being addressed ................................................. 15 4.2 Trends in Assessment results ......................................................................................... 15
5 Other data collection for eel ....................................................................................................... 16 5.1 Yellow eel abundance surveys ....................................................................................... 16 5.2 Silver eel escapement surveys ....................................................................................... 16 5.3 Life-history parameters .................................................................................................. 16 5.4 Diseases, Parasites & Pathogens or Contaminants ........................................................ 16
6 New Information ......................................................................................................................... 17 7 References ................................................................................................................................... 18
II | ICES SCIENTIFIC REPORTS 2:85 | ICES
Report on the eel stock, fishery and other impacts, in Finland, 2019–2020
Authors Jouni Tulonen, Research Scientist, Natural Resources Institute Finland, [email protected]
Sami Vesala, Specialist, Natural Resources Institute Finland, [email protected]
Reporting Period: This report was completed in September 2020, and contains data up 2019 and some provisional data for 2020

4 | ICES SCIENTIFIC REPORTS 2:85 | ICES
1 Summary of national and international stock status indicators
1.1 Escapement biomass and mortality rates
No available data.
1.2 Recruitment time-series
No available data.

ICES | WGEEL 2020 | 5
2 Overview of the national stock and its management
2.1 Describe the eel stock and its management
There are not available data to provide stock indicators of silver eel escapement biomass and mortality rates. In Finland, eels are on their North-Eastern limits of natural geographical distri-bution. Natural eel populations have probably always been very sparse, and the overall im-portance of the species has been low. In freshwaters only in few areas in Southern parts of the country eel has been a target in the recreational fisheries. According to old fishermen, the catch and the importance of eel to local fisheries were still high in 1940–1960 in some parts of the Gulf of Finland, mainly in the estuary of the river Kymijoki and east of the city of Kotka. Also in Finnish Archipelago, eel was a common species at that time. Almost all rivers running to the Baltic are closed by hydroelectric power plants. Natural eel immigration is possible only in few freshwater systems near the coast and in the coastal areas of the Baltic. Eel populations and eel fisheries in Finnish inland waters depend almost completely on introductions and re-stockings. First introductions were conducted in 1893, but until now, the most numerous introductions were made in the sixties and 1970s. During the years 1979–1988, it was not allowed to import eels because eel was detected to be a possible carrier of some viral fish diseases. For this reason, it was decided in 1989 to carry on re-stockings only with glass eels reared in a careful quarantine. Since then glass eels originating from River Severn in the UK have been imported through a Swedish quarantine and re-stocked in almost one hundred lakes in Southern Finland and in the Baltic along the Southern coast of Finland.
Finnish EMP covers the whole Finnish national territory as one eel river basin. It is bounded to the ICES Ecoregion Baltic Sea.
Terms used in the EMP to define natural habitats for the eel were:
• outlet of the river basin is in Finland’s national territory; • there has been natural immigration of elvers before the damming of the rivers; • there have been considerable stockings lately; • there has been regular eel fishery.
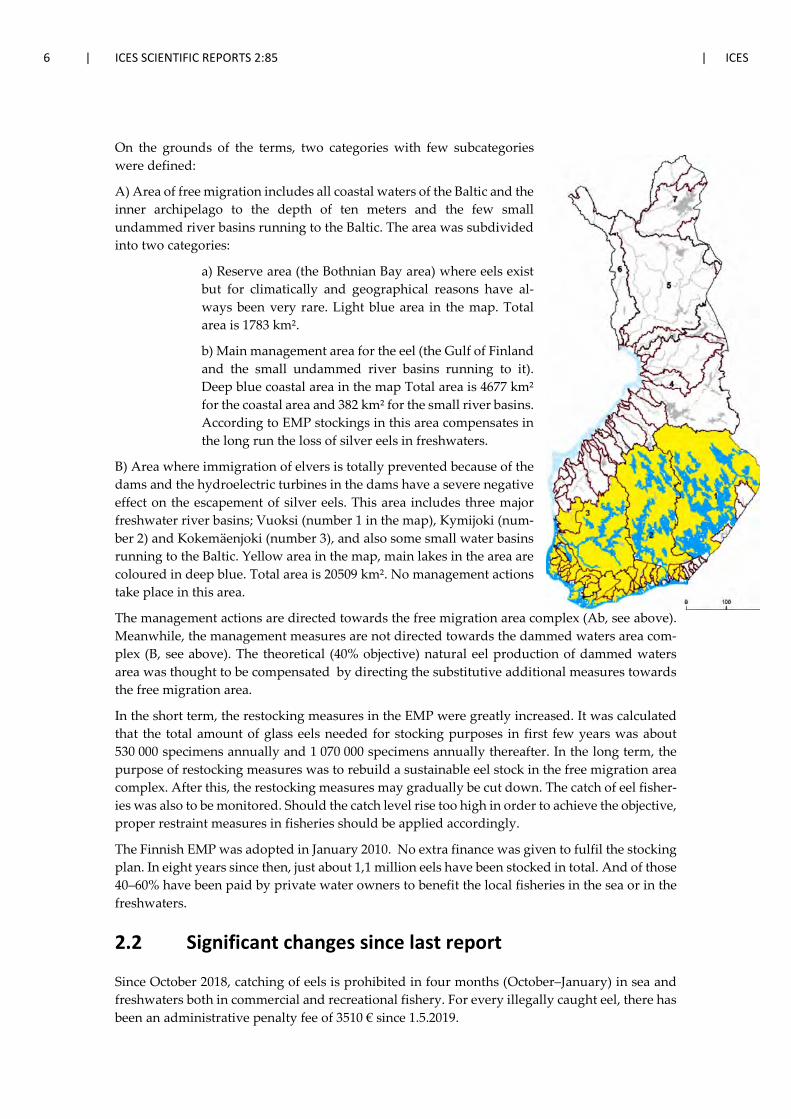
6 | ICES SCIENTIFIC REPORTS 2:85 | ICES
On the grounds of the terms, two categories with few subcategories were defined:
A) Area of free migration includes all coastal waters of the Baltic and the inner archipelago to the depth of ten meters and the few small undammed river basins running to the Baltic. The area was subdivided into two categories:
a) Reserve area (the Bothnian Bay area) where eels exist but for climatically and geographical reasons have al-ways been very rare. Light blue area in the map. Total area is 1783 km².
b) Main management area for the eel (the Gulf of Finland and the small undammed river basins running to it). Deep blue coastal area in the map Total area is 4677 km² for the coastal area and 382 km² for the small river basins. According to EMP stockings in this area compensates in the long run the loss of silver eels in freshwaters.
B) Area where immigration of elvers is totally prevented because of the dams and the hydroelectric turbines in the dams have a severe negative effect on the escapement of silver eels. This area includes three major freshwater river basins; Vuoksi (number 1 in the map), Kymijoki (num-ber 2) and Kokemäenjoki (number 3), and also some small water basins running to the Baltic. Yellow area in the map, main lakes in the area are coloured in deep blue. Total area is 20509 km². No management actions take place in this area.
The management actions are directed towards the free migration area complex (Ab, see above). Meanwhile, the management measures are not directed towards the dammed waters area com-plex (B, see above). The theoretical (40% objective) natural eel production of dammed waters area was thought to be compensated by directing the substitutive additional measures towards the free migration area.
In the short term, the restocking measures in the EMP were greatly increased. It was calculated that the total amount of glass eels needed for stocking purposes in first few years was about 530 000 specimens annually and 1 070 000 specimens annually thereafter. In the long term, the purpose of restocking measures was to rebuild a sustainable eel stock in the free migration area complex. After this, the restocking measures may gradually be cut down. The catch of eel fisher-ies was also to be monitored. Should the catch level rise too high in order to achieve the objective, proper restraint measures in fisheries should be applied accordingly.
The Finnish EMP was adopted in January 2010. No extra finance was given to fulfil the stocking plan. In eight years since then, just about 1,1 million eels have been stocked in total. And of those 40–60% have been paid by private water owners to benefit the local fisheries in the sea or in the freshwaters.
2.2 Significant changes since last report
Since October 2018, catching of eels is prohibited in four months (October–January) in sea and freshwaters both in commercial and recreational fishery. For every illegally caught eel, there has been an administrative penalty fee of 3510 € since 1.5.2019.
ICES | WGEEL 2020 | 7
3 Impacts on the national stock
3.1 Fisheries
Finnish eel catches are very low and there are no fisheries targeting eel. Annual catch estimates are available for professional and biennial for recreational fisheries. Earlier studies suggest that most eels in Finland originates from restocking programsme. It is possible to get limited number of eel samples from the fykenet fisheries bycatch.
3.1.1 Glass eel fisheries
There is no glass eel fisheries in Finland as glass eels don’t exist there.
3.1.2 Yellow eel fisheries
There are no specific data on yellow eel fisheries. During 2008–2018, the total professional marine eel landings (yellow and silver together) have varied between 609–2300 kg/year. In 2019, it was only 299 kg, mainly due to the four months closure of fisheries. Landings in the professional fisheries are based in the sea on annual logbook data and in freshwaters until year 2016 on ques-tionnaires made every second year to professional and semi-professional fishermen. In freshwa-ter commercial fisheries, the number of fishermen grew when a new logbook based registry was implemented form 2016 onwards. As a result, the landings of commercial fisheries were 49 kg in 2016, 36 kg in 2017 and 31 kg in 2018. Landings for 2019 will be officially available in October 2020 but most probably, they will be of the same magnitude as in previous years. During 2008–2018 in recreational fisheries the landings in freshwater have varied between 2000–11 000 kg/year and in the sea from almost zero to13 000 kg/year. In recreational fisheries landings are based on data collected by questionnaires every second year. Data are collected with a postal survey. The sample is taken from the population information system maintained by the Population Register Centre. Data are collected from household-dwellings, the statistical unit of the survey. The big variation in the eel landings is mainly explained by the small sample size of only 6000–7000 households.

8 | ICES SCIENTIFIC REPORTS 2:85 | ICES
Table 1. Commercial landings (kg) of eels (yellow and silver together) in freshwaters and sea from 2008 to 2019. (EMU = Fl Finl, NC = Not collected).
Year Commercial Fresh Commercial Sea Fl Finl alltogether
2008 0 1000 1000
2009 NC 1800 1800
2010 0 2300 2300
2011 NC 1549 1549
2012 0 1539 1539
2013 NC 1307 1307
2014 0 1021 1021
2015 NC 609 609
2016 49 1277 1326
2017 36 1045 1081
2018 31 1064 1095
2019 ready in October 2020 299
Table 2. Recreational landings (kg, rounded to the nearest thousand)) of eels (yellow and silver together) in freshwaters and sea from 2008 to 2019. (EMU = Fl Finl, NC = Not collected).
Year Recreational Fresh Recreational Sea Fl Finl altogether
2008 4000 13000 17000
2009 NC NC
2010 9000 1000 10000
2011 NC NC
2012 3000 2000 5000
2013 NC NC
2014 11000 9000 20000
2015 NC NC
2016 1000 7000 8000
2017 NC NC
2018 2000 0 2000
2019 NC NC
No available data on effort.
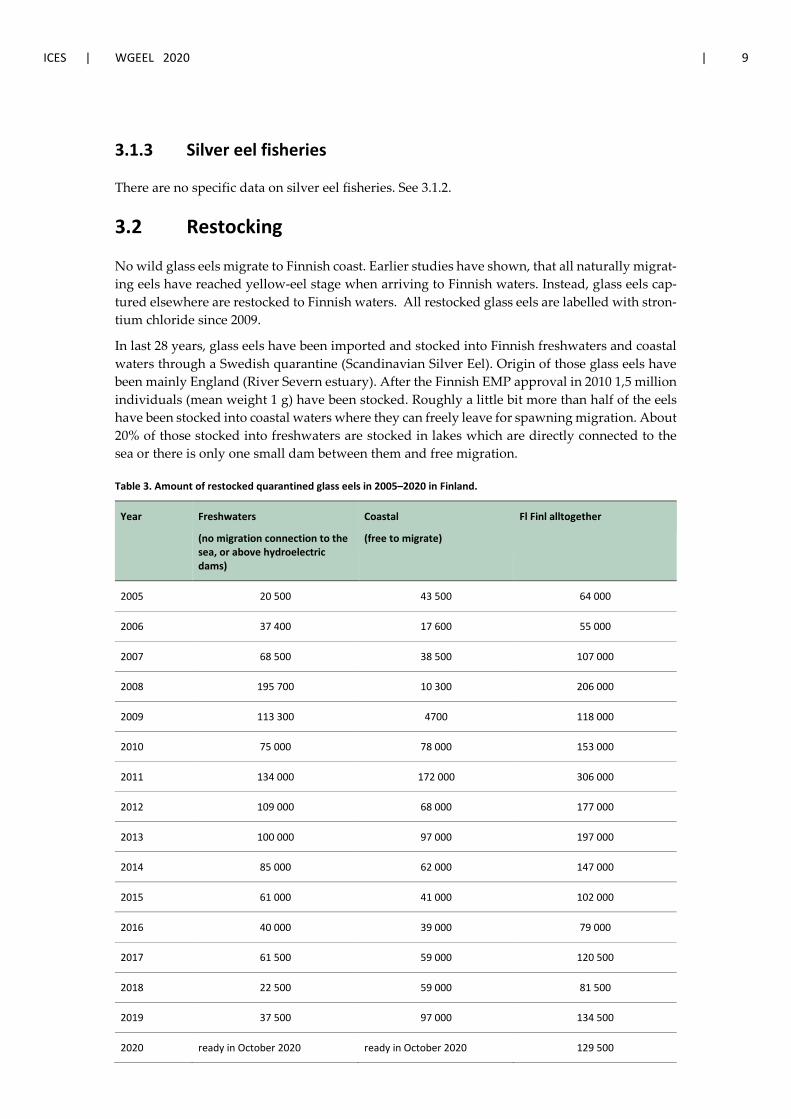
ICES | WGEEL 2020 | 9
3.1.3 Silver eel fisheries
There are no specific data on silver eel fisheries. See 3.1.2.
3.2 Restocking
No wild glass eels migrate to Finnish coast. Earlier studies have shown, that all naturally migrat-ing eels have reached yellow-eel stage when arriving to Finnish waters. Instead, glass eels cap-tured elsewhere are restocked to Finnish waters. All restocked glass eels are labelled with stron-tium chloride since 2009.
In last 28 years, glass eels have been imported and stocked into Finnish freshwaters and coastal waters through a Swedish quarantine (Scandinavian Silver Eel). Origin of those glass eels have been mainly England (River Severn estuary). After the Finnish EMP approval in 2010 1,5 million individuals (mean weight 1 g) have been stocked. Roughly a little bit more than half of the eels have been stocked into coastal waters where they can freely leave for spawning migration. About 20% of those stocked into freshwaters are stocked in lakes which are directly connected to the sea or there is only one small dam between them and free migration.
Table 3. Amount of restocked quarantined glass eels in 2005–2020 in Finland.
Year Freshwaters
(no migration connection to the sea, or above hydroelectric dams)
Coastal
(free to migrate)
Fl Finl alltogether
2005 20 500 43 500 64 000
2006 37 400 17 600 55 000
2007 68 500 38 500 107 000
2008 195 700 10 300 206 000
2009 113 300 4700 118 000
2010 75 000 78 000 153 000
2011 134 000 172 000 306 000
2012 109 000 68 000 177 000
2013 100 000 97 000 197 000
2014 85 000 62 000 147 000
2015 61 000 41 000 102 000
2016 40 000 39 000 79 000
2017 61 500 59 000 120 500
2018 22 500 59 000 81 500
2019 37 500 97 000 134 500
2020 ready in October 2020 ready in October 2020 129 500

10 | ICES SCIENTIFIC REPORTS 2:85 | ICES
3.3 Aquaculture
At the moment there is no eel aquaculture in Finland. In 2013, 40 000 glass eels (on-grown ~1 g) were imported to aquaculture through the Swedish quarantine. According to the fish farmer (Polar Fish) in 2014 and 2015, the import was 50 000 glass eels annually. Since then glass eels have not been imported to aquaculture in Finland.
Production was about 500 kg in 2014 and also in 2015. This is not official information but based on the discussions with the one and only eel farmer in the country. Farming was experimental and conducted in a recirculation system. There were still some eels in the farm in 2016–2017 but the farm was going out of the business due to slow growth of the fish and economic reasons.
3.4 Entrainment
Figure 1. Hydroelectric power plants and other dams in Finland.
In southern Finland, all big rivers are totally blocked for upriver migration. There are several hydroelectric power plants with turbines. Also downstream migration for eels is almost impos-sible and mortality is high but unknown.
In the coastal area in some small watercourses from Virojoki to Vaasa migration is still possible both ways.
3.5 Habitat Quantity and Quality
In the Vuoksi watercourse (brown on the map) eels have hardly existed because of the rapids in Imatra have been too rough even for eels to climb up. Nowadays there are electric power plants in the rapids. Otherwise, the habitats are suitable growing areas for eels.

ICES | WGEEL 2020 | 11
Lower reaches of the Kymijoki watercourse (blue on the map), Kokemäenjoki watercourse (red on the map) and the small coastal watercourses in the south and in the west (green on the map) have been the main distribution area of eel in Finland. All those watercourses are excellent grow-ing areas for eels. But in Kymijoki and Kokemäenjoki watercourses, there have been several hy-droelectric dams since 1920–1930 and upstream migration has been impossible since that. All eels there originates from stockings. Downstream migration is possible but high mortality in turbines have been observed in both watercourses.
Of the 108 500 hectares in the small coastal watercourses from Vaasa in the west to Virojoki in the east only 37 800 hectares are still accessible for eels. From those areas, it is also possible for eels to migrate downstream freely. In the same coastal region, there are still over 4 million hec-tares of suitable growing areas for eel in the Baltic (from shoreline to the depth of 10 meters) where free migration is possible.
Figure 2. The three main watercourses and the small coastal watercourses in southern Finland and their water areas in hectares. Only in the coastal watercourses (green) there is some 30 000 hectares of suitable habitats left for natural immigration on eels. In all other areas eel populations originates from stockings.
3.6 Other impacts

12 | ICES SCIENTIFIC REPORTS 2:85 | ICES
4 National stock assessment
4.1 Description of Method
4.1.1 Data collection
An index for the abundance of yellow eels and silver eels along the Finnish coast is obtained from fisheries statistics. Both yellow and silver eels are caught as bycatch in professional and recreational fisheries. Eel has been also included in the EU Data Collection Programme in Fin-land since 2017. Since that samples are collected along the Finnish coast to estimate the share of yellow/silver eels and restocked/wild eels (on the basis of strontium chloride label, only for in-dividuals from year class 2009 and later)(Table 4). Samples are collected in two locations in in-land waters as well: lake Kulovesi (Kokemäenjoki watershed, Table 5) and lake Vesijärvi (Kymi-joki watershed, Table 6), where all eels are supposed to be of restocked origin due to migration barriers.
Samples have been collected in freshwaters with the help of local recreational fishermen and in the sea by a professional fishermen. Fish have been collected mainly alive from the fishermen but occasionally also as frozen. In few cases, the fishermen have measured (weight and length) the fish and delivered the head and the guts together with the length/weight data to Luke where otolihs have been removed and swim bladder examined for Anguillicola.
For every fish the following information has been collected:
• Catching date and killing date; • Catching site; • Fishing gear; • Length; • Weight; • Sex; • Colour (sides and belly); • Vertical and horizontal diameter of the eye; • Weight of the gonad (only occasionally); • Anguillicola (no/yes, how many, size).
So far when age analysis has been done grinding and polishing method has been used, Swedish style as described in ICES WKAREA Report 2009 in Bordeaux. Lately also cutting slices with otolith saw and etching using EDTA and staining using neural red has been used.
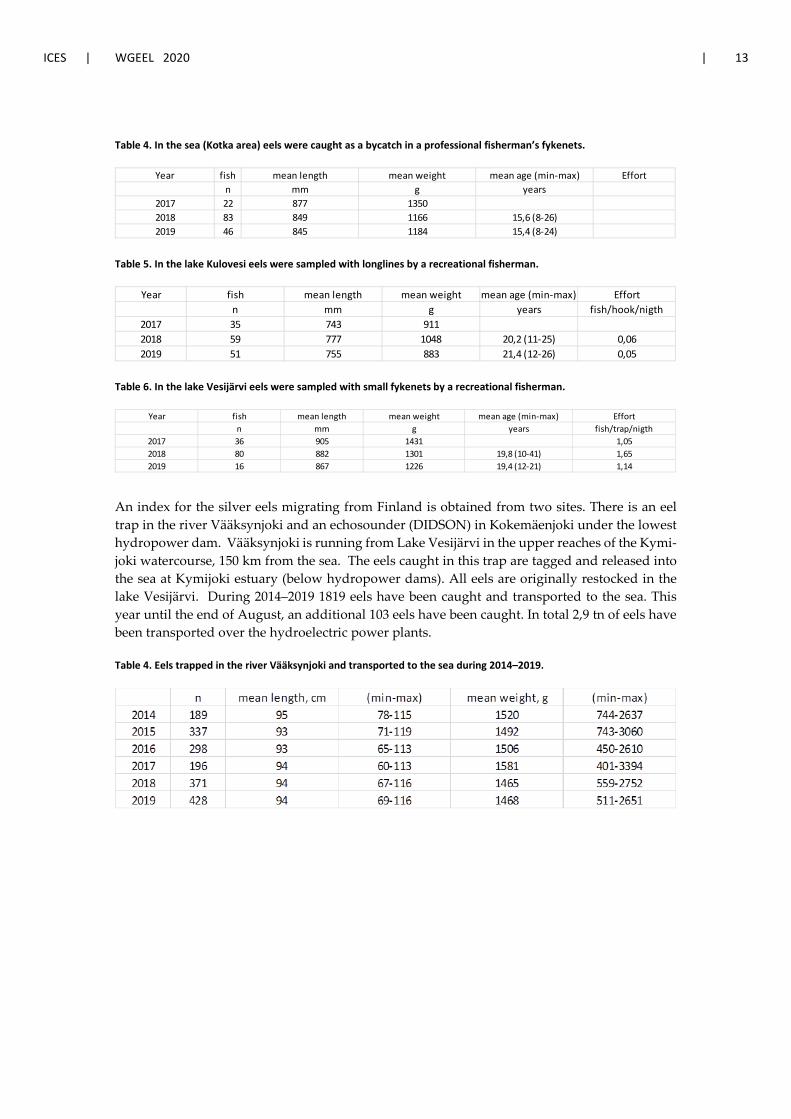
ICES | WGEEL 2020 | 13
Table 4. In the sea (Kotka area) eels were caught as a bycatch in a professional fisherman’s fykenets.
Table 5. In the lake Kulovesi eels were sampled with longlines by a recreational fisherman.
Table 6. In the lake Vesijärvi eels were sampled with small fykenets by a recreational fisherman.
An index for the silver eels migrating from Finland is obtained from two sites. There is an eel trap in the river Vääksynjoki and an echosounder (DIDSON) in Kokemäenjoki under the lowest hydropower dam. Vääksynjoki is running from Lake Vesijärvi in the upper reaches of the Kymi-joki watercourse, 150 km from the sea. The eels caught in this trap are tagged and released into the sea at Kymijoki estuary (below hydropower dams). All eels are originally restocked in the lake Vesijärvi. During 2014–2019 1819 eels have been caught and transported to the sea. This year until the end of August, an additional 103 eels have been caught. In total 2,9 tn of eels have been transported over the hydroelectric power plants.
Table 4. Eels trapped in the river Vääksynjoki and transported to the sea during 2014–2019.
Year fish mean length mean weight mean age (min-max) Effortn mm g years
2017 22 877 13502018 83 849 1166 15,6 (8-26)2019 46 845 1184 15,4 (8-24)
Year fish mean length mean weight mean age (min-max) Effortn mm g years fish/hook/nigth
2017 35 743 9112018 59 777 1048 20,2 (11-25) 0,062019 51 755 883 21,4 (12-26) 0,05
Year fish mean length mean weight mean age (min-max) Effortn mm g years fish/trap/nigth
2017 36 905 1431 1,052018 80 882 1301 19,8 (10-41) 1,652019 16 867 1226 19,4 (12-21) 1,14
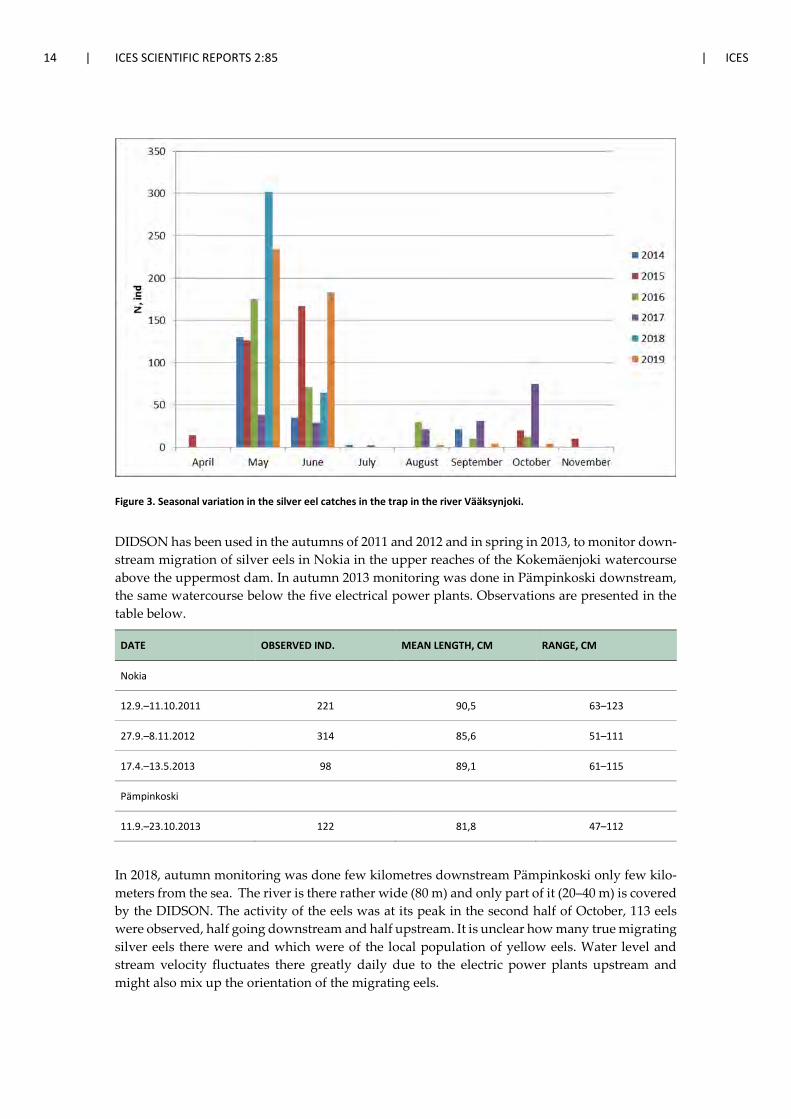
14 | ICES SCIENTIFIC REPORTS 2:85 | ICES
Figure 3. Seasonal variation in the silver eel catches in the trap in the river Vääksynjoki.
DIDSON has been used in the autumns of 2011 and 2012 and in spring in 2013, to monitor down-stream migration of silver eels in Nokia in the upper reaches of the Kokemäenjoki watercourse above the uppermost dam. In autumn 2013 monitoring was done in Pämpinkoski downstream, the same watercourse below the five electrical power plants. Observations are presented in the table below.
DATE OBSERVED IND. MEAN LENGTH, CM RANGE, CM
Nokia
12.9.–11.10.2011 221 90,5 63–123
27.9.–8.11.2012 314 85,6 51–111
17.4.–13.5.2013 98 89,1 61–115
Pämpinkoski
11.9.–23.10.2013 122 81,8 47–112
In 2018, autumn monitoring was done few kilometres downstream Pämpinkoski only few kilo-meters from the sea. The river is there rather wide (80 m) and only part of it (20–40 m) is covered by the DIDSON. The activity of the eels was at its peak in the second half of October, 113 eels were observed, half going downstream and half upstream. It is unclear how many true migrating silver eels there were and which were of the local population of yellow eels. Water level and stream velocity fluctuates there greatly daily due to the electric power plants upstream and might also mix up the orientation of the migrating eels.
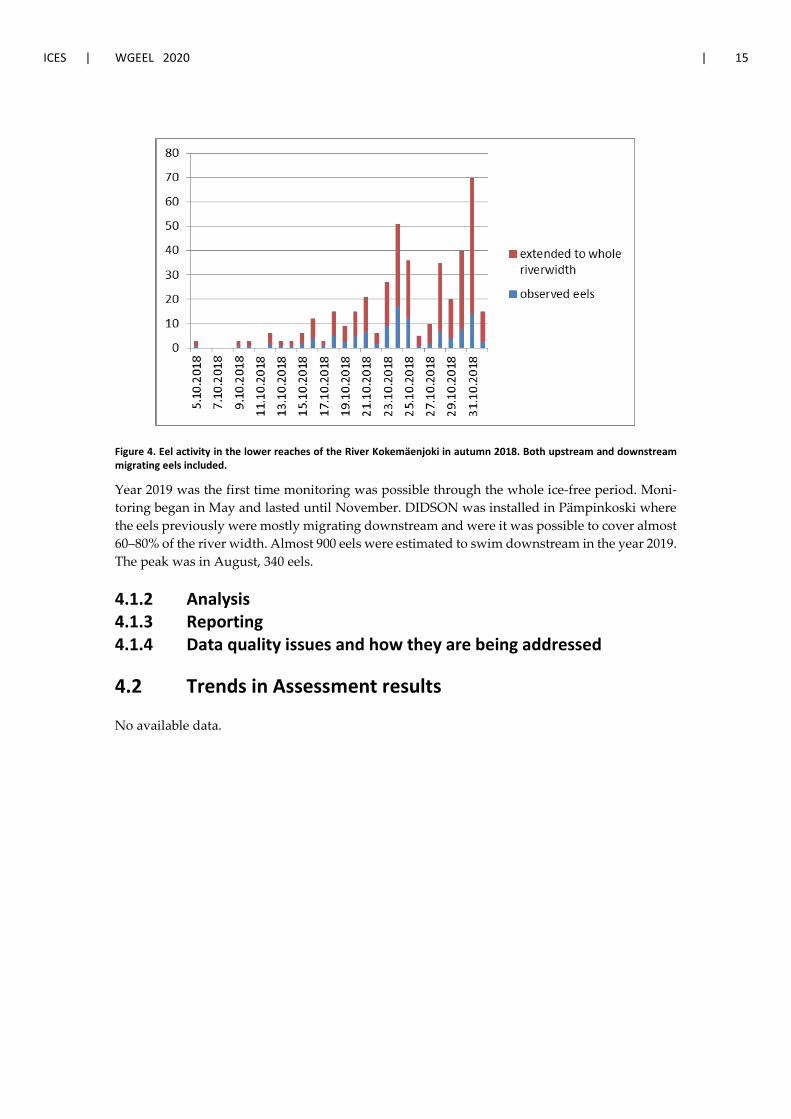
ICES | WGEEL 2020 | 15
Figure 4. Eel activity in the lower reaches of the River Kokemäenjoki in autumn 2018. Both upstream and downstream migrating eels included.
Year 2019 was the first time monitoring was possible through the whole ice-free period. Moni-toring began in May and lasted until November. DIDSON was installed in Pämpinkoski where the eels previously were mostly migrating downstream and were it was possible to cover almost 60–80% of the river width. Almost 900 eels were estimated to swim downstream in the year 2019. The peak was in August, 340 eels.
4.1.2 Analysis 4.1.3 Reporting 4.1.4 Data quality issues and how they are being addressed
4.2 Trends in Assessment results
No available data.

16 | ICES SCIENTIFIC REPORTS 2:85 | ICES
5 Other data collection for eel
5.1 Yellow eel abundance surveys
See 4.1.1.
5.2 Silver eel escapement surveys
See 4.1.1.
5.3 Life-history parameters
During 1974–1994 over 2000 eels were collected in thirty lakes and in some lake outlets in South-ern Finland. Length, weight, eye diameter, colour of the sides and belly, sex and weight of the gonads (not always) were determined and after 1986, also swim bladders were examined for Anguillicola. Age and growth were also determined. The aim of the study was to evaluate the biological outcome of eel stockings made in 1960s and 1970s, and to estimate the yield to fishery and the proportions of eels escaping the lakes. The results were published mainly in 1980s (Pur-siainen and Toivonen, 1984; Pursiainen and Tulonen, 1986; Tulonen, 1988; Tulonen 1990, Tulo-nen and Pursiainen, 1992).
There were no routine biological sampling programmes or eel research projects during 1994–2005. Some occasional samples were taken in few lakes on the author’s personal interest. Also in some small water systems silver eel escapement has been monitored since 1974 (one place), 1980 (two places) and 1989 (two places) with eel boxes in the outlets. Eels in the lakes have been re-stocked there in 1967, 1978 and 1989 respectively.
In 2006, a four year study on the biological and economical outcome of eel stockings made since 1989 and on the state of natural eel stocks was established in FGFRI. The main goal was to com-pile the facts and other biological data about eels in Finland to the Eel Management Plan. In the study, some sampling was also done in ten lakes in southern Finland and in eight areas in the Baltic along the coasts of Gulf of Finland and Bothnian Bay and in the rivers running into them. Due to sparse populations the sample sizes are only in few cases big enough (>100 individuals) to make any scientific evaluations. Since 2010, there has been sampling in the most interesting locations.
In recent years, there has been eel marking programmes going on to shed some light into migra-tory behaviour of restocked eels.
5.4 Diseases, Parasites & Pathogens or Contaminants
One sample of “natural” elvers has been collected in 2002 in southwest Finland and on the coast of the Bothnian Bay. One third of the elvers were infected with Anguillicola. This was the first time Anguillicola ever found in Finland (Tulonen, 2002). Since then Anguillicola has spread al-most to every eel population in the sea and after 2007, also to some freshwater populations where it is still spreading.
The concentrations of radionuclides 134Cs and 137Cs and PCB in eels were investigated in 1995 (Tulonen and Saxen, 1996; Tulonen and Vuorinen, 1996).
ICES | WGEEL 2020 | 17
6 New Information
The first observation of a spontaneously matured female European eel was made in an aquarium house (Maretarium) in the city of Kotka. The 43-year-old eel, together with eleven other females, resided at the aquarium house since their capture in 2002 and stocking as glass eels in 1978. In June 2019, the girth of the belly of the female increased as a sign of oocyte maturation. The spec-imen had an estimated gonadosomatic index (GSI) of 47, only half of the oocytes were hydrated and matured, indicating that European eels are polycyclic batch spawners. The live eels of the cohort were still in the previtellogenic phase but their eye sizes were close to that of the matured eel. It was hypothesized that substances released by other maturing and spawning fishes may have triggered puberty of the eel. This first observation, and the possibility of more eels maturing in the near future, provides a natural reference for the sexual maturation of the European eel.
A. P. Palstra, P. Jéhannet, W. Swinkels, L. T. N. Heinsbroek, P. M. Lokman, S. Vesala, J. Tulonen, T. Lakka and S. Saukkonen. 2020. First Observation of a Spontaneously Matured Female European Eel (Anguilla anguilla). Scientific Reports volume 10, Article number: 2339 (2020).
18 | ICES SCIENTIFIC REPORTS 2:85 | ICES
7 References
Pursiainen M. and Toivonen J. 1984. The enhancement of eel stocks in Finland; a review of introduction and stockings. EIFAC Technical Paper No. 42, Suppl., 1:59–67.
Pursiainen M. and Tulonen J. 1986. Eel escapement from small forest lakes. Vie Milieu 36 (4): 287–290.
Tulonen J. 1988. Ankeriaan ikä, sukupuolijakaumat ja kasvu eräissä eteläsuomalaisissa järvissä. (Age, sex ratio and growth of eels in some lakes in southern Finland). Rktl, Monistettuja julkaisuja 81: 1–106.
Tulonen J. 1990. Growth and sex ratio of eels (Anguilla anguilla) of known age in four small lakes in southern Finland. Abstract in: Int. Revue ges. Hydrobiol. 75: 792.
Tulonen J. and Pursiainen M. 1992. Ankeriasistutukset Evon kalastuskoeaseman ja kalanviljelylaitoksen vesissä. (Eel stockings in the waters of the Evo State Fisheries and Aquaculture Research Station) Su-omen Kalatalous 60:246–261.
Tulonen J. and Saxen R. 1996. Radionuclides 134Cs and 137Cs in eel (Anguilla anguilla L.) in Finnish fresh-waters after the accident at Chernobyl nuclear power station in 1986 Arch. Ryb. Pol. 4:267–275.
Tulonen J. and Vuorinen P. 1996. Concentrations of PCBs and other organ chlorine compounds in eels (Anguilla anguilla L.) of the Vanajavesi watercourse in southern Finland, 1990–1993. The Science of the Total Environment 187 (1996): 11–18.
Tulonen J. 2002. Anguillicola crassus tavattu ensikerran Suomessa (Anguillicola crassus found in Finland). Suomen Kalastuslehti 4(2002):36–37.

ICES | WGEEL 2020 | I
Contents
1 Summary of national and international stock status indicators.................................................... 3 1.1 Escapement biomass and mortality rates ........................................................................ 3 1.2 Recruitment time-series .................................................................................................. 3
2 Overview of the national stock and its management.................................................................... 6 2.1 Describe the eel stock and its management .................................................................... 6 2.1.1 EMUs, EMPs ..................................................................................................................... 6 2.1.2 Management authorities ................................................................................................. 7 2.1.3 Regulations ...................................................................................................................... 7 2.1.4 Management actions ....................................................................................................... 8 2.2 Significant changes since last report .............................................................................. 15
3 Impacts on the national stock ..................................................................................................... 16 3.1 Fisheries ......................................................................................................................... 16 3.1.1 Glass eel fisheries ........................................................................................................... 16 3.1.2 Yellow/Silver eel fisheries .............................................................................................. 16 3.1.2.1 Commercial .................................................................................................................... 16 3.1.2.2 Recreational ................................................................................................................... 17 3.1.2.3 Fishing effort .................................................................................................................. 18 3.1.2.4 Economic importance .................................................................................................... 20 3.1.2.5 Underreporting and illegal catches ................................................................................ 20 3.2 Restocking ...................................................................................................................... 21 3.3 Aquaculture ................................................................................................................... 24 3.3.1 Aquaculture Seed supply ............................................................................................... 24 3.3.2 Aquaculture production ................................................................................................. 25 3.4 Entrainment ................................................................................................................... 25 3.5 Habitat Quantity and Quality ......................................................................................... 26 3.6 Other impacts ................................................................................................................ 26
4 National stock assessment .......................................................................................................... 28 4.1 Description of Method ................................................................................................... 28 4.1.1 Data collection ............................................................................................................... 28 4.1.2 Analysis .......................................................................................................................... 29 4.1.3 Reporting ....................................................................................................................... 29 4.1.4 Data quality issues and how they are being addressed ................................................. 29 4.2 Trends in Assessment results ......................................................................................... 29
5 Other data collection for eel ....................................................................................................... 33 5.1 Yellow eel abundance surveys ....................................................................................... 33 5.2 Silver eel escapement surveys ....................................................................................... 33 5.3 Life-history parameters .................................................................................................. 34 5.4 Diseases, Parasites and Pathogens or Contaminants .................................................... 34
6 New Information ......................................................................................................................... 37 7 References ................................................................................................................................... 38
II | ICES SCIENTIFIC REPORTS 2:85 | ICES
Report on the eel stock, fishery and other impacts in GERMANY, 2019–2020
Lead Author Lasse Marohn, Thünen Institute of Fisheries Ecology, Herwigstraße 31, 27572 Bremerhaven, Ger-many Tel: +49 471 94460 132 [email protected]
Reporting Period: This report was completed in September 2020. It contains data up to 2016 and, where available, some provisional data up to 2019.
Acknowledgments Jan-Dag Pohlmann, Thünen Institute of Fisheries Ecology, Bremerhaven
Erik Fladung, Uwe Brämick, Janek Simon: Institute for Inland Fisheries, Potsdam-Sacrow
Malte Dorow and Jens Frankowski: State Research Centre for Agriculture and Fisheries Meck-lenburg-Pomerania, Institute of Fisheries, Rostock
Markus Diekmann: Lower Saxony State Office for Consumer Protection and Food Safety, De-partment for Inland Fishery, Hannover
Karin Camara: North Rhine-Westphalia State Agency for Nature, Environment and Consumer Protection, Fishery Ecology, Kirchhundem-Albaum
Jan Baer: Fisheries Research Station Baden-Württemberg, Langenargen
Svenja Zakrzewski: State Agency for Agriculture, Environment and Rural Areas of Schleswig-Holstein, Department Fisheries

ICES | WGEEL 2020 | 3
1 Summary of national and international stock status indicators
1.1 Escapement biomass and mortality rates
Table 1 presents the most recent data on assessed areas and stock indicators for the relevant German RBDs.
Table 1. Stock indicators of silver eel escapement, biomass and mortality rates, and assessed habitat area. EMUs aver-aged from 2014–2016 (Fladung and Brämick, 2018).
Year EMU_code Assessed
Area
(ha)
B0 (t) Bcurr (t) Bbest (t) Bcurr/B0 (%) ∑F ∑H ∑A
2014–2016 DE_Eide4 468,783 1,708 638 659 37.34 0.01 0.01 0.03
2014–2016 DE_Elbe2 201,019 1,553 101 38 6.48 1.15 0.27 1.42
2014–2016 DE_Ems2 44,088 820 176 87 21.41 0.11 0.01 0.12
2014–2016 DE_Maas1 892 9 0 0 0.67 0.73 0.11 0.84
2014–2016 DE_Oder2 80,366 373 91 82 24.48 0.20 0.00 0.21
2014–2016 DE_Rhei1 61,065 532 223 8 41.98 0.26 0.64 0.89
2014–2016 DE_Schl3 333,379 4,205 2,038 2,029 48.47 0.03 0.00 0.03
2014–2016 DE_Warn3 368,309 1,367 1,441 1,486 105.36 0.07 0.00 0.07
2014–2016 DE_Wese2 55,472 730 130 47 17.81 0.34 0.20 0.54
Key: EMU_code = Eel Management Unit code (see Table 2 for list of codes); B0 = the amount of silver eel biomass that would have existed if no anthropogenic influences had impacted the stock (kg); Bcurr = the amount of silver eel biomass that currently escapes to the sea to spawn (in the assessment year) (kg); Bbest = the amount of silver eel bio-mass that would have existed if no anthropogenic influences had impacted the current stock (kg); ∑F = mortality due to fishing, summed over the age groups in the stock (rate); ∑H = anthropogenic mortality excluding the fishery, summed over the age groups in the stock (rate); ∑A = all anthropogenic mortality summed over the age groups in the stock (rate); Assessed area (ha) = combined area total (ha) of transitional and inland waters. 1Inland waters, 2Inland and transitional waters; 3Inland and coastal waters; 4Inland, transitional and coastal waters
1.2 Recruitment time-series
The WGEEL uses these time-series data to calculate the Recruitment Indices, relative to the ref-erence period of 1960–1979, and the results form the basis of the annual Single Stock Advice reported to the EU Commission. These recruitment indices are also used by the EU CITES Scien-tific Review Group in their annual review of the Non-Detriment Finding position. At present, four German recruitment time-series are included in the international assessment (Frische Grube (‘WiFG’), Wallensteingraben (‘WisW’), Dove Elde eel ladder (‘DoEl’), Verlath Pumping Station (“Verl”)).
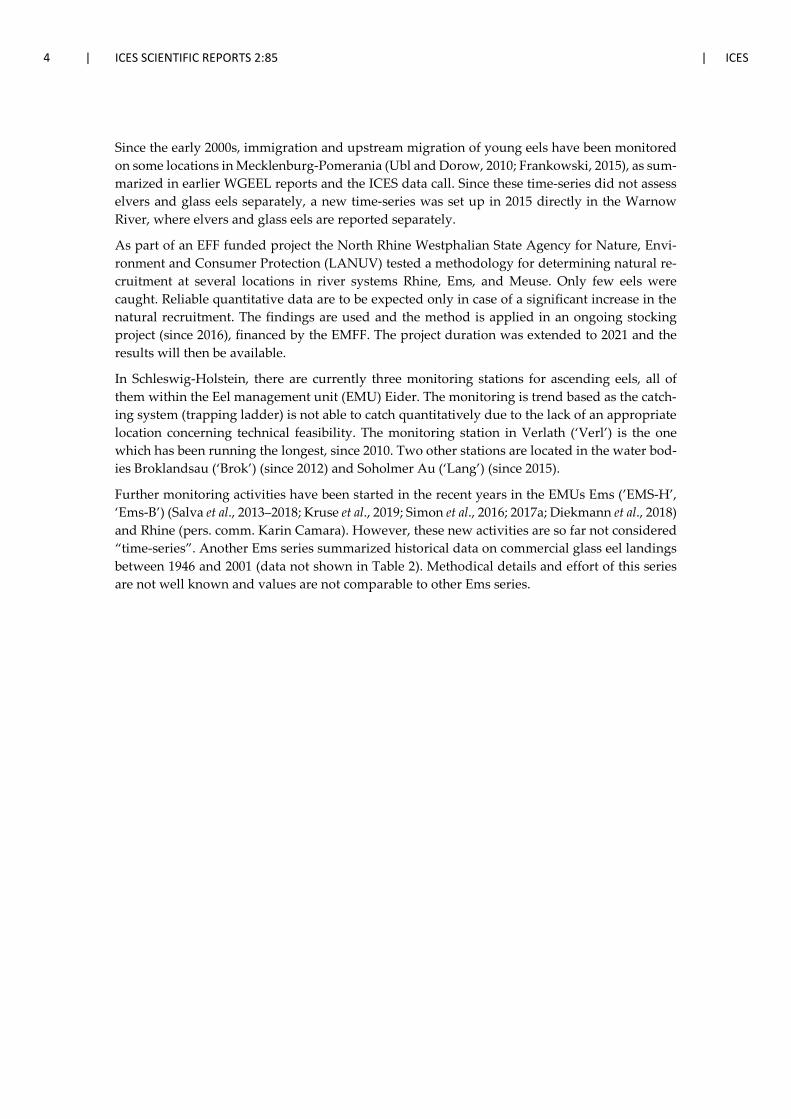
4 | ICES SCIENTIFIC REPORTS 2:85 | ICES
Since the early 2000s, immigration and upstream migration of young eels have been monitored on some locations in Mecklenburg-Pomerania (Ubl and Dorow, 2010; Frankowski, 2015), as sum-marized in earlier WGEEL reports and the ICES data call. Since these time-series did not assess elvers and glass eels separately, a new time-series was set up in 2015 directly in the Warnow River, where elvers and glass eels are reported separately.
As part of an EFF funded project the North Rhine Westphalian State Agency for Nature, Envi-ronment and Consumer Protection (LANUV) tested a methodology for determining natural re-cruitment at several locations in river systems Rhine, Ems, and Meuse. Only few eels were caught. Reliable quantitative data are to be expected only in case of a significant increase in the natural recruitment. The findings are used and the method is applied in an ongoing stocking project (since 2016), financed by the EMFF. The project duration was extended to 2021 and the results will then be available.
In Schleswig-Holstein, there are currently three monitoring stations for ascending eels, all of them within the Eel management unit (EMU) Eider. The monitoring is trend based as the catch-ing system (trapping ladder) is not able to catch quantitatively due to the lack of an appropriate location concerning technical feasibility. The monitoring station in Verlath (‘Verl’) is the one which has been running the longest, since 2010. Two other stations are located in the water bod-ies Broklandsau (‘Brok’) (since 2012) and Soholmer Au (‘Lang’) (since 2015).
Further monitoring activities have been started in the recent years in the EMUs Ems (’EMS-H’, ‘Ems-B’) (Salva et al., 2013–2018; Kruse et al., 2019; Simon et al., 2016; 2017a; Diekmann et al., 2018) and Rhine (pers. comm. Karin Camara). However, these new activities are so far not considered “time-series”. Another Ems series summarized historical data on commercial glass eel landings between 1946 and 2001 (data not shown in Table 2). Methodical details and effort of this series are not well known and values are not comparable to other Ems series.
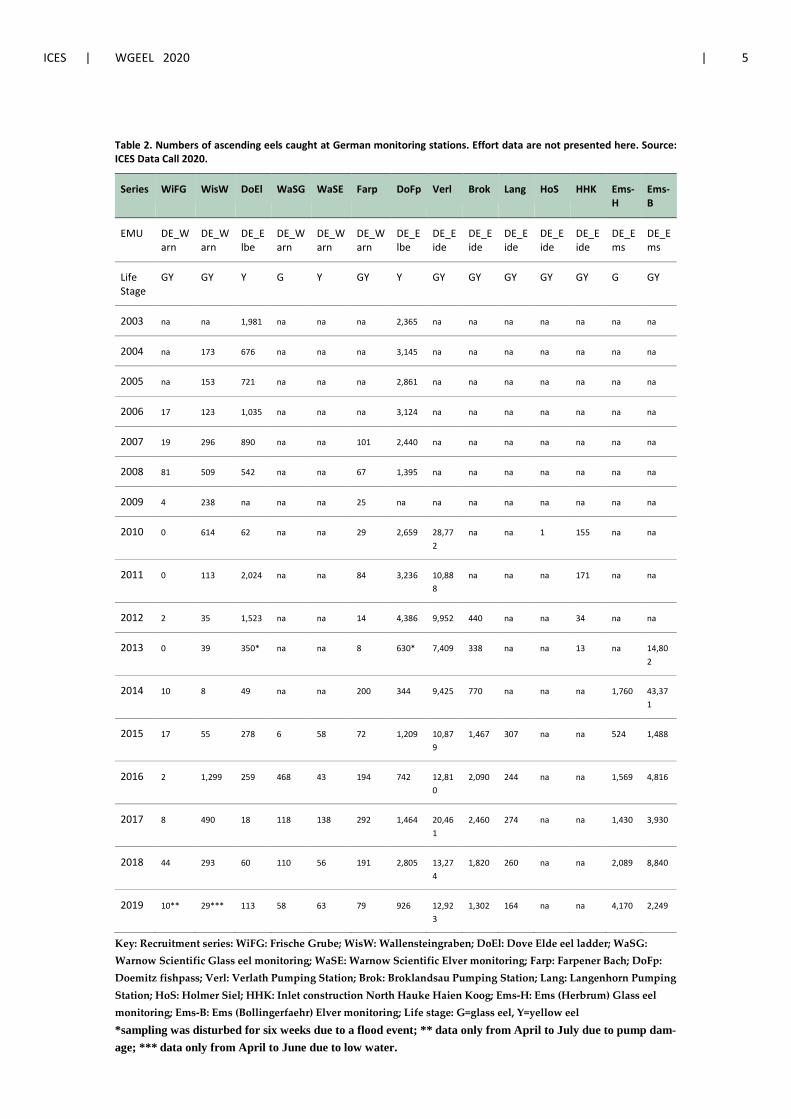
ICES | WGEEL 2020 | 5
Table 2. Numbers of ascending eels caught at German monitoring stations. Effort data are not presented here. Source: ICES Data Call 2020.
Series WiFG WisW DoEl WaSG WaSE Farp DoFp Verl Brok Lang HoS HHK Ems-H
Ems-B
EMU DE_Warn
DE_Warn
DE_Elbe
DE_Warn
DE_Warn
DE_Warn
DE_Elbe
DE_Eide
DE_Eide
DE_Eide
DE_Eide
DE_Eide
DE_Ems
DE_Ems
Life Stage
GY GY Y G Y GY Y GY GY GY GY GY G GY
2003 na na 1,981 na na na 2,365 na na na na na na na
2004 na 173 676 na na na 3,145 na na na na na na na
2005 na 153 721 na na na 2,861 na na na na na na na
2006 17 123 1,035 na na na 3,124 na na na na na na na
2007 19 296 890 na na 101 2,440 na na na na na na na
2008 81 509 542 na na 67 1,395 na na na na na na na
2009 4 238 na na na 25 na na na na na na na na
2010 0 614 62 na na 29 2,659 28,772
na na 1 155 na na
2011 0 113 2,024 na na 84 3,236 10,888
na na na 171 na na
2012 2 35 1,523 na na 14 4,386 9,952 440 na na 34 na na
2013 0 39 350* na na 8 630* 7,409 338 na na 13 na 14,802
2014 10 8 49 na na 200 344 9,425 770 na na na 1,760 43,371
2015 17 55 278 6 58 72 1,209 10,879
1,467 307 na na 524 1,488
2016 2 1,299 259 468 43 194 742 12,810
2,090 244 na na 1,569 4,816
2017 8 490 18 118 138 292 1,464 20,461
2,460 274 na na 1,430 3,930
2018 44 293 60 110 56 191 2,805 13,274
1,820 260 na na 2,089 8,840
2019 10** 29*** 113 58 63 79 926 12,923
1,302 164 na na 4,170 2,249
Key: Recruitment series: WiFG: Frische Grube; WisW: Wallensteingraben; DoEl: Dove Elde eel ladder; WaSG: Warnow Scientific Glass eel monitoring; WaSE: Warnow Scientific Elver monitoring; Farp: Farpener Bach; DoFp: Doemitz fishpass; Verl: Verlath Pumping Station; Brok: Broklandsau Pumping Station; Lang: Langenhorn Pumping Station; HoS: Holmer Siel; HHK: Inlet construction North Hauke Haien Koog; Ems-H: Ems (Herbrum) Glass eel monitoring; Ems-B: Ems (Bollingerfaehr) Elver monitoring; Life stage: G=glass eel, Y=yellow eel *sampling was disturbed for six weeks due to a flood event; ** data only from April to July due to pump dam-age; *** data only from April to June due to low water.
6 | ICES SCIENTIFIC REPORTS 2:85 | ICES
2 Overview of the national stock and its management
2.1 Describe the eel stock and its management
This report provides the most recent information about eel stocks, eel fishery and eel surveys in Germany. During the implementation process of the Eel Management Plans (EMPs), the author-ities in the States (“Bundesländer”) in Germany established a dedicated (permanent) working group. However, the group mainly focuses on the requirements of the EMP progress reports (i.e. reports in three-year intervals), but not on an annual calculation of the stock parameters in the “in-between-periods”.
In 2018, the third progress report of the German EMPs and the recent development of the eel stocks was submitted to the European Commission (Fladung and Brämick, 2018). It covers the period 2014 to 2016 and many data in the here presented Country Report also refer to this period. The most recent version of the German Eel Model (GEM IIIb) has been used in all nine German Eel management units (EMUs) to calculate the eel population parameters.
If new data for years later than 2016 had become available, they were included in the report. For practical reasons, the relevant authorities and institutions in the States mainly focus on the re-quirements of the reports to the EU Commission and not on providing detailed data on an annual basis. This is mainly caused by limited resources and capacities of the regional fisheries author-ities, which are confronted with an increasing effort for European and national regulations. Therefore, there is no permanent new calculation of escapement, production and other popula-tion parameters for each year.
2.1.1 EMUs, EMPs
In December 2008, Germany has submitted EMPs for all River Basin Districts (RBDs, see Water Framework Directive) (Figure 1) that constitute a natural habitat for the European eel, as re-quired by the EU Council Regulation 1100/2007, which will further be referred to as Eel Manage-ment Units (EMUs). The plans had been prepared for nine EMUs (Eider, Elbe, Ems, Meuse, Oder, Rhine, Schlei/Trave, Warnow/Peene and Weser). No plan was prepared for the river Danube, since according to a decision of the European Commission the Danube does not constitute a nat-ural distribution area for eel in the sense of the Council Regulation 1100/2007.
The relevant German river systems belong to the ICES Ecoregions North Sea (Rhine, Elbe, Weser, Ems, Eider) and Baltic Sea (Oder, Warnow/Peene, Schlei/Trave).
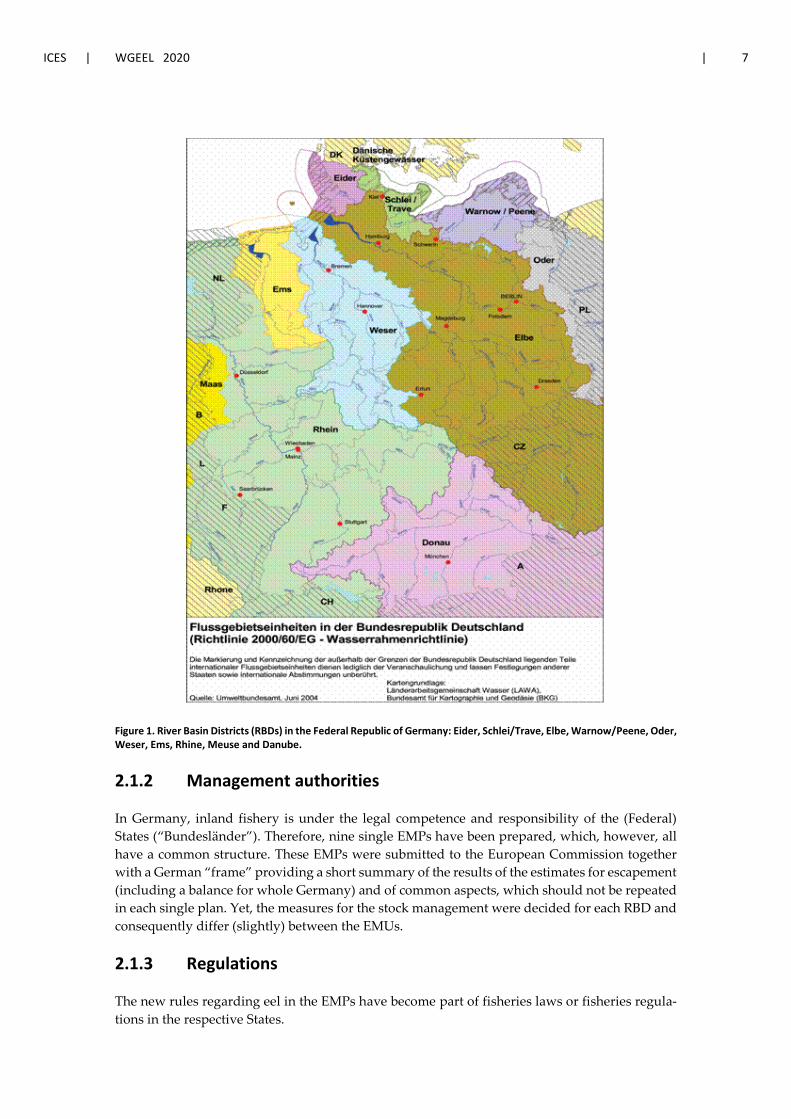
ICES | WGEEL 2020 | 7
Figure 1. River Basin Districts (RBDs) in the Federal Republic of Germany: Eider, Schlei/Trave, Elbe, Warnow/Peene, Oder, Weser, Ems, Rhine, Meuse and Danube.
2.1.2 Management authorities
In Germany, inland fishery is under the legal competence and responsibility of the (Federal) States (“Bundesländer”). Therefore, nine single EMPs have been prepared, which, however, all have a common structure. These EMPs were submitted to the European Commission together with a German “frame” providing a short summary of the results of the estimates for escapement (including a balance for whole Germany) and of common aspects, which should not be repeated in each single plan. Yet, the measures for the stock management were decided for each RBD and consequently differ (slightly) between the EMUs.
2.1.3 Regulations
The new rules regarding eel in the EMPs have become part of fisheries laws or fisheries regula-tions in the respective States.
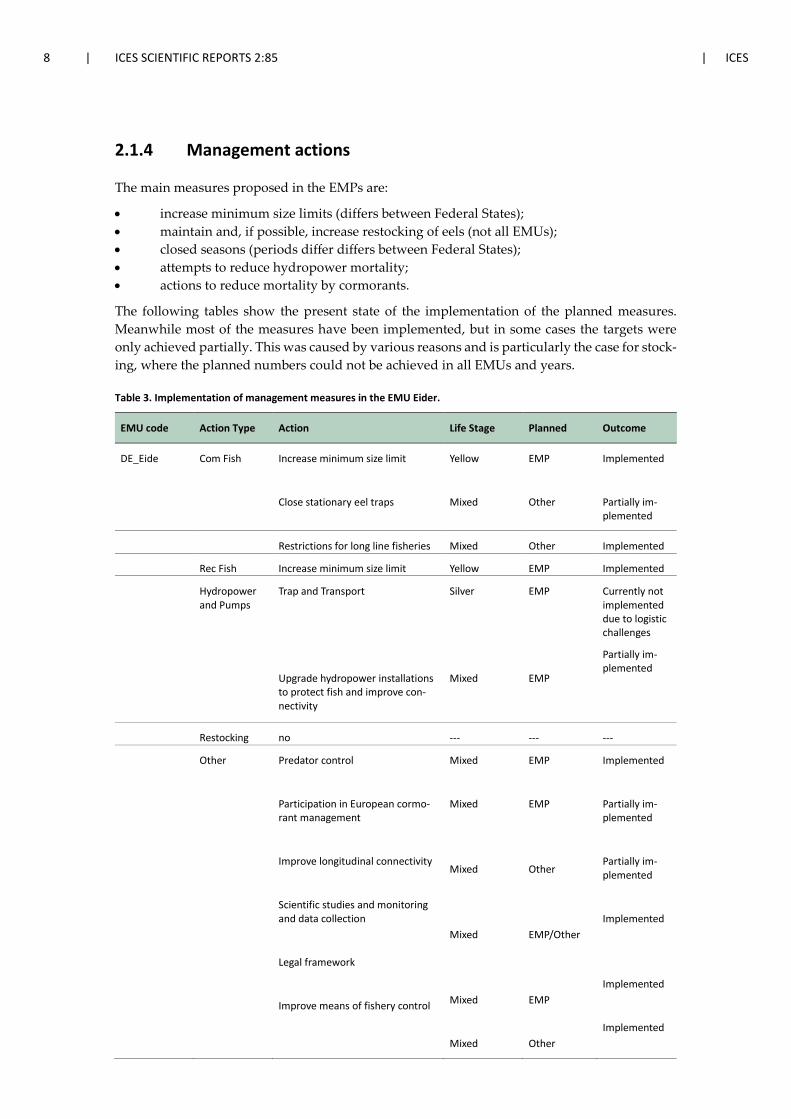
8 | ICES SCIENTIFIC REPORTS 2:85 | ICES
2.1.4 Management actions
The main measures proposed in the EMPs are:
• increase minimum size limits (differs between Federal States); • maintain and, if possible, increase restocking of eels (not all EMUs); • closed seasons (periods differ differs between Federal States); • attempts to reduce hydropower mortality; • actions to reduce mortality by cormorants.
The following tables show the present state of the implementation of the planned measures. Meanwhile most of the measures have been implemented, but in some cases the targets were only achieved partially. This was caused by various reasons and is particularly the case for stock-ing, where the planned numbers could not be achieved in all EMUs and years.
Table 3. Implementation of management measures in the EMU Eider.
EMU code Action Type Action Life Stage Planned Outcome
DE_Eide Com Fish Increase minimum size limit
Close stationary eel traps
Yellow
Mixed
EMP
Other
Implemented
Partially im-plemented
Restrictions for long line fisheries Mixed Other Implemented
Rec Fish Increase minimum size limit Yellow EMP Implemented
Hydropower and Pumps
Trap and Transport
Upgrade hydropower installations to protect fish and improve con-nectivity
Silver
Mixed
EMP
EMP
Currently not implemented due to logistic challenges
Partially im-plemented
Restocking no --- --- ---
Other Predator control
Participation in European cormo-rant management
Improve longitudinal connectivity
Scientific studies and monitoring and data collection
Legal framework
Improve means of fishery control
Mixed
Mixed
Mixed
Mixed
Mixed
Mixed
EMP
EMP
Other
EMP/Other
EMP
Other
Implemented
Partially im-plemented
Partially im-plemented
Implemented
Implemented
Implemented
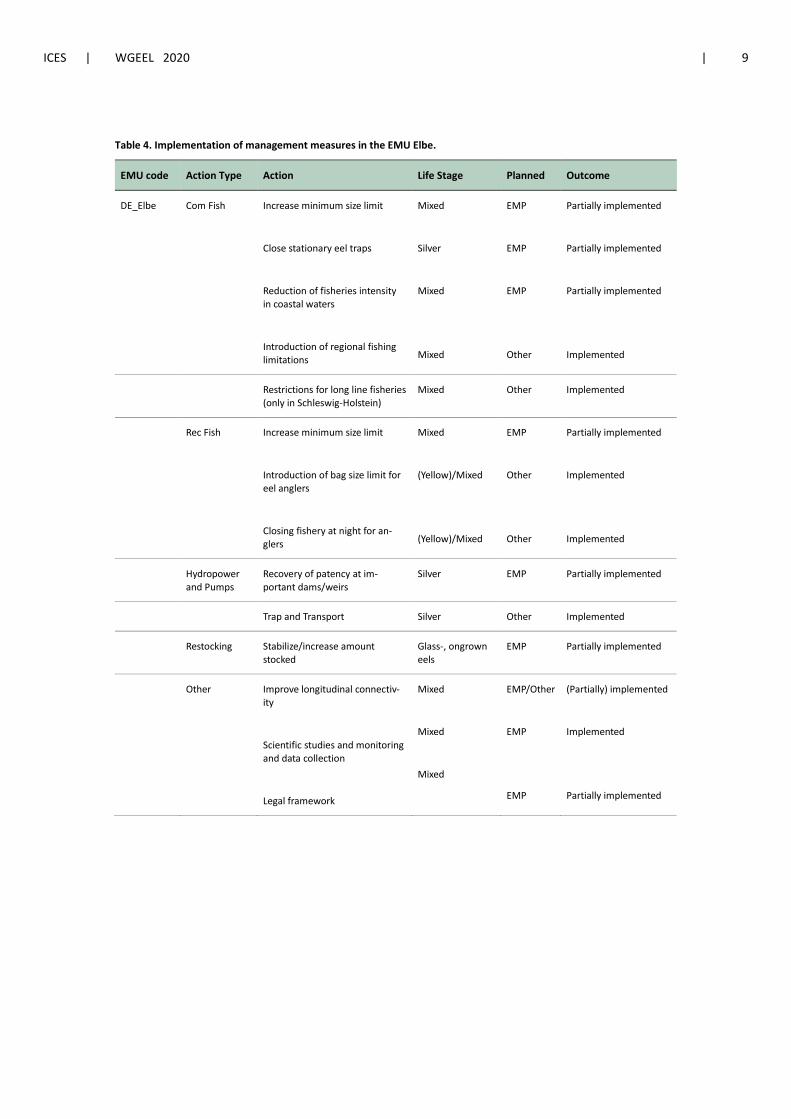
ICES | WGEEL 2020 | 9
Table 4. Implementation of management measures in the EMU Elbe.
EMU code Action Type Action Life Stage Planned Outcome
DE_Elbe Com Fish Increase minimum size limit
Close stationary eel traps
Reduction of fisheries intensity in coastal waters
Introduction of regional fishing limitations
Mixed
Silver
Mixed
Mixed
EMP
EMP
EMP
Other
Partially implemented
Partially implemented
Partially implemented
Implemented
Restrictions for long line fisheries (only in Schleswig-Holstein)
Mixed Other Implemented
Rec Fish Increase minimum size limit
Introduction of bag size limit for eel anglers
Closing fishery at night for an-glers
Mixed
(Yellow)/Mixed
(Yellow)/Mixed
EMP
Other
Other
Partially implemented
Implemented
Implemented
Hydropower and Pumps
Recovery of patency at im-portant dams/weirs
Silver EMP Partially implemented
Trap and Transport Silver Other Implemented
Restocking Stabilize/increase amount stocked
Glass-, ongrown eels
EMP Partially implemented
Other Improve longitudinal connectiv-ity
Scientific studies and monitoring and data collection
Legal framework
Mixed
Mixed
Mixed
EMP/Other
EMP
EMP
(Partially) implemented
Implemented
Partially implemented
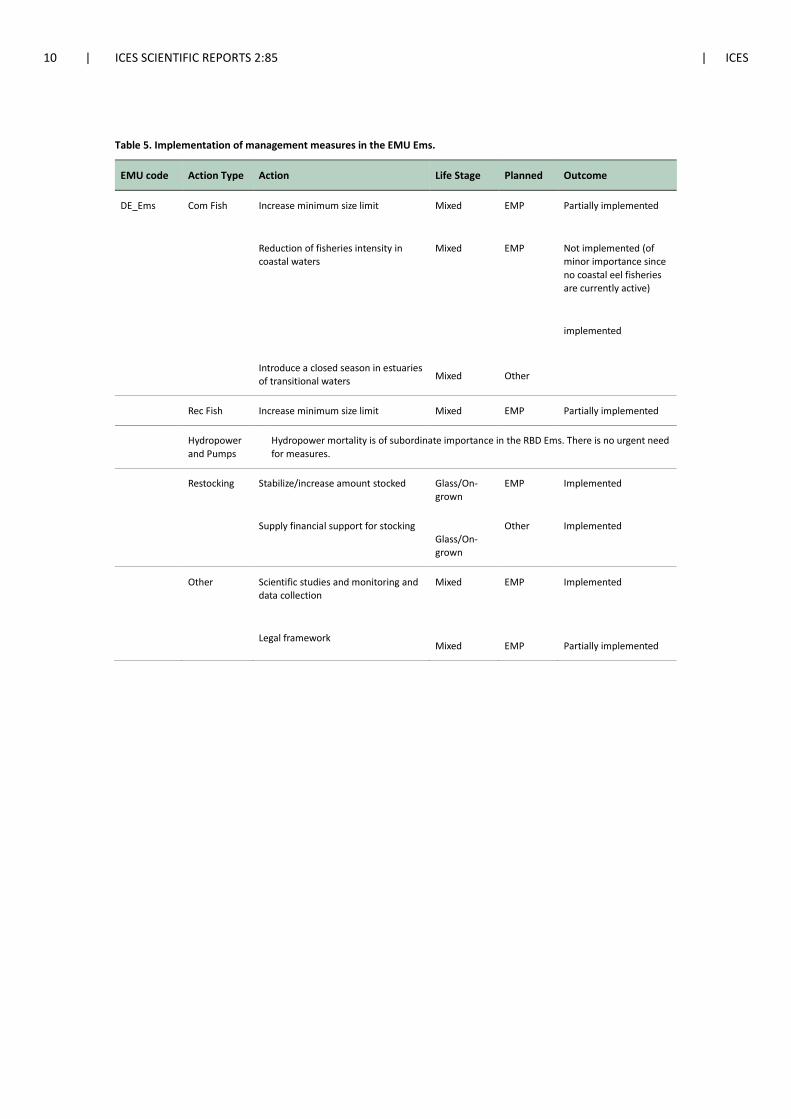
10 | ICES SCIENTIFIC REPORTS 2:85 | ICES
Table 5. Implementation of management measures in the EMU Ems.
EMU code Action Type Action Life Stage Planned Outcome
DE_Ems Com Fish Increase minimum size limit
Reduction of fisheries intensity in coastal waters
Introduce a closed season in estuaries of transitional waters
Mixed
Mixed
Mixed
EMP
EMP
Other
Partially implemented
Not implemented (of minor importance since no coastal eel fisheries are currently active)
implemented
Rec Fish Increase minimum size limit Mixed EMP Partially implemented
Hydropower and Pumps
Hydropower mortality is of subordinate importance in the RBD Ems. There is no urgent need for measures.
Restocking Stabilize/increase amount stocked
Supply financial support for stocking
Glass/On-grown
Glass/On-grown
EMP
Other
Implemented
Implemented
Other Scientific studies and monitoring and data collection
Legal framework
Mixed
Mixed
EMP
EMP
Implemented
Partially implemented
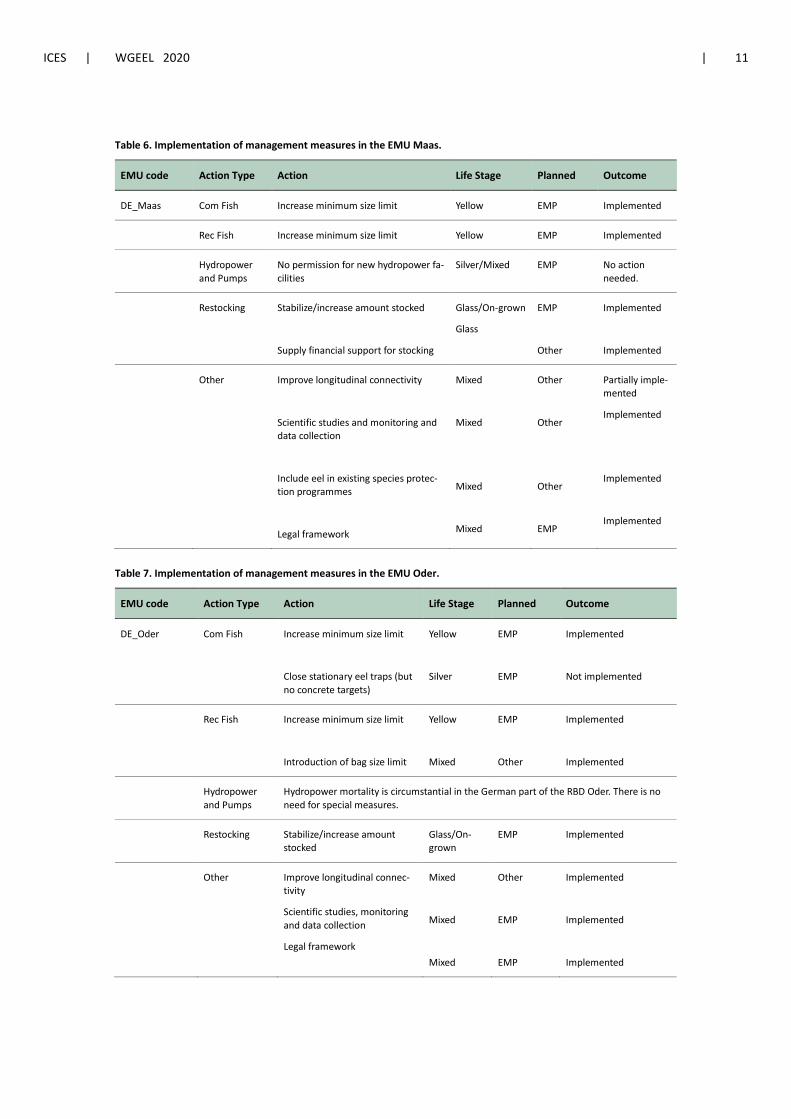
ICES | WGEEL 2020 | 11
Table 6. Implementation of management measures in the EMU Maas.
EMU code Action Type Action Life Stage Planned Outcome
DE_Maas Com Fish Increase minimum size limit Yellow EMP Implemented
Rec Fish Increase minimum size limit Yellow EMP Implemented
Hydropower and Pumps
No permission for new hydropower fa-cilities
Silver/Mixed EMP No action needed.
Restocking Stabilize/increase amount stocked
Supply financial support for stocking
Glass/On-grown
Glass
EMP
Other
Implemented
Implemented
Other Improve longitudinal connectivity
Scientific studies and monitoring and data collection
Include eel in existing species protec-tion programmes
Legal framework
Mixed
Mixed
Mixed
Mixed
Other
Other
Other
EMP
Partially imple-mented
Implemented
Implemented
Implemented
Table 7. Implementation of management measures in the EMU Oder.
EMU code Action Type Action Life Stage Planned Outcome
DE_Oder Com Fish Increase minimum size limit
Close stationary eel traps (but no concrete targets)
Yellow
Silver
EMP
EMP
Implemented
Not implemented
Rec Fish Increase minimum size limit
Introduction of bag size limit
Yellow
Mixed
EMP
Other
Implemented
Implemented
Hydropower and Pumps
Hydropower mortality is circumstantial in the German part of the RBD Oder. There is no need for special measures.
Restocking Stabilize/increase amount stocked
Glass/On-grown
EMP Implemented
Other Improve longitudinal connec-tivity
Scientific studies, monitoring and data collection
Legal framework
Mixed
Mixed
Mixed
Other
EMP
EMP
Implemented
Implemented
Implemented
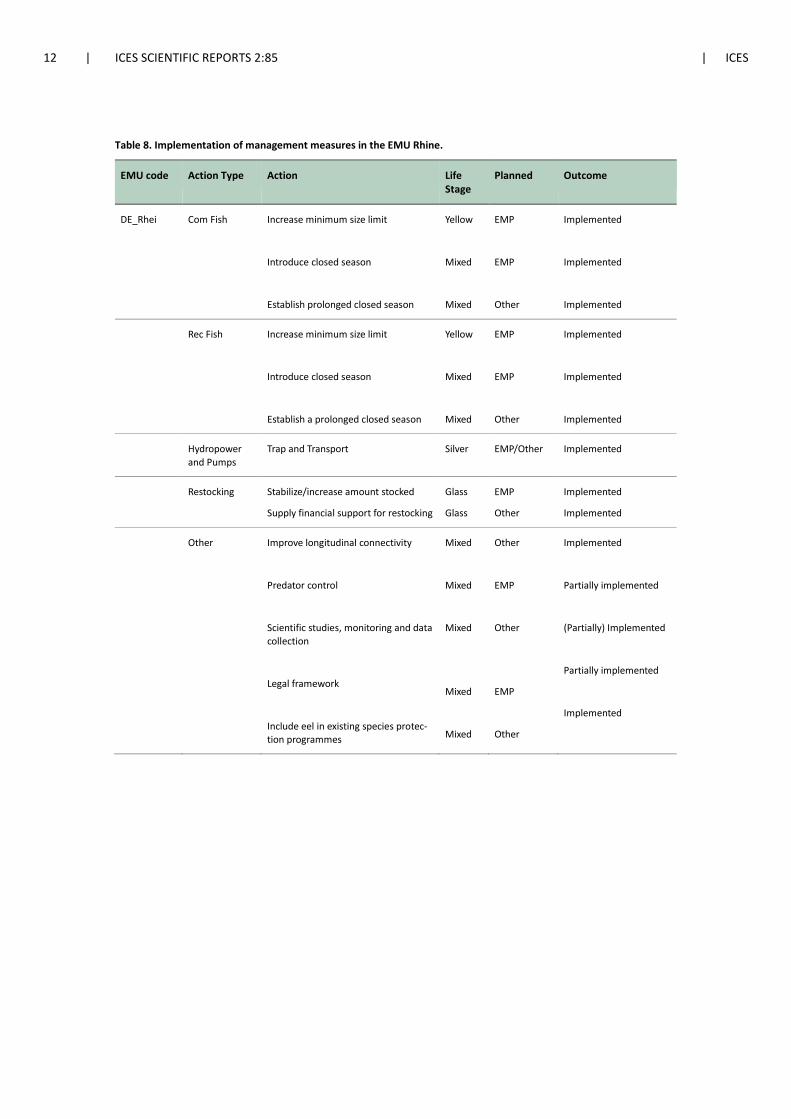
12 | ICES SCIENTIFIC REPORTS 2:85 | ICES
Table 8. Implementation of management measures in the EMU Rhine.
EMU code Action Type Action Life Stage
Planned Outcome
DE_Rhei Com Fish Increase minimum size limit
Introduce closed season
Establish prolonged closed season
Yellow
Mixed
Mixed
EMP
EMP
Other
Implemented
Implemented
Implemented
Rec Fish Increase minimum size limit
Introduce closed season
Establish a prolonged closed season
Yellow
Mixed
Mixed
EMP
EMP
Other
Implemented
Implemented
Implemented
Hydropower and Pumps
Trap and Transport Silver EMP/Other Implemented
Restocking Stabilize/increase amount stocked
Supply financial support for restocking
Glass
Glass
EMP
Other
Implemented
Implemented
Other Improve longitudinal connectivity
Predator control
Scientific studies, monitoring and data collection
Legal framework
Include eel in existing species protec-tion programmes
Mixed
Mixed
Mixed
Mixed
Mixed
Other
EMP
Other
EMP
Other
Implemented
Partially implemented
(Partially) Implemented
Partially implemented
Implemented
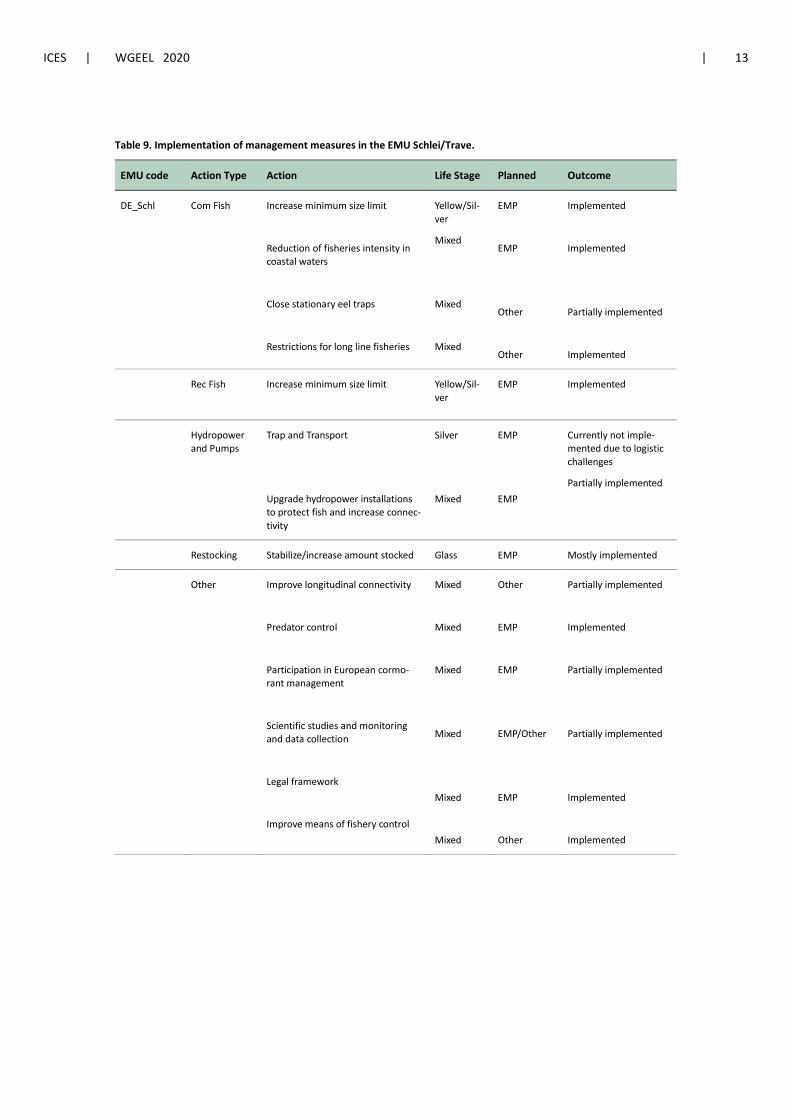
ICES | WGEEL 2020 | 13
Table 9. Implementation of management measures in the EMU Schlei/Trave.
EMU code Action Type Action Life Stage Planned Outcome
DE_Schl Com Fish Increase minimum size limit
Reduction of fisheries intensity in coastal waters
Close stationary eel traps
Restrictions for long line fisheries
Yellow/Sil-ver
Mixed
Mixed
Mixed
EMP
EMP
Other
Other
Implemented
Implemented
Partially implemented
Implemented
Rec Fish Increase minimum size limit
Yellow/Sil-ver
EMP Implemented
Hydropower and Pumps
Trap and Transport
Upgrade hydropower installations to protect fish and increase connec-tivity
Silver
Mixed
EMP
EMP
Currently not imple-mented due to logistic challenges
Partially implemented
Restocking Stabilize/increase amount stocked Glass EMP Mostly implemented
Other Improve longitudinal connectivity
Predator control
Participation in European cormo-rant management
Scientific studies and monitoring and data collection
Legal framework
Improve means of fishery control
Mixed
Mixed
Mixed
Mixed
Mixed
Mixed
Other
EMP
EMP
EMP/Other
EMP
Other
Partially implemented
Implemented
Partially implemented
Partially implemented
Implemented
Implemented
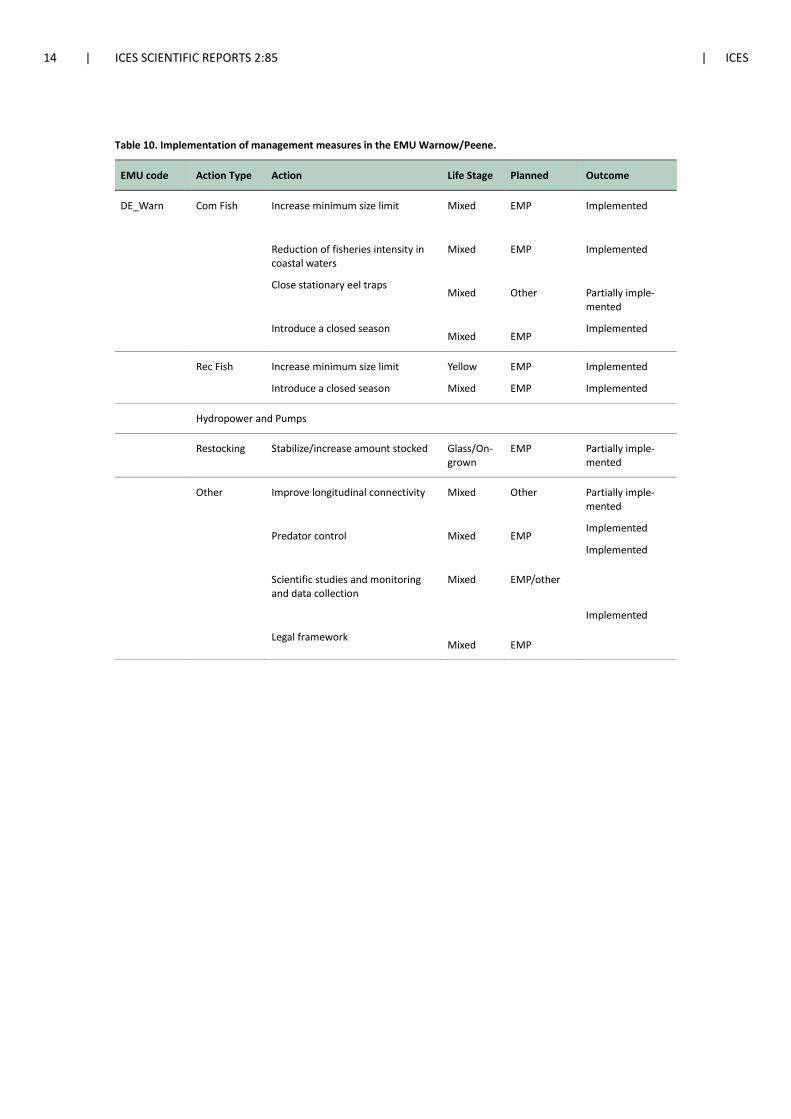
14 | ICES SCIENTIFIC REPORTS 2:85 | ICES
Table 10. Implementation of management measures in the EMU Warnow/Peene.
EMU code Action Type Action Life Stage Planned Outcome
DE_Warn Com Fish Increase minimum size limit
Reduction of fisheries intensity in coastal waters
Close stationary eel traps
Introduce a closed season
Mixed
Mixed
Mixed
Mixed
EMP
EMP
Other
EMP
Implemented
Implemented
Partially imple-mented
Implemented
Rec Fish Increase minimum size limit
Introduce a closed season
Yellow
Mixed
EMP
EMP
Implemented
Implemented
Hydropower and Pumps
Restocking Stabilize/increase amount stocked Glass/On-grown
EMP Partially imple-mented
Other Improve longitudinal connectivity
Predator control
Scientific studies and monitoring and data collection
Legal framework
Mixed
Mixed
Mixed
Mixed
Other
EMP
EMP/other
EMP
Partially imple-mented
Implemented
Implemented
Implemented
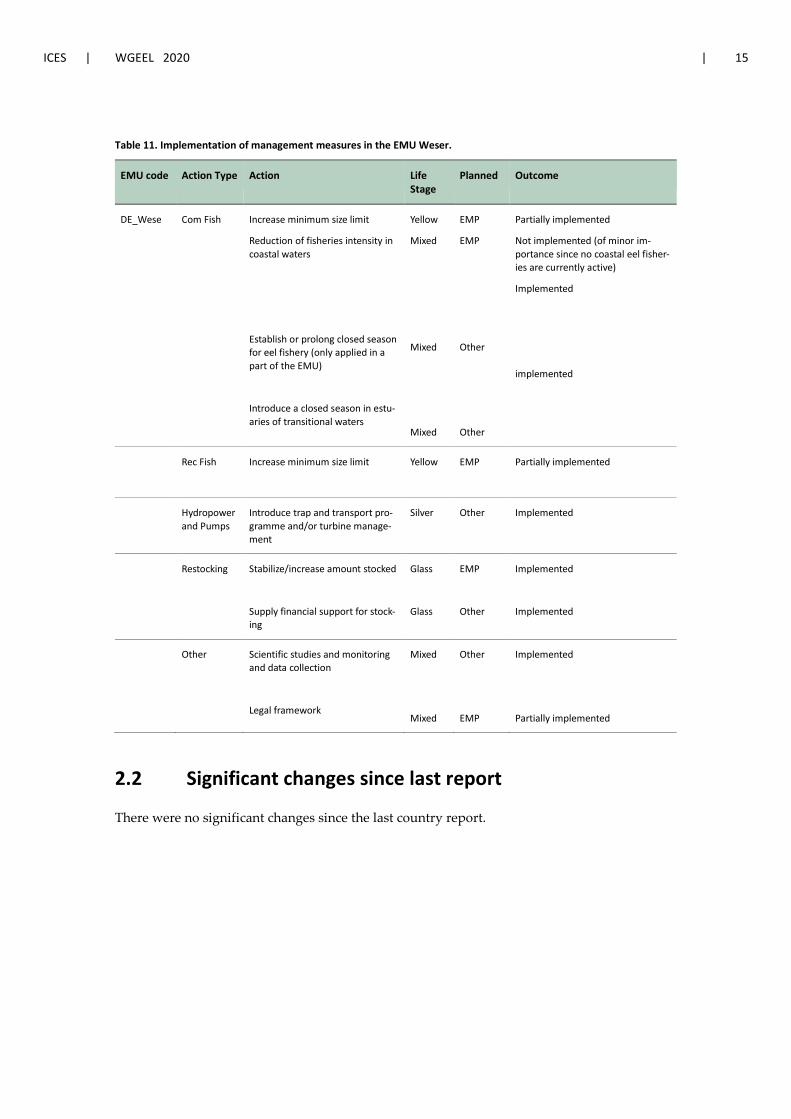
ICES | WGEEL 2020 | 15
Table 11. Implementation of management measures in the EMU Weser.
EMU code Action Type Action Life Stage
Planned Outcome
DE_Wese Com Fish Increase minimum size limit
Reduction of fisheries intensity in coastal waters
Establish or prolong closed season for eel fishery (only applied in a part of the EMU)
Introduce a closed season in estu-aries of transitional waters
Yellow
Mixed
Mixed
Mixed
EMP
EMP
Other
Other
Partially implemented
Not implemented (of minor im-portance since no coastal eel fisher-ies are currently active)
Implemented
implemented
Rec Fish Increase minimum size limit
Yellow EMP Partially implemented
Hydropower and Pumps
Introduce trap and transport pro-gramme and/or turbine manage-ment
Silver Other Implemented
Restocking Stabilize/increase amount stocked
Supply financial support for stock-ing
Glass
Glass
EMP
Other
Implemented
Implemented
Other Scientific studies and monitoring and data collection
Legal framework
Mixed
Mixed
Other
EMP
Implemented
Partially implemented
2.2 Significant changes since last report
There were no significant changes since the last country report.
16 | ICES SCIENTIFIC REPORTS 2:85 | ICES
3 Impacts on the national stock
3.1 Fisheries
Commercial fisheries in Germany usually are mixed fisheries, which catch different species and also both eel stages, yellow and silver eel (though some gears primarily target one of these stages). Landings of yellow and silver eels have not been reported separately in the past. Though separate reports have recently been implemented in some states, these numbers were only avail-able for the EMUs Warnow/Peene, Schlei/Trave, and Eider. Data presented in Tables 12 and 13 were taken from the Joint ICES/GFCM/EIFAAC Eel Data Call 2020. Fishing effort data are pre-sented in Table 14.
3.1.1 Glass eel fisheries
There is no glass eel fishery in Germany
3.1.2 Yellow/Silver eel fisheries
3.1.2.1 Commercial Landings data are recorded by fishers and reported to regional authorities. Separate data for landings of yellow and silver are not yet available for all EMUs.
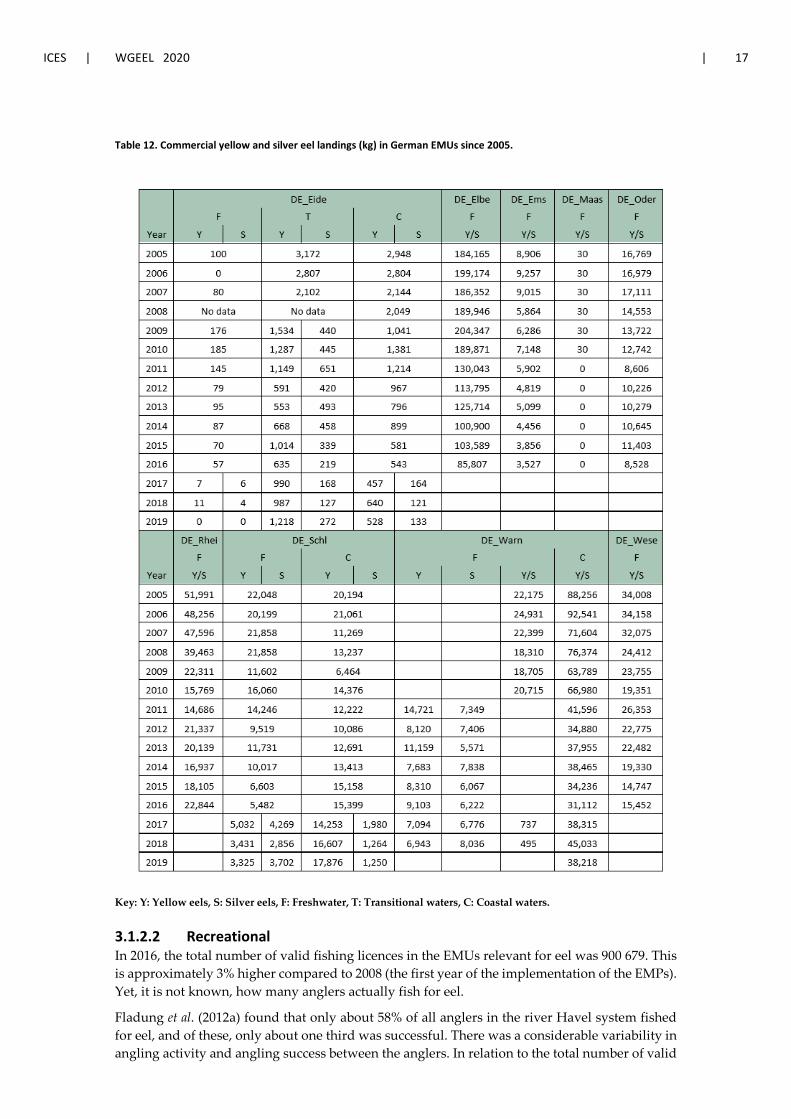
ICES | WGEEL 2020 | 17
Table 12. Commercial yellow and silver eel landings (kg) in German EMUs since 2005.
Key: Y: Yellow eels, S: Silver eels, F: Freshwater, T: Transitional waters, C: Coastal waters.
3.1.2.2 Recreational In 2016, the total number of valid fishing licences in the EMUs relevant for eel was 900 679. This is approximately 3% higher compared to 2008 (the first year of the implementation of the EMPs). Yet, it is not known, how many anglers actually fish for eel.
Fladung et al. (2012a) found that only about 58% of all anglers in the river Havel system fished for eel, and of these, only about one third was successful. There was a considerable variability in angling activity and angling success between the anglers. In relation to the total number of valid

18 | ICES SCIENTIFIC REPORTS 2:85 | ICES
fishing licences, the annual yield was 0.6 eels or 288 g eel per angler in this system. Similar results had been found for the State Mecklenburg-Pomerania in an earlier study (Dorow and Arling-haus, 2008, 2009).
Data on releases of undersized eels are not available in Germany and accordingly not considered in the calculation of losses due to recreational fisheries. However, two studies investigated the post-release mortality of eels (Weltersbach et al., 2016, 2018) and found that fishing gear signifi-cantly affected the catch of undersized eels with mortalities between 8.4 and 64.4%, thus high-lighting the need to consider these effects in future management approaches.
Table 13. Recreational yellow and silver eel landings (kg) in German EMUs since 2005.
Year DE_Eide F
DE_Eide C
DE_Elbe DE_Ems DE_Maas DE_Oder DE_Rhein DE_Schl F
DE_Schl C
DE_Warn F
DE_Warn C
DE_Wese
2005 5,704 525 113,328 25,315 407 11,314 87,007 12,205 4,302 22,386 8,460 66,192
2006 5,133 525 113,883 22,322 370 11,235 92,700 12,205 4,087 22,322 8,436 66,091
2007 4,620 525 112,805 15,896 404 10,656 91,558 12,205 3,882 22,904 8,656 61,575
2008 4,158 525 112,886 12,001 95 10,887 63,763 9,000 3,688 22,805 8,619 44,880
2009 3,742 525 116,049 13,116 82 11,178 60,096 8,000 3,504 23,408 8,847 37,514
2010 3,368 525 104,471 13,062 95 9,647 48,728 7,000 3,504 22,947 8,673 30,530
2011 3,031 525 105,971 10,563 84 10,088 45,416 6,000 3,504 23,544 10,590 31,584
2012 2,728 525 106,766 11,242 81 10,103 41,358 6,000 3,504 23,131 10,486 30,388
2013 2,455 525 105,111 11,898 80 10,102 42,929 6,000 3,504 22,353 10,053 35,971
2014 2,210 525 109,578 11,518 60 10,483 42,040 6,000 3,504 22,599 10,164 35,807
2015 2,210 525 109,413 9,438 60 10,541 41,243 6,000 3,504 23,150 10,412 39,128
2016 2,210 525 111,090 9,960 58 10,560 40,835 6,000 3,504 23,106 10,392 39,538
2017 23,553 12,088
2018 22,701 11,651
2019 23,406 12,013
Key: F: Freshwater, C: Coastal waters.
3.1.2.3 Fishing effort In the frame of the implementation of the EMPs, data on fishing effort became available due to documentation requirements in the Regulation 1100/2007. Data were taken from the third EMP progress report to the EU Commission (Fladung and Brämick, 2018) and refer to 2016.
Fisheries in Germany usually are mixed fisheries, which catch different species and also both stages of eel, yellow and silver eel (even though some gears are more specialized for one of the stages). Therefore, fishing effort cannot be presented separately for yellow and silver eels. Hence, Table 14 gives the data on total fishing effort on both stages.
The main fishing gears for eel in Germany are fykenets (different types), among which the “small fykes” are the most important group. It is important to note that for this gear, a reduction of 38%

ICES | WGEEL 2020 | 19
in effort was documented between 2008 and 2016, thus continuing the downward trend that was already reported earlier (e.g. Dorow and Lill, 2014; Fladung and Brämick, 2015). All other gears also showed a reduction in effort, which is notable for stownets with 37% (which mostly target silver eels). Though effort for ‘hook buoys’ and stationary traps was greatly reduced, they only account for a very small fraction of the total effort.
Table 14. Fishing effort with the most relevant eel fishing gears of commercial and semi-commercial fisheries in German waters in 2016 and change (%) in relation to the 2008-data. Data are presented as gear * days used.
EMU
Smal
l fyk
es
Larg
e fy
kes
Long
lines
(eel
line
10
0 at
hoo
ks)
Aalp
uppe
n (“
Hoo
k bu
oy”)
Stow
nets
Stat
iona
ry e
el tr
aps
Elec
tro
fishi
ng
Eider 7,985 6,268 0 127 0 0
Elbe* 230,486 287,902 171 4,180 1,618 255 49
Ems 2,552 5,609 0 3,995 0 0
Maas 0 0 0 0 0 0
Oder 195,460 26,534 3,354 5,626 240 2 55
Rhein 126,199 5,990 45 217 0 349
Schlei/Trave 418,150 7,450 415 0 20 0
Warnow/Peene 2,724,110 51,365 114,574 2,591 0 264 14
Weser 130,803 2,834 0 0 710 0 0
Total 3,835,745 393,952 118,559 12,397 6,907 541 467
Change from 2008 to 2016 (%) *, **
-38 -8 -36 -69 -37 -77 -24
*Without Hamburg, because no data were reported, **Without the State of Brandenburg, because no data were available for 2008.
EMU Eider • 70 full- and part-time fishers / fishing enterprises, about 260 hobby fishers (only pots and
fykenets allowed); • about 20 000 anglers (in 2016, Fladung and Brämick, 2018).
EMU Elbe • 413 full- and part-time fishers / fishing enterprises, (11 102 fykenets, 31 stownets, 24 elec-
trofishing gears, 38 stationary eel traps in 2007); • 412 370 anglers (in 2016, Fladung and Brämick, 2018)
EMU Ems • four full-time and five part-time fishers (using fykenets and stownets); • 50 811 anglers (in 2016, Fladung and Brämick, 2018).
20 | ICES SCIENTIFIC REPORTS 2:85 | ICES
EMU Maas • 5830 anglers (in 2016, Fladung and Brämick, 2018).
EMU Oder • 89 full- and part-time fishers / fishing enterprises (using 2116 fykenets, seven stownets,
23 electrofishing gears, five stationary eel traps in 2007); • 36 667 anglers (in 2016, Fladung and Brämick, 2018).
EMU Rhein • approximately 288 (full-) and part-time fishers (fykenets and a few stownets); • 158 569 anglers (in 2016, Fladung and Brämick, 2018).
EMU Schlei/Trave • 239 full- and part-time fishers / fishing enterprises, about 410 hobby fishers (only pots
and fykenets allowed); • about 25 000 anglers.
EMU Warnow/Peene • coastal fishery in 2016: 255 full-time fishers, 128 part-time fishers, less than 150 hobby-
fishers; • inland fishery in 2017: 39 fishing enterprises with ca. 120 vessels; • 76 873 anglers (in 2016, Fladung and Brämick, 2018).
EMU Weser • 17 full-time fishers, 99 part-time fishers (using stownets, fykenets, traps); • 114 879 anglers (in 2016, Fladung and Brämick, 2018).
3.1.2.4 Economic importance Data on the real economic importance of eel for the German fisheries are rare. However, a study by Fladung and Ebeling (2016) revealed that eel is still very important for the inland fishery in the State Brandenburg (which is one of the most important States for the German inland fishery sector). On average, eel contributed 27% to the revenues of the fishing companies, which is re-lated to the comparably high prices for eel, which can be three to four times the prices for other freshwater fish.
In a study focussing on the economic importance of the eel fishery in inland waters in the State Mecklenburg-Pomerania, similar results on the economic importance of eel have been found us-ing a written survey (Dorow and Frankowski, 2019). For example, depending on the individual commercial fishery the eel accounts between 40–70% of the harvest revenues.
A study on the economic impact of eel management measures on stakeholders (Hanel et al., 2019) in four countries (France, Germany, Greece and Spain) clearly shows the lack of economic data for eel fisheries in European inland waters. This lack of data hinders the assessment of the eco-nomic importance of eel for fisheries and an economic impact assessment of management measures.
3.1.2.5 Underreporting and illegal catches No data available.

ICES | WGEEL 2020 | 21
3.2 Restocking
Available data on eel stocking were taken from the ICES data call on eel 2020. The information for 2017–2019 is not yet complete. Generally, restocking intensity is influenced by glass eel price, funding and the contribution of commercial and recreational fishers. In Tables 17 and 18 infor-mation on restocked ongrown and yellow eels is combined.
Table 15. Total weight (kg) of glass eels restocked in German EMUs since 2005.
Year DE_Eide DE_Elbe DE_Ems DE_Maas DE_Oder DE_Rhein DE_Schl DE_Schl DE_Warn DE_Warn DE_Wese
F* F* F* F** F* F** F C F C F*
2005 254 131
1,454
67
2006
74
1,689
52
2007
53
1,943
2
16
2008
34
859
8
10
2009 34 25
1,062
8
48
2010 1153 39 21
1,028
3
37
2011 548 36 30
3,070 30 50 3
47
2012 885 8 51 3 2,217
3
34
2013 1416
56 26 2,318 2 22 3
49
2014 2025
80 94 1,167 26 572 3 120 393
2015 1036
37 59 1,313 34 117 8 120 91
2016 581 14
81 844 116 254 20 114 246
2017
119 301
2018
137 177 189
2019
88 344
F: freshwater, C: coastal, * including transitional waters, ** including all eels of age group 0.
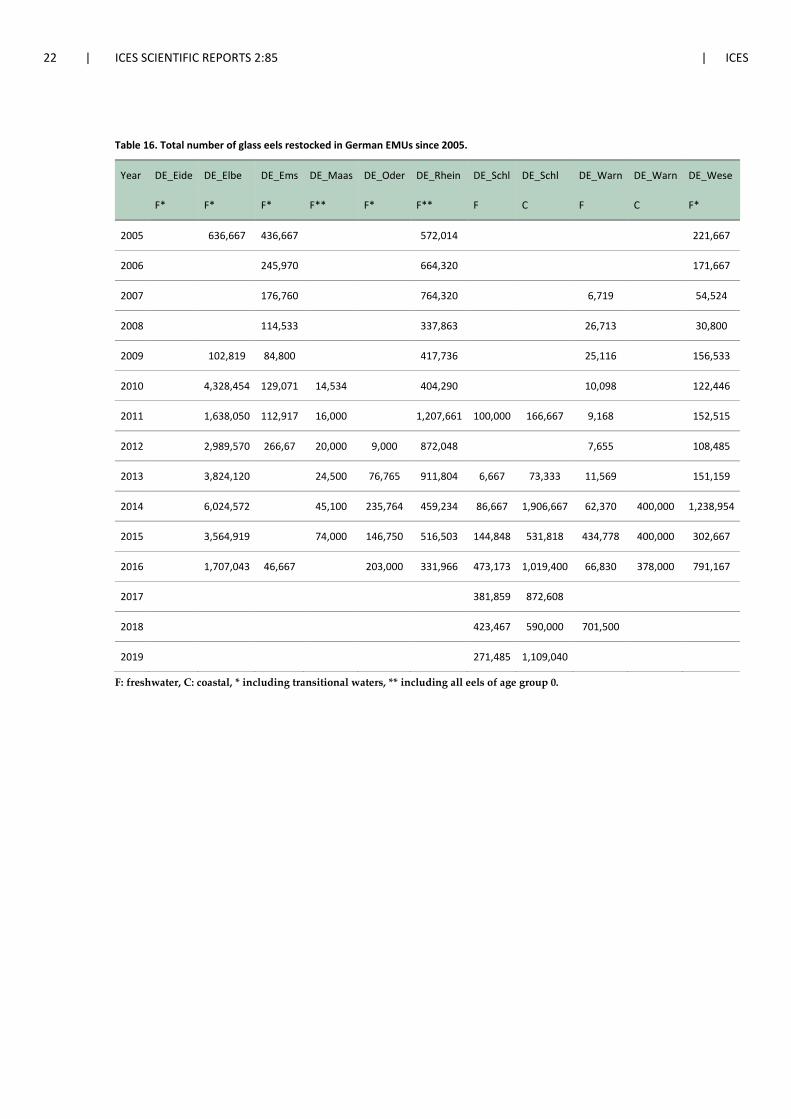
22 | ICES SCIENTIFIC REPORTS 2:85 | ICES
Table 16. Total number of glass eels restocked in German EMUs since 2005.
Year DE_Eide DE_Elbe DE_Ems DE_Maas DE_Oder DE_Rhein DE_Schl DE_Schl DE_Warn DE_Warn DE_Wese
F* F* F* F** F* F** F C F C F*
2005 636,667 436,667
572,014
221,667
2006
245,970
664,320
171,667
2007
176,760
764,320
6,719
54,524
2008
114,533
337,863
26,713
30,800
2009 102,819 84,800
417,736
25,116
156,533
2010 4,328,454 129,071 14,534
404,290
10,098
122,446
2011 1,638,050 112,917 16,000
1,207,661 100,000 166,667 9,168
152,515
2012 2,989,570 266,67 20,000 9,000 872,048
7,655
108,485
2013 3,824,120
24,500 76,765 911,804 6,667 73,333 11,569
151,159
2014 6,024,572
45,100 235,764 459,234 86,667 1,906,667 62,370 400,000 1,238,954
2015 3,564,919
74,000 146,750 516,503 144,848 531,818 434,778 400,000 302,667
2016 1,707,043 46,667
203,000 331,966 473,173 1,019,400 66,830 378,000 791,167
2017
381,859 872,608
2018
423,467 590,000 701,500
2019
271,485 1,109,040
F: freshwater, C: coastal, * including transitional waters, ** including all eels of age group 0.
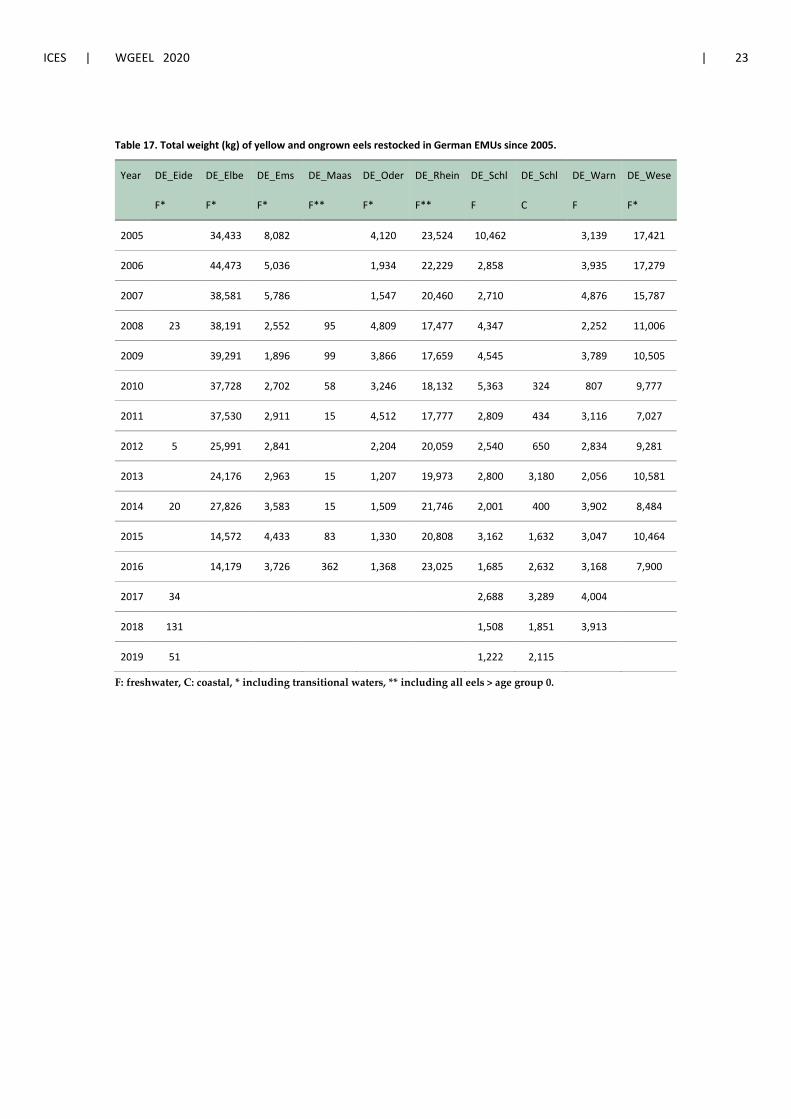
ICES | WGEEL 2020 | 23
Table 17. Total weight (kg) of yellow and ongrown eels restocked in German EMUs since 2005.
Year DE_Eide DE_Elbe DE_Ems DE_Maas DE_Oder DE_Rhein DE_Schl DE_Schl DE_Warn DE_Wese
F* F* F* F** F* F** F C F F*
2005
34,433 8,082
4,120 23,524 10,462
3,139 17,421
2006
44,473 5,036
1,934 22,229 2,858
3,935 17,279
2007
38,581 5,786
1,547 20,460 2,710
4,876 15,787
2008 23 38,191 2,552 95 4,809 17,477 4,347
2,252 11,006
2009
39,291 1,896 99 3,866 17,659 4,545
3,789 10,505
2010
37,728 2,702 58 3,246 18,132 5,363 324 807 9,777
2011
37,530 2,911 15 4,512 17,777 2,809 434 3,116 7,027
2012 5 25,991 2,841
2,204 20,059 2,540 650 2,834 9,281
2013
24,176 2,963 15 1,207 19,973 2,800 3,180 2,056 10,581
2014 20 27,826 3,583 15 1,509 21,746 2,001 400 3,902 8,484
2015
14,572 4,433 83 1,330 20,808 3,162 1,632 3,047 10,464
2016
14,179 3,726 362 1,368 23,025 1,685 2,632 3,168 7,900
2017 34
2,688 3,289 4,004
2018 131
1,508 1,851 3,913
2019 51
1,222 2,115
F: freshwater, C: coastal, * including transitional waters, ** including all eels > age group 0.
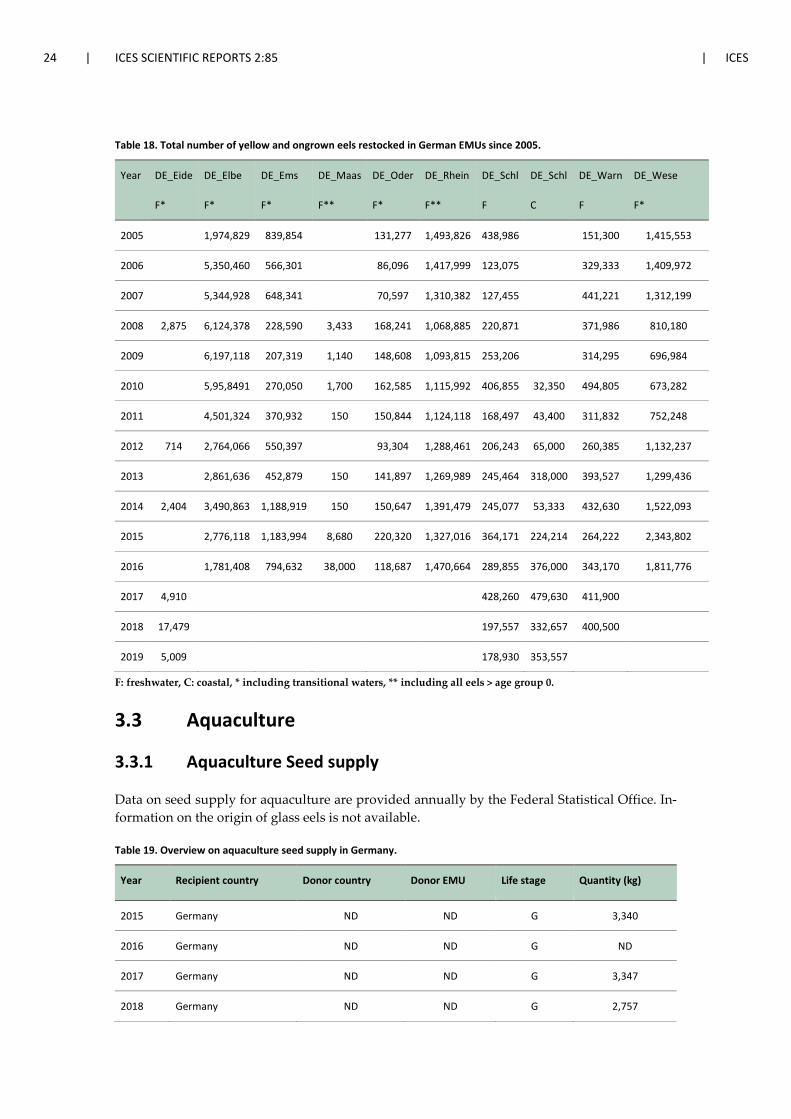
24 | ICES SCIENTIFIC REPORTS 2:85 | ICES
Table 18. Total number of yellow and ongrown eels restocked in German EMUs since 2005.
Year DE_Eide DE_Elbe DE_Ems DE_Maas DE_Oder DE_Rhein DE_Schl DE_Schl DE_Warn DE_Wese
F* F* F* F** F* F** F C F F*
2005
1,974,829 839,854
131,277 1,493,826 438,986
151,300 1,415,553
2006
5,350,460 566,301
86,096 1,417,999 123,075
329,333 1,409,972
2007
5,344,928 648,341
70,597 1,310,382 127,455
441,221 1,312,199
2008 2,875 6,124,378 228,590 3,433 168,241 1,068,885 220,871
371,986 810,180
2009
6,197,118 207,319 1,140 148,608 1,093,815 253,206
314,295 696,984
2010
5,95,8491 270,050 1,700 162,585 1,115,992 406,855 32,350 494,805 673,282
2011
4,501,324 370,932 150 150,844 1,124,118 168,497 43,400 311,832 752,248
2012 714 2,764,066 550,397
93,304 1,288,461 206,243 65,000 260,385 1,132,237
2013
2,861,636 452,879 150 141,897 1,269,989 245,464 318,000 393,527 1,299,436
2014 2,404 3,490,863 1,188,919 150 150,647 1,391,479 245,077 53,333 432,630 1,522,093
2015
2,776,118 1,183,994 8,680 220,320 1,327,016 364,171 224,214 264,222 2,343,802
2016
1,781,408 794,632 38,000 118,687 1,470,664 289,855 376,000 343,170 1,811,776
2017 4,910
428,260 479,630 411,900
2018 17,479
197,557 332,657 400,500
2019 5,009
178,930 353,557
F: freshwater, C: coastal, * including transitional waters, ** including all eels > age group 0.
3.3 Aquaculture
3.3.1 Aquaculture Seed supply
Data on seed supply for aquaculture are provided annually by the Federal Statistical Office. In-formation on the origin of glass eels is not available.
Table 19. Overview on aquaculture seed supply in Germany.
Year Recipient country Donor country Donor EMU Life stage Quantity (kg)
2015 Germany ND ND G 3,340
2016 Germany ND ND G ND
2017 Germany ND ND G 3,347
2018 Germany ND ND G 2,757
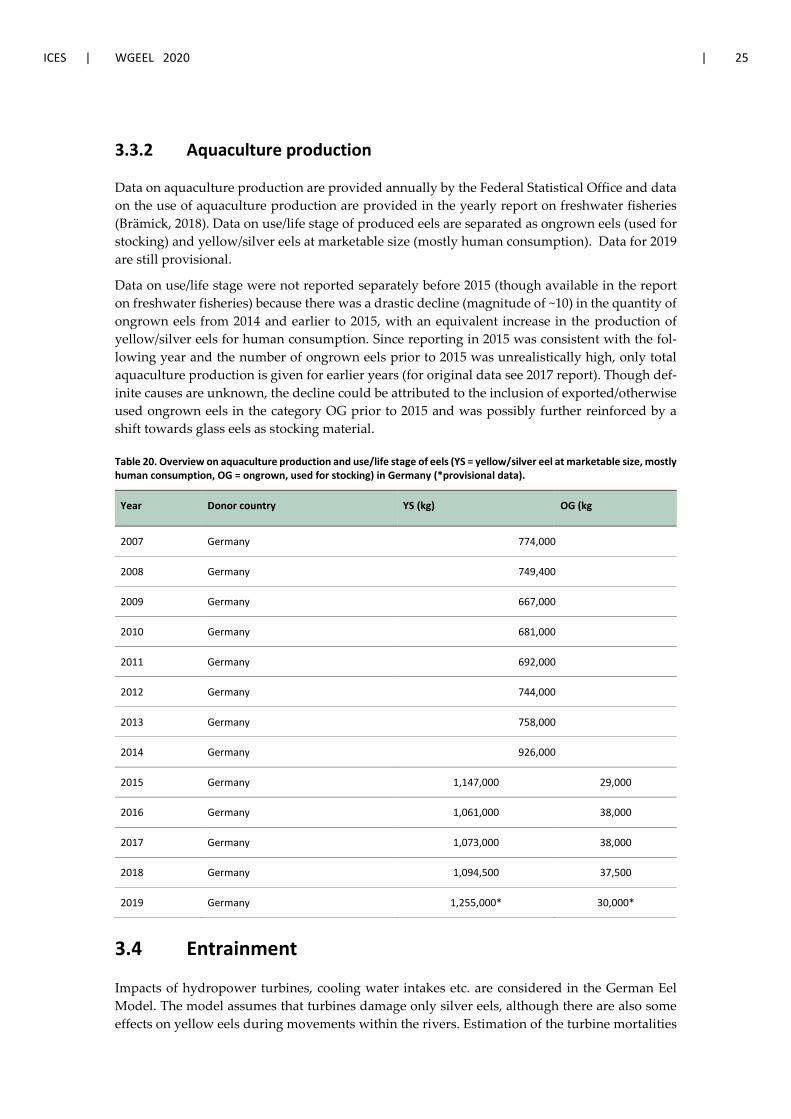
ICES | WGEEL 2020 | 25
3.3.2 Aquaculture production
Data on aquaculture production are provided annually by the Federal Statistical Office and data on the use of aquaculture production are provided in the yearly report on freshwater fisheries (Brämick, 2018). Data on use/life stage of produced eels are separated as ongrown eels (used for stocking) and yellow/silver eels at marketable size (mostly human consumption). Data for 2019 are still provisional.
Data on use/life stage were not reported separately before 2015 (though available in the report on freshwater fisheries) because there was a drastic decline (magnitude of ~10) in the quantity of ongrown eels from 2014 and earlier to 2015, with an equivalent increase in the production of yellow/silver eels for human consumption. Since reporting in 2015 was consistent with the fol-lowing year and the number of ongrown eels prior to 2015 was unrealistically high, only total aquaculture production is given for earlier years (for original data see 2017 report). Though def-inite causes are unknown, the decline could be attributed to the inclusion of exported/otherwise used ongrown eels in the category OG prior to 2015 and was possibly further reinforced by a shift towards glass eels as stocking material.
Table 20. Overview on aquaculture production and use/life stage of eels (YS = yellow/silver eel at marketable size, mostly human consumption, OG = ongrown, used for stocking) in Germany (*provisional data).
Year Donor country YS (kg) OG (kg
2007 Germany 774,000
2008 Germany 749,400
2009 Germany 667,000
2010 Germany 681,000
2011 Germany 692,000
2012 Germany 744,000
2013 Germany 758,000
2014 Germany 926,000
2015 Germany 1,147,000 29,000
2016 Germany 1,061,000 38,000
2017 Germany 1,073,000 38,000
2018 Germany 1,094,500 37,500
2019 Germany 1,255,000* 30,000*
3.4 Entrainment
Impacts of hydropower turbines, cooling water intakes etc. are considered in the German Eel Model. The model assumes that turbines damage only silver eels, although there are also some effects on yellow eels during movements within the rivers. Estimation of the turbine mortalities
26 | ICES SCIENTIFIC REPORTS 2:85 | ICES
are based on original data or average mortality of ~30% less a percentage for the protection de-vice.
According to the position of the obstacles and the known or estimated mortality rates at each location, the RBDs can be divided into several subareas, for each of which the cumulative turbine mortality down to the estuary can be calculated. By using a step size of ten per cent, the whole system can be divided into ten subareas of similar turbine mortality. This way of modelling makes it easy to study the effect of improvement of the migration capacity of hydropower sta-tions because the influenced area will be added to another subarea.
Based on this stratified structure, the overall impact of technical obstructions on the eel stocks is calculated on EMU basis. However, this modelling approach assumes equal distribution of eels in the EMUs, while it is likely that the abundance is higher in downstream regions. Therefore, hydropower mortality might be overestimated. Comprehensive information on the spatial dis-tribution of these impacts is not available.
3.5 Habitat Quantity and Quality
So far, aspects of habitat quality are only considered indirectly by including the effects of tech-nical obstructions at barriers (see above) and predation by cormorants in the GEM. Furthermore, habitat-specific growth rates are used in most areas, which can be considered an effect of habitat quality.
However, effects of contaminants, diseases or parasites so far cannot be quantified and are, hence, not considered.
3.6 Other impacts
The impact of predation by cormorants on the eel stock is controversially debated in Germany. In the GEM cormorant predation has been included in the term “natural mortality”. Table 21 provides estimates for predation of eels by cormorants for the German RBDs between 2005 and 2016. The order of magnitude has clearly increased again since 2011. Estimates are based on numbers of cormorants in the relevant regions and proportion of eels in the diet of cormorants. The most recent EMP progress report (Fladung and Brämick, 2018) further highlights that pre-dation by cormorants is most relevant in age groups 2–4, causing ~15–26% of the overall yearly mortality in this age groups (average of all EMUs between 2014–2016).
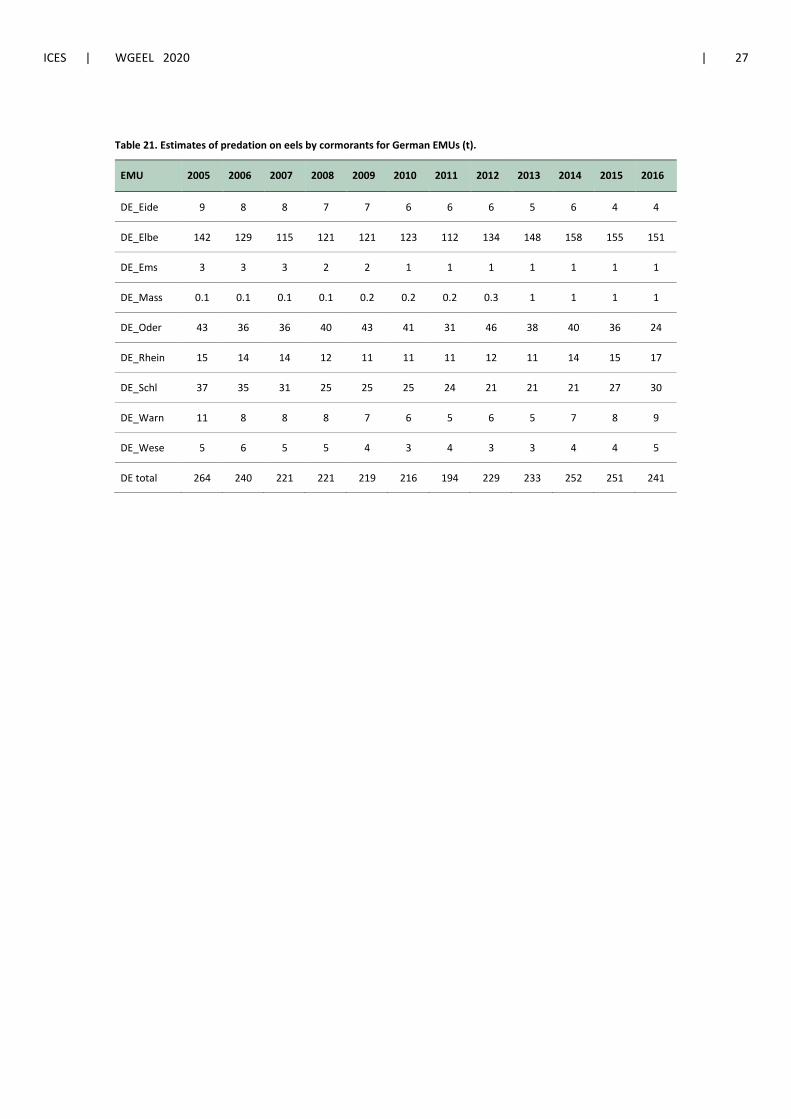
ICES | WGEEL 2020 | 27
Table 21. Estimates of predation on eels by cormorants for German EMUs (t).
EMU 2005 2006 2007 2008 2009 2010 2011 2012 2013 2014 2015 2016
DE_Eide 9 8 8 7 7 6 6 6 5 6 4 4
DE_Elbe 142 129 115 121 121 123 112 134 148 158 155 151
DE_Ems 3 3 3 2 2 1 1 1 1 1 1 1
DE_Mass 0.1 0.1 0.1 0.1 0.2 0.2 0.2 0.3 1 1 1 1
DE_Oder 43 36 36 40 43 41 31 46 38 40 36 24
DE_Rhein 15 14 14 12 11 11 11 12 11 14 15 17
DE_Schl 37 35 31 25 25 25 24 21 21 21 27 30
DE_Warn 11 8 8 8 7 6 5 6 5 7 8 9
DE_Wese 5 6 5 5 4 3 4 3 3 4 4 5
DE total 264 240 221 221 219 216 194 229 233 252 251 241
28 | ICES SCIENTIFIC REPORTS 2:85 | ICES
4 National stock assessment
4.1 Description of Method
There is no continuous calculation of the stock indicators on an annual basis. For the calculation of the stock indicators for the third EMP progress report (Fladung and Brämick, 2018), the GEM III was used. It includes the option to calculate the cohort development separately for males (no habitat specific growth rates in all EMUs) and females and also the possibility to calculate the mortality rates. The model has already been used for management considerations (Brämick et al., 2015) in the river Havel system, the largest tributary to the river Elbe. A description of the pre-vious version (GEM II) has been published by Oeberst and Fladung (2012).
The model incorporates the weight and sex of eel as well as the mean water temperature to esti-mate the natural mortality. Natural mortality was estimated based on Bevaqua et al. (2011). In addition, three density levels of the eel stock are considered to determine natural mortality. The areas given in the EMPs and in the reports include all habitats, which would be potential eel habitats under undisturbed conditions; only some habitats e.g. in the trout region, far away from the coast may have been excluded, because these areas are no typical eel habitats. Areas above impassable barriers are also included in the calculation of escapement. In agreement with the eel regulation, coastal waters have been included in some cases but not in others. When they were not included, fisheries should be decreased by 50% outside the areas covered by the EMP.
All estimates refer to the whole EMU without assuming differences within the system except for hydropower mortality. It is obvious that there will be differences between different habitat types, but the available data do not allow for a more differentiated approach. As a consequence, the values represent a mean value for the whole EMU. Though based on knowingly false assump-tions, this is regarded the best possible approach under pragmatic aspects. The model predic-tions have been compared to empiric data by tagging experiments and empirical monitoring of silver eel escapement. These experiments largely supported model estimates, at least in the order of magnitude in the Elbe and Schwentine river systems (Fladung et al., 2012b; Prigge et al., 2013). Some of the input data are still not available for each EMU (e.g. length at maturation), in which case values from the EMU Elbe were used. However, efforts continue to collect system-specific data in the frame of the DCF.
Restocking is not included in the calculation of B0 and Bbest. Bcurrent includes the effect of restocking in all RBDs, where restocking applies. The values of ∑A represent real mortalities and are not lowered by restocking.
4.1.1 Data collection
The main input parameters of the model are: fisheries yield (commercial (from national landing statistics) and recreational), stocking and estimates for natural immigration based on the ICES recruitment time-series, predation by cormorants, mortality by hydropower (turbines, etc.) growth functions and length–weight relationships. For details, see Oeberst and Fladung (2012).
The biological sampling, e.g. to determine growth etc., is mainly done in the frame of the DCF, which is explained in more detail in the relevant chapter (see below). Additionally, various DCF independent data collection programmes exist in several states aiming to provide input data for the GEM III.
ICES | WGEEL 2020 | 29
4.1.2 Analysis
A description of the basic model has been given by Oeberst and Fladung (2012). A first example of how the model can be used for management consideration has been given by Brämick et al. (2015).
4.1.3 Reporting
The results are presented in the EMP progress reports according to the EU Eel Regulation (1100/2007) and in the annual WGEEL Country Reports. The implementation reports are publicly available (in German):
https://www.portal-fischerei.de/bund/bestandsmanagement/aalbewirtschaftungsplaene/um-setzungsbericht/?no_cache=1andsword_list%5B%5D=Aal
Data which are obtained in the frame of the DCF are regularly reported to the EU.
4.1.4 Data quality issues and how they are being addressed
The quality of the available data is not easy to assess. There is no long history of eel stock assess-ment in Germany and hence the results are based on landing statistics, estimates and model cal-culations. The reliability of the landing statistics has not been evaluated so far. The model used to calculate the different population parameters of eel in German waters (Oeberst and Fladung, 2012), has been further developed (GEM III) and has also been tested in the frame of the POSE project. The model results have been compared to data obtained by tagging studies and are con-sidered acceptable (Fladung et al., 2012b; Prigge et al., 2013). Yet, the studies also indicated that the quality of the results strongly depends on the quality of the input data. Hence, the data basis for the modelling of the stock will have to be improved continuously in the future. The reliability of the results will also be enhanced by increasingly using river-specific data obtained in the frame of the DCF sampling.
These issues have been further addressed with the implementation of EU MAP in 2016, aiming at a data collection that provides more comprehensive and robust input data for the model.
4.2 Trends in Assessment results
In absolute terms, mortalities due to fisheries (i.e. landings) and hydropower (i.e. eels lost to turbines and cooling water intakes) were reduced in all German EMUs from 2005–2007 to 2014–2016 (Tables 22 and 23). In some EMUs, however, (modelled) fishing and other anthropogenic mortality rates actually increased in the observed time period (Table 24). This contradiction is partly attributed to the fact that the modelled decrease in the abundance of eels in the fished population (i.e. above minimum landing size) or exposed to hydropower mortality (i.e. silver eels) was higher than the observed decrease in catches. Yet, the overall fishing effort also de-creased (Table 14), which suggests a decrease in both, absolute and relative mortalities. It is, however, hardly possible to standardize fishing effort considering the large differences between the gears used. Thus, the overall decrease in fishing effort does not necessarily entail a decrease in fishing mortality rates since gears might vary with respect to fishing efficiency. Furthermore, the decrease in effort was not consistent for all gears and/or EMUs (yet, some areas did show a notable decrease in fishing intensity, e.g. the southern Baltic coastal areas, see above). Accord-ingly, the presented results remain somewhat inconclusive and it is unclear to which degree they are related to uncertainties in the model and/or respective input data.
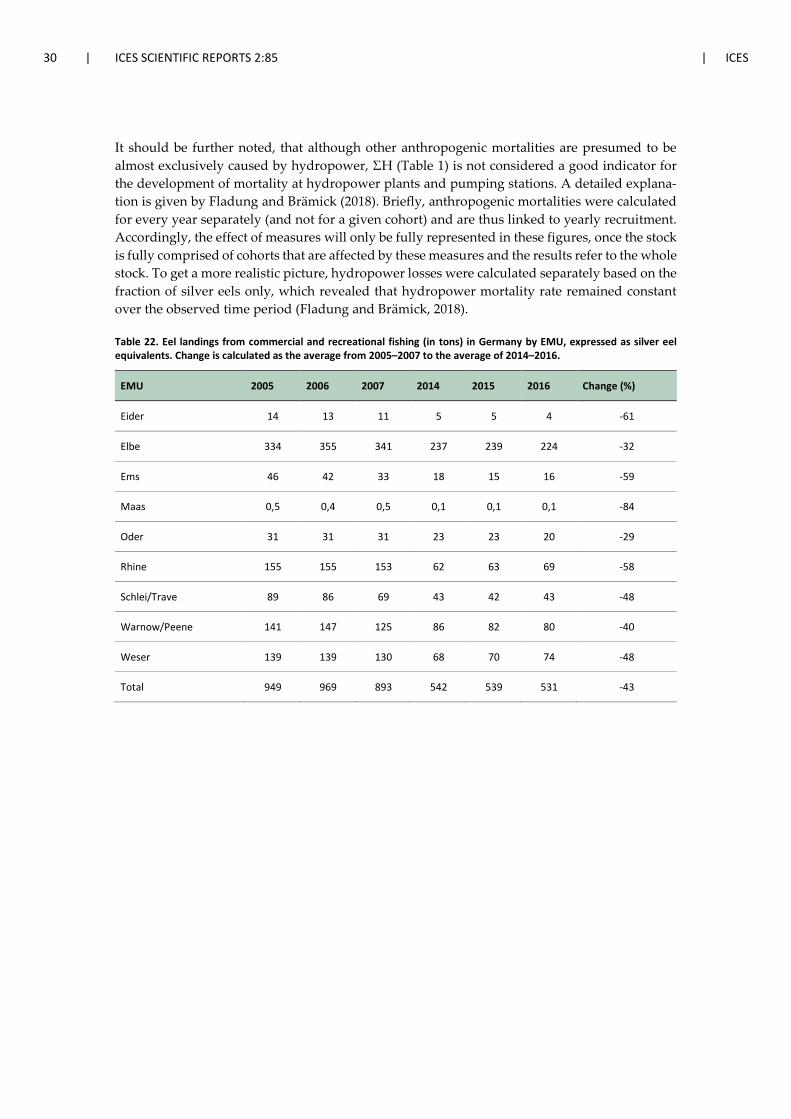
30 | ICES SCIENTIFIC REPORTS 2:85 | ICES
It should be further noted, that although other anthropogenic mortalities are presumed to be almost exclusively caused by hydropower, ΣH (Table 1) is not considered a good indicator for the development of mortality at hydropower plants and pumping stations. A detailed explana-tion is given by Fladung and Brämick (2018). Briefly, anthropogenic mortalities were calculated for every year separately (and not for a given cohort) and are thus linked to yearly recruitment. Accordingly, the effect of measures will only be fully represented in these figures, once the stock is fully comprised of cohorts that are affected by these measures and the results refer to the whole stock. To get a more realistic picture, hydropower losses were calculated separately based on the fraction of silver eels only, which revealed that hydropower mortality rate remained constant over the observed time period (Fladung and Brämick, 2018).
Table 22. Eel landings from commercial and recreational fishing (in tons) in Germany by EMU, expressed as silver eel equivalents. Change is calculated as the average from 2005–2007 to the average of 2014–2016.
EMU 2005 2006 2007 2014 2015 2016 Change (%)
Eider 14 13 11 5 5 4 -61
Elbe 334 355 341 237 239 224 -32
Ems 46 42 33 18 15 16 -59
Maas 0,5 0,4 0,5 0,1 0,1 0,1 -84
Oder 31 31 31 23 23 20 -29
Rhine 155 155 153 62 63 69 -58
Schlei/Trave 89 86 69 43 42 43 -48
Warnow/Peene 141 147 125 86 82 80 -40
Weser 139 139 130 68 70 74 -48
Total 949 969 893 542 539 531 -43
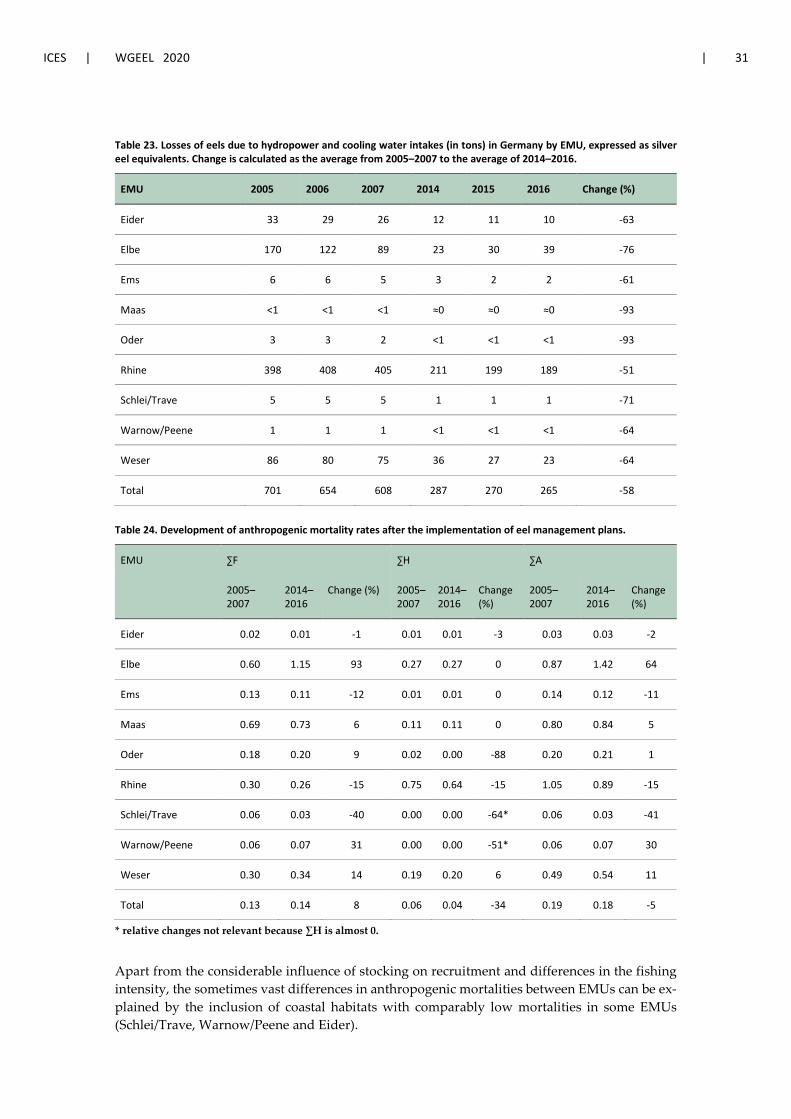
ICES | WGEEL 2020 | 31
Table 23. Losses of eels due to hydropower and cooling water intakes (in tons) in Germany by EMU, expressed as silver eel equivalents. Change is calculated as the average from 2005–2007 to the average of 2014–2016.
EMU 2005 2006 2007 2014 2015 2016 Change (%)
Eider 33 29 26 12 11 10 -63
Elbe 170 122 89 23 30 39 -76
Ems 6 6 5 3 2 2 -61
Maas <1 <1 <1 ≈0 ≈0 ≈0 -93
Oder 3 3 2 <1 <1 <1 -93
Rhine 398 408 405 211 199 189 -51
Schlei/Trave 5 5 5 1 1 1 -71
Warnow/Peene 1 1 1 <1 <1 <1 -64
Weser 86 80 75 36 27 23 -64
Total 701 654 608 287 270 265 -58
Table 24. Development of anthropogenic mortality rates after the implementation of eel management plans.
EMU ∑F ∑H ∑A
2005–2007
2014–2016
Change (%) 2005–2007
2014–2016
Change (%)
2005–2007
2014–2016
Change (%)
Eider 0.02 0.01 -1 0.01 0.01 -3 0.03 0.03 -2
Elbe 0.60 1.15 93 0.27 0.27 0 0.87 1.42 64
Ems 0.13 0.11 -12 0.01 0.01 0 0.14 0.12 -11
Maas 0.69 0.73 6 0.11 0.11 0 0.80 0.84 5
Oder 0.18 0.20 9 0.02 0.00 -88 0.20 0.21 1
Rhine 0.30 0.26 -15 0.75 0.64 -15 1.05 0.89 -15
Schlei/Trave 0.06 0.03 -40 0.00 0.00 -64* 0.06 0.03 -41
Warnow/Peene 0.06 0.07 31 0.00 0.00 -51* 0.06 0.07 30
Weser 0.30 0.34 14 0.19 0.20 6 0.49 0.54 11
Total 0.13 0.14 8 0.06 0.04 -34 0.19 0.18 -5
* relative changes not relevant because ∑H is almost 0.
Apart from the considerable influence of stocking on recruitment and differences in the fishing intensity, the sometimes vast differences in anthropogenic mortalities between EMUs can be ex-plained by the inclusion of coastal habitats with comparably low mortalities in some EMUs (Schlei/Trave, Warnow/Peene and Eider).

32 | ICES SCIENTIFIC REPORTS 2:85 | ICES
Considering the fraction of silver eels only, hydropower mortality rate remained constant in six out of nine EMUs and was reduced due to the implementation of trap and transport (Rhine, -11%) and reduced stocking (Oder, -88%) while a slight increase in the Weser (+6%) is attributed to newly built hydropower facilities (For details see Fladung and Brämick, 2018). Due to the implementation of the WFD (EC 2000/60) it is to be expected that mortalities will be reduced in the future. So far, however, measures focused mostly on enabling upstream migration, which explains the largely unchanged hydropower mortality for silver eels in most EMUs.
ICES | WGEEL 2020 | 33
5 Other data collection for eel
5.1 Yellow eel abundance surveys
The enclosure monitoring approach is running in the coastal waters of Mecklenburg-Pomerania since 2008. In 2015 and 2016 an experimental evaluation of the fishing efficiency of the enclosure-fykenet system was conducted addressing the efficiency of the external boundary net (Dorow et al., 2019) and the proportion of enclosed eels harvested within the standard of 48 hours (Dorow et al., 2020). Based on the evaluation studies a correction factor was derived allowing the estima-tion of unbiased yellow eel densities based on the enclosure monitoring harvest results.
In 2014, 2016, 2017 and 2019, an abundance survey for eel in the Schleswig-Holstein part of the Baltic Sea was carried out, using a standardized catching method that catches eel >36 cm quan-titatively using the enclosure approach of Ubl and Dorow (2015). The results were used to esti-mate eel recruitment as an input parameter for the GEM.
Since 2004, a logbook study with commercial coastal fishing enterprises is conducted in the state Mecklenburg-Pomerania (Dorow and Lill, 2014). The generated data allow the calculation of yel-low eel specific CPUE data considering different size classes and gear types. A change point analysis was applied to detect time-series changes. After a period of decreasing or constant har-vest rates, the fykenet data revealed increasing yellow eel numbers within recent years (Dorow et al., submitted).
5.2 Silver eel escapement surveys
Since 2004, approximately 150 marked silver eels were released per year in the tributaries of the German part of the river Rhine. Purpose was studying: 1) the migratory behaviour of silver eel from the Rhine system to the North Sea, and 2) the success in actually reaching the sea. The study is performed by North Rhine Westphalian State Agency for Nature, Environment and Consumer Protection (LANUV, Germany) in cooperation with RWS Water, Verkeer en Leefomgeving (the Netherlands), and will be continued in order to gain information about the effects of the opening of the Haringvliet sluices (Rhine-Meuse Delta) in 2018.
In the years 2013 and 2014, a total of 65 marked silver eel were released in the tributaries Havel and Dahme of the German part of the river Elbe. Purpose was studying the migratory behaviour (routes, time periods, speed). The study was performed by the Institute for Inland Fisheries Pots-dam-Sacrow (IFB, Germany) and finished in 2016.
A scientific stownet system is used to monitor the silver eel escapement in the River Warnow (EMU Warnow/Peene). Since 2009, the stownet is used in a standardized way (Reckordt et al., 2014). After a decrease in catch rates until 2015, an increase of the silver eel escapement was observed since 2016 (Frankowski, unpublished data). Data on escapement rate, behaviour and mortality have been assessed by means of acoustic telemetry in the Warnow River. In the context of a permanent silver eel descent in the freshwater part of the Warnow River, a permanent es-capement was likewise occurring into the Baltic Sea (Frankowski et al., 2019).
In summer 2020, a telemetry study started in the River Ems aiming to quantify total silver eel escapement from the EMU. The results obtained until 2022 will be used to validate the GEM III and are expected to further improve the quality of the model. Movement patterns, migration speed and the effect of river constructions (i.e. water gates) on the downstream migration behav-iour will also be assessed.
34 | ICES SCIENTIFIC REPORTS 2:85 | ICES
5.3 Life-history parameters
Sampling of European eels in freshwater is mandatory under the DCF. Biological parameters (i.e. length, weight, age, sex and stage) are collected in all RBDs except Meuse (no commercial fish-eries) and Danube (no natural habitat of A. anguilla). With the implementation of the multiannual programme for the collection, management and use of fisheries data (EU MAP, EU 2016/1251) in 2016, the data collection was renewed. Since large parts of the required data can only be provided through modelling, sampling is now focused on providing system-specific data on local eel sub-populations in order to improve input data for the GEM and validate the results. The respective data requirements (mostly data related to silver eel escapement) were elicited on a national level in close cooperation with national authorities and in accordance with end-user needs (e.g. ICES Data call, EMP progress reports, management authorities). Furthermore, sampling is conducted in a way that minimizes the amount of sacrificed fished to a required minimum, thus age read-ings are only conducted if directly required by relevant end-users. Details on the data collection for the period from 2020–2021 are specified in the National Workplan for Germany. Some addi-tional parameters were and will be analysed, such as Anguillicola crassus infestation and concen-tration of some contaminants. However, these additional investigations are not mandatory un-der the DCF. At present, no data on the fishery itself are sampled within the DCF. This was decided, because a lot of these data have to be obtained in the frame of the Eel Management Plans and the formal and administrative requirements of the EU Council Regulation 1100/2007.
Since 2015, a project with the aim of comparing the performance (survival, growth) of stocked glass eels and stocked farm eels has been carried out in parts of the Schleswig-Holstein Baltic Sea, which was finished in 2019 (report available under https://www.schleswig-hol-stein.de/DE/Fachinhalte/F/fischerei/Downloads/abschlussberichtAalprojekt.pdf?__blob=publi-cationFileandv=2 (in German).
Aiming to evaluate the efficiency of glass eel stocking in coastal waters of the southern Baltic a scientific stocking experiment was started in the coastal waters in 2014 (Dorow and Schaarschmidt, 2014). Recaptures of stocked eels marked with Alizarin red indicate high growth rates compared to nearby inland waters during the first period of the continental life phase in brackish coastal waters (Simon et al., 2017b). Furthermore, growth differences between natural immigrants and stocked eels were detected where three year aged stocked eels showed higher total lengths compared to three year aged natural immigrants (Wichmann et al., 2018). The pro-gramme ended in 2020 and the obtained data indicate that glass eel stocking could be a mean-ingful addition to conservation-orientated eel stocking in inland waters to increase the overall silver eel escapement in a specific EMU (Buck and Kullmann, 2020).
The bioaccumulation potential of Alizarin red S (used for otolith marking and therefore im-portant for life-history studies) was investigated in order to assess potential health risks for con-sumers (Kullmann et al., 2020). Alizarin red S concentration was analysed by liquid chromatog-raphy mass spectrometry in muscle tissue of eels following a regular otolith marking procedure (bath in Alizarin red S solution). Analysed eels differed in size and length and muscle alizarin concentration was analysed between 0 and 3 days after exposure. The results showed that the bioaccumulation of Alizarin red S in eel muscle is highly unlikely.
5.4 Diseases, Parasites and Pathogens or Contaminants
Several studies on eel parasites and pathogens have been conducted during the recent years. Here a short description of the results of studies in this field from the recent years is given to allow an overview about the general situation in German waters.
ICES | WGEEL 2020 | 35
Leuner (2013) studied the infestation with A. crassus in eels in Lake Starnberger See. In 2013, the swimbladders of 90 eels were investigated in September and October and a prevalence of 87% was found (for comparison: 1998: 91%, 2006: 61%, 2012: 81%). Most recent results (Leuner, 2015) indicate that the prevalence of A. crassus declined to 61%. Infection intensity was highest in 1998 (12 nematodes per swimbladder) and varied between five and nine parasites per swimbladder in the following years. In 2013, the value was six parasites per swimbladder. The proportion of swimbladders showing callosity was 18% in 1998 and increased to 100% in the following years. In 2012 (55%) and 2013 (56%) lower proportions of callosity were documented, possibly because younger eels had been studied. Most recent results (Leuner, 2015) indicate that the prevalence of A. crassus declined to 61%.
Kullmann (2014) studied the infestation with A. crassus in eels from the river Elbe estuary, the Kiel Canal and the Elbe-Lübeck-Canal. Prevalence was highest in the Kiel Canal (64.91%), fol-lowed by eels from the river Elbe estuary (54.83%) and the Elbe-Lübeck-Canal (43.66%). Mean infection intensity (nematodes per swimbladder) was significantly higher in the Kiel Canal (5.94) than in river Elbe estuary (3.07) and the Elbe-Lübeck-Canal (1.04).
Information on infestation of eels with A. crassus is also given by Marohn et al. (2014) for the Schwentine system. Prevalence of A. crassus infection was 79.9% and 21.4% of all analysed eels had infection intensities above ten nematodes per host and were considered to be severely in-fected. Most specimens showed visible but moderate swimbladder damages (Hartmann class 2 and 3; 89.2% (Hartmann, 1994)), whereas 4.3% were classified as severely damaged (Hartmann class 4; Hartmann, 1994). Only 6.5% were unaffected (Hartmann class 1). 73.3% of all nematode-free swimbladders showed signs of earlier infections.
The infestation of eels with the swimbladder parasite Anguillicola crassus in north German inland and coastal waters was studied by Wysujack et al. (2014). Between 1996 and 2011, the swimblad-ders of 17 219 eels from eight freshwater and coastal water areas were analysed. Prevalence, abundance of parasites, infection intensity and severity of the damage to the swimbladder were recorded by visual inspection. In the freshwaters, the prevalence was in the range of 65–83%, whereas significantly lower values were found in the brackish waters. The differences were less clear for infection intensity but significantly lower values were found in the outermost location in the Baltic Sea. Mean damage to the swimbladders was highest in eels from the Rivers Weser and Elbe and lowest in the Baltic coastal waters. Prevalence and damage degree were stable in all waters except for two rivers, where a decreasing trend in infection intensity was found. Infor-mation on the A. crassus infection in two lakes in the state Mecklenburg-Pomerania including the infection rate of wrongly stocked American eels (Frankowski et al., 2013) are provided by Thieser et al. (2013).
There are currently studies going on within an EMFF (European Marine Fisheries Fund) project monitoring restocking (2016–2019) in North Rhine Westphalia (Germany) focusing on parasitic, viral (AngHV 1 (HVA), EVEX (Eel Virus European X), Eel-Picornavirus (EPV-1)) and bacterial diseases in the rivers Rhine, Ems and Lippe.
Anguillid herpesvirus 1 (AngHV 1) infection was investigated in eels from the Northern German Schlei Fjord. 68% of the eels were found to be virus positive while larger specimens were more often infected (Kullmann et al., 2017).
To examine the impact of an A. crassus infection on the silver eel migration, Simon et al. (2018) com-pared the in situ diving behaviour of a migrating silver eel infested with Anguillicola crassus to three uninfested specimens. Results suggest that diving behaviour is not affected during the first stretch of the spawning migration, while further excluding the possibility that eels stay in a hy-drostatic equilibrium, thus indicating a more complex role of the swimbladder for vertical mi-grations than previously thought.
36 | ICES SCIENTIFIC REPORTS 2:85 | ICES
Regarding contaminants, several studies on contaminants in eel have been conducted in Ger-many. It is not possible to provide all details here. Instead the references are given:
Belpaire C, Hodson P, Pierron F, Freese M. 2019. Impact of chemical pollution on Atlantic eels: facts, re-search needs and implications for management. Curr Opinion Environ Sci Health: In Press.
Brinkmann M, Freese M, Pohlmann J-D, Kammann U, Preuss TG, Buchinger S, Reifferscheid G, Beiermeis-ter A, Hanel R, Hollert H. 2015. A physiologically based toxicokinetic (PBTK) model for moderately hydrophobic organic chemicals in the European eel (Anguilla anguilla). Sci Total Environ 536:279–287, DOI:10.1016/j.scitotenv.2015.07.046.
Freese M, Sühring R, Pohlmann J-D, Wolschke H, Magath V, Ebinghaus R, Hanel R. 2016. A question of origin: dioxin-like PCBs and their relevance in stock management of European eels. Ecotoxicol 25(1):41–55, DOI:10.1007/s10646-015-1565-y.
Freese M, Yokota Rizzo L, Pohlmann J-D, Marohn L, Witten PE, Gremse F, Rütten S, Güvener N, Michael S, Wysujack K, Lammers T, Kiessling F, Hollert H, Hanel R, Brinkmann M. 2019. Bone resorption and body reorganization during maturation induce maternal transfer of toxic metals in anguillid eels. Proc Nat Acad Sci USA: In press.
Freese M, Sühring R, Marohn L, Pohlmann JD, Wolschke H, Byer JD, Alaee M, Ebinghaus R, Hanel R. 2017. Maternal transfer of dioxin-like compounds in artificially matured European eels. Env Poll (227):348–356.
Hohenadler MAA,Nachev M,Freese M, Pohlmann JD, Hanel R, Sures B. 2019. How Ponto-Caspian invaders affect local parasite communities of native fish Parasitology research, 1–13.
Kammann U, Brinkmann M, Freese M, Pohlmann J-D, Stoffels S, Hollert H, Hanel R. 2014. PAH metabolites, GST and EROD in European eel (Anguilla anguilla) as possible indicators for eel habitat quality in Ger-man rivers. Environ Sci Pollut Res 21(4):2519–2530, doi:10.1007/s11356-013-2121-z.
Michel N, Freese M, Brinkmann M, Pohlmann J-D, Hollert H, Kammann U, Haarich M, Theobald N, Gerwinski W, Rotard W, Hanel R. 2016. Fipronil and two of its transformation products in water and European eel from the river Elbe. Sci Total Environ 568:171–179.
Nagel F, Kammann U, Wagner C, Hanel R. 2012. Metabolites of polycyclic aromatic hydrocarbons (PAHs) in bile as biomarkers of pollution in European eel (Anguilla anguilla) from German rivers. Arch Environ Contamin Toxicol 62(2):254–263, doi:10.1007/s00244-011-9693-8.
Nagel F, Wagner C, Hanel R, Kammann U. 2012. The silvering process in European eel (Anguilla anguilla) influences PAH metabolite concentration in bile fluid - consequences for monitoring. Chemosphere 87(1):91–96, doi:10.1016/j.chemosphere.2011.11.071.
Sühring R, Byer J, Freese M, Pohlmann J-D, Wolschke H, Möller A, Hodson PV, Alaee M, Hanel R, Ebinghaus R. 2014. Brominated flame retardants and Dechloranes in European and American eels from glass to silver life stages. Chemosphere 116:104–111, doi:10.1016/j.chemosphere.2013.10.096.
Sühring R, Freese M, Schneider M, Schubert S, Pohlmann J-D, Alaee M, Wolschke H, Hanel R, Ebinghaus R, Marohn L. 2015. Maternal transfer of emerging brominated and chlorinated flame retardants in Eu-ropean eels. Sci Total Environ 530–531:209–218, DOI:10.1016/j.scitotenv.2015.05.094.
Sühring R, Möller A, Freese M, Pohlmann J-D, Wolschke H, Sturm R, Xie Z, Hanel R, Ebinghaus R. 2013. Brominated flame retardants and dechloranes in eels from German rivers. Chemosphere 90(1):118–124, doi:10.1016/j.chemosphere.2012.08.016.
Sühring, R. Ortiz, X., Pena Abaurrea, M., Jobst, K.J., Freese, M., Pohlmann, J-D., Marohn, L., Ebinghaus, R., Backus, S.M., Hanel, R., Reiner, E.J. 2016. Evidence for high concentrations and maternal transfer of substituted diphenylamins in European eels analyzed by GCxGC-ToF and GC-FTICR-MS. Environ-mental Science and Technology, DOI: 10.1021/acs.est.6b04382.

ICES | WGEEL 2020 | 37
6 New Information
Dorow, M., Jünger, J. Frankowski, J. and Ubl., C. 2020. Application of a 3-pass removal experiment to assess the yellow eel specific capture efficiency of a 1-ha enclosure. Fisheries Research 221. https://doi.org/10.1016/j.fishres.2019.105409.
Kullmann, L., Habedank, F., Kullmann, B., Tollkühn, E., Frankowski, J., Dorow, M., and Thiel, R. 2020. Evaluation of the bioaccumulation potential of alizarin red S in fish muscle tissue using the European eel as a model. Analytical and Bioanalytical Chemistry, 412(5), 1181–1192.
Pohlmann J-D, Freese M, Reiser S, Hanel R. 2019. Evaluation of lethal and non-lethal assessment methods of muscle fat content in European eel (Anguilla anguilla). Can J Fish Aquat Sci 76(4):569–575.

38 | ICES SCIENTIFIC REPORTS 2:85 | ICES
7 References
Bevacqua, D.; Melià, P.; De Leo, G.A.; Gatto, M. 2011. Intra-specific scaling of natural mortality in fish: the paradigmatic case of the European eel. Oecologia. 1-7. DOI 10.1007/s00442-010-1727-9.
Brämick, U. 2018. Jahresbericht zur Deutschen Binnenfischerei und Binnenaquakultur 2018. IBG Potsdam-Sacrow.
Brämick, U., Fladung, E. and Simon, J. 2015. Stocking is essential to meet the silver eel escapement target in a river system with currently low natural recruitment. ICES Journal of Marine Science. Doi:10.1093/icesjms/fsv113.
Buck, M. and Kullmann, L. 2020. Glasaalbesatz in Küstengewässern als Managementoption – Evaluierung eines großskaligen Besatzversuchs. Abschlussbericht. Landesforschungsanstalt für Landwirtschaft und Fischerei M-V, 41 S. (in German).
Diekmann, M, Simon, J, Salva, J. On the actual recruitment of European eel (Anguilla anguilla) in the River Ems, Germany. Fish Manag Ecol. 2019; 26: 20–30.
Dorow, M. and Arlinghaus, R. 2008. Ermittlung der Aalentnahme durch die Angelfischerei in Binnen- und Küstengewässern Mecklenburg-Vorpommerns. Projektendbericht; Institut für Gewässerökologie und Binnenfischerei (IGB) Berlin, 150 pp.
Dorow, M. and Arlinghaus, R. 2009. Angelbegeisterung und anglerische Fischerträge in Binnen- und Küstengewässern Mecklenburg-Vorpommerns unter besonderer Berücksichti-gung des Aals (Anguilla anguilla). Fischerei and Fischmarkt in Mecklenburg-Vorpommern 9 (2), 36–46.
Dorow, M. and Lill, D. 2014. Entwicklung der berufsfischereilichen Aalfänge in den Küstengewässern von Mecklenburg-Vorpommern. Fischerei and Fischmarkt in Mecklenburg-Vorpommern 14(1): 22–27.
Dorow, M. and Schaarschmidt, T. 2014. Effektivität von Aalbesatz in Küstengewässern – Vorstellung eines neuen wissenschaftlichen Projektes. Fischerei and Fischmarkt in Mecklenburg-Vorpommern 14 (2): 41–42.
Dorow, M. and Frankowski, J. 2019. Weiterführung der Umsetzung der Europäischen Aalverordnung in Mecklenburg-Vorpommern – Monitoring, Aalbesatz und sozio-ökonomische Dimension als Grund-pfeiler einer nachhaltigen adaptiven Bewirtschaftung. Jahresbericht der LFA-MV 2018: 54.
Dorow, M.; Schulz, S.; Frankowski, J. and Ubl, C. 2019. Using a telemetry study to assess the boundary net efficiency of an enclosure system used for yellow eel density monitoring. Fisheries Management and Ecology 26: 70–75.
Dorow, M., Jünger, J. Frankowski, J. and Ubl., C. 2020. Application of a 3-pass removal experiment to assess the yellow eel specific capture efficiency of a 1-ha enclosure. Fisheries Research 221. https://doi.org/10.1016/j.fishres.2019.105409.
Fladung, E. and Brämick, U. 2015. Umsetzungsbericht 2015 zu den Aalbewirtschaftungsplänen der deutschen Länder 2008. Auftraggeber: Niedersächsisches Ministerium für Ernährung, Landwirtschaft, Verbraucherschutz und Landesentwicklung. 48 pp. http://www.portal-fischerei.de/filead-min/redaktion/dokumente/fischerei/Bund/Umsetzungsbericht_deutsche_Aalbewirtschaftung-splaene_2015.pdf.
Fladung, E. and Brämick, U. 2018. Umsetzungsbericht 2018 zu den Aalbewirtschaftungsplänen der deutschen Länder 2008. Auftraggeber: Niedersächsisches Ministerium für Ernährung, Landwirtschaft, Verbraucherschutz und Landesentwicklung. https://www.portal-fischerei.de/filead-min/redaktion/dokumente/fischerei/Bund/Bestandsmanagement/Umsetzungsber-icht_dt._AMP_2018.pdf.
Fladung, E. and Ebeling, M. W. 2016. Struktur und betriebswirtschaftliche Situation der Seen- und Flussfischerei Brandenburgs. Schriften des Instituts für Binnenfischerei e. V. Potsdam-Sacrow, Band 43: 78 pp.
ICES | WGEEL 2020 | 39
Fladung, E., Simon, J., Brämick, U., Doering-Arjes, P., Stein, F., Wolf, P., Weichler, F. Kolew, J. and Han-nemann, N. 2012a. Quantifizierung der Sterblichkeit von Aalen in deutschen Binnengewässern am Beispiel der Havel. Institut für Binnenfischerei e.V. Potsdam-Sacrow, Projektabschlussbericht, Pots-dam, 135 pp.
Fladung, E., Simon, J., Hannemann, N. and Kolew, J. 2012b. Untersuchung der Blankaalabwanderung in der niedersächsischen Mittelelbe bei Gorleben. Institut für Binnenfischerei e.V. Potsdam-Sacrow, Pro-jektbericht im Auftrag des Niedersächsischen Landesamtes für Verbraucherschutz und Lebensmittel-sicherheit (LAVES), Potsdam, 21 S.
Frankowski, J., Ubl, C. and Dorow, M. 2013. Ergebnisse der genetischen Überwachung des Aalbestands in Mecklenburg-Vorpommern. Fischer and Teichwirt.
Frankowski, J. 2015. Umsetzung der Aalmanagementpläne in den Aaleinzugsgebieten Mecklenburg-Vor-pommerns. LFA M-V, Endbericht 23 S. plus Anhang.
Frankowski J., Dorow M., Jünger J., Reckordt M., Schulz S., Ubl C and Winkler H. 2019. Behaviour, escape-ment and mortality of female European silver eels within a regulated lowland river draining into the Baltic Sea. Fish Manag Ecol.;26:86–96. https://doi. org/10.1111/fme.12307.
Hanel, R., Briand, C., Diaz, E., Döring, R., Sapounidis, A., Warmerdam, W., Andrés, M., Freese, M., Mar-celis, A., Marohn, L., Pohlmann, J.-D., van Scharrenburg, M., Waidmann, N., Walstra, J., Werkman, M., de Wilde, J., Wysujack, K. 2019. Research for PECH Committee – Environmental, social and economic sustainability of European eel management, European Parliament, Policy Department for Structural and Cohesion Policies, Brussels.
Hartmann, F. 1994. Untersuchungen zur Biologie, Epidemiologie und Schadwirkung von Anguillicola cras-sus Kuwahara, Niimi und Itagaki 1974 (Nematoda), einem blutsaugenden Parasiten in der Schwimm-blase des europäischen Aals (Anguilla anguilla L.) Shaker Verlag Aachen. 139. pp.
Kruse, J., Poll, K.-H., Wilkens, H.-J., Zaudtke, B., Deuling, H., Diekmann, M. 2019. Glas- und Steigaa-laufstieg an der Ems an den Stauwehren Herbrum und Bollingerfähr sowie in der Goldfischdever am Stauwehr Herbrum/Lehe im Jahr 2019. Gemeinsamer Abschlussbericht im Auftrag des LAVES.
Kullmann, B. 2014. Bestandsstruktur und Wachstum des Europäischen Aals Anguilla anguilla (Linnaeus, 1758) im Nord-Ostsee-Kanal, Elbe-Lübeck-Kanal und Elbeästuar. Master Thesis. Hamburg University. 64 pp.
Kullmann, B., Adamek, M., Steinhagen, D., and Thiel, R. 2017. Anthropogenic spreading of anguillid her-pesvirus 1 by stocking of infected farmed European eels, Anguilla anguilla (L.), in the Schlei fjord in northern Germany. Journal of fish diseases. doi:10.1111/jfd.12637.
Kullmann, L., Habedank, F., Kullmann, B., Tollkühn, E., Frankowski, J., Dorow, M., and Thiel, R. 2020. Evaluation of the bioaccumulation potential of alizarin red S in fish muscle tissue using the European eel as a model. Analytical and Bioanalytical Chemistry, 412(5), 1181–1192.
Leuner, E. 2013. Untersuchungen zum Befall von Aalen mit dem Schwimmblasenwurm Anguillicoloides crassus. In: Jahresbericht 2013. Bayerische Landesanstalt für Landwirtschaft, Institut für Fischerei. Kap. 3.2.5: 41–43.
Leuner, E. 2015. Untersuchungen zum Befall von Aalen mit dem Schwimmblasenwurm Anguillicoloides crassus. In: Jahresbericht 2015. Bayerische Landesanstalt für Landwirtschaft, Institut für Fischerei. Kap. 3.2.6: 49–50.
Marohn, L., Prigge, E. and Hanel, R. 2014. Escapement success of silver eels from a German river system is low compared to management-based estimates. Freshwater Biology 59: 64–72.
Oeberst, R. and Fladung, E. 2012. German Eel Model (GEM II) for describing eel, Anguilla anguilla (L.), stock dynamics in the river Elbe system. Inf. Fischereiforsch. 59: 9–17.
Prigge, E., Marohn, L., Oeberst, R. and Hanel, R. 2013. Model Prediction versus Reality – Testing the pre-dictions of a European eel (Anguilla anguilla) stock dynamics model against the in situ observation of silver eel escapement in compliance with the European Eel Regulation. ICES-Journal of Marine Science 70(2): 309–318.
40 | ICES SCIENTIFIC REPORTS 2:85 | ICES
Reckordt, M., Ubl, C. Wagner, C. and Dorow, M. 2014. Downstream migration dynamics of female and male silver eels (Anguilla anguilla L.) in the regulated German lowland River Warnow. Ecology of Freshwater Fishes 23: 7–20.
Salva, J. 2013. Monitoring des Glas- und Steigaalaufkommens in der niedersächsischen Ems am Stauwehr Bollingerfähr April 2013–Oktober 2013. Bericht. Niedersächsisches Landesamt für Verbraucherschutz und Lebensmittelsicherheit, Dezernat Binnenfischerei. 32 pp.
Salva, J., Bröring, H., Poll, K.-H., Wilkens, H.-J., Zaudtke, B. and Diekmann, M. 2014. Glas- und Steigaa-laufstieg an der Ems an den Stauwehren Herbrum und Bollingerfähr im Jahr 2014. Gemeinsamer Ab-schlussbericht im Auftrag des LAVES.
Salva, J., Poll, K.-H., Wilkens, H.-J., Zaudtke, B. and Diekmann, M. 2015. Glas- und Steigaalaufstieg an der Ems an den Stauwehren Herbrum und Bollingerfähr im Jahr 2015. Gemeinsamer Abschlussbericht im Auftrag des LAVES.
Salva, J., Poll, K.-H., Wilkens, H.-J., Zaudtke, B., Deuling, H., Diekmann, M. 2016. Glas- und Steigaalaufstieg an der Ems an den Stauwehren Herbrum und Bollingerfähr im Jahr 2016. Gemeinsamer Abschlussber-icht im Auftrag des LAVES.
Salva, J., Poll, K.-H., Wilkens, H.-J., Zaudtke, B., Deuling, H., Diekmann, M. 2017. Glas- und Steigaalaufstieg an der Ems an den Stauwehren Herbrum und Bollingerfähr sowie in der Goldfischdever am Stauwehr Herbrum/Lehe im Jahr 2017. Gemeinsamer Abschlussbericht im Auftrag des LAVES.
Salva, J., Pelz, T., Poll, K.-H., Wilkens, H.-J., Zaudtke, B., Deuling, H., Diekmann, M. 2018. Glas- und Stei-gaalaufstieg an der Ems an den Stauwehren Herbrum und Bollingerfähr. Gemeinsamer Abschlussber-icht im Auftrag des LAVES.
Simon, J.; Zaudtke, B.; Poll, K.-H.; Wilkens, H.-J.; Deuling, H., Diekmann, M. 2016. Quantifizierung des Glas- und Steigaalaufkommens an der Ems im Jahr 2016. Gemeinsamer Abschlussbericht der Projekte: „Markierung von Steigaalen an der Ems (Herbrum)“ und „Untersuchung von Steigaalen an der Ems (Bollingerfähr) auf Farbmarkierung der Otolithen“, Institut für Binnenfischerei e.V. Potsdam-Sacrow, im Auftrag des LAVES.
Simon, J.; Arlt, E.; Poll, K.-H.; Wilkens, H.-J. and Diekmann, M. 2017a. Untersuchung von Steigaalen an der Ems (Stauwehr Bollingerfähr) auf Farbmarkierung der Otolithen. Abschlussbericht Institut für Binnen-fischerei e.V. Potsdam-Sacrow, im Auftrag des LAVES.
Simon, J., Dorow, M.; Ubl, C.; Frankowski, J. and Schaarschmidt, T. 2017b. Altersbestimmung von Aalen (Anguilla anguilla) in den Binnen- und Küstengewässern von Mecklenburg-Vorpommerns und deren Validierung. Mitteilungen der Landesforschungsanstalt für Landwirtschaft und Fischerei M-V 58: 89–101.
Simon, J.; Westerberg, H.; Righton, D.; Sjöberg, N.B. and Dorow, M. 2018. Diving activity of migrating silver eel with and without Anguillicola crassus infection. Journal of Applied Ichthyology 34:659–668.
Thieser, T.; Dorow, M.; Frankowski, J. and Taraschewski; H. 2013. Der Befall des Europäischen Aals (An-guilla anguilla) und des Amerikanischen Aals (A. rostrata) mit Anguillicola crassus in zwei norddeutschen Seen. Fischerei und Fischmarkt in MV 12(3): 39–43.
Ubl, C. and Dorow, M. 2010. Aktuelle Ergebnisse des Glas- und Jungaalmonitorings in Mecklenburg-Vor-pommern. Fischerei and Fischmarkt in Mecklenburg-Vorpommern 10(1): 31–37.
Ubl, C. and Dorow, M. 2015. A novel enclosure approach to assessing the yellow eel (Anguilla anguilla) density in non-tidal coastal waters. Fisheries Research 161: 57–63.
Weltersbach, M. S., Ferter, K., Sambraus, F., and Strehlow, H. V. 2016. Hook shedding and post-release fate of deep-hooked European eel. Biological Conservation, 199, 16–24.
Weltersbach, M. S., Strehlow, H. V., Ferter, K., Klefoth, T., de Graaf, M., and Dorow, M. 2018. Estimating and mitigating post-release mortality of European eel by combining citizen science with a catch-and-release angling experiment. Fisheries Research, 201, 98–108.

ICES | WGEEL 2020 | 41
Wichmann, L.; Dorow, M.; Frankowski, J.; Kullmann, B., Schaarschmidt, T. and Thiel, R. 2018. First results of glass eel stocking in the southern Baltic Sea. Poster presented at the Fisheries Society of British Isles Symposium 2018.
Wysujack, K., Dorow, M. and Ubl, C. 2014. The infection of the European eel with the parasitic nematode Anguillicoloides crassus in inland and coastal waters of northern Germany. J Coast Conserv 18(2): 121–130.
ICES | WGEEL 2020 | I
Contents
Report on the eel stock, fishery and other impacts in Greece, 2019–2020 ............................................... ii Authors .......................................................................................................................................... ii Research teams ............................................................................................................................. ii
1 Summary of national and international stock status indicators.................................................... 1 1.1 Escapement biomass and mortality rates ........................................................................ 1 1.2 Recruitment time-series .................................................................................................. 1
2 Overview of the national stock and its management.................................................................... 3 2.1 Describe the eel stock and its management .................................................................... 3 2.2 Significant changes since last report ................................................................................ 5
3 Impacts on the national stock ....................................................................................................... 6 3.1 Fisheries ........................................................................................................................... 6 3.1.1 Glass eel fisheries ............................................................................................................. 6 3.1.2 Yellow eel fisheries .......................................................................................................... 6 3.1.3 Silver eel fisheries ............................................................................................................ 6 3.2 Restocking ........................................................................................................................ 7 3.3 Aquaculture ..................................................................................................................... 7 3.4 Entrainment ..................................................................................................................... 7 3.5 Habitat Quantity and Quality ........................................................................................... 7 3.6 Other impacts .................................................................................................................. 7
4 National stock assessment ............................................................................................................ 8 4.1 Description of Method ..................................................................................................... 8 4.1.1 Data collection ................................................................................................................. 8 4.1.2 Analysis ............................................................................................................................ 8 Age analysis ................................................................................................................................... 8 4.1.3 Reporting ......................................................................................................................... 9 4.1.4 Data quality issues and how they are being addressed ................................................... 9 4.2 Trends in Assessment results ........................................................................................... 9
5 Other data collection for eel ....................................................................................................... 10 5.1 Yellow eel abundance surveys ....................................................................................... 10 5.2 Silver eel escapement surveys ....................................................................................... 10 5.3 Life-history parameters .................................................................................................. 10 Age Distribution ........................................................................................................................... 10 Length Distribution ...................................................................................................................... 10 5.4 Diseases, Parasites and Pathogens or Contaminants .................................................... 11 Parasites and Pathogens ............................................................................................................. 11
6 New Information ......................................................................................................................... 12 7 References ................................................................................................................................... 13
II | ICES SCIENTIFIC REPORTS 2:85 | ICES
Report on the eel stock, fishery and other impacts in Greece, 2019–2020
Authors Dr. Sapounidis Argyrios1, Dr. Koutrakis Manos¹, Prof. Koutsikopoulos Kostantinos², Prof. Leo-nardos Ioannis³
¹ Hellenic Agricultural Organization “DEMETER” - Fisheries Research Institute (F.R.I), Sector of Inland waters and Lagoons. Email: [email protected]
² Department of Biology, University of Patras, Patras. Email: [email protected]
³ Department of biological applications and technology, University of Ioannina, Ioannina. Email: [email protected]
Reporting Period: This report was completed in August 2020, and contains data up to 2019.
Research teams • Fisheries Research Institute – Hellenic Agricultural Organization “Demeter”
• Sapounidis Argyrios • Koutrakis Manos • Arapoglou Fotis • Christidis Aris • Papadopoulou Paraskevi
Acknowledgments: The project was completed with the cooperation of the Fisheries Depart-ments of different Regional Units. For this purpose, we would like to thank Malamidis Dimitris, Patsiatzi Anastasia, Tsianis Dimitris and Theodoridou Argyro from the Region of Eastern Mac-edonia and Thrace (Regional Units of Evros, Rodopi, Xanthi, Kavala).
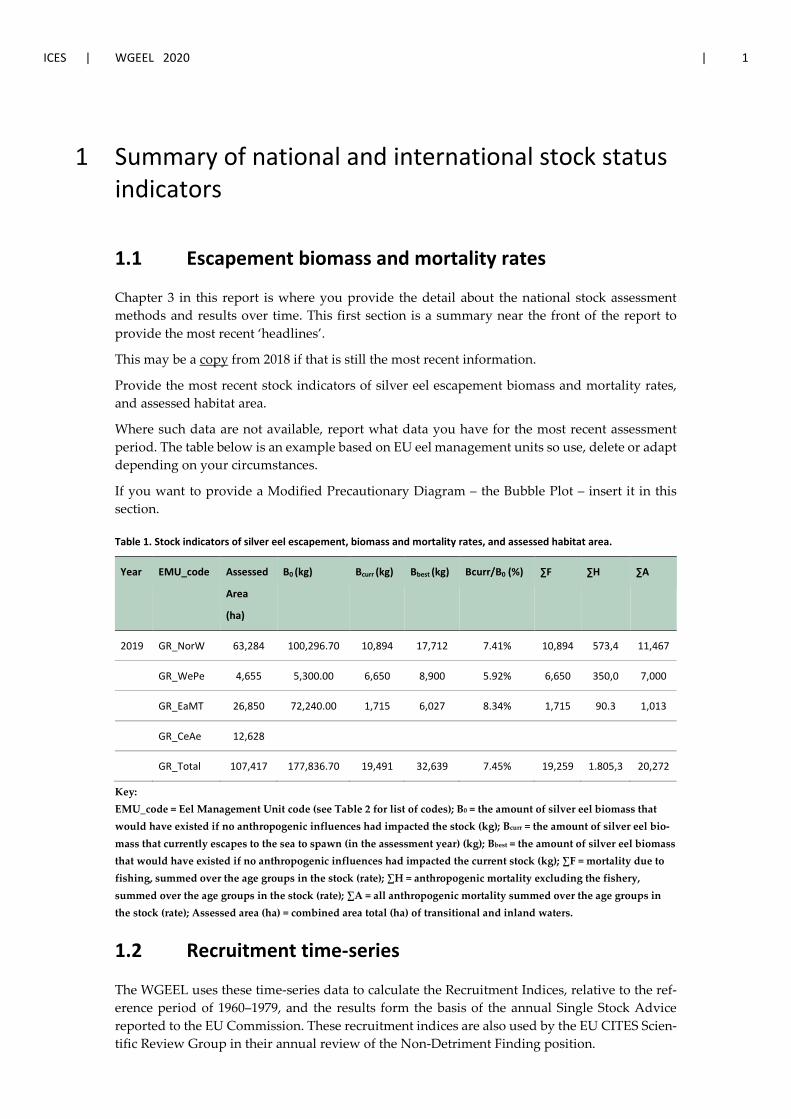
ICES | WGEEL 2020 | 1
1 Summary of national and international stock status indicators
1.1 Escapement biomass and mortality rates
Chapter 3 in this report is where you provide the detail about the national stock assessment methods and results over time. This first section is a summary near the front of the report to provide the most recent ‘headlines’.
This may be a copy from 2018 if that is still the most recent information.
Provide the most recent stock indicators of silver eel escapement biomass and mortality rates, and assessed habitat area.
Where such data are not available, report what data you have for the most recent assessment period. The table below is an example based on EU eel management units so use, delete or adapt depending on your circumstances.
If you want to provide a Modified Precautionary Diagram – the Bubble Plot – insert it in this section.
Table 1. Stock indicators of silver eel escapement, biomass and mortality rates, and assessed habitat area.
Year EMU_code Assessed
Area
(ha)
B0 (kg) Bcurr (kg) Bbest (kg) Bcurr/B0 (%) ∑F ∑H ∑A
2019 GR_NorW 63,284 100,296.70 10,894 17,712 7.41% 10,894 573,4 11,467
GR_WePe 4,655 5,300.00 6,650 8,900 5.92% 6,650 350,0 7,000
GR_EaMT 26,850 72,240.00 1,715 6,027 8.34% 1,715 90.3 1,013
GR_CeAe 12,628
GR_Total 107,417 177,836.70 19,491 32,639 7.45% 19,259 1.805,3 20,272
Key: EMU_code = Eel Management Unit code (see Table 2 for list of codes); B0 = the amount of silver eel biomass that would have existed if no anthropogenic influences had impacted the stock (kg); Bcurr = the amount of silver eel bio-mass that currently escapes to the sea to spawn (in the assessment year) (kg); Bbest = the amount of silver eel biomass that would have existed if no anthropogenic influences had impacted the current stock (kg); ∑F = mortality due to fishing, summed over the age groups in the stock (rate); ∑H = anthropogenic mortality excluding the fishery, summed over the age groups in the stock (rate); ∑A = all anthropogenic mortality summed over the age groups in the stock (rate); Assessed area (ha) = combined area total (ha) of transitional and inland waters.
1.2 Recruitment time-series
The WGEEL uses these time-series data to calculate the Recruitment Indices, relative to the ref-erence period of 1960–1979, and the results form the basis of the annual Single Stock Advice reported to the EU Commission. These recruitment indices are also used by the EU CITES Scien-tific Review Group in their annual review of the Non-Detriment Finding position.

2 | ICES SCIENTIFIC REPORTS 2:85 | ICES
In the framework of the EU DCF, data on eel fisheries and demographics (age and length com-position of the population) are presented. Since the implementation of the EMP, further data are acquired for the preparation of the WGEEL Country Report, such as maturity, parasites infec-tions and mortality by predators (i.e. cormorants).
Data on eel landings in the lagoons are collected from both the Fishermen cooperatives and the Region-al Fisheries Department. Additionally, length and weight data are recorded on site every two weeks as to have a complete data series for the size composition of the populations in Greece.

ICES | WGEEL 2020 | 3
2 Overview of the national stock and its management
2.1 Describe the eel stock and its management
The Hellenic Eel Management Plan defines four Eel Management Units (EMU) (Figure 2.1.1.). Their definition is based on the main climatic characteristics, on the spatial distribution of la-goons, lakes and rivers, on the existing Ecoregions (Directive 2000/60/EC), on the distribution of the eel fisheries and on the location of the main authorities involved in water and eel manage-ment. The management measures concerning fishing restrictions and environmental aspects are applied to all EMUs. The nature and scale of the proposed specific actions, like stocking or pilot studies, respect the relative importance of the EMUs.
The fishery of eel in Greece is limited to the capture of adults during their migration to the At-lantic for reproduction. In Western Greece there is limited fishery of yellow eels, as part of the local tradition (influences from Italy) of consuming younger eels, a practice that is not found elsewhere in Greece. Concerning the fishery of underage eels or otherwise glass eels, it is not performed despite efforts were made with the purpose to be used in aquaculture units. It should also be mentioned that the fishery of the eels is prohibited and only performed with a special permission from the regional authorities. Moreover, there are no scientific data for eel recrea-tional fishing until today.
GR_NorW or EMU-01 (seven Prefectures, three Regions) is located on the North Western Greece. It comprises 70% of the total Hellenic lagoons surface and 45% of the lakes surface. Despite the considerable decrease of the EMU-01 landings (180 t in mid-1980, 50 t the recent years), the unit remains the most important eel producer.
GR_WePe or EMU-02 (five Prefectures, two Regions) is located on the Western Peloponnesus. It comprises 5% of the total Hellenic lagoons surface and 3% of the lakes. The eel landings of this EMU increased since the mid-1980s, contrary to the general pattern and now represents about 40% of the Hellenic lagoon landings (about 40 t).
GR_EaMT or EMU-03 (four Prefectures, one Region) is located on the North Eastern part of the country. It comprises 24% of the total Hellenic lagoons surface and 9% of the lakes surface. The landings dropped from 70 t in early 1980s to less than 10 t.
GR_CeAe or EMU-04 covers the rest of the country, mainly central eastern continental Greece and the islands of the Aegean Sea (35 Prefectures and eight Regions). The landings of the EMU-04 are almost zero.
The eel fishery usually is performed with traditional traps, which catch alive the eels during their reproduction migration carried from September to January every year. The fykenets are also used in certain lagoons, where no permanent installed traps exist or during the year except the period of migration. The fishermen cooperatives usually have the adequate infrastructure to store live eels up to their sale (the largest quantity of these are exported to other European coun-tries, such as Italy and Germany). The total fishery of the eels and the total fishery of the rest species must declare every month to the regional authorities. The fishermen cooperatives are obliged to release 30% of the annual eel production in the framework of the Hellenic EMP.
Also, some of the catches are made in the lakes and in the estuaries but eel fishing in the rivers is prohibited. In the lakes, fishermen use special eel traps (fykenets). However, this fishing method, due to the fact that catches have declined significantly during the last decades, has al-most disappeared. However, after the implementation of the Ministerial Decision 643/39462/01-
4 | ICES SCIENTIFIC REPORTS 2:85 | ICES
04-13 (in the implementation of the European Regulation 1100/07) an eel fishery with fykenets is also banned.
Since the adaptation of the first Hellenic Eel Management Plan in 2009, a significant number of measures were implemented towards the protection and enhancement of the European eel pop-ulation.
One of the first measures implemented was the release by the fishermen of the 30% of the total eel production. The target was achieved in 2014, when the total releases were slightly higher than 30%. Apart from these releases, the aquaculture units that import glass eels are obliged to release the 10% of the total imported glass eel biomass. Fishing cooperatives, however, constantly de-clare fewer and fewer quantities of eels. There is an essence of a tendency to conceal real produc-tion data. Besides concealing part of the production, it has been found that in some specific oc-casions, fishing cooperatives indicate zero catches while available information from traders re-port significant catches from the same fishing cooperatives. It seems that the obligation to release part of the eel catches pushed the fishing cooperatives to intensify the concealing of the real catches. As fisheries cooperatives are obliged to release 30% of the catches by declaring smaller quantities, necessarily release less. This was more pronounced at the beginning of the season because in most areas was the first implementation of the measure introduced by the EMP. In the process, given that licences are needed for eel exports, the concealing of real catches de-creased.
Also, other important measures for the protection of the species is the ban of eel fisheries in rivers and estuaries with any type of gear and the ban of fisheries with fykenets inside the lagoons. In addition, all the eels that are going to be exported in other EU countries or transported inside the country are allowed only after the issue of licence in accordance to the regulations of CITES.
Measures that have not been implemented concerns the further reduction of eel mortality due to the fisheries. This is because the implementation of this measure requires the realization of a study for the modification of the permanent installed traps in the lagoons that will increase the escapement of eels and then the modification of the relative legislation.
With the purpose to describe the population dynamics of eels in Greece, attempts are made to apply the Eel Population Dynamics Model (Aschonitis et al., 2015) in Vistonida lagoon, which is located in the area of EMU-03. In the next phase, this model will be calibrated in order to be applied at the whole country.
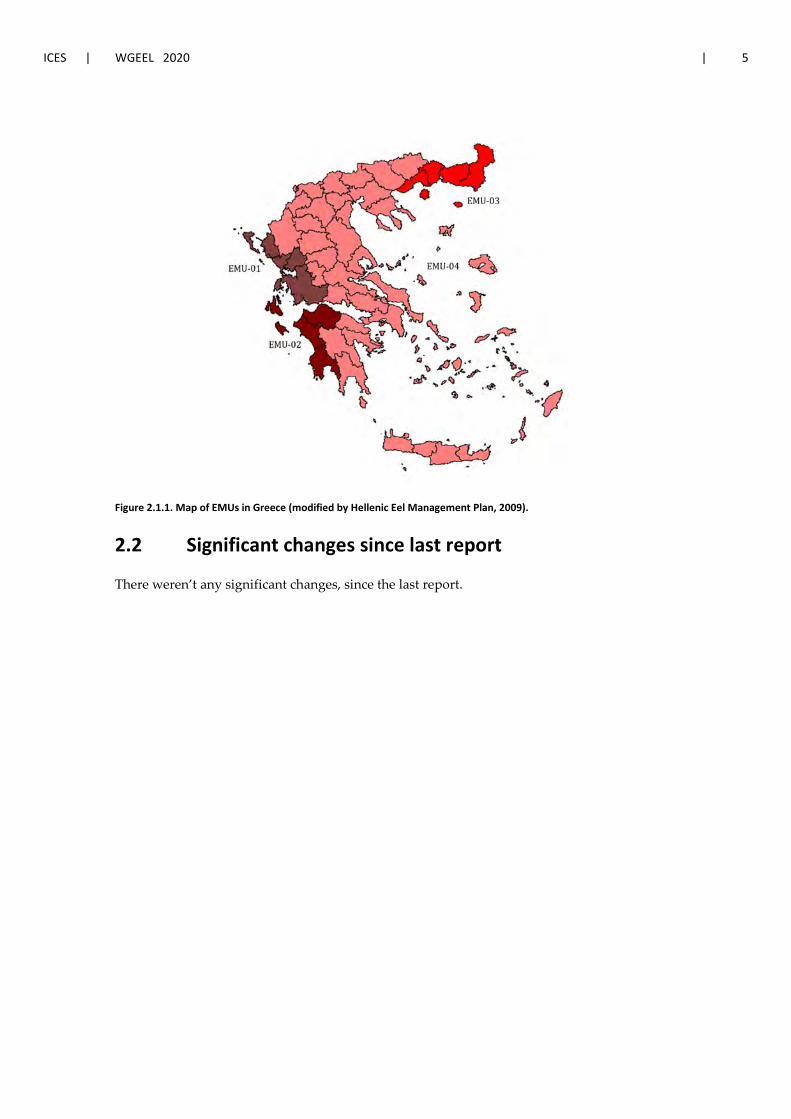
ICES | WGEEL 2020 | 5
Figure 2.1.1. Map of EMUs in Greece (modified by Hellenic Eel Management Plan, 2009).
2.2 Significant changes since last report
There weren’t any significant changes, since the last report.

6 | ICES SCIENTIFIC REPORTS 2:85 | ICES
3 Impacts on the national stock
The impact categories align with the categories proposed for the 2018 EMP Progress reports.
The Data Call has tables for Catches, Restocking and Aquaculture production so there are no tables for these in the CR excel file.
3.1 Fisheries
In Greece, a framework regulating the collection of eel data has been established after the ap-proval of the Hellenic Eel Management plan (HEMP) on 2011, but only landings of silver eels, captured at the permanent installations of the commercially exploited lagoons were recorded. Due to the ban of the fykenets in all the lagoons, yellow eels are not fished. There are no data for eel landings of any stage from the freshwater fisheries. It must be mentioned that due to the fact the eel fisheries are implemented by using fixed fishing installations in the lagoons, the fishing effort is considered stable during the years, changing only by the number of lagoons, where fish-ing is applied. Due to the specific fishing methodology, the fishing capacity is equal to fishing effort, since it is a passive fishing device and the fishing effort is not affected by any other factor such as fuel consumption.
3.1.1 Glass eel fisheries
Glass eel fisheries are prohibited according to the RD/142/1971, however, some data on glass eels can be found in published research papers (Daoulas et al., 2000; Cladas et al., 1999; Zompola et al., 2008).
3.1.2 Yellow eel fisheries
RD/142/1971 also indicates that both fishing and commercial exploitation of eels smaller than 30 cm is entirely prohibited. Therefore, there are no yellow eel fisheries in Greece. Concerning yellow eel fisheries effort, after the implementation of HEMP, it is prohibited to use fykenets in the lagoons, so there are not legal catches of yellow eel and therefore fishing effort cannot be estimated.
3.1.3 Silver eel fisheries
Most of the eels are caught in the lagoons using fixed barrier fish traps. The lagoons are leased and operated by co-operatives of fishermen. Individual fishermen operating around the lagoons and in lakes also catch eels (fishing in rivers and river Deltas is prohibited). Small catches have also been recorded in coastal areas, mainly through the use of static fishing equipment used in coastal fisheries, but some quantities are also fished by trawls and purse seines. Specialists esti-mate that 90% of the eel catches come from fishing in the lagoons. Furthermore, in 2018, specifi-cally for River Evros (EMU-03), six special licences are issued for eel fisheries in the river. These licences are used for two years and concerns professional fisheries with boat.
The number of the fishing traps in the lagoons remained unchanged in the last 2–3 decades. Therefore, the main fishing dynamics and effort can be considered stable.
It is characteristic that fishing dynamics and effort in the Messolonghi-Aitoliko lagoons during 2012 remained stable despite an increase of the mesh size in fishing traps. This took place in an
ICES | WGEEL 2020 | 7
attempt to decrease the discards of this type of fishing. Smaller eels are expected to escape these traps, but there are no quantitative data available.
The total landings in 2019 for the three EMUs (EMU-01, EMU-02 and EMU-03) were 19 491 kg. In EMU-1 (GR_NorW) the landings recorded were 10 894 kg, in EMU-2 (GR_WePe) the total landings were 6650 kg and finally in EMU-3 (GR_EaMT) the landings were 1715 kg.
3.2 Restocking
According to the Greek EMP, 10% of the imported glass eels for rearing must be used in stocking actions in selected ecosystems. Since 2009 that the HEMP was officially accepted, this action is taking place every year. According to the CITES office, in 2019, one permission was issued for the import of 155 kg of glass eel from France, 15.5 kg of which were released in estuaries.
Moreover, the fishing cooperatives that manage the lagoons are obliged by CITES to release the 30% of the annual silver eels catches in order to get a permission to export silver eels to other EU countries. For 2019, the total biomass of silver eels that were released was 7467 kg, which corre-sponds to a 38.31% of the total annual silver eel catches, while the limit that was set by the HEMP was 30%.
3.3 Aquaculture
No available data.
3.4 Entrainment
According to the Public Electricity Company (Argyrakis, 2008), in Greece there are 16 large-scale and eight small-scale hydropower stations. However, since the hydropower stations are installed on the mountainous part of the rivers in high altitude, the mortality caused by the turbines, pumps are very low to zero. The main problem for the eel movement is caused by the obstacles that are found in the lowland part of the rivers, such as irrigation dams and “ford” type bridges that disrupts the river connectivity.
3.5 Habitat Quantity and Quality
No available data.
3.6 Other impacts
No available data.
8 | ICES SCIENTIFIC REPORTS 2:85 | ICES
4 National stock assessment
4.1 Description of Method
This section is an overview of methods used in the National Stock Assessment(s). Describe how you sample and measure, if possible referring (and summarising) existing protocols. The level of detail in your description is up to you but report at least on the items in these sections.
Where available, please provide links to any publicly available reports and papers describing management plans, Progress Reports and any publications describing your assessment methods.
4.1.1 Data collection
Biological and commercial samplings were conducted during the implementation of the Na-tional Data Collection Project. In particular, as regards the biological sampling, samples of eels were collected for further processing. The number of samples taken per region under the DCF was determined by SGRN (STECF) (2007) that suggested 200 specimens per 20 t of production. Thus, 200 specimens were randomly collected from each of the three Greek EMU. This number corresponds to the minimum number of specimens required for the examination of the external morphometric characteristics. For internal organs (gonads, liver, digestive system, otoliths) in any case and for small productions a sample of 30 specimens is the minimum required.
For the measuring of the external characteristics, an ichthyometer specially designed for meas-uring eels and accuracy of 1 mm was used. Finally, for the measurement of the body weight, a digital precision scale (± 0.1 gr) was used. Also, a precision digital scale was used (± 0.01 mm) was used to measure the eye of the fish. This in an important biometric measurement usually associated with other biological and ecological parameters of the species. Finally, for the deter-mination of the age, the method of age determination through otolith reading was used.
4.1.2 Analysis
Age analysis The age determination of eel, for 2019, carried out according to the modified Crack and Burn protocol, which was used for 2017 and 2018.

ICES | WGEEL 2020 | 9
4.1.3 Reporting
The results of the above-mentioned analysis are reported both in the DCF report and also in the country report submitted to the WGEEL.
4.1.4 Data quality issues and how they are being addressed
Describe what information you have on data quality issues for all levels of the assessment, in-cluding timeliness, spatial coverage, eel biology coverage and quality of data used.
4.2 Trends in Assessment results
Chapter 1 provides the most recent results, so here you can report changes or trends over time in stock indicators (e.g. biomass and mortality rates) or other assessments.
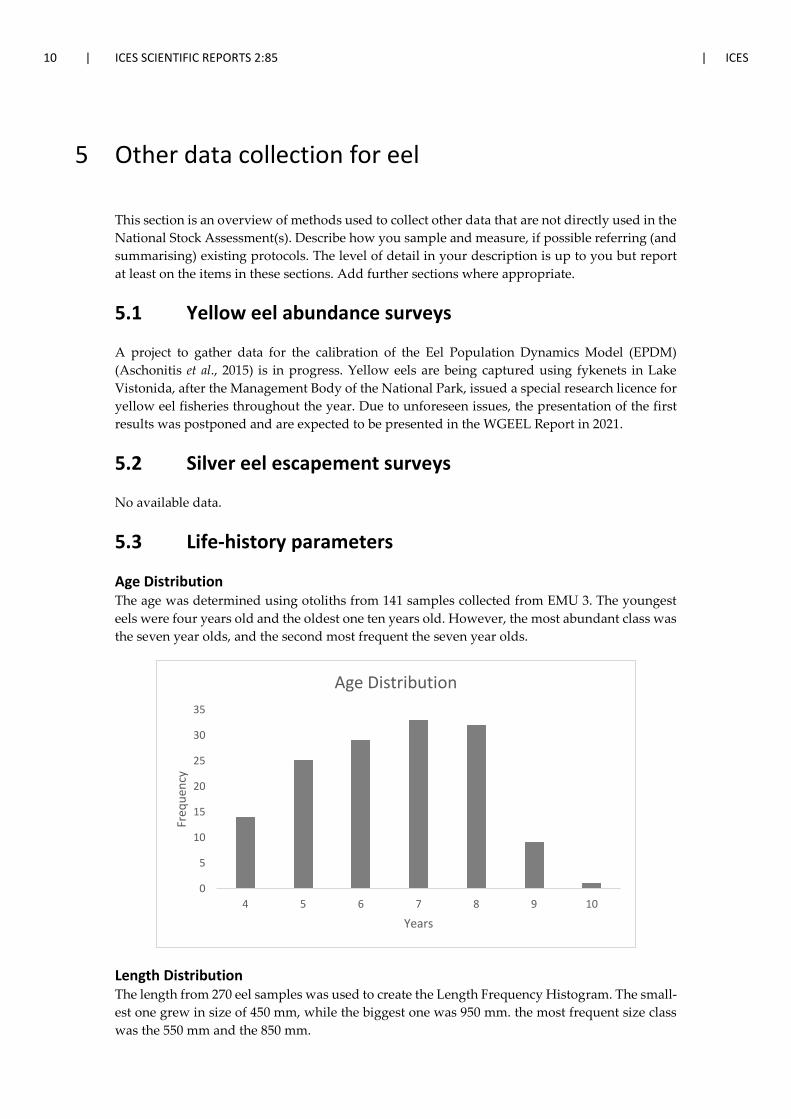
10 | ICES SCIENTIFIC REPORTS 2:85 | ICES
5 Other data collection for eel
This section is an overview of methods used to collect other data that are not directly used in the National Stock Assessment(s). Describe how you sample and measure, if possible referring (and summarising) existing protocols. The level of detail in your description is up to you but report at least on the items in these sections. Add further sections where appropriate.
5.1 Yellow eel abundance surveys
A project to gather data for the calibration of the Eel Population Dynamics Model (EPDM) (Aschonitis et al., 2015) is in progress. Yellow eels are being captured using fykenets in Lake Vistonida, after the Management Body of the National Park, issued a special research licence for yellow eel fisheries throughout the year. Due to unforeseen issues, the presentation of the first results was postponed and are expected to be presented in the WGEEL Report in 2021.
5.2 Silver eel escapement surveys
No available data.
5.3 Life-history parameters
Age Distribution The age was determined using otoliths from 141 samples collected from EMU 3. The youngest eels were four years old and the oldest one ten years old. However, the most abundant class was the seven year olds, and the second most frequent the seven year olds.
Length Distribution The length from 270 eel samples was used to create the Length Frequency Histogram. The small-est one grew in size of 450 mm, while the biggest one was 950 mm. the most frequent size class was the 550 mm and the 850 mm.
0
5
10
15
20
25
30
35
4 5 6 7 8 9 10
Freq
uenc
y
Years
Age Distribution
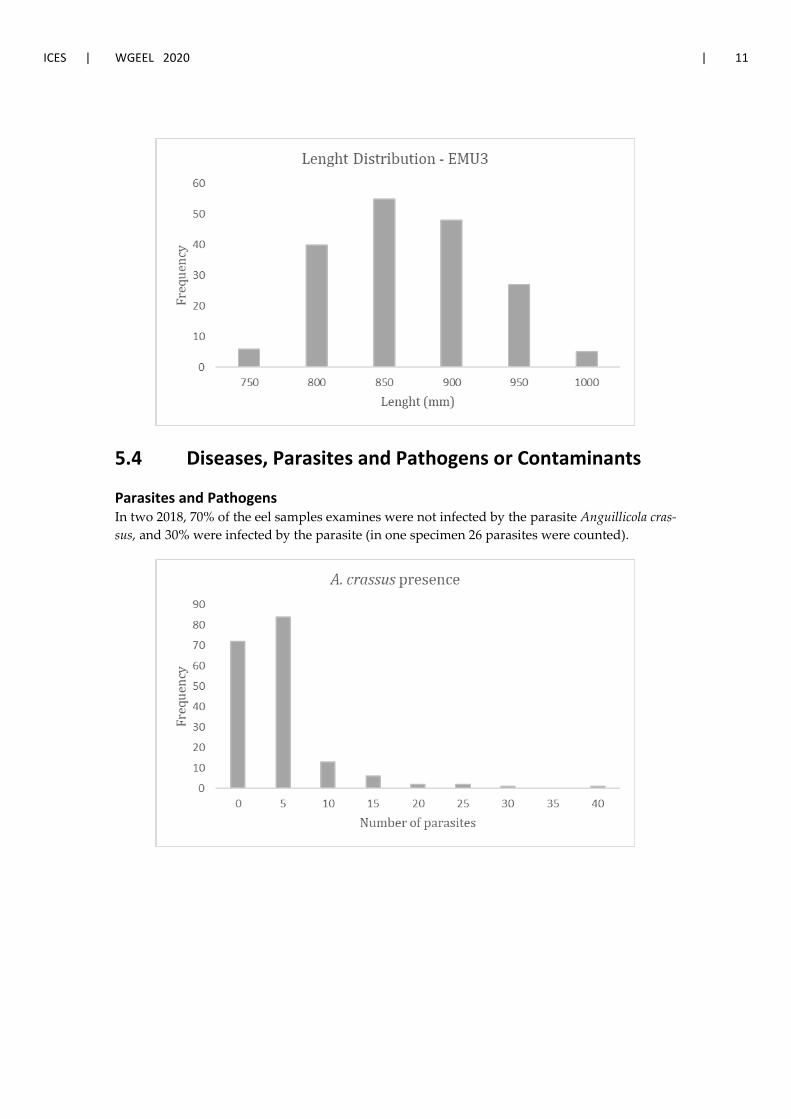
ICES | WGEEL 2020 | 11
5.4 Diseases, Parasites and Pathogens or Contaminants
Parasites and Pathogens In two 2018, 70% of the eel samples examines were not infected by the parasite Anguillicola cras-sus, and 30% were infected by the parasite (in one specimen 26 parasites were counted).

12 | ICES SCIENTIFIC REPORTS 2:85 | ICES
6 New Information
WGEEL will use information in this section to answer the ToR on advising ICES etc. of any New and Emerging Threats and Opportunities.
This is a free format section where you can report on anything new or forthcoming that may be of interest to the eel community. For example, list recent papers published, project reports, new projects implemented, new threats identified, etc.
ICES | WGEEL 2020 | 13
7 References
Aschonitis V.G., Castaldelli G., Lanzoni M., Merighi M., Gelli F., Giari L., Rossi R., Fano E.A. 2015. A size–age model based on bootstrapping and Bayesian approaches to assess population dynamics of Anguilla anguilla L. in semi-closed lagoon. Ecology of Freshwater Fish 2017: 26: 217–232.
Cladas Y., Koutsikopoulos C., Zompola S. and Ioannou G. 1999. Glass eel (Anguilla anguilla, L.) of the west-ern Greek coast: abundance and size composition fluctuations in relation to environmental factors. 8th Int. Congress on the Zoogeography and Ecology of Greece and adjacent regions, Kavala, Greece.
Daoulas C., Economou A.N., Psarras Th., Barbieri-Tseliki R., Papadakis V., Economou A.I. 2000. A study on glass eels (Anguilla anguilla L.) and the support of their ascent and dispersal in inland waters. Pro-ceedings of the 9th Hellenic Congress of Ichthyologists, 165-168 (in Greek with English abstract).
Durif C., Guibert A., Elie P. 2009. Morphological discrimination of the silvering stages of the European eel. p. 103–111. In: Casselman, J. M., Cairns, D. K. (Eds) Eels at the Edge: Science, Status, and Conservation Concerns. American Fisheries Society Symposium. Bethesda, MD, U.S.A.
ICES. 2009. Workshop on Age Reading of European and American Eel (WKAREA), 20–24 April 2009, Bor-deaux, France. ICES CM 2009\ACOM: 48. 66 pp.
Katselis G., Koutsikopoulos C., Dimitriou E. and Rogdakis Y. 2003. Spatial patterns and temporal trends in the fishery landings of the Messolonghi-Aitoliko lagoon system (western Greek coast).Scientia Marina, 67(4): 501–511.
Koutrakis E.T., Conides A., Parpoura A.C., van Ham E.H., Katselis G. and Koutsikopoulos C. 2007. Lagoon Fisheries’ Resources in Hellas. Chapter 6, pp. 223-234. In. Papaconstantinou C., Zenetos A., Vassilopou-lou V. and Tserpes G. (eds), State of Hellenic Fisheries. Hellenic Centre for Marine Research, Athens, Greece.
Koutsikopoulos C., Cladas Y., Katselis G., Zompola S., Dimitriou E., Mitropoulos D. and Chatzispyrou A. 2009. Hellenic Eel Management Plan. General Directorate of Fisheries of the Ministry of Rural Devel-opment and Food (MRDF, Des.No. 147800), 55pp.
MacNamara R., Koutrakis E.T., Sapounidis A., Lachouvaris D., Arapoglou F., Panora D. and McCarthy T.K. 2013. Reproductive potential of silver European eels (Anguilla anguilla) migrating from Vistonis Lake (Northern Aegean Sea, Greece). Mediterranean Marine Science. In press.
MacNamara R., McCarthy T.K. 2012. Size-related variation in fecundity of European eel (Anguilla anguilla). ICES Journal of Marine Science, 69: 1333–1337.
Pankhurst N.W. 1982. Relation of visual changes to the onset of sexual maturation in the European eel Anguilla anguilla (L.). Journal of Fish Biology, 21: 127–140.
Scientific, Technical and Economic Committee for Fisheries (STECF) Evaluation of 2014 MS DCF Annual Reports and Data Transmission (STECF-15-13). 2015. Publications Office of the European Union, Lux-embourg, EUR 27410 EN, JRC 96975, 287 pp.
Tesch F.W. 2003. The Eel. Fifth edition. Blackwell, Oxford, UK, 408 pp.
Volponi S. 1997. Cormorants wintering in the Po Delta: estimated and possible impact on aquaculture pro-duction. Suppl. Ric. Biol.323–332.
Zompola S., Cladas Y., Vavoulis D., Kentrou A., Pagoni S., Koutsikopoulos C. 2001. European eel (Anguilla anguilla L.) fisheries production in Greece. Proceedings of the 10th Hellenic Congress of Ichthyologists, 237–240 (in Greek with abstract in English).
ICES | WGEEL 2020 | I
Contents
Report on the eel stock, fishery and other impacts in Ireland, 2019–2020 ................................................iii Authors ..........................................................................................................................................iii Acknowledgments .........................................................................................................................iii Contributors to the report include ................................................................................................iii
1 Summary of national and international stock status indicators.................................................... 1 1.1 Escapement biomass and mortality rates ........................................................................ 1 1.2 Recruitment time-series .................................................................................................. 1
2 Overview of the national stock and its management.................................................................... 2 2.1 Describe the eel stock and its management .................................................................... 2 2.2 Significant changes since last report ................................................................................ 2
3 Impacts on the national stock ....................................................................................................... 3 3.1 Fisheries ........................................................................................................................... 3 3.1.1 Glass eel fisheries ............................................................................................................. 3 3.1.2 Yellow eel fisheries .......................................................................................................... 3 3.1.3 Silver eel fisheries ............................................................................................................ 3 3.2 Restocking ........................................................................................................................ 3 3.3 Aquaculture ..................................................................................................................... 3 3.4 Entrainment ..................................................................................................................... 3 3.5 Habitat Quantity and Quality ........................................................................................... 4 Water Quality ................................................................................................................................ 4 Barriers .......................................................................................................................................... 4 3.6 Other impacts .................................................................................................................. 4 Fish Kills ......................................................................................................................................... 4
4 National stock assessment ............................................................................................................ 6 4.1 Description of Method ..................................................................................................... 6 4.1.1 Data collection ................................................................................................................. 6 4.1.2 Analysis ............................................................................................................................ 6 4.1.3 Reporting ......................................................................................................................... 6 4.1.4 Data quality issues and how they are being addressed ................................................... 7 4.2 Trends in Assessment results ........................................................................................... 7
5 Other data collection for eel ......................................................................................................... 8 5.1 Yellow eel abundance surveys ......................................................................................... 8 2019 Survey ................................................................................................................................... 8 WFD 2018 Results .......................................................................................................................... 8 Lakes .............................................................................................................................................. 8 Rivers ............................................................................................................................................. 9 Transitional Waters ....................................................................................................................... 9 5.2 Silver eel escapement surveys ......................................................................................... 9 Shannon: IE_ShIRBD ...................................................................................................................... 9 Burrishoole: IE_WRBD ................................................................................................................... 9 Erne: IE_NWRBD ............................................................................................................................ 9 Fane: IE_EEMU .............................................................................................................................. 9 Barrow: IE_SERBD ........................................................................................................................ 10 5.3 Life-history parameters .................................................................................................. 10 5.4 Diseases, Parasites & Pathogens or Contaminants ........................................................ 10 Prevalence of Anguillicola crassus ............................................................................................... 10 Contaminants .............................................................................................................................. 10
6 New Information ......................................................................................................................... 11 List of publications ....................................................................................................................... 11
7 References ................................................................................................................................... 12
ICES | WGEEL 2020 | III
Report on the eel stock, fishery and other impacts in Ireland, 2019–2020
Authors
Dr. Ciara O’Leary, Inland Fisheries Ireland, 3044 Lake Drive, Citywest Business Campus, Dublin 24, Ireland, D24Y265.
Tel: 00-353-1-8842600. Fax: 00-353-1-836-0060 [email protected]
Reporting Period: This report was completed in September 2020 and contains data up to August 2020. It should be noted that a comprehensive national report of all the monitoring and assess-ment activity in 2019 is available as a backup document to this country report: contact Ciara O’Leary.
Acknowledgments
Contributors to the report include Electricity Supply Board Inland Fisheries Ireland Irish Technical Expert Group on Eel Marine Institute National University of Ireland, Galway
ICES | WGEEL 2020 | 1
1 Summary of national and international stock status indicators
1.1 Escapement biomass and mortality rates
No new data for 2019/2020 period.
1.2 Recruitment time-series
The WGEEL uses these time-series data to calculate the Recruitment Indices, relative to the ref-erence period of 1960–1979, and the results form the basis of the annual Single Stock Advice reported to the EU Commission. These recruitment indices are also used by the EU CITES Scien-tific Review Group in their annual review of the Non-Detriment Finding position.
There are eight recruitment time-series for Ireland reported to the WGEEL under the annual Data call.
• LiffGY Liffey glass and yellow eel • ShaPY Shannon Parteen yellow eel • BurrG Burrishoole glass eel • ErneGY Erne glass and yellow eel • FealGY Feale glass and yellow eel • InagGY Inagh glass and yellow eel • MaigG Maigue glass and yellow eel • ShaAGY Shannon Ardnacrusha glass and yellow
The Burrishoole glass eel trap reported a catch of 1.347 kg up to July 27th however it is still trapping eels. In 2019, the trap caught 0.568 kg and closed on 5th September.
The Erne trap caught 322.1 kgs as of the 31st July. This trap caught 83.99 kg for the 2019 recruit-ment season.
The Liffey caught 1.024 kg up to the 27th July and 1.504 kg in 2019. The trap was catching eels up to 15th October 2019.
The Shannon Ardnarcrusha site caught 104.87 kg of eels up to 24th August 2020. In 2019, the traps caught 37.5 kg closing on the 27th September.
The Shannon Parteen site caught 903.5 kg yellow eels up to the 24th August 2020. In 2019, the traps caught 374 kg.
No data are available for the Maigue, Inagh and Feale traps.

2 | ICES SCIENTIFIC REPORTS 2:85 | ICES
2 Overview of the national stock and its management
2.1 Describe the eel stock and its management
No new information since last report Country Report for Ireland 2018.
Figure 2.1.1.
2.2 Significant changes since last report
No changes since last report.
ICES | WGEEL 2020 | 3
3 Impacts on the national stock
3.1 Fisheries
All management regions confirmed a closure of the eel fishery for the 2018 season with no com-mercial or recreational licences issued. The eel fishery, with the exception of the strictly managed L. Neagh, also remained closed in N. Ireland in 2018. Some illegal fishing was reported which led to some seizures of gear in the Shannon IRBD, the Eastern/Neagh Bann IRBD, the North West RBD and the SouthWest RBD.
3.1.1 Glass eel fisheries
There is no authorised commercial or recreational catch of juvenile eel in Ireland as glass eel and elver fishing in Ireland is prohibited by law (1959 Fisheries Act, Sec. 173).
There are no recreational glass eel fisheries in Ireland.
3.1.2 Yellow eel fisheries
There are no new landings data since 2008 as the commercial fisheries were closed in 2009. There are no data available for yellow eel caught by recreational fishermen (only rod angling). Rod angling catches are required by law to be released alive.
3.1.3 Silver eel fisheries
Commercial Silver Eel Fisheries were closed in 2009 and remained closed in 2019.
3.2 Restocking
Stocking has not taken place in Ireland between 2009 and 2020. Currently stocking is not in-cluded in the Irish Eel Management Plan.
3.3 Aquaculture
There are no aquaculture facilities in Ireland.
3.4 Entrainment
No new information available since last reported on in the 2018 Country Report. A mortality study was conducted in the North West River Basin District in 2018 and 2019; results are being analysed and are not available for this report.

4 | ICES SCIENTIFIC REPORTS 2:85 | ICES
3.5 Habitat Quantity and Quality
Water Quality
The EPA published the “Water Quality in Ireland 2013–2018” report in 2019. The report found that 52.8% of surface waterbodies assessed are in satisfactory ecological health being in either good or high ecological status. The remaining surface waters (which amount to 47.2%) were found to be in moderate, poor, or bad ecological status. In comparison to the previous reporting period 2012–2015 when 55.4% of surface waterbodies were noted as being at satisfactory status (a decrease of 2.6%).
Coastal waters have the highest proportion of waterbodies in good or high ecological status (80%), followed by rivers (53%), lakes (50.5%) and estuaries (38%). Groundwater bodies fared best in the report as regards status, with 92% found to be in good chemical and quantitative status. This represents a 1% improvement in the number of waterbodies in good chemical and quantitative status compared to the previous sampling round (2010–2015).
The 2013–2018 report found that 68.4% (1831) of waterbodies did not change in status, 18% (481) declined and 13.6% (364) improved. This related to an overall decline in 117 surface waterbodies or 4.4% of the sampled area. This change was almost entirely an effect of declining status in river waterbodies, specifically in 128 waterbodies or 5.5%. Coastal waters showed a net improvement in water quality (a net improvement in two coastal waterbodies) and lakes (a net improvement in 12 lakes).
The main drivers of change in the majority of cases are; agriculture, forestry and hydro-morpho-logical effects. However, in the case of the 5.5% loss of pristine river waterbodies noted in the report, there is a shift in the causative drivers, with forestry and hydro-morpology being more important than agriculture. This is mostly due to the fact that such river waterbodies are found in upland areas and are upstream of most agricultural influences but under direct pressure from forestry and hydro-morphology effects.
Barriers
To fulfil its remit to produce a georeferenced database of barriers to fish passage on the Irish river network, the National Barriers Programme (NBP) has produced a geodatabase of 73 055 potential barriers. These structures are being assessed using field surveys and desk-based anal-ysis photographs or video of barrier sites. To date 15,058 structures have been assessed, 10 815 were classified as being not a barrier with 4243 classified as a potential barrier requiring further work. Detailed assessments using the SNIFFER survey have been carried out on 121 structures in advance of mitigation works.
3.6 Other impacts
Fish Kills
There were 20 reported fish kills in 2019 (Table 3.1). This is a decrease on numbers recorded for 2018 (40) but is an increase on 2017 (14).
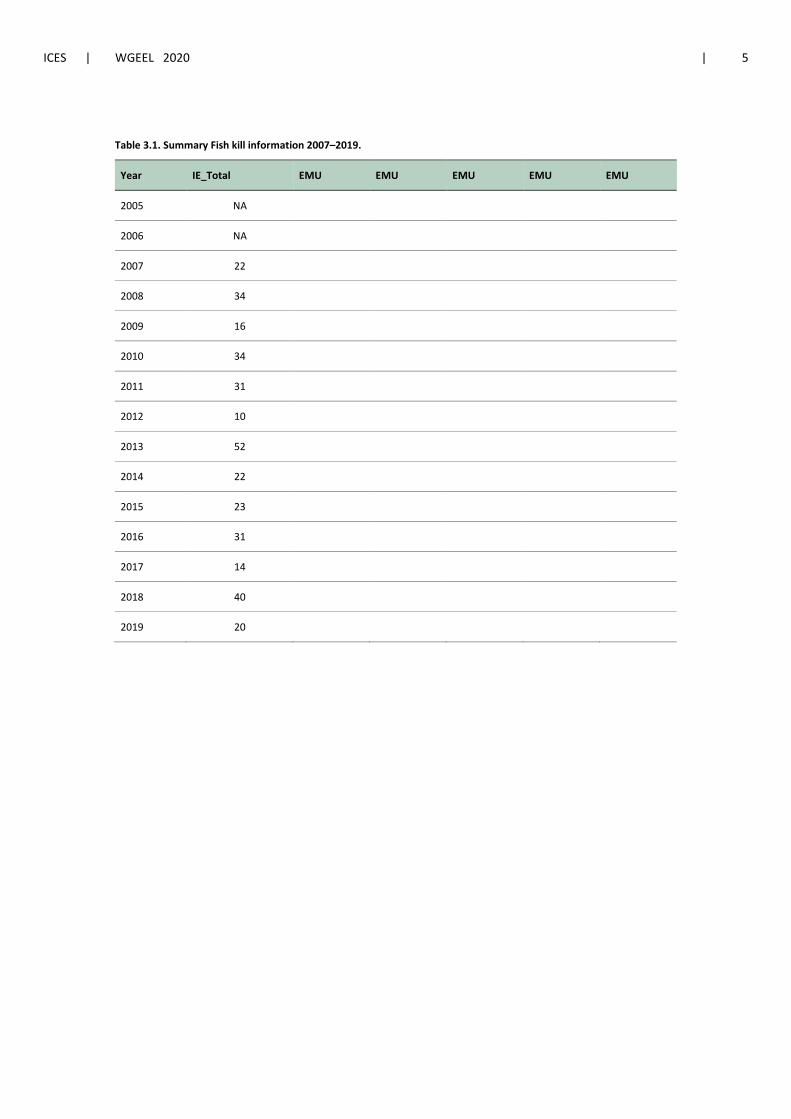
ICES | WGEEL 2020 | 5
Table 3.1. Summary Fish kill information 2007–2019.
Year IE_Total EMU EMU EMU EMU EMU
2005 NA
2006 NA
2007 22
2008 34
2009 16
2010 34
2011 31
2012 10
2013 52
2014 22
2015 23
2016 31
2017 14
2018 40
2019 20
6 | ICES SCIENTIFIC REPORTS 2:85 | ICES
4 National stock assessment
4.1 Description of Method
The stock assessment methods are described in the Irish Eel Management Plan and in the 2012, 2015 and 2018 Irish Management Reports to the EU.
4.1.1 Data collection
Recruitment: mostly using fixed station river ladder traps. With the exception of the Shannon and the Erne, these are partial traps subject to considerable site-specific environmental variation (river flow, tidal height).
Yellow Eel: standard Dutch type double ended summer fykenets and depletion and single pass electrofishing in shallow rivers.
Silver Eel: Index Rivers using mark-recapture and index fishing stations (Erne, Shannon, Fane, Barrow) and permanent river trap (Burrishoole).
Hydropower mortality: using acoustic tags and arrays of listening stations.
4.1.2 Analysis
Ireland used a system of extrapolating from index data-rich catchments to data-poor catchments for calculating estimates of pristine and current biomass as described in the Irish Eel Manage-ment Plan (Chapter 5) and the WGEEL report (ICES, 2008).
Eel production in transitional waters was estimated using CPUE from fykenet surveys to cali-brate an analysis of transitional waterbody types and habitat and this was applied retrospec-tively back to 2009.
Note: Coastal waters were not included in the production and escapement analysis.
Further information is available in the National reports to the EU.
4.1.3 Reporting
Assessment data collected by the various agencies are collated by the Technical Expert Group on Eel and reported annually. The data are then reported to the EU every three years as required under the Regulation. Key data are included in the Country Report for ICES.
Previous reports are available on the Inland Fisheries Ireland Eel Management webpage:
https://www.fisheriesireland.ie/Fisheries-Management/eel-management-plan.html#manage-ment-actions
ICES | WGEEL 2020 | 7
4.1.4 Data quality issues and how they are being addressed
Data are reported to the Irish Technical Eel Group (TEGE - formerly the SSCE) on an annual basis and any issues are discussed and the agencies responsible notified.
An all-Ireland eel age intercalibration workshop was carried out in December 2014.
Identification of subjective variables, such as fish colour, presence of lateral line dots in silver eels, can be interpreted differently between observers.
Very low levels of fishing effort, such as some fykenet effort in transitional waters under WFD sampling, need to be interpreted with caution.
4.2 Trends in Assessment results
No new information since the 2018 report to the EU.
8 | ICES SCIENTIFIC REPORTS 2:85 | ICES
5 Other data collection for eel
5.1 Yellow eel abundance surveys
Yellow eel stock monitoring is integral to gaining an understanding of the current status of local stocks and for informing models of escapement, particularly within transitional waters where silver eel escapement is extremely difficult to measure directly. Such monitoring also provides a means of evaluating post-management changes and forecasting the effects of these changes on silver eel escapement. The monitoring strategy aims to determine, at a local scale, an estimate of relative stock density, the stock’s length, age and sex profiles, and the proportion of each length class that migrate as silvers each year.
2019 Survey
Yellow eel surveys took place in two lakes (Lough Feeagh and Bunaveela), two riverine catch-ment (Barrow and Munster Blackwater) and two transitional waters (Waterford Harbour and Lough Furnace).
In Lough Bunaveela, a total 27 eels were caught with a CPUE of 0. 45 eels/net/night. The average length was 44.3 cm and ranged in length from 33.3 cm to 62.5 cm. Three recaptures were noted out of 24 tagged. While in Lough Feeagh, 52 eels were caught with a CPUE of 0.87 eels/net/night. The average length of eels was 41.7 cm and ranged in length from 30.8 cm to 63.2 cm. 83.3% of the sacrificed eels contained A. crassus with an infection intensity of 6.9 continuing the rising trend in infection rates in the Burrishoole yellow eel stock.
The Barrow River results suggest a reduced distribution of eels within the Barrow catchment. The only locations where reasonable eel numbers were captured were downstream of St Mullins and the high watermark. Once sampling efforts were focused above the high watermark (HWM) on the Barrow, the catches reduced dramatically. The IFI fykenetting surveys on the Munster Blackwater River (near Clondulane Weir) have delivered consistent results between years. The length frequencies presented appear to resemble that of eels captured in a productive lake system as the impounded habitat being examined essentially provides just such a habitat for eel growth and development.
In the Marine Institute sampling of Lough Furnace, 23 eels were caught with a CPUE of 0.38 eels/net/night. The average length was 37.5 cm ranging from 30.7 cm to 64.5 cm. A total weight of 2.24 kg was caught. In the Lower Lough Furnace, 43 eels were caught with a CPUE of 1.4 eels/net/night. The average length was 45.6 cm ranging in length from 29.8 cm to 66.3 cm, with a total weight of 8.11 kg caught.
The IFI survey of Waterford Estuary was repeated at the same locations as sampled in previous years. The survey yielded a total catch of 1021 eels, with a total weight of 118.9 kg. The average length was 38.8 cm, with a range from 22.5 to 70.0 cm. The PIT tagging recapture results yielded a recapture rate of 3.9% (332 eels tagged with 13 recaptures).
WFD 2018 Results
Lakes A total of 20 lakes (spanning 13 catchments), were sampled with eels present in 16 lakes (80% of sites). A total of 172 eels were caught during lake surveys, 135 eels from four lakes. They ranged in length from 33 to 80 cm. A mean CPUE of 0.6 was found across all lake sites. While the highest
ICES | WGEEL 2020 | 9
CPUE value for eels was found in White Lough (Ballybay) (Erne, CPUE = 2.7) the lowest were noted in Loughs Cullin (Moy, CPUE = 0.1) Gur (Shannon, CPUE = 0.1), Loughapreaghaun (Ow-enriff, CPUE = 0.1) and Muckanagh (Fergus, CPUE = 0.1). No eels were captured in Loughs Ateeaun, Corrinshigo, Owel and Shannaghree.
Rivers A total of 144 river sites (across 13 catchments) were covered in the 2018 surveys. The WFD river sites had a 20% eel presence rate, 17% of sites with eels have ≤five eels, 3% of sites caught between five and ten eels, no sites had >ten eels. A total of 76 eels were caught, ranging from 7 to 48 cm. Densities ranged from 0.0001 eels per m2 in the Suir River (Kilsheelan Br_A and Swiss Cottage_A) to 0.0598 eels per m2 in the Bride (Shanowennadrimia) River (Stable Crossroads_A).
Transitional Waters A total of seven estuaries (across seven catchments) were covered in the 2018 surveys. A total of 188 eels were captured ranging in length from 7 to 72 cm. The majority of the catch (n=131) was recorded in the Avoca Estuary. CPUE values for transitional water sites ranged from 0.2 (Bal-lysadare Estuary and Castlemaine Harbour) to 7.3 (Avoca Estuary).
5.2 Silver eel escapement surveys
Silver eels were assessed by annual fishing stations on the Shannon, Erne, Burrishoole, Fane and Barrow catchments in 2018.
Shannon: IE_ShIRBD In 2019/2020 conservation eel fishing was conducted at three sites, two at Athlone, and one at Killaloe. A total of 5364 kg of eels were caught at Athlone (4660 kg at Jolly Mariner and 704 kg at Yacht Club), and a further 6667 kg were caught at Killaloe, giving an overall catch for the Shan-non of 12 031 kg.
Silver eel production, was estimated to have been 38 028 kg. This low production level, which was comparable to the previous year, suggests that a collapse of the Shannon eel stock may be occurring though further years of monitoring would be needed to confirm such a trend.
Burrishoole: IE_WRBD Silver eel trapping was continued in Burrishoole in 2018/2019 and the total run amounted to 1997 eels (end of April 2019); lower than recorded in 2016 or 2017. The total run in 2019/2020 amounted to 2225 eels (end of March 2020), higher than recorded in 2017 or 2018. As in other years, the highest proportion of the total catch (83%) was made in the Salmon Leap trap. Almost 70% of the run was completed by the end of October with the remainder in November.
Erne: IE_NWRBD The total catch contributed to the Trap and Transport programme was 39 651 kg. The silver eel production was estimated to be 66 175 kg, and escapement was estimated to be 54 209 kg (81.9% of production). The trap and transport catch of 39 651 kg at the six fishing sites represented 59.9% of the production (exceeding the 50% target by 6563 kg).
Fane: IE_EEMU Silver eel catches at the Fane Fishery in 2019 were down on 2018 numbers with a total catch of 500 kg (1323 eels) and 26 nights fished. The Fane catch is made up of approximately 62% female eels and 40% male eels.

10 | ICES SCIENTIFIC REPORTS 2:85 | ICES
Barrow: IE_SERBD The River Barrow had a silver eel catch of 1329 eels over 24 fishing nights. The majority of the catch (n = 1,159) was recorded during just six nights in September (relatively early in the silver eel season).
5.3 Life-history parameters
Biological measurements are taken on yellow and silver eels such as length, weight, horizontal and vertical eye measurements, pectoral fin length, head diameter in addition to pigment col-ouration and presence of black spots on lateral line. In key locations, samples are taken back to the laboratory for further analysis.
5.4 Diseases, Parasites & Pathogens or Contaminants
Prevalence of Anguillicola crassus
Considered ubiquitous across Europe and since last reported (Becerra-Jurado et al., 2014) it con-tinues to spread through Irish watercourses.
Contaminants
No new information for 2019.

ICES | WGEEL 2020 | 11
6 New Information
List of publications
O’Leary, C., Cruikshanks, R., Becerra-Jurado, G., and Gargan, P. 2020. The use of otter guards in fyke net surveys and their effect on catches of European Eel Anguilla anguilla. Fisheries Research, 228, 105570.
Weldon, L., O’Leary, C., Steer, M., Newton, L., Macdonald, H., and Sargeant, S. L. 2020. A comparison of European eel Anguilla anguilla eDNA concentrations to fyke net catches in five Irish lakes. Environ-mental DNA.
Durif, CMF, Diserud, OH, Sandlund, OT, et al. Age of European silver eels during a period of declining abundance in Norway. Ecol Evol. 2020; 10: 4801–4815. https://doi.org/10.1002/ece3.6234
12 | ICES SCIENTIFIC REPORTS 2:85 | ICES
7 References
Anon. 2012. Report on the implementation of eel management plans for Ireland, including the transbound-ary NWIRBD 2009–2011. Dept. of Communications & Natural Resources, Dublin.
Anon. 2015. Report on the implementation of eel management plans for Ireland, including the transbound-ary NWIRBD 2012–2014. Dept. of Communications & Natural Resources, Dublin.
Anon. 2018. DRAFT Report on the implementation of eel management plans for Ireland, including the transboundary NWIRBD 2012–2014. Dept. of Communications, Climate Action and Environment, Dublin.
SSCE. 2012. Report on the Status of the Eel Stock in Ireland, 2009–2011. DCENR, 204pp.
SSCE. 2015. Report on the Status of the Eel Stock in Ireland, 2012-2014. Annex to the National Report to the European Commission. DCENR, 95pp.
SSCE. 2018. Report on the Status of the Eel Stock in Ireland, 2015-2017. Annex to the DRAFT National Report to the European Commission. DCCAE, 106pp.
ICES | WGEEL 2020 | I
Contents
Report on the eel stock, fishery and other impacts in Italy, 2019–2020 .................................................... ii 1 Summary of national and international stock status indicators.................................................... 3
1.1 Escapement biomass and mortality rates ........................................................................ 3 1.2 Recruitment time-series .................................................................................................. 4
2 Overview of the national stock and its management.................................................................... 8 2.1 Describe the eel stock and its management .................................................................... 8 2.2 Significant changes since last report .............................................................................. 11
3 Impacts on the national stock ..................................................................................................... 12 3.1 Fisheries ......................................................................................................................... 12 3.1.1 Glass eel fisheries ........................................................................................................... 12 3.1.2 Yellow eel fisheries ........................................................................................................ 13 3.1.3 Silver eel fisheries .......................................................................................................... 16 3.2 Restocking ...................................................................................................................... 20 3.3 Aquaculture ................................................................................................................... 20 3.4 Entrainment ................................................................................................................... 21 3.5 Habitat Quantity and Quality ......................................................................................... 21 3.6 Other impacts ................................................................................................................ 21
4 National stock assessment .......................................................................................................... 22 4.1 Description of Method ................................................................................................... 22 4.1.1 Data collection ............................................................................................................... 23 4.1.2 Analysis .......................................................................................................................... 24 Age determination ...................................................................................................................... 24 Life stages .................................................................................................................................... 24 Sex determination ....................................................................................................................... 24 4.1.3 Reporting ....................................................................................................................... 24 4.1.4 Data quality issues and how they are being addressed ................................................. 24 4.2 Trends in Assessment results ......................................................................................... 25
5 Other data collection for eel ....................................................................................................... 26 5.1 Yellow eel abundance surveys ....................................................................................... 26 5.2 Silver eel escapement surveys ....................................................................................... 26 5.3 Life-history parameters .................................................................................................. 26 5.4 Diseases, Parasites & Pathogens or Contaminants ........................................................ 26
6 New Information ......................................................................................................................... 27 7 References ................................................................................................................................... 28

II | ICES SCIENTIFIC REPORTS 2:85 | ICES
Report on the eel stock, fishery and other impacts in Italy, 2019–2020
Eleonora Ciccotti1, Chiara Leone1, Francesca De Luca1, Fabrizio Capoccioni2.
1Dipartimento di Biologia, Università di Roma – Tor Vergata
2Consiglio per la Ricerca in Agricoltura e l'Analisi dell'Economia Agraria (CREA) - Centro di Zootecnia e Acquacoltura (ZA).
Reporting Period: This report was completed in August 2020, and contains data up to 2018.
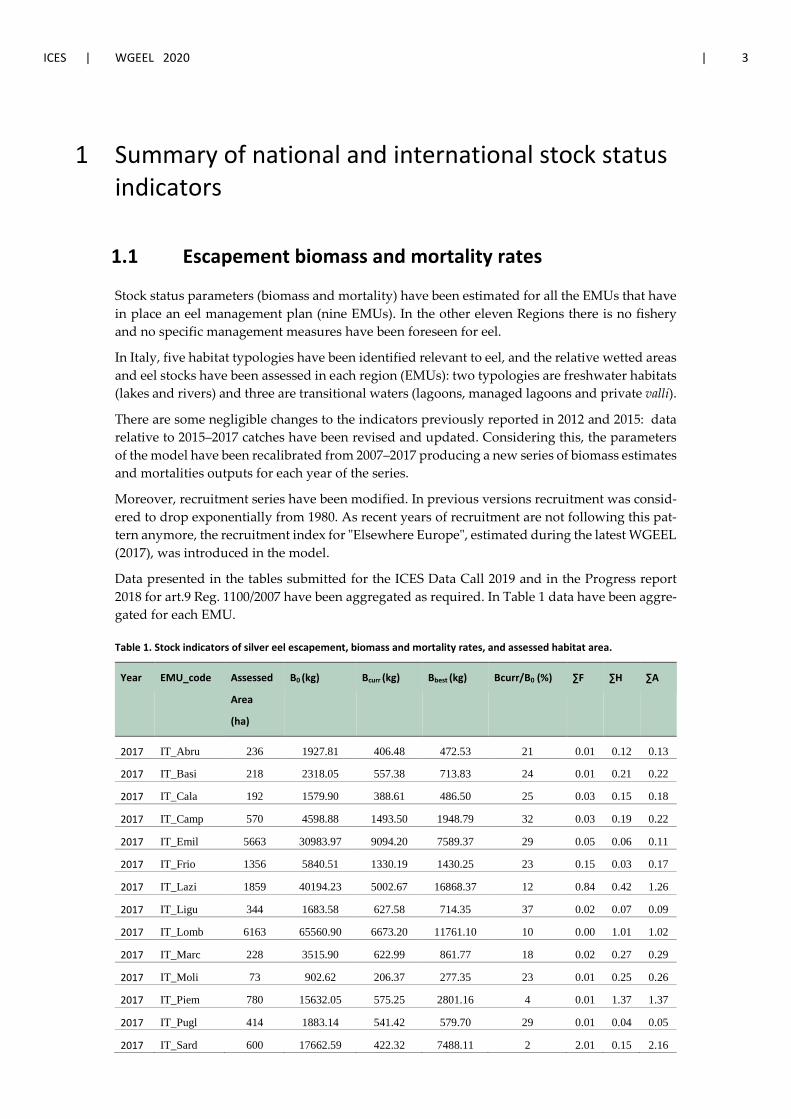
ICES | WGEEL 2020 | 3
1 Summary of national and international stock status indicators
1.1 Escapement biomass and mortality rates
Stock status parameters (biomass and mortality) have been estimated for all the EMUs that have in place an eel management plan (nine EMUs). In the other eleven Regions there is no fishery and no specific management measures have been foreseen for eel.
In Italy, five habitat typologies have been identified relevant to eel, and the relative wetted areas and eel stocks have been assessed in each region (EMUs): two typologies are freshwater habitats (lakes and rivers) and three are transitional waters (lagoons, managed lagoons and private valli).
There are some negligible changes to the indicators previously reported in 2012 and 2015: data relative to 2015–2017 catches have been revised and updated. Considering this, the parameters of the model have been recalibrated from 2007–2017 producing a new series of biomass estimates and mortalities outputs for each year of the series.
Moreover, recruitment series have been modified. In previous versions recruitment was consid-ered to drop exponentially from 1980. As recent years of recruitment are not following this pat-tern anymore, the recruitment index for "Elsewhere Europe", estimated during the latest WGEEL (2017), was introduced in the model.
Data presented in the tables submitted for the ICES Data Call 2019 and in the Progress report 2018 for art.9 Reg. 1100/2007 have been aggregated as required. In Table 1 data have been aggre-gated for each EMU.
Table 1. Stock indicators of silver eel escapement, biomass and mortality rates, and assessed habitat area.
Year EMU_code Assessed
Area
(ha)
B0 (kg) Bcurr (kg) Bbest (kg) Bcurr/B0 (%) ∑F ∑H ∑A
2017 IT_Abru 236 1927.81 406.48 472.53 21 0.01 0.12 0.13
2017 IT_Basi 218 2318.05 557.38 713.83 24 0.01 0.21 0.22
2017 IT_Cala 192 1579.90 388.61 486.50 25 0.03 0.15 0.18
2017 IT_Camp 570 4598.88 1493.50 1948.79 32 0.03 0.19 0.22
2017 IT_Emil 5663 30983.97 9094.20 7589.37 29 0.05 0.06 0.11
2017 IT_Frio 1356 5840.51 1330.19 1430.25 23 0.15 0.03 0.17
2017 IT_Lazi 1859 40194.23 5002.67 16868.37 12 0.84 0.42 1.26
2017 IT_Ligu 344 1683.58 627.58 714.35 37 0.02 0.07 0.09
2017 IT_Lomb 6163 65560.90 6673.20 11761.10 10 0.00 1.01 1.02
2017 IT_Marc 228 3515.90 622.99 861.77 18 0.02 0.27 0.29
2017 IT_Moli 73 902.62 206.37 277.35 23 0.01 0.25 0.26
2017 IT_Piem 780 15632.05 575.25 2801.16 4 0.01 1.37 1.37
2017 IT_Pugl 414 1883.14 541.42 579.70 29 0.01 0.04 0.05
2017 IT_Sard 600 17662.59 422.32 7488.11 2 2.01 0.15 2.16
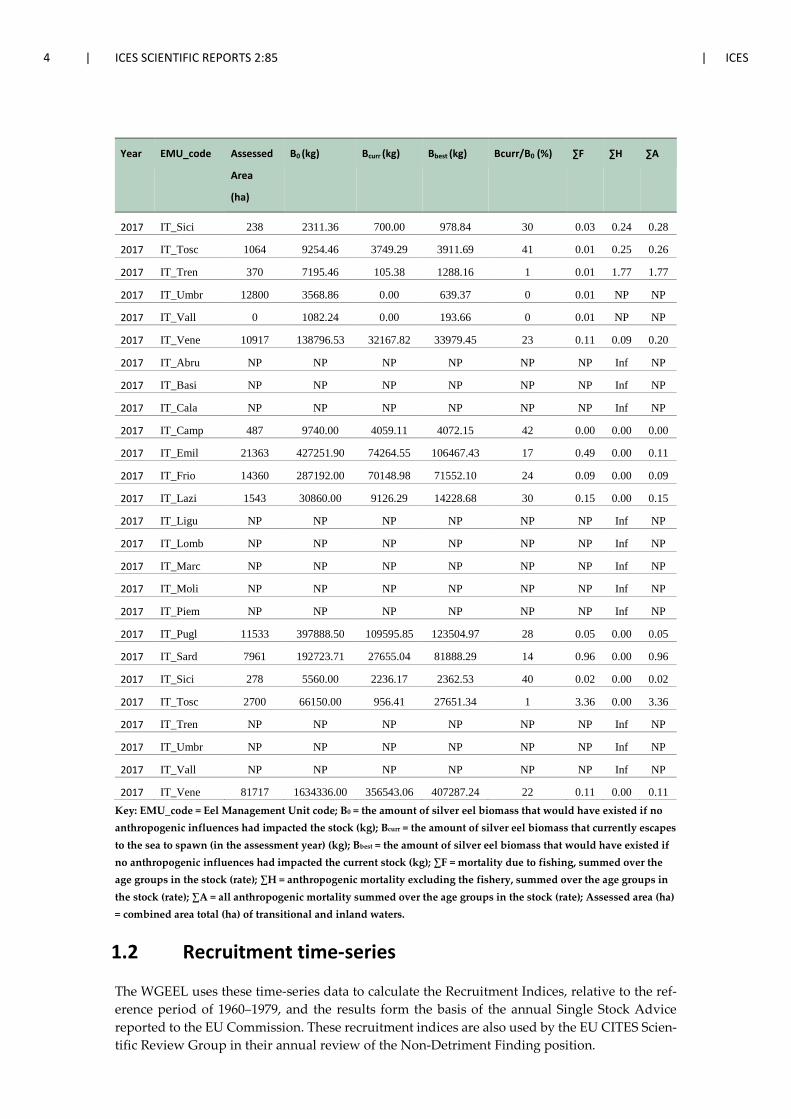
4 | ICES SCIENTIFIC REPORTS 2:85 | ICES
Year EMU_code Assessed
Area
(ha)
B0 (kg) Bcurr (kg) Bbest (kg) Bcurr/B0 (%) ∑F ∑H ∑A
2017 IT_Sici 238 2311.36 700.00 978.84 30 0.03 0.24 0.28
2017 IT_Tosc 1064 9254.46 3749.29 3911.69 41 0.01 0.25 0.26
2017 IT_Tren 370 7195.46 105.38 1288.16 1 0.01 1.77 1.77
2017 IT_Umbr 12800 3568.86 0.00 639.37 0 0.01 NP NP
2017 IT_Vall 0 1082.24 0.00 193.66 0 0.01 NP NP
2017 IT_Vene 10917 138796.53 32167.82 33979.45 23 0.11 0.09 0.20
2017 IT_Abru NP NP NP NP NP NP Inf NP
2017 IT_Basi NP NP NP NP NP NP Inf NP
2017 IT_Cala NP NP NP NP NP NP Inf NP
2017 IT_Camp 487 9740.00 4059.11 4072.15 42 0.00 0.00 0.00
2017 IT_Emil 21363 427251.90 74264.55 106467.43 17 0.49 0.00 0.11
2017 IT_Frio 14360 287192.00 70148.98 71552.10 24 0.09 0.00 0.09
2017 IT_Lazi 1543 30860.00 9126.29 14228.68 30 0.15 0.00 0.15
2017 IT_Ligu NP NP NP NP NP NP Inf NP
2017 IT_Lomb NP NP NP NP NP NP Inf NP
2017 IT_Marc NP NP NP NP NP NP Inf NP
2017 IT_Moli NP NP NP NP NP NP Inf NP
2017 IT_Piem NP NP NP NP NP NP Inf NP
2017 IT_Pugl 11533 397888.50 109595.85 123504.97 28 0.05 0.00 0.05
2017 IT_Sard 7961 192723.71 27655.04 81888.29 14 0.96 0.00 0.96
2017 IT_Sici 278 5560.00 2236.17 2362.53 40 0.02 0.00 0.02
2017 IT_Tosc 2700 66150.00 956.41 27651.34 1 3.36 0.00 3.36
2017 IT_Tren NP NP NP NP NP NP Inf NP
2017 IT_Umbr NP NP NP NP NP NP Inf NP
2017 IT_Vall NP NP NP NP NP NP Inf NP
2017 IT_Vene 81717 1634336.00 356543.06 407287.24 22 0.11 0.00 0.11 Key: EMU_code = Eel Management Unit code; B0 = the amount of silver eel biomass that would have existed if no anthropogenic influences had impacted the stock (kg); Bcurr = the amount of silver eel biomass that currently escapes to the sea to spawn (in the assessment year) (kg); Bbest = the amount of silver eel biomass that would have existed if no anthropogenic influences had impacted the current stock (kg); ∑F = mortality due to fishing, summed over the age groups in the stock (rate); ∑H = anthropogenic mortality excluding the fishery, summed over the age groups in the stock (rate); ∑A = all anthropogenic mortality summed over the age groups in the stock (rate); Assessed area (ha) = combined area total (ha) of transitional and inland waters.
1.2 Recruitment time-series
The WGEEL uses these time-series data to calculate the Recruitment Indices, relative to the ref-erence period of 1960–1979, and the results form the basis of the annual Single Stock Advice reported to the EU Commission. These recruitment indices are also used by the EU CITES Scien-tific Review Group in their annual review of the Non-Detriment Finding position.
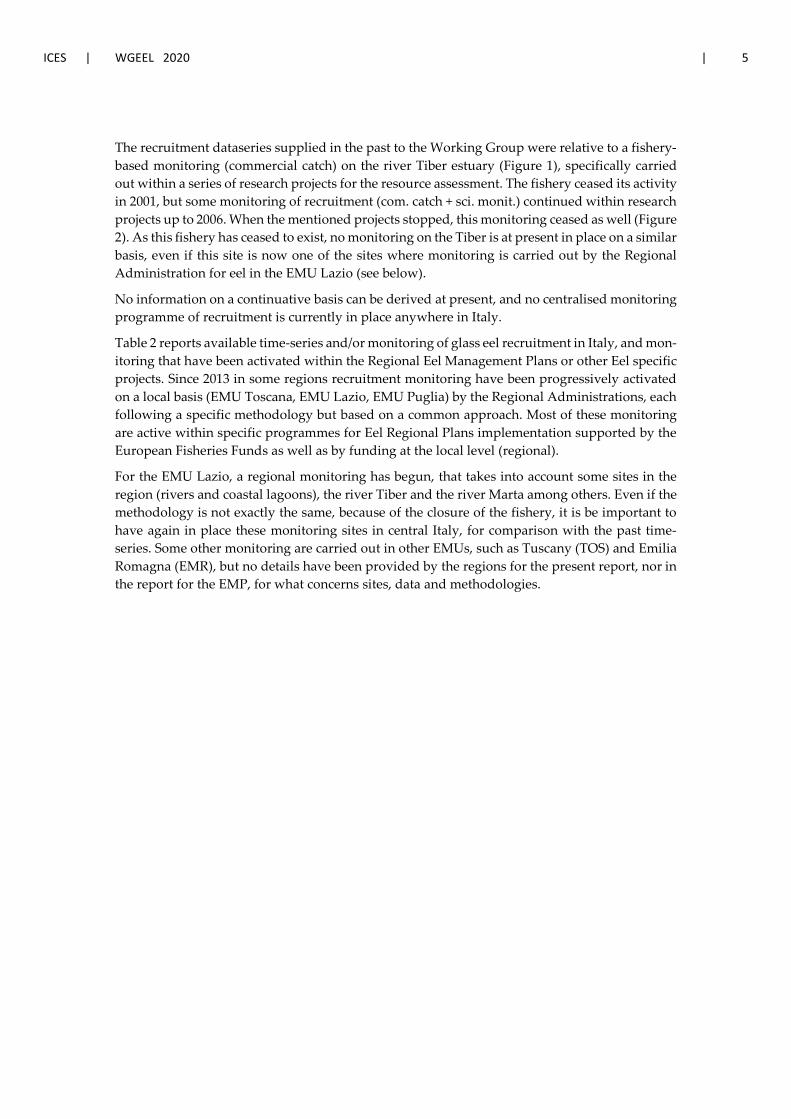
ICES | WGEEL 2020 | 5
The recruitment dataseries supplied in the past to the Working Group were relative to a fishery-based monitoring (commercial catch) on the river Tiber estuary (Figure 1), specifically carried out within a series of research projects for the resource assessment. The fishery ceased its activity in 2001, but some monitoring of recruitment (com. catch + sci. monit.) continued within research projects up to 2006. When the mentioned projects stopped, this monitoring ceased as well (Figure 2). As this fishery has ceased to exist, no monitoring on the Tiber is at present in place on a similar basis, even if this site is now one of the sites where monitoring is carried out by the Regional Administration for eel in the EMU Lazio (see below).
No information on a continuative basis can be derived at present, and no centralised monitoring programme of recruitment is currently in place anywhere in Italy.
Table 2 reports available time-series and/or monitoring of glass eel recruitment in Italy, and mon-itoring that have been activated within the Regional Eel Management Plans or other Eel specific projects. Since 2013 in some regions recruitment monitoring have been progressively activated on a local basis (EMU Toscana, EMU Lazio, EMU Puglia) by the Regional Administrations, each following a specific methodology but based on a common approach. Most of these monitoring are active within specific programmes for Eel Regional Plans implementation supported by the European Fisheries Funds as well as by funding at the local level (regional).
For the EMU Lazio, a regional monitoring has begun, that takes into account some sites in the region (rivers and coastal lagoons), the river Tiber and the river Marta among others. Even if the methodology is not exactly the same, because of the closure of the fishery, it is be important to have again in place these monitoring sites in central Italy, for comparison with the past time-series. Some other monitoring are carried out in other EMUs, such as Tuscany (TOS) and Emilia Romagna (EMR), but no details have been provided by the regions for the present report, nor in the report for the EMP, for what concerns sites, data and methodologies.
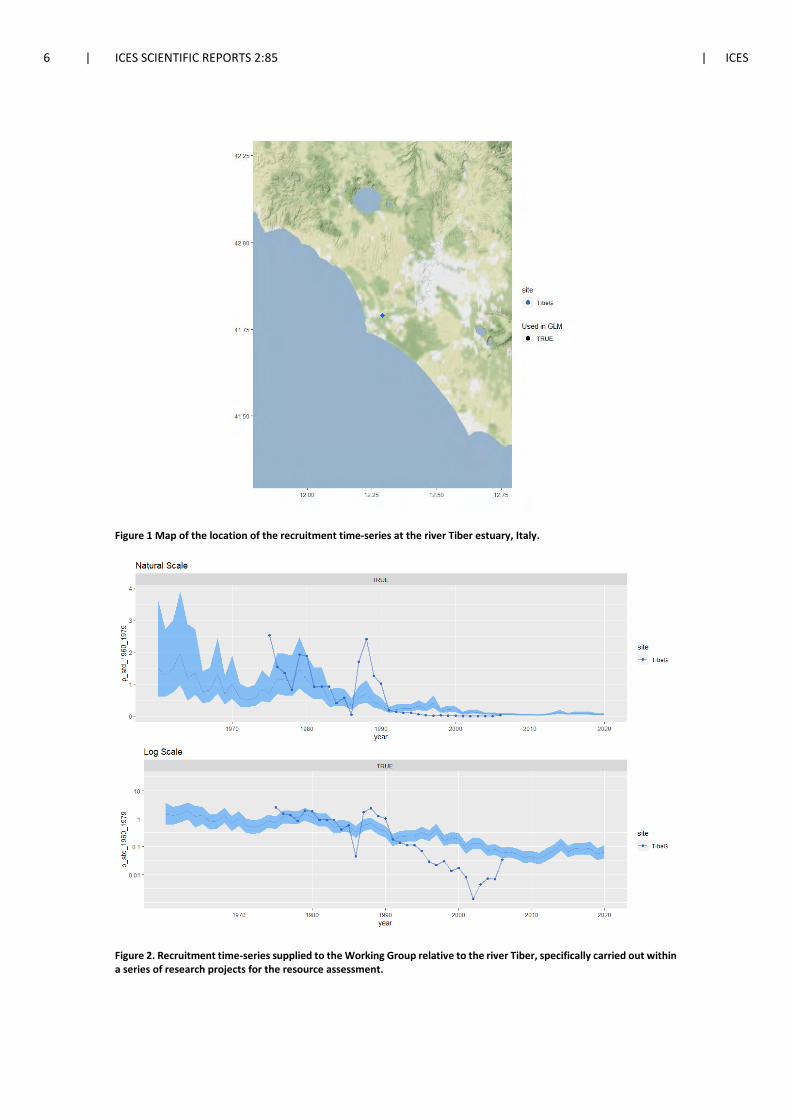
6 | ICES SCIENTIFIC REPORTS 2:85 | ICES
Figure 1 Map of the location of the recruitment time-series at the river Tiber estuary, Italy.
Figure 2. Recruitment time-series supplied to the Working Group relative to the river Tiber, specifically carried out within a series of research projects for the resource assessment.
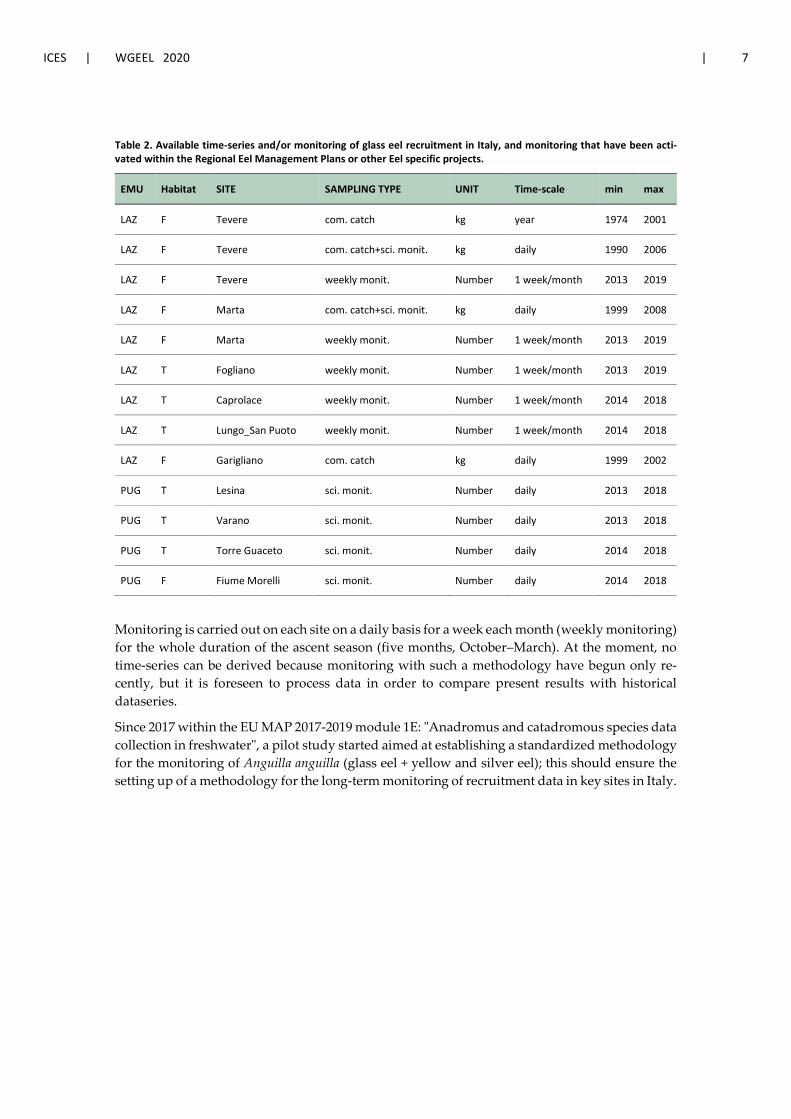
ICES | WGEEL 2020 | 7
Table 2. Available time-series and/or monitoring of glass eel recruitment in Italy, and monitoring that have been acti-vated within the Regional Eel Management Plans or other Eel specific projects.
EMU Habitat SITE SAMPLING TYPE UNIT Time-scale min max
LAZ F Tevere com. catch kg year 1974 2001
LAZ F Tevere com. catch+sci. monit. kg daily 1990 2006
LAZ F Tevere weekly monit. Number 1 week/month 2013 2019
LAZ F Marta com. catch+sci. monit. kg daily 1999 2008
LAZ F Marta weekly monit. Number 1 week/month 2013 2019
LAZ T Fogliano weekly monit. Number 1 week/month 2013 2019
LAZ T Caprolace weekly monit. Number 1 week/month 2014 2018
LAZ T Lungo_San Puoto weekly monit. Number 1 week/month 2014 2018
LAZ F Garigliano com. catch kg daily 1999 2002
PUG T Lesina sci. monit. Number daily 2013 2018
PUG T Varano sci. monit. Number daily 2013 2018
PUG T Torre Guaceto sci. monit. Number daily 2014 2018
PUG F Fiume Morelli sci. monit. Number daily 2014 2018
Monitoring is carried out on each site on a daily basis for a week each month (weekly monitoring) for the whole duration of the ascent season (five months, October–March). At the moment, no time-series can be derived because monitoring with such a methodology have begun only re-cently, but it is foreseen to process data in order to compare present results with historical dataseries.
Since 2017 within the EU MAP 2017-2019 module 1E: "Anadromus and catadromous species data collection in freshwater", a pilot study started aimed at establishing a standardized methodology for the monitoring of Anguilla anguilla (glass eel + yellow and silver eel); this should ensure the setting up of a methodology for the long-term monitoring of recruitment data in key sites in Italy.
8 | ICES SCIENTIFIC REPORTS 2:85 | ICES
2 Overview of the national stock and its management
2.1 Describe the eel stock and its management
Eel (Anguilla anguilla L.) exploitation in Italy has a long-standing tradition, and is still important, despite a progressive and increased loss of interest towards this species. Fisheries still concern all continental stages, i.e. glass eel, yellow and migratory silver eel.
Administrative responsibility for eel fisheries is still fragmented, despite the coordination re-quired by the application of the Regulation 1100/2007: sea fisheries and sea fishing up to river mouths are under the responsibility of central government (Ministry of Agricultural, Food and Forestry Policy - Directorate-General for Sea Fishing and Aquaculture), whereas Regions are re-sponsible for inland waters fisheries, including eel fishing, because Presidential Decrees No 11 of 15 January 1972 and No 616 of 24 July 1977 gave them this responsibility. Therefore, the only eel fisheries under a central Administration are glass eel fisheries practised in estuaries, as no marine adult eel fishery is allowed in marine water in Italy (Ministry decree n° 403 25 July 2019). With regards to inland fisheries, that include lagoon as well as lake and river fisheries, each Re-gion has its own regulation. Since 2009, specific regulations for eel are being issued in relation to the application of the Eel Management Plans. Up to now, no specific eel fishing licenses are fore-seen, and as a rule individual professional fishing licences for inland water fishing are issued valid for six years, by each Region, and are enlisted in registers. The permitted gears vary from region to region, also in relation to local traditions, and are specified by each Administration, together with authorised times and places.
In the last two years (2019, 2020) after the Recommendation GFCM 42/2018/1 on a multiannual management plan for European eel in the Mediterranean Sea and the Council Regulation (EU) 2019/124 of 30 January 2019, art. 42, a Ministry decree n°403 25/07/2019 in 2019 set different fish-ing closure of three consecutive months in all the 9 EMUs, that has been harmonized at the Na-tional level from 2020 establishing a common fishery closure from 1st January to 31st March.
Italy has established, since 2009, its Data Collection Framework for Eel, as foreseen by the Regu-lation 199/2008, and therefore eel has been included in the DCF Italian National Programme. The Eel Fisheries Data Collection (under Reg. 199/2008, DCF) is at present definitively in place, now as National Data Collection Program (PLNRDA 2017-2021 (under EC Decision C(2016) 8906 – 12/19/2016), and concerns all eel fisheries in inland and coastal waters, commercial as well recre-ational. Most data presented in this Report for the year 2019 are derived from the PLNRDA, presented at the national level or environmental typology (such as inland or coastal waters), and/or disaggregated by Region (EMU) as well.
The management framework for DCF is the same that has been set up for the Eel Management Plan under Regulation 1100/2007. In the eleven Regions that preferred to delegate eel manage-ment to the central government (Directorate-General for Sea Fishing and Aquaculture of the Ministry of Agricultural, Food and Forestry Policy) where commercial eel fishing has been stopped completely since the year 2009, no data collection is carried out (Figure 3). In the remain-ing nine regions -EMUs, where eel fisheries are still ongoing, eel fishery data, both commercial and recreational, are collected with a standard methodology, as foreseen by the Italian National Plan for the Data Collection Framework (Figure 3).
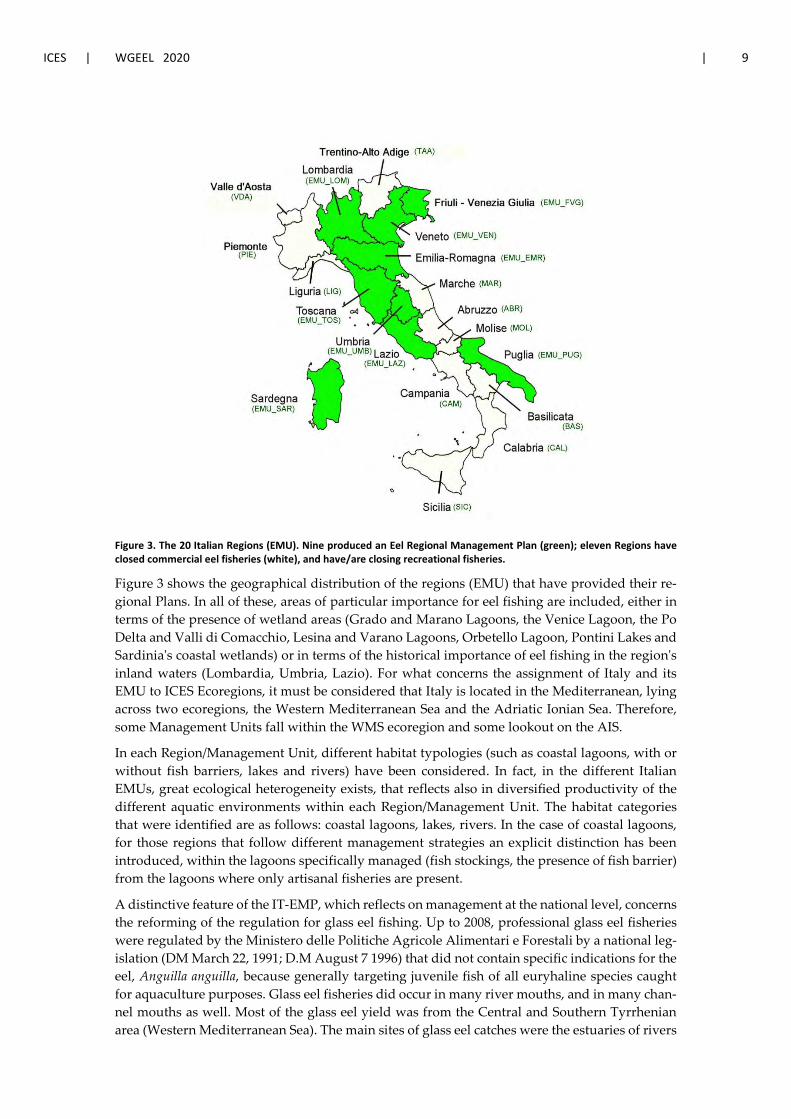
ICES | WGEEL 2020 | 9
Figure 3. The 20 Italian Regions (EMU). Nine produced an Eel Regional Management Plan (green); eleven Regions have closed commercial eel fisheries (white), and have/are closing recreational fisheries.
Figure 3 shows the geographical distribution of the regions (EMU) that have provided their re-gional Plans. In all of these, areas of particular importance for eel fishing are included, either in terms of the presence of wetland areas (Grado and Marano Lagoons, the Venice Lagoon, the Po Delta and Valli di Comacchio, Lesina and Varano Lagoons, Orbetello Lagoon, Pontini Lakes and Sardinia's coastal wetlands) or in terms of the historical importance of eel fishing in the region's inland waters (Lombardia, Umbria, Lazio). For what concerns the assignment of Italy and its EMU to ICES Ecoregions, it must be considered that Italy is located in the Mediterranean, lying across two ecoregions, the Western Mediterranean Sea and the Adriatic Ionian Sea. Therefore, some Management Units fall within the WMS ecoregion and some lookout on the AIS.
In each Region/Management Unit, different habitat typologies (such as coastal lagoons, with or without fish barriers, lakes and rivers) have been considered. In fact, in the different Italian EMUs, great ecological heterogeneity exists, that reflects also in diversified productivity of the different aquatic environments within each Region/Management Unit. The habitat categories that were identified are as follows: coastal lagoons, lakes, rivers. In the case of coastal lagoons, for those regions that follow different management strategies an explicit distinction has been introduced, within the lagoons specifically managed (fish stockings, the presence of fish barrier) from the lagoons where only artisanal fisheries are present.
A distinctive feature of the IT-EMP, which reflects on management at the national level, concerns the reforming of the regulation for glass eel fishing. Up to 2008, professional glass eel fisheries were regulated by the Ministero delle Politiche Agricole Alimentari e Forestali by a national leg-islation (DM March 22, 1991; D.M August 7 1996) that did not contain specific indications for the eel, Anguilla anguilla, because generally targeting juvenile fish of all euryhaline species caught for aquaculture purposes. Glass eel fisheries did occur in many river mouths, and in many chan-nel mouths as well. Most of the glass eel yield was from the Central and Southern Tyrrhenian area (Western Mediterranean Sea). The main sites of glass eel catches were the estuaries of rivers
10 | ICES SCIENTIFIC REPORTS 2:85 | ICES
such as the Arno and Ombrone in Toscana, the Tiber and the Garigliano in Lazio, and the Vol-turno and Sele in the Campania region. Occasionally fry fishers from other regions, who reached those sites with trucks equipped with oxygenated tanks to collect mullet, sea bass, sea bream and eel fry, frequented those sites usually used by local fishers. Local fishers were usually single or cooperative fishers that are were equipped with boats and structures to store the product alive. Fishing instruments vary depending on the characteristics of the site.
The Italian National Management Plan has contemplated the implementation of a new legisla-tion specific for glass eel fishery, on the basis of the fact that this fishing takes place in sites (es-tuarine areas and low river courses) legally partitioned between State and Regions. The new legislation prepared by the Ministero delle Politiche Agricole Alimentari, Forestali e del Turimo (MIPAAF) (DM 12/01/2011, 26/01/2011 OJ, 20 - "Regulation of fishing and marketing of juvenile eels, glass eel and elvers of the species Anguilla anguilla L.") regulates fishing of glass eels (eels <12 cm) in marine and brackish waters of the Italian territory. This new legislation lays down rules regarding monitoring of the fishing and end-use of the product, and gives priority to use for restocking purposes (thus aiming to reach the target of 60% of catches by 2013, as provided in Article 7 of the regulation), specifying that this quota relates to restocking into waters which flow into the sea, so that the measure will contribute to recovery of the eel stock. One of the ways envisaged for meeting the obligations under the Council regulation is to create a system to in-clude a national register of fishers authorised to fish glass eel, allocation of quotas and the obli-gation to submit catch returns. This new legislation has come in force in 2011, and, together with reinforced controls by the Carabinieri Forestali, should ensure that information on recruitment in Italy is available from year to year, that most glass eels are conveyed to restocking and that illegal fishing is definitively broken off.
Glass eel fishing in inland waters, i.e. in rivers above the limit of salt and brackish waters, are under Regional regulations. Therefore, the EMUs (Regions) that have their own Regional Eel management Plans have taken steps to regulate glass eel fishing in inland waters in a manner consistent with the National law. Glass eel fisheries are currently allowed in inland waters of two EMUs on the Tyrrhenian coast: Toscana (TOS) and Lazio (LAZ, D.G.R. n. 76 of 2/3/2012). Tuscany has, through a Regional Document for the implementation of the Eel Management Plan, set up the instrument for the implementation of the measures provided for Eel Regional Plan, financed by regional laws that regulate the fishing industry (LR 66/2005 and L.R. 7/2005). Among these actions, the provinces of Grosseto and Pisa have created two facilities for stocking glass eels fished within the region. The EMU Lazio has taken steps to enact a specific discipline for glass eel fishery, which provides inter alia that the juvenile eel caught in inland waters of the Lazio region are exclusively for farming or restocking inland waters of the region. Glass eel fish-eries are explicitly prohibited fishing in inland waters of the Veneto region (VEN, DGR n. 91 18/05/2012), Emilia Romagna (EMR) and Friuli Venezia Giulia (FVG), while the remaining EMUs are not interested in this fishery for natural reasons (no access to the sea, scarce glass eel ascent) or have not yet enacted specific rules. In the eleven regions that have not submitted any Eel Management Plan, glass eel fishing is prohibited, as well as any other activity involving eels, such as commercial and recreational fishing for eels. For the moment, only five regions (Pie-monte, Valle d'Aosta, Liguria, Marche and Sicilia) have implemented such forbiddance with ex-plicit rules, the other six regions are still providing.
In the last three years, the responsibility for the management framework of glass eel fishing/re-stocking, and all eel related measures have encountered a complication related to the fact that for due to a decree of the Government for a spending review, in most regions the number of provinces has been reduced (in most cases by the elimination of some provinces or by fusion of some). Therefore, competences for fisheries in many cases have fallen back to Regions. This has created some confusion, and difficulty in managing operations and as a consequence getting data since the year 2017/2019.
ICES | WGEEL 2020 | 11
2.2 Significant changes since last report
During 2017–2019, several coordination meetings have been held among MIPAAF (Ministero delle Politiche Agricole Alimentari, Forestali) and the representatives of Regional Administra-tions, technicians, and scientists. Purposes of the meetings were: updating the current state of the implemented measures provided for Regulation 1100/2007; setting up a coordination frame-work for the new EU MAP Regulation; carry out a shared quality-check of eel landings and fish-ing effort data of the last years for the evaluation of the parameters required to assess progress achieved by Article 9 of Regulation 1100/2007; provide guidelines for the monitoring of all eel life stages in order to harmonize the survey methods as required by the new EUMAP Regulation. These activities have been aimed at a greater coordination and agreement between the Ministry and the Regions, and therefore greater access to the data required for the eel scheduled assess-ment for 2018 (Art. 9 Reg. 1100/2007).
Notwithstanding this, a number of critical issues have emerged clearly. In light of these critical issues, some corrective measures are underway, also on the basis of what emerged by a Coordi-nation meeting between MIPAAF, Directorate for Fisheries, and Regional Administrations.
The most consistent critical points are the following: need for interaction with multiple Admin-istrations (Regions) for the fishery data collection in order to quantify the fishers universe and identify the sample of fishers to be interviewed; difficulties in the interactions with fishermen; difficulty in operating for sampling and monitoring, high costs; presence of fishing, transport and/or commercialization that are difficult to check and describe, and consequent potential bias of the quality of estimates obtained from the Data Collection system.
In addition during the last years (2019 and 2020) several coordination issues have arisen: need for coordination with other activities at national and international level for the eel species (CITES); need for coordination with the monitoring and assessment activities foreseen by Regu-lation 1100/2007 for the management and restoration of the eel stock; need for coordination with activities required by further international frameworks for the management and restoration of the eel stock (Recommendation GFCM / 42/2018/1 on a multiannual management plan for Euro-pean eel, whose transitional measures are implemented by the EU Regulation No. 2019/124 of the Council of 30 January 2019; EU Evaluation ROADMAP of Eel Management Plans).
The corrective measure to this situation, in order to implement the data collection system, has been identified in the opportunity to involve the Regional Administrations in a specific Coordi-nation Program. This hypothesis is being discussed with the Fishery Directorate of MIPAAFT, to be set up within the EMFF, and may envisage a coordination for some common activities of Eel Management Plans, delegating to the Regions some data collection activities and monitor-ing, sharing and coordinated methodologies. This will allow to set up a shared framework also for the Eel Data Collection, which satisfies both the requirements of EU-MAP in the next years and those imposed by the need to assess the eel stock pursuant to Art. 9 of EC Regulation 1100/2007, as well as all additional frameworks that are being defined at various national and international levels (CITES; GFCM, etc).
Notwithstanding these past efforts, during the present year, 2020, eel coordination has been lack-ing, also as a consequence of reduced activities linked to the long lock-down due to COVID-19 pandemics. This has also reflected on the delayed response to international obligations and Data Calls.
12 | ICES SCIENTIFIC REPORTS 2:85 | ICES
3 Impacts on the national stock
3.1 Fisheries
The most distinctive exploitation pattern for eel in Italy has been in the past coastal lagoon fish-ery, that yielded most of yellow and silver eel extensive culture and fishery production (Ciccotti, 1997; Ciccotti et al., 2000; Ciccotti, 2005; Ciccotti, 2015; Aalto et al., 2016). Inland eel fisheries are still found in main rivers and lakes, even if a relic activity. Professional eel fisheries in rivers have never been important, confined to the low course of a small number of rivers even in the past, and further reduced now.
Total fishing capacity for eel in Italy has proved to be difficult to assess. Theoretically, it would coincide with the whole amount of fishers licensed for fishing in inland waters (river and lakes) and coastal lagoons, both commercial and recreational, even if in the practice fishers really inter-ested and involved in eel fishing are only a part of the whole universe of fishers. To these, au-thorized glass eel fishers in coastal and inland waters must be added.
For both commercial and recreational fisheries, targets are both the yellow and the silver eel stage that are exploited by fishers on a seasonal basis.
The methodology to describe the commercial fishing effort is based on direct and detailed inter-views to a sample of fishermen, extracted on a statistical basis for each habitat typology in each MU. Most eel catch is from fykenets fisheries, used in all habitat typologies in all MUs, to which seasonal eel catches at fish barriers used in managed coastal lagoons must be added. Longlines are used sporadically only in one or two lakes.
The interviews consist of questionnaires where each fisher reports catch data (yellow and silver eel separated), type of gear, number of gears used daily, and number of fishing days per year. A detailed cpue in each habitat typology of all nine EMUs is derived from a reliable subset of in-terviewed fishers: an average parameter of fishing effort (number of gears * number of fishing days) is multiplied by the total fishermen operant in each habitat typology. Yellow and silver eel catches are assessed with the same method. The same methodology (interviews to a sample of fishers) is used to assess data for recreational anglers.
Annual mean cpue for 2019 for commercial landings and recreational landings are reported and available within Technical National Report relative to the Data Collection Framework 2017–2019, modules “Work Package 2 – Biological sampling - Task 2.3a Anguilla Work Pack-age 3 – Recrea-tional Fishing - Task 3.1 Anguilla”, and have been provided with the ICES Data Call 2020.
3.1.1 Glass eel fisheries
The glass eel regulation foresees that glass eel fisheries can continue on a local scale, provided that 60% is used for restocking in national inland waters open to the sea, and provided that fish-ers compile specific and detailed logbooks of catches and sales. This system, together with rein-forced controls by the Carabinieri Forestali, should ensure that information on recruitment in Italy is available from year to year, that most glass eels are conveyed to restocking and that illegal fishing is definitively broken off. With regard to the destination of glass eel catches and to the proportion retained for restocking, on the basis of the forms returned to administrations, it has been possible to document the destination of glass eel only in a generic way. Glass eel destination from national fisheries seems documented, while import data apparently escape registration.
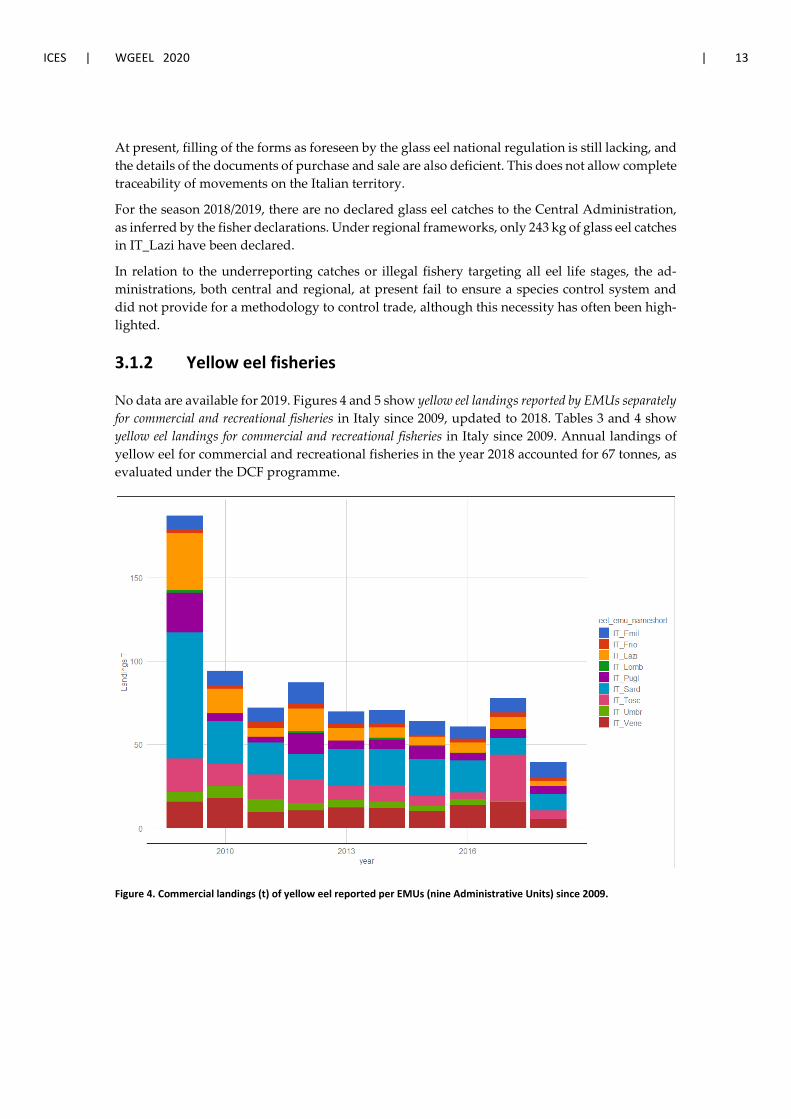
ICES | WGEEL 2020 | 13
At present, filling of the forms as foreseen by the glass eel national regulation is still lacking, and the details of the documents of purchase and sale are also deficient. This does not allow complete traceability of movements on the Italian territory.
For the season 2018/2019, there are no declared glass eel catches to the Central Administration, as inferred by the fisher declarations. Under regional frameworks, only 243 kg of glass eel catches in IT_Lazi have been declared.
In relation to the underreporting catches or illegal fishery targeting all eel life stages, the ad-ministrations, both central and regional, at present fail to ensure a species control system and did not provide for a methodology to control trade, although this necessity has often been high-lighted.
3.1.2 Yellow eel fisheries
No data are available for 2019. Figures 4 and 5 show yellow eel landings reported by EMUs separately for commercial and recreational fisheries in Italy since 2009, updated to 2018. Tables 3 and 4 show yellow eel landings for commercial and recreational fisheries in Italy since 2009. Annual landings of yellow eel for commercial and recreational fisheries in the year 2018 accounted for 67 tonnes, as evaluated under the DCF programme.
Figure 4. Commercial landings (t) of yellow eel reported per EMUs (nine Administrative Units) since 2009.
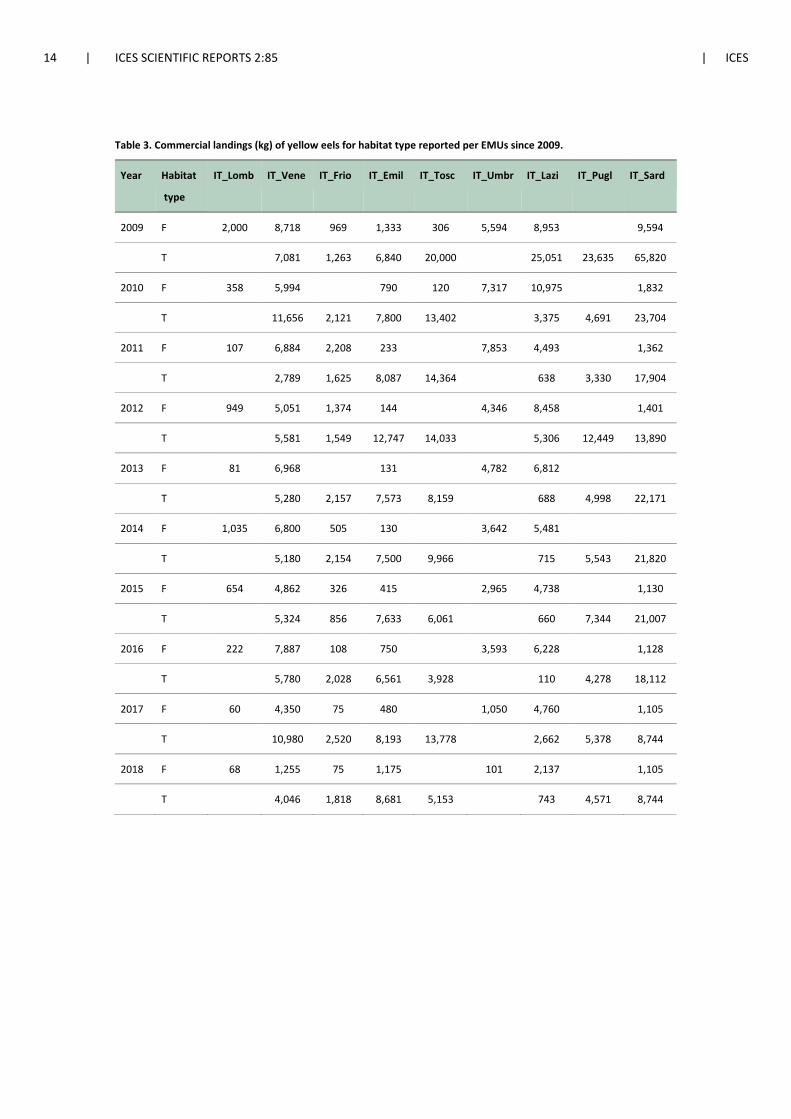
14 | ICES SCIENTIFIC REPORTS 2:85 | ICES
Table 3. Commercial landings (kg) of yellow eels for habitat type reported per EMUs since 2009.
Year Habitat
type
IT_Lomb IT_Vene IT_Frio IT_Emil IT_Tosc IT_Umbr IT_Lazi IT_Pugl IT_Sard
2009 F 2,000 8,718 969 1,333 306 5,594 8,953 9,594
T 7,081 1,263 6,840 20,000 25,051 23,635 65,820
2010 F 358 5,994 790 120 7,317 10,975 1,832
T 11,656 2,121 7,800 13,402 3,375 4,691 23,704
2011 F 107 6,884 2,208 233 7,853 4,493 1,362
T 2,789 1,625 8,087 14,364 638 3,330 17,904
2012 F 949 5,051 1,374 144 4,346 8,458 1,401
T 5,581 1,549 12,747 14,033 5,306 12,449 13,890
2013 F 81 6,968 131 4,782 6,812
T 5,280 2,157 7,573 8,159 688 4,998 22,171
2014 F 1,035 6,800 505 130 3,642 5,481
T 5,180 2,154 7,500 9,966 715 5,543 21,820
2015 F 654 4,862 326 415 2,965 4,738 1,130
T 5,324 856 7,633 6,061 660 7,344 21,007
2016 F 222 7,887 108 750 3,593 6,228 1,128
T 5,780 2,028 6,561 3,928 110 4,278 18,112
2017 F 60 4,350 75 480 1,050 4,760 1,105
T 10,980 2,520 8,193 13,778 2,662 5,378 8,744
2018 F 68 1,255 75 1,175 101 2,137 1,105
T 4,046 1,818 8,681 5,153 743 4,571 8,744
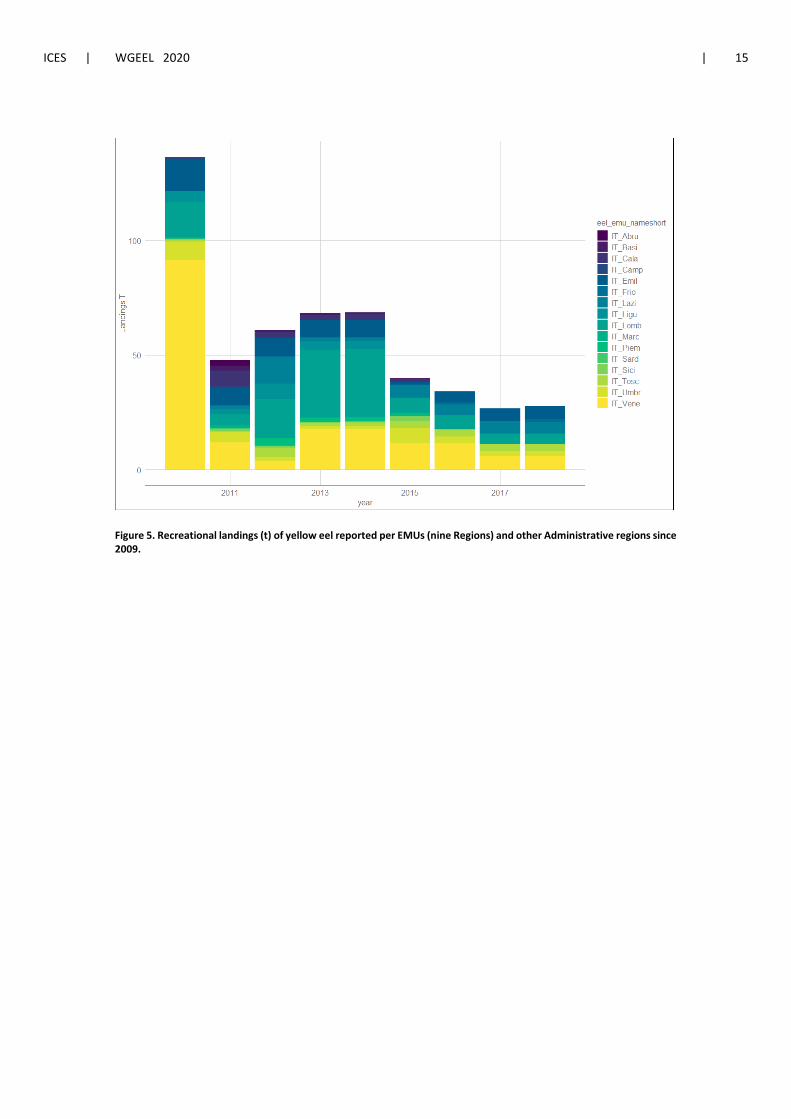
ICES | WGEEL 2020 | 15
Figure 5. Recreational landings (t) of yellow eel reported per EMUs (nine Regions) and other Administrative regions since 2009.

16 | ICES SCIENTIFIC REPORTS 2:85 | ICES
Table 4. Recreational landings (kg) of yellow eels for habitat type reported per EMUs since 2009.
In relation to the underreporting of catches or illegal fishery targeting all eel life stages, it is em-phasized that Administrations, both central and regional, at present fail to ensure a species con-trol system and did not provide for a methodology to control trade, although this necessity has often been highlighted.
3.1.3 Silver eel fisheries
No data are available for 2019. Figures 6 and 7 show silver eel landings reported by EMUs sepa-rately for commercial and recreational fisheries in Italy since 2009, updated to 2018. Tables 5 and 6 show silver eel landings for commercial and recreational fisheries in Italy since 2009. Annual landings of silver eel for commercial and recreational fisheries in the year 2018 accounted for 130 tonnes, as evaluated under the DCF programme.
year Habitat type IT_Lomb IT_Vene IT_Frio IT_Emil IT_Tosc IT_Umbr IT_Lazi IT_Pugl IT_Sard Other
2010 F 15,307 91,334
13,457 876 7,960
7,302
T
2011 F 4,670 6,563
7,610 421 4,367 1,296
17,574
T
5,312
2012 F 16,988 3,834
8,303 4,114 1,679 11,705
14,189
T
2013 F 29,657 17,707 217 7,526 1,348 1,361 1,619
8,923
T
2014 F 29,693 17,771 217 7,693 1,428 1,378 1,364
8,988
T
2015 F 6,712 6,381 113 1,174 3,364 6,260 5,638
4,830
T
5,264
2016 F 6,063 6,175 897 4,698 2,931 2,905 4,596
607
T
5,290
2017 F 4,710 5,962
5,638 2,998 2,003 5,340
84
T
2018 F 4,711 5,962 1,301 5,637 2,998 2,003 5,079
84
T
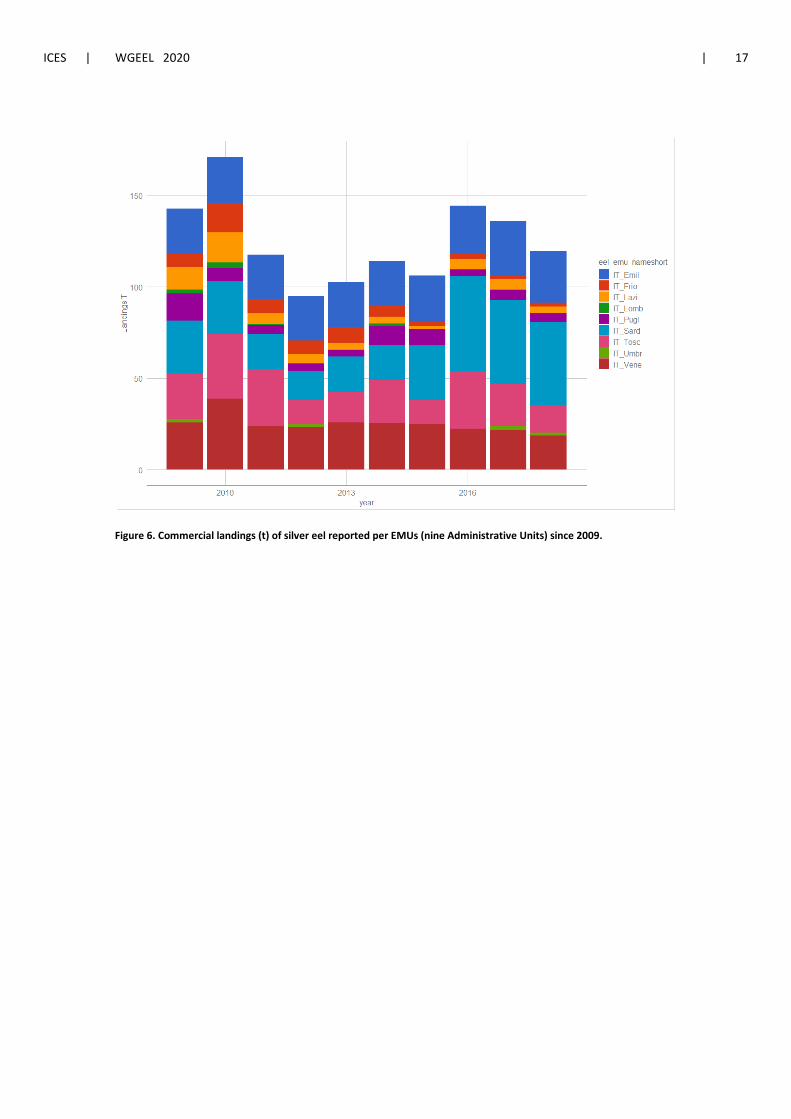
ICES | WGEEL 2020 | 17
Figure 6. Commercial landings (t) of silver eel reported per EMUs (nine Administrative Units) since 2009.
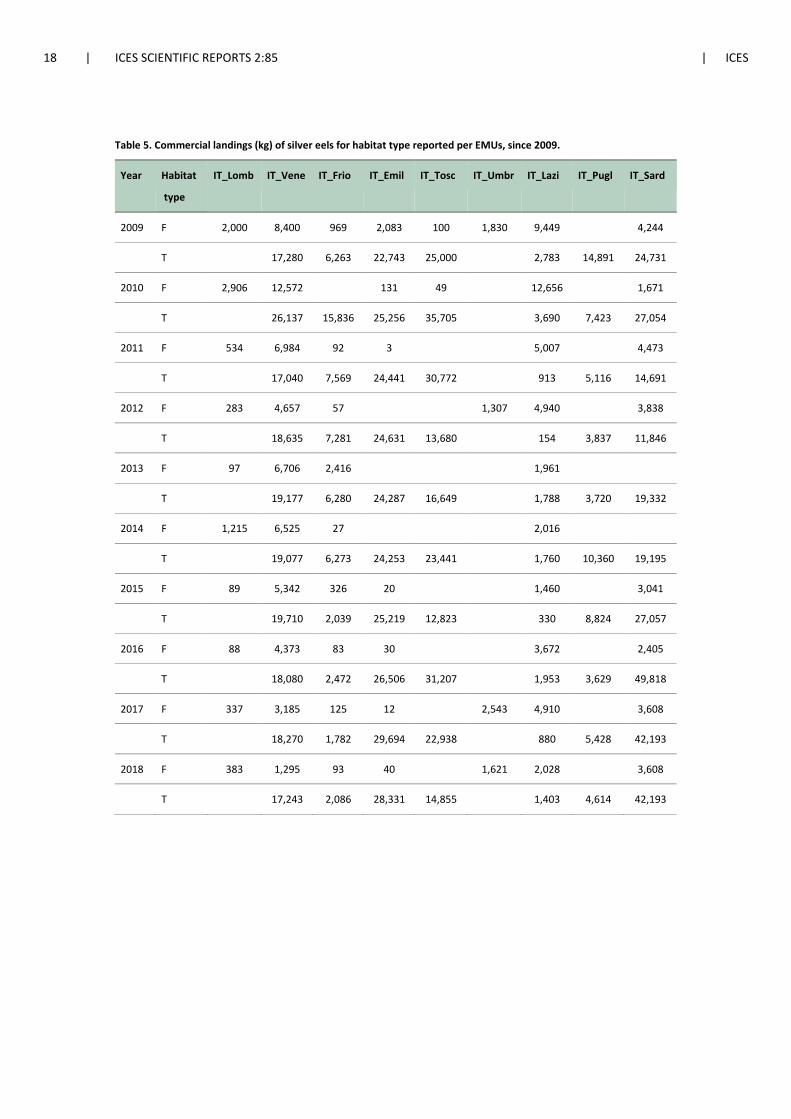
18 | ICES SCIENTIFIC REPORTS 2:85 | ICES
Table 5. Commercial landings (kg) of silver eels for habitat type reported per EMUs, since 2009.
Year Habitat
type
IT_Lomb IT_Vene IT_Frio IT_Emil IT_Tosc IT_Umbr IT_Lazi IT_Pugl IT_Sard
2009 F 2,000 8,400 969 2,083 100 1,830 9,449 4,244
T 17,280 6,263 22,743 25,000 2,783 14,891 24,731
2010 F 2,906 12,572 131 49 12,656 1,671
T 26,137 15,836 25,256 35,705 3,690 7,423 27,054
2011 F 534 6,984 92 3 5,007 4,473
T 17,040 7,569 24,441 30,772 913 5,116 14,691
2012 F 283 4,657 57 1,307 4,940 3,838
T 18,635 7,281 24,631 13,680 154 3,837 11,846
2013 F 97 6,706 2,416 1,961
T 19,177 6,280 24,287 16,649 1,788 3,720 19,332
2014 F 1,215 6,525 27 2,016
T 19,077 6,273 24,253 23,441 1,760 10,360 19,195
2015 F 89 5,342 326 20 1,460 3,041
T 19,710 2,039 25,219 12,823 330 8,824 27,057
2016 F 88 4,373 83 30 3,672 2,405
T 18,080 2,472 26,506 31,207 1,953 3,629 49,818
2017 F 337 3,185 125 12 2,543 4,910 3,608
T 18,270 1,782 29,694 22,938 880 5,428 42,193
2018 F 383 1,295 93 40 1,621 2,028 3,608
T 17,243 2,086 28,331 14,855 1,403 4,614 42,193
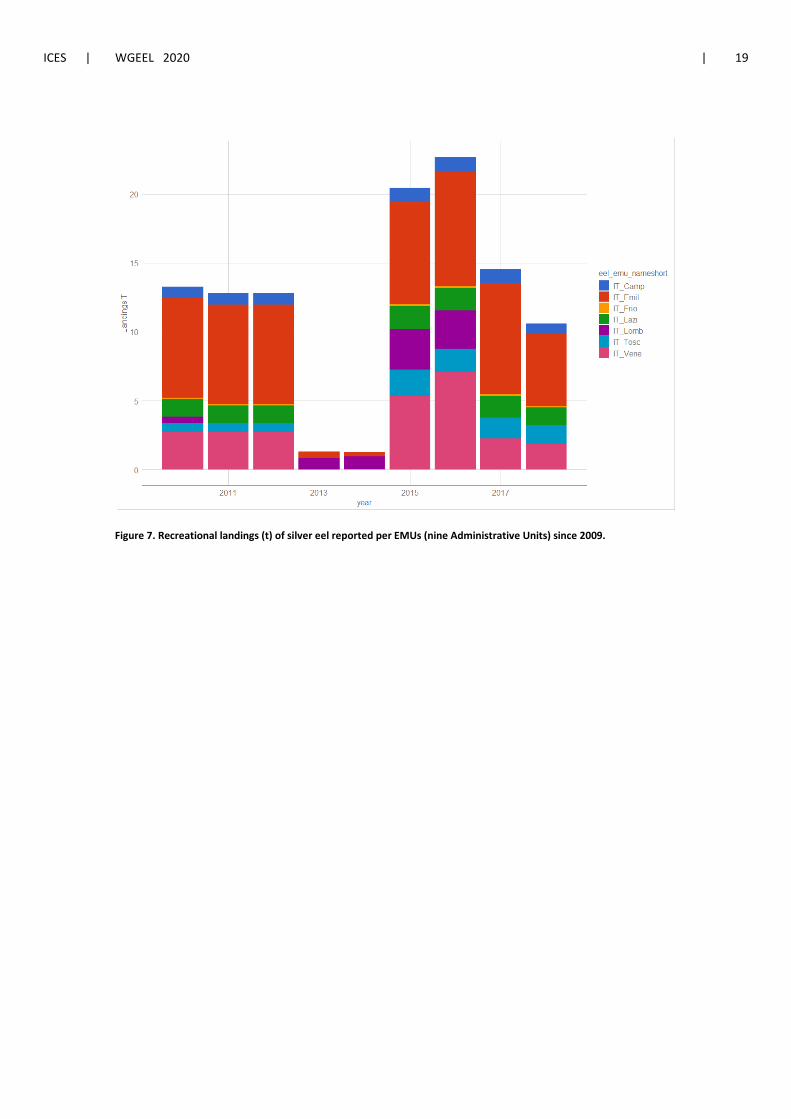
ICES | WGEEL 2020 | 19
Figure 7. Recreational landings (t) of silver eel reported per EMUs (nine Administrative Units) since 2009.
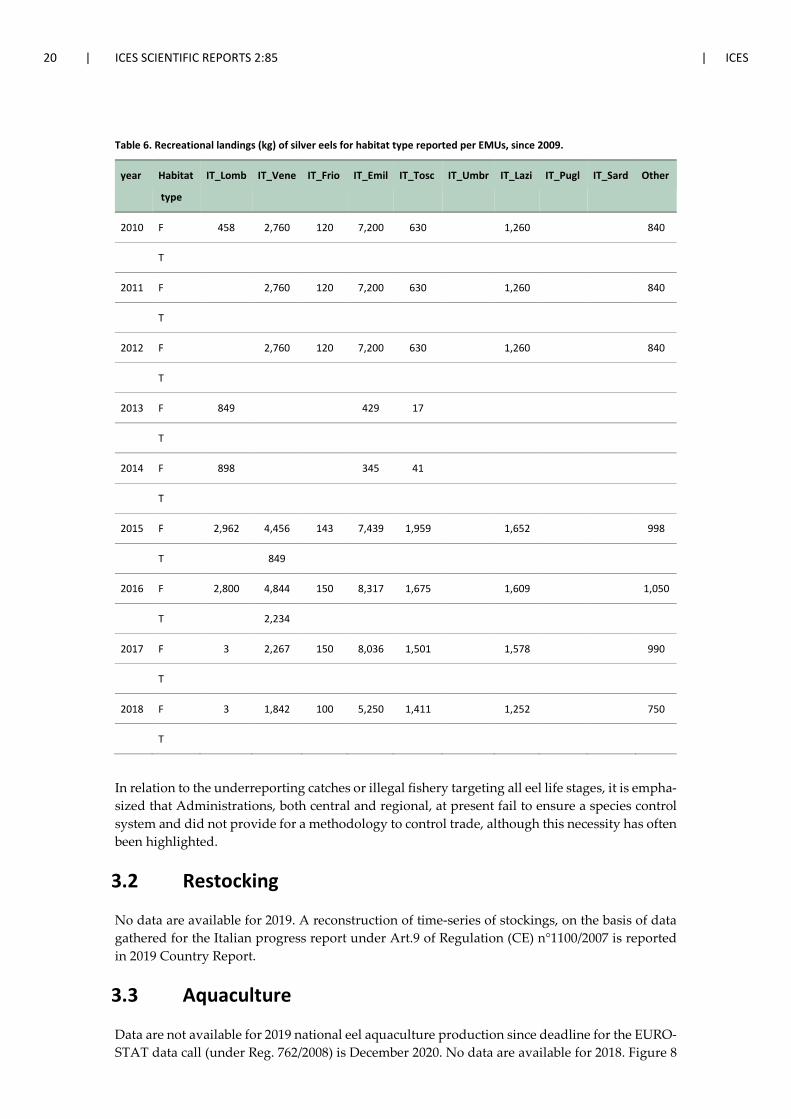
20 | ICES SCIENTIFIC REPORTS 2:85 | ICES
Table 6. Recreational landings (kg) of silver eels for habitat type reported per EMUs, since 2009.
year Habitat
type
IT_Lomb IT_Vene IT_Frio IT_Emil IT_Tosc IT_Umbr IT_Lazi IT_Pugl IT_Sard Other
2010 F 458 2,760 120 7,200 630
1,260
840
T
2011 F
2,760 120 7,200 630
1,260
840
T
2012 F
2,760 120 7,200 630
1,260
840
T
2013 F 849
429 17
T
2014 F 898
345 41
T
2015 F 2,962 4,456 143 7,439 1,959
1,652
998
T
849
2016 F 2,800 4,844 150 8,317 1,675
1,609
1,050
T
2,234
2017 F 3 2,267 150 8,036 1,501
1,578
990
T
2018 F 3 1,842 100 5,250 1,411
1,252
750
T
In relation to the underreporting catches or illegal fishery targeting all eel life stages, it is empha-sized that Administrations, both central and regional, at present fail to ensure a species control system and did not provide for a methodology to control trade, although this necessity has often been highlighted.
3.2 Restocking
No data are available for 2019. A reconstruction of time-series of stockings, on the basis of data gathered for the Italian progress report under Art.9 of Regulation (CE) n°1100/2007 is reported in 2019 Country Report.
3.3 Aquaculture
Data are not available for 2019 national eel aquaculture production since deadline for the EURO-STAT data call (under Reg. 762/2008) is December 2020. No data are available for 2018. Figure 8
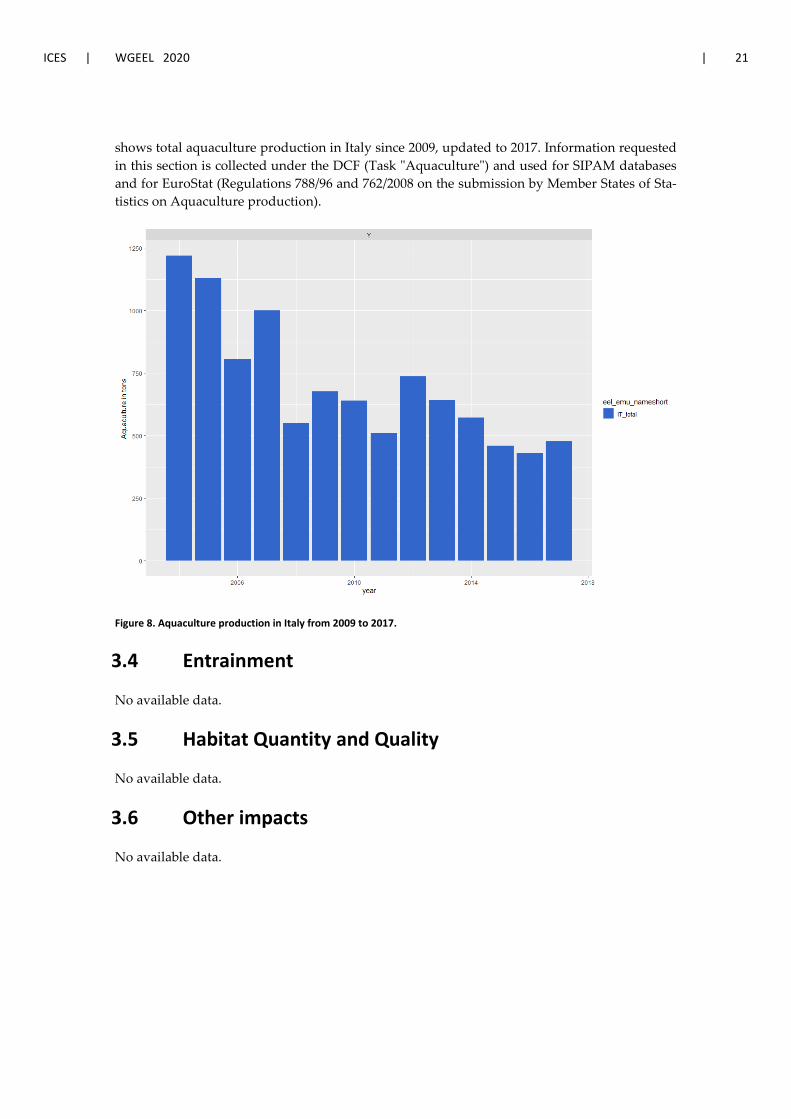
ICES | WGEEL 2020 | 21
shows total aquaculture production in Italy since 2009, updated to 2017. Information requested in this section is collected under the DCF (Task "Aquaculture") and used for SIPAM databases and for EuroStat (Regulations 788/96 and 762/2008 on the submission by Member States of Sta-tistics on Aquaculture production).
Figure 8. Aquaculture production in Italy from 2009 to 2017.
3.4 Entrainment
No available data.
3.5 Habitat Quantity and Quality
No available data.
3.6 Other impacts
No available data.
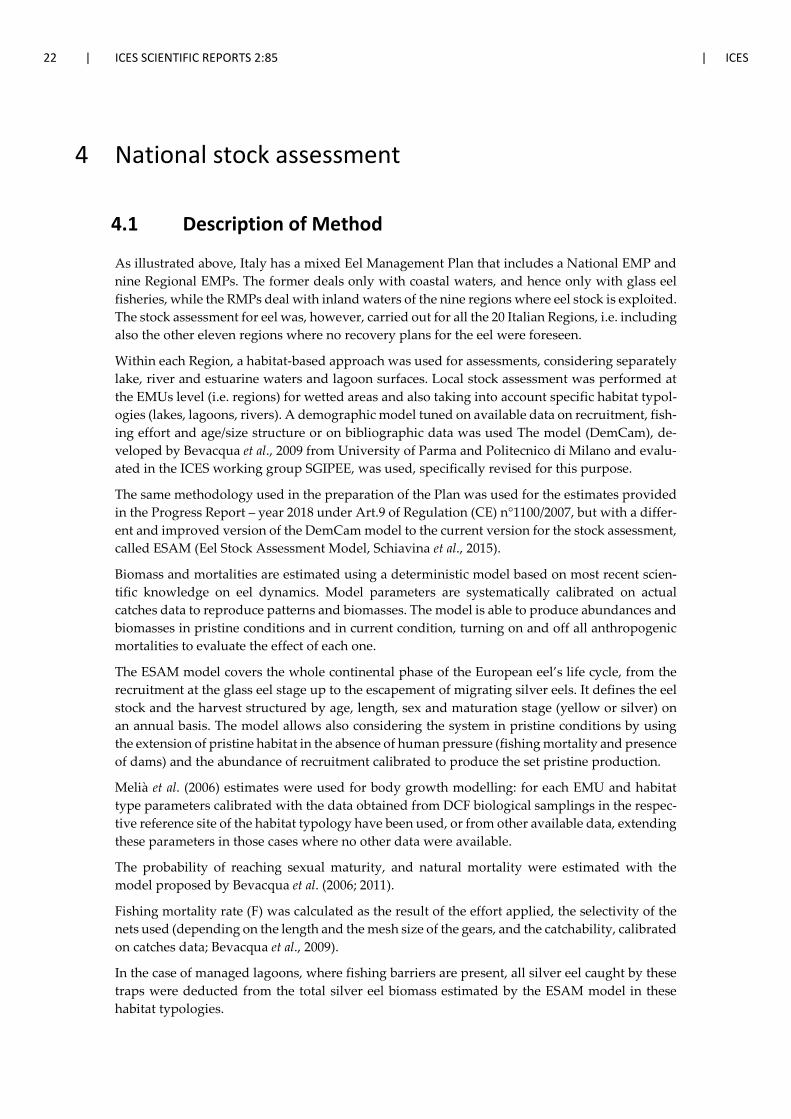
22 | ICES SCIENTIFIC REPORTS 2:85 | ICES
4 National stock assessment
4.1 Description of Method
As illustrated above, Italy has a mixed Eel Management Plan that includes a National EMP and nine Regional EMPs. The former deals only with coastal waters, and hence only with glass eel fisheries, while the RMPs deal with inland waters of the nine regions where eel stock is exploited. The stock assessment for eel was, however, carried out for all the 20 Italian Regions, i.e. including also the other eleven regions where no recovery plans for the eel were foreseen.
Within each Region, a habitat-based approach was used for assessments, considering separately lake, river and estuarine waters and lagoon surfaces. Local stock assessment was performed at the EMUs level (i.e. regions) for wetted areas and also taking into account specific habitat typol-ogies (lakes, lagoons, rivers). A demographic model tuned on available data on recruitment, fish-ing effort and age/size structure or on bibliographic data was used The model (DemCam), de-veloped by Bevacqua et al., 2009 from University of Parma and Politecnico di Milano and evalu-ated in the ICES working group SGIPEE, was used, specifically revised for this purpose.
The same methodology used in the preparation of the Plan was used for the estimates provided in the Progress Report – year 2018 under Art.9 of Regulation (CE) n°1100/2007, but with a differ-ent and improved version of the DemCam model to the current version for the stock assessment, called ESAM (Eel Stock Assessment Model, Schiavina et al., 2015).
Biomass and mortalities are estimated using a deterministic model based on most recent scien-tific knowledge on eel dynamics. Model parameters are systematically calibrated on actual catches data to reproduce patterns and biomasses. The model is able to produce abundances and biomasses in pristine conditions and in current condition, turning on and off all anthropogenic mortalities to evaluate the effect of each one.
The ESAM model covers the whole continental phase of the European eel’s life cycle, from the recruitment at the glass eel stage up to the escapement of migrating silver eels. It defines the eel stock and the harvest structured by age, length, sex and maturation stage (yellow or silver) on an annual basis. The model allows also considering the system in pristine conditions by using the extension of pristine habitat in the absence of human pressure (fishing mortality and presence of dams) and the abundance of recruitment calibrated to produce the set pristine production.
Melià et al. (2006) estimates were used for body growth modelling: for each EMU and habitat type parameters calibrated with the data obtained from DCF biological samplings in the respec-tive reference site of the habitat typology have been used, or from other available data, extending these parameters in those cases where no other data were available.
The probability of reaching sexual maturity, and natural mortality were estimated with the model proposed by Bevacqua et al. (2006; 2011).
Fishing mortality rate (F) was calculated as the result of the effort applied, the selectivity of the nets used (depending on the length and the mesh size of the gears, and the catchability, calibrated on catches data; Bevacqua et al., 2009).
In the case of managed lagoons, where fishing barriers are present, all silver eel caught by these traps were deducted from the total silver eel biomass estimated by the ESAM model in these habitat typologies.
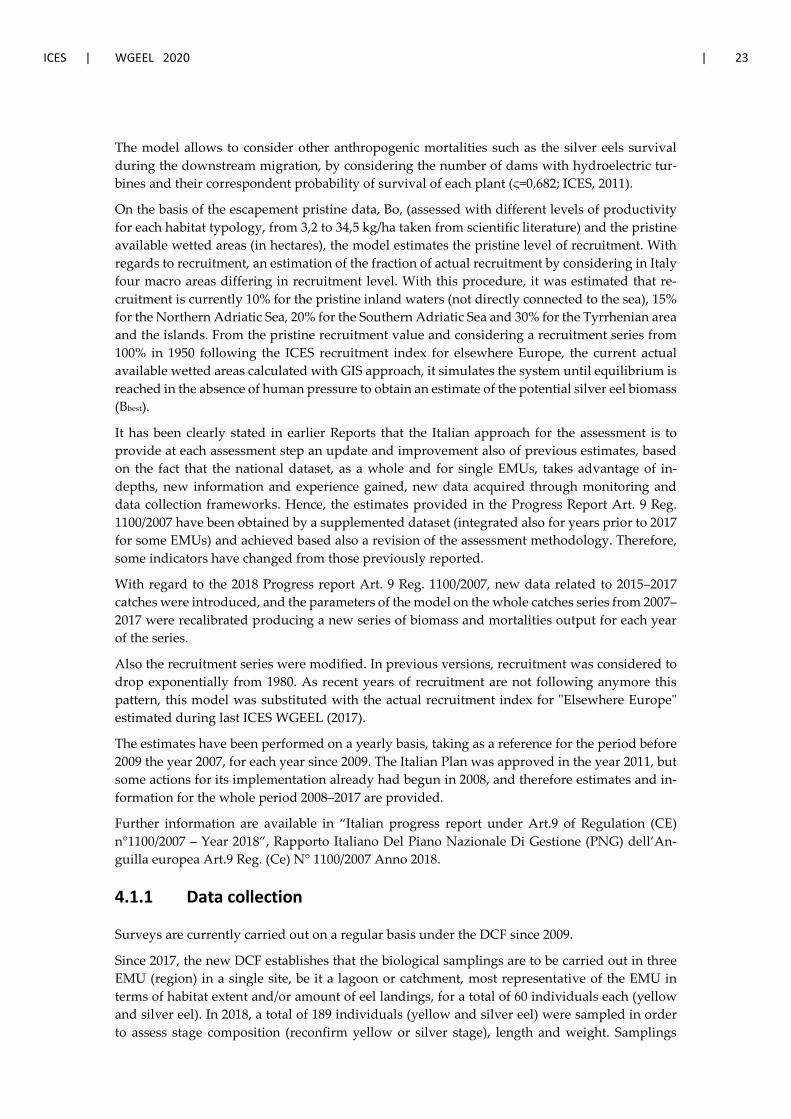
ICES | WGEEL 2020 | 23
The model allows to consider other anthropogenic mortalities such as the silver eels survival during the downstream migration, by considering the number of dams with hydroelectric tur-bines and their correspondent probability of survival of each plant (ς=0,682; ICES, 2011).
On the basis of the escapement pristine data, Bo, (assessed with different levels of productivity for each habitat typology, from 3,2 to 34,5 kg/ha taken from scientific literature) and the pristine available wetted areas (in hectares), the model estimates the pristine level of recruitment. With regards to recruitment, an estimation of the fraction of actual recruitment by considering in Italy four macro areas differing in recruitment level. With this procedure, it was estimated that re-cruitment is currently 10% for the pristine inland waters (not directly connected to the sea), 15% for the Northern Adriatic Sea, 20% for the Southern Adriatic Sea and 30% for the Tyrrhenian area and the islands. From the pristine recruitment value and considering a recruitment series from 100% in 1950 following the ICES recruitment index for elsewhere Europe, the current actual available wetted areas calculated with GIS approach, it simulates the system until equilibrium is reached in the absence of human pressure to obtain an estimate of the potential silver eel biomass (Bbest).
It has been clearly stated in earlier Reports that the Italian approach for the assessment is to provide at each assessment step an update and improvement also of previous estimates, based on the fact that the national dataset, as a whole and for single EMUs, takes advantage of in-depths, new information and experience gained, new data acquired through monitoring and data collection frameworks. Hence, the estimates provided in the Progress Report Art. 9 Reg. 1100/2007 have been obtained by a supplemented dataset (integrated also for years prior to 2017 for some EMUs) and achieved based also a revision of the assessment methodology. Therefore, some indicators have changed from those previously reported.
With regard to the 2018 Progress report Art. 9 Reg. 1100/2007, new data related to 2015–2017 catches were introduced, and the parameters of the model on the whole catches series from 2007–2017 were recalibrated producing a new series of biomass and mortalities output for each year of the series.
Also the recruitment series were modified. In previous versions, recruitment was considered to drop exponentially from 1980. As recent years of recruitment are not following anymore this pattern, this model was substituted with the actual recruitment index for "Elsewhere Europe" estimated during last ICES WGEEL (2017).
The estimates have been performed on a yearly basis, taking as a reference for the period before 2009 the year 2007, for each year since 2009. The Italian Plan was approved in the year 2011, but some actions for its implementation already had begun in 2008, and therefore estimates and in-formation for the whole period 2008–2017 are provided.
Further information are available in “Italian progress report under Art.9 of Regulation (CE) n°1100/2007 – Year 2018”, Rapporto Italiano Del Piano Nazionale Di Gestione (PNG) dell’An-guilla europea Art.9 Reg. (Ce) N° 1100/2007 Anno 2018.
4.1.1 Data collection
Surveys are currently carried out on a regular basis under the DCF since 2009.
Since 2017, the new DCF establishes that the biological samplings are to be carried out in three EMU (region) in a single site, be it a lagoon or catchment, most representative of the EMU in terms of habitat extent and/or amount of eel landings, for a total of 60 individuals each (yellow and silver eel). In 2018, a total of 189 individuals (yellow and silver eel) were sampled in order to assess stage composition (reconfirm yellow or silver stage), length and weight. Samplings
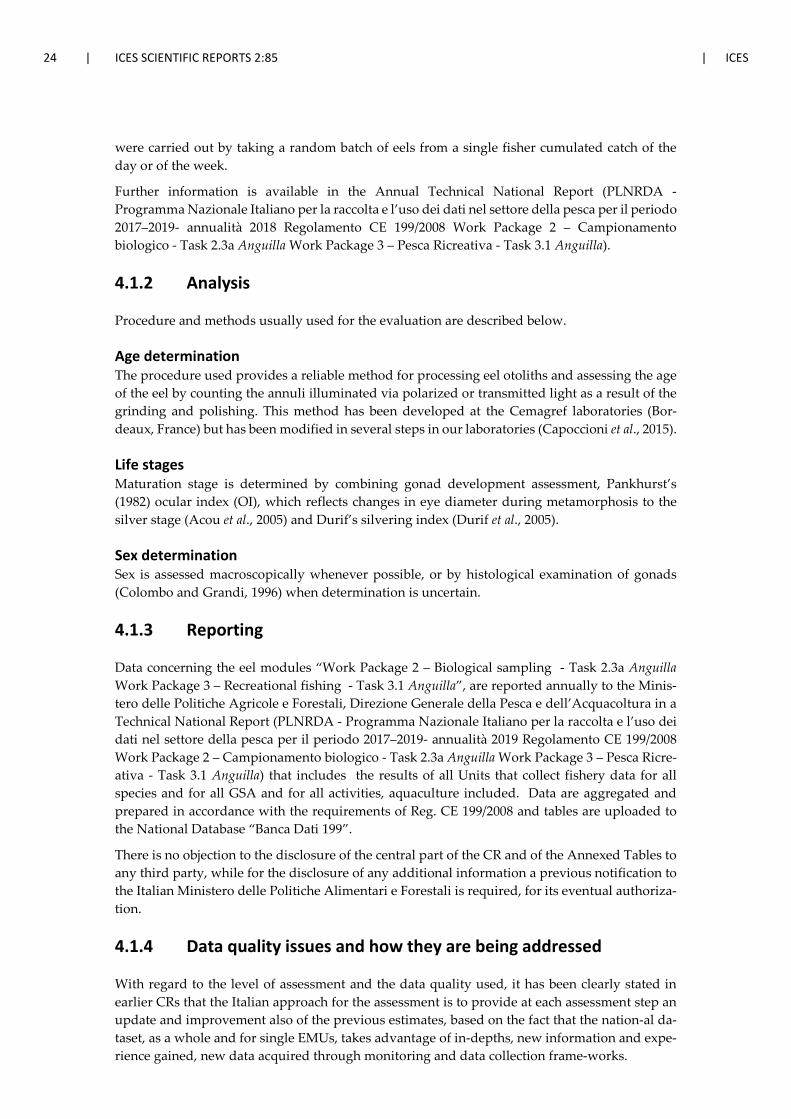
24 | ICES SCIENTIFIC REPORTS 2:85 | ICES
were carried out by taking a random batch of eels from a single fisher cumulated catch of the day or of the week.
Further information is available in the Annual Technical National Report (PLNRDA - Programma Nazionale Italiano per la raccolta e l’uso dei dati nel settore della pesca per il periodo 2017–2019- annualità 2018 Regolamento CE 199/2008 Work Package 2 – Campionamento biologico - Task 2.3a Anguilla Work Package 3 – Pesca Ricreativa - Task 3.1 Anguilla).
4.1.2 Analysis
Procedure and methods usually used for the evaluation are described below.
Age determination The procedure used provides a reliable method for processing eel otoliths and assessing the age of the eel by counting the annuli illuminated via polarized or transmitted light as a result of the grinding and polishing. This method has been developed at the Cemagref laboratories (Bor-deaux, France) but has been modified in several steps in our laboratories (Capoccioni et al., 2015).
Life stages Maturation stage is determined by combining gonad development assessment, Pankhurst’s (1982) ocular index (OI), which reflects changes in eye diameter during metamorphosis to the silver stage (Acou et al., 2005) and Durif’s silvering index (Durif et al., 2005).
Sex determination Sex is assessed macroscopically whenever possible, or by histological examination of gonads (Colombo and Grandi, 1996) when determination is uncertain.
4.1.3 Reporting
Data concerning the eel modules “Work Package 2 – Biological sampling - Task 2.3a Anguilla Work Package 3 – Recreational fishing - Task 3.1 Anguilla”, are reported annually to the Minis-tero delle Politiche Agricole e Forestali, Direzione Generale della Pesca e dell’Acquacoltura in a Technical National Report (PLNRDA - Programma Nazionale Italiano per la raccolta e l’uso dei dati nel settore della pesca per il periodo 2017–2019- annualità 2019 Regolamento CE 199/2008 Work Package 2 – Campionamento biologico - Task 2.3a Anguilla Work Package 3 – Pesca Ricre-ativa - Task 3.1 Anguilla) that includes the results of all Units that collect fishery data for all species and for all GSA and for all activities, aquaculture included. Data are aggregated and prepared in accordance with the requirements of Reg. CE 199/2008 and tables are uploaded to the National Database “Banca Dati 199”.
There is no objection to the disclosure of the central part of the CR and of the Annexed Tables to any third party, while for the disclosure of any additional information a previous notification to the Italian Ministero delle Politiche Alimentari e Forestali is required, for its eventual authoriza-tion.
4.1.4 Data quality issues and how they are being addressed
With regard to the level of assessment and the data quality used, it has been clearly stated in earlier CRs that the Italian approach for the assessment is to provide at each assessment step an update and improvement also of the previous estimates, based on the fact that the nation-al da-taset, as a whole and for single EMUs, takes advantage of in-depths, new information and expe-rience gained, new data acquired through monitoring and data collection frame-works.

ICES | WGEEL 2020 | 25
The whole set of data used for the assessment for single EMUs has been prepared and checked by scientists, based on the whole and best available information from all possible sources.
Among the activities that have to be mentioned for the data gathering, undoubtedly, the DCF, with the eel modules concerning the commercial and recreational fisheries, and the biological samplings, proved to be important, but also the specific monitoring carried out by Regions al local level, but with a standardized methodology, are an irreplaceable tool and indeed the avail-ability of the results of these activities influenced the results of the estimates.
4.2 Trends in Assessment results
The results of the 2018 Italian progress report under Art.9 of Regulation (CE) n°1100/2007 shows that the measures envisaged for the first phase of implementation of the EMP have been applied, first above all, a fishing effort reduction, that involved all the EMUs and all eel life stages.
This led to an immediate improvement in the Bcurrent, which, however, did not persist, did not lead to an increase in recruitment, and did not substantially influence the trend of emigration levels at the national level and therefore the achievement of the target.
With regard to the national targets, it is emphasised that the improvement of biomass parameters (Bcurrent and Bbest) depends on natural recruitment, at a global scale, as well as on actions imple-mented by Member States, such as the reduction of actions, such as fishing effort and the restor-ing of habitats.
In many EMUs, the process of implementing the measures envisaged for the second phase of the EMP has begun and includes medium-long term measures, based essentially on restocking and habitat restoration measures.
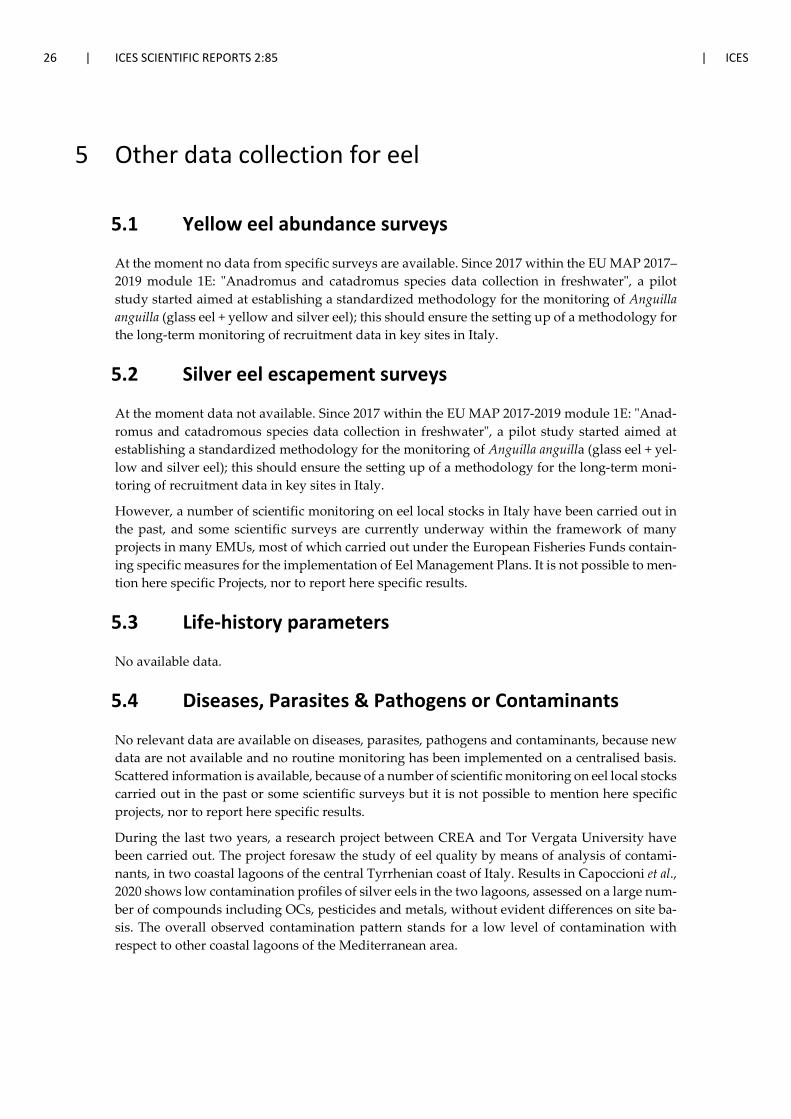
26 | ICES SCIENTIFIC REPORTS 2:85 | ICES
5 Other data collection for eel
5.1 Yellow eel abundance surveys
At the moment no data from specific surveys are available. Since 2017 within the EU MAP 2017–2019 module 1E: "Anadromus and catadromus species data collection in freshwater", a pilot study started aimed at establishing a standardized methodology for the monitoring of Anguilla anguilla (glass eel + yellow and silver eel); this should ensure the setting up of a methodology for the long-term monitoring of recruitment data in key sites in Italy.
5.2 Silver eel escapement surveys
At the moment data not available. Since 2017 within the EU MAP 2017-2019 module 1E: "Anad-romus and catadromous species data collection in freshwater", a pilot study started aimed at establishing a standardized methodology for the monitoring of Anguilla anguilla (glass eel + yel-low and silver eel); this should ensure the setting up of a methodology for the long-term moni-toring of recruitment data in key sites in Italy.
However, a number of scientific monitoring on eel local stocks in Italy have been carried out in the past, and some scientific surveys are currently underway within the framework of many projects in many EMUs, most of which carried out under the European Fisheries Funds contain-ing specific measures for the implementation of Eel Management Plans. It is not possible to men-tion here specific Projects, nor to report here specific results.
5.3 Life-history parameters
No available data.
5.4 Diseases, Parasites & Pathogens or Contaminants
No relevant data are available on diseases, parasites, pathogens and contaminants, because new data are not available and no routine monitoring has been implemented on a centralised basis. Scattered information is available, because of a number of scientific monitoring on eel local stocks carried out in the past or some scientific surveys but it is not possible to mention here specific projects, nor to report here specific results.
During the last two years, a research project between CREA and Tor Vergata University have been carried out. The project foresaw the study of eel quality by means of analysis of contami-nants, in two coastal lagoons of the central Tyrrhenian coast of Italy. Results in Capoccioni et al., 2020 shows low contamination profiles of silver eels in the two lagoons, assessed on a large num-ber of compounds including OCs, pesticides and metals, without evident differences on site ba-sis. The overall observed contamination pattern stands for a low level of contamination with respect to other coastal lagoons of the Mediterranean area.

ICES | WGEEL 2020 | 27
6 New Information
No available data.
28 | ICES SCIENTIFIC REPORTS 2:85 | ICES
7 References
Aalto, E., Capoccioni, F., Terradez Mas, J., Schiavina, M., Leone, C., De Leo, G. and Ciccotti E. 2016. Quan-tifying 60 years of declining European eel (Anguilla anguilla L., 1758) fishery yields in Mediterranean coastal lagoons. ICES J. Mar. Sci. first published online May 8, 2015 doi:10.1093/icesjms/fsv084.
Acou A., Boury P., Laffaille P., Crivelli A.J., Feunteun E. 2005. Towards a standardized characterization of the potentially migrating silver European eel (Anguilla anguilla L.). Arch. Hydrobiol., 164, 237−255.
Bevacqua, D., G. De Leo, M. Gatto, and P. Melià. 2009. Size selectivity of fykenets for European eel Anguilla anguilla. Journal of Fish Biology, 74:2178–2186.
Bevacqua, D., Melià, P., Crivelli, A.J., De Leo, G.A. and Gatto, M. 2006. Timing and rate of sexual maturation of European eel in brackish and freshwater environments. Journal of Fish Biology, 69 Supplement C:200–208.
Bevacqua, D., Melià, P., De Leo, G.A. and Gatto M. 2011. Intra-specific scaling of natural mortality in fish: the paradigmatic case of the European eel. Oecologia 165, 333–339.
Capoccioni, F., Leone, C., and Ciccotti E., 2015. In Handbook for fish age determination theory and practice in Italian Data Collection Framework Context. Report Del Progetto Di Ricerca: Costituzione Di Gruppi Di Lavoro Finalizzati All’ottimizzazione Delle Metodologie d’indagine Campionarie Per La Valutazione Dello Stato Delle Risorse (Ministero Delle Politiche Agricole, Alimentari E Fore-stali – Direzione Pesca E Acquacoltura) - gruppo di lavoro sulla lettura dell’età dei pesci. SOCIETÀ ITALIANA DI BIOLOGIA MARINA: 210 Pp.
Capoccioni, F., Leone, C., Belpaire, C., Malarvannan, G., Poma, G., De Matteis, G., ... and Ciccotti, E. 2020. Quality assessment of escaping silver eel (Anguilla anguilla L.) to support management and conserva-tion strategies in Mediterranean coastal lagoons. Environmental Monitoring and Assessment, 192(9), 1–22.
Ciccotti E. 1997. Italy. In: Moriarty C. and W. Dekker (Editors.), Management of European eel fisheries. Fisheries Bulletin (Dublin), 15: 91–100.
Ciccotti, E. 2005. Interactions between capture fisheries and aquaculture: the case of the eel (Anguilla anguilla L., 1758). In Interactions between Capture Fisheries and Aquaculture: a methodological perspective, pp. 190–203. Ed. by S. Cataudella, D. Crosetti, and F. Massa. GFCM Studies and Reviews, N. 78, Rome.
Ciccotti, E., Busilacchi, S., and Cataudella, S. 2000. Eel, Anguilla anguilla (L.). Italy: recruitment, fisheries and aquaculture. Dana, 12, 7–15.
Ciccotti E. 2015. Italy Country Report, 116–156. In: Cataudella S., Crosetti D., Massa F. (Editors). Mediterra-nean coastal lagoons: sustainable management and interactions among aquaculture, capture fisheries and the environment. Studies and Reviews. General Fisheries Commission for the Mediterranean. No 95. Rome, FAO. 2015. 278 pp.
Colombo G. and Grandi G. 1996. Histological study of the development and sex differentiation of the gonad in the European eel. J. Fish Biol., 48, 493−512.
Council Regulation (EC) No 199/2008 of 25 February 2008 concerning the establishment of a Community framework for the collection, management and use of data in the fisheries sector and support for sci-entific advice regarding the Common Fisheries Policy.
Council Regulation (EC) No 762/2008 of the European Parliament and of the Council of 9 July 2008 on the submission by Member States of statistics on aquaculture and repealing Council Regulation (EC) No 788/96.
Durif C., Dufour S. and Elie P. 2005. The silvering process of Anguilla anguilla: a new classification from the yellow resident to the silver migration stage. J. Fish Biol., 66, 1025−1043.
ICES | WGEEL 2020 | 29
European Commission. 2007. Council Regulation (EC) No 1100/2007 of 18 September 2007 establishing measures for the recovery of the stock of European eel. Official Journal of the European Union 22.9.2007 L 248: 17–23.
GFCM (The General Fisheries Commission for the Mediterranean). 2018. Recommendation GFCM/42/2018/1 on a multiannual management plan for European eel in the Mediterranean Sea.
ICES. 2009. Report of the 2009 session of the Joint EIFAC/ICES Working Group on Eels. ICES CM 2009/ACOM:15, 117 pp.
ICES. 2011. Report of the 2011 session of the Joint EIFAC/ICES Working Group on Eels. ICES CM 2011/ACOM:18, 223 pp.
Melià, P., Bevacqua, D., Crivelli, A.J., De Leo, G.A., Panfili, J. and Gatto, M. 2006. Age and growth of Anguilla anguilla in the Camargue lagoons. Journal of Fish Biology 68:876–890.
PNG Italia. 2011. Piano Nazionale di Gestione (PNG) per l’anguilla in Italia Reg. (CE) 1100/07. February 2011.
Schiavina, M., Bevacqua, D., Melià, P., Crivelli, A.J., Gatto, M. and De Leo, A.G. 2015. A user-friendly tool to assess management plans for European eel fishery and conservation. Modelling & Software, 64 (c): 9–17.
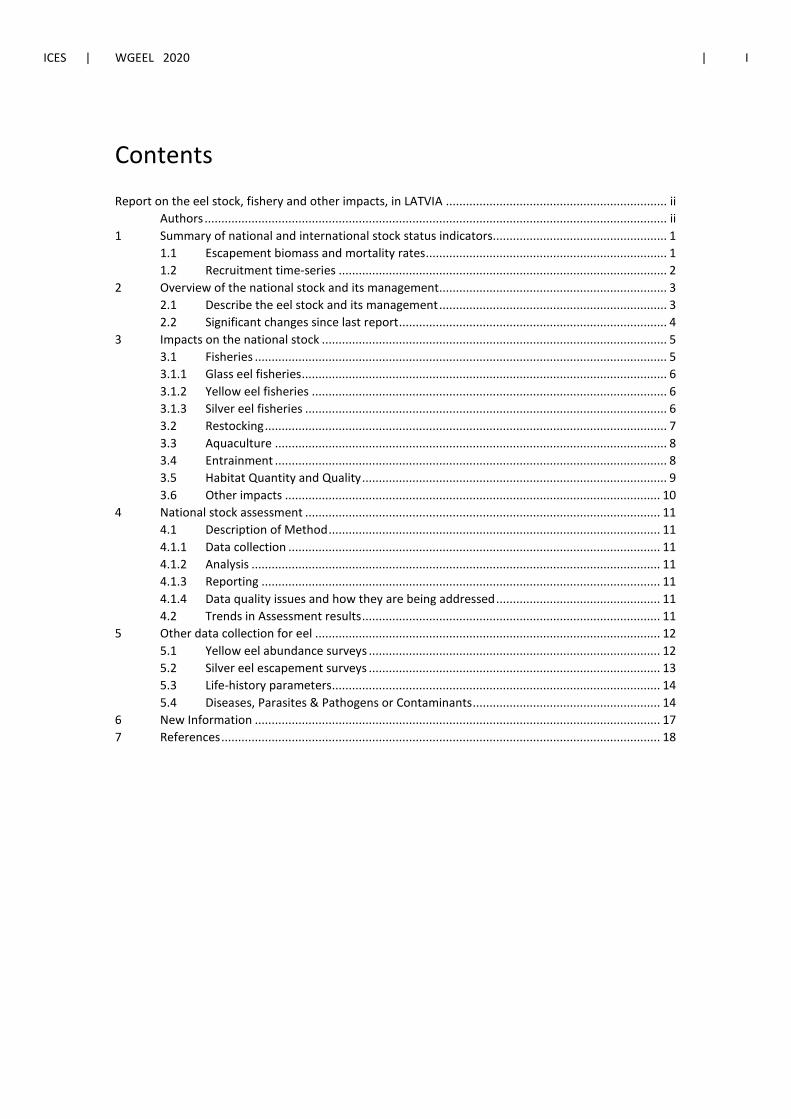
ICES | WGEEL 2020 | I
Contents
Report on the eel stock, fishery and other impacts, in LATVIA .................................................................. ii Authors .......................................................................................................................................... ii
1 Summary of national and international stock status indicators.................................................... 1 1.1 Escapement biomass and mortality rates ........................................................................ 1 1.2 Recruitment time-series .................................................................................................. 2
2 Overview of the national stock and its management.................................................................... 3 2.1 Describe the eel stock and its management .................................................................... 3 2.2 Significant changes since last report ................................................................................ 4
3 Impacts on the national stock ....................................................................................................... 5 3.1 Fisheries ........................................................................................................................... 5 3.1.1 Glass eel fisheries ............................................................................................................. 6 3.1.2 Yellow eel fisheries .......................................................................................................... 6 3.1.3 Silver eel fisheries ............................................................................................................ 6 3.2 Restocking ........................................................................................................................ 7 3.3 Aquaculture ..................................................................................................................... 8 3.4 Entrainment ..................................................................................................................... 8 3.5 Habitat Quantity and Quality ........................................................................................... 9 3.6 Other impacts ................................................................................................................ 10
4 National stock assessment .......................................................................................................... 11 4.1 Description of Method ................................................................................................... 11 4.1.1 Data collection ............................................................................................................... 11 4.1.2 Analysis .......................................................................................................................... 11 4.1.3 Reporting ....................................................................................................................... 11 4.1.4 Data quality issues and how they are being addressed ................................................. 11 4.2 Trends in Assessment results ......................................................................................... 11
5 Other data collection for eel ....................................................................................................... 12 5.1 Yellow eel abundance surveys ....................................................................................... 12 5.2 Silver eel escapement surveys ....................................................................................... 13 5.3 Life-history parameters .................................................................................................. 14 5.4 Diseases, Parasites & Pathogens or Contaminants ........................................................ 14
6 New Information ......................................................................................................................... 17 7 References ................................................................................................................................... 18
II | ICES SCIENTIFIC REPORTS 2:85 | ICES
Report on the eel stock, fishery and other impacts, in LATVIA
Authors
Ms. Janis Bajinskis, Institute of Food safety, animal health and Environment, BIOR, Riga, Latvia. Tel: +37167612536 [email protected]
Reporting Period: This report was completed in September 2020, and contains data up to 2019 and some provisional data for 2020.
ICES | WGEEL 2020 | 1
1 Summary of national and international stock status indicators
1.1 Escapement biomass and mortality rates
Currently there are not enough data to provide good and reliable stock indicators for eel in Lat-via. Eel landings in coastal waters of Latvia have fallen down to value less than 0.3 t per year. Only the part of freshwaters is accessible for eel. In the frame of eel recovery since 2011 glass eel restocking is carried out in waterbodies without man-made obstacles.
The total amount of waters in Latvia, where eel have been found historically in pristine or nearly pristine conditions, is unknown. For many watercourses there is no reliable historical infor-mation about whether eels have historically been found in these watercourses before the con-struction of the mill dams. In Soviet times, eel restocking had been done in some lakes where there is no information on eel presence before, thus expanding the overall range of this species in the country. According to 1950s survey data, the eels were found in 150 lakes, but frequently found, only in twelve of them (Kotov et al., 1958). According to rough estimates amount of waters in Latvia, where eel have been found historically could be 151 394 ha and historic silver eel bio-mass (B0) accordingly about 259 600 kg.
The maximum eel productivity obtained in eel farming lakes in Latvia, after restocking them with glass eel, has ranged from 0.7–5.6 kg/ha. According to fishing statistics, the highest produc-tivity of silver eel has been in some lakes in Daugava river basin district and it ranged from 4 to 5 kg/ha a year. This could be close to potential silver eel escapement from inland waters in pris-tine or nearly pristine conditions.
Historically coastal waters have yielded the highest eel landings in Latvia. In 1920s–1930s, they reached 100–130 t of eels per year. Today the proportion of eels in the total landings of coastal waters is less than 0.1%. Based on historical fisheries data, potential silver eel escapement from coastal waters could be estimated as 2 kg/ha.
Currently no data available on mortality rates.
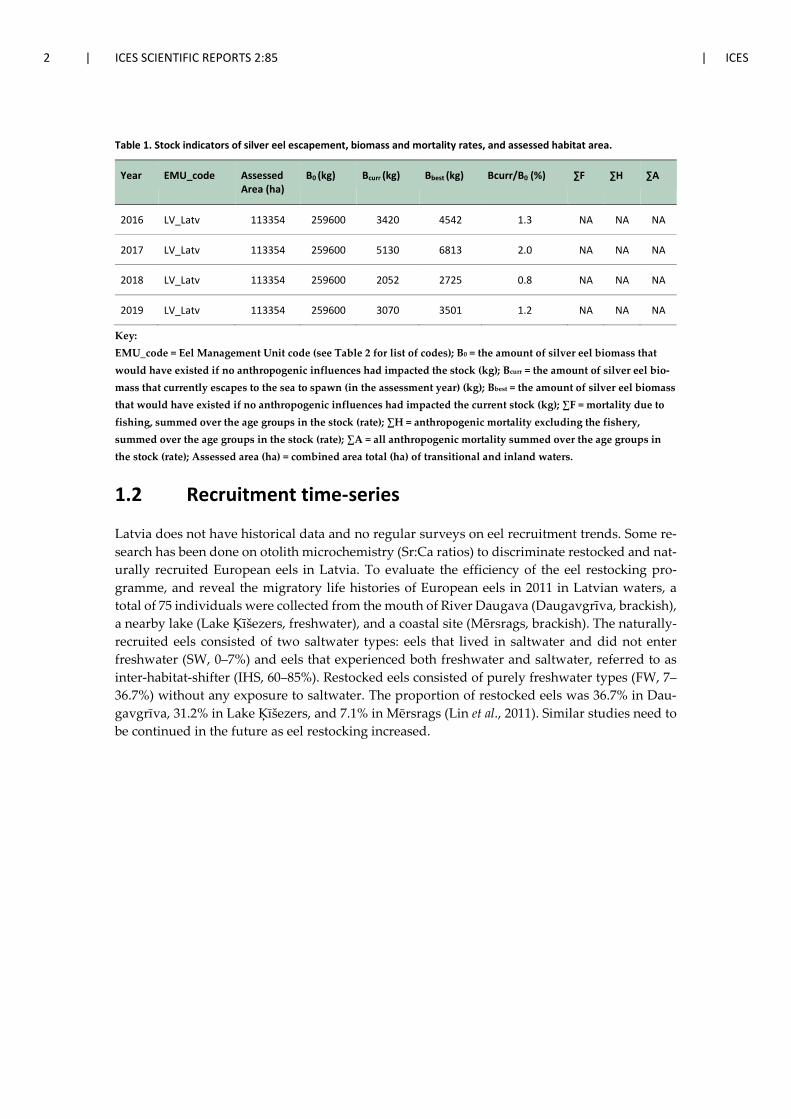
2 | ICES SCIENTIFIC REPORTS 2:85 | ICES
Table 1. Stock indicators of silver eel escapement, biomass and mortality rates, and assessed habitat area.
Year EMU_code Assessed Area (ha)
B0 (kg) Bcurr (kg) Bbest (kg) Bcurr/B0 (%) ∑F ∑H ∑A
2016 LV_Latv 113354 259600 3420 4542 1.3 NA NA NA
2017 LV_Latv 113354 259600 5130 6813 2.0 NA NA NA
2018 LV_Latv 113354 259600 2052 2725 0.8 NA NA NA
2019 LV_Latv 113354 259600 3070 3501 1.2 NA NA NA
Key: EMU_code = Eel Management Unit code (see Table 2 for list of codes); B0 = the amount of silver eel biomass that would have existed if no anthropogenic influences had impacted the stock (kg); Bcurr = the amount of silver eel bio-mass that currently escapes to the sea to spawn (in the assessment year) (kg); Bbest = the amount of silver eel biomass that would have existed if no anthropogenic influences had impacted the current stock (kg); ∑F = mortality due to fishing, summed over the age groups in the stock (rate); ∑H = anthropogenic mortality excluding the fishery, summed over the age groups in the stock (rate); ∑A = all anthropogenic mortality summed over the age groups in the stock (rate); Assessed area (ha) = combined area total (ha) of transitional and inland waters.
1.2 Recruitment time-series
Latvia does not have historical data and no regular surveys on eel recruitment trends. Some re-search has been done on otolith microchemistry (Sr:Ca ratios) to discriminate restocked and nat-urally recruited European eels in Latvia. To evaluate the efficiency of the eel restocking pro-gramme, and reveal the migratory life histories of European eels in 2011 in Latvian waters, a total of 75 individuals were collected from the mouth of River Daugava (Daugavgrīva, brackish), a nearby lake (Lake Ķīšezers, freshwater), and a coastal site (Mērsrags, brackish). The naturally-recruited eels consisted of two saltwater types: eels that lived in saltwater and did not enter freshwater (SW, 0–7%) and eels that experienced both freshwater and saltwater, referred to as inter-habitat-shifter (IHS, 60–85%). Restocked eels consisted of purely freshwater types (FW, 7–36.7%) without any exposure to saltwater. The proportion of restocked eels was 36.7% in Dau-gavgrīva, 31.2% in Lake Ķīšezers, and 7.1% in Mērsrags (Lin et al., 2011). Similar studies need to be continued in the future as eel restocking increased.

ICES | WGEEL 2020 | 3
2 Overview of the national stock and its management
2.1 Describe the eel stock and its management
In comparison with 1990s several countrywide restrictions were introduced for inland fisheries since early 2000s (before eel Regulation) like: prohibition for use of seines and longlines, prohi-bition (with exception for river lamprey fishing) of commercial fishing in the rivers. At present eel fishing at commercial value is carried out only in the twelve inland lakes and rivers between these lakes (inaccessible for free eel migration due to HPS or old mill dams). These lakes were restocked by glass eel several times in 1960–1980.
There are several main management actions provided to increase the silver eel escapement in Latvia:
• restocking of inland waters with glass eel (waters without HPS dams downstream, free way out to the see);
All together more than 4.4 million glass eel were restocked in 2011, 2012, 2014, 2017 and 2018 in the rivers and lakes of Latvia. In 2019, restocking of glass eel was continued (690 000 glass eel restocked). • mitigation of fisheries impact;
This management measure was not planned for EMP in the period for 2009–2013. Due to low and negligible impact on eel stock, fisheries were severely decreased and regulated by other rea-sons (not eel problems) in early 2000s. However, looking forward, some technical regulation measures enforced: increased size limit from 40 to 50 cm, decreasing of bag limit for anglers from five to three individuals per angling occasion (bag limit).
Some research activities related to eel management carried out:
• tagging experiment of silver eel to assess the eel mortality in different fisheries at differ-ent regions of Baltic Sea;
Taking into account frequently unsuccessful restocking of glass eel in Soviet period in 1970–1980 some rules regulating restocking practice were established regarding stocking density and sea-son.
• monitoring effectiveness of glass eel restocking;
Monitoring of yellow eel density carried out in the lakes and rivers restocked by glass eel in 2011–2020.
• study of eel quality;
Study results are published in:
Bajinskis J., Aleksejevs Ē., Ozoliņa Z., Začs D. 2020. The composition and quality of European eel Anguilla anguilla stock in Lake Rāznas. Environ Exp Biol 18: 51–52.
Rudovica V., Bartkevics V. 2015. Chemical elements in the muscle tissues of European eel (Anguilla anguilla) from selected lakes in Latvia. Environ. Monit. Assess. 187: 608. DOI 10.1007s/10661-015-4832-8.
Zacs D., Rjabova J., Fernandes A., Bartkevics V. 2016. Brominated, chlorinated and mixed brominated/chlo-rinated persistent organic pollutants in European eels (Anquilla anquilla) from Latvian lakes. Food ad-ditives&Contaminats: Part A. V.33., issue 3.
4 | ICES SCIENTIFIC REPORTS 2:85 | ICES
• study of predators (cormorant) impact.
Identification of problems scale has been done in Latvia. Impact consider as negligible. Taking into account insignificant effect, no measures have been taken regarding the control of predators.
Fishing effort in Latvia is regulated at the level of the Cabinet of Ministers annually, limiting the number of fishing gears in each of the water bodies where it is carried out. These restrictions apply both to public and private waters. In accordance with Latvian legislation, amendments to fishing effort for commercial and self-consumption can be made in each calendar year, changing the number of fishing gears or the type of fishing gear authorized. This change requires a scien-tific justification.
Starting from 2018, every year closed season is set for eel fishing, angling from November till January in coastal waters of Latvia.
2.2 Significant changes since last report
No significant changes.
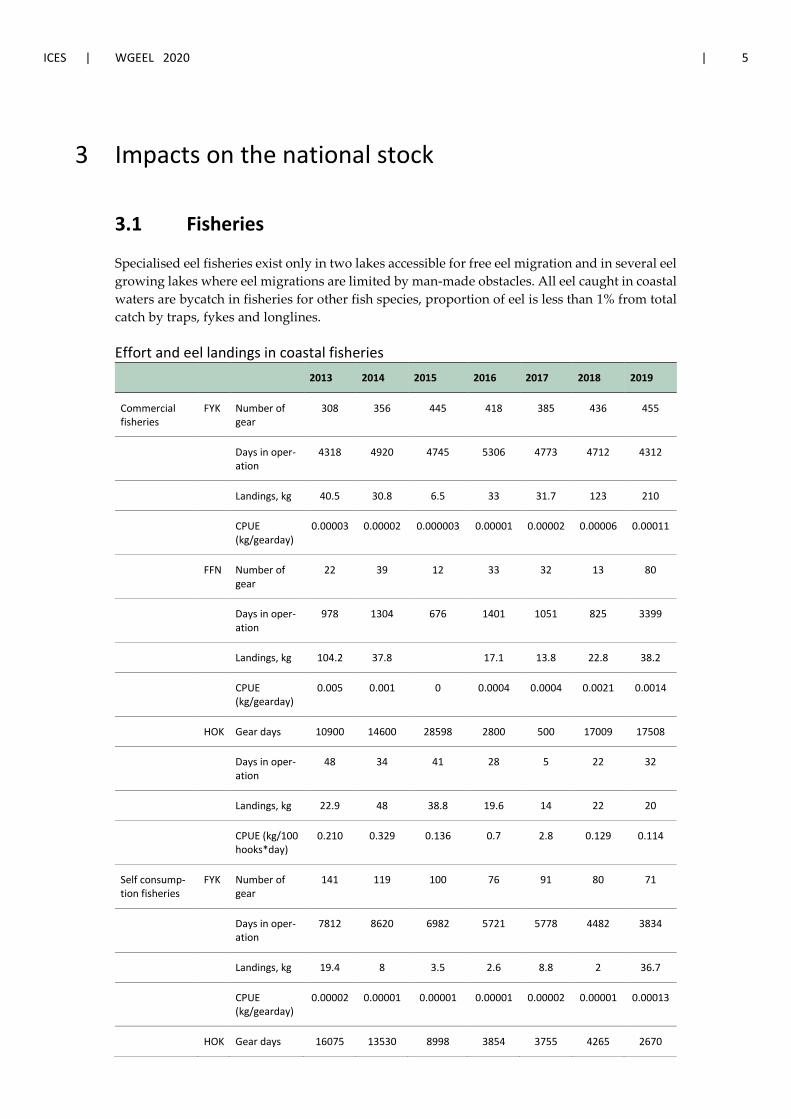
ICES | WGEEL 2020 | 5
3 Impacts on the national stock
3.1 Fisheries
Specialised eel fisheries exist only in two lakes accessible for free eel migration and in several eel growing lakes where eel migrations are limited by man-made obstacles. All eel caught in coastal waters are bycatch in fisheries for other fish species, proportion of eel is less than 1% from total catch by traps, fykes and longlines.
Effort and eel landings in coastal fisheries 2013 2014 2015 2016 2017 2018 2019
Commercial fisheries
FYK Number of gear
308 356 445 418 385 436 455
Days in oper-ation
4318 4920 4745 5306 4773 4712 4312
Landings, kg 40.5 30.8 6.5 33 31.7 123 210
CPUE (kg/gearday)
0.00003 0.00002 0.000003 0.00001 0.00002 0.00006 0.00011
FFN Number of gear
22 39 12 33 32 13 80
Days in oper-ation
978 1304 676 1401 1051 825 3399
Landings, kg 104.2 37.8
17.1 13.8 22.8 38.2
CPUE (kg/gearday)
0.005 0.001 0 0.0004 0.0004 0.0021 0.0014
HOK Gear days 10900 14600 28598 2800 500 17009 17508
Days in oper-ation
48 34 41 28 5 22 32
Landings, kg 22.9 48 38.8 19.6 14 22 20
CPUE (kg/100 hooks*day)
0.210 0.329 0.136 0.7 2.8 0.129 0.114
Self consump-tion fisheries
FYK Number of gear
141 119 100 76 91 80 71
Days in oper-ation
7812 8620 6982 5721 5778 4482 3834
Landings, kg 19.4 8 3.5 2.6 8.8 2 36.7
CPUE (kg/gearday)
0.00002 0.00001 0.00001 0.00001 0.00002 0.00001 0.00013
HOK Gear days 16075 13530 8998 3854 3755 4265 2670
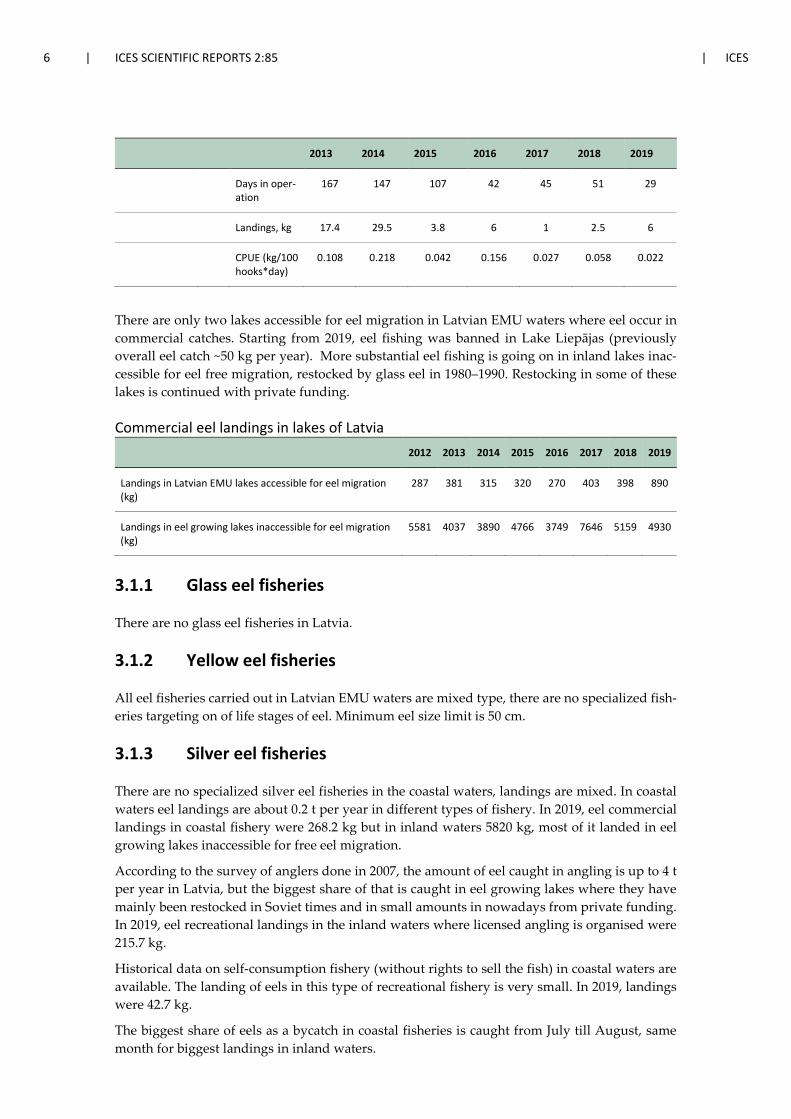
6 | ICES SCIENTIFIC REPORTS 2:85 | ICES
2013 2014 2015 2016 2017 2018 2019
Days in oper-ation
167 147 107 42 45 51 29
Landings, kg 17.4 29.5 3.8 6 1 2.5 6
CPUE (kg/100 hooks*day)
0.108 0.218 0.042 0.156 0.027 0.058 0.022
There are only two lakes accessible for eel migration in Latvian EMU waters where eel occur in commercial catches. Starting from 2019, eel fishing was banned in Lake Liepājas (previously overall eel catch ~50 kg per year). More substantial eel fishing is going on in inland lakes inac-cessible for eel free migration, restocked by glass eel in 1980–1990. Restocking in some of these lakes is continued with private funding.
Commercial eel landings in lakes of Latvia 2012 2013 2014 2015 2016 2017 2018 2019
Landings in Latvian EMU lakes accessible for eel migration (kg)
287 381 315 320 270 403 398 890
Landings in eel growing lakes inaccessible for eel migration (kg)
5581 4037 3890 4766 3749 7646 5159 4930
3.1.1 Glass eel fisheries
There are no glass eel fisheries in Latvia.
3.1.2 Yellow eel fisheries
All eel fisheries carried out in Latvian EMU waters are mixed type, there are no specialized fish-eries targeting on of life stages of eel. Minimum eel size limit is 50 cm.
3.1.3 Silver eel fisheries
There are no specialized silver eel fisheries in the coastal waters, landings are mixed. In coastal waters eel landings are about 0.2 t per year in different types of fishery. In 2019, eel commercial landings in coastal fishery were 268.2 kg but in inland waters 5820 kg, most of it landed in eel growing lakes inaccessible for free eel migration.
According to the survey of anglers done in 2007, the amount of eel caught in angling is up to 4 t per year in Latvia, but the biggest share of that is caught in eel growing lakes where they have mainly been restocked in Soviet times and in small amounts in nowadays from private funding. In 2019, eel recreational landings in the inland waters where licensed angling is organised were 215.7 kg.
Historical data on self-consumption fishery (without rights to sell the fish) in coastal waters are available. The landing of eels in this type of recreational fishery is very small. In 2019, landings were 42.7 kg.
The biggest share of eels as a bycatch in coastal fisheries is caught from July till August, same month for biggest landings in inland waters.
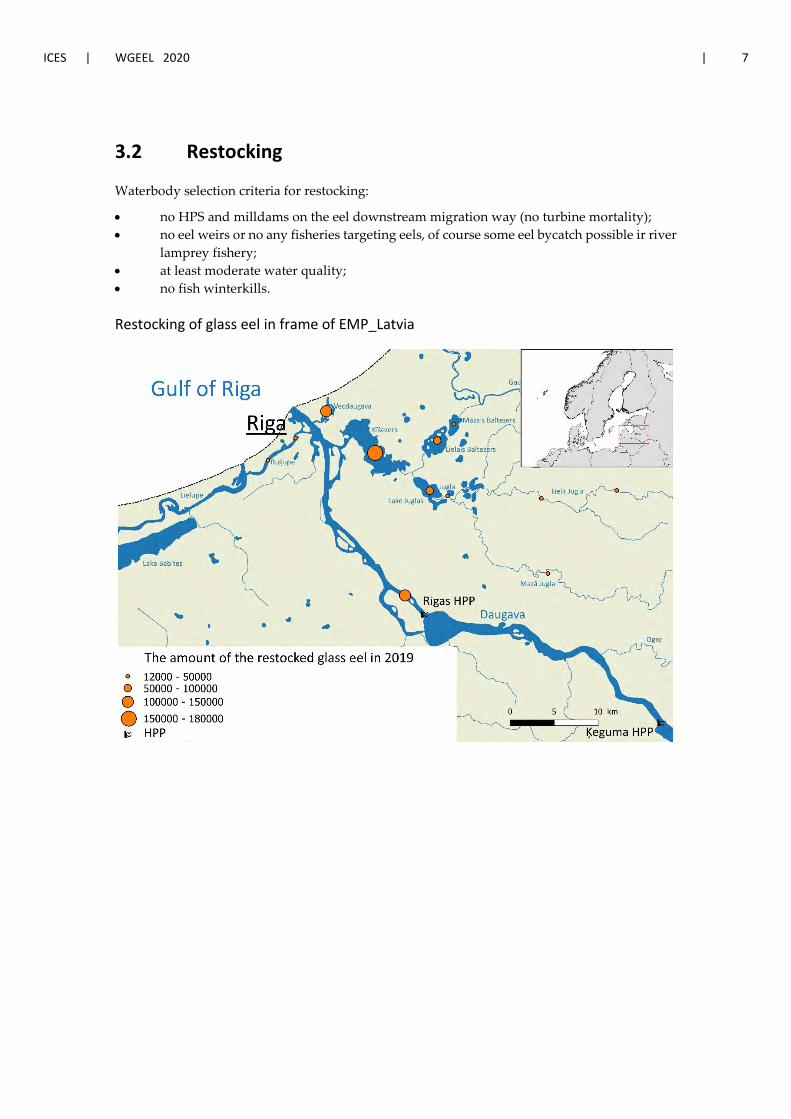
ICES | WGEEL 2020 | 7
3.2 Restocking
Waterbody selection criteria for restocking:
• no HPS and milldams on the eel downstream migration way (no turbine mortality); • no eel weirs or no any fisheries targeting eels, of course some eel bycatch possible ir river
lamprey fishery; • at least moderate water quality; • no fish winterkills.
Restocking of glass eel in frame of EMP_Latvia
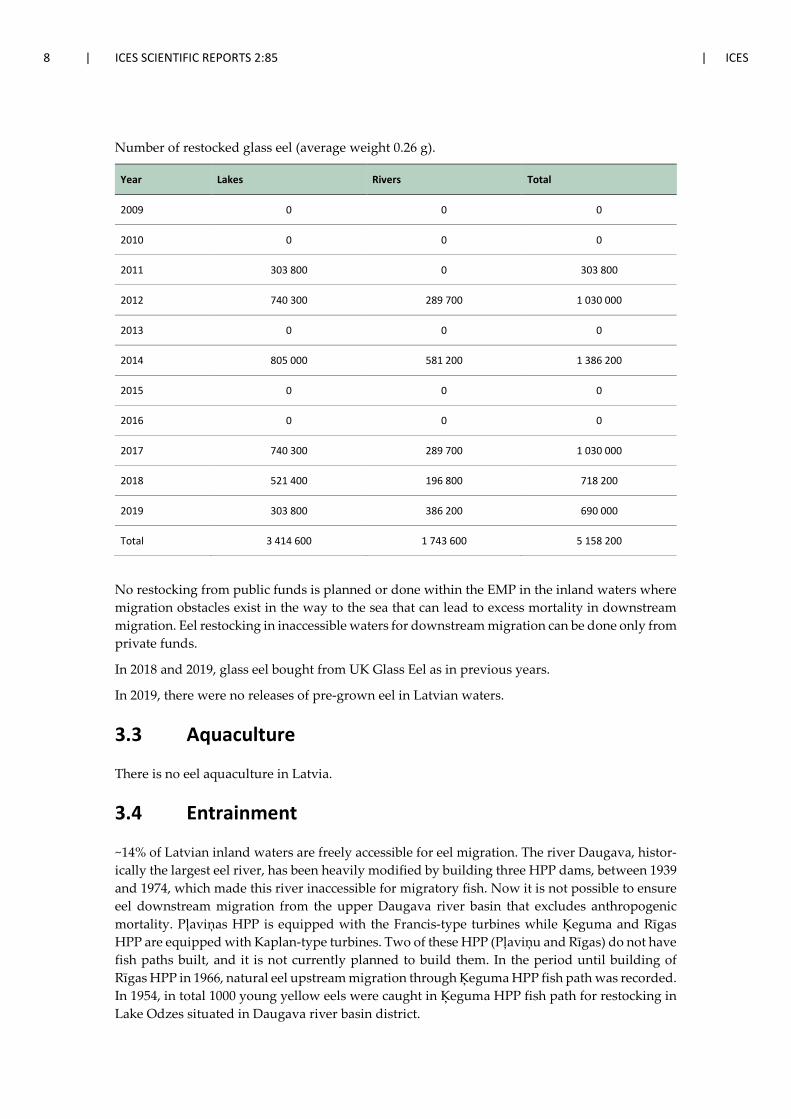
8 | ICES SCIENTIFIC REPORTS 2:85 | ICES
Number of restocked glass eel (average weight 0.26 g).
Year Lakes Rivers Total
2009 0 0 0
2010 0 0 0
2011 303 800 0 303 800
2012 740 300 289 700 1 030 000
2013 0 0 0
2014 805 000 581 200 1 386 200
2015 0 0 0
2016 0 0 0
2017 740 300 289 700 1 030 000
2018 521 400 196 800 718 200
2019 303 800 386 200 690 000
Total 3 414 600 1 743 600 5 158 200
No restocking from public funds is planned or done within the EMP in the inland waters where migration obstacles exist in the way to the sea that can lead to excess mortality in downstream migration. Eel restocking in inaccessible waters for downstream migration can be done only from private funds.
In 2018 and 2019, glass eel bought from UK Glass Eel as in previous years.
In 2019, there were no releases of pre-grown eel in Latvian waters.
3.3 Aquaculture
There is no eel aquaculture in Latvia.
3.4 Entrainment
~14% of Latvian inland waters are freely accessible for eel migration. The river Daugava, histor-ically the largest eel river, has been heavily modified by building three HPP dams, between 1939 and 1974, which made this river inaccessible for migratory fish. Now it is not possible to ensure eel downstream migration from the upper Daugava river basin that excludes anthropogenic mortality. Pļaviņas HPP is equipped with the Francis-type turbines while Ķeguma and Rīgas HPP are equipped with Kaplan-type turbines. Two of these HPP (Pļaviņu and Rīgas) do not have fish paths built, and it is not currently planned to build them. In the period until building of Rīgas HPP in 1966, natural eel upstream migration through Ķeguma HPP fish path was recorded. In 1954, in total 1000 young yellow eels were caught in Ķeguma HPP fish path for restocking in Lake Odzes situated in Daugava river basin district.
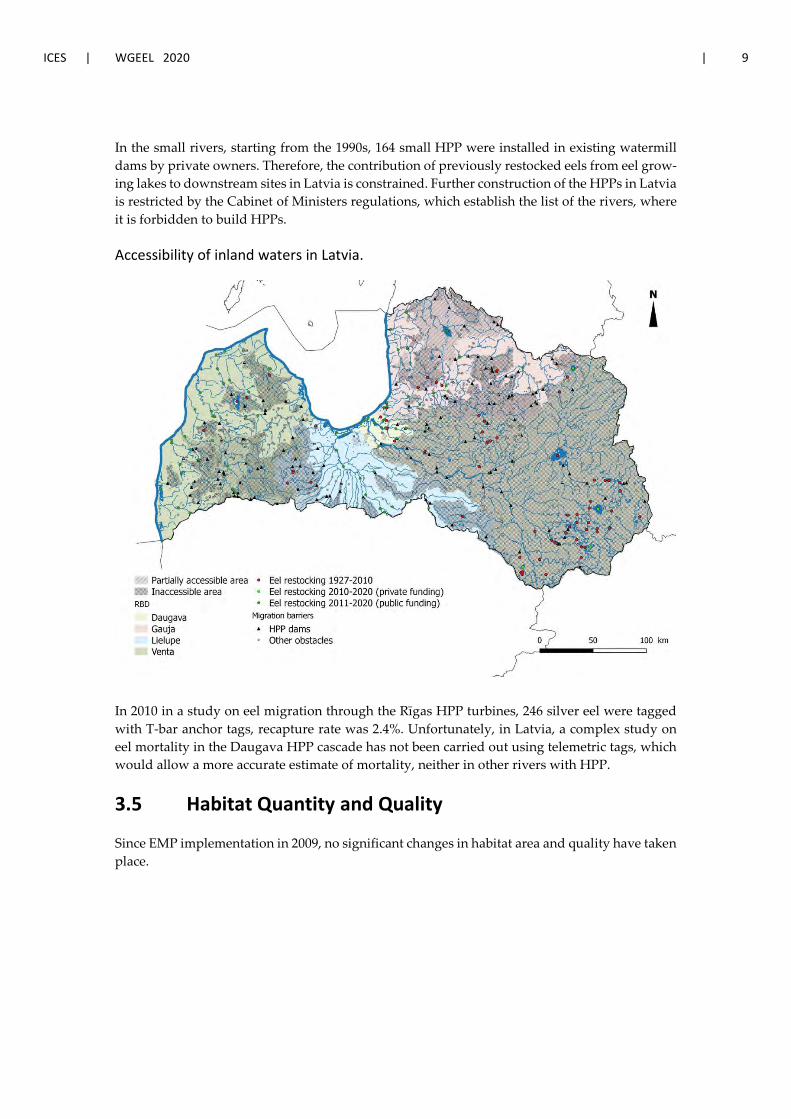
ICES | WGEEL 2020 | 9
In the small rivers, starting from the 1990s, 164 small HPP were installed in existing watermill dams by private owners. Therefore, the contribution of previously restocked eels from eel grow-ing lakes to downstream sites in Latvia is constrained. Further construction of the HPPs in Latvia is restricted by the Cabinet of Ministers regulations, which establish the list of the rivers, where it is forbidden to build HPPs.
Accessibility of inland waters in Latvia.
In 2010 in a study on eel migration through the Rīgas HPP turbines, 246 silver eel were tagged with T-bar anchor tags, recapture rate was 2.4%. Unfortunately, in Latvia, a complex study on eel mortality in the Daugava HPP cascade has not been carried out using telemetric tags, which would allow a more accurate estimate of mortality, neither in other rivers with HPP.
3.5 Habitat Quantity and Quality
Since EMP implementation in 2009, no significant changes in habitat area and quality have taken place.
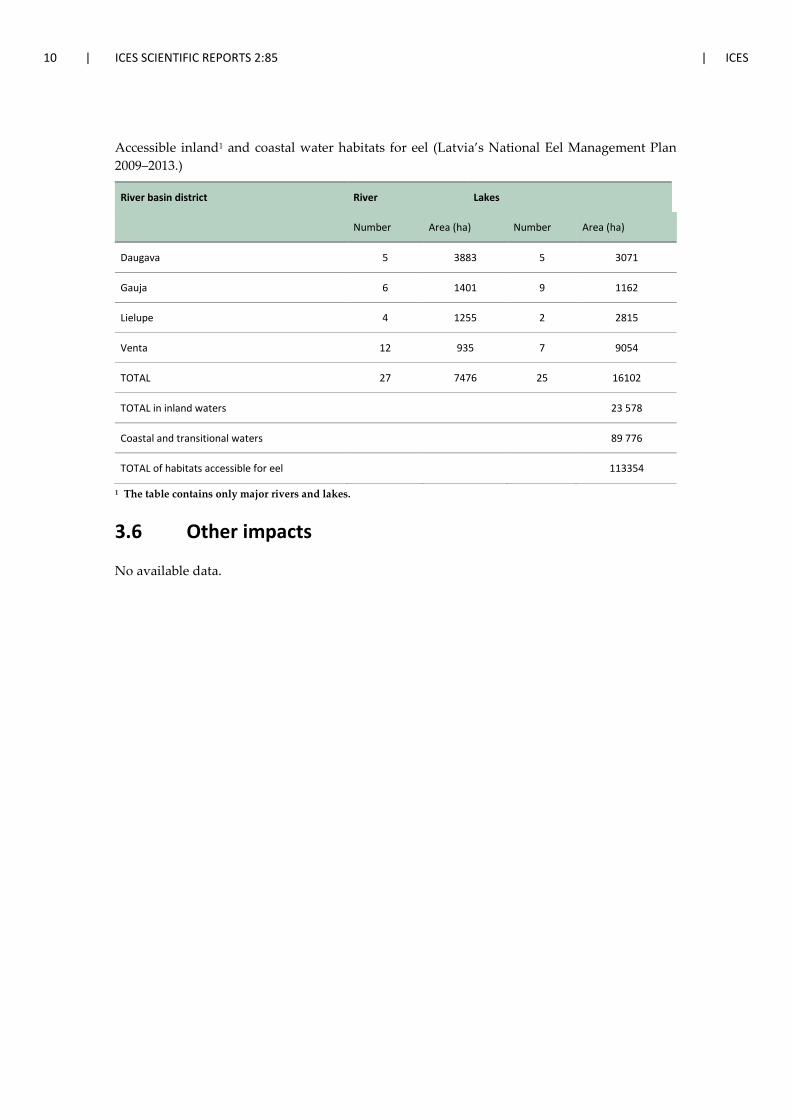
10 | ICES SCIENTIFIC REPORTS 2:85 | ICES
Accessible inland1 and coastal water habitats for eel (Latvia’s National Eel Management Plan 2009–2013.)
River basin district River Lakes
Number Area (ha) Number Area (ha)
Daugava 5 3883 5 3071
Gauja 6 1401 9 1162
Lielupe 4 1255 2 2815
Venta 12 935 7 9054
TOTAL 27 7476 25 16102
TOTAL in inland waters 23 578
Coastal and transitional waters 89 776
TOTAL of habitats accessible for eel 113354
1 The table contains only major rivers and lakes.
3.6 Other impacts
No available data.
ICES | WGEEL 2020 | 11
4 National stock assessment
4.1 Description of Method
4.1.1 Data collection
The collection of biological data of eel in Latvia is rather complicated as the volumes of landings are very small. In the fishery, eels are not sorted in silver and yellow eel and it is not determined by Latvian legislation as well. Proportion of silver and yellow eel in the fisheries can be roughly assessed using the results of biological analyses performed to eel caught by contract fishermen. The collection of biological data on eel from commercial fishing in Latvia have rather short his-tory, it was started in 2006, and only data from 2008 can be used to estimate proportion of silver and yellow eel in landings. Data from biological analyses in Lake Ķīšezers and the Gulf of Riga until 2011, indicate that all analysed eel were silver eel females at various silvering stages accord-ing to Durif et al. (2009).
Data collection in commercial fishery is carried out by sampling of all landed eels from one se-lected trap in the Gulf of Riga. Number of sampled eels was <100 in last three years. All landed eels are sampled; length, weight, sex, eye diameter, weight, pectoral fin length, stomach contents, Anguillicola crassus presence/absence in swimming bladder registered. Otoliths are collected for age reading which was started in 2017.
4.1.2 Analysis
Silvering stage determined according to Durif et al. (2009).
4.1.3 Reporting
Reported in annual country report, also in national report for Latvian Ministry of Agriculture.
4.1.4 Data quality issues and how they are being addressed
No available data.
4.2 Trends in Assessment results
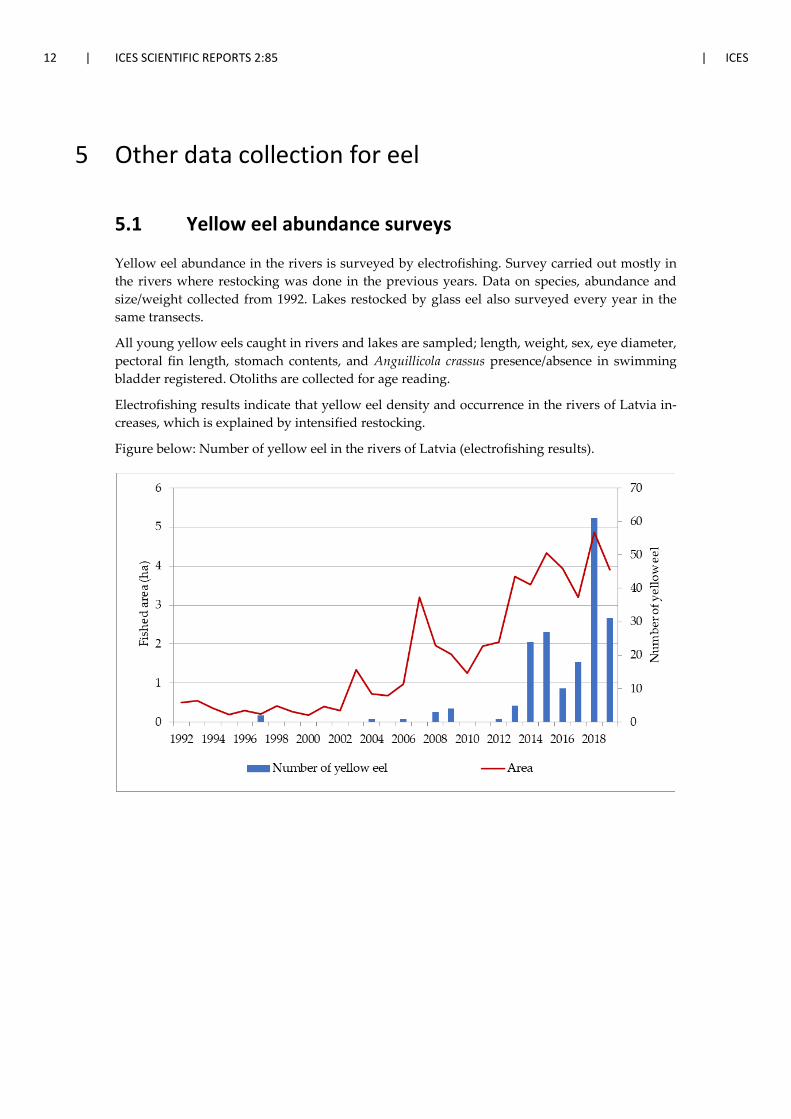
12 | ICES SCIENTIFIC REPORTS 2:85 | ICES
5 Other data collection for eel
5.1 Yellow eel abundance surveys
Yellow eel abundance in the rivers is surveyed by electrofishing. Survey carried out mostly in the rivers where restocking was done in the previous years. Data on species, abundance and size/weight collected from 1992. Lakes restocked by glass eel also surveyed every year in the same transects.
All young yellow eels caught in rivers and lakes are sampled; length, weight, sex, eye diameter, pectoral fin length, stomach contents, and Anguillicola crassus presence/absence in swimming bladder registered. Otoliths are collected for age reading.
Electrofishing results indicate that yellow eel density and occurrence in the rivers of Latvia in-creases, which is explained by intensified restocking.
Figure below: Number of yellow eel in the rivers of Latvia (electrofishing results).
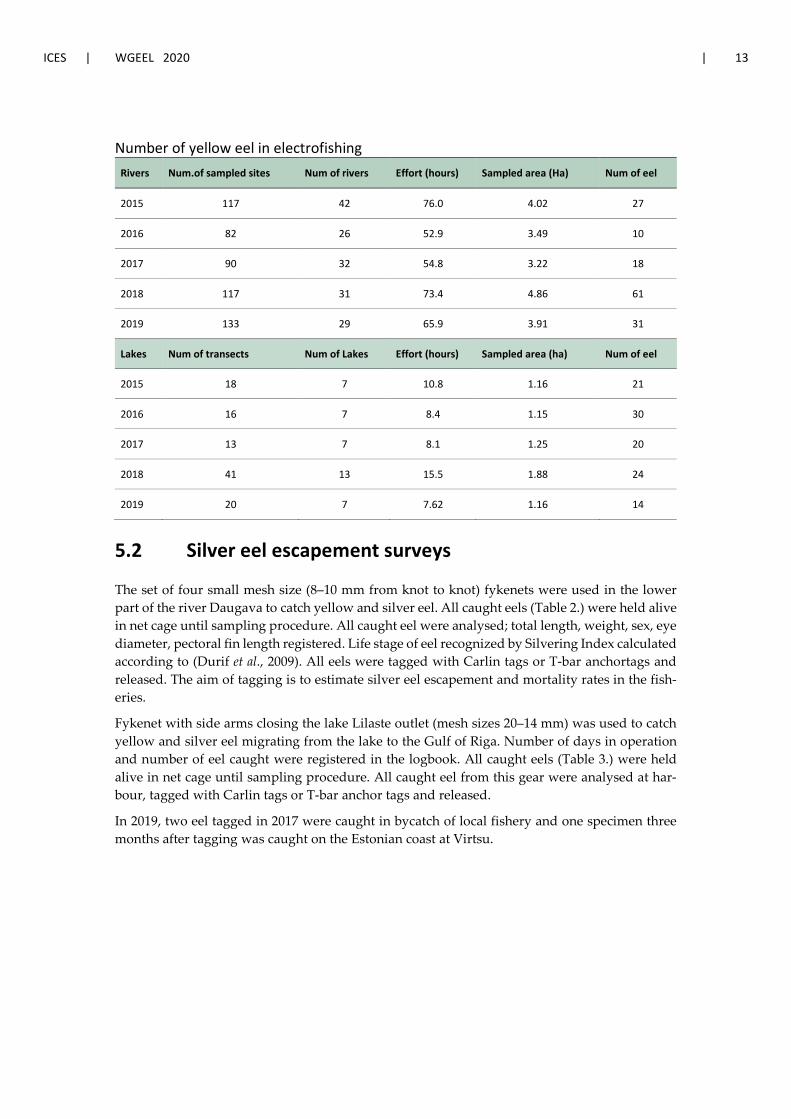
ICES | WGEEL 2020 | 13
Number of yellow eel in electrofishing Rivers Num.of sampled sites Num of rivers Effort (hours) Sampled area (Ha) Num of eel
2015 117 42 76.0 4.02 27
2016 82 26 52.9 3.49 10
2017 90 32 54.8 3.22 18
2018 117 31 73.4 4.86 61
2019 133 29 65.9 3.91 31
Lakes Num of transects Num of Lakes Effort (hours) Sampled area (ha) Num of eel
2015 18 7 10.8 1.16 21
2016 16 7 8.4 1.15 30
2017 13 7 8.1 1.25 20
2018 41 13 15.5 1.88 24
2019 20 7 7.62 1.16 14
5.2 Silver eel escapement surveys
The set of four small mesh size (8–10 mm from knot to knot) fykenets were used in the lower part of the river Daugava to catch yellow and silver eel. All caught eels (Table 2.) were held alive in net cage until sampling procedure. All caught eel were analysed; total length, weight, sex, eye diameter, pectoral fin length registered. Life stage of eel recognized by Silvering Index calculated according to (Durif et al., 2009). All eels were tagged with Carlin tags or T-bar anchortags and released. The aim of tagging is to estimate silver eel escapement and mortality rates in the fish-eries.
Fykenet with side arms closing the lake Lilaste outlet (mesh sizes 20–14 mm) was used to catch yellow and silver eel migrating from the lake to the Gulf of Riga. Number of days in operation and number of eel caught were registered in the logbook. All caught eels (Table 3.) were held alive in net cage until sampling procedure. All caught eel from this gear were analysed at har-bour, tagged with Carlin tags or T-bar anchor tags and released.
In 2019, two eel tagged in 2017 were caught in bycatch of local fishery and one specimen three months after tagging was caught on the Estonian coast at Virtsu.

14 | ICES SCIENTIFIC REPORTS 2:85 | ICES
Data on the river Daugava yellow/silver eel test fishing.
Year Days in opera-tion
Number of Yellow eel
Number of Silver eel
CPUE Yellow eel
CPUE Silver eel
Total CPUE
2014 135 6 5 0.04 0.04 0.08
2015 153 59 7 0.49 0.06 0.43
2016 70 26 4 0.34 0.07 0.43
2017 108 47 1 0.44 0.01 0.44
2018 77 14 0 0.18 0.00 0.18
2019 114 49 28 0.43 0.25 0.68
Data on the river Lilaste yellow/silver eel test fishing.
Year Days in opera-tion
Number of Yellow eel
Number of Silver eel
CPUE Yellow eel
CPUE Silver eel
Total CPUE
2017 97 96 3 0.99 0.03 1.02
2018 103 7 9 0.06 0.09 0.16
2019 99 5 4 0.05 0.04 0.09
5.3 Life-history parameters
In 2019, 40 eel caught in scientific fishery (fykenets and electrofishing) of different life stages were analysed and aged using otolith thin sections. According to results, population is domi-nated by five to eight year old eels mostly corresponding to restocking years.
Age structure of eels caught in scientific fishery in 2019 in inland waters of Latvia accessible for eel migration.
Age class Average length Average weight number of males number of females Undefined
5 434 166.3 7 7 -
6 433 146.3 0 2 -
7 580 410.3 1 4 -
8 718.5 821.1 0 19 -
5.4 Diseases, Parasites & Pathogens or Contaminants
Eels sampled in the frame of DCF are also examined for presence of Anguillicola. Results are summarized in table below. The prevalence of Anguillicola crassus in the territory of Latvia is generally not identified but it is found both in the eel natural distribution waters and in the eel growing lakes.
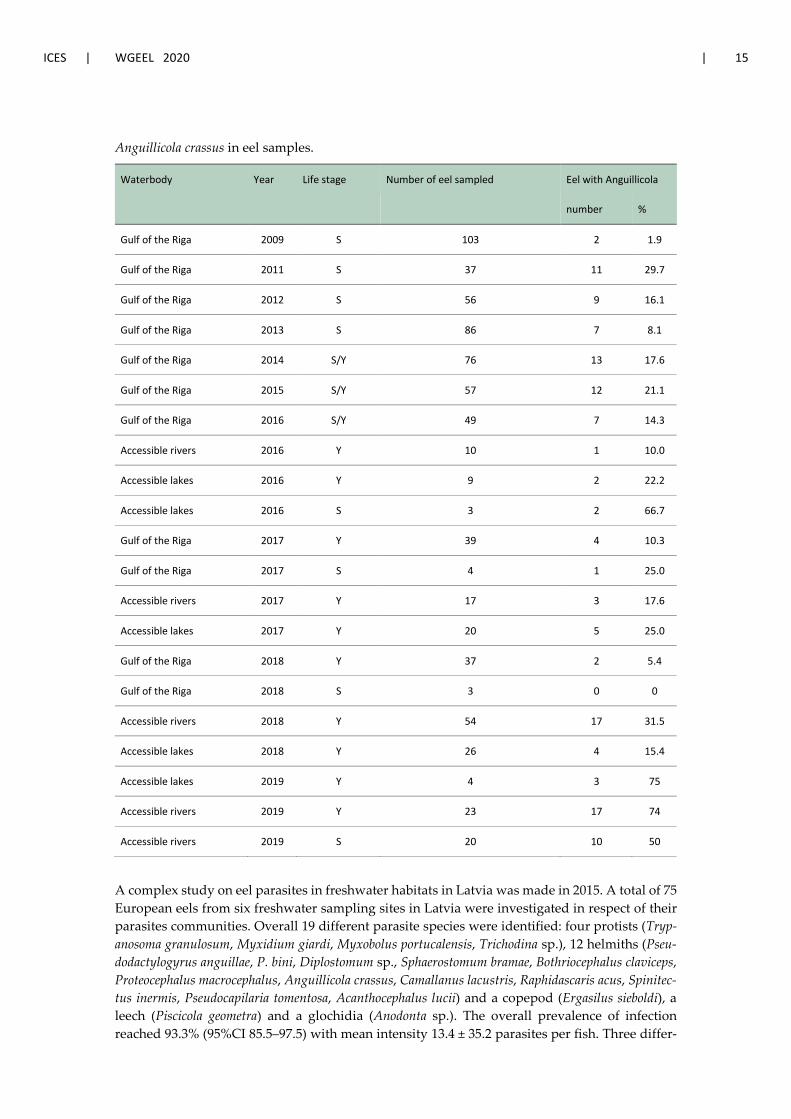
ICES | WGEEL 2020 | 15
Anguillicola crassus in eel samples.
Waterbody Year Life stage Number of eel sampled Eel with Anguillicola
number %
Gulf of the Riga 2009 S 103 2 1.9
Gulf of the Riga 2011 S 37 11 29.7
Gulf of the Riga 2012 S 56 9 16.1
Gulf of the Riga 2013 S 86 7 8.1
Gulf of the Riga 2014 S/Y 76 13 17.6
Gulf of the Riga 2015 S/Y 57 12 21.1
Gulf of the Riga 2016 S/Y 49 7 14.3
Accessible rivers 2016 Y 10 1 10.0
Accessible lakes 2016 Y 9 2 22.2
Accessible lakes 2016 S 3 2 66.7
Gulf of the Riga 2017 Y 39 4 10.3
Gulf of the Riga 2017 S 4 1 25.0
Accessible rivers 2017 Y 17 3 17.6
Accessible lakes 2017 Y 20 5 25.0
Gulf of the Riga 2018 Y 37 2 5.4
Gulf of the Riga 2018 S 3 0 0
Accessible rivers 2018 Y 54 17 31.5
Accessible lakes 2018 Y 26 4 15.4
Accessible lakes 2019 Y 4 3 75
Accessible rivers 2019 Y 23 17 74
Accessible rivers 2019 S 20 10 50
A complex study on eel parasites in freshwater habitats in Latvia was made in 2015. A total of 75 European eels from six freshwater sampling sites in Latvia were investigated in respect of their parasites communities. Overall 19 different parasite species were identified: four protists (Tryp-anosoma granulosum, Myxidium giardi, Myxobolus portucalensis, Trichodina sp.), 12 helmiths (Pseu-dodactylogyrus anguillae, P. bini, Diplostomum sp., Sphaerostomum bramae, Bothriocephalus claviceps, Proteocephalus macrocephalus, Anguillicola crassus, Camallanus lacustris, Raphidascaris acus, Spinitec-tus inermis, Pseudocapilaria tomentosa, Acanthocephalus lucii) and a copepod (Ergasilus sieboldi), a leech (Piscicola geometra) and a glochidia (Anodonta sp.). The overall prevalence of infection reached 93.3% (95%CI 85.5–97.5) with mean intensity 13.4 ± 35.2 parasites per fish. Three differ-

16 | ICES SCIENTIFIC REPORTS 2:85 | ICES
ent parasite communities with different species richness, diversity, evenness and dominant spe-cies were defined. This was a first report about M. portucalensis and S. inermis in eels from lakes in Latvia and this is a new geographic record for those species (Deksne et al., 2015a; Deksne et al., 2015b).
In 2015 also, study has been made on microhabitat preference and relationships between meta-zoan parasites on the gill apparatus of the European eel from freshwaters of Latvia (Zolovs et al., 2015).
A recent research results demonstrated that PCBs, PBBs and other POPs groups’ chemical com-pounds concentration in eels muscle tissues are below the Concentrations determined in Regu-lation EK 1259/2011. The concentration of main elements determined in muscle tissues varied within the following ranges: for Pb 0.019–0.047; Cd 0.0051–0.011; Hg 0.13–0.36; Cu 0.76–0.92; Zn 28–42; and As 0.13–0.23 mg kg−1 wet weight determined limitation (Bajinskis et al., 2020; Ru-dovica and Bartkevis, 2015; Zacs et al., 2016).

ICES | WGEEL 2020 | 17
6 New Information
No available data.
18 | ICES SCIENTIFIC REPORTS 2:85 | ICES
7 References
Bajinskis J., Aleksejevs Ē., Ozoliņa Z., Začs D. 2020. The composition and quality of European eel Anguilla anguilla stock in Lake Rāznas. Environ Exp Biol 18: 51–52.
Deksne G., Daukšte J., Aizups J., Zolovs M., Kirjušina M. 2015a. Parasite communities of European eels Anguilla anguilla in freshwater habitats in Latvia. Book of Abstracts of the 8th International Conference on Biodiversity Research, Daugavpils, Latvia, 28–30 April, 56.
Deksne G., Aizups J., Zolovs M., Daukste J. 2015b. New geographic record of Myxobolus portucalensis (Saraiva & Molnar, 1990) and Spinitectus inermis (Zeder, 1800) in European eel (Anguilla anguilla) para-site communities from Latvia freshwaters. Acta Biologica Universitatis Daugavpiliensis, vol. 15, no. 2: 259–265.
Durif C., Guibert A., Elie P. 2009. Morphological discrimination of the silvering stages of the European eel. American Fisheries Society Symposium 58, 103–111.
Kotov N.D., Nikanorova E.A., Nikanorov J.I. 1958. Ribohozjajstvennije issledovanija ozer Latvijskoj SSR. Ribnoje hozjajstvo vnutrennih vodoemov LSSR. vip. II tr. VII 259–292 (In Russian).
Lin Y. J., Shiao J. C., Plikshs M., Minde A., Iizuka Y., Rashal I., Tzeng W. N. 2011. Otolith Sr:Ca Ratios as Natural Mark to Discriminate the Restocked and Naturally Recruited European Eels in Latvia. 76th American Fisheries Society Symposium.
Rudovica V., Bartkevics V. 2015. Chemical elements in the muscle tissues of European eel (Anguilla anguilla) from selected lakes in Latvia. Environ. Monit. Assess. 187: 608. DOI 10.1007s/10661-015-4832-8.
Zacs D., Rjabova J., Fernandes A., Bartkevics V. 2016. Brominated, chlorinated and mixed brominated/chlo-rinated persistent organic pollutants in European eels (Anquilla anquilla) from Latvian lakes. Food Ad-ditives & Contaminants: Part A. V.33., issue 3.
Zolovs M., Deksne G., Daukste J., Aizups J., Kirjusina M. 2015. Microhabitat preference and relationships between metazoan parasites on the gill apparatus of the European eel (Anguilla anguilla) from freshwa-ters of Latvia. Acta Biologica Universitatis Daugavpiliensis, vol. 15, no. 1: 241–249.
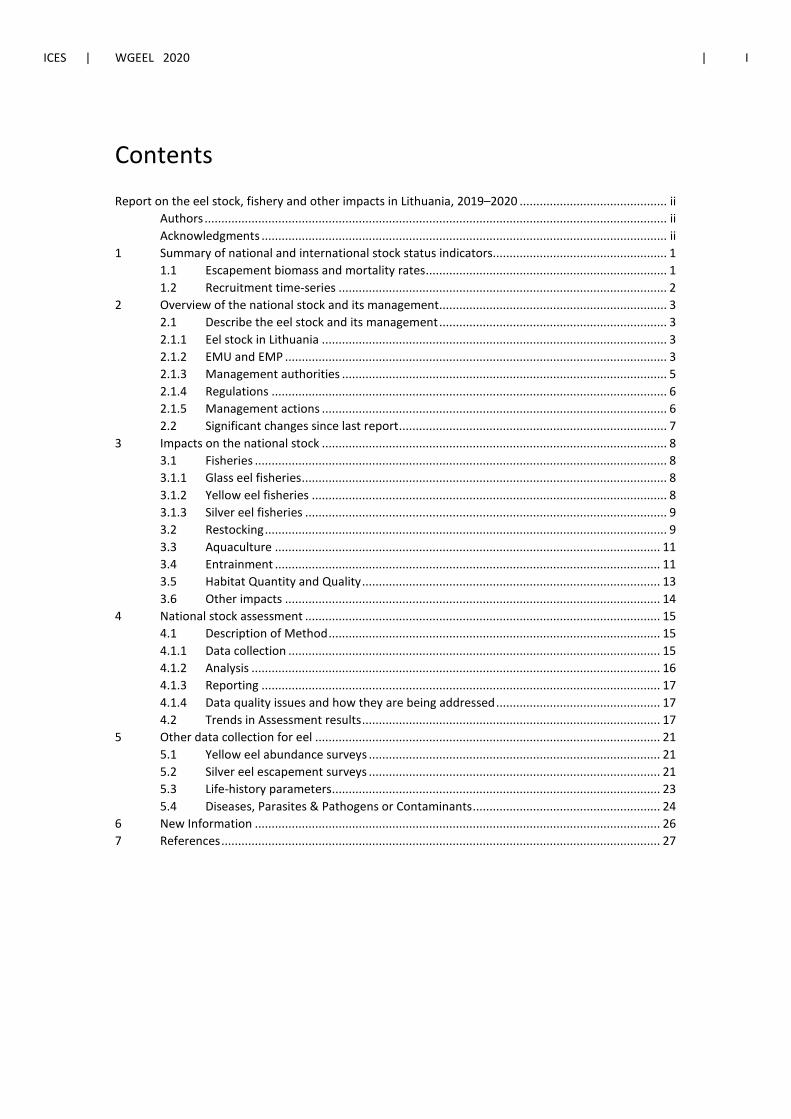
ICES | WGEEL 2020 | I
Contents
Report on the eel stock, fishery and other impacts in Lithuania, 2019–2020 ............................................ ii Authors .......................................................................................................................................... ii Acknowledgments ......................................................................................................................... ii
1 Summary of national and international stock status indicators.................................................... 1 1.1 Escapement biomass and mortality rates ........................................................................ 1 1.2 Recruitment time-series .................................................................................................. 2
2 Overview of the national stock and its management.................................................................... 3 2.1 Describe the eel stock and its management .................................................................... 3 2.1.1 Eel stock in Lithuania ....................................................................................................... 3 2.1.2 EMU and EMP .................................................................................................................. 3 2.1.3 Management authorities ................................................................................................. 5 2.1.4 Regulations ...................................................................................................................... 6 2.1.5 Management actions ....................................................................................................... 6 2.2 Significant changes since last report ................................................................................ 7
3 Impacts on the national stock ....................................................................................................... 8 3.1 Fisheries ........................................................................................................................... 8 3.1.1 Glass eel fisheries ............................................................................................................. 8 3.1.2 Yellow eel fisheries .......................................................................................................... 8 3.1.3 Silver eel fisheries ............................................................................................................ 9 3.2 Restocking ........................................................................................................................ 9 3.3 Aquaculture ................................................................................................................... 11 3.4 Entrainment ................................................................................................................... 11 3.5 Habitat Quantity and Quality ......................................................................................... 13 3.6 Other impacts ................................................................................................................ 14
4 National stock assessment .......................................................................................................... 15 4.1 Description of Method ................................................................................................... 15 4.1.1 Data collection ............................................................................................................... 15 4.1.2 Analysis .......................................................................................................................... 16 4.1.3 Reporting ....................................................................................................................... 17 4.1.4 Data quality issues and how they are being addressed ................................................. 17 4.2 Trends in Assessment results ......................................................................................... 17
5 Other data collection for eel ....................................................................................................... 21 5.1 Yellow eel abundance surveys ....................................................................................... 21 5.2 Silver eel escapement surveys ....................................................................................... 21 5.3 Life-history parameters .................................................................................................. 23 5.4 Diseases, Parasites & Pathogens or Contaminants ........................................................ 24
6 New Information ......................................................................................................................... 26 7 References ................................................................................................................................... 27
II | ICES SCIENTIFIC REPORTS 2:85 | ICES
Report on the eel stock, fishery and other impacts in Lithuania, 2019–2020
Authors
Dr Linas Ložys, Nature Research Centre, Laboratory of Marine Ecology, Lithuania. Tel: +370 5 2729257, [email protected]
Dr Justas Dainys, Nature Research Centre, Laboratory of Marine Ecology, Lithuania. [email protected]
Justas Poviliūnas, Fisheries service under the ministry of Agriculture of the Republic of Lithua-nia. [email protected]
Dr Arvydas Švagždys, Klaipeda University Marine Research Institute, Lithuania. [email protected]
Reporting Period: This report was completed in August 2020, and contains data up to 2019 and 2020
Contribution to the report: L. Ložys and J. Dainys did the update of the assessment of eel stock in Lithuania, provided information on most other parts of the report and edited the text. J. Povil-iūnas provided information on eel sampling and analyses performed by Fisheries Service under Ministry of Agriculture and contributed to the text of the report. A. Švagždys provided infor-mation and results on eel sampling implemented by Klaipeda University (chapters 5.3 and 5.4).
Acknowledgments
Fisheries Service under Ministry of Agriculture funded assessment of eel stock and impacts in Lithuania during 2017–2018 and 2020.
We express our sincere gratitude to Dr Willem Dekker for his help in 2018 and 2020 with assess-ments of Lithuanian eel stock.
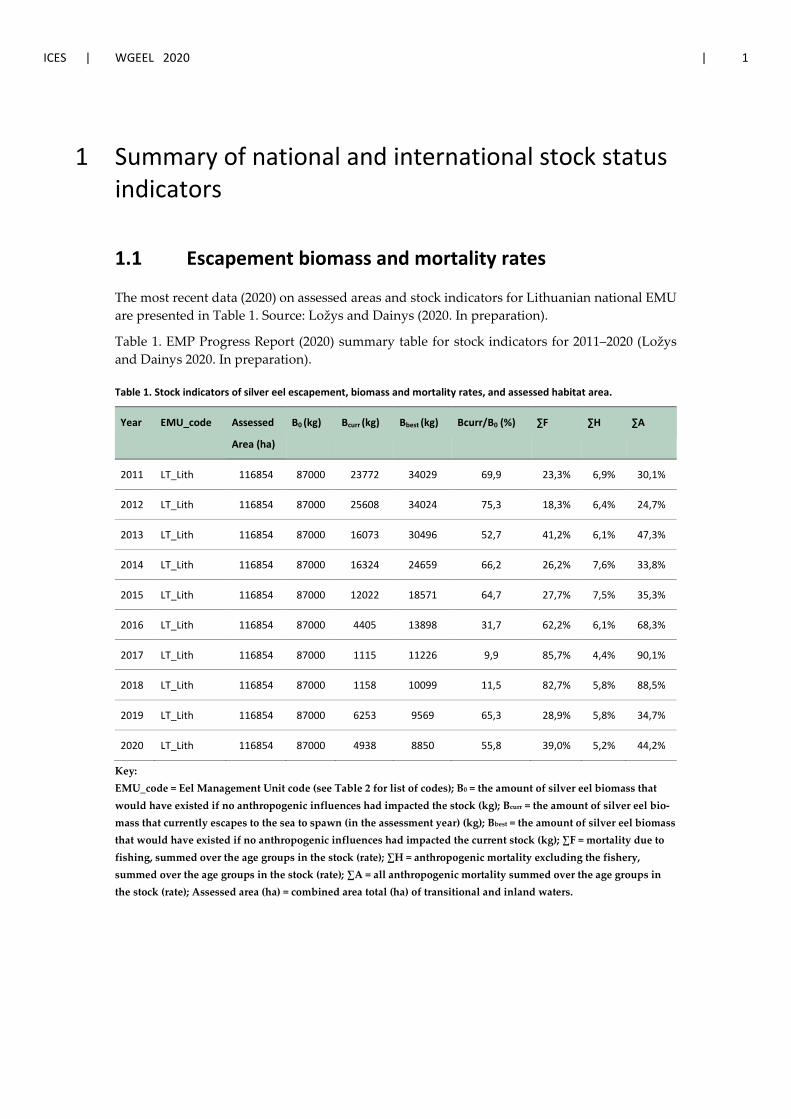
ICES | WGEEL 2020 | 1
1 Summary of national and international stock status indicators
1.1 Escapement biomass and mortality rates
The most recent data (2020) on assessed areas and stock indicators for Lithuanian national EMU are presented in Table 1. Source: Ložys and Dainys (2020. In preparation).
Table 1. EMP Progress Report (2020) summary table for stock indicators for 2011–2020 (Ložys and Dainys 2020. In preparation).
Table 1. Stock indicators of silver eel escapement, biomass and mortality rates, and assessed habitat area.
Year EMU_code Assessed
Area (ha)
B0 (kg) Bcurr (kg) Bbest (kg) Bcurr/B0 (%) ∑F ∑H ∑A
2011 LT_Lith 116854 87000 23772 34029 69,9 23,3% 6,9% 30,1%
2012 LT_Lith 116854 87000 25608 34024 75,3 18,3% 6,4% 24,7%
2013 LT_Lith 116854 87000 16073 30496 52,7 41,2% 6,1% 47,3%
2014 LT_Lith 116854 87000 16324 24659 66,2 26,2% 7,6% 33,8%
2015 LT_Lith 116854 87000 12022 18571 64,7 27,7% 7,5% 35,3%
2016 LT_Lith 116854 87000 4405 13898 31,7 62,2% 6,1% 68,3%
2017 LT_Lith 116854 87000 1115 11226 9,9 85,7% 4,4% 90,1%
2018 LT_Lith 116854 87000 1158 10099 11,5 82,7% 5,8% 88,5%
2019 LT_Lith 116854 87000 6253 9569 65,3 28,9% 5,8% 34,7%
2020 LT_Lith 116854 87000 4938 8850 55,8 39,0% 5,2% 44,2%
Key: EMU_code = Eel Management Unit code (see Table 2 for list of codes); B0 = the amount of silver eel biomass that would have existed if no anthropogenic influences had impacted the stock (kg); Bcurr = the amount of silver eel bio-mass that currently escapes to the sea to spawn (in the assessment year) (kg); Bbest = the amount of silver eel biomass that would have existed if no anthropogenic influences had impacted the current stock (kg); ∑F = mortality due to fishing, summed over the age groups in the stock (rate); ∑H = anthropogenic mortality excluding the fishery, summed over the age groups in the stock (rate); ∑A = all anthropogenic mortality summed over the age groups in the stock (rate); Assessed area (ha) = combined area total (ha) of transitional and inland waters.
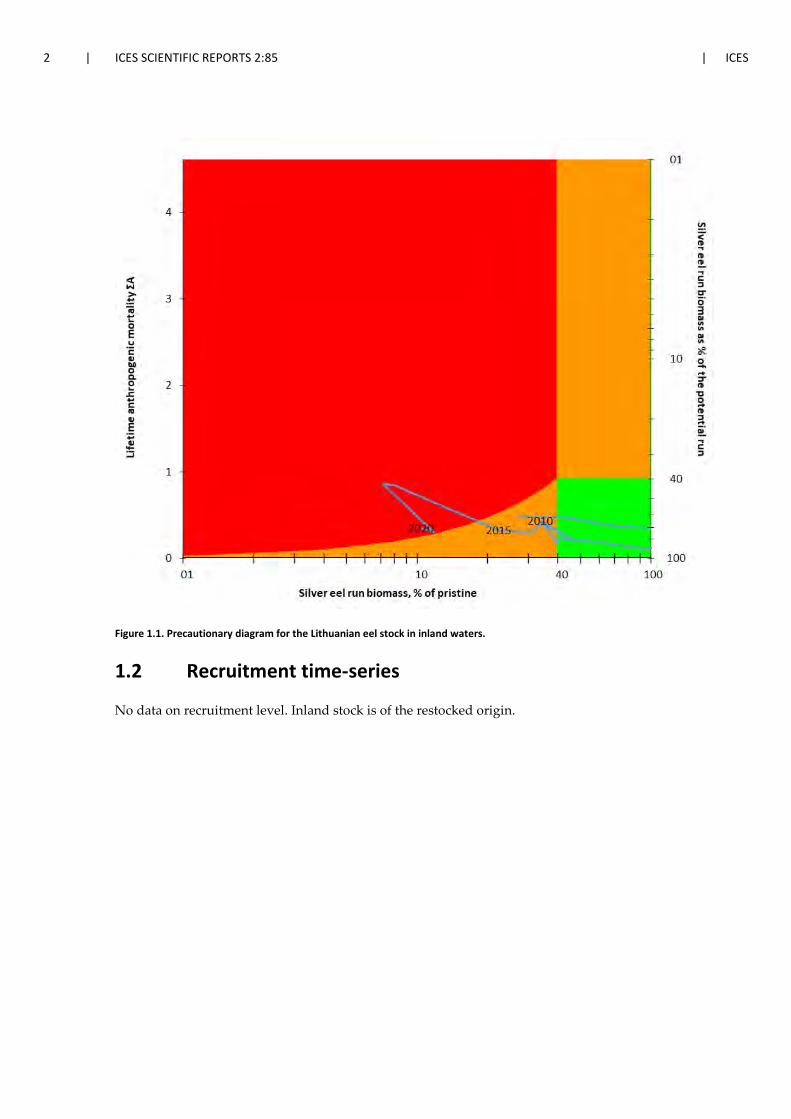
2 | ICES SCIENTIFIC REPORTS 2:85 | ICES
Figure 1.1. Precautionary diagram for the Lithuanian eel stock in inland waters.
1.2 Recruitment time-series
No data on recruitment level. Inland stock is of the restocked origin.

ICES | WGEEL 2020 | 3
2 Overview of the national stock and its management
2.1 Describe the eel stock and its management
2.1.1 Eel stock in Lithuania
Typical eel habitats in Lithuania are lakes, ponds, Curonian lagoon and coastal waters of the Baltic Sea. Rivers, especially small, in Lithuania are not considered as typical eel habitats (Anon. 2008); however, in some rare cases single eels are caught in rivers during research surveys or by anglers. According to dr. T. Virbickas (personal communication 2008 and 2016) in Lithuania only single eels are caught during electrofishing surveys in rivers and in all cases in close distance from stocked lakes. On the other hand, in recent years, some eels were stocked to large rivers and of course rivers serve as ways for eel, including silver eel, migration.
It is known that eels in the inland waters are of stocked origin (Anon. 2008). However, according to otolith microchemical analyses, eels in the Curonian Lagoon and the Baltic Sea coastal zone 80% and 98% respectively are of natural origin and 20% and 2% are stocked (Shiao et al., 2006 and Lin et al., 2007).
Even in the past when eel stock was in good condition in the all distribution range and stocking was not launched yet, large eel fishery was known in the Curonian lagoon, while there are no data on specialized fishery for eels in the inland waters. Study done on eel otoliths in 2015 sug-gests that 94% of eels caught in the Curonian lagoon were of stocked and only 6% of natural origin. However, most of caught and analysed eels (80%) were at silver eel stage and caught during autumn, i.e. likely migrated from lakes for spawning in the Atlantic Ocean.
According to historical data (Shiao et al., 2006) first stockings in Lithuanian inland waters were performed during 1928–1939 in Vilnius region (currently part of stocked lakes belongs to Bela-rus). Stocking of lakes resulted in later rise of eel fishery in continental part of Lithuania. Com-mercial catches until the beginning of sixties were registered almost only in waterbodies of Vil-nius region where eels were stocked during 1928–1939, while in the rest part of the country fish-ery for eels did not exist or was negligible. After first post-war stockings (starting from 1956), eel catches during 1970–1991 reasonably increased in the entire territory of Lithuania. It is evident, that inland stock and its abundance, directly depends on stocking; natural eel stocks in the Cu-ronian lagoon and coastal waters of the Baltic Sea are in steep decline due to overall decline of the stock in all range of the species distribution.
2.1.2 EMU and EMP
ICES estimated eel stock to be outside safe biological limits and continuously (1999–20006) rec-ommended to take urgent international measures to protect the stock by reducing fishery mor-tality as much as possible until plan to protect and restore eel stock will be developed. As the result EC prepared a Communication entitled "Development of a Community Action Plan for the management of European Eel (COM(2003) 573 final)” in 2003. In 2005, EC announced the initial proposal for a Council Regulation establishing measures for the recovery of the stock of European eel. The final decision concerning the Council Regulation has been approved in 2007 ((EC) No 1100/2007). The Regulation obligates Member States to define the current state of their stocks, identify measures necessary for the recovery of stocks, implement these measures and assess the effectiveness of these actions.
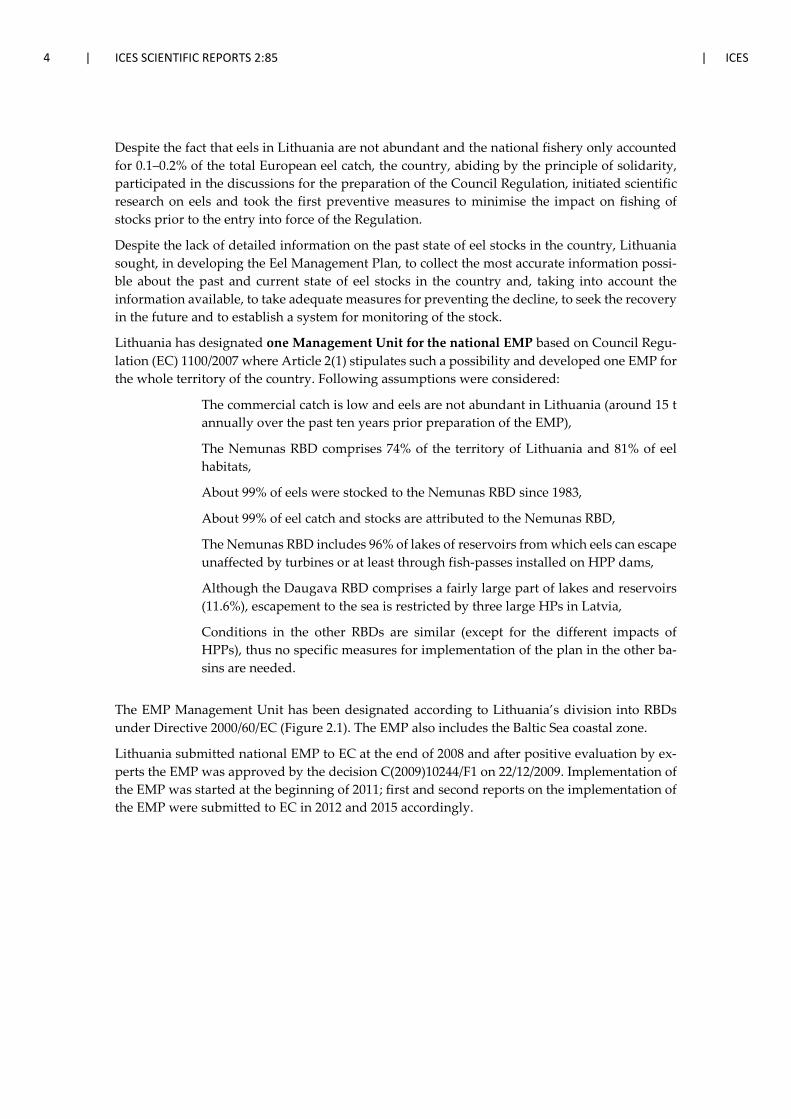
4 | ICES SCIENTIFIC REPORTS 2:85 | ICES
Despite the fact that eels in Lithuania are not abundant and the national fishery only accounted for 0.1–0.2% of the total European eel catch, the country, abiding by the principle of solidarity, participated in the discussions for the preparation of the Council Regulation, initiated scientific research on eels and took the first preventive measures to minimise the impact on fishing of stocks prior to the entry into force of the Regulation.
Despite the lack of detailed information on the past state of eel stocks in the country, Lithuania sought, in developing the Eel Management Plan, to collect the most accurate information possi-ble about the past and current state of eel stocks in the country and, taking into account the information available, to take adequate measures for preventing the decline, to seek the recovery in the future and to establish a system for monitoring of the stock.
Lithuania has designated one Management Unit for the national EMP based on Council Regu-lation (EC) 1100/2007 where Article 2(1) stipulates such a possibility and developed one EMP for the whole territory of the country. Following assumptions were considered:
The commercial catch is low and eels are not abundant in Lithuania (around 15 t annually over the past ten years prior preparation of the EMP),
The Nemunas RBD comprises 74% of the territory of Lithuania and 81% of eel habitats,
About 99% of eels were stocked to the Nemunas RBD since 1983,
About 99% of eel catch and stocks are attributed to the Nemunas RBD,
The Nemunas RBD includes 96% of lakes of reservoirs from which eels can escape unaffected by turbines or at least through fish-passes installed on HPP dams,
Although the Daugava RBD comprises a fairly large part of lakes and reservoirs (11.6%), escapement to the sea is restricted by three large HPs in Latvia,
Conditions in the other RBDs are similar (except for the different impacts of HPPs), thus no specific measures for implementation of the plan in the other ba-sins are needed.
The EMP Management Unit has been designated according to Lithuania’s division into RBDs under Directive 2000/60/EC (Figure 2.1). The EMP also includes the Baltic Sea coastal zone.
Lithuania submitted national EMP to EC at the end of 2008 and after positive evaluation by ex-perts the EMP was approved by the decision C(2009)10244/F1 on 22/12/2009. Implementation of the EMP was started at the beginning of 2011; first and second reports on the implementation of the EMP were submitted to EC in 2012 and 2015 accordingly.
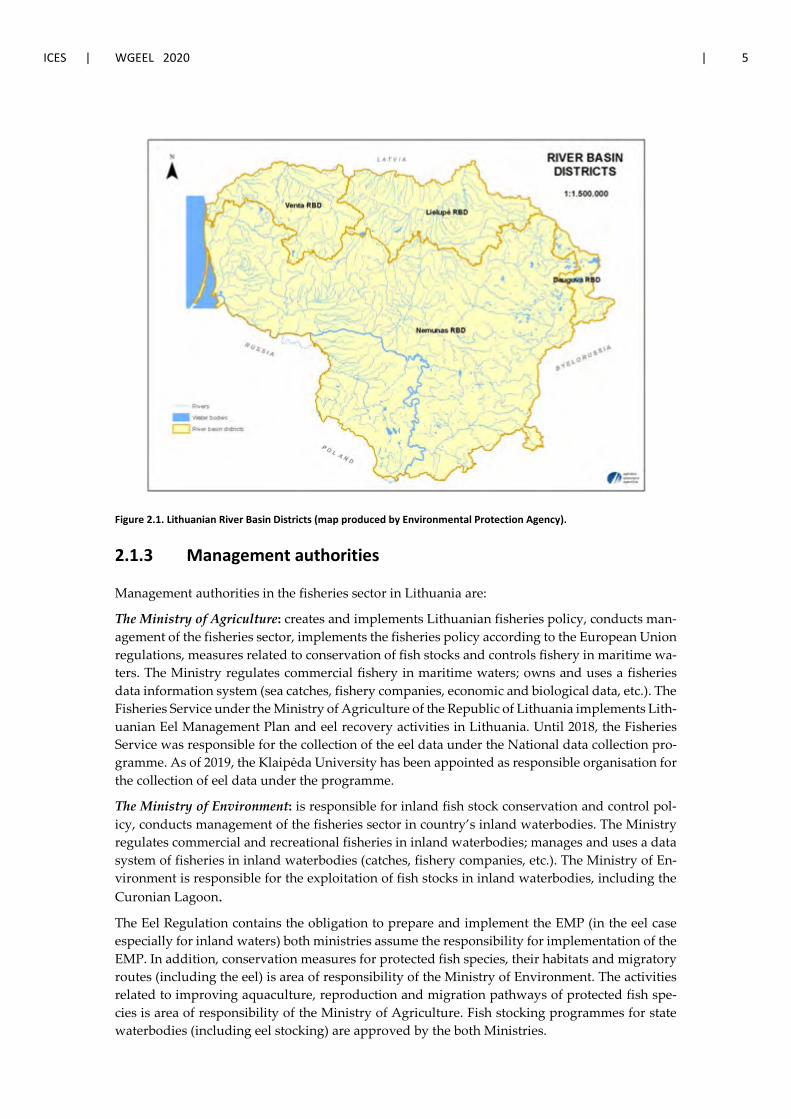
ICES | WGEEL 2020 | 5
Figure 2.1. Lithuanian River Basin Districts (map produced by Environmental Protection Agency).
2.1.3 Management authorities
Management authorities in the fisheries sector in Lithuania are:
The Ministry of Agriculture: creates and implements Lithuanian fisheries policy, conducts man-agement of the fisheries sector, implements the fisheries policy according to the European Union regulations, measures related to conservation of fish stocks and controls fishery in maritime wa-ters. The Ministry regulates commercial fishery in maritime waters; owns and uses a fisheries data information system (sea catches, fishery companies, economic and biological data, etc.). The Fisheries Service under the Ministry of Agriculture of the Republic of Lithuania implements Lith-uanian Eel Management Plan and eel recovery activities in Lithuania. Until 2018, the Fisheries Service was responsible for the collection of the eel data under the National data collection pro-gramme. As of 2019, the Klaipėda University has been appointed as responsible organisation for the collection of eel data under the programme.
The Ministry of Environment: is responsible for inland fish stock conservation and control pol-icy, conducts management of the fisheries sector in country’s inland waterbodies. The Ministry regulates commercial and recreational fisheries in inland waterbodies; manages and uses a data system of fisheries in inland waterbodies (catches, fishery companies, etc.). The Ministry of En-vironment is responsible for the exploitation of fish stocks in inland waterbodies, including the Curonian Lagoon. The Eel Regulation contains the obligation to prepare and implement the EMP (in the eel case especially for inland waters) both ministries assume the responsibility for implementation of the EMP. In addition, conservation measures for protected fish species, their habitats and migratory routes (including the eel) is area of responsibility of the Ministry of Environment. The activities related to improving aquaculture, reproduction and migration pathways of protected fish spe-cies is area of responsibility of the Ministry of Agriculture. Fish stocking programmes for state waterbodies (including eel stocking) are approved by the both Ministries.
6 | ICES SCIENTIFIC REPORTS 2:85 | ICES
2.1.4 Regulations
The fishery for eels has been regulated in several ways in Lithuania. Licensing for particular number of fishing sites on streams/rivers goes through auction performed by the Fisheries Ser-vice; the commercial fishery is restricted to two and half month per year (from mid-March till the end of May), commercial eel fishery in lakes is banned. In the Curonian lagoon number of fishing gears (fykenets) is reduced (eels are caught as minor bycatch). All companies operating in commercial fishery must have licences and fill in log-books daily. Daily bag limit in recrea-tional fishery is reduced to three eels per fishing trip. In the Baltic Sea, commercial fishery is not allowed to target eel, and practically is banned (see additional details related to fishery re-strictions in chapter 2.1.5).
2.1.5 Management actions
Preparing national EMP some practical precautionary measures were planned and included into the EMP aiming to reduce anthropogenic mortality in order to stop stock decline and to ensure stock recovery: to introduce some restrictions for eel fishery in the Curonian Lagoon and the Baltic Sea, to shorten overall fishing season in the inland waters, to restrict fishing season for yellow eels to three months/year, to introduce restrictions related to longline fishery, to reduce bag limit in recreational fishery (i. e. angling) and etc.
Aiming to reduce silver eel mortality the Ministry of Environment reduced number of fishing sites for migrating eels on small rivers by 43% in 2009 (however, later increased, and reduction from the starting point has been 34% currently), and banned specialized eel fishery using eel fykenets in lakes and ponds for period from 15 of March until 30 of June. In addition, aiming to improve protection of migrating fish commercial fishery was banned in three northernmost fish-ing sectors of the Curonian Lagoon (closest to the Klaipeda Strait). Bag/day limit in recreational fishery was reduced from five eels to three. Season for migrating (silver) eel fishery was consid-erably shortened to two months from 2010: it is allowed from 1 of April until 1st of June; autumn season for the fishery has been banned (used to be from 1 of September to 31 of October). Aiming to reduce bycatch of young eel, it was banned to use earth worms in longline fishery.
In 2015, in Lithuanian inland waters commercial fishery has been banned by the Ministry of En-vironment, however, fishery for migrating eels, lake smelt, vendace and river lamprey is still allowed. However, specialized fishery for eels using fykenets and longlines is actually banned and only fishery for migrating eels in rivers allowed from 15th of March until 1st of June.
Number of Lagoon fykenets was reduced by 46% in the Curonian Lagoon: from 413 in 2008 to 223 currently. In the Baltic Sea specialized eel fishery is banned. It is complicated to estimate extent of illegal fishery for migrating eels in rivers, however, despite very high fines (in 2020 increased from 290 to 480 euro per fish) it still might take place and make some impact on the stock.
Since the beginning of the EMP implementation, bag limit has been reduced from five to three eels in recreational fishery (under the definition „recreational fishery“ falls, not only angling but also spearfishing). Spearfishing was allowed in eleven waterbodies (twelve in 2012) but now number has been reduced to seven (six lakes and coastal waters of the Baltic Sea). However, in case of waterbody is rented, owner of a lake personally decides to allow spearfishing or not. Impact of recreational fishery is not well known, and still is under discussion among experts despite some attempts to make such estimation.
After EMP was approved by EC first stockings were performed in 2011 and until 2016, 154 wa-terbodies (mostly lakes) were stocked with almost 3 million of young eels, i.e. 0,6 million annu-ally on average during the period from 2011 to 2018. Due to unsuccessful public tender in 2017
ICES | WGEEL 2020 | 7
stocking has not been done, although, in 2018 1,65 million, in 2019 1,60 million, in 2020 1,37 mil-lion of on-grown (OG) eels where stocked. According to the national EMP, eels in Lithuania should not be stocked to basins upstream hydropower.
2.2 Significant changes since last report
For the first time after the beginning of the implementation of the national EMP, scientific-based assessment of eel stock and human caused impacts has been made in Lithuania in 2018, updated in this report including stock assessment for 2020.
Fines for illegal fishing (or other activities lethal for eels) are increased in 2020 from Euro 290 to 480 per eel.
In the current report, the model for national stock assessment was updated with revised and additional data on catch, stocking and eel growth.
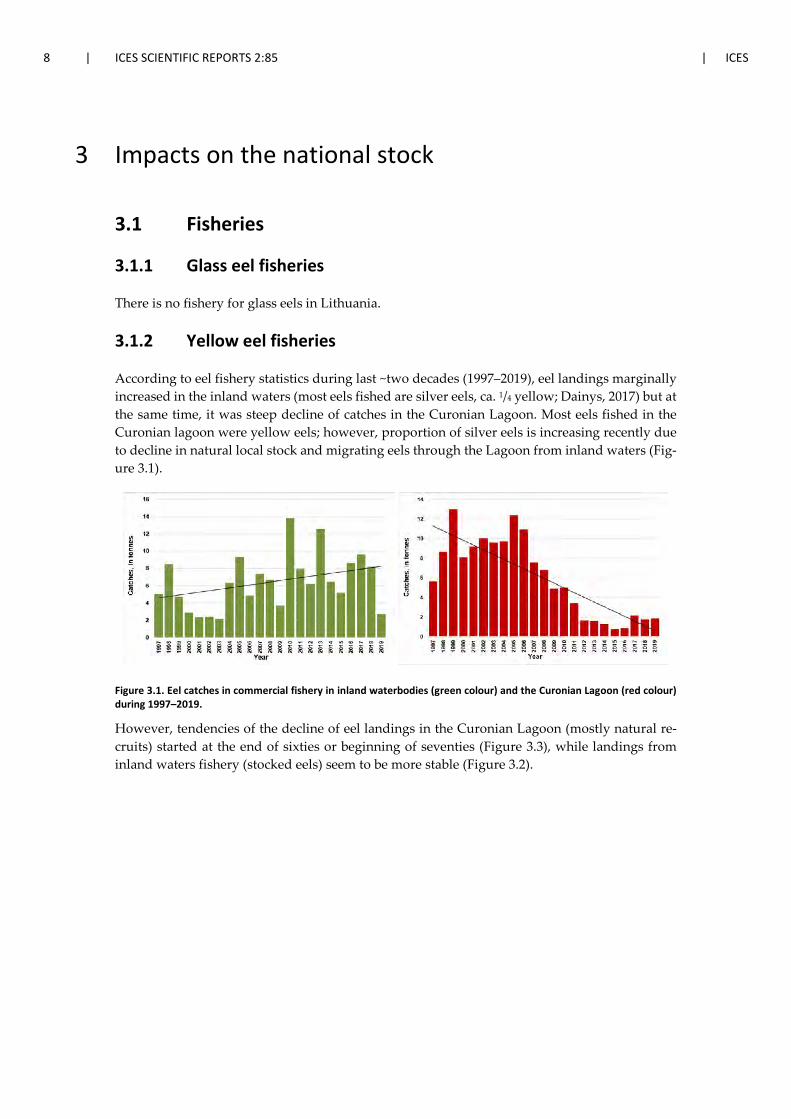
8 | ICES SCIENTIFIC REPORTS 2:85 | ICES
3 Impacts on the national stock
3.1 Fisheries
3.1.1 Glass eel fisheries
There is no fishery for glass eels in Lithuania.
3.1.2 Yellow eel fisheries
According to eel fishery statistics during last ~two decades (1997–2019), eel landings marginally increased in the inland waters (most eels fished are silver eels, ca. 1/4 yellow; Dainys, 2017) but at the same time, it was steep decline of catches in the Curonian Lagoon. Most eels fished in the Curonian lagoon were yellow eels; however, proportion of silver eels is increasing recently due to decline in natural local stock and migrating eels through the Lagoon from inland waters (Fig-ure 3.1).
Figure 3.1. Eel catches in commercial fishery in inland waterbodies (green colour) and the Curonian Lagoon (red colour) during 1997–2019.
However, tendencies of the decline of eel landings in the Curonian Lagoon (mostly natural re-cruits) started at the end of sixties or beginning of seventies (Figure 3.3), while landings from inland waters fishery (stocked eels) seem to be more stable (Figure 3.2).
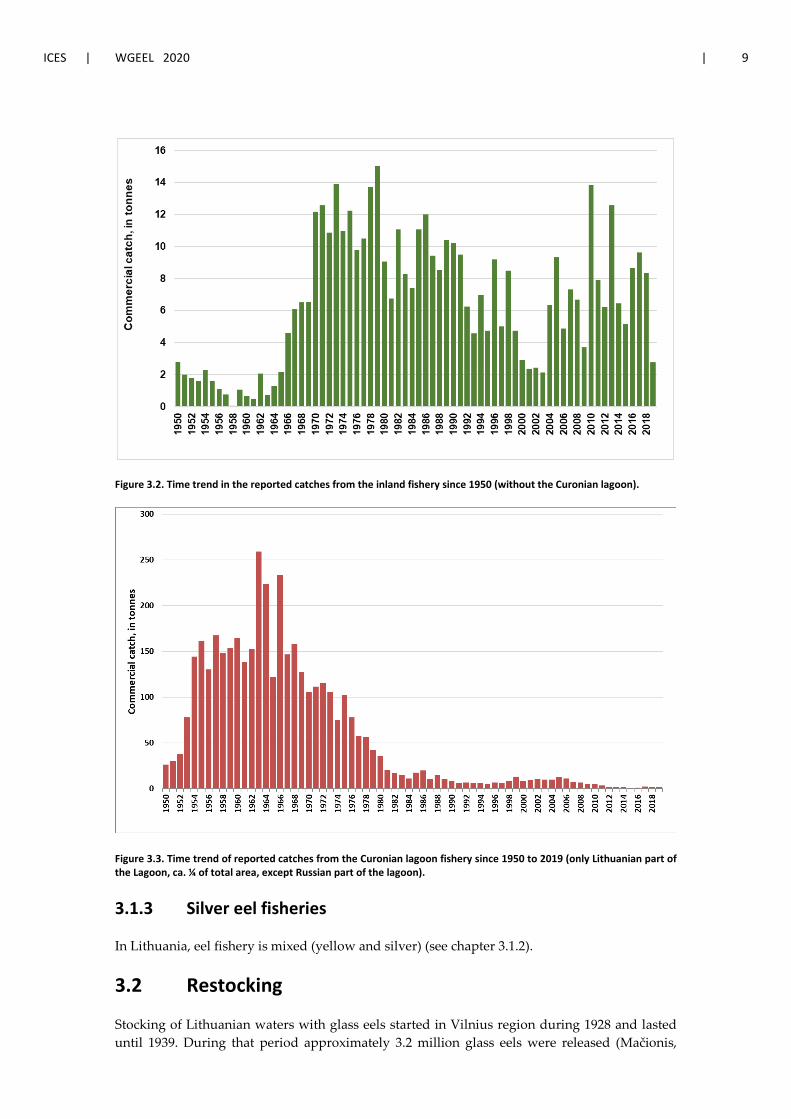
ICES | WGEEL 2020 | 9
Figure 3.2. Time trend in the reported catches from the inland fishery since 1950 (without the Curonian lagoon).
Figure 3.3. Time trend of reported catches from the Curonian lagoon fishery since 1950 to 2019 (only Lithuanian part of the Lagoon, ca. ¼ of total area, except Russian part of the lagoon).
3.1.3 Silver eel fisheries
In Lithuania, eel fishery is mixed (yellow and silver) (see chapter 3.1.2).
3.2 Restocking
Stocking of Lithuanian waters with glass eels started in Vilnius region during 1928 and lasted until 1939. During that period approximately 3.2 million glass eels were released (Mačionis,
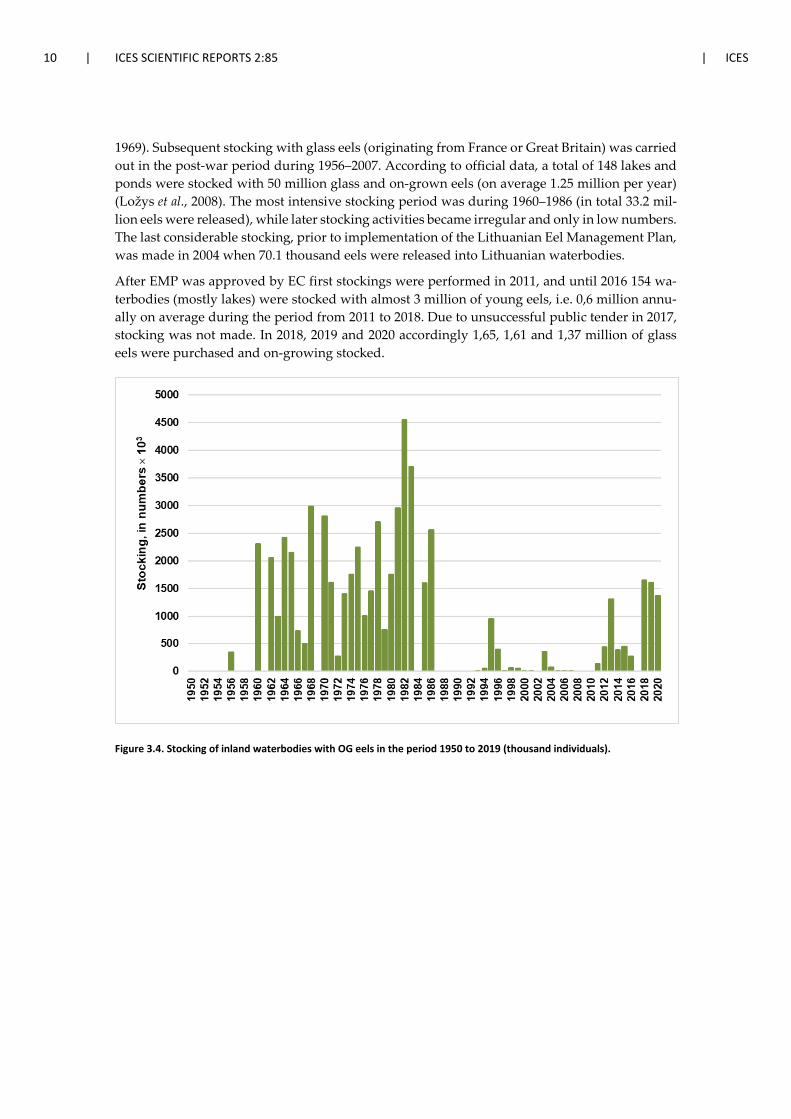
10 | ICES SCIENTIFIC REPORTS 2:85 | ICES
1969). Subsequent stocking with glass eels (originating from France or Great Britain) was carried out in the post-war period during 1956–2007. According to official data, a total of 148 lakes and ponds were stocked with 50 million glass and on-grown eels (on average 1.25 million per year) (Ložys et al., 2008). The most intensive stocking period was during 1960–1986 (in total 33.2 mil-lion eels were released), while later stocking activities became irregular and only in low numbers. The last considerable stocking, prior to implementation of the Lithuanian Eel Management Plan, was made in 2004 when 70.1 thousand eels were released into Lithuanian waterbodies.
After EMP was approved by EC first stockings were performed in 2011, and until 2016 154 wa-terbodies (mostly lakes) were stocked with almost 3 million of young eels, i.e. 0,6 million annu-ally on average during the period from 2011 to 2018. Due to unsuccessful public tender in 2017, stocking was not made. In 2018, 2019 and 2020 accordingly 1,65, 1,61 and 1,37 million of glass eels were purchased and on-growing stocked.
Figure 3.4. Stocking of inland waterbodies with OG eels in the period 1950 to 2019 (thousand individuals).
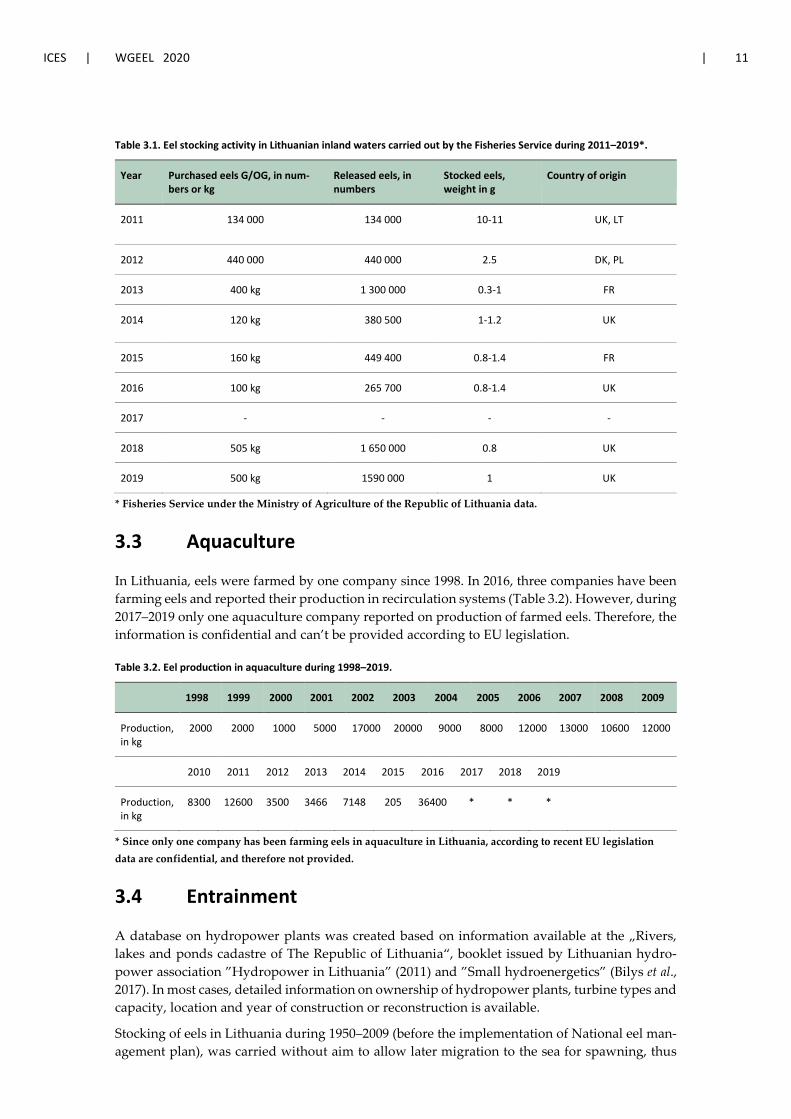
ICES | WGEEL 2020 | 11
Table 3.1. Eel stocking activity in Lithuanian inland waters carried out by the Fisheries Service during 2011–2019*.
Year Purchased eels G/OG, in num-bers or kg
Released eels, in numbers
Stocked eels, weight in g
Country of origin
2011 134 000 134 000 10-11 UK, LT
2012 440 000 440 000 2.5 DK, PL
2013 400 kg 1 300 000 0.3-1 FR
2014 120 kg 380 500 1-1.2 UK
2015 160 kg 449 400 0.8-1.4 FR
2016 100 kg 265 700 0.8-1.4 UK
2017 - - - -
2018 505 kg 1 650 000 0.8 UK
2019 500 kg 1590 000 1 UK
* Fisheries Service under the Ministry of Agriculture of the Republic of Lithuania data.
3.3 Aquaculture
In Lithuania, eels were farmed by one company since 1998. In 2016, three companies have been farming eels and reported their production in recirculation systems (Table 3.2). However, during 2017–2019 only one aquaculture company reported on production of farmed eels. Therefore, the information is confidential and can’t be provided according to EU legislation.
Table 3.2. Eel production in aquaculture during 1998–2019.
1998 1999 2000 2001 2002 2003 2004 2005 2006 2007 2008 2009
Production, in kg
2000 2000 1000 5000 17000 20000 9000 8000 12000 13000 10600 12000
2010 2011 2012 2013 2014 2015 2016 2017 2018 2019
Production, in kg
8300 12600 3500 3466 7148 205 36400 * * *
* Since only one company has been farming eels in aquaculture in Lithuania, according to recent EU legislation data are confidential, and therefore not provided.
3.4 Entrainment
A database on hydropower plants was created based on information available at the „Rivers, lakes and ponds cadastre of The Republic of Lithuania“, booklet issued by Lithuanian hydro-power association ”Hydropower in Lithuania” (2011) and ”Small hydroenergetics” (Bilys et al., 2017). In most cases, detailed information on ownership of hydropower plants, turbine types and capacity, location and year of construction or reconstruction is available.
Stocking of eels in Lithuania during 1950–2009 (before the implementation of National eel man-agement plan), was carried without aim to allow later migration to the sea for spawning, thus
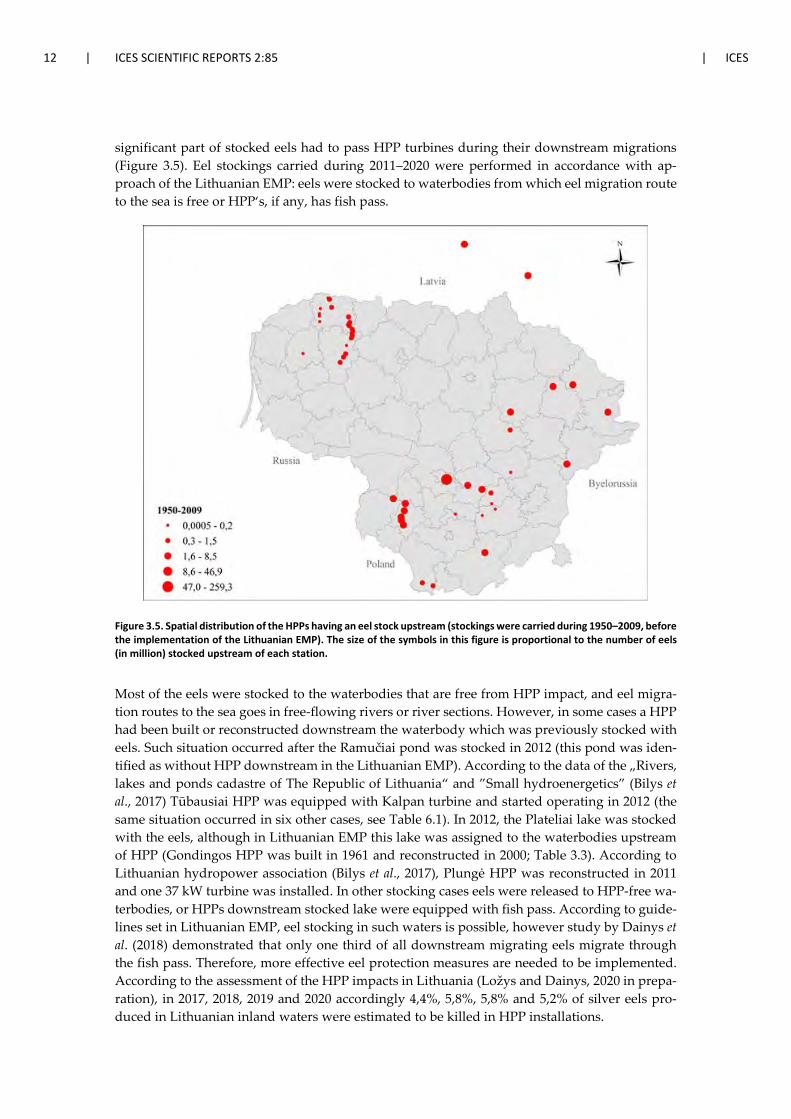
12 | ICES SCIENTIFIC REPORTS 2:85 | ICES
significant part of stocked eels had to pass HPP turbines during their downstream migrations (Figure 3.5). Eel stockings carried during 2011–2020 were performed in accordance with ap-proach of the Lithuanian EMP: eels were stocked to waterbodies from which eel migration route to the sea is free or HPP‘s, if any, has fish pass.
Figure 3.5. Spatial distribution of the HPPs having an eel stock upstream (stockings were carried during 1950–2009, before the implementation of the Lithuanian EMP). The size of the symbols in this figure is proportional to the number of eels (in million) stocked upstream of each station.
Most of the eels were stocked to the waterbodies that are free from HPP impact, and eel migra-tion routes to the sea goes in free-flowing rivers or river sections. However, in some cases a HPP had been built or reconstructed downstream the waterbody which was previously stocked with eels. Such situation occurred after the Ramučiai pond was stocked in 2012 (this pond was iden-tified as without HPP downstream in the Lithuanian EMP). According to the data of the „Rivers, lakes and ponds cadastre of The Republic of Lithuania“ and ”Small hydroenergetics” (Bilys et al., 2017) Tūbausiai HPP was equipped with Kalpan turbine and started operating in 2012 (the same situation occurred in six other cases, see Table 6.1). In 2012, the Plateliai lake was stocked with the eels, although in Lithuanian EMP this lake was assigned to the waterbodies upstream of HPP (Gondingos HPP was built in 1961 and reconstructed in 2000; Table 3.3). According to Lithuanian hydropower association (Bilys et al., 2017), Plungė HPP was reconstructed in 2011 and one 37 kW turbine was installed. In other stocking cases eels were released to HPP-free wa-terbodies, or HPPs downstream stocked lake were equipped with fish pass. According to guide-lines set in Lithuanian EMP, eel stocking in such waters is possible, however study by Dainys et al. (2018) demonstrated that only one third of all downstream migrating eels migrate through the fish pass. Therefore, more effective eel protection measures are needed to be implemented. According to the assessment of the HPP impacts in Lithuania (Ložys and Dainys, 2020 in prepa-ration), in 2017, 2018, 2019 and 2020 accordingly 4,4%, 5,8%, 5,8% and 5,2% of silver eels pro-duced in Lithuanian inland waters were estimated to be killed in HPP installations.
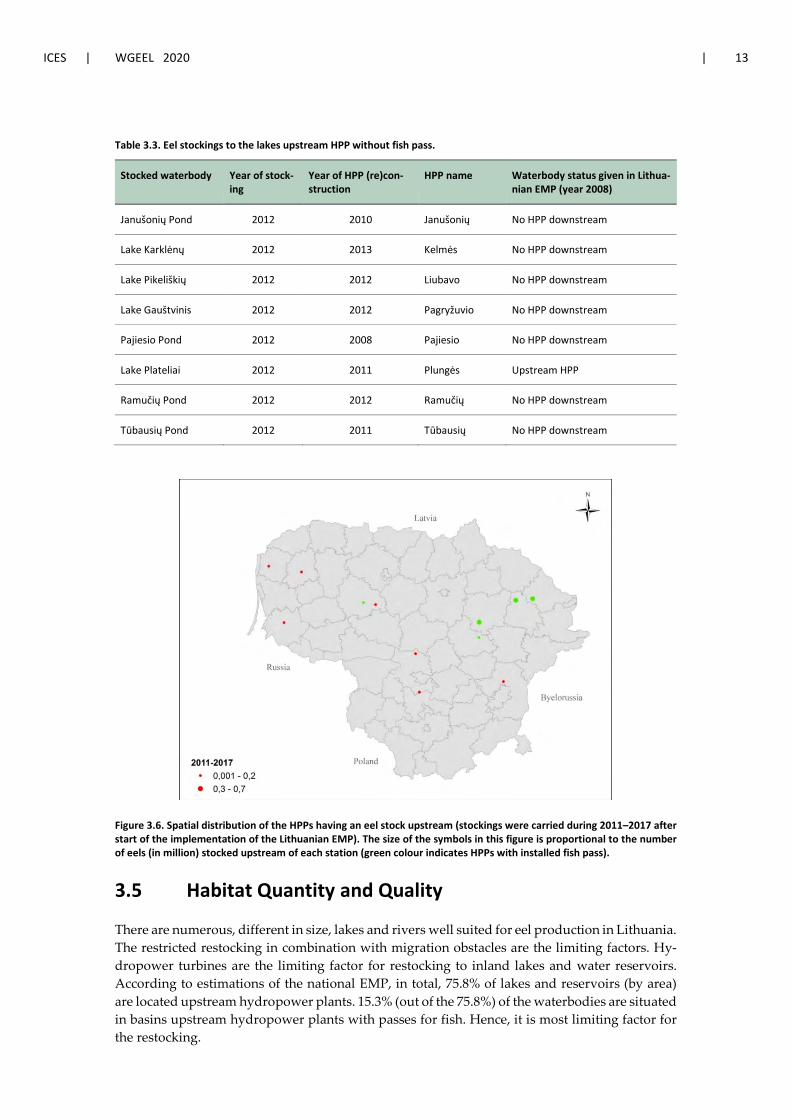
ICES | WGEEL 2020 | 13
Table 3.3. Eel stockings to the lakes upstream HPP without fish pass.
Stocked waterbody Year of stock-ing
Year of HPP (re)con-struction
HPP name Waterbody status given in Lithua-nian EMP (year 2008)
Janušonių Pond 2012 2010 Janušonių No HPP downstream
Lake Karklėnų 2012 2013 Kelmės No HPP downstream
Lake Pikeliškių 2012 2012 Liubavo No HPP downstream
Lake Gauštvinis 2012 2012 Pagryžuvio No HPP downstream
Pajiesio Pond 2012 2008 Pajiesio No HPP downstream
Lake Plateliai 2012 2011 Plungės Upstream HPP
Ramučių Pond 2012 2012 Ramučių No HPP downstream
Tūbausių Pond 2012 2011 Tūbausių No HPP downstream
Figure 3.6. Spatial distribution of the HPPs having an eel stock upstream (stockings were carried during 2011–2017 after start of the implementation of the Lithuanian EMP). The size of the symbols in this figure is proportional to the number of eels (in million) stocked upstream of each station (green colour indicates HPPs with installed fish pass).
3.5 Habitat Quantity and Quality
There are numerous, different in size, lakes and rivers well suited for eel production in Lithuania. The restricted restocking in combination with migration obstacles are the limiting factors. Hy-dropower turbines are the limiting factor for restocking to inland lakes and water reservoirs. According to estimations of the national EMP, in total, 75.8% of lakes and reservoirs (by area) are located upstream hydropower plants. 15.3% (out of the 75.8%) of the waterbodies are situated in basins upstream hydropower plants with passes for fish. Hence, it is most limiting factor for the restocking.

14 | ICES SCIENTIFIC REPORTS 2:85 | ICES
3.6 Other impacts
No available data.
ICES | WGEEL 2020 | 15
4 National stock assessment
4.1 Description of Method
In Lithuanian inland waters most anthropogenic interactions with the eel stock happen to relate to either the youngest (glass eels and elvers) or the oldest stages (silver eel, or yellow eel close to the silver eel stage) due to fishery (F) and hydropower (H) related mortality; impacts during the long growing stage are much more infrequent. Developing a simple conversion between the youngest and the oldest stages, the silver eel production over the past seven decades is recon-structed based on eel restocking (import from abroad), in a spatially explicit reconstruction. Sub-tracting the fishing harvest and downsizing for the mortality incurred when passing hydro-power stations, an estimate of the biomass of silver eel escaping to the sea is derived.
A reconstruction of the silver eel production from historical data on their youngest ages, requires an extrapolation over many years, assumptions on growth and mortality, and a comparison be-tween reconstructed (production) and actually observed (catch) variables. Though this makes the best use of the available information, it might not reflect the results to be fully reliable in all detail. Production estimates for individual lakes in specific years will certainly be much less re-liable than nationwide estimates, or decadal averages, and so forth. Hence, the presentation of results will be restricted to nationwide averages.
4.1.1 Data collection
Statistics of commercial catch and eel restocking, specifying year, quantity (number), life stage (glass eels), destination location (name of the lake/river) have been collected in various Lithua-nian archives and covered years since 1928, but in some cases detailed time-series are not com-plete or data are missing. Dataseries of higher reliability start in 1950 and continue until nowa-days. However, even during this period part of total catches and part of stocked eels was not possible assign to exact waterbody, thus in the analysis this part of commercial catch or stocked eels was assigned to “unidentified waterbody”. However, for some waterbodies, continuous da-taseries exist since the beginning of eel fishery or stocking in the particular waterbody, and these series are considered to be complete and highly reliable. To increase reliability of the further analysis, historical records of catches/stockings were merged into the smaller sets of lakes (in total 80 groups) that allowed unique assignment of all data based on river basin and HPPs that are affecting those waterbodies. These data represent eel catches and stockings only in inland waters (without the Curonian lagoon).
The current assessment reconstructed the production of silver eel available to the fishery by lake and year, from information on restocking. For the eel derived from restocking, the release loca-tion is known (lake/river name); it is assumed that within-river migration has not notably altered the spatial distribution, or more often, that downstream migration in the silver eel stage brought the eel back to the lake from which it had migrated upstream after stocking.
A database of hydropower plants was made based on information available at the „Rivers, lakes and ponds cadastre of The Republic of Lithuania“, book issued by Lithuanian hydropower as-sociation ”Hydropower in Lithuania” (2011) and ”Small hydroenergetics” (Bilys et al., 2017). In most cases, detailed information on ownership, turbine types and capacity, location and year of construction or reconstruction was available. The mortality of eel passing a hydropower station depends on type and size of the turbine, thus mortality rate of eels passing different turbines was based on previous studies carried in Lithuania and neighbour countries (Dainys et al., 2018;

16 | ICES SCIENTIFIC REPORTS 2:85 | ICES
Larinier and Travade, 2002; Dêbowski et al., 2016). If migrating eels had to pass six or more HPPs during their downstream migration it is assumed that mortality of these eels is 100% regardless of what turbine type is installed in each HPP.
For all locations where eel had been stocked, the route towards the sea was traced and the list of HPPs on that route derived. Individual routes pass from 0 up to 14 HPPs. For each HPP, the biomass of the escaping silver eel was reduced by a certain percentage. Summing the biomasses over all HPP gives an estimate of the total hydropower related mortality (ΣH), while the remain-ing biomass gives an estimate of the escapement towards the sea.
As consistent sampling of eels from Lithuanian waters (waterbodies of different trophic level; eels of different age groups and etc.) started in 2017 only, the conversion from glass eels to silver eels, eel length–weight relation and eel “silvering at age” was estimated as described by Dekker (2015). However, further sampling of eels for length, weight, maturity and age analysis is con-tinuing on a regular basis in order to obtain silvering curves for eels stocked into Lithuanian waterbodies.
There are no studies on natural eel mortality (M) in Lithuania. However, we assume that M in Lithuanian and Swedish waters should be very similar. For that reason, we refer to Dekker (2015) where M=0.10.
4.1.2 Analysis
Given the time-series of restocking, silver eel production is derived from the growth, silvering pattern and natural mortality:
𝑃𝑃𝑃𝑃𝑃𝑃𝑃𝑃𝑃𝑃𝑃𝑃𝑃𝑃𝑃𝑃𝑃𝑃𝑃𝑃 = 𝑓𝑓(𝑠𝑠𝑃𝑃𝑃𝑃𝑃𝑃𝑠𝑠𝑃𝑃𝑃𝑃𝑠𝑠,𝑠𝑠𝑃𝑃𝑃𝑃𝑔𝑔𝑃𝑃ℎ,𝑚𝑚𝑃𝑃𝑃𝑃𝑃𝑃𝑚𝑚𝑚𝑚𝑃𝑃𝑃𝑃𝑚𝑚,𝑚𝑚𝑚𝑚𝑃𝑃𝑃𝑃𝑃𝑃𝑚𝑚𝑃𝑃𝑃𝑃𝑃𝑃𝑃𝑃 )
The fisheries are targeting this migrating eels (ΣF), resulting in an effective silver eel run of:
𝑆𝑆𝑃𝑃𝑚𝑚𝑆𝑆𝑆𝑆𝑃𝑃_𝑆𝑆𝑆𝑆𝑚𝑚_𝑃𝑃𝑃𝑃𝑃𝑃 = 𝑃𝑃𝑃𝑃𝑃𝑃𝑃𝑃𝑃𝑃𝑃𝑃𝑃𝑃𝑃𝑃𝑃𝑃𝑃𝑃 − 𝐶𝐶𝑚𝑚𝑃𝑃𝑃𝑃ℎ
Passing hydropower generation stations reduces the silver eel run to:
𝐸𝐸𝑠𝑠𝑃𝑃𝑚𝑚𝐸𝐸𝑆𝑆𝑚𝑚𝑆𝑆𝑃𝑃𝑃𝑃 = 𝑆𝑆𝑃𝑃𝑚𝑚𝑆𝑆𝑆𝑆𝑃𝑃_𝑆𝑆𝑆𝑆𝑚𝑚_𝑃𝑃𝑃𝑃𝑃𝑃 × 𝑆𝑆𝑒𝑒𝐸𝐸−∑𝐻𝐻
The hydropower-related mortality ∑𝐻𝐻 is summed over all hydropower stations on the route towards the sea, which is a different sum for each location (and year), and Escapement is the silver eel biomass escaping towards the sea on their route towards the spawning places. It is assumed that, other than fisheries and hydropower, no other mortality during the migration to-wards the sea occurs.
Rearranging the above yields:
𝐸𝐸𝑠𝑠𝑃𝑃𝑚𝑚𝐸𝐸𝑆𝑆𝑚𝑚𝑆𝑆𝑃𝑃𝑃𝑃 = (𝑃𝑃𝑃𝑃𝑃𝑃𝑃𝑃𝑃𝑃𝑃𝑃𝑃𝑃𝑃𝑃𝑃𝑃𝑃𝑃 − 𝐶𝐶𝑚𝑚𝑃𝑃𝑃𝑃ℎ) × 𝑆𝑆𝑒𝑒𝐸𝐸−∑𝐻𝐻 = 𝑃𝑃𝑃𝑃𝑃𝑃𝑃𝑃𝑃𝑃𝑃𝑃𝑃𝑃𝑃𝑃𝑃𝑃𝑃𝑃 × 𝑆𝑆𝑒𝑒𝐸𝐸−∑𝐻𝐻 − 𝐶𝐶𝑚𝑚𝑃𝑃𝑃𝑃ℎ × 𝑆𝑆𝑒𝑒𝐸𝐸−∑𝐻𝐻
The latter splits the production data (first term) from the fishery data (latter term) and post hoc sums them up; this allows processing different spatial entities for different datasets (e.g. point locations for release of recruits vs. lake totals for fisheries).
Recent restocking will contribute to the escapement of silver eels about fifteen years from now, but some slow-growers or late-maturing eels may be found for up to twenty-five years or more. By that time, the stock will be dominated by year classes that have not been stocked yet and will be under the influence of management measures taken in coming years. That is: the effect of today’s actions can only be assessed by analysing their effect in the future, but future trends are

ICES | WGEEL 2020 | 17
also influenced by yet unknown actions. Not knowing those future trends and actions, the result of today’s actions are assessed by extrapolating the status quo indefinitely into the future. It is assumed that future stocking is equal to the average observed value during 2011–2020 and that future fisheries and hydropower generation have an impact equal to the most recent estimate (constant mortality rate). Keeping the status quo unchanged, results for future years will express the expected effect of today’s actions but will not provide an accurate prediction of the real de-velopments (continued upward or downward trends, extra actions, and autonomous develop-ments).
4.1.3 Reporting
Results of the assessment were reported to the Fisheries Service under Ministry of Agriculture and the European Commission in 2018 as country report on the implementation of national EMP. Interim report on the national eel stock assessment is submitted to Fisheries Service under Min-istry of Agriculture in 2020; final report will be submitted at the end of 2020.
4.1.4 Data quality issues and how they are being addressed
During the implementation of the EMP and evaluation of the progress of eel stock restoration in Lithuania some new data for improvement of the estimations (and reduction of biases) of eel stock in the country were collected. However, aiming to improve it further, it is needed to im-prove knowledge about mortalities in recreational fishery (particular study is needed) as it is still under discussion. It is also not well known about silver eel mortality in the Curonian Lagoon fishery during their migration from lakes to the sea. There are no detailed studies on predation, despite it is not likely to be very high. These additional data would allow to adjust the model built for this assessment and more precisely estimate production of silver eels in the context of measures taken under EMP and effects of natural or anthropogenic factors. But, most essential: aiming to improve assessment of all EMPs in the Baltic region it is urgently needed pan-Baltic standardized and internationally recognized/approved methodologies.
4.2 Trends in Assessment results
Overall predicted silver eel production was relatively low during 1960–1970, on average ~2 t. Later silver eel production sharply increased and in 1998 reached its maximum of 366 t. How-ever, since 2000 silver eel production started decreasing and in 2007–2017 it was on average ~27 t per year. If stocking intensity will remain same as it was since the beginning of EMP implemen-tation, silver eel productions is expected to increase up to ca. 113 tons in 2030–2040 (Figure 4.1.).
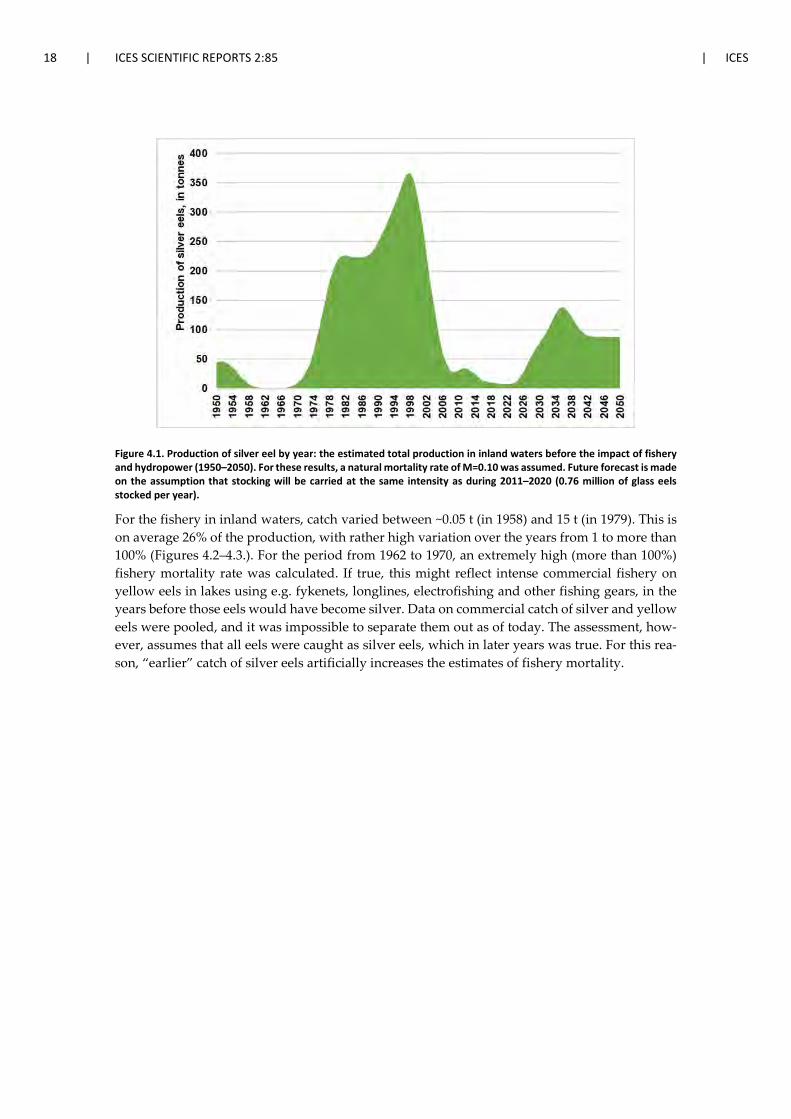
18 | ICES SCIENTIFIC REPORTS 2:85 | ICES
Figure 4.1. Production of silver eel by year: the estimated total production in inland waters before the impact of fishery and hydropower (1950–2050). For these results, a natural mortality rate of M=0.10 was assumed. Future forecast is made on the assumption that stocking will be carried at the same intensity as during 2011–2020 (0.76 million of glass eels stocked per year).
For the fishery in inland waters, catch varied between ~0.05 t (in 1958) and 15 t (in 1979). This is on average 26% of the production, with rather high variation over the years from 1 to more than 100% (Figures 4.2–4.3.). For the period from 1962 to 1970, an extremely high (more than 100%) fishery mortality rate was calculated. If true, this might reflect intense commercial fishery on yellow eels in lakes using e.g. fykenets, longlines, electrofishing and other fishing gears, in the years before those eels would have become silver. Data on commercial catch of silver and yellow eels were pooled, and it was impossible to separate them out as of today. The assessment, how-ever, assumes that all eels were caught as silver eels, which in later years was true. For this rea-son, “earlier” catch of silver eels artificially increases the estimates of fishery mortality.
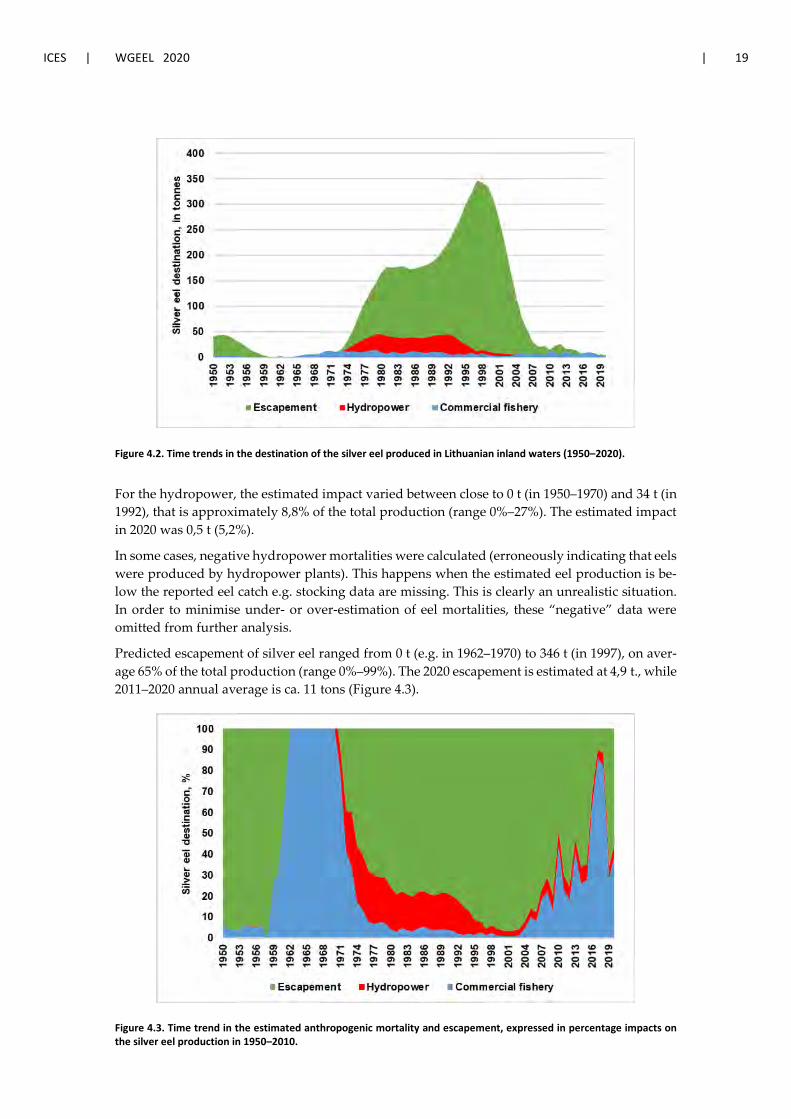
ICES | WGEEL 2020 | 19
Figure 4.2. Time trends in the destination of the silver eel produced in Lithuanian inland waters (1950–2020).
For the hydropower, the estimated impact varied between close to 0 t (in 1950–1970) and 34 t (in 1992), that is approximately 8,8% of the total production (range 0%–27%). The estimated impact in 2020 was 0,5 t (5,2%).
In some cases, negative hydropower mortalities were calculated (erroneously indicating that eels were produced by hydropower plants). This happens when the estimated eel production is be-low the reported eel catch e.g. stocking data are missing. This is clearly an unrealistic situation. In order to minimise under- or over-estimation of eel mortalities, these “negative” data were omitted from further analysis.
Predicted escapement of silver eel ranged from 0 t (e.g. in 1962–1970) to 346 t (in 1997), on aver-age 65% of the total production (range 0%–99%). The 2020 escapement is estimated at 4,9 t., while 2011–2020 annual average is ca. 11 tons (Figure 4.3).
Figure 4.3. Time trend in the estimated anthropogenic mortality and escapement, expressed in percentage impacts on the silver eel production in 1950–2010.
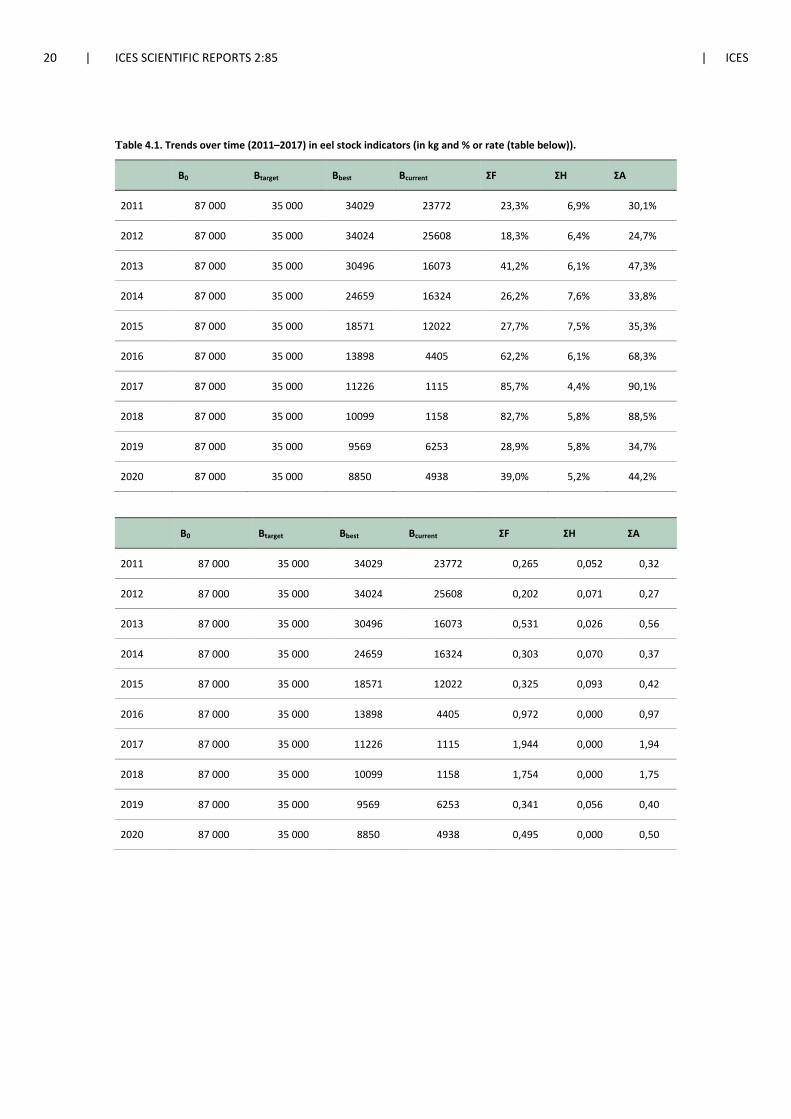
20 | ICES SCIENTIFIC REPORTS 2:85 | ICES
Table 4.1. Trends over time (2011–2017) in eel stock indicators (in kg and % or rate (table below)).
B0 Btarget Bbest Bcurrent ΣF ΣH ΣA
2011 87 000 35 000 34029 23772 23,3% 6,9% 30,1%
2012 87 000 35 000 34024 25608 18,3% 6,4% 24,7%
2013 87 000 35 000 30496 16073 41,2% 6,1% 47,3%
2014 87 000 35 000 24659 16324 26,2% 7,6% 33,8%
2015 87 000 35 000 18571 12022 27,7% 7,5% 35,3%
2016 87 000 35 000 13898 4405 62,2% 6,1% 68,3%
2017 87 000 35 000 11226 1115 85,7% 4,4% 90,1%
2018 87 000 35 000 10099 1158 82,7% 5,8% 88,5%
2019 87 000 35 000 9569 6253 28,9% 5,8% 34,7%
2020 87 000 35 000 8850 4938 39,0% 5,2% 44,2%
B0 Btarget Bbest Bcurrent ΣF ΣH ΣA
2011 87 000 35 000 34029 23772 0,265 0,052 0,32
2012 87 000 35 000 34024 25608 0,202 0,071 0,27
2013 87 000 35 000 30496 16073 0,531 0,026 0,56
2014 87 000 35 000 24659 16324 0,303 0,070 0,37
2015 87 000 35 000 18571 12022 0,325 0,093 0,42
2016 87 000 35 000 13898 4405 0,972 0,000 0,97
2017 87 000 35 000 11226 1115 1,944 0,000 1,94
2018 87 000 35 000 10099 1158 1,754 0,000 1,75
2019 87 000 35 000 9569 6253 0,341 0,056 0,40
2020 87 000 35 000 8850 4938 0,495 0,000 0,50
ICES | WGEEL 2020 | 21
5 Other data collection for eel
Lithuanian waters are not recruited by eels at glass eel stage; yellow eel recruitment is not mon-itored.
DCF data on eels in the Curonian lagoon in 2018 and 2019 were regularly sampled in harbours from May to October. In inland waters, eels were sampled in rivers at two sites during April–May, and at one site from April to June. Eel sampling was carried out in five lakes using longlines and small fykenets.
202 eels were caught in lakes and analysed in 2018 for age, length, weight and other parameters. 242 eels analysed from rivers in 2018. 100 eels from the Curonian Lagoon commercial fishery and additional 100 eels from inland fishery (in rivers) were purchased for the research purposes.
During 2017–2020 study on recreational eel catch was carried out by the Fisheries Service.
75 silver and 168 yellow eels were sampled for analyses accordingly in rivers and Curonian la-goon by Klaipėda University and Fisheries Service in 2019.
5.1 Yellow eel abundance surveys
There are no yellow eel abundance surveys carried out in Lithuania (except one case mark–re-capture study in 2014). Regular yellow eel sampling in some lakes is focused on collection of biological data. In 2017–2019 yellow eel sampling was done in five inland lakes: Paežerių, Ūkojas, Balsys, Kretuonas, Aisetas and in Krokų Lanka lake estuary (close to the Curonian Lagoon). Eels were caught and analysed by age, length, weight, and other parameters.
5.2 Silver eel escapement surveys
After stocked eels mature and reach silver eel stage, they start migrating downstream towards the sea or ocean. During these migrations substantial mortality can drastically reduce the num-ber of successful spawners. Success of Eel Management Plans and restoration activities is gauged in the context of EU Regulations by determining in the numbers of silver eels leaving inland waters to spawn. Barriers, especially hydropower installations, are considered to be one of the major threats for eels’ downstream spawning migration. First attempt to evaluate silver eel mi-gration success from Lithuanian inland waterbodies was carried in 2014. The results of this study are presented by Dainys et al. (2017).
A total of 63 silver eels were caught in four rivers in the Eastern Lithuania during their spawning migrations using fykenets of 16–20 mm mesh size, and tagged with Vemco acoustic tags in spring and autumn of 2014. After implantation of acoustic tags eels were released back to three free-flowing and one dammed river. Eel migration was tracked using four Vemco VR2W receivers that were installed in the vicinity of the Kaunas HPP water intake to detect eels entering turbines and four receivers were installed just below the Kaunas HPP to detect those eels that had passed through. To detect eels that successfully migrated downstream, four receivers were installed on navigational buoys in the Nemunas Delta and four in the Klaipėda Strait (Figure 5.1).
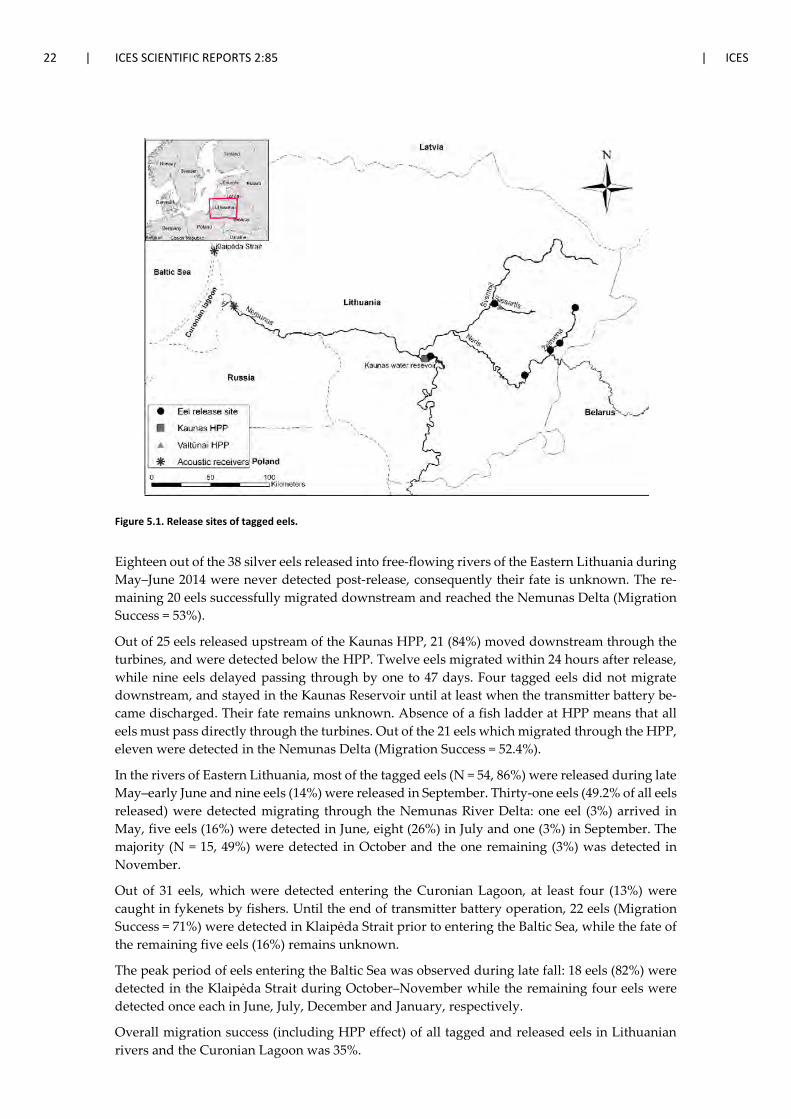
22 | ICES SCIENTIFIC REPORTS 2:85 | ICES
Figure 5.1. Release sites of tagged eels.
Eighteen out of the 38 silver eels released into free-flowing rivers of the Eastern Lithuania during May–June 2014 were never detected post-release, consequently their fate is unknown. The re-maining 20 eels successfully migrated downstream and reached the Nemunas Delta (Migration Success = 53%).
Out of 25 eels released upstream of the Kaunas HPP, 21 (84%) moved downstream through the turbines, and were detected below the HPP. Twelve eels migrated within 24 hours after release, while nine eels delayed passing through by one to 47 days. Four tagged eels did not migrate downstream, and stayed in the Kaunas Reservoir until at least when the transmitter battery be-came discharged. Their fate remains unknown. Absence of a fish ladder at HPP means that all eels must pass directly through the turbines. Out of the 21 eels which migrated through the HPP, eleven were detected in the Nemunas Delta (Migration Success = 52.4%).
In the rivers of Eastern Lithuania, most of the tagged eels (N = 54, 86%) were released during late May–early June and nine eels (14%) were released in September. Thirty-one eels (49.2% of all eels released) were detected migrating through the Nemunas River Delta: one eel (3%) arrived in May, five eels (16%) were detected in June, eight (26%) in July and one (3%) in September. The majority (N = 15, 49%) were detected in October and the one remaining (3%) was detected in November.
Out of 31 eels, which were detected entering the Curonian Lagoon, at least four (13%) were caught in fykenets by fishers. Until the end of transmitter battery operation, 22 eels (Migration Success = 71%) were detected in Klaipėda Strait prior to entering the Baltic Sea, while the fate of the remaining five eels (16%) remains unknown.
The peak period of eels entering the Baltic Sea was observed during late fall: 18 eels (82%) were detected in the Klaipėda Strait during October–November while the remaining four eels were detected once each in June, July, December and January, respectively.
Overall migration success (including HPP effect) of all tagged and released eels in Lithuanian rivers and the Curonian Lagoon was 35%.
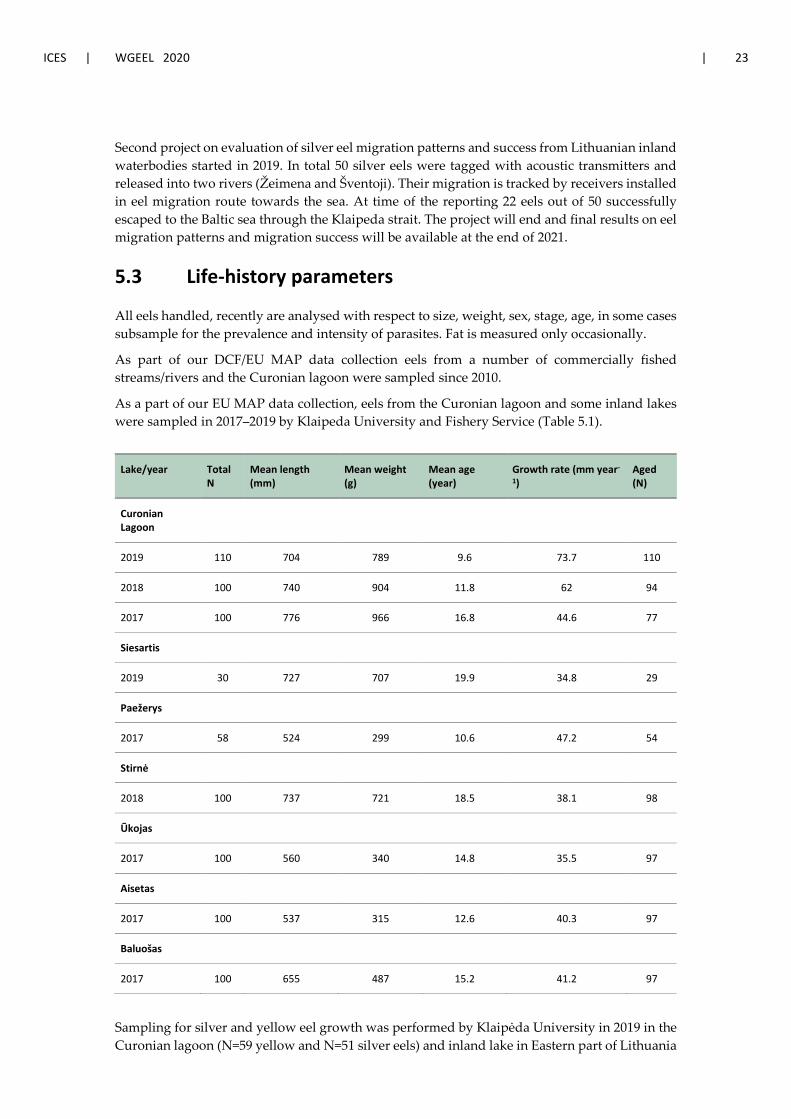
ICES | WGEEL 2020 | 23
Second project on evaluation of silver eel migration patterns and success from Lithuanian inland waterbodies started in 2019. In total 50 silver eels were tagged with acoustic transmitters and released into two rivers (Žeimena and Šventoji). Their migration is tracked by receivers installed in eel migration route towards the sea. At time of the reporting 22 eels out of 50 successfully escaped to the Baltic sea through the Klaipeda strait. The project will end and final results on eel migration patterns and migration success will be available at the end of 2021.
5.3 Life-history parameters
All eels handled, recently are analysed with respect to size, weight, sex, stage, age, in some cases subsample for the prevalence and intensity of parasites. Fat is measured only occasionally.
As part of our DCF/EU MAP data collection eels from a number of commercially fished streams/rivers and the Curonian lagoon were sampled since 2010.
As a part of our EU MAP data collection, eels from the Curonian lagoon and some inland lakes were sampled in 2017–2019 by Klaipeda University and Fishery Service (Table 5.1).
Lake/year Total N
Mean length (mm)
Mean weight (g)
Mean age (year)
Growth rate (mm year-
1) Aged (N)
Curonian Lagoon
2019 110 704 789 9.6 73.7 110
2018 100 740 904 11.8 62 94
2017 100 776 966 16.8 44.6 77
Siesartis
2019 30 727 707 19.9 34.8 29
Paežerys
2017 58 524 299 10.6 47.2 54
Stirnė
2018 100 737 721 18.5 38.1 98
Ūkojas
2017 100 560 340 14.8 35.5 97
Aisetas
2017 100 537 315 12.6 40.3 97
Baluošas
2017 100 655 487 15.2 41.2 97
Sampling for silver and yellow eel growth was performed by Klaipėda University in 2019 in the Curonian lagoon (N=59 yellow and N=51 silver eels) and inland lake in Eastern part of Lithuania

24 | ICES SCIENTIFIC REPORTS 2:85 | ICES
(Siesartis; N=seven yellow and N=23 silver eels). Length-at-age and weight-at-age for yellow eels (Figure 5.2) suggests higher growth rate in the Curonian Lagoon comparing to Lake Siesartis: average growth rate in the lagoon was 84.4 mm/year vs. 33.4 mm/year in the lake; mean length-at-age was accordingly 68.6 cm and 65.8 cm for the lagoon and lake. Length-at-age and weight-at-age for silver eels (Figure 5.3) suggests higher growth rate in the Curonian Lagoon compared to Lake Siesartis: average growth rate in the lagoon was 64.2 mm/year vs. 35.1 mm/year in the lake; mean age at length was accordingly 72.5 cm and 74.8 cm for the lagoon and lake. However, it must be kept in mind that silver eels from lakes migrate through the lagoon; hence, silver eels caught in the Curonian lagoon might be on the way of their migrations from inland lakes.
Figure 5.2. Length-at-age and weight-at-age of yellow eels caught in 2019 (n=110 lagoon and n=30 lake).
Figure 5.3. Length-at-age and weight-at-age of silver eels caught in 2019 (n=110 lagoon and n=30 lake).
5.4 Diseases, Parasites & Pathogens or Contaminants
Eel viruses and diseases have not been monitored in Lithuania. No large-scale or long-term stud-ies on eel parasites and pathogens were carried out in Lithuania. Consistent sampling of eels from Lithuanian waters (waterbodies of different trophic level; eels of different age groups and etc.) has started in 2017 only, thus since then eels were analysed at the Nature research centre and/or the Fisheries Service under the Ministry of Agriculture of the Republic of Lithuania are screened by the naked eye for Anguillicola crassus. Most of analysed eels in 2017 were infected with A. crassus. Infection intensity was relatively low: usually ranging between one and four nematodes (highest observed intensity was 23 parasites for one eel). Additionally, two other par-asite species (Diplostomum spathaceum and Pseudodactylogyrus sp.) were found in analysed eels in 2017 (analysis was carried by the Fisheries Service).
In 2019, 108 eels were screened for Anguillicola crassus at Klaipeda University. 80% (N=75) and 88% (N=33) of eels accordingly from the Curonian lagoon and lake in Eastern part of Lithuania
60
70
80
90
5 7 9 11 13 15 17 19 21 23 25
Leng
th, c
m
Length at age, yellow eelLake SiesartisCuronian Lagoon
300
800
1300
1800
6 8 10 12 14 16 18 20 22 24 age
Wei
ght,
g
Weight at age, yellow eelLake SiesartisCuronian Lagoon
60
70
80
90
5 7 9 11 13 15 17 19 21 23 25
Leng
th, c
m
Length at age, silver eelLake SiesartisCuronian Lagoon
300
800
1300
6 8 10 12 14 16 18 20 22 24 age
Wei
ght,
g
Weight at age, silver eelLake SiesartisCuronian Lagoon

ICES | WGEEL 2020 | 25
(Siesartis) were infested. Infection intensity was found to be on average 3.4 and 4.4 nematodes respectively in the lagoon and lake.
26 | ICES SCIENTIFIC REPORTS 2:85 | ICES
6 New Information
Three shipments of about 66 tonnes in total of European eel as cooked fillets “kabayaki” (frozen) were arrested at customs in Klaipeda port in 2020. These shipments from China were supposed to go to Belarus.
50 silver migrating eels were tagged with Thelma transmitters (batteries will last >2 years) in autumn 2019. One tag recently (summer 2020) was recovered in Germany (coastal area) and one in the outlet straits of the Baltic Sea (Denmark).
In 2017, PhD thesis on eels was defended: Dainys J. 2017. Migration of stocked European eels (Anguilla anguilla L.) in Lithuania and potential contribution to spawning stock restoration. Vil-nius, 98 p.
Most recent publications of studies on eels in Lithuania:
• Dainys J., Stakėnas S., Gorfine H., Ložys L. 2018. Mortality of Silver Eels Migrating Through Different Types of Hydropower Turbines in Lithuania. River Research and Applications, 34: 52–59. DOI: 10.1002/rra.3224.
• Dainys J., Gorfine H., Šidagytė E., Jakubavičiūtė E., Kirka M., Pūtys Ž., Ložys L. 2018. Are Lithuanian Eels Fat Enough To Reach The Spawning Grounds? Environmental Biology of Fishes, 101: 127:136. DOI: 10.1007/s10641-017-0686-y.
• Dainys J., Stakėnas S., Gorfine H., Ložys L. 2017. Silver eel, Anguilla anguilla (Linnaeus, 1758), migration patterns in lowland rivers and lagoons in the North-Eastern region of their distribution range. Journal of Applied Ichthyology, 33: 918–924. DOI: 10.1111/jai.13426.
• Dainys J, Gorfine H., Šidagytė E., Jakubavičiūtė E., Kirka M., Pūtys Ž., Ložys L. 2017. Do young on-grown eels, Anguilla anguilla (Linnaeus, 1758), outperform glass eels after transition to a natural prey diet? Journal of Applied Ichthyology, 33:361–365. DOI: 10.1111/jai.13347.
ICES | WGEEL 2020 | 27
7 References
Anon. 2008. Europinių ungurių Anguilla anguilla L. išteklių valdymo planas (National Eel (Anguilla anguilla L.) management plan), Ministry of Agriculture of the Republic of Lithuania, 93 p.
Bilys S., Gužauskas R., Jakštas L., Kairys L., Kasiulis E., Punys P., Sabaliauskas A., Sabaliauskas L., Tornau V. 2017. Mažoji hidroenergetika. Vilnius: Trys žvaigždutės, 208 p.
Dainys J., Stakėnas S., Gorfine H., Ložys L. 2018. Mortality of Silver Eels Migrating Through Different Types of Hydropower Turbines in Lithuania. River Research and Applications, 34: 52–59. DOI: 10.1002/rra.
Dainys J. 2017. Migration of stocked European eels (Anguilla anguilla L.) in Lithuania and potential contri-bution to spawning stock restoration. Phd thesis. Vilnius, 98 p.
Dekker W. 2015. Assessment of the eel stock in Sweden, Spring 2015. Second postevaluation of the Swedish Eel Management Plan. Swedish University of Agricultural Sciences, Aqua reports 2015:11. Drottning-holm, 93 p.
Lietuvos hidroenergetikų asociacija (Lithuanian hydropower association). 2011. Lietuvos hidroenergetika. 61 p. DOI: https://www.lsta.lt/files/Leidiniai/Lietuvos%20HIDROENERGETIKA/Knyga_Lietu-vos%20HIDROENERGETIKA.pdf.
Lin Y.J., Ložys L., Shiao J.C., Iizuka Y., Tzeng W.N. 2007. Growth differences between naturally recruited and stocked European eel Anguilla anguilla from different habitats in Lithuania. Journal of Fish Biology 71: 1773-1787.
Ložys L., Dainys J. 2020. Assessment of restoration and monitoring of the stock of European eel. (Europinių ungurių populiacijos išteklių atstatymo ir būklės monitoringo tyrimai). In prep., Nature Research Cen-tre, Vilnius.
Ložys L., Repečka R., Pūtys Ž., Gurjanovaitė K. 2008. Scientific justification of European eel (Anguilla an-guilla) management plan: [in Lithuanian]. Vilnius.
Mačionis A. 1969. Introduction of elvers into the lakes of the former region of Vilnius in 1928–1939. Vilnius: V. Kapsukas Stale University; pp. 241–254: [in Lithuanian].
Shiao J.C., Ložys L., Iizuka Y., Tzeng W.N. 2006. Migratory patterns and contribution of stocking to popu-lation of European eel in Lithuanian waters as indicated by otolith Sr:Ca ratios. J Fish Biol 69:749–769. DOI: 10.1111/j.1095-8649.2006.01147.x.
ICES | WGEEL 2020 | I
Contents
Report on the eel stock, fishery and other impacts, in The Netherlands ...................................................iii Authors ..........................................................................................................................................iii
1 Summary of national and international stock status indicators.................................................... 1 1.1 Escapement biomass and mortality rates ........................................................................ 1 1.2 Recruitment time-series .................................................................................................. 1
2 Overview of the national stock and its management.................................................................... 7 2.1 Describe the eel stock and its management .................................................................... 7
Eel Management Units and Eel Management Plans ........................................................ 7 Management authorities ................................................................................................. 7 Fisheries ........................................................................................................................... 7 Management actions ....................................................................................................... 8
2.2 Significant changes since last report ................................................................................ 8 3 Impacts on the national stock ....................................................................................................... 9
3.1 Fisheries ........................................................................................................................... 9 General information ........................................................................................................ 9 Spatial subdivision of the territory ................................................................................ 10 Fishing capacity .............................................................................................................. 11 Glass eel fisheries ........................................................................................................... 11 Yellow eel fisheries ........................................................................................................ 11
3.1.5.1 Commercial .................................................................................................................... 11 3.1.5.2 Recreational Fishery....................................................................................................... 13
Silver eel fisheries .......................................................................................................... 14 3.1.6.1 Commercial .................................................................................................................... 14 3.2 Restocking ...................................................................................................................... 14
Reconstructed Time-series on Stocking ......................................................................... 14 Amount stocked ............................................................................................................. 15
3.3 Aquaculture ................................................................................................................... 16 Seed supply .................................................................................................................... 16
3.3.1.1 Production ..................................................................................................................... 17 3.4 Entrainment ................................................................................................................... 17
Mortality rates and transition from polder to boezem or the sea ................................ 18 Mortality rates from boezem waterbodies to national waterbodies, and
hydropower stations ...................................................................................................... 19 Mortality rates from national waterbodies to sea, and hydropower stations .............. 19 Migration mortality ........................................................................................................ 19
3.5 Habitat Quantity and Quality ......................................................................................... 20 3.6 Other impacts ................................................................................................................ 20
Assisted migration of silver eel ...................................................................................... 20 Illegal, unreported and unregulated (IUU) fishing ......................................................... 21
4 National stock assessment .......................................................................................................... 24 4.1 Description of Method ................................................................................................... 24
Data collection ............................................................................................................... 24 4.1.1.1 Sampling commercial catches 2019 ............................................................................... 26
Analysis .......................................................................................................................... 26 4.1.2.1 Age and growth increment analysis ............................................................................... 26 4.1.2.2 Life stages ...................................................................................................................... 27 4.1.2.3 Sex determinations ........................................................................................................ 27
Reporting ....................................................................................................................... 27 Data quality issues and how they are being addressed ................................................. 27
4.1.4.1 Pristine silver eel biomass (B0) ....................................................................................... 27

ii | ICES SCIENTIFIC REPORTS 2: 85 | ICES
4.1.4.2 Anthropogenic mortality (Bbest, Bcurrent and LAM) ........................................................... 27 4.1.4.3 Unquantified sources of anthropogenic mortality ........................................................ 27 4.2 Trends in Assessment results ......................................................................................... 27 Current biomass of escaping silver eel (Bcurrent) ........................................................................... 27 Current best possible biomass (Bbest) .......................................................................................... 28 Lifetime Anthropogenic Mortality (LAM) .................................................................................... 28
5 Other data collection for eel ....................................................................................................... 29 5.1 Yellow eel abundance surveys ....................................................................................... 29
Recreational ................................................................................................................... 29 Fishery-independent ...................................................................................................... 29
5.1.2.1 Lake IJsselmeer/Markermeer (active gear) ................................................................... 29 5.1.2.2 Main rivers (active gear) ................................................................................................ 31 5.1.2.3 Main rivers (passive gear) .............................................................................................. 32 5.1.2.4 Coastal waters (active gear) ........................................................................................... 34 5.2 Silver eel escapement surveys ....................................................................................... 35 5.3 Life-history parameters .................................................................................................. 35 5.4 Diseases, Parasites & Pathogens or Contaminants ........................................................ 35 5.5 Contaminants ................................................................................................................. 37 5.6 Predators ....................................................................................................................... 40
6 New Information ......................................................................................................................... 42 Glass eel detectors ...................................................................................................................... 42
7 References ................................................................................................................................... 43
ICES | WGEEL 2020 | III
Report on the eel stock, fishery and other impacts, in The Netherlands
Authors
Dr. Jacco C. van Rijssel, Wageningen Marine Research, Wageningen University Research, IJmuiden, The Netherlands. Tel: +31628397424 [email protected]
Dr. Tessa van der Hammen, Wageningen Marine Research, Wageningen University Research, IJmuiden, The Netherlands. Tel: +31317487180 [email protected]
Reporting Period: This report was completed in September 2020, and contains data up to 2019 and some provisional data for 2020.
Acknowledgments: DUPAN (glass eel stocking data, assisted migration silver eel and eel aqua-culture production), NVWA (data on illegal fishing), RVO (licences fishermen), Ben Griffioen (Wageningen Marine Research; glass eel index), Olvin van Keeken (Wageningen Marine Re-search: eel survey data), Twan Leijzer (Wageningen Marine Research; parasite infections, fisher-ies data); Jaap van der Meer (yellow eel data NIOZ fyke), Michiel Kotterman (Wageningen Ma-rine Research; data on contaminants).
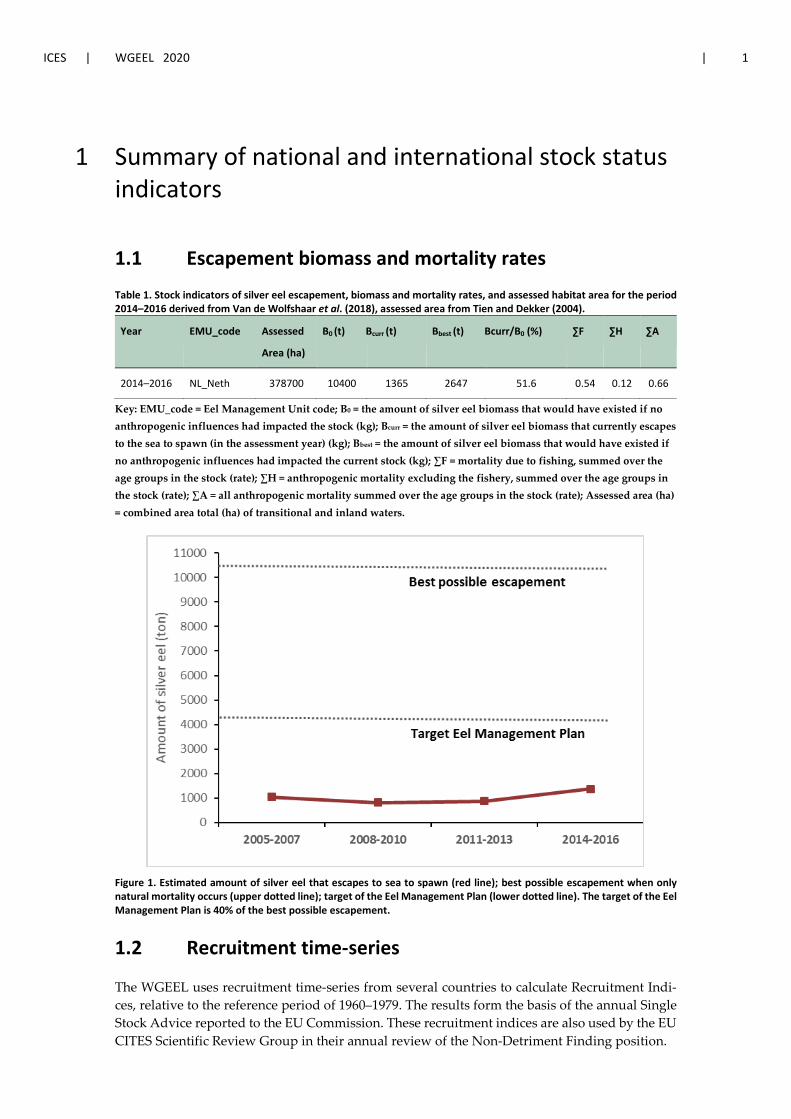
ICES | WGEEL 2020 | 1
1 Summary of national and international stock status indicators
1.1 Escapement biomass and mortality rates
Table 1. Stock indicators of silver eel escapement, biomass and mortality rates, and assessed habitat area for the period 2014–2016 derived from Van de Wolfshaar et al. (2018), assessed area from Tien and Dekker (2004).
Year EMU_code Assessed
Area (ha)
B0 (t) Bcurr (t) Bbest (t) Bcurr/B0 (%) ∑F ∑H ∑A
2014–2016 NL_Neth 378700 10400 1365 2647 51.6 0.54 0.12 0.66
Key: EMU_code = Eel Management Unit code; B0 = the amount of silver eel biomass that would have existed if no anthropogenic influences had impacted the stock (kg); Bcurr = the amount of silver eel biomass that currently escapes to the sea to spawn (in the assessment year) (kg); Bbest = the amount of silver eel biomass that would have existed if no anthropogenic influences had impacted the current stock (kg); ∑F = mortality due to fishing, summed over the age groups in the stock (rate); ∑H = anthropogenic mortality excluding the fishery, summed over the age groups in the stock (rate); ∑A = all anthropogenic mortality summed over the age groups in the stock (rate); Assessed area (ha) = combined area total (ha) of transitional and inland waters.
Figure 1. Estimated amount of silver eel that escapes to sea to spawn (red line); best possible escapement when only natural mortality occurs (upper dotted line); target of the Eel Management Plan (lower dotted line). The target of the Eel Management Plan is 40% of the best possible escapement.
1.2 Recruitment time-series
The WGEEL uses recruitment time-series from several countries to calculate Recruitment Indi-ces, relative to the reference period of 1960–1979. The results form the basis of the annual Single Stock Advice reported to the EU Commission. These recruitment indices are also used by the EU CITES Scientific Review Group in their annual review of the Non-Detriment Finding position.
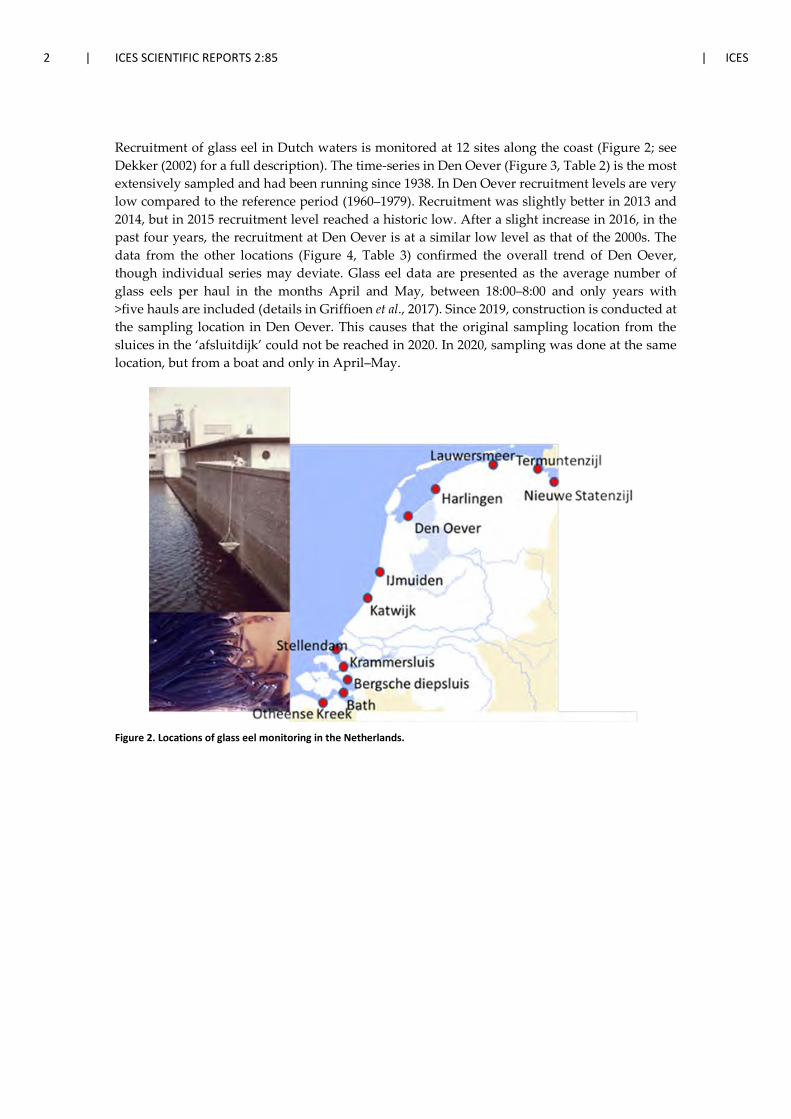
2 | ICES SCIENTIFIC REPORTS 2:85 | ICES
Recruitment of glass eel in Dutch waters is monitored at 12 sites along the coast (Figure 2; see Dekker (2002) for a full description). The time-series in Den Oever (Figure 3, Table 2) is the most extensively sampled and had been running since 1938. In Den Oever recruitment levels are very low compared to the reference period (1960–1979). Recruitment was slightly better in 2013 and 2014, but in 2015 recruitment level reached a historic low. After a slight increase in 2016, in the past four years, the recruitment at Den Oever is at a similar low level as that of the 2000s. The data from the other locations (Figure 4, Table 3) confirmed the overall trend of Den Oever, though individual series may deviate. Glass eel data are presented as the average number of glass eels per haul in the months April and May, between 18:00–8:00 and only years with >five hauls are included (details in Griffioen et al., 2017). Since 2019, construction is conducted at the sampling location in Den Oever. This causes that the original sampling location from the sluices in the ‘afsluitdijk’ could not be reached in 2020. In 2020, sampling was done at the same location, but from a boat and only in April–May.
Figure 2. Locations of glass eel monitoring in the Netherlands.
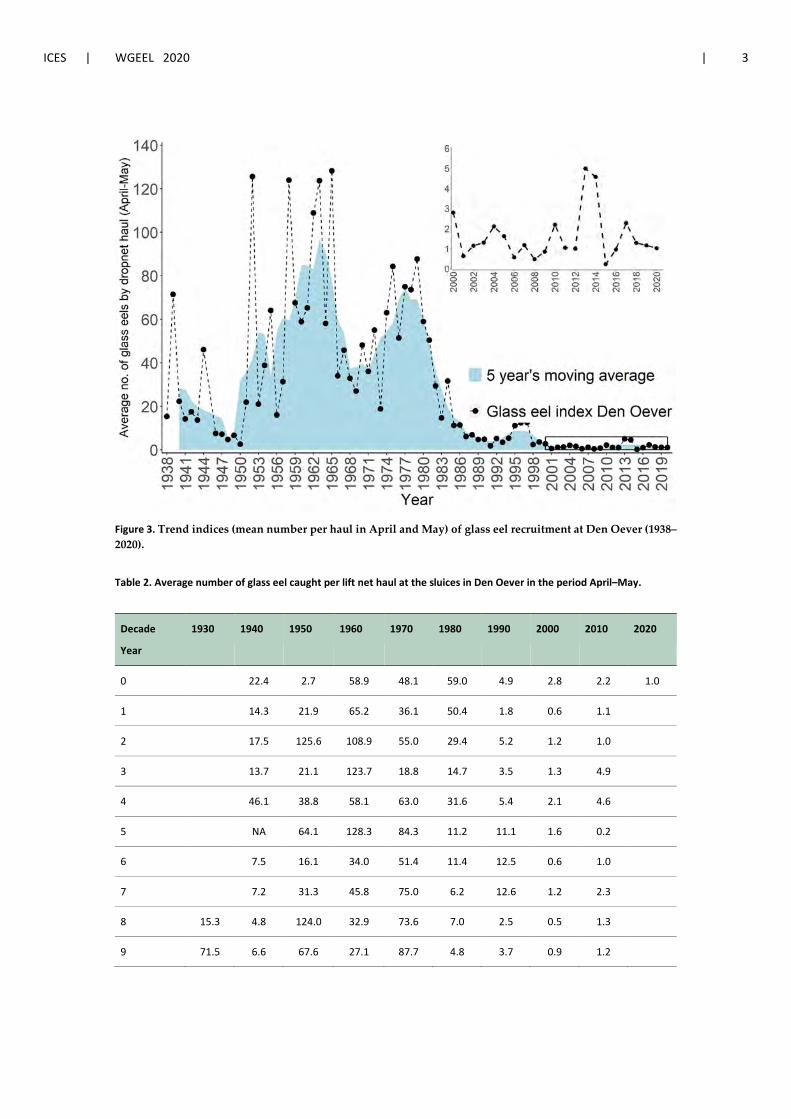
ICES | WGEEL 2020 | 3
Figure 3. Trend indices (mean number per haul in April and May) of glass eel recruitment at Den Oever (1938–2020).
Table 2. Average number of glass eel caught per lift net haul at the sluices in Den Oever in the period April–May.
Decade
Year
1930 1940 1950 1960 1970 1980 1990 2000 2010 2020
0 22.4 2.7 58.9 48.1 59.0 4.9 2.8 2.2 1.0
1 14.3 21.9 65.2 36.1 50.4 1.8 0.6 1.1
2 17.5 125.6 108.9 55.0 29.4 5.2 1.2 1.0
3 13.7 21.1 123.7 18.8 14.7 3.5 1.3 4.9
4 46.1 38.8 58.1 63.0 31.6 5.4 2.1 4.6
5 NA 64.1 128.3 84.3 11.2 11.1 1.6 0.2
6 7.5 16.1 34.0 51.4 11.4 12.5 0.6 1.0
7 7.2 31.3 45.8 75.0 6.2 12.6 1.2 2.3
8 15.3 4.8 124.0 32.9 73.6 7.0 2.5 0.5 1.3
9 71.5 6.6 67.6 27.1 87.7 4.8 3.7 0.9 1.2
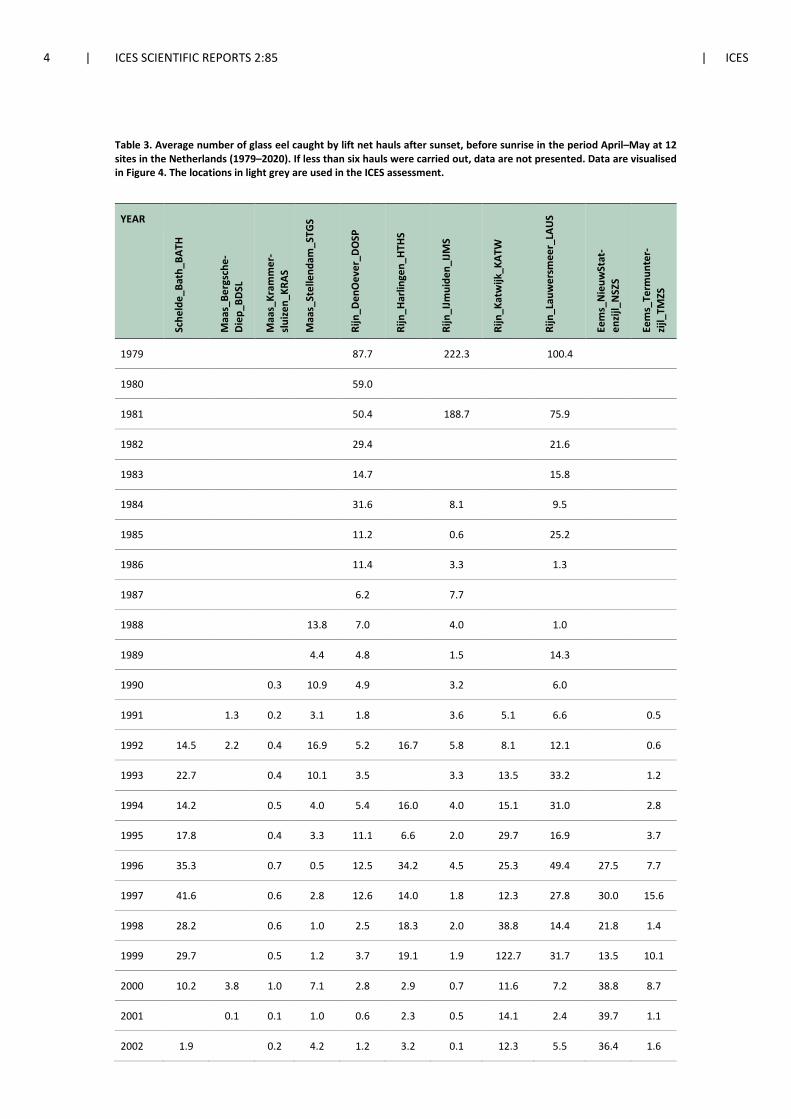
4 | ICES SCIENTIFIC REPORTS 2:85 | ICES
Table 3. Average number of glass eel caught by lift net hauls after sunset, before sunrise in the period April–May at 12 sites in the Netherlands (1979–2020). If less than six hauls were carried out, data are not presented. Data are visualised in Figure 4. The locations in light grey are used in the ICES assessment.
YEAR
Sche
lde_
Bath
_BAT
H
Maa
s_Be
rgsc
he-
Die
p_BD
SL
Maa
s_Kr
amm
er-
slui
zen_
KRAS
Maa
s_St
elle
ndam
_STG
S
Rijn
_Den
Oev
er_D
OSP
Rijn
_Har
linge
n_H
THS
Rijn
_IJm
uide
n_IJM
S
Rijn
_Kat
wijk
_KAT
W
Rijn
_Lau
wer
smee
r_LA
US
Eem
s_N
ieuw
Stat
-en
zijl_
NSZ
S
Eem
s_Te
rmun
ter-
zijl_
TMZS
1979
87.7
222.3
100.4
1980
59.0
1981
50.4
188.7
75.9
1982
29.4
21.6
1983
14.7
15.8
1984
31.6
8.1
9.5
1985
11.2
0.6
25.2
1986
11.4
3.3
1.3
1987
6.2
7.7
1988
13.8 7.0
4.0
1.0
1989
4.4 4.8
1.5
14.3
1990
0.3 10.9 4.9
3.2
6.0
1991
1.3 0.2 3.1 1.8
3.6 5.1 6.6
0.5
1992 14.5 2.2 0.4 16.9 5.2 16.7 5.8 8.1 12.1
0.6
1993 22.7
0.4 10.1 3.5
3.3 13.5 33.2
1.2
1994 14.2
0.5 4.0 5.4 16.0 4.0 15.1 31.0
2.8
1995 17.8
0.4 3.3 11.1 6.6 2.0 29.7 16.9
3.7
1996 35.3
0.7 0.5 12.5 34.2 4.5 25.3 49.4 27.5 7.7
1997 41.6
0.6 2.8 12.6 14.0 1.8 12.3 27.8 30.0 15.6
1998 28.2
0.6 1.0 2.5 18.3 2.0 38.8 14.4 21.8 1.4
1999 29.7
0.5 1.2 3.7 19.1 1.9 122.7 31.7 13.5 10.1
2000 10.2 3.8 1.0 7.1 2.8 2.9 0.7 11.6 7.2 38.8 8.7
2001
0.1 0.1 1.0 0.6 2.3 0.5 14.1 2.4 39.7 1.1
2002 1.9
0.2 4.2 1.2 3.2 0.1 12.3 5.5 36.4 1.6
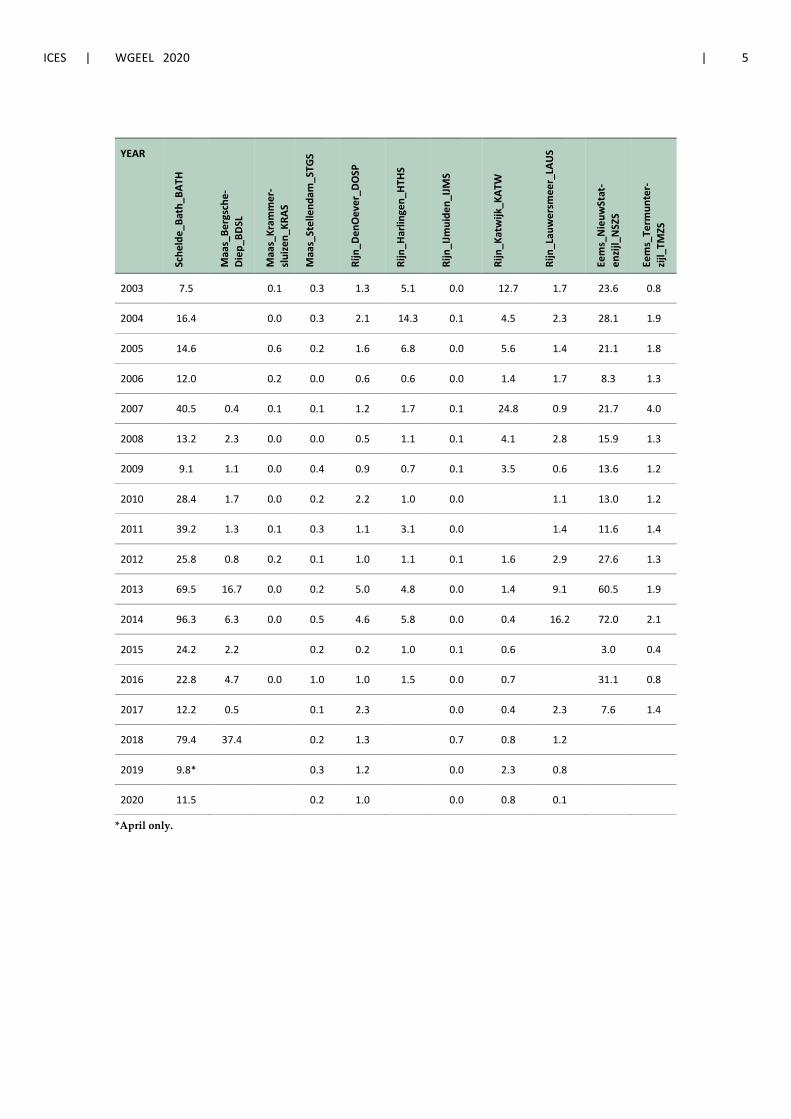
ICES | WGEEL 2020 | 5
YEAR
Sche
lde_
Bath
_BAT
H
Maa
s_Be
rgsc
he-
Die
p_BD
SL
Maa
s_Kr
amm
er-
slui
zen_
KRAS
Maa
s_St
elle
ndam
_STG
S
Rijn
_Den
Oev
er_D
OSP
Rijn
_Har
linge
n_H
THS
Rijn
_IJm
uide
n_IJM
S
Rijn
_Kat
wijk
_KAT
W
Rijn
_Lau
wer
smee
r_LA
US
Eem
s_N
ieuw
Stat
-en
zijl_
NSZ
S
Eem
s_Te
rmun
ter-
zijl_
TMZS
2003 7.5
0.1 0.3 1.3 5.1 0.0 12.7 1.7 23.6 0.8
2004 16.4
0.0 0.3 2.1 14.3 0.1 4.5 2.3 28.1 1.9
2005 14.6
0.6 0.2 1.6 6.8 0.0 5.6 1.4 21.1 1.8
2006 12.0
0.2 0.0 0.6 0.6 0.0 1.4 1.7 8.3 1.3
2007 40.5 0.4 0.1 0.1 1.2 1.7 0.1 24.8 0.9 21.7 4.0
2008 13.2 2.3 0.0 0.0 0.5 1.1 0.1 4.1 2.8 15.9 1.3
2009 9.1 1.1 0.0 0.4 0.9 0.7 0.1 3.5 0.6 13.6 1.2
2010 28.4 1.7 0.0 0.2 2.2 1.0 0.0
1.1 13.0 1.2
2011 39.2 1.3 0.1 0.3 1.1 3.1 0.0
1.4 11.6 1.4
2012 25.8 0.8 0.2 0.1 1.0 1.1 0.1 1.6 2.9 27.6 1.3
2013 69.5 16.7 0.0 0.2 5.0 4.8 0.0 1.4 9.1 60.5 1.9
2014 96.3 6.3 0.0 0.5 4.6 5.8 0.0 0.4 16.2 72.0 2.1
2015 24.2 2.2
0.2 0.2 1.0 0.1 0.6
3.0 0.4
2016 22.8 4.7 0.0 1.0 1.0 1.5 0.0 0.7
31.1 0.8
2017 12.2 0.5
0.1 2.3
0.0 0.4 2.3 7.6 1.4
2018 79.4 37.4 0.2 1.3 0.7 0.8 1.2
2019 9.8* 0.3 1.2 0.0 2.3 0.8
2020 11.5 0.2 1.0 0.0 0.8 0.1
*April only.
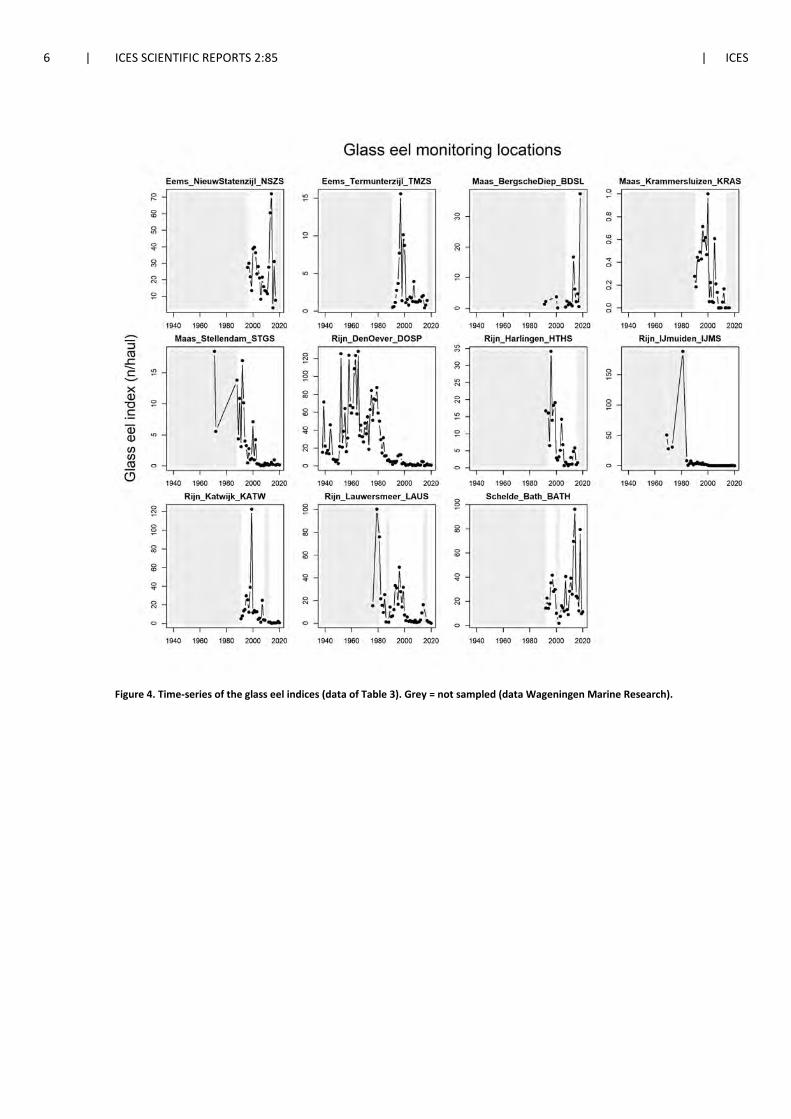
6 | ICES SCIENTIFIC REPORTS 2:85 | ICES
Figure 4. Time-series of the glass eel indices (data of Table 3). Grey = not sampled (data Wageningen Marine Research).
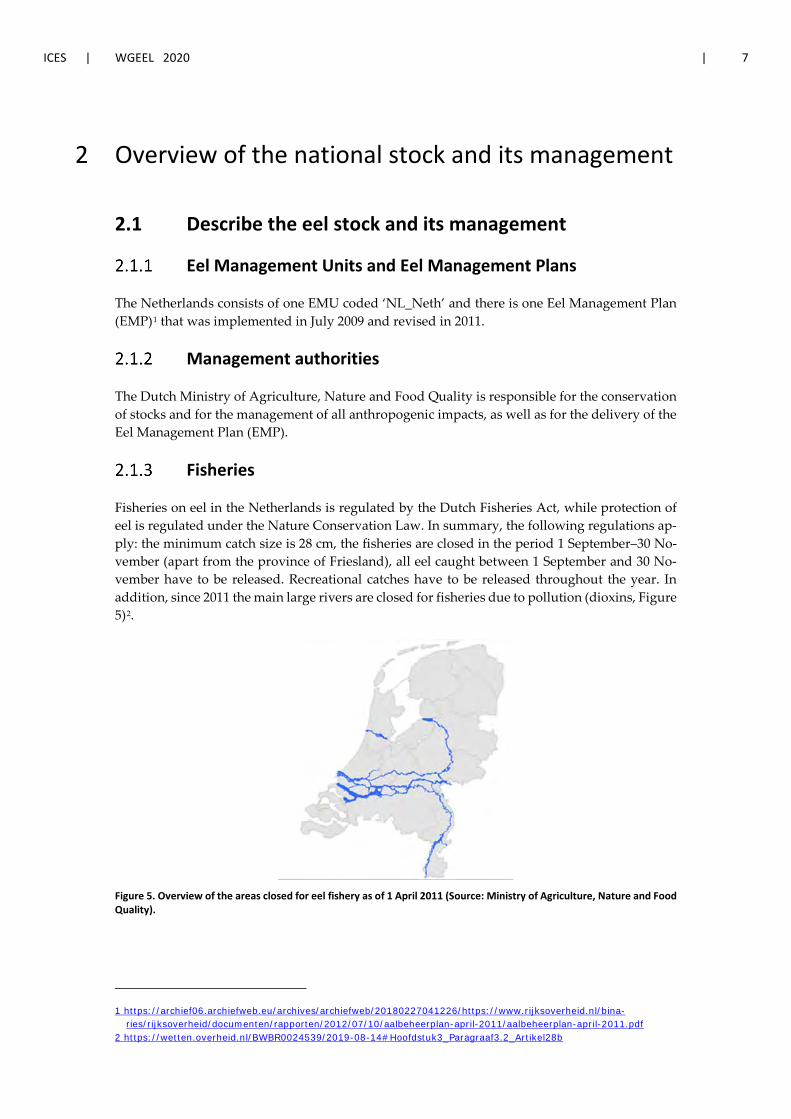
ICES | WGEEL 2020 | 7
2 Overview of the national stock and its management
2.1 Describe the eel stock and its management
Eel Management Units and Eel Management Plans
The Netherlands consists of one EMU coded ‘NL_Neth’ and there is one Eel Management Plan (EMP)1 that was implemented in July 2009 and revised in 2011.
Management authorities
The Dutch Ministry of Agriculture, Nature and Food Quality is responsible for the conservation of stocks and for the management of all anthropogenic impacts, as well as for the delivery of the Eel Management Plan (EMP).
Fisheries
Fisheries on eel in the Netherlands is regulated by the Dutch Fisheries Act, while protection of eel is regulated under the Nature Conservation Law. In summary, the following regulations ap-ply: the minimum catch size is 28 cm, the fisheries are closed in the period 1 September–30 No-vember (apart from the province of Friesland), all eel caught between 1 September and 30 No-vember have to be released. Recreational catches have to be released throughout the year. In addition, since 2011 the main large rivers are closed for fisheries due to pollution (dioxins, Figure 5)2.
Figure 5. Overview of the areas closed for eel fishery as of 1 April 2011 (Source: Ministry of Agriculture, Nature and Food Quality).
1 https://archief06.archiefweb.eu/archives/archiefweb/20180227041226/https://www.rijksoverheid.nl/bina-ries/rijksoverheid/documenten/rapporten/2012/07/10/aalbeheerplan-april-2011/aalbeheerplan-april-2011.pdf
2 https://wetten.overheid.nl/BWBR0024539/2019-08-14#Hoofdstuk3_Paragraaf3.2_Artikel28b
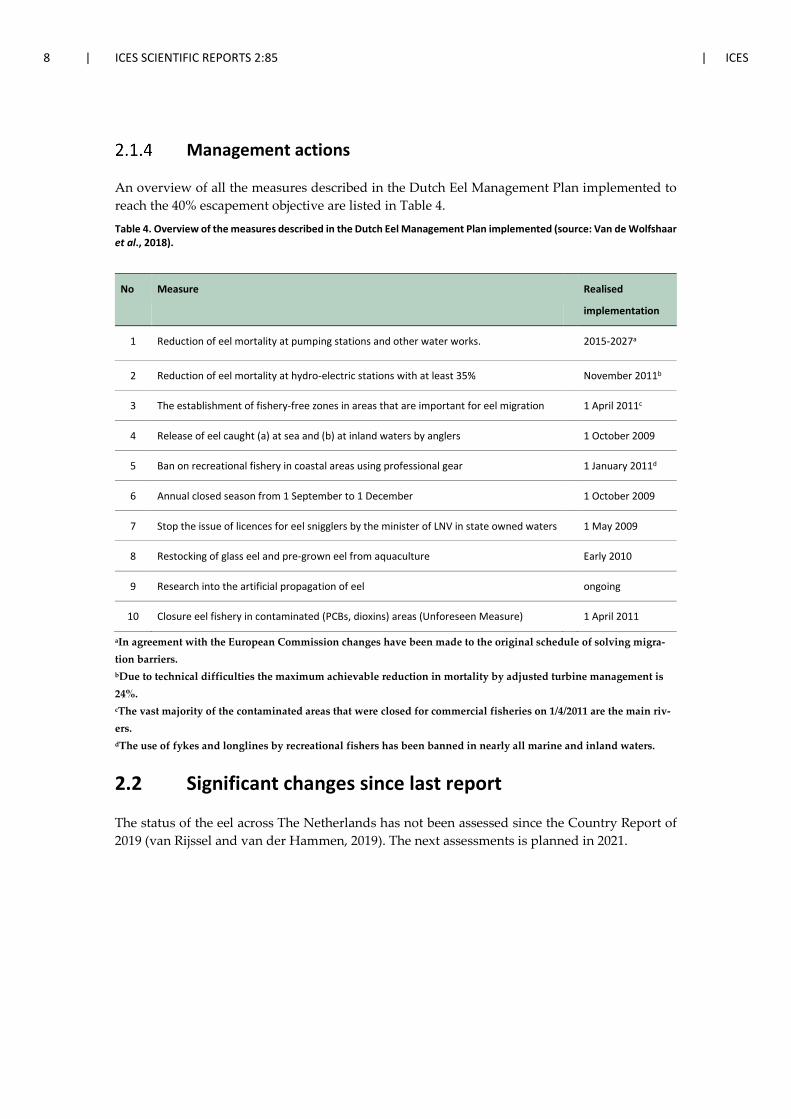
8 | ICES SCIENTIFIC REPORTS 2:85 | ICES
Management actions
An overview of all the measures described in the Dutch Eel Management Plan implemented to reach the 40% escapement objective are listed in Table 4.
Table 4. Overview of the measures described in the Dutch Eel Management Plan implemented (source: Van de Wolfshaar et al., 2018).
No Measure Realised
implementation
1 Reduction of eel mortality at pumping stations and other water works. 2015-2027a
2 Reduction of eel mortality at hydro-electric stations with at least 35% November 2011b
3 The establishment of fishery-free zones in areas that are important for eel migration 1 April 2011c
4 Release of eel caught (a) at sea and (b) at inland waters by anglers 1 October 2009
5 Ban on recreational fishery in coastal areas using professional gear 1 January 2011d
6 Annual closed season from 1 September to 1 December 1 October 2009
7 Stop the issue of licences for eel snigglers by the minister of LNV in state owned waters 1 May 2009
8 Restocking of glass eel and pre-grown eel from aquaculture Early 2010
9 Research into the artificial propagation of eel ongoing
10 Closure eel fishery in contaminated (PCBs, dioxins) areas (Unforeseen Measure) 1 April 2011
aIn agreement with the European Commission changes have been made to the original schedule of solving migra-tion barriers. bDue to technical difficulties the maximum achievable reduction in mortality by adjusted turbine management is 24%. cThe vast majority of the contaminated areas that were closed for commercial fisheries on 1/4/2011 are the main riv-ers. dThe use of fykes and longlines by recreational fishers has been banned in nearly all marine and inland waters.
2.2 Significant changes since last report
The status of the eel across The Netherlands has not been assessed since the Country Report of 2019 (van Rijssel and van der Hammen, 2019). The next assessments is planned in 2021.
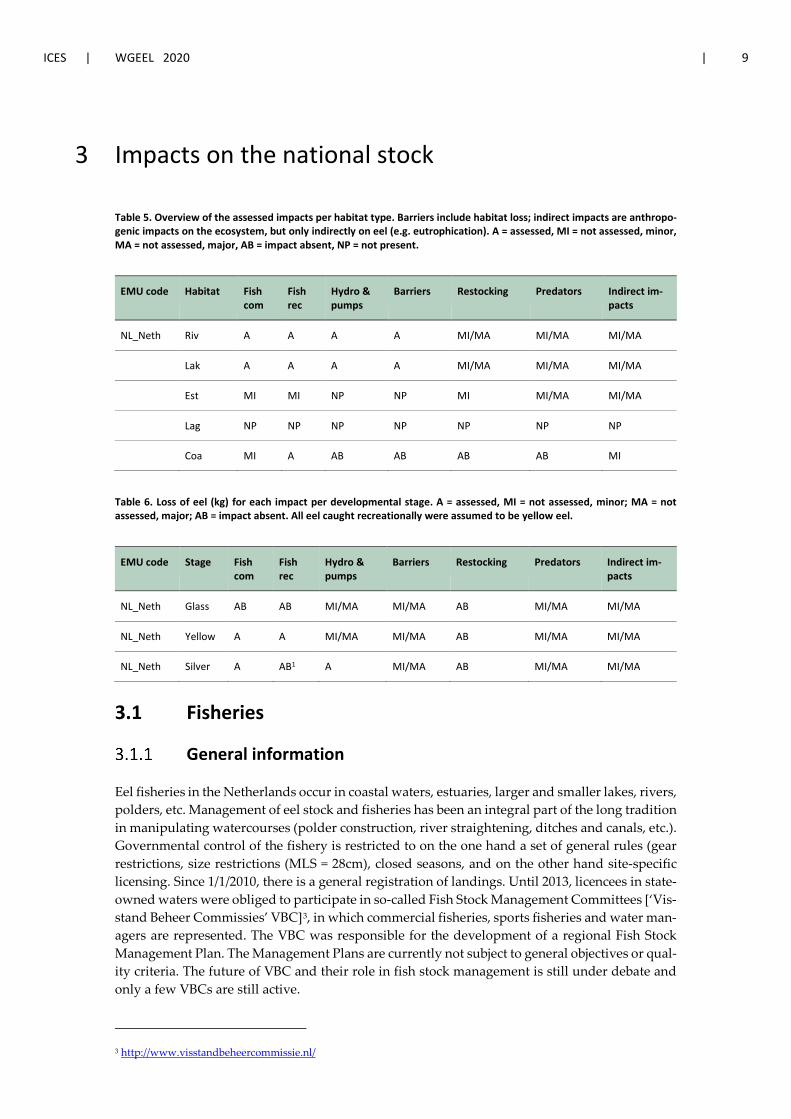
ICES | WGEEL 2020 | 9
3 Impacts on the national stock
Table 5. Overview of the assessed impacts per habitat type. Barriers include habitat loss; indirect impacts are anthropo-genic impacts on the ecosystem, but only indirectly on eel (e.g. eutrophication). A = assessed, MI = not assessed, minor, MA = not assessed, major, AB = impact absent, NP = not present.
EMU code Habitat Fish com
Fish rec
Hydro & pumps
Barriers Restocking Predators Indirect im-pacts
NL_Neth Riv A A A A MI/MA MI/MA MI/MA
Lak A A A A MI/MA MI/MA MI/MA
Est MI MI NP NP MI MI/MA MI/MA
Lag NP NP NP NP NP NP NP
Coa MI A AB AB AB AB MI
Table 6. Loss of eel (kg) for each impact per developmental stage. A = assessed, MI = not assessed, minor; MA = not assessed, major; AB = impact absent. All eel caught recreationally were assumed to be yellow eel.
EMU code Stage Fish com
Fish rec
Hydro & pumps
Barriers Restocking Predators Indirect im-pacts
NL_Neth Glass AB AB MI/MA MI/MA AB MI/MA MI/MA
NL_Neth Yellow A A MI/MA MI/MA AB MI/MA MI/MA
NL_Neth Silver A AB1 A MI/MA AB MI/MA MI/MA
3.1 Fisheries
General information
Eel fisheries in the Netherlands occur in coastal waters, estuaries, larger and smaller lakes, rivers, polders, etc. Management of eel stock and fisheries has been an integral part of the long tradition in manipulating watercourses (polder construction, river straightening, ditches and canals, etc.). Governmental control of the fishery is restricted to on the one hand a set of general rules (gear restrictions, size restrictions (MLS = 28cm), closed seasons, and on the other hand site-specific licensing. Since 1/1/2010, there is a general registration of landings. Until 2013, licencees in state-owned waters were obliged to participate in so-called Fish Stock Management Committees [‘Vis-stand Beheer Commissies’ VBC]3, in which commercial fisheries, sports fisheries and water man-agers are represented. The VBC was responsible for the development of a regional Fish Stock Management Plan. The Management Plans are currently not subject to general objectives or qual-ity criteria. The future of VBC and their role in fish stock management is still under debate and only a few VBCs are still active.
3 http://www.visstandbeheercommissie.nl/
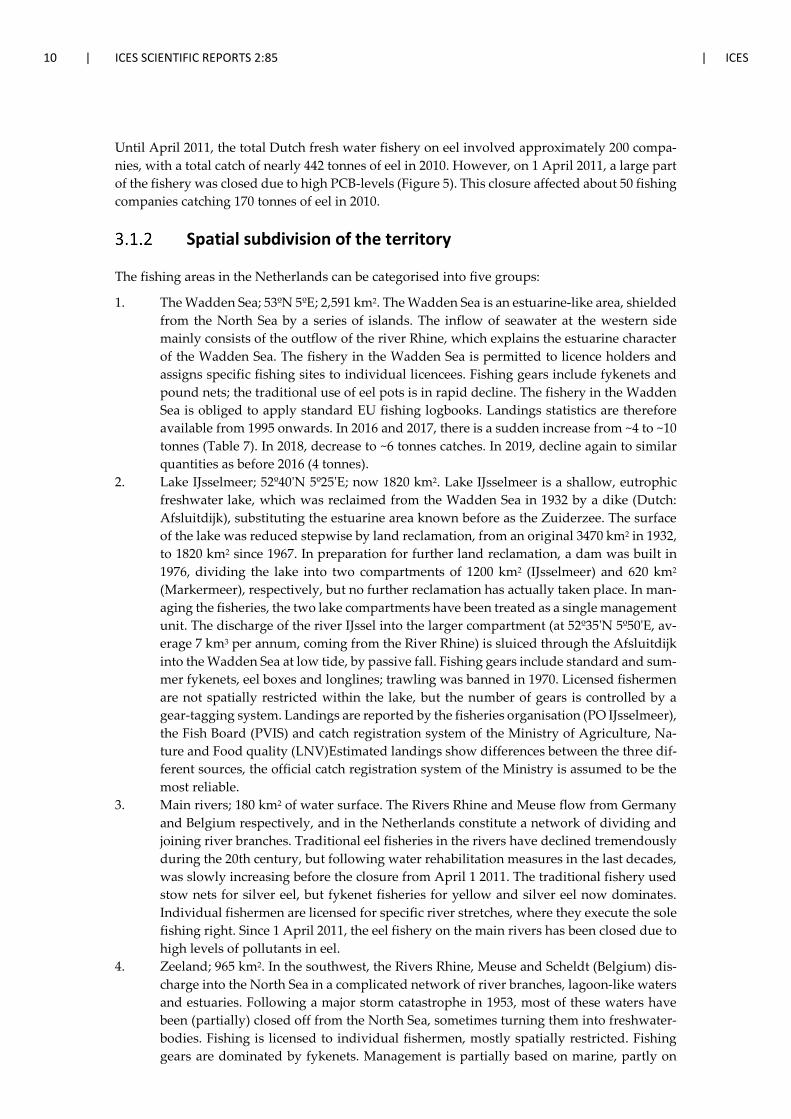
10 | ICES SCIENTIFIC REPORTS 2:85 | ICES
Until April 2011, the total Dutch fresh water fishery on eel involved approximately 200 compa-nies, with a total catch of nearly 442 tonnes of eel in 2010. However, on 1 April 2011, a large part of the fishery was closed due to high PCB-levels (Figure 5). This closure affected about 50 fishing companies catching 170 tonnes of eel in 2010.
Spatial subdivision of the territory
The fishing areas in the Netherlands can be categorised into five groups:
1. The Wadden Sea; 53ºN 5ºE; 2,591 km2. The Wadden Sea is an estuarine-like area, shielded from the North Sea by a series of islands. The inflow of seawater at the western side mainly consists of the outflow of the river Rhine, which explains the estuarine character of the Wadden Sea. The fishery in the Wadden Sea is permitted to licence holders and assigns specific fishing sites to individual licencees. Fishing gears include fykenets and pound nets; the traditional use of eel pots is in rapid decline. The fishery in the Wadden Sea is obliged to apply standard EU fishing logbooks. Landings statistics are therefore available from 1995 onwards. In 2016 and 2017, there is a sudden increase from ~4 to ~10 tonnes (Table 7). In 2018, decrease to ~6 tonnes catches. In 2019, decline again to similar quantities as before 2016 (4 tonnes).
2. Lake IJsselmeer; 52º40'N 5º25'E; now 1820 km2. Lake IJsselmeer is a shallow, eutrophic freshwater lake, which was reclaimed from the Wadden Sea in 1932 by a dike (Dutch: Afsluitdijk), substituting the estuarine area known before as the Zuiderzee. The surface of the lake was reduced stepwise by land reclamation, from an original 3470 km2 in 1932, to 1820 km2 since 1967. In preparation for further land reclamation, a dam was built in 1976, dividing the lake into two compartments of 1200 km2 (IJsselmeer) and 620 km2 (Markermeer), respectively, but no further reclamation has actually taken place. In man-aging the fisheries, the two lake compartments have been treated as a single management unit. The discharge of the river IJssel into the larger compartment (at 52º35'N 5º50'E, av-erage 7 km3 per annum, coming from the River Rhine) is sluiced through the Afsluitdijk into the Wadden Sea at low tide, by passive fall. Fishing gears include standard and sum-mer fykenets, eel boxes and longlines; trawling was banned in 1970. Licensed fishermen are not spatially restricted within the lake, but the number of gears is controlled by a gear-tagging system. Landings are reported by the fisheries organisation (PO IJsselmeer), the Fish Board (PVIS) and catch registration system of the Ministry of Agriculture, Na-ture and Food quality (LNV)Estimated landings show differences between the three dif-ferent sources, the official catch registration system of the Ministry is assumed to be the most reliable.
3. Main rivers; 180 km2 of water surface. The Rivers Rhine and Meuse flow from Germany and Belgium respectively, and in the Netherlands constitute a network of dividing and joining river branches. Traditional eel fisheries in the rivers have declined tremendously during the 20th century, but following water rehabilitation measures in the last decades, was slowly increasing before the closure from April 1 2011. The traditional fishery used stow nets for silver eel, but fykenet fisheries for yellow and silver eel now dominates. Individual fishermen are licensed for specific river stretches, where they execute the sole fishing right. Since 1 April 2011, the eel fishery on the main rivers has been closed due to high levels of pollutants in eel.
4. Zeeland; 965 km2. In the southwest, the Rivers Rhine, Meuse and Scheldt (Belgium) dis-charge into the North Sea in a complicated network of river branches, lagoon-like waters and estuaries. Following a major storm catastrophe in 1953, most of these waters have been (partially) closed off from the North Sea, sometimes turning them into freshwater-bodies. Fishing is licensed to individual fishermen, mostly spatially restricted. Fishing gears are dominated by fykenets. Management is partially based on marine, partly on
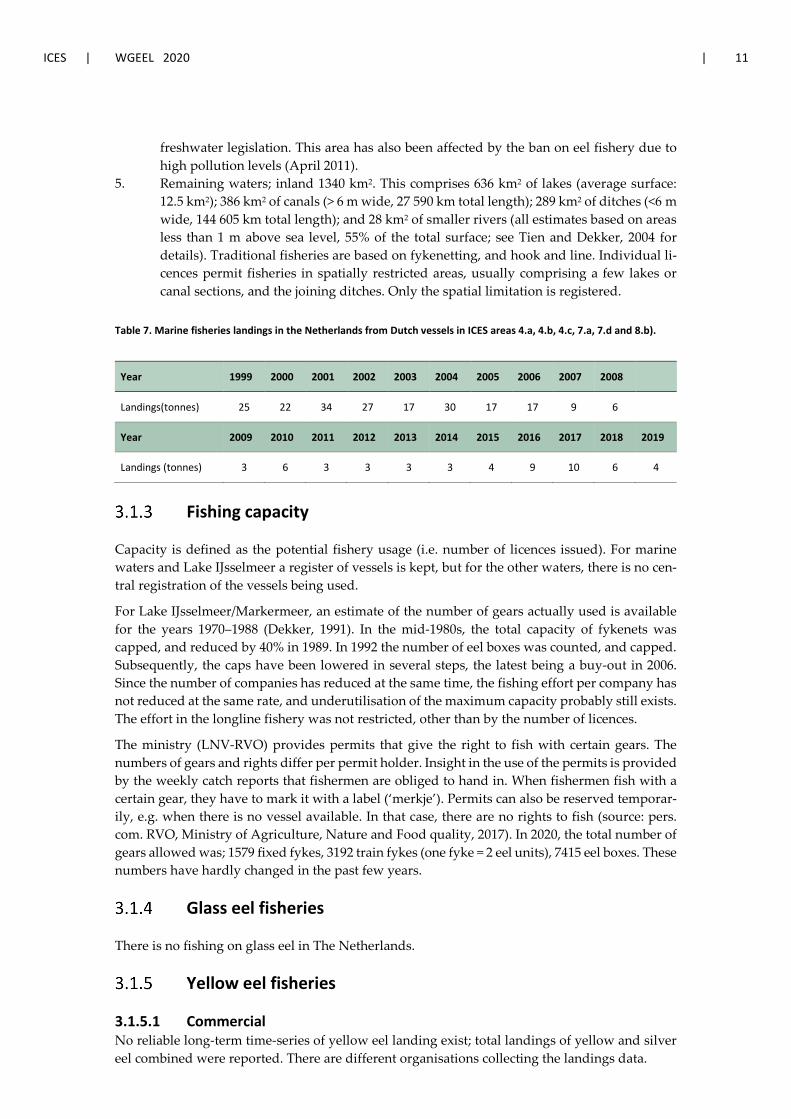
ICES | WGEEL 2020 | 11
freshwater legislation. This area has also been affected by the ban on eel fishery due to high pollution levels (April 2011).
5. Remaining waters; inland 1340 km2. This comprises 636 km2 of lakes (average surface: 12.5 km2); 386 km2 of canals (> 6 m wide, 27 590 km total length); 289 km2 of ditches (<6 m wide, 144 605 km total length); and 28 km2 of smaller rivers (all estimates based on areas less than 1 m above sea level, 55% of the total surface; see Tien and Dekker, 2004 for details). Traditional fisheries are based on fykenetting, and hook and line. Individual li-cences permit fisheries in spatially restricted areas, usually comprising a few lakes or canal sections, and the joining ditches. Only the spatial limitation is registered.
Table 7. Marine fisheries landings in the Netherlands from Dutch vessels in ICES areas 4.a, 4.b, 4.c, 7.a, 7.d and 8.b).
Year 1999 2000 2001 2002 2003 2004 2005 2006 2007 2008
Landings(tonnes) 25 22 34 27 17 30 17 17 9 6
Year 2009 2010 2011 2012 2013 2014 2015 2016 2017 2018 2019
Landings (tonnes) 3 6 3 3 3 3 4 9 10 6 4
Fishing capacity
Capacity is defined as the potential fishery usage (i.e. number of licences issued). For marine waters and Lake IJsselmeer a register of vessels is kept, but for the other waters, there is no cen-tral registration of the vessels being used.
For Lake IJsselmeer/Markermeer, an estimate of the number of gears actually used is available for the years 1970–1988 (Dekker, 1991). In the mid-1980s, the total capacity of fykenets was capped, and reduced by 40% in 1989. In 1992 the number of eel boxes was counted, and capped. Subsequently, the caps have been lowered in several steps, the latest being a buy-out in 2006. Since the number of companies has reduced at the same time, the fishing effort per company has not reduced at the same rate, and underutilisation of the maximum capacity probably still exists. The effort in the longline fishery was not restricted, other than by the number of licences.
The ministry (LNV-RVO) provides permits that give the right to fish with certain gears. The numbers of gears and rights differ per permit holder. Insight in the use of the permits is provided by the weekly catch reports that fishermen are obliged to hand in. When fishermen fish with a certain gear, they have to mark it with a label (‘merkje’). Permits can also be reserved temporar-ily, e.g. when there is no vessel available. In that case, there are no rights to fish (source: pers. com. RVO, Ministry of Agriculture, Nature and Food quality, 2017). In 2020, the total number of gears allowed was; 1579 fixed fykes, 3192 train fykes (one fyke = 2 eel units), 7415 eel boxes. These numbers have hardly changed in the past few years.
Glass eel fisheries
There is no fishing on glass eel in The Netherlands.
Yellow eel fisheries
3.1.5.1 Commercial No reliable long-term time-series of yellow eel landing exist; total landings of yellow and silver eel combined were reported. There are different organisations collecting the landings data.
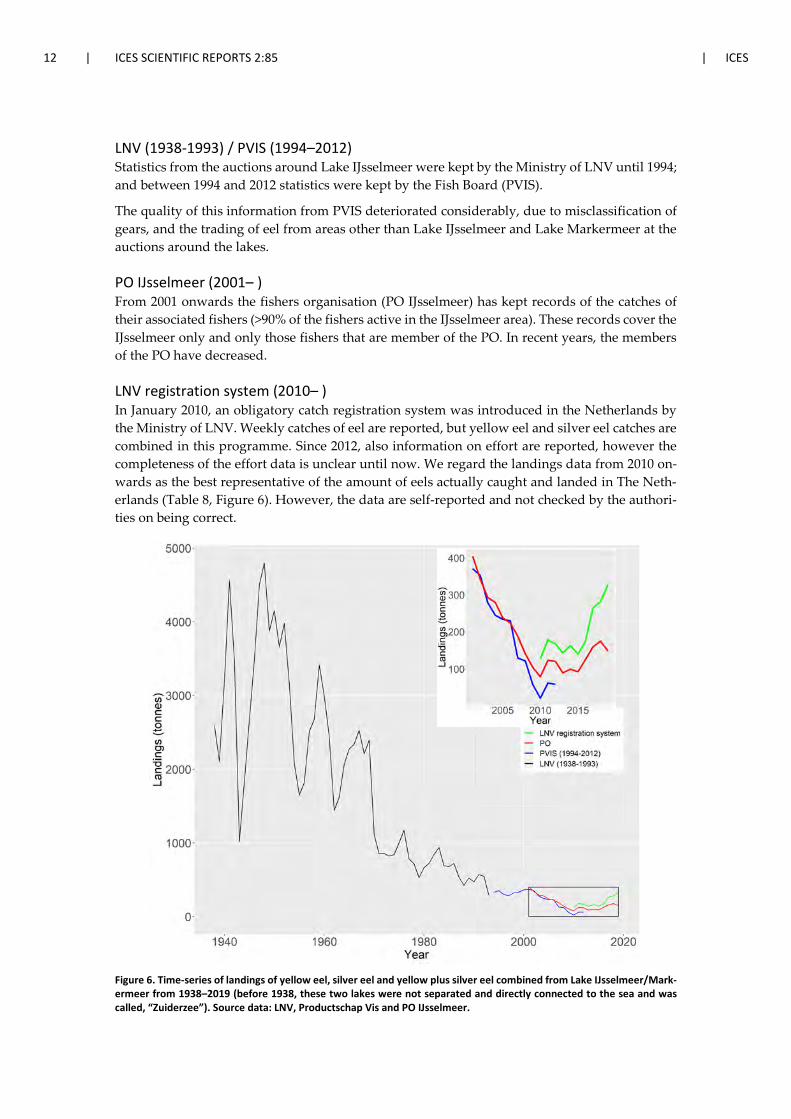
12 | ICES SCIENTIFIC REPORTS 2:85 | ICES
LNV (1938-1993) / PVIS (1994–2012) Statistics from the auctions around Lake IJsselmeer were kept by the Ministry of LNV until 1994; and between 1994 and 2012 statistics were kept by the Fish Board (PVIS).
The quality of this information from PVIS deteriorated considerably, due to misclassification of gears, and the trading of eel from areas other than Lake IJsselmeer and Lake Markermeer at the auctions around the lakes.
PO IJsselmeer (2001– ) From 2001 onwards the fishers organisation (PO IJsselmeer) has kept records of the catches of their associated fishers (>90% of the fishers active in the IJsselmeer area). These records cover the IJsselmeer only and only those fishers that are member of the PO. In recent years, the members of the PO have decreased.
LNV registration system (2010– ) In January 2010, an obligatory catch registration system was introduced in the Netherlands by the Ministry of LNV. Weekly catches of eel are reported, but yellow eel and silver eel catches are combined in this programme. Since 2012, also information on effort are reported, however the completeness of the effort data is unclear until now. We regard the landings data from 2010 on-wards as the best representative of the amount of eels actually caught and landed in The Neth-erlands (Table 8, Figure 6). However, the data are self-reported and not checked by the authori-ties on being correct.
Figure 6. Time-series of landings of yellow eel, silver eel and yellow plus silver eel combined from Lake IJsselmeer/Mark-ermeer from 1938–2019 (before 1938, these two lakes were not separated and directly connected to the sea and was called, “Zuiderzee”). Source data: LNV, Productschap Vis and PO IJsselmeer.
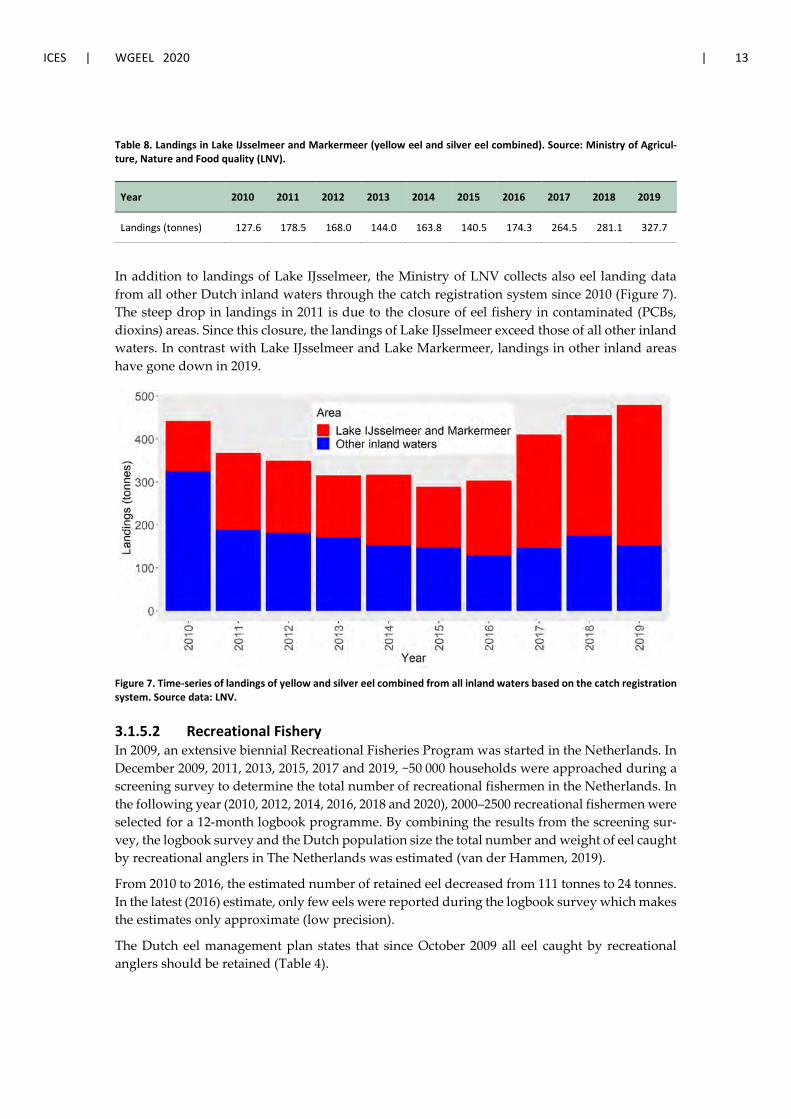
ICES | WGEEL 2020 | 13
Table 8. Landings in Lake IJsselmeer and Markermeer (yellow eel and silver eel combined). Source: Ministry of Agricul-ture, Nature and Food quality (LNV).
Year 2010 2011 2012 2013 2014 2015 2016 2017 2018 2019
Landings (tonnes) 127.6 178.5 168.0 144.0 163.8 140.5 174.3 264.5 281.1 327.7
In addition to landings of Lake IJsselmeer, the Ministry of LNV collects also eel landing data from all other Dutch inland waters through the catch registration system since 2010 (Figure 7). The steep drop in landings in 2011 is due to the closure of eel fishery in contaminated (PCBs, dioxins) areas. Since this closure, the landings of Lake IJsselmeer exceed those of all other inland waters. In contrast with Lake IJsselmeer and Lake Markermeer, landings in other inland areas have gone down in 2019.
Figure 7. Time-series of landings of yellow and silver eel combined from all inland waters based on the catch registration system. Source data: LNV.
3.1.5.2 Recreational Fishery In 2009, an extensive biennial Recreational Fisheries Program was started in the Netherlands. In December 2009, 2011, 2013, 2015, 2017 and 2019, ~50 000 households were approached during a screening survey to determine the total number of recreational fishermen in the Netherlands. In the following year (2010, 2012, 2014, 2016, 2018 and 2020), 2000–2500 recreational fishermen were selected for a 12-month logbook programme. By combining the results from the screening sur-vey, the logbook survey and the Dutch population size the total number and weight of eel caught by recreational anglers in The Netherlands was estimated (van der Hammen, 2019).
From 2010 to 2016, the estimated number of retained eel decreased from 111 tonnes to 24 tonnes. In the latest (2016) estimate, only few eels were reported during the logbook survey which makes the estimates only approximate (low precision).
The Dutch eel management plan states that since October 2009 all eel caught by recreational anglers should be retained (Table 4).
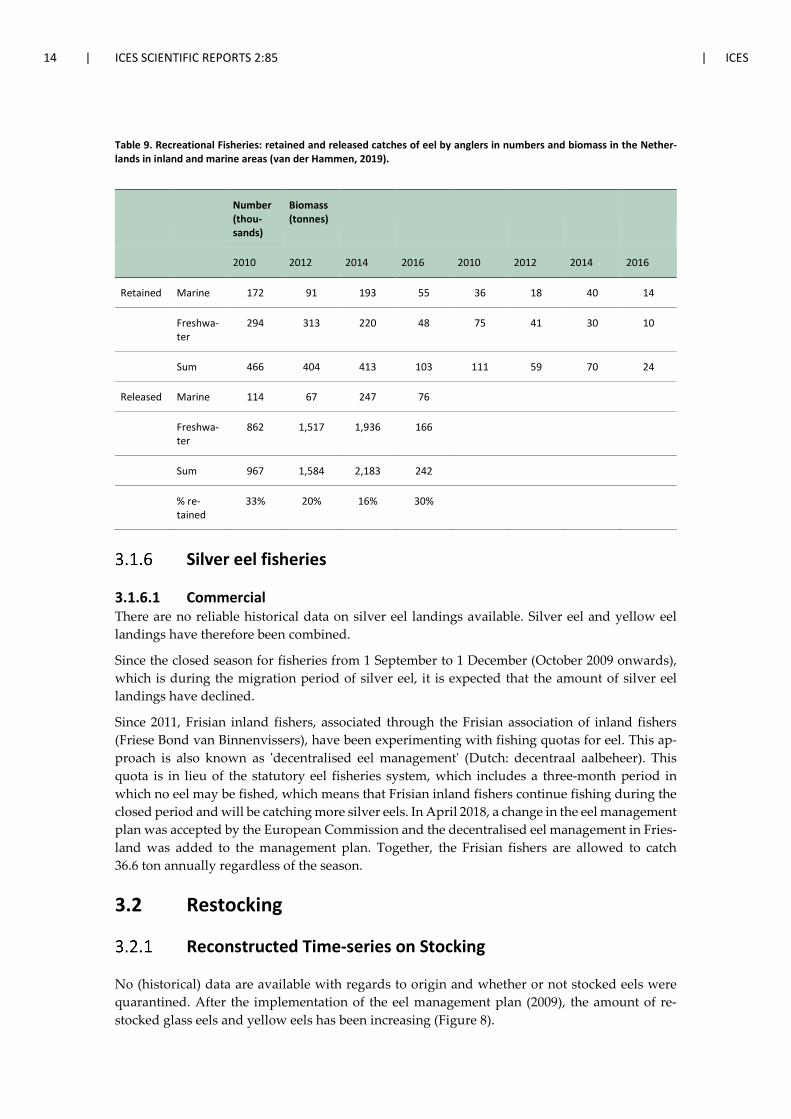
14 | ICES SCIENTIFIC REPORTS 2:85 | ICES
Table 9. Recreational Fisheries: retained and released catches of eel by anglers in numbers and biomass in the Nether-lands in inland and marine areas (van der Hammen, 2019).
Number (thou-sands)
Biomass (tonnes)
2010 2012 2014 2016 2010 2012 2014 2016
Retained Marine 172 91 193 55 36 18 40 14
Freshwa-ter
294 313 220 48 75 41 30 10
Sum 466 404 413 103 111 59 70 24
Released Marine 114 67 247 76
Freshwa-ter
862 1,517 1,936 166
Sum 967 1,584 2,183 242
% re-tained
33% 20% 16% 30%
Silver eel fisheries
3.1.6.1 Commercial There are no reliable historical data on silver eel landings available. Silver eel and yellow eel landings have therefore been combined.
Since the closed season for fisheries from 1 September to 1 December (October 2009 onwards), which is during the migration period of silver eel, it is expected that the amount of silver eel landings have declined.
Since 2011, Frisian inland fishers, associated through the Frisian association of inland fishers (Friese Bond van Binnenvissers), have been experimenting with fishing quotas for eel. This ap-proach is also known as 'decentralised eel management' (Dutch: decentraal aalbeheer). This quota is in lieu of the statutory eel fisheries system, which includes a three-month period in which no eel may be fished, which means that Frisian inland fishers continue fishing during the closed period and will be catching more silver eels. In April 2018, a change in the eel management plan was accepted by the European Commission and the decentralised eel management in Fries-land was added to the management plan. Together, the Frisian fishers are allowed to catch 36.6 ton annually regardless of the season.
3.2 Restocking
Reconstructed Time-series on Stocking
No (historical) data are available with regards to origin and whether or not stocked eels were quarantined. After the implementation of the eel management plan (2009), the amount of re-stocked glass eels and yellow eels has been increasing (Figure 8).
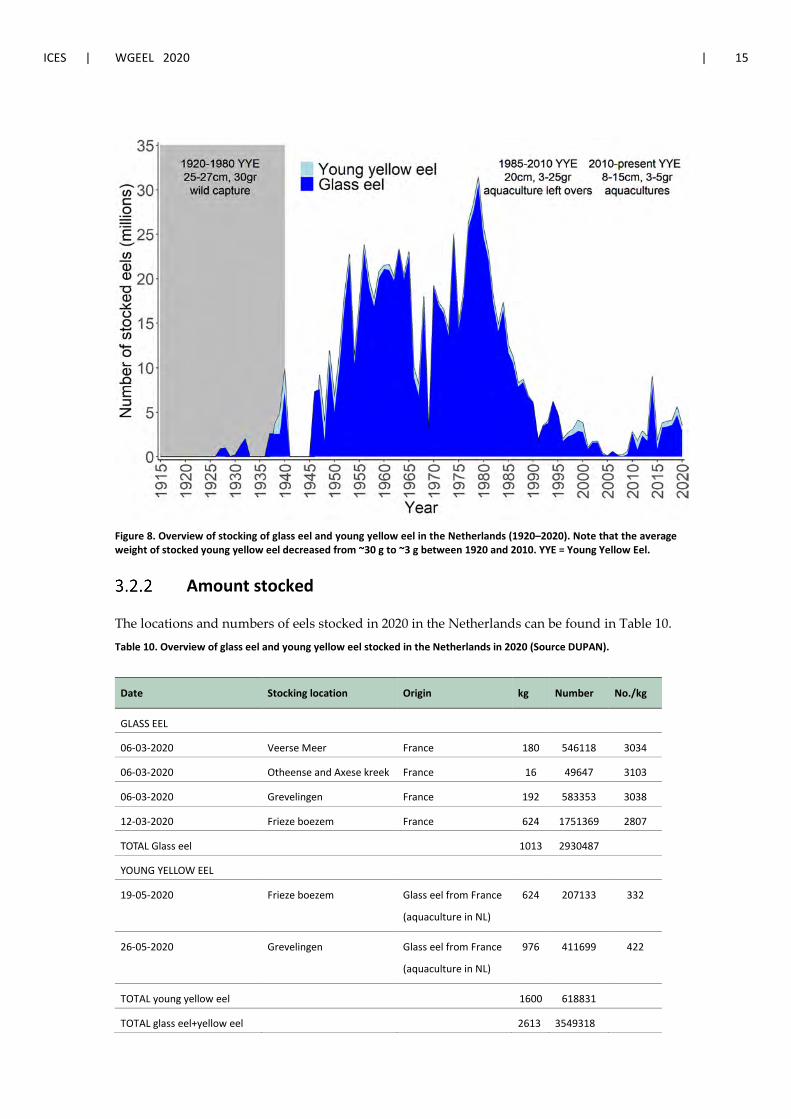
ICES | WGEEL 2020 | 15
Figure 8. Overview of stocking of glass eel and young yellow eel in the Netherlands (1920–2020). Note that the average weight of stocked young yellow eel decreased from ~30 g to ~3 g between 1920 and 2010. YYE = Young Yellow Eel.
Amount stocked
The locations and numbers of eels stocked in 2020 in the Netherlands can be found in Table 10.
Table 10. Overview of glass eel and young yellow eel stocked in the Netherlands in 2020 (Source DUPAN).
Date Stocking location Origin kg Number No./kg
GLASS EEL
06-03-2020 Veerse Meer France 180 546118 3034
06-03-2020 Otheense and Axese kreek France 16 49647 3103
06-03-2020 Grevelingen France 192 583353 3038
12-03-2020 Frieze boezem France 624 1751369 2807
TOTAL Glass eel 1013 2930487
YOUNG YELLOW EEL
19-05-2020 Frieze boezem Glass eel from France
(aquaculture in NL)
624 207133 332
26-05-2020 Grevelingen Glass eel from France
(aquaculture in NL)
976 411699 422
TOTAL young yellow eel 1600 618831
TOTAL glass eel+yellow eel 2613 3549318
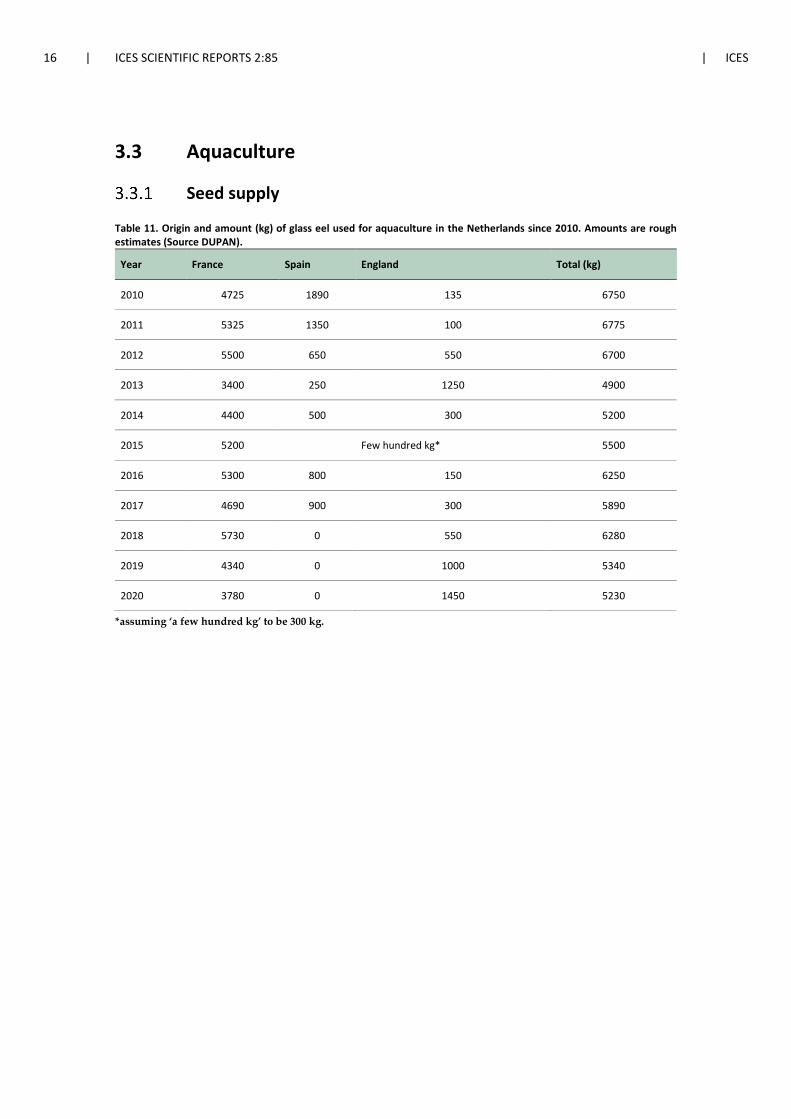
16 | ICES SCIENTIFIC REPORTS 2:85 | ICES
3.3 Aquaculture
Seed supply
Table 11. Origin and amount (kg) of glass eel used for aquaculture in the Netherlands since 2010. Amounts are rough estimates (Source DUPAN).
Year France Spain England Total (kg)
2010 4725 1890 135 6750
2011 5325 1350 100 6775
2012 5500 650 550 6700
2013 3400 250 1250 4900
2014 4400 500 300 5200
2015 5200 Few hundred kg* 5500
2016 5300 800 150 6250
2017 4690 900 300 5890
2018 5730 0 550 6280
2019 4340 0 1000 5340
2020 3780 0 1450 5230
*assuming ‘a few hundred kg’ to be 300 kg.
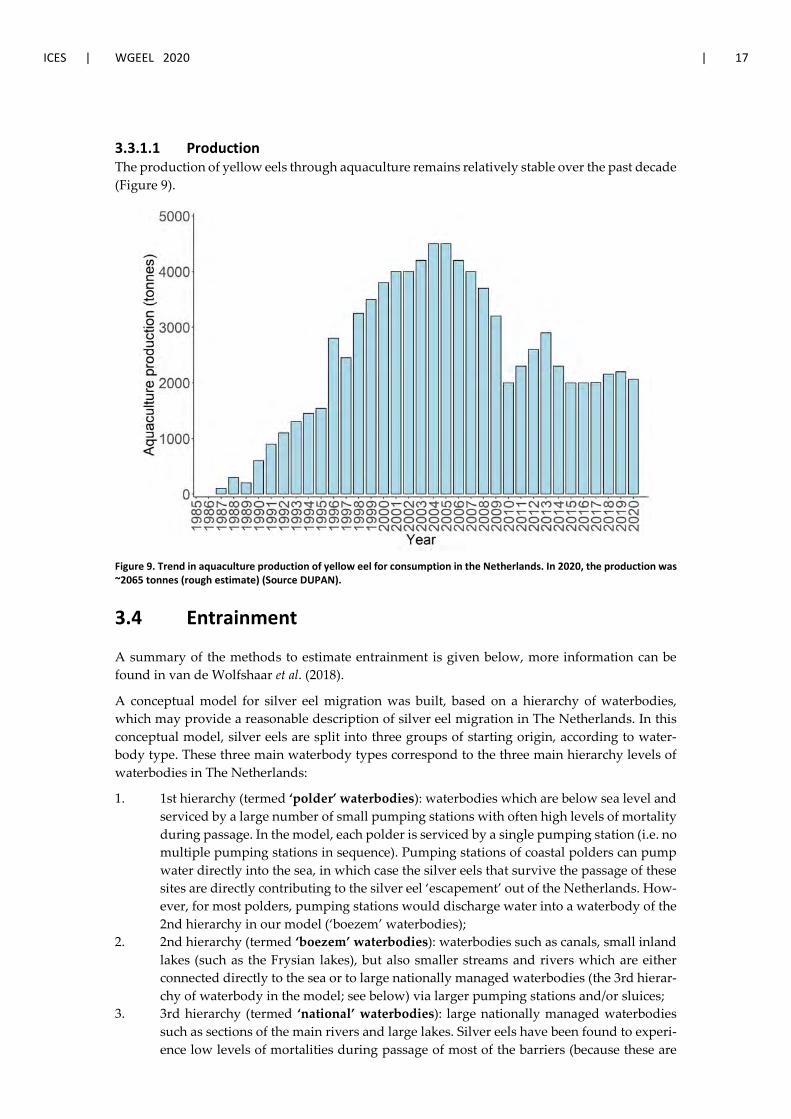
ICES | WGEEL 2020 | 17
3.3.1.1 Production The production of yellow eels through aquaculture remains relatively stable over the past decade (Figure 9).
Figure 9. Trend in aquaculture production of yellow eel for consumption in the Netherlands. In 2020, the production was ~2065 tonnes (rough estimate) (Source DUPAN).
3.4 Entrainment
A summary of the methods to estimate entrainment is given below, more information can be found in van de Wolfshaar et al. (2018).
A conceptual model for silver eel migration was built, based on a hierarchy of waterbodies, which may provide a reasonable description of silver eel migration in The Netherlands. In this conceptual model, silver eels are split into three groups of starting origin, according to water-body type. These three main waterbody types correspond to the three main hierarchy levels of waterbodies in The Netherlands:
1. 1st hierarchy (termed ‘polder’ waterbodies): waterbodies which are below sea level and serviced by a large number of small pumping stations with often high levels of mortality during passage. In the model, each polder is serviced by a single pumping station (i.e. no multiple pumping stations in sequence). Pumping stations of coastal polders can pump water directly into the sea, in which case the silver eels that survive the passage of these sites are directly contributing to the silver eel ‘escapement’ out of the Netherlands. How-ever, for most polders, pumping stations would discharge water into a waterbody of the 2nd hierarchy in our model (‘boezem’ waterbodies);
2. 2nd hierarchy (termed ‘boezem’ waterbodies): waterbodies such as canals, small inland lakes (such as the Frysian lakes), but also smaller streams and rivers which are either connected directly to the sea or to large nationally managed waterbodies (the 3rd hierar-chy of waterbody in the model; see below) via larger pumping stations and/or sluices;
3. 3rd hierarchy (termed ‘national’ waterbodies): large nationally managed waterbodies such as sections of the main rivers and large lakes. Silver eels have been found to experi-ence low levels of mortalities during passage of most of the barriers (because these are
18 | ICES SCIENTIFIC REPORTS 2:85 | ICES
mainly discharge sluice complexes) in these large waterbodies. The exception is the pas-sages of hydropower plants by eels that start their migration from upstream sections of the main rivers Rhine and Meuse. Both these sections hold a substantial biomass of silver eel (van de Wolfshaar et al., 2018).
A key assumption in this model is that barriers within a hierarchical class, for example within polder waters, are never in sequence. Instead, sequential barrier mortality only occurs when sil-ver eels are transferred from one hierarchical class to another, for example from polder to boezem. This approach is thought to hold true in the majority of cases. However, there are some polder waters with two boezem layers, in which polder waters are pumped into an ‘inner boezem’ and subsequently pumped into an ‘outer boezem’ (which would be the second hierar-chy in the model presented here).
Given the assessed mortality and transition rates, the percentage of silver eels (out of the total starting biomass) that is estimated to die during migration, is dependent only on the proportional distribution of silver eel biomass over the different hierarchies of waterbodies. Instead, the bio-mass of silver eels that is estimated to die during migration will be dependent on the absolute biomass of all starting silver eel.
For the parameterisation of the barrier mortality model, we use “net mortality rates” for barriers: the proportion of silver eels that ends up in front of that barrier multiplied by the proportion that dies during passage. If there is only one route available in passing a barrier, the mortality rate of this barrier can be multiplied by the number of silver eels that end up in front of the barrier. In our approach, we consider blockage (i.e. silver eels that end up at barriers but are not passing), the same as mortality, since in both cases these silver eels do not contribute to the ‘escapement’ of silver eel to sea. In case an alternative route for migration trough a pumping station or hydro-power plant is available, such as a ship lock, sluice of fish pass, estimates of net mortality rates are typically lower than the proportion of silver eels that suffer mortality attempting to pass the pumping station or hydropower plant.
Mortality rates and transition from polder to boezem or the sea
Silver eel migrating from the polders to the boezem waters will encounter pumping stations. There are direct and indirect effects of pumping stations on silver eel migration. In the first place, pumping stations can cause damage and direct or delayed mortality in eel when passing through a pump. Secondly, a pumping station may function as a barrier for eel, both during upstream and downstream migration.
Pumping stations can roughly be divided into three groups: 1) water wheels, 2) Archimedes screws, and 3) pumps [centrifugal pumps (radial water flow); propeller-centrifugal pumps (ra-dial/axial water flow), propeller pumps (axial water flow)]. Based on literature, mainly studies conducted in the Netherlands and Belgium, propeller pumps have the highest mortality (Table 12), these type of propeller pumps are the most common type used to regulate water levels.
For the 1st hierarchy ‘polder waters’, average densities per polder area and an overall estimate of mortality rate based on the national distribution of types of pumping stations and estimated mortality rates were used to provide an overall estimate of escapement from polders to sea, and to the 2nd hierarchy of boezem waters. From polder waters to boezem waters or to the sea: a best guess estimate of 35% mortality was used. Regionally, the starting biomass and mortality rates will be different to the average, but for the purpose of estimating a national mortality rate, this generic approach for the 1st hierarchy will largely level out.
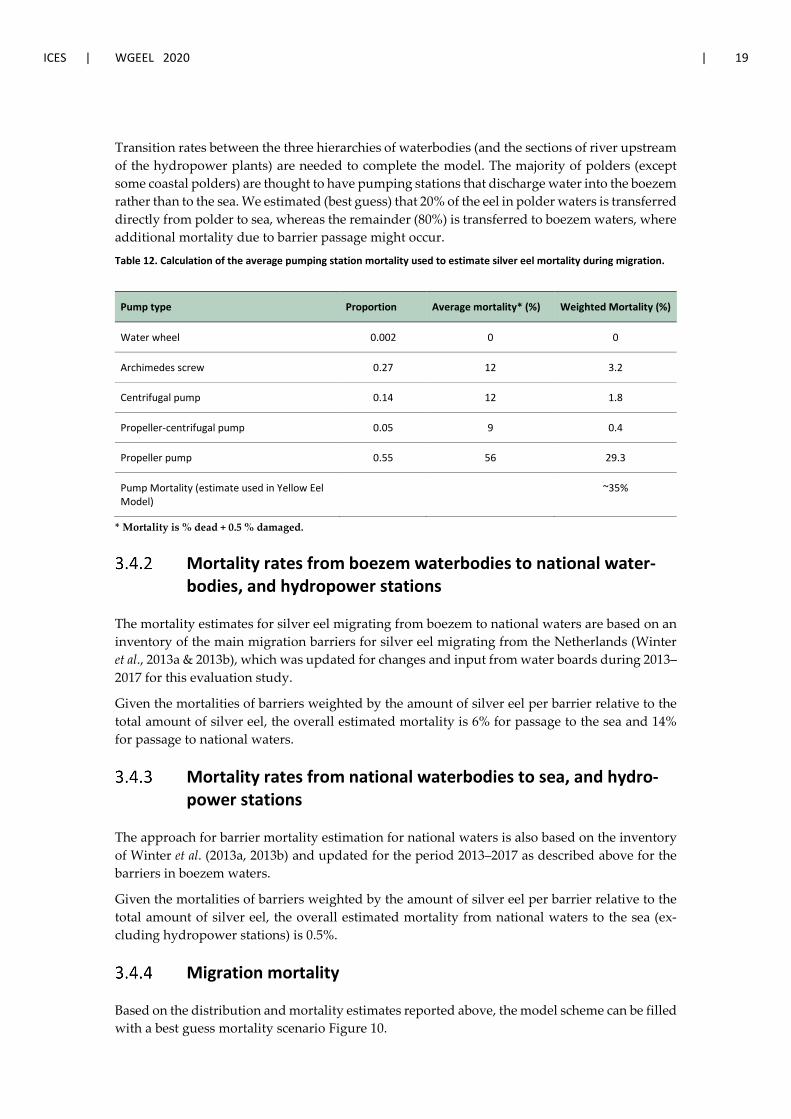
ICES | WGEEL 2020 | 19
Transition rates between the three hierarchies of waterbodies (and the sections of river upstream of the hydropower plants) are needed to complete the model. The majority of polders (except some coastal polders) are thought to have pumping stations that discharge water into the boezem rather than to the sea. We estimated (best guess) that 20% of the eel in polder waters is transferred directly from polder to sea, whereas the remainder (80%) is transferred to boezem waters, where additional mortality due to barrier passage might occur.
Table 12. Calculation of the average pumping station mortality used to estimate silver eel mortality during migration.
Pump type Proportion Average mortality* (%) Weighted Mortality (%)
Water wheel 0.002 0 0
Archimedes screw 0.27 12 3.2
Centrifugal pump 0.14 12 1.8
Propeller-centrifugal pump 0.05 9 0.4
Propeller pump 0.55 56 29.3
Pump Mortality (estimate used in Yellow Eel Model)
~35%
* Mortality is % dead + 0.5 % damaged.
Mortality rates from boezem waterbodies to national water-bodies, and hydropower stations
The mortality estimates for silver eel migrating from boezem to national waters are based on an inventory of the main migration barriers for silver eel migrating from the Netherlands (Winter et al., 2013a & 2013b), which was updated for changes and input from water boards during 2013–2017 for this evaluation study.
Given the mortalities of barriers weighted by the amount of silver eel per barrier relative to the total amount of silver eel, the overall estimated mortality is 6% for passage to the sea and 14% for passage to national waters.
Mortality rates from national waterbodies to sea, and hydro-power stations
The approach for barrier mortality estimation for national waters is also based on the inventory of Winter et al. (2013a, 2013b) and updated for the period 2013–2017 as described above for the barriers in boezem waters.
Given the mortalities of barriers weighted by the amount of silver eel per barrier relative to the total amount of silver eel, the overall estimated mortality from national waters to the sea (ex-cluding hydropower stations) is 0.5%.
Migration mortality
Based on the distribution and mortality estimates reported above, the model scheme can be filled with a best guess mortality scenario Figure 10.
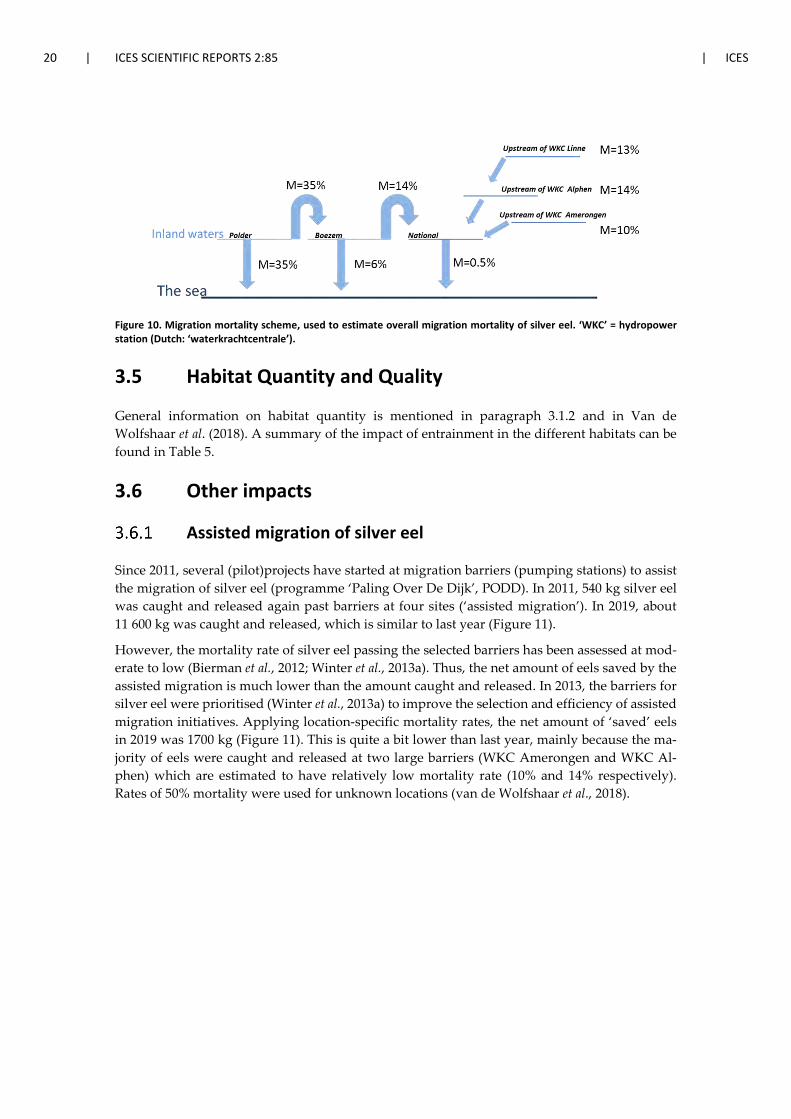
20 | ICES SCIENTIFIC REPORTS 2:85 | ICES
Figure 10. Migration mortality scheme, used to estimate overall migration mortality of silver eel. ‘WKC’ = hydropower station (Dutch: ‘waterkrachtcentrale’).
3.5 Habitat Quantity and Quality
General information on habitat quantity is mentioned in paragraph 3.1.2 and in Van de Wolfshaar et al. (2018). A summary of the impact of entrainment in the different habitats can be found in Table 5.
3.6 Other impacts
Assisted migration of silver eel
Since 2011, several (pilot)projects have started at migration barriers (pumping stations) to assist the migration of silver eel (programme ‘Paling Over De Dijk’, PODD). In 2011, 540 kg silver eel was caught and released again past barriers at four sites (‘assisted migration’). In 2019, about 11 600 kg was caught and released, which is similar to last year (Figure 11).
However, the mortality rate of silver eel passing the selected barriers has been assessed at mod-erate to low (Bierman et al., 2012; Winter et al., 2013a). Thus, the net amount of eels saved by the assisted migration is much lower than the amount caught and released. In 2013, the barriers for silver eel were prioritised (Winter et al., 2013a) to improve the selection and efficiency of assisted migration initiatives. Applying location-specific mortality rates, the net amount of ‘saved’ eels in 2019 was 1700 kg (Figure 11). This is quite a bit lower than last year, mainly because the ma-jority of eels were caught and released at two large barriers (WKC Amerongen and WKC Al-phen) which are estimated to have relatively low mortality rate (10% and 14% respectively). Rates of 50% mortality were used for unknown locations (van de Wolfshaar et al., 2018).

ICES | WGEEL 2020 | 21
Figure 11. Overview of the “gross” and “net” amount of silver eel assisted over migration barriers in the Netherlands (2011–2019).
Illegal, unreported and unregulated (IUU) fishing
The task of adherence to rules and regulations pertaining to eel fishery is carried out by the Netherlands Food and Consumer Product Safety Authority (NVWA). Following indication of illegal eel fishing in 2012, they intensified their monitoring in 2013. In 2015, in total 202 fishing gears associated with illegal eel fishing were seized (61 incidents), this number decreased to 51 (24 incidents) in 2017 (Figure 12). As we lacked data for 2018 in the previous report, data on both 2018 and 2019 are presented in this report. In 2018, this number increased again to at least 89 and about 150 kg of eel was confiscated (the NVWA does not record weights of illegal catches so this is an estimate). The most common cause of illegal fishing was fishing using illegal gears (Table 13). In 2019, both the number of incidents and the number of gears seized did not change much and most common cause of illegal fishing was fishing without a licence (Table 14, Figure 12).
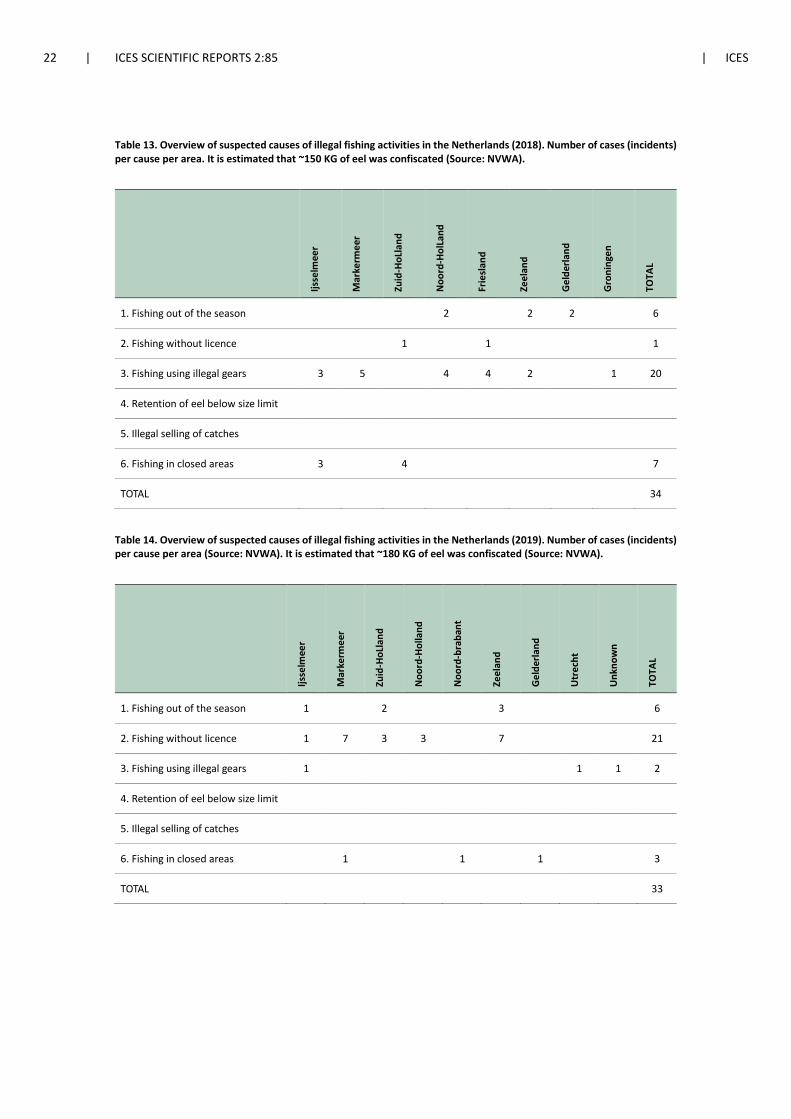
22 | ICES SCIENTIFIC REPORTS 2:85 | ICES
Table 13. Overview of suspected causes of illegal fishing activities in the Netherlands (2018). Number of cases (incidents) per cause per area. It is estimated that ~150 KG of eel was confiscated (Source: NVWA).
Ijsse
lmee
r
Mar
kerm
eer
Zuid
-HoL
land
Noo
rd-H
olLa
nd
Frie
slan
d
Zeel
and
Gel
derla
nd
Gro
ning
en
TOTA
L
1. Fishing out of the season
2
2 2 6
2. Fishing without licence
1
1
1
3. Fishing using illegal gears 3 5
4 4 2 1 20
4. Retention of eel below size limit
5. Illegal selling of catches
6. Fishing in closed areas 3
4
7
TOTAL
34
Table 14. Overview of suspected causes of illegal fishing activities in the Netherlands (2019). Number of cases (incidents) per cause per area (Source: NVWA). It is estimated that ~180 KG of eel was confiscated (Source: NVWA).
Ijsse
lmee
r
Mar
kerm
eer
Zuid
-HoL
land
Noo
rd-H
olla
nd
Noo
rd-b
raba
nt
Zeel
and
Gel
derla
nd
Utr
echt
Unk
now
n
TOTA
L
1. Fishing out of the season 1
2
3 6
2. Fishing without licence 1 7 3 3
7 21
3. Fishing using illegal gears 1
1 1 2
4. Retention of eel below size limit
5. Illegal selling of catches
6. Fishing in closed areas
1
1
1 3
TOTAL
33
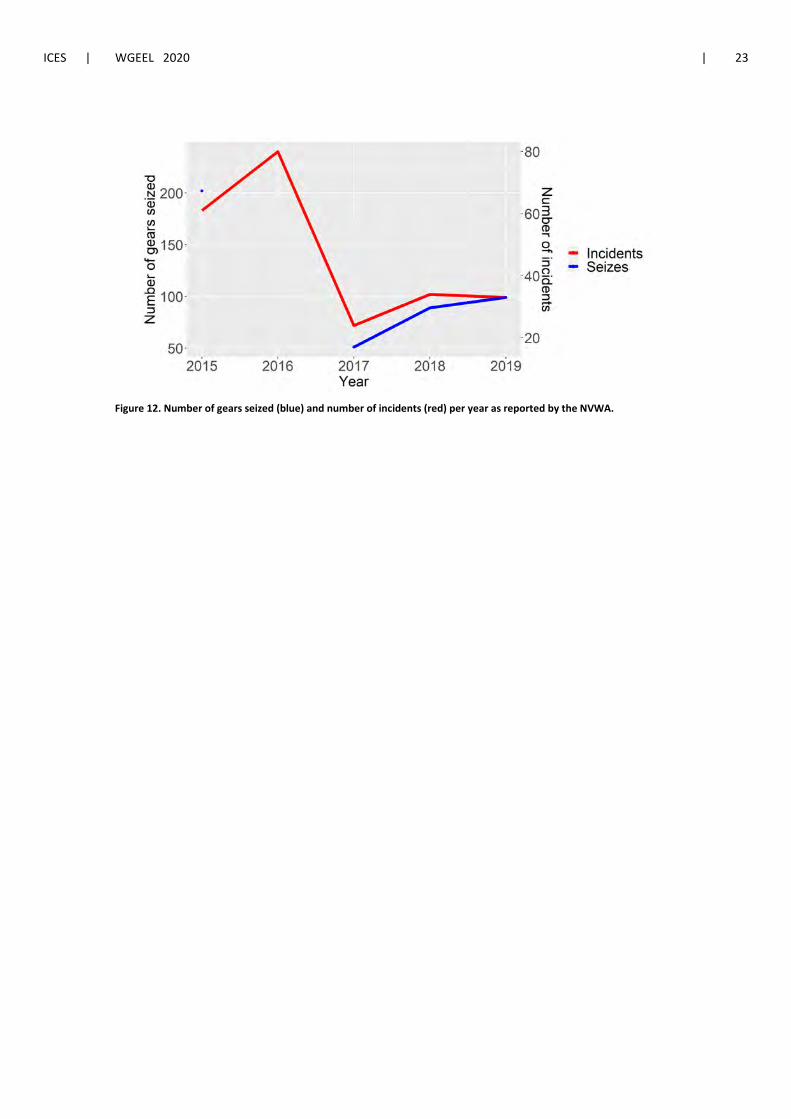
ICES | WGEEL 2020 | 23
Figure 12. Number of gears seized (blue) and number of incidents (red) per year as reported by the NVWA.
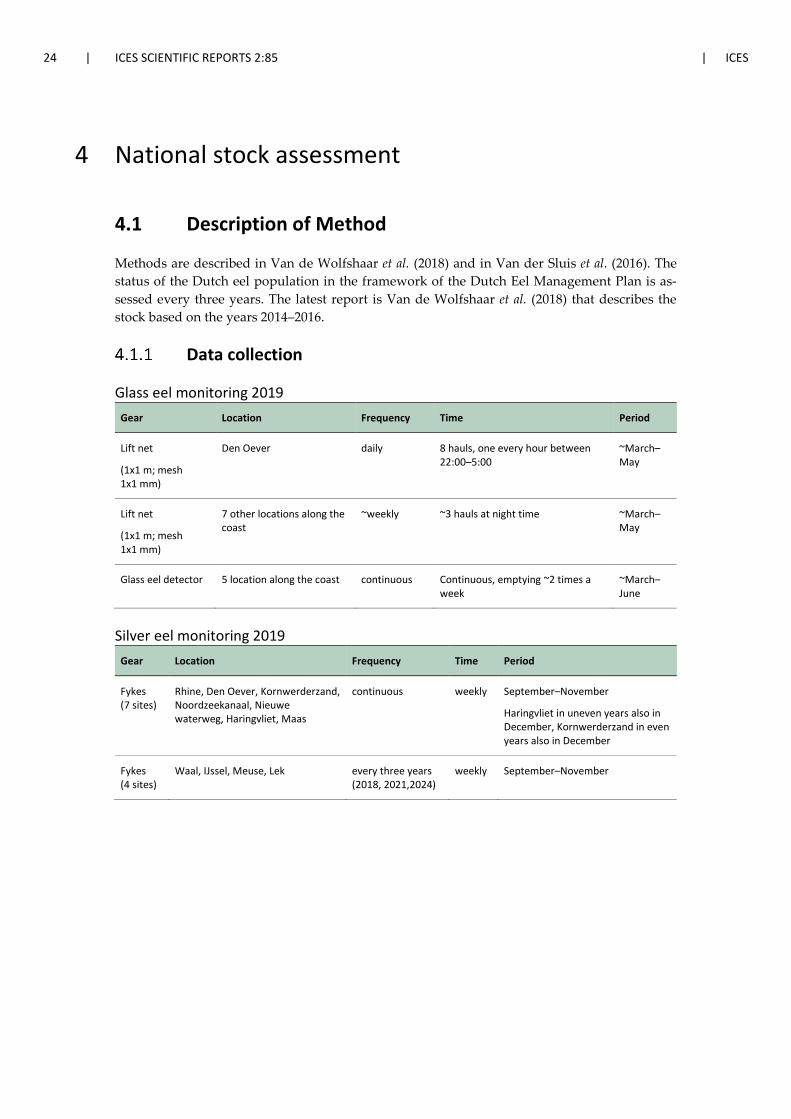
24 | ICES SCIENTIFIC REPORTS 2:85 | ICES
4 National stock assessment
4.1 Description of Method
Methods are described in Van de Wolfshaar et al. (2018) and in Van der Sluis et al. (2016). The status of the Dutch eel population in the framework of the Dutch Eel Management Plan is as-sessed every three years. The latest report is Van de Wolfshaar et al. (2018) that describes the stock based on the years 2014–2016.
Data collection
Glass eel monitoring 2019 Gear Location Frequency Time Period
Lift net
(1x1 m; mesh 1x1 mm)
Den Oever daily 8 hauls, one every hour between 22:00–5:00
~March–May
Lift net
(1x1 m; mesh 1x1 mm)
7 other locations along the coast
~weekly ~3 hauls at night time ~March–May
Glass eel detector 5 location along the coast continuous Continuous, emptying ~2 times a week
~March–June
Silver eel monitoring 2019 Gear Location Frequency Time Period
Fykes (7 sites)
Rhine, Den Oever, Kornwerderzand, Noordzeekanaal, Nieuwe waterweg, Haringvliet, Maas
continuous weekly September–November
Haringvliet in uneven years also in December, Kornwerderzand in even years also in December
Fykes (4 sites)
Waal, IJssel, Meuse, Lek every three years (2018, 2021,2024)
weekly September–November
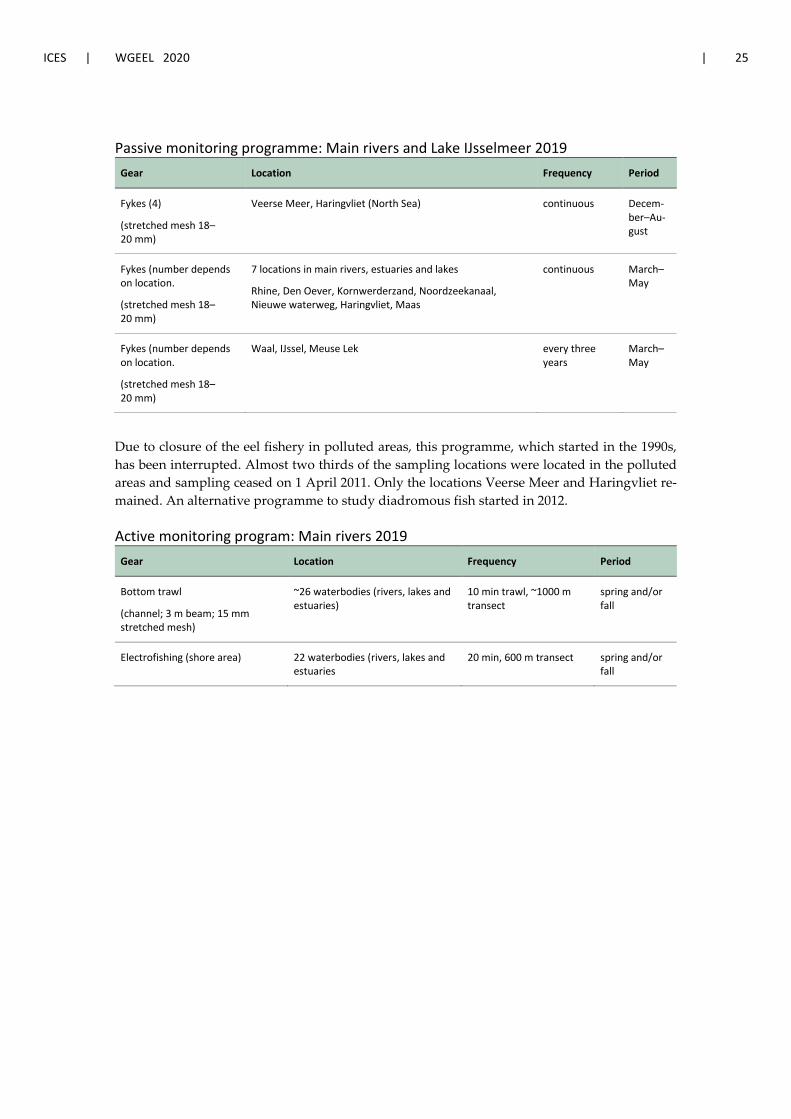
ICES | WGEEL 2020 | 25
Passive monitoring programme: Main rivers and Lake IJsselmeer 2019 Gear Location Frequency Period
Fykes (4)
(stretched mesh 18–20 mm)
Veerse Meer, Haringvliet (North Sea) continuous Decem-ber–Au-gust
Fykes (number depends on location.
(stretched mesh 18–20 mm)
7 locations in main rivers, estuaries and lakes
Rhine, Den Oever, Kornwerderzand, Noordzeekanaal, Nieuwe waterweg, Haringvliet, Maas
continuous March–May
Fykes (number depends on location.
(stretched mesh 18–20 mm)
Waal, IJssel, Meuse Lek every three years
March–May
Due to closure of the eel fishery in polluted areas, this programme, which started in the 1990s, has been interrupted. Almost two thirds of the sampling locations were located in the polluted areas and sampling ceased on 1 April 2011. Only the locations Veerse Meer and Haringvliet re-mained. An alternative programme to study diadromous fish started in 2012.
Active monitoring program: Main rivers 2019 Gear Location Frequency Period
Bottom trawl
(channel; 3 m beam; 15 mm stretched mesh)
~26 waterbodies (rivers, lakes and estuaries)
10 min trawl, ~1000 m transect
spring and/or fall
Electrofishing (shore area) 22 waterbodies (rivers, lakes and estuaries
20 min, 600 m transect spring and/or fall
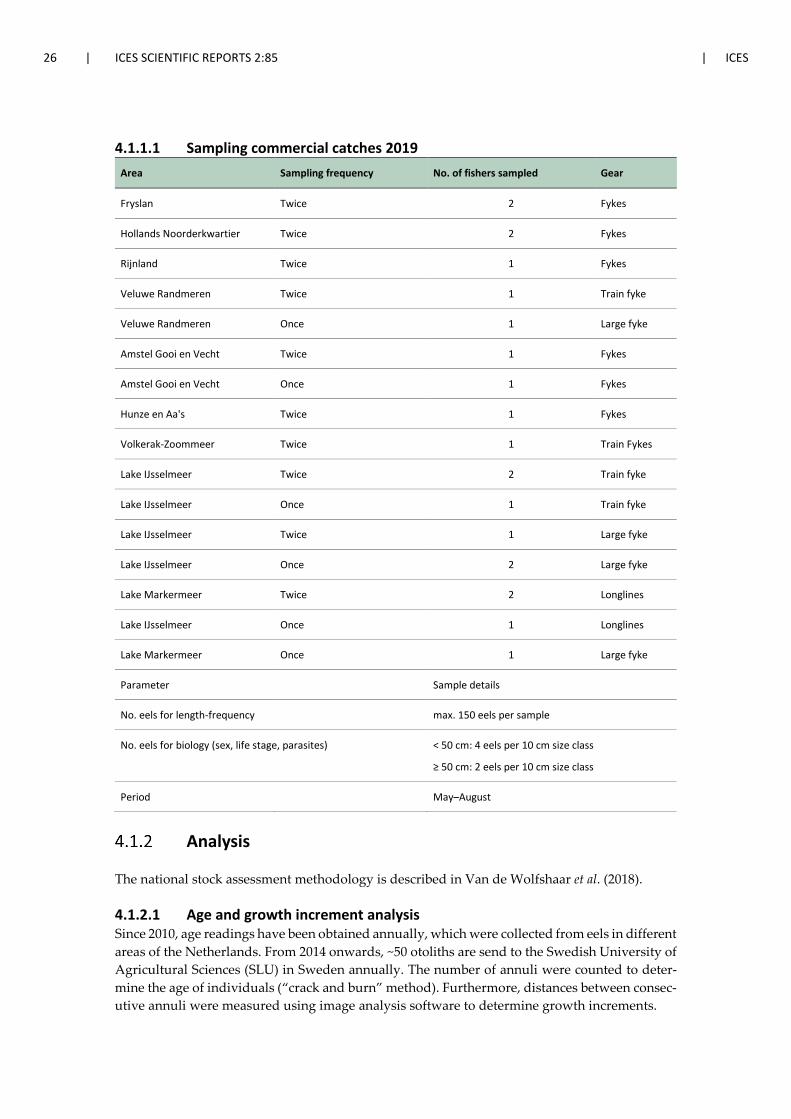
26 | ICES SCIENTIFIC REPORTS 2:85 | ICES
4.1.1.1 Sampling commercial catches 2019 Area Sampling frequency No. of fishers sampled Gear
Fryslan Twice 2 Fykes
Hollands Noorderkwartier Twice 2 Fykes
Rijnland Twice 1 Fykes
Veluwe Randmeren Twice 1 Train fyke
Veluwe Randmeren Once 1 Large fyke
Amstel Gooi en Vecht Twice 1 Fykes
Amstel Gooi en Vecht Once 1 Fykes
Hunze en Aa's Twice 1 Fykes
Volkerak-Zoommeer Twice 1 Train Fykes
Lake IJsselmeer Twice 2 Train fyke
Lake IJsselmeer Once 1 Train fyke
Lake IJsselmeer Twice 1 Large fyke
Lake IJsselmeer Once 2 Large fyke
Lake Markermeer Twice 2 Longlines
Lake IJsselmeer Once 1 Longlines
Lake Markermeer Once 1 Large fyke
Parameter Sample details
No. eels for length-frequency max. 150 eels per sample
No. eels for biology (sex, life stage, parasites) < 50 cm: 4 eels per 10 cm size class
≥ 50 cm: 2 eels per 10 cm size class
Period May–August
Analysis
The national stock assessment methodology is described in Van de Wolfshaar et al. (2018).
4.1.2.1 Age and growth increment analysis Since 2010, age readings have been obtained annually, which were collected from eels in different areas of the Netherlands. From 2014 onwards, ~50 otoliths are send to the Swedish University of Agricultural Sciences (SLU) in Sweden annually. The number of annuli were counted to deter-mine the age of individuals (“crack and burn” method). Furthermore, distances between consec-utive annuli were measured using image analysis software to determine growth increments.
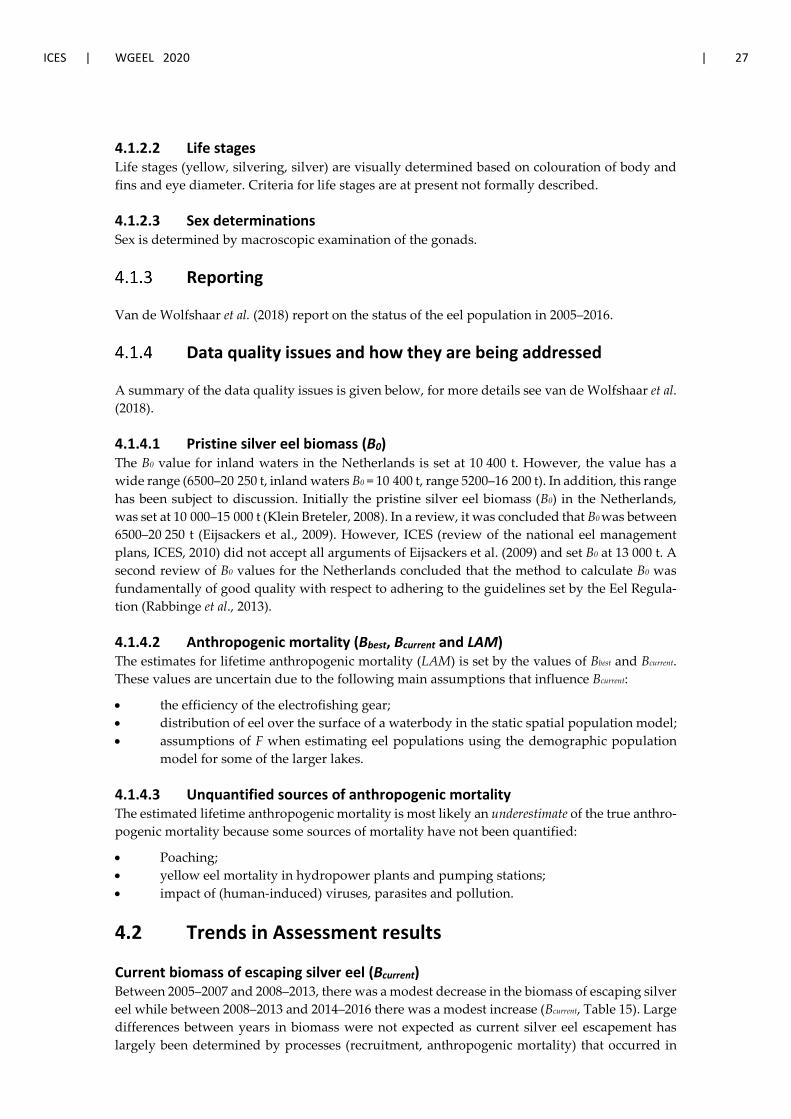
ICES | WGEEL 2020 | 27
4.1.2.2 Life stages Life stages (yellow, silvering, silver) are visually determined based on colouration of body and fins and eye diameter. Criteria for life stages are at present not formally described.
4.1.2.3 Sex determinations Sex is determined by macroscopic examination of the gonads.
Reporting
Van de Wolfshaar et al. (2018) report on the status of the eel population in 2005–2016.
Data quality issues and how they are being addressed
A summary of the data quality issues is given below, for more details see van de Wolfshaar et al. (2018).
4.1.4.1 Pristine silver eel biomass (B0) The B0 value for inland waters in the Netherlands is set at 10 400 t. However, the value has a wide range (6500–20 250 t, inland waters B0 = 10 400 t, range 5200–16 200 t). In addition, this range has been subject to discussion. Initially the pristine silver eel biomass (B0) in the Netherlands, was set at 10 000–15 000 t (Klein Breteler, 2008). In a review, it was concluded that B0 was between 6500–20 250 t (Eijsackers et al., 2009). However, ICES (review of the national eel management plans, ICES, 2010) did not accept all arguments of Eijsackers et al. (2009) and set B0 at 13 000 t. A second review of B0 values for the Netherlands concluded that the method to calculate B0 was fundamentally of good quality with respect to adhering to the guidelines set by the Eel Regula-tion (Rabbinge et al., 2013).
4.1.4.2 Anthropogenic mortality (Bbest, Bcurrent and LAM) The estimates for lifetime anthropogenic mortality (LAM) is set by the values of Bbest and Bcurrent. These values are uncertain due to the following main assumptions that influence Bcurrent:
• the efficiency of the electrofishing gear; • distribution of eel over the surface of a waterbody in the static spatial population model; • assumptions of F when estimating eel populations using the demographic population
model for some of the larger lakes.
4.1.4.3 Unquantified sources of anthropogenic mortality The estimated lifetime anthropogenic mortality is most likely an underestimate of the true anthro-pogenic mortality because some sources of mortality have not been quantified:
• Poaching; • yellow eel mortality in hydropower plants and pumping stations; • impact of (human-induced) viruses, parasites and pollution.
4.2 Trends in Assessment results
Current biomass of escaping silver eel (Bcurrent) Between 2005–2007 and 2008–2013, there was a modest decrease in the biomass of escaping silver eel while between 2008–2013 and 2014–2016 there was a modest increase (Bcurrent, Table 15). Large differences between years in biomass were not expected as current silver eel escapement has largely been determined by processes (recruitment, anthropogenic mortality) that occurred in
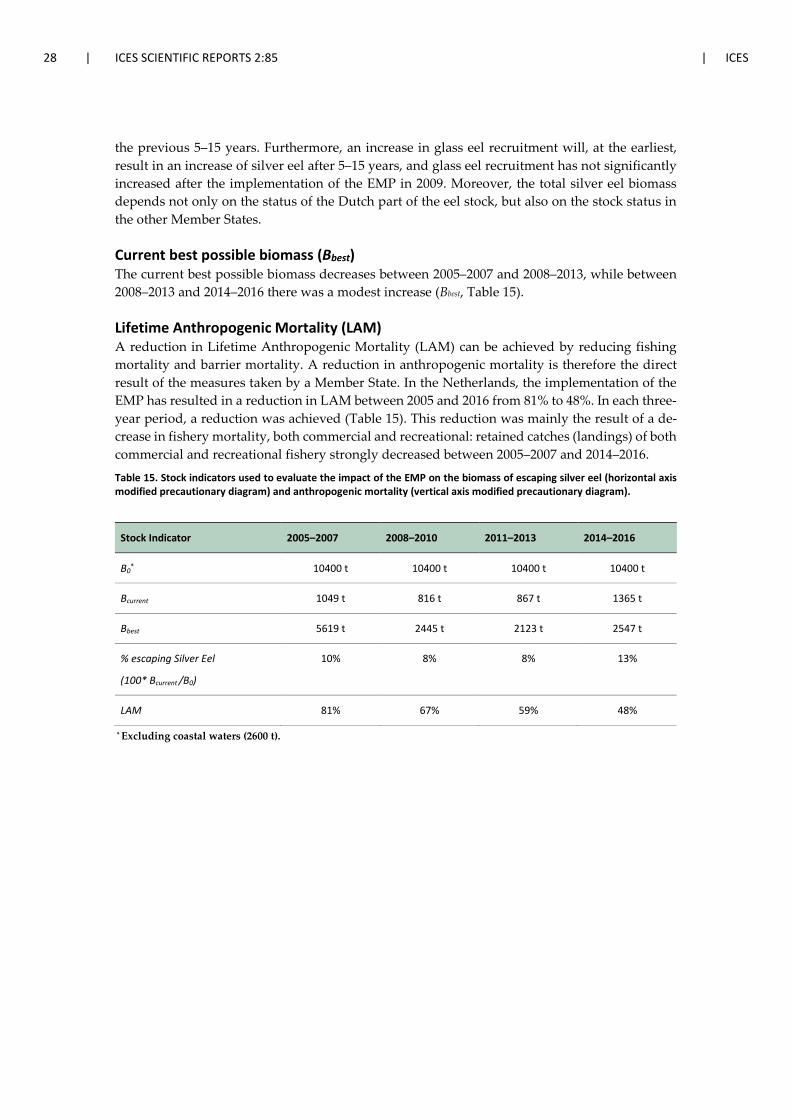
28 | ICES SCIENTIFIC REPORTS 2:85 | ICES
the previous 5–15 years. Furthermore, an increase in glass eel recruitment will, at the earliest, result in an increase of silver eel after 5–15 years, and glass eel recruitment has not significantly increased after the implementation of the EMP in 2009. Moreover, the total silver eel biomass depends not only on the status of the Dutch part of the eel stock, but also on the stock status in the other Member States.
Current best possible biomass (Bbest) The current best possible biomass decreases between 2005–2007 and 2008–2013, while between 2008–2013 and 2014–2016 there was a modest increase (Bbest, Table 15).
Lifetime Anthropogenic Mortality (LAM) A reduction in Lifetime Anthropogenic Mortality (LAM) can be achieved by reducing fishing mortality and barrier mortality. A reduction in anthropogenic mortality is therefore the direct result of the measures taken by a Member State. In the Netherlands, the implementation of the EMP has resulted in a reduction in LAM between 2005 and 2016 from 81% to 48%. In each three-year period, a reduction was achieved (Table 15). This reduction was mainly the result of a de-crease in fishery mortality, both commercial and recreational: retained catches (landings) of both commercial and recreational fishery strongly decreased between 2005–2007 and 2014–2016.
Table 15. Stock indicators used to evaluate the impact of the EMP on the biomass of escaping silver eel (horizontal axis modified precautionary diagram) and anthropogenic mortality (vertical axis modified precautionary diagram).
Stock Indicator 2005–2007 2008–2010 2011–2013 2014–2016
B0* 10400 t 10400 t 10400 t 10400 t
Bcurrent 1049 t 816 t 867 t 1365 t
Bbest 5619 t 2445 t 2123 t 2547 t
% escaping Silver Eel
(100* Bcurrent /B0)
10% 8% 8% 13%
LAM 81% 67% 59% 48%
* Excluding coastal waters (2600 t).
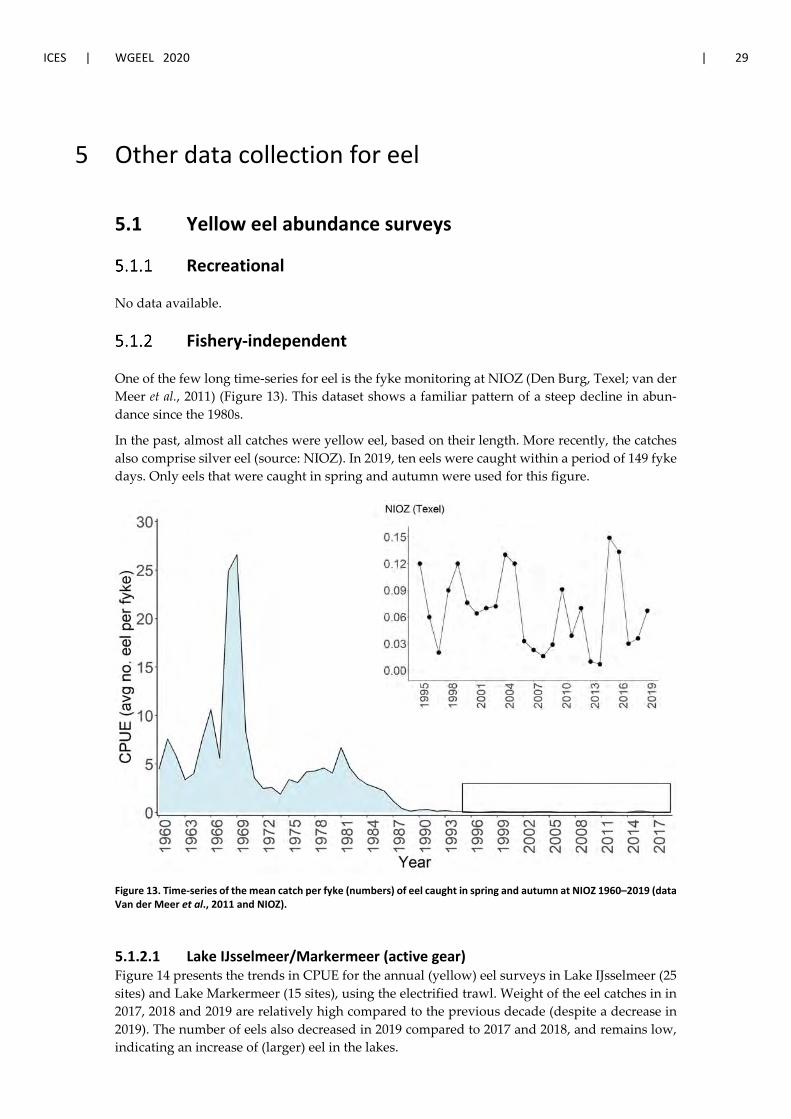
ICES | WGEEL 2020 | 29
5 Other data collection for eel
5.1 Yellow eel abundance surveys
Recreational
No data available.
Fishery-independent
One of the few long time-series for eel is the fyke monitoring at NIOZ (Den Burg, Texel; van der Meer et al., 2011) (Figure 13). This dataset shows a familiar pattern of a steep decline in abun-dance since the 1980s.
In the past, almost all catches were yellow eel, based on their length. More recently, the catches also comprise silver eel (source: NIOZ). In 2019, ten eels were caught within a period of 149 fyke days. Only eels that were caught in spring and autumn were used for this figure.
Figure 13. Time-series of the mean catch per fyke (numbers) of eel caught in spring and autumn at NIOZ 1960–2019 (data Van der Meer et al., 2011 and NIOZ).
5.1.2.1 Lake IJsselmeer/Markermeer (active gear) Figure 14 presents the trends in CPUE for the annual (yellow) eel surveys in Lake IJsselmeer (25 sites) and Lake Markermeer (15 sites), using the electrified trawl. Weight of the eel catches in in 2017, 2018 and 2019 are relatively high compared to the previous decade (despite a decrease in 2019). The number of eels also decreased in 2019 compared to 2017 and 2018, and remains low, indicating an increase of (larger) eel in the lakes.
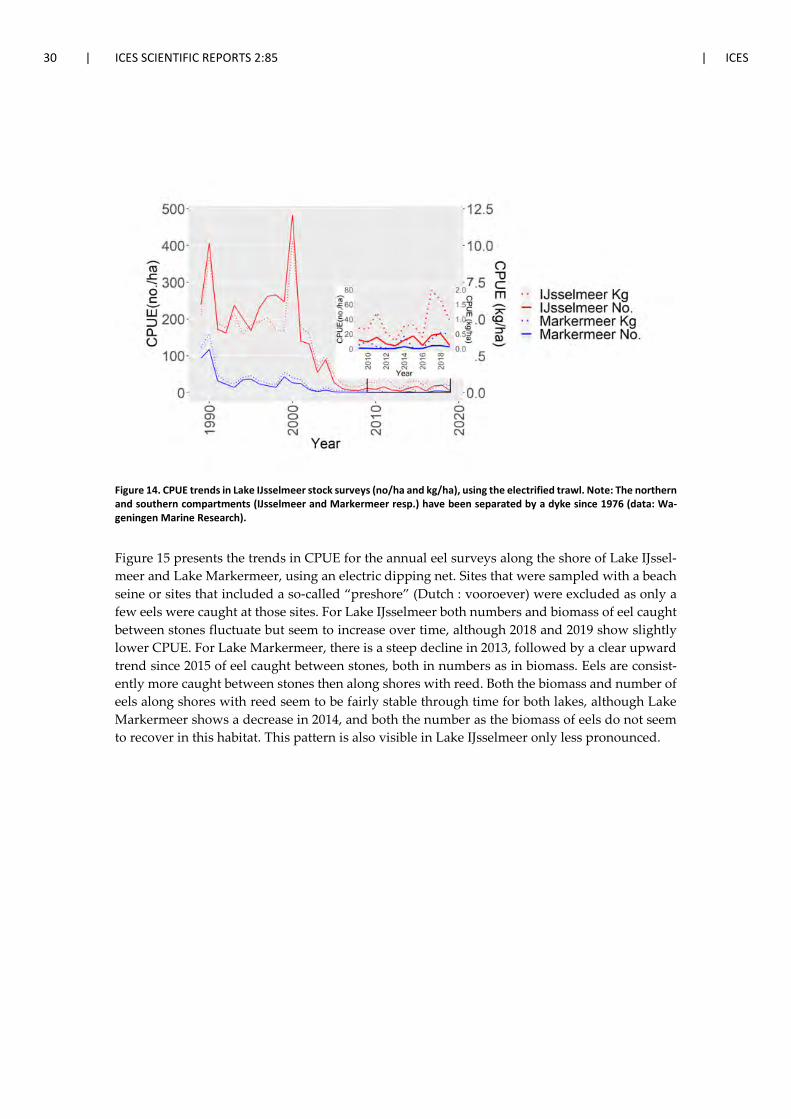
30 | ICES SCIENTIFIC REPORTS 2:85 | ICES
Figure 14. CPUE trends in Lake IJsselmeer stock surveys (no/ha and kg/ha), using the electrified trawl. Note: The northern and southern compartments (IJsselmeer and Markermeer resp.) have been separated by a dyke since 1976 (data: Wa-geningen Marine Research).
Figure 15 presents the trends in CPUE for the annual eel surveys along the shore of Lake IJssel-meer and Lake Markermeer, using an electric dipping net. Sites that were sampled with a beach seine or sites that included a so-called “preshore” (Dutch : vooroever) were excluded as only a few eels were caught at those sites. For Lake IJsselmeer both numbers and biomass of eel caught between stones fluctuate but seem to increase over time, although 2018 and 2019 show slightly lower CPUE. For Lake Markermeer, there is a steep decline in 2013, followed by a clear upward trend since 2015 of eel caught between stones, both in numbers as in biomass. Eels are consist-ently more caught between stones then along shores with reed. Both the biomass and number of eels along shores with reed seem to be fairly stable through time for both lakes, although Lake Markermeer shows a decrease in 2014, and both the number as the biomass of eels do not seem to recover in this habitat. This pattern is also visible in Lake IJsselmeer only less pronounced.
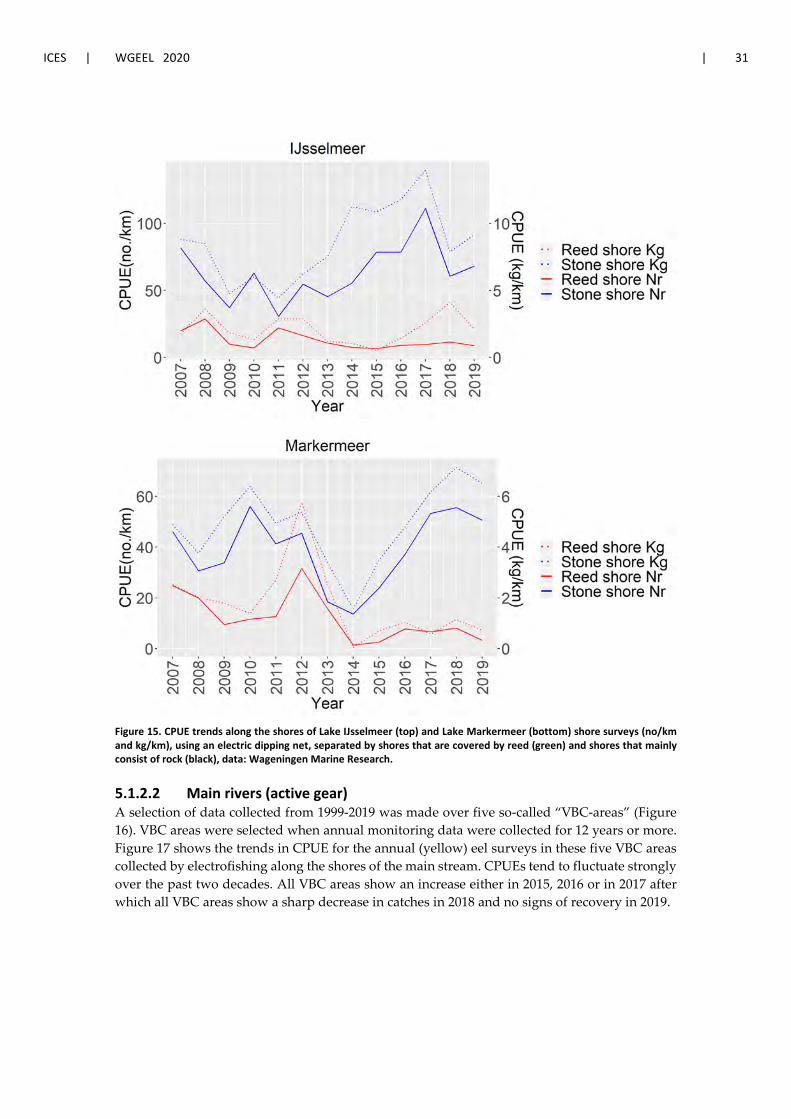
ICES | WGEEL 2020 | 31
Figure 15. CPUE trends along the shores of Lake IJsselmeer (top) and Lake Markermeer (bottom) shore surveys (no/km and kg/km), using an electric dipping net, separated by shores that are covered by reed (green) and shores that mainly consist of rock (black), data: Wageningen Marine Research.
5.1.2.2 Main rivers (active gear) A selection of data collected from 1999-2019 was made over five so-called “VBC-areas” (Figure 16). VBC areas were selected when annual monitoring data were collected for 12 years or more. Figure 17 shows the trends in CPUE for the annual (yellow) eel surveys in these five VBC areas collected by electrofishing along the shores of the main stream. CPUEs tend to fluctuate strongly over the past two decades. All VBC areas show an increase either in 2015, 2016 or in 2017 after which all VBC areas show a sharp decrease in catches in 2018 and no signs of recovery in 2019.
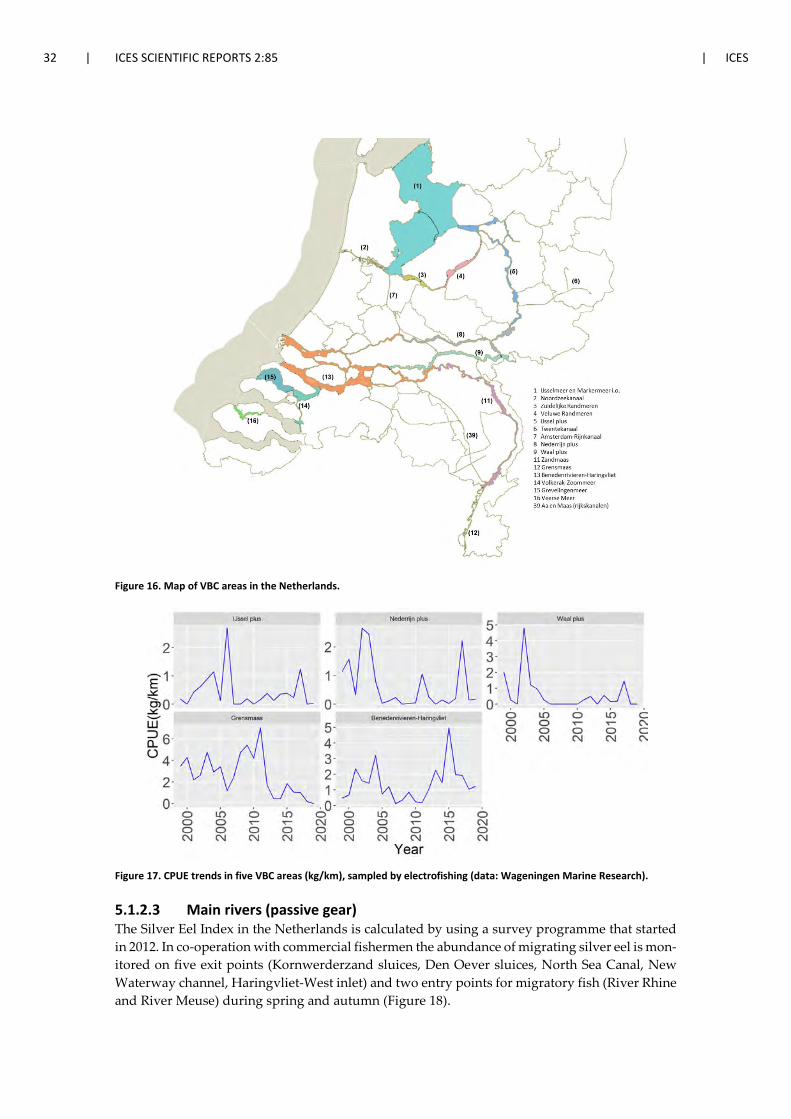
32 | ICES SCIENTIFIC REPORTS 2:85 | ICES
Figure 16. Map of VBC areas in the Netherlands.
Figure 17. CPUE trends in five VBC areas (kg/km), sampled by electrofishing (data: Wageningen Marine Research).
5.1.2.3 Main rivers (passive gear) The Silver Eel Index in the Netherlands is calculated by using a survey programme that started in 2012. In co-operation with commercial fishermen the abundance of migrating silver eel is mon-itored on five exit points (Kornwerderzand sluices, Den Oever sluices, North Sea Canal, New Waterway channel, Haringvliet-West inlet) and two entry points for migratory fish (River Rhine and River Meuse) during spring and autumn (Figure 18).
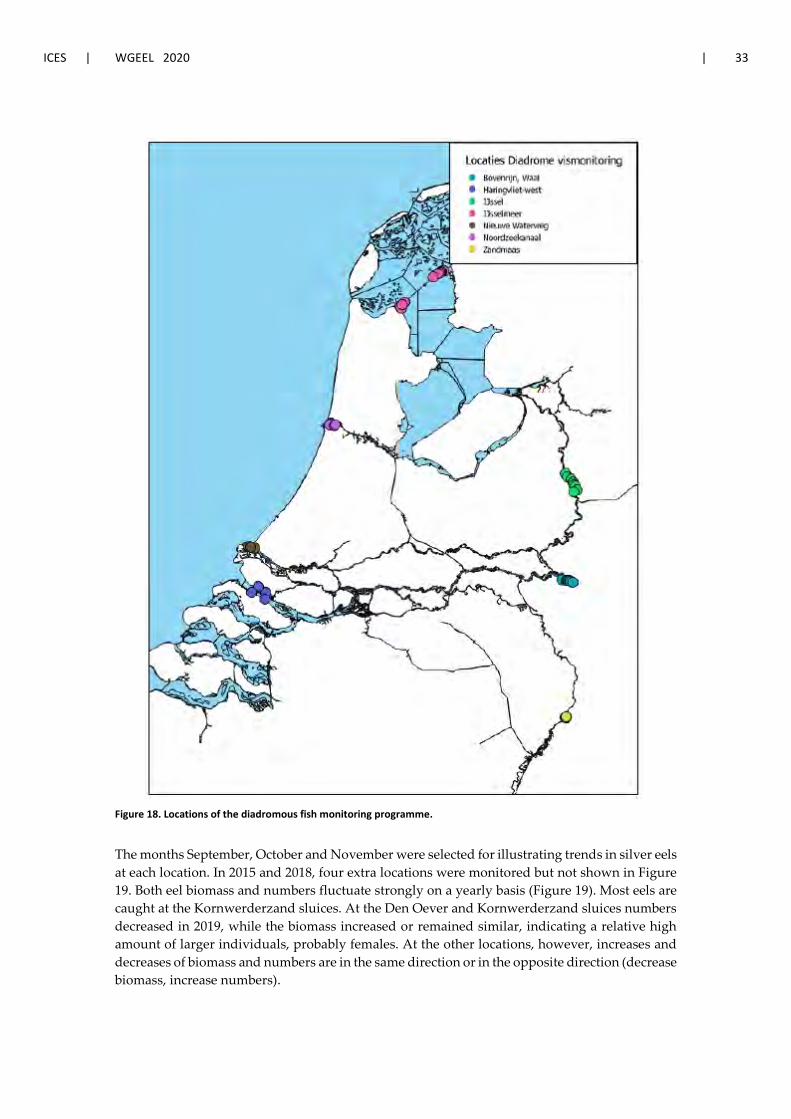
ICES | WGEEL 2020 | 33
Figure 18. Locations of the diadromous fish monitoring programme.
The months September, October and November were selected for illustrating trends in silver eels at each location. In 2015 and 2018, four extra locations were monitored but not shown in Figure 19. Both eel biomass and numbers fluctuate strongly on a yearly basis (Figure 19). Most eels are caught at the Kornwerderzand sluices. At the Den Oever and Kornwerderzand sluices numbers decreased in 2019, while the biomass increased or remained similar, indicating a relative high amount of larger individuals, probably females. At the other locations, however, increases and decreases of biomass and numbers are in the same direction or in the opposite direction (decrease biomass, increase numbers).
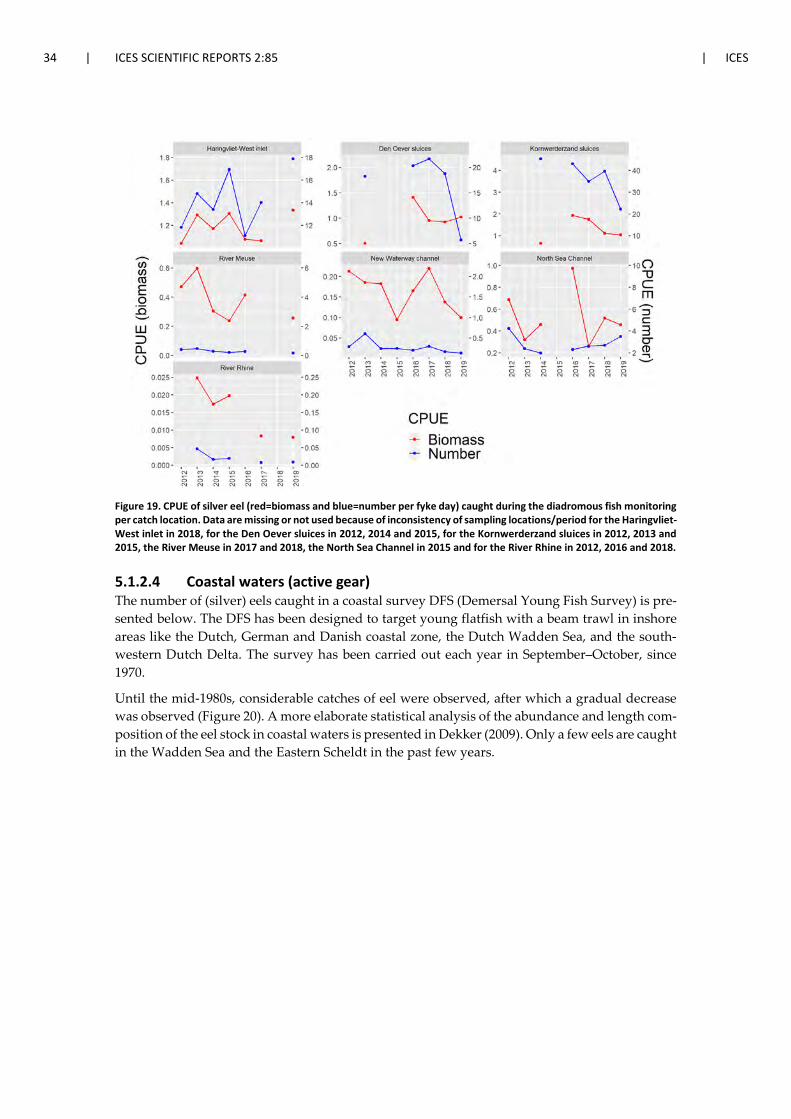
34 | ICES SCIENTIFIC REPORTS 2:85 | ICES
Figure 19. CPUE of silver eel (red=biomass and blue=number per fyke day) caught during the diadromous fish monitoring per catch location. Data are missing or not used because of inconsistency of sampling locations/period for the Haringvliet-West inlet in 2018, for the Den Oever sluices in 2012, 2014 and 2015, for the Kornwerderzand sluices in 2012, 2013 and 2015, the River Meuse in 2017 and 2018, the North Sea Channel in 2015 and for the River Rhine in 2012, 2016 and 2018.
5.1.2.4 Coastal waters (active gear) The number of (silver) eels caught in a coastal survey DFS (Demersal Young Fish Survey) is pre-sented below. The DFS has been designed to target young flatfish with a beam trawl in inshore areas like the Dutch, German and Danish coastal zone, the Dutch Wadden Sea, and the south-western Dutch Delta. The survey has been carried out each year in September–October, since 1970.
Until the mid-1980s, considerable catches of eel were observed, after which a gradual decrease was observed (Figure 20). A more elaborate statistical analysis of the abundance and length com-position of the eel stock in coastal waters is presented in Dekker (2009). Only a few eels are caught in the Wadden Sea and the Eastern Scheldt in the past few years.
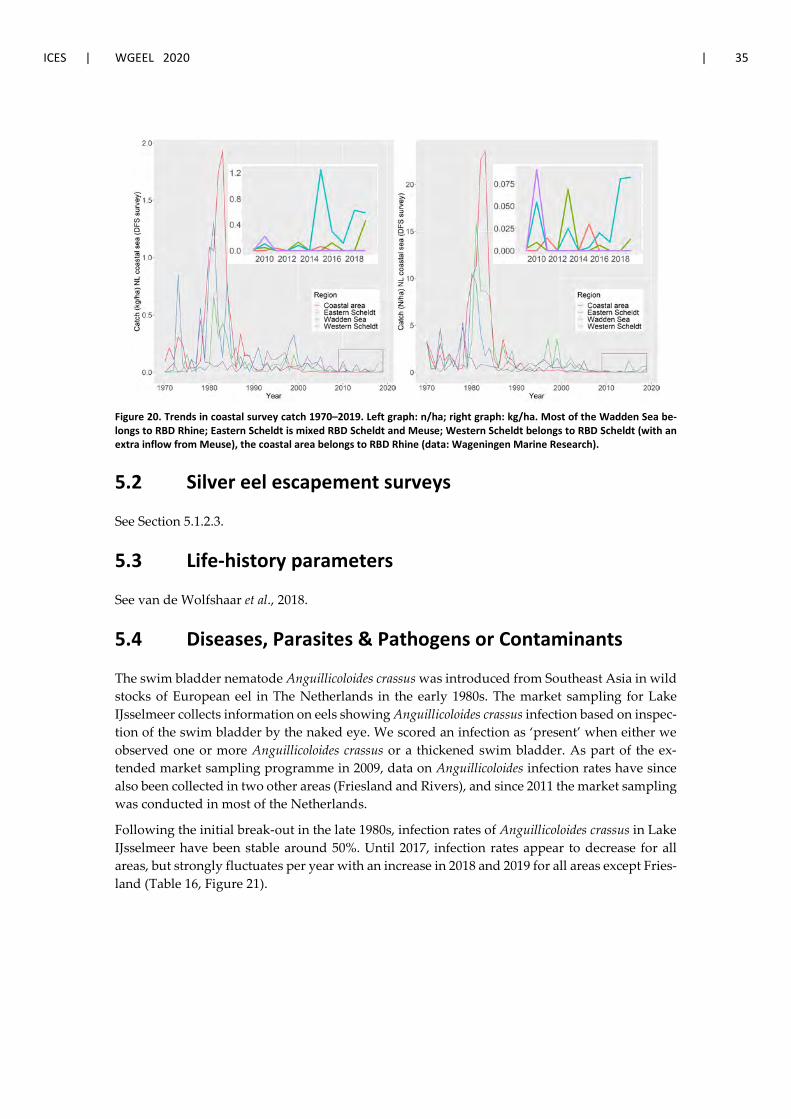
ICES | WGEEL 2020 | 35
Figure 20. Trends in coastal survey catch 1970–2019. Left graph: n/ha; right graph: kg/ha. Most of the Wadden Sea be-longs to RBD Rhine; Eastern Scheldt is mixed RBD Scheldt and Meuse; Western Scheldt belongs to RBD Scheldt (with an extra inflow from Meuse), the coastal area belongs to RBD Rhine (data: Wageningen Marine Research).
5.2 Silver eel escapement surveys
See Section 5.1.2.3.
5.3 Life-history parameters
See van de Wolfshaar et al., 2018.
5.4 Diseases, Parasites & Pathogens or Contaminants
The swim bladder nematode Anguillicoloides crassus was introduced from Southeast Asia in wild stocks of European eel in The Netherlands in the early 1980s. The market sampling for Lake IJsselmeer collects information on eels showing Anguillicoloides crassus infection based on inspec-tion of the swim bladder by the naked eye. We scored an infection as ‘present’ when either we observed one or more Anguillicoloides crassus or a thickened swim bladder. As part of the ex-tended market sampling programme in 2009, data on Anguillicoloides infection rates have since also been collected in two other areas (Friesland and Rivers), and since 2011 the market sampling was conducted in most of the Netherlands.
Following the initial break-out in the late 1980s, infection rates of Anguillicoloides crassus in Lake IJsselmeer have been stable around 50%. Until 2017, infection rates appear to decrease for all areas, but strongly fluctuates per year with an increase in 2018 and 2019 for all areas except Fries-land (Table 16, Figure 21).

36 | ICES SCIENTIFIC REPORTS 2:85 | ICES
Table 16. Infection rates of eels (2010–2019) with ‘Anguillicoloides crassus’, in the Netherlands. Median infection rates of all sampled locations.
Fryslan Lake IJsselmeer LakeMarkermeer Rest NL
N eels N infected
(% infected)
N eels N infected
(% infected)
N eels N infected
(% infected)
N eels N infected
(% infected)
2010 509 232(46%) 375 188(50%) 225 108(48%) 511 258(50%)
2011 107 40(37%) 293 127(43%) 104 35(34%) 583 231(40%)
2012 133 44(33%) 320 170(53%) 253 95(38%) 517 186(36%)
2013 17 8(47%) 159 88(55%) 93 41(44%) 283 106(37%)
2014 49 31(63%) 202 100(50%) 46 12(26%) 321 127(40%)
2015 61 24(39%) 267 111(42%) nc nc 297 112(38%)
2016 65 14(22%) 260 89(34%) 77 27(35%) 240 70(29%)
2017 74 34(46%) 149 31(21%) 151 25(17%) 272 70(26%)
2018 85 22(26%) 244 78(32%) 49 17(35%) 285 84(29%)
2019 78 15(19%) 215 78(36%) 96 38(40%) 278 120(43%)
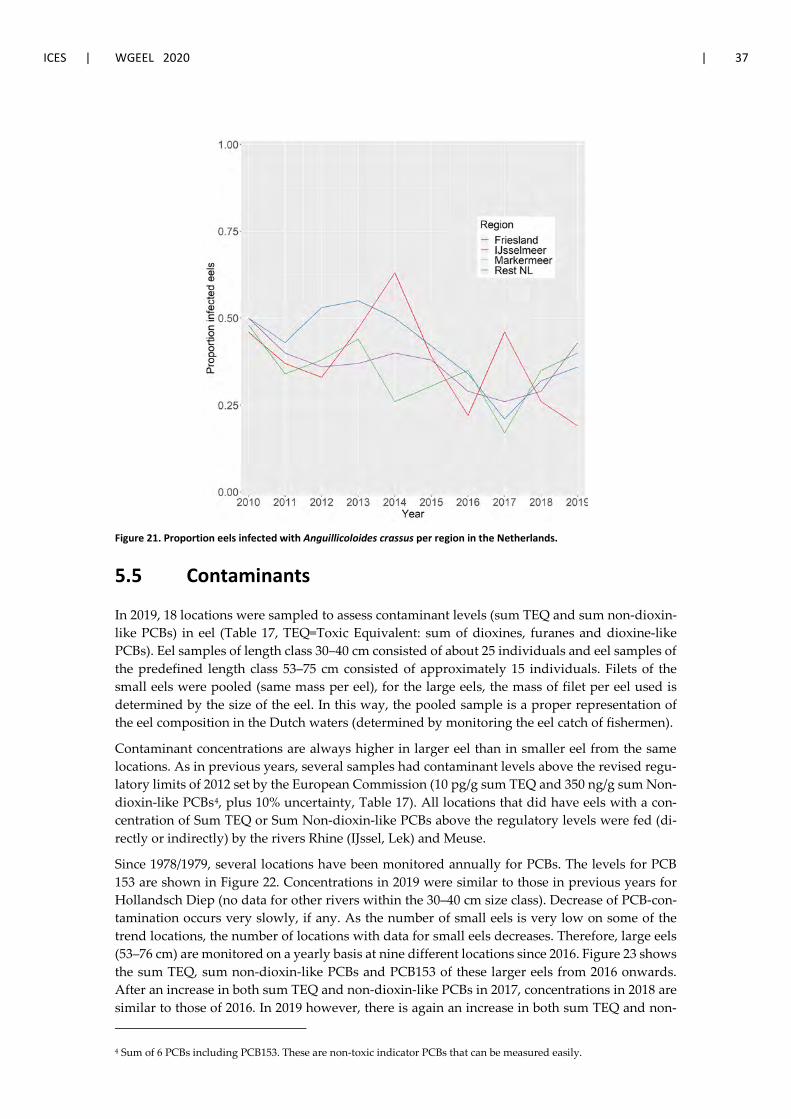
ICES | WGEEL 2020 | 37
Figure 21. Proportion eels infected with Anguillicoloides crassus per region in the Netherlands.
5.5 Contaminants
In 2019, 18 locations were sampled to assess contaminant levels (sum TEQ and sum non-dioxin-like PCBs) in eel (Table 17, TEQ=Toxic Equivalent: sum of dioxines, furanes and dioxine-like PCBs). Eel samples of length class 30–40 cm consisted of about 25 individuals and eel samples of the predefined length class 53–75 cm consisted of approximately 15 individuals. Filets of the small eels were pooled (same mass per eel), for the large eels, the mass of filet per eel used is determined by the size of the eel. In this way, the pooled sample is a proper representation of the eel composition in the Dutch waters (determined by monitoring the eel catch of fishermen).
Contaminant concentrations are always higher in larger eel than in smaller eel from the same locations. As in previous years, several samples had contaminant levels above the revised regu-latory limits of 2012 set by the European Commission (10 pg/g sum TEQ and 350 ng/g sum Non-dioxin-like PCBs4, plus 10% uncertainty, Table 17). All locations that did have eels with a con-centration of Sum TEQ or Sum Non-dioxin-like PCBs above the regulatory levels were fed (di-rectly or indirectly) by the rivers Rhine (IJssel, Lek) and Meuse.
Since 1978/1979, several locations have been monitored annually for PCBs. The levels for PCB 153 are shown in Figure 22. Concentrations in 2019 were similar to those in previous years for Hollandsch Diep (no data for other rivers within the 30–40 cm size class). Decrease of PCB-con-tamination occurs very slowly, if any. As the number of small eels is very low on some of the trend locations, the number of locations with data for small eels decreases. Therefore, large eels (53–76 cm) are monitored on a yearly basis at nine different locations since 2016. Figure 23 shows the sum TEQ, sum non-dioxin-like PCBs and PCB153 of these larger eels from 2016 onwards. After an increase in both sum TEQ and non-dioxin-like PCBs in 2017, concentrations in 2018 are similar to those of 2016. In 2019 however, there is again an increase in both sum TEQ and non- 4 Sum of 6 PCBs including PCB153. These are non-toxic indicator PCBs that can be measured easily.
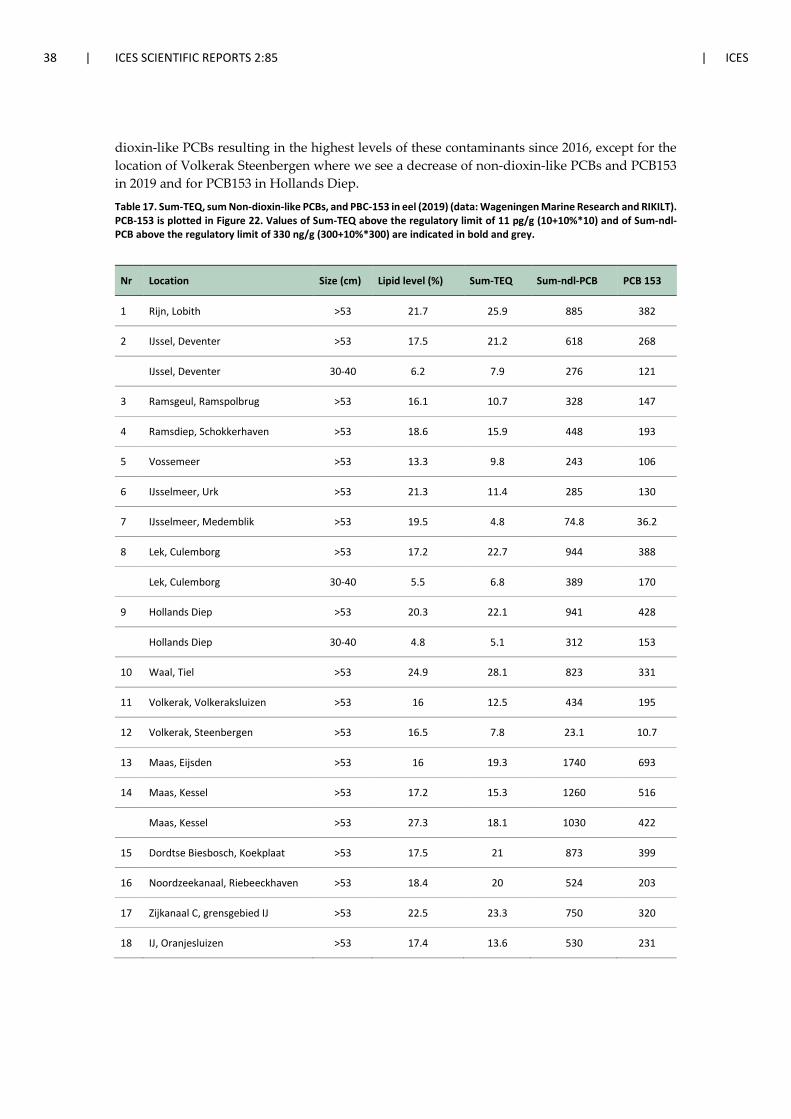
38 | ICES SCIENTIFIC REPORTS 2:85 | ICES
dioxin-like PCBs resulting in the highest levels of these contaminants since 2016, except for the location of Volkerak Steenbergen where we see a decrease of non-dioxin-like PCBs and PCB153 in 2019 and for PCB153 in Hollands Diep.
Table 17. Sum-TEQ, sum Non-dioxin-like PCBs, and PBC-153 in eel (2019) (data: Wageningen Marine Research and RIKILT). PCB-153 is plotted in Figure 22. Values of Sum-TEQ above the regulatory limit of 11 pg/g (10+10%*10) and of Sum-ndl-PCB above the regulatory limit of 330 ng/g (300+10%*300) are indicated in bold and grey.
Nr Location Size (cm) Lipid level (%) Sum-TEQ Sum-ndl-PCB PCB 153
1 Rijn, Lobith >53 21.7 25.9 885 382
2 IJssel, Deventer >53 17.5 21.2 618 268
IJssel, Deventer 30-40 6.2 7.9 276 121
3 Ramsgeul, Ramspolbrug >53 16.1 10.7 328 147
4 Ramsdiep, Schokkerhaven >53 18.6 15.9 448 193
5 Vossemeer >53 13.3 9.8 243 106
6 IJsselmeer, Urk >53 21.3 11.4 285 130
7 IJsselmeer, Medemblik >53 19.5 4.8 74.8 36.2
8 Lek, Culemborg >53 17.2 22.7 944 388
Lek, Culemborg 30-40 5.5 6.8 389 170
9 Hollands Diep >53 20.3 22.1 941 428
Hollands Diep 30-40 4.8 5.1 312 153
10 Waal, Tiel >53 24.9 28.1 823 331
11 Volkerak, Volkeraksluizen >53 16 12.5 434 195
12 Volkerak, Steenbergen >53 16.5 7.8 23.1 10.7
13 Maas, Eijsden >53 16 19.3 1740 693
14 Maas, Kessel >53 17.2 15.3 1260 516
Maas, Kessel >53 27.3 18.1 1030 422
15 Dordtse Biesbosch, Koekplaat >53 17.5 21 873 399
16 Noordzeekanaal, Riebeeckhaven >53 18.4 20 524 203
17 Zijkanaal C, grensgebied IJ >53 22.5 23.3 750 320
18 IJ, Oranjesluizen >53 17.4 13.6 530 231
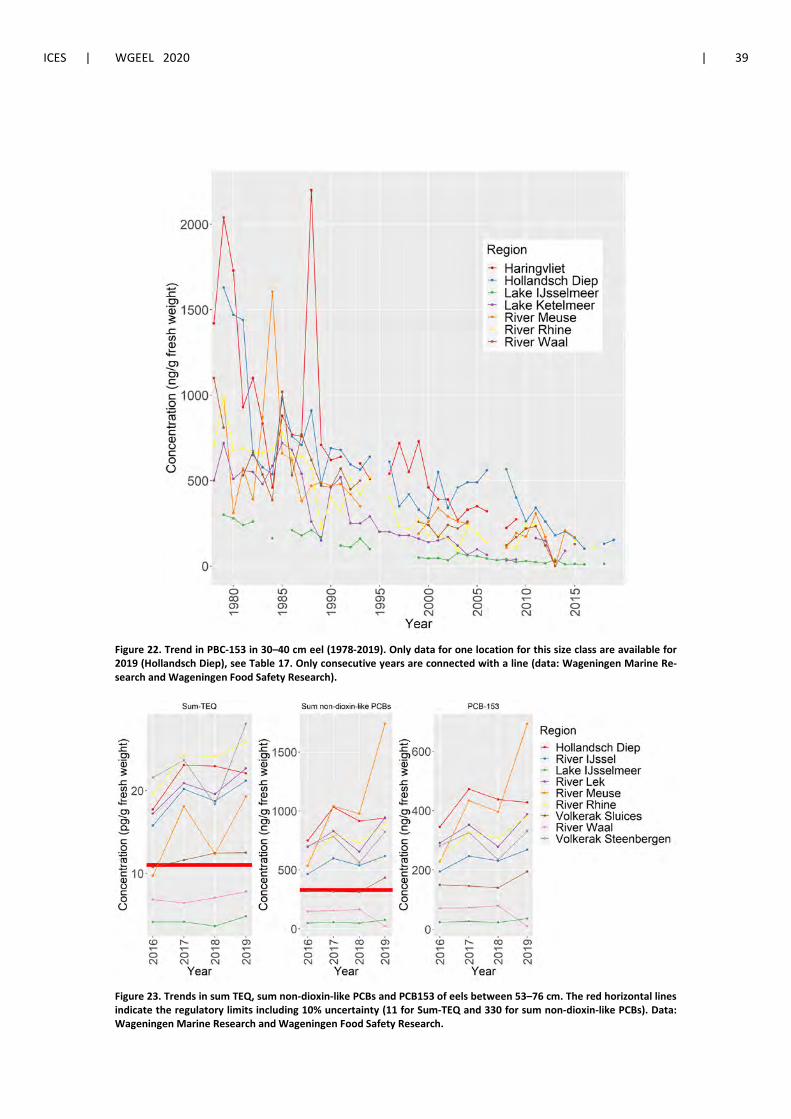
ICES | WGEEL 2020 | 39
Figure 22. Trend in PBC-153 in 30–40 cm eel (1978-2019). Only data for one location for this size class are available for 2019 (Hollandsch Diep), see Table 17. Only consecutive years are connected with a line (data: Wageningen Marine Re-search and Wageningen Food Safety Research).
Figure 23. Trends in sum TEQ, sum non-dioxin-like PCBs and PCB153 of eels between 53–76 cm. The red horizontal lines indicate the regulatory limits including 10% uncertainty (11 for Sum-TEQ and 330 for sum non-dioxin-like PCBs). Data: Wageningen Marine Research and Wageningen Food Safety Research.
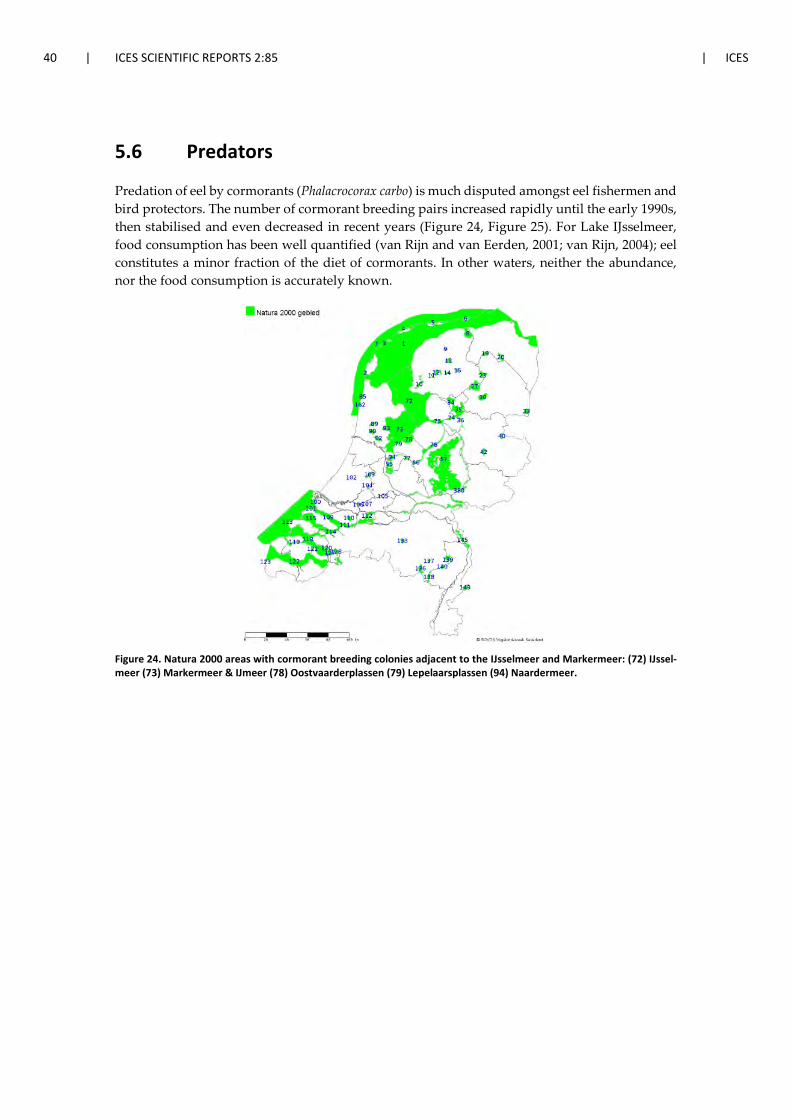
40 | ICES SCIENTIFIC REPORTS 2:85 | ICES
5.6 Predators
Predation of eel by cormorants (Phalacrocorax carbo) is much disputed amongst eel fishermen and bird protectors. The number of cormorant breeding pairs increased rapidly until the early 1990s, then stabilised and even decreased in recent years (Figure 24, Figure 25). For Lake IJsselmeer, food consumption has been well quantified (van Rijn and van Eerden, 2001; van Rijn, 2004); eel constitutes a minor fraction of the diet of cormorants. In other waters, neither the abundance, nor the food consumption is accurately known.
Figure 24. Natura 2000 areas with cormorant breeding colonies adjacent to the IJsselmeer and Markermeer: (72) IJssel-meer (73) Markermeer & IJmeer (78) Oostvaarderplassen (79) Lepelaarsplassen (94) Naardermeer.
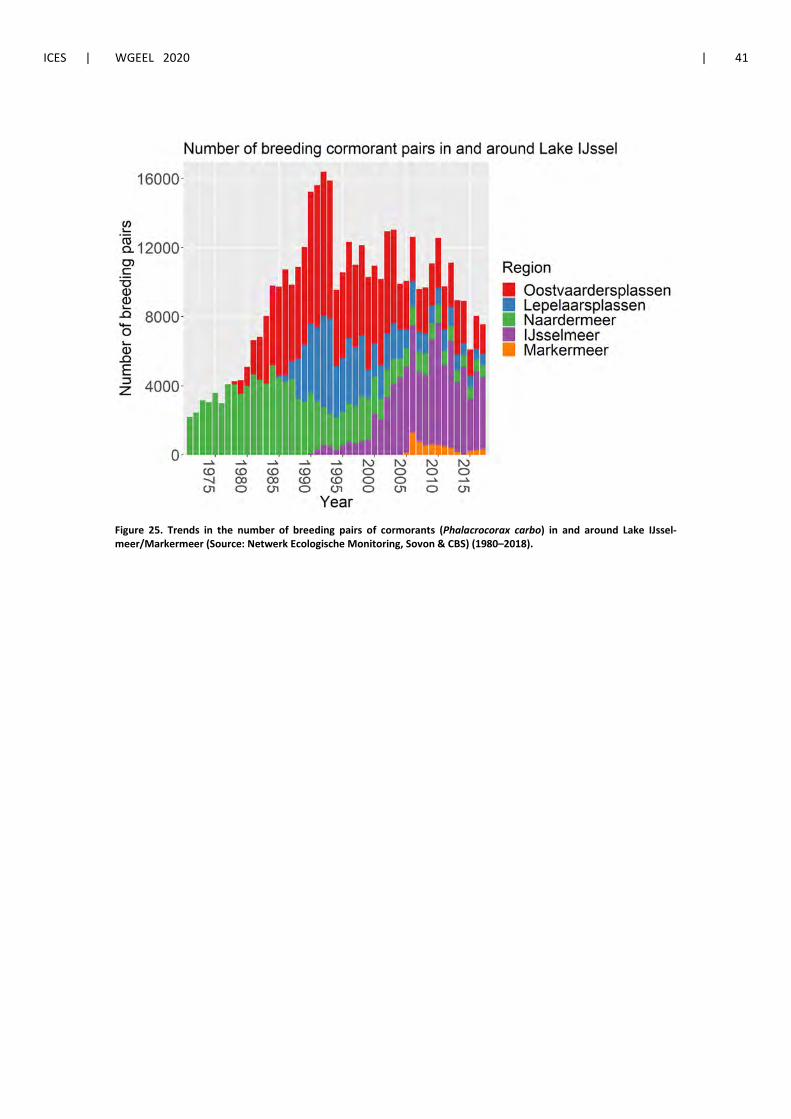
ICES | WGEEL 2020 | 41
Figure 25. Trends in the number of breeding pairs of cormorants (Phalacrocorax carbo) in and around Lake IJssel-meer/Markermeer (Source: Netwerk Ecologische Monitoring, Sovon & CBS) (1980–2018).
42 | ICES SCIENTIFIC REPORTS 2:85 | ICES
6 New Information
Glass eel detectors Due to the low catchability of glass eels with lift nets and because it is difficult to find volunteers to do the lift net sampling, sampling with glass eel detectors has been carried out at the ICES locations (Den Oever, Katwijk, Stellendam, Lauwersoog and IJmuiden) for the second year in a row now. Monitoring with glass eel detectors is continuous, so the effort is the same at all loca-tions. In addition, many more glass eels are caught compared to the lift net sampling, which gives a higher precision. The lift net sampling must run for at least three years at the same time as the new sampling in order to properly calibrate the new sampling. The new sampling with glass eel detectors will be evaluated, and it will be examined whether this can replace the regular lift net sampling. It is expected that, after a few overlapping years, the lift net sampling will no longer be necessary. The 2019 and 2020 data from the glass eel detectors have not been analysed yet.
Two major improvements in terms of eel migration possibilities have been/will be implemented.
The Haringvliet sluices separate the North Sea and the freshwater inlet “Haringvliet” since 1970. The Haringvliet is an important estuary of the Rhine-Meuse delta. In order to improve the eco-logical situation in the rivers Meuse and Rhine, several sluices are officially opened on 15th No-vember 2018. This allows the return of brackish water and will partly restore the main route for migrating fish (especially salmonids). In addition, migrating (glass) eels might benefit from this opening as well. Because of the drought in the summer of 2018, only one sluice was actually opened which occurred on 16th January 2019. On 12th February 2019, the sluices were opened for a second time; five sluices were opened during the first tide and three sluices were opened during the second tide. After that, the sluices were open on a regular base according to Rijkwa-terstaat. The sluices were foreseen to be closed during the period of low river discharges (Sep-tember–October) which is concurrent with the silver eel migration to the sea, indicating that this measure might be more beneficial to glass eel than silver eel migration. In addition, Winter and Bierman (2010) have shown that silver eels usually make use of the lock at the Haringvliet sluices for migrating to the sea (Griffioen et al., 2018). However, Rijkswaterstaat has conducted research on saltwater movement at the Haringvliet sluices in October 2019. On 10th October at high tide, seawater was led into the Haringvliet and from 10–21 October, river water from the Haringvliet was led out into sea to test whether the Haringvliet would become fresh again after the saltwater inlet. From 21 October, the sluices were closed again. The opening of the sluices in October might have created opportunities for migrating silver eels.
The Afsluitdijk is a hard barrier (dike) between the salty Wadden Sea and the fresh IJsselmeer. There are two openings: the Stevin locks at Den Oever and the Lorentz locks at Kornwerderzand. However, these locks only allow large amounts of freshwater from the IJsselmeer into the Wad-den Sea and not the other way around. In addition, the current is much too strong for most spe-cies of migratory fish to swim against. As a solution, a “Fish Migration River” (an opening in the Afsluitdijk) will be constructed in 2020–2023 so that migratory fish can swim from fresh to salt-water and vice versa. Especially glass eels might benefit from the tide current created by the Fish Migration River.
ICES | WGEEL 2020 | 43
7 References
Bierman, S.M., N. Tien , K.E. van de Wolfshaar., H.V. Winter and M. de Graaf. 2012. Evaluation of the Dutch Eel Management Plan 2009–2011. Imares report C067/12.
Bos, O.G. 2018. Report on the eel stock and fishery in the Netherlands 2016/2017. CVO report 18.005.
Dekker, W. (Editor) 2002. Monitoring of glass eel recruitment. Netherlands Institute of Fisheries Research, IJmuiden, Report C007/02-WD, 256 pp.
Dekker, W. 1991. Assessment of the historical downfall of the IJsselmeer fisheries using anonymous inquir-ies for effort data. In: I.G. Cowx (Ed.): Catch Effort Sampling Strategies, their Application in Freshwater Management, pp. 233–240. Fishing News Books, Oxford. 420 pp.
Dekker, W. 2009. Bottom trawl surveys in the southern North Sea. Working document presented to the Study Group on Anguillid Eels in Saline Waters, Goteborg Sweden, 3–5 September 2009, 11 pp.
Eijsackers H, Nagelkerke LAJ, van der Meer J, Klinge M, van Dijk J. 2009. Streefbeeld Aal, een deskundigenoordeel. Adviesrapport op verzoek van de Minister van L.N.V., Den Haag.
Griffioen AB, De Vries P, Twijnstra RH, De Graaf M. 2017. Glass eel monitoring in the Netherlands (http://library.wur.nl/WebQuery/wurpubs/519629). Wageningen Marine Research. Report C010/17.
Griffioen, A.B. asnd Winter, H.V., Van Hal, R. 2018. Prognose visstand in en rond het Haringvliet na invoering van het kierbesluit in 2018. Wageningen University and Research rapport C081/17.
Klein Breteler J, Vriese T, Borcherding J, Breukelaar, A, Jörgensen L, Staas S, de Laak G, and Ingendahl D. 2007. Assessment of population size and migration routes of silver eel in the River Rhine based on a 2-year combined mark-recapture and telemetry study. – ICES Journal of Marine Science, 64: 1450–1456.
Rabbinge R, van der Meer J, Quak J, Verreth JAJ, van der Waal AG, Nagelkerke LAJ. 2013. Herberekening Streefbeeld Aal: Een analyse van het bestaande Nederlandse streefbeeld in relatie tot de buurlanden. Een advies op verzoek van de Minister van Economische Zaken, pp. 87.
Tien, N. and W. Dekker. 2004. Trends in eel habitat abundance in the Netherlands during the 20th century. ICES C.M. 2004/S:12 (mimeo).
Van de Wolfshaar, K.E., Griffioen, A.B., Winter, H.V., Tien, N., Gerla, D., van Keeken, O., van der Hammen, T. 2018. Evaluation of the Dutch Eel Management Plan 2018: status of the eel population in 2005–2016. CVO report 18.009.
Van der Hammen, T. 2019. Recreational fisheries in the Netherlands: Analyses of the 2017 screening survey and the 2016–2017 logbook survey. CVO report: 18.025. DOI: https://doi.org/10.18174/466439.
Van der Meer, J., H.W. van der Veer and J.IJ. Witte. 2011.The disappearance of the European eel from the western Wadden Sea. Journal of Sea Research 66; 434–439.
Van der Sluis, N.S.H Tien, A.B. Griffioen, O.A. van Keeken, E. van Os-Koomen, K.E. van de Wolfshaar, J.A.M. Wiegerinck, M. Lohman. 2016. Toestand vis en visserij in de zoete Rijkswateren 2015; Deel II: Methoden.Wageningen, Wageningen UR (University & Research centre), IMARES rapport C16/115.
Van Rijn S. and M.R. van Eerden. 2001. Aalscholvers in het IJsselmeergebied: concurrent of graadmeter? [Cormorants in the IJsselmeer area: competitor or indicator?] RIZA report 2001.058.
Van Rijn, S. 2004. Monitoring Aalscholvers in het IJsselmeergebied [Monitoring cormorants in the IJsselmeer area]. Voortgangsverslag 2004. RIZA working document 2004.187x.
Van Rijssel, J.C. and van der Hammen, T. 2019. Report on the eel stock, fishery and other impacts, in The Netherlands. ICES WGEEL 2019.
Winter, H. V., and S. M. Bierman. 2010. De uitrekmogelijkheden voor schieraal via de haringvlietsluizen IMARES rapport nr C155/10.

44 | ICES SCIENTIFIC REPORTS 2:85 | ICES
Winter, H.V,. A.B. Griffioen and K.E. van de Wolfshaar. 2013a. Knelpunten inventarisatie voor de uittrek van schieraal t.b.v. ‘Paling Over De Dijk’ Report C134/13.
Winter, H.V., Griffioen, A.B., van de Wolfshaar, K.E. 2013b. Inventarisatie van de belangrijkste knelpunten voor de uittrek van schieraal in Nederland. IMARES Rapport C107/13.

ICES | WGEEL 2020 | I
Contents
Report on the eel stock, fishery and other impacts in Norway, 2018–2019 .............................................. ii Authors .......................................................................................................................................... ii
1 Summary of national and international stock status indicators.................................................... 1 1.1 Escapement biomass and mortality rates ........................................................................ 1 1.2 Recruitment time-series .................................................................................................. 1
2 Overview of the national stock and its management.................................................................... 3 2.1 Describe the eel stock and its management .................................................................... 3 2.2 Significant changes since last report ................................................................................ 3
3 Impacts on the national stock ....................................................................................................... 4 3.1 Fisheries ........................................................................................................................... 4 3.1.1 Glass eel fisheries ............................................................................................................. 4 3.1.2 Yellow eel fisheries .......................................................................................................... 4 3.1.3 Silver eel fisheries ............................................................................................................ 4 3.2 Restocking ........................................................................................................................ 4 3.3 Aquaculture ..................................................................................................................... 4 3.4 Entrainment ..................................................................................................................... 4 3.5 Habitat Quantity and Quality ........................................................................................... 4 3.6 Other impacts .................................................................................................................. 5
4 National stock assessment ............................................................................................................ 6 4.1 Description of Method ..................................................................................................... 6 4.1.1 Data collection ................................................................................................................. 6 4.1.2 Analysis ............................................................................................................................ 6 4.1.3 Reporting ......................................................................................................................... 6 4.1.4 Data quality issues and how they are being addressed ................................................... 6 4.2 Trends in Assessment results ........................................................................................... 6
5 Other data collection for eel ......................................................................................................... 7 5.1 Yellow eel abundance surveys ......................................................................................... 7 5.2 Silver eel escapement surveys ......................................................................................... 7 5.3 Life-history parameters .................................................................................................... 7 5.4 Diseases, Parasites & Pathogens or Contaminants .......................................................... 7
6 New Information ........................................................................................................................... 8 7 References ..................................................................................................................................... 9
II | ICES SCIENTIFIC REPORTS 2:85 | ICES
Report on the eel stock, fishery and other impacts in Norway, 2018–2019
Authors
Caroline Durif, Institute of Marine Research (IMR), NO-5392 Storebø, Norway. Tel: +47 976 27 269. e-mail: [email protected]
Eva B. Thorstad, Norwegian Institute for Nature Research (NINA), NO-7485 Trondheim, Nor-way. Tel: +47 73 80 14 00 / +47 91 66 11 30. FAX +47 73 80 14 01. [email protected]
Reporting Period: This report was completed in August 2019, and contains data up to 2018 and some provisional data for 2019.
Acknowledgments:
Knut Aanestad Bergesen, Norwegian Institute for Nature Research (NINA)
Martin Ohldieck, Institute of Marine Research

ICES | WGEEL 2020 | 1
1 Summary of national and international stock status indicators
1.1 Escapement biomass and mortality rates
Table 1. Stock indicators of silver eel escapement, biomass and mortality rates, and assessed habitat area.
Year EMU_code Assessed
Area
(ha)
B0 (kg) Bcurr (kg) Bbest (kg) Bcurr/B0 (%) ∑F ∑H ∑A
2017 NO_ToT 24600 No data 276600 279800 No data 0.014 No data No data
2018 NO_TOT 24600 No data 302000 304000 No data 0.006 No data No data
Key: EMU_code = Eel Management Unit code (see Table 2 for list of codes); B0 = the amount of silver eel biomass that would have existed if no anthropogenic influences had impacted the stock (kg); Bcurr = the amount of silver eel bio-mass that currently escapes to the sea to spawn (in the assessment year) (kg); Bbest = the amount of silver eel biomass that would have existed if no anthropogenic influences had impacted the current stock (kg); ∑F = mortality due to fishing, summed over the age groups in the stock (rate); ∑H = anthropogenic mortality excluding the fishery, summed over the age groups in the stock (rate); ∑A = all anthropogenic mortality summed over the age groups in the stock (rate); Assessed area (ha) = combined area total (ha) of transitional and inland waters.
1.2 Recruitment time-series
The WGEEL uses these time-series data to calculate the Recruitment Indices, relative to the ref-erence period of 1960–1979, and the results form the basis of the annual Single Stock Advice reported to the EU Commission. These recruitment indices are also used by the EU CITES Scien-tific Review Group in their annual review of the Non-Detriment Finding position.
The only available time-series of elvers is from a trap at the mouth of the River Imsa in south-western Norway (58°50’ N, 5°58’ E) (Figures 1 and 2, Table 1, 2 and 3). The staff at the Norwegian Institute for Nature Research (NINA) Research Station at Ims have been trapping and recording upstream migration of elvers annually since 1975. There is a wolf trap across the river at this site, collecting all downstream migrating fish as well. A few elvers may be able to migrate upstream at this site without being trapped, but probably not in large numbers. Larger elvers (>3 mm di-ameter) are counted, whereas smaller ones are measured in litres, with the assumption that there are 2000 elvers per litre. This assumption should have been checked. There should also have been a control check of the historical data, but still, the quality of the dataseries seems good. It should be noted that in Imsa, recruits migrating upstream are not true glass eel, but have already achieved a brown colour, and are here therefore termed elvers.
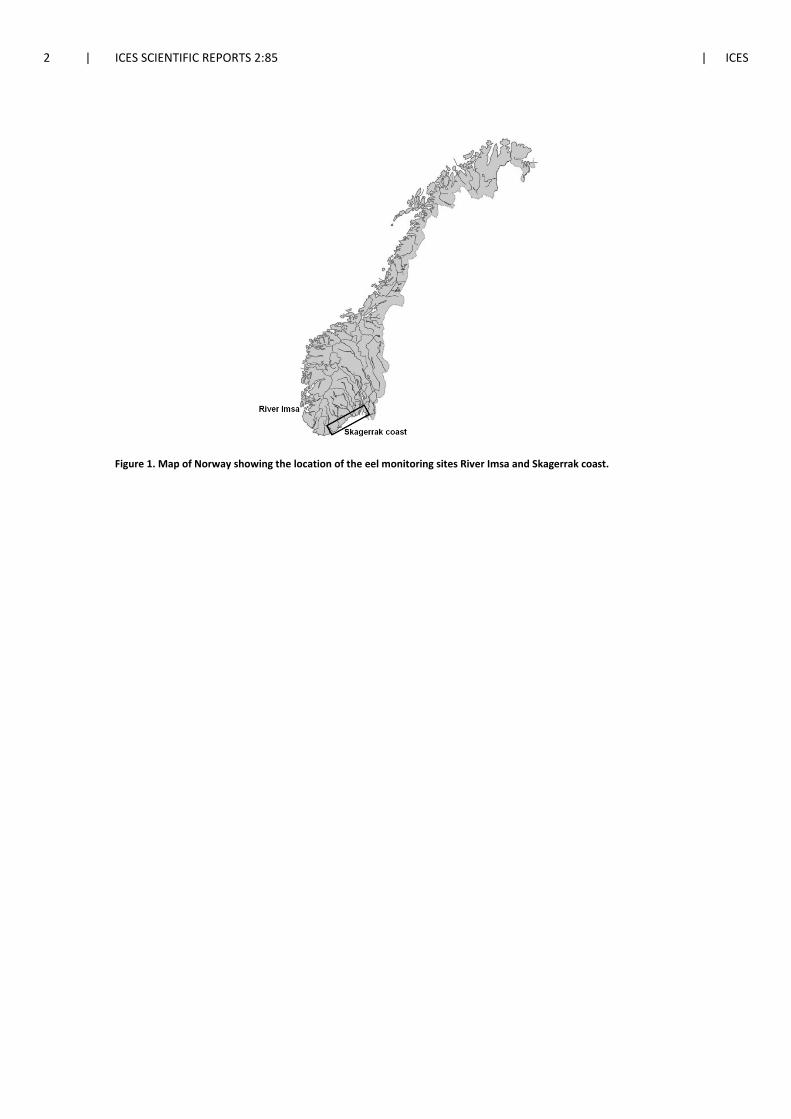
2 | ICES SCIENTIFIC REPORTS 2:85 | ICES
Figure 1. Map of Norway showing the location of the eel monitoring sites River Imsa and Skagerrak coast.

ICES | WGEEL 2020 | 3
2 Overview of the national stock and its management
2.1 Describe the eel stock and its management
Durif and Skiftesvik, 2018 (in Norwegian) summarizes the monitoring programme started in 2017.
2.2 Significant changes since last report
No changes.
4 | ICES SCIENTIFIC REPORTS 2:85 | ICES
3 Impacts on the national stock
3.1 Fisheries
3.1.1 Glass eel fisheries
No glass eel fisheries.
3.1.2 Yellow eel fisheries
Data are in the data spreadsheet.
3.1.3 Silver eel fisheries
There are no silver eel fisheries.
3.2 Restocking
There is no restocking.
3.3 Aquaculture
There is no aquaculture.
3.4 Entrainment
Approximately one third of the water-covered areas are influenced by hydropower develop-ment. There are between 600 and 700 hydropower stations with an installed effect larger than 1 MW in operation. Effects by hydropower development on eel and eel distribution have not been studied or quantified.
3.5 Habitat Quantity and Quality
Norway has abundant rivers and lakes, and 6% of the total area of 323 802 km2 is covered by freshwater. There are 144 river systems with a catchment area ≥ 200 km2.
Eels are present everywhere along the Norwegian coastline. It’s also been registered inland, in every one of Norway’s administrative regions (Thorstad et al., 2010). Eel fisheries were tradition-ally located in southern Norway (Skagerrak coast). However, there have also been eel fishers in the western and central part of Norway. These fishers operate in saltwater but mostly in fjords and wind protected areas.
The analysis of telemetry data obtained on eleven eel in the sea in southern Norway (Arendal) shows that eels residing in the marine area occupy move at depths between 2 and 6 meters. Their home range varied between 2 to 5.6 km2 .
ICES | WGEEL 2020 | 5
In Norway, the landscape is quickly elevated when leaving the coast. This limits the ascension of eels high up into the watersheds. That is, 63% of the eels were registered less than 10 km from the coastline. 50% of the lakes where eel is documented, are located 50 meters above sea level.
Overall, the eel density and carrying capacity of habitats in fresh- and saltwater in Norway is poorly known.
3.6 Other impacts
Acidification has caused the loss or reduction of many Atlantic salmon (Salmo salar L.) popula-tions in southern Norway, and some rivers are still severely affected by chronic or episodic acid water. The areas affected by acidification have likely been among the most important areas for eel in Norway. Based on surveys in 13 rivers that are now limed, it seems that occurrence and density of eel was reduced due to acidification (Thorstad et al., 2010; Larsen et al., 2014). Densities of eel increased more than four-fold after liming, when compared with pre-liming levels.
6 | ICES SCIENTIFIC REPORTS 2:85 | ICES
4 National stock assessment
4.1 Description of Method
Durif and Skiftesvik, 2018 (in Norwegian) summarizes the monitoring program started in 2017.
4.1.1 Data collection
Eel densities (in number of eels per length of coastline) are based on mark–recapture experiments in two locations (western and southern Norway). Available habitat is calculated by GIS taking the whole coastline.
4.1.2 Analysis
Methods are described in Durif and Skiftesvik, 2018.
4.1.3 Reporting
The results are reported to the Norwegian Directorate of Fisheries (last year in 2019).
4.1.4 Data quality issues and how they are being addressed
No available data.
4.2 Trends in Assessment results
We only have stock indicators for two consecutive years (2017–2018).
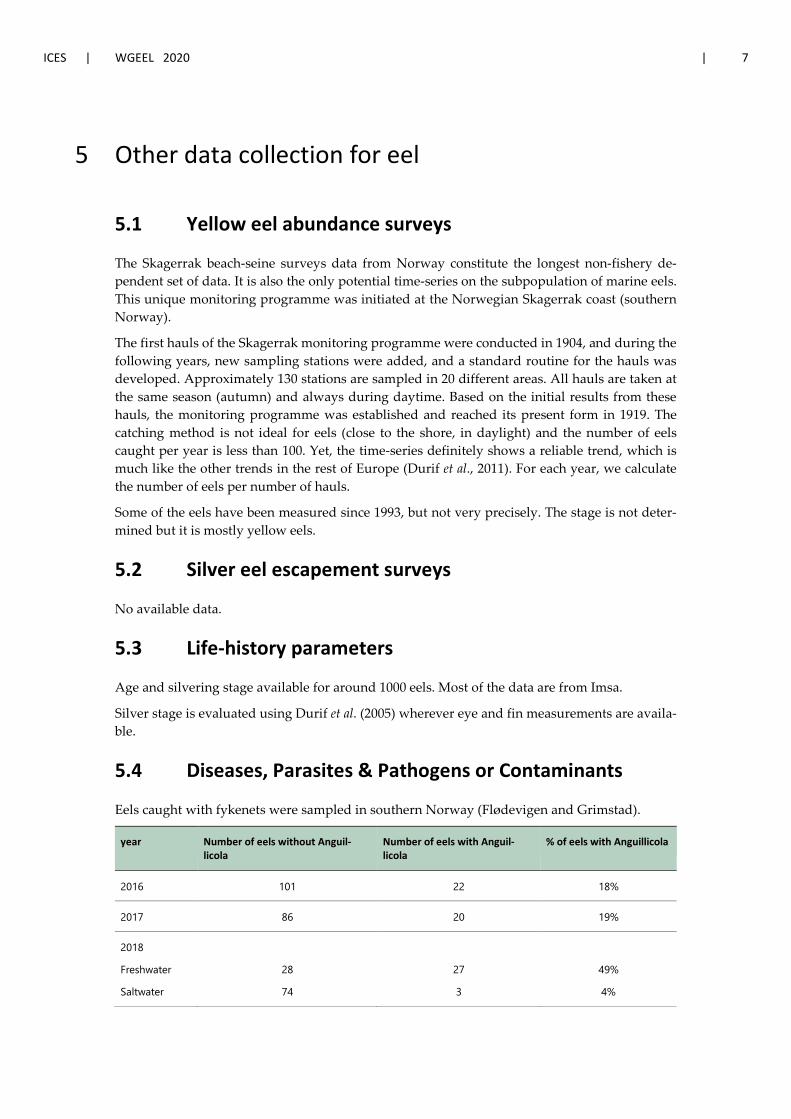
ICES | WGEEL 2020 | 7
5 Other data collection for eel
5.1 Yellow eel abundance surveys
The Skagerrak beach-seine surveys data from Norway constitute the longest non-fishery de-pendent set of data. It is also the only potential time-series on the subpopulation of marine eels. This unique monitoring programme was initiated at the Norwegian Skagerrak coast (southern Norway).
The first hauls of the Skagerrak monitoring programme were conducted in 1904, and during the following years, new sampling stations were added, and a standard routine for the hauls was developed. Approximately 130 stations are sampled in 20 different areas. All hauls are taken at the same season (autumn) and always during daytime. Based on the initial results from these hauls, the monitoring programme was established and reached its present form in 1919. The catching method is not ideal for eels (close to the shore, in daylight) and the number of eels caught per year is less than 100. Yet, the time-series definitely shows a reliable trend, which is much like the other trends in the rest of Europe (Durif et al., 2011). For each year, we calculate the number of eels per number of hauls.
Some of the eels have been measured since 1993, but not very precisely. The stage is not deter-mined but it is mostly yellow eels.
5.2 Silver eel escapement surveys
No available data.
5.3 Life-history parameters
Age and silvering stage available for around 1000 eels. Most of the data are from Imsa.
Silver stage is evaluated using Durif et al. (2005) wherever eye and fin measurements are availa-ble.
5.4 Diseases, Parasites & Pathogens or Contaminants
Eels caught with fykenets were sampled in southern Norway (Flødevigen and Grimstad).
year Number of eels without Anguil-licola
Number of eels with Anguil-licola
% of eels with Anguillicola
2016 101 22 18%
2017 86 20 19%
2018
Freshwater
Saltwater
28
74
27
3
49%
4%

8 | ICES SCIENTIFIC REPORTS 2:85 | ICES
6 New Information
Nothing to report.

ICES | WGEEL 2020 | 9
7 References
Diserud, O. H., et al. 2017. Oppvandring og bestandsstruktur hos ål i Imsa, 1975–2016, NOTAT til Miljødirektoratet: 13.
Durif, C. M. F. and A. B. Skiftesvik. 2017. Forskningsfangst av ål- Sluttrapport HI prosjekt 81333. Rapport fra Havforskningen, Havforskningsinstituttet: 50.

ICES | WGEEL 2020 | I
Contents
Report on the eel stock, fishery and other impacts, in POLAND ................................................................ ii Authors .......................................................................................................................................... ii
1 Summary of national and international stock status indicators.................................................... 1 1.1 Escapement biomass and mortality rates ........................................................................ 1 1.2 Recruitment time-series .................................................................................................. 1
2 Overview of the national stock and its management.................................................................... 3 2.1 Describe the eel stock and its management .................................................................... 3 2.2 Significant changes since last report ................................................................................ 5
3 Impacts on the national stock ....................................................................................................... 6 3.1 Fisheries ........................................................................................................................... 6 3.1.1 Glass eel fisheries ............................................................................................................. 6 3.1.2 Yellow eel fisheries .......................................................................................................... 6 3.1.3 Silver eel fisheries ............................................................................................................ 7 3.2 Restocking ........................................................................................................................ 7 3.3 Aquaculture ..................................................................................................................... 8 3.4 Entrainment ..................................................................................................................... 8 3.5 Habitat Quantity and Quality ........................................................................................... 9 3.6 Other impacts .................................................................................................................. 9
4 National stock assessment .......................................................................................................... 10 4.1 Description of Method ................................................................................................... 10 4.1.1 Data collection ............................................................................................................... 11 4.1.2 Analysis .......................................................................................................................... 11 4.1.3 Reporting ....................................................................................................................... 11 4.1.4 Data quality issues and how they are being addressed ................................................. 11 4.2 Trends in Assessment results ......................................................................................... 12
5 Other data collection for eel ....................................................................................................... 14 5.1 Yellow eel abundance surveys ....................................................................................... 14 5.2 Silver eel escapement surveys ....................................................................................... 14 5.3 Life-history parameters .................................................................................................. 15 5.4 Diseases, Parasites & Pathogens or Contaminants ........................................................ 15
6 New Information ......................................................................................................................... 16 7 References ................................................................................................................................... 17

II | ICES SCIENTIFIC REPORTS 2:85 | ICES
Report on the eel stock, fishery and other impacts, in POLAND
Authors
Tomasz Nermer, National Marine Fisheries Research Institute (NMFRI), Poland. Tel: 48 (0) 58 73 56 211. Fax: +48 (0) 58 73 56 110. [email protected]
Stanisław Robak, Inland Fisheries Institute (IFI), Poland. Tel. 48 (0) 55 89 524 01 71. Fax +48 (0) 89 524 05 05. [email protected]
Reporting Period: This report was completed in September 2020, and contains data up to 2019.
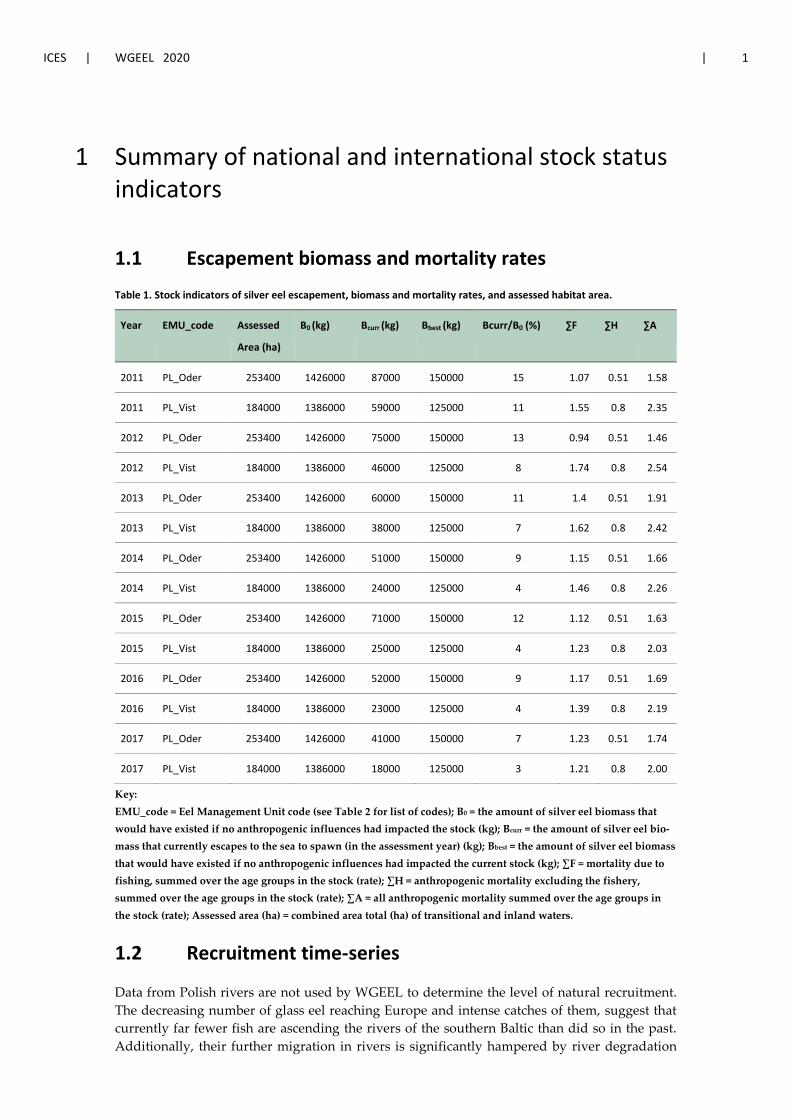
ICES | WGEEL 2020 | 1
1 Summary of national and international stock status indicators
1.1 Escapement biomass and mortality rates
Table 1. Stock indicators of silver eel escapement, biomass and mortality rates, and assessed habitat area.
Year EMU_code Assessed
Area (ha)
B0 (kg) Bcurr (kg) Bbest (kg) Bcurr/B0 (%) ∑F ∑H ∑A
2011 PL_Oder 253400 1426000 87000 150000 15 1.07 0.51 1.58
2011 PL_Vist 184000 1386000 59000 125000 11 1.55 0.8 2.35
2012 PL_Oder 253400 1426000 75000 150000 13 0.94 0.51 1.46
2012 PL_Vist 184000 1386000 46000 125000 8 1.74 0.8 2.54
2013 PL_Oder 253400 1426000 60000 150000 11 1.4 0.51 1.91
2013 PL_Vist 184000 1386000 38000 125000 7 1.62 0.8 2.42
2014 PL_Oder 253400 1426000 51000 150000 9 1.15 0.51 1.66
2014 PL_Vist 184000 1386000 24000 125000 4 1.46 0.8 2.26
2015 PL_Oder 253400 1426000 71000 150000 12 1.12 0.51 1.63
2015 PL_Vist 184000 1386000 25000 125000 4 1.23 0.8 2.03
2016 PL_Oder 253400 1426000 52000 150000 9 1.17 0.51 1.69
2016 PL_Vist 184000 1386000 23000 125000 4 1.39 0.8 2.19
2017 PL_Oder 253400 1426000 41000 150000 7 1.23 0.51 1.74
2017 PL_Vist 184000 1386000 18000 125000 3 1.21 0.8 2.00
Key: EMU_code = Eel Management Unit code (see Table 2 for list of codes); B0 = the amount of silver eel biomass that would have existed if no anthropogenic influences had impacted the stock (kg); Bcurr = the amount of silver eel bio-mass that currently escapes to the sea to spawn (in the assessment year) (kg); Bbest = the amount of silver eel biomass that would have existed if no anthropogenic influences had impacted the current stock (kg); ∑F = mortality due to fishing, summed over the age groups in the stock (rate); ∑H = anthropogenic mortality excluding the fishery, summed over the age groups in the stock (rate); ∑A = all anthropogenic mortality summed over the age groups in the stock (rate); Assessed area (ha) = combined area total (ha) of transitional and inland waters.
1.2 Recruitment time-series
Data from Polish rivers are not used by WGEEL to determine the level of natural recruitment. The decreasing number of glass eel reaching Europe and intense catches of them, suggest that currently far fewer fish are ascending the rivers of the southern Baltic than did so in the past. Additionally, their further migration in rivers is significantly hampered by river degradation
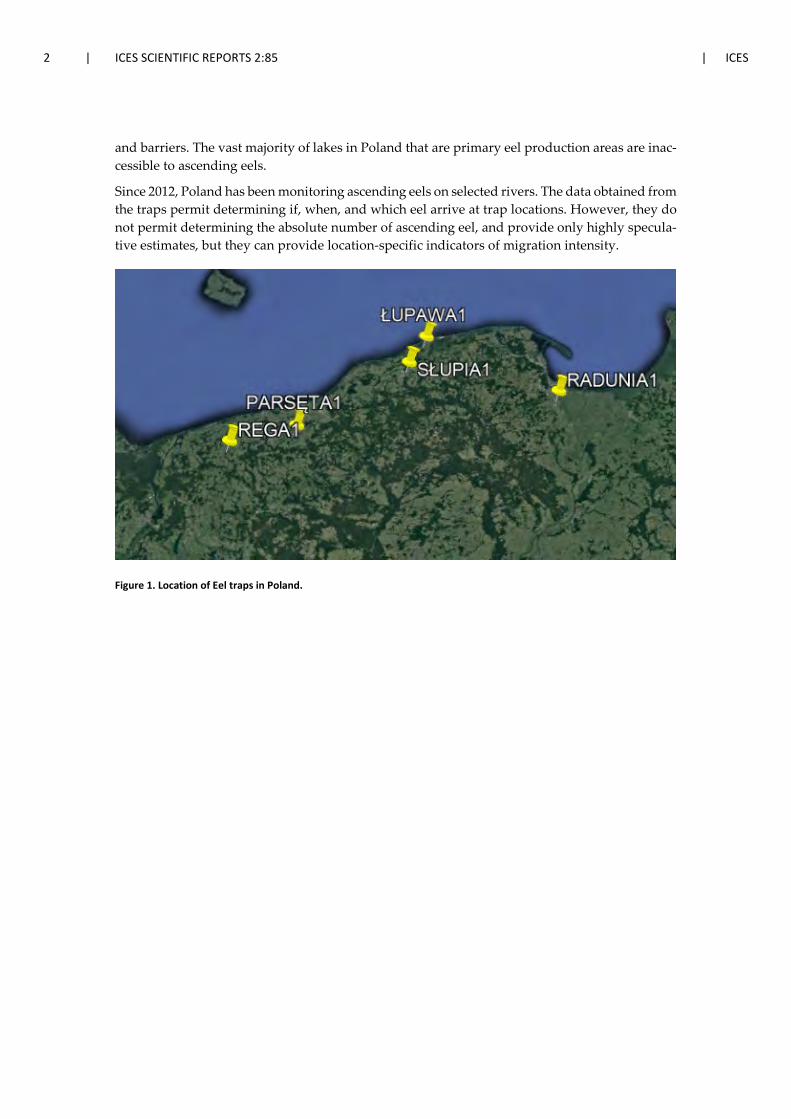
2 | ICES SCIENTIFIC REPORTS 2:85 | ICES
and barriers. The vast majority of lakes in Poland that are primary eel production areas are inac-cessible to ascending eels.
Since 2012, Poland has been monitoring ascending eels on selected rivers. The data obtained from the traps permit determining if, when, and which eel arrive at trap locations. However, they do not permit determining the absolute number of ascending eel, and provide only highly specula-tive estimates, but they can provide location-specific indicators of migration intensity.
Figure 1. Location of Eel traps in Poland.

ICES | WGEEL 2020 | 3
2 Overview of the national stock and its management
2.1 Describe the eel stock and its management
Eel fisheries in Poland is conducted in lakes, rivers, coastal open waters, and two brackish water basins; the Szczecin and Vistula lagoons. Part of the Szczecin Lagoon belongs to Germany, while part of the Vistula Lagoon belongs to Russia. Inland and coastal fisheries target silver and yellow eel, but no data on the shares of these forms in the catches are available. The total area of inland lakes and reservoirs exceeding 50 ha is 2293 km2. Dams in the Vistula and Oder rivers and in many of their tributaries prevent migrations of eel and other fish species.
Eel fisheries has a long tradition in Poland. Prior to World War II it was conducted mainly in inland waters because the short length of coastline within Polish borders did not provide enough access to conduct sea fisheries. Following the war, the length of the Polish coastline increased considerably to over 500 km. With this broader access to the Baltic Sea, Polish coastal eel fisheries developed and landings were as much as 388 tons annually. Inland eel fisheries also expanded to a substantially larger number of lakes, and landings were as much as 1500 tons annually. In the 1974–1994 period, inland catches comprised up to 75% of the total annual Polish eel catch. Since the end of this period, catches have declined considerably, and the two types of eel fisheries together currently land about 200 tons annually.
Until the late 1950s, Polish eel fisheries were based almost exclusively on natural recruitment. Later, extensive stocking programmes that released mainly glass eel were conducted in many lakes and in both lagoons. Changes in fishery management and the high price of glass eel, put a near stop to these programmes by the late 1990s. This, in turn, resulted in very serious decrease in eel catches, mainly in inland fisheries.
The first version of Polish EMP was submitted to the EU in December 2008, and was updated by the document submitted in June 2009. The EU officially accepted the Polish EMP in January 2010. Regulations for protecting eel, such as designated minimum length and closed seasons, were introduced into Polish law in 2010, and stocking started in August 2011. In June 2015, Poland submitted Joint Polish/Russian Transboundary Eel Management Plan in Pregola RBD and Vis-tula Lagoon. The Plan has not been revised yet.
For the needs of the Eel Management Plan, in consideration of the availability of data essential to estimating the population size and the potential escapement of silver eel and in consultation with countries that share transboundary river basins, the territory of Poland was divided into two Eel Management Units.
These EMUs include the following river basins, running waters, and maritime waters: Oder (Odra) EMU and Vistula EMU.
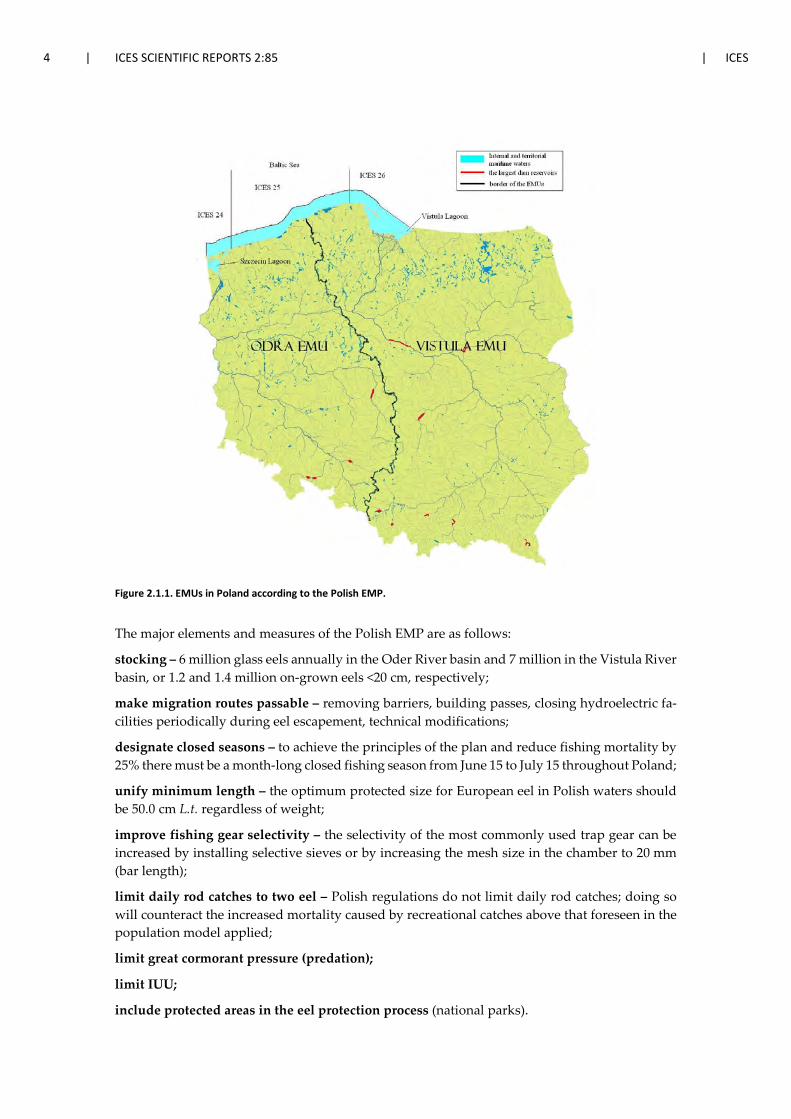
4 | ICES SCIENTIFIC REPORTS 2:85 | ICES
Figure 2.1.1. EMUs in Poland according to the Polish EMP.
The major elements and measures of the Polish EMP are as follows:
stocking – 6 million glass eels annually in the Oder River basin and 7 million in the Vistula River basin, or 1.2 and 1.4 million on-grown eels <20 cm, respectively;
make migration routes passable – removing barriers, building passes, closing hydroelectric fa-cilities periodically during eel escapement, technical modifications;
designate closed seasons – to achieve the principles of the plan and reduce fishing mortality by 25% there must be a month-long closed fishing season from June 15 to July 15 throughout Poland;
unify minimum length – the optimum protected size for European eel in Polish waters should be 50.0 cm L.t. regardless of weight;
improve fishing gear selectivity – the selectivity of the most commonly used trap gear can be increased by installing selective sieves or by increasing the mesh size in the chamber to 20 mm (bar length);
limit daily rod catches to two eel – Polish regulations do not limit daily rod catches; doing so will counteract the increased mortality caused by recreational catches above that foreseen in the population model applied;
limit great cormorant pressure (predation);
limit IUU;
include protected areas in the eel protection process (national parks).

ICES | WGEEL 2020 | 5
2.2 Significant changes since last report
No significant changes.
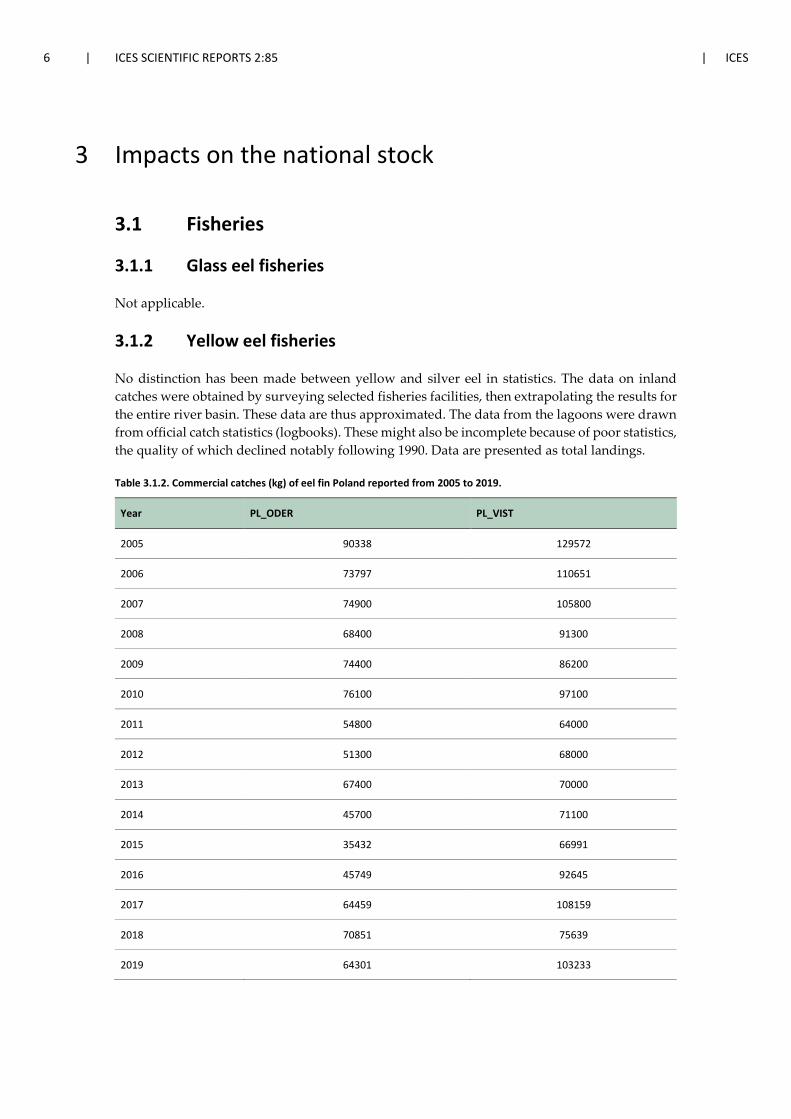
6 | ICES SCIENTIFIC REPORTS 2:85 | ICES
3 Impacts on the national stock
3.1 Fisheries
3.1.1 Glass eel fisheries
Not applicable.
3.1.2 Yellow eel fisheries
No distinction has been made between yellow and silver eel in statistics. The data on inland catches were obtained by surveying selected fisheries facilities, then extrapolating the results for the entire river basin. These data are thus approximated. The data from the lagoons were drawn from official catch statistics (logbooks). These might also be incomplete because of poor statistics, the quality of which declined notably following 1990. Data are presented as total landings.
Table 3.1.2. Commercial catches (kg) of eel fin Poland reported from 2005 to 2019.
Year PL_ODER PL_VIST
2005 90338 129572
2006 73797 110651
2007 74900 105800
2008 68400 91300
2009 74400 86200
2010 76100 97100
2011 54800 64000
2012 51300 68000
2013 67400 70000
2014 45700 71100
2015 35432 66991
2016 45749 92645
2017 64459 108159
2018 70851 75639
2019 64301 103233
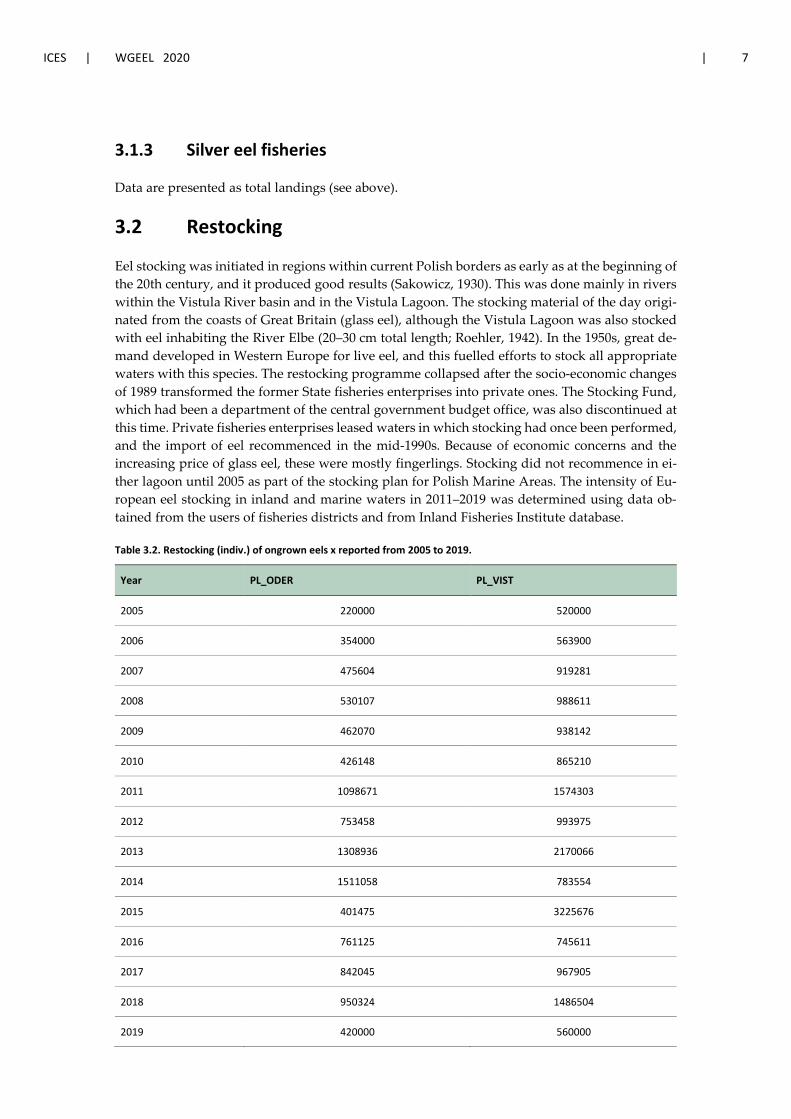
ICES | WGEEL 2020 | 7
3.1.3 Silver eel fisheries
Data are presented as total landings (see above).
3.2 Restocking
Eel stocking was initiated in regions within current Polish borders as early as at the beginning of the 20th century, and it produced good results (Sakowicz, 1930). This was done mainly in rivers within the Vistula River basin and in the Vistula Lagoon. The stocking material of the day origi-nated from the coasts of Great Britain (glass eel), although the Vistula Lagoon was also stocked with eel inhabiting the River Elbe (20–30 cm total length; Roehler, 1942). In the 1950s, great de-mand developed in Western Europe for live eel, and this fuelled efforts to stock all appropriate waters with this species. The restocking programme collapsed after the socio-economic changes of 1989 transformed the former State fisheries enterprises into private ones. The Stocking Fund, which had been a department of the central government budget office, was also discontinued at this time. Private fisheries enterprises leased waters in which stocking had once been performed, and the import of eel recommenced in the mid-1990s. Because of economic concerns and the increasing price of glass eel, these were mostly fingerlings. Stocking did not recommence in ei-ther lagoon until 2005 as part of the stocking plan for Polish Marine Areas. The intensity of Eu-ropean eel stocking in inland and marine waters in 2011–2019 was determined using data ob-tained from the users of fisheries districts and from Inland Fisheries Institute database.
Table 3.2. Restocking (indiv.) of ongrown eels x reported from 2005 to 2019.
Year PL_ODER PL_VIST
2005 220000 520000
2006 354000 563900
2007 475604 919281
2008 530107 988611
2009 462070 938142
2010 426148 865210
2011 1098671 1574303
2012 753458 993975
2013 1308936 2170066
2014 1511058 783554
2015 401475 3225676
2016 761125 745611
2017 842045 967905
2018 950324 1486504
2019 420000 560000
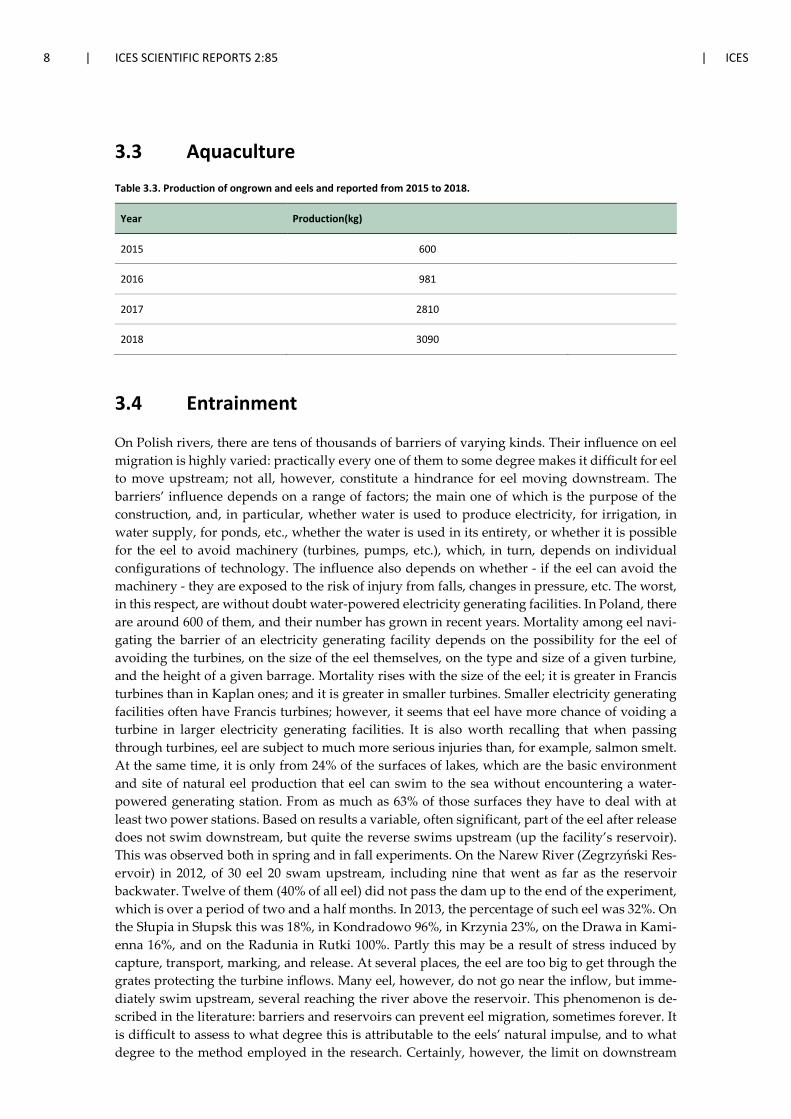
8 | ICES SCIENTIFIC REPORTS 2:85 | ICES
3.3 Aquaculture
Table 3.3. Production of ongrown and eels and reported from 2015 to 2018.
Year Production(kg)
2015 600
2016 981
2017 2810
2018 3090
3.4 Entrainment
On Polish rivers, there are tens of thousands of barriers of varying kinds. Their influence on eel migration is highly varied: practically every one of them to some degree makes it difficult for eel to move upstream; not all, however, constitute a hindrance for eel moving downstream. The barriers’ influence depends on a range of factors; the main one of which is the purpose of the construction, and, in particular, whether water is used to produce electricity, for irrigation, in water supply, for ponds, etc., whether the water is used in its entirety, or whether it is possible for the eel to avoid machinery (turbines, pumps, etc.), which, in turn, depends on individual configurations of technology. The influence also depends on whether - if the eel can avoid the machinery - they are exposed to the risk of injury from falls, changes in pressure, etc. The worst, in this respect, are without doubt water-powered electricity generating facilities. In Poland, there are around 600 of them, and their number has grown in recent years. Mortality among eel navi-gating the barrier of an electricity generating facility depends on the possibility for the eel of avoiding the turbines, on the size of the eel themselves, on the type and size of a given turbine, and the height of a given barrage. Mortality rises with the size of the eel; it is greater in Francis turbines than in Kaplan ones; and it is greater in smaller turbines. Smaller electricity generating facilities often have Francis turbines; however, it seems that eel have more chance of voiding a turbine in larger electricity generating facilities. It is also worth recalling that when passing through turbines, eel are subject to much more serious injuries than, for example, salmon smelt. At the same time, it is only from 24% of the surfaces of lakes, which are the basic environment and site of natural eel production that eel can swim to the sea without encountering a water-powered generating station. From as much as 63% of those surfaces they have to deal with at least two power stations. Based on results a variable, often significant, part of the eel after release does not swim downstream, but quite the reverse swims upstream (up the facility’s reservoir). This was observed both in spring and in fall experiments. On the Narew River (Zegrzyński Res-ervoir) in 2012, of 30 eel 20 swam upstream, including nine that went as far as the reservoir backwater. Twelve of them (40% of all eel) did not pass the dam up to the end of the experiment, which is over a period of two and a half months. In 2013, the percentage of such eel was 32%. On the Słupia in Słupsk this was 18%, in Kondradowo 96%, in Krzynia 23%, on the Drawa in Kami-enna 16%, and on the Radunia in Rutki 100%. Partly this may be a result of stress induced by capture, transport, marking, and release. At several places, the eel are too big to get through the grates protecting the turbine inflows. Many eel, however, do not go near the inflow, but imme-diately swim upstream, several reaching the river above the reservoir. This phenomenon is de-scribed in the literature: barriers and reservoirs can prevent eel migration, sometimes forever. It is difficult to assess to what degree this is attributable to the eels’ natural impulse, and to what degree to the method employed in the research. Certainly, however, the limit on downstream
ICES | WGEEL 2020 | 9
movement placed on silver eel by barriers is not restricted to the injuries eel may suffer in passing through the turbines of a power station.
The Polish Eel Management Plan (PEMP) assumes an improvement in the conditions of down-stream migration, and makes the success of the plan dependent on such improvement, and des-ignates it as a fundamental course of action.
3.5 Habitat Quantity and Quality
No new data available.
3.6 Other impacts
No new data available.

10 | ICES SCIENTIFIC REPORTS 2:85 | ICES
4 National stock assessment
4.1 Description of Method
The stock dynamics of eel in both RBDs was estimated using a version of the CAGEAN model (Deriso et al., 1985). The model was originally fitted to data covering the period of 1960–2011. There were many gaps in the age-structure data, and for some data, only approximate or as-sumed values were available, so the model was fitted using simplified assumptions. The availa-ble data included:
• fishery and recreational catches covering whole period; • stocking numbers covering whole period; • age structure and weight-at-age for several years, but in most years these data were not
available and the best age and weight data are from 2006; • cormorant eel predation.
In the CAGEAN model, fishing mortality (F) was separated into year effect (fishing mortality at reference age in a year) and age effect (selection). Until 2005, data for estimating year effect in F were too scarce, the F is presented as a time-dependent polynomial of the 7th degree, and co-efficients of this polynomial were estimated in the model. Since 2006, F can be calculated for each year as age data are available. Cormorant predation mortality was included, but it appeared to be low (usually well below 0.1). Recruitment to the model was assumed as proportional to re-cruitment indices estimated using GLM by WGEEL (ICES, 2017) and the co-efficient of propor-tionality (Ralfa) was estimated in the model. Selection was estimated at ages 3–6, at others it was assumed at 1. Another parameter was Zini, which was total mortality used to estimate initial stock numbers (in 1960) from average recruitment at the beginning of the simulation period.
The model was fitted by minimizing the sum of squared residuals between observed and mod-elled catches and observed and modelled catch-at-age in those years in which age distribution was available. The residuals were determined from logged values. Details of the model were presented in the 2008 Polish eel management plan. The inverse of variance weighting was ap-plied to weight terms of the total sum of squared residuals. Estimated fishing mortality and Ralfa were inversely correlated, and there was relatively little information in the data for selecting the most representative estimate of Ralfa. Thus, the model was run for series of Ralfa values, and as a representative for eel dynamics the Ralfa selected was that at which the minimized sum of squared residuals showed low changes, while the total mortality was relatively close to the mor-tality estimates from the catch curve. Otherwise, the minimizing procedure tended to select high Ralfa and produced unrealistically low fishing mortality.
Changes in the data and model fit in 2017 compared with previous fit were as follows:
• new recruitment indices provided by GLM estimates presented in the WGEEL Report in 2017 were used, and they differed only slightly from previous estimates;
• new data on catches, stocking, and the age structure of catches in 2015–2017 were in-cluded in the analysis;
• historical data on catches and stocking were updated for a few years; • age data from ages older than 14, were combined into a plus group and included in the
analysis for the six most recent years, previously the abundance of fish at age >14 was so low (practically zero), so it was omitted.
ICES | WGEEL 2020 | 11
4.1.1 Data collection
During 2015–2016, the eel monitoring was conducted exclusively in marine and transitional wa-ters, based on the requirements of Council Regulation (EC) No 199/2008. The monitoring pro-gramme was based on the collection of catch and biological data, such as length, age, weight, and state of gonads.
Since 2010, WGEEL has been indicating the need of an assessment of biomass and mortality in-dicators in management as well as scientific reference points to ultimately result in a scientific advice framework that works in line with the ICES precautionary approach (RCM Baltic, 2016). The sampling design had to provide relevant data for biomass assessment to WGEEL to perform the approach for international stock assessment.
As required by Commission Implementing Decision (EU) 2016/1251 of 12 July 2016, data col-lection for two Polish EMUs (Oder and Vistula) from 2017 onwards must consist of:
• catch quantities derived from inland and marine commercial fisheries (logbooks and of-ficial statistical questionnaires) biological variables - age, length, weight, sex, and life stage.
• abundance of recruits - catch data obtained on eel ladders set in Pomeranian rivers, data on stocking from statistical questionnaires and resellers.
• abundance of the standing stock - calculated by mathematical modelling, supplemented by data from scientific non selective fykenets set in lagoons and electrofishing in lakes.
• number of emigrating silver eels will be calculated by mathematical modelling.
The stock dynamics of eel for both EMUs is estimated using a version of CAGEAN model (Deriso et al., 1985), described in the Polish Eel Management Plan. Data was delivered to WGEEL annu-ally.
4.1.2 Analysis
Eel Model is described in paragraph 4.1.
4.1.3 Reporting
Results of DCF sampling are stored in the international database - FishFrame. Data needed by WGEEL were sent to stock coordinator.
4.1.4 Data quality issues and how they are being addressed
Data collection in coastal and transitional waters meets quality requirements of the DCF. From 2019 onwards, NMFRI and IFI will put more effort into quality aspects including better spatial coverage of freshwater samples, cross reading of otoliths, incorporating new data into the eel model.
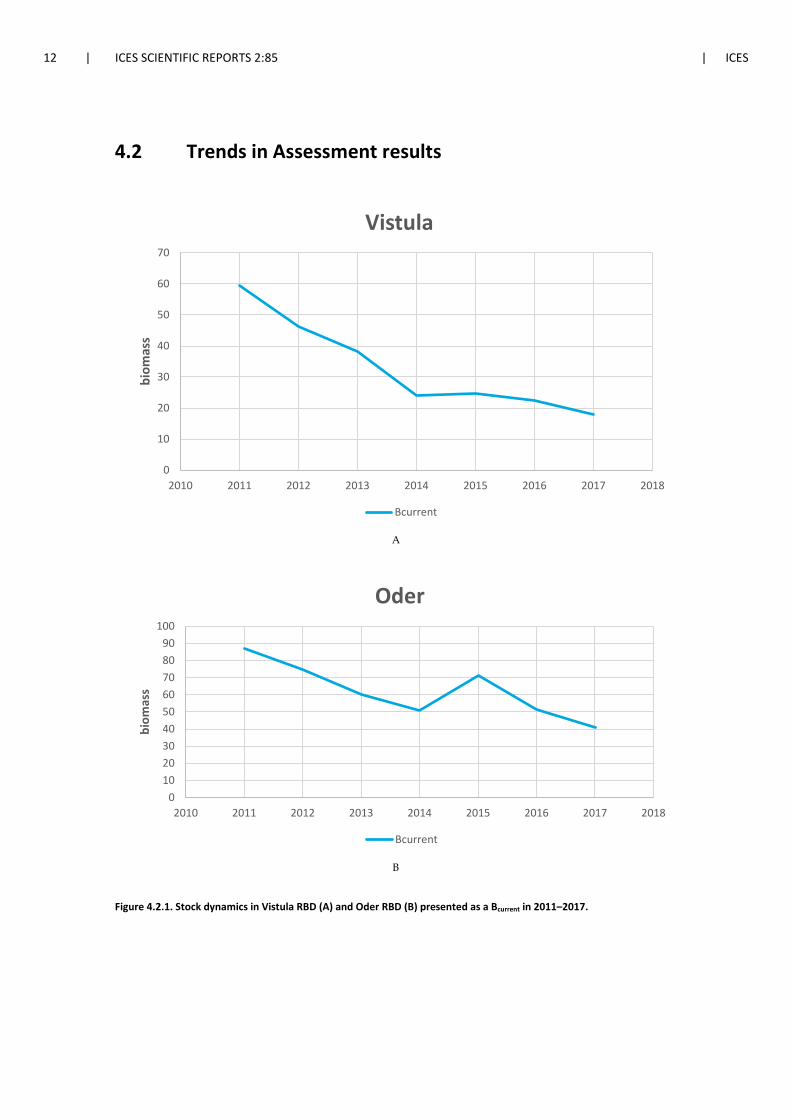
12 | ICES SCIENTIFIC REPORTS 2:85 | ICES
4.2 Trends in Assessment results
A
B
Figure 4.2.1. Stock dynamics in Vistula RBD (A) and Oder RBD (B) presented as a Bcurrent in 2011–2017.
0
10
20
30
40
50
60
70
2010 2011 2012 2013 2014 2015 2016 2017 2018
biom
ass
Vistula
Bcurrent
0102030405060708090
100
2010 2011 2012 2013 2014 2015 2016 2017 2018
biom
ass
Oder
Bcurrent
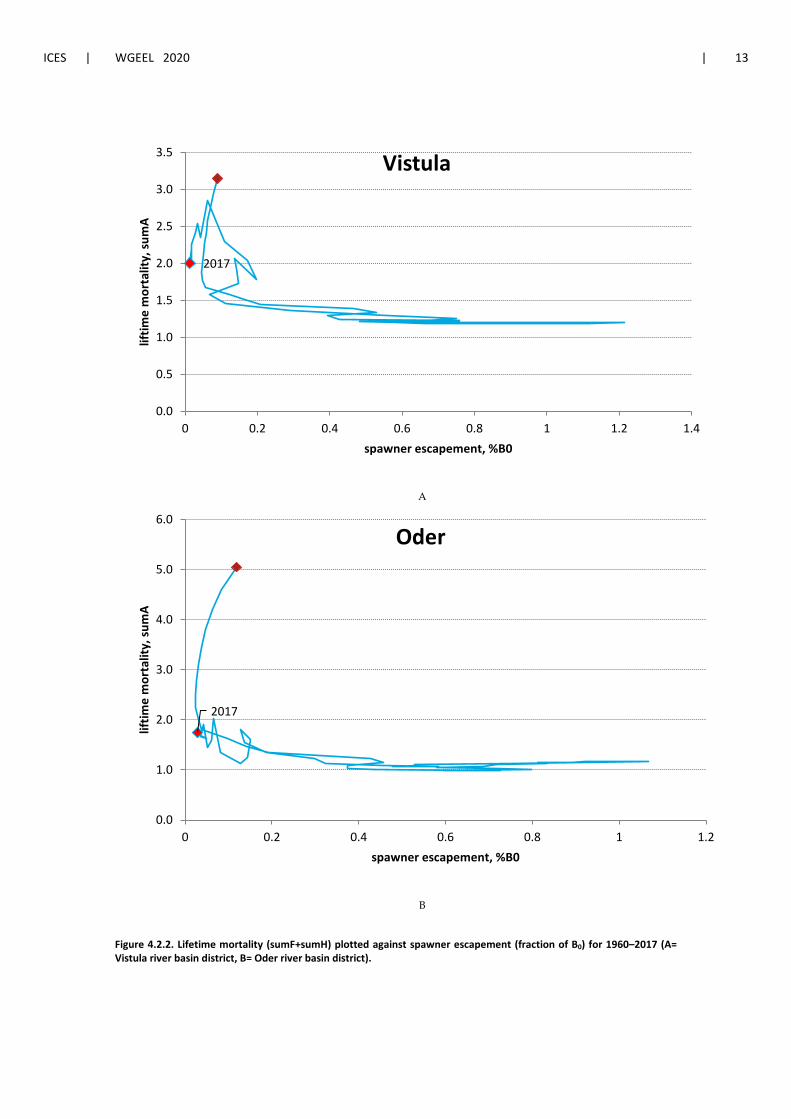
ICES | WGEEL 2020 | 13
A
B
Figure 4.2.2. Lifetime mortality (sumF+sumH) plotted against spawner escapement (fraction of B0) for 1960–2017 (A= Vistula river basin district, B= Oder river basin district).
2017
0.0
0.5
1.0
1.5
2.0
2.5
3.0
3.5
0 0.2 0.4 0.6 0.8 1 1.2 1.4
liftim
e m
orta
lity,
sum
A
spawner escapement, %B0
Vistula
2017
0.0
1.0
2.0
3.0
4.0
5.0
6.0
0 0.2 0.4 0.6 0.8 1 1.2
liftim
e m
orta
lity,
sum
A
spawner escapement, %B0
Oder
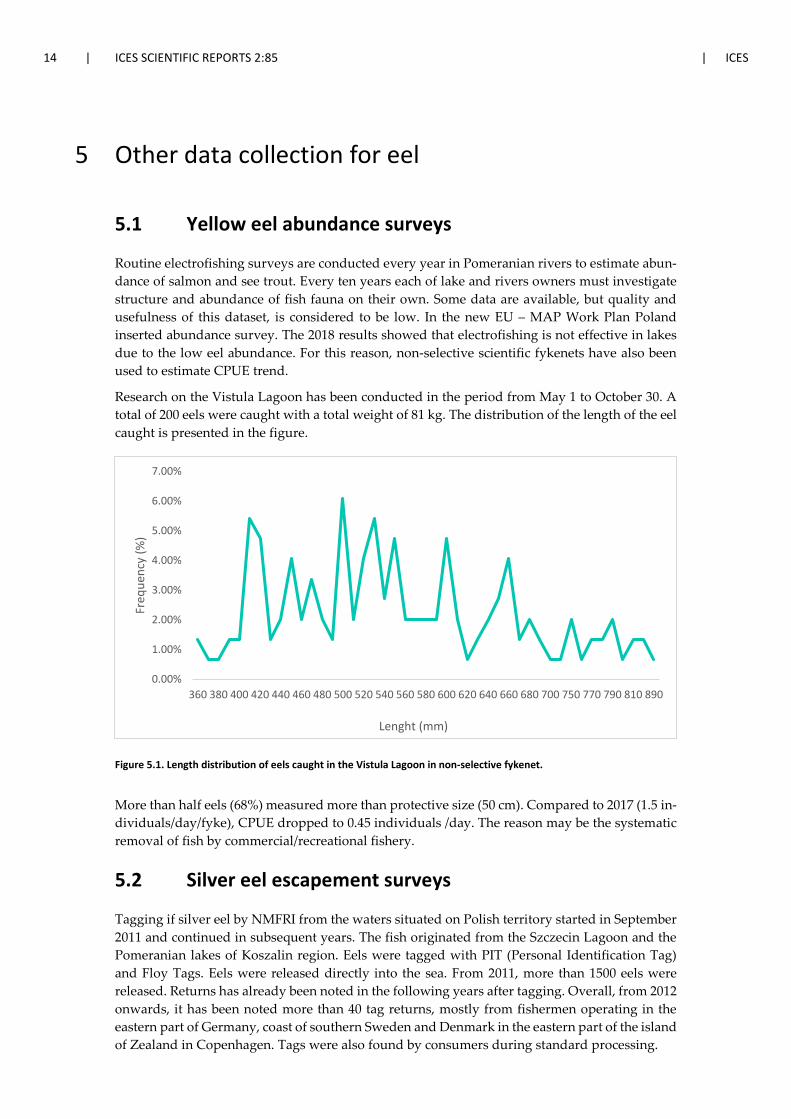
14 | ICES SCIENTIFIC REPORTS 2:85 | ICES
5 Other data collection for eel
5.1 Yellow eel abundance surveys
Routine electrofishing surveys are conducted every year in Pomeranian rivers to estimate abun-dance of salmon and see trout. Every ten years each of lake and rivers owners must investigate structure and abundance of fish fauna on their own. Some data are available, but quality and usefulness of this dataset, is considered to be low. In the new EU – MAP Work Plan Poland inserted abundance survey. The 2018 results showed that electrofishing is not effective in lakes due to the low eel abundance. For this reason, non-selective scientific fykenets have also been used to estimate CPUE trend.
Research on the Vistula Lagoon has been conducted in the period from May 1 to October 30. A total of 200 eels were caught with a total weight of 81 kg. The distribution of the length of the eel caught is presented in the figure.
Figure 5.1. Length distribution of eels caught in the Vistula Lagoon in non-selective fykenet.
More than half eels (68%) measured more than protective size (50 cm). Compared to 2017 (1.5 in-dividuals/day/fyke), CPUE dropped to 0.45 individuals /day. The reason may be the systematic removal of fish by commercial/recreational fishery.
5.2 Silver eel escapement surveys
Tagging if silver eel by NMFRI from the waters situated on Polish territory started in September 2011 and continued in subsequent years. The fish originated from the Szczecin Lagoon and the Pomeranian lakes of Koszalin region. Eels were tagged with PIT (Personal Identification Tag) and Floy Tags. Eels were released directly into the sea. From 2011, more than 1500 eels were released. Returns has already been noted in the following years after tagging. Overall, from 2012 onwards, it has been noted more than 40 tag returns, mostly from fishermen operating in the eastern part of Germany, coast of southern Sweden and Denmark in the eastern part of the island of Zealand in Copenhagen. Tags were also found by consumers during standard processing.
0.00%
1.00%
2.00%
3.00%
4.00%
5.00%
6.00%
7.00%
360 380 400 420 440 460 480 500 520 540 560 580 600 620 640 660 680 700 750 770 790 810 890
Freq
uenc
y (%
)
Lenght (mm)
ICES | WGEEL 2020 | 15
Currently no silver eels surveys is being performed. The number of emigrating silver eels is cal-culated using mathematical models.
5.3 Life-history parameters
Data are collected according to EU – MAP requirements and includes standard analysis of length, age (from sectioned otoliths), and maturity stage (silvering index). During 2015–2018 more than 2000 eel from commercial fisheries were collected and analysed. On the basis of bio-logical analyses, the age structure of eel was identified, and then it was used in a mathematical model that permitted calculating biomass and mortality indicators. In 2018, age data from inland waters were also included.
In inland waters, age groups ranging from six to 26 in the Oder EMU, and from four to 33 in the Vistula EMU were identified. The most abundant fish were from age groups 12–14 in the Oder EMU (30% of the total frequency) and from age groups 16–18 in the Vistula EMU (30% of the frequency). Both EMUs were characterized by quite numerous individuals from age groups 14+, for which 100% silvering was assumed.
The age structure in transitional waters differed and age groups 4–8 dominated. The biomass in these basins is supplemented regularly by intense stocking, the eel have good living conditions, and the growth rate is higher than in inland waters.
5.4 Diseases, Parasites & Pathogens or Contaminants
The cormorant daily food ration and annual food requirement in 2015–2017 were estimated as-suming the following:
• the cormorant breeding population in Poland was approximately 30 000 pairs; • the population of non-nesting cormorants accounted for 20% of the breeding population,
or approximately 12 000 birds; • adult cormorants consume approximately 400 g of fish daily; • cormorants roost in Poland for 150 days; • chicks are fed from May to July (90 days) and their dietary requirement is approximately
250 g per individual; • cormorant breeding success is 2.2 chicks/nest; • weight share (%) of eel in the cormorant diet was 0.14%.
The estimate of the mean number of cormorants in Poland was based on data from the literature. In 2015–2017 the number of cormorants was approximately 130 000 individuals. Assuming that a cormorant individual consumes approximately 0.4 kg of fish per day, the cormorant population that migrates to Poland annually consumes approximately 576 000 tons of fish annually. The share of eels in the cormorant diet, which was estimated based on studies from 2012–2014, is 0.14%, which means that the great cormorant population of approximately 130 000 individuals consumes approximately 80 tons of eel in Poland annually. Considering the location of the larg-est colonies of this bird (in 2017, 50% of the cormorant population inhabited coastal waters, then approximately 40 tons of eels consumed by cormorants are from inland waters and approxi-mately 40 tons are from coastal waters.

16 | ICES SCIENTIFIC REPORTS 2:85 | ICES
6 New Information
No data available.

ICES | WGEEL 2020 | 17
7 References
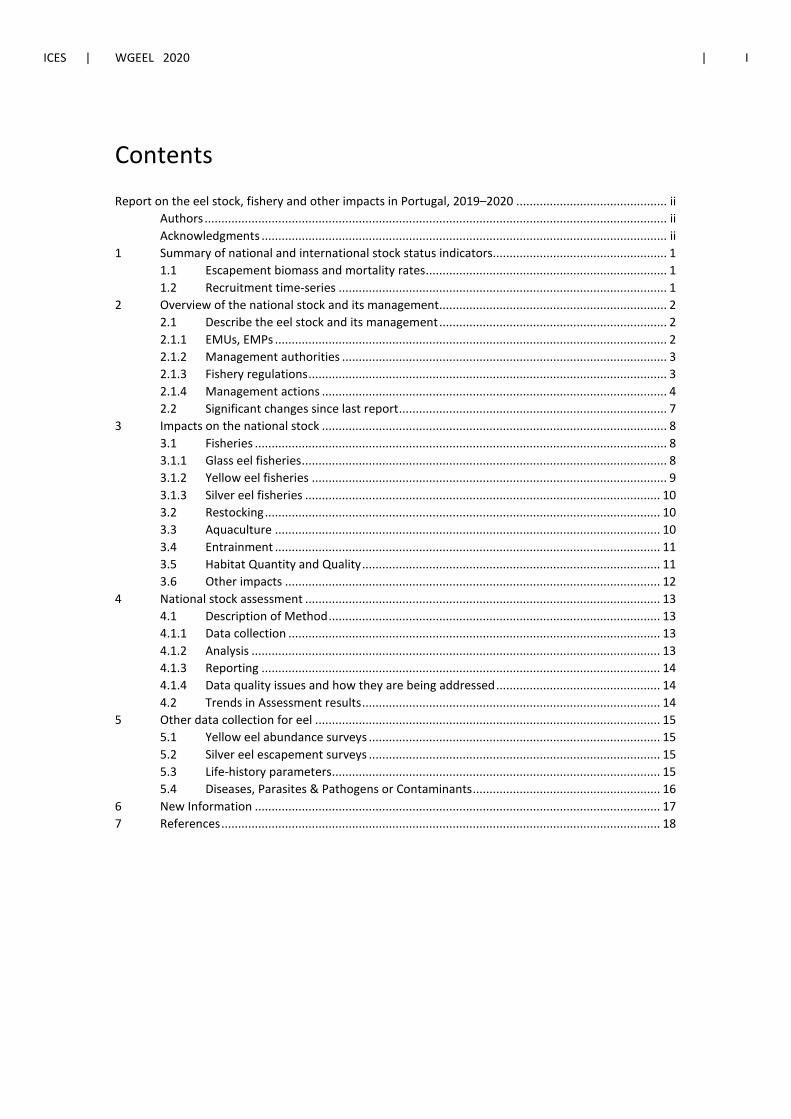
ICES | WGEEL 2020 | I
Contents
Report on the eel stock, fishery and other impacts in Portugal, 2019–2020 ............................................. ii Authors .......................................................................................................................................... ii Acknowledgments ......................................................................................................................... ii
1 Summary of national and international stock status indicators.................................................... 1 1.1 Escapement biomass and mortality rates ........................................................................ 1 1.2 Recruitment time-series .................................................................................................. 1
2 Overview of the national stock and its management.................................................................... 2 2.1 Describe the eel stock and its management .................................................................... 2 2.1.1 EMUs, EMPs ..................................................................................................................... 2 2.1.2 Management authorities ................................................................................................. 3 2.1.3 Fishery regulations ........................................................................................................... 3 2.1.4 Management actions ....................................................................................................... 4 2.2 Significant changes since last report ................................................................................ 7
3 Impacts on the national stock ....................................................................................................... 8 3.1 Fisheries ........................................................................................................................... 8 3.1.1 Glass eel fisheries ............................................................................................................. 8 3.1.2 Yellow eel fisheries .......................................................................................................... 9 3.1.3 Silver eel fisheries .......................................................................................................... 10 3.2 Restocking ...................................................................................................................... 10 3.3 Aquaculture ................................................................................................................... 10 3.4 Entrainment ................................................................................................................... 11 3.5 Habitat Quantity and Quality ......................................................................................... 11 3.6 Other impacts ................................................................................................................ 12
4 National stock assessment .......................................................................................................... 13 4.1 Description of Method ................................................................................................... 13 4.1.1 Data collection ............................................................................................................... 13 4.1.2 Analysis .......................................................................................................................... 13 4.1.3 Reporting ....................................................................................................................... 14 4.1.4 Data quality issues and how they are being addressed ................................................. 14 4.2 Trends in Assessment results ......................................................................................... 14
5 Other data collection for eel ....................................................................................................... 15 5.1 Yellow eel abundance surveys ....................................................................................... 15 5.2 Silver eel escapement surveys ....................................................................................... 15 5.3 Life-history parameters .................................................................................................. 15 5.4 Diseases, Parasites & Pathogens or Contaminants ........................................................ 16
6 New Information ......................................................................................................................... 17 7 References ................................................................................................................................... 18
II | ICES SCIENTIFIC REPORTS 2:85 | ICES
Report on the eel stock, fishery and other impacts in Portugal, 2019–2020
Authors
Isabel Domingos, Marine and Environmental Sciences Centre (MARE), Faculty of Sciences, Uni-versity of Lisbon, Campo Grande, 1749-016, Lisboa, Portugal
Tel: +351 217500970; Fax: +351 217500009 [email protected]
Carlos Antunes, Centre of Marine and Environmental Research (CIMAR), Rua dos Bragas 289, 4050-123, Porto, Portugal
Tel: +351 223401800; Fax: +351 223390608 [email protected]
Reporting Period: This report was completed in September 2020, contains data up to 2019 and some provisional data for 2020.
Acknowledgments
Capitania do Porto de Caminha
DGRM (General Directorate of Natural Resources, Maritime Safety and Services)
ICNF (Institute of Conservation of Nature and Forests)
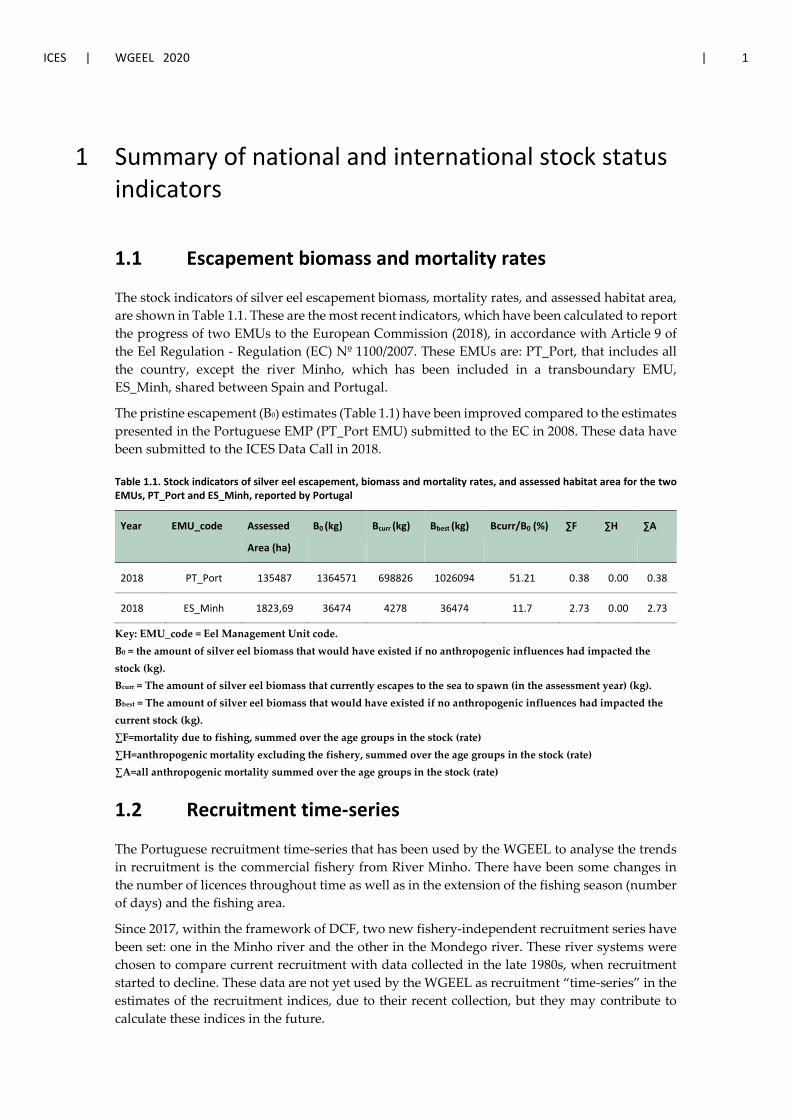
ICES | WGEEL 2020 | 1
1 Summary of national and international stock status indicators
1.1 Escapement biomass and mortality rates
The stock indicators of silver eel escapement biomass, mortality rates, and assessed habitat area, are shown in Table 1.1. These are the most recent indicators, which have been calculated to report the progress of two EMUs to the European Commission (2018), in accordance with Article 9 of the Eel Regulation - Regulation (EC) Nº 1100/2007. These EMUs are: PT_Port, that includes all the country, except the river Minho, which has been included in a transboundary EMU, ES_Minh, shared between Spain and Portugal.
The pristine escapement (B0) estimates (Table 1.1) have been improved compared to the estimates presented in the Portuguese EMP (PT_Port EMU) submitted to the EC in 2008. These data have been submitted to the ICES Data Call in 2018.
Table 1.1. Stock indicators of silver eel escapement, biomass and mortality rates, and assessed habitat area for the two EMUs, PT_Port and ES_Minh, reported by Portugal
Year EMU_code Assessed
Area (ha)
B0 (kg) Bcurr (kg) Bbest (kg) Bcurr/B0 (%) ∑F ∑H ∑A
2018 PT_Port 135487 1364571 698826 1026094 51.21 0.38 0.00 0.38
2018 ES_Minh 1823,69 36474 4278 36474 11.7 2.73 0.00 2.73
Key: EMU_code = Eel Management Unit code. B0 = the amount of silver eel biomass that would have existed if no anthropogenic influences had impacted the stock (kg). Bcurr = The amount of silver eel biomass that currently escapes to the sea to spawn (in the assessment year) (kg). Bbest = The amount of silver eel biomass that would have existed if no anthropogenic influences had impacted the current stock (kg). ∑F=mortality due to fishing, summed over the age groups in the stock (rate) ∑H=anthropogenic mortality excluding the fishery, summed over the age groups in the stock (rate) ∑A=all anthropogenic mortality summed over the age groups in the stock (rate)
1.2 Recruitment time-series
The Portuguese recruitment time-series that has been used by the WGEEL to analyse the trends in recruitment is the commercial fishery from River Minho. There have been some changes in the number of licences throughout time as well as in the extension of the fishing season (number of days) and the fishing area.
Since 2017, within the framework of DCF, two new fishery-independent recruitment series have been set: one in the Minho river and the other in the Mondego river. These river systems were chosen to compare current recruitment with data collected in the late 1980s, when recruitment started to decline. These data are not yet used by the WGEEL as recruitment “time-series” in the estimates of the recruitment indices, due to their recent collection, but they may contribute to calculate these indices in the future.

2 | ICES SCIENTIFIC REPORTS 2:85 | ICES
2 Overview of the national stock and its management
2.1 Describe the eel stock and its management
2.1.1 EMUs, EMPs
In compliance with Regulation EC 1100/2007, Portugal has considered two EMUs in accordance with Article 2 of the Eel Regulation: one that includes the entire territory (mainland), and the other that includes the International River Minho. Therefore, Portugal submitted two EMPs: one national EMP and a transboundary EMP, shared with Spain, for the River Minho.
The Portuguese Eel Management Plan was submitted in December 2008. This EMP was ap-proved by the European Commission on the 5th April 2011, following the delivery of the last revised version on the 19th November 2010.
Despite the existence of five river basins extending beyond Portugal (Minho, Lima, Douro, Ta-gus, and Guadiana) (Figure 2.1a), and included in three different River Basin Districts (Figure 2.1b), it was agreed between both countries that the only Transboundary Eel Management Plan that should be considered was for River Minho, as it is the only international river where the river mouth is shared by both countries and there is a strong interest on the glass eel fishing. As coordination between the two countries was delayed, it was not possible to consider it in Decem-ber 2008, when submitting the Portuguese Eel Management Plan.
Figure 2.1. Map showing Portuguese River basins including the catchment area extending to Spain (a), and limits of the eight Portuguese River Basin Districts defined according to the Directive 2000/60/EC (b). RBD is labeled as RH in the map.
A first version of the Transboundary EMP, for River Minho, was sent to the European Commis-sion in June 2011 followed by a revised version in November of the same year. The Transbound-ary EMP was approved by the European Commission on the 21st May 2012.
Because the EMP for the River Minho was not delivered in time, Portugal had to reduce the fisheries effort until the implementation of the EMP in that river. Hence, several measures were taken to comply with the provisions of Article 4, number 4, i.e. to reduce fishing effort by at least
(b)(a)
ICES | WGEEL 2020 | 3
50% relative to the average effort deployed from 2004 to 2006. Those measures included reducing the number of fishing licences to fish glass eels, shrinking the authorized fishing zone for glass eels, shortening the fishing period, and banning the fishery for eels.
2.1.2 Management authorities
Eel fishery is managed by DGRM (General Directorate of Natural Resources, Maritime Safety and Services) with responsibility in coastal waters, and ICNF (Institute of Conservation of Na-ture and Forests) with responsibility in inland waters. These institutions are under two minis-tries: Ministry of Sea and Ministry of Agriculture, Forestry and Rural Development respectively. The exception is River Minho because as an international river with a common stretch bordering both countries, there is a Commission (Standing Transboundary Commission of the River Mi-nho) that includes representatives from both countries setting specific rules that are applied to the fishery conducted in the international section of that river basin. Licences to fish in inland waters are issued by ICNF, whereas licences to fish in transitional and coastal waters are issued by DGRM. Licences for Portuguese fishermen to fish for glass eels in the Minho River are issued by Capitania do Porto de Caminha.
The management of waterbodies is the responsibility of APA (Portuguese Environment Agency) and five regional administration authorities for inland waters, which are under the Ministry of Environment. These authorities are responsible for the implementation of Water Framework Di-rective and therefore for obstacles in water basins.
Finally, ICNF is also the National Authority for the CITES convention, which implies they also have a role in the implementation of the EMPs.
2.1.3 Fishery regulations
Glass eel fishery is forbidden in all river basins since 2000 (Decreto Regulamentar nº 7/2000), except for the international River Minho where it is still permitted (Decreto Lei nº 316, artº 55 of 26/11/81).
Yellow eel fishery is ruled by eleven specific byelaws applied to eleven fishing areas in coastal waters (estuaries and coastal lagoons) and nine other byelaws that are applied to specific fishing areas called ZPPs (Zonas de Pesca Profissional / Professional Fishing Zones) (See Figure 2.2a), which are the only areas where professional eel fishery is allowed in inland waters. These laws set the rules for types and characteristics of fishing gears and in most cases, limit the maximum number of gears per fishing licence. Fishing effort is not recorded. In inland waters, professional fishery is ruled by Law 112/2017 (6 September 2017) in the stretches represented in green, whereas in the sections represented in yellow it is ruled by the byelaws (Figure 2.2b).
Fisheries managed by DGRM have mandatory landing reports because eels are sold at fish auc-tions, while in inland waters, there are no auctions. In 2012, in line with the implementation of the EMP, professional fishermen have become obliged to report catches annually to be able to renew their fishing licences. Minimum legal size is 22 cm in both areas of jurisdiction. The yellow fishery is permitted from January 1st until September 30th.
To promote silver eel escapement, a three month closure was implemented from October to December. This prohibition to fish eels (yellow and silver) was first set in 2010 for waters within the jurisdiction of DGRM, i.e. estuaries and coastal lagoons (Portaria nº 928/2010, from 20 Sep-tember) and in 2012 for waters under the jurisdiction of ICNF, i.e. inland waters (Portaria nº 180/2012, from 6th June). In River Minho the yellow and silver eel fishery is forbidden since the fishing season 2011–2012.

4 | ICES SCIENTIFIC REPORTS 2:85 | ICES
Figure 2.2. Map showing areas where professional fisheries can be conducted both in estuaries and coastal lagoons (ju-risdiction of DGRM, previous DGPA) and in inland waters (jurisdiction of ICNF, previous AFN) (a). The limit of maritime jurisdiction and the byelaws that rule the fisheries at each area are presented in the map (a). (Source: ICNF). The habitat that is accessible for the eel is also represented in green (b).
Finally, eel recreational fishing has been banned throughout the country, first in maritime juris-diction (Portaria No. 14/2014) and second in freshwater jurisdiction (Portaria No. 108/2018). In the international part of River Minho, recreational fishing was prohibited in 2011 by Edital nº 32/2011 from the Capitania do porto de Caminha.
2.1.4 Management actions
The main objective of the Portuguese Eel Management Plan (PT_Port RMU), which considered the entire country as one management unit, was to establish a series of measures to be applied at the national level that could contribute to reduce mortality and increase silver eel escapement as requested by Regulation 1100/2007. These measures can be classified into four categories:
• Fisheries restrictions. • Mitigation of obstacles to upstream migration. • Reinforcing police control on glass eel poaching. • Data collection (Habitat/stock assessment).
An overview of the measures foreseen in the EMP, can be seen in Table 2.1.
ZPP Tejo – OrtigaPortaria nº 444/2004, 30 Apr
ZPP Médio MondegoPortaria nº 84/2003, 22 Jan
ZPP VougaPortaria nº 1080/1999, 16 Dec
ZPP Tejo – Constância-BarquinhaPortaria nº 461/2007, 18 Apr
ZPP GuadianaPortaria nº 1274/2001, 13 Nov
ZPP CávadoPortaria nº 159/99, 90 Mar
ZPP LimaPortaria nº 929/2004, 20 Oct
DouroPortaria nº 568/90, 19 Jul
Ria de AveiroPortaria nº 563/90, 19 Jul
Lagoa de ÓbidosPortaria nº 567/90, 19 Jul
CávadoPortaria nº 565/90, 19 Jul
MinhoDecreto nº 8/2008, 9 Apr
LimaPortaria nº 465/90, 19 Jul
TejoPortaria nº 569/90, 19 Jul
Baía S. Martinho do PortoPortaria nº 566/90, 19 Jul
ZPP Baixo MondegoPortaria nº 164/2004, 10 Mar
SadoPortaria nº 562/90, 19 Jul
ZPP Lagoa Sto AndréPortaria nº 86/2004, 8 Jan
Ria FormosaPortaria nº 560/90, 19 Jul
MondegoPortaria nº 564/2004, 19 Jul
GuadianaWithout byelaw
Professional fishery - DGPA
Areas of Professional fishery -AFN
Professional fishery - AFN
Limit of maritime jurisdiction
(a) (b)
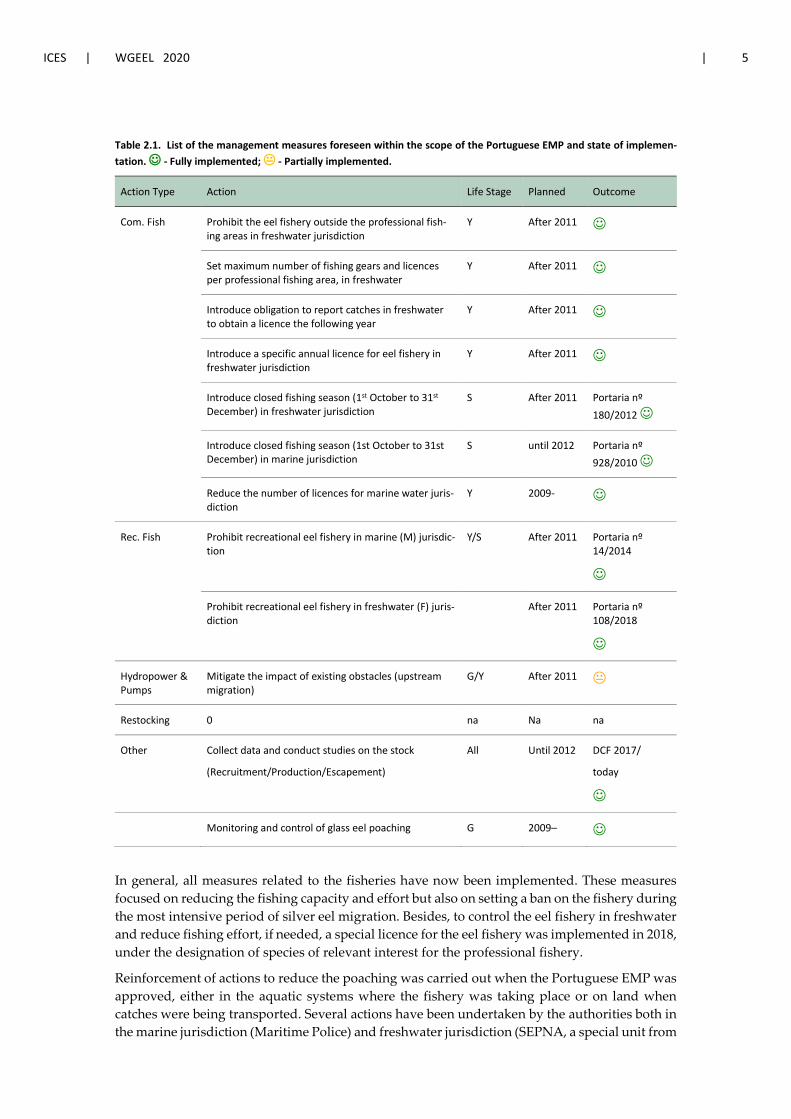
ICES | WGEEL 2020 | 5
Table 2.1. List of the management measures foreseen within the scope of the Portuguese EMP and state of implemen-tation. - Fully implemented; - Partially implemented.
Action Type Action Life Stage Planned Outcome
Com. Fish Prohibit the eel fishery outside the professional fish-ing areas in freshwater jurisdiction
Y After 2011
Set maximum number of fishing gears and licences per professional fishing area, in freshwater
Y After 2011
Introduce obligation to report catches in freshwater to obtain a licence the following year
Y After 2011
Introduce a specific annual licence for eel fishery in freshwater jurisdiction
Y After 2011
Introduce closed fishing season (1st October to 31st December) in freshwater jurisdiction
S After 2011 Portaria nº 180/2012
Introduce closed fishing season (1st October to 31st December) in marine jurisdiction
S until 2012 Portaria nº 928/2010
Reduce the number of licences for marine water juris-diction
Y 2009-
Rec. Fish Prohibit recreational eel fishery in marine (M) jurisdic-tion
Y/S After 2011 Portaria nº 14/2014
Prohibit recreational eel fishery in freshwater (F) juris-diction
After 2011 Portaria nº 108/2018
Hydropower & Pumps
Mitigate the impact of existing obstacles (upstream migration)
G/Y After 2011
Restocking 0 na Na na
Other Collect data and conduct studies on the stock
(Recruitment/Production/Escapement)
All Until 2012 DCF 2017/
today
Monitoring and control of glass eel poaching G 2009–
In general, all measures related to the fisheries have now been implemented. These measures focused on reducing the fishing capacity and effort but also on setting a ban on the fishery during the most intensive period of silver eel migration. Besides, to control the eel fishery in freshwater and reduce fishing effort, if needed, a special licence for the eel fishery was implemented in 2018, under the designation of species of relevant interest for the professional fishery.
Reinforcement of actions to reduce the poaching was carried out when the Portuguese EMP was approved, either in the aquatic systems where the fishery was taking place or on land when catches were being transported. Several actions have been undertaken by the authorities both in the marine jurisdiction (Maritime Police) and freshwater jurisdiction (SEPNA, a special unit from
6 | ICES SCIENTIFIC REPORTS 2:85 | ICES
GNR, the National Republican Guard). These authorities have been making a huge effort to con-trol the situation; however, the nets seized are rapidly substituted by new ones. SEPNA has among other competences, the obligation to monitor the illegal activities of fishing and can act on land. However, another special unit from GNR, the UCC acts close to the coast and has also been involved in these actions.
In recent years , with the pressure on international illegal trade generated by the listing of An-guilla anguilla in CITES, the Portuguese Food and Economic Security Authority (ASAE) together with the CITES authority have been involved in joint actions that resulted in the seizure of glass eels at several Portuguese airports, on various occasions. Cooperation with the Spanish authori-ties, Europol and Interpol, have also been improved within the scope of the illegal trade on glass eels. The Sargasso operation, which ended in March 2018, resulted in the seizure of 600 kg of glass eels as well as all the material used for storage and transport.). In the fishing season 2018/2019, the control force from GNR, has been involved in the “Freshwater Operation”, that resulted in the seizure of 518 kg of glass eels, as well as material used in the fishing operation and transport (More information about the operation at https://sudoang.eu/wp-content/up-loads/2019/07/Workshopcontrol-GNR.pdf and also at https://www.dn.pt/edicao-do-dia/01-jul-2019/interior/do-atlantico-aos-pratos-na-asia-trafico-de-enguias-bebes-da-milhoes-e-passa-por-portugal-11059967.html). In the fishing season 2019/2020, ASAE announced in October 2019 the dismantling of a network dedicated to the illegal trafficking of glass eels to Asian countries as part of a joint international investigation (More information about the operation at https://tvi24.iol.pt/sociedade/autoridade-de-seguranca-alimentar-e-economica/asae-desman-tela-rede-de-trafico-de-meixao).
The most difficult measures to implement are related to restoring longitudinal connectivity for fish migration because there are numerous obstacles and their impact has not been evaluated. As for the need to collect data on the stock (recruitment/production and escapement), vital to accomplish the objectives set by the Eel Regulation, it was finally started in 2017, under the EU MAP obligations.
The implementation of the Transboundary EMP for the River Minho has been more successful, mostly because it includes a smaller area and the measures were all focused on the fishing activ-ity, which is easier to implement. The results can be consulted in Table 2.2.
Table 2.2. List of the management measures foreseen within the scope of the Transboundary Eel Management Plan for the River Minho and state of implementation. - Fully implemented.
Action Type Action Life Stage Planned Outcome
Com Fish Prohibit the eel fishery Y/S EMP
Reduce fishing effort G EMP
Introduce obligation to fill in logbooks G After approval
Rec Fish Prohibit the eel fishery in marine jurisdiction Y/S EMP
Hydropower & Pumps 0 na na na
Restocking 0 na na na
Other 0 na na na
ICES | WGEEL 2020 | 7
In the international hydrographic basin of River Minho, and within the scope of the MigraMiño-Minho project (http://migraminho.org/) some actions were undertaken to improve the connec-tivity for migratory fish in two of its Portuguese tributaries.
2.2 Significant changes since last report
No significant changes since last report. The stock indicators have been provided for the first time both for the ICES data call 2018 and the 2018 EMPs Progress Reports.
The collection of information about the stock as well as biological sampling are being conducted since 2017, within the framework of DCF, following the Commission Implementing Decision (EU) 2016/1251 - Multiannual Programme for the collection, management and use of data in the fisheries and aquaculture sectors for the period 2017–2019, and the follow up for 2020–2021.
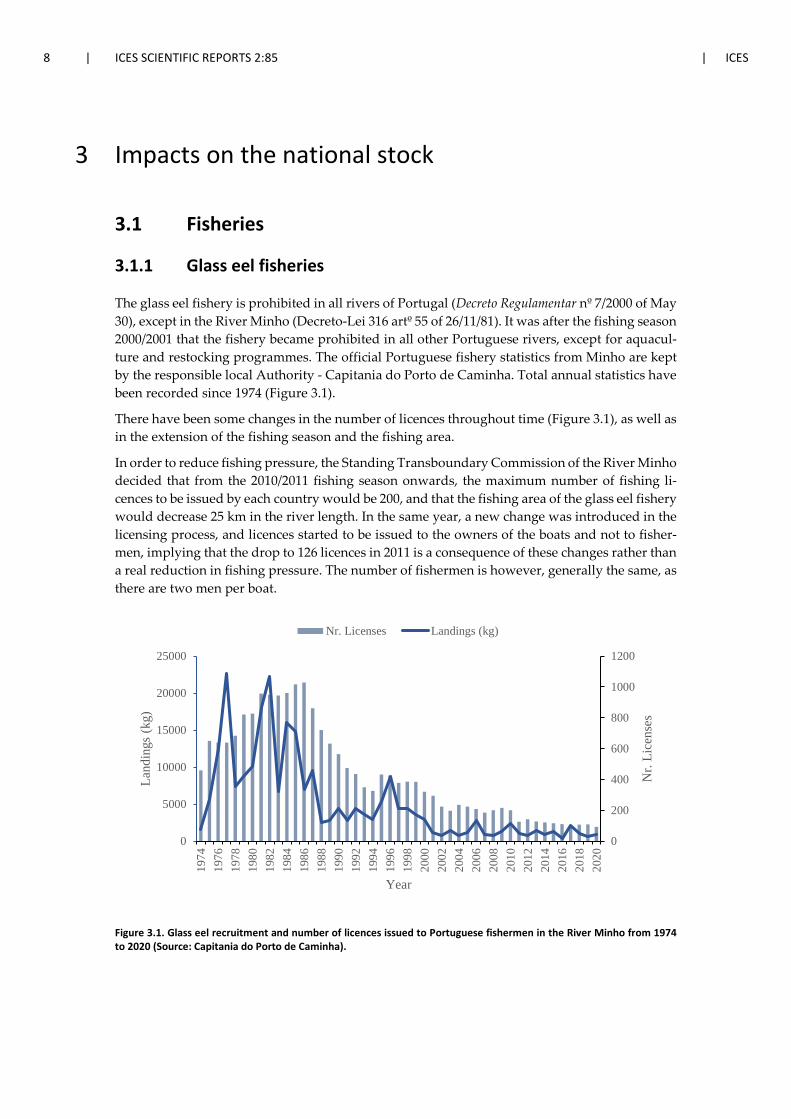
8 | ICES SCIENTIFIC REPORTS 2:85 | ICES
3 Impacts on the national stock
3.1 Fisheries
3.1.1 Glass eel fisheries
The glass eel fishery is prohibited in all rivers of Portugal (Decreto Regulamentar nº 7/2000 of May 30), except in the River Minho (Decreto-Lei 316 artº 55 of 26/11/81). It was after the fishing season 2000/2001 that the fishery became prohibited in all other Portuguese rivers, except for aquacul-ture and restocking programmes. The official Portuguese fishery statistics from Minho are kept by the responsible local Authority - Capitania do Porto de Caminha. Total annual statistics have been recorded since 1974 (Figure 3.1).
There have been some changes in the number of licences throughout time (Figure 3.1), as well as in the extension of the fishing season and the fishing area.
In order to reduce fishing pressure, the Standing Transboundary Commission of the River Minho decided that from the 2010/2011 fishing season onwards, the maximum number of fishing li-cences to be issued by each country would be 200, and that the fishing area of the glass eel fishery would decrease 25 km in the river length. In the same year, a new change was introduced in the licensing process, and licences started to be issued to the owners of the boats and not to fisher-men, implying that the drop to 126 licences in 2011 is a consequence of these changes rather than a real reduction in fishing pressure. The number of fishermen is however, generally the same, as there are two men per boat.
Figure 3.1. Glass eel recruitment and number of licences issued to Portuguese fishermen in the River Minho from 1974 to 2020 (Source: Capitania do Porto de Caminha).
0
200
400
600
800
1000
1200
0
5000
10000
15000
20000
25000
1974
1976
1978
1980
1982
1984
1986
1988
1990
1992
1994
1996
1998
2000
2002
2004
2006
2008
2010
2012
2014
2016
2018
2020
Nr.
Lice
nses
Land
ings
(kg)
Year
Nr. Licenses Landings (kg)
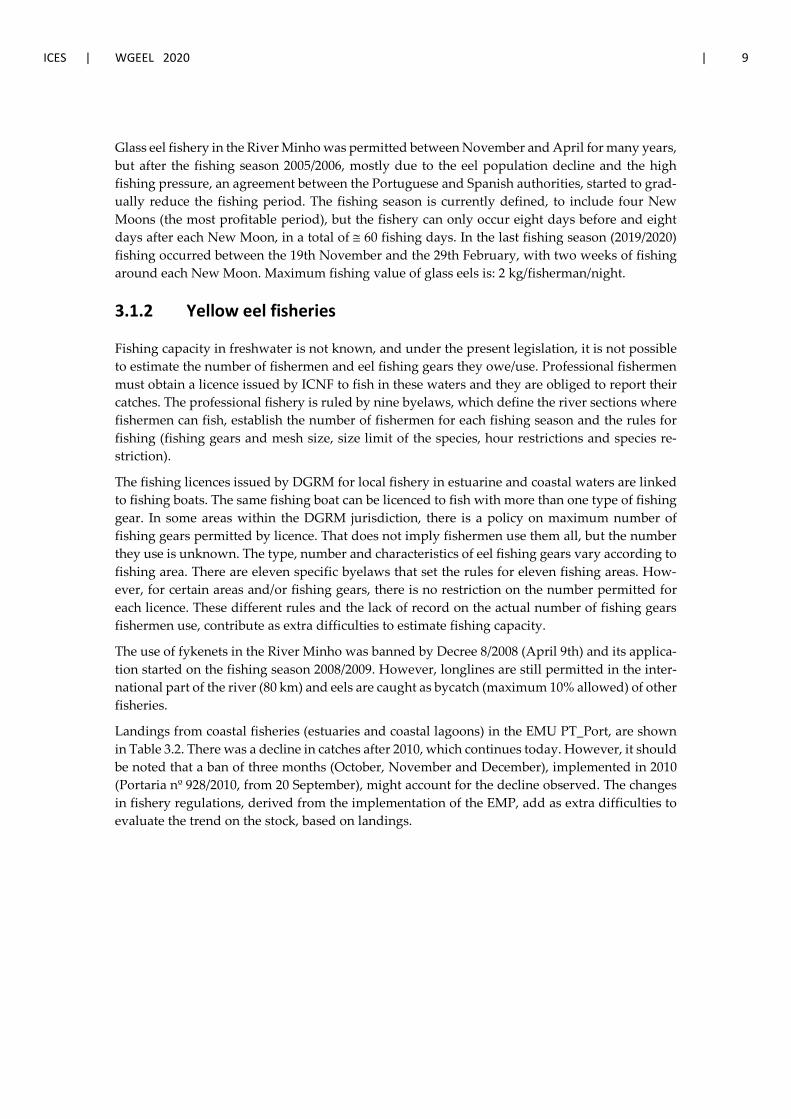
ICES | WGEEL 2020 | 9
Glass eel fishery in the River Minho was permitted between November and April for many years, but after the fishing season 2005/2006, mostly due to the eel population decline and the high fishing pressure, an agreement between the Portuguese and Spanish authorities, started to grad-ually reduce the fishing period. The fishing season is currently defined, to include four New Moons (the most profitable period), but the fishery can only occur eight days before and eight days after each New Moon, in a total of ≅ 60 fishing days. In the last fishing season (2019/2020) fishing occurred between the 19th November and the 29th February, with two weeks of fishing around each New Moon. Maximum fishing value of glass eels is: 2 kg/fisherman/night.
3.1.2 Yellow eel fisheries
Fishing capacity in freshwater is not known, and under the present legislation, it is not possible to estimate the number of fishermen and eel fishing gears they owe/use. Professional fishermen must obtain a licence issued by ICNF to fish in these waters and they are obliged to report their catches. The professional fishery is ruled by nine byelaws, which define the river sections where fishermen can fish, establish the number of fishermen for each fishing season and the rules for fishing (fishing gears and mesh size, size limit of the species, hour restrictions and species re-striction).
The fishing licences issued by DGRM for local fishery in estuarine and coastal waters are linked to fishing boats. The same fishing boat can be licenced to fish with more than one type of fishing gear. In some areas within the DGRM jurisdiction, there is a policy on maximum number of fishing gears permitted by licence. That does not imply fishermen use them all, but the number they use is unknown. The type, number and characteristics of eel fishing gears vary according to fishing area. There are eleven specific byelaws that set the rules for eleven fishing areas. How-ever, for certain areas and/or fishing gears, there is no restriction on the number permitted for each licence. These different rules and the lack of record on the actual number of fishing gears fishermen use, contribute as extra difficulties to estimate fishing capacity.
The use of fykenets in the River Minho was banned by Decree 8/2008 (April 9th) and its applica-tion started on the fishing season 2008/2009. However, longlines are still permitted in the inter-national part of the river (80 km) and eels are caught as bycatch (maximum 10% allowed) of other fisheries.
Landings from coastal fisheries (estuaries and coastal lagoons) in the EMU PT_Port, are shown in Table 3.2. There was a decline in catches after 2010, which continues today. However, it should be noted that a ban of three months (October, November and December), implemented in 2010 (Portaria nº 928/2010, from 20 September), might account for the decline observed. The changes in fishery regulations, derived from the implementation of the EMP, add as extra difficulties to evaluate the trend on the stock, based on landings.
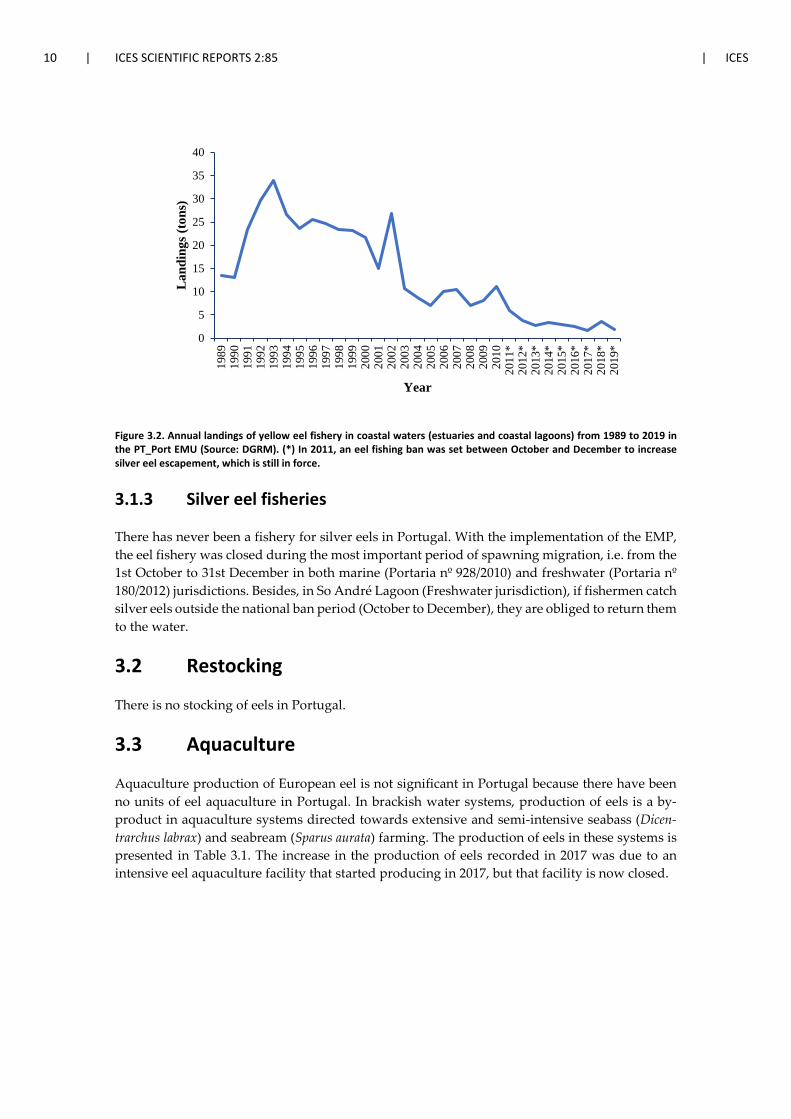
10 | ICES SCIENTIFIC REPORTS 2:85 | ICES
Figure 3.2. Annual landings of yellow eel fishery in coastal waters (estuaries and coastal lagoons) from 1989 to 2019 in the PT_Port EMU (Source: DGRM). (*) In 2011, an eel fishing ban was set between October and December to increase silver eel escapement, which is still in force.
3.1.3 Silver eel fisheries
There has never been a fishery for silver eels in Portugal. With the implementation of the EMP, the eel fishery was closed during the most important period of spawning migration, i.e. from the 1st October to 31st December in both marine (Portaria nº 928/2010) and freshwater (Portaria nº 180/2012) jurisdictions. Besides, in So André Lagoon (Freshwater jurisdiction), if fishermen catch silver eels outside the national ban period (October to December), they are obliged to return them to the water.
3.2 Restocking
There is no stocking of eels in Portugal.
3.3 Aquaculture
Aquaculture production of European eel is not significant in Portugal because there have been no units of eel aquaculture in Portugal. In brackish water systems, production of eels is a by-product in aquaculture systems directed towards extensive and semi-intensive seabass (Dicen-trarchus labrax) and seabream (Sparus aurata) farming. The production of eels in these systems is presented in Table 3.1. The increase in the production of eels recorded in 2017 was due to an intensive eel aquaculture facility that started producing in 2017, but that facility is now closed.
0
5
10
15
20
25
30
35
40
1989
1990
1991
1992
1993
1994
1995
1996
1997
1998
1999
2000
2001
2002
2003
2004
2005
2006
2007
2008
2009
2010
2011
*20
12*
2013
*20
14*
2015
*20
16*
2017
*20
18*
2019
*
Lan
ding
s (to
ns)
Year
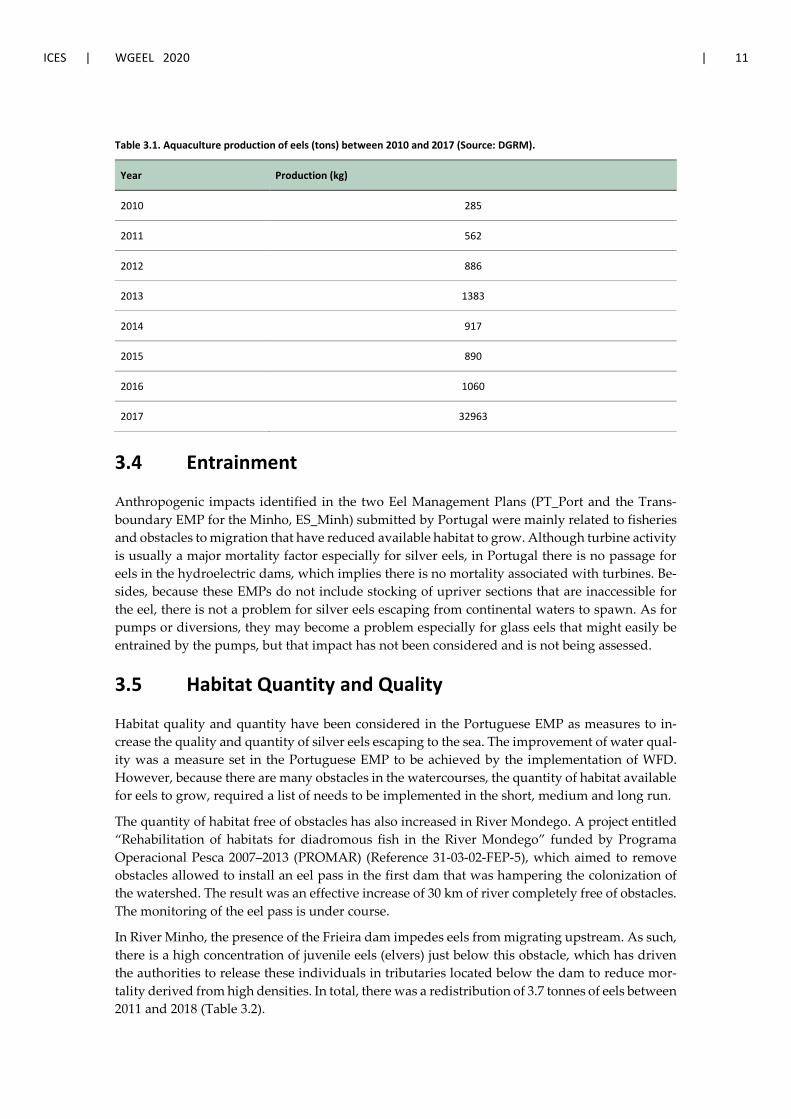
ICES | WGEEL 2020 | 11
Table 3.1. Aquaculture production of eels (tons) between 2010 and 2017 (Source: DGRM).
Year Production (kg)
2010 285
2011 562
2012 886
2013 1383
2014 917
2015 890
2016 1060
2017 32963
3.4 Entrainment
Anthropogenic impacts identified in the two Eel Management Plans (PT_Port and the Trans-boundary EMP for the Minho, ES_Minh) submitted by Portugal were mainly related to fisheries and obstacles to migration that have reduced available habitat to grow. Although turbine activity is usually a major mortality factor especially for silver eels, in Portugal there is no passage for eels in the hydroelectric dams, which implies there is no mortality associated with turbines. Be-sides, because these EMPs do not include stocking of upriver sections that are inaccessible for the eel, there is not a problem for silver eels escaping from continental waters to spawn. As for pumps or diversions, they may become a problem especially for glass eels that might easily be entrained by the pumps, but that impact has not been considered and is not being assessed.
3.5 Habitat Quantity and Quality
Habitat quality and quantity have been considered in the Portuguese EMP as measures to in-crease the quality and quantity of silver eels escaping to the sea. The improvement of water qual-ity was a measure set in the Portuguese EMP to be achieved by the implementation of WFD. However, because there are many obstacles in the watercourses, the quantity of habitat available for eels to grow, required a list of needs to be implemented in the short, medium and long run.
The quantity of habitat free of obstacles has also increased in River Mondego. A project entitled “Rehabilitation of habitats for diadromous fish in the River Mondego” funded by Programa Operacional Pesca 2007–2013 (PROMAR) (Reference 31-03-02-FEP-5), which aimed to remove obstacles allowed to install an eel pass in the first dam that was hampering the colonization of the watershed. The result was an effective increase of 30 km of river completely free of obstacles. The monitoring of the eel pass is under course.
In River Minho, the presence of the Frieira dam impedes eels from migrating upstream. As such, there is a high concentration of juvenile eels (elvers) just below this obstacle, which has driven the authorities to release these individuals in tributaries located below the dam to reduce mor-tality derived from high densities. In total, there was a redistribution of 3.7 tonnes of eels between 2011 and 2018 (Table 3.2).
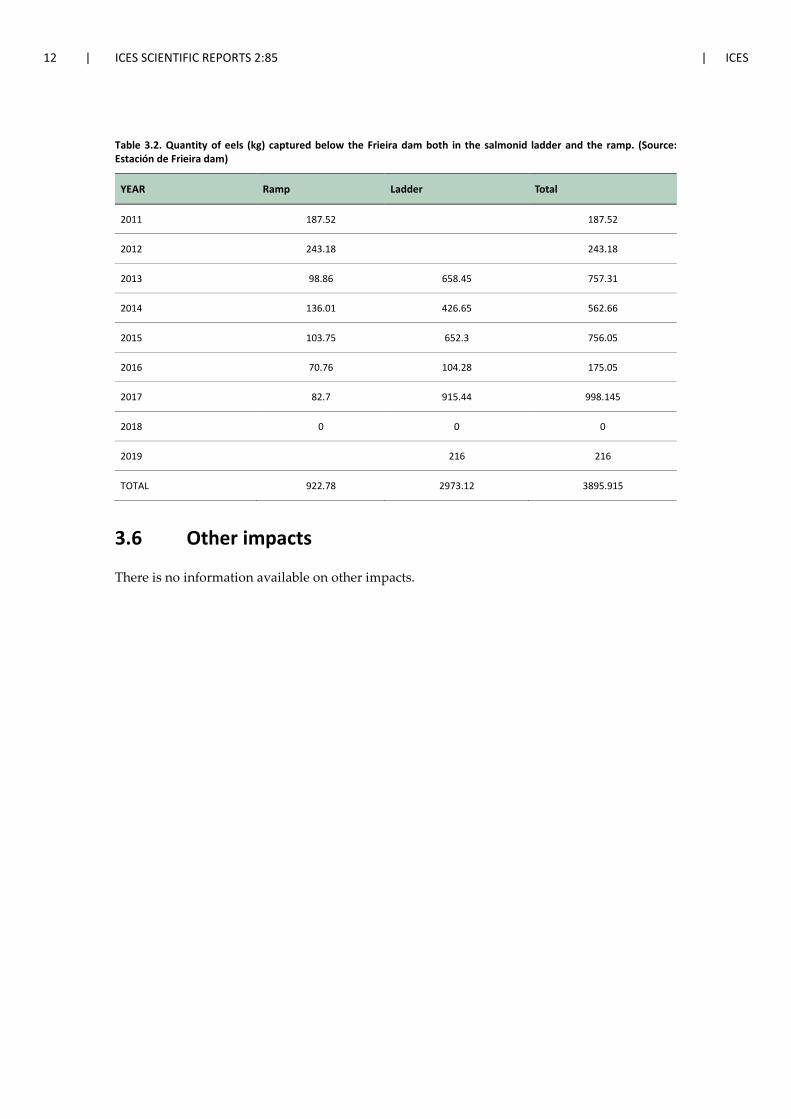
12 | ICES SCIENTIFIC REPORTS 2:85 | ICES
Table 3.2. Quantity of eels (kg) captured below the Frieira dam both in the salmonid ladder and the ramp. (Source: Estación de Frieira dam)
YEAR Ramp Ladder Total
2011 187.52
187.52
2012 243.18
243.18
2013 98.86 658.45 757.31
2014 136.01 426.65 562.66
2015 103.75 652.3 756.05
2016 70.76 104.28 175.05
2017 82.7 915.44 998.145
2018 0 0 0
2019 216 216
TOTAL 922.78 2973.12 3895.915
3.6 Other impacts
There is no information available on other impacts.
ICES | WGEEL 2020 | 13
4 National stock assessment
4.1 Description of Method
4.1.1 Data collection
Surveys are currently done under the DCF (Periods 2017–2019 and 2020–2021). A combination of methods including the commercial fishery and independent surveys are used as a proxy to estimate stock indicators. Wherever there is a fishery, it is monitored, but in the absence of a fishery, experimental fishing is carried out.
The river basin chosen to represent the PT_Port EMU was River Mondego (estuary and freshwa-ter) to compare with data from the 1990s but because this EMU is the whole country and the production of eels is affected by the type of aquatic system, a coastal lagoon (Santo André La-goon) was also included in the data collection to represent the variety of aquatic systems (river + estuary + coastal lagoon). These surveys include experimental fishing for recruitment estimates (monthly from November to April) and surveys on yellow and silver eels in the Mondego river. Moreover, still within the framework of DFC biological sampling is also being conducted. A sample of eels is collected each year for length, weight, sex and age determination.
As for the other EMU, ES_Minh, the same surveys and biological sampling are being conducted under DCF. The yellow eel fishery is prohibited, which implies biological sampling is done by experimental fishing.
4.1.2 Analysis
Estimates of the silver eel biomass were improved compared to the estimated biomass provided in the Portuguese EMP presented in 2008, in which calculations were done by extrapolating data from watersheds of France. The biomass estimates herein presented are based on the densities of yellow eel surveys conducted in the Mondego river, using electric fishing. Additionally, sam-pling of yellow and silver eels that has been conducted between 2014 and 2016 within the frame-work of the Project “Rehabilitation of habitats for diadromous fish in the River Mondego” funded by PROMAR, provided data to determine the mean silvering age, the mean weight (yel-low and silver eels), and the silvering rate. Data from scientific surveys conducted in 1988–1990 (Domingos, unpublished data) was used to improve estimates of the pristine biomass of silver eels.
The stock indicators were calculated for the PT_Port EMU, extrapolating the silver eel production obtained in the river Mondego, according to the following expressions:
B0 = [[(YE densities 1988)*(silvering rate)]*mean SE weight] * wetted area
Bcurrent = [[(YE densities 2017)*(silvering rate)]*mean SE weight] * wetted area
Bbest = Bcurrent + Anthropogenic mortality in Silver Eel Equivalents (SEE)
The silvering rate and mean silver eel weight were obtained by conducting surveys in the river Mondego during the autumn period when silver eels can be distinguished morphologically. The silvering rate was estimated calculating the ratio between these individuals and the non-migrat-ing ones (Durif et al., 2009), being 2.8%, and the mean weight considered was 109 g.
14 | ICES SCIENTIFIC REPORTS 2:85 | ICES
The wetted area is the natural habitat of eel in the PT_Port EMU, which was considered un-changed since 1988, because all the anthropogenic obstacles present in 2017 already existed in 1988. Therefore, the pristine habitat (referred to the period 1988) in the EMU is the same as the current habitat and amounts to a total of 135 487 ha (see Table 1.1).
The anthropogenic mortality in SEE was calculated using the method proposed by the WGEEL and considering a five-year generation time, based on the age determined for silver eels from the Mondego. The catches of glass and yellow eel (silver eel fishery is forbidden), from five and three years ago, respectively, were used, and an 80% mortality in glass eel settlement and annual mor-tality of 0.138 were considered (Dekker, 2000); we assumed yellow eel average weight of 23.6 g and silver eel average weight of 109.0 g (Table 4.1).
Since glass eel catches are forbidden in the PT_Port EMU, the catches from the Minho river (fishery allowed) were used to estimate the illegal catches in the EMU by extrapolation. It was therefore considered that the main river basins (Lima, Cávado, Ave, Douro, Vouga, Mondego, Tejo, Sado, Mira, Guadiana) from the PT_Port EMU had the same amount of illegal fishing as the legal fishing that occurs in the Minho river, and the total of illegal catches estimated by this method was considered to represent illegal catches of glass eel throughout the whole EMU.
Table 4.1. Data used to estimate the anthropogenic mortality in SEE for the PT_Port EMU.
Glass eel
mean weight
(g)
Yellow eel
mean weight
(g)
Silver eel
mean weight
(g)
Yellow eel mean age
Silver eel
mean age
Glass eel settlement mortality
Eel natural mor-tality
0.28 23.6 109.0 3 5 80% 0.138
The only anthropogenic mortality considered was the mortality derived from the fisheries, which was estimated using the following expression:
SumF= -ln (Bcurrent/(Bcurrent+kg SEE)).
4.1.3 Reporting
The stock indicators shown in Table 1.1 were calculated to include in the 2018 EMPs progress reports (PT EMU and PT Minho EMU) to deliver to the EC, as required by the EC Eel Regulation (1100/2007). They were also provided for the ICES Data Call 2018.
The data, which started to be obtained in the frame of the DCF for the period 2017–2019, and continued for 2020–2021, are regularly reported to the EC, and are used/included in the ICES data call and contributed to estimate the indicators and to improve the quality of stock assess-ment.
4.1.4 Data quality issues and how they are being addressed
No information available.
4.2 Trends in Assessment results
The assessment results presented in chapter 1 were the first stock indicators estimated since the submission of the EMPs. Therefore, it is not possible to report any changes over time.
ICES | WGEEL 2020 | 15
5 Other data collection for eel
Sampling of yellow and silver eels has been conducted between 2014 and 2016, within the frame-work of two Projects “Rehabilitation of habitats for diadromous fish in the River Mondego” and “Sustainable Management of the Eel Fisheries in Santo André Lagoon", both funded by PRO-MAR. Biological aspects to be studied included sex ratio, age, Anguillicola crassus infection, and silvering rate. Ecological aspects include size distribution, abundance, influence of obstacles and escapement.
In the River Minho, the project “Migra Miño-Minho”, funded by INTERREG – POCTEP (2017–2020), aims to improve river connectivity for diadromous species including the eel.
Within the framework of SUDOANG project (SOE2/P5/E0617) sampling of eel was conducted in the Mondego and Minho pilot basins, based on common sampling protocols.
An ongoing project (LIFE16 ENV/PT/000411) entitled “Conservation and management actions for migratory fish in the Vouga river basin” aims to improve habitat accessibility for migratory species. The European eel will also benefit from this project that will end in 2022 (1st August 2017 to 31st July 2022).
5.1 Yellow eel abundance surveys
There have been surveys on yellow eels in the Mondego River and in Santo André Lagoon, under the framework of two projects funded by PROMAR. The same was done in River Minho tribu-taries and River Mondego, under SUDOANG project following a common sampling protocol. These data will contribute to improve the quality of estimates of production in coastal lagoons and rivers presented in the EMP. These surveys have been continued within the framework of DCF for the period 2020–2021.
5.2 Silver eel escapement surveys
Scientific surveys on silver eel escapement have been conducted within the scope of two projects funded by PROMAR: one in the River Mondego and the other in Santo André Lagoon. In both cases, receivers were installed along the watercourse in the two aquatic systems studied, from the upper sections until the river mouth (Mondego River) and in the coastal area close to the opening of the lagoon (Santo André Lagoon) to measure escapement. The results obtained for the Mondego River have been compared with new data from the SUDOANG project (SOE2/P5/E0617), funded by Interreg, in which acoustic transmitters were once again used to measure real escapement aiming at calibrating a model for escapement in the SUDOE area.
Scientific surveys on silver eel abundance in River Minho basin have been conducted within the scope of SUDOANG and MigraMinho projects through surveys on eel in tributaries using elec-tric fishing and in the Miver Minho using fykenets.
5.3 Life-history parameters
Biological parameters have been collected under DCF since 2017 according to the Commission Implementing Decision (EU) 2016/1251 of 12 July 2016 adopting a multiannual Union pro-gramme for the collection, management and use of data in the fisheries and aquaculture sectors
16 | ICES SCIENTIFIC REPORTS 2:85 | ICES
for the period 2017–2019. River Mondego and Santo André Lagoon were selected as representa-tive of all types of habitats (river, estuary and coastal lagoon) present in the PT_Port EMU, which comprises the entire country. The same parameters are being collected for the river Minho, which was also included in the DCF programme to sample biological parameters from the transbound-ary EMP for the other EMU.
In studies of eel age, which have been conducted in Portugal, sagitta otoliths have been removed, cleaned with water, stored dry, and cleared in 70% alcohol (Vollestad, 1985) for ten minutes be-fore being examined under a stereoscope microscope. The otoliths were read by more than one person (Gordo and Jorge, 1991), or by the same person who read them twice (Costa, 1989; Do-mingos, 2003; Lopes, 2013; Monteiro, 2015). In the lack of agreement between both readings, a third reading was performed and if inconsistent, otoliths were excluded from analyses.
The same procedure is being followed for age reading. Silver stage is being identified according to Durif et al. (2009).
Stock assessment requires the collection of stock indicators to accomplish the goals set by the Eel Regulation (mortality and biomass indicators). A combination of methods including the com-mercial fishery and independent surveys are being used to estimate those indicators in both EMUs.
5.4 Diseases, Parasites & Pathogens or Contaminants
There is not a national programme to monitor parasites or pathogens. Anguillicola crassus is how-ever, spread throughout the country. Despite not mandatory, the assessment of the infection by the parasite Anguillicola crassus is being carried out under DCF. The results are being analysed. In previous studies, only adults were taken into consideration. A summary of the infection ana-lysed in previous years is presented below.
In a study conducted in 2008 in five brackish water systems (Aveiro Lagoon, Óbidos lagoon, Tagus estuary, Santo André Lagoon and Mira estuary) it was concluded that A. crassus was spread in all systems except in Óbidos lagoon, which was probably related to the higher salinity observed in this lagoon, similarly to what happens in one sampling site (Barreiro) (Neto et al., 2010) located in the lower part of the Tagus estuary. Prevalence values ranged from 0 to 100% and intensity values ranging from 0.4 to 5.8 (unpublished data). Within the DCF programme, the parasite was found in the swimbladder of seven among the 404 eels examined for the Óbidos Lagoon in 2009. The low prevalence found (1.73%) reinforces the idea that the infection rate is very low in areas with higher salinity, as it is the case in this lagoon. The presence of the parasite had already been reported for the River Minho (Antunes, 1999) and River Mondego (Domingos, 2003), which suggests the parasite is probably widespread in Portugal. In River Minho, the pres-ence of the parasite was reported for the entire international section of the river and prevalence ranged between 23% and 100% (Braga, 2011).
ICES | WGEEL 2020 | 17
6 New Information
Correia et al. (2018) used the 40-year long time-series of glass eel fishery catch in the Minho estu-ary, Portugal, to assess (a) whether local recruitment followed the general pattern of decline of A. anguilla observed elsewhere, and (b) whether environmental variables may explain interan-nual fluctuations in glass eel recruitment in the Minho estuary. The analysis showed that, in contrast to the majority of coastal systems in northern Europe and the Mediterranean, CPUE of glass eel in the Minho estuary did not exhibit a marked decline between 1974–2015 and never dropped below 20% of the 10-year mean (1974–1983), taken as baseline. The difference between the recruitment trend observed in the Minho river and that reported by WGEEL for wider Euro-pean geographical scales, highlighted the need to calculate recruitment indices with a higher geographic resolution to better support the assessment of the status of the European eel popula-tion.
Correia et al. (2019) used a 40-year time-series of eel fishery in the Santo André Coastal Lagoon and discussed the implication of the fishery management, the conditions of the lagoon as an enclosed coastal system and the EMP.
Félix et al. (2020) analysed the impacts that restocking of glass eels on areas where recruitment no longer exists due to the presence of obstacles, on the invertebrate and fish community. The results indicated the suitability of these habitats for the eel.
Monteiro et al. (2020) used telemetry to analyse downstream migration of silver eel males as well as the exact time of their exit from the estuary escapement to the sea. The conclusion was that silver eels leave continental water by the end of December and January, although the descending through the freshwater section starts earlier.
18 | ICES SCIENTIFIC REPORTS 2:85 | ICES
7 References
Antunes C. 1999. Anguillicola infestation of eel population from the Rio Minho (North of Portugal). ICES-EIFAC, 20–24 September, Silkeborg, Denmark.
Braga A.C.R. 2011. Susceptibilidade da enguia europeia, Anguilla anguilla e do parasita Anguillicoloides crassus, às concentrações de metais pesados no rio Minho internacional. Master Thesis, ICBAS, University of Porto, Portugal.
Cerqueira, L. 2005. Distribuição e ecologia alimentar da Lontra (Lutra lutra) em dois sistemas costeiros em Portugal). [Distribution and feeding ecology of the otter (Lutra lutra) from two Portuguese coastal sys-tems]. Master Thesis, University of Minho, Portugal.
Correia M.J., J.L. Costa, C. Antunes, G. De Leo and I. Domingos. 2018. The decline in recruitment of the European eel: new insights from a 40-year-long time-series in the Minho estuary (Portugal). ICES Jour-nal of Marine Science, 75: 1975–1983. doi:10.1093/icesjms/fsy073.
Correia M.J., I. Domingos, J. Santos, V. Lopes, G. De Leo, J.L. Costa. 2019. Challenges to reconcile conserva-tion and exploitation of the threatened Anguilla anguilla (Linnaeus, 1758) in Santo André lagoon (Por-tugal). Ocean and Coastal Management. 181: doi.org/10.1016/j.ocecoaman.2019.104892.
Costa J.L. 1989. Estudo da biologia e ecologia da enguia europeia Anguilla anguilla (Linnaeus, 1758) no estuário do Tejo e tributários. Final degree in Biology, Faculdade de Ciências da Universidade de Lis-boa.
Costa, J.L., I. Domingos, A.J. Almeida, E. Feunteun, and M.J. Costa. 2008. Interaction between Halobatrachus didactylus and Anguilla anguilla: What happens when these two species occur in sympatry? Cybium, 32:111–117.
Dekker, W. 2000. A Procrustean assessment of the European eel stock. ICES Journal of Marine Science, 57: 938–947.
Dias, E. 2007. Estudo da dieta do Corvo‐marinho‐de‐faces‐brancas (Phalacrocorax carbo Linnaeus, 1758) no Estuário do Rio Minho (NO‐Portugal). [A study on the diet of the cormorant (Phalacrocorax carbo Lin-naeus, 1758) in the Minho estuary]. Master Thesis, University of Porto, Portugal.
Domingos I. 2003. A enguia-europeia, Anguilla anguilla (L., 1758), na bacia hidrográfica do Rio Mondego. [The European eel (Anguilla anguilla (L.1758) in the Mondego River catchment]. PhD dissertation, Universidade de Lisboa.
Domingos, I., J.L. Costa, and M.J. Costa. 2006. Factors determining length distribution and abundance of the European eel, Anguilla anguilla, in the River Mondego (Portugal). Freshwater Biology, 51:2265–2281.
Domingos I., R. Monteiro, P. Félix, T. Pereira, C. Alexandre, J. L. Costa, P.R. Almeida and B. Quintella. 2016. Production or escapement of silver eels? VI Iberian Congress of ichthyology. Murcia 21/06/2016.
Durif C., Guibert, A., and Pierre, E. 2009. Morphological discrimination of the silvering stages of the Euro-pean eel. In J. M. Casselman & D. K. Cairns (Eds.), Eels at the Edge. Science, Status, and Conservation Concerns (pp. 103–111). Bethesda, MA: American Fisheries Society Symposium 58.
Félix P.M., J.L. Costa, R. Monteiro, N. Castro, B.R. Quintella, P.R. Almeida, I. Domingos. 2020. Can a re-stocking event with European (glass) eels cause early changes in local biological communities and its ecological status? Global Ecology and Conservation, 21. doi.org/10.1016/j.gecco.2019.e008842.
Gordo L.S. and Jorge I.M. 1991. Age and growth of the European eel, Anguilla anguilla (Linnaeus, 1758) in the Aveiro Lagoon, Portugal. Scientia Marina, 55:389–395.
Gravato C., Guimarães L., Santos J., Faria M. and Alves A. 2010. Comparative study about the effects of pollution on glass and yellow eels (Anguilla anguilla) from the estuaries of Minho, Lima and Douro Rivers. Ecotoxicology and Environmental Safety, 73:524–533.
ICES 2009. Workshop on Age Reading of European and American Eel (WKAREA). ICES CM 2009\ACOM: 48. 63p.

ICES | WGEEL 2020 | 19
Lopes V.C.P. 2013. A enguia na lagoa de Santo André - Contributo para a gestão da sua pesca. [The eel in the Santo André Lagoon – a contribution to the management of its fishery]. Master Thesis, Faculty of Sciences, University of Lisbon.
Marques J.P. 2016. Ecologia e migração da enguia prateada na Lagoa de Santo André: um contributo para a gestão da pesca e da abertura da lagoa ao mar. [Ecology and Migration of silver eels in Santo André Lagoon: a contribution for the management of the fishery and the opening of the lagoon]. Master Thesis, Faculty of Sciences, University of Lisbon.
Monteiro R.M.C. 2015. A enguia-europeia no Rio Mondego: estrutura populacional, taxa de prateação e fuga de reprodutores [The eel in the River Mondego – population structure, silvering rate and silver eel es-capement]. Master Thesis, Faculty of Sciences, University of Lisbon.
Monteiro R.M., I. Domingos, P.R. Almeida, J.L. Costa, C.M. Alexandre, B.R. Quintella. 2020. Migration and escapement of silver eel males, Anguilla anguilla, from a southwestern European river. Ecology of Freshwater Fish, 29: 679–692. DOI: 10.1111/eff.12545.
Neto A.F. 2008. Susceptibilidade da enguia-europeia (Anguilla anguilla) à degradação ambiental no estuário do Tejo: contaminação biológica pelo parasita Anguillicola crassus e contaminação química por metais pesados. [Susceptibility of the European eel (Anguilla anguilla) to environmental degradation in the Tagus estuary: biological contamination by Anguillicola crassus and chemical contamination by heavy metals]. Master Thesis, Faculty of Sciences, University of Lisbon.
Neto A.F., Costa J.L., Costa M.J. and Domingos I. 2010. Epidemiology and pathology of Anguillicoloides crassus in the European eel, Anguilla anguilla, from the Tagus estuary (Portugal). Journal of Aquatic Diseases, 88:225–233.
Neto, A.F., Passos, D., Costa, J.L., Costa, M.J., Caçador, I., Pereira, M.E., Duarte, A.C., Pacheco, M. and Domingos, I. 2011a. Metal concentrations in the European eel, Anguilla anguilla (L., 1758), in estuaries and coastal lagoons from Portugal. Vie et milieu - life and environment, 61: 167–177.
Neto, A.F., Passos, D., Costa, J.L., Costa, M.J., Caçador, I., Pereira, M.E., Duarte, A.C., Pacheco, M. and Domingos, I. 2011b. Accumulation of metals in Anguilla anguilla from the Tagus estuary and relation-ship to environmental contamination. Journal of Applied Ichthyology, 27:1265–1271.
Ovegård M.K., Öhman K., Mikkelsen J.S., and Jepsen N. 2017. Cormorant predation overlaps with fish communities and commercial-fishery interest in a Swedish lake. Marine and Freshwater Research, 68: 1677–1685.
Passos D.M. 2008. Concentração de metais pesados na enguia europeia, Anguilla anguilla (Linnaeus, 1758), em estuários e lagoas costeiras de Portugal [Heavy metal concentration in the European eel, Anguilla anguilla (Linnaeus, 1758), in Portuguese estuaries and coastal lagoons]. Biology Degree Thesis, University de Aveiro.
Santos J.F.T. 2016. Ecologia da enguia e gestão da sua pesca na Lagoa de Santo André. [Ecology and Manage-ment of the European eel in Santo André Lagoon]. Master Thesis, Faculty of Sciences, University of Lisbon.
Stratoudakis Y., P.B. Oliveira, A. Teles-Machado, J.M. Oliveira, M.J. Correia and C. Antunes. 2018. Glass eel (Anguilla anguilla) recruitment to the river Lis: Ingress dynamics in relation to oceanographic processes in the western Iberian margin and shelf. Fisheries Oceanography. DOI: 10.1111/fog.12274.
Trigo M.I. 1994. Predação por lontra (Lutra lutra Linnaeus, 1758) em pisciculturas do estuário do Mira. [Pre-dation by the otter (Lutra lutra Linnaeus, 1758) in fish cultures from the Mira estuary]. Biology Degree Thesis, University of Lisbon.
Vollestad L.A. 1985. Age determination and growth of yellow eels, Anguilla anguilla L. from a brackish water, Norway. Journal of Fish Biology, 26:521–525.
ICES | WGEEL 2020 | I
Contents
Report on the eel stock, fishery and other impacts Spain, 2019–2020 ...................................................... ii Authors .......................................................................................................................................... ii
1 Summary of national and international stock status indicators.................................................... 1 1.1 Escapement biomass and mortality rates ........................................................................ 1 1.2 Recruitment time-series .................................................................................................. 3
2 Overview of the national stock and its management.................................................................... 6 2.1 Describe the eel stock and its management .................................................................... 6 2.2 Significant changes since last report ................................................................................ 6
3 Impacts on the national stock ....................................................................................................... 7 3.1 Fisheries ........................................................................................................................... 7 3.1.1 Glass eel fisheries ............................................................................................................. 7 3.1.2 Yellow eel fisheries .......................................................................................................... 8 3.1.3 Silver eel fisheries ............................................................................................................ 9 3.2 Restocking ...................................................................................................................... 10 3.3 Aquaculture ................................................................................................................... 11 3.4 Entrainment ................................................................................................................... 13 3.5 Habitat Quantity and Quality ......................................................................................... 13 3.6 Other impacts ................................................................................................................ 14
4 National stock assessment .......................................................................................................... 15 5 Other data collection for eel ....................................................................................................... 16
5.1 Yellow eel abundance surveys ....................................................................................... 16 5.2 Silver eel escapement surveys ....................................................................................... 17 5.3 Life-history parameters .................................................................................................. 18 5.4 Diseases, Parasites & Pathogens or Contaminants ........................................................ 18
6 New Information ......................................................................................................................... 19 7 References ................................................................................................................................... 24
II | ICES SCIENTIFIC REPORTS 2:85 | ICES
Report on the eel stock, fishery and other impacts Spain, 2019–2020
Authors
Estíbaliz Díaz, Maria Korta, AZTI-Tecnalia, Txatxarramendi ugartea z/g - 48395 Sukarrieta, Bizkaia, Spain. Tel: +34 94 657 40.00. FAX: +34 94 6572555. * [email protected]
Reporting Period: This report was completed in September and contains data up to 2019.
Contributors to the report
• Ignacio Ferrando; Vaersa and the Council of the Environment, Water, Urban Develop-ment and Housing. Government of Valencia.
• Francesc Jesús Gómez Fernández; Service for the Territorial Shore of Ebro. Department of Agriculture, Food and Rural Action. Government of Catalunya.
• Almudena Alvarez: Fisheries experimentation Service. Rural and fishery Council. Gov-ernment of Asturias.
• Agustín Alberto Gil Ramos; Hunting and Inland Fishing Service. General Directorate of Natural Heritage. Government of Galicia.
• Guillermo Ceballos; Council of the Environment and Territorial Planning. Government of Andalucía.
• José Peñalver; Fishing and aquaculture Service. General Directorate of Livestock farming and Fishing. Department of agriculture and water. Government of Murcia.
ICES | WGEEL 2020 | 1
1 Summary of national and international stock status indicators
1.1 Escapement biomass and mortality rates
European eel has disappeared from the inner communities due to the construction of large dams, thus current indicators estimates are limited to Spanish coastal regions. Stock status indicators are compiled here as reported in the Spanish EMP post-evaluation report (2018).
In that sense, and considering the tasks proposed in the 2015 Spanish EMP post evaluation report related to the 2nd phase, the pristine escapement estimations were improved compared to the above-mentioned report. Both Andalucía and Murcia regions improved the pristine biomass es-timation by using recently collected field data and in the case of Murcia also including freshwater surface of Segura River?
This made the overall pristine biomass to increase in almost 500 000 kg comparing to the 2015 estimate. However, Bcurr decreased compared to previous exercise while Bbest increased.
According to the estimations of the Spanish 2018 post-evaluation report, European eel popula-tion status varies greatly among the different EMUs (Table 1), ranging from 0, in those inner regions where eel disappeared after dams construction, to 55.2% of the target (Table 1). When the whole territory is considered, Bcurr in Spain is 8.96% of the pristine one, and has thus slightly decreased in relation to 2015 post-evaluation report (9.1%).
According to the estimations provided by the EMUs, the most important anthropogenic mortal-ity is fishery. But non-fishery impacts, i.e. entrainment and mortality at water intakes, habitat quantity and quality decrease are underestimated because there are insufficient data for their estimation.

2 | ICES SCIENTIFIC REPORTS 2:85 | ICES
Table 1.Stock indicators of silver eel escapement, biomass and mortality rates, and assessed habitat area.
Year EMU_code A0 (ha) Acurr (ha)
B0 (kg) Bcurr (kg) Bbest (kg) Bcurr/B0 (%)
∑F ∑H ∑A
2017 ES_Anda 126477 60767 6057545 128457 310599 2.1 0.885 -0.006 0.879
2017 ES_Astu 3774 2591 63495 29466 81143 46.4 1.010 0.002 1.010
2017 ES_Bale 4253 4253 330883 138586 138556 41.9 NP ND ND
2017 ES_Basq 4050 3991 245040 127072 161787 51.9 0.242 ND 0.242
2017 ES_Cant 1936 615 9680 1723 6579 17.8 1.465 -0.125 1.340
2017 ES_Cast 1174 0 23488 0 0 0.0 NP NP NP
2017 ES_Cata 9895 5567 364607 95415 196371 26.2 0.740 ND 0.740
2017 ES_Gali 5535 4548 110700 12785 103785 11.5 2.087 0.054 2.141
2017 ES_Inne 66868 0 2420205 0 0 0.0 NP NP NP
2017 ES_Murc 13719 13500 26270 8095 54445 30.8 1.900 0.000 1.900
2017 ES_Nava 272 231 5448 1134 ND 20.8 ND ND ND
2017 ES_Vale 18217 6630 698026 385175 419444 55.2 0.088 0.003 0.091
2017 TOTAL 10355387 102693 10355387 927906 1472739 8.96
Key: EMU_code = Eel Management Unit cod A0 = Assessed pristine area; Acurr = Assessed current area B0 = the amount of silver eel biomass that would have existed if no anthropogenic influences had impacted the stock (kg); Bcurr = the amount of silver eel biomass that currently escapes to the sea to spawn (in the assessment year) (kg); Bbest = the amount of silver eel biomass that would have existed if no anthropogenic influences had impacted the current stock (kg); ∑F = mortality due to fishing, summed over the age groups in the stock (rate); ∑H = anthropogenic mor-tality excluding the fishery, summed over the age groups in the stock (rate); ∑A = all anthropogenic mortality summed over the age groups in the stock (rate); Assessed area (ha) = combined area total (ha) of transitional and inland waters.
The modified precautionary diagram (ICES, 2012) shows that the Spanish EMUs are located in different areas: safe (green), buffer (orange) and outside safe biological limits (red) (Figure 1). However, the EMUs have used different methodological approaches to calculate the indicators, so caution should be exercised in interpreting the differences between the different EMUs.

ICES | WGEEL 2020 | 3
Figure 1. Stock status of the Spanish EMU (Spanish post evaluation report 2018) according to the modified Precautionary Diagram (ICES, 2012). ES_Cast and ES_Inne not plotted because Bbest is not available.
1.2 Recruitment time-series
The Spanish series show a decrease in catches since late 1970s. During the last years, the catches remained low showing some interannual variability without any clear trend. In 2020, catches decreased in the Atlantic series and Ebro and decreased in the Albufera series compared to 2019 (Figure 2).
These are the characteristics of the fishery dependent series:
• San Juan de la Arena fish market in Asturias: It includes almost all the catches from the Nalón River. Until the 1970s only land fishing existed, then fishermen started to fish in boats, and the catches increased notably.
• The Albufera in C. Valenciana: During the 1949–2000 period, data were collected from fishermen guilds corresponding to three fishing points (Golas of Pujol, Perelló and Perellonet). From 2001 on, the administration of C. Valenciana also compiles data from other fishing points in the Albufera, and the rest of C. Valenciana. To maintain the coher-ence of the data series, the Pujol, Perelló and Perrellonet data will be considered for the historical data series of the Albufera. As this series contains also effort data, both the catch series and the catch-per-unit-of-effort series are provided.
• The Delta del Ebro lagoons in Catalonia: Data are obtained from the fish markets in the area. Since 1998, the administration from Catalonia compiles data for the fish markets corresponding to the Ebro river mouth, obtaining total catches in the Ebro. Additionally, since 1998 it also compiles information from the rest of Catalonian rivers.
• The Miño: the Miño River command compiles the Spanish catches data.
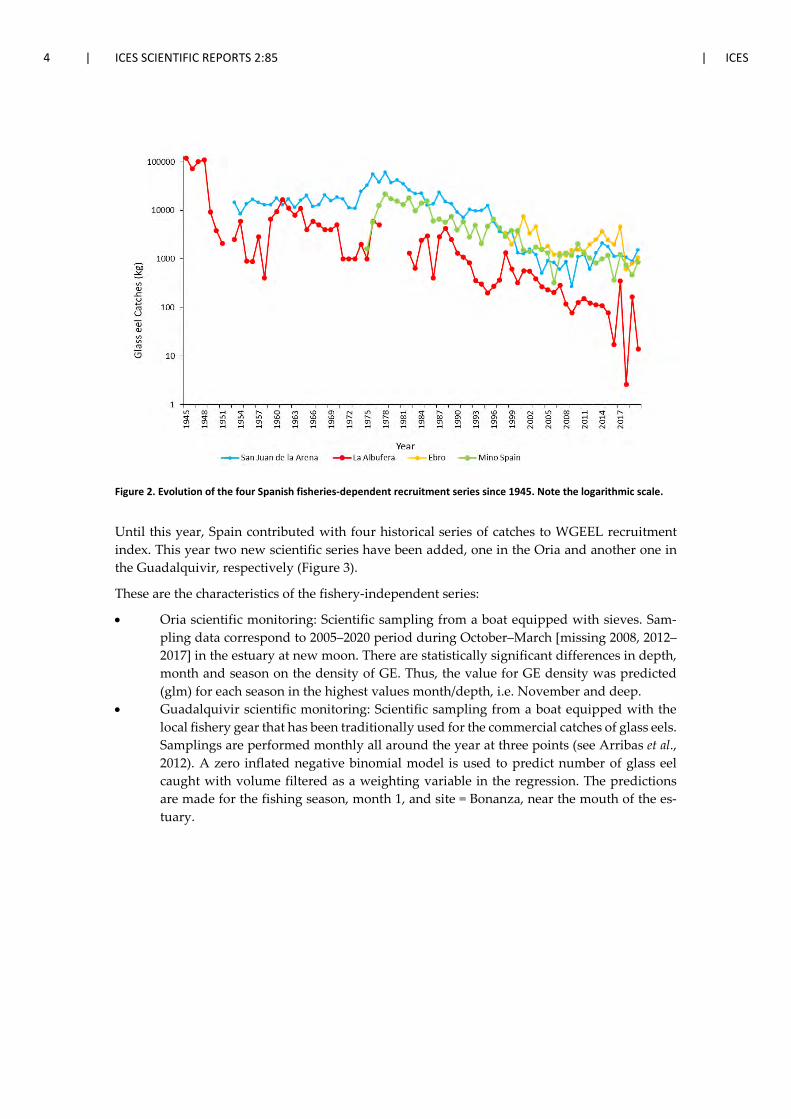
4 | ICES SCIENTIFIC REPORTS 2:85 | ICES
Figure 2. Evolution of the four Spanish fisheries-dependent recruitment series since 1945. Note the logarithmic scale.
Until this year, Spain contributed with four historical series of catches to WGEEL recruitment index. This year two new scientific series have been added, one in the Oria and another one in the Guadalquivir, respectively (Figure 3).
These are the characteristics of the fishery-independent series:
• Oria scientific monitoring: Scientific sampling from a boat equipped with sieves. Sam-pling data correspond to 2005–2020 period during October–March [missing 2008, 2012–2017] in the estuary at new moon. There are statistically significant differences in depth, month and season on the density of GE. Thus, the value for GE density was predicted (glm) for each season in the highest values month/depth, i.e. November and deep.
• Guadalquivir scientific monitoring: Scientific sampling from a boat equipped with the local fishery gear that has been traditionally used for the commercial catches of glass eels. Samplings are performed monthly all around the year at three points (see Arribas et al., 2012). A zero inflated negative binomial model is used to predict number of glass eel caught with volume filtered as a weighting variable in the regression. The predictions are made for the fishing season, month 1, and site = Bonanza, near the mouth of the es-tuary.
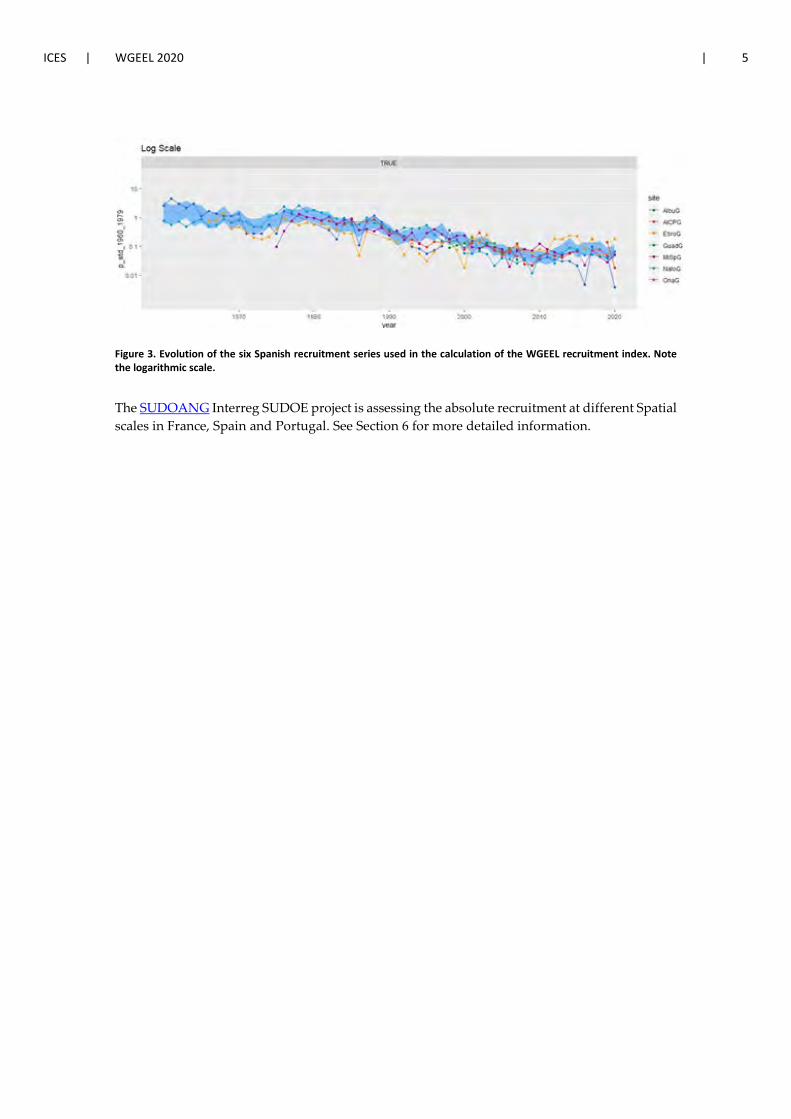
ICES | WGEEL 2020 | 5
Figure 3. Evolution of the six Spanish recruitment series used in the calculation of the WGEEL recruitment index. Note the logarithmic scale.
The SUDOANG Interreg SUDOE project is assessing the absolute recruitment at different Spatial scales in France, Spain and Portugal. See Section 6 for more detailed information.
6 | ICES SCIENTIFIC REPORTS 2:85 | ICES
2 Overview of the national stock and its management
No new information since last year's report (Korta and Díaz, 2018).
2.1 Describe the eel stock and its management
None.
2.2 Significant changes since last report
None.
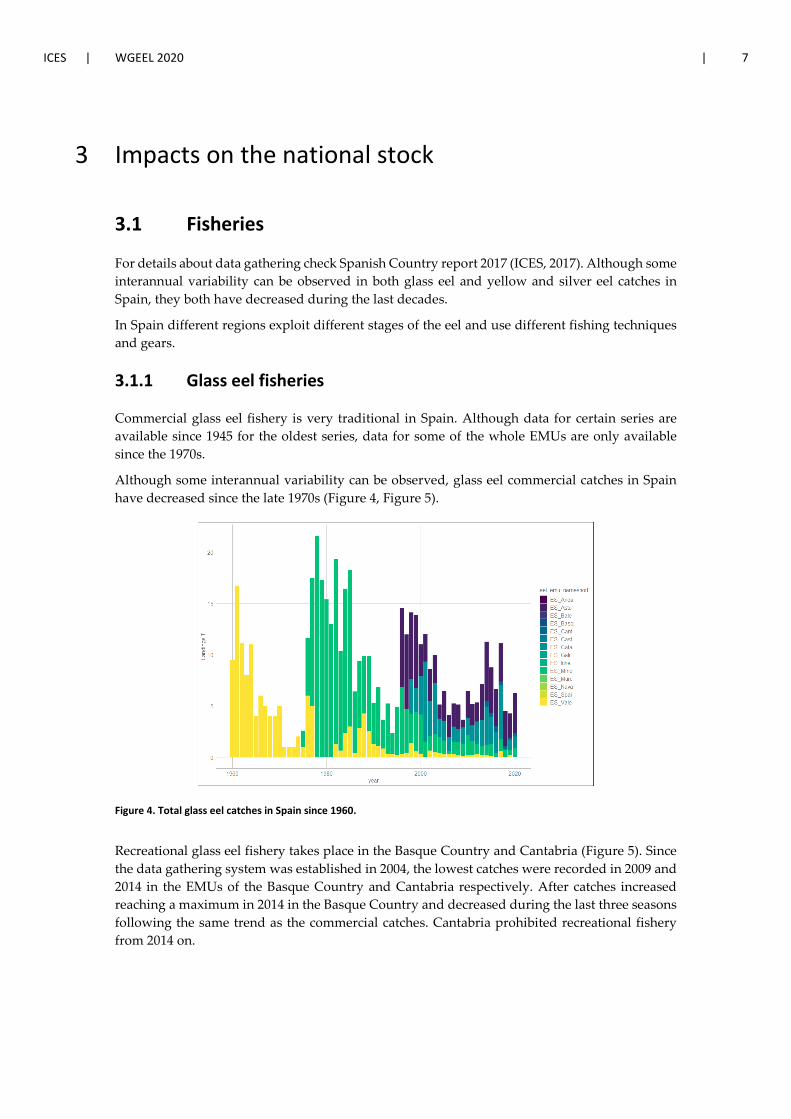
ICES | WGEEL 2020 | 7
3 Impacts on the national stock
3.1 Fisheries
For details about data gathering check Spanish Country report 2017 (ICES, 2017). Although some interannual variability can be observed in both glass eel and yellow and silver eel catches in Spain, they both have decreased during the last decades.
In Spain different regions exploit different stages of the eel and use different fishing techniques and gears.
3.1.1 Glass eel fisheries
Commercial glass eel fishery is very traditional in Spain. Although data for certain series are available since 1945 for the oldest series, data for some of the whole EMUs are only available since the 1970s.
Although some interannual variability can be observed, glass eel commercial catches in Spain have decreased since the late 1970s (Figure 4, Figure 5).
Figure 4. Total glass eel catches in Spain since 1960.
Recreational glass eel fishery takes place in the Basque Country and Cantabria (Figure 5). Since the data gathering system was established in 2004, the lowest catches were recorded in 2009 and 2014 in the EMUs of the Basque Country and Cantabria respectively. After catches increased reaching a maximum in 2014 in the Basque Country and decreased during the last three seasons following the same trend as the commercial catches. Cantabria prohibited recreational fishery from 2014 on.
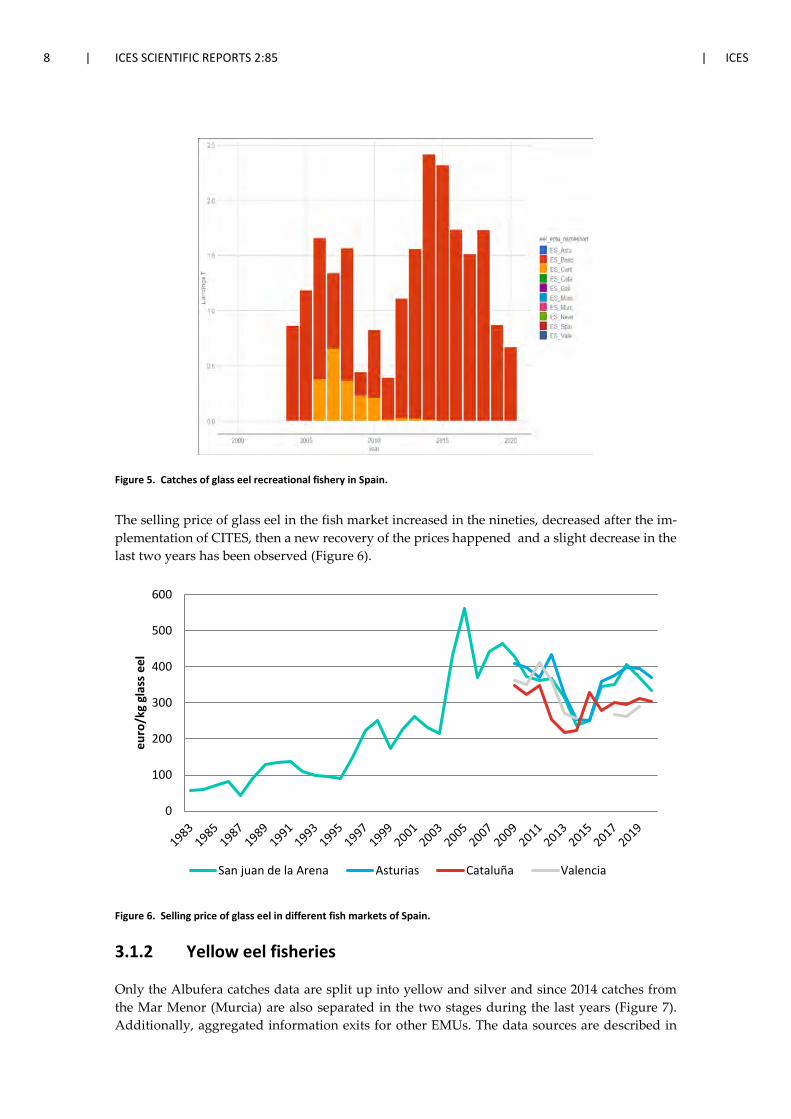
8 | ICES SCIENTIFIC REPORTS 2:85 | ICES
Figure 5. Catches of glass eel recreational fishery in Spain.
The selling price of glass eel in the fish market increased in the nineties, decreased after the im-plementation of CITES, then a new recovery of the prices happened and a slight decrease in the last two years has been observed (Figure 6).
Figure 6. Selling price of glass eel in different fish markets of Spain.
3.1.2 Yellow eel fisheries
Only the Albufera catches data are split up into yellow and silver and since 2014 catches from the Mar Menor (Murcia) are also separated in the two stages during the last years (Figure 7). Additionally, aggregated information exits for other EMUs. The data sources are described in
0
100
200
300
400
500
600
euro
/kg
glas
s ee
l
San juan de la Arena Asturias Cataluña Valencia
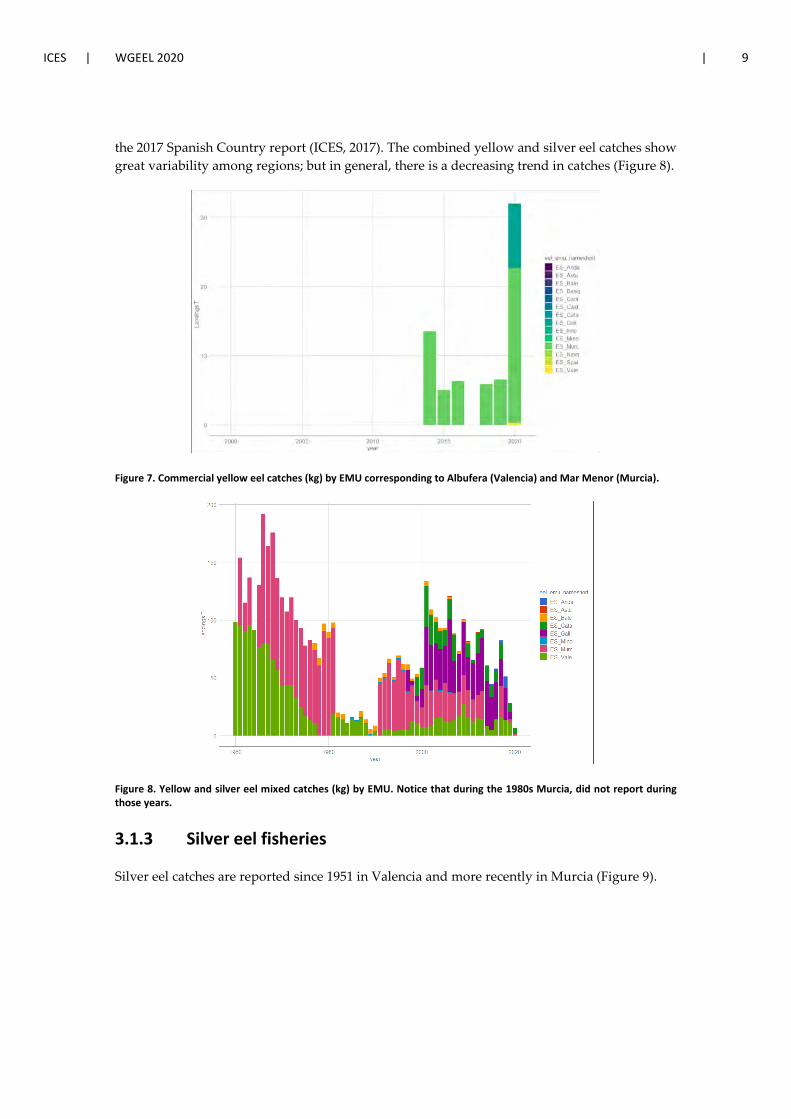
ICES | WGEEL 2020 | 9
the 2017 Spanish Country report (ICES, 2017). The combined yellow and silver eel catches show great variability among regions; but in general, there is a decreasing trend in catches (Figure 8).
Figure 7. Commercial yellow eel catches (kg) by EMU corresponding to Albufera (Valencia) and Mar Menor (Murcia).
Figure 8. Yellow and silver eel mixed catches (kg) by EMU. Notice that during the 1980s Murcia, did not report during those years.
3.1.3 Silver eel fisheries
Silver eel catches are reported since 1951 in Valencia and more recently in Murcia (Figure 9).
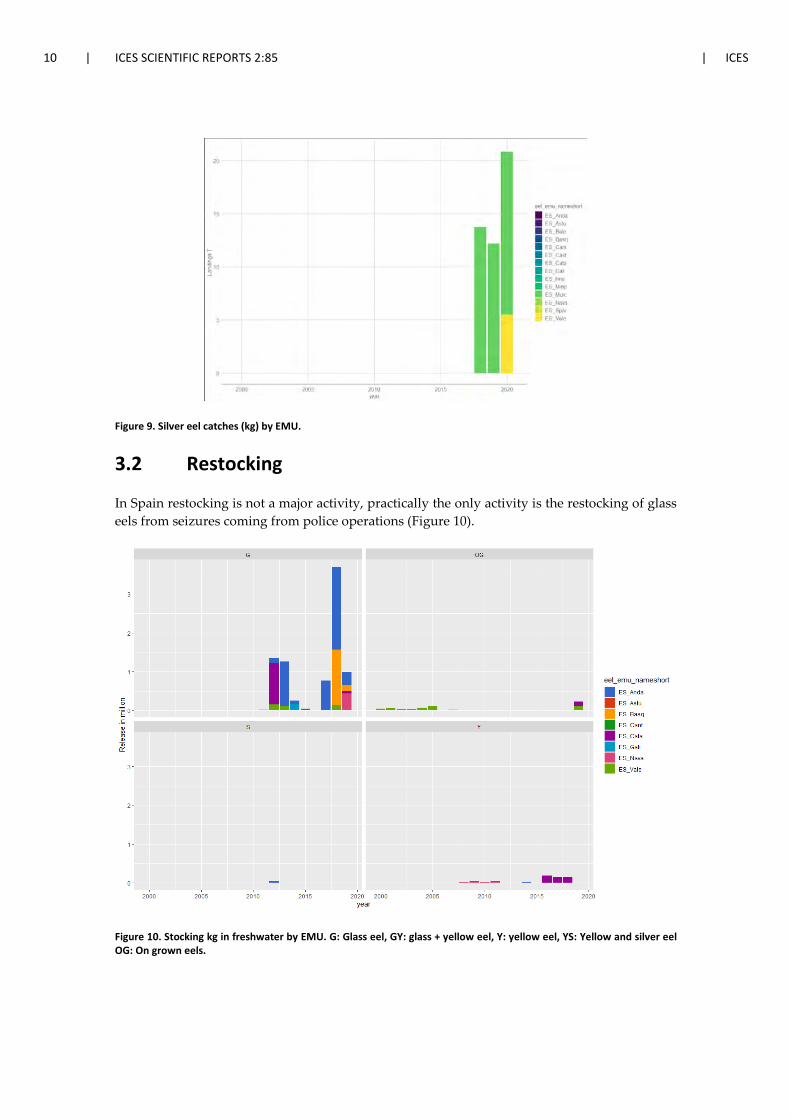
10 | ICES SCIENTIFIC REPORTS 2:85 | ICES
Figure 9. Silver eel catches (kg) by EMU.
3.2 Restocking
In Spain restocking is not a major activity, practically the only activity is the restocking of glass eels from seizures coming from police operations (Figure 10).
Figure 10. Stocking kg in freshwater by EMU. G: Glass eel, GY: glass + yellow eel, Y: yellow eel, YS: Yellow and silver eel OG: On grown eels.
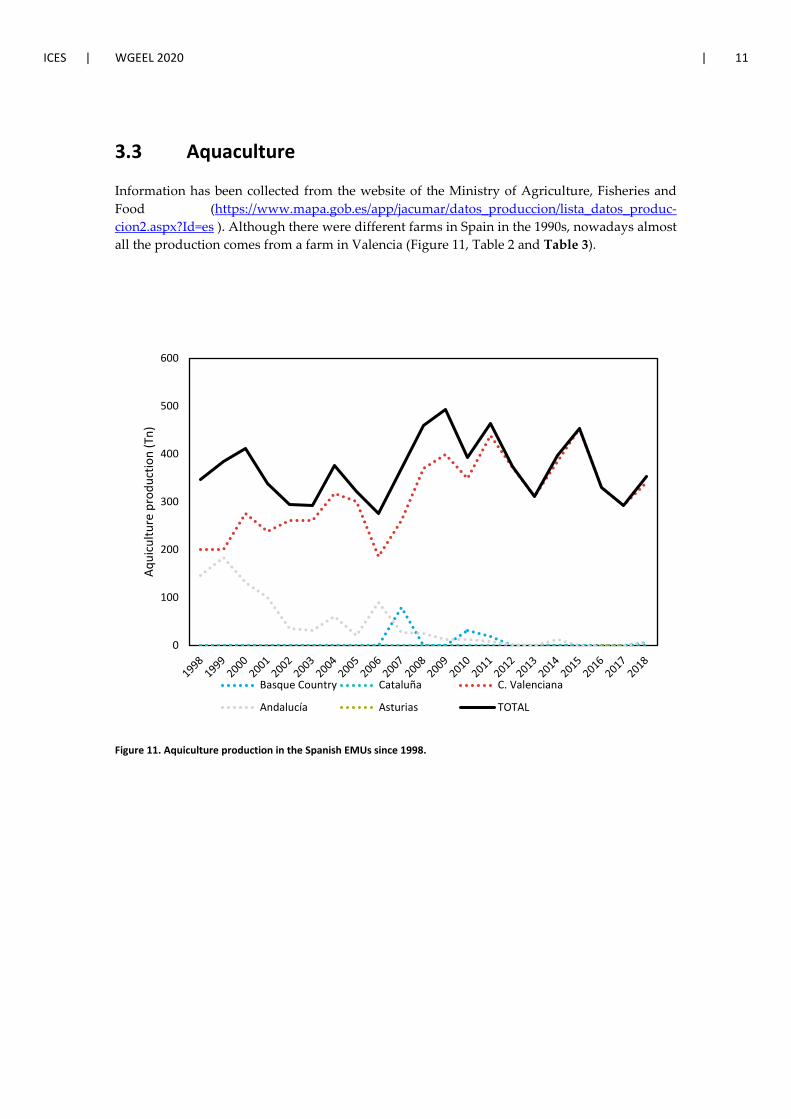
ICES | WGEEL 2020 | 11
3.3 Aquaculture
Information has been collected from the website of the Ministry of Agriculture, Fisheries and Food (https://www.mapa.gob.es/app/jacumar/datos_produccion/lista_datos_produc-cion2.aspx?Id=es ). Although there were different farms in Spain in the 1990s, nowadays almost all the production comes from a farm in Valencia (Figure 11, Table 2 and Table 3).
Figure 11. Aquiculture production in the Spanish EMUs since 1998.
0
100
200
300
400
500
600
Aqui
cultu
re p
rodu
ctio
n (T
n)
Basque Country Cataluña C. Valenciana
Andalucía Asturias TOTAL
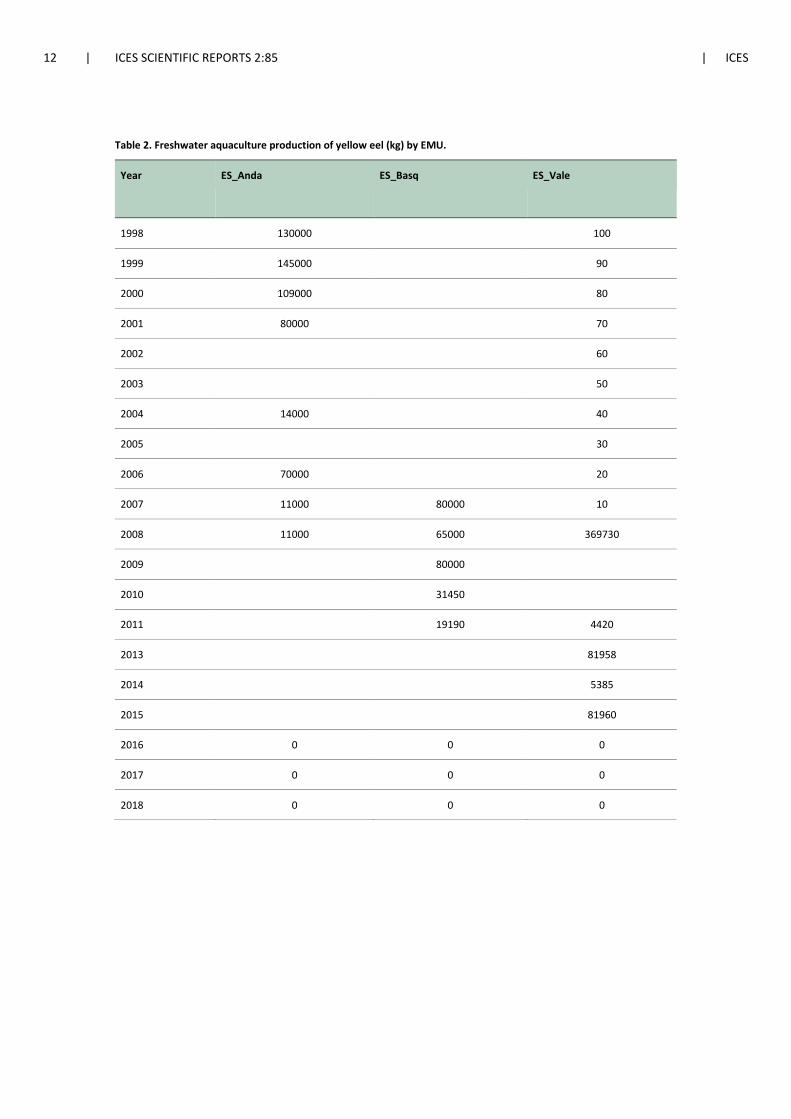
12 | ICES SCIENTIFIC REPORTS 2:85 | ICES
Table 2. Freshwater aquaculture production of yellow eel (kg) by EMU.
Year ES_Anda ES_Basq ES_Vale
1998 130000
100
1999 145000
90
2000 109000
80
2001 80000
70
2002
60
2003
50
2004 14000
40
2005
30
2006 70000
20
2007 11000 80000 10
2008 11000 65000 369730
2009
80000
2010
31450
2011
19190 4420
2013
81958
2014
5385
2015
81960
2016 0 0 0
2017 0 0 0
2018 0 0 0
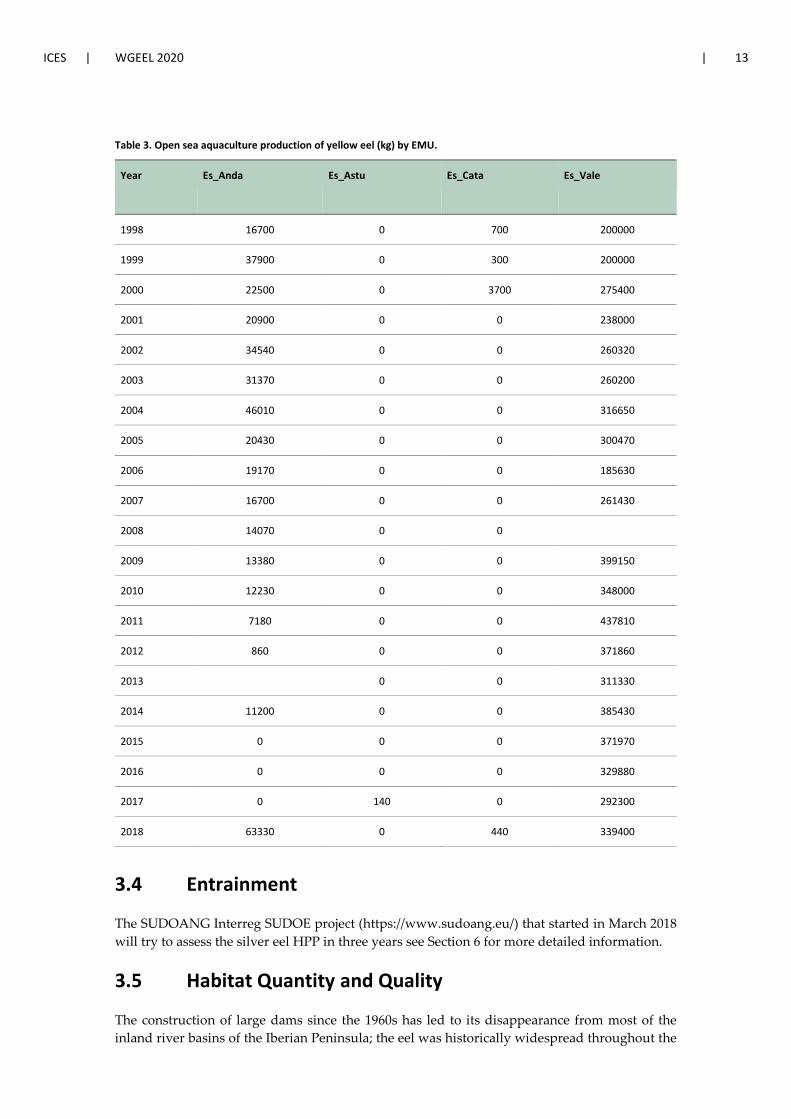
ICES | WGEEL 2020 | 13
Table 3. Open sea aquaculture production of yellow eel (kg) by EMU.
Year Es_Anda Es_Astu Es_Cata Es_Vale
1998 16700 0 700 200000
1999 37900 0 300 200000
2000 22500 0 3700 275400
2001 20900 0 0 238000
2002 34540 0 0 260320
2003 31370 0 0 260200
2004 46010 0 0 316650
2005 20430 0 0 300470
2006 19170 0 0 185630
2007 16700 0 0 261430
2008 14070 0 0
2009 13380 0 0 399150
2010 12230 0 0 348000
2011 7180 0 0 437810
2012 860 0 0 371860
2013
0 0 311330
2014 11200 0 0 385430
2015 0 0 0 371970
2016 0 0 0 329880
2017 0 140 0 292300
2018 63330 0 440 339400
3.4 Entrainment
The SUDOANG Interreg SUDOE project (https://www.sudoang.eu/) that started in March 2018 will try to assess the silver eel HPP in three years see Section 6 for more detailed information.
3.5 Habitat Quantity and Quality
The construction of large dams since the 1960s has led to its disappearance from most of the inland river basins of the Iberian Peninsula; the eel was historically widespread throughout the
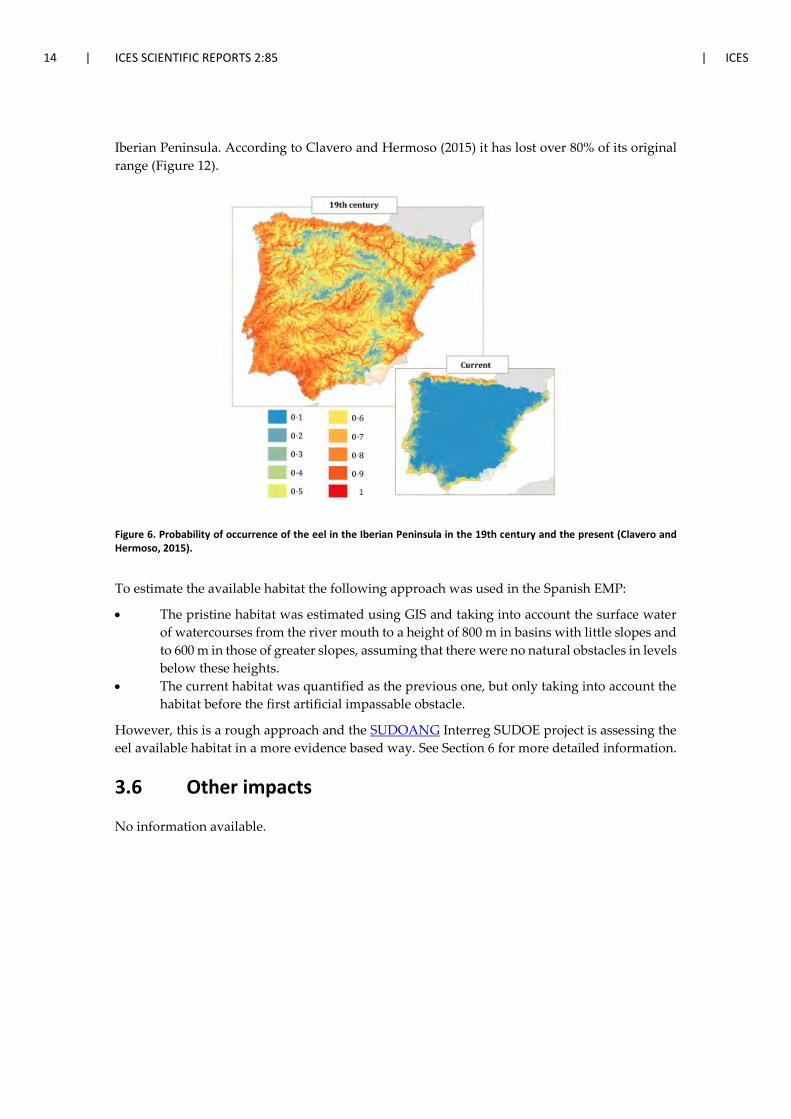
14 | ICES SCIENTIFIC REPORTS 2:85 | ICES
Iberian Peninsula. According to Clavero and Hermoso (2015) it has lost over 80% of its original range (Figure 12).
Figure 6. Probability of occurrence of the eel in the Iberian Peninsula in the 19th century and the present (Clavero and Hermoso, 2015).
To estimate the available habitat the following approach was used in the Spanish EMP:
• The pristine habitat was estimated using GIS and taking into account the surface water of watercourses from the river mouth to a height of 800 m in basins with little slopes and to 600 m in those of greater slopes, assuming that there were no natural obstacles in levels below these heights.
• The current habitat was quantified as the previous one, but only taking into account the habitat before the first artificial impassable obstacle.
However, this is a rough approach and the SUDOANG Interreg SUDOE project is assessing the eel available habitat in a more evidence based way. See Section 6 for more detailed information.
3.6 Other impacts
No information available.

ICES | WGEEL 2020 | 15
4 National stock assessment
No new information since last year's report (Korta and Díaz, 2018).
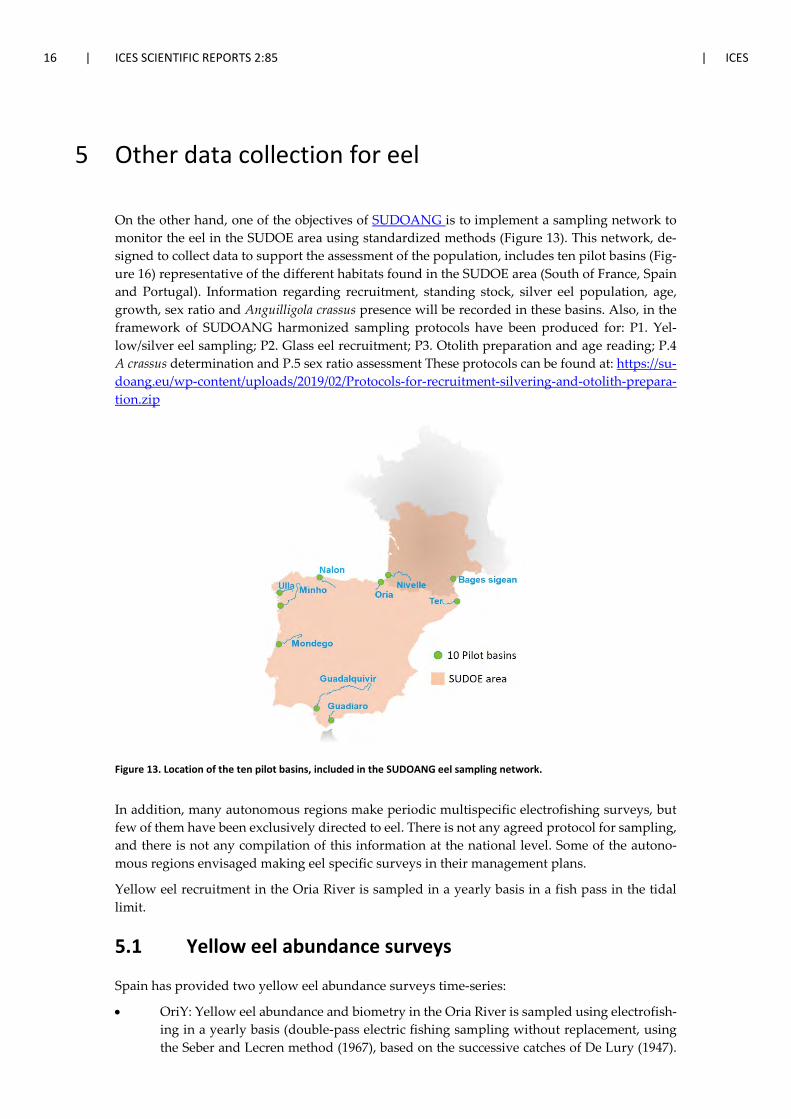
16 | ICES SCIENTIFIC REPORTS 2:85 | ICES
5 Other data collection for eel
On the other hand, one of the objectives of SUDOANG is to implement a sampling network to monitor the eel in the SUDOE area using standardized methods (Figure 13). This network, de-signed to collect data to support the assessment of the population, includes ten pilot basins (Fig-ure 16) representative of the different habitats found in the SUDOE area (South of France, Spain and Portugal). Information regarding recruitment, standing stock, silver eel population, age, growth, sex ratio and Anguilligola crassus presence will be recorded in these basins. Also, in the framework of SUDOANG harmonized sampling protocols have been produced for: P1. Yel-low/silver eel sampling; P2. Glass eel recruitment; P3. Otolith preparation and age reading; P.4 A crassus determination and P.5 sex ratio assessment These protocols can be found at: https://su-doang.eu/wp-content/uploads/2019/02/Protocols-for-recruitment-silvering-and-otolith-prepara-tion.zip
Figure 13. Location of the ten pilot basins, included in the SUDOANG eel sampling network.
In addition, many autonomous regions make periodic multispecific electrofishing surveys, but few of them have been exclusively directed to eel. There is not any agreed protocol for sampling, and there is not any compilation of this information at the national level. Some of the autono-mous regions envisaged making eel specific surveys in their management plans.
Yellow eel recruitment in the Oria River is sampled in a yearly basis in a fish pass in the tidal limit.
5.1 Yellow eel abundance surveys
Spain has provided two yellow eel abundance surveys time-series:
• OriY: Yellow eel abundance and biometry in the Oria River is sampled using electrofish-ing in a yearly basis (double-pass electric fishing sampling without replacement, using the Seber and Lecren method (1967), based on the successive catches of De Lury (1947).
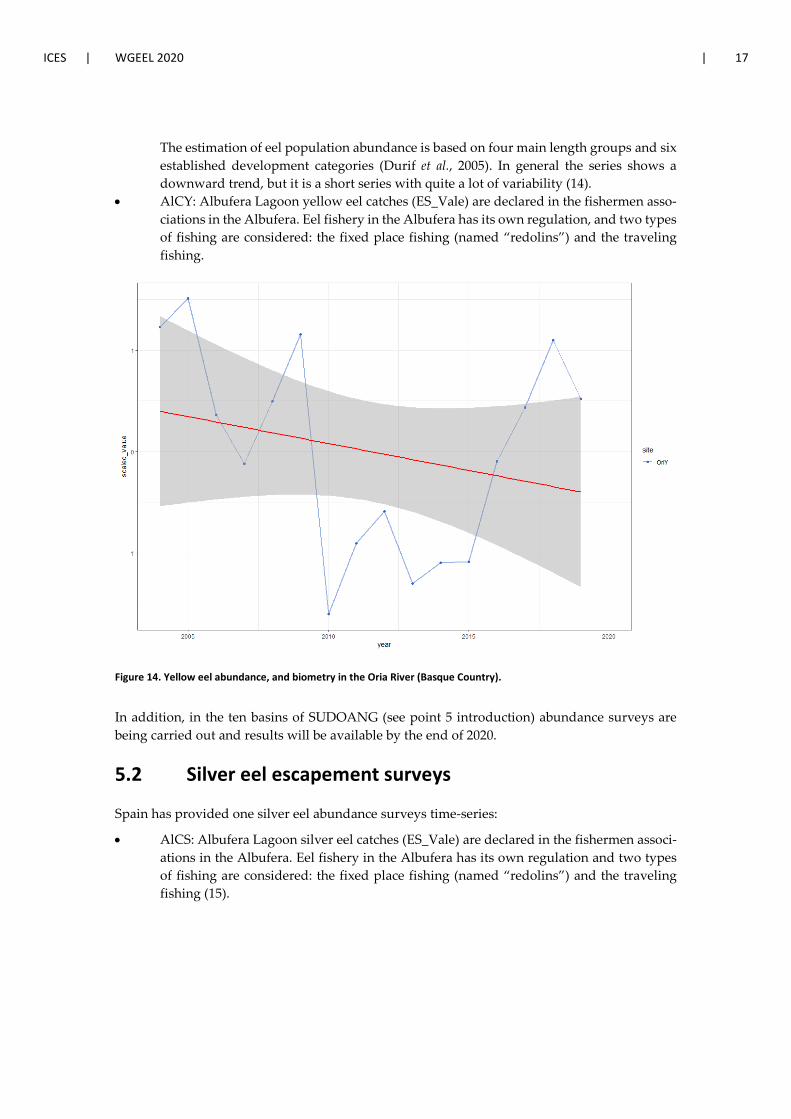
ICES | WGEEL 2020 | 17
The estimation of eel population abundance is based on four main length groups and six established development categories (Durif et al., 2005). In general the series shows a downward trend, but it is a short series with quite a lot of variability (14).
• AlCY: Albufera Lagoon yellow eel catches (ES_Vale) are declared in the fishermen asso-ciations in the Albufera. Eel fishery in the Albufera has its own regulation, and two types of fishing are considered: the fixed place fishing (named “redolins”) and the traveling fishing.
Figure 14. Yellow eel abundance, and biometry in the Oria River (Basque Country).
In addition, in the ten basins of SUDOANG (see point 5 introduction) abundance surveys are being carried out and results will be available by the end of 2020.
5.2 Silver eel escapement surveys
Spain has provided one silver eel abundance surveys time-series:
• AlCS: Albufera Lagoon silver eel catches (ES_Vale) are declared in the fishermen associ-ations in the Albufera. Eel fishery in the Albufera has its own regulation and two types of fishing are considered: the fixed place fishing (named “redolins”) and the traveling fishing (15).

18 | ICES SCIENTIFIC REPORTS 2:85 | ICES
Figure 15. Silver eel abundance (catches) in the Albufera (ES_Vale).
5.3 Life-history parameters
In the ten basins of SUDOANG (see point 5 introduction) information is being collected on per-centages of silvering, sex ratio and growth and otoliths that will be available by the end of 2020.
In addition, a silvering model is been applied in SUDOANG that provides percentage of silver eel and female in the Sudoe area (see Section 6 for more detailed information.).
5.4 Diseases, Parasites & Pathogens or Contaminants
No new information, last update in the 2019 Spanish Country Report.
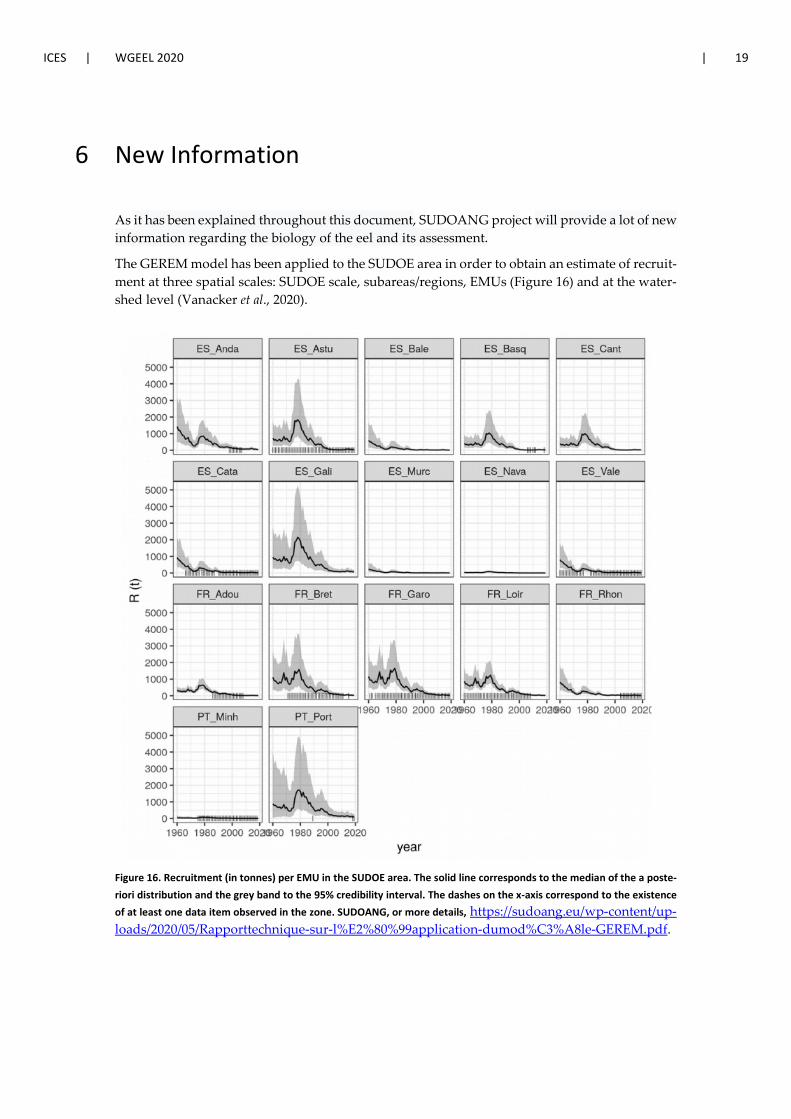
ICES | WGEEL 2020 | 19
6 New Information
As it has been explained throughout this document, SUDOANG project will provide a lot of new information regarding the biology of the eel and its assessment.
The GEREM model has been applied to the SUDOE area in order to obtain an estimate of recruit-ment at three spatial scales: SUDOE scale, subareas/regions, EMUs (Figure 16) and at the water-shed level (Vanacker et al., 2020).
Figure 16. Recruitment (in tonnes) per EMU in the SUDOE area. The solid line corresponds to the median of the a poste-riori distribution and the grey band to the 95% credibility interval. The dashes on the x-axis correspond to the existence of at least one data item observed in the zone. SUDOANG, or more details, https://sudoang.eu/wp-content/up-loads/2020/05/Rapporttechnique-sur-l%E2%80%99application-dumod%C3%A8le-GEREM.pdf.
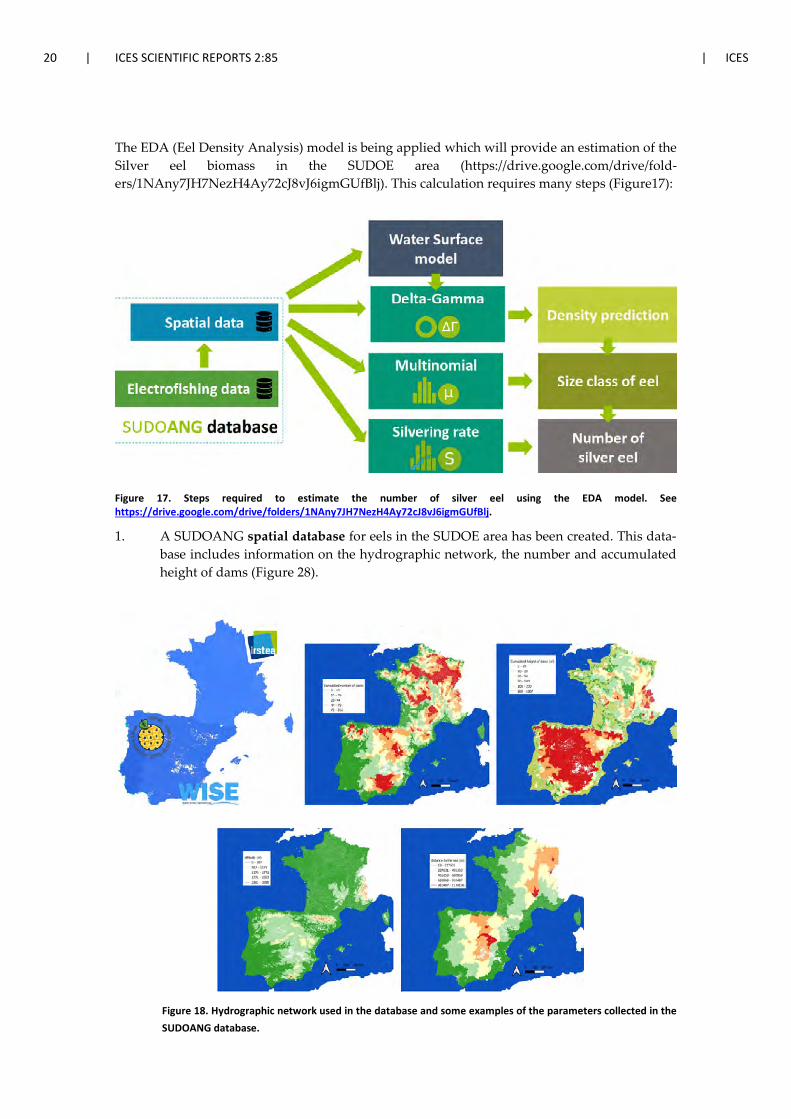
20 | ICES SCIENTIFIC REPORTS 2:85 | ICES
The EDA (Eel Density Analysis) model is being applied which will provide an estimation of the Silver eel biomass in the SUDOE area (https://drive.google.com/drive/fold-ers/1NAny7JH7NezH4Ay72cJ8vJ6igmGUfBlj). This calculation requires many steps (Figure17):
Figure 17. Steps required to estimate the number of silver eel using the EDA model. See https://drive.google.com/drive/folders/1NAny7JH7NezH4Ay72cJ8vJ6igmGUfBlj.
1. A SUDOANG spatial database for eels in the SUDOE area has been created. This data-base includes information on the hydrographic network, the number and accumulated height of dams (Figure 28).
Figure 18. Hydrographic network used in the database and some examples of the parameters collected in the SUDOANG database.
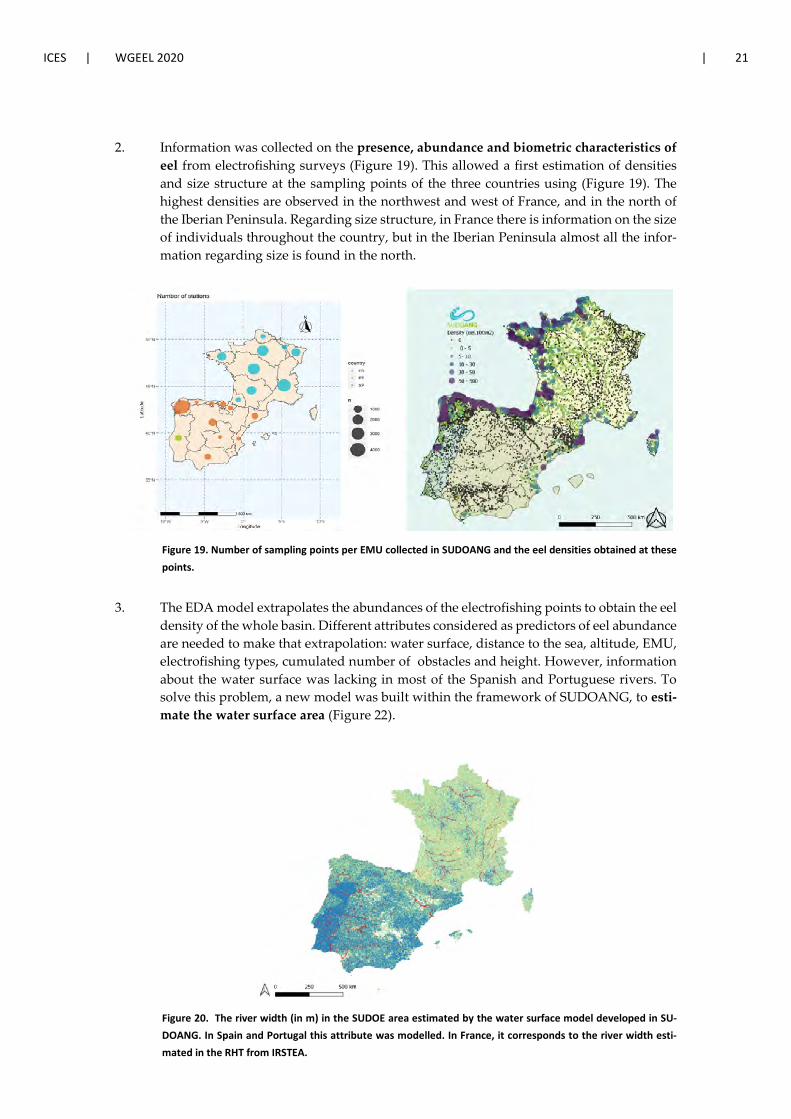
ICES | WGEEL 2020 | 21
2. Information was collected on the presence, abundance and biometric characteristics of eel from electrofishing surveys (Figure 19). This allowed a first estimation of densities and size structure at the sampling points of the three countries using (Figure 19). The highest densities are observed in the northwest and west of France, and in the north of the Iberian Peninsula. Regarding size structure, in France there is information on the size of individuals throughout the country, but in the Iberian Peninsula almost all the infor-mation regarding size is found in the north.
Figure 19. Number of sampling points per EMU collected in SUDOANG and the eel densities obtained at these points.
3. The EDA model extrapolates the abundances of the electrofishing points to obtain the eel density of the whole basin. Different attributes considered as predictors of eel abundance are needed to make that extrapolation: water surface, distance to the sea, altitude, EMU, electrofishing types, cumulated number of obstacles and height. However, information about the water surface was lacking in most of the Spanish and Portuguese rivers. To solve this problem, a new model was built within the framework of SUDOANG, to esti-mate the water surface area (Figure 22).
Figure 20. The river width (in m) in the SUDOE area estimated by the water surface model developed in SU-DOANG. In Spain and Portugal this attribute was modelled. In France, it corresponds to the river width esti-mated in the RHT from IRSTEA.
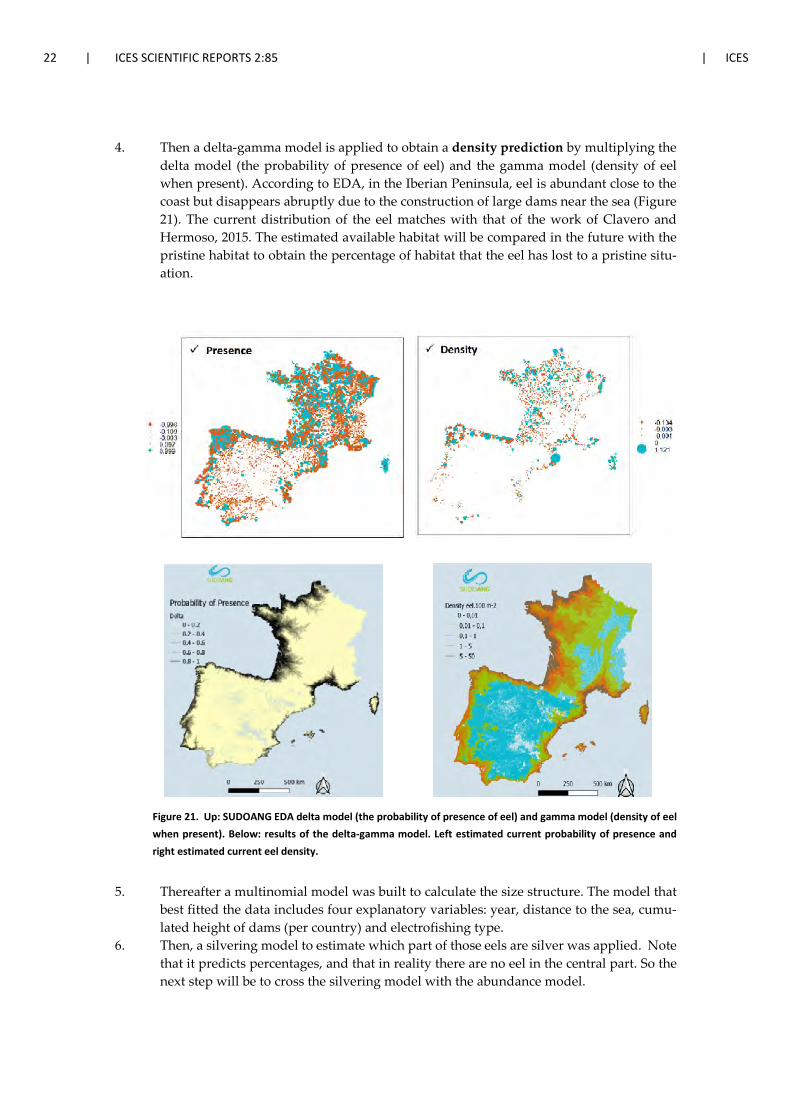
22 | ICES SCIENTIFIC REPORTS 2:85 | ICES
4. Then a delta-gamma model is applied to obtain a density prediction by multiplying the delta model (the probability of presence of eel) and the gamma model (density of eel when present). According to EDA, in the Iberian Peninsula, eel is abundant close to the coast but disappears abruptly due to the construction of large dams near the sea (Figure 21). The current distribution of the eel matches with that of the work of Clavero and Hermoso, 2015. The estimated available habitat will be compared in the future with the pristine habitat to obtain the percentage of habitat that the eel has lost to a pristine situ-ation.
Figure 21. Up: SUDOANG EDA delta model (the probability of presence of eel) and gamma model (density of eel when present). Below: results of the delta-gamma model. Left estimated current probability of presence and right estimated current eel density.
5. Thereafter a multinomial model was built to calculate the size structure. The model that best fitted the data includes four explanatory variables: year, distance to the sea, cumu-lated height of dams (per country) and electrofishing type.
6. Then, a silvering model to estimate which part of those eels are silver was applied. Note that it predicts percentages, and that in reality there are no eel in the central part. So the next step will be to cross the silvering model with the abundance model.
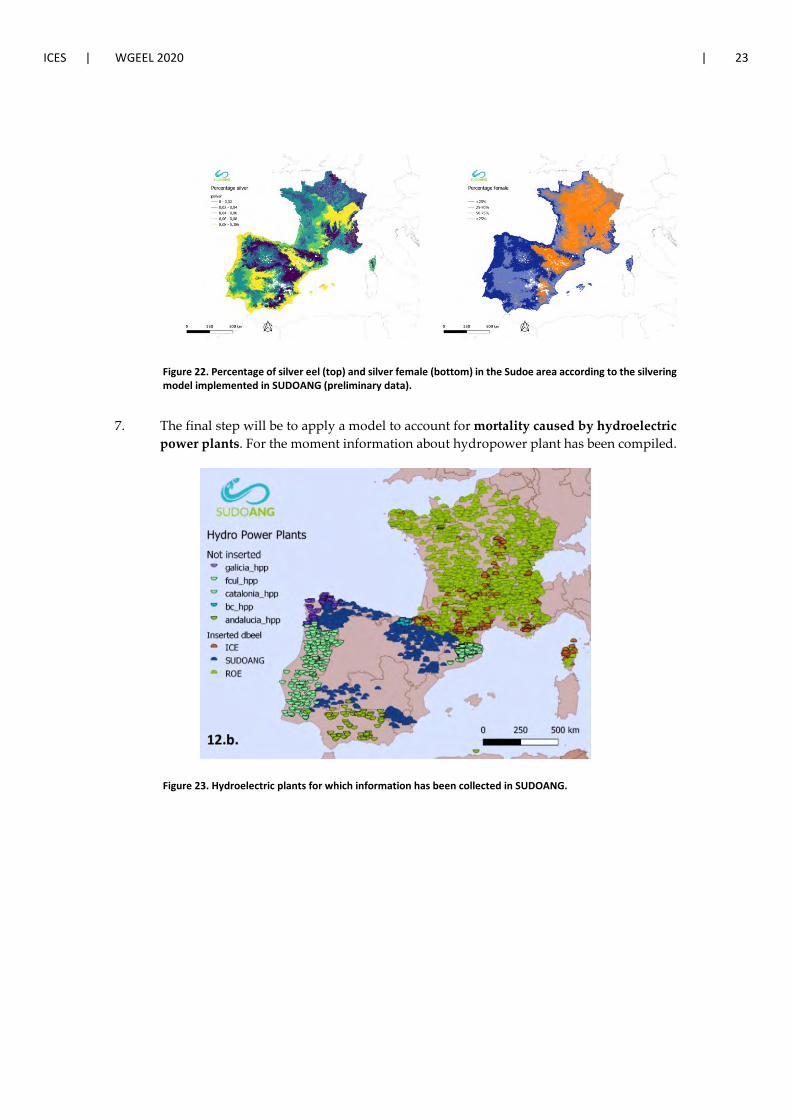
ICES | WGEEL 2020 | 23
Figure 22. Percentage of silver eel (top) and silver female (bottom) in the Sudoe area according to the silvering model implemented in SUDOANG (preliminary data).
7. The final step will be to apply a model to account for mortality caused by hydroelectric power plants. For the moment information about hydropower plant has been compiled.
Figure 23. Hydroelectric plants for which information has been collected in SUDOANG.

24 | ICES SCIENTIFIC REPORTS 2:85 | ICES
7 References
Clavero, M., Hermoso, V. 2015. Historical data to plan the recovery of the European Eel. Journal of Applied Ecology 2015, 52, 960–968 doi: 10.1111/1365-2664.124.
Durif, C., Dufour, S., Elie, P. 2005. The silvering process of Anguilla anguilla: a new classification from the yellow resident to the silver migrating stage Journal of Fish Biology 66 (4), 1025–1043.
Korta, M., Díaz, E. 2019. Report on the eel stock, fishery and other impacts, in Spain. Report of the Joint EIFAAC/ICES/GFCM Working Group on Eels (WGEEL) 27 August–2 September 2018 Bergen.
Vanacker, M., Briand, C., Matero, M., Drouineau, H. 2020. Rapport technique sur l’application du modèle GEREM. Deliverable E.3.1.2 of the Interreg Sudoe SUDOANG project. https://sudoang.eu/wp-con-tent/uploads/2020/05/Rapporttechnique-sur-l%E2%80%99application-dumod%C3%A8le-GEREM.pdf.
ICES | WGEEL 2020 | I
Contents
Report on the eel stock, fishery and other impacts in Sweden, 2019–2020 .............................................. ii Authors .......................................................................................................................................... ii
1 Summary of national and international stock status indicators.................................................... 1 1.1 Escapement biomass and mortality rates ........................................................................ 1 1.2 Recruitment time-series .................................................................................................. 1
2 Overview of the national stock and its management.................................................................... 5 2.1 Describe the eel stock and its management .................................................................... 5 2.1.1 EMUs, EMPs ..................................................................................................................... 5 2.1.2 Management authorities ................................................................................................. 5 2.1.3 Regulations ...................................................................................................................... 5 2.1.4 Management actions ....................................................................................................... 6 2.1.5 Local stock assessment .................................................................................................... 6 Reporting ....................................................................................................................................... 6 Data quality issues and how they are being addressed ................................................................ 6 Assessment results ........................................................................................................................ 6 2.2 Significant changes since last report ................................................................................ 7
3 Impacts on the national stock ....................................................................................................... 8 3.1 Fisheries ........................................................................................................................... 8 3.1.1 Glass eel fisheries ............................................................................................................. 8 3.1.2 Yellow eel fisheries .......................................................................................................... 8 3.1.3 Silver eel fisheries ............................................................................................................ 8 3.2 Restocking ...................................................................................................................... 11 3.3 Aquaculture ................................................................................................................... 12 3.4 Entrainment ................................................................................................................... 12 3.5 Habitat Quantity and Quality ......................................................................................... 13 3.6 Other impacts ................................................................................................................ 14 3.6.1 Predation ....................................................................................................................... 14
4 National stock assessment .......................................................................................................... 15 4.1 Description of Method ................................................................................................... 15 4.1.1 Data collection ............................................................................................................... 15 4.1.2 Analysis .......................................................................................................................... 16 4.1.3 Reporting ....................................................................................................................... 16 4.1.4 Data quality issues and how they are being addressed ................................................. 17 4.2 Trends in Assessment results ......................................................................................... 17
5 Other data collection for eel ....................................................................................................... 18 5.1 Yellow eel abundance surveys ....................................................................................... 18 5.2 Silver eel escapement surveys ....................................................................................... 18 5.2.1 Eel tagging programme in the Baltic Sea ....................................................................... 18 5.3 Life-history parameters .................................................................................................. 22 5.4 Diseases, Parasites & Pathogens or Contaminants ........................................................ 23 5.4.1 Parasites & Pathogens ................................................................................................... 23 5.4.2 Contaminants ................................................................................................................. 27
6 New Information ......................................................................................................................... 28 7 References ................................................................................................................................... 29
II | ICES SCIENTIFIC REPORTS 2:85 | ICES
Report on the eel stock, fishery and other impacts in Sweden, 2019–2020
Authors
Dr Josefin Sundin, Swedish University of Agricultural Sciences, Department of Aquatic Sciences, Institute of Freshwater Research, Drottningholm, Sweden.
Tel: +46-761317908. FAX: +46-104784269 [email protected]
Dr Willem Dekker, Swedish University of Agricultural Sciences, Department of Aquatic Sci-ences, Institute of Freshwater Research, Drottningholm, Sweden.
Tel: +46-761268136. FAX: +46-104784269 [email protected]
Dr Andreas Bryhn, Swedish University of Agricultural Sciences, Department of Aquatic Re-sources, Institute of Coastal Research, Öregrund, Sweden.
Tel: +46-104784152 [email protected]
Dr Håkan Wickström, Swedish University of Agricultural Sciences, Department of Aquatic Sci-ences, Institute of Freshwater Research, Drottningholm, Sweden.
Tel: +46-761268134. FAX: +46-104784269 [email protected]
Dr Niklas B. Sjöberg, Swedish University of Agricultural Sciences, Department of Aquatic Sci-ences, Institute of Freshwater Research, Drottningholm, Sweden.
Tel: +46-104784244. FAX: +46-104784269 [email protected]
Reporting Period: This report was completed in September 2020 and contains data up to 2019 and some provisional data for 2020.
Acknowledgments: Richard Fordham at Scandinavian Silver Eel AB kindly provided data on the aquaculture production and on restocking.
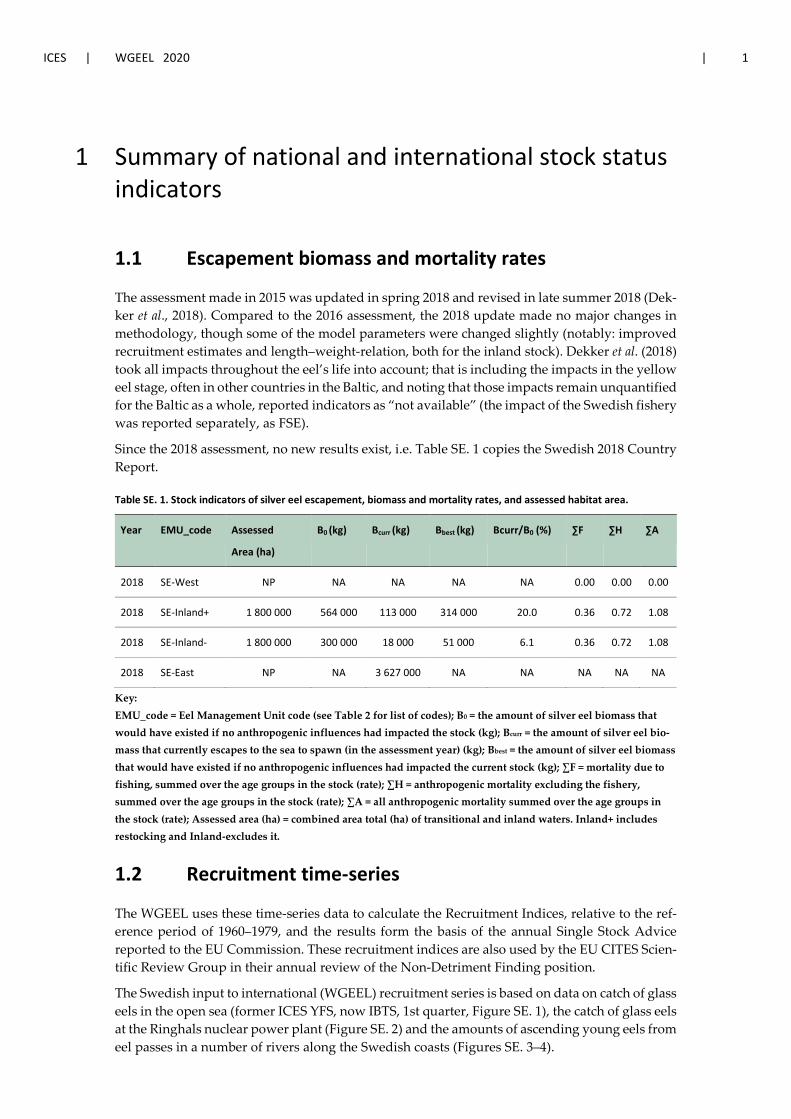
ICES | WGEEL 2020 | 1
1 Summary of national and international stock status indicators
1.1 Escapement biomass and mortality rates
The assessment made in 2015 was updated in spring 2018 and revised in late summer 2018 (Dek-ker et al., 2018). Compared to the 2016 assessment, the 2018 update made no major changes in methodology, though some of the model parameters were changed slightly (notably: improved recruitment estimates and length–weight-relation, both for the inland stock). Dekker et al. (2018) took all impacts throughout the eel’s life into account; that is including the impacts in the yellow eel stage, often in other countries in the Baltic, and noting that those impacts remain unquantified for the Baltic as a whole, reported indicators as “not available” (the impact of the Swedish fishery was reported separately, as FSE).
Since the 2018 assessment, no new results exist, i.e. Table SE. 1 copies the Swedish 2018 Country Report.
Table SE. 1. Stock indicators of silver eel escapement, biomass and mortality rates, and assessed habitat area.
Year EMU_code Assessed
Area (ha)
B0 (kg) Bcurr (kg) Bbest (kg) Bcurr/B0 (%) ∑F ∑H ∑A
2018 SE-West NP NA NA NA NA 0.00 0.00 0.00
2018 SE-Inland+ 1 800 000 564 000 113 000 314 000 20.0 0.36 0.72 1.08
2018 SE-Inland- 1 800 000 300 000 18 000 51 000 6.1 0.36 0.72 1.08
2018 SE-East NP NA 3 627 000 NA NA NA NA NA
Key: EMU_code = Eel Management Unit code (see Table 2 for list of codes); B0 = the amount of silver eel biomass that would have existed if no anthropogenic influences had impacted the stock (kg); Bcurr = the amount of silver eel bio-mass that currently escapes to the sea to spawn (in the assessment year) (kg); Bbest = the amount of silver eel biomass that would have existed if no anthropogenic influences had impacted the current stock (kg); ∑F = mortality due to fishing, summed over the age groups in the stock (rate); ∑H = anthropogenic mortality excluding the fishery, summed over the age groups in the stock (rate); ∑A = all anthropogenic mortality summed over the age groups in the stock (rate); Assessed area (ha) = combined area total (ha) of transitional and inland waters. Inland+ includes restocking and Inland-excludes it.
1.2 Recruitment time-series
The WGEEL uses these time-series data to calculate the Recruitment Indices, relative to the ref-erence period of 1960–1979, and the results form the basis of the annual Single Stock Advice reported to the EU Commission. These recruitment indices are also used by the EU CITES Scien-tific Review Group in their annual review of the Non-Detriment Finding position.
The Swedish input to international (WGEEL) recruitment series is based on data on catch of glass eels in the open sea (former ICES YFS, now IBTS, 1st quarter, Figure SE. 1), the catch of glass eels at the Ringhals nuclear power plant (Figure SE. 2) and the amounts of ascending young eels from eel passes in a number of rivers along the Swedish coasts (Figures SE. 3–4).
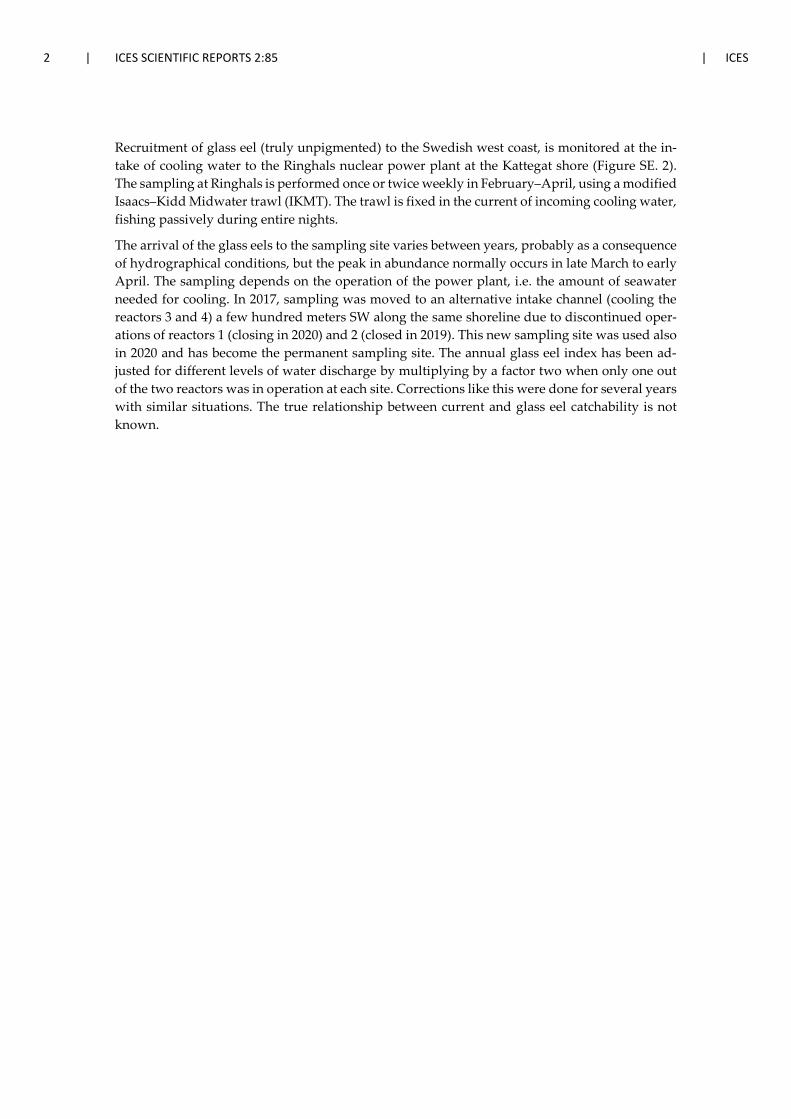
2 | ICES SCIENTIFIC REPORTS 2:85 | ICES
Recruitment of glass eel (truly unpigmented) to the Swedish west coast, is monitored at the in-take of cooling water to the Ringhals nuclear power plant at the Kattegat shore (Figure SE. 2). The sampling at Ringhals is performed once or twice weekly in February–April, using a modified Isaacs–Kidd Midwater trawl (IKMT). The trawl is fixed in the current of incoming cooling water, fishing passively during entire nights.
The arrival of the glass eels to the sampling site varies between years, probably as a consequence of hydrographical conditions, but the peak in abundance normally occurs in late March to early April. The sampling depends on the operation of the power plant, i.e. the amount of seawater needed for cooling. In 2017, sampling was moved to an alternative intake channel (cooling the reactors 3 and 4) a few hundred meters SW along the same shoreline due to discontinued oper-ations of reactors 1 (closing in 2020) and 2 (closed in 2019). This new sampling site was used also in 2020 and has become the permanent sampling site. The annual glass eel index has been ad-justed for different levels of water discharge by multiplying by a factor two when only one out of the two reactors was in operation at each site. Corrections like this were done for several years with similar situations. The true relationship between current and glass eel catchability is not known.
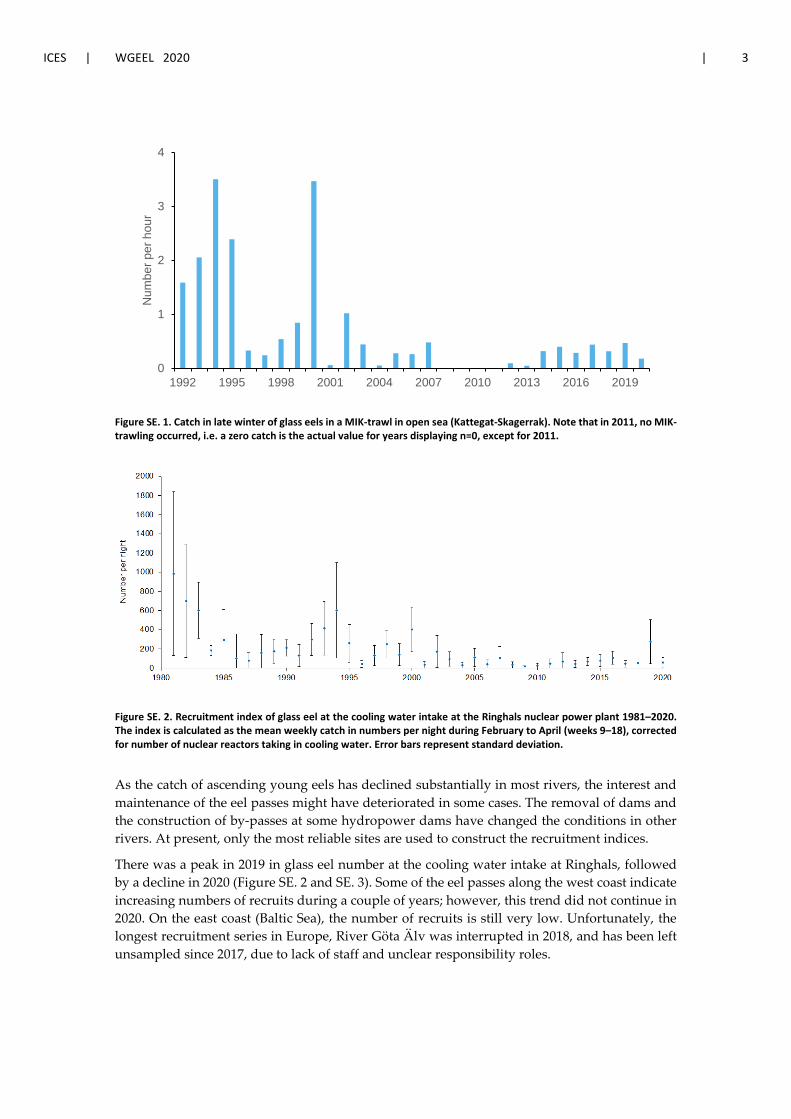
ICES | WGEEL 2020 | 3
Figure SE. 1. Catch in late winter of glass eels in a MIK-trawl in open sea (Kattegat-Skagerrak). Note that in 2011, no MIK-trawling occurred, i.e. a zero catch is the actual value for years displaying n=0, except for 2011.
Figure SE. 2. Recruitment index of glass eel at the cooling water intake at the Ringhals nuclear power plant 1981–2020. The index is calculated as the mean weekly catch in numbers per night during February to April (weeks 9–18), corrected for number of nuclear reactors taking in cooling water. Error bars represent standard deviation.
As the catch of ascending young eels has declined substantially in most rivers, the interest and maintenance of the eel passes might have deteriorated in some cases. The removal of dams and the construction of by-passes at some hydropower dams have changed the conditions in other rivers. At present, only the most reliable sites are used to construct the recruitment indices.
There was a peak in 2019 in glass eel number at the cooling water intake at Ringhals, followed by a decline in 2020 (Figure SE. 2 and SE. 3). Some of the eel passes along the west coast indicate increasing numbers of recruits during a couple of years; however, this trend did not continue in 2020. On the east coast (Baltic Sea), the number of recruits is still very low. Unfortunately, the longest recruitment series in Europe, River Göta Älv was interrupted in 2018, and has been left unsampled since 2017, due to lack of staff and unclear responsibility roles.
0
1
2
3
4
1992 1995 1998 2001 2004 2007 2010 2013 2016 2019
Num
ber p
er h
our

4 | ICES SCIENTIFIC REPORTS 2:85 | ICES
Figure SE. 3. Recruitment of young eels in eight rivers (relative to the average for 1971–1980, except for River Kävlingeån that relates to 2002–2011) from 1900–2019.
Figure SE. 4. Recruitment of young eels in eight rivers (relative to the average for 1971–1980, except for River Kävlingeån that relates to 2002–2011). Same data as above in Figure SE 3, but reduced to 1960–2019 to show recent years more clearly.
To increase and improve the recruitment monitoring programmes, young-of-the-year elvers could be monitored along the west coast at stations that operate independently from dam owners or similar. So far, no such monitoring programme has been implemented. There is, however, an ongoing extensive electro-fishing program. This programme is being run in streams and small rivers and is financed from several different sources. The target species are normally salmonids such as salmon and trout, but when eels are caught, data are collected also for this species. In addition, 15 sites are specifically electrofished for eels. All data are stored in the national database SERS, and it could be used for analyses on recruitment and abundance of mainly yellow eels in freshwater systems.
0
500
1,000
1,500
2,000
2,500
0
500
1,000
1,500
1900 1920 1940 1960 1980 2000 2020 % o
f the
197
1-19
80 m
ean
(Mot
ala
strö
m)
% o
f the
197
1-19
80 m
ean
Göta Älv Dalälven Viskan Lagan
Mörrumsån Rönneå Kävlingeån Aritmetic mean
Geometric mean Motala Ström
0
500
1,000
0
400
800
1960 1980 2000 2020
% o
f the
197
1-19
80 m
ean
(Mot
ala
strö
m)
% o
f the
197
1-19
80 m
ean
Göta Älv Dalälven Viskan Lagan
Mörrumsån Rönneå Kävlingeån Aritmetic mean
Geometric mean Motala Ström
ICES | WGEEL 2020 | 5
2 Overview of the national stock and its management
2.1 Describe the eel stock and its management
2.1.1 EMUs, EMPs
Sweden has one Eel Management Plan (EMP), covering the entire country, including the moun-tain region in the north and northwest where eels factually do not occur anymore. However, for various reasons, assessments are made for three separate regions, i.e. there are three Eel Man-agement Units (EMU), namely the west coast (SE-West), Baltic (SE-East) and the Inland (SE-In-land). Data, habitats and management measures differ fundamentally between the regions.
Two ecoregions are concerned, namely the North Sea and the Baltic Sea. However, the fishery for eels along the Swedish west coast north of Torekov, in the North Sea area, was closed in spring 2012. Öresund is the strait between Sweden and Denmark where most silver eels from the Baltic Sea have to pass when leaving for the North Sea and the Atlantic Ocean. Öresund is de-fined as part of the Baltic Sea in this report and by all relevant eel advice and management au-thorities.
In the Baltic Sea, there are two main types of eel fisheries. One is the traditional fishery with fixed traps (poundnets) along the “Eel Coast” in the southernmost county Scania, where silver eels are the target species. The other type of fishery also uses large poundnets, but targets several species including cod, perch, pike, flounder, etc. depending on the site and abundance of different spe-cies. Fykenets of different sizes are also used at several sites.
Finally, there are eel fisheries in a number (ca. 20) of inland lakes. The major part of eel landings today are from lakes Mälaren, Vänern and Hjälmaren. The lake fisheries are also mainly main-tained using poundnets and target additional species to eels.
2.1.2 Management authorities
The fish stocks and the fisheries are managed by the governmental agency, Swedish Agency for Marine and Water Management, SwAM. Data and advice for management use are mainly given by the Department of Aquatic Resources at the Swedish University of Agricultural Sciences (SLU Aqua).
2.1.3 Regulations
The fishery for eels has been regulated in several different ways since 2007, e.g. through a man-datory eel fishing licence, an increased minimum legal size, effort restrictions in time and num-ber of fishing gears, and an upper limit in total catch per licence. No new licences are issued, and thus the number of licensed fishers is steadily decreasing. As previously mentioned, since spring 2012, eel fishing on the west coast has been completely closed (north of Torekov, 56°25’, in the Kattegat). South of Torekov and in the Baltic Sea the fishing is limited to the period May 1–September 14, or an individually determined period of 90 consecutive days. In the part of Katte-gat just north of Öresund this determined period is restricted to 60 days. In freshwater, eel fishing is allowed for licensed fishers during 120 individually determined days.
6 | ICES SCIENTIFIC REPORTS 2:85 | ICES
Since, 2017, the EU Ministerial Council has taken annual decisions on a three-month fishing clo-sure in Swedish and other marine waters in the EU. The moratorium should cover three consec-utive months. According to the 2019 decision, the three-month closure should be placed within August 1, 2020 and February 28, 2021. SwAM decided to keep a November–January closure, similar to previous years.
2.1.4 Management actions
The Swedish EMP is an adaptive plan where a restricted fishery is one management action among others; the aim of the EMP is to reduce anthropogenic impacts to a level that will allow the stock to recover. Stocking is another action, where the target was to double the previous amounts of pre-grown elvers to about 2.5 million individuals stocked annually. An improved escapement of silver eels at hydropower plants is also a management measure in the EMP as well as an improved control of the fishery.
The stocking target was reached within a few years and has been reached for the majority of years. Trap and Transport (T&T) of silver eels from upstream to downstream sites in rivers has been implemented, but a few hydropower plants have also been reconstructed to allow down-stream migration of silver eels. Within the T&T-program, approximately 119 000 kg silver eels were transported downstream by road between 2013 and 2019. T&T will continue as one meas-ure to decrease eel mortalities due to hydropower exploitation.
2.1.5 Local stock assessment
Assessments of the local stock can be found in Dekker (2012; 2015) and Dekker et al. (2018). The assessments are broken down along geographical lines since most anthropogenic impacts differ between geographical areas. This division also consider the differences in impacts, resulting in four blocks, with little interaction in between (inland waters and coastal areas are contrasted and west coast vs. Baltic coast (east and south)). These blocks are described in detail in the Swedish Country Report 2018.
Reporting Selected results from Swedish eel studies were reported to the EU as requested in 2012, 2015 and 2018. This was done by the responsible agency, SwAM, based on an assessment report published by our department report series Aqua reports (e.g. Dekker, 2012; Dekker, 2015; Dekker et al., 2018). Additionally, relevant data are used for scientific papers (see reference list below). Selected data and results are also reported to ICES and WGEEL when appropriate.
Data quality issues and how they are being addressed The assessments reported in Dekker (2015) make use of extensive data on recruitment, elver transport, restocking, landings, age and growth, hydropower installations, river geography, and more; covering an extended geographical area, over a period of many decades. The 2018 assess-ment was essentially a repetition of the 2015 assessment with a few more years of data (Dekker et al., 2018).
For the west coast, no assessment was produced in 2015. Historical data have been compiled, (re)-checked and analysed (Magnusson and Dekker, accepted).
Assessment results No new assessments have been made since 2018. We refer to the Swedish 2018 Country Report for the latest assessment results. For the inland waters, Figures SE. 5 and 6 present the assessed trends in eel production (Figure SE. 5) and impacts (Figure SE. 6).
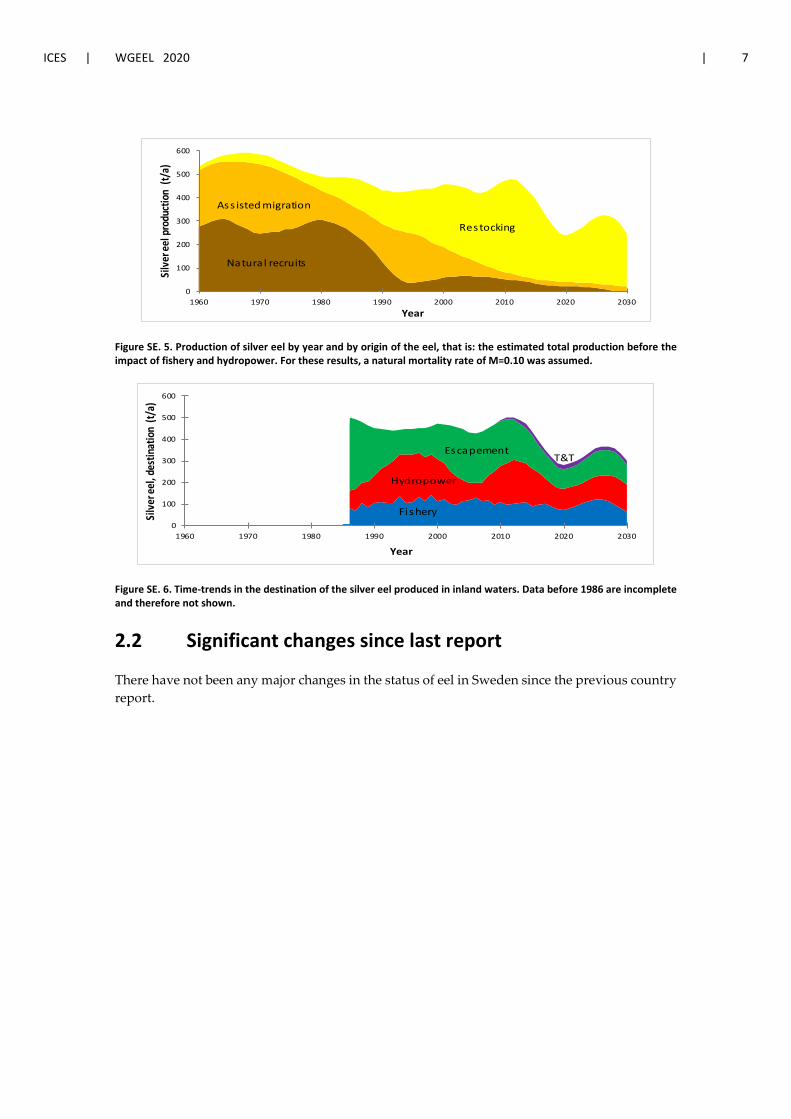
ICES | WGEEL 2020 | 7
Figure SE. 5. Production of silver eel by year and by origin of the eel, that is: the estimated total production before the impact of fishery and hydropower. For these results, a natural mortality rate of M=0.10 was assumed.
Figure SE. 6. Time-trends in the destination of the silver eel produced in inland waters. Data before 1986 are incomplete and therefore not shown.
2.2 Significant changes since last report
There have not been any major changes in the status of eel in Sweden since the previous country report.
0
100
200
300
400
500
600
1960 1970 1980 1990 2000 2010 2020 2030
Silv
er ee
l pro
duct
ion
(t/a)
Year
Natura l recruits
Ass isted migration
Restocking
0
100
200
300
400
500
600
1960 1970 1980 1990 2000 2010 2020 2030
Silv
er ee
l, de
stin
atio
n (t/
a)
Year
Fishery
Hydropower
EscapementT&T

8 | ICES SCIENTIFIC REPORTS 2:85 | ICES
3 Impacts on the national stock
3.1 Fisheries
3.1.1 Glass eel fisheries
NP; there is no fishery for glass eels in Sweden. The reasons are twofold as there has never been any local demand for such small eels, and the fact that high minimum legal size (700 mm) pre-clude fishing for glass eels.
3.1.2 Yellow eel fisheries
Most eels fished today are silver eels or “half-silver”, i.e. close to the silver stage. The minimum legal size of 700 mm may be the explanation to why no or few yellow eels are fished. Since the fishery almost exclusively targets silver eel, no separate samples are taken of yellow eel. Data from mixed samples of yellow and silver eel, representative for the catch, are presented below in Section 3.1.3.
3.1.3 Silver eel fisheries
As detailed above in Section 3.1.2, most eels fished in Sweden are silver eels or close to the silver stage. The coastal fishery is limited to the east and south coast (the Baltic Sea), and the west coast south of 56°25’ (Öresund and the southernmost part of the Kattegat). In 2019, the Swedish coastal fisheries had a record low total catch of 84 tonnes, out of which 71 tonnes were caught in the Baltic Proper (Figure SE. 7–8). The freshwater catch for 2019 was 88,5 tonnes (Figure SE. 9), i.e. together with the brackish/marine fisheries the total Swedish catch for 2019 was 172,5 tonnes. The catch per unit of effort (CPUE) in two monitored coastal fisheries of the Baltic Sea has been quite stable in recent years, in particular in southern Östergötland (Figure SE. 10).
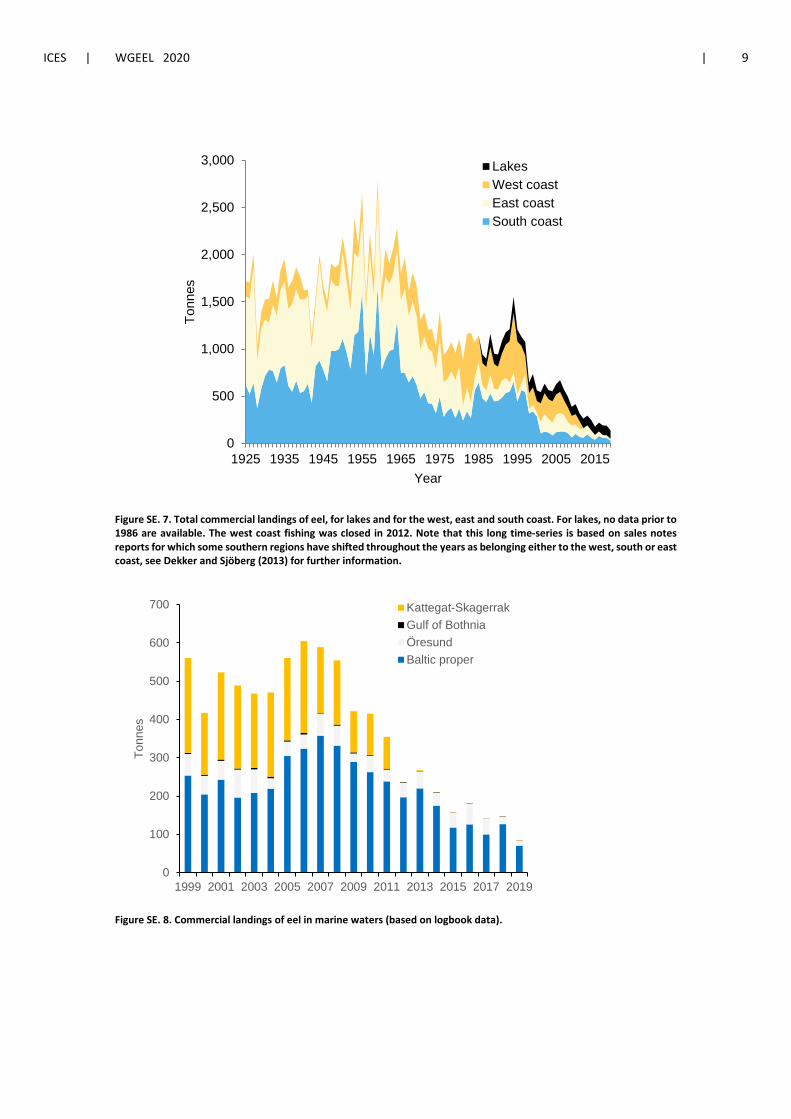
ICES | WGEEL 2020 | 9
Figure SE. 7. Total commercial landings of eel, for lakes and for the west, east and south coast. For lakes, no data prior to 1986 are available. The west coast fishing was closed in 2012. Note that this long time-series is based on sales notes reports for which some southern regions have shifted throughout the years as belonging either to the west, south or east coast, see Dekker and Sjöberg (2013) for further information.
Figure SE. 8. Commercial landings of eel in marine waters (based on logbook data).
0
500
1,000
1,500
2,000
2,500
3,000
1925 1935 1945 1955 1965 1975 1985 1995 2005 2015
Tonn
es
Year
LakesWest coastEast coastSouth coast
0
100
200
300
400
500
600
700
1999 2001 2003 2005 2007 2009 2011 2013 2015 2017 2019
Tonn
es
Kattegat-SkagerrakGulf of BothniaÖresundBaltic proper
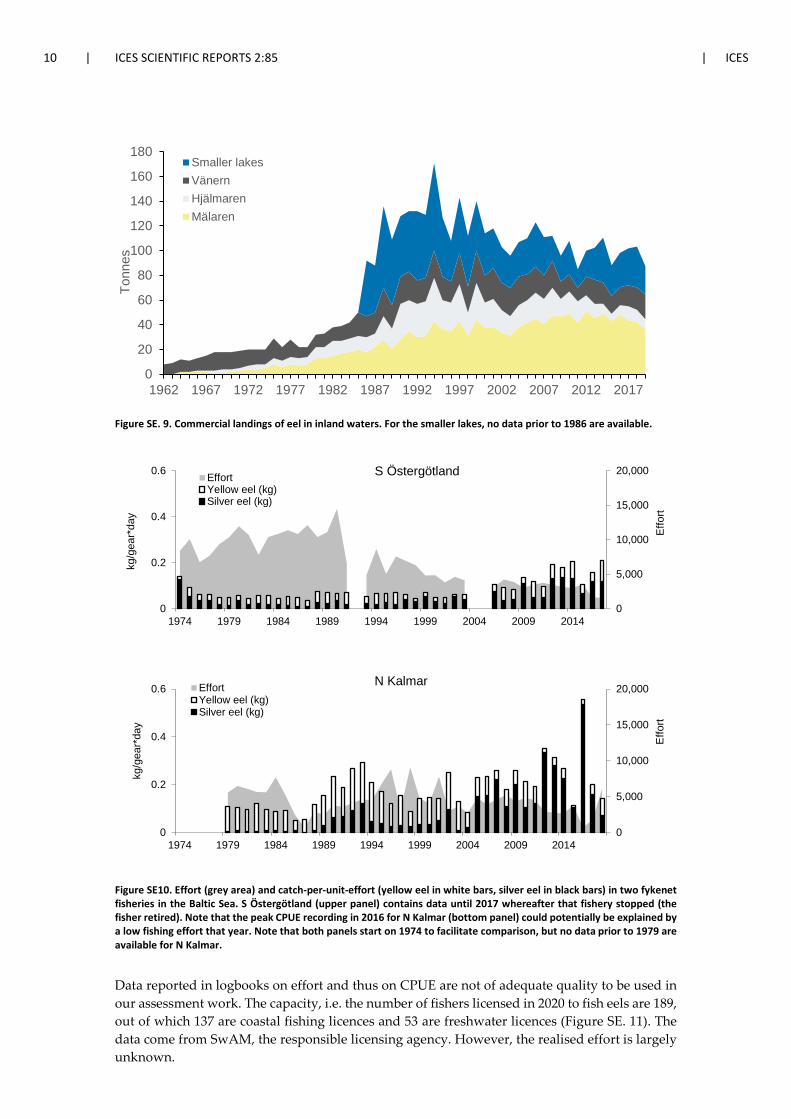
10 | ICES SCIENTIFIC REPORTS 2:85 | ICES
Figure SE. 9. Commercial landings of eel in inland waters. For the smaller lakes, no data prior to 1986 are available.
Figure SE10. Effort (grey area) and catch-per-unit-effort (yellow eel in white bars, silver eel in black bars) in two fykenet fisheries in the Baltic Sea. S Östergötland (upper panel) contains data until 2017 whereafter that fishery stopped (the fisher retired). Note that the peak CPUE recording in 2016 for N Kalmar (bottom panel) could potentially be explained by a low fishing effort that year. Note that both panels start on 1974 to facilitate comparison, but no data prior to 1979 are available for N Kalmar.
Data reported in logbooks on effort and thus on CPUE are not of adequate quality to be used in our assessment work. The capacity, i.e. the number of fishers licensed in 2020 to fish eels are 189, out of which 137 are coastal fishing licences and 53 are freshwater licences (Figure SE. 11). The data come from SwAM, the responsible licensing agency. However, the realised effort is largely unknown.
0
20
40
60
80
100
120
140
160
180
1962 1967 1972 1977 1982 1987 1992 1997 2002 2007 2012 2017
Tonn
es
Smaller lakesVänernHjälmarenMälaren
0
5,000
10,000
15,000
20,000
0
0.2
0.4
0.6
1974 1979 1984 1989 1994 1999 2004 2009 2014
Effo
rt
kg/g
ear*
day
S ÖstergötlandEffortYellow eel (kg)Silver eel (kg)
0
5,000
10,000
15,000
20,000
0
0.2
0.4
0.6
1974 1979 1984 1989 1994 1999 2004 2009 2014
Effo
rt
kg/g
ear*
day
N KalmarEffortYellow eel (kg)Silver eel (kg)
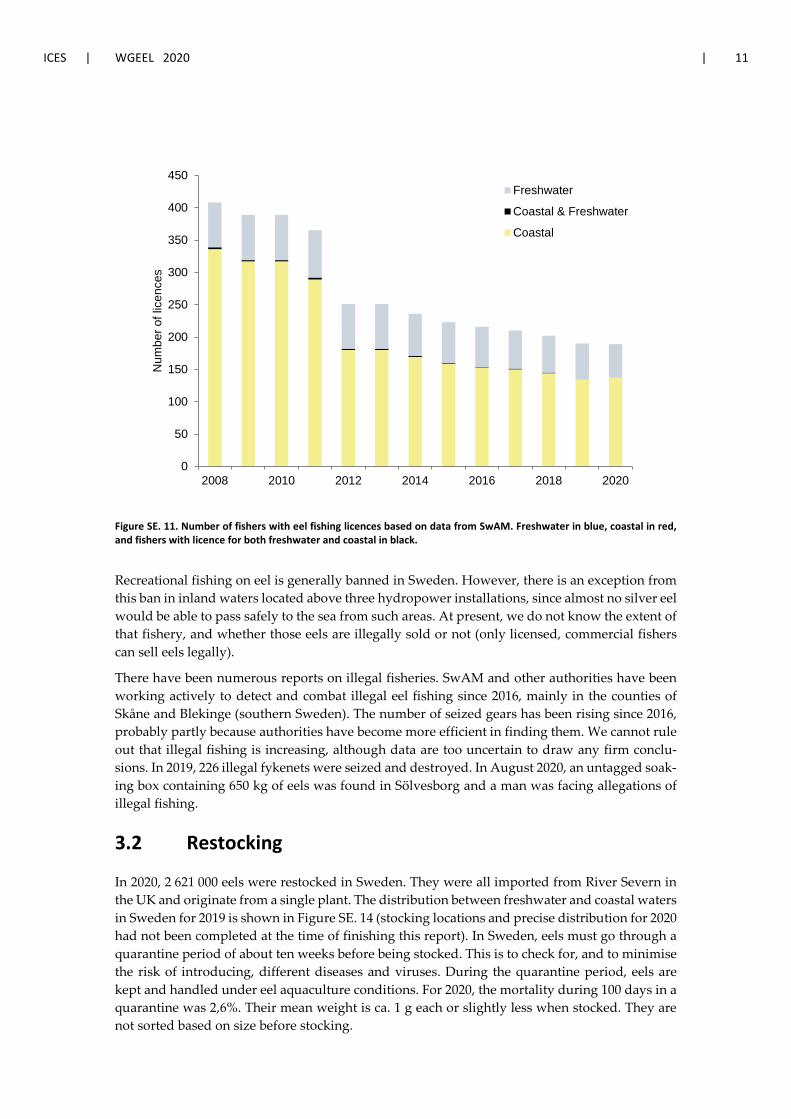
ICES | WGEEL 2020 | 11
Figure SE. 11. Number of fishers with eel fishing licences based on data from SwAM. Freshwater in blue, coastal in red, and fishers with licence for both freshwater and coastal in black.
Recreational fishing on eel is generally banned in Sweden. However, there is an exception from this ban in inland waters located above three hydropower installations, since almost no silver eel would be able to pass safely to the sea from such areas. At present, we do not know the extent of that fishery, and whether those eels are illegally sold or not (only licensed, commercial fishers can sell eels legally).
There have been numerous reports on illegal fisheries. SwAM and other authorities have been working actively to detect and combat illegal eel fishing since 2016, mainly in the counties of Skåne and Blekinge (southern Sweden). The number of seized gears has been rising since 2016, probably partly because authorities have become more efficient in finding them. We cannot rule out that illegal fishing is increasing, although data are too uncertain to draw any firm conclu-sions. In 2019, 226 illegal fykenets were seized and destroyed. In August 2020, an untagged soak-ing box containing 650 kg of eels was found in Sölvesborg and a man was facing allegations of illegal fishing.
3.2 Restocking
In 2020, 2 621 000 eels were restocked in Sweden. They were all imported from River Severn in the UK and originate from a single plant. The distribution between freshwater and coastal waters in Sweden for 2019 is shown in Figure SE. 14 (stocking locations and precise distribution for 2020 had not been completed at the time of finishing this report). In Sweden, eels must go through a quarantine period of about ten weeks before being stocked. This is to check for, and to minimise the risk of introducing, different diseases and viruses. During the quarantine period, eels are kept and handled under eel aquaculture conditions. For 2020, the mortality during 100 days in a quarantine was 2,6%. Their mean weight is ca. 1 g each or slightly less when stocked. They are not sorted based on size before stocking.
0
50
100
150
200
250
300
350
400
450
2008 2010 2012 2014 2016 2018 2020
Num
ber o
f lic
ence
s
Freshwater
Coastal & Freshwater
Coastal
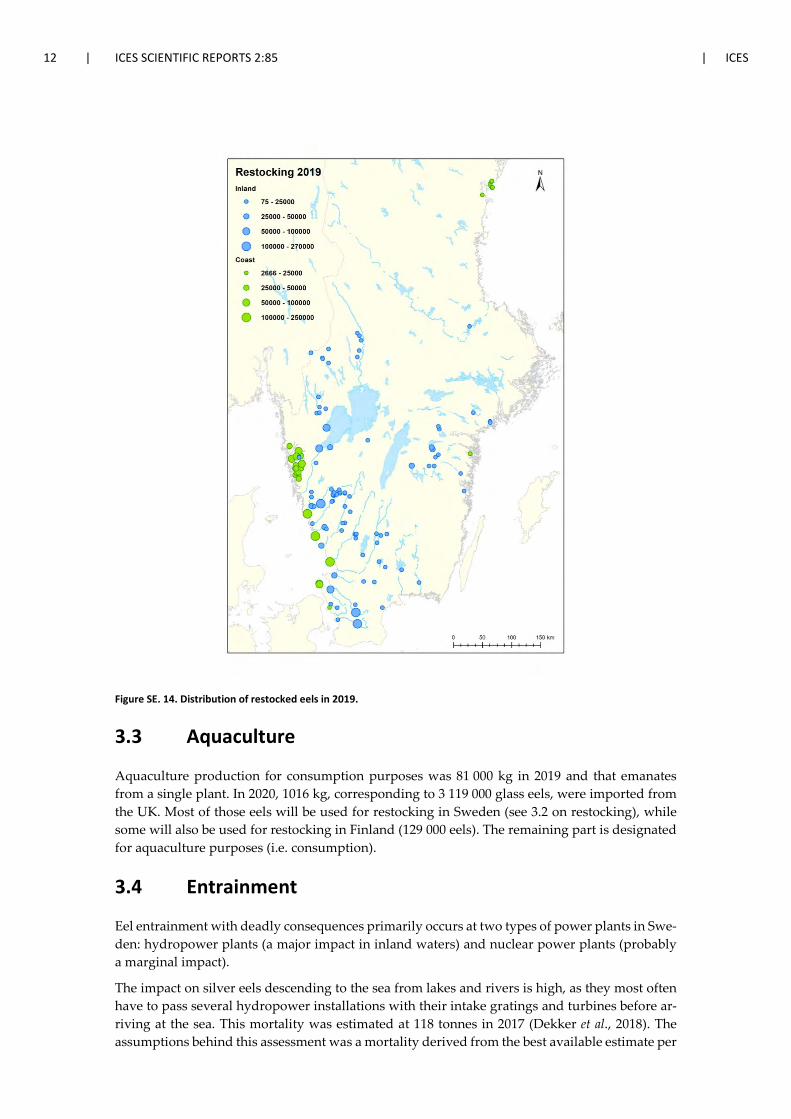
12 | ICES SCIENTIFIC REPORTS 2:85 | ICES
Figure SE. 14. Distribution of restocked eels in 2019.
3.3 Aquaculture
Aquaculture production for consumption purposes was 81 000 kg in 2019 and that emanates from a single plant. In 2020, 1016 kg, corresponding to 3 119 000 glass eels, were imported from the UK. Most of those eels will be used for restocking in Sweden (see 3.2 on restocking), while some will also be used for restocking in Finland (129 000 eels). The remaining part is designated for aquaculture purposes (i.e. consumption).
3.4 Entrainment
Eel entrainment with deadly consequences primarily occurs at two types of power plants in Swe-den: hydropower plants (a major impact in inland waters) and nuclear power plants (probably a marginal impact).
The impact on silver eels descending to the sea from lakes and rivers is high, as they most often have to pass several hydropower installations with their intake gratings and turbines before ar-riving at the sea. This mortality was estimated at 118 tonnes in 2017 (Dekker et al., 2018). The assumptions behind this assessment was a mortality derived from the best available estimate per

ICES | WGEEL 2020 | 13
individual turbine passage of silver eels that were modelled to have been produced upstream based on natural recruitment and stocking. As there are several turbines to pass in most rivers, the accumulated mortality is quite high and is of the same magnitude as the commercial fishery for eels in freshwater, or higher (Dekker, 2015; Dekker et al., 2018). Uncertainty in the average impact per hydropower station hardly affects this, due to the high number of hydropower sta-tions to pass (Dekker et al., 2018).
Sweden has three nuclear power plants by the sea (Ringhals, Forsmark and Simpevarp) which use seawater for cooling. During this process, eels and other fishes are entrained into or im-pinged in the cooling water intake or circuit. At the Ringhals nuclear power plant on the Swedish west coast, many glass eels (albeit an unknown number per time unit) pass through the whole cooling system and their mortality has been estimated to 13.4%; which is low compared to other juvenile fishes (Bryhn et al., 2014). Larger eels (mainly yellow eels) are also entrained at this nu-clear power plant, which has a fish diversion system, and the mortality for larger eels has been estimated to about 14% (Bryhn et al., 2013). However, the absolute number of eel entrainment at Ringhals has not been systematically investigated. The remaining two nuclear power stations (Forsmark and Simpevarp) are located on the east coast and they do not entrain or impinge glass eel since glass eels do not occur there. However, yellow and silver eels have about 100% mortality at entrainment as they die in the sieving stations (Bryhn et al., 2013). It has been estimated that 1900 individuals died in 2010 and 1200 died in 2011 at the Forsmark nuclear power plant (Bryhn et al., 2013). At Forsmark, the greatest eel loss occurs in autumn. In autumn 2020, the power company will collect eels in the sieving station before they are killed. Almost all of these eels are silvers, based on previous statistics. Subsequently, the eels will be transported alive by SLU and released into the sea at Hargshamn, some 30 km south of Forsmark and its cooling water intake. The collection and release procedure will be evaluated later. The eel loss at the Simpevarp nu-clear power plant has not been systematically investigated. The entrainment monitoring at Sim-pevarp was discontinued, when the plant operator started to draw cooling water from the deeper and colder coastal hypolimnion where fish (but not necessarily eel) abundance might be lower than at the surface, from where cooling water was previously taken.
3.5 Habitat Quantity and Quality
There are numerous large and small lakes and rivers well suited for eel production in Sweden. The low numbers of recruits and restricted restocking, in combination with migration obstacles like dams and hydropower turbines, are the limiting factors of today, not lack of wetted areas as such. Historical habitat decreases in inland waters have most likely been substantial, but have not been quantified.
Many eels in Sweden spend most of their lives in coastal waters and their habitats are generally of high quality (Andersson et al., 2019), although the shoreline in many places been drastically altered by anthropogenic disturbance, for example leading to habitat loss (Baden et al., 2003). The shoreline is also altered by anthropogenic constructions (e.g. harbours, jetties, bridges, etc.). However, such habitat change is believed to constrain the eel habitat area to a much lesser extent than historical habitat changes in inland areas, e.g. due to construction of hydropower dams and historical lowering of lakes and drainage of wetlands to create agricultural land.
14 | ICES SCIENTIFIC REPORTS 2:85 | ICES
3.6 Other impacts
3.6.1 Predation
Predation by cormorants (Phalacrocorax carbo sinensis) as well as by grey seals and harbour seals (Halichoerus grypus and Phoca vitulina) have been suggested as possible major causes of eel mor-tality in Sweden, however results are not congruent (Engström, 2001; Lundström et al., 2010; Östman et al., 2012; 2013; Hansson et al., 2017; Ovegård et al., 2017). Ongoing studies suggest that eel is one of the species that risks being underestimated in diet analyses, since the otoliths erode fast. Using DNA sampling, in addition to the traditional diet analysis, might provide data of higher quality regarding species composition (personal communication, Karl Lundström, SLU Aqua).
ICES | WGEEL 2020 | 15
4 National stock assessment
4.1 Description of Method
There are several eel projects running, both in freshwater and in the brackish/marine environ-ment. In freshwater and coastal waters, the collection of silver eels from the commercial fishery is a major part of Sweden’s EU MAP programme. In addition, recruitment is monitored through electrofishing in small rivers and streams as well as counting ascending young eels caught in eel passes. As part of the recruitment studies a number of eels are chemically analysed for their origin, being naturally recruited or stocked (Wickström and Sjöberg, 2013). The basis for this latter project is that all stocked eels since 2009 are marked with strontium, which makes clear marks in their otoliths. The analysis rationale is that if the stocked eels have high survival and stay where they have been released, they will be rather abundant and would hence most likely bias some of our (natural) recruitment series used for indices, both at a national and international level. So far, very few of the ascending recruits were of stocked origin. This marking project also facilitates evaluation of the restocking programme.
All sampled eels (from glass eels to larger) are analysed with respect to length, weight, stage, prevalence and intensity of Anguillicola crassus, and sex (sex is only determined in eels larger than 250 mm). A subset of eels are also aged.
Fat is measured occasionally (only on eel sampled alive and usually done when tagging) with a Fish Fatmeter (model FFM-992). Fecundity is usually not estimated, but some results and com-parisons between different stocks, were given by MacNamara et al. (2016).
To assess the fishing mortality of silver eels leaving the Baltic Sea a mark–recapture programme running since the early 1900s, was restarted in 2012, mostly using eels caught by fishers fishing on the coast. More information about this programme is presented under 5.2.1.
As prescribed in EU MAP there should be at least one designated index river in each EMU. In 2018, River Kävlingeån in Skåne in southern Sweden was chosen as suitable for this purpose as we have data on recruitment and fisheries in this drainage system. To facilitate monitoring of descending silver eels an existing Wolf trap was repaired and a fish counter with camera was installed during early 2019. In 2020, a PIT-tag antenna has been installed with the purpose of validating the fish counter.
In Lake Bolmen, a small project is running in 2018–2021, aimed at understanding why the pro-duction of silver eels from this lake does not match our model predictions. Growth and the prev-alence of Anguillicola crassus are the main parameters studied.
4.1.1 Data collection
In ICES subdivisions (SD) 23 (Öresund), 25 and 27 (Baltic Proper), 200 silver eel samples have previously been bought from the poundnet fishery. SD 24 no longer has any commercial fishery and SD 23 was not sampled in 2019 due to financial constraints, and difficulties in finding fishers. Length is measured, and at least five eels from each cm class are weighed and aged. Total weight of landings and discards is also registered. The difficulty in finding suitable coastal fishers to collaborate with is due to the declining number of licences. This has prompted us to request further funding to enable fisheries-independent monitoring at ten sites in the Baltic Sea and five sites (i.e. one additional) on the west coast.
16 | ICES SCIENTIFIC REPORTS 2:85 | ICES
In SD 23 (Öresund), fishery-independent sampling of yellow eel and silver eel is also performed, using fykenets. Yellow eels and silver eels are measured by length, but only yellow eels are weighed and aged (at least 200 individuals; a maximum of five from every cm class). Sampling is terminated if/when more than 500 yellow eels have been caught.
The coastal fish communities along the Swedish west coast are monitored by standardized fish-ing with fykenets in shallow water (2–5 m). Fishery-independent sampling of yellow eel and, occasionally (when caught), silver eel is performed in SD 20 (Fjällbacka and Stenungsund in the Skagerrak) and SD 21 (Vendelsöarna in the Kattegat). Sampling is terminated if/when more than 500 yellow eels have been caught. Eels are measured according to length and at least 200 yellow eels (a maximum of five from every cm class) are weighed and aged.
In freshwater, commercially fished eels are sampled annually from three lakes. Which three lakes that will be sampled is alternated every few years in order to cover most of the inland eel fisher-ies. From each lake, 125 eels are randomly sampled over the main fishing season, and then ana-lysed for size, maturity (stage) age, prevalence and intensity of Anguillicola crassus, etc.
From the recruitment monitoring during 2010–2019 (using electro fishing), 988 young eels (out of 2389 in total) were aged, and 620 were analysed for a strontium mark to determine whether the origin was stocked or natural recruit.
4.1.2 Analysis
In order to make stock assessments we use extensive data on recruitment, elver transport, re-stocking, landings, age and growth, hydropower installations, river geography, and more, cov-ering an extended geographical area, over a period of many decades (Dekker et al., 2018).
For the inland waters, yellow and silver eel abundance is predicted from the available infor-mation on recruits (natural, translocated, restocked) forward in time, towards the yellow and silver eel stage (Dekker et al., 2018). No general independent verification on yellow or silver eel data has been made.
For the Baltic coastal fishery, mortality rates were analysed with survival analysis using a cen-tury of mark–recapture data (Dekker and Sjöberg, 2013; Dekker et al., 2018). Stock size (biomass) estimates were derived from the survival analysis results (fishing mortality), in combination with available landings data (Dekker et al., 2018). The quality of the landings data, especially when catch (landings) and estimated fishing mortalities are low, appears to put severe constraints on the credibility of the results. Landings data constituting a census (full coverage of all operations) rather than a survey (statistical sampling) imply that the reliability cannot be quantified. The targeted silver eel stock is derived from a) yellow eel stocks along the Swedish coast, b) Swedish inland waters and c) coastal and inland waters in other countries all over the Baltic area. In order to cross-check the Swedish escapement biomass estimates, a joint assessment of the whole Baltic stock is required (which in itself will be required to develop joint management of this shared stock). A proposal for an international research project to develop this joint assessment has been compiled (Dekker, 2013), but was not prioritised policy-wise.
4.1.3 Reporting
Selected results from Swedish eel studies are reported to the EU as requested in 2012, 2015 and 2018. This is done by the responsible agency SwAM, but the underlying data are also published in our department report series Aqua reports (e.g. Dekker et al., 2018). Relevant data are also used for scientific papers (see the reference list below). In addition, selected data and results are re-ported to ICES and WGEEL when appropriate.
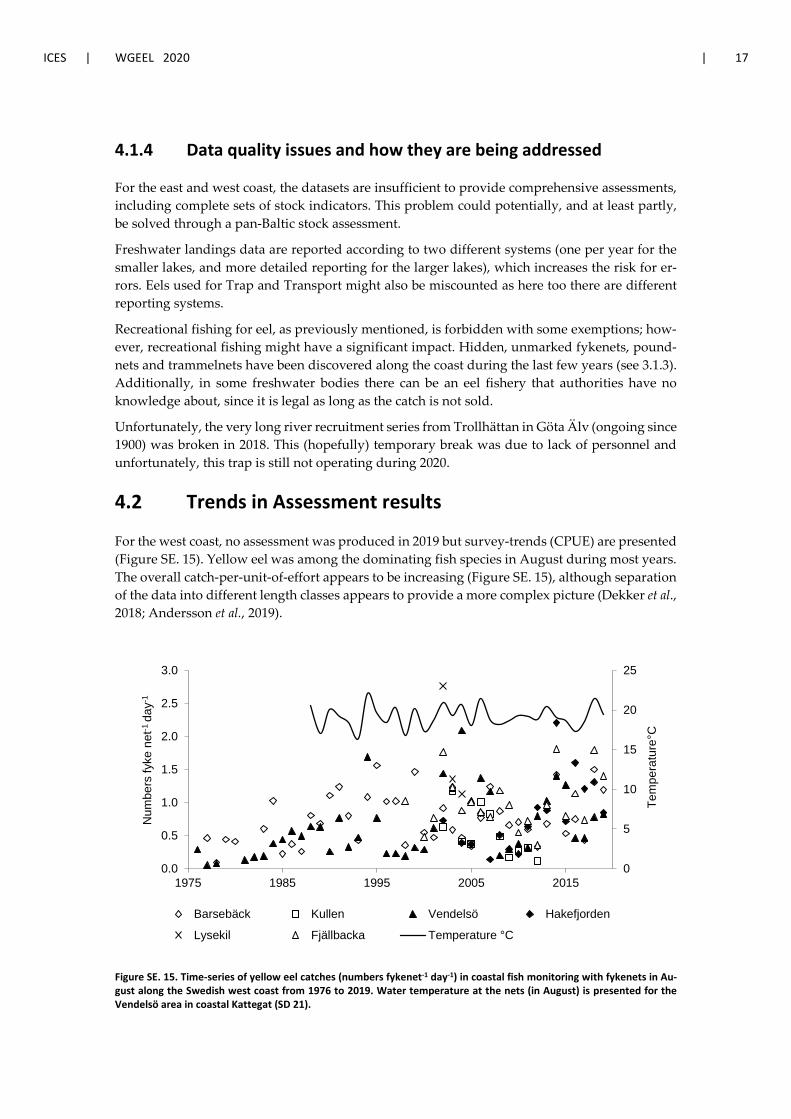
ICES | WGEEL 2020 | 17
4.1.4 Data quality issues and how they are being addressed
For the east and west coast, the datasets are insufficient to provide comprehensive assessments, including complete sets of stock indicators. This problem could potentially, and at least partly, be solved through a pan-Baltic stock assessment.
Freshwater landings data are reported according to two different systems (one per year for the smaller lakes, and more detailed reporting for the larger lakes), which increases the risk for er-rors. Eels used for Trap and Transport might also be miscounted as here too there are different reporting systems.
Recreational fishing for eel, as previously mentioned, is forbidden with some exemptions; how-ever, recreational fishing might have a significant impact. Hidden, unmarked fykenets, pound-nets and trammelnets have been discovered along the coast during the last few years (see 3.1.3). Additionally, in some freshwater bodies there can be an eel fishery that authorities have no knowledge about, since it is legal as long as the catch is not sold.
Unfortunately, the very long river recruitment series from Trollhättan in Göta Älv (ongoing since 1900) was broken in 2018. This (hopefully) temporary break was due to lack of personnel and unfortunately, this trap is still not operating during 2020.
4.2 Trends in Assessment results
For the west coast, no assessment was produced in 2019 but survey-trends (CPUE) are presented (Figure SE. 15). Yellow eel was among the dominating fish species in August during most years. The overall catch-per-unit-of-effort appears to be increasing (Figure SE. 15), although separation of the data into different length classes appears to provide a more complex picture (Dekker et al., 2018; Andersson et al., 2019).
Figure SE. 15. Time-series of yellow eel catches (numbers fykenet-1 day-1) in coastal fish monitoring with fykenets in Au-gust along the Swedish west coast from 1976 to 2019. Water temperature at the nets (in August) is presented for the Vendelsö area in coastal Kattegat (SD 21).
0
5
10
15
20
25
0.0
0.5
1.0
1.5
2.0
2.5
3.0
1975 1985 1995 2005 2015
Tem
pera
ture
°C
Num
bers
fyke
net
-1 d
ay-1
Barsebäck Kullen Vendelsö Hakefjorden
Lysekil Fjällbacka Temperature °C

18 | ICES SCIENTIFIC REPORTS 2:85 | ICES
5 Other data collection for eel
5.1 Yellow eel abundance surveys
In addition to the yellow eel abundance surveys presented in chapter 4, some smaller projects follow the development of stocked eel populations using fykenets or outlet traps. In 1997, a cove in Lake Mälaren was stocked with 5000 marked (Alizarin) elvers. This introduced stock has been monitored in a fykenet fishery since. After a few years the local stock was dominated by the stocked eels and their proportion has been about 60% since 2005 (Figure SE. 16). As more and more eels now become silvers and leave this open system, the CPUE and the proportion of marked eels is declining. Until 2020, 14,3% of the stocked eels have been recaptured. In 2011, this cove was stocked with another 1862 elvers, this time marked with both strontium and barium in their otoliths. Some of them are now among the smallest eels caught which might explain the increasing ratio of unmarked eels in recent years (Figure SE. 16).
Figure SE. 16. Number of unmarked and alizarin marked eels as well as the percent marked eels in a stocked population in Lake Mälaren from 1999 to 2020.
5.2 Silver eel escapement surveys
Please see Section 4.1.
5.2.1 Eel tagging programme in the Baltic Sea
In the Baltic region, tagging experiments started in 1903 with the objective to gain general infor-mation on migration direction and migration routes (Sjöberg, 2015). Since then, thousands of eels have been tagged, most of them with silver plates and Carlin tags. Recaptures of tagged eel were relatively scarce in the early 1900s, probably because fish tagging was a new phenomenon and the fishers were unaware of the ongoing experiments (hence, recaptures might have occurred,
0
20
40
60
80
100
0
20
40
60
80
100
120
140
1999 2001 2003 2005 2007 2009 2011 2013 2015 2017 2019
% m
arke
d
Num
bers
UnmarkedAlizarin marked% alizarin marked

ICES | WGEEL 2020 | 19
but they were not reported). As the Swedish eel landings from the Baltic Sea started to increase, so did the recapture rates (Figure 17). Similarly, when the catches started to decrease in the 1960s, the recapture rates decreased as well. However, a bit unsynchronized since the intensity of the fishery started to decrease somewhat later, in the early 1970s, as shown in Andersson et al. (2012). Regular tagging programmes were run until 1995, and were then re-started in 2012, continuing with the same method as before. Approximately 70% of the recaptures were made in the Swedish fishery at the east and south coast, while 26% were recaptured in Denmark (Figure SE. 18, Table SE. 2). A few individuals were recaptured in Poland, Estonia and Finland (Figure SE. 18, Table SE. 2). The tagging programme has become an important part within the EU´s data collection programme (EC No 665/2008) and it is the basis for estimating the fisheries impact on eels leaving the Baltic Sea region to spawn (Dekker and Sjöberg, 2013; Dekker, 2015). The 3-month fishing closure between November–January in Denmark and Sweden, enforced since 2018, will presum-ably affect recapture numbers from the outlet straits in Öresund and the Danish Belts in 2020, as well as in coming years.
Figure SE. 17. Landings from the Swedish fishery on the east and south coast (grey area). Recaptures (percentage) of tagged eels made in Sweden, Denmark, Germany, Poland, Estonia, and Finland (black bars).
0
10
20
30
40
50
60
70
80
90
100
0
500
1,000
1,500
2,000
2,500
3,000
1925 1935 1945 1955 1965 1975 1985 1995 2005 2015
Land
ings
(ton
nes)
Landings east and south coastRecaptured (%)
Rec
aptu
res
(%)
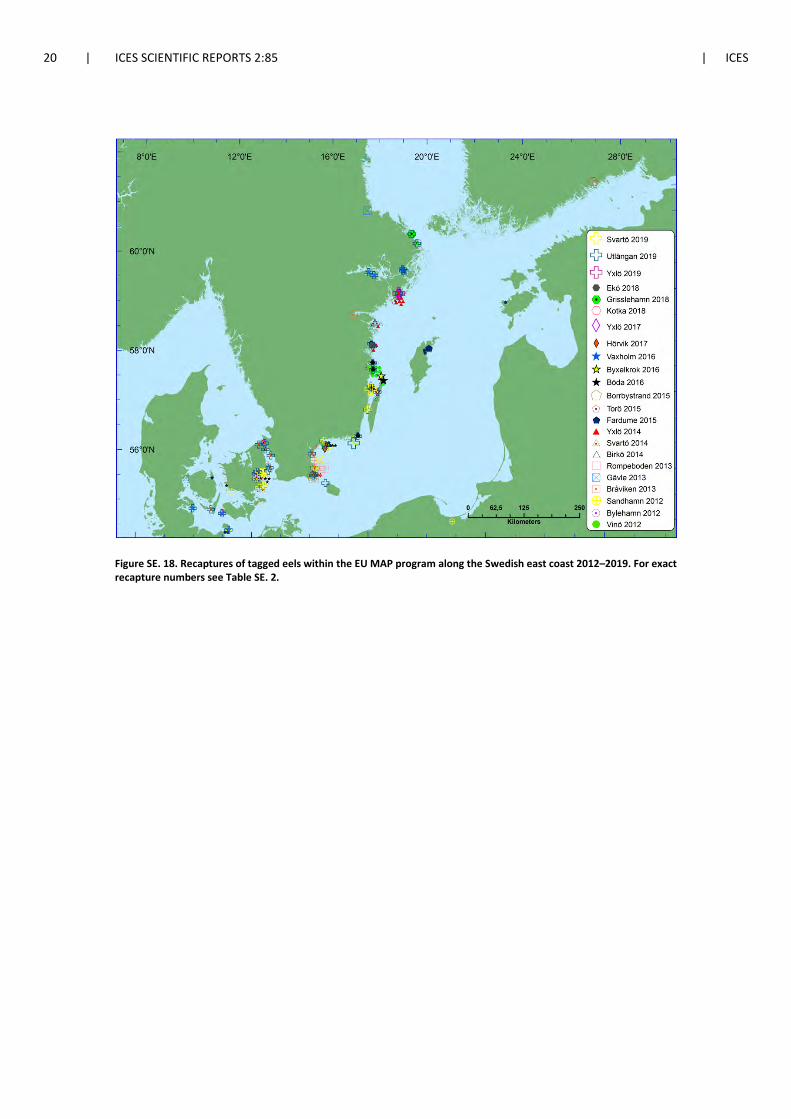
20 | ICES SCIENTIFIC REPORTS 2:85 | ICES
Figure SE. 18. Recaptures of tagged eels within the EU MAP program along the Swedish east coast 2012–2019. For exact recapture numbers see Table SE. 2.
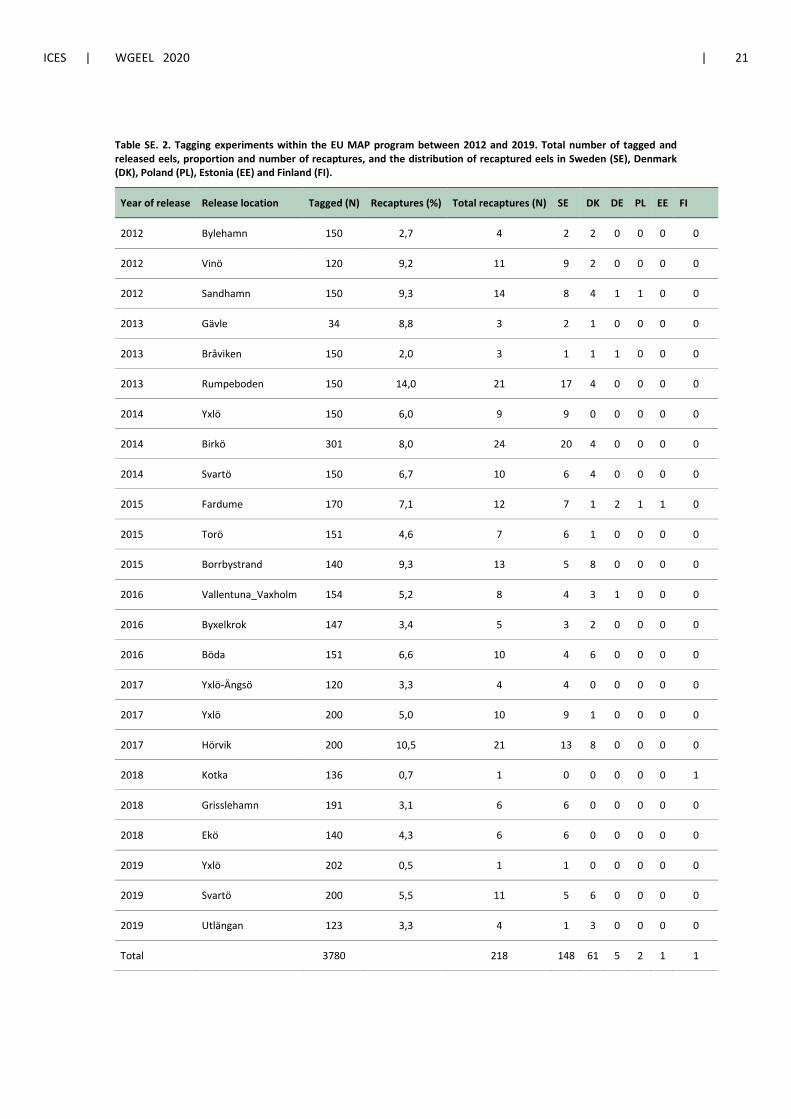
ICES | WGEEL 2020 | 21
Table SE. 2. Tagging experiments within the EU MAP program between 2012 and 2019. Total number of tagged and released eels, proportion and number of recaptures, and the distribution of recaptured eels in Sweden (SE), Denmark (DK), Poland (PL), Estonia (EE) and Finland (FI).
Year of release Release location Tagged (N) Recaptures (%) Total recaptures (N) SE DK DE PL EE FI
2012 Bylehamn 150 2,7 4 2 2 0 0 0 0
2012 Vinö 120 9,2 11 9 2 0 0 0 0
2012 Sandhamn 150 9,3 14 8 4 1 1 0 0
2013 Gävle 34 8,8 3 2 1 0 0 0 0
2013 Bråviken 150 2,0 3 1 1 1 0 0 0
2013 Rumpeboden 150 14,0 21 17 4 0 0 0 0
2014 Yxlö 150 6,0 9 9 0 0 0 0 0
2014 Birkö 301 8,0 24 20 4 0 0 0 0
2014 Svartö 150 6,7 10 6 4 0 0 0 0
2015 Fardume 170 7,1 12 7 1 2 1 1 0
2015 Torö 151 4,6 7 6 1 0 0 0 0
2015 Borrbystrand 140 9,3 13 5 8 0 0 0 0
2016 Vallentuna_Vaxholm 154 5,2 8 4 3 1 0 0 0
2016 Byxelkrok 147 3,4 5 3 2 0 0 0 0
2016 Böda 151 6,6 10 4 6 0 0 0 0
2017 Yxlö-Ängsö 120 3,3 4 4 0 0 0 0 0
2017 Yxlö 200 5,0 10 9 1 0 0 0 0
2017 Hörvik 200 10,5 21 13 8 0 0 0 0
2018 Kotka 136 0,7 1 0 0 0 0 0 1
2018 Grisslehamn 191 3,1 6 6 0 0 0 0 0
2018 Ekö 140 4,3 6 6 0 0 0 0 0
2019 Yxlö 202 0,5 1 1 0 0 0 0 0
2019 Svartö 200 5,5 11 5 6 0 0 0 0
2019 Utlängan 123 3,3 4 1 3 0 0 0 0
Total 3780
218 148 61 5 2 1 1
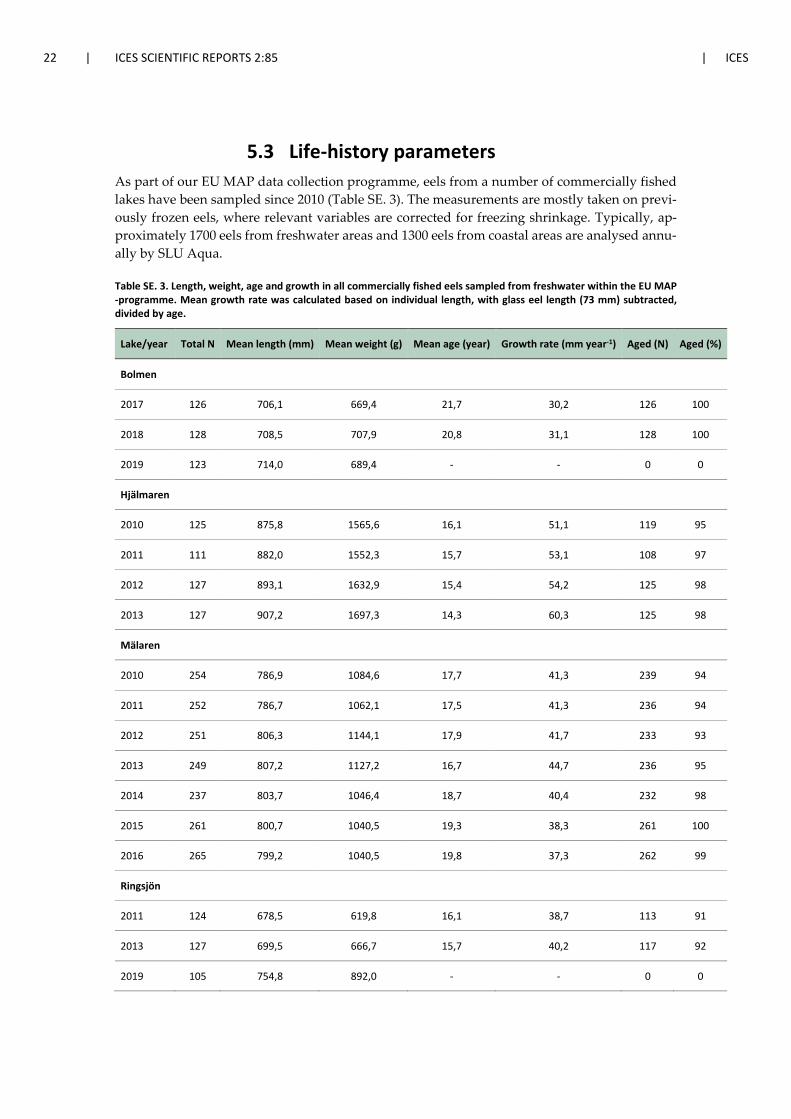
22 | ICES SCIENTIFIC REPORTS 2:85 | ICES
5.3 Life-history parameters As part of our EU MAP data collection programme, eels from a number of commercially fished lakes have been sampled since 2010 (Table SE. 3). The measurements are mostly taken on previ-ously frozen eels, where relevant variables are corrected for freezing shrinkage. Typically, ap-proximately 1700 eels from freshwater areas and 1300 eels from coastal areas are analysed annu-ally by SLU Aqua.
Table SE. 3. Length, weight, age and growth in all commercially fished eels sampled from freshwater within the EU MAP -programme. Mean growth rate was calculated based on individual length, with glass eel length (73 mm) subtracted, divided by age.
Lake/year Total N Mean length (mm) Mean weight (g) Mean age (year) Growth rate (mm year-1) Aged (N) Aged (%)
Bolmen
2017 126 706,1 669,4 21,7 30,2 126 100
2018 128 708,5 707,9 20,8 31,1 128 100
2019 123 714,0 689,4 - - 0 0
Hjälmaren
2010 125 875,8 1565,6 16,1 51,1 119 95
2011 111 882,0 1552,3 15,7 53,1 108 97
2012 127 893,1 1632,9 15,4 54,2 125 98
2013 127 907,2 1697,3 14,3 60,3 125 98
Mälaren
2010 254 786,9 1084,6 17,7 41,3 239 94
2011 252 786,7 1062,1 17,5 41,3 236 94
2012 251 806,3 1144,1 17,9 41,7 233 93
2013 249 807,2 1127,2 16,7 44,7 236 95
2014 237 803,7 1046,4 18,7 40,4 232 98
2015 261 800,7 1040,5 19,3 38,3 261 100
2016 265 799,2 1040,5 19,8 37,3 262 99
Ringsjön
2011 124 678,5 619,8 16,1 38,7 113 91
2013 127 699,5 666,7 15,7 40,2 117 92
2019 105 754,8 892,0 - - 0 0
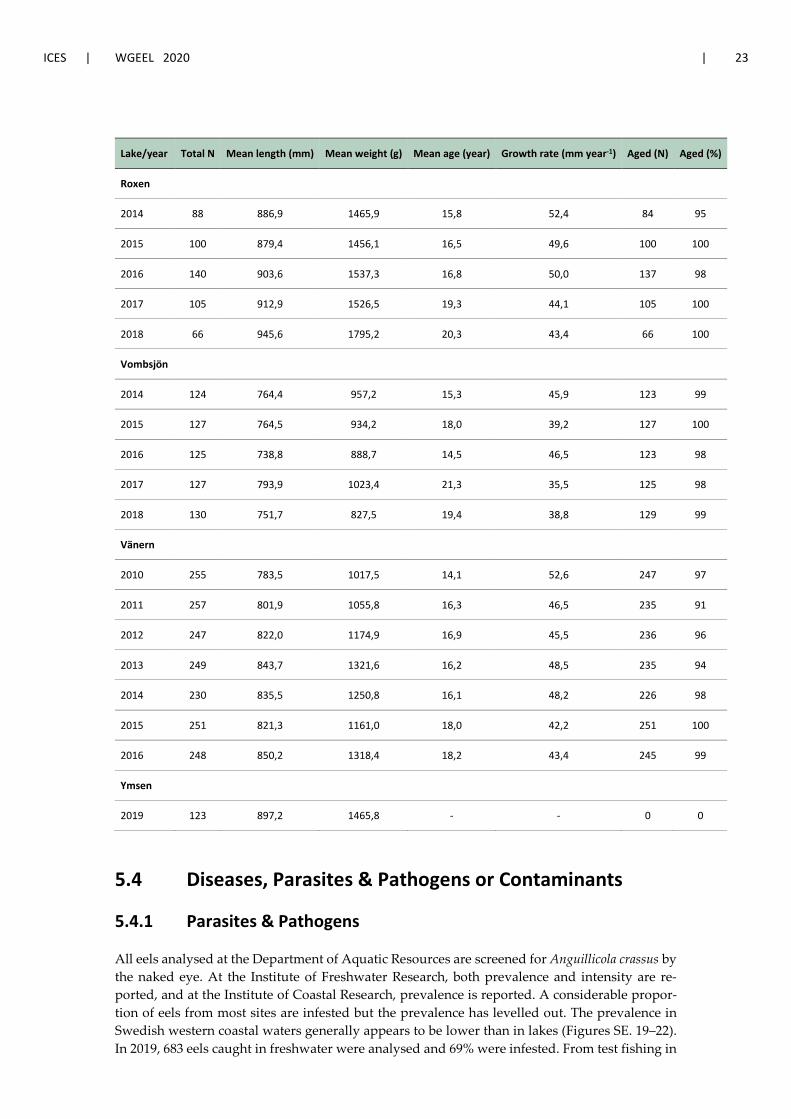
ICES | WGEEL 2020 | 23
Lake/year Total N Mean length (mm) Mean weight (g) Mean age (year) Growth rate (mm year-1) Aged (N) Aged (%)
Roxen
2014 88 886,9 1465,9 15,8 52,4 84 95
2015 100 879,4 1456,1 16,5 49,6 100 100
2016 140 903,6 1537,3 16,8 50,0 137 98
2017 105 912,9 1526,5 19,3 44,1 105 100
2018 66 945,6 1795,2 20,3 43,4 66 100
Vombsjön
2014 124 764,4 957,2 15,3 45,9 123 99
2015 127 764,5 934,2 18,0 39,2 127 100
2016 125 738,8 888,7 14,5 46,5 123 98
2017 127 793,9 1023,4 21,3 35,5 125 98
2018 130 751,7 827,5 19,4 38,8 129 99
Vänern
2010 255 783,5 1017,5 14,1 52,6 247 97
2011 257 801,9 1055,8 16,3 46,5 235 91
2012 247 822,0 1174,9 16,9 45,5 236 96
2013 249 843,7 1321,6 16,2 48,5 235 94
2014 230 835,5 1250,8 16,1 48,2 226 98
2015 251 821,3 1161,0 18,0 42,2 251 100
2016 248 850,2 1318,4 18,2 43,4 245 99
Ymsen
2019 123 897,2 1465,8 - - 0 0
5.4 Diseases, Parasites & Pathogens or Contaminants
5.4.1 Parasites & Pathogens
All eels analysed at the Department of Aquatic Resources are screened for Anguillicola crassus by the naked eye. At the Institute of Freshwater Research, both prevalence and intensity are re-ported, and at the Institute of Coastal Research, prevalence is reported. A considerable propor-tion of eels from most sites are infested but the prevalence has levelled out. The prevalence in Swedish western coastal waters generally appears to be lower than in lakes (Figures SE. 19–22). In 2019, 683 eels caught in freshwater were analysed and 69% were infested. From test fishing in

24 | ICES SCIENTIFIC REPORTS 2:85 | ICES
coastal waters, 1001 yellow eels were analysed and 14% were infested. Moreover, 345 silver eels were analysed in 2018, and 52% of the silver eels were infested. The 2019 data for silver eels had not been reported by the time of Country Report writing due to understaffing and issues related to COVID-19.

ICES | WGEEL 2020 | 25
Figure SE. 19. Prevalence (%) of the parasite Anguillicola crassus in yellow eel along the Swedish coast. SD refers to ICES subdivisions.
Figure SE. 20. Prevalence (%) of the parasite Anguillicola crassus in silver eel along the Swedish coast. SD refers to ICES subdivisions.
0
10
20
30
40
50
60
70
80
90
100
2002 2004 2006 2008 2010 2012 2014 2016 2018 2020
Prev
alen
ce (%
)
SD 20 SD 21 SD 23 SD 25 SD 27
0
10
20
30
40
50
60
70
2005 2006 2007 2008 2009 2010 2011 2012 2013 2014 2015 2016 2017 2018
Prev
alen
ce (%
)
SD 23 SD 24 SD 25 SD 27

26 | ICES SCIENTIFIC REPORTS 2:85 | ICES
Figure SE. 21. Prevalence (%) and number of eels analysed for Anguillicola crassus at one site in Lake Mälaren 1998–2020.
Figure SE. 22. Prevalence (%) and number of eels analysed for Anguillicola crassus in Lake Ymsen 2002–2019.
Imported eels used for stocking and for aquaculture purposes are monitored by the Swedish National Veterinary Institute (SVA) mainly for Infectious pancreatic necrosis virus (IPNV) dur-ing the quarantine phase, investigating both glass eel initially and finally sentinel species (Axén C. and Hällbom H. SVA pers. comm.). SVA is also assigned to monitor diseases in wild eels by the Swedish Agency for Marine and Water Management.
Parasites and other pathogens are diagnosed by SVA in case of suspected disease/acute mortal-ity, or due to temporary investigations. At necropsy, standard routine fish necropsy protocol is
0
20
40
60
80
100
0
20
40
60
80
100
120
140
1998 2000 2002 2004 2006 2008 2010 2012 2014 2016 2018 2020
Prev
alen
ce (%
)
Num
bers
N analysedPrevalence %
0
10
20
30
40
50
60
70
80
90
100
0
20
40
60
80
100
120
140
2002 2004 2006 2008 2010 2012 2014 2016 2018
% in
fest
ed
Num
ber a
naly
sed
N analysed
%Prevalence
ICES | WGEEL 2020 | 27
followed, with examination of skin, gills, fins, eyes, muscle tissue, organs, etc. In case of a sus-pected bacterial disease, samples are taken from the kidney as well as organs with pathological changes (e.g. wounds).
Samples are cultured on agar, and bacteria are typed by MALDI-TOF or biochemical methods. If findings indicate viral disease, samples are taken for cell cultures (general cells sensitive for IPN, EVEX and VHS) and molecular analysis. In case of virus growth on cell culture, the virus is further typed by immunological and molecular methods. Wild eels are also routinely controlled for Anguillid herpesvirus by molecular methods.
It was reported (during the summer of 2020) that some eels in River Ätran had the parasite-caused “white spot disease”.
5.4.2 Contaminants
No new data since the 2018 Country Report.
28 | ICES SCIENTIFIC REPORTS 2:85 | ICES
6 New Information
According to a study performed in Sweden by Nilsson et al. (2020), juvenile ascending elvers tend to prefer small habitats with pebble substrate, and this preference is not changed in the presence of piscivore scent. However, larger yellow eels in lotic environments tended to prefer coarser substrates, high temperatures and a large distance to the river mouth (Degerman et al., 2019). Leander et al. (2020) evaluated two acoustic telemetry systems for monitoring downstream migrating eel and salmon and found that they had different advantages and disadvantages.
In recent years, we have observed an increasing ratio of barium chloride-marked eels among the smallest individuals in the yearly fykenet test fishing in Lake Mälaren. Those eels originate from a stocking event in 2011, where eels (of about 1g) were marked with Ba (in addition to strontium chloride). When more data have been obtained from a few years more of sampling, the growth of these eels can be compared to the growth of eels from an earlier marking experiment in 1997, when Alizarin was used to mark stocked eels (see Figure SE. 16).
In Lake Mälaren, we have also tagged a small number of yellow eels with Data Storage Tags. In recent years, some of those tags have been retrieved when the eels have been recaptured in the fykenet test fishing. The tags have stored data on depth and temperature (temperature: one measurement every third minute, depth: one measurement per minute) and indicate that the eels are rather stationary.
In late 2019, Sweden joined a collaboration initiated by the Technical University of Denmark (DTU-Aqua) with the aim to start up an international (pan Baltic) fishery-independent data col-lection and assessment of the silver eel fishery using acoustic telemetry. Today, Sweden have three areas prepared with hydrophones to collect signals from migrating eels and DTU-Aqua have another three in the outlet straits of the Baltic Sea. During the autumn of 2019, 248 eels were tagged with acoustic transmitters, and during the autumn of 2020, 120 eels will be tagged. Sev-eral of the eels tagged in 2019 have been detected by the receivers in the outlet straits of the Baltic Sea. In addition to fishing pressure, the study also includes investigations related to stocking and Trap and transport.
Effects of COVID-19, Sweden have not been in lockdown but we still had some issues with un-derstaffing that caused delays for some of the data collections.
Concern to be raised: For most years, eels for restocking are sourced from the UK, and this might be affected by Brexit. Earlier sourcing from France resulted in very low restocking numbers due to an Eel Virus European X (EVEX) outbreak.
ICES | WGEEL 2020 | 29
7 References
Andersson J., Florin A. B., Petersson E. 2012. Escapement of eel (Anguilla anguilla) in coastal areas in Sweden over a 50-year period. ICES Journal of Marine Science, 69: 991–999.
Andersson, J., Wickström, H., Bryhn, A., Magnusson. K., Odelström, A., Dekker, W. 2019. Assessing the dynamics of the European eel stock along the Swedish west coast. Aqua Reports 2019:17. Swedish Uni-versity of Agricultural Sciences, Öregrund.
Baden, S., Gullström, M., Lundén, B., Pihl, L., Rosenberg, R. 2003. Vanishing seagrass (Zostera marina, L.) in Swedish coastal waters. AMBIO: a Journal of the Human Environment. 32, 374–378.
Bryhn, A. C., Andersson, J., Petersson, E. (2014). Mortality of European glass eel (Anguilla anguilla juveniles) at a nuclear power plant. International Review of Hydrobiology. 99, 312–316.
Bryhn, A. C., Bergenius, M. A. J., Dimberg, P. H. and Adill, A. 2013. Biomass and number of fish impinged at a nuclear power plant by the Baltic Sea. Environmental Monitoring and Assessment. 185: 10073–10084.
Degerman E., Tamario C., Watz J., Nilsson P.A., Calles O. 2019. Occurrence and habitat use of European eel (Anguilla Anguilla) in running waters: lessons for improved monitoring, habitat restoration and stock-ing. Aquatic Ecology, 53: 639–650.
Dekker W. 2012. Assessment of the eel stock in Sweden, spring 2012; first post-evaluation of the Swedish Eel Management Plan. Aqua reports 2012:9. Swedish University of Agricultural Sciences, Drottning-holm. 77 pp.
Dekker W. 2013. Baltic Eel: towards a comprehensive assessment in support of joint management of this shared stock. Proposal 2012-30 to Bonus call: Viable ecosystems. 24 pp.
Dekker W. 2015. Assessment of the eel stock in Sweden, spring 2015; second post-evaluation of the Swedish Eel Management Plan. Aqua reports 2015:11. Swedish University of Agricultural Sciences, Drottning-holm. 93 pp.
Dekker W. and Sjöberg N. B. 2013. Assessment of the fishing impact on the silver eel stock in the Baltic using survival analysis. Canadian Journal of Fisheries and Aquatic Sciences. 70, 1673–1684.
Dekker, W., Bryhn, A., Magnusson, K., Sjöberg, N., Wickström, H. 2018. Assessment of the eel stock in Sweden, spring 2018. Third post-evaluation of the Swedish Eel Management Plan. Swedish University of Agricultural Sciences, Drottningholm, Lysekil, Öregrund. 113 p.
Engström, H. 2001. Long term effects of cormorant predation on fish communities and fishery in a fresh-water lake. Ecography. 24, 127–138.
Hansson, S., Bergström, U., Bonsdorff, E., Härkönen, T., Jepsen, N., Kautsky, L., Lundström, K., Lunneryd, S.G., Ovegård, M., Salmi, J., Sendek, D., Vetemaa, M. 2017. Competition for the fish – fish extraction from the Baltic Sea by humans, aquatic mammals, and birds. ICES Journal of Marine Science. fsx207.
Leander J., Klaminder J., Jonsson M., Brodin T., Leonardsson K., Hellström G. 2020. The old and the new: evaluating performance of acoustic telemetry systems in tracking migrating Atlantic salmon (Salmo salar) smolt and European eel (Anguilla anguilla) around hydropower facilities. Canadian Journal of Fish-eries and Aquatic Sciences, 77: 177–187.
Lundström, K., Hjerne, O., Lunneryd, S. G., Karlsson, O. 2010. Understanding the diet composition of ma-rine mammals: grey seals (Halichoerus grypus) in the Baltic Sea. ICES Journal of Marine Science. 67, 1230–1239.
MacNamara, R., McCarthy, T. K., Wickström, H., Clevestam, P. D. 2016. Fecundity of silver-phase eels (An-guilla anguilla) from different habitat types and geographic locations. ICES Journal of Marine Science. 73, 135–141.
Magnusson, A. K. and Dekker, W. Accepted. Economic development in times of biological population de-cline - a century of European eel fishing on the Swedish west coast. ICES Journal of Marine Science.
30 | ICES SCIENTIFIC REPORTS 2:85 | ICES
Nilsson P.A., Pettersson, I.J., Degerman E., Elghagen J, Watz J., Calles O. 2020. Substrate-size choice in Eu-ropean eel (Anguilla anguilla) elvers is not altered by piscivore chemical cues. Journal of Fish Biology, 96:1534–1537.
Ovegård, M. 2017. The interactions between cormorants and wild fish populations. Diss. (summary) Upp-sala: Sveriges lantbruksuniversitet, Acta Universitatis agriculturae Sueciae. 2017:12, 1652–6880. ISBN 978-91-576-8797-5, eISBN 978-91-576-8798-2.
Ovegård, M. K., Öhman, K., Mikkelsen, J. S., Jepsen, N. 2017. Cormorant predation overlaps with fish com-munities and commercial-fishery interest in a Swedish lake. Marine and Freshwater Research. 68, 1677–1685.
Sjöberg, N. 2015. Eel migration – results from tagging studies with relevance to management. PhD thesis, Stockholm University.
Wickström, H. and Sjöberg, N. B. 2013. Traceability of stocked eels – the Swedish approach. Ecology of Fresh-water Fish. 23: 33–39.
Östman, Ö., Bergenius, M., Boström, M. K., Lunneryd, S. G. 2012. Do cormorant colonies affect local fish communities in the Baltic Sea? Canadian Journal of Fisheries and Aquatic Sciences. 69: 1047–1055.
Östman, Ö., Boström, M. K., Bergström, U., Andersson, J., Lunneryd S. G. 2013. Estimating competition between wildlife and humans–a case of cormorants and coastal fisheries in the Baltic Sea. PLoS ONE. 8, e83763.

ICES | WGEEL 2020 | I
Contents
Report on the eel stock, fishery and other impacts in Turkey, 2019–2020 ................................................ ii Authors .......................................................................................................................................... ii
1 Summary of national and international stock status indicators.................................................... 1 1.1 Escapement biomass and mortality rates ........................................................................ 1 1.2 Recruitment time-series .................................................................................................. 1
2 Overview of the national stock and its management.................................................................... 2 2.1 Describe the eel stock and its management .................................................................... 2 2.2 Significant changes since last report ................................................................................ 2
3 Impacts on the national stock ....................................................................................................... 3 3.1 Fisheries ........................................................................................................................... 3 3.1.1 Glass eel fisheries ............................................................................................................. 3 3.1.2 Yellow eel fisheries .......................................................................................................... 3 3.1.3 Silver eel fisheries ............................................................................................................ 5 3.2 Restocking ........................................................................................................................ 5 3.3 Aquaculture ..................................................................................................................... 5 3.4 Entrainment ..................................................................................................................... 5 3.5 Habitat Quantity and Quality ........................................................................................... 6 3.6 Other impacts .................................................................................................................. 6
4 National stock assessment ............................................................................................................ 7 4.1 Description of Method ..................................................................................................... 7 4.1.1 Data collection ................................................................................................................. 7 4.1.2 Analysis ............................................................................................................................ 7 4.1.3 Reporting ......................................................................................................................... 7 4.1.4 Data quality issues and how they are being addressed ................................................... 7 4.2 Trends in Assessment results ........................................................................................... 7
5 Other data collection for eel ......................................................................................................... 8 5.1 Yellow eel abundance surveys ......................................................................................... 8 5.2 Silver eel escapement surveys ......................................................................................... 8 5.3 Life-history parameters .................................................................................................... 8 5.4 Diseases, Parasites & Pathogens or Contaminants .......................................................... 8
6 New Information ........................................................................................................................... 9 7 References ................................................................................................................................... 10
II | ICES SCIENTIFIC REPORTS 2:85 | ICES
Report on the eel stock, fishery and other impacts in Turkey, 2019–2020
Authors
Şükran YALÇIN ÖZDİLEK, Çanakkale Onsekiz Mart University, Faculty of Science and Arts, Department of Biology, 17100 Çanakkale, Turkey
Tel: 90-286-2180018 FAX: 90-286-2180533 [email protected]
Reporting Period: This report was completed in September 2020, and contains data up to 2019.

ICES | WGEEL 2020 | 1
1 Summary of national and international stock status indicators
1.1 Escapement biomass and mortality rates
No available data.
1.2 Recruitment time-series
No available data.
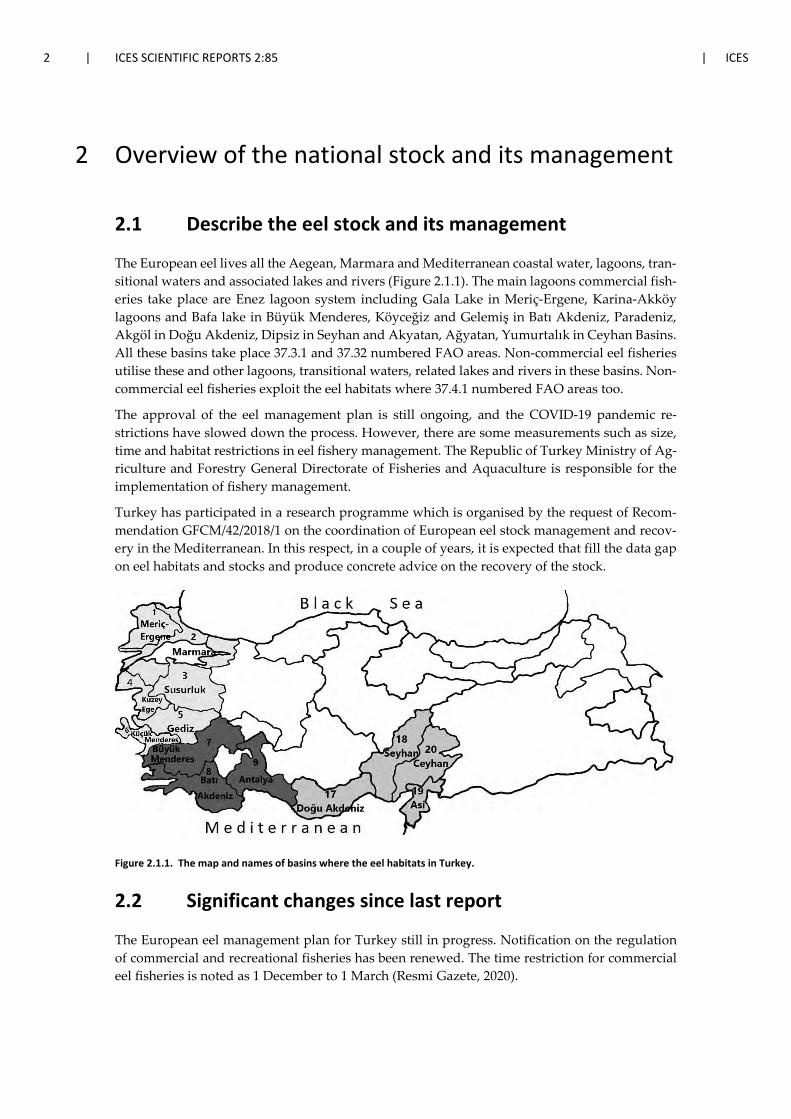
2 | ICES SCIENTIFIC REPORTS 2:85 | ICES
2 Overview of the national stock and its management
2.1 Describe the eel stock and its management
The European eel lives all the Aegean, Marmara and Mediterranean coastal water, lagoons, tran-sitional waters and associated lakes and rivers (Figure 2.1.1). The main lagoons commercial fish-eries take place are Enez lagoon system including Gala Lake in Meriç-Ergene, Karina-Akköy lagoons and Bafa lake in Büyük Menderes, Köyceğiz and Gelemiş in Batı Akdeniz, Paradeniz, Akgöl in Doğu Akdeniz, Dipsiz in Seyhan and Akyatan, Ağyatan, Yumurtalık in Ceyhan Basins. All these basins take place 37.3.1 and 37.32 numbered FAO areas. Non-commercial eel fisheries utilise these and other lagoons, transitional waters, related lakes and rivers in these basins. Non-commercial eel fisheries exploit the eel habitats where 37.4.1 numbered FAO areas too.
The approval of the eel management plan is still ongoing, and the COVID-19 pandemic re-strictions have slowed down the process. However, there are some measurements such as size, time and habitat restrictions in eel fishery management. The Republic of Turkey Ministry of Ag-riculture and Forestry General Directorate of Fisheries and Aquaculture is responsible for the implementation of fishery management.
Turkey has participated in a research programme which is organised by the request of Recom-mendation GFCM/42/2018/1 on the coordination of European eel stock management and recov-ery in the Mediterranean. In this respect, in a couple of years, it is expected that fill the data gap on eel habitats and stocks and produce concrete advice on the recovery of the stock.
Figure 2.1.1. The map and names of basins where the eel habitats in Turkey.
2.2 Significant changes since last report
The European eel management plan for Turkey still in progress. Notification on the regulation of commercial and recreational fisheries has been renewed. The time restriction for commercial eel fisheries is noted as 1 December to 1 March (Resmi Gazete, 2020).
ICES | WGEEL 2020 | 3
3 Impacts on the national stock
3.1 Fisheries
3.1.1 Glass eel fisheries
There are no commercial or recreational glass eel fisheries in Turkey. There is a size restriction, and <50 cm eels are not allowed to be caught.
3.1.2 Yellow eel fisheries
There is no record on only yellow stage of eel fisheries data. The fisheries data have been col-lected both yellow and silver stage together in Turkey. The data are collected by commercial fisheries and there are no data on recreational fisheries. Over the 50 years, the minimum and maximum catching data are 28.3 and 756 tonnes since 1969 in Turkey (Figure 3.1.2).
The particular measures on the eel fisheries are listed below:
• For the fishing vessels to be used in eel fishing, it is obligatory to obtain the "Permit Cer-tificate";
• Size restriction: catching <50 cm eel is not allowed; • Time restriction: 1 December to 1 March closed months to eel fisheries; • Area restriction:
• Except two international river basin districts (Meriç-Ergene and Asi) all the rivers are closed to commercial fisheries.
• Fishing for fisheries is prohibited in areas with a radius of 500 meters towards the sea and the direction of the stream.
There are no data on the illegal fisheries and also recreational fisheries.

4 | ICES SCIENTIFIC REPORTS 2:85 | ICES
Table 3.1.2.1. Commercial catches (kg) of yellow + silver eel from 2000 to 2020. NP = not pertinent, in this case because the data have not been collected yet (TUIK, 2020).
Year Total Catch, kg
2000 176000
2001 122000
2002 147000
2003 158000
2004 165000
2005 176000
2006 162000
2007 179000
2008 171000
2009 158000
2010 182000
2011 28300
2012 38000
2013 48200
2014 56000
2015 71000
2016 75000
2017 81000
2018 111000
2019 330000
2020 NP
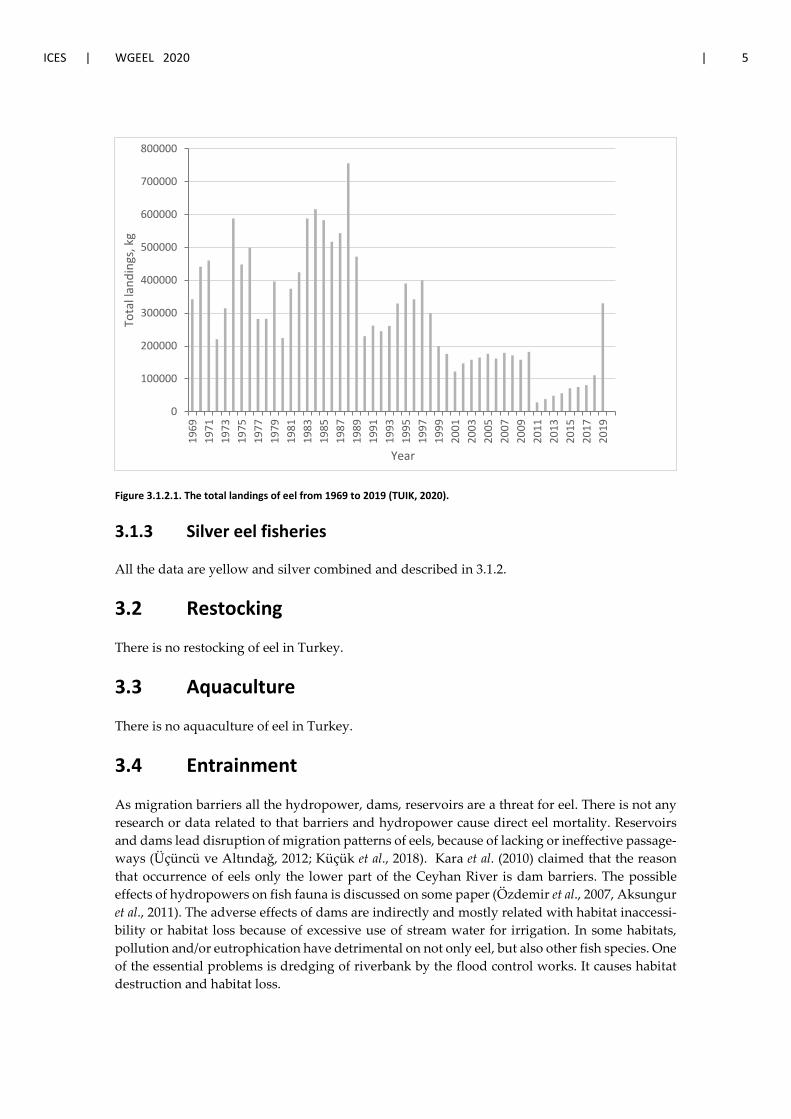
ICES | WGEEL 2020 | 5
Figure 3.1.2.1. The total landings of eel from 1969 to 2019 (TUIK, 2020).
3.1.3 Silver eel fisheries
All the data are yellow and silver combined and described in 3.1.2.
3.2 Restocking
There is no restocking of eel in Turkey.
3.3 Aquaculture
There is no aquaculture of eel in Turkey.
3.4 Entrainment
As migration barriers all the hydropower, dams, reservoirs are a threat for eel. There is not any research or data related to that barriers and hydropower cause direct eel mortality. Reservoirs and dams lead disruption of migration patterns of eels, because of lacking or ineffective passage-ways (Üçüncü ve Altındağ, 2012; Küçük et al., 2018). Kara et al. (2010) claimed that the reason that occurrence of eels only the lower part of the Ceyhan River is dam barriers. The possible effects of hydropowers on fish fauna is discussed on some paper (Özdemir et al., 2007, Aksungur et al., 2011). The adverse effects of dams are indirectly and mostly related with habitat inaccessi-bility or habitat loss because of excessive use of stream water for irrigation. In some habitats, pollution and/or eutrophication have detrimental on not only eel, but also other fish species. One of the essential problems is dredging of riverbank by the flood control works. It causes habitat destruction and habitat loss.
0
100000
200000
300000
400000
500000
600000
700000
800000
1969
1971
1973
1975
1977
1979
1981
1983
1985
1987
1989
1991
1993
1995
1997
1999
2001
2003
2005
2007
2009
2011
2013
2015
2017
2019
Tota
l lan
ding
s, k
g
Year

6 | ICES SCIENTIFIC REPORTS 2:85 | ICES
3.5 Habitat Quantity and Quality
The records on impacts to eel habitat quantity and quality is limited. As mentioned on the pre-vious country report (Yalçın Özdilek et al., 2017), habitat loose is one of the main problem for eels in Turkey. Even no particular study on the habitat lose, there are some reports on the habitat losing because of some flood control implementations. A few studies focusing on the general occurrence and absence of eels on some particular habitats (Innal et al., 2017; Sarı et al., 2019). The habitat quality was assessed on some studies by evaluation of the water quality (Kazanlı and Dügel, 2000) and heavy metal concentrations in European eel from Köyceğiz-Dalyan Lagoon System (Yorulmaz et al., 2015) from Akyatan lagoon (Türkmen et al., 2012) were reported. The last studies related with habitat quality remarks that the relationship between heavy metal con-centration and toxicogenetic damages of European eel living in Asi River (Turan et al., 2020). Ulman et al. (2020) reported a timeline of commercial fisheries extirpations including Anguilla anguilla in the Turkish part of Black Sea and Marmara Sea.
3.6 Other impacts
A predator of European eel, drake mallard (Anas platyrhynchos L.) is reported from Gediz Delta (Salman, 2017).
ICES | WGEEL 2020 | 7
4 National stock assessment
4.1 Description of Method
No available data.
4.1.1 Data collection
No available data.
4.1.2 Analysis
No available data.
4.1.3 Reporting
No available data.
4.1.4 Data quality issues and how they are being addressed
No available data.
4.2 Trends in Assessment results
No available data.
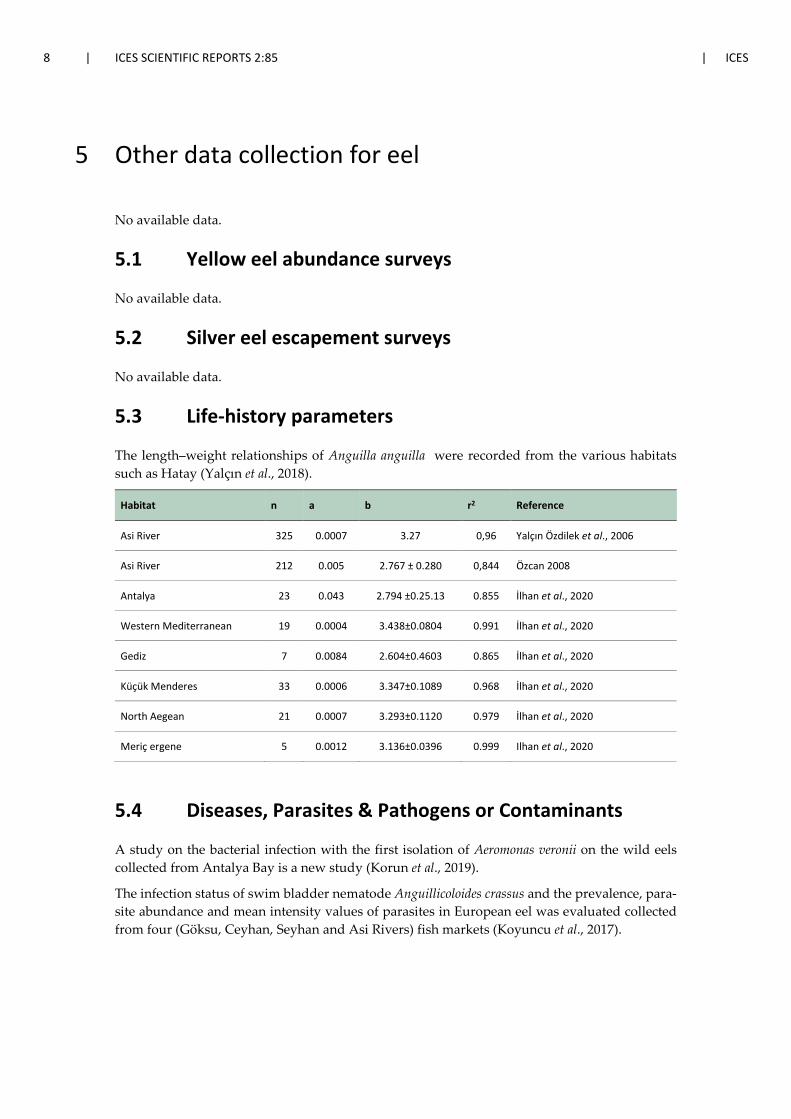
8 | ICES SCIENTIFIC REPORTS 2:85 | ICES
5 Other data collection for eel
No available data.
5.1 Yellow eel abundance surveys
No available data.
5.2 Silver eel escapement surveys
No available data.
5.3 Life-history parameters
The length–weight relationships of Anguilla anguilla were recorded from the various habitats such as Hatay (Yalçın et al., 2018).
Habitat n a b r2 Reference
Asi River 325 0.0007 3.27 0,96 Yalçın Özdilek et al., 2006
Asi River 212 0.005 2.767 ± 0.280 0,844 Özcan 2008
Antalya 23 0.043 2.794 ±0.25.13 0.855 İlhan et al., 2020
Western Mediterranean 19 0.0004 3.438±0.0804 0.991 İlhan et al., 2020
Gediz 7 0.0084 2.604±0.4603 0.865 İlhan et al., 2020
Küçük Menderes 33 0.0006 3.347±0.1089 0.968 İlhan et al., 2020
North Aegean 21 0.0007 3.293±0.1120 0.979 İlhan et al., 2020
Meriç ergene 5 0.0012 3.136±0.0396 0.999 Ilhan et al., 2020
5.4 Diseases, Parasites & Pathogens or Contaminants
A study on the bacterial infection with the first isolation of Aeromonas veronii on the wild eels collected from Antalya Bay is a new study (Korun et al., 2019).
The infection status of swim bladder nematode Anguillicoloides crassus and the prevalence, para-site abundance and mean intensity values of parasites in European eel was evaluated collected from four (Göksu, Ceyhan, Seyhan and Asi Rivers) fish markets (Koyuncu et al., 2017).

ICES | WGEEL 2020 | 9
6 New Information
The new studies on the European eel are: Tosunoğlu Z. and Saygı H. 2019. Analysis of Long and Short Terms Fishery Landings of Köyceğiz Lagoon
(Turkey). Turk. J. Fish.& Aquat. Sci. 19(3), 199-208 http://doi.org/10.4194/1303-2712-v19_3_03. In this paper, the long-term (1974–2016) European eel time-series landing data are recorded from Köyceğiz lagoon. The decreasing trends of landings for the last decade is explained by the restriction of export quota. Eel fishery arrangement in Köyceğiz lagoon led that remark-able amount of eel escaped from the lagoon barrier to the seaward each year. They mention that about 20 tonnes of European eel can be exploited from Köyceğiz lagoon each year. They report that Köyceğiz lagoon is still pristine biomass level of eel stocks because of the protec-tion measurements.
There are three studies on biometric features of European eel reported from Köyceğiz La-goon ( Yalçın Özdilek et al., 2018a), from Karamenderes River Delta, Gala and Bafa Lakes (Yalçın Özdilek and Balkan, 2018b) and from the museum materials collected from Antalya, Western Mediterranean, Gediz, Küçük Menderes, North Aegean and Meriç - Ergene basins (İlhan et al., 2020).
The new projects o the European eel are: Turkey has participated in a research programme on multiannual management plan for Euro-pean eel in Mediterranean which is coordinated by GFCM. The project is at the beginning data collection stage.
10 | ICES SCIENTIFIC REPORTS 2:85 | ICES
7 References
Aksungur, M., Ak, O., Özdemir, A. 2011. Nehir Tipi Hidroelektrik Santrallerinin Sucul Ekosisteme Etkisi: Trabzon Örneği. Journal of Fisheries Sciences.com, 5(1): 79–92.
İlhan, A., İlhan, D., Hammed R.O. 2020. Comparisons of Morphometric Characteristics and Length–Weight Relationship of European Eel (Anguılla anguılla L., 1758) in Turkish Inland Waters. Egyptian Journal of Zoology (EJZ) DOI: 10.12816/ejz.2020.29177.103.
Innal, D, Gülle, I, Avşar D., Dügel M. 2017. Akdeniz’e Dökülen Bazı Nehir Sistemlerinin Östarin Balık Fau-nasının Çok Değişkenli Analizlerle Alansal ve Zamansal Değişiminin Belirlenmesi. TUBITAK 114Z259 codded Project report.
Kara C., Alp A., Şimşekli M. 2010. Distribution of Fish Fauna on the Upper and Middle Basin of Ceyhan River, Turkey. Turkish Journal of Fisheries and Aquatic Sciences 10: 111–122.
Kazanlı N, Dügel M. 2000. An evaluation of the water quality of Yuvarlak Stream, in the Köyceğiz-Dalyan Protected Area, SW Turkey. Turk J Zool. 24:69–80.
Korun, J., Çelik, Y.S., Yılmaz, M., Gökoğlu, M. 2019. Isolations of Shewanella and Aeromonas Species from Silver European Eel Fish (Anguilla anguilla Linnaeus, 1758). J Adv VetBio Sci Tech. 4(1): 9-15. DOI: http://doi.org/10.31797/vetbio.544847.
Koyuncu C.E., Kaya, D., Özer, S., Barış, M., Genç, E. 2017. Infection status of Anguillicoloides crassus in wild European eels (Anguilla anguilla) from Four Rivers of the Northeast Mediterranean Region, Turkey. Acta Biologica Turcica 30(4): 152–156.
Küçük, F., and İkiz, R. 2004. Antalya Körfezi’ne dökülen akarsuların balık faunası. EÜ SuÜrünleri Dergisi, 21(3-4), 287–294.
Özcan G. 2008. Length–Weight Relationships of Five Freshwater Fish Species From The Hatay Province, Turkey. Journal of FisheriesSciences.com. 2(1): 51–53.
Özdemir, N., Yılmaz, F., and Yorulmaz, B. 2007. Dalaman Çayı Üzerindeki Bereket Hidro-Elektrik Santrali Baraj Gölü Suyunun Bazı Fiziko-Kimyasal Parametrelerinin ve Balık Faunasının Araştırıl-ması. Ekoloji, 16(62), 30–36.
Resmi Gazete. 2020. 5/1 numaralı ticari amaçlı su ürünleri avcılığının düzenlenmesi hakkındaki tebliğ (Tebliğ no: 2020/20)https://www.resmigazete.gov.tr/eskiler/2020/08/20200822-8.pdf.
Salman, A. 2017. First Observation of European eel (Anguilla anguilla) As a Prey for Mallard (Anas platyrhyn-chos) in Gediz Delta Ramsar Area (İzmir Turkey). LIMNOFISH-Journal of Limnology and Freshwater Fisheries Research 3(3): 187–188.
Sarı, H. M., İlhan, A., Saç, G. and Özuluğ, M. 2019. Fish fauna of Yıldız Mountains (North-Eastern Thrace, Turkey). Ege Journal of Fisheries and Aquatic Sciences, 36(1), 65–73. DOI: 10.12714/egejfas.2019.36.1.08.
Tosunoğlu Z. and Saygı H. 2019. Analysis of Long and Short Terms Fishery Landings of Köyceğiz Lagoon (Turkey). Turk. J. Fish.& Aquat. Sci. 19(3), 199–208 http://doi.org/10.4194/1303-2712-v19_3_03.
TUIK. 2020. Su Ürünleri İstatistikleri. http://tuikapp.tuik.gov.tr/balikcilikdagitimapp/balikcilik.zul retrived on 20.09.2020.
Turan, F., Karan, S., Ergenler, A. 2020. Effect of heavy metals on toxicogenetic damage of European eels Anguilla anguilla. Environmental Science and Pollution Research (2020) 27:38047–38055. https://doi.org/10.1007/s11356-020-09749-2.
Türkmen, A., Tepe, Y., Türkmen, M., and Ateş, A. 2012. Investigation of metals in tissues of fish species from Akyatan lagoon. Fresenius Environmental Bulletin, 21(11c), 3562–3567.
Ulman A, Zengin M, Demirel N and Pauly D. 2020. The Lost Rsh of Turkey: A Recent History of Disap-peared Species and Commercial Rshery Extinctions for the Turkish Marmara and Black Seas. Front. Mar. Sci. 7:650. doi: 10.3389/fmars.2020.00650.
ICES | WGEEL 2020 | 11
Üçüncü, E., and Altindağ A. 2012. Balık Geçitleri ve Tasarımı Üzerine Genel Bir Bakış." Kahramanmaras Sutcu Imam University Journal of Natural Sciences 15.2: 50–58.
Yalçın-Özdilek, Ş., Gümüş, A., and Dekker, W. 2006. Growth of European eel in a Turkish river at the South-Eastern limit of its distribution. Electronic Journal of Ichthyology, 2: 55–64.
Yalçın Özdilek Ş. 2017. Report on the eel stock, fishery and other impacts, in: Turkey 2017. ICES/EI-FAAC/GFCM WGEEL.
Yalçın Özdilek Ş., Balkan E.İ., Yalım B. Emre Y., Küçük F., Akın Ş., Güçlü S.S., Yağcı, A., Kaymak, N., Kurtoğlu, A. Toslak C., Özbolat A. 2018a. Some biometric characteristics of Anguilla anguilla in Köyceğiz Lagoon System in Turkey. Second International Fisheries Symposium. -8 NOVEMBER 2018 Girne / TURKISH REPUBLIC OF NORTHERN CYPRUS. Pp. 41–42.
Yalçın Özdilek Ş., Balkan E.İ. 2018b. Some biometric characteristics of Anguilla anguilla from Karamenderes River Delta, Lakes of Gala and Bafa in Turkey. Second International Fisheries Symposium. 4–8 NO-VEMBER 2018 Girne / TURKISH REPUBLIC OF NORTHERN CYPRUS. Pp. 41–42.
Yorulmaz, B., Yılmaz, F., and Genç, T. O. 2015. Heavy Metal Concentrations in European Eel (Anguilla an-guilla L., 1758) from Köyceğiz-Dalyan Lagoon System. Fres. Environ. Bull, 24(5), 1607–1613.
ICES | WGEEL 2020 | I
Contents
Report to ICES on the eel stock, fishery and other impacts in UK, 2019–2020 ..........................................iii Authors ..........................................................................................................................................iii Acknowledgments .........................................................................................................................iii Foreword .......................................................................................................................................iv
1 Summary of stock status indicators for national and international purposes .............................. 1 1.1 Recruitment time-series .................................................................................................. 2 1.1.1 UK Recruitment time-series contributing to the WGEEL whole-stock
Recruitment Indices ......................................................................................................... 2 Fishery-dependent series .............................................................................................................. 3 Fishery-independent ..................................................................................................................... 3 1.1.2 Other recruitment time-series ......................................................................................... 4
2 Overview of the national stock and its management.................................................................... 6 2.1 Describe the eel stock and its management .................................................................... 6 2.1.1 Eel Management Units (EMUs) ........................................................................................ 6 2.1.2 Management authorities ................................................................................................. 6 2.1.3 Fisheries and their regulations......................................................................................... 8 2.1.4 Management actions ....................................................................................................... 9 2.2 Significant changes since last report (2018/2019) ......................................................... 10
3 Human factors impacting on the national stock ......................................................................... 12 3.1 Fisheries ......................................................................................................................... 12 3.1.1 Glass eel fisheries ........................................................................................................... 12 3.1.1.1 Commercial .................................................................................................................... 12 3.1.1.2 Proportion retained for stocking ................................................................................... 14 3.1.1.3 Recreational fisheries for glass eel ................................................................................ 15 3.1.2 Yellow eel fisheries ........................................................................................................ 15 3.1.2.1 Commercial .................................................................................................................... 15 3.1.2.2 Recreational fishing for yellow eels ............................................................................... 18 3.1.3 Silver eel fisheries .......................................................................................................... 18 3.1.3.1 Commercial .................................................................................................................... 18 3.1.3.2 Recreational fishing for silver eels ................................................................................. 20 3.1.4 Illegal, underreported or unrecorded catch .................................................................. 20 3.1.5 Bycatch of non-target species ........................................................................................ 20 Eel caught in gears targeting other fish species .......................................................................... 20 Other fish species caught in gears targeting eels ........................................................................ 20 3.2 Restocking ...................................................................................................................... 20 Restocking in the UK .................................................................................................................... 21 Assisted migration ....................................................................................................................... 23 Stocking of glass eel from UK fisheries into other countries ....................................................... 23 3.3 Aquaculture ................................................................................................................... 24 3.4 Entrainment ................................................................................................................... 25 Pumping stations ......................................................................................................................... 25 Surface water abstraction sites ................................................................................................... 25 Cooling water intakes at power stations ..................................................................................... 26 Hydropower facilities .................................................................................................................. 26 3.5 Habitat Quantity and Quality ......................................................................................... 27 Habitat Quantity .......................................................................................................................... 27 England and Wales ...................................................................................................................... 27 Scotland ....................................................................................................................................... 28 Northern Ireland .......................................................................................................................... 28 Habitat Quality ............................................................................................................................ 29
ii | ICES SCIENTIFIC REPORTS 2: 85 | ICES
Chemical quality .......................................................................................................................... 29 Trophic status .............................................................................................................................. 29 Contaminants .............................................................................................................................. 29 3.6 Other impacts ................................................................................................................ 31
4 National stock assessment .......................................................................................................... 32 4.1 Description of Method ................................................................................................... 32 England and Wales: GB_Nort, GB_Humb, GB_Angl, GB_Tham, GB_SouE, GB_SouW, GB_Seve, GB_Wale, GB_Dee, GB_NorW, GB_Solw..................................................................... 32 Estimation of B0 ........................................................................................................................... 32 Scotland: GB_Scot ....................................................................................................................... 32 Northern Ireland .......................................................................................................................... 33 4.1.1 Data collection ............................................................................................................... 36 4.1.2 Analysis .......................................................................................................................... 37 4.1.3 Reporting ....................................................................................................................... 37 4.1.4 Data quality issues and how they are being addressed ................................................. 37 4.2 Trends in Assessment results ......................................................................................... 37 4.2.1 Habitat quantities .......................................................................................................... 37 4.2.2 Silver eel biomass indicators .......................................................................................... 39 4.2.3 Human-induced mortality rates ..................................................................................... 39
5 Other data collection for eel ....................................................................................................... 48 5.1 Yellow eel abundance surveys ....................................................................................... 48 Rivers ........................................................................................................................................... 48 England and Wales EMUs ............................................................................................................ 48 GB_Scot ....................................................................................................................................... 48 Standing waters ........................................................................................................................... 49 GB_Scot ....................................................................................................................................... 49 GB_NorE ...................................................................................................................................... 49 IE_NorW* .................................................................................................................................... 49 GB_Neag ...................................................................................................................................... 49 5.2 Silver eel escapement surveys ....................................................................................... 50 GB_NorW and GB_SouW............................................................................................................. 50 GB_Scot ....................................................................................................................................... 50 GB_Neag ...................................................................................................................................... 51 GB_NorE ...................................................................................................................................... 51 IE_NorW* .................................................................................................................................... 51 5.3 Life-history parameters .................................................................................................. 51 England and Wales EMUs ............................................................................................................ 51 GB_Scot ....................................................................................................................................... 51 GB_Neag ...................................................................................................................................... 53 5.4 Diseases, Parasites & Pathogens or Contaminants ........................................................ 55 5.4.1 Parasites & Pathogens ................................................................................................... 55 Anguillicola crassus ..................................................................................................................... 55 Diseases ....................................................................................................................................... 56 5.4.2 Contaminants ................................................................................................................. 56
6 New Information–research programmes, etc. ............................................................................ 58 Publications ................................................................................................................................. 58 Publications ................................................................................................................................. 59
7 References ................................................................................................................................... 62
ICES | WGEEL 2020 | III
Report to ICES on the eel stock, fishery and other impacts in UK, 2019–2020
Authors
Tea Bašić; Cefas, Pakefield Road, Lowestoft, Suffolk, England, NR33 0HT. Tel: 00-44-1502-524544, [email protected];
Alan Walker; Cefas, Pakefield Road, Lowestoft, Suffolk, England, NR33 0HT. Tel: 00-44-1502-524434/4351, Fax: 00-44-1502-526351; [email protected];
Ayesha Taylor; Environment Agency, Richard Fairclough House, Knutsford Road, Warrington, Cheshire, England, WA4 1HG. Tel: 00-44-2030-250429; [email protected];
Kerry Sims; Environment Agency, Romsey Office, Canal Walk, Hampshire, England SO51 7LP. Tel: 00-44-2084-745896, [email protected];
Jason Godfrey, Marine Scotland – Science, Freshwater Laboratory, Faskally, Pitlochry, Perth-shire, Scotland, PH16 5LB. Tel: 00-44-1796-472060, Fax: 00-44-1796-473523; [email protected];
Derek Evans and Robert Rosell, Agri-Food & Biosciences Institute Northern Ireland, Newforge Lane, Belfast BT9 5PX. Tel: 00-44-28-90255506, Fax: 00-44-028-90255004; [email protected]; [email protected];
Robert Evans, Natural Resources Wales, Ty Cambria, Newport Road, Cardiff CF24 0TP. Tel: 00-44-2920-466155 Fax: 00-44-2920-889234; [email protected] .
Reporting Period: This report was completed in September 2020 and contains finalised data up to and including 2019 and some provisional data for 2020.
Acknowledgments
This report has been compiled jointly by staff from the Centre for Environment, Fisheries and Aquaculture Science (Cefas), Agri-Food & Biosciences Institute Northern Ireland (AFBI), the En-vironment Agency (EA), Marine Scotland – Science (MSS) and the Natural Resources Wales (NRW). The monitoring and assessment of eel throughout the UK is funded by Defra, DAERA, Scottish Government and Welsh Government, plus co-funding from the EU’s Data Collection Framework (DCF). All participating organisation would like to extend their thanks and recogni-tion to the various operational fisheries staff who have collected and compiled the data for this report. Thanks to other contributors from the Environment Agency including Martin James, Chris Williams, Ros Wright, and Ryan Bird, and to John Taylor from Natural Resources Wales. All commercial catch data for Lough Neagh and the River Bann in Northern Ireland is provided by the Lough Neagh Fishermen’s Cooperative Society (LNFCS).
IV | ICES SCIENTIFIC REPORTS 2:85 | ICES
Foreword
Annual reports on the state of eel stock and fisheries throughout the UK have been produced since 2003. These reports present an update for the most recent year to assist the International Council for the Exploration of the Sea (ICES) in providing scientific advice to the European Com-mission and others on the state of the international eel stock.
Until 2016, each annual report was designed to stand alone, to provide a single reference source of data and supporting information for the Working Group on Eel (WGEEL), a joint group of the European Inland Fisheries and Aquaculture Advice Commission (EIFAAC), ICES and the Gen-eral Fisheries Commission for the Mediterranean (GFCM). Since 2017, however, ICES has issued annual Data Calls requesting updates on fishery catches, recruitment indices, aquaculture pro-duction and restocking levels, and triennial updates on silver eel escapement biomass and mor-tality rates caused by human factors. These Data Calls are answered using a series of spreadsheet tables (Annexes) containing the data and associated metadata. Therefore, lengthy time-series of data are no longer provided in this report, but are summarised where considered necessary.
It should be noted that the data and information in the most recent year herein are provisional (with some exceptions) and will be updated and confirmed as complete later (usually in the next year’s report).
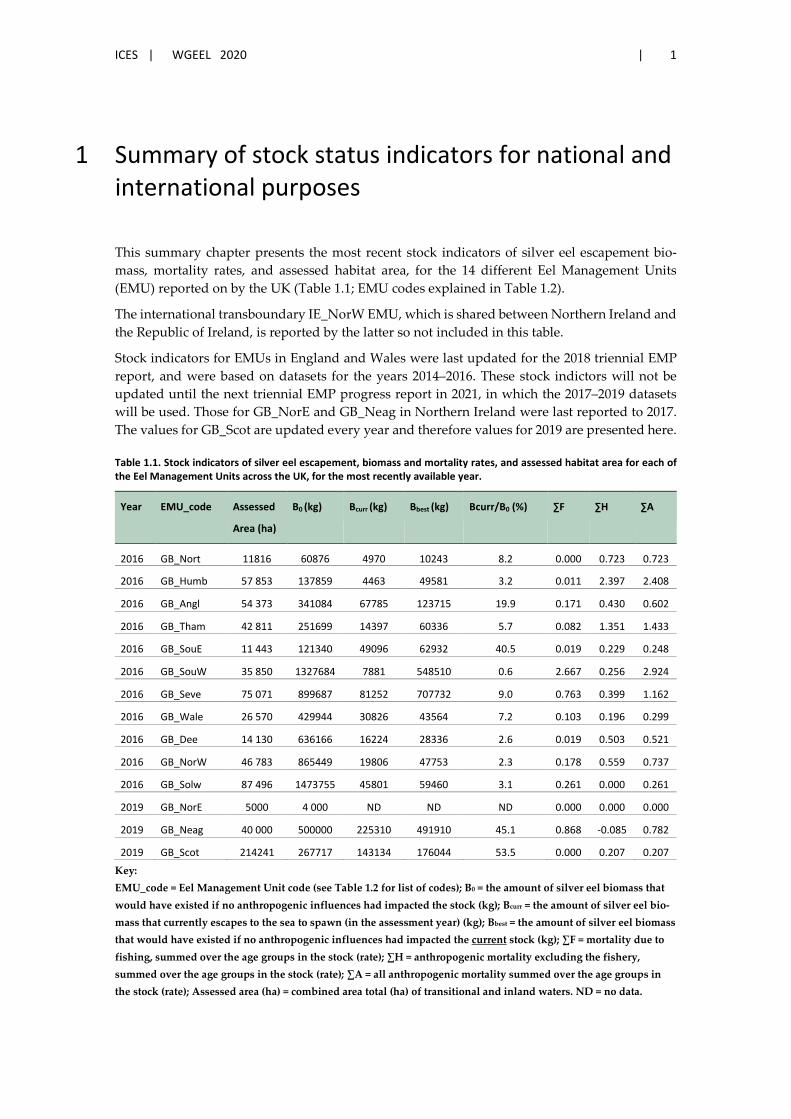
ICES | WGEEL 2020 | 1
1 Summary of stock status indicators for national and international purposes
This summary chapter presents the most recent stock indicators of silver eel escapement bio-mass, mortality rates, and assessed habitat area, for the 14 different Eel Management Units (EMU) reported on by the UK (Table 1.1; EMU codes explained in Table 1.2).
The international transboundary IE_NorW EMU, which is shared between Northern Ireland and the Republic of Ireland, is reported by the latter so not included in this table.
Stock indicators for EMUs in England and Wales were last updated for the 2018 triennial EMP report, and were based on datasets for the years 2014–2016. These stock indictors will not be updated until the next triennial EMP progress report in 2021, in which the 2017–2019 datasets will be used. Those for GB_NorE and GB_Neag in Northern Ireland were last reported to 2017. The values for GB_Scot are updated every year and therefore values for 2019 are presented here.
Table 1.1. Stock indicators of silver eel escapement, biomass and mortality rates, and assessed habitat area for each of the Eel Management Units across the UK, for the most recently available year.
Year EMU_code Assessed
Area (ha)
B0 (kg) Bcurr (kg) Bbest (kg) Bcurr/B0 (%) ∑F ∑H ∑A
2016 GB_Nort 11816 60876 4970 10243 8.2 0.000 0.723 0.723
2016 GB_Humb 57 853 137859 4463 49581 3.2 0.011 2.397 2.408
2016 GB_Angl 54 373 341084 67785 123715 19.9 0.171 0.430 0.602
2016 GB_Tham 42 811 251699 14397 60336 5.7 0.082 1.351 1.433
2016 GB_SouE 11 443 121340 49096 62932 40.5 0.019 0.229 0.248
2016 GB_SouW 35 850 1327684 7881 548510 0.6 2.667 0.256 2.924
2016 GB_Seve 75 071 899687 81252 707732 9.0 0.763 0.399 1.162
2016 GB_Wale 26 570 429944 30826 43564 7.2 0.103 0.196 0.299
2016 GB_Dee 14 130 636166 16224 28336 2.6 0.019 0.503 0.521
2016 GB_NorW 46 783 865449 19806 47753 2.3 0.178 0.559 0.737
2016 GB_Solw 87 496 1473755 45801 59460 3.1 0.261 0.000 0.261
2019 GB_NorE 5000 4 000 ND ND ND 0.000 0.000 0.000
2019 GB_Neag 40 000 500000 225310 491910 45.1 0.868 -0.085 0.782
2019 GB_Scot 214241 267717 143134 176044 53.5 0.000 0.207 0.207
Key: EMU_code = Eel Management Unit code (see Table 1.2 for list of codes); B0 = the amount of silver eel biomass that would have existed if no anthropogenic influences had impacted the stock (kg); Bcurr = the amount of silver eel bio-mass that currently escapes to the sea to spawn (in the assessment year) (kg); Bbest = the amount of silver eel biomass that would have existed if no anthropogenic influences had impacted the current stock (kg); ∑F = mortality due to fishing, summed over the age groups in the stock (rate); ∑H = anthropogenic mortality excluding the fishery, summed over the age groups in the stock (rate); ∑A = all anthropogenic mortality summed over the age groups in the stock (rate); Assessed area (ha) = combined area total (ha) of transitional and inland waters. ND = no data.
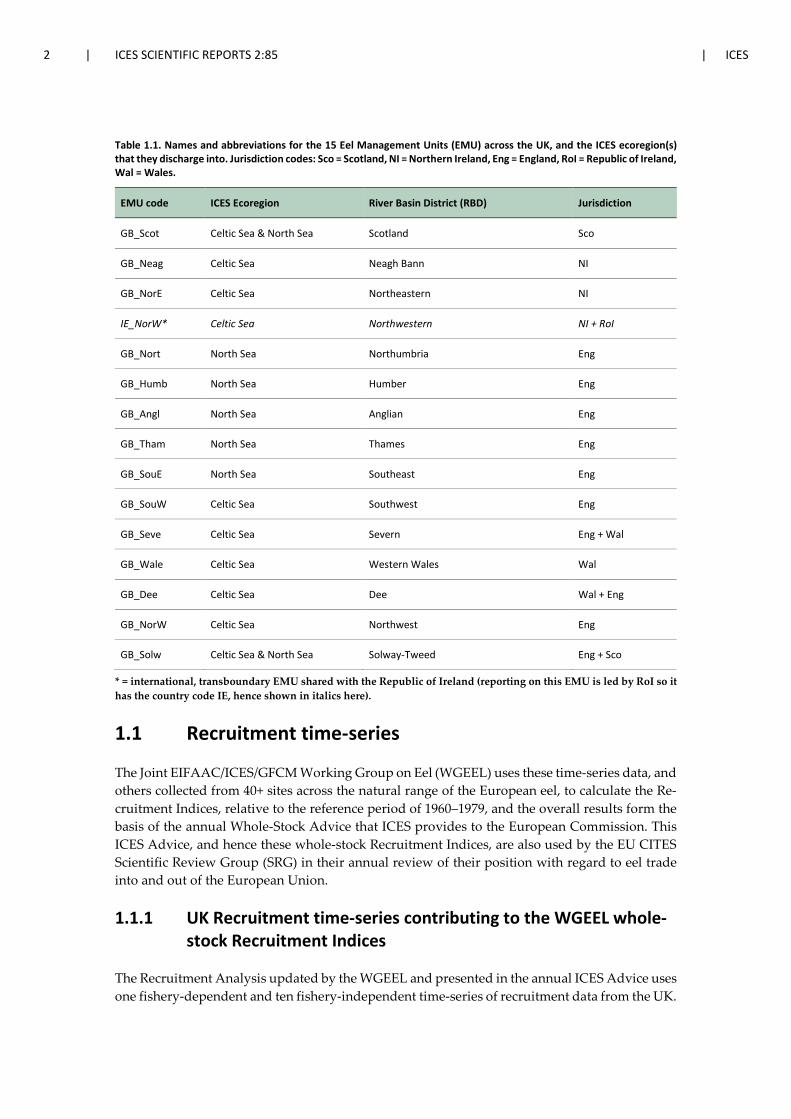
2 | ICES SCIENTIFIC REPORTS 2:85 | ICES
Table 1.1. Names and abbreviations for the 15 Eel Management Units (EMU) across the UK, and the ICES ecoregion(s) that they discharge into. Jurisdiction codes: Sco = Scotland, NI = Northern Ireland, Eng = England, RoI = Republic of Ireland, Wal = Wales.
EMU code ICES Ecoregion River Basin District (RBD) Jurisdiction
GB_Scot Celtic Sea & North Sea Scotland Sco
GB_Neag Celtic Sea Neagh Bann NI
GB_NorE Celtic Sea Northeastern NI
IE_NorW* Celtic Sea Northwestern NI + RoI
GB_Nort North Sea Northumbria Eng
GB_Humb North Sea Humber Eng
GB_Angl North Sea Anglian Eng
GB_Tham North Sea Thames Eng
GB_SouE North Sea Southeast Eng
GB_SouW Celtic Sea Southwest Eng
GB_Seve Celtic Sea Severn Eng + Wal
GB_Wale Celtic Sea Western Wales Wal
GB_Dee Celtic Sea Dee Wal + Eng
GB_NorW Celtic Sea Northwest Eng
GB_Solw Celtic Sea & North Sea Solway-Tweed Eng + Sco
* = international, transboundary EMU shared with the Republic of Ireland (reporting on this EMU is led by RoI so it has the country code IE, hence shown in italics here).
1.1 Recruitment time-series
The Joint EIFAAC/ICES/GFCM Working Group on Eel (WGEEL) uses these time-series data, and others collected from 40+ sites across the natural range of the European eel, to calculate the Re-cruitment Indices, relative to the reference period of 1960–1979, and the overall results form the basis of the annual Whole-Stock Advice that ICES provides to the European Commission. This ICES Advice, and hence these whole-stock Recruitment Indices, are also used by the EU CITES Scientific Review Group (SRG) in their annual review of their position with regard to eel trade into and out of the European Union.
1.1.1 UK Recruitment time-series contributing to the WGEEL whole-stock Recruitment Indices
The Recruitment Analysis updated by the WGEEL and presented in the annual ICES Advice uses one fishery-dependent and ten fishery-independent time-series of recruitment data from the UK.
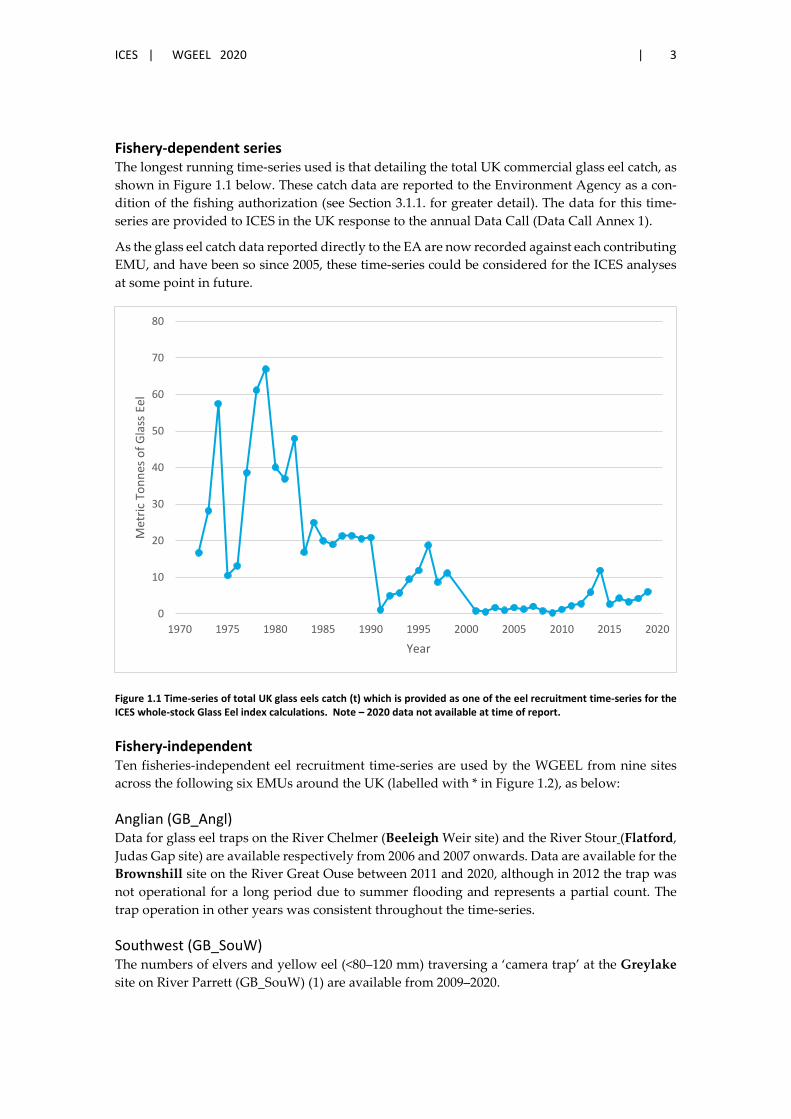
ICES | WGEEL 2020 | 3
Fishery-dependent series The longest running time-series used is that detailing the total UK commercial glass eel catch, as shown in Figure 1.1 below. These catch data are reported to the Environment Agency as a con-dition of the fishing authorization (see Section 3.1.1. for greater detail). The data for this time-series are provided to ICES in the UK response to the annual Data Call (Data Call Annex 1).
As the glass eel catch data reported directly to the EA are now recorded against each contributing EMU, and have been so since 2005, these time-series could be considered for the ICES analyses at some point in future.
Figure 1.1 Time-series of total UK glass eels catch (t) which is provided as one of the eel recruitment time-series for the ICES whole-stock Glass Eel index calculations. Note – 2020 data not available at time of report.
Fishery-independent Ten fisheries-independent eel recruitment time-series are used by the WGEEL from nine sites across the following six EMUs around the UK (labelled with * in Figure 1.2), as below:
Anglian (GB_Angl) Data for glass eel traps on the River Chelmer (Beeleigh Weir site) and the River Stour (Flatford, Judas Gap site) are available respectively from 2006 and 2007 onwards. Data are available for the Brownshill site on the River Great Ouse between 2011 and 2020, although in 2012 the trap was not operational for a long period due to summer flooding and represents a partial count. The trap operation in other years was consistent throughout the time-series.
Southwest (GB_SouW) The numbers of elvers and yellow eel (<80–120 mm) traversing a ‘camera trap’ at the Greylake site on River Parrett (GB_SouW) (1) are available from 2009–2020.
0
10
20
30
40
50
60
70
80
1970 1975 1980 1985 1990 1995 2000 2005 2010 2015 2020
Met
ric T
onne
s of G
lass
Eel
Year
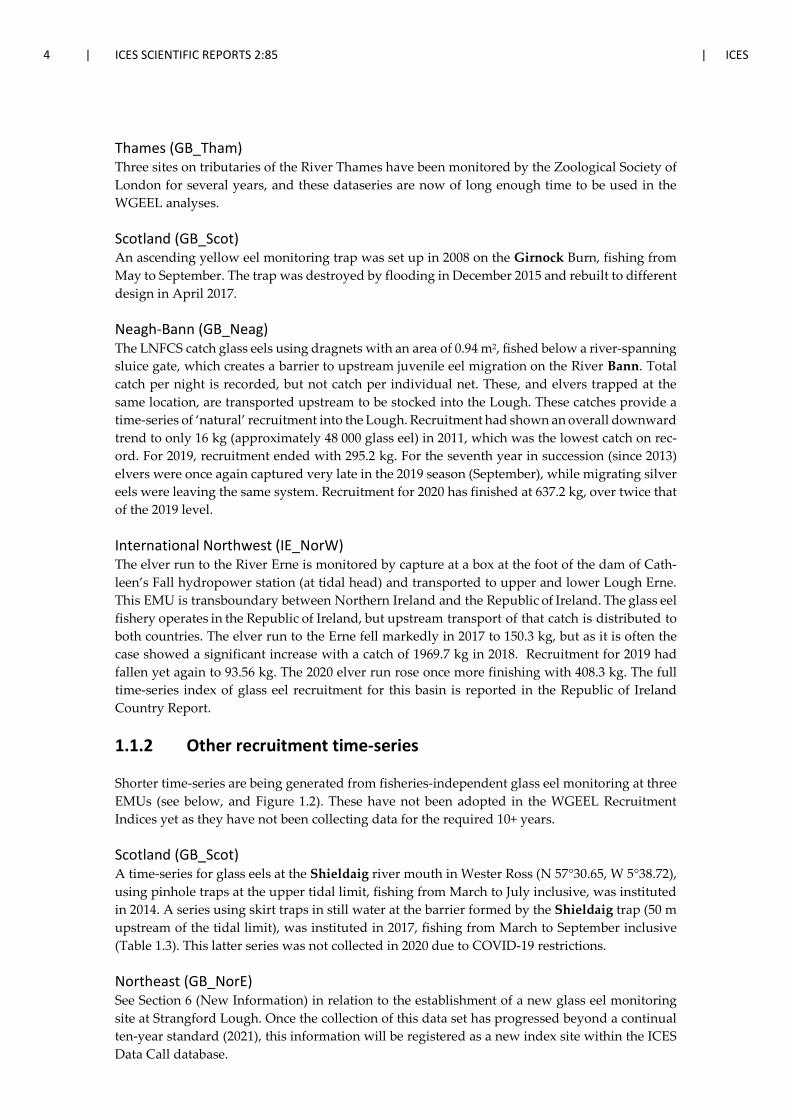
4 | ICES SCIENTIFIC REPORTS 2:85 | ICES
Thames (GB_Tham) Three sites on tributaries of the River Thames have been monitored by the Zoological Society of London for several years, and these dataseries are now of long enough time to be used in the WGEEL analyses.
Scotland (GB_Scot) An ascending yellow eel monitoring trap was set up in 2008 on the Girnock Burn, fishing from May to September. The trap was destroyed by flooding in December 2015 and rebuilt to different design in April 2017.
Neagh-Bann (GB_Neag) The LNFCS catch glass eels using dragnets with an area of 0.94 m2, fished below a river-spanning sluice gate, which creates a barrier to upstream juvenile eel migration on the River Bann. Total catch per night is recorded, but not catch per individual net. These, and elvers trapped at the same location, are transported upstream to be stocked into the Lough. These catches provide a time-series of ‘natural’ recruitment into the Lough. Recruitment had shown an overall downward trend to only 16 kg (approximately 48 000 glass eel) in 2011, which was the lowest catch on rec-ord. For 2019, recruitment ended with 295.2 kg. For the seventh year in succession (since 2013) elvers were once again captured very late in the 2019 season (September), while migrating silver eels were leaving the same system. Recruitment for 2020 has finished at 637.2 kg, over twice that of the 2019 level.
International Northwest (IE_NorW) The elver run to the River Erne is monitored by capture at a box at the foot of the dam of Cath-leen’s Fall hydropower station (at tidal head) and transported to upper and lower Lough Erne. This EMU is transboundary between Northern Ireland and the Republic of Ireland. The glass eel fishery operates in the Republic of Ireland, but upstream transport of that catch is distributed to both countries. The elver run to the Erne fell markedly in 2017 to 150.3 kg, but as it is often the case showed a significant increase with a catch of 1969.7 kg in 2018. Recruitment for 2019 had fallen yet again to 93.56 kg. The 2020 elver run rose once more finishing with 408.3 kg. The full time-series index of glass eel recruitment for this basin is reported in the Republic of Ireland Country Report.
1.1.2 Other recruitment time-series
Shorter time-series are being generated from fisheries-independent glass eel monitoring at three EMUs (see below, and Figure 1.2). These have not been adopted in the WGEEL Recruitment Indices yet as they have not been collecting data for the required 10+ years.
Scotland (GB_Scot) A time-series for glass eels at the Shieldaig river mouth in Wester Ross (N 57°30.65, W 5°38.72), using pinhole traps at the upper tidal limit, fishing from March to July inclusive, was instituted in 2014. A series using skirt traps in still water at the barrier formed by the Shieldaig trap (50 m upstream of the tidal limit), was instituted in 2017, fishing from March to September inclusive (Table 1.3). This latter series was not collected in 2020 due to COVID-19 restrictions.
Northeast (GB_NorE) See Section 6 (New Information) in relation to the establishment of a new glass eel monitoring site at Strangford Lough. Once the collection of this data set has progressed beyond a continual ten-year standard (2021), this information will be registered as a new index site within the ICES Data Call database.
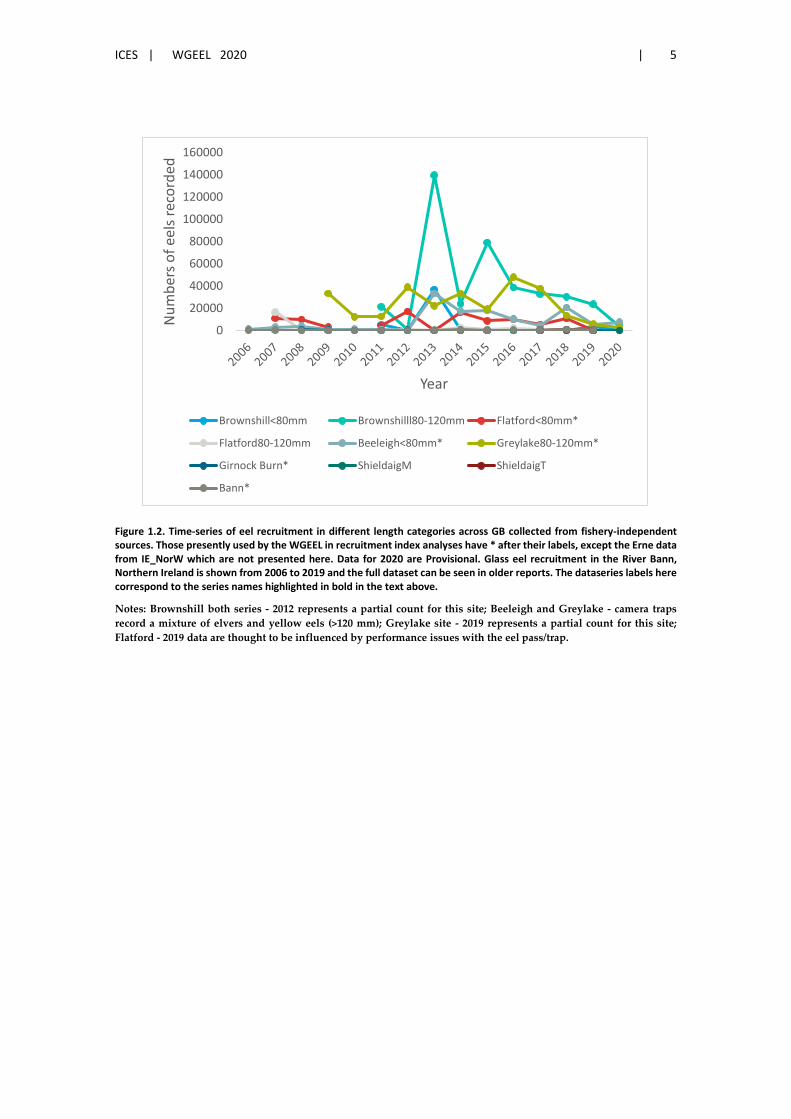
ICES | WGEEL 2020 | 5
Figure 1.2. Time-series of eel recruitment in different length categories across GB collected from fishery-independent sources. Those presently used by the WGEEL in recruitment index analyses have * after their labels, except the Erne data from IE_NorW which are not presented here. Data for 2020 are Provisional. Glass eel recruitment in the River Bann, Northern Ireland is shown from 2006 to 2019 and the full dataset can be seen in older reports. The dataseries labels here correspond to the series names highlighted in bold in the text above.
Notes: Brownshill both series - 2012 represents a partial count for this site; Beeleigh and Greylake - camera traps record a mixture of elvers and yellow eels (>120 mm); Greylake site - 2019 represents a partial count for this site; Flatford - 2019 data are thought to be influenced by performance issues with the eel pass/trap.
0
20000
40000
60000
80000
100000
120000
140000
160000N
umbe
rs o
f eel
s rec
orde
d
Year
Brownshill<80mm Brownshilll80-120mm Flatford<80mm*
Flatford80-120mm Beeleigh<80mm* Greylake80-120mm*
Girnock Burn* ShieldaigM ShieldaigT
Bann*

6 | ICES SCIENTIFIC REPORTS 2:85 | ICES
2 Overview of the national stock and its management
2.1 Describe the eel stock and its management
This chapter provides brief descriptions of the approaches used across the UK to manage eel and human impacts, including management units, authorities and regulations, to assess the status of eel, quantifying the human impacts because of fisheries (commercial and recreational) and other human impacts.
2.1.1 Eel Management Units (EMUs)
Eels are widespread throughout estuaries, rivers and lakes of the UK, with the exception of the upper reaches of some rivers, particularly in Scotland, due to difficulties of access. There are 15 EMUs across the UK, including one shared with the Republic of Ireland (Table 1.2; Figure 2.1). Most of the UK EMUs have been set at the River Basin District (RBD) level, as defined under the Water Framework Directive (WFD). The RBDs in Northern Ireland deviate slightly from those defined for the WFD, owing to their transboundary nature. An Eel Management Plan (EMP) has been implemented for each EMU (see https://www.gov.uk/government/publications/2010-to-2015-government-policy-freshwater-fisheries/2010-to-2015-government-policy-freshwater-fish-eries).
2.1.2 Management authorities
Responsibility for the management of eel, including human impacts, and the delivery of EMPs rests with the Environment Agency (EA) in England and with Natural Resources Wales (NRW) in Wales – the EA leads on the cross-border Severn EMP whereas the NRW leads on the Dee EMP. In Scotland, Marine Scotland is responsible for the management of all anthropogenic im-pacts and for the conservation of stocks and the delivery of the Scotland EMP (the EA is respon-sible for delivery of the Solway-Tweed EMP). In Northern Ireland, overall responsibility for the supervision of commercial eel fisheries, the sustainable harvest of eel populations within these, and for the establishment and development of those fisheries rests with the Department of Ag-riculture Environment & Rural Affairs (DAERA). The Agri-Food and Biosciences Institute for N. Ireland (AFBI) is employed by DAERA to provide the scientific basis for eel management in Northern Ireland. Whilst all aspects of eel conservation and compliance measures assessment is shared between NI and RoI, by agreement, the Inland Fisheries Institute (IFI), Ireland is respon-sible for the delivery of information relating to the transboundary Northwest International EMP (IE_NorW).
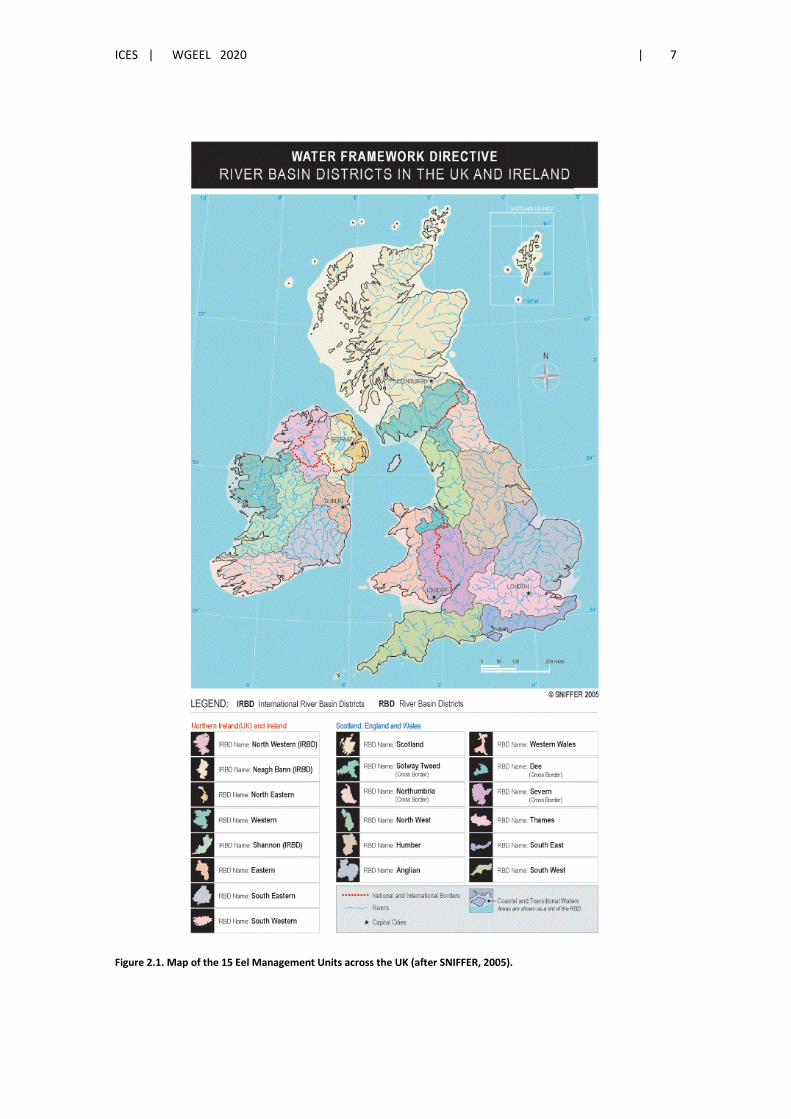
ICES | WGEEL 2020 | 7
Figure 2.1. Map of the 15 Eel Management Units across the UK (after SNIFFER, 2005).

8 | ICES SCIENTIFIC REPORTS 2:85 | ICES
2.1.3 Fisheries and their regulations
All fishing for eel in England and Wales requires authorisation, which is subject to standard national conditions that control seasons, methods, and apply geographic restrictions and other measures to protect bycatch species. The EA, under formal agreement, issues authorisations on behalf of NRW for those fisheries operating in Wales.
Standard conditions allow the use of four instrument types for eel fishing: permanently fixed traps (e.g. weir or rack traps and ‘putts’); moveable or temporary nets or traps without leaders or wings and with a maximum diameter of less than 75 cm; moveable or temporary nets or traps with leaders or wings with a maximum diameter of less than 100 cm (usually fykenets); and elver (glass eel) dipnets. Recreational angling for any fish species is only permitted using rod-and-line, but all rod-caught eels must be returned alive to the waters from where they were caught. Appendix 1 in the 2007 UK report to the WGEEL provides a summary description of netting and trapping methods used to catch eels in England and Wales (see http://ices.dk/sites/pub/Publication%20Reports/Expert%20Group%20Re-port/acom/2007/WGEEL/WGEELcountryreports07-final.pdf).
Conditions also stipulate that all eel (apart from glass eel) less than 300 mm in length must be returned alive to the water, that no part of any net, wing or leader shall be made of a mesh greater than 36 mm stretched mesh, and that monofilament material is prohibited (except for an elver dipnet or fishing with rod-and-line). It is also a requirement that nets set in tidal waters should not dry out, unless they are checked just before they do so, and that nets should not cover more than half the width of the watercourse, or should not be set closer than 30 m apart (apart from in still waters and tidal waters). All fykenets must be fitted with an otter guard (a 100 mm square mesh hard plastic frame, fitted in the mouth of the first trap) to prevent otters becoming trapped in the nets. No fishing is allowed within 10 m upstream or downstream of any obstruction. Elver dipnets must be used singly, by hand and without the use of chains, or boats. Small wingless traps and winged traps (fykes) can be used in specified RBDs in England and Wales unless local byelaw restrictions apply.
Since the imposition of the EC Fishing Opportunities Regulation, which required all EU Member States to have a three-month prohibition on eel fishing, the UK eel fisheries in England and Wales are closed in December-February inclusive. The current fishing season for yellow and silver eel in England and Wales is from 1 April to 30 November inclusive in 2019/2020. The 2019 elver and glass eel season was 15 February to 25 May, in 2020 the elver and glass eel fishing season was 1 March to 25 May.
Since 2010, the yellow and silver eel fisheries have been limited to those individuals who were already authorised, and these individuals are limited to the number of nets that they can apply for based on previous effort. Applications from newcomers are considered, but only for scientific studies and stock monitoring Thus, commercial fishing for yellow and silver eels is effectively capped to existing fisherman who can use up to a capped number of nets.
The glass eel fishery is restricted to two zones: (i) parts of South Wales and Southwest England, and (ii) parts of Northwest England.
Every authorized instrument must carry an identity tag issued by the EA and it is a legal require-ment that all eel and elver fishermen submit a catch return. The EA, under formal agreement, collates catch return information on behalf of NRW. Eel fishers are required to give details of the number of days they have fished, the location and type of water fished, the total weight of eel caught and retained or a statement that no eel have been caught. Annual eel and elver net au-thorization sales and catches are summarized by the instrument type for England and Wales and

ICES | WGEEL 2020 | 9
reported in the “Salmonid and Freshwater Fisheries Statistics for England and Wales” series (https://www.gov.uk/government/publications/salmonid-and-freshwater-fisheries-statistics).
Eel fisheries have never been regulated in Scotland, but the last known fishery closed in 2005. Legislation was introduced in 2009 requiring that anyone wishing to fish for eel in Scotland by any method must obtain a licence from the Scottish ministers. Since 2013, three applications have been received but none have been approved.
Lough Neagh in Northern Ireland (GB_Neag) is the largest freshwater lake in the UK. Prior to 1983, estimates of annual recruitment of glass eel to the Lough consistently exceeded 4000 kg (12 M fish) and averaged 3858 kg (11.6 M) (based on a mean weight of 3000 glass eel per kg) from 1923–1982. Productivity is such that the Lough sustains a large population of yellow eel and produces many silver eels that migrate via the outflowing Lower River Bann.
The system sustains the largest (by catch weight) commercial wild eel fishery in Europe, produc-ing 13.8% of total EU landings and supplying 3.1% of the entire EU market (wild-caught + aqua-culture) in 2016. Fishing rights to all eel life stages are owned by the Lough Neagh Fishermen’s Co-operative Society (LNFCS). The fishery is managed to enable the capture of approximately 250–350 t of yellow eel and 75–100 t of silver eels annually, with an escapement of silver eels at least equivalent to the catch of silvers. While it is illegal to fish for glass eels in N. Ireland, provi-sion is made whereby LNFCS staff are allowed to catch glass eels using dragnets below a river-spanning sluice gate, which creates a barrier to upstream juvenile eel migration, for onward placement into L. Neagh. Elvers are also trapped at the same location and placed into the Lough.
The yellow eel fishery (May–September, five days a week) supports a peak season average of 85–95 boats, each with a crew of two men using draftnets and baited longlines. Eels are collected and marketed centrally by the cooperative. Silver eels are caught in two weirs in the Lower River Bann. Profit from the less labour-intensive (five to six men) silver eel fishery sustains the man-agement of the whole cooperative venture, providing working capital for policing, marketing and stocking activity.
Natural recruitment has been supplemented since 1984 by the purchase of glass eel from outside the EMU. As of 2019, approximately 115.3 million (38.3 t) additional glass eel have been stocked by the LNFCS. Reviews on the fishery, its history and operation can be found in Kennedy (1999) and Rosell et al. (2005).
The transboundary Erne system (IE_NorW* and reported in Ireland Country Report) is compa-rable in size to L. Neagh and produces a fishery yield in the region of 33 t of eels per year. Within N. Ireland, the Upper and Lower Lough Erne sustained a small-scale yellow eel fishery, which was closed in 2010 under the terms of the EMP. There has been no commercial silver eel fishery on the Erne since 2001, but a trap and transport conservation silver eel fishery was instigated in 2009. Elvers are trapped at the mouth of the River Erne using ladders placed at the base of the hydroelectric facility that spans the Erne, and trucked upstream into the Erne lake system. A comprehensive study into the structure, composition and biology of the eel fisheries on the Erne was conducted by Matthews et al. (2001).
2.1.4 Management actions
In January 2010, the Eels (England and Wales) Regulations, 2009 Statutory Instrument came into force. This legislation was specifically developed to facilitate the implementation of Council Reg-ulation (EC) No 1100/2007 in England and Wales. The legislation makes provisions for the regu-lation of the fishery and gives powers to require the installation of eel passes at obstructions and to screen intakes for eels.
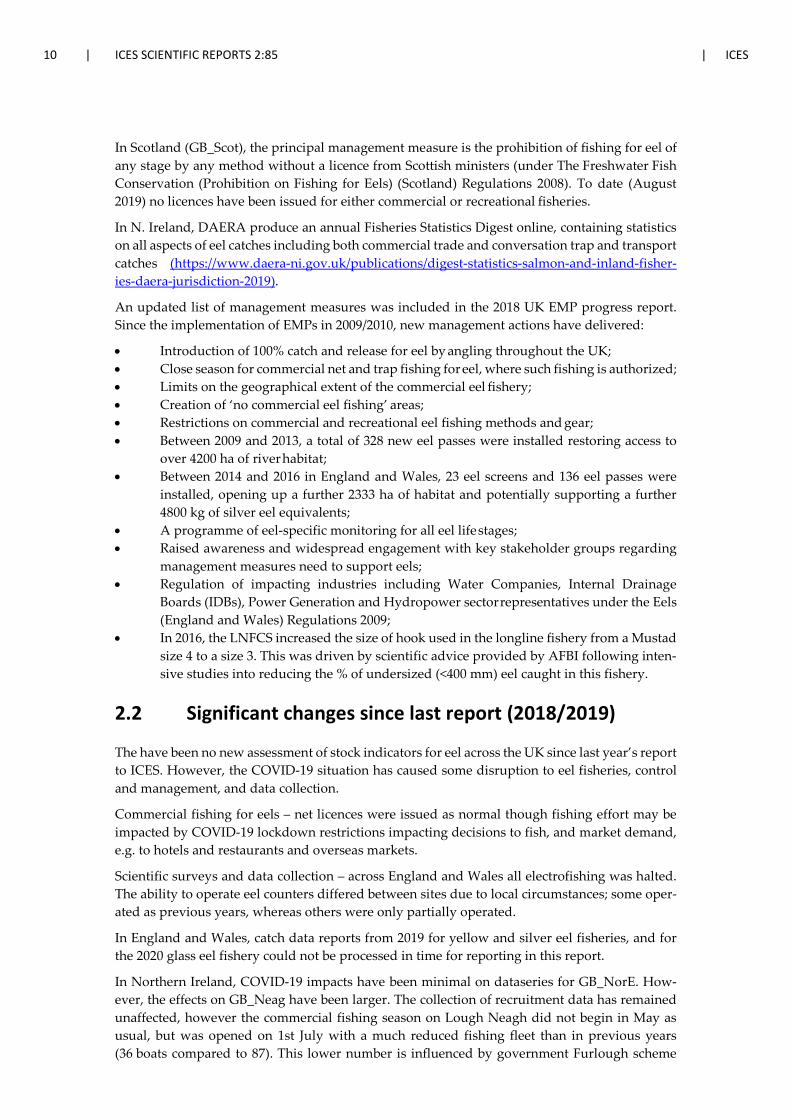
10 | ICES SCIENTIFIC REPORTS 2:85 | ICES
In Scotland (GB_Scot), the principal management measure is the prohibition of fishing for eel of any stage by any method without a licence from Scottish ministers (under The Freshwater Fish Conservation (Prohibition on Fishing for Eels) (Scotland) Regulations 2008). To date (August 2019) no licences have been issued for either commercial or recreational fisheries.
In N. Ireland, DAERA produce an annual Fisheries Statistics Digest online, containing statistics on all aspects of eel catches including both commercial trade and conversation trap and transport catches (https://www.daera-ni.gov.uk/publications/digest-statistics-salmon-and-inland-fisher-ies-daera-jurisdiction-2019).
An updated list of management measures was included in the 2018 UK EMP progress report. Since the implementation of EMPs in 2009/2010, new management actions have delivered:
• Introduction of 100% catch and release for eel by angling throughout the UK; • Close season for commercial net and trap fishing for eel, where such fishing is authorized; • Limits on the geographical extent of the commercial eel fishery; • Creation of ‘no commercial eel fishing’ areas; • Restrictions on commercial and recreational eel fishing methods and gear; • Between 2009 and 2013, a total of 328 new eel passes were installed restoring access to
over 4200 ha of river habitat; • Between 2014 and 2016 in England and Wales, 23 eel screens and 136 eel passes were
installed, opening up a further 2333 ha of habitat and potentially supporting a further 4800 kg of silver eel equivalents;
• A programme of eel-specific monitoring for all eel life stages; • Raised awareness and widespread engagement with key stakeholder groups regarding
management measures need to support eels; • Regulation of impacting industries including Water Companies, Internal Drainage
Boards (IDBs), Power Generation and Hydropower sector representatives under the Eels (England and Wales) Regulations 2009;
• In 2016, the LNFCS increased the size of hook used in the longline fishery from a Mustad size 4 to a size 3. This was driven by scientific advice provided by AFBI following inten-sive studies into reducing the % of undersized (<400 mm) eel caught in this fishery.
2.2 Significant changes since last report (2018/2019)
The have been no new assessment of stock indicators for eel across the UK since last year’s report to ICES. However, the COVID-19 situation has caused some disruption to eel fisheries, control and management, and data collection.
Commercial fishing for eels – net licences were issued as normal though fishing effort may be impacted by COVID-19 lockdown restrictions impacting decisions to fish, and market demand, e.g. to hotels and restaurants and overseas markets.
Scientific surveys and data collection – across England and Wales all electrofishing was halted. The ability to operate eel counters differed between sites due to local circumstances; some oper-ated as previous years, whereas others were only partially operated.
In England and Wales, catch data reports from 2019 for yellow and silver eel fisheries, and for the 2020 glass eel fishery could not be processed in time for reporting in this report.
In Northern Ireland, COVID-19 impacts have been minimal on dataseries for GB_NorE. How-ever, the effects on GB_Neag have been larger. The collection of recruitment data has remained unaffected, however the commercial fishing season on Lough Neagh did not begin in May as usual, but was opened on 1st July with a much reduced fishing fleet than in previous years (36 boats compared to 87). This lower number is influenced by government Furlough scheme
ICES | WGEEL 2020 | 11
payments to self-employed workers (such as fishermen) and the loss in continental markets for yellow eel as a direct result of lockdowns/loss of tourism in Holland and Germany. This has meant a reduced daily catch quota being issued, resulting in fishermen making the economic comparison between Furlough hardship payment and reduced fishing earnings. This, in turn, has meant a much-reduced collection of fishery-dependent data from this EMU, which will now effectively only really cover half a season and half the normal sampling efficacy across a reduced fishing fleet.
These changes are anticipated to remain through the coming months and thus into the silver eel migration period and associated silver eel fishery on the River Bann exiting L. Neagh. Plans are in place to incept a Scientific Fishery during key lunar darks through the autumn and winter of 2020 to enable EMP compliance assessments to continue.
Field working and laboratory analysis of materials has taken a significant impact in terms of travelling solo to sites, reduced staff presence at fieldwork, additional preparation time and working conditions in laboratories (now on rotational basis to reduce staff numbers). COVID-19 guidance on working practices has meant a reduced the capacity for on-boat working. All AFBI laboratory staff since March 24th have been sent home, and are only beginning to return in a phased and rotational basis from 10th August: this has created significant backlogs in sample analysis.

12 | ICES SCIENTIFIC REPORTS 2:85 | ICES
3 Human factors impacting on the national stock
There is a broad range of human-induced factors that impact on eels. The WGEEL has grouped these factors into six categories (fisheries, restocking, aquaculture, entrainment, habitat, others), in order to simplify reporting. This chapter provides updates on the impact levels of these fac-tors, and the methods used to quantify these impacts.
3.1 Fisheries
The WGEEL uses these data to report trends in catches and landings in the ICES Single Stock Advice. The Agreement between ICES and the European Commission explicitly requests annual updates on catches by fisheries.
Catches are defined as the quantity of eel that are caught by fishing gears (defined by the FAO as the ‘gross catch’) i.e. the quantity of eel that is removed from the water, but which can include those that are subsequently returned alive to this or other waters.
Landings are defined as the quantity of eel that are retained after capture (defined by the FAO as the Retained Catch), or to put it another way, removed from the water basin or management unit. So, Landings should not include any eels subject to assisted migration within the same river basin, or scientific studies where they are returned alive to the waters where they were caught. Therefore, Landings are effectively the quantity of eel that is (permanently removed from the productive potential of that water basin) killed or transported to a different river basin (re-stocked).
Fishing effort and catch per unit of effort (CPUE) are presented and discussed where available.
3.1.1 Glass eel fisheries
3.1.1.1 Commercial Commercial glass eel fisheries currently exist in only five EMUs: GB_NorW, GB_Dee, GB_Wal, GB_Seve and GB_SouW (Table 3.1). A fishery in GB_SouE has not been authorised since 2010 and any commercial fishing for glass eel in other UK EMUs is forbidden.
The fisheries are prosecuted by hand-held dipnets, in rivers and estuaries draining into the Bristol Channel, in particular from the Rivers Severn and Wye (GB_Seve) and Parrett (GB_SouW) but also rivers in Wales (GB_Wal) , with smaller fisheries elsewhere, such as that in Morecambe Bay, Cumbria (GB_NorW) and in the estuary of the River Dee (GB_Dee).
Glass eel fisheries are required to report their annual catch by weight, effort in terms of days and gears fished, location and water type (coastal, river, still water). Catches reported to the EA have historically been aggregated and reported to the WGEEL as the catch for England and Wales. In addition to these catch returns, annual trade statistics from Her Majesty’s Revenue & Customs (HMRC) provided an alternative indication of catches, for the period 1979–2006. Comparison be-tween the catch reported to the EA and the net exports from HMRC data for 1979–2006 suggested a significant but variable level of underreporting to the Agency, by between five and 15 times.
In 2009, legislation was introduced to improve the traceability of eel caught, such that there are now three sources of data, as presented here in Table 3.1:
1. Catch returns to the EA;
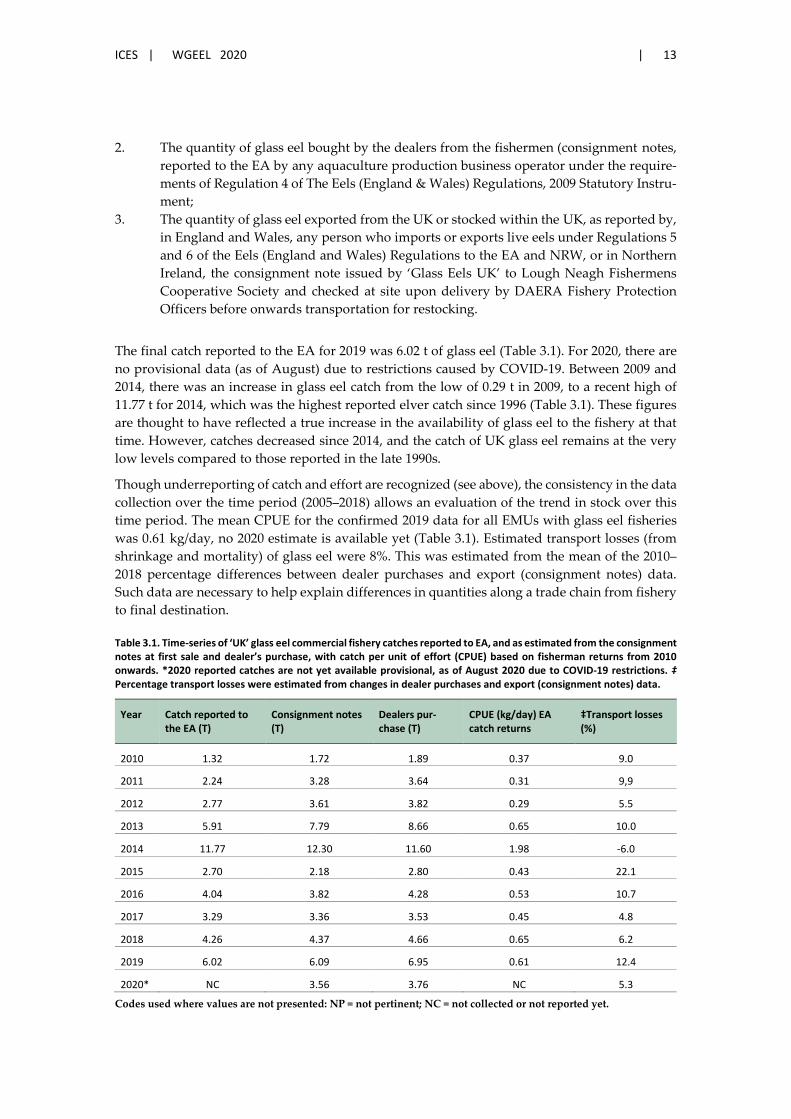
ICES | WGEEL 2020 | 13
2. The quantity of glass eel bought by the dealers from the fishermen (consignment notes, reported to the EA by any aquaculture production business operator under the require-ments of Regulation 4 of The Eels (England & Wales) Regulations, 2009 Statutory Instru-ment;
3. The quantity of glass eel exported from the UK or stocked within the UK, as reported by, in England and Wales, any person who imports or exports live eels under Regulations 5 and 6 of the Eels (England and Wales) Regulations to the EA and NRW, or in Northern Ireland, the consignment note issued by ‘Glass Eels UK’ to Lough Neagh Fishermens Cooperative Society and checked at site upon delivery by DAERA Fishery Protection Officers before onwards transportation for restocking.
The final catch reported to the EA for 2019 was 6.02 t of glass eel (Table 3.1). For 2020, there are no provisional data (as of August) due to restrictions caused by COVID-19. Between 2009 and 2014, there was an increase in glass eel catch from the low of 0.29 t in 2009, to a recent high of 11.77 t for 2014, which was the highest reported elver catch since 1996 (Table 3.1). These figures are thought to have reflected a true increase in the availability of glass eel to the fishery at that time. However, catches decreased since 2014, and the catch of UK glass eel remains at the very low levels compared to those reported in the late 1990s.
Though underreporting of catch and effort are recognized (see above), the consistency in the data collection over the time period (2005–2018) allows an evaluation of the trend in stock over this time period. The mean CPUE for the confirmed 2019 data for all EMUs with glass eel fisheries was 0.61 kg/day, no 2020 estimate is available yet (Table 3.1). Estimated transport losses (from shrinkage and mortality) of glass eel were 8%. This was estimated from the mean of the 2010–2018 percentage differences between dealer purchases and export (consignment notes) data. Such data are necessary to help explain differences in quantities along a trade chain from fishery to final destination.
Table 3.1. Time-series of ‘UK’ glass eel commercial fishery catches reported to EA, and as estimated from the consignment notes at first sale and dealer’s purchase, with catch per unit of effort (CPUE) based on fisherman returns from 2010 onwards. *2020 reported catches are not yet available provisional, as of August 2020 due to COVID-19 restrictions. ‡ Percentage transport losses were estimated from changes in dealer purchases and export (consignment notes) data.
Year Catch reported to the EA (T)
Consignment notes (T)
Dealers pur-chase (T)
CPUE (kg/day) EA catch returns
‡Transport losses (%)
2010 1.32 1.72 1.89 0.37 9.0
2011 2.24 3.28 3.64 0.31 9,9
2012 2.77 3.61 3.82 0.29 5.5
2013 5.91 7.79 8.66 0.65 10.0
2014 11.77 12.30 11.60 1.98 -6.0
2015 2.70 2.18 2.80 0.43 22.1
2016 4.04 3.82 4.28 0.53 10.7
2017 3.29 3.36 3.53 0.45 4.8
2018 4.26 4.37 4.66 0.65 6.2
2019 6.02 6.09 6.95 0.61 12.4
2020* NC 3.56 3.76 NC 5.3
Codes used where values are not presented: NP = not pertinent; NC = not collected or not reported yet.
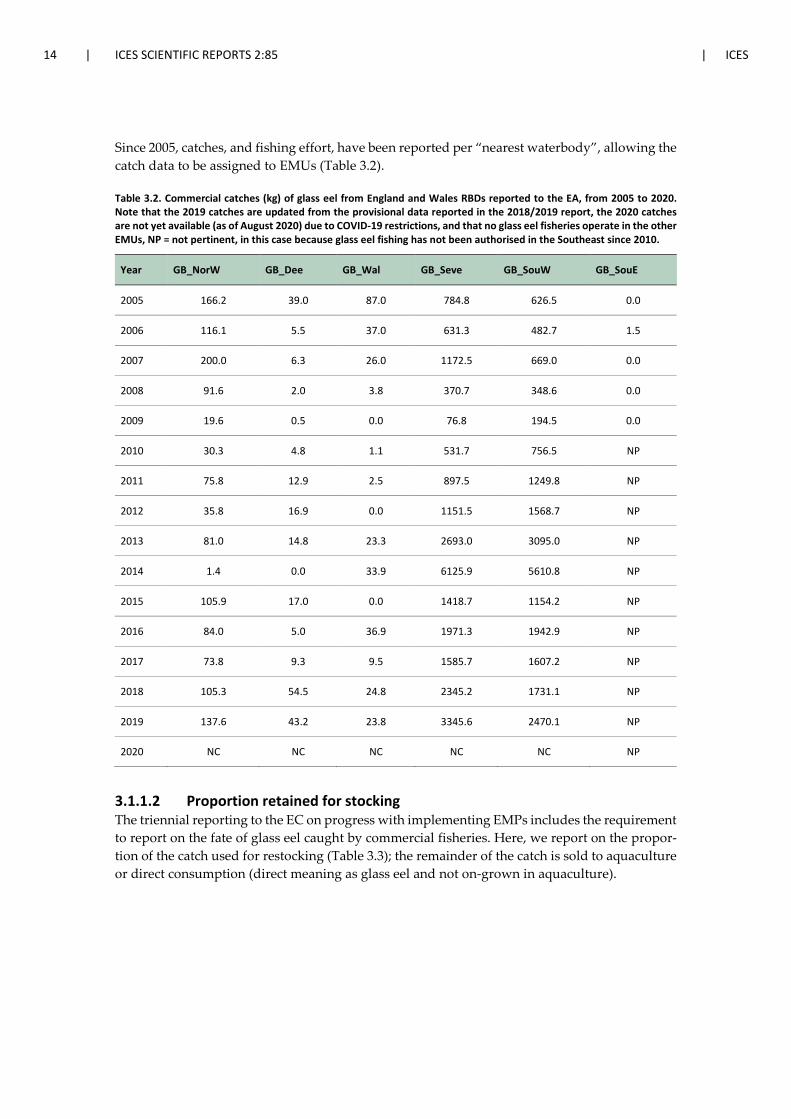
14 | ICES SCIENTIFIC REPORTS 2:85 | ICES
Since 2005, catches, and fishing effort, have been reported per “nearest waterbody”, allowing the catch data to be assigned to EMUs (Table 3.2).
Table 3.2. Commercial catches (kg) of glass eel from England and Wales RBDs reported to the EA, from 2005 to 2020. Note that the 2019 catches are updated from the provisional data reported in the 2018/2019 report, the 2020 catches are not yet available (as of August 2020) due to COVID-19 restrictions, and that no glass eel fisheries operate in the other EMUs, NP = not pertinent, in this case because glass eel fishing has not been authorised in the Southeast since 2010.
Year GB_NorW GB_Dee GB_Wal GB_Seve GB_SouW GB_SouE
2005 166.2 39.0 87.0 784.8 626.5 0.0
2006 116.1 5.5 37.0 631.3 482.7 1.5
2007 200.0 6.3 26.0 1172.5 669.0 0.0
2008 91.6 2.0 3.8 370.7 348.6 0.0
2009 19.6 0.5 0.0 76.8 194.5 0.0
2010 30.3 4.8 1.1 531.7 756.5 NP
2011 75.8 12.9 2.5 897.5 1249.8 NP
2012 35.8 16.9 0.0 1151.5 1568.7 NP
2013 81.0 14.8 23.3 2693.0 3095.0 NP
2014 1.4 0.0 33.9 6125.9 5610.8 NP
2015 105.9 17.0 0.0 1418.7 1154.2 NP
2016 84.0 5.0 36.9 1971.3 1942.9 NP
2017 73.8 9.3 9.5 1585.7 1607.2 NP
2018 105.3 54.5 24.8 2345.2 1731.1 NP
2019 137.6 43.2 23.8 3345.6 2470.1 NP
2020 NC NC NC NC NC NP
3.1.1.2 Proportion retained for stocking The triennial reporting to the EC on progress with implementing EMPs includes the requirement to report on the fate of glass eel caught by commercial fisheries. Here, we report on the propor-tion of the catch used for restocking (Table 3.3); the remainder of the catch is sold to aquaculture or direct consumption (direct meaning as glass eel and not on-grown in aquaculture).
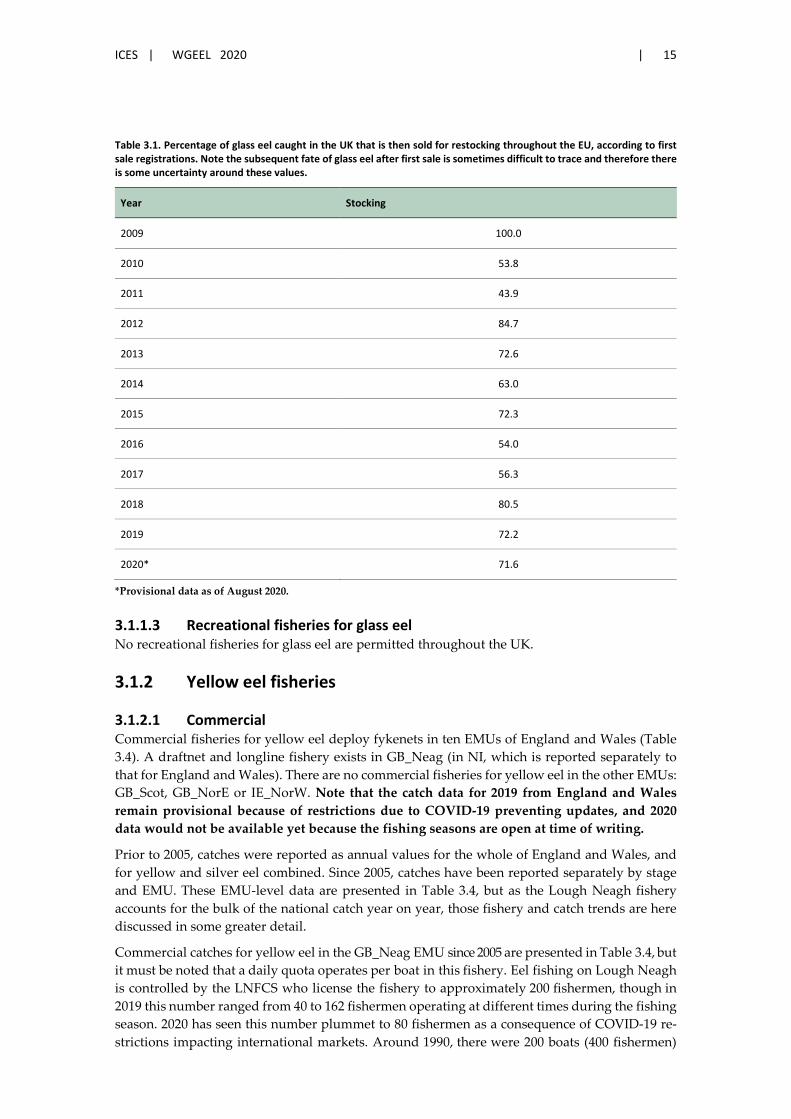
ICES | WGEEL 2020 | 15
Table 3.1. Percentage of glass eel caught in the UK that is then sold for restocking throughout the EU, according to first sale registrations. Note the subsequent fate of glass eel after first sale is sometimes difficult to trace and therefore there is some uncertainty around these values.
Year Stocking
2009 100.0
2010 53.8
2011 43.9
2012 84.7
2013 72.6
2014 63.0
2015 72.3
2016 54.0
2017 56.3
2018 80.5
2019 72.2
2020* 71.6
*Provisional data as of August 2020.
3.1.1.3 Recreational fisheries for glass eel No recreational fisheries for glass eel are permitted throughout the UK.
3.1.2 Yellow eel fisheries
3.1.2.1 Commercial Commercial fisheries for yellow eel deploy fykenets in ten EMUs of England and Wales (Table 3.4). A draftnet and longline fishery exists in GB_Neag (in NI, which is reported separately to that for England and Wales). There are no commercial fisheries for yellow eel in the other EMUs: GB_Scot, GB_NorE or IE_NorW. Note that the catch data for 2019 from England and Wales remain provisional because of restrictions due to COVID-19 preventing updates, and 2020 data would not be available yet because the fishing seasons are open at time of writing.
Prior to 2005, catches were reported as annual values for the whole of England and Wales, and for yellow and silver eel combined. Since 2005, catches have been reported separately by stage and EMU. These EMU-level data are presented in Table 3.4, but as the Lough Neagh fishery accounts for the bulk of the national catch year on year, those fishery and catch trends are here discussed in some greater detail.
Commercial catches for yellow eel in the GB_Neag EMU since 2005 are presented in Table 3.4, but it must be noted that a daily quota operates per boat in this fishery. Eel fishing on Lough Neagh is controlled by the LNFCS who license the fishery to approximately 200 fishermen, though in 2019 this number ranged from 40 to 162 fishermen operating at different times during the fishing season. 2020 has seen this number plummet to 80 fishermen as a consequence of COVID-19 re-strictions impacting international markets. Around 1990, there were 200 boats (400 fishermen)
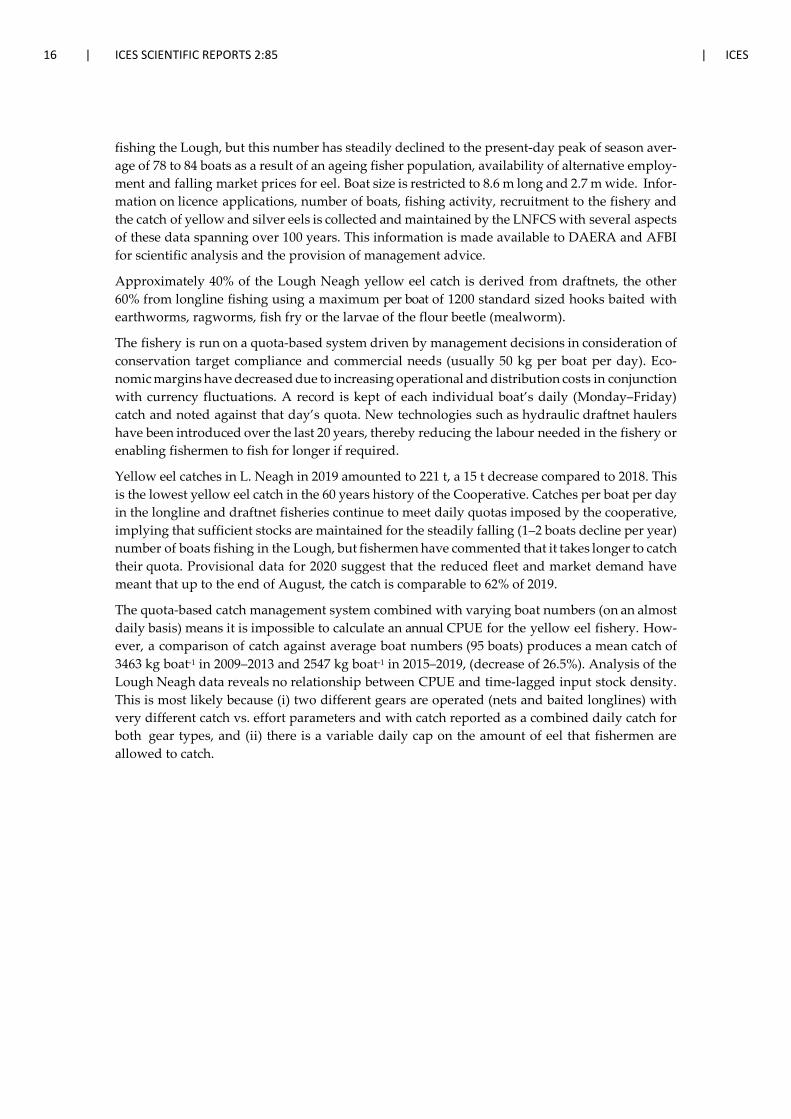
16 | ICES SCIENTIFIC REPORTS 2:85 | ICES
fishing the Lough, but this number has steadily declined to the present-day peak of season aver-age of 78 to 84 boats as a result of an ageing fisher population, availability of alternative employ-ment and falling market prices for eel. Boat size is restricted to 8.6 m long and 2.7 m wide. Infor-mation on licence applications, number of boats, fishing activity, recruitment to the fishery and the catch of yellow and silver eels is collected and maintained by the LNFCS with several aspects of these data spanning over 100 years. This information is made available to DAERA and AFBI for scientific analysis and the provision of management advice.
Approximately 40% of the Lough Neagh yellow eel catch is derived from draftnets, the other 60% from longline fishing using a maximum per boat of 1200 standard sized hooks baited with earthworms, ragworms, fish fry or the larvae of the flour beetle (mealworm).
The fishery is run on a quota-based system driven by management decisions in consideration of conservation target compliance and commercial needs (usually 50 kg per boat per day). Eco-nomic margins have decreased due to increasing operational and distribution costs in conjunction with currency fluctuations. A record is kept of each individual boat’s daily (Monday–Friday) catch and noted against that day’s quota. New technologies such as hydraulic draftnet haulers have been introduced over the last 20 years, thereby reducing the labour needed in the fishery or enabling fishermen to fish for longer if required.
Yellow eel catches in L. Neagh in 2019 amounted to 221 t, a 15 t decrease compared to 2018. This is the lowest yellow eel catch in the 60 years history of the Cooperative. Catches per boat per day in the longline and draftnet fisheries continue to meet daily quotas imposed by the cooperative, implying that sufficient stocks are maintained for the steadily falling (1–2 boats decline per year) number of boats fishing in the Lough, but fishermen have commented that it takes longer to catch their quota. Provisional data for 2020 suggest that the reduced fleet and market demand have meant that up to the end of August, the catch is comparable to 62% of 2019.
The quota-based catch management system combined with varying boat numbers (on an almost daily basis) means it is impossible to calculate an annual CPUE for the yellow eel fishery. How-ever, a comparison of catch against average boat numbers (95 boats) produces a mean catch of 3463 kg boat-1 in 2009–2013 and 2547 kg boat-1 in 2015–2019, (decrease of 26.5%). Analysis of the Lough Neagh data reveals no relationship between CPUE and time-lagged input stock density. This is most likely because (i) two different gears are operated (nets and baited longlines) with very different catch vs. effort parameters and with catch reported as a combined daily catch for both gear types, and (ii) there is a variable daily cap on the amount of eel that fishermen are allowed to catch.
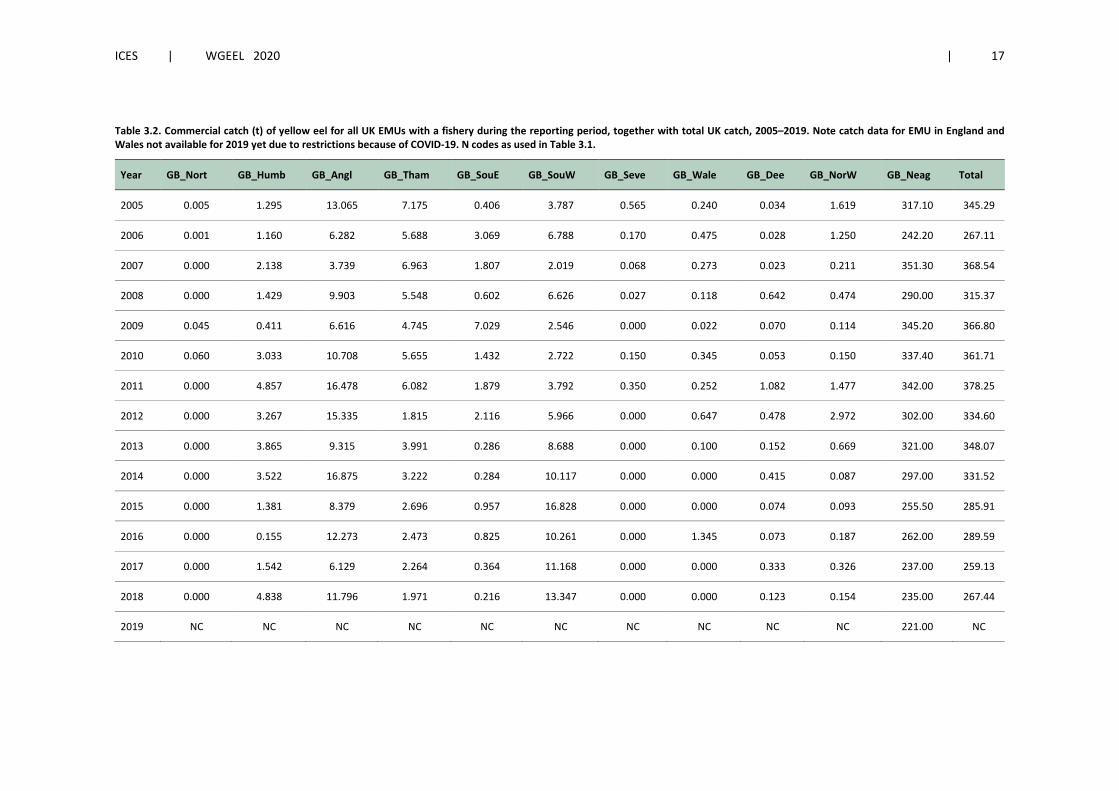
ICES | WGEEL 2020 | 17
Table 3.2. Commercial catch (t) of yellow eel for all UK EMUs with a fishery during the reporting period, together with total UK catch, 2005–2019. Note catch data for EMU in England and Wales not available for 2019 yet due to restrictions because of COVID-19. N codes as used in Table 3.1.
Year GB_Nort GB_Humb GB_Angl GB_Tham GB_SouE GB_SouW GB_Seve GB_Wale GB_Dee GB_NorW GB_Neag Total
2005 0.005 1.295 13.065 7.175 0.406 3.787 0.565 0.240 0.034 1.619 317.10 345.29
2006 0.001 1.160 6.282 5.688 3.069 6.788 0.170 0.475 0.028 1.250 242.20 267.11
2007 0.000 2.138 3.739 6.963 1.807 2.019 0.068 0.273 0.023 0.211 351.30 368.54
2008 0.000 1.429 9.903 5.548 0.602 6.626 0.027 0.118 0.642 0.474 290.00 315.37
2009 0.045 0.411 6.616 4.745 7.029 2.546 0.000 0.022 0.070 0.114 345.20 366.80
2010 0.060 3.033 10.708 5.655 1.432 2.722 0.150 0.345 0.053 0.150 337.40 361.71
2011 0.000 4.857 16.478 6.082 1.879 3.792 0.350 0.252 1.082 1.477 342.00 378.25
2012 0.000 3.267 15.335 1.815 2.116 5.966 0.000 0.647 0.478 2.972 302.00 334.60
2013 0.000 3.865 9.315 3.991 0.286 8.688 0.000 0.100 0.152 0.669 321.00 348.07
2014 0.000 3.522 16.875 3.222 0.284 10.117 0.000 0.000 0.415 0.087 297.00 331.52
2015 0.000 1.381 8.379 2.696 0.957 16.828 0.000 0.000 0.074 0.093 255.50 285.91
2016 0.000 0.155 12.273 2.473 0.825 10.261 0.000 1.345 0.073 0.187 262.00 289.59
2017 0.000 1.542 6.129 2.264 0.364 11.168 0.000 0.000 0.333 0.326 237.00 259.13
2018 0.000 4.838 11.796 1.971 0.216 13.347 0.000 0.000 0.123 0.154 235.00 267.44
2019 NC NC NC NC NC NC NC NC NC NC 221.00 NC
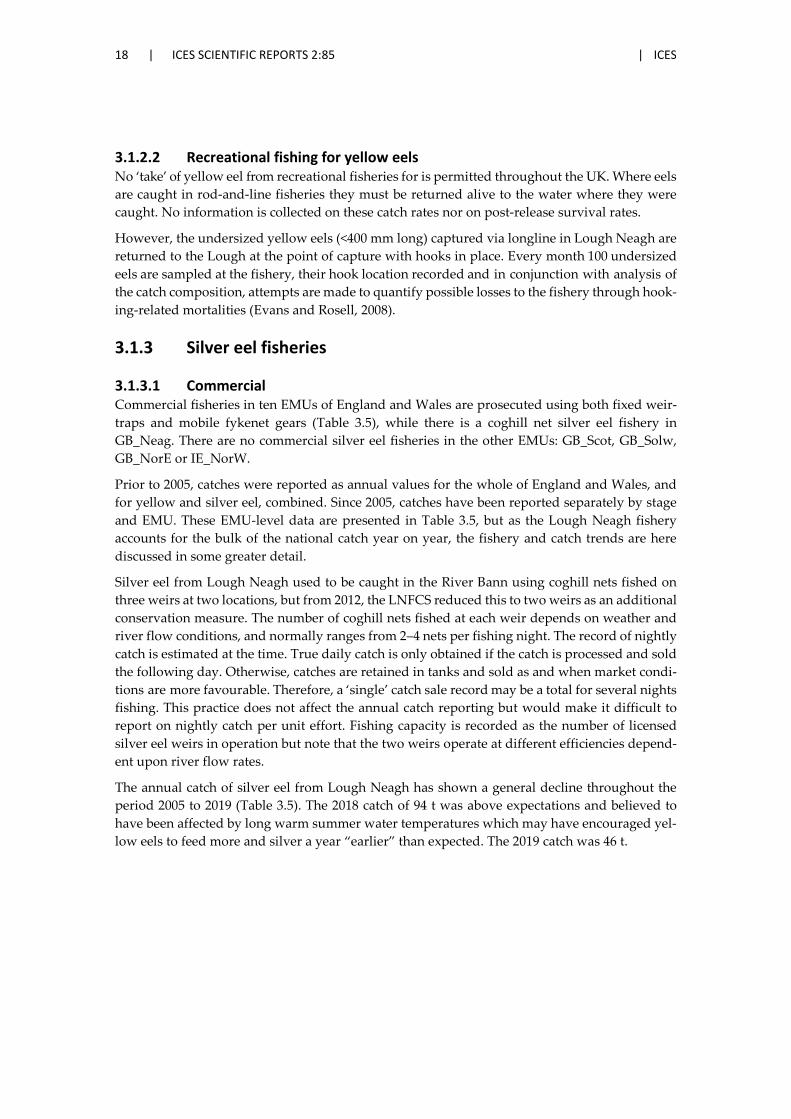
18 | ICES SCIENTIFIC REPORTS 2:85 | ICES
3.1.2.2 Recreational fishing for yellow eels No ‘take’ of yellow eel from recreational fisheries for is permitted throughout the UK. Where eels are caught in rod-and-line fisheries they must be returned alive to the water where they were caught. No information is collected on these catch rates nor on post-release survival rates.
However, the undersized yellow eels (<400 mm long) captured via longline in Lough Neagh are returned to the Lough at the point of capture with hooks in place. Every month 100 undersized eels are sampled at the fishery, their hook location recorded and in conjunction with analysis of the catch composition, attempts are made to quantify possible losses to the fishery through hook-ing-related mortalities (Evans and Rosell, 2008).
3.1.3 Silver eel fisheries
3.1.3.1 Commercial Commercial fisheries in ten EMUs of England and Wales are prosecuted using both fixed weir-traps and mobile fykenet gears (Table 3.5), while there is a coghill net silver eel fishery in GB_Neag. There are no commercial silver eel fisheries in the other EMUs: GB_Scot, GB_Solw, GB_NorE or IE_NorW.
Prior to 2005, catches were reported as annual values for the whole of England and Wales, and for yellow and silver eel, combined. Since 2005, catches have been reported separately by stage and EMU. These EMU-level data are presented in Table 3.5, but as the Lough Neagh fishery accounts for the bulk of the national catch year on year, the fishery and catch trends are here discussed in some greater detail.
Silver eel from Lough Neagh used to be caught in the River Bann using coghill nets fished on three weirs at two locations, but from 2012, the LNFCS reduced this to two weirs as an additional conservation measure. The number of coghill nets fished at each weir depends on weather and river flow conditions, and normally ranges from 2–4 nets per fishing night. The record of nightly catch is estimated at the time. True daily catch is only obtained if the catch is processed and sold the following day. Otherwise, catches are retained in tanks and sold as and when market condi-tions are more favourable. Therefore, a ‘single’ catch sale record may be a total for several nights fishing. This practice does not affect the annual catch reporting but would make it difficult to report on nightly catch per unit effort. Fishing capacity is recorded as the number of licensed silver eel weirs in operation but note that the two weirs operate at different efficiencies depend-ent upon river flow rates.
The annual catch of silver eel from Lough Neagh has shown a general decline throughout the period 2005 to 2019 (Table 3.5). The 2018 catch of 94 t was above expectations and believed to have been affected by long warm summer water temperatures which may have encouraged yel-low eels to feed more and silver a year “earlier” than expected. The 2019 catch was 46 t.
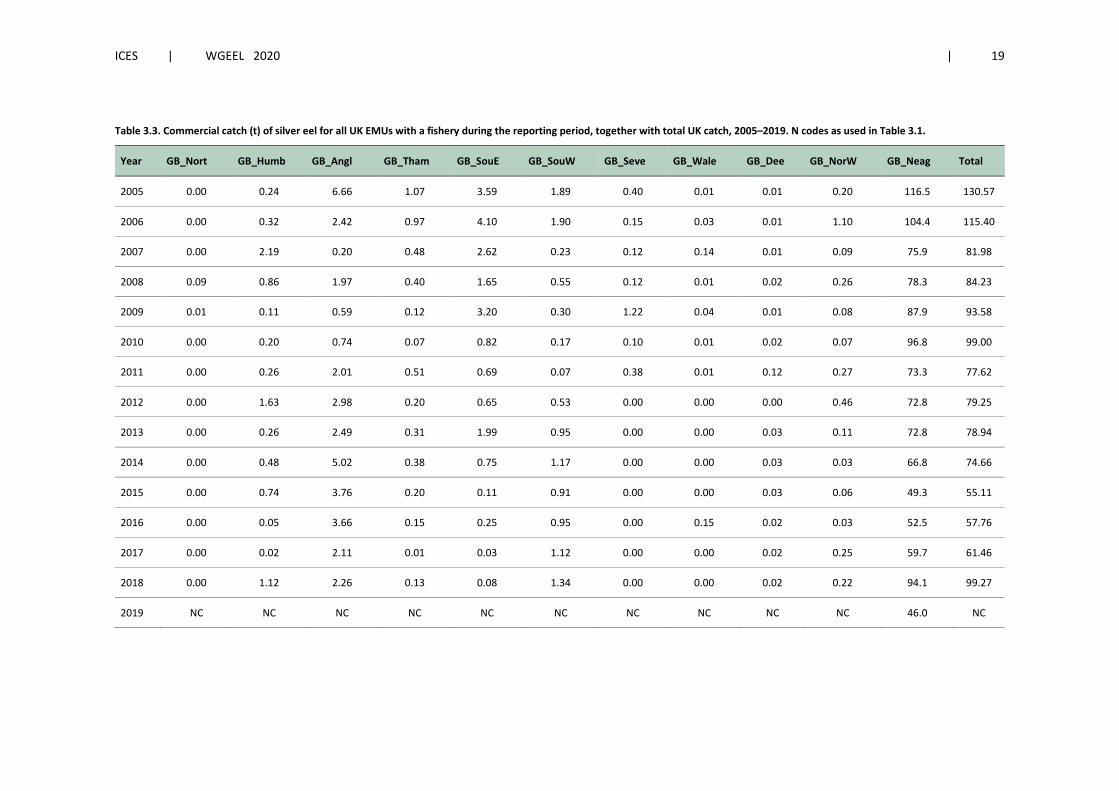
ICES | WGEEL 2020 | 19
Table 3.3. Commercial catch (t) of silver eel for all UK EMUs with a fishery during the reporting period, together with total UK catch, 2005–2019. N codes as used in Table 3.1.
Year GB_Nort GB_Humb GB_Angl GB_Tham GB_SouE GB_SouW GB_Seve GB_Wale GB_Dee GB_NorW GB_Neag Total
2005 0.00 0.24 6.66 1.07 3.59 1.89 0.40 0.01 0.01 0.20 116.5 130.57
2006 0.00 0.32 2.42 0.97 4.10 1.90 0.15 0.03 0.01 1.10 104.4 115.40
2007 0.00 2.19 0.20 0.48 2.62 0.23 0.12 0.14 0.01 0.09 75.9 81.98
2008 0.09 0.86 1.97 0.40 1.65 0.55 0.12 0.01 0.02 0.26 78.3 84.23
2009 0.01 0.11 0.59 0.12 3.20 0.30 1.22 0.04 0.01 0.08 87.9 93.58
2010 0.00 0.20 0.74 0.07 0.82 0.17 0.10 0.01 0.02 0.07 96.8 99.00
2011 0.00 0.26 2.01 0.51 0.69 0.07 0.38 0.01 0.12 0.27 73.3 77.62
2012 0.00 1.63 2.98 0.20 0.65 0.53 0.00 0.00 0.00 0.46 72.8 79.25
2013 0.00 0.26 2.49 0.31 1.99 0.95 0.00 0.00 0.03 0.11 72.8 78.94
2014 0.00 0.48 5.02 0.38 0.75 1.17 0.00 0.00 0.03 0.03 66.8 74.66
2015 0.00 0.74 3.76 0.20 0.11 0.91 0.00 0.00 0.03 0.06 49.3 55.11
2016 0.00 0.05 3.66 0.15 0.25 0.95 0.00 0.15 0.02 0.03 52.5 57.76
2017 0.00 0.02 2.11 0.01 0.03 1.12 0.00 0.00 0.02 0.25 59.7 61.46
2018 0.00 1.12 2.26 0.13 0.08 1.34 0.00 0.00 0.02 0.22 94.1 99.27
2019 NC NC NC NC NC NC NC NC NC NC 46.0 NC
20 | ICES SCIENTIFIC REPORTS 2:85 | ICES
3.1.3.2 Recreational fishing for silver eels No ‘take’ of silver eel is permitted from recreational fisheries throughout the UK. It is thought unlikely that silver eel would be accidentally caught in rod-and-line fisheries, but if this were to occur, then they must be returned alive to the water where they were caught. No information is collected on these catch rates nor on post-release survival rates.
3.1.4 Illegal, underreported or unrecorded catch
Limited information on underreporting rates for commercial glass eel fisheries in EMUs of Eng-land and Wales is provided in Section 3.1.1.1 above. Enforcement operations by the Environment Agency, Natural Resources Wales and local Police forces uncover some illegal operations from time to time.
The only known illegal eel trafficking operation based in UK was successfully disrupted, result-ing in prosecution and conviction. In this case, the eels being illegally traded were not derived from UK fisheries, but had first been imported from France / Spain.
No data exist for illegal, underreported or unrecorded catches in England and Wales EMUs for silver or yellow eels. Enforcement operations by the Environment Agency, Natural Resources Wales and local Police forces uncover some illegal operations from time to time. However, no data are currently available in quantities of illegal catch.
All eel fishing in Scotland is illegal without licence (and no commercial licences have been issued since the introduction of legislation in 2009), however, no data on the extent of illegal activity are available.
Commercial fishing in Lough Neagh is tightly controlled by the LNFCS and underreporting is thought to be very minor, if at all. In other EMUs in Northern Ireland, there have been no reports of illegal fishing for, or trade in, eel.
3.1.5 Bycatch of non-target species
Eel caught in gears targeting other fish species No data are collected on the bycatch of eel in gears targeting other fish species, but it is thought to be very small.
Other fish species caught in gears targeting eels Few data are collected on the bycatch of other species in gears targeting eel but a series of surveys by AFBI from the Lough Neagh fishery confirmed previous assertions that any level of bycatch and its impact are small. In 2018, Toome weir (four nets) in five nights caught 87 377 fish of which 9.1% was bycatch and of that bycatch 6.2% was released alive. Kilrea weir (three nets) in five nights caught 31 373 fish of which 0.02% was bycatch. In 2019, Toome weir (four nets) in five nights caught 15 710 fish of which 35% was bycatch and of that bycatch 88% was released alive. Kilrea weir (three nets) in five nights caught 16 345 fish of which 7.3% was bycatch.
3.2 Restocking
The WGEEL retains a time-series of amounts of eel used for restocking from country to country. This information is periodically used to examine the fate of eel and trade routes.
The term ‘restocking’ is deliberately used by the WGEEL because it refers to the practice of mov-ing fish of wild origin from one water to another, ‘stocking’ is typically used to describe moving

ICES | WGEEL 2020 | 21
fish reared artificially (hatcheries, farms or other aquaculture facilities) to the wild. This is a com-plicated topic area however, with questions over the minimum transfer distance when moving fish changes from assisted migration to restocking, and the maximum time wild fish can be held in culture facilities (e.g. for quarantine purposes) before restocking becomes stocking. The WGEEL 2020 will publish definitions for each of these circumstances in the hope of providing definitive clarity.
Restocking in the UK Some trial restocking of glass eel has taken place across seven EMUs in England and Wales since 2009, plus annual restocking of glass eel into Northern Ireland (Table 3.6), although only Lough Neagh in the Neagh-Bann EMU has received what might be considered significant quantities (100s as opposed to ones and tens of kg). Data on the amounts restocked are available from the Neagh-Bann EMU since 1984, and from other EMUs since 2009. In most years, the glass eel origi-nated from the commercial fisheries in the Severn and Southwest EMUs. However, in 2010, the 996 kg of glass eel restocked into Lough Neagh (GB-Neag) originated from fisheries in San Se-bastian, Spain and the west coast of France, and in 2011 and 2012, material was sourced from France and the UK fisheries (proportions not available). There was no restocking of glass eel into Lough Neagh in 2016 because of issues with availability and supply from the UK fishery.
Glass eel are not routinely quarantined before restocking into Lough Neagh, but arrive from UK Glass Eels Ltd with a Veterinary Health certificate and approved biosecurity protocols. However, following the recent purchases from outside the UK, 1 kg of each new delivery is held in tanks at the LNFCS HQ and survival rates monitored for several weeks by AFBI. In 2019 and 2020, 307 kg and 609 kg respectively of glass eels stocked into Neagh were of French (Gironde) origin.
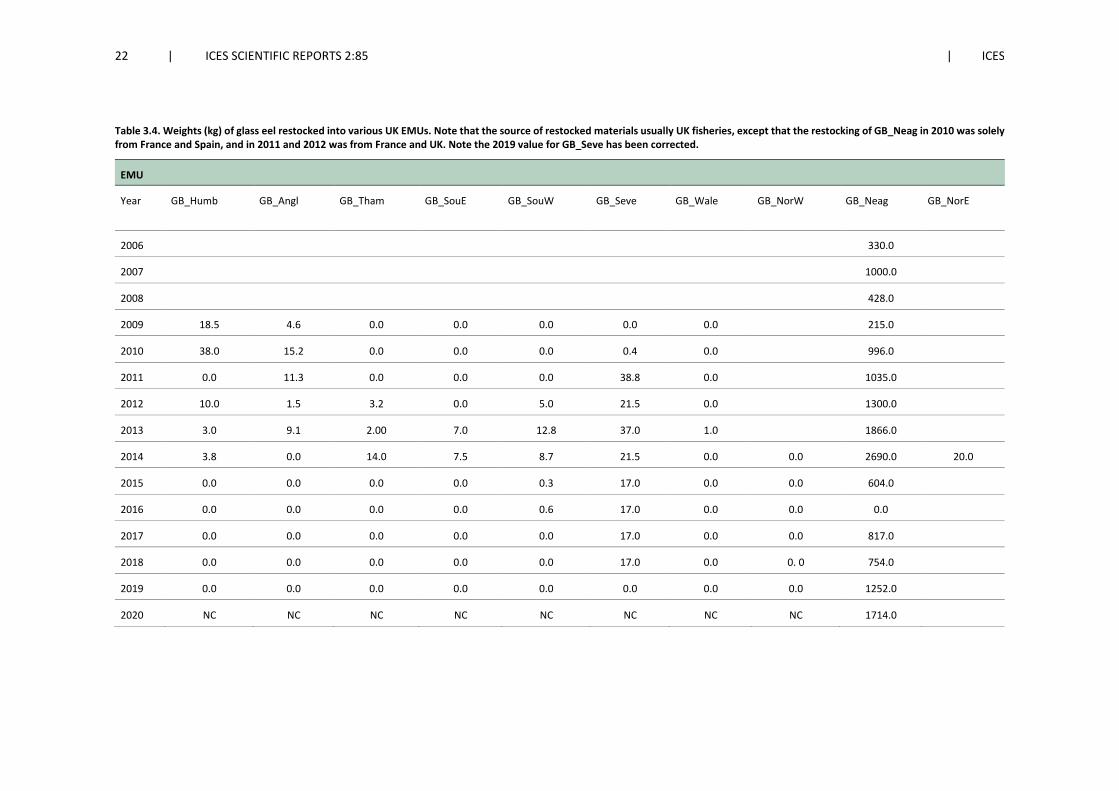
22 | ICES SCIENTIFIC REPORTS 2:85 | ICES
Table 3.4. Weights (kg) of glass eel restocked into various UK EMUs. Note that the source of restocked materials usually UK fisheries, except that the restocking of GB_Neag in 2010 was solely from France and Spain, and in 2011 and 2012 was from France and UK. Note the 2019 value for GB_Seve has been corrected.
EMU
Year GB_Humb GB_Angl GB_Tham GB_SouE GB_SouW GB_Seve GB_Wale GB_NorW GB_Neag GB_NorE
2006 330.0
2007 1000.0
2008 428.0
2009 18.5 4.6 0.0 0.0 0.0 0.0 0.0 215.0
2010 38.0 15.2 0.0 0.0 0.0 0.4 0.0 996.0
2011 0.0 11.3 0.0 0.0 0.0 38.8 0.0 1035.0
2012 10.0 1.5 3.2 0.0 5.0 21.5 0.0 1300.0
2013 3.0 9.1 2.00 7.0 12.8 37.0 1.0 1866.0
2014 3.8 0.0 14.0 7.5 8.7 21.5 0.0 0.0 2690.0 20.0
2015 0.0 0.0 0.0 0.0 0.3 17.0 0.0 0.0 604.0
2016 0.0 0.0 0.0 0.0 0.6 17.0 0.0 0.0 0.0
2017 0.0 0.0 0.0 0.0 0.0 17.0 0.0 0.0 817.0
2018 0.0 0.0 0.0 0.0 0.0 17.0 0.0 0. 0 754.0
2019 0.0 0.0 0.0 0.0 0.0 0.0 0.0 0.0 1252.0
2020 NC NC NC NC NC NC NC NC 1714.0
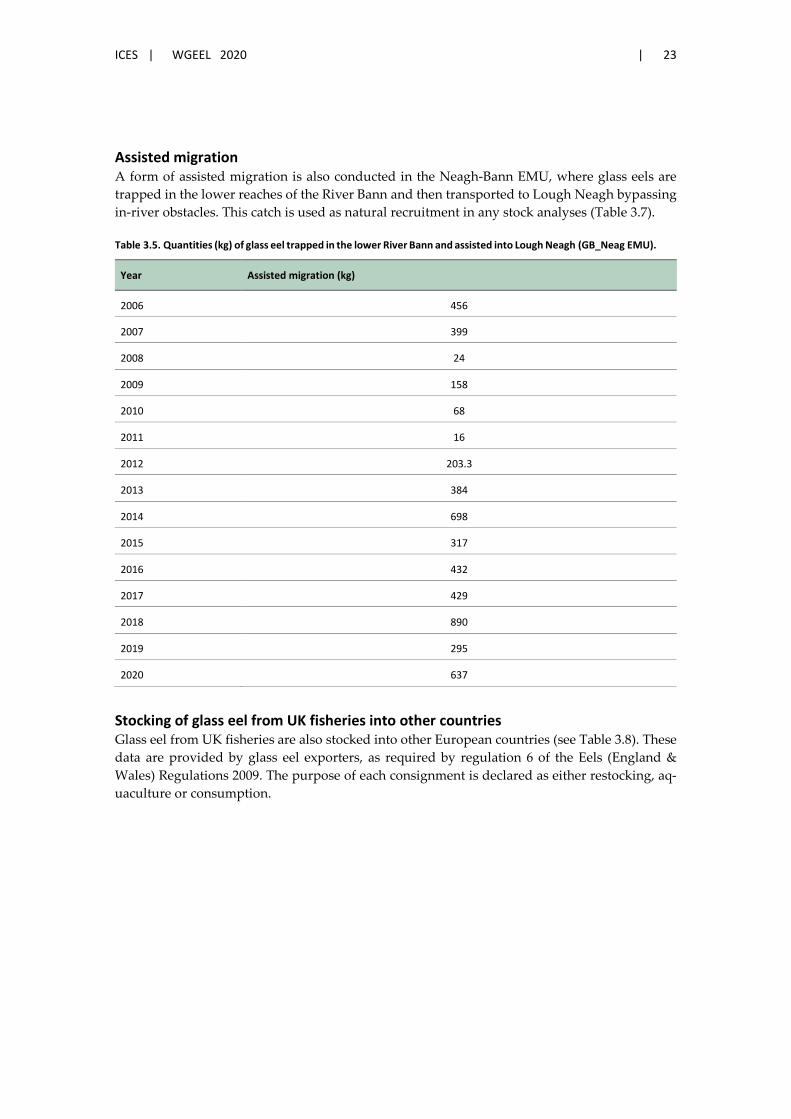
ICES | WGEEL 2020 | 23
Assisted migration A form of assisted migration is also conducted in the Neagh-Bann EMU, where glass eels are trapped in the lower reaches of the River Bann and then transported to Lough Neagh bypassing in-river obstacles. This catch is used as natural recruitment in any stock analyses (Table 3.7).
Table 3.5. Quantities (kg) of glass eel trapped in the lower River Bann and assisted into Lough Neagh (GB_Neag EMU).
Year Assisted migration (kg)
2006 456
2007 399
2008 24
2009 158
2010 68
2011 16
2012 203.3
2013 384
2014 698
2015 317
2016 432
2017 429
2018 890
2019 295
2020 637
Stocking of glass eel from UK fisheries into other countries Glass eel from UK fisheries are also stocked into other European countries (see Table 3.8). These data are provided by glass eel exporters, as required by regulation 6 of the Eels (England & Wales) Regulations 2009. The purpose of each consignment is declared as either restocking, aq-uaculture or consumption.

24 | ICES SCIENTIFIC REPORTS 2:85 | ICES
Table 3.6. The export destinations and kg of glass eel caught in the UK. Note this does not include the restocking to Lough Neagh, Northern Ireland because this is a trade within the UK *2020 is provisional.
2009 2010 2011 2012 2013 2014 2015 2016 2017 2018 2019 *2020
Belgium 4 2
Bulgaria 70
Czech Rep 30 76 470 594 32 80 63 70 65 70
Denmark 200 515 400 400 250
Estonia 307 90 480 420 250 152 150 162 608
France 863 100 185 320 98
Germany 97 882 384 470 1199 323 1074 1134 1081 904 359
Greece 411 1005 650 40 600 96
Latvia 100 343 15 483 10 290 226.8 230
Lithuania 180 330 120 158 505 805 404
Netherlands 1288 593 100 1620 2232 350 51 109 309 1020 610
Poland 120 95 15 5 127 35 120
Slovakia 85 80 14 60
Spain 500 460
Sweden 205 1200 1300 1400 672 892 1250 1250 1018
3.3 Aquaculture
There is no eel aquaculture in the UK. Some glass eels are exported to other EU countries for aquaculture and these are reported in Table 3.9.
There are historic issues of underreporting the catch, which mean that it is not appropriate to derive a proportion stocked directly from this historical catch data. Measures to record catch and destination were implemented as part of the EMPs. The submission of catch returns, trade and restocking records is delivered via the Eels (England and Wales) Regulations 2009. Data are avail-able from 2009 onwards (Table 3.9). Through the EC 1100/2007 there was a legislative require-ment to place a proportion of glass eel caught on the market for use in restocking. This was 35% in 2010, 40% in 2011, 50% in 2012 and 60% from 2013 onwards. Table 3.9 indicates that these stated proportions were actually used for restocking for all years except 2016 and 2017.
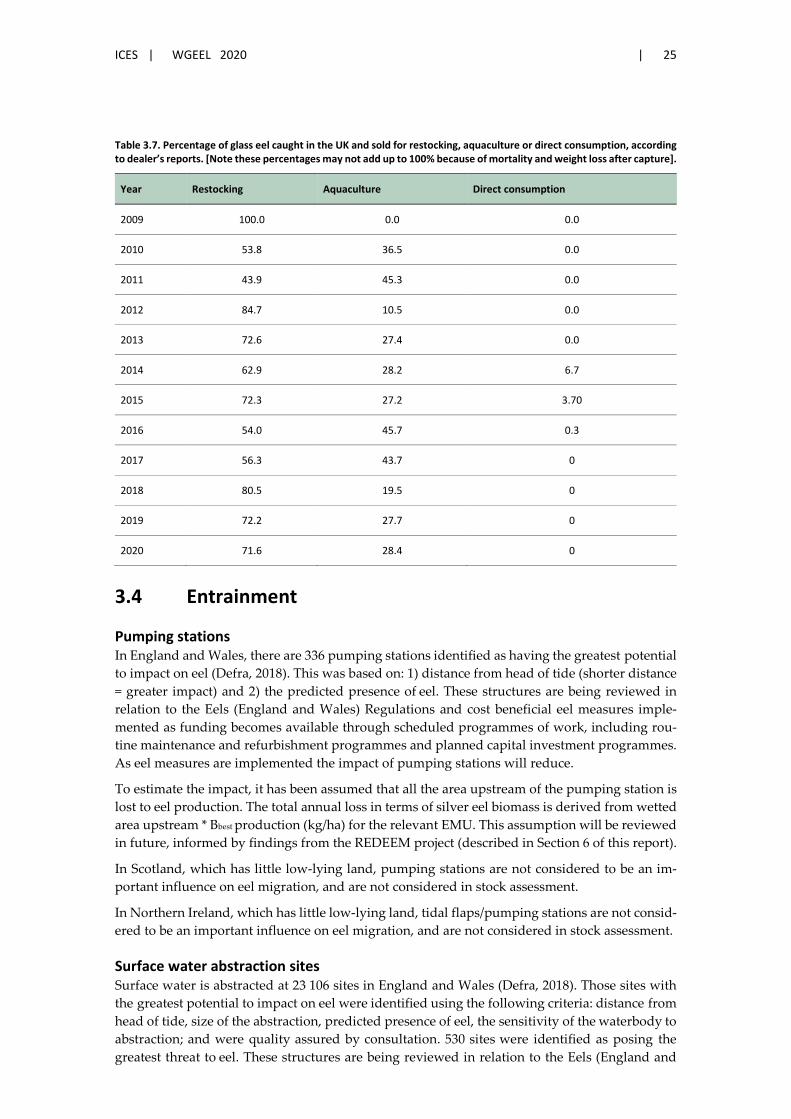
ICES | WGEEL 2020 | 25
Table 3.7. Percentage of glass eel caught in the UK and sold for restocking, aquaculture or direct consumption, according to dealer’s reports. [Note these percentages may not add up to 100% because of mortality and weight loss after capture].
Year Restocking Aquaculture Direct consumption
2009 100.0 0.0 0.0
2010 53.8 36.5 0.0
2011 43.9 45.3 0.0
2012 84.7 10.5 0.0
2013 72.6 27.4 0.0
2014 62.9 28.2 6.7
2015 72.3 27.2 3.70
2016 54.0 45.7 0.3
2017 56.3 43.7 0
2018 80.5 19.5 0
2019 72.2 27.7 0
2020 71.6 28.4 0
3.4 Entrainment
Pumping stations In England and Wales, there are 336 pumping stations identified as having the greatest potential to impact on eel (Defra, 2018). This was based on: 1) distance from head of tide (shorter distance = greater impact) and 2) the predicted presence of eel. These structures are being reviewed in relation to the Eels (England and Wales) Regulations and cost beneficial eel measures imple-mented as funding becomes available through scheduled programmes of work, including rou-tine maintenance and refurbishment programmes and planned capital investment programmes. As eel measures are implemented the impact of pumping stations will reduce.
To estimate the impact, it has been assumed that all the area upstream of the pumping station is lost to eel production. The total annual loss in terms of silver eel biomass is derived from wetted area upstream * Bbest production (kg/ha) for the relevant EMU. This assumption will be reviewed in future, informed by findings from the REDEEM project (described in Section 6 of this report).
In Scotland, which has little low-lying land, pumping stations are not considered to be an im-portant influence on eel migration, and are not considered in stock assessment.
In Northern Ireland, which has little low-lying land, tidal flaps/pumping stations are not consid-ered to be an important influence on eel migration, and are not considered in stock assessment.
Surface water abstraction sites Surface water is abstracted at 23 106 sites in England and Wales (Defra, 2018). Those sites with the greatest potential to impact on eel were identified using the following criteria: distance from head of tide, size of the abstraction, predicted presence of eel, the sensitivity of the waterbody to abstraction; and were quality assured by consultation. 530 sites were identified as posing the greatest threat to eel. These structures are being reviewed in relation to the Eels (England and
26 | ICES SCIENTIFIC REPORTS 2:85 | ICES
Wales) Regulations and cost beneficial eel measures implemented as funding opportunities arise through scheduled programmes of work, including routine maintenance and refurbishment pro-grammes and planned capital investment programmes.
A study of eel entrainment and mortality has been carried out at twelve surface water abstraction sites. The average number of eel entrained at these twelve sites was 627 eels per year, with the average age of those eel being two years (~150 mm). The equivalent in terms of silver eel biomass is estimated to be 0.03 kg per entrained eel. This equates to 18.81 kg per year entrained per ab-straction. As more eel screens are installed at these intakes the impact on eel will reduce. This is accounted for in each triennial assessment.
Surface water extraction is regarded as likely to have only a minor impact on eel in Scotland and Northern Ireland, and does not contribute to stock-assessment.
Cooling water intakes at power stations The UK EMP report 2018 (Defra, 2018) recorded 51 power stations across England and Wales where eels may be impacted by cooling water intakes. This number is likely to fall over the com-ing years as coal-fired stations are gradually decommissioned. This is in line with government’s energy plan to introduce a greater mix of renewable energy. All existing power stations have been reviewed in relation to the Eels (England and Wales) Regulations and cost beneficial eel measures determined. These measures are being implemented.
Hydropower facilities In England and Wales, there are 212 hydropower facilities in operation affecting 11 188 ha of eel producing habitat. The impact of each hydropower facility on eel is estimated according to the Bbest production (kg/ha) for the relevant EMU, the area of habitat upstream, the presence or ab-sence of screens (preventing eel entrainment) and the type of turbine. For those sites with screens, the proportion of eel entering the turbine(s) was assumed to be zero if the spacing between the bars/mesh was <15 mm, 50% if the spacing was between 16–29 mm and 100% if >30 mm: 27.6% of hydropower schemes (excluding Archimedes screws) are adequately screened to prevent the entrainment of eel (i.e. spacing was <15 mm). The estimates of turbine mortality were taken from the WGEEL (ICES, 2011) report and were: Archimedes screw 0%, Francis Turbine 32%, Kaplan turbine 38%. All hydropower facilities have some form of bypass channel that provides an alter-native route for fish around the turbine. On this basis, it has been assumed that approximately 50% of the silver eels produced upstream of a turbine will become entrained therein. It should be noted that these estimates only take account of impacts on downstream migrating silver eel and not on other life stages of eel.
On those river systems where there is more than one hydropower facility, the loss of production from the upstream turbine(s) has been accounted for in estimating the potential impact of tur-bines further downstream, i.e. the cumulative impact of all turbines has been calculated.
In Scotland, a more conservative assessment approach has been adopted in which, in the absence of further information, eel production upstream of hydropower facilities is assumed to be zero.
In Northern Ireland, AFBI undertook a two-year hydroacoustic telemetry turbine mortality study begun in December 2018 assessing turbine passage and associated mortality at the two hydroelectric plants at the outflow of the River Erne into the Atlantic Ocean (Transboundary EMU IE_NorW). Sixty silver eels were tagged and released in December of each of the two years. The tagging and associated releases were in two separate batches of 30 to coincide with low flow and high flow regimes out of the system to coincide with different turbine/spilling operating regimes. The findings from this study were presented at WGEEL 2019, with data included in that year’s review on Hydropower Impacts. Having now been completed, this study is being written up.
ICES | WGEEL 2020 | 27
Provisional Results are that the Total mortality on the two batches of eels released in 2018 ranged from 46.7–66.7%, whilst in 2019, it was measured at 56.7% under both water flow regimes (high and low).
These results indicate a significant difference to mortality figures reported previously for the two Erne hydroelectric stations - 2016/2017 SSCE: All Ireland Eel Report lists individual station im-pacts ranging from 7.7%–27.5% under various generation and flow regimes: and cumulative of 18.3% mortality.
Consideration of these reviewed data will be necessary with particular emphasis on:
a) the impact of this higher mortality rate on escapement data reported previously; b) establishment of a revised mortality figure; c) associated implications of this in terms of EU conservation target compliance for
NWIRBD based on the calculation derived in (a); d) additional conservation measures that could be recommended; e) the recent review on Hydro impacts carried out by ICES, WGEEL (2019) which found the
levels of eel mortality to be equitable to that associated with fishing (see Section 4.3).
3.5 Habitat Quantity and Quality
Habitat Quantity The quantities of eel habitat in each of the EMUs are reported in the Assessed Area column in Table 1.1 above, and according to gross habitat type (Freshwater, Estuary etc) in Table 4.3 below.
England and Wales Throughout England and Wales, it is assumed that all freshwater with connection to the sea constitutes potential eel habitat, based on presence/absence data from fish surveys. The seaward boundary of this habitat area is the boundary of the Transitional Waterbodies, as delineated for River Basin Districts (RBD) in accordance with the Water Framework Directive (WFD).
There are about 19 000 potential barriers (partial and complete barriers) to eel migration across England and Wales. The impact of barriers (including tidal gates) is estimated using a general linear model derived from eel data in 27 rivers from 2008 to 2013 (r2 = 0.196), as described in Annex A of the UK EMP report 2018.
Those barriers (not including tidal structures, see below) with the greatest potential to impact on eel were ranked using the following criteria:
• distance from head of tide; • number of barriers downstream; and • potential extra habitat available if an eel pass were installed at the structure.
Priority eel barriers are being reviewed in relation to the Eels (England and Wales) Regulations and cost-beneficial eel passage measures implemented as funding opportunities arise through scheduled programmes of work, including routine maintenance and refurbishment programmes and planned capital investment programmes. Therefore, the impact of barriers will reduce over time as these structures are addressed and more habitat is opened up to eel. This is accounted for in each triennial assessment.
A total of 1048 tidal sluices exist within England and Wales. A study was undertaken in 2012 to produce a nationally consistent, prioritised list of tidal outfall structures in England and Wales where upstream and/or downstream fish passage is adversely affected (HIFI, unpublished). The decision of which sluices to assess was initially made on the basis of channel width, with the narrowest watercourses (those <5 m wide) rejected because these are unlikely to provide large
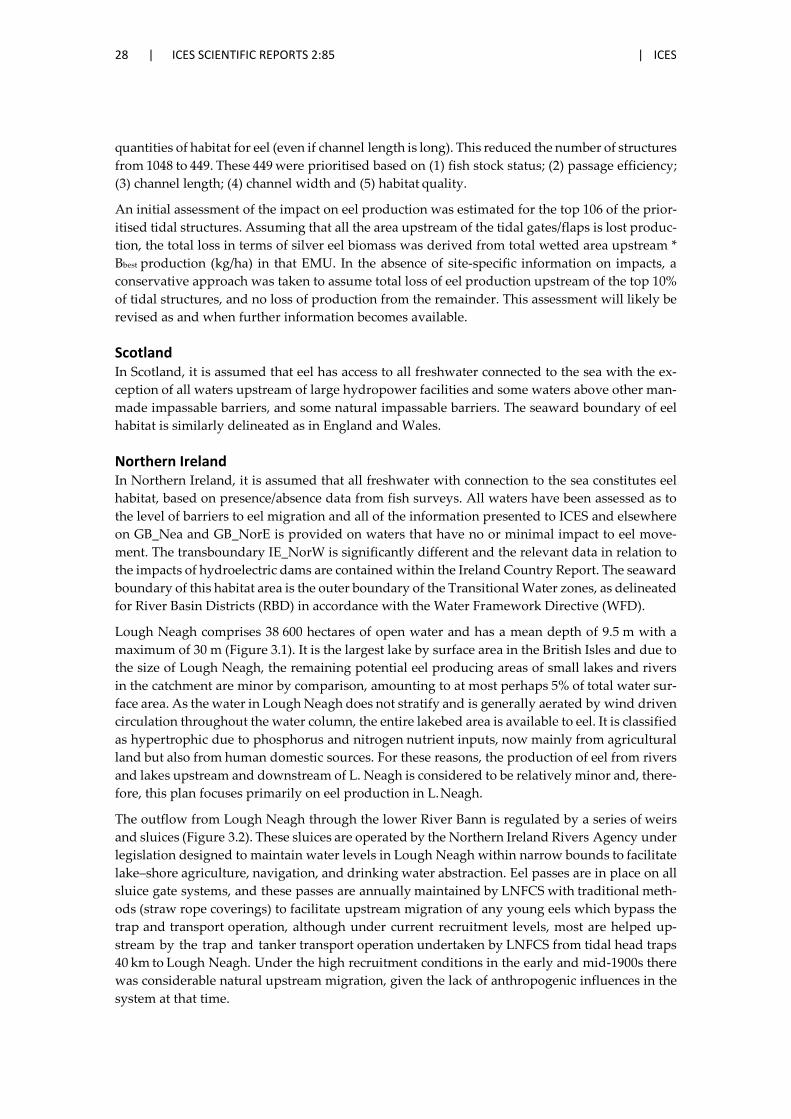
28 | ICES SCIENTIFIC REPORTS 2:85 | ICES
quantities of habitat for eel (even if channel length is long). This reduced the number of structures from 1048 to 449. These 449 were prioritised based on (1) fish stock status; (2) passage efficiency; (3) channel length; (4) channel width and (5) habitat quality.
An initial assessment of the impact on eel production was estimated for the top 106 of the prior-itised tidal structures. Assuming that all the area upstream of the tidal gates/flaps is lost produc-tion, the total loss in terms of silver eel biomass was derived from total wetted area upstream * Bbest production (kg/ha) in that EMU. In the absence of site-specific information on impacts, a conservative approach was taken to assume total loss of eel production upstream of the top 10% of tidal structures, and no loss of production from the remainder. This assessment will likely be revised as and when further information becomes available.
Scotland In Scotland, it is assumed that eel has access to all freshwater connected to the sea with the ex-ception of all waters upstream of large hydropower facilities and some waters above other man-made impassable barriers, and some natural impassable barriers. The seaward boundary of eel habitat is similarly delineated as in England and Wales.
Northern Ireland In Northern Ireland, it is assumed that all freshwater with connection to the sea constitutes eel habitat, based on presence/absence data from fish surveys. All waters have been assessed as to the level of barriers to eel migration and all of the information presented to ICES and elsewhere on GB_Nea and GB_NorE is provided on waters that have no or minimal impact to eel move-ment. The transboundary IE_NorW is significantly different and the relevant data in relation to the impacts of hydroelectric dams are contained within the Ireland Country Report. The seaward boundary of this habitat area is the outer boundary of the Transitional Water zones, as delineated for River Basin Districts (RBD) in accordance with the Water Framework Directive (WFD).
Lough Neagh comprises 38 600 hectares of open water and has a mean depth of 9.5 m with a maximum of 30 m (Figure 3.1). It is the largest lake by surface area in the British Isles and due to the size of Lough Neagh, the remaining potential eel producing areas of small lakes and rivers in the catchment are minor by comparison, amounting to at most perhaps 5% of total water sur-face area. As the water in Lough Neagh does not stratify and is generally aerated by wind driven circulation throughout the water column, the entire lakebed area is available to eel. It is classified as hypertrophic due to phosphorus and nitrogen nutrient inputs, now mainly from agricultural land but also from human domestic sources. For these reasons, the production of eel from rivers and lakes upstream and downstream of L. Neagh is considered to be relatively minor and, there-fore, this plan focuses primarily on eel production in L. Neagh.
The outflow from Lough Neagh through the lower River Bann is regulated by a series of weirs and sluices (Figure 3.2). These sluices are operated by the Northern Ireland Rivers Agency under legislation designed to maintain water levels in Lough Neagh within narrow bounds to facilitate lake–shore agriculture, navigation, and drinking water abstraction. Eel passes are in place on all sluice gate systems, and these passes are annually maintained by LNFCS with traditional meth-ods (straw rope coverings) to facilitate upstream migration of any young eels which bypass the trap and transport operation, although under current recruitment levels, most are helped up-stream by the trap and tanker transport operation undertaken by LNFCS from tidal head traps 40 km to Lough Neagh. Under the high recruitment conditions in the early and mid-1900s there was considerable natural upstream migration, given the lack of anthropogenic influences in the system at that time.

ICES | WGEEL 2020 | 29
Any silver eels which use the minimum 10% free gap past active silver fisheries are therefore free to run to sea. The outflowing River Bann is free of any turbine, power generation system or major water abstraction, which might impede the escapement of silver eels to the sea.
The GB-NorE EMP covers the Northeast coastal fringe of Northern Ireland, comprising the Northeastern River Basin District as defined for Ecoregion 17 (The Island of Ireland) for WFD purposes, with the addition of those County Down coastal catchments draining into Carlingford Lough from Northern Ireland and those parts of the river catchments of South County Armagh not draining north to Lough Neagh but draining southward to the Irish Republic.
This EMP contains a diverse range of river and lake habitats, ranging from high gradient moun-tain streams of low productivity and little or no production of eel, to lowland inter-drumlin lakes in areas of high productivity and with significant capability, at least on a per unit area basis, to produce eel. The potential eel productive area in the region is largely in two of these sections or catchment groups, i.e. the River Lagan and associated rivers entering the Irish Sea at Belfast, and the collected catchments draining to the fjord-like Strangford Lough.
Habitat Quality It is not possible to define habitat suitability criteria for eels from which to assess UK waters in terms of their quality for eel production. However, there are a range of water quality metrics that possibly/probably have some influence on eels; examples are provided below from Northern Ireland. No national-scale assessment of water quality is reported here but is probably available from other sources.
Chemical quality The chemical quality of Lough Neagh and the River Bann is assessed by the Northern Ireland Environment agency at sites in the Lough and the outflowing River Bann at quarterly intervals. Three determinants are used to score the quality according to the UK: biochemical oxygen de-mand (BOD), dissolved oxygen (DO) and ammonia, and categorised under the UK General Qual-ity Assessment (GQA) system. In this system, there are six quality classes ranging from Very Good through Fair to Bad. Monitoring results for rolling three-year sampling periods are used. Thus, for example, the GQA chemical classification for 2003 is based on a combination of the re-sults obtained during 2001, 2002 and 2003. Lough Neagh currently scores at GQA class 3 (fairly good) which means that it is suitable for potable supply after treatment, all other abstractions, good cyprinid fisheries, and is capable of supporting a natural ecosystem.
Trophic status AFBI monitors nutrient levels (forms of Nitrogen and Phosphorus, Silica, Algal species and quan-tity) on a fortnightly basis, along with Chlorophylla and Secchi disk transparency. These data class Lough Neagh as eutrophic or hypertrophic on the OECD/Vollenweider system, as a result of mainly agricultural but also some domestic N and P inputs. While this is a concern for other interests (e.g. the salmon and trout fisheries), the turbidity and high biological productivity are actually positive factors to the eel, and probably account for the Lake’s capability to produce ex-traordinary quantities of eel relative to glass eel inputs. Some eel food items, particularly chiron-omid larvae, are present in very high abundance.
Contaminants Lough Neagh has an essentially agricultural catchment with very low levels of industrialisation and only small or medium sized towns. Hence, in the absence of routine monitoring of eel qual-ity, it is inferred that there is no local problem of contamination of eel with organic chemical residues, heavy metals, or other pollutants which would give grounds for concern for human consumption or indeed for eel spawner viability (see Section 5.4.2).
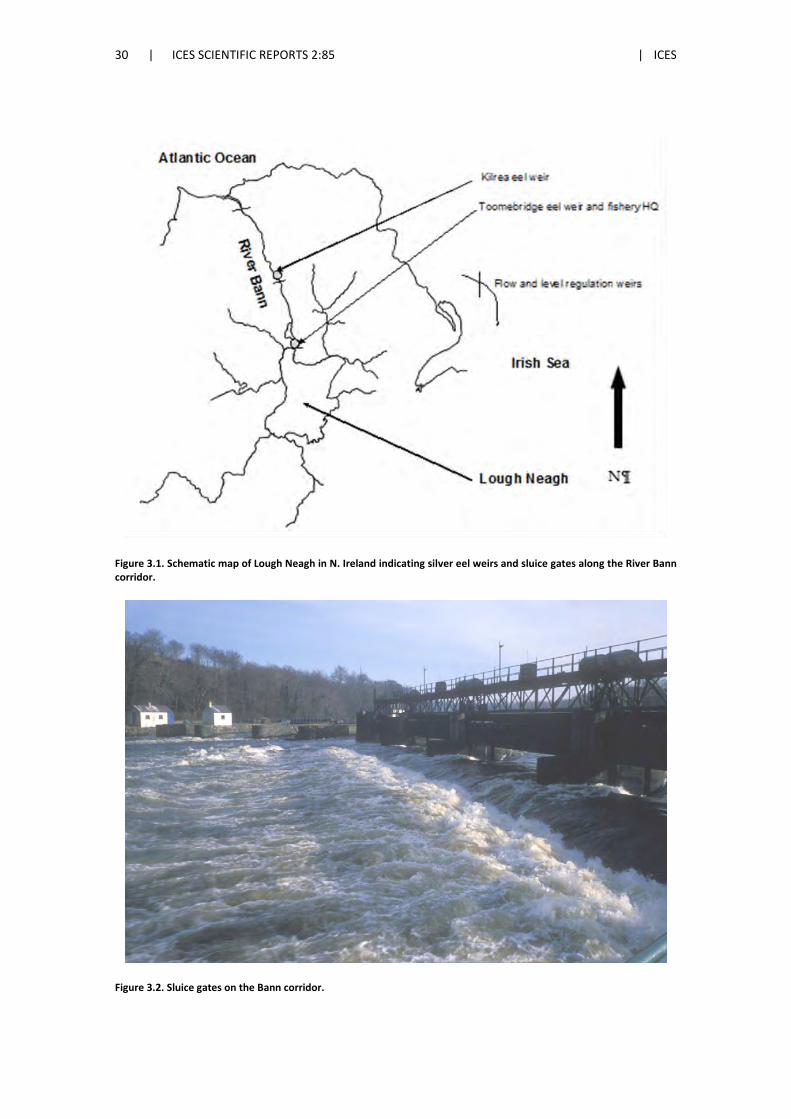
30 | ICES SCIENTIFIC REPORTS 2:85 | ICES
Figure 3.1. Schematic map of Lough Neagh in N. Ireland indicating silver eel weirs and sluice gates along the River Bann corridor.
Figure 3.2. Sluice gates on the Bann corridor.

ICES | WGEEL 2020 | 31
3.6 Other impacts
There is no information available on other impacts.
32 | ICES SCIENTIFIC REPORTS 2:85 | ICES
4 National stock assessment
4.1 Description of Method
Reflecting the differing management authorities within the UK, stock assessments differ between England and Wales, Scotland and Northern Ireland.
England and Wales: GB_Nort, GB_Humb, GB_Angl, GB_Tham, GB_SouE, GB_SouW, GB_Seve, GB_Wale, GB_Dee, GB_NorW, GB_Solw Silver eel escapement estimates for these EMUs are derived from yellow eel electric fishing sur-veys extrapolated to silver eel escapement using the SMEP II model and various analyses to esti-mate losses due to fisheries and other human impacts.
The numbers of potential silver eel emigrants arising from the yellow eel population in the sur-vey year, is estimated from the abundance and length distribution of those yellow eels consid-ered to be long enough to have a probability >0 of becoming silver eels in that year. The biomass of silver eels is estimated from the numbers-at-length using a length–weight relationship derived from data for over 16 000 eels sampled throughout England and Wales (Aprahamian et al., 2007; Walker et al., 2013).
To estimate fishing mortality rate, the yellow and glass eel catches were first converted to silver eel equivalents.
The biomass of yellow eel caught was considered to be the equivalent of the potential silver eel escapement as the instantaneous mortality rate of 0.139 yr-1 (Dekker, 2000) approximated to the instantaneous growth rate of 0.2 yr-1 (Aprahamian, 1986).
For the glass eel catch, 1 kg of glass eel was considered equivalent to 59.4 kg of silver eel, based on the instantaneous mortality of 0.00915 day-1 for the first 50 days post-settlement and there after a mortality of 0.139 yr-1, a 50:50 sex ratio with males maturing at 12 years (@90 g) and females at 18 years (@570 g) (Aprahamian, 1988).
The methods used to estimate other human-induced mortality rates are described in the 2018 UK EMP report.
Estimation of B0 The 2015 triennial UK Eel Management Plan (EMP) progress report had an updated methodol-ogy for the calculation on historical biomass (B0) compared to the 2012 and 2013 assessments. The improved model better reflected the actual state of eel stocks in rivers. Although the basic life-history model used for compliance calculations did not change, some of the assumptions and key datasets used within the model changed significantly (for more details on the methodology, see annex A in the 2018 UK EMP report). The same method was used in for the 2018 UK EMP Report. Although our model has been improved, the confidence limits around the biomass esti-mates are inherently wide.
Scotland: GB_Scot Stock assessment methods have been developed for the Scotland EMU based on quantification of upstream and downstream eel movements at traps on three rivers. The estimates of B0, Bcurrent
and Bbest rely heavily on the extrapolation of data from small study areas to the EMU as a whole, with the inherent possibility of bias. To derive an estimate of current production and anthropo-genic mortality for the EMU from the available data has required a number of assumptions; these
ICES | WGEEL 2020 | 33
have tended to be precautionary in nature (i.e. likely to underestimate current production and overestimate current anthropogenic mortality (see Scotland RBD EMP, 2010 for details). Some of these precautionary assumptions could be tested, and the production/mortality estimates ad-justed accordingly, if resources become available. Scotland RBD EMP is available at: http://www.gov.scot/Resource/Doc/295194/0118349.pdf.
From 2013, and following the methods used in England and Wales, Scotland has adopted the inclusion of a silver eel production estimate for transitional waters based on the simplistic as-sumption that this is equivalent to silver eel production in the lowland rivers and lochs of Scot-land (<240 m). Pristine production for transitional waters is assumed to be equivalent to pristine production in Scottish freshwaters during the reference period. For this reason, the inclusion of transitional waters has no effect on modelled silver eel output as a percentage of pristine output. However, because anthropogenic mortality (∑A) is assumed to be zero in transitional waters, as there are no fisheries, the inclusion of transitional waters leads to a substantial reduction in the es-timate of the value of ∑A for the Scotland EMU.
Pristine escapement, B0, was estimated via three different methods: one based on historical measures of escapement from the Girnock Burn 1967–1980; one based on reference to a similar habitat elsewhere (Burrishoole data); and one based on the Irish Catchment Geology model. De-tails are presented in the Scotland RBD EMP (http://www.gov.scot/Re-source/Doc/295194/0118349.pdf). All three methods yielded broadly similar results, and accord-ingly the mean value for pristine escapement of the three methods was adopted as B0. Since the EMP was published the estimate of B0 has been slightly increased to take account of trap efficiency in one of the estimated methods. Further details can be found in the UK 2015 EMP progress report to the EC.
Northern Ireland
GB_NorE The estimate of pristine escapement from the Northeast RBD was calculated with reference to the ecology and hydrology of similar systems (option c Article 5 of the Regulation) as described in Section 2.4.1 of the EMP. Current escapement was monitored in autumn and winter of 2017 and 2018 providing an extrapolated Bcurrent across the EMU of 969 kg and 847 kg respectively. All rivers and upland lakes which are suitable for eel have been assessed as having no barriers to migration. As such under adequate recruitment levels and an adherence to the criteria laid down in the Northeast RBD EMP, this EMU should reach or better the 40% target naturally.
GB_Neag The monitoring of silver eel migration and subsequent estimations of silver eel escapement from the GB_Nea EMU are carried out by direct measurement. Given the geography of the RBD, in par-ticular the single outflow point of Lough Neagh via the Lower River Bann at Toome, an annual mark–recapture programme of silver eel emigrating from Lough Neagh was initiated in October 2003, to estimate silver eel escapement (Bcurrent) past the weir fishery, which is subject to a trap-free gap in the river channel, a three-month fishing season (some silver eel movement occurs outside this season), and inefficient fishing when river flows are very high. Recaptures occur both during the year of release and at least one or even two years afterwards. To date, 10 439 silver eels have been tagged and maximum estimates of escapement, based on the proportion of recaptured FloyTM tagged eels, range from 111 t to 338 t during 2003 to 2018 (Table 4.2). No tagging was undertaken in 2007 due to the sporadic nature of the silver eel run. The Neagh/Bann estimate of Bbest is derived from a known history of natural recruitment plus enhancement stocking, time-lagged for known growth rates of silver eel. The current fishery management arrangements sig-nificantly contribute to the outputs from this system.
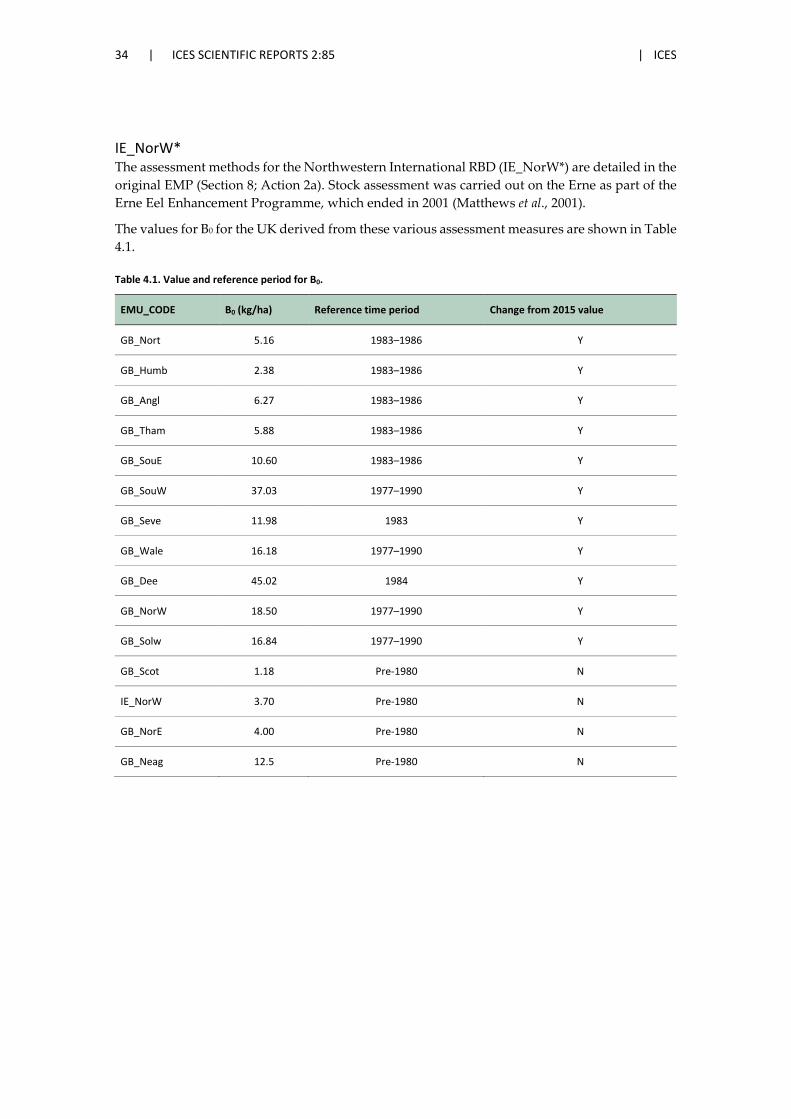
34 | ICES SCIENTIFIC REPORTS 2:85 | ICES
IE_NorW* The assessment methods for the Northwestern International RBD (IE_NorW*) are detailed in the original EMP (Section 8; Action 2a). Stock assessment was carried out on the Erne as part of the Erne Eel Enhancement Programme, which ended in 2001 (Matthews et al., 2001).
The values for B0 for the UK derived from these various assessment measures are shown in Table 4.1.
Table 4.1. Value and reference period for B0.
EMU_CODE B0 (kg/ha) Reference time period Change from 2015 value
GB_Nort 5.16 1983–1986 Y
GB_Humb 2.38 1983–1986 Y
GB_Angl 6.27 1983–1986 Y
GB_Tham 5.88 1983–1986 Y
GB_SouE 10.60 1983–1986 Y
GB_SouW 37.03 1977–1990 Y
GB_Seve 11.98 1983 Y
GB_Wale 16.18 1977–1990 Y
GB_Dee 45.02 1984 Y
GB_NorW 18.50 1977–1990 Y
GB_Solw 16.84 1977–1990 Y
GB_Scot 1.18 Pre-1980 N
IE_NorW 3.70 Pre-1980 N
GB_NorE 4.00 Pre-1980 N
GB_Neag 12.5 Pre-1980 N
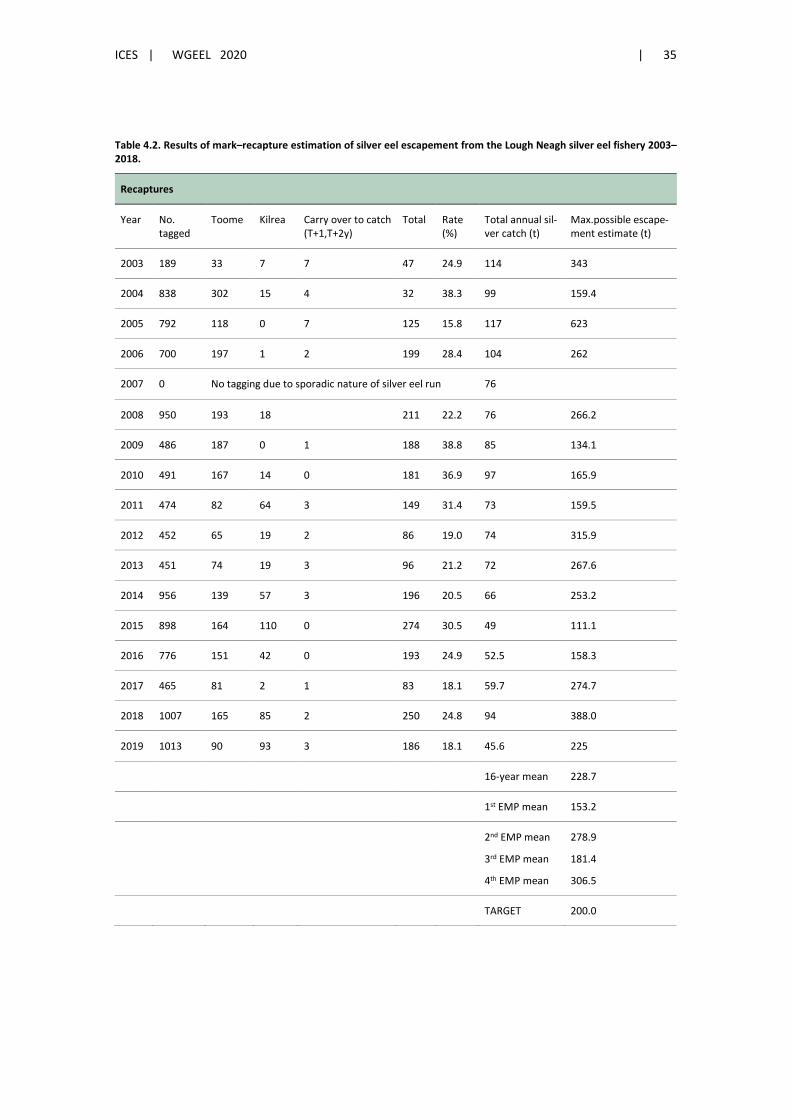
ICES | WGEEL 2020 | 35
Table 4.2. Results of mark–recapture estimation of silver eel escapement from the Lough Neagh silver eel fishery 2003–2018.
Recaptures
Year No. tagged
Toome Kilrea Carry over to catch (T+1,T+2y)
Total Rate (%)
Total annual sil-ver catch (t)
Max.possible escape-ment estimate (t)
2003 189 33 7 7 47 24.9 114 343
2004 838 302 15 4 32 38.3 99 159.4
2005 792 118 0 7 125 15.8 117 623
2006 700 197 1 2 199 28.4 104 262
2007 0 No tagging due to sporadic nature of silver eel run 76
2008 950 193 18 211 22.2 76 266.2
2009 486 187 0 1 188 38.8 85 134.1
2010 491 167 14 0 181 36.9 97 165.9
2011 474 82 64 3 149 31.4 73 159.5
2012 452 65 19 2 86 19.0 74 315.9
2013 451 74 19 3 96 21.2 72 267.6
2014 956 139 57 3 196 20.5 66 253.2
2015 898 164 110 0 274 30.5 49 111.1
2016 776 151 42 0 193 24.9 52.5 158.3
2017 465 81 2 1 83 18.1 59.7 274.7
2018 1007 165 85 2 250 24.8 94 388.0
2019 1013 90 93 3 186 18.1 45.6 225
16-year mean 228.7
1st EMP mean 153.2
2nd EMP mean
3rd EMP mean
4th EMP mean
278.9
181.4
306.5
TARGET 200.0
36 | ICES SCIENTIFIC REPORTS 2:85 | ICES
4.1.1 Data collection
Data collection is managed through separate agencies in the four Devolved Authorities so there are variations between the methods. The following summarises the data collection strategy as applied in the UK’s Annual Workplan for the EU Data Collection Framework (DCF).
There are 15 Eel Management Units (EMUs), including one shared with the Republic of Ireland. Most EMUs have been set at the River Basin District (RBD) level, as defined under the Water Framework Directive.
ICES (2012) recommended eel fisheries and stock data be collected annually, except stock abun-dance should be collected once per EMP reporting period (presently every three years).
Commercial fisheries for eels (recruits, yellow and silver eels) in England and Wales are legally required to report catch quantities (weight), effort as days fished, the location and type of water fished. No data are collected on other biological characteristics: maturity and fecundity are not applicable as all exploited life stages are immature; other characteristics are not required for na-tional stock assessments. Commercial fisheries in Lough Neagh (Northern Ireland) are reported to AFBI/DAERA by the Lough Neagh Fishermen’s Co-operative Society Ltd. Weekly sampling of 20 yellow eel over 20 weeks (May to September), and ten silver eel over a 12 week period, provide age and length, weight, fat content, sex, age, stomach contents, and parasite load. Sex ratio of the silver eel population is estimated from size grading the catch into boxes of small (male) and large (female) eels. There are no commercial fisheries for eel in Scotland.
Any eel that are caught by recreational fisheries must be returned alive to the water.
The abundance of recruits is estimated from traps in five EMUs (Scotland, Anglian, Thames, Northwest, Southwest) yielding numbers or batch weights of glass eel/elvers and numbers and lengths of yellow eel; from a time-series of CPUE from the commercial fishery in England (Sev-ern); from dragnet surveys twice monthly from March/April to July/August in Northern Ireland (River Bann; Strangford Lough) yielding numbers per kg and length frequencies from 50 juve-niles per sample; and model-based hindcasting from yellow eel abundance estimates in other EMUs.
The abundance of standing stock (yellow eels) is collected from electrofishing surveys in rivers across all 15 EMUs. Sites are fished every one to three years, depending on programme specifi-cation, and provide numbers per unit area, length frequency distribution and estimated individ-ual weights.
Information on the numbers or weight, and sex ratio of silver eels, is collected annually from three EMUs using commercial catch sampling (Northern Ireland), downstream traps (Scotland) or electronic counters (England), and once in every EMP reporting period (as per the require-ments of the EC Eel Regulation 1100/2007), for the remaining twelve EMUs using model-based estimates derived from yellow eel abundance surveys. The model-based methods are described in the 2015 EMP Progress Report to the EU, at: http://sciencesearch.defra.gov.uk/Docu-ment.aspx?Document=12571_UKEMP2015report.pdf.
GB_Neag Eel are sampled regularly as part of a long-term research programme, which investigates all life stages throughout the year. Yellow eel catches are sampled weekly over 20 weeks (from May to September). A sample of 20 eels is chosen to reflect all size ranges caught, and analysed for age and length. In addition, the entire, ungraded landing of two fishing crew on one day each month is sampled, usually comprising 400–600 eels captured by longline and a similar number by draft-net, to enable comparison between methods. Every eel is measured for length, and the total catch recorded.
ICES | WGEEL 2020 | 37
Preliminary analysis indicates that a larger proportion of small eels (<40 cm) are captured by draftnets (34%, compared to 21.4% on longlines), whereas more of the larger eels (>60 cm) are taken on longlines. Furthermore, there was significant variation in the numbers of small eels cap-tured by longlining dependent upon bait type (earthworms caught more) and hook size (larger hook caught fewer small eels).
GB_NorE A fykenet survey was undertaken in Killough within this EMU in summer 2017 and was directly assessed for silver eel migration in autumn and winter of 2017 and 2018, data provided in the data call. The 2019 silver eel netting survey was wiped out in flood conditions with no data (ND) available for this year.
4.1.2 Analysis
No information available.
4.1.3 Reporting
In addition to reporting the data and information in this report and the associated Data Call annexes to ICES on an annual basis, the stock indicators and other details have been reported to the European Commission on a triennial basis.
4.1.4 Data quality issues and how they are being addressed
No information available.
4.2 Trends in Assessment results
Chapter 1 provides the most recent assessment results at the spatial scale of the EMUs, whereas the most recent EMP Progress report to the EC (Defra, 2018) provides the triennial time-series since EMP implementation in 2009/2010. Some additional detail on habitat quantities and hu-man-induced mortality rates are presented in this section.
4.2.1 Habitat quantities
The wetted area used for calculating the stock assessment indicators for each EMU are shown in Table 4.3. Such wetted area habitats include rivers, lakes, inland waters, lagoons, coastal waters, and estuaries. The wetted area of rivers and lakes in Scotland, England and Wales were calcu-lated from UK Ordnance Survey MasterMaps, scales 1:10 000 and 1:1250. Below a certain channel width (defined as normal winter flow width) the digital network represents channels as a single dimensional line, which thus provides no data on the width of river channels. On 1:10 000 scale maps this occurs nominally on channels below 5 m in width; at the 1:1250 scale, it is for channels below 1 m. To provide a reasonable measure of the true extent of water area represented by all non-determined widths of channels, these were attributed 1 m width in Scotland and 1.5 m width in England and Wales. In some cases, this will overestimate and in others underestimate the true width and hence wetted areas. Area of the WFD defined transitional waters, combining estuarine and lagoon waters, was also calculated in GIS.
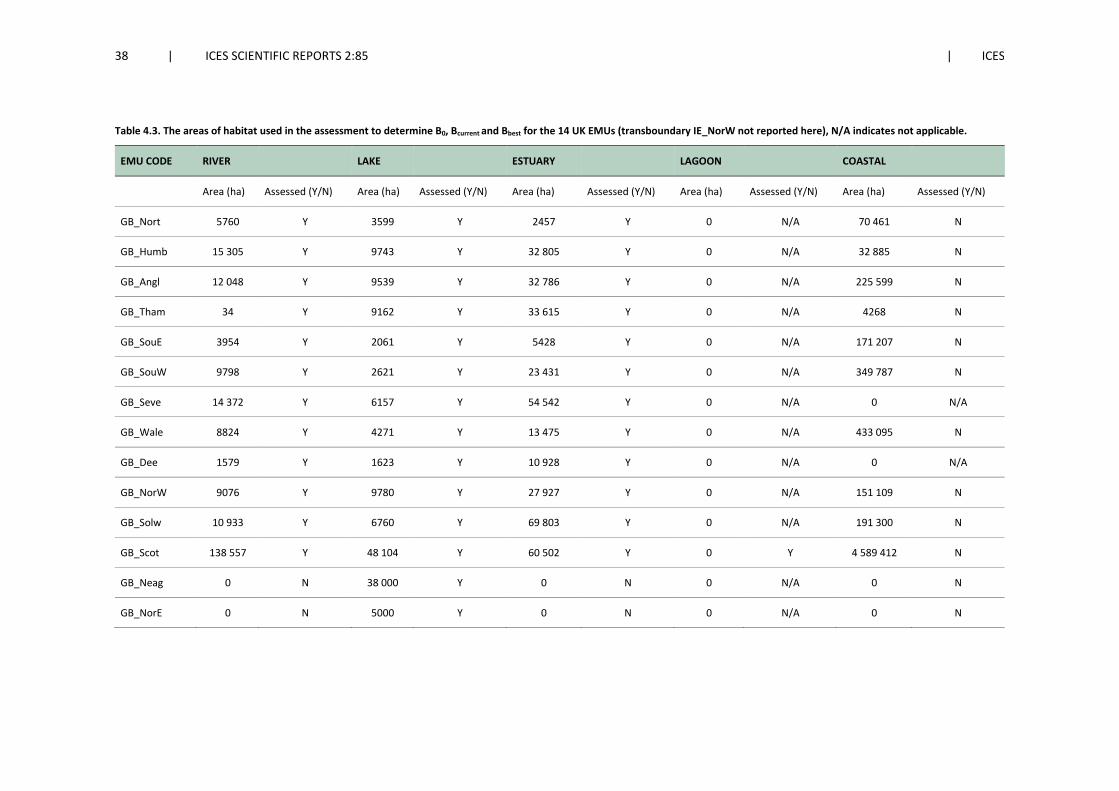
38 | ICES SCIENTIFIC REPORTS 2:85 | ICES
Table 4.3. The areas of habitat used in the assessment to determine B0, Bcurrent and Bbest for the 14 UK EMUs (transboundary IE_NorW not reported here), N/A indicates not applicable.
EMU CODE RIVER LAKE ESTUARY LAGOON COASTAL
Area (ha) Assessed (Y/N) Area (ha) Assessed (Y/N) Area (ha) Assessed (Y/N) Area (ha) Assessed (Y/N) Area (ha) Assessed (Y/N)
GB_Nort 5760 Y 3599 Y 2457 Y 0 N/A 70 461 N
GB_Humb 15 305 Y 9743 Y 32 805 Y 0 N/A 32 885 N
GB_Angl 12 048 Y 9539 Y 32 786 Y 0 N/A 225 599 N
GB_Tham 34 Y 9162 Y 33 615 Y 0 N/A 4268 N
GB_SouE 3954 Y 2061 Y 5428 Y 0 N/A 171 207 N
GB_SouW 9798 Y 2621 Y 23 431 Y 0 N/A 349 787 N
GB_Seve 14 372 Y 6157 Y 54 542 Y 0 N/A 0 N/A
GB_Wale 8824 Y 4271 Y 13 475 Y 0 N/A 433 095 N
GB_Dee 1579 Y 1623 Y 10 928 Y 0 N/A 0 N/A
GB_NorW 9076 Y 9780 Y 27 927 Y 0 N/A 151 109 N
GB_Solw 10 933 Y 6760 Y 69 803 Y 0 N/A 191 300 N
GB_Scot 138 557 Y 48 104 Y 60 502 Y 0 Y 4 589 412 N
GB_Neag 0 N 38 000 Y 0 N 0 N/A 0 N
GB_NorE 0 N 5000 Y 0 N 0 N/A 0 N
ICES | WGEEL 2020 | 39
4.2.2 Silver eel biomass indicators
See Table 1.1 for the most recent results and Defra (2018) for previous silver eel escapement esti-mates from the triennial reporting.
4.2.3 Human-induced mortality rates
Fisheries and other human-induced mortality rates for each EMU are shown in Tables 4.4 to 4.7. Non-fisheries mortality rates include hydropower, surface water abstractions, pumping stations (recorded under Hydro & Pumps) and barriers (including tidal).
Commercial fisheries and hydropower installations have been assessed for all EMUs, with tidal gates, pumping stations and surface water abstractions being additionally assessed in the eleven EMUs of England and Wales. An assessment of the impacts of other man-made obstructions has been completed for these E&W EMUs and this barrier assessment methodology is detailed in Annex A of the UK EMP 2018 report (Defra, 2018). The impacts of the recreational fishery, pred-ators and contaminants and parasites are treated as part of natural mortality and therefore not accounted for in these estimates.
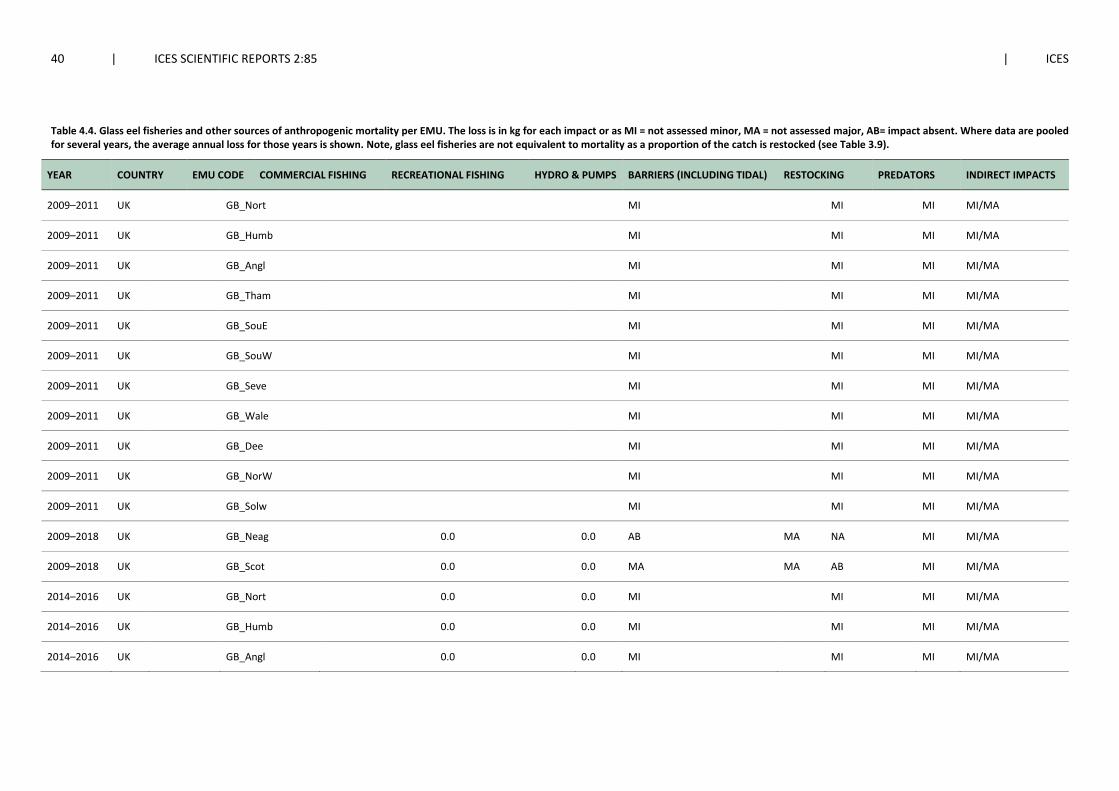
40 | ICES SCIENTIFIC REPORTS 2:85 | ICES
Table 4.4. Glass eel fisheries and other sources of anthropogenic mortality per EMU. The loss is in kg for each impact or as MI = not assessed minor, MA = not assessed major, AB= impact absent. Where data are pooled for several years, the average annual loss for those years is shown. Note, glass eel fisheries are not equivalent to mortality as a proportion of the catch is restocked (see Table 3.9).
YEAR COUNTRY EMU CODE COMMERCIAL FISHING RECREATIONAL FISHING HYDRO & PUMPS BARRIERS (INCLUDING TIDAL) RESTOCKING PREDATORS INDIRECT IMPACTS
2009–2011 UK GB_Nort MI MI MI MI/MA
2009–2011 UK GB_Humb MI MI MI MI/MA
2009–2011 UK GB_Angl MI MI MI MI/MA
2009–2011 UK GB_Tham MI MI MI MI/MA
2009–2011 UK GB_SouE MI MI MI MI/MA
2009–2011 UK GB_SouW MI MI MI MI/MA
2009–2011 UK GB_Seve MI MI MI MI/MA
2009–2011 UK GB_Wale MI MI MI MI/MA
2009–2011 UK GB_Dee MI MI MI MI/MA
2009–2011 UK GB_NorW MI MI MI MI/MA
2009–2011 UK GB_Solw MI MI MI MI/MA
2009–2018 UK GB_Neag 0.0 0.0 AB MA NA MI MI/MA
2009–2018 UK GB_Scot 0.0 0.0 MA MA AB MI MI/MA
2014–2016 UK GB_Nort 0.0 0.0 MI MI MI MI/MA
2014–2016 UK GB_Humb 0.0 0.0 MI MI MI MI/MA
2014–2016 UK GB_Angl 0.0 0.0 MI MI MI MI/MA
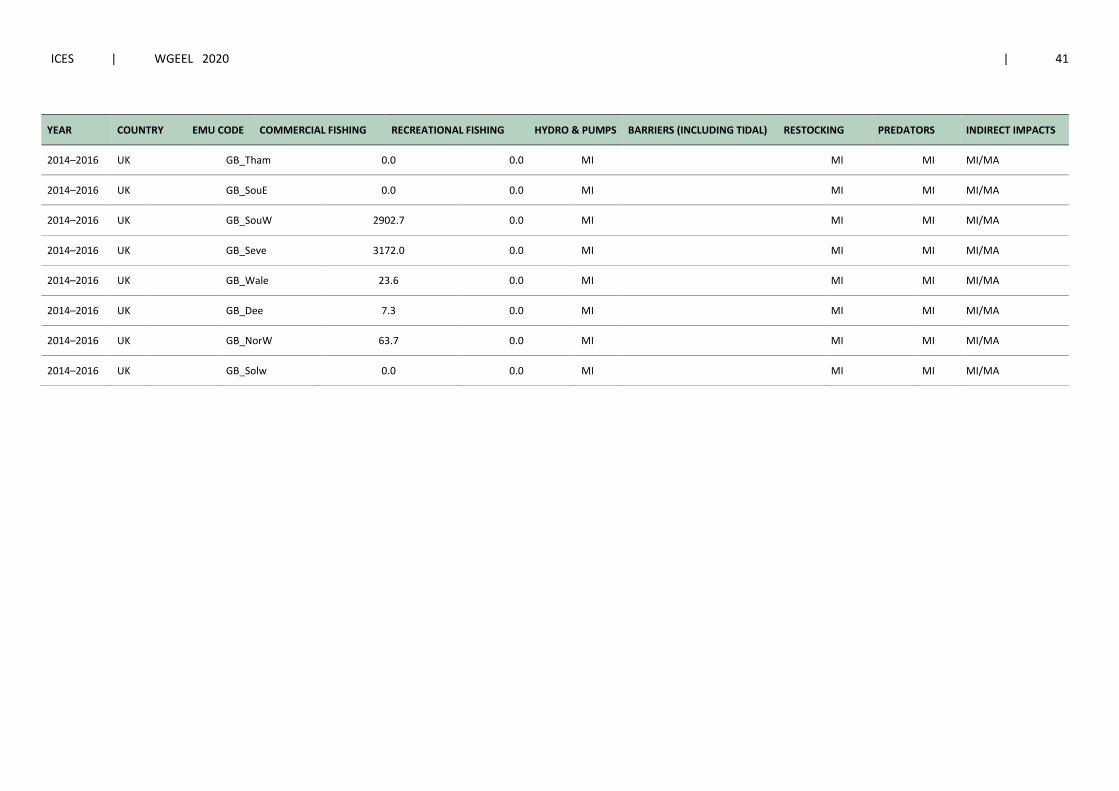
ICES | WGEEL 2020 | 41
YEAR COUNTRY EMU CODE COMMERCIAL FISHING RECREATIONAL FISHING HYDRO & PUMPS BARRIERS (INCLUDING TIDAL) RESTOCKING PREDATORS INDIRECT IMPACTS
2014–2016 UK GB_Tham 0.0 0.0 MI MI MI MI/MA
2014–2016 UK GB_SouE 0.0 0.0 MI MI MI MI/MA
2014–2016 UK GB_SouW 2902.7 0.0 MI MI MI MI/MA
2014–2016 UK GB_Seve 3172.0 0.0 MI MI MI MI/MA
2014–2016 UK GB_Wale 23.6 0.0 MI MI MI MI/MA
2014–2016 UK GB_Dee 7.3 0.0 MI MI MI MI/MA
2014–2016 UK GB_NorW 63.7 0.0 MI MI MI MI/MA
2014–2016 UK GB_Solw 0.0 0.0 MI MI MI MI/MA
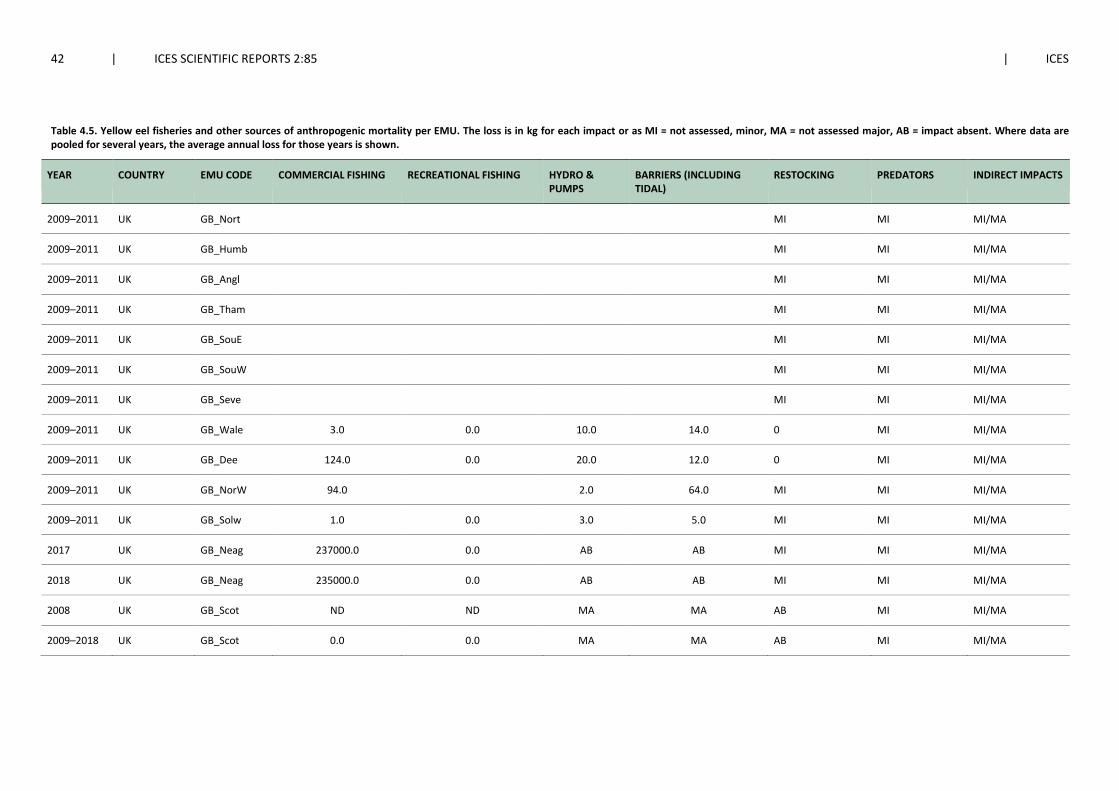
42 | ICES SCIENTIFIC REPORTS 2:85 | ICES
Table 4.5. Yellow eel fisheries and other sources of anthropogenic mortality per EMU. The loss is in kg for each impact or as MI = not assessed, minor, MA = not assessed major, AB = impact absent. Where data are pooled for several years, the average annual loss for those years is shown.
YEAR COUNTRY EMU CODE COMMERCIAL FISHING RECREATIONAL FISHING HYDRO & PUMPS
BARRIERS (INCLUDING TIDAL)
RESTOCKING PREDATORS INDIRECT IMPACTS
2009–2011 UK GB_Nort MI MI MI/MA
2009–2011 UK GB_Humb MI MI MI/MA
2009–2011 UK GB_Angl MI MI MI/MA
2009–2011 UK GB_Tham MI MI MI/MA
2009–2011 UK GB_SouE MI MI MI/MA
2009–2011 UK GB_SouW MI MI MI/MA
2009–2011 UK GB_Seve MI MI MI/MA
2009–2011 UK GB_Wale 3.0 0.0 10.0 14.0 0 MI MI/MA
2009–2011 UK GB_Dee 124.0 0.0 20.0 12.0 0 MI MI/MA
2009–2011 UK GB_NorW 94.0 2.0 64.0 MI MI MI/MA
2009–2011 UK GB_Solw 1.0 0.0 3.0 5.0 MI MI MI/MA
2017 UK GB_Neag 237000.0 0.0 AB AB MI MI MI/MA
2018 UK GB_Neag 235000.0 0.0 AB AB MI MI MI/MA
2008 UK GB_Scot ND ND MA MA AB MI MI/MA
2009–2018 UK GB_Scot 0.0 0.0 MA MA AB MI MI/MA
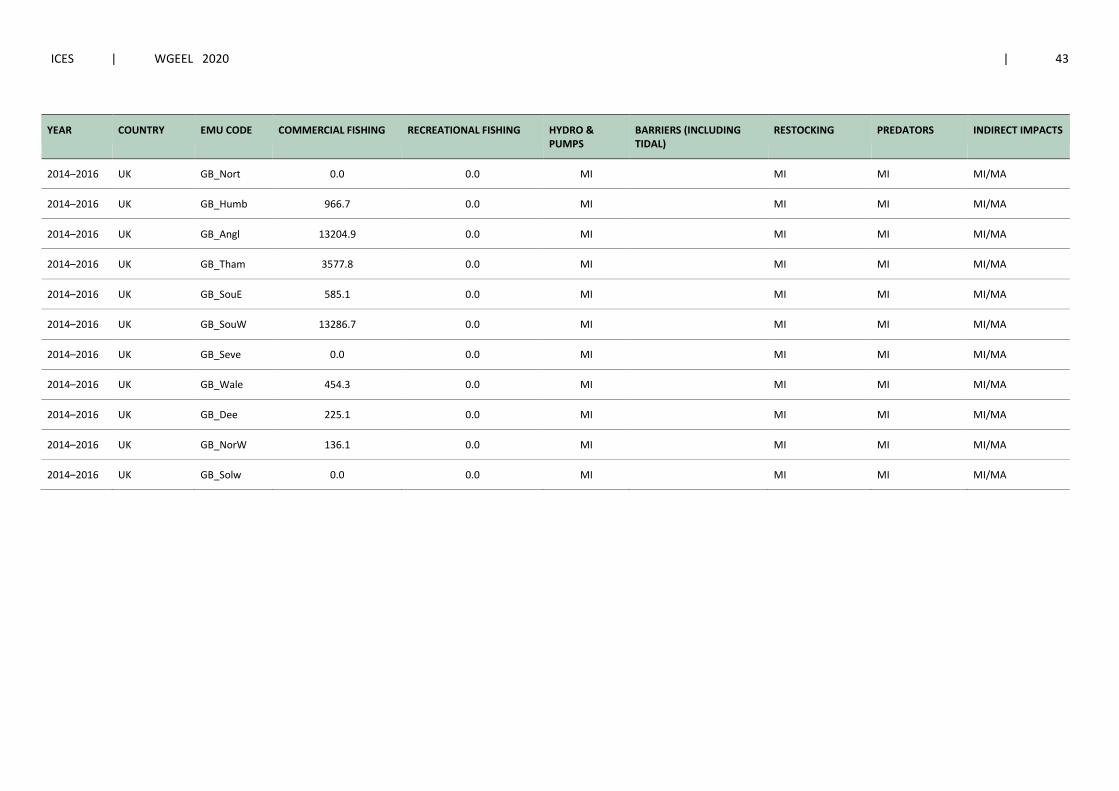
ICES | WGEEL 2020 | 43
YEAR COUNTRY EMU CODE COMMERCIAL FISHING RECREATIONAL FISHING HYDRO & PUMPS
BARRIERS (INCLUDING TIDAL)
RESTOCKING PREDATORS INDIRECT IMPACTS
2014–2016 UK GB_Nort 0.0 0.0 MI MI MI MI/MA
2014–2016 UK GB_Humb 966.7 0.0 MI MI MI MI/MA
2014–2016 UK GB_Angl 13204.9 0.0 MI MI MI MI/MA
2014–2016 UK GB_Tham 3577.8 0.0 MI MI MI MI/MA
2014–2016 UK GB_SouE 585.1 0.0 MI MI MI MI/MA
2014–2016 UK GB_SouW 13286.7 0.0 MI MI MI MI/MA
2014–2016 UK GB_Seve 0.0 0.0 MI MI MI MI/MA
2014–2016 UK GB_Wale 454.3 0.0 MI MI MI MI/MA
2014–2016 UK GB_Dee 225.1 0.0 MI MI MI MI/MA
2014–2016 UK GB_NorW 136.1 0.0 MI MI MI MI/MA
2014–2016 UK GB_Solw 0.0 0.0 MI MI MI MI/MA
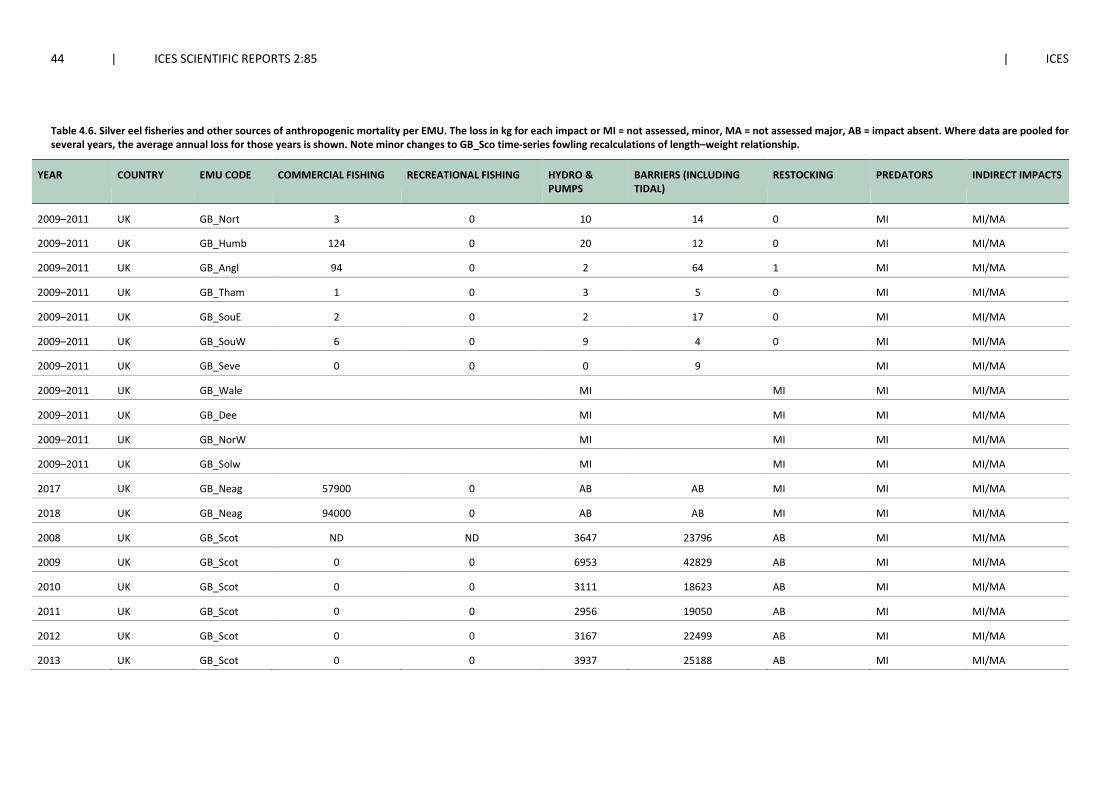
44 | ICES SCIENTIFIC REPORTS 2:85 | ICES
Table 4.6. Silver eel fisheries and other sources of anthropogenic mortality per EMU. The loss in kg for each impact or MI = not assessed, minor, MA = not assessed major, AB = impact absent. Where data are pooled for several years, the average annual loss for those years is shown. Note minor changes to GB_Sco time-series fowling recalculations of length–weight relationship.
YEAR COUNTRY EMU CODE COMMERCIAL FISHING RECREATIONAL FISHING HYDRO & PUMPS
BARRIERS (INCLUDING TIDAL)
RESTOCKING PREDATORS INDIRECT IMPACTS
2009–2011 UK GB_Nort 3 0 10 14 0 MI MI/MA
2009–2011 UK GB_Humb 124 0 20 12 0 MI MI/MA
2009–2011 UK GB_Angl 94 0 2 64 1 MI MI/MA
2009–2011 UK GB_Tham 1 0 3 5 0 MI MI/MA
2009–2011 UK GB_SouE 2 0 2 17 0 MI MI/MA
2009–2011 UK GB_SouW 6 0 9 4 0 MI MI/MA
2009–2011 UK GB_Seve 0 0 0 9 MI MI/MA
2009–2011 UK GB_Wale MI MI MI MI/MA
2009–2011 UK GB_Dee MI MI MI MI/MA
2009–2011 UK GB_NorW MI MI MI MI/MA
2009–2011 UK GB_Solw MI MI MI MI/MA
2017 UK GB_Neag 57900 0 AB AB MI MI MI/MA
2018 UK GB_Neag 94000 0 AB AB MI MI MI/MA
2008 UK GB_Scot ND ND 3647 23796 AB MI MI/MA
2009 UK GB_Scot 0 0 6953 42829 AB MI MI/MA
2010 UK GB_Scot 0 0 3111 18623 AB MI MI/MA
2011 UK GB_Scot 0 0 2956 19050 AB MI MI/MA
2012 UK GB_Scot 0 0 3167 22499 AB MI MI/MA
2013 UK GB_Scot 0 0 3937 25188 AB MI MI/MA

ICES | WGEEL 2020 | 45
YEAR COUNTRY EMU CODE COMMERCIAL FISHING RECREATIONAL FISHING HYDRO & PUMPS
BARRIERS (INCLUDING TIDAL)
RESTOCKING PREDATORS INDIRECT IMPACTS
2014 UK GB_Scot 0 0 10858 64325 AB MI MI/MA
2015 UK GB_Scot 0 0 6851 39543 AB MI MI/MA
2016 UK GB_Scot 0 0 5892 36747 AB MI MI/MA
2017 UK GB_Scot 0 0 6418 43407 AB MI MI/MA
2018 UK GB_Scot 0 0 5454 35179 AB MI MI/MA
2019 UK GB_Scot 0 0 4496 28414 AB MI MI/MA
2014–2016 UK GB_Nort 0.0 0 MI MI MI MI/MA
2014–2016 UK GB_Humb 181.3 0 MI MI MI MI/MA
2014–2016 UK GB_Angl 3312.3 0 MI MI MI MI/MA
2014–2016 UK GB_Tham 178.7 0 MI MI MI MI/MA
2014–2016 UK GB_SouE 409.1 0 MI MI MI MI/MA
2014–2016 UK GB_SouW 1669.2 0 MI MI MI MI/MA
2014–2016 UK GB_Seve 16.7 0 MI MI MI MI/MA
2014–2016 UK GB_Wale 53.3 0 MI MI MI MI/MA
2014–2016 UK GB_Dee 38.6 0 MI MI MI MI/MA
2014–2016 UK GB_NorW 126.0 0 MI MI MI MI/MA
2014–2016 UK GB_Solw 0.0 0 MI MI MI MI/MA

46 | ICES SCIENTIFIC REPORTS 2:85 | ICES
Table 4.7. Silver eel equivalents of fisheries and other sources of anthropogenic mortality per EMU. The loss in kg for each impact or MI = not assessed, minor, MA = not assessed major, AB = impact absent. Where data are pooled for several years, the average annual loss for those years is shown. Note minor changes to GB_Sco time-series fowling recalculations of length–weight relationship.
YEAR COUNTRY EMU CODE COMMERCIAL FISHING RECREATIONAL FISHING HYDRO & PUMPS
BARRIERS (INCLUDING TIDAL) RESTOCKING PREDATORS INDIRECT IMPACTS
2009–2011 UK GB_Nort MI MI MI MI/MA
2009–2011 UK GB_Humb MI MI MI MI/MA
2009–2011 UK GB_Angl MI MI MI MI/MA
2009–2011 UK GB_Tham MI MI MI MI/MA
2009–2011 UK GB_SouE MI MI MI MI/MA
2009–2011 UK GB_SouW MI MI MI MI/MA
2009–2011 UK GB_Seve MI MI MI MI/MA
2009–2011 UK GB_Wale MI MI MI MI/MA
2009–2011 UK GB_Dee MI MI MI MI/MA
2009–2011 UK GB_NorW MI MI MI MI/MA
2009–2011 UK GB_Solw MI MI MI MI/MA
2017 UK GB_Neag 295000 0 AB AB MI MI MI/MA
2018 UK GB_Neag 329000 0 AB AB MI MI MI/MA
2008 UK GB_Scot ND ND 3647 23796 AB MI MI/MA
2009 UK GB_Scot 0 0 6953 42829 AB MI MI/MA
2010 UK GB_Scot 0 0 3111 18623 AB MI MI/MA
2011 UK GB_Scot 0 0 2956 19050 AB MI MI/MA
2012 UK GB_Scot 0 0 3167 22499 AB MI MI/MA
2013 UK GB_Scot 0 0 3937 25188 AB MI MI/MA
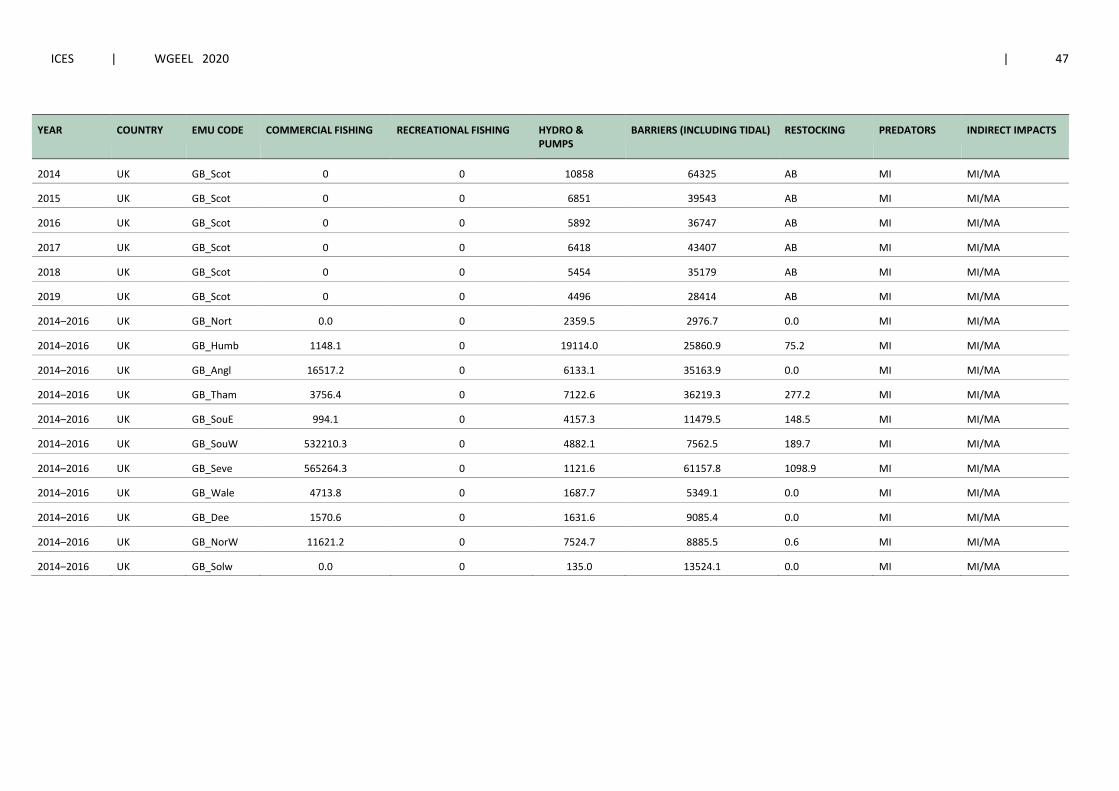
ICES | WGEEL 2020 | 47
YEAR COUNTRY EMU CODE COMMERCIAL FISHING RECREATIONAL FISHING HYDRO & PUMPS
BARRIERS (INCLUDING TIDAL) RESTOCKING PREDATORS INDIRECT IMPACTS
2014 UK GB_Scot 0 0 10858 64325 AB MI MI/MA
2015 UK GB_Scot 0 0 6851 39543 AB MI MI/MA
2016 UK GB_Scot 0 0 5892 36747 AB MI MI/MA
2017 UK GB_Scot 0 0 6418 43407 AB MI MI/MA
2018 UK GB_Scot 0 0 5454 35179 AB MI MI/MA
2019 UK GB_Scot 0 0 4496 28414 AB MI MI/MA
2014–2016 UK GB_Nort 0.0 0 2359.5 2976.7 0.0 MI MI/MA
2014–2016 UK GB_Humb 1148.1 0 19114.0 25860.9 75.2 MI MI/MA
2014–2016 UK GB_Angl 16517.2 0 6133.1 35163.9 0.0 MI MI/MA
2014–2016 UK GB_Tham 3756.4 0 7122.6 36219.3 277.2 MI MI/MA
2014–2016 UK GB_SouE 994.1 0 4157.3 11479.5 148.5 MI MI/MA
2014–2016 UK GB_SouW 532210.3 0 4882.1 7562.5 189.7 MI MI/MA
2014–2016 UK GB_Seve 565264.3 0 1121.6 61157.8 1098.9 MI MI/MA
2014–2016 UK GB_Wale 4713.8 0 1687.7 5349.1 0.0 MI MI/MA
2014–2016 UK GB_Dee 1570.6 0 1631.6 9085.4 0.0 MI MI/MA
2014–2016 UK GB_NorW 11621.2 0 7524.7 8885.5 0.6 MI MI/MA
2014–2016 UK GB_Solw 0.0 0 135.0 13524.1 0.0 MI MI/MA
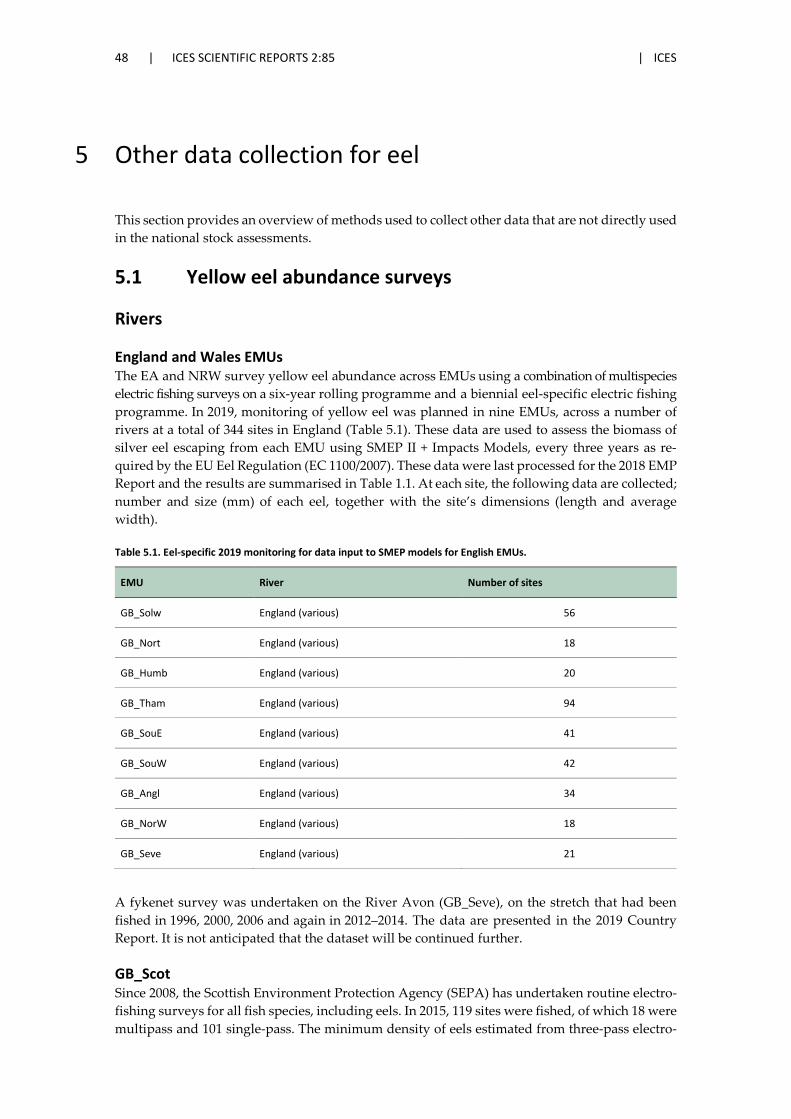
48 | ICES SCIENTIFIC REPORTS 2:85 | ICES
5 Other data collection for eel
This section provides an overview of methods used to collect other data that are not directly used in the national stock assessments.
5.1 Yellow eel abundance surveys
Rivers
England and Wales EMUs The EA and NRW survey yellow eel abundance across EMUs using a combination of multispecies electric fishing surveys on a six-year rolling programme and a biennial eel-specific electric fishing programme. In 2019, monitoring of yellow eel was planned in nine EMUs, across a number of rivers at a total of 344 sites in England (Table 5.1). These data are used to assess the biomass of silver eel escaping from each EMU using SMEP II + Impacts Models, every three years as re-quired by the EU Eel Regulation (EC 1100/2007). These data were last processed for the 2018 EMP Report and the results are summarised in Table 1.1. At each site, the following data are collected; number and size (mm) of each eel, together with the site’s dimensions (length and average width).
Table 5.1. Eel-specific 2019 monitoring for data input to SMEP models for English EMUs.
EMU River Number of sites
GB_Solw England (various) 56
GB_Nort England (various) 18
GB_Humb England (various) 20
GB_Tham England (various) 94
GB_SouE England (various) 41
GB_SouW England (various) 42
GB_Angl England (various) 34
GB_NorW England (various) 18
GB_Seve England (various) 21
A fykenet survey was undertaken on the River Avon (GB_Seve), on the stretch that had been fished in 1996, 2000, 2006 and again in 2012–2014. The data are presented in the 2019 Country Report. It is not anticipated that the dataset will be continued further.
GB_Scot Since 2008, the Scottish Environment Protection Agency (SEPA) has undertaken routine electro-fishing surveys for all fish species, including eels. In 2015, 119 sites were fished, of which 18 were multipass and 101 single-pass. The minimum density of eels estimated from three-pass electro-
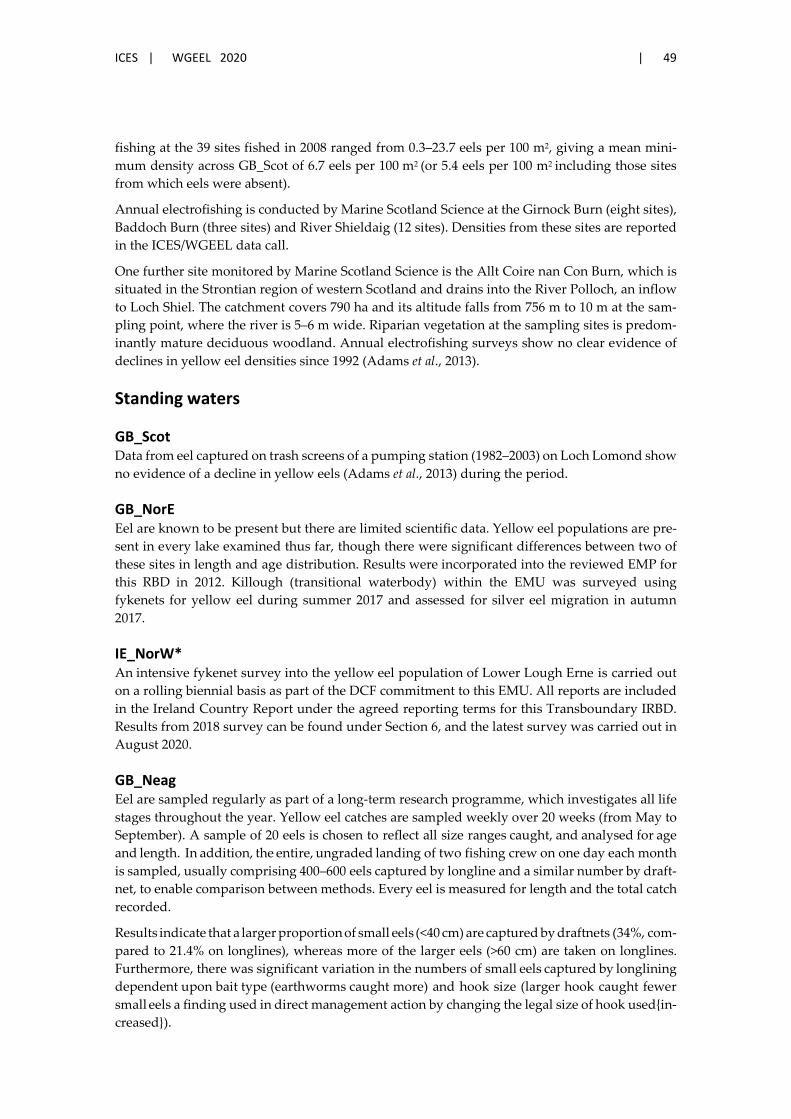
ICES | WGEEL 2020 | 49
fishing at the 39 sites fished in 2008 ranged from 0.3–23.7 eels per 100 m2, giving a mean mini-mum density across GB_Scot of 6.7 eels per 100 m2 (or 5.4 eels per 100 m2 including those sites from which eels were absent).
Annual electrofishing is conducted by Marine Scotland Science at the Girnock Burn (eight sites), Baddoch Burn (three sites) and River Shieldaig (12 sites). Densities from these sites are reported in the ICES/WGEEL data call.
One further site monitored by Marine Scotland Science is the Allt Coire nan Con Burn, which is situated in the Strontian region of western Scotland and drains into the River Polloch, an inflow to Loch Shiel. The catchment covers 790 ha and its altitude falls from 756 m to 10 m at the sam-pling point, where the river is 5–6 m wide. Riparian vegetation at the sampling sites is predom-inantly mature deciduous woodland. Annual electrofishing surveys show no clear evidence of declines in yellow eel densities since 1992 (Adams et al., 2013).
Standing waters
GB_Scot Data from eel captured on trash screens of a pumping station (1982–2003) on Loch Lomond show no evidence of a decline in yellow eels (Adams et al., 2013) during the period.
GB_NorE Eel are known to be present but there are limited scientific data. Yellow eel populations are pre-sent in every lake examined thus far, though there were significant differences between two of these sites in length and age distribution. Results were incorporated into the reviewed EMP for this RBD in 2012. Killough (transitional waterbody) within the EMU was surveyed using fykenets for yellow eel during summer 2017 and assessed for silver eel migration in autumn 2017.
IE_NorW* An intensive fykenet survey into the yellow eel population of Lower Lough Erne is carried out on a rolling biennial basis as part of the DCF commitment to this EMU. All reports are included in the Ireland Country Report under the agreed reporting terms for this Transboundary IRBD. Results from 2018 survey can be found under Section 6, and the latest survey was carried out in August 2020.
GB_Neag Eel are sampled regularly as part of a long-term research programme, which investigates all life stages throughout the year. Yellow eel catches are sampled weekly over 20 weeks (from May to September). A sample of 20 eels is chosen to reflect all size ranges caught, and analysed for age and length. In addition, the entire, ungraded landing of two fishing crew on one day each month is sampled, usually comprising 400–600 eels captured by longline and a similar number by draft-net, to enable comparison between methods. Every eel is measured for length and the total catch recorded.
Results indicate that a larger proportion of small eels (<40 cm) are captured by draftnets (34%, com-pared to 21.4% on longlines), whereas more of the larger eels (>60 cm) are taken on longlines. Furthermore, there was significant variation in the numbers of small eels captured by longlining dependent upon bait type (earthworms caught more) and hook size (larger hook caught fewer small eels a finding used in direct management action by changing the legal size of hook used{in-creased}).
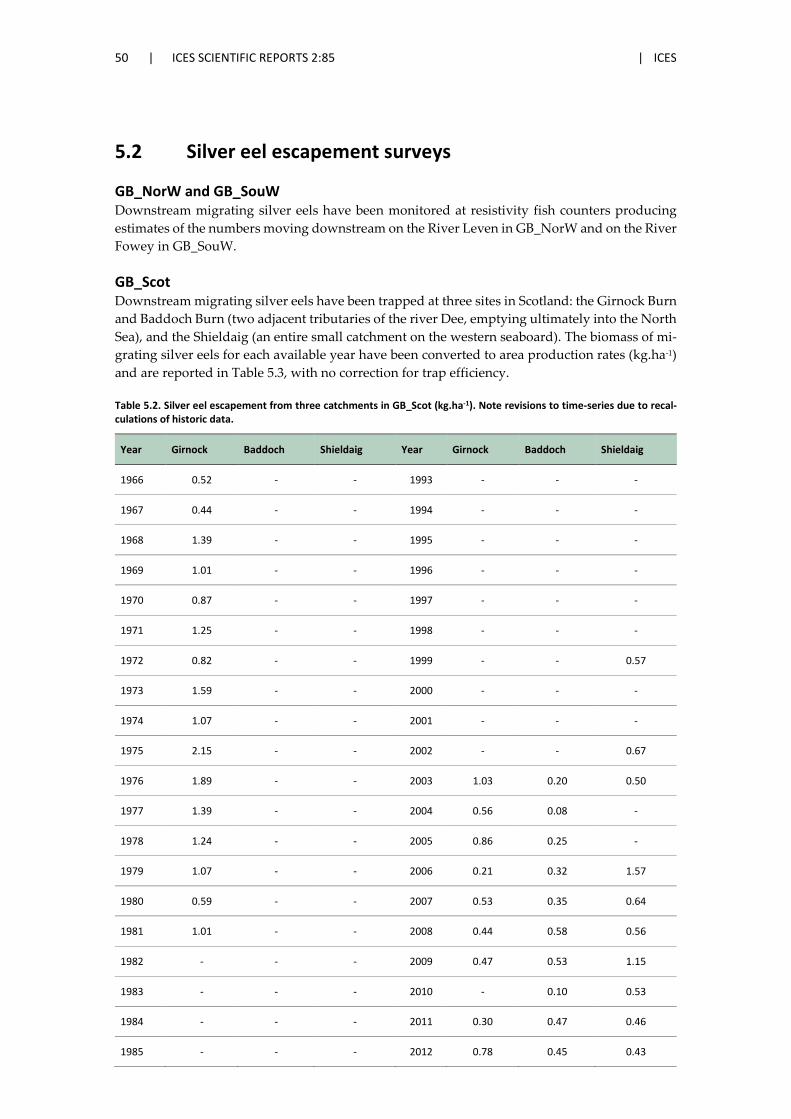
50 | ICES SCIENTIFIC REPORTS 2:85 | ICES
5.2 Silver eel escapement surveys
GB_NorW and GB_SouW Downstream migrating silver eels have been monitored at resistivity fish counters producing estimates of the numbers moving downstream on the River Leven in GB_NorW and on the River Fowey in GB_SouW.
GB_Scot Downstream migrating silver eels have been trapped at three sites in Scotland: the Girnock Burn and Baddoch Burn (two adjacent tributaries of the river Dee, emptying ultimately into the North Sea), and the Shieldaig (an entire small catchment on the western seaboard). The biomass of mi-grating silver eels for each available year have been converted to area production rates (kg.ha-1) and are reported in Table 5.3, with no correction for trap efficiency.
Table 5.2. Silver eel escapement from three catchments in GB_Scot (kg.ha-1). Note revisions to time-series due to recal-culations of historic data.
Year Girnock Baddoch Shieldaig Year Girnock Baddoch Shieldaig
1966 0.52 - - 1993 - - -
1967 0.44 - - 1994 - - -
1968 1.39 - - 1995 - - -
1969 1.01 - - 1996 - - -
1970 0.87 - - 1997 - - -
1971 1.25 - - 1998 - - -
1972 0.82 - - 1999 - - 0.57
1973 1.59 - - 2000 - - -
1974 1.07 - - 2001 - - -
1975 2.15 - - 2002 - - 0.67
1976 1.89 - - 2003 1.03 0.20 0.50
1977 1.39 - - 2004 0.56 0.08 -
1978 1.24 - - 2005 0.86 0.25 -
1979 1.07 - - 2006 0.21 0.32 1.57
1980 0.59 - - 2007 0.53 0.35 0.64
1981 1.01 - - 2008 0.44 0.58 0.56
1982 - - - 2009 0.47 0.53 1.15
1983 - - - 2010 - 0.10 0.53
1984 - - - 2011 0.30 0.47 0.46
1985 - - - 2012 0.78 0.45 0.43
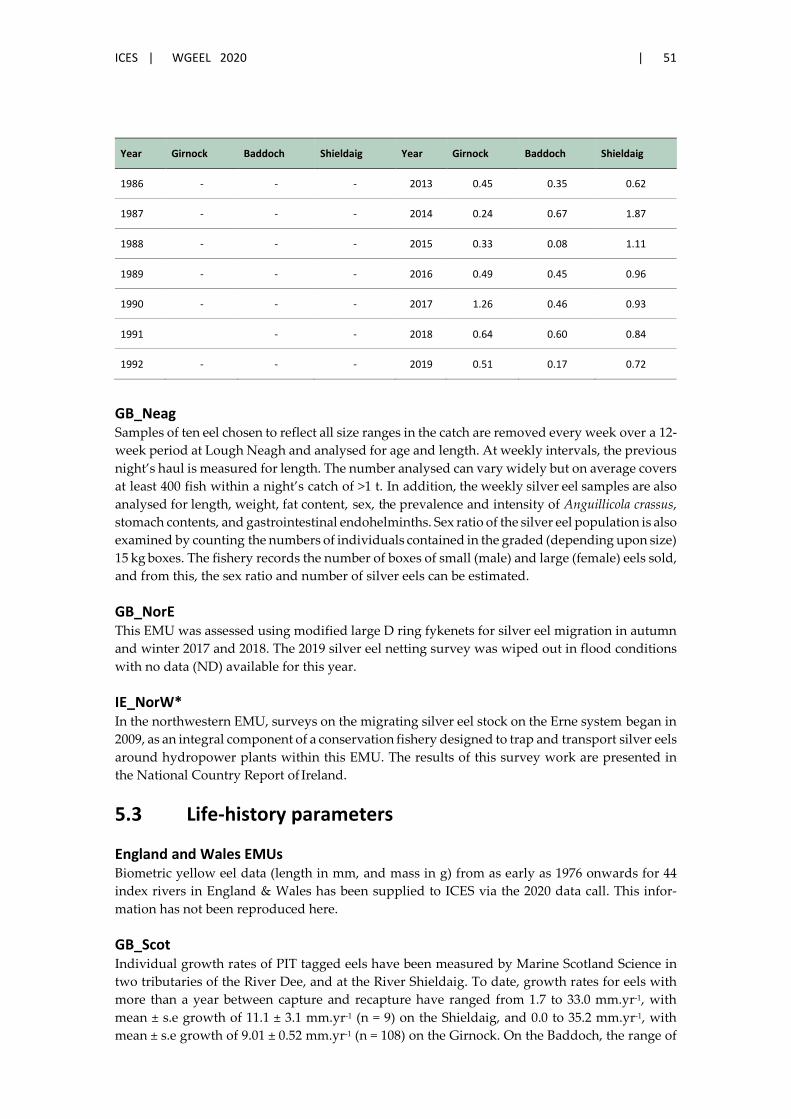
ICES | WGEEL 2020 | 51
Year Girnock Baddoch Shieldaig Year Girnock Baddoch Shieldaig
1986 - - - 2013 0.45 0.35 0.62
1987 - - - 2014 0.24 0.67 1.87
1988 - - - 2015 0.33 0.08 1.11
1989 - - - 2016 0.49 0.45 0.96
1990 - - - 2017 1.26 0.46 0.93
1991 - - 2018 0.64 0.60 0.84
1992 - - - 2019 0.51 0.17 0.72
GB_Neag Samples of ten eel chosen to reflect all size ranges in the catch are removed every week over a 12-week period at Lough Neagh and analysed for age and length. At weekly intervals, the previous night’s haul is measured for length. The number analysed can vary widely but on average covers at least 400 fish within a night’s catch of >1 t. In addition, the weekly silver eel samples are also analysed for length, weight, fat content, sex, the prevalence and intensity of Anguillicola crassus, stomach contents, and gastrointestinal endohelminths. Sex ratio of the silver eel population is also examined by counting the numbers of individuals contained in the graded (depending upon size) 15 kg boxes. The fishery records the number of boxes of small (male) and large (female) eels sold, and from this, the sex ratio and number of silver eels can be estimated.
GB_NorE This EMU was assessed using modified large D ring fykenets for silver eel migration in autumn and winter 2017 and 2018. The 2019 silver eel netting survey was wiped out in flood conditions with no data (ND) available for this year.
IE_NorW* In the northwestern EMU, surveys on the migrating silver eel stock on the Erne system began in 2009, as an integral component of a conservation fishery designed to trap and transport silver eels around hydropower plants within this EMU. The results of this survey work are presented in the National Country Report of Ireland.
5.3 Life-history parameters
England and Wales EMUs Biometric yellow eel data (length in mm, and mass in g) from as early as 1976 onwards for 44 index rivers in England & Wales has been supplied to ICES via the 2020 data call. This infor-mation has not been reproduced here.
GB_Scot Individual growth rates of PIT tagged eels have been measured by Marine Scotland Science in two tributaries of the River Dee, and at the River Shieldaig. To date, growth rates for eels with more than a year between capture and recapture have ranged from 1.7 to 33.0 mm.yr-1, with mean ± s.e growth of 11.1 ± 3.1 mm.yr-1 (n = 9) on the Shieldaig, and 0.0 to 35.2 mm.yr-1, with mean ± s.e growth of 9.01 ± 0.52 mm.yr-1 (n = 108) on the Girnock. On the Baddoch, the range of

52 | ICES SCIENTIFIC REPORTS 2:85 | ICES
growth rates was 0.8–21.0 mm.yr-1, with mean ± s.e growth rates of 6.17 ± 0.66 mm.yr-1 (n = 31). These may be the lowest growth rates ever reported for the European eel.
Some Fisheries Trusts collect data on the length of eels captured during routine electrofishing surveys targeted at salmonids (1136 eels were measured between 1996 and 2008). Lochaber Fish-eries Trust conducted an eel-specific survey in 2010, and data are available at http://www.loch-aberfish.org.uk/cust_images/Lochaber_eel_report_2010[1].pdf.
The sex ratio of silver eels at the Girnock Burn monitoring site has remained broadly stable since the 1960s at about 98% male (Table 5.4). The data comprise two periods: 1966–1981 and 2002–2018. Male eels silvered at shorter lengths during the earlier period (mean 339 mm) than the latter (mean 353 mm), but there is no evidence for an increase in length from 2002 to present (Table 5.4).
Table 5.3 Biological characteristics of silver eels emigrating from the Girnock Burn, GB_Scot. Sex based on assumption that ≥450 mm body length = female. Note revisions to the Females’ Mean Wt values from 2004–2018 because Males’ data had been erroneously reported previously. N codes are as described in Table 3.1.
MALES FEMALES
Year % Mean L (mm) Mean Wt (g) % Mean L (mm) Mean Wt (g)
1966 98.7 330.9 NC 1.3 550 NC
1967 98.4 331 NC 1.6 510 NC
1968 96.8 337.5 NC 3.2 540.8 NC
1969 98 335.6 NC 2 606.7 NC
1970 99.2 342.2 NC 0.8 475 NC
1971 99.4 339.2 NC 0.6 520 NC
1972 99.1 337.8 NC 0.9 660 NC
1973 99.1 335.9 NC 0.9 575 NC
1974 99.3 338.9 NC 0.7 490 NC
1975 97.9 338.1 NC 2.1 627.5 NC
1976 99.7 341.2 NC 0.3 450 NC
1977 99.2 334.3 NC 0.8 572.5 NC
1978 99.4 339.9 NC 0.6 660 NC
1979 98.6 342.2 NC 1.4 490 NC
1980 95.9 346.8 NC 4.1 561.7 NC
1981 99.3 349.8 NC 0.7 550 NC
2002 100 356.8 73 0 NP NP
2003 97.7 350.4 68.3 2.3 535 232.9
2004 98.3 359.8 74.4 1.7 488 194.2

ICES | WGEEL 2020 | 53
MALES FEMALES
Year % Mean L (mm) Mean Wt (g) % Mean L (mm) Mean Wt (g)
2005 99.1 361.3 76.1 0.9 450 117.3
2006 100 353.4 71.4 0 NP NP
2007 94.9 354.3 74.4 5.1 529.7 266.2
2008 100 355.5 72.5 0 NP NP
2009 96.5 350 71.5 3.5 509.5 220.7
2010 94.1 355.1 74.3 5.9 500 171.4
2011 100 358.2 74.6 0 NP NP
2012 96.7 356 75.5 3.3 511.7 234.4
2013 96.5 344.8 64.2 3.5 549.5 277.4
2014 90.9 354.8 69.9 9.1 629.5 389.3
2015 100 345.2 67.4 0 NP NP
2016 98.5 347.5 66 1.5 465 155.6
2017 98.2 348.3 68.3 1.8 485.7 181.4
2018 98.8 349 69.2 1.2 468 154.6
2019 96.8 355.8 72.2 3.2 486 200
Eel otoliths (about 100 pairs) have been collected (by SEPA) and read (by Marine Scotland Sci-ence) from a number of sites around GB_Scot, see Oliver et al. (2015) for some further details.
Historical data are available for age (estimated from otoliths) and length composition at a variety of sites in Scotland from a survey conducted in the early 1970s (Williamson, 1975).
In 2018, a new national electrofishing scheme has been implemented in Scotland deploying a generalised random tessellation stratified sampling design. Length and weight data for eels will be collected at 801 sites.
GB_Neag The sex ratio of the silver eel population is estimated by counting the numbers of individuals contained in the graded 15 kg boxes which the Fishery use. Eels are graded as small (males) and large (females), based on a length–sex key derived from previous sampling. Sex ratios in the silver eels in 2004 to 2005 were numerically close to 1:1, but changed in 2006 and 2007 to 63% and 62% females (Table 5.5). However, in 2008, 2009 and 2010, this trend has reverted to close to 1:1 (48, 52 and 47% females) and continues up to 2019 with 46% females. Taking account of differing sizes and weights of males and females, 70% of the recorded silver eel biomass is now female.
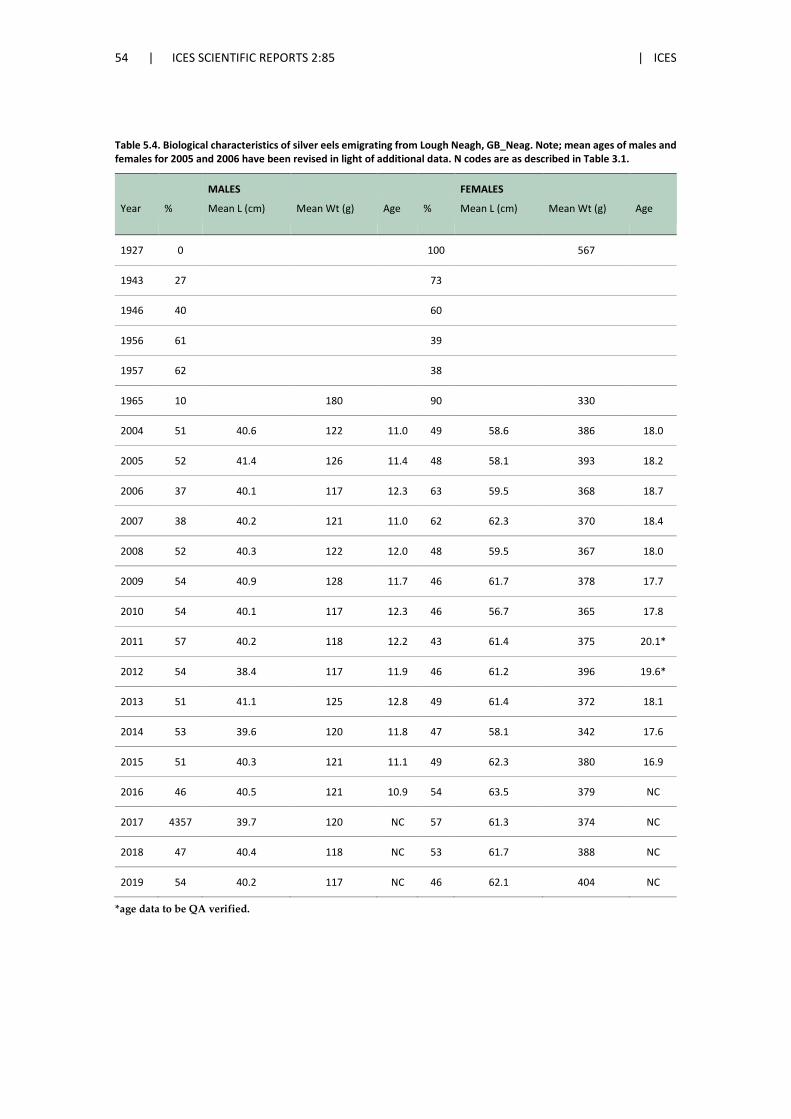
54 | ICES SCIENTIFIC REPORTS 2:85 | ICES
Table 5.4. Biological characteristics of silver eels emigrating from Lough Neagh, GB_Neag. Note; mean ages of males and females for 2005 and 2006 have been revised in light of additional data. N codes are as described in Table 3.1.
MALES FEMALES
Year % Mean L (cm) Mean Wt (g) Age % Mean L (cm) Mean Wt (g) Age
1927 0 100 567
1943 27 73
1946 40 60
1956 61 39
1957 62 38
1965 10 180 90 330
2004 51 40.6 122 11.0 49 58.6 386 18.0
2005 52 41.4 126 11.4 48 58.1 393 18.2
2006 37 40.1 117 12.3 63 59.5 368 18.7
2007 38 40.2 121 11.0 62 62.3 370 18.4
2008 52 40.3 122 12.0 48 59.5 367 18.0
2009 54 40.9 128 11.7 46 61.7 378 17.7
2010 54 40.1 117 12.3 46 56.7 365 17.8
2011 57 40.2 118 12.2 43 61.4 375 20.1*
2012 54 38.4 117 11.9 46 61.2 396 19.6*
2013 51 41.1 125 12.8 49 61.4 372 18.1
2014 53 39.6 120 11.8 47 58.1 342 17.6
2015 51 40.3 121 11.1 49 62.3 380 16.9
2016 46 40.5 121 10.9 54 63.5 379 NC
2017 4357 39.7 120 NC 57 61.3 374 NC
2018 47 40.4 118 NC 53 61.7 388 NC
2019 54 40.2 117 NC 46 62.1 404 NC
*age data to be QA verified.

ICES | WGEEL 2020 | 55
5.4 Diseases, Parasites & Pathogens or Contaminants
5.4.1 Parasites & Pathogens
Anguillicola crassus In 2017, 61.3% of yellow eels (N= 320) and 86% of silver eels (N=100) were found to be infected with the nematode A. crassus, the highest infection parameters observed since 2008. As noted in previous Country Reports, the mean intensity of individual worms per infected eel remains sig-nificantly higher in silver eels with on average ten worms per fish compared to four in yellow eels.
In Lough Neagh, the glass eel/elvers are monitored for the presence of Anguillicola crassus, and the weekly samples of yellow eels are also examined for length, weight, fat content, sex, age, stomach contents, the prevalence and intensity of A. crassus, and gastrointestinal endohelminths. In 2015, the prevalence of A. crassus in yellow and silver eels was 52% and 71%, respectively. The infection parameters of yellow and silver eels are recorded annually from Lough Neagh (Table 5.6).
Table 5.5. A. crassus infection parameters from eel sampled in Lough Neagh, Northern Ireland.
Year YELLOW SILVER
prev (N) mean int range prev (N) mean int range
2003 24.4 (340) 2.2 1-9 57 (100) 2.5 1-9
2004 69 (300) 3.6 1-47 90 (100) 4.3 1-47
2005 92.5 (190) 7.7 1-60 100 (100) 7.8 1-56
2006 78.2 (153) 12.9 1-54 89 (100) 16.6 1-129
2007 70.4 (340) 7.0 1-52 76 (100) 11.4 1-66
2008 67.3 (290) 6.4 1-67 86 (100) 13.0 1-73
2009 55.8 (280) 4.4 1-27 73 (100) 8.4 1-32
2010 48.8 (280) 4.4 1-28 80.7 (100) 9.9 1-143
2011 56.7 (290) 3.9 1-32 74 (100) 6.6 1-32
2012 40.5 (285) 3.7 1-17 55 (100) 5.0 1-34
2013 50.9 (290) 3.5 1-32 70 (100) 7.6 1-37
2014 52.6 (250) 4.1 1-21 76 (100) 10.1 1-32
2015 54.1 (320) 4.5 1-38 69 (100) 6.9 1-47
2016 49.1 (270) 4.6 1-29 76 (100) 7.3 1-39
2017 61.3 (240) 4.4 1-22 86 (100) 10.0 1-44
2018 58.4 (260) 3.8 1-21 78 (100) 9.7 1-51
2019 64.8 (305) 3.9 1-19 84 (100) 11.7 1-31
56 | ICES SCIENTIFIC REPORTS 2:85 | ICES
Diseases Since 2009, Anguillid herpesvirus (AngHv-1) (formerly known as Herpesvirus anguillae, HVA) has been detected during disease investigations of European eel, Anguilla anguilla L. in 17 fishery sites in England. Most of these events have occurred in enclosed still waters. Detailed post-mortem examinations have revealed clinical and histopathological changes consistent with the dis-ease. These include haemorrhaging in the fins, skin lesions and necrosis and inflammatory changes within the gills, skin, kidney and liver. Transmission electron microscopy has confirmed active virion replication within the gill tissue (Armitage et al., 2013). A review of AngHv-1 is underway to better understand the triggers for disease and assess the distribution of the virus within wild eels.
In summer 2018, Eel Virus European X (EVEX) was detected for the first time during an eel-specific mortality in a river catchment in East Anglia. Unfortunately, only dead fish were avail-able for examination, limiting understanding of the role of the virus in the observed losses. Co-infections with Ang-Hv1, eel birnavirus and Vibrio anguillarum further complicated the cause of these losses. This case represented the first detection of EVEX during a mortality event of wild eels in England. Work is underway to improve understanding of this virus with ongoing moni-toring of the affected waterbodies. Restrictions have been placed on the movement of eels out of this catchment whilst further investigations are underway and biosecurity guidance has been issued to fishermen operating on these rivers to raise awareness and avoid potential spread of pathogens between fisheries.
A number of collaborative projects are underway to progress understanding of European eel health interactions. This includes development of standardised protocols to harmonise assess-ments of eel health, the development of non-destructive diagnostic tools for disease surveillance and better understanding of pathogen interactions on eel fitness and passage.
In May of both 2015 and 2016, dead eels were reported in parts of the river Dee catchment, GB_Scot. In 2016, some of these were identified at the Girnock monitoring site, and the Fish Health Inspectorate isolated Flavobacterium psycrophilum from moribund specimens.
In Northern Ireland, there has been no evidence of anguillid herpes virus in any life-history stage of the wild European eel population of Lough Neagh. Eel virus European (EVE) and Eel virus European X (EVEX) were found but at a very low prevalence, suggesting that the presence of these diseases has not reached levels of concern to the population’s health status (Evans et al., 2018).
5.4.2 Contaminants
A comparison of recent lipid and pollutant levels in Scottish yellow eel tissue with data from 1980 showed lipid levels were notably higher in the more recent eel samples (Oliver et al., 2015).
In Lough Neagh eels, levels of contaminants were generally extremely low, and in many cases, among the lowest recorded in similar studies. Concentrations of those contaminants regulated by the European Commission (2006) with regard to human health (Pb, Cd, Hg, dioxins and PCBs) were all within current limits (2011; 2015). Concentrations of whole-body heavy metal burdens were generally very low in Lough Neagh eels, and in most cases were significantly lower than the average reported from studies conducted on eels elsewhere in Europe.
Analysis for 2018 for combined sample of 20 silver eels also recorded that all results were less than the maximum permitted by current legislation (Table 5.7).
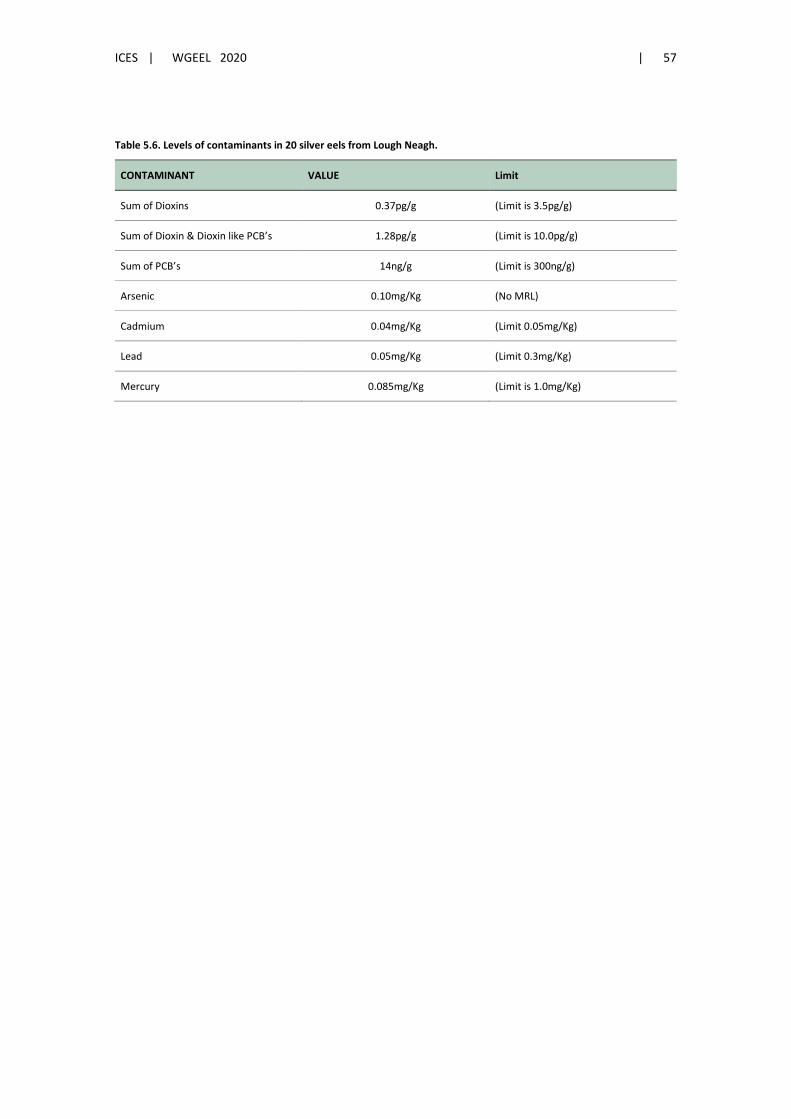
ICES | WGEEL 2020 | 57
Table 5.6. Levels of contaminants in 20 silver eels from Lough Neagh.
CONTAMINANT VALUE Limit
Sum of Dioxins 0.37pg/g (Limit is 3.5pg/g)
Sum of Dioxin & Dioxin like PCB’s 1.28pg/g (Limit is 10.0pg/g)
Sum of PCB’s 14ng/g (Limit is 300ng/g)
Arsenic 0.10mg/Kg (No MRL)
Cadmium 0.04mg/Kg (Limit 0.05mg/Kg)
Lead 0.05mg/Kg (Limit 0.3mg/Kg)
Mercury 0.085mg/Kg (Limit is 1.0mg/Kg)
58 | ICES SCIENTIFIC REPORTS 2:85 | ICES
6 New Information–research programmes, etc.
The WGEEL has a recurring task to report on any New and Emerging Threats and Opportunities to eel. This section of the report provides new information that would support the WGEEL in delivering this task, including new research programmes, etc.
1. REDEEM project: REsearch and Development of fish and Eel Entrainment Mitigation at pumping stations
As well as abiding with the requirements of the EC Eel Regulation (1100/2007), the UK has spe-cific legislation (Eels (England and Wales) Regulations 2009) for screening intakes, including pumping stations. Water is frequently pumped from or into rivers for flood protection, water level management, domestic supply, agriculture, Industry and hydropower generation. Fish and eels can be entrained in pumps and water intakes, especially adult silver eels during downstream migration; providing flood protection and safe eel passage is a particular problem. However, the extent of the problem is not fully understood and gaps in our knowledge prevent identification of adequate, cost-effective mitigation measures.
This research consortium will focus on understanding fish and eel behaviour to assess the effec-tiveness of existing and new technologies for minimising entrainment at pumping stations and develop innovative measures to provide applied outcomes. Specifically, the research will focus on understanding the spatial distribution of fish and eels in pumped catchments, the processes that lead to entrainment and the effectiveness of altered operating regimes, fish-friendly pumps and novel downstream bypass channels for minimising entrainment.
Funding has been provided by Environment Agency (EA), EU European Marine and Fisheries Fund (ENG2130), Internal Drainage Boards, Association of Drainage Authorities and the Uni-versity of Hull (UoH). The research cluster will bring together knowledge and expertise in state-of-the-art acoustic telemetry (under Home Office Licence), multibeam imaging sonar, eDNA and flow modelling techniques performed by staff and researchers across the EA, UoH and the Insti-tute of Zoology (ZSL), to make major advances in the field and maximise research quality.
The knowledge arising from this strategic, interdisciplinary and international applied research investigation is anticipated to inform and revise guidance for mitigating fish and eel entrainment at pumping stations and water intakes at national, European and global levels.
For more information about the project, please contact Jon Bolland (UoH research lead; [email protected]) or Ros Wright (EA research lead; [email protected])
Publications Bolland, JD, Murphy, LA, Stanford, RJ, Angelopoulos, NV, Baker, NJ, Wright, RM, Reeds, JD and Cowx, I
2019. Direct and indirect impacts of pumping station operation on downstream migration of critically endangered European eel (Anguilla anguilla). Fisheries Management and Ecology 26, 76–85. https://doi.org/10.1111/fme.12312
Baker, N., Haro, A., Watten, B., Noreika, J. and Bolland, J.D. 2019. Comparison of attraction, entrance and passage of downstream migrant American eels (Anguilla rostrata) through airlift and siphon deep en-trance bypass systems. Ecological Engineering 126, 74–82. https://doi.org/10.1016/j.ecoleng.2018.10.011
Bolland, J.D and Wright, R,M. 2019 Understanding eel behaviour to improve protection and passage at pumping stations. In Eels, Biology, Monitoring, Management, Culture and Exploitation, Proceedings of the First International Eel Symposium 228–236.
ICES | WGEEL 2020 | 59
2. Understanding eel behaviour to improve protection and passage at river structures: a summary of several UK-based studies
These Environment Agency projects in partnership with ZSL, University of Southampton and other organisations studied the behaviour of eels to find better ways to improve passage and protection at flood control structures, weirs, hydropower sites and other intakes. The studies showed significant impacts of some river structures on migrating eels, and that by understand-ing eel behaviour in relation to flow at such structures and intakes operational changes can be made at critical times of year to minimise delays and entrainment and improve passage.
The success of ‘trap and transport’ from reservoirs to river systems has also been assessed.
A project is in progress to improve eel pass design and performance. This evidence will help to inform guidance for provision of eel passes.
Publications Piper, AT, Wright, RM and Kemp, P. 2019. Understanding eel behaviour to improve protection and passage
at river structures. In Eels, Biology, Monitoring, Management, Culture and Exploitation, Proceedings of the First International Eel Symposium 236–257.
Piper, A.T., Wright, R.M. and Kemp, P.S. 2012. The influence of attraction flow on upstream passage of European eel (Anguilla anguilla) at intertidal barriers. Ecological Engineering, 44, 329–336. doi.org/10.1016/j.ecoleng.2012.04.019
Piper, A.T., Wright, R.M., Walker, A.M. and Kemp, P.S. 2013. Escapement, route choice, barrier passage and entrainment of seaward migrating European eel, Anguilla anguilla, within a highly regulated low-land river. Ecological Engineering, 57, 88–96. doi.org/10.1016/j.ecoleng.2013.04.030
Piper, A.T., Manes, C., Siniscalchi, F., Marion, A., Wright, R.M. and Kemp, P.S. 2015. Response of seaward-migrating European eel (Anguilla anguilla) to manipulated flow fields. Proceedings of the Royal Society B: Biological Sciences, 282 (1811). doi.org/10.1098/rspb.2015.1098
Piper, A.T., Svendsen, J., Wright, R.M. and Kemp, P.S. 2017. Movement patterns of seaward migrating Eu-ropean eel (Anguilla anguilla) at a complex of riverine barriers: implications for conservation. Ecology of Freshwater Fish, 26 (1), 87–98. doi.org/10.1111/eff.12257
Piper, A.T., Rosewarne, P.J., Wright, R.M. and Kemp, P.S. 2018. The impact of an Archimedes screw hydro-power turbine on fish migration in a lowland river. Ecological Engineering, 118, 31–42. doi.org/10.1016/j.ecoleng.2018.04.009
Piper, A.T., White, P.R., Wright, R.M., Leighton, T.M. and Kemp, P.S. 2019. Response of seaward-migrating European eel (Anguilla anguilla) to an infrasound deterrent. Ecological Engineering, 127, 480–486. doi.org/10.1016/j.ecoleng.2018.12.001
Piper, A.T., Rosewarne, P.J., Wright, R.M. and Kemp, P.S. 2020. Using ‘trap and transport’ to facilitate sea-ward migration of landlocked European eel (Anguilla anguilla) from lakes and reservoirs. Fisheries Re-search 228 105567 https://www.sciencedirect.com/science/article/pii/S0165783620300849
60 | ICES SCIENTIFIC REPORTS 2:85 | ICES
3. Azores Eel Project Summary
The EU Eel Regulation (EC 1100/2007) has obligated Member States to implement eel manage-ment plans (EMPs) to increase the biomass of eels leaving EU waters on their way to the spawn-ing area in the Sargasso Sea. However, these eels still have about 4-6,000 km to migrate across the ocean before spawning so EU targets cannot guarantee to increase the actual spawning stock and ensure stock recovery.
Locating where eels spawn is critical for understanding the reasons for their decline and con-serving this globally important species. Many factors could influence migratory success, both in freshwater and in the marine environment. The fundamental questions of where do the eels spawn and how do they get there, need to be answered before we can address questions about factors affecting migratory and spawning success and managing these factors to support stock recovery.
Several attempts have been made to monitor migrating silver eels from Europe. The waters around the Azores were the last point to which an eel has been tracked using satellite tags. A scoping study carried out by volunteers from EA, ZSL and Defra in December 2017 confirmed the presence of European eel populations on several islands within the Azores archipelago, which means there was the chance to track eels from a point closer to their speculative spawning area, which greatly increases the chance of success using current technology. An international partnership project is underway with the specific objective to track the migration routes and behaviours of eel from the Azores to their spawning area. A total of 26 silver eels have been satellite tagged in 2018 and 2019 revealing the next stage of their journey to the Sargasso Sea. A publication is in preparation.
For further information on this project, contact Ros Wright ([email protected])
4. Phenology and ecology of the critically endangered European eel during their marine to freshwater transition (Phd with University of Bournemouth)
The research aim is to overcome the considerable knowledge gaps on the migration phenology of the critically endangered European eel and the ecology of their marine-freshwater transition. The aim is met by working at two spatial scales: (i) across their European range, with assessment of their migration phenology; and (ii) within the River Frome, Dorset, where the ecology of their transition from glass-eel through to yellow eel is investigated. The objectives are:
a) Evaluate the migration phenology of glass eel in Europe, with testing of relation-ships between the timings of freshwater arrival with latitude and longitude, and sea and freshwater temperatures, and assess their probable migration routes in relation to ocean currents;
b) Quantify the length, age composition and trophic (feeding) ecology data of glass eels and elvers across European rivers, with a focus on early arrivals and in the migration peak;
c) For a specific river catchment, test the temporal and spatial relationships between juvenile eel stage (glass/elver/yellow eel) and their lengths, ages and trophic ecology; and
d) In the same catchment as Objective 3, assess the ecology of elvers and yellow eels within specific sites in their initial years of freshwater residence, including their movements.
Samples of glass eels from a range of European countries are needed for this project so support from WGEEL in making contact with potential sources of samples would be appreciated.
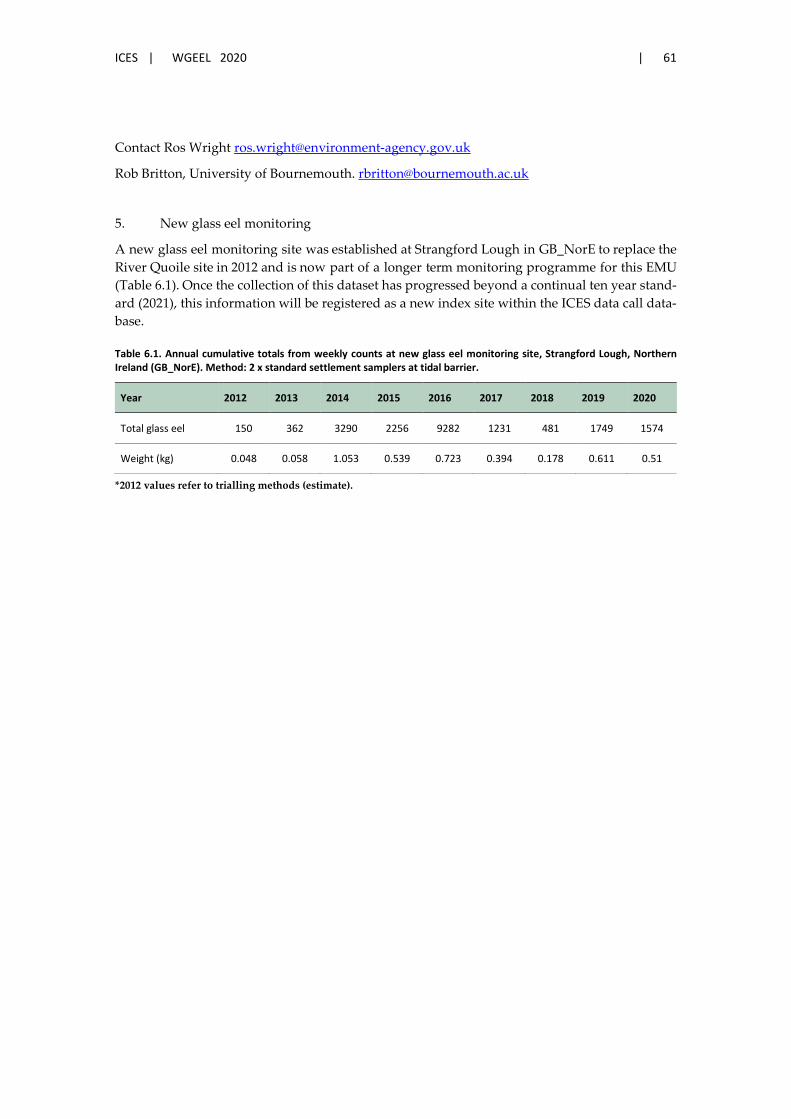
ICES | WGEEL 2020 | 61
Contact Ros Wright [email protected]
Rob Britton, University of Bournemouth. [email protected]
5. New glass eel monitoring
A new glass eel monitoring site was established at Strangford Lough in GB_NorE to replace the River Quoile site in 2012 and is now part of a longer term monitoring programme for this EMU (Table 6.1). Once the collection of this dataset has progressed beyond a continual ten year stand-ard (2021), this information will be registered as a new index site within the ICES data call data-base.
Table 6.1. Annual cumulative totals from weekly counts at new glass eel monitoring site, Strangford Lough, Northern Ireland (GB_NorE). Method: 2 x standard settlement samplers at tidal barrier.
Year 2012 2013 2014 2015 2016 2017 2018 2019 2020
Total glass eel 150 362 3290 2256 9282 1231 481 1749 1574
Weight (kg) 0.048 0.058 1.053 0.539 0.723 0.394 0.178 0.611 0.51
*2012 values refer to trialling methods (estimate).
62 | ICES SCIENTIFIC REPORTS 2:85 | ICES
7 References
Adams, C.E., Godfrey, J.D., Dodd, J.A. and Maitland, P.S. 2013. Is proximity to the North Atlantic Drift and the Continental Shelf Current sustaining freshwater European eel populations in western Scotland? Freshwater Biology, 58: 1–9.
Aprahamian, M. W. 1986. Eel (Anguilla anguilla L.) production in the River Severn, England. Polskie Archiwum Hydrobiologii 33: 373–389.
Aprahamian, M. W. 1988. Age structure of eel, Anguilla anguilla (L.), populations in the River Severn, Eng-land, and the River Dee, Wales. Aquaculture and Fisheries Management 19: 365–376.
Aprahamian, M. W., Walker, A. M., Williams, B., Bark, A., and Knights, B. 2007. On the application of mod-els of European eel (Anguilla anguilla) production and escapement to the development of Eel Manage-ment Plans: The River Severn. ICES Journal of Marine Science, 64: 1472–1482.
Armitage, J., Hewlett, N. R., Twigg, M., Lewin, N. C., Reading, A. J., Williams, C. F., Aprahamian, M., Way. K., Feist, S. W. and Peeler, E. J. 2014. Detection of Herpesvirus anguillae during two mortality investiga-tions of wild European eel in England: implications for fishery management. Fisheries Management and Ecology, 21: 1–12.
Defra. 2018. Report to the European Commission in line with Article 9 of the Eel Regulation 1100/2007: Implementation of the UK Eel Management Plans, June 2018. 58 pp.
Dekker, W. 2000. A Procrustean assessment of the European eel stock. ICES Journal of Marine Science, 57: 938–947.
Evans, D., McConville, J., Fringuelli, E., and Savage, P. 2018. First examination of the Lough Neagh Euro-pean eel (Anguilla anguilla) population for eel virus European, eel virus European X and Anguillid Herpesvirus-1 infection by employing novel molecular techniques. Journal of fish diseases, 12: 1783–1791.
Evans, D.W. and Rosell, R.S. 2008. Hook Location in Commercially Caught Yellow Eel (Anguilla anguilla) from the Lough Neagh Eel Fishery: Implications for Discarded Undersized Eel. Proceedings of the World Fisheries Congress, Yokohama, Japan 2008.
ICES. 2011. Report of the 2011 Session of the Joint EIFAAC/ICES Working Group on Eels. Lisbon, Portugal, 5–9 September 2011, ICES CM 2011/ACOM:18 and FAO EIFAAC Occasional Paper 48, 224 pp.
ICES. 2012. Report of the Workshop on Eel and Salmon DCF Data (WKESDCF), 3–6 July 2012, ICES HQ, Copenhagen, Denmark. ICES CM / ACOM:62. 67 pp.
Kennedy Rev. O.P. 1999. The commercial eel fishery on Lough Neagh. In: L. Watson, C. Moriarty and P. Gargan (Eds) Development of the Irish Eel Fishery. Fisheries Bulletin, Marine Institute, Dublin, Ireland 17, pp. 27–32.
Matthews, M., Evans, D., Rosell, R., Moriarty, C. and Marsh, I. 2001. The Erne Eel Enhancement Programme. EU Programme for Peace and Reconciliation Project Number EU15, Bord Iascaigh Regiunach An Tuais-ceart, Ballyshannon, Co. Donegal, Ireland. 348 pp.
Oliver IW, Macgregor K, Godfrey JD, Harris, L and Duguid, A. 2015. Lipid increases in European eel (Anguilla anguilla) in Scotland 1986–2008: an assessment of physical parameters and the influence of organic pol-lutants. Environmental Science and Pollution Research, 22: 7519–7528.
Rosell, R.S., Evans, D. and Allen, M. 2005. The Eel fishery in Lough Neagh, Northern Ireland-An example of sustainable management? Fisheries management and Ecology, 12: 377–385.
Walker, A. M., E. Andonegi, P. Apostolaki, M. Aprahamian, L. Beaulaton, D. Bevacqua, C. Briand, A. Can-nas, E. De Eyto, W. Dekker, G. A. De Leo, E. Diaz, P. Doering-Arjes, E. Fladung, C. Jouanin, P. Lambert, R. Poole, R. Oeberst and M. Schiavina. 2013. Lot 2: Pilot project to estimate potential and actual escape-

ICES | WGEEL 2020 | 63
ment of silver eel. Final project report, Service contract S12.539598, Studies and Pilot Projects for Car-rying out the Common Fisheries Policy. Brussels, European Commission, Directorate - General for Maritime Affairs and Fisheries (DG MARE): 358 pp.
Williamson, G.R. 1976. Eels in the Scottish Highlands, Highlands and Islands Development Board, Commis-sioned Report 1976/15.