Ecological risk assessment of pelagic sharks caught in Atlantic pelagic longline fisheries
Upload
khangminh22Category
view
3download
0
Advisory Committee on Fishery Management ICES CM 2002/ACFM:19
REPORT OF THE
NORTHERN PELAGIC AND BLUE WHITING FISHERIES WORKING GROUP
Vigo, Spain 29 April - 8 May 2002
This report is not to be quoted without prior consultation with the General Secretary. The document is a report of an expert group under the auspices of the International Council for the Exploration of the Sea and does not necessarily represent the views of the Council.
International Council for the Exploration of the Sea
Conseil International pour l’Exploration de la Mer
Palægade 2–4 DK–1261 Copenhagen K Denmark
i

1 GENERAL COMMENTS.......................................................................................................................................... 1 2 ECOLOGICAL CONSIDERATIONS....................................................................................................................... 1 3 NORWEGIAN SPRING SPAWNING HERRING (HER-NOSS) ............................................................................ 1
3.1 Fishery ............................................................................................................................................................ 1 3.2 Data available.................................................................................................................................................. 1 3.3 Assessment method(s)..................................................................................................................................... 2
3.3.1 SeaStar .............................................................................................................................................. 2 3.3.2 ISVPA............................................................................................................................................... 2
3.4 Recruitment estimates ..................................................................................................................................... 3 3.5 Short term prediction ...................................................................................................................................... 3 3.6 Medium term considerations........................................................................................................................... 4 3.7 Biological reference points ............................................................................................................................. 4
4 BARENTS SEA CAPELIN ....................................................................................................................................... 5 5 CAPELIN IN THE ICELAND-EAST, GREENLAND, JAN MAYEN AREA (CAP-ICEL) ................................... 5 6 BLUE WHITING (WHB-COMB)............................................................................................................................. 5
6.1 Fishery ............................................................................................................................................................ 5 6.2 Data available.................................................................................................................................................. 5 6.3 Assessment method......................................................................................................................................... 5 6.4 Short term prediction ...................................................................................................................................... 7 6.5 Medium term considerations........................................................................................................................... 7 6.6 Biological reference points ............................................................................................................................. 7
7 ICELANDIC SUMMER SPAWNING HERRING (HER-VASU)............................................................................ 7 7.1 Fishery ............................................................................................................................................................ 7 7.2 Data available.................................................................................................................................................. 7 7.3 Assessment method......................................................................................................................................... 8
O:\ACFM\WGREPS\WGNPBW\REPORTS\2002\Sec-1.Doc 17/09/02 14:28 ii
TECHNICAL MINUTES
Subgroup Northern Pelagic and Blue Whiting Fisheries Working Group (WGNPBW)
ACFM Meeting May 2002
Thursday 23/5/2002: 9:00-19:30 Beverton room Subgroup chair: Martin Pastoors Presenter: Asta Gudmundsdottir
Reviewers: Nils Hammer, Vladimir Shebanov Participants: Dankert Skagen, Steve Cadrin
Observer: Eskild Kirkegaard
1. GENERAL COMMENTS
Subgroup liked introductory chapters very much. The approach for the precautionary approach for blue whiting was clear although in Figure 1.5.1 the legend should be better explained.
Concerning the description of the methods used in the WG, the subgroup considered that the description should be focussed on the general properties of the methods and that the implementation should be treated in the chapters on the stocks. Notably, the subgroup recommended that the SeaStar program be described more concisely and without reference to the application to Norwegian Spring Spawning herring. The section on the analysis of young herring and on the use of tagging data as a measure of stock abundance was considered to be very unclear.
2. ECOLOGICAL CONSIDERATIONS
The subgroup liked the presentation of the ecological and environmental information. It was considered very informative and well written. However, it was noted that there was hardly any linkage with the stock chapters to the chapter on ecological considerations and this was regretted.
3. NORWEGIAN SPRING SPAWNING HERRING (HER-NOSS)
In general the subgroup considered that the structure of section 3 needed a thorough revision, so as to guide the reader through the assessment. Suggested headings are: fishery – data available (biological data, surveys, tagging) – stock assessment (exploratory analysis, final assessment including uncertainty analysis and retrospective analysis) – recruitment estimation – short term prediction – medium term prediction – biological reference points (e.g. yield per recruit) – quality of the assessment - management considerations
3.1 Fishery
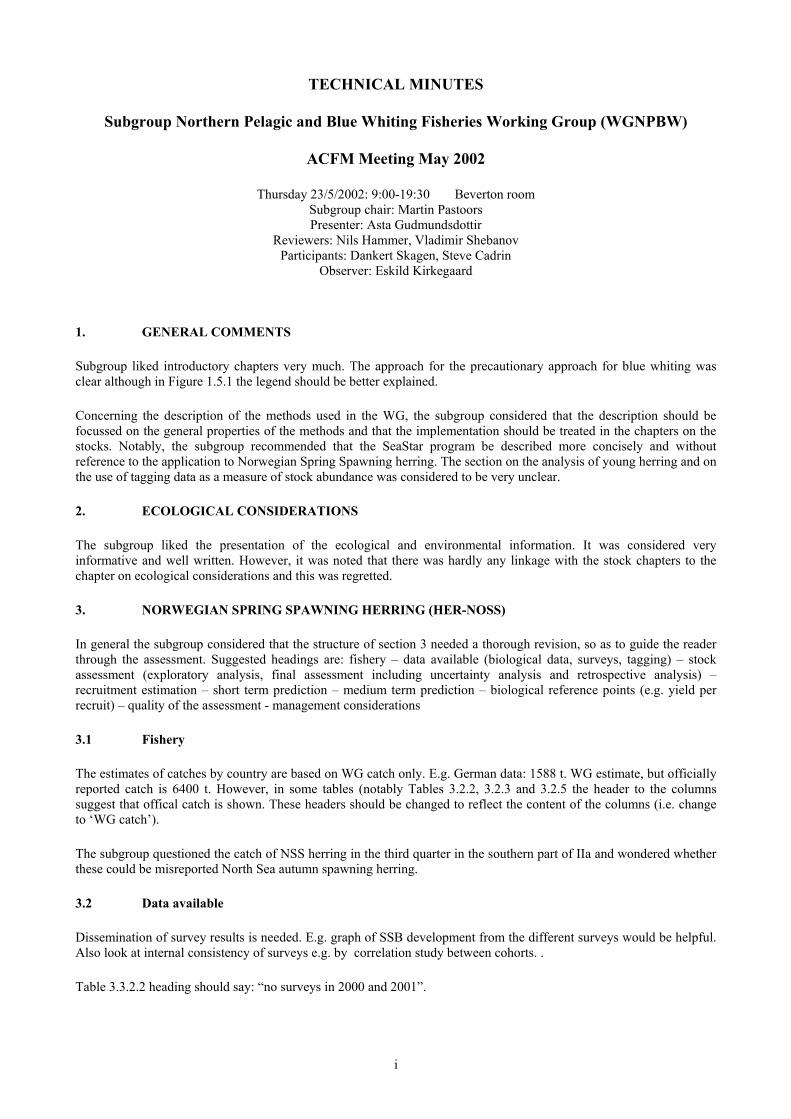
The estimates of catches by country are based on WG catch only. E.g. German data: 1588 t. WG estimate, but officially reported catch is 6400 t. However, in some tables (notably Tables 3.2.2, 3.2.3 and 3.2.5 the header to the columns suggest that offical catch is shown. These headers should be changed to reflect the content of the columns (i.e. change to ‘WG catch’).
The subgroup questioned the catch of NSS herring in the third quarter in the southern part of IIa and wondered whether these could be misreported North Sea autumn spawning herring.
3.2 Data available
Dissemination of survey results is needed. E.g. graph of SSB development from the different surveys would be helpful. Also look at internal consistency of surveys e.g. by correlation study between cohorts. .
Table 3.3.2.2 heading should say: “no surveys in 2000 and 2001”.
i

In the section surveys, there should only be a description of the results of the surveys and not an argumentation of why they are used or not. That should be under the exploratory assessment section.
It is not clear what the larval survey is supposed to measure and how.
3.3 Assessment method(s)
3.3.1 SeaStar
If a reference is made to a website, it is recommended to refer to a single document on that web-site that contains the most recent manual (pdf) of the program. Otherwise the reader first has to search through the website to find what he/she is looking for.
Different runs have been carried out. It is not clear why was a particular run was chosen.
The subgroup liked the attempt to present alternative diagnostic plots for the assessment. However, the subgroup also noted that most of the graphs did not have labels on the axis. And the subgroup missed the interpretation of the diagnostics. In practice this means that the assessment cannot be evaluated by the subgroup. The acceptance of the final run can therefore only be based on the good faith that the WG made the right decisions. This will no longer be accepted next year.
The subgroup suggests to have the method peer-reviewed by ICES. Also the main responsible persons may be invited to the ACFM subgroup next year.
Figure 3.5.4 should have interpretable parameter-names rather than numbers.
The reasoning of why to use the SeaStar method unclear. Subgroup would like to see systematic testing of basis hypothesis.
The retrospective plot is not very reassuring regarding the ability of the model to pick up the trends in the stock.
The formatting of output should be directly from the model used. It is highly unwanted that the parameter estimated in the model should be entered into another model (conventional VPA) to arrive at standard tables. In this way it will be very confusing what is the final result as there may be differences between the model used (SeaStar) and the model for presentation. .
Assessment of uncertainty should be under stock assessment.
It is unclear how the bootstrap resamples are drawn. What are the assumptions about the variance.
Suggestion of present the graph of F values with the y-axis cut off at 1 so that you can see the trends better.
The subgroup noted that the final assessment would not include the period 1907-1949 as the report documents that this is not reviewed yet. The subgroup would appreciate a thorough discussion of the extension of the time series before it is implemented.
3.3.2 ISVPA
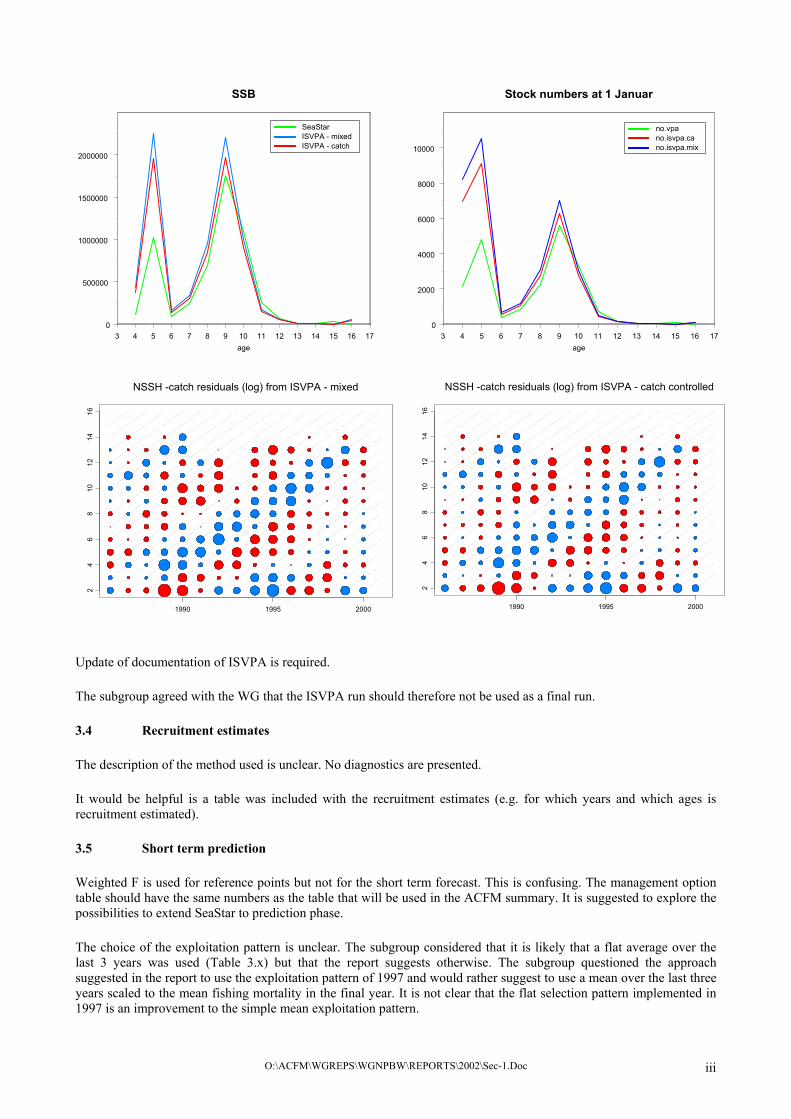
Gives very different results from the SeaStar model. ISVPA is based on catch data only. Youngest ages in catch data are difficult to follow. Very high estimates of juveniles (e.g. 5 year olds). Residuals dependent on year class (either all positive or all negative). See figures below.
The subgroup considered ISVPA an interesting approach for exploring the signals in the catch data. However is may be very sensitive to the assumption of stable selection.
O:\ACFM\WGREPS\WGNPBW\REPORTS\2002\Sec-1.Doc ii
3 4 5 6 7 8 9 10 11 12 13 14 15 16 17age
0
500000
1000000
1500000
2000000
SeaStarISVPA - mixedISVPA - catch
SSB
3 4 5 6 7 8 9 10 11 12 13 14 15 16 17age
0
2000
4000
6000
8000
10000
no.vpano.isvpa.cano.isvpa.mix
Stock numbers at 1 Januar
1990 1995 2000
24
68
1012
1416
NSSH -catch residuals (log) from ISVPA - catch controlled
1990 1995 2000
24
68
1012
1416
NSSH -catch residuals (log) from ISVPA - mixed
Update of documentation of ISVPA is required.
The subgroup agreed with the WG that the ISVPA run should therefore not be used as a final run.
3.4 Recruitment estimates
The description of the method used is unclear. No diagnostics are presented.
It would be helpful is a table was included with the recruitment estimates (e.g. for which years and which ages is recruitment estimated).
3.5 Short term prediction
Weighted F is used for reference points but not for the short term forecast. This is confusing. The management option table should have the same numbers as the table that will be used in the ACFM summary. It is suggested to explore the possibilities to extend SeaStar to prediction phase.
The choice of the exploitation pattern is unclear. The subgroup considered that it is likely that a flat average over the last 3 years was used (Table 3.x) but that the report suggests otherwise. The subgroup questioned the approach suggested in the report to use the exploitation pattern of 1997 and would rather suggest to use a mean over the last three years scaled to the mean fishing mortality in the final year. It is not clear that the flat selection pattern implemented in 1997 is an improvement to the simple mean exploitation pattern.
O:\ACFM\WGREPS\WGNPBW\REPORTS\2002\Sec-1.Doc iii

It is unclear what the relationship is between input to the prediction and output from the VPA assessment and Sea Star. Notably the recruitment estimates could not be traced.
At ACFM a short term prediction was run, using a flat selection from age 8, scaled to the weighted F from last year. It is actually the selection pattern from 1997, when the selection pattern was re-evaluated on the basis of the recruitment of the 1991 and 1992 year classes. The selection is dependent on this two big year classes, leading to much noise in the fishing mortalites for other ages. The selection used is:
Age selection 3 0.002 4 0.020 5 0.084 6 0.105 7 0.127 8 0.148 9 0.148 10 0.148 11 0.148 12 0.148 13 0.148 14 0.148 15 0.148 16+ 0.148
The resulting short term prediction is:
2002 Biomass SSB F 5-14 WF 5-14 Landings
7139 5276 0.186 0.173 850
2003 2004Biomass SSB F 5-14 WF 5-14 Landings Biomass SSB
7007 5837 0.123 0.103 600 6432 5965 5832 0.134 0.113 650 6383 5913 5826 0.147 0.124 710 6326 5850 5821 0.156 0.131 750 6287 5807 5815 0.167 0.14 800 6239 5755 5810 0.178 0.15 850 6190 5703
3.6 Medium term considerations
The stock recruit-plot is from 1950 onwards without a clear explanation. The subgroup suggest to explore the effects of using the long time series.
Perhaps a graph of the Beverton-Holt curve on a log scale would be instructive.
The subgroup questioned the need for medium term analysis if it is so dependent on the estimate of the most recent yearclass. The perception is very different from last year.
The exploitation pattern used in not documented. The subgroup suggest to include a table with the input to the medium term analysis.
The explanation of the medium term analysis in the table would benefit from a more extensive explanation directly linked to the table, rather than in the text. The text table itself is not very informative.
3.7 Biological reference points
Subgroup suggests to include a table with reference points estimated by the yield per recruit analysis.
O:\ACFM\WGREPS\WGNPBW\REPORTS\2002\Sec-1.Doc iv

4. BARENTS SEA CAPELIN
Not discussed by the subgroup
5. CAPELIN IN THE ICELAND-EAST, GREENLAND, JAN MAYEN AREA (CAP-ICEL)
Only briefly discussed.
The 0-group survey is not used in the assessment.
6. BLUE WHITING (WHB-COMB)
Assessment is clearly more optimistic than a year ago. Due to better recruitment; previously underestimated. Surveys at the spawning grounds. Russian and Norwegian surveys carried out together.
Norwegian vessel has keel mounted transducer, Russian vessel a hull mounted transducer. This may explain some of the differences between the Russian and Norwegian acoustic surveys.
In general this chapter was considered good to read although the tables were not always well designed.
6.1 Fishery
The starting sentence on stock identity is confusing. If there is a potential problem regarding stock structure, the biology should be better elaborated. It appears that just out of convenience we assess the blue whiting as one stock.
6.2 Data available
It was unclear whether maturity was estimated or assumed fixed. The input tables to the assessment suggested that maturity was constant over time.
When natural mortality was estimated using ISVPA, the subgroup wondered how the estimates of fishing mortality looked. The group wondered how sensitive the objective function was to the estimated parameters.
More dissemination of surveys is required and this should be in the report. It is suggested to look at the internal consistency of the surveys. The naming of the surveys is also not consistent. What is Norwegian survey, Icelandic survey and Norwegian Sea survey. Relate to table 6.4.5.1.
It is said that the catchability of 2002 survey was exceptionally high. The group wondered how this could be explained and how this would affect the outcome of the assessment.
It was suggested to present the data of all surveys in a consistent set of tables in the table section, rather than as text table as it stands now.
6.3 Assessment method
CPUE data not used: down-weighted youngest age group. Suggest to take them out if they do not reflect the dynamics of the stock.
Conclusion on ICA and AMCI is missing. What are the differences and similarities between the results. Why does the WG choose AMCI in the end. It was noted that in the Technical minutes from last year there was a detailed argumentation for AMCI.
Output from ISVPA is very limited. In Table 6.4.4.3 the year 2001 missing. There is a need for explanation of the table as well.
Residuals from AMCI are missing.
O:\ACFM\WGREPS\WGNPBW\REPORTS\2002\Sec-1.Doc v

ISVPA blows up the most recent year classes. See figures below. Figures 6.4.4.3 and 6.4.4.4 are difficult to understand. Should have more interpretation.
Figure 6.4.4.2 is missing
Recruitment of the 2000 year class is considered to be extremely uncertain. How does that translate into the forecast and interpretation of the forecast?
What is the basis for the quarterly split of fishing mortality (p 157).
p 158. 2.4 million ton SSB. Management table: 2.2 SSB. AMCI uses mean number over spawning season. Creates confusion.
Here we should mention, that it would be much more consistency in the results, if we used one assessment software instead of taking numbers from one program to the other:-)
0 2 4 6 8 10age
0
20000
40000
60000
BW - Stock numbers - 1 January 2001
amci.noisvpa.no
0 2 4 6 8 10age
0
500
1000
1500
2000
amci.ssbisvpa.ssb
BW - SSB by age 1 January 2001
1985 1990 1995 2000
24
68
10
BW -ISVPA, M=0.2, catch-controlled
1980 1985 1990 1995 2000year
0
2000000
4000000
6000000
8000000AMCIICAISVPA
BW - SSB
tonn
es
O:\ACFM\WGREPS\WGNPBW\REPORTS\2002\Sec-1.Doc vi

6.4 Short term prediction
Suggest to use GM over shorter time period e.g. 81 and 98 instead of 1981-2000.
Recruitment is estimated in the 3rd quarter whereas prediction program assumes 1st january.
The WG could consider to compare the AMCI prediction status quo prediction with the MFDP prediction.
6.5 Medium term considerations
Table 6.6.1 missing
Figure on medium term simulation is not presented.
Different catches in 2002 when compared to the short term prediction.
6.6 Biological reference points
What is basis for the revision of ref. points. lllll
Recovery plan discussions with EU. Bpa is arbitrarily set at 50% higher than Blim.
Target for recovery. Harvest control rule – well tested. – that would substitute Bpa.
Possible candidate of points. Refer to PA group.
Coastal state have harvest strategy. Based on the current reference points. Flim .51 would drive stock well below Flim.
ACFM to decide about the outline of the approach, but the choice of the actual values to be decided later (perhaps outside ICES).
A consistent Flim is likely to be lower than the current Flim. More to be done.
New F values are consistent with old Bpa.
Management plan agreed. ACFM to comment on that. Suggest that F may be lower.
Section 6.8 in catch section.
Quality of biological data on catch section.
7. ICELANDIC SUMMER SPAWNING HERRING (HER-VASU)
7.1 Fishery
No comments
7.2 Data available
Surveys did not locate all of the stock due to difficult weather conditions. Therefore SSB much lower than assumed last year. Survey last year was very reliable.
Surveys are structured to go where you found the herring last year.
Recruitment as separate section
Perhaps use a three year average weight rather than a regression
O:\ACFM\WGREPS\WGNPBW\REPORTS\2002\Sec-1.Doc vii

Use GM instead of normal mean for recruitment.
Fishery starts in september. So advice is given for 2002/2003 only.
7.3 Assessment method
Structure of assessment section: exploration and final assessment.
The summary table and F/N tables for the final run are missing..
For explored runs: skip tables of output as it is confusing what is the final run.
Final run: VPA type. The WG is asked to consider using alternative assessment methods in the future. e.g. AMCI.
Retrospective shows clear underestimation of F. However the correction of bias may not be the right approach.
O:\ACFM\WGREPS\WGNPBW\REPORTS\2002\Sec-1.Doc viii

O:\ACFM\WGREPS\WGNPBW\REPORTS\2002\Sec-1.Doc 1

TABLE OF CONTENTS
Section Page
1 INTRODUCTION...................................................................................................................................................... 1 1.1 Terms of reference .......................................................................................................................................... 1 1.2 List of participants .......................................................................................................................................... 1 1.3 Non-standard assessment methods.................................................................................................................. 2
1.3.1 SeaStar .............................................................................................................................................. 2 1.3.1.1 Tuning.............................................................................................................................. 2
1.3.2 AMCI................................................................................................................................................ 5 1.3.3 STPR................................................................................................................................................. 6 1.3.4 Iceland summer spawning herring assessment.................................................................................. 7 1.3.5 Capelin in the Iceland–East Greenland–Jan Mayen area .................................................................. 7 1.3.6 ISVPA............................................................................................................................................... 8
1.4 Quality Control ............................................................................................................................................. 10 1.5 Special requests concerning Blue Whiting.................................................................................................... 10
2 ECOLOGICAL CONSIDERATIONS..................................................................................................................... 17 2.1 Barents Sea ................................................................................................................................................... 17
2.1.1 Climate............................................................................................................................................ 17 2.1.2 Predicting Barents Sea temperature ................................................................................................ 17 2.1.3 Zooplankton .................................................................................................................................... 18 2.1.4 Prediction of capelin recruitment .................................................................................................... 18 2.1.5 Consumption by cod, saithe, blue whiting, harp seals, and minke whales...................................... 19
2.2 Norwegian Sea .............................................................................................................................................. 19 2.2.1 Hydrography and climate................................................................................................................ 19 2.2.2 Phytoplankton ................................................................................................................................. 20 2.2.3 Zooplankton .................................................................................................................................... 21 2.2.4 Herring growth and food availability.............................................................................................. 21 2.2.5 Predictions for zooplankton biomass and herring feeding conditions............................................. 22 2.2.6 Elements of herring biomass production......................................................................................... 23 2.2.7 Natural mortality of herring ............................................................................................................ 23
2.2.7.1 Possible variation in M due to constant predation ......................................................... 23 2.3 Icelandic Waters............................................................................................................................................ 23
2.3.1 Hydrography and climate................................................................................................................ 23 2.3.2 Zooplankton .................................................................................................................................... 24
2.4 Hydrography of the waters west of the British Isles ..................................................................................... 24 3 NORWEGIAN SPRING-SPAWNING HERRING ................................................................................................. 46
3.1 TAC and Fisheries ........................................................................................................................................ 46 3.1.1 TAC agreements for 2001 and 2002 ............................................................................................... 46 3.1.2 The Fisheries................................................................................................................................... 46
3.1.2.1 Description of the national fisheries in 2001.................................................................. 46 3.2 Catch statistics .............................................................................................................................................. 47 3.3 Surveys.......................................................................................................................................................... 48
3.3.1 Spawning areas ............................................................................................................................... 48 3.3.2 Wintering areas ............................................................................................................................... 48 3.3.3 Feeding areas .................................................................................................................................. 48 3.3.4 Nursery area.................................................................................................................................... 48 3.3.5 Herring larval survey 2002 ............................................................................................................. 48
3.4 Tagging experiments..................................................................................................................................... 49 3.5 Stock Assessment.......................................................................................................................................... 49
3.5.1 Model.............................................................................................................................................. 49 3.5.2 Data................................................................................................................................................. 49
3.5.2.1 Survey data..................................................................................................................... 49 3.5.2.2 Tagging data................................................................................................................... 50 3.5.2.3 Larval indices................................................................................................................. 50 3.5.2.4 Weight-at-age in the stock in the assessment year ......................................................... 50
3.5.3 Implementation of survey data and tagging data in the assessment model ..................................... 50 3.5.4 Stock assessment............................................................................................................................. 50
3.5.4.1 Retrospective analysis.................................................................................................... 51 3.5.4.2 Diagnostics..................................................................................................................... 51 3.5.4.3 Assessment using ISVPA............................................................................................... 52
O:\ACFM\WGREPS\WGNPBW\REPORTS\2002\Sec-1.Doc 1
3.5.5 Analysis of young fish not in the tuning ......................................................................................... 52 3.5.6 The final VPA................................................................................................................................. 52 3.5.7 Yield-per-recruit analysis................................................................................................................ 53
3.6 Short-term predictions .................................................................................................................................. 53 3.6.1 Input data to the short-term prediction............................................................................................ 53 3.6.2 Results of the short-term prediction................................................................................................ 53
3.7 Assessment of uncertainty ............................................................................................................................ 53 3.8 Long-Term Management Plan and Precautionary Reference Points............................................................. 54 3.9 Harvest control rule....................................................................................................................................... 54
3.9.1 Evaluation of adaptive recovering strategies in the event SSB falls below Bpa .............................. 54 3.10 Medium-term projections.............................................................................................................................. 54
3.11 MANAGEMENT CONSIDERATIONS.................................................................................................................. 56
4 BARENTS SEA CAPELIN ................................................................................................................................... 124 4.1 Regulation of the Barents Sea Capelin Fishery........................................................................................... 124 4.2 Catch Statistics............................................................................................................................................ 124 4.3 Stock Size Estimates ................................................................................................................................... 124
4.3.1 Larval and 0-group estimates in 2001........................................................................................... 124 4.3.2 Acoustic stock size estimates in 2001........................................................................................... 124 4.3.3 Other surveys ................................................................................................................................ 125
4.4 Historical stock development...................................................................................................................... 125 4.5 Stock assessment autumn 2001................................................................................................................... 125 4.6 Management considerations........................................................................................................................ 126 4.7 Sampling ..................................................................................................................................................... 126
@#
5 CAPELIN IN THE ICELAND-EAST GREENLAND-JAN MAYEN AREA ...................................................... 136 5.1 The Fishery ................................................................................................................................................. 136
5.1.1 Regulation of the fishery............................................................................................................... 136 5.1.2 The fishery in the 2001/2002 season............................................................................................. 136
5.2 Catch Statistics............................................................................................................................................ 136 5.3 Surveys of Stock Abundance ...................................................................................................................... 137
5.3.1 0-group surveys............................................................................................................................. 137 5.3.2 Stock abundance in autumn 2001 and winter 2002....................................................................... 137
5.4 Historical Stock Abundance........................................................................................................................ 138 5.5 Stock Prognoses .......................................................................................................................................... 138
5.5.1 Stock prognosis and TAC in the 2001/2002 season...................................................................... 138 5.5.2 Stock prognosis and assessment for the 2002/2003 season .......................................................... 139 5.5.3 Management of capelin in the Iceland-East Greenland-Jan Mayen area ...................................... 139
5.6 Precautionary Approach to Fisheries Management..................................................................................... 140 5.7 Special Comments ...................................................................................................................................... 140
5.8 SAMPLING ........................................................................................................................................................... 140
6 BLUE WHITING................................................................................................................................................... 153 6.1 Stock Identity and Stock Separation ........................................................................................................... 153
6.1.1 ACFM advice and management applicable to 2001 and 2002...................................................... 153 6.2 Fisheries in 2001 ......................................................................................................................................... 153
6.2.1 Description of the national fisheries ............................................................................................. 154 6.3 Biological Characteristics ........................................................................................................................... 156
6.3.1 Length composition of catches ..................................................................................................... 156 6.3.2 Age composition of catches .......................................................................................................... 156 6.3.3 Weight-at-age................................................................................................................................ 156 6.3.4 Maturity-at-age ............................................................................................................................. 156 6.3.5 The value of the natural mortality coefficient M for blue whiting................................................ 156
6.4 Stock estimates............................................................................................................................................ 157 6.4.1 Acoustic surveys ........................................................................................................................... 157
6.4.1.1 Surveys in the spawning season................................................................................... 157 6.4.1.2 Surveys in the feeding season ...................................................................................... 158
6.4.2 Bottom trawl surveys in the southern area.................................................................................... 159 6.4.3 Catch per unit effort ...................................................................................................................... 159 6.4.4 Data exploration............................................................................................................................ 159
6.4.4.1 Stock assessment with AMCI ...................................................................................... 159 6.4.4.2 Stock assessment with ISVPA ..................................................................................... 160
O:\ACFM\WGREPS\WGNPBW\REPORTS\2002\Sec-1.Doc 2

6.4.5 Stock assessment........................................................................................................................... 161 6.5 Short-Term Projection................................................................................................................................. 162 6.6 Medium-Term Projection............................................................................................................................ 162 6.7 Precautionary Reference Points .................................................................................................................. 163 6.8 Spatial and temporal distribution ................................................................................................................ 164 6.9 Management consideration ......................................................................................................................... 164 6.10 Recommendations....................................................................................................................................... 165
7 ICELANDIC SUMMER-SPAWNING HERRING ............................................................................................... 249 7.1 The fishery .................................................................................................................................................. 249 7.2 Catch in numbers, weight-at-age and maturity ........................................................................................... 249 7.3 Acoustic surveys ......................................................................................................................................... 249 7.4 Stock assessment......................................................................................................................................... 250
7.4.1 ADAPT-type of VPA.................................................................................................................... 250 7.4.2 AMCI assessment ......................................................................................................................... 250 7.4.3 ISVPA assessment ........................................................................................................................ 251
7.5 Catch and stock projections ........................................................................................................................ 251 7.6 Management consideration ......................................................................................................................... 251 7.7 Stock recruitment ........................................................................................................................................ 252 7.8 Sampling ..................................................................................................................................................... 252
8 REFERENCES AND WORKING DOCUMENTS ............................................................................................... 285 APPENDIX .................................................................................................................................................................... 289
O:\ACFM\WGREPS\WGNPBW\REPORTS\2002\Sec-1.Doc 3

1 INTRODUCTION
A note from the Chair
Around noon on the final day of the meeting Sergei Belikov, on behalf of the ‘Russian delegation’, presented a document, which is an annex to this report. The Working Group did not have time to consider its contents.
1.1 Terms of reference
The Northern Pelagic and Blue Whiting Fisheries Working Group [WGNPBW] (Chair: A. Gudmundsdottir, Iceland) will meet in Vigo, Spain from 29 April to 8 May 2002 to:
a) assess the status of and provide catch options for 2003 for the Norwegian spring-spawning herring stock; b) assess the status of and provide catch options for the 2002–2003 season for the Icelandic summer-spawning
herring stocks; c) assess the status of capelin in Subareas V and XIV and provide catch options for the summer/autumn 2002 and
winter 2003 seasons; d) assess the status of and provide catch options for capelin in Subareas I and II (excluding Division IIa west of 5°W)
in 2003; e) assess the status of and provide catch options for 2003 for the blue whiting stock. Review the biological reference
points for blue whiting. If a rebuilding plan is required, provide relevant information for establishing such a plan; f) provide specific information on possible deficiencies in the assessments including at least: Major inadequacies in
the data on catches, effort or discards; major inadequacies if any in research vessel surveys data and major difficulties if any in model formulation; including inadequacies in available software. The Group should clarify the consequences from these deficiencies for a) assessment of the status of the stocks and b) for the projection;
g) for stocks for which a full analytical assessment is presented, comment on this meeting’s assessments compared to the last assessment of the same stock;
h) consider the results presented in the reports of the WGMG and the SGPA with a view to applying these in the assessments;
i) review the draft Quality Handbook.
WGNPBW will report by 9 May 2002 for the attention of ACFM.
1.2 List of participants
Asta Gudmundsdottir (Chair) [email protected] Iceland Alexander Krysov [email protected] Russia Aril Slotte [email protected] Norway Brian S. Nakashima [email protected] Canada Dimitri Vasilyev [email protected] Russia Harald Gjösæter [email protected] Norway Hjalmar Vilhjalmsson [email protected] Iceland Ingolf Röttingen [email protected] Norway Jørgen Dalskov [email protected] Denmark Jan Arge Jacobsen [email protected] Faroe Islands Jim E. Carscadden [email protected] Canada Manuel Meixide [email protected] Spain Mikko Heino [email protected] Norway Nikolay Timoshenko [email protected] Russia (2.5 – 8.5) Paulino Lucio [email protected] Spain Sergei Belikov [email protected] Russia Sigurd Tjelmeland [email protected] Norway Jens Chr. Holst [email protected] Norway Webjörn Melle [email protected] Norway
O:\ACFM\WGREPS\WGNPBW\REPORTS\2002\Sec-1.Doc 1

1.3 Non-standard assessment methods
This WG has traditionally developed assessment specific software for several of its stocks, instead of using software that has become standard in ICES. The main motive for this is to be able to take stock-specific biological features into account, as well as the types of data that are available. Thus, for Norwegian spring spawning herring, the stock is dominated by a few very large year classes, which are estimated by tuning to the survey data, while the data for the other year classes generally are of poorer quality and should not be allowed to influence the assessment too strongly. In addition, there are tag recapture data that carry valuable information about the stock abundance. For blue whiting, ICA has been the standard software for some years, but the assessment has always been problematic due to noisy and to some extent conflicting data. This year AMCI was attempted in order to solve some of these problems, or at least get a better understanding of the impact of the various data sources.
Another motive for developing alternative software is to apply insight and solutions made by others to approach problems also for our stocks. Thus, the WG has in some cases preferred to use bootstrap to estimate uncertainty in the assessment rather than deriving the variance from the Hessian matrix (delta method), to take more direct account of the noise in the data. The Sea Star model uses bootstrap, and the AMCI can do both methods. The gradually changing selection pattern in AMCI has some similarity to the time series models (Gudmundson, 1994; Ianelli and Fournier, 1998). The separate handling of outstanding year classes has recently been used for Western horse mackerel (ICES 2001)
For medium projections, no standard has been firmly adopted by ICES, and the choice of method has been mostly dependent on traditions in the group, and on the software used for historic assessment. Thus, assessment by ICA naturally leads to using ICP for medium term predictions. For some of the stocks analysed by this WG, a spreadsheet programme has been used for some years, with the @Risk add-in in EXCEL as a tool for making stochastic predictions. Recent work has shown that the outcome of medium term projections to quite some extent is dependent on the method used, as well as the assumptions made within the method framework, which to some extent carry over from the assessment. (Patterson & al, 2000). The methods also vary with respect to which kind of scenarios they may simulate. This year, the STPR software was used, partly because it allows a range of simulation scenarios, partly because it is independent of ICA, and finally to avoid the use of spreadsheets that are generally error-prone.
This section gives a brief description of the various non-standard methods used by this WG.
1.3.1 SeaStar
The assessment program SeaStar is essentially the same model as used during the 2000 and 2001 meetings for tuning Norwegian spring-spawning herring. The model is documented on the web site www.assessment.imr.no, where the user guide and the Mathematica code can be found, as well as supplementary documentation material. A provisional user guide and model description is a Working Document to this meeting (WD by Tjelmeland). Before the 2002 meeting the documentation has been somewhat expanded. The analysis of young fish has been changed from linear regressions with a time trend to regressions based on a power-law dependence of the 0-group on the independent data (0-group index and acoustic surveys in the Barents Sea). Also, a provisional way of dealing with the problem that more scales are discarded as unreadable as the fish grows older was implemented prior to the meeting.
1.3.1.1 Tuning
SeaStar is a traditional back-calculating tuning model using a VPA based on Pope’s approximation. If needed, solving the catch equation is implemented in case the model should be used for a stock with high fishing mortality. The stock is assessed by running the VPA, which is dependent on the F-values in the last year and the F-values for the oldest true age group. Taking the historic stock as the expectation value in underlying distributions for the observed survey data the probability of observing the survey data is calculated. This probability is referred to as the likelihood function. There is provision for selecting different functions to describe the survey distribution. In the present tuning the gamma distribution with a constant CV is chosen, in accordance with recent practice. Similarly, the probability of observing the tag return data is calculated and included in the likelihood function. It is assumed that the probability of tag returns, which are rare events, follows a Poisson distribution. At the 2000 meeting also a larval observation series was added, where the probability of observation is based on the spawning stock.
The historic stock is assessed by varying the unknown parameters until the maximum of the likelihood function is reached. The parameters that are varied (free parameters, tuning parameters) are:
• Catchabilities for the surveys
O:\ACFM\WGREPS\WGNPBW\REPORTS\2002\Sec-1.Doc 2

• CVs of the surveys and of the larval data • Tagging survival • Terminal F-values SeaStar provides for basing the likelihood only on the strongest year classes. Also, only the terminal F values for the strongest year classes may be used as tuning variables. The rationale for this is to stabilise the tuning by avoiding bias from large relative errors in the catch in the terminal year of weak year classes, which mediated by the catchabilities would propagate also to the stronger year classes. The terminal F values of the weak year classes are linearly interpolated between the terminal F values that are tuning parameters. The terminal F values of the fish younger than the youngest tuned year class are linearly interpolated to zero at age -1.
The most important output variable is the estimated spawning stock in the assessment year, which is calculated on the basis of number-at-age, weight-at-age, and maturity-at-age at January 1 in the assessment year. Number-at-age is taken from the VPA by calculating forward one year using the catch information in the last year. Maturation-at-age in the assessment year is assumed equal to the maturation-at-age in the last year in the VPA. Weight-at-age in the assessment year is input data. However, it is assumed that the "timeBeforeSpawning" part of a year spreads into the assessment year, and in order to calculate the decrease until spawning time the same F as in the last year of catch is assumed also to apply for the assessment year. However, the WG will also assume that a fixed catch of "catchAssessmentYear" million tonnes will be taken in the assessment year, which may correspond to a somewhat different F. Also, the number-at-age at January 1 in the assessment year for fish younger than the youngest year class in the tuning (in the list "estimateTerminalFYearclasses") is determined by the analysis of the young, and may differ from the number that results from the tuning process since the latter comes from a rather arbitrary assumption that F decreases linearly to 0.0 at age -1. This is corrected for when the exploratory runs table is made. However, it is not possible to make a fully consistent correction, since then the bootstrap would have to be run for all exploratory runs. Normally, it will be possible to run the bootstrap for only the run chosen by the WG to be the most appropriate. For this run the ratio of the corrected and uncorrected spawning stock is calculated and applied to all other runs.
This correction of the exploratory spawning stock in the exploratory runs is more important this year than earlier, since the un-tuned 1998 year class now starts to mature.
Analysis of assessment uncertainty using bootstrap
The analysis of assessment uncertainty is done using bootstrap. The assessment is run many times, each time new data sets are generated by resampling from the original data set. Catch, survey data, tagging data and larval data may be resampled separately or jointly by appropriate settings which are asked for when the routine Bootstrap is invoked from the main menu, - see the chapter "Running an assessment/Uncertainty analysis by bootstrapping" for details.
Surveys
The surveys are resampled from the distribution that is assumed when the likelihood function is constructed, based on the unperturbed surveys. This is done by a call to the routine drawSurveys from the routine doOneRun before the likelihood function is evaluated.
Tagging
The number of tags recovered are sampled from the same distribution as assumed when the likelihood function is evaluated, i.e. Poisson. The number of fish screened for tags is assumed normally distributed with a CV specified in the input data list. The uncertainty in the number of screened fish stems from uncertainty regarding the amount of fish screened and uncertainty in the calculation of number-at-age screened from biological samples taken from the catch. The number of tagged fish released is also assumed uncertain where the normal distribution with a CV specified in the input data list is assumed.
Catch
The catches are considered certain, so there is no distribution from which to draw catch data. The best method would be to base the catch data bootstrap on the biological samples used for distributing the catch on age. However, a possibly large source of error in the age distribution of the catch data comes from using biological samples from one space-time domain on catches from another space-time domain. This is necessary because of inadequate biological sampling of the catch from the countries involved in the fishery. The associated error cannot be dealt with, however, without
O:\ACFM\WGREPS\WGNPBW\REPORTS\2002\Sec-1.Doc 3

implementation of the biological samples from all countries and by using a time-space model of the fish distribution. This is an important, but large project that ideally should be a joint effort of the countries involved.
An alternative might be to base the uncertainty in catch at numbers on a parametric distribution. The multinomial distribution based on the number of age samples and assuming perfect mixing has been tried earlier. This approach yielded a very narrow distribution, and the approach is not very satisfactory in that the underlying correlation between age groups takes little notice of the causes for a correlation between age groups. There is reason to believe that the strongest correlation between age groups is due to mis-reading of nearby age groups. Thus, in the present assessment program an algorithm based on the assumption that the error in number by age stems from transfer of catch between neighbouring age groups is implemented. For two neighbouring age groups with number-at-age of stock1 and stock2 (as based on the unperturbed assessment) the catch to transfer is calculated as:
transferred=maxTransferCoefficient(1.0 - Abs(stock1-stock2)/(stock1+stock2) )
where maxTransferCoefficient is a setting. Thus, it has not been possible to avoid subjective elements altogether. However, the proposed formulation to some extent allows the bootstrap to be based on whatever knowledge one may have of misreading fish in neighbouring age groups.
Uncertainty in last year's catch or in the last true age of tuned year classes may be especially significant. Therefore, the possibility of not taking into account the uncertainty of the last (or several of the last) years has been built into the software, so this effect can be studied.
Larvae
As for the surveys, the larval data are resampled from the assumed distribution.
In bootstrap runs first a run with the original data is performed. In the first run the setting perform<bootstrap Tag>Bootstrap must be True and the setting draw<bootstrap tag>Bootstrap must be False, where <bootstrap Tag> is Survey, Catch or Tagging. The first run may then be used as a basis for bias correction of the bootstrap.
The bootstrap replicates contain all the information that may be requested later by other assessment programs: historic spawning stocks, historic recruitments, and when the program is used for tuning Northeast Arctic cod, even the cod stock-dependent part of the predation by cod on capelin.
The bootstrap replicates may be viewed by the top-level routine showBootstrapEntities, which is also used when the standard output is produced.
Bias in the assessment due to discarding of old scales
When the herring grows older the yearly growth zones in the scales become closer together and will eventually become difficult to distinguish from one another. When the age readers are uncertain about the age using a certain scale they may discard the scale. Thus, more scales from old fish than from young fish will be discarded. This may introduce a bias in the assessment that may be serious.
A procedure for dealing with this effect has been proposed (Tore Schweder, pers. comm.). If the readers are not sure about the age they record a minimum age and signify this with a special code on the raw data sheet. The fish could be either the minimum age or older. However, implementing this method on the historic material by re-reading scales is a huge undertaking, and simpler, but statistically stringent methods should be found.
This problem becomes especially important this year as the strong 1991 and 1992 year classes grow into the problematic age range. Earlier, we have dealt with the problem that fish have been transferred from the 1983 year class to the 1985 year class, probably because of the same effect.
As a coarse way of investigating the seriousness of this effect a vector over age of the proportion of discarded scales was introduced at the present meeting. 5% of the scales from 5-year-old herring were assumed discarded and the proportion was linearly increased to 32.5% at age 15. These numbers have some support from investigations of the number of discarded scale as a function of length (WD by Slotte). In one exploratory run (Run 4) this correction vector was applied to numbers-at-age in all acoustic surveys and to the catch numbers-at-age. The result is an increase in the perceived spawning stock of about 0.75 million tonnes, which is an indication that this effect may be serious. A method for implementing corrections, preferably on a year-by-year and survey-by-survey basis should be found.
O:\ACFM\WGREPS\WGNPBW\REPORTS\2002\Sec-1.Doc 4

Analysis of young herring
The analysis of young fish included into SeaStar at the 2001 meeting was modified for the present meeting. The linear trend was removed and a power-law instead of a linear regression was performed. The logarithm was taken for all entities, including the logarithmic 0-group index. For the acoustic surveys in the Barents Sea, acoustic estimates of one- and two-year-old fish made during the joint IMR-PINRO survey in September were included during the present meeting. These numbers were calculated to the time of the May-June survey used in the regressions. However, estimates of herring are scarce in these surveys which are directed towards capelin. No measurements were available in 1995 or earlier for use in the regression period which ends in 1993. Measurements were however available for the 1998 and 1999 year classes as 1- and 2-year-old fish. When the regressions were used for assessing the young fish a draw was made whether to use the May-June or the September measurements, before the year class as 0-group was calculated from the regression formula. At the present implementation it is assumed that there is no catch between the 0-group stage and the age at which the herring is measured in the acoustic surveys used in the regressions.
Medium-term predictions
Medium-term projections are performed by first making a draw from the bootstrap replicates of tuned assessments of older fish. Next, the regressions of younger fish are performed and one draw for each year class as 0-group is made and calculated to the assessment year (2001). Thereafter the parameters in a Beverton-Holt recruitment model (log-scale) are estimated, and the stock is projected forward 10 years using the current harvesting control rule.
Recruitment model
The recruitment model is a traditional Beverton-Holt model where the parameters are estimated on log-scale. However, the recruitment is highly dynamic with a few outstanding year classes. To better adopt the model to this stock the 10% highest recruitments are excluded from the regression. When a draw from the recruitment model is made these year classes are selected with 10% probability and a draw with equal probability is made. If the highest recruitments are not selected the recruitment is given as the exponentiation of the logarithm of the Beverton-Holt model with a random draw from the residuals added.
Weight-at-age model
The weight-at-age is not random in the model, but explicitly given by year. However, there is a provision for changing the weight at some given year.
Maturation-at-age model
The maturation-at-age is constant. However, there is a provision for changing the maturation at some given year.
Harvesting control rule
The harvesting control rule is based on a fixed F-value (target F) combined with a catch ceiling. Two reference points are defined, Blim and Bpa. When the spawning stock falls below Bpa the F-value is linearly interpolated between the target F-value at Bpa and a specified lower value at Blim.
Sampling
During simulation the spawning stock and the yield are sampled. Stability of catches is calculated by first calculating the relative change in catches from one year to the next, then averaging over one trajectory and finally taking the median over trajectories.
1.3.2 AMCI
The AMCI (Assessment Model Combining Information from various sources) is similar to ICA in many respects, but is more flexible with respect to separability of fishing mortality, type of input data, in the way in which information from various data is combined, estimated parameters, and with respect to how uncertainty can be estimated. The underlying population model is age-disaggregated, describing stock numbers-at-age in each time step. The stock numbers are related within the year classes through mortalities given by a parametric mortality model. The initial abundance in numbers of each year class is also specified as parameters. Thus, the population is in principle self-contained, being
O:\ACFM\WGREPS\WGNPBW\REPORTS\2002\Sec-1.Doc 5

defined uniquely by parameters. Additional models describe the relation between the modeled population and the observed data or data derived from the observations. An objective function measures the deviance of the model from the observations. The parameters are estimated by minimizing the objective function. Uncertainty in the estimates and in the modeled population can be derived from the derivatives of the objective function with respect to the parameters, or by bootstrapping. This design places the program in the category 'statistical catch-at-age models'.
Within this framework, AMCI has some special features:
• The observation data that can be related to the model include measures of spawning stock biomass and tagging data, in addition to age-structured catch and survey data.
• The model operates internally on a quarterly basis, and it is possible (but not necessary), to use quarter-wise catch data.
• Catch data are treated fleet-wise, with individually defined fishing mortality models for each fleet. • The model allows for spatially disaggregated data. • Several selection models are available. • Recruitments in some years can be substituted by expected values according to a stock-recruitment function. • The user can choose which parameters one will regard as known and which are to be estimated by attaching
‘active flags’ to the parameters. • There is a range of different objective functions that can be combined and weighted as specified by the user. • Basically, fishing mortalities are modeled as separable. It is possible to recursively update the selection at age,
allowing for a slow change in the selection, according to the yearly catches. In the extreme, this leads to a VPA-like algorithm.
• The diagnostics include computation of the first and second derivative of each term in the objective function with respect to the parameters (Jacobian matrix).
• The uncertainty in the assessment is primarily estimated by bootstrapping (parametric or non-parametric) of the data. In addition, variances of the parameters and correlations between parameters can be obtained from the Hessian matrix.
• The model runs forwards in time. It is therefore straightforward to extend the time range beyond the present, as a short time prediction, provided that the necessary parameters are specified. If the model is run in the bootstrap mode, stochastic recruitments are used for the future years, giving a stochastic prediction with uncertainty at the present stock numbers and future recruitments.
The present version (Version 2.1) is documented in a manual, which was presented to the Working Group.
An earlier version of the model was used by the WGMHSA (ICES CM2001/ACFM:06) as an alternative assessment model for mackerel, in order to make use of the tagging data, and on sardine in order to clarify possible shifts in the selection pattern.
1.3.3 STPR
The STPR is a program for making stochastic medium-term projections (Skagen, 1997, Patterson, & al 2000) and was originally developed for evaluating harvest control rules for North Sea herring (ICES 1997a, Patterson, Skagen, Pastoors, & Lassen, 1997).
It is in most respects rather similar to ICP in that it projects the stock forwards with stochastic parameters, and presents statistics of a large number (normally 1000) of replicas. The stochastic elements are recruitments, weights, maturities and initial stock numbers, while STPR, unlike ICP, takes fishing mortality as fixed inputs. The recruitment is assumed to be log-normally distributed with expectation values according to a stock-recruitment function. For weights and maturities, historical data are used, by drawing a random year each time such data are needed, and using all the data from that year. Initial stock numbers are input. If a covariance matrix can be provided, the initial numbers are regarded as multinormally distributed on the log scale. The model allows two fleets and allows simulating simple harvest control rules, where fishing mortalities or catch ceilings are stated for each of 3 levels of current SSB. For the first (intermediate year), a TAC constraint is always assumed, for the subsequent years, F-constraints can be specified which would overrule the harvest control rule. The harvest control rule can either be applied to the current stock abundance, or to a stock abundance that is altered by a random term to simulate bias in the assessments or overfishing or TAC's. The output includes the distribution of catches, recruitments, SSB's and fishing mortalities for each year. In addition, the probability of exceeding reference levels of SSB each year and at least once in the projection period is tabulated. There
O:\ACFM\WGREPS\WGNPBW\REPORTS\2002\Sec-1.Doc 6

is also included a measure of stability, which is the range of catches over the last 5 years, divided by the mean catch over that period.
1.3.4 Iceland summer spawning herring assessment
An ADAPT-type of assessment has been used by the stock assessment of the Icelandic summer spawners for several years. It assumes a one-to-one relationship between the acoustic estimate in numbers and the stock numbers derived from a classical VPA. The objective is to find an F which minimizes ∑( log(ac4+) - log(vpa4+))2 over all years in the assessment, where ac4+ is the sum of the numbers of 4 ringers and older in the acoustic survey and corresponding for the VPA.
When the abundance of juvenile 2–4 ringed herring has been assessed by acoustic surveys, the resulting abundance estimates have been used in the tuning process. In cases where no such information is available for the youngest age group (2 ringers) the size of this age group is set at 400 millions, which is close to the lower quartile of the recruitment observed since 1980.
1.3.5 Capelin in the Iceland–East Greenland–Jan Mayen area
The preliminary TAC should be set at a level to open the fishery, when appropriate, before the October/November survey, and to keep the residual spawning stock at or above 400,000 tonnes. Thus the prognosis procedure needs to predict the fishable stock in the beginning of the season in order to predict the effects of fishing. To account for the highly variable year class strength and maturing ratio, the procedure needs to predict separately the two major components of the mature stock (age groups 2 and 3). These predictions need to be done in spring.
Available data include acoustic survey estimates of the different age groups in August, October and January. It has been found that, when available, autumn (October/November) acoustic estimates of the abundance of age groups 1 and 2 can be used as predictors of fishable stock abundance about 8 months prior to the fishery.
The maturing part of age group 2 in summer (N2mat) is a part of the survivors of the 1-group of the previous autumn (N1), which is measured in October/November in the year before. A prediction model based on a linear relationship between the historic back-calculated numerical abundance of maturing capelin at age 2 (N2mat) and the autumn acoustic estimates of the same year classes at age 1 (N1acoust) is used to predict the adult 2-group abundance at the beginning of the fishing season some 8 months later.
The maturing part of the 3-group in summer corresponds to that part of the year class, which did not mature and spawn in the year before. Because autumn surveys of immature capelin of age 2 (N2imm) have usually produced underestimates of varying magnitude such data have little predictive value. Similarly, January/February surveys of this year class only estimate the part that will spawn and thus are no indicators of what will appear in summer of next year.
However, maturity at age 2 is inversely related to year class size (N2tot), i.e. the maturing ratio is a function of year class abundance. Therefore, the total abundance of age group 2 in summer should be an indication of what will appear as 3-group in the following season. A regression relating the back-calculated total abundance of year classes at age 2 (N2tot) on 1 August to their abundance at age 3 (N3mat) is therefore used to predict the numerical abundance of age 3 capelin.
During the last ten years the weight at age of adult capelin has been inversely related to the total adult stock abundance in numbers. Linear regressions of total adult stock in numbers on the mean weight at age in autumn are used for predicting the mean weights of age groups 2 and 3.
The data sets comprising all comparisons of numbers by age and maturity, as well as total numbers and weight at age relevant to these prediction models are given in Tables 5.4.1, 5.5.1.1 and 5.5.1.2.
The above regressions have been updated as new data became available. A comparison of the predicted TAC updated with data from the autumn surveys is given in Table 5.5.1.3.
O:\ACFM\WGREPS\WGNPBW\REPORTS\2002\Sec-1.Doc 7

1.3.6 ISVPA
This assessment model is designed specifically to assess stocks where only catch at age data are available, or other data are considered to be too noisy.
Instead of assuming the fishing mortality to be separable, it considers the instantaneous mortality
ϕ(a,y) = C(a,y)/(N(a,y)*exp(-M(a,y)/2)
and regards ϕ as separable:
ϕa,y = sa fy
In addition, it puts constraints on the matrix of ϕ residuals. The objective function which is minimised is the median of the squared log catch residuals. Using the median instead of the sum renders the estimate more robust to outliers in the data.
The separability assumption is widely used in various cohort models (Pope, 1974; Doubleday, 1976; Pope and Shepherd, 1982; Fournier and Archibald, 1982; Deriso et al., 1985; Kimura, 1986; Gudmundsson, 1986; Patterson, 1995; etc.). A simple version of separable cohort model, named ISVPA, was also proposed by Kizner and Vasilyev (Kizner and Vasilyev, 1997; Vasilyev, 1998, 1998a, 2000). The model ISVPA is similar in many aspects to other separable models. But its parameter-estimating procedure is based on some principles of robust statistics which helps to diminish the influence of error (noise) in catch-at-age data on the results if the assessment. Besides, special parameterization of the model makes it unnecessary to use any preliminary assumptions about the age of unit selectivity and about the shape of selectivity pattern. This helps to get unique solution in cases when catch-at-age data are noisy and auxiliary information is too controversial or is not available. Otherwise ISVPA may be used in order to outline stock tendencies from catch-at-age data taken alone.
Basic equations of the model are the consequence of traditional separable VPA and cohort analysis by Pope, which implies the assumption that catch is taken within a short time interval. One of the main differences of ISVPA lies in representation of fishing mortality (it is expressed in terms of fractions).
Following are the main equations of the catch-controlled version of ISVPA:
N N e C ea y a yM
a yM
, ,/
,/(= ++ +1 1
2 ) 2 , (1)
Ca,y=ϕa,y Na,ye-M/2, (2)
ϕa,y = sa fy, (a=1,..., m-1; y=1,...,n-1), where
a: age index, m: total number of age groups, y: year index, n: total number of years, Na,y: abundance of the age group a in year y, Ca,y: catch from age group a in year y, M: natural mortality coefficient, ϕ(a,y): fraction of the abundance of age group a, taken as a catch in the middle of the year y (plays the role similar to that of Fa,y in traditional VPA), fy: year factor (or effort factor), sa: age factor (or selectivity factor).
Selectivity factors are normalized: , (3) saa
m=
=∑ 1
1
It is not needed to use in calculations any additional assumption about sa, except that sa for the two oldest ages are equal to each other (if the oldest age group is a “+ group”, then the three oldest sa should be equal to each other). This seems to be a rather weak restriction if a sufficient number of ages are included into analysis.
Estimated values of ϕa,y may be recalculated into instantaneous fishing mortality coefficients Fa,y by the formula: Fa,y = - ln[1- ϕa,y] , which is obvious if you rewrite expression (1) as: ln[Na,y/Na+1,y+1] = M - ln[1-ϕa,y] and compare it with the traditional VPA equation: ln[Na,y/Na+1,y+1] = M + Fa,y.
O:\ACFM\WGREPS\WGNPBW\REPORTS\2002\Sec-1.Doc 8

The catch-controlled version is more appropriate if there is much more confidence in the precision of catch-at-age data than in the validity of the separability assumption.
The effort-controlled version of ISVPA is obtained by substitution of the estimated catch, C = safyNa,ye-M/2 for Ca,y in (1), that is, by replacing equation (1) with
$,a y
NN e
s fa ya y
M
a y,
,=−+ +1 1
1. (4)
This version of the ISVPA is more appropriate when catch-at-age data include a very high level of noise, that is rather often, except when fishery is known to be extremely nonseparable.
In practice in most cases both assumptions (that catch-at-age data are precise or fishery is well separable) are rather far from reality. If there are some ideas about their relative validity it is possible to use mixed version of ISVPA in which the equation of stock dynamics is a mixture (with the coefficient given by user) of equations (1) and (4). In this version of the ISVPA the same weight (or “level of relative confidence”) of the two assumptions is used for all points.
Since often the user has no preliminary ideas about relative validity of the above-mentioned assumptions and since the relative weight of these assumptions may be strongly different for different points (a,y), the 4th version of ISVPA named mixed with weighting by points (or mixed WBP in menu) is also available. In this version for every point (a,y) the equations (1) and (4) are weighted by reciprocal squared residuals between the given catch(a,y) value and its respective “theoretical” value: C = safyNa,ye-M/2 where N$
,a y a,y is calculated by equation (1) or (4). These weights are
recalculated in every iteration within the iterative procedure of the model parameters estimation (see below).
For each version of the ISVPA the algorithm consists of a 'core', in which all the model parameters are evaluated from the iterative procedure at a given natural mortality coefficient, M, and terminal fishing effort, fn, and an outward 'shell', a loop in which the best M and fn are fitted. The ‘core’ is represented in the program by 4 iterative procedures. The first, “basic”, iterative procedure ensures unbiased separabilisation:
∑ =0, and ∑ =0 , where ϕa,y= sa⋅fy+εa,y. εa ya
m
,=1
εa yy
n
,=1
The second “Logarithmic” (geometrical mean) procedure ensures unbiased model estimates of log-transformed catches:
[ln ln $ ], ,*C Ca y a y
a
m− =
=∑
10 and ∑ , where C = safyNa,ye-M/2 [ln ln $ ], ,
*C Ca y a yy
n−
=10= $
,a y
It can be simply shown that this procedure provides unbiased estimates of logarithms of all parameters.
The third “Weighted arithmetical mean” procedure may be more appropriate when errors corresponding to different age groups hardly can be regarded as equally distributed. In this version inverse selectivities serve as weights. This version ensures unbiased separabilization, but weighted by selectivities.
The 4-th procedure is intended to produce the best fit to catch-at-age data, but the solution will be free from any restriction on bias.
Median minimization. Minimization of the median, MDN, of squared residuals (that is, the use of the least median or LMSQ principle) instead of their sum (the classical LSQ-principle) is sometimes thought to be more resistant with respect to outliers, those elements of the data set which overstep considerably reasonable confidence limits and, hence, are suspected of containing extremely high errors (Hampel et al., 1986).
O:\ACFM\WGREPS\WGNPBW\REPORTS\2002\Sec-1.Doc 9

According to this concept, an alternative ISVPA solution may be looked for as providing estimates of M and fn, which secure a minimum of the median of the distribution of the squared logarithmic residuals,
SE C Ca y a y a y, , ,*(ln ln $ )= − 2
(a = 1,...,m; y=1,...,n). The corresponding loss function will be denoted as MDN*(M, fn).
In practice, the median of a random series is estimated by rearranging its elements in a descending or increasing order and taking the central element of the new series or the mean of two central elements (depending on whether the total number of the elements is odd or even). However, when used within the framework of ISVPA, this estimate may sometimes cause a certain roughness of the surface MDN(M, fn). In order to make the loss function smoother, the median is estimated here as the mean of a number (for example, 10) central elements of the ordered series of SEa,y.
Dealing with zeros in catch-at-age matrix. Existence of zeros in catch-at-age matrix is known to be a rather complicated problem (and may be logically controversial in dealing with logarithmic residuals), and it is solved in different ways in different methods. In ISVPA the following algorithm is applied:
1. If Ca,y=0, then the value of ϕa,y is taken equal to its “theoretical” value, that is ϕa,y= sa fy .
2. Residuals for points of zero catches are taken equal zero.
3. Stock abundance is estimated as follows: if Na+1,y+1>0 and Ca,y=0, then Na,y is calculated by equation (1); if Na+1,y+1>0
and Ca,y>0, then Na,y is calculated by equation (1) or (4) or their mixture according to the version chosen; if Na+1,y+1=0,
then Na,y is calculated by formula (2) – the same way as for terminal points.
1.4 Quality Control
Commercial catch data input, quality control
Input spreadsheet and initial data processing
Since 1997 (catch data 1996), the Working Group members have used a spreadsheet to provide all necessary landing and sampling data, which was developed originally for the Mackerel Working Group (WGMHSA) and further adapted to the special needs of the Northern Pelagic and Blue Whiting Fisheries Working Group. The current version used for reporting the 2001 catch data was v1.4.1. The majority of commercial catch data of multinational fleets was again provided on these spreadsheets and further processed with the SALLOCL-application (Patterson et al., 1997). This program gives the needed standard outputs on sampling status and biological parameters. It also clearly documents any decisions made by the species co-ordinators for filling in missing data and raising the catch information of one nation/quarter/area with information from another data set. This allows recalculation of data in the future, choosing the same (subjective) decisions made today. Ideally, all data for the various areas should be provided on the standard spreadsheet and processed similarly, resulting in a single output file for all stocks covered by this Working Group.
Comments on the ICES quality control handbook
The WG was again asked to comment on the ICES quality control handbook (see Terms of reference: i). In the light of the little development the QC handbook has undergone in the last year, and that ACFM has been unable to review the comments of the different working groups, WGNPBW decided not to comment on this issue again. However, the group is prepared to revisit the topic whenever significant progress is visible.
1.5 Special requests concerning Blue Whiting
The Working Group was asked to consider the following requests with regards to Blue Whiting:
O:\ACFM\WGREPS\WGNPBW\REPORTS\2002\Sec-1.Doc 10

1. A NEAFC request dated 16 November 2001:
“Regarding blue whiting stocks: provide medium-term projections using scenarios as considered appropriate”. This request is answered in Section 6.6 “Medium-term projections”.
2. A request from the European Community, the Faroe Islands, Greenland, Iceland, Norway, and the Russian Federation dated 11-12 February 2002 (this request was delivered to ICES shortly before the 2002 WG meeting):
“Request to the International Council for the Exploration of the Sea
The European Community, the Faroe Islands, Greenland, Iceland, Norway, and the Russian Federation at the Meeting on the Management Measures for the Blue Whiting Stock held in Reykjavik on the 11 to 12 February 2002 agreed on the need to develop a multi-annual recovery plan that ensures a safe recovery of the blue whiting stock.
The parties agreed that the plan should include:
• A harvest rule specifying the upper limits of the catches to be taken during the recovery period
• Measures to enhance the exploitation pattern with the aim of securing a low fishing mortality on juveniles.
Within the above context, ICES is requested to provide advice on possible harvest rules and technical measures to be included in a recovery plan.
Harvest rules
1) ICES is requested to identify candidate harvest rules and to evaluate them, in particular with respect to risks associated with a range of TAC’s in the rebuilding phase and a range of targets for the rebuilding. In addition to the uncertainty about initial numbers and future exploitation pattern and weights and maturates, ICES should at least take into account:
• The uncertainty in the estimates of those year classes that will enter the spawning stock in the rebuilding period, given the present lack of information about the stock at these ages;
• A range of levels of exploitation on juveniles; • A range of scenarios for how the recruitment will respond to SSB being below Blim; • The robustness to bias in the assessment; • The robustness to a sequence of poor year classes.
The performance criteria to be evaluated should include:
• The probability that the SSB will be below Blim;
• The probability that the stock will reach a target level within various time frames;
• The year-to-year variation in the catches in the recovery period.
2) In order to establish realistic targets for the rebuilding and as a guideline for future harvest rules, ICES is requested to revisit the reference point. In particular, the fact that fishing at the current Fpa will lead to a substantial probability of SSB<Bpa should be considered.
3) As a guideline for evaluating harvest rules for the situation where the state of the stock is satisfactory, ICES is requested to provide the likely range of yearly catches in stochastic long-term simulations, for a range of combinations of fishing mortality on adult and juvenile fish.
Exploitation pattern
ICES is requested to provide as detailed information as possible on the age/size composition in different segments of the blue whiting fishery and to evaluate the effect on the stock and the fisheries of possible measures to reduce exploitation of juveniles.
O:\ACFM\WGREPS\WGNPBW\REPORTS\2002\Sec-1.Doc 11

The evaluation should include, but not be restricted to the effects of introducing a minimum size and closed areas/seasons.”
In connection with a meeting of the ICES SGPA meeting in March 2002, work was undertaken that partly answered this request. Those calculations were based on the assessment made during the 2001 WGNPBW meeting. It was planned to redo all calculations during the 2002 WGNPBW meeting to include the latest data available, but due to lack of time not all the model runs could be redone during this meeting. However, the studies of long-term equilibria presented to the SGPA are probably unaffected by one extra year of data, and most of the medium-term simulations were made during the 2002 WGNPBW meeting.
Due to exceptionally strong incoming year classes, the assessment made by the 2002 WGNPBW is more optimistic than that made in 2001 (Section 6.4.5, 6.5 and 6.6). The need for a rebuilding plan is, accordingly, not as urgent as it appeared in 2001. However, even if the SSB is currently above the present Bpa, and also above a suggested action level of B as introduced below, the current high fishing mortality will, in the medium term, reduce the stock size heavily. Unless the recruitment should continue to be above the long-term average value also in the coming years, the current F will bring the SSB below the Blim in 2004–2005. In this situation the WG put more effort into suggesting a harvest control rule than to concentrate on a rebuilding plan.
In the request, ICES is asked to revisit the biological reference points. This task was also in the terms of reference from ICES to the WGNPBW, and this task is covered in Section 6.7.
Harvest rules
The harvest control rules explored included:
• A fixed fishing mortality at high SSB; • Below an ‘action level’ of SSB, the fishing mortality was reduced linearly with SSB, to reach F=0.05 at and below
a Blim of 1.5 million tonnes; • A maximum allowable catch of 1.2 million tonnes. Some alternative runs were made with 0.8 million tonnes
instead of 1.2 million tonnes; • Runs were made with and without a normally distributed error with C.V. = 30% in the stock estimates on which
decisions about next years fishing mortality was made.
The performance of the simulated scenarios was evaluated according to the following criteria:
• Probability of SSB < 1.5 million tonnes in the true stock at least once in the 10-year simulation period;
• Probability that the decision would be taken to apply the fishing mortality valid for SSB < 1.5 million tonnes at least once in the 10-year simulation period. This probability deviates from the one above both because of error in the assessment, and because the decision rule, applied in situations where a low F will bring the SSB above a limit, while a higher F will bring it below the limit, applies the lower F;
• The 50th percentile of SSB in year 10;
• The 50th percentile of the year-to-year variation of the catch in years 5–10, measured as the range of catches in the period divided by the mean, within each replica;
• The 50th percentile of the mean catch in years 1–10.
The main results are shown in Figure 1.5.1.
Inferences:
• The risk of bringing SSB below the 1.5 million tonnes limit is quite sensitive to the fishing mortality, as expected. If there is error in the future assessment, the risk that SSB in reality is below the limit generally is higher, but not much. However, managers will far more often be led to act as if this were the case.
• Beginning to reduce the fishing mortality at some level above 1.5 million tonnes has a substantial effect in reducing the risks.
O:\ACFM\WGREPS\WGNPBW\REPORTS\2002\Sec-1.Doc 12

• The long-term average catch increases somewhat with increasing fishing mortality, but the increase is modest, and is little influenced by the choice of ‘action level’. Noisy assessments lead to a slightly higher average catch.
• In addition to what is shown in Figure 1.5.1, it was found that the year-to-year variation in the catches increased with increasing fishing mortality, and that it became much higher when noisy assessments were assumed.
These simulations were made with an upper limit on the yearly catch of 1.2 million tonnes. This limit was rarely reached except in the cases with the highest fishing mortality and errors in the assessment, where it was reached with 3-5 % probability. With a lower limit of 800 000 tonnes, the limit was reached more often. This led to a slight reduction in the risk of reaching 1.5 million tonnes SSB, but led to a considerable reduction in the long-term yield.
Conclusions
1) One should hesitate to allow SSB to fall below the Bloss of 1.5 million tonnes. A fishing mortality in the order of 0.25 could be appropriate as an Fpa, provided that the exploitation of juveniles is kept low, and that the weights-at-age remain within the historical range. This would give an approximately 1–2% risk that SSB falls below Blim in any year. The risk increases quite rapidly when F increases above this. The long-term average catch will be about 7% below the maximum catch achievable, but this maximum catch requires that the recruitment does not decline at low SSBs.
2) Even a moderate increase in the exploitation of juveniles will require a substantial reduction in adult F in order to keep the risk of dropping below 1.5 million tonnes at a low level. Fishery for juveniles should therefore be kept at a minimum.
3) The present Bpa, which represents a safety margin to the limit SSB, but in practise, serves as a target biomass, is not useful as guidance for management.
4) This stock illustrates quite clearly the dilemma when there is no experience of recruitment failure, and the Bloss is the lower bound of a relatively narrow range of historical SSB values. If the uncertainty of the assessment were to be taken properly into account, this would lead to a Bpa, which is difficult to reach even at a very moderate exploitation. Adopting such a Bpa would imply that the stock, even if exploited very moderately, would be outside safe biological limits most of the time, which is unnecessarily restrictive.
5) An alternative framework for advice, with emphasis on advising on fishing mortalities aimed at keeping the probability of SSB being above the historical low should be considered. In such a regime, it may be feasible to have an ‘action level’, below which the fishing mortality is reduced according to the SSB. An upper limit on the catch may be considered as an extra precaution, but does not seem to have any substantial beneficial effect.
Based on these considerations, the following advisory framework is suggested for the blue whiting:
• Keep Blim at 1.5 mill tonnes.
• Let Bpa be undefined.
• Define a precautionary management with: a) An F target associated with low risk of reaching Blim in the long term (i.e. F in the order of0.25); b) A gradual reduction of F below some action level of SSB (SSB in the order of 2.0 million tonnes); c) A catch ceiling to protect against too high catches caused by an overly optimistic assessment in the order of
0.8 – 1.2 million tonnes may also be considered, but this measure may be relatively unimportant; d) A strong restriction on the F on juveniles, e.g. approximately F 0-1 = 0.03, which corresponds to F0-1 at the
proposed F with the historical selection pattern.
• If a Flim is needed, it may be in the order of 0.35, which according to the present calculations implies an approximately 20% probability of falling below Blim, and a 5 percentile for SSB of about 1.3 mill. tonnes.
A graphical representation of the suggested harvest control rule for blue whiting is shown in Figure 1.5.2.
ICES is requested by NEAFC (The European Community, the Faroe Islands, Greenland, Iceland, Norway, and the Russian Federation) to:
• provide as detailed information as possible on the age/size composition in different segments of the blue whiting fishery and to evaluate the effect on the stock and the fisheries of possible measures to reduce exploitation of juveniles.
O:\ACFM\WGREPS\WGNPBW\REPORTS\2002\Sec-1.Doc 13

The evaluation should include but not be restricted to the effects of introducing a minimum size and closed areas/seasons.
To be able to provide age/size composition in different segments of the blue whiting fishery and to evaluate the effect on the stock the following information is needed.
• Homogeneous definition of “Fisheries”, where following parameters are taken into account: - Gear and mesh size; - Area and time.
• Implementation of biological sampling schemes, which follows the above definitions.
At this WGNPBW meeting the issues on defining “different segments of the blue whiting fishery” was discussed in order to provide catch at age from the different “Fisheries”, and the following “Fisheries” were defined:
In the North Sea and Skagerrak area blue whiting is taken in:
• a directed fishery for blue whiting using trawls with a mesh size of >=40 mm; • a fishery where blue whiting is taken as by-catch. In this fishery trawl with mesh sizes less than 40 mm is used. In the Northern areas outside the North Sea and Skagerrak blue whiting is taken in:
• a directed blue whiting fishery where trawls with mesh sizes of at least 40 mm are used; • fisheries for Norwegian Spring-spawning herring where blue whiting is taken as by-catch. This fishery is carried
out by purse seiners and trawlers using gears with mesh sizes of at least 36 mm; • fisheries for other species where blue whiting is taken as by-catch, using gears with mesh sizes less than 36 mm.
Landings of blue whiting caught in the Southern area is taken in:
• a directed offshore fishery for blue whiting using trawls with a mesh size of >=55 mm; • a more coastal fishery where blue whiting is taken as by-catch. In this fishery trawl with mesh sizes less than 65
mm is used.
It was only possible to provide catch by fisheries for the North Sea and Skagerrak and only for 2001.
In order to evaluate the effect different “Fisheries” have on the blue whiting stock, landing figures by “Fishery” for at least five years should be available. With the very short time notice old data for and for some areas even new (2001) data could not be obtained. It was in relation also discussed whether it within the next year is possible to give historical data on this aggregation level. The general view was that it will be a very time-consuming task and that it will probably not be possible to raise sampled catch to total catch as done at previous WG meetings.
O:\ACFM\WGREPS\WGNPBW\REPORTS\2002\Sec-1.Doc 14

Prob true SSB <1.5 mill. tonnes
02468
101214
0.15 0.2 0.25 0.3 0.35
F 3-7
Prob
%
150018002200150018002200
Prob decision as for SSB <1.5 mill. tonnes
0102030405060708090
0.15 0.2 0.25 0.3 0.35
F 3-7
Prob
%
1500
1800
2200
1500
1800
2200
SSB50 percentile in year 10
0
500
1000
1500
2000
2500
3000
0.15 0.2 0.25 0.3 0.35
F 3-7
SSB
150018002200150018002200
Avg catch year 1-1050 percentile
0100200300400500600700
0.15 0.2 0.25 0.3 0.35
F 3-7
Cat
ch
150018002200150018002200
Figure 1.5.1 Results of medium-term simulations. Each curve represents one ‘action level’ for SSB. Filled symbols are assuming that future assessments are exact, open symbols are assuming errors in future assessments with a C.V. of 30%. The probabilities of SSB being below the limit is the probability that this will happen at least once in the 10-year simulation period.
O:\ACFM\WGREPS\WGNPBW\REPORTS\2002\Sec-1.Doc 15

O:\ACFM\WGREPS\WGNPBW\REPORTS\2002\Sec-1.Doc 16
Figure 1.5.2. Graphical representation of the suggested harvest control rule for Blue Whiting. According to the simulations done, an Ftarget associated with low risk of reaching Blim in the long-term would be in the order 0.25. When SSB decreases below the action level, F is reduced gradually, eventually to reach Fmin (the lowest attainable F, associated with unavoidable by-catch of Blue Whiting in other fisheries) at Blim. The action level of SSB could be in the order of 2.0 million tonnes. Blim is suggested to be at the Bloss (1 500 000 t.). The two other components suggested being included in the harvest control rule, a catch ceiling and strong restrictions on fishing mortality on the juveniles are not shown in this figure.

O:\ACFM\WGREPS\WGNPBW\REPORTS\2002\Sec-2.Doc 17
2 ECOLOGICAL CONSIDERATIONS
2.1 Barents Sea
2.1.1 Climate
Figure 2.1.1.1 gives an overview of the surface currents of the Nordic and Barents Seas. Figure 2.1.1.2 shows the position of standard sections and fixed stations worked by the Institute of Marine Research, Bergen, The University of Bergen, and PINRO, Murmansk.
Transport of Atlantic water to the Barents Sea has been measured since August 1997 (Figure 2.1.1.3). The flow of Atlantic water is very variable. Most of the time there is a net inflow of Atlantic water to the Barents Sea, but in some periods large outflows are observed. Large outflows occurred in April in both 1998 and 1999. In 2000 there were two periods with strong outflows, one in January and a second one in June. In spring 2001, the net inflow was much lower than in earlier years. Results from a wind-driven model show similar results. The inflow during the first four months was stronger than average, while the model gave reduced inflow during late spring and summer.
There was a period of warming up in the western Barents Sea from 1989 to 1995 followed by cooling in 1996-1997. In winter and spring 1998 the temperature in the Fugløya-Bear Island section (Figure 2.1.1.4) increased to the long-term mean, and in January 1999 the temperature was 1ºC above the long-term mean. The latter value represents the highest temperature measured in January since 1983. Thereafter the temperature decreased to 0.87ºC above the long-term mean in March, 0.36ºC above the long-term mean in April 1999, and 0.3ºC above the long-term mean in summer 1999. During autumn 1999 there was a significant increase in temperature and in January 2000 the temperature was 1.1ºC above the long-term mean. Throughout 2000 the temperature in the western parts of the Barents Sea decreased, and in October the temperature was only 0.1ºC above the long-term mean. In January 2001 the temperature was 0.4ºC above the long-term mean. In the first half of 2001, the temperature in the Atlantic water in the western part of the Barents Sea was 0.6-0.8ºC above the long-term mean. The temperature decreased during summer, and in late August the temperature was only 0.1ºC above the long-term mean. In January 2002, the conditions were exactly the same with a temperature of 0.1ºC above the long-term mean, the coldest January since 1997. During the first half of 2001 the temperature in the Kola Section (33º30 E, 70º30-72º30 N) was 0.7–0.8ºC above the long-term mean. In January and February 2002, temperatures were close to the mean. It is expected that the temperature in the eastern Barents Sea will continue to decrease in 2002 because of the decreasing temperature in the western Barents Sea.
Fig 2.1.1.5 shows the Barents Sea ice index. The variability in ice coverage is closely linked to the temperature of the inflowing Atlantic water. The ice has a relatively short response time to temperature change (about one year), but usually the sea ice distribution in the eastern Barents Sea responds more slowly than in the western part. The ice coverage in 2001 was the lowest since 1970. This was not due to the winter situation because during the winter 2001 there was slightly more ice than the previous winter. The ice melt during summer, however, was extremely high, resulting in the extreme value of the ice index. The ice coverage in the beginning of 2002 is greater than in 2001 because of the reduced sea temperature.
Conclusions: • The inflow of Atlantic water was lower in 2001 than observed earlier. • 2001 was warmer than average, especially in the eastern Barents Sea. There was a clear signal of decreasing
temperature during fall. • The temperature in 2002 is expected to be lower than in 2001, and will be close to the long-term mean in most of
the Barents Sea.
2.1.2 Predicting Barents Sea temperature
Prediction of Barents Sea temperature is complicated because the variation is governed by processes of both external and local origin that operate on different time scales (WD by Loeng et al.). The volume flux and temperature of inflowing Atlantic water masses as well as heat exchange with the atmosphere is important in determining the temperature of the Barents Sea. Both slowly moving advective propagation and rapid barotropic responses due to large-scale changes in air pressure must be considered. The major changes in Barents Sea climate take place during the winter months. The variability in the amount of heat flowing in with Atlantic water masses from the south is particularly high in the winter. Furthermore, variability in low-pressure passages and cloud cover has a strong influence on the winter atmosphere-ocean heat exchange.

O:\ACFM\WGREPS\WGNPBW\REPORTS\2002\Sec-2.Doc 18
This seasonal difference is reflected in the utility of simple six-month forecasts of Kola-section temperature based on linear regression models. The tendency is that persistence across the spring and summer months is higher than for other seasons, allowing for reasonably reliable forecasts from spring until autumn. Data available until February 2002 allow for a six-month forecast for August 2002. The value for February 2002 of 3.6 ºC is inserted into the equation TAugust = 2.37 + 0.67* TFebruary, statistically derived from data for the years 1921-1997 (WD by Loeng et al.). This gives an objective temperature forecast for August 2002 of 4.8 ºC. This will be slightly above the 1921-1999 mean of 4.67 ºC. We conclude that summer sea temperatures in the southern Barents Sea are expected to be approximately equal to, or marginally above the long-term mean.
Assuming that temperatures in the Barents Sea fluctuate periodically, it is possible to forecast using statistical methods. The results of Anon. (2002) indicate a decrease in Barents Sea temperatures towards a minimum in 2002-2003, followed by temperatures around or below the long-term mean. A Russian prognosis (V. K. Ozhigin, PINRO, Murmansk, pers. comm.) to 2006 shows much the same development, but with a minimum in 2003, a year later than that of Anon. (2002). However, the precision of such forecasts has low accuracy. Ottersen et al. (2000) showed that historically only about 25% of the variability in the time-series was explained by forecasts as those given by Anon. (2002). With this in mind these predictions should be treated with caution.
Conclusions: • Summer sea temperatures in the southern Barents Sea in 2002 are predicted to be approximately equal to, or
marginally above the long-term mean. • A relatively uncertain long-term prediction indicates that the temperature will decrease for another 1-2 years.
2.1.3 Zooplankton
The standing stock of zooplankton has been monitored in the Barents Sea from the early eighties in connection with the joint Norwegian/Russian 0-group and capelin surveys in August-October. At this time of the year most of the production has taken place and zooplankton biomass can be seen as an expression of the size of the overwintering population of zooplankton. The samples are taken with dip nets and MOCNESS (Multiple Opening Closing Net and Environmental Sensing System) hauls and are subdivided into three different size categories 180-1000µm, 1000-2000µm, and above 2000 µm. The mean values for zooplankton for the whole Barents Sea from 1988 to present are shown in Figure 2.1.3.1.
There was a marked increase in zooplankton biomass during the period 1991-94. After 1994 the biomass of zooplankton decreased, and in 2001 zooplankton biomass was reduced to the level of the period prior to 1991. This development was most pronounced in the western parts of the sea. Expected temperatures at the long-term mean in 2002 together with reduced overwintering zooplankton biomass will result in reduced zooplankton production and feeding conditions for capelin, herring, and juvenile fish in the Barents Sea in 2002 compared to 2001.
Figure 2.1.3.2 shows the total biomass of zooplankton together with capelin stock size. A commonly observed inverse relationship between capelin stock size and zooplankton biomass can be seen from the figure, indicating that capelin exerts strong feedback control on the system through its predation pressure on zooplankton.
Conclusion: • Expected temperatures close to the long-term mean in 2002 together with an overwintering zooplankton biomass
close to the average will result in average zooplankton production and feeding conditions for capelin and juvenile fish in the Barents Sea.
2.1.4 Prediction of capelin recruitment
Predictions of the recruitment in fish stocks are essential for future harvesting of the fish stocks. Traditionally prediction methods have not included effects of climate variability. Multiple linear regression models can be used to incorporate both climate and fish parameters. Especially interesting are the cases where a time lag exists between the predictor and response variables since this gives the opportunity to make a prognostic prediction.
Models (WD by Loeng et al.), based on climate (e.g. NAO winter index and sea surface temperature in the Barents Sea) and fish parameters (e.g. SSB from VPA, maturing biomass, 0-group index), to predict recruitment have been given. The model of capelin recruitment predicted 206 109 one-year-old fish of Barents Sea Capelin in September 2002. The prognosis can be extended for another year in September 2002.

O:\ACFM\WGREPS\WGNPBW\REPORTS\2002\Sec-2.Doc 19
The models are preliminary. However, the fit of the model is encouraging, and the models might at present prove useful as background information in stock assessment.
Conclusions: • The number of recruits of Barents Sea capelin is expected to be at a medium level in 2002.
2.1.5 Consumption by cod, saithe, blue whiting, harp seals, and minke whales
Bogstad et al. (2000) reviewed the estimated consumption of fish in the Barents Sea by various predators. The three most important predator species are cod, harp seal, and minke whale. The consumption by cod of various prey species for the period 1984-2001 is given in Table 2.1, using the same method as described by Bogstad and Mehl (1997). The changes in the diet of cod from 2000 to 2001 were moderate. The consumption of shrimp decreased by about 40%, while that of blue whiting increased to 159 000 tonnes, the highest value in the 18-year time-series. There was also some decrease in the consumption of capelin by cod.
The consumption by minke whales (Folkow et al., 2000) and by harp seals (Nilssen et al., 2000) is given in Table 2.2. These consumption estimates are based on stock size estimates of 85 000 minke whales in the Barents Sea and Norwegian coastal waters (Schweder et al., 1997) and of 2 223 000 harp seals in the Barents Sea (ICES 1999/ACFM:7). The consumption by harp seals is calculated both for situations with high and low capelin stock, while the consumption by minke whale is calculated for a situation with a high herring stock and a low capelin stock. It is worth noting that the abundance estimate of harp seals was revised considerably upwards in 1998 (ICES 1999/ACFM:7), which also increased estimates of the consumption by harp seals correspondingly. Food consumption by harp seals and minke whales combined is at about the same level as the food consumption by cod, and the predation by these two marine mammal species needs to be considered when calculating the mortality of capelin and young herring in the Barents Sea.
In the period 1992-1999, the mean annual consumption of immature herring by minke whales in the southern Barents Sea varied considerably (640-118 000 t) (Lindstrøm et al., 2002). The major part of the consumed herring belonged to
the strong 1991 and 1992 year classes and there was a substantial reduction in the dietary importance of herring to whales after 1995, when a major part of both the 1991 and 1992 year classes migrated out of the Barents Sea. In 1992-1997, minke whales may have consumed 230 000 and 74 000 t, corresponding to 14.6 and 2.8×10⁹ individuals of the herring year classes of 1991 and 1992, respectively. The dietary importance of herring to whales appeared to increase non-linearly with herring abundance.
According to Bogstad et al. (2000), the total consumption of capelin by these three predators is higher than both the acoustic abundance estimates of capelin and the calculated MOB (M-output-biomass, i.e. the biomass output through natural mortality, see (Gjøsæter, 1997)) in several of the years with low capelin abundance. However, the total consumption of herring by the three main predators is much lower than the MOB (based on M=0.9 on ages 1 and 2) in those years. These discrepancies merit consideration in the assessment of the capelin and herring stocks in the Barents Sea.
The consumption estimates in Table 2.1 do not include the consumption by mature cod in the period when it is outside the Barents Sea (assumed to be 3 months during the first half of the year). During this period it may consume significant amounts of adult herring (Bogstad and Mehl, 1997).
Conclusion: • The changes in the diet of cod from 2000 to 2001 were moderate. The consumption of shrimp decreased by about
40%, while the consumption of blue whiting increased to 159 000 tonnes, the highest value in the 18-year time-series. There was also some decrease in the consumption of capelin by cod.
2.2 Norwegian Sea
2.2.1 Hydrography and climate
During the last decades the Nordic Seas have been characterized by increased input of Arctic waters. The Arctic waters to the Norwegian Sea are mainly carried by the East Icelandic Current and also to some extent by the Jan Mayen Current. During periods of increased Arctic water input, the western extension of Atlantic water is moved eastward. As a result, over the last 25 years the southern and western Norwegian Sea has become colder and fresher while the eastern Norwegian Sea has warmed. Atmospheric forcing drives this trend. Since the mid-1960’s the North Atlantic Oscillation index (NAO) has increased (Figure 2.2.1.1). NAO as it is used here is the normalised air pressure difference at sea level
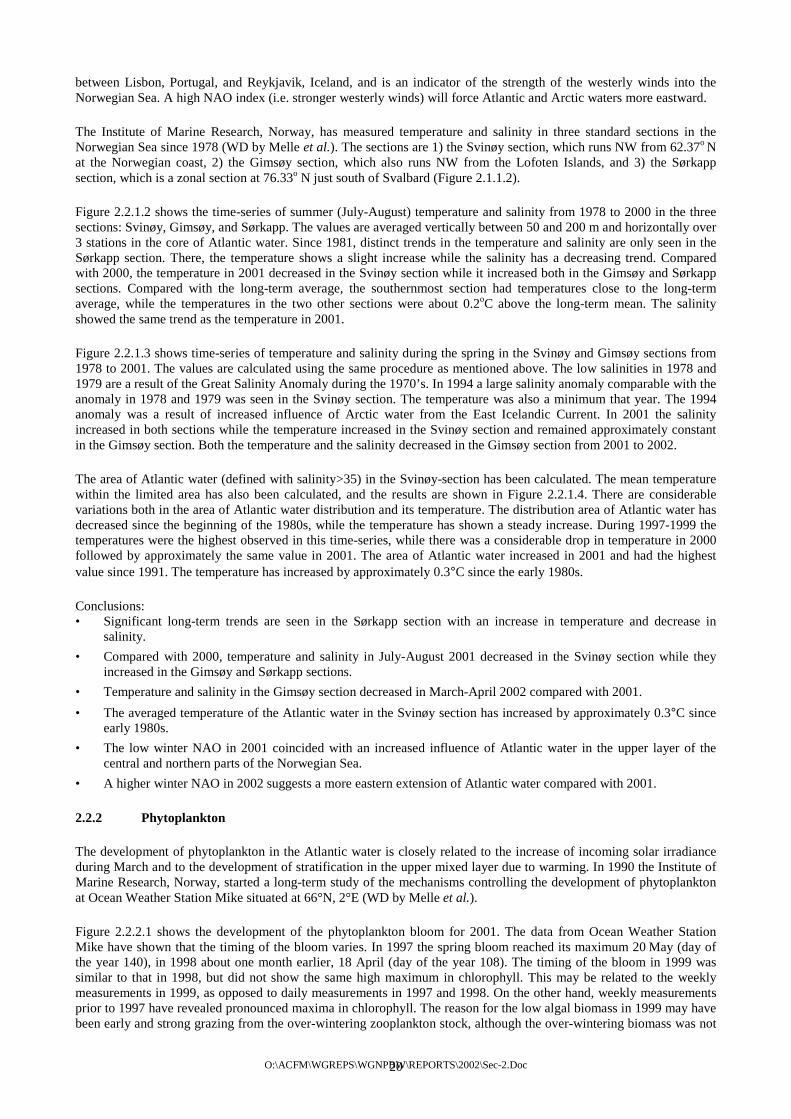
O:\ACFM\WGREPS\WGNPBW\REPORTS\2002\Sec-2.Doc 20
between Lisbon, Portugal, and Reykjavik, Iceland, and is an indicator of the strength of the westerly winds into the Norwegian Sea. A high NAO index (i.e. stronger westerly winds) will force Atlantic and Arctic waters more eastward.
The Institute of Marine Research, Norway, has measured temperature and salinity in three standard sections in the Norwegian Sea since 1978 (WD by Melle et al.). The sections are 1) the Svinøy section, which runs NW from 62.37o N at the Norwegian coast, 2) the Gimsøy section, which also runs NW from the Lofoten Islands, and 3) the Sørkapp section, which is a zonal section at 76.33o N just south of Svalbard (Figure 2.1.1.2).
Figure 2.2.1.2 shows the time-series of summer (July-August) temperature and salinity from 1978 to 2000 in the three sections: Svinøy, Gimsøy, and Sørkapp. The values are averaged vertically between 50 and 200 m and horizontally over 3 stations in the core of Atlantic water. Since 1981, distinct trends in the temperature and salinity are only seen in the Sørkapp section. There, the temperature shows a slight increase while the salinity has a decreasing trend. Compared with 2000, the temperature in 2001 decreased in the Svinøy section while it increased both in the Gimsøy and Sørkapp sections. Compared with the long-term average, the southernmost section had temperatures close to the long-term average, while the temperatures in the two other sections were about 0.2oC above the long-term mean. The salinity showed the same trend as the temperature in 2001.
Figure 2.2.1.3 shows time-series of temperature and salinity during the spring in the Svinøy and Gimsøy sections from 1978 to 2001. The values are calculated using the same procedure as mentioned above. The low salinities in 1978 and 1979 are a result of the Great Salinity Anomaly during the 1970’s. In 1994 a large salinity anomaly comparable with the anomaly in 1978 and 1979 was seen in the Svinøy section. The temperature was also a minimum that year. The 1994 anomaly was a result of increased influence of Arctic water from the East Icelandic Current. In 2001 the salinity increased in both sections while the temperature increased in the Svinøy section and remained approximately constant in the Gimsøy section. Both the temperature and the salinity decreased in the Gimsøy section from 2001 to 2002.
The area of Atlantic water (defined with salinity>35) in the Svinøy-section has been calculated. The mean temperature within the limited area has also been calculated, and the results are shown in Figure 2.2.1.4. There are considerable variations both in the area of Atlantic water distribution and its temperature. The distribution area of Atlantic water has decreased since the beginning of the 1980s, while the temperature has shown a steady increase. During 1997-1999 the temperatures were the highest observed in this time-series, while there was a considerable drop in temperature in 2000 followed by approximately the same value in 2001. The area of Atlantic water increased in 2001 and had the highest value since 1991. The temperature has increased by approximately 0.3°C since the early 1980s.
Conclusions: • Significant long-term trends are seen in the Sørkapp section with an increase in temperature and decrease in
salinity. • Compared with 2000, temperature and salinity in July-August 2001 decreased in the Svinøy section while they
increased in the Gimsøy and Sørkapp sections. • Temperature and salinity in the Gimsøy section decreased in March-April 2002 compared with 2001. • The averaged temperature of the Atlantic water in the Svinøy section has increased by approximately 0.3°C since
early 1980s. • The low winter NAO in 2001 coincided with an increased influence of Atlantic water in the upper layer of the
central and northern parts of the Norwegian Sea. • A higher winter NAO in 2002 suggests a more eastern extension of Atlantic water compared with 2001.
2.2.2 Phytoplankton
The development of phytoplankton in the Atlantic water is closely related to the increase of incoming solar irradiance during March and to the development of stratification in the upper mixed layer due to warming. In 1990 the Institute of Marine Research, Norway, started a long-term study of the mechanisms controlling the development of phytoplankton at Ocean Weather Station Mike situated at 66°N, 2°E (WD by Melle et al.).
Figure 2.2.2.1 shows the development of the phytoplankton bloom for 2001. The data from Ocean Weather Station Mike have shown that the timing of the bloom varies. In 1997 the spring bloom reached its maximum 20 May (day of the year 140), in 1998 about one month earlier, 18 April (day of the year 108). The timing of the bloom in 1999 was similar to that in 1998, but did not show the same high maximum in chlorophyll. This may be related to the weekly measurements in 1999, as opposed to daily measurements in 1997 and 1998. On the other hand, weekly measurements prior to 1997 have revealed pronounced maxima in chlorophyll. The reason for the low algal biomass in 1999 may have been early and strong grazing from the over-wintering zooplankton stock, although the over-wintering biomass was not

O:\ACFM\WGREPS\WGNPBW\REPORTS\2002\Sec-2.Doc 21
particularly large this year. In all these years a strong peak has characterized the bloom. The situation in 2001 was different. First, the spring bloom started somewhat later (first week of May) compared to 1998 and 1999 and was followed by relatively moderate chlorophyll concentrations, culminating with a major peak in the first week of June. Also a distinct early autumn bloom was observed in the middle of August. The development of the phytoplankton prior to the spring bloom may be separated into two phases. The first phase, from day 1 to about day 50, is characterised by extremely low phytoplankton biomass expressed as chlorophyll a. This is the winter season during which phytoplankton growth is mainly limited by the low incoming irradiance. The second phase, from about day 50 to day 100, is characterised by a gradual increase of phytoplankton biomass, but without reaching bloom conditions. This is the pre-bloom phase during which the increase in biomass is related to the increase in incoming irradiance, and the lack of a bloom is due to the deep upper mixed layer still present at this time.
Figure 2.2.2.2 shows the extension in time for these two phases and the timing of the spring bloom for the period 1991-2001. In a "normal" year the winter season extends to about 2 March. The pre-bloom phase extends on average from the 2 March to 16 April. The spring bloom usually starts on 16 April and reaches its maximum on 21 May, but the year-to-year variations are much larger than those of the previous phases. From 1991 to 1995 the trend was towards earlier spring blooms. This trend was broken in 1996, and thereafter year-to-year variability in the timing of the bloom has been greater.
Conclusions: • The phytoplankton bloom in 2001 developed later than in 1997, 1998, and 1999. • Chlorophyll a concentrations peaked first in early May 2001, and then again in early June 2001. This could have
been the result of a relaxation in the grazing pressure after the first peak as indicated by a decrease of the phaeopigment concentrations relative to chlorophyll a between the two peaks.
2.2.3 Zooplankton
Zooplankton biomass distribution in the Norwegian Sea has been mapped annually in May (since 1995) and in July (since 1994). Zooplankton samples for biomass estimation were collected by vertical net hauls (WP2) or oblique net hauls (MOCNESS). In the present report results based on samples from the upper 200 m are analysed (WD by Melle et al.). Total zooplankton biomass (g dry weight m-2) in May was averaged over sampling stations within three water masses, Atlantic water (salinity >35 at 20 m depths), Arctic water (salinity <35, west of 1.4°E), and Coastal water (salinity <35, east of 1.4°E) (Figure 2.2.3.1). In Atlantic and Arctic water masses the zooplankton biomass decreased to a minimum in 1997. Thereafter the zooplankton biomass increased until 2001, when the biomass decreased again. Due to reduced cruise time the Arctic water mass was not sampled in 2001. In the Coastal water masses, which include the Norwegian continental shelf and slope waters influenced by Norwegian coastal water, the trend was different with a general increase towards a maximum in 1998 and a decrease the following years.
In July the total zooplankton biomass (g dry weight m-2) in the upper 200 m was calculated by integrating biomass at sampling stations within a selected area in the central and eastern Norwegian Sea. There is no obvious trend in the zooplankton biomass in July since 1994 (Figure 2.2.3.2).
Conclusions: • Average zooplankton biomass in Atlantic water masses of the Norwegian Sea in May 2001 was the lowest since
1997. • Zooplankton biomass in July 2001 was somewhat lower than in 2000.
2.2.4 Herring growth and food availability
Individual growth of the Norwegian spring-spawning herring during the 1990s, as measured by condition or length-specific weight after the summer feeding period in the Norwegian Sea, has been characterised by large fluctuations (Figure 2.2.4.1). During 1991 and 1993 individual condition was good, but from 1994 on the condition of the herring started to decline and by 1997 it reached the lowest level during the 1990’s. The level observed in 1997 corresponds with the absolute long-term low level observed during the period 1935–1994 (Holst, 1996). After 1997 the condition of the herring in the Norwegian Sea improved until 1999, when the condition started to decrease again. In 2001 the condition was at the lowest since 1997.
Since 1995, when the large-scale migration pattern of the herring has been mapped during two annual cruises, May and July-August, herring have been feeding most heavily in Atlantic water. The herring condition index obtained after the feeding period in the Norwegian Sea is related to the average zooplankton biomass of Atlantic water (Figure 2.2.4.2). This indicates that variation in the production of zooplankton in Atlantic water is a major reason for the observed

O:\ACFM\WGREPS\WGNPBW\REPORTS\2002\Sec-2.Doc 22
variability in herring growth. It was noticed, however, that in 1999, the herring was feeding mostly in Arctic water where the zooplankton biomass is much higher than in Atlantic water. This year the herring condition index was especially high, while the zooplankton biomass in Atlantic water was moderate.
Conclusions: • The herring condition decreased from 2000 to 2001. • There is a direct relationship between zooplankton biomass in May and herring condition in the autumn during the
years 1995–2001.
2.2.5 Predictions for zooplankton biomass and herring feeding conditions
A factor possibly governing zooplankton biomass is the size of the zooplankton spawning stock, or the size of the over-wintering population. Zooplankton biomass in July represents the mixed population of zooplankton species at the start of the over-wintering period. A linear regression between the biomass in July and the biomass in May the following year explains 63% of the total variation (Figure 2.2.5.1). The moderate to low biomass in July 2001 suggests that the zooplankton biomass in May 2002 will be rather low (Figure 2.2.5.1). However, the time-series is short, the variability is large, and there is no trend in the July zooplankton biomass that could be related to the trend observed in the May data. Thus, this time-series should be expanded before it is used for prediction.
The North Atlantic Oscillation index (NAO) is a proxy for the strength and duration of southwesterly winds, and is correlated with the inflow of Atlantic water to the Norwegian Sea. In the Norwegian Sea the winter NAO (December to March) was most strongly correlated with zooplankton biomass in May the following year (Figure 2.2.5.2). A multiple regression analysis showed that biomass in May was directly related both to the winter NAO index the previous year and the same year (equation 1). The one-year lag in the relationship may be related to the influence of ocean climate on the production of recruits that will become the zooplankton spawning stock next year. The relationship between zooplankton biomass and the winter NAO the same year may be due to the effect of rapid changes in the NAO from one year to the other, such as in 1996 and 2001. Equation 1 predicts a biomass of ~9 g m-2 in May 2002, less than one g higher than in 2001 (Figure 2.2.5.2). The winter NAO for the winter 2001-2002 was not available at the time when this report was finished, but correlation with other available NAO time-series suggests a winter NAO of 0.96 in 2002 (R2=0.97).
Biomass = 1.2*NAO yr1+0.93*NAO yr2+9.56 (1)
R2=0.84, P=0.027(NAOyr1=NAO winter index of the previous year)
(NAOyr2=NAO winter index of the same year)
The time-series for the herring condition index has been calculated for the period from 1991 to 2001. A multiple regression of the herring condition index on the NAO winter index the previous year and the same year explained 65% of the variation in the data (equation 2). Figure 2.2.5.3 shows that the herring condition in 1996 and in 2001 appeared to be lower than predicted from the NAO. The reason for this is not clear, but as commented on above, the zooplankton production these years was lower than what could be predicted from the NAO. The NAO winter index is known after March, and offers the opportunity to predict the herring condition in the autumn (9 months time period). The herring condition index for 2002 is predicted to be 0.81. In 2001 the herring condition was 0.80. Thus, the decrease in herring condition that started in 2000 is expected to stop. Prediction of the herring condition using only the NAO winter index the previous year (Figure 2.2.5.3) gives a condition factor of 0.84 in 2003.
Condition=0.009*NAO yr1+0.011*NAO yr2+0.806 (2)
R2=0.66, P=0.013
(NAOyr1=NAO winter index of the previous year)
(NAOyr2=NAO winter index of the same year)

O:\ACFM\WGREPS\WGNPBW\REPORTS\2002\Sec-2.Doc 23
Conclusions: • A direct, but weak, relationship between the zooplankton biomass in July and the zooplankton biomass in May the
following year is suggested by the time-series from 1994 to 2001. • The winter NAO the previous year and the same year are directly related to the zooplankton biomass in May and
herring condition in the autumn. • The NAO winter index for the winters 2001 and 2002 predicts the zooplankton biomass to be ~9 g m-2 in May
2002 and the herring condition index to be 0.81 in the autumn 2002. • Unless the NAO for 2003 increases considerably, the production of zooplankton and herring growth in the
Norwegian Sea in 2003 will be moderate.
2.2.6 Elements of herring biomass production
When studying ecosystems, the production of biomass by important species or groups in the ecosystem is of considerable interest. Biomass production can be described as the sum of the following processes:
• Change in the biomass of the stock from 1 January of one year to 1 January of the next year ("growth"). • Loss of biomass through natural mortality. • Loss of biomass through fishing mortality (catch). • "Loss" of biomass through the release of spawning products. For Norwegian spring-spawning herring the main
spawning period is February - March, and the biomass of the spawning products is not reflected in the change of stock biomass from one year to the next.
The contribution of these elements to the total biomass has been estimated (WD by A. Dommasnes) and the results are given in Figs. 2.2.6.1 and 2.2.6.2. For 1–3 year old herring growth dominates the production, with natural mortality as the second most important process. For 4+ herring, growth is less important, and is partly replaced by the production of spawning products. Overall, for 4+ herring after the commencement of the international fishery in 1994, the four processes of growth, production of spawning products, natural mortality, and catch contribute about equally to the overall production of the stock.
2.2.7 Natural mortality of herring
2.2.7.1 Possible variation in M due to constant predation
In traditional VPA-based models for Norwegian spring-spawning herring (NSSH), and in the prognoses for the stock, the natural mortality (M) is assumed to be a constant instantaneous value. This means that the biomass lost to natural mortality is a fixed proportion of the biomass of the stock. The Northern Pelagic and Blue Whiting Fisheries Working Group (WGNPBW) has used M=0.9 for ages 0-2 and M=0.15 for ages 3+. Although all of the major predators on herring such as cod, saithe, and minke whales feed on a range of prey organisms, they have now had several years to establish a dependency on herring as an important prey and, possibly, a "preference" for herring as food. The question then arises how the predators locate herring schools, and whether they are able to locate herring schools even when the herring stock is reduced to a level considerably lower than the present. If the herring stock is reduced, will predators still take only a fixed proportion of the stock, or will some of the predators be able to take what they need until the stock reaches a very low level? These issues were analysed in a WD by Dommasnes and Nøttestad. For example, a constant predation of 470 000 t can result in a sharp increase in M when the spawning stock biomass falls below 1.5–2.0 million tonnes.
2.3 Icelandic Waters
2.3.1 Hydrography and climate
Due to the proximity of the oceanic Polar Front in the northern North Atlantic, hydrographic conditions in the sea north of Iceland are highly variable. Changes in intensity of the influx of Atlantic water and/or the variable admixture of polar water to the surface layers north of Iceland may lead to marked fluctuations in temperatures and salinities, both in space and time. Off the south and west coasts, where Atlantic water predominates, fluctuations are much smaller.
Climatic conditions in the North Atlantic improved greatly around 1920 and remained good until the mid-1960s, when they deteriorated suddenly. In the area north and east of Iceland temperature and salinity declined sharply in 1965 and

O:\ACFM\WGREPS\WGNPBW\REPORTS\2002\Sec-2.Doc 24
these severely cold conditions lasted until 1971. After that, climatic conditions of the area north and east of Iceland improved again, but were variable and warm years have alternated with cold years (Figure 2.3.1.1).
In the latter half of 1997, there was a pronounced increase in the intensity of the Irminger Current south and west of Iceland, resulting in temperatures (6-8˚C) and salinities (35.0-35.2) similar to those recorded in these waters in the 1950s and the early 1960s. There were no signs of a reduction of this flow of warm water off South and West Iceland in February or May 2001. Thus, the inflow of Atlantic water to the north Icelandic area was quite pronounced in these months and the cold East Icelandic Current was weak and relatively far offshore.
In November 2001, high temperatures still prevailed in the Atlantic water south and west of Iceland while salinities were lower. Atlantic water predominated to the 250 m isobath off the southern part of the Vestfirdir peninsula (NW-Iceland), but to the Northwest of Vestfirdir the warm water only reached 20-25 nautical miles offshore. From there, a broad tongue of cold, low salinity water of about 100 m thickness covered the outer part of the shelf east to 21˚W. Off the central west coast relatively warm water reached out over the shelf break. East of the Siglunes section (central N-coast) the warm water area was narrow as usual, but the 5˚C isotherm reached east past the Langanes promontory (NE-Iceland). Both temperature and salinity were above average in the shelf region east of Iceland. The western border of the East Icelandic current was observed in a position similar to previous years, while both temperatures and salinities of the East-Icelandic Current were lower than in previous years.
In February 2002, both temperatures and salinities of the Atlantic water south and west of Iceland were high. On the other hand, there was considerable drift ice in the Denmark Strait and north of Iceland where the inflow of Atlantic water had been reduced. In this area, temperatures were generally 1–2˚C lower and salinities considerably reduced compared to the last few years. Furthermore, bottom temperatures off N- and NE-Iceland were 1–2˚C lower than in 2001. This situation is similar to that observed in February 1997. On the other hand, average hydrographic conditions were recorded over the shelf east of Iceland.
Although not clearly evident from Icelandic hydrographic data, it seems likely that the East-Icelandic Current at present must be considerably stronger and reach farther southeast towards the Faroes than observed in recent years. An indication of such a situation is the fishery of about 20 000 t of pre-spawning capelin in the Faroese EEZ where some of the catch was taken as far as 50 nautical miles inside the Faroese zone. Although such deviations from the ‘usual’ migration pattern have probably occurred before, this is the first record of such a scenario.
2.3.2 Zooplankton
In the area north of Iceland, zooplankton biomass is significantly higher during years with a strong inflow of Atlantic water than in years when Atlantic inflow is weak and salinity lowered in the surface layer. A continued strong inflow of Atlantic water to the north Icelandic area will therefore indicate that the zooplankton biomass will be above average in spring and summer 2002.
Long-term changes of zooplankton biomass north of Iceland are shown in Figure 2.3.2.1. The values represent averages of all stations on the Siglunes section. In north Icelandic waters, the high values of zooplankton in the beginning of the series dropped drastically with the onset of the ‘Great Salinity Anomaly’ of the 1960s. Since then the zooplankton biomass was variable throughout the 1970s and 1980s, but has increased in the 1990s as compared to the period 1965-1990.
2.4 Hydrography of the waters west of the British Isles
The hydrography of the waters west of the British Isles is described in a WD by Godø et al. (a). The horizontal distribution of temperature at 10 and 400 meters depths are shown in Figure 2.4.1 and 2.4.2 respectively. The maps are based on data collected onboard Johan Hjort and CTD data provided by the scientists onboard the Russian ships Fridtjof Nansen and Atlantniro, who were running simultaneous surveys.
On the shelf and on the Rockall Bank the water is well mixed with only small vertical variation in salinity and temperature from the surface to the bottom. South of the Wyville Thompson ridge (~60°N) this is true for the waters off the shelf, with temperatures at 1000 m typically between 7 and 8°C, i.e. the vertical temperature decreases by only 2-3°C from the surface to 1000 m depth (Figure 2.4.3, Porcupine section). In the Faroe-Shetland channel the situation is different with a layer of warm saline Atlantic water overlying cold deep waters originating in the Norwegian Sea (Figure 2.4.4, Faroe-Shetland section).

O:\ACFM\WGREPS\WGNPBW\REPORTS\2002\Sec-2.Doc 25
The horizontal gradients are generally very small in the area south of the Wyville Thompson ridge. In particular the north-south gradients are very small, and along the shelf the temperature drops only by about 2°C from 50°N to 60°N. Thus, along the shelf edge warm water penetrates far north, with the 10°C isotherm at 10 m depth extending north to about 60°N. This warm water also has high salinity, above 35.4, and is associated with the shelf edge current flowing north along the shelf edge.
The warm saline water along the shelf edge is typical for the hydrographic conditions in the area; however, both the temperatures and the salinities are higher than in the previous years. Visual inspection indicates that this year’s temperatures are typically 0.5 °C and salinities about 0.05 higher than the previous years. On the section in the Faroe-Shetland channel, the warm saline water extends farther towards the Faroes than normal, but this is a dynamically active region and it may be due to an eddy located to the north of the section.
The high temperatures and salinities are confirmed by a study of the temperatures and salinities on all blue whiting cruises from 1986 through 2002. Since the hydrographic surveys have been dependent on the fishery surveys, the CTD stations have been distributed along the shelf edge and have in general not been in the same positions from year-to-year. In order to make time-series, the data were grouped in boxes with horizontal dimensions of 2°latitude times 2°longitude, and for each year the mean temperature and salinity from 50 to 600 m of all the stations in each box was calculated. Some of the boxes had good coverage nearly every year, while others had many years missing. However, in general the same variation from year-to-year was seen in the boxes along the shelf edge south of the Wyville Thompson ridge. The box with limits, 52° to 54°N and 16° to 14°W, had few gaps; the temperature is shown in Figure 2.4.5. The pattern seen is that after some years with temperatures around 10.1°C in the 1980s, it dropped to a minimum in 1994 (~9.8°C). After 1994 an increase in temperature is seen, and in 1998 temperature reaches a local maximum (~10.5°C) with the three following years a few tenths of a degree colder. 2002 is the warmest on record with ~10.7°C. There is no clear linear trend, but the last five years are warmer than the average of the whole period, and about 0.5°C above the first years in the period. Even though the increase is not as evident in the salinity curve, the high temperatures are associated with high salinities (Figure 2.4.5). Thus the high temperatures and salinities are probably mainly caused by advection of warm and saline water from lower latitudes, with local winter cooling as the secondary effect.
Table 2.1. Consumption by Northeast Arctic cod (thousand tonnes).
Year Amphipods Krill Shrimp Capelin Herring Polar cod Cod Haddock Redfish G. halibut Blue whiting Other Total1984 27 112 431 713 77 15 21 50 359 0 0 501 23061985 169 58 154 1602 181 3 31 47 222 0 1 1148 36161986 1212 107 141 828 132 140 81 109 310 0 0 658 37181987 1075 67 189 227 32 203 25 4 319 1 0 674 28161988 1226 314 128 336 8 91 9 3 221 0 4 403 27421989 794 239 131 575 3 32 8 10 230 0 0 719 27421990 135 82 192 1578 7 6 19 15 240 0 85 1433 37921991 65 75 186 2870 8 12 26 20 309 7 10 1065 46521992 101 155 369 2428 328 96 54 105 187 19 2 1003 48471993 250 702 312 3010 162 275 282 71 99 2 2 774 59401994 564 705 518 1086 147 581 225 49 79 0 1 669 46231995 979 514 362 629 116 254 392 116 194 1 0 853 44101996 633 1162 341 537 47 104 534 68 96 0 10 640 41731997 389 522 313 905 5 113 341 41 36 0 56 433 31541998 363 466 331 746 92 149 173 34 11 0 15 449 28281999 144 278 251 1715 133 217 71 26 19 1 32 395 32842000 152 301 407 1619 51 181 74 49 7 0 35 375 32512001 151 352 233 1354 57 188 47 77 4 0 159 565 3188
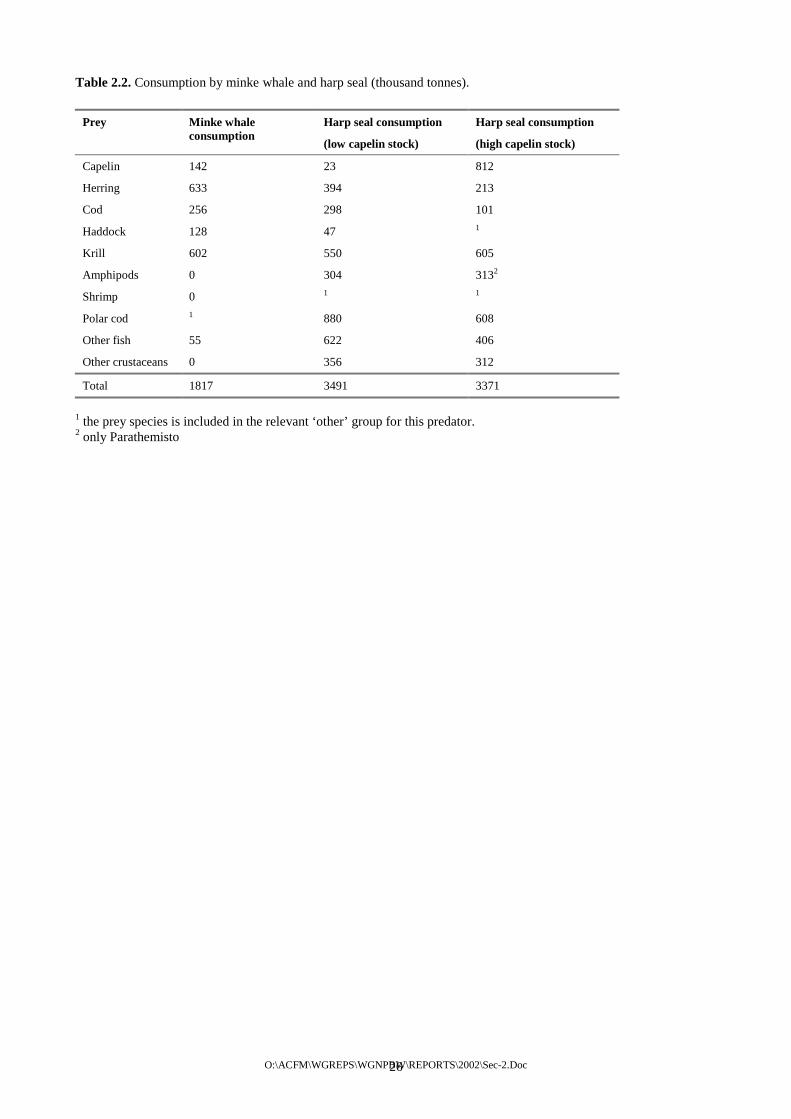
O:\ACFM\WGREPS\WGNPBW\REPORTS\2002\Sec-2.Doc 26
Table 2.2. Consumption by minke whale and harp seal (thousand tonnes).
Prey Minke whale consumption
Harp seal consumption
(low capelin stock)
Harp seal consumption
(high capelin stock)
Capelin 142 23 812
Herring 633 394 213
Cod 256 298 101
Haddock 128 47 1
Krill 602 550 605
Amphipods 0 304 3132
Shrimp 0 1 1
Polar cod 1 880 608
Other fish 55 622 406
Other crustaceans 0 356 312
Total 1817 3491 3371
1 the prey species is included in the relevant ‘other’ group for this predator. 2 only Parathemisto

O:\ACFM\WGREPS\WGNPBW\REPORTS\2002\Sec-2.Doc 27
Figure 2.1.1.1. Main surface currents of the Nordic and Barents Seas.
Figure 2.1.1.2. Standard Sections and fixed oceanographic stations surveyed by the Institute of Marine Research, Bergen. The University of Bergen is responsible for station M, while the Kola Section is operated by PINRO, Murmansk (Anon. 2001).
75° N
70°N
65° N
60°N
10° V 0 10° Ø 20°Ø 30° Ø 40° Ø
Feie-Shetland
Utsira Usira I\Y
St. M
Gimsøy
Svinøy
Bjørnøya Vest
Kola
EggumSkrova
Bud
Sognesjøen
Lista
Hanstholm-AberdeenOksø-Hanstholm
Fugløya-Bjørnøya
Ingøy
Vardø N
Sørkapp
Torungen-Hirtshals
Semøyene

O:\ACFM\WGREPS\WGNPBW\REPORTS\2002\Sec-2.Doc 28
Figure 2.1.1.3. Total volume flux across the Section Norway-Bear Island. All data have been low pass filtered over 30 days.
Figure 2.1.1.4. Temperature anomalies (upper panel) and salinity anomalies (lower panel) in the Section Fugløya – Bear Island (Anon., 2002).

O:\ACFM\WGREPS\WGNPBW\REPORTS\2002\Sec-2.Doc 29
Figure 2.1.1.5. Ice index for the period 1970-2001. Positive values mean less ice than average, while negative values show more severe ice conditions.
-2000
-1500
-1000
-500
0
500
1000
1500
2000
2500
1970 1972 1974 1976 1978 1980 1982 1984 1986 1988 1990 1992 1994 1996 1998 2000

O:\ACFM\WGREPS\WGNPBW\REPORTS\2002\Sec-2.Doc 30
Figure 2.1.3.1. Average zooplankton biomass (g m-2) for the 7 different areas in the Barents Sea during 1988-2001 (Anon.2002).
0
1
2
3
4
5
6
7
8
1984
1985
1986
1987
1988
1989
1990
1991
1992
1993
1994
1995
1996
1997
1998
1999
2000
2001
Year
Cap
elin
(mill
ion
tonn
es)
0,00
2,00
4,00
6,00
8,00
10,00
12,00
14,00
16,00
Zoop
lank
ton
(g m
-2)
CapelinZooplankton
Figure 2.1.3.2. Average zooplankton biomass (g m-2) together with biomass of one year and older capelin (million tonnes) during 1973 – 2001, in the Barents Sea (capelin data from Gjøsæter et al. (2000) updated to 2001). (Dalpadado et al. 2002).

O:\ACFM\WGREPS\WGNPBW\REPORTS\2002\Sec-2.Doc 31
Figure 2.2.1.1. Winter (December-March) North Atlantic Oscillation index (NAO).
-6
-4
-2
0
2
4
6
8
10
1978 1980 1982 1984 1986 1988 1990 1992 1994 1996 1998 2000 2002
Tem
pera
ture
o C
34,9
35
35,1
35,2
35,3
35,4
35,5
35,6
35,7
Salin
ity
Svinøy
Gimsøy
Sørkapp
Svinøy
Sørkapp
Gimsøy
Figure 2.2.1.2. Temperature (ºC) and salinity observed during July/August, in the core of Atlantic Water beyond the shelf edge in the Sections Svinøy - NW, Gimsøy - NW and Sørkapp - W, averaged between 50 and 200 m depth and horizontally over three stations across the core.

O:\ACFM\WGREPS\WGNPBW\REPORTS\2002\Sec-2.Doc 32
4.0
4.5
5.0
5.5
6.0
6.5
7.0
7.5
8.0
1975 1980 1985 1990 1995 2000
Tem
pera
ture
35.05
35.10
35.15
35.20
35.25
35.30
35.35
35.40
35.45
35.50
Salin
ity
Tem
Sal
SVINØY - NWTemperature and salinity in March-April
0
1
2
3
4
5
6
7
8
1975 1980 1985 1990 1995 2000
Tem
pera
tur
34,95
35,00
35,05
35,10
35,15
35,20
35,25
35,30
Salin
ity
Temp
Sal
GIMSØY - NWTemperature and salinity in March-April
Figure 2.2.1.3. Temperature and salinity in the Sections Svinøy – NW and Gimsøy - NW, observed during March/April, in the core of Atlantic Water near the shelf edge, averaged between 50 and 200 m depth and horizontally over three stations across the core.

O:\ACFM\WGREPS\WGNPBW\REPORTS\2002\Sec-2.Doc 33
6,7
7,0
7,3
7,6
7,9
8,2
8,5
1978 1980 1982 1984 1986 1988 1990 1992 1994 1996 1998 2000 2002
Tem
pera
ture
[o C]
10
30
50
70
90
110
130
Are
a [k
m2 ]
Temperature
Area
Figure 2.2.1.4. Time-series of area (in km2) and averaged temperature (blue) of Atlantic water in the Svinøy Section, observed in July/August 1978-2001.
0
0,5
1
1,5
2
2,5
3
31.12 30.01 01.03 31.03 30.04 30.05 29.06 29.07 28.08 27.09 27.10
DATE
Chl
orop
hyll
a (m
gm-3
)
Figure 2.2.2.1. Distribution of chlorophyll a at 10 m depth during the year at Weather Station Mike in 2001.

O:\ACFM\WGREPS\WGNPBW\REPORTS\2002\Sec-2.Doc 34
40
60
80
100
120
140
160
180
1991 1992 1993 1994 1995 1996 1997 1998 1999 2000 2001
Julia
n da
ys
Year
BLOOM
PREBLOOM
WINTER
23 May
17 April
2 March
Figure 2.2.2.2. Year-to-year variation in the different phases of the development of phytoplankton at Weather Station Mike in the period 1991 to 2001. Circles: winter phase; squares: pre-bloom phase; diamonds: spring bloom. Continuous lines represent the average for each period. Broken lines represent one standard deviation for each period.
Zooplankton biomass in May
0
5
10
15
20
25
30
35
1995 1996 1997 1998 1999 2000 2001
Year
Dry
wei
ght (
g m
-2)
Arctic waterAtlantic waterCoastal water
Figure 2.2.3.1. Zooplankton biomass (dry weight) in the upper 200 m in May. A: Arctic influenced water (salinity <35, west of 1.4ºE). B: Atlantic water (salinity >35). B: Norwegian Coastal water (salinity <35, east of 1.4ºE). Error bars: 95% confidence limits.

O:\ACFM\WGREPS\WGNPBW\REPORTS\2002\Sec-2.Doc 35
Zooplankton biomass in July
0
5
10
15
1994 1995 1996 1997 1998 1999 2000 2001
Year
Dry
wei
ght (
g m
-2)
Figure 2.2.3.2. Zooplankton biomass in July-August in the eastern Norwegian Sea (0-200 m). Integrated biomass within a fixed geographical region divided by its area.
Herring condition index
0.75
0.80
0.85
0.90
0.95
1991 1992 1993 1994 1995 1996 1997 1998 1999 2000 2001
Year
Her
ring
cond
ition
inde
x
Figure 2.2.4.1. Individual weight-to-length ratio (herring condition index) for Norwegian spring-spawning herring. Data from November and December for herring 30-35 cm body length. Error bars: 95% confidence limits.

O:\ACFM\WGREPS\WGNPBW\REPORTS\2002\Sec-2.Doc 36
Atlantic water
02468
10121416182022
1995 1996 1997 1998 1999 2000 2001
Year
Zoop
lank
ton
biom
ass
(g m
-2)
0.72
0.74
0.76
0.78
0.80
0.82
0.84
0.86
0.88
Her
ring
Con
ditio
n In
dex
Zooplankton biomassHerring Condition
Linear regression of herring condition on Zooplankton biomass:
y = 0.005x + 0.758R2 = 0.39
Figure 2.2.4.2. Zooplankton biomass (dry weight) in Atlantic water in the Norwegian Sea in May (0-200 m) and herring condition index (individual weight-to-length ratio, November and December, 30-35 cm). Error bars: 95% confidence limits.
Atlantic water
y = 1.61x - 0.14R2 = 0.63
0
4
8
12
16
20
4 6 8 10 12
Zooplankton biomass in July, year n (g m-2)
Zoop
lank
ton
biom
ass
in M
ayye
ar n
+1 (g
m-2
)
Figure 2.2.5.1. Zooplankton biomass in July (year n) vs. zooplankton biomass in May (year n+1).

O:\ACFM\WGREPS\WGNPBW\REPORTS\2002\Sec-2.37
Atlantic water
y = 1.07x + 10.15R2 = 0.47
0
2
4
6
8
10
12
14
16
18
20
-5 -4 -3 -2 -1 0 1 2 3 4
NAO, year n
Zoop
lank
ton
biom
ass,
yea
r n+1
(g m
-2)
Arctic water
y = 1.99x + 16.38R2 = 0.63
0
5
10
15
20
25
30
35
-5 -4 -3 -2 -1 0 1 2 3 4
NAO, year n
Zoop
lank
ton
biom
ass,
yea
r n+1
(g m
-2)
Figure 2.2.5.2. Winter (December-March) North Atlantic oscillation index (NAOMay (year n+1). Open circles: 1996 and 2001. Square: prediction of zooplanequation (1).
`01
`96
5
`96Doc
5
) (year n) vs. zooplankton biomass in kton biomass in May 2002 based on

O:\ACFM\WGREPS\WGNPBW\REPORTS\2002\Sec-2.Doc 38
y = 0.0119x + 0.8269R2 = 0.37
0,76
0,78
0,80
0,82
0,84
0,86
0,88
0,90
0,92
-5 -4 -3 -2 -1 0 1 2 3 4 5
NAO (year n)
Her
ring
cond
ition
inde
x (y
ear n
+1)
Figure 2.2.5.3. Herring condition index (year n+1) vs. winter NAO (year n). Open triangles: 1996 and 2001. Square: prediction of herring condition in 2002 based on equation (2).
Figure 2.2.6.1. Biomass production for Norwegian spring-spawning herring during the years 1950 - 1998 for ages 1 – 3 showing the contribution from growth, natural mortality, and catch.
`96
`01
NSS HERRING 1 - 3 years CONTRIBUTION FROM DIFFERENT PROCESSES
IN BIOMASS PRODUCTION
0
2000
4000
6000
8000
10000
12000
1950 1955 1960 1965 1970 1975 1980 1985 1990 1995
Thous. tonnes
GrowthNat.mort.CatchSUM 1-3 YEARS

O:\ACFM\WGREPS\WGNPBW\REPORTS\2002\Sec-2.Doc 39
Figure 2.2.6.2. Biomass production for Norwegian spring-spawning herring during the years 1950 - 1998 for ages 4+ showing the contribution from growth, spawning products, natural mortality, and catch.
Figure. 2.3.1.1. Temperature (upper panel) and salinity (lower panel) deviations on the Siglunes section off the central north coast of Iceland 1952-2000.
NSS HERRING 4 - 16+ years CONTRIBUTION FROM DIFFERENT PROCESSES
IN BIOMASS PRODUCTION
0
1000
2000
3000
4000
5000
6000
7000
1950 1955 1960 1965 1970 1975 1980 1985 1990 1995
Thous. tonnes
Growth
Spawn.
Nat.mort.
Catch
SUM 4 - 16+ YEARS

O:\ACFM\WGREPS\WGNPBW\REPORTS\2002\Sec-2.Doc 40
YEAR1960 1965 1970 1975 1980 1985 1990 1995 2000
DR
Y W
EIG
HT
(g m
-2)
0
5
10
15
Figure 2.3.2.1. Variations in zooplankton biomass (g dry weight m-2, 0-50 m) in spring at Siglunes (A) and Selvogsbanki (B) sections. The columns show means for all stations at the respective sections and the vertical bars denote standard error. The curved line shows the 7-year running mean.

O:\ACFM\WGREPS\WGNPBW\REPORTS\2002\Sec-2.Doc 41
62°
60°
58°
56°
54°
52°
50°
0°5°10°15° 5°
TEMPERATURE 10M 2002
9.5°
10.0°
11.0°10.0°
9.0°
9.5°
10.5°
7.0°8.0°
Figure 2.4.1. Horizontal temperature distribution, °C, at 10 m depth.

O:\ACFM\WGREPS\WGNPBW\REPORTS\2002\Sec-2.Doc 42
62°
60°
58°
56°
54°
52°
50°
0°5°10°15° 5°
TEMPERATURE 400M 2002
9.5°
10.5°10.0°
9.5° 9.0°
11.0°
8.0°6.0°4.0°
2.0°
Figure 2.4.2. Horizontal temperature (oC) distribution at 400 m depth.

O:\ACFM\WGREPS\WGNPBW\REPORTS\2002\Sec-2.Doc 43
217218219220221222223224225
LONGITUDE
-1500
-1000
-500
0
DEP
TH [m
]
15°W 14°W 13°W 12°W
217218219220221222223224225
LONGITUDE
-1500
-1000
-500
0
DEP
TH [m
]
35.50
15°W 12°W14°W 13°W
Figure 2.4.3. Vertical distribution of temperature (°C) and salinity in a section crossing the Porcupine Bank at 53° 30'N. Station numbers at the top of the panels.

O:\ACFM\WGREPS\WGNPBW\REPORTS\2002\Sec-2.Doc 44
291 292 293 294 295 296 297 298 299 300
LONGITUDE
-1500
-1000
-500
0
DEP
TH [m
]
5°W 4°W 3°W 2°W
291 292 293 294 295 296 297 298 299 300
LONGITUDE
-1500
-1000
-500
0
DEP
TH [m
]
5°W 4°W 3°W 2°W
Figure 2.4.4. Vertical distribution of temperature (°C) and salinity in a section from the Faroes to Shetland (Nolsø-Flugga). Station numbers at the top of the panels.

O:\ACFM\WGREPS\WGNPBW\REPORTS\2002\Sec-2.Doc 45
1986 1988 1990 1992 1994 1996 1998 2000 2002 20049.5
10
10.5
11Te
mpe
ratu
re [C
]
Year
1986 1988 1990 1992 1994 1996 1998 2000 2002 200435.3
35.35
35.4
35.45
35.5
35.55
Sal
inity
Year
Figure 2.4.5. Temperature and salinity from 50-600 m means (crosses) of all stations in a box west of the Porcupine bank bounded by 52° to 54°N and 16 to 14°W. Dotted lines are drawn at plus-minus one standard deviation of all observations in each box, each year.

O:\ACFM\WGREPS\WGNPBW\REPORTS\2002\Sec-3.Doc 46
3 NORWEGIAN SPRING-SPAWNING HERRING
3.1 TAC and Fisheries
3.1.1 TAC agreements for 2001 and 2002
At the annual meeting in Skagen, Denmark in October 2000 the coastal states (European Union, Faroe Islands, Iceland, Norway, and Russia) agreed to limit their catches to 850 000 t in 2001.
At the corresponding annual meeting in Harstad, Norway in October 2001 the Parties agreed to prolong this catch limit (850 000 t) for 2002.
3.1.2 The Fisheries
3.1.2.1 Description of the national fisheries in 2001
The catches of Norwegian spring-spawning herring by all countries in 2001 by ICES rectangles are shown in Figure 3.1.1 (total whole year) and in Figure 3.1.2 (per quarter). In 2001 the catch provided as catch by rectangle represented approximately 756 845 tonnes or 98.3% of the total catch. In general the development of the international fishery shown by these figures follows the known migration pattern for Norwegian spring-spawning herring. The migration pattern, together with environmental factors, was mapped in 2001 during the ICES PGSPFN (Working Group on Surveys on Pelagic Fish in the Norwegian Sea) investigations (ICES 2001/D:07 Ref ACFM, ACME).
Denmark: The Danish fishery of Norwegian spring-spawning herring is carried out mostly by purse seiners (84%) and most of the landings were landed in Norway. In 2001 the first fishing period started in the southern part of Division IIa in February and continued into March where app. 8 500 t were caught. The second fishing period started in May and ended in the beginning of July and the fishery was carried out in the Norwegian Sea and in the Jan Mayen area (app. 11 300 t). Finally the third period began in the Jan Mayen area in August and ended in mid-September (4 200 t).
The Faroes: The Faroese herring fishery (9 vessels) started in late February in Norwegian EEZ (IIa), relatively close to the coast west of Møre and continued in that area the first two weeks of March. In mid-May the fishery resumed in the international waters and in the Jan Mayen zone north of 70°N (ICES Division IIa), and the spring and summer fishery terminated in late June in the northern part of IIa (71–73°30'N). The autumn fishery started in the northern part of the Norwegian zone close to the Svalbard zone (IIa) in late August and lasted one week into September. After that the fishery again resumed in the Lofoten area in mid-September and lasted to the first week of October. All catches were taken with purse-seine.
France: France reported no catches in 2001.
Germany: The information from the German fishery was restricted to the amount and location of catches.
Iceland: The Icelandic fishery in 2001 began in the third week of May when about 5 000 tonnes were taken, mostly in international waters near 72˚N, between 05˚E and 06˚E. A few individual catches were taken in international waters further to the SW and in the southeastern EEZ of Jan Mayen. The herring were scattered and below purse seining depth most of the time. Catch rates improved in late May-early June and during 29 May-3 June the catch was about 32 200 tonnes. As before, almost all of this catch was taken between 71˚40’N and 72˚30’N, and 6˚E-7˚E. There were very few catch records from the Jan Mayen EEZ. The week of 4–10 June yielded about 10 100 tonnes. All of this catch was taken near the eastern boundary of the international zone between 72˚N and 73˚30’N. About 17 500 tonnes were caught during 11–17 June. Again, most of the catch was taken very close to the eastern limit of the international zone, between 72˚40’N and 72˚45’N as well as between 71˚N and 72˚15’N. Small catches were also taken east of Jan Mayen, between about 3˚30’W and the zero meridian. The week 19–25 June yielded only some 200 tonnes, taken in 4 sets just south of 72˚N, and the Icelandic fleet caught only 600 tonnes in July. The August catch was 5300 tonnes, mostly taken near 73˚N, 12˚E. Almost all of the September catch of 6200 tonnes was taken in the Norwegian EEZ northwest of Lofoten, between 68˚N and 69˚30’N. The total Icelandic catch of Norwegian spring-spawning was 77 693 tonnes of which about 75% were taken by purse seine and 25% with pelagic trawl.
Ireland: Ireland reported no catches in 2001.
Netherlands: The information from the Dutch fishery was restricted to the amount and location of catches.
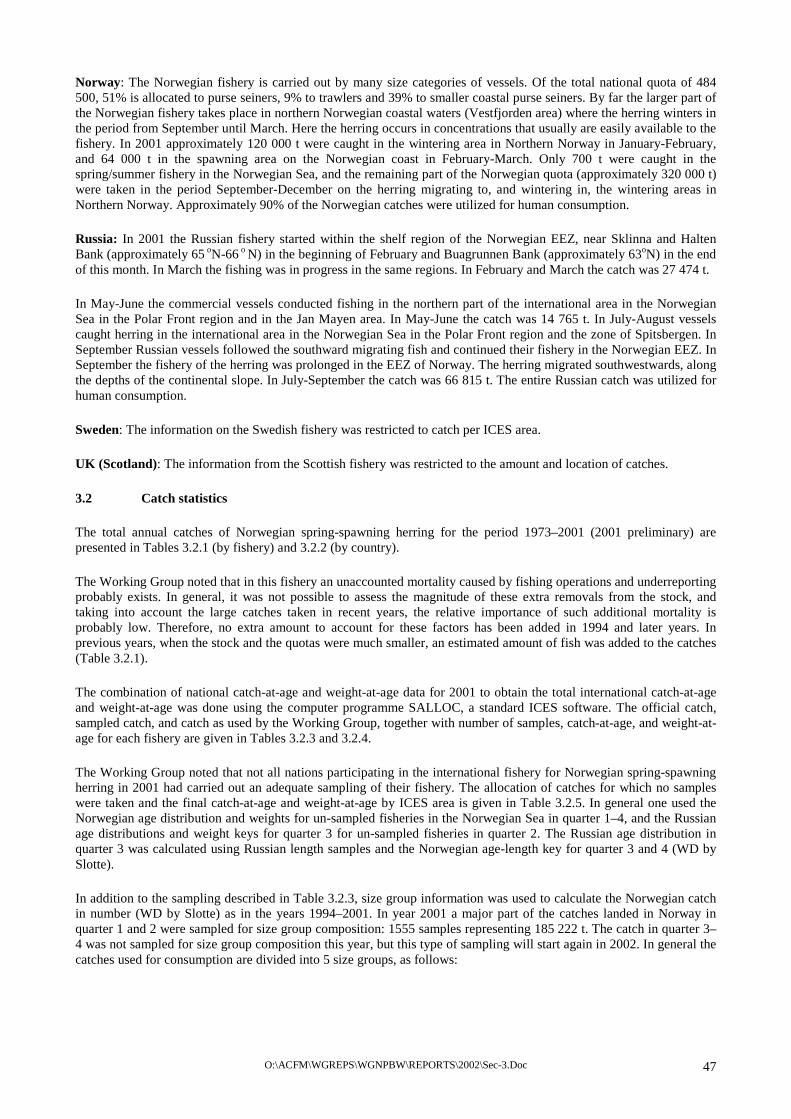
O:\ACFM\WGREPS\WGNPBW\REPORTS\2002\Sec-3.Doc 47
Norway: The Norwegian fishery is carried out by many size categories of vessels. Of the total national quota of 484 500, 51% is allocated to purse seiners, 9% to trawlers and 39% to smaller coastal purse seiners. By far the larger part of the Norwegian fishery takes place in northern Norwegian coastal waters (Vestfjorden area) where the herring winters in the period from September until March. Here the herring occurs in concentrations that usually are easily available to the fishery. In 2001 approximately 120 000 t were caught in the wintering area in Northern Norway in January-February, and 64 000 t in the spawning area on the Norwegian coast in February-March. Only 700 t were caught in the spring/summer fishery in the Norwegian Sea, and the remaining part of the Norwegian quota (approximately 320 000 t) were taken in the period September-December on the herring migrating to, and wintering in, the wintering areas in Northern Norway. Approximately 90% of the Norwegian catches were utilized for human consumption.
Russia: In 2001 the Russian fishery started within the shelf region of the Norwegian EEZ, near Sklinna and Halten Bank (approximately 65 oN-66 o N) in the beginning of February and Buagrunnen Bank (approximately 63oN) in the end of this month. In March the fishing was in progress in the same regions. In February and March the catch was 27 474 t.
In May-June the commercial vessels conducted fishing in the northern part of the international area in the Norwegian Sea in the Polar Front region and in the Jan Mayen area. In May-June the catch was 14 765 t. In July-August vessels caught herring in the international area in the Norwegian Sea in the Polar Front region and the zone of Spitsbergen. In September Russian vessels followed the southward migrating fish and continued their fishery in the Norwegian EEZ. In September the fishery of the herring was prolonged in the EEZ of Norway. The herring migrated southwestwards, along the depths of the continental slope. In July-September the catch was 66 815 t. The entire Russian catch was utilized for human consumption.
Sweden: The information on the Swedish fishery was restricted to catch per ICES area.
UK (Scotland): The information from the Scottish fishery was restricted to the amount and location of catches.
3.2 Catch statistics
The total annual catches of Norwegian spring-spawning herring for the period 1973–2001 (2001 preliminary) are presented in Tables 3.2.1 (by fishery) and 3.2.2 (by country).
The Working Group noted that in this fishery an unaccounted mortality caused by fishing operations and underreporting probably exists. In general, it was not possible to assess the magnitude of these extra removals from the stock, and taking into account the large catches taken in recent years, the relative importance of such additional mortality is probably low. Therefore, no extra amount to account for these factors has been added in 1994 and later years. In previous years, when the stock and the quotas were much smaller, an estimated amount of fish was added to the catches (Table 3.2.1).
The combination of national catch-at-age and weight-at-age data for 2001 to obtain the total international catch-at-age and weight-at-age was done using the computer programme SALLOC, a standard ICES software. The official catch, sampled catch, and catch as used by the Working Group, together with number of samples, catch-at-age, and weight-at-age for each fishery are given in Tables 3.2.3 and 3.2.4.
The Working Group noted that not all nations participating in the international fishery for Norwegian spring-spawning herring in 2001 had carried out an adequate sampling of their fishery. The allocation of catches for which no samples were taken and the final catch-at-age and weight-at-age by ICES area is given in Table 3.2.5. In general one used the Norwegian age distribution and weights for un-sampled fisheries in the Norwegian Sea in quarter 1–4, and the Russian age distributions and weight keys for quarter 3 for un-sampled fisheries in quarter 2. The Russian age distribution in quarter 3 was calculated using Russian length samples and the Norwegian age-length key for quarter 3 and 4 (WD by Slotte).
In addition to the sampling described in Table 3.2.3, size group information was used to calculate the Norwegian catch in number (WD by Slotte) as in the years 1994–2001. In year 2001 a major part of the catches landed in Norway in quarter 1 and 2 were sampled for size group composition: 1555 samples representing 185 222 t. The catch in quarter 3–4 was not sampled for size group composition this year, but this type of sampling will start again in 2002. In general the catches used for consumption are divided into 5 size groups, as follows:

O:\ACFM\WGREPS\WGNPBW\REPORTS\2002\Sec-3.Doc 48
Group Weight (g) 1 > 333 2 200–333 3 125–200 4 83–125 5 < 83
The percentage of the total catch in kg is calculated for each size group, by taking out sub-samples of the catch during the production process. These percentages are registered by the Norwegian sales organisation for pelagic fish. The age composition within each size group is then estimated from age-sampled catches, and the total catch in number is calculated (WD by Slotte).
3.3 Surveys
3.3.1 Spawning areas
There was no acoustic survey to determine the abundance of herring in the spawning areas in 2002 (Table 3.3.1.1).
3.3.2 Wintering areas
The wintering area was surveyed acoustically in November 2001 (WD by I. Røttingen). The abundance estimate obtained during this survey is given in Table 3.3.2.1. There was no acoustic survey of the wintering area in January 2001 (Table 3.3.2.2).
3.3.3 Feeding areas
The feeding area in the Norwegian Sea was surveyed acoustically during the ICES coordinated herring survey (PGSPFN) in 27 April - 08 June 2001 (ICES 2001/Ref ACFM. The PGSPFN reports from 1995 can be viewed on the site www.iMrno\PGSPFN). The abundance estimate is given in Table 3.3.3.1.
3.3.4 Nursery area
The nursery area of the Norwegian spring-spawning herring is Norwegian fjord and coastal areas, and in the Barents Sea. Since 1988, when the 1983 year class spawned for the first time, the latter area has increased in importance as a nursery area for the herring.
Results from the Russian acoustic survey in the Barents Sea in June 2001 (WD by A. Krysov) are given in Table 3.3.4.1. This year the Working Group decided to include data on immature herring obtained during the annual the joint Norwegian-Russian capelin survey in September in estimating the younger year classes (Section 3.3.5). The results from this survey are given in Table 3.3.4.4. The results from the 0-group herring survey in Norwegian Fjords and Coastal areas are given in Table 3.3.4.2 and the results from the joint Norwegian-Russian 0-group survey in the Barents Sea are given in Table 3.3.4.3.
3.3.5 Herring larval survey 2002
The larval survey in 2002 was carried out during the period 8–25 April. The survey started at Tromsøflaket (70ºN) and the Norwegian shelf south to 58ºN was covered. High densities of herring larvae were found from the start of the survey. Between 100 to 1000 larvae m–2 were found on the banks outside Senja, Vesterålen, and at the Røstbank. Most of these larvae were in the first post-yolk-sac stages. In contrast to the last years a relative high abundance of large larvae was found all the way from Lofoten to Møre (62oN), with few areas with densities above 1000 larvae m–2. South of Stad (62 oN) few larvae were recorded. A higher proportion of larvae were found in the northern part of the investigated area, compared to what has been found the previous years. The reason for this can be strong advection from the central spawning areas, or that more of the spawning took place on the northern spawning grounds. The mean length of larvae was 13.51 mm, which are the longest larvae recorded in the middle of April since 1985. The relative high number of larvae in addition to the high mean length in the middle of April is a positive first step towards a strong 2002 year class. The estimated index is given in Table 3.3.5.1 and the geographical distribution of the larvae is given in Fig 3.3.5.1.

O:\ACFM\WGREPS\WGNPBW\REPORTS\2002\Sec-3.Doc 49
3.4 Tagging experiments
The annual tagging experiments were also carried out in March-April 2001. However, this year the herring left the coast immediately after spawning and were not available for the tagging crew. Thus, no herring were tagged during the three weeks cruise. Consequently, the tagging experiment will be carried out in the wintering areas in autumn 2002. This would imply tagging on maturing herring instead of spent herring. In this regard it should be mentioned that tagging experiments on captive herring carried out in 2000–2001 indicated that neither tagging mortality nor tag loss is significantly influenced by this shift of tagging season.
Recovery of tags from supervised detector plants has continued, as well as recovery from the standard magnets in the production line of fish processing plants and from individuals.
During the tagging process, the total length of each tagged herring is measured. For each purse seine catch that is used for tagging, a sample of 100 fish is taken to determine the age distribution within each length group. The age composition in this batch of tagged herring is then estimated from the age distribution in the sample.
If it is later found, from the age composition or other criteria, that a batch of tagged herring may have contained herring from one of the local stocks in the fjords, this batch is not used for stock assessment.
Recoveries are made from commercial catches and from tag detectors installed at fish processing factories.
For stock assessment purposes, tags are used only from supervised factories where detector efficiency has been tested, and where it is known that the detectors have been working as intended. Two factories met these criteria in 2001, and a total of 31.887 million herring were screened at these factories. Magnet efficiency in 2001 was 100% with few exceptions, in which the number of herring screened was reduced corresponding to the efficiency before being included in the total. The numbers of fish screened given in Table 3.4.1 are thus corrected for efficiency.
All tagged herring which were recovered were measured, weighed, and aged.
In 2001, 34 tags were recovered from the year classes 1983+, 1985, 1989, 1990, 1991, 1992, and 1994, that filled the criteria above (Table 3.4.1).
3.5 Stock Assessment
The assessment model SeaStar was used for assessing the Norwegian spring-spawning herring stock.
3.5.1 Model
SeaStar is described in Section 1.3.1. A more elaborate documentation of the model is available (Tjelmeland, WD). The model is written in Mathematica and the code can be viewed on the site www.assessment.iMrno.
3.5.2 Data
The year and age range, natural mortality and handling of missing data in the catch-at-age matrix were unchanged from last year.
The analysis was run for ages 0 to 15 with a 16+ group. M is set equal to 0.15 for ages 3 and older and 0.9 for ages 0 to 2 in all years. The proportion of F and M before spawning is set to 0.1, as has been the case earlier. In the 2001 assessment this proportion due to an error was 0.0. The weight-at-age in the stock was updated by copying the weight-at-age in the stock in the assessment year 2001. However, the weight-at-age in the stock in 1999 is the same as in 1998, and needs to be updated. The proportion mature at age was copied from last year, since there is no new data.
The catch-at-age, weight-at-age in the stock and in the catch and maturity ogive are given in Tables 3.5.2.1–3.5.2.4.
3.5.2.1 Survey data
The same surveys as used at previous WG meetings were used also this year (Tables 3.3.1.1, 3.3.2.1, 3.3.2.2, 3.3.3.1 and 3.3.4.1). The age groups included in the tuning are age 4 and older in the December survey and age 5 and older in the other surveys. During the 1998 meeting of this WG some points were perceived as outliers because of the noise they

O:\ACFM\WGREPS\WGNPBW\REPORTS\2002\Sec-3.Doc 50
generated in the assessment and were consequently excluded from the analysis. These points have been excluded also in later meetings. Also, acoustic data earlier than 1991 were excluded in 1998 because the WG then felt that the different acoustic equipment before 1991 made the earlier points incompatible to those from 1991 and later years.
3.5.2.2 Tagging data
The same tagging data series as used last year were included in the likelihood function this year (Table 3.4.1). The first recoveries used were those obtained two years after release.
3.5.2.3 Larval indices
The two larval indices available for SeaStar are shown in Table 3.3.5.1. The numbers for 2000 were in error during the previous WG meeting and were corrected at the present meeting.
3.5.2.4 Weight-at-age in the stock in the assessment year
The weight-at-age at 1 January 2002 was taken as the unweighted mean of Norwegian samples from November and December for corresponding year classes, except for age 2 and 3 for which the mean weight of the corresponding year classes in the joint IMR-PINRO survey in the Barents Sea in September 2001 was used ( Anon. 2001).
3.5.3 Implementation of survey data and tagging data in the assessment model
The survey structural relationship is unchanged from last year. Also this year only terminal F-values for the most abundant year classes were included among the free parameters to be estimated, and only these year classes (1983, 1990, 1991, 1992, and 1993) were included in the likelihood function. The year classes 1998 and 1999 were not recruited to the acoustic series used for tuning.
The assumption that the probability of tag return follows the Poisson distribution used last year was assumed also for this meeting.
3.5.4 Stock assessment
The parameters estimated in the run considered the most appropriate by the Working Group were:
• Catchability of the survey on the spawning grounds • Catchability of the December survey in Lofoten • Catchability of the January survey in Lofoten • Catchability of the international survey in the Norwegian Sea • Catchability of the larval survey index • F in the last year of catch data for the 1983 year class not being in the plus-group (1998) • F in the last year of catch data for the 1990 year class • F in the last year of catch data for the 1991 year class • F in the last year of catch data for the 1992 year class • F in the last year of catch data for the 1993 year class • Survival of tagged fish in the tagging year • CV of the survey probability distributions • CV of the larval survey index
Altogether 13 parameters were estimated. It should be noted that the herring is considered fully recruited to the acoustic survey series used. The catchabilities are therefore scalars, i.e., no dependence of the survey observation model on abundance or age is assumed.
The following exploratory runs were made:
Run 1: Settings unchanged from 2001

O:\ACFM\WGREPS\WGNPBW\REPORTS\2002\Sec-3.Doc 51
Run 2: With respect to Run 1 the tagging data for the 1986–1989 year classes were not grouped
Run 3: With respect to Run 1 the tagging data for the 1994 year class were included
Run 4: With respect to Run 1 a coarse correction for the aging problem of the old was attempted
Run 5: With respect to Run 1 the tags were left one year more in the sea (used 3 years after release)
Run 6: With respect to Run 1 the larval production index was included
Run 7: With respect to Run 3 the tagging data for the 1986–1989 year classes were not grouped
Run 8: With respect to Run 1 the larval production index was used instead of the larval index
Run 9: Only tags were used as independent information
Run 10: With respect to Run 1 the M-value was estimated
Run 11: With respect to Run 9 the M-value was estimated
These runs are summarized in Table 3.5.1. The spawning stocks shown are corrected for analysis of young fish by multiplying the ratio of corrected spawning stock to original spawning stock for Run 1 to all runs. Run 1 gives a spawning stock that is somewhat smaller than the spawning stock prognoses in 2002 at the 2001 WG meeting (5.5 million tonnes). However, all time-series used for tuning exhibit a downward trend, and the WG found no reason to discard this run in favour of any other run. The difference between runs is small and gives confidence in the robustness of the model. The catchability of the survey in the Norwegian Sea is close to 1, and this survey also gives the best fit to the VPA, as is seen in Figure 3.5.1.1 to 3.5.1.4. There is one notable exception to reasonable good fits when there are more than a couple of points. The 1991 year class in the wintering area December survey recruited to this survey rather late.
The surveys fitted as well as at the WG meeting 2001, as is seen from the log likelihood per term. The tags fitted better, and the larvae somewhat worse. Run 2 where the tag data for the 1986–1989 year classes are not treated as a group gave a notably better fit to the tag data.
In run 10 the M is estimated at 0.14, which is strikingly close to the M of 0.15 adopted by the Working Group
Run 4 where the older age groups were increased in an attempt to simulate the effect that more scales from older fish are discarded as basis for age-readings compared with scales from younger fish. (WD by Slotte) gave an estimate of SSB about 0.7 million tonnes higher than that of Run 1. This is an indication that this effect may become serious as the 1991 and 1992 year classes grow older, and the WG strongly recommends that measures are taken to deal with this problem in a statistically stringent way.
The Working Group adopted Run 1.
3.5.4.1 Retrospective analysis
A retrospective analysis was performed by setting the assessment year to 2002, 2001, 2000, 1999, 1998, and 1997 using the same settings as in Run 1. However, year classes younger than 5 years were deleted from the tuning. Figure 3.5.2 shows the retrospective plot. The spawning stocks shown in the figure have not been corrected for analysis of young fish. There is good agreement between assessments for the three last years. The stock as perceived by assessments in 1999 and 1998 is much higher. This is connected to unexpected increases in year class estimates in the surveys on the wintering and spawning areas these years (Tables 3.3.1.1, 3.3.2.1 and 3.3.2.2). The reason for these increases remains unclear. Such increases were not seen in the survey in the Norwegian Sea. The somewhat lower level of the estimate made in 1997 is because to the 1991 and 1992 year classes had not recruited to the survey indices by then.
3.5.4.2 Diagnostics
The probability distribution of the cumulative density function (CDF) is uniform between 0 and 1 if the assumptions made of the probability distribution of a measurement are met by the realised model. The CDF values from all measurements can thus be combined, and the relative number of CDF values smaller than, say, 0.1 should be 0.1. Figure 3.5.3 shows the number of CDF values smaller than the quantiles given on the X-axis for the survey and larvae terms in the likelihood. The points lie on a straight line showing that the assumptions made are well met by the realised model. This diagnostic is appropriate only for continuous distributions, however, so the Poisson distribution used for the tag returns cannot be tested in the same way.

O:\ACFM\WGREPS\WGNPBW\REPORTS\2002\Sec-3.Doc 52
Figure 3.5.4 shows the log-likelihood function as a function of one parameter at a time varied 50% to each side of the maximum likelihood estimate. As in previous years the likelihood is skewed.
Figure 3.5.5.1 shows a histogram of the new spawning stock estimates (uncorrected for young fish) obtained by deleting terms from the surveys one by one, by deleting terms from the tag return data one by one (Figure 3.5.5.2), and by deleting terms from the larval data one by one (Figure 3.5.5.3). Except for a couple of points the spawning stock estimate is not much affected by removing individual terms from tagging. This is also the case for the larvae terms. The survey points, however, may influence the spawning stock estimate quite considerably. The survey points that affect the spawning stock estimate the most should be evaluated, preferably together with an evaluation of survey points that the WG has earlier considered as outliers and consequently removed from the analysis.
3.5.4.3 Assessment using ISVPA
Because the Norwegian spring-spawning herring fishery is known to have a strongly variable selection pattern, only the catch-controlled and mixed versions of the ISVPA were applied. The range of data was restricted to 1986–2001 to describe only the recent state of fishery. The ages used in the ISVPA runs were 2–16+. The 0 and 1 age groups, which have not occurred in the catches during the last 7 years, were excluded from the analysis. The ISVPA model is described in Section 1.3.6.
Using SSE as ISVPA loss function revealed no minima, while use of a more robust loss function, the median of squared residuals in log-scaled catches, was successful for both versions of the model, and for the latter version the minimum was more profound (Figure 3.5.6).
The estimates of SSB, TSB, recruitment at age 2, and F(2–13) from the two versions of ISVPA, are presented in Figure 3.5.7 and Table 3.5.2. Abundance estimates and tables of residuals for the catch control versions are presented in Tables 3.5.3a and Table 3.5.3.b, respectively. Abundance estimates and tables of residuals for the mixed version are presented in Tables 3.5.4a and Table 3.5.4b, respectively. Table 3.5.4c represents the final weights of the catch-controlled routine in the mixed version of ISVPA by points. As it can be seen, in this version of the model the estimates of older ages are mostly based on the catch-controlled routine, while the weights of catch-controlled and effort-controlled routines become almost equal to each other for younger age groups.
Both versions of ISVPA indicate that the decrease in SSB which started in 1997 has finished. In 2001 the SSB value (6.7–7.6 million tonnes on 1 of January) is somewhat higher than in 2000 (6.6–7.2 million tonnes). The value of F(2–13) in 2001 is estimated as 0.119 and 0.106 for the catch-controlled and mixed versions of ISVPA, respectively.
3.5.5 Analysis of young fish not in the tuning
The youngest year class in the tuning is the 1993 year class. Younger year classes are assessed using information from the 0-group surveys in the Barents Sea and acoustic surveys in the Barents Sea. At the WG meeting 2001 the one- and two-year-old herring in the May/June surveys in the Barents Sea were used. These surveys were conducted in the period 1984 to 1995 by Norway and in 1996–1997 as a joint Russian-Norwegian survey. From 1998 this survey has been conducted by Russia only, because Norwegian vessels have not been permitted to enter the Russian EEZ. In order to bring in more information and because of the conflicting evidence about the 1999 year class from these surveys, acoustic estimates of herring from the joint Russian-Norwegian surveys in September (Table 3.3.4.4) were included as auxiliary information on the 1998 and 1999 year classes at the present WG meeting. Also at the present WG meeting the one- and two-year-old herring from the estimates in the Barents Sea were used. The method used is described in Section 1.3.1. Figure 3.5.8 shows the resulting percentiles of the younger year classes. Table 3.6.2.1 gives the median of the youngest year classes that are used as input data for the short-term prognosis.
3.5.6 The final VPA
The final VPA was run using the values of the terminal F from the WG’s best estimate (Run 1, Section 3.5.4). The results from the VPA are presented thus:
Fishing mortality: Table 3.5.6.1 Stock numbers: Table 3.5.6.2 Stock biomass at age: Table 3.5.6.3 Spawning stock biomass: Table 3.5.6.4 Summary: Table 3.5.6.5 and Figure 3.5.9 Summary of fishing mortality: Table 3.5.6.6
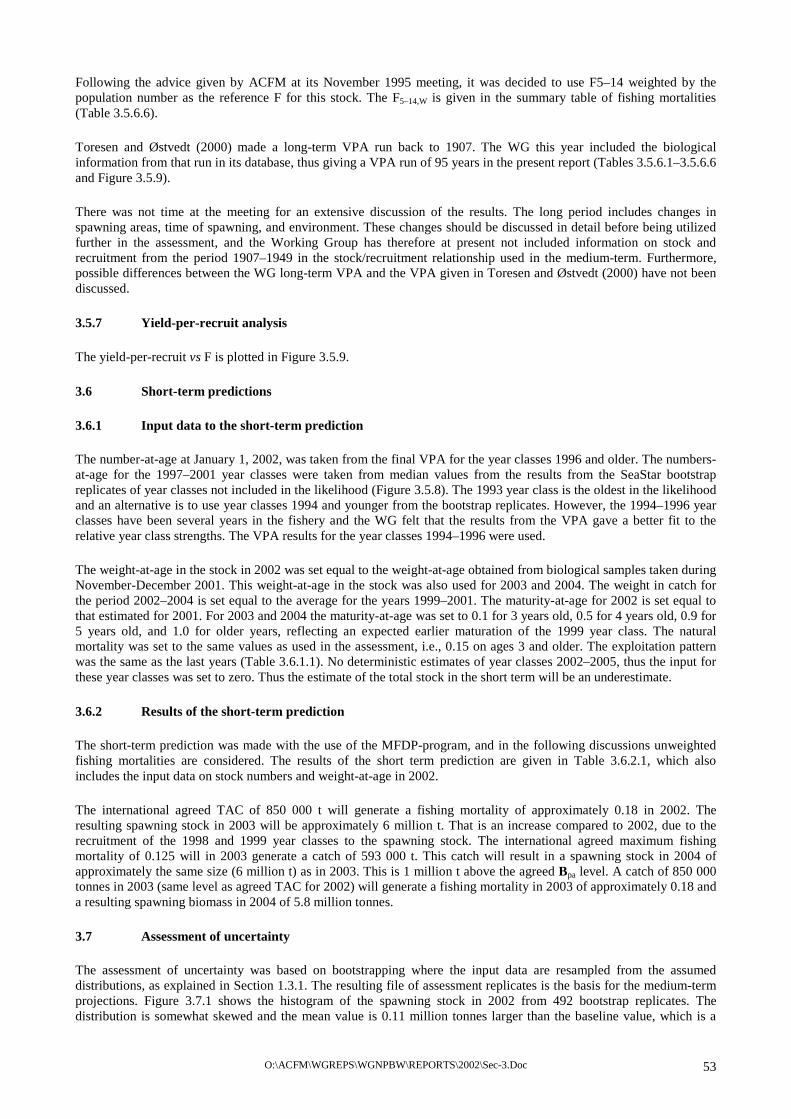
O:\ACFM\WGREPS\WGNPBW\REPORTS\2002\Sec-3.Doc 53
Following the advice given by ACFM at its November 1995 meeting, it was decided to use F5–14 weighted by the population number as the reference F for this stock. The F5–14,W is given in the summary table of fishing mortalities (Table 3.5.6.6).
Toresen and Østvedt (2000) made a long-term VPA run back to 1907. The WG this year included the biological information from that run in its database, thus giving a VPA run of 95 years in the present report (Tables 3.5.6.1–3.5.6.6 and Figure 3.5.9).
There was not time at the meeting for an extensive discussion of the results. The long period includes changes in spawning areas, time of spawning, and environment. These changes should be discussed in detail before being utilized further in the assessment, and the Working Group has therefore at present not included information on stock and recruitment from the period 1907–1949 in the stock/recruitment relationship used in the medium-term. Furthermore, possible differences between the WG long-term VPA and the VPA given in Toresen and Østvedt (2000) have not been discussed.
3.5.7 Yield-per-recruit analysis
The yield-per-recruit vs F is plotted in Figure 3.5.9.
3.6 Short-term predictions
3.6.1 Input data to the short-term prediction
The number-at-age at January 1, 2002, was taken from the final VPA for the year classes 1996 and older. The numbers-at-age for the 1997–2001 year classes were taken from median values from the results from the SeaStar bootstrap replicates of year classes not included in the likelihood (Figure 3.5.8). The 1993 year class is the oldest in the likelihood and an alternative is to use year classes 1994 and younger from the bootstrap replicates. However, the 1994–1996 year classes have been several years in the fishery and the WG felt that the results from the VPA gave a better fit to the relative year class strengths. The VPA results for the year classes 1994–1996 were used.
The weight-at-age in the stock in 2002 was set equal to the weight-at-age obtained from biological samples taken during November-December 2001. This weight-at-age in the stock was also used for 2003 and 2004. The weight in catch for the period 2002–2004 is set equal to the average for the years 1999–2001. The maturity-at-age for 2002 is set equal to that estimated for 2001. For 2003 and 2004 the maturity-at-age was set to 0.1 for 3 years old, 0.5 for 4 years old, 0.9 for 5 years old, and 1.0 for older years, reflecting an expected earlier maturation of the 1999 year class. The natural mortality was set to the same values as used in the assessment, i.e., 0.15 on ages 3 and older. The exploitation pattern was the same as the last years (Table 3.6.1.1). No deterministic estimates of year classes 2002–2005, thus the input for these year classes was set to zero. Thus the estimate of the total stock in the short term will be an underestimate.
3.6.2 Results of the short-term prediction
The short-term prediction was made with the use of the MFDP-program, and in the following discussions unweighted fishing mortalities are considered. The results of the short term prediction are given in Table 3.6.2.1, which also includes the input data on stock numbers and weight-at-age in 2002.
The international agreed TAC of 850 000 t will generate a fishing mortality of approximately 0.18 in 2002. The resulting spawning stock in 2003 will be approximately 6 million t. That is an increase compared to 2002, due to the recruitment of the 1998 and 1999 year classes to the spawning stock. The international agreed maximum fishing mortality of 0.125 will in 2003 generate a catch of 593 000 t. This catch will result in a spawning stock in 2004 of approximately the same size (6 million t) as in 2003. This is 1 million t above the agreed Bpa level. A catch of 850 000 tonnes in 2003 (same level as agreed TAC for 2002) will generate a fishing mortality in 2003 of approximately 0.18 and a resulting spawning biomass in 2004 of 5.8 million tonnes.
3.7 Assessment of uncertainty
The assessment of uncertainty was based on bootstrapping where the input data are resampled from the assumed distributions, as explained in Section 1.3.1. The resulting file of assessment replicates is the basis for the medium-term projections. Figure 3.7.1 shows the histogram of the spawning stock in 2002 from 492 bootstrap replicates. The distribution is somewhat skewed and the mean value is 0.11 million tonnes larger than the baseline value, which is a

O:\ACFM\WGREPS\WGNPBW\REPORTS\2002\Sec-3.Doc 54
smaller deviation than seen at the 2001 assessment. The median is 0.04 million tonnes smaller than the baseline value. The standard deviation is 1.0 million tones, which is the same as obtained at the 2001 assessment.
3.8 Long-Term Management Plan and Precautionary Reference Points
At the meeting in Tórshavn in October 1999 (Section 3.1.1), the coastal states (European Union, Faroe Islands, Iceland, Norway, and Russia) agreed to implement a long-term management plan for Norwegian spring-spawning herring. At the coastal meeting in Harstad in October 2001 the coastal states agreed to extend the plan to include a recovery plan in case the SSB falls below Bpa. The agreed long-term management plan now consists of the following elements:
1) Every effort shall be made to maintain a level of Spawning Stock Biomass (SSB) greater than the critical level (Blim) of 2 500 000 tonnes.
2) For the year 2001 and subsequent years, the Parties agreed to restrict their fishing on the basis of a TAC consistent with a fishing mortality rate of less than 0.125 for appropriate age groups as defined by ICES, unless future scientific advice requires modification of this fishing mortality rate.
3) Should the SSB fall below a reference point of 5 000 000 tonnes (Bpa), the fishing mortality rate, referred under paragraph 2, shall be adapted in the light of scientific estimates of the conditions then prevailing to ensure a safe and rapid recovery of the SSB to a level in excess of 5 000 000 tonnes. The basis for such adaptation should be at least a linear reduction in the biomass mortality rate from 0.125 at Bpa (5 000 000) to 0.05 at Blim (2 500 000 tonnes).
4) The Parties shall, as appropriate, review and revise these management measures and strategies on the basis of any new advice provided by ICES.
The WGNPBW has in accordance with the agreed long-term management plan used the following values in the reference run in the medium-term simulations.
Bpa = 5.0 million tonnes Blim = 2.5 million tonnes Fishing mortality (F) above Bpa = 0.125 Linear reduction in F from 0.125 at SSB=5 000 000 tonnes to 0.05 at SSB=2 500 000 tonnes
3.9 Harvest control rule
3.9.1 Evaluation of adaptive recovering strategies in the event SSB falls below Bpa
An extensive evaluation of different adaptive recovery strategies is given in the WG Report for 2001. On the basis of this ACFM suggested that the use of a recovery strategy, including linear decrease in fishing mortality from Bpa to 0.05 at Blim, could be suitable for this stock.
At the coastal states meeting in Harstad in October 2001 the management agency decided to incorporate this type of recovery strategy in the long-term management plan for this stock.
The issue on recovery strategies is therefore not further elaborated in this years report. The agreed recovery strategy is applied in the present medium-term considerations (Section 3.10).
3.10 Medium-term projections
The WG run for the medium-term predation followed the same options as last year. The medium-term projections were done with the SeaStar model, which is described in Section 3.1.1. For each simulation one historic assessment was selected at random. Based on the selected historic assessment regressions of young fish were performed. Numbers-at-age for young fish were then selected at random. This procedure ensures proper correlation properties between age groups in the initial stock. Thereafter the parameters in the recruitment model were estimated and the simulation carried out.
The Beverton-Holt recruitment model was used also this year. The largest year classes were treated separately, as described in Section 1.3.1. A ceiling of 1000 billion 0-group fish was enforced, as was done at the 2001 WG meeting. Figure 3.10.1 shows the recruitment points labelled with recruitment year and the estimated Beverton-Holt function, which appears rather linear below a spawning stock of 15 million tonnes. The highest recruitment points are plotted in red. When the spawning stock has been below 1.0 million tonnes the recruitment has invariably been poor, with

O:\ACFM\WGREPS\WGNPBW\REPORTS\2002\Sec-3.Doc 55
exception of the 1983 year class. It is also interesting to note periods of similar recruitment for spawning stocks of similar magnitude.
The projections started at January 1 2002 and the allocated catch of 0.85 million tonnes for 2002 was implemented by solving for F. The F-value by age applied during the simulation is the F-value in the harvest control rule multiplied by the exploitation pattern given in Table 3.6.1.1 and divided by the population weighted average over ages 5–14 of these numbers. Assumptions about weight-at-age, exploitation pattern, proportion mature at age, and weight-at-age in the catch are the same as those used for the short-term prediction, see Section 3.6. From 2005 the weight-at-age in the stock is the average over the last ten years and the proportion mature by age is the same as assumed for 2002.
A summary of the medium-term simulations are given in Table 3.10.1. The medium-term simulations give a more negative picture of the stock in the medium term compared to the medium-term simulation given in the last report. The main reason for this is the high estimate (more than 100 billion individuals) of the 1999 year class obtained in the acoustic surveys in the Barents Sea in May 2000 (Table 3.3.4.1) which had a main impact on the medium-term simulations carried out in 2001. However, the high estimate of the 1999 year class has not been confirmed during the investigations carried out in 2001 (Tables 3.3.4.1 and 3.3.4.4). The input estimate of this year class in the medium term this year is therefore considerably lower.
Figures 3.10.2 and 3.10.3 show the development of SSB and yield for F=0.125 above Bpa =5.0 million t with a linear reduction to F=0.05 at Blim= 2.5 million t and a catch ceiling of 1.5 million t. 5, 25, 50, 75, and 95 percentiles are given to illustrate the uncertainty in the prognosis.
According to the medium-term simulations the following conclusions may be drawn:
1) Continued fishing at F=0.125 (international agreed maximum fishing mortality) and a reduction in F below Bpa as in the pre-agreed recovery plan, and with a catch ceiling of 1.5 million t, gives a low probability of the stock falling below Blim in the medium term (5 and 10 years). This harvesting strategy results in a 15% average annual change in the TAC.
2) There is, however, a probability of about 50% of the spawning stock falling below Bpa 3) There are no signals in the medium-term simulations that indicate that the present agreed long time strategy and
recovery plan for this stock is not in accordance with the precautionary approach in fisheries.
The text table below gives the option and the technical performance values:
Parameter Options Technical performance values Fishing mortality for SSB above Bpa
0.0, 0.05, 0.08, 0.10, 0.125, 0.15, 0.2
As options
Catch ceiling None 1.5 million t. One run with catch ceiling of 850 000 t, the level of the TAC for 2001 and 2002.
Value of Bpa 5.0 million t As option Value of Blim 2.5 million t As option Time range 5 and 10 years As option Fishing mortality for F below Bpa
Linear decrease in F from 0.125 at Bpa to 0.05 at Blim in accordance with long-term management plan (Section 3.8) (similar decreases were also made with other requested F’s (0.05, 0.08, 0.10, 0.15, 0.2)).
Measure of stability of catches
average percentage change in catches from year-to-year
As option
Yield average catches over the same ten year period
Average annual yield (tonnes) of the time range for the simulation run (5 or 10 years).
Risk Probability that SSB will fall below Bpa and Blim in a 5 and 10 year period
Risk to fall below Bpa and Blim within the time range for the simulation run (5 or 10 years).

O:\ACFM\WGREPS\WGNPBW\REPORTS\2002\Sec-3.Doc 56
3.11 Management considerations
The immatures and adults of this stock form a central part of the ecosystem in the Barents Sea and Norwegian Sea, respectively. The herring has an important role as a transformer of the production of zooplankton biomass and energy to a form that is available to organisms at a higher level of the food chain.
The Coastal states European Union, Faroe Islands, Iceland, Norway, and Russia have agreed on a long-term management plan, including a maximum fishing mortality of 0.125, and on a precautionary reference point (Bpa = 5.0 million t) and limit reference point (Blim = 2.5 million t) for this stock. The limit reference point (2.5 million t) is seen as a spawning stock threshold that, if crossed, can result in a high probability of impaired recruitment, and the Bpa as a safeguard measure. In 2001 the coastal states incorporated a pre-agreed recovery strategy to the long time management plan, the main element being a reduction of fishing mortality from 0.125 at Bpa (5.0 million t) to 0.05 at Blim (2.5 million t).
The current stock assessment indicates a spawning stock of approximately 5 million t in 2002, the spawning stock abundance having declined from more than 8 million t in 1997. The future prospects indicate, if exploited at the agreed level (maximum fishing mortality of 0.125), an increasing spawning stock to approximately 6 million t in 2003–2004 due to the recruitment of the 1998 and 1999 year classes. However, a new decline in the spawning stock is expected when the weak year classes 2000 and 2001 recruit to the spawning stock from 2005.

O:\ACFM\WGREPS\WGNPBW\REPORTS\2002\Sec-3.Doc 57
Table 3.2.1 Catches of Norwegian spring-spawning herring (tonnes) since 1972.
Year A B1 C D Total Total catch used in WG
1972 - 9895 3,2662 - 13,161 13,161 1973 139 6,602 276 - 7,017 7,017 1974 906 6,093 620 - 7,619 7,619 1975 53 3,372 288 - 3,713 13,713 1976 - 247 189 - 436 10,436 1977 374 11,834 498 - 12,706 22,706 1978 484 9,151 189 - 9,824 19,824 1979 691 1,866 307 - 2,864 12,864 1980 878 7,634 65 - 8,577 18,577 1981 844 7,814 78 - 8,736 13,736 1982 983 10,447 225 - 11,655 16,655 1983 3,857 13,290 907 - 18,054 23,054 1984 18,730 29,463 339 - 48,532 53,532 1985 29,363 37,187 197 4,300 71,047 169,872 1986 71,1223 55,507 156 - 126,785 225,256 1987 62,910 49,798 181 - 112,899 127,306 1988 78,592 46,582 127 - 125,301 135,301 1989 52,003 41,770 57 - 93,830 103,830 1990 48,633 29,770 8 - 78,411 86,411 1991 48,353 31,280 50 - 79,683 84,683 1992 43,688 55,737 23 - 99,448 104,448 1993 117,195 110,212 50 - 227,457 232,457 1994 288,581 190,643 4 - 479,228 479,228 1995 320,731 581,495 0 - 902,226 902,226 1996 462,248 758,035 0 - 1,220,283 1,220,283 19975 0 - 1,426,507 1,426,507 19985 0 - 1,223,131 1,223,131 19996 0 - 1,235,433 1,235,433 20007 0 - 1,207,201 1,207,201 20018 0 - 770,066 770,066 A = catches of adult herring in winter B = mixed herring fishery in remaining part of the year C = by-catches of 0- and 1-group herring in the sprat fishery D = USSR-Norway by-catch in the capelin fishery (2-group) 1 Includes also by-catches of adult herring in other fisheries 2 In 1972, there was also a directed herring 0-group fishery 3 Includes 26,000 t of immature herring (1983 year class) fished by USSR in the Barents Sea 4 Preliminary, as provided by Working Group members 5 Details of catches by fishery and ICES area given in ICES 1999 6 Details of catches by fishery and ICES area given in ICES 2000 7 Details of catches by fishery and ICES area given in ICES 2001 8 Details of catches by fishery and ICES area given in Tables 3.2.3-3.2.5

O:\ACFM\WGREPS\WGNPBW\REPORTS\2002\Sec-3.Doc 58
Table 3.2.2 Total catch of Norwegian spring-spawning herring (tonnes) since 1972.
Data provided by Working Group members.
Year
Norway
USSR/ Russia
Denmark
Faroes Iceland Ireland Nether-
landsGreenland UK
Germany
France Sweden Total
1972 1973 1974 1975 1976 1977 1978 1979 1980 1981 1982 1983 1984 1985 1986 1987 1988 1989 1990 1991 1992 1993 1994 1995 1996
1997
1998
1999
2000 20011
13,161 7,017 7,619
13,713 10,436 22,706 19,824 12,864 18,577 13,736 16,655 23,054 53,532
167,272 199,256 108,417 115,076
88,707 74,604 73,683 91,111
199,771 380,771 529,838 699,161 860,963 743,925 740,640 713,500 495,036
- - - - - - - - - - - - -
2,600 26,000 18,889 20,225 15,123 11,807 11,000 13,337 32,645 74,400
101,987 119,290 168,900 124,049 157,328 163,261
109,054
- - - - - - - - - - - - - - - - - - - - - - -
30,577
60,681 44,292 35,519 37,010 34,968 24,038
- - - - - - - - - - - - - - - - - - - - - -
2,911 57,084 52,788 59,987 68,136 55,527 68,625 34,170
----------------------
21,146174,109164,957220,154197,789203,381186,035
77,693
------------------------
19,54111,1792,4372,4128,939
-
-----------------------
7,96919,6648,694
12,8275,871
-6,439
-----------------------
2,500------
-----------------------
88146,13125,14915,97119,20714,09612,230
- - - - - - - - - - - - - - - - - - - - - - -
556 11,978 6,190 7,003
- 3,298 1,588
- - - - - - - - - - - - - - - - - - - - - - - - -
1,500 605
- - -
------------------------
22,42419,49914,86314,05714,7499,818
13,1617,0177,619
13,71310,43622,70619,82412,86418,57713,73616,65523,05453,532
169,872225,256127,306135,301103,830
86,41184,683
104,448232,457479,228905,501
1,220,2831,426,5071,223,1311,235,4331,207,201
770,0661 Preliminary, as provided by Working Group members.

O:\ACFM\WGREPS\WGNPBW\REPORTS\2002\Sec-3.Doc 59
Table 3.2.3. Catch-at-age by country.

O:\ACFM\WGREPS\WGNPBW\REPORTS\2002\Sec-3.Doc 60
Table 3.2.4. Weight (kg) at age by country.

O:\ACFM\WGREPS\WGNPBW\REPORTS\2002\Sec-3.Doc 61
Table 3.2.5 Summary of Sampling by Country ------------------------------ AREA : IVa ---------- Country Sampled Working No. of No. No. SOP Catch Catch samples measured aged % Norway 0.00 2921.00 0 0 0 0.00 Total IVa 0.00 2921.00 0 0 0 0.00 Unallocated Catch : 0.00 Working Group Catch : 2921.00 AREA : IIb ---------- Country Sampled Working No. of No. No. SOP Catch Catch samples measured aged % Sweden 0.00 75.00 0 0 0 0.00 Russia 0.00 4371.00 0 0 0 0.00 Iceland 678.00 5086.00 3 150 142 100.09 Total IIb 678.00 9532.00 3 150 142 100.09 Unallocated Catch : 0.00 Working Group Catch : 9532.00 AREA : IIa ---------- Country Sampled Working No. of No. No. SOP Catch Catch samples measured aged % UK(Scot) 0.00 12230.00 0 0 0 0.00 Sweden 0.00 9743.00 0 0 0 0.00 Russia 89918.00 104683.00 257 51585 1670 101.05 Norway 492115.00 492115.00 135 14844 7088 100.63 Netherlands 6439.00 6439.00 19 1518 475 99.79 Iceland 64366.00 72595.00 22 1023 975 100.00 Germany 1558.00 1588.00 3 498 497 99.05 Faroes 0.00 34170.00 0 0 0 0.00 Denmark 8497.00 24038.00 3 387 387 99.71 Total IIa 662893.00 757601.00 439 69855 11092 100.60 Unallocated Catch : 0.00 Working Group Catch : 757601.00 PERIOD : 1 Country Sampled Working No. of No. No. SOP Catch Catch samples measured aged % UK(Scot) 0.00 7793.00 0 0 0 0.00 Russia 27474.00 27474.00 137 27482 697 99.99 Norway 184778.00 187568.00 43 4370 2468 101.60 Germany 1558.00 1558.00 3 498 497 99.05 Faroes 0.00 5690.00 0 0 0 0.00 Denmark 8497.00 8497.00 3 387 387 99.71 Period Total 222307.00 238580.00 186 32737 4049 101.31 Unallocated Catch : 0.00 Working Group Catch : 238580.00

O:\ACFM\WGREPS\WGNPBW\REPORTS\2002\Sec-3.Doc 62
PERIOD : 2 Country Sampled Working No. of No. No. SOP Catch Catch samples measured aged % UK(Scot) 0.00 1052.00 0 0 0 0.00 Sweden 0.00 9818.00 0 0 0 0.00 Russia 0.00 14765.00 0 0 0 0.00 Norway 555.00 619.00 12 560 560 111.50 Netherlands 3459.00 3459.00 6 571 150 99.39 Iceland 65044.00 65044.00 25 1173 1117 100.00 Germany 0.00 30.00 0 0 0 0.00 Faroes 0.00 16152.00 0 0 0 0.00 Denmark 0.00 11324.00 0 0 0 0.00 Period Total 69058.00 122263.00 43 2304 1827 100.06 Unallocated Catch : 0.00 Working Group Catch : 122263.00 PERIOD : 3 Country Sampled Working No. of No. No. SOP Catch Catch samples measured aged % UK(Scot) 0.00 3045.00 0 0 0 0.00 Russia 62444.00 66815.00 120 24103 973 101.52 Norway 49531.00 49544.00 26 3335 1259 100.02 Netherlands 2980.00 2980.00 13 947 325 100.26 Iceland 0.00 12637.00 0 0 0 0.00 Faroes 0.00 11356.00 0 0 0 0.00 Denmark 0.00 4217.00 0 0 0 0.00 Period Total 114955.00 150594.00 159 28385 2557 100.84 Unallocated Catch : 0.00 Working Group Catch : 150594.00 PERIOD : 4 Country Sampled Working No. of No. No. SOP Catch Catch samples measured aged % UK(Scot) 0.00 340.00 0 0 0 0.00 Norway 257251.00 257305.00 54 6579 2801 100.02 Faroes 0.00 972.00 0 0 0 0.00 Period Total 257251.00 258617.00 54 6579 2801 100.02 Unallocated Catch : 0.00 Working Group Catch : 258617.00 Total over all Areas and Periods -------------------------------- Country Sampled Working No. of No. No. SOP Catch Catch samples measured aged % UK(Scot) 0.00 12230.00 0 0 0 0.00 Sweden 0.00 9818.00 0 0 0 0.00 Russia 89918.00 109054.00 257 51585 1670 101.05 Norway 492115.00 495036.00 135 14844 7088 100.63 Netherlands 6439.00 6439.00 19 1518 475 99.79 Iceland 65044.00 77681.00 25 1173 1117 100.00 Germany 1558.00 1588.00 3 498 497 99.05 Faroes 0.00 34170.00 0 0 0 0.00 Denmark 8497.00 24038.00 3 387 387 99.71 Total for Stock 663571.00 770054.00 442 70005 11234 100.60 Unallocated Catch : 0.00 Working Group Catch : 770054.00

O:\ACFM\WGREPS\WGNPBW\REPORTS\2002\Sec-3.Doc 63
DETAILS OF DATA FILLING-IN -------------------------- Filling-in for record : ( 5) Norway 1 IVa Using Only >> ( 1) Norway 1 IIa Filling-in for record : ( 6) Norway 2 IVa Using Only >> ( 2) Norway 2 IIa Filling-in for record : ( 7) Norway 3 IVa Using Only >> ( 3) Norway 3 IIa Filling-in for record : ( 8) Norway 4 IVa Using Only >> ( 4) Norway 4 IIa Filling-in for record : ( 10) Russia 2 IIa Using Only >> ( 11) Russia 3 IIa Filling-in for record : ( 12) Russia 3 IIb Using Only >> ( 11) Russia 3 IIa Filling-in for record : ( 14) Denmark 2 IIa Using Only >> ( 2) Norway 2 IIa Filling-in for record : ( 15) Denmark 3 IIa Using Only >> ( 3) Norway 3 IIa Filling-in for record : ( 17) Iceland 3 IIa Using Only >> ( 3) Norway 3 IIa Filling-in for record : ( 19) Iceland 3 IIb Using Only >> ( 3) Norway 3 IIa Filling-in for record : ( 20) Sweden 2 IIa Using Only >> ( 2) Norway 2 IIa Filling-in for record : ( 21) Sweden 2 IIb Using Only >> ( 2) Norway 2 IIa Filling-in for record : ( 23) Germany 2 IIa Using Only >> ( 2) Norway 2 IIa Filling-in for record : ( 24) UK(Scot) 1 IIa Using Only >> ( 1) Norway 1 IIa Filling-in for record : ( 25) UK(Scot) 2 IIa Using Only >> ( 2) Norway 2 IIa Filling-in for record : ( 26) UK(Scot) 3 IIa Using Only >> ( 3) Norway 3 IIa Filling-in for record : ( 27) UK(Scot) 4 IIa Using Only >> ( 4) Norway 4 IIa Filling-in for record : ( 28) Faroes 1 IIa Using Only >> ( 1) Norway 1 IIa Filling-in for record : ( 29) Faroes 2 IIa Using Only >> ( 2) Norway 2 IIa Filling-in for record : ( 30) Faroes 3 IIa

O:\ACFM\WGREPS\WGNPBW\REPORTS\2002\Sec-3.Doc 64
Using Only >> ( 3) Norway 3 IIa Filling-in for record : ( 31) Faroes 4 IIa Using Only >> ( 4) Norway 4 IIa Catch Numbers at Age by Area ---------------------------- Ages IVa IIb IIa Total 0 0.00 0.00 0.00 0.00 1 0.00 0.00 0.00 0.00 2 7.70 19.04 2049.66 2076.41 3 185.83 1336.41 100771.22 102293.46 4 701.13 1466.86 158510.50 160678.50 5 2430.06 3476.45 420916.06 426822.59 6 79.17 341.77 38328.17 38749.12 7 330.39 1243.82 94417.49 95991.70 8 1065.47 3094.25 292300.53 296460.25 9 3729.77 9241.79 826165.31 839136.88 10 1561.27 7141.15 498403.81 507106.22 11 326.79 873.15 72473.10 73673.03 12 79.01 227.59 23416.17 23722.77 13 0.25 63.09 3442.50 3505.84 14 10.79 15.49 3330.19 3356.47 15 54.71 357.18 21752.48 22164.37 Mean Weight at Age by Area (Kg) ------------------------------- Ages IVa IIb IIa Total 0 0.0000 0.0000 0.0000 0.0000 1 0.0000 0.0000 0.0000 0.0000 2 0.0880 0.0810 0.1051 0.1049 3 0.1380 0.1755 0.1660 0.1661 4 0.1794 0.2505 0.2142 0.2144 5 0.2356 0.2897 0.2514 0.2516 6 0.2561 0.3376 0.2678 0.2684 7 0.2936 0.3335 0.3045 0.3048 8 0.2954 0.3399 0.3072 0.3075 9 0.3084 0.3513 0.3225 0.3228 10 0.3226 0.3551 0.3370 0.3372 11 0.3455 0.3967 0.3631 0.3634 12 0.2765 0.3966 0.3531 0.3532 13 0.4068 0.3935 0.3781 0.3784 14 0.4351 0.4293 0.4004 0.4006 15 0.4183 0.4640 0.4266 0.4272

O:\ACFM\WGREPS\WGNPBW\REPORTS\2002\Sec-3.Doc 65
Table 3.3.1.1 Norwegian Spring-spawning herring. Estimates obtained on the acoustic surveys on the spawning stock in February-March. Numbers in millions. Year 1988 1989 1990 1991 1992 1993 1994 1995 1996 1997 1998 1999 2000Age 2 101 183 44 16 407 106 15163 255 5 187 59 128 1792 231 1366 6904 146 373 0 54 676 7621 7638 381 337 19965 6805 103 345 12 1375 3807 11243 1905 1286 1646 202 5402 112 354 476 2151 2586 10640 2979 5927 182 4489 122 63 322 957 6708 11791 19978 146 4148 13 20 471 1280 7534 77149 102 140 1 0 434 1912 424010 35 124 0 130 568 55311 1820 63 165 39 132 7112 2573 0 0 0 313 2024 175 0 014 0 392 615+ 804 437 361Total 7408 6166 5462 4895 - - 4742 18474 25756 - 22496 28840 19903In 1992, 1993 and 1997 there was no estimate due to poor weather conditions. No surveys have been conducted after 2000. Table 3.3.2.1 Norwegian Spring-spawning herring. Estimates obtained on the acoustic surveys in the wintering areas in November-December. Numbers in millions.
Year 1992 1993 1994 1995 1996 1997 1998 1999 2000 2001 Age 1 72 380 9 65 74 56 362 2 36 1518 16 183 1465 73 1207 159 322 522 3 1247 2389 3708 5133 3008 661 441 2425 1522 3916 4 1317 3287 4124 5274 13180 1480 1833 296 5260 1528 5 173 1267 2593 1839 5637 6110 3869 837 165 2615 6 16 13 1096 1040 994 4458 12052 2066 497 82 7 208 13 34 308 552 1843 8242 6601 1869 338 8 139 158 25 19 92 743 2068 4168 4785 864 9 3742 26 196 13 0 66 629 755 3635 3160 10 69 4435 29 111 7 0 111 212 668 2216 11 3239 39 41 0 14 0 205 384 12 907 15 126 0 15 0 127 13 393 0 392 0 0 0 14+ 842 221 146 168 18 Total 6947 13178 15209 15246 25384 16411 31144 17754 19152 16132

O:\ACFM\WGREPS\WGNPBW\REPORTS\2002\Sec-3.Doc 66
Table 3.3.2.2 Norwegian Spring-spawning herring. Estimates obtained on the acoustic surveys in the wintering areas in January. Numbers in millions. No surveys carried out in 2000.
Year 1991 1992 1993 1994 1995 1996 1997 1998 1999Age 2 90 73 214 03 220 410 61 642 47 315 267 13584 70 820 1905 3431 3781 10442 1938 1995 20 260 2048 4847 4013 13557 4162 14556 180 60 256 1503 2445 4312 9647 44527 150 510 27 102 1215 1271 6974 129718 5500 120 269 29 42 290 1518 72269 440 4690 182 161 24 22 743 187610 30 5691 131 267 25 16 49911 128 3679 29 200 4 1612 4326 58 0 1613 1146 181 014 7 15615+ 314 220Total 6670 6900 10567 14598 16189 31638 - 25985 30444In 1997 there was no estimate due to poor weather conditions. In 2000 there was no estimate due to technical problems, since then no surveys have been conducted in January.
Table 3.3.3.1 Norwegian spring-spawning herring. Estimates obtained in the international acoustic surveys on the feeding areas in the Norwegian Sea in May. Numbers in millions.
Year 1996 1997 1998 1999 2000 2001 Age 3 4114 1169 367 2191 1353 8312 4 22461 3599 1099 322 2783 1430 5 13244 18867 4410 965 92 1463 6 4916 13546 16378 3067 384 179 7 2045 2473 10160 11763 1302 204 8 424 1771 2059 6077 7194 3215 9 14 178 804 853 5344 5433 10 7 77 183 258 1689 1220 11 155 288 0 5 271 94 12 0 415 0 14 0 178 13 3134 60 112 0 114 0 14 2472 0 158 1135 0 15+ 415 128 1135 85 Total 50504 44915 35987 25801 21661 21810
Table 3.3.4.1 Norwegian spring-spawning herring. Acoustic estimates (billion individuals) of immature herring in the Barents Sea in May/June. 1990-2001.See footnotes.
Year 1991 1992 1993 1994 1995 19961 19972 19983 1999 2000 2001 Age
1 24.3 32.6 102.7 6.6 0.5 0.1 2.6 9.5 49.5 105.4 0.3 2 5.2 14.0 25.8 59.2 7.7 0.25 0.04 4.7 4.9 27.9 7.6 3 5.7 1.5 18.0 8.0 1.8 0.4 0.01 0.00 0.00 8.8 4 1.7 1.1 0.6 0.35 0.01 0.00 0.00 0.00 5 0.03 0.05 0.00 0.00 0.00 0.00 1 Average of Norwegian and Russian estimates 2 Combination of Norwegian and Russian estimates as described in 1998 WG report, since then only Russian estimates

O:\ACFM\WGREPS\WGNPBW\REPORTS\2002\Sec-3.Doc 67
Table 3.3.4.2 Norwegian spring spawners. Acoustic abundance (TS = 20 logL - 71.9) of 0-group herring in Norwegian coastal waters in 1975–2001 (numbers in millions).
Year Area Total South of 62oN 62°N-65°N 65°N-68°N North of 68°30'
1975 164 346 28 5381976 208 1 305 375 1 888 1977 35 153 19 207 1978 151 256 196 603 1979 455 1 130 144 1 729 1980 6 2 109 117 1981 132 1 1 134 1982 32 286 1 151 1 469 1983 162 2 276 4 432 6 866 1984 2 234 465 701 1985 221 177 104 502 1986 5 72 127 204 1987 327 26 57 410 1988 14 552 708 1 274 1989 575 263 2 052 2 890 1990 75 146 788 1 009 1991 80 299 2 428 2 807 1992 73 1 993 621 2 891 1993 290 109 140 288 827 1994 157 452 323 6 168 7 101 1995 0 27 2 0 29 1996 0 20 114 8 800 8 934 1997 208 69 544 5 244 6 065 1998 424 273 442 11 640 12 779 1999 121 658 271 6 329 7 379 2000 570 127 996 7 237 8 9302001 89 324 134 1421 1968

O:\ACFM\WGREPS\WGNPBW\REPORTS\2002\Sec-3.Doc 68
Table 3.3.4.3 Norwegian spring-spawning herring. Abundance indices for 0-group herring in the Barents Sea, 1973-2001.
Year Log index Year Log index1974 0.01 1988 0.30 1975 0.00 1989 0.58 1976 0.00 1990 0.31 1977 0.01 1991 1.19 1978 0.02 1992 1.05 1979 0.09 1993 0.75 1980 0.00 1994 0.28 1981 0.00 1995 0.16 1982 0.00 1996 0.65 1983 1.77 1997 0.39 1984 0.34 1998 0.59 1985 0.23 1999 0.41 1986 0.00 2000 0.30 1987 0.00 2001 0.13
Table 3.3.4.4 Norwegian spring-spawning herring. Acoustic estimates (billion individuals) of immature herring in the Barents Sea in September/October . 2000-2001.
Year 2000 2001 Age
1 14.7 0.5 2 11.5 10.5 3 0.00 1.7 4 0.00 0.00 5 0.00 0.00
Table 3.3.5.1 The indices for herring larvae for the period 1981-2002 (N*10-12).
Year Index 1 Index 2 Year Index 1 Index 2 1981 1982 1983 1984 1985 1986 1987 1988 1989 1990 1991
0.3 0.7 2.5 1.4 2.3 1.0 1.3 9.2 13.4 18.3 8.6
4.0 25.5 28.7 29.2 23.5
1992 1993 1994 1995 1996 1997 1998 1999 2000 2001 2002
6.3 24.7 19.5 18.2 27.7 66.6 42.4 19.9 19.8 40.7 27.1
27.8 78.0 48.6 36.3 81.7 147.5 138.6 73.0 127.5

O:\ACFM\WGREPS\WGNPBW\REPORTS\2002\Sec-3.Doc 69
Table 3.4.1. Tagging data included in the tuning. Numbers screened and recovered every year by year class.
Tagging data for the 1983+ year class
Year
Number screened in
millionNumber tagged
87 release
88 release
89 release
90 release
91 release
92 release
93 release
94 release
95 release
96 release
97 release
98 release
1987 330671988 381521989 10695 20620 121990 5489 24585 4 101991 5545 12558 1 7 51992 1737 15262 4 0 2 21993 9372 15839 6 13 6 12 91994 9474 5364 2 10 7 8 4 111995 11554 859 6 10 5 15 6 9 71996 4038 2879 3 2 6 10 2 1 4 31997 3867 2266 0 3 1 3 2 3 0 0 01998 509 648 1 3 1 1 2 2 0 0 0 11999 379 0 0 0 1 1 0 0 1 0 0 0 12000 413 0 1 0 3 0 1 0 0 0 0 0 02001 35 0 1 0 0 0 0 0 0 0 0 0 0
Tagging data for the 1984 year class
Year
Number screened in
millionNumber tagged
88 release
89 release
90 release
91 release
92 release
93 release
94 release
95 release
96 release
97 release
98 release
1988 13421989 11751990 157 1097 01991 138 257 0 01992 30 767 0 0 01993 287 479 2 1 1 01994 267 160 0 0 0 2 11995 264 56 0 0 0 0 0 01996 281 113 0 0 0 0 0 0 01997 0 0 0 0 0 0 0 0 0 01998 1 0 0 0 0 0 0 0 0 0 01999 0 0 0 0 0 0 0 0 0 0 0 02000 0 0 0 0 0 0 0 0 0 0 0 0 02001 0 0 0 0 0 0 0 0 0 0 0 0 0
Tagging data for the 1985 year class
Year
Number screened in
millionNumber tagged
89 release
90 release
91 release
92 release
93 release
94 release
95 release
96 release
97 release
98 release
1989 29821990 10811991 355 1154 01992 114 851 0 01993 573 1465 1 1 11994 345 368 2 0 0 11995 735 167 0 0 0 2 11996 427 564 1 0 0 0 0 01997 888 555 0 2 0 3 1 1 11998 497 778 0 1 0 0 1 0 0 01999 623 0 1 0 0 0 0 0 0 0 12000 703 0 0 0 0 1 0 0 0 0 22001 139 1 0 0 0 0 0 0 0 0 1
Recaptured
Recaptured
Recaptured

O:\ACFM\WGREPS\WGNPBW\REPORTS\2002\Sec-3.Doc 70
Table 3.4.1. Continued.
Tagging data for the 1986 year class
Year
Number screened in
millionNumber tagged
90 release
91 release
92 release
93 release
94 release
95 release
96 release
97 release
98 release
1990 3811991 1651992 17 210 01993 19 52 0 01994 65 256 0 0 01995 104 0 1 0 0 01996 92 213 0 0 1 0 01997 166 15 0 0 0 0 0 01998 0 84 0 0 0 0 0 0 01999 0 0 0 0 0 0 0 0 0 02000 3 0 0 0 0 0 0 0 0 02001 0 0 0 0 0 0 0 0 0 0
Tagging data for the 1987 year class
Year
Number screened in
millionNumber tagged
91 release
92 release
93 release
94 release
95 release
96 release
97 release
98 release
1991 6341992 11461993 329 1569 01994 259 315 0 01995 90 27 1 0 11996 43 0 0 0 1 01997 224 135 0 0 0 0 01998 8 0 0 1 0 0 0 01999 81 0 0 0 0 0 0 0 02000 0 0 0 0 0 0 0 0 02001 22 0 0 0 0 0 0 0 0
Tagging data for the 1988 year class
Year
Number screened in
millionNumber tagged
92 release
93 release
94 release
95 release
96 release
97 release
98 release
1992 58271993 52671994 3506 4473 31995 3729 1041 4 01996 1176 2109 3 3 21997 811 1940 0 0 0 01998 148 215 1 0 1 0 01999 12 0 0 0 0 0 0 02000 75 0 0 0 0 0 0 02001 0 0 1 0 0 0 0 0
Tagging data for the 1989 year class
Year
Number screened in
millionNumber tagged
93 release
94 release
95 release
96 release
97 release
98 release
1993 75841994 118731995 9463 2348 41996 4636 5170 1 51997 3346 4103 2 7 01998 1183 1176 0 0 0 11999 1179 0 1 0 0 1 12000 790 0 2 0 0 0 12001 841 1 1 0 2 0 0
Recaptured
Recaptured
Recaptured
Recaptured

O:\ACFM\WGREPS\WGNPBW\REPORTS\2002\Sec-3.Doc 71
Table 3.4.1. Continued.
Tagging data for the 1990 year class
Year
Number screened in
millionNumber tagged
94 release
95 release
96 release
97 release
98 release
1994 107841995 38681996 9009 6171 91997 9830 4057 7 31998 2828 2381 1 1 11999 3402 0 1 2 2 12000 3146 0 2 2 0 12001 1052 2 0 0 0 0
Tagging data for the 1991 year class
Year
Number screened in
millionNumber tagged
95 release
96 release
97 release
98 release
1995 215281996 256831997 30952 7129 211998 12459 6002 8 61999 14968 0 7 14 42000 18461 7 10 1 92001 10032 3 5 2 1
Tagging data for the 1992 year class
Year
Number screened in
millionNumber tagged
96 release
97 release
98 release
1996 84171997 83531998 20695 22320 71999 23790 0 4 92000 31430 15 7 202001 14668 4 0 8
Tagging data for the 1993 year class
Year
Number screened in
millionNumber tagged
97 release
98 release
1997 9761998 20151999 8046 0 02000 9049 0 32001 3994 0 0
Tagging data for the 1994 year classRecapt.
Year
Number screened in
millionNumber tagged
98 release
1998 37521999 02000 2450 12001 1104 1
Recapt.
Recaptured
Recaptured
Recaptured

O:\ACFM\WGREPS\WGNPBW\REPORTS\2002\Sec-3.Doc 72
Table 3.5.1 Exploratory runs for Norwegian spring-spawning herring
For explanations of each run, see the text Run 1 Run 2 Run 3 Run 4 Run 5 Run 6 Run 7 Run 8 Run 9 Run 10 Run 11 SSB 2002 4.76 4.98 4.92 5.53 5.24 5.30 4.92 5.06 2.68 4.61 1.18 SSB 2001 5.30 5.51 5.44 6.13 5.77 5.80 5.44 5.57 3.10 5.10 1.68 SSB 2000 5.71 5.90 5.83 6.60 6.16 6.14 5.83 5.94 3.45 5.48 2.34 SSB 1999 6.88 7.08 7.00 7.85 7.34 7.30 7.00 7.10 4.50 6.58 3.22 Total log-likelihood -489.62 -508.01 -491.93 -497.27 -408.92 -564.51 -491.93 -497.24 -269.60 -489.36 -265.32 Log-likelihood surveys per term -1.55 -1.55 -1.55 -1.60 -1.54 -1.55 -1.55 -1.55 -1.55 Number survey terms 95.00 95.00 95.00 95.00 95.00 95.00 95.00 95.00 0.00 95.00 0.00 Log-likelihood tag returns per term -1.75 -1.35 -1.75 -1.77 -1.64 -1.76 -1.75 -1.76 -1.72 -1.75 -1.69 Number tag return terms 157.00 218.00 159.00 157.00 119.00 157.00 159.00 157.00 157.00 157.00 157.00 Log-likelihood larval index per term -3.05 -3.04 -3.05 -3.07 -3.03 -3.72 -3.05 -4.65 -3.07 Number larval index terms 22.00 22.00 22.00 22.00 22.00 38.00 22.00 16.00 0.00 22.00 0.00 Catchability Spawning grounds 0.82 0.80 0.80 0.73 0.80 0.80 0.80 0.80 0.86 Catchability December in Ofoten 0.71 0.69 0.70 0.62 0.67 0.67 0.70 0.69 0.74 Catchability January in Ofoten 0.80 0.78 0.79 0.70 0.77 0.77 0.79 0.78 0.84 Catchability Young herring in the Barents Sea Catchability Herring in the Norwegian Sea 1.03 1.00 1.01 0.92 0.98 0.97 1.01 1.00 1.08 Terminal F 1983 0.44 0.42 0.43 0.39 0.42 0.41 0.43 0.43 1.37 0.47 2.31 Terminal F 1990 0.11 0.11 0.11 0.10 0.11 0.10 0.11 0.11 0.16 0.12 1.09 Terminal F 1991 0.18 0.17 0.17 0.15 0.16 0.16 0.17 0.17 0.53 0.19 10.07 Terminal F 1992 0.18 0.17 0.17 0.15 0.16 0.16 0.17 0.17 0.59 0.18 43.04 Terminal F 1993 0.15 0.15 0.15 0.13 0.14 0.14 0.15 0.14 0.17 0.16 0.24 Distribution parameter 0.42 0.42 0.42 0.42 0.41 0.42 0.42 0.42 0.42 Catchability larval index 4.09 4.03 4.08 3.52 3.97 3.96 4.08 4.26 Larval distribution parameter 0.60 0.60 0.60 0.61 0.59 0.55 0.60 0.48 0.61 Tagging survival 0.40 0.42 0.40 0.45 0.39 0.41 0.40 0.40 0.33 0.37 0.21

O:\ACFM\WGREPS\WGNPBW\REPORTS\2002\Sec-3.Doc 73
Table 3.5.2. NSS herringResults of stock assessment by means of ISVPA 1 and 2 refer to catch control version and the mixed version respectively of ISVPA
1 2 1 2 1 2 1 21986 225 2014 1729 414 405 1548 1461 0.862 1.3001987 127 7074 9110 808 761 2889 2847 0.393 0.4381988 135 1643 2590 2514 2329 3179 3084 0.298 0.3251989 104 1610 1791 3084 2795 3642 3510 0.068 0.0751990 86 4060 2955 3363 3225 4017 3829 0.068 0.0761991 85 11623 9207 3516 3344 4196 3881 0.029 0.0331992 104 19354 16837 3413 3255 4816 4406 0.031 0.0351993 232 53847 53497 3313 3082 5923 5466 0.023 0.0241994 479 69157 74800 3801 3442 8040 7683 0.073 0.0791995 906 20313 22762 4735 4329 9178 8933 0.115 0.1231996 1220 6702 6937 6471 6307 9558 9626 0.148 0.1481997 1427 2592 2797 8056 8357 9315 9727 0.294 0.2871998 1223 32562 36874 7537 7972 8757 9331 0.217 0.2121999 1235 20144 23698 7173 7649 9146 9905 0.155 0.1502000 1207 27094 32815 6563 7220 9628 10790 0.183 0.1712001 770 2185 2683 6746 7634 8711 9971 0.119 0.106

O:\ACFM\WGREPS\WGNPBW\REPORTS\2002\Sec-3.Doc 74
Table 3.5.2.1 Run title : Herring spring-spawn (run: SVPBJA12/V12) At 6/05/2002 14:07 Table 1 Catch numbers-at-age Numbers*10**-4 YEAR, 1907, 1908, 1909, 1910, 1911, AGE 0, 64356, 133467, 145485, 174766, 226214, 1, 95002, 128128, 160034, 51402, 309160, 2, 10832, 20641, 52337, 51833, 33125, 3, 46100, 49359, 77259, 49760, 36437, 4, 15420, 8564, 279, 6637, 164, 5, 12850, 5176, 20986, 4345, 1432, 6, 10280, 5882, 5757, 25543, 8427, 7, 8752, 6164, 2182, 3247, 26139, 8, 13406, 4847, 2554, 1337, 1759, 9, 2362, 7152, 3250, 1958, 818, 10, 1598, 2729, 7057, 1194, 1105, 11, 1181, 2023, 1161, 1814, 450, 12, 1528, 1835, 1114, 382, 532, 13, 625, 1600, 650, 334, 82, 14, 347, 612, 929, 143, 0, 15, 0, 471, 511, 239, 0, +gp, 0, 0, 0, 0, 0, 0 TOTALNUM, 284639, 378649, 481543, 374933, 645842, TONSLAND, 207600, 233400, 288500, 250000, 253500, SOPCOF %, 76, 95, 96, 104, 94, Table 1 Catch numbers-at-age Numbers*10**-4 YEAR, 1912, 1913, 1914, 1915, 1916, 1917, 1918, 1919, 1920, 1921, AGE 0, 403272, 307011, 225428, 191652, 293272, 191445, 379924, 395199, 196325, 255174, 1, 161309, 76753, 548869, 149989, 76034, 122525, 113015, 450527, 178706, 287750, 2, 39131, 13352, 30534, 38019, 9408, 19896, 47394, 32862, 33965, 18797, 3, 11509, 18248, 12214, 9505, 22908, 15571, 12287, 21032, 10103, 21429, 4, 402, 849, 1435, 588, 6732, 16635, 1372, 5146, 2914, 764, 5, 1005, 1893, 2218, 5749, 4997, 12098, 22247, 5682, 3816, 8973, 6, 1930, 3068, 3718, 2809, 10479, 2475, 12251, 35485, 2844, 1623, 7, 6837, 1436, 2805, 3267, 2707, 4881, 3528, 13401, 20466, 1861, 8, 23567, 7245, 3457, 2287, 3192, 1650, 7743, 2573, 8256, 13221, 9, 2976, 42753, 9327, 3463, 2637, 1787, 2646, 5039, 2289, 5584, 10, 965, 2480, 32806, 8167, 3192, 1444, 2450, 2144, 3538, 1432, 11, 1207, 2089, 3326, 34758, 7634, 2131, 2352, 2359, 1041, 1957, 12, 523, 587, 2152, 2548, 24637, 5087, 4410, 1823, 1041, 1002, 13, 563, 2676, 2087, 653, 1457, 18973, 8331, 2680, 1318, 1002, 14, 80, 0, 1109, 653, 416, 1031, 28912, 2037, 1318, 621, 15, 161, 0, 717, 392, 486, 412, 1666, 28302, 20466, 8973, +gp, 0, 0, 0, 0, 0, 0, 0, 0, 0, 0, 0 TOTALNUM, 655436, 480440, 882201, 454500, 470188, 418040, 650529, 1006289, 488405, 630163, TONSLAND, 245200, 290700, 356000, 306100, 296900, 276200, 433500, 498100, 316500, 258500, SOPCOF %, 105, 101, 90, 100, 101, 99, 103, 96, 99, 94, Table 1 Catch numbers-at-age Numbers*10**-4 YEAR, 1922, 1923, 1924, 1925, 1926, 1927, 1928, 1929, 1930, 1931, AGE 0, 289750, 171875, 140436, 220343, 210773, 227876, 799203, 224268, 828385, 220609, 1, 89998, 87720, 283992, 102947, 581441, 618521, 95904, 797396, 23226, 676215, 2, 46833, 14049, 12800, 12814, 6290, 19579, 37728, 25721, 42368, 3207, 3, 42630, 15843, 3976, 6540, 12719, 9147, 104076, 69814, 5084, 11403, 4, 8633, 3395, 2511, 2751, 1456, 18602, 8162, 16317, 3441, 249, 5, 16096, 40458, 6696, 5217, 16014, 12440, 33413, 15494, 15312, 2363, 6, 11487, 12920, 32110, 7209, 4913, 8138, 15814, 31262, 11871, 22382, 7, 878, 9431, 11642, 38036, 6915, 4999, 8162, 17414, 39571, 11688, 8, 2341, 1226, 7609, 14133, 28752, 7906, 7907, 5896, 23227, 26858, 9, 11267, 2075, 1674, 10813, 12829, 32320, 13773, 8913, 9291, 14300, 10, 3292, 9431, 1750, 2182, 7370, 11626, 20150, 13712, 13420, 5844, 11, 1317, 2358, 4261, 1707, 1911, 7441, 5994, 15631, 12216, 6590, 12, 1756, 1415, 1141, 5312, 1729, 1860, 3826, 5485, 28216, 5720, 13, 1098, 1132, 761, 1613, 4367, 2441, 2168, 2742, 7570, 20641, 14, 1390, 849, 685, 759, 1092, 2558, 1530, 1508, 3785, 3109, 15, 13535, 8582, 4337, 5122, 3276, 5929, 1913, 2057, 3269, 4476, +gp, 0, 0, 0, 0, 0, 0, 0, 0, 0, 0, 0 TOTALNUM, 542302, 382758, 516380, 437497, 901847, 991382, 1159721, 1253630, 1070252, 1035655, TONSLAND, 349900, 330500, 295000, 355500, 403800, 489900, 611900, 624600, 704500, 538200, SOPCOF %, 102, 99, 94, 100, 89, 91, 103, 89, 107, 89,

O:\ACFM\WGREPS\WGNPBW\REPORTS\2002\Sec-3.Doc 75
Table 3.5.2.1 Continued Table 1 Catch numbers-at-age Numbers*10**-4 YEAR, 1932, 1933, 1934, 1935, 1936, 1937, 1938, 1939, 1940, 1941, AGE 0, 853301, 1053080, 657522, 334444, 273771, 818806, 360691, 269555, 1181358, 737439, 1, 330737, 618820, 354379, 721694, 587802, 127370, 564157, 667468, 937535, 919347, 2, 45673, 49899, 92484, 26110, 22859, 6669, 3376, 25322, 19625, 23376, 3, 1281, 152952, 35847, 15343, 12320, 14391, 7249, 3939, 30696, 57884, 4, 5047, 1120, 1760, 6780, 22580, 14550, 10019, 2713, 299, 1525, 5, 701, 4481, 5720, 69682, 23332, 41005, 35859, 9256, 2246, 803, 6, 5467, 871, 5532, 8475, 99601, 12566, 65389, 32716, 28144, 4335, 7, 26636, 6473, 691, 7722, 10035, 78923, 15029, 39419, 24551, 24888, 8, 10514, 28382, 3080, 942, 6774, 6834, 74354, 8937, 34431, 13247, 9, 32804, 13942, 12572, 7157, 1254, 4630, 5010, 34951, 6138, 13809, 10, 18505, 30000, 5657, 22976, 7276, 1543, 6592, 1436, 32036, 3693, 11, 5748, 15311, 11440, 10735, 20071, 4189, 791, 5107, 898, 11320, 12, 6309, 4979, 7292, 24106, 10537, 18518, 5273, 958, 5090, 1525, 13, 3645, 4730, 1509, 14690, 20572, 8377, 13974, 1756, 599, 1445, 14, 18225, 1369, 1006, 2448, 10788, 13448, 5801, 7660, 599, 401, 15, 3084, 12697, 5657, 10546, 10788, 14109, 23730, 14523, 14671, 2810, +gp, 0, 0, 0, 0, 0, 0, 0, 0, 0, 0, 0 TOTALNUM, 1367676, 1999109, 1202147, 1283847, 1140358, 1185928, 1197294, 1125717, 2318914, 1817848, TONSLAND, 652600, 818200, 451700, 649400, 775200, 695900, 783600, 703400, 923100, 594000, SOPCOF %, 103, 96, 103, 81, 84, 88, 80, 100, 109, 98, Table 1 Catch numbers-at-age Numbers*10**-4 YEAR, 1942, 1943, 1944, 1945, 1946, 1947, 1948, 1949, 1950, 1951, AGE 0, 533526, 702770, 258788, 375255, 196012, 242324, 254610, 321128, 511260, 163550, 1, 577313, 109802, 270716, 573554, 297393, 117378, 415863, 450521, 200000, 760770, 2, 32791, 24161, 7257, 28817, 15686, 9132, 8101, 16663, 60000, 40000, 3, 26023, 30120, 7852, 4502, 16409, 13958, 12291, 8071, 27620, 660, 4, 615, 2259, 3423, 5015, 5581, 29493, 48299, 12539, 18480, 38380, 5, 5077, 8209, 3516, 11830, 5883, 6320, 106195, 51722, 1855, 17240, 6, 1616, 25305, 17577, 6301, 11313, 5568, 9288, 54269, 54700, 16440, 7, 7077, 1732, 26366, 18387, 7391, 9781, 8050, 4310, 62860, 51560, 8, 26386, 5046, 2128, 32917, 22324, 4966, 10217, 3331, 7950, 60200, 9, 10847, 12427, 6846, 2572, 38916, 17154, 6502, 5682, 8860, 7710, 10, 9924, 7305, 14247, 9772, 5129, 27085, 24149, 4114, 10950, 8270, 11, 3846, 4293, 7679, 21088, 11011, 4213, 37772, 10188, 8690, 10310, 12, 6770, 3013, 3978, 8486, 25039, 8426, 5883, 20180, 19450, 10760, 13, 308, 2033, 3793, 5015, 8899, 16702, 14242, 3331, 36830, 25350, 14, 1692, 151, 833, 1672, 3620, 5267, 21053, 5682, 6640, 34800, 15, 2693, 1431, 1573, 1543, 4224, 5568, 16100, 13518, 10700, 4740, +gp, 0, 0, 0, 0, 0, 0, 0, 0, 23730, 30510, 0 TOTALNUM, 1246504, 940057, 636571, 1106725, 674829, 523333, 998615, 985248, 1070575, 1281250, TONSLAND, 592700, 556600, 587800, 554400, 586200, 710400, 1012600, 783000, 933000, 1278400, SOPCOF %, 124, 157, 152, 94, 96, 139, 97, 110, 104, 100, Table 1 Catch numbers-at-age Numbers*10**-4 YEAR, 1952, 1953, 1954, 1955, 1956, 1957, 1958, 1959, 1960, 1961, AGE 0, 1372160, 569720, 1067600, 517560, 536390, 500190, 966700, 1789630, 1288430, 620750, 1, 914970, 505500, 707110, 287110, 202370, 329080, 279810, 198530, 1358080, 1607560, 2, 123290, 58130, 85540, 51010, 62710, 21950, 66640, 32550, 39250, 288480, 3, 3930, 74010, 26630, 9300, 11650, 2330, 1750, 1510, 12170, 3120, 4, 6050, 4660, 143550, 27640, 25160, 37330, 1790, 2680, 1820, 810, 5, 60230, 10090, 14290, 204510, 31420, 15380, 11090, 2590, 2810, 410, 6, 13630, 35560, 23600, 11430, 255510, 22850, 8930, 14660, 2440, 1500, 7, 20450, 8190, 49030, 18960, 11000, 198530, 19440, 11480, 9620, 1940, 8, 38020, 11090, 12810, 27470, 20390, 7200, 97350, 24070, 7330, 6160, 9, 37790, 31410, 19980, 8530, 26420, 12730, 7070, 110380, 20390, 4920, 10, 7920, 39490, 44040, 19340, 13070, 18250, 12300, 8860, 116300, 1361, 11, 8570, 6170, 46070, 29560, 19830, 8840, 20090, 12430, 8520, 72810, 12, 10770, 9120, 8840, 20320, 27280, 12120, 9870, 19800, 12970, 4970, 13, 10680, 9410, 10060, 5870, 16330, 14930, 7740, 8850, 15350, 4500, 14, 18650, 9880, 13300, 8460, 6300, 13160, 7090, 7740, 5670, 6300, 15, 25630, 21550, 12680, 10360, 8890, 3370, 6940, 8520, 4720, 2170, +gp, 30810, 51490, 67640, 47700, 47620, 24770, 18620, 15070, 12170, 3840, 0 TOTALNUM, 2703550, 1455470, 2352770, 1305130, 1322340, 1243010, 1543220, 2269350, 2918040, 2631601, TONSLAND, 1254800, 1090600, 1644500, 1359800, 1659400, 1319500, 986600, 1111100, 1101800, 830100, SOPCOF %, 100, 100, 100, 100, 100, 100, 100, 100, 100, 107,

O:\ACFM\WGREPS\WGNPBW\REPORTS\2002\Sec-3.Doc 76
Table 3.5.2.1 Continued Table 1 Catch numbers-at-age Numbers*10**-4 YEAR, 1962, 1963, 1964, 1965, 1966, 1967, 1968, 1969, 1970, 1971, AGE 0, 369320, 480700, 361300, 230300, 392650, 42680, 178360, 56120, 11930, 3050, 1, 408110, 211920, 272830, 378090, 66280, 987710, 43700, 50710, 52940, 4290, 2, 104130, 204530, 22030, 285360, 167800, 7040, 38830, 14190, 3320, 8510, 3, 184380, 76040, 11460, 8990, 204870, 139230, 9910, 18820, 630, 182, 4, 800, 83580, 39900, 25620, 2690, 325400, 188050, 80, 1860, 102, 5, 310, 530, 204580, 57110, 46660, 2660, 138740, 880, 60, 124, 6, 720, 180, 1370, 219970, 130600, 42130, 1422, 470, 330, 36, 7, 2020, 360, 150, 1950, 288450, 113200, 9400, 70, 330, 111, 8, 1190, 1830, 300, 1490, 3790, 172080, 13410, 1170, 100, 113, 9, 5910, 930, 2490, 740, 1430, 890, 34510, 3360, 1340, 36, 10, 5260, 10770, 2930, 1910, 1740, 570, 200, 3600, 2620, 441, 11, 11700, 9250, 9560, 4000, 2620, 350, 110, 30, 2810, 691, 12, 81350, 17410, 8240, 10050, 1100, 850, 83, 20, 30, 545, 13, 4420, 92370, 15300, 10780, 6910, 890, 250, 20, 10, 0, 14, 5470, 7960, 77280, 13870, 7210, 1750, 260, 20, 20, 2, 15, 6560, 6040, 4580, 70400, 9670, 1430, 180, 40, 10, 12, +gp, 8670, 12490, 29100, 17910, 46000, 9010, 1520, 200, 190, 0, 0 TOTALNUM, 1200320, 1216890, 1063400, 1338540, 1380470, 1847870, 658935, 149800, 78530, 18245, TONSLAND, 848600, 984500, 1281800, 1547700, 1955000, 1677200, 712200, 67800, 62300, 21100, SOPCOF %, 100, 100, 100, 100, 100, 100, 100, 100, 100, 100, Table 1 Catch numbers-at-age Numbers*10**-4 YEAR, 1972, 1973, 1974, 1975, 1976, 1977, 1978, 1979, 1980, 1981, AGE 0, 34710, 2930, 6590, 3060, 2010, 4300, 2010, 3260, 690, 830, 1, 4100, 350, 780, 360, 240, 620, 240, 380, 80, 110, 2, 2040, 170, 390, 180, 120, 310, 120, 190, 40, 1190, 3, 3538, 239, 10, 327, 2325, 2210, 302, 635, 641, 417, 4, 348, 2520, 24, 13, 544, 2360, 1216, 187, 581, 459, 5, 358, 65, 2451, 91, 0, 34, 2032, 687, 228, 860, 6, 248, 151, 26, 3067, 0, 0, 87, 1122, 817, 220, 7, 69, 28, 20, 1, 1309, 42, 0, 33, 1584, 451, 8, 149, 18, 0, 0, 0, 1077, 62, 0, 44, 828, 9, 20, 0, 0, 0, 0, 0, 503, 0, 1, 35, 10, 0, 0, 0, 0, 0, 0, 0, 253, 0, 10, 11, 49, 0, 0, 0, 0, 0, 0, 0, 269, 11, 12, 59, 0, 0, 0, 0, 0, 0, 0, 0, 96, 13, 59, 0, 0, 0, 0, 0, 0, 0, 0, 0, 14, 0, 18, 0, 0, 0, 0, 0, 0, 0, 0, 15, 0, 0, 0, 0, 0, 0, 0, 0, 0, 0, +gp, 0, 0, 0, 0, 0, 0, 0, 0, 0, 0, 0 TOTALNUM, 45748, 6489, 10291, 7099, 6548, 10953, 6572, 6747, 4975, 5518, TONSLAND, 13161, 7017, 7619, 13713, 10436, 22706, 19824, 12864, 18577, 13736, SOPCOF %, 99, 100, 101, 100, 100, 100, 100, 100, 100, 100, Table 1 Catch numbers-at-age Numbers*10**-4 YEAR, 1982, 1983, 1984, 1985, 1986, 1987, 1988, 1989, 1990, 1991, AGE 0, 2260, 12700, 3386, 2857, 1381, 1385, 1549, 712, 102, 10, 1, 110, 468, 170, 1315, 138, 633, 279, 193, 40, 337, 2, 20, 168, 249, 20722, 309, 3577, 911, 2520, 1554, 333, 3, 1382, 318, 448, 2150, 53979, 1978, 6292, 289, 1863, 844, 4, 789, 2119, 539, 1550, 1759, 50139, 2506, 362, 266, 278, 5, 451, 952, 6154, 1650, 1450, 1867, 55037, 565, 1188, 141, 6, 626, 618, 1820, 13000, 1550, 350, 945, 32429, 1085, 1470, 7, 196, 682, 1264, 5900, 10500, 706, 368, 347, 22628, 887, 8, 508, 129, 1561, 5500, 7500, 2800, 596, 80, 129, 21885, 9, 605, 460, 722, 6300, 4200, 1200, 1458, 68, 152, 250, 10, 12, 733, 1634, 1000, 7700, 950, 887, 330, 204, 46, 11, 4, 14, 648, 3100, 1947, 450, 282, 138, 242, 9, 12, 4, 4, 0, 5000, 6600, 783, 336, 68, 65, 69, 13, 12, 14, 0, 0, 8000, 650, 268, 32, 18, 10, 14, 0, 86, 0, 0, 0, 700, 157, 26, 59, 26, 15, 0, 0, 165, 0, 0, 45, 54, 0, 17, 53, +gp, 0, 0, 0, 264, 247, 0, 0, 0, 31, 1, 0 TOTALNUM, 6978, 19466, 18760, 70309, 107260, 68213, 71925, 38158, 29641, 26648, TONSLAND, 16655, 23054, 53532, 169872, 225256, 127306, 135301, 103830, 86411, 84683, SOPCOF %, 100, 100, 100, 100, 100, 100, 100, 100, 100, 100,

O:\ACFM\WGREPS\WGNPBW\REPORTS\2002\Sec-3.Doc 77
Table 3.5.2.1 Continued Table 1 Catch numbers-at-age Numbers*10**-4 YEAR, 1992, 1993, 1994, 1995, 1996, 1997, 1998, 1999, 2000, 2001, AGE 0, 163, 657, 43, 0, 0, 0, 0, 0, 0, 0, 1, 15, 13, 2, 0, 0, 0, 0, 0, 0, 0, 2, 134, 724, 810, 113, 3014, 2182, 8289, 503, 1440, 208, 3, 1259, 2841, 3250, 5759, 3437, 13045, 7032, 13763, 8402, 10229, 4, 3310, 10687, 11009, 34646, 71363, 27095, 24237, 3582, 56038, 16068, 5, 498, 8727, 36392, 62281, 157100, 179578, 36831, 13481, 3493, 42682, 6, 119, 863, 16480, 63784, 94058, 199362, 176032, 42943, 11072, 3875, 7, 1198, 365, 1558, 23109, 40628, 76121, 126375, 160496, 40446, 9599, 8, 575, 2960, 814, 1551, 10341, 32649, 38148, 116426, 129925, 29646, 9, 22568, 1863, 3733, 1585, 568, 6087, 12997, 29139, 104500, 83914, 10, 248, 41011, 3566, 6975, 737, 2002, 4250, 10601, 21698, 50711, 11, 64, 0, 64541, 8374, 6609, 3241, 2534, 1452, 7159, 7367, 12, 25, 0, 283, 91188, 1757, 9052, 348, 4004, 1626, 2372, 13, 124, 0, 46, 407, 83655, 1912, 11260, 720, 2270, 351, 14, 0, 0, 10, 25, 0, 37033, 563, 8860, 2332, 336, 15, 0, 0, 207, 0, 0, 30, 10852, 0, 3447, 0, +gp, 0, 0, 0, 45, 0, 0, 0, 6398, 3734, 2216, 0 TOTALNUM, 30300, 70711, 142742, 299842, 473266, 589388, 459749, 412369, 397582, 259573, TONSLAND, 104448, 232457, 479228, 905501, 1220283, 1426507, 1223131, 1235433, 1207201, 770054, SOPCOF %, 100, 100, 102, 100, 101, 100, 100, 100, 100, 99, Table 3.5.2.2. Run title : Herring spring-spawn (run: SVPBJA12/V12) At 6/05/2002 14:07 Table 2 Catch weights-at-age (kg) YEAR, 1907, 1908, 1909, 1910, 1911, AGE 0, .0080, .0080, .0080, .0080, .0080, 1, .0230, .0230, .0230, .0230, .0230, 2, .0580, .0580, .0580, .0580, .0580, 3, .1100, .1100, .1100, .1100, .1100, 4, .1970, .1970, .1970, .1970, .1970, 5, .2510, .2510, .2510, .2510, .2510, 6, .2780, .2780, .2780, .2780, .2780, 7, .3020, .3020, .3020, .3020, .3020, 8, .3240, .3240, .3240, .3240, .3240, 9, .3390, .3390, .3390, .3390, .3390, 10, .3550, .3550, .3550, .3550, .3550, 11, .3670, .3670, .3670, .3670, .3670, 12, .3730, .3730, .3730, .3730, .3730, 13, .3800, .3800, .3800, .3800, .3800, 14, .3880, .3880, .3880, .3880, .3880, 15, .3970, .3970, .3970, .3970, .3970, +gp, .4010, .4010, .4010, .4010, .4010, 0 SOPCOFAC, .7618, .9508, .9602, 1.0354, .9350, Table 2 Catch weights-at-age (kg) YEAR, 1912, 1913, 1914, 1915, 1916, 1917, 1918, 1919, 1920, 1921, AGE 0, .0080, .0080, .0080, .0080, .0080, .0080, .0080, .0080, .0080, .0080, 1, .0230, .0230, .0230, .0230, .0230, .0230, .0230, .0230, .0230, .0230, 2, .0580, .0580, .0580, .0580, .0580, .0580, .0580, .0580, .0580, .0580, 3, .1100, .1100, .1100, .1100, .1100, .1100, .1100, .1100, .1100, .1100, 4, .1970, .1970, .1970, .1970, .1970, .1970, .1970, .1970, .1970, .1970, 5, .2510, .2510, .2510, .2510, .2510, .2510, .2510, .2510, .2510, .2510, 6, .2780, .2780, .2780, .2780, .2780, .2780, .2780, .2780, .2780, .2780, 7, .3020, .3020, .3020, .3020, .3020, .3020, .3020, .3020, .3020, .3020, 8, .3240, .3240, .3240, .3240, .3240, .3240, .3240, .3240, .3240, .3240, 9, .3390, .3390, .3390, .3390, .3390, .3390, .3390, .3390, .3390, .3390, 10, .3550, .3550, .3550, .3550, .3550, .3550, .3550, .3550, .3550, .3550, 11, .3670, .3670, .3670, .3670, .3670, .3670, .3670, .3670, .3670, .3670, 12, .3730, .3730, .3730, .3730, .3730, .3730, .3730, .3730, .3730, .3730, 13, .3800, .3800, .3800, .3800, .3800, .3800, .3800, .3800, .3800, .3800, 14, .3880, .3880, .3880, .3880, .3880, .3880, .3880, .3880, .3880, .3880, 15, .3970, .3970, .3970, .3970, .3970, .3970, .3970, .3970, .3970, .3970, +gp, .4010, .4010, .4010, .4010, .4010, .4010, .4010, .4010, .4010, .4010, 0 SOPCOFAC, 1.0506, 1.0145, .8962, .9958, 1.0087, .9936, 1.0348, .9581, .9928, .9405, 1

O:\ACFM\WGREPS\WGNPBW\REPORTS\2002\Sec-3.Doc 78
Table 3.5.2.2 Continued Table 2 Catch weights-at-age (kg) YEAR, 1922, 1923, 1924, 1925, 1926, 1927, 1928, 1929, 1930, 1931, AGE 0, .0080, .0080, .0080, .0080, .0080, .0080, .0080, .0080, .0080, .0080, 1, .0230, .0230, .0230, .0230, .0230, .0230, .0230, .0230, .0230, .0230, 2, .0580, .0580, .0580, .0580, .0580, .0580, .0580, .0580, .0580, .0580, 3, .1100, .1100, .1100, .1100, .1100, .1100, .1100, .1100, .1100, .1100, 4, .1970, .1970, .1970, .1970, .1970, .1970, .1970, .1970, .1970, .1970, 5, .2510, .2510, .2510, .2510, .2510, .2510, .2510, .2510, .2510, .2510, 6, .2780, .2780, .2780, .2780, .2780, .2780, .2780, .2780, .2780, .2780, 7, .3020, .3020, .3020, .3020, .3020, .3020, .3020, .3020, .3020, .3020, 8, .3240, .3240, .3240, .3240, .3240, .3240, .3240, .3240, .3240, .3240, 9, .3390, .3390, .3390, .3390, .3390, .3390, .3390, .3390, .3390, .3390, 10, .3550, .3550, .3550, .3550, .3550, .3550, .3550, .3550, .3550, .3550, 11, .3670, .3670, .3670, .3670, .3670, .3670, .3670, .3670, .3670, .3670, 12, .3730, .3730, .3730, .3730, .3730, .3730, .3730, .3730, .3730, .3730, 13, .3800, .3800, .3800, .3800, .3800, .3800, .3800, .3800, .3800, .3800, 14, .3880, .3880, .3880, .3880, .3880, .3880, .3880, .3880, .3880, .3880, 15, .3970, .3970, .3970, .3970, .3970, .3970, .3970, .3970, .3970, .3970, +gp, .4010, .4010, .4010, .4010, .4010, .4010, .4010, .4010, .4010, .4010, 0 SOPCOFAC, 1.0229, .9948, .9403, 1.0013, .8856, .9057, 1.0322, .8874, 1.0668, .8947, Table 2 Catch weights-at-age (kg) YEAR, 1932, 1933, 1934, 1935, 1936, 1937, 1938, 1939, 1940, 1941, AGE 0, .0080, .0080, .0080, .0080, .0080, .0080, .0080, .0080, .0080, .0080, 1, .0230, .0230, .0230, .0230, .0230, .0230, .0230, .0230, .0230, .0230, 2, .0580, .0580, .0580, .0580, .0580, .0580, .0580, .0580, .0580, .0580, 3, .1100, .1100, .1100, .1100, .1100, .1100, .1100, .1100, .1100, .1100, 4, .1970, .1970, .1970, .1970, .1970, .1970, .1970, .1970, .1970, .1970, 5, .2510, .2510, .2510, .2510, .2510, .2510, .2510, .2510, .2510, .2510, 6, .2780, .2780, .2780, .2780, .2780, .2780, .2780, .2780, .2780, .2780, 7, .3020, .3020, .3020, .3020, .3020, .3020, .3020, .3020, .3020, .3020, 8, .3240, .3240, .3240, .3240, .3240, .3240, .3240, .3240, .3240, .3240, 9, .3390, .3390, .3390, .3390, .3390, .3390, .3390, .3390, .3390, .3390, 10, .3550, .3550, .3550, .3550, .3550, .3550, .3550, .3550, .3550, .3550, 11, .3670, .3670, .3670, .3670, .3670, .3670, .3670, .3670, .3670, .3670, 12, .3730, .3730, .3730, .3730, .3730, .3730, .3730, .3730, .3730, .3730, 13, .3800, .3800, .3800, .3800, .3800, .3800, .3800, .3800, .3800, .3800, 14, .3880, .3880, .3880, .3880, .3880, .3880, .3880, .3880, .3880, .3880, 15, .3970, .3970, .3970, .3970, .3970, .3970, .3970, .3970, .3970, .3970, +gp, .4010, .4010, .4010, .4010, .4010, .4010, .4010, .4010, .4010, .4010, 0 SOPCOFAC, 1.0326, .9588, 1.0350, .8064, .8408, .8841, .8003, 1.0026, 1.0923, .9767, Table 2 Catch weights-at-age (kg) YEAR, 1942, 1943, 1944, 1945, 1946, 1947, 1948, 1949, 1950, 1951, AGE 0, .0080, .0080, .0080, .0080, .0080, .0080, .0080, .0080, .0070, .0090, 1, .0230, .0230, .0230, .0230, .0230, .0230, .0230, .0230, .0250, .0290, 2, .0580, .0580, .0580, .0580, .0580, .0580, .0580, .0580, .0580, .0680, 3, .1100, .1100, .1100, .1100, .1100, .1100, .1100, .1100, .1100, .1300, 4, .1970, .1970, .1970, .1970, .1970, .1970, .1970, .1970, .1880, .2220, 5, .2510, .2510, .2510, .2510, .2510, .2510, .2510, .2510, .2110, .2490, 6, .2780, .2780, .2780, .2780, .2780, .2780, .2780, .2780, .2340, .2760, 7, .3020, .3020, .3020, .3020, .3020, .3020, .3020, .3020, .2530, .2980, 8, .3240, .3240, .3240, .3240, .3240, .3240, .3240, .3240, .2660, .3140, 9, .3390, .3390, .3390, .3390, .3390, .3390, .3390, .3390, .2800, .3300, 10, .3550, .3550, .3550, .3550, .3550, .3550, .3550, .3550, .2940, .3460, 11, .3670, .3670, .3670, .3670, .3670, .3670, .3670, .3670, .3030, .3570, 12, .3730, .3730, .3730, .3730, .3730, .3730, .3730, .3730, .3120, .3680, 13, .3800, .3800, .3800, .3800, .3800, .3800, .3800, .3800, .3200, .3770, 14, .3880, .3880, .3880, .3880, .3880, .3880, .3880, .3880, .3230, .3810, 15, .3970, .3970, .3970, .3970, .3970, .3970, .3970, .3970, .3310, .3900, +gp, .4010, .4010, .4010, .4010, .4010, .4010, .4010, .4010, .3350, .3950, 0 SOPCOFAC, 1.2394, 1.5694, 1.5171, .9445, .9584, 1.3948, .9669, 1.0998, 1.0412, 1.0009,

O:\ACFM\WGREPS\WGNPBW\REPORTS\2002\Sec-3.Doc 79
Table 3.5.2.2 Continued Table 2 Catch weights-at-age (kg) YEAR, 1952, 1953, 1954, 1955, 1956, 1957, 1958, 1959, 1960, 1961, AGE 0, .0080, .0080, .0080, .0080, .0080, .0080, .0090, .0090, .0060, .0060, 1, .0260, .0270, .0260, .0270, .0280, .0280, .0300, .0300, .0110, .0100, 2, .0610, .0630, .0620, .0630, .0660, .0660, .0700, .0710, .0740, .0450, 3, .1150, .1200, .1170, .1190, .1260, .1270, .1330, .1350, .1190, .0870, 4, .1970, .2050, .2010, .2040, .2150, .2160, .2270, .2310, .1880, .1590, 5, .2210, .2300, .2250, .2290, .2410, .2430, .2550, .2590, .2770, .2760, 6, .2450, .2550, .2500, .2540, .2680, .2690, .2830, .2870, .3370, .3220, 7, .2650, .2750, .2690, .2740, .2890, .2900, .3050, .3100, .3180, .3720, 8, .2790, .2900, .2840, .2890, .3040, .3060, .3210, .3270, .3630, .3630, 9, .2930, .3050, .2990, .3040, .3200, .3220, .3380, .3440, .3790, .3930, 10, .3080, .3200, .3130, .3180, .3360, .3380, .3550, .3600, .3600, .4070, 11, .3170, .3300, .3230, .3280, .3460, .3480, .3660, .3720, .4200, .3970, 12, .3270, .3400, .3330, .3380, .3570, .3590, .3770, .3830, .4110, .4220, 13, .3350, .3470, .3410, .3460, .3650, .3670, .3860, .3920, .4390, .4470, 14, .3390, .3510, .3450, .3500, .3690, .3710, .3900, .3970, .4500, .4650, 15, .3460, .3590, .3520, .3580, .3780, .3800, .3990, .4060, .4440, .4520, +gp, .3510, .3640, .3570, .3630, .3830, .3850, .4040, .4110, .4480, .4520, 0 SOPCOFAC, .9963, .9994, 1.0006, .9995, 1.0013, 1.0030, .9985, 1.0004, 1.0014, 1.0658, Table 2 Catch weights-at-age (kg) YEAR, 1962, 1963, 1964, 1965, 1966, 1967, 1968, 1969, 1970, 1971, AGE 0, .0090, .0080, .0090, .0090, .0080, .0090, .0100, .0090, .0080, .0110, 1, .0230, .0260, .0240, .0160, .0170, .0150, .0270, .0210, .0580, .0530, 2, .0550, .0470, .0590, .0480, .0400, .0360, .0490, .0470, .0850, .1210, 3, .0850, .0980, .1390, .0890, .0630, .0660, .0750, .0720, .1050, .1770, 4, .1480, .1710, .2190, .2170, .2460, .0930, .1080, .1050, .1710, .2160, 5, .2880, .2750, .2390, .2340, .2600, .3050, .1580, .1520, .2560, .2500, 6, .3330, .2680, .2980, .2620, .2650, .3050, .3750, .2960, .2160, .2770, 7, .3600, .3230, .2950, .3310, .3010, .3100, .3830, .3760, .2770, .3050, 8, .3520, .3290, .3390, .3600, .4100, .3330, .3640, .3290, .2980, .3330, 9, .3500, .3360, .3500, .3670, .4250, .3590, .3820, .3290, .3040, .3530, 10, .3740, .3410, .3580, .3860, .4560, .4130, .4410, .3410, .3050, .3660, 11, .3840, .3580, .3510, .3950, .4600, .4460, .4100, .3630, .3090, .3770, 12, .3740, .3850, .3670, .3930, .4670, .4010, .4420, .3850, .3570, .3880, 13, .3940, .3530, .3750, .4040, .4460, .4080, .5170, .3770, .3480, .3990, 14, .3990, .3810, .3720, .4010, .4590, .4390, .4910, .4510, .3570, .4190, 15, .4110, .3860, .4270, .4290, .4650, .4270, .4640, .4230, .3670, .4440, +gp, .4160, .3860, .4340, .4370, .4740, .4310, .4870, .4290, .3760, .4440, 0 SOPCOFAC, .9997, 1.0003, .9995, .9995, 1.0001, 1.0005, .9990, 1.0036, 1.0030, 1.0001, Table 2 Catch weights-at-age (kg) YEAR, 1972, 1973, 1974, 1975, 1976, 1977, 1978, 1979, 1980, 1981, AGE 0, .0110, .0060, .0060, .0090, .0070, .0110, .0120, .0100, .0120, .0100, 1, .0290, .0530, .0550, .0790, .0620, .0910, .1000, .0880, .1010, .0820, 2, .0620, .1060, .1170, .1690, .1320, .1930, .2100, .1810, .2020, .1630, 3, .1030, .1610, .1680, .2410, .1890, .3160, .2740, .2930, .2660, .1960, 4, .1540, .2130, .2220, .3180, .2500, .3500, .4240, .3590, .3990, .2910, 5, .2150, .2390, .2490, .3580, .2800, .3980, .4540, .4160, .4490, .3410, 6, .2580, .2550, .2650, .3810, .2980, .4390, .4950, .4360, .4600, .3680, 7, .2950, .2770, .2880, .4130, .3230, .4950, .5240, .4820, .4850, .3800, 8, .3220, .2870, .2990, .4290, .3360, .5110, .5960, .4820, .4720, .3970, 9, .3410, .3240, .3370, .4840, .3790, .5580, .6130, .5390, .6180, .4360, 10, .3540, .3380, .3520, .5060, .3960, .5830, .6500, .5530, .6450, .4500, 11, .3650, .2570, .2670, .3840, .3000, .5370, .5900, .5180, .6080, .4920, 12, .3760, .2570, .3240, .4660, .3640, .5370, .5900, .5180, .5940, .4810, 13, .3870, .2570, .3240, .4660, .3640, .5370, .5900, .5180, .5940, .4810, 14, .4060, .2570, .3240, .4660, .3640, .5370, .5900, .5180, .5940, .4810, 15, .4300, .2570, .3240, .4660, .3640, .5370, .5900, .5180, .5940, .4810, +gp, .4300, .2570, .3240, .4660, .3640, .5370, .5900, .5180, .5940, .4810, 0 SOPCOFAC, .9935, 1.0011, 1.0051, 1.0002, 1.0004, .9991, .9998, 1.0016, .9999, 1.0007,

O:\ACFM\WGREPS\WGNPBW\REPORTS\2002\Sec-3.Doc 80
Table 3.5.2.2 Continued Table 2 Catch weights-at-age (kg) YEAR, 1982, 1983, 1984, 1985, 1986, 1987, 1988, 1989, 1990, 1991, AGE 0, .0100, .0110, .0090, .0090, .0070, .0100, .0080, .0100, .0070, .0070, 1, .0870, .0900, .0470, .0220, .0770, .0750, .0620, .0600, .0780, .0150, 2, .1590, .1650, .1450, .0220, .0970, .0910, .0750, .2040, .1020, .1040, 3, .2560, .2170, .2180, .2140, .0550, .1240, .1240, .1880, .2300, .2080, 4, .3120, .2650, .2620, .2770, .2490, .1730, .1540, .2640, .2390, .2500, 5, .3780, .3370, .3250, .2950, .2940, .2530, .1940, .2600, .2660, .2880, 6, .4150, .3780, .3460, .3380, .3120, .2320, .2410, .2820, .3050, .3120, 7, .4350, .4100, .3810, .3600, .3520, .3120, .2650, .3060, .3080, .3160, 8, .4490, .4260, .4000, .3810, .3740, .3280, .3040, .3090, .3760, .3300, 9, .4480, .4350, .4130, .3970, .3980, .3490, .3050, .3910, .4070, .3440, 10, .5060, .4440, .4050, .4090, .4020, .3530, .3170, .4220, .4120, .3720, 11, .4930, .4680, .4260, .4170, .4010, .3700, .3080, .3640, .4240, .3540, 12, .4990, .4610, .4150, .4350, .4100, .3850, .3340, .4290, .4280, .3980, 13, .4990, .4610, .4150, .4350, .4100, .3850, .3340, .4290, .4280, .3980, 14, .4990, .4610, .4150, .4350, .4100, .3850, .3340, .4290, .4280, .3980, 15, .4990, .4610, .4150, .4350, .4100, .3850, .3340, .4290, .4280, .3980, +gp, .4990, .4610, .4150, .4350, .4100, .3850, .3340, .4290, .4280, .3980, 0 SOPCOFAC, 1.0001, .9981, .9999, .9997, 1.0010, .9979, .9998, 1.0007, .9992, 1.0015, Table 2 Catch weights-at-age (kg) YEAR, 1992, 1993, 1994, 1995, 1996, 1997, 1998, 1999, 2000, 2001, AGE 0, .0070, .0070, .0070, .0070, .0070, .0070, .0070, .0070, .0070, .0070, 1, .0750, .0300, .0630, .0630, .0630, .0630, .0630, .0630, .0630, .0630, 2, .1030, .1060, .1020, .1020, .1360, .0890, .1110, .0960, .1240, .1050, 3, .1910, .1530, .1940, .1530, .1360, .1670, .1500, .1730, .1750, .1660, 4, .2330, .2430, .2390, .1920, .1680, .1840, .2160, .2280, .2220, .2140, 5, .3040, .2820, .2800, .2340, .2060, .2070, .2210, .2620, .2420, .2520, 6, .3370, .3200, .3170, .2830, .2620, .2320, .2490, .2740, .2890, .2680, 7, .3650, .3300, .3280, .3280, .3090, .2770, .2770, .2920, .3030, .3050, 8, .3610, .3650, .3560, .3490, .3370, .3050, .3160, .3070, .3100, .3080, 9, .3710, .3730, .3720, .3560, .3660, .3310, .3380, .3350, .3280, .3220, 10, .4030, .3790, .3900, .3740, .3600, .3280, .3740, .3620, .3490, .3370, 11, .3650, .3800, .3790, .3660, .3610, .3440, .3720, .3710, .3830, .3630, 12, .3940, .3850, .3990, .3930, .3670, .3430, .3660, .3990, .4110, .3530, 13, .4040, .3900, .4030, .3870, .3790, .3970, .3960, .3960, .4100, .3780, 14, .4060, .3950, .4050, .4000, .3790, .3570, .3770, .4000, .4190, .4000, 15, .4080, .4000, .4070, .4000, .3790, .5100, .4060, .4000, .4090, .4270, +gp, .4100, .4050, .4050, .4000, .3790, .5100, .4060, .4040, .4090, .4270, 0 SOPCOFAC, 1.0024, .9981, 1.0192, 1.0000, 1.0075, .9996, .9995, 1.0020, .9996, .9892,

O:\ACFM\WGREPS\WGNPBW\REPORTS\2002\Sec-3.Doc 81
Table 3.5.2.3. Run title : Herring spring-spawn (run: SVPBJA12/V12) At 6/05/2002 14:07 Table 3 Stock weights-at-age (kg) YEAR, 1907, 1908, 1909, 1910, 1911, AGE 0, .0010, .0010, .0010, .0010, .0010, 1, .0080, .0080, .0080, .0080, .0080, 2, .0470, .0470, .0470, .0470, .0470, 3, .1000, .1000, .1000, .1000, .1000, 4, .1990, .1990, .1990, .1990, .1990, 5, .2370, .2370, .2370, .2370, .2370, 6, .2670, .2670, .2670, .2670, .2670, 7, .2860, .2860, .2860, .2860, .2860, 8, .3070, .3070, .3070, .3070, .3070, 9, .3150, .3150, .3150, .3150, .3150, 10, .3240, .3240, .3240, .3240, .3240, 11, .3320, .3320, .3320, .3320, .3320, 12, .3390, .3390, .3390, .3390, .3390, 13, .3480, .3480, .3480, .3480, .3480, 14, .3540, .3540, .3540, .3540, .3540, 15, .3680, .3680, .3680, .3680, .3680, +gp, .3700, .3700, .3700, .3700, .3700, Table 3 Stock weights-at-age (kg) YEAR, 1912, 1913, 1914, 1915, 1916, 1917, 1918, 1919, 1920, 1921, AGE 0, .0010, .0010, .0010, .0010, .0010, .0010, .0010, .0010, .0010, .0010, 1, .0080, .0080, .0080, .0080, .0080, .0080, .0080, .0080, .0080, .0080, 2, .0470, .0470, .0470, .0470, .0470, .0470, .0470, .0470, .0470, .0470, 3, .1000, .1000, .1000, .1000, .1000, .1000, .1000, .1000, .1000, .1000, 4, .1990, .1990, .1990, .1990, .1990, .1990, .1990, .1990, .1990, .1990, 5, .2370, .2370, .2370, .2370, .2370, .2370, .2370, .2370, .2370, .2370, 6, .2670, .2670, .2670, .2670, .2670, .2670, .2670, .2670, .2670, .2670, 7, .2860, .2860, .2860, .2860, .2860, .2860, .2860, .2860, .2860, .2860, 8, .3070, .3070, .3070, .3070, .3070, .3070, .3070, .3070, .3070, .3070, 9, .3150, .3150, .3150, .3150, .3150, .3150, .3150, .3150, .3150, .3150, 10, .3240, .3240, .3240, .3240, .3240, .3240, .3240, .3240, .3240, .3240, 11, .3320, .3320, .3320, .3320, .3320, .3320, .3320, .3320, .3320, .3320, 12, .3390, .3390, .3390, .3390, .3390, .3390, .3390, .3390, .3390, .3390, 13, .3480, .3480, .3480, .3480, .3480, .3480, .3480, .3480, .3480, .3480, 14, .3540, .3540, .3540, .3540, .3540, .3540, .3540, .3540, .3540, .3540, 15, .3680, .3680, .3680, .3680, .3680, .3680, .3680, .3680, .3680, .3680, +gp, .3700, .3700, .3700, .3700, .3700, .3700, .3700, .3700, .3700, .3700, 1 Table 3 Stock weights-at-age (kg) YEAR, 1922, 1923, 1924, 1925, 1926, 1927, 1928, 1929, 1930, 1931, AGE 0, .0010, .0010, .0010, .0010, .0010, .0010, .0010, .0010, .0010, .0010, 1, .0080, .0080, .0080, .0080, .0080, .0080, .0080, .0080, .0080, .0080, 2, .0470, .0470, .0470, .0470, .0470, .0470, .0470, .0470, .0470, .0470, 3, .1000, .1000, .1000, .1000, .1000, .1000, .1000, .1000, .1000, .1000, 4, .1990, .1990, .1990, .1990, .1990, .1990, .1990, .1990, .1990, .1990, 5, .2370, .2370, .2370, .2370, .2370, .2370, .2370, .2370, .2370, .2370, 6, .2670, .2670, .2670, .2670, .2670, .2670, .2670, .2670, .2670, .2670, 7, .2860, .2860, .2860, .2860, .2860, .2860, .2860, .2860, .2860, .2860, 8, .3070, .3070, .3070, .3070, .3070, .3070, .3070, .3070, .3070, .3070, 9, .3150, .3150, .3150, .3150, .3150, .3150, .3150, .3150, .3150, .3150, 10, .3240, .3240, .3240, .3240, .3240, .3240, .3240, .3240, .3240, .3240, 11, .3320, .3320, .3320, .3320, .3320, .3320, .3320, .3320, .3320, .3320, 12, .3390, .3390, .3390, .3390, .3390, .3390, .3390, .3390, .3390, .3390, 13, .3480, .3480, .3480, .3480, .3480, .3480, .3480, .3480, .3480, .3480, 14, .3540, .3540, .3540, .3540, .3540, .3540, .3540, .3540, .3540, .3540, 15, .3680, .3680, .3680, .3680, .3680, .3680, .3680, .3680, .3680, .3680, +gp, .3700, .3700, .3700, .3700, .3700, .3700, .3700, .3700, .3700, .3700,

O:\ACFM\WGREPS\WGNPBW\REPORTS\2002\Sec-3.Doc 82
Table 3.5.2.3 Continued. Table 3 Stock weights-at-age (kg) YEAR, 1932, 1933, 1934, 1935, 1936, 1937, 1938, 1939, 1940, 1941, AGE 0, .0010, .0010, .0010, .0010, .0010, .0010, .0010, .0010, .0010, .0010, 1, .0080, .0080, .0080, .0080, .0080, .0080, .0080, .0080, .0080, .0080, 2, .0470, .0470, .0470, .0600, .0600, .0470, .0500, .0600, .0470, .0470, 3, .1000, .1000, .1000, .1290, .1230, .1160, .0870, .0980, .1000, .0600, 4, .1990, .1990, .1990, .1800, .1570, .1730, .1620, .1720, .1860, .1020, 5, .2370, .2370, .2370, .1850, .2010, .1910, .1850, .2050, .2060, .1970, 6, .2670, .2670, .2670, .2470, .2290, .2290, .2160, .2180, .2120, .2170, 7, .2860, .2860, .2860, .2730, .2700, .2460, .2530, .2390, .2490, .2340, 8, .3070, .3070, .3070, .2840, .2980, .2820, .2660, .2640, .2640, .2700, 9, .3150, .3150, .3150, .3050, .3070, .2940, .2880, .2760, .2840, .2810, 10, .3240, .3240, .3240, .3060, .3180, .3140, .3070, .2920, .2910, .2950, 11, .3320, .3320, .3320, .3030, .3260, .3120, .3080, .3110, .3140, .3020, 12, .3390, .3390, .3390, .3090, .3200, .3190, .3160, .3000, .3170, .3040, 13, .3480, .3480, .3480, .3100, .3250, .3160, .3170, .3110, .3240, .3240, 14, .3540, .3540, .3540, .3090, .3300, .3220, .3140, .3090, .3210, .3210, 15, .3680, .3680, .3680, .3210, .3350, .3210, .3190, .3080, .3180, .3210, +gp, .3700, .3700, .3700, .3350, .3400, .3350, .3350, .3150, .3300, .3300, Table 3 Stock weights-at-age (kg) YEAR, 1942, 1943, 1944, 1945, 1946, 1947, 1948, 1949, 1950, 1951, AGE 0, .0010, .0010, .0010, .0010, .0010, .0010, .0010, .0010, .0010, .0010, 1, .0080, .0080, .0080, .0080, .0080, .0080, .0080, .0080, .0080, .0080, 2, .0470, .0470, .0470, .0470, .0470, .0470, .0470, .0470, .0470, .0470, 3, .1000, .1000, .1000, .1000, .1000, .1000, .1190, .1000, .1000, .1000, 4, .1990, .1990, .1990, .1990, .1990, .1990, .1940, .1990, .2040, .2040, 5, .2370, .2370, .2370, .2370, .2370, .2370, .2230, .2370, .2300, .2300, 6, .2670, .2670, .2670, .2670, .2670, .2670, .2780, .2670, .2550, .2550, 7, .2860, .2860, .2860, .2860, .2860, .2860, .2970, .2860, .2750, .2750, 8, .3070, .3070, .3070, .3070, .3070, .3070, .3050, .3070, .2900, .2900, 9, .3150, .3150, .3150, .3150, .3150, .3150, .3040, .3150, .3050, .3050, 10, .3240, .3240, .3240, .3240, .3240, .3240, .3120, .3240, .3150, .3150, 11, .3320, .3320, .3320, .3320, .3320, .3320, .3160, .3320, .3250, .3250, 12, .3390, .3390, .3390, .3390, .3390, .3390, .3260, .3390, .3300, .3300, 13, .3480, .3480, .3480, .3480, .3480, .3480, .3310, .3480, .3400, .3400, 14, .3540, .3540, .3540, .3540, .3540, .3540, .3330, .3540, .3450, .3450, 15, .3680, .3680, .3680, .3680, .3680, .3680, .3490, .3680, .3620, .3620, +gp, .3700, .3700, .3700, .3700, .3700, .3700, .3650, .3700, .3650, .3650, Table 3 Stock weights-at-age (kg) YEAR, 1952, 1953, 1954, 1955, 1956, 1957, 1958, 1959, 1960, 1961, AGE 0, .0010, .0010, .0010, .0010, .0010, .0010, .0010, .0010, .0010, .0010, 1, .0080, .0080, .0080, .0080, .0080, .0080, .0080, .0080, .0080, .0080, 2, .0470, .0470, .0470, .0470, .0470, .0470, .0470, .0470, .0470, .0470, 3, .1000, .1000, .1000, .1000, .1000, .1000, .1000, .1000, .1000, .1000, 4, .2040, .2040, .2040, .1950, .2050, .1360, .2040, .2040, .2040, .2320, 5, .2300, .2300, .2300, .2130, .2300, .2280, .2420, .2520, .2700, .2500, 6, .2550, .2550, .2550, .2600, .2490, .2550, .2920, .2600, .2910, .2920, 7, .2750, .2750, .2750, .2750, .2750, .2620, .2950, .2900, .2930, .3020, 8, .2900, .2900, .2900, .2900, .2900, .2900, .2930, .3000, .3210, .3040, 9, .3050, .3050, .3050, .3050, .3050, .3050, .3050, .3050, .3180, .3230, 10, .3150, .3150, .3150, .3150, .3150, .3150, .3150, .3150, .3200, .3220, 11, .3250, .3250, .3250, .3250, .3250, .3250, .3300, .3250, .3440, .3210, 12, .3300, .3300, .3300, .3300, .3300, .3300, .3400, .3300, .3490, .3440, 13, .3400, .3400, .3400, .3400, .3400, .3400, .3450, .3400, .3700, .3570, 14, .3450, .3450, .3450, .3450, .3450, .3450, .3520, .3450, .3790, .3630, 15, .3620, .3620, .3620, .3620, .3620, .3620, .3600, .3550, .3750, .3650, +gp, .3650, .3650, .3650, .3650, .3650, .3650, .3650, .3600, .3800, .3700,

O:\ACFM\WGREPS\WGNPBW\REPORTS\2002\Sec-3.Doc 83
Table 3.5.2.3 Continued. Table 3 Stock weights-at-age (kg) YEAR, 1962, 1963, 1964, 1965, 1966, 1967, 1968, 1969, 1970, 1971, AGE 0, .0010, .0010, .0010, .0010, .0010, .0010, .0010, .0010, .0010, .0010, 1, .0080, .0080, .0080, .0080, .0080, .0080, .0080, .0080, .0080, .0150, 2, .0470, .0470, .0470, .0470, .0470, .0470, .0470, .0470, .0470, .0800, 3, .1000, .1000, .1000, .1000, .1000, .1000, .1000, .1000, .1000, .1000, 4, .2190, .1850, .1940, .1860, .1850, .1800, .1150, .1150, .2090, .1900, 5, .2910, .2530, .2130, .1990, .2190, .2280, .2060, .1450, .2720, .2250, 6, .3000, .2940, .2640, .2360, .2220, .2690, .2660, .2700, .2300, .2500, 7, .3160, .3120, .3170, .2600, .2490, .2700, .2750, .3000, .2950, .2750, 8, .3240, .3290, .3630, .3630, .3060, .2940, .2740, .3060, .3170, .2900, 9, .3260, .3270, .3530, .3500, .3540, .3240, .2850, .3080, .3230, .3100, 10, .3350, .3340, .3490, .3700, .3770, .4200, .3500, .3180, .3250, .3250, 11, .3380, .3410, .3540, .3600, .3910, .4300, .3250, .3400, .3290, .3350, 12, .3340, .3490, .3570, .3780, .3790, .3660, .3630, .3680, .3800, .3450, 13, .3470, .3410, .3590, .3870, .3780, .3680, .4080, .3600, .3700, .3550, 14, .3540, .3580, .3650, .3900, .3610, .4330, .3880, .3930, .3800, .3650, 15, .3580, .3750, .4020, .3940, .3830, .4140, .3780, .3970, .3910, .3900, +gp, .3580, .3750, .4020, .3940, .3830, .4140, .3780, .3970, .3910, .3900, Table 3 Stock weights-at-age (kg) YEAR, 1972, 1973, 1974, 1975, 1976, 1977, 1978, 1979, 1980, 1981, AGE 0, .0010, .0010, .0010, .0010, .0010, .0010, .0010, .0010, .0010, .0010, 1, .0100, .0100, .0100, .0100, .0100, .0100, .0100, .0100, .0100, .0100, 2, .0700, .0850, .0850, .0850, .0850, .0850, .0850, .0850, .0850, .0850, 3, .1500, .1700, .1700, .1810, .1810, .1810, .1800, .1780, .1750, .1700, 4, .1500, .2590, .2590, .2590, .2590, .2590, .2940, .2320, .2830, .2240, 5, .1400, .3420, .3420, .3420, .3420, .3430, .3260, .3590, .3470, .3360, 6, .2100, .3840, .3840, .3840, .3840, .3840, .3710, .3850, .4020, .3780, 7, .2400, .4090, .4090, .4090, .4090, .4090, .4090, .4200, .4210, .3870, 8, .2700, .4040, .4440, .4440, .4440, .4440, .4610, .4440, .4650, .4080, 9, .3000, .4610, .4610, .4610, .4610, .4610, .4760, .5050, .4650, .3970, 10, .3250, .5200, .5200, .5200, .5200, .5200, .5200, .5200, .5200, .5200, 11, .3350, .5340, .5430, .5430, .5430, .5430, .5430, .5510, .5340, .5430, 12, .3450, .5000, .4820, .4820, .4820, .4820, .5000, .5000, .5000, .5120, 13, .3550, .5000, .4820, .4820, .4820, .4820, .5000, .5000, .5000, .5120, 14, .3650, .5000, .4820, .4820, .4820, .4820, .5000, .5000, .5000, .5120, 15, .3900, .5000, .4820, .4820, .4820, .4820, .5000, .5000, .5000, .5120, +gp, .3900, .5000, .4820, .4820, .4820, .4820, .5000, .5000, .5000, .5120, Table 3 Stock weights-at-age (kg) YEAR, 1982, 1983, 1984, 1985, 1986, 1987, 1988, 1989, 1990, 1991, AGE 0, .0010, .0010, .0010, .0010, .0010, .0010, .0010, .0010, .0010, .0010, 1, .0100, .0100, .0100, .0100, .0100, .0100, .0150, .0150, .0080, .0110, 2, .0850, .0850, .0850, .0230, .0850, .0550, .0500, .1000, .0480, .0370, 3, .1700, .1550, .1400, .1480, .0540, .0900, .0980, .1540, .2190, .1470, 4, .2040, .2490, .2040, .2340, .2060, .1430, .1350, .1750, .1980, .2100, 5, .3030, .3040, .2950, .2650, .2650, .2410, .1970, .2090, .2580, .2440, 6, .3550, .3680, .3380, .3120, .2890, .2790, .2770, .2520, .2880, .3000, 7, .3830, .4040, .3760, .3460, .3390, .2990, .3150, .3050, .3090, .3240, 8, .3950, .4240, .3950, .3700, .3680, .3160, .3390, .3670, .4280, .3360, 9, .4130, .4370, .4070, .3950, .3910, .3420, .3430, .3770, .3700, .3430, 10, .4530, .4360, .4130, .3970, .3820, .3430, .3590, .3590, .4030, .3820, 11, .4680, .4930, .4220, .4280, .3880, .3620, .3650, .3950, .3870, .3660, 12, .5060, .4950, .4370, .4280, .3950, .3760, .3760, .3960, .4400, .4250, 13, .5060, .4950, .4370, .4280, .3950, .3760, .3760, .3960, .4400, .4250, 14, .5060, .4950, .4370, .4280, .3950, .3760, .3760, .3960, .4400, .4250, 15, .5060, .4950, .4370, .4280, .3950, .3760, .3760, .3960, .4400, .4250, +gp, .5060, .4950, .4370, .4280, .3950, .3760, .3760, .3960, .4400, .4250,

O:\ACFM\WGREPS\WGNPBW\REPORTS\2002\Sec-3.Doc 84
Table 3.5.2.3 Continued. Table 3 Stock weights-at-age (kg) YEAR, 1992, 1993, 1994, 1995, 1996, 1997, 1998, 1999, 2000, 2001, AGE 0, .0010, .0010, .0010, .0010, .0010, .0010, .0010, .0010, .0010, .0010, 1, .0070, .0080, .0100, .0180, .0180, .0180, .0180, .0180, .0180, .0180, 2, .0300, .0250, .0250, .0250, .0250, .0250, .0250, .0250, .0250, .0250, 3, .1280, .0810, .0750, .0660, .0760, .0960, .0740, .1020, .1020, .0750, 4, .2240, .2010, .1510, .1380, .1180, .1180, .1470, .1500, .1500, .1780, 5, .2960, .2650, .2540, .2300, .1880, .1740, .1740, .2230, .2230, .2380, 6, .3270, .3230, .3180, .2960, .2610, .2290, .2170, .2400, .2400, .2470, 7, .3550, .3540, .3710, .3460, .3160, .2860, .2420, .2640, .2640, .2960, 8, .3450, .3580, .3470, .3880, .3460, .3230, .2780, .2830, .2830, .3070, 9, .3670, .3810, .4120, .3630, .3740, .3700, .3040, .3150, .3150, .3140, 10, .3410, .3690, .3820, .4090, .3900, .3780, .3100, .3450, .3450, .3280, 11, .3610, .3960, .4070, .4140, .3900, .3860, .3590, .3860, .3860, .3510, 12, .4300, .3930, .4100, .4220, .3840, .3600, .3400, .3860, .3860, .3760, 13, .4700, .3740, .4100, .4100, .3980, .3930, .3440, .3860, .3860, .4060, 14, .4700, .4030, .4100, .4100, .3980, .3910, .3850, .3820, .3820, .4140, 15, .4700, .4000, .4100, .4050, .3980, .3910, .3630, .3820, .3820, .4250, +gp, .4500, .4000, .4100, .4470, .3980, .3910, .3750, .4070, .4070, .4250,
Table 3.5.2.4 Run title : Herring spring-spawn (run: SVPBJA12/V12) At 6/05/2002 14:07 Table 5 Proportion mature at age YEAR, 1907, 1908, 1909, 1910, 1911, AGE 0, .0000, .0000, .0000, .0000, .0000, 1, .0000, .0000, .0000, .0000, .0000, 2, .0000, .0000, .0000, .0000, .0000, 3, .0300, .0300, .0300, .0300, .0300, 4, .1600, .1600, .1600, .1600, .1600, 5, .3800, .3800, .3800, .3800, .3800, 6, .7400, .7400, .7400, .7400, .7400, 7, .9700, .9700, .9700, .9700, .9700, 8, 1.0000, 1.0000, 1.0000, 1.0000, 1.0000, 9, 1.0000, 1.0000, 1.0000, 1.0000, 1.0000, 10, 1.0000, 1.0000, 1.0000, 1.0000, 1.0000, 11, 1.0000, 1.0000, 1.0000, 1.0000, 1.0000, 12, 1.0000, 1.0000, 1.0000, 1.0000, 1.0000, 13, 1.0000, 1.0000, 1.0000, 1.0000, 1.0000, 14, 1.0000, 1.0000, 1.0000, 1.0000, 1.0000, 15, 1.0000, 1.0000, 1.0000, 1.0000, 1.0000, +gp, 1.0000, 1.0000, 1.0000, 1.0000, 1.0000, Table 5 Proportion mature at age YEAR, 1912, 1913, 1914, 1915, 1916, 1917, 1918, 1919, 1920, 1921, AGE 0, .0000, .0000, .0000, .0000, .0000, .0000, .0000, .0000, .0000, .0000, 1, .0000, .0000, .0000, .0000, .0000, .0000, .0000, .0000, .0000, .0000, 2, .0000, .0000, .0000, .0000, .0000, .0000, .0000, .0000, .0000, .0000, 3, .0300, .0300, .0300, .0300, .0300, .0300, .0300, .0300, .0300, .0300, 4, .1600, .1600, .1600, .1600, .1600, .1600, .1600, .1600, .1600, .1600, 5, .3800, .3800, .3800, .3800, .3800, .3800, .3800, .3800, .3800, .3800, 6, .7400, .7400, .7400, .7400, .7400, .7400, .7400, .7400, .7400, .7400, 7, .9700, .9700, .9700, .9700, .9700, .9700, .9700, .9700, .9700, .9700, 8, 1.0000, 1.0000, 1.0000, 1.0000, 1.0000, 1.0000, 1.0000, 1.0000, 1.0000, 1.0000, 9, 1.0000, 1.0000, 1.0000, 1.0000, 1.0000, 1.0000, 1.0000, 1.0000, 1.0000, 1.0000, 10, 1.0000, 1.0000, 1.0000, 1.0000, 1.0000, 1.0000, 1.0000, 1.0000, 1.0000, 1.0000, 11, 1.0000, 1.0000, 1.0000, 1.0000, 1.0000, 1.0000, 1.0000, 1.0000, 1.0000, 1.0000, 12, 1.0000, 1.0000, 1.0000, 1.0000, 1.0000, 1.0000, 1.0000, 1.0000, 1.0000, 1.0000, 13, 1.0000, 1.0000, 1.0000, 1.0000, 1.0000, 1.0000, 1.0000, 1.0000, 1.0000, 1.0000, 14, 1.0000, 1.0000, 1.0000, 1.0000, 1.0000, 1.0000, 1.0000, 1.0000, 1.0000, 1.0000, 15, 1.0000, 1.0000, 1.0000, 1.0000, 1.0000, 1.0000, 1.0000, 1.0000, 1.0000, 1.0000, +gp, 1.0000, 1.0000, 1.0000, 1.0000, 1.0000, 1.0000, 1.0000, 1.0000, 1.0000, 1.0000,

O:\ACFM\WGREPS\WGNPBW\REPORTS\2002\Sec-3.Doc 85
Table 3.5.2.4 Continued Table 5 Proportion mature at age YEAR, 1922, 1923, 1924, 1925, 1926, 1927, 1928, 1929, 1930, 1931, AGE 0, .0000, .0000, .0000, .0000, .0000, .0000, .0000, .0000, .0000, .0000, 1, .0000, .0000, .0000, .0000, .0000, .0000, .0000, .0000, .0000, .0000, 2, .0000, .0000, .0000, .0000, .0000, .0000, .0000, .0000, .0000, .0000, 3, .0300, .0300, .0300, .0300, .0300, .0300, .0300, .0300, .0300, .0300, 4, .1600, .1600, .1600, .1600, .1600, .1600, .1600, .1600, .1600, .1600, 5, .3800, .3800, .3800, .3800, .3800, .3800, .3800, .3800, .3800, .3800, 6, .7400, .7400, .7400, .7400, .7400, .7400, .7400, .7400, .7400, .7400, 7, .9700, .9700, .9700, .9700, .9700, .9700, .9700, .9700, .9700, .9700, 8, 1.0000, 1.0000, 1.0000, 1.0000, 1.0000, 1.0000, 1.0000, 1.0000, 1.0000, 1.0000, 9, 1.0000, 1.0000, 1.0000, 1.0000, 1.0000, 1.0000, 1.0000, 1.0000, 1.0000, 1.0000, 10, 1.0000, 1.0000, 1.0000, 1.0000, 1.0000, 1.0000, 1.0000, 1.0000, 1.0000, 1.0000, 11, 1.0000, 1.0000, 1.0000, 1.0000, 1.0000, 1.0000, 1.0000, 1.0000, 1.0000, 1.0000, 12, 1.0000, 1.0000, 1.0000, 1.0000, 1.0000, 1.0000, 1.0000, 1.0000, 1.0000, 1.0000, 13, 1.0000, 1.0000, 1.0000, 1.0000, 1.0000, 1.0000, 1.0000, 1.0000, 1.0000, 1.0000, 14, 1.0000, 1.0000, 1.0000, 1.0000, 1.0000, 1.0000, 1.0000, 1.0000, 1.0000, 1.0000, 15, 1.0000, 1.0000, 1.0000, 1.0000, 1.0000, 1.0000, 1.0000, 1.0000, 1.0000, 1.0000, +gp, 1.0000, 1.0000, 1.0000, 1.0000, 1.0000, 1.0000, 1.0000, 1.0000, 1.0000, 1.0000, Table 5 Proportion mature at age YEAR, 1932, 1933, 1934, 1935, 1936, 1937, 1938, 1939, 1940, 1941, AGE 0, .0000, .0000, .0000, .0000, .0000, .0000, .0000, .0000, .0000, .0000, 1, .0000, .0000, .0000, .0000, .0000, .0000, .0000, .0000, .0000, .0000, 2, .0000, .0000, .0000, .0000, .0000, .0000, .0000, .0000, .0000, .0000, 3, .0300, .0300, .0300, .0300, .0300, .0300, .0300, .0300, .0300, .0300, 4, .1600, .1600, .1600, .1600, .1600, .1600, .1600, .1600, .1600, .1600, 5, .3800, .3800, .3800, .3800, .3800, .3800, .3800, .3800, .3800, .3800, 6, .7400, .7400, .7400, .7400, .7400, .7400, .7400, .7400, .7400, .7400, 7, .9700, .9700, .9700, .9700, .9700, .9700, .9700, .9700, .9700, .9700, 8, 1.0000, 1.0000, 1.0000, 1.0000, 1.0000, 1.0000, 1.0000, 1.0000, 1.0000, 1.0000, 9, 1.0000, 1.0000, 1.0000, 1.0000, 1.0000, 1.0000, 1.0000, 1.0000, 1.0000, 1.0000, 10, 1.0000, 1.0000, 1.0000, 1.0000, 1.0000, 1.0000, 1.0000, 1.0000, 1.0000, 1.0000, 11, 1.0000, 1.0000, 1.0000, 1.0000, 1.0000, 1.0000, 1.0000, 1.0000, 1.0000, 1.0000, 12, 1.0000, 1.0000, 1.0000, 1.0000, 1.0000, 1.0000, 1.0000, 1.0000, 1.0000, 1.0000, 13, 1.0000, 1.0000, 1.0000, 1.0000, 1.0000, 1.0000, 1.0000, 1.0000, 1.0000, 1.0000, 14, 1.0000, 1.0000, 1.0000, 1.0000, 1.0000, 1.0000, 1.0000, 1.0000, 1.0000, 1.0000, 15, 1.0000, 1.0000, 1.0000, 1.0000, 1.0000, 1.0000, 1.0000, 1.0000, 1.0000, 1.0000, +gp, 1.0000, 1.0000, 1.0000, 1.0000, 1.0000, 1.0000, 1.0000, 1.0000, 1.0000, 1.0000, Table 5 Proportion mature at age YEAR, 1942, 1943, 1944, 1945, 1946, 1947, 1948, 1949, 1950, 1951, AGE 0, .0000, .0000, .0000, .0000, .0000, .0000, .0000, .0000, .0000, .0000, 1, .0000, .0000, .0000, .0000, .0000, .0000, .0000, .0000, .0000, .0000, 2, .0000, .0000, .0000, .0000, .0000, .0000, .0000, .0000, .0000, .0000, 3, .0300, .0300, .0300, .0300, .0300, .0300, .0300, .0300, .0000, .0000, 4, .1600, .1600, .1600, .1600, .1600, .1600, .1600, .1600, .1000, .1000, 5, .3800, .3800, .3800, .3800, .3800, .3800, .3800, .3800, .3000, .3000, 6, .7400, .7400, .7400, .7400, .7400, .7400, .7400, .7400, .6000, .6000, 7, .9700, .9700, .9700, .9700, .9700, .9700, .9700, .9700, .9000, .9000, 8, 1.0000, 1.0000, 1.0000, 1.0000, 1.0000, 1.0000, 1.0000, 1.0000, 1.0000, 1.0000, 9, 1.0000, 1.0000, 1.0000, 1.0000, 1.0000, 1.0000, 1.0000, 1.0000, 1.0000, 1.0000, 10, 1.0000, 1.0000, 1.0000, 1.0000, 1.0000, 1.0000, 1.0000, 1.0000, 1.0000, 1.0000, 11, 1.0000, 1.0000, 1.0000, 1.0000, 1.0000, 1.0000, 1.0000, 1.0000, 1.0000, 1.0000, 12, 1.0000, 1.0000, 1.0000, 1.0000, 1.0000, 1.0000, 1.0000, 1.0000, 1.0000, 1.0000, 13, 1.0000, 1.0000, 1.0000, 1.0000, 1.0000, 1.0000, 1.0000, 1.0000, 1.0000, 1.0000, 14, 1.0000, 1.0000, 1.0000, 1.0000, 1.0000, 1.0000, 1.0000, 1.0000, 1.0000, 1.0000, 15, 1.0000, 1.0000, 1.0000, 1.0000, 1.0000, 1.0000, 1.0000, 1.0000, 1.0000, 1.0000, +gp, 1.0000, 1.0000, 1.0000, 1.0000, 1.0000, 1.0000, 1.0000, 1.0000, 1.0000, 1.0000,

O:\ACFM\WGREPS\WGNPBW\REPORTS\2002\Sec-3.Doc 86
Table 3.5.2.4 Continued Table 5 Proportion mature at age YEAR, 1952, 1953, 1954, 1955, 1956, 1957, 1958, 1959, 1960, 1961, AGE 0, .0000, .0000, .0000, .0000, .0000, .0000, .0000, .0000, .0000, .0000, 1, .0000, .0000, .0000, .0000, .0000, .0000, .0000, .0000, .0000, .0000, 2, .0000, .0000, .0000, .0000, .0000, .0000, .0000, .0000, .0000, .0000, 3, .0000, .0000, .0000, .0800, .0800, .0000, .0800, .0800, .0800, .0400, 4, .1000, .1000, .1000, .2200, .2200, .0000, .2200, .2200, .2200, .3500, 5, .3000, .3000, .3000, .3700, .3700, .5000, .3700, .3700, .3700, .6800, 6, .6000, .6000, .6000, .8500, .8500, .6000, .8500, .8500, .8500, .9400, 7, .9000, .9000, .9000, 1.0000, 1.0000, 1.0000, 1.0000, 1.0000, 1.0000, 1.0000, 8, 1.0000, 1.0000, 1.0000, 1.0000, 1.0000, 1.0000, 1.0000, 1.0000, 1.0000, 1.0000, 9, 1.0000, 1.0000, 1.0000, 1.0000, 1.0000, 1.0000, 1.0000, 1.0000, 1.0000, 1.0000, 10, 1.0000, 1.0000, 1.0000, 1.0000, 1.0000, 1.0000, 1.0000, 1.0000, 1.0000, 1.0000, 11, 1.0000, 1.0000, 1.0000, 1.0000, 1.0000, 1.0000, 1.0000, 1.0000, 1.0000, 1.0000, 12, 1.0000, 1.0000, 1.0000, 1.0000, 1.0000, 1.0000, 1.0000, 1.0000, 1.0000, 1.0000, 13, 1.0000, 1.0000, 1.0000, 1.0000, 1.0000, 1.0000, 1.0000, 1.0000, 1.0000, 1.0000, 14, 1.0000, 1.0000, 1.0000, 1.0000, 1.0000, 1.0000, 1.0000, 1.0000, 1.0000, 1.0000, 15, 1.0000, 1.0000, 1.0000, 1.0000, 1.0000, 1.0000, 1.0000, 1.0000, 1.0000, 1.0000, +gp, 1.0000, 1.0000, 1.0000, 1.0000, 1.0000, 1.0000, 1.0000, 1.0000, 1.0000, 1.0000, Table 5 Proportion mature at age YEAR, 1962, 1963, 1964, 1965, 1966, 1967, 1968, 1969, 1970, 1971, AGE 0, .0000, .0000, .0000, .0000, .0000, .0000, .0000, .0000, .0000, .0000, 1, .0000, .0000, .0000, .0000, .0000, .0000, .0000, .0000, .0000, .0000, 2, .0000, .0000, .0000, .0000, .0000, .0000, .0000, .0000, .0000, .0000, 3, .0000, .0400, .0200, .0000, .0100, .0000, .0000, .6200, .0600, .1000, 4, .1100, .0300, .0600, .3400, .1500, .0100, .0000, .8900, .1300, .2500, 5, .6700, .3200, .2800, .3500, 1.0000, .2300, .0100, .9500, .3100, .6000, 6, 1.0000, .9000, .3200, .7600, .9600, 1.0000, .7600, 1.0000, .1700, .9000, 7, 1.0000, 1.0000, 1.0000, 1.0000, 1.0000, 1.0000, 1.0000, 1.0000, 1.0000, 1.0000, 8, 1.0000, 1.0000, 1.0000, 1.0000, 1.0000, 1.0000, 1.0000, 1.0000, 1.0000, 1.0000, 9, 1.0000, 1.0000, 1.0000, 1.0000, 1.0000, 1.0000, 1.0000, 1.0000, 1.0000, 1.0000, 10, 1.0000, 1.0000, 1.0000, 1.0000, 1.0000, 1.0000, 1.0000, 1.0000, 1.0000, 1.0000, 11, 1.0000, 1.0000, 1.0000, 1.0000, 1.0000, 1.0000, 1.0000, 1.0000, 1.0000, 1.0000, 12, 1.0000, 1.0000, 1.0000, 1.0000, 1.0000, 1.0000, 1.0000, 1.0000, 1.0000, 1.0000, 13, 1.0000, 1.0000, 1.0000, 1.0000, 1.0000, 1.0000, 1.0000, 1.0000, 1.0000, 1.0000, 14, 1.0000, 1.0000, 1.0000, 1.0000, 1.0000, 1.0000, 1.0000, 1.0000, 1.0000, 1.0000, 15, 1.0000, 1.0000, 1.0000, 1.0000, 1.0000, 1.0000, 1.0000, 1.0000, 1.0000, 1.0000, +gp, 1.0000, 1.0000, 1.0000, 1.0000, 1.0000, 1.0000, 1.0000, 1.0000, 1.0000, 1.0000, Table 5 Proportion mature at age YEAR, 1972, 1973, 1974, 1975, 1976, 1977, 1978, 1979, 1980, 1981, AGE 0, .0000, .0000, .0000, .0000, .0000, .0000, .0000, .0000, .0000, .0000, 1, .0000, .0000, .0000, .0000, .0000, .0000, .0000, .0000, .0000, .0000, 2, .0000, .1000, .1000, .1000, .1000, .0000, .0000, .0000, .0000, .0000, 3, .0000, .5000, .5000, .5000, .5000, .7300, .1300, .1000, .2500, .3000, 4, .1000, .9000, .9000, 1.0000, .9000, .8900, .9000, .6200, .5000, .5000, 5, .2500, 1.0000, 1.0000, 1.0000, 1.0000, 1.0000, 1.0000, .9500, .9700, .9000, 6, .6000, 1.0000, 1.0000, 1.0000, 1.0000, 1.0000, 1.0000, 1.0000, 1.0000, 1.0000, 7, .9000, 1.0000, 1.0000, 1.0000, 1.0000, 1.0000, 1.0000, 1.0000, 1.0000, 1.0000, 8, 1.0000, 1.0000, 1.0000, 1.0000, 1.0000, 1.0000, 1.0000, 1.0000, 1.0000, 1.0000, 9, 1.0000, 1.0000, 1.0000, 1.0000, 1.0000, 1.0000, 1.0000, 1.0000, 1.0000, 1.0000, 10, 1.0000, 1.0000, 1.0000, 1.0000, 1.0000, 1.0000, 1.0000, 1.0000, 1.0000, 1.0000, 11, 1.0000, 1.0000, 1.0000, 1.0000, 1.0000, 1.0000, 1.0000, 1.0000, 1.0000, 1.0000, 12, 1.0000, 1.0000, 1.0000, 1.0000, 1.0000, 1.0000, 1.0000, 1.0000, 1.0000, 1.0000, 13, 1.0000, 1.0000, 1.0000, 1.0000, 1.0000, 1.0000, 1.0000, 1.0000, 1.0000, 1.0000, 14, 1.0000, 1.0000, 1.0000, 1.0000, 1.0000, 1.0000, 1.0000, 1.0000, 1.0000, 1.0000, 15, 1.0000, 1.0000, 1.0000, 1.0000, 1.0000, 1.0000, 1.0000, 1.0000, 1.0000, 1.0000, +gp, 1.0000, 1.0000, 1.0000, 1.0000, 1.0000, 1.0000, 1.0000, 1.0000, 1.0000, 1.0000,

O:\ACFM\WGREPS\WGNPBW\REPORTS\2002\Sec-3.Doc 87
Table 3.5.2.4 Continued Table 5 Proportion mature at age YEAR, 1982, 1983, 1984, 1985, 1986, 1987, 1988, 1989, 1990, 1991, AGE 0, .0000, .0000, .0000, .0000, .0000, .0000, .0000, .0000, .0000, .0000, 1, .0000, .0000, .0000, .0000, .0000, .0000, .0000, .0000, .0000, .0000, 2, .0000, .0000, .0000, .0000, .0000, .0000, .0000, .0000, .0000, .0000, 3, .1000, .1000, .1000, .1000, .1000, .1000, .1000, .1000, .4000, .1000, 4, .4800, .5000, .5000, .5000, .2000, .3000, .3000, .3000, .8000, .7000, 5, .7000, .6900, .9000, .9000, .9000, .9000, .9000, .9000, .9000, 1.0000, 6, 1.0000, .7100, .9500, 1.0000, 1.0000, 1.0000, 1.0000, 1.0000, .9000, 1.0000, 7, 1.0000, 1.0000, 1.0000, 1.0000, 1.0000, 1.0000, 1.0000, 1.0000, .9000, 1.0000, 8, 1.0000, 1.0000, 1.0000, 1.0000, 1.0000, 1.0000, 1.0000, 1.0000, 1.0000, 1.0000, 9, 1.0000, 1.0000, 1.0000, 1.0000, 1.0000, 1.0000, 1.0000, 1.0000, 1.0000, 1.0000, 10, 1.0000, 1.0000, 1.0000, 1.0000, 1.0000, 1.0000, 1.0000, 1.0000, 1.0000, 1.0000, 11, 1.0000, 1.0000, 1.0000, 1.0000, 1.0000, 1.0000, 1.0000, 1.0000, 1.0000, 1.0000, 12, 1.0000, 1.0000, 1.0000, 1.0000, 1.0000, 1.0000, 1.0000, 1.0000, 1.0000, 1.0000, 13, 1.0000, 1.0000, 1.0000, 1.0000, 1.0000, 1.0000, 1.0000, 1.0000, 1.0000, 1.0000, 14, 1.0000, 1.0000, 1.0000, 1.0000, 1.0000, 1.0000, 1.0000, 1.0000, 1.0000, 1.0000, 15, 1.0000, 1.0000, 1.0000, 1.0000, 1.0000, 1.0000, 1.0000, 1.0000, 1.0000, 1.0000, +gp, 1.0000, 1.0000, 1.0000, 1.0000, 1.0000, 1.0000, 1.0000, 1.0000, 1.0000, 1.0000, Table 5 Proportion mature at age YEAR, 1992, 1993, 1994, 1995, 1996, 1997, 1998, 1999, 2000, 2001, AGE 0, .0000, .0000, .0000, .0000, .0000, .0000, .0000, .0000, .0000, .0000, 1, .0000, .0000, .0000, .0000, .0000, .0000, .0000, .0000, .0000, .0000, 2, .0000, .0000, .0000, .0000, .0000, .0000, .0000, .0000, .0000, .0000, 3, .1000, .0100, .0100, .0000, .0000, .0000, .0000, .0000, .0000, .0000, 4, .2000, .3000, .3000, .3000, .3000, .3000, .3000, .3000, .3000, .3000, 5, .8000, .8000, .8000, .8000, .9000, .9000, .9000, .9000, .9000, .9000, 6, 1.0000, 1.0000, 1.0000, 1.0000, 1.0000, 1.0000, 1.0000, 1.0000, 1.0000, 1.0000, 7, 1.0000, 1.0000, 1.0000, 1.0000, 1.0000, 1.0000, 1.0000, 1.0000, 1.0000, 1.0000, 8, 1.0000, 1.0000, 1.0000, 1.0000, 1.0000, 1.0000, 1.0000, 1.0000, 1.0000, 1.0000, 9, 1.0000, 1.0000, 1.0000, 1.0000, 1.0000, 1.0000, 1.0000, 1.0000, 1.0000, 1.0000, 10, 1.0000, 1.0000, 1.0000, 1.0000, 1.0000, 1.0000, 1.0000, 1.0000, 1.0000, 1.0000, 11, 1.0000, 1.0000, 1.0000, 1.0000, 1.0000, 1.0000, 1.0000, 1.0000, 1.0000, 1.0000, 12, 1.0000, 1.0000, 1.0000, 1.0000, 1.0000, 1.0000, 1.0000, 1.0000, 1.0000, 1.0000, 13, 1.0000, 1.0000, 1.0000, 1.0000, 1.0000, 1.0000, 1.0000, 1.0000, 1.0000, 1.0000, 14, 1.0000, 1.0000, 1.0000, 1.0000, 1.0000, 1.0000, 1.0000, 1.0000, 1.0000, 1.0000, 15, 1.0000, 1.0000, 1.0000, 1.0000, 1.0000, 1.0000, 1.0000, 1.0000, 1.0000, 1.0000, +gp, 1.0000, 1.0000, 1.0000, 1.0000, 1.0000, 1.0000, 1.0000, 1.0000, 1.0000, 1.0000,

O:\ACFM\WGREPS\WGNPBW\REPORTS\2002\Sec-3.Doc 88
Table 3.5.3a. NSS herring abunance estimates (ISVPA, catch-controlled version)
2 3 4 5 6 7 8 9 10 11 12 13 14 15 161986 2013525 1.94E+07 107269.8 38931.85 42632.48 236469.6 116748.3 72578.17 115674.3 37570.98 83878.16 96589.3 929.7274 0 2773.2251987 7074454 816667.3 1.62E+07 76005.26 20056.67 22314.09 106118.2 30905.4 23503.38 28125.56 14275.41 10963.53 8915.7 800.2238 01988 1642925 2853450 684565 1.35E+07 48095.51 14013.98 12657.91 65360 15467.6 11415.99 20033.04 5019.015 3406.068 1179.61 01989 1609794 662153.5 2397611 565962.3 1.11E+07 32627.15 8648.774 5361.698 42726.59 5082.148 7211.451 14129.09 1831.698 0 01990 4059823 638423.1 567239.6 2060282 481886.5 9260306 24864.11 6701.875 3984.918 33716.35 3098.598 5577.016 11863.22 1337.199 2529.4011991 1.16E+07 1640691 532209.2 485761.8 1762284 404693.8 7760490 20204.88 4359.115 1540.965 26779.43 2067.666 4634.116 9668.037 181.731992 1.94E+07 4723616 1404327 455497.6 416790.9 1503176 340096.9 6476478 15072.07 3324.235 1245.608 22409.13 0 0 01993 5.38E+07 7867894 4053977 1178007 387430.2 357628.4 1282680 287391.4 5364986 10669.06 2268.367 842.9517 18141.02 0 01994 6.92E+07 2.19E+07 6745604 3390146 932957.1 325462.5 304429.3 1076549 230075.3 4237209 9182.946 1952.402 725.5352 15614.12 01995 2.03E+07 2.81E+07 1.88E+07 5703861 2580299 650115.2 265674.8 254470.1 891962.6 164945.3 3048230 5282.96 1254.614 0 2202.9831996 6702216 8258058 2.41E+07 1.59E+07 4331555 1629133 345169 214276.4 204316 703010.2 64282.31 1777645 772.0975 0 01997 2591987 2705698 7075895 2.01E+07 1.22E+07 2855592 1025282 201153.6 179162.6 169022.6 543768.2 39024.13 753926.3 664.5505 01998 3.26E+07 1039913 2207797 5838908 1.56E+07 8650881 1751619 579573.2 116667.4 135634.2 115415.6 384047.2 15849.92 305335.5 01999 2.01E+07 1.32E+07 829818.6 1675415 4683896 1.18E+07 6273446 1153714 378262.6 60984.66 93229.61 96112.43 226084.9 0 241710.22000 2.71E+07 8186570 1.12E+07 680999.7 1316972 3633062 8698742 4319468 722672 227227.3 39015.44 43095.69 76043.13 112396.8 121761.62001 2184578 1.10E+07 6968301 9138455 553733 1030809 2751771 6281703 2748307 420707.8 129160.1 18495.79 16032.1 0 105880.6
Table 3.5.3b. NSS herring: residuals in LnC (ISVPA, catch-controlled version)
2 3 4 5 6 7 8 9 10 11 12 13 14 15 16 Sum1986 -0.9681 -0.3528 0.5143 0.6286 0.2002 0.1143 0.3379 0.0184 -0.1646 -0.3628 0.0073 0.0273 0.0000 0.0000 0.0000 0.00001987 0.6768 -0.0372 -0.7020 0.6653 -0.0805 0.2279 -0.0991 0.0722 -0.2107 -1.0851 0.0997 0.1457 0.3271 0.0000 0.0000 0.00001988 0.9779 0.0778 -0.3240 -0.9221 0.2464 0.2503 0.6894 -0.2732 0.3480 -0.4429 -0.8782 0.2505 0.0000 0.0000 0.0000 0.00001989 3.3243 -0.2334 -2.2027 -1.0205 -0.3518 0.6550 0.3700 0.4691 -0.3493 0.9575 -0.1457 -1.5987 0.1263 0.0000 0.0000 0.00011990 1.9159 1.6668 -1.0710 -1.5698 -0.6111 -0.8154 -0.2090 1.0512 1.5410 -0.3715 0.6492 -1.2532 -0.9232 0.0000 0.0000 0.00001991 0.1379 0.7444 -0.1488 -1.4422 -0.7910 -0.1109 -0.0042 1.2591 0.7795 0.2041 -0.6280 0.0000 0.0000 0.0000 0.0000 0.00001992 -1.3399 0.0277 1.2990 -0.1750 -1.9194 -1.1811 -0.5752 -0.0667 1.1637 1.3703 1.3537 0.0429 0.0000 0.0000 0.0000 0.00001993 -0.9764 0.0331 1.1124 1.4399 -0.1667 -1.2329 -0.5622 0.2556 0.0974 0.0000 0.0000 0.0000 0.0000 0.0000 0.0000 0.00001994 -1.6346 -1.3752 0.1131 1.2909 1.3846 -0.2068 -0.9345 -0.8900 0.2843 0.3192 0.9745 0.6743 0.0000 0.0000 0.0000 0.00001995 -2.8020 -1.4789 -0.1912 0.8826 1.2954 1.3729 -0.5791 -0.7293 -0.8251 1.0978 0.5212 1.4357 0.0000 0.0000 0.0000 0.00001996 1.3607 -0.9973 0.0545 0.5575 0.9386 0.7913 0.8289 -1.8116 -1.8266 -0.8158 0.2040 0.7158 0.0000 0.0000 0.0000 0.00001997 1.4060 0.8711 -0.2680 -0.1274 0.0730 0.2766 0.3086 0.0425 -1.2768 -0.6846 -0.8735 0.1747 0.0778 0.0000 0.0000 0.00001998 0.4560 1.4553 1.0311 -0.2288 -0.0547 -0.0791 0.1745 -0.0113 0.1509 -0.4645 -2.3368 -0.0929 0.0000 0.0000 0.0000 0.00001999 -1.5712 -0.1187 0.3923 0.3092 0.0354 0.1410 0.3091 0.4022 0.1832 0.0728 0.6148 -1.1625 0.3923 0.0000 0.0000 0.00002000 -0.9633 -0.2827 0.3909 -0.2881 -0.1984 -0.2033 -0.0552 0.2120 0.1050 0.2054 0.4375 0.6404 0.0000 0.0000 0.0000 0.00002001 0.0000 0.0000 0.0000 0.0000 0.0000 0.0000 0.0000 0.0000 0.0000 0.0000 0.0000 0.0000 0.0000 0.0000 0.0000 0.0000
Sum: 0.0000 0.0000 0.0000 0.0000 0.0000 0.0000 0.0000 0.0000 0.0000 0.0000 0.0000 0.0001 0.0002 0.0000 0.0000

O:\ACFM\WGREPS\WGNPBW\REPORTS\2002\Sec-3.Doc 89
Table 3.5.4a. NSS herring abunance estimates (ISVPA, mixed version)
2 3 4 5 6 7 8 9 10 11 12 13 14 15 161986 1729057 1.84E+07 77275.87 31450.36 35044.25 240976.8 105396.4 75758.98 125522.7 38213.44 83726.01 95974.56 845.9818 0 2461.8321987 9110194 699773.9 1.53E+07 54417.63 16783.37 17318.59 110352.7 27580.53 25051.71 34743.4 13619.37 10470.87 8312.122 728.1432 01988 2589818 3685238 585041.1 1.25E+07 34450.73 11254.92 9294.003 66647.31 13065.58 11664.38 21955.27 4573.865 3119.935 1080.514 01989 1790508 1048366 3108509 478090.7 9.88E+06 22516.69 6778.361 3886.833 41547.18 4054.417 6790.412 13777.88 1629.298 0 01990 2954574 719610.1 898315.7 2653642 402464.1 8149517 17118.11 5239.717 2868.019 31987.33 2615.14 5154.343 10949.5 1177.036 2226.4421991 9.21E+06 1195748 608828.6 765991.3 2242331 332985 6684376 13573.71 3568.018 1307.388 24762.14 1791.219 4061.418 8473.233 159.27131992 1.68E+07 3741497 1023881 520925.4 653956.3 1902321 278321.1 5554257 10258.68 2763.83 1053.968 20372.91 0 0 01993 5.35E+07 6843407 3209874 862631.8 442660.5 555878.3 1606813 232610.3 4569331 7376.394 2006.808 761.3606 16385.12 0 01994 7.48E+07 2.17E+07 5866121 2699992 694420.3 371365.3 467415.8 1337727 185740 3584609 6348.921 1727.275 655.3091 14102.8 01995 2.28E+07 3.04E+07 1.86E+07 4957164 2114118 504471.3 301688.2 383130.3 1079642 132028.9 2582619 3708.487 1158.045 0 2033.4181996 6937068 9247513 2.60E+07 1.57E+07 3866533 1445604 300383.1 237618.4 299537.4 809256.7 61020.06 1548286 771.6663 0 01997 2797130 2808473 7899107 2.17E+07 1.24E+07 2728313 973645.8 190213.2 185553.5 227084.8 593411.3 37711.97 741824.2 664.1794 01998 3.69E+07 1128632 2332725 6504166 1.69E+07 8872241 1735327 576977.7 109974.6 123226.4 147623.9 377825.3 15846.37 305267.1 01999 2.37E+07 1.49E+07 931168.6 1854635 5203083 1.29E+07 6425061 1169838 377074.3 58495.1 78775.3 108144.6 216931.2 0 242779.52000 3.28E+07 9625175 1.27E+07 773151.9 1485405 4074764 9635851 4585612 778425.3 234310.9 37721.47 39385.1 78942.93 116682.9 126404.82001 2683360 1.33E+07 8192863 10516930 627082.9 1162420 3083357 7035042 3061532 475979.9 141511.7 19924.19 17471.92 0 115389.7
Table 3.5.4.b. NSS herring: residuals in LnC (ISVPA, mixed version)
2 3 4 5 6 7 8 9 10 11 12 13 14 15 16 Sum1986 -0.8152 -0.3130 0.7990 0.7774 0.3154 0.0105 0.3489 -0.1164 -0.3435 -0.4614 -0.1047 -0.0971 0.0000 0.0000 0.0000 0.00001987 0.4491 0.1280 -0.6592 0.9595 0.0417 0.4211 -0.2049 0.1188 -0.3469 -1.3534 0.0577 0.0857 0.3028 0.0000 0.0000 0.00001988 0.5547 -0.1606 -0.1788 -0.8752 0.5308 0.4159 0.9383 -0.3532 0.4510 -0.5147 -1.0522 0.2440 0.0000 0.0000 0.0000 0.00001989 3.2307 -0.6946 -2.4934 -0.9041 -0.3029 0.9532 0.5346 0.7112 -0.4062 1.1140 -0.1870 -1.6920 0.1365 0.0000 0.0000 0.00001990 2.2257 1.5247 -1.5824 -1.8960 -0.5202 -0.7810 0.0645 1.1970 1.7642 -0.4090 0.6966 -1.3135 -0.9707 0.0000 0.0000 0.00001991 0.3587 1.0339 -0.3393 -1.9750 -1.1254 -0.0136 0.0409 1.5522 0.8698 0.2740 -0.6762 0.0000 0.0000 0.0000 0.0000 0.00001992 -1.2134 0.2335 1.5584 -0.3872 -2.4640 -1.5149 -0.4795 -0.0183 1.4379 1.4599 1.3937 -0.0060 0.0000 0.0000 0.0000 0.00001993 -0.9356 0.1924 1.3364 1.7206 -0.3470 -1.7252 -0.8451 0.4090 0.1945 0.0000 0.0000 0.0000 0.0000 0.0000 0.0000 0.00001994 -1.6952 -1.3652 0.2269 1.4712 1.6165 -0.4063 -1.4373 -1.1818 0.4185 0.4221 1.2471 0.6834 0.0000 0.0000 0.0000 0.00001995 -2.8763 -1.5319 -0.1864 0.9973 1.4530 1.5806 -0.7585 -1.1914 -1.0742 1.2777 0.6122 1.6978 0.0000 0.0000 0.0000 0.00001996 1.4242 -1.0271 0.0342 0.6016 1.0688 0.9233 0.9740 -1.9095 -2.2089 -0.9408 0.2397 0.8206 0.0000 0.0000 0.0000 0.00001997 1.4490 0.9384 -0.3027 -0.1509 0.0973 0.3558 0.3875 0.1251 -1.2904 -0.9430 -0.9561 0.1968 0.0934 0.0000 0.0000 0.00001998 0.4511 1.4783 1.0517 -0.2824 -0.0943 -0.0704 0.2114 0.0203 0.2317 -0.3313 -2.5778 -0.0884 0.0000 0.0000 0.0000 0.00001999 -1.6096 -0.1346 0.3574 0.2665 -0.0269 0.0974 0.3174 0.4200 0.2127 0.1563 0.7930 -1.2877 0.4381 0.0000 0.0000 0.00002000 -0.9979 -0.3021 0.3781 -0.3231 -0.2429 -0.2465 -0.0923 0.2169 0.0900 0.2496 0.5140 0.7563 0.0000 0.0000 0.0000 0.00002001 0.0000 0.0000 0.0000 0.0000 0.0000 0.0000 0.0000 0.0000 0.0000 0.0000 0.0000 0.0000 0.0000 0.0000 0.0000 0.0000
Sum: 0.0000 0.0000 0.0000 0.0000 0.0000 0.0000 0.0000 0.0000 0.0000 0.0000 0.0000 0.0000 0.0001 0.0000 0.0000
Table 3.5.4c. NSS herring: final weights of catch-controlled routine in mixed version of ISVPA.77 - as for terminal points
2 3 4 5 6 7 8 9 10 11 12 13 14 15 161986 0.503 0.522 0.558 0.627 0.702 0.777 0.826 0.902 0.995 0.984 0.997 1 1 77 771987 0.502 0.514 0.535 0.576 0.619 0.664 0.694 0.746 0.849 0.826 0.853 0.870 0.902 77 771988 0.502 0.511 0.528 0.560 0.594 0.629 0.653 0.694 0.778 0.758 0.782 0.797 77.000 77 771989 0.500 0.503 0.508 0.516 0.525 0.533 0.539 0.548 0.568 0.564 0.569 0.573 0.580 77 771990 0.500 0.503 0.508 0.516 0.525 0.534 0.539 0.549 0.570 0.565 0.571 0.574 0.582 77 771991 0.500 0.501 0.503 0.507 0.511 0.515 0.517 0.521 0.530 0.528 0.530 77 77 77 771992 0.500 0.501 0.504 0.508 0.512 0.516 0.518 0.523 0.532 0.530 0.532 0.534 77 77 771993 0.500 0.502 0.505 0.510 0.515 0.520 0.524 0.529 0.541 1 1 1 1 77 771994 0.500 0.503 0.508 0.517 0.526 0.535 0.541 0.551 0.573 0.568 0.574 0.577 77 77 771995 0.501 0.505 0.512 0.526 0.539 0.553 0.563 0.579 0.612 0.604 0.614 0.620 77 77 771996 0.501 0.506 0.514 0.530 0.547 0.564 0.575 0.594 0.635 0.625 0.636 0.644 1 77 771997 0.501 0.510 0.526 0.554 0.585 0.616 0.637 0.674 0.750 0.732 0.753 0.767 0.794 77 771998 0.501 0.508 0.520 0.542 0.565 0.589 0.605 0.633 0.690 0.677 0.693 0.704 77 77 771999 0.501 0.506 0.515 0.531 0.548 0.565 0.576 0.596 0.637 0.627 0.639 0.646 0.661 77 772000 0.501 0.506 0.517 0.535 0.554 0.573 0.586 0.608 0.655 0.644 0.657 0.666 77 77 772001 77 77 77 77 77 77 77 77 77 77 77 77 77 77 77

O:\ACFM\WGREPS\WGNPBW\REPORTS\2002\Sec-3.Doc 90
Table 3.5.6.1 Run title : Herring spring-spawn (run: SVPBJA12/V12) At 6/05/2002 14:08 Table 8 Fishing mortality (F) at age YEAR, 1907, 1908, 1909, 1910, 1911, AGE 0, .0060, .0177, .0371, .0305, .0654, 1, .0293, .0296, .0541, .0334, .1436, 2, .0040, .0160, .0307, .0453, .0552, 3, .0175, .0327, .1117, .0532, .0588, 4, .0955, .0038, .0002, .0119, .0002, 5, .2289, .0399, .0109, .0040, .0030, 6, .1957, .1472, .0540, .0157, .0090, 7, .2109, .1633, .0709, .0371, .0189, 8, .2636, .1639, .0893, .0537, .0241, 9, .2815, .2072, .1494, .0869, .0400, 10, .1830, .5709, .3059, .0713, .0614, 11, .1990, .3494, .4794, .1133, .0329, 12, .1963, .5043, .3116, .2689, .0418, 13, .0757, .3057, .3154, .1366, .0801, 14, .0587, .0936, .2761, .1000, .0000, 15, .0000, .1000, .1000, .1000, .0000, +gp, .0000, .1000, .1000, .1000, .0000, 0 FBAR 2-13, .1626, .2087, .1608, .0748, .0354, Table 8 Fishing mortality (F) at age YEAR, 1912, 1913, 1914, 1915, 1916, 1917, 1918, 1919, 1920, 1921, AGE 0, .0662, .0484, .0816, .0570, .0494, .0355, .0211, .0544, .0192, .0270, 1, .1256, .0327, .2422, .1490, .0589, .0534, .0538, .0641, .0641, .0723, 2, .0496, .0278, .0330, .0485, .0253, .0399, .0536, .0404, .0124, .0173, 3, .0352, .0424, .0462, .0185, .0539, .0771, .0450, .0438, .0224, .0139, 4, .0008, .0031, .0040, .0027, .0155, .0478, .0083, .0227, .0072, .0020, 5, .0015, .0043, .0094, .0187, .0265, .0331, .0792, .0407, .0199, .0263, 6, .0047, .0053, .0098, .0140, .0408, .0156, .0403, .1655, .0244, .0100, 7, .0085, .0041, .0057, .0101, .0159, .0228, .0264, .0537, .1285, .0190, 8, .0202, .0106, .0115, .0054, .0116, .0114, .0434, .0229, .0403, .1087, 9, .0490, .0440, .0161, .0136, .0073, .0076, .0216, .0341, .0243, .0329, 10, .0576, .0499, .0409, .0166, .0148, .0047, .0122, .0208, .0287, .0180, 11, .0837, .1612, .0830, .0528, .0184, .0116, .0089, .0139, .0119, .0189, 12, .0462, .0507, .2348, .0801, .0457, .0145, .0285, .0081, .0072, .0135, 13, .0539, .3291, .2409, .0982, .0571, .0427, .0281, .0206, .0068, .0081, 14, .1000, .0000, .2081, .1045, .0795, .0495, .0804, .0081, .0120, .0038, 15, .1000, .0000, .1000, .1000, .1000, .1000, .1000, .1000, .1000, .1000, +gp, .1000, .0000, .1000, .1000, .1000, .1000, .1000, .1000, .1000, .1000, 0 FBAR 2-13, .0342, .0610, .0613, .0316, .0277, .0274, .0329, .0406, .0278, .0240, 1 Table 8 Fishing mortality (F) at age YEAR, 1922, 1923, 1924, 1925, 1926, 1927, 1928, 1929, 1930, 1931, AGE 0, .0202, .0071, .0106, .0122, .0370, .0865, .1583, .1047, .0611, .0347, 1, .0241, .0153, .0291, .0194, .0824, .3101, .0981, .5273, .0287, .1346, 2, .0306, .0094, .0056, .0033, .0029, .0072, .0572, .0705, .0983, .0099, 3, .0718, .0185, .0047, .0050, .0057, .0075, .0692, .2113, .0257, .0501, 4, .0066, .0069, .0035, .0038, .0013, .0098, .0079, .0131, .0136, .0015, 5, .0501, .0364, .0160, .0084, .0259, .0129, .0208, .0176, .0145, .0110, 6, .0404, .0491, .0348, .0204, .0093, .0156, .0194, .0231, .0159, .0252, 7, .0063, .0401, .0541, .0500, .0233, .0111, .0185, .0254, .0350, .0185, 8, .0284, .0104, .0392, .0816, .0460, .0318, .0206, .0158, .0406, .0285, 9, .1207, .0301, .0167, .0682, .0939, .0635, .0676, .0277, .0296, .0301, 10, .0232, .1332, .0304, .0258, .0575, .1094, .0487, .0843, .0503, .0222, 11, .0196, .0197, .0778, .0356, .0269, .0719, .0718, .0460, .0954, .0299, 12, .0201, .0250, .0112, .1245, .0436, .0314, .0456, .0825, .1038, .0560, 13, .0174, .0153, .0160, .0187, .1354, .0759, .0441, .0396, .1482, .0976, 14, .0132, .0159, .0109, .0188, .0150, .1039, .0592, .0371, .0670, .0793, 15, .1000, .1000, .1000, .1000, .1000, .1000, .1000, .1000, .1000, .1000, +gp, .1000, .1000, .1000, .1000, .1000, .1000, .1000, .1000, .1000, .1000, 0 FBAR 2-13, .0363, .0328, .0258, .0371, .0393, .0373, .0409, .0547, .0559, .0317,
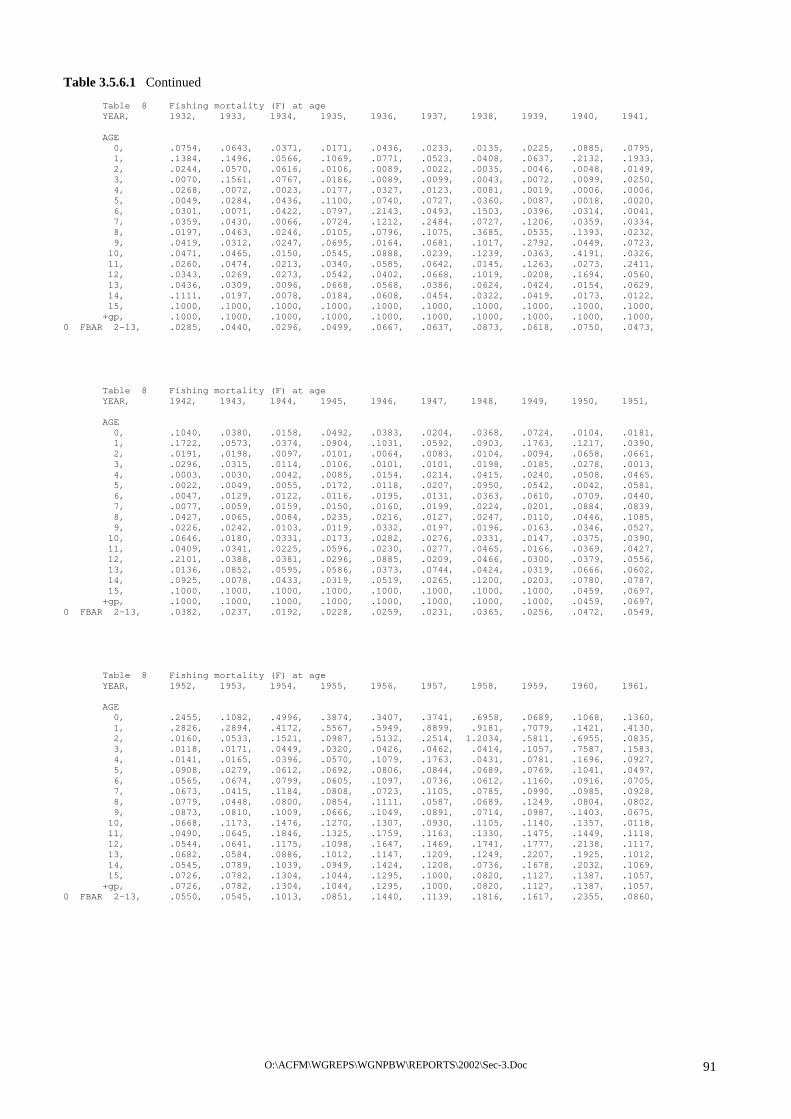
O:\ACFM\WGREPS\WGNPBW\REPORTS\2002\Sec-3.Doc 91
Table 3.5.6.1 Continued Table 8 Fishing mortality (F) at age YEAR, 1932, 1933, 1934, 1935, 1936, 1937, 1938, 1939, 1940, 1941, AGE 0, .0754, .0643, .0371, .0171, .0436, .0233, .0135, .0225, .0885, .0795, 1, .1384, .1496, .0566, .1069, .0771, .0523, .0408, .0637, .2132, .1933, 2, .0244, .0570, .0616, .0106, .0089, .0022, .0035, .0046, .0048, .0149, 3, .0070, .1561, .0767, .0186, .0089, .0099, .0043, .0072, .0099, .0250, 4, .0268, .0072, .0023, .0177, .0327, .0123, .0081, .0019, .0006, .0006, 5, .0049, .0284, .0436, .1100, .0740, .0727, .0360, .0087, .0018, .0020, 6, .0301, .0071, .0422, .0797, .2143, .0493, .1503, .0396, .0314, .0041, 7, .0359, .0430, .0066, .0724, .1212, .2484, .0727, .1206, .0359, .0334, 8, .0197, .0463, .0246, .0105, .0796, .1075, .3685, .0535, .1393, .0232, 9, .0419, .0312, .0247, .0695, .0164, .0681, .1017, .2792, .0449, .0723, 10, .0471, .0465, .0150, .0545, .0888, .0239, .1239, .0363, .4191, .0326, 11, .0260, .0474, .0213, .0340, .0585, .0642, .0145, .1263, .0273, .2411, 12, .0343, .0269, .0273, .0542, .0402, .0668, .1019, .0208, .1694, .0560, 13, .0436, .0309, .0096, .0668, .0568, .0386, .0624, .0424, .0154, .0629, 14, .1111, .0197, .0078, .0184, .0608, .0454, .0322, .0419, .0173, .0122, 15, .1000, .1000, .1000, .1000, .1000, .1000, .1000, .1000, .1000, .1000, +gp, .1000, .1000, .1000, .1000, .1000, .1000, .1000, .1000, .1000, .1000, 0 FBAR 2-13, .0285, .0440, .0296, .0499, .0667, .0637, .0873, .0618, .0750, .0473, Table 8 Fishing mortality (F) at age YEAR, 1942, 1943, 1944, 1945, 1946, 1947, 1948, 1949, 1950, 1951, AGE 0, .1040, .0380, .0158, .0492, .0383, .0204, .0368, .0724, .0104, .0181, 1, .1722, .0573, .0374, .0904, .1031, .0592, .0903, .1763, .1217, .0390, 2, .0191, .0198, .0097, .0101, .0064, .0083, .0104, .0094, .0658, .0661, 3, .0296, .0315, .0114, .0106, .0101, .0101, .0198, .0185, .0278, .0013, 4, .0003, .0030, .0042, .0085, .0154, .0214, .0415, .0240, .0508, .0465, 5, .0022, .0049, .0055, .0172, .0118, .0207, .0950, .0542, .0042, .0581, 6, .0047, .0129, .0122, .0116, .0195, .0131, .0363, .0610, .0709, .0440, 7, .0077, .0059, .0159, .0150, .0160, .0199, .0224, .0201, .0884, .0839, 8, .0427, .0065, .0084, .0235, .0216, .0127, .0247, .0110, .0446, .1085, 9, .0226, .0242, .0103, .0119, .0332, .0197, .0196, .0163, .0346, .0527, 10, .0646, .0180, .0331, .0173, .0282, .0276, .0331, .0147, .0375, .0390, 11, .0409, .0341, .0225, .0596, .0230, .0277, .0465, .0166, .0369, .0427, 12, .2101, .0388, .0381, .0296, .0885, .0209, .0466, .0300, .0379, .0556, 13, .0136, .0852, .0595, .0586, .0373, .0744, .0424, .0319, .0666, .0602, 14, .0925, .0078, .0433, .0319, .0519, .0265, .1200, .0203, .0780, .0787, 15, .1000, .1000, .1000, .1000, .1000, .1000, .1000, .1000, .0459, .0697, +gp, .1000, .1000, .1000, .1000, .1000, .1000, .1000, .1000, .0459, .0697, 0 FBAR 2-13, .0382, .0237, .0192, .0228, .0259, .0231, .0365, .0256, .0472, .0549, Table 8 Fishing mortality (F) at age YEAR, 1952, 1953, 1954, 1955, 1956, 1957, 1958, 1959, 1960, 1961, AGE 0, .2455, .1082, .4996, .3874, .3407, .3741, .6958, .0689, .1068, .1360, 1, .2826, .2894, .4172, .5567, .5949, .8899, .9181, .7079, .1421, .4130, 2, .0160, .0533, .1521, .0987, .5132, .2514, 1.2034, .5811, .6955, .0835, 3, .0118, .0171, .0449, .0320, .0426, .0462, .0414, .1057, .7587, .1583, 4, .0141, .0165, .0396, .0570, .1079, .1763, .0431, .0781, .1696, .0927, 5, .0908, .0279, .0612, .0692, .0806, .0844, .0689, .0769, .1041, .0497, 6, .0565, .0674, .0799, .0605, .1097, .0736, .0612, .1160, .0916, .0705, 7, .0673, .0415, .1184, .0808, .0723, .1105, .0785, .0990, .0985, .0928, 8, .0779, .0448, .0800, .0854, .1111, .0587, .0689, .1249, .0804, .0802, 9, .0873, .0810, .1009, .0666, .1049, .0891, .0714, .0987, .1403, .0675, 10, .0668, .1173, .1476, .1270, .1307, .0930, .1105, .1140, .1357, .0118, 11, .0490, .0645, .1846, .1325, .1759, .1163, .1330, .1475, .1449, .1118, 12, .0544, .0641, .1175, .1098, .1647, .1469, .1741, .1777, .2138, .1117, 13, .0682, .0584, .0886, .1012, .1147, .1209, .1249, .2207, .1925, .1012, 14, .0545, .0789, .1039, .0949, .1424, .1208, .0736, .1678, .2032, .1069, 15, .0726, .0782, .1304, .1044, .1295, .1000, .0820, .1127, .1387, .1057, +gp, .0726, .0782, .1304, .1044, .1295, .1000, .0820, .1127, .1387, .1057, 0 FBAR 2-13, .0550, .0545, .1013, .0851, .1440, .1139, .1816, .1617, .2355, .0860,

O:\ACFM\WGREPS\WGNPBW\REPORTS\2002\Sec-3.Doc 92
Table 3.5.6.1 Continued Table 8 Fishing mortality (F) at age YEAR, 1962, 1963, 1964, 1965, 1966, 1967, 1968, 1969, 1970, 1971, AGE 0, .3679, .0451, .0621, .5500, .1392, .1961, .7997, .0921, .3347, .2441, 1, .2658, .9250, .0665, .1786, .7192, 1.7622, .7439, 1.6597, .2501, .4295, 2, .0871, .4621, .5117, .1927, .2389, .3323, .6937, 1.7485, 1.2205, .1204, 3, .1028, .1240, .0612, .6736, .3137, .5034, 3.2066, 2.0406, .5307, .2855, 4, .0525, .0588, .0840, .1789, .4084, 1.1192, 4.5599, .2604, 1.4843, .1419, 5, .0442, .0424, .1886, .1573, .5321, .8588, 4.7169, .7590, .2998, .3119, 6, .1096, .0310, .1391, .2997, .5982, 1.3102, 1.8057, .6023, .6842, .2794, 7, .1213, .0697, .0309, .2829, .7536, 1.6834, 1.2122, .3507, 1.1086, .4857, 8, .0718, .1458, .0724, .4469, 1.3073, 1.4826, .9377, .4226, 1.1726, 1.6241, 9, .0976, .0700, .2847, .2419, .9789, 1.3296, 1.5726, .6056, 1.1825, 2.5238, 10, .0907, .2443, .3074, .3472, 1.3384, 1.4496, 1.2945, .6310, 1.3751, 1.9510, 11, .1256, .2153, .3356, .8375, 1.0666, 1.0769, 1.3204, .6261, 1.5563, 2.2737, 12, .1666, .2626, .2856, .6639, .5451, 1.2609, .7690, .8732, 3.9033, 1.8357, 13, .1302, .2729, .3657, .6932, 1.3723, 1.1286, 1.9490, .3927, 1.6255, .2170, 14, .1628, .3429, .3634, .6227, 1.4701, 1.9718, 1.2342, .8364, .8120, 2.7742, 15, .1466, .2569, .3195, .6204, 1.1880, 1.4777, 1.3620, .5776, 1.4061, 2.0280, +gp, .1466, .2569, .3195, .6204, 1.1880, 1.4777, 1.3620, .5776, 1.4061, 2.0280, 0 FBAR 2-13, .1000, .1666, .2223, .4180, .7878, 1.1279, 2.0032, .7761, 1.3453, 1.0042, Table 8 Fishing mortality (F) at age YEAR, 1972, 1973, 1974, 1975, 1976, 1977, 1978, 1979, 1980, 1981, AGE 0, .7939, .0035, .0118, .0159, .0030, .0130, .0050, .0040, .0068, .0116, 1, 1.7489, .0323, .0023, .0016, .0031, .0023, .0018, .0023, .0002, .0027, 2, .9309, .7288, .0937, .0013, .0013, .0099, .0011, .0035, .0006, .0089, 3, .0983, .4069, .1233, .1561, .0300, .0432, .0171, .0103, .0210, .0110, 4, 1.2887, .0893, .0609, .2243, .3938, .0365, .0286, .0124, .0110, .0178, 5, .9578, .8552, .1115, .3212, .0022, .0354, .0379, .0192, .0179, .0193, 6, 1.8090, 1.5110, .9654, .1880, .0005, .0026, .1147, .0251, .0272, .0205, 7, 1.2502, 1.1078, .7734, .0379, .1083, .2687, .0030, .0544, .0426, .0179, 8, 2.9486, 1.3527, .0086, .0141, .0090, .1158, .7485, .0035, .0920, .0268, 9, 1.7610, .0147, .0192, .0101, .0083, .0106, .0690, .0021, .0333, .0916, 10, .0388, .0293, .0174, .0228, .0119, .0097, .0124, .0427, .0025, .6964, 11, 1.5553, .0471, .0351, .0206, .0271, .0140, .0114, .0146, .0553, .3917, 12, 2.0473, .0090, .0576, .0424, .0244, .0325, .0165, .0134, .0173, .0240, 13, 1.1132, .0136, .0105, .0714, .0517, .0291, .0391, .0195, .0158, .0205, 14, .3301, 1.2442, .0161, .0124, .0899, .0636, .0350, .0474, .0232, .0186, 15, 2.1062, .6032, .0165, .0190, .0146, .1157, .0793, .0422, .0581, .0276, +gp, 2.1062, .6032, .0165, .0190, .0146, .1157, .0793, .0422, .0581, .0276, 0 FBAR 2-13, 1.3166, .5138, .1897, .0925, .0557, .0507, .0916, .0184, .0280, .1122, Table 8 Fishing mortality (F) at age YEAR, 1982, 1983, 1984, 1985, 1986, 1987, 1988, 1989, 1990, 1991, AGE 0, .0148, .0005, .0045, .0006, .0018, .0022, .0010, .0001, .0000, .0000, 1, .0038, .0076, .0000, .0043, .0001, .0021, .0011, .0003, .0000, .0001, 2, .0012, .0144, .0101, .0052, .0025, .0043, .0073, .0241, .0058, .0004, 3, .0182, .0340, .0701, .1654, .0238, .0285, .0132, .0041, .0321, .0056, 4, .0247, .0333, .0705, .3436, .1875, .0264, .0435, .0009, .0044, .0057, 5, .0207, .0357, .1211, .3000, .5875, .2929, .0347, .0117, .0034, .0027, 6, .0166, .0339, .0841, .3781, .4797, .2553, .2236, .0245, .0266, .0049, 7, .0216, .0214, .0853, .3991, .5624, .3946, .4372, .1131, .0203, .0260, 8, .0238, .0169, .0592, .5933, 1.2624, .2676, .6414, .1497, .0531, .0233, 9, .0233, .0257, .1171, .3356, 1.2486, .6434, .2055, .1275, .4384, .1310, 10, .0399, .0338, .1136, .2228, .8276, 1.0630, 1.4616, .0619, .6363, .2163, 11, .5462, .0575, .0359, .3073, .8219, .0924, 1.0588, .9170, .0559, .0455, 12, .1999, 2.2586, .0005, .3953, 2.0562, .9048, .0876, .7529, 1.6749, .0193, 13, .0035, 3.2773, .2937, .0006, 2.1502, 1.5336, .8806, .0102, .4237, 1.6296, 14, .0243, .0298, .2407, .5035, .0007, 1.4985, 4.7159, .1734, .0220, 1.9531, 15, .0221, .0290, .0698, .3792, 1.3962, .4168, .3809, .0897, .1527, .0238, +gp, .0221, .0290, .0698, .3792, 1.3962, .4168, .3809, .0897, .1527, .0238, 0 FBAR 2-13, .0783, .4869, .0884, .2872, .8509, .4589, .4246, .1831, .2812, .1759,

O:\ACFM\WGREPS\WGNPBW\REPORTS\2002\Sec-3.Doc 93
Table 3.5.6.1 Continued Table 8 Fishing mortality (F) at age YEAR, 1992, 1993, 1994, 1995, 1996, 1997, 1998, 1999, 2000, 2001, FBAR 99-** AGE 0, .0000, .0001, .0000, .0000, .0000, .0000, .0000, .0000, .0000, .0000, .0000, 1, .0000, .0000, .0000, .0000, .0000, .0000, .0000, .0000, .0000, .0000, .0000, 2, .0001, .0002, .0002, .0001, .0080, .0176, .0070, .0012, .0053, .0510, .0192, 3, .0028, .0034, .0015, .0024, .0051, .0626, .1051, .0205, .0356, .0680, .0414, 4, .0257, .0279, .0156, .0186, .0345, .0484, .1499, .0679, .1031, .0840, .0850, 5, .0119, .0831, .1186, .1092, .1043, .1082, .0815, .1105, .0829, .1010, .0981, 6, .0027, .0244, .2105, .2954, .2258, .1767, .1394, .1221, .1181, .1180, .1194, 7, .0047, .0095, .0532, .4787, .2934, .2719, .1536, .1724, .1532, .1350, .1536, 8, .0200, .0135, .0251, .0653, .3851, .3828, .2010, .1955, .1948, .1520, .1808, 9, .0286, .0791, .0202, .0593, .0291, .3874, .2435, .2200, .2550, .1760, .2170, 10, .1762, .0632, .2018, .0452, .0335, .1288, .4836, .3025, .2394, .1790, .2403, 11, .4904, .0001, .1270, .9284, .0522, .1911, .2255, .2844, .3244, .1130, .2406, 12, .1664, .0012, .3500, .2510, .4705, .0891, .0267, .6202, .5558, .1600, .4454, 13, .0413, .0009, .9446, 1.1850, .3619, 1.3907, .1446, .0672, .8315, .2070, .3686, 14, .0483, .0000, .1000, 4.0282, .0007, .2543, 6.3344, .1534, .3020, .2540, .2365, 15, .0286, .0592, .1000, .0000, .3033, .2616, .1040, .1300, .0780, .0000, .0693, +gp, .0286, .0592, .1000, .0000, .3033, .2616, .1040, .1300, .0780, .0000, 0 FBAR 2-13, .0809, .0255, .1724, .2865, .1670, .2713, .1634, .1820, .2416, .1287,
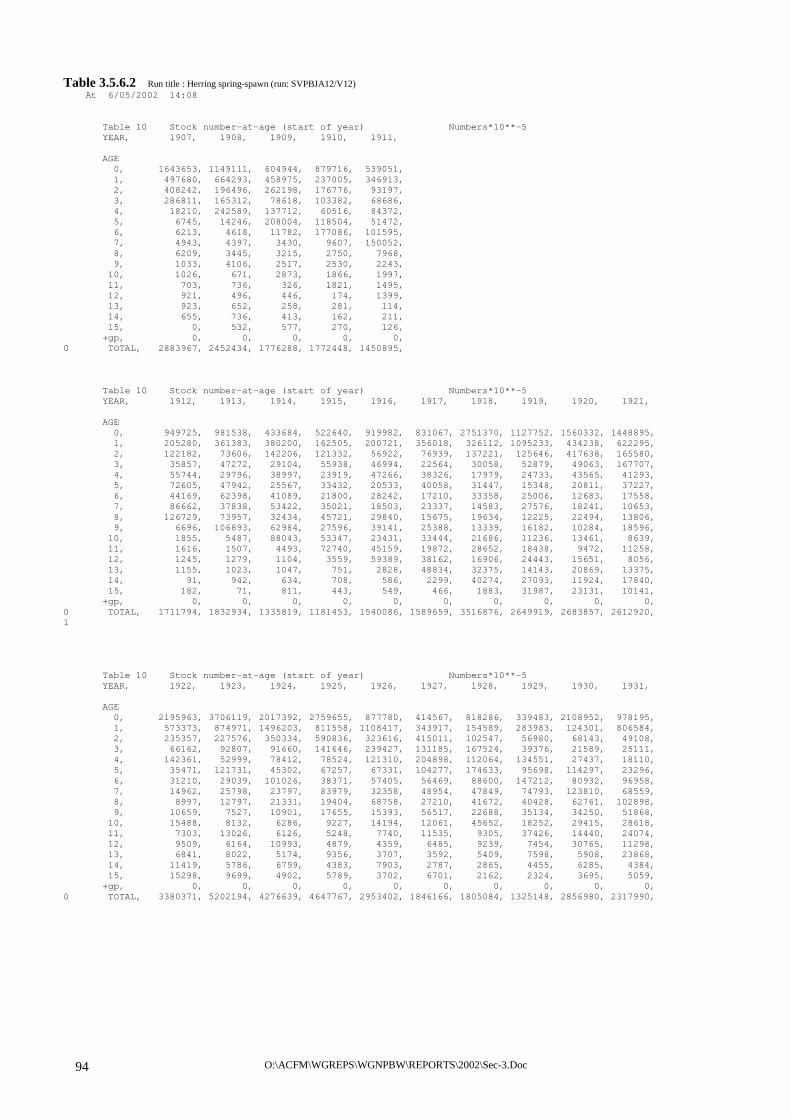
O:\ACFM\WGREPS\WGNPBW\REPORTS\2002\Sec-3.Doc 94
Table 3.5.6.2 Run title : Herring spring-spawn (run: SVPBJA12/V12) At 6/05/2002 14:08 Table 10 Stock number-at-age (start of year) Numbers*10**-5 YEAR, 1907, 1908, 1909, 1910, 1911, AGE 0, 1643653, 1149111, 604944, 879716, 539051, 1, 497680, 664293, 458975, 237005, 346913, 2, 408242, 196496, 262198, 176776, 93197, 3, 286811, 165312, 78618, 103382, 68686, 4, 18210, 242589, 137712, 60516, 84372, 5, 6745, 14246, 208004, 118504, 51472, 6, 6213, 4618, 11782, 177086, 101595, 7, 4943, 4397, 3430, 9607, 150052, 8, 6209, 3445, 3215, 2750, 7968, 9, 1033, 4106, 2517, 2530, 2243, 10, 1026, 671, 2873, 1866, 1997, 11, 703, 736, 326, 1821, 1495, 12, 921, 496, 446, 174, 1399, 13, 923, 652, 258, 281, 114, 14, 655, 736, 413, 162, 211, 15, 0, 532, 577, 270, 126, +gp, 0, 0, 0, 0, 0, 0 TOTAL, 2883967, 2452434, 1776288, 1772448, 1450895, Table 10 Stock number-at-age (start of year) Numbers*10**-5 YEAR, 1912, 1913, 1914, 1915, 1916, 1917, 1918, 1919, 1920, 1921, AGE 0, 949725, 981538, 433684, 522640, 919982, 831067, 2751370, 1127752, 1560332, 1448895, 1, 205280, 361383, 380200, 162505, 200721, 356018, 326112, 1095233, 434238, 622295, 2, 122182, 73606, 142206, 121332, 56922, 76939, 137221, 125646, 417638, 165580, 3, 35857, 47272, 29104, 55938, 46994, 22564, 30058, 52879, 49063, 167707, 4, 55744, 29796, 38997, 23919, 47266, 38326, 17979, 24733, 43565, 41293, 5, 72605, 47942, 25567, 33432, 20533, 40058, 31447, 15348, 20811, 37227, 6, 44169, 62398, 41089, 21800, 28242, 17210, 33358, 25006, 12683, 17558, 7, 86662, 37838, 53422, 35021, 18503, 23337, 14583, 27576, 18241, 10653, 8, 126729, 73957, 32434, 45721, 29840, 15675, 19634, 12225, 22494, 13806, 9, 6696, 106893, 62984, 27596, 39141, 25388, 13339, 16182, 10284, 18596, 10, 1855, 5487, 88043, 53347, 23431, 33444, 21686, 11236, 13461, 8639, 11, 1616, 1507, 4493, 72740, 45159, 19872, 28652, 18438, 9472, 11258, 12, 1245, 1279, 1104, 3559, 59389, 38162, 16906, 24443, 15651, 8056, 13, 1155, 1023, 1047, 751, 2828, 48834, 32375, 14143, 20869, 13375, 14, 91, 942, 634, 708, 586, 2299, 40274, 27093, 11924, 17840, 15, 182, 71, 811, 443, 549, 466, 1883, 31987, 23131, 10141, +gp, 0, 0, 0, 0, 0, 0, 0, 0, 0, 0, 0 TOTAL, 1711794, 1832934, 1335819, 1181453, 1540086, 1589659, 3516876, 2649919, 2683857, 2612920, 1 Table 10 Stock number-at-age (start of year) Numbers*10**-5 YEAR, 1922, 1923, 1924, 1925, 1926, 1927, 1928, 1929, 1930, 1931, AGE 0, 2195963, 3706119, 2017392, 2759655, 877780, 414567, 818286, 339483, 2108952, 978195, 1, 573373, 874971, 1496203, 811558, 1108417, 343917, 154589, 283983, 124301, 806584, 2, 235357, 227576, 350334, 590836, 323616, 415011, 102547, 56980, 68143, 49108, 3, 66162, 92807, 91660, 141646, 239427, 131185, 167524, 39376, 21589, 25111, 4, 142361, 52999, 78412, 78524, 121310, 204898, 112064, 134551, 27437, 18110, 5, 35471, 121731, 45302, 67257, 67331, 104277, 174633, 95698, 114297, 23296, 6, 31210, 29039, 101026, 38371, 57405, 56469, 88600, 147212, 80932, 96958, 7, 14962, 25798, 23797, 83979, 32358, 48954, 47849, 74793, 123810, 68559, 8, 8997, 12797, 21331, 19404, 68758, 27210, 41672, 40428, 62761, 102898, 9, 10659, 7527, 10901, 17655, 15393, 56517, 22688, 35134, 34250, 51868, 10, 15488, 8132, 6286, 9227, 14194, 12061, 45652, 18252, 29415, 28618, 11, 7303, 13026, 6126, 5248, 7740, 11535, 9305, 37426, 14440, 24074, 12, 9509, 6164, 10993, 4879, 4359, 6485, 9239, 7454, 30765, 11298, 13, 6841, 8022, 5174, 9356, 3707, 3592, 5409, 7598, 5908, 23868, 14, 11419, 5786, 6799, 4383, 7903, 2787, 2865, 4455, 6285, 4384, 15, 15298, 9699, 4902, 5789, 3702, 6701, 2162, 2324, 3695, 5059, +gp, 0, 0, 0, 0, 0, 0, 0, 0, 0, 0, 0 TOTAL, 3380371, 5202194, 4276639, 4647767, 2953402, 1846166, 1805084, 1325148, 2856980, 2317990,

O:\ACFM\WGREPS\WGNPBW\REPORTS\2002\Sec-3.Doc 95
Table 3.5.6.2 Continued Table 10 Stock number-at-age (start of year) Numbers*10**-5 YEAR, 1932, 1933, 1934, 1935, 1936, 1937, 1938, 1939, 1940, 1941, AGE 0, 1771991, 2552840, 2733436, 2987647, 970236, 5374021, 4069980, 1834130, 2101857, 1455025, 1, 384136, 668111, 973277, 1070898, 1194090, 377641, 2134511, 1632511, 729108, 782183, 2, 286649, 135992, 233896, 373943, 391244, 449440, 145714, 833144, 622764, 239525, 3, 19768, 113731, 52226, 89418, 150425, 157660, 182318, 59035, 337170, 251987, 4, 20557, 16896, 83740, 41632, 75541, 128330, 134365, 156251, 50447, 287360, 5, 15565, 17226, 14439, 71913, 35205, 62927, 109107, 114721, 134235, 43392, 6, 19833, 13332, 14412, 11898, 55446, 28140, 50364, 90587, 97883, 115329, 7, 81378, 16563, 11394, 11892, 9456, 38516, 23057, 37299, 74938, 81641, 8, 57926, 67575, 13657, 9743, 9520, 7210, 25858, 18453, 28456, 62225, 9, 86077, 48883, 55533, 11469, 8298, 7567, 5573, 15396, 15055, 21306, 10, 43318, 71048, 40782, 46633, 9209, 7026, 6084, 4333, 10024, 12390, 11, 24091, 35570, 58373, 34578, 38009, 7252, 5905, 4627, 3596, 5674, 12, 20110, 20202, 29197, 49182, 28767, 30856, 5854, 5009, 3510, 3012, 13, 9194, 16725, 16927, 24454, 40098, 23783, 24843, 4551, 4222, 2550, 14, 18633, 7576, 13957, 14429, 19688, 32607, 19695, 20088, 3754, 3579, 15, 3486, 14350, 6394, 11920, 12193, 15946, 26820, 16414, 16581, 3176, +gp, 0, 0, 0, 0, 0, 0, 0, 0, 0, 0, 0 TOTAL, 2862711, 3816622, 4351639, 4861648, 3047426, 6748924, 6970046, 4846549, 4233598, 3370353, Table 10 Stock number-at-age (start of year) Numbers*10**-5 YEAR, 1942, 1943, 1944, 1945, 1946, 1947, 1948, 1949, 1950, 1951, AGE 0, 813257, 2847228, 2496907, 1180478, 787959, 1821387, 1064689, 693743, 7473747, 1382719, 1, 546361, 298000, 1114383, 999227, 456891, 308308, 725601, 417213, 262358, 3007097, 2, 262126, 186985, 114415, 436427, 371125, 167560, 118142, 269535, 142205, 94445, 3, 95944, 104553, 74535, 46071, 175662, 149922, 67562, 47534, 108558, 54134, 4, 211524, 80168, 87199, 63425, 39236, 149673, 127745, 57012, 40165, 90878, 5, 247192, 182003, 68792, 74736, 54126, 33254, 126092, 105477, 47909, 32858, 6, 37274, 212289, 155891, 58884, 63229, 46041, 28036, 98697, 85994, 41064, 7, 98863, 31932, 180374, 132547, 50098, 53374, 39112, 23270, 79923, 68950, 8, 67963, 84436, 27323, 152806, 112381, 42435, 45033, 32918, 19630, 62971, 9, 52330, 56052, 72207, 23320, 128471, 94658, 36064, 37814, 28024, 16159, 10, 17060, 44036, 47093, 61515, 19834, 106971, 79884, 30438, 32020, 23300, 11, 10322, 13764, 37225, 39214, 52041, 16596, 89561, 66519, 25817, 26545, 12, 3837, 8528, 11449, 31328, 31798, 43771, 13894, 73587, 56309, 21416, 13, 2451, 2677, 7061, 9486, 26178, 25051, 36894, 11414, 61467, 46664, 14, 2061, 2081, 2116, 5726, 7700, 21707, 20015, 30435, 9515, 49494, 15, 3043, 1617, 1777, 1744, 4773, 6292, 18196, 15278, 25669, 7575, +gp, 0, 0, 0, 0, 0, 0, 0, 0, 56929, 48758, 0 TOTAL, 2471607, 4156351, 4498748, 3316934, 2381504, 3087000, 2636519, 2010885, 8556240, 5075027, Table 10 Stock number-at-age (start of year) Numbers*10**-5 YEAR, 1952, 1953, 1954, 1955, 1956, 1957, 1958, 1959, 1960, 1961, AGE 0, 938988, 835771, 397029, 237538, 274771, 236506, 278105, 4053427, 1913386, 732827, 1, 552100, 298670, 304949, 97946, 65556, 79456, 66148, 56387, 1538204, 699104, 2, 1175817, 169209, 90917, 81693, 22821, 14702, 13267, 10738, 11294, 542521, 3, 35944, 470458, 65225, 31748, 30092, 5554, 4649, 1619, 2442, 2291, 4, 46533, 30573, 398069, 53673, 26464, 24821, 4564, 3839, 1254, 984, 5, 74664, 39490, 25883, 329322, 43636, 20449, 17911, 3763, 3056, 911, 6, 26685, 58688, 33055, 20954, 264511, 34649, 16177, 14389, 2999, 2370, 7, 33821, 21705, 47220, 26265, 16977, 204017, 27707, 13096, 11028, 2355, 8, 54572, 27216, 17923, 36105, 20851, 13593, 157223, 22047, 10209, 8601, 9, 48627, 43450, 22398, 14241, 28532, 16060, 11033, 126308, 16749, 8109, 10, 13194, 38355, 34489, 17428, 11467, 22112, 12644, 8841, 98496, 12529, 11, 19288, 10623, 29358, 25611, 13211, 8660, 17343, 9744, 6790, 74015, 12, 21893, 15808, 8572, 21008, 19308, 9537, 6636, 13068, 7237, 5056, 13, 17436, 17846, 12761, 6559, 16201, 14095, 7087, 4799, 9416, 5030, 14, 37816, 14018, 14488, 10052, 5102, 12433, 10750, 5384, 3312, 6686, 15, 39378, 30821, 11151, 11239, 7869, 3809, 9483, 8596, 3918, 2327, +gp, 47336, 73642, 59483, 51748, 42150, 27995, 25443, 15205, 10102, 4117, 0 TOTAL, 3184092, 2196343, 1572969, 1073130, 909520, 748449, 686170, 4371250, 3649892, 2109831,

O:\ACFM\WGREPS\WGNPBW\REPORTS\2002\Sec-3.Doc 96
Table 3.5.6.2 Continued Table 10 Stock number-at-age (start of year) Numbers*10**-5 YEAR, 1962, 1963, 1964, 1965, 1966, 1967, 1968, 1969, 1970, 1971, AGE 0, 177129, 1646402, 905560, 79326, 453493, 35822, 46386, 96073, 6207, 2098, 1, 260052, 49849, 639834, 345996, 18608, 160413, 11970, 8476, 35624, 1806, 2, 188063, 81052, 8037, 243395, 117663, 3686, 11196, 2313, 655, 11279, 3, 202893, 70081, 20760, 1959, 81610, 37672, 1075, 2275, 164, 79, 4, 1683, 157564, 53282, 16807, 860, 51327, 19600, 37, 254, 83, 5, 772, 1374, 127875, 42166, 12097, 492, 14426, 177, 25, 50, 6, 746, 636, 1134, 91146, 31010, 6115, 179, 111, 71, 16, 7, 1901, 575, 531, 849, 58137, 14675, 1420, 25, 52, 31, 8, 1847, 1450, 462, 443, 551, 23551, 2346, 364, 15, 15, 9, 6833, 1480, 1078, 370, 244, 128, 4602, 791, 205, 4, 10, 6524, 5334, 1188, 698, 250, 79, 29, 822, 371, 54, 11, 10658, 5128, 3596, 752, 425, 56, 16, 7, 376, 81, 12, 56966, 8091, 3559, 2213, 280, 126, 17, 4, 3, 68, 13, 3892, 41507, 5355, 2302, 980, 140, 31, 7, 1, 0, 14, 3913, 2940, 27193, 3198, 991, 214, 39, 4, 4, 0, 15, 5171, 2862, 1796, 16274, 1476, 196, 26, 10, 1, 1, +gp, 6834, 5918, 11413, 4140, 7024, 1235, 216, 49, 27, 0, 0 TOTAL, 935876, 2082241, 1812652, 852033, 785698, 335927, 113574, 111544, 44057, 15664, Table 10 Stock number-at-age (start of year) Numbers*10**-5 YEAR, 1972, 1973, 1974, 1975, 1976, 1977, 1978, 1979, 1980, 1981, AGE 0, 9074, 127017, 85007, 29426, 100187, 50393, 61332, 124347, 15393, 10919, 1, 668, 1668, 51461, 34155, 11775, 40609, 20224, 24812, 50355, 6216, 2, 478, 47, 657, 20874, 13864, 4773, 16472, 8207, 10064, 20468, 3, 4065, 77, 9, 243, 8476, 5629, 1921, 6690, 3325, 4089, 4, 51, 3172, 44, 7, 179, 7080, 4641, 1626, 5699, 2803, 5, 62, 12, 2497, 36, 5, 104, 5875, 3881, 1382, 4851, 6, 31, 20, 4, 1922, 22, 4, 86, 4868, 3277, 1168, 7, 10, 4, 4, 1, 1371, 19, 4, 66, 4086, 2745, 8, 16, 3, 1, 2, 1, 1059, 13, 3, 54, 3370, 9, 3, 1, 1, 1, 1, 1, 812, 5, 3, 42, 10, 0, 0, 1, 0, 1, 1, 1, 652, 4, 2, 11, 7, 0, 0, 1, 0, 1, 1, 1, 538, 4, 12, 7, 1, 0, 0, 0, 0, 1, 1, 1, 438, 13, 9, 1, 1, 0, 0, 0, 0, 1, 1, 1, 14, 0, 3, 1, 1, 0, 0, 0, 0, 0, 1, 15, 0, 0, 1, 1, 1, 0, 0, 0, 0, 0, +gp, 0, 0, 1, 1, 1, 0, 0, 0, 0, 0, 0 TOTAL, 14482, 132026, 139688, 86671, 135886, 109675, 111382, 175161, 94183, 57118, Table 10 Stock number-at-age (start of year) Numbers*10**-5 YEAR, 1982, 1983, 1984, 1985, 1986, 1987, 1988, 1989, 1990, 1991, AGE 0, 23297, 3692372, 114045, 771347, 115167, 97144, 245711, 725372, 1326004, 3496035, 1, 4388, 9333, 1500424, 46159, 313430, 46738, 39411, 99803, 294870, 539107, 2, 2520, 1777, 3766, 610017, 18686, 127423, 18963, 16006, 40565, 119883, 3, 8248, 1024, 712, 1516, 246737, 7578, 51586, 7654, 6352, 16397, 4, 3481, 6971, 851, 572, 1106, 207367, 6339, 43817, 6561, 5295, 5, 2370, 2923, 5804, 683, 349, 789, 173837, 5224, 37680, 5622, 6, 4096, 1998, 2428, 4426, 435, 167, 507, 144524, 4444, 32322, 7, 985, 3467, 1662, 1921, 2610, 232, 111, 349, 121388, 3724, 8, 2321, 830, 2921, 1314, 1109, 1280, 135, 62, 268, 102383, 9, 2824, 1951, 702, 2370, 625, 270, 843, 61, 46, 219, 10, 33, 2375, 1636, 538, 1458, 154, 122, 591, 46, 25, 11, 1, 28, 1976, 1257, 370, 549, 46, 24, 478, 21, 12, 2, 0, 22, 1641, 796, 140, 431, 14, 8, 389, 13, 368, 2, 0, 19, 951, 88, 49, 339, 6, 1, 14, 0, 316, 0, 0, 17, 95, 16, 17, 289, 3, 15, 0, 0, 264, 0, 0, 14, 18, 0, 13, 244, +gp, 0, 0, 0, 90, 35, 0, 0, 0, 24, 5, 0 TOTAL, 54937, 3725366, 1637215, 1443868, 703881, 490029, 538125, 1043858, 1839043, 4321675,

O:\ACFM\WGREPS\WGNPBW\REPORTS\2002\Sec-3.Doc 97
Table 3.5.6.2 Continued Table 10 Stock number-at-age (start of year) Numbers*10**-5 YEAR, 1992, 1993, 1994, 1995, 1996, 1997, 1998, 1999, 2000, 2001, 2002, GMST 7-99 AMST 7-99 AGE 0, 3924332, 1073137, 347152, 114822, 1093623, 384802, 250441, 3816, 0, 0, 0, 492600, 1190663, 1, 1421381, 1595504, 436265, 141139, 46683, 444634, 156449, 101822, 1552, 0, 0, 194055, 470745, 2, 219164, 577890, 648683, 177372, 57383, 18980, 180775, 63607, 41398, 631, 0, 66245, 179254, 3, 48720, 89097, 234908, 263685, 72107, 23144, 7582, 72987, 25830, 16742, 244, 24200, 73743, 4, 14035, 41817, 76423, 201886, 226422, 61745, 18712, 5875, 61545, 21454, 13463, 18021, 60910, 5, 4532, 11773, 35002, 64758, 170554, 188272, 50634, 13864, 4725, 47785, 16978, 13531, 50928, 6, 4826, 3854, 9325, 26759, 49973, 132255, 145425, 40171, 10685, 3743, 37178, 9901, 41738, 7, 27683, 4143, 3237, 6503, 17141, 34319, 95395, 108881, 30601, 8172, 2863, 7038, 33464, 8, 3124, 23716, 3532, 2642, 3468, 11002, 22507, 70417, 78870, 22597, 6145, 4946, 26106, 9, 86094, 2635, 20138, 2965, 2131, 2031, 6457, 15845, 49843, 55871, 16707, 3272, 20674, 10, 165, 72010, 2096, 16987, 2405, 1781, 1187, 4357, 10944, 33245, 40328, 2245, 16806, 11, 18, 119, 58182, 1474, 13975, 2002, 1348, 630, 2771, 7415, 23925, 1530, 13641, 12, 17, 9, 103, 44105, 501, 11416, 1423, 926, 408, 1724, 5700, 1046, 11052, 13, 329, 13, 8, 62, 29536, 270, 8988, 1193, 429, 201, 1265, 671, 8844, 14, 0, 271, 11, 3, 16, 17703, 58, 6694, 960, 161, 141 424, 6995, 15, 0, 0, 233, 8, 0, 14, 11815, 0, 4942, 611, 107 215, 5514, +gp, 0, 0, 0, 0, 0, 0, 0, 5643, 5354, 0, 526, 0 TOTAL, 5754419, 3495990, 1875298, 1065169, 1785917, 1334368, 959196, 516726, 330856, 220352, 165569,
Table 3.5.6.3 Run title : Herring spring-spawn (run: SVPBJA12/V12) At 6/05/2002 14:08 Table 12 Stock biomass at age (start of year) Tonnes*10**-1 YEAR, 1907, 1908, 1909, 1910, 1911, AGE 0, 16437, 11491, 6049, 8797, 5391, 1, 39814, 53143, 36718, 18960, 27753, 2, 191874, 92353, 123233, 83085, 43803, 3, 286811, 165312, 78618, 103382, 68686, 4, 36237, 482751, 274047, 120427, 167901, 5, 15985, 33762, 492970, 280855, 121988, 6, 16590, 12329, 31457, 472820, 271258, 7, 14136, 12576, 9811, 27477, 429150, 8, 19061, 10577, 9869, 8444, 24463, 9, 3254, 12933, 7928, 7971, 7067, 10, 3325, 2174, 9307, 6045, 6470, 11, 2334, 2442, 1083, 6045, 4964, 12, 3123, 1681, 1514, 589, 4743, 13, 3211, 2267, 897, 979, 398, 14, 2319, 2607, 1462, 573, 748, 15, 0, 1957, 2124, 993, 464, +gp, 0, 0, 0, 0, 0, 0 TOTALBIO, 654511, 900357, 1087089, 1147443, 1185246, Table 12 Stock biomass at age (start of year) Tonnes*10**-1 YEAR, 1912, 1913, 1914, 1915, 1916, 1917, 1918, 1919, 1920, 1921, AGE 0, 9497, 9815, 4337, 5226, 9200, 8311, 27514, 11278, 15603, 14489, 1, 16422, 28911, 30416, 13000, 16058, 28481, 26089, 87619, 34739, 49784, 2, 57426, 34595, 66837, 57026, 26753, 36161, 64494, 59054, 196290, 77823, 3, 35857, 47272, 29104, 55938, 46994, 22564, 30058, 52879, 49063, 167707, 4, 110931, 59294, 77603, 47599, 94059, 76269, 35778, 49218, 86694, 82173, 5, 172073, 113623, 60594, 79233, 48663, 94938, 74529, 36374, 49322, 88227, 6, 117933, 166604, 109707, 58207, 75406, 45950, 89065, 66767, 33865, 46881, 7, 247855, 108217, 152788, 100160, 52920, 66745, 41708, 78868, 52169, 30468, 8, 389058, 227049, 99574, 140364, 91609, 48123, 60278, 37531, 69056, 42385, 9, 21091, 336713, 198401, 86928, 123293, 79971, 42017, 50974, 32394, 58577, 10, 6011, 17779, 285260, 172844, 75918, 108359, 70262, 36403, 43615, 27991, 11, 5366, 5004, 14917, 241498, 149929, 65974, 95124, 61214, 31447, 37378, 12, 4222, 4337, 3743, 12066, 201327, 129367, 57312, 82862, 53057, 27310, 13, 4020, 3562, 3643, 2615, 9840, 169943, 112663, 49217, 72625, 46544, 14, 322, 3335, 2244, 2507, 2076, 8138, 142571, 95910, 42213, 63155, 15, 669, 260, 2984, 1630, 2021, 1715, 6930, 117713, 85120, 37320, +gp, 0, 0, 0, 0, 0, 0, 0, 0, 0, 0, 0 TOTALBIO, 1198752, 1166369, 1142152, 1076841, 1026064, 991010, 976391, 973880, 947272, 898211, 1

O:\ACFM\WGREPS\WGNPBW\REPORTS\2002\Sec-3.Doc 98
Table 3.5.6.3 Continued Table 12 Stock biomass at age (start of year) Tonnes*10**-1 YEAR, 1922, 1923, 1924, 1925, 1926, 1927, 1928, 1929, 1930, 1931, AGE 0, 21960, 37061, 20174, 27597, 8778, 4146, 8183, 3395, 21090, 9782, 1, 45870, 69998, 119696, 64925, 88673, 27513, 12367, 22719, 9944, 64527, 2, 110618, 106961, 164657, 277693, 152099, 195055, 48197, 26781, 32027, 23081, 3, 66162, 92807, 91660, 141646, 239427, 131185, 167524, 39376, 21589, 25111, 4, 283297, 105467, 156040, 156263, 241407, 407747, 223008, 267757, 54600, 36040, 5, 84065, 288502, 107365, 159399, 159575, 247137, 413881, 226805, 270885, 55213, 6, 83330, 77534, 269740, 102451, 153272, 150772, 236561, 393057, 216089, 258877, 7, 42792, 73783, 68060, 240181, 92545, 140008, 136848, 213908, 354097, 196079, 8, 27620, 39286, 65487, 59571, 211088, 83536, 127932, 124113, 192678, 315897, 9, 33577, 23709, 34337, 55613, 48487, 178030, 71466, 110674, 107888, 163383, 10, 50182, 26347, 20367, 29896, 45990, 39077, 147912, 59136, 95304, 92724, 11, 24246, 43245, 20340, 17424, 25696, 38295, 30892, 124256, 47941, 79927, 12, 32235, 20895, 37266, 16538, 14777, 21983, 31320, 25268, 104294, 38299, 13, 23807, 27916, 18006, 32558, 12902, 12499, 18823, 26440, 20558, 83061, 14, 40422, 20484, 24070, 15516, 27977, 9866, 10143, 15770, 22250, 15520, 15, 56296, 35694, 18039, 21303, 13624, 24660, 7956, 8554, 13596, 18618, +gp, 0, 0, 0, 0, 0, 0, 0, 0, 0, 0, 0 TOTALBIO, 1026480, 1089690, 1235303, 1418574, 1536318, 1711510, 1693014, 1688007, 1584828, 1476139, Table 12 Stock biomass at age (start of year) Tonnes*10**-1 YEAR, 1932, 1933, 1934, 1935, 1936, 1937, 1938, 1939, 1940, 1941, AGE 0, 17720, 25528, 27334, 29876, 9702, 53740, 40700, 18341, 21019, 14550, 1, 30731, 53449, 77862, 85672, 95527, 30211, 170761, 130601, 58329, 62575, 2, 134725, 63916, 109931, 224366, 234747, 211237, 72857, 499886, 292699, 112577, 3, 19768, 113731, 52226, 115349, 185023, 182885, 158617, 57854, 337170, 151192, 4, 40909, 33623, 166643, 74938, 118599, 222012, 217671, 268751, 93831, 293107, 5, 36888, 40826, 34220, 133039, 70762, 120190, 201847, 235177, 276523, 85482, 6, 52953, 35596, 38479, 29387, 126972, 64442, 108787, 197479, 207512, 250263, 7, 232742, 47371, 32587, 32464, 25530, 94749, 58333, 89146, 186595, 191040, 8, 177833, 207456, 41926, 27670, 28370, 20332, 68783, 48717, 75123, 168008, 9, 271142, 153982, 174930, 34980, 25476, 22247, 16050, 42494, 42757, 59871, 10, 140350, 230195, 132135, 142698, 29284, 22063, 18678, 12652, 29169, 36549, 11, 79981, 118092, 193797, 104770, 123911, 22627, 18186, 14389, 11292, 17134, 12, 68174, 68486, 98978, 151971, 92053, 98431, 18500, 15026, 11126, 9157, 13, 31996, 58202, 58906, 75809, 130319, 75156, 78753, 14153, 13681, 8262, 14, 65959, 26819, 49407, 44587, 64970, 104996, 61841, 62073, 12051, 11488, 15, 12828, 52809, 23529, 38262, 40845, 51187, 85555, 50555, 52726, 10194, +gp, 0, 0, 0, 0, 0, 0, 0, 0, 0, 0, 0 TOTALBIO, 1414700, 1330084, 1312891, 1345838, 1402091, 1396505, 1395920, 1757295, 1721603, 1481450, Table 12 Stock biomass at age (start of year) Tonnes*10**-1 YEAR, 1942, 1943, 1944, 1945, 1946, 1947, 1948, 1949, 1950, 1951, AGE 0, 8133, 28472, 24969, 11805, 7880, 18214, 10647, 6937, 74737, 13827, 1, 43709, 23840, 89151, 79938, 36551, 24665, 58048, 33377, 20989, 240568, 2, 123199, 87883, 53775, 205121, 174429, 78753, 55527, 126682, 66837, 44389, 3, 95944, 104553, 74535, 46071, 175662, 149922, 80399, 47534, 108558, 54134, 4, 420932, 159535, 173526, 126216, 78080, 297850, 247826, 113454, 81936, 185391, 5, 585845, 431348, 163037, 177124, 128278, 78811, 281185, 249980, 110191, 75574, 6, 99520, 566813, 416228, 157220, 168823, 122930, 77940, 263522, 219285, 104712, 7, 282747, 91325, 515870, 379086, 143281, 152649, 116163, 66553, 219789, 189613, 8, 208648, 259218, 83883, 469115, 345009, 130275, 137350, 101059, 56926, 182615, 9, 164840, 176565, 227452, 73459, 404685, 298174, 109634, 119113, 85474, 49285, 10, 55274, 142677, 152582, 199308, 64261, 346585, 249237, 98619, 100863, 73395, 11, 34268, 45698, 123588, 130189, 172775, 55098, 283013, 220843, 83905, 86272, 12, 13008, 28908, 38814, 106204, 107796, 148385, 45294, 249460, 185821, 70672, 13, 8531, 9316, 24571, 33012, 91101, 87177, 122118, 39719, 208988, 158658, 14, 7296, 7368, 7490, 20270, 27259, 76844, 66649, 107741, 32827, 170756, 15, 11199, 5951, 6541, 6418, 17566, 23156, 63503, 56225, 92923, 27421, +gp, 0, 0, 0, 0, 0, 0, 0, 0, 207790, 177966, 0 TOTALBIO, 2163091, 2169470, 2176012, 2220554, 2143436, 2089489, 2004534, 1900818, 1957839, 1905249,

O:\ACFM\WGREPS\WGNPBW\REPORTS\2002\Sec-3.Doc 99
Table 3.5.6.3 Continued Table 12 Stock biomass at age (start of year) Tonnes*10**-1 YEAR, 1952, 1953, 1954, 1955, 1956, 1957, 1958, 1959, 1960, 1961, AGE 0, 9390, 8358, 3970, 2375, 2748, 2365, 2781, 40534, 19134, 7328, 1, 44168, 23894, 24396, 7836, 5244, 6356, 5292, 4511, 123056, 55928, 2, 552634, 79528, 42731, 38396, 10726, 6910, 6236, 5047, 5308, 254985, 3, 35944, 470458, 65225, 31748, 30092, 5554, 4649, 1619, 2442, 2291, 4, 94927, 62369, 812060, 104662, 54252, 33756, 9311, 7832, 2558, 2283, 5, 171727, 90828, 59530, 701456, 100364, 46624, 43345, 9482, 8252, 2277, 6, 68046, 149653, 84290, 54480, 658633, 88355, 47236, 37412, 8726, 6922, 7, 93007, 59690, 129854, 72230, 46685, 534524, 81735, 37980, 32312, 7112, 8, 158259, 78927, 51977, 104703, 60469, 39420, 460663, 66142, 32772, 26148, 9, 148313, 132523, 68313, 43434, 87023, 48982, 33650, 385239, 53261, 26191, 10, 41561, 120818, 108642, 54899, 36121, 69653, 39829, 27850, 315187, 40344, 11, 62687, 34524, 95412, 83235, 42936, 28146, 57231, 31669, 23357, 237588, 12, 72246, 52166, 28286, 69326, 63717, 31472, 22562, 43124, 25257, 17392, 13, 59283, 60675, 43388, 22302, 55083, 47924, 24451, 16315, 34841, 17957, 14, 130466, 48363, 49985, 34680, 17603, 42893, 37841, 18574, 12553, 24268, 15, 142548, 111573, 40366, 40685, 28485, 13788, 34139, 30517, 14692, 8492, +gp, 172778, 268794, 217113, 188878, 153848, 102182, 92867, 54738, 38387, 15234, 0 TOTALBIO, 2057984, 1853140, 1925538, 1655328, 1454029, 1148905, 1003816, 818584, 752095, 752740, Table 12 Stock biomass at age (start of year) Tonnes*10**-1 YEAR, 1962, 1963, 1964, 1965, 1966, 1967, 1968, 1969, 1970, 1971, AGE 0, 1771, 16464, 9056, 793, 4535, 358, 464, 961, 62, 21, 1, 20804, 3988, 51187, 27680, 1489, 12833, 958, 678, 2850, 271, 2, 88390, 38094, 3777, 114396, 55302, 1732, 5262, 1087, 308, 9023, 3, 202893, 70081, 20760, 1959, 81610, 37672, 1075, 2275, 164, 79, 4, 3685, 291492, 103368, 31261, 1590, 92389, 22540, 43, 532, 157, 5, 2247, 3477, 272374, 83911, 26492, 1121, 29718, 256, 68, 112, 6, 2238, 1869, 2993, 215104, 68842, 16450, 477, 300, 164, 40, 7, 6008, 1795, 1682, 2208, 144762, 39622, 3905, 76, 154, 85, 8, 5986, 4769, 1677, 1607, 1685, 69240, 6428, 1113, 49, 43, 9, 22275, 4839, 3807, 1294, 863, 416, 13116, 2435, 662, 13, 10, 21854, 17816, 4145, 2583, 942, 331, 102, 2614, 1207, 176, 11, 36024, 17486, 12729, 2706, 1660, 243, 52, 23, 1238, 271, 12, 190266, 28236, 12704, 8363, 1061, 460, 60, 13, 12, 236, 13, 13504, 141538, 19225, 8908, 3706, 514, 125, 24, 5, 0, 14, 13851, 10527, 99253, 12471, 3576, 926, 151, 15, 15, 1, 15, 18513, 10732, 7221, 64121, 5655, 811, 97, 39, 5, 6, +gp, 24467, 22192, 45879, 16313, 26900, 5113, 818, 193, 104, 0, 0 TOTALBIO, 674775, 685396, 671836, 595677, 430670, 280233, 85348, 12145, 7599, 10532, Table 12 Stock biomass at age (start of year) Tonnes*10**-1 YEAR, 1972, 1973, 1974, 1975, 1976, 1977, 1978, 1979, 1980, 1981, AGE 0, 91, 1270, 850, 294, 1002, 504, 613, 1243, 154, 109, 1, 67, 167, 5146, 3416, 1178, 4061, 2022, 2481, 5036, 622, 2, 334, 40, 558, 17743, 11785, 4057, 14002, 6976, 8555, 17398, 3, 6098, 130, 16, 440, 15341, 10189, 3458, 11908, 5819, 6952, 4, 76, 8215, 114, 18, 463, 18337, 13643, 3772, 16128, 6278, 5, 87, 41, 8538, 122, 17, 356, 19153, 13934, 4795, 16301, 6, 66, 78, 17, 7381, 85, 16, 320, 18744, 13174, 4416, 7, 25, 18, 16, 6, 5606, 78, 15, 278, 17204, 10623, 8, 44, 10, 6, 7, 5, 4700, 58, 14, 251, 13752, 9, 8, 3, 3, 5, 6, 5, 3863, 26, 12, 168, 10, 1, 2, 3, 2, 5, 6, 5, 3390, 23, 11, 11, 22, 1, 2, 3, 2, 4, 5, 4, 2871, 20, 12, 25, 6, 1, 1, 2, 2, 3, 4, 3, 2242, 13, 33, 4, 5, 1, 1, 2, 1, 3, 3, 3, 14, 0, 13, 3, 4, 1, 1, 2, 1, 2, 3, 15, 0, 0, 3, 3, 4, 0, 1, 1, 1, 2, +gp, 0, 0, 3, 3, 4, 0, 1, 1, 1, 2, 0 TOTALBIO, 6977, 10000, 15283, 29448, 35506, 42318, 57164, 62781, 74033, 78902,

O:\ACFM\WGREPS\WGNPBW\REPORTS\2002\Sec-3.Doc 100
Table 3.5.6.3 Continued Table 12 Stock biomass at age (start of year) Tonnes*10**-1 YEAR, 1982, 1983, 1984, 1985, 1986, 1987, 1988, 1989, 1990, 1991, AGE 0, 233, 36924, 1140, 7713, 1152, 971, 2457, 7254, 13260, 34960, 1, 439, 933, 150042, 4616, 31343, 4674, 5912, 14971, 23590, 59302, 2, 2142, 1511, 3201, 140304, 15883, 70083, 9482, 16006, 19471, 44357, 3, 14022, 1586, 997, 2243, 133238, 6820, 50554, 11787, 13912, 24103, 4, 7102, 17359, 1737, 1337, 2278, 296535, 8558, 76680, 12991, 11119, 5, 7180, 8886, 17122, 1810, 925, 1901, 342458, 10918, 97215, 13719, 6, 14541, 7352, 8206, 13809, 1258, 466, 1403, 364199, 12799, 96965, 7, 3773, 14008, 6250, 6647, 8848, 694, 350, 1064, 375088, 12067, 8, 9167, 3519, 11539, 4861, 4082, 4045, 456, 227, 1147, 344005, 9, 11664, 8524, 2858, 9361, 2443, 924, 2892, 230, 170, 750, 10, 151, 10354, 6758, 2135, 5570, 529, 439, 2121, 186, 97, 11, 4, 136, 8339, 5380, 1437, 1986, 167, 96, 1850, 77, 12, 11, 2, 98, 7023, 3143, 527, 1619, 54, 37, 1654, 13, 1862, 8, 0, 82, 3757, 329, 183, 1344, 24, 6, 14, 2, 1562, 0, 0, 65, 359, 61, 69, 1273, 13, 15, 2, 2, 1152, 0, 0, 54, 69, 0, 55, 1035, +gp, 2, 2, 1, 383, 137, 0, 0, 0, 105, 19, 0 TOTALBIO, 72299, 112668, 219441, 207705, 215560, 390896, 427062, 507022, 573173, 644250, Table 12 Stock biomass at age (start of year) Tonnes*10**-1 YEAR, 1992, 1993, 1994, 1995, 1996, 1997, 1998, 1999, 2000, 2001, AGE 0, 39243, 10731, 3472, 1148, 10936, 3848, 2504, 38, 0, 0, 1, 99497, 127640, 43626, 25405, 8403, 80034, 28161, 18328, 279, 0, 2, 65749, 144472, 162171, 44343, 14346, 4745, 45194, 15902, 10349, 158, 3, 62362, 72169, 176181, 174032, 54801, 22219, 5611, 74446, 26346, 12557, 4, 31438, 84053, 115399, 278602, 267178, 72859, 27507, 8813, 92317, 38187, 5, 13414, 31198, 88906, 148943, 320642, 327593, 88104, 30916, 10537, 113728, 6, 15782, 12449, 29654, 79205, 130429, 302864, 315572, 96410, 25643, 9246, 7, 98276, 14666, 12011, 22499, 54166, 98151, 230857, 287445, 80787, 24188, 8, 10776, 84904, 12256, 10252, 11998, 35535, 62569, 199279, 223203, 69373, 9, 315964, 10040, 82970, 10761, 7968, 7514, 19630, 49911, 157006, 175436, 10, 563, 265719, 8005, 69478, 9379, 6733, 3678, 15031, 37757, 109045, 11, 64, 472, 236800, 6102, 54503, 7726, 4839, 2431, 10697, 26025, 12, 74, 37, 421, 186123, 1925, 41099, 4839, 3574, 1574, 6483, 13, 1544, 47, 33, 255, 117553, 1059, 30919, 4604, 1654, 817, 14, 1, 1093, 44, 11, 65, 69218, 222, 25572, 3667, 665, 15, 2, 1, 957, 34, 0, 55, 42890, 0, 18879, 2596, +gp, 2, 1, 0, 0, 0, 0, 0, 22967, 21790, 0, 0 TOTALBIO, 754749, 859692, 972906, 1057196, 1064293, 1081251, 913094, 855666, 722488, 588504,

O:\ACFM\WGREPS\WGNPBW\REPORTS\2002\Sec-3.Doc 101
Table 3.5.6.4 Run title : Herring spring-spawn (run: SVPBJA12/V12) At 6/05/2002 14:08 Table 13 Spawning stock biomass at age (spawning time) Tonnes*10**-1 YEAR, 1907, 1908, 1909, 1910, 1911, AGE 0, 0, 0, 0, 0, 0, 1, 0, 0, 0, 0, 0, 2, 0, 0, 0, 0, 0, 3, 8461, 4870, 2298, 3039, 2018, 4, 5657, 76061, 43194, 18959, 26464, 5, 5848, 12588, 184338, 105094, 45652, 6, 11859, 8856, 22808, 344139, 197565, 7, 13226, 11823, 9308, 26159, 409302, 8, 18289, 10250, 9636, 8273, 24041, 9, 3116, 12479, 7695, 7784, 6934, 10, 3217, 2023, 8892, 5913, 6334, 11, 2254, 2323, 1017, 5888, 4874, 12, 3016, 1574, 1445, 565, 4653, 13, 3140, 2166, 856, 952, 389, 14, 2271, 2544, 1401, 559, 737, 15, 0, 1909, 2072, 968, 457, +gp, 0, 0, 0, 0, 0, 0 TOTSPBIO, 80355, 149467, 294961, 528293, 729420, Table 13 Spawning stock biomass at age (spawning time) Tonnes*10**-1 YEAR, 1912, 1913, 1914, 1915, 1916, 1917, 1918, 1919, 1920, 1921, AGE 0, 0, 0, 0, 0, 0, 0, 0, 0, 0, 0, 1, 0, 0, 0, 0, 0, 0, 0, 0, 0, 0, 2, 0, 0, 0, 0, 0, 0, 0, 0, 0, 0, 3, 1056, 1391, 856, 1650, 1381, 662, 884, 1556, 1447, 4949, 4, 17483, 9343, 12227, 7500, 14802, 11964, 5635, 7740, 13655, 12949, 5, 64405, 42516, 22662, 29605, 18168, 35422, 27679, 13561, 18426, 32940, 6, 85930, 121387, 79896, 42372, 54746, 33444, 64665, 47873, 24626, 34141, 7, 236638, 103365, 145915, 95612, 50487, 63634, 39749, 74959, 49214, 29059, 8, 382492, 223432, 97978, 138200, 90140, 47352, 59123, 36887, 67754, 41303, 9, 20675, 330243, 195133, 85518, 121369, 78721, 41302, 50044, 31834, 57515, 10, 5887, 17427, 279865, 169988, 74677, 106696, 69131, 35787, 42842, 27524, 11, 5242, 4851, 14574, 236650, 147425, 64917, 93625, 60219, 30942, 36752, 12, 4140, 4251, 3602, 11791, 197426, 127257, 56299, 81562, 52230, 26867, 13, 3938, 3395, 3503, 2551, 9638, 166699, 110675, 48384, 71495, 45814, 14, 314, 3285, 2165, 2444, 2028, 7977, 139324, 94405, 41534, 62191, 15, 653, 257, 2910, 1590, 1971, 1673, 6758, 114807, 83019, 36399, +gp, 0, 0, 0, 0, 0, 0, 0, 0, 0, 0, 0 TOTSPBIO, 828853, 865143, 861286, 825471, 784262, 746418, 714851, 667786, 529019, 448405, 1 Table 13 Spawning stock biomass at age (spawning time) Tonnes*10**-1 YEAR, 1922, 1923, 1924, 1925, 1926, 1927, 1928, 1929, 1930, 1931, AGE 0, 0, 0, 0, 0, 0, 0, 0, 0, 0, 0, 1, 0, 0, 0, 0, 0, 0, 0, 0, 0, 0, 2, 0, 0, 0, 0, 0, 0, 0, 0, 0, 0, 3, 1941, 2738, 2708, 4184, 7072, 3874, 4917, 1139, 636, 738, 4, 44623, 16612, 24586, 24620, 38045, 64205, 35122, 42148, 8594, 5680, 5, 31312, 107606, 40127, 59620, 59581, 92395, 154611, 84753, 101256, 20646, 6, 60501, 56244, 195953, 74532, 111629, 109738, 172115, 285870, 157275, 188243, 7, 40865, 70222, 64684, 228363, 88226, 133638, 130524, 203883, 337178, 187018, 8, 27132, 38661, 64260, 58207, 206990, 82031, 125768, 122072, 189039, 310308, 9, 32681, 23286, 33770, 54413, 47318, 174269, 69928, 108724, 105967, 160466, 10, 49320, 25612, 20002, 29375, 45045, 38076, 145002, 57767, 93413, 91141, 11, 23838, 42518, 19882, 17104, 25245, 37454, 30214, 121844, 46779, 78502, 12, 31692, 20533, 36670, 16091, 14494, 21588, 30713, 24687, 101680, 37518, 13, 23412, 27458, 17710, 32014, 12539, 12220, 18462, 25943, 19954, 81029, 14, 39768, 20147, 23686, 15256, 27520, 9618, 9933, 15478, 21772, 15169, 15, 54906, 34813, 17593, 20777, 13287, 24052, 7760, 8343, 13260, 18158, +gp, 0, 0, 0, 0, 0, 0, 0, 0, 0, 0, 0 TOTSPBIO, 461991, 486448, 561630, 634556, 696993, 803159, 935069, 1102652, 1196804, 1194616,

O:\ACFM\WGREPS\WGNPBW\REPORTS\2002\Sec-3.Doc 102
Table 3.5.6.4 Continued Table 13 Spawning stock biomass at age (spawning time) Tonnes*10**-1 YEAR, 1932, 1933, 1934, 1935, 1936, 1937, 1938, 1939, 1940, 1941, AGE 0, 0, 0, 0, 0, 0, 0, 0, 0, 0, 0, 1, 0, 0, 0, 0, 0, 0, 0, 0, 0, 0, 2, 0, 0, 0, 0, 0, 0, 0, 0, 0, 0, 3, 584, 3309, 1532, 3403, 5463, 5400, 4686, 1709, 9955, 4457, 4, 6431, 5296, 26260, 11791, 18632, 34950, 34281, 42352, 14788, 46196, 5, 13802, 15240, 12754, 49257, 26294, 44666, 75288, 87960, 103496, 31993, 6, 38486, 25930, 27932, 21253, 90598, 46746, 78121, 143389, 150798, 182364, 7, 221602, 45072, 31118, 30798, 24102, 88317, 55337, 84163, 177664, 181942, 8, 174840, 203424, 41200, 27229, 27726, 19815, 65308, 47735, 72981, 165123, 9, 265988, 151217, 171901, 34221, 25056, 21767, 15651, 40709, 41931, 58555, 10, 137611, 225716, 129972, 139809, 28593, 21682, 18174, 12419, 27555, 35888, 11, 78585, 115783, 190505, 102860, 121354, 22148, 17889, 13997, 11094, 16477, 12, 66929, 67285, 97239, 148900, 90319, 96320, 18039, 14772, 10776, 8970, 13, 31383, 57159, 57973, 74183, 127652, 73751, 77097, 13883, 13456, 8088, 14, 64259, 26368, 48634, 43842, 63615, 102964, 60724, 60893, 11851, 11303, 15, 12511, 51505, 22948, 37317, 39837, 49924, 83443, 49306, 51425, 9942, +gp, 0, 0, 0, 0, 0, 0, 0, 0, 0, 0, 0 TOTSPBIO, 1113012, 993305, 859970, 724862, 689240, 628451, 604039, 613287, 697770, 761299, Table 13 Spawning stock biomass at age (spawning time) Tonnes*10**-1 YEAR, 1942, 1943, 1944, 1945, 1946, 1947, 1948, 1949, 1950, 1951, AGE 0, 0, 0, 0, 0, 0, 0, 0, 0, 0, 0, 1, 0, 0, 0, 0, 0, 0, 0, 0, 0, 0, 2, 0, 0, 0, 0, 0, 0, 0, 0, 0, 0, 3, 2827, 3080, 2200, 1360, 5186, 4426, 2371, 1402, 0, 0, 4, 66344, 25138, 27339, 19877, 12288, 46846, 38900, 17840, 8031, 18178, 5, 219258, 161393, 60998, 66191, 47963, 29441, 104265, 93072, 32551, 22205, 6, 72515, 412663, 303053, 114478, 122830, 89497, 56611, 190935, 128696, 61620, 7, 269972, 87216, 492163, 361694, 136694, 145575, 110752, 63468, 193150, 166707, 8, 204666, 255194, 82565, 461048, 339138, 128173, 134971, 99446, 55829, 177955, 9, 162020, 173516, 223836, 72279, 397340, 293156, 107791, 117148, 83911, 48296, 10, 54100, 140299, 149814, 196002, 63126, 340483, 244715, 97009, 98989, 72021, 11, 33620, 44864, 121474, 127488, 169811, 54128, 277507, 217194, 82351, 84626, 12, 12548, 28368, 38090, 104313, 105256, 145870, 44412, 245011, 182362, 69234, 13, 8392, 9099, 24062, 32330, 89411, 85242, 119790, 39003, 204510, 155357, 14, 7121, 7253, 7346, 19904, 26714, 75500, 64874, 105922, 32087, 166896, 15, 10922, 5804, 6380, 6259, 17132, 22584, 61935, 54836, 91121, 26825, +gp, 0, 0, 0, 0, 0, 0, 0, 0, 203759, 174098, 0 TOTSPBIO, 1124305, 1353888, 1539320, 1583224, 1532890, 1460923, 1368896, 1342285, 1397347, 1244019, Table 13 Spawning stock biomass at age (spawning time) Tonnes*10**-1 YEAR, 1952, 1953, 1954, 1955, 1956, 1957, 1958, 1959, 1960, 1961, AGE 0, 0, 0, 0, 0, 0, 0, 0, 0, 0, 0, 1, 0, 0, 0, 0, 0, 0, 0, 0, 0, 0, 2, 0, 0, 0, 0, 0, 0, 0, 0, 0, 0, 3, 0, 0, 0, 2494, 2361, 0, 365, 126, 178, 89, 4, 9338, 6134, 79681, 22554, 11632, 0, 2009, 1684, 545, 780, 5, 50293, 26768, 17486, 253913, 36288, 22772, 15690, 3429, 2977, 1518, 6, 39993, 87861, 49424, 45343, 545487, 51841, 39312, 30965, 7240, 6364, 7, 81908, 52702, 113774, 70581, 45659, 520777, 79888, 37046, 31519, 6942, 8, 154693, 77404, 50795, 102268, 58910, 38606, 450687, 64349, 32026, 25553, 9, 144835, 129497, 66621, 42503, 84833, 47824, 32913, 375776, 51737, 25627, 10, 40670, 117631, 105456, 53399, 35121, 67982, 38804, 27125, 306308, 39697, 11, 61452, 33791, 92272, 80917, 41559, 27406, 55634, 30741, 22678, 231448, 12, 70784, 51061, 27539, 67548, 61743, 30551, 21842, 41734, 24355, 16943, 13, 58003, 59424, 42365, 21749, 53644, 46643, 23788, 15722, 33668, 17512, 14, 127825, 47269, 48731, 33841, 17096, 41747, 37004, 17993, 12118, 23653, 15, 139410, 109056, 39250, 39664, 27700, 13447, 33356, 29726, 14274, 8278, +gp, 168975, 262730, 211109, 184134, 149608, 99659, 90738, 53319, 37294, 14849, 0 TOTSPBIO, 1148177, 1061326, 944504, 1020908, 1171641, 1009257, 922030, 729733, 576917, 419252,

O:\ACFM\WGREPS\WGNPBW\REPORTS\2002\Sec-3.Doc 103
Table 3.5.6.4 Continued Table 13 Spawning stock biomass at age (spawning time) Tonnes*10**-1 YEAR, 1962, 1963, 1964, 1965, 1966, 1967, 1968, 1969, 1970, 1971, AGE 0, 0, 0, 0, 0, 0, 0, 0, 0, 0, 0, 1, 0, 0, 0, 0, 0, 0, 0, 0, 0, 0, 2, 0, 0, 0, 0, 0, 0, 0, 0, 0, 0, 3, 0, 2727, 407, 0, 779, 0, 0, 1133, 9, 8, 4, 397, 8564, 6059, 10285, 226, 814, 0, 37, 59, 38, 5, 1476, 1091, 73726, 28480, 24745, 233, 183, 222, 20, 64, 6, 2181, 1652, 931, 156291, 61324, 14215, 298, 278, 26, 34, 7, 5847, 1756, 1652, 2114, 132254, 32985, 3408, 72, 136, 80, 8, 5854, 4630, 1640, 1514, 1457, 58810, 5766, 1051, 43, 36, 9, 21730, 4734, 3645, 1245, 771, 358, 11041, 2258, 580, 10, 10, 21334, 17127, 3959, 2458, 812, 282, 88, 2418, 1036, 143, 11, 35044, 16859, 12126, 2452, 1470, 215, 45, 22, 1044, 212, 12, 184337, 27095, 12162, 7710, 990, 400, 55, 12, 8, 193, 13, 13130, 135677, 18259, 8188, 3183, 453, 101, 23, 4, 0, 14, 13425, 10021, 94286, 11543, 3041, 749, 131, 13, 13, 1, 15, 17972, 10304, 6890, 59367, 4947, 690, 83, 36, 5, 5, +gp, 23752, 21307, 43775, 15103, 23531, 4345, 703, 180, 89, 0, 0 TOTSPBIO, 346480, 263544, 279515, 306748, 259530, 114549, 21903, 7754, 3072, 823, Table 13 Spawning stock biomass at age (spawning time) Tonnes*10**-1 YEAR, 1972, 1973, 1974, 1975, 1976, 1977, 1978, 1979, 1980, 1981, AGE 0, 0, 0, 0, 0, 0, 0, 0, 0, 0, 0, 1, 0, 0, 0, 0, 0, 0, 0, 0, 0, 0, 2, 0, 3, 51, 1621, 1077, 0, 0, 0, 0, 0, 3, 0, 62, 8, 213, 7534, 7296, 442, 1172, 1430, 2052, 4, 7, 7218, 100, 18, 395, 16018, 12061, 2301, 7935, 3087, 5, 19, 37, 8318, 116, 16, 350, 18796, 13015, 4574, 14424, 6, 32, 66, 15, 7135, 84, 16, 312, 18418, 12943, 4342, 7, 19, 16, 14, 6, 5463, 75, 14, 273, 16876, 10446, 8, 32, 9, 5, 7, 5, 4577, 53, 13, 245, 13511, 9, 6, 3, 3, 5, 6, 5, 3779, 25, 12, 164, 10, 1, 2, 3, 2, 5, 6, 4, 3326, 22, 10, 11, 19, 1, 2, 3, 2, 4, 5, 4, 2813, 19, 12, 20, 6, 1, 1, 2, 2, 3, 4, 3, 2203, 13, 29, 4, 5, 1, 1, 2, 1, 3, 3, 3, 14, 0, 12, 3, 4, 1, 1, 2, 1, 2, 3, 15, 0, 0, 3, 3, 4, 0, 1, 1, 1, 2, +gp, 0, 0, 3, 3, 4, 0, 1, 1, 1, 2, 0 TOTSPBIO, 185, 7440, 8534, 9138, 14598, 28351, 35475, 38558, 46861, 50269, Table 13 Spawning stock biomass at age (spawning time) Tonnes*10**-1 YEAR, 1982, 1983, 1984, 1985, 1986, 1987, 1988, 1989, 1990, 1991, AGE 0, 0, 0, 0, 0, 0, 0, 0, 0, 0, 0, 1, 0, 0, 0, 0, 0, 0, 0, 0, 0, 0, 2, 0, 0, 0, 0, 0, 0, 0, 0, 0, 0, 3, 1379, 156, 98, 217, 13094, 670, 4974, 1161, 5464, 2373, 4, 3350, 8522, 850, 637, 440, 87405, 2518, 22660, 10233, 7663, 5, 4941, 6019, 14997, 1557, 773, 1637, 302573, 9669, 86162, 13511, 6, 14300, 5125, 7615, 13099, 1182, 447, 1352, 357901, 11317, 95475, 7, 3709, 13770, 6105, 6292, 8240, 657, 331, 1036, 331880, 11857, 8, 9009, 3460, 11300, 4513, 3545, 3880, 422, 220, 1124, 338096, 9, 11464, 8375, 2783, 8917, 2124, 854, 2791, 224, 160, 729, 10, 148, 10166, 6582, 2056, 5051, 469, 373, 2077, 172, 94, 11, 4, 133, 8186, 5140, 1304, 1938, 148, 87, 1812, 76, 12, 11, 2, 96, 6650, 2521, 474, 1581, 50, 31, 1626, 13, 1834, 5, 0, 81, 2985, 278, 166, 1323, 23, 5, 14, 2, 1534, 0, 0, 64, 304, 38, 67, 1251, 11, 15, 2, 2, 1127, 0, 0, 51, 65, 0, 54, 1017, +gp, 2, 2, 1, 364, 118, 0, 0, 0, 102, 19, 0 TOTSPBIO, 50156, 57271, 59740, 49523, 41441, 99064, 317331, 396474, 449785, 472551,

O:\ACFM\WGREPS\WGNPBW\REPORTS\2002\Sec-3.Doc 104
Table 3.5.6.4 Continued Table 13 Spawning stock biomass at age (spawning time) Tonnes*10**-1 YEAR, 1992, 1993, 1994, 1995, 1996, 1997, 1998, 1999, 2000, 2001, AGE 0, 0, 0, 0, 0, 0, 0, 0, 0, 0, 0, 1, 0, 0, 0, 0, 0, 0, 0, 0, 0, 0, 2, 0, 0, 0, 0, 0, 0, 0, 0, 0, 0, 3, 6142, 711, 1735, 0, 0, 0, 0, 0, 0, 0, 4, 6178, 24771, 34051, 82183, 78688, 21428, 8008, 2587, 27003, 11191, 5, 10559, 24384, 69240, 116106, 281331, 287317, 77479, 27109, 9265, 99818, 6, 15542, 12234, 28604, 75755, 125619, 293129, 306570, 93822, 24965, 9002, 7, 96768, 14434, 11769, 21128, 51816, 94097, 223953, 278324, 78374, 23509, 8, 10594, 83527, 12043, 10033, 11373, 33691, 60411, 192510, 215639, 67309, 9, 310370, 9813, 81570, 10538, 7827, 7121, 18873, 48098, 150775, 169809, 10, 545, 260112, 7728, 68135, 9208, 6548, 3452, 14366, 36316, 105515, 11, 60, 465, 230331, 5479, 53412, 7467, 4660, 2327, 10201, 25350, 12, 72, 36, 400, 178808, 1809, 40127, 4754, 3309, 1467, 6285, 13, 1515, 46, 29, 223, 111687, 908, 30021, 4505, 1500, 789, 14, 1, 1077, 43, 7, 64, 66475, 116, 24808, 3505, 639, 15, 2, 1, 934, 34, 0, 53, 41814, 0, 18453, 2557, +gp, 2, 1, 0, 0, 0, 0, 0, 22333, 21299, 0, 0 TOTSPBIO, 458349, 431611, 478479, 568430, 732835, 858362, 780111, 714098, 598762, 521773,

O:\ACFM\WGREPS\WGNPBW\REPORTS\2002\Sec-3.Doc 105
Table 3.5.6.5 Run title : Herring spring-spawn (run: SVPBJA12/V12), At 6/05/2002 14:08 Table 16 Summary (without SOP correction) , RECRUITS, TOTALBIO, TOTSPBIO, LANDINGS, YIELD/SSB, FBAR 2-13, , Age 0 1907, 164365264, 6545115, 803555, 207600, .2584, .1626, 1908, 114911136, 9003567, 1494670, 233400, .1562, .2087, 1909, 60494424, 10870889, 2949608, 288500, .0978, .1608, 1910, 87971592, 11474429, 5282926, 250000, .0473, .0748, 1911, 53905144, 11852464, 7294199, 253500, .0348, .0354, 1912, 94972448, 11987521, 8288534, 245200, .0296, .0342, 1913, 98153792, 11663692, 8651432, 290700, .0336, .0610, 1914, 43368360, 11421515, 8612863, 356000, .0413, .0613, 1915, 52263976, 10768414, 8254712, 306100, .0371, .0316, 1916, 91998232, 10260643, 7842621, 296900, .0379, .0277, 1917, 83106728, 9910096, 7464179, 276200, .0370, .0274, 1918, 275137024, 9763913, 7148507, 433500, .0606, .0329, 1919, 112775144, 9738795, 6677863, 498100, .0746, .0406, 1920, 156033152, 9472722, 5290193, 316500, .0598, .0278, 1921, 144889488, 8982107, 4484050, 258500, .0576, .0240, 1922, 219596272, 10264798, 4619909, 349900, .0757, .0363, 1923, 370611936, 10896899, 4864480, 330500, .0679, .0328, 1924, 201739232, 12353034, 5616303, 295000, .0525, .0258, 1925, 275965472, 14185738, 6345559, 355500, .0560, .0371, 1926, 87778040, 15363178, 6969931, 403800, .0579, .0393, 1927, 41456696, 17115098, 8031588, 489900, .0610, .0373, 1928, 81828616, 16930140, 9350691, 611900, .0654, .0409, 1929, 33948260, 16880070, 11026518, 624600, .0566, .0547, 1930, 210895152, 15848282, 11968044, 704500, .0589, .0559, 1931, 97819544, 14761387, 11946162, 538200, .0451, .0317, 1932, 177199056, 14146996, 11130121, 652600, .0586, .0285, 1933, 255283968, 13300836, 9933054, 818200, .0824, .0440, 1934, 273343584, 13128912, 8599695, 451700, .0525, .0296, 1935, 298764704, 13458381, 7248624, 649400, .0896, .0499, 1936, 97023624, 14020911, 6892399, 775200, .1125, .0667, 1937, 537402112, 13965046, 6284506, 695900, .1107, .0637, 1938, 406997952, 13959195, 6040393, 783600, .1297, .0873, 1939, 183413024, 17572954, 6132873, 703400, .1147, .0618, 1940, 210185680, 17216028, 6977698, 923100, .1323, .0750, 1941, 145502496, 14814504, 7612994, 594000, .0780, .0473, 1942, 81325672, 21630908, 11243054, 592700, .0527, .0382, 1943, 284722784, 21694702, 13538880, 556600, .0411, .0237, 1944, 249690640, 21760122, 15393198, 587800, .0382, .0192, 1945, 118047744, 22205536, 15832243, 554400, .0350, .0228, 1946, 78795904, 21434354, 15328896, 586200, .0382, .0259, 1947, 182138736, 20894888, 14609226, 710400, .0486, .0231, 1948, 106468888, 20045338, 13688959, 1012600, .0740, .0365, 1949, 69374288, 19008182, 13422845, 783000, .0583, .0256, 1950, 747374656, 19578392, 13973473, 933000, .0668, .0472, 1951, 138271856, 19052486, 12440190, 1278400, .1028, .0549, 1952, 93898752, 20579838, 11481773, 1254800, .1093, .0550, 1953, 83577056, 18531402, 10613262, 1090600, .1028, .0545, 1954, 39702936, 19255380, 9445040, 1644500, .1741, .1013, 1955, 23753764, 16553276, 10209083, 1359800, .1332, .0851, 1956, 27477146, 14540287, 11716413, 1659400, .1416, .1440, 1957, 23650648, 11489048, 10092566, 1319500, .1307, .1139, 1958, 27810502, 10038164, 9220304, 986600, .1070, .1816, 1959, 405342656, 8185840, 7297327, 1111100, .1523, .1617, 1960, 191338608, 7520952, 5769169, 1101800, .1910, .2355, 1961, 73282680, 7527398, 4192520, 830100, .1980, .0860, 1962, 17712882, 6747753, 3464804, 848600, .2449, .1000, 1963, 164640160, 6853956, 2635437, 984500, .3736, .1666, 1964, 90556040, 6718364, 2795154, 1281800, .4586, .2223, 1965, 7932618, 5956773, 3067483, 1547700, .5046, .4180, 1966, 45349292, 4306700, 2595295, 1955000, .7533, .7878, 1967, 3582245, 2802332, 1145486, 1677200, 1.4642, 1.1279, 1968, 4638550, 853483, 219026, 712200, 3.2517, 2.0032, 1969, 9607348, 121451, 77541, 67800, .8744, .7761, 1970, 620670, 75989, 30718, 62300, 2.0281, 1.3453, 1971, 209800, 105320, 8231, 21100, 2.5633, 1.0042, 1972, 907351, 69767, 1854, 13161, 7.0991, 1.3166, 1973, 12701698, 100002, 74400, 7017, .0943, .5138, 1974, 8500675, 152834, 85341, 7619, .0893, .1897, 1975, 2942588, 294481, 91377, 13713, .1501, .0925, 1976, 10018746, 355060, 145980, 10436, .0715, .0557, 1977, 5039343, 423184, 283511, 22706, .0801, .0507, 1978, 6133163, 571644, 354752, 19824, .0559, .0916, 1979, 12434718, 627810, 385577, 12864, .0334, .0184, 1980, 1539331, 740332, 468611, 18577, .0396, .0280, 1981, 1091881, 789022, 502691, 13736, .0273, .1122, 1982, 2329740, 722993, 501560, 16655, .0332, .0783, 1983, 369237184, 1126681, 572712, 23054, .0403, .4869, 1984, 11404527, 2194407, 597396, 53532, .0896, .0884, 1985, 77134728, 2077049, 495227, 169872, .3430, .2872, 1986, 11516681, 2155599, 414411, 225256, .5436, .8509, 1987, 9714410, 3908961, 990639, 127306, .1285, .4589, 1988, 24571120, 4270615, 3173305, 135301, .0426, .4246, 1989, 72537216, 5070218, 3964735, 103830, .0262, .1831, 1990, 132600400, 5731729, 4497853, 86411, .0192, .2812, 1991, 349603520, 6442496, 4725509, 84683, .0179, .1759,

O:\ACFM\WGREPS\WGNPBW\REPORTS\2002\Sec-3.Doc 106
Table 3.5.6.5 Continued. 1992, 392433184, 7547493, 4583487, 104448, .0228, .0809, 1993, 107313712, 8596920, 4316113, 232457, .0539, .0255, 1994, 34715184, 9729062, 4784792, 479228, .1002, .1724, 1995, 11482169, 10571957, 5684302, 905501, .1593, .2865, 1996, 109362248, 10642925, 7328347, 1220283, .1665, .1670, 1997, 38480160, 10812513, 8583621, 1426507, .1662, .2713, 1998, 25044138, 9130939, 7801115, 1223131, .1568, .1634, 1999, 381638, 8556661, 7140983, 1235433, .1730, .1820, 2000, 0, 7224881, 5987621, 1207201, .2016, .2416, 2001, 0, 5885045, 5217729, 770054, .1476, .1287, Arith. Mean , 116559667, 9963056, 6078259, 582557, .2895, .1994, 0 Units, (Thousands), (Tonnes), (Tonnes), (Tonnes),

O:\ACFM\WGREPS\WGNPBW\REPORTS\2002\Sec-3.Doc 107
Table 3.5.6.6 Summary of unweighted and weighted fishing mortalites.
Range of years 5-14
Year FBAR 5-14 FWEI 5-14 Year FBAR 5-14 FWEI 5-141907 0.1893 0.2161 1955 0.0878 0.06871908 0.2545 0.1331 1956 0.1156 0.09661909 0.2063 0.0222 1957 0.0941 0.08931910 0.0888 0.0140 1958 0.0880 0.06771911 0.0311 0.0139 1959 0.1243 0.09661912 0.0425 0.0126 1960 0.1289 0.11441913 0.0659 0.0209 1961 0.0702 0.07671914 0.0860 0.0224 1962 0.0985 0.11631915 0.0414 0.0240 1963 0.1525 0.19671916 0.0318 0.0251 1964 0.2171 0.20631917 0.0214 0.0213 1965 0.4422 0.27751918 0.0369 0.0417 1966 0.9889 0.69981919 0.0388 0.0432 1967 1.3621 1.51741920 0.0304 0.0328 1968 1.6898 3.45141921 0.0259 0.0263 1969 0.5782 0.59461922 0.0339 0.0371 1970 1.3777 1.32521923 0.0375 0.0376 1971 1.3101 1.52721924 0.0307 0.0315 1972 1.5170 1.57161925 0.0452 0.0370 1973 0.9425 1.33821926 0.0477 0.0339 1974 0.1922 0.06811927 0.0527 0.0307 1975 0.0623 0.10721928 0.0416 0.0276 1976 0.0246 0.05581929 0.0399 0.0276 1977 0.0589 0.05881930 0.0600 0.0362 1978 0.1121 0.03901931 0.0398 0.0301 1979 0.0263 0.02231932 0.0395 0.0377 1980 0.0390 0.03221933 0.0327 0.0386 1981 0.1352 0.02241934 0.0223 0.0221 1982 0.0910 0.02071935 0.0570 0.0660 1983 0.4170 0.02991936 0.0811 0.0954 1984 0.0841 0.09021937 0.0785 0.0891 1985 0.3228 0.37711938 0.1064 0.0973 1986 1.0615 1.09171939 0.0769 0.0516 1987 0.7044 0.38861940 0.0903 0.0498 1988 1.1038 0.04721941 0.0543 0.0266 1989 0.2273 0.02981942 0.0507 0.0158 1990 0.3288 0.02121943 0.0242 0.0120 1991 0.3393 0.02291944 0.0253 0.0150 1992 0.0957 0.02681945 0.0285 0.0215 1993 0.0295 0.06301946 0.0338 0.0272 1994 0.2183 0.12891947 0.0273 0.0233 1995 0.6669 0.21261948 0.0518 0.0526 1996 0.2190 0.17441949 0.0283 0.0341 1997 0.3675 0.16701950 0.0463 0.0510 1998 0.7888 0.14441951 0.0607 0.0662 1999 0.2333 0.17521952 0.0645 0.0680 2000 0.3057 0.20401953 0.0616 0.0605 2001 0.1595 0.14811954 0.1077 0.1046

O:\ACFM\WGREPS\WGNPBW\REPORTS\2002\Sec-3.Doc 108
Table 3.6.1.1 Norwegian spring-spawning herring. Selection pattern.
Table 3.6.2.1 Norwegian spring-spawning herring. Short term prediction
Table includes number (million) at age on 1 January 2002 and weight-at-age used for 2002.
Table 3.10.1 Medium-term simulation 5 Years 10 years Mean yield RiskBlim RiskBpa Stability Mean yield RiskBlim RiskBpa Stability Ceiling 1.5 F = 0. 0.17 0.00 0.22 0.25 0.08 0.00 0.15 0.11 Ceiling 1.5 F = 0.05 0.38 0.00 0.34 0.23 0.33 0.02 0.29 0.15 Ceiling 1.5 F = 0.08 0.48 0.00 0.37 0.19 0.44 0.02 0.35 0.14 Ceiling 1.5 F = 0.1 0.55 0.01 0.40 0.16 0.49 0.04 0.39 0.13 Ceiling 1.5 F = 0.125 0.60 0.01 0.52 0.14 0.54 0.04 0.48 0.15 Ceiling 1.5 F = 0.15 0.69 0.00 0.53 0.13 0.61 0.03 0.50 0.15 Ceiling 1.5 F = 0.2 0.78 0.01 0.67 0.20 0.67 0.06 0.59 0.20 Ceiling 0.85 F = 0.125 0.60 0.00 0.52 0.14 0.53 0.03 0.48 0.15
Age Selection0 0.0001 0.0002 0.0193 0.0414 0.0855 0.0986 0.1197 0.1548 0.1819 0.217
10 0.24011 0.24112 0.44513 0.36914 0.26515 0.07816 0.078
MFDP version 1Run: test22TestProjection index file 15/3/99.Time and date: 12:24 07.05.2002Fbar age range: 5-14Input units are millions and kg output is kilotonnes.
Input 2002 2002 2003 2004Age N W Biomass SSB FMult FBar Landings Biomass SSB FMult FBar Landings Biomass SSB
0 0 0.001 7266 5288 0.7711 0.1795 850 7055 6141 0 0 0 6999 66361 5000 0.01 6135 0.05 0.0116 60 6941 65732 3240 0.023 6129 0.1 0.0233 119 6884 65113 7010 0.057 6124 0.15 0.0349 177 6828 64504 9860 0.177 6118 0.2 0.0466 235 6772 63905 3060 0.241 6112 0.25 0.0582 292 6717 63306 3717 0.275 6107 0.3 0.0699 349 6663 62717 286 0.302 6101 0.35 0.0815 405 6609 62138 614 0.311 6095 0.4 0.0931 460 6556 61569 1670 0.314 6090 0.45 0.1048 515 6503 6099
10 4032 0.328 6084 0.5 0.1164 569 6451 604311 2392 0.341 6079 0.55 0.1281 622 6400 598812 570 0.372 6073 0.6 0.1397 675 6349 593413 126 0.405 6067 0.65 0.1514 727 6299 588014 14 0.415 6062 0.7 0.163 779 6249 582715 10 0.467 6056 0.75 0.1746 830 6200 577416 52 0.409 6051 0.8 0.1863 880 6151 5722
6045 0.85 0.1979 930 6103 56716040 0.9 0.2096 980 6056 56206034 0.95 0.2212 1029 6009 55706029 1 0.2328 1077 5962 5521

O:\ACFM\WGREPS\WGNPBW\REPORTS\2002\Sec-3.Doc 109
Figure 3.1.1. Total catches of Norwegian spring-spawning herring in 2001 by ICES rectangle. Grading of the symbols: black dots less than 300 t, open squares 300-3 000 t, and black squares > 3 000 t.
60°N
65°N
70°N
75°N
W 10°W 0°E 20°E10°E 30°E

O:\ACFM\WGREPS\WGNPBW\REPORTS\2002\Sec-3.Doc 110
60°N
65°N
70°N
75°N
W 10°W 0°E 20°E10°E 30°E
60°N
65°N
70°N
75°N
W 10°W 0°E 20°E10°E 30°E
Q1 Q2
60°N
65°N
70°N
75°N
W 10°W 0°E 20°E10°E 30°E
60°N
65°N
70°N
75°N
W 10°W 0°E 20°E10°E 30°E
Q3 Q4
Figure 3.1.2. Total catches of Norwegian spring-spawning herring in 2001 by quarter and ICES rectangle. Grading of the symbols: black dots less than 300 t, open squares 300-3 000 t, and black squares > 3 000 t.

O:\ACFM\WGREPS\WGNPBW\REPORTS\2002\Sec-3.Doc 111
Figure 3.3.5.1 Herring larvae distribution in April 2002.

O:\ACFM\WGREPS\WGNPBW\REPORTS\2002\Sec-3.Doc 112
Figure 3.5.1.1 Fit of Spawning grounds to the VPA.
Figure 3.5.1.2 Fit of wintering area in December to the VPA.
1995 2000
5
10
15
Spawning grounds
Yearclass 1993
Yearclass 1992
Yearclass 1991
Yearclass 1990
Yearclass 1983
1995 2000
5
10
15
December in Ofoten
Yearclass 1993
Yearclass 1992
Yearclass 1991
Yearclass 1990
Yearclass 1983

O:\ACFM\WGREPS\WGNPBW\REPORTS\2002\Sec-3.Doc 113
Figure 3.5.1.3 Fit of January in wintering area to the VPA.
Figure 3.5.1.4 Fit of Norwegian Sea to the VPA.
2000
5
10
15
20
25
Herring in the Norwegian Sea
Yearclass 1993
Yearclass 1992
Yearclass 1991
Yearclass 1990
Yearclass 1983
1995
5
10
15
January in Ofoten
Yearclass 1992
Yearclass 1991
Yearclass 1990
Yearclass 1983

O:\ACFM\WGREPS\WGNPBW\REPORTS\2002\Sec-3.Doc 114
1985 1990 1995 2000
2
4
6
8
10
Retrospective analysisnorwegianSpringSpawningHerring
Figure 3.5.2. Retrospective plot for Norwegian spring-spawning herring.
0 0.2 0.4 0.6 0.8 1
0
0.2
0.4
0.6
0.8
1
95 survey points0 tagging points
22 larvae points
Figure 3.5.3. Quantile-quantile plot for the survey and larvae terms.

O:\ACFM\WGREPS\WGNPBW\REPORTS\2002\Sec-3.Doc 115
2 4 6 8 10
-520
-510
-500
-490
1
1
2
3
3
4
5
5
6
6
7
7
8
8
9
9
10
10
12
13
13
Figure 3.5.4. The log-likelihood for Norwegian spring-spawning herring as a function of parameters which are varied 50% to each side of the maximum likelihood estimate. Parameter numbering in the text.
0.2 0.4 0.6
2
4
6
8
10
12
14
16
Histogram of spawning stocks by removing
likelihood from surveys terms one by one
Figure 3.5.5.1. Histogram of spawning stock estimates obtained by deleting survey points one by one.

O:\ACFM\WGREPS\WGNPBW\REPORTS\2002\Sec-3.Doc 116
-0.025 0.025 0.05 0.075 0.1 0.125 0.15
20
40
60
80
100
Histogram of spawning stocks by removinglikelihood from tags terms one by one
Figure 3.5.5.2. Histogram of spawning stock estimates obtained by deleting tagging points one by one.
-0.1 -0.08 -0.06 -0.04 -0.02 0.02 0.04
0.5
1
1.5
2
2.5
3
3.5
4
Histogram of spawning stocks by removing
likelihood from larvae terms one by one
Figure 3.5.5.3. Histogram of spawning stock estimates obtained by deleting larvae points one by one.

O:\ACFM\WGREPS\WGNPBW\REPORTS\2002\Sec-3.Doc 117
Figure.3.5.6 NSS herring: profiles of ISVPA loss function
21
23
25
27
1 2 3 4
f(term)
MD
N·1
00
catch-contr., MDN -> min.
130
140
150
160
1 2 3 4
f(term)
SSE
catch-contr., SSE -> min.
160
170
180
190
1 2 3 4
f(term)
SSE
mixed version, SSE -> min.
26
27
28
29
30
1 2 3 4
f(term)
MD
N·1
00
mixed version, MDN -> min.

O:\ACFM\WGREPS\WGNPBW\REPORTS\2002\Sec-3.Doc 118
Figure.3.5.7 NSS herring: ISVPA results.
0
1000
2000
3000
4000
5000
6000
7000
8000
9000
1985 1987 1989 1991 1993 1995 1997 1999 2001 2003
SSB
(mln
.t.)
1. ISVPA , catch-controlled version, MDN
2. ISVPA , mixed version, MDN
0
0.2
0.4
0.6
0.8
1
1.2
1.4
1985 1987 1989 1991 1993 1995 1997 1999 2001 2003
F(2-
13)
1. ISVPA , catch-controlled version, MDN
2. ISVPA , mixed version, MDN
0
0.5
1
1.5
2
2.5
2 3 4 5 6 7 8 9 10 11 12 13 14 15 16
S(ag
e) w
rt F
(2-1
3)
1. ISVPA , catch-controlled version, MDN
2. ISVPA , mixed version, MDN
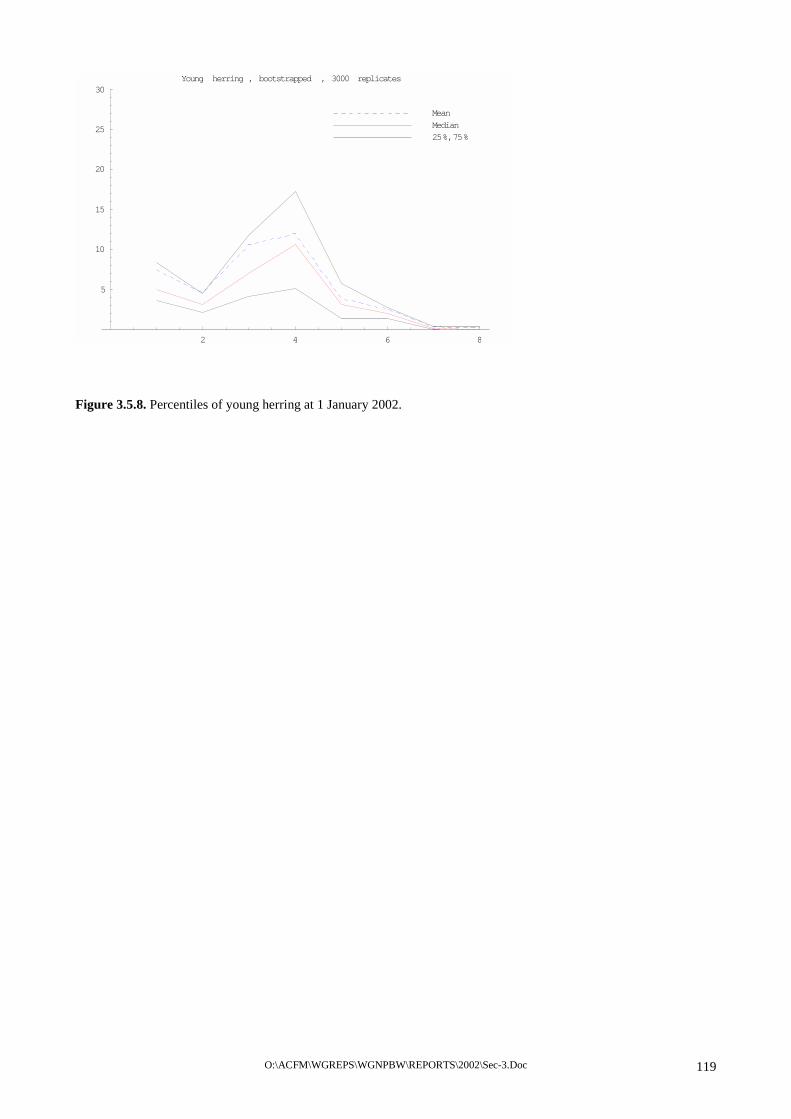
O:\ACFM\WGREPS\WGNPBW\REPORTS\2002\Sec-3.Doc 119
2 4 6 8
5
10
15
20
25
30Young herring , bootstrapped , 3000 replicates
Mean
Median25%,75%
Figure 3.5.8. Percentiles of young herring at 1 January 2002.

O:\ACFM\WGREPS\WGNPBW\REPORTS\2002\Sec-3.Doc 120
Figure. 3.5.9 Stock summary.
Year
Yiel
d (1
000
t)
FWEI
5-1
4
1905 1915 1925 1935 1945 1955 1965 1975 1985 19950
200
400
600
800
1000
1200
1400
1600
1800
2000
2200
0
0.5
1.0
1.5
2.0
2.5
3.0
3.5
4.0
Yield FWEI 5-14
SSB
(106 t
onne
s)
Rec
ruitm
ent a
t age
0 (1
09 i
ndiv
idua
ls)
1905 1915 1925 1935 1945 1955 1965 1975 1985 19950
2
4
6
8
10
12
14
16
18
0
100
200
300
400
500
600
700
800
SSB R0

O:\ACFM\WGREPS\WGNPBW\REPORTS\2002\Sec-3.Doc 121
Figure 3.5.10 Results of yield per recruit analysis
3 4 5 6 7 8 9
20
40
60
80
100
120
140
Histogram of spawning stock last year
Number replicates 492Baseline 4.60161Mean 4.71251Median 4.55933Standard deviation 1.00786
Figure 3.7.1. Histogram of bootstrap replicates of the spawning stock uncorrected for young fish not in the tuning
Yi
eld
per r
ecru
it (g
)
SSB
(100
0 t)
at s
paw
ning
tim
e
0.000.05
0.100.15
0.200.25
0.300.35
0.400.45
FBAR5-14
0
10
20
30
40
50
60
70
80
90
100
3000
4000
5000
6000
7000
8000
9000
10000
11000
12000
Yield SSB
Yiel
d in
200
3 (1
000
t)
SSB
in 2
004
(100
0 t)
0.000.02
0.040.06
0.080.10
0.120.14
0.160.18
0.200.22
FBAR 5-14
0
100
200
300
400
500
600
700
800
900
1000
1100
5400
5600
5800
6000
6200
6400
6600
6800
Yield SSB

O:\ACFM\WGREPS\WGNPBW\REPORTS\2002\Sec-3.Doc 122
2 4 6 8 10 12 14
Spawning stockmillion tonnes
200
400
600
800
Recruitmentbillion
609763
519093 99 5264 98 536189
0166 5496 5694 55 5788 586285 00957379848774 6576697886 6877 6775728280817071
50
5992
9183
Figure 3.10.1. Beverton-Holt recruitment model for Norwegian spring-spawning herring. Rich year classes treated separately are shown in red.
2 4 6 8 10
2
4
6
8
10
12
14
Figure 3.10.2. Development of the spawning stock in the medium term for default options. 5%, 25%, 50%, 75% and 95% quantiles.

O:\ACFM\WGREPS\WGNPBW\REPORTS\2002\Sec-3.Doc 123
2 4 6 8 10
0.2
0.4
0.6
0.8
1
1.2
1.4
Figure 3.10.3. Development of the catch in the medium term for default options. 5%, 25%, 50%, 75% and 95% quantiles.
O:\ACFM\WGREPS\WGNPBW\REPORTS\2002\Sec-4.Doc 124
4 BARENTS SEA CAPELIN
4.1 Regulation of the Barents Sea Capelin Fishery
Since 1979, the Barents Sea capelin fishery has been regulated by a bilateral fishery management agreement between Russia (former USSR) and Norway. A TAC has been set separately for the winter fishery and for the autumn fishery. In recent years no autumn fishery has taken place, except for a small Russian experimental fishery. The fishery was closed from 1 May to 15 August until 1984. During the period 1984 to 1986, the fishery was closed from 1 May to 1 September. A minimum landing size of 11 cm has been in force for several years. From the autumn of 1986 to the winter of 1991, and from the autumn 1993 to the winter 1999 no fishery took place. The fishery was re-opened in the winter season 1991 and again in the winter season 1999, on a recovered stock.
In its autumn meeting of 2001, ACFM considered a harvest control rule, which was consistent with the precautionary approach. This rule defined the harvest level based on a maximum probability of 5% that SSB would fall below Blim (corresponding to a catch of 650 000 t of pre-spawning capelin in 2002). ACFM also recommended that this harvest control rule be applied in 2002 (See also Section 4.5). During its Autumn 2001 meeting the Mixed Russian Norwegian Fishery Commission decided to set a quota of 650 000 t on Barents Sea capelin for the winter season 2001, divided by 60% (378 000 t) to Norway and 40% (252 000 t) to Russia.
4.2 Catch Statistics
The international catch by country and season in the years 1965-2001 is given in Table 4.2.1. The catch by age and length groups during the spring season 2001 is given in Table 4.2.2. The total catch in winter 2001 given in Table 4.2.1 was 557 000 t. This is 73 000 tonnes below the quota and the maximum TAC recommended by ACFM. The catch by age and length taken in the Russian experimental fishery during autumn 2001 (11 000 t) is shown in Table 4.2.3.
The final catch statistics for the winter-spring season 2002 are not available yet. By April 1 both Norway and Russia had landed their quotas.
4.3 Stock Size Estimates
4.3.1 Larval and 0-group estimates in 2001
Norwegian larval surveys based on Gulf III plankton samples have been carried out in June each year since 1981. The estimated total number of larvae is shown in Table 4.3.1.1. These larval abundance estimates do not show a high correlation with year-class strength at age one, but should reflect the amount of larvae produced each year (Gundersen and Gjøsæter, 1998). The year 1986 was exceptional, in that no larvae were found. This may have been due to late spawning that year, and eggs may have hatched after the survey was carried out. Also in other years some spawning is known to have taken place during the summer, and offspring from such late spawning is not reflected in the larval abundance estimates in Table 4.3.1.1. Since 1997, permission has not been granted to enter the Russian EEZ during the larval survey, and consequently the total larval distribution area has not been covered. The estimate of 10.7· 1012 larvae in 2001 is slightly higher than the average for the period 1981–2001, but is much lower than during the two previous years. During the international 0-group surveys in August an area-based index for the abundance of 0-group capelin is calculated (Table 4.3.1.1). Gundersen and Gjøsæter (1998) found these indices to be well correlated (r2= 0.75) with the 1-group acoustic estimates for the same year class obtained by the annual capelin acoustic surveys in autumn. Data points up to 1994 were included in this analysis. When this regression is updated with the survey results from 1981–2000 the parameters in the regression were slightly changed and the r2 was reduced to 0.68. Based on this regression, (ln 1-group estimate = -1.77 + 1.19 · ln 0-group index), the 0-group index obtained in 2001 of 221 would correspond to a year class strength of 107 billion one-year-olds in autumn 2002. A year class of this size would be about half the size of an average year class in the period 1972–2001, and the smallest since 1995.
4.3.2 Acoustic stock size estimates in 2001
Two Russian and two Norwegian vessels jointly carried out the 2001 acoustic survey in the period 10 September to 5 October (WD by Bogstad et al.). As previously the Norwegian vessels had restricted access to the Russian EEZ, but since two (partly three) of the four vessels available to the survey could work in the Russian EEZ, the coverage of the total stock was considered complete. The results from the survey are given in Table 4.3.2.1, and are compared to previous years’ results in Table 4.3.2.2. The stock size was estimated at 3.6 million tonnes. The 2000 year class (one-year-olds) constituted about 30% by numbers and 10% by weight of the total stock and was considerably less abundant

O:\ACFM\WGREPS\WGNPBW\REPORTS\2002\Sec-4.Doc 125
than the 1999 year class at the same age. About 50% (2.0 mill t) of the stock biomass consisted of maturing fish (> 14 cm).
4.3.3 Other surveys
Russian observations of capelin were made during a survey from 8 February to 5 March 2002 (WD by Ushakov and Prozorkevitch). An acoustic abundance estimate of 1.4 million tonnes of pre-spawning capelin corresponds well with the amount of maturing fish estimated during autumn 2001 after accounting for natural mortality. During the Norwegian demersal fish survey in February 2002 observations of capelin by acoustics and by pelagic and demersal trawls were made (WD by Gjøsæter). However, no stock size estimate was attempted. Samples of cod stomachs during this period give valuable information for the modelling of maturing capelin as prey for cod (Bogstad and Gjøsæter, 2001).
4.4 Historical stock development
An overview of the development of the Barents Sea capelin stock in the period 1991–2001 is given in Tables 4.4.1–4.4.7. The methods and assumptions used for constructing the tables are explained in Appendix A to ICES 1995 Assess: 9. In that report, the complete time-series back to 1973 can also be found. It should be noted that several of the assumptions and parameter values used in constructing these tables are provisional and future research may alter some of the tables considerably. For instance, M-values for immature capelin will be calculated using new estimates of the length at maturity and M-values for mature capelin will be calculated taking the predation by cod into account. This will also affect the estimates of spawning stock biomass given in the stock summary table (Table 4.4.7). Also, it should be noted that these values, coming from a deterministic model cannot directly be compared to those coming from the probabilistic assessment model used for this stock. However, as a crude overview of the development of the Barents Sea capelin stock the tables may be adequate.
Estimates of stock in number by age group and total biomass for the period are shown in Table 4.4.1. Catch in numbers at age and total landings are shown for the spring and autumn seasons in Tables 4.4.2 and 4.4.3. Natural mortality coefficients by age group for immature and mature capelin are shown in Table 4.4.4. Stock size at 1 January in numbers at age and total biomass is shown in Table 4.4.5. Spawning stock biomass per age group is shown in Table 4.4.6. Table 4.4.7 gives an aggregated summary for the entire period 1973–2001.
4.5 Stock assessment autumn 2001
As decided by the Northern Pelagic and Blue Whiting Fisheries Working Group at its 2001 meeting (ICES 2001/ACFM:17), the assessment of Barents Sea capelin was left to the parties responsible for the autumn survey, i.e., IMR in Bergen and PINRO in Murmansk, who reported directly to ACFM before its autumn 2001 meeting (Bogstad et al., WD).
A probabilistic projection of the spawning stock to the time of spawning at 1 April 2002 was presented, using the spreadsheet model CapTool, implemented using the @RISK add-on for EXCEL. The projection was based on a probabilistic maturation model with parameters estimated by the model Bifrost (former CapSex), with uncertainty taken into account; data on size and composition of the cod stock (from the Arctic Fisheries Working Group, ICES 2002/ACFM:19, but made probabilistic in CapTool in accordance with the risk analysis made by the Arctic Fisheries Working Group).
There is clearly a need for a target biomass reference point for capelin. Calculations of Btarget were not made, but are planned for the future. A Blim (SSBlim) management approach was suggested for this stock. As in 2000, the meeting suggested the spawning stock size in 1989 as a Blim. The rationale behind this was that this biomass produced one of the strongest year classes observed during the period 1972–2001. It should also be noted that this year is within the time range for which quantitative stomach content data are available. It can be argued that the SSB in 1989 was sufficiently large to produce a good year class under favourable recruitment conditions in a “non-herring situation” (Gjøsæter and Bogstad, 1998).
Probabilistic prognoses for the maturing stock from October 1 2001 until April 1 2002 were made, with a CV of 0.20 on the abundance estimate. The meeting concluded that capelin recruitment in 2002 would probably not be influenced to any noticeable degree by the stock of young herring now found in the Barents Sea.
ACFM at its autumn 2001 meeting (ICES 2001/CRR:246) took most of the points in the report into account. ACFM agreed to the view that fishing mortality reference points and a Bpa are not relevant for this stock, and that a target

O:\ACFM\WGREPS\WGNPBW\REPORTS\2002\Sec-4.Doc 126
escapement management strategy is the most useful way of ensuring a minimum amount of spawners. Further ACFM agreed to the strategy adopted of directing the fishery at the spawning stock just prior to spawning, to allow the capelin to be available to predators as long as possible. The idea of a stochastic Blim set equal to the modelled density distribution of the spawning stock in 1989 was considered “a good basis for such a reference point in a non-herring situation”. Because the assessment method may not yet account for all sources of uncertainty, and because there are inconsistencies in the data series, ACFM did not adopt the suggested Blim. Rather, ACFM set a Blim of 200 000 t and consequently advised that a TAC should not exceed 630 000 t. This was based on adopting the forecast of the SSB using the limit reference points referred above, and following the harvest control rule that the SSB should fall below Blim with a maximum 5% probability. ACFM also considered that adjustments of the harvest control rule should be further investigated for the purpose of taking better account of the uncertainty in the predicted amount of abundance of spawners, the likely interactions with herring, and the role of capelin as prey.
4.6 Management considerations
Since the assessment of the stock is directly based on the acoustic survey conducted annually in September-October, and the main fishing season does not begin until January, advice for this stock must be given during the autumn ACFM meeting and the TAC must be set by the Mixed Norwegian-Russian Fishery Commission during its meeting in November-December. As previously decided by the Northern Pelagic and Blue Whiting Fisheries Working Group, the assessment of Barents Sea capelin is left to the parties responsible for the autumn survey, i.e., IMR in Bergen and PINRO in Murmansk, who will report directly to the 2002 ACFM autumn meeting.
4.7 Sampling
The sampling from scientific surveys and from commercial fishing on capelin is summarised below:
Investigation No. of samples Length measurements Aged individuals
Acoustic survey 2001 (Norway)
144 11460 6750
Acoustic survey 2001 (Russia)
175 33158 1281
Norwegian bottom trawl survey winter 2002
221 6578 2331
Russian winter capelin survey 2002
93 9105 900
Norwegian fishery winter 2002
58 5949 300
Russian fishery autumn 2001
213 22153 900
Russian fishery winter 2002
106 13145 751

O:\ACFM\WGREPS\WGNPBW\REPORTS\2002\Sec-4.Doc 127
Table 4.2.1 Barents Sea CAPELIN. International catch (‘000 t) as used by the Working Group.
Year Winter Summer-Autumn Total Norway Russia Others Total Norway Russia Total
1965 217 7 0 224 0 0 0 2241966 380 9 0 389 0 0 0 3891967 403 6 0 409 0 0 0 4091968 460 15 0 475 62 0 62 5371969 436 1 0 437 243 0 243 6801970 955 8 0 963 346 5 351 13141971 1300 14 0 1314 71 7 78 13921972 1208 24 0 1232 347 11 358 15911973 1078 35 0 1112 213 10 223 13361974 749 80 0 829 237 82 319 11491975 559 301 43 903 407 129 536 14391976 1252 231 0 1482 739 366 1105 25871977 1441 345 2 1788 722 477 1199 29871978 784 436 25 1245 360 311 671 19161979 539 343 5 887 570 326 896 17831980 539 253 9 801 459 388 847 16481981 784 428 28 1240 454 292 746 19861982 568 260 5 833 591 336 927 17601983 751 374 36 1161 758 439 1197 23581984 330 257 42 628 481 367 849 14771985 340 234 17 590 113 164 278 8681986 72 51 0 123 0 0 0 1231987 0 0 0 0 0 0 0 01988 0 0 0 0 0 0 0 01989 0 0 0 0 0 0 0 01990 0 0 0 0 0 0 0 01991 528 156 20 704 31 195 226 9291992 620 247 24 891 73 159 232 11231993 402 170 14 586 0 0 0 5861994 0 0 0 0 0 0 0 01995 0 0 0 0 0 0 0 01996 0 0 0 0 0 0 0 01997 0 0 0 0 0 1 1 11998 0 0 0 0 0 1 1 11999 46 32 0 78 0 23 23 1012000 283 95 8 386 0 28 28 4142001 368 180 8 557 0 11 11 568

O:\ACFM\WGREPS\WGNPBW\REPORTS\2002\Sec-4.Doc 128
Table 4.2.2 Barents Sea CAPELIN. International catch in number (106) and biomass (t) during the spring season 2001, as used by the Working Group.
Length Age 1 Age 2 Age 3 Age 4 Age 5+ Sumcm N B N B N B N B N B N % B %
5.0–5.5 0 0 0 0 0 0 0 0 0 0 0 0 0 05.5–6.0 0 0 0 0 0 0 0 0 0 0 0 0 0 06.0–6.5 0 0 0 0 0 0 0 0 0 0 0 0 0 06.5–7.0 2 2 0 0 0 0 0 0 0 0 2 0 2 07.0–7.5 0 0 0 0 0 0 0 0 0 0 0 0 0 07.5–8.0 0 0 2 3 0 0 0 0 0 0 2 0 3 08.0–8.5 0 0 0 0 0 0 0 0 0 0 0 0 0 08.5–9.0 0 0 38 88 0 0 0 0 0 0 38 0 88 09.0–9.5 0 0 38 100 0 0 0 0 0 0 38 0 100 0
9.5–10.0 2 0 38 149 0 0 0 0 0 0 41 0 149 010.0–10.5 7 0 77 295 0 0 0 0 0 0 84 0 295 010.5–11.0 7 0 154 694 0 0 0 0 0 0 161 1 694 011.0–11.5 7 0 77 463 0 0 0 0 0 0 84 0 463 011.5–12.0 12 0 0 88 0 0 0 0 0 0 12 0 88 012.0–12.5 15 0 38 570 0 0 0 0 0 0 53 0 570 012.5–13.0 20 0 10 155 38 323 0 0 0 0 69 0 478 013.0–13.5 10 0 18 159 102 1037 0 0 0 0 130 1 1196 013.5–14.0 0 0 0 47 462 5379 0 0 0 0 462 2 5426 114.0–14.5 5 0 0 0 753 10341 29 420 0 0 787 4 10761 214.5–15.0 0 0 0 0 1164 17506 149 2502 0 0 1313 6 20008 415.0–15.5 0 0 13 220 1325 22193 619 11095 0 0 1957 9 33509 615.5–16.0 0 0 7 111 1149 21805 1134 23055 37 634 2327 10 45605 816.0–16.5 0 0 0 0 933 20023 1871 41496 85 1913 2889 13 63432 1116.5–17.0 0 0 0 0 795 19714 1891 47194 121 3005 2807 12 69913 1317.0–17.5 0 0 0 0 522 14502 1826 50960 332 9432 2680 12 74894 1317.5–18.0 0 0 0 0 225 6815 1807 56001 406 12685 2439 11 75501 1418.0–18.5 0 0 0 0 55 1777 1248 42747 295 9955 1598 7 54478 1018.5–19.0 0 0 0 0 35 1273 834 31091 489 18205 1358 6 50570 919.0–19.5 0 0 0 0 0 0 484 19652 249 10170 733 3 29822 519.5–20.0 0 0 0 0 0 0 154 6886 114 5431 268 1 12317 220.0–20.5 0 0 0 0 0 0 77 3631 50 2372 127 1 6003 120.5–21.0 0 0 0 0 0 0 7 356 0 12 8 0 368 021.0–21.5 0 0 0 0 0 0 0 0 0 0 0 0 0 021.5–22.0 0 0 0 0 0 0 0 0 0 0 0 0 0 0
Sum 90 2 512 3143 7560 142688 12132 337087 2177 73814 22470 100 556734 100

O:\ACFM\WGREPS\WGNPBW\REPORTS\2002\Sec-4.Doc
Table 4.2.3 Barents Sea CAPELIN. Russian catch in number (106) and biomass (t) during the autumn season 2001, as us
Length Age 1 Age 2 Age 3 Age 4 Age 5+cm N B N B N B N B N B
5.0–5.5 0 0 0 0 0 0 0 0 0 05.5–6.0 0 0 0 0 0 0 0 0 0 06.0–6.5 0 0 0 0 0 0 0 0 0 06.5–7.0 0 0 0 0 0 0 0 0 0 07.0–7.5 0 0 0 0 0 0 0 0 0 07.5–8.0 0 0 0 0 0 0 0 0 0 08.0–8.5 0 0 0 0 0 0 0 0 0 08.5–9.0 0 0 0 0 0 0 0 0 0 09.0–9.5 0 0 0 0 0 0 0 0 0 0
9.5–10.0 1 4 0 0 0 0 0 0 0 010.0–10.5 1 3 0 0 0 0 0 0 0 010.5–11.0 1 4 0 2 0 0 0 0 0 011.0–11.5 2 10 2 13 0 0 0 0 0 011.5–12.0 0 0 7 50 0 0 0 0 0 012.0–12.5 1 3 12 99 0 0 0 0 0 012.5–13.0 0 0 23 204 0 0 0 0 0 013.0–13.5 0 0 27 279 0 0 0 0 0 013.5–14.0 0 0 43 488 0 0 0 0 0 014.0–14.5 1 6 39 494 1 14 0 0 0 014.5–15.0 0 0 49 640 1 12 0 0 0 015.0–15.5 0 0 51 851 5 87 0 0 0 015.5–16.0 0 0 45 777 11 168 0 0 0 016.0–16.5 0 0 37 783 19 423 0 0 0 016.5–17.0 0 0 30 591 21 416 1 11 0 017.0–17.5 0 0 16 411 28 731 0 0 0 017.5–18.0 0 0 8 223 40 1098 4 103 0 018.0–18.5 0 0 3 84 26 833 7 222 0 018.5–19.0 0 0 0 0 14 468 3 101 0 019.0–19.5 0 0 0 0 7 250 2 61 0 019.5–20.0 0 0 0 0 2 59 0 0 0 020.0–20.5 0 0 0 0 2 62 2 65 0 020.5–21.0 0 0 0 0 0 0 0 0 0 021.0–21.5 0 0 0 0 0 0 0 0 0 021.5–22.0 0 0 0 0 0 0 0 0 0 0
Sum 6 30 393 5989 175 4620 18 564 0 0
Table 4.2.3 Barents Sea CAPELIN. Russian catch in number (106) and biomass (t) during the autumn season 2001, a
129
ed by the Working Group.
SumN % B %0 0 0 00 0 0 00 0 0 00 0 0 00 0 0 00 0 0 00 0 0 00 0 0 00 0 0 01 0 4 01 0 3 01 0 6 04 1 23 07 1 50 0
13 2 102 123 4 204 227 5 279 243 7 488 441 7 514 550 8 652 656 10 937 856 9 945 856 9 1207 1151 9 1018 944 8 1142 1052 9 1424 1336 6 1139 1017 3 569 5
9 1 310 32 0 59 13 1 128 10 0 0 00 0 0 00 0 0 0
592 100 11204 100
s used by the Working Group.
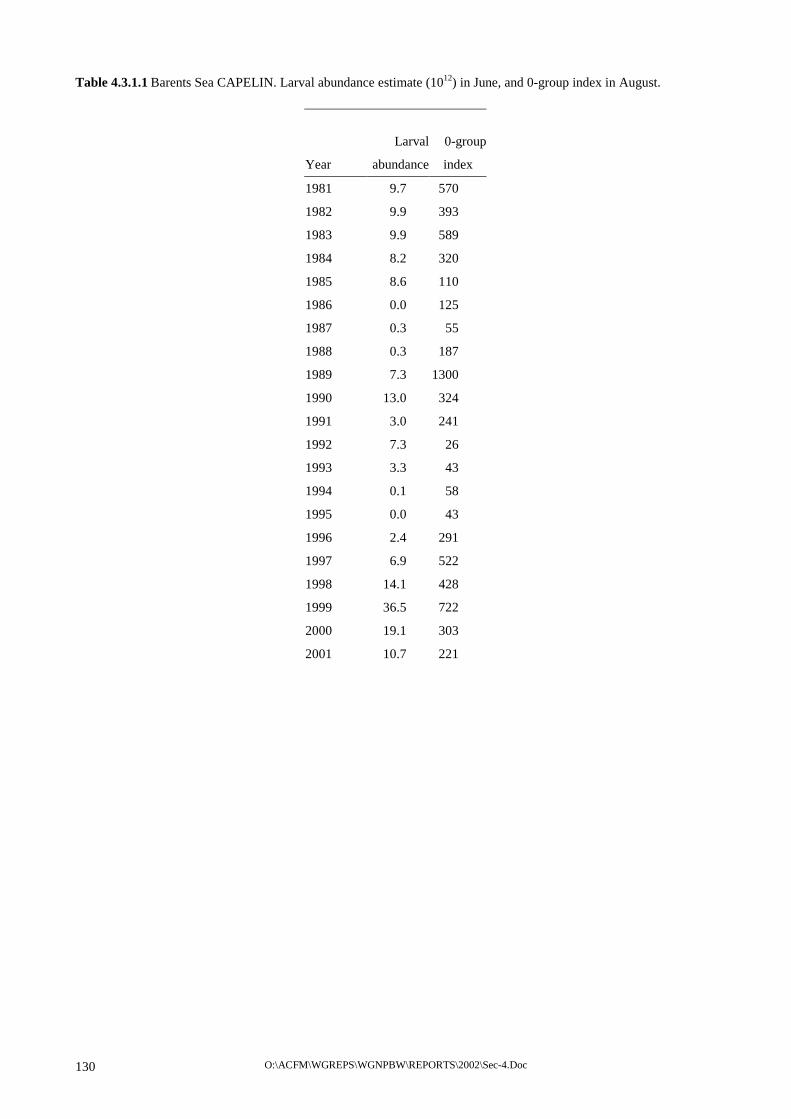
O:\ACFM\WGREPS\WGNPBW\REPORTS\2002\Sec-4.Doc 130
Table 4.3.1.1 Barents Sea CAPELIN. Larval abundance estimate (1012) in June, and 0-group index in August.
Larval 0-group
Year abundance index
1981 9.7 570
1982 9.9 393
1983 9.9 589
1984 8.2 320
1985 8.6 110
1986 0.0 125
1987 0.3 55
1988 0.3 187
1989 7.3 1300
1990 13.0 324
1991 3.0 241
1992 7.3 26
1993 3.3 43
1994 0.1 58
1995 0.0 43
1996 2.4 291
1997 6.9 522
1998 14.1 428
1999 36.5 722
2000 19.1 303
2001 10.7 221

O:\ACFM\WGREPS\WGNPBW\REPORTS\2002\Sec-4.Doc 131
Table 4.3.2.1 Barents Sea CAPELIN. Estimated stock size from the acoustic survey in September-October 2001. Based on TS value 19.1 log L –74.0 dB, corresponding to σ = 5.0 ⋅ 107 ⋅ L1.91.
Length (cm) 1 2 3 4 5+ Sum Biomass Mean 1999 1998 1997 1996 1995 (109) (103 t) weight (g)
5.0 - 5.5 0.034 0.034 0.000 0.5005.5 - 6.0 0.000 0.000 6.0 - 6.5 0.296 0.296 0.300 0.9006.5 - 7.0 1.199 1.199 1.300 1.1007.0 - 7.5 2.592 2.592 2.800 1.1007.5 - 8.0 3.756 3.756 5.000 1.3008.0 - 8.5 5.134 5.134 9.700 1.9008.5 - 9.0 9.207 9.207 21.000 2.3009.0 - 9.5 17.351 0.003 17.353 46.100 2.7009.5 - 10.0 23.350 0.042 23.391 74.300 3.200
10.0 - 10.5 25.616 0.381 25.998 93.500 3.60010.5 - 11.0 15.014 2.457 17.471 77.200 4.40011.0 - 11.5 7.086 8.039 15.125 80.600 5.30011.5 - 12.0 2.815 24.258 27.073 169.200 6.30012.0 - 12.5 0.085 32.271 0.006 32.362 236.900 7.30012.5 - 13.0 0.029 32.591 0.063 32.683 266.200 8.10013.0 - 13.5 28.541 0.052 28.592 275.700 9.60013.5 - 14.0 0.023 21.965 0.089 22.078 251.300 11.40014.0 - 14.5 21.221 0.209 0.019 21.450 282.400 13.20014.5 - 15.0 17.545 0.372 17.917 270.200 15.10015.0 - 15.5 9.455 2.430 11.885 199.000 16.70015.5 - 16.0 7.900 3.588 0.050 11.538 223.800 19.40016.0 - 16.5 4.619 4.476 0.007 9.102 200.600 22.00016.5 - 17.0 3.888 6.355 0.007 10.250 259.600 25.30017.0 - 17.5 2.315 4.657 0.280 7.253 213.800 29.50017.5 - 18.0 1.024 3.171 0.059 4.253 139.900 32.90018.0 - 18.5 0.119 3.685 0.198 4.002 146.800 36.70018.5 - 19.0 0.044 0.860 0.351 0.061 1.316 54.400 41.30019.0 - 19.5 0.060 0.463 0.046 0.569 24.700 43.40019.5 - 20.0 0.025 0.034 0.059 2.900 49.10020.0 - 20.5 0.011 0.011 0.500 48.00020.5 - 21.0
TSN (109) 113.587 218.737 30.500 1.063 0.061 363.948 TSB (103 t) 374.8 2401.1 813.8 37.7 2.5 3630 Mean length (cm) 9.80 13.40 16.80 18.00 18.80 12.6 Mean weight (g) 3.3 11.0 26.7 35.5 41.4 10.0SSN (109) 0.000 68.190 30.291 1.062 0.061 99.605 SSB (103 t) 0.0 1167.0 811.6 37.7 2.5 2018.8
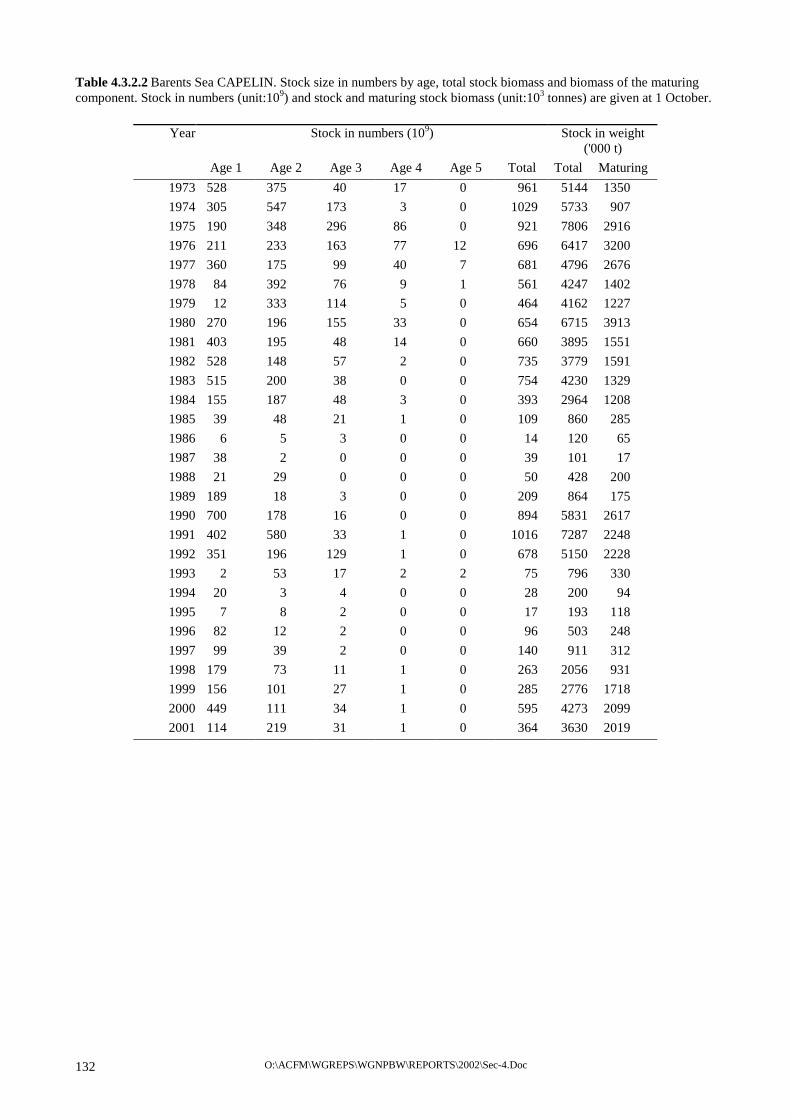
O:\ACFM\WGREPS\WGNPBW\REPORTS\2002\Sec-4.Doc 132
Table 4.3.2.2 Barents Sea CAPELIN. Stock size in numbers by age, total stock biomass and biomass of the maturing component. Stock in numbers (unit:109) and stock and maturing stock biomass (unit:103 tonnes) are given at 1 October.
Year Stock in numbers (109) Stock in weight ('000 t)
Age 1 Age 2 Age 3 Age 4 Age 5 Total Total Maturing 1973 528 375 40 17 0 961 5144 1350 1974 305 547 173 3 0 1029 5733 907 1975 190 348 296 86 0 921 7806 2916 1976 211 233 163 77 12 696 6417 3200 1977 360 175 99 40 7 681 4796 2676 1978 84 392 76 9 1 561 4247 1402 1979 12 333 114 5 0 464 4162 1227 1980 270 196 155 33 0 654 6715 3913 1981 403 195 48 14 0 660 3895 1551 1982 528 148 57 2 0 735 3779 1591 1983 515 200 38 0 0 754 4230 1329 1984 155 187 48 3 0 393 2964 1208 1985 39 48 21 1 0 109 860 285 1986 6 5 3 0 0 14 120 65 1987 38 2 0 0 0 39 101 17 1988 21 29 0 0 0 50 428 200 1989 189 18 3 0 0 209 864 175 1990 700 178 16 0 0 894 5831 2617 1991 402 580 33 1 0 1016 7287 2248 1992 351 196 129 1 0 678 5150 2228 1993 2 53 17 2 2 75 796 330 1994 20 3 4 0 0 28 200 94 1995 7 8 2 0 0 17 193 118 1996 82 12 2 0 0 96 503 248 1997 99 39 2 0 0 140 911 312 1998 179 73 11 1 0 263 2056 931 1999 156 101 27 1 0 285 2776 1718 2000 449 111 34 1 0 595 4273 2099 2001 114 219 31 1 0 364 3630 2019
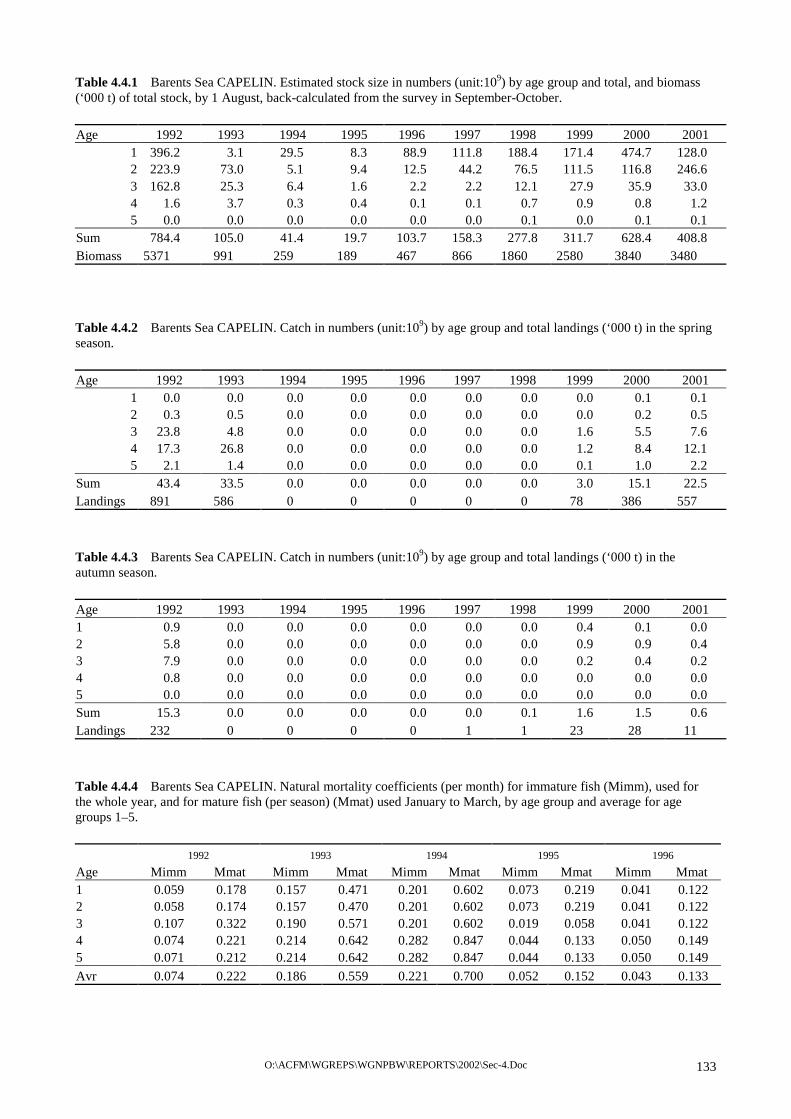
O:\ACFM\WGREPS\WGNPBW\REPORTS\2002\Sec-4.Doc 133
Table 4.4.1 Barents Sea CAPELIN. Estimated stock size in numbers (unit:109) by age group and total, and biomass (‘000 t) of total stock, by 1 August, back-calculated from the survey in September-October.
Age 1992 1993 1994 1995 1996 1997 1998 1999 2000 2001 1 396.2 3.1 29.5 8.3 88.9 111.8 188.4 171.4 474.7 128.0 2 223.9 73.0 5.1 9.4 12.5 44.2 76.5 111.5 116.8 246.6 3 162.8 25.3 6.4 1.6 2.2 2.2 12.1 27.9 35.9 33.0 4 1.6 3.7 0.3 0.4 0.1 0.1 0.7 0.9 0.8 1.2 5 0.0 0.0 0.0 0.0 0.0 0.0 0.1 0.0 0.1 0.1
Sum 784.4 105.0 41.4 19.7 103.7 158.3 277.8 311.7 628.4 408.8 Biomass 5371 991 259 189 467 866 1860 2580 3840 3480
Table 4.4.2 Barents Sea CAPELIN. Catch in numbers (unit:109) by age group and total landings (‘000 t) in the spring season.
Age 1992 1993 1994 1995 1996 1997 1998 1999 2000 2001 1 0.0 0.0 0.0 0.0 0.0 0.0 0.0 0.0 0.1 0.1 2 0.3 0.5 0.0 0.0 0.0 0.0 0.0 0.0 0.2 0.5 3 23.8 4.8 0.0 0.0 0.0 0.0 0.0 1.6 5.5 7.6 4 17.3 26.8 0.0 0.0 0.0 0.0 0.0 1.2 8.4 12.1 5 2.1 1.4 0.0 0.0 0.0 0.0 0.0 0.1 1.0 2.2
Sum 43.4 33.5 0.0 0.0 0.0 0.0 0.0 3.0 15.1 22.5 Landings 891 586 0 0 0 0 0 78 386 557
Table 4.4.3 Barents Sea CAPELIN. Catch in numbers (unit:109) by age group and total landings (‘000 t) in the autumn season.
Age 1992 1993 1994 1995 1996 1997 1998 1999 2000 2001 1 0.9 0.0 0.0 0.0 0.0 0.0 0.0 0.4 0.1 0.0 2 5.8 0.0 0.0 0.0 0.0 0.0 0.0 0.9 0.9 0.4 3 7.9 0.0 0.0 0.0 0.0 0.0 0.0 0.2 0.4 0.2 4 0.8 0.0 0.0 0.0 0.0 0.0 0.0 0.0 0.0 0.0 5 0.0 0.0 0.0 0.0 0.0 0.0 0.0 0.0 0.0 0.0 Sum 15.3 0.0 0.0 0.0 0.0 0.0 0.1 1.6 1.5 0.6 Landings 232 0 0 0 0 1 1 23 28 11
Table 4.4.4 Barents Sea CAPELIN. Natural mortality coefficients (per month) for immature fish (Mimm), used for the whole year, and for mature fish (per season) (Mmat) used January to March, by age group and average for age groups 1–5.
1992 1993 1994 1995 1996 Age Mimm Mmat Mimm Mmat Mimm Mmat Mimm Mmat Mimm Mmat 1 0.059 0.178 0.157 0.471 0.201 0.602 0.073 0.219 0.041 0.122 2 0.058 0.174 0.157 0.470 0.201 0.602 0.073 0.219 0.041 0.122 3 0.107 0.322 0.190 0.571 0.201 0.602 0.019 0.058 0.041 0.122 4 0.074 0.221 0.214 0.642 0.282 0.847 0.044 0.133 0.050 0.149 5 0.071 0.212 0.214 0.642 0.282 0.847 0.044 0.133 0.050 0.149 Avr 0.074 0.222 0.186 0.559 0.221 0.700 0.052 0.152 0.043 0.133

O:\ACFM\WGREPS\WGNPBW\REPORTS\2002\Sec-4.Doc 134
Table 4.4.4 (Continued)
1997 1998 1999 2000 2001 Age Mimm Mmat Mimm Mmat Mimm Mmat Mimm Mmat Mimm Mmat 1 0.062 0.185 0.026 0.077 0.047 0.142 0.028 0.083 0.060 0.180 2 0.062 0.185 0.026 0.077 0.047 0.142 0.028 0.083 0.060 0.180 3 0.062 0.185 0.071 0.212 0.025 0.074 0.026 0.079 0.040 0.120 4 0.014 0.041 0.071 0.212 0.025 0.074 0.026 0.079 0.040 0.120 5 0.014 0.041 0.071 0.212 0.025 0.074 0.026 0.079 0.040 0.120 Avr 0.042 0.127 0.053 0.158 0.034 0.101 0.027 0.080 0.048 0.144
Table 4.4.5 Barents Sea CAPELIN. Estimated stock size in numbers (unit:109) by age group and total, and biomass (‘000 t) of total stock, by 1 January.
Age 1992 1993 1994 1995 1996 1997 1998 1999 2000 2001 1 600.1 9.2 120.3 13.8 118.2 172.0 225.5 238.5 576.1 194.7 2 382.0 293.7 1.4 10.8 5.7 72.5 82.2 165.8 135.3 413.3 3 548.6 162.6 33.3 1.9 6.5 10.2 32.5 67.3 88.1 100.9 4 25.7 89.2 9.8 2.4 1.4 1.8 1.6 8.5 24.7 31.1 5 0.3 0.5 1.3 0.1 0.3 0.1 0.1 0.5 0.8 0.7 Sum 1556.8 555.2 166.1 28.9 132.2 256.6 341.9 480.6 824.9 740.6 Biomass 8299 4372 737 156 313 779 1240 2456 3571 4558
Table 4.4.6 Barents Sea CAPELIN. Estimated spawning stock biomass (‘000 t) by 1 April.
Age 1992 1993 1994 1995 1996 1997 1998 1999 2000 2001 1 0 0 0 0 0 0 0 0 0 0 2 0 0 0 1 3 1 1 2 24 0 3 919 129 34 15 71 175 217 650 819 836 4 79 331 60 38 24 49 34 193 472 852 5 0 0 11 1 7 2 2 10 0 0 Sum 998 460 105 55 105 228 254 856 1315 1688

O:\ACFM\WGREPS\WGNPBW\REPORTS\2002\Sec-4.Doc 135
Table 4.4.7 Barents Sea CAPELIN. Stock summary table. Recruitment (number of 1 year old fish (unit:109) and stock biomass (‘000 t) given at 1 August, spawning stock (‘000 t) at time of spawning (1. April). Landings (‘000 t) are the sum of the total landings in the two fishing seasons within the year indicated. The SSB is obtained by projecting the stock forward assuming a natural mortality that does not take the current predation mortality fully into account.
YearStock
biomass Recruit-
ment Age 1
Spawning stock
biomass Landings 1965 224 1966 389 1967 409 1968 537 1969 680 1970 1314 1971 1392 1972 5831 1592 1973 6630 1140 1242 1336 1974 7121 737 343 1149 1975 8841 494 90 1439 1976 7584 433 1147 2587 1977 6254 830 890 2987 1978 6119 855 460 1916 1979 6576 551 193 1783 1980 8219 592 87 1648 1981 4489 466 1731 1986 1982 4205 611 546 1760 1983 4772 612 47 2358 1984 3303 183 171 1477 1985 1087 47 106 868 1986 157 9 13 123 1987 107 46 16 0 1988 361 22 11 0 1989 771 195 141 0 1990 4901 708 179 0 1991 6647 415 1584 929 1992 5371 396 998 1123 1993 991 3 460 586 1994 259 30 105 0 1995 189 8 55 0 1996 467 89 105 0 1997 866 112 228 1 1998 1860 188 254 1 1999 2580 171 856 106 2000 3840 475 1315 414 2001 3480 128 1688 568

O:\ACFM\WGREPS\WGNPBW\REPORTS\2002\Sec-5.Doc 136
5 CAPELIN IN THE ICELAND-EAST GREENLAND-JAN MAYEN AREA
5.1 The Fishery
5.1.1 Regulation of the fishery
The fishery depends upon maturing capelin, i.e. that part of each year class which spawns at age 3, as well as those fish at age 4 that did not mature and spawn at age 3. The abundance of the immature component is difficult to assess before their recruitment to the adult stock at ages 2 and 3. This is especially true of the age 3 immatures.
The fishery of the Iceland-East Greenland-Jan Mayen capelin has, therefore, been regulated by preliminary catch quotas set prior to each fishing season (July–March). Predictions of TACs have been computed based on data from surveys of the abundance of 1- and 2-year-old capelin, carried out in the autumn of the year before. The process includes historical relationships between such data and the back-calculated abundance of the same year classes, growth rate and stock in numbers, natural mortality, and the provision of a remaining spawning stock biomass of 400 000 t. Final catch quotas for each season have then been set according to the results of acoustic surveys of the maturing, fishable stock, carried out in autumn (October–November) and/or winter (January/February) in that fishing season. A more detailed description of the method is given in Section 1.3.5. A summary of the results of this catch regulation procedure is given in Table 5.1.1.
Over the years, fishing has not been permitted during April-June and the season opened in July/August or later, depending on the state of the stock. Due to very low stock abundance there was a fishing ban lasting from December 1981 to November 1983. In addition, areas with high abundances of juvenile age 1 and 2 capelin (in the shelf region off NW-, N-, and NE-Iceland) have usually been closed to the summer and autumn fishery.
5.1.2 The fishery in the 2001/2002 season
In accordance with a previously determined procedure, ACFM recommended that the preliminary TAC should not exceed 700 000 t. This is 2/3 of the total TAC predicted for the 2001/2002 season, i.e. 1 050 000 t. This advice was accepted by all parties concerned.
The season opened on 20 June and the fishery began in deep waters north of the shelf edge northeast and north of Iceland. As usual the fishing grounds gradually shifted to the northwest and north in July. Catch rates were low in the beginning, but improved considerably in July as the capelin migrated north. Towards the end of July the northward migration stopped, the capelin began moving back south again, and soon scattered. By the end of July, the total catch was 276 000 t. After July the capelin remained scattered and no catches were made for the rest of the year, except for 18 000 t taken in December.
The total catch in the 2001 summer and autumn season was approximately 294 000 t.
In January 2002, large fishable concentrations of adult capelin were located in deep waters off the shelf east of Iceland and resulted immediately in a successful fishery. A total catch of approximately 250 000 t of capelin was taken in deep waters east and southeast of Iceland, before the first spawning migration approached shallow waters off the eastern south coast. In addition, Faroese vessels took about 20 000 t within the Faroese EEZ, some of it up to 40-50 nautical miles on the Faroese side of the division line. While capelin have occasionally been recorded near the EEZ boundary between the Faroes and Iceland, these are the first catches made within the Faroese EEZ in recorded history.
Catch rates were extremely high in the Icelandic coastal area throughout February and in the first 20 days of March. The total catch during these 6 weeks almost reached 600 000 t. A small body of capelin, assessed acoustically at 105 000 t, arrived at the central west coast spawning grounds in the third week of March. These capelin were smaller and less mature, thus prolonging the winter fishery by about one week.
The total catch during the 2002 winter season was 955 000 t, the highest on record.
5.2 Catch Statistics
The total annual catch of capelin in the Iceland-East Greenland-Jan Mayen area since 1964 is given by weight, season, and fleet in Table 5.2.1.

O:\ACFM\WGREPS\WGNPBW\REPORTS\2002\Sec-5.Doc 137
The total catch in numbers during the summer/autumn 1979–2001 and winter 1980–2002 seasons is given by age and years in Tables 5.2.2 and 5.2.3.
The distribution of the catch during the summer-autumn 2000 and winter 2001 seasons is given by length groups-at-age in Tables 5.2.4 and 5.2.5.
5.3 Surveys of Stock Abundance
5.3.1 0-group surveys
The distribution and abundance of 0-group capelin in the Iceland-East Greenland-Jan Mayen area has been recorded during surveys carried out in August since 1970. The survey methods and computations of abundance indices were described by Vilhjálmsson and Fridgeirsson (1976). The abundance indices of 0-group capelin, divided according to areas, are given in Table 5.3.1.1.
Acoustic estimates of the abundance of 1-group capelin have also been obtained during the August 0-group surveys (e.g. Vilhjálmsson 1994). The abundance of 1-group capelin by number, mean length, and weight for 1983–2000 is given in Table 5.3.1.2.
5.3.2 Stock abundance in autumn 2001 and winter 2002
An acoustic survey was carried out by two research vessels in the period 12-28 November (WD by Vilhjalmsson). The distribution of the stock was more or less continuous, reaching from 28oW, west of the NW-peninsula of Iceland (Vestfirdir), across the outer part of the shelf northwest and north of Iceland to 15oW off the eastern north coast. The most extensive and dense capelin concentrations were recorded over the outer shelf northwest and north of Vestfirdir and the western north coast.
Due to drift ice it was not possible to carry out an adequate survey of parts of the Denmark Strait and a period of prolonged storms precluded surveying northeast and east of Iceland. In the area surveyed, the capelin were almost exclusively recorded as scattering layers of varying densities at depths of 50-150 m in darkness, but somewhat deeper in the daytime. In most of the area surveyed, the echo recordings consisted of a mixture of adults and juveniles (age groups 1 and 2), with a predominance of age group 1 in the juvenile component.
According to the autumn 2001 survey, the immature stock amounted to 100.3 and 2.4 * 109 fish, belonging to age groups 1 and 2 respectively (year classes 2000 and 1999). The estimated total fishable/spawning stock abundance was only 24.3 * 109 fish in late November 2001. The observed mean weight in the fishable stock was 16.1 g and the estimated fishable/spawning stock biomass was only 390 000 t.
Both total adult stock biomass and the contribution of the older age group to it were below expectations. For these reasons and due to the fact that parts of the potential distribution area could not be surveyed, it was concluded that the autumn 2001 survey had probably failed to locate a large part of the fishable stock. The same can be said for the age 2 immatures. On the other hand, the survey registered fairly large numbers of immature age 1's. However, large areas that normally contain this age group could not be surveyed and therefore the abundance of age group 1 was also underestimated. Details of the autumn 2001 acoustic estimate of adult capelin are given in Table 5.3.2.1, and those of the immature stock in Table 5.3.2.2.
During 10-21 January 2002, the abundance of mature capelin was assessed at and outside the shelf edge east of Iceland. Surveying conditions were exemplary in January 2002. Thus, most of the capelin were located in areas with clear outer boundaries. Although the survey occasionally came across extremely dense schools, the ship’s sonar usually showed the presence of more schools of similar densities in the neighbourhood. However, as a rule capelin were recorded as large aggregations having moderate densities.
It is common knowledge that capelin migrate south off the east coast of Iceland in January. However, these migrations do not maintain a steady pace and may even stop altogether for a day or two. Consequently, the speed of migration has to be considered when assessing stock abundance during the migration period. There are models available that adjust for migration against or with the direction of the survey; however, they cannot be used unless the speed of the migration is known. Although the capelin probably was migrating south during the survey, the position and progress of the fishery indicated that the speed of migration was slow. Because the area with the dense distribution south of 64˚45’ was surveyed in a couple of days, it is unlikely that migration affected the estimate there to any great extent. On the other hand, the more northern and larger part of the distribution area was surveyed over a longer time period and against the

O:\ACFM\WGREPS\WGNPBW\REPORTS\2002\Sec-5.Doc 138
direction of migration. The January survey may therefore have underestimated adult stock abundance somewhat. In addition, a short survey of a migration, in the process of arriving at the West Iceland spawning grounds, was carried out during 11-15 March 2002.
The total biomass of adult capelin east of Iceland in January 2002 was estimated to be 1 330 000 t, and an additional 105 000 t were recorded when more capelin arrived at the central west coast in early March. Practically no immature capelin were recorded east of Iceland in January 2002. However, the survey could not be continued to search for and assess the concentrations of immature capelin in deeper waters east and northeast of Iceland.
Details of the winter 2001 acoustic estimates of adult capelin are given in Tables 5.3.2.3.
5.4 Historical Stock Abundance
The historical estimates of stock abundance are based on the “best” acoustic estimates of the abundance of maturing capelin in autumn and/or winter surveys, the “best” in each case being defined as that estimate on which the final decision of TAC was based. Taking account of the catch in number and a monthly natural mortality rate of M = 0.035 (ICES 1991/Assess:17) abundance estimates of each age group are then projected to the appropriate point in time. Since natural mortality rates of juvenile capelin are not known, their abundance by number has been projected using the same natural mortality rate.
The annual abundance by number and weight-at-age for mature and immature capelin in the Iceland-East Greenland-Jan Mayen area has been calculated with reference to 1 August and 1 January of the following year for the 1978/79–2000/01 seasons. The results are given in Tables 5.4.1 and 5.4.2 (1 August and 1 January, respectively). Table 5.4.2 also gives the remaining spawning stock by number and biomass in March/April 1979–2001.
The observed annual mean weight-at-age was used to calculate the stock biomass on 1 January. With the exception of juvenile capelin, which are surveyed in summer, the average weight-at-age of adult capelin in autumn (Table 5.5.1.2) is used to calculate stock biomass of the maturing components in summer. Because there is a small weight increase among mature capelin in February and March, the remaining spawning stock biomass is underestimated.
5.5 Stock Prognoses
5.5.1 Stock prognosis and TAC in the 2001/2002 season
The models (ICES 1993/Assess:6; Section 3.1.5) for predicting the numbers of maturing capelin of ages 2 and 3 from the November 1999 acoustic assessment of the 1998 and 1997 year classes gave estimates of 77.1 and 16.9*109 maturing 2- and 3-group capelin on 1 August 2001.
During the last ten years the weight-at-age of adult capelin has been inversely related to adult stock abundance. Simple linear regressions of these data result in R2 = 0.66 and 0.76 for age groups 2 and 3, respectively. The two regression plots are shown in Figure 5.5.3.2. Applying the appropriate regression equations, y = -0.035x + 19.4; r2 = 0.66; p<0.05 for the younger component, and y = -0.070x + 29.0; r2 = 0.76; p<0.05 for the older one, and using the predicted abundance of age groups 2 and 3 on 1 August 2001 combined, i.e. 95.0 * 109 fish, results in estimated mean weights of 16.1 and 22.4 g for age groups 2 and 3, respectively.
The fishable stock biomass, obtained by multiplying the stock in numbers by the predicted mean weight of maturing capelin in autumn, was projected forward to spawning time in March 2001 assuming a monthly M = 0.035 and a remaining spawning stock of 400 000 t. This resulted in a predicted TAC of 1 050 000 t spread evenly over August 2001-March 2002 (Table 5.5.1.3). Using the same approach as in previous years, i.e. that the preliminary TAC be set at 2/3 of the predicted total for the season, the Working Group recommended that a preliminary TAC for the 2001/02 capelin fishery be set at 700 000 t.
According to the January and March 2002 survey results described in Section 5.3.2, the fishable spawning stock was estimated at 65.9*109 fish on 20 January 2001. At that time the observed mean weight in the fishable stock was 21.6 g and the stock biomass was about 1 425 000 t. With the usual prerequisites of a monthly natural mortality rate of 0.035 and a remaining spawning stock of 400 000 t, the above abundance estimate indicated a TAC of 975 000 t was available for the remainder of the 2002 winter fishery. Adding this to the catch of 350 000 t already taken from June 2001–January 2002 resulted in a total TAC of 1 325 000 t for the 2001/2002 season.

O:\ACFM\WGREPS\WGNPBW\REPORTS\2002\Sec-5.Doc 139
The difference between the predicted TAC and the final TAC calculated for the 2001/2002 season is due to a larger contribution by numbers of the 1999 year class and a higher mean weight than expected. About 75 000 t of the TAC remained at the end of the winter fishery. As a result, 475 000 t of capelin remained to spawn in 2002.
5.5.2 Stock prognosis and assessment for the 2002/2003 season
Calculations of expected TAC for the 2002/2003 season, based on the method described in Section 3.1.5 and data from Table 5.5.1.1, were used to predict the abundance of maturing capelin of ages 2 and 3 on 1 August 2002.
An updated linear regression of the measured abundance of 1-group capelin (N1) on the backcalculated abundance of mature 2-group fish (N2mat) gives y = 0.577x + 19.3; R2 = 0.83; p <0.05. Similarly for the older stock component, where N2tot is regressed on N3mat, gives y = 0.285x - 7.1; R2 = 0.51; p <0.05. The two regression plots are shown in Figure 5.5.3.1.
The Working Group decided that the November 2001 estimate of the abundance of 1-group capelin (year class 2000) was a reasonable basis for predicting the abundance of maturing capelin of the 2000 year class on 1 August 2002.
Projections of 77.2 and 17.3 billion mature fish belonging to the 2000 and 1999 year classes respectively, are given in Table 5.5.1.1.
During the last ten years the weight-at-age of adult capelin has been inversely related to adult stock abundance, and simple linear regressions result in R2 = 0.64 and 0.68 for age groups 2 and 3, respectively. These two regression plots are shown in Figure 5.5.3.2. Applying the appropriate regression equations, y = -0.034x + 19.4; r2 = 0.64; p<0.05 for the younger component, and y = -0.068x + 29.0; r2 = 0.68; p<0.05 for the older one and using the predicted abundance of age groups 2 and 3 on 1 August 2001 combined, i.e. 95.6 * 109 fish, results in estimated mean weights of 16.2 and 22.6 g for age groups 2 and 3, respectively.
Applying the estimated mean weight results in a predicted TAC of 1 040 000 t spread evenly from August 2002-March 2003. This corresponds to a preliminary TAC of 690 000 t. As in previous years, decisions on the final TAC for the 2002/2003 season should be based on surveys carried out in October/November 2002 and January/February 2003.
5.5.3 Management of capelin in the Iceland-East Greenland-Jan Mayen area
The fishable stock consists of 2 age groups (2- and 3-year-olds, spawning at ages 3 and 4). The fishing season usually begins in June/July and ends in March of the following year when the remainder of the fishable stock spawns and dies. The fishable stock, which is also the maturing stock, is thus renewed annually and its exploitation must of necessity be cautious. Due to the short life span and high spawning mortality, stock abundance can only be assessed by acoustic surveys.
Since 1992, the key elements in the management of capelin in the Iceland-East Greenland-Jan Mayen area have been as follows:
Acoustic survey estimates of juvenile capelin abundance have been used to predict fishable stock abundance in the following year (fishing season). Historical average mean weight-at-age (in later years a relationship between numerical stock abundance and growth), growth rates, and natural mortality have been used for calculations and projections of maturing and fishable stock biomass.
Based on the data described above, a TAC is predicted in the spring of the year in which the season begins, allowing for 400 000 t to spawn at the end of the season. For precautionary purposes, a preliminary TAC, corresponding to 2/3 of the predicted total TAC for the season, has then been allocated to the period July–December. With regard to a precautionary approach, the Working Group stresses the importance of the continued setting of a preliminary TAC for the first half of the season.
The final decision on a TAC for each fishing season has been based on the results of acoustic stock abundance surveys in late autumn or in January/February of the following year during the fishing season.
The procedure just described has worked well in the past for ‘normal’ ranges of stock abundance. However, it is clear that extra care should be taken when dealing with stock abundance below or above the norm, corresponding to TACs lower than 500 000 t or greater than 1 600 000 t.

O:\ACFM\WGREPS\WGNPBW\REPORTS\2002\Sec-5.Doc 140
5.6 Precautionary Approach to Fisheries Management
Due to the short life span of capelin and their high spawning mortality, the main management objective is to maintain enough spawners for the propagation of the stock. Since 1979 the targeted remaining spawning stock for capelin in the Iceland-East Greenland Jan Mayen area has been 400 000 t. Although there have been large fluctuations in stock abundance during this period, these appear to be environmentally induced and not due to excessive fishing. Therefore, the criterion of maintaining a remaining spawning stock may be defined as Blim, i.e. stock abundance below which no fishery should be permitted.
The definition of other precautionary reference points is more problematic. However, due to uncertainties inherent in predicting the abundance of short-lived species and the importance of capelin as forage fish for predators such as cod, saithe, Greenland halibut, baleen whales, and sea birds, extra precaution should be taken when stock biomass projections indicate TACs lower than 500 000 t and greater than 1 600 000 t. In the former case, the fishery should not be opened until after the completion of a stock assessment survey in autumn/winter in that season. The latter simply represents a scenario where projected stock abundance is beyond the highest historical abundance on record. In such cases the preliminary TAC should not exceed 1 100 000 t.
5.7 Special Comments
In most years, the largest capelin can be caught in late June, July, and the first half of August. After that, the average size in the catches has usually declined drastically and does not increase again until late autumn. There are two main reasons for this. First, the oldest and largest fish migrate ahead of other stock components to feed in the plankton-rich oceanic area between Iceland, Greenland, and Jan Mayen. Later on, these larger capelin are joined by younger, slower-growing adults and even juveniles in parts of the fishing area, their? location is variable from year to year. Second, as the food supply diminishes in the southern part of the feeding area in August, the fishable stock becomes more scattered and sometimes mixes with juveniles.
The Working Group recommends that the 2002 summer/autumn season be opened around 20 June. To prevent catches of juvenile capelin (ages 1 and 2) it is recommended that the authorities responsible for the management of this stock (Greenland, Iceland, and Norway) monitor the fishery and be prepared to intervene quickly on short notice, using area closures to prevent fishing on mixed concentrations of juveniles and adults.
An overview of stock development during 1978–2001 is given in Table 5.7.1.
5.8 Sampling
Investigation No. of samples Length meas. individuals Aged individuals Fishery 2001 20 3540 1955 Survey 2001 42 4200 4135 Fishery 2002 77 7700 7534 Survey 2002 32 3200 3176
Table 5.1.1 Preliminary TACs for the summer/autumn fishery, recommended TACs for the entire season, landings and remaining spawning stock (000 tonnes) in the 1989/90–2001/02 seasons.
Season 89/90 90/91 91/92 92/93 93/94 94/95 95/96 96/97 97/98 98/99 99/00 00/01 01/02 Prelim. TAC 900 600 0 500 900 950 800 1100 850 950 866 975 1050Rec. TAC - 250 740 900 1250 850 1390 1600 1265 1200 1000 1090 1325Landings 808 314 677 788 1179 842 930 1571 1245 1100 934 1065 1249Spawn. stock 115 330 475 460 460 420 830 430 492 500 650 450 475

O:\ACFM\WGREPS\WGNPBW\REPORTS\2002\Sec-5.Doc 141
Table 5.2.1 The international capelin catch 1964–2002 (thousand tonnes).
Winter season Summer and autumn season Year
Iceland Nor-way
Faroes
Green-land
Season total
Iceland
Nor-way
Faroes
Green-land
EU
Season total Total
1964 8.6 - - 8.6 - - - - - 8.6 1965 49.7 - - 49.7 - - - - - 49.7 1966 124.5 - - 124.5 - - - - - 124.5 1967 97.2 - - 97.2 - - - - - 97.2 1968 78.1 - - 78.1 - - - - - 78.1 1969 170.6 - - 170.6 - - - - - 170.6 1970 190.8 - - 190.8 - - - - - 190.8 1971 182.9 - - 182.9 - - - - - 182.9 1972 276.5 - - 276.5 - - - - 276.5 1973 440.9 - - 440.9 - - - - - 440.9 1974 461.9 - - 461.9 - - - - - 461.9 1975 457.1 - - 457.1 3.1 - - - 3.1 460.2 1976 338.7 - - 338.7 114.4 - - - 114.4 453.1 1977 549.2 - 24.3 573.5 259.7 - - - 259.7 833.2 1978 468.4 - 36.2 504.6 497.5 154.1 3.4 - 655.0 1,159.6 1979 521.7 - 18.2 539.9 442.0 124.0 22.0 - 588.0 1,127.9 1980 392.1 - - 392.1 367.4 118.7 24.2 17.3 527.6 919.7 1981 156.0 - - 156.0 484.6 91.4 16.2 20.8 613.0 769.0 1982 13.2 - - 13.2 - - - - - 13.2 1983 - - - - 133.4 - - - 133.4 133.4 1984 439.6 - - 439.6 425.2 104.6 10.2 8.5 548.5 988.1 1985 348.5 - - 348.5 644.8 193.0 65.9 16.0 919.7 1,268.2 1986 341.8 50.0 - 391.8 552.5 149.7 65.4 5.3 772.9 1,164.7 1987 500.6 59.9 - 560.5 311.3 82.1 65.2 - 458.6 1,019.1 1988 600.6 56.6 - 657.2 311.4 11.5 48.5 - 371.4 1,028.6 1989 609.1 56.0 - 665.1 53.9 52.7 14.4 - 121.0 786,1 1990 612.0 62.5 12.3 686,8 83.7 21.9 5.6 - 111.2 798.0 1991 202.4 - - 202.4 56.0 - - - 56.0 258.4 1992 573.5 47.6 - 621.1 213.4 65.3 18.9 0.5 298.1 919.2 1993 489.1 - - 0.5 489.6 450.0 127.5 23.9 10.2 611.6 1,101.2 1994 550.3 15.0 - 1.8 567.1 210.7 99.0 12.3 2.1 324.1 891.2 1995 539.4 - - 0.4 539.8 175.5 28.0 - 2.2 205.7 745.5 1996 707.9 - 10.0 5.7 723.6 474.3 206.0 17.6 15.0 60.9 773.8 1,497.4 1997 774.9 - 16.1 6.1 797.1 536.0 153.6 20.5 6.5 47.1 763.6 1,561.5 1998 457.0 - 14.7 9.6 481.3 290.8 72.9 26.9 8.0 41.9 440.5 921.8 1999 607.8 14.8 13.8 22.5 658.9 83.0 11.4 6.0 2.0 102.4 761.3 2000 761.4 14.9 32.0 22.0 830.3 126.5 80.1 30.0 7.5 21.0 265.1 1,095.4 2001 767.2 - 10.0 29.0 806.2 150.0 106.0 12.0 9.0 17.0 294.0 1,061.2 2002 901.0 - 28.0 26.0 955.0

O:\ACFM\WGREPS\WGNPBW\REPORTS\2002\Sec-5.Doc 142
Table 5.2.2 The total international catch of capelin in the Iceland-East Greenland-Jan Mayen area by age group in numbers (billions) and the total catch by numbers and weight (thousand tonnes) in the autumn season (August-December) 1980–2001.
Year Age 1980 1981 1982 1983 1984 1985 1986 1987 1988 1989 19901 4.9 0.6 - 0.6 0.5 0.8 + + 0.3 1.7 0.82 17.2 27.9 - 7.2 9.8 25.6 10.0 27.7 13.6 6.0 5.93 5.4 2.0 - 0.8 7.8 15.4 23.3 6.7 5.4 1.5 1.04 - + - - 0.1 0.2 0.5 + + + +Total number 27.5 30.5 - 8.6 18.2 42.0 33.8 34.4 19.3 9.2 7.7Total weight 527.6 613.0 - 133.4 548.5 919.7 772.9 458.6 371.4 121.0 111.2 Year Age 1991 1992 1993 1994 1995 1996 1997 1998 1999 2000 20011 0.3 1.7 0.2 0.6 1.5 0.2 1.8 0.9 0.3 0.2 +2 2.7 14.0 24.9 15.0 9.7 25.2 33.4 25.1 4.7 12.9 17.63 0.4 2.1 5.4 2.8 1.1 12.7 10.2 2.9 0.7 3.3 1.24 + + 0.2 + + 0.2 0.4 + + 0.1 +Total number 3.4 17.8 30.7 18.4 12.3 38.4 45.8 28.9 5.7 16.5 18.8Total weight 56.0 298.1 611.6 324.1 205.7 773.7 763.6 440.5 102.4 265.1 294.0
Table 5.2.3 The total international catch of capelin in the Iceland-East Greenland-Jan Mayen area by age group in
numbers (billions) and the total catch by numbers and weight (thousand tonnes) in the winter season (January-March) 1981–2002.
Year Age 1981 1982 1983 1984 1985 1986 1987 1988 1989 1990 19912 1.7 - - 2.1 0.4 0.1 + + 0.1 1.4 0.53 7.1 0.8 - 18.1 9.1 9.8 6.9 23.4 22.9 24.8 7.44 1.9 0.1 - 3.4 5.4 6.9 15.5 7.2 7.8 9.6 1.55 - - - - - 0.2 - 0.3 + 0.1 +Total number 10.7 0.9 - 23.6 14.5 17.0 22.4 30.9 30.8 35.9 9.4Total weight 156.0 13.2 - 439.6 348.5 391.8 560.5 657.2 665.1 686.8 202.4 Year Age 1992 1993 1994 1995 1996 1997 1998 1999 2000 2001 20022 2.7 0.2 0.6 1.3 0.6 0.9 0.3 0.5 0.3 0.4 0.13 29.4 20.1 22.7 17.6 27.4 29.1 20.4 31.2 36.3 27.9 33.14 2.8 2.5 3.9 5.9 7.7 11.0 5.4 7.5 5.4 6.7 4.25 + + + + + + + + + + +Total number 34.9 22.8 27.2 24.8 35.7 41.0 26.1 39.2 42.0 35.0 37.4Total weight 621.1 489.6 567.1 539.8 723.6 797.6 481.3 658.9 830.3 787.2 955.0

O:\ACFM\WGREPS\WGNPBW\REPORTS\2002\Sec-5.Doc 143
Table 5.2.4 The total international catch in numbers (millions) of capelin in the Iceland-East Greenland-Jan Mayen area in the summer/autumn season of 2000 by age and length, and the catch in weight (thousand tonnes) by age group.
Total length (cm) Age 1 Age 2 Age 3 Age 4 Total Percentage
11.5 - 34 0 - 34 0.2 12 - 495 0 - 495 2.6
12.5 - 1383 0 - 1383 7.4 13 + 2356 17 - 2373 12.7
13.5 + 3158 34 - 3192 17.0 14 - 3499 102 - 3602 19.2
14.5 + 2851 222 - 3072 16.4 15 - 1946 171 - 2117 11.3
15.5 - 1195 256 + 1451 7.7 16 - 393 256 + 649 3.5
16.5 - 239 68 - 307 1.6 17 - 34 34 + 68 0.4
Total number + 17581 1161 + 16415 Percentage + 94.0 6.0 + 100.0 100.0 Total weight + 270.7 23.2 294.0
Table 5.2.5 The total international catch in numbers (millions) of capelin in the Iceland-East Greenland-Jan
Mayen area in the winter season of 2002 by age and length, and the catch in weight (thousand tonnes) by age group.
Total length (cm) Age 2 Age 3 Age 4 Age 5 Total Percentage
11.5 - 15 0 - 15 0.0
12 - 15 0 - 15 0.0 12.5 - 120 0 - 120 0.3
13 + 344 15 - 359 0.8 13.5 + 1423 15 - 1438 3.1
14 - 2995 105 - 3100 6.7 14.5 + 4867 150 - 5016 10.9
15 - 6993 255 - 7247 15.7 15.5 - 5885 524 - 6409 13.9
16 - 6544 824 - 7367 16.0 16.5 - 5286 854 - 6139 13.3
17 - 3279 913 + 4193 9.1 17.5 - 1737 854 - 2591 5.6
18 - 854 479 + 1333 2.9 18.5 - 120 374 - 494 1.1
19 - 90 165 + 255 0.6 19.5 - 45 15 - 60 0.1
Total number 35 40610 5540 5 46190 Percentage + 88.0 12.0 + 100.0 100.0 Total weight 0.1 807.3 147.3 + 954.7

O:\ACFM\WGREPS\WGNPBW\REPORTS\2002\Sec-5.Doc 144
Table 5.3.1.1 Abundance indices of 0-group capelin 1970-2001 and their division by areas.
Year Area 1970 1971 1972 1973 1974 1975 1976 1977 1978 1979 1980 1981 1982NW-Irminger Sea 1 + + 14 26 3 2 2 + 4 3 10 +W-Iceland 8 7 30 39 44 37 5 19 2 19 18 13 8N-Iceland 2 12 52 46 57 46 10 19 29 25 19 6 5East Iceland - + 7 17 7 3 15 3 + 1 + - +Total 11 19 89 116 134 89 32 43 31 49 40 29 13 Year Area 1983 1984 1985 1986 1987 1988 1989 1990 1991 1992 1993 1994 1995NW-Irminger Sea + + 1 + 1 3 1 + 8 3 2 3 +W-Iceland 3 2 8 16 6 22 13 7 2 11 21 12 6N-Iceland 18 17 19 17 6 26 24 12 43 20 13 69 10East Iceland 1 9 3 4 1 1 2 2 1 + 15 10 8Total 22 28 31 37 14 52 40 21 54 34 51 94 24
Year 1996 1997 1998 1999 2000 2001 NW-Irminger Sea 2 5 + W-Iceland 17 14 7 25 1 25 N-Iceland 57 30 34 51 7 53 East Iceland 6 12 5 7 4 4 Total 82 61 46 83 12 82
Table 5.3.1.2 Estimated numbers, mean length and weight of age 1 capelin in the August surveys for
1983–2001.
Year 1983 1984 1985 1986 1987 1988 1989 1990 1991 1992 1993 1994 1995 1996
Number (109) 155 286 31 71 101 147 111 36 50 87 33 85 189 138Mean length (cm) 10.4 9.7 10.2 9.5 9.1 8.8 10.1 10.4 10.7 9.7 9.4 9.0 9.8 9.3Mean weight (g) 4.2 3.6 3.8 3.3 3.0 2.6 3.4 4.0 5.1 3.4 3.0 2.8 3.4 2.9
Year
1997 1998 1999 2000 2001 Number (109) 143 87 55 94 99 Mean length (cm) 9.3 9.0 9.5 9.5 10.0 Mean weight (g) 2.8 2.9 3.2 3.1 3.7

O:\ACFM\WGREPS\WGNPBW\REPORTS\2002\Sec-5.Doc 145
Table 5.3.2.1 Acoustic abundance estimate of maturing capelin, 12-28 November 2001.
Table 5.3.2.2 Acoustic estimate of immature capelin, 12-28 November 2001.
NUMBERS (10-9)
BIOMASS (10-9)
(Age) Year class Avgwt (Age) Year class Length (cm) (1) 2000 (2) 1999 (3) 1998 Total (g) (1) 2000 (2) 1999 (3) 1998 Total
11.5 0.160 - - 0.160 5.7 0.9 0.0 0.0 0.912 0.000 - - - 0.0 0.0 0.0 0.0
12.5 0.250 0.059 - 0.309 7.5 1.9 0.4 0.0 2.313 0.385 0.346 - 0.731 .7 3.3 3.0 0.0 6.3
13.5 0.381 1.664 - 2.045 10.3 3.9 17.2 0.0 21.114 0.133 3.165 0.000 3.298 11.8 1.6 37.5 0.0 39.0
14.5 0.116 4.792 0.077 4.985 13.7 1.6 65.5 1.1 68.215 0.025 2.825 0.050 2.901 15.4 0.4 43.5 0.8 44.7
15.5 0.038 3.342 0.114 3.494 17.9 0.7 59.8 2.0 62.516 - 2.944 0.000 2.944 20.3 0.0 59.8 0.0 59.8
16.5 - 1.958 0.154 2.112 22.8 0.0 44.6 3.5 48.117 - 0.566 0.068 0.634 26.5 0.0 15.0 1.8 16.8
17.5 - 0.257 0.096 0.353 28.3 0.0 7.3 2.7 10.018 - 0.107 0.064 0.171 35.1 0.0 3.7 2.2 6.0
18.5 - 0.047 0.071 0.118 34.9 0.0 1.6 2.5 4.119 - 0.022 - 0.022 38.5 0.0 0.8 0.0 0.8
Total 1.489 22.093 0.694 24.276 16.1 14.3 359.9 16.6 390.8Average length 13.2 15.0 16.5 15.0
Average weight 9.6 16.3 23.9 16.1
NUMBERS (10-9)
BIOMASS (10-6 t)
(Age) Year class AvgWt (Age) Year class Length (cm) (1) 2000 (2) 1999 (3) 1998 Total (g) (1) 2000 (2) 1999 (3) 1998 Total
7.5 0.244 0.000 0.000 0.244 1.167 0.3 0.0 0.0 0.38 2.225 0.000 0.000 2.225 1.600 3.6 0.0 0.0 3.6
8.5 8.820 0.000 0.000 8.820 2.025 17.9 0.0 0.0 17.99 14.901 0.000 0.000 14.901 2.435 36.3 0.0 0.0 36.3
9.5 17.191 0.000 0.000 17.191 2.996 51.5 0.0 0.0 51.510 17.523 0.000 0.000 17.523 3.552 62.2 0.0 0.0 62.2
10.5 15.028 0.059 0.000 15.087 4.072 61.2 0.2 0.0 61.411 11.311 0.056 0.000 11.367 4.778 54.0 0.3 0.0 54.3
11.5 6.567 0.208 0.000 6.775 5.544 36.4 1.2 0.0 37.612 4.084 0.280 0.000 4.365 6.375 26.0 1.8 0.0 27.8
12.5 1.710 0.402 0.000 2.113 7.475 12.8 3.0 0.0 15.813 0.626 0.562 0.000 1.187 8.664 5.4 4.9 0.0 10.3
13.5 0.108 0.471 0.000 0.579 10.323 1.1 4.9 0.0 6.014 0.007 0.172 0.000 0.179 11.838 0.1 2.0 0.0 2.1
14.5 0.002 0.075 0.001 0.079 13.673 0.0 1.0 0.0 1.115 0.001 0.076 0.001 0.078 15.400 0.0 1.2 0.0 1.2
15.5 0.000 0.037 0.001 0.038 17.887 0.0 0.7 0.0 0.7Total 100.348 2.399 0.004 102.751 3.796 368.9 21.1 0.1 390.0Average length (cm) 10.0 12.9 15.0 10.1Average weight (g) 3.7 8.8 15.7 3.8

O:\ACFM\WGREPS\WGNPBW\REPORTS\2002\Sec-5.Doc 146
Table 5.3.2.3 Acoustic abundance estimate of mature capelin, 10-21 January 2002.
Table 5 Acoustic estimate of a spawning migration, arriving at Snæfellsnes, W-Iceland, from the northwest, 12-15 February 2002.
NUMBERS (10-9)
BIOMASS (10-3 t)
(Age) Year class Avg. (Age) Year class Length (cm) (3) 1999 (4) 1998 Total wt. (3) 1999 (4) 1998 Total
12 0.029 0.000 0.029 8.6 0.2 0.0 0.2 12.5 0.039 0.000 0.039 9.7 0.4 0.0 0.4
13 0.194 0.000 0.194 10.5 2.0 0.0 2.0 13.5 0.523 0.000 0.523 11.6 6.1 0.0 6.1
14 0.736 0.010 0.746 12.6 9.3 0.1 9.4 14.5 0.726 0.068 0.794 14.6 10.6 1.0 11.6
15 0.620 0.126 0.746 17.0 10.6 2.0 12.7 15.5 0.814 0.203 1.017 19.5 16.1 3.8 19.9
16 0.445 0.242 0.688 21.5 9.7 5.1 14.8 16.5 0.329 0.155 0.484 23.8 7.9 3.7 11.5
17 0.097 0.242 0.339 27.1 2.8 6.4 9.2 17.5 0.000 0.107 0.107 31.2 0.0 3.3 3.3
18 0.019 0.019 0.039 35.1 0.7 0.6 1.4 18.5 0.000 0.048 0.058 36.6 0.0 1.7 2.1
19 0.010 0.000 0.010 44.0 0.4 0.0 0.4 Total 4.581 1.220 5.801 18.1 76.9 27.8 104.9 Average length (cm) 14.8 16.2 15.2
NUMBERS (10-3) BIOMASS (10-3 t)
(Age) Year class Avgwt (Age) Year class Length (cm) (2) 2000 (3) 1999 (4) 1998 Total (g) (2) 2000 (3) 1999 (4) 1998 Total
12.5 0.024 0.019 0 0.043 6.9 0.2 0.1 0.0 0.313 0.010 0.199 0 0.209 8.4 0.1 1.7 0.0 1.8
13.5 0.055 0.718 0.014 0.787 9.6 0.5 6.9 0.1 7.514 0.017 2.146 0.034 2.196 11.1 0.2 23.7 0.4 24.3
14.5 0.000 3.504 0.034 3.538 12.6 0.0 44.2 0.4 44.615 0.000 5.244 0.243 5.487 14.2 0.0 74.7 3.5 78.2
15.5 0.000 5.983 0.443 6.426 16.1 0.0 96.1 7.1 103.316 0.000 6.444 0.590 7.034 18.5 0.0 119.2 10.9 130.1
16.5 0.000 6.022 0.726 6.748 20.6 0.0 124.3 15.0 139.317 0.000 6.406 1.039 7.445 23.3 0.0 149.4 24.2 173.6
17.5 0.000 5.510 1.804 7.314 26.0 0.0 143.4 47.0 190.418 0.000 3.159 1.231 4.390 30.2 0.0 95.5 37.2 132.7
18.5 0.000 3.516 1.295 4.812 33.6 0.0 118.1 43.5 161.619 0.000 1.618 0.809 2.427 36.9 0.0 59.7 29.8 89.5
19.5 0.000 0.550 0.350 0.900 40.1 0.0 22.1 14.0 36.120 0.000 0.225 0.150 0.375 45.7 0.0 10.3 6.9 17.1
Total 0.106 51.263 8.761 60.130 22.1 1.0 1089.3 240.0 1330.3Average length 13.3 16.4 17.5 16.6Average weight 9.1 21.2 27.4 22.1

O:\ACFM\WGREPS\WGNPBW\REPORTS\2002\Sec-5.Doc 147
Average weight (g) 16.8 22.8 18.1 Table 5.4.1 The estimated number (billions) of capelin on 1 August 1978–2002 by age and maturity groups. The
total number (billions) and weight (thousand tonnes) of the immature and maturing (fishable) stock components are also given.
Year Age/maturity 1978 1979 1980 1981 1982 1983 1984 1985 1986 19871 juvenile 163.8 60.3 66.1 48.9 146.4 124.2 250.5 98.9 156.2 144.02 immature 15.3 16.4 4.2 3.7 15.0 42.5 40.9 100.0 29.4 37.22 mature 81.9 91.3 35.4 39.7 17.1 53.7 40.7 64.6 35.6 65.43 mature 29.1 10.1 10.8 2.8 2.3 9.8 27.9 27.0 65.8 20.14 mature 0.4 0.3 + + + 0.1 0.4 0.4 0.7 0.1Number immat. 179.2 76.7 70.3 52.6 161.4 166.7 291.4 198.9 185.6 181.2Number mature 111.4 101.7 46.2 42.5 19.4 63.6 69.0 92.0 102.1 85.6Weight immat 751 366 283 209 683 985 1067 1168 876 950Weight mature 2081 1769 847 829 355 1085 1340 1643 2260 1689 Year Age/maturity 1988 1989 1990 1991 1992 1993 1994 1995 1996 19971 juvenile 80.8 63.9 117.5 132.9 162.9 144.3 224.1 197.3 191.2 165.4 2 immature 24.0 10.3 10.1 9.7 16.6 20.1 35.2 45.1 28.7 35.22 mature 70.3 42.8 31.9 67.7 70.7 86.9 59.8 102.2 100.7 90.33 mature 24.5 15.8 6.8 6.7 6.4 10.9 13.2 23.0 29.6 19.04 mature 0.4 + + + + 0.2 - + + +Number immat. 104.8 74.2 127.6 142.6 179.5 164.7 259.2 242.4 219.9 200.6Number mature 95.2 58.6 38.7 74.4 77.1 98.0 73.0 125.1 130.3 109.3Weight immat 438 309 542 702 747 702 1019 1188 985 758Weight mature 1663 1173 751 1273 1311 1585 1268 2037 2200 1659 Year Age/maturity 1998 1999 2000 2001 2002 1 juvenile 167.9 138.0 *174.1 *122.4 2 immature 19.2 24.4 *25.0 *27.7 2 mature 89.5 85.9 65.7 86.7 **77.2 3 mature 23.2 12.6 16.0 16.9 **17.3 4 mature + + Number immat. 187.1 162.4 *199.1 *150.1 Number mature 112.7 98.5 81.7 103.6 **94.5 Weight immat 621 612 *714 *622 Weight mature 1682 1703 1519 1817 **1640
* Preliminary ** Predicted

O:\ACFM\WGREPS\WGNPBW\REPORTS\2002\Sec-5.Doc 148
Table 5.4.2 The estimated number (billions) of capelin on 1 January 1979–2002 by age and maturity groups. The total number (billions) and weight (thousand tonnes) of the immature and maturing (fishable) stock components and the remaining spawning stock by number and weight are also given.
Year Age/maturity 1979 1980 1981 1982 1983 1984 1985 1986 1987 19882 juvenile 137.6 50.6 55.3 41.2 123.7 105.0 211.6 83.2 131.9 120.53 immature 12.8 13.8 3.5 3.0 12.6 35.7 34.3 83.9 25.6 31.23 mature 51.8 53.4 16.3 8.0 14.3 39.8 25.2 34.5 22.1 34.14 mature 14.8 3.6 4.9 0.5 2.0 7.6 15.6 10.5 37.0 11.75 mature 0.3 0.2 + + + 0.1 0.3 0.2 0.2 +Number immat. 150.4 64.4 58.8 44.2 136.3 140.7 245.9 167.1 157.5 151.3Number mature 66.9 57.2 21.2 8.5 16.3 47.5 41.1 45.2 59.1 45.8Weight immat. 1028 502 527 292 685 984 1467 1414 1003 1083Weight mature 1358 980 471 171 315 966 913 1059 1355 993Number sp.st. 29.0 17.5 7.7 6.8 13.5 21.6 20.7 19.6 18.3 18.5Weight sp. st 600 300 170 140 260 440 460 460 420 400 Year Age/maturity 1989 1990 1991 1992 1993 1994 1995 1996 1997 19982 juvenile 67.8 53.9 98.9 111.6 124.6 121.3 188.1 165.2 160.0 138.83 immature 20.1 8.6 8.6 8.1 13.9 16.9 29.5 37.9 24.1 29.53 mature 48.8 31.2 22.3 54.8 46.5 50.5 35.1 75.5 72.4 50.14 mature 16.0 12.1 4.5 5.3 3.5 4.6 8.7 20.1 24.8 7.95 mature 0.3 + + + + + + + + +Number immat. 87.9 62.5 107.5 119.7 138.5 138.2 217.6 203.1 184.1 168.3Number mature 64.8 43.3 26.8 60.1 50.0 55.1 43.8 95.6 97.2 58.0Weight immat. 434 291 501 487 622 573 696 800 672 621Weight mature 1298 904 544 1106 1017 1063 914 1820 1881 1106Number sp.st. 22.0 5.5 16.3 25.8 23.6 24.8 19.2 42.8 21.8 27.6Weight sp. st. 440 115 330 475 499 460 420 830 430 492 Year Age/maturity 1999 2000 2001 2002 2 juvenile 140.9 115.8 *148.6 *102.4 3 immature 16.1 20.5 17.2 *24.1 3 mature 53.2 68.2 46.3 59.3 4 mature 16.0 10.0 10.5 10.5 5 mature + + + + Number immat. 157.0 136.3 *161.2 *126.5 Number mature 69.3 78.2 56.8 69.8 Weight immat. 585 535 *621 *591 Weight mature 1171 1485 1197 1445 Number sp.st. 29.5 34.2 21.3 22.9 Weight sp. st. 500 650 450 475
*Preliminary/Predicted

O:\ACFM\WGREPS\WGNPBW\REPORTS\2002\Sec-5.Doc 149
Table 5.5.1.1 The data used in the comparisons between abundance of age groups (numbers) when predicting fishable stock abundance for the calculation of preliminary TACs.
Age 1 Age 2 Age 2 Age 2 Age 3 Acoustics Back-calc. Acoustics Back-calc. Back-calc. Mature Immature Total Mature Year class N1 N2mat N2imm N2tot N3tot 1980 23.7 17.1 1.7 32.1 9.8 1981 68.0 53.7 8.2 96.2 27.9 1982 44.1 40.7 4.6 81.6 27.0 1983 73.8 64.6 12.6 164.6 65.8 1984 33.8 35.6 1.4 65.0 20.1 1985 58.0 65.4 5.4 102.6 24.5 1986 70.2 70.3 6.7 94.6 15.8 1987 43.9 42.8 1.8 53.1 6.8 1988 29.2 31.9 1.3 42.0 6.7 1989 *39.2 67.7 5.2 77.2 6.4 1990 60.0 70.7 2.3 87.3 10.9 1991 104.6 86.9 10.8 107.0 13.2 1992 100.4 59.8 6.9 95.0 24.0 1993 119.0 102.2 46.3 147.2 29.6 1994 165.0 100.7 16.4 129.4 19.0 1995 111.9 90.3 30.8 125.5 23.2 1996 128.5 89.5 6.3 108.0 12.6 1997 121.0 85.9 5.0 98.5 16.0 1998 89.8 65.7 11.0 84.1. 16.9
1999 103.0 86.7 2.4 *89.1 2000 100.3
* Invalid due to ice conditions. ** Preliminary Table 5.5.1.2 Mean weight (g) in autumn of maturing capelin. Years 1981 1982 1983 1984 1985 1986 1987 1988 Age 2 19.2 16.5 16.1 15.8 15.5 18.1 17.9 15.5 Age 3 24.0 24.1 22.5 25.7 23.8 24.1 25.8 23.4 Years 1989 1990 1991 1992 1993 1994 1995 1996 Age 2 18.0 18.1 16.3 16.5 16.2 16.0 15.3 15.8 Age 3 25.5 25.5 25.4 22.6 23.3 23.6 20.5 20.6 Years 1997 1998 1999 2000 2001 Age 2 14.3 14.1 16.8 17.1 16.3 Age 3 20.3 18.1 20.6 24.7 23.9

O:\ACFM\WGREPS\WGNPBW\REPORTS\2002\Sec-5.Doc 150
Table 5.5.1.3 Predictions of fishable stock abundance and TACs for the 1984/85–2000/01 seasons. The last row gives contemporary advice on TACs for comparison.
Age 2 and age 3 = Numbers in billions in age groups at the beginning of season. Fishable stock = calculated weight of maturing capelin in thousand tonnes (ref. August). TAC calc = predicted in thousand tonnes. Season 84/85 85/86 86/87 87/88 88/89 89/90 90/91 91/92 92/93Year classes 82-81 83-82 84-83 85-84 86-85 87-86 88-87 89-88 90-89Age 2 43.4 67.8 34.9 55.5 64.8 43.2 31.1 39.4 56.4Age 3 26.3 20.2 55.0 13.7 29.0 25.5 8.2 3.7 18.3Fishable stock 1373 1637 1926 1268 1800 1350 724 755 1398Calculated TAC 733 963 1215 642 1105 713 170 197 755Advised TAC 897 1311 1333 1115 1036 550 265 740 *900 Season 93/94 94/95 95/96 96/97 97/98 98/99 99/00 00/01 01/02Year classes 91-90 92-91 93-92 94-93 95-94 96-95 97/96 98 /97 99/98Age 2 93.1 89.6 92.5 90.0 83.8 94.4 89.2 65.7 78.1Age 3 22.6 27.0 14.9 35.0 30.9 30.8 23.3 16.0 16.9Fishable stock 2123 2170 1916 2352 2019 2088 1885 1416 1636Calculated TAC 1385 1427 1200 1635 1265 1420 1285 975 1050Advised TAC 1250 850 1390 1600 1265 1200 1000 **1090 1350 *In January 1993, 80 000 t were added to the 820 000 t recommended after the October 1992 survey due to an unexpected large increase in mean weights. ** In March 2001, 100 000t were added to the 990 000 t recommended after the January/February 2001 survey due to much higher mean weights in the catch during 1 February-10 March than measured during the survey.

O:\ACFM\WGREPS\WGNPBW\REPORTS\2002\Sec-5.Doc 151
Table 5.7.1 Capelin in the Iceland-East Greenland-Jan Mayen area. Recruitment of 1-year-old fish (unit 109) and total stock biomass (‘000 t) are given for 1 August. Spawning stock biomass (‘000 t) is given at the time of spawning (March next year). Landings (‘000 t) are the sum of the total landings in the season starting in the summer/autumn of the year indicated and ending in March of the following year.
Year
Recruitment Total
Stock biomass LandingsSpawning
stock biomass 1978 164 2832 1195 600 1979 60 2135 980 300 1980 66 1130 684 170 1981 49 1038 626 140 1982 146 1020 0 260 1983 124 2070 573 440 1984 251 2427 897 460 1985 99 2811 1312 460 1986 156 3106 1333 420 1987 144 2639 1116 400 1988 81 2101 1037 440 1989 64 1482 808 115 1990 118 1293 314 330 1991 133 1975 677 475 1992 163 2058 788 499 1993 144 2363 1179 460 1994 224 2287 864 420 1995 197 3174 929 830 1996 191 3310 1571 430 1997 165 3014 1245 492 1998 168 2197 1100 500 1999 138 2314 934 650 2000 *174 *2233 1071 450 2001 *122 *2260 1249 475
*Preliminary

O:\ACFM\WGREPS\WGNPBW\REPORTS\2002\Sec-5.Doc 152
Figure 5.5.3.1. The relationship between the measured numbers of immature 1-group capelin in autumn acoustic surveys and the numbers of maturing capelin in 1 August of the following year (left hand figure), and between measured total numbers of 2-group capelin and the maturing 3-group capelin in the following year (right hand figure).
Figure 5.5.3.2. The relationship between the total numbers in the maturing stock and the mean weight of maturing 2-
group (left hand figure) and 3-group (right hand figure) in autumn 1989–2001.

O:\ACFM\WGREPS\WGNPBW\REPORTS\2002\Sec-6.Doc 153
6 BLUE WHITING
6.1 Stock Identity and Stock Separation
Blue whiting stock is treated as a single stock for assessment purposes although morphological, physiological, and genetic research has indicated that the southern and northern components of the stock may mix in the spawning area west of the British Isles (ICES C.M. 2000/ACFM:16).
6.1.1 ACFM advice and management applicable to 2001 and 2002
At the ACFM (May) meeting in 2001, it was stated that the stock was considered to be outside safe biological limits, and in recent years the stock has rapidly declined. SSB was estimated to have been at Bpa (2.25 mill. t) in 2000 and expected to be close to Blim (1.5 mill. t) in 2001. Fishing mortality has increased from around the proposed Fpa (0.32) in 1997, to well above Fpa in 1998 and 1999, and well above Flim (0.51) in 2000. Total landings in 2000 were 1.4 million t, far above the ICES recommended catch of 800 000 t. Landings in 2000 consisted mainly of the strong 1996 and 1997 year classes.
Therefore ICES advised that the fishery in 2002 for blue whiting in all areas be closed until a rebuilding plan has been implemented.
At present there are no agreed management objectives implemented for this stock, and there is no agreed TAC for the combined area.
6.2 Fisheries in 2001
Estimates of the total landings of blue whiting in 2001 by various fisheries are given by country in Tables 6.2.1 - 6.2.5 and summarised in Table 6.2.6.
Landings of 1 780 000 t in 2001 were the highest ever and were 368 000 t more than the total landings of 1 412 000 t in 2000. Total landings for 1999 were 1 256 000 tonnes.
As in previous years, nearly 60% of blue whiting catches were taken in the spawning area. The catch there was 1 044 000 t in 2001 compared to 997 000 t in 2000, representing a slight increase of 5% from 2000 to 2001.
Blue whiting is caught by different gears and mesh sizes and can be grouped in two types of fisheries:
A directed fishery, where by-catches of other species are insignificant. These landings are used for human consumption or for meal and oil production.
A mixed fishery, where varying proportions of blue whiting are caught together with Norway pout or other species. The majority of these landings are for meal and oil production.
As in previous years, the predominant part (1 676 000 t or 94%) of the total landings in 2001 was taken in the directed fishery and 104 000 t taken as by-catch in other fisheries, such as the Norway pout fishery. Most (74 000 t) of the by-catch of blue whiting is taken in the North Sea (Table 6.2.3).
The fishery in 2001 took place mainly in the second and third quarter. In the first quarter the fishery occurred on the spawning grounds from the Porcupine Bank to Rockall. The fishery continued in the area west of Rockall and in the shelf area off the Hebrides. In the second quarter the fishery was conducted mainly in Division VIa and in Division Vb and southeast of Iceland (Table 6.2.7 and Figure 6.8.1). During summer and autumn a significant fishery also took place in the southern part of the Norwegian Sea (Figure 6.8.1).
The landings from the Norwegian Sea (Divisions I and II) and the area southeast of Iceland between Iceland and the Faroe Islands increased from 277 000 t in 2000 to 592 000 t in 2001 (Tables 6.2.1 and 6.2.6).

O:\ACFM\WGREPS\WGNPBW\REPORTS\2002\Sec-6.Doc 154
6.2.1 Description of the national fisheries
Denmark:
The Danish blue whiting fishery is conducted by trawlers using a minimum mesh size of 40 mm in the directed fishery, and the fisheries where blue whiting is taken as by-catch uses trawl with mesh sizes between 16 and 36 mm. The directed fishery caught 44 600 t mainly in Divisions IIa, Iva, and Vb, with small catches from Divisions VIa and VIIc. By-catches of blue whiting (8 700 t) are caught mainly in the Norway pout fishery in the North Sea and in the Skagerrak. Some blue whiting by-catches are also taken during the human consumption herring fishery in the Skagerrak.
Germany:
As there was no participation from Germany at this WG meeting, no information on the German fishery was available to the Working Group.
Faroe Islands:
The Faroese blue whiting fishery in 2001 was carried out by 10 vessels and most of the landings were taken by trawls with mesh sizes of 40-44 mm.The fishery began in ICES Division VIIc on the western edge of the Porcupine Bank in February. In March the fishery continued in VIIc and gradually moved northwards into VIb and VIa. In April the fishery continued in VIa, and later in the month the blue whiting had entered the southern part of the Faroese waters (Vb). During May the fishery continued in the area south and west of the Faroe plateau (Vb), indicating that the fish migrated west of the Faroe Islands on their way north. In June the fleet had entered Icelandic waters east of Iceland on the northern edge of the Faroe-Iceland ridge (Divisions Va and IIa). The fishery continued in the Icelandic zone in the first part of July and then moved eastwards into the Faroese zone later in July (Vb and IIa). In August the fishery continued north of the Faroes (Vb and IIa) and later in the month fished on the southern side of the Faroe-Iceland ridge (Areas Va and Vb). In September and October the fishery gradually diminished in the Icelandic zone and resumed in the southwestern part of the Faroese zone during both months. In November and December the fishery continued in the Faroese zone southwest of the Faroe Islands.
France:
As there was no participation from France at this WG meeting, no information on the French fishery was available to the Working Group.
Iceland:
Iceland:
The first icelandic catches of 1800 t were taken late March within in the icelandic EEZ. The fishery then had to be abondoned because of a strike. The fishery resumed in mid May in the Faeroese EEZ, but had by the end of the month shifted NW to the Icelandic EEZ. They May-June catch was about 55 000 t. The fishery continued in the Icelandic EEZ until the latter half of July when some catches were taken in the Faroese EEZ, close to the boundary with Iceland and about 80 nautical miles north of the Faroes. The July catch was about 100 000 t. The August fishery yielded about 75 000 t caught mainly within the Icelandic EEZ to the southeast of Iceland. In early September the fishery shifted to approximately 70 nautical miles south of the Faroe Islands. The September catch was taken in Faroese waters and the remainder in the Icelandic EEZ. Icelandic vessels continued to fish blue whiting during October, November until mid-December. The total catch in this period was 18 000 t. In November and December almost all the catch was taken within Faroese jurisdiction, to the northwest, west and south of the Faroe Islands, indicating the start of the southward spawning migration. The Icelandic fishery was carried out by trawlers mainly using a mesh size of 40 mm.
Ireland:
As there was no participation from Ireland at this WG meeting, no information on the Irish fishery was available to the Working Group.

O:\ACFM\WGREPS\WGNPBW\REPORTS\2002\Sec-6.Doc 155
Netherlands:
As there was no participation from the Netherlands at this WG meeting, no information on the Dutch fishery was available to the Working Group.
Norway:
Norway set a blue whiting quota of 250 000 t for the Norwegian EEZ, Jan Mayen zone, and international waters for 2001. In addition, through international agreements, 190 640 t in the EEZ of EU and 47 000 t in the Faroese zone were made available to the Norwegian fishery. The total quota for Norwegian vessels in 2001 was 487 640 t.
The main Norwegian fishery is a directed pelagic trawl fishery, regulated by vessel quotas, and is carried out on and west of the spawning areas west of the British Isles. The Norwegian fishery in 2001 started at the end of January in international waters. The fishery moved to the Porcupine bank area, the main fishing area, at the end of March/beginning of April. Later the main fishery was at St. Kilda. From there the fishery shifted to the Faroese zone. The Norwegian fishery was stopped in the Faroese zone on 9 May when the quota for that area was taken.
In July-August a directed fishery by purse seiners and pelagic trawlers was conducted on blue whiting in the Norwegian EEZ and in international waters north of 62oN. This fishery was stopped on 20 August when the quota for this area was reached. The catch in the summer fishery was 54 000 t in the Norwegian EEZ and 9000 t in international waters in the Norwegian Sea.
In addition, young blue whiting are fished by Norway as by-catch in other fisheries in the North Sea (areas south of 64oN). An estimated catch of approximately 70 000 t was taken in this fishery in 2001.
Portugal:
As there was no participation from Portugal at this WG meeting, no information on the Portuguese fishery was available to the Working Group.
Russia:
The Russian blue whiting fishery occurs year round from January to December. Wintering concentrations of blue whiting in January are fished in the Faroese fishery zone (Vb1). In February–April Russian fishing vessels are located in international waters to the west off the British Isles. In May–September Russian fleets fish on feeding concentrations of blue whiting in the Faroese fishery zone (Vb1), Norwegian EEZ (IIa), and in international waters of the Norwegian Sea. In October–December the Russian fishery operates mostly in the Faroese fishery zone (Vb1). The directed blue whiting fishery occurred in all seasons by large fishing vessels using trawls with mesh sizes of 35-40 mm.
Spain:
The Spanish blue whiting fishery is carried out mainly by bottom pair trawlers in a directed fishery and by single bottom trawlers in a by-catch fishery, both using a minimum mesh size of app. 55 mm. The pair trawl fleet landed 20 273 t, taken mainly on the border between Divisions VIIIc and IXa. By-catches of blue whiting (2 878 t) were caught mainly in the bottom trawl fishery in Spanish waters in Divisions VIIIc and IXa; small quantities (67 t) were also caught by longliners. These coastal fisheries have trip durations of 1 or 2 days, and all catches are for human consumption. Thus, coastal landings are rather stable due mainly to market forces.
Sweden:
As there was no participation from Sweden at this WG meeting, no information on the Swedish fishery was available to the Working Group.
UK (Scotland):
As there was no participation from UK at this WG meeting, no information on the Scottish fishery was available to the Working Group.

O:\ACFM\WGREPS\WGNPBW\REPORTS\2002\Sec-6.Doc 156
6.3 Biological Characteristics
6.3.1 Length composition of catches
Data on the combined length composition of the 2001 commercial catch from the directed fisheries in the Norwegian Sea and the spawning area of the blue whiting stock by quarter of the year were provided by the Faroes, Iceland, Ireland, Netherlands, Norway, Russia, and partly from Germany. Length composition of blue whiting varied from 14 to 40 cm, with most fish ranging from 23 – 29 cm in length with a mode of 25.3 cm (Table 6.3.1.1). Length compositions of the blue whiting by-catch from “other fisheries” in the North Sea and Skagerrak were presented by Norway and Denmark (Table 6.3.1.2). The catches of blue whiting from the mixed industrial fisheries consisted of fish with lengths of 14 - 38 cm and a mode of 22.4 cm. Spain and Portugal caught blue whiting in the Southern area. The Spanish data used for length distribution of catches showed a length range from 15 - 30 cm with a modal length of 21.1 cm (Table 6.3.1.3).
6.3.2 Age composition of catches
For the directed fisheries in the northern area in 2001, age compositions were provided by the Faroe Islands, Iceland, Ireland, Norway, and Russia, which together accounted for 86 % of the catch. Estimates of catch in numbers for unsampled catches were raised according to the knowledge of how, where, and when the catches were taken. The age compositions in the directed fisheries are given in Table 6.3.2.1.
Age compositions for blue whiting by-catches from “other fisheries” in the North Sea and Skagerrak were available for 78% of catches. Norwegian data were used for allocation of the remaining part of the total in that area. The age compositions are given in Table 6.3.2.2.
For the fisheries in the Southern area, age compositions representing 100% of the catch were presented by Spain and Portugal. The age compositions in the southern fishery are given in Table 6.3.2.3.
The combined age composition for the directed fisheries in the Northern area, i.e. the spawning area and the Norwegian Sea, as well as for the by-catch of blue whiting in “other fisheries” and for landings in the Southern area, were assumed to represent the overall age composition of the total landings for the blue whiting stock. The catch numbers-at-age used in the stock assessment are given in Table 6.3.2.4. The 1999 and 2000 year classes were the most numerous in the catches, followed by the 1997 and 1998 year classes. To calculate the total international catch-at-age, and to document how it was done, the program SALLOC was used (ICES 1998/ACFM:18). The allocations are shown in Table 6.3.2.5 (ALLOC files).
6.3.3 Weight-at-age
Mean weight-at-age data were available from Norway, Russia, the Faroes, Iceland, Ireland, and Spain. Mean weight-at-age for other countries was based on the allocations shown in Table 6.3.2.5 (ALLOC files) and was estimated by the SALLOC program for the total international catch. Table 6.3.3.1 shows the mean weight-at-age for the total catch during 1982 - 2001 used in the stock assessment. The weight-at-age for the stock was assumed to be the same as the weight-at-age for the catch.
6.3.4 Maturity-at-age
Maturity-at-age used in the assessment was obtained by combining maturity ogives from the southern and northern areas, weighted by catch in numbers-at-age (ICES 1995/Assess:7). These are the same as those used since 1994 (Table 6.5.1). However, during the spring survey to the spawning area in 2002, more than 85 % of the 2-year-olds were mature (Figure 6.4.1.3) comprising more than 50 % of the spawning stock.
6.3.5 The value of the natural mortality coefficient M for blue whiting
The correct choice of M might be regarded as less important for species with a relatively low natural mortality and stable catches. However, for pelagic species natural and fishing mortalities are often of the same level of magnitude, and a more precise choice of M is becoming more important in a management context, especially in the case of dramatic rise of catches. At present, M equal to 0.2 is used, according to the results of investigations undertaken by the Blue Whiting Working Group in the early 1980s that were based on analysis of the age distribution in the stock before the large industrial fishery started.

O:\ACFM\WGREPS\WGNPBW\REPORTS\2002\Sec-6.Doc 157
One possible reason for biomass estimates of blue whiting in stock assessment by means of cohort models normally being significantly lower than survey estimates could lie in a somewhat underestimated value of the natural mortality coefficient. On the other hand, preliminary experiments undertaken during the Norwegian acoustic survey on the spawning grounds in 2002 (WD Godø et al., 2002b) indicate that the TS value presently used for blue whiting in acoustic surveys may be too low, and the biomass obtained by this method may consequently be too high.
In a WD to the 2002 WG by Vasilyev and Belikov, an attempt was made to apply the ISVPA model for estimation of the natural mortality coefficient for blue whiting using catch-at-age data only. An estimate of M close to 0.4 for an age range of 3-10 was established. The ISVPA model runs carried out at the present WG meeting that included catch-at-age data for 2001 also indicated that the value of M may be higher than the presently used value (see Section 6.4.4.2 with ISVPA results).
Another indication that the value of M for blue whiting might be higher than presently assumed comes from the application of biological methods, based on relationships found for other species between M and some “physiological” characteristics (age of mass maturity, maximum age, growth parameters, etc.). In the WD by Vasilyev and Belikov the methods by Richter & Efanov (1977) and by Alverson & Carney (1975) were applied. The value of M for blue whiting estimated by these methods was in the range of 0.38-0.60. The estimate of M equal to 0.35 for age groups 2-10 was also obtained previously by Timoshenko (1982) who used Tyurin’s method (Tyurin 1972).
All estimates of M for blue whiting are point estimates that do not involve any assessment of uncertainty associated with the estimate. The Working Group considers the incorporation of a more accurate estimate of the natural mortality coefficient into blue whiting models to be important and requiring further investigations.
6.4 Stock estimates
6.4.1 Acoustic surveys
6.4.1.1 Surveys in the spawning season
Three vessels, R.V. “Atlantniro” and R.V. “Fridtjof Nansen” from Russia and R.V. “Johan Hjort” from Norway, participated in the spawning stock investigations in February–April 2002. Survey strategies and acoustic instrumentation of all these vessels were similar, but the survey tracks and timing of surveys were different. The main results of these surveys are presented in a joint report (WD Godø et al., 2002a), whereas more details are to be found in individual reports (WD Godø et al., 2002b, WD Timoshenko 2002). Significant discrepancies in the results of these surveys precluded a joint estimation of spawning stock to be made available to the WG.
Estimates of total and spawning biomass of blue whiting in the spawning area made by Russian, Norwegian, and Faroese surveys since 1983 are given in Table 6.4.1.1. Usually, the acoustic estimates have been well above the assessments, and these estimates have therefore been used only as relative indices. A factor contributing to the high acoustic estimates is the value of target strength that is probably too low (WD Godø et al., 2002b).
Norwegian and Russian surveys yield strikingly different abundance estimates, despite the comparable spatial coverage of the surveys. Furthermore, the estimated age structure is different: the Norwegian estimate is dominated by ages 2 and 3, whereas the Russian estimates show considerable numbers of older fish as well. A number of factors contributing to these differences have been identified (WD Godø et al., 2002b): 1) Timing and spatial coverage of the spawning area in relation to the migrations of blue whiting, 2) Performance of acoustics, with the instrumentation in the Norwegian vessel giving higher acoustic densities than those in the Russian vessels, 3) Selectivity of sampling, with the Norwegian trawl under-sampling large fish relative to the Russian trawls, and 4) Differences in onboard age readings.
Russian surveys. R.V. “Atlantniro” carried out a survey in the international waters west of the British Isles (between 54°10’N and 58°40’N) in 21 February–12 March (WD Timoshenko 2002). This survey gives a stock estimate of 2.1 million t (20.4 x 10⁹ individuals) in the survey area, which is lower than in the spring 2001 (3.5 million t). The modal length in 2002 is slightly lower than in 2001. The area was surveyed for a second time in 15 March–10 April, yielding an estimate of 1.2 million t. The difference reflects the movement of blue whiting shoals over the limits of the survey area.
Russian spawning stock survey was carried out by R.V. “Fridtjof Nansen” and R.V. “Atlantniro”; the contribution from R.V. “Atlantniro” corresponds to the latter survey period of that vessel mentioned above (WD Timoshenko 2002, WD Godø et al., 2002b). This is the first Russian survey with an extensive spatial coverage after 1996. The total stock biomass in the survey region was estimated to be 5.3 million t (69.3 x 10⁹ individuals), which is slightly above the

O:\ACFM\WGREPS\WGNPBW\REPORTS\2002\Sec-6.Doc 158
average of this time-series. The most abundant year class is that of 2000, although year class 1997 makes the highest contribution to the total biomass.
Norwegian survey. R.V. “Johan Hjort” surveyed the blue whiting stock in the shelf edge and bank areas west of the British Isles and in the southern Faroese waters (WD Godø et al., 2002a). High recordings of blue whiting were observed on northwestern parts of the Rockall bank, and on the western part of the Porcupine Bank, where the high recordings extended northwards along the shelf edge. The highest values were recorded west and northwest of the Hebrides (Figure 6.4.1.1).
The spawning stock was estimated to be 10.9 million t (146.8 x 10⁹ individuals), while the immature part of the stock in the survey area was estimated at 1.2 million t (28.8 x 10⁹ individuals). Both the number and biomass of the spawning stock are about twice as high as the estimate of 2001. The age-stratified estimate of the total stock for 2002 is given in Table 6.4.1.2.
The decreasing tendency observed in the stock sizes between 1999 and 2001 appears now to be reversed. The increase in biomass is largely due to the presence of two very strong year classes (1999 and 2000) in the spawning area (Figure 6.4.1.2). The estimated abundance of the 2000 year class is the highest in this survey time-series, whereas the abundance of the 1999 year class is the third highest. These year classes dominated the whole survey area, except in the northernmost area (>60ºN) where year class 2001 appeared as more abundant than that of 1999. The spawning stock, therefore, continues to be dominated by very young fish. A significant proportion of age-1 fish (year class 2001) in the survey area are mature, and virtually all fish are mature by age 3 (Figure 6.4.1.3).
Examination of development of year class abundance over consecutive years indicates that catchability in the 2002 survey was exceptionally high, whereas in 2001 the catchability appears to have been lower than average.
6.4.1.2 Surveys in the feeding season
Since 1995, Norway, Russia, Iceland, and Faroes, and since 1997 also the EU, have coordinated their survey effort on pelagic fish stocks in the Norwegian Sea. Holst et al. (2001) reported on distributions and migrations of blue whiting in 2001.
When the Russian survey was conducted, blue whiting were distributed over most of the surveyed area with the main concentrations to the south of 65º N, eastwards from 3º W, and in the northwestern part of the Norwegian Sea. Blue whiting were registered mainly as scattering layers at different depths from 150 m to 300 m. The acoustic registrations consisted of blue whiting with a length distribution of mostly 17-27 cm fish, corresponding to the 1999 and 2000 year classes. The total biomass, recorded in June in the southern part of the Norwegian Sea, was estimated at about 2.4 million t (text table below) and 32.8 109 fish, while in July about 1.3 million t and 14.9 109 fish were recorded in the northern part.
Year Russian survey (million t) 2000 1.2 2001 2.4
For both the Icelandic EEZ and Norwegian Sea age-stratified estimates of blue whiting were reported; these are given in Tables 6.4.1.3 and 6.4.1.4, respectively.
The Norwegian and Icelandic surveys conducted in July–August in 1998–2001 covered approximately the same area from year to year. There has been a steady downward trend in the biomass estimate in the surveys from 1998 to 2000. The biomass estimated in 2001 was more than two times higher than the 2000 estimate, as shown in the text table below.
Year Norwegian survey (million t)
Icelandic survey (million t)
Total (million t)
1998 6.6 1.6 8.2 1999 4.2 1.8 6.0 2000 2.5 1.0 3.5 2001 5.9 2.1 8.0

O:\ACFM\WGREPS\WGNPBW\REPORTS\2002\Sec-6.Doc 159
The biomass estimates of blue whiting from the Faroese area and the Norwegian Sea in 2001 were about twice the estimates in 2000, consisting of mainly one-year-old fish (50% of the biomass). This indicates that the 2000 year class might be strong. Generally the blue whiting stock is presently dominated by the immature year classes of 1999 and 2000. The biomass estimate of blue whiting from the Icelandic area was also much higher in 2001 than in 2000 (67% higher) and in fact higher than in any previous surveys. The 0-group blue whiting was even more numerous in Icelandic waters than in 1999 and 2000, indicating that this may also be a strong year class.
6.4.2 Bottom trawl surveys in the southern area
Bottom trawl surveys have been conducted off the Galician (NW Spain) and Portuguese coasts since 1980 and 1979 respectively, following a stratified random sampling design and covering depths down to 500 m. Since 1983, the area covered in the Spanish survey was extended to completely cover Spanish waters in Division VIIIc. The area covered in the Portuguese survey was also extended in 1989 to the 750 m contour. A new stratification in the Spanish surveys has been established since 1997. Stratified mean catches and standard errors from the Spanish and Portuguese surveys are shown in Tables 6.4.2.1 and 6.4.2.2. In both areas larger mean catch rates are observed in the 100 - 500 m depth range. Since 1988 the highest catch rates in the Spanish survey were observed in 1999 (124 kg/haul). The 2001 estimate is relatively low (42 kg/haul). The Portuguese summer surveys generally give higher values than in the autumn surveys, and a better correlation with the Spanish surveys (Figure 6.4.2.1).
6.4.3 Catch per unit effort
Only new CPUE data for Spanish commercial pair trawlers in Divisions VIIIc and IXa have been submitted to the Working Group since 1984 and they are used as tuning data (see below).
CPUE data from the Norwegian commercial fleet (pelagic trawl) in the spawning area were not updated this year.
6.4.4 Data exploration
To explore various interpretations of the assessment data, the models ICA (Patterson 1999), AMCI (Section 1.3.2) and ISVPA (section 1.3.6) were used.
Only one ICA run, comparable to the final AMCI run, was made in 2002. The key ICA run had the same settings as last year except that the number of years with a separability constraint was decreased from 5 to 4 years, which is the same as in 2000. Furthermore, age 1 in Spanish CPUE tuning series was down-weighted, as in the final AMCI run. The options are given in Table 6.4.4.1, and the results in Table 6.4.4.2. Some diagnostic plots are given in Figure 6.4.4.1.
6.4.4.1 Stock assessment with AMCI
Based on previous experience and inspection of the data, various problems were identified. Among those was that the surveys cover the distribution area of the stock to a variable extent, and the indices may not be representative for the state of the stock as a whole. Additionally, not all age groups in the tuning series or in the catch-at-age matrix are equally representative for the real population.
To address such problems, a series of preliminary runs were made using the model AMCI (Section 1.3.2). Based on the comparison of the methods made in 2001 and the conclusions drawn by the 2001 WG (ICES 2001/ACFM:17), AMCI was selected as the assessment software for the Working Group also in 2002.
The effect of the various tuning fleets on the assessment was explored by comparing assessments with only one tuning series to the basic run (all fleets included) by AMCI. In previous years each of the tuning series from acoustic surveys was split according to which year the Simrad EK500 was introduced on the vessels participating, since it has been shown that the higher performance of that echo sounder could change the catchabilities of the time-series. However, in the current version of AMCI the catchabilities for various parts of a survey time-series may be estimated, and the previously split series could therefore be rejoined. This is only a technical change in the way data are treated and has no influence on the results.
None of the tuning series completely cover the distribution area of the stock. The survey at the spawning grounds is probably the best for the adult stock. The Spanish CPUE index represents a fleet exploiting blue whiting over a small part of the distribution of this species. The relevance of this index has been questioned by ACFM, and the 2001 WG was requested in the technical minutes to address this. The 2001 WG decided to keep the series in the tuning, since single fleet tuning runs showed that it made little difference to the overall result. The Norwegian Sea acoustic survey

O:\ACFM\WGREPS\WGNPBW\REPORTS\2002\Sec-6.Doc 160
also covers only part of the area and is based on a cruise track with very wide spacing of transects. The sampling on this survey is sparse, and the coverage area does not include Icelandic waters where considerable amounts of blue whiting have been observed in the same period.
The results showed that survey series 1 (Norwegian acoustic survey in spawning areas), 2 (Russian acoustic survey in spawning areas; discontinued in 1996), and 4 (Acoustic survey in the Norwegian Sea in July) showed similar development of the stock, while series 3 (CPUE from Spanish bottom trawl survey) predicted substantially lower recruitment in recent years, in particular for the 2000 year class (Fig 6.4.4.2). Similar signals in the three tuning series from the northern areas were confirmed by a run where these were combined and gave similar results to those from the single-fleet tuning runs on these series. Seemingly, the 2000 year class shows up as a very strong one in the northern areas and, although being stronger than average also in the southern series, does not appear as strong as in the north. Similar situations have been encountered by the WG before, and the WG reasoned that this could well reflect a real biological situation. The 2000 year class has been encountered over large areas in the north, in addition to those covered by surveys included in the tuning, e.g. in Icelandic waters and in the south-western Barents Sea (WD by Belikov). This could be caused by a more northerly distribution of the 2000 year class than normal, and may have resulted in lower abundance in the southern area relative to the northern area. The WG considered leaving out the whole series from the southern area. However, since the age groups older than 1 year reflects the year-class strength quite well, it was decided to keep the series in, but instead, to down-weight heavily the 1-year-olds (weight 0.01).
Scrutinizing various diagnostics produced by AMCI revealed that some data points gave rise to particularly high residuals, for instance the youngest age groups in the tuning series from the northern area in recent years. It was considered to down-weight such points based on their influence and magnitude of residuals. However, the WG realised that in doing this, one would reduce the influence of the few data points that carried information about the apparently strong 2000 year class. This would in turn leave the estimation of the strength of this year class to relay heavily on the two data points in the catch matrix carrying information about this year class (age 0 in 2000 and age 1 in 2001). Knowing that the age groups 0 and 1 only to a small degree enter into the fishery, this was not considered to be a good solution. Consequently, the WG decided to give the relevant data points in the tuning files equal weight to the others. The WG noted, however, that the estimated abundance of the 2000 year class will be extremely uncertain.
6.4.4.2 Stock assessment with ISVPA
This year the blue whiting ISVPA runs were used to analyze abundance trends using catch-at-age data, and to estimate the instantaneous natural mortality coefficient (M) using catch-at-age data. The ISVPA model is described in Section 1.3.6 of ICES (2001)
In agreement with the results of preliminary runs with data for 1981-2000 (WD Vasilyev and Belikov), the estimate of the value of M for age interval 3-10+ for 1981-2001 catch-at-age data was found close to 0.38 (Fig. 6.4.4.3). Additionally, the value of M was estimated for the 1-10+ age interval and was found equal to 0.47 (Fig. 6.4.4.4). In both cases the effort-controlled version of ISVPA with minimization of median was used. Both estimates are in rather good agreement with the results of the application of “physiological” methods by Rikhter and Efanov (1977) and by Alverson and Carney (1975), presented in the WD by Vasilyev and Belikov.
Bearing in mind that the estimates of M for the whole interval of ages used in ISVPA runs (1-10+) made for shorter intervals of years are extremely unstable, the stock assessment by ISVPA was undertaken for three values of natural mortality: M=0.38 (the value found for age interval 3-10+, here applied to age groups 1 and 2 as well), M=0.47 (the value found for age groups 1-10+), and the traditional M=0.2.
For M=0.2 and M=0.38 a reliable minimum of the effort-controlled version ISVPA loss function was found, even for traditional sum of squared errors (SSE) in the log-transformed catch-at-age. For the catch-controlled version of ISVPA, considering catch-at-age data as true and attributing the residuals to violation of assumption about stability of the selection pattern, minimization of SSE revealed no minima (Fig. 6.4.4.6). However, the minimum appears when the median of the distribution of squared errors in log-transformed catches (MDN) was used instead of SSE, and moreover, it was found approximately at the same place as for the effort-controlled version of ISVPA with minimization of SSE. The estimates of SSB, TSB, recruitment at age 1, selection pattern, and F(3-7), found for the 4 cases described above, are presented in Fig. 6.4.4.5 and Table 6.4.4.3. Residuals are given in the Table 6.4.4.4a-d.
The results of the application of ISVPA to blue whiting catch-at-age data indicates that for the traditionally used M=0.2 the estimate of SSB in 2001 is about 7.4-8.3 million t and F(3-7) is about 0.25-0.28.
Among the four cases tested, ISVPA runs with “estimated” values of M gave the lowest SSE values between the estimates of SSB from Norwegian surveys and ISVPA-derived estimates for the case of M=0.38, while M=0.47 gave

O:\ACFM\WGREPS\WGNPBW\REPORTS\2002\Sec-6.Doc 161
the best, although rather low, correlation between them (see table in Fig. 6.4.4.5). The WG considers the problem of correction of the value of the natural mortality coefficient for blue whiting to be important, but at present it needs more investigations.
6.4.5 Stock assessment
There are six tuning fleets available for the blue whiting stock: the Norwegian Sea acoustic survey, which covers the feeding area of the northern stock component, the Norwegian and the Russian acoustic surveys on the spawning grounds, the CPUE from Spanish pair trawlers, the Spanish bottom trawl survey, and the Portuguese bottom trawl survey, where the last three fleets cover the southern component of the stock. The WG decided to leave the two last fleets out of the tuning in 1998.
In 1999 the WG decided to split three of the tuning series (the Norwegian Sea acoustic survey, and the Norwegian survey and the Russian survey on the spawning grounds). The reason for splitting these index series was the change to a Simrad EK-500 echosounder in 1991 in the first two series and in 1992 in the Russian tuning series. However, the AMCI version used during the 2002 WG meeting allows estimation of separate catchabilities for different time periods. Therefore, it was possible to reunite the index series split in 1999. Consequently there are now four tuning fleets. The indices are shown in Table 6.4.5.1.
The final assessment was done with the AMCI model v. 2.1 (see Section 1.3.2) with the following data and settings:
Catches-at-age 0-10, with age 10 treated as a plus group, 1981-2001
Survey indices:
Norwegian acoustic survey on the spawning grounds, ages 2-8, 1981-2002
Russian acoustic survey on the spawning grounds, ages 3-8, 1982-1996
Spanish pair trawlers CPUE, ages 1-6, 1983-2001
Norwegian Sea acoustic survey, ages 1-7, 1981-2001
The objective functions were a sum of the following partial objective functions:
Log sum of squares of catches-at-age, weight 1
Log sum of squares of yearly yields, weight 1
Log sum of squares for survey indices at age, weight 1 for each fleet
Note that the weight applied to log sum of squares of yearly yields corresponds to the weighting used by the WG in 2001, but the actual numerical value is changed because of an internal change in AMCI.
Catch-at-age data were down-weighted by a factor of 0.1 for age 0 and with a factor of 0.5 for age 1, and the tuning index for age 1 in fleet 3 was down-weighted by a factor of 0.01.
Fishing mortality was modelled as separable, but with a gradual change in the selection. The gain factor for change in selection was 0.5 for age 0, 0.2 for age 1, and 0.1 for the older ages. This implies that the selection at ages 0 and 1 is allowed to vary more according to the year-to-year variation in the catches than the selection at the older ages. The selection in 1981 was fixed at values equal to the average of 1981-1989, as obtained after one iteration. This was done because the fishing mortality and stock numbers in the initial year tend to be highly correlated. Fishing mortality in 2002 was assumed to be equal to that in 2001, and the recruitment in 2001 was estimated according to the stock-recruitment function. The stock-recruitment function was the 'Ockham’s razor', with a constant recruitment at SSB > 1 500 000 t, and a linear decrease towards the origin below that SSB value. This function was fitted to the data by minimising the sum of the squared log residuals independent of the overall objective function. Survey indices were assumed to be related to the stock numbers by simple proportionality. Survey catchabilities were estimated at each age and assumed constant for the periods 1981-1990 and 1991-2001/2002 (tuning fleets 1 and 4), or for the periods 1982-1991 and 1992-1996 (tuning fleet 2), or over the whole period (tuning fleet 3).

O:\ACFM\WGREPS\WGNPBW\REPORTS\2002\Sec-6.Doc 162
The model accepts yearly catch-at-age data, but operates internally on a quarterly basis. The spawning stock is derived from the mean stock numbers in the first quarter, and the survey indices are related to the mean values in the survey season. The yearly fishing mortality was split on quarters assuming that the proportion 0.35 of the total annual fishing mortality occurs in the first and in the second quarter, 0.2 in the third quarter, and 0.1 in the fourth quarter. Natural mortality was assumed constant at 0.2 for all ages.
The model was run until 2004. The results for 2002 to 2004 are predicted values assuming a fishing mortality as in 2001. The results are presented in Tables 6.4.5.2 to 6.4.5.6. A bootstrap run was made where catches-at-age and survey indices at age, as well as recruitments in the years 2001 - 2004 were drawn randomly. This was done by non-parametric bootstrap, i.e. catch-at-age and survey indices were drawn by using the modelled values and their residuals, and drawing residuals randomly to each data point, which were added to the modelled values. Recruitments were drawn assuming a lognormal distribution. New parameter estimation was done for each replicate set of data. 1000 replicates were run. The results are summarised in Figure 6.4.5.1. A retrospective run for terminal year set to 1994-2001 was made, to compare the 2002 assessment to those of recent years (Figure 6.4.5.2).
The results of the assessment (Table 6.4.5.6) show a strong increase in fishing mortality over the last years, reaching F=0.82 in 2001. Spawning stock has declined in the last years, but the estimated SSB for 2002, 2.4 million t, is still above the Blim=1.5 million t. However, the estimated F is well above the Flim=0.51. The abundances of strong 1995 and 1996 and older year classes are considerably reduced, and the stock is dominated by young fish. The 1999 year class is strong, at the same level as the large year classes 1995 and 1997, but somewhat less abundant than the very rich 1996 year class. The 2000 year class seems even more abundant than the 1995, 1997, and 1999 year classes, although the strength of this year class is still poorly estimated. It can be concluded that only because of exceptionally good recruitment since 1995 this stock has managed to uphold an SSB at a level above the Bpa since 1998, despite the increased catch level.
The retrospective plot (Fig. 6.4.5.2) shows that there is a tendency to underestimate the recruiting year classes at age 0. This underestimation will, in turn, lead to an underestimation of SSB and an overestimation of fishing mortality. A possible reason could be that the 0-group is poorly represented in the catch-at-age matrix, and none of the tuning series included in the model seem to reflect the year-class strength reliably at this age. On the other hand, an underestimation of recruitment in the model could also be caused by other factors.
The estimated age structure implies that the stock will decline if the fishing mortality is maintained at the level of 2001 (F=0.82) also in 2002. This F corresponds to a catch of about 1.5 million t in 2002.
The bootstrap run (Figure 6.4.5.1) gives an indication of the uncertainty in the assessment. The trend in fishing mortality and SSB are consistently estimated in the bootstrap datasets. However, the strengths of the 1999 and 2000 year classes are still highly uncertain, which influences also the estimations of fishing mortality and SSB in the ultimate year.
6.5 Short-Term Projection
Based on the final AMCI run, a deterministic short-term projection was made using the MFDP (version 1a) program, and the yield-per-recruit estimations were made by means of the MFYPR (version 2a) program, with the input stated in Table 6.5.1. The weight in the stock and catch were taken from the average of the last three years values. The selection pattern and the reference F in 2001 from the final AMCI run were used as input values in 2002. The recruitment in 2002-2004 was set as the geometric mean of the recruitment values in the period 1981-2000 in the AMCI run. For all ages the output values in 2002 from the AMCI run were used as the initial stock size. The proportion of F and M before spawning was set to 0.25, taking into account the proportion of the catches that take place before the spawning period.
The results are given in Table 6.5.2 and the standard plots are given in Figure 6.5.1. Continuing fishing at the 2001 level predicts a catch of 1.5 million t in 2001 (this value is close to the sum of the autonomous quotas set by the coastal states) and 1.3 million t in 2002. This exploitation rate implies a decreasing trend of SSB with 2.2 million t in 2002 and 1.9 and 1.4 million t in 2003 and 2004, respectively. The predicted total stock biomass will also decrease from 5.1 million t in 2002 to 4.1 and 3.3 million t in the following years.
6.6 Medium-Term Projection
Medium-term projections this year were done using the STPR software (see Section 1.3.3), which appeared to be the most convenient way to use the outputs produced by AMCI.

O:\ACFM\WGREPS\WGNPBW\REPORTS\2002\Sec-6.Doc 163
An 'Ockham’s razor' stock-recruitment function was assumed, with a constant expected recruitment at SSB above 1.5 million t, a linear decline towards the origin at lower SSB, and a constant coefficient of variation. This function was chosen because the recruitment shows no dependence on the SSB within the range for which there is data. The function is shown in Figure 6.6.1.
Initial numbers were taken from the final AMCI run. The program uses the numbers at the start of the last assessment year and a catch constraint for that year. Accordingly, the stock numbers at the start of 2001 and the total catch in 2001 were used. Initial numbers in 2002 were taken from bootstrap runs of AMCI. The selection pattern used was that for 2001. This pattern has been relatively stable over the whole time period. Weights-at-age were taken from the historical values, and the maturity ogive was the standard ogive used in the assessment.
Runs were made with two options for catch in 2002, one with an F constraint where F was equal to the F in 2001 (0.82), and the other with a catch constraint where the catch was set equal to the sum of the autonomous quotas indicated by the coastal states to be applied for 2002 (1 450 000 t). For the future years, various levels of constant fishing mortality were simulated, in order to outline the risk of bringing the SSB below the limit and pa-levels, and the prospect of bringing it above these levels. The results are summarised in Table 6.6.1.
The results indicate that with F2002 = F2001 (generating a median catch in 2002 equal to 1 374 000 t), there is a risk of 4% to 9% that the SSB in 2003 will be below Blim, depending on the fishing mortality applied in 2003. At low fishing mortality from 2003 onwards, the probability of SSB being below Blim becomes small within a few years, but this risk persists at fishing mortalities above 0.25. The prospects for bringing SSB above Bpa=2 250 000 t is between 30% and 40% in 2003, but is fairly high in the medium term for F’s below 0.25.
With a higher F corresponding to a catch of 1 450 000 t in 2002, the risk that SSB shall be below Blim is considerably higher (18-25% in 2003), but the probability of reaching the Bpa in the medium term is high if the future fishing mortality is moderate (below 0.25).
Thus, according to the medium-term projections, the stock will benefit considerably from a rapid reduction of the fishing mortality to lower levels.
6.7 Precautionary Reference Points
The reference points for blue whiting have been revisited (WD by Skagen). The reference points set have been criticised as there may be an inconsistency between the chosen Bpa and Fpa. This discussion is based on the 2001 assessment.
The present values and their technical basis are:
Blim: 1.5 mill tonnes; Bloss
Bpa: 2.25 mill. tonnes; Blim*1.5
Flim: 0.51; Floss
Fpa: 0.32; Fmed.
The inconsistency problem is that fishing at Fpa implies a high probability of bringing the stock below Bpa. The recent increase in the fishery has become a matter of concern, and work has been initiated by several coastal states to develop recovery plans. This adds to the need to revise the reference points, because of their role as targets for rebuilding and guidelines for future exploitation. In particular, one may question whether the present Bpa is an adequate target for management purposes.
Recruitment dynamics can be summarised as:
Within the range of historical observations, there is no trend in recruitment as a function of SSB. Thus, bringing the stock below Blim implies ‘unknown dynamics’ in the ACFM terminology.
Historically, there have been strong year classes with 6-7 years intervals, and a sequence of 3-4 weak year classes inbetween.

O:\ACFM\WGREPS\WGNPBW\REPORTS\2002\Sec-6.Doc 164
The SSB has increased each time a strong year class entered the spawning stock, and decreased in the periods where the spawning stock was dominated by weak year classes.
The Fmed is intended to stabilise the SSB around the mean historical value. The Fmed replacement line implies an SSB – recruitment ratio that, with geometric mean recruitment, is at equilibrium with an SSB about 1.9 million tonnes, which is well below Bpa.
In recent years, there has been an improvement in the recruitment. The 1995 year class was strong, which might be expected, but the 1996 year class was far stronger. The 1997 year class was also strong, and there are indications of strong year classes both in 1999 and 2000. The strong year classes have been most prominent in the north and may have led to a more northerly distribution of the stock as a whole. The reason for this is not known.
Exploitation of the blue whiting stocks can be summarised as:
Over the years, the fishing mortality has fluctuated between 0.2 and 0.45. It was reduced in 1991 because the stock was declining. The stock improved both because of this and because a new strong year class came in.
In recent years, there has been a dramatic increase in catches and in the fishing mortality.
The exploitation pattern has been relatively stable according to the 2001 assessment, with the major exploitation being on adults. The exploitation of juveniles has been modest.
In 2001, a large fishery developed in the Norwegian Sea and in the areas between Iceland and the Faroe Islands in the summer, and the proportion of juveniles was large in that fishery. Thus, it is likely that a new specific fishery for juveniles is developing.
The stock assessments carried out have shown that SSB has been in the range between Blim and Bpa in most of the historical years. Except for the most recent period, the stock has mostly been moderately exploited, and there is no trend in the recruitment as a function of SSB. Thus, the safety margin built into the Bpa is so wide that the stock at moderate exploitation is dependent on well above average year classes to reach the present Bpa.
On the basis of the analyses made on long-term and medium-term simulations and on the stock assessment carried out it could be suggested that Blim could be kept at 1.5 million t and that Bpa could be undefined. An appropriate Fpa of 0.25 could be set on the assumption that exploitation of juveniles is kept low and that the weights-at-age remain within the historical range. This would give a 1 - 2% risk that SSB falls below Blim in any year. If Flim is needed, it may be in the order of 0.35, which according to the calculations made implies an approximately 20 % probability of falling below Blim, and a 5 percentile for SSB of about 1.3 million t.
6.8 Spatial and temporal distribution
Geographical distribution of the catches of blue whiting in 2001 is given by quota and ICES rectangles in Figure 6.8.1. The distribution of the catch for the whole year is given in Figure 6.8.2. In 2001 the catch provided as catch by rectangle represented approximately 1.75 million t (98.4%).
6.9 Management consideration
The fishery for blue whiting has expanded rapidly in recent years, while no agreement on TAC has been reached. The reported catches in 1998 to 2001 were all well above 1 million t reaching 1.7 million t in 2001, corresponding to an F of 0.82. In spite of this very high exploitation rate, the SSB has been at a fairly high level, due to exceptionally good recruitment in recent years. The year classes 1995, 1996, 1997, 1999, and 2000 are all far above average strength. The estimated strength of the 1999 and 2000 year classes are highly uncertain (Figure 6.4.5.1). Without these strong year classes the extensive fishery would lead to a severe depletion of the stock before now.
However, the assessment made in 2002 gives a more optimistic view of the present stock situation compared to that made in 2001. The main reason is that the incoming year classes are seemingly stronger than estimated previously. The SSB in 2001 is at present above the Bpa presently used. The reference F is, on the other hand at 0.82, and the exploitation on younger fish is also considerable. Lowering the F will increase the long-term yield.

O:\ACFM\WGREPS\WGNPBW\REPORTS\2002\Sec-6.Doc 165
Quality of Catch Data and Biological Sampling Data
The Working Group members generally accepted that the total landings data seem to be reliable and that misreporting of landings by area was minor. As there was no agreed TAC for this stock, there is unlikely to be a motive for over- or underreporting landings. Therefore discarding of blue whiting was assumed to be insignificant.
In total 985 samples were collected from the commercial fishery, 174 000 fish measured and 18 000 fish aged. However, sampling was not evenly distributed throughout all quarters and areas.
The text table below shows the number of samples and total landings by the three areas, Northern, North Sea and Skagerrak, and Southern, and by quarter.
Quarter Northern NS-SK Southern Total Number of samples 73 9 134 216 1 Landings (t) 370 262 16 932 6 357 393 552 Number of samples 94 35 154 283 2 Landings (t) 614 383 63 863 6 457 684 703 Number of samples 136 7 146 289 3 Landings (t) 485 815 18 481 6 148 510 444 Number of samples 42 18 137 197 4 Landings (t) 162 222 19 247 6 003 191 471 Number of samples 345 69 571 985 Total Landings (t) 1 636 683 118 523 24 964 1 780 170
On average there was one sample for every 4 744 t landed in Northern, one sample for every 1 854 t landed in the North Sea and Skagerrak, and one sample for every 44 t landed in Southern.
The WG used the samples to estimate catch in numbers and mean length and mean weight. The overall sampling level is considered acceptable, however improvements are required because some countries do not have adequate sampling. Detailed information on the number of samples, number of fish measured, and number of fish aged by country and quarter is given in Table 6.10.1. As can be seen, no sampling is carried out by France, Scotland, and Sweden and only limited sampling by Denmark, Germany, and Ireland.
Therefore, the WG recommends that all countries that exploit this stock should develop appropriate sampling schemes. In this context it should be mentioned that with the implementation of the EU Data Collection of Fisheries Data in 2002 (EU Commissions Regulation 1639/2001), sampling is expected to improve when minimum sampling requirements (1 sample per 1000 t landed) are met by EU countries.
6.10 Recommendations
The WGNPBW recommends that:
all countries that exploit the blue whiting stock should develop appropriate sampling schemes,
catch data for 2002 as well as catch data for 2001 shall be made available by “Fishery”, quarter, and area level by country at the WGNPBW meeting in 2003,
research seeking to clarify the population biology and ecological role of blue whiting in the ecosystems of the northeast Atlantic is given a high priority in the research agenda of national fisheries research institutions,
national fisheries research institutions intensify their efforts on making ecological data on blue whiting available to each other.

O:\ACFM\WGREPS\WGNPBW\REPORTS\2002\Sec-6.Doc 166
Country 1987 1988 1989 3) 1990 1991 1992 1993 1994 2) 1995 3) 1996 1997 1998 1999 2000 2001
Denmark 15 7,721 5,723
Estonia - - - - - - - - - 377 161 904 - - -
Faroes 9,290 - 1,047 - - - - - - 345 - 44,594 11,507 17,980 64,496
Germany 1,010 3 1,341 - - - - 2 3 32 - 78 - - 3117
Greenland - - - - - - - - - - - - - -
Iceland - - 4,977 - - - - - 369 302 10,464 64,863 4) 99,092 146,903 245,814
Latvia - - - - - - - 422 - - - - - - -
Netherlands - - - - - - - - 72 25 - 63 435 - 5180
Norway 5) 64,581
Norway 6) - - - 566 100 912 240 - - 58 1,386 12,132 5,455 - 28,812
Poland 56 10 - - - - - - - - - - - - -
USSR/Russia 1) 112,686 55,816 35,250 1,540 78,603 61,400 43,000 22,250 23,289 22,308 50,559 51,042 65,932 103,941 173,860
Total 123,042 55,829 42,615 2,106 78,703 62,312 43,240 22,674 23,733 23,447 62,570 173,676 182,436 276,545 591,583
Country 1987 1988 1989 1990 1991 1992 1993 1994 1995 1996 1997 1998 1) 1999 2000 2001
Denmark 2,655 797 25 - - 3,167 - 770 - 269 - 5051 19,625 11,856 18,110
Estonia - - - - - 6,156 1,033 4,342 7754 10,605 5,517 5,416 - - -
Faroes 70,625 79,339 70,711 43,405 10,208 12,731 14,984 22,548 26,009 18,258 22,480 26,328 93,234 129,969 188,464
France - - 2,190 - - - 1,195 - 720 6,442 12,446 7,984 6,662 13,481 13,480
Germany 3,850 5,263 4,073 1,699 349 1,307 91 - 6,310 6,844 4,724 17,891 3,170 12,655 15,862
Iceland - - - - - - - - - - - - 61,438 113,280 119,287
Ireland 3,706 4,646 2,014 - - 781 - 3 222 1,709 25,785 45635 35,240 25,200 29,854
Japan - - - - - 918 1,742 2,574 - - - - - - -
Latvia - - - - - 10,742 10,626 2,160 - - - - - - -
Lithauen - - - - - - 2,046 - - - - - - - -
Netherlands2) 5,627 800 2,078 7,280 17,359 11,034 18,436 21,076 26,703 17,644 23,676 27,884 35,408 46,128 68,415
Norway 191,012 208,416 258,386 281,036 114,866 148,733 198,916 226,235 261,272 337,434 318,531 519,622 475,004 460,274 399,932
UK (Scotland) 3,315 5,071 8,020 6,006 3,541 6,849 2,032 4,465 10,583 14,325 33,398 92,383 98,853 42,478 50,147
USSR/Russia 3) 165,497 121,705 127,682 124,069 72,623 115,600 96,000 94,531 83,931 64,547 68,097 79,000 112,247 141,257 141,549
Total 446,287 426,037 475,179 463,495 218,946 318,018 347,101 378,704 423,504 478,077 514,654 827,194 940,881 996,578 1,045,100
4) include mixed in Va and directed in Vb.
2) Revised for the years 1987, 1988, 1989, 1992, 1995,1996,19973) From 1992 only Russia
Table 6.2.2 Landings (tonnes) of BLUE WHITING from directed fisheries (Division Vb,VIa,b, VIIb,c. VIIg-k and Sub-area XII) 1987–2001,as estimated by the Working Group.
Table 6.2.1 Landings (tonnes) of BLUE WHITING from the directed fisheries (Sub-areas I and II, Division Va, XIVa and XIVb) 1987–2001,as estimated by the Working Group.
6) By-catches of blue whiting in other fisheries.
1) Including some directed fishery also in Division IVa.
1) From 1992 only Russia
5) Directed fishery
2) Includes Vb for Russia.3) Icelandic mixed fishery in Va.

O:\ACFM\WGREPS\WGNPBW\REPORTS\2002\Sec-6.Doc 167
Country 1987 1988 1989 1990 1991 1992 1993 3) 1994 1995 1996 1997 1998 2) 1999 2000 2001Denmark 4) 3,632 10,972 5,961 4,438 25,003 5,108 4,848 29,137 9,552 40,143 36,492 30,360 21,995
Denmark 5) 22,973 16,080 9,577 26,751 16,050 14,578 7,591 22,695 16,718 16,329 8,521 7,749 7,505
Faroes 4) 6) - - - 60
Faroes 5) 6) 296 265 42 6,741
Germany 1) 115 280 3 - - 25 9 - - - - - 81
Netherlands - - - 20 - 2 46 - - - 793 - -
Norway 4) 21,804
Norway 5) 58,182
Russia 69
Sweden 2,013 1,229 3,062 1,503 1,000 2,058 2,867 3,675 13,000 4,000 4,568 9,299 12,993 3,319 2,086
UK - 100 7 - 335 18 252 - - 1 - - -
Total 62,689 45,143 75,958 63,192 39,872 65,974 58,082 28,563 104,004 119,359 65,091 94,881 106,609 114,476 118,523
Country 1987 1988 1989 1990 1991 1992 1993 1994 1995 1996 1997 1998 1999 2000 2001
Netherlands - - - 450 10 - - - - - - 10 1) - - -
Norway 4 - - - - - - - - - - - -
Portugal 9,148 5,979 3,557 2,864 2,813 4,928 1,236 1,350 2,285 3,561 2,439 1,900 2,625 2,032 1,746
Spain 23,644 24,847 30,108 29,490 29,180 23,794 31,020 28,118 25,379 21,538 27,683 27,490 23,777 22,622 23,218
UK 23 12 29 13 - - - 5 - - - - - - -
France - - 1 - - - - - - - - - - - -
Total 32,819 30,838 33,695 32,817 32,003 28,722 32,256 29,473 27,664 25,099 30,122 29,390 26,402 24,654 24,9641) Directed fisheries in VIIIa
1) Including directed fishery also in Division IVa.2) Including mixed industrial fishery in the Norwegian Sea3) Imprecise estimates for Sweden: reported catch of 34265 t in 1993 is replaced by the mean of 1992 and 1994, i.e. 2,867 t, and used in the assessment.
5) By-catches of blue whiting in other fisheries.
Table 6.2.4 Landings (tonnes) of BLUE WHITING from the Southern areas (Sub-areas VIII and IX and Divisions VIIg-k and VIId,e)1987–2001, as estimated by the Working Group.
4) Directed fishery
6) For the periode 1987-2000 landings figures also include landings from mixed fisheries in Division Vb.
Table 6.2.3 Landings (tonnes) of BLUE WHITING from directed fisheries and by-catches caught in other fisheries in Divisions IIIa, IVa1987–2001, as estimated by the WG.
28,541 18,144
24,969 24,898 42,956 29,336 22,644 31,977 12,333 78,5653,408
-
48,338 73,00628,81457,458 27,394
6,068 6,066355 705 1,522 1,7947,051 492 3,325 5,281
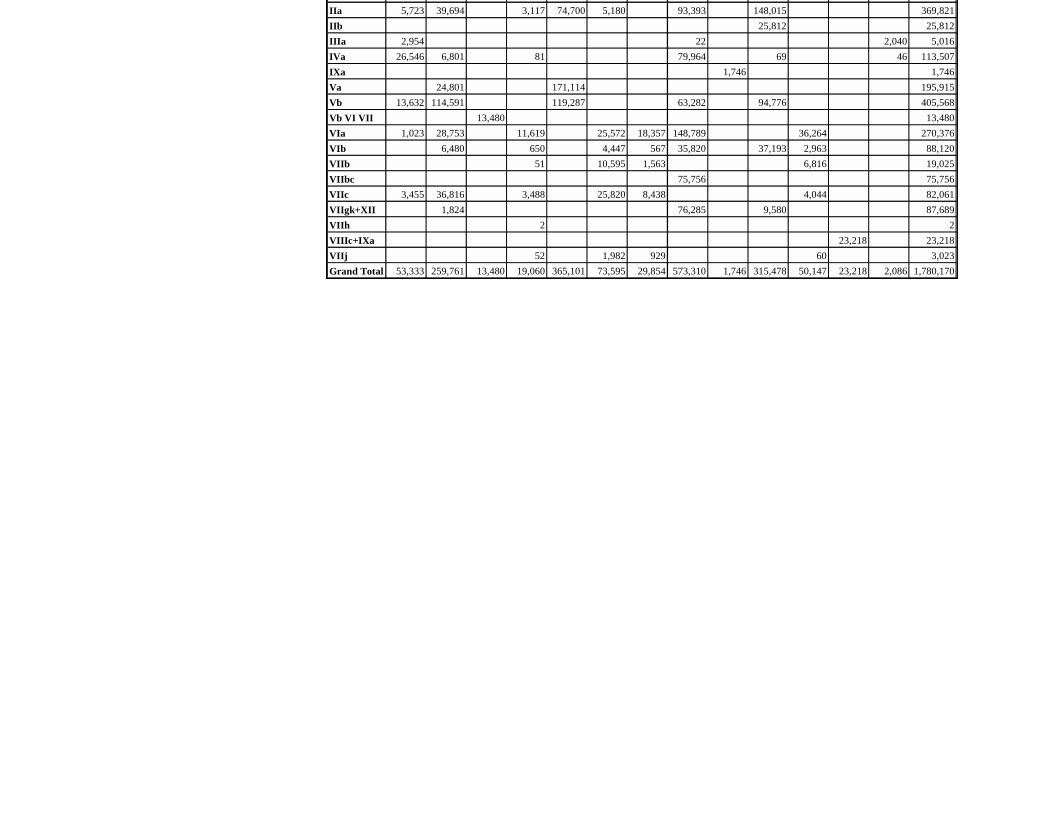
IIa 5,723 39,694 3,117 74,700 5,180 93,393 148,015 369,821IIb 25,812 25,812IIIa 2,954 22 2,040 5,016IVa 26,546 6,801 81 79,964 69 46 113,507IXa 1,746 1,746Va 24,801 171,114 195,915Vb 13,632 114,591 119,287 63,282 94,776 405,568Vb VI VII 13,480 13,480VIa 1,023 28,753 11,619 25,572 18,357 148,789 36,264 270,376VIb 6,480 650 4,447 567 35,820 37,193 2,963 88,120VIIb 51 10,595 1,563 6,816 19,025VIIbc 75,756 75,756VIIc 3,455 36,816 3,488 25,820 8,438 4,044 82,061VIIgk+XII 1,824 76,285 9,580 87,689VIIh 2 2VIIIc+IXa 23,218 23,218VIIj 52 1,982 929 60 3,023Grand Total 53,333 259,761 13,480 19,060 365,101 73,595 29,854 573,310 1,746 315,478 50,147 23,218 2,086 1,780,170
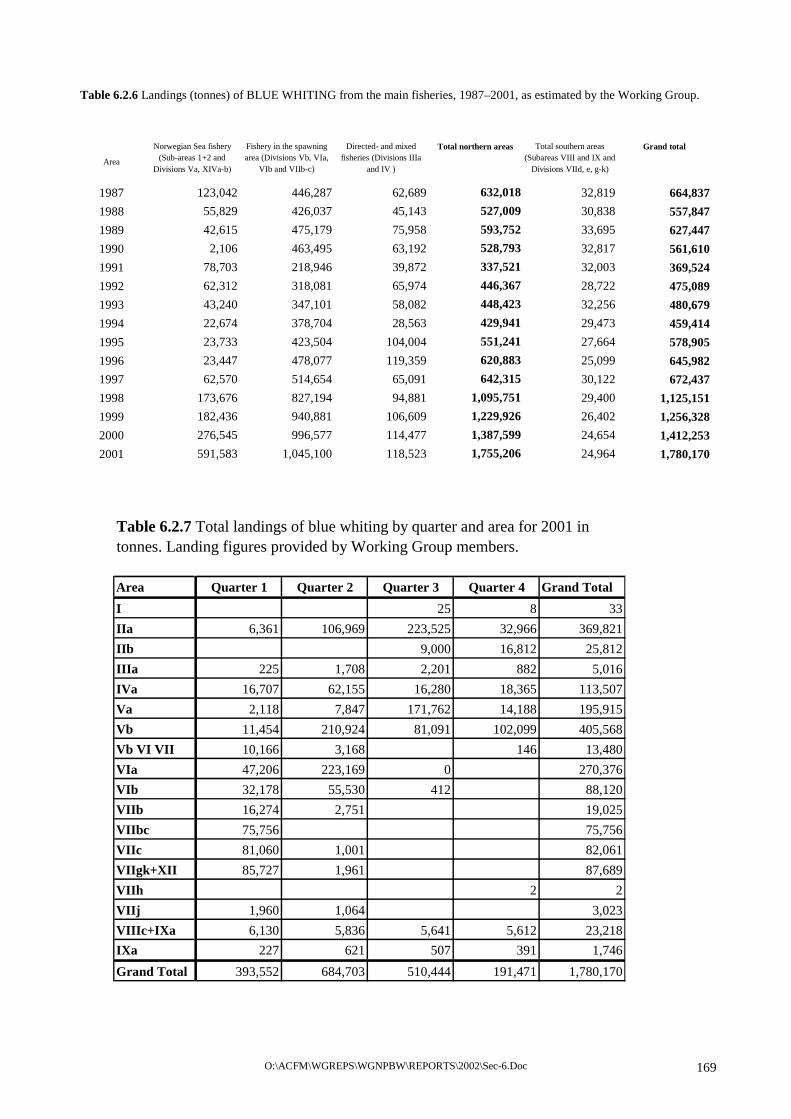
O:\ACFM\WGREPS\WGNPBW\REPORTS\2002\Sec-6.Doc 169
Area
Norwegian Sea fishery (Sub-areas 1+2 and
Divisions Va, XIVa-b)
Fishery in the spawning area (Divisions Vb, VIa,
VIb and VIIb-c)
Directed- and mixed fisheries (Divisions IIIa
and IV )
Total northern areas Total southern areas (Subareas VIII and IX and
Divisions VIId, e, g-k)
Grand total
1987 123,042 446,287 62,689 632,018 32,819 664,8371988 55,829 426,037 45,143 527,009 30,838 557,8471989 42,615 475,179 75,958 593,752 33,695 627,4471990 2,106 463,495 63,192 528,793 32,817 561,6101991 78,703 218,946 39,872 337,521 32,003 369,5241992 62,312 318,081 65,974 446,367 28,722 475,0891993 43,240 347,101 58,082 448,423 32,256 480,6791994 22,674 378,704 28,563 429,941 29,473 459,4141995 23,733 423,504 104,004 551,241 27,664 578,9051996 23,447 478,077 119,359 620,883 25,099 645,9821997 62,570 514,654 65,091 642,315 30,122 672,4371998 173,676 827,194 94,881 1,095,751 29,400 1,125,1511999 182,436 940,881 106,609 1,229,926 26,402 1,256,3282000 276,545 996,577 114,477 1,387,599 24,654 1,412,2532001 591,583 1,045,100 118,523 1,755,206 24,964 1,780,170
Table 6.2.6 Landings (tonnes) of BLUE WHITING from the main fisheries, 1987–2001, as estimated by the Working Group.
Area Quarter 1 Quarter 2 Quarter 3 Quarter 4 Grand TotalI 25 8 33IIa 6,361 106,969 223,525 32,966 369,821IIb 9,000 16,812 25,812IIIa 225 1,708 2,201 882 5,016IVa 16,707 62,155 16,280 18,365 113,507Va 2,118 7,847 171,762 14,188 195,915Vb 11,454 210,924 81,091 102,099 405,568Vb VI VII 10,166 3,168 146 13,480VIa 47,206 223,169 0 270,376VIb 32,178 55,530 412 88,120VIIb 16,274 2,751 19,025VIIbc 75,756 75,756VIIc 81,060 1,001 82,061VIIgk+XII 85,727 1,961 87,689VIIh 2 2VIIj 1,960 1,064 3,023VIIIc+IXa 6,130 5,836 5,641 5,612 23,218IXa 227 621 507 391 1,746Grand Total 393,552 684,703 510,444 191,471 1,780,170
Table 6.2.7 Total landings of blue whiting by quarter and area for 2001 in tonnes. Landing figures provided by Working Group members.

O:\ACFM\WGREPS\WGNPBW\REPORTS\2002\Sec-6.Doc 170
Length Quarter Quarter Quarter Quarter All year(cm) 1 2 3 4
5 6 7 8 9
10 11 12 13 14 15 8 1 816 16 3 2 2117 4 27 44 2 7718 5 58 171 5 24019 5 104 305 13 42720 11 85 232 27 35421 19 46 237 28 33022 43 490 72 30 63523 87 1 489 54 15 1 64524 112 2 469 58 13 2 65225 155 1 611 55 12 1 83426 231 1 628 36 10 1 90627 287 1 774 27 7 2 09428 276 2 273 7 5 2 56129 210 818 7 4 1 03930 136 270 2 3 41131 111 217 1 33032 77 289 1 36733 59 151 2 2 21334 21 29 1 5135 9 18 2736 9 12 2137 1 17 1838 4 11 1539 1 2 340 1 141 42 43 44 45 46 47 48 49 50
TOTAL numbers ('000) 1 899 13 889 1 312 181 17 281
Official Catch (t.) 370 262 614 383 485 815 166 222 1636 683
Table 6.3.1.1. Blue whiting. Landings in numbers ('000) by length group (cm) and quarters for the Northern Area in 2001.

O:\ACFM\WGREPS\WGNPBW\REPORTS\2002\Sec-6.Doc 171
Length Quarter Quarter Quarter Quarter All year(cm) 1 2 3 4
5 6 7 8 9
10 11 12 13 14 1 115 7 2 916 15 3 2 9 2917 9 26 24 21 7918 12 52 51 15 13019 10 92 84 15 20220 12 73 65 27 17721 15 31 60 33 14022 18 62 25 35 14023 19 110 16 18 16424 18 92 16 17 14325 11 95 16 14 13526 12 55 12 14 9327 13 61 7 7 8828 11 40 3 4 5829 8 22 2 3 3530 5 16 1 2 2431 4 9 1 1432 3 6 1 1133 2 3 1 1 734 1 3 1 435 2 236 1 137 2 238 1 139 40 41 42 43 44 45 46 47 48 49 50
TOTAL numbers ('000) 209 858 382 240 1 689
Official Catch (t.) 16 932 63 863 18 481 19 247 118 523
Table 6.3.1.2. Blue whiting. Landings in numbers ('000) by length group (cm) and quarters for the North Sea and Skagerrak in 2001.

O:\ACFM\WGREPS\WGNPBW\REPORTS\2002\Sec-6.Doc 172
Length Quarter Quarter Quarter Quarter All year(cm) 1 2 3 4
5 6 7 8 9
10 11 12 13 14 15 1 116 5 1 1 717 10 7 3 2 2318 9 18 10 6 4219 4 22 18 9 5420 9 15 12 10 4621 17 13 10 12 5122 16 15 11 12 5423 14 11 10 12 4724 9 7 8 8 3125 6 3 6 7 2126 2 2 3 3 1127 1 1 2 2 628 1 1 1 329 130 131 32 33 34 35 36 37 38 39 40 41 42 43 44 45 46 47 48 49 50
TOTAL numbers ('000) 104 116 95 83 398
Official Catch (t.) 6 357 6 457 6 148 6 003 24 964
Table 6.3.1.3. Blue whiting. Landings in numbers ('000) by length group (cm) and quarters for the Southern Area in 2001.
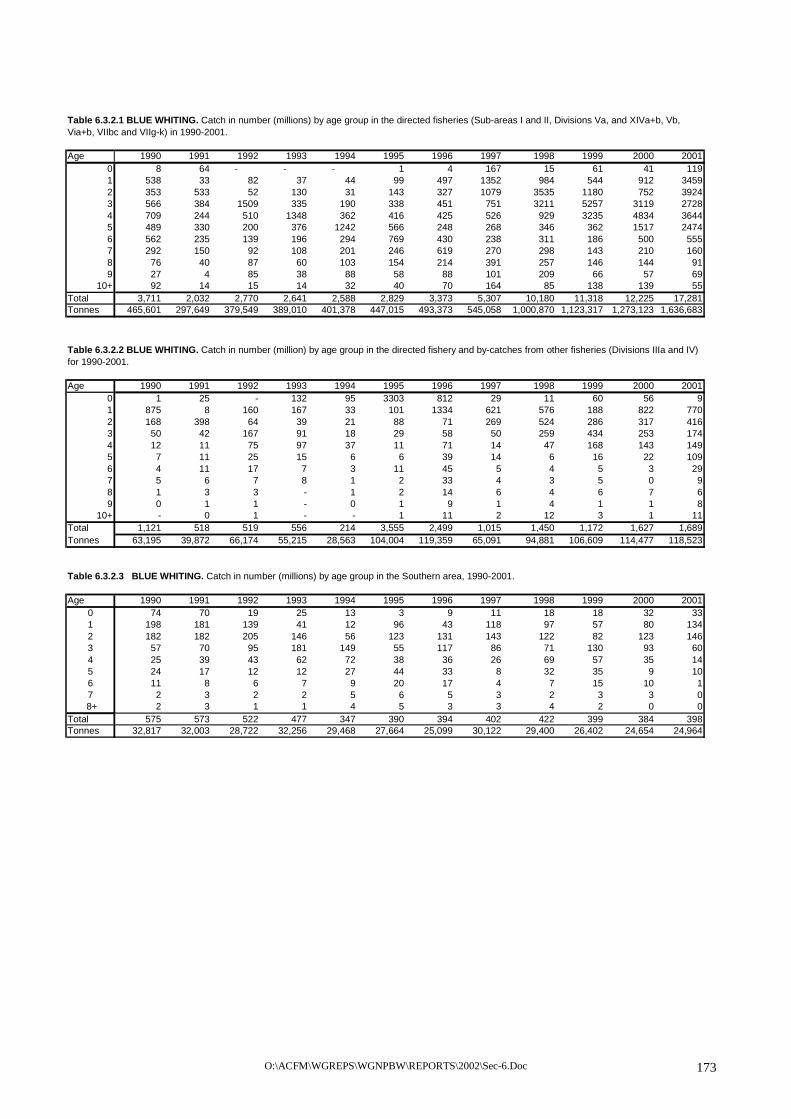
O:\ACFM\WGREPS\WGNPBW\REPORTS\2002\Sec-6.Doc 173
Age 1990 1991 1992 1993 1994 1995 1996 1997 1998 1999 2000 20010 8 64 - - - 1 4 167 15 61 41 1191 538 33 82 37 44 99 497 1352 984 544 912 34592 353 533 52 130 31 143 327 1079 3535 1180 752 39243 566 384 1509 335 190 338 451 751 3211 5257 3119 27284 709 244 510 1348 362 416 425 526 929 3235 4834 36445 489 330 200 376 1242 566 248 268 346 362 1517 24746 562 235 139 196 294 769 430 238 311 186 500 5557 292 150 92 108 201 246 619 270 298 143 210 1608 76 40 87 60 103 154 214 391 257 146 144 919 27 4 85 38 88 58 88 101 209 66 57 69
10+ 92 14 15 14 32 40 70 164 85 138 139 55Total 3,711 2,032 2,770 2,641 2,588 2,829 3,373 5,307 10,180 11,318 12,225 17,281Tonnes 465,601 297,649 379,549 389,010 401,378 447,015 493,373 545,058 1,000,870 1,123,317 1,273,123 1,636,683
Age 1990 1991 1992 1993 1994 1995 1996 1997 1998 1999 2000 20010 1 25 - 132 95 3303 812 29 11 60 56 91 875 8 160 167 33 101 1334 621 576 188 822 7702 168 398 64 39 21 88 71 269 524 286 317 4163 50 42 167 91 18 29 58 50 259 434 253 1744 12 11 75 97 37 11 71 14 47 168 143 1495 7 11 25 15 6 6 39 14 6 16 22 1096 4 11 17 7 3 11 45 5 4 5 3 297 5 6 7 8 1 2 33 4 3 5 0 98 1 3 3 - 1 2 14 6 4 6 7 69 0 1 1 - 0 1 9 1 4 1 1 8
10+ - 0 1 - - 1 11 2 12 3 1 11Total 1,121 518 519 556 214 3,555 2,499 1,015 1,450 1,172 1,627 1,689Tonnes 63,195 39,872 66,174 55,215 28,563 104,004 119,359 65,091 94,881 106,609 114,477 118,523
Table 6.3.2.3 BLUE WHITING. Catch in number (millions) by age group in the Southern area, 1990-2001.
Age 1990 1991 1992 1993 1994 1995 1996 1997 1998 1999 2000 20010 74 70 19 25 13 3 9 11 18 18 32 331 198 181 139 41 12 96 43 118 97 57 80 1342 182 182 205 146 56 123 131 143 122 82 123 1463 57 70 95 181 149 55 117 86 71 130 93 604 25 39 43 62 72 38 36 26 69 57 35 145 24 17 12 12 27 44 33 8 32 35 9 106 11 8 6 7 9 20 17 4 7 15 10 17 2 3 2 2 5 6 5 3 2 3 3 0
8+ 2 3 1 1 4 5 3 3 4 2 0 0Total 575 573 522 477 347 390 394 402 422 399 384 398Tonnes 32,817 32,003 28,722 32,256 29,468 27,664 25,099 30,122 29,400 26,402 24,654 24,964
Table 6.3.2.2 BLUE WHITING. Catch in number (million) by age group in the directed fishery and by-catches from other fisheries (Divisions IIIa and IV) for 1990-2001.
Table 6.3.2.1 BLUE WHITING. Catch in number (millions) by age group in the directed fisheries (Sub-areas I and II, Divisions Va, and XIVa+b, Vb, Via+b, VIIbc and VIIg-k) in 1990-2001.

O:\ACFM\WGREPS\WGNPBW\REPORTS\2002\Sec-6.Doc 174
Table 6.3.2.4 Blue Whiting. Total catch in numbers at age (millions) in 1982-2001
Age 1982 1983 1984 1985 1986 1987 1988 1989 1990 19910 3,512 437 584 1,174 84 341 46 1,949 83 1611 148 2,283 2,291 1,305 650 838 425 865 1,611 2672 274 567 2,331 2,044 816 578 721 718 703 1,0243 326 270 455 1,933 1,862 728 614 1,340 672 5144 548 286 260 303 1,717 1,897 683 791 753 3025 264 299 285 188 393 726 1,303 837 520 3636 276 304 445 321 187 137 618 708 577 2587 266 287 262 257 201 105 84 139 299 1598 272 286 193 174 198 123 53 50 78 499 284 225 154 93 174 103 33 25 27 5
10+ 673 334 255 259 398 195 50 38 95 10Total 6,843 5,578 7,515 8,051 6,680 5,771 4,630 7,460 5,418 3,112
Tonnes 576,419 570,072 641,776 695,596 826,986 664,837 557,847 627,447 561,610 369,524
Age 1992 1993 1994 1995 1996 1997 1998 1999 2000 20010 19 198 42 3,307 833 212 43 139 129 1621 408 263 307 296 1,893 2,131 1,657 788 1,815 4,3642 654 305 108 354 534 1,519 4,181 1,549 1,193 4,4863 1,642 621 368 422 632 904 3,541 5,821 3,466 2,9624 569 1,571 389 465 537 578 1,045 3,461 5,015 3,8075 217 411 1,222 616 323 296 384 413 1,550 2,5936 154 191 281 800 497 252 323 207 514 5867 110 107 174 254 663 282 303 151 213 1708 80 65 90 160 232 407 264 153 151 979 32 38 79 60 98 104 212 69 58 77
10+ 12 17 31 42 83 169 86 141 140 66Total 3,896 3,788 3,091 6,775 6,327 6,854 12,039 12,891 14,244 19,369
Tonnes 475,089 480,679 459,414 578,905 645,982 672,437 1,125,151 1,256,328 1,412,253 1,780,170
The table is revised according to the figures used in the asessment runs (CANUM file). There were minor correction for some years. For 1997 there was a revision from 7,127 to 6,854 mill.

O:\ACFM\WGREPS\WGNPBW\REPORTS\2002\Sec-6.Doc 175
Table 6.3.2.5. Blue whiting. Documentation of “DETAILS OF DATA FILLING-IN” of the landings data for 2001.
Filling-in for record : (1) Denmark 1 IIa Using Only >> (49) Faroe Islands 1 IVa Filling-in for record : (2) Denmark 2 IIa Mean Weighted by Sampled Catches of: >> (46) Faroe Islands 2 IIa >> (110) Iceland 2 IIa >> (122) The Netherlands 2 IIa >> (182) Russia 2 IIa Filling-in for record : (3) Denmark 3 IIa Mean Weighted by Sampled Catches of: >> (47) Faroe Islands 3 IIa >> (111) Iceland 3 IIa >> (155) Norway 3 IIa >> (183) Russia 3 IIa Filling-in for record : (4) Denmark 4 IIa Mean Weighted by Sampled Catches of: >> (48) Faroe Islands 4 IIa >> (112) Iceland 4 IIa >> (184) Russia 4 IIa Filling-in for record : (7) Denmark 3 IIIa Mean Weighted by Sampled Catches of: >> (47) Faroe Islands 3 IIa >> (111) Iceland 3 IIa >> (155) Norway 3 IIa >> (183) Russia 3 IIa Filling-in for record : (8) Denmark 4 IIIa Mean Weighted by Sampled Catches of: >> (48) Faroe Islands 4 IIa >> (112) Iceland 4 IIa >> (184) Russia 4 IIa Filling-in for record : (9) Denmark 1 IVa Using Only >> (49) Faroe Islands 1 IVa Filling-in for record : (10) Denmark 2 IVa Using Only >> (162) Norway 2 IVa Filling-in for record : (11) Denmark 3 IVa Mean Weighted by Sampled Catches of: >> (47) Faroe Islands 3 IIa >> (111) Iceland 3 IIa >> (155) Norway 3 IIa >> (183) Russia 3 IIa Filling-in for record : (12) Denmark 4 IVa Mean Weighted by Sampled Catches of: >> (48) Faroe Islands 4 IIa >> (112) Iceland 4 IIa >> (184) Russia 4 IIa
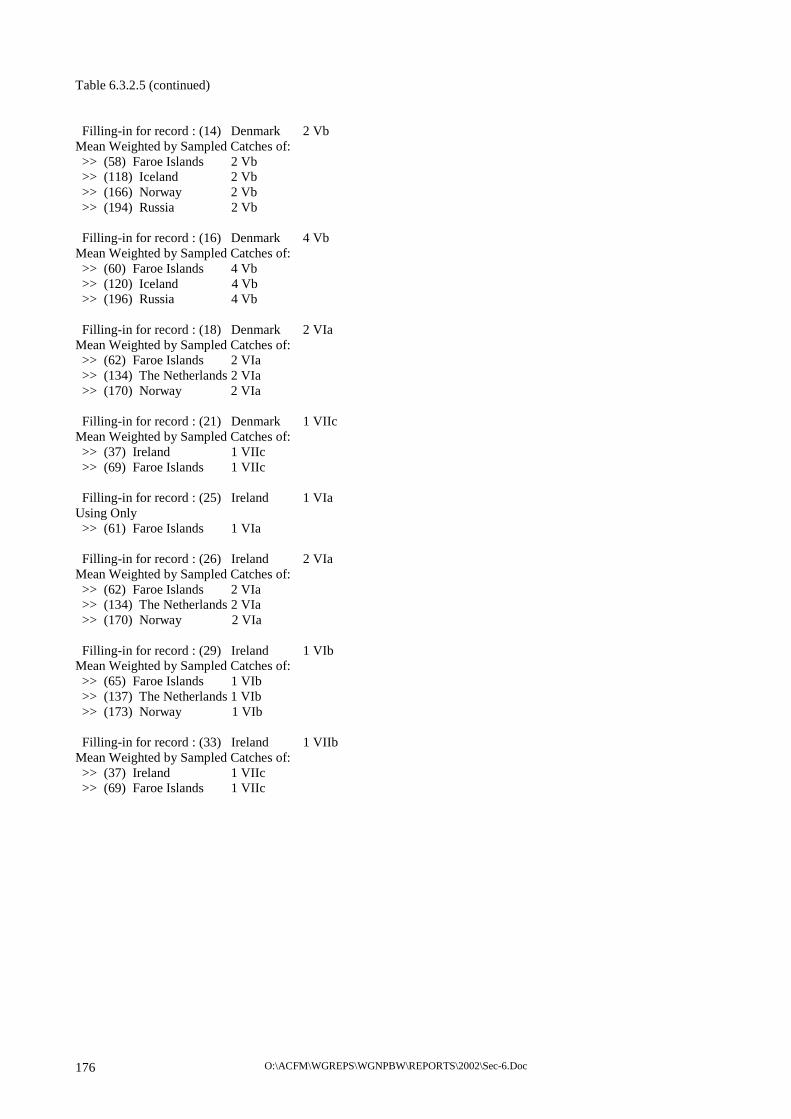
O:\ACFM\WGREPS\WGNPBW\REPORTS\2002\Sec-6.Doc 176
Table 6.3.2.5 (continued) Filling-in for record : (14) Denmark 2 Vb Mean Weighted by Sampled Catches of: >> (58) Faroe Islands 2 Vb >> (118) Iceland 2 Vb >> (166) Norway 2 Vb >> (194) Russia 2 Vb Filling-in for record : (16) Denmark 4 Vb Mean Weighted by Sampled Catches of: >> (60) Faroe Islands 4 Vb >> (120) Iceland 4 Vb >> (196) Russia 4 Vb Filling-in for record : (18) Denmark 2 VIa Mean Weighted by Sampled Catches of: >> (62) Faroe Islands 2 VIa >> (134) The Netherlands 2 VIa >> (170) Norway 2 VIa Filling-in for record : (21) Denmark 1 VIIc Mean Weighted by Sampled Catches of: >> (37) Ireland 1 VIIc >> (69) Faroe Islands 1 VIIc Filling-in for record : (25) Ireland 1 VIa Using Only >> (61) Faroe Islands 1 VIa Filling-in for record : (26) Ireland 2 VIa Mean Weighted by Sampled Catches of: >> (62) Faroe Islands 2 VIa >> (134) The Netherlands 2 VIa >> (170) Norway 2 VIa Filling-in for record : (29) Ireland 1 VIb Mean Weighted by Sampled Catches of: >> (65) Faroe Islands 1 VIb >> (137) The Netherlands 1 VIb >> (173) Norway 1 VIb Filling-in for record : (33) Ireland 1 VIIb Mean Weighted by Sampled Catches of: >> (37) Ireland 1 VIIc >> (69) Faroe Islands 1 VIIc

O:\ACFM\WGREPS\WGNPBW\REPORTS\2002\Sec-6.Doc 177
Table 6.3.2.5. (con't)
Filling-in for record : (34) Ireland 2 VIIb Using Only >> (142) The Netherlands 2 VIIb Filling-in for record : (41) Ireland 1 VIIj Mean Weighted by Sampled Catches of: >> (37) Ireland 1 VIIc >> (69) Faroe Islands 1 VIIc Filling-in for record : (42) Ireland 2 VIIj Using Only >> (174) Norway 2 VIb Filling-in for record : (78) Germany 2 IIa Mean Weighted by Sampled Catches of: >> (46) Faroe Islands 2 IIa >> (110) Iceland 2 IIa >> (122) The Netherlands 2 IIa >> (182) Russia 2 IIa Filling-in for record : (79) Germany 3 IIa Mean Weighted by Sampled Catches of: >> (47) Faroe Islands 3 IIa >> (111) Iceland 3 IIa >> (155) Norway 3 IIa >> (183) Russia 3 IIa Filling-in for record : (80) Germany 4 IIa Mean Weighted by Sampled Catches of: >> (48) Faroe Islands 4 IIa >> (112) Iceland 4 IIa >> (184) Russia 4 IIa Filling-in for record : (82) Germany 2 IVa Using Only >> (162) Norway 2 IVa Filling-in for record : (85) Germany 1 VIa Using Only >> (61) Faroe Islands 1 VIa Filling-in for record : (86) Germany 2 VIa Mean Weighted by Sampled Catches of: >> (62) Faroe Islands 2 VIa >> (134) The Netherlands 2 VIa >> (170) Norway 2 VIa Filling-in for record : (89) Germany 1 VIb Mean Weighted by Sampled Catches of: >> (65) Faroe Islands 1 VIb >> (137) The Netherlands 1 VIb >> (173) Norway 1 VIb Filling-in for record : (93) Germany 1 VIIb Mean Weighted by Sampled Catches of: >> (37) Ireland 1 VIIc >> (69) Faroe Islands 1 VIIc

O:\ACFM\WGREPS\WGNPBW\REPORTS\2002\Sec-6.Doc 178
Table 6.3.2.5. (con't) Filling-in for record : (97) Germany 1 VIIc Mean Weighted by Sampled Catches of: >> (37) Ireland 1 VIIc >> (69) Faroe Islands 1 VIIc Filling-in for record : (104) Germany 4 VIIh Mean Weighted by Sampled Catches of: >> (184) Russia 4 IIa >> (188) Russia 4 IIb >> (56) Faroe Islands 4 Va >> (60) Faroe Islands 4 Vb Filling-in for record : (105) Germany 1 VIIj Mean Weighted by Sampled Catches of: >> (37) Ireland 1 VIIc >> (69) Faroe Islands 1 VIIc Filling-in for record : (106) Germany 2 VIIj Using Only >> (174) Norway 2 VIb Filling-in for record : (117) Iceland 1 Vb Using Only >> (61) Faroe Islands 1 VIa Filling-in for record : (133) Netherlands 1 VIa Using Only >> (61) Faroe Islands 1 VIa Filling-in for record : (141) Netherlands 1 VIIb Mean Weighted by Sampled Catches of: >> (37) Ireland 1 VIIc >> (69) Faroe Islands 1 VIIc Filling-in for record : (146) Netherlands 2 VIIc Using Only >> (174) Norway 2 VIb Filling-in for record : (149) Netherlands 1 VIIj Mean Weighted by Sampled Catches of: >> (37) Ireland 1 VIIc >> (69) Faroe Islands 1 VIIc Filling-in for record : (150) Netherlands 2 VIIj Using Only >> (174) Norway 2 VIb Filling-in for record : (158) Norway 2 IIIa Mean Weighted by Sampled Catches of: >> (46) Faroe Islands 2 IIa >> (110) Iceland 2 IIa >> (122) The Netherlands 2 IIa >> (182) Russia 2 IIa Filling-in for record : (169) Norway 1 VIa Using Only >> (61) Faroe Islands 1 VIa

O:\ACFM\WGREPS\WGNPBW\REPORTS\2002\Sec-6.Doc 179
Table 6.3.2.5. (con't) Filling-in for record : (179) Russia 3 I Using Only >> (180) Russia 4 I Filling-in for record : (181) Russia 1 IIa Using Only >> (49) Faroe Islands 1 IVa Filling-in for record : (187) Russia 3 IIb Using Only >> (188) Russia 4 IIb Filling-in for record : (189) Russia 1 IVa Using Only >> (49) Faroe Islands 1 IVa Filling-in for record : (191) Russia 3 IVa Mean Weighted by Sampled Catches of: >> (47) Faroe Islands 3 IIa >> (111) Iceland 3 IIa >> (155) Norway 3 IIa >> (183) Russia 3 IIa Filling-in for record : (193) Russia 1 Vb Using Only >> (61) Faroe Islands 1 VIa Filling-in for record : (197) Russia 1 VIb Mean Weighted by Sampled Catches of: >> (65) Faroe Islands 1 VIb >> (137) The Netherlands 1 VIb >> (173) Norway 1 VIb Filling-in for record : (198) Russia 2 VIb Using Only >> (174) Norway 2 VIb Filling-in for record : (199) Russia 3 VIb Mean Weighted by Sampled Catches of: >> (55) Faroe Islands 3 Va >> (115) Iceland 3 Va >> (59) Faroe Islands 3 Vb >> (119) Iceland 3 Vb >> (195) Russia 3 Vb Filling-in for record : (201) Russia 1 VIIgk+XII Using Only >> (73) Faroe Islands 1 VIIgk+XII Filling-in for record : (205) Scotland 1 VIa Using Only >> (61) Faroe Islands 1 VIa Filling-in for record : (206) Scotland 2 VIa Mean Weighted by Sampled Catches of: >> (62) Faroe Islands 2 VIa >> (134) The Netherlands 2 VIa >> (170) Norway 2 VIa

O:\ACFM\WGREPS\WGNPBW\REPORTS\2002\Sec-6.Doc 180
Table 6.3.2.5. (con't) Filling-in for record : (207) Scotland 3 VIa Mean Weighted by Sampled Catches of: >> (55) Faroe Islands 3 Va >> (115) Iceland 3 Va >> (59) Faroe Islands 3 Vb >> (119) Iceland 3 Vb >> (195) Russia 3 Vb Filling-in for record : (209) Scotland 1 VIb Mean Weighted by Sampled Catches of: >> (65) Faroe Islands 1 VIb >> (137) The Netherlands 1 VIb >> (173) Norway 1 VIb Filling-in for record : (213) Scotland 1 VIIb Mean Weighted by Sampled Catches of: >> (37) Ireland 1 VIIc >> (69) Faroe Islands 1 VIIc Filling-in for record : (217) Scotland 1 VIIc Mean Weighted by Sampled Catches of: >> (37) Ireland 1 VIIc >> (69) Faroe Islands 1 VIIc Filling-in for record : (221) Scotland 1 VIIj Mean Weighted by Sampled Catches of: >> (37) Ireland 1 VIIc >> (69) Faroe Islands 1 VIIc Filling-in for record : (222) France 1 VbVIVII Mean Weighted by Sampled Catches of: >> (37) Ireland 1 VIIc >> (69) Faroe Islands 1 VIIc Filling-in for record : (223) France 2 VbVIVII Using Only >> (174) Norway 2 VIb Filling-in for record : (225) France 4 VbVIVII Mean Weighted by Sampled Catches of: >> (184) Russia 4 IIa >> (188) Russia 4 IIb >> (56) Faroe Islands 4 Va >> (60) Faroe Islands 4 Vb

O:\ACFM\WGREPS\WGNPBW\REPORTS\2002\Sec-6.Doc 181
Table 6.3.3.1 Blue Whiting. Mean weights at age for the total catch in 1981-2001
Age 1982 1983 1984 1985 1986 1987 1988 1989 1990 19910 0.018 0.020 0.026 0.016 0.030 0.023 0.031 0.014 0.034 0.0361 0.045 0.046 0.035 0.038 0.040 0.048 0.053 0.059 0.045 0.0552 0.072 0.074 0.078 0.074 0.073 0.086 0.076 0.079 0.070 0.0913 0.111 0.118 0.089 0.097 0.108 0.106 0.097 0.103 0.106 0.1074 0.143 0.140 0.132 0.114 0.130 0.124 0.128 0.126 0.123 0.1365 0.156 0.153 0.153 0.157 0.165 0.147 0.142 0.148 0.147 0.1746 0.177 0.176 0.161 0.177 0.199 0.177 0.157 0.158 0.168 0.1907 0.195 0.195 0.175 0.199 0.209 0.208 0.179 0.171 0.175 0.2068 0.200 0.200 0.189 0.208 0.243 0.221 0.199 0.203 0.214 0.2309 0.204 0.204 0.186 0.218 0.246 0.222 0.222 0.224 0.217 0.232
10+ 0.231 0.228 0.206 0.237 0.257 0.254 0.260 0.253 0.256 0.266
Age 1992 1993 1994 1995 1996 1997 1998 1999 2000 20010 0.024 0.028 0.033 0.022 0.018 0.031 0.033 0.035 0.031 0.0381 0.057 0.066 0.061 0.064 0.041 0.047 0.048 0.063 0.057 0.0502 0.083 0.082 0.087 0.091 0.080 0.072 0.072 0.078 0.075 0.0783 0.119 0.109 0.108 0.118 0.102 0.102 0.094 0.088 0.086 0.0944 0.140 0.137 0.137 0.143 0.116 0.121 0.125 0.109 0.104 0.1085 0.167 0.163 0.164 0.154 0.147 0.140 0.149 0.142 0.133 0.1296 0.193 0.177 0.189 0.167 0.170 0.166 0.178 0.170 0.156 0.1637 0.226 0.200 0.207 0.203 0.214 0.177 0.183 0.199 0.179 0.1868 0.235 0.217 0.217 0.206 0.230 0.183 0.188 0.193 0.187 0.1939 0.284 0.225 0.247 0.236 0.238 0.203 0.221 0.192 0.232 0.231
10+ 0.294 0.281 0.254 0.256 0.279 0.232 0.248 0.245 0.241 0.243

O:\ACFM\WGREPS\WGNPBW\REPORTS\2002\Sec-6.Doc 182
Table 6.4.1.1. BLUE WHITING Biomass estimate (million tonnes) in the spawning area.
Table 6.4.1.2. Age stratified estimates of blue whiting in the spawning area west of The British Isles, R.V."J.Hjort" March/April 2002. Numbers in millions, weight in thousand t, mean length in cm, mean weight in grams.
Age 1 2 3 4 5 6 7 8 9+ Total
Numbers 20455 71996 54740 12757 5266 8404 1450 305 15120 175634Percentage 12 41 31 7 3 5 1 0 9 100Mean length 19.7 22.8 25.7 27.4 28.9 29.1 30.1 32.4 33.6 24.2Mean weight 37 55.7 78.3 96.1 114.7 117.4 131.4 180.3 191.4 69.3Weight 757 4010 4286 1226 604 987 191 55 2894 12170
Table 6.4.1.3 Age stratified estimates of blue whiting in the Icelandic EEZ in July 2001Numbers in millions, weight in thousand t, length in cm, mean weight in grams.
Age 0 1 2 3 4 5 6 7 8 9 TotalNumbers 27305 4090 5215 1657 1614 398 132 37 6 2 40456Mean length 15.1 22.4 25.3 26.4 28.1 29.9 31.8 32.6 33.0 37.0 18.3Mean weight 24 72 109 127 143 165 190 218 194 234 50.8Percentage 65.5 10.1 12.9 4.1 4.0 1.0 0.3 0.1 0.0 0.0 100Weight 661 294 568 211 231 66 25 8 1 0 2063
Table 6.4.1.4 Age stratified estimates of blue whiting in the Norwegian Sea, R.V. G.O. Sars, July 2001. Numbers in millions, weight in thousand t, length in cm, mean weight in grams.
Age 0 1 2 3 4 5 6 7 8 9 TotalNumbers 641 61470 22051 7883 3225 1824 156 12 0 68 97330Mean length 16.32 20.18 24.00 25.55 27.14 28.28 29.47 31.17 0.0 38.49 21.9Mean weight 25 47 78 91 106 119 124 147 0 345 61.8Percentage 0.7 63.2 22.7 8.1 3.3 1.9 0.2 0.0 0.0 0.1 100.0Weight 16 2866 1715 713 342 216 19 2 0 23 5913
Russia Russia Norway Norway Faroes FaroesYear total spawning total spawning total spawning
1983 3.6 3.6 4.7 4.41984 3.4 2.7 2.8 2.1 2.4 2.21985 2.8 2.7 6.4 1.71986 6.4 5.6 2.6 2.01987 5.4 5.1 4.3 4.11988 3.7 3.1 7.1 6.81989 6.3 5.7 7.0 6.11990 5.4 5.1 6.3 5.71991 4.6 4.2 5.1 4.81992 3.6 3.3 4.3 4.21993 3.8 3.7 5.2 5.01994 4.1 4.11995 6.8 6.0 6.7 6.11996 7.1 5.8 5.1 4.519971998 5.5 4.71999 8.9 8.52000 8.3 7.82001 6.7 5.62002 5.2 12.2 10.9
Mean 4.9 4.4 5.9 5.4 4.4 2.0

O:\ACFM\WGREPS\WGNPBW\REPORTS\2002\Sec-6.Doc 183
Table 6.4.2.1 Stratified mean catch (Kg/haul and Number/haul) and standard error of BLUE WHITING in bottom trawl surveys in Spanish waters (Divisions VIIIc and IXa north). All surveys in September-October.
Kg/haul 30-100 m 101-200 m 201-500 m TOTAL 30-500 mMean SD Mean SD Mean SD Mean SD
1985 9.50 5.87 119.75 45.99 68.18 13.79 92.83 28.241986 9.74 7.13 45.41 12.37 29.54 8.70 36.93 7.951987 - - - - - - - -1988 2.90 2.59 154.12 38.69 183.07 141.94 143.30 45.841989 14.17 12.03 76.92 17.08 18.79 6.23 59.00 11.681990 6.25 3.29 52.54 9.00 18.80 4.99 43.60 6.601991 64.59 34.65 126.41 26.06 46.07 18.99 97.10 17.161992 6.37 2.59 44.12 6.64 29.50 6.16 34.60 4.231993 1.06 0.63 14.07 3.73 51.08 22.02 22.59 6.441994 8.04 5.28 37.18 8.45 25.42 5.27 29.70 5.191995 19.97 13.87 36.43 4.82 15.97 4.10 28.52 3.661996 7.27 3.95 49.23 7.19 92.54 17.76 54.52 6.36
70-120 m 121-200 m 201-500 m TOTAL 70-500 m1997 17.87 7.35 44.68 10.52 57.14 16.60 42.62 7.291998 14.13 4.17 42.78 8.13 78.88 22.01 47.14 7.581999 92.66 14.60 111.76 19.87 169.21 50.26 124.27 17.832000 62.39 12.00 91.99 14.75 58.72 24.94 76.19 10.612001 8.35 3.31 50.18 10.09 52.41 16.71 42.02 7.02
Number/haul 30-100 m 101-200 m 201-500 m TOTAL 30-500 mMean SD Mean SD Mean SD Mean SD
1985 267 181.71 3669 1578.86 1377 262.98 2644 963.201986 368 237.56 2486 1006.67 752 238.87 1763 616.401987 - - - - - - - -1988 83 71.74 6112 1847.36 7276 6339.88 5694 2086.001989 629 537.29 3197 876.75 566 213.11 2412 599.001990 220 115.48 2219 426.46 578 185.43 1722 276.001991 2922 1645.73 5563 1184.69 1789 847.33 4214 780.881992 124 50.81 1412 233.99 845 199.12 1069 146.871993 14 8.61 257 69.61 894 427.77 401 124.531994 346 234.12 2002 456.50 997 245.91 1487 689.001995 1291 864.97 2004 341.48 485 137.81 1493 240.371996 147 82.71 1167 167.20 2097 385.23 1263 142.30
70-120 m 121-200 m 201-500 m TOTAL 70-500 m1997 552 235.60 1443 361.89 1183 323.14 1180 209.941998 351 105.96 1463 320.26 2012 590.04 1387 234.821999 2502 427.23 4358 847.87 6119 2026.39 4474 727.322000 2267 414.97 3930 604.11 2009 859.71 3027 400.872001 171 77.34 1310 263.84 1232 381.49 1048 172.74

O:\ACFM\WGREPS\WGNPBW\REPORTS\2002\Sec-6.Doc 184
Table 6.4.2.2 BLUE WHITING. Stratified mean catch (Kg/haul ) and standard error of in bottom trawl surveys in Portuguese waters (Division IXa ).
20-100 m 100-200 m 200-500 m 500-750 m TOTAL: 20-500 m TOTAL: 20-750 mYear Month y sy y sy y sy y sy y sy y sy1979 June 0 0 33 23 86 35 - - 31 12 - -
Oct./Nov. 5 5 17 8 103 48 - - 28 9 - -
1980 March 0 0 178 173 5 1 - - 72 69 - -May/June 1 3 4 2 45 18 - - 11 4 - -October 4 3 10 4 587 306 - - 117 58 - -
1981 March 0 0 24 17 186 113 - - 42 22 - -June 0 0 4 2 178 25 - - 34 4 - -
1982 April/May 0 0 3 3 136 39 - - 26 7 - -September 1 1 85 42 271 123 - - 86 29 - -
1983 March 1 1 14 10 259 96 - - 54 18 - -June 0 0 23 8 177 47 - - 42 9 - -
1985 June 0 0 194 146 405 162 - - 159 68 - -October 4 3 133 84 341 39 - - 120 35 - -
1986 June 4 1 59 19 196 31 - - 65 10 - -October 2 1 357 144 650 111 - - 276 63 - -
1987 October 3 0 297 64 747 229 - - 263 50 - -
1988 October 4 2 165 47 457 106 - - 155 28 - -
1989 July 0 0 42 21 323 143 79 36 - - 78 24October 7 4 70 26 306 84 24 2 - - 79 16
1990 July 2 2 153 103 242 42 50 5 - - 96 35October 11 5 90 28 762 234 42 10 - - 153 35
1991 July 1 1 140 40 268 38 64 18 - - 98 15October 8 5 83 18 259 53 121 27 - - 91 11
1992 February 7 7 43 35 249 21 73 3 68 12July 1 1 29 18 216 43 27 5 - - 47 9October 1 1 22 7 208 44 80 3 - - 54 7
1993 February 0 0 19 14 105 31 36 0 - - 42 10July 0 0 3 3 151 28 55 5 - - 34 4November 0 0 90 0 189 43 6 1 - - 86 9
1994 October 0 0 374 30 283 32 49 7 - - 174 11
1995 July 0 0 18 14 130 20 52 3 - - 35 5October 18 15 103 21 328 91 31 12 - - 94 16
1996 October 25 24 12 2 36 6 25 7 22 8
1997 June 0 0 3 3 116 42 45 12 - - 27 7October 2 1 54 20 77 13 7 2 - - 32 8
1998 July 0 0 8 5 105 17 38 3 - - 25 3October 1 1 384 87 427 101 20 2 - - 212 36
1999 July 1 60 66 25 - - 37 n/aOctober 0 70 78 18 - - 41 n/a
2000 July n/a n/a n/a n/a - - n/a n/aOctober n/a n/a n/a n/a - - n/a n/a
2001 July n/a n/a n/a n/a - - n/a n/aOctober n/a n/a n/a n/a - - n/a n/a
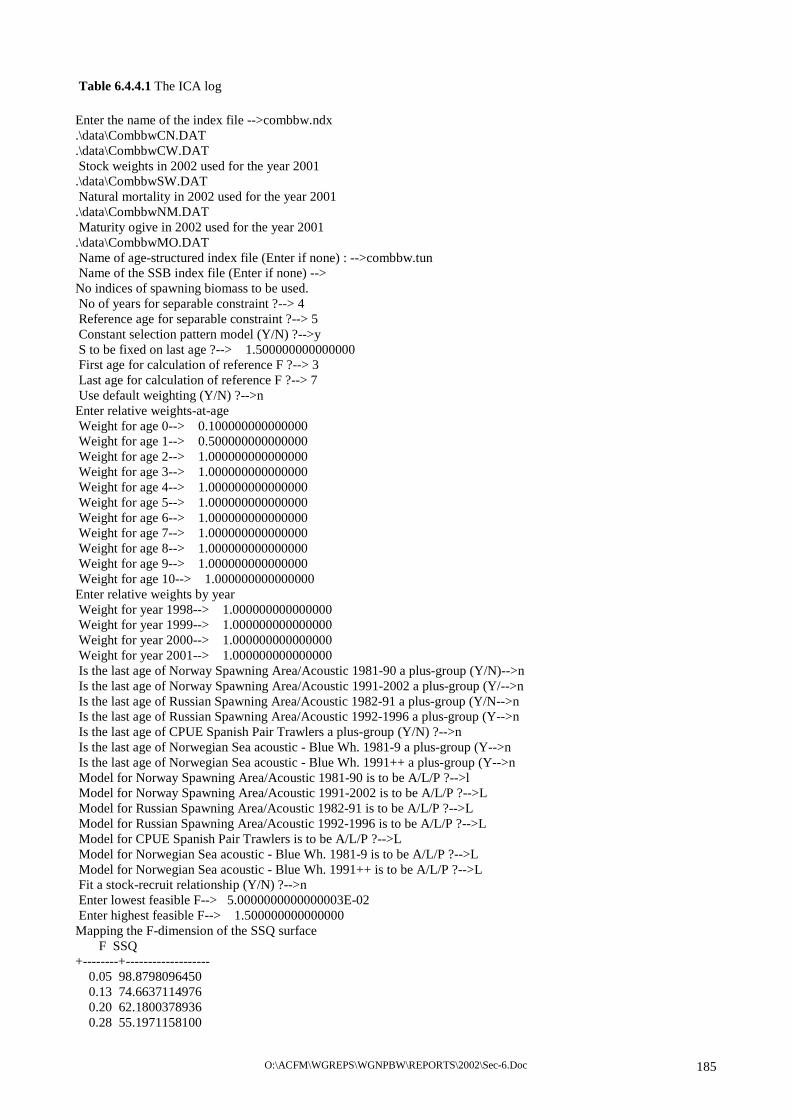
O:\ACFM\WGREPS\WGNPBW\REPORTS\2002\Sec-6.Doc 185
Table 6.4.4.1 The ICA log
Enter the name of the index file -->combbw.ndx .\data\CombbwCN.DAT .\data\CombbwCW.DAT Stock weights in 2002 used for the year 2001 .\data\CombbwSW.DAT Natural mortality in 2002 used for the year 2001 .\data\CombbwNM.DAT Maturity ogive in 2002 used for the year 2001 .\data\CombbwMO.DAT Name of age-structured index file (Enter if none) : -->combbw.tun Name of the SSB index file (Enter if none) --> No indices of spawning biomass to be used. No of years for separable constraint ?--> 4 Reference age for separable constraint ?--> 5 Constant selection pattern model (Y/N) ?-->y S to be fixed on last age ?--> 1.500000000000000 First age for calculation of reference F ?--> 3 Last age for calculation of reference F ?--> 7 Use default weighting (Y/N) ?-->n Enter relative weights-at-age Weight for age 0--> 0.100000000000000 Weight for age 1--> 0.500000000000000 Weight for age 2--> 1.000000000000000 Weight for age 3--> 1.000000000000000 Weight for age 4--> 1.000000000000000 Weight for age 5--> 1.000000000000000 Weight for age 6--> 1.000000000000000 Weight for age 7--> 1.000000000000000 Weight for age 8--> 1.000000000000000 Weight for age 9--> 1.000000000000000 Weight for age 10--> 1.000000000000000 Enter relative weights by year Weight for year 1998--> 1.000000000000000 Weight for year 1999--> 1.000000000000000 Weight for year 2000--> 1.000000000000000 Weight for year 2001--> 1.000000000000000 Is the last age of Norway Spawning Area/Acoustic 1981-90 a plus-group (Y/N)-->n Is the last age of Norway Spawning Area/Acoustic 1991-2002 a plus-group (Y/-->n Is the last age of Russian Spawning Area/Acoustic 1982-91 a plus-group (Y/N-->n Is the last age of Russian Spawning Area/Acoustic 1992-1996 a plus-group (Y-->n Is the last age of CPUE Spanish Pair Trawlers a plus-group (Y/N) ?-->n Is the last age of Norwegian Sea acoustic - Blue Wh. 1981-9 a plus-group (Y-->n Is the last age of Norwegian Sea acoustic - Blue Wh. 1991++ a plus-group (Y-->n Model for Norway Spawning Area/Acoustic 1981-90 is to be A/L/P ?-->l Model for Norway Spawning Area/Acoustic 1991-2002 is to be A/L/P ?-->L Model for Russian Spawning Area/Acoustic 1982-91 is to be A/L/P ?-->L Model for Russian Spawning Area/Acoustic 1992-1996 is to be A/L/P ?-->L Model for CPUE Spanish Pair Trawlers is to be A/L/P ?-->L Model for Norwegian Sea acoustic - Blue Wh. 1981-9 is to be A/L/P ?-->L Model for Norwegian Sea acoustic - Blue Wh. 1991++ is to be A/L/P ?-->L Fit a stock-recruit relationship (Y/N) ?-->n Enter lowest feasible F--> 5.0000000000000003E-02 Enter highest feasible F--> 1.500000000000000 Mapping the F-dimension of the SSQ surface F SSQ +--------+------------------- 0.05 98.8798096450 0.13 74.6637114976 0.20 62.1800378936 0.28 55.1971158100

O:\ACFM\WGREPS\WGNPBW\REPORTS\2002\Sec-6.Doc 186
Table 6.4.4.1 (continued) 0.36 51.0669668497 0.43 48.5153805483 0.51 46.8922504108 0.58 45.8469441609 0.66 45.1802269083 0.74 44.7733502752 0.81 44.5524529617 0.89 44.4698532447 0.97 44.4938029246 1.04 44.6056529037 1.12 44.7935885707 1.19 45.0405209983 1.27 45.3393179482 1.35 45.6854065908 1.42 46.0763528290 1.50 46.5117273685 Lowest SSQ is for F = 0.908 ----------------------------------------------------------------- No of years for separable analysis : 4 Age range in the analysis : 0 . . . 10 Year range in the analysis : 1981 . . . 2001 Number of indices of SSB : 0 Number of age-structured indices : 7 Parameters to estimate : 71 Number of observations : 497 Conventional single selection vector model to be fitted. ----------------------------------------------------------------- Survey weighting to be Manual (recommended) or Iterative (M/I) ?-->m Enter weight for Norway Spawning Area/Acoustic 1981-90 at age 2--> 1.000000000000000 Enter weight for Norway Spawning Area/Acoustic 1981-90 at age 3--> 1.000000000000000 Enter weight for Norway Spawning Area/Acoustic 1981-90 at age 4--> 1.000000000000000 Enter weight for Norway Spawning Area/Acoustic 1981-90 at age 5--> 1.000000000000000 Enter weight for Norway Spawning Area/Acoustic 1981-90 at age 6--> 1.000000000000000 Enter weight for Norway Spawning Area/Acoustic 1981-90 at age 7--> 1.000000000000000 Enter weight for Norway Spawning Area/Acoustic 1981-90 at age 8--> 1.000000000000000 Enter weight for Norway Spawning Area/Acoustic 1991-2002 at age 2--> 1.000000000000000 Enter weight for Norway Spawning Area/Acoustic 1991-2002 at age 3--> 1.000000000000000 Enter weight for Norway Spawning Area/Acoustic 1991-2002 at age 4--> 1.000000000000000 Enter weight for Norway Spawning Area/Acoustic 1991-2002 at age 5--> 1.000000000000000 Enter weight for Norway Spawning Area/Acoustic 1991-2002 at age 6--> 1.000000000000000 Enter weight for Norway Spawning Area/Acoustic 1991-2002 at age 7--> 1.000000000000000 Enter weight for Norway Spawning Area/Acoustic 1991-2002 at age 8--> 1.000000000000000 Enter weight for Russian Spawning Area/Acoustic 1982-91 at age 3--> 1.000000000000000 Enter weight for Russian Spawning Area/Acoustic 1982-91 at age 4--> 1.000000000000000 Enter weight for Russian Spawning Area/Acoustic 1982-91 at age 5--> 1.000000000000000 Enter weight for Russian Spawning Area/Acoustic 1982-91 at age 6--> 1.000000000000000 Enter weight for Russian Spawning Area/Acoustic 1982-91 at age 7--> 1.000000000000000 Enter weight for Russian Spawning Area/Acoustic 1982-91 at age 8--> 1.000000000000000 Enter weight for Russian Spawning Area/Acoustic 1992-1996 at age 3--> 1.000000000000000 Enter weight for Russian Spawning Area/Acoustic 1992-1996 at age 4--> 1.000000000000000 Enter weight for Russian Spawning Area/Acoustic 1992-1996 at age 5--> 1.000000000000000 Enter weight for Russian Spawning Area/Acoustic 1992-1996 at age 6--> 1.000000000000000 Enter weight for Russian Spawning Area/Acoustic 1992-1996 at age 7--> 1.000000000000000 Enter weight for Russian Spawning Area/Acoustic 1992-1996 at age 8--> 1.000000000000000 Enter weight for CPUE Spanish Pair Trawlers at age 1--> 1.0000000000000000E-02 Enter weight for CPUE Spanish Pair Trawlers at age 2--> 1.000000000000000 Enter weight for CPUE Spanish Pair Trawlers at age 3--> 1.000000000000000 Enter weight for CPUE Spanish Pair Trawlers at age 4--> 1.000000000000000 Enter weight for CPUE Spanish Pair Trawlers at age 5--> 1.000000000000000 Enter weight for CPUE Spanish Pair Trawlers at age 6--> 1.000000000000000 Enter weight for Norwegian Sea acoustic - Blue Wh. 1981-9 at age 1--> 1.000000000000000

O:\ACFM\WGREPS\WGNPBW\REPORTS\2002\Sec-6.Doc 187
Table 6.4.4.1 (continued) Enter weight for Norwegian Sea acoustic - Blue Wh. 1981-9 at age 2--> 1.000000000000000 Enter weight for Norwegian Sea acoustic - Blue Wh. 1981-9 at age 3--> 1.000000000000000 Enter weight for Norwegian Sea acoustic - Blue Wh. 1981-9 at age 4--> 1.000000000000000 Enter weight for Norwegian Sea acoustic - Blue Wh. 1981-9 at age 5--> 1.000000000000000 Enter weight for Norwegian Sea acoustic - Blue Wh. 1981-9 at age 6--> 1.000000000000000 Enter weight for Norwegian Sea acoustic - Blue Wh. 1981-9 at age 7--> 1.000000000000000 Enter weight for Norwegian Sea acoustic - Blue Wh. 1991++ at age 1--> 1.000000000000000 Enter weight for Norwegian Sea acoustic - Blue Wh. 1991++ at age 2--> 1.000000000000000 Enter weight for Norwegian Sea acoustic - Blue Wh. 1991++ at age 3--> 1.000000000000000 Enter weight for Norwegian Sea acoustic - Blue Wh. 1991++ at age 4--> 1.000000000000000 Enter weight for Norwegian Sea acoustic - Blue Wh. 1991++ at age 5--> 1.000000000000000 Enter weight for Norwegian Sea acoustic - Blue Wh. 1991++ at age 6--> 1.000000000000000 Enter weight for Norwegian Sea acoustic - Blue Wh. 1991++ at age 7--> 1.000000000000000 Enter estimates of the extent to which errors in the age-structured indices are correlated across ages. This can be in the range 0 (independence) to 1 (correlated errors). Enter value for Norway Spawning Area/Acoustic 1981-90--> 1.000000000000000 Enter value for Norway Spawning Area/Acoustic 1991-2002--> 1.000000000000000 Enter value for Russian Spawning Area/Acoustic 1982-91--> 1.000000000000000 Enter value for Russian Spawning Area/Acoustic 1992-1996--> 1.000000000000000 Enter value for CPUE Spanish Pair Trawlers--> 1.000000000000000 Enter value for Norwegian Sea acoustic - Blue Wh. 1981-9--> 1.000000000000000 Enter value for Norwegian Sea acoustic - Blue Wh. 1991++--> 1.000000000000000 Do you want to shrink the final fishing mortality (Y/N) ?-->N Aged index weights Norway Spawning Area/Acoustic 1981-90 Age : 2 3 4 5 6 7 8 Wts : 0.143 0.143 0.143 0.143 0.143 0.143 0.143 Norway Spawning Area/Acoustic 1991-2002 Age : 2 3 4 5 6 7 8 Wts : 0.143 0.143 0.143 0.143 0.143 0.143 0.143 Russian Spawning Area/Acoustic 1982-91 Age : 3 4 5 6 7 8 Wts : 0.167 0.167 0.167 0.167 0.167 0.167 Russian Spawning Area/Acoustic 1992-1996 Age : 3 4 5 6 7 8 Wts : 0.167 0.167 0.167 0.167 0.167 0.167 CPUE Spanish Pair Trawlers Age : 1 2 3 4 5 6 Wts : 0.002 0.167 0.167 0.167 0.167 0.167 Norwegian Sea acoustic - Blue Wh. 1981-9 Age : 1 2 3 4 5 6 7 Wts : 0.143 0.143 0.143 0.143 0.143 0.143 0.143 Norwegian Sea acoustic - Blue Wh. 1991++ Age : 1 2 3 4 5 6 7 Wts : 0.143 0.143 0.143 0.143 0.143 0.143 0.143 F in 2001 at age 5 is 0.793101 in iteration 1 Detailed, Normal or Summary output (D/N/S)-->D Output page width in characters (e.g. 80..132) ?--> 80 Estimate historical assessment uncertainty ?-->n Succesful exit from ICA
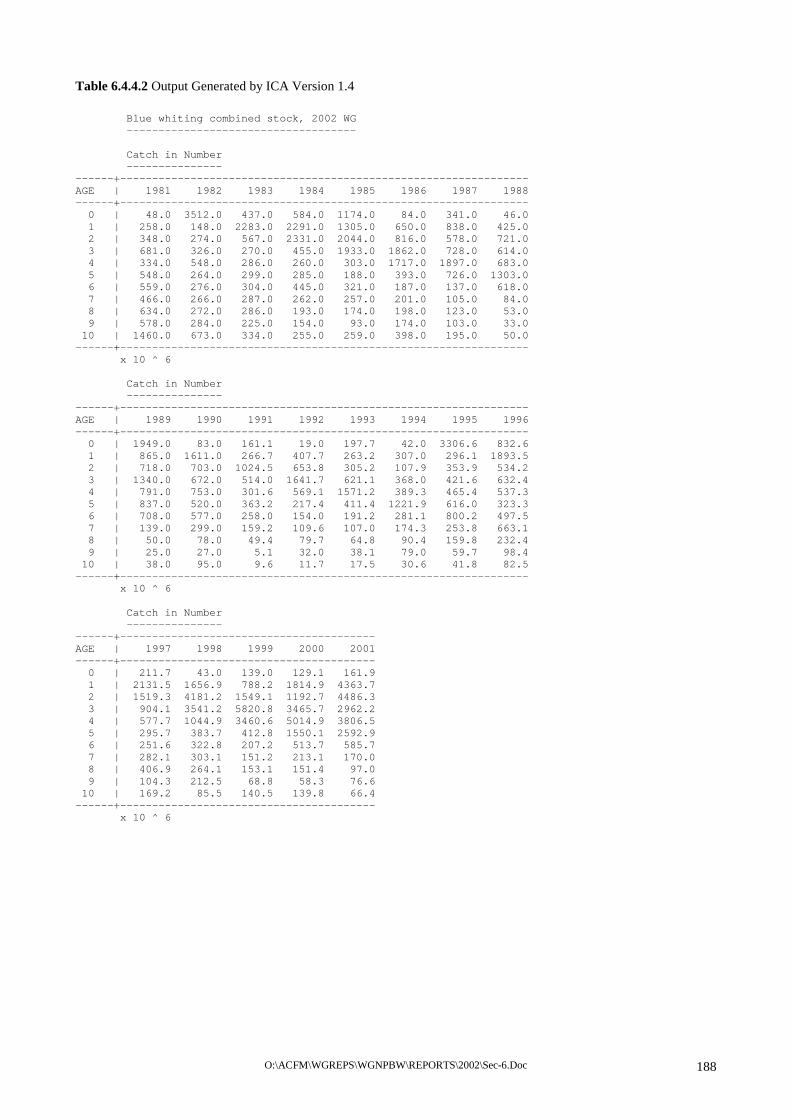
O:\ACFM\WGREPS\WGNPBW\REPORTS\2002\Sec-6.Doc 188
Table 6.4.4.2 Output Generated by ICA Version 1.4
Blue whiting combined stock, 2002 WG ------------------------------------ Catch in Number --------------- ------+---------------------------------------------------------------- AGE | 1981 1982 1983 1984 1985 1986 1987 1988 ------+---------------------------------------------------------------- 0 | 48.0 3512.0 437.0 584.0 1174.0 84.0 341.0 46.0 1 | 258.0 148.0 2283.0 2291.0 1305.0 650.0 838.0 425.0 2 | 348.0 274.0 567.0 2331.0 2044.0 816.0 578.0 721.0 3 | 681.0 326.0 270.0 455.0 1933.0 1862.0 728.0 614.0 4 | 334.0 548.0 286.0 260.0 303.0 1717.0 1897.0 683.0 5 | 548.0 264.0 299.0 285.0 188.0 393.0 726.0 1303.0 6 | 559.0 276.0 304.0 445.0 321.0 187.0 137.0 618.0 7 | 466.0 266.0 287.0 262.0 257.0 201.0 105.0 84.0 8 | 634.0 272.0 286.0 193.0 174.0 198.0 123.0 53.0 9 | 578.0 284.0 225.0 154.0 93.0 174.0 103.0 33.0 10 | 1460.0 673.0 334.0 255.0 259.0 398.0 195.0 50.0 ------+---------------------------------------------------------------- x 10 ^ 6 Catch in Number --------------- ------+---------------------------------------------------------------- AGE | 1989 1990 1991 1992 1993 1994 1995 1996 ------+---------------------------------------------------------------- 0 | 1949.0 83.0 161.1 19.0 197.7 42.0 3306.6 832.6 1 | 865.0 1611.0 266.7 407.7 263.2 307.0 296.1 1893.5 2 | 718.0 703.0 1024.5 653.8 305.2 107.9 353.9 534.2 3 | 1340.0 672.0 514.0 1641.7 621.1 368.0 421.6 632.4 4 | 791.0 753.0 301.6 569.1 1571.2 389.3 465.4 537.3 5 | 837.0 520.0 363.2 217.4 411.4 1221.9 616.0 323.3 6 | 708.0 577.0 258.0 154.0 191.2 281.1 800.2 497.5 7 | 139.0 299.0 159.2 109.6 107.0 174.3 253.8 663.1 8 | 50.0 78.0 49.4 79.7 64.8 90.4 159.8 232.4 9 | 25.0 27.0 5.1 32.0 38.1 79.0 59.7 98.4 10 | 38.0 95.0 9.6 11.7 17.5 30.6 41.8 82.5 ------+---------------------------------------------------------------- x 10 ^ 6 Catch in Number --------------- ------+---------------------------------------- AGE | 1997 1998 1999 2000 2001 ------+---------------------------------------- 0 | 211.7 43.0 139.0 129.1 161.9 1 | 2131.5 1656.9 788.2 1814.9 4363.7 2 | 1519.3 4181.2 1549.1 1192.7 4486.3 3 | 904.1 3541.2 5820.8 3465.7 2962.2 4 | 577.7 1044.9 3460.6 5014.9 3806.5 5 | 295.7 383.7 412.8 1550.1 2592.9 6 | 251.6 322.8 207.2 513.7 585.7 7 | 282.1 303.1 151.2 213.1 170.0 8 | 406.9 264.1 153.1 151.4 97.0 9 | 104.3 212.5 68.8 58.3 76.6 10 | 169.2 85.5 140.5 139.8 66.4 ------+---------------------------------------- x 10 ^ 6

O:\ACFM\WGREPS\WGNPBW\REPORTS\2002\Sec-6.Doc 189
Table 6.4.4.2 (continued) Predicted Catch in Number ------------------------- ------+-------------------------------- AGE | 1998 1999 2000 2001 ------+-------------------------------- 0 | 37.9 89.7 226.8 161.9 1 | 1143.6 672.0 2536.3 5315.3 2 | 3339.1 1586.6 1472.7 4514.9 3 | 3269.4 5663.9 4089.7 2957.7 4 | 1420.8 2466.9 6355.3 3309.8 5 | 504.7 508.6 1352.4 2399.3 6 | 353.3 230.4 352.9 660.8 7 | 252.2 174.3 170.9 182.6 8 | 223.3 128.4 130.4 86.2 9 | 212.5 75.9 65.1 42.6 ------+-------------------------------- x 10 ^ 6 Weights-at-age in the catches (Kg) ---------------------------------- ------+---------------------------------------------------------------- AGE | 1981 1982 1983 1984 1985 1986 1987 1988 ------+---------------------------------------------------------------- 0 | 0.03800 0.01800 0.02000 0.02600 0.01600 0.03000 0.02300 0.03100 1 | 0.05200 0.04500 0.04600 0.03500 0.03800 0.04000 0.04800 0.05300 2 | 0.06500 0.07200 0.07400 0.07800 0.07400 0.07300 0.08600 0.07600 3 | 0.10300 0.11100 0.11800 0.08900 0.09700 0.10800 0.10600 0.09700 4 | 0.12500 0.14300 0.14000 0.13200 0.11400 0.13000 0.12400 0.12800 5 | 0.14100 0.15600 0.15300 0.15300 0.15700 0.16500 0.14700 0.14200 6 | 0.15500 0.17700 0.17600 0.16100 0.17700 0.19900 0.17700 0.15700 7 | 0.17000 0.19500 0.19500 0.17500 0.19900 0.20900 0.20800 0.17900 8 | 0.17800 0.20000 0.20000 0.18900 0.20800 0.24300 0.22100 0.19900 9 | 0.18700 0.20400 0.20400 0.18600 0.21800 0.24600 0.22200 0.22200 10 | 0.21300 0.23100 0.22800 0.20600 0.23700 0.25700 0.25400 0.26000 ------+---------------------------------------------------------------- Weights-at-age in the catches (Kg) ---------------------------------- ------+---------------------------------------------------------------- AGE | 1989 1990 1991 1992 1993 1994 1995 1996 ------+---------------------------------------------------------------- 0 | 0.01400 0.03400 0.03600 0.02400 0.02800 0.03300 0.02200 0.01800 1 | 0.05900 0.04500 0.05500 0.05700 0.06600 0.06100 0.06400 0.04100 2 | 0.07900 0.07000 0.09100 0.08300 0.08200 0.08700 0.09100 0.08000 3 | 0.10300 0.10600 0.10700 0.11900 0.10900 0.10800 0.11800 0.10200 4 | 0.12600 0.12300 0.13600 0.14000 0.13700 0.13700 0.14300 0.11600 5 | 0.14800 0.14700 0.17400 0.16700 0.16300 0.16400 0.15400 0.14700 6 | 0.15800 0.16800 0.19000 0.19300 0.17700 0.18900 0.16700 0.17000 7 | 0.17100 0.17500 0.20600 0.22600 0.20000 0.20700 0.20300 0.21400 8 | 0.20300 0.21400 0.23000 0.23500 0.21700 0.21700 0.20600 0.23000 9 | 0.22400 0.21700 0.23200 0.28400 0.22500 0.24700 0.23600 0.23800 10 | 0.25300 0.25600 0.26600 0.29400 0.28100 0.25400 0.25600 0.27900 ------+---------------------------------------------------------------- Weights-at-age in the catches (Kg) ---------------------------------- ------+---------------------------------------- AGE | 1997 1998 1999 2000 2001 ------+---------------------------------------- 0 | 0.03100 0.03300 0.03500 0.03100 0.03800 1 | 0.04700 0.04800 0.06300 0.05700 0.05000 2 | 0.07200 0.07200 0.07800 0.07500 0.07800 3 | 0.10200 0.09400 0.08800 0.08600 0.09400 4 | 0.12100 0.12500 0.10900 0.10400 0.10800 5 | 0.14000 0.14900 0.14200 0.13300 0.12900 6 | 0.16600 0.17800 0.17000 0.15600 0.16300 7 | 0.17700 0.18300 0.19900 0.17900 0.18600 8 | 0.18300 0.18800 0.19300 0.18700 0.19300 9 | 0.20300 0.22100 0.19200 0.23200 0.23000 10 | 0.23200 0.24800 0.24500 0.24100 0.24300 ------+----------------------------------------

O:\ACFM\WGREPS\WGNPBW\REPORTS\2002\Sec-6.Doc 190
Table 6.4.4.2 (continued) Weights-at-age in the stock (Kg) -------------------------------- ------+---------------------------------------------------------------- AGE | 1981 1982 1983 1984 1985 1986 1987 1988 ------+---------------------------------------------------------------- 0 | 0.03800 0.01800 0.02000 0.02600 0.01600 0.03000 0.02300 0.03100 1 | 0.05200 0.04500 0.04600 0.03500 0.03800 0.04000 0.04800 0.05300 2 | 0.06500 0.07200 0.07400 0.07800 0.07400 0.07300 0.08600 0.07600 3 | 0.10300 0.11100 0.11800 0.08900 0.09700 0.10800 0.10600 0.09700 4 | 0.12500 0.14300 0.14000 0.13200 0.11400 0.13000 0.12400 0.12800 5 | 0.14100 0.15600 0.15300 0.15300 0.15700 0.16500 0.14700 0.14200 6 | 0.15500 0.17700 0.17600 0.16100 0.17700 0.19900 0.17700 0.15700 7 | 0.17000 0.19500 0.19500 0.17500 0.19900 0.20900 0.20800 0.17900 8 | 0.17800 0.20000 0.20000 0.18900 0.20800 0.24300 0.22100 0.19900 9 | 0.18700 0.20400 0.20400 0.18600 0.21800 0.24600 0.22200 0.22200 10 | 0.21300 0.23100 0.22800 0.20600 0.23700 0.25700 0.25400 0.26000 ------+---------------------------------------------------------------- Weights-at-age in the stock (Kg) -------------------------------- ------+---------------------------------------------------------------- AGE | 1989 1990 1991 1992 1993 1994 1995 1996 ------+---------------------------------------------------------------- 0 | 0.01400 0.03400 0.03600 0.02400 0.02800 0.03300 0.02200 0.01800 1 | 0.05900 0.04500 0.05500 0.05700 0.06600 0.06100 0.06400 0.04100 2 | 0.07900 0.07000 0.09100 0.08300 0.08200 0.08700 0.09100 0.08000 3 | 0.10300 0.10600 0.10700 0.11900 0.10900 0.10800 0.11800 0.10200 4 | 0.12600 0.12300 0.13600 0.14000 0.13700 0.13700 0.14300 0.11600 5 | 0.14800 0.14700 0.17400 0.16700 0.16300 0.16400 0.15400 0.14700 6 | 0.15800 0.16800 0.19000 0.19300 0.17700 0.18900 0.16700 0.17000 7 | 0.17100 0.17500 0.20600 0.22600 0.20000 0.20700 0.20300 0.21400 8 | 0.20300 0.21400 0.23000 0.23500 0.21700 0.21700 0.20600 0.23000 9 | 0.22400 0.21700 0.23200 0.28400 0.22500 0.24700 0.23600 0.23800 10 | 0.25300 0.25600 0.26600 0.29400 0.28100 0.25400 0.25600 0.27900 ------+---------------------------------------------------------------- Weights-at-age in the stock (Kg) -------------------------------- ------+---------------------------------------- AGE | 1997 1998 1999 2000 2001 ------+---------------------------------------- 0 | 0.03100 0.03300 0.03500 0.03100 0.03800 1 | 0.04700 0.04800 0.06300 0.05700 0.05000 2 | 0.07200 0.07200 0.07800 0.07500 0.07800 3 | 0.10200 0.09400 0.08800 0.08600 0.09400 4 | 0.12100 0.12500 0.10900 0.10400 0.10800 5 | 0.14000 0.14900 0.14200 0.13300 0.12900 6 | 0.16600 0.17800 0.17000 0.15600 0.16300 7 | 0.17700 0.18300 0.19900 0.17900 0.18600 8 | 0.18300 0.18800 0.19300 0.18700 0.19300 9 | 0.20300 0.22100 0.19200 0.23200 0.23000 10 | 0.23200 0.24800 0.24500 0.24100 0.24300 ------+---------------------------------------- Natural Mortality (per year) ---------------------------- ------+---------------------------------------------------------------- AGE | 1981 1982 1983 1984 1985 1986 1987 1988 ------+---------------------------------------------------------------- 0 | 0.20000 0.20000 0.20000 0.20000 0.20000 0.20000 0.20000 0.20000 1 | 0.20000 0.20000 0.20000 0.20000 0.20000 0.20000 0.20000 0.20000 2 | 0.20000 0.20000 0.20000 0.20000 0.20000 0.20000 0.20000 0.20000 3 | 0.20000 0.20000 0.20000 0.20000 0.20000 0.20000 0.20000 0.20000 4 | 0.20000 0.20000 0.20000 0.20000 0.20000 0.20000 0.20000 0.20000 5 | 0.20000 0.20000 0.20000 0.20000 0.20000 0.20000 0.20000 0.20000 6 | 0.20000 0.20000 0.20000 0.20000 0.20000 0.20000 0.20000 0.20000 7 | 0.20000 0.20000 0.20000 0.20000 0.20000 0.20000 0.20000 0.20000 8 | 0.20000 0.20000 0.20000 0.20000 0.20000 0.20000 0.20000 0.20000 9 | 0.20000 0.20000 0.20000 0.20000 0.20000 0.20000 0.20000 0.20000 10 | 0.20000 0.20000 0.20000 0.20000 0.20000 0.20000 0.20000 0.20000 ------+----------------------------------------------------------------

O:\ACFM\WGREPS\WGNPBW\REPORTS\2002\Sec-6.Doc 191
Table 6.4.4.2 (continued) Natural Mortality (per year) ---------------------------- ------+---------------------------------------------------------------- AGE | 1989 1990 1991 1992 1993 1994 1995 1996 ------+---------------------------------------------------------------- 0 | 0.20000 0.20000 0.20000 0.20000 0.20000 0.20000 0.20000 0.20000 1 | 0.20000 0.20000 0.20000 0.20000 0.20000 0.20000 0.20000 0.20000 2 | 0.20000 0.20000 0.20000 0.20000 0.20000 0.20000 0.20000 0.20000 3 | 0.20000 0.20000 0.20000 0.20000 0.20000 0.20000 0.20000 0.20000 4 | 0.20000 0.20000 0.20000 0.20000 0.20000 0.20000 0.20000 0.20000 5 | 0.20000 0.20000 0.20000 0.20000 0.20000 0.20000 0.20000 0.20000 6 | 0.20000 0.20000 0.20000 0.20000 0.20000 0.20000 0.20000 0.20000 7 | 0.20000 0.20000 0.20000 0.20000 0.20000 0.20000 0.20000 0.20000 8 | 0.20000 0.20000 0.20000 0.20000 0.20000 0.20000 0.20000 0.20000 9 | 0.20000 0.20000 0.20000 0.20000 0.20000 0.20000 0.20000 0.20000 10 | 0.20000 0.20000 0.20000 0.20000 0.20000 0.20000 0.20000 0.20000 ------+---------------------------------------------------------------- Natural Mortality (per year) ---------------------------- ------+---------------------------------------- AGE | 1997 1998 1999 2000 2001 ------+---------------------------------------- 0 | 0.20000 0.20000 0.20000 0.20000 0.20000 1 | 0.20000 0.20000 0.20000 0.20000 0.20000 2 | 0.20000 0.20000 0.20000 0.20000 0.20000 3 | 0.20000 0.20000 0.20000 0.20000 0.20000 4 | 0.20000 0.20000 0.20000 0.20000 0.20000 5 | 0.20000 0.20000 0.20000 0.20000 0.20000 6 | 0.20000 0.20000 0.20000 0.20000 0.20000 7 | 0.20000 0.20000 0.20000 0.20000 0.20000 8 | 0.20000 0.20000 0.20000 0.20000 0.20000 9 | 0.20000 0.20000 0.20000 0.20000 0.20000 10 | 0.20000 0.20000 0.20000 0.20000 0.20000 ------+---------------------------------------- Proportion of fish spawning --------------------------- ------+---------------------------------------------------------------- AGE | 1981 1982 1983 1984 1985 1986 1987 1988 ------+---------------------------------------------------------------- 0 | 0.0000 0.0000 0.0000 0.0000 0.0000 0.0000 0.0000 0.0000 1 | 0.1100 0.1100 0.1100 0.1100 0.1100 0.1100 0.1100 0.1100 2 | 0.4000 0.4000 0.4000 0.4000 0.4000 0.4000 0.4000 0.4000 3 | 0.8200 0.8200 0.8200 0.8200 0.8200 0.8200 0.8200 0.8200 4 | 0.8600 0.8600 0.8600 0.8600 0.8600 0.8600 0.8600 0.8600 5 | 0.9100 0.9100 0.9100 0.9100 0.9100 0.9100 0.9100 0.9100 6 | 0.9400 0.9400 0.9400 0.9400 0.9400 0.9400 0.9400 0.9400 7 | 1.0000 1.0000 1.0000 1.0000 1.0000 1.0000 1.0000 1.0000 8 | 1.0000 1.0000 1.0000 1.0000 1.0000 1.0000 1.0000 1.0000 9 | 1.0000 1.0000 1.0000 1.0000 1.0000 1.0000 1.0000 1.0000 10 | 1.0000 1.0000 1.0000 1.0000 1.0000 1.0000 1.0000 1.0000 ------+---------------------------------------------------------------- Proportion of fish spawning --------------------------- ------+---------------------------------------------------------------- AGE | 1989 1990 1991 1992 1993 1994 1995 1996 ------+---------------------------------------------------------------- 0 | 0.0000 0.0000 0.0000 0.0000 0.0000 0.0000 0.0000 0.0000 1 | 0.1100 0.1100 0.1100 0.1100 0.1100 0.1100 0.1100 0.1100 2 | 0.4000 0.4000 0.4000 0.4000 0.4000 0.4000 0.4000 0.4000 3 | 0.8200 0.8200 0.8200 0.8200 0.8200 0.8200 0.8200 0.8200 4 | 0.8600 0.8600 0.8600 0.8600 0.8600 0.8600 0.8600 0.8600 5 | 0.9100 0.9100 0.9100 0.9100 0.9100 0.9100 0.9100 0.9100 6 | 0.9400 0.9400 0.9400 0.9400 0.9400 0.9400 0.9400 0.9400 7 | 1.0000 1.0000 1.0000 1.0000 1.0000 1.0000 1.0000 1.0000 8 | 1.0000 1.0000 1.0000 1.0000 1.0000 1.0000 1.0000 1.0000 9 | 1.0000 1.0000 1.0000 1.0000 1.0000 1.0000 1.0000 1.0000 10 | 1.0000 1.0000 1.0000 1.0000 1.0000 1.0000 1.0000 1.0000 ------+----------------------------------------------------------------

O:\ACFM\WGREPS\WGNPBW\REPORTS\2002\Sec-6.Doc 192
Table 6.4.4.2 (continued) Proportion of fish spawning --------------------------- ------+---------------------------------------- AGE | 1997 1998 1999 2000 2001 ------+---------------------------------------- 0 | 0.0000 0.0000 0.0000 0.0000 0.0000 1 | 0.1100 0.1100 0.1100 0.1100 0.1100 2 | 0.4000 0.4000 0.4000 0.4000 0.4000 3 | 0.8200 0.8200 0.8200 0.8200 0.8200 4 | 0.8600 0.8600 0.8600 0.8600 0.8600 5 | 0.9100 0.9100 0.9100 0.9100 0.9100 6 | 0.9400 0.9400 0.9400 0.9400 0.9400 7 | 1.0000 1.0000 1.0000 1.0000 1.0000 8 | 1.0000 1.0000 1.0000 1.0000 1.0000 9 | 1.0000 1.0000 1.0000 1.0000 1.0000 10 | 1.0000 1.0000 1.0000 1.0000 1.0000 ------+---------------------------------------- AGE-STRUCTURED INDICES ----------------------- Norway Spawning Area/Acoustic 1981-90 ------------------------------------- ------+---------------------------------------------------------------- AGE | 1981 1982 1983 1984 1985 1986 1987 1988 ------+---------------------------------------------------------------- 2 | 2372. 999990. 297. 15767. 999990. 1003. 4960. 9712. 3 | 7583. 999990. 2108. 1721. 999990. 5829. 8417. 9090. 4 | 3253. 999990. 2723. 1616. 999990. 4122. 22589. 12367. 5 | 3647. 999990. 6511. 1719. 999990. 624. 4735. 20392. 6 | 4611. 999990. 3735. 1858. 999990. 228. 282. 7355. 7 | 4638. 999990. 3650. 1128. 999990. 203. 417. 723. 8 | 3654. 999990. 3153. 567. 999990. 250. 385. 599. ------+---------------------------------------------------------------- Norway Spawning Area/Acoustic 1981-90 ------------------------------------- ------+---------------- AGE | 1989 1990 ------+---------------- 2 | 6787. 14169. 3 | 22270. 12670. 4 | 9973. 11228. 5 | 10504. 5587. 6 | 7803. 6556. 7 | 933. 3273. 8 | 293. 516. ------+---------------- Norway Spawning Area/Acoustic 1991-2002 --------------------------------------- ------+---------------------------------------------------------------- AGE | 1991 1992 1993 1994 1995 1996 1997 1998 ------+---------------------------------------------------------------- 2 | 11147. 1232. 4489. 1603. 8538. 8781. 999990. 18218. 3 | 6340. 26123. 3321. 2950. 9874. 7433. 999990. 34991. 4 | 8497. 4719. 26771. 4476. 7906. 8371. 999990. 4697. 5 | 7407. 1574. 2643. 11354. 6861. 2399. 999990. 1674. 6 | 4558. 1386. 1270. 1742. 9467. 4455. 999990. 279. 7 | 2019. 810. 557. 1687. 1795. 4111. 999990. 407. 8 | 545. 616. 426. 908. 1083. 1202. 999990. 381. ------+---------------------------------------------------------------- Norway Spawning Area/Acoustic 1991-2002 --------------------------------------- ------+-------------------------------- AGE | 1999 2000 2001 2002 ------+-------------------------------- 2 | 19034. 8613. 44162. 71996. 3 | 60309. 31011. 12843. 54740. 4 | 26103. 41382. 13805. 12757. 5 | 1481. 6843. 8292. 5266. 6 | 316. 898. 718. 8404. 7 | 72. 427. 175. 1450. 8 | 153. 228. 51. 305. ------+--------------------------------

O:\ACFM\WGREPS\WGNPBW\REPORTS\2002\Sec-6.Doc 193
Table 6.4.4.2 (continued) Russian Spawning Area/Acoustic 1982-91 -------------------------------------- ------+---------------------------------------------------------------- AGE | 1982 1983 1984 1985 1986 1987 1988 1989 ------+---------------------------------------------------------------- 3 | 540. 2330. 2900. 13220. 18750. 4480. 3710. 11910. 4 | 2750. 2930. 800. 930. 23180. 19170. 4550. 7120. 5 | 1340. 9390. 1100. 580. 2540. 5860. 8610. 6670. 6 | 1380. 3880. 4200. 1780. 610. 1070. 4130. 6970. 7 | 1570. 1970. 2200. 860. 620. 500. 1270. 4580. 8 | 2350. 1370. 1200. 610. 750. 810. 480. 2750. ------+---------------------------------------------------------------- Russian Spawning Area/Acoustic 1982-91 -------------------------------------- ------+---------------- AGE | 1990 1991 ------+---------------- 3 | 9740. 10300. 4 | 12140. 5350. 5 | 5740. 5130. 6 | 2580. 2630. 7 | 1470. 1770. 8 | 220. 870. ------+---------------- Russian Spawning Area/Acoustic 1992-1996 ---------------------------------------- ------+---------------------------------------- AGE | 1992 1993 1994 1995 1996 ------+---------------------------------------- 3 | 20010. 4728. 999990. 12657. 15285. 4 | 6700. 12337. 999990. 10028. 10629. 5 | 1350. 5304. 999990. 8942. 4897. 6 | 440. 2249. 999990. 2651. 6940. 7 | 390. 1316. 999990. 1093. 1482. 8 | 170. 621. 999990. 408. 653. ------+---------------------------------------- CPUE Spanish Pair Trawlers -------------------------- ------+---------------------------------------------------------------- AGE | 1983 1984 1985 1986 1987 1988 1989 1990 ------+---------------------------------------------------------------- 1 | 7196. 13710. 14573. 3721. 25328. 7778. 15272. 21444. 2 | 16392. 27286. 23823. 14131. 13153. 21473. 18486. 19407. 3 | 9311. 14845. 14126. 14745. 6664. 18436. 17160. 5194. 4 | 7476. 4836. 6256. 7113. 2938. 6391. 8374. 1803. 5 | 6326. 1755. 1232. 1278. 1029. 1300. 3760. 1357. 6 | 1718. 1750. 217. 505. 166. 781. 1003. 451. ------+---------------------------------------------------------------- CPUE Spanish Pair Trawlers -------------------------- ------+---------------------------------------------------------------- AGE | 1991 1992 1993 1994 1995 1996 1997 1998 ------+---------------------------------------------------------------- 1 | 15924. 10007. 4036. 543. 9090. 3905. 8742. 5884. 2 | 15370. 24235. 13991. 6066. 14409. 14557. 15875. 13236. 3 | 4989. 9671. 22493. 15917. 6833. 14449. 11134. 9803. 4 | 2329. 4316. 7979. 7474. 4551. 3931. 3698. 10844. 5 | 1045. 1194. 1354. 2990. 1990. 3639. 1046. 5229. 6 | 440. 462. 658. 1055. 623. 1834. 450. 1153. ------+---------------------------------------------------------------- CPUE Spanish Pair Trawlers -------------------------- ------+------------------------ AGE | 1999 2000 2001 ------+------------------------ 1 | 2048. 6207. 16223. 2 | 10268. 15518. 16488. 3 | 20242. 13987. 6830. 4 | 9833. 5375. 1620. 5 | 6287. 1264. 1148. 6 | 3047. 1414. 162. ------+------------------------

O:\ACFM\WGREPS\WGNPBW\REPORTS\2002\Sec-6.Doc 194
Table 6.4.4.2 (continued) Norwegian Sea acoustic - Blue Wh. 1981-9 ---------------------------------------- ------+---------------------------------------------------------------- AGE | 1981 1982 1983 1984 1985 1986 1987 1988 ------+---------------------------------------------------------------- 1 | 182. 184. 22356. 30380. 5969. 2324. 8204. 4992. 2 | 728. 460. 396. 13916. 23876. 2380. 4032. 2880. 3 | 4542. 1242. 468. 833. 12502. 7224. 5180. 2640. 4 | 3874. 4715. 756. 392. 658. 6944. 5572. 3480. 5 | 2678. 3611. 1404. 539. 423. 1876. 1204. 912. 6 | 2834. 3128. 576. 539. 188. 952. 224. 120. 7 | 2964. 2323. 468. 343. 235. 336. 168. 96. ------+---------------------------------------------------------------- Norwegian Sea acoustic - Blue Wh. 1981-9 ---------------------------------------- ------+---------------- AGE | 1989 1990 ------+---------------- 1 | 1172. 999990. 2 | 1125. 999990. 3 | 812. 999990. 4 | 379. 999990. 5 | 410. 999990. 6 | 212. 999990. 7 | 22. 999990. ------+---------------- Norwegian Sea acoustic - Blue Wh. 1991++ ---------------------------------------- ------+---------------------------------------------------------------- AGE | 1991 1992 1993 1994 1995 1996 1997 1998 ------+---------------------------------------------------------------- 1 | 999990. 792. 830. 999990. 6974. 23464. 30227. 24244. 2 | 999990. 1134. 125. 999990. 2811. 1057. 25638. 47815. 3 | 999990. 6939. 1070. 999990. 1999. 899. 1524. 16282. 4 | 999990. 766. 6392. 999990. 1209. 649. 779. 556. 5 | 999990. 247. 1222. 999990. 1622. 436. 300. 212. 6 | 999990. 172. 489. 999990. 775. 505. 407. 100. 7 | 999990. 90. 248. 999990. 173. 755. 260. 64. ------+---------------------------------------------------------------- Norwegian Sea acoustic - Blue Wh. 1991++ ---------------------------------------- ------+------------------------ AGE | 1999 2000 2001 ------+------------------------ 1 | 14367. 25813. 61470. 2 | 9750. 3298. 22051. 3 | 23701. 2721. 7883. 4 | 9754. 3078. 3225. 5 | 1733. 23. 1824. 6 | 466. 46. 156. 7 | 79. 6. 12. ------+------------------------ Fishing Mortality (per year) ---------------------------- ------+---------------------------------------------------------------- AGE | 1981 1982 1983 1984 1985 1986 1987 1988 ------+---------------------------------------------------------------- 0 | 0.0098 0.1731 0.0204 0.0491 0.1204 0.0087 0.0444 0.0046 1 | 0.0853 0.0377 0.1626 0.1411 0.1475 0.0905 0.1125 0.0716 2 | 0.1019 0.1226 0.1975 0.2483 0.1803 0.1295 0.1085 0.1337 3 | 0.1702 0.1309 0.1707 0.2406 0.3356 0.2480 0.1632 0.1609 4 | 0.1247 0.2012 0.1622 0.2466 0.2500 0.5638 0.4295 0.2268 5 | 0.3096 0.1372 0.1609 0.2409 0.2835 0.5932 0.4969 0.5957 6 | 0.3620 0.2528 0.2314 0.3801 0.4672 0.5056 0.4243 1.0873 7 | 0.3802 0.2928 0.4528 0.3197 0.3947 0.6060 0.5988 0.5030 8 | 0.4571 0.3999 0.5879 0.6331 0.3644 0.6047 0.9651 0.7024 9 | 0.5110 0.3820 0.6822 0.7444 0.7321 0.7626 0.7478 0.7641 10 | 0.5110 0.3820 0.6822 0.7444 0.7321 0.7626 0.7478 0.7641 ------+----------------------------------------------------------------

O:\ACFM\WGREPS\WGNPBW\REPORTS\2002\Sec-6.Doc 195
Table 6.4.4.2 (continued) Fishing Mortality (per year) ---------------------------- ------+---------------------------------------------------------------- AGE | 1989 1990 1991 1992 1993 1994 1995 1996 ------+---------------------------------------------------------------- 0 | 0.0814 0.0085 0.0240 0.0031 0.0289 0.0043 0.1315 0.0189 1 | 0.1112 0.0895 0.0340 0.0781 0.0541 0.0573 0.0381 0.1035 2 | 0.1660 0.1242 0.0756 0.1092 0.0772 0.0282 0.0866 0.0894 3 | 0.3906 0.2309 0.1256 0.1665 0.1436 0.1257 0.1466 0.2195 4 | 0.3202 0.3974 0.1539 0.1994 0.2377 0.1258 0.2313 0.2814 5 | 0.4771 0.3607 0.3393 0.1583 0.2166 0.2939 0.2989 0.2494 6 | 0.7740 0.7189 0.3058 0.2353 0.2035 0.2255 0.3190 0.4200 7 | 0.7826 0.9195 0.4402 0.2056 0.2548 0.2888 0.3263 0.4770 8 | 0.6428 1.6257 0.3671 0.4129 0.1801 0.3554 0.4683 0.5620 9 | 0.8800 0.8973 0.4000 0.4311 0.3553 0.3472 0.4209 0.5948 10 | 0.8800 0.8973 0.4000 0.4311 0.3553 0.3472 0.4209 0.5948 ------+---------------------------------------------------------------- Fishing Mortality (per year) ---------------------------- ------+---------------------------------------- AGE | 1997 1998 1999 2000 2001 ------+---------------------------------------- 0 | 0.0091 0.0025 0.0022 0.0032 0.0039 1 | 0.0616 0.0625 0.0559 0.0805 0.0970 2 | 0.1131 0.1294 0.1156 0.1666 0.2007 3 | 0.2142 0.3757 0.3358 0.4838 0.5829 4 | 0.3194 0.6079 0.5433 0.7828 0.9431 5 | 0.2466 0.5113 0.4569 0.6583 0.7931 6 | 0.3133 0.5214 0.4659 0.6714 0.8088 7 | 0.4483 0.5948 0.5315 0.7659 0.9226 8 | 0.6108 0.7856 0.7020 1.0116 1.2187 9 | 0.5338 0.7669 0.6853 0.9875 1.1897 10 | 0.5338 0.7669 0.6853 0.9875 1.1897 ------+---------------------------------------- Population Abundance (1 January) -------------------------------- ------+---------------------------------------------------------------- AGE | 1981 1982 1983 1984 1985 1986 1987 1988 ------+---------------------------------------------------------------- 0 | 5443. 24309. 23892. 13433. 11400. 10682. 8653. 11105. 1 | 3477. 4413. 16740. 19166. 10471. 8275. 8670. 6777. 2 | 3957. 2614. 3479. 11648. 13627. 7397. 6189. 6343. 3 | 4788. 2926. 1893. 2338. 7440. 9316. 5321. 4546. 4 | 3136. 3306. 2102. 1307. 1505. 4355. 5952. 3700. 5 | 2259. 2266. 2214. 1463. 836. 960. 2029. 3172. 6 | 2019. 1357. 1617. 1543. 942. 516. 434. 1011. 7 | 1616. 1151. 863. 1051. 864. 483. 255. 233. 8 | 1892. 904. 703. 449. 625. 477. 216. 115. 9 | 1580. 981. 496. 320. 195. 355. 213. 67. 10 | 3992. 2324. 737. 529. 544. 813. 404. 102. ------+---------------------------------------------------------------- x 10 ^ 6 Population Abundance (1 January) -------------------------------- ------+---------------------------------------------------------------- AGE | 1989 1990 1991 1992 1993 1994 1995 1996 ------+---------------------------------------------------------------- 0 | 27456. 10839. 7479. 6753. 7640. 10716. 29538. 48973. 1 | 9050. 20721. 8800. 5978. 5511. 6077. 8736. 21203. 2 | 5165. 6630. 15512. 6964. 4527. 4275. 4698. 6885. 3 | 4543. 3582. 4794. 11776. 5112. 3431. 3403. 3527. 4 | 3169. 2517. 2328. 3462. 8162. 3626. 2477. 2406. 5 | 2415. 1884. 1385. 1634. 2322. 5269. 2617. 1609. 6 | 1431. 1227. 1075. 808. 1142. 1531. 3215. 1589. 7 | 279. 540. 490. 648. 523. 763. 1000. 1914. 8 | 115. 104. 176. 258. 432. 332. 468. 591. 9 | 46. 50. 17. 100. 140. 296. 190. 240. 10 | 71. 174. 32. 37. 64. 115. 133. 201. ------+---------------------------------------------------------------- x 10 ^ 6

O:\ACFM\WGREPS\WGNPBW\REPORTS\2002\Sec-6.Doc 196
Table 6.4.4.2 (continued) Population Abundance (1 January) -------------------------------- ------+------------------------------------------------ AGE | 1997 1998 1999 2000 2001 2002 ------+------------------------------------------------ 0 | 25643. 16697. 44240. 77641. 46013. 27616. 1 | 39344. 20804. 13636. 36139. 63363. 37526. 2 | 15652. 30289. 16001. 10558. 27300. 47083. 3 | 5155. 11445. 21789. 11670. 7317. 18287. 4 | 2319. 3407. 6435. 12751. 5890. 3345. 5 | 1487. 1379. 1519. 3060. 4772. 1878. 6 | 1027. 951. 677. 787. 1297. 1768. 7 | 855. 615. 462. 348. 329. 473. 8 | 972. 447. 278. 222. 132. 107. 9 | 276. 432. 167. 113. 66. 32. 10 | 447. 174. 309. 242. 103. 42. ------+------------------------------------------------ x 10 ^ 6 Weighting factors for the catches in number ------------------------------------------- ------+-------------------------------- AGE | 1998 1999 2000 2001 ------+-------------------------------- 0 | 0.1000 0.1000 0.1000 0.1000 1 | 0.5000 0.5000 0.5000 0.5000 2 | 1.0000 1.0000 1.0000 1.0000 3 | 1.0000 1.0000 1.0000 1.0000 4 | 1.0000 1.0000 1.0000 1.0000 5 | 1.0000 1.0000 1.0000 1.0000 6 | 1.0000 1.0000 1.0000 1.0000 7 | 1.0000 1.0000 1.0000 1.0000 8 | 1.0000 1.0000 1.0000 1.0000 9 | 1.0000 1.0000 1.0000 1.0000 ------+-------------------------------- Predicted Age-Structured Index Values -------------------------------------- Norway Spawning Area/Acoustic 1981-90 Predicted ----------------------------------------------- ------+---------------------------------------------------------------- AGE | 1981 1982 1983 1984 1985 1986 1987 1988 ------+---------------------------------------------------------------- 2 | 2604. 999990. 2244. 7433. 999990. 4839. 4067. 4146. 3 | 7779. 999990. 3076. 3743. 999990. 14892. 8658. 7401. 4 | 6592. 999990. 4384. 2678. 999990. 8349. 11738. 7615. 5 | 5229. 999990. 5286. 3436. 999990. 2093. 4515. 6913. 6 | 4432. 999990. 3650. 3375. 999990. 1098. 941. 1905. 7 | 3713. 999990. 1953. 2446. 999990. 1059. 559. 521. 8 | 4568. 999990. 1651. 1045. 999990. 1115. 468. 263. ------+---------------------------------------------------------------- Norway Spawning Area/Acoustic 1981-90 Predicted ----------------------------------------------- ------+---------------- AGE | 1989 1990 ------+---------------- 2 | 3353. 4342. 3 | 7048. 5746. 4 | 6394. 4997. 5 | 5396. 4313. 6 | 2882. 2499. 7 | 589. 1109. 8 | 267. 197. ------+----------------

O:\ACFM\WGREPS\WGNPBW\REPORTS\2002\Sec-6.Doc 197
Table 6.4.4.2 (continued) Norway Spawning Area/Acoustic 1991-2002 Predicted ------------------------------------------------- ------+---------------------------------------------------------------- AGE | 1991 1992 1993 1994 1995 1996 1997 1998 ------+---------------------------------------------------------------- 2 | 13229. 5897. 3859. 3682. 3997. 5855. 999990. 25540. 3 | 9460. 23037. 10048. 6769. 6684. 6824. 999990. 21427. 4 | 6446. 9495. 22208. 10099. 6749. 6486. 999990. 8576. 5 | 2540. 3113. 4370. 9758. 4842. 3008. 999990. 2441. 6 | 1516. 1156. 1645. 2195. 4522. 2188. 999990. 1282. 7 | 612. 851. 679. 984. 1280. 2373. 999990. 744. 8 | 268. 388. 682. 504. 695. 860. 999990. 621. ------+---------------------------------------------------------------- Norway Spawning Area/Acoustic 1991-2002 Predicted ------------------------------------------------- ------+-------------------------------- AGE | 1999 2000 2001 2002 ------+-------------------------------- 2 | 13531. 8833. 22678. 39112. 3 | 41136. 21358. 13116. 32779. 4 | 16421. 30940. 13818. 7847. 5 | 2718. 5250. 7958. 3131. 6 | 924. 1028. 1646. 2243. 7 | 567. 406. 372. 534. 8 | 392. 295. 168. 136. ------+-------------------------------- Russian Spawning Area/Acoustic 1982-91 Predicted ------------------------------------------------ ------+---------------------------------------------------------------- AGE | 1982 1983 1984 1985 1986 1987 1988 1989 ------+---------------------------------------------------------------- 3 | 3775. 2423. 2948. 9195. 11727. 6818. 5828. 5550. 4 | 5810. 3723. 2275. 2617. 7091. 9969. 6467. 5430. 5 | 4668. 4537. 2949. 1670. 1796. 3875. 5934. 4632. 6 | 3265. 3909. 3614. 2165. 1176. 1007. 2040. 3087. 7 | 3152. 2286. 2862. 2317. 1239. 654. 609. 689. 8 | 2977. 2224. 1408. 2072. 1503. 631. 354. 360. ------+---------------------------------------------------------------- Russian Spawning Area/Acoustic 1982-91 Predicted ------------------------------------------------ ------+---------------- AGE | 1990 1991 ------+---------------- 3 | 4525. 6192. 4 | 4244. 4131. 5 | 3702. 2734. 6 | 2677. 2558. 7 | 1298. 1300. 8 | 266. 585. ------+---------------- Russian Spawning Area/Acoustic 1992-199 Predicted ------------------------------------------------- ------+---------------------------------------- AGE | 1992 1993 1994 1995 1996 ------+---------------------------------------- 3 | 26427. 11527. 999990. 7668. 7828. 4 | 9383. 21946. 999990. 6670. 6410. 5 | 3491. 4901. 999990. 5430. 3373. 6 | 1146. 1632. 999990. 4484. 2170. 7 | 706. 563. 999990. 1062. 1968. 8 | 252. 443. 999990. 451. 559. ------+----------------------------------------
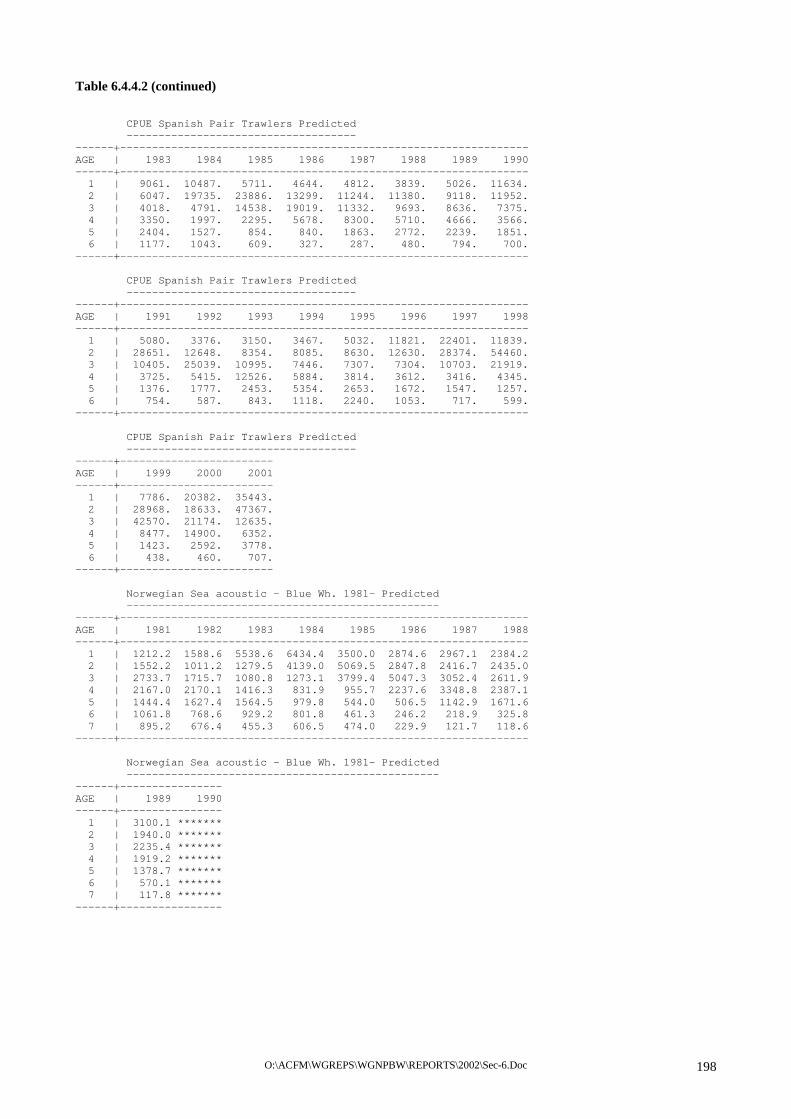
O:\ACFM\WGREPS\WGNPBW\REPORTS\2002\Sec-6.Doc 198
Table 6.4.4.2 (continued) CPUE Spanish Pair Trawlers Predicted ------------------------------------ ------+---------------------------------------------------------------- AGE | 1983 1984 1985 1986 1987 1988 1989 1990 ------+---------------------------------------------------------------- 1 | 9061. 10487. 5711. 4644. 4812. 3839. 5026. 11634. 2 | 6047. 19735. 23886. 13299. 11244. 11380. 9118. 11952. 3 | 4018. 4791. 14538. 19019. 11332. 9693. 8636. 7375. 4 | 3350. 1997. 2295. 5678. 8300. 5710. 4666. 3566. 5 | 2404. 1527. 854. 840. 1863. 2772. 2239. 1851. 6 | 1177. 1043. 609. 327. 287. 480. 794. 700. ------+---------------------------------------------------------------- CPUE Spanish Pair Trawlers Predicted ------------------------------------ ------+---------------------------------------------------------------- AGE | 1991 1992 1993 1994 1995 1996 1997 1998 ------+---------------------------------------------------------------- 1 | 5080. 3376. 3150. 3467. 5032. 11821. 22401. 11839. 2 | 28651. 12648. 8354. 8085. 8630. 12630. 28374. 54460. 3 | 10405. 25039. 10995. 7446. 7307. 7304. 10703. 21919. 4 | 3725. 5415. 12526. 5884. 3814. 3612. 3416. 4345. 5 | 1376. 1777. 2453. 5354. 2653. 1672. 1547. 1257. 6 | 754. 587. 843. 1118. 2240. 1053. 717. 599. ------+---------------------------------------------------------------- CPUE Spanish Pair Trawlers Predicted ------------------------------------ ------+------------------------ AGE | 1999 2000 2001 ------+------------------------ 1 | 7786. 20382. 35443. 2 | 28968. 18633. 47367. 3 | 42570. 21174. 12635. 4 | 8477. 14900. 6352. 5 | 1423. 2592. 3778. 6 | 438. 460. 707. ------+------------------------ Norwegian Sea acoustic - Blue Wh. 1981- Predicted ------------------------------------------------- ------+---------------------------------------------------------------- AGE | 1981 1982 1983 1984 1985 1986 1987 1988 ------+---------------------------------------------------------------- 1 | 1212.2 1588.6 5538.6 6434.4 3500.0 2874.6 2967.1 2384.2 2 | 1552.2 1011.2 1279.5 4139.0 5069.5 2847.8 2416.7 2435.0 3 | 2733.7 1715.7 1080.8 1273.1 3799.4 5047.3 3052.4 2611.9 4 | 2167.0 2170.1 1416.3 831.9 955.7 2237.6 3348.8 2387.1 5 | 1444.4 1627.4 1564.5 979.8 544.0 506.5 1142.9 1671.6 6 | 1061.8 768.6 929.2 801.8 461.3 246.2 218.9 325.8 7 | 895.2 676.4 455.3 606.5 474.0 229.9 121.7 118.6 ------+---------------------------------------------------------------- Norwegian Sea acoustic - Blue Wh. 1981- Predicted ------------------------------------------------- ------+---------------- AGE | 1989 1990 ------+---------------- 1 | 3100.1 ******* 2 | 1940.0 ******* 3 | 2235.4 ******* 4 | 1919.2 ******* 5 | 1378.7 ******* 6 | 570.1 ******* 7 | 117.8 ******* ------+----------------

O:\ACFM\WGREPS\WGNPBW\REPORTS\2002\Sec-6.Doc 199
Table 6.4.4.2 (continued) Norwegian Sea acoustic - Blue Wh. 1991+ Predicted ------------------------------------------------- ------+---------------------------------------------------------------- AGE | 1991 1992 1993 1994 1995 1996 1997 1998 ------+---------------------------------------------------------------- 1 | 999990. 3620. 3392. 999990. 5435. 12621. 24092. 12731. 2 | 999990. 2665. 1770. 999990. 1825. 2670. 5974. 11433. 3 | 999990. 6486. 2860. 999990. 1900. 1875. 2750. 5474. 4 | 999990. 1643. 3776. 999990. 1151. 1081. 1015. 1227. 5 | 999990. 428. 585. 999990. 624. 397. 367. 285. 6 | 999990. 207. 300. 999990. 781. 360. 250. 201. 7 | 999990. 107. 84. 999990. 153. 264. 120. 78. ------+---------------------------------------------------------------- Norwegian Sea acoustic - Blue Wh. 1991+ Predicted ------------------------------------------------- ------+------------------------ AGE | 1999 2000 2001 ------+------------------------ 1 | 8382. 21849. 37884. 2 | 6096. 3886. 9821. 3 | 10706. 5189. 3043. 4 | 2422. 4082. 1692. 5 | 325. 572. 815. 6 | 149. 151. 226. 7 | 61. 39. 34. ------+------------------------ Fitted Selection Pattern ------------------------ ------+---------------------------------------------------------------- AGE | 1981 1982 1983 1984 1985 1986 1987 1988 ------+---------------------------------------------------------------- 0 | 0.0316 1.2613 0.1267 0.2039 0.4245 0.0147 0.0894 0.0077 1 | 0.2755 0.2746 1.0105 0.5857 0.5203 0.1526 0.2265 0.1202 2 | 0.3291 0.8935 1.2274 1.0309 0.6359 0.2183 0.2184 0.2244 3 | 0.5498 0.9535 1.0606 0.9989 1.1835 0.4180 0.3284 0.2701 4 | 0.4030 1.4661 1.0080 1.0240 0.8818 0.9504 0.8643 0.3807 5 | 1.0000 1.0000 1.0000 1.0000 1.0000 1.0000 1.0000 1.0000 6 | 1.1694 1.8423 1.4381 1.5780 1.6478 0.8522 0.8539 1.8254 7 | 1.2281 2.1334 2.8142 1.3275 1.3919 1.0215 1.2050 0.8444 8 | 1.4767 2.9141 3.6540 2.6284 1.2852 1.0193 1.9423 1.1792 9 | 1.6508 2.7831 4.2401 3.0907 2.5818 1.2854 1.5050 1.2827 10 | 1.6508 2.7831 4.2401 3.0907 2.5818 1.2854 1.5050 1.2827 ------+---------------------------------------------------------------- Fitted Selection Pattern ------------------------ ------+---------------------------------------------------------------- AGE | 1989 1990 1991 1992 1993 1994 1995 1996 ------+---------------------------------------------------------------- 0 | 0.1707 0.0235 0.0708 0.0196 0.1336 0.0147 0.4400 0.0759 1 | 0.2331 0.2483 0.1002 0.4936 0.2496 0.1949 0.1274 0.4151 2 | 0.3480 0.3442 0.2227 0.6896 0.3563 0.0961 0.2899 0.3583 3 | 0.8187 0.6403 0.3702 1.0520 0.6627 0.4276 0.4905 0.8801 4 | 0.6711 1.1018 0.4534 1.2597 1.0972 0.4281 0.7737 1.1281 5 | 1.0000 1.0000 1.0000 1.0000 1.0000 1.0000 1.0000 1.0000 6 | 1.6224 1.9934 0.9012 1.4862 0.9395 0.7673 1.0672 1.6840 7 | 1.6404 2.5496 1.2975 1.2988 1.1764 0.9828 1.0918 1.9125 8 | 1.3473 4.5076 1.0819 2.6086 0.8316 1.2093 1.5666 2.2533 9 | 1.8446 2.4879 1.1789 2.7233 1.6403 1.1813 1.4082 2.3849 10 | 1.8446 2.4879 1.1789 2.7233 1.6403 1.1813 1.4082 2.3849 ------+----------------------------------------------------------------
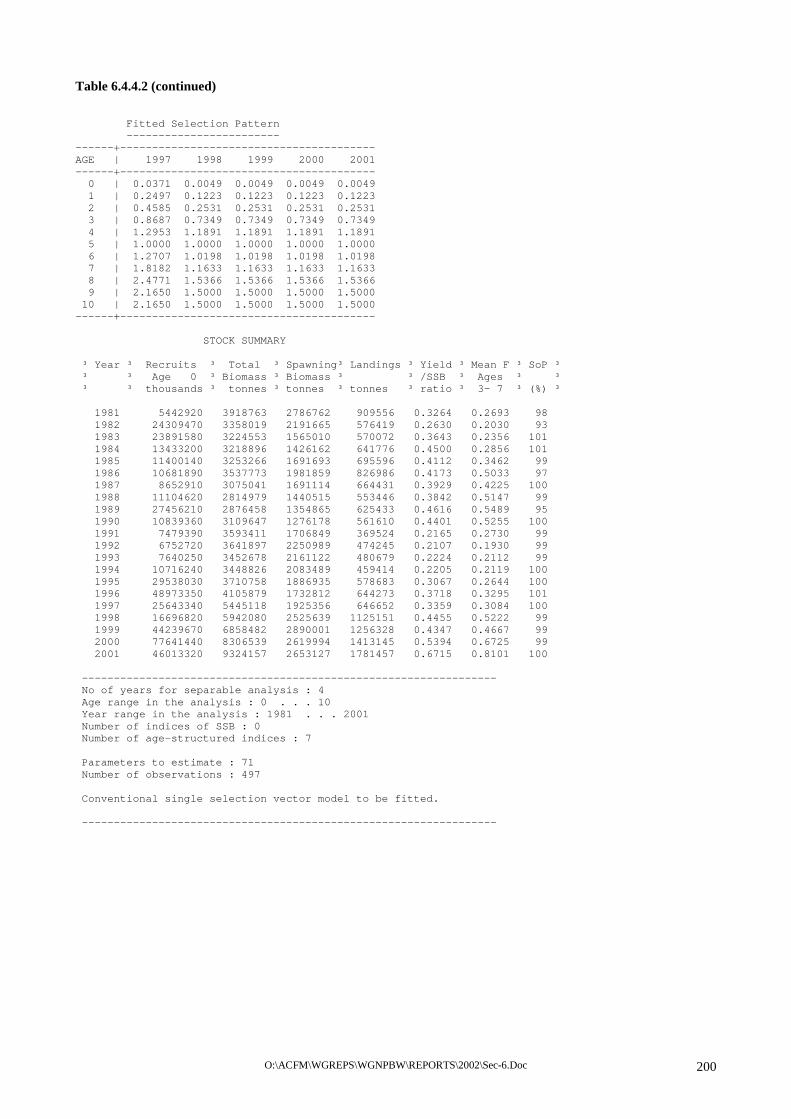
O:\ACFM\WGREPS\WGNPBW\REPORTS\2002\Sec-6.Doc 200
Table 6.4.4.2 (continued) Fitted Selection Pattern ------------------------ ------+---------------------------------------- AGE | 1997 1998 1999 2000 2001 ------+---------------------------------------- 0 | 0.0371 0.0049 0.0049 0.0049 0.0049 1 | 0.2497 0.1223 0.1223 0.1223 0.1223 2 | 0.4585 0.2531 0.2531 0.2531 0.2531 3 | 0.8687 0.7349 0.7349 0.7349 0.7349 4 | 1.2953 1.1891 1.1891 1.1891 1.1891 5 | 1.0000 1.0000 1.0000 1.0000 1.0000 6 | 1.2707 1.0198 1.0198 1.0198 1.0198 7 | 1.8182 1.1633 1.1633 1.1633 1.1633 8 | 2.4771 1.5366 1.5366 1.5366 1.5366 9 | 2.1650 1.5000 1.5000 1.5000 1.5000 10 | 2.1650 1.5000 1.5000 1.5000 1.5000 ------+---------------------------------------- STOCK SUMMARY ³ Year ³ Recruits ³ Total ³ Spawning³ Landings ³ Yield ³ Mean F ³ SoP ³ ³ ³ Age 0 ³ Biomass ³ Biomass ³ ³ /SSB ³ Ages ³ ³ ³ ³ thousands ³ tonnes ³ tonnes ³ tonnes ³ ratio ³ 3- 7 ³ (%) ³ 1981 5442920 3918763 2786762 909556 0.3264 0.2693 98 1982 24309470 3358019 2191665 576419 0.2630 0.2030 93 1983 23891580 3224553 1565010 570072 0.3643 0.2356 101 1984 13433200 3218896 1426162 641776 0.4500 0.2856 101 1985 11400140 3253266 1691693 695596 0.4112 0.3462 99 1986 10681890 3537773 1981859 826986 0.4173 0.5033 97 1987 8652910 3075041 1691114 664431 0.3929 0.4225 100 1988 11104620 2814979 1440515 553446 0.3842 0.5147 99 1989 27456210 2876458 1354865 625433 0.4616 0.5489 95 1990 10839360 3109647 1276178 561610 0.4401 0.5255 100 1991 7479390 3593411 1706849 369524 0.2165 0.2730 99 1992 6752720 3641897 2250989 474245 0.2107 0.1930 99 1993 7640250 3452678 2161122 480679 0.2224 0.2112 99 1994 10716240 3448826 2083489 459414 0.2205 0.2119 100 1995 29538030 3710758 1886935 578683 0.3067 0.2644 100 1996 48973350 4105879 1732812 644273 0.3718 0.3295 101 1997 25643340 5445118 1925356 646652 0.3359 0.3084 100 1998 16696820 5942080 2525639 1125151 0.4455 0.5222 99 1999 44239670 6858482 2890001 1256328 0.4347 0.4667 99 2000 77641440 8306539 2619994 1413145 0.5394 0.6725 99 2001 46013320 9324157 2653127 1781457 0.6715 0.8101 100 ----------------------------------------------------------------- No of years for separable analysis : 4 Age range in the analysis : 0 . . . 10 Year range in the analysis : 1981 . . . 2001 Number of indices of SSB : 0 Number of age-structured indices : 7 Parameters to estimate : 71 Number of observations : 497 Conventional single selection vector model to be fitted. -----------------------------------------------------------------

O:\ACFM\WGREPS\WGNPBW\REPORTS\2002\Sec-6.Doc 201
Table 6.4.4.2 (continued) PARAMETER ESTIMATES ³Parm.³ ³ Maximum ³ ³ ³ ³ ³ ³ Mean of ³ ³ No. ³ ³ Likelh. ³ CV ³ Lower ³ Upper ³ -s.e. ³ +s.e. ³ Param. ³ ³ ³ ³ Estimate³ (%)³ 95% CL ³ 95% CL ³ ³ ³ Distrib.³ Separable model : F by year 1 1998 0.5113 18 0.3589 0.7283 0.4268 0.6124 0.5197 2 1999 0.4569 17 0.3216 0.6492 0.3819 0.5466 0.4643 3 2000 0.6583 18 0.4619 0.9383 0.5495 0.7888 0.6692 4 2001 0.7931 22 0.5140 1.2237 0.6357 0.9895 0.8128 Separable Model: Selection (S) by age 5 0 0.0049 62 0.0014 0.0167 0.0026 0.0092 0.0060 6 1 0.1223 30 0.0673 0.2221 0.0901 0.1658 0.1281 7 2 0.2531 23 0.1583 0.4047 0.1992 0.3216 0.2604 8 3 0.7349 22 0.4725 1.1431 0.5866 0.9207 0.7538 9 4 1.1891 21 0.7821 1.8079 0.9602 1.4725 1.2166 5 1.0000 Fixed : Reference Age 10 6 1.0198 21 0.6699 1.5526 0.8230 1.2637 1.0436 11 7 1.1633 20 0.7776 1.7404 0.9472 1.4288 1.1882 12 8 1.5366 18 1.0616 2.2241 1.2724 1.8556 1.5642 9 1.5000 Fixed : Last true age Separable model: Populations in year 2001 13 0 46013326 118 4495802 470934027 14045542 150740080 93034618 14 1 63362552 39 29164321 137661803 42648493 94137278 68527419 15 2 27300295 24 16730070 44548892 21264857 35048725 28165785 16 3 7317277 19 4999529 10709519 6024920 8886847 7456761 17 4 5889508 17 4147512 8363159 4924695 7043340 5984524 18 5 4772023 18 3336280 6825627 3975543 5728075 4852254 19 6 1297188 18 910972 1847144 1083147 1553524 1318451 20 7 329408 18 227777 476386 272890 397632 335296 21 8 132462 21 87144 201347 106981 164011 135520 22 9 66234 26 39622 110719 50961 86085 68549 Separable model: Populations at age 23 1998 432211 33 222749 838638 308190 606139 457649 24 1999 166847 27 97869 284438 127092 219037 173142 25 2000 112624 24 70279 180483 88540 143260 115932 Age-structured index catchabilities Norway Spawning Area/Acoustic 1981-90 Linear model fitted. Slopes at age : 26 2 Q .7011E-03 29 .5282E-03 .1679E-02 .7011E-03 .1265E-02 .9835E-03 27 3 Q .1756E-02 29 .1323E-02 .4205E-02 .1756E-02 .3168E-02 .2464E-02 28 4 Q .2251E-02 29 .1696E-02 .5389E-02 .2251E-02 .4060E-02 .3157E-02 29 5 Q .2576E-02 29 .1941E-02 .6167E-02 .2576E-02 .4646E-02 .3613E-02 30 6 Q .2471E-02 29 .1861E-02 .5915E-02 .2471E-02 .4456E-02 .3466E-02 31 7 Q .2596E-02 29 .1956E-02 .6215E-02 .2596E-02 .4682E-02 .3641E-02 32 8 Q .2771E-02 29 .2088E-02 .6635E-02 .2771E-02 .4999E-02 .3887E-02 Norway Spawning Area/Acoustic 1991-2002 Linear model fitted. Slopes at age : 33 2 Q .9036E-03 25 .7044E-03 .1948E-02 .9036E-03 .1518E-02 .1211E-02 34 3 Q .2113E-02 25 .1652E-02 .4513E-02 .2113E-02 .3529E-02 .2822E-02 35 4 Q .2983E-02 25 .2332E-02 .6371E-02 .2983E-02 .4981E-02 .3983E-02 36 5 Q .2054E-02 25 .1605E-02 .4398E-02 .2054E-02 .3436E-02 .2746E-02 37 6 Q .1568E-02 25 .1225E-02 .3359E-02 .1568E-02 .2624E-02 .2097E-02 38 7 Q .1430E-02 25 .1116E-02 .3071E-02 .1430E-02 .2397E-02 .1914E-02 39 8 Q .1708E-02 26 .1329E-02 .3707E-02 .1708E-02 .2883E-02 .2297E-02 Russian Spawning Area/Acoustic 1982-91 Linear model fitted. Slopes at age : 40 3 Q .1383E-02 24 .1094E-02 .2850E-02 .1383E-02 .2254E-02 .1819E-02 41 4 Q .1912E-02 24 .1512E-02 .3939E-02 .1912E-02 .3116E-02 .2514E-02 42 5 Q .2211E-02 24 .1749E-02 .4556E-02 .2211E-02 .3604E-02 .2908E-02 43 6 Q .2646E-02 24 .2093E-02 .5452E-02 .2646E-02 .4312E-02 .3480E-02 44 7 Q .3038E-02 24 .2403E-02 .6260E-02 .3038E-02 .4952E-02 .3996E-02 45 8 Q .3733E-02 24 .2953E-02 .7692E-02 .3733E-02 .6084E-02 .4910E-02 Russian Spawning Area/Acoustic 1992-199 Linear model fitted. Slopes at age : 46 3 Q .2424E-02 38 .1673E-02 .7602E-02 .2424E-02 .5247E-02 .3842E-02 47 4 Q .2948E-02 38 .2035E-02 .9245E-02 .2948E-02 .6381E-02 .4673E-02 48 5 Q .2304E-02 38 .1590E-02 .7225E-02 .2304E-02 .4987E-02 .3652E-02 49 6 Q .1555E-02 38 .1073E-02 .4878E-02 .1555E-02 .3367E-02 .2465E-02 50 7 Q .1186E-02 38 .8184E-03 .3719E-02 .1186E-02 .2567E-02 .1880E-02

O:\ACFM\WGREPS\WGNPBW\REPORTS\2002\Sec-6.Doc 202
51 8 Q .1110E-02 38 .7660E-03 .3481E-02 .1110E-02 .2403E-02 .1759E-02
Table 6.4.4.2 (continued) CPUE Spanish Pair Trawlers Linear model fitted. Slopes at age : 52 1 Q .6489E-03 177 .1184E-03 .1231 .6489E-03 .2247E-01 .1836E-01 53 2 Q .2120E-02 17 .1785E-02 .3600E-02 .2120E-02 .3032E-02 .2576E-02 54 3 Q .2554E-02 17 .2152E-02 .4331E-02 .2554E-02 .3649E-02 .3102E-02 55 4 Q .1910E-02 17 .1609E-02 .3239E-02 .1910E-02 .2729E-02 .2320E-02 56 5 Q .1301E-02 17 .1096E-02 .2206E-02 .1301E-02 .1859E-02 .1580E-02 57 6 Q .9031E-03 17 .7608E-03 .1532E-02 .9031E-03 .1291E-02 .1097E-02 Norwegian Sea acoustic - Blue Wh. 1981- Linear model fitted. Slopes at age : 58 1 Q .4226E-03 27 .3236E-03 .9626E-03 .4226E-03 .7370E-03 .5801E-03 59 2 Q .4809E-03 27 .3682E-03 .1095E-02 .4809E-03 .8387E-03 .6601E-03 60 3 Q .7331E-03 27 .5613E-03 .1670E-02 .7331E-03 .1278E-02 .1006E-02 61 4 Q .8605E-03 27 .6589E-03 .1960E-02 .8605E-03 .1501E-02 .1181E-02 62 5 Q .9017E-03 27 .6904E-03 .2054E-02 .9017E-03 .1573E-02 .1238E-02 63 6 Q .7687E-03 27 .5886E-03 .1751E-02 .7687E-03 .1341E-02 .1055E-02 64 7 Q .8198E-03 27 .6277E-03 .1867E-02 .8198E-03 .1430E-02 .1125E-02 Norwegian Sea acoustic - Blue Wh. 1991+ Linear model fitted. Slopes at age : 65 1 Q .7306E-03 28 .5546E-03 .1709E-02 .7306E-03 .1297E-02 .1015E-02 66 2 Q .4715E-03 28 .3593E-03 .1090E-02 .4715E-03 .8304E-03 .6513E-03 67 3 Q .7054E-03 28 .5380E-03 .1626E-02 .7054E-03 .1240E-02 .9734E-03 68 4 Q .6216E-03 28 .4741E-03 .1433E-02 .6216E-03 .1093E-02 .8577E-03 69 5 Q .3339E-03 28 .2546E-03 .7703E-03 .3339E-03 .5873E-03 .4608E-03 70 6 Q .3446E-03 28 .2626E-03 .7963E-03 .3446E-03 .6069E-03 .4760E-03 71 7 Q .2176E-03 28 .1656E-03 .5050E-03 .2176E-03 .3843E-03 .3011E-03 RESIDUALS ABOUT THE MODEL FIT ------------------------------ Separable Model Residuals ------------------------- ------+-------------------------------- Age | 1998 1999 2000 2001 ------+-------------------------------- 0 | 0.1261 0.4376 -0.5634 0.0001 1 | 0.3708 0.1595 -0.3347 -0.1973 2 | 0.2249 -0.0239 -0.2109 -0.0064 3 | 0.0799 0.0273 -0.1655 0.0015 4 | -0.3073 0.3385 -0.2369 0.1398 5 | -0.2741 -0.2088 0.1364 0.0776 6 | -0.0904 -0.1062 0.3755 -0.1207 7 | 0.1838 -0.1421 0.2205 -0.0715 8 | 0.1676 0.1761 0.1491 0.1178 9 | 0.0000 -0.0978 -0.1106 0.5877 ------+-------------------------------- AGE-STRUCTURED INDEX RESIDUALS ------------------------------- Norway Spawning Area/Acoustic 1981-90 ------------------------------------- ------+---------------------------------------------------------------- Age | 1981 1982 1983 1984 1985 1986 1987 1988 ------+---------------------------------------------------------------- 2 | -0.093 ******* -2.022 0.752 ******* -1.574 0.199 0.851 3 | -0.026 ******* -0.378 -0.777 ******* -0.938 -0.028 0.206 4 | -0.706 ******* -0.476 -0.505 ******* -0.706 0.655 0.485 5 | -0.360 ******* 0.208 -0.692 ******* -1.210 0.048 1.082 6 | 0.040 ******* 0.023 -0.597 ******* -1.572 -1.205 1.351 7 | 0.223 ******* 0.625 -0.774 ******* -1.652 -0.293 0.328 8 | -0.223 ******* 0.647 -0.612 ******* -1.496 -0.196 0.825 ------+---------------------------------------------------------------- Norway Spawning Area/Acoustic 1981-90 ------------------------------------- ------+---------------- Age | 1989 1990 ------+---------------- 2 | 0.705 1.183 3 | 1.151 0.791 4 | 0.445 0.810 5 | 0.666 0.259 6 | 0.996 0.964 7 | 0.460 1.082 8 | 0.092 0.962

O:\ACFM\WGREPS\WGNPBW\REPORTS\2002\Sec-6.Doc 203
------+----------------
Table 6.4.4.2 (continued) Norway Spawning Area/Acoustic 1991-2002 --------------------------------------- ------+---------------------------------------------------------------- Age | 1991 1992 1993 1994 1995 1996 1997 1998 ------+---------------------------------------------------------------- 2 | -0.171 -1.566 0.151 -0.832 0.759 0.405 ******* -0.338 3 | -0.400 0.126 -1.107 -0.831 0.390 0.085 ******* 0.490 4 | 0.276 -0.699 0.187 -0.814 0.158 0.255 ******* -0.602 5 | 1.070 -0.682 -0.503 0.152 0.349 -0.226 ******* -0.377 6 | 1.101 0.182 -0.259 -0.231 0.739 0.711 ******* -1.525 7 | 1.194 -0.050 -0.198 0.539 0.338 0.549 ******* -0.603 8 | 0.711 0.463 -0.470 0.588 0.444 0.334 ******* -0.489 ------+---------------------------------------------------------------- Norway Spawning Area/Acoustic 1991-2002 --------------------------------------- ------+-------------------------------- Age | 1999 2000 2001 2002 ------+-------------------------------- 2 | 0.341 -0.025 0.666 0.610 3 | 0.383 0.373 -0.021 0.513 4 | 0.463 0.291 -0.001 0.486 5 | -0.607 0.265 0.041 0.520 6 | -1.072 -0.135 -0.830 1.321 7 | -2.064 0.050 -0.754 0.998 8 | -0.942 -0.257 -1.192 0.808 ------+-------------------------------- Russian Spawning Area/Acoustic 1982-91 -------------------------------------- ------+---------------------------------------------------------------- Age | 1982 1983 1984 1985 1986 1987 1988 1989 ------+---------------------------------------------------------------- 3 | -1.945 -0.039 -0.016 0.363 0.469 -0.420 -0.452 0.764 4 | -0.748 -0.240 -1.045 -1.035 1.184 0.654 -0.352 0.271 5 | -1.248 0.727 -0.986 -1.058 0.347 0.414 0.372 0.365 6 | -0.861 -0.007 0.150 -0.196 -0.657 0.060 0.705 0.815 7 | -0.697 -0.149 -0.263 -0.991 -0.693 -0.269 0.734 1.894 8 | -0.236 -0.485 -0.160 -1.223 -0.695 0.250 0.305 2.033 ------+---------------------------------------------------------------- Russian Spawning Area/Acoustic 1982-91 -------------------------------------- ------+---------------- Age | 1990 1991 ------+---------------- 3 | 0.767 0.509 4 | 1.051 0.259 5 | 0.439 0.629 6 | -0.037 0.028 7 | 0.124 0.309 8 | -0.189 0.397 ------+---------------- Russian Spawning Area/Acoustic 1992-199 --------------------------------------- ------+---------------------------------------- Age | 1992 1993 1994 1995 1996 ------+---------------------------------------- 3 | -0.278 -0.891 ******* 0.501 0.669 4 | -0.337 -0.576 ******* 0.408 0.506 5 | -0.950 0.079 ******* 0.499 0.373 6 | -0.957 0.321 ******* -0.526 1.163 7 | -0.593 0.849 ******* 0.029 -0.284 8 | -0.393 0.338 ******* -0.101 0.156 ------+----------------------------------------

O:\ACFM\WGREPS\WGNPBW\REPORTS\2002\Sec-6.Doc 204
Table 6.4.4.2 (continued) CPUE Spanish Pair Trawlers -------------------------- ------+---------------------------------------------------------------- Age | 1983 1984 1985 1986 1987 1988 1989 1990 ------+---------------------------------------------------------------- 1 | -0.230 0.268 0.937 -0.222 1.661 0.706 1.111 0.612 2 | 0.997 0.324 -0.003 0.061 0.157 0.635 0.707 0.485 3 | 0.840 1.131 -0.029 -0.255 -0.531 0.643 0.687 -0.351 4 | 0.803 0.885 1.003 0.225 -1.038 0.113 0.585 -0.682 5 | 0.967 0.139 0.366 0.420 -0.593 -0.757 0.518 -0.311 6 | 0.378 0.518 -1.032 0.434 -0.547 0.488 0.233 -0.440 ------+---------------------------------------------------------------- CPUE Spanish Pair Trawlers -------------------------- ------+---------------------------------------------------------------- Age | 1991 1992 1993 1994 1995 1996 1997 1998 ------+---------------------------------------------------------------- 1 | 1.143 1.087 0.248 -1.854 0.591 -1.108 -0.941 -0.699 2 | -0.623 0.650 0.516 -0.287 0.513 0.142 -0.581 -1.415 3 | -0.735 -0.951 0.716 0.760 -0.067 0.682 0.039 -0.805 4 | -0.470 -0.227 -0.451 0.239 0.177 0.085 0.079 0.915 5 | -0.275 -0.398 -0.594 -0.583 -0.288 0.778 -0.391 1.425 6 | -0.539 -0.239 -0.248 -0.058 -1.280 0.555 -0.466 0.655 ------+---------------------------------------------------------------- CPUE Spanish Pair Trawlers -------------------------- ------+------------------------ Age | 1999 2000 2001 ------+------------------------ 1 | -1.335 -1.189 -0.781 2 | -1.037 -0.183 -1.055 3 | -0.743 -0.415 -0.615 4 | 0.148 -1.020 -1.366 5 | 1.486 -0.718 -1.191 6 | 1.939 1.123 -1.474 ------+------------------------ Norwegian Sea acoustic - Blue Wh. 1981- --------------------------------------- ------+---------------------------------------------------------------- Age | 1981 1982 1983 1984 1985 1986 1987 1988 ------+---------------------------------------------------------------- 1 | -1.896 -2.156 1.395 1.552 0.534 -0.213 1.017 0.739 2 | -0.757 -0.788 -1.173 1.213 1.550 -0.179 0.512 0.168 3 | 0.508 -0.323 -0.837 -0.424 1.191 0.359 0.529 0.011 4 | 0.581 0.776 -0.628 -0.752 -0.373 1.132 0.509 0.377 5 | 0.617 0.797 -0.108 -0.598 -0.252 1.309 0.052 -0.606 6 | 0.982 1.404 -0.478 -0.397 -0.898 1.353 0.023 -0.999 7 | 1.197 1.234 0.027 -0.570 -0.702 0.380 0.322 -0.211 ------+---------------------------------------------------------------- Norwegian Sea acoustic - Blue Wh. 1981- --------------------------------------- ------+---------------- Age | 1989 1990 ------+---------------- 1 | -0.973 ******* 2 | -0.545 ******* 3 | -1.013 ******* 4 | -1.622 ******* 5 | -1.213 ******* 6 | -0.989 ******* 7 | -1.678 ******* ------+----------------

O:\ACFM\WGREPS\WGNPBW\REPORTS\2002\Sec-6.Doc 205
Table 6.4.4.2 (continued) Norwegian Sea acoustic - Blue Wh. 1991+ --------------------------------------- ------+---------------------------------------------------------------- Age | 1991 1992 1993 1994 1995 1996 1997 1998 ------+---------------------------------------------------------------- 1 | ******* -1.520 -1.408 ******* 0.249 0.620 0.227 0.644 2 | ******* -0.854 -2.650 ******* 0.432 -0.927 1.457 1.431 3 | ******* 0.067 -0.983 ******* 0.051 -0.735 -0.590 1.090 4 | ******* -0.763 0.526 ******* 0.049 -0.510 -0.265 -0.792 5 | ******* -0.551 0.736 ******* 0.955 0.094 -0.202 -0.296 6 | ******* -0.187 0.490 ******* -0.007 0.337 0.486 -0.700 7 | ******* -0.176 1.087 ******* 0.126 1.052 0.772 -0.200 ------+---------------------------------------------------------------- Norwegian Sea acoustic - Blue Wh. 1991+ --------------------------------------- ------+------------------------ Age | 1999 2000 2001 ------+------------------------ 1 | 0.539 0.167 0.484 2 | 0.470 -0.164 0.809 3 | 0.795 -0.645 0.952 4 | 1.393 -0.282 0.645 5 | 1.672 -3.214 0.806 6 | 1.141 -1.187 -0.372 7 | 0.252 -1.883 -1.029 ------+------------------------ PARAMETERS OF THE DISTRIBUTION OF ln(CATCHES-AT-AGE) ----------------------------------------------------- Separable model fitted from 1998 to 2001 Variance0.1008 Skewness test stat. 2.1918 Kurtosis test statistic 0.5222 Partial chi-square 0.1192 Significance in fit 0.0000 Degrees of freedom 15 PARAMETERS OF THE DISTRIBUTION OF THE AGE-STRUCTURED INDICES ------------------------------------------------------------ DISTRIBUTION STATISTICS FOR Norway Spawning Area/Acoustic 1981-90 Linear catchability relationship assumed Age 2 3 4 5 6 7 8 Variance 0.2000 0.0739 0.0611 0.0775 0.1638 0.1091 0.0965 Skewness test stat. -0.9703 0.3213 0.0453 -0.2481 -0.2152 -0.8830 -0.5938 Kurtosis test statisti -0.4861 -0.5670 -1.0521 -0.4645 -0.7630 -0.2127 -0.3617 Partial chi-square 0.1724 0.0585 0.0490 0.0661 0.1563 0.1081 0.1057 Significance in fit 0.0000 0.0000 0.0000 0.0000 0.0000 0.0000 0.0000 Number of observations 8 8 8 8 8 8 8 Degrees of freedom 7 7 7 7 7 7 7 Weight in the analysis 0.1429 0.1429 0.1429 0.1429 0.1429 0.1429 0.1429 DISTRIBUTION STATISTICS FOR Norway Spawning Area/Acoustic 1991-2002 Linear catchability relationship assumed Age 2 3 4 5 6 7 8 Variance 0.0712 0.0434 0.0321 0.0416 0.1192 0.1195 0.0695 Skewness test stat. -1.3675 -1.3312 -1.0798 0.6298 -0.1818 -1.1853 -0.6081 Kurtosis test statisti 0.1316 -0.2625 -0.6638 -0.4116 -0.7175 0.2904 -0.8289 Partial chi-square 0.0806 0.0465 0.0349 0.0520 0.1617 0.1868 0.1243 Significance in fit 0.0000 0.0000 0.0000 0.0000 0.0000 0.0000 0.0000 Number of observations 11 11 11 11 11 11 11 Degrees of freedom 10 10 10 10 10 10 10 Weight in the analysis 0.1429 0.1429 0.1429 0.1429 0.1429 0.1429 0.1429

O:\ACFM\WGREPS\WGNPBW\REPORTS\2002\Sec-6.Doc 206
Table 6.4.4.2 (continued) DISTRIBUTION STATISTICS FOR Russian Spawning Area/Acoustic 1982-91 Linear catchability relationship assumed Age 3 4 5 6 7 8 Variance 0.1101 0.1107 0.0987 0.0445 0.1175 0.1255 Skewness test stat. -1.7857 0.1159 -1.0475 -0.0385 1.4125 1.4369 Kurtosis test statisti 0.8375 -0.8436 -0.7594 -0.3394 0.4029 0.8257 Partial chi-square 0.1180 0.1194 0.1103 0.0515 0.1542 0.1770 Significance in fit 0.0000 0.0000 0.0000 0.0000 0.0000 0.0000 Number of observations 10 10 10 10 10 10 Degrees of freedom 9 9 9 9 9 9 Weight in the analysis 0.1667 0.1667 0.1667 0.1667 0.1667 0.1667 DISTRIBUTION STATISTICS FOR Russian Spawning Area/Acoustic 1992-199 Linear catchability relationship assumed Age 3 4 5 6 7 8 Variance 0.0873 0.0482 0.0720 0.1471 0.0641 0.0168 Skewness test stat. -0.2522 -0.0649 -0.7534 0.2204 0.5000 -0.1881 Kurtosis test statisti -0.6286 -0.7558 -0.3545 -0.5831 -0.4282 -0.5566 Partial chi-square 0.0284 0.0156 0.0262 0.0588 0.0297 0.0087 Significance in fit 0.0013 0.0005 0.0011 0.0037 0.0013 0.0002 Number of observations 4 4 4 4 4 4 Degrees of freedom 3 3 3 3 3 3 Weight in the analysis 0.1667 0.1667 0.1667 0.1667 0.1667 0.1667 DISTRIBUTION STATISTICS FOR CPUE Spanish Pair Trawlers Linear catchability relationship assumed Age 1 2 3 4 5 6 Variance 0.0017 0.0766 0.0750 0.0808 0.0972 0.1171 Skewness test stat. -0.2980 -1.0719 0.3530 -0.6129 1.0282 0.4527 Kurtosis test statisti -1.0468 -0.5774 -1.2647 -0.6921 -0.6123 -0.0281 Partial chi-square 0.0036 0.1385 0.1464 0.1711 0.2319 0.3267 Significance in fit 0.0000 0.0000 0.0000 0.0000 0.0000 0.0000 Number of observations 19 19 19 19 19 19 Degrees of freedom 18 18 18 18 18 18 Weight in the analysis 0.0017 0.1667 0.1667 0.1667 0.1667 0.1667 DISTRIBUTION STATISTICS FOR Norwegian Sea acoustic - Blue Wh. 1981- Linear catchability relationship assumed Age 1 2 3 4 5 6 7 Variance 0.2760 0.1261 0.0731 0.1135 0.0893 0.1416 0.1229 Skewness test stat. -0.5867 0.5758 0.1240 -0.6176 0.2461 0.5470 -0.3219 Kurtosis test statisti -0.7651 -0.6549 -0.6016 -0.5230 -0.5344 -0.8880 -0.3614 Partial chi-square 0.2851 0.1284 0.0753 0.1208 0.1043 0.1832 0.1747 Significance in fit 0.0000 0.0000 0.0000 0.0000 0.0000 0.0000 0.0000 Number of observations 9 9 9 9 9 9 9 Degrees of freedom 8 8 8 8 8 8 8 Weight in the analysis 0.1429 0.1429 0.1429 0.1429 0.1429 0.1429 0.1429 DISTRIBUTION STATISTICS FOR Norwegian Sea acoustic - Blue Wh. 1991+ Linear catchability relationship assumed Age 1 2 3 4 5 6 7 Variance 0.1028 0.2477 0.0894 0.0760 0.2799 0.0708 0.1365 Skewness test stat. -1.4610 -0.9466 0.2753 0.8382 -1.5953 -0.1473 -0.8447 Kurtosis test statisti -0.2194 -0.1234 -0.9233 -0.3680 0.7706 -0.4114 -0.2623 Partial chi-square 0.0971 0.2469 0.0865 0.0804 0.3583 0.1099 0.2702 Significance in fit 0.0000 0.0000 0.0000 0.0000 0.0000 0.0000 0.0000 Number of observations 9 9 9 9 9 9 9 Degrees of freedom 8 8 8 8 8 8 8 Weight in the analysis 0.1429 0.1429 0.1429 0.1429 0.1429 0.1429 0.1429

O:\ACFM\WGREPS\WGNPBW\REPORTS\2002\Sec-6.Doc 207
Table 6.4.4.2 (continued) ANALYSIS OF VARIANCE -------------------------- Unweighted Statistics Variance SSQ Data Parameters d.f. Variance Total for model 291.6748 497 71 426 0.6847 Catches-at-age 2.1421 40 25 15 0.1428 Aged Indices Norway Spawning Area/Acoustic 1981-90 38.3182 56 7 49 0.7820 Norway Spawning Area/Acoustic 1991-200 34.7553 77 7 70 0.4965 Russian Spawning Area/Acoustic 1982-91 32.7772 60 6 54 0.6070 Russian Spawning Area/Acoustic 1992-19 7.8394 24 6 18 0.4355 CPUE Spanish Pair Trawlers 66.8944 114 6 108 0.6194 Norwegian Sea acoustic - Blue Wh. 1981 52.7826 63 7 56 0.9425 Norwegian Sea acoustic - Blue Wh. 1991 56.1657 63 7 56 1.0030 Weighted Statistics Variance SSQ Data Parameters d.f. Variance Total for model 7.6956 497 71 426 0.0181 Catches-at-age 1.5127 40 25 15 0.1008 Aged Indices Norway Spawning Area/Acoustic 1981-90 0.7820 56 7 49 0.0160 Norway Spawning Area/Acoustic 1991-200 0.7093 77 7 70 0.0101 Russian Spawning Area/Acoustic 1982-91 0.9105 60 6 54 0.0169 Russian Spawning Area/Acoustic 1992-19 0.2178 24 6 18 0.0121 CPUE Spanish Pair Trawlers 1.3399 114 6 108 0.0124 Norwegian Sea acoustic - Blue Wh. 1981 1.0772 63 7 56 0.0192 Norwegian Sea acoustic - Blue Wh. 1991 1.1462 63 7 56 0.0205

O:\ACFM\WGREPS\WGNPBW\REPORTS\2002\Sec-6.Doc 208
Table 6.4.4.3 Results of stock assessment with the ISVPA.
Year Catch R(1) SSB B(1+) F(3-7)th.t. mln. th.t. th.t.
1 2 3 4 1 2 3 4 1 2 3 4 1 2 3 41981 909 4461 10847 17995 3508 4275 7496 10482 3484 4960 8974 12786 3998 0.220 0.131 0.097 0.2661982 576 6342 13983 22454 4472 3430 5772 7868 2638 4091 7111 9902 3105 0.162 0.103 0.079 0.2061983 570 2922 5827 9195 16915 2455 3888 5153 1887 2990 4867 6586 2868 0.294 0.200 0.157 0.3071984 641 11857 25590 42230 19444 1774 2697 3531 1681 2387 3895 5406 2936 0.391 0.274 0.215 0.3761985 695 11843 27059 46316 10695 1579 2426 3269 1985 2465 4221 6159 3140 0.417 0.293 0.228 0.3841986 827 17751 43677 77519 8720 1843 2953 4164 2364 3031 5552 8538 3292 0.477 0.328 0.250 0.4471987 664 7608 19817 36051 8881 1876 3291 4920 2011 3077 5939 9377 2971 0.457 0.303 0.224 0.4101988 553 7952 21796 40229 7073 1820 3306 5024 1732 2713 5396 8638 2567 0.427 0.271 0.196 0.3871989 625 9450 26420 48560 9456 1767 3308 5086 1659 2761 5774 9412 2606 0.515 0.307 0.216 0.4921990 561 15378 43459 79146 21478 1627 3274 5142 1575 2705 6084 10097 2885 0.517 0.280 0.191 0.4551991 369 8261 22944 40769 9425 1808 3979 6361 2002 3005 7039 11608 3526 0.222 0.117 0.080 0.2081992 474 6538 17829 31129 6696 2235 4679 7211 2649 3170 6957 10993 3732 0.223 0.121 0.085 0.2121993 480 9578 25586 43814 6396 2196 4379 6518 2585 3265 6983 10806 3535 0.184 0.104 0.075 0.1811994 459 6268 15305 25073 6669 2318 4344 6229 2550 3273 6493 9614 3426 0.174 0.104 0.078 0.1671995 579 7303 16608 26249 9387 2339 4136 5742 2374 3266 6091 8721 3408 0.232 0.147 0.114 0.2211996 638 15436 32951 50515 27427 2135 3538 4738 2274 3145 5578 7778 3794 0.321 0.212 0.168 0.2851997 634 50043 102532 153947 56894 2212 3691 4962 2666 4974 9190 13099 6126 0.291 0.201 0.163 0.2501998 1125 52699 102728 151013 48986 3199 5261 7037 4028 7338 12952 18050 8415 0.387 0.278 0.230 0.3291999 1256 34684 65167 94392 35202 4703 7427 9735 5541 9049 15077 20423 10024 0.273 0.206 0.175 0.2332000 1413 68282 124098 177459 75222 5892 8636 10957 6500 11338 17992 23962 12432 0.296 0.241 0.210 0.2572001 1780 75511 133642 189259 87893 7429 10255 12738 8262 14027 21078 27501 15852 0.282 0.250 0.225 0.253

O:\ACFM\WGREPS\WGNPBW\REPORTS\2002\Sec-6.Doc 209
Table 6.4.4.4 Residuals (Ln(Cobserved(a,y))-Ln(Cestimated(a,y))) from the ISVPA stock assessment.
a. ISVPA, M=0.2, effort-controlled
Year \ Age 1 2 3 4 5 6 7 81981 0.218 0.102 -0.352 -1.090 0.490 0.459 0.200 -0.0271982 -0.413 0.411 0.031 -0.188 -0.781 0.294 0.383 0.2631983 2.569 0.244 -0.435 -0.560 -1.103 -1.011 0.123 0.1731984 0.935 2.224 -0.471 -0.559 -0.472 -0.658 -0.915 -0.0841985 0.323 0.661 1.758 -0.720 -0.527 -0.029 -0.654 -0.8111986 -0.884 -0.356 0.242 1.758 -0.138 -0.238 0.035 -0.4181987 0.251 -1.061 -0.641 0.551 1.404 -0.703 -0.068 0.2671988 -0.419 0.056 -1.158 -0.406 0.686 1.732 -0.452 -0.0391989 -0.025 -0.142 0.314 -0.820 0.087 0.340 0.745 -0.4991990 0.107 -0.323 -0.405 0.012 -0.740 0.202 0.237 0.9101991 -0.375 0.262 -0.134 -0.233 0.481 -0.255 0.374 -0.1201992 0.280 0.374 0.449 0.071 -0.294 -0.165 -0.722 0.0061993 -0.367 0.019 0.214 0.685 0.189 -0.033 0.038 -0.7451994 0.265 -1.357 -0.034 -0.116 0.726 0.042 0.275 0.2001995 -0.184 -0.008 -0.552 0.017 0.313 0.212 0.013 0.1901996 0.643 -0.015 0.015 -0.476 -0.349 0.045 0.149 -0.0131997 -0.332 0.382 0.343 0.174 -0.641 -0.208 0.075 0.2081998 -0.872 -0.024 0.733 0.401 -0.145 -0.508 0.220 0.1961999 -0.905 -0.757 0.369 1.208 0.168 -0.097 -0.375 0.3882000 -0.816 -0.692 -0.286 0.290 0.648 0.582 0.318 -0.0452001 0.000 0.000 0.000 0.000 0.000 0.000 0.000 0.000
b. ISVPA, M=0.38, effort-controlled
Year \ Age 1 2 3 4 5 6 7 81981 0.265 0.123 -0.351 -1.106 0.475 0.441 0.184 -0.0311982 -0.321 0.431 0.029 -0.200 -0.808 0.269 0.359 0.2421983 2.679 0.288 -0.456 -0.585 -1.129 -1.049 0.098 0.1521984 0.930 2.320 -0.439 -0.585 -0.499 -0.684 -0.945 -0.0991985 0.255 0.662 1.859 -0.683 -0.548 -0.047 -0.670 -0.8291986 -1.017 -0.406 0.261 1.874 -0.087 -0.243 0.033 -0.4161987 0.095 -1.157 -0.655 0.595 1.539 -0.633 -0.061 0.2761988 -0.586 -0.055 -1.212 -0.391 0.752 1.888 -0.371 -0.0241989 -0.173 -0.264 0.243 -0.845 0.124 0.424 0.908 -0.4161990 0.029 -0.395 -0.461 -0.020 -0.745 0.249 0.303 1.0401991 -0.343 0.268 -0.135 -0.251 0.462 -0.262 0.378 -0.1171992 0.302 0.401 0.451 0.071 -0.312 -0.186 -0.731 0.0051993 -0.355 0.035 0.237 0.687 0.190 -0.052 0.016 -0.7581994 0.313 -1.370 -0.039 -0.102 0.724 0.038 0.257 0.1801995 -0.130 0.007 -0.592 -0.001 0.320 0.205 0.014 0.1781996 0.708 0.012 0.007 -0.529 -0.375 0.045 0.142 -0.0121997 -0.258 0.432 0.357 0.155 -0.704 -0.244 0.068 0.1941998 -0.797 0.023 0.759 0.398 -0.176 -0.580 0.183 0.1901999 -0.825 -0.701 0.399 1.218 0.151 -0.139 -0.453 0.3502000 -0.771 -0.653 -0.264 0.299 0.647 0.561 0.287 -0.1052001 0.000 0.000 0.000 0.000 0.000 0.000 0.000 0.000
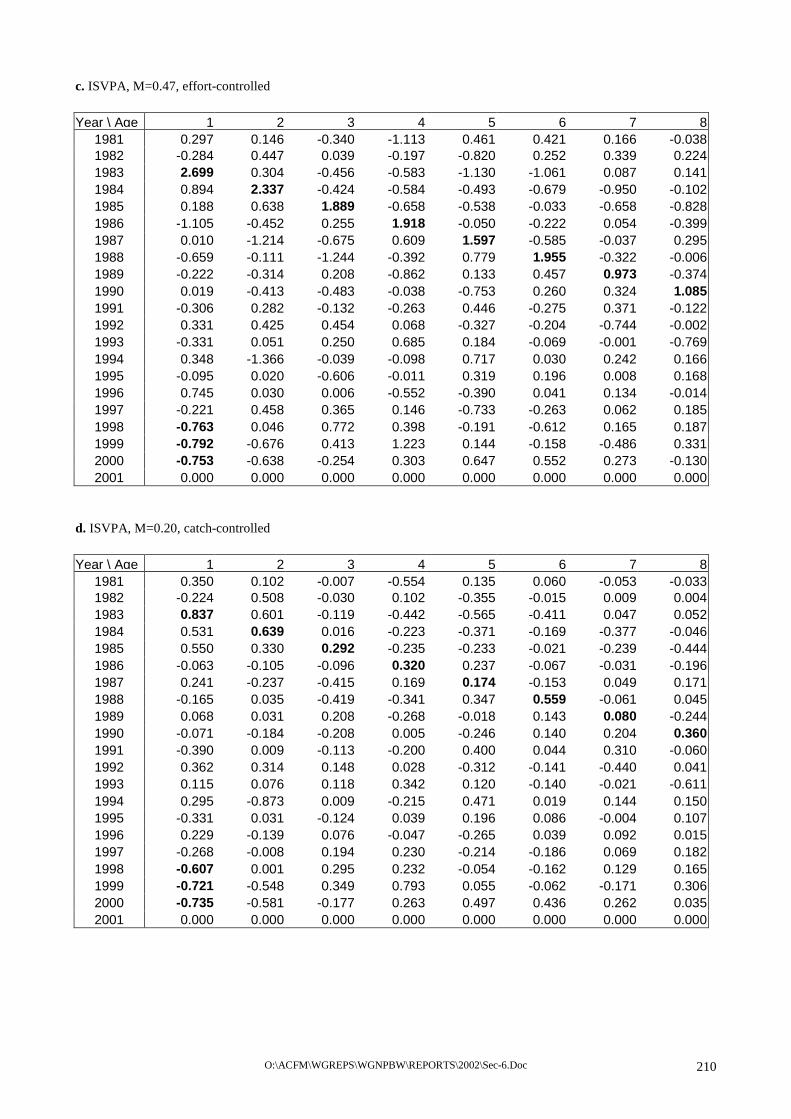
O:\ACFM\WGREPS\WGNPBW\REPORTS\2002\Sec-6.Doc 210
c. ISVPA, M=0.47, effort-controlled
Year \ Age 1 2 3 4 5 6 7 81981 0.297 0.146 -0.340 -1.113 0.461 0.421 0.166 -0.0381982 -0.284 0.447 0.039 -0.197 -0.820 0.252 0.339 0.2241983 2.699 0.304 -0.456 -0.583 -1.130 -1.061 0.087 0.1411984 0.894 2.337 -0.424 -0.584 -0.493 -0.679 -0.950 -0.1021985 0.188 0.638 1.889 -0.658 -0.538 -0.033 -0.658 -0.8281986 -1.105 -0.452 0.255 1.918 -0.050 -0.222 0.054 -0.3991987 0.010 -1.214 -0.675 0.609 1.597 -0.585 -0.037 0.2951988 -0.659 -0.111 -1.244 -0.392 0.779 1.955 -0.322 -0.0061989 -0.222 -0.314 0.208 -0.862 0.133 0.457 0.973 -0.3741990 0.019 -0.413 -0.483 -0.038 -0.753 0.260 0.324 1.0851991 -0.306 0.282 -0.132 -0.263 0.446 -0.275 0.371 -0.1221992 0.331 0.425 0.454 0.068 -0.327 -0.204 -0.744 -0.0021993 -0.331 0.051 0.250 0.685 0.184 -0.069 -0.001 -0.7691994 0.348 -1.366 -0.039 -0.098 0.717 0.030 0.242 0.1661995 -0.095 0.020 -0.606 -0.011 0.319 0.196 0.008 0.1681996 0.745 0.030 0.006 -0.552 -0.390 0.041 0.134 -0.0141997 -0.221 0.458 0.365 0.146 -0.733 -0.263 0.062 0.1851998 -0.763 0.046 0.772 0.398 -0.191 -0.612 0.165 0.1871999 -0.792 -0.676 0.413 1.223 0.144 -0.158 -0.486 0.3312000 -0.753 -0.638 -0.254 0.303 0.647 0.552 0.273 -0.1302001 0.000 0.000 0.000 0.000 0.000 0.000 0.000 0.000
d. ISVPA, M=0.20, catch-controlled
Year \ Age 1 2 3 4 5 6 7 81981 0.350 0.102 -0.007 -0.554 0.135 0.060 -0.053 -0.0331982 -0.224 0.508 -0.030 0.102 -0.355 -0.015 0.009 0.0041983 0.837 0.601 -0.119 -0.442 -0.565 -0.411 0.047 0.0521984 0.531 0.639 0.016 -0.223 -0.371 -0.169 -0.377 -0.0461985 0.550 0.330 0.292 -0.235 -0.233 -0.021 -0.239 -0.4441986 -0.063 -0.105 -0.096 0.320 0.237 -0.067 -0.031 -0.1961987 0.241 -0.237 -0.415 0.169 0.174 -0.153 0.049 0.1711988 -0.165 0.035 -0.419 -0.341 0.347 0.559 -0.061 0.0451989 0.068 0.031 0.208 -0.268 -0.018 0.143 0.080 -0.2441990 -0.071 -0.184 -0.208 0.005 -0.246 0.140 0.204 0.3601991 -0.390 0.009 -0.113 -0.200 0.400 0.044 0.310 -0.0601992 0.362 0.314 0.148 0.028 -0.312 -0.141 -0.440 0.0411993 0.115 0.076 0.118 0.342 0.120 -0.140 -0.021 -0.6111994 0.295 -0.873 0.009 -0.215 0.471 0.019 0.144 0.1501995 -0.331 0.031 -0.124 0.039 0.196 0.086 -0.004 0.1071996 0.229 -0.139 0.076 -0.047 -0.265 0.039 0.092 0.0151997 -0.268 -0.008 0.194 0.230 -0.214 -0.186 0.069 0.1821998 -0.607 0.001 0.295 0.232 -0.054 -0.162 0.129 0.1651999 -0.721 -0.548 0.349 0.793 0.055 -0.062 -0.171 0.3062000 -0.735 -0.581 -0.177 0.263 0.497 0.436 0.262 0.0352001 0.000 0.000 0.000 0.000 0.000 0.000 0.000 0.000

O:\ACFM\WGREPS\WGNPBW\REPORTS\2002\Sec-6.Doc 211
Table 6.4.5.1 Tuning data for the blue whiting assessment with input values framed. BLUE WHITING-COMBINED, 2002 WG, 4 fleets
1 2 8 0 Norway Spawning Acoustic 1981-2002Year Seas. Num. Res. 2 3 4 5 6 7 8 9 10
1981 1 1 1 2372 7583 3253 3647 4611 4638 3654 2591 17851982 1 1 1 -1 -1 -1 -1 -1 -1 -1 -1 -11983 1 1 1 297 2108 2723 6511 3735 3650 3153 2279 11821984 1 1 1 15767 1721 1616 1719 1858 1128 567 440 3481985 1 1 1 -1 -1 -1 -1 -1 -1 -1 -1 -11986 1 1 1 1003 5829 4122 624 228 203 250 137 1701987 1 1 1 4960 8417 22589 4735 282 417 385 159 271988 1 1 1 9712 9090 12367 20392 7355 723 599 326 3981989 1 1 1 6787 22270 9973 10504 7803 933 293 177 461990 1 1 1 14169 12670 11228 5587 6556 3273 516 183 1081991 1 1 1 11147 6340 8497 7407 4558 2019 545 96 161992 1 1 1 1232 26123 4719 1574 1386 810 616 257 191993 1 1 1 4489 3321 26771 2643 1270 557 426 108 221994 1 1 1 1603 2950 4476 11354 1742 1687 908 770 2071995 1 1 1 8538 9874 7906 6861 9467 1795 1083 482 1491996 1 1 1 8781 7433 8371 2399 4455 4111 1202 459 1621997 1 1 1 -1 -1 -1 -1 -1 -1 -1 -1 -11998 1 1 1 18218 34991 4697 1674 279 407 381 351 861999 1 1 1 19034 60309 26103 1481 316 72 153 141 02000 1 1 1 8613 31011 41382 6843 898 427 228 139 1152001 1 1 1 44162 12843 13805 8292 718 175 51 0 02002 1 1 1 71996 54740 12757 5266 8404 1450 305 15 176
2 3 8 0 Russian spawning acoustic 1982-96Year Seas. Num. Res. 3 4 5 6 7 8 9 10
1982 1 2 10 540 2750 1340 1380 1570 2350 1730 12901983 1 2 10 2330 2930 9390 3880 1970 1370 780 6601984 1 2 10 2900 800 1100 4200 2200 1200 1700 12001985 1 2 10 13220 930 580 1780 860 610 580 5401986 1 2 10 18750 23180 2540 610 620 750 640 7101987 1 2 10 4480 19170 5860 1070 500 810 860 6701988 1 2 10 3710 4550 8610 4130 1270 480 250 2601989 1 2 10 11910 7120 6670 6970 4580 2750 1880 8101990 1 2 10 9740 12140 5740 2580 1470 220 80 101991 1 2 10 10300 5350 5130 2630 1770 870 300 2201992 1 2 1 20010 6700 1350 440 390 170 0 01993 1 2 1 4728 12337 5304 2249 1316 621 386 1501994 1 2 1 -1 -1 -1 -1 -1 -1 -1 -11995 1 2 1 12657 10028 8942 2651 1093 408 131 141996 1 2 1 15285 10629 4897 6940 1482 653 85 0
3 1 6 0 CPUE Spanish Pair Trawlers 1983-2001Year Seas. Num. Res. 1 2 3 4 5 6
1983 3 3 50 7196 16392 9311 7476 6326 17181984 3 3 50 13710 27286 14845 4836 1755 17501985 3 3 50 14573 23823 14126 6256 1232 2171986 3 3 50 3721 14131 14745 7113 1278 5051987 3 3 50 25328 13153 6664 2938 1029 1661988 3 3 50 7778 21473 18436 6391 1300 7811989 3 3 50 15272 18486 17160 8374 3760 10031990 3 3 50 21444 19407 5194 1803 1357 4511991 3 3 50 15924 15370 4989 2329 1045 4401992 3 3 50 10007 24235 9671 4316 1194 4621993 3 3 50 4036 13991 22493 7979 1354 6581994 3 3 50 543 6066 15917 7474 2990 10551995 3 3 50 9090 14409 6833 4551 1990 6231996 3 3 50 3905 14557 14449 3931 3639 18341997 3 3 50 8742 15875 11134 3698 1046 4501998 3 3 50 5884 13236 9803 10844 5229 11531999 3 3 50 2048 10268 20242 9833 6287 30472000 3 3 50 6207 15518 13987 5375 1264 14142001 3 3 50 16223 16488 6830 1620 1148 162
4 1 7 0 Norwegian Sea acoustic 1981-2001Year Seas. Num. Res. 1 2 3 4 5 6 7 8 9
1981 3 4 1 182 728 4542 3874 2678 2834 2964 2756 20541982 3 4 1 184 460 1242 4715 3611 3128 2323 1679 8741983 3 4 1 22356 396 468 756 1404 576 468 432 3241984 3 4 1 30380 13916 833 392 539 539 343 49 491985 3 4 1 5969 23876 12502 658 423 188 235 141 3761986 3 4 1 2324 2380 7224 6944 1876 952 336 308 1401987 3 4 1 8204 4032 5180 5572 1204 224 168 56 841988 3 4 1 4992 2880 2640 3480 912 120 96 24 481989 3 4 1 1172 1125 812 379 410 212 22 32 -11990 3 4 1 -1 -1 -1 -1 -1 -1 -1 -1 -11991 3 4 1 -1 -1 -1 -1 -1 -1 -1 -1 -11992 3 4 1 792 1134 6939 766 247 172 90 11 181993 3 4 1 830 125 1070 6392 1222 489 248 58 881994 3 4 1 -1 -1 -1 -1 -1 -1 -1 -1 -11995 3 4 1 6974 2811 1999 1209 1622 775 173 61 11996 3 4 1 23464 1057 899 649 436 505 755 69 411997 3 4 1 30227 25638 1524 779 300 407 260 137 1231998 3 4 1 24244 47815 16282 556 212 100 64 10 2551999 3 4 1 14367 9750 23701 9754 1733 466 79 48 912000 3 4 1 25813 3298 2721 3078 23 46 62001 3 4 1 61470 22051 7883 3225 1824 156 12 0 68

O:\ACFM\WGREPS\WGNPBW\REPORTS\2002\Sec-6.Doc 212
Table 6.4.5.2.a Modelled catches by year (tonnes) Blue whiting, Output from final AMCI run Run id 20020504 152739.761 Modelled catches by year 1981 1982 1983 1984 1985 1986 1987 1988 0 95457.2 5025307.1 4492118.0 2675763.6 2575782.6 1649875.3 1050472.6 589274.1 1 208086.3 170914.7 859751.6 1777741.9 1342309.0 1253210.2 1061209.9 764014.0 2 318686.4 180711.2 265203.8 1060646.4 1790099.2 1480266.4 1060574.4 942038.2 3 674755.8 283199.8 234793.0 356438.9 1120122.0 2019412.2 1185026.9 884629.2 4 548764.6 438819.8 280780.1 261513.5 321291.4 1055798.4 1386343.5 856749.1 5 515784.9 300084.5 357543.0 261758.0 201799.3 276736.9 596703.1 803582.9 6 625051.2 303856.8 283470.2 391506.2 240212.9 195706.3 173661.7 392448.9 7 580111.3 293471.9 234515.8 242741.1 265756.7 164099.5 92110.2 87585.3 8 577954.3 267817.8 225257.3 192185.4 158168.1 178148.5 75854.2 44396.0 9 507555.6 235289.9 180270.7 158509.0 105061.7 91903.1 69969.1 28147.9 10 1255967.8 768963.7 664625.7 598207.0 431816.9 329159.1 162380.3 87152.1 Modelled catches by year 1989 1990 1991 1992 1993 1994 1995 1996 0 3328079.3 802632.7 282637.3 148618.2 346252.7 257247.2 4583293.3 5823483.7 1 1027961.0 2349730.5 412351.2 318991.2 249965.7 264275.9 370411.2 1436086.1 2 987342.1 1090317.9 1203358.2 570265.3 356839.0 269353.3 350114.9 525000.0 3 1091897.4 931785.3 495064.1 1392511.1 586489.9 382817.8 386651.6 513117.6 4 863232.3 815650.9 337909.5 468487.4 1198064.3 507638.7 419695.7 426173.3 5 683222.4 544885.5 258620.8 279432.6 346087.5 912371.4 504454.1 397524.1 6 642024.9 421410.5 176362.1 213985.3 213683.0 270469.6 848391.0 448719.3 7 230381.5 282598.7 92338.1 107896.3 122026.0 133163.6 212413.1 647690.8 8 54219.1 112143.9 71086.6 64759.7 68304.0 83258.4 112516.0 172177.6 9 20794.9 19240.3 23006.9 46664.5 37422.3 45154.9 66532.6 80875.9 10 57108.7 37244.1 9172.8 21559.7 41314.3 46792.9 63888.8 87609.8 Modelled catches by year 1997 1998 1999 2000 2001 2002 2003 2004 0 1765313.0 775095.0 1019635.4 1022923.3 402125.7 563657.7 563657.7 563657.7 1 2516058.7 1782629.3 949821.8 2606751.2 4585236.0 1379789.7 1934044.7 1934044.7 2 1604052.2 4057563.7 1933926.6 1417395.4 4209700.1 5267259.5 1585024.2 2221721.0 3 674021.9 2870342.7 4875338.4 3143588.6 2293792.1 4726883.0 5914368.8 1779752.4 4 473358.3 817197.8 2307308.7 4939775.6 2935410.8 1366955.8 2816924.8 3524591.7 5 324206.3 458014.6 480220.9 1618668.6 3020746.1 1097559.7 511109.2 1053257.4 6 296542.5 319651.6 284330.1 396747.9 1116786.8 1389793.3 504968.3 235152.6 7 278892.3 247399.0 163744.6 192707.3 209555.4 403579.7 502237.7 182483.3 8 427457.2 233920.2 124841.4 106421.0 96214.2 65647.3 126429.1 157335.6 9 95636.7 288276.3 89306.4 55584.6 34218.2 16384.2 11179.0 21529.5 10 96416.9 126935.3 166013.6 127646.9 68134.4 17497.3 5182.7 2109.2

O:\ACFM\WGREPS\WGNPBW\REPORTS\2002\Sec-6.Doc 213
Table 6.4.5.2.b Observed catches by year (tonnes) Blue whiting, Output from final AMCI run Run id 20020504 152739.761 Observed catches by year 1981 1982 1983 1984 1985 1986 1987 1988 0 48000.0 3512000.0 437000.0 584000.0 1174000.0 84000.0 341000.0 46000.0 1 258000.0 148000.0 2283000.0 2291000.0 1305000.0 650000.0 838000.0 425000.0 2 348000.0 274000.0 567000.0 2331000.0 2044000.0 816000.0 578000.0 721000.0 3 681000.0 326000.0 270000.0 455000.0 1933000.0 1862000.0 728000.0 614000.0 4 334000.0 548000.0 286000.0 260000.0 303000.0 1717000.0 1897000.0 683000.0 5 548000.0 264000.0 299000.0 285000.0 188000.0 393000.0 726000.0 1303000.0 6 559000.0 276000.0 304000.0 445000.0 321000.0 187000.0 137000.0 618000.0 7 466000.0 266000.0 287000.0 262000.0 257000.0 201000.0 105000.0 84000.0 8 634000.0 272000.0 286000.0 193000.0 174000.0 198000.0 123000.0 53000.0 9 578000.0 284000.0 225000.0 154000.0 93000.0 174000.0 103000.0 33000.0 10 1460000.0 673000.0 334000.0 255000.0 259000.0 398000.0 195000.0 50000.0 Observed catches by year 1989 1990 1991 1992 1993 1994 1995 1996 0 1949000.0 83000.0 161080.0 19000.0 197689.0 41999.0 3306610.0 832587.0 1 865000.0 1611000.0 266686.0 407730.0 263184.0 306951.0 296100.0 1893453.0 2 718000.0 703000.0 1024468.0 653838.0 305180.0 107935.0 353949.0 534221.0 3 1340000.0 672000.0 513959.0 1641714.0 621085.0 367962.0 421560.0 632361.0 4 791000.0 753000.0 301627.0 569094.0 1571236.0 389264.0 465358.0 537280.0 5 837000.0 520000.0 363204.0 217386.0 411367.0 1221919.0 615994.0 323324.0 6 708000.0 577000.0 258038.0 154044.0 191241.0 281120.0 800201.0 497458.0 7 139000.0 299000.0 159153.0 109580.0 107005.0 174256.0 253818.0 663133.0 8 50000.0 78000.0 49431.0 79663.0 64769.0 90429.0 159797.0 232420.0 9 25000.0 27000.0 5060.0 31987.0 38118.0 79014.0 59670.0 98415.0 10 38000.0 95000.0 9570.0 11706.0 17476.0 30614.0 41811.0 82521.0 Observed catches by year 1997 1998 1999 2000 2001 0 211664.0 42985.0 139000.0 129117.0 161897.0 1 2131494.0 1656926.0 788200.0 1814851.0 4363690.0 2 1519327.0 4181175.0 1549100.0 1192657.0 4486315.0 3 904074.0 3541231.0 5820800.0 3465739.0 2962163.0 4 577676.0 1044897.0 3460600.0 5014862.0 3806520.0 5 295671.0 383658.0 412800.0 1550063.0 2592933.0 6 251642.0 322777.0 207200.0 513663.0 585666.0 7 282056.0 303058.0 151200.0 213057.0 170020.0 8 406910.0 264105.0 153100.0 151429.0 97032.0 9 104320.0 212452.0 68800.0 58277.0 76624.0 10 169235.0 85513.0 140500.0 139791.0 66410.0

O:\ACFM\WGREPS\WGNPBW\REPORTS\2002\Sec-6.Doc 214
Table 6.4.5.2.c Log catch residuals Blue whiting, Output from final AMCI run Residuals: log (Obs/mod), fleet 1 area 1 1981 1982 1983 1984 1985 1986 1987 1988 0 -0.7 -0.4 -2.3 -1.5 -0.8 -3.0 -1.1 -2.6 1 0.2 -0.1 1.0 0.3 0.0 -0.7 -0.2 -0.6 2 0.1 0.4 0.8 0.8 0.1 -0.6 -0.6 -0.3 3 0.0 0.1 0.1 0.2 0.5 -0.1 -0.5 -0.4 4 -0.5 0.2 0.0 0.0 -0.1 0.5 0.3 -0.2 5 0.1 -0.1 -0.2 0.1 -0.1 0.4 0.2 0.5 6 -0.1 -0.1 0.1 0.1 0.3 0.0 -0.2 0.5 7 -0.2 -0.1 0.2 0.1 0.0 0.2 0.1 0.0 8 0.1 0.0 0.2 0.0 0.1 0.1 0.5 0.2 9 0.1 0.2 0.2 0.0 -0.1 0.6 0.4 0.2 10 0.2 -0.1 -0.7 -0.9 -0.5 0.2 0.2 -0.6 Residuals: log (Obs/mod), fleet 1 area 1 1989 1990 1991 1992 1993 1994 1995 1996 0 -0.5 -2.3 -0.6 -2.1 -0.6 -1.8 -0.3 -1.9 1 -0.2 -0.4 -0.4 0.2 0.1 0.1 -0.2 0.3 2 -0.3 -0.4 -0.2 0.1 -0.2 -0.9 0.0 0.0 3 0.2 -0.3 0.0 0.2 0.1 0.0 0.1 0.2 4 -0.1 -0.1 -0.1 0.2 0.3 -0.3 0.1 0.2 5 0.2 0.0 0.3 -0.3 0.2 0.3 0.2 -0.2 6 0.1 0.3 0.4 -0.3 -0.1 0.0 -0.1 0.1 7 -0.5 0.1 0.5 0.0 -0.1 0.3 0.2 0.0 8 -0.1 -0.4 -0.4 0.2 -0.1 0.1 0.4 0.3 9 0.2 0.3 -1.5 -0.4 0.0 0.6 -0.1 0.2 10 -0.4 0.9 0.0 -0.6 -0.9 -0.4 -0.4 -0.1 Residuals: log (Obs/mod), fleet 1 area 1 1997 1998 1999 2000 2001 0 -2.1 -2.9 -2.0 -2.1 -0.9 1 -0.2 -0.1 -0.2 -0.4 0.0 2 -0.1 0.0 -0.2 -0.2 0.1 3 0.3 0.2 0.2 0.1 0.3 4 0.2 0.2 0.4 0.0 0.3 5 -0.1 -0.2 -0.2 0.0 -0.2 6 -0.2 0.0 -0.3 0.3 -0.6 7 0.0 0.2 -0.1 0.1 -0.2 8 0.0 0.1 0.2 0.4 0.0 9 0.1 -0.3 -0.3 0.0 0.8 10 0.6 -0.4 -0.2 0.1 0.0

O:\ACFM\WGREPS\WGNPBW\REPORTS\2002\Sec-6.Doc 215
Table 6.4.5.3.a Modelled surveys indices by year, Norwegian spawningground acoustic survey Blue whiting, Output from final AMCI run Run id 20020504 152739.761 Modelled surveys indices by year 1981 1982 1983 1984 1985 1986 1987 1988 0 -1.0 -1.0 -1.0 -1.0 -1.0 -1.0 -1.0 -1.0 1 -1.0 -1.0 -1.0 -1.0 -1.0 -1.0 -1.0 -1.0 2 2368.9 1739.4 2063.7 5658.6 8368.3 5630.9 4526.8 4433.0 3 7506.4 4231.0 3167.5 3659.5 9536.1 13653.7 8907.7 7358.3 4 6584.2 6962.6 4081.4 2985.3 3285.2 8084.8 10927.8 7391.9 5 6121.4 4889.0 5435.6 3102.9 2147.2 2254.4 5082.1 6954.0 6 5230.9 3453.6 2943.8 3177.8 1693.9 1111.5 1071.8 2466.3 7 4283.5 2930.7 2110.1 1723.7 1699.1 830.1 488.9 499.2 8 3668.0 2258.5 1706.7 1164.0 855.3 775.8 327.8 201.3 9 -1.0 -1.0 -1.0 -1.0 -1.0 -1.0 -1.0 -1.0 10 -1.0 -1.0 -1.0 -1.0 -1.0 -1.0 -1.0 -1.0 1989 1990 1991 1992 1993 1994 1995 1996 0 -1.0 -1.0 -1.0 -1.0 -1.0 -1.0 -1.0 -1.0 1 -1.0 -1.0 -1.0 -1.0 -1.0 -1.0 -1.0 -1.0 2 3884.4 4295.3 14324.2 6575.9 4587.5 3943.2 4405.9 5573.4 3 7229.5 6136.8 8526.5 23152.4 10626.4 7491.3 6470.9 7111.1 4 6171.4 5696.3 5978.6 7970.4 21590.4 10048.7 7108.0 5977.3 5 4756.8 3697.9 2308.1 2521.5 3349.1 9176.9 4303.6 2945.2 6 3318.0 2040.7 1055.1 1302.3 1434.3 1939.7 5315.5 2380.9 7 1138.0 1350.0 532.3 612.7 765.0 868.9 1184.2 3090.8 8 209.1 432.2 344.1 301.5 347.7 449.8 510.0 650.1 9 -1.0 -1.0 -1.0 -1.0 -1.0 -1.0 -1.0 -1.0 10 -1.0 -1.0 -1.0 -1.0 -1.0 -1.0 -1.0 -1.0 1997 1998 1999 2000 2001 2002 0 -1.0 -1.0 -1.0 -1.0 -1.0 -1.0 1 -1.0 -1.0 -1.0 -1.0 -1.0 -1.0 2 16828.4 29905.4 14973.6 8531.8 18672.8 23363.8 3 8852.0 26255.2 44870.6 22219.7 11844.5 24408.4 4 6379.2 7698.8 21111.9 35332.1 15539.6 7236.5 5 2384.4 2467.1 2693.2 7143.0 10397.3 3777.8 6 1572.2 1234.5 1156.3 1242.4 2856.9 3555.3 7 1308.8 834.6 570.3 530.6 463.2 892.0 8 1597.5 644.3 343.8 228.3 166.4 113.5 9 -1.0 -1.0 -1.0 -1.0 -1.0 -1.0 10 -1.0 -1.0 -1.0 -1.0 -1.0 -1.0

O:\ACFM\WGREPS\WGNPBW\REPORTS\2002\Sec-6.Doc 216
Table 6.4.5.3.b Observed surveys indices by year, Norwegian spawningground acoustic survey Blue whiting, Output from final AMCI run Run id 20020504 152739.761 Observed surveys indices by year 1981 1982 1983 1984 1985 1986 1987 1988 0 -1.0 -1.0 -1.0 -1.0 -1.0 -1.0 -1.0 -1.0 1 -1.0 -1.0 -1.0 -1.0 -1.0 -1.0 -1.0 -1.0 2 2372.0 -1.0 297.0 15767.0 -1.0 1003.0 4960.0 9712.0 3 7583.0 -1.0 2108.0 1721.0 -1.0 5829.0 8417.0 9090.0 4 3253.0 -1.0 2723.0 1616.0 -1.0 4122.0 22589.0 12367.0 5 3647.0 -1.0 6511.0 1719.0 -1.0 624.0 4735.0 20392.0 6 4611.0 -1.0 3735.0 1858.0 -1.0 228.0 282.0 7355.0 7 4638.0 -1.0 3650.0 1128.0 -1.0 203.0 417.0 723.0 8 3654.0 -1.0 3153.0 567.0 -1.0 250.0 385.0 599.0 9 -1.0 -1.0 -1.0 -1.0 -1.0 -1.0 -1.0 -1.0 10 -1.0 -1.0 -1.0 -1.0 -1.0 -1.0 -1.0 -1.0 1989 1990 1991 1992 1993 1994 1995 1996 0 -1.0 -1.0 -1.0 -1.0 -1.0 -1.0 -1.0 -1.0 1 -1.0 -1.0 -1.0 -1.0 -1.0 -1.0 -1.0 -1.0 2 6787.0 14169.0 11147.0 1232.0 4489.0 1603.0 8538.0 8781.0 3 22270.0 12670.0 6340.0 26123.0 3321.0 2950.0 9874.0 7433.0 4 9973.0 11228.0 8497.0 4719.0 26771.0 4476.0 7906.0 8371.0 5 10504.0 5587.0 7407.0 1574.0 2643.0 11354.0 6861.0 2399.0 6 7803.0 6556.0 4558.0 1386.0 1270.0 1742.0 9467.0 4455.0 7 933.0 3273.0 2019.0 810.0 557.0 1687.0 1795.0 4111.0 8 293.0 516.0 545.0 616.0 426.0 908.0 1083.0 1202.0 9 -1.0 -1.0 -1.0 -1.0 -1.0 -1.0 -1.0 -1.0 10 -1.0 -1.0 -1.0 -1.0 -1.0 -1.0 -1.0 -1.0 1997 1998 1999 2000 2001 2002 0 -1.0 -1.0 -1.0 -1.0 -1.0 -1.0 1 -1.0 -1.0 -1.0 -1.0 -1.0 -1.0 2 -1.0 18218.0 19034.0 8613.0 44162.0 71996.0 3 -1.0 34991.0 60309.0 31011.0 12843.0 54740.0 4 -1.0 4697.0 26103.0 41382.0 13805.0 12757.0 5 -1.0 1674.0 1481.0 6843.0 8292.0 5266.0 6 -1.0 279.0 316.0 898.0 718.0 8404.0 7 -1.0 407.0 72.0 427.0 175.0 1450.0 8 -1.0 381.0 153.0 228.0 51.0 305.0 9 -1.0 -1.0 -1.0 -1.0 -1.0 -1.0 10 -1.0 -1.0 -1.0 -1.0 -1.0 -1.0

O:\ACFM\WGREPS\WGNPBW\REPORTS\2002\Sec-6.Doc 217
Table 6.4.5.3.c Modelled surveys indices by year, Norwegian spawninggrounds acoustic survey Blue whiting, Output from final AMCI run Run id 20020504 152739.761 Survey residuals by year 1981 1982 1983 1984 1985 1986 1987 1988 0 0.00 0.00 0.00 0.00 0.00 0.00 0.00 0.00 1 0.00 0.00 0.00 0.00 0.00 0.00 0.00 0.00 2 0.00 0.00 -1.94 1.02 0.00 -1.73 0.09 0.78 3 0.01 0.00 -0.41 -0.75 0.00 -0.85 -0.06 0.21 4 -0.71 0.00 -0.40 -0.61 0.00 -0.67 0.73 0.51 5 -0.52 0.00 0.18 -0.59 0.00 -1.28 -0.07 1.08 6 -0.13 0.00 0.24 -0.54 0.00 -1.58 -1.34 1.09 7 0.08 0.00 0.55 -0.42 0.00 -1.41 -0.16 0.37 8 0.00 0.00 0.61 -0.72 0.00 -1.13 0.16 1.09 9 0.00 0.00 0.00 0.00 0.00 0.00 0.00 0.00 10 0.00 0.00 0.00 0.00 0.00 0.00 0.00 0.00 1989 1990 1991 1992 1993 1994 1995 1996 0 0.00 0.00 0.00 0.00 0.00 0.00 0.00 0.00 1 0.00 0.00 0.00 0.00 0.00 0.00 0.00 0.00 2 0.56 1.19 -0.25 -1.67 -0.02 -0.90 0.66 0.45 3 1.13 0.72 -0.30 0.12 -1.16 -0.93 0.42 0.04 4 0.48 0.68 0.35 -0.52 0.22 -0.81 0.11 0.34 5 0.79 0.41 1.17 -0.47 -0.24 0.21 0.47 -0.21 6 0.86 1.17 1.46 0.06 -0.12 -0.11 0.58 0.63 7 -0.20 0.89 1.33 0.28 -0.32 0.66 0.42 0.29 8 0.34 0.18 0.46 0.71 0.20 0.70 0.75 0.61 9 0.00 0.00 0.00 0.00 0.00 0.00 0.00 0.00 10 0.00 0.00 0.00 0.00 0.00 0.00 0.00 0.00 1997 1998 1999 2000 2001 2002 0 0.00 0.00 0.00 0.00 0.00 0.00 1 0.00 0.00 0.00 0.00 0.00 0.00 2 0.00 -0.50 0.24 0.01 0.86 1.13 3 0.00 0.29 0.30 0.33 0.08 0.81 4 0.00 -0.49 0.21 0.16 -0.12 0.57 5 0.00 -0.39 -0.60 -0.04 -0.23 0.33 6 0.00 -1.49 -1.30 -0.32 -1.38 0.86 7 0.00 -0.72 -2.07 -0.22 -0.97 0.49 8 0.00 -0.53 -0.81 0.00 -1.18 0.99 9 0.00 0.00 0.00 0.00 0.00 0.00 10 0.00 0.00 0.00 0.00 0.00 0.00

O:\ACFM\WGREPS\WGNPBW\REPORTS\2002\Sec-6.Doc 218
Table 6.4.5.3.d Modelled surveys indices by year, Russian spawninggrounds acoustic survey Blue whiting, Output from final AMCI run Run id 20020504 152739.761 Modelled surveys indices by year, fleet 2 1981 1982 1983 1984 1985 1986 1987 1988 0 -1.0 -1.0 -1.0 -1.0 -1.0 -1.0 -1.0 -1.0 1 -1.0 -1.0 -1.0 -1.0 -1.0 -1.0 -1.0 -1.0 2 -1.0 -1.0 -1.0 -1.0 -1.0 -1.0 -1.0 -1.0 3 -1.0 3476.9 2602.9 3007.2 7836.4 11220.0 7320.0 6046.7 4 -1.0 5855.4 3432.4 2510.6 2762.8 6799.2 9190.0 6216.4 5 -1.0 4230.3 4703.2 2684.8 1857.9 1950.7 4397.3 6017.0 6 -1.0 3836.0 3269.7 3529.7 1881.4 1234.6 1190.5 2739.3 7 -1.0 3816.5 2747.8 2244.6 2212.6 1081.0 636.7 650.1 8 -1.0 2941.1 2222.5 1515.7 1113.8 1010.2 426.9 262.2 9 -1.0 -1.0 -1.0 -1.0 -1.0 -1.0 -1.0 -1.0 10 -1.0 -1.0 -1.0 -1.0 -1.0 -1.0 -1.0 -1.0 1989 1990 1991 1992 1993 1994 1995 1996 0 -1.0 -1.0 -1.0 -1.0 -1.0 -1.0 -1.0 -1.0 1 -1.0 -1.0 -1.0 -1.0 -1.0 -1.0 -1.0 -1.0 2 -1.0 -1.0 -1.0 -1.0 -1.0 -1.0 -1.0 -1.0 3 5940.9 5043.0 5769.6 26132.7 11994.2 8455.6 7303.8 8026.4 4 5190.0 4790.5 4245.3 8347.7 22612.6 10524.4 7444.5 6260.3 5 4115.9 3199.7 3080.6 3296.1 4377.9 11995.9 5625.6 3850.0 6 3685.3 2266.6 1859.8 1219.5 1343.1 1816.5 4977.8 2229.6 7 1481.9 1758.0 1100.0 544.6 680.0 772.3 1052.6 2747.3 8 272.3 562.8 711.2 268.0 309.1 399.8 453.3 577.8 9 -1.0 -1.0 -1.0 -1.0 -1.0 -1.0 -1.0 -1.0 10 -1.0 -1.0 -1.0 -1.0 -1.0 -1.0 -1.0 -1.0

O:\ACFM\WGREPS\WGNPBW\REPORTS\2002\Sec-6.Doc 219
Table 6.4.5.3.e Observed surveys indices by year, Russian spawninggrounds acoustic survey Blue whiting, Output from final AMCI run Run id 20020504 152739.761 1981 1982 1983 1984 1985 1986 1987 1988 0 -1.0 -1.0 -1.0 -1.0 -1.0 -1.0 -1.0 -1.0 1 -1.0 -1.0 -1.0 -1.0 -1.0 -1.0 -1.0 -1.0 2 -1.0 -1.0 -1.0 -1.0 -1.0 -1.0 -1.0 -1.0 3 -1.0 540.0 2330.0 2900.0 13220.0 18750.0 4480.0 3710.0 4 -1.0 2750.0 2930.0 800.0 930.0 23180.0 19170.0 4550.0 5 -1.0 1340.0 9390.0 1100.0 580.0 2540.0 5860.0 8610.0 6 -1.0 1380.0 3880.0 4200.0 1780.0 610.0 1070.0 4130.0 7 -1.0 1570.0 1970.0 2200.0 860.0 620.0 500.0 1270.0 8 -1.0 2350.0 1370.0 1200.0 610.0 750.0 810.0 480.0 9 -1.0 -1.0 -1.0 -1.0 -1.0 -1.0 -1.0 -1.0 10 -1.0 -1.0 -1.0 -1.0 -1.0 -1.0 -1.0 -1.0 1989 1990 1991 1992 1993 1994 1995 1996 0 -1.0 -1.0 -1.0 -1.0 -1.0 -1.0 -1.0 -1.0 1 -1.0 -1.0 -1.0 -1.0 -1.0 -1.0 -1.0 -1.0 2 -1.0 -1.0 -1.0 -1.0 -1.0 -1.0 -1.0 -1.0 3 11910.0 9740.0 10300.0 20010.0 4728.0 -1.0 12657.0 15285.0 4 7120.0 12140.0 5350.0 6700.0 12337.0 -1.0 10028.0 10629.0 5 6670.0 5740.0 5130.0 1350.0 5304.0 -1.0 8942.0 4897.0 6 6970.0 2580.0 2630.0 440.0 2249.0 -1.0 2651.0 6940.0 7 4580.0 1470.0 1770.0 390.0 1316.0 -1.0 1093.0 1482.0 8 2750.0 220.0 870.0 170.0 621.0 -1.0 408.0 653.0 9 -1.0 -1.0 -1.0 -1.0 -1.0 -1.0 -1.0 -1.0 10 -1.0 -1.0 -1.0 -1.0 -1.0 -1.0 -1.0 -1.0

O:\ACFM\WGREPS\WGNPBW\REPORTS\2002\Sec-6.Doc 220
Table 6.4.5.3.f Surveys residuals by year, Russian spawninggrounds acoustic survey Blue whiting, Output from final AMCI run Run id 20020504 152739.761 1981 1982 1983 1984 1985 1986 1987 1988 0 0.00 0.00 0.00 0.00 0.00 0.00 0.00 0.00 1 0.00 0.00 0.00 0.00 0.00 0.00 0.00 0.00 2 0.00 0.00 0.00 0.00 0.00 0.00 0.00 0.00 3 0.00 -1.86 -0.11 -0.04 0.52 0.51 -0.49 -0.49 4 0.00 -0.76 -0.16 -1.14 -1.09 1.23 0.74 -0.31 5 0.00 -1.15 0.69 -0.89 -1.16 0.26 0.29 0.36 6 0.00 -1.02 0.17 0.17 -0.06 -0.71 -0.11 0.41 7 0.00 -0.89 -0.33 -0.02 -0.95 -0.56 -0.24 0.67 8 0.00 -0.22 -0.48 -0.23 -0.60 -0.30 0.64 0.60 9 0.00 0.00 0.00 0.00 0.00 0.00 0.00 0.00 10 0.00 0.00 0.00 0.00 0.00 0.00 0.00 0.00 1989 1990 1991 1992 1993 1994 1995 1996 0 0.00 0.00 0.00 0.00 0.00 0.00 0.00 0.00 1 0.00 0.00 0.00 0.00 0.00 0.00 0.00 0.00 2 0.00 0.00 0.00 0.00 0.00 0.00 0.00 0.00 3 0.70 0.66 0.58 -0.27 -0.93 0.00 0.55 0.64 4 0.32 0.93 0.23 -0.22 -0.61 0.00 0.30 0.53 5 0.48 0.58 0.51 -0.89 0.19 0.00 0.46 0.24 6 0.64 0.13 0.35 -1.02 0.52 0.00 -0.63 1.14 7 1.13 -0.18 0.48 -0.33 0.66 0.00 0.04 -0.62 8 2.31 -0.94 0.20 -0.46 0.70 0.00 -0.11 0.12 9 0.00 0.00 0.00 0.00 0.00 0.00 0.00 0.00 10 0.00 0.00 0.00 0.00 0.00 0.00 0.00 0.00

O:\ACFM\WGREPS\WGNPBW\REPORTS\2002\Sec-6.Doc 221
Table 6.4.5.3.g Modelled surveys indices by year, Spanish CPUE Blue whiting, Output from final AMCI run Run id 20020504 152739.761 1981 1982 1983 1984 1985 1986 1987 1988 0 -1.0 -1.0 -1.0 -1.0 -1.0 -1.0 -1.0 -1.0 1 -1.0 -1.0 6574.9 9828.3 6683.0 5368.9 5218.3 4583.2 2 -1.0 -1.0 5766.1 15299.7 22288.1 14577.0 11916.3 11817.0 3 -1.0 -1.0 4306.0 4814.7 12186.7 16670.9 11124.3 9366.3 4 -1.0 -1.0 2957.6 2084.1 2246.3 5155.7 7025.5 4866.2 5 -1.0 -1.0 2004.1 1095.7 741.0 723.8 1654.3 2274.2 6 -1.0 -1.0 1118.2 1135.7 579.0 348.4 348.5 807.6 7 -1.0 -1.0 -1.0 -1.0 -1.0 -1.0 -1.0 -1.0 8 -1.0 -1.0 -1.0 -1.0 -1.0 -1.0 -1.0 -1.0 9 -1.0 -1.0 -1.0 -1.0 -1.0 -1.0 -1.0 -1.0 10 -1.0 -1.0 -1.0 -1.0 -1.0 -1.0 -1.0 -1.0 1989 1990 1991 1992 1993 1994 1995 1996 0 -1.0 -1.0 -1.0 -1.0 -1.0 -1.0 -1.0 -1.0 1 5089.2 12189.2 5517.9 3846.4 3296.7 3690.5 4687.9 14198.7 2 10108.0 11179.9 29678.9 13597.5 9548.5 8264.7 9159.3 11460.8 3 8785.5 7448.9 9592.1 25954.7 12011.4 8525.3 7258.8 7811.1 4 3855.7 3532.8 3671.2 4868.9 13288.8 6255.5 4339.3 3545.8 5 1444.7 1111.9 1292.1 1414.2 1899.3 5234.5 2390.5 1592.2 6 992.2 588.3 623.3 772.4 869.2 1191.1 3174.1 1364.2 7 -1.0 -1.0 -1.0 -1.0 -1.0 -1.0 -1.0 -1.0 8 -1.0 -1.0 -1.0 -1.0 -1.0 -1.0 -1.0 -1.0 9 -1.0 -1.0 -1.0 -1.0 -1.0 -1.0 -1.0 -1.0 10 -1.0 -1.0 -1.0 -1.0 -1.0 -1.0 -1.0 -1.0 1997 1998 1999 2000 2001 0 -1.0 -1.0 -1.0 -1.0 -1.0 1 25452.2 12789.5 7339.9 16354.9 20597.4 2 34576.0 59601.1 29991.3 16608.1 34667.6 3 9656.9 27009.9 46215.9 21526.4 10332.1 4 3758.0 4189.9 11395.2 17568.7 6676.4 5 1287.0 1229.5 1358.6 3317.6 4285.5 6 900.6 635.0 607.2 577.1 1161.8 7 -1.0 -1.0 -1.0 -1.0 -1.0 8 -1.0 -1.0 -1.0 -1.0 -1.0 9 -1.0 -1.0 -1.0 -1.0 -1.0 10 -1.0 -1.0 -1.0 -1.0 -1.0

O:\ACFM\WGREPS\WGNPBW\REPORTS\2002\Sec-6.Doc 222
Table 6.4.5.3.h Observed surveys indices by year, Spanish CPUE Blue whiting, Output from final AMCI run Run id 20020504 152739.761 1981 1982 1983 1984 1985 1986 1987 1988 0 -1.0 -1.0 -1.0 -1.0 -1.0 -1.0 -1.0 -1.0 1 -1.0 -1.0 7196.0 13710.0 14573.0 3721.0 25328.0 7778.0 2 -1.0 -1.0 16392.0 27286.0 23823.0 14131.0 13153.0 21473.0 3 -1.0 -1.0 9311.0 14845.0 14126.0 14745.0 6664.0 18436.0 4 -1.0 -1.0 7476.0 4836.0 6256.0 7113.0 2938.0 6391.0 5 -1.0 -1.0 6326.0 1755.0 1232.0 1278.0 1029.0 1300.0 6 -1.0 -1.0 1718.0 1750.0 217.0 505.0 166.0 781.0 7 -1.0 -1.0 -1.0 -1.0 -1.0 -1.0 -1.0 -1.0 8 -1.0 -1.0 -1.0 -1.0 -1.0 -1.0 -1.0 -1.0 9 -1.0 -1.0 -1.0 -1.0 -1.0 -1.0 -1.0 -1.0 10 -1.0 -1.0 -1.0 -1.0 -1.0 -1.0 -1.0 -1.0 1989 1990 1991 1992 1993 1994 1995 1996 0 -1.0 -1.0 -1.0 -1.0 -1.0 -1.0 -1.0 -1.0 1 15272.0 21444.0 15924.0 10007.0 4036.0 543.0 9090.0 3905.0 2 18486.0 19407.0 15370.0 24235.0 13991.0 6066.0 14409.0 14557.0 3 17160.0 5194.0 4989.0 9671.0 22493.0 15917.0 6833.0 14449.0 4 8374.0 1803.0 2329.0 4316.0 7979.0 7474.0 4551.0 3931.0 5 3760.0 1357.0 1045.0 1194.0 1354.0 2990.0 1990.0 3639.0 6 1003.0 451.0 440.0 462.0 658.0 1055.0 623.0 1834.0 7 -1.0 -1.0 -1.0 -1.0 -1.0 -1.0 -1.0 -1.0 8 -1.0 -1.0 -1.0 -1.0 -1.0 -1.0 -1.0 -1.0 9 -1.0 -1.0 -1.0 -1.0 -1.0 -1.0 -1.0 -1.0 10 -1.0 -1.0 -1.0 -1.0 -1.0 -1.0 -1.0 -1.0 1997 1998 1999 2000 2001 0 -1.0 -1.0 -1.0 -1.0 -1.0 1 8742.0 5884.0 2048.0 6207.0 16223.0 2 15875.0 13236.0 10268.0 15518.0 16488.0 3 11134.0 9803.0 20242.0 13987.0 6830.0 4 3698.0 10844.0 9833.0 5375.0 1620.0 5 1046.0 5229.0 6287.0 1264.0 1148.0 6 450.0 1153.0 3047.0 1414.0 162.0 7 -1.0 -1.0 -1.0 -1.0 -1.0 8 -1.0 -1.0 -1.0 -1.0 -1.0 9 -1.0 -1.0 -1.0 -1.0 -1.0 10 -1.0 -1.0 -1.0 -1.0 -1.0

O:\ACFM\WGREPS\WGNPBW\REPORTS\2002\Sec-6.Doc 223
Table 6.4.5.3.i Survey residuals by year, Spanish CPUE Blue whiting, Output from final AMCI run Run id 20020504 152739.761 1981 1982 1983 1984 1985 1986 1987 1988 0 0.00 0.00 0.00 0.00 0.00 0.00 0.00 0.00 1 0.00 0.00 0.09 0.33 0.78 -0.37 1.58 0.53 2 0.00 0.00 1.04 0.58 0.07 -0.03 0.10 0.60 3 0.00 0.00 0.77 1.13 0.15 -0.12 -0.51 0.68 4 0.00 0.00 0.93 0.84 1.02 0.32 -0.87 0.27 5 0.00 0.00 1.15 0.47 0.51 0.57 -0.47 -0.56 6 0.00 0.00 0.43 0.43 -0.98 0.37 -0.74 -0.03 7 0.00 0.00 0.00 0.00 0.00 0.00 0.00 0.00 8 0.00 0.00 0.00 0.00 0.00 0.00 0.00 0.00 9 0.00 0.00 0.00 0.00 0.00 0.00 0.00 0.00 10 0.00 0.00 0.00 0.00 0.00 0.00 0.00 0.00 1989 1990 1991 1992 1993 1994 1995 1996 0 0.00 0.00 0.00 0.00 0.00 0.00 0.00 0.00 1 1.10 0.56 1.06 0.96 0.20 -1.92 0.66 -1.29 2 0.60 0.55 -0.66 0.58 0.38 -0.31 0.45 0.24 3 0.67 -0.36 -0.65 -0.99 0.63 0.62 -0.06 0.62 4 0.78 -0.67 -0.46 -0.12 -0.51 0.18 0.05 0.10 5 0.96 0.20 -0.21 -0.17 -0.34 -0.56 -0.18 0.83 6 0.01 -0.27 -0.35 -0.51 -0.28 -0.12 -1.63 0.30 7 0.00 0.00 0.00 0.00 0.00 0.00 0.00 0.00 8 0.00 0.00 0.00 0.00 0.00 0.00 0.00 0.00 9 0.00 0.00 0.00 0.00 0.00 0.00 0.00 0.00 10 0.00 0.00 0.00 0.00 0.00 0.00 0.00 0.00 1997 1998 1999 2000 2001 0 0.00 0.00 0.00 0.00 0.00 1 -1.07 -0.78 -1.28 -0.97 -0.24 2 -0.78 -1.50 -1.07 -0.07 -0.74 3 0.14 -1.01 -0.83 -0.43 -0.41 4 -0.02 0.95 -0.15 -1.18 -1.42 5 -0.21 1.45 1.53 -0.96 -1.32 6 -0.69 0.60 1.61 0.90 -1.97 7 0.00 0.00 0.00 0.00 0.00 8 0.00 0.00 0.00 0.00 0.00 9 0.00 0.00 0.00 0.00 0.00 10 0.00 0.00 0.00 0.00 0.00
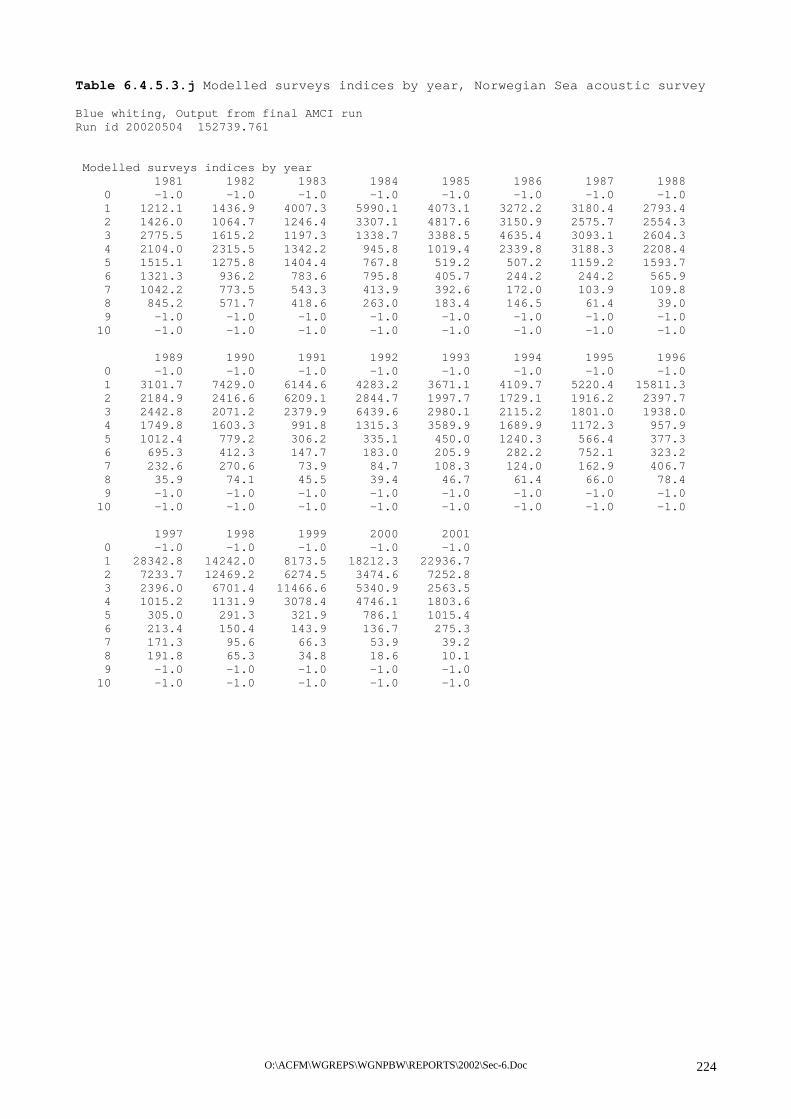
O:\ACFM\WGREPS\WGNPBW\REPORTS\2002\Sec-6.Doc 224
Table 6.4.5.3.j Modelled surveys indices by year, Norwegian Sea acoustic survey Blue whiting, Output from final AMCI run Run id 20020504 152739.761 Modelled surveys indices by year 1981 1982 1983 1984 1985 1986 1987 1988 0 -1.0 -1.0 -1.0 -1.0 -1.0 -1.0 -1.0 -1.0 1 1212.1 1436.9 4007.3 5990.1 4073.1 3272.2 3180.4 2793.4 2 1426.0 1064.7 1246.4 3307.1 4817.6 3150.9 2575.7 2554.3 3 2775.5 1615.2 1197.3 1338.7 3388.5 4635.4 3093.1 2604.3 4 2104.0 2315.5 1342.2 945.8 1019.4 2339.8 3188.3 2208.4 5 1515.1 1275.8 1404.4 767.8 519.2 507.2 1159.2 1593.7 6 1321.3 936.2 783.6 795.8 405.7 244.2 244.2 565.9 7 1042.2 773.5 543.3 413.9 392.6 172.0 103.9 109.8 8 845.2 571.7 418.6 263.0 183.4 146.5 61.4 39.0 9 -1.0 -1.0 -1.0 -1.0 -1.0 -1.0 -1.0 -1.0 10 -1.0 -1.0 -1.0 -1.0 -1.0 -1.0 -1.0 -1.0 1989 1990 1991 1992 1993 1994 1995 1996 0 -1.0 -1.0 -1.0 -1.0 -1.0 -1.0 -1.0 -1.0 1 3101.7 7429.0 6144.6 4283.2 3671.1 4109.7 5220.4 15811.3 2 2184.9 2416.6 6209.1 2844.7 1997.7 1729.1 1916.2 2397.7 3 2442.8 2071.2 2379.9 6439.6 2980.1 2115.2 1801.0 1938.0 4 1749.8 1603.3 991.8 1315.3 3589.9 1689.9 1172.3 957.9 5 1012.4 779.2 306.2 335.1 450.0 1240.3 566.4 377.3 6 695.3 412.3 147.7 183.0 205.9 282.2 752.1 323.2 7 232.6 270.6 73.9 84.7 108.3 124.0 162.9 406.7 8 35.9 74.1 45.5 39.4 46.7 61.4 66.0 78.4 9 -1.0 -1.0 -1.0 -1.0 -1.0 -1.0 -1.0 -1.0 10 -1.0 -1.0 -1.0 -1.0 -1.0 -1.0 -1.0 -1.0 1997 1998 1999 2000 2001 0 -1.0 -1.0 -1.0 -1.0 -1.0 1 28342.8 14242.0 8173.5 18212.3 22936.7 2 7233.7 12469.2 6274.5 3474.6 7252.8 3 2396.0 6701.4 11466.6 5340.9 2563.5 4 1015.2 1131.9 3078.4 4746.1 1803.6 5 305.0 291.3 321.9 786.1 1015.4 6 213.4 150.4 143.9 136.7 275.3 7 171.3 95.6 66.3 53.9 39.2 8 191.8 65.3 34.8 18.6 10.1 9 -1.0 -1.0 -1.0 -1.0 -1.0 10 -1.0 -1.0 -1.0 -1.0 -1.0

O:\ACFM\WGREPS\WGNPBW\REPORTS\2002\Sec-6.Doc 225
Table 6.4.5.3.k Observed surveys indices by year, Norwegian Sea acoustic survey Blue whiting, Output from final AMCI run Run id 20020504 152739.761 1981 1982 1983 1984 1985 1986 1987 1988 0 -1.0 -1.0 -1.0 -1.0 -1.0 -1.0 -1.0 -1.0 1 182.0 184.0 22356.0 30380.0 5969.0 2324.0 8204.0 4992.0 2 728.0 460.0 396.0 13916.0 23876.0 2380.0 4032.0 2880.0 3 4542.0 1242.0 468.0 833.0 12502.0 7224.0 5180.0 2640.0 4 3874.0 4715.0 756.0 392.0 658.0 6944.0 5572.0 3480.0 5 2678.0 3611.0 1404.0 539.0 423.0 1876.0 1204.0 912.0 6 2834.0 3128.0 576.0 539.0 188.0 952.0 224.0 120.0 7 2964.0 2323.0 468.0 343.0 235.0 336.0 168.0 96.0 8 -1.0 -1.0 -1.0 -1.0 -1.0 -1.0 -1.0 -1.0 9 -1.0 -1.0 -1.0 -1.0 -1.0 -1.0 -1.0 -1.0 10 -1.0 -1.0 -1.0 -1.0 -1.0 -1.0 -1.0 -1.0 1989 1990 1991 1992 1993 1994 1995 1996 0 -1.0 -1.0 -1.0 -1.0 -1.0 -1.0 -1.0 -1.0 1 1172.0 -1.0 -1.0 792.0 830.0 -1.0 6974.0 23464.0 2 1125.0 -1.0 -1.0 1134.0 125.0 -1.0 2811.0 1057.0 3 812.0 -1.0 -1.0 6939.0 1070.0 -1.0 1999.0 899.0 4 379.0 -1.0 -1.0 766.0 6392.0 -1.0 1209.0 649.0 5 410.0 -1.0 -1.0 247.0 1222.0 -1.0 1622.0 436.0 6 212.0 -1.0 -1.0 172.0 489.0 -1.0 775.0 505.0 7 22.0 -1.0 -1.0 90.0 248.0 -1.0 173.0 755.0 8 -1.0 -1.0 -1.0 -1.0 -1.0 -1.0 -1.0 -1.0 9 -1.0 -1.0 -1.0 -1.0 -1.0 -1.0 -1.0 -1.0 10 -1.0 -1.0 -1.0 -1.0 -1.0 -1.0 -1.0 -1.0 1997 1998 1999 2000 2001 0 -1.0 -1.0 -1.0 -1.0 -1.0 1 30227.0 24244.0 14367.0 25813.0 61470.0 2 25638.0 47815.0 9750.0 3298.0 22051.0 3 1524.0 16282.0 23701.0 2721.0 7883.0 4 779.0 556.0 9754.0 3078.0 3225.0 5 300.0 212.0 1733.0 23.0 1824.0 6 407.0 100.0 466.0 46.0 156.0 7 260.0 64.0 79.0 6.0 12.0 8 -1.0 -1.0 -1.0 -1.0 -1.0 9 -1.0 -1.0 -1.0 -1.0 -1.0 10 -1.0 -1.0 -1.0 -1.0 -1.0

O:\ACFM\WGREPS\WGNPBW\REPORTS\2002\Sec-6.Doc 226
Table 6.4.5.3.l Survey residuals by year, Norwegian Sea acoustic survey Blue whiting, Output from final AMCI run Run id 20020504 152739.761 1981 1982 1983 1984 1985 1986 1987 1988 0 0.00 0.00 0.00 0.00 0.00 0.00 0.00 0.00 1 -1.90 -2.06 1.72 1.62 0.38 -0.34 0.95 0.58 2 -0.67 -0.84 -1.15 1.44 1.60 -0.28 0.45 0.12 3 0.49 -0.26 -0.94 -0.47 1.31 0.44 0.52 0.01 4 0.61 0.71 -0.57 -0.88 -0.44 1.09 0.56 0.45 5 0.57 1.04 0.00 -0.35 -0.20 1.31 0.04 -0.56 6 0.76 1.21 -0.31 -0.39 -0.77 1.36 -0.09 -1.55 7 1.05 1.10 -0.15 -0.19 -0.51 0.67 0.48 -0.13 8 0.00 0.00 0.00 0.00 0.00 0.00 0.00 0.00 9 0.00 0.00 0.00 0.00 0.00 0.00 0.00 0.00 10 0.00 0.00 0.00 0.00 0.00 0.00 0.00 0.00 1989 1990 1991 1992 1993 1994 1995 1996 0 0.00 0.00 0.00 0.00 0.00 0.00 0.00 0.00 1 -0.97 0.00 0.00 -1.69 -1.49 0.00 0.29 0.39 2 -0.66 0.00 0.00 -0.92 -2.77 0.00 0.38 -0.82 3 -1.10 0.00 0.00 0.07 -1.02 0.00 0.10 -0.77 4 -1.53 0.00 0.00 -0.54 0.58 0.00 0.03 -0.39 5 -0.90 0.00 0.00 -0.30 1.00 0.00 1.05 0.14 6 -1.19 0.00 0.00 -0.06 0.86 0.00 0.03 0.45 7 -2.36 0.00 0.00 0.06 0.83 0.00 0.06 0.62 8 0.00 0.00 0.00 0.00 0.00 0.00 0.00 0.00 9 0.00 0.00 0.00 0.00 0.00 0.00 0.00 0.00 10 0.00 0.00 0.00 0.00 0.00 0.00 0.00 0.00 1997 1998 1999 2000 2001 0 0.00 0.00 0.00 0.00 0.00 1 0.06 0.53 0.56 0.35 0.99 2 1.27 1.34 0.44 -0.05 1.11 3 -0.45 0.89 0.73 -0.67 1.12 4 -0.26 -0.71 1.15 -0.43 0.58 5 -0.02 -0.32 1.68 -3.53 0.59 6 0.65 -0.41 1.18 -1.09 -0.57 7 0.42 -0.40 0.17 -2.19 -1.18 8 0.00 0.00 0.00 0.00 0.00 9 0.00 0.00 0.00 0.00 0.00 10 0.00 0.00 0.00 0.00 0.00

O:\ACFM\WGREPS\WGNPBW\REPORTS\2002\Sec-6.Doc 227
Table 6.4.5.4 Fishing mortalities at age and Fref=F3-7 Blue whiting, Output from final AMCI run Run id 20020504 152739.761 1981 1982 1983 1984 1985 1986 1987 1988 0 0.0248 0.3775 0.2366 0.2080 0.2406 0.1674 0.1265 0.0647 1 0.0758 0.0528 0.0939 0.1283 0.1418 0.1635 0.1433 0.1185 2 0.1138 0.0871 0.1084 0.1605 0.1844 0.2295 0.2029 0.1829 3 0.1911 0.1401 0.1559 0.2079 0.2540 0.3265 0.2906 0.2602 4 0.2467 0.1831 0.2008 0.2602 0.2933 0.4039 0.3908 0.3532 5 0.2914 0.2070 0.2229 0.2916 0.3283 0.4428 0.4208 0.4132 6 0.3913 0.2790 0.3080 0.4052 0.4760 0.6139 0.5562 0.5446 7 0.4511 0.3215 0.3611 0.4724 0.5339 0.7078 0.6679 0.6129 8 0.5375 0.3882 0.4386 0.5695 0.6532 0.8571 0.8693 0.8186 9 0.5916 0.4377 0.4937 0.6389 0.7167 1.0543 1.0507 0.9888 10 0.5645 0.4011 0.4175 0.5116 0.5582 0.7391 0.7030 0.6226 Fref 0.3143 0.2262 0.2497 0.3275 0.3771 0.4990 0.4652 0.4368 Total yearly fishing mortalities at age 1989 1990 1991 1992 1993 1994 1995 1996 0 0.1468 0.0863 0.0443 0.0275 0.0566 0.0334 0.1797 0.1308 1 0.1422 0.1359 0.0542 0.0601 0.0550 0.0520 0.0573 0.0730 2 0.2212 0.2207 0.0957 0.0989 0.0884 0.0774 0.0904 0.1077 3 0.3336 0.3354 0.1476 0.1531 0.1400 0.1292 0.1521 0.1854 4 0.4361 0.4477 0.1948 0.2030 0.1910 0.1730 0.2040 0.2496 5 0.5305 0.5464 0.2477 0.2448 0.2271 0.2179 0.2601 0.3033 6 0.6890 0.7471 0.3406 0.3342 0.3000 0.2790 0.3236 0.3894 7 0.7301 0.7614 0.3553 0.3613 0.3237 0.3097 0.3688 0.4398 8 1.0139 1.0160 0.4351 0.4550 0.4107 0.3838 0.4690 0.5815 9 1.2815 1.4255 0.5898 0.5755 0.5233 0.5284 0.6095 0.7439 10 0.7467 1.1502 0.5061 0.4861 0.4151 0.3715 0.4184 0.4941 Fref 0.5439 0.5676 0.2572 0.2593 0.2363 0.2217 0.2617 0.3135 Total yearly fishing mortalities at age 1997 1998 1999 2000 2001 2002 2003 2004 0 0.0792 0.0615 0.0361 0.0279 0.0363 0.0363 0.0363 0.0363 1 0.0713 0.0996 0.0926 0.1132 0.1555 0.1555 0.1555 0.1555 2 0.1090 0.1573 0.1494 0.1946 0.2693 0.2693 0.2693 0.2693 3 0.1963 0.2893 0.2874 0.3842 0.5494 0.5494 0.5494 0.5494 4 0.2606 0.3864 0.3993 0.5292 0.7595 0.7595 0.7595 0.7595 5 0.3057 0.4327 0.4133 0.5444 0.7335 0.7335 0.7335 0.7335 6 0.3898 0.5615 0.5285 0.7235 0.9351 0.9351 0.9351 0.9351 7 0.4483 0.6620 0.6371 0.8541 1.1451 1.1451 1.1451 1.1451 8 0.5889 0.8612 0.8630 1.2164 1.6980 1.6980 1.6980 1.6980 9 0.7660 1.0730 1.0142 1.3562 2.5700 2.5700 2.5700 2.5700 10 0.5550 0.7722 0.7361 0.9857 1.3548 1.3548 1.3548 1.3548 Fref 0.3202 0.4664 0.4531 0.6071 0.8245 0.8245 0.8245 0.8245

O:\ACFM\WGREPS\WGNPBW\REPORTS\2002\Sec-6.Doc 228
Table 6.4.5.5 Stock numbers-at-age (*106) Blue whiting, Output from final AMCI run Run id 20020504 152739.761 Data by 1. Jan., except at youngest age which are at recruitment time 1981 1982 1983 1984 1985 1986 1987 1988 0 4055.3 16639.7 22220.2 14847.7 12544.8 11151.7 9213.8 9810.1 1 3074.8 3579.4 10322.6 15869.9 10911.7 8923.6 8534.8 7346.6 2 3192.6 2333.8 2779.7 7694.0 11428.3 7752.7 6204.0 6054.6 3 4174.6 2332.7 1751.3 2042.0 5365.4 7781.3 5045.6 4146.5 4 2698.9 2823.3 1660.2 1226.9 1358.0 3407.4 4596.4 3089.4 5 2193.0 1726.5 1924.8 1111.9 774.4 829.3 1862.8 2545.9 6 2071.4 1341.7 1149.2 1261.0 680.1 456.6 436.0 1001.2 7 1713.5 1146.7 831.0 691.5 688.5 345.9 202.3 204.7 8 1488.8 893.6 680.7 474.2 353.0 330.5 139.5 84.9 9 1216.5 712.1 496.2 359.4 219.7 150.4 114.8 47.9 10 3117.3 2498.1 2089.7 1601.0 1081.4 673.4 344.0 201.4 1989 1990 1991 1992 1993 1994 1995 1996 0 25384.2 10114.2 6792.6 5701.1 6554.0 8169.1 29012.2 49460.8 1 8320.7 19833.2 8395.2 5879.8 5018.5 5604.0 7149.2 21933.0 2 5343.0 5909.2 14174.1 6510.8 4533.4 3888.9 4355.6 5527.3 3 4128.4 3506.5 3879.8 10545.4 4828.6 3397.4 2946.7 3257.8 4 2617.0 2421.2 2052.8 2740.7 7408.1 3437.0 2444.5 2072.2 5 1776.7 1385.3 1266.9 1383.3 1831.6 5010.7 2367.0 1632.0 6 1378.9 855.8 656.7 809.7 886.7 1194.9 3299.2 1494.1 7 475.5 566.8 331.9 382.5 474.6 537.8 740.1 1954.5 8 90.8 187.6 216.7 190.5 218.2 281.1 323.0 419.1 9 30.7 27.0 55.6 114.8 99.0 118.5 156.8 165.5 10 116.1 58.1 24.9 60.3 131.0 162.5 201.2 241.7 1997 1998 1999 2000 2001 2002 2003 2004 0 24158.8 13545.7 29937.1 38754.5 11760.0 16483.9 16483.9 16483.9 1 39265.3 20195.4 11525.8 26126.8 34102.0 10262.0 14384.2 14384.2 2 16693.8 29934.3 14967.6 8601.7 19101.3 23900.0 7192.0 10081.0 3 4063.3 12256.1 20940.4 10554.0 5797.4 11946.8 14948.1 4498.2 4 2215.8 2733.9 7513.4 12862.7 5884.2 2740.1 5646.7 7065.2 5 1321.8 1397.9 1521.0 4126.5 6203.8 2254.1 1049.7 2163.1 6 986.6 797.1 742.5 823.7 1960.1 2439.2 886.3 412.7 7 828.7 547.0 372.2 358.4 327.1 630.0 784.0 284.8 8 1030.8 433.3 231.0 161.2 124.9 85.2 164.1 204.2 9 191.8 468.4 150.0 79.8 39.1 18.7 12.8 24.6 10 243.2 252.8 341.5 217.6 97.7 25.1 7.4 3.0

O:\ACFM\WGREPS\WGNPBW\REPORTS\2002\Sec-6.Doc 229
Table 6.4.5.6 Results of stock assessment Blue whiting, Output from final AMCI run Run id 20020504 152739.761 SUMMARY TABLE Year Recruits
age 0 (103)
SSB Mean F at age 3-7
Catch (SOP)
1981 4055289 2524227 0.3143 9248041982 16639719 2076892 0.2262 6138591983 22220166 1701049 0.2497 5620841984 14847654 1415142 0.3275 6307531985 12544761 1543316 0.3771 6969981986 11151699 1728281 0.4990 8496651987 9213750 1546722 0.4652 6625611988 9810064 1365409 0.4368 5536901989 25384230 1293635 0.5439 6576021990 10114204 1175685 0.5676 5609501991 6792609 1514241 0.2572 3698061992 5701122 2026704 0.2593 4750481993 6554003 1987685 0.2363 4807331994 8169103 1959444 0.2217 4590821995 29012229 1819742 0.2617 5779211996 49460845 1694646 0.3135 6360901997 24158783 1870973 0.3202 6462421998 13545724 2648888 0.4664 11333731999 29937139 3043905 0.4531 12658982000 38754471 2784253 0.6071 14164512001 11760000 2561316 0.8245 1777957

O:\ACFM\WGREPS\WGNPBW\REPORTS\2002\Sec-6.Doc 230
Table 6.5.1. Blue Whiting. Input data for the deterministic short-term prediction
MFDP version 1aRun: bw02Time and date: 17:29 04/05/02Fbar age range: 3-7
Stock Natural Maturity Prop. of F Prop. of M Weight Exploit. WeightAge size mortality ogive bef. spaw. bef. spaw. in stock pattern in catch
0 13983 0.2 0.00 0.25 0.25 0.035 0.036 0.0351 10262 0.2 0.11 0.25 0.25 0.057 0.156 0.0572 23900 0.2 0.40 0.25 0.25 0.077 0.269 0.0773 11947 0.2 0.82 0.25 0.25 0.089 0.549 0.0894 2740 0.2 0.86 0.25 0.25 0.107 0.760 0.1075 2254 0.2 0.91 0.25 0.25 0.135 0.734 0.1356 2439 0.2 0.94 0.25 0.25 0.163 0.935 0.1637 630 0.2 1.00 0.25 0.25 0.188 1.145 0.1888 85 0.2 1.00 0.25 0.25 0.191 1.698 0.1919 19 0.2 1.00 0.25 0.25 0.218 2.570 0.218
10 25 0.2 1.00 0.25 0.25 0.243 1.355 0.243
Stock Natural Maturity Prop. of F Prop. of M Weight Exploit. WeightAge size mortality ogive bef. spaw. bef. spaw. in stock pattern in catch
0 13983 0.2 0.00 0.25 0.25 0.035 0.036 0.0351 . 0.2 0.11 0.25 0.25 0.057 0.156 0.0572 . 0.2 0.40 0.25 0.25 0.077 0.269 0.0773 . 0.2 0.82 0.25 0.25 0.089 0.549 0.0894 . 0.2 0.86 0.25 0.25 0.107 0.760 0.1075 . 0.2 0.91 0.25 0.25 0.135 0.734 0.1356 . 0.2 0.94 0.25 0.25 0.163 0.935 0.1637 . 0.2 1.00 0.25 0.25 0.188 1.145 0.1888 . 0.2 1.00 0.25 0.25 0.191 1.698 0.1919 . 0.2 1.00 0.25 0.25 0.218 2.570 0.218
10 . 0.2 1.00 0.25 0.25 0.243 1.355 0.243
Input units are millions and kg - output in kilotonnes
2002
2003
2004

O:\ACFM\WGREPS\WGNPBW\REPORTS\2002\Sec-6.Doc 231
Table 6.5.2 Blue Whiting. Prediction with management option table:Basis for 2002: F2002 = F2001; Recruitment: GM 1981-2000 = 13 983 millions
MFDP version 1arun: bw02Blue whiting combined stock, 2002 WGTime and date: 17:29 04/05/02Fbar age range: 3-7Basis for 2002: F2002 = F2001; Recruitment: GM 1981-2000 = 13 982 millions
Biomass SSB FMult FBar Landings Biomass SSB FMult FBar Landings Biomass SSB5113 2238 1 0.8245 1505 4073 2238 0.0 0.000 0 4720 2756
. 2202 0.1 0.083 169 4537 2559
. 2167 0.2 0.165 327 4365 2378
. 2132 0.3 0.247 476 4204 2214
. 2098 0.4 0.330 615 4053 2063
. 2065 0.5 0.412 747 3912 1924
. 2033 0.6 0.495 870 3779 1797
. 2001 0.7 0.577 986 3654 1680
. 1969 0.8 0.660 1096 3536 1573
. 1938 0.9 0.742 1199 3425 1474
. 1908 1.0 0.825 1296 3321 1383
. 1878 1.1 0.907 1388 3222 1298
. 1849 1.2 0.989 1475 3129 1220
. 1820 1.3 1.072 1557 3042 1148
. 1792 1.4 1.154 1635 2958 1082
. 1764 1.5 1.237 1709 2880 1020
. 1737 1.6 1.319 1779 2805 962
. 1711 1.7 1.402 1846 2735 909
. 1684 1.8 1.484 1909 2668 860
. 1659 1.9 1.567 1969 2605 814
. 1633 2.0 1.649 2026 2545 771
Input units are millions and kg - output in kilotonnes
2002 2003 2004

O:\ACFM\WGREPS\WGNPBW\REPORTS\2002\Sec-6.Doc 232
Table 6.6.1 Blue whiting. Medium term projections
Catch in 2002 1.45 million tonn
F in 2003and after 2003 2012 2003 2012 25% 50% 75% 25% 50% 75%0.05 17.9 0.0 38.5 100.0 2004 2006 1450 77 98 1210.10 18.8 0.0 37.6 100.0 2004 2006 151 192 2380.15 19.5 0.0 36.3 100.0 2005 2007 223 283 3500.20 20.5 0.0 35.4 97.5 2005 2010 291 370 4580.25 21.2 0.0 34.3 89.5 2005 >2012 358 454 5610.30 22.6 0.7 33.5 74.1 2006 >2012 422 534 6600.32=Fpa 22.9 1.6 33.2 67.3 2006 >2012 446 565 6990.35 23.5 2.9 32.3 57.3 2007 >2012 483 612 7560.40 24.7 7.1 31.2 37.9 >2012 >2012 541 686 847
F in 2002 equals F in 2001 (F=0.8245)
F in 2003and after 2003 2012 2003 2012 25% 50% 75% 25% 50% 75%0.05 4.1 0.0 38.8 100.0 2003 2005 1216 1374 1558 89 102 1170.10 4.6 0.0 36.9 100.0 2003 2005 174 200 2300.15 5.5 0.0 35.8 99.8 2004 2006 255 294 3360.20 5.8 0.0 34.4 97.7 2004 2008 334 384 4400.25 6.6 0.0 32.2 89.7 2004 >2012 409 470 5400.30 7.4 0.6 30.7 74.6 2004 >2012 481 554 6350.32=Fpa 7.4 1.3 30.4 68.2 2004 >2012 509 586 6720.35 7.8 2.6 29.9 58.1 2004 >2012 551 634 7260.40 8.7 6.9 28.2 38.8 >2012 >2012 618 711 815
Year when prob. B>Bpa is above 95%
B<BlimProbabilities (%)
B>BpaFractiles of catch in 2002 Fractiles of catch in 2003
Probabilities (%) Year when risk B<Blim is
below 5%
Year when prob. B>Bpa is above 95%
Fractiles of catch in 2002 Fractiles of catch in 2003B<Blim B>Bpa
Year when risk B<Blim is
below 5%

O:\ACFM\WGREPS\WGNPBW\REPORTS\2002\Sec-6.Doc 233

O:\ACFM\WGREPS\WGNPBW\REPORTS\2002\Sec-6.Doc 234
62°
60°
58°
56°
54°
52°
50°
0°5°10°15° 5°
0300100030006000
0>6000
3000
300
0
1000
3000
300
1000
0
300
1000
0300
0
00
3000
1000
300
Figure 6.4.1.1. Distribution of blue whiting, R.V. ”Johan Hjort” , spring 2002. Echo intensity (SA-values) in m2/(n.mile)2.

O:\ACFM\WGREPS\WGNPBW\REPORTS\2002\Sec-6.Doc 235
0
10
20
30
15 20 25 30 35 40 0 2 4 6 8
Length Age
0
10
20
30
40
50
60Total stockN = 175635
A
0
10
20
30
15 20 25 30 35 40 0 2 4 6 8 10
Length Age
0
10
20
30
40
50
60Spawning stock
N = 146807
B
Figure 6.4.1.2 Total (A) and spawning (B) stocks length and age distribution of blue whiting in the area to the west of The British Isles, spring 2002. N*10-6, weighted by abundance in survey strata.

O:\ACFM\WGREPS\WGNPBW\REPORTS\2002\Sec-6.Doc 236
0.0
0.2
0.4
0.6
0.8
1.0
0 1 2 3 4 5 6
Age (yr)
0.0
0.2
0.4
0.6
0.8
1.0
0 10 20 30 40
Length (cm)
Figure 6.4.1.3. Maturity ogive of blue whiting in the area to the west of The British Isles in spring 2002 by age (upper panel) and length (lower panel).

O:\ACFM\WGREPS\WGNPBW\REPORTS\2002\Sec-6.Doc 237
Figure 6.4.2.1 Mean catch rates in the bottom trawl surveys from the southern area.
Portuguese bottom trawl survey (Summer)
0
60
120
180
240
1978 1980 1982 1984 1986 1988 1990 1992 1994 1996 1998 2000Year
Kg/
hour
Spanish Bottom Trawl Surveys
0
50
100
150
200
1978 1980 1982 1984 1986 1988 1990 1992 1994 1996 1998 2000
Year
Kg/
haul
Portuguese bottom trawl survey (Autumn)
0
100
200
300
400
1978 1980 1982 1984 1986 1988 1990 1992 1994 1996 1998 2000Year
Kg/
hour

O:\ACFM\WGREPS\WGNPBW\REPORTS\2002\Sec-6.Doc 238
Figure 6.4.4.1 ICA diagnostics.

O:\ACFM\WGREPS\WGNPBW\REPORTS\2002\Sec-6.Doc 239
Figure 6.4.4.2 Results of the AMCI assessment single fleet tuning compared to the final run(Fleet no 2 was discontinued in 1996 and is not shown)
Recruitment (millions)
0
10
20
30
40
50
60
1981 1982 1983 1984 1985 1986 1987 1988 1989 1990 1991 1992 1993 1994 1995 1996 1997 1998 1999 2000
Final runAll fleets, all dataFleet 1Fleet 3Fleet 4
SSB (million tonnes)
0.0
0.5
1.0
1.5
2.0
2.5
3.0
3.5
4.0
1981 1982 1983 1984 1985 1986 1987 1988 1989 1990 1991 1992 1993 1994 1995 1996 1997 1998 1999 2000 2001 2002
Final runAll fleets, all dataFleet 1Fleet 3Fleet 4
Reference F (3-7)
0.0
0.2
0.4
0.6
0.8
1.0
1.2
1.4
1.6
1981 1982 1983 1984 1985 1986 1987 1988 1989 1990 1991 1992 1993 1994 1995 1996 1997 1998 1999 2000 2001
Final runAll fleets, all dataFleet 1Fleet 3Fleet 4

O:\ACFM\WGREPS\WGNPBW\REPORTS\2002\Sec-6.Doc 240
1 1.5 2 2.5 3 3.5 4 4.5 5
f(2001)
0.1
0.15
0.2
0.25
0.3
0.35
0.4
0.45
0.5M
(3-1
0)
Fig. 6.4.4.3 Surface of the ISVPA loss function (MDN, 20-points window) with respect to M(3-10) and f(term); effort-controlled version.
1 1.5 2 2.5 3 3.5 4 4.5 5f(2001)
0.1
0.15
0.2
0.25
0.3
0.35
0.4
0.45
0.5
0.55
0.6
M(1
-10)
Fig. 6.4.4.4 Surface of the ISVPA loss function (MDN) with respect to M(1-10) and f(term). Based on the effort-controlled ISVPA version with unbiased estimates of log-catches.

O:\ACFM\WGREPS\WGNPBW\REPORTS\2002\Sec-6.Doc 241
0
2
4
6
8
10
12
14
1980 1985 1990 1995 2000 2005
SSB
(mln
.t.)
1. ISVPA (M=0.2), effort-controlled version, SSENorv.SSB surveys.2. ISVPA(M=0.38), effort-controlled version,SSE3. ISVPA(M=0.47), effort-controlled version,MDN4. ISVPA(M=0.20), catch-controlled version,MDN
0
0.1
0.2
0.3
0.4
0.5
0.6
1980 1985 1990 1995 2000 2005
F(3-
7)
1. ISVPA (M=0.2), effort-controlled version, SSE2. ISVPA(M=0.38), effort-controlled version,SSE3. ISVPA(M=0.47), effort-controlled version,MDN4. ISVPA(M=0.20), catch-controlled version,MDN
0
0.2
0.4
0.6
0.8
1
1.2
1.4
1.6
1.8
2
1 2 3 4 5 6 7 8 9 10
S(ag
e) w
rt F
(3-7
)
1. ISVPA (M=0.2), effort-controlled version, SSE2. ISVPA(M=0.38), effort-controlled version,SSE3. ISVPA(M=0.47), effort-controlled version,MDN4. ISVPA(M=0.20), catch-controlled version,MDN
Model 1 Model 2 Model 3 Model 4 Correlation between survey and model-derived SSB 0.478 0.541 0.578 0.571 SSE between survey and model-derived SSB 136.6 59.0 100.3 134.7 Fig. 6.4.4.5 ISVPA results.

O:\ACFM\WGREPS\WGNPBW\REPORTS\2002\Sec-6.Doc 242
58
59
60
61
1 2 3 4 5
f(term)
SSE
M=0.20, effort-contr., SSE
63
64
65
66
1 2 3 4 5
f(term)
SSE
M=0.38, effort-contr., SSE
11
12
13
14
15
16
17
1 2 3 4 5
f(term)
SSE
M=0.20, catch-contr., SSE
3
3.1
3.2
3.3
3.4
3.5
1 2 3 4 5
f(term)
MD
N·1
00M=0.20, catch-contr., MDN
Fig. 6.4.4.6 ISVPA loss function with respect to f(term) for M(1-10) fixed at 0.20 and 0.38.

O:\ACFM\WGREPS\WGNPBW\REPORTS\2002\Sec-6.Doc 243
SSB (5%, 25%, 50%, 75%, 95%)
0.0
0.5
1.0
1.5
2.0
2.5
3.0
3.5
4.0
1981 1982 1983 1984 1985 1986 1987 1988 1989 1990 1991 1992 1993 1994 1995 1996 1997 1998 1999 2000 2001
mill
ion
tonn
es
Recruitment (5%, 25%, 50%, 75%, 95%)
0
10
20
30
40
50
60
70
1981 1982 1983 1984 1985 1986 1987 1988 1989 1990 1991 1992 1993 1994 1995 1996 1997 1998 1999 2000
109 in
divi
dual
s
Fishing mortality (5%, 25%, 50%, 75%, 95%)
0.0
0.2
0.4
0.6
0.8
1.0
1.2
1981 1982 1983 1984 1985 1986 1987 1988 1989 1990 1991 1992 1993 1994 1995 1996 1997 1998 1999 2000
Figure 6.4.5.1 Results of the bootstrap AMCI runs.

O:\ACFM\WGREPS\WGNPBW\REPORTS\2002\Sec-6.Doc 244
0.0
0.3
0.6
0.9
1980 1987 1994 2001
Fish
ing
mor
talit
y
0.0
0.5
1.0
1.5
2.0
2.5
3.0
3.5
1980 1987 1994 2001
SSB
(milli
on to
nnes
)
1.0
10.0
100.0
1980 1987 1994 2001
Rec
ruitm
ent (
milli
ards
)
Figure 6.4.5.2 Retrospective AMCI runs.

O:\ACFM\WGREPS\WGNPBW\REPORTS\2002\Sec-6.Doc 245

O:\ACFM\WGREPS\WGNPBW\REPORTS\2002\Sec-6.Doc 246
0
10000
20000
30000
40000
50000
60000
0 1000 2000 3000
Spawning stock biomass (thousand t)
Rec
ruit
men
t, a
ge 0
(mill
ion
s)
Figure 6.6.1. The relationship between spawning stock and recruitment of blue whiting in 1981-2000, and the fitted “Ockham’s razor” (with average and ±1 S.D.) assuming a break point at 1500 thousand t.

O:\ACFM\WGREPS\WGNPBW\REPORTS\2002\Sec-6.Doc 247
70°N
75°N
65°N
10°W 30°E20°E10°E0°E20°W40°N
45°N
50°N
55°N
60°N
70°N
75°N
65°N
10°W 30°E20°E10°E0°E20°W40°N
45°N
50°N
55°N
60°N
Q1 Q2
70°N
75°N
65°N
10°W 30°E20°E10°E0°E20°W40°N
45°N
50°N
55°N
60°N
70°N
75°N
65°N
10°W 30°E20°E10°E0°E20°W40°N
45°N
50°N
55°N
60°N
Q3 Q4
Figure 6.8.1. Total catches of blue whiting in 2001 by quarter and ICES rectangle. Grading of the symbols: small dots 10-100 t, white squares 100-1 000 t, grey squares 1 000-10 000 t, and black squares > 10 000 t.

O:\ACFM\WGREPS\WGNPBW\REPORTS\2002\Sec-6.Doc 248
70°N
75°N
65°N
10°W 30°E20°E10°E0°E20°W40°N
45°N
50°N
55°N
60°N
Figure 6.8.2. Total catches of blue whiting in 2001 by ICES rectangle. Grading of the symbols: small dots 10-100 t, white squares 100-1 000 t, grey squares 1 000-10 000 t, and black squares > 10 000 t.

O:\ACFM\WGREPS\WGNPBW\REPORTS\2002\Sec-7.Doc 249
7 ICELANDIC SUMMER-SPAWNING HERRING
7.1 The fishery
The catches of Icelandic summer-spawning herring from 1982 - 2001 are given in Tables 7.1.1, 7.1.2, and 7.1.3. No estimate of discards was made for the 2001/2002 season. The fishery started in September and terminated in January. The catch in September-January was 95 278 t, see Table 7.1.2. The catch was taken with traditional purse-seines and pelagic trawls. The main purse-seine fishery took place off the east coast of Iceland in September-November and only minor quantities were taken west of Iceland in October-January. The pelagic trawl fishery started in September, which is unusually early, but only 2500 t were taken east of Iceland throughout the month. In October-January the pelagic trawl fishery took place both east and west of Iceland. In the 1997/98 season 59% of the catch was taken by purse seines, 78% in 1998/99, 61% in 1999/2000, and 72% in 2000/2001. Only 47% of the catch in the 2001/2002 season was taken by seines and the remainder by pelagic trawl.
The proportion used for reduction to meal and oil was 29% in 1997/98 and increased to 72% in 1998/99. This decreased again to 69% in 1999/2000, and to 64% in 2000/2001. Only 12% of the catch taken in the 2001/2002 season was reduced to meal and oil. The remainder was either salted or frozen for human consumption.
Until 1990, the herring fishery took place during the last three months of the calendar year, but since 1990 the autumn fishery has continued in January and early February of the following year. In 1994 the fishery started in September. Therefore, all references to the years 1990-1993 imply seasons starting in October of that year, but after that in September. Landings, catches, and recommended TACs since 1984 are given in thousand tonnes in Table 7.1.1.
7.2 Catch in numbers, weight-at-age and maturity
The catches of the Icelandic summer-spawners in numbers-at-age for the period 1981-2000 are given in Table 7.1.3. Age is now given as real age instead of rings, as in earlier WG reports.
During the 1995/96 - 1997/98 seasons, catches were mainly distributed on the 4 year classes from 1988–1991. On the other hand, catches during the 1998/99 and 1999/2000 seasons were dominated by the strong 1994 year class. In 2000/2001 the very strong 1994 and 1996 year classes were most abundant in the catch, while in 2001/2002 the 1996 year class was the most abundant.
The weight-at-age for each year is given in Table 7.2.1, and the proportion mature-at-age is given in Table 7.2.2.
7.3 Acoustic surveys
The Icelandic summer-spawning herring stock has been monitored by annual acoustic surveys since 1973. These surveys have been conducted in October-December or January. The 2001 survey was carried out during 29 November – 11 December. The estimated size of the adult stock was about 360 000 t, which is much less than expected. On the traditional fishing grounds off the east coast the survey recorded 180 000 t, while only 60 000 t were located in this region in 2000. West of Iceland, about 180 000 t were recorded, which is similar to last year’s findings. However, extremely difficult weather conditions prevailed during the 2001 survey. Furthermore, the groundfish surveys conducted in autumn 2001 and spring 2002, indicated the presence of herring in large areas west and northwest of Iceland, in particular in areas farther offshore than usual. It is therefore likely that the acoustic survey failed to locate all of the stock west of Iceland. For these reasons, a new survey was conducted in January 2002, but also failed due to adverse weather conditions. In the January survey only a small amount of 3-year-old herring was located at the spawning grounds southwest of the Reykjanes promontory.
In spite of the difficulties just described, the 2001/2002 acoustic assessment surveys confirmed that the 1999 year class is well above average (Table 7.3.1).
The sum of results obtained in winter 2001/2002 acoustic surveys have been used as the basis for the present assessment of age 5 (age 6 on 1 January) and older herring (Table 7.3.1).
Jakobsson et al. (1993) formally tested whether it was feasible to maintain a one-to-one relationship between acoustic and VPA estimates of stock size. It was found that a modification of the target strength, from TS=21.7 log(L) - 75.5 dB to TS=20 log(L)-72 dB, gave a much better fit between the two data sets. The resulting target strength TS = 20 log(L) -72 dB was used to recalculate historic acoustic stock assessments. This TS = 20 log(L) - 72 dB has been the basis of calculations of stock abundance from acoustic survey data since 1993.

O:\ACFM\WGREPS\WGNPBW\REPORTS\2002\Sec-7.Doc 250
7.4 Stock assessment
7.4.1 ADAPT-type of VPA
Using the results from the acoustic survey and the catch in numbers, a first estimate of F was made. In this analysis, herring at age 6 (on 1 Jan 2002) and older have been grouped for estimating the fishing mortality for the oldest herring. For F on the oldest age group, an average F for ages 7-14 was used. The resulting ADAPT-type run gave an F of 0.16, see Figure 7.4.1.1. The resulting stock trend from VPA is plotted together with the acoustic estimates in Figure 7.4.1.2 and the relationship between the two estimates is shown in Figure 7.4.1.3.
A retrospective plot (Figure 7.4.1.4) shows that the terminal F values have been underestimated in the last 4 years. Therefore, like last year, the terminal F this year was increased by 27%, which is the mean underestimate in the last 4 years, resulting in an F of 0.2.
Using the catch data given in Table 7.1.3 and the erased F to 0.2, a final VPA was run, using a natural mortality rate of 0.1 for all age groups and the proportion of M before spawning as 0.5. Fishing mortality-at-age for 1982–2001 and stock in numbers-at-age and spawning stock biomass on 1 July 1982–2001 are given in Tables 7.4.1.1, 7.4.1.2, and 7.4.1.3, respectively. The standard plots of the time-series of spawning stock biomass and recruitment and trends in yield and fishing mortality are shown in Figure 7.4.1.5. In the absence of reliable abundance estimates for the 1997, 1998, 1999, and 2000 year classes, the RCT3 programme was used. It estimated the sizes of these year classes as 803, 588, 1159, and 684 millions respectively (see Tables 7.4.1.4 and 7.4.1.5).
According to the present assessment, the spawning stock biomass was about 540 000 t on 1 July 2001, which is about 150 000 t lower than the estimate from last year. The main reason for this difference is the much lower number of the 1996 year class this year. This is most likely due to inconclusive acoustic survey results and a bias in the age readings.
7.4.2 AMCI assessment
The assessment program AMCI21 (Section 1.3.2) was also used. The objective function was a sum of the following partial objective function:
Log sum of squares of catches at age, weight 1
Log sum of squares of yearly yields, weight 1
Log sum of squares for the acoustic survey indices at age, weight 1
Fishing mortality was modelled as separable, with a gradual change in selection. The gain factor for a change in selection was 0.5 for ages 2 and 3, 0.2 for age 4, and 0.1 for older ages. For 1981 the fishing mortality was derived through parameter estimation. In 2002 the fishing mortality was assumed to be 0.22 and the recruitment 650 millions, which is close to the long-term mean of 2-year-old recruiting herring. The yearly fishing mortality was split on quarters, assuming 0.05 in the third quarter of the year and 0.95 in the fourth quarter. Natural mortality of 0.1 was assumed.
The model was run until 2003. The results for 2002 and 2003 are predicted values assuming a fishing mortality of 0.22. The results are presented in Tables 7.4.2.1 to 7.4.2.5.
A retroplot was also made (Figure 7.4.2.1). It can be seen from this figure that although AMCI has overestimated the F, it is more consistent in the last 3 years than the ADAPT-VPA.
A bootstrap run was made with the same settings as described above, using the option of resampling of log residuals from the assessment, both for the catch and the survey. One thousand replicates were run. The results are shown in Figure 7.4.2.2. A slight decrease in fishing mortality can be seen in the last years. The uncertainty in the recruitment in the late nineties influences the spawning stock biomass in the most recent years.
According to this assessment the spawning stock biomass was 575 000 t at 1 January 2002. The annual unweighted fishing mortality, F 5-15, amounted to 0.25, which corresponds to a weighted F of 0.18. The results from this assessment are in line with the results from the ADAPT-type of VPA assessment.

O:\ACFM\WGREPS\WGNPBW\REPORTS\2002\Sec-7.Doc 251
7.4.3 ISVPA assessment
As a third assessment program ISVPA (Section 1.3.6) was also run. Several possibilities were explored. The options chosen were:
• The catch-controlled version • f(y) and s(a) were found by log (GM) procedure • minimisation of the AMD=median(abs(resid(a,y)-median(resid(a,y))) • natural mortality assumed 0.1 for all ages • part of the year (from start) when catch was taken was assumed 0.8
The results are shown in Table 7.4.3.1-7.4.3.4. It looks as if ISVPA has difficulties estimating the stock numbers in the last years, especially for the younger ages and therefore does not give similar results to the ADAPT-type of VPA and AMCI.
7.5 Catch and stock projections
Based on the ADAPT-VPA assessment short-term projections were made using the MFDP program. The input data are given in Table 7.5.1.
As in previous years, a regression of increase in weight on mean weight in the previous year has been used to predict the weight-at-age for ages 3–9, using as input the weight-at-ages 2–8 in the year before. Data for the regression included the period 1991–2001 as starting years. For one-year-old herring and 10+, a simple average of mean weights-at-age for the period 1997–2001 was used for the prediction. Weights-at-age for 2–8 ringers in the catch were obtained using the relationship:
Wy+1 - Wy = -0.24 * Wy + 95.01 (g)
where Wy and Wy+1 are the mean weight of the same year class in year y and y+1, respectively.
As a selection pattern, the mean selection pattern of 1997–2000 is used, assuming 1 on age 5 and older.
Outputs of the prediction, assuming catches corresponding to a fishing mortality rate of F0.1= 0.22 (weighted F), are given in Table 7.5.2, and projections of spawning stock biomass and catches (tonnes) for a range of values of Fs are given in Table 7.5.3.
Yield per recruit, spawning stock per recruit and short-term yield and spawning stock biomass are shown in Figure 7.4.5, using the long-term average (1982-2001) values given in Table 7.5.4.
7.6 Management consideration
During the last 20 years the Icelandic summer-spawning herring stock has been managed at levels corresponding fairly closely to fishing at F0.1. Exploiting the stock at a fishing mortality rate of F0.1=0.22 during the 2002/2003 season would result in a catch of about 105 000 t (Table 7.5.2 and 7.5.3). The spawning stock biomass in 2002 is expected to be about 550 000 t and about 603 000 t in the year 2002.
Due to the AMCI assessment, a catch of 96 000 t in 2002 would exploit the stock at a fishing mortality level of a weighted F of 0.18. The spawning stock would be about 570 000 t on 1 January. The results from both of these assessments support each other, so a catch of 105 000 t is within safe limits.
The Working Group points out that managing this stock at an exploitation rate at or near F0.1 has been successful in the past. Thus the Working Group agreed in 1998 with the SGPAFM on using Fpa= F0.1= 0.22, Bpa= Blim * e1.645σ= 300 000 t where Blim= 200 000 t.
Jakobsson and Stefansson (1999) made a risk analysis and stated that the probability of stock collapse needs no further consideration as long as the target fishing mortality is kept below 0.25. The present F for this stock is estimated to be

O:\ACFM\WGREPS\WGNPBW\REPORTS\2002\Sec-7.Doc 252
0.18, which is well below Fpa=0.22. Furthermore, the spawning stock is estimated to be 695 000 t compared to Bpa=300 000 t. Therefore, the stock is in a healthy state and well above any “alarm level”.
7.7 Stock recruitment
A stock recruitment plot is shown in Figure 7.7.1.
7.8 Sampling
Investigation No. of samples Length-measured individuals
Aged individuals
Fishery 69 3642 3429 Acoustic, wintering area 22 3873 647

O:\ACFM\WGREPS\WGNPBW\REPORTS\2002\Sec-7.Doc 253
Table 7.1.1 Icelandic summer spawners. Landings, catches and recommended TACs in thousand tonnes.
Year Landings Catches Recommended TACs
1984 50.3 50.3 50.0 1985 49.1 49.1 50.0 1986 65.5 65.5 65.0 1987 73.0 73.0 70.0 1988 92.8 92.8 100.0 1989 97.3 101.0 90.0 1990/1991 101.6 105.1 90.0 1991/1992 98.5 109.5 79.0 1992/1993 106.7 108.5 86.0 1993/1994 101.5 102.7 90.0 1994/1995 132.0 134.0 120.0 1995/1996 125.0 125.9 110.0 1996/1997 95.9 95.9 100.0 1997/1998 64.7 64.7 100.0 1998/1999 87.0 87.0 90.0 1999/2000 92.9 92.9 100.0 2000/2001 100.3 100.3 110.0 2001/2002* 95.3 95.3 125.0
*Preliminary

O:\ACFM\WGREPS\WGNPBW\REPORTS\2002\Sec-7.Doc 254
Table 7.1.2 Icelandic summer spawners. Catch in tonnes by Icelandic squares, ICES rectangles and months.
Icelandic Squares
ICES rectangles
September 2000
October 2000
November 2000
December 2000
January 2001
312 55D7 42 313 55D6 63 319 55D0 369 323 55C6 2387 324 55C5 3061 326 55C3 285 363 55D6 216 364 56D5 221 366 56D3 90 2311 63 372 56C7 32 373 56C6 685 374 56C5 848 375 56C4 105 376 56C3 32 412 57D7 74 69 2856 163 413 57D6 7360 2213 8098 414 57D5 1702 53 32 416 57D3 42 423 57C6 258 424 57C5 53 425 57C4 148 379 426 57C3 53 63 462 58D7 179 463 58D6 1117 475 58C4 464 21 775 476 58C3 320 1992 11 477 58C2 53 512 59D7 148 37 513 59D6 158 525 59C4 316 211 627 11 526 59C3 74 3641 8325 1033 527 59C2 221 561 60D8 469 2254 647 562 60D7 200 2474 4953 1660 563 60D6 446 2529 1117 74 564 60D5 195 575 60C4 453 1049 63 74 576 60C3 532 6689 2961 1085 612 61D7 16 5380 221 613 61D6 643 838 625 61C4 446 232 21 626 61C3 316 137 232 662 62D7 63 672 62C7 32 674 62C5 2147 126 675 62C4 137 676 62C3 179 823 62B6 32

O:\ACFM\WGREPS\WGNPBW\REPORTS\2002\Sec-7.Doc 255
Table 7.1.3 Icelandic summer spawners. Catch in numbers (millions) and total catch in weight (thous. tonnes).
Age/Year 1982 1983 1984 1985 1986 1987 1988 2 0.454 1.475 0.421 0.112 0.100 0.029 0.879 3 19.187 22.499 18.015 12.872 8.172 3.144 4.757 4 28.109 151.718 32.244 24.659 33.938 44.590 41.331 5 38.280 30.285 141.354 21.656 23.452 60.285 99.366 6 16.623 21.599 17.043 85.210 20.681 20.622 69.331 7 38.308 8.667 7.113 11.903 77.629 19.751 22.955 8 43.770 14.065 3.916 5.740 18.252 46.240 20.131 9 6.813 13.713 4.113 2.336 10.986 15.232 32.201
10 6.633 3.728 4.517 4.363 8.594 13.963 12.349 11 10.457 2.381 1.828 4.053 9.675 10.179 10.250 12 2.354 3.436 0.202 2.773 7.183 13.216 7.378 13 0.594 0.554 0.255 0.975 3.682 6.224 7.284 14 0.075 0.100 0.260 0.480 2.918 4.723 4.807 15 0.211 0.003 0.003 0.581 1.788 2.280 1.957
Catch 56.528 58.867 50.304 49.368 65.500 75.439 92.828
Age/year 1989 1990 1991 1992 1993 1994 1995 2 3.974 11.009 35.869 12.006 0.869 6.225 7.411 3 22.628 14.345 92.758 79.782 35.560 110.079 26.221 4 26.649 57.024 51.047 131.543 170.106 99.377 159.170 5 77.824 34.347 87.606 43.787 87.363 150.310 86.940 6 188.654 77.819 33.436 56.083 25.146 90.824 105.542 7 43.114 152.236 54.840 41.932 28.802 23.926 74.326 8 8.116 32.265 109.418 36.224 18.306 20.809 20.076 9 5.897 8.713 9.251 44.765 24.268 19.164 13.797
10 7.292 4.432 3.796 9.244 14.318 17.973 8.873 11 4.780 4.287 2.634 2.259 3.639 16.222 9.140 12 3.449 2.517 1.826 0.582 0.878 2.955 7.079 13 1.410 1.226 0.516 0.305 0.300 1.433 2.376 14 0.844 1.019 0.262 0.203 0.200 0.345 0.927 15 0.348 0.610 0.298 0.102 0.100 0.345 0.124
Catch 101.000 105.097 109.489 108.504 102.741 134.003 125.851
Age/Year 1996 1997 1998 1999 2000 2001 2 1.100 9.323 16.161 0.629 7.958 10.206 3 18.723 27.072 37.787 43.537 52.921 23.944 4 45.304 28.397 151.853 65.871 131.153 76.666 5 92.948 29.451 42.833 145.127 44.334 107.849 6 69.878 42.267 19.872 24.653 102.925 46.646 7 86.261 35.285 30.280 20.614 10.962 51.585 8 37.447 28.506 22.572 25.853 9.312 18.504 9 13.207 21.828 32.779 21.163 17.218 11.356
10 6.854 8.160 14.366 14.436 9.471 7.933 11 4.012 3.815 4.802 6.973 7.610 8.547 12 1.672 1.696 2.199 2.164 1.930 5.090 13 4.179 6.570 1.084 2.426 5.199 4.346 14 1.672 1.378 5.081 0.473 0.552 1.611 15 0.100 1.802 3.036 0.961 0.166 0.864
Catch 95.882 64.682 86.998 92.896 100.332 95.278

O:\ACFM\WGREPS\WGNPBW\REPORTS\2002\Sec-7.Doc 256
Table 7.2.1 Icelandic summer spawners. Weight-at-age (g).
Age/Year 1982 1983 1984 1985 1986 1987 1988 2 65 59 49 53 60 60 75 3 141 132 131 146 140 168 157 4 186 180 189 219 200 200 221 5 217 218 217 266 252 240 239 6 274 260 245 285 282 278 271 7 293 309 277 315 298 304 298 8 323 329 315 335 320 325 319 9 354 356 322 365 334 339 334
10 385 370 351 388 373 356 354 11 389 407 334 400 380 378 352 12 400 437 362 453 394 400 371 13 394 459 446 469 408 404 390 14 390 430 417 433 405 424 408 15 420 472 392 447 439 430 437
Age/Year 1989 1990 1991 1992 1993 1994 1995
2 63 75 74 63 74 67 69 3 130 119 139 144 150 135 129 4 206 198 188 190 212 204 178 5 246 244 228 232 245 249 236 6 261 273 267 276 288 269 276 7 290 286 292 317 330 302 292 8 331 309 303 334 358 336 314 9 338 329 325 346 373 368 349
10 352 351 343 364 387 379 374 11 369 369 348 392 401 398 381 12 389 387 369 444 425 387 400 13 380 422 388 399 387 421 409 14 434 408 404 419 414 402 438 15 409 436 396 428 420 390 469
Age/Year 1996 1997 1998 1999 2000 2001 2002*
2 78 62 78 64 58 78 70 3 140 137 147 143 158 140 154 4 166 197 184 211 214 217 201 5 208 234 213 236 256 242 259 6 258 270 246 268 284 281 278 7 294 299 286 300 326 294 307 8 312 323 314 318 333 309 317 9 324 342 341 349 366 339 329
10 360 358 351 347 383 350 363 11 349 363 354 377 402 367 376 12 388 373 350 359 405 375 389 13 403 412 372 403 422 403 402 14 385 394 400 408 406 426 409 15 420 429 437 445 444 425 428
* Predicted

O:\ACFM\WGREPS\WGNPBW\REPORTS\2002\Sec-7.Doc 257
Table 7.2.2 Icelandic summer spawners. Proportion mature-at-age.
Age/Year 1982 1983 1984 1985 1986 1987 1988 2 0.020 0.000 0.000 0.000 0.000 0.000 0.000 3 0.050 0.000 0.010 0.000 0.030 0.010 0.045 4 0.850 0.640 0.820 0.900 0.890 0.870 0.900 5 1.000 1.000 1.000 1.000 1.000 1.000 1.000 6 1.000 1.000 1.000 1.000 1.000 1.000 1.000 7 1.000 1.000 1.000 1.000 1.000 1.000 1.000 8 1.000 1.000 1.000 1.000 1.000 1.000 1.000 9 1.000 1.000 1.000 1.000 1.000 1.000 1.000
10 1.000 1.000 1.000 1.000 1.000 1.000 1.000 11 1.000 1.000 1.000 1.000 1.000 1.000 1.000 12 1.000 1.000 1.000 1.000 1.000 1.000 1.000 13 1.000 1.000 1.000 1.000 1.000 1.000 1.000 14 1.000 1.000 1.000 1.000 1.000 1.000 1.000 15 1.000 1.000 1.000 1.000 1.000 1.000 1.000
Age/Year 1989 1990 1991 1992 1993 1994 1995
2 0.000 0.000 0.000 0.000 0.000 0.000 0.000 3 0.060 0.000 0.013 0.020 0.049 0.054 0.157 4 0.930 0.780 0.720 0.930 0.999 1.000 0.982 5 1.000 1.000 1.000 1.000 1.000 0.992 0.998 6 1.000 1.000 1.000 1.000 1.000 1.000 1.000 7 1.000 1.000 1.000 1.000 1.000 1.000 1.000 8 1.000 1.000 1.000 1.000 1.000 1.000 1.000 9 1.000 1.000 1.000 1.000 1.000 1.000 1.000
10 1.000 1.000 1.000 1.000 1.000 1.000 1.000 11 1.000 1.000 1.000 1.000 1.000 1.000 1.000 12 1.000 1.000 1.000 1.000 1.000 1.000 1.000 13 1.000 1.000 1.000 1.000 1.000 1.000 1.000 14 1.000 1.000 1.000 1.000 1.000 1.000 1.000 15 1.000 1.000 1.000 1.000 1.000 1.000 1.000
Age/Year 1996 1997 1998 1999 2000 2001 2002*
2 0.000 0.000 0.000 0.000 0.000 0.000 0.000 3 0.049 0.160 0.265 0.074 0.279 0.101 0.151 4 0.990 0.925 0.935 0.879 0.831 0.981 0.897 5 1.000 0.989 0.995 0.977 0.992 0.997 0.988 6 1.000 1.000 1.000 1.000 1.000 1.000 1.000 7 1.000 1.000 1.000 1.000 1.000 1.000 1.000 8 1.000 1.000 1.000 1.000 1.000 1.000 1.000 9 1.000 1.000 1.000 1.000 1.000 1.000 1.000
10 1.000 1.000 1.000 1.000 1.000 1.000 1.000 11 1.000 1.000 1.000 1.000 1.000 1.000 1.000 12 1.000 1.000 1.000 1.000 1.000 1.000 1.000 13 1.000 1.000 1.000 1.000 1.000 1.000 1.000 14 1.000 1.000 1.000 1.000 1.000 1.000 1.000 15 1.000 1.000 1.000 1.000 1.000 1.000 1.000
* Predicted (mean of 1999-2001)

O:\ACFM\WGREPS\WGNPBW\REPORTS\2002\Sec-7.Doc 258
Table 7.3.1 Acoustic estimates (in millions) of the Icelandic summer-spawning herring, 1974-2000. The surveys are conducted in October-December or January. The year given is the following year, i.e. if the survey is conducted in the season 1973/1974, then 1974 is given.
Ages Year 2 3 4 5 6 7 8 9 10 11 12 13 14 15 16 6+1974 -1 154 -1 -1 -1 -1 -1 -1 -1 -1 -1 -1 -1 -1 -1 -11975 -1 5 137 19 21 2 2 -1 -1 -1 -1 -1 -1 -1 -1 251976 -1 136 20 133 17 10 3 3 -1 -1 -1 -1 -1 -1 -1 331977 -1 -1 -1 -1 -1 -1 -1 -1 -1 -1 -1 -1 -1 -1 -1 -11978 -1 212 424 46 19 139 18 18 10 -1 -1 -1 -1 -1 -1 2041979 -1 158 334 215 49 20 111 30 30 20 -1 -1 -1 -1 -1 2601980 -1 19 177 360 253 51 41 93 10 -1 -1 -1 -1 -1 -1 4481981 625 361 462 85 170 182 33 29 58 10 -1 -1 -1 -1 -1 4821982 -1 17 75 159 42 123 162 24 8 46 10 -1 -1 -1 -1 4151983 -1 -1 -1 -1 -1 -1 -1 -1 -1 -1 -1 -1 -1 -1 -1 -11984 -1 171 310 724 80 39 15 27 26 10 5 12 -1 -1 -1 2141985 -1 28 67 56 360 65 32 16 17 18 9 7 4 5 5 5381986 201 652 208 110 86 425 67 41 17 27 26 16 6 6 1 7181987 -1 -1 -1 -1 -1 -1 -1 -1 -1 -1 -1 -1 -1 -1 -1 -11988 406 126 352 836 287 53 37 76 25 21 14 17 8 6 3 5471989 370 725 181 249 381 171 42 23 30 16 10 9 5 3 2 6921990 -1 178 593 177 302 538 185 -1 -1 -1 18 -1 -1 -1 -1 10431991 710 805 227 304 137 176 387 40 10 2 -1 -1 -1 -1 -1 7521992 465 745 850 353 273 94 81 210 32 11 -1 17 -1 -1 -1 7181993 1418 254 858 687 160 99 87 44 92 39 -1 -1 -1 -1 -1 5211994 183 234 533 860 443 55 69 43 86 55 2 -1 6 -1 -1 7531995 -1 -1 -1 -1 -1 -1 -1 -1 -1 -1 -1 -1 -1 -1 -1 -11996 845 98 165 515 316 361 166 110 52 29 16 27 19 8 2 11051997 266 792 65 139 459 280 410 150 101 50 35 15 65 32 -1 15971998 1629 237 716 100 116 240 161 130 97 35 15 11 43 8 15 8701999 -1 -1 188 790 240 101 73 47 77 47 10 10 -1 22 -1 6272000 1069 527 740 296 606 99 71 164 108 98 15 44 5 13 7 12302001 2832 101 561 1069 323 609 30 31 38 13 18 6 9 4 1 10822002 561 942 247 187 265 173 302 69 48 55 54 16 18 1 -1 1001

O:\ACFM\WGREPS\WGNPBW\REPORTS\2002\Sec-7.Doc 259
Table 7.4.1.1 Icelandic summer spawners. Fishing mortality at age. Marine Research Institute Tue Apr 23 10:39:12 2002 Virtual Population Analysis : Fishing mortality Age 1982 1983 1984 1985 1986 1987 1988 2 0.002 0.007 0.001 0.000 0.000 0.000 0.002 3 0.026 0.116 0.101 0.031 0.008 0.006 0.017 4 0.159 0.258 0.218 0.175 0.097 0.048 0.089 5 0.300 0.229 0.360 0.199 0.224 0.222 0.130 6 0.221 0.246 0.175 0.341 0.264 0.280 0.378 7 0.390 0.154 0.107 0.160 0.525 0.384 0.506 8 0.566 0.216 0.087 0.106 0.347 0.605 0.746 9 0.212 0.307 0.081 0.061 0.271 0.481 1.014 10 0.336 0.154 0.140 0.104 0.298 0.572 0.801 11 0.576 0.173 0.095 0.162 0.313 0.602 0.980 12 0.259 0.333 0.018 0.183 0.420 0.806 1.078 13 1.540 0.080 0.033 0.101 0.347 0.690 1.390 14 1.967 1.159 0.044 0.072 0.432 0.882 1.836 15 0.731 0.322 0.076 0.119 0.369 0.628 1.044 W.Av 5-15 0.366 0.225 0.255 0.228 0.360 0.381 0.297 Ave 5-15 0.645 0.307 0.111 0.146 0.346 0.559 0.900 Age 1989 1990 1991 1992 1993 1994 1995 2 0.011 0.012 0.034 0.018 0.001 0.019 0.021 3 0.055 0.045 0.124 0.088 0.061 0.181 0.092 4 0.110 0.172 0.201 0.232 0.245 0.217 0.382 5 0.214 0.181 0.382 0.237 0.213 0.317 0.267 6 0.344 0.306 0.241 0.399 0.186 0.319 0.341 7 0.379 0.455 0.327 0.472 0.327 0.242 0.414 8 0.298 0.480 0.612 0.332 0.345 0.369 0.293 9 0.446 0.529 0.218 0.481 0.344 0.644 0.395 10 0.582 0.627 0.410 0.312 0.247 0.410 0.622 11 0.746 0.718 0.847 0.405 0.174 0.431 0.335 12 0.965 1.033 0.683 0.395 0.242 0.187 0.301 13 0.529 1.018 0.530 0.200 0.323 0.677 0.202 14 0.493 0.813 0.543 0.363 0.175 0.661 1.171 15 0.555 0.709 0.521 0.370 0.272 0.453 0.467 W.Av 5-15 0.316 0.371 0.401 0.363 0.243 0.332 0.333 Ave 5-15 0.505 0.624 0.483 0.361 0.259 0.428 0.437 Age 1996 1997 1998 1999 2000 2001 1997-2000 2 0.001 0.016 0.016 0.001 0.014 0.009 0.012 3 0.060 0.029 0.077 0.049 0.080 0.049 0.059 4 0.202 0.110 0.204 0.167 0.182 0.142 0.166 5 0.357 0.176 0.215 0.273 0.145 0.200 0.202 6 0.317 0.243 0.155 0.166 0.283 0.200 0.212 7 0.457 0.234 0.246 0.213 0.093 0.200 0.196 8 0.337 0.238 0.206 0.305 0.126 0.200 0.219 9 0.284 0.298 0.418 0.271 0.304 0.200 0.323 10 0.310 0.254 0.291 0.291 0.167 0.200 0.251 11 0.564 0.253 0.208 0.200 0.219 0.200 0.220 12 0.084 0.438 0.203 0.123 0.070 0.200 0.208 13 0.260 0.478 0.491 0.320 0.424 0.200 0.428 14 0.191 0.115 0.739 0.365 0.100 0.200 0.330 15 0.311 0.288 0.350 0.261 0.188 0.200 0.272 W.Av 5-15 0.355 0.237 0.246 0.252 0.202 0.200 0.219 Ave 5-15 0.316 0.274 0.320 0.253 0.193 0.200 0.260

O:\ACFM\WGREPS\WGNPBW\REPORTS\2002\Sec-7.Doc 260
Table 7.4.1.2 Icelandic summer spawners. VPA stock size. Marine Research Institute Tue Apr 23 10:39:11 2002 Virtual Population Analysis : Stock in numbers, millions Age 1982 1983 1984 1985 1986 1987 1988 2 237.907 219.289 488.503 1220.902 628.367 332.913 490.373 3 794.226 214.836 197.019 441.615 1104.612 568.475 301.204 4 200.729 700.405 173.019 161.155 387.354 991.725 511.388 5 154.837 154.935 489.803 125.951 122.407 318.249 854.969 6 88.040 103.795 111.451 309.190 93.408 88.501 230.748 7 124.127 63.885 73.423 84.664 198.975 64.898 60.517 8 105.935 76.008 49.575 59.679 65.304 106.548 40.002 9 37.358 54.430 55.425 41.137 48.547 41.785 52.662 10 24.342 27.336 36.245 46.243 35.002 33.505 23.383 11 24.980 15.736 21.195 28.506 37.697 23.520 17.103 12 10.805 12.708 11.978 17.441 21.945 24.934 11.651 13 0.785 7.543 8.240 10.646 13.148 13.050 10.078 14 0.090 0.152 6.299 7.214 8.706 8.406 5.924 15 0.425 0.011 0.043 5.452 6.071 5.113 3.148 Total No 1804.585 1651.071 1722.218 2559.794 2771.544 2621.621 2613.149 Age 1989 1990 1991 1992 1993 1994 1995 2 380.102 931.883 1131.659 706.140 770.040 353.656 379.286 3 442.872 340.153 832.736 989.872 627.528 695.934 314.083 4 268.019 379.222 294.148 665.385 819.870 534.017 525.199 5 423.454 217.198 288.992 217.700 477.231 580.436 388.878 6 679.230 309.291 163.920 178.455 155.431 348.896 382.656 7 143.074 435.726 206.053 116.593 108.324 116.767 229.564 8 33.022 88.593 250.056 134.442 65.783 70.704 82.951 9 17.171 22.182 49.606 122.746 87.300 42.167 44.250 10 17.286 9.951 11.823 36.105 68.671 55.984 20.029 11 9.493 8.740 4.812 7.101 23.902 48.549 33.625 12 5.807 4.073 3.856 1.867 4.284 18.173 28.560 13 3.588 2.001 1.312 1.763 1.138 3.043 13.638 14 2.270 1.912 0.654 0.699 1.306 0.745 1.398 15 0.855 1.255 0.768 0.344 0.440 0.992 0.348 Total No 2426.244 2752.180 3240.395 3179.212 3211.249 2870.064 2444.467 Age 1996 1997 1998 1999 2000 2001 2002 2 1085.741 603.625 1078.142 803.000 588.000 1159.000 684.000 3 336.147 981.373 537.319 960.179 725.987 524.470 1038.999 4 259.281 286.365 862.248 450.280 827.426 606.649 451.777 5 324.354 191.603 232.137 636.053 344.885 624.170 476.158 6 269.390 205.372 145.408 169.392 437.846 269.961 462.397 7 246.173 177.486 145.720 112.700 129.864 298.545 199.992 8 137.289 141.037 127.111 103.121 82.409 107.091 221.168 9 56.015 88.718 100.565 93.590 68.788 65.722 79.335 10 26.964 38.156 59.572 59.935 64.606 45.912 48.688 11 9.729 17.897 26.783 40.276 40.538 49.465 34.012 12 21.759 5.007 12.575 19.676 29.824 29.458 36.645 13 19.128 18.100 2.923 9.291 15.748 25.152 21.823 14 10.085 13.343 10.155 1.619 6.106 9.324 18.633 15 0.392 7.538 10.764 4.387 1.016 5.000 6.907 Total No 2802.448 2775.620 3351.423 3463.498 3363.044 3819.919 3780.533

O:\ACFM\WGREPS\WGNPBW\REPORTS\2002\Sec-7.Doc 261
Table 7.4.1.3 Icelandic summer spawners. Marine Research Institute Tue Apr 23 10:39:11 2002 Virtual Population Analysis : SSB in 1000 x tons Age 1982 1983 1984 1985 1986 1987 1988 2 0.294 0.000 0.000 0.000 0.000 0.000 0.000 3 5.326 0.000 0.246 0.000 4.404 0.906 2.026 4 30.204 76.624 25.453 30.215 65.718 164.390 96.798 5 32.005 32.143 101.010 31.845 29.296 72.594 194.047 6 22.921 25.661 25.963 83.910 25.074 23.378 59.483 7 34.631 18.753 19.339 25.336 56.384 18.748 17.154 8 32.548 23.765 14.836 18.995 19.884 32.970 12.134 9 12.572 18.458 16.961 14.283 15.442 13.466 16.711 10 8.905 9.626 12.091 17.076 12.409 11.340 7.874 11 9.236 6.091 6.730 10.860 13.612 8.448 5.719 12 4.115 5.278 4.123 7.515 8.222 9.492 4.116 13 0.294 3.291 3.498 4.749 5.100 5.010 3.743 14 0.034 0.062 2.501 2.970 3.352 3.391 2.302 15 0.170 0.005 0.016 2.317 2.535 2.090 1.307 Total 193.256 219.757 232.768 250.069 261.432 366.223 423.414 Age 1989 1990 1991 1992 1993 1994 1995 2 0.000 0.000 0.000 0.000 0.000 0.000 0.000 3 3.299 0.000 1.427 2.719 4.373 4.816 6.065 4 48.938 55.851 37.793 111.545 164.858 103.830 87.481 5 99.049 50.391 62.704 47.981 111.356 136.498 87.192 6 168.633 80.289 41.617 46.936 42.551 89.375 100.499 7 39.536 118.374 57.272 35.146 33.962 33.522 63.720 8 10.407 26.040 72.048 42.739 22.383 22.584 24.800 9 5.516 6.936 15.326 40.422 30.958 14.752 14.707 10 5.794 3.322 3.856 12.491 25.260 20.162 7.125 11 3.328 3.068 1.593 2.650 9.120 18.366 12.174 12 2.147 1.499 1.354 0.789 1.733 6.697 10.880 13 1.297 0.802 0.484 0.669 0.419 1.219 5.306 14 0.938 0.742 0.252 0.278 0.514 0.285 0.583 15 0.333 0.521 0.289 0.140 0.175 0.368 0.155 Total 389.214 347.835 296.016 344.506 447.662 452.475 420.688 Age 1996 1997 1998 1999 2000 2001 2 0.000 0.000 0.000 0.000 0.000 0.000 3 2.200 20.522 19.883 9.672 30.346 7.069 4 40.581 49.739 141.260 79.365 139.837 122.617 5 64.330 42.161 46.865 139.740 83.313 143.074 6 66.087 52.726 33.957 43.264 118.242 72.108 7 68.868 50.514 39.657 32.204 40.234 83.378 8 40.797 43.280 38.027 31.213 26.112 31.508 9 17.274 28.904 32.611 31.079 23.916 21.212 10 9.236 12.994 19.879 19.760 23.513 15.285 11 3.227 6.177 9.016 14.436 15.506 17.264 12 8.029 1.775 4.192 6.723 11.490 10.516 13 7.340 7.097 1.033 3.558 6.329 9.647 14 3.697 5.004 3.859 0.628 2.356 3.783 15 0.157 3.075 4.471 1.856 0.430 2.022 Total 331.823 323.968 394.710 413.497 521.623 539.483

O:\ACFM\WGREPS\WGNPBW\REPORTS\2002\Sec-7.Doc 262
Table 7.4.1.4 Icelandic summer spawners. Input data for the RCT3 program. Iceland Herring: VPA and acoustic survey data 3 21 2 'Yearcl' 'VPAage2' 'Surv4' 'Surv3' 'Surv2' 1980 238 310 -11 -11 1981 219 67 171 -11 1982 489 208 28 -11 1983 1221 -11 652 -11 1984 628 352 -11 201 1985 333 181 126 -11 1986 490 593 725 406 1987 380 227 178 370 1988 932 850 805 -11 1989 1132 858 745 710 1990 706 533 254 465 1991 770 -11 234 1418 1992 354 165 -11 183 1993 379 65 98 -11 1994 1086 716 792 845 1995 604 188 237 266 1996 1078 740 -11 1629 1997 -11 561 527 -11 1998 -11 247 101 1069 1999 -11 -11 942 2832 2000 -11 -11 -11 561

O:\ACFM\WGREPS\WGNPBW\REPORTS\2002\Sec-7.Doc 263
Table 7.4.1.5 Icelandic summer spawners. Output from the RCT3 program. Analysis by RCT3 ver3.1 of data from file : data2002.txt Iceland Herring: VPA and acoustic survey data Data for 3 surveys over 21 years : 1980 - 2000 Regression type = C Tapered time weighting applied power = 3 over 20 years Survey weighting not applied Final estimates shrunk towards mean Minimum S.E. for any survey taken as .20 Minimum of 3 points used for regression Forecast/Hindcast variance correction used. Yearclass = 1997 I-----------Regression----------I I-----------Prediction---------I Survey/ Slope Inter- Std Rsquare No. Index Predicted Std WAP Series cept Error Pts Value Value Error Weights Surv4 .68 2.48 .34 .707 15 6.33 6.76 .399 .458 Surv3 .71 2.40 .46 .547 13 6.27 6.86 .556 .236 Surv2 VPA Mean = 6.45 .488 .307 Yearclass = 1998 I-----------Regression----------I I-----------Prediction---------I Survey/ Slope Inter- Std Rsquare No. Index Predicted Std WAP Series cept Error Pts Value Value Error Weights Surv4 .66 2.61 .33 .719 15 5.51 6.23 .387 .360 Surv3 .69 2.51 .42 .579 13 4.62 5.71 .556 .175 Surv2 .71 2.07 .38 .604 10 6.98 7.03 .484 .230 VPA Mean = 6.47 .479 .235 Yearclass = 1999 I-----------Regression----------I I-----------Prediction---------I Survey/ Slope Inter- Std Rsquare No. Index Predicted Std WAP Series cept Error Pts Value Value Error Weights Surv4 Surv3 .67 2.64 .39 .618 13 6.85 7.24 .524 .328 Surv2 .70 2.14 .37 .617 10 7.95 7.69 .578 .270 VPA Mean = 6.48 .473 .402 Yearclass = 2000 I-----------Regression----------I I-----------Prediction---------I Survey/ Slope Inter- Std Rsquare No. Index Predicted Std WAP Series cept Error Pts Value Value Error Weights Surv4 Surv3 Surv2 .68 2.23 .37 .632 10 6.33 6.56 .464 .505 VPA Mean = 6.49 .469 .495 Year Weighted Log Int Ext Var VPA Log Class Average WAP Std Std Ratio VPA Prediction Error Error 1997 803 6.69 .27 .12 .18 1998 588 6.38 .23 .25 1.13 1999 1159 7.06 .30 .36 1.41 2000 684 6.53 .33 .03 .01

O:\ACFM\WGREPS\WGNPBW\REPORTS\2002\Sec-7.Doc 264
Table 7.4.2.1 Summer-spawning herring, from final AMCI run
Modelled catches by year, fleet 1 area 1 1981 1982 1983 1984 1985 1986 1987 1988 2 1123.6 554.5 1244.2 917.2 991.4 500.2 138.8 326.2 3 4780.8 16911.6 17545.9 18100.9 20783.6 34556.4 12304.9 4876.5 4 14280.3 25500.6 82964.4 25602.3 34960.3 84038.3 153065.5 101551.9 5 16217.8 21486.7 20396.8 49766.4 23502.5 49595.0 89588.9 210908.7 6 36939.6 26910.2 16548.7 13609.9 40261.2 26738.0 37156.9 76744.3 7 41843.1 48308.2 16267.8 8675.9 11986.1 47596.5 20713.0 32648.7 8 17499.1 39165.3 20510.8 6923.8 6680.2 13199.2 33046.2 16349.6 9 7028.9 14208.6 14295.7 7271.5 4554.1 6477.8 8373.9 23533.6 10 8965.8 7598.9 7099.5 6623.8 6235.5 5773.4 5619.3 7990.5 11 1787.9 6721.3 2603.7 2466.1 4274.0 5972.0 3826.1 4347.9 12 396.9 1903.0 3173.9 1073.1 1896.4 4789.6 4713.0 3296.6 13 204.0 455.5 946.9 1335.3 889.6 2236.3 3697.5 3751.6 14 109.0 110.3 110.3 240.2 657.2 742.9 1318.4 2490.7 15 64.3 105.0 43.5 34.4 180.5 742.0 512.6 657.8 Modelled catches by year, fleet 1 area 1 1989 1990 1991 1992 1993 1994 1995 1996 2 2232.8 7330.2 24246.8 12481.3 4200.3 4848.1 6394.3 6423.9 3 15119.9 14291.4 62392.8 77498.0 36702.7 79519.3 35146.2 23078.7 4 36577.0 60898.5 51867.8 84154.1 107353.9 101846.3 97022.7 42655.2 5 99708.5 52701.8 76607.7 55209.3 70827.7 149899.5 91928.6 56339.2 6 124571.0 86328.6 38825.3 49281.5 34385.2 88180.4 118079.1 58724.6 7 42455.3 96289.0 55675.9 25075.9 30481.3 43286.6 70632.3 77378.9 8 15523.4 29352.0 57872.6 30606.5 12600.3 30852.8 28309.1 36594.8 9 6962.6 10149.1 14911.6 23054.5 13171.3 11509.9 17908.0 13696.1 10 13112.2 5597.3 6566.9 9048.4 11530.1 12404.5 6202.4 7877.0 11 3788.9 9218.6 3262.4 3498.0 4605.6 12200.1 7787.7 2954.4 12 2005.5 2413.6 4869.7 1490.0 1583.1 4331.3 6859.2 3207.4 13 1404.4 1057.4 982.4 1774.2 550.0 1319.7 2390.4 3070.8 14 1438.6 794.9 464.9 399.3 744.2 479.5 752.7 1157.7 15 564.6 588.4 280.4 149.0 136.8 546.6 283.1 259.4 Modelled catches by year, fleet 1 area 1 1997 1998 1999 2000 2001 2002 2003 2 4931.1 11280.4 1501.7 4860.8 11653.3 4855.6 4855.6 3 32925.0 28019.0 46788.7 33248.5 29505.8 75006.7 35527.2 4 37993.2 113116.3 78716.7 140523.9 41771.3 41660.9 120894.9 5 29398.7 40877.2 89900.1 62269.1 147741.8 30489.8 34877.4 6 39390.6 28482.8 26395.2 57909.2 55620.2 115994.8 27472.5 7 44745.9 41308.3 20551.6 18128.6 47842.1 39978.7 95847.2 8 47182.9 38149.0 24226.3 11688.3 15119.3 33843.2 32545.8 9 21622.4 39875.4 22125.4 14214.8 9764.7 10536.1 27172.6 10 7451.6 16463.5 20010.7 10931.9 9172.4 5278.8 6571.2 11 4614.3 6041.4 8837.3 10678.9 8130.1 5916.6 3918.5 12 1413.6 3116.4 2705.9 3794.9 6378.3 4115.3 3445.7 13 2144.8 1301.5 2009.5 2190.1 4414.5 6493.0 4804.6 14 1692.4 1636.1 669.5 964.7 1134.8 1973.6 3346.4 15 577.8 1311.2 736.5 341.7 629.9 636.9 1210.3 Observed catches by year, fleet 1 area 1 1981 1982 1983 1984 1985 1986 1987 1988 2 2283.0 454.0 1475.0 421.0 112.0 100.0 29.0 879.0 3 4629.0 19187.0 22499.0 18015.0 12872.0 8172.0 3144.0 4757.0 4 16771.0 28109.0 151718.0 32244.0 24659.0 33938.0 44590.0 41331.0 5 12126.0 38280.0 30285.0 141354.0 21656.0 23452.0 60285.0 99366.0 6 36871.0 16623.0 21599.0 17043.0 85210.0 20681.0 20622.0 69331.0 7 41917.0 38308.0 8667.0 7113.0 11903.0 77629.0 19751.0 22955.0 8 7299.0 43770.0 14065.0 3916.0 5740.0 18252.0 46240.0 20131.0 9 4863.0 6813.0 13713.0 4113.0 2336.0 10986.0 15232.0 32201.0 10 13416.0 6633.0 3728.0 4517.0 4363.0 8594.0 13963.0 12349.0 11 1032.0 10457.0 2381.0 1828.0 4053.0 9675.0 10179.0 10250.0 12 884.0 2354.0 3436.0 202.0 2773.0 7183.0 13216.0 7378.0 13 760.0 594.0 554.0 255.0 975.0 3682.0 6224.0 7284.0 14 101.0 75.0 100.0 260.0 480.0 2918.0 4723.0 4807.0 15 62.0 211.0 3.0 3.0 581.0 1788.0 2280.0 1957.0 Observed catches by year, fleet 1 area 1 1989 1990 1991 1992 1993 1994 1995 1996 2 3974.0 11009.0 35869.0 12006.0 869.0 6225.0 7411.0 1100.0 3 22628.0 14345.0 92758.0 79782.0 35560.0 110079.0 26221.0 18723.0 4 26649.0 57024.0 51047.0 131543.0 170106.0 99377.0 159170.0 45304.0 5 77824.0 34347.0 87606.0 43787.0 87363.0 150310.0 86940.0 92948.0 6 188654.0 77819.0 33436.0 56083.0 25146.0 90824.0 105542.0 69878.0

O:\ACFM\WGREPS\WGNPBW\REPORTS\2002\Sec-7.Doc 265
Table 7.4.2.1 (continued) 7 43114.0 152236.0 54840.0 41932.0 28802.0 23926.0 74326.0 86261.0 8 8116.0 32265.0 109418.0 36224.0 18306.0 20809.0 20076.0 37447.0 9 5897.0 8713.0 9251.0 44765.0 24268.0 19164.0 13797.0 13207.0 10 7292.0 4432.0 3796.0 9244.0 14318.0 17973.0 8873.0 6854.0 11 4780.0 4287.0 2634.0 2259.0 3639.0 16222.0 9140.0 4012.0 12 3449.0 2517.0 1826.0 582.0 878.0 2955.0 7079.0 1672.0 13 1410.0 1226.0 516.0 305.0 300.0 1433.0 2376.0 4179.0 14 844.0 1019.0 262.0 203.0 200.0 345.0 927.0 1672.0 15 348.0 610.0 298.0 102.0 100.0 345.0 124.0 100.0 Observed catches by year, fleet 1 area 1 1997 1998 1999 2000 2001 2002 2003 2 9323.0 16161.0 629.0 7958.0 10206.0 0.0 0.0 3 27072.0 37787.0 43537.0 52921.0 23944.0 0.0 0.0 4 28397.0 151853.0 65871.0 131153.0 76666.0 0.0 0.0 5 29451.0 42833.0 145127.0 44334.0 107849.0 0.0 0.0 6 42267.0 19872.0 24653.0 102925.0 46646.0 0.0 0.0 7 35285.0 30280.0 20614.0 10962.0 51585.0 0.0 0.0 8 28506.0 22572.0 25853.0 9312.0 18504.0 0.0 0.0 9 21828.0 32779.0 21163.0 17218.0 11356.0 0.0 0.0 10 8160.0 14366.0 14436.0 9471.0 7933.0 0.0 0.0 11 3815.0 4802.0 6973.0 7610.0 8547.0 0.0 0.0 12 1696.0 2199.0 2164.0 1930.0 5090.0 0.0 0.0 13 6570.0 1084.0 2426.0 5199.0 4346.0 0.0 0.0 14 1378.0 5081.0 473.0 552.0 1611.0 0.0 0.0 15 1802.0 3036.0 961.0 166.0 864.0 0.0 0.0 Residuals: log (Obs/mod), fleet 1 area 1 1981 1982 1983 1984 1985 1986 1987 1988 2 0.7 -0.2 0.2 -0.8 -2.2 -1.6 -1.6 1.0 3 0.0 0.1 0.2 0.0 -0.5 -1.4 -1.4 0.0 4 0.2 0.1 0.6 0.2 -0.3 -0.9 -1.2 -0.9 5 -0.3 0.6 0.4 1.0 -0.1 -0.7 -0.4 -0.8 6 0.0 -0.5 0.3 0.2 0.7 -0.3 -0.6 -0.1 7 0.0 -0.2 -0.6 -0.2 0.0 0.5 0.0 -0.4 8 -0.9 0.1 -0.4 -0.6 -0.2 0.3 0.3 0.2 9 -0.4 -0.7 0.0 -0.6 -0.7 0.5 0.6 0.3 10 0.4 -0.1 -0.6 -0.4 -0.4 0.4 0.9 0.4 11 -0.5 0.4 -0.1 -0.3 -0.1 0.5 1.0 0.9 12 0.8 0.2 0.1 -1.7 0.4 0.4 1.0 0.8 13 1.3 0.3 -0.5 -1.7 0.1 0.5 0.5 0.7 14 -0.1 -0.4 -0.1 0.1 -0.3 1.4 1.3 0.7 15 0.0 0.7 -2.7 -2.4 1.2 0.9 1.5 1.1 Residuals: log (Obs/mod), fleet 1 area 1 1989 1990 1991 1992 1993 1994 1995 1996 2 0.6 0.4 0.4 0.0 -1.6 0.2 0.1 -1.8 3 0.4 0.0 0.4 0.0 0.0 0.3 -0.3 -0.2 4 -0.3 -0.1 0.0 0.4 0.5 0.0 0.5 0.1 5 -0.2 -0.4 0.1 -0.2 0.2 0.0 -0.1 0.5 6 0.4 -0.1 -0.1 0.1 -0.3 0.0 -0.1 0.2 7 0.0 0.5 0.0 0.5 -0.1 -0.6 0.1 0.1 8 -0.6 0.1 0.6 0.2 0.4 -0.4 -0.3 0.0 9 -0.2 -0.2 -0.5 0.7 0.6 0.5 -0.3 0.0 10 -0.6 -0.2 -0.5 0.0 0.2 0.4 0.4 -0.1 11 0.2 -0.8 -0.2 -0.4 -0.2 0.3 0.2 0.3 12 0.5 0.0 -1.0 -0.9 -0.6 -0.4 0.0 -0.7 13 0.0 0.1 -0.6 -1.8 -0.6 0.1 0.0 0.3 14 -0.5 0.2 -0.6 -0.7 -1.3 -0.3 0.2 0.4 15 -0.5 0.0 0.1 -0.4 -0.3 -0.5 -0.8 -1.0 Residuals: log (Obs/mod), fleet 1 area 1 1997 1998 1999 2000 2001 2002 2003 2 0.6 0.4 -0.9 0.5 -0.1 0.0 0.0 3 -0.2 0.3 -0.1 0.5 -0.2 0.0 0.0 4 -0.3 0.3 -0.2 -0.1 0.6 0.0 0.0 5 0.0 0.0 0.5 -0.3 -0.3 0.0 0.0 6 0.1 -0.4 -0.1 0.6 -0.2 0.0 0.0 7 -0.2 -0.3 0.0 -0.5 0.1 0.0 0.0 8 -0.5 -0.5 0.1 -0.2 0.2 0.0 0.0 9 0.0 -0.2 0.0 0.2 0.2 0.0 0.0 10 0.1 -0.1 -0.3 -0.1 -0.1 0.0 0.0 11 -0.2 -0.2 -0.2 -0.3 0.1 0.0 0.0 12 0.2 -0.3 -0.2 -0.7 -0.2 0.0 0.0 13 1.1 -0.2 0.2 0.9 0.0 0.0 0.0 14 -0.2 1.1 -0.3 -0.6 0.4 0.0 0.0 15 1.1 0.8 0.3 -0.7 0.3 0.0 0.0

O:\ACFM\WGREPS\WGNPBW\REPORTS\2002\Sec-7.Doc 266
Table 7.4.2.2 Summer-spawning herring, from final AMCI run Modelled surveys indices by year, fleet 1 1981 1982 1983 1984 1985 1986 1987 1988 2 483.2 217.7 -1.0 544.7 1043.8 613.1 -1.0 441.3 3 85.1 235.7 -1.0 150.0 265.8 509.8 -1.0 139.1 4 99.4 122.2 -1.0 143.9 208.3 377.5 -1.0 433.5 5 117.4 98.8 -1.0 301.8 138.5 202.4 -1.0 678.6 6 187.4 96.7 -1.0 89.5 240.6 109.7 -1.0 246.0 7 169.8 140.2 -1.0 53.1 71.1 187.3 -1.0 100.4 8 67.9 106.2 -1.0 39.9 37.5 49.8 -1.0 46.4 9 30.2 44.0 -1.0 46.9 29.1 27.2 -1.0 72.0 10 35.7 21.6 -1.0 40.2 37.2 23.0 -1.0 21.9 11 9.9 24.7 -1.0 18.7 31.5 29.0 -1.0 12.5 12 1.9 6.1 -1.0 7.4 12.3 20.6 -1.0 8.8 13 1.1 1.7 -1.0 11.5 7.4 12.2 -1.0 14.4 14 1.2 0.9 -1.0 3.8 10.2 6.5 -1.0 14.3 15 1.4 1.3 -1.0 1.0 3.5 9.0 -1.0 5.7 1989 1990 1991 1992 1993 1994 1995 1996 2 396.1 706.4 1021.4 655.5 549.8 298.6 -1.0 748.5 3 215.6 192.6 342.0 488.3 314.8 266.9 -1.0 150.3 4 202.0 307.4 274.1 459.3 664.4 438.1 -1.0 186.5 5 394.6 193.7 290.1 260.8 439.7 649.2 -1.0 288.8 6 445.1 281.1 134.4 203.4 196.2 352.2 -1.0 293.4 7 155.4 295.7 178.9 88.0 142.9 151.1 -1.0 331.6 8 55.1 93.1 162.2 100.7 51.8 93.9 -1.0 142.8 9 25.9 34.5 55.3 89.8 60.9 34.3 -1.0 52.3 10 44.6 17.6 22.5 37.4 62.0 44.5 -1.0 33.7 11 12.5 28.8 10.9 14.6 26.2 47.1 -1.0 13.5 12 5.7 6.2 13.9 5.4 8.1 16.1 -1.0 15.7 13 6.4 4.3 4.4 10.5 4.6 7.6 -1.0 21.7 14 10.0 4.8 3.1 3.3 8.6 4.1 -1.0 11.2 15 5.8 5.5 2.7 1.7 2.1 6.4 -1.0 4.1 1997 1998 1999 2000 2001 2002 2003 2 641.6 1436.9 365.8 405.8 1164.4 550.9 -1.0 3 363.0 311.4 697.3 178.1 196.1 563.9 -1.0 4 205.1 512.1 439.5 995.8 238.7 268.1 -1.0 5 170.8 195.9 472.5 422.4 991.6 230.3 -1.0 6 221.9 135.0 147.9 365.1 343.9 805.9 -1.0 7 218.6 170.4 99.1 113.5 287.5 269.7 -1.0 8 211.6 145.6 107.3 65.7 80.5 202.1 -1.0 9 92.9 144.4 93.9 72.9 47.7 57.7 -1.0 10 35.8 66.3 96.8 66.7 54.8 35.4 -1.0 11 23.9 26.4 46.0 71.5 52.4 42.8 -1.0 12 7.7 14.3 14.9 27.7 45.7 33.2 -1.0 13 14.6 7.4 13.1 14.3 27.9 46.0 -1.0 14 18.5 12.4 6.0 11.0 12.0 23.3 -1.0 15 8.1 14.0 8.6 5.0 8.6 9.6 -1.0 Observed surveys indices by year, fleet 1 1981 1982 1983 1984 1985 1986 1987 1988 2 625.0 -1.0 -1.0 -1.0 -1.0 201.0 -1.0 406.0 3 361.0 17.0 -1.0 171.0 28.0 652.0 -1.0 126.0 4 462.0 75.0 -1.0 310.0 67.0 208.0 -1.0 352.0 5 85.0 159.0 -1.0 724.0 56.0 110.0 -1.0 836.0 6 170.0 42.0 -1.0 80.0 360.0 86.0 -1.0 287.0 7 182.0 123.0 -1.0 39.0 65.0 425.0 -1.0 53.0 8 33.0 162.0 -1.0 15.0 32.0 67.0 -1.0 37.0 9 29.0 24.0 -1.0 27.0 16.0 41.0 -1.0 76.0 10 58.0 8.0 -1.0 26.0 17.0 17.0 -1.0 25.0 11 10.0 46.0 -1.0 10.0 18.0 27.0 -1.0 21.0 12 -1.0 10.0 -1.0 5.0 9.0 26.0 -1.0 14.0 13 -1.0 -1.0 -1.0 12.0 7.0 16.0 -1.0 17.0 14 -1.0 -1.0 -1.0 -1.0 4.0 6.0 -1.0 8.0 15 -1.0 -1.0 -1.0 -1.0 5.0 6.0 -1.0 6.0 1989 1990 1991 1992 1993 1994 1995 1996 2 370.0 -1.0 710.0 465.0 1418.0 183.0 -1.0 845.0 3 725.0 178.0 805.0 745.0 254.0 234.0 -1.0 98.0 4 181.0 593.0 227.0 850.0 858.0 533.0 -1.0 165.0 5 249.0 177.0 304.0 353.0 687.0 860.0 -1.0 515.0 6 381.0 302.0 137.0 273.0 160.0 443.0 -1.0 316.0 7 171.0 538.0 176.0 94.0 99.0 55.0 -1.0 361.0 8 42.0 185.0 387.0 81.0 87.0 69.0 -1.0 166.0 9 23.0 -1.0 40.0 210.0 44.0 43.0 -1.0 110.0 10 30.0 -1.0 10.0 32.0 92.0 86.0 -1.0 52.0 11 16.0 -1.0 2.0 11.0 39.0 55.0 -1.0 29.0 12 10.0 18.0 -1.0 -1.0 -1.0 2.0 -1.0 16.0

O:\ACFM\WGREPS\WGNPBW\REPORTS\2002\Sec-7.Doc 267
13 9.0 -1.0 -1.0 17.0 -1.0 -1.0 -1.0 27.0
Table 7.4.2.2 (continued) 14 5.0 -1.0 -1.0 -1.0 -1.0 6.0 -1.0 19.0 15 3.0 -1.0 -1.0 -1.0 -1.0 -1.0 -1.0 8.0 1997 1998 1999 2000 2001 2002 2003 2 266.0 1629.0 -1.0 1069.0 2832.0 561.0 -1.0 3 792.0 237.0 -1.0 527.0 101.0 942.0 -1.0 4 65.0 716.0 188.0 740.0 561.0 247.0 -1.0 5 139.0 100.0 790.0 296.0 1069.0 187.0 -1.0 6 459.0 116.0 240.0 606.0 323.0 265.0 -1.0 7 280.0 240.0 101.0 99.0 609.0 173.0 -1.0 8 410.0 161.0 73.0 71.0 30.0 302.0 -1.0 9 150.0 130.0 47.0 164.0 31.0 69.0 -1.0 10 101.0 97.0 77.0 108.0 38.0 48.0 -1.0 11 50.0 35.0 47.0 98.0 13.0 55.0 -1.0 12 35.0 15.0 10.0 15.0 18.0 54.0 -1.0 13 15.0 11.0 10.0 44.0 6.0 16.0 -1.0 14 65.0 43.0 -1.0 5.0 9.0 18.0 -1.0 15 32.0 8.0 22.0 13.0 4.0 1.0 -1.0 Survey residuals by year, fleet 1 1981 1982 1983 1984 1985 1986 1987 1988 2 0.26 0.00 0.00 0.00 0.00 -1.12 0.00 -0.08 3 1.44 -2.63 0.00 0.13 -2.25 0.25 0.00 -0.10 4 1.54 -0.49 0.00 0.77 -1.13 -0.60 0.00 -0.21 5 -0.32 0.48 0.00 0.88 -0.91 -0.61 0.00 0.21 6 -0.10 -0.83 0.00 -0.11 0.40 -0.24 0.00 0.15 7 0.07 -0.13 0.00 -0.31 -0.09 0.82 0.00 -0.64 8 -0.72 0.42 0.00 -0.98 -0.16 0.30 0.00 -0.23 9 -0.04 -0.61 0.00 -0.55 -0.60 0.41 0.00 0.05 10 0.48 -0.99 0.00 -0.44 -0.78 -0.30 0.00 0.13 11 0.01 0.62 0.00 -0.63 -0.56 -0.07 0.00 0.52 12 0.00 0.50 0.00 -0.39 -0.31 0.23 0.00 0.46 13 0.00 0.00 0.00 0.04 -0.05 0.27 0.00 0.17 14 0.00 0.00 0.00 0.00 -0.94 -0.08 0.00 -0.58 15 0.00 0.00 0.00 0.00 0.37 -0.40 0.00 0.05 1989 1990 1991 1992 1993 1994 1995 1996 2 -0.07 0.00 -0.36 -0.34 0.95 -0.49 0.00 0.12 3 1.21 -0.08 0.86 0.42 -0.21 -0.13 0.00 -0.43 4 -0.11 0.66 -0.19 0.62 0.26 0.20 0.00 -0.12 5 -0.46 -0.09 0.05 0.30 0.45 0.28 0.00 0.58 6 -0.16 0.07 0.02 0.29 -0.20 0.23 0.00 0.07 7 0.10 0.60 -0.02 0.07 -0.37 -1.01 0.00 0.08 8 -0.27 0.69 0.87 -0.22 0.52 -0.31 0.00 0.15 9 -0.12 0.00 -0.32 0.85 -0.32 0.23 0.00 0.74 10 -0.40 0.00 -0.81 -0.16 0.40 0.66 0.00 0.43 11 0.25 0.00 -1.69 -0.28 0.40 0.15 0.00 0.77 12 0.56 1.07 0.00 0.00 0.00 -2.09 0.00 0.02 13 0.33 0.00 0.00 0.48 0.00 0.00 0.00 0.22 14 -0.69 0.00 0.00 0.00 0.00 0.38 0.00 0.53 15 -0.66 0.00 0.00 0.00 0.00 0.00 0.00 0.67 1997 1998 1999 2000 2001 2002 2003 2 -0.88 0.13 0.00 0.97 0.89 0.02 0.00 3 0.78 -0.27 0.00 1.08 -0.66 0.51 0.00 4 -1.15 0.34 -0.85 -0.30 0.85 -0.08 0.00 5 -0.21 -0.67 0.51 -0.36 0.08 -0.21 0.00 6 0.73 -0.15 0.48 0.51 -0.06 -1.11 0.00 7 0.25 0.34 0.02 -0.14 0.75 -0.44 0.00 8 0.66 0.10 -0.38 0.08 -0.99 0.40 0.00 9 0.48 -0.10 -0.69 0.81 -0.43 0.18 0.00 10 1.04 0.38 -0.23 0.48 -0.37 0.30 0.00 11 0.74 0.28 0.02 0.32 -1.39 0.25 0.00 12 1.51 0.04 -0.40 -0.61 -0.93 0.49 0.00 13 0.03 0.40 -0.27 1.12 -1.54 -1.06 0.00 14 1.25 1.25 0.00 -0.79 -0.29 -0.26 0.00
15 1.37 -0.56 0.94 0.95 -0.77 -2.27 0.00

O:\ACFM\WGREPS\WGNPBW\REPORTS\2002\Sec-7.Doc 268
Table 7.4.2.3 Summer-spawning herring, from final AMCI run Total yearly fishing mortalities at age 1981 1982 1983 1984 1985 1986 1987 1988 2 0.0022 0.0024 0.0037 0.0016 0.0009 0.0008 0.0005 0.0007 3 0.0284 0.0365 0.0861 0.0621 0.0398 0.0344 0.0207 0.0176 4 0.1245 0.1862 0.2247 0.1566 0.1470 0.2001 0.1879 0.2117 5 0.1507 0.2489 0.1996 0.1828 0.1887 0.2852 0.3023 0.3778 6 0.2373 0.3540 0.2751 0.1779 0.1976 0.3024 0.3192 0.4066 7 0.3239 0.4891 0.3338 0.2027 0.2100 0.3359 0.3599 0.4541 8 0.3239 0.5033 0.3511 0.2063 0.2123 0.3346 0.3658 0.4745 9 0.2846 0.4203 0.3065 0.1802 0.1822 0.2922 0.3265 0.4270 10 0.3285 0.4993 0.3404 0.2030 0.2072 0.3284 0.3934 0.5227 11 0.2393 0.3889 0.2815 0.1693 0.1750 0.2792 0.3351 0.5312 12 0.2437 0.3826 0.2852 0.1603 0.1705 0.2702 0.3296 0.4764 13 0.2722 0.4306 0.2962 0.1666 0.1736 0.2773 0.3073 0.4207 14 0.3408 0.5104 0.3698 0.2335 0.2387 0.4696 0.5890 0.8428 15 0.3065 0.6356 0.4088 0.2272 0.3610 0.6504 0.7785 1.0785 Fref 0.2774 0.4421 0.3135 0.1918 0.2106 0.3478 0.4006 0.5466 1989 1990 1991 1992 1993 1994 1995 1996 2 0.0052 0.0096 0.0222 0.0177 0.0071 0.0151 0.0190 0.0080 3 0.0356 0.0377 0.0954 0.0825 0.0599 0.1609 0.1300 0.0797 4 0.1596 0.1760 0.1674 0.1616 0.1411 0.2099 0.2683 0.2061 5 0.2955 0.3222 0.3112 0.2412 0.1781 0.2663 0.2652 0.2201 6 0.3562 0.3988 0.3702 0.3004 0.2080 0.3122 0.3088 0.2413 7 0.3664 0.4549 0.4296 0.3854 0.2739 0.3880 0.3920 0.3038 8 0.3597 0.4126 0.4823 0.3946 0.3027 0.4344 0.4194 0.3214 9 0.3367 0.3751 0.3380 0.3188 0.2616 0.4412 0.4292 0.3267 10 0.3975 0.4394 0.3937 0.3143 0.2326 0.3727 0.4010 0.3020 11 0.4461 0.4768 0.4392 0.3342 0.2329 0.3655 0.3760 0.3008 12 0.4422 0.5037 0.4411 0.3263 0.2213 0.3182 0.3205 0.2330 13 0.3388 0.3917 0.3490 0.2527 0.1713 0.2589 0.2595 0.2070 14 0.6419 0.7712 0.6879 0.5145 0.3381 0.4879 0.5099 0.4167 15 0.8227 0.9427 0.9092 0.6930 0.4788 0.6823 0.6378 0.4569 Fref 0.4367 0.4990 0.4683 0.3705 0.2636 0.3934 0.3927 0.3027 Total yearly fishing mortalities at age 1997 1998 1999 2000 2001 2002 2003 2 0.0071 0.0073 0.0038 0.0111 0.0093 0.0082 0.0082 3 0.0463 0.0459 0.0340 0.0977 0.0780 0.0687 0.0687 4 0.1636 0.1983 0.1577 0.1221 0.1538 0.1353 0.1353 5 0.1916 0.2373 0.2140 0.1617 0.1636 0.1440 0.1440 6 0.2110 0.2562 0.2122 0.1862 0.1903 0.1675 0.1675 7 0.2612 0.3177 0.2651 0.1977 0.2069 0.1821 0.1821 8 0.2735 0.3301 0.2776 0.2118 0.2251 0.1981 0.1981 9 0.2845 0.3477 0.2886 0.2326 0.2456 0.2162 0.2162 10 0.2644 0.3241 0.2622 0.2018 0.2067 0.1819 0.1819 11 0.2591 0.3162 0.2577 0.1946 0.2031 0.1787 0.1787 12 0.2053 0.2494 0.2035 0.1503 0.1530 0.1346 0.1346 13 0.2155 0.2637 0.2255 0.2255 0.2337 0.2057 0.2057 14 0.3587 0.5695 0.4594 0.3410 0.3735 0.3287 0.3287 15 0.5300 0.7701 0.6808 0.4994 0.5481 0.4824 0.4824 Fref 0.2777 0.3620 0.3042 0.2366 0.2499 0.2200 0.2200

O:\ACFM\WGREPS\WGNPBW\REPORTS\2002\Sec-7.Doc 269
Table 7.4.2.4 Summer-spawning herring, from final AMCI run
Stocknumbers-at-age, in area 1 1981 1982 1983 1984 1985 1986 1987 1988
2 570094.0 256835.9 363509.8 642660.5 1231587.1 723444.9 335991.2 520732.8 3 185892.4 514734.2 231847.9 327690.3 580598.8 1113408.5 654106.8 303880.6 4 132969.6 163487.4 449077.9 192485.8 278659.6 504857.2 973385.5 579729.1 5 126310.8 106235.5 122792.7 324562.1 148927.8 217676.8 373979.5 729880.6 6 190501.2 98301.1 74948.1 91001.2 244612.9 111586.5 148083.5 250100.8 7 164729.3 135960.4 62429.1 51505.3 68924.1 181649.0 74619.3 97378.0 8 68890.8 107816.5 75435.2 40457.1 38051.6 50550.4 117463.4 47110.1 9 30915.3 45089.5 58977.4 48045.2 29782.0 27845.8 32733.8 73725.8 10 34871.8 21045.7 26799.7 39276.2 36304.7 22458.4 18812.2 21367.2 11 9151.0 22717.6 11557.7 17253.4 29009.1 26703.4 14632.2 11485.5 12 1999.0 6517.8 13933.1 7891.7 13180.3 22035.3 18276.9 9469.7 13 932.5 1417.5 4022.5 9479.1 6082.8 10056.6 15218.2 11893.5 14 882.9 642.7 833.9 2706.5 7260.7 4627.0 6895.7 10126.5 15 570.0 519.8 303.3 397.6 1398.7 3619.6 2201.7 2297.7 1989 1990 1991 1992 1993 1994 1995 1996 2 467361.7 833447.8 1205097.3 773476.8 648749.9 352326.2 369763.3 883148.0 3 470857.0 420685.1 746909.0 1066516.1 687566.4 582872.2 314018.1 328271.4 4 270155.7 411143.4 366563.9 614334.9 888631.1 585951.7 449024.2 249490.5 5 424471.2 208392.7 311995.0 280559.4 472926.2 698241.7 429813.2 310678.1 6 452616.2 285816.1 136629.2 206815.0 199448.0 358104.1 484068.1 298314.8 7 150697.8 286806.3 173569.4 85375.8 138572.0 146576.8 237135.4 321649.9 8 55951.5 94528.1 164663.7 102205.8 52544.9 95344.5 89980.0 144978.9 9 26523.2 35332.6 56617.6 91986.6 62324.0 35126.9 55875.7 53526.9 10 43526.8 17138.8 21971.2 36537.4 60514.9 43411.6 20444.7 32915.2 11 11463.9 26466.3 9993.9 13410.6 24144.2 43391.9 27058.5 12388.3 12 6109.7 6640.1 14866.2 5828.8 8687.4 17306.9 27241.1 16810.0 13 5321.2 3552.5 3630.7 8654.1 3805.7 6300.2 11391.8 17889.6 14 7066.0 3431.0 2172.7 2317.3 6082.0 2901.4 4400.2 7952.0 15 2334.8 2229.0 1087.0 693.5 841.1 2571.9 1398.6 1654.4 1997 1998 1999 2000 2001 2002 2003 2 757070.1 1695355.0 431626.9 478755.2 1373837.5 650000.0 650000.0 3 792771.7 680164.7 1522904.1 389072.2 428403.0 1231610.1 583356.9 4 274279.9 684871.5 587824.5 1331861.4 319268.5 358546.5 1040458.9 5 183705.1 210728.5 508219.9 454301.4 1066599.5 247713.2 283360.3 6 225583.3 137245.7 150389.9 371252.6 349689.3 819469.7 194084.9 7 212050.0 165292.7 96116.5 110064.3 278844.0 261589.9 627149.9 8 214786.7 147771.6 108859.0 66716.3 81721.6 205153.7 197289.5 9 95120.0 147846.0 96118.1 74624.6 48846.7 59042.9 152272.0 10 34936.1 64758.4 94485.7 65167.2 53512.7 34574.4 43039.3 11 22020.3 24267.6 42373.5 65773.7 48190.6 39379.7 26081.0 12 8297.8 15377.0 16004.9 29631.5 48988.2 35591.1 29800.1 13 12048.9 6114.8 10842.4 11814.8 23070.8 38038.9 28147.3 14 13160.5 8788.5 4250.3 7830.1 8531.9 16524.4 28019.1 15 3282.4 5674.4 3474.3 2033.8 3488.4 3894.7 7401.5

O:\ACFM\WGREPS\WGNPBW\REPORTS\2002\Sec-7.Doc 270
Table 7.4.2.5 Summer-spawning herring, from final AMCI run
SUMMARY TABLE Year Recruits SSB F Catch Weighted F age 2 5 -15 SOP 5-15 1981 570094 186495 0.2774 39461 0.2597 1982 256835 177008 0.4421 56472 0.4102 1983 363509 172964 0.3135 58694 0.2843 1984 642660 179600 0.1918 50132 0.1856 1985 1231587 229954 0.2106 49309 0.1966 1986 723444 273480 0.3478 65361 0.3094 1987 335991 373578 0.4006 75295 0.3276 1988 520732 418844 0.5466 92711 0.4058 1989 467361 349238 0.4367 100868 0.3409 1990 833447 312132 0.4990 104854 0.4055 1991 1205097 275004 0.4683 109235 0.3836 1992 773476 327511 0.3705 108275 0.3045 1993 648749 460584 0.2636 102513 0.2142 1994 352326 489949 0.3934 133753 0.3132 1995 369763 439064 0.3927 125673 0.325 1996 883147 348587 0.3027 95722 0.2687 1997 757070 343377 0.2777 64261 0.2436 1998 1695354 381127 0.3620 86849 0.3013 1999 431626 410574 0.3042 92735 0.2385 2000 478755 590025 0.2366 100406 0.1847 2001 1373837 575053 0.2499 95352 0.1829 2002 650000 570915 0.2200 0 0.1745 2003* 650000 644693 0.2200 0 0.1822

O:\ACFM\WGREPS\WGNPBW\REPORTS\2002\Sec-7.Doc 271
Table 7.4.3.1 Summer spawners, catch residuals from final ISVPA run.
Year 2 3 4 5 6 7 8 91982 -0.61 -0.75 -0.16 0.09 -0.28 0.15 0.40 -0.511983 0.84 0.90 0.46 0.04 0.00 -0.48 -0.21 0.071984 -0.28 1.69 1.23 1.35 0.61 0.10 -0.14 -0.241985 -2.58 0.51 0.98 0.78 1.15 0.41 0.00 -0.551986 -2.59 -1.43 -0.12 0.33 0.37 0.88 0.51 0.271987 -3.36 -1.88 -0.96 0.18 0.26 0.47 0.79 0.581988 -0.87 -1.38 -0.91 -0.86 -0.01 0.14 0.39 0.561989 0.90 -0.22 -0.74 -0.43 -0.12 -0.08 -0.35 -0.041990 0.87 -0.53 -0.45 -0.73 -0.37 -0.09 -0.05 -0.051991 1.79 0.38 -0.34 -0.12 -0.64 -0.42 0.06 -0.761992 1.41 0.23 -0.02 -0.31 0.01 0.06 -0.25 0.061993 -0.89 0.38 0.45 0.04 -0.18 0.24 0.22 0.201994 1.39 0.80 -0.17 -0.21 -0.28 -0.56 -0.25 0.111995 1.55 0.27 0.29 -0.29 -0.25 -0.10 -0.41 -0.181996 -1.01 0.37 0.30 0.39 0.23 0.39 0.18 0.011997 1.70 -0.46 -0.29 -0.17 -0.08 -0.12 -0.23 0.041998 1.43 0.33 0.02 -0.16 -0.56 -0.30 -0.42 0.031999 -1.18 0.16 0.21 0.30 -0.13 0.02 0.21 0.162000 1.49 0.62 0.20 -0.23 0.26 -0.71 -0.45 0.242001 0.00 0.00 0.00 0.00 0.00 0.00 0.00 0.00
Year 10 11 12 13 14 15
1982 -0.30 0.19 -0.05 0.93 0.90 0.001983 -0.64 -0.84 0.04 -1.14 0.97 0.001984 0.27 -0.25 -1.96 -1.50 -0.90 0.001985 -0.06 0.30 0.51 -0.54 -0.91 0.001986 0.35 0.33 0.78 0.28 0.05 0.001987 0.71 0.70 1.10 0.78 0.65 0.001988 0.40 0.48 0.75 0.65 0.66 0.001989 0.18 0.28 0.67 0.09 -0.14 0.001990 0.08 0.16 0.57 0.39 0.19 0.001991 -0.31 0.19 0.33 -0.10 -0.07 0.001992 -0.24 -0.18 0.07 -0.58 -0.26 0.001993 -0.03 -0.33 0.04 0.16 -0.31 0.001994 -0.23 -0.16 -0.60 0.08 0.09 0.001995 0.09 -0.43 -0.18 -0.71 0.34 0.001996 0.10 0.45 -1.02 -0.01 -0.37 0.001997 -0.12 -0.14 0.45 0.25 -0.84 0.001998 -0.12 -0.49 -0.27 0.20 0.31 0.001999 0.09 -0.08 -0.41 0.30 0.35 0.002000 -0.20 -0.18 -0.79 0.48 -0.71 0.002001 0.00 0.00 0.00 0.00 0.00 0.00

O:\ACFM\WGREPS\WGNPBW\REPORTS\2002\Sec-7.Doc 272
Table 7.4.3.2 Summer spawners, fishing mortality from final ISVPA run Year 2 3 4 5 6 7 8 9
1982 0.00 0.05 0.19 0.27 0.30 0.33 0.34 0.351983 0.00 0.05 0.15 0.22 0.25 0.26 0.27 0.281984 0.00 0.02 0.06 0.08 0.09 0.10 0.10 0.101985 0.00 0.02 0.06 0.09 0.10 0.10 0.11 0.111986 0.00 0.03 0.11 0.16 0.17 0.19 0.19 0.201987 0.00 0.04 0.13 0.19 0.21 0.22 0.23 0.241988 0.00 0.07 0.24 0.35 0.39 0.42 0.44 0.461989 0.00 0.07 0.25 0.36 0.41 0.44 0.46 0.471990 0.01 0.08 0.29 0.42 0.48 0.52 0.55 0.571991 0.01 0.09 0.31 0.45 0.52 0.56 0.59 0.611992 0.00 0.07 0.25 0.36 0.41 0.44 0.46 0.481993 0.00 0.05 0.15 0.22 0.24 0.26 0.27 0.281994 0.01 0.08 0.29 0.43 0.49 0.53 0.55 0.571995 0.01 0.08 0.29 0.43 0.49 0.53 0.56 0.581996 0.00 0.05 0.18 0.26 0.29 0.31 0.32 0.331997 0.00 0.06 0.20 0.28 0.32 0.34 0.35 0.361998 0.00 0.07 0.25 0.36 0.41 0.44 0.46 0.481999 0.00 0.05 0.18 0.25 0.29 0.31 0.32 0.332000 0.00 0.06 0.19 0.27 0.31 0.33 0.34 0.352001 0.00 0.06 0.20 0.28 0.32 0.34 0.35 0.37
Year 10 11 12 13 14 15
1982 0.36 0.38 0.30 0.38 0.44 0.441983 0.29 0.30 0.24 0.31 0.35 0.351984 0.10 0.11 0.09 0.11 0.13 0.131985 0.11 0.12 0.09 0.12 0.13 0.131986 0.20 0.21 0.17 0.22 0.24 0.241987 0.24 0.26 0.20 0.26 0.30 0.301988 0.46 0.50 0.38 0.50 0.58 0.581989 0.48 0.51 0.40 0.52 0.60 0.601990 0.58 0.62 0.47 0.63 0.73 0.731991 0.62 0.67 0.51 0.68 0.80 0.801992 0.49 0.52 0.40 0.52 0.61 0.611993 0.28 0.30 0.24 0.31 0.35 0.351994 0.58 0.62 0.48 0.63 0.74 0.741995 0.58 0.63 0.48 0.64 0.74 0.741996 0.34 0.36 0.28 0.36 0.41 0.411997 0.37 0.39 0.31 0.40 0.46 0.461998 0.48 0.52 0.40 0.52 0.61 0.611999 0.34 0.36 0.28 0.36 0.41 0.412000 0.36 0.38 0.30 0.39 0.44 0.442001 0.37 0.39 0.31 0.40 0.46 0.46

O:\ACFM\WGREPS\WGNPBW\REPORTS\2002\Sec-7.Doc 273
Table 7.4.3.3 Summer spawners, stock in numbers from final Ispva run. Year 2 3 4 5 6 7 8 9
1982 245.630 820.688 207.319 159.894 90.591 128.449 109.632 41.4841983 226.366 221.811 723.782 160.037 107.156 65.676 78.676 56.2961984 495.863 203.378 178.649 506.191 115.123 75.787 50.931 57.4031985 1248.341 448.263 166.366 130.043 319.466 87.462 61.603 42.2461986 644.063 1129.436 392.988 126.364 96.440 205.542 67.471 50.1151987 342.230 582.674 1013.946 322.324 91.351 66.991 109.890 43.1601988 497.247 309.634 524.143 873.749 232.560 62.444 41.256 54.1081989 376.403 449.066 275.506 433.752 693.203 142.471 34.001 17.5981990 927.703 336.688 384.152 223.166 316.192 442.317 86.652 22.8101991 1143.139 828.629 290.587 291.700 168.263 209.824 251.004 46.7801992 673.553 999.196 658.854 212.898 178.070 119.476 136.103 119.8661993 751.954 597.688 825.908 467.217 149.718 106.152 67.005 87.6441994 309.186 679.544 505.955 580.575 337.123 110.823 67.818 42.6851995 312.468 273.662 506.978 360.397 377.992 216.016 76.824 40.9681996 932.835 275.469 221.918 302.714 240.883 238.569 122.605 49.8351997 485.077 842.986 230.902 156.392 182.800 149.465 131.313 74.2321998 889.703 429.778 736.229 181.094 112.642 123.974 100.656 90.8761999 634.270 789.195 351.840 517.322 121.876 82.444 82.496 68.9522000 527.152 573.294 671.419 253.792 325.839 86.113 54.393 49.3042001 2908.505 469.187 466.865 478.969 186.184 193.944 67.173 40.089
Year 10 11 12 13 14 15
1982 32.381 29.793 10.404 0.797 0.093 0.6431983 30.858 22.798 16.708 7.106 0.139 0.0111984 37.497 24.267 18.295 11.750 5.887 0.0281985 47.909 29.502 20.166 16.356 10.382 5.0721986 35.936 39.073 22.721 15.529 13.844 8.9231987 34.577 24.092 25.871 13.518 10.442 9.6661988 24.122 17.600 11.822 10.455 6.131 4.8191989 17.396 9.722 5.878 3.465 2.320 0.8361990 10.143 8.593 4.112 1.938 1.753 1.2721991 12.099 4.834 3.573 1.253 0.552 0.5881992 33.261 7.227 1.792 1.443 0.628 0.2431993 64.581 21.035 4.325 1.051 1.007 0.3691994 55.516 44.401 15.466 3.053 0.657 0.7151995 19.838 32.616 24.275 11.098 1.358 0.2561996 23.545 9.253 20.553 15.026 7.713 0.3201997 32.147 14.586 4.440 16.958 9.500 5.3401998 45.772 21.089 9.459 2.355 8.905 7.2451999 50.098 27.335 14.376 6.403 1.069 3.0772000 41.646 31.180 17.898 10.886 3.416 0.5032001 27.735 28.400 20.754 14.303 4.754 2.550

O:\ACFM\WGREPS\WGNPBW\REPORTS\2002\Sec-7.Doc 274
Table 7.4.3.4 Summer spawners, ISVPA summary Age M(age) s(age) 2 0.1000000 0.0010528 3 0.1000000 0.0153116 4 0.1000000 0.0492700 5 0.1000000 0.0675585 6 0.1000000 0.0751697 7 0.1000000 0.0798027 8 0.1000000 0.0826494 9 0.1000000 0.0849908 10 0.1000000 0.0858175 11 0.1000000 0.0902968 12 0.1000000 0.0735857 13 0.1000000 0.0911637 14 0.1000000 0.1016654 15 0.1000000 0.1016654 ------------------------------------------------------------- Year f(year) Total Stock (in N) Total Stock (in W) 1982 3.494805 1877.798 346.3869 1983 2.90457 1717.42 332.9702 1984 1.156186 1781.049 313.8574 1985 1.220622 2633.175 411.5255 1986 2.135056 2848.444 486.8043 1987 2.513398 2690.733 540.3919 1988 4.327212 2670.091 550.9971 1989 4.436238 2461.617 499.9507 1990 5.109221 2767.492 498.0368 1991 5.404311 3252.825 526.2543 1992 4.480162 3142.609 551.5833 1993 2.883899 3145.653 605.1643 1994 5.141267 2753.516 569.528 1995 5.160583 2254.745 473.0732 1996 3.332499 2461.237 426.5601 1997 3.59588 2336.139 421.5805 1998 4.465239 2759.776 466.9193 1999 3.327948 2750.751 495.518 2000 3.51495 2646.835 527.7458 2001 3.610545 4909.411 689.1036 --------------------------------------------------

O:\ACFM\WGREPS\WGNPBW\REPORTS\2002\Sec-7.Doc 275
Table 7.4.5 Input data for medium-term predictions. MFDP version 1 Run: run6 Time and date: 15:59 5/6/2002 Fbar age range: 5-15
2002 Age N M Mat PF PM SWt Sel CWt
2 684000 0.1 0 0 0.5 0.07 0.009 0.069 3 1038999 0.1 0.151 0 0.5 0.154 0.047 0.154 4 451777 0.1 0.897 0 0.5 0.201 0.132 0.201 5 476158 0.1 0.988 0 0.5 0.259 0.149 0.259 6 462397 0.1 1 0 0.5 0.278 0.2 0.278 7 199992 0.1 1 0 0.5 0.307 0.2 0.307 8 221168 0.1 1 0 0.5 0.317 0.2 0.317 9 79335 0.1 1 0 0.5 0.329 0.2 0.329
10 48688 0.1 1 0 0.5 0.363 0.2 0.363 11 34012 0.1 1 0 0.5 0.376 0.2 0.376 12 36645 0.1 1 0 0.5 0.389 0.2 0.389 13 21823 0.1 1 0 0.5 0.402 0.2 0.402 14 18633 0.1 1 0 0.5 0.409 0.2 0.409 15 6907 0.1 1 0 0.5 0.428 0.2 0.428
2003 Age N M Mat PF PM SWt Sel CWt
2 650000 0.1 0 0 0.5 0.07 0.009 0.069 3 . 0.1 0.151 0 0.5 0.154 0.047 0.154 4 . 0.1 0.897 0 0.5 0.201 0.132 0.201 5 . 0.1 0.988 0 0.5 0.259 0.149 0.259 6 . 0.1 1 0 0.5 0.278 0.2 0.278 7 . 0.1 1 0 0.5 0.307 0.2 0.307 8 . 0.1 1 0 0.5 0.317 0.2 0.317 9 . 0.1 1 0 0.5 0.329 0.2 0.329
10 . 0.1 1 0 0.5 0.363 0.2 0.363 11 . 0.1 1 0 0.5 0.376 0.2 0.376 12 . 0.1 1 0 0.5 0.389 0.2 0.389 13 . 0.1 1 0 0.5 0.402 0.2 0.402 14 . 0.1 1 0 0.5 0.409 0.2 0.409 15 . 0.1 1 0 0.5 0.428 0.2 0.428
2004
Age N M Mat PF PM SWt Sel CWt 2 650000 0.1 0 0 0.5 0.07 0.009 0.069 3 . 0.1 0.151 0 0.5 0.154 0.047 0.154 4 . 0.1 0.897 0 0.5 0.201 0.132 0.201 5 . 0.1 0.988 0 0.5 0.259 0.149 0.259 6 . 0.1 1 0 0.5 0.278 0.2 0.278 7 . 0.1 1 0 0.5 0.307 0.2 0.307 8 . 0.1 1 0 0.5 0.317 0.2 0.317 9 . 0.1 1 0 0.5 0.329 0.2 0.329
10 . 0.1 1 0 0.5 0.363 0.2 0.363 11 . 0.1 1 0 0.5 0.376 0.2 0.376 12 . 0.1 1 0 0.5 0.389 0.2 0.389 13 . 0.1 1 0 0.5 0.402 0.2 0.402 14 . 0.1 1 0 0.5 0.409 0.2 0.409 15 . 0.1 1 0 0.5 0.428 0.2 0.428
Input units are thousands and kg - output in tonnes

O:\ACFM\WGREPS\WGNPBW\REPORTS\2002\Sec-7.Doc 276
Table 7.5.2 MFDP version 1 Run: run6 Time and date: 15:59 5/6/2002 Fbar age range: 5-15
Year: 2002 F multiplier: 1.12 Fbar: 0.2188 Age F CatchNos Yield StockNos Biomass SSNos(Jan) SSB(Jan) SSNos(ST) SSB(ST)
2 0.0101 6529 450 684000 47880 0 0 0 03 0.0526 50723 7811 1038999 160006 156889 24161 149237 229834 0.1478 59157 11891 451777 90807 405244 81454 385480 774815 0.1669 69741 18063 476158 123325 470444 121845 447500 1159036 0.224 88472 24595 462397 128546 462397 128546 439846 1222777 0.224 38265 11747 199992 61398 199992 61398 190238 584038 0.224 42317 13414 221168 70110 221168 70110 210382 666919 0.224 15179 4994 79335 26101 79335 26101 75466 24828
10 0.224 9316 3382 48688 17674 48688 17674 46313 1681211 0.224 6508 2447 34012 12789 34012 12789 32353 1216512 0.224 7011 2727 36645 14255 36645 14255 34858 1356013 0.224 4175 1679 21823 8773 21823 8773 20759 834514 0.224 3565 1458 18633 7621 18633 7621 17724 724915 0.224 1322 566 6907 2956 6907 2956 6570 2812
Total 402281 105225 3780534 772240 2162177 577682 2056726 549509
Year: 2003 F multiplier: 1 Fbar: 0.1954 Age F CatchNos Yield StockNos Biomass SSNos(Jan) SSB(Jan) SSNos(ST) SSB(ST)
2 0.009 5542 382 650000 45500 0 0 0 03 0.047 26780 4124 612702 94356 92518 14248 88006 135534 0.132 105074 21120 891917 179275 800050 160810 761031 1529675 0.149 46508 12046 352605 91325 348374 90229 331383 858286 0.2 63003 17515 364625 101366 364625 101366 346842 964227 0.2 57785 17740 334429 102670 334429 102670 318118 976628 0.2 24993 7923 144644 45852 144644 45852 137590 436169 0.2 27639 9093 159960 52627 159960 52627 152158 50060
10 0.2 9914 3599 57379 20829 57379 20829 54581 1981311 0.2 6084 2288 35214 13240 35214 13240 33496 1259512 0.2 4250 1653 24599 9569 24599 9569 23399 910213 0.2 4579 1841 26504 10654 26504 10654 25211 1013514 0.2 2727 1115 15783 6455 15783 6455 15014 614115 0.2 2329 997 13476 5768 13476 5768 12819 5487
Total 387209 101436 3683837 779486 2417554 634317 2299649 603381
Year: 2004 F multiplier: 1 Fbar: 0.1954 Age F CatchNos Yield StockNos Biomass SSNos(Jan) SSB(Jan) SSNos(ST) SSB(ST)
2 0.009 5542 382 650000 45500 0 0 0 03 0.047 25477 3923 582875 89763 88014 13554 83722 128934 0.132 62313 12525 528942 106317 474461 95367 451321 907155 0.149 93284 24160 707242 183176 698755 180978 664676 1721516 0.2 47497 13204 274884 76418 274884 76418 261478 726917 0.2 46674 14329 270121 82927 270121 82927 256947 788838 0.2 42808 13570 247751 78537 247751 78537 235668 747079 0.2 18515 6091 107155 35254 107155 35254 101929 33535
10 0.2 20476 7433 118501 43016 118501 43016 112722 4091811 0.2 7345 2762 42507 15983 42507 15983 40434 1520312 0.2 4507 1753 26087 10148 26087 10148 24815 965313 0.2 3149 1266 18224 7326 18224 7326 17335 696914 0.2 3393 1388 19634 8030 19634 8030 18677 763915 0.2 2020 865 11693 5004 11693 5004 11122 4760
Total 382999 103652 3605615 787399 2397787 652542 2280845 620717

O:\ACFM\WGREPS\WGNPBW\REPORTS\2002\Sec-7.Doc 277
Table 7.5.3 MFDP version 1 Run: run6 MFDP Index file 06/05/2002 Time and date: 15:59 5/6/2002 Fbar age range: 5-15
2002 Biomass SSB FMult FBar Landings
772240 549509 1.12 0.2188 105225
2003 2004 Biomass SSB FMult FBar Landings Biomass SSB
779486 603381 0 0 0 894824 721451 . 603381 0.1 0.0195 10937 883244 710584 . 603381 0.2 0.0391 21690 871860 699903 . 603381 0.3 0.0586 32260 860667 689403 . 603381 0.4 0.0781 42653 849662 679081 . 603381 0.5 0.0977 52870 838842 668934 . 603381 0.6 0.1172 62915 828204 658959 . 603381 0.7 0.1368 72791 817743 649153 . 603381 0.8 0.1563 82501 807457 639512 . 603381 0.9 0.1758 92049 797344 630034 . 603381 1.00 0.1954 101436 787399 620717 . 603381 1.10 0.2149 110666 777620 611556 . 603381 1.20 0.2344 119741 768003 602550 . 603381 1.30 0.254 128665 758547 593695 . 603381 1.40 0.2735 137440 749248 584988 . 603381 1.50 0.293 146069 740103 576428 . 603381 1.60 0.3126 154554 731110 568012 . 603381 1.70 0.3321 162898 722265 559737 . 603381 1.80 0.3517 171104 713567 551600 . 603381 1.90 0.3712 179173 705013 543599 . 603381 2.00 0.3907 187108 696600 535732
Input units are thousands and kg - output in tonnes

O:\ACFM\WGREPS\WGNPBW\REPORTS\2002\Sec-7.Doc 278
Table 7.5.4 Input data for Yield per recruit. MFYPR version 1 Run: run2 finMFYPR Index file 06/05/2002 Time and date: 17:05 5/6/2002 Fbar age range: 5-15
Age M Mat PF PM SWt Sel CWt 2 0.1 0.001 0 0.5 0.066 0.006 0.066 3 0.1 0.071 0 0.5 0.141 0.05 0.141 4 0.1 0.887 0 0.5 0.198 0.141 0.198 5 0.1 0.997 0 0.5 0.236 0.183 0.236 6 0.1 1 0 0.5 0.271 0.205 0.271 7 0.1 1 0 0.5 0.3 0.22 0.3 8 0.1 1 0 0.5 0.323 0.22 0.323 9 0.1 1 0 0.5 0.345 0.22 0.345
10 0.1 1 0 0.5 0.364 0.22 0.364 11 0.1 1 0 0.5 0.375 0.22 0.375 12 0.1 1 0 0.5 0.394 0.22 0.394 13 0.1 1 0 0.5 0.41 0.22 0.41 14 0.1 1 0 0.5 0.412 0.22 0.412 15 0.1 1 0 0.5 0.429 0.22 0.429
Weights in kilograms

O:\ACFM\WGREPS\WGNPBW\REPORTS\2002\Sec-7.Doc 279
Figure 7.4.1.1 Icelandic summer spawners. Sum of squares used for fitting VPA to acoustic data, as a function of terminal fishing mortality.
Terminal F
SSE
0.1 0.2 0.3 0.4 0.5
02
46
Figure 7.4.1.2 Icelandic summer spawners. Trend in acoustics and VPA stock numbers.
Year
Num
bers
1985 1990 1995 2000
050
010
0015
00
F=0.16
AcousticsVpa

O:\ACFM\WGREPS\WGNPBW\REPORTS\2002\Sec-7.Doc 280
Figure 7.4.1.3 Icelandic summer spawners. Acoustics estimates vs VPA stock numbers (at the 1st of January)
VPA
Acou
stic
s
0 200 400 600 800 1000 1200 1400
050
010
0015
00
1982
1984
1985
1986
1988
1989
1990
19911992
1993
1994
1996
1997
1998
1999
2000
20012002
Figure 7.4.1.4 Retrospective plots
1982
1983
1984
1985
1986
1987
1988
1989
1990
1991
1992
1993
1994
1995
1996
1997
1998
1999
2000
0.1
0.2
0.3
0.4
F W
.Av.
5-1
5
Adapt

O:\ACFM\WGREPS\WGNPBW\REPORTS\2002\Sec-7.Doc 281
Figure 7.4.2.1
Year
F5-1
5
1985 1990 1995 2000
0.0
0.1
0.2
0.3
0.4
0.5
Amci21 - retroplot for summer spawners
Year
SSB
(thou
s. t)
1985 1990 1995 2000
020
040
060
080
0

O:\ACFM\WGREPS\WGNPBW\REPORTS\2002\Sec-7.Doc 282
Figure 7.4.2.2
Fishing mortality (5%, 25%, 50%, 75%, 95%)
0.0
0.1
0.2
0.3
0.4
0.5
0.6
0.7
0.8
1981 1983 1985 1987 1989 1991 1993 1995 1997 1999 2001
SSB (5%, 25%, 50%, 75%, 95%)
0.0
100.0
200.0
300.0
400.0
500.0
600.0
700.0
800.0
900.0
1000.0
1981 1983 1985 1987 1989 1991 1993 1995 1997 1999 2001 2003
thou
sand
tonn
es
R ecruit ment ( 5%, 2 5%, 50 %, 75%, 9 5%)
0.0
0.5
1.0
1.5
2.0
2.5
3.0
3.5
4.0
4.5
5.0
1981 1982 1983 1984 1985 1986 1987 1988 1989 1990 1991 1992 1993 1994 1995 1996 1997 1998 1999 2000 2001
Modelled catches (5%, 25%, 50%, 75%, 95%)
0.0
20.0
40.0
60.0
80.0
100.0
120.0
140.0
160.0
180.0
1981 1983 1985 1987 1989 1991 1993 1995 1997 1999 2001 2003
thou
sand
tonn
es

O:\ACFM\WGREPS\WGNPBW\REPORTS\2002\Sec-7.Doc 283
Figure 7.4.1.5 Fish stock summary. Herring Icelandic Summer-spawning (Fishing Area Va)
Yield per recruit
0.00
0.02
0.04
0.06
0.08
0.10
0.12
0.14
0.16
0.18
0.00 0.10 0.20 0.30 0.40 0.50
Fbar
Yiel
d pe
r rec
ruit
0.00
0.75
1.50
2.25
3.00
3.75
Spaw
ner p
er re
crui
t
YieldSSBSpwn
Short term forecast
0
20000
40000
60000
80000
100000
120000
140000
160000
180000
200000
0.00 0.05 0.10 0.15 0.20 0.25 0.30 0.35 0.40 0.45
Fbar
Land
ings
500000
600000
700000
800000
900000
1000000
SSB
LandingsSSB

O:\ACFM\WGREPS\WGNPBW\REPORTS\2002\Sec-7.Doc 284
Figure 7.7.1 Stock-recruitment relationship from 1982-1999
0 100 200 300 400SSB (thous. tonnes) at spawning time
0
400
800
1200
Rec
ruitm
ent a
t age
2 (m
illion
s)

O:\ACFM\WGREPS\WGNPBW\REPORTS\2002\Sec-8.Doc 285
8 REFERENCES AND WORKING DOCUMENTS
8.1 References
Alverson D.L. and M.J.Carney. 1975. A graphic review of the growth and decay of population cohorts. J.Cons.Int.Explor.Mer., 36:133-143.
Anon. 2001. Havets Miljø 2001. FiskenHav. Særnr. 2, 2001. Institute of Marine Research, Bergen, Norway. In Norwegian with English subtitles.
Anon. 2002. Havets Miljø 2002. FiskenHav. Særnr. 2, 2002. Institute of Marine Research, Bergen, Norway. In Norwegian with English subtitles.
Bogstad, B. and Gjøsæter, H. 2001. Predation by cod (Gadus morhua) on capelin (Mallotus villosus) in the Barents Sea: implications for capelin stock assessment. Fisheries Research, 53:197-209.
Bogstad, B. and Mehl, S. 1997. Interactions between cod and its prey species in the Barents Sea. Proceedings of the International Symposium on The Role of Forage Fishes in Marine Ecosystems. University of Alaska, Fairbanks. Alaska Sea Grant College Program Report No. 97-01, p. 591-615.
Bogstad, B., Haug, T. and Mehl, S. 2000. Who eats whom in the Barents Sea? NAMMCO Sci. Publ., 2 :98-119.
Dalpadado, P., Bogstad, B., Gjøsæter, H., Mehl, S. and Skjoldal, H. R. 2002. Zooplankton-fish interactions in the Barents Sea. In Large Marine Ecosystems. Blackwell Science Inc.
Folkow, L. P., Haug, T., Nilssen, K.T., and Nordøy, E.S. 2000. Estimated food consumption of minke whales Balaenoptera acutorostrata in Northeast Atlantic waters in 1992-1995. NAMMCO Sci. Publ. 2.
Gjøsæter, H. 1997. The Barents Sea capelin stock (Mallotus villosus): A brief review. Proceedings of the International Symposium on The Role of Forage Fishes in Marine Ecosystems. University of Alaska, Fairbanks. Alaska Sea Grant College Program Report No. 97-01, p. 469-484.
Gjøsæter, H. and Bogstad, B. 1998. Effects of the presence of herring (Clupea harengus) on the stock-recruitment relationship of Barents Sea capelin (Mallotus villosus). Fisheries Research, 38:57-71.
Gjøsæter,H., Dalpadado, P., Hassel, A. and Skjoldal, H. R. 2000. Growth of the Barents Sea capelin (Mallotus villosus Müller). In H.Gjøsæter, Dr. philos. thesis, University of Bergen, Norway. Paper IV.
Gundersen, A.C. and Gjøsæter, H. 1998. A comparison between abundance estimates of the Barents Sea capelin (Mallotus villosus Müller) at the larval, 0-group and 1-group stage, for the year classes 1981-1994. ICES Journal of Marine Science, 55: 95-101.
Holst et al. 2000. Report on surveys of the distribution, abundance and migrations of the Norwegian spring-spawning herring, other pelagic fish and the environment in the Norwegian Sea and adjacent waters in late winter, spring and summer of 2000. ICES C.M. 2000/D:03. 42 pp.
Holst, J.C. 1996. Long-term trends in the growth of the Norwegian spring spawning herring (Clupea harengus L.). Dr.scient thesis, University of Bergen, Norway.
ICES 1991/Assess:17. Report of the Atlanto-Scandian Herring and Capelin Working Group. Copenhagen, 8-12 April 1991. ICES C.M. 1991/Assess:17, 62 pp.
ICES 1993/Assess:6. Report of the Atlanto-Scandian Herring and Capelin Working Group. Copenhagen, 19-23 October 1992. ICES C.M. 1993/Assess:6, 74 pp.
ICES 1995/Assess:7. Report of the Blue Whiting Assessment Working Group, Vigo, Spain 8 - 14 September 1994. ICES C.M. 1995/Assess:7.

O:\ACFM\WGREPS\WGNPBW\REPORTS\2002\Sec-8.Doc 286
ICES 1995/Assess:9. Report of the Atlanto-Scandian Herring and Capelin Working Group, Copenhagen 17-21 October 1994. ICES CM 1995/Assess:9 101pp.
ICES 1998/ACFM:18. Report of the Northern Pelagic and Blue Whiting Fisheries Working Group. ICES Headquarters 28 April - 6 May 1998. ICES CM 1998/ACFM:18, 276 pp.
ICES 1999/ACFM:7. Report of the Joint ICES/NAFO Working Group on harp and hooded seals. Tromsø, Norway, 29 September – 2 October 1998. ICES CM 1999/ACFM:7, 36 pp.
ICES 2000/ACFM:16. Report of the Northern Pelagic and Blue Whiting Fisheries Working Group. ICES Headquarters 26 April - 4 May 2000. ICES CM 2000/ACFM:16. 307 pp.
ICES 2001/ACFM:6. Report of the Working Group on the Assessment of Mackerel, Horse Mackerel, Sardine and Anchovy. ICES Headquarters, 4-13, September 2001. ICES 2001/ACFM:6
ICES 2001/ACFM:17. Report of the Northern Pelagic and Blue Whiting Fisheries Working Group. Reykjavik, Iceland, 18-27 April 2001. ICES CM 2001/ACFM:17.
ICES 2001/ACFM:19. Report of the Arctic Fisheries Working Group. Bergen, Norway, 24 April – 3 May 2001. ICES CM 2001/ACFM:19.
ICES 2001/CRR:246. Report from the ICES Advisory Committee on Fishery Management, 2001. Part 1. 300 pp.
Jakobsson, J., Gudmundsdottir, A., and Stefansson, G. 1993. Stock-related changes in biological parameters of the Icelandic summer-spawning herring. Fisheries Oceanography, 2:260-277.
Jakobsson, J. and Stefansson, G. 1999. Management of summer-spawning herring off Iceland. ICES Journar of Marine Science, 56:827-833.
Lindstrøm, U., Haug, T. and Røttingen. 2002. Predation on herring, Clupea harengus, by minke whales, Balaenoptera acutorostrata, in the Barents Sea. ICES Journal of Marine Science, 59:58-70.
Nilssen, K. T., Pedersen, O.-P., Folkow, L. P., and Haug, T. 2000. Food consumption estimates of Barents Sea harp seals. NAMMCO Scientific Publications, 2:9-27.
Ottersen, G., Ådlandsvik, B., and Loeng, H. 2000. Predictability of Barents Sea temperature. Fisheries Oceanography, 9:121-136.
Patterson, K.R. 1999. Integrated catch at age analysis. Version 1.4. Marine Laboratory, Aberdeen.
Patterson, K.R., Skagen D., Pastoors, M., and Lassen H. 1997. HAWG 1997. Harvest control rules for North Sea herring. Working Document to ACFM 1997.
Rikhter V.A. and V.N. Efanov. 1977. About one of possible approaches to estimation of natural mortality of fish populations. Trudi AtlantNIRO, 73:77-85 (in Russian).
Røttingen, I. A revew of the process leading to the establishment of limit and precautionary reference points for the stock of Norwegian-spring spawning herring
Schweder, T., Skaug, H. J., Dimakos,X. K., Langaas, M. and Øien, N. 1997. Abundance of northeastern Atlantic minke whales estimates for 1989 and 1995. Report of the International Whaling Commision, 47:453-483.
Tjelmeland, S. and Bogstad, B. 1998. Multspec - a review of a multspecies modelling project for the Barents Sea. Fisheries Research, 37:127-142.
Timoshenko N. 1982.Preliminary results of studies on blue whiting from the areas south of Ireland. ICES C.M.1982/H:25.

O:\ACFM\WGREPS\WGNPBW\REPORTS\2002\Sec-8.Doc 287
Toresen, R. and Østvedt, O.J. 2000. Variation in abundance of Norwegian spring-spawning herring (Clupea harengus, Clupeidae) throughout the 20th century and the influence of climatic fluctuations. Fish and Fisheries, 1:231-256.
Tyurin, P.V., 1972. "Normal" curves of the survival and natural mortality rates of the fish as a theoretical basis for fishery regulation. Izvestiya GOSNIORKh, 7l:71-128.
Vilhjálmsson, H., 1994. The Icelandic capelin stock. Capelin Mallotus villosus (Müller ) in the Iceland, Greenland, Jan Mayen area. Rit Fiskideildar, 13: 281 pp.
Vilhjálmsson, H. and E. Friðgeirsson 1976. A review of 0-group surveys in the Iceland-East Greenland area in the years 1970 - 1975. ICES Coop. Res. Rep. 54: 1-34.
Working Documents
Belikov, S. V. Results of Russian research on blue whiting in the Barents Sea in autumn and winter 2001.
Bogstad, B., Dolgolenko, I., Gjøsæter, H., Prokhorova, T., Prozorkevich, D., Ratushnyy, S., Tjelemeland, S., Trofimov, A., and Ushakov, N. Report from the 2001 joint Russian- Norwegian meeting to assess the Barents Sea capelin stock. Vadsø, October 5-7, 2001.
Dommasnes, A. and Nøttestad, L. Natural mortality for herring (Clupea harengus L.) may be a function of population size.
Dommasnes, A. Biomass production 1950-1998 from a virtual population of Norwegian spring-spawning herring.
Gjøsæter, H. First draft of chapter 4, Barents Sea capelin.
Gjøsæter, H. Survey report from the joint Norwegian/Russian acoustic survey of pelagic fish in the Barents Sea September-October 2001.
Gjøsæter, H., Maslova, R., Prokhorova, T., Prozorkevich, D., Røttingen, B., Røttingen, J., Tereschenko, E., Ushakov, N. Age compositions of capelin otoliths by Norwegian and Russian readers 1999-2001.
Godø, O. R., Heino, M., Oganin, I., Ratushnyy, S., Sentyabov, E., Gerber, E. and Timoshenko, N (a). Report and preliminary evaluation of Norwegian and Russian blue whiting surveys in 2002.
Godø, O. R., Heino, M., Søiland, H., Alvarez, J., Dahl, M., de Lange, J., Gullaksen, O., Tangen, O. and Torkelsen, T. (b). Blue whiting survey during spring 2002.
Krysov, A. Report on a survey of the distribution of immature herring and environmental conditions in the Barents Sea during 17 May-6 June 2001.
Loeng, H., Dalpadado, P., Ingvaldsen, R., Ottersen, G., Stiansen, J. E. The Barents Sea ecosystem, 2001-2002.
Melle, W., Mork, K., A, Holst, J. C. and Rey, F. The Norwegian Sea; Hydrography, plankton and herring feeding. Status report April 2002.
Røttingen, B., Anthonypillai, V., Gjøsæter, H. Report on Norwegian research and capelin fishery during winter 2002.
Røttingen, I. Acoustic estimates of Norwegian spring spawning herring in the wintering area in November 2001.
Skagen, D. Reference points for blue whiting revisited.
Slotte, A Data from tagging experiments on Norwegian spring spawning herring in 2001.
Slotte, A. The Norwegian age specific fishery of Norwegian spring spawning herring in 2001.

O:\ACFM\WGREPS\WGNPBW\REPORTS\2002\Sec-8.Doc 288
Slotte, A. Underestimated abundance of old individuals in the Norwegian spring spawning herring stock: artifacts of age readings.
Sveinbjörnsson, S. Cruise no. A9/2001. A survey report on blue whiting biomass estimates assessment in Icelandic waters 17 July-30 July 2001.
Timoshenko, N. The blue whiting distribution detected by RV “Atlantniro” in spring 2002.
Ushakov, N. G. and Prozorkevich, D. V. Russian investigations of the Barents Sea capelin.
Vasilyev, D. A. and Belikov, S. V. Blue whiting: what about natural mortality?
Vilhjálmsson, H. A summary of acoustic assessment surveys of capelin in the Iceland-East Greenland-Jan Mayen area during autumn 2001 and winter 2002.

O:\ACFM\WGREPS\WGNPBW\REPORTS\2002\Appendix.Doc 289
APPENDIX
Special opinion of the Russian delegation
On the basis of scientific materials presented to the Working Group and results of modelling undertaken by the Russian delegation at the meeting of the Working Group using the international data approved by the Working Group, the Russian delegation considers it necessary to formulate the following special opinion:
1. Considering the state of the stock and perspectives of fishery of blue whiting:
The state of the stock is currently in a much better state than is shown in the Summary Sheet. The value of SSB in 2001 is about 7.4 million tonnes (see Section 6.4.4.2. of the Report) and in 2002 - about 8.7 million tons, which is much more in agreement with survey results and fishery experience. Assuming that the total catch in 2002 will be equal to 1.4 million tonnes, the catch forecast for 2003 is the following:
F(3-7) in 2003 SSB in 2003 catch in 2003 SSB in 2004 0 8.6 0 9.7
0.05 8.6 0.4 9.2 0.1 8.6 0.8 8.9
0.15 8.6 1.2 8.5 0.2 8.6 1.5 8.2
0.25 8.6 1.9 7.8
Forecast options: recruitment-at-age 1 for 2001-2004 is taken equal to its mean historical value; weight-at-age and selection pattern are also taken equal to historical mean values of the estimates obtained with the effort-controlled version of ISVPA for M=0.2. The estimates of SSB in the table above are given on 1 of January.
2. Considering the state of the stock and perspectives of fishery of Norwegian spring-spawning herring:
The results of the assessment (see Section 3.5.4.3) show that the spawning stock biomass in 2001 has stopped declining and has stabilized at a level above 6.7 million tonnes, while in 2002 the SSB value is estimated as 7.45 million tonnes. Assuming that the total catch in 2002 will be equal to 850 000 tonnes, the catch forecast for 2003 is the following:
F(2-13) in 2003 F(5-14), weighted by
abundance
SSB in 2003 catch in 2003 SSB in 2004
0 0 7.54 0 7.72 0.05 0.047 7.54 0.365 7.37 0.1 0.094 7.54 0.707 7.04
0.125 0.118 7.54 0.870 6.88 0.13 0.123 7.54 0.902 6.85
0.135 0.127 7.54 0.934 6.82
Forecast options: recruitment-at age-2 for 2002-2004 is taken equal to its mean historical value; weight-at-age and selection pattern are also taken equal to historical mean values of the estimates obtained with the catch-controlled version of ISVPA. The estimates of SSB in the table above are given on 1 of January.
S. Belikov
Copyright © 2022 FDOKUMEN