Fisheries 7 - RIOB
200
101 Fisheries 7 The Mekong River has one of the most diverse and abundant fisheries in the world. There are more than 1200 species in the river. 1 The yield of the Mekong’s capture fishery is an estimated 1.5 million tonnes per year, 2 with another 500,000 tonnes raised in reservoirs and other forms of aquaculture. In Cambodia alone, fishers annually catch between 300,000 – 400,000 tonnes, which makes Cambodia’s fishery the fourth largest in the world, after China, India and Bangladesh. 3 Estimates of annual mean fish yield for the Tonle Sap Great Lake in Cambodia are 230 kg per hectare for the Tonle Sap Lake and floodplain. 4 This figure is much higher than that for other Asian floodplain fisheries, which average about 100 kg per hectare per year. 5 The Mekong owes its abundance to the annual monsoon flood and low gradient in the lower basin. Each year during the southwest monsoon from June to October, torrents of water pour into the basin’s catchment and swell the Mekong’s tributaries from small streams to turbulent rivers. These waters in turn increase the discharge of the Mekong 20 to 25 times. Floodplains are the most highly productive part of any river system. The rise and fall of the annual floods result in the recycling of plants, animals and nutrients with each ‘flood pulse’. The annual change from dry to wet season causes dramatic changes in aquatic habitats, water quality, food availability for fish and fish recruitment. Floodplains that expand and shrink dramatically each year support higher yields than do stable aquatic or terrestrial ecosystems. 6 The Mekong’s fishery is of enormous importance to the 55 million people living in the basin. Some 40 million people or two thirds of the basin’s population are involved in the Mekong’s fishery at least part-time or seasonally. Not only do they derive their livelihood from the fishery, they also depend on fish and other aquatic animals for food security. It is estimated that on average, people consume about 36 kg/ person/year. The 2 million tonnes of fish and aquatic products caught and cultured in the basin are worth $1,400 million at first point of sale. The great majority of this is consumed within the basin. More than 30 percent of the people in the basin have incomes below the poverty line, and they rely on the basin’s fishery for most of their animal protein and essential micronutrients (notably calcium and Vitamin A). Thus preserving the fishery is of enormous importance. As the population of the Lower Mekong Basin grows by 2025 to an estimated 90 million, even more people will depend on the fishery. If it were to seriously decline, as fisheries have done in so many parts of the world, the consequences would be grave for the livelihoods and food security of rural people. Hauling in a catch of fish from a dai fishery unit
-
Upload
khangminh22 -
Category
Documents
-
view
0 -
download
0
Transcript of Fisheries 7 - RIOB

101
7 - Fisheries
Fisheries 7
The Mekong River has one of the most diverse and abundant fisheries in the world. There are morethan 1200 species in the river.1 The yield of the Mekong’s capture fishery is an estimated 1.5 milliontonnes per year,2 with another 500,000 tonnes raised in reservoirs and other forms of aquaculture.In Cambodia alone, fishers annually catch between 300,000 – 400,000 tonnes, which makesCambodia’s fishery the fourth largest in the world, after China, India and Bangladesh.3 Estimates ofannual mean fish yield for the Tonle Sap Great Lake in Cambodia are 230 kg per hectare for theTonle Sap Lake and floodplain.4 This figure is much higher than that for other Asian floodplainfisheries, which average about 100 kg per hectare per year.5
The Mekong owes its abundance to the annual monsoon flood and low gradient in the lower basin.Each year during the southwest monsoon from June to October, torrents of water pour into thebasin’s catchment and swell the Mekong’s tributaries from small streams to turbulent rivers. Thesewaters in turn increase the discharge of the Mekong 20 to 25 times.
Floodplains are the most highly productive part of any river system. The rise and fall of the annualfloods result in the recycling of plants, animals and nutrients with each ‘flood pulse’. The annualchange from dry to wet season causes dramatic changes in aquatic habitats, water quality, foodavailability for fish and fish recruitment. Floodplains that expand and shrink dramatically each yearsupport higher yields than do stable aquatic or terrestrial ecosystems.6
The Mekong’s fishery is of enormousimportance to the 55 million people livingin the basin. Some 40 million people or twothirds of the basin’s population are involvedin the Mekong’s fishery at least part-timeor seasonally. Not only do they derive theirlivelihood from the fishery, they alsodepend on fish and other aquatic animalsfor food security. It is estimated that onaverage, people consume about 36 kg/person/year. The 2 million tonnes of fishand aquatic products caught and culturedin the basin are worth $1,400 million at firstpoint of sale. The great majority of this isconsumed within the basin.
More than 30 percent of the people in the basin have incomes below the poverty line, and they relyon the basin’s fishery for most of their animal protein and essential micronutrients (notably calciumand Vitamin A). Thus preserving the fishery is of enormous importance. As the population of theLower Mekong Basin grows by 2025 to an estimated 90 million, even more people will depend onthe fishery. If it were to seriously decline, as fisheries have done in so many parts of the world, theconsequences would be grave for the livelihoods and food security of rural people.
Hauling in a catch of fish from a dai fishery unit

102
State of the Basin Report - 2003
Flood plain river systems are highly vulnerable for a number of reasons: they often face conflictingdemands from different sectors (fisheries, forestry, water abstractions, hydropower, water drainage,industry, navigation, etc.); and impacts from upstream such as damming, pollution, and deforestation.These all have negative impacts on flora, fauna and the livelihoods of people downstream. Inlandwaters of the Asian region provide more than half the world’s inland capture fisheries yield, andyet, despite their high values, flood plain river habitats are now amongst the fastest disappearing ofall ecological habitats.7
As this chapter indicates, the Mekong Basin’s aquatic ecosystem is still in good condition, but thereare a number of threats to the fishery which must be understood and addressed, or the fishery couldbe decimated in as little as a generation. In the chapter that follows, research findings are presentedon capture fisheries, aquaculture and other aquatic products such as food, medicines and buildingmaterials which are harvested from wetlands. The topics covered in the chapter include: biodiversity;the numbers of people involved in the fishery; consumption, yield and economic value; threats tofisheries; and the extent of, potential for, and threats to aquaculture.
1. The importance of varied habitat and migrations
The habitat mixture in the Mekong River Basin is extremely diverse and while this resourcecomplexity is maintained by appropriate management measures, the fishery resource will remainrich in both biodiversity and productivity. Habitat diversity is greatest in the floodplain areas offlooded grasslands, flooded forests, as well as small and large river channels and permanent andtemporary lakes and pools. Each type of habitat is used by different fish species for different activitiessuch as spawning, nursing, shelter and feeding. Key habitats must be kept accessible through thefloodplain channels.
Figure 1. Generalised life cycle of migratory Mekong fishes, in relation to seasonal conditions.
The main river channels are comparatively unproductive because stronger currents and shiftingsubstrates result in lower primary production.8 The quantity and quality of water in rivers is vitalfor maintaining system productivity.
Source: Adapted from Hoggarth et al. 1999

103
7 - Fisheries
Rising waters, turbidity and/or the first rains trigger adults of many Mekong fish species to spawn.9
Long distance migratory fish species or “white” fish have adapted to spawn at the onset of themonsoon season (May-July), so that their fry and juveniles are ready to enter and feed when theplains become flooded from July to September.10 Short distance migratory or “black” fish speciesalso migrate to spawn and feed in the inundated floodplains.11
Deep pools and channels in the mainstream of the Mekong near Kratie in Cambodia, in the NamTheun and Nam Hinboun in Lao PDR, and in the Se San River in Cambodia are widely acknowledgedas dry season refuges for fish, which re-colonise flooded areas during the following monsoon.13
Important spawning areas are located in the Mekong in Kratie and Stung Treng Provinces. The longdistance fish migrations within main river channels and their main tributaries are referred to as“longitudinal migrations”. Such long distance migrations can cover distances of hundreds ofkilometres from the Mekong Delta in Viet Nam, through Cambodia, to (i) Thailand or Lao PDR
through the Mekong River mainstream, (ii)Lao PDR through the Se Kong River, or(iii) the Central Highlands in Viet Namthrough the Se San and Sre Pok Rivers.14
Another type of fish movement in rivers isthe passive downstream movement by fishlarvae, or “larval drift”. During the floodseason, larvae of some species may driftseveral hundred kilometres from upstreamspawning areas to downstream nurseryareas in the floodplains.15
The most comprehensive study to date on fish migrations in the Mekong River was produced byPoulsen and his co-authors in 2000.16 Migration studies confirm the critical importance of migrationevents in the biological functioning of the fish resource. Some 63 percent of the total catch taken bylarge and middle scale gears in the Tonle Sap fisheries constitutes longitudinally migrating fish.17
Other important migration patterns include lateral migration from the mainstream to the floodplains,breeding migrations of adult broodstock, migration of eggs and juveniles with water currents, feedingmigration and migration to dry season refuge habitats with water currents as water levels decline.All these migrations are essential features of the Mekong fish resource.
Tonle Sap
The Tonle Sap Great Lake area varies dramatically in area from 2,500 - 3,000 km2 in thedry season to up to 13,000 square km in thewet season, when the water level rises eightmetres or more above the average dry seasonlevel.12 This provides fish with temporaryaccess to enormous quantities of food,especially in the flooded forest areas. Manyfish species release eggs just before or duringthe floods and their seed are thereby widelydispersed across the floodplains.
A small section of the Sambor Rapids, northern Cambodia

104
State of the Basin Report - 2003
Although rivers and their associated floodplains encompass a range of different fish habitats, theyare all ecologically linked in a complex “fish migration network”. Therefore, from the point of viewof migrating fish species, the Mekong River Basin functions as one ecological unit.18 The fishmigration corridors interconnect upstream spawning habitats with downstream nursery habitatsand dry season refuge habitats with wet season floodplain habitats.19 The large floodplain areas inthe Mekong Delta and around the Tonle Sap Great Lake in Cambodia, are crucial nursery habitatsfor the Mekong fishery.20
Figure 2. Relationship between the maximum flood level of the season and the fish catch of the daior bagnet fishery in the Tonle Sap river.
Note: This is a small fishery of 63 bagnet units (60 in 2001-02) targeting “white” fish migrating out of the floodplains around the Great Lake to the Mekong river.Source: Sverdrup-Jensen 2002

105
7 - Fisheries
2. Capture fisheries
2.1 Biodiversity
The Mekong River Basin is characterised by a high degree of biodiversity and endemicity. That is,many of its fish species are only found in the Mekong Basin,21 and often only in the basin of one ofthe Mekong’s tributaries (see for example Kottelat 2000).
The number of fish species found in any river is difficult to determine because, besides fish specieswhich complete their life cycle in freshwater, there are other species that may or must spend part oftheir lives in the sea. Some of these typically live in the estuaries, while others have life cycles thatrequire them to move between river and ocean at well-defined and regular stages.22
It is thus not surprising that the number of fish species in the Mekong River is contentious. As thefollowing indicate, leading fish taxonomists give quite different estimates:
Rainboth (1996) – ‘The total number of species recorded or expected from the Mekong, asinferred from the known zoogeography of southeast Asia, includes about 1,200 species. Thisnumber will undoubtedly increase as additional taxonomic studies and fish surveys arecompleted.’
Kottelat (2001) – ‘There are documented records of about 700 species from the MekongBasin.’
Dr. Walter Rainboth (personal communication 2001) – ‘The new Atlas on the Fish of theMekong will include 1,700 species. Many of the species are marine vagrants.’
Dr. Tyson Roberts (personal communication 2002) – ‘1,100 freshwater species.’
ICLARM’s Fish Base lists 748 species from the Mekong at the moment,23 and MRC’s Mekong FishDatabase 2003 currently counts 924 species.24
There is, however, no doubt that the Mekong is among the most species-rich rivers in the world.The number of fish species per unit area of catchment in the Mekong is several times that found inthe Amazon River Basin.25 Species cataloguing is incomplete, and further taxonomic studies arerequired in the upper reaches of tributaries, particularly in Lao PDR and Cambodia where new fishspecies still remain to be discovered.26
One notable aspect of the fish fauna is the large number of fish families present. In Laotian watersalone, the native fish fauna comprises 47 families.27 The Mekong Fish Database 2003 lists 91families in the basin, which indicates that the Mekong has the highest number of fish families ofany river in the world.28 In addition, the Mekong fishes, in common with fishes in other large riversis characterised by a high degree of within-species diversity (i.e. genetic diversity).29
The fish occurring in the lowlands and floodplains of the Mekong Basin have been broadly categorisedinto two groups – black fish and white fish.30 Black fish, which are mostly fish-eating carnivoresand eaters of aquatic debris, live year round in perennial waters, including swamps, and makelimited local, lateral migrations. This group includes the families of snakeheads (Channidae), airbreathing catfishes (Clariidae), bagrid catfishes (Bagridae) and climbing perch (Anabantidae).31

106
State of the Basin Report - 2003
White fish are species that show strong lateral movements between habitats (for example betweenflooded forest and deeper water in the Tonle Sap Great Lake) as well as swimming long distancesup or down river,32 and often across national borders.33 The white fish group includes the sheatfishes(Siluridae) and the river catfishes (Pangasiidae), as well as species belonging to the minnow andcarp family (Cyprinidae).34
There is clear evidence that some fishspecies, particularly the large, slow-growing, late-maturing species arebecoming scarcer.35 Based on the limitedinformation available, it appears that thepopulation sizes of the three giant species,namely the giant Mekong catfish(Pangasianodon gigas), the seven-linebarb (Probarbus jullieni) and the giantbarb (Catlocarpio siamensis) havedecreased substantially over the last fewdecades.36 The Mekong giant catfish andthe seven-line barb are both classified as‘endangered’ on the 2000 InternationalUnion for the Conservation of Nature(IUCN) Red List. The giant barb is becoming increasingly rare. Catches in Cambodia have droppedfrom 200 tonnes in 1964, to 50 fish in 1980 and 12 fish in 2000.37 The giant species are particularlysusceptible to over-fishing because of their sheer size, their mobility and their comparatively lateage of sexual maturity.
To date, no fish species within the Mekong Basin has become extinct, though a number of specieshave become locally rare or absent, although not necessarily due to fishing.38
2.2 Numbers of people involved in the fishery
Most of the 12 million rural households in the LMB earn their living by rice farming and fishing.An estimated 40 million rural dwellers (66 percent) are active in the fishery, with captured fishbeing an important element in household nutrition and income generation.39 Seventy-one percentof rural households (2.9 million people) in Lao PDR are reliant on fishing to varying degrees forsubsistence and additional cash income.40 The wild fishery is particularly important for the poorestand landless rural households, making significant contributions to their nutrition, food security andincome.
More than 1.2 million people living in fishing communes around the Tonle Sap Lake area dependalmost entirely on fishing as their principal livelihood.41 The net result is very high participation inthe fishery, with recorded involvement ranging from 64 to 93 percent of household.42 In Cambodia,the so-called small or “family fisheries” produce higher catches than the large-scale commercialfisheries.43
2.3 Consumption and fisheries yield
It has become obvious that people in the region are far more dependent on the Mekong’s fishery forhousehold nutrition, income and livelihoods than was previously believed.44 In the 1990s, householdsurveys on the quantities of freshwater fish, fish products and aquatic animals eaten and theirsupply source were conducted by several different agencies in 15 of 87 provinces in the LMB.45
The release of a tagged specimen of Siamese giant barb(Catlocarpio siamensis), Cambodia

107
7 - Fisheries
The surveys found that people in the region are consuming less than 20 kg per person in mountainousareas that have limited access to fish resources, and about 60 kg per person in floodplain areas ofCambodia and Viet Nam where fish is abundant most of the year.46 In Northeast Thailand, home toabout one-third of the population in the basin, annual fish consumption is about 35 kg per person.47
The overall average total for fish and other aquatic products consumed in the LMB, is 36 kg/person/year (see Table 1).
The results of other household consumption and expenditure surveys conducted by the nationalstatistical authorities in Lao PDR and Cambodia between 1998-2000 are largely consistent with thehousehold consumption figures given above.
2.4 Size and value of the fishery in the Lower Mekong Basin.
Estimating the yield of the fishery in theLMB is extremely difficult usingtraditional fisheries statistics collectionmethodologies. In the LMB, the fisheriesare widely dispersed, effectively operatingalong the lengths of all the main rivers andmost tributaries. There are no centralisedlanding ports where data can be easilycollected. There are numerous species, thecatch of which varies seasonally and withthe many different types of gears. Mostimportantly, the fisheries operate at acommercial, semi-commercial andsubsistence level. Statistics on family orsubsistence level fisheries have not beencollected in the past by fisheries authorities in the LMB, and this has led to serious underestimationsof fisheries yields, and hence the economic and nutritional importance of the fisheries.*
Sjorslev48 used these data and regional population figures to determine regional consumption offish and other aquatic products. For the 15 surveyed provinces, mean fish consumption figures andcensus population data were used to calculate total annual provincial fish consumption volumes.The 72 provinces that were not surveyed were classified according to area and type of water resourcesand fish habitats, before being assigned the mean consumption figure of the most similar surveyedprovince. Extrapolation of the household survey findings as above gives an annual total consumptionof freshwater fish, fish products and other aquatic animal products in the LMB of about 2,033,000tonnes (see Table 1).
To use fish consumption data as an estimate of fisheries yield requires the assumption that theimport and export of fisheries products in the region are similar in magnitude. Unfortunately, thereare no reliable data on the import and export of fishery products in the LMB. However, export isconsiderable: for instance in Cambodia, at least 50,000 tonnes of freshwater fish are exported toThailand annually.49 We do not know regional import levels. Nevertheless, one can reasonablyassume for the present purposes that import into the LMB is approximately equal to export out ofthe LMB.
* The data presented here are preliminary and are currently being re-analysed to provide a more accurateestimation of the size and value of the fishery.
A busy market where many species of Mekong River fishes are traded

108
State of the Basin Report - 2003
Given this assumption, it follows that fish consumption is approximately equal to the amount offish caught plus that produced from fish farming. In 1999-2000, 260,000 tonnes of fish were producedby the aquaculture industry,50 and 240,000 tonnes of fish were taken from reservoirs51 in the LMB.Therefore, the total yield from the freshwater riverine and wetland capture fishery is at presentabout 1,533,000 tonnes per year.
The validity of this estimate can be cross-checked using data from studies on fisheries yieldsfrom wetlands in the LMB. Estimates of mean fish yield range from about 205 kg per hectare peryear for the Great Lake area to 375 kg per hectare per year for the floodplain near Phnom Penh,though these means are based upon small survey areas. Based on a much larger survey area,Baran et al. (2001) estimate the annual yield of the Tonle Sap Lake and floodplain to be 230 kgper hectare. An average yield of 230 kg per hectare from the 9.69 million hectares of wetlands inthe basin52 extrapolates to a total yield of 2.23 million tonnes per year. Therefore, the estimate of1.533 million tonnes (equivalent to 158 kg/ha of wetlands) of freshwater fish and aquatic productscaptured from the river and wetlands fishery in the LMB each year is considered realistic, andpossibly conservative.
The Mekong fishery is probably the largest river fisheryin the world.53 In 1999 the total world capture fisheries(marine and freshwater) catch was 92.3 million tonnes.54
Based on the figures presented here, the Lower MekongBasin freshwater fishery is about 2 percent of the totalworld capture fisheries yield.
The value of the fishery in the LMB is very difficult toestimate, because the relative proportions of fish,processed fish products and other aquatic animals arenot well described, and the average prices of thesedifferent products in different regions are not known.Nevertheless, we can get an approximate idea of thevalue of the fishery if we apply fish prices to the totalyield of fish, fish products and other aquatic animals.We can use an average farm gate price of $1.05 per kgfor cultured fish 55 and an average first hand sale priceof $0.68 per kg for capture fish.56 For the reservoir
Table 1. Estimated freshwater fish and aquatic product consumption in the Lower Mekong Basin.
Cambodia total 10,775,000 47 (10-89) 508,000Lao total 5,087,000 26 (17-36) 133,000N-E Thailand 22,439,000 35 (20-41) 795,000Viet Nam - Mekong delta 17,958,000 33 (15-60) 597,000
TOTAL 56,259,000 36 2,033,000
Assessed totalconsumption of
freshwater fish, fishproducts and aquatic
animals (tonnes)1999/2000
Assessed consumptionin per capita per year
of all fisheriesproducts. Average
(range), kgs
Country Population in LMB1999/2000
Source: Sjorslev (in press)
A river catfish, very important in thecapture fishery and in aquaculture

109
7 - Fisheries
fisheries, the conservative value of $0.68/kg is used, because although the fish are produced byboth aquaculture and capture fisheries, the relative proportions cannot be estimated. This resultsin an estimate of $1,478 million for the value of the fishery. This is for first sale price only, andso does not include any estimate of the multiplier effects of the fish trade.
2.5 Nutritional value
Nutrition, health and poverty baseline surveys in Cambodia confirm that fish and aquatic animalsprovide more than 75 percent of animal protein intake in rural areas.57 In the lowland areas of theLMB, where the bulk of the population lives, between 40-80 percent of animal protein is suppliedby aquatic animals.58
The average protein requirement for adults is between 0.8-1.0 g protein/kg body weight/day. In theLMB this is normally, or very nearly, met on an annual basis.59 However, in some areas of the LMB,seasonal malnutrition is quite common.60 Rice provides more than half the daily protein requirementin the LMB, but it is deficient in lysine, an essential amino acid. Fish and other aquatic productscontain 33 percent more lysine than terrestrial animal protein sources such as poultry, beef andpork.61
Calcium intake is also particularly important in human nutrition for skeletal growth of young children,for foetal growth, for lactating mothers and for the elderly to prevent brittle bones (osteoporosis).The World Health Organisation and the Food and Agriculture Organization (FAO) recommend adaily intake of 400-500 mg of calcium per day for adults and 500-700 mg per day for adolescents.62
Milk and other dairy products supply most of the calcium used by humans in western countries. InSoutheast Asia, where rice and most fruits lack calcium, it is primarily provided by small fish, thatare often eaten whole, and other traditional products made from small fish.63 Small dried fisheaten whole contain more than 1,000 mg of calcium per 100 g, while dried fermented fish exceeds2,000 mg of calcium per 100 g. Importantly, the calcium uptake by the human body is the same forsmall fried fish eaten whole as it is for fresh milk.64 As well as supplying animal protein andminerals such as calcium, fish are important in the human diet as a source of vitamins (includingvitamin A).65

110
State of the Basin Report - 2003
2.6 Economic value
Table 2 shows that the entire fisheries capture and culture sector in the LMB is estimated to beworth $1,478 million annually. The value of the wild riverine fishery in the LMB is estimated to be$1,042 million, the aquaculture sector is worth $273 million, and the reservoir fishery is valued at$163 million annually. (See Table 3)
Cambodia’s freshwater capture fishery of 400,000 tonnes has an estimated value at the landing sitesof $200 million and an estimated retail value of over $300 million annually.68 Studies on livelihoodstrategies found that villagers around the Great Lake spent less time on fishing activities but generated3.5 times more value than for their farming activities.69
High value fish such as snakeheads (Channa micropeltes and C. striata) and sand goby (Oxyeleotrismarmorata), are sometimes exported out of the region. Sand goby, for instance, is considered adelicacy through much of eastern Asia and can fetch prices as high as $10 per kg in Viet Nam, HongKong and Singapore.70 Export of fish and aquatic products from Cambodia to neighbouring Thailandand other countries is being stimulated by the construction of improved roads and bridges and thegreater availability of ice for cold storage.
Cultured and captured river catfishes Pangasianodon hypophthalmus and Pangasius bocourti areincreasingly being exported from Viet Nam. Processed river catfish are exported to Australia underthe name of Pacific Dorado71 and they are also exported frozen to the USA.72 (See Table 2)
The annual catch from the dai fishery inCambodia ranges from 7,000 – 18,000 tonnes.Most of the catch is processed to make atraditional fish paste called prahoc.66 Themajority of the catch (55 percent by weight)consists of small cyprinids Henicorhynchus spp.and Paralaubuca typus.67 Fish yield in the LMBpeaks seasonally during the dry season and atthe start of the rainy season. To provide fish atother times, fish are sun dried, salted, pickled,smoked, fermented and made into fish sauces,oils and pastes.
Table 2. Fish production and value in the LMB
Fish and aquatic product source Quantity (tonnes) Price ($ per kg) Value ($ millions)
Riverine capture fisheries 1,533,000 0.681 1,042Aquaculture 260,000 1.052 273Reservoirs 240,000 0.68* 163
TOTAL 2,033,000 1,478
Note: * The reservoir fishery consists of both capture and aquaculture sectors, but the respective proportions of eachare unknown. To estimate the value of the reservoir fishery, we have been conservative in using the lower priceestimate of $0.68.
Sources: 1. Aeron-Thomas in prep; 2. Phillips 2002

111
7 - Fisheries
Table 3 shows the 10 most common fish species caught by the large- and middle-scale fisheries inthe provinces around the Great Lake and the Tonle Sap River in Cambodia. Seventy-five fish speciesare routinely found in the catch, of which at least 44 species are found in the dai fishery and 62species in the catch of the middle-scale fisheries. The most expensive fish are the snakeheads(Channa spp.), because they have good quality meat and they can be kept alive for a long time in themarket.
The rich biodiversity of the Mekong wetlands also has an economic value for purposes other thanthe fishery. For example, the Irrawaddy dolphins living in the Mekong River below the Khone Fallshave a high economic ‘existence value’ for tourism because of their rarity.73
○ ○ ○ ○ ○ ○ ○ ○ ○ ○ ○ ○ ○ ○ ○ ○ ○ ○ ○ ○ ○ ○ ○ ○ ○ ○ ○ ○ ○ ○ ○ ○ ○ ○ ○ ○ ○ ○ ○ ○ ○ ○ ○ ○ ○ ○ ○ ○ ○ ○ ○ ○ ○ ○ ○
Table 3. Species composition and value of the ten most common fish species groups in the 1995/1996 catch, by type of fishery, around the Great Lake and the Tonle Sap River
Fish Species Group Large-Scale Fisheries
Fishing Lots Dai Fisheries Middle-Scale Total Catch Total Value[%] [%] Fisheries [%] [%] [%]
Henicorhynchus spp. 11 40 20 21 9 Channa micropeltes 16 - 8 9 19 Cyclocheilichthys enoplos 8 1 13 9 8 Dangila spp. 5 6 7 6 2 Osteochilus spp. 2 10 2 4 2 Cirrhinus microlepis 5 3 2 3 4 Pangasius spp. 8 0 1 3 3 Barbonymus gonionotus 3 0 4 3 2 Paralaubuca typus 1 11 0 3 1 Channa striata 5 - 1 2 6
Weight percentage of 10 species 64 70 59 63 56 groups (in the particular fishery) Number of species recorded >75 44 62 >75
Note: Family and rice field fisheries are not included because of insufficient data.Source: Deap Loeung and Van Zalinge 1998
Irrawaddy Dolphin

112
State of the Basin Report - 2003
2.7 Factors impacting on fisheries resources
2.7.1 Dams and water extraction
Development of water resources, particularly dam and weir construction for hydroelectric power,irrigated agriculture, water supply and flood control has led to water abstraction, water diversion,water retention, and increased water evaporation. At impoundment sites and at locations downstreamfrom them, aquatic habitats have been lost or modified. Dams for reservoirs, headponds, and weirschange rivers and streams and also change the timing, duration and quantity of flooding furtherdownstream.74
To date, the only dams that have been built across the mainstream Mekong are the Manwan andDachaoshan Dams in Yunnan Province of China.75 The 300 metre high Xiaowan Dam is underconstruction and China has proposals to construct more mainstream dams on the Lancang JiangRiver, as the Mekong River is known in Yunnan.76
Dams are of concern because they cause fragmentation of aquatic habitats, block fish migrationroutes, change water flow patterns and water levels through water abstraction and water retention,and increase water loss by evaporation.77
The construction of a diversionary weir at Nam Song in Lao PDR seriously disrupted the naturalriver flow patterns of the Nam Song River, which is part of the Nam Ngum sub-catchment. Followingcompletion of the Nam Song weir in 1996, 40 fish species disappeared and 20 trans-boundarymigratory fish species were lost from catches in neighbouring countries (Table 5).78 Of these, 20species were trans-boundary migratory (TBM) or long distance migratory species (LDM).79 (SeeTable 4)
Prior to the construction of a dam in Northeast Thailand, there was a large-scale fishery for thetrans-boundary long distance migrating Pangasius macronema at Pak Mun. After the constructionof the dam, a series of more than 50 rapids, which were important spawning grounds for P.macronema, were flooded. This has caused a significant decrease in the size of the P. macronemafishery.80
Before filling the Pak Mun Dam, which has a catchment area of 117,000 km2, 265 fish species wererecorded in its diverse variety of aquatic habitats, and the fish spawning grounds were accessed byfish from the Mekong mainstream. Following the construction of the dam, only 96 fish species havebeen recorded upstream of the dam, and of those, 51 fish species have declined in abundance. Theconstruction of the dam has caused the upstream extinction of long distance trans-boundary migratoryspecies, which previously returned annually to spawn in the rapids.81
A variety of fish have evolved to fill the specialised feeding niches, which are available in theMekong River Basin. Many Mekong River fish species in the Cyprinidae and Gyrinocheilidaefamilies feed primarily on periphyton (algae attached to substrate). Changes in light intensity,increased water levels, increased turbidity, and reduction in nutrient levels caused by constructionof dams and weirs can wipe out the periphyton populations on which specialised feeding fishdepend. Increased water levels caused by the Nam Hinboun and the Theun-Hinboun hydropowerprojects in Lao PDR wiped out periphyton communities and with them, the periphyton-feedingfish species.82

113
7 - Fisheries
Filter-feeding mussels are commonly found in highland streams and rivers of the Mekong Basinand are an important food source for fish species such as seven-line barb (Probarbus jullieni), botialoaches (Botia spp.), and the pangasiid Helicophagus waandersi.83 Since mussels are sedentary orstatic, they depend on the current to bring them sufficient food to survive. Changes in water velocitypatterns and water quality following dam and weir construction can negatively impact bivalves andthe fish and other aquatic animals, which feed on them.
Dams also impact water quality, affecting downstream total suspended solids and nutrient levels,especially total phosphorus and dissolved oxygen levels. Reservoirs deeper than 10 metres becomestratified with warmer water at the surface and cooler water at the bottom. Oxygen-consumingdecomposition of organic material mainly occurs at the bottom, and the bottom water can becomehypoxic or even anoxic if the reservoir is stratified. If oxygen-depleted bottom water is releasedfrom a dam, fish kills can occur downstream.
Table 4. Indigenous fish species that disappeared from the catches downstream of the diversionweir in Nam Song in Lao PDR after its completion.
Family CLUPEIDAE Family PANGASIIDAE
Tenualosa thibaudeaui TBM Helicophagus waandersi TBMPangasius bocourti TBM
Family CYPRINIDAE Pangasius djambal TBMBangana behri TBM Pangasianodon hypophthalmus TBMBarbonymus altus Pangasius larnaudii TBMBarbonymus schwanenfeldii Pangasius sanitwongsei TBMCirrhinus jullieni Cirrhinus microlepis TBM Family SISORIDAEHenicorhynchus sp. TBM Bagarius bagarius LDMLabeo chrysophekadion TBM Bagarius suchus LDMLabeo erythropterus Bagarius yarrelli TBMLobocheilos melanotaenia Luciosoma bleekeri Family DATNIOIDIDAEMekongina erythrospila TBM Datnioides undecimradiatus LDMNeolissochilus blanci Paralaubuca typus TBM Family OSPHRONEMIDAEProbarbus jullieni TBM Osphronemus exodonProbarbus labeomajor TBM Osphronemus goramyRaiamas guttatus TBMScaphognathops stejnegeri Family CHANNIDAETor tambroides Channa gachua
Channa micropeltesFamily COBITIDAE Channa marulioidesAcanthopsis sp. 1Acanthopsis sp. 5 Family SOLEIDAE
Brachirus harmandiFamily GYRINOCHEILIDAEGyrinocheilus pennocki
Note: TBM= Transboundary Migratory Fish Species; LDM= Long Distance Migrating Fish SpeciesSource: Schouten (in press).

114
State of the Basin Report - 2003
2.7.2 Barriers to fish migration
Dams and other structures across streams are barriers to migrating fish. A mainstream dam, onthe Mekong below the Khone Falls, for instance, would prevent the migration of adult white fishfrom the floodplains and others to their spawning grounds upstream in northeast Cambodia.84 Attimes of peak migration from the Tonle Sap to the Mekong River, the movement of fish species isconcentrated in time and abundance. At these times at least 50,000 fish per minute are swimmingpast a given point in the Tonle Sap River.85 No existing fish ladder design could cope with thesenumbers of fish.86
Floodplains can be altered through land use and modifiedby development of water resources, resulting in changes inwater flow and the timing, frequency, duration, and heightof flooding. Other important aquatic habitats such as rapidsand riffles, backwaters, and deep pools can also be impactedby changes in water flow regime. Fish migration is closelyrelated to annual fluctuations in water flow and water levels.If natural water flow fluctuation patterns change drastically,fish will be unable to complete their migrations, andspawning and recruitment will be reduced, and hence fishresources will be reduced.
While the spawning of the majority of Mekong fish speciesis triggered by monsoon rains, rising water levels, andturbidity, other species such as members of the genusProbarbus, spawn during low flow periods.87 All threespecies in this genus are extremely popular as food fishand are all included on the IUCN list of endangeredspecies.88 Dry season spawning species are likely to be
especially susceptible to water released from dams during the dry season because they may beunable to find suitable spawning sites or their eggs may be washed away or smothered by sedimentdeposits.
If an integrated approach to fish and water resource management is to be undertaken, methodologiesare needed that can quantify the importance of migrations in the production cycle and quantify theimpact of dams on migrations, fish yield, and the livelihoods of fisher communities.
2.7.3 Habitat loss
Fresh waters account for less than 1 percent of the world’s surface area, but they provide at least 8percent of global fisheries yield. These productive ecosystems are, however, under pressure from agrowing human population, conversion and draining of wetlands, construction of dams, waterdiversions, canals, increased water consumption and pollution.89
Fisheries productivity and diversity varies with habitat type. Productivity is often considered to behighest in flooded forests and lowest in rice fields, but there is no literature and no studies from theMekong region to support this opinion.
In the Mekong, destruction of flooded forest for fuel, or conversion to rice fields or other uses hasa negative impact on recruitment to the wild fishery and fish growth.90
Catching fish in area with rapids orwater fall

115
7 - Fisheries
The conversion of floodplains into arable land, especially rice fields, is a serious threat to a crucialecological habitat, and therefore to fish production and diversity. It has been determined by aerialphoto surveys conducted in 1973-1976 and 1992-1993, that 33 percent of the flooded forest area ofCambodia was cleared in that 20-year period.91 Around the Great Lake, 27 percent of the floodedforest cover was cut during the same period.92 It is imperative that as much flooded forest as possiblebe preserved if fisheries productivity is to be maintained. To achieve this, the communities responsiblefor fisheries management must be convinced to conserve and protect flooded forest and wetlandhabitats, because the loss of critical fish habitats is usually irreversible.93
Development projects for the Tonle Sap Lake, such as the building of harbours, roads, and oil andgas exploration, will increase accessibility and employment in the area and bring in more people.Increased population pressure will result in destruction of natural habitats and ecological damageas land is converted for agriculture and trees are cut for fuel. Another solution would be to createemployment opportunities in areas outside the floodplains to relieve development pressure on theflooded forests and critical wetlands.
2.7.4 Fishing pressure
The Mekong fishery comprises at least 120 commercial species, hundreds of fishing gear types, and40 million fishers, many of whom have low levels of literacy. At least 180 different fishing gearshave been identified in Cambodia alone.94 There are an equally diverse number of gears in LaoPDR.95 Given this situation, it is difficult to accurately monitor fishing yield and effort.
The most valuable long-term fish capture data sets have been collected from the dai fishery on theTonle Sap River by the MRC Fisheries Programme. Time series data indicate that fish yield iscorrelated with average peak flood levels. Annual dai catches for October in the Tonle Sap Riverclosely follow the average October water level in the same river.96 Flood control measures, includingdam construction, that lower average peak flood levels can reduce fish catches.97
The mean fish size for different fish species caught in thegill net Scaphognathops fishery in Khong District,Champasak Province, Lao PDR from 1993 and 1998 98
was also variable for all species, but no species wasdeclining in mean size. The number of species caughtbetween 1993 and 1998 varied from 30 to 76, but thedata give no indication that the number of species in thecatches is declining.
Fishers also complain that their catches have declinedover time, and data show that catch per fisher has declinedapproximately 44 percent between the 1940s and 1995.Despite this, the total fish yield in the Tonle Sap area hasincreased 84 percent from 125,000 to 230,000 tonnesduring the same period because of the massive increasein the number of fishers. While the overall catch volumeof the Tonle Sap fishery may yet increase further, and theproportion of small, prolific, fast maturing and growingspecies like Henicorhynchus spp. in the catch mightincrease, the overall value of the fishery may decline.99Giant lift nets in action

116
State of the Basin Report - 2003
This indicator is a classical symptom of a fishery under heavy exploitation. Systematic and continuedmonitoring of the fishery is therefore of critical importance if the fishery is to be managedsustainably.
Modelling of the fish and hydro-biological resources of the Mekong Basin identified water level,flood duration, timing of the flood, continuity of flooding, floodplain area, area of different floodedvegetation types, dry season refuges and fish migration as the variables most likely to influence fishcatch.100
The current very high yield levels for the Tonle Sap area reflect both high exploitation rates and theincreasing proportion of small, early maturing species in the catch.101 Even so, piscivorous (fisheating) snakeheads still represent 11 percent by weight and 25 percent by value in the fishing lotand medium-scale fisheries in Cambodia.102
Figure 3. Illustration of the fishing-down process
When multi-species fisheries are heavilyfished, the following changes logicallyoccur: (i) annual catch of large- andmedium-sized fish decrease, while smallfish species, which reproduce faster andfeed low in the food chain form a greaterproportion of the catch by weight; (ii) moretime is needed to catch the same amount offish; (iii) the number of fish species caughtdeclines; and (iv) there is an increase inconflicts between stakeholders in thefisheries sector.103 Data held by the MRCfisheries programme indicate that (i), (ii),and (iv) are already occurring.
Note: In 1940 the Tonle Sap Great Lake region catch of 125,000 tonnes consisted mainlyof large and medium sized fish, while the 1995-96 catch of 235,000 tonnes containedhardly any large fish and was strongly dominated by small fish.
Source: Sverdrup-Jensen 2002
The dai Fishery in Cambodia

117
7 - Fisheries
Even though the total yield may in fact be increasing, there are indications of selective over-fishing.104
Species that need more than one year to reproduce are declining quickest.105 The LMB populationis growing at an average of 1.45 percent per annum,106 though with the growth rate in Cambodia at2.6 percent and Lao PDR at 2.8 percent,107 there will be greater pressure on natural aquatic resourcesin years to come.
2.7.5 Other impacts
River modification
River modification includes construction of navigation channels, locks and weirs, which alter rivertopography and water flow patterns. Some of the likely impacts on the fishery are typified byinvestigations conducted for the Mekong River Channel Improvement Project (MKRCIP), designedto increase the navigability for shipping in the upper Mekong River, 360 km from the Chineseborder down to Ban Houei Sai in Lao PDR.108 The MKRCIP plans the removal of assorted sand bars(mid-channel bars, bank-attached bars, tributary-mouth bars, and bedrock bars).
Roberts 109 considers that the blasting of rapids, rock bars and islands, the dredging of substrate,construction of ports, and other development, may lead to fish kills in the project zone, but alsothere will be significant international “trans-boundary” implications.
Deforestation
There is currently no information available on the impactof deforestation in the highlands on the fisheriesresources of the Mekong Basin. The serious implicationsof removal or conversion of flooded forest on thefloodplains is covered in Section 2.7.3, and within theLMB, the deep pools, which are important dry seasonfish habitats, would be in danger from excessive siltdeposition resulting from increased erosion caused bydeforestation.
In general terms, deforestation is associated with increasederosion and instantaneous run-off to streams and rivers.Erosion increases sedimentation, turbidity, totalsuspended solids, and conductivity. High suspended solidloads irritate fish gills and smother fish eggs, preventingoxygen exchange. Increased run-off to rivers alsoincreases nutrient concentrations and nutrient loads inrivers. Deforestation alters water temperature anddecreases the leaf litter available to the aquatic food chain.All the above adversely affect aquatic flora and fauna.110
Destructive fishing practices
Destructive fishing practices include the use of fine meshed nets, fishing during spawning seasonsand in dry season refuge areas, and using electricity, poisons and explosives. Fishers use explosives indeep pools and channels in northeast Cambodia during the dry season.111 This illegal fishing methoddestroys spawning populations, which are sheltering in the deep pools until the next flood pulse.112
Conversion of flooded forest to agriculturalland is a threat to fish production

118
State of the Basin Report - 2003
Juvenile pangasiid catfishes have traditionally been capturedin fine meshed dai nets in the Mekong River in southernCambodia and northern Viet Nam for stocking in grow-outcages or ponds. Only 15 percent of this catch is kept; theother eighty five percent are killed and discarded in theseparation process.113 These are the larvae of 160 non-targetspecies. Thus approximately 9 kg of non-target fish seedare killed for each kg of river catfish seed collected. Fearingthe damage done by this destructive fishing method, thecapture of wild pangasiid fry and fingerlings has beenprohibited in both Cambodia and in Viet Nam.114 DespiteViet Nam producing more than 270 million river catfish fryby artificial propagation in 1999, fish farmers believe thatwild fish grow faster and prefer to buy wild fry, even if theyare more expensive.115 As a result, the illegal collection ofriver catfish seed still continues, particularly in Cambodia.116
Introduction of exotics
Exotics are generally introduced for aquaculture, forbiological pest control, and for the aquarium trade. The bighead carp (Hypophthalmichthys nobilis), silver carp(Hypophthalmichthys molitrix), grass carp (Ctenopharyngodon idellus), common carp (Cyprinuscarpio), rohu (Labeo rohita), catla (Catla catla), mrigal (Cirrhinus cirrhosus), tilapia (Oreochromissp.), and the African catfish (Clarias gariepinus), are now widely used for aquaculture in the fourLMB countries. Most of the above mentioned species have probably established breeding populationsin all or part of the basin.117 It has further been reported that fishes introduced in the Mekong Basinin China are now appearing in Thailand.118
The guppy (Poecilia reticulata) and the mosquito fish (Gambusia affinis), originally introduced asornamentals and to control mosquitoes are now widespread in ditches and ricefields throughout thebasin. These same habitats have been colonised by the South American loricariid catfish (Hypostomusplecostomus), which is common in polluted water bodies.119
There is also a growing, but as yet unregulated, aquarium fish trade from Thailand to Singapore,and also from Lao PDR to Thailand and to Viet Nam. Fish species are also traded into the MekongBasin from outside the region. There are concerns that without appropriate management measures,trade in aquarium fish will negatively affect biodiversity in the near future. 120
Risks from the uncontrolled introduction of exotic fish species include competition and displacementof indigenous fish species, reduced biodiversity, hybridisation, loss of genetic diversity and thepossible introduction of disease pathogens and parasites.121
Pollution
Pollution would become a major concern for the Mekong fishery if it formed a biological barrier tothe dispersion of fish eggs or the migration of fish larvae and adults. Pollution includes agriculturalrun-off (fertilisers, herbicides and pesticides); human sewage and storm water from urban areas;and industrial effluents. Point sources of pollution are currently not a major issue for the fisheriesof the LMB, although there have been instances of localised pollution which have been sufficientlysevere to cause fish kills. 122
Fishing with explosives cost this StungTreng fisher the lower part of
his right arm

119
7 - Fisheries
Fertiliser run-off into water bodiesoften results in eutrofication as thewater becomes overly nutrient rich.Eutrofication may increase the yieldof certain fish species, but it isgenerally accompanied by a declinein the number of fish species andbiodiversity. The increase in land areaunder agriculture production and theintensification of agriculture has alsoincreased the use of insecticides andpesticides.123 An analysis of 20 fishsamples of two fish species in theMekong Basin in Thailand in June1988 showed that all samples were contaminated with at least one type of organochlorinepesticide. Dieldrin, DDT and its metabolites were the most encountered organochlorines, eventhough both DDT and Dieldrin are banned from importation into Thailand.124
Recently, the use of pesticides banned in Thailand, Viet Nam and many other countries has beenreported in Cambodia.125 In 1999, 100 percent of 81 specimens of 27 different fish species (16freshwater and 11 marine) taken from Cambodia were contaminated with organochlorines andpolychlorinated biphenyls. DDT was the predominant pesticide found at levels ranging from 0.5 –25 nano gm per gm of wet fish. DDT levels were higher in freshwater fish than marine, suggestingthat the DDT originated from inland river catchments.126 DDT is used extensively during the earlyrainy season to control insects, and mosquitoes in particular.127
3. Aquaculture
3.1 Importance of aquaculture
Aquaculture in the region is a diverse activity encompassing production and sale of fry and fingerlingsand the raising of wild or artificially-produced fry and fingerlings in enclosed or semi-enclosedwater bodies for sale and home consumption. In addition to the farming process, the supply of
inputs, and the handling, processing and marketing ofaquaculture products are the basis of rural livelihoods in manyremote parts of the basin. 128
Capture fisheries and aquaculture are closely interlinked withthe culture of several farmed species being completely orpartially dependant on capture fisheries for seed supply.129 Wildriver catfish (P. bocourti) seed is stocked in culture cages alongthe Mekong River in Thailand. Wild river catfish seed andgiant freshwater prawn (Macrobrachium rosenbergii) post-larvae are still the only sources of seed available for culture insome areas of Viet Nam. Small wild fish are also an importantfeed source for intensive cage culture of snakeheads, catfish,sand goby and seabass (Lates calcarifer) in Cambodia andThailand.130
Giant fresh water prawns
Commercialisation of agriculture increases the use offertiliser and pesticides

120
State of the Basin Report - 2003
Total freshwater aquaculture production inthe LMB has risen from 60,000 tonnes in1990 to 255,000 tonnes per annum in 2001.This is worth an estimated $244.6 million.131
See Table 6, in which marine prawnaquaculture in the Mekong Delta isexcluded. The Mekong Delta of Viet Namand Northeast Thailand, in that order, arethe most important producers of culturedfish in the LMB. In these areas betterinfrastructure facilitates easier access toinputs and markets than in the more remoterural areas of Cambodia and Lao PDR. Atleast two million rural households in theLMB are culturing fish. In Northeast Thailand, for example, more than 6 percent of the 2.6 millionrural households are involved in small-scale aquaculture, while in Viet Nam the proportion is 60-70percent.132
Small-scale aquaculture contributes to food supplyin areas where wild fish are not available and inseasons when wild fish are in short supply. It providesopportunities for flexible supplementary income andhelps families diversify from fishing and rice farmingactivities.
Aquaculture appears to have particularly goodpotential where there is food insecurity and in areaswhere wild fish stocks are insufficient to meetdemand. There are a number of important factorsinfluencing development, including infrastructure,access to markets, supply of inputs, access toextension and other support services, and availabilityof fish seed. In Lao PDR, for example, economicfactors are a major constraint and include a poorlydeveloped market economy outside major towns andlimited access to long-term credit.133
3.1.1 Viet Nam
Viet Nam has the largest aquaculture area in the basin, covering 330,000 hectares. Freshwateraquaculture production in the Mekong Delta of Viet Nam in 1999 was 171,570 tonnes. Productionis high, with a mean annual pond production of 4.8 tonnes per ha. Over 100 hatcheries in the deltaof Viet Nam produced an estimated 1,615 million fry and 595 million fingerlings in 1999.134 Themost commonly-cultured fish species are river catfish (Pangasianodon hypophthalmus), silver barb(Barbonymus gonionotus)¸ common carp (Cyprinus carpio), tilapia (Oreochromis spp.), giantgourami (Osphronemus goramy), sand goby (Oxyeleotris marmorata), hybrid catfish (Clariasgariepinus ´ C. macrocephalus), silver carp (Hypophthalmichthys molitrix), Indian carps, andsnakehead (Channa striata). Polyculture of mixed species is the norm, and pond production isgenerally integrated under the ‘VAC’ system, an acronym from the Vietnamese words for ‘livestock’,‘pond’ and ‘vegetables’.135
Extension services are crucial for successful development of aquaculture
Harvesting a village pond

121
7 - Fisheries
Table 5. Freshwater aquaculture production in the LMB (based on latest available statistics 1997-2001)
Number of households Estimated annual Estimated value ($)1
engaged in aquaculture production (tonnes)
Thailand >156,000 33,521 2+30,0003 20,400,0004
Lao PDR 55,4005 5,3786 7,000,000Cambodia 14,1007 17,200,000Viet Nam 1,606,000 – 1,873,0008 171,5709 200,000,000
Total 255,569 244,600,000
Notes: 1: This value is the theoretical cash value of production and does not reflect the actual income/expenditure on aquatic resources; 2: DOF 1997 official production statistics for NE Thailand; 3: Estimatedunreported small-scale aquaculture production; 4: Estimated from 1997 DOF data on the averagefreshwater fish price of Baht 27/kg and 1997 annual production figures and an exchange rate of 1US$=Baht45; 5: Lao Agricultural Census, 1998/99. Steering Committee for the Agricultural Census. AgriculturalCensus Office. Vientiane, February 2000 ; 6: Pond production estimated as: estimated pond area x averageproductivity 800 kg/ha, rice fish culture area x 120 kg/ha. 7: Official DOF figures for 1998; 8: Le Than Luu2001; 9: The figure excludes shrimp production – in 2000 there were 82,656 tonnes, 191,516 ha and79.1% of the total productivity 0.432 t/ha/year in the Mekong Delta region.
Source: Phillips 2002
Eighty thousand hectares are presently underrice-fish culture. Silver barb, common carp,silver carp, tilapia, Indian carps, climbingperch (Anabas testudineus), and snakeskingourami (Trichogaster pectoralis) are mostfrequently stocked in rice-fish systems. Themean annual production is 0.37 tonnes perhectare.136 Fish are often held in the rice fieldsfor two or three successive rice crops.
There are nearly 5,000 fish cages in the watersof the Mekong Delta in Viet Nam, rangingfrom 50 to 400 m2 in size. River catfish,snakehead, red-tail tin foil barb (Barbonymusaltus), silver barb and common carp are the common species reared in these cages. Cages are mostoften stocked with wild captured fry or juveniles. Fish are fed wet sticky balls of mixed rice bran,broken rice, trash fish and vegetables. Fish are cultured for 10 to 14 months and yields range from80 to 120 kg/m3. Cage culture of high value species requires investment levels beyond the reach ofpoor and marginal farmers.
The government of Viet Nam has recently begun promoting giant freshwater prawn(Macrobrachium rosenbergii) culture in the Mekong Delta. In 1999, there were 2,940 hectares ofMacrobrachium ponds, typically 50 – 200 m2 in area and stocked with 1 – 5 post larvae persquare metre. There were also 6,730 hectares of rice-prawn plots, stocked with 1 – 2 wild-caughtpost larvae per square metre. In ponds, Macrobrachium are fed a mixture of rice bran, brokenrice, fishmeal or trash fish. No feed is provided in rice-prawn systems. Mean annual productionin 1999 was 0.33 tonnes per hectare.137 Present giant freshwater prawn production is about 5,000tonnes per year, but the government of Viet Nam has set a target of 60,000 tonnes by the year2010.138
Feeding fish in cages

122
State of the Basin Report - 2003
3.1.2 Northeast Thailand
Aquaculture in Northeast Thailand has expanded significantly over the past ten years. Fish culturein ponds, rice fields, ditches and cages contributes over 33,500 tonnes per year, according to officialDepartment of Fisheries statistics. These statistics underestimate total production since small-scaleproducers are not included. With production from small-scale operations estimated to be in excessof 30,000 tonnes per year, a conservative estimate for the total annual aquaculture production is65,000 tonnes.139
Pond culture makes the biggest contribution to total production. Both exotic and indigenous speciesare produced. Species include a mixture of indigenous catfish, snakeheads, silver barb and exoticspecies including tilapias, and Chinese andIndian carps. Pond culture is based largelyon the use of agricultural by-products, suchas manures and vegetable matter, inorganicfertilisers and the increasing use of pelleteddiets. Larger integrated farms are foundaround urban centres where organic matterfrom pigs and chickens and agro-industrialprocessing wastes are readily available.Rice-fish culture is also practiced.
Cage culture of tilapia, supported by largeragro-industrial concerns, has expanded inthe past three years in reservoirs and theMekong mainstream. Cage culture of rivercatfish (Pangasius bocourti andPangasianodon hypophthalmus) usingwild seed is also conducted in the Mekong River, and its expansion can be anticipated if the breedingtechnologies become more widely adopted. Northeast Thailand is also an important supplier ofseed and feed to areas in Lao PDR bordering the Mekong River.
3.1.3 Cambodia
In Cambodia, over 80 percent of aquaculture productioncomes from cages and pens in the Great Lake and the TonleSap, Mekong and Bassac Rivers.140 The major species areriver catfish and snakeheads. Juvenile river catfish andsnakeheads are collected from the wild fishery. Pondculture and farming fish in rice fields is less developed inCambodia, although its importance has been increasing inrecent years as a result of NGO and international donor-assisted projects.
There are two basic pond systems used in Cambodia.Intensive catfish culture is common in and around PhnomPenh and Kandal Province near urban markets. Fishfingerlings are collected from the wild, held in smallponds, and intensively fed rice bran or wild fish whenthese are abundant. The second type is low-input pond
Floating fish feed factory in An Giang Province,Viet Nam. The feed is produced from dried fish (mostlyimported from Cambodia) and used in the cage culture
of Pangasiid catfishes in Viet Nam.
Rice fields are important for aquaticanimal production

123
7 - Fisheries
culture, rice-fish and other integrated fish/livestock/vegetable culture techniques using variousexotic and indigenous species. Although pond and rice-fish culture makes a limited contributionto total production, small-scale farming provides an important opportunity for poor householdsto improve nutrition and to generate cash income in fish-deficient areas farther from the TonleSap and other major rivers.
3.1.4 Lao PDR
Fish culture in ponds and rice fields is widely practised in Lao PDR, and a variety of systems areused, depending on the agro-climatic characteristics of the area. The attraction of aquaculture torural farmers is most obvious in locations where capture fisheries are inaccessible or requireexcessive effort for a limited catch. There is a small amount of cage culture in reservoirs andrivers, but this system presently makes only a small contribution to national production. Mostponds are hand constructed and shallow, with water depths of less than 50 cm. Low productivityfigures for aquaculture ponds reflect the limited amount of inputs applied, limited stocking offish seed and a short grow-out season. A diverse number of species are cultured, including exoticcarps and indigenous fish.
3.2 Factors impacting the sector
3.2.1 Availability of seed
The availability of good quality and healthy fishfingerlings is a pre-requisite for the developmentof aquaculture. The supply of seed foraquaculture has increased substantially in thepast 10 years, especially in Thailand andVietnam, where significant hatchery and nurserydevelopment has occurred, involving both thegovernment and private sector. In Cambodia andLao PDR, many ponds are not regularly stocked,one of the reasons being the lack of access oravailability of fish fingerlings, although withincreasing numbers of farmers and infrastructure,the market incentives and supply of seed willincrease. The widespread adoption of the ‘hapa’technology within the basin (the nursing of fryto large fingerling size in small net cages), hascontributed to the availability of largerfingerlings that are less vulnerable to predatorswhen stocked in ponds.
At least two billion fingerlings are used forproducing around 250,000 tonnes of aquacultureproduct within the basin.141 For aquaculture togrow, a significant expansion in hatchery andnursing capacity will be required. Thedevelopment of local small-scale hatcheries, “hapa’’ nursing, nursing and trading networks, and on-farm breeding has proved to be a catalyst for rural, small-scale aquaculture development. Furtherdevelopment of “hapa” nursing and nursing networks will therefore be essential to support
There are an estimated 5,000 fish cageoperations in the delta in Viet Nam
Fingerling fish ready for stocking

124
State of the Basin Report - 2003
aquaculture, particularly in areas lacking good infrastructure in Cambodia and Lao PDR. Withoutlocal networks, seed will be transported over large distances between watersheds, with attendantrisk of disease spread and genetic mixing of fish stocks.
The role of government and private sector investment in seed production centres needs to be carefullyanalysed in the context of development of effective genetic management and species strategies forthe basin.142
3.2.2 Availability of feed and fertilisers
Inputs come from on-farm and off-farm. Ricebran is an important ingredient in feed, butthere are other inputs, depending on localresources. These include vegetation,chemical fertilisers, human “night soil” andwaste from integrated livestock/vegetable/aquaculture systems. Geographically, off-farm inputs are more readily available in VietNam and Thailand. Fish farmers inCambodia and Lao PDR will have accessto more inputs as infrastructure develops andas markets for agricultural inputs (fertilisersand lime) expand. The infrastructure changesin these countries will gradually open moreoptions for pond inputs.
It is likely that more high-input aquaculture will develop near urban centres where there is a marketfor high priced products. In rural areas, however, low-intensity aquaculture, producing both forhousehold consumption and as a cash crop, will become increasingly important.143
3.2.3 Availability of water and land
Most of the small-scale aquaculture ponds in the basin are rainfed and therefore use of ponds andtheir success varies from year to year, depending on climate. The use of water is not likely to be aconstraint with rainfed ponds, unless there are dramatic changes in climate. In irrigated farmingareas, or where there are multiple users of water, other considerations may arise. Aquaculture canbe an efficient user of water, particularly when integrated with agriculture.
Ponds in several parts of the basin are faced with productivity problems due to poor and acidicsoils, and inappropriate management practices. In more ‘open’ farming systems such as cages, orthe culture of fish in rice fields, water pollution from various sources, including pesticides, is aconcern. The use of integrated pest management (IPM), which employs a variety of techniques, canreduce the need for pesticides and can benefit both rice and fish culture. In cage and pen culturelocated in publicly-accessible waters, more attention needs to be given to environmental managementand planning to ensure that water pollution is controlled and that water surface area is fairly sharedwith other users.
Overall, adequate land is available to support aquaculture development in the LMB. Rice land ormarginal land in rice growing areas is available in many parts of the basin for pond construction,although in some areas, such as the upland areas in Lao PDR, flat land is scarce and primarily usedfor rice cultivation. 144
Waste from livestock supplies feed for fish

125
7 - Fisheries
3.2.4 Habitat degradation
The Government of Viet Nam has identified1.8 million hectares of water surface suitablefor aquaculture. 145 However, freshwater andcoastal aquatic resources are under threat fromenvironmental degradation, over-exploitationand poor management practices.146
Construction of large prawn ponds in Viet Namand failed harvests caused by disease hasresulted in indebtedness. An estimated 75percent of the mangroves and 95 percent ofthe Melaleuca forests have been destroyed inViet Nam,147 although only a small part of thisfisheries habitat loss is attributable toaquaculture developments.
3.2.5 Disease
To date, the epizootic ulcerative syndrome (EUS) in the 1980s has been the only large-scale fishdisease outbreak in freshwater aquaculture in the region. However, it is likely that such problemswill increase in future with further expansion and intensification of aquaculture. Prawn aquaculturein the Mekong Delta has recently been plagued by major disease outbreaks. Intensive cage culturein the Mekong and Bassac Rivers, and in reservoirs in central Viet Nam, have suffered losses of fishduring the past five years. Low-level health problems are known to be a constraint in small-scalepond culture.
The infection of humans from liver flukes (trematodes) is a serious health concern in parts of theMekong Basin where raw fish is consumed. 148 Aquaculture can be a means to reduce infection oftrematodes, though it may also be a source of infection. In Lao PDR, trematode infection of wildfish occurs where rivers, streams and paddies are used as latrines. Ponds with over-hung latrines inthe Mekong Delta (a practice which is actually illegal) are still a major source of cultured fish, andalso a possible source of infection for humans. However, the risk factors and management strategiesrelating to these issues require further research.
3.2.6 Extension services
Aquaculture extension systems are well developed in Thailand, less so in Viet Nam, and quitelimited in Cambodia and Lao PDR. Within government agencies, there has been a tendency tofocus on peri-urban aquaculture (due to accessibility, private entrepreneur involvement, betteravailability of inputs and access to markets). Focusing government support on small-scale aquacultureand poorer rural households will provide a necessary balance to more commercially-orientedaquaculture. However, this has to be supported by skills development. 149
Flooded forests are crucial habitat for fish

126
State of the Basin Report - 2003
Because little research is conducted on theharvesting of aquatic animals other than
fish, their importance in insuring foodsecurity often goes unrecognised
4. Aquatic products from wetlands
The wetlands of the LMB are vital life support systems for communities throughout the region.They are responsible for providing a vast array of goods and services to the people in the region.Services are the ecological functions provided by wetlands such as habitats for fish and wildlife,support for the food chain, retention of water to prevent flooding, a trap for sediment, and purificationand replenishment of ground water. Goods are the plants and animals that people harvest for food,medicine, construction, household products and so on.
The goods from wetlands products are very significantfor the livelihoods of people in the Lower Mekong Basin.Most of the estimated 40 million rural peopleconcentrated along the Mekong River, its tributaries andrelated wetlands, are subsistence farmers obtaining theirlivelihoods through a combination of rice farming,fishing and foraging from nearby wetlands and forests.Besides supplementing their food supply, the harvestfrom wetlands supplies protein during the dry seasonwhen fish are less available and ensures food securityin years when the rice crop fails.
Isolated communities in the basin with limited access tomarkets and roads depend on locally-available flora astheir primary source of edible fruits, vegetables, fodderfor livestock, medicines and construction materials. Thuswetlands have been called the “poor man’s supermarket”.The abundance and diversity of species, plus theiravailability in different seasons, are crucial factors inproviding the “safety net” that increases rural foodsecurity. However, few people outside the basin areaware of the importance of harvesting these key aquaticresources.
4.1. Aquatic animals for food
Aquatic animals, other than fish, are sometimesconsidered “less serious” catches. This may be becausethe catching is usually the work of women and children.They use smaller fishing gear, and do their catchingand gathering around the edges of the lakes, seasonalwetlands, or in rice fields. Although the catches are “lowprofile”, added together they provide crucial foodsecurity for rural households through periods when otherfoods may be in short supply. The catch is mainly fordaily home consumption, but often the excess catch issold to obtain cash income.
Aquatic products are largelyharvested by women and children

127
7 - Fisheries
4.1.1. Molluscs – snails clams and mussels.
The Mekong is known to have a rich molluscan fauna(see Chapter 4). At least six species of bivalves and fourkinds of snails are commonly consumed in Lao PDR andother riparian countries.150 Snails are abundant in the dryseason around the edges of lakes or rice fields, and at thebeginning of the rainy season (May-June) when the fieldsare filled with new water. In the rainy season, snails comeout from their dry season refuge in the ground and can beseen and easily caught. A typical harvest at one time is 2-10 kg, enough for 2-5 family meals. The excess catch ofsmaller snails (hoi jeub), is sold in local markets whilelarger snails (hoi pang and hoi kong), which are morevaluable, are sold to traders or in the district market.
In Cambodia, the harvest of leah (bivalves) from naturallakes is very important for consumption and the localeconomy. The catch takes place when the water recedes,from November to April. Over 138 tonnes were caughtannually by 130 families in the three sampled villages near Beoung Thom Lake, Kompong ChamProvince. Leah is sold to village traders, with farm-gate earnings of between $90 and $180 for eachfamily every year. Leah is cheap and widely consumed with beer after being cooked by the sun, orstir-fried with herbs and eaten with rice.
4.1.2 Crustacea – shrimps and crabs.
Small freshwater shrimps (Macrobrachium spp.) are commonly caught in the shallow water aroundthe edges of lakes or ponds, as water recedes from November to March. Usually women andchildren engage in this catch, using hand nets or bamboo baskets. The catch is about 0.5-2 kg for 1-3 hours work. Shrimps may be caught daily or only once or twice per week, depending on thedistance of villagers from the source, and the availability of family labour. The estimated catches oflakeside communities range from 15 – 600 kg per year, amounting to up to $250 per family peryear.151 Shrimps are boiled or stewed with various vegetables or prepared as salad. Crabs are alsocommonly collected in rice fields and eaten. Commonly-eaten species apparently all belong to thegenus Somanniathelphusa and are known in Lao PDR by the common names pou na, poukhilek and pou hin.
Snails are abundant in the dry season,providing animal protein at a time when
fish are less plentiful
Small freshwater shrimp arecaught in shallow water at theedges of lakes andponds during thedry season

128
State of the Basin Report - 2003
4.1.3 Insects - water bugs, beetles and others
Insects are an important source of supplementaryprotein for local communities throughout the year,and more significantly, in the early dry season. Atleast 14 kinds of aquatic insects are known to beconsumed in Northeast Thailand and other LMBcountries.152 The most commonly eaten are giantwater bugs (Lethocerus indicus: Belostomatidae)or mangda (in Laotian and Thai), beetles (mainlyDystiscidae), dragonfly larvae (Odonata) (mang nioor mang rangum), and blackflies (Simuliidae).
Aquatic insects are mainly harvested in Novemberand December, as the water in rice fields and pondsdries up. Some insects are caught in water bodiesby women and children using a circular basket madeof bamboo, while flying adult insects are attracted by flourescent lamps fixed to poles and caughtwhen they land on a sheet of plastic beneath the light. Some insects are stewed with vegetables orgrilled in banana leaves with spices, while Simuliidae are used as an ingredient in soup.
Unlike other aquatic insects, mangda are used to flavor other foods, rather than eaten on their own.In Thailand, especially in the Northeast, where mangda are widely consumed, their essence isextracted and bottled for sale in local grocery stores. Due to the high levels of pesticides andfertilisers used in farming in Thailand, the catch of mangda has greatly declined in recent years andas a result, mangda are now an exported from Cambodia, through the border town of Poipet. At theborder, mangda are sold for $90 per kg (about 100 insects/kg). The mangda trade from Cambodiato Thailand is estimated to be several tonnes per year.
4.1.4 Amphibians - frogs and toads
Several species of frog are commonly consumed in the basin. Large frogs such as Hoplobatrachusrugalosa are hunted for domestic consumption and local trade. Frogs are most abundant and easilycaught in large quantities at the beginning of the rainy season, in May and June. Hunters use torchlights to search for frogs at night in the rain. In southern Lao PDR, the average catch is between 3-5 kg per night.153 The average rainy season catch (in 2-3 months) around Beoung Thom Lake is 20-30 kg/family/year, or 3.6 tonnes from the four villages surveyed. The excess amount is sold inneighbouring villages or markets at $0.75-1.00/kg, which is equal to one day’s wage for farm labourin Cambodia.154
Tadpoles are collected by methods similar to thoseused with the aquatic stages of insects. They arewidely consumed in Northeast Thailand, andconsidered a delicacy by city people. One kilogramsells for as much as $5 – two to three times theprice of fish.
Frogs are key sources of protein for rural familiesduring the peak of the dry season (March to May),when fish and other aquatic animals are scarce.Frogs hibernate in the dry season, and usually are
Mangda, large water insects, which are caughtin rice fields and wetlands in Cambodia are sold
at the Thai border for $90 per kilo
Frogs are an important source of animal proteinfrom March to May when fish are scarce

129
7 - Fisheries
caught in holes in rice fields, or on the edge of drying ponds or streams. Although the frog catch issporadic and much smaller than in the rainy season, together with snails and crabs, they provideimportant supplementary food for rural people throughout the dry season.
4.1.5 Reptiles - turtles, snakes and lizards
A number of snakes and turtles are hunted forconsumption or sold for food or medicine in localmarkets. In the past decade, income from theseanimals has increased as Cambodia, Lao PDR andViet Nam have adopted market economies.Bocourt’s watersnakes (Enhydris bocoti), puff-faced watersnakes (Homalopsis bacata), waterdragon (physignathus), reticulated phython(Phython reticulatus) and the Tonle Sapwatersnake (Enydris longicauda) are allcommonly hunted for food and trade. Turtles,which are sold for meat and for medicine, aremostly caught in Cambodia and Lao PDR, as wildstocks in other parts of Asia have diminished.
4.2. Aquatic plants as food
At least 20 kinds of aquatic plants are commonly harvested by basin residents for food, and somesurpluses are sold in local markets. These plants give fishers and farmers a supply of fresh vegetablesnearly all year round.
The tuber, stems, and seeds of lotus (Nelumbo nucifera) are collected and consumed basin-wide.Young seeds of lotus are sold fresh as snack food, and mature lotus seeds are processed into a sweetby glazing them with sugar. These are important commercially for communities around Tonle SapLake in Cambodia. Water hyacinth (Eichhornia crassipes) flowers are eaten fresh as salad or withsauce or paste made from fish. Young riang leaves (Barringtonia acutangula) are collected andcommonly eaten with a meal of fish and rice, or as a condiment in noodle soup. Throughout thebasin, water morning glory (Impomoea aquatica) is the most frequently consumed aquatic vegetable.
In seasonally-flooded areas along theSongkram River and its tributaries,bamboo shoots are of significant value,both for food and for income generation.This harvest is 200-500 kg/family/year.For rural households in this area, bambooshoots and other wetland productscontribute more food and income thanrice production. Each year, tonnes offresh and canned bamboo are sold in bothlocal and regional markets. Canning andtrade in bamboo shoots are the mainincome generation activity undertaken byseveral women’s groups and villagecooperatives in the Songkram Basin.
Water hyacinth is eaten as a vegetable and alsofed to livestock
Turtles are sold for meat and medicine

130
State of the Basin Report - 2003
Water morning glory, water lily and water hyacinth are the most commonly-consumed plants inCambodia. About 400-700 bunches of these vegetables, worth around $35, are collected per familyper year by Boeung Thom lakeside communities. Wild plants comprise about half the total vegetableconsumption in many rural communities in the basin.155
Other commonly consumed wild plants include water cress (Neptunia oleracea), water chestnut(Trapa bicornis), aquatic fern (Ceratoperis thalictroides), pak waen (Marsilliaceae), and bon(Colocasia).
4.3 Aquatic plants as animal feed
Fodder plants for local livestock are also important,in particular in Cambodia and Lao PDR. Assortedplants such as Utricularia, Eichchornia, Lemna,Ludwigia, and Rhynchospora are harvested and fedto ducks, cows and pigs. A water fern, Salviniacucullata and water cabbage (Pista strattiotes) areboiled and fed to pigs and poultry. In the floatingvillages of the Tonle Sap, pigs as well as their ownerseat floating plants most of the year.
4.4. Aquatic plants for non-food uses
In addition to their use as food sources for peopleand domesticated animals, plants are harvested for avariety of other essential uses.
4.4.1. Medicinal plants
Mcdonald and Veasna156 recorded the use of 35 species of wetland plants for medicinal purposes inthe community of Prek Sramaoch on Tonle Sap Lake. Medical uses include the elimination ofparasites (Diospryos spp.), the reduction of fevers (Heliotropium indicum, Ludwigia dscendens,and Quisquallia indica) and as an anti-inflammatory (Stenocaulon kleninii). Uses of particularplants seem to be widely known, confirming old traditions of use of medicinal plants.
4.4.2 Firewood
Most rural communities in Lao PDR, Cambodia andViet Nam depend solely on charcoal and firewoodfor their heating and cooking needs. Firewood is alsoneeded for processing rice wine, smoking fish,making rice noodles, processing palm sugar andboiling aquatic plants/rice bran for pig and poultryfeed. Lowland communities, such as those inCambodia and in the Viet Nam Delta, cut theirfirewood primarily from wetland shrubs and treesand have done so for many years. Firewood fromthe highlands is of better quality, but is expensivebecause of transportation costs.
Along with fisheries, changes in water flowscould also reduce the abundance of
aquatic vegetables
Most rural people use firewood for cooking
130

131
7 - Fisheries
Wetland plants are used for many householdpurposes, including making fish traps
Fourteen plant species from secondary scrubland provide most of the firewood for local communitiesaround the Tonle Sap Great Lake. Particular species are usually preferred for special uses. Forexample toau (Terminalia cambodiana) is preferred by veteran fish smokers because of the aromait gives to the fish.157
In the Boeung Thom area, household cooking consumed an average of 8-10 m3 meters of firewoodper family per year. Additionally, about 5 percent of all households from villages within 10 km ofthe lake carry out small processing activities requiring wood. About 90 percent of this firewooddemand is supplied by shrubs and trees from Boeung Thom flooded forest.158
The annual firewood supply from Beoung Thom flooded forest is estimated to be 62,000 m3/yearfor nearby communities, with a value of over $150,000. The cost to lowland families if they had tobuy highland firewood would be about $40 per household per year – a very high amount for familieswhose annual income is usually less than $300 per year.
4.2.3 Materials for construction tools and crafts
Native plants from wetlands provide materials for houseposts, floor planks, roof thatching, beam ties, etc.Diospyros Cambodiana (ptual) is preferred for housestilts and posts. Impomoea obscura, Stenocaulon kleiniiand Derris laotica are used in tying beams off, securingroof thatching, and fixing fish traps and nets.
Poorer villagers close to the shores of Beoung ThomLake use sedge (coarse marsh grasses) harvested fromalong lakeshore streams and channels for roofing andwalling their houses. A 4 x 5 metre house uses up to15 m3 of sedge for a roof and walls, which must bereplaced every two years.
Stems and branches of wetland plants also provide otherbasic rural household goods and farming tools,including handles for knives, axes, hoes, spades, rakes,sickles, ploughs and harrowing tools. Strings madefrom sedge are widely used to tie newly-harvestedbundles of rice stems before they were transportedhome for drying and threshing.
Stems and branches of wetland trees and shrubs are alsoused for making pig stables, chicken houses and fences for home vegetable gardens. Branches arecommonly used to make supports in gardens for climbing plants such as cucumbers, string beans andwax gourds. Barringtonia branches are piled up in the shallows of lakes to make brush parks forfishing (samrah). This tangle of submerged branches can later be fenced and the fish easily caught.This method of fishing is, however, illegal in some Lower Mekong countries.
Water hyacinth and sedges are also used by many rural families to produce craft items for incomegeneration. These plants are harvested and dried, and their dyed fibre used to make craft items.The softer and finer fibre of water hyacinth is woven into accessories such as hats, wallets,purses, jewellery boxes, and baskets. The durable fibre of sedge is woven to make floor andplace mats.
7 - Fisheries
131

132
State of the Basin Report - 2003
The processing and selling ofthese crafts provides jobs andsupplementary income for ruralwomen and children in the dryseason. With the growth of tourism,making crafts from wetland productsis becoming an increasinglyimportant source of income,especially in Cambodia and VietNam. Nearly 50 percent of familiesin some villages near wetlandsengage in mat weaving, producingabout 30-100 mats per family perseason. The farm gate price for a 1x 2 m mat made from sedge is $1-3,with round sedge products earning the higher price. Remote villages residing close tolakes depend on these crafts to supplement their earnings from fishing, and they areespecially important in supplementing income for villages with limited land holdings.
5. Conclusion
The Mekong River and its many sub-basins constitute an extremely diverse and complex ecosystem,which is highly dynamic in time and space. This combination has created one of the most diverse fishcommunities in any river system in the world. The ecology of the many fish species is intimatelylinked to the hydrology of the system. Fish are still abundant and the stocks are healthy, due to arelatively unpolluted and intact environment with no dams on the mainstream outside China. TheLower Mekong River Basin, with 1.5 million tonnes of fish landed annually, still sustains one of thelargest freshwater capture fisheries in the world, providing food and employment for many of the 55million people living in the basin.
A rapidly growing population means more mouths to feed. Increasing fishing pressure has contributedto the decline of the large and slow-growing species. They are gradually being replaced in thefishery by small, fast-growing opportunists that mature sexually after one year. Looking across allfisheries, it appears the total catch is probably close to being fully exploited so further expansion offishing will become increasingly problematic.
In spite of an impressive expansion in aquaculture over the last decade, it is not a substitute forcapture fisheries. It does, however, have an important role in providing food and income for ruraldwellers, particularly those remote from the rivers and their fisheries. Aquaculture of exotic speciesposes some threats to natural stocks of fishes, if the exotic species happen to establish reproducingpopulations in the natural environment. Some aquaculture systems are based on the collection of fryfrom capture fisheries, as well as the supply of fish as food for the cultured fish. Unlimited frycollection and the use of fish as a feed source in aquaculture are not in the best interests of thefisheries or the people dependent on them.
While at the macro level, development of the Mekong’s water and related resources could benefitnational economies and the economy of the region, if not well planned and carefully managed, itcould also significantly impact the wetlands upon which rural people heavily depend, both for foodsecurity and for their livelihoods.
Women earn important cash income from makinghousehold products and crafts

133
7 - Fisheries
Endnotes
1 Rainboth 19962 Sjorslev in prep.3 Van Zalinge et al. 20004 Baran et al. 20015 Hoggarth et al. 19996 Junk et al. 19897 Hogarth et al. 19998 Welcomme 19859 Poulsen 2000; Poulsen and Valbo-Jorgensen 2000; Boakhamvongsa and Poulsen 200110 Poulsen and Valbo-Jorgensen 200011 Chanh et al. 200012 MRC 199713 Poulsen and Valbo-Jorgensen 200114 Coates et al. 200115 Poulsen and Valbo-Jørgensen 200016 MRC 2003a17 Van Zalinge et al. 200018 Poulsen and Valbo-Jørgensen 200019 Coates et al. 200120 Poulsen and Valbo-Jørgensen 200021 Coates 200122 Northcote 198423 www.FishBase.org July 200224 MRC 2003b25 Coates 200126 Kottelat 2000; Mattson et al. 200227 Kottelat 200128 Groombridge and Jenkins 199829 Coates 200130 Bardach 195931 Bardach 195932 Bardach 195933 Coates et al. 200134 Bardach 195935 Sverdrup-Jensen 200236 Van Zalinge et al. 200037 Mattson et al. 200238 Rainboth 199639 Sverdrup-Jensen 200240 Lao PDR 200041 Van Zalinge et al. 200142 Coates 200143 Ahmed et al. 199844 Sverdrup-Jensen 2002; Sjorslev in prep.45 Sjorslev in prep.46 Sjorslev in prep.47 Sjorslev in prep.48 Sjorslev in prep.

134
State of the Basin Report - 2003
4 9 Van Zalinge 20025 0 Phillips 200251 Virapat and Mattson 2001; Mattson 2002, personal communication, February 200252 MRC 1997, MRCS 199753 Coates 200154 FAO 200055 Phillips 200256 Aeron-Thomas in prep.57 Kenefick 199958 Guttman 199959 Sjorslev in prep.60 Tickner 1996 in Guttman 199961 Garrow and James 199362 Hansen et al. 199863 Jensen 200164 Hansen et al. 199865 Roos et al. 1998; Roos et al. 199966 Van Zalinge et al. 200067 Lieng et al 199568 Van Zalinge et al. 200169 Yin et al. 200070 Schouten in press71 Mekong Secretariat 199272 Trong et al. 200273 Sverdrup-Jensen 200274 Schouten in press75 McCormack 2001; Chapman and He undated76 Hori 200077 World Commission on Dams 200078 Schouten in press79 Schouten in press80 Baird et al. 200181 Schouten in press82 Schouten in press83 Rainboth 199684 Van Zalinge et al. 200185 Baran et al. 200186 Roberts 1995; Sverdrup-Jensen 200287 Poulsen and Valbo-Jørgensen 200088 Baird and Flaherty 2000; Poulsen and Valbo-Jørgensen 200089 FAO 200090 Troeung Rot 2000; Van Zalinge et al. 200191 Baran et al. 200192 Degen et al. 200093 Baran et al. 200194 Deap Loeung personal communication February 200295 Claridge et al. 199796 Baran et al. 200197 Van Zalinge et al. 200198 based on analysis of data provided to the author by Ian Baird99 Sverdrup-Jensen 2002

135
7 - Fisheries
1 0 0 Baran et al. 2001101 Van Zalinge et al. 2000102 Van Zalinge et al. 2000103 Hoggarth et al. 1999104 Degen et al. 2001105 Van Zalinge et al. 2000106 Sverdrup-Jensen 2002107 MRC 1997108 Anon. 2001109 Roberts 2001110 Kottelat 2001111 Van Zalinge et al. 2001112 MRC 2003a113 Van Zalinge 2001114 Trong et al.. 2002115 Trong et al.. 2002116 Ngor 1999; Van Zalinge et al. 2002117 Welcomme and Vidthayanon 2000118 Vidthayanon and Kottelat 1995119 Welcomme and Vidthayanon 2000120 Kottelat and Whitten 1996; Rainboth 1996; Welcomme and Vidthayanon 2000121 Coates 2001122 Roberts 1993; TV News, Channel 9, Thailand April 22nd, 2002123 Mekong Secretariat 1997124 MRC 1994 in Schouten in press125 CEDAC 2001 in Schouten in press126 In et al. 1999127 Touch 1996128 Phillips 2002129 Sverdrup-Jensen 2002130 Phillips 2002131 Phillips 2002132 Le 2001133 Phillips 2002134 Phillips 2002135 Trong et al. 2001136 Trong et al. 2001137 Trong et al. 2001138 Dr. Nguyen Van Hao, Research Institute for Aquaculture No. 2, Ho Chi Minh City, personnel
communication, February 2002139 Phillips 2002140 Phillips 2002141 Phillips 2002142 Phillips 2002143 Phillips 2002144 Phillips 2002145 Le 2001146 DFID 2000147 Le 2001148 WHO 1999149 Phillips 2002

136
State of the Basin Report - 2003
1 5 0 Campbell and Parnrong 2000; Claridge 1996.151 Juntopas 2000.152 Buri 1978, Campbell and Parnrong 2000; Claridge 1996; Sangpradub 1982.153 Claridge 1996.154 Juntopas 2000.155 Juntopas 2000156 McDonald and Veasna 1996.157 McDonald and Veasna 1996.158 Juntopas 2000.

137
7 - Fisheries
References
Aeron-Thomas, M. In prep. Strategies for the assessment of the economic value of capture fisheries.Consultancy report for the Fisheries Implementation Programme of the Mekong RiverCommission, Phnom Penh.
Ahmed, M., H. Navy, L.Vuthy & M. Tiongco. 1998. Socio-economic assessment of freshwater capturefisheries in Cambodia. Report on a household survey. Mekong River Commission, Phnom Penh.
Anon. 2001. Environmental impact assessment of the Mekong River Channel Improvement Project(MKRCIP); A report to the Lao PDR National Mekong Committee. Mekong River Commission,Phnom Penh.
Baird, I. G. & M. S. Flaherty. 2000. Local waters, international markets: a review of the sustainabilityof a Mekong River Probarbus fishery in Southern Laos, CESVI, Pakse, Lao PDR.
Baird, I. G., M. S. Flaherty & B. Phylavanh. 2000. Rhythms of the river: lunar phases and smallcyprinid migrations in the Mekong River. Technical report prepared for the Environmental Protectionand Community Development in Siphandone Wetland Project, CESVI, Pakse, Lao PDR. 23 pp.
Baird, I., Z. Hogan, B. Phylavanh & P. Moyle. 2001. A communal fishery for the migratory catfishPangasius macronema in the Mekong River. Asian Fisheries Science 14: 25-41.
Baran, E., N. van Zalinge, P. B. Ngor & D. Coates. 2001. Fish resource and hydro-biological modelingapproaches in the Mekong Basin. ICLARM, Penang, Malaysia and the Mekong River CommissionSecretariat, Phnom Penh. 61 pp.
Bardach, J. 1959. Report on fisheries in Cambodia. USOM/Cambodia, Phnom Penh. 80 pp.
Bouakhamvongsa, K. & A. F. Poulsen. 2001. Fish migration and hydrology in the Mekong River. p.114-121. In: Matics, K. I. Editor. Proceedings of the Third Technical Symposium on MekongFisheries, 8-9 December 2000.
Buri, P. 1978. On some edible aquatic flora and fauna of northern Thailand – their morphology,ecology, distribution and their utilization. Natural History Bulletin of the Siam Society. 27:1-22.
Campbell, I. 2002. The Mekong River – water, people and fisheries in a politically complex riverbasin. Mekong River Commission, Phnom Penh. 15 pp.
Campbell, I.C. and Parnrong, S. 2000. Limnology in Thailand: present status and future needs.Verhandlungen der Internationale Vereinigung fur Theoretische und Angewandte Limnologie.27:2135-2141
Chanh, S., C. K. Chhuon & J. Valbo-Jorgensen. 2000. Lateral fish migration between Tonle SapRiver and its floodplain. p. 102-113. In: Matics, K. I. Editor. Proceedings of the Third TechnicalSymposium on Mekong Fisheries, 8-9 December 2000.
Chapman, E. C. & D. He. Undated. Downstream implications of China’s dams on the LancangJiang (upper Mekong) and their potential significance for greater regional cooperation, basin-wide.Accessed at http://www.anu.edu.au/asianstudies/mekong/dams.html, February 2002.

138
State of the Basin Report - 2003
Claridge, G.F, Compiler. 1996. An inventory of Wetlands of Laos PDR. IUCN. Bangkok.
Claridge, G., T. Sorangkhoun & I. Baird. 1997. Community fisheries in Lao PDR: a survey of techniquesand issues. Technical Report 1. IUCN – The World Conservation Union, Vientiane. 69 pp.
Clark, R. B. 1989. Marine pollution. Clarendon Press, Oxford, UK. 220 pp.
Coates, D. 2001. Biodiversity and fisheries management opportunities in the Mekong River Basin.“Blue millenium - managing global fisheries for biodiversity.” GEF-IDRC. 3-7 July 2001. WorldFisheries Trust, Victoria, Canada. CD Rom.
Coates, D., A. F. Poulsen & S. Viravong. 2000. Governance and transboundary migratory fishstocks in the Mekong River Basin. Paper presented at the MRC Third Fisheries Technical Symposium.Mekong River Commission, Phnom Penh, Cambodia, 8-9th December 2000.
Deap, L. & N. P. van Zalinge. Editors. 1998. Catch statistics of the Cambodian freshwater fisheries.MRC/DOF/Danida Project for the management of the freshwater capture fisheries of Cambodia.Mekong River Commission, Phnom Penh.
Degen, P., F. van Acker, N. van Zalinge, T. Nao & L. Deap. 2000. Taken for granted: conflicts overCambodia’s freshwater fish resources. Presentation at 8th IASCP Conference, Bloomington, Indiana,USA. 31 May – 4 June 2000.
DFID. 2000. Poverty and aquatic resources in Viet Nam: an assessment of the role and potential ofaquatic resource management in poor people’s livelihoods. DFID, Bangkok. 36 pp.
Dubeau, P., P. Ouch & J. Sjorslev. 2001. Estimating fish and aquatic animal productivity/yield perarea in Kampong Tralach: an integrated approach. p 20-43. In: Matics, K. I. Editor. Proceedings ofthe Third Technical Symposium on Mekong Fisheries, 8-9 December 2000. Mekong ConferenceSeries No. 1
FAO. 1993. Report of the expert consultation on utilization and conservation of aquatic geneticresources, 9-13 November, 1992. Grottaferrata, Italy. FAO Fisheries Report 491. FAO. Rome. 58 pp.
FAO Fisheries Development Staff. 2001. Aquaculture and inland fisheries: fact sheet. FAOAquaculture Newsletter, July 2001. 27:18-27.
FAO. 2000. The state of world fisheries and aquaculture 2000. FAO, Rome. 142 pp.
Garrow, J. S. & W. P. T. James. Editors. 1993. Human nutrition and dietetics, 9th ed. ChurchillLivingstone, Edinburgh.
Groombridge, B. & M. Jenkins. 1998. Freshwater Biodiversity: a preliminary global Assessment.WCMC – World Conservation Press, Cambridge, UK. 104 pp.
Guttman, H. 1999. Rice fields fisheries - a resource for Cambodia. Naga, The ICLARM Quarterly,22 (2):11-15.
Hansen, M., S. H. Thilsted, B. Sandstrom, K. Kongsbak, T. Larsen, M. Jensen & S. S. Soerensen.1998. Calcium absorption from small soft-boned fish. Journal of Trace Elements Medical Biology,12:148-154.

139
7 - Fisheries
Haylor, G. 2001. Report of the email conference on poverty and aquatic resources. Aquatic ResourcesManagement Programme. DFID South East Asia, Bangkok.
Hoggarth, D. D., V. J. Cowan, A. S. Halls, M. Aeron-Thomas, J. A. McGregor, C. A. Garaway, A. I.Payne & R. L. Welcomme. 1999. Management guidelines for Asian floodplain fisheries. Part 1: aspatial hierarchical and integrated strategy for adaptive co-management. FAO Fisheries TechnicalPaper 384/1. FAO. Bangkok. 63 pp.
Hori, H. 2000. The Mekong, environment and development. United Nations University Press. Tokyo.398 pp.
In, M., I. H. Nakata, S. Tanabe & S. T. Touch. 1999. Persistent organochlorine residues in marineand freshwater fish in Cambodia. Marine Pollution Bulletin, 38 (7):604-612.
Jensen, J. 2001. Traditional fish products: the milk of Southeast Asia. Mekong. Catch and Culture,6 (4):1-4 & 16.
Junk, W. J., P. B. Bayley & R. E. Sparks. 1989. The flood pulse concept in river-floodplain systems.In: Dodge, D. P. Editor. Proceedings of the International Large River Symposium. Can. SpecialPublication Aquatic Science, 106:110-127.
Juntopas, M. Editor. 1999. The Findings Report of Beoung Thom Wetland Socio-economic Survey.The Inventory and Management of Cambodia Wetlands Project. Mekong River Commission.Phnom Penh.
Kenefick, E. 1999. Report on the Cambodian joint UNICEF-WFP baseline survey of CASD projectand WFP target areas. UNICEF and WFP in collaboration with the Royal Government of Cambodia,Ministry of Planning, Phnom Pehn.
Kottelat, M. 1989. Zoogeography of the fishes from Indochinese inland waters with an annotatedcheck-list. Bulletin of the Zoölogical Museum University of Amsterdam, 12 (1):1-55.
Kottelat, M. 2000. Diagnoses of a new genus and 64 new species of fishes from Laos (Teleostei:cyprinidae, balitoridae, bagridae, syngnathidae, chaudhuriidae and tertraodontidae). Journal of SouthAsian Natural History, 5 (1): 37-82, 73 figs.
Kottelat, M. 2001. Fishes of Laos. Wildlife Heritage Trust, Colombo. 198 pp.
Kottelat, M. & T. Whitten. 1996. Freshwater biodiversity in Asia with special reference to fish.World Bank Technical Paper 343. The World Bank, Washington, D.C. 59 pp.
Lao PDR. 2000. Agricultural census, 1998/99. Steering Committee for the Agricultural Census.Agricultural Census Office. Vientiane.
Le, T. L. 2001. Sustainable aquaculture for poverty alleviation (SAPA): a new rural developmentstrategy for Viet Nam - Part 1. FAO Aquaculture Newsletter, July 2001. 27:12-17.
Lieng S., C. Yim & N. P. van Zalinge. 1995. Freshwater fisheries in Cambodia, 1: the Bagnet (Dai)fishery in the Tonle Sap River. Asian Fisheries Science, 8:255-262.

140
State of the Basin Report - 2003
Mattson, N. S., K. Buakhamvongsa, N. Sukumasavin, T. Nguyen, & V. Ouk. 2002. Mekong giantfish species: on their management and biology. MRC Technical Paper No. 3, Mekong RiverCommission, Phnom Penh. 29 pp.
McConnell, S. K., J. S. Fielding, D. Skibinski, & G. C. Mair. 2001. An example of the use ofgenetic markers. In: MRC/FAO. 2001. Strategies for genetic resource identification and managementin the Mekong River Basin. Mekong River Commission Secretariat. Phnom
McCormack, G. 2001. Water margins: competing paradigms in China. Critical Asian Studies, 33(1):5-30.
McDonald, A. & S. Veasna 1997. Plant Communities of Tonle Sap Floodplain: Final Report incontribution to the nomination of Tonle Sap as a Biosphere Reserve for UNESCO’s Man in theBiosphere Programme. UNESCO. Phnom Penh.
MRC. 1997. Mekong River Basin diagnostic study final report. Mekong River Commission, Bangkok.
MRCS. 1997. Inventory and management of the wetlands in the Lower Mekong Basin: Phase 1.Final Report January 1990 – June 1996. Mekong River Commission Secretariat, Bangkok.
MRC. 2002. The Mekong fisheries, status and perspectives. Mekong River Commission, PhnomPenh. 90 pp.
MCS. 1992. Review of the Fishery Sector in the Lower Mekong Basin, Main Report, Annexes.Interim Committee for Coordination of Investigations of the Lower Mekong Basin Secretariat,(Mekong Committee Secretariat), Bangkok.
MRCS. 1997. Mekong River Commission water quality monitoring network, data of water qualityin Lao PDR. Mekong River Commission Secretariat, Bangkok.
MRC. 1997. Mekong River Basin diagnostic study. Final Report. Mekong River Commission,Bangkok.
MRC. 2003a. Fish Migrations in the Mekong River Basin. CD produced by the Mekong RiverCommission, Phnom Penh.
MRC. 2003b. Mekong fish database, version 2002. CD-ROM, Mekong River Commission, PhnomPenh. MRC 2003b.
Nam, S. 2000. Mekong River flow data analysis. p. 23-29. In: Van Zalinge, N., T. Nao & S. Lieng.Editors. Management aspects of Cambodia’s freshwater capture fisheries. Mekong RiverCommission, Phnom Penh.
Ngor, P. B. 1999. Catfish fry collection in the Mekong River of Kandal/Phnom Penh. p. 124-134.In: Van Zalinge, N., T. Nao & L. Deap. Editors. Present status of Cambodia’s freshwater capturefisheries and management implications. Mekong River Commission. Phnom Penh.
Northcote, T.G. 1984. Mechanisms of fish migration in rivers. p. 317-355. In: McCleave, J. D., G. P.Arnold, J. J. Dodson & W. H. Neill. Editors. Mechanisms of migration in fishes. Plenum Press. NewYork, USA.

141
7 - Fisheries
Phillips, M. 2002. Freshwater aquaculture in the Lower Mekong Basin. MRC Technical Paper No.6. Mekong River Commission, Phnom Penh. 62 pp.
Poulsen, A. F. 2000. Fish migration and hydrology – how the fishers see it. Catch and Culture, 6(1):4-5.
Poulsen, A. F. & J. Valbo-Jorgensen. Editors. 2000. Fish migrations and spawning habits in theMekong mainstream – a survey using local knowledge. Assessment of Mekong Fisheries: FishMigrations and Spawning and the Impact of Water Management Project (AMFC). Vientiane. 132 pp.
Poulsen, A. F. & J. Valbo-Jorgensen. 2001. Deep pools in the Mekong River. Catch and Culture, 7(1):1 & 8-9.
Poulsen, A., P. Ouch, S. Viravong, U. Suntornratana & T. T. Nguyen. 2002. Deep pools as dryseason habitat in the Mekong River Basin. MRC Technical Paper No. 4. Mekong River Commission,Phnom Penh. 24 pp.
Rainboth, W. J. 1996. Fishes of the Cambodian Mekong. FAO species identification field guide forfishery purposes. FAO, Rome, 27 colour plates, 265 pp.
Roberts, T. R. 1993. Just another dammed river? Negative impacts of Pak Mun Dam on fishes of theMekong Basin. Natural History Bulletin of the Siam Society, 41:105-133.
Roberts, T. R. 1995. Mekong mainstream hydropower dams: run-of-the-river or ruin-of the river?Natural History Bulletin of the Siam Society, 43:9-19.
Roberts, T. R. 2001. Killing the Mekong: China’s fluvicidal hydropower and navigation developmentscheme. 29 pp.
Roos, N., Md. M. Islam, S. H. Thilsted, M. Ashrafuddin, M. Mursheduzzaman, D.M. Mohsin & A.B. M. Shamsuddin. 1999. Culture of mola (Amblypharyngodon mola) in polyculture with carps –experience from a field trial in Bangladesh. Naga, The ICLARM Quarterly, 22 (2):16-19.
Roos, N., S. H. Thilsted, M. A. Wahab & M. M. Islam. 1998. Nutritional impact of culture of smallindigenous fish species in seasonal ponds, Bangladesh. Book of Abstracts. The Fifth Asian FisheriesForum: 199.
Sangpradub, N. 1982. Edible invertebrates in the northeastern part of Thailand. Biology Department,Chulalongkorn University, Bangkok. M.Sc. Thesis
Schouten, R. In press. Threats to healthy fisheries in the Lower Mekong Basin. MRC TechnicalPaper, Mekong River Commission, Phnom Penh.
Sjorslev, J. G. In prep. Assessment of consumption of fish and aquatic animals in the Lower MekongBasin. Mekong Development Series, Mekong River Commission, Phnom Penh. 35 pp.
Smith, J. D. 2001. Biodiversity, the life of Cambodia – Cambodian biodiversity status report 2001.Cambodia biodiversity enabling activity. Phnom Penh. 244 pp.
Soukhaseum, V., C. Soulignavong, B. Saadsy & T . J. Warren. 2000. Migration studies and CPUEdata collection in southern Lao PDR. The Living Aquatic Resources and Research Center (LARReC),Vientiane.

142
State of the Basin Report - 2003
Sverdrup-Jensen, S. 2002. Fisheries in the Lower Mekong Basin: status and perspectives. MRCTechnical Paper No. 6, Mekong River Commission, Phnom Penh. 95 pp.Touch, S. T. 1996. Water quality impact on the fisheries and aquaculture of Cambodian freshwatersystems. Water Report, 1996. 38-41 pp.
Troeung, R. 2000. Status of the inundated forest in fishing lot #2, Battambang Province, Cambodia.Paper presented at the MRC Third Fisheries Technical Symposium. Mekong River Commission,Phnom Penh, 8-9th December 2000.
Trong, T. Q., V. H. Nguyen & D. Griffiths. 2001. Aquaculture status in the Mekong Delta of VietNam. Rural Extension for Aquaculture Development, Cai Be, Viet Nam. 2 pp.
Trong, T. Q., V. H. Nguyen & D. Griffiths. 2002. Status of pangasiid aquaculture in Viet Nam.Mekong River Commission Secretariat, MRC Technical Paper No. 2. Mekong River Commission,Phnom Penh. 16 pp.
Van Zalinge, N., S. Lieng, P. B. Ngor, K. Heng & J. Valbo-Jorgensen. 2002. Status of the MekongPangasianodon hypophthalmus resources with special reference to the stock shared betweenCambodia and Viet Nam. MRC Technical Paper No. 1. Mekong River Commission, Phnom Penh.29 pp.
Van Zalinge, N. & T. Nao. 1999. Present status of Cambodia’s freshwater capture fisheries andmanagement implications. p. 11-20. In: Proceedings of the Annual meeting of the Department ofFisheries of the Ministry of Agriculture, Forestry and Fisheries, 19-21 January 1999. Mekong RiverCommission and the Department of Fisheries, Phnom Penh.
Van Zalinge, N., T. Nao & N. Sam. 2001. Status of the Cambodian inland capture fisheries sectorwith special reference to the Tonle Sap Great Lake. p. 10-17. In: Inland Fisheries Research andDevelopment Institute of Cambodia (IFReDI), Technical Paper Series 3. Phnom Penh.
Van Zalinge, N., T. Nao, S. T. Touch & L. Deap. 2000. Where there is water, there is fish? Cambodianfisheries issues in a Mekong River Basin perspective. p. 37-48. In: Ahmed, M. & P. Hirsch. Editors.Common property in the Mekong: issues of sustainability and subsistence. ICLARM Studies andReviews, 26.
Vidthayanon, C. & M. Kottelat. 1995. First record of Abbottina rivularis (Cyprinidae: gobioninae)from the Mekong Basin. Japanese Journal of Ichthyology, 41: 463-465.
Virapat, C. & N. Mattson. 2001. Inventory of reservoir fishery resources in Thailand. In: De Silva,S. S. Editor. Reservoir and culture-based fisheries: biology and management. Proceedings of aninternational workshop held in Bangkok, Thailand from 15-18 February 2000. ACIAR ProceedingsNo. 98. 384 pp.
Welcomme, R.L. 1985. River fisheries. FAO Fish. Technical Paper 262. FAO. Rome. 230 pp.
Welcomme, R. L., & C. Vidthayanon. 2000. The impacts of introductions and stocking of exoticspecies in the Mekong Basin and policies for their control. Mekong River Commission FisheriesProgramme, Management of Reservoir Fisheries in the Mekong Basin II, Component Report 4.Vientiane. 69 pp.

143
7 - Fisheries
World Commission on Dams. 2000. Dams and development: a new framework for decision-making. Earthscan Publications, London, UK. i-xxxvii + 404 pp.
World Health Organisation. 1999. Food safety issues associated with products from aquaculture.Report of a joint FAO/NACA/WHO study group. WHO Technical Report Series 883. Geneva.
Yin D., V. Ly, L. H. Prak, T. Olsen & P. Degen. 2000. Time allocation of fisher-farmer householdsin Phlong Village, in fishing lot #14, Kampong Chhnang Province. p. 167-176. In: Matics, K. I.Editor. Proceedings of the Third Technical Symposium on Mekong Fisheries, 8-9 December 2000.Mekong Conference Series No. 1, Mekong River Commission, Phnom Penh.

144
State of the Basin Report - 2003

145
8 - Agriculture
Agriculture 8
The agriculture sector is of criticalimportance to the economic lives ofthe people of the Lower MekongBasin (LMB) as well as to theenvironmental well-being of theregion. Agricultural activitiesprovide the livelihoods of themajority of the basin’s populationand comprise, arguably, the mostimportant use of, and pressure upon,natural resources. Over 40 percentof the basin’s land area is devotedto agriculture, and there areimportant interconnections betweenthe ongoing expansion of theagricultural cultivation area and landuse change, especially deforestation.1 In terms of water use, irrigation – either through the storageof receding flood waters at the end of the rainy season or the diversion of water from rivers andstreams – comprises approximately 80 to 90 percent of all water abstractions in the basin.2 Yieldsfrom crop production in the LMB are generally low by international standards, and there is scopefor increasing the scale, intensity and efficiency of production. Such changes could significantlyenhance rural incomes and national macroeconomic performance. Increasing commercialisationof production, expansion and intensification of irrigation and the diversification of rice-basedproduction systems into alternative crops with greater financial returns, are all important trendsin this direction. These trends are, however, progressing at very different speeds across the variousregions of the basin. Furthermore, increasing agricultural production could come at the cost ofgreater pressure on both land and water resources. There is the possibility of harmful feedbackcycles where poorly managed agricultural expansion could undermine the long-term sustainabilityof the sector. Poorly managed agricultural development could have negative implications forfuture agricultural activities, as well as other forms of land and water use.
Unlike most of the chapters in this report, agricultural statistics were available at a basin level.Thus most of the data in the tables that follow are only for areas of Thailand and Viet Nam that liewithin the basin. Because almost all of Cambodia and Lao PDR lie within the basin, national-level data have been used for these countries. In those few tables where only national level datawere available for Thailand and Viet Nam, this has been indicated with the symbol * in a notebelow the table.
Rice yields range from 5 tonnes per hectare in the MekongDelta to 1.5 tonnes in upland, rainfed areas

146
State of the Basin Report - 2003
1. Economic importance of agriculture and forestry
Agriculture is the single most import economic activity in the Lower Mekong Basin. Overall, 75percent of the region’s population is estimated to be dependent upon agricultural crops, fisheries,livestock or forestry, but the picture varies considerably between countries.3 The tables below showthe contributions of the sector to GDP and exports in the four LMB countries.
a For Viet Nam, figures for livestock are aggregated with those for crops.
The differences between the countries reflect varying levels of industrialisation. Agriculture and forestrycontribute considerably less to total economic output in Thailand and Viet Nam than in Cambodia orLao PDR. The relative importance of agriculture decreased in all four countries over the 1990s, but todiffering degrees. The change was most pronounced in Viet Nam, which industrialised rapidly duringthis period, and was least dramatic in Thailand’s Northeast Region, where the major economictransformations had begun earlier. Also, the available figures for Viet Nam are for the country aswhole, and understate the importance of agriculture in the basin region, particularly in the MekongDelta, where a major part of the nation’s rice is grown. Breakdowns for 1998 put the contribution ofagriculture to regional GDP at 55 percent for the delta and 70 percent for the Central Highlands.4 Thatyear the 12 provinces within the delta produced rice, cash-crops, and aquaculture products thatcontributed 51.9 percent of total production for the country and exports worth an estimated $1.36million.5 Furthermore, despite the decreasing contribution of agricultural goods to Thai and Vietnameseexports, such products, particularly rice, have long been important foreign exchange earners for bothcountries.
Table 2. Contribution of agriculture and forestry to LMB country exports
Cambodia Lao PDR Thailand* Viet Nam*1995 1999 1995 1999 1993 2000 1995 1998
Share of Total Exports (%) Agriculture 15 5 13 6 30 22 32 24 Forestry 69 16 39 29 0 0 3 2
Note: “*” data are for the whole country rather than for just for the territory within the basin. Sources: Thailand National Statistics Office 1997, 2001; Viet Nam General Statistical Office 1999)
IMF 2002a; IMF 2002b;
Table 1. Contribution of agriculture and forestry to GDP
Cambodia Lao PDR Thailand Viet Nam*1995 1999 1990 1999 1993 1997 1990 1999
Share of GDP (%) Crops 26.1 21.3 36.7 28.7 16.6 14.8 - 20.4 Livestock/Fisheriesa 13.4 15.2 20.7 18.5 4.3 3.5 - 2.3 Forestry 6.6 3.9 3.2 4.9 0 0 - 0.9
Total Share of GDP 46.1 40.4 60.6 52.1 20.9 18 - 23.6
Note: “*” data are for the whole country rather than for just for the territory within the basin.Sources: Lao PDR Ministry of Agriculture and Forestry 2000; Thailand National Statistics Office 2000;
Viet Nam General Statistical Office 1999; IMF 2002a; IMF 2002d

147
8 - Agriculture
In Lao PDR, the declining relative importance of agriculturereflects the fact that growth in this sector has lagged behindthat of the economy as a whole. While declining agriculturalproduction per capita caused considerable concern over foodsecurity in the 1990s, rice self-sufficiency was achieved in2000, after several years of stronger growth in the sector.6However, despite national rice self-sufficiency, there areserious rice shortages for as much as six to eight months peryear in a number of provinces.7 While agriculture and forestrycomprise a high proportion of employment and GDP in LaoPDR, their contribution to national exports is lower than mightbe expected in a pre-industrial economy because of the largeamounts of hydro-power sold to Viet Nam and Thailand.
Between 1995 and 1999, the importance of agriculture tothe Cambodian economy decreased by approximately 15percent (6 percentage points.) However, the sector is likelyto remain the most important in the economy for theforeseeable future. Rice and livestock/fisheries eachcontribute about a third of agricultural output and togethercomprised about 28.5 percent of GDP in 1999.8 For the sameyear, forestry contributed only 3.9 percent of officiallyrecorded GDP.
For the 1999/2000 crop year, the Cambodian government estimated a rice surplus of 260,710 tonnes.This was approximately 15 percent above national requirements.9 However, there are largediscrepancies in the degree to which individual farmers are able to produce enough to meet theirneeds and in their ability to buy food to compensate for shortfalls on the market. Some provinceshave chronic shortages, despite national sufficiency.10 Furthermore, the overall margin of surplus iscomparatively thin and the situation could easily go into deficiency if there are floods or drought.Thus, there is an ongoing need to promote food security.11 With food security a major concern,Cambodia has not exported much rice or other food crops over the past decade. The bulk of exportearnings came from forestry products in the mid-1990s, but the export share of this sector has sinceslipped to around 15 percent because of the growing importance of garment manufacturing, whichmade up the majority of exports in 1999.12 Almost all of Cambodia’s non-forestry agriculture sectorexports are dry rubber.13
It is also important to note that althoughthe relative contribution of agriculture tothe national economies of the ripariancountries is decreasing, the absolute valuesof agricultural production have beenincreasing. The absolute value ofagricultural output increased by 12 percentbetween 1995 and 1999 in Cambodia, by22 percent in Lao PDR, 10 percent inThailand and 19 percent in Viet Nam.14
The trend is thus not one of contractingagricultural sectors but rather ofagricultural growth lagging behind growthin the manufacturing and services sectors.
With growth in the manufacturing andservice sectors, agriculture’s share of
GDP has declined
Landlessness forces rural people to migrate to urbanareas to find work

148
State of the Basin Report - 2003
2. Land use in the Lower Mekong Basin
The Lower Mekong Basin covers approximately 61 million ha. The table below gives an overviewof estimated areas devoted to different kinds of land use within the Mekong Basin areas of theriparian countries. Figures for Viet Nam are broken down between the Central Highlands and theMekong Delta because of the dramatically differing topographies of the two regions. The data aredrawn from the MRC Land-Cover Dataset.15 This dataset is one of the most complete available butdoes not go beyond 1997, and thus does not capture the rapid land-use change that is believed tohave taken place in Cambodia and Lao PDR since then.
Of the 25.2 million ha categorised as agricultural land, more than 10 percent, 2.73 million ha, iscrop mosaic, a mixture of cropped and non-cropped areas. In lowland areas, crop mosaic mayrepresent a mosaic of permanent agricultural land and remnant woodland. In upland areas, cropmosaic may also indicate areas under shifting cultivation. Land used for mosaic cropping accountsfor 2 percent of Cambodia, 8 percent of Lao PDR, 2 percent of the LMB area of Thailand, and 10percent of the Viet Nam Central Highlands, with none in the Mekong Delta. Agricultural landincludes fallow, as well as currently- cultivated land, and thus overestimates the area of landactively used for crop growing or grazing. Comparison of the land-cover data for 1997 to previousdata is problematic because of dataset inconsistencies, however, there are general indicationsthat over the 1990s, the extent of agricultural land has been increasing at the expense of forestland.
The soil quality of land used for agriculture varies substantially across the basin. Areas of soil withfew limitations to development (deep, non-gravely, with medium-high fertility) occupy nearly 20percent of the whole basin area.16 A preliminary land suitability assessment prepared by MRCindicated that for paddy rice, upland crops, and tree crops, 70-75 percent of the basin’s land issuitable. However, the majority of this area is only marginally suitable for such cultivation.17
Furthermore, preliminary data indicate that there is a lack of land highly suitable for upland cropsand tree crops because of the paucity of deep, well-drained, fertile, non-gravely, highly stable soilson gentle slopes.
An overall representation of land use and land use suitability in the basin in 1997 is shown inFigure 1.
Table 3. Land use in the Lower Mekong Basin in 1997
Source: MRC Land Cover Dataset 1997
Land Cover(%)
ForestWoodland /grasslandAgricultureWetland/waterOther
Lao PDR
41.2242.0714.010.961.74
100.00
Cambodia
56.1815.0023.415.150.26
100.00
Thailand
15.743.47
79.281.400.12
100.00
Viet NamDelta
1.090.34
83.9910.344.24
100.00
Viet NamHighlands
47.4622.6529.460.270.16
100.00

149
8 - Agriculture
Figure 1. Landcover of the Lower Mekong Basin

150
State of the Basin Report - 2003
In Cambodia, rehabilitation of theagriculture sector and full utilisation ofland available for cultivation is hamperedby the continued presence of unexplodedlandmines and other ordinance. In 1995minefields were estimated to cover over40 percent of arable land.18 Whileconsiderable effort has been made to clearmines, the process has been slow and manyminefields remain. This situation has ledto the clearing of forest by returningfarmers who are unable to safely use theirown lands. Furthermore, evidencesuggests that land availability in Cambodiawould be insufficient to support thepopulation even if all the remainingordinance were cleared.19
Estimates of arable land in Lao PDR vary, but there are indications that such land is not currentlyfully utilised, leaving room for extended cultivation in the future. The MRC Land-Use data give anagricultural land area of 2.9 million ha, but government statistics record only approximately 800,000ha under active cultivation. 20 Over 400,000 ha is cultivated on slopes greater than 20 percent,which is not conducive to the growing of annual crops under current cultivation systems and makeserosion and other forms of environmental degradation more likely.21 Conceptually, Lao PDR can bedivided into two distinct categories of land area which support dual agricultural economies.22 Thefirst is the relatively flat and fertile land of the Mekong Corridor. This area is predominantly usedfor rice production and has recently undergone rapid market-driven economic transition, wherebyfarmers increasingly buy agricultural inputs through commercial channels and market a proportionof their produce. The second area consists of sloping lands that are less suitable for rice cultivation.These remote areas are characterised by subsistence agriculture and a lack of access to markets andtechnologies. Population pressure and inherent ecological vulnerabilities are leading to environmentaldegradation. As in Cambodia, these remote areas, especially those in the northeast, face problemswith unexploded ordinance. Socio-economic indicators for the sloping lands and flat lands divergedsharply in the mid 1990s, with per capita annual income as low as $56 per annum in the slopingareas, as opposed to an annual average of $350-360 per annum in the Mekong corridor.23
In Viet Nam, there are major land-usedifferences between the Mekong Delta andthe Central Highlands Region. The deltaconsists almost entirely (84 percent) ofagricultural land, with the majority of thisbeing devoted to rice growing. However,the area cultivated with perennial crops andfruit gardens covers 12 percent.24 There isno significant forest area in the delta. Theland area of the Central Highlands is 68percent covered by forest, woodlands, andgrasslands, with agricultural land covering0.6 million ha, and crop mosaic accountingfor 0.3 million ha. Upland and tree crops,along with shifting agriculture, predominate
Coffee is an important cash crop in upland areas inLao PDR and Viet Nam
The threat of mines prevents farmers from cultivatinglarge areas of productive land

151
8 - Agriculture
in this region. Land in the Central Highlands is relatively abundant given the low population density,and the government has been encouraging the resettlement of lowlanders to the these provinces toexploit opportunities for expanding production of cash-crops such as coffee, tea and rubber.
The Korat Plateau and the rest of the Northeastern Region of Thailand, following rapid deforestationin the 1980s, are now almost 80 percent agricultural land. There are three main geographic areas –the upper and the lower sections of the Chi-Mun rivers and the smaller Mekong tributaries. The soilis generally low in fertility and highly saline.25 Most agricultural cultivation takes place mainly inthe alluvial soils in the middle and lower portions of the river valleys where there are pockets ofhigher productivity.
3. Agricultural methods and production
3.1 Overview
Agricultural crop growing takes place in the upland and lowland (floodplain) areas of the MekongBasin. Forms of upland agriculture vary considerably depending upon cultural practices and localsoil and topographic conditions. Majorupland farming systems include shiftingand semi-shifting cultivation. Crops areusually rainfed, with relatively lowirrigation ratios in the upland areas. Rice isgrown, as are fruit trees along with a varietyof industrial cash crops. Agriculture in theuplands is typically less efficient than inthe Mekong floodplains and other lowlandareas, where the majority of cropproduction takes place. The floodplainsaround the Mekong are flat and nutrient richand under extensive rice cultivation.Lowland rice farming systems include wetseason rice, floating rice, flood recessionrice, dry season irrigated rice, and multi-crop production systems. The variousregions of the basin record between one and three harvests per year. The main harvest is the wetseason crop, with smaller numbers of farmers planting in the dry season as well (with or withoutirrigation.) Some parts of the delta area of Viet Nam also grow a third harvest later in the year.Cropping patterns vary, although rice predominates. Dry season cropping is mostly combined withcontinued wet season rice, and sometimes with other crops such as corn, soybean, and vegetables.26
Agriculture across the basin involves a mix of subsistence and commercialised production. Ingeneral, farming households focus first on production to meet household needs and then sellwhatever surplus they have, although barter predominates in remote regions with weak marketsystems. Gradually, lowland households have accumulated sufficient wealth from sale of theirsurplus to make the transition into increasingly commercialised agriculture: production for saleand increased purchase of food for household consumption. This shift involves increaseddependence on market-supplied inputs such as fertilisers and pesticides, machinery and advancedseed varieties. Commercialised agriculture has been practised for some time on the Korat Plateauand is now being pursued with vigour in Viet Nam’s Mekong Delta and, to a lesser extent, in theCentral Highlands. This trend is likely to accelerate as governments stress increased regional and
Farmers are increasingly diversifying from rice intoother more profitable crops

152
State of the Basin Report - 2003
global economic integration, and as socialattitudes change. However, the shifttoward commercialisation is occurringmuch more slowly in remote and highlandregions and will probably requiresubstantial government or donorassistance and investment. Cambodia andLao PDR have the double challenges ofensuring food security and movingtowards market-oriented, commercialagriculture, which is likely to ensure thatthe process of change is slow in thesecountries.
3.2 Irrigation
Irrigation is any process other than natural rainfall that supplies water to crops and other cultivatedplants. The main crop under irrigation in the LMB is rice, and most of the data on irrigated cropsrefer in reality to irrigated rice. The use of irrigation is increasing in the lowland areas of the basin,not only as a means of allowing dry season and even third season rice crops, and dry season orperennial cash-crops, but also to provide extra water for wet season production.
More attention is also being paid to improving the efficiency of existing schemes throughrehabilitation, water management and institutional strengthening. Despite these developments, theLMB irrigation ratio (irrigated area over cultivated area) is still low by international standards. In1998, the ratio was estimated at 7-10 percent, as compared with 45 percent for the whole of Asia.27
There are, however, significant differences in the extent of irrigation in the basin, with the VietNam Delta, for example, irrigating approximately 60 percent of crops.28
There are huge variations in the scale and type of irrigationschemes in use across the basin. The largest individual schemeis the 50,000 ha Lam Pao project in Thailand, while thesmallest are simple manual lift operations, irrigating less thana hectare. The most basic systems provide only supplementarywater during the wet season, while more intensive schemeshave the capacity to grow two to three crops per year. Majortypes of irrigation systems include: the use of gravity to divertrivers, lakes, or streams to provide supplementary water inthe wet season, with no storage; the pumping of water fromrivers in the wet or dry season, with no storage; the use ofpumps or gravity to divert water from streams, rivers andrunoff into reservoirs for use in dry or wet season irrigation;and the storage of receding flood waters in reservoirs for usein preparing land for cropping and wet or dry seasonirrigation.29
Irrigation systems in LMB currently face significantchallenges that complicate balancing the increasing demandfor irrigation water with requirements to conserve waterresources. Studies show that water is lost while flowing
In Northeast Thailand and Cambodia, tobacco isa major cash crop
Only 10 percent of LMB land isirrigated compared to an average of
45 percent for Asia

153
8 - Agriculture
through irrigation systems and this, in combination with over-use of irrigation water, has led toconstruction of reservoirs that are three to five times larger than necessary.30 There are also problemsfinancing irrigation schemes. These include: a lack of mechanisms for control and measurement ofwater use; user fees that are not high enough to encourage efficiency improvements; and a lack offinancial resources to adequately maintain and manage systems.31
Irrigation fees are being introduced selectively, but are meeting with mixed success. In Thailand,for example, attempts to introduce an irrigation service fee have resulted in mass protests. There arealso institutional problems related to the management of schemes. These include: a “top down”approach to planning and managing schemes that involves little farmer participation; a lack of legalauthority for water user associations; a lack of mechanisms for transferring management responsibilityto user associations; poor extension services; and a lack of coordination among concerned governmentagencies and user groups.32 Although management of irrigation systems is now being handed overto farmer groups in order to increase participation, little data is available on the effectiveness ofsuch transfers. Finally, irrigation systems tend to be designed specifically to suit rice production,which makes it difficult for farmers to diversify into non-rice crops.33
The table below gives details on the extent of irrigation across the LMB. The data are drawn fromthe MRC Irrigation Database and cover only schemes recorded by local authorities and thus omitmany small, unrecorded schemes. The data refer to the potential area under irrigation if the schemeswere operating to full capacity, which is not always the case (See Figure 9, Chapter 3 for a mapshowing the distribution of irrigation schemes in the basin).
Table 4. Irrigated areas in the Mekong River Basin, 2001
Notes: Dash (-) indicates no information. (*) – except for Viet Nam, all data are for the whole country.1 Where there is no comprehensive wet or dry season cropping data available, the irrigated area has
been taken as the common measure of the irrigation area.2 The total irrigated area in Lao PDR has been recorded at 280,000 ha, the difference being many
small schemes which have not been formally inventoried or mapped.3 Total of schemes and areas where data is available.
Source: MRC LRIAD database 2002
Location
Lao PDR*Thailand* - Royal Irrigation Dept(med/large) - RID(other) - RID(small) - Department of Energy Development Promotion - Ministry of InteriorCambodia*Viet Nam DeltaViet Nam Highlands
Total 3
Number ofSchemes
25328764
441
29154971072
14631012
8576
12,469
Area of WetSeason
Irrigation(ha)
224,232-
330,056
---
-248,842
1,683,09436,008
-
Area of DrySeason
Irrigation(ha)
151,940-
72,140
---
-181,506
1,417,5497,290
-
Area of 3rd
SeasonIrrigation(ha)
0-0
---
-0
351,506-
-
IrrigatedArea(ha) 1
224,2322
941,425330,056
--
517,205
94,164392,117
1,683,09436,008
3,276,876

154
State of the Basin Report - 2003
Irrigation schemes in Cambodia largely rely onthe use of receding flood waters as the sourceof irrigation water. This kind of rice productionis known as recession rice and is graduallyreplacing lower yielding traditional floatingrice. Pumping is also a major feature ofCambodian irrigation. Traditionally this wasdone manually, but petrol-propelled pumps aregradually becoming more common. Manualpumping for a lift of 0.5 m requires labour ofabout three to four work hours per day for oneha of flood recession rice. This labourrequirement is approximately 40-50 percenthigher than that needed for automated pumping.Planting of a second irrigated rice crop in the dry season occurs in only approximately 10 percent ofthe total wet season rice production area. Limited ability to control water constrains the furtherexpansion of second season cropping.34
In Lao PDR, the use of irrigation expanded rapidly over the 1990s, with the government reportingan eight-fold increase in irrigated rice area during this decade.35 However, the irrigation area islargely confined to the relatively affluent lands of the Mekong corridor, and remains a rarity in theupland areas. The increase in irrigation use in the lowlands is partly due to a move away from a fewlarge, government-managed schemes, in favour of numerous small farmer-managed arrangements.36
The creation of water user associations, and a related legal framework to support them, has alsobeen important.37
In Northeast Thailand, where farming methods remain comparatively traditional, irrigation ratiosare much lower than in other parts of the country.38 Various large-scale irrigation projects have beenconstructed on the Chi and Mun Rivers, but local opposition to dam projects has made it difficultfor the government to undertake further large- and medium-scale developments.39 Furthermore,water scarcity is a major concern. Water shortages prevent full utilisation of existing irrigationworks in the dry season, and there are even reports of water shortages in the rainy season.40
Irrigation is extremely important in the Viet NamMekong Delta region, and enables the very highproductivity of agriculture in this area. More thanhalf of the total area of the delta is flooded duringthe rainy season.41 Irrigation therefore plays acritical role because it allows farmers to storewater for use in intensive rice cropping duringthe flood free period. Irrigation schemescontributed to the tripling of food productionbetween 1975-1995 and over the last 15 years,almost all the low-yielding floating rice (estimatedat half a million hectares in 1995) has beenreplaced by irrigated rice. The rapid rise inirrigation development in Viet Nam is the result
of intensive investment in irrigation, related flood- and salinity-control works, and the market-orientatedDoi Moi economic reforms. Government planning and management of irrigation has been decentralised,with autonomous provincial authorities now financing many irrigation activities. In the Central Highlands,irrigation is less developed than in the delta, with upland rice and coffee being the main irrigated crops.
Irrigation comprises 80-90 percent of all waterabstractions in the LMB
There are huge variations in scale and type ofirrigations schemes in the LMB

155
8 - Agriculture
3.3 Rice production
Rice cultivation is the most important agricultural activity in the LMB countries. As shown in thetables below, rice production has increased greatly over the past decade: by 81 percent between1993 and 2000 in Cambodia; by 38 percent between 1990 and 1999 in Lao PDR; by 33 percentbetween 1994 and 2001 in Northeast Thailand; and by 27 percent between 1995 and 1999 in thedelta and Central Highlands in Viet Nam. These increases are due to the use of higher yieldingseed varieties, increased irrigation and larger areas under cultivation. Yields vary greatly acrossthe LMB, depending upon location, irrigation, and season. Spring paddy in the Mekong Basinregion of Viet Nam yields five tonnes per hectare, while the figure is only 1.55 for unirrigatedupland rice in Lao PDR. However, over the basin as a whole, rice production remains inefficientand of comparatively little economic value to farmers, making sustainable resource managementunlikely.42 The average yield for the entire area is 2.75 tonnes/ha, whereas the average for theAsia-Pacific region in 2000 was 3.9 tonnes/ha.43
Rice production in Cambodia has increasedin efficiency since the early 1990s, due toongoing post-war rehabilitation andinfrastructure reconstruction. While total wetseason cultivated area has increased duringthis period from less than 1.7 million ha in1993 to 1.9 million ha in 2000, this area isstill considerably less than the 2.47 million hadevoted to rice growing in the late 1960s.44
Furthermore, yields continue to lag behindthose of neighbouring Viet Nam andThailand, mainly as a result of lower qualityagricultural inputs and management systems.The dominant production system is rainfedlowland rice, which is concentrated near theMekong, Bassac, and Tonle Sap Rivers.45
Deepwater and floating rice is also found around the shores of the Tonle Sap River and the GreatLake, as well as the inundated areas of the Mekong and the Bassac near Viet Nam. There is alsosmall-scale dry land rice production in hilly areas of the country.46
Rice is the dominant crop in Lao PDR, covering approximately 600,000 ha or 80 percent of the totalcropped area.47 There are major disparities in productivity across the country, with yield in irrigated
areas above 4 tonnes/ha, compared with 1.5tonnes/ha for rice grown in upland areas.While the harvested area for lowland ricehas been on the increase, it has becomesmaller in the upland areas, due to thegovernment’s attempts to discourageshifting cultivation.
Over 80 percent of the cultivated area inNortheast Thailand is used for growing riceor a mix of rice and upland crops. Localvarieties of drought-resistant glutinous riceare generally used, and these tend to havelow yields and poor responses to fertiliser
Rice yields are generally low in the basin due to lack of inputs such as fertilisers, pesticides
and improved seed
Over 40 percent of the basin’s land area isdevoted to agriculture

156
State of the Basin Report - 2003
application.48 There are three main rice cropping patterns based on generalised land types.49 Lowerpaddy land is planted annually with paddy rice in the wet season and is at risk of flooding andtemporary water logging. Middle paddy land is the most productive, with better water control andreduced flood risk. In upper paddy land, short duration rice is planted in only three or four years outof ten. Upland crops are cultivated at other times, and farmers face major problems with weedmanagement. All three cropping systems use bunded planting, which involves the construction ofsoil embankments around rice plots to retain water.
Table 5. Cambodia rice production, 1993-2000
Wet Season RiceArea harvested (‘000 ha)Production (‘000 tonne)Yield (tonne/ha)
Dry Season RiceArea harvested (‘000 ha)Production (‘000 tonne)Yield (tonne/ha)
Total RiceArea harvested (‘000 ha)Production (‘000 tonne)Yield (tonne/ha)
Source: Cambodia National Institute of Statistics 1994, 2000
2000
1,8463,333
1.81
233708
3.04
2,0794,041
1.94
1993
---
---
1,6852,221
1.31
Table 6. Lao PDR rice production, 1990-1999
Wet Season RiceArea harvested (‘000 ha)Production (‘000 tonne)Yield (tonne/ha)
Irrigated RiceArea harvested (‘000 ha)Production (‘000 tonne)Yield (tonne/ha)
Upland RiceArea harvested (‘000 ha)Production (‘000 tonne)Yield (tonne/ha)
Total RiceArea harvested (‘000 ha)Production (‘000 tonne)Yield (tonne/ha)
Source: Lao PDR Ministry of Agriculture and Forestry 2000
1999
477.515023.15
87354
4.07
153.6238
1.55
718.120942.92
1995
367.31071.3
2.92
13.650.43.71
179296.1
1.65
559.91417.8
2.53
1990
392.41088.5
2.77
1139.13.55
260.2379.9
1.46
663.61507.5
2.27

157
8 - Agriculture
1994
4,3567,125
1.64
1432
2.25
4,3707,158
1.64
2001
4,6759,046
1.93
138451
3.27
153.6238
1.97
1997
4,5577,978
1.75
63190
3.03
4,6208,168
1.77
Table 7. Northeast Thailand rice production, 1990-1999
Major RiceArea harvested (‘000 ha)Production (‘000 tonne)Yield (tonne/ha)
Second RiceArea harvested (‘000 ha)Production (‘000 tonne)Yield (tonne/ha)
Total RiceArea harvested (‘000 ha)Production (‘000 tonne)Yield (tonne/ha)
Source: Thailand National Statistics Office 1997, 2001
The LMB area of Viet Nam, specificallythe delta region, is the core rice growingarea of the country. There are three majorcropping seasons in the delta: winter-spring, summer-autumn or mid-season,and wet season-long duration.Approximately 60 percent of the ricegrown in this region is grown in irrigatedlowlands, with the remainder underrainfed lowland cultivation.50 Rice yieldsin the delta are extremely high by LMBstandards and the area is nearing itscarrying capacity, with high yielding ricevarieties and very intensive cropping –up to three harvests per year in someplaces.51 There is scope for furtherimproving efficiency by overcoming constraints to production which include: farm sizes that aretoo small; a lack of roads and other physical infrastructure; and inadequate market and distributionsystems.52 There are also problems with the efficiency of post-harvest crop processing facilitiesthat have resulted in post-harvest losses as high as 13-16 percent.53 Furthermore, the MekongDelta faces environmental constraints including flooding at the end of the rainy season, droughtin the dry season, salinity in coastal areas, and acid sulphate soils in the Plain of Reeds and theLong Xuyen Quadrangle. Upland production in the Central Highlands is less efficient, withirrigation a rarity and yields averaging only 3 tonnes per hectare in 1999, as opposed to 4 tonnesin the delta.
With irrigation, some parts of the Viet Nam Delta growthree crops of rice per year

158
State of the Basin Report - 2003
Spring PaddyArea harvested (‘000 ha)Production (‘000 tonne)Yield (tonne/ha)
Autumn PaddyArea harvested (‘000 ha)Production (‘000 tonne)Yield (tonne/ha)
Winter PaddyArea harvested (‘000 ha)Production (‘000 tonne)Yield (tonne/ha)
Total RiceArea harvested (‘000 ha)Production (‘000 tonne)Yield (tonne/ha)
Source: Viet Nam General Statistical Office 1999
1,0365,349
5.16
1,3985,296
3.79
7572,187
2.89
3,19112,832
4.02
1,4507,252
5.00
1,9347,201
3.72
6031,828
3.03
3,98716,281
4.08
Table 8. Viet Nam rice production (Mekong Delta Region), 1995-1999
1995 1999
Spring PaddyArea harvested (‘000 ha)Production (‘000 tonne)Yield (tonne/ha)
Winter PaddyArea harvested (‘000 ha)Production (‘000 tonne)Yield (tonne/ha)
Total RiceArea harvested (‘000 ha)Production (‘000 tonne)Yield (tonne/ha)
Source: Viet Nam General Statistical Office 1999
2597
3.85
118252
2.14
143349
2.44
Table 9. Central Highlands region rice production, Viet Nam, 1995-1999
1995 1999
33155
4.63
101259
2.57
134414
3.08

159
8 - Agriculture
3.4 Non-rice crops
While traditionally dwarfed in importance by rice, there are also considerable quantities of othercrops produced in the LMB. Such crops include maize, fruit and vegetables, oil crops, fibre crops,and cash-crops such as coffee, tea,sugarcane and tobacco. Many of thesecrops can offer higher economic returnsthan rice. It is likely that the basin willwitness increasing diversification into suchproducts with more balanced croppingpatterns throughout the year as rice farmingfails to deliver desired increases in livingstandards.54 In particular, the basin as awhole faces shortages of oil crops such assoybeans. These are necessary for cookingand animal protein feed, which createsprofitable opportunities for those farmerswilling and able to diversify.55
In Cambodia, non-rice crops accounted for 8 percent of GDP in 1999.56 Non-rice food crops weretraditionally considered to be of secondary importance to rice, but have grown in popularity due tolocal rice deficits and the clearing of upland areas suitable for their cultivation.57 Maize production, inparticular, has increased as a result of this trend. High value commercial crops such as soy, mungbeanand vegetables have also been planted over a greater area as market reforms have encouragedsmallholders to adapt their planting patterns. However, the area devoted to such crops coversapproximately 250,000 ha, which, as is the case for rice, is substantially less than the 310,000 ha usedfor producing such products in the 1960s, before war began.58 This decline in cultivation is mostlikely a result of the lingering presence of minefields. Rubber tapping areas cover approximately45,000 ha and their output comprises the main Cambodian agricultural export earner.
Lack of markets and marketing infrastructure inhibitscrop diversification
Note: “*” data are for the whole country rather than for just for the territory within the basin.Source: Cambodia National Institute of Statistics 2000
Table 10. Cambodia selected non-rice crops, 1999/2000*
Crop
MaizeYellow MaizeCassavaSweet PotatoVegetablesMung BeanPeanutSoy BeanSugar CaneSesameTobaccoJuteRubberCastor Oil
Harvested Area (ha)
59,73932,01114,003
9,32231,24026,74710,55734,945
8,37416,410
8,292261
39,7181,515
Production (tonne)
95,27454,680
228,51232,516
181,85115,913
9,24435,063
159,8597,3856,358
26445,204
1,365
Yield (tonne/ha)
1.591.71
16.323.495.820.590.881.00
19.090.450.771.011.120.90

160
State of the Basin Report - 2003
In Lao PDR, the maize planting area hasfluctuated over the 1990s, although yieldshave increased substantially. Mungbeanproduction has declined considerablybecause of poor local markets. As far asindustrial crops are concerned, coffee andsugarcane production increased by averageannual rates of 22.3 percent and 36.7 percent,respectively, between 1996 and 2000.59
These increases have resulted more fromimproving yields than expanded productionareas. Coffee is the major agricultural exportearner, and despite increasing yields, thereare serious problems with quality control,with the result that Lao PDR coffee export prices are 10 percent less than world market prices.60 Teaproduction has declined by 23.5 percent per annum and cotton by 12.2 percent. This has also been inresponse to market conditions.61 Vegetable production has increased rapidly, mainly driven by demandin urban centres and exports to Thailand.
Table 11. Lao PDR selected non-rice crops, 1990-2000
Maize is the most common non-rice crop in Cambodia
Item Crop Area Production Yield(‘000 ha) (‘000 tonne) (tonne/ha)
1990 1999 1990 1999 1990 1999
Maize 48.1 40.7 81.77 96.052 1.7 2.36Starchy roots 19.8 13.1 162.756 80.565 8.22 6.15Vegetables/beans 7.9 41.1 60.672 235.914 7.68 5.74 Mungbeans 4.6 1.7 2.622 1.496 0.57 0.88 Soybeans 5.6 6.8 4.48 5.916 0.8 0.87 Peanuts 8.5 12.9 7.99 13.029 0.94 1.01 Tobacco 12.0 4.3 58.44 23.392 4.87 5.44 Cotton 6.9 4.4 4.968 4.312 0.72 0.98 Sugarcane 4.0 4.7 111.92 173.618 27.98 36.94 Coffee 17.3 42.3 5.363 17.343 0.31 0.41 Tea 0.4 0.9 1.6 0.396 4.0 0.44
Source: Lao PDR Ministry of Agriculture and Forestry 2000

161
8 - Agriculture
Diversification into various kinds of non-ricecrops has taken place to a greater extent inThailand than in the other three countries,with a wide range of such crops grownextensively.62 However, non-rice crops stillonly cover approximately 20 percent of thecultivated area in the Northeast Region. 63
Vegetables, legumes, kenaf and tobacco aresometimes combined with rice in paddylands. In unbunded fields in the uplands,cassava, kenaf, sugarcane and legumes, suchas groundnuts and mungbeans, are oftengrown as mono-crops.64 The majorconstraints on production in such uplandareas are soil quality problems and the build-up of disease in continuously-cropped areas.65 Cassava,maize and sugarcane are the most important non-rice crops, although the area devoted to cassavahas reduced substantially. Although figures for the Northeast Region are unavailable, there havebeen major increases in the production of vegetables such as shallots and garlic.66 Yields for mostcrops have seen moderate improvements since 1994, with a major (28 percent) increase for theyield of sugarcane.
Whereas rice is the agricultural mainstay in Viet Nam’s delta region, perennial and tree crops tendto dominate in the Central Highlands, with 269,000 ha devoted to the growing of major non-ricecrops, compared to 143,000 ha for rice. The production figures below indicate that the land areadevoted to major non-rice crops decreased by more than 10 percent in the Mekong Delta and increasedby 33 percent in the Central Highlands between 1995 and 1999. These trends reflect the individualresponses of small-holders and agribusiness operators to regional comparative advantage in theface of the relaxation of socialist market controls. Also important are government attempts to increaserice production in the delta and promote the growing of non-rice cash-crops such as coffee inupland areas by encouraging migration to the highland provinces.
Table 12. Northeastern Thailand selected non-rice crops 1990-2000
Crop yields in the LMB are generally low byinternational standards
Harvested Area Production (‘000 T) Yield (T/ha)(‘000 ha)
Item 1994 2000 1994 2000 1994 2000
Maize 313 334 838 1041 2.67 3.12Sorghum 3 2 4 3 1.47 1.69Mungbean 20 22 12 15 0.62 0.68Cassava 862 646 11680 10472 13.56 16.21Sugarcane 205 206 9382 12098 45.79 58.71Soybean 48 38 66 54 1.39 1.41Groundnut 30 30 43 46 1.42 1.54Kenaf 82 17 120 29 1.46 1.74Cotton 9 4 12 6 1.34 1.43
Note: Figures for fruit and vegetable production for the Northeast Region were not availableSource: Thailand National Statistics Office 1997, 2000 and 2001

162
State of the Basin Report - 2003
Table 14. Viet Nam (Central Highlands Region) selected non-rice crops, 1995-1999
Table 13. Viet Nam (Mekong Delta Region) selected non-rice crops 1995-1999
Planted Area Output (‘000 tonne) Yield(‘000 ha)
Name 1995 1999 1995 1999 1995 1999
Other CerealsMaizeSweet PotatoesCassavaCottonSugarcanePeanutsSoybeansTobacco
Source: Viet Nam General Statistical Office 1999
75.536.69.0
29.31.8
11.322.59.81.5
100.160.1
6.832.3
9.927.918.311.22.2
278.9170.7
46.3278.011.4
1230.218.911.11.9
179.270
62.6262.0
2464.223.610.90.7
2.371.916.968.941.1141.081.051.110.47
2.792.846.818.611.15
44.091.030.990.86
Planted Area Output (‘000 tonne) Yield(‘000 ha)
Name 1995 1999 1995 1999 1995 1999
Other Cereals 46.3 39.0 159.2 49.8 3.44 1.28Maize 20.2 15.8 84.0 49.8 4.16 3.15Sweet Potatoes 11.5 10.7 123.0 143.8 10.70 13.44Cassava 10.2 9.2 79.6 84.5 7.80 9.18Jute 3.6 0.6 6.0 1.1 1.67 1.83Rush 5.2 2.8 38.2 16.1 7.35 5.75Sugar Cane 98.0 102.8 5395.7 6435.5 55.06 62.60Peanut 15.0 10.4 27.2 16.1 1.81 1.55Soybean 11.2 9.1 22.9 20.6 2.04 2.26Tobacco 1.0 0.7 1.9 1.2 1.90 1.71
Source: Viet Nam General Statistical Office 1999

163
8 - Agriculture
Use of fertilisers and pesticides
Use of commercially-produced fertilisers and pesticides has been growing rapidly in the LMB,particularly following the market reforms in Lao PDR, Cambodia and Viet Nam. Governmentattempts to promote cash crops and greater cropping intensity have also increased the use ofthese products.67 On a region-by-region basis, the use of such inputs is generally correlatedwith higher agricultural productivity. For example, in the Mekong corridor area of Lao PDR,both fertiliser and pesticide use and rice yields are much higher than in the upland parts of thecountry. The same comparison can be made between the Mekong Delta and the Central Highlandsareas of Viet Nam. More broadly, fertiliser use is much higher in Thailand and Viet Nam. Thosecountries use, respectively, 100 and 263 kg of mineral fertiliser per hectare of cropland. InCambodia and Lao PDR, fertiliser use is only 2 and 8 kg per hectare, respectively. In Thailand’sNortheast, although use of fertilisers is widespread (employed by about 86 percent of farmers)it is lower in intensity than the rest of the country, with an average application of only 47kg/hafor rice.68
The tables below show FAO estimates for use of various kinds of pesticides. Figures are notavailable for every year or for all varieties of pesticides used. There are no available data forCambodia in this dataset.69 Survey data from the International Rice Research Institute (IRRI)suggest that in lowland Cambodia, the percentage of wet season farmers using pesticides rangesfrom 8-50 percent depending upon the province, with a range of 40-100 percent for dry seasonfarmers.70 The same study found that the most commonly-used pesticides in the country fallunder the World Health Organisation’s “most hazardous” classification.
Table 15. LMB total for mineral fertiliser used (‘000 Metric tonnes)
CambodiaLao PDRThailand*Viet Nam*
Note: “*” data are for the whole country rather than for just for the territory within the basin.Source: FAO 2001
1989
0.30.3
818.8563
1999
7.98.1
1801.71934.6
Table 16. LMB use of mineral fertiliser per ha of agricultural land (kg/ha)
CambodiaLao PDRThailand*Viet Nam*Asia-Pacific
Note: * Includes entire country rather than only Mekong Basin AreaSource: FAO 2001
1999
2.18.5
100.1263.2149.7
1989
0.10.4
39.888.2
102.4

164
State of the Basin Report - 2003
Note: “*” data are for the whole country rather than for just for the territory within the basin.Source: FAO 2002 (FAOSTAT Agriculture)
1993
599255267
0280
1,0958012
01,2183,9909,0581,6015,5183,444
9032,974
80818
2,317265
9118
1,1221,498
11
37433
1994
989197200115172668
8271
1,3584,8859,5552,1625,6863,7941,1603,001
91632
2,29329011132
6082,290
11
40606
1995
1,502300244
0216
1,226359
62
1,3854,827
11,9352,0606,8274,4621,0753,874
62630
2,637443154
30524
2,93511
47681
Item
AmidesBenzimidazolesBipiridilsBotanic. Produc&BiologicCarbamates HerbicidesCarbamates InsecticidesChlorinated HydrocarbonsDiazines, MorpholinesDinitroanilinesDithiocarbamatesFungic/Bacterial/Seed TreatmentHerbicidesInorganicsInsecticidesOrgano-PhosphatesOther FungicidesOther HerbicidesOther InsecticidesOther RodenticidesPhenoxy Hormone ProductsPlant Growth RegulatorsPyrethroidsRodenticidesSulfonyl UreasTriazineTriazoles, DiazolesUrea derivates
Total
Table 18. Thailand* pesticide use (Metric tonnes)
Source: FAO 2002 (FAOSTAT Agriculture)
Table 17. Lao PDR pesticide use (Metric tonnes)
Item 1992 1993 1997
Carbamates Insecticides 0 18 3Fungic/Bacterial/Seed Treatment 0 8 0Herbicides 0 0 1Inorganics 0 8 0Insecticides 17 34 3Organo-Phosphates 17 16 0Rodenticides 4 4 0Triazine 0 0 1
Total 38 88 8

165
8 - Agriculture
3.5 Upland agriculture/shifting cultivation
One of the most important agricultural systems in the LMB is the group of farming techniquesknow as shifting cultivation. Shifting cultivation is practiced mostly in marginal upland areas. Inthe LMB it occurs most often in the Viet Nam Central Highlands, the northeast of Cambodia, andthe sloping land areas of Lao PDR. Because shifting agriculture occurs in remote areas and isalmost entirely removed from the formal economy, it is very difficult to measure its geographicextent and productive output. However, assessment of the phenomenon is important because itprovides the household consumption needs for large numbers of people, and is often deeply rooted
in the culture of upland minority people. Shiftingcultivation is also of consequence because it is widelyconsidered to be a major contributor to deforestation.Estimates put the area under shifting cultivation in thebasin at about 2 million ha, with 25 percent of that landclassified as forest.71
A typical shifting cultivation system involves householdsin wooded or forested areas clearing and cultivating plotsof land on a rotational basis. At the beginning of the cyclea plot, typically 1.5 ha per household, will be cleared usingthe slash and burn method.72 Rice and various other uplandcrops will be planted and the plot will be worked untilharvest. Because of marginal soil fertility, a second yearof cultivation on the plot would result in lower yields.The household therefore leaves the plot fallow and moveson to clear a second plot for the following year. The processis repeated until the original plot has been left fallow forlong enough for its fertility to be restored, generally 10-20 years.73 Variations to this system include pioneeringcultivation where plots are worked for longer periods until
soil fertility is completely exhausted, and semi-shifting cultivation, which involves greater numbersof people working from fixed homesteads on flatter land.74 Most groups combine shifting cultivationwith other activities such as the gathering of non-timber forest products.75
Table 19. Viet Nam* pesticide use (Metric tonnes)
Item 1994 1995 1996 1997
Fungic/Bacterial/Seed Treatment 3,139 3,465 8,188 7,684Herbicides 2,547 4,979 7,205 6,710Insecticides 15,226 16,452 17,352 17,851Plant Growth Regulators 667Rodenticides 107
Total 20,912 24,896 32,745 33,019
Note: “*” data are for the whole country rather than for just for the territory within the basin.Source: FAO 2002 (FAOSTAT Agriculture)
Because of marginal soil fertility, manyshifting agriculture plots are cultivated
for only 1-2 years and left fallow for 10-20 years

166
State of the Basin Report - 2003
The environmental implications of shiftingcultivation depend upon the intensity withwhich it is practised and upon the nature ofthe land in question. The key to whether thepractice is environmentally sustainable is thelength of the fallow period, which itselfdepends upon population density.76 Thecarrying capacity of land under shiftingcultivation is estimated to be 20-40 personsper km2. In the northeast of Cambodia, forexample, population density is less than 20people per km2, and shifting agriculture,although prevalent, is not considered to be amajor environmental problem.77 Population densities in this range allow for the required fallowperiods of 10-20 years, but if there are more people in an area, land scarcity forces shorter periods,often as low as 5-7 years. Such periods do not allow for full regeneration of soil fertility, nor do theyallow trees to grow tall enough to overshadow and kill off invading plants and weeds.78 Otherconsequences of excessively short fallow periods include increased erosion due to the reducedcapacity of the soil to retain water. Sloping lands are particularly vulnerable to developing erosionproblems when fallow periods become too short. When such areas are near river tributaries, erosionmay increase the load of silt washing into rivers.
Increasingly, the carrying capacity of shiftingcultivation land is being exceeded because ofpopulation growth, government sponsored orindependent in-migration, and decreasing landavailability due to hydro-power schemes,reclassification of forests as protected areasand the granting of logging concessions.79 Theinsecure land tenure arrangements prevalentacross the basin also contribute to the problemby making it easier for the land of shiftingcultivators to be expropriated, which givesthem less incentive to ensure its environmentalpreservation.80 Such changes can start anoften-observed cycle whereby increased land pressure leads to shortened fallow periods, which inturn cause a loss of soil fertility and declining crop yields, as well as increased erosion, downstreamsiltation, flooding and drought, all of which increase human poverty and vulnerability.81
Shifting cultivation is most significant as an environmental and social problem in Lao PDR.Government figures indicate that between 1982 and 1989, over 300,000 ha were cleared and plantedfor shifting cultivation by an estimated 280,000 families. 82 In the 1990s, government programmesto resettle upland residents and provide them with alternative livelihoods helped stabilise the practice.By 1995, the area decreased to 192,258 ha with 198,868 households and by 1998 to 148,000 hawith 156,720 households. However, most of the rehabilitated area was in the sloping landssurrounding the Mekong Corridor, while shifting cultivation continued unabated in the remoterupland areas.83 It is estimated that 70 percent of northern households practice shifting cultivation,compared to only 12 percent for the flatter southern region.84 There are two main types of shiftingcultivation based on ethnic minority practices. The Khmu in the midlands traditionally practicerotational cultivation, while the Hmong and other highland groups have more commonly practicedthe pioneering variant, with frequent moves to virgin areas.
Ethnic minority Thai Luu plant red corn for cattle feed
Shifting cultivators are primarily from ethnic minorities

167
8 - Agriculture
In Thailand, shifting cultivation often occurs on lands opened up by logging. Rainfed crops are used andyields are high for the first few years because of the nutrients released by the burning or degradationof the forest cover, but soil fertility drops dramatically after a few seasons.85 This practice is notlimited to subsistence farmers, large scale cash-crop cultivation is also carried out in this fashion andlocal minority groups are often driven out of traditional lands by encroaching outsiders.86
In Viet Nam, there are about 800,000-1,000,000 people practising shifting cultivation, and abouttwo million engaged in semi-shifting cultivation, most of them upland minorities.87 These farmers,the majority of whom live outside the Mekong Basin in northern Viet Nam, generally operate on asubsistence basis on steep slopes. Serious soil erosion problems and endemic poverty are common.As far and the LMB portion of the country is concerned, such practices are common in the CentralHighlands and rare in the intensively-farmed Mekong Delta region. The situation in the Highlandsis worsening because of large-scale government-sponsored and independent in-migration, which isincreasing population densities and forcing resident ethnic minorities to move into increasinglymarginal forest areas.88
Cambodia experiences similar problems, but the situation is complicated by the fact that many post-war returnees are unable to use their family land because of minefields or conflicts over tenure and somust clear and plant upland forest areas to make a living.89 Comprehensive mine clearance is thusrequired before shifting upland cultivation will end and people will return to the lowlands.
3.6 Livestock
Livestock rearing has traditionally formed animportant part of farm systems, providinghaulage, natural fertilisers, cash income andadditional dietary protein. Dependence uponlivestock is especially high for peopleemploying subsistence production systems,with numerous groups using animals as anintegral part of their livelihood strategies.Livestock, particularly large animals, are alsoan important provider of financial security forpeople in subsistence economies. Buffalo andother animals tend to be the most valuabletradable asset owned by such people and canbe sold to meet emergency financialrequirements or to make major investments. The loss of animals is thus identified as a majordeterminant of poverty. Small animals such as pigs and poultry are raised to provide farmhouseholds with a major source of animal protein.
Over recent decades, subsistence-based livestock systems have become increasingly linked to thewider economy and commercialised husbandry has become more common.90 Intensification ofproduction has increased and the role played by animals has changed from integrated components offarm systems (e.g. buffaloes used primarily for haulage) to discrete output units (e.g. cows grown formeat and milk.)91 The tables below indicate that livestock production has increased substantiallyduring the 1990s in Cambodia, Viet Nam and Lao PDR. The increases are probably due to the impactof economic reforms in Viet Nam and Lao PDR and increasing political stability in rural areas inCambodia. Livestock production in Thailand, after an initial 20 percent increase in the early 1990s,remained reasonably constant for the rest of the decade. Breakdowns for changes in the populations of
Integrated farming is practiced to a greater extent inNortheast Thailand than in other areas of the LMB

168
State of the Basin Report - 2003
various kinds of animals reveal varying trends for theindividual countries, although there has been a generaldecrease in the buffalo population and increased numbersof cattle, chickens, and ducks.
There is significant scope for increasing livestockproduction, particularly in Lao PDR where there arelarge amounts of potential pasture land available andthe government is actively encouraging uplandhouseholds to switch to animal husbandry as analternative to shifting cultivation. However,increasing the capacity of livestock production isconstrained by low quality forage and fodder,inadequate animal health services, and the lowproductivity of native varieties.92 Also, traditionallivestock management practices can present potentialtrans-boundary environmental problems in that semi-nomadic herders in remote border areas often roambetween countries, and in the process, can causeanimal diseases to spread across borders.
Table 20. LMB livestock production index 1990-2000
1992 1996 2000
Cambodia 120.3 134.7 157.3Lao PDR 111.6 142.3 139.4Thailand* 120.6 129.8 124.2Viet Nam* 112.1 137.9 174.8
1989-1991 = 100 gross livestock productsNote: “*” data are for the whole country rather than for just for the territory within the basin.Source: FAO 2001
Table 21. LMB average annual growth rate of livestock population 1990-2000
Animal (%) Cambodia Lao PDR Thailand* Viet Nam*
Cattle +3.1 +1.7 +0.3 +3.3Buffaloes -1.2 -0.6 -9.4 +0.2Pigs +1.5 -2.2 +6.5 +5.1Sheep +1.9 N/A -16.1 N/AGoats N/A -1.2 -1.1 +5.6Chickens +4.7 +4.5 +4.4 +9.2Ducks +3.5 +16.8 +1.6 +6.4
1989-1991 = 100 gross livestock productsNote: “*” data are for the whole country rather than for just for the territory within the basin.Source: FAO 2001
Buffaloes provide natural fertilisers, cashincome and are used for tilling fields
Poultry provide cash income as well as asupplementary source of protein

169
8 - Agriculture
4. Agriculture and the environment
Agriculture has important environmental implications and significantly affects the quality andquantity of water and related resources in the Mekong Basin. The major mechanisms by whichagriculture affects the environment are: deforestation due to the clearing of land for shifting orsedentary cultivation; irrigation; and the use of chemical fertilisers and pesticides. Also significantare the conversion of acid-sulphate soils to agricultural use and human interference in the balanceof ecosystems. All of these environmental influences affect resource use and sustainability and putconstraints on agricultural activity.
4.1 Environmental impacts of deforestation
The typical effects of deforestation are soilerosion, soil compacting and gullying,reduced water regulation capacity andincreased flooding, and increasedsediment in streams, rivers, andwetlands.93 Deforestation is of particularconcern in vulnerable watershed areas –land on steep or very steep slopes at highelevations in the headwater areas of theriver system. Such land is particularlyprone to erosion. The problem isexacerbated in steep areas of Lao PDR andNortheast Thailand because contouragriculture is not practised, whichincreases the severity of erosion problemscaused by agricultural activity. A recent MRC study found that deforested critical watershed areascovered 3.5 percent of Cambodia, 20 percent of Lao PDR, and 7.5 percent of basin Viet Nam, withdata for Thailand being unavailable.94 The impact of this situation in terms of erosion and runoff isdifficult to precisely estimate because essential data on runoff and retention rates under differentkinds of vegetation cover are not available.95 While erosion and resultant sedimentation certainlyremain major problems, MRC water testing data indicate that levels of suspended solids are currentlydecreasing across the basin.96 The reduction of sediment loads could be the result of the developmentof large numbers of small irrigation schemes that collect sediment in their reservoirs.
4.2 Environmental impacts of irrigation
As the greatest user of water in the basin, irrigation schemes have implications for water levelsand water quality in the Mekong River and its tributaries. It is estimated that in Cambodia, irrigatedagriculture accounts for around 94 percent of total abstractions, with a figure of 82 percent forLao PDR, 91 percent for Thailand, and 86 percent for Viet Nam.97 With demand for water rapidlyincreasing, there are strains on the supply of water for agricultural use. In many communities,water supply is insufficient for 2-5 months of the year, and reservoirs are often not full enough tomeet irrigation demands, especially in Thailand.98 In the dry season month of April, irrigatedagriculture in the Vietnamese section of the delta now extracts 53 percent of the available flow inthat section of the river.99 Water deficits are particularly noticeable in the Isarn region of Thailand.Low water levels also contribute to other environmental problems such as soil acidity and theincreasing intrusion of sea water in the Mekong Delta. These problems are likely to increase ifwater abstractions upstream lead to less water downstream to flush away contaminants.100 With
If not properly managed, agricultural development couldundermine land use sustainability

170
State of the Basin Report - 2003
the riparian countries all endeavouring toincrease rice production, and henceextending irrigation systems, there is likelyto be growing water scarcity and water-useconflicts between the agricultural, industrial,and domestic sectors. Diversification ofproduction into crops that use less water thanrice could be one solution to the problem.
The establishment of irrigation reservoirs cancause changes to the river’s flow regime,which have important environmentalimplications. Reservoirs can reduce severeflooding and shorten the duration of flooding,which generally assist wet season cultivation in the flood plain. They also can delay the onset offloods, which is especially beneficial in the lower parts of the river. The associated reduction in theflood plain area does, however, adversely affect fish production and thus fish catches. This, in turn,has serious consequences for the millions dependent on the fishery for subsistence and livelihoods.Also, the ability of reservoirs to reduce theflood peak under extreme conditions isuncertain. Emergency releases from reservoirscan quickly cause flood flows equal to orgreater than natural river flows and causemajor damage to cropping (and to life andproperty) in areas where reduced floodingduring normal years creates a sense ofcomplacency. Irrigation reservoirs aremanaged primarily to meet the demands ofirrigation, and are normally kept as full aspossible to guarantee dry season requirements.Greater understanding of inflows couldimprove their potential for flood control.
Excessive irrigation in the dry season and irrigation with poor drainage can, in combinationwith certain soil and water conditions, cause salinity problems. Salt can accumulate in the sub-soil and at the surface, and cause immediate damage to agriculture and fish production andproductivity, as well as long-term soil deterioration. Salinity problems in the Korat Plateau inNortheast Thailand stem from the irrigationof saline soils and rock-salt exploitation.101
Sodium chloride concentrations in this arearange from 2,000-10,000 mg/L.102 Similarproblems occur in the Vientiane Plain.
In the Viet Nam Delta, salinity is caused bythe intrusion of seawater. This is a concern tofarmers near the mouth of the river, whereabout 750,000 ha is affected by saline waterduring the dry season. 103 Efforts to controlsalinity intrusion by blocking seawater leadto other problems. Water stagnates and mayresult in fish-killing algae blooms, and water
Dykes and other infrastructure protect delta farmland from salt water intrusion
Much of the LMB suffers from both chronic floodingand drought
In the Viet Nam Delta, inundation of seawaterthreatens agricultural production

171
8 - Agriculture
polluted with human waste, pesticides and other substances is not flushed into the sea.104 Also theuse of river water to flush away intruding seawater reduces the availability of water for irrigation.At the end of the dry season, total flow in the coastal part of the delta is about 2000 m3, which wouldbe sufficient for irrigation purposes, except that approximately 1500 m3 are required to wash awaythe saline water intruding from the sea.105 However, recent MRC water quality testing shows thatsalinity levels have been decreasing across the basin, particularly in Northeast Thailand.106 Thereasons for this are still unclear, but could include a general shift from small-holder to commercialisedsalt extraction that may be more efficient and result in lower levels of salt run-off.
4.3 Environmental impacts of pesticide and fertiliser use
Pesticide and fertiliser use is another important means by which agricultural activity may impact theresources of the basin. While overall the rate of chemical application in the basin is comparativelylow, there are problems with improper handling and the use of banned pesticides. Farmers in Thailandand Viet Nam are generally aware of the potential dangers of pesticides, but such awareness is lowerin Lao PDR and Cambodia, where these products have only recently begun to be used on a largescale.107 Persistent pesticides are banned in the riparian countries, but it is clear that residual andillegally imported stocks continue to be used because residues of DTT, Dieldrin, and similar chemicalshave been found in fish across the basin.108 However, investigation into the build-up of pesticide
residues in the bodies of such fish hasrevealed that contaminant levels are wellbelow the maximum safety levels specifiedby the World Health Organisation.109
Pesticides can also cause environmentalproblems through build-up in the soil,toxicity to humans and the development ofresistance on the part of pests. The latter hasbeen held responsible for localised outbreaksof pests such as brown plant hopper.110 Thereis currently little available data to indicatethe extent of such problems. The relationshipbetween pesticide use and fisheries is furtherdiscussed in Chapter Seven on fisheries.
Because of high intensities of fertiliser use, the Korat Plateau in Thailand and the Mekong Delta areareas of ongoing concern for ground and surface water contamination.111 In the delta there is concernover excessive fertiliser use affecting water quality and damaging integrated aquaculture operations.MRC water quality surveys have revealed an increase in levels of nutrients in the water.112 There isa need for further systematic investigation of this issue, but it appears that in general, the use ofnitrogen, phosphate and potassium fertilisers is not at levels likely to cause significant damage toecosystems.113
4.4 Acid sulphate soils
The conversion of acid-sulphate soils to agricultural use, especially in the Mekong Delta, is creatingmore agricultural land, but acid runoff is damaging other subsystems downstream such as the culturingof fish in rice fields.114 Acid sulphate soils occur in the mangroves and grasslands of the delta,covering some 1.6 million ha, or 40 percent of its soils, mainly in the Plain of Reeds, the LongXuyen Quadrangle, and the Ca Mau Peninsula.115 These soils are also characterised by high levelsof potentially toxic aluminium and poor phosphorous availability. The issue is mostly localised to
Pesticides banned elsewhere in the world are readilyavailable in some areas of the LMB

172
State of the Basin Report - 2003
these areas and does not extend into the Cambodian area of the delta. In the dry season, the acidsulphate water rises to the surface and is discharged into the canals at the onset of the rains. Whilethe acidity causes soil and water quality problems and can result in lower crop yields and fishpopulations, farmers are able to mitigate the harm it causes by diluting it with irrigation water andfertilisers. However, these responses have second order effects such as increased water consumptionand fertiliser nutrient build-up.
4.5 Agriculture and biodiversity
Agricultural practices also have implications for bio-diversity and the balances between species inecosystems. Such changes can in turn impinge upon agricultural productivity in harmful feedbackloops. For example, Golden Apple Snails ( Pomacea sp.) from South America have been introducedin Cambodia, Thailand, and Viet Nam for breeding as a supplementary food source, but have escapedcaptivity and proliferated rapidly in agricultural areas. 116 In Thailand and Viet Nam they havealready become a major rice pest, as they have in other parts of Asia and there is a danger of similarproblems emerging in Cambodia. Also problematic are rapid increases in populations of crop-destroying pests such as rats, following the efforts of rural people to eliminate snakes, which arenatural predators of rats. There is thus an ongoing need to monitor the complex linkages betweenagriculture and the environment – particularly the ways in which agricultural activity causesenvironmental damage and the ways in which environmental degradation in turn constrainsagricultural production.
5. Institutional factors affecting agriculture
5.1 National agricultural strategies and policies
All four LMB countries see the promotion of agriculture as a critical component of rural and nationaldevelopment. Improving the agriculture sector is considered a key means by which LMB countriescan improve national food security and increase export earnings.117 Until recently, governmentpolicy and institutional support for the sector has focused most closely on increasing rice productionthrough more efficient farming methods, improved inputs, and increased dry season irrigation.118 Inrecent years, more attention has been paid to the diversification of crops, improvement of physicaland market infrastructure, and sustainable management of environmental resources. Emphasis isalso being placed on the strengthening and expansion of agricultural extension services. Such servicesare generally inadequate in the riparian countries. There are not enough extension workers, andthey are often insufficiently trained and lacking the required technical knowledge. This situationhampers attempts to encourage diversification of crops and the re-training of people who migrate toareas where unfamiliar production systems are used.
The Cambodia 2001-2005 Socio-Economic Development Plan focuses on poverty alleviation andrecognises that poverty rates are highest among rural families involved in the agriculture sector.119
Rural development and agricultural development are therefore accorded high priorities. The targetfor agricultural GDP growth for the period is 3.5 percent per annum. The government intends toprovide a supportive policy framework for agriculture, including the provision of core economicand social infrastructure and services that allow farmers to make their own investments and productiondecisions.120 Major initiatives and components include: 1) accelerated and sustainable irrigationdevelopment, including increased farmer participation through strengthening of Water UsersAssociations; 2) development of highly productive and diversified farming systems through

173
8 - Agriculture
improvement of technological and financial inputs and management techniques; 3) land administrationreform to cover measures for alleviating land conflicts and unregulated land encroachments,accelerated rural land titling and providing land for the landless; 4) tackling market failures andinfrastructure problems that impose high transport and distribution costs and inefficient disseminationof price signals; 5) gaining greater access to international markets for agricultural products; 6)strengthening of extension services and of relevant public institutions; 7) expansion of livestockproduction, with emphasis on animal health services, nutrition and range management; and 8)promotion of community-based integrated agroforestry systems. 121
In its “Strategic Vision for the Agriculture Sector,” the Lao PDR government lays out a dual strategyto deal with the dual rural economies along the Mekong Corridor and on sloping lands. The approachto agriculture in the comparatively prosperous corridor area is to encourage acceleration of themarket driven forces for change already underway.122 This will involve agricultural intensificationand diversification: increasing productivity, improving value-added processing and expandingmarketing and sales. Initiatives to be undertaken will include: the strengthening of rural creditfacilities using market determined interest rates; government and private sector sponsored marketresearch; market information systems and regional marketing links; developing internationally-accepted product grades and standards; and rehabilitating, expanding and intensifying dry seasonirrigation schemes with participatory community based management.123 There has also been a shiftfrom focusing on supply to expansion of demand through the liberalisation of international tradepolicy and removal of inter-provincial trade and transport restrictions.124
In the more economically backward sloping land areas, the government has identified the keyconstraints to development as: 1) lack of markets and market information flows; 2) inadequateaccess to transport links; 3) low incidence of rural savings and investment; 4) absence of productivity-enhancing technology flows; 5) slow implementation of formal land tenure arrangements; and 6)insufficient community-based irrigation infrastructure to optimise water resource productivity withinthe agricultural sector.125 The government’s general intention is to tackle the problems of lack ofaccess to various important resources and shift away from low-input/low-output farming systems(e.g. shifting cultivation) that are incapable of helping the growing populations on sloping landbreak out of cycles of poverty. Key strategies include: opening community market access throughfeeder road upgrading and expansion and market information delivery; improving rural credit systemsthrough institutional, legal and financial support for private and public banks serving this market;improved land use planning, incorporating farmer participation and consideration of relevant bio-physical and socio-economic parameters; regularising land tenure; and introducing new crops andtechnologies through improved, farmer-driven extension.126
The crux of Thai agricultural policy is raising rural incomes through crop diversification and improvedagricultural practices, especially for products with good export potential.127 Water management is ahigh priority, especially in terms of improving the efficiency of the many existing water managementprojects, and promoting basin-wide coordination of water resources. Essential steps toward theachievement of these goals include: improving irrigation management efficiency, promoting thedevelopment of small-scale irrigation projects, and strengthening farmers groups and Water UsersAssociations.128 Significant progress has been made toward the last of these objectives, with theThai government authorising legal recognition of the associations and transferring some watermanagement responsibilities to them.129 More generally, the government intends to support projectswith immediate returns and income generating potential, and to increase links between smallholdersand agribusiness. There have been numerous successful agricultural development and extensionprogrammes in the Northeastern Region and Thai agricultural extension programmes are wellresourced and well coordinated, compared to those in the other LMB countries.130

174
State of the Basin Report - 2003
Viet Nam’s agricultural policies must be seen against the context of the country’s ongoing transitionfrom a command economy to a market-based system. As with the other LMB countries, theoverriding national goals involve increasing food security and export earnings through expandedrice, industrial crop and non-rice food production. However the policy focus is mostly on thereform of relevant legislation so as to support market-driven development. Key areas for reforminclude land registration, the rural financial sector, and more generally the transformation of thegovernment’s role from ownership of agricultural production to supporting farmers throughextension, research, irrigation and water management, flood control, and infrastructureimprovement.131 Of particular relevance to the natural resources of the Mekong Basin are plansto expand irrigation, improve existing schemes, and expand the delta water management systemsto deal with acid-sulphate soils and salt intrusion.132
Agricultural policies for the delta and highlands regionsare very different. In the delta, the government iscommitted to protecting most rice land, but proposes toconvert up to 500,000 ha of low-productivity land fromrice production to other cash crops.133 Public researchefforts have been focused on improving various rice-based farming systems, including: rice and fishintegrated with fruit trees; rice and shrimp in salineareas; rice and fish in deepwater areas, and rice withcash crops in floating rice areas.134 The policy for theCentral Highlands is strong support for non-rice cash-crops such as coffee, tea and rubber. Expansion of thesecrops is one of the reasons that the government hasresettled lowlanders into the Central Highlands, so theyprovide a labour force to exploit the available land. Moregenerally, the focus of the 2001-2005 socio-economicplan for Viet Nam is strongly biased towards increasedindustrialisation. This includes a programme of ruralindustrialisation to reduce the dependence of ruralpeople on agriculture. As a result, the GDP share ofagriculture is projected to drop by 10 percent by 2020.
5.2 Land tenure issues
In all four LMB countries there are problems of unclear or insecure tenure over land and other naturalresources in rural areas. These are having serious social, environmental, and economic consequences.Most land in the LMB technically belongs to the state, but there are mechanisms in each country forgroup or private tenure.135 However, the lack of clarity and transparency of these mechanisms, and thedegree to which they overlap with other traditional or state decreed laws and rights causes ambiguityand conflict. One major problem is a general lack of land-title for rural small holders. In Thailand in1992, for example, 40 percent of Thai farmers were estimated not to have title over their land.136 Itwas therefore relatively easy for big developers to annex smallholders’ land, creating a situation ofinsecurity that gave farmers little incentive to invest in the sustainable environmental management oftheir land. Lack of title also means that land cannot be used as collateral for loans, cutting farmers offfrom financing and stunting the development of rural credit markets.
Titling problems are particularly pronounced in forest areas and areas designated unclassified orunused, which are usually utilised for shifting cultivation or grazing. In such areas, overlappinglocal claims are difficult to verify and are often at odds with the results of government-driven
In some upland areas, shifting cultivationis degrading watersheds

175
8 - Agriculture
allocation processes.137 Also problematic are attempts to reclassify forest land, especially the endowingof protected status, which overrules the traditional land use rights of forest residents, forcing them tomove elsewhere to make their living and increasing land-use intensity in the areas in which they endup.138
5.3 Agricultural market issues
One of the biggest challenges for agricultural development in the LMB is the development ofefficient and responsive markets and market infrastructures for agricultural inputs and produce.Unless farmers know what crops to grow and are able to market their surpluses, they have littleincentive to produce them and unless they produce surpluses, they are likely to remain poor.Some would suggest, therefore, that improving the efficiency of agricultural marketing a keyfactor in rural poverty alleviation.
Key components of efficient agricultural markets include: affordable and accessible rural credit;high quality agricultural inputs such as seeds, fertilisers, pesticides, machines, and relatedtechnology; effective marketing and market information for farmers; rural transportation systems;national distribution networks; and international trade polices and relationships.
Rural credit is most necessary for the purchase of inputs for livestock and dry season crops and isthus an important requirement in moving from low value-added rice production to more lucrativeagricultural pursuits. Of the four LMB countries, only Thailand has an extensive formal ruralcredit system, the Bank of Agriculture and Agricultural Co-operatives.139 However, rates of creditutilisation have been relatively low, with only a minority of farmers in debt, and most of thesebeing wealthier farmers who could afford to take the risks inherent in borrowing money.140 InCambodia, NGOs and international donors have been attempting to build rural credit networks.While they have had some degree of success, the system covers only a limited portion of thecountry and is criticised for charging interest rates as high as 60 percent per annum.141 In VietNam, rural credit is provided predominantly by the Viet Nam Bank for Agriculture. However,loan procedural difficulties and limited government funds have resulted in difficulties in meetingthe demand for credit, and the interest rates offered by private lenders are often extremely high.There is also a lack of medium and long-term credit facilities. Similar problems can be seen inLao PDR. National savings are low (only 4 percent of GDP, the lowest for the ASEAN group)and there is no viable nation-wide rural financial system.142 Informal lending predominates, withvillage revolving funds and household-to-household loans being common. Such arrangementsare often in kind, rather than moneterised, especially in the remoter sloping land areas. There area few formal credit organisations operating in the Mekong Corridor area, and the Lao PDR
government intends to support thedevelopment and extension of this sectorby allowing the market to set interest ratesabove inflation rates and establishing acorps of Mobile Credit Officers to “bringthe banks to the farmers.”143
In terms of marketing and marketinformation, the most important factorsinclude “identification of potentialmarkets, knowledge about potential cropsfor those markets, suitable crop productionplans, availability of pre- and post-harvesttechnologies, and marketing mechanisms
Throughout the basin, livestock are becoming anincreasingly important part of agricultural production

176
State of the Basin Report - 2003
and arrangements.”144 In general, such facilities are underdeveloped across the basin, making itharder for farmers to make the best decisions on what crops produce, and whether the pricesthey receive could be better. The solution to these problems is generally held to be more effectiveon-farm extension programs, but such moves are often hampered by a lack of experiencedmanagement staff at the field level, and limited flexibility in government operations andbudgeting support.145 Another marketing-related issue is the development of mechanisms suchas product grades to ensure that crop qualities meet the standards of local, national andinternational markets.
Rural infrastructure is important because it determines the ease with which products are able to movefrom the farm gate to the final consumer market, and is hence a major determinant of their final costand competitiveness. Infrastructure problems exist across the basin area, but are most pronounced inLao PDR, where the 1992/3 census found that approximately 20 percent of the population lived inareas not accessible by truck and over half were more than 10 km from the nearest market.146 While itis difficult to estimate the costs of such a situation to rural communities, they are sure to be considerable.In response, the Lao PDR government, along with the other LMB countries, has made the upgradingof farm-to-market road networks a high development priority in rural areas.
6. Conclusion
Agriculture provides the livelihood of 75 percent of the population of the Lower Mekong Basin andis a key driver of national development in each of the riparian countries. The sector is also a majorsource of pressure on the natural resources of the region. Understanding and monitoring the linksbetween agricultural activities, land and water use, and environmental change are critical to anyattempts to ensure the sustainable development of the LMB.
• Agricultural activities are the mainstays of the Cambodian and Lao PDR economies and majorproviders of employment and export earnings for Thailand and Viet Nam.
• Rice growing dominates the sector, although diversification into fruits and vegetables and uplandand tree crops is occurring.
• Lowland rice fed by rains and floods predominates, with irrigation common in some regions,particularly in the Mekong Delta, but rare in other regions.
• Irrigation is expanding and intensifying across the four countries, but is faced with institutionaland natural resource-related constraints.
• These are great variations in productivity, with rice yields in upland Lao PDR about 1.55tonnes/ha, compared to approximately 5 tonnes/ha for the Viet Nam Mekong Delta. Productivityis linked to the quality of agricultural inputs including land, irrigation, seed, fertilisers andpesticides, as well as supporting services such as finance and distribution networks.
• The upland regions of the basin, with less favourable environmental and market conditions,tend to have lower productivity levels and higher incidences of rural poverty than the moreprosperous lowland and floodplain regions.
• Shifting cultivation is a very common upland farming system, which although environmentallysustainable under low population densities, appears to be exceeding carrying capacity and causingenvironmental degradation in many areas.

177
8 - Agriculture
• Deforestation, caused by the clearing of land for shifting and sedentary cultivation, along withlogging and other human activities, is leading to deteriorating watershed quality with increasederosion and sediment runoff. These problems are particularly marked in the upland areas ofcritical watersheds.
• Activities that increase agricultural production can also cause damage to the environment.Irrigation developments can increase salinity and cause other forms of water quality deterioration,as well as creating obvious pressures on water quantity. There are reports of water shortages inthe Korat Plateau and salinity problems in the Mekong Delta. There are also concerns aboutpesticides and fertilisers causing contamination of ground and surface water.
• Environmental deterioration in turn can potentially affect agriculture by limiting crop yieldswhen soil quality worsens, increasing the severity of floods and droughts, and increasing problemswith pests and disease.
• All four governments place a high priority on agricultural development, generally promotingintensification of production through irrigation and technology improvements and diversificationinto products with higher returns than rice, while endeavouring to strengthen the supportingpolicy, legislation, and institutional environments.
• Institutional problems remain, including weaknesses in extension services, inadequate landtenure systems and market failures and inefficiencies, particularly in terms of markets for credit,market information and physical market infrastructure.
• The combination of rural poverty, economic reform and expansion, and national developmentinitiatives is placing increasing pressure on the agriculture sector and hence upon land andwater resources. If not managed properly, agricultural expansion could cause environmentalchanges that undermine the sustainability of the sector, as well as other sectors that dependupon the land and water of the Mekong Basin

178
State of the Basin Report - 2003
Endnotes
1 MRC 20012 FAO 1997; 1999a; 1999b; 1999c3 MRC 1997, p. 5-14 UNDP-Viet Nam 20025 KOICA 2000, p. 216 Lao PDR Ministry of Agriculture and Forestry 1999, pp. 15-177 Lao PDR National Statistical Centre 19998 IMF 2002a9 Cambodia Ministry of Agriculture, Forestry and Fisheries (2000), p.61 0 FAO/MAFF 1999; FAO/WFP 19991 1 Cambodia Ministry of Planning 19961 2 IMF 2002a1 3 IMF 2002a, p. 251 4 IMF 2002a; IMF 2002b; IMF 2002c; IMF 2002d1 5 MRC 20011 6 MRC 2002c, Executive Summary1 7 MRC 2002c, p. 561 8 MRC 1997, p. 5-11 9 Desbarats & Sik 20002 0 MRC 1997, p. 5-2; MRC 2001; Lao PDR Ministry of Agriculture and Forestry 1999, p. 72 1 MRC 1997, p. 5-22 2 Lao PDR Ministry of Agriculture and Forestry 1999, Executive Summary2 3 Lao PDR Ministry of Agriculture and Forestry 1999, Executive Summary2 4 KOICA 2000, p. 212 5 Hori, 2000, p. 152 6 MRC 1998a, p. 132 7 MRC 1998a, p. 132 8 MRC 2002d2 9 FAO 1999a, pp. 4-53 0 MRC 1998a, p. 183 1 MRC 1998a, p. 173 2 MRC 1998a, p. 193 3 MRC 1998a, p. 173 4 Hori 2000, p. 483 5 Lao PDR Ministry of Agriculture and Forestry 19993 6 Lao PDR Ministry of Agriculture and Forestry 1999, p. 253 7 Lao PDR Ministry of Agriculture and Forestry 1999, p. 263 8 Hori 2000, p. 433 9 Hori 2000, p. 434 0 MRC 1997b, p. 334 1 Hori 2000, p. 454 2 MRC 1999, p. 164 3 FAO 2001, p. 214 4 FAO/UNDP 1994, p. 324 5 FAO/UNDP 1994, p. 324 6 Hori 2000. p. 484 7 Lao PDR Ministry of Agriculture and Forestry 1999, p. 74 8 JICA 1993, pp. 2-3

179
8 - Agriculture
4 9 JICA 1993, pp. 2-35 0 MRC 2002d5 1 MRC 1997, p. 5-25 2 IRRI 20025 3 MRC 1997, p. 5-25 4 MRC 1998a, p. 165 5 MRC 1998a, p. 135 6 IMF 2002a5 7 FAO/UNDP 1994, p. 335 8 FAO/UNDP 1994, p. 325 9 JICA 2001, AP. 6-56 0 JICA 2001, AP. 6-56 1 JICA 2001, AP. 6-56 2 MRC 1998a, p. 136 3 MRC 1997b, p. 336 4 JICA 1993, p. 2-36 5 JICA 1993, p. 2-36 6 JICA 1993, p. 2-26 7 MRC 1997, p. 5-46 8 JICA 1993, pp. 2-36 9 FAO 20027 0 IRRI 1997, p. 907 1 MRC 2000, p. 207 2 Lao PDR Ministry of Agriculture and Forestry 1999, p. 267 3 Lao PDR Ministry of Agriculture and Forestry 1999, p. 267 4 MRC 1997, p. 5-37 5 MRC 2000, p. 207 6 MRC 1997, p. 5-37 7 MRC 2000, p. 207 8 Lao PDR Ministry of Agriculture and Forestry 1999, pp. 26-277 9 MRC 2000, p. 208 0 MRC 1997, p. 5-38 1 MRC 2000, p. 208 2 Lao PDR Ministry of Agriculture and Forestry 1999, p. 268 3 Lao PDR Ministry of Agriculture and Forestry 1999, p. 268 4 MRC 2000, p. 208 5 MRC 2000, p. 198 6 MRC 2000, p. 198 7 MRC 1997, p. 5-38 8 MRC 2000, p. 288 9 MRC 1997, p. 5-49 0 Falvey 2000, p. 2459 1 Falvey 2000, p. 2089 2 Lao PDR Ministry of Agriculture and Forestry 1999, pp. 28-99 3 MRC 1997, p. 5-49 4 MRC 2000, p. 99 5 FCMP 1999, p. 59 6 MRC 2002b9 7 FAO 1997; 1999a; 1999b; 1999c9 8 FCMP 1999, p. 69 9 Ringler 2001

180
State of the Basin Report - 2003
1 0 0 MRC 1998a, p. 241 0 1 MRC 1997, pp. 5-61 0 2 MRC 1997, pp. 2-221 0 3 MRC 1998a, p. 241 0 4 MRC 1997, pp. 5-61 0 5 Hori, 2000, p. 461 0 6 MRC 2002b1 0 7 MRC 1998a, p. 241 0 8 Monrith et. al. 1999; MRC 19931 0 9 Monrith et. al. 1999; MRC 19931 1 0 MRC 1998a, p. 241 1 1 Lao PDR Ministry of Agriculture and Forestry 1999, pp. 5-61 1 2 MRC 2002b1 1 3 MRC 1998a), p. 241 1 4 MRC 1997, pp. 5-61 1 5 IRRI 20021 1 6 IRRI 1997, p. 891 1 7 MRC 1997, p. 5-11 1 8 MRC 1998a, p. 131 1 9 MRC 2002a1 2 0 MRC 2002a, p. 71 2 1 MRC 2002a, pp. 12-13; Cambodia Ministry of Planning 1996, p. 361 2 2 Lao PDR Ministry of Agriculture and Forestry 1999, Executive Summary1 2 3 Lao PDR Ministry of Agriculture and Forestry 1999, Executive Summary1 2 4 Lao PDR Ministry of Agriculture and Forestry 1999, Executive Summary1 2 5 Lao PDR Ministry of Agriculture and Forestry 1999, Executive Summary1 2 6 Lao PDR Ministry of Agriculture and Forestry 1999, Executive Summary1 2 7 MRC 1998a, Annex 41 2 8 MRC 1998a, Annex 41 2 9 MRC 1998a, pp. 25-61 3 0 MRC 1998a, pp. 21-22, pp. 25-261 3 1 MRC 1998a, Annex 41 3 2 MRC 1998a, Annex 41 3 3 Viet Nam Ministry of Agriculture and Rural Development 2000; Viet Nam Ministry of
Planning and Investment 20011 3 4 IRRI 20021 3 5 MRC 2000, p. 131 3 6 MRC 1997, p. 5-31 3 7 MRC 2000, p. 131 3 8 MRC 2000, pp. 25-261 3 9 MRC 1998a, p. 211 4 0 JICA 1993, pp. 1-31 4 1 Green 2002, pp. 8-91 4 2 Lao PDR Ministry of Agriculture and Forestry 1999, p. 301 4 3 Lao PDR Ministry of Agriculture and Forestry 1999, p. 301 4 4 MRC 1998a, p. 151 4 5 MRC 1998a, p. 161 4 6 Lao PDR Ministry of Agriculture and Forestry 1999, p. 18

181
8 - Agriculture
References
Cambodia, Ministry of Planning. 1996. Summary: first socioeconomic development plan, 1996-2000.Ministry of Planning, Government of Cambodia, Phnom Penh.
Cambodia, Ministry of Agriculture. 1993. Agricultural statistics: quarter 1 1993. Ministry of Agriculture,Government of Cambodia, Phnom Penh.
Cambodia, Ministry of Agriculture, Forestry and Fisheries. 2000. Agricultural statistics 1999-2000.Ministry of Agriculture, Government of Cambodia, Phnom Penh.
Cambodia, National Institute of Statistics. 1998. 1998 Population census of Cambodia. NationalInstitute of Statistics, Government of Cambodia, Phnom Penh.
Desbarats, J. & B. Sik. 2000. People and land in rural Cambodia. Cambodia Development Review,4 (3): 6-10.
Falvey, L. 2000. Thai agriculture: golden cradle of millennia. Kasetsart University Press,Bangkok.
FAO/UNDP. 1994. Cambodia: agricultural development options review (phase I), volume 1: sectorreview. FAO/UNDP, Phnom Penh.
FAO. 1997. FAO-AQUASTAT: Thailand country profile.Accessed at http://www.fao.org/ag/agl/aglw/aquasat/countries/thailand/index.stm on 20 October 2002.
FAO. 1999a. FAO-AQUASTAT: Cambodia country profile.Accessed at http://www.fao.org/ag/agl/aglw/aquasat/countries/cambodia/index.stm on 20 October2002.
FAO. 1999b. FAO-AQUASTAT: Lao PDR country profile.Accessed at http://www.fao.org/ag/agl/aglw/aquasat/countries/laos/index.stm on 20 October 2002.
FAO. 1999c. FAO-AQUASTAT: Vietnam country profile.Accessed at http://www.fao.org/ag/agl/aglw/aquasat/countries/viet_nam/index.stm on 20 October2002.
FAO. 2001. Selected indicators of food and agriculture in the Asia-Pacific Region 1990-2000. Food and Agriculture Organization of the United Nations, Regional Office for Asia and thePacific, Bangkok.
FAO. 2002. FAOSTAT- Agriculture database.Accessed at http://apps.fao.org/page/collections?subset=agriculture on 13 August 2002.
FAO/MAFF. 1999. National Food Security and Nutrition. Paper presented at the National Seminaron Food Security and Nutrition, Royal University of Agriculture, April 1999.
FAO/WFP, 1999. FAO/WFP Crop and Food Supply Assessment Mission to Cambodia, SpecialReport, February 1999. www.fao.org.kh.

182
State of the Basin Report - 2003
FCMP. 1999. Forest cover monitoring project. Final Report. MRC/GTZ, Mekong River Commission.Vientiane.
Gregory, R. & H. Guttman. 2002. The ricefield catch and rural food security. pp. 1-13. In: Edwards,P., D. C. Little & H. Demaine. Editors. 2002. Rural aquaculture. CABI Publishing, Wallingford,UK.
Green, C. 2002. Micro-finance: who’s helping whom? The Phnom Penh Post, May 24 - June 6,2002. 11 (11). Phnom Penh.
Halcrow, W. 2002. Review of historic water resources development and water use: water utilisationprogramme component. Mekong River Commission, Phnom Penh.
Hori, H. 2000. The Mekong: environment and development. United Nations University Press,Tokyo.
Huguet, J. W., A. Chamratrithriong, N. R. Rao & S. T. San. 2000. Results of the 1998 populationcensus in Cambodia. Asia-Pacific Population Journal.
IMF. 2002a. Cambodia: statistical appendix. International Monetary Fund, Washington DC.
IMF. 2002b. Lao PDR: selected issues and statistical appendix. International Monetary Fund,Washington DC.
IMF. 2002c. Thailand: statistical appendix. International Monetary Fund, Washington DC.
IMF. 2002d. Viet Nam: selected issues and statistical appendix. International Monetary Fund,Washington DC.
IRRI. 1997. Rice production in Cambodia: a Cambodia-IRRI-Australia project. International RiceResearch Institute, Manila.
IRRI. 2002. International Rice Research Institute country statistics.Accessed at http://www.Riceweb.org on 13 August 2002.
JICA. 1993. The study on the regional development plan for the lower northeast and the upper eastregions in the Kingdom of Thailand. Final Report. Volume I: Agriculture. Japan InternationalCooperation Agency and the Social and Economic Development Board, Government of Thailand,Bangkok.
JICA. 2001. Master plan study on integrated agricultural development in Lao Peoples DemocraticRepublic. Volume III: Appendices. Japan International Cooperation Agency and Ministry of Agricultureand Forestry, Government of Lao PDR,Vientiane.
KOICA. 2000. Flood control planning for development of the Mekong Basin Delta (basinwide).Final Report. Volume 1: Main Report. Korea International Cooperation Agency (KOICA), PhnomPenh.
Lao PDR Ministry of Agriculture and Forestry. 1999. The government’s strategic vision for theagricultural sector. Ministry of Agriculture and Forestry, Government of Lao PDR, Vientiane.
Lao PDR National Statistical Centre. 2000. Basic statistics of the Lao PDR: 1975-2000. NationalStatistical Centre, Government of Lao PDR,Vientiane.

183
8 - Agriculture
Miller, F., V. T. Nguyen & T. M. D. Do. 1999. Resource management in the Vietnamese MekongDelta. Australian Mekong Resource Centre University of Sydney, Sydney, Australia.
Monirith, I., H. Nakata, S. Tanabe & S.T. Touch. 1999. Persistent organochlorine residues in marineand freshwater fish in Cambodia. Marine Pollution Bulletin, 38 (7): 604-612.
Mekong Committee. 1993. Mekong water quality monitoring and assessment expert meeting: residuepesticide monitoring in the Mekong Basin. Interim Committee for Investigation of the Lower MekongBasin (Mekong Committee), Bangkok.
MRC. 1997. Mekong River Basin diagnostic study: Final Report. Mekong River Commission, Bangkok.
MRC. 1997b. Mekong Basin development plan phase I - a country report: Thailand. Mekong RiverCommission, Bangkok.
MRC. 1998a. Agriculture and irrigation programme for co-operations towards sustainable developmentof the Lower Mekong Basin. Mekong River Commission, Bangkok.
MRC. 1998b. Guidelines on mainstreaming gender in water resources development in the LowerMekong Basin. Mekong River Commission, Bangkok.
MRC. 1999. Basin development plan draft working paper 2: baseline conditions. Mekong RiverCommission, Phnom Penh.
MRC. 2000. Strategy study on the development of the watershed management/forestry sector inthe Lower Mekong Basin: strategy and action plan. Mekong River, Phnom Penh.
MRC. 2001. Metadata for MRC Secretariat GIS core datasets. Mekong River Commission, PhnomPenh.
MRC. 2002a. Cambodia national policies. Unpublished Paper by Solieng Mak, MRCS-BDP. MekongRiver Commission, Phnom Penh.
MRC. 2002b. MRC-EP Water quality data. Mekong River Commission, Phnom Penh.
MRC. 2002c. Land resources inventory for agricultural development project. Technical Report –Part III. Mekong River Commission, Phnom Penh.
MRC. 2002d. MRC LRIAD irrigation database. Mekong River Commission, Phnom Penh.
Ringler, C. 2001. Optimal water allocation in the Mekong River Basin ZEF. Discussion Report 38 onDevelopment Policy.
Thailand, National Statistics Office. 2000. Statistical reports of region: Northeastern region 2000.National Statistics Office, Government of Thailand, Bangkok.
Thailand, Ministry of Agriculture and Cooperatives. 2001. Agricultural statistics of Thailand, cropyear 2000/2001. Ministry of Agriculture and Cooperatives, Government of Thailand, Bangkok.

184
State of the Basin Report - 2003
UNDP–Viet Nam, 2002. Viet Nam Human Development Report 2002. www.undp.or.vn
Viet Nam, Ministry of Planning and Investment. 2001. The 5-Year Plan for Socio-EconomicDevelopment (2001-2005). Government of Viet Nam, Hanoi: MPI, October 2001. www.vdic.org.vn
Viet Nam, Ministry of Agriculture and Rural Development. 2000. Agriculture and Rural Development5-Year Plan (2001-2005). Government of Viet Nam, Hanoi: MARD, August 2000. www.vdic.org.vn
Viet Nam, General Statistics Office. 1999. Statistical yearbook: 1999. Statistical Publishing House,Government of Viet Nam. Hanoi.
Viet Nam, Ministry of Agriculture and Rural Development. 2000. Agriculture and Rural Development5-Year Plan (2001-2005). Government of Viet Nam, Hanoi: MARD, August 2002. www.vdic.org.vn
Viet Nam, Ministry of Planning and Investment. 2001. The 5-Year Plan for Socio-EconomicDevelopment (2001-2005). Government of Viet Nam, Hanoi: MPI, October 2001. www.vdic.org.vn
World Bank. 1999. Vietnam Mekong Delta water resources project, project appraisal document.
World Bank. 2000. Water utilisation project. Project Appraisal Report.
World Bank. 2001. Cambodia emergency flood recovery project: project information document.

185
9 - Forestry
Forestry 9
The forestry sector is of great importance to the future of land and water resources in the LMB, aswell as to the social and economic development of the riparian countries. Forests are heavily exploitedin parts of the LMB, and this has important implications for the quality of land and water resources.Forestry activity takes place on two levels: commercial logging, and the gathering of wood andother forest products by individual smallholders. On the commercial level, forestry is of considerableeconomic value and forms an important component of GDP and export earnings for Lao PDR andCambodia. However, this industry faces problems related to illegal over-exploitation of resources.In terms of smallholder activity, exploitation of forest resources is a major source of livelihood forpeople who live in or around forests. It is estimated that 17 percent of the people living in the basindraw a significant proportion of their livelihood from forest resources, particularly in terms ofgathering food, non-timber forest products and fuelwood.1
Forest resource use is causing loss of forest cover, with MRC data suggesting an annual basin-widedeforestation rate of 0.53 percent between 1993 and 1997. Although the causes of deforestationcannot be directly determined from the data available, it appears that logging is a driving force behindforest degradation, and that degraded forest lands are often cleared and converted to agricultural use.Human activity in the forestry and agriculture sectors is thus reducing the stock of forest resources inthe LMB. While 0.53 percent per annum may not seem a large figure, this rate will have profoundimplications if it remains steady or accelerates in the longer term. If this rate of deforestation remainsconstant, the LMB will have only about 20 percent forest cover left in less than 100 years from now,as opposed to the more than 35 percent that it currently possesses. The environmental impacts of
deforestation on such a scale are complex and uncertain,but could involve greater erosion and soil degradation, withincreased run off of silt and sediment into the river systemand a resulting decline in the quality of water resources.
Forestry management has become a highly controversialissue in the Lower Mekong Basin and adjacent areas.Controversies centre on three main issues. The firstconcerns the exploitation of forests and forest products,including non-timber forest products. Important questionsinclude: Who should be permitted to use forests? For whatpurposes should forests be used and at what rates? Asecond issue is prevention of the illegal exploitation offorests and their resources, including the illegal alienationof forest lands, illegal logging and illegal trade in wildlife.The environmental consequences of forest loss, the thirdimportant issue, includes potential impacts on hydrologicalprocesses, water quality and soil loss. It is not appropriateto discuss all these issues in this report but more detaileddiscussions may be found elsewhere in publications bythe Siam Society and Smith.2Logging in watersheds can have serious
consequences

186
State of the Basin Report - 2003
Unlike most of the chapters in this report, forestry statistics were available at a basin level. Thusmost of the data in the tables that follow are only for areas of Thailand and Viet Nam that liewithin the basin. Because almost all of Cambodia and Lao PDR lie within the basin, national-level data have been used for these countries. In those few tables where only national level datawere available for Thailand and Viet Nam, this has been indicated with the symbol * in a notebelow the table.
1. Forestry sector activities
1.1 Overview of the forestry sector
Forestry across the LMB is characterised by active logging, often carried out across borders, ineffectivelogging bans and application of regulations, and a reforestation process that is too slow to keep upwith forest cutting and biased toward mono-culture.3 The forestry sector covers commercial logging,private and commercial gathering of fuelwood, and the harvesting of non-timber forest products(NTFP.) The sector contributes 5 percent of the GDP for Lao PDR, 4 percent for Cambodia, 1percent for Viet Nam, and below 1 percent for Thailand. However, these figures understate theimportance of forest resources in the economic and social lives of LMB people because of the large
numbers who draw their livelihoods partiallyor fully from the forests. Forests are also ofenormous indirect value by virtue of the rolethey play in protecting watersheds from erosionand other forms of degradation.
The tables below give Food and AgricultureOrganization (FAO) estimates of the quantityof various forest resources exploited in the LMBcountries, including concession and non-concession (illegal and smallholder) activity.Figures for Thailand and Viet Nam are onlyavailable at the national rather than the basinlevel.
Table 1. Cambodia forestry sector output 1990-2000 (m3)
Item 1990 1995 2000
Industrial roundwood 567,000 1,040,000 809,000Other industrial roundwood 457,000 630,000 630,000Plywood 2,300 29,000 27,000Roundwood 11,795,231 12,026,632 10,928,409Sawlogs+veneer logs 110,000 410,000 179,000Sawnwood 71,000 140,000 3,000Veneer sheets 0 29,000 45,000Wood-based panels 2,300 58,000 72,000Wood charcoal 25,036 36,275 31,042Wood fuel 11,228,231 10,986,632 10,119,409
Source: FAO 2002a
Uncontrolled and illegal logging continues in muchof the basin

187
9 - Forestry
Table 2. Lao PDR forestry sector output 1990-2000 (m3)
Table 3. Thailand* forestry sector output 1990-2000 (m3)
Item 1990 1995 2000
Industrial roundwood 455,000 994,000 866,000Other indust. roundwd 105,000 119,000 132,000Plywood 10,000 8,500 125,000Roundwood 6,082,031 6,724,394 6,737,960Sawlogs+veneer logs 350,000 875,000 734,000Sawnwood 100,000 465,000 350,000Wood-based panels 10,000 8,500 125,000Wood charcoal 12,892 14,717 16,772Wood fuel 5,627,031 5,730,394 5,871,960
Source: FAO 2002a
Item 1990 1995 2000
Chips and particles 0 0 1,449,000Fibreboard 131,000 181,000 194,000Fibreboard, Compressed 82,000 0 0Hardboard 0 70,000 102,000Industrial roundwood 3,093,000 2,775,000 2,894,000Insulating board 49,000 30,000 0MDF 0 81,000 92,000Other indust. roundwd 2,601,000 2,742,000 2,848,000Particle board 60,000 216,000 1,039,000Plywood 122,000 278,000 91,000Roundwood 24,899,980 23,500,478 23,446,514Sawlogs+veneer logs 492,000 33,000 46,000Sawnwood 1,170,000 425,900 294,000Veneer sheets 136,000 8,000 3,000Wood-based panels 449,000 683,000 1,327,000Wood charcoal 1,064,983 1,122,083 1,202,869Wood fuel 21,806,980 20,725,478 20,552,514
Note: “*” data are for the whole country rather than for just for the territory withinthe basin.
Source: FAO 2002a

188
State of the Basin Report - 2003
Table 4. Viet Nam* forestry sector output 1990-2000 (m3)
1.2 Commercial logging
In terms of commercially-produced lumber and timber, the region as a whole consumes most ofthe wood it produces, but there are significant intra-regional flows, with Cambodia and LaoPDR producing a surplus and Thailand and Viet Nam importing to meet their needs.4 Demandin the latter two countries is driven primarily by construction needs that cannot be satisfied dueto domestic logging bans. Thailand has banned commercial logging entirely, following annualdeforestation rates as high as 4-5 percent in the 1980s and a series of floods and landslides thatcaused public scandal in 1989.5 As result, unsatisfied timber and lumber demand in Thailandhas increased pressure on forest resources in Cambodia and Lao PDR. This situation is unlikelyto abate in the near future, with wood demand in Thailand estimated to be increasing at the rateof 5 percent per year.6
Tables 5 and 6 below show the relative importance of forestry exports and provide estimates of thequantity of roundwood logs traded between the LMB countries in 1999. Much of this trade isconducted illegally, in defiance of government established quotas, bans and concession rules. It isthus difficult to accurately ascertain the quantities of wood involved and estimates must be taken asindicative only. Legal logging within government quota restrictions is not considered to present amajor problem in terms of environmental sustainability, although there are issues with inefficientlogging practices and poor planning causing greater forest cover loss and environmental degradationthan is necessary given the quantities being harvested.7 For example, a considerable proportion ofthe wood harvested in Lao PDR is lost due to poor management practices.8
Illegal logging, which appears extensive in Cambodia and Lao PDR, presents a greater environmentalconcern in terms of sustainability and deforestation, although again, it is difficult to ascertain thequantities of timber involved. There are particular problems with concession operators adjacent toprotected areas logging within the protected areas and merging the illegally-acquired logs with theirlegitimate harvest to avoid detection. Furthermore, the concession granting process is often nottransparent and enforcement is weak, leading to over-cutting of valuable trees at an unsustainablerate.9 The enforcement of regulation and implementation of policy is made difficult by a lack ofresources for forestry agencies.10
Item 1990 1995 2000
Industrial roundwood 4,669,000 4,425,000 4,556,000Other Industrial Roundwood 1,813,000 2,009,000 2,140,000Particle board 2,000 2,000 2,000Plywood 37,000 37,000 37,000Roundwood 31,203,428 31,218,304 31,241,548Sawlogs+veneer logs 2,856,000 2,416,000 2,416,000Sawnwood 896,000 721,000 721,000Wood-based panels 39,000 39,000 39,000Wood charcoal 109,512 126,659 108,258Wood fuel 26,534,428 26,793,304 26,685,548
Note: “*” data are for the whole country rather than for just for the territory withinthe basin.
Source: FAO 2002a

189
9 - Forestry
Table 5. Contribution of forestry to LMB country exports (%)
Table 6. Lower Mekong Basin industrial roundwood trade 1999
1.3 Fuelwood collection
While commercial logging attracts the most attention asa source of pressure on LMB forest resources, fuelwoodcollection is also an important driver of demand for wood.In 1995, for example, Cambodia is estimated to havesupplied 95 percent of its energy requirements forcooking and boiling water with fuelwood. In Lao PDR,80 percent of cooking energy requirements are providedby fuelwood, and a substantial proportion of wood felledis for fuel, with a similar situation in Thailand and VietNam.11 The cutting of mangroves for charcoal productionis also common in some regions. Because most fuelwoodis consumed by the collecting household rather thanentering the formal economy, it is difficult to ascertainthe quantities collected.12 In Cambodia, for example,various estimates of fuelwood production for the mid1990s run between 6-11 million m3.13 For Lao PDR, thegovernment estimates that about 12.7 million m3 isgathered annually, although FAO figures are about halfthis level.14 One estimate for Viet Nam suggests that ifconverted to its area equivalent, the quantity of fuelwoodgathered would account for six times as much harvesting
Cambodia Lao PDR Thailand* Viet Nam*1995 1999 1995 1999 1993 2000 1995 1998
Share of total exports
Forestry 69 16 39 29 0 0 3 2
Note: “*” data are for the whole country rather than for just for the territory within the basin.Source: Thailand National Statistics Office 1997, 2001; Viet Nam General Statistical Office
1999; IMF 2002a; IMF 2002b
ImportersCountry Cambodia Lao PDR Thailand* Viet Nam* Other Total
Cambodia X Little 1500 800 700 3000Lao PDR - X 300 100 100 500Thailand - - X - 500 500Viet Nam - - - X 500 500Other - - 3200 500 X 3700Total - Little 5000 1400 1800 8200
Note: Units (1000s M3 rwe per year) * data are for the whole country rather than for just for the territory within the basin.Source: updated from Castren 1999, cited in MRC 2000, p 18.
Exp
orte
rs
The majority of people in the basin usewood or charcoal for cooking and
boiling water

190
State of the Basin Report - 2003
as commercial logging.15 However these figures, while significant, do not translate directly topressure on forest resources because a significant proportion of the wood collected comes fromscattered trees in non-forest areas, or consists of branches that are cut off standing trees.
1.4 Non-timber forest products (NTFPs)
Another important component of the forestry industry is NTFP harvesting. The NTFP categoryencompasses a wide range of forest resources, including wildlife, wild fruits, medicinal plants,resins, gums, precious woods, rattan and bamboo. Demand for these products is growing throughoutthe LMB and in China. This is leading to increased income-earning opportunities for forest dwellers,but is also creating the danger of unsustainable resource use.16 While such products are not includedin official forest valuations, they comprise important primary and secondary sources of income forlarge numbers of people, as well as sources of food and cash-income for farmers during poor harvestyears. In Thailand, for example, an estimated 5 million people derive their primary income fromNTFPs.17 Given that the cutting of lumber for sale is either illegal or requires a government concessionin the riparian countries, NTFPs provide smallholders with a means of generating income fromforest resources in a way that timber cannot. The yields from the harvesting and cultivation ofNTFPs in upland conditions are often such that their economic value per hectare is greater than forrice cultivation, which means that NTFP harvesting can be a more attractive option for forest dwellersthan shifting cultivation.18 As such, NTFPs enhance the value of intact forests to local people anddiscourage deforestation.19 Gathering these products is also superior to commercial forestry as aprovider of employment. On average, ten hectares of NTFPs require thirty labourers to work them,which is ten times the number needed for a similar area of lumber production.20 NTFPs are veryimportant in the Central Highlands of Viet Nam, and across the country as a whole. In the early1990s, they provided subsistence livelihoods and cash-income for an estimated 20 million people(across all of Viet Nam), as well as valuable export earnings.21 The critical importance of suchproducts compounds the negative social consequences of deforestation because loss of forests depriveslarge numbers of people with access to resources upon which they depend.
2. Forest cover and deforestation
2.1 Trends in LMB forest cover
This section presents details about forest cover and deforestation in the Lower Mekong Basin(LMB) between 1993 and 1997, which have been derived from MRC’s Forest and Land CoverData Set, compiled between 1993 and 1999.22 This data set, which is based on visual interpretationsof Landsat satellite images, combined with limited ground truthing, is one of the most completeavailable.23 However, it does not go beyond 1997, and thus fails to capture any land-use changesthat may have taken place in the LMB since then. For more information on the availability andreliability of forest cover data, please refer to the box below titled “Forest cover data availability:issues and problems”.
The term forest is used here as defined by the Forest Cover Monitoring Project: “An area is consideredas forest if the tree cover (crown cover) is at least 20 percent and if tree height can be assumed tobe about 10 meters or more. If the tree cover is equal or more than 20 percent, but tree height rangesonly between 5 and 10 meters, an assignment to the class ‘forest regrowth’ appeared to beappropriate...” 24 All figures given here for individual countries only refer to those parts of the countriesthat are located within the LMB. Map 1 presents forest cover in the Lower Mekong Basin in 1997.

191
9 - Forestry
The most densely-forested country in 1997 wasCambodia, with almost two thirds of its area covered byforest, while the most sparsely-forested country wasThailand, with less than one sixth forested. Almost all ofthe forested land in the LMB area of Viet Nam is in theCentral Highlands region, and forest cover was moreextensive in southern and central Lao PDR than in thenorthern part of the country. In assessing forest coverfigures across the four countries, one can see that thereis a strong negative correlation between populationdensity and forest cover. Lao PDR and Cambodia havepopulation densities of 21 and 49 persons per km2 andhave 41 percent and 58 percent forest cover respectively,while the basin portions of Thailand and Viet Nam with128 and 224 persons per km2 have 16 percent and 24percent, respectively.25
Table 7, below, details changes in forest cover in thebasin areas of the four countries between 1993 and 1997.The forest cover in all four countries, and hence in theLMB as a whole, has decreased during the periodobserved from an overall 36.7 percent in 1993 to 35.9percent in 1997.
Table 7. Forest cover in the LMB in 1993 and 1997
Table 8, below, presents a breakdown by classes of forest cover, and shows that the largest losseshave occurred in areas classified as “open/distributed forest”, followed by “regrowth forest” and“closed forest”.
Table 8. Distribution of forest cover types in the LMB in 1993 and 1997
Area Forest cover 1993 Forest cover 1997 Total sizeha % ha % ha %
Cambodia 9,274,703 59.4 9,092,093 58.2 15,618,908 100Lao PDR 8,746,487 42.2 8,544,584 41.3 20,712,008 100Thailand 3,038,772 16.1 2,990,087 15.9 18,827,978 100Viet Nam 1,664,005 24.7 1,615,670 24.0 6,745,651 100LMB 22,723,966 36.7 22,242,433 35.9 61,904,545 100
Non-timber forest products include wildlife,wild fruits and vegetables, medicinal plants,
resins, gums, precious woods,rattan and bamboo
Type Forest cover 1993 Forest cover 1997ha % of 1993 ha % of 1993
total total
Forest, closed 2,945,301 13.0 2,897,159 12.7Forest, open/disturbed 15,010,897 66.1 14,662,059 64.5Forest, mosaic with non-forest types 3,527,399 15.5 3,521,009 15.5Forest regrowth 762,940 3.3 685,276 3.0Other forest types 477,429 2.1 476,930 2.1Total 22,723,966 100.0 22,242,433 97.9
Note: % values refer to Total in 1993. For detailed definitions of Forest Classes see FCMP 1997

192
State of the Basin Report - 2003
Deforestation is compared with reforestation and regrowth in Table 9. In all four countries, deforestationand reforestation/regrowth have been taking place simultaneously, with the latter partly compensatingfor the former. The Net Forest Cover Loss of Table 8 equals Deforestation minus Reforestation &Regrowth. Lao PDR has suffered the largest net forest cover loss in absolute terms, while Viet Namhas lost the greatest percentage of its forest cover. The LMB as a whole has lost close to 500,000 ha,or slightly over 2 percent of its forest cover within only four years.
Table 9. Deforestation and reforestation & regrowth 1993 – 1997
There have been significant differences in the ratio of deforestation versus reforestation andregrowth in the individual countries. Reforestation programmes, while legally required of manylogging concessionaires and generally accorded a high priority by LMB governments, have hadvaried success. On the whole they lag behind deforestation by a substantial margin. Viet Nam hashad the most success in this area and has compensated for over one third of the deforestation it hasexperienced through reforestation and regrowth. This is most likely related to the government’srecent reforestation efforts: almost 90 percent of the total reforestation and regrowth found inViet Nam during the period observed was made up of forest plantations.26 Reforestation rates inthe other three countries are much lower, and in all four countries are far from sufficient to stabiliseforest area.There is also cause for concern about the nature of reforestation efforts. There is ageneral bias towards mono-culture, resulting in decreasing bio-diversity. Furthermore, survivalrates for planted trees are low due to poor planning, use of inappropriate species and insufficientinstitutional support.27
For easier comparison, the Net Forest Cover Loss of Table 9 can be expressed in the form of annualdeforestation rates shown in Table 10. For example, the rate given for the LMB means that theregion as a whole has annually lost an average 0.53 percent of its forest cover during the periodobserved.
Area Deforestation Reforest. & regrowth Net forest cover lossha % ha % ha %
Cambodia 194,800 2.1 12,190 0.1 182,610 2.0Lao PDR 212,263 2.4 10,360 0.1 201,903 2.3Thailand 49,982 1.6 1,297 0.0 48,685 1.6Viet Nam 77,427 4.6 29,092 1.7 48,335 2.9LMB 534,472 2.3 52,939 0.2 481,533 2.1
Note: % values refer to Forest Cover 1993 of the respective Area in Table 7.
Table 10. Annual deforestation rates 1993 – 1997
Area Deforestation rate %
Cambodia 0.50Lao PDR 0.58Thailand 0.40Viet Nam 0.73LMB 0.53

193
9 - Forestry
Figure 1. Lower Mekong Basin – Forests 1997

194
State of the Basin Report - 2003
As Map 1, above, shows, deforestation has not been evenly dispersed across the entire LMB. Rather,there have been quite distinct “hot spots” of deforestation, found mainly around existing populationcentres (see clusters of deforestation around and near Chiang Rai, Luang Namtha, Attapeu, KonTum, Buon Ma Thuot, Ban Lung, Kampong Thom) and in the vicinity of roads. Further, deforestationis found in particular along the Thai-Cambodian and the Lao-Chinese borders. Also note that thetwo densest clusters of deforestation (Attapeu and Ban Lung) are both linked by road to nearbymore-populated neighbouring countries, thushaving potential access to their markets fortimber and agricultural produce.
It appears from this geographical distributionthat deforestation does not take placerandomly, but at least to some extent followspredictable patterns. To a certain degree,deforestation further appears to be aninternational (cross–border) problem. Thisindicates that reducing deforestation mayrequire regionally-integrated approaches, theimplementation of which may in a number ofcases be beyond the capacity of any singlegovernment.
Forest cover data availability: issues and problems
Reliable data on forest cover, and even more so on its changes, are difficultto obtain. For example, data sampled from a limited number of publicly-accessible sources show an enormous variety of forest cover figures. ForCambodia (whole country), one academic source28 offers “Scientific DataProducts” which, when evaluated, yield forest cover figures of 27.3 percent(1985)a and 47.6 percent (1992)b. Had this been the case, Cambodia wouldhave enjoyed an annual reforestation rate of 8.25 percent. For the Lao PDR(whole country), forest cover figures range from 47 percent (in 1994)29, 47.2percent (in 1992)30, 54.4 percent (in 1989)31, 54.4 percent (in 2000)32, 33, 34,55.5 percent ( in 1989)35, 56.7 percent (in 1990)36 to over 80 percent (in2000)c. One source attempts to clarify: “A massive 85 percent of Laos isforested, with 47 percent classed as forests in the 1989 inventory and 38percent as unstocked and bamboo forests…”37 Such diversity of figures makesreliable determination of deforestation rates nearly impossible. Even worsethan their numerical uncertainty is the fact that most available figures andtheir source data are fuzzy in a geographical sense, i.e. they do not allow theidentification of deforestation “hot spots”, and thus do not supportprioritisation of intervention measures.
What causes such enormous diversity? Likely causes are incompatible datageneration methods, lack of background knowledge on the analyst’s part,lack of funds or time, politically-motivated interference with study methodsand results, and the classic dilemma of public goods. Incompatible data
The current rate of logging in the LMB is at anunsustainable level

195
9 - Forestry
generation methods result in different studies not being comparable. Thishappens, for example, when studies use different definitions of whatconstitutes a forest or work with different base maps. Lack of backgroundknowledge on the analyst’s part often leads to misinterpretations of naturalphenomena. For example, the impacts of the seasonal monsoon climate onthe appearance of different vegetation types on remotely sensed images areoften completely neglected in studies performed by researchers with littlelocal or forestry-related experience. This may result in grossly biasedestimations of forest cover figures. Lack of funds or time results in the use ofinappropriate data generation methods, with speedy delivery of products ofwhatever quality being given priority over accuracy and reliability. Outsideinterference with study methods and results sometimes involves the deliberatealteration of forest cover figures to make them suit a particular agenda. Datagenerated by national institutions may be subject to this type of bias. In thedilemma of public goods, all those who would benefit from the provision ofsuch goods find it costly to contribute and would prefer others to pay for thegoods instead. This is certainly the case with data on forest cover: due to thehigh cost of their generation, many organisations resort to recycling of existing– and often outdated – data instead of investing in the generation of newdata. It is obvious that in such a situation, accuracy and reliability suffer.
Unreliable figures, whatever their cause, are likely to result in poor decision-making. Setting political as well as geographical priorities is difficult withoutreliable information about the location and magnitude of deforestationproblems. In fact, the MRC’s Forest and Land Cover Data Set is so far theonly source of reliable information at the basin-wide level, which has beengenerated with an appropriate methodology,d and has been subject toindependent accuracy testing. 38
However, even this data set is already out of date. It was last updated in1997, so there is no reliable information about the deforestation that hasoccurred since then. Given the importance of forests for the health of theLMB, an update is urgently required if access to reliable information aboutthe status and trends of the LMB’s forests is deemed important for makingappropriate decisions. Past experience has shown that such an update willcome at a cost.e One possible solution to make monitoring of deforestationeasier and less expensive could be the application of statistically-soundsampling procedures instead of traditional mapping approaches, which wouldmap the whole basin.
a assuming all clouds and their shadows in the GIS data set conceal forest, without this assumption23.5 %
b assuming all clouds and their shadows in the GIS data set conceal forest, without this assumption40.9 %
c calculated from Forest map on http://www.fao.org/forestry/fo/country index.jsp?lang_id=1&geo_id=39d Interdependent interpretation of satellite image time series, see Forest Cover Monitoring Project
MRC/GTZ. 1998 [1].e The Forest Cover Monitoring Project, which created the MRC’s Forest and Land Cover Data Set,
had a budget of $ 3.2 million over 6 years.

196
State of the Basin Report - 2003
f A distinction of shifting cultivation and other more permanent forms of upland agriculture was not possible in most cases from satellite images only. Therefore they have been combined into the class Shifting Cultivation or Upland Agriculture used here.
Swiddon agriculture is often the only option formarginalised, ethnic minorities
Area Degraded tree & Shifting cultiv. or Permanent Other types Total shrub vegetation upland agriculture agriculture
ha % ha % ha % ha % ha %
Cambodia 55,332 28.4 92,827 47.7 39,341 20.2 7,300 3.7 194,800 100Lao PDR 55,305 26 132,175 62.3 24,574 11.6 209 0.1 212,263 100Thailand 4,505 9 28,769 57.6 14,150 28.3 2,558 5.1 49,982 100Viet Nam 9,016 11.6 33,072 42.7 17,142 22.2 18,197 23.5 77,427 100LMB 124,158 23.2 286,843 53.7 95,207 17.8 28,264 5.3 534,472 100
Note: % values refer to the sum of all types for each country.
2.2 Forces driving deforestation
Possible causes of deforestation include commercial logging, fuelwood collection, shifting cultivation,and the encroachment of sedentary agriculture. Secondary causes include forest fires and infrastructuredevelopment. However, the specific forces driving deforestation in the LMB cannot be directlyidentified from the source data. What can be done is identifying into which land cover types theareas affected by deforestation are transformed (see Table 11), and from this, draw at least somepartial conclusions. During the period observed, deforestation has resulted in degraded vegetationtypes on about one quarter (23.2 percent) of the area it affected. On more than half of the affectedarea (53.7 percent), forest has been replaced by shifting cultivation or upland agriculture, and onanother 17.8 percent, by permanent agriculture.Hence, on altogether more than 70 percent ofthe area affected, forest has given way to someform of agriculture.f One might therefore assumea growing population’s increasing demand forfood is the main cause of deforestation.
However, there are strong indications that otheragents precede the ultimate conversion fromforest to agriculture. As Table 12 shows, thoseforests that have been converted to shiftingcultivation or upland agriculture were mostly(80.4 percent) already degraded beforehand.
Table 11. Land cover types after deforestation
Although again the forces driving this degradation cannot be directly identified from the sourcedata, it is very likely that much of it was caused by logging, simply because other degrading agentshave a much smaller impact on the details visible on satellite images (i.e. would hardly lead to theclassification of an area as being degraded). This is fully in line with findings elsewhere in theliterature, for example, with the observation that “in many tropical regions logging paves the wayfor agricultural expansion by providing the necessary roads and capital”.39

197
9 - Forestry
Area Degraded forest Other forest Totalha % ha % ha %
Cambodia 74,236 80.0 18,591 20.0 92,827 100Lao PDR 117,737 89.1 14,438 10.9 132,175 100Thailand 12,969 45.1 15,800 54.9 28,769 100Viet Nam 25,661 77.6 7,411 22.4 33,072 100LMB 230,603 80.4 56,240 19.6 286,843 100
Table 12. Forest types in 1993 converted to shifting cultivation/upland agriculture 1993 – 1997
2.3 Possible future scenarios for deforestation
While the 0.53 percent average annual LMB deforestation indicated in Table 9 does not seem a greatdeal at first glance, this figure gets an entirely different meaning when used to predict how much ofthe forest cover of the LMB would be lost during the next century, assuming deforestation continuesat the same annual rate.
Under this assumption, the LMB would have only about 20 percent forest cover left in less than 100years from now. Even worse, Lao PDR, the country whose forests now cover a significant proportionof the mountainous headwater areas of major tributaries of the Mekong River, would experience areduction of its forest cover from today’s level of over 40 percent to only slightly more than 20percent. The effects that deforestation of this magnitude could have on the steadiness of water flowfrom headwater areas, and on floods in the entire Mekong River system, could be considerable.
The assumption regarding the deforestation rate made above is rather conservative. For example, itdoes not take into consideration the fact that the LMB population is likely to grow further and thathence the demand for forest products and for agricultural land will increase, thus leading to evenmore forest degradation and ultimately more deforestation than predicted in Figure 1.
Figure 2. Development of forest cover at annual deforestation rates of 0.53 percent (LMB) and 0.58 percent (Lao PDR)

198
State of the Basin Report - 2003
3. Environmental consequences of deforestation
The most direct environmental consequence of deforestation is the loss of the forest biota in thedeforested area. Because forests are almost always more biologically diverse than the systems withwhich they are replaced, this usually results in a local loss of biodiversity, and potentially a reductionin global species diversity. While many of the larger more conspicuous forest species (the “charismaticmegafauna”such as tigers and rhinos which are often associated with calls for biodiversityconservation), tend to have large distributions, many of the small, less spectacular species do not.Insects and small herbaceous plants are far more limited in distribution and it is these species thatare most frequently lost when forest is cleared.
An issue of great concern in the LMB and the region as a whole has been the consequences of forestclearance on hydrology and related processes such as flooding, soil erosion and mass soil movement.Much of the literature to 1990 on this issue was reviewed by Bruijnzeel.40 The outcomes are notsimple and depend greatly on how the forest is removed, the soil type, slope and rainfall patterns ofthe area from which the forest is removed, and the subsequent fate of the area.
The way the forest is removed, and even the seasonal timing of the removal, influence the amount ofsoil disturbance and soil compaction. For example, use of heavy equipment tends to compact soil sothat commercial logging operations using bulldozers will cause more compaction than other formsof logging or clearance due to swidden agricultural practices. Similarly compaction occurs more inwet than dry soils so forest clearance during the wet seasons is likely to cause greater compactionand dry season clearing.41 Compaction and soil disturbance can have important consequences forerosion and water infiltration.
When mature forest is cleared, the hydrological consequences depend on the subsequent use of theland. For example, there are a number of studies showing that young, regenerating forest has highertranspiration rates than mature forest so the consequence may be decreased runoff and stream flow.On the other hand if the forest is replaced with grassland or paved areas, runoff may increase andstreamflows will be higher, although the seasonal pattern may alter with wet season flows increasingat the expense of dry season flows.
All these hydrological impacts have been documented from controlled studies on relatively smallcatchments. Attempts to demonstrate that they occur on the scale of large river basins have so farnot been successful. In tropical regions such attempts have been made for catchments in Thailand,on the island of Taiwan and the Amazon.42
A suggested reason for the failure to detectthe effects is that the spatial and temporalvariability of rainfall in large tropicalcatchments is too great and masks theimpact of catchment vegetation change.
Increasing run off in logged areascan result in erosion, turbidity and
sedimentation

199
9 - Forestry
4. Social consequences of deforestation
Deforestation is also a major concern on both asocial and economic level. Across the basin,large numbers of people draw upon forestryresources for a high proportion of theirsubsistence and income needs. In Lao PDR, forexample, over 85 percent of the populationdepend upon forests for at least part of theirlivelihood.43 Such people face numerousproblems when forests are destroyed.44 The foodsecurity provided by NTFPs is lost, creating agreater need to generate cash income to buy foodon the market. Malnourishment often results, andis compounded by, the loss of good qualitydrinking water. Fuelwood gathering becomesmore difficult and takes more time away from other activities. The loss of livelihoods causes manymales to migrate in search of work, which can lead to family disintegration, greater workloads forwomen and a general lowering of female status as a result of the second marriages migrating menmay make.45 The agricultural encroachment that follows deforestation often causes the loss oftraditional land use rights and traditional conservation mechanisms. Ethnic minority groups tend tosuffer these effects most severely and often find themselves pushed into increasingly marginal areasin the face of conflicts with governments or logging companies.
5. Conclusion
• The forestry sector is of major economic, social, and environmental importance in the LowerMekong Basin. Forest resources are exploited by commercial and smallholder operations fortimber, fuelwood, and non-timber forest products.
• The commercial logging sector is characterised by active logging, often carried out on a cross-border basis. The demand for wood in Thailand (where logging has been banned since 1989)and Viet Nam, is a major factor driving logging in Cambodia and Lao PDR.
• Commercial forestry activity is often carried out on an unsustainable scale, with governmentregulatory controls sometimes unable to prevent overexploitation. There is a need for greaterresources for the management of forestry concessions and the enforcement of regulations.
• Large numbers of smallholders also live in and around forests and draw all or part of their livingfrom the collection of fuelwood and non-timber forest products for household consumption andsometimes sale for small amounts of cash.
• Forest resources are being used faster than natural or plantation regrowth can replenish them.Data shows that the average rate of deforestation across the LMB between 1993 and 1997 was0.53 percent per annum.
• The available evidence suggests that logging is the most important activity causing the degradationof forested lands, and that degraded forests are commonly converted to agricultural use, causingloss of forest cover.
Rapid population growth in upland areas meansthat shifting agriculture can no longer be practiced
sustainably

200
State of the Basin Report - 2003
• Forest losses have important environmental consequences as they can cause erosion and watersheddegradation. These changes may reduce water regulation capacities, which in turn could resultin higher incidences of flooding, and declines in water quality and even quantity. The loss ofbio-diversity is another important consequence of deforestation.
• The environmental changes that forest losses contribute to can have significant negativeimplications for human activities such as agriculture and fisheries, with reduced land and waterquality constraining crop yields, and feeding into harmful cycles of poverty and overexploitationof the environment.
• Loss of forest cover is also a major concern on a social level because forest dwellers and othersoften lose their livelihoods when forests are logged and this, in turn, contributes to socialproblems.

201
9 - Forestry
Endnotes
1 MRC 2000, Executive Summary2 Siam Society 1989; Smith 20013 MRC 1997, pp. 5-74 MRC 2000, p. 175 FCMP 1999b, p. 66 MRC 1997, p. 5-97 MRC 2000, p. 32; MRC 1997, pp. 5-88 MRC 2000, p. 32; MRC 1997, pp. 5-89 MRC 1997, pp. 5-9; MRC 2000, p. 31; Azimi et al. 2000, p. 1210 MRC 2000, pp. 31-3311 MRC 1997, pp. 5-712 MRC 1997, pp. 5-713 Azimi et al. 2000, p. 10; FAO 200214 Lao PDR Ministry of Agriculture and Forestry 1999, p. 19; FAO 200215 Azimi et al. 2000, p. 1516 MRC 2000, p. 1917 MRC 2000, p. 1918 Durst et al. 1994, p. 15719 MRC 2000, pp. 15-1620 Durst et al. 1994, p. 15721 Durst et al. 1994, p. 156; Azimi et al. 2000, pp. 14-1522 FCMP 1999a; FCMP 1999b23 FCMP 199724 FCMP 199725 MRC 2000, pp. 15-1626 FCMP 1999a27 MRC 1997, p. 5-9, 5-1028 Michigan State University. 2000.29 Lao PDR Ministry of Agriculture and Forestry 199930 FAO. 200031 FAO. 200032 FAO. 200033 FAO. 200134 FAO. 200235 FAO. 200036 FAO. 200137 Nordic Institute of Asian Studies 2000, p. 2038 Malyvanh and Feldkotter 199939 Kaimowitz 200040 Bruijnzeel 199041 Bruijnzeel 199042 Bruijnzeel 199043 Azimi et al. 2000, p. 1344 MRC 2000, pp. 23-2445 MRC 2000, pp. 23-24

202
State of the Basin Report - 2003
References
AFN. 2000. Report of the regional community forest management workshop: volume 1. Asia ForestsNetwork, Bangkok.
Azimi, A., W. Knowland, J. Carew-Reid, I. Ruzicka, & A. Zola. 2000. Environments in Transition:Cambodia, Lao PDR, Thailand, Viet Nam Asian Development Bank, Manila.
Bruijnzeel, L.A. 1990. Hydrology of moist tropical forests and effects of conversion: a state ofknowledge review. UNESCO International Hydrological Programme, Amsterdam. 224 pp.
Cambodia, Ministry of Planning 1996. Summary: first socioeconomic development plan, 1996-2000. Ministry of Planning, Government of Cambodia, Phnom Penh.
Cambodia, Ministry of Agriculture, Forestry and Fisheries. 2000. Agricultural statistics 1999-2000.Ministry of Agriculture, Government of Cambodia, Phnom Penh.
Durst, P. B., W. Ulrich, M. Kasio. Editors. 1994. Non-wood forest products in Asia. Food andAgriculture Organization, Bangkok.
FAO. 2000. Forestry Information System (FORIS) – Country profiles.Accessed at http://www.fao.org/forestry/fo/country/index.jsp?lang_id=1&geo_id=39 on 02 Sep2002. Links accessed: Latest state, Statistics (national), Summary
FAO. 2001a. Selected indicators of food and agriculture in the Asia-Pacific region 1990-2000.Food and Agriculture Organization of the United Nations, Regional Office for Asia and the Pacific,Bangkok.
FAO. 2001b. State of the World’s Forests.Accessed at http://www.fao.org/forestry/FO/SOFO/SOFO2001/publ-e.stm on 02 Sep 2002.Link accessed: Annexes.
FAO. 2002a. FAOSTAT- Forestry database.Accessed at http://apps.fao.org/page/collections?subset=forestry on 13 August 2002.
FAO. 2002b. Forest Resources Assessment Programme.Accessed at http://www.fao.org/forestry/foris/webview/forestry2/index.jsp?siteId=101&langId=1 on 02 Sep 2002. Link accessed: FRA Reports FCMP. 1997. Forest cover monitoring project MRC / GTZ: technical notes 2 - interpretation anddelineation from satellite images. Vientiane, Lao PDR.
FCMP.1998. Forest cover monitoring project MRC / GTZ: technical notes 6 - processing of 1996 /97 and 1975 / 76 satellite images. Vientiane, Lao PDR.
FCMP.1999a. Forest cover monitoring project MRC / GTZ: forest and land cover GIS data set.Phnom Penh, Cambodia.
FCMP.1999b. Forest cover monitoring project MRC/GTZ: final report. Mekong River Commission,Phnom Penh, Cambodia.

203
9 - Forestry
IMF. 2002a. Cambodia: statistical appendix. International Monetary Fund, Washington D.C.
IMF. 2002b. Lao PDR: selected issues and statistical appendix. International Monetary Fund,Washington D.C.
IMF. 2002c. Thailand: statistical appendix. International Monetary Fund, Washington D.C.
IMF 2002d. Viet Nam: selected issues and statistical appendix. International Monetary Fund,Washington D.C.
JICA. 2001. Master plan study on integrated agricultural development in Lao Peoples DemocraticRepublic. Volume III: Appendices. Japan International Cooperation Agency and Lao PDR Ministryof Agriculture and Forestry, Vientiane.
Kim Phat, N., S. Ouk, Y. Uozumi & T. Ueko. An outline of the causes of deforestation in Cambodia.Accessed at www.mekonginfo.org on 18 June 2002.
Kaimowitz, D. 2000. Forestry assistance and tropical deforestation: why the public doesn’t get whatit pays for. The International Forestry Review, 2 (3): 225 - 231.
Lao PDR, Ministry of Agriculture and Forestry. 1999. The government’s strategic vision for theagricultural sector. Ministry of Agriculture and Forestry, Government of Lao PDR,Vientiane.
Lao PDR, National Statistical Centre. 2000. Basic statistics of the Lao PDR: 1975-2000. NationalStatistical Centre, Government of Lao PDR,Vientiane.
Malyvanh, M. & C. Feldkotter. 1999. Application of remote sensing and GIS for forest covermonitoring in Lao PDR. In: GTZ. 1999. Application of Resource Information Technologies (GIS/GPS RS) in Forest Land & Resources Management. GTZ. Hanoi.
Michigan State University. 2000. Derived Scientific Data Products.Forest Cover Data Sets for Countries of Indochina from 1973-1992.Accessed at http://www.bsrsi.msu.edu/trfic/products/seasia_products/indochina_countries.html on 02 Sep 2002. Links accessed: Download Cambodia data file cambodia_85.Z, DownloadCambodia data file cambodia_ascii.Z
MRC. 1997. Mekong River Basin diagnostic study. Final Report. Mekong River Commission,Bangkok.
MRC. 1999. Basin development plan draft. Working Paper 2: Baseline conditions. Mekong RiverCommission, Phnom Penh.
MRC. 2000. Strategy study on the development of the watershed management/forestry sector in theLower Mekong Basin: strategy and action plan. Mekong River Commission, Phnom Penh.
MRC. 2001. Metadata for MRC SECRETARIAT GIS core datasets. Mekong River Commission,Phnom Penh.
MRC. 2002. MRC-EP water quality data. Mekong River Commission, Phnom Penh.

204
State of the Basin Report - 2003
Nordic Institute of Asian Studies. 2000. Sisouphanthong, B. & C. Taillard. Atlas of Laos. The spatialstructures of economic and social development of the Lao People’s Democratic Republic. SilkwormBooks. Chiang Mai, Thailand.
Siam Society. 1989. Culture and Environment in Thailand. Siam Society, Bangkok. 558 pp.
Smith, J. 2001. Biodiversity the Life of Cambodia. Cambodia’s Biodiversity Status Report – 2001.Cambodia Biodiversity Enabling Activity, Phnom Penh, Cambodia, 244 pp.
Thailand, National Statistics Office. 2000. Statistical reports of region: Northeastern Region 2000.National Statistics Office, Government of Thailand, Bangkok.
Thailand, Ministry of Agriculture and Cooperatives. 2001. Agricultural statistics of Thailand, cropyear 2000/2001. Ministry of Agriculture and Cooperatives, Government of Thailand, Bangkok.
Viet Nam, General Statistics Office. 1999. Statistical yearbook: 1999. Statistical Publishing House,Government of Viet Nam, Hanoi.

205
10 - Hydropower
Hydropower 10
The hydroelectric potential of the Mekong and its tributaries is largely undeveloped. In the 1960s,the Committee for Coordination of the Investigation of the Lower Mekong Basin (known as theMekong Committee) carried out extensive research and planned more than 12 hydroelectric projectson the Mekong mainstream, but few of these were actually built, due to decades of war and civilunrest. Although peace has come to the region, so far only 5 percent (some 1,600 MW) of the lowerbasin’s hydroelectric potential of approximately 30, 000 MW have been developed, and these fewprojects are only on the tributaries. The only dams on the Mekong’s mainstream are two in the upperbasin in the People’s Republic of China.
When the Mekong River Commission replaced the Mekong Committee in 1995, the focus changed.MRC was established as a river basin management organisation, with as much emphasis placed onsharing resources equitably and sustaining the environment as on developing resources.
In 2001, MRC’s Council and Joint Committee approved a new Hydropower Development Strategy.This treats hydro potential as one of many renewable natural resources and considers both the benefitsand the adverse consequences of hydroelectric development.
The Strategy was developed through extensive research and consultation with a wide range ofstakeholders that included National Mekong Committees, lines agencies, international organisationsand civil society groups. It is based on five principles which MRC’s Council endorsed at its annualmeeting in 1998: (1) information exchange; (2) international cooperation on sustainable developmentof hydropower projects; (3) integrated overall planning of the mainstream and sub-basins (up tothe pre-investment stage); (4) cumulative environmental and socio-economic aspects as well as
public participation; and (5)encouragement of the privatesector to join in developinghydropower potential with properconsideration of the environmentand the well-being of the people.
The objectives of the Strategy aregrouped into three strategic areas:consideration of integrated wateruse and environmental and socio-economic factors; efficienthydropower generation anddistribution mechanisms; andinformation system and capacitybuilding. The Khone falls in Lao PDR near the Cambodian border

206
State of the Basin Report - 2003
The chapter which follows discusses: the importance of electric power; the potential for hydrodevelopment in the Mekong Basin; projected growth in the demand for electric power in the LMB;the status of hydropower development in the LMB and factors which influence hydropowerdevelopment; positive and negative impacts of hydropower development; and, China’s plans forhydro projects in the upper basin.
1. Importance of electric power and common sources
Electric power is required both for economic development and for domestic use. As economiesdevelop and people’s living standards improve, their requirements for electric power increase. In theLower Mekong Basin, the combination of rapid economic development and improvement of people’sliving standards has greatly increased the demand for electric power.
Worldwide a variety of power sources are used. These include fossil fuels (coal, petroleum, naturalgas), nuclear power, renewable energies (hydro, geo-thermal, wind, solar power) and othergenerating systems such as fuel cells. According to estimates made in 1999 by the US government’sEnergy Information Administration, globally about 63 percent of power is generated from fossilfuels, 19 percent from hydro, 17 percent from nuclear power and 1 percent from other sources(EIA 1999).
The world’s deposits of fossil fuels are limited and the price of fossil fuels fluctuates greatly. Thereare also concerns that using fossil fuels emits CO2, which contributes to global warming and addsother environmentally-damaging substances to the atmosphere (SOx, NOx, micro dust, etc.). In orderto reduce dependency on fossil fuels and mitigate the adverse impacts on the environment, effortsare being made worldwide to develop other means of generating electricity. In recent years, interestin using nuclear power has declined because of concerns about safety. Although alternative powersources such as fuel cells, solar and wind power are used to a limited extent, these alternatives arecurrently either too expensive or their capacity is too limited to meet more than a small fraction ofthe demand for electric power.
Of energy sources other than fossil and nuclear fuels, only hydro is currently a major source ofelectric power. Although worldwide, hydropower is limited by the availability of suitable sites,in the Mekong River Basin, the potential for hydro development is considerable. Since knownenergy sources other than hydro are limited in the Mekong Basin, especially in Lao PDR andCambodia, the development of hydropower could be of considerable benefit. Provided projectsdo not cause serious environmental or social consequences (as discussed later in this chapter),they could meet both local needs for power and earn income from sales to more-industralisedneighbouring countries.
2. The potential for hydropower development in the Mekong basin
The total potential for feasible hydropower projects in the four Lower Mekong Basin countries isapproximately 30,000 megawatts (MW). Of this, 13,000 MW are on the Mekong’s mainstream,and the remaining potential is in the tributaries (13,000 MW on tributaries in Lao PDR, 2,200MW on tributaries in Cambodia and 2,000 MW on tributaries in Viet Nam). As stated above, only5 percent (some 1,600 MW) of the Lower Mekong’s hydro potential have been developed, and allprojects are on the tributaries, not on the mainstream. There is also considerable hydro potentialin the Upper Mekong Basin. In Yunnan Province of the People’s Republic of China, total hydropotential is an estimated 23,000 MW, and two projects, totalling 2,850 MW, have already begun

207
10 - Hydropower
operating. The hydro projects currently built inthe Mekong Basin are shown in Figure 1 andtheir capacity is listed in Table 1.
Concern about the development of hydroprojects in the basin has grown in recent years.For example, in Thailand, the Pak Mun projecthas been criticised for significantly reducingthe fishery in the Moon River and causing otherproblems. Unannounced releases of water fromthe Yali Falls Dam on the Se San River in VietNam have caused loss of life and propertydownstream in Cambodia, and civil societygroups in Cambodia have criticised Viet Nam’splans to develop more hydro projects on theSe San.
In signing the 1995 Agreement that establishedthe Mekong River Commission, membercountries all agreed that before any hydro projectcan be built on the mainstream of the Mekong,all four members must agree. Although MRCmembers are only required to notify each otherof their intention to build a project on a tributary,the 1995 Agreement obligates members toensure that no harmful effects will occurdownstream in neighbouring countries.
Increasingly, MRC has been called upon to facilitate dialogue among governments and otherstakeholders to ensure that transboundary impacts are considered.
Table 1. List of completed hydropower projects (10 MW<)
Country Name Location Capacity Output Commissioning (MW) (GWh/year)
China Manwan M 1,500 7,870 1993Dachaoshan M 1,350 5,930 2001
Lao PDR Nam Ngum TR 150 900 1971-85Xeset TR 45 150 1991Theun Hinboun TR 210 1,645 1998Houay Ho TR 150 600 1999Nam Leuk TR 60 184 2000
Thailand Sirindhorn TR 36 115 1968Chulabhorn TR 15 62 1971Ubolratana TR 25 75 1966Pak Mun TR 136 462 1997
Viet Nam Dray Ling TR 13 70 1995Yaly TR 720 3,642 2000
Note: TR = tributary and M = mainstreamSource: MRC 2001
Rapids on the Mekong River just below theChinese border

208
State of the Basin Report - 2003
Figure 1. Completed hydropower projects in the Mekong Basin (10MW<)

209
10 - Hydropower
3. Demand
In Tables 2 and 3, actual electricity consumption and peak load over the last 10 years are presentedfor the four countries of the Lower Mekong Basin.
Table 2. Actual electricity consumption (1990-2000)
Table 3. Actual peak load (1990-2000)
Year Cambodia Lao PDR Thailand Viet Nam Peak Annual Peak Annual Peak Annual Peak AnnualLoad Growth Load Growth Load Growth Load Growth
(MW) Rate (MW) Rate(%) (MW) Rate(%) (MW) Rate(%)
1990 48 7,094 1,6601991 55 14.6 8,045 13.4 1,850 11.41992 63 14.5 8,877 10.3 2,005 8.41993 64 1.6 9,730 9.6 2,143 6.91994 71 10.9 10,709 10.1 2,408 12.41995 85 19.7 12,268 14.6 2,796 16.11996 95 11.8 13,311 8.5 3,177 13.61997 108 13.7 14,506 9.0 3,595 13.21998 126 16.7 14,180 -2.2 3,875 7.81999 146 15.9 13,712 -3.3 4,329 11.72000 114 167 14.4 14,918 8.8 4,890 13.0
Note: data are for countries as a whole.Source: ADB 2001
Year Cambodia Lao PDR Thailand Viet NamEnergy Annual Energy Annual Energy Annual Energy Annual
Sales Growth Demand Growth Demand Growth Demand Growth(GWh) Rate(%) (GWh) Rate(%) (GWh) Rate(%) (GWh) Rate(%)
1990 273 43,189 8,6781991 311 13.9 49,225 14.0 9,152 5.51992 356 14.5 56,006 13.8 9,654 5.51993 373 4.8 62,180 11.0 10,665 10.51994 394 5.6 69,651 12.0 12,284 15.21995 121 480 21.8 78,880 13.3 14,636 19.11996 200 65.3 543 13.1 85,924 8.9 16,946 15.81997 254 27.0 604 11.2 92,725 7.9 19,151 13.01998 304 19.7 688 13.9 92,134 -0.6 21,665 13.11999 313 3.0 772 12.2 90,414 -1.9 23,739 9.62000 381 21.7 865 12.0 96,781 7.0 26,722 12.6
Notes: The above data for Cambodia are for energy sales and only for the government’s agency,Electricité du Cambodge. All data are for countries as a whole.
Source: ADB 2001

210
State of the Basin Report - 2003
These tables show that in the four countries, growth in demand was considerable (an average ofsome 10 percent per year during the 1990s). The exception to this was Thailand in 1998 and 1999,where the Asian Financial Crisis drastically slowed the economy. Data on Cambodia indicate onlypower that is currently supplied, and not actual demand. It is thought that the demand for electricpower in the LMB will continue to grow rapidly. Demand forecasts for each country are provided inTables 4 and 5.
Table 4. Energy demand forecast (GWh per year)
Table 5. Peak demand forecast (MW)
It is estimated that over the next 20 years, demand forelectric power in the whole Mekong Region willincrease by an average of about 7 percent per year.Thus in 20 years, the total generating capacity in theregion will about four times greater than what isavailable today.
Year 2000 2005 2010 2020
Cambodia 586 1300 2,500 5,700Lao PDR 865 1,500 2,500 4,400Thailand 96,781 135,000 184,000 328,000Viet Nam 26,722 44,000 72,000 169,000Total demand 124,954 181,800 261,000 507,100
Source: ADB 2001
Year 2000 2005 2010 2020
Cambodia 114 280 530 1,100Lao PDR 167 280 440 780Thailand 14,918 21,000 28,000 51,000Viet Nam 4,890 7,800 12,000 28,000Total demand 20,089 29,360 40,970 80,880
Note: data are for countries as a whole.Source: ADB 2001
Demand for electricity is growing atabout 7% per year

211
10 - Hydropower
4. Status of hydropower development
Over the next ten years, according toprojections made by the AsianDevelopment Bank in 2001, MRCmember countries will need to developabout 20,000 MW of new generatingcapacity. After this period, generatingcapacity will have to be developed at aneven higher pace. Most of the powergeneration developments currentlyplanned for Thailand and Viet Nam arethermal and gas turbine projects (fuelledprimarily by natural gas and coal). Thereare plans as well for the development ofhydropower, but mainly in Lao PDR (ontributaries of the Mekong) and in VietNam (mostly outside the Mekong Basin).
Since hydropower potential in the Mekong Basin is largely undeveloped, hydropower may becomean increasingly important source of electricity in the future. However, for now, plans involve only asmall part of the potential, concern only the tributaries and are likely to take a long time to beimplemented. No plans are currently being considered for damming the mainstream in the lowerbasin. One small project is under consideration for the mainstream in Lao PDR but this will notinvolve damming the river. The Thaknoh hydropower project, which is currently at the pre-feasibilitystage, is a small run-of-the-river project. As such, it would use the river’s natural flow to generatepower and not require damming the river.
There are a number of reasons why it is difficult to develop hydro projects. These include:
4.1 Difficulties in finding funds
Hydropower projects are generally characterised by high initial investment and a long paybackperiod. These conditions have made it difficult for developing countries to fund hydro projects fromdomestic sources and instead, they have usually obtained funds from international lending agencies
such as the World Bank and the AsianDevelopment Bank. In recent years,however, because investment costs are sohigh and hydro projects can have adverseimpacts on the environment and on localpeople, international funding agencies havebeen much less willing to fund projects. Asresult, developing countries have had to turnto the private sector for funding.
In Lao PDR, all the large-scale hydroprojects currently being planned will bedeveloped by independent power producers(IPPs). These IPPs are consortia made upprimarily of private investors and it is the
Hydropower dam on the Nam Ngum River, one of theMekong’s tributaries in Lao PDR
The pay-back period for a hydro project is typicallytwo or three times longer than that for
a thermal project

212
State of the Basin Report - 2003
responsibility of the IPPs to secure the funds needed to develop projects. Here again there areproblems. As governments privatise, the electric utilities that buy power from producers will requireproducers to bid against each other on a regular basis. Without long-term guarantees from utilities tobuy their power at a profitable fixed price, it will be difficult for IPPs to raise the substantial fundsneeded to develop hydro projects.
4. 2 Undeveloped power market
Most of the hydropower potential in the Lower Mekong Basin is in Lao PDR and Cambodia, butboth of these countries do not have a large enough domestic market (demand) to warrant developinglarge-scale projects. For the foreseeable future, domestic demand could be satisfied with thedevelopment of small-scale projects.
It is expected that in future a regional power network will be developed connecting all the nationalpower systems in the Greater Mekong Sub-region. Under these conditions there will likely be amarket for the Mekong Basin’s hydro potential. But this is a long-term goal, and at this time, it isdifficult for a number of technical and political reasons to create an integrated power system. Inthe short term, only isolated hydro projects, intended largely for export to a single country, arelikely to be developed. Even in these cases, developers must demonstrate that their projects arecompetitive with projects using fossil fuels – something that will be difficult to do for the reasonsjust given.
4.3 Environmental and social impacts
Development of the Lower Mekong Basin’shydro potential is also likely to take some timebecause extensive investigations are neededprior to construction to ensure that dams willnot have serious adverse effects on theenvironment and/or human welfare. Prior to thedevelopment of hydro projects, investigationsof the actual environmental situation andassessments of negative as well as positiveimpacts have to be undertaken and carefullyevaluated in order to judge whether a projectwill be acceptable or not. Unfortunately, thebenefits and negative impacts of hydro projectscannot be measured on a common scale. Toooften emphasis is placed on the economicbenefits or on certain negative impacts, withouta balanced appraisal of both. Also, due todifferences in standards between countries, itis difficult to judge the transboundary impactsthat projects may have.
Dams and reservoirs alter the ecology andbiodiversity of a river system

213
10 - Hydropower
In considering whether to proceed with hydro development, the following negative and positive impactsneed to be considered:
4.3.1 Negative impacts of hydro projects
• adverse impacts on the ecosystem(aquatic life, animals, birds, vegetation)
• blocking of the flow of sediment • negative impacts due to changing a river’s
flow pattern • negative social impacts (resettlement, loss
of livelihood) • loss of scenic landscapes (tourism
potential) • negative impacts on water quality due to
storage of water (eutrophication, lowertemperatures for discharged water)
• negative impacts on other users of water(navigation, fisheries)
• problems during the construction period(noise, vibration, dust, traffic problems)
4.3.2 Positive impacts of hydro projects
• harnessing of a renewable natural resource• reducing of the negative impacts that power generation has on the global environment (for
example, reducing the use of fossil fuels will lessen air and water pollution)• increasing the river’s flow in the dry season, and reducing peak flow during the flood season• increasing the availability of electrical power will stimulate economic development and
improve people’s living standards• revenues will be earned from the sale of power
5. Hydropower development in the People’s Republic of China
In Yunnan Province on the upper stream of the Mekong, China is implementing hydro projects on themainstream without official consultation with the countries downstream. China currently has plans toconstruct six dams/power stations, in addition to the two that are already operating. These projectsare: the Manwan dam/hydropower station with a reservoir capacity of 920 million m3 and an installedgeneration capacity of 1,500 MW; and the Dachaoshan dam/hydropower station with a reservoircapacity of 880 million m3 and an installed generation capacity of 1,350 MW. The six hydro projectsplanned on the Mekong River for Yunnan Province in China are presented in Table 6 and the locationof the projects is shown on the map in Figure 2.
Only five percent of the basin’s hydroelectricpotential has thus far been developed

214
State of the Basin Report - 2003
Table 6. List of planned and completed hydropower projects on the Mekong in China
China plans to complete three more hydro projects between 2010 and 2020. These are the Xiaowanproject, with a reservoir capacity of 15,130 million m3 and an installed generation capacity of 4,200MW; the Jinghong project with a reservoir capacity of 1,040 million m3 and an installed generationcapacity of 1,500 MW; and the Nuozhadu project with a reservoir capacity of 24,670 million m3 andan installed generation capacity of 5,500 MW. On January 20, 2002 China announced thecommencement of construction on the Xiaowan project.
Now that the first two dams, Dachaoshan and Manwan, have been constructed and are operating,some downstream impacts such as changing of the river’s flow pattern, blocking of sediment andimpacts on the environment have occurred. The reduction in suspended sediment concentrations
resulting from sediment trapping inManwan Dam is already apparent as fardownstream as Pakse in southern LaoPDR. The next two projects, Xiaowan andNuozhadu, will have much largerreservoirs and could also change the river’sflow on a seasonal basis.
To maximise the positive impacts andminimise the negative impacts from dams,they should be planned and operated inconsultation with all countries in a riverbasin. Ideally such a scheme forconsultation and rules for dam operationwill be established by 2008-2009 – beforethe commencement of ponding in theXiaowan reservoir.
Sharing data among countries on a common river system is crucial. The kinds of data that are requiredby countries downstream from planned hydropower projects include: information on real-time andscheduled dam operation (operation data for the power station, inflows, water level of the reservoir,discharges from the spillway, discharges to maintain river flow, utilisation of water for irrigation anddomestic use). In order to exchange data on these subjects a system must be developed collaborativelyamong the countries concerned.
Name of Installed Annual Total Catchment Average CommissProject Capacity Generation storage C. Area Flow -ioning
(MW) (GWh) (million m3) (km2) (m3/s)
Gongguoqiao 750 4,670 510 97,300 985Xiaowan 4,200 18,540 15,130 113,300 1,220 2010-12Manwan 1,500 7,870 920 114,500 1,230 1993Dachaoshan 1,350 7,090 880 121,000 1,230 2001Nuozhadu 5,500 22,670 24,670 144,700 1,750 2013-16Jinghong 1,500 8,470 1,040 149,100 1,840 2012-13Ganlanba 150 1,010 151,800 1,880Mengsong 600 3,740 160,000 2,020Total 15,550 74,060
Source: Committee of Science and Technology 1993; ADB 2001.
Dachaoshan Dam in China is the second of two largedams built on the Mekong mainstream in China. China is
planning to build 6 more dams on the mainstream

215
10 - Hydropower
On 1 April 2002, China signed an agreement with MRC to provide data on river levels at two stationslocated on the Upper Mekong in China. Though the information provided by China is still limited, thisagreement is an important first step in establishing cooperation between China and countriesdownstream.
Figure 2. Planned and completed hydropower projects on the Mekong in China

216
State of the Basin Report - 2003
6. Implementation of hydropower development
From an economic point of view and for the benefit of the global environment, hydropower hasmuch to offer in the Mekong Basin, provided that adverse social and environmental impacts areconsidered and mitigated. Ideally, in evaluating the benefits and consequences of hydro development,and in deciding how to manage the river’s flow, all of the Mekong Basin’s countries, includingChina, should be involved.
References
ADB. 2001. Indicative Master Plan on Power Interconnection in GMS Countries. Asian DevelopmentBank, Manila.
Committee of Science and Technology. 1993. Study on Lancang River in Yunnan Province, Committeeof Science and Technology for Yunnan Province, Kunming, China.
EIA. 1999. National Electrical Generation by type.Accessed at http://www.eia.doe.gov/emeu/table63.html on 9 September 2002.
MRC. 2001. Hydropower Development Strategy. Mekong River Commission. Phnom Penh.

217
11 - Trade and transport
Trade and transport 11
In the Lower Mekong Basin, watertransport has traditionally been theprincipal means of travel for much of thepopulation. Locating their communitieson or near waterways has providedcommunities not only with an abundanceof fish and fertile sediments foragriculture, it has also enabled them totrade with neighbouring communities upand down the river.
Not only is waterway transport importantfor people living near rivers and streamsin the basin, it is also becomingincreasingly important for internationaltrade. Although the 15 m high Khone Fallson the border between Lao PDR and Cambodia prevents boats from passing, above and below thefalls, boats are used to transport both people and goods for hundreds of kilometres. As the economiesof the LMB countries grow, not only will river trade between them increase, but shipping beyondthe Lower Basin will grow as well.
Waterway transport has much to offer local communities living along the river, governments andthose involved in large-scale trade and transportation. River transport can move people and cargo atcosts that are lower than road and air transport and river facilities are less expensive to build andmaintain than road and rail networks. If proper precautions are taken to protect the environment,river transport can be more environmentally-friendly than other forms of transport, both in terms ofless intrusive infrastructure and with regards to fuel economy, which in turn results in less airpollution.
Although the advantages of river transportare numerous, government polices, plans,and spending priorities continue topromote road, rail and air transport overinland water transport (IWT). This is astrue in the Lower Mekong Basin, as it iselsewhere in the world.
More than one third of the people living along the Mekongin Cambodia and Lao PDR live ten kilometres or more
from a year-round road
River transport can move cargo and peoplefor lower costs than road or air transport

218
State of the Basin Report - 2003
The chapter that follows discusses the following topics:
• passenger and cargo traffic on the waterways of the Lower Mekong Basin• the contribution of river transport to poverty alleviation• modal shares of inland waterway transport versus those of competitive transport modes• navigational channels and inland ports• the extent of IWT vessel fleets• government transport policies related to IWT development• conditions for increased international navigation• environmental protection measures for IWT
Because data on inland waterway transport were extremely limited in the Lower Mekong Basin,this chapter is largely based on a study conducted by the MRC in April and May 2002. During thisstudy a researcher visited all four lower basin countries to gather transport-related data. Althoughgathering this data was a challenge because in some countries IWT records are kept by individualports and not necessarily passed on to the national government, sufficient data were collected tocover the above-listed topics.
Four main factors influence the extent to which the Mekong and its tributaries are used fortransportation purposes. These are:
• economic and trade growth• the availability of choices in type of transport and the strength of competition from
other types of transport (most notably from road transport)• physical restrictions, such as limitations on vessel draft, imposed by the maximum
depth of water available in the dry season or (in the case of parts of the delta affected bytides) at low tide
• the non-physical (or institutional) barriers to international navigation
1. Importance of inland waterway transport to the remote communities in the Lower Mekong Basin
Throughout the Lower Mekong Basin, the Mekong and itstributaries provide poor communities with the means of gettingto markets, health clinics and education services located indistrict or provincial centres. This is particularly true duringthe monsoon season when roads become impassable formonths at a time. While the dependence of riversidecommunitiesa on inland waterway transport is graduallydeclining as a result of the on-going construction of new roadsin the Lower Mekong Basin, more than one-third ofpopulations living along the Mekong in Cambodia and on itstributaries in Lao PDR live further than 10-11 km from a year-round road (see Figures 1 and 2). For such communities, theriver is the only means of transport.
a For the purposes of this review, “riverside communities” are defined as those within 10-11 km of the Mekong Riveror one of its tributaries.
During the monsoon season, when roads become impassable, waterways are the only means transportation for millions of people

219
11 - Trade and transport
In Cambodia, only those living near a national or provincial road are likely to have year-round roadtransport because roads of lesser importance are rarely built for year-round use. Dependence oninland waterway transport in Cambodia is greatest along the mainstream of the Mekong River,rather than along its tributaries. This is because there are long stretches of the river, such as betweenStung Treng and Kratie, which are relatively remote from national or provincial roads. Altogether,some 970 villages along the Mekong River and its tributaries, housing some 1.36 million Cambodians,are totally dependent on inland waterways for transportation.
By contrast in Lao PDR, with the possible exception of some stretches between Kenthao and LuangPrabang, the Mekong River runs close to all-season roads for its entire length.b For communitieslocated along the Mekong’s tributaries in Lao PDR, access is considerably more restricted, especiallywhere (as is the case with the Nam Ou and the Se Kong), these tributaries pass through remote,mountainous terrain. The number of villages in Lao PDR estimated to be wholly dependent oninland waterways for navigation for most of the year is estimated at 915, with a population of about320,000.
Figure 1: All-season road access for river populations in Cambodia
Sources: UN World Food Programme and Mekong River Commission, GIS data bases; Cambodia National Population Census 1998 and Cambodian Socio-Economic Survey, 1999
While road access data for the Mekong Delta region in Viet Nam were not available for this review,modal share data demonstrate the dependence of communities on IWT in the 12 main provinces ofthis region. Annually about 73 percent of the region’s cargo tonnage and about 27 percent of itspassengers travel by water.c In addition, the relatively short average distances for passenger trips oninland waterways in the delta (only 15 km), suggest that waterways are satisfying a crucial need oflocal communities for intra-district transportation. While it is likely that road building projectsalready underway will result in fewer passengers using the waterways, cargo transport is unlikelyto decline. Cargo transport is dominated by rice exports and other trade in agricultural commodities.These use high-capacity bulk transport and transfer facilities of a type that cannot be provided byroad operators.
b World Food Programme. 2001. Poverty Indicators. National Statistics Centre and State Planning Committee, Lao PDR,in collaboration with World Food Programme, Vientiane.
c Viet Nam National Statistical Yearbook, 2000 and information supplied by Viet Nam Inland Waterway Administration(Southern Branch) during MRC mission to Ho Chi Minh City, April 2002.

220
State of the Basin Report - 2003
Figure 2: All-season road access for river populations in Lao PDR
Sources: UN World Food Programme (Lao PDR), GIS data base; Agricultural Census, Lao PDR, 1998
Of all member countries, Thailand alone has thebenefit of a dense network of paved all-season roadsrunning both parallel, and at right angles, to theMekong River.
It should be emphasised that although the communitieswhich benefit most from river transport are thosewhich have no, or very limited, year-round access toother modes of transport, for many others, which dohave better road access, boats still provide by far thecheapest means of transport. Thus, even poorcommunities with relatively good road access, are stilllikely to depend on the river to satisfy their basictransport needs.
In the Mekong Delta in Viet Nam about 73 percentof the region’s cargo is transported by waterways

221
11 - Trade and transport
2. Contribution of river transport to poverty alleviation
Available evidence suggests that the poorest communities in the Mekong Basin are rarely locatedalong the Mekong River and its tributaries. In Cambodia, for example, the poorest communities(those with more than 40 percent of the population below the poverty line) live some distance fromthe river.d Generally speaking, the communities along the Mekong River and its tributaries haveless than 40 percent of their households below the poverty line (on average 25-40 percent).e Theexceptions are the communities bordering the Tonle Sap River and Lake.
Another way of looking at this evidence is that the communities bordering the Mekong and itstributaries have already benefited economically from the river’s attributes, whether they be relatedto water for irrigation, to fishery resources or to transport uses. As a result, they are considerablyless poor than they would have been had they been remote from the river. While it is practicallyimpossible to separate the benefits provided by these attributes, there is little doubt that the year-round transport capability provided by the river has contributed substantially to the economic well-being of its communities.
In the very few instances where riverside communities appear not to be realising the full economicbenefits from use of the river for transportation (as appears to be the case with communities locatedalong the Tonle Sap River and Lake), measures to improve benefits range from infrastructureimprovements to reducing the burden of taxes and charges on boat operation.
d UNWFP et al. (February 2001), page 47.e UN World Food Programme in cooperation with the Ministry of Planning, Cambodia and UNDP, Identifying Poor
Areas in Cambodia, February 2001. In this study, “poor households” have been defined as those with consumptionexpenditure below the 54,050 Riel per month estimated as necessary to purchase a 2100 calorie food basket per dayand to meet other minimal expenditures.
In 2001, river trade between China and Lao PDR totalled $350 million.

222
State of the Basin Report - 2003
3. Trade benefits of river transportation
In 2001, trade valued at an estimated $4,700 millionwas transported in the LMB on the Mekong River andits associated waterways. This comprised trade between:Thailand and Lao PDR amounting to $350 million;between Thailand and China (Yunnan Province) worth$88 million; trade into and out of Cambodia, worth $235million; and trade into and out of the Mekong Delta inViet Nam (excluding trade with Cambodia) worth$4,000 million.f
As the only land-locked Lower Mekong Basin country,Lao PDR has realised substantial benefits from the useof the Mekong River as the principal conduit for itsinternational trade flows. In 2001, the value of theexport, import and transit trade flowing through thatcountry’s river customs checkpoints opposite Thailandis estimated to have amounted to $348.52 million, or44 percent, of a total trade value of $795.49 million(see Figure 3).
River customs checkpoints account for an even greatershare of the value of Lao PDR’s exports – about 64percent – since export flows tend to be dominated bylogs, timber products and other agricultural commodities(such as coffee). All of these are well adapted to transportby river, but some can cause substantial damage topavements if transported by road.
Four river customs checkpoints – Kenthao (oppositeLoei Province of Thailand), Pakxan (opposite BeungKarn, Thailand), Thakhek (opposite Nakhon Phanom,Thailand), and Savannakhet (opposite Mukdahan,Thailand) account for more than 90 percent of the valueand volume of all trade through Lao river checkpoints.However, in future, the continuing rapid growth of trucktraffic over the Friendship Bridge (averaging 16 percentper annum over the past five years), coupled with theimpending construction of a new bridge across theMekong River at Mukdahan, is likely to cut sharply thevalue and volume of foreign trade passing through theseriver checkpoints.
Although the advantages of river transport arenumerous, LMB governments, like those worldwide,
continue to favour road, rail and air transport
During the wet season, about 1.3 millionCambodians living along the Mekong are
totally dependent on the river and itstributaries for transport
f Estimates by the author on the basis of CIF value data supplied by customs departments (Cambodia, Lao PDR,Thailand)and national statistical publications (Viet Nam).

223
11 - Trade and transport
Since for much of its passage through the two countries,the Mekong River forms the border between Thailand andLao PDR, the value of the foreign trade moved on the riverbetween these two countries is as much a measure of valueto Thailand as it is to Lao PDR. In addition, in recent years,Thailand has been benefiting from use of the river totransport a growing proportion of its bilateral trade withYunnan Province in China. This has been mostly throughthe Lower Mekong Basin ports of Chiang Saen and ChiangKhong. In a single year the value of this trade more thandoubled, from $43.21 million in 2000 to $87.85 million in2001.g It is likely that implementation by the UpperMekong countries of the April 2000 Agreement onCommercial Navigation has had a major influence on thisexpansion of trade, which serves to demonstrate the speedand extent of trade benefits flowing to countries willingto make the necessary institutional adjustments to removetrade barriers.
Figure 3: Estimated value of trade (export, import and transit) passing through river and land border checkpoints of Lao PDR and Thailand, 1999-2001
Source: Customs Departments, Lao PDR and Thailand April –May 2002
Transport is constrained along muchof the river because of limited depth in
the dry season
g From data supplied by the Thai Customs Department, June 2002.

224
State of the Basin Report - 2003
In Viet Nam, some 90 percent of theexport tonnage of rice and some 60percent of the export tonnage of fruit andvegetables (fresh and processed)originates in the Mekong Delta and istransported by inland waterway vesselsat least as far as Ho Chi Minh City andthe main export ports on the Mekong andBassac Rivers. The tonnage and valueof export rice transported in 1999 on thewaterways of the Mekong Delta wasestimated at approximately 4.06 milliontonnes and $1,800 million.h
Corresponding estimates of the volumeand value of fresh and processed fruitand vegetable exports in the same yearwere 63,000 and $63 million respectively. Thus, the combined value of agricultural exports movedby inland waterway vessels in the Mekong Delta can be estimated at nearly $2,000 million annually.If this figure was augmented by the value of other export commodities and by the value of thesizeable import volumes moving into the region, it is not inconceivable that the total value of thetrade being moved annually on the waterways of the Mekong Delta could amount to $4,000million, or nearly 20 percent of the country’s overall foreign trade value.
4. River navigation conditions
Unlike some of the world’s great waterways, the flow and depth of the Mekong is essentiallyunregulated. This means that the passage of vessels along much of the river is constrained by thelimited depth of water available in the main navigation channels during the dry season, and in theestuaries during low tide. Infrastructure for navigation along the river is otherwise limited to dredgingat a very few locations, bank protection, the provision of landing and cargo handling facilities atinland ports, and the installation of navigational aids.
All sections of the Mekong River and its associated waterways are navigable during the high waterseason (i.e. for about eight months of the year), with the exception of a 14-km section, just north ofthe border between Cambodia and Lao PDR, which contains the impassable barrier of the KhoneFalls. Of the remaining sections, one (of 261 km between Savannakhet and Pakse) is only navigableduring the low water season by vessels smaller than 10 dead weight tonnes (DWT), and severalother sections are navigable at low water with lesser (but still severe) restrictions on vessel size.
h Estimates by the author based on export volume and value data taken from the Viet Nam National StatisticalYearbook, 2000.
In the Mekong Delta in Viet Nam, 90 percent of exportedrice and 60 percent of exported fruits and vegetables are
transported to ports by inland waterways

225
11 - Trade and transport
Figu
re 4
. Ve
ssel
size
rest
rictio
n on
the
Mek
ong
Riv
er -
Lao
PDR
and
Tha
iland

226
State of the Basin Report - 2003
Figu
re 5
. Ve
ssel
size
rest
rictio
n on
the
Mek
ong
Riv
er -
Cam
bodi
a an
d Vi
et N
am

227
11 - Trade and transport
Figu
re 6
. Ve
ssel
size
rest
rictio
n on
the
Mek
ong
Riv
er -
Vie
t Nam
Del
ta

228
State of the Basin Report - 2003
5. Inland ports and intermodal connections
Port facilities along the Mekong and its tributaries range from crude, makeshift landings formed byboats moored side by side against the river bank, to concrete ferry ramps (as in Lao PDR andThailand), to purpose-built concrete quay structures equipped with modern cargo handlingtechnology. Port infrastructure is at its most sophisticated level in the Mekong Delta in Viet Nam,where five maritime bulk-handling ports (three on the Mekong River and two on the Bassac River)share with the ports of Ho Chi Minh City the task of consolidating and dispatching 90 percent ofViet Nam’s annual exports of rice. Among these ports is Can Tho (located on the Bassac Riverabout 80 km upstream of the estuary), which has been designated for expansion and improvementunder the World Bank’s “Viet Nam Inland Waterways and Port Modernization Project”. As part ofthis project, Can Tho Port is being equipped with high capacity cargo handling equipment, includingmobile cranes for the lifting of containers.
Twenty-three of the 25 major ports in the Lower Mekong Basin (four in Thailand, eight in LaoPDR, six in Cambodia and seven in Viet Nam) are connected to main (either national or provincial)roads. The only exceptions are two ports located between Vientiane and Luang Prabang. However,the density of the main road networks in the vicinity of ports varies widely. It is densest in Thailand,and least dense in Lao PDR and Cambodia. In the Mekong Delta in Viet Nam, the low-lying andswampy nature of the terrain has, until recently, imposed a barrier to the expansion and improvementof the main road network. This has been recognised as a major impediment to the development ofrural and industrial communities in the delta. Thus, a World Bank-funded project is now underwayto remove this impediment by upgrading segments of Highway 1, as well as national and provincialroads in the delta provinces.i This project may be expected to contribute significantly to improvingthe intermodal linkages of several delta ports, including Can Tho.
The World Bank is assisting with the improvementof Can Tho Port in Viet Nam
i PO42927 Mekong Transport and Flood Protection Project (approved on 20 December 2000, for completion by 30June 2006).

229
11 - Trade and transport
6. Growth and composition of inland waterway vessel fleets
Much of the available data on the growth and composition of the inland water transport vesselfleets of the LMB member countries were incomplete, inconsistent and unreliable. In Cambodia, inparticular, the lack of any central control over boat licensing, meant it was not possible to identifyin national statistics the fleets of small boats registered and licensed in the provinces.j
Notwithstanding the data deficiencies, it was possible to develop a limited picture of fleet growthand composition in the four LMB member countries.
At the end of 2000, the IWT fleet of Lao PDR totalled 1098 boats, of which 405 (37 percent) werecargo or multi-purpose boats and 693 (63 percent) were passenger-carrying boats. Over the pastfive years, there has been little change in the size of the overall fleet. More than two-thirds of thecargo-carrying fleet was comprised of boats with a deadweight tonnage of 10 or less, reflecting arequirement for the operation of small boats during the dry season, especially for the stretch of theriver between Vientiane and Luang Prabang. About half of the passenger boats had less than 16seats, but those with 16-50 seats accounted for nearly one third of the passenger-carrying fleet.
The IWT fleet in the Thai portion of theLower Mekong Basin has been stable forthe past five years, numbering 110 vessels(55 passenger, 35 cargo and 20 multi-purpose passenger and cargo vessels). Themajority of vessels are of less than 30 DWT,but several large flat-topped barges of 200-300 DWT operate as vehicle-carryingferries from Beung Karn, Nakhon Phanomand Mukdahan ports to Laotian ports acrossthe river. The relatively small size of theThai fleet reflects the negligible use of theriver for domestic transport.
In Cambodia, the number of centrally-registered vessels as of 30 November 2001, totalled 593, including 127 dry cargo boats, 226 combinedpassenger/cargo and express boats, 24 tankers, 93 tugboats, 90 barges and pontoons, 8 ferries and25 service boats. It is understood that there has been little or no growth in this fleet over the pastfive years. No breakdown of this fleet by deadweight tonnage was available.
As of 30 April 2002, the registered inland waterway fleet of the Mekong Delta in Viet Nam numbered57,791 vessels. This fleet was reported to have nearly doubled in size since 1997.k More than three-quarters of the fleet comprised motorised or non-motorised barges of between 200-1500 DWT.Passenger vessels (licensed to carry 20-150 passengers), numbered 7,519 units, or 13 percent of theregistered fleet. Not included in the fleet data provided by the Viet Nam Inland WaterwaysAdministration were some 350,000 small “country” boats, mostly of 10-20 DWT, which operate onthe waterways of the Mekong Delta under private ownership. Details of this “country boat” fleetcould not be reported as registration processes are decentralised and it is understood that only 45percent of the fleet is, in fact, registered.
j In Cambodia, all boats except those with an engine power rating of more than 90 HP are inspected, registered andtaxed by the provinces in which they are based. Only the latter group is inspected, registered and taxed by the Ministryof Publics Works and Transport in Phnom Penh.
k Source, Viet Nam Inland Waterways Administration (Southern Division), during MRC mission, April 2002.
According to a study conducted in 2002, 37 percent ofriver traffic were cargo vessels and
63 percent carried passengers

230
State of the Basin Report - 2003
Figure 7. Modal Linkages in the Lower Mekong Basin

231
11 - Trade and transport
7. IWT traffic and modal share analysis
The LMB line agencies largely lack comprehensive and up-to-date records of passenger and cargotraffic plying the river and its associated waterways. As a result, estimates of traffic volumes had tobe made from a variety of different sources. In some member countries (notably in Lao PDR andCambodia), much of the authority for vessel licensing and port operation has been decentralised toprovincial offices, and with it, the responsibility for record-keeping. In most cases, records aremanually maintained and provincial staff are under no obligation to submit returns on a regularbasis to line agency head offices.
In the case of Cambodia, not only was there an absence of reliable and consistent data on IWTpassenger and cargo flows, but information on traffic flows for some other transport modes wasalso practically non-existent. For example, data on road traffic flows were unavailable, becausetraffic counts have not been undertaken on the main roads since 1996. For the purposes of thisstudy, road traffic was estimated from vehicle crossing data supplied by the three main ferry operatorsin Cambodia, at Prek Kdam, Tonlebet and Neak Luong. While this data covered long distancetraffic on Highways 1,5, and 7, it did not cover traffic on Highway 4, which is likely to be substantial.Nor did it cover short-distance traffic on the major highways, which does not use the ferries. Forthese reasons, the estimates of road traffic flows are likely to understate significantly the actualvolumes of passenger traffic moving on the main road system.l
Estimates of passenger and cargo trafficvolumes and modal shares for alltransport modes operating in the LMBindicate that only in the case of theMekong Delta in Viet Nam has IWTachieved dominance over other transportmodes, and then only for cargo transport(Table 2). Recently, however, IWTpassenger and freight volumes in LaoPDR have begun to increase, albeit froma low base. The declining trend in IWTpassenger volumes for all countries,except in Lao PDR, reflects the impactof an expansion of the region’s main roadnetworks. A negative impact on passengervolumes carried by inland waterway vessels in Lao PDR must also be expected, both as a resultof the ongoing improvement of the main road network, and of the impending construction of anew bridge across the river between Mukdahan (Thailand) and Savannakhet (the second largestcity in Lao PDR).
Despite road network improvements in the vicinity of the major ports of the Mekong Delta in VietNam, it is unlikely that the IWT mode will lose its dominance of cargo transportation in that region,due mainly to the advantages of IWT for bulk cargo movement.
l However, if this omission could be rectified, it would have little practical effect on IWT mode shares, which arealready very low (at about 1.1 percent of traffic carried by all modes in Cambodia during the reference year of 2001).
River transport facilities are less expensive to build andmaintain than road and rail facilities

232
State of the Basin Report - 2003
Of the four LMB member countries, only Thailand does not make significant use of the river and itsassociated waterways for domestic transport. This may be attributed to the high density of the networkof all-season roads linking all major and minor population centres along the river in Thailand. Thepresence of flexible, convenient and relatively fast road transport alternatives throughout the basinarea in Thailand has meant that IWT is now used only where such alternatives are unavailable, such asfor cross-river (and cross-border) traffic at locations not yet connected by a road bridge. Data collectedfrom Thai customs and immigration offices in the LMB show that road vehicles crossing the FriendshipBridge between Nong Khai (Thailand) and Tarnaleng (Lao PDR) now account for 88 percent of allpassenger traffic, and 55 percent of all cargo traffic, between Thailand and the PDR. The share of roadtransport in this cross-border traffic will inevitably increase as soon as the planned bridge connectingMukdahan with Savannakhet is available for service in about 2005.
Cargo traffic between Simao (Yunnan Province of China) and the Thai ports of Chiang Saen andChiang Khong has recently been growing at a very rapid rate (40 percent per year), but the tonnagescarried still represent a very small share of the total volume of trade between Yunnan Province andThailand. The bulk of this traffic is distributed by shipping services through Chinese coastal portsand from there by rail and road to Kunming. Thus, there is a major opportunity for water transportto use its cost advantage to increase its share substantially.
Remote communities in Lao PDR depend onwater transport

233
11 - Trade and transport
Traffic category/ Volumes Shares (%)Country
IWT Air
2.3
0.9 -
0.2
10.6
1.9-
2.0
----
-
0.3---
-
Rail
-
0.2
0.2
-
32.4 -
32.4
--
0.4-
0.4
--
108.3-
108.3
Vol.
1.80.20.3
86.0
88.3
72.80.5
54.31292.1
1419.2
0.40.71.50.5
21.8
24.9
200.058.9
2.953.2
2316.5
2631.5
Av.annualgrowth
%*
9.1
-1.9
11.2
-1.5
40.16.9
-6.47.4
40.116.8
-6.77.5
Road
19.1 1.6
23.6230.0
274.3
1423.73.3
2365.36049.0
9838.0
1.51.82.18.0
13.4
162.23.6
488.0652.0
1305.8
Air
0.5
0.2
0.7
178.3
48.7
227.0
- - - -
-
0.6 - --
0.6
Total
21.41.8
24.3316.0
363.5
1674.83.8
2500.77341.1
11520.4
0.42.23.33.0
29.8
38.7
200.0221.7
6.5649.5
2968.5
4046.2
IWT
8.411.11.1
27.0
24.4
4.313.2
2.217.6
12.4
31.845.516.773.2
64.3
26.644.6
8.278.0
65.0
Rail
-
0.9 -
-
-
1.3-
0.3
- -
13.3 -
1.1
- -
16.7-
2.7
Total
100.0100.0100.0100.0
100.0
100.0100.0100.0100.0
100.0
100.0100.0100.0100.0
100.0
100.0100.0100.0100.0
100.0
Road
89.388.997.173.0
75.4
85.186.894.682.4
85.3
68.254.570.026.8
34.6
73.155.475.122.0
32.3
Passenger trafficMill. passengers -2001Lao PDR, domesticTh.-Lao PDR –Th.CambodiaViet Nam (Mekong Delta)
TOTAL – LMB
Mill. pass.-km -2001Lao PDR, domesticTh.-Lao PDR –Th.CambodiaViet Nam (Mekong Delta)
TOTAL - LMB
Cargo trafficMill. metric tonnes -2001Thailand-China-ThailandLao PDR, domesticTh.-Lao PDR -Th.CambodiaViet Nam (Mekong Delta)
TOTAL – LMB
Mill. tonne.-km -2001Thailand-China-ThailandLao PDR, domesticTh.-Lao PDR –Th.CambodiaViet Nam (Mekong Delta)
TOTAL - LMB
Note: Data for Lao PDR domestic traffic are for the Year 2000. Average annual rates of growth were computed for IWT traffic over the past five years.
Sources: MRC missions to member countries, April-May 2002; National statistical yearbooks for 2001
Table 1 : Traffic flows, by mode, in the Lower Mekong Basin

234
State of the Basin Report - 2003
8. Government transport policies and IWT development
A study undertaken in 1982 for the Congressional Budget Office of the US Congress concludedthat inland barge transport was at least three and a half times more energy efficient than trucktransport, and 1.7 times more energy efficient than rail transport.m These conclusions werereinforced by other studies undertaken in the United States of America during the 1970s and1980s, which found even greater margins of advantage for inland waterway transport in terms ofenergy consumption.n
While the relative energy efficiency and other cost advantages of inland waterway transport haveyet to be fully investigated and confirmed for the Lower Mekong Basin, there is no reason toexpect that IWT in this region would not enjoy the same, or even greater, advantages over landtransport as those recorded in the United States. However, there is evidence that the economicadvantages of IWT may not be properly reflected in the comparative commercial charges of IWTand road transport operators in some areas of the Lower Mekong Basin. In fact, informationprovided by the Ministry of Communication, Transport, Post and Construction in Lao PDR suggeststhat in some cases, charges made by IWT operators are three times the applicable road transportcharges for the same traffic.
To some extent, this may be due to distortions in government charges which fail to recover the fullcost of providing road infrastructure from truck operators, while also penalising boat operators whoare obliged in all LMB countries to contribute to road development funds, through their paymentsof fuel tax.o Boat operators in some LMB countries, notably in Lao PDR, may also be prevented
from realising maximum commercial advantages from theiroperations because during the low water season, they mustoperate small boats with a payload capacity smaller than thatof a ten-wheel truck (but without a commensurate reductionin operating costs).
What is reasonably clear, is that in all LMB member countries,government transport expenditure priorities consistently failto recognise the environmental and economic advantages ofthe IWT mode. A comparison of government capital andoperating expenditures on inland waterways and roads duringthe most recent five-year period for which data were available,shows that in three of the four LMB countries, inlandwaterways attract less than 1.5 percent of all expenditure onboth modes. This comparison is shown in Table 2.
m Congressional Budget Office, US Congress, Energy Use in Freight Transportation, Washington DC, February1982, page 10.
n Mooz, W.E., The Effect of Fuel Price Increases on Energy Intensiveness of Freight Transport, Rand Corporation ,Santa Monica, CA, December 1971 and Eastman S.E., Fuel Efficiency in Freight Transportation, The AmericanWaterway Operators Inc., Arlington, VA, June 1980.
o In Lao PDR, for example, government tax revenue represents 28 percent of the pump price of diesel fuel in Vientiane(about 2,635 Kip or about US 30 cents per litre), including a direct “road fund” contribution of 40 Kip per litre.[Information obtained during an MRC mission to Vientiane in April 2002]
With World Bank funding, two major canal routes in Viet Namare being dredged to a depth of three metres, allowingoperation of barges of 500 DWT

235
11 - Trade and transport
Table 2: Five-year capital and operating expenditure allocations by governments
Data for Thailand were not included in this table, because it is understood that the section of theMekong River for which Thailand has responsibility, attracts only a small share of nationalexpenditure on inland waterway development and maintenance. Therefore, the inclusion of nationaldata is unlikely to be representative of expenditure allocations at the LMB level.
Nevertheless, it might be reasonable to conclude that the Mekong River in Thailand attracts a shareof expenditures that is significantly less than 1 percent of the total amount expended on roads andinland waterways combined. It is important to note that if it were possible to include in Table 2expenditures allocated to other modes, such as railways and air transport, the inland waterwayexpenditure shares would be even lower than indicated in the table.
Data indicate that not only are expenditure allocations disproportionate to the economic “worth” ofIWT, but also that they are disproportionate to IWT’s share in the national transport figures of allLMB member countries (Table 2). For example, the river and its associated waterways are estimatedto carry 73 percent of all cargo tonnage in the Mekong Delta Region of Viet Nam, 45 percent of allcargo tonnage between Thailand and Lao PDR, 31 percent of all cargo tonnage within Lao PDR and17 percent of all cargo tonnage within Cambodia.
Unless LMB governments commit a higher level of funding for essential river works, especiallyfor dredging of some dangerous spots, bank protection, port improvement, installation of aidsto navigation, and establishing navigation training, it will be difficult for the IWT sector tomaintain its significant role in cargo transport. Similarly, a more realistic funding approach,which in reality requires nothing more than a re-ordering of mode funding priorities, will benecessary for the IWT sector to establish a significant role in passenger transport (especially intourist transport).
Country Inland waterways Roads Total (two modes)
CambodiaLao PDRViet Nam
5-yearexpenditure
(US$ million)
0.4110.314
33.233
Share(%)
1.20.31.3
5-yearexpenditure
(US$ million)
34.024121.425
2,584.333
Share(%)
98.899.798.7
5-yearexpenditure
(US$ million)
34.435121.739
2,617.566
Share(%)
100.0100.0100.0
Notes: Cambodia data are for the five-year period 1997-2001; Lao PDR data are for the five-year period1996-2000 (fiscal years commencing 01 October); and Viet Nam data are for the five-year period,1995-1999, but purport to include only capital expenditures.
Sources: National Statistical Yearbook, Viet Nam, 2000; MRC missions to LMB member countries, April- May 2002

236
State of the Basin Report - 2003
9. Support by international agencies for transport network improvement in the LMB
The two main international development funding agencies are implementing major transportinfrastructure improvement projects which will have a significant impact on the development of anintegrated transport network within the Lower Mekong Basin.
The Asian Development Bank, through its Greater Mekong Subregion Programmep, is funding theimprovement of two international highway links:
• Highway 9, forming part of the GMS East-West Corridor linking Northeast Thailand throughLao PDR to Danang Port in Viet Nam (this project involves the improvement of 78 km inLao PDR and 83 km in Viet Nam, for an estimated cost of $67 million)
• The highway linking Phnom Penh in Cambodia with Ho Chi Minh City in Viet Nam(involving the improvement of 105 km in Cambodia and 80 km in Viet Nam, for an estimatedcost of $125 million)
Coupled with ADB support for rural road improvement projects in Lao PDR and Cambodia, as wellfor construction of the R3 missing road link in the GMS Northern Economic Corridor (Kunming-Chiang Rai), these projects will improve the road linkages of inland ports, throughout the LMB.q
The World Bank is implementing a number of projects,which may also be expected to enhance the intermodallinkages of the inland waterway system in the LowerMekong Basin. They include:
• The Viet Nam Inland Waterway and PortRehabilitation Project, involving dredging oftwo major canal routes, expansion of verticalclearances under five bridges, port improvementsat Can Tho and Ca Mau, instal lat ion ofnavigational aids throughout the Mekong Delta,and evaluation of alternatives for deepening theBassac River Estuary. This project is beingimplemented over the period April 1997-June2003, at a cost of about $85 million.
p for more information on ADB/GMS, see Chapter 15 on Cooperation.q The R3 missing link between Boten on the China/Lao PDR border and Huayxay on the Mekong River in Lao PDR,
forms part of what is known as the GMS Northern Economic Corridor.
ADB and the World Bank areenhancing the intermodal linkages
in the LMB

237
11 - Trade and transport
• The Mekong Transport and Flood Protection Project in Viet Nam, involves, among otherthings, the upgrade of 180 km of Highway 1 between Can Tho and Ca Mau and another 182km of national and provincial roads throughout the Mekong Delta. The estimated cost ofthis project is $144 million, and it is being implemented over the period December 2000-June 2006. Significantly, the upgrading of Highway 1 will include strengthening of highwaybridges to accept 30 tonne gross vehicle weights, which will be necessary to permit thepassage of container-carrying semi-trailer vehicles.
• Two projects in Lao PDR , the Third Highway Improvement Project and the ProvincialInfrastructure Project, aimed respectively at reconstruction of 230 km of Highway 13between Savannakhet and Pakse, and the provision of year-round road access to villages inthe remote northern provinces of Oudomxay and Phongsaly. These projects are beingimplemented by December 2003 and November 2006, respectively, at costs estimated,respectively, at $69 million and $28 million.
• A Road Rehabilitation Project in Cambodia, involving upgrading of 89.3 km of NationalRoad 6 and of 21.5 km of National Road 3, as well as rehabilitation of urban streets inPhnom Penh and Sihanoukville and institutional strengthening and capacity building. Thisproject is being implemented over a five-year period, between 1999 and 2004, at an estimatedcost at $48 million.
The World Bank’s Viet Nam Inland Waterway and Port Improvement Project can be expected toresult in substantial improvements to navigation in the Mekong Delta.
The two major canal routes, Ho Chi Minh City to Kien Luong and Ho Chi Minh City to Ca Mau arebeing dredged to a minimum three metre depth, allowing the operation of 500 DWT barges (upfrom 200 DWT currently).
The ports of Can Tho and Ca Mau are being provided with modern, high capacity cargo handlingequipment, including that for handling containers.
The Bassac Estuary is subject to a high rate ofsiltation and a tidal variation of 2.5-3 metres.At low water depth (3.6 metres), vessels of only3,000 DWT can pass through the estuary, butthe extra 3 metres of the high tide allowsvessels of 6,000 -7,000 DWT to enter.However, the government of Viet Nam iscommitted to improving access to the port ofCan Tho and wants to allow vessels of between10,000 and 20,000 DWT to enter the BassacRiver. This is likely to involve the constructionof a channel to by-pass the estuary, whichcannot provide stable conditions fornavigation. Subject to its satisfactory financialand economic justification, there is a strongpossibility that the World Bank will take a leadingrole in the development of this project. Significantly, one of the major benefits of the project will be toallow sea-going vessels to proceed as far as Phnom Penh using the Bassac River (and the Vam NaoCanal to the Mekong River). This, coupled with other measures, will result in the removal of all physicaland non-physical obstructions on this transit route.
If institutional impediments are removed, Phnom PenhPort could capture a large share of cargo bound to
eastern Asia

238
State of the Basin Report - 2003
10. Potential for operational linkage of IWT with other transport modes
The increasing demand for transportation of heavy commodities such as logs and constructionmaterials is beginning to pose major problems for road maintenance, especially in Lao PDR andCambodia. With limited road infrastructure, both countries can ill afford to have their road surfacesseverely damaged by overloaded trucks. However, such threats translate into opportunities forIWT, since boats are able to take over the linehaul transport of heavy commodities from truckswithout the necessity of upgrading either the capacity of boat fleets or of existing portinfrastructure.
In Lao PDR, one such opportunity could involve the integration of road and inland waterwaytransport in the movement of cement traffic, amounting to more than 350,000 tonnes per year.Two plants recently constructed under joint Chinese/Lao ownership at Vang Vien, about 150 kmnorth of Vientiane, have the capacity to produce up to 375,000 tonnes of cement annually,equivalent to the entire national demand for cement. However, as a result of the poor condition ofthe national highway network (and consequently extended truck cycle times), the companyoperating these plants has been unable to secure sufficient trucks to transport cement. A solutionto this problem could involve trucking the cement about 80 km to a port on the Mekong River,and then completing distribution to Vientiane, Luang Prabang and Savannakhet by boats, eachwith a minimum capacity of 50 DWT. The economics of this type of integrated transport operationwould be enhanced by the possibility of back-hauling limestone from Savannakhet (a major sourceof supply for the cement plants).r
11. Potential for increased international navigation
The adoption in 2001 of a harmonised system of aids to navigation on the Mekong River and itsassociated waterways, developed jointly by the United Nations Economic and Social Commission(ESCAP) and the Mekong River Commission, will remove at least one significant barrier tointernational navigation within both the Upper and Lower Mekong Rivers.
There appear to be few, if any, difficulties of an institutional nature impeding international navigationbetween China and Thailand (affecting the ports of Chiang Saen and Chiang Khong in the LMB), nor,for that matter, between Thailand or Lao PDR, since existing transit agreements between these countrieshave been in force for many years. Between Lao PDR and Cambodia, navigation is prevented by thephysical obstacle of the Khone Falls. However, between Cambodia and Viet Nam, internationalnavigation continues to be restricted by a delay in realising an agreement on protocol terms.
Apart from institutional impediments, there should be no reason why the port of Phnom Penh shouldnot capture a major share of international cargo traffic originating from, or bound for, countries tothe northeast of Cambodia, especially China, Japan, the Philippines and the Republic of Korea aswell as to and from Singapore and Viet Nam. If such traffic is to be distributed instead throughSihanoukville Port, a distance penalty of 490 km will be incurred. Currently, the direct river journeytakes about the same time as a journey to Sihanoukville, but this is due to a prohibition on navigationof the river by night, as well as to delays associated with border crossing formalities. Elimination ofthese river transit delays would result in a time saving of at least 12 hours for the direct river journeyover the Sihanoukville option.
r From information supplied by the Ministry of Commerce, Lao PDR, during the MRC mission to Vientiane during April 2002.

239
11 - Trade and transport
Figure 8: Comparative traffic growth of Phnom Penh and Sihanoukville ports
Sources: Phnom Penh Autonomous Port and Sihanoukville Port Authority
Yet, as may be observed in Figure 4, the robust traffic growth of Sihanoukville over the past fiveyears (+3.8 percent per year for ship calls and +18.9 percent per year for cargo throughput) is instark contrast with the declining traffic growth registered by Phnom Penh over the same period(–8.7 percent for ship calls and –3.0 percent for cargo throughput). It is possible that these widelydivergent growth outcomes may have been due in part to Sihanoukville Port capturing some of thetrade flows which, in the absence of transit delays (and possibly, punitive transit charges) on theriver route, might have been directed to Phnom Penh Port.
A key element in the reduction of border crossing delays on the river route is the bilateral agreementon waterway transport between Cambodia and Viet Nam, signed in December 1998. This agreementis significant in that it, and its associated protocol, limit to two the number of places at whichvessels are required to stop for completion of customs and other border-crossing formalities – VungTau in Viet Nam and Phnom Penh Port in Cambodia. Another agreement dealing with Transit ofGoods between Cambodia and Viet Nam, was signed in September 2000. Previously there were
four such stopping places, including theofficial border checkpoints of Vinh Xoungin Viet Nam and Kaom Samnor inCambodia. Unfortunately, owing to delaysin the resolution of differences betweenthe two governments regarding the list ofprohibited transit goods, the agreement hasyet to be put into full operation. Its earlyimplementation is becoming a matter ofconcern, since some new internationaltraffic opportunities – including a touristpassenger boat service between Siem Reapand Ho Chi Minh City – are being delayedby the absence of an enforceableagreement between the two countries.
Vietnamese customs officers on drug patrol inthe Mekong Delta

240
State of the Basin Report - 2003
More effective use of the Mekong river system as an international transit route will materialisewhen both countries can benefit. One of the factors influencing such development will be the strongpossibility that international shippers will make greater use of the economic trade potential madepossible by the triangle of Ho Chi Minh City, Phnom Penh and Can Tho Ports.
12. Navigation and the environment
12.1 Environmental Impacts of inland water navigation
Of the four governments of the Lower Mekong Basin, Thailand appears have the strongest regulationsto deter boat and port operators from discharging fuel or other liquid or solid waste matter intowaterways or onto adjoining land. In Thailand, the Harbour Department has authority under itsenabling legislation to issue fines for those who spill foreign matter into waterways. However, anumber of ports along the Thai side of the Mekong are not owned and managed by the HarbourDepartment, but instead by provincial government authorities. Thus the Harbour Department doesnot have the power to prosecute all the infringements that could occur.
While there have been no reports of major spills, researchs
indicates that no agency has the possibility of rapidlymobilising the trained personnel and specialised equipmentneeded to clean up after a spill. Only in Thailand and VietNam do the relevant line agencies have the necessarypersonnel and equipment, but they are located in Bangkokand Ho Chi Minh City, some 600-700 km and some 150 km,respectively, from the main waterways of the Lower MekongBasin.
In Viet Nam, all new projects involving dredging ordevelopment of infrastructure, in and beside waterways, arenow required to undergo an environmental impact assessment(EIA). In Thailand, EIAs are required for port developmentprojects designed to handle vessels of greater than 500 DWT,which would seem to exempt most, if not all, portdevelopment projects likely to proceed along the MekongRiver in Thailand. In Cambodia and Lao PDR, there appearsas yet to be no requirement for EIAs to be completed forinland waterway projects.
Better monitoring, coordination and control of navigation activities can contribute significantly toa better environment by reducing shipping accidents and regulating the movement of dangerousand toxic substances. For example, the provision of specialised port facilities would eliminate therisks involved in the beach landings of petroleum tanker barges where no such specialised facilitiesexist. In addition, the introduction of common rules and regulations will reduce the frequency ofcollisions, and with it the pollution risk.
s MRC missions to member countries, April – May 2002.
Provision of specialised port facilitieswould reduce the risks posed by shipsand barges carrying petroleum andother potentially-dangerous cargo

241
11 - Trade and transport
12.2 Some environmental and socio-economic benefits of water transportation
The considerable environmental and social benefits which can be derived from the use of inlandwater transportation, as opposed to other forms of transportation (e.g. road transport) can besummarised as follows:
• IWT transportation operates in a waterway environment that has few junctions whichtends to reduce both the number and severity of accidents.
• The environment of the waterway system often places more distance between vessels andthe surrounding population and property than is the case with either truck or rail transport.
• Inland waterways, unlike road and rail networks, require lower initial investment and loweron-going costs for maintenance.
• Because of their much greater capacity, IWT with large barges, requires far fewer unitsthan either rail or truck transport to move an equivalent amount of cargo. Barges thushave proportionately fewer accidents and burn less fuel in carrying the same volume ofcargo.
• For remote communities near waterways, IWT is usually less expensive and lessenvironmentally damaging than extension of roads to these areas.
In remote areas, waterway transport helpsproducers get their goods to market

242
State of the Basin Report - 2003
References
Congressional Budget Office, US Congress. 1982. Energy use in freight transportation, WashingtonDC.
Eastman S.E. 1980. Fuel efficiency in freight transportation, The American Waterway OperatorsInc., Arlington, VA.
Mekong River Commission. 2000. Updating the strategy and programme for navigation developmentand coordination in the Lower Mekong Basin, Mekong River Commission, Phnom Penh.
Mooz, W.E. 1971. The effect of fuel price increases on energy intensiveness of freight transport,Rand Corporation , Santa Monica, USA.
Viet Nam National Statistics Office. 2000. Viet Nam National Statistical Yearbook, StatisticalPublishing, Government of Viet Nam, Hanoi.
United Nations World Food Programme and Mekong River Commission, GIS databases. WorldFood Programme, Phnom Penh.
United Nations World Food Programme. 2001a. Identifying poor areas in Cambodia. Ministry ofPlanning, Cambodia and UNDP, World Food Programme, Phnom Penh.
United Nations World Food Programme. 2001b. Poverty indicators. National Statistics Centre andState Planning Committee, Lao PDR, World Food Programme, Vientiane.

243
12 - Domestic water and sanitation
In rural areas, women andchildren often walk long distances
to obtain drinking water
Domestic water 12and sanitation
If volume were the only consideration, use of the Mekong Basin’s water for domestic purposes andsanitation would be of small importance. Its demands represent no more than 5 or 6 percent1 of allground and surface water used for any purpose in the basin, and water used for all purposes is only10 percent of the water flowing from the river’s mouth (Table 1).2
Table 1 Freshwater withdrawal for domestic use and sanitation
From other perspectives, however, domestic water and sanitation are of very high importance indeed.First, water quality and hygiene have a significant impact on human health and productivity. Second,
access to domestic water, to sufficient quantities of it and tosupplies that are reliable year-round, need to be assured to meeteveryday basic human needs.
Domestic water and sanitation are clearly essentials for the healthand productivity of all 55 million people living in the LowerMekong Basin. But as Figure 1 indicates, a very high proportionof people in the basin lack adequate access to safe water andsanitation. This is particularly so in Cambodia, Lao PDR and VietNam, which all have largely rural, relatively dispersed populationsin their areas of the basin. And water for domestic use is not alwaysevenly distributed geographically, seasonally or equitably – factorswhich in turn can have severe impacts on development in general,and on poverty reduction in particular.
In rural areas, the poor are the most vulnerable to inadequatesupplies of domestic water. It is their children who are the mostlikely to contract water-and-sanitation related diseases, especially
Country and year Domestic use sector% of total water usage
Cambodia (1987) 5Lao PDR (1987) 8Thailand (1990) 5Viet Nam (1990/1992) 4
Note: Data are for the whole countrySources: World Resources Institute 2000; Gleick 2000

244
State of the Basin Report - 2003
diarrhoea. In addition to health risks, in rural areas poor people often have to walk some distanceto supply their families with water. Women and children, who are the family members most likelyto carry water, may spend hours of their day doing so. This is a loss not only of time that could bespent on more productive activities, but if the water source is far from home, personal safety maybecome an additional issue.
Figure 1. Access to domestic water and sanitation in the LMB countries
Notes: Figures shown are countrywide, in the absence of more specific data for that part of eachcountry falling within the LMB. Scales are based on approximate percent of populationsserved
Source: UNICEF 2002
In urban areas of the basin, a much higher percentage of people have water piped into their homesand are able to flush sewage away, but the poorest urban dwellers, whose numbers are increasing themost rapidly due to migration from rural areas, often lack such conveniences. Governments cannotkeep up with the demand for water and sanitation services as more and more people settle in urbanareas. Problems are arising as well in urban areas because the water and sanitation systems builtdecades ago are reaching the end of their lifespans and are beginning to break down. As a result,service levels are low, significant amounts of water are lost and water becomes contaminated as itflows through leaking pipes.
As LMB populations grow and coalesce inurban areas, providing water and sanitationservices will become an even-greaterchallenge. Populations are likely to demandbetter quality water and greater quantitiesof it, and compete with other users of watersuch as agriculture and industry.
Thus although in a largely water-rich areasuch as the Lower Mekong Basin, domesticwater may not at first seem as important asother water uses, it is, in fact, one of themost crucial uses for water, and likely tobecome more so in the near future asprovision becomes even more challenging.
The poorest urban dwellers, who are often recentmigrants from rural areas, usually lack adequate
domestic water and sanitation

245
12 - Domestic water and sanitation
The provision of domestic water and sanitation services must be included in development plansthroughout the LMB. The success of social and economic development depends on adequate accessto these services, which will remain an essential indicator of progress.
In the chapter that follows, national policy will be overviewed, along with threats to water quality,as an example of a number of basin-wide issues. Available data on water and sanitation coverageand water-related disease statistics will also be presented, as will the need for more appropriateindicators of progress than just the extent of coverage. Finally, some overall conclusions aredrawn.
1. The scope of domestic water and sanitation
Domestic water use within the LMBtypically includes household use(drinking water, cooking, bathing,washing of clothes etc.), small-scalegardening and, where facilities areavailable, the flushing away of sewage.In urban areas, the water and sanitationsystems established to meet domesticneeds also serve businesses, governmentand public services such as educationalinstitutions and hospitals. However, thewater used for industry, powergeneration, irrigation, livestock andaquaculture is usually excluded from thedomestic water sector.
The water sources used for domesticpurposes and sanitation include not onlysurface water, but also groundwater, springs and rainwater. While cities and many towns in the basinhave systems that pipe water to people’s homes, most rural dwellers get their water from boreholes,wells, springs, streams, rivers, ponds and rainwater, and these supplies are often communal. Incities, human waste is flushed into sewerage systems, septic tanks or cesspits, or, in low-incomeareas, discharged in whatever way is available. In rural areas, people use latrines or pits dug into theground or discharging into ponds or water courses, or people relieve themselves in the open.
2. Domestic water and sanitation (DWS) policy within the LowerMekong Basin
Providing adequate access to domestic water and sanitation has been identified as one of the mostimportant challenges facing the four riparian states. This is well reflected in national policies, strategiesand plans, as well as those of donor and lending agencies. This is particularly so in Cambodia, LaoPDR and Viet Nam, and is in line with international priorities and commitments. Amongst otherthings, current policy seeks to shift the emphasis from a focus solely on physical coverage as ameasure of success to include a number of other aspects now considered crucial. Among these arethe need to develop water supply, sanitation, hygiene awareness and behavioural change in parallel,and increase emphasis on factors which ensure long-term sustainability.
Clean water can easily become contaminated during use ifgood hygiene is not practiced

246
State of the Basin Report - 2003
During the 1990s, it becameincreasingly clear worldwide thatattempts to expand water supplywere not having the desired impact.Firstly the facilities were not alwaysused, maintained, or providing thehealth and other benefits that wereintended. Secondly, the rate of newconstruction was not keeping upwith growing populations.
New approaches developedinternationally, and endorsed byLMB governments, call forcommunities (with the exception ofthe more affluent urban areas), toown and manage facilities, theprivate sector to provide goods andservices, and governments tofacilitate the process. In rural andlow-income urban areas, demand-responsive approaches allow beneficiaries to guide and fully participate in making key investmentdecisions. These are in accord with the internationally-adopted Dublin Principles set out in Box 2.
Although the principle that users should investin water and sanitation services has nowbecome well-established, in Lao PDR andCambodia, for example, governmentstrategies recognise that where communitiesand users cannot afford to fully financeschemes, the government should contributesignificantly towards their costs. Whenappropriate technology is used andcommunities take responsibility for managingand sustaining systems, this assurescommunities of a basic level of service.However, if users want more than a basic levelof service, they are expected to pay for it.
Box 1. LMB commitments to International Development Targets for Water Supplyand Sanitation
• By 2015 to reduce by one-half the proportion of people without access to hygienicsanitation facilities.
• By 2015 to reduce by one-half the proportion of people without sustainable accessto adequate quantities of affordable and safe water.
• By 2025 to provide water, sanitation and hygiene for all.
Source: WHO/UNICEF/WSSCC 2001.
Box 2. The Dublin PrinciplesThe following principles have been adopted bygovernments within the basin as well as internationally.
Principle No. 1 - Fresh water is a finite and vulnerableresource, essential to sustain life, development and theenvironment.
Principle No. 2 - Water development and managementshould be based on a participatory approach, involvingusers, planners and policy-makers at all levels.
Principle No. 3 - Women play a central part in theprovision, management and safeguarding of water.
Principle No. 4 - Water has an economic value in all itscompeting uses and should be recognised as an economicgood.
Source: ICWE 1992
In rural areas wells and spring water are preferable tosurface water which is often polluted with human and
animal wastes

247
12 - Domestic water and sanitation
Among the major institutional and structural challenges addressed in various LMB policy papersare the need to: (a) improve the design, implementation and management of water and sanitationservices in both rural and urban areas through identification of affordable, sustainable and equitablesolutions; (b) better integrate domestic water and sanitation within the context of water resourcesmanagement as a whole, with emphasis on quality as well as quantity; (c) enhance the capacity ofcountries to design, mobilise and manage operational support and investment from a wider group ofpartners; (d) match the provision and type of services with the users’ willingness to pay (economicdemand), while at the same time providing initial help to ensure basic services to those who cannotafford to pay the full costs; (e) demonstrate best practices and share information to encourage wideruse of these; and (f) apply, monitor, learn from and adapt new strategies in support of these principles,in accordance with international consensus.
The importance of improving domestic water and sanitation in the LMB has been recognised by theMekong River Commission and will be a key consideration as MRC develops its Basin DevelopmentPlan by 2004. MRC also recognises that domestic water and sanitation are important transboundaryconsiderations. Other agencies with Mekong Basin programmes such as ADB’s Greater MekongSubregion initiative, the World Bank Water and Sanitation Program for East Asia and the Pacific(WSP-EAP) and the United Nations Children’s Fund (UNICEF) have also made domestic water andsanitation an important focus.
3. Country and basin-wide issues
Alongside the strategic issues related to the development and management of the sector alreadypresented in the previous section, there are a number of more specific issues, at both country andbasin level, that also affect domestic water and sanitation in the LMB. Some selected illustrationsare presented, followed by a more-detailed review of what is likely to be a paramount basin-wideissue: water quality.
3.1 Some factors impacting on the provision of domestic water and sanitation
3.1.1 Drought
Drought is a frequent concern, particularlyin Northeast Thailand. In 1992 and 1994,droughts in this part of the basin seriouslyreduced domestic water supplies in the dryseason. The consequences of droughts in theNortheast could be made worse if plans arefollowed through to divert Mekong waterinto the Chao Praya River system fordomestic, agricultural and industrial use incentral Thailand.3
3.1.2 Saline intrusion
If dams and irrigation withdrawals upstream and potential drought reduce the volume of waterreaching the Mekong Delta in Viet Nam, the intrusion of saline tidal water could increase significantlyand threaten surface and groundwater sources, as well as agricultural land (Box 3).
In Northeast Thailand, droughts can seriously reducedomestic water supplies in the dry season

248
State of the Basin Report - 2003
Box 3. Viet Nam - Increasing access to water supply and overcoming quality changes
Saltwater intrusion and increased agricultural activity have polluted surface water throughoutthe Mekong Delta.
To find fresh water, more than 43,000 tube wells up to 400 metres in depth have been drilled totap fresh water aquifers. Furthermore, when surveys carried out in 1996 and 1997 indicatedthat thousands of wells were used at only about 5 percent of their capacity, efforts were made toeffectively exploit existing wells, rather than drill new ones. In the commune of Luong Hoa,extensive discussions with community members led to an agreement to construct and maintaina piping system that brought water directly to people’s homes. Virtually every household agreedto contribute financial support. The funds collected for each cubic metre of water supplied areenough to cover electricity and operational costs, as well as cover future repairs and expansionof the system.
The project has expanded to supply piping systems in 49 communes in the provinces of VinhLong and Tien Giang, benefiting an estimated 22,000 people.
This experience shows that relatively small amounts of capital can act as a catalyst in helpingpeople to help themselves. Community support for small piping systems can be a low-costmethod of increasing rural water supplies.
Source: WHO/UNICEF/WSSCC 2001
3.1.3 Deteriorating infrastructure
The deterioration of domestic water and sanitation infrastructure is a concern, especially in urbanareas. Infrastructure is reaching the end of its working life, and requires extensive funding forrehabilitation. In 2000, it was estimated thatover 80 percent of sewage/storm waterdrains in Cambodia’s urban centres were nolonger functioning.4 In addition, wherepreventive maintenance is insufficient,systems are declining even faster. Theseproblems result not only in inconvenienceand health problems, but also in economiclosses due to investment wasted oninfrastructure that under-performs, and thecost of pumping and treating water that islater lost.5 Basin-wide investment planningpriorities will need to include the cost ofrehabilitating existing water and seweragesystems.
3.1.4. Recognising the importance of groundwater
Groundwater is often excluded from basin planning discussions, even though it is a crucialconsideration both as a domestic source and because its quality is threatened by human waste andother pollutants. The use of groundwater in the basin for domestic purposes is already significant.In Thailand, for example, 60 percent of groundwater abstraction is used for domestic supply.6 InCambodia, more than half of the population uses groundwater for domestic needs, and in rural
In many urban areas of the LMB, sewage and stormwater drains are in poor condition and no longer
function well

249
12 - Domestic water and sanitation
areas, the figure rises to 60 percent.7 It is therefore particularly important to protect groundwaterquality and ensure that water tables remain adequate to meet domestic needs. Unfortunately, comparedwith surface water, very little is known about the quantity or quality of groundwater or the factorsthat threaten it.
3.1.5 Other issues
Other issues in the basin that may have implications for domestic water supply and sanitation includedeforestation due to logging and clearing of land for agriculture (reducing groundwater rechargeand increasing runoff and sediment loads), and extraction of water for irrigation (lowering groundwatertables and competing for surface water). More generally, climate change could increase evaporationand reduce precipitation, which in turn could reduce the surface and groundwater available fordomestic and other users.
3.2. Water quality: An example of a basin-wide issue affecting domestic use and sanitation
Although the issues listed above are all significant, one of the most important basin-wide concernsthat affects domestic water use is that of water quality. Water quality is a good example of a growingbasin-wide concern affecting many different uses. It has special relevance - and high importance -for domestic water and sanitation. Clearly, quality of water is especially important when the end-useis for domestic purposes such as drinking and personal hygiene. Unlike other uses, the final qualityof domestic water has a very direct link with personal health, well-being and personal productivity.
Of course, surface water in the Mekong system cannot, and indeed should not, be maintained atdrinking water quality. All water from rivers needs to be treated to render it fit for drinking withouthealth risk. But maintaining good general water quality in the river and its tributaries will certainlyreduce the cost of the treatment needed for domestic water. It will also reduce risks to people’shealth when bathing, swimming, boating, fishing and laundering.
Safeguarding groundwater quality is even moreimportant. Achieving this can help to ensure that in mostcases, if hygiene awareness is high and put into practice,protected wells in rural areas will continue to deliveran adequate quality of domestic water without treatmentbeing required.
3.2.1 Sources of contamination
Pollution of water supply sources – both surface andgroundwater – with human and animal waste, as wellas garbage, is common in the basin and increasing. InLao PDR, for example, the length of rivers where waterquality is adversely affected by human activity wasestimated in 1997 at 10 percent with severe impact, and20 percent with moderate impact.8
Pollution of surface water is common in urban areas and increasing

250
State of the Basin Report - 2003
Sources of contamination are widespread. They include the discharge of untreated or partially-treatedhuman sewage; the practice of combining sewage with storm water drainage; the emptying oroverflowing of septic tanks and cess pits; the use of untreated night soil in agriculture; seepage frompit latrines; defecation in the open; pollution by the waste from intensive livestock operations; andcontamination from people bathing or washing clothes in water courses. These sources affect surfacewater or groundwater, and in some cases, both.
Pollutants from industries such as paper mills, textile mills and chemical factories may become athreat in the future as more of these industries are established in the LMB. Problems could occur notonly in larger centres such as Phnom Penh and Vientiane, but also in fast-expanding smaller citiessuch as Ubon Ratchathani, Udon Thani, Khon Kaen and Nong Khai in Northeast Thailand and areasin the Mekong Delta in Viet Nam which have been targeted for development. Increasing pollution ofwater sources by industries in cities and towns may well hinder the already difficult task of extendingbasic water and sanitation services to the urban poor.
3.2.2 Contamination of groundwater, including arsenic contamination
Distinction needs to be made between shallowgroundwater that is vulnerable to pollution but easilyaccessed with simple drilling equipment or digging byhand, and deeper, more reliable groundwater. Many ruralcommunities rely, at least in part, on shallowgroundwater. This is vulnerable to contamination fromrun-off, flooding, latrines and other sources of faecalcontamination, and when users draw water.Contamination of groundwater may be made more likelyas a result of poorly installed or badly maintainedboreholes and wells. Mining, manufacturing and leaksfrom underground petrochemical tanks may threatengroundwater quality in future.
Contamination of groundwater from natural sources isreceiving much greater attention following the discoveryof high arsenic levels in groundwater in many parts ofSouth and Southeast Asia, with associated impacts onthe health of communities. Both fluoride and arsenicare now increasingly recognised as threats to waterquality. Iron and manganese salts may be as well, butmore for aesthetic than for health reasons.
Box 4. Arsenic
Arsenic, in particular, is an increasing concern. As a WHO meeting recognised in 20029, arseniccontamination of groundwater is a very complex problem, not only in terms of its origin,movement and transformation, but also because of its very significant health and social impacts.The areas at most risk in the LMB appear to be along the valley and floodplains of the Mekong/Tonle Sap/Bassac and deltaic areas. Here rock, soil and aquifers may contain historic arsenic-rich deposits washed down from the Himalayas. The precise mechanisms of arsenic release
A high frequency of gastro-enteric, worm-related and other diseases are linked withcontamination of, or shortage of, domestic
water and poor sanitation

251
12 - Domestic water and sanitation
from sediments into groundwater, and in particular, the influence of human activities (such asintensity of water use) on the process, are not yet clearly understood however, making exactpredictions difficult.
What is clear from surveys so far is that arsenic is likely to be a significant future problem inCambodia, Lao PDR and Viet Nam (the position in Thailand is less clear). However, becauseimproved wells have been developed more recently in the Mekong countries, the use of potentiallyarsenic-contaminated waters may have been less universal and for shorter periods than in someother countries at risk. Therefore, if timely and appropriate action is taken by governments andtheir external supporters (including identification of alternative drinking water sources for theaffected wells – or failing that, appropriate treatment of the water), the associated health problemsneed not be as serious as they have been elsewhere.
While arsenic in groundwater remains a serious issue for the LMB, it must also be set within thebroader water quality context. Risks must be balanced with those of widespread microbialcontamination of many traditional sources, and excess fluoride in others - both of which alsohave major health impacts.10
Source: After WHO 2002
3.2.3 Contamination of surface water
Deforestation leads to land degradation, soil erosion and increased sediment content in surfacewater, and raises the cost of water treatment. So does flooding, if it increases the organic content inwater supplies. Coal mining, oil exploration and gem mining can increase turbidity in surface watersand also pollute them with toxic chemicals. These impacts are exacerbated by lack of monitoringand enforcement.
Natural erosion and that induced by human activity may expose toxic rock. For example, toxicaluminium compounds have been eroded from rock in western Cambodia. Construction of dams,roads and other infrastructure may contaminate drinking water sources directly with wastes, orindirectly by exposing toxic bedrock to erosion. Residues from past warfare are another un-assessedsource of contamination, as is leechate from solid waste disposal sites, especially sites with hazardouswastes.
Pesticides could become a concern in future if their use increases as agriculture intensifies in theLMB. They can contaminate surface and groundwater through run-off after application, whenirrigation water returns to watercourses, and when agricultural equipment is washed. In addition todamaging ecosystems, pesticides threaten humans both by contaminating domestic water suppliesand by concentrating in the fish and other aquatic animals that humans eat.
Increasing use of fertilisers is also a potential problem, raising levels of nutrients in the delta inViet Nam, for example. This may cause eutrophication and an explosive growth of algae. Algalblooms are a threat not only to fish, but some forms are also highly toxic to humans. However, arecent study11 identified only a moderate risk of human waste and fertiliser triggering surfacewater algal blooms downstream from Phnom Penh. On the other hand, the potential increase innitrate/nitrite levels in groundwater, particularly in areas where fertiliser use is extensive, needsto be monitored.

252
State of the Basin Report - 2003
In the future, as river transportationincreases both in the upper reaches of theriver between China and Thailand, andbetween the mouth of the river and citiesand ports in Viet Nam and Cambodia, spillsof fuel and toxic chemicals could threatendomestic water sources. The impact of aspill would likely be felt for long distancesdownstream. (See Chapter 11 on trade andtransport).
In urban areas, where populations areincreasing rapidly due to rural-urbanmigration, authorities are finding itimpossible to keep pace with therequirements for water and sewerage infrastructure. Domestic water supplies, particularly thosesourced from surface water, are increasingly threatened from human, industrial and hospital wastes.In Phnom Penh, for example, a preliminary assessment found a moderate-to-high risks of healthproblems if domestic water was drawn from the Chaktomuk or Tonle Sap Rivers, or the upperreaches of the Bassac.12 Urban water supplies are also contaminated by deteriorating water systems.
3.2.4 Contamination during use and secondary risks
Contamination during the drawing, transport, handling and storage of water is often not given nearlyenough attention. Whilst water may start out clean, it can be quickly contaminated during use ifgood hygiene is not practised at every stage. In some cases, contamination occurs because peoplelack knowledge about proper hygiene. In others they simply lack sufficient water and soap to washtheir hands.
A high frequency of gastro-enteric, worm related and other diseases in the LMB are linked withdomestic water supply and poor sanitation, particularly in rural areas. These diseases exacerbate theeffects of poor nutrition and the ravages of other diseases. Survival rates, quality of life and economicproductivity are all clearly affected. Section 4.6 gives some statistics on typical diseases.
There are also some secondary risks. Wild and cultured fish, shrimp and the other aquatic creaturesconsumed as human food in the LMB can all carry faecal bacteria in their gut and on their surfaces,and serve as intermediate hosts for parasites. With so many people dependent on aquatic products astheir major source of protein, increasing contamination of water bodies with sewage could becomea serious problem.
3.2.5 Monitoring and managing domestic water quality in the LMB
International guidelines exist on the recommended limits for pollutants in drinking water.13 However,important linkages need to be made in the LMB (as is the case elsewhere in the world), between thestandards required for drinking water and those required for other uses such as business and industry,and maintaining ecosystem health.
In the LMB, water quality surveillance programmes, particularly those for drinking water sources,are still limited and generally lack sufficient equipment, laboratory facilities, communications andskilled personnel. Among positive trends is the recent development of national drinking waterstandards in Viet Nam and Lao PDR and an ongoing process to do so in Cambodia (Thailand has had
In all cases, river and other surface water in the LMBrequires treatment to render it safe for drinking

253
12 - Domestic water and sanitation
them for some years). Cambodia has alsoundertaken a major drinking water qualityassessment.14 In rural areas, there is anincreasing movement towards localmonitoring of drinking water quality,leading to early and appropriate action, withless reliance on national or centralisedmonitoring programmes that sometimesproved ineffective in the past.
Measures to prevent the decline of waterquality at its source or point of use – or anystage in between - and its recontaminationafter treatment need as much attention assetting standards and monitoring whetherstandards are being met. Water sources needto be protected to avoid contamination, leaking systems in urban areas need to be repaired andpeople need to understand the importance of hygiene and how to change their behaviour to preventcontamination between source and point of use.
4. Data on water and sanitation in the Lower Mekong Basin
4.1 The importance of monitoring equity, use, sustainability and impact – not just coverage
Traditionally, in the LMB as well as elsewhere in the world, progress in domestic water and sanitationprovision has been measured in terms of number and types of improved water and sanitation facilities,numbers of people served, amount invested or quantity of water delivered. However, this “supplyside” approach to monitoring is now recognised as giving no real indication of whether theimprovements are: (a) equitable, (b) actually used, (c) maintained and financed, and (d) likely toyield positive health and socio-economic benefits to users (Box 5). Assessment of continuing use,sustainability and impact has not been widely attempted. It is also quite difficult to assess andcompare data on the investment and recurrent costs for domestic water use and sanitation. This areaclearly needs much more work in future, within the basin as well as globally.
Box 5. Some suggested definitions for equity, use, sustainability and impact
• Equity means that everyone (e.g. men and women, rich and poor, social minoritiesand major groups) has equal voice and an informed choice in decision-making, equalaccess to information, external inputs and benefits, and shares burdens and responsibilitiesfairly.
• Use means that water and sanitation improvements are actually used by all, and thatusers prefer them to their previous arrangements.
• Sustainability means that the improvements are maintained, repaired (and eventuallyreplaced), and that this is fully financed by the users.
• Impact means that the improvements actually have a positive health and socio-economicbenefit through reduced disease, time saving, convenience, security of women, etc.
Source: After Dayal et al. 2001 and others
In the LMB, drinking water quality increasingly needs to be monitored at the local level and be linked to
early and appropriate action

254
State of the Basin Report - 2003
Although data on coverage are available for the LMB, these data are problematic. Definitions vary,as does the quality of data. For example, definitions of what is “rural” and what is “urban” vary.When service providers supply data, they often neglect to check whether facilities are actuallyfunctioning, let alone used or having any impact. Conversely, self-built or community-initiatedfacilities may not be counted by those gathering data. Data sets from different sources vary widelyas well (see Table 2).
A further problem arises because national data do not necessarily conform to the boundaries of theMekong Basin. This is not so important for Cambodia and Lao PDR (where 86 and 97 percent of eachrespective country lies within the basin), but may be significant when using national data for Viet Namand Thailand, which have much less of their territory in the basin (20 percent and 36 percent respectively).For all these reasons, making comparison between countries and years can be difficult.
Box 6. Definitions of coverage“Access to improved drinking water” in urban areas is usually defined as access to pipedwater or a public standpipe within 200 metres of a dwelling or housing unit. In rural areas,reasonable access implies that a family does not spend a disproportionate part of the day fetchingwater. Improved drinking water may include treated surface water and untreated water fromprotected springs, boreholes and sanitary wells. Other definitions also mention the need for anadequate quantity of water for good hygiene and household use.
“Access to improved sanitation” in urban areas usually refers to connections to public sewersor household systems such as pit privies, pour-flush latrines, septic tanks, communal toilets,and other such facilities. Rural population access is defined as those with adequate disposalsuch as pit privies, pour-flush latrines, or similar facilities. Other definitions specifically mentionprevention of human, animal and insect contact with excreta, or pollution of water sources.
Source: based on WHO/UNICEF/WSSCC 2001
The most important limitation, however,remains lack of data on use andsustainability (the degree to which facilitiescontinue to be financed, maintained andoperated) and on benefits (maximisinghealth, saving users’ time and increasingpersonal safety, especially that of womenwho are able to access water much closerto home). Nor is there data on equity ofaccess within and between communities andbetween genders and age groups.
4.2 Coverage data
Although there are limitations with regard to coverage data, some recent consistent data are nonethelesspresented below. But serious inconsistencies still remain. Rural Lao PDR, for example, is reportedinternationally as having 100 percent safe water supply coverage, although this is almost certainlynot the case. The original country data presented below probably show more appropriate figures.
During the flood season river and other forms of surfacewater is even more likely to be contaminated

255
12 - Domestic water and sanitation
There are big differences between the four MRCcountries with regard to providing safe water andsanitation services and these differences are likely to bereflected in each country’s part of the basin. Viet Namand Thailand have made relatively slower progress overthe last decade, though from much higher starting points.In Cambodia and Lao PDR, coverage levels improvedmore sharply in the 1990s, albeit from very low levels.Nevertheless, Cambodia remains one of only three Asiancountries with water supply coverage of less than 50percent.15
According to the World Resources Institute,16 estimatesof safe water coverage (rural and urban combined),averaged out over the period 1990-1996, indicated thatCambodia had approximately 36 percent coverage(ranking 89 out of 101 countries globally). Lao PDRhad 52 percent coverage (ranking 74th), Thailand had89 percent coverage (ranking 19th) and Viet Nam had38 percent coverage (ranking 84th).
Comparable sanitation coverage figures from the same source and for the year 2000, were 14 percentfor Cambodia, (ranking 97th out of 101), 28 percent for Lao PDR (ranking 78th), 96 percent forThailand (ranking 6th), and 21 percent for Viet Nam (ranking 87th). The combined global rankingfor “potential exposure to polluted water” placed Cambodia 89th out of 101, Lao PDR 76th, Thailand18th and Viet Nam 86th.17 Although the data for Thailand and Viet Nam are for the whole country andtherefore include significant territory outside the basin, circumstances in the LMB are likely to beworse than national averages, not better.
Despite the wide variability in the data, referred to earlier, what is clear from the figures quotedabove - and also from the sources used in compiling Tables 2 and 3 - is that in three of the LMBcountries, as in almost every country worldwide, water supply coverage is higher than sanitationcoverage. This seriously limits the benefits from improvements in water supply. Without parallelimprovements in sanitation, it is difficult to improve hygiene and hence health.
According to a WHO/UNICEF/WSSCC report,18 Thailand appears to be one of only seven countriesworldwide where sanitation coverage has outstripped water supply, with sanitation coverage levelsof over 95 percent. In contrast, and in the same report, Cambodia is noted for having “extremelylow” levels of sanitation coverage, one of only two Asian countries where both sanitation and watersupply coverage is less than 50 percent. In Lao PDR, over half the overall population also lacksproper sanitation, with one source also putting Viet Nam’s sanitation coverage at less than 50 percentin rural areas.19
Moreover, rural services lag far behind urban ones, and the gap between urban and rural coverage isvery wide. In Cambodia and Lao PDR, rural water supply coverage is probably half or less thatwhich is available in urban areas, although for Viet Nam, the ratio is nearer 60 percent. In Thailand,the ratio is around 86 percent. Rural/urban comparisons for sanitation can be even greater. InCambodia, rural sanitation coverage is only one-sixth as high as coverage in urban areas, while inLao PDR, the rural/urban coverage ratio is less than 40 percent.20
Water quality and hygiene have a significantimpact on human health and productivity

256
State of the Basin Report - 2003
The very poor are usually even worse off. In Cambodia, for example, it is estimated that for thepoorest 20 percent of the rural population, the percentage with access to improved water supply fallsto a mere 1 in 25.21 Access to adequate sanitation is likely to be even lower.
Table 2. Improved water - population with access (%)
Country Year
Cambodia 2000 26 54 30Lao PDR 2000 29 61 90Thailand 2000 81 95 80Viet Nam 2000 72 95 56Average for 2000 67 93 76East Asia/PacificRegion(UNICEF)
Notes: 1. Figures shown are national, in the absence of more specific data for LMB areas of countries. 2. To help comparison, a source that presents comparable data for all four countries has been selected, although other international and single-country data, varying widely, exist as well.
Sources: WHO/UNICEF/WSSCC 2001; UNICEF/WHO 2002; UNICEF 2002.
Rural water supplycoverage(%)
UNICEF/ WHO(country-level inputs tothe 2000 Global WaterSupply and Sanitation
Assessment)
Urban watersupplycoverage(%)
UNICEF/ WHO(country-level inputs tothe 2000 Global WaterSupply and Sanitation
Assessment)
Total water supplycoverage(%)
WHO/UNICEF/WSSCC(2000 Global Water
Supply and SanitationAssessment)
Table 3. Improved sanitation - population with access (%)
Country Year
Cambodia 2000 10 56 18Lao PDR 2000 19 67 46Thailand 2000 96 96 96Viet Nam 2000 38 82 73
Notes: 1. Figures shown are national, in the absence of more specific data for LMB areas of countries.2. To help comparison, a source that presents comparable data for all four countries has been
selected, although other international and single-country data, varying widely, exist as well.Sources: WHO/UNICEF/WSSCC 2001; UNICEF/WHO 2002; UNICEF 2002
Rural sanitationcoverage(%)
UNICEF/ WHO(country-level inputs tothe 2000 Global WaterSupply and Sanitation
Assessment)
Urban sanitationcoverage(%)
UNICEF/ WHO(country-level inputs tothe 2000 Global WaterSupply and Sanitation
Assessment)
Urban sanitationcoverage(%)
WHO/UNICEF/WSSCC(2000 Global Water
Supply and SanitationAssessment)

257
12 - Domestic water and sanitation
4.3 Challenges in improving access: rural/urban ratios and populationgrowth rates
The populations of all four LMB countries remain predominantly rural – between 77 and 84 percentoverall, according to one estimate (Table 4). This presents special challenges for the equitableupgrading of domestic water systems because communities are often numerous, small and spreadout. This is especially the case in the more remote areas of Lao PDR and Cambodia.
Rapidly increasing populations are another challenge. Targets for coverage are constantly growing,reducing the impact of new investment. According to the World Resources Institute, during theperiod 1995-2000, the population of Cambodia grew by 2.2 percent annually. In Lao PDR, populationgrowth was 2.6 percent for the same period, 0.9 percent in Thailand and 1.6 percent in Viet Nam.22
By 2025, the current LMB population of 55 million is projected to grow to as much as 90 million.
Rapidly growing populations are a problem not only in major cities, but also in secondary towns andcities as well. The latter are projected to bear the brunt of rural-urban migration as governments
promote export-oriented agriculture andindustry in areas such as the Mekong Delta inViet Nam and around Savannakhet in Lao PDR.Urban growth is expected as well along thenetwork of new and rebuilt roads that are beingdeveloped through the Asian DevelopmentBank-funded Greater Mekong SubregionProgramme, which is promoting integration inthe Mekong Basin (See Chapter 14 onCooperation).
The special demands of tourism – and itsinfluence both on localised water demands andwaste management needs – are of growingimportance in towns like Siem Reap in
Cambodia and Luang Prabang in Lao PDR. Growing localised pollution and the difficulty of providingwater supply to fast growing floating village populations in Viet Nam and Cambodia is anotherspecial case.
Population growth rate (%) Rural/urban ratio(%)
Rural Urban
Country
1980- 2000- 2020- 1980- 2000- 2020- 1980 2000 20201985 2005 2025 1985 2005 2025
Cambodia 11,168 2.1 1.0 0.3 6.2 4.4 3.1 88/12 84/16 74/26Lao PDR 5,433 1.8 2.0 0.7 5.4 5.2 3.5 87/13 77/23 64/36Thailand 61,399 1.6 0.2 (0.6) 2.8 2.5 2.3 83/17 78/22 67/33Viet Nam 79,832 2.1 1.3 0.2 2.5 2.4 3.3 81/19 80/20 73/27
Sources: World Resources Institute 2000; World Resources Institute 2002
Table 4. Rural/urban growth rates and population ratios
TotalPopulation
in 2000(thousands)
Where communities live on or beside lakes andrivers, household sewage flows directly into the
water without treatment

258
State of the Basin Report - 2003
In summary, the populations needing water and sanitation services are not only increasing overall, butthey are also concentrating in or near urban areas. It is clear that achieving the international target 23
of halving the proportion of people in the basin without access to improved water and sanitationservices by the year 2015 will require enormous effort.
4.4 Types of water supply and sanitation systems used
Between rural and urban areas (and within urban centres between low and higher income areas),there are wide variations in the type of system or facility used. The same could be said for levels ofservice achieved (degree of reliability, availability, accessibility, and water quality).
Data on types of water supply and sanitation facilities in use, and their potential to be both safe andadequate, are extremely variable. As with data on coverage, definitions vary from one country toanother, as does quality of data, again making it difficult to make comparisons between countriesand between years. Trends in user preferences, affordability and convenience of systems are thereforedifficult to track. But some trends are clear: there is high use of rainwater harvesting to ensure watersecurity in Thailand (26.5 percent nationwide, but likely to be much higher in the dry areas of theNortheast that lie within the LMB). There are also a high percentage of unspecified wells in ruralareas in Viet Nam (53.2 percent), with attendant risks of contamination if unprotected (Table 5).
In general, there are more data on systems for water supply than for sanitation. Sanitation optionsrange from simple improvements in open defecation (such as burying excreta), to simple pit latrines,ecological toilets, water flush latrines, composting or septic-tank linked facilities, and connection toa sewerage system, with or without piped water flushing. As with water supply, a range of choices isusually offered.24
0.70.3
22.22.1
1.0
1.534.2
30.03.50.14.4
100
3.310.815.7
7.4
16.7
32.70.10.3
13.0100
7.80.9
26.5
17.940.9
4.0
0.70.70.6
100
2.60.6
17.4
53.214.6
11.40.2
100
32.91.8
13.81.6
3.817.5
11.811.10.25.5
100
26.79.3
17.013.3
0.2
16.1
5.00.19.13.2
100
57.90.9
13.7
4.73.5
0.1
16.13.1
100
66.24.0
4.8
17.70.7
4.50.2
1.9100
Rural (% of population served) Urban (% of population served)
Cam
bodi
a(2
000)
Lao
PD
R(2
000)
Tha
iland
(198
7)
Vie
t Nam
(199
7)
Cam
bodi
a(2
000)
Lao
PD
R(2
000)
Tha
iland
(198
7)
Vie
t Nam
(199
7)
Table 5. Types of water supply systems used
Notes: These are overall country statistics (rather than LMB only) and are for different years. Blanks indicate no data available, not necessarily zero use.Source: Based on WHO/UNICEF/WSSCC 2001
Uni
mpr
oved
(like
ly to
be
unsa
fe)
Impr
oved
(pot
entia
lly sa
fe)
Type of water supply
Piped into dwelling, yard or plotPublic tap/gravity-fed systemTube well, borehole with pumpProtected dug well or protectedspringRainwater collection
Well in residence/yardPublic well, unprotected dug wellor springRiver, spring, surface waterPond, river, stream, lake or damTanker truck/vendorBottled waterOther/missingTotal
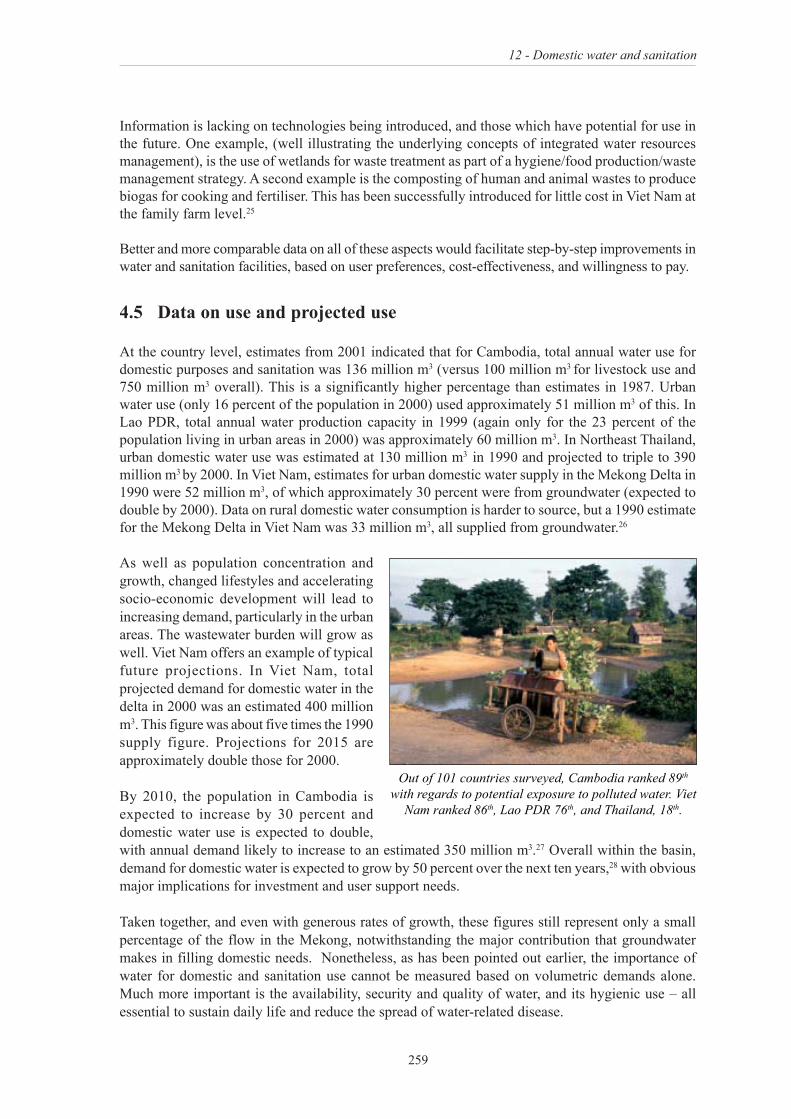
259
12 - Domestic water and sanitation
Information is lacking on technologies being introduced, and those which have potential for use inthe future. One example, (well illustrating the underlying concepts of integrated water resourcesmanagement), is the use of wetlands for waste treatment as part of a hygiene/food production/wastemanagement strategy. A second example is the composting of human and animal wastes to producebiogas for cooking and fertiliser. This has been successfully introduced for little cost in Viet Nam atthe family farm level.25
Better and more comparable data on all of these aspects would facilitate step-by-step improvements inwater and sanitation facilities, based on user preferences, cost-effectiveness, and willingness to pay.
4.5 Data on use and projected use
At the country level, estimates from 2001 indicated that for Cambodia, total annual water use fordomestic purposes and sanitation was 136 million m3 (versus 100 million m3 for livestock use and750 million m3 overall). This is a significantly higher percentage than estimates in 1987. Urbanwater use (only 16 percent of the population in 2000) used approximately 51 million m3 of this. InLao PDR, total annual water production capacity in 1999 (again only for the 23 percent of thepopulation living in urban areas in 2000) was approximately 60 million m3. In Northeast Thailand,urban domestic water use was estimated at 130 million m3 in 1990 and projected to triple to 390million m3 by 2000. In Viet Nam, estimates for urban domestic water supply in the Mekong Delta in1990 were 52 million m3, of which approximately 30 percent were from groundwater (expected todouble by 2000). Data on rural domestic water consumption is harder to source, but a 1990 estimatefor the Mekong Delta in Viet Nam was 33 million m3, all supplied from groundwater.26
As well as population concentration andgrowth, changed lifestyles and acceleratingsocio-economic development will lead toincreasing demand, particularly in the urbanareas. The wastewater burden will grow aswell. Viet Nam offers an example of typicalfuture projections. In Viet Nam, totalprojected demand for domestic water in thedelta in 2000 was an estimated 400 millionm3. This figure was about five times the 1990supply figure. Projections for 2015 areapproximately double those for 2000.
By 2010, the population in Cambodia isexpected to increase by 30 percent anddomestic water use is expected to double,with annual demand likely to increase to an estimated 350 million m3.27 Overall within the basin,demand for domestic water is expected to grow by 50 percent over the next ten years,28 with obviousmajor implications for investment and user support needs.
Taken together, and even with generous rates of growth, these figures still represent only a smallpercentage of the flow in the Mekong, notwithstanding the major contribution that groundwatermakes in filling domestic needs. Nonetheless, as has been pointed out earlier, the importance ofwater for domestic and sanitation use cannot be measured based on volumetric demands alone.Much more important is the availability, security and quality of water, and its hygienic use – allessential to sustain daily life and reduce the spread of water-related disease.
Out of 101 countries surveyed, Cambodia ranked 89th
with regards to potential exposure to polluted water. VietNam ranked 86th, Lao PDR 76th, and Thailand, 18th.

260
State of the Basin Report - 2003
4.6 Data on diseases related to domestic water and sanitation
Comparable data appear to be limited in detail, with rather more available from Lao PDR thanelsewhere (see Table 6), but data are still largely limited to the monitoring of diarrhoea, cholera andschistosomiasis. There is still little systematic monitoring of the impacts from arsenic, fluoride,pesticides, nitrate from fertiliser, and other chemical pollutants. As stated previously, the countrydata discussed here are not necessarily representative of the LMB area.
A recent MRC report 29 concluded that datacollection on water-linked diseases is notsystemised across the four countries andthere is no common database from which todraw basin-wide summaries andconclusions.
There is clearly a need to establish a morestandardised and complete monitoringsystem for diseases related to domestic watersupply and sanitation. This could perhapsbe divided into diseases that aremicrobiological in origin and those ofchemical origin. Microbiological diseasescould in turn be classified into those that arewater-borne, linked to water washing, water-
based, and water bred/vector transmitted. Classification would help to spotlight the most appropriateinterventions. Such information could also enable broad comparisons between countries and overtime (see example in Box 7 above).
However, there are well proven difficultiesin directly linking disease statistics withimproved water and sanitation alone.Attempts should be made therefore to assessthe proper use and functioning of improvedsupplies, and of monitoring behaviouralchanges with regard to hygiene. These couldthen be used as appropriate proxies forlikely impacts on health.
From the limited data available, it is clearthat alongside the more specific faecal-oraldiseases such as cholera, typhoid, viralhepatitis and dysentery, general diarrhoeais widely prevalent and has a high impact. Usually diarrhoea is linked to lack of domestic water andsanitation, and exacerbated by poor hygiene practices and low availability of water. In particular,rapid dehydration caused by diarrhoea is likely to be a major cause of mortality among children inthe basin. It has been estimated that improvements in safe water supply, and in particular improvementsin hygiene and sanitation, could reduce the incidence of diarrhoea by one-fifth and deaths due todiarrhoea by one-half.30
Box 7. The benefits of wide access to proper sanitation in Thailand
Thailand has made remarkable progress inensuring universal sanitation, and, as a result,in reducing mortality due to diarrhoea and othergastro-intestinal diseases. A sixteen-foldreduction in deaths related to gastro-intestinalillnesses was achieved from 1960 to 1999.During this time period, there was a parallelincrease in sanitary latrine coverage from lessthan 1 percent to over 98 percent.
Source: UNICEF 2001
If pesticide use increases, it will threaten humans bothby contaminating water supplies and by concentrating in
the aquatic animals that people consume

261
12 - Domestic water and sanitation
Intestinal worms, cholera, dysentery, typhoid, viral hepatitis, schistosomiasis and trachoma(blindness caused by eye infections, which might be prevented by regular washing of infectedeyes and better home hygiene), are also closely linked with domestic water and sanitation andhygiene practices within the LMB. Domestic water and sanitation contribute as well to the spreadof some insect vector-transmitted diseases such as malaria and dengue through poor storage ofwater, ponding in pits or discarded containers around the home, and the inadequate drainage ofsurplus domestic water.
As an illustration, of the eight most common health complaints in rural Cambodia, all but two arewater-linked. Four of these diseases (diarrhoea, hepatitis, typhoid and cholera) can be directly impactedby interrupting faecal-oral disease transmission routes through access to better domestic water andsanitation and improved hygiene. And most significantly, simple diarrhoea is still one of the twomain causes of death of Cambodian children under five years.31
Table 6. Some country-wide statistics on water and sanitation-linked diseaseC
ases
764
39
56824,042
23,971d21
1,828b149c
60,105c#
29,294b10,950c21,902c14,490b
679c#
18
765
124d0
0c
10c
5c
0c2c#
146
31
45123,771
64
0be50,418
1,054,904e14,527b8,731e /
212e7,932be
7c
283,756c
14,175c
28,260c669c#
0
142
0
0be352e
3e /0e
37e
0c
283,756c
14,175c
28,260c669c#
1,1723
9
78025,518
25
4,614e1,157,629e
7,165e /226e
6,415e
9c
265,056c
15,992c
24,856c1,017c#
74
584
0
25e323e
1e /0e
21e
1c
14c
7c
0c1c#
173139a
2
1109
0
13e215e
1e /1e
18e
0#
10#
6#
0#3c#
2,8501,788a8,729d
23
10718,692
65
3,092e963,246e
5,986e /184e
6,357e
212c#
259,076c#
11,055#
18,985#976c#
129
1464,059
7
1,252e954,019e
5,548e /210e
6,476e
0#
255,793#180,938d
6,929#
22,000#585c#
1
034
1
5e196e
5e /0e
26e
0#
7#
2#
0#1c#
Country
Cambodia
Lao PDR
Thailand
Viet Nam<>
Cas
es
Dea
ths
Dea
ths
Cas
es
Dea
ths
Cas
es
Dea
ths
Cas
es
Dea
ths
Example of 1996 1997 1998 1999 2000water andsanitation-linked disease
Cholera
DiarrhoeaSchistosomiasis
CholeraDiarrhoea
Schistosomiasis
Severe DiarrhoeaDiarrhoea
Typhoid/Paratyphoid
Hepatitis
Cholera
Diarrhoea
Typhoid/ParatyphoidDysenteryHepatitis
Notes: 1. * indicates disaggregated for provinces in the LMB only2. # indicates for Mekong Delta only3. <>: for Viet Nam, unless otherwise marked, data applies to South Area, comprising 19 provinces4. Blank indicates no data currently available to MRC
Sources: MRC 2000, except for those annotated: a: MBDSC 2002; b: SEAMIC 2002; c: T. K. Nguyen,Viet Nam National Mekong Committee, Personal correspondence, July 2002; d: WHO 2002a; ande: Ministry of Public Health 2002

262
State of the Basin Report - 2003
4.7 Improving the focus, collection and use of LMB data
For success in measuring improvement, relevantstakeholders in the basin should be encouraged tocollect data that: (a) meet uniform standards,preferably in accord with formats established bythe joint Global Water Supply and SanitationAssessment Report;32 (b) can be grouped into LMBand non-LMB clusters, and ideally into Sub-areascorresponding with those used in MRC’s BasinDevelopment Plan and in national administrativeunits; (c) show the mix of technologies used inways that are comparable, promote choice andmonitor the essential transition from likely unsafeto potentially safe systems; (d) include insights intouse, condition, sustainability, likely impact andequity (rather than just a “snapshot” of coverage);and (e) give a consistent basis for comparison ofinvestment and recurrent costs (total, per capita andfor each technology used) as well as for number ofpeople served, installations completed, andquantity and quality of water supplied.
Regular monitoring procedures need strengtheningso that data are more reflective of the changingsituation, and provide managers, planners and communities with relevant information. Analysis andinformation sharing skills need improvement so that data are available and used. Finally, as waterfor domestic use and sanitation is a complex matrix of technical and social/behavioural issues, therealso needs to be much more emphasis on mutual learning and feedback regarding the methodologiesapplied in order to understand what works and what does not work, and why. The focus shouldtherefore be much broader than on statistical data alone.
5. Conclusion
Meeting needs in the LMB for adequatedomestic water and sanitation services isa great challenge. In much of the basin,the population is growing rapidly, and asdevelopment increases, competition forwater is likely to grow and water qualityto decline as well. There is also a need toclose the growing gap between people whohave adequate water and sanitationservices and those who do not. Inequitiescurrently exist based on geographiclocation, income, gender and ethnicity.
The potential triple benefits from improveddomestic water and sanitation, betterhealth, time saving and convenience, are
Of the eight most common health complaints inCambodia, all but two are water linked
Water treatment becomes increasingly difficult andexpensive as pollution levels rise

263
12 - Domestic water and sanitation
not automatic and must be vigorously pursued. In particular, in addition to improving water suppliesand sanitation and making them financially and operationally sustainable, improvements must takeplace with regard to hygiene. Basin experience indicates that unless households protect watersupplies, transport, store and use waterhygienically and wash their hands properly,improvements in water supply will probablynot have their desired health impact.
To ensure that investments in systems areworthwhile, monitoring is consideredimportant not only with regard to coverageof services, but also with regard to howinvestments are made, how systems aremanaged and maintained and whethercoverage is equitable and is having animpact.
The fact that governments have appropriatepolices and strategies in place with regardsto providing domestic water and sanitationand experience with multi-stakeholder participation, bodes well for success in attracting the necessaryinvestment. If investment is based on sound nationally-derived policy and strategies, with high levelsof user involvement, it is much more likely to be sustainable and successful in improving humanhealth and welfare within the Basin.
By ensuring near universal access to adequatesanitation, alongside safe water and hygieneimprovements, Thailand has drastically cut
deaths from gastro-intestinal disease

264
State of the Basin Report - 2003
Endnotes
1 Gleik 20002 Nielsen 20023 Bangkok Post. Many rivers to cross. 30 December 1998. p.1; Hori 20004 ADB 20005 Webster et al. 20026 World Resources Institute 20007 Feldman et al. 20018 ADB 19979 WHO 200210 WHO 200211 Hart 200112 Hart 200113 WHO 199714 Feldman et al. 200115 UNICEF 200116 World Resources Institute 200017 World Resources Institute 200018 WHO/UNICEF/WSSSC 200119 UNICEF 200220 UNICEF 200121 RGC 200122 World Resources Institute 200023 WHO/UNICEF/WSSCC 200124 Phouangphet et al. 200025 E. Ongley, consultant, MRC Environment Programme, personal communication June 200226 MRC 2001; ADB 2001; Gleik 200027 ADB 200128 Nielsen 200229 MRC 200230 UNICEF 200231 RGC 200132 WHO/UNICEF/WSSCC 2001

265
12 - Domestic water and sanitation
References
ADB. 1997. National water sector profile Lao PDR. Unpublished draft. Asian Development Bank,Manila. 33 pp.
ADB. 2000. Environments in transition: Cambodia, Lao PDR, Thailand, Viet Nam. ProgramsDepartment (West). Asian Development Bank. 114 pp.
ADB. 2001. Capacity building in Ministry of Water Resources and Meteorology. Final report: mainreport. Project Report No. 30. Sir M. Macdonald and Partners. Phnom Penh.
Dayal, R., C. van Wijk & N. Mukherjee. 2001. Methodology for participatory assessments withcommunities, institutions and policy makers. World Bank. Washington, DC.
ESCAP. 1998. Towards efficient water use in urban areas in Asia and the Pacific. ST/ESCAP/1874.United Nations. New York, USA.
Feldman, P. & J. W. Rosenboom. 2001. Final activity report: drinking water quality assessment inCambodia. Ministry of Rural Development, Ministry of Industry Mines and Energy and WHO.Phnom Penh. 144 pp.
Gleick, P. H. 2000. The world’s water 2000-2001: the biennial report on freshwater resources.Island Press, Washington, DC. 300 pp.
Hart, B. 2001. Transboundary water quality issues in the Mekong River Basin. Water Studies Centre,Monash University/Mekong River Commission. Melbourne, Australia.
Hori, H. 2000. The Mekong. Environment and development. United Nations University Press. Tokyo.398 pp.
ICWE. 1992. International Conference on Water and the Environment (ICWE), Dublin, Ireland,26-31 January 1992 – Conference Report.
Mills, G. 2002. Personal correspondence. Phnom Penh, Cambodia.
MBDSC. 2002. Mekong Basin disease surveillance collaboration.Accessed at http://epid.moph.go.th/mbds/index_t.html in May 2002.
Ministry of Public Health. 2002. Royal Thai Government. Via personal correspondence with KhunOrapan Payakkaporn, Environment Cordinator, Thai National Mekong Committee.
MoRD. 2001a. Policy framework – rural water supply and sanitation sector (RWSS). Ministryof Rural Development, Cambodia. 21 pp.
MoRD. 2001b. Ten-year sector strategy: 2001-2011 – rural water supply and sanitation sector(RWSS). Draft. Ministry of Rural Development. Phnom Penh. 37 pp.
MRC. 2001. Working Paper No. 2 – review of historic water resources development and water use.Halcrow Water. Phnom Penh. 63 pp.

266
State of the Basin Report - 2003
MRC. 2002. Waterborne disease data/information in progress in Cambodia, Laos, Thailand and VietNam. Draft. Mekong River Commission, Phnom Penh. 6 pp.
Maniphousay, N., S. Chanthphone & M. Seager. 1998a. The Lao experience: learning from a 30month policy reform and institutional strengthening initiative in Lao PDR’s RWSS. Fieldnote. Water and Sanitation Program, the World Bank. Jakarta, Indonesia. 6 pp.
Maniphousay, N., N. Mukherjee & M. Seager. 1998b. Rural poor choose their water and sanitationservices in Lao PDR. Field note. Water and Sanitation Program, the World Bank. Jakarta. 8 pp.
MoC & MoARD. 2000. National rural clean water supply and sanitation strategy up to the year2020. Ministry of Construction & Ministry of Agriculture and Rural Development, Government ofViet Nam. Hanoi. 84 pp.
Nielsen, T. K. 2002. Water utilisation in the Lower Mekong Basin. DHI Water & Environment.Accessed at http://staff.dhi.dk/tkn/mekong/w-uses.htm in May 2002.
NWSEHP. 1997. Sector strategy and guideline national framework for the Lao water andenvironmental health sector. National Water Supply and Environmental Health Programme,Government of Lao PDR, Vientiane.
Phouangphet, K., S. Chanthaphone, S. Lahiri & C. Badloe. 2000. Sanitation and hygiene promotionin Lao PDR: learning from the National Water Supply and Environmental Health Programme.Field note. Water and Sanitation Programme. The World Bank, Jakarta. 8 pp.
Ringler. 2001. Optimal water allocation in the Mekong Basin. Discussion Paper No. 38. Centrefor Development Research, University of Bonn. Bonn, Germany. 50 pp.
RGC. 2001. Second five-year socio-economic development plan 2001-2005: National economicgrowth and poverty reduction strategy. Draft. Royal Government of Cambodia, Ministry ofPlanning. Phnom Penh. 55 pp.
SEAMIC. 2002. Morbidity from infectious diseases. South East Asia Medical Information Centre.Tokyo. Accessed at http://www.seamic-imfj.or.jp in May 2002.
Seager, M. 1997. Developing indigenous and sustainable water sector policies: on going lessonsfrom Laos. Paper presented to the Economic Development Institute (EDI) / The World Bank/Government of Cambodia Water Policy Seminar. Phnom Penh.
Thionkeo, C. & T. Meadley. 2001. Demand responsive approach (DRA) into practice: learningfrom the application of Lao PDR National RWSS Strategy. Presentation to World BankInfrastructure Forum, Washington D. C. NWSEHP. Vientiane, Lao PDR. 40 pp.Accessed at http://www.wsp.org/english/eap/lao-pdr.html in April 2002.
UNDP. 2002. The SEILA programme and the Cambodia Area Rehabilitation and RegenerationProject (CARERE). UNDP, Cambodia. Accessed at http://mirror.undp.org/carere in April 2002.UNDP. Phnom Penh.
UNICEF. 2001. Shaping the future for children in East Asia and the Pacific. Fifth East Asia andPacific Ministerial Consultation, 14-16 May 2001, Beijing. UNICEF. New York. USA. 89 pp.

267
12 - Domestic water and sanitation
UNICEF/WHO. 2002. End decade data bases.Accessed at http://www.childinfo.org/eddb/water/trends.html in April 2002.
UNICEF. 2002. Water and environmental sanitation.Accessed at http://www.unicef.org/programme/wes in April 2002.
WASA, DHUP, URI, WSP. 2002. Case study: a comparative study of small town water andsanitation services in developing countries – Lao PDR. Government of Lao PDR/World BankWater and Sanitation Program. Vientiane. 40 pp.
Webster, D. & L. Ti. 2002. Guidelines on strategic planning and management of water resources.Draft. ESCAP. Bangkok. 44 pp.
WHO/UNICEF/WSSCC. 2001. Global water supply and sanitation assessment 2000 report. WorldHeatlh Organisation, Geneva.
WHO. 1997. Guidelines for drinking-water quality: volume 3: surveillance and control ofcommunity water supplies. Second edition. World Health Organisation, Geneva. 238 pp.
WHO. 2002. Key points and recommendations from arsenic and water quality roundtable. Bangkok.8-9 March 2002. World Health Organisation, Geneva. 6 pp
WHO. 2002a. WPRO. Accessed at http://www.wpro.int/chips/chip01 in May 2002.
World Resources Institute. 2000. World resources 2000-2001: people and ecosystems: the frayingweb of life. World Resources Institute, in collaboration with the United Nations DevelopmentProgramme, the United Nations Environment Programme, and the World Bank. World ResourcesInstitute. Washington DC. 400 pp.
World Resources Institute. 2002. WRI earthtrends. Washington DC.Accessed at http://www.earthtrends.wri.org
WSP. 1997. The Hygiene Awareness, Sanitation and Water Supply (HASWAS) sub-project: insertsfor the World Bank project appraisal document. The World Bank. Water and SanitationProgramme. Vientiane, Lao PDR. 138 pp.
WSP. 2002. Water and Sanitation Program, The World Bank. Washington DC.Accessed at http://www.wsp.org/english/index.html in JuneEndnotes.

268
State of the Basin Report - 2003

269
13 - Flood in the Lower Mekong basin
Floods in the 13Lower Mekong Basin
Floods are a recurring event in the Lower MekongBasin. Flooding of the mainstream and tributariesof the Mekong River is an important source for thewealth of biodiversity, abundance of fish and soilfertility in the basin. At the same time, each year,flooding results in loss of life and property, causesdamage to agriculture and rural infrastructure anddisrupts the social and economic activities of peopleliving throughout the basin. At the same time, Floodmanagement and mitigation (FMM) has become apriority issue at the national and regional levels,particularly in the aftermath of the disastrous floodsof 2000 and 2001.
The chapter which follows presents information onthe nature and extent of flooding, causes andcontributing factors, the environmental benefits offloods, the economic and social costs, and trends,hotspots and trans-boundary issues.
1. Nature and extent of flooding
Climate, and particularly the southwest monsoon, is theimmediate cause of the annual floods. The level of theMekong starts to rise in May and reaches its peak in mid-August or early September in the upper reaches, and inmid-September or early October in the delta region.1
However, the flood patterns are very different movingdownstream through Lao PDR, Thailand, Cambodia andViet Nam (see Chapter 2).
In Lao PDR, flooding is very much influenced by tributaryflows. The combined effects of large flows in the tributariesand the mainstream of the Mekong cause serious damage,including flash flooding on tributaries and bank overflow in
The annual floods in the Mekong Basincontribute to the wealth of biodiversity,
abundance of fish and soil fertility in the basin
In Lao PDR, the tributaries arelargely responsible for flooding

270
State of the Basin Report - 2003
lowland areas. According to MRC estimates, 80 percent of the rural flooding and 20 percent of theurban flooding is caused by tributaries.2 The four major flood prone areas in Lao PDR are situatedalong the mainstream near large tributaries: i) Vientiane Plain, ii) Khammoune Province (Thakhektown), iii) Savannakhet Province and iv) Champasak Province (Pakse town).3
In Thailand, the principal flood prone areas of the LMB in Thailand include low-lying areas alongthe Mekong and tributaries in Nong Khai, Mukdahan, Nakhon Phanom and Ubon Ratchataneeprovinces.
In Cambodia, the Mekong enters thelow-lying delta and becomes a wide,slow-flowing river. The area is very flatand there is extensive lateral flow offlood waters from Kratie to the borderwith Viet Nam. Bank overflows alsooccur along the entire length of theTonle Sap River. Following heavyrainfalls, surface runoff often flowsparallel to the rivers, filling landdepressions lateral to and between thetwo rivers. Up to 4 million ha oflowland areas in Cambodia areinundated annually.4
During the wet season, the dischargecapacity of the Mekong and BassacRivers south of Phnom Penh is inadequate to handle flood flows. This results in backflow up theTonle Sap River and into the Great Lake until the water levels in the Mekong and Great Lake areequal (usually in late September). The total natural storage capacity of the Great Lake and theTonle Sap is estimated to be 150 billion m3. During the flood season, the surface area of the lakeexpands from 250,000-300,000 ha (dry season area) to 1-1.4 million ha.5
In Viet Nam, the Mekong River formsa highly fertile and productive delta.Flooding in the delta is influenced bytidal effects from the South China Sea,combined with high discharge from theMekong River and heavy rain in thedelta itself. Flooding frequentlyinundates the entire flood plain in theVietnamese delta, that is, up to 1.8million ha.6 In the Central Highlandsof Viet Nam, steep mountain slopes andinsufficient storage capacity for rainsduring the wet season often result inflash flooding.
The surface area of the Great Lake expands from250,000-300,000 ha in the dry season to 1-1.4 million ha
in the wet season.
In Viet Nam, flooding frequently inundates the entire floodplain of the delta – up to 1.8 million ha

271
13 - Flood in the Lower Mekong basin
Figure 1. Duration of flooding in Cambodia and the Viet Nam Delta, 2000

272
State of the Basin Report - 2003
Figure 2. Depth of flooding in Cambodia and the Viet Nam Delta, 2000

273
13 - Flood in the Lower Mekong basin
2. Causes and contributing factors to flooding
The hydro-meteorological causes of floods in the Mekong Basin are prolonged, heavy rains onsaturated soils. This leads to an increase in surface run-off that can only slowly be discharged throughthe river system into the South China Sea. Other natural and man-made factors can also affectflooding in the basin.
2.1 Climate change: Climate change and global warming are likely to be contributing factors toincreased frequency and intensity of severe flooding, particularly in low-lying coastal and estuaryareas. Warmer water temperatures in the South China Sea may increase the number and intensity oftyphoons, in turn causing sea surges that inundate low-lying areas. Some estimates indicate that15,000-20,000 km2 of land in the Mekong Delta could be threatened.7 However if there is lowerrainfall in the basin as a result of climate change, which is possible under some modeling scenarios,there may be decreased flooding in some parts of the basin.
2.2 Deforestation: Deforestation and landclearance in upland areas of the basinresults in increased volume and speed ofsurface run-off. This, in turn, contributesto increases in peak discharges and peakwater levels. The impact of these factorson flooding is more pronounced for smalland medium sized floods along tributariesof the Mekong.8
2.3 Land degradation: Land degradationoccurs in areas of intensive shiftingcultivation, shortened fallow periods andwhere agricultural systems are not adaptedto topographic and soil conditions. Thisleads to increased erosion and sedimentdeposit in the Mekong and tributaries thatcan reduce drainage capacity, thuscontributing at a regional scale to increasedflood hazards.9
2.4 Changes in flood storage capacity:The construction of flood embankments andother man-made structures designed toprotect areas along the Mekong results in aloss of natural floodplain storage capacity.Flood waters continue downstream withoutthe mitigating effects of that storage. Ingeneral, the impact of a single embankmentmay not be that great. However, thecumulative effects of many embankmentscan result in the loss of a significant volumeof floodplain storage that causes increaseddischarge and higher flood levels bothupstream and downstream.10
Reclamation and infilling of low-lying wetlands foragriculture and other purposes contributes to
flooding in the LMB
Deforestation and land clearance in upland areas canincrease the volume and speed of surface run-off and
lead to small- and medium-scale flooding in tributaries

274
State of the Basin Report - 2003
2.5 Reclamation of floodplains and wetlands: Increased reclamation and infilling of low-lyingfloodplain land and wetlands for agricultural and other purposes is a factor contributing to floodingin the LMB. This process also results in the loss of floodplain storage and, like structural measures,can have significant cumulative effects on flood discharge and levels.
2.6 Rapid expansion of urban settlements and infrastructure: Increased urbanisation replacesnatural vegetation with sealed surfaces such as roads, roofs of homes and other buildings. As aresult, the lag time between intense rainfall and peak stream flow is shortened, peak flow isgreater and total surface runoff is compressed into a shorter time interval – all favorableconditions for flooding. In addition, the development of roads, bridges and culverts can contributeto flooding, particularly where the location and design of this infrastructure impedes naturaldrainage patterns.
2.7 Channel migration and other man-made modifications to river channels: Channelmigration due to erosion and sediment deposition along the Mekong can, as at Kampong Cham,threaten to destroy flood banks that presently protect large areas of the town from inundationduring annual floods.11 Similarly, dredging and other modifications to river channels can changethe characteristics of water flow, erosion and sedimentation, affecting peak discharges duringthe flood season.
2.8 Reservoir operation: During the First Annual MRC Flood Forum in 2002, representativesfrom Cambodia and Viet Nam identified the presence and, particularly, the operation of reservoirsin the basin as a contributing factor to Mekong floods.12
3. Environmental benefits of floods
The environmental benefits of flooding are considerable. Not only do they contribute to the ecologicalhealth of the basin, they are also important in maintaining livelihoods:
3.1 Soil fertility: Flooding of agriculturalland leaves behind silt deposits that addnutrients to the soils. Throughout the basin,flood recession agriculture is practiced togrow vegetables and other crops that are asource of food and cash income for ruralhouseholds.
3.2 Ecological health of the river system:Flooding also serves to flush out pollutantsthat are deposited in the mainstream andtributaries during low flow periods. Floodsalso refill floodplain wetlands and rechargegroundwater.
3.3 Fish and other wildlife: Many fish species in the Mekong migrate during the flood season tospawning grounds in the flooded forests of Tonle Sap Lake and other locations. Flooding thathelps to maintain the river ecosystem, provides breeding, nesting, feeding and nursery areas forfish, migrating waterfowl and other wildlife.
Flooding of agricultural land leaves behindnutrient-rich silt deposits

275
13 - Flood in the Lower Mekong basin
3.4 River bank and floodplain vegetation: the local plant life that occurs along the river isadapted to the annual variation in flows including the floods. If there are changes in flood extentor frequency the distributions of the plants will change as a consequence, including the distributionsof many plants that are used by the local people.
3.5 River channel maintenance: Floods are essential to maintain the physical form of the riverchannel. They flush out fine deposited material, cleanse gravel beds and reset the vegetation onislands. In the absence of floods, river channels reduce in capacity as fine sediments deposit andvegetation encroaches to fill in the channel.
4. Economic and social costs of flooding
The 2000 floods in the Mekong Basin werethe worst in the region in 40-50 years. Highlevels of flooding in 2000 were followedby serious floods in 2001 and, some earlyreports suggest, in 2002. Due to this patternof recent flooding, people and governmentsin the basin have suffered substantial direct,indirect and cumulative economic andsocial costs.
In 2000, severe flooding affected 22 of the24 provinces in Cambodia.13 The RoyalGovernment of Cambodia (RGC) put thedeath toll at 347 people, of whom 80 percentwere children. A total of 760,000 families(over 3.4 million people) were affected, with 85,000families (387,000 people) temporarily evacuated fromtheir homes and villages. The RCG estimated totalphysical damage at $161 million. In 2001, 62 people died,again mostly children, and damage amounted to $36million. In October 2002, the National DisasterManagement Committee estimated that nearly 1.5 millionpeople and 60,000 ha had been affected by 2002 flooding.a
Flood levels in Lao PDR in 2000 reached unprecedentedlevels in the central and southern provinces, and remainedhigh for long periods.14 Preliminary estimates indicatedthat nearly 73,000 rural households (395,600 people)were seriously affected in 1,200 villages in sevenprovinces (Vientiane, Bolikhamsay, Khammouane,Savannakhet, Saravane, Champassak, Attapeu). A totalof 80,000 ha of rice fields were flooded and an estimated10 percent of the wet season production was completelylost. Irrigation systems and rural road infrastructure werewidely damaged, as well as large parts of provincialtowns. Production losses amounted to approximately $20million. Some 80 percent of those who die in floods
are childrena In 2002, Cambodia also suffered severe drought in many regions, with effects that were more widespread than flooding in 2002.
In the Viet Nam Delta in 2000, a total of 5 million peoplewere affected by floods

276
State of the Basin Report - 2003
In the portion of Thailand in the MekongBasin, reported production losses due tothe 2000 floods amounted to about $21million.15 In 2001, the region of UdonThani was particularly hard hit byflooding, with 2.8 million affected people(727,600 households); 47,350 km2 offarmland inundated; and, 5,300 km ofroads damaged.
In the Mekong Delta in Viet Nam, over500 people died due to the 2000 floods.As in Cambodia, most were children. Atotal of 5 million people were affected;825,000 homes damaged or destroyed, and60,000 households had to evacuate theirhomes. Nearly all the summer-autumn rice crop was lost, and thousands of kilometers of national
and provincial roads were damaged. The total costs offlood damage amounted to $285 million. In 2001, 230people drowned during floods in the delta, including180 children. As of late September 2002, flood waterscovered half of the 12-province delta region, affectingabout 270,000 people. A total of 71 people died due tofloods, including 65 children. Although 112,000 peoplewere in urgent need of food relief, most of the ricecrop had not been affected because of early completionof the harvest. About 54,000 houses were flooded andnearly 700 km of roads submerged.
In addition to these direct costs, flooding causessignificant indirect and cumulative effects. The mostserious problems facing many people living in ruralflood prone areas are food and income security. Inthe immediate aftermath of floods, the lostproduction of rice and other food crops meansmonths of insufficient food for many households.The lack of grazing lands for livestock forcesfarmers to sell animals at low prices. The timerequired to regrow damaged fruit and plantation treesmeans lower incomes for several years.
Official government figures for flood damage do notinclude the costs to households to repair or replace
their damaged housing and crop storage facilities. Transportation costs increase when damagedroads and bridges can not be restored quickly, causing increases in the prices of some goods andservices. This, in turn, undermines trade and production efforts. The direct and indirect effects onnational economies can be significant. In Cambodia, for example, it is generally agreed that the2000 floods reduced GDP growth by 1.0 percent (from predicted levels of 5.5 percent to about 4.5percent for the year).
If global climate change results in highertemperatures and sea levels, flooding in the
Mekong Delta will be more severe
In 2000, the total cost of flood damage in Viet Nam wasan estimated $285 million

277
13 - Flood in the Lower Mekong basin
Damaged hospitals and clinics seriously limitthe availability of health services at a timewhen the risk of flood-related diseases ishigh. Children frequently loose many weeksof education as schools are flooded ordamaged. During prolonged flooding,community and family social structures aredisrupted and individuals suffer increasedstress-related problems related temporarydisplacement, anxiety, etc. Followingfloods, there is often increased rural-urbanmigration of flood-affected people seekingwork.
The impacts of flooding on the poor areparticularly significant. In Cambodia, forexample, rural households generally haveone hectare of rice land. The loss of 350,000ha of paddy during the 2000 floods meantthat a very large number of households losttheir primary asset for assuring their ownfood security, as well as for generating cashincome. Catastrophic events such as thisoften cause households to sell their land inorder to buy food or other essentials, withsignificantly higher risks that they will fallbelow the poverty line or not be able to getout of poverty.
5. Trends, hotspots and trans-boundary issues
The interaction of natural and man-made factors suggests a number of important trends for floodingand the effects on people living in the basin. Some of these may become serious hotspots or trans-boundary issues among the riparian countries.
5.1. Increasing frequency of serious floods: As measured by the number of people killed byfloods, historical data suggest that the frequency of serious floods is increasing in the basin. Forexample, in Viet Nam about 540 people were killed by floods and typhoons annually in the years1985-1989, compared with 225 people killed in the 1976-1979 period.16
5.2 Increased flooding in low-lying coastal and estuary areas: Climate changes that increasetemperatures and sea levels will cause greater flooding in low-lying estuary areas in the MekongDelta. Effects may include altered flow of estuaries, coastal rivers and wetlands, and increasederosion and salinisation of tidal wetlands and coastal mangrove forests.
When flood-damaged roads and bridges are not restoredquickly, transportation and shipping costs rise and with
them, the prices paid by consumers
During prolonged flooding, community and family socialstructures are disrupted and individuals suffer increased
stress-related problems

278
State of the Basin Report - 2003
5.3 Population growth and increased urbanisation: The growth of primary and secondary urbancenters in the Mekong floodplains will result in expanded areas of residential development, otherbuildings, roads, etc. The loss of floodplain storage capacity will increase the severity of the directeffects of flood events (extent, depth and duration of flooded areas), as well as the economic andsocial consequences (urban centers as the location of higher, “value-added” economic activities;number of people living in urban centers; etc.).
5.4 Rural development issues in the LMB: National policies in support of higher value commercialagriculture in the basin increase the economic risks associated with exposure to floods. Increasedpopulation pressures in upland areas that result in deforestation may also contribute to the intensityof flooding in the basin, although there is no data so far that demonstrates an increase in floods as aresult of forest clearance at the scale of large basins such as the Mekong.
5.5 Reduced capacity to cope with floods: The recent phenomenon of serious flooding in thebasin in successive years has raised another major concern – that of reduction of the capacity ofgovernments, communities and households to cope with floods due to the cumulative social andeconomic effects. For example, recovery in the basin after the 2001 floods was more difficult due tolingering effects of the 2000 floods: infrastructure had not yet been repaired; households had notfully replaced houses and other assets lost the previous year; and economic production (agriculturaland non-farm) had not been fully re-established, etc.
Hotspots and trans-boundary issues related to flooding in the basin are interrelated. Cambodia andViet Nam, the downstream countries, are most severely affected by flooding. Land management,structural measures and in-stream modifications that occur in the northern part of the Mekong Basin(including the Upper Basin) have the potential to influence flooding in the downstream portions. Interms of flooding, Northeast Thailand is also “downstream” of flood season discharges from thetributaries in Lao PDR.
Other hot spots may emerge due to interventions that cause loss of floodplain storage capacity (e.g.,structures and/or land reclamation), particularly in areas of the Mekong floodplains being developedfor higher value uses (e.g., commercial agriculture, urban development). Whether they will beconsidered to constitute a trans-boundary flood management issue will depend on their locationsand the degree of cumulative impacts.

279
13 - Flood in the Lower Mekong basin
Wet season
Note: Image is a single Landsat ETM image from 25 March 2000, the end of dry season (RGB=542).Colour code: black = deep or clear water; blue = shallow or turbid water; green = activelygrowing vegetation; pink/ red/orange = dry, bare or hot areas (e.g. bare soil or rock).
Source: TRFIC database (http://www.bsrsi.msu.edu/trfic/)
Figure 3. Satellite images of the Tonle Sap Great Lake in the wet and dry seasons
Dry season
Note: Image is a composite Landsat image, circa 1990, from the end of the wet season (RGB=742).Colour code: black = deep or clear water; blue = shallow or turbid water; green = activelygrowing vegetation; pink/ red/orange = dry, bare or hot areas (e.g. bare soil or rock). Source: Earthsat (https://zulu.ssc.nasa.gov/mrsid/)

280
State of the Basin Report - 2003
Flood forecasting in the Lower Mekong Basin
Every year starting in mid-June, the Mekong River Commission broadcasts daily informationon flood risks at key points along the Mekong mainstream in Cambodia, Lao PDR, Thailand,and Viet Nam. This information is made available on the MRC website, www.mrcmekong.org,until the end of the flood season in late October or November.
This important part of MRC’swebsite aims to provide themost up-to-date informationavailable about current andforecasted hydrologicalconditions in the MekongBasin, and presents this in ane a s i l y - u n d e r s t a n d a b l emanner. Clicking on the pointfor each monitoring station ona digital map providesinformation on daily waterlevels as well as a 5-dayforecast of water levels. Thesedata are shown both on aschematic cross-section foreach station and on a graph.Each station’s point on themap of the lower basin and ona list of stations is colour-coded to show three levels of
warning – “no warning”, “alarm level” and “flood level”. For each station, the website alsomakes available a series of maps in different scales which depict areas of flood risk, land useand topography. The MRC website also provides maps for the basin as a whole.
MRC oversees the operations of 41 monitoring stations, including two in China. These are alllocated along the Mekong mainstream from Jinghong in China to the Mekong Delta at TanChau, in Viet Nam. Every day throughout the flood season, each monitoring station transmitsinformation on water levels and the previous day’s rainfall to the MRC Secretariat in PhnomPenh. Upon receipt, these data are entered into a mathematical model and then compared withdata from weather maps and rainfall forecasts received from the US National Oceanic andAtmospheric Administration (NOAA). Based upon this comparison, a 5-day forecast of waterlevels is made and the results broadcast every day on MRC’s website at 12:00 pm.
Between flood seasons – from November to May/mid June – MRC continues to broadcast dataon water levels and 7-day forecasts. This information is updated once a week on a Monday,rather than daily, as is the case during the flood season.
MRC is continuously improving its forecasting capability and working closely with partners toensure that forecasts meet communities’ needs and that warnings are effectively and accuratelydisseminated. MRC also encourages agencies and individuals working on disaster preparednessto send enquiries and suggestions directly to MRC, where improvements in flood forecastingare continually being made.

281
13 - Flood in the Lower Mekong basin
Endnotes
1 MRC, 20012 MRC, 20013 MRC, 20014 MRC, 20015 MRC, 20016 CNN, 20027 IPCC, n.d.8 MRC. 20019 MRC, 200110 MRC, 200111 Ministry of Water Resources and Meteorology (Cambodia), 200212 MRC, 200213 Data on Cambodia are summarized in Chan Sophal, 2001 and CDRI, 200214 Data on Lao PDR are summarized in WFP, 2000 and MRC, 200115 Data on Thailand are summarized in MRC, 2001 and MRC 200216 ARDC, 1999
References
ADRC, 1999. Viet Nam Country Report 1999.http://www.adrc.or.jp/countryreport/VNM/VNMeng99/Vietnam99.htm
CDRI, 2002. The Impact of Flooding and Drought in Cambodia. Cambodia Development Review,Vol. 6, Issue 4, October-December 2002.
CNN, 2002. Floods kill 49 in Vietnam (Monday, 23 September 2002).http://asia.cnn.com/2002/WORLD/asiapcf/southeast/09/23/vietnam.floods.reut/index.html
IPCC, n.d. IPCC Special Report on the Regional Impacts of Climate Change, An Assessment ofVulnerability. www.grida.no/climate/ipcc/regional/index.htm
MRC, 2002. First Annual Mekong Flood Forum: Proceedings. Mekong River Commission, PhnomPenh.
MRC, 2001. MRC Strategy on Flood Management and Mitigation. Mekong River Commission,Phnom Penh.
Ministry of Water Resources and Meteorology (Cambodia), 2002. Managing the Effects ofSedimentation and Channel Migration, Mekong River at Kampong Cham Province
Chan, S. 2001. The Impact of Cambodia’s Recent Floods. Cambodia Development Review, Vol. 5,Issue 1. January-March 2001, pp. 1-4.

282
State of the Basin Report - 2003

283
14 - Cooperation in the Mekong Basin
Cooperation in the 14Mekong Basin
1. Cooperation is crucial
Countries that share boundaries are stronglyinfluenced by their neighbours. Populations havealways moved, but increasing numbers are movingto seek employment and better living conditions.Thus wealthy countries attract people from poorerneighbouring countries and this can cause socialproblems in both countries. Similarly,environmental and other political decisions takenin one country can affect its neighbours. If onecountry introduces very strict industrial effluentlaws, some polluting industries may relocate toneighbouring countries. If over-exploitation usesup a particular natural resource in one country itmay lead to increased exploitation in neighbouringcountries to supply the market.
Where countries share river basins, the potentialfor the actions of one country to influence anotheris even more acute. Upstream countries may divertwater, reducing availability for downstream users.Flood protection works at one site along a rivermay exacerbate flooding problems elsewhere,either by downstream retardation structuresincreasing upstream flooding, or upstream drainagestructures increasing floods downstream. Barrierserected to control saline water intrusion may impede the movements of anadromous and catadromousfish that move between the river and the sea, thus affecting upstream fisheries, while pollution fromupstream sources may impact on downstream fisheries.
If people from several countries are to live peacefully and equitably within a river basin it isobvious that there must be a spirit of transparency, trust and cooperation both within and betweencountries. If development is to be successful within river basins, it is also clear that developmentmust take a basinwide perspective if it is to help in reducing, rather than intensifying, tensionsbetween countries.
Toxic spills in a river can affect water quality andaquatic life far downstream

284
State of the Basin Report - 2003
Within the Mekong River Basin, buildingcooperation is particularly challenging.Extensive development is required to raisethe standard of living of the people, whichmeans that there is the possibility of intensecompetition for resources, both natural andeconomic, if development is not carefullymanaged. The countries that share the basinhave profound differences in their political,economic and social systems. Some havelong histories of political conflict, and thepast ten years represent the only time inrecent history that all have been at peace.
2. Beginnings of cooperation – the Mekong Committee1
Formal cooperation commenced relativelyearly in the Mekong Basin. In 1957 theCommittee for Coordination of theInvestigation of the Lower Mekong Basin,known as “The Mekong Committee” wasestablished. Members were Cambodia, LaoPDR, Thailand and Viet Nam, and the agencywas set up with the assistance of ECAFE, theEconomic Commission for Asia and the FarEast (now called ESCAP, the United NationsEconomic and Social Commission for Asiaand the Pacific).
In the era of post-World War II reconstruction,the plan was to develop one of the world’s great‘untamed’ rivers, and the ‘Mekong Project’ wasthe largest single project undertaken by ECAFE. In 1965, U Thant, Secretary General of the UnitedNations, described it as “…one of the most important and one of the most significant actions everundertaken by the United Nations”.
The founding statute establishing the Mekong Committee was itself groundbreaking. Nointernational river body had previously been given such a broad mandate. It included
responsibilities for financing, construction, management andmaintenance of projects on the river.
Under the auspices of ECAFE and the Mekong Committee, a seriesof surveys were conducted to “gather sufficient data to permitadequate planning” for development of the Mekong. Surveys ofthe basin’s geology, hydrology, meteorology, topography,sedimentation, fisheries, agriculture and navigation were completedin the 1950s and 1960s. This led to the development of the MekongCommittee’s Indicative Basin Plan in 1970, which identified 180potential projects worth an estimated $12,000 million.
ECAFE and the Mekong Committee undertookextensive studies in the lower basin
Barriers to stop sea water intrusion may prevent fishmoving between the river and sea
Mekong Committee logo

285
14 - Cooperation in the Mekong Basin
In the years that followed, for a variety of reasons, including conflict in some of the Basin’scountries, few of the Mekong Committee’s ambitious projects were ever realised. However, thePlan did lay the foundations for the Lower Mekong governments’ involvement in natural resourceplanning.
In the late 1970s, lack of political stability in the region led to the interruption of Mekong Committeesessions. As a consequence, in 1977, Lao PDR, Thailand and Viet Nam adopted a new statute toestablish an Interim Mekong Committee to allow activities to continue. The statute provided for thereactivation of Cambodia’s membership, which was requested in 1991. The request led to lengthydiscussion that resulted in the transformation of the Mekong Committee into the Mekong RiverCommission through the 1995 Agreement.
3. The Mekong River Commission 2
The “Agreement on the Cooperation for the Sustainable Development of the Mekong River Basin”was signed at Chiang Rai, Thailand on the 5th April 1995. The agreement broadened the focus ofMekong cooperation from the development of large-scale projects to sustainable development andthe management of natural resources.
The Mekong River Commission (MRC) differed significantly from the Mekong Committee thatpreceded it because it was no longer under the direction of the United Nations. The overallmanagement responsibility is vested in a ministerial council which appoints the Chief ExecutiveOfficer. The CEO reports to a Joint Committee of senior government officials of the member countrieswho in turn report to the Council.
To demonstrate their commitment to the Mekong River Commission, in 2000 the member countriesagreed to increase their annual contributions to the Commission’s operating budget. They plan toincrementally take over the financing of all core activities by 2014. The Council adopted a vision forthe basin and a mission statement committing the organisation to equitably sharing resources andsustaining the environment and human welfare.
MRC’s Vision for the Mekong Basin: An economically prosperous, socially just andenvironmentally sound Mekong River Basin
MRC’s Mission Statement: To promote and coordinate sustainable managementand development of water and related resources for the countries’ mutual benefitand the people’s well being by implementing strategic programmes and activitiesand providing scientific information and policy advice

286
State of the Basin Report - 2003
The 1995 Agreement on Cooperation for theSustainable Development of the Mekong Basin3
The 1995 Agreement is a relatively short document thatcodifies general principles of international water lawand emerging principles of international environmentallaw. It also provides a basis for cooperation, which willbe robust enough to enable decision-making under avariety of conditions.
Similar to the 1997 United Nations Convention on theLaw of the Non-Navigational Uses of InternationalWatercourses, the 1995 Agreement is a frameworkagreement that needs to be further developed by adoptingvarious technical rules and procedures through a dynamicconsensus-building process. It is common internationalpractice, especially with resources shared by more thantwo countries, to set up a framework agreement and agreeto develop additional rules or standards through subsequentstudies and negotiations, or to separate technical standardsfrom the basic treaty.
Under the 1995 Agreement, all decisions must be adoptedby a unanimous vote, unless otherwise decided by MRC’sgoverning bodies. In practice, decisions are reached byconsensus through a process of consultation andnegotiation that balances the interests of all stakeholdersand seeks acceptable solutions for all parties without anyvote required.
If disputes arise, the agreement provides for a four-step process. At the first level, MRC’s governingbodies, its Council and Joint Committee, attempt to resolve the dispute. If the dispute cannot beresolved at that level, then diplomatic channels are used to negotiate among the governmentsconcerned. If diplomacy fails, then third-party intervention takes place that includes fact-findingmissions and mediation. Finally, if all these efforts fail, principles of international law are applied.These provisions are a considerable change, as the Mekong Committee, which preceded MRC,never considered contentious items.
Cooperative decision-making is assured by MRC’s structure. The four countries are equallyrepresented on the two bodies that govern the Mekong River Commission – the MRC Council andthe MRC Joint Committee. The MRC Council, which is comprised of one cabinet-level ministerfrom each country and meets once a year, sets the overall policy for the organisation. The JointCommittee, which is comprised of one member at director-general level from a water resourcesline agency in each country, meets at least two times a year to approve MRC annual work plansand oversee the financial management of the organisation. The Secretariat undertakes the work ofthe Commission and provides administrative and technical support.
National Mekong Committees (NMCs) were originally established under the Mekong Committeeto coordinate implementation of projects at the national level. Today each NMC provides supportto its national members of MRC’s Council and Joint Committee. The NMCs also play anincreasingly important role in coordinating MRC’s work at the national level and in implementingMRC programmes in conjunction with line agencies.
The 1995 Agreement significantlybroadened the focus of Mekong
Cooperation

287
14 - Cooperation in the Mekong Basin
4. Cooperation to promote economic development
UN-ESCAP, the United Nations Economic and Social Commission for Asia and the Pacific, is theagency with the longest history of promoting economic development in the Mekong Region. Withan ambit far broader than just the Mekong, ESCAP was established in 1947 as the EconomicCommission for Asia and the Far East (ECAFE) to assist in post-war reconstruction. It serves countriesin the Asia Pacific Region, including all six Mekong Basin countries. Although ESCAP covers abroad territory, it has a long history of fostering cooperation in the Mekong Region, with ECAFEbeing instrumental in setting up the Mekong Committee and ESCAP establishing the AsianDevelopment Bank, an important contributor to Mekong Basin economic cooperation.4
Although ESCAP’s involvement inthe Mekong Basin declined in the1970s and 1980s, as did the work ofthe Mekong Committee, in the lastfew years, ESCAP has again hadbasin-oriented programmes. In 2000,at its annual Commission Session,ESCAP declared 2000-2009 theDecade of Greater Mekong Sub-region Development Co-operation.The goal of the decade is to drawattention to the region and encourageinternational support in intensifyingeconomic and social development inthe region.5
ASEAN, the Association of Southeast Asian Nations, is another organisation that fosters economiclinkages in the Mekong Basin. Set up in 1967 to promote free-market principles and improve standardsof living, ASEAN includes all the countries in Southeast Asia. The original members of ASEANwere Indonesia, Malaysia, Thailand, the Philippines and Singapore. Brunei joined nearly 20 yearslater in 1984, Viet Nam in 1995, Lao PDR and Myanmar in 1997, and Cambodia in 1999.
In keeping with ASEAN’s focus on raising standards of living and closing the gap between theoriginal members and the newer (and poorer) ones, in 1996, ASEAN inaugurated the Basic Frameworkof ASEAN-Mekong Basin Development Cooperation (AMBDC). This framework lays out theobjectives and principles for cooperation, and also identifies infrastructure, trade and investmentactivities, agriculture, forestry and minerals, industry, tourism, human resource development, andscience and technology as priorities. It also seeks to complement the development initiatives ofother Mekong-related multilateral institutions. Several AMBDC meetings have been held since 1996and identified possible AMBDC projects, including the Singapore-Kunming Rail Link Project.Momentum for these projects lagged in the aftermath of the 1997 Asian Financial Crisis, but hasrecently increased again. Recent discussions have considered expanding AMBDC’s core membershipto include Japan and Korea. 6
The largest of the programmes promoting regional economic cooperation in the Mekong area is theGreater Mekong Subregion (GMS) Economic Cooperation Programme.7 This was established in1992 by the Asian Development Bank to realise and enhance development opportunities; encouragetrade and investment among GMS countries; resolve or mitigate cross-border problems; and meetcommon resource and policy needs. All four Lower Mekong Basin countries are members, as wellas Myanmar and Yunnan Province of China.
MRC’s Secretariat carries out the work of the Commission andprovides administrative and technical support

288
State of the Basin Report - 2003
In its first decade, the GMS Programmepromoted economic cooperation ineight sectors: transportation, energy,telecommunications, human resourcedevelopment, tourism, environment, tradeand investment. In 2002, agriculture andwater resources management were added asadditional sectors.
At the end of 2002, GMS investment totalledabout $2,000 million. A few examples ofADB/GMS projects include a network ofroads now under construction that will linkall six GMS countries with each other andwith seaports. When completed, thesehighways will be promoted as “economic corridors” – geographic areas where infrastructureimprovements are linked with production, trade and other development opportunities. GMSagreements are also reducing non-physical barriers such as customs regulations that impede theflow of goods, vehicles and people. In the energy sector, the GMS programme is encouragingsubregional cooperation in developing fossil fuel and hydropower projects as well as a subregionalpower network that will facilitate sales of electric power from one GSM country to another. In thetelecommunications sector, projects include upgrading infrastructure, creating common standards,and adjusting regulations, policies, and tariffs to facilitate communications. Tourism is anotherimportant area of regional cooperation, as are initiatives to promote trade and investment and tosustain the environment.
The ADB/GMS programme is an important contributor to regional cooperation not only because ofthe resources the programme can mobilise to foster and strengthen cooperation, but also because itpromotes cooperation among all six Mekong Basin countries.
Recognising the importance of private sector involvement in strengthening economic linkages inthe basin, ESCAP, in partnership with ADB/GMS, established the GMS Business Forum.8 Thisindependent, non-governmental body brings together representatives from industry and nationalchambers of commerce in all six Mekong countries and develops local private sector capacity.Chambers of commerce from developed countries outsidethe region have been encouraged to join as well so thatthe Forum articulates private sector perspectives fromboth inside and outside the GMS sub-region. ESCAPand ADB/GMS have also collaborated in establishingthe Mekong Tourism Forum, which brings the sixMekong countries together to plan ongoing tourisminitiatives, including an annual exhibition andconference.9
Lack of transportation infrastructure in the LMB impedeseconomic development
Tourism is an areawith strong potential
for regional cooperation

289
14 - Cooperation in the Mekong Basin
5. Cooperation to promote environmental sustainability
A number of international organisations have developed basin-level initiatives to promoteenvironmental sustainability and natural resource conservation. These include the World ConservationUnion, the World Wide Fund for Nature (WWF) and Oxfam. All of these agencies have long historiesof promoting cooperation to sustain the environment in individual Mekong countries, but fosteringregional cooperation is a relatively new initiative.
The World Conservation Union (IUCN)10 has recently developed an Asia programme that focuseson conservation of forests, bio-diversity and aquatic ecosystems. Thailand was one of the originalsignatories to the IUCN Charter, and in the early 1960s IUCN assisted the government in setting upThailand’s National Park system and developing legislation concerning wildlife. In the 1980s and1990s, IUCN played similar roles in the other three Lower Mekong countries and has worked withthem on preparations to sign and implement international agreements such as the Ramsar Conventionand the Convention on Biological Diversity.
In the 1990s, with the coming of peace tothe LMB and the planning of large-scaleinfrastructure projects such as regionalhighways and dams, IUCN has beenhelping governments and developmentagencies to conduct baseline studies inenvironmentally-fragile areas such aswetlands and watersheds. IUCN has alsobeen working with local communities infragile areas to develop sustainablelivelihoods such as eco-tourism.
In 2003, in partnership with MRC andUNDP, IUCN began a five-year, $32.6million programme to promote regionalcooperation in assessing and conserving biodiversity. The Mekong River Basin Wetland BiodiversityConservation and Sustainable Use Programme is being funded by the Global Environment Fundthrough UNDP. Working in demonstration areas within the four lower Mekong basin countries, theprogramme will include components to determine the economic value of biodiversity in the MekongBasin and test the suitability of incentives to preserve biodiversity. A study of environmental flowswill identify the water quantity and water quality requirements of Mekong River and flood plainecosystems and determine how to ensure that these requirements are considered in planning andmanaging water resources development.11
The World Wide Fund for Nature, like IUCN, has a long history of promoting cooperation amongmultiple stakeholders and has been working in the Lower Mekong Basin for more than a decade. In2002, WWF launched its five-year Indochina Strategy that encompasses Cambodia, Lao PDR andViet Nam. The goal of this strategy is to ensure that biological diversity is valued and conserved bycurrent and future generations. To identify priority conservation problems and develop realisticsolutions, WWF promotes collaboration among LMB government agencies, local communities,mass organisations and international agencies. WWF has also identified the Mekong River as one ofits Global 200 Highest Priority Ecoregions and featured the Mekong as one of five “Living Rivers”in its worldwide “Living Waters Campaign”.12
Pressure to develop resources is growing rapidly in the LMB

290
State of the Basin Report - 2003
In 2002, MRC and WWF signed a memorandumof understanding that allows the twoorganisations to work together in areas ofcommon interest that include: promotion of theMekong’s natural richness rather than just itsshort-term economic potential; sustainableagricultural practices; conservation of threatenedspecies; sustainable watershed management;sustainable use of natural resources; promotionof wetland conservation and restoration;consideration and promotion of renewableenergies and energy conservation; anddevelopment that meets the needs of the peoplebut at the same time ensures the long-termsustainability of the river and its relatedresources.13
Oxfam works with local partners in more than100 countries to achieve greater impact inaddressing issues of poverty and related injusticearound the world. Projects focus on humanitarian relief, community-driven development and socialjustice. In the Mekong Basin, the Oxfam Mekong Initiative (OMI) 14 works in all six Mekongcountries on four thematic issues: trade, poverty reduction, infrastructure, and capacity building. Ata time of rapid development with transboundary impacts, OMI works with local-level NGOs toensure that people have a voice in planning, managing and monitoring what happens to their resourcesand their communities.
The initiatives of all the agencies just described arestrengthening the capacity of governments, civil societygroups and other key stakeholders to work together ata regional level in finding solutions to basin-wide andtransboundary environmental problems and continuingthis collaboration for the long term.
IUCN, WWF and Oxfam are all working at thecommunity level to ensure that local people are
involved in planning resource development
There are still very few bridgesacross the Mekong

291
14 - Cooperation in the Mekong Basin
6. Challenge of cooperation
The Mekong Basin is a complex region politically, socially and in terms of its environment. Thereare many players: international organisations such as ASEAN, ESCAP and MRC, six nationalgovernments, and many provincial and local level government organisations. In addition there areorganisations providing development support, including the World Bank, the Asian DevelopmentBank and many donor countries. Civil society organisations complete the mix, and these range fromlarge international organisations such as IUCN, WWF and Oxfam to small local groups includingunions, cooperatives and conservation groups.
Previous attempts at regional planning such as the Mekong Committee’s Indicative Basin Plan in1970 are seen as having had limited success. There are a number of possible contributing factors.Clearly any planning process must achieve some sort of consensus on what the basin should be. Thetechnical aspects of planning, development and environmental management are relatively simple incomparison with the challenge of identifying the preferred outcome for the basin.
One can envisage two extremes along a development spectrum. At one end, a completely pristinebasin with intact ecosystems and almost no people – a kind of wilderness. At the other extreme abasin covered in concrete and factories, with a polluted river reduced to a chain of reservoirs. Neitherextreme would be acceptable to most of the people in the basin – but the challenge lies in achievingconsensus on what point, between the extremes would be acceptable. What kind of river, what kindof environment, do the people of the basin want?
The six countries within the Mekong Basin have different national development goals. The visionsof development held by national governments do not always accord with development visions ofpeople at the village level. Plans of government agencies may not match the views of civil societygroups. There is now broad recognition throughout the worldthat successful planning must be inclusive, and take intoconsideration the needs and aspirations of all the stakeholdergroups.
The MRC Basin Development Plan project is one recent initiativethat is working to develop an inclusive planning process.However, the achievement of that goal will not be easy. Even indeveloped countries with far greater resources of time and money,inclusive planning processes have been difficult to achieve.Inevitably the plans produced leave some stakeholder groupsdissatisfied, and usually no group achieves all it wants.
The first step in effective planning is to build cooperation acrossthe basin. There is a need for greater understanding, trust andbreadth of vision. The advantage that the Mekong Basin hasover many other regions is that a start has been made while theriver is still in good condition, and there are still sufficient naturalresources available in the basin. It should be easier to limitdegradation and loss of resources than to restore degradedsystems. However, the longer we wait the more difficult itbecomes.
The Mekong River system is still ingood condition and basin wide
cooperation at all levels is crucialto ensure that it stays that way

292
State of the Basin Report - 2003
Endnotes
1 MRC 20022 Sokhem 20023 Sokhem 20024 Dore 20015 UN-ESCAP 20006 MITI 20017 ADB 20028 GMS-BF 20019 Dore 200110 IUCN 200211 Hans Friederich, Head of Regional Wetland and Water Resource Program, IUCN, personal
communication, December 2002.12 WWF website13 MRC 2002b14 Oxfam OMI website

293
14 - Cooperation in the Mekong Basin
References
ADB. 2002. Economic Cooperation in the Greater Mekong Subregion: An Overview. AsianDevelopment Bank, Manila. pp 30.
Dore J. 2001. Environmental Governance in the Greater Mekong Subregion. Background paper forthe Mekong Regional Environmental Governance Project of the Resource Policy Support Initiative,Chiang Mai, Thailand.
GMS-BF. 2001. Greater Mekong Subregion Business Support Center. GMS Business Forum, GMS-BF Secretariat, Lao PDR. Accessed at www.gmsbizforum.com in December 2002.
IUCN. 2002. Website of IUCN Asia.Accessed at http://www.iucn.org/places/asia/ in December 2002.
MITI. 2001. Progress of the Asean-Mekong Basin Development Cooperation Initiative (AMBDC)Ministry of International Trade and Industry, Government of Indonesia.http://www.miti.gov.my/trade/linkagec.htm.
MRC. 2002a. The Story of Mekong Cooperation. Mekong River Commission. Phnom Penh. pp 22.
MRC. 2002b. Minutes of the Sixteenth Meeting of the Joint Committee, 10-11 July 2002, MekongRiver Commission, Phnom Penh.
OMI. 2002. Website of the Oxfam Mekong Initiative.Accessed at http://www.oxfammekong.org/omi_main.html in December 2002.
Sokhem, P. 1995. Mekong Agreement and importance of institutional frameworks for developingresources while minimizing environmental impact. Unpublished paper. Mekong River Commission.Phnom Penh
UN-ESCAP. 2000. Press release REC/92 accessed at www.un.org/russian/dhl/resguide/rec-92.htmon 23 December 2002.

294
State of the Basin Report - 2003

295
14 - Cooperation in the Mekong Basin
Authors and Contributors
IntroductionIan Campbell, Senior Environment Specialist, MRC
Physical landforms of the Mekong BasinIan Campbell, Senior Environment Specialist, MRCMargaret Little, Consultant *
Water in the Mekong BasinIan Campbell, Senior Environment Specialist, MRCMargaret Little, Consultant *Sok Saing Im, Senior Hydrologist, MRC
Biota of the Mekong BasinIan Campbell, Senior Environment Specialist, MRCMargaret Little, Research Assistant *
Peoples of the MekongSusan Novak, Senior Social Development Planner, Basin Development Plan, MRC *
Macroeconomics in the Lower Mekong BasinGunhild Sander Garsdal, Consultant *based on a working paper prepared by Keith Ward, Consultant *
FisheriesDon Griffith, Consultant *Aquatic products section - Muanpong Juntopas, Socio-Economist andBasin Development Plan, MRC and Worawan Sukraroek, Junior Riparian Professional, MRC
AgricultureJacob Hook, Consultant *Irrigation section - Adrian Young, Consultant *
ForestryJacob Hook, Consultant *Forest cover and deforestation section - Christoph Feldkotter, GIS Specialist, MRC-GTZ CooperationProgramme
______________________________* Assignment completed

296
State of the Basin Report - 2003
HydropowerToru Ishihata, Senior Adviser, Water Resources Programme *
Trade and transportPeter Hodgkinson, Consultant *Lieven Geerinck, Programme Manager, Navigation, MRC
Domestic water and sanitationMichael Seager, Water Resources Management Advisor (Cambodia), MRC
Floods in the Lower Mekong BasinSusan Novak, Senior Social Development Planner, Basin Development Plan, MRC *Bun Veasna, Programme Officer, Water Resources, MRC
Cooperation in the Mekong BasinAnn Bishop, Technical Publications Coordinator, MRC *Ian Campbell, Senior Environment Specialist, MRCAnn Lund, Programme Officer, Office of the Chief Executive, MRCPech Sokhem, Director, Technical Support Division, MRC
Map makersPenroong Bamrungrach, GIS Specialist, MRCChristoph Feldkotter, GIS Specialist, MRC-GTZ Cooperation ProgrammeNoun Kunthea, GIS Assistant, MRCManithaphone Mahaxay, Image Interpretation SpecialistSou Virak, Carthographic Technician, MRC
PhotographersChris BarlowCEDACPete DavidsonPeter DegenGlobal WitnessZeb HoganJim HolmesJorgen JensenMikkel OestergaardAnders PoulsenMichael WildWildlife Conservation SocietyNiek van Zalinge
Photographic scansSo Sawaddh, IEC Materials Assistant, MRC
______________________________* Assignment completed

297
14 - Cooperation in the Mekong Basin
ProofreadersCynthia Andruske – citations and referencesJacob Hook – numerical dataFlora Stubbs – text
DesignerBoonruang Song-ngam
Coordinator and EditorAnn Bishop

298
State of the Basin Report - 2003

299
14 - Cooperation in the Mekong Basin
Reviewers and ResourcePersons
Jeff Anderson, Consultant, Melbourne, AustraliaWouter Lincklaen Ariens, Lead Water Resources Specialist, Asian Development BankTissa Bandargoda, Director South East Asia Regional Office, International Water ManagementInstitute, Southeast AsiaChristopher Barlow, Senior Programme Officer, Fisheries, MRCAlf Birch, ADB Adviser, National Water Resources Council, Viet NamBun Veasna, Programme Officer, Water Resources, MRCIan Campbell, Senior Specialist, Environment Programme, MRCStephen Carson, Senior River Basin Planner, Basin Development Plan, MRCTerry Clayton, Editorial Consultant, MRCDang Tinh Ngoc, Hydrologist, Flood Management and Mitigation, MRCJohn Dore, Senior Research Associate, Mekong Region, Social Research Institute, Chiang MaiUniversity, ThailandH.E. Pich Dun, Deputy Secretary General, Cambodia National Mekong CommitteeMarcel Durocher, Field Survey Manager, Cambodia National Level 1 Survey ProjectChristoph Feldkotter, GIS Specialist, MRC-GTZ Cooperation ProgrammeHans Friederich, Head of Regional Wetland and Water Resource Program, World ConservationUnion (IUCN)Mark Goichot, Coodinator, Living Mekong Initiative, World Wide Fund for Nature (WWF), IndochinaLeo Goulet, Consultant, Sutton, CanadaHans Guttman, Coordinator, Environment Programme, MRCWolf Hartmann, Field Office Coordinator (Lao PDR), Fisheries, MRCKent Hortle, Field Office Coordinator (Cambodia and Vietnam), Fisheries, MRCThanongdeth Insisiengmay, Programme Officer, Flood Management and Mitigation, MRCKittipong Jirayuth, Modeler, Hydrology, MRCRobyn Johnston, Natural Resource Planner, Basin Development Plan, MRCMuanpong Juntopas, Socio-Economist, Basin Development Plan, MRCMinoru Kamoto, Advisor, Basin Development Plan, MRCJoern Kristensen, Chief Executive Officer, MRCSantanu Lahiri, Country Team Leader Lao PDR, WSP-EAPJohn Leake, Institute for International Development Limited, AustraliaT.V. Luong, UNICEF Consultant, Bangkok, Thailand

300
State of the Basin Report - 2003
Ann Lund, Programme Officer, Office of the Chief Executive, MRCMak Solieng, Natural Resource Planner, Basin Development Plan, MRCMohammad Mainuddin, Irrigation Specialist, International Water Management Institute, SoutheastAsiaPaul Matthews, Resident Coordinator of the United Nations system in Cambodia (1996-1999)Andy Maxwell, Adviser, World Wide Fund for Nature (WWF), CambodiaElayne McKay, Adviser, Ministry of Womens’ and Veterans’ Affairs, CambodiaThomas Meadley, Water and Sanitation Specialist Lao PDR, WSP-EAPJohn Metzger, Management Advisor, Water Utilisation Programme, MRCGeoff Mills, Training Specialist, AHNIP Project, MRCPaul Mosley, ADB Adviser, Ministry of Water Resources and Meteorology, CambodiaNguyen Chi Cong, Team Leader, Basin Development Plan, MRCNguyen Cong Thanh, Senior Operations Officer, World Bank Viet NamTue Kell Nielsen, Chief Engineer, Water Management Department, DHI ConsultantsSomsanith Nhoybouakong, Head of Working Group 2, Water Utilisation Programme, MRCSusan Novak, Senior Social Development Planner, Basin Development Plan, MRCEdwin Ongley, Consultant, MRC Environment ProgrammeSisavanh Phanouvong, Research Officer Lao PDR, WSP-EAPPech Sokhem, Director, Technical Support Division, MRCDelia Paul, Communication and Public Participation Officer, MRCClaus A.Pedersen, Junior Professional Officer, Basin Development Plan, MRCSopheap Phin, Programme Officer, Environment Programme, MRCChumnarn Pongsri, Programme Officer, Fisheries, MRCRick Pollard, Regional Team Leader, WSP-EAPQuoc An Nguyen, Programme Officer, Fisheries, MRCNuanedeng Rajvong, Development Economist, Basin Development Plan, MRCDan Reik, Independent Consultant, Bangkok, ThailandMichael Seager, Water Resources Management Advisor (Cambodia), MRCSein Mya, Environmental Data and Monitoring Specialist, Environment Programme, MRCSin Chhay, Project Officer, Navigation, MRCChaiyuth Sukhsri, Team Leader, Water Resources Programme, MRCWorawan Sukraroek, Junior Riparian Professional, MRCSusumu Uchiumi, Senior Adviser, Agriculture and Irrigation, MRCCornelis van Tuyll, Programme Coordinator, MRC-GTZ Cooperation ProgrammeNicolaas van Zalinge, Component coordinator, MRC Fisheries ProgrammeKhamtanh Vatthanatham, Programme Officer, Fisheries, MRCNathaniel von Einsiedel, Regional Coordinator for Asia and the Pacific, UNDP/UNCHS/WorldBank Urban Management ProgrammeMalcolm Wallace, Team Leader, Basin Modelling and Knowledge Base Project, MRCMichael Wild, Editorial Consultant