Revisiting Safe Biological Limits in Fisheries
17
Revisiting safe biological limits in fisheries Rainer Froese 1 , Gianpaolo Coro 2 , Kristin Kleisner 3 & Nazli Demirel 4 1 GEOMAR Helmholtz-Centre for Ocean Research, D€ usternbrooker Weg 20, 24105, Kiel, Germany; 2 Istituto di Scienza e Tecnologie dell’Informazione “A. Faedo”, Consiglio Nazionale delle Ricerche (CNR), via Moruzzi 1, 56124 Pisa, Italy; 3 Sea Around Us Project, Fisheries Centre, UBC, 2202 Main Mall, Vancouver, BC, Canada, V6J 1Z4; 4 Institute of Marine Sciences and Management, Istanbul University, Muskule Sok. No: 17, Vefa, 34134, Fatih, Istanbul, Turkey Abstract The appropriateness of three official fisheries management reference points used in the north-east Atlantic was investigated: (i) the smallest stock size that is still within safe biological limits (SSB pa ), (ii) the maximum sustainable rate of exploita- tion (F msy ) and (iii) the age at first capture. As for (i), in 45% of the examined stocks, the official value for SSB pa was below the consensus estimates determined from three different methods. With respect to (ii), the official estimates of F msy exceeded natural mortality M in 76% of the stocks, although M is widely regarded as natural upper limit for F msy . And regarding (iii), the age at first capture was below the age at maturity in 74% of the stocks. No official estimates of the stock size (SSB msy ) that can produce the maximum sustainable yield (MSY) are available for the north-east Atlantic. An analysis of stocks from other areas confirmed that twice SSB pa provides a reasonable preliminary estimate. Comparing stock sizes in 2013 against this proxy showed that 88% were below the level that can produce MSY. Also, 52% of the stocks were outside of safe biological limits, and 12% were severely depleted. Fishing mortality in 2013 exceeded natural mortality in 73% of the stocks, including those that were severely depleted. These results point to the urgent need to re-assess fisheries reference points in the north-east Atlantic and to implement the regulations of the new European Common Fisheries Policy regarding sustainable fishing pressure, healthy stock sizes and adult age/size at first capture. Keywords Bayesian hockey stick, fisheries reference points, maximum sustainable yield, natural mortality, north-east Atlantic, safe biological limits Correspondence: Rainer Froese, GEOMAR Helmholtz- Centre for Ocean Research, D€ usternb- rooker Weg 20, 24105 Kiel Germany Tel.: +49 431 6004579 Fax: +49 431 600 1699 E-mail: rfroese@ geomar.de Received 13 May 2014 Accepted 23 Sep 2014 Introduction 194 Hockey sticks and lower limit of spawning biomass 194 Fishing mortality and natural mortality 195 Age and size at maturity 195 Material and methods 196 Data sources 196 Fisheries Library hockey stick 196 Rule-based hockey stick 197 Bayesian hockey stick 197 Other data and reference points 200 Availability of code and data 200 © 2014 John Wiley & Sons Ltd DOI: 10.1111/faf.12102 193 FISH and FISHERIES, 2016, 17, 193–209
Transcript of Revisiting Safe Biological Limits in Fisheries
Revisiting safe biological limits in fisheries
Rainer Froese1, Gianpaolo Coro2, Kristin Kleisner3 & Nazli Demirel4
1GEOMAR Helmholtz-Centre for Ocean Research, D€usternbrooker Weg 20, 24105, Kiel, Germany; 2Istituto di Scienza e
Tecnologie dell’Informazione “A. Faedo”, Consiglio Nazionale delle Ricerche (CNR), via Moruzzi 1, 56124 Pisa, Italy;3Sea Around Us Project, Fisheries Centre, UBC, 2202 Main Mall, Vancouver, BC, Canada, V6J 1Z4; 4Institute of Marine
Sciences and Management, Istanbul University, Muskule Sok. No: 17, Vefa, 34134, Fatih, Istanbul, Turkey
AbstractThe appropriateness of three official fisheries management reference points used in
the north-east Atlantic was investigated: (i) the smallest stock size that is still
within safe biological limits (SSBpa), (ii) the maximum sustainable rate of exploita-
tion (Fmsy) and (iii) the age at first capture. As for (i), in 45% of the examined
stocks, the official value for SSBpa was below the consensus estimates determined
from three different methods. With respect to (ii), the official estimates of Fmsy
exceeded natural mortality M in 76% of the stocks, although M is widely regarded
as natural upper limit for Fmsy. And regarding (iii), the age at first capture was
below the age at maturity in 74% of the stocks. No official estimates of the stock
size (SSBmsy) that can produce the maximum sustainable yield (MSY) are available
for the north-east Atlantic. An analysis of stocks from other areas confirmed that
twice SSBpa provides a reasonable preliminary estimate. Comparing stock sizes in
2013 against this proxy showed that 88% were below the level that can produce
MSY. Also, 52% of the stocks were outside of safe biological limits, and 12% were
severely depleted. Fishing mortality in 2013 exceeded natural mortality in 73% of
the stocks, including those that were severely depleted. These results point to the
urgent need to re-assess fisheries reference points in the north-east Atlantic and to
implement the regulations of the new European Common Fisheries Policy regarding
sustainable fishing pressure, healthy stock sizes and adult age/size at first capture.
Keywords Bayesian hockey stick, fisheries reference points, maximum sustainable
yield, natural mortality, north-east Atlantic, safe biological limits
Correspondence:
Rainer Froese,
GEOMAR Helmholtz-
Centre for Ocean
Research, D€usternb-
rooker Weg 20,
24105 Kiel Germany
Tel.: +49 431
6004579
Fax: +49 431 600
1699
E-mail: rfroese@
geomar.de
Received 13 May
2014
Accepted 23 Sep
2014
Introduction 194
Hockey sticks and lower limit of spawning biomass 194
Fishing mortality and natural mortality 195
Age and size at maturity 195
Material and methods 196
Data sources 196
Fisheries Library hockey stick 196
Rule-based hockey stick 197
Bayesian hockey stick 197
Other data and reference points 200
Availability of code and data 200
© 2014 John Wiley & Sons Ltd DOI: 10.1111/faf.12102 193
F I SH and F I SHER I E S , 2016, 17, 193–209
Results 200
Comparison of biomass reference points 200
Comparison of fishing mortality and natural mortality 201
Gear selectivity and maturity 201
Discussion 201
Performance of hockey-stick models 201
Comparison of biomass limit estimates 204
A proxy for the biomass that can produce the maximum sustainable yield 205
Fishing mortality versus natural mortality 205
Gear selectivity and age at maturity 206
Summary 207
Acknowledgements 207
References 207
Introduction
Fish in the sea are a common good, the exploita-
tion of which needs to be limited to avoid overhar-
vesting and destruction (Hardin 1968). Three
practical limits of exploitation in fisheries manage-
ment can be defined as (i) the smallest size of the
fished stock that is considered to be within safe
biological limits (SSBpa), (ii) the maximum sustain-
able rate of exploitation (Fmsy) and (iii) the age at
first capture resulting from the selectivity of legal
gears, which should allow for individual reproduc-
tion. This study explores the adherence to these
common sense limits in the management of fish
stocks of the north-east Atlantic.
Hockey sticks and lower limit of spawning
biomass
The lower limit of biomass below which the produc-
tion of recruits may be compromised is a commonly
accepted limit of exploitation (Beddington and
Cooke 1983; Myers et al. 1994; ICES 2010). The
International Council for the Exploration of the
Seas (ICES) defines this point as the biomass below
which recruitment becomes impaired or the
dynamics of the stock are unknown (ICES 2010).
This stock size (SSBlim) can be derived from an
analysis of recruitment and spawning stock bio-
mass data, for example, by fitting stock–recruitment
functions such as the widely used Beverton and
Holt (1957) or Ricker (1954) functions. These
curved functions have been criticized because at
low population sizes, they predict an increase in
number of recruits-per-spawner (Barrowman and
Myers 2000), basically assuming highest productiv-
ity when the stock has collapsed. Also, these func-
tions make assumptions about a continuing
increase (Beverton and Holt 1957) or decline (Rick-
er 1954) of recruitment at large stock sizes,
although data to support such assumptions are typ-
ically missing. Simple hockey-stick functions can
overcome these problems by assuming a constant
recruit-per-spawner ratio at low population sizes
and constant recruitment at large population sizes
(Clark et al. 1985; Barrowman and Myers 2000;
O’Brien et al. 2003). Such hockey sticks are seg-
mented regressions with the first segment (the
blade of the hockey stick) anchored in the origin of
a stock–recruitment plot. The break-point beyond
which the second segment of the regression runs
parallel to the x-axis marks SSBlim and the height of
the second segment (the shaft of the hockey stick)
represents the average recruitment over the range
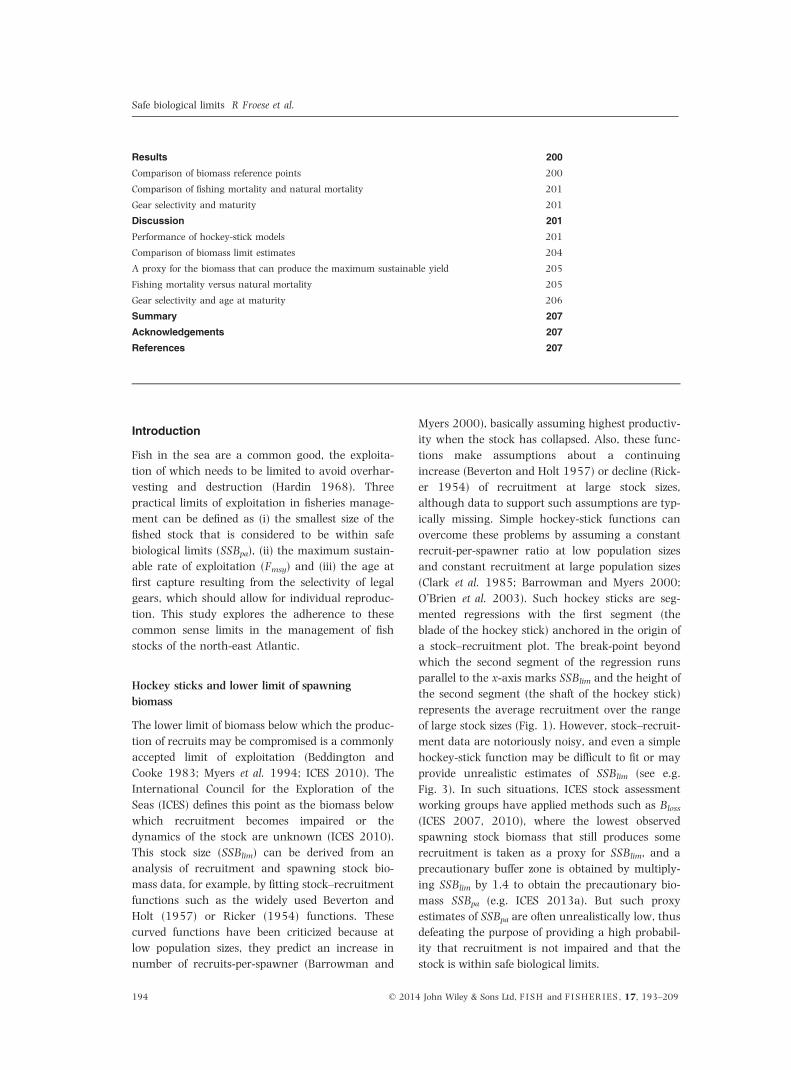
of large stock sizes (Fig. 1). However, stock–recruit-
ment data are notoriously noisy, and even a simple
hockey-stick function may be difficult to fit or may
provide unrealistic estimates of SSBlim (see e.g.
Fig. 3). In such situations, ICES stock assessment
working groups have applied methods such as Bloss
(ICES 2007, 2010), where the lowest observed
spawning stock biomass that still produces some
recruitment is taken as a proxy for SSBlim, and a
precautionary buffer zone is obtained by multiply-
ing SSBlim by 1.4 to obtain the precautionary bio-
mass SSBpa (e.g. ICES 2013a). But such proxy
estimates of SSBpa are often unrealistically low, thus
defeating the purpose of providing a high probabil-
ity that recruitment is not impaired and that the
stock is within safe biological limits.
194 © 2014 John Wiley & Sons Ltd, F I SH and F I SHER IES , 17, 193–209
Safe biological limits R Froese et al.
Here, three implementations of the hockey-stick
function fitted to stock–recruitment data are
explored. The first implementation makes use of
the segmented regression function in the Fisheries
Library in R (http://www.flr-project.org, Kell et al.
2007), a standard toolbox in stock assessment,
which is developed for use in R (R Development
Core Team 2013). The second implementation is a
rule-based hockey stick where the rules are
derived from textbook principles of stock assess-
ment. Interpretation of highly variable data such
as stock recruitment data can benefit from the
combination of formal analysis with expert knowl-
edge. The third implementation is therefore a
Bayesian inference fit of the hockey stick, where
the analysis of the data is informed by general
knowledge about stock–recruitment relationships.
The results of these three methods were then com-
pared to the biomass reference points used in the
management advice documents produced by ICES,
which are used by the European Commission to
assess the status of European fish stocks (EC
2013).
Fishing mortality and natural mortality
A second limit of exploitation is the maximum
sustainable rate of fishing, that is the maximum
amount of fish that can be caught on a perma-
nent basis relative to the amount of fish in the
water. In fisheries science, this rate is expressed
as the fishing mortality F and the United Nations
Fish Stock Agreement (UNFSA 1995) defines the
respective limit reference point as the fishing
mortality Fmsy that will result in the biomass
that can produce the maximum sustainable catch
or yield (MSY). There are a variety of methods
to obtain estimates of Fmsy, but there is also
long-standing consensus in fisheries science (e.g.
Gulland 1971; Sheperd 1981; Beddington and
Cooke 1983; Clark et al. 1985; Beverton 1990;
Patterson 1992; Thompson 1993; Walters and
Martell 2002, 2004; MacCall 2009; Pikitch et al.
2012) that the mortality caused by fishing F
shall not exceed the average rate of natural mor-
tality (M) of the exploited phase of the stock,
resulting from the sum of natural causes such as
predation, diseases, hazards or old age. In other
words, F may not exceed Fmsy, which may not
exceed M. In a practical application of this con-
sensus, the National Oceanic and Atmospheric
Administration (NOAA) in the United States uses
M as proxy for Fmsy for data-limited stocks
(NOAA 2013). Here, the estimates of Fmsy used
in the official management advice documents of
ICES are compared with the rate of natural mor-
tality.
Age and size at maturity
A third limit of exploitation is given by the small-
est acceptable size or age of fishes targeted by the
fishery. It is long known that yield per recruit can
be increased if fishing starts at a later age and
thus targets larger sizes of fishes (Beverton and
Holt 1957), up to about two-thirds of maximum
Figure 1 Conceptual drawing of the hockey-stick relationship between spawning stock size and recruitment. SSBlim
marks the border below which recruitment declines, SSBpa marks a precautionary distance to SSBlim, and 2 9 SSBpa
can be used as a proxy for SSBmsy, the stock size that can produce the maximum sustainable catch.
© 2014 John Wiley & Sons Ltd, F I SH and F I SHER IES , 17, 193–209 195
Safe biological limits R Froese et al.
length, where the theoretical maximum catch can
be obtained with infinite effort (Holt 1958), or
where a given catch has the lowest impact on
cohort biomass (Froese et al. 2008). Also, it has
been formally shown that a stock is unlikely to
become overfished if all individuals are allowed to
spawn at least once (Myers and Mertz 1998).
Thus, the size and age where most fish have
reproduced at least once marks the third limit ref-
erence point chosen in this study.
In summary, the purpose of this study was to
compare biomass, fishing pressure and selectivity
reference points used in north-east Atlantic fisher-
ies management with international standards and
to evaluate the status of the fish stocks against
these reference points.
Material and methods
Data sources
Stock–recruitment data, natural mortality at age,
proportion mature at age and fishing mortality at
age were obtained from the ICES Stock Summary
database (downloaded from http://ices.dk in July
2013) for 50 fully assessed stocks. Family assign-
ments, scientific names and common names follow
FishBase (Froese and Pauly 2014) and are given
together with stock identifiers in Table 1. Doubtful
values were checked against assessment reports
available from http://ices.dk, and some errors in
the database were corrected and reported to ICES.
Spawning stock biomass and fishing mortality in
2013 were obtained from ICES advice documents
in 2013, available from http://ices.dk. The full
URLs are indicated in the respective spreadsheets
available as online material at http://oceanrep.
geomar.de/25749/.
For the purpose of comparing estimates of SSBpa
with estimates of the biomass that can produce
the maximum sustainable yield SSBmsy, data for
31 stocks managed by other agencies (mostly
NOAA) were analysed. These were selected from
stocks with recent assessments where the range of
stock sizes in the respective time series included
one-half of SSBmsy, because analysis of stocks
which have never been depleted or which have
never been outside the depletion area cannot yield
reliable estimates of SSBpa. Also, in some cases,
data from years before 1960, where recruitment
was derived from model assumptions rather than
observations, were excluded from the analysis. The
full results of this analysis and the used data set
are available from http://oceanrep.geomar.de/
25749/.
Fisheries Library hockey stick
To obtain independent estimates of the biomass
below which recruitment may be impaired, three
different models were fitted to stock–recruitment
data, with recruitment offset by the age of recruits.
The Fisheries Library hockey stick was fitted by
the segreg() function available in the FLCore
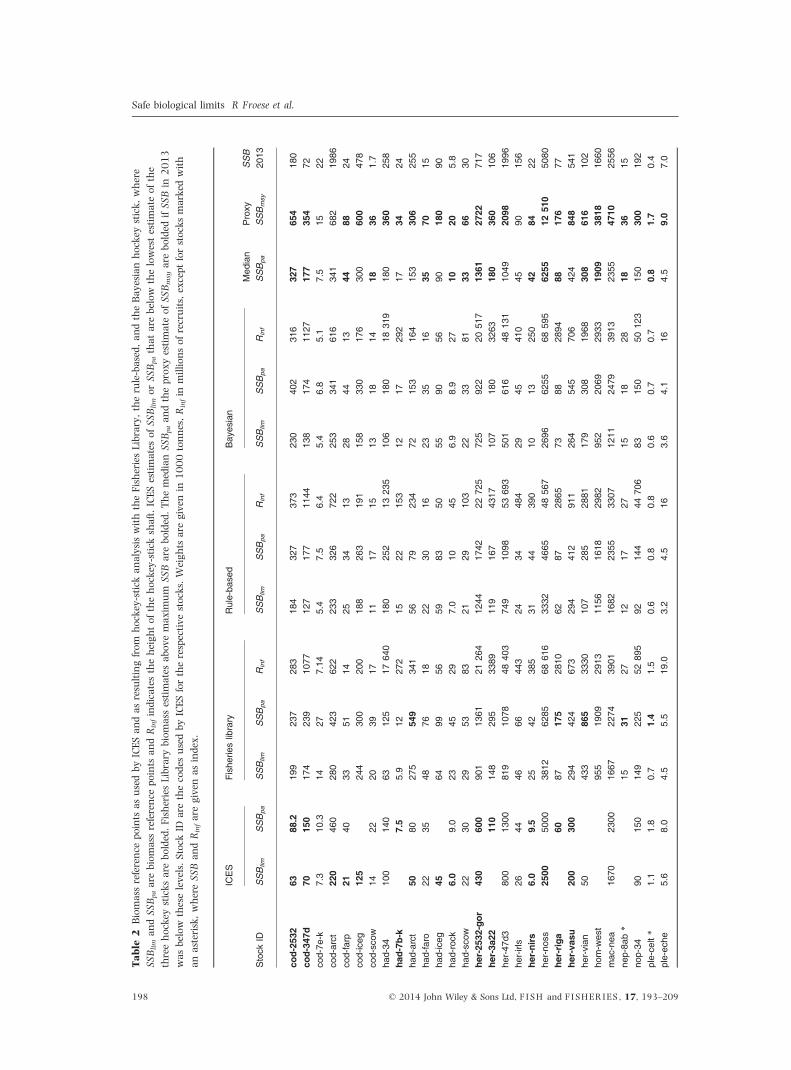
Table 1 Families, scientific names, common names and stock identifiers used in Tables 2, 4 and 5.
Family Species Common name Stocks
Ammodytidae Ammodytes tobianus Small sandeel san�Carangidae Trachurus trachurus Atlantic horse mackerel hom�Clupeidae Clupea harengus Atlantic herring her�
Sardina pilchardus European pilchard sar�Sprattus sprattus European sprat spr�
Gadidae Gadus morhua Atlantic cod cod�Melanogrammus aeglefinus Haddock had�Merlangius merlangus Whiting whg�Micromesistius poutassou Blue whiting whb�Pollachius virens Saithe sai�Trisopterus esmarkii Norway pout nop�
Nephropidae Nephrops norvegicus Norway lobster nep�Pleuronectidae Pleuronectes platessa European plaice ple�Scombridae Scomber scombrus Atlantic mackerel mac�Soleidae Solea solea Common sole sol�
196 © 2014 John Wiley & Sons Ltd, F I SH and F I SHER IES , 17, 193–209
Safe biological limits R Froese et al.
library of the Fisheries Library for R (Kell 2011).
This routine uses the function:
R¼ ifelseðSSB\¼ SSBlim; slope� SSB; slope� SSBlimÞð1Þ
where R is the number of recruits, SSB is the
spawning stock biomass of their parents, SSBlim is
the limit spawning stock biomass below which
recruitment is reduced, and slope is the slope of
the hockey-stick blade. The upper 95% confidence
limit of SSBlim was derived iteratively as described
in Kell (2011). This upper confidence limit was
used as the SSBpa estimate of the Fisheries Library
hockey stick.
Rule-based hockey stick
The hockey-stick function assumes that at stock
sizes above a certain biomass threshold, recruit-
ment fluctuates with a log-normal distribution
around a central value, which is the height of
the shaft of the hockey stick, parallel to the bio-
mass axis. Below the threshold, recruitment
declines linearly with biomass, with a constant
recruit-per-spawner ratio, representing the slope
of the blade of the hockey stick with its tip in
the origin of a stock–recruitment plot (Fig. 1).
The rule-based hockey stick tries to capture this
general knowledge by applying the following
rules:
1. An arbitrary boundary to large stock sizes is
obtained as the mid-point of the range of avail-
able biomass data. The geometric mean of
recruitment above that mid-point gives the rule-
based height of the hockey-stick shaft RB_Rinf;
2. A boundary to reduced recruitment RB_SSBlim
is determined as the biomass below which all
observations of recruitment are smaller than
RB_Rinf;
3. A precautionary buffer to the boundary of
reduced recruitment RB_SSBpa is obtained by
one of the three methods described below. The
method that provides the largest biomass esti-
mate is chosen.
a. An empirical buffer is applied by increasing
SSBlim by 40% with RB_SSBpa = 1.4
RB_SSBlim;
b. RB_SSBpa is determined as the biomass
below which all observations of recruitment
are smaller than the upper 95% confidence
limit of RB_Rinf;
c. Stocks are assumed prone to reduced repro-
ductive capacity if their biomass falls below
20% of the unexploited biomass (Beddington
and Cooke 1983; Myers et al. 1994). As the
largest biomass in a time series of fisheries
data is unlikely to be larger than the unex-
ploited biomass, it follows that RB_SSBlim
may not be smaller than 20%, and RB_SSBpa
not smaller than 1.4 RB_SSBlim => 28% of
the largest observed biomass.
Bayesian hockey stick
Bayesian inference combines existing knowledge
(the prior information) with the analysis of new
data in an appropriate model (the likelihood func-
tion) to obtain updated posterior knowledge. Prior
information must be described by a probability
distribution of the respective parameters, based
on previous knowledge. Here, the definitions of
the hockey stick and of SSBlim are used to obtain
priors for the central values of the distribution of
the height of the hockey stick and the point
where it connects to the blade. In other words,
the prior knowledge that the height of the shaft
will be near the geometric mean of recruitment
at large stock sizes and that the blade connects
near the point below which recruitment is less
than the geometric mean at large stock sizes is
incorporated into the analysis of the data at
hand. This is similar to the recommended prac-
tice of normalizing observations by subtracting
the mean (Kruschke 2011). Prior knowledge
would then be expressed as the expected type
and width of a prior distribution with a central
value of zero. In this study, the rule-based esti-
mates of RB_Rinf and RB_SSBlim were accepted as
prior central values for the Bayesian hockey stick.
The width of the respective distributions was
obtained from independently observed variability
across the 50 stocks in Table 2. In particular,
log-normal distributions were assumed for R, Rinf,
SSB, SSBlim and SSBpa. The central values and
relative standard deviations used for the priors
for SSBlim and Rinf are given in Table 3. The
JAGS software (Plummer 2003) was used to esti-
mate the Bayesian posterior distributions by
means of a Markov Chains Monte Carlo simula-
tion (Smith and Roberts 1993). A light-weight
guide to JAGS is included among the online
material (Coro 2013). The JAGS model is shown
as Equation (2).
© 2014 John Wiley & Sons Ltd, F I SH and F I SHER IES , 17, 193–209 197
Safe biological limits R Froese et al.
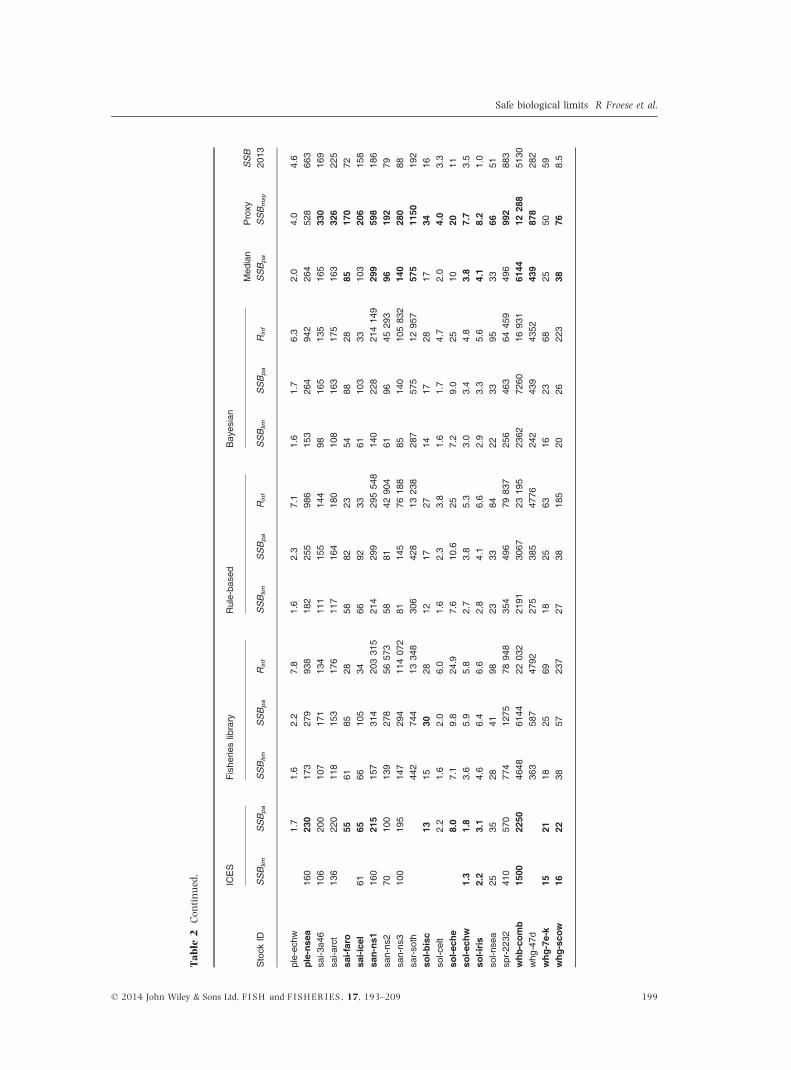
Table
2Biomass
reference
points
asusedbyICESandasresultingfrom
hockey-stick
analysiswiththeFisheriesLibrary,therule-based,andtheBayesianhockey
stick,where
SSBlimandSSBpaare
biomass
reference
points
andRinfindicatestheheightofthehockey-stick
shaft.ICESestimatesofSSBlimorSSBpathatare
below
thelowestestimate
ofthe
threehockey
sticksare
bolded.FisheriesLibrary
biomass
estimatesabovemaxim
um
SSBare
bolded.ThemedianSSBpaandtheproxyestimate
ofSSBmsy
are
bolded
ifSSBin
2013
wasbelow
theselevels.Stock
IDare
thecodes
usedbyICESfortherespectivestocks.Weights
are
given
in1000tonnes,Rinfin
millionsofrecruits,exceptforstocksmarked
with
anasterisk,whereSSBandRinfare
given
asindex.
Stock
ID
ICES
Fishe
rieslibrary
Rule-ba
sed
Bay
esian
Med
ian
SSBpa
Proxy
SSBmsy
SSB
2013
SSBlim
SSBpa
SSBlim
SSBpa
Rinf
SSBlim
SSBpa
Rinf
SSBlim
SSBpa
Rinf
cod-25
3263
88.2
199
237
283
184
327
373
230
402
316
327
654
180
cod-34
7d70
150
174
239
1077
127
177
1144
138
174
1127
177
354
72co
d-7e
-k7.3
10.3
1427
7.14
5.4
7.5
6.4
5.4
6.8
5.1
7.5
1522
cod-arct
220
460
280
423
622
233
326
722
253
341
616
341
682
1986
cod-farp
2140
3351
1425
3413
2844
1344
8824
cod-iceg
125
244
300
200
188
263
191
158
330
176
300
600
478
cod-scow
1422
2039
1711
1715
1318
1418
361.7
had-34
100
140
6312
517
640
180
252
1323
510
618
018
319
180
360
258
had-7b
-k7.5
5.9
1227
215
2215
312
1729
217
3424
had-arct
5080
275
549
341
5679
234
7215
316
415
330
625
5ha
d-faro
2235
4876
1822
3016
2335
1635
7015
had-iceg
4564
9956
5983
5055
9056
9018
090
had-rock
6.0
9.0
2345
297.0
1045
6.9
8.9
2710
205.8
had-scow
2230
2953
8321
2910
322
3381
3366
30he
r-25
32-gor
430
600
901
1361
2126
412
4417
4222
725
725
922
2051
713
6127
2271
7he
r-3a
2211
014
829
533
8911
916
743
1710
718
032
6318
036
010
6he
r-47
d380
013
0081
910
7848
403
749
1098
5369
350
161
648
131
1049
2098
1996
her-irls
2644
4666
443
2434
484
2945
410
4590
156
her-nirs
6.0
9.5
2542
385
3144
390
1013
250
4284
22he
r-no
ss25
0050
0038
1262
8568
616
3332
4665
4856
726
9662
5568
595
6255
1251
050
80he
r-riga
6087
175
2810
6287
2865
7388
2894
8817
677
her-va
su20
030
029
442
467
329
441
291
126
454
570
642
484
854
1he
r-vian
5043
386
533
3010
728
528
8117
930
819
6830
861
610
2ho
m-w
est
955
1909
2913
1156
1618
2982
952
2069
2933
1909
3818
1660
mac
-nea
1670
2300
1667
2274
3901
1682
2355
3307
1211
2479
3913
2355
4710
2556
nep-8a
b*
1531
2712
1727
1518
2818
3615
nop-34
9015
014
922
552
895
9214
444
706
8315
050
123
150
300
192
ple-ce
lt*
1.1
1.8
0.7
1.4
1.5
0.6
0.8
0.8
0.6
0.7
0.7
0.8
1.7
0.4
ple-ec
he5.6
8.0
4.5
5.5
19.0
3.2
4.5
163.6
4.1
164.5
9.0
7.0
198 © 2014 John Wiley & Sons Ltd, F I SH and F I SHER IES , 17, 193–209
Safe biological limits R Froese et al.
Table
2Continued.
Stock
ID
ICES
Fishe
rieslibrary
Rule-ba
sed
Bay
esian
Med
ian
SSBpa
Proxy
SSBmsy
SSB
2013
SSBlim
SSBpa
SSBlim
SSBpa
Rinf
SSBlim
SSBpa
Rinf
SSBlim
SSBpa
Rinf
ple-ec
hw1.7
1.6
2.2
7.8
1.6
2.3
7.1
1.6
1.7
6.3
2.0
4.0
4.6
ple-ns
ea16
023
017
327
993
818
225
598
615
326
494
226
452
866
3sa
i-3a4
610
620
010
717
113
411
115
514
498
165
135
165
330
169
sai-a
rct
136
220
118
153
176
117
164
180
108
163
175
163
326
225
sai-faro
5561
8528
5882
2354
8828
8517
072
sai-ice
l61
6566
105
3466
9233
6110
333
103
206
158
san-ns1
160
215
157
314
20331
521
429
929
554
814
022
821
414
929
959
818
6sa
n-ns
270
100
139
278
5657
358
8142
904
6196
4529
396
192
79sa
n-ns
310
019
514
729
411
407
281
145
7618
885
140
10583
214
028
088
sar-so
th44
274
413
348
306
428
1323
828
757
512
957
575
1150
192
sol-b
isc
1315
3028
1217
2714
1728
1734
16so
l-celt
2.2
1.6
2.0
6.0
1.6
2.3
3.8
1.6
1.7
4.7
2.0
4.0
3.3
sol-e
che
8.0
7.1
9.8
24.9
7.6
10.6
257.2
9.0
2510
2011
sol-e
chw
1.3
1.8
3.6
5.9
5.8
2.7
3.8
5.3
3.0
3.4
4.8
3.8
7.7
3.5
sol-iris
2.2
3.1
4.6
6.4
6.6
2.8
4.1
6.6
2.9
3.3
5.6
4.1
8.2
1.0
sol-n
sea
2535
2841
9823
3384
2233
9533
6651
spr-22
3241
057
077
412
7578
948
354
496
7983
725
646
364
459
496
992
883
whb-co
mb
1500
2250
4648
6144
2203
221
9130
6723
195
2362
7260
1693
161
4412
288
5130
whg
-47d
363
587
4792
275
385
4776
242
439
4352
439
878
282
whg
-7e-k
1521
1825
6918
2563
1623
6825
5059
whg
-sco
w16
2238
5723
727
3818
520
2622
338
768.5
© 2014 John Wiley & Sons Ltd, F I SH and F I SHER IES , 17, 193–209 199
Safe biological limits R Froese et al.
where the first two priors contain random normal
distributions of Rinf and SSBlim, and the third prior
contains the random normal distribution of the
standard deviation SD of log(R). The prefix tau
indicates that precision is used instead of standard
deviation, as required by JAGS, with tau = SD�2.
The data model is the same as used in Equa-
tion (1), only that the slope is expressed as Rinf/
SSBlim. For every biomass observation log.SSB[j],
the likelihood of the predicted logyh[j] is modelled,
given the observed value of log.R[j] and the priors.
The antilog of the mean of the medians of these
distributions then gives the central values for
SSBlim and for Rinf. The antilog of the upper 95%
confidence limit of log SSBlim gives the estimate of
SSBpa.
Other data and reference points
Estimates for fishing mortalities F and Fmsy and
for natural mortality M were used as published by
ICES. Gear selectivity was estimated from fishing
mortality at age as given by ICES. For the purpose
of this study, an age class was regarded as having
entered the fishery if F exceeded 33% of the maxi-
mum F value given for any age class. Age at full
maturity was estimated from proportion mature
as given by ICES. For the purpose of this study,
the age class with more than 90% mature individ-
uals was considered as fully mature. In two cases
(had-7b-k, sol-eche) where knife-edge selection
resulted in unrealistically low ages at first matu-
rity, the subsequent age class was chosen as fully
mature.
Availability of code and data
The stock–recruitment data, the R-code and the
results of the analysis are available online from
http://oceanrep.geomar.de/25749/.
Results
Comparison of biomass reference points
Estimates of SSBlim and SSBpa as used by ICES in
the advice provided in 2013 and as derived in this
study are shown in Table 2 for 50 stocks of the
north-east Atlantic. Median SSBpa across the three
methods and twice that median as proxy for SSBmsy
are indicated. Table 2 also shows the ICES estimate
of spawning stock biomass in 2013, for comparison
against the reference points. Of the 38 stocks where
ICES provided estimates of SSBlim, 17 estimates
(45%) were below the lowest estimate provided by
the three hockey-stick functions. Of the 43 stocks
where ICES provided estimates of SSBpa, 19 esti-
mates (44%) were below the lowest estimate pro-
vided by the hockey sticks. Using the median as a
modelf# priors
log:Rinf:ran� dnormðpr log:Rinf; pr tau:logRinfÞlog:SSBlim:ran� dnormðpr log:SSBlim; pr tau:log:SSBlimÞSD:logR� dnormðpr SD:log:Rinf; pr tau:SD:log:RinfÞtau:log:R\� powðSD:log:R;�2Þ# data model and likelihood
forðj in 1 : JÞflogyh½j�\� ifelseðlog:SSB½j�\log:SSBlim:ran;
log:SSB½j� � log:Rinf:ran=log:SSBlim:ran;log:Rinf:ranÞlog:R½j� � dnormðloghy½j�; tau:log:RÞ
gg
ð2Þ
Table 3 Means, coefficient of variation (CV) and
number of stocks used for defining the log-normal
distributions of the priors in the Bayesian hockey-stick
analysis.
Priors Mean CV SD Stocks
log(SSBlim) log(RB_SSBlim) 0.071 0.078 50log(R), log(Rinf) log(RB_Rinf) 0.15 0.18 50
200 © 2014 John Wiley & Sons Ltd, F I SH and F I SHER IES , 17, 193–209
Safe biological limits R Froese et al.
consensus estimate of SSBpa across the three meth-
ods and comparing it with SSB estimates for the
year 2013 shows that 26 of the 50 stocks (52%)
were below the threshold and thus outside of safe
biological limits. Only six of the 50 stocks (12%)
were above the proxy MSY biomass level SSBmsy.
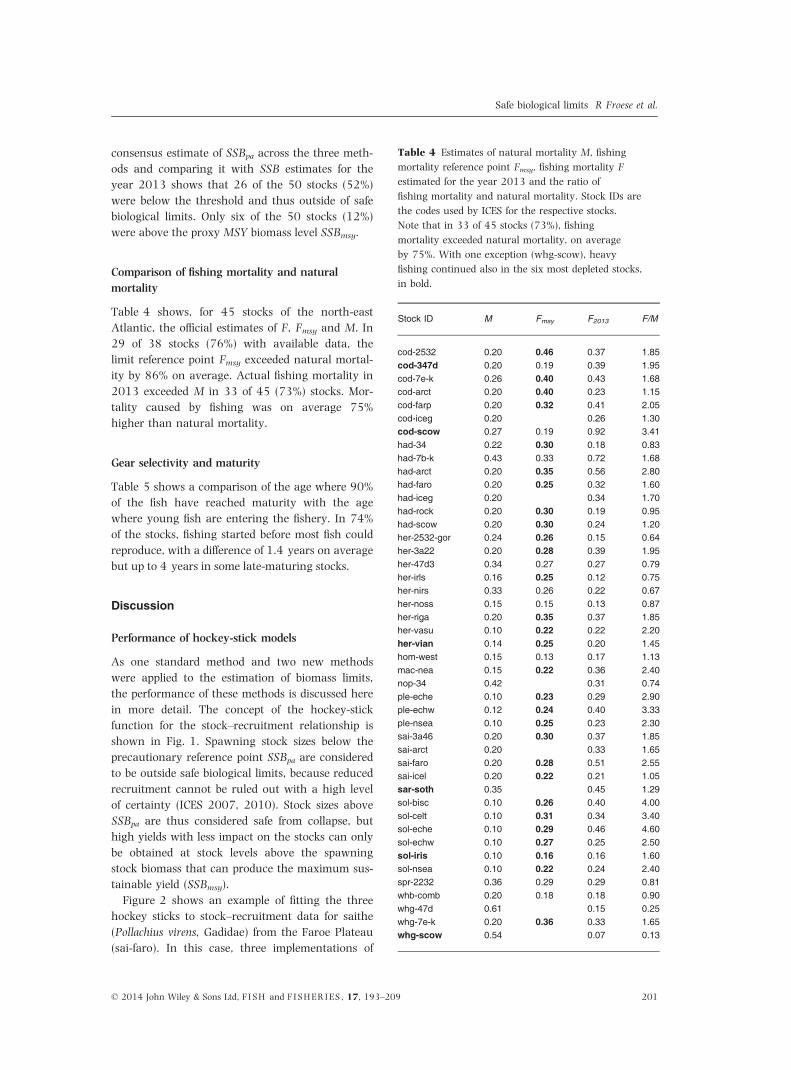
Comparison of fishing mortality and natural
mortality
Table 4 shows, for 45 stocks of the north-east
Atlantic, the official estimates of F, Fmsy and M. In
29 of 38 stocks (76%) with available data, the
limit reference point Fmsy exceeded natural mortal-
ity by 86% on average. Actual fishing mortality in
2013 exceeded M in 33 of 45 (73%) stocks. Mor-
tality caused by fishing was on average 75%
higher than natural mortality.
Gear selectivity and maturity
Table 5 shows a comparison of the age where 90%
of the fish have reached maturity with the age
where young fish are entering the fishery. In 74%
of the stocks, fishing started before most fish could
reproduce, with a difference of 1.4 years on average
but up to 4 years in some late-maturing stocks.
Discussion
Performance of hockey-stick models
As one standard method and two new methods
were applied to the estimation of biomass limits,
the performance of these methods is discussed here
in more detail. The concept of the hockey-stick
function for the stock–recruitment relationship is
shown in Fig. 1. Spawning stock sizes below the
precautionary reference point SSBpa are considered
to be outside safe biological limits, because reduced
recruitment cannot be ruled out with a high level
of certainty (ICES 2007, 2010). Stock sizes above
SSBpa are thus considered safe from collapse, but
high yields with less impact on the stocks can only
be obtained at stock levels above the spawning
stock biomass that can produce the maximum sus-
tainable yield (SSBmsy).
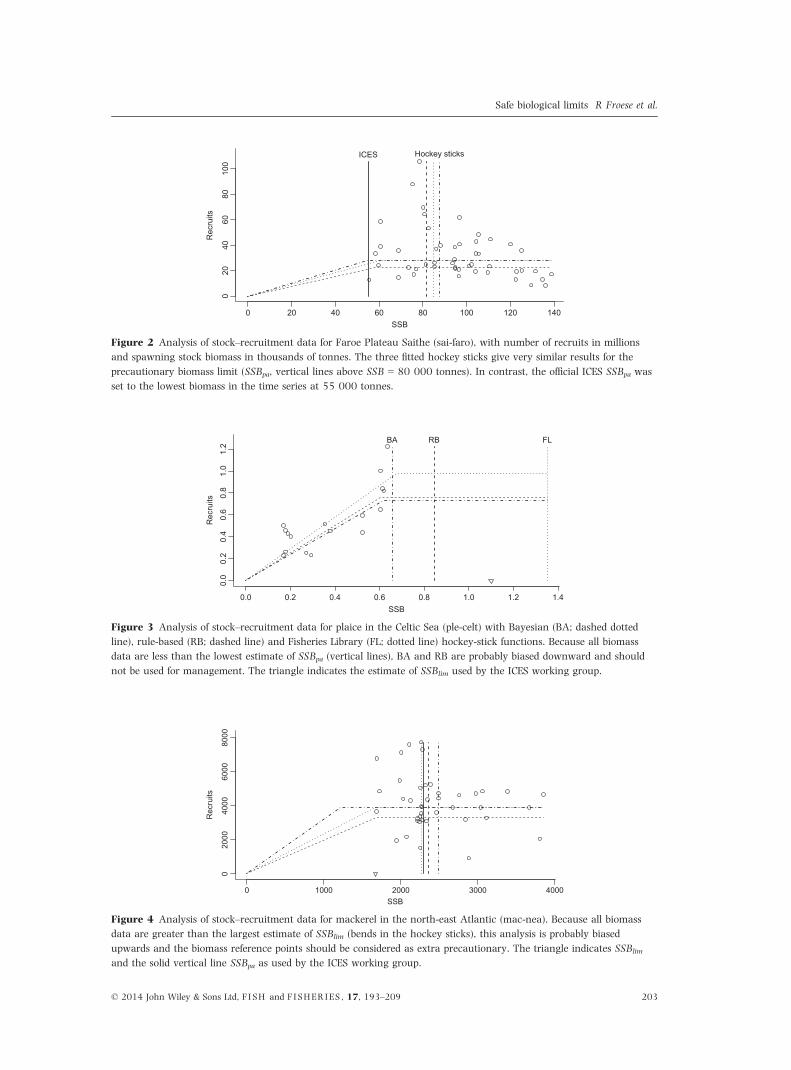
Figure 2 shows an example of fitting the three
hockey sticks to stock–recruitment data for saithe
(Pollachius virens, Gadidae) from the Faroe Plateau
(sai-faro). In this case, three implementations of
Table 4 Estimates of natural mortality M, fishing
mortality reference point Fmsy, fishing mortality F
estimated for the year 2013 and the ratio of
fishing mortality and natural mortality. Stock IDs are
the codes used by ICES for the respective stocks.
Note that in 33 of 45 stocks (73%), fishing
mortality exceeded natural mortality, on average
by 75%. With one exception (whg-scow), heavy
fishing continued also in the six most depleted stocks,
in bold.
Stock ID M Fmsy F2013 F/M
cod-2532 0.20 0.46 0.37 1.85cod-347d 0.20 0.19 0.39 1.95cod-7e-k 0.26 0.40 0.43 1.68cod-arct 0.20 0.40 0.23 1.15cod-farp 0.20 0.32 0.41 2.05cod-iceg 0.20 0.26 1.30cod-scow 0.27 0.19 0.92 3.41had-34 0.22 0.30 0.18 0.83had-7b-k 0.43 0.33 0.72 1.68had-arct 0.20 0.35 0.56 2.80had-faro 0.20 0.25 0.32 1.60had-iceg 0.20 0.34 1.70had-rock 0.20 0.30 0.19 0.95had-scow 0.20 0.30 0.24 1.20her-2532-gor 0.24 0.26 0.15 0.64her-3a22 0.20 0.28 0.39 1.95her-47d3 0.34 0.27 0.27 0.79her-irls 0.16 0.25 0.12 0.75her-nirs 0.33 0.26 0.22 0.67her-noss 0.15 0.15 0.13 0.87her-riga 0.20 0.35 0.37 1.85her-vasu 0.10 0.22 0.22 2.20her-vian 0.14 0.25 0.20 1.45hom-west 0.15 0.13 0.17 1.13mac-nea 0.15 0.22 0.36 2.40nop-34 0.42 0.31 0.74ple-eche 0.10 0.23 0.29 2.90ple-echw 0.12 0.24 0.40 3.33ple-nsea 0.10 0.25 0.23 2.30sai-3a46 0.20 0.30 0.37 1.85sai-arct 0.20 0.33 1.65sai-faro 0.20 0.28 0.51 2.55sai-icel 0.20 0.22 0.21 1.05sar-soth 0.35 0.45 1.29sol-bisc 0.10 0.26 0.40 4.00sol-celt 0.10 0.31 0.34 3.40sol-eche 0.10 0.29 0.46 4.60sol-echw 0.10 0.27 0.25 2.50sol-iris 0.10 0.16 0.16 1.60sol-nsea 0.10 0.22 0.24 2.40spr-2232 0.36 0.29 0.29 0.81whb-comb 0.20 0.18 0.18 0.90whg-47d 0.61 0.15 0.25whg-7e-k 0.20 0.36 0.33 1.65whg-scow 0.54 0.07 0.13
© 2014 John Wiley & Sons Ltd, F I SH and F I SHER IES , 17, 193–209 201
Safe biological limits R Froese et al.

the hockey stick led to very similar estimates of
SSBpa between 80 000 and 90 000 tonnes despite
the considerable scatter in the data. In contrast,
the official SSBpa estimate of ICES was taken as the
lowest biomass in the time series at 55 000 ton-
nes (ICES 2013b).
Clearly, reasonable predictions of the spawning
biomass below which recruitment declines can
only be derived from data sets that include this
threshold. In other words, time series where all
biomass data are above or below SSBlim will give
biased results. If such a situation is visible in the
stock recruitment plot, then no modelling should
be attempted. An example for a depleted stock is
shown in Fig. 3 for plaice (Pleuronectes platessa,
Pleuronectidae) in the Celtic Sea (ple-celt). Because
all biomass data are smaller than the lowest esti-
mate of SSBpa, the stock can be treated as outside
the safe biological limits. Thus, the proposed refer-
ence points are probably biased downwards and
should not be used. Similarly, Fig. 4 shows the fit-
ted hockey sticks for mackerel (Scomber scombrus,
Scombridae) in the north-east Atlantic (mac-nea).
This stock has never been depleted, and therefore,
the data do not contain information about limit
reference points. This situation is less critical than
the previous one, because the proposed biased ref-
erence points err on the precautionary side, that
is, they are probably overestimated.
The segmented regression of the Fisheries
Library provides its estimates based on the best fit
of a hockey-stick function to the available data.
This approach suffers from the general problem
that even a very good fit may give misleading
results if the data at hand are a biased subsample
of the unknown ‘true’ distribution. Such bias is
common in stock recruitment data because obser-
vations of recruitment at very small or at large
stock sizes are typically missing. In this study, the
segmented regression tended to overestimate
SSBlim if there was no clear levelling-off of recruit-
ment at higher biomass values. Also, it tended to
overestimate SSBpa if there was high variability in
recruitment. In six cases (12%; bolded in Table 2),
the SSBpa estimates of the Fisheries Library hockey
stick far exceeded the largest biomass value in the
time series. This is an unlikely result, as it would
suggest that all observations in the time series
were taken from a stock far outside safe biological
limits. One such case is depicted in Fig. 5 for Baltic
Herring (Clupea harengus, Clupeidae) in the Gulf of
Riga (her-riga). A closer inspection of available
time-series data for biomass and fishing mortality
suggests that this stock was above SSBpa at least
in some years. This was also true for most of the
other cases. In Norway lobster (Nephrops norvegi-
cus, Nephropidae) (nep-8ab) and sole (Solea solea,
Soleidae) in the Bay of Biscay (sol-bisc), biomass
Table 5 Age in years where more than 90% of the fish
have reached maturity (tm90), age of entry in the fishery
(tF33 where fishing mortality exceeds 33% of the highest
age-specific value) and difference between these ages
(delta t).
Stock ID tm90 tF33 delta t
cod-2532 5 3 �2cod-7e-k 4 2 �2cod-arct 9 6 �3cod-farp 5 3 �2cod-iceg 8 5 �3cod-scow 4 4 0ghl-arct 14 8 �6had-34 5 3 �2had-7b-k 3 3 0had-arct 8 4 �4had-faro 4 3 �1had-rock 3 4 1had-scow 3 1 �2her-2532-gor 4 3 �1her-3a22 5 1 �4her-47d3 4 2 �2her-irls 2 2 0her-nirs 3 2 �1her-noss 6 5 �1her-riga 2 2 0her-vian 3 2 �1hom-west 5 1 �4mac-nea 4 4 0nep-8ab 4 3 �1ple-celt 5 3 �2ple-eche 4 2 �2ple-echw 5 3 �2ple-nsea 4 3 �1sai-3a46 7 4 �3sai-arct 8 4 �4sai-faro 8 5 �3sar-soth 2 1 �1sol-bisc 4 3 �1sol-celt 5 3 �2sol-eche 4 3 �1sol-echw 5 3 �2sol-iris 4 3 �1sol-nsea 3 3 0spr-2232 2 1 �1whb-comb 3 4 1whg-47d 2 3 1whg-7e-k 3 3 0whg-scow 2 3 1
202 © 2014 John Wiley & Sons Ltd, F I SH and F I SHER IES , 17, 193–209
Safe biological limits R Froese et al.
0 20 40 60 80 100 120 140
020
4060
8010
0
SSB
Rec
ruits
Hockey sticksICES
Figure 2 Analysis of stock–recruitment data for Faroe Plateau Saithe (sai-faro), with number of recruits in millions
and spawning stock biomass in thousands of tonnes. The three fitted hockey sticks give very similar results for the
precautionary biomass limit (SSBpa, vertical lines above SSB = 80 000 tonnes). In contrast, the official ICES SSBpa was
set to the lowest biomass in the time series at 55 000 tonnes.
0.0 0.2 0.4 0.6 0.8 1.0 1.2 1.4
0.0
0.2
0.4
0.6
0.8
1.0
1.2
SSB
Rec
ruits
RBBA FL
Figure 3 Analysis of stock–recruitment data for plaice in the Celtic Sea (ple-celt) with Bayesian (BA; dashed dotted
line), rule-based (RB; dashed line) and Fisheries Library (FL; dotted line) hockey-stick functions. Because all biomass
data are less than the lowest estimate of SSBpa (vertical lines), BA and RB are probably biased downward and should
not be used for management. The triangle indicates the estimate of SSBlim used by the ICES working group.
0 1000 2000 3000 4000
020
0040
0060
0080
00
SSB
Rec
ruits
Figure 4 Analysis of stock–recruitment data for mackerel in the north-east Atlantic (mac-nea). Because all biomass
data are greater than the largest estimate of SSBlim (bends in the hockey sticks), this analysis is probably biased
upwards and the biomass reference points should be considered as extra precautionary. The triangle indicates SSBlim
and the solid vertical line SSBpa as used by the ICES working group.
© 2014 John Wiley & Sons Ltd, F I SH and F I SHER IES , 17, 193–209 203
Safe biological limits R Froese et al.

status was more difficult to judge, but the sug-
gested precautionary level of twice the maximum
biomass on record still seemed unlikely. These
overestimates by the Fisheries Library hockey stick
underline the need for additional models that draw
on general knowledge about stock recruitment
relationships, beyond the data at hand. Such addi-
tional knowledge is built into the rule-based
hockey stick and the Bayesian hockey stick.
By design, the rule-based method cannot pro-
pose SSBlim estimates below the minimum or
above the maximum biomass in the time series.
Compared with the other two models, it tended to
underestimate SSBlim if there was a single high
recruitment event at very low biomass, or if there
was no clear levelling-off of recruitment at larger
stock sizes. However, despite its simplicity, the
rule-based method provided reasonable estimates
that were, in the majority of cases, close to the
estimates provided by the other two methods (see
Table 2).
The Bayesian hockey stick combined prior
knowledge about stock–recruitment relationships
and about the general variability of the parameters
with an analysis of the stock-specific data at hand.
Thus, not surprisingly, it was often intermediate to
the SSBpa estimates of the Fisheries Library and of
the rule-based hockey stick. However, all three
methods provided minimum or maximum SSBpa
estimates in some cases and therefore selecting the
most appropriate SSBpa estimate in these instances
was not straightforward. The precautionary princi-
ple holds that in the case of uncertainty, the result
with the least potential harm for the stock is to be
favoured (FEU 2009; Froese et al. 2011). Thus, in
cases where the three methods provided different
estimates for SSBpa, the highest estimate should be
chosen. However, as pointed out above, there were
cases where the validity of the highest estimate
was doubtful. As a pragmatic implementation of
these considerations, the median of the available
estimates was chosen as representative of a con-
sensus SSBpa. The median has the advantage that
it is insensitive to outliers.
Comparison of biomass limit estimates
The main purpose of this study was to compare
official reference points for fisheries management
with independent estimates. With regard to bio-
mass, nearly half of the official values were below
estimates derived with three independent methods
in this study. Figures 2 and 5 show two examples
of such cases. Of the 15 stocks where ICES did not
provide estimates of SSBlim or SSBpa, such esti-
mates were available from the hockey sticks. We
appreciate that ICES stock assessment working
groups will have reasons for setting biomass refer-
ence points as they did, or for not providing such
estimates. But, we would like to point out that the
available data and the methods used in this study
allowed an estimation of reference points for all
examined stocks and that these independent esti-
mates were often more precautionary than the
official reference points.
For example, the precautionary reference point
SSBpa is used to identify stocks that are outside of
safe biological limits (EC 2013). This study found
52% (26 of 50) of the stocks in that danger zone.
This is considerably more than the 33% (14 of
0 50 100 150
020
0040
0060
00
SSB
Rec
ruits
RB & BA FLICES
Figure 5 Analysis of stock–recruitment data for herring (her-riga) in the Gulf of Riga, with number of recruits in
millions and spawning stock biomass in thousands of tonnes. The vertical lines indicate the precautionary biomass
limits (SSBpa) estimated by ICES and by the three hockey-stick implementations. The estimate of the Fisheries Library
(FL) far exceeds the maximum observed biomass and appears unrealistic.
204 © 2014 John Wiley & Sons Ltd, F I SH and F I SHER IES , 17, 193–209
Safe biological limits R Froese et al.
43) resulting from the official SSBpa reference
points. Using ICES reference points with a slightly
different set of stocks, the European Commission
concluded that 41% of the European stocks (17 of
41) were outside of safe biological limits (EC
2013), which is closer to, but still below the inde-
pendent estimate obtained in this study.
A proxy for the biomass that can produce the
maximum sustainable yield
As indicated in Fig. 1, the precautionary biomass
limit to reduced reproduction, SSBpa, can be used
as a proxy for the biomass that can produce the
maximum sustainable yield, SSBmsy. This follows
from the common assumption that the probability
of reduced recruitment is increasing at stock sizes
below 20% of the unexploited biomass, B0 (e.g.
Beddington and Cooke 1983; Myers et al. 1994;
Gabriel and Mace 1999), whereas production
models place the biomass that can produce MSY
between 0.37 B0 (Fox 1975) and 0.5 B0 (Schaefer
1954). If SSBpa � 0.2 B0, it follows that
2 SSBpa � SSBmsy. Such relationship also follows
from the ICES definition of SSBtrigger, which is sup-
posed to mark the lower range of biomass candi-
dates for SSBmsy (ICES 2010), and which was set
by ICES working groups equal to SSBpa in the
stocks we have examined (ICES 2012). If we
assume a precautionary uncertainty range of +/�50% around SSBmsy, then we again obtain
SSBmsy � 2 SSBpa. Other agencies provide esti-
mates of SSBmsy for their fully assessed stocks. For
31 stocks with such estimates and available
recruitment time-series data, we applied the three
methods for fitting hockey sticks and compared
the median estimate of SSBpa with the respective
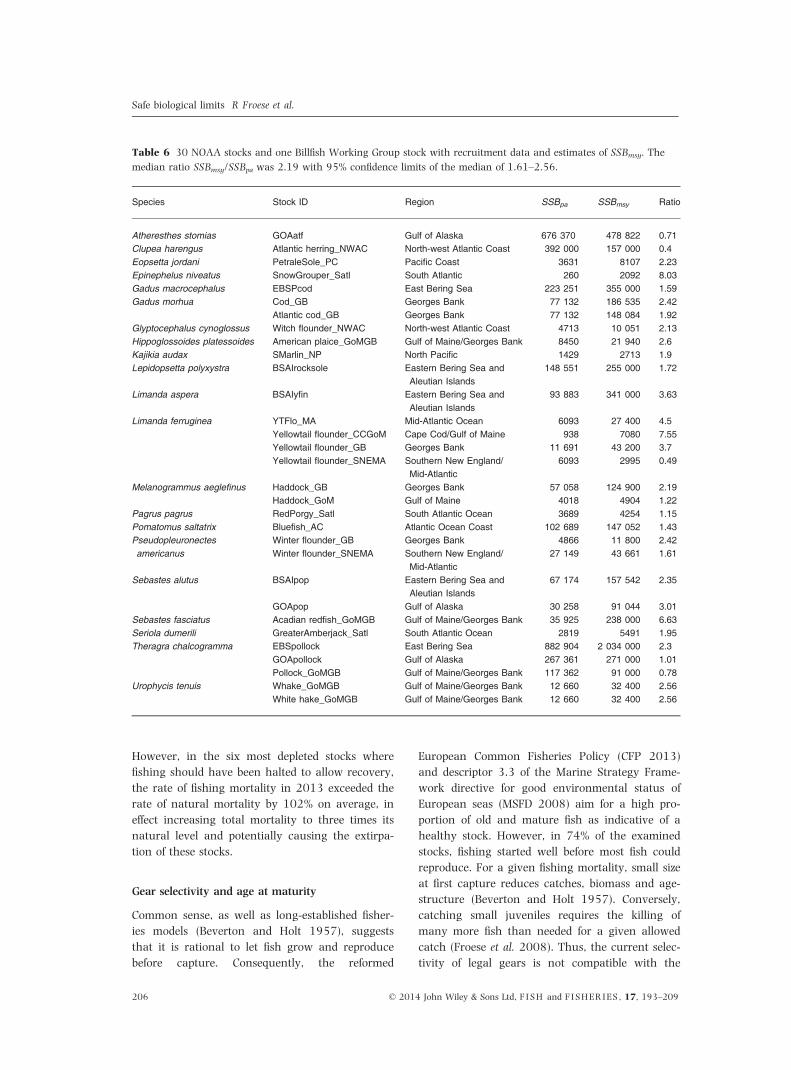
estimates of SSBmsy (Table 6). The median ratio
was 2.2, with 95% confidence limits of 1.6–2.6,
that is the proposed factor of two falls within the
confidence limits and is thus empirically con-
firmed. The median of the SSBpa estimates was
therefore used to calculate proxy estimates of
SSBmsy for the 50 ICES stocks (Table 2).
Comparing biomass in 2013 against the proxy
SSBmsy derived in this study, only 12% of the
stocks were above the biomass level that can pro-
duce the maximum sustainable yield, the thresh-
old set in the reformed European Common
Fisheries Policy (CFP 2013) and in descriptor 3.2
of the Marine Strategy Framework directive for
good environmental status of European seas
(MSFD 2008). Of the stocks that were below the
threshold, five were close enough (SSB2013 > 80%
SSBmsy) to reach SSBmsy in 2014 if fishing was
strongly reduced in that year. Most of the other
stocks would be able to reach SSBmsy within sev-
eral years if fishing was reduced to adequate
rebuilding levels (Froese and Quaas 2013). How-
ever, six (12%) of the considered stocks, such as
cod (Gadus morhua, Gadidae, cod-347d) in the
North Sea, were so depleted (SSB2013 < 20%
SSBmsy) that rebuilding plans are needed to pre-
vent their collapse (Froese and Quaas 2012).
Fishing mortality versus natural mortality
The reformed European Common Fisheries Policy
(CFP 2013) and descriptor 3.1 of the Marine Strat-
egy Framework directive for good environmental
status of European seas (MSFD 2008) require that
mortality caused by fishing does not exceed the
level (Fmsy) that can produce the maximum sus-
tainable yield. ICES provides estimates of Fmsy for
most of the fully accessed stocks, but how good
are these estimates? In the introduction, it was
pointed out that the rate of natural mortality can
be seen as a ‘natural’ upper limit to Fmsy. Setting
F = M in effect doubles the mortality in the
exploited part of the population and reduces adult
life expectancy and average duration of the repro-
ductive phase by half. Because fish grow through-
out their life, reducing average life expectancy also
shrinks the biomass of the stock by about half as
the numbers and weight of fish are reduced. In
other words, setting F = M results in a strong
impact on the stock that may overstretch the pro-
ductivity of the stock, and thus, F = M is not a
target but a limit reference point, with candidate
values for long-term sustainable fishing pressure
being somewhere below that level (Beddington
and Cooke 1983; Walters and Martell 2002,
2004; MacCall 2009; Pikitch et al. 2012).
Comparing the official reference points for Fmsy
with the estimates of natural mortality showed
that in about three-fourths of the stocks, Fmsy val-
ues were substantially higher than M. Thus the
proposed reference point for sustainable fishing
allowed more fish to be killed via fishing than due
to all other causes of mortality combined. Fortu-
nately, decreasing trends in fishing mortality have
been illustrated in northern European seas in
recent years, and several stocks have responded
with increases in biomass (Gascuel et al. 2014).
© 2014 John Wiley & Sons Ltd, F I SH and F I SHER IES , 17, 193–209 205
Safe biological limits R Froese et al.
However, in the six most depleted stocks where
fishing should have been halted to allow recovery,
the rate of fishing mortality in 2013 exceeded the
rate of natural mortality by 102% on average, in
effect increasing total mortality to three times its
natural level and potentially causing the extirpa-
tion of these stocks.
Gear selectivity and age at maturity
Common sense, as well as long-established fisher-
ies models (Beverton and Holt 1957), suggests
that it is rational to let fish grow and reproduce
before capture. Consequently, the reformed
European Common Fisheries Policy (CFP 2013)
and descriptor 3.3 of the Marine Strategy Frame-
work directive for good environmental status of
European seas (MSFD 2008) aim for a high pro-
portion of old and mature fish as indicative of a
healthy stock. However, in 74% of the examined
stocks, fishing started well before most fish could
reproduce. For a given fishing mortality, small size
at first capture reduces catches, biomass and age-
structure (Beverton and Holt 1957). Conversely,
catching small juveniles requires the killing of
many more fish than needed for a given allowed
catch (Froese et al. 2008). Thus, the current selec-
tivity of legal gears is not compatible with the
Table 6 30 NOAA stocks and one Billfish Working Group stock with recruitment data and estimates of SSBmsy. The
median ratio SSBmsy/SSBpa was 2.19 with 95% confidence limits of the median of 1.61–2.56.
Species Stock ID Region SSBpa SSBmsy Ratio
Atheresthes stomias GOAatf Gulf of Alaska 676 370 478 822 0.71Clupea harengus Atlantic herring_NWAC North-west Atlantic Coast 392 000 157 000 0.4Eopsetta jordani PetraleSole_PC Pacific Coast 3631 8107 2.23Epinephelus niveatus SnowGrouper_Satl South Atlantic 260 2092 8.03Gadus macrocephalus EBSPcod East Bering Sea 223 251 355 000 1.59Gadus morhua Cod_GB Georges Bank 77 132 186 535 2.42
Atlantic cod_GB Georges Bank 77 132 148 084 1.92Glyptocephalus cynoglossus Witch flounder_NWAC North-west Atlantic Coast 4713 10 051 2.13Hippoglossoides platessoides American plaice_GoMGB Gulf of Maine/Georges Bank 8450 21 940 2.6Kajikia audax SMarlin_NP North Pacific 1429 2713 1.9Lepidopsetta polyxystra BSAIrocksole Eastern Bering Sea and
Aleutian Islands148 551 255 000 1.72
Limanda aspera BSAIyfin Eastern Bering Sea andAleutian Islands
93 883 341 000 3.63
Limanda ferruginea YTFlo_MA Mid-Atlantic Ocean 6093 27 400 4.5Yellowtail flounder_CCGoM Cape Cod/Gulf of Maine 938 7080 7.55Yellowtail flounder_GB Georges Bank 11 691 43 200 3.7Yellowtail flounder_SNEMA Southern New England/
Mid-Atlantic6093 2995 0.49
Melanogrammus aeglefinus Haddock_GB Georges Bank 57 058 124 900 2.19Haddock_GoM Gulf of Maine 4018 4904 1.22
Pagrus pagrus RedPorgy_Satl South Atlantic Ocean 3689 4254 1.15Pomatomus saltatrix Bluefish_AC Atlantic Ocean Coast 102 689 147 052 1.43Pseudopleuronectesamericanus
Winter flounder_GB Georges Bank 4866 11 800 2.42Winter flounder_SNEMA Southern New England/
Mid-Atlantic27 149 43 661 1.61
Sebastes alutus BSAIpop Eastern Bering Sea andAleutian Islands
67 174 157 542 2.35
GOApop Gulf of Alaska 30 258 91 044 3.01Sebastes fasciatus Acadian redfish_GoMGB Gulf of Maine/Georges Bank 35 925 238 000 6.63Seriola dumerili GreaterAmberjack_Satl South Atlantic Ocean 2819 5491 1.95Theragra chalcogramma EBSpollock East Bering Sea 882 904 2 034 000 2.3
GOApollock Gulf of Alaska 267 361 271 000 1.01Pollock_GoMGB Gulf of Maine/Georges Bank 117 362 91 000 0.78
Urophycis tenuis Whake_GoMGB Gulf of Maine/Georges Bank 12 660 32 400 2.56White hake_GoMGB Gulf of Maine/Georges Bank 12 660 32 400 2.56
206 © 2014 John Wiley & Sons Ltd, F I SH and F I SHER IES , 17, 193–209
Safe biological limits R Froese et al.

expressed goals of European fisheries and ecosys-
tem management.
Summary
Official fisheries management reference points used
for stocks in the north-east Atlantic were investi-
gated as to the appropriateness of their current
levels. In 46% of the stocks, the official estimate of
the precautionary biomass limit SSBpa was found
to be below the consensus estimate of three
different methods. The official exploitation limit
Fmsy was found to exceed the rate of natural mor-
tality in 76% of the stocks. Selectivity of official
gears resulted in an age at first capture that was
below the age of full maturity in 74% of the
stocks.
The Law of the Sea (UNCLOS 1982), the Marine
Strategy Framework of the EU (MSFD 2008) and
the new Common Fisheries Policy of Europe (CFP
2013) require that fish stocks shall be rebuilt to
and maintained above the biomass level (SSBmsy)
that can produce the maximum sustainable yield.
In its advice for 2014, ICES did not provide esti-
mates of SSBmsy, which makes it difficult to judge
where Europe stands with regard to these commit-
ments (Froese and Proelss 2010). Using the proxy
for SSBmsy developed in this study and looking at
stock sizes in 2013, 88% were below the level that
can produce the maximum sustainable yield, 52%
were outside of safe biological limits, and 12%
were severely depleted. The rate of fishing mortal-
ity in 2013 exceeded the rate of natural mortality
in 73% of the stocks and fishing continued also in
the severely depleted stocks. Thus, while the new
Common Fisheries Policy (CFP 2013) of the Euro-
pean Community is widely regarded as a big step
in the right direction, much remains to be done to
rebuild healthy fish stocks and fisheries in the
north-east Atlantic.
Acknowledgements
We thank James Thorson and Samu M€antyniemi
for useful comments on the implementation of the
Bayesian hockey stick. Gianpaolo Coro acknowl-
edges support by the iMarine project (FP7 of the
European Commission, INFRASTRUCTURES-2011-
2, Contract No. 283644). Rainer Froese acknowl-
edges support by the European Union’s Seventh
Framework Programme (FP7/2007-2013) under
grant agreement 244706/ECOKNOWS project
and by the Lenfest Ocean Program at The Pew
Charitable Trusts under contract ID 00002841.
Nazli Demirel acknowledges support from The Sci-
entific and Technological Research Council of Tur-
key (TUBITAK). Kristin Kleisner acknowledges
support from the Sea Around Us, a scientific collab-
oration between the University of British Columbia
and the Pew Charitable Trusts. This is FIN Contri-
bution Number 163.
References
Barrowman, N.J. and Myers, R.A. (2000) Still more
spawner-recruitment curves: the hockey stick and its
generalizations. Canadian Journal of Fisheries and Aquatic
Sciences 57, 665–676.
Beddington, J.R. and Cooke, J. (1983) The potential yield
of previously unexploited stocks. FAO Fisheries Techni-
cal Paper No. 242, 63 pp.
Beverton, R. (1990) Small marine pelagic fish and the
threat of fishing; are they endangered? Journal of Fish
Biology 37(Suppl A), 5–16.
Beverton, R.J.H. and Holt, S.J. (1957) On the Dynamics of
Exploited Fish Populations. (Fisheries Investigation Ser-
ies, II). 19, Her Majesty’s Stationary Office, London.
CFP (2013) Regulation (EU) No 1380/2013 of the
European Parliament and of the Council of 11 Decem-
ber 2013 on the Common Fisheries Policy, amending
Council Regulations (EC) No 1954/2003 and (EC) No
1224/2009 and repealing Council Regulations (EC) No
2371/2002 and (EC) No 639/2004 and Council Deci-
sion 2004/585/EC. Official Journal of the European
Union L 354, 22–61.
Clark, C.W., Charles, A.T., Beddington, J.R. and Mangel,
M. (1985) Optimal capacity decisions in a developing
fishery. Marine Resource Economics 2, 25–54.
Coro, G. (2013) A lightweight guide on Gibbs sampling
and JAGS. ISTI-CNR, Technical Report cnr.isti/2013-
TR-036, Pisa, Italy. Available at: http://puma.isti.cnr.
it/linkdoc.php?idauth=1&idcol=1&icode=2013-TR-
036&authority=cnr.isti&collection=cnr.isti&lanver=it
(accessed 15 September 2014).
EC (2013) Communication from the Commission to the
Council concerning a consultation on fishing opportu-
nities for 2014. COM(2013) 319 final. Retrieved from
http://eur-lex.europa.eu/LexUriServ/LexUriServ.do?uri=
COM:2013:0319:FIN:EN:PDF (accessed 15 September
2013).
FEU (2009) Treaty on the Functioning of the European
Union. OJ C 115 of 9.5.2008:47–200. Retrieved from
http://eur-lex.europa.eu/LexUriServ/LexUriServ.do?
uri=OJ:C:2008:115:0047:0199:EN:PDF (accessed January
2010).
Fox, W.W. (1975) Fitting the generalised stock-produc-
tion model by least-squares and equilibrium approxi-
mation. Fishery Bulletin 73, 23–26.
© 2014 John Wiley & Sons Ltd, F I SH and F I SHER IES , 17, 193–209 207
Safe biological limits R Froese et al.

Froese, R. and Pauly, D. eds (2014) FishBase. World
Wide Web electronic publication. www.fishbase.org,
version (04/2014), accessed at www.fishbase.org in
May 2014.
Froese, R. and Proelss, A. (2010) Rebuilding fish stocks
no later than 2015: will Europe meet the deadline?
Fish and Fisheries 11, 194–202.
Froese, R. and Quaas, M. (2012) Mismanagement of the
North Sea cod by the European Council. Ocean and
Coastal Management 70, 54–58.
Froese, R. and Quaas, M. (2013) Rio+20 and the reform
of the Common Fisheries Policy in Europe. Marine Pol-
icy 39, 53–55.
Froese, R., Stern-Pirlot, A., Winker, H. and Gascuel, D.
(2008) Size matters: how single-species management
can contribute to ecosystem-based fisheries manage-
ment. Fisheries Research 92, 231–241.
Froese, R., Branch, T.A., Proelss, A., Quaas, M., Sains-
bury, K. and Zimmermann, C. (2011) Generic harvest
control rules for European fisheries. Fish and Fisheries
12, 340–351.
Gabriel, W.L. and Mace, P.M. (1999) A review of biologi-
cal reference points in the context of the precautionary
approach. NOAA Technical Memorandum, NMFS-F/SPO-
40, 34–45.
Gascuel, D., Coll, M., Fox, C. et al. (2014) Fishing impact
and environmental status in European seas: a diagno-
sis from stock assessments and ecosystem indicators.
Fish and Fisheries, doi:10.1111/faf.12090.
Gulland, J.A. (1971) The Fisheries Resources of the Ocean.
Fishing News, London.
Hardin, G. (1968) The tragedy of the commons. Science
162, 1243–1248.
Holt, J.S. (1958) The evaluation of fisheries resources by
the dynamic analysis of stocks, and notes on the time
factors involved. ICNAF Special Publication I, 77–95.
ICES (2007) Report of the workshop on limit and target
reference points (WKREF). ICES CM 2007/ACFM:05,
93 pp.
ICES (2010) Chair’s report of the workshop on the form of
advice (WKFORM), ICES CM 2009/ACOM:53, 15 pp.
ICES (2012) Marine Strategy Framework Directive –
Descriptor 3 + . ICES CM/ACOM:62, 169 pp.
ICES (2013a) Cod in subdivisions 25-32 (Eastern Baltic
Sea), advice May 2013. Downloaded in July 2013
from http://www.ices.dk/sites/pub/Publication%20Re
ports/Advice/2013/2013/cod-2532_201304112231.
pdf.
ICES (2013b) Saithe in Division Vb, advice June 2013.
Downloaded in March 2013 from http://www.ices.dk/
sites/pub/Publication%20Reports/Advice/2013/2013/
sai-faro.pdf.
Kell, L.T. (2011) FLSR. Downloaded in July 2013 from
http://tyflr.flr-project.org/.
Kell, L.T., Mosqueira, I., Grosjean, P. et al. (2007) FLR:
An open-source framework for the evaluation and
development of management strategies. ICES Journal of
Marine Science 64, 640–646.
Kruschke, J.K. (2011) Doing Bayesian Data Analysis: A
Tutorial with R and BUGS. Elsevier, Amsterdam.
MacCall, A.D. (2009) Depletion-corrected average catch:
a simple formula for estimating sustainable yields in
data-poor situations. ICES Journal of Marine Science 66,
2267–2271.
MSFD (2008) Marine strategy framework directive. Offi-
cial Journal of the European Union 2008 L 164/19.
Available at: http://eur-lex.europa.eu/LexUriServ/Lex-
UriServ.do?uri=OJ:L:2008:164:0019:0040:EN:PDFS
(accessed 20 July 2012).
Myers, R.A. and Mertz, G. (1998) The limits of exploita-
tion: a precautionary approach. Ecological Applications
8, S165–S169.
Myers, R.A., Rosenberg, A.A., Mace, P.M., Barrowman,
N.J. and Restrepo, V.R. (1994) In search of thresholds
for recruitment overfishing. ICES Journal of Marine Sci-
ence 51, 191–205.
NOAA (2013) Fishery Management Plan for Groundfish
of the Bering Sea and Aleutian Islands Management
Area. North Pacific Fishery Management Council,
Anchorage, Alaska, 142 pp. Accessible from http://
www.npfmc.org/wp-content/PDFdocuments/fmp/BSAI/
BSAIfmp613.pdf (accessed 15 March 2014).
O’Brien, C.M., Kell, L.T. and Smith, M.T. (2003) Evalua-
tion of the use of segmented regression through simu-
lation for a characterization of the North Sea cod
(Gadus morhua) stock, in order to determine the proper-
ties of Blim (the biomass at which recruitment is
impaired). ICES CM, 2003/Y:10.
Patterson, K. (1992) Fisheries for small pelagic species:
an empirical approach to management targets. Reviews
in Fish Biology and Fisheries 2, 321–338.
Pikitch, E., Boersma, P.D., Boyd, I.L. et al. (2012) Little
Fish, Big Impact: Managing a Crucial Link in Ocean Food
Webs. Lenfest Ocean Program, Washington, DC, 208
pp.
Plummer, M. (2003) JAGS: A program for analysis of
Bayesian graphical models using Gibbs sampling (Pro-
ceedings of the 3rd International Workshop on Dis-
tributed Statistical Computing (DSC 2003) March 20-
22, Vienna, 2003). (eds K. Hornik, F. Leisch and A.
Zeileis), Vienna Technical University, Vienna, pp. 20–
22.
R Development Core Team (2013) R: A Language and
Environment for Statistical Computing. R Foundation for
Statistical Computing, Vienna. http://www.r-project.
org/.
Ricker, W.E. (1954) Stock and recruitment. Journal of
Fisheries Research Board of Canada 11, 559–623.
Schaefer, M.B. (1954) Some aspects of the dynamics of
populations important to the management of commer-
cial marine fisheries. Bulletin of the Inter-American-Trop-
ical Tuna Commission 1, 25–56.
208 © 2014 John Wiley & Sons Ltd, F I SH and F I SHER IES , 17, 193–209
Safe biological limits R Froese et al.
Sheperd, J.G. (1981) Cautious management of marine
resources. Mathematical Biosciences 55, 179–181.
Smith, A.F.M. and Roberts, G.O. (1993) Bayesian
computation via the Gibbs sampler and related
Markov chain Monte Carlo methods. Journal of the
Royal Statistical Society. Series B (Methodological)
55, 3–23.
Thompson, G.G. (1993) A proposal for a threshold stock
size and maximum fishing mortality rate. In: Risk Eval-
uation and Biological Reference Points for Fisheries Man-
agement (eds S.J. Smith, J.J. Hunt and D. Rivard).
Canadian Special Publication of Fisheries and Aquatic
Sciences, Ottawa, Canada, pp. 120, 303–320.
UNCLOS (1982) United Nations Convention on the Law
of the Sea. Retrieved from www.un.org/Depts/
los/convention_agreements/texts/unclos/closindx.
htm (accessed June 2010).
UNFSA (1995) Agreement for the implementation of the
provisions of the United Nations Convention on the
Law of the Sea of 10 December 1982, relating to the
conservation and management of straddling fish stocks
and highly migratory fish stocks. 2167 UNTS 88,
1995. Retrieved from/http://www.un.org/Depts/los/
convention_agreements/texts/fish_stocks_agreement/
CONF164_37.htm (accessed April 2013).
Walters, C. and Martell, S.J.D. (2002) Stock assessment
needs for sustainable fisheries management. Bulletin of
Marine Science 70, 629–638.
Walters, C.J. and Martell, S.J.D. (2004) Fisheries Ecology
and Management. Princeton University Press, Princeton.
© 2014 John Wiley & Sons Ltd, F I SH and F I SHER IES , 17, 193–209 209
Safe biological limits R Froese et al.


![[Revised] Revisiting Verb Aspect in T'boli](https://static.fdokumen.com/doc/165x107/631ef9e50ff042c6110c9f71/revised-revisiting-verb-aspect-in-tboli.jpg)