Untitled - Fisheries and Oceans Canada Library
71
-
Upload
khangminh22 -
Category
Documents
-
view
0 -
download
0
Transcript of Untitled - Fisheries and Oceans Canada Library

LA PEROUSE PROJECT
SIXTH ANNUAL PROGRESS REPORT
1990
JUNE 1991
CONTENTS
1. INTRODUCTION ...... .
2. STANDARD SAMPLING GRIDS
3. INVESTIGATORS SUMMARIES
3.1 PHYSICAL OCEANOGRAPHY PROGRAM
3.1.1 Current and Water property observations in 1990
3.1.2 Numerical model results for the southwest coast of
Page
1
5
8
Vancouver Island . . . . . . . . . . . . . . . . .. 24
3.1.3 Drifter Program: upstream studies in Queen Charlotte Sound and Hecate Strait . . . . . . . . . . . . . .. 30
3.1.4 Ananlysis of sea level, alongshore currents, and wind stress off Vancouver Island . . . . . . . . . . . .. 32
3.2 BIOLOGICAL OCEANOGRAPHY PROGRAM
3.2.1 Program rationale and sampling strategy. . . . 36
3.2.2 Seasonal cycle of plankton biomass and species composition . . . . . . . . . . . . . . . . . 37
3.2.3 West coast phytoplankton productivity in 1990 . 40
3.3 FISHERIES OCEANOGRAPHY PROGRAM
3.3.1 Pacific Hake Distribution and Recruitment
3.3.2 Herring Mortality, Distribution and Recruitment
3.3.3 Pacific Cod Recruitment ....
42
45
52
3.3.4 Herring growth and size-at-age 54
3.3.5 Species and size composition of euphausiids as prey 56
3.3.6 Multispecies predator-prey modelling 58
3.3.7 Production system modelling
4. SUMMARY OF 1990 SURVEYS
5. LA PEROUSE PUBLICATION LIST
6. LIST OF PARTICIPANTS ..
7. MISCELLANEOUS REFERENCES
59
60
61
65
66

1
1. INTRODUCTION
The La Perouse Project is a multidisciplinary, mu1tispecies investigation intended to provide long-term physical and biological data for managing the major commercial fish stocks off the west coast of Vancouver Island. Initiated in early 1985 shortly after the strong 1982/83 El Nino-Southern Oscillation (ENSO) event, the project has entered the second half of its projected 10-year term. Considerable progress has been made toward identification of the dominant physical processes affecting the circulation and water property structure, to quantifying the statistical variability of the seasonal and interannual cycles, and toward direct estimation of the impact of interannual fluctuations on the planktonic food web, Pacific herring, sablefish, Pacific hake, and Pacific cod. The proj ect may soon achieve another of its original goals: observation of the effects of a moderate-to-strong ENSO event on the Vancouver Island coastal fisheries.
La Perouse Bank (Figures la, b) is situated within the coastal upwelling production zone that extends from northern Vancouver Island to Baj a California, and is one of the most productive fishing areas in Canada. Over the past decade, the catch of commercial fish from the La Perouse area has averaged 6.6 tonnes/km2/yr, about 5 times the average yield per unit area along the eastern boundary of the Gulf of Alaska. In s"ummer, the La Perouse region is visited by large migratory fish stocks from California, such as Pacific hake and Pacific mackerel. The summer hake fishery is currently the largest single species fishery in the Pacific region. Large numbers of Pacific sardine also visited the region prior to the collapse of the fishery in the 1950s. Sablefish support another important fishery and provide further justification for the cooperative fishery/oceanography work being conducted around La Perouse Bank. For example, research on the early life history of sablefish indicates that onshore movement of surface waters and enhanced poleward coastal winds in winter produce strong year-classes. Other factors such as the interaction of succeeding year-classes may also be important in determining the age structure of the stock either through direct competition and/or cannibalism. Strong year-classes can double the size of the stock in the Canadian zone, and can have a major impact on other commercially important fishes (such as Pacific herring). From a fisheries perspective, one of the most important goals of the program is to improve the Department of Fisheries and Oceans' ability to make accurate forecasts of herring and sablefish recruitment success a few years in advance. This ability could provide considerable benefit to the commercial fishing industry through increased catch quotas. A 1000 tonne increase in the quota would add about $2 million to the value of the roe herring industry and about $4 million to the sablefish industry.
Unlike conditions in northern British Columbia waters, the La Perouse Bank production system is characterized by relatively intense wind-induced upwelling, a narrow continental shelf and high euphausiid biomass. The results of the Sixth Annual Meeting of the proj ect investigators held at Cowichan Bay from April 10 to 11, 1991 suggest that
2
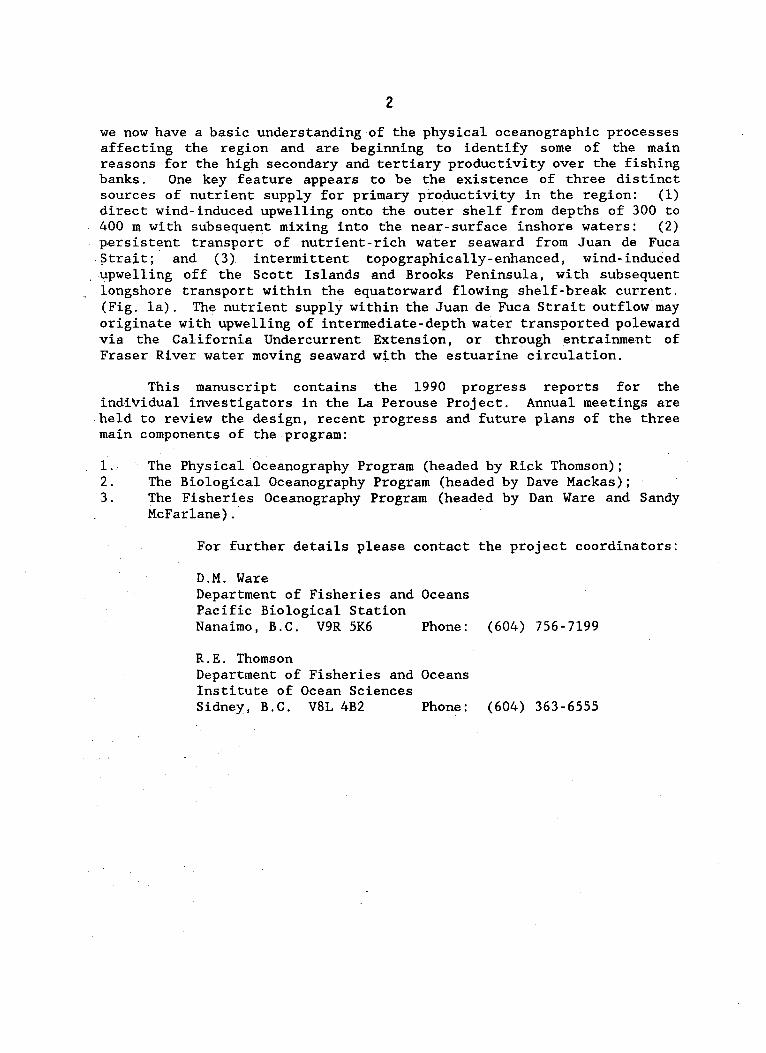
we now have a basic understanding of the physical oceanographic processes affecting the region and are beginning to identify some of the main reasons for the high secondary and tertiary productivity over the fishing banks. One key feature appears to be the existence of three distinct sources of nutrient supply for primary productivity in the region: (1) direct wind-induced upwelling onto the outer shelf from depths of 300 to 400 m with subsequent mixing into the near-surface inshore waters: (2) persistent transport of nutrient-rich water seaward from Juan de Fuca .~trait; and (3) intermittent topographically-enhanced, wind-induced upwelling off the Sc.ott Islands and Brooks Peninsula, with subsequent longshore transport within the equatorward flowing shelf-break current. (Fig. 1a). The nutrient supply within the Juan de Fuca Strait outflow may originate with upwelling of intermediate-depth water transported poleward via- the California Undercurrent Extension, or through entrainment of Fraser River water moving seaward with the estuarine circulation.
This manuscript contains the 1990 progress reports for the individual investigators in the La Perouse Project. Annual meetings are held to review the design, recent progress and future plans of the three main components of the program:
1 .. - The Physical Oceanography Program (headed by Rick Thomson); 2. The Biological Oceanography Program (headed by Dave Mackas); 3. The Fisheries Oceanography Program (headed by Dan Ware and Sandy
McFarlane) .
For further details please contact the project coordinators:
D.M. Ware Department of Fisheries and Oceans Pacific Biological Station Nanaimo, B.C. V9R 5K6 Phone: (604) 756-7199
R.E. Thomson Department of Fisheries and Oceans Institute of Ocean Sciences Sidney, B.C. V8L 4B2 Phone: (604) 363-6555

126°30' 126°00' 49°00' I s:: ttJ (\ .<~ 125"30'
~ ''[iNS·~ ~, 125°00'
VANCOUVER ISLAND
49°00'
~~ I I ~ I ~~~;l!'i·~t~;,i;;; ~I -V ~ 48°30' 48°30' J ' ...•..• .. . .. .
\°Go .,A
~\)c.~ Q~ .. ~
.p
\I' <"0
..0 ~
("Go-
':~.p , «'1--
~
t '# ~
~
48"00'1 7" " I ) ( \t I',' I; 126°30' 126°00' 125°30' 125"00'
Figure la. General summer circulation pattern on La Perouse Bank and surrounding waters. stipple region denotes an area of confused flow.
48°00'
LV

49°00'
48°30'
'\
48°00'
, ...... _-,
1 I , , ,
14.1
.... " IOOOm .... ....
'--, ,.-\,. ,
" 13.1 - .... I
I I
FISHING SUBAREAS I. BARKLEY SOUND 2.FIRING RANGE 3.SW CORNER 4. POTHOLES 5.12 MILE BANK 6.40 MILE BANK 7. FINGER BANK 8. BOTTLENECK 9. SW I FTSU RE BAN K 10. EDDY II. WEST BANK 12. SOUTH SLOPE I3.CENTRAL SLOPE 14. NORTH SLOPE
'\ \
...... --, (_I
\ (..J
1 "' /......... ,-..J __ --J I
12.1 "
,, '
\
126°00'
I ..-"-
---, ,... ..-"
l \ I ,
/ I
, \ \ ,. " \
10.1
C I / I--I ,. -'/ 1 ,-
/ I ' I \ 200m" I \ 1 I I I .... I / I I '" '" I / I
" I I 9 I \ \ I l) I • \ ) \ I., .I , I
,-"1), r I I -.II.... I I I
" C I ( ..... -- I I
f'J I ,
I r-" '/ I ) " ,.....,,- \r,1 I
/ } I ,
200m 200m 100m I I I \
125°00'
Figure lb. La Perouse Bank fishing subareas. The map shows the locations of·some important places mentioned in the r~port. .
01:»

5
2. STANDARD SAMPLING GRIDS
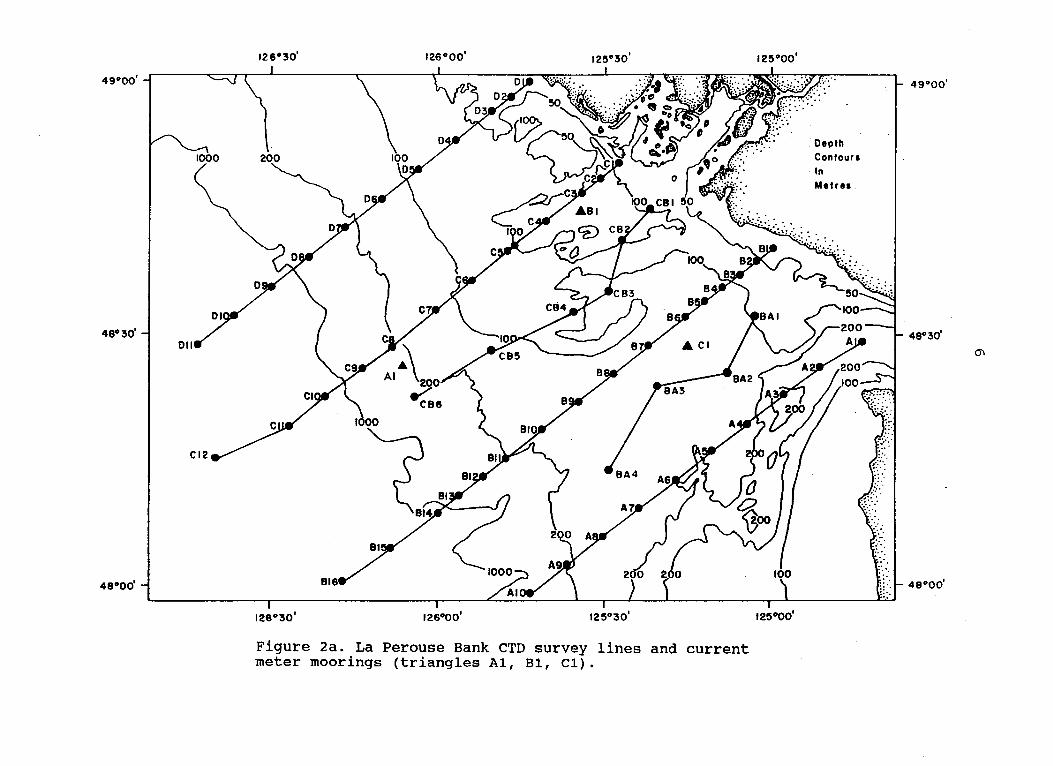
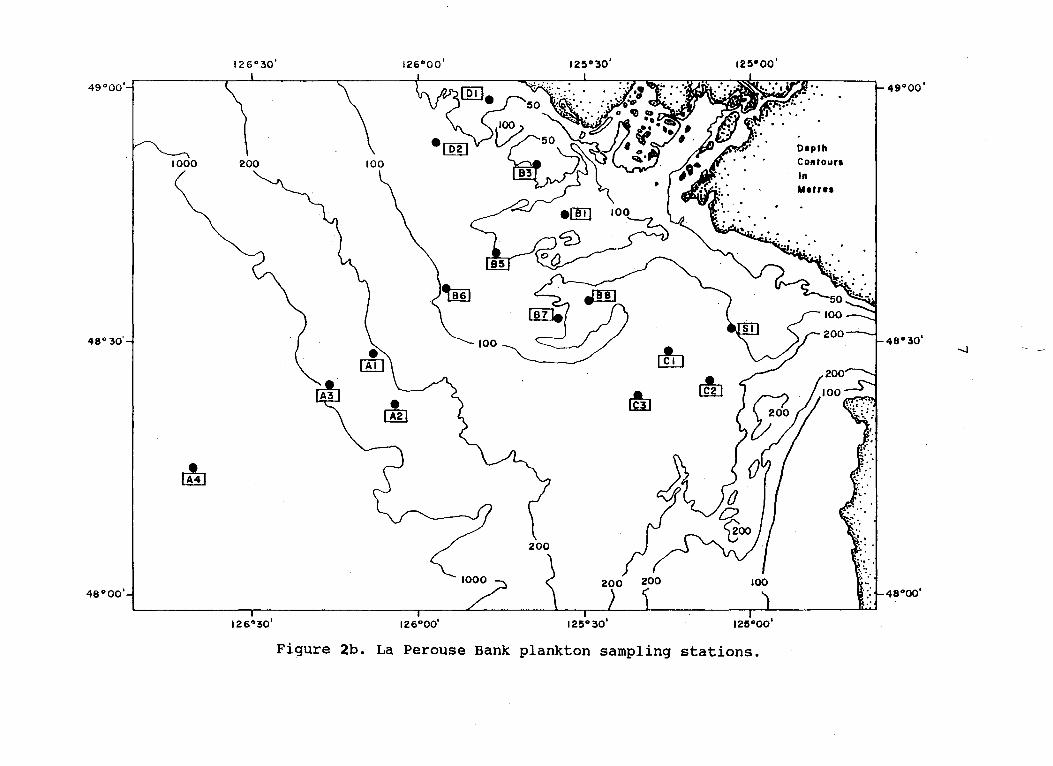
The standard sampling grids for CTD/hydro profile stations and plankton tow stations are presented in Figures 2a and 2b, respectively. Figure 2a also shows the locations of the current meter moorings for 1990, AI, Bl, and Cl. Generally, the area of interest is defined from north to south, between 49°00.0' and 48°00.0'N latitude, and from east to west, between 124°40.0' and 126°50.0' ~ longitude. Furthermore, the sampling grid transect lines run perpendicular to the coast of Vancouver Island and pass through the above defined area at an approximate bearing of 235° true N.
49°00'
1000
48°30' Oil
48°00'
126°30' 126°00' 12~030'
126°30' 126°00' 125°30'
Figure 2a. La Perouse Bank CTD survey lines and current meter moorings (triangles A1, B1, C1).
12~000'
125°00'
Depth Contour. In Metre.
49°00'
48°30'
0'1
48°00'
126°30'
49°00'
1000 200
48° 30'
@
48°00'
126"30'
126°00' 12!!030' 12!!eoo'
~
~ r&
126°00' 125°30' 125°00'
Figure 2b. La Perouse Bank plankton sampling stations.
D'pth Contours In M.,,..
49°00'
48°30'
48°00'
-..J

8
3. INVESTIGATORS SUMMARIES
3.1 PHYSICAL OCEANOGRAPHIC PROGRAM
3.1.1 Current and Water Property Observations in 1990
The physical oceanographic component of the La Perouse Project provides information on current and water property structure along the west coast of Vancouver Island in support of fisheries management and climate-related investigati<ms. The observations help define the dynamics qf the shelf circulation and contribute to a data base for the study of interannual and decade-scale (El-Nino type) variability in the northeast Pacific Ocean. Additional applications include the study of shelf/slope flux processes, determination of the interannual variation in the timing and intensity of the Spring and Fall transitions, and the provision 'o·f boundary/verification data for numerical circulation models. Data collected during the program are used in the development of oil-spill trajectory models, in the interpretation of sea-bird distribution and in studies of sediment distribution and transport. In 1990, observations were collected in support of airborne synthetic aperture radar (SAR) surveys by the Canadian Centre for Remote Sensing.
Data Collection
The number of oceanic surveys conducted off the west coast in support of the La Perouse Project again declined in 1990. Data in the
,survey region (Fig. 2a) were collected during 9 separate cruises between January 1 and December 31, compared with 10 cruises in 1989 and 17 in 1988. The decline from 1988 to 1989 was due to structural problems on the RICKER which forced cancellation of scientific cruises during the main portion of the field season. No such ready explanation can account for the decline in vessel time in 1990. All data collected by the various contributing groups have been processed and are available from Richard Thomson of the Institute of Ocean Sciences.
Archived water property files include plots and listings of individual vertical profiles of temperature, salinity and light attenuation together with horizontal maps and cross-sectional maps of temperature, salinity, density, dissolved oxygen, light attenuation coefficient, dynamic height and geostrophic currents. Transect records from the shipboard SAIL system also are available. As in previous years, the initial editing was conducted in-house by Joe Linguanti while the remaining analysis was done under contract.
Current Meter Moorings
The standard deployment positions for the La Perouse current meter moorings AI, Bl, and Cl are shown in Figure 2a. Owing to heavy fishing activity and associated data losses in recent years, we suspended deployment of mooring Bl following the recovery cruise of April 1990. This mooring was originally intended to measure flow within the start-up

9
region of the buoyancy-driven, northwestward flowing Vancouver Island Coastal Current. However, results from the La Perouse program indicate that the Coastal Current is not simply an along-shore extension of outflow from Juan de Fuca Strait but originates from the region of convoluted circulation and low density water that forms off the broad southern shelf in summer. To accurately monitor the variability in this important near-shore current, we therefore moved Bl to a relatively "safe" quasi-permanent mooring site, E01, off Estevan Point. The Coastal Current is known to be stable and well defined at this location (Thomson et al. 1989). A companion mooring was established at site E03 to monitor the intense southeastward flowing Shelf-Break Current. With its core centered near the 200 m depth contour, the Shelf-Break Current is thought to be a direct measure of upwelling intensity and extent along the Vancouver Island shelf. Mooring E03 will further help to establish the long-term timing and intensity of the spring and fall transitions off the west coast of the Island.
Moorings BP1, J and NJ, were deployed from April through October as part of the Canadian JGOFS program (co- investigators K. Denman, S. Calvert, R. Forbes, and D. Mackas). The J ("Jet") and NJ ("No Jet") moorings each consisted of a sediment trap and two current meters deployed south and north of Brooks Peninsula in roughly 500 m of water (Fig. 3). The near-surface (~ 35 m depth) and mid-depth (~ 205 m depth) current meter on each mooring measured current velocity, temperature and salinity at half-hourly intervals. Simultaneous measurements of near-surface water clarity were obtained from a 25-cm pathlength beam transmissometer positioned -in the vane of the upper current meter. The deeper current meter on each mooring was located 5 m below a l2-cup sequentially measuring sediment trap. Mooring BP1, consisting of current meters at 35 and 75 m depth at the edge of the steeply sloping shelf, provides data on the intense and highly sheared flow past Brooks Peninsula and will be maintained as an integral part of our long-term fisheries-climate program.
Servicing of all moorings took place in April and October 1990. The JGOFS sediment trap moorings were also serviced and redeployed in July 1990 during an Ocean Ecology cruise. Moorings deployed over_ the winter of 1989/90 were returned without losses. However, problems with the April 1990 array began in early summer. Mooring E03 was "hit" in June and __ the lower portion of the mooring (instruments from 175 and 400 m depth) later returned by a fisherman. In October 1990, we recovered the 100 m instrument and the mid-depth thermistor chain from this mooring. Losses include the 35 m instrument and the acoustic release. Mooring Cl was hit on July 26, 1990 with all instrumentation except the top (35 m) current meter returned by a fisherman. The CSS TULLY found the pinger and top float from Cl on a separate cruise. Moorings Al, E01, BP1, J, and NJ survived the summer without incident and had full data tapes. In addition, the 150 m instrument and thermistor-chain data logger from a long-lost mooring deployed at A1 on November 18, 1987 was dragged up in Barkley Sound on March 11, 1991. Both data loggers had full records and the T-chain data logger was still cycling!

128' , ---~----.- ----------
!
127'
10
• SUBSURFACE
CURRENT METER
MOORING
AES WIND
'8'-t=======~ ____________________ ~ ____________ T-__ ~ ____ ~~~~~~wro~~~ ,
129 0 128' 126'
50'
48'
Figure 3. Location of current meter moorings on the west coast of Vancouver Island during 1990. Moorings J and NJ had sediment traps at 205 m depth. Location of AES Weather Buoy and 1988 J-Buoy mooring are also shown.

Mooring Status as of October 1990
Station ID
Al-12
EOl-12
E03-12
BP01
Latitude oN
48 31. 82
49 20.00
49 05.00
50 03.75
Longitude oW
126 11.71
126 37.20
127 00.00
127 53.70
11
Deployment DD-MM-YY
10-10-90
Water
9-10-90
Water
10-10-90
Water
7-10-90
Water
Depth (m)
RCM 35 RCM 100
TR 102 RCM 175 RCM 400
depth 500
S4 25 RCM 35 RCM 75
depth 90
RCM 35 RCM 100
TR 101 RCM 175 RCM 400
depth 500
RCM 35 RCM 75
depth 90 ----------------------------------------------------------------
Safeguarding Moorings
Several steps are taken each year to safeguard the moorings. In March 1991, over 5000 full page flyers (some in Japanese, Russian and Polish) were sent for distribution to the fisherman licensing agencies th~ough Ms. Judy Roberts of the Commercial Licensing Division Region of DFO. Distribution to the trawlers was kindly handled by Mr. Athol Lang of the Hake Consortium. The flyers detail the instrument configurations and locations for each mooring and supply telephone numbers of institute staff. The exact positions are also supplied to Tofino Coast Guard Radio for direct transmission to marine traffic in the area of the moorings.
Guard buoys were deployed from April through October 1989 to protect the three southern moorings (A1, B1, C1) from fishing damage (see the 1989 Annual Report). This procedure was abandoned in 1990. Ignorance of, or disregard for, the guard buoys was evident. One of the Ocean Physics technicians observed a vessel tow its net through the centre of guard buoys surrounding mooring C1. The conclusion is that small guard buoys such as we had available are not very effective and that it is questionable whether larger, permanently installed buoys would fare much better. As noted in last year's report, the lights and radar reflectors

12
mounted on the buoys were at 4 m elevation and were found to be detectable by ship's radar up to 5 nautical miles in moderate seas. In near gale conditions, the buoys become lost to sea-clutter. Operators at the Tofino Coast Guard Navigational Radar could identify mooring Bl most of the time while the two more distant moorings were visible in light-to-moderate sea conditions. Despite our efforts, all moorings were damaged or lost to fishing gear in 1989. The cost and effort to maintain small guard buoys is not justified; our losses are no worse without the buoys.
Oceanic Winds
The Atmospheric Environment Service has maintained a 3 -m discus wind buoy at 48°50.05' N, 125°59.74' W on La Perouse Bank since November 1, 1988. Data are transmitted to shore via the GOES satellite and are archived by the Marine Environmental Data Service in Ottawa. Winds for the period November 1, 1988 to January 1, 1990 are on-file at the Institute of Ocean Sciences as part of the La Perouse data bank. All wind data are now archived at AES in Vancouver and arrangements have been made to have these data transmitted to Ocean Physics, lOS.
Standard Oceanographic Products
The edited oceanographic data are processes using a set of standard techniques that have been customized for the La Perouse region. Standard products derived from these data are listed below. (Further details can be found in the 1988 Annual Report published in March 1989.) Also, objectively mapped water properties at specific La Perouse grid sites for specified standard depths can now be obtained. Archived data products are:
1. Files and plots of l-m averaged temperature, salinity and light attenuation as a function of depth for all oceanic surveys from June 1984 to January 1991. Dissolved oxygen profiles from wat'er bottle casts at standard depths are available for many of the La Perouse grid stations.
2. Files at standard hydrographic depths (e.g. 0,10,20,30, 50m, ... ) of temperature, salinity, density (sigma-t), light attenuation coefficient, dissolved oxygen, sound speed, and dynamic height.
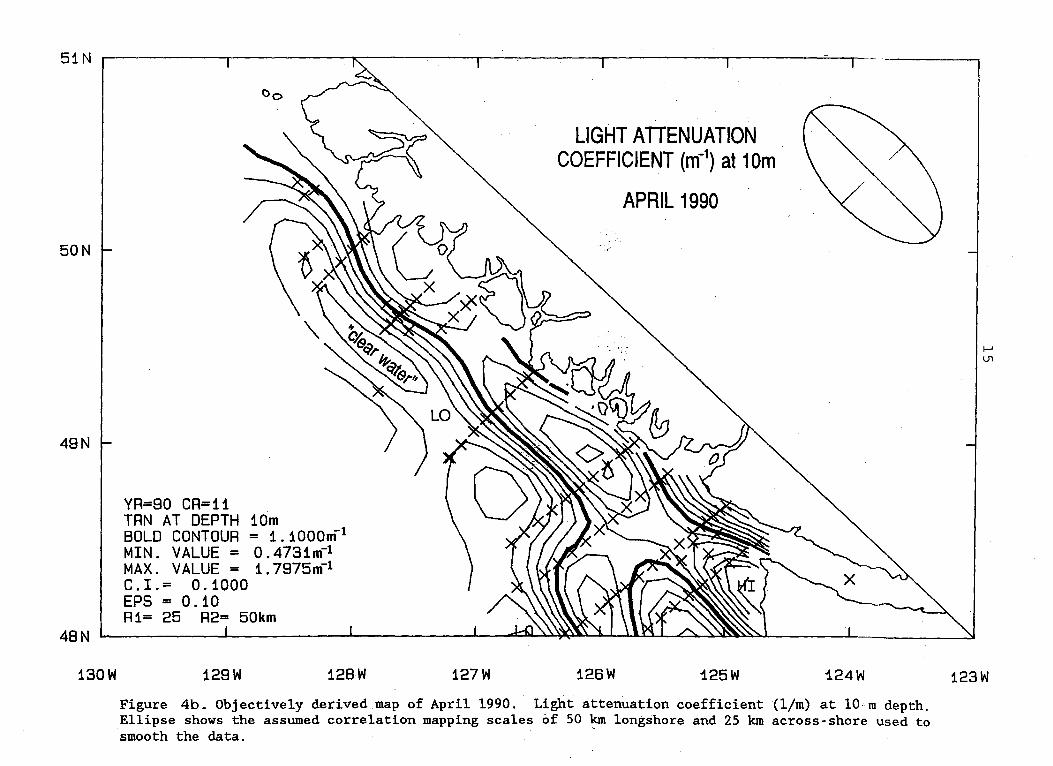
3. Objectively mapped water properties on horizontal surfaces at standard oceanic depths for each oceanic survey including temperature, salinity, density (sigma-t), dissolved oxygen, light attenuation coefficient, depth of sigma-t surfaces and geostrophic velocity (Fig. 4a,b). The digital grid data for each plot can be obtained via contract upon request.
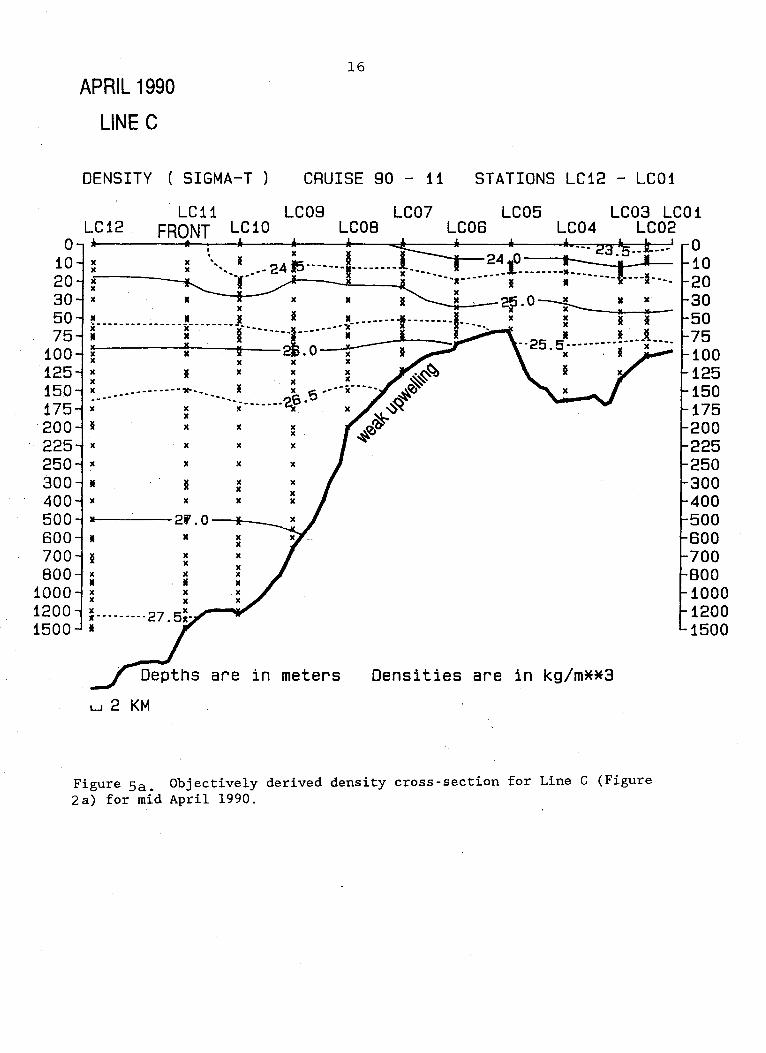
4. Objectively mapped cross-sections of the above oceanic properties along all cross-shore survey lines (Fig. 5a,b). The digital grid data for each plot can be obtained via contract upon request.

13
5. Three-dimensional maps of water properties for the La Perouse region including bottom topography. [Not available for 1990 data sets due to a lack of funds.]
6. Edited current meter records for all sites plus hourly and low pass filtered records. [The 1990 data are not yet available due to a lack of funds and computing support.]
7. Satellite thermal imagery (NOAA AVHRR data) for specific cruises. There is no mechanism to process the acquired data' other than through contractors that specialize in these products (e.g. Borstad Associates and Arctic Sciences Ltd.) [The La Perouse Project has built an inventory that can be accessed upon request on a user-pay basis. ]
8. Problems remain with the analysis and dissemination of the shipboard acoustic Doppler current meter data for the west coast. The contractor who normally does the analysis and who has written all the software (Luc Cuypers) was on an extended holiday in Asia.
Additional Products for 1990/91
In addition to the standard products, a number of products were completed in 1990 to aid in the display and interpretation of the La Perouse data.
1. Spline- interpolated time series of water properties at selected frequently-sampled stations (Fig. 6a) within the survey region for the period 1979 to 1989. Also, bi-weekly and seasonally-averaged time series for selected stations (Fig. 6b).
All data from the La Perouse study region have been mapped via objective analysis onto a regularly spaced grid of 20x20 km resolution (Fig. 6a), covering an area of 260 x 160 km. Where possible we have used data back to May 1979. The data base covers a total of 100 cruises. A number of "Goodness of fit" criteria have been applied to each of the values contributing to the data base. The procedure checks for reasonableness with actual neighbouring data values and rejects interpolated values that have less than 50% confidence level. The correlation scales of 25 and 50 km used for the across- and alongshore directions are a compromise intended to ensure full use of as much data as possible and still represent the mesoscale variability on the shelf.
2. A revised and corrected Five (5) Year Summary of moored time series data. Includes current meter data (velocity, temperature, salinity, density), thermistor ch~in records, pressure gauge and wind data.
Time series records from current meters, thermistor chains, pressure gauges, and anemometers from all La Perouse moorings have been summarized. Results include means and standard deviations, tidal harmonics, hourly plots and low-pass filtered plots. Specific

51N K
50N
49N
48N
130W
Co
YA=90 CA=11 SIG AT DEPTH 10m 80LD CONTOUA = 24.5000 MIN. VALUE = 23.3879 MAX. VALUE = 25 . 0684 C.I.= 0.1000 EPS = 0.10 A1= 25 R2= 50km
129W 128W
"
127W
DENSITY (q) at 10m
APRIL 1990
126W 125W
Correlation scales
f--' ~
124W 123W
Figure 4a. Objectively derived map of mid April 1990. Density (sigma-t) at 10 m depth.
51N K
50N
49N
48N
130W
Co
YA=90 CA=11 TAN AT DEPTH 10m BOLD CONTOUA = 1.1000m1
MIN. VALUE = O. 4731m-1
MAX. VALUE = 1 . 7975 m"'"l C.1.= 0.1000 EPS = 0.10 A1= 25 A2= 50km
129W 128W 127W
LIGHT ATIENUATION COEFFICIENT (m-1
) at 10m
APRIL 1990
126W 125W 124W
Figure 4b. Objectively derived map of April 1990. Light attenuation coefficient (11m) at 10 m depth. Ellipse shows the assumed correlation mapping scales of 50 km longshore and 25 km across-shore used to smooth the data.
I-' Ul
123W
APRIL 1990
LINE C
16
DENSITY ( SIGMA-T ) CRUISE 90 - 11 STATIONS LC12 - LC01
)C )C )C
)C )C )C
• x x x x
x )C x
2'.0 II x
x x x x x )C )C
, • II
are in meters Densities are in kg/m**3
L..J 2 KM
Figure Sa. Objectively derived density cross-section for Line C (Figure 2a) for mid April 1990.

APRIL 1990
LINE C
17
TRANSMISSIVITY (L. A. C.) CRUISE 90 - 11 STATIONS LC12 - LC01
0 10 20 30 50 75
100 125 150 175 200 225 250 300 400 500 600 700 800
1000 1200
-, 1500
LC12
x
II .II .' : 11---------------11-.. II x x 11 II
~p II . x
II x x
I x
x x
x x
.. §
x x
II II
.. II
~ x x
x x II .. x x x x If
LC09
II •• ----,0.5·, ·----i-------, I' ,
I '.' ...-~ x x: II • II .-
x x ' ~ If II : II II II ,
X X X ~
x
lC
x x x
I x X
lC
II X .. lC lC' .. '
.'-x , ,
LC07 LC05
in meters At tenuat ian cae f f . s (m-1)
l...J 2 KM
Figure 5b. Obj ective1y derived light attenuation coefficient crosssection for Line C (Figure 2a) for mid April 1990.
o 10 20 30 50 75 100 125 150 175 200 225 250 300 400 500 600 700 800 1000 1200 1500

18
CANDIDATE GRID LOCATIONS FOR THE TIME SERIES ANALYSIS 5iN
50N
49N
48N
47N
i29W
()o
A
X 102
X X 101 84 A
A
87 ~ 78
X X sa 100 X 83 ~ ~8
~ 71
X 88 X
A
82 85 ~ X ~ 70 ~ 84 A ~ 62
98 91 ~
~ 78 88~ 83 ~ ~ 81
A 75 88~ ~ 82 X 53
80 97 X
X 87 80 ~
~
32 ~
31 24 ~ 89 X
81 X
74 ~ X 68 52~ 30 saA A 44 37~
23 ~ ~
~
A
73 X
B5 X 57
68 51 ~ ~ 28 A 43 38 ~ 60 ~
X 35 28~ X 48 X
42X A 20
34 X 27 A 41 X
33 18
28 X
X 18 25
X X
X 11
EXTRAPOLATED DATA EXCLUDED "17 X
S
10 X 2
EXTRAPOLATED DATA INCLUDED X
X NOT ENOUGH DATA TO QUALIFY "1
i28W i27W 126W
22 15 ~
~
21 ~ 14 A
8
A 12
X 3
13 A
X 4
5
125W 124W
Figure 6a. Time series of water temperature derived from objective maps for the La Perouse Bank region. Locations of time series of grid sites.

19
TIME SERIES BIMONTHLY MEANS FOR LOCATION 4S"311N 126"161W AT VARIOUS DEPTHS
Ie o M iii ..
5 tJ
C CI 16 , °0,&' QI 'D .. ~ ..
.~~ :'9, e.. % I- ~
~ ~'l) III
50 M I"-.. ai
tJ
CI QI N 'D l"-
e.. III
% I-
l\i III 100m 100 M ~ III
tJ
CI QI III 'D
ai e.. % l-
Ii! 10 5
I"- 200m 200 M fa I"-
tJ
CI QI :!I 'D
e.. I"-
% I-
~ 10 III 300m SOD M ~
·ai
tJ
CI QI l"-'D 0
e.. m % I-
~ ID
JAN FEB MAR APR MAY JUN JUL AUG SEP OCT NOV DEC JAN
Time in months
numerals along the lines denote number of observations
Figure 6b. Time series of water temperature derived from objective maps for the La Perouse Bank region. Bi-month1y average values of temperature at station #45 for the period September 1984 to September 1989.
20
variables are: (a) Cross- and alongshore currents; (b) current along principal and minor axes; (c) temperature and salinity records; (d) bottom-mounted pressure records; and (e) cross- and alongshore winds.
Research Projects
Because of reduced funding and reallocation of support staff within the Ocean Physics Division in 1990, it only was possible to conduct minimal post-editing analysis of the La Perouse data sets. Data from some of the major cruises has yet to be put into the data base. Much of our effort went into support of editing, software development and processing for data dissemination to colleagues within the project. Therecently proposed cut-backs in shiptime, research funding and personnel suggest that there again will be little support for major post-analysis in 1991/92 .
Project-related research conducted in 1990/91 is listed as follows:
The Vancouver Island Coastal Current
The poleward flowing, buoyancy-driven Vancouver Island Coastal Current (VICC) is a permanent feature of the circulation off the west coast of Vancouver Island. Evidence from the La Perouse project indicates that in summer. the current originates with outflow from Juan de Fuca Strait but· is not organized into a well-defined boundary current until north of Barkley Sound. In a sense, the Coastal Current "emerges" from the region of low density water and confused circulation that forms over La Perouse Bank and only rarely is the consequence of direct outflow from the Strait.
A recent paper by Hickey, Thomson, Yih and LeBlond (J. Geophysical Research 1991) based on the 1984 Vancouver Island Coastal Current Experiment, shows that roughly 50 to 75% of the velocity variance over the shelf in summer and fall is related to wind- generated currents. The wind-generated currents are, in turn, dominated by first and second mode continental shelf waves. Buoyant forcing accounts for 10 to 20% of the ve10ci ty variance in the coastal current. This variance is, in turn, coupled to time-dependent buoyant plumes that propagate out of Juan de Fuca Strait at fortnightly and monthly intervals. The buoyant plumes originate from Fraser River runoff which exits the inner passage through a tidally controlled fortnightly modulated estuarine circulation system (Griffin and LeBlond, Estuarine, Coastal and Shelf Science 1990). Velocity anomalies associated with the plume over the shelf are in the range of 10 to 20 cm/s. The plumes propagate along the coast at speeds that exceed the mean shelf currents by 10 to 20 krn/day in the region within 50 krn of the mouth of the Strait. Plume width is about 30 km and pulses are evident for up to 130 krn from the mouth. LeBlond, Griffin and Thomson (1991, in preparation) show that a diagnostic m.ode1 based on the known Fraser River runoff, winds over the Strait of Georgia and neap/spring tidal cycle in Haro Strait - - can be used to accurately predict the arrival of low density pulses at Race Rocks and to a lesser
21
degree at the channel marker (J-Buo.y) at the entrance to. Juan de Fuca Strait.
Wo.rk planned fer 1991/92 includes a detailed analysis o.f all current meter o.bservatio.ns in the VICC regio.n starting fro.m 1979 to. present. We will attempt to. verify the "pu1se mechanism" fer flew variability by co.mparing o.bservatio.ns with the Griffin- LeB10.nd mo.de1. Mo.o.rings dep10.yed o.ff Estevan Po.int in the summer o.f 1988 and fro.m April 1989 to. present as part o.f the 10.ng-term o.bservatio.ns will pro.vide additio.na1 info.rmatio.n en scales o.f variability in the co.asta1 current.
Currents at the mo.uth o.f Juan de Fuca Strait
Current measurements were taken at the mo.uth o.f Juan de Fuca Strait near J-Buo.y (Fig. 3) fro.m April to. September 1988 as part o.f the jo.int wo.rk with the Department o.f Oceano.graphy at the University o.f British C0.1umbia en the pro.pagatio.n o.f buo.yant pulses within so.uthern co.asta1 waters. These data are being used by Dr. M. Fo.reman in a numerical study o.f the circu1atio.n ever the fishing banks and fer co.mpariso.n with shipbo.ard Do.pp1er current pro. filer measurements. Numero.us calibration erro.rs were disco.vered in the o.rigina1 editing co.nducted under the o.rigina1 co.ntract. In 1991, an ever-ranging pro.b1em was fo.und in the data which had to. be rectified thro.ugh a third co.ntracto.r. Based en the amplitudes and phases o.f the tidal co.nstituents, the data are new co.rrect.
The J-Buo.y data reveals several interesting aspects o.f the inf10.w in the central po.rtio.n o.f the channel that eventually impacts en the La Pero.use regio.n: (1) Mean o.utf10.w o.ccurs in the upper 50 to. 75 m o.f the water c0.1umn with near-surface (10 m depth) speed o.f aro.und 25 cm/s; mean inf10.ws o.ccurs fro.m 50 m to. the bo.tto.m (200 m) with maximum speeds near 15 cm/s; (2) Mo.nth1y and fo.rtnight1y tidal currents -- which are indicative o.f the lew density pulses fro.m Hare Strait -- are stro.ngest at the surface (z 10 cm/s at 10 m depth) and decrease rapidly to. less than 3cm/s by 30m depth. There is a marked phase and/o.r ellipse o.rientatio.n change between 30 to. 75 m depth, suggesting that individual pulses penetrate less than 50 m; (3) K1 diurnal currents and M2 semidiurna1 currents have amp1itudeso.f aro.und 25 and 35 cm/s, respectively, and are nearly unifo.rm with depth. Currents at 150 m depth are 180 0 o.ut o.f phase with currents at sha110.wer depths, suggesting that tidal mo.tio.ns are net baro.tro.pic but have the fo.rm o.f standing baro.c1inic waves.
Synthetic Aperture Radar (SAR) Study
The June 1990 La Pero.use survey was co.mbined with a high res0.1utio.n airbo.rne radar imaging survey o.f the west co.ast o.f Vanco.uver Island by the Canadian Centre fer Remo.te Sensing (CCRS, Ottawa) and G .A. Bo.rstad Asso.ciates (Sidney). The primary purpo.se o.f this study was to. test SAR's ability to. pro.vide "snap-sho.ts" o.f o.ceanic features such internal gravity waves, o.i1 slicks and fro.nts ever bread areas o.f the co.asta1 do.main. During the experiment, SAR also. attempted to. "see" a surface drift net launched as part o.f the study fro.m the CSS PARIZEAU at the time o.f o.ne of the ever flights.

22
Several cross-shore and alongshore flight tracks were flown off the coast from Juan de Fuca Strait to Cape Scott over a three day period. Oceanic surface features are detected through changes in ocean radar-scale "brightness" patterns associated with modifications to the centimetre-scale surface gravity waves. Simultaneous water properties and currents obtained from the ship plus satellite thermal imagery provide ground-truth data for the survey. Despite stormy weather and the fact that the overflights were limited to the hours after midnight because of United States-Canada military exercises off the west coast, the radar data showed a number of interesting features which support the use of this technique for oceanic studies. These include several examples of internal wave fields which appear to be propagating normal to the shelf-break and an excellent delineation of the flow pattern off Brooks Peninsula that is consistent with the oceanographic survey results. The radar also was able to detect a several kilometre long ridge that cuts across the shelf south of Brooks Peninsula and yielded evidence for wind-induced Karman Vortex streets in the lee of the Peninsula. Because of the intense radar clutter caused by strong winds and high seas, it was impossible to detect. the drift net using the radar. To be useful, the technique appears to be limited to relatively calm sea condition. A report on the preliminary findings is presented by Borstad et al. (1991).
Deep-Water Renewal
Three inter-related projects were conducted on the temporal and spatial scales for the intrusion of deep oceanic water from the west coast of Vancouver Island through Juan de Fuca Strait into the northern Strait of Georgia. In cooperation with Dr. B. Riddell and R. Herlinveaux, Arctic Sciences (Sidney) was contracted to compile and analyze the temperature, salini ty and sound speed records from the Nanoose Bay Weapons Testing Range (northern Strait of Georgia) for the period 1967 to 1990. Arctic Sciences and lOS also have completed an l8-month current and water property study supported by the UP Program to measure the intrusion of deep water from the eastern end of Juan de Fuca Strait into the southern portion of the Strait of Georgia. These data have then been combined with wind, current and water property data from the west coast of the Island in order to understand the mechanisms controlling the intrusion of bottom water into the inner coastal waters and inlets. Summary reports and preliminary analysis is to be found in Fissel et al. (Arctic Sciences Report to DFO, 1986).
Shelf-Break Current/JGOFS
The study of upwelling and stability of the Vancouver Island Shelf-break Current from AVHRR imagery is continuing. In conjunction with Gordon Staples of the Department of Oceanography (UBC), we have been using satellite thermal imagery from 1982 to 1990 to determine the causes for the intensification and break-up of the shelf break flow off northern Vancouver Island. We find that cold pockets of the shelf-break current jet form seaward of Brooks Peninsula and near the Scott Islands off the northern end of the Island. The cold water pools then coalesce and act as a tracer to the intensification to the strong baroclinic southward jet of

23
cold water. Preliminary analysis suggests that the Cape Scott and Brooks Peninsula are regions where nutrient-rich upwelled water from depths up to 400 m penetrates directly into the surface layer. Each event lasts several weeks whereupon the upwelling appears to weaken and the cold core of the shelf-break current retreats rapidly northward. The strong upwelling and vertical mixing that takes place at these locations is possibly the source of zooplankton and nutrients that feed the shelfbreak communities. Nutrients and phytoplankton growth in the current would lead to increased zooplankton growth which are then transported longshore toward the La Perouse region. The event-like nature of the localized upwelling processes means that there are times when the transport mechanism breaks down and other sources of nutrients, such upwelling through Juan de Fuca Canyon and local upwelling over the shelf, are needed to maintain the high biological productivity.
The shelf-break study compliments theJGOFS mooring and sediment program conducted from April to September, 1990. Preliminary results suggest that the near-surface currents measured by the offshore JGOFS moorings can be interpreted in terms of the flow instability process suggested by the Shelf-break study.
R.E. Thomson
24
3.1.2 NUMERICAL MODEL RESULTS FOR THE SOUTHWEST COAST OF VANCOUVER ISLAND
The two-dimensional, finite element, tidal model that has been described in previous years has now been extensive~y validated (Foreman and Walters, 1990) and attention has turned to applications and the extension to three dimensions. Deficiencies in the accuracy of the 2D model currents are almost completely due to the exclusion of density variations and vertically-varying mean currents such as the Vancouver Island Coastal Current. It is hoped that these deficiencies will be rectified with the three dimensional model.
In collaboration with Howard Freeland, work continued this past year on developing and comparing two methods for removing tides from ship-mounted acoustic Doppler current profi1er (ADCP) measurements (Foreman and Freeland, 1991). Since tidal currents can comprise over 50X of the signal off the southwest coast of Vancouver Island, their presence can be expected to mask or contaminate other components in the ADCP measurements. It is therefore necessary to to find a means of removing the tides before analysing for other flow patterns. The first technique that we investigated predicted tidal currents using model results corrected by historical observations. These values were then subtracted from the ADCP observations and the residual currents were examined for evidence of mean flow patterns. Using three days of data collected in October 1988, this approach produced residual currents that corresponded well with geopotentia1 surfaces calculated from simultaneous salinity and temperature measurements. These currents also showed clear evidence of the Juan de Fuca Eddy (Freeland and Denman, 1984). The second tide-removal technique was the direct harmonic analysis of ADCP measurements using polynomials to approximate the spatial variability of the tidal parameters. Although this approach has been successful in regions where the M2 constituent is dominant (Candela et a1., 1990), we found the process to be very sensitive numerically and unable to remove the tides for our 3-day data set.
A second application for the 2D tidal model was the determination of particle retention around Swiftsure Bank. This work was done in collaboration with Antonio Baptista and Roy Walters (Foreman et a1., 1991) . Retention charactersitics of the Bank, in the absence of wind-driven and buoyancy-driven currents, were estimated by using Lagrangian particle tracking techniques to calculate average Stokes and Lagrangian residual velocities. (Fig. 7). In particular, a first order estimate of the average Stokes velocity due to spatial variations in the amplitudes and phases of eight tidal constituent velocities suggested cancellation of the Eulerian residual eddy due to tidal rectification (see Fig. 8 in the 1989 LaPerouse Report), and no particle retention. These estimates were·confirmed with a series of 29-day drifter experiments using the 2D tidal model. Using an extension of these same experiments, it was also demonstrated .that the Eulerian Eddy around Swiftsure Bank did not confer any energy advantage to fish (with a simple swimming strategy) who wish to remain around the Bank.

i 11
\ \
J r I
\ i \ \ I-
"-
"
t
\ ) 'I.
I
{ I
1<..1
25
2.0
,.
Figure 7. Estimated average Lagrangian velocities calculated from eight tidal constituents and the tidally rectified currents. Each full shaft in multi-shafted vectors represents 4 cm/s. Depth contours are in metres.
cm/s
26
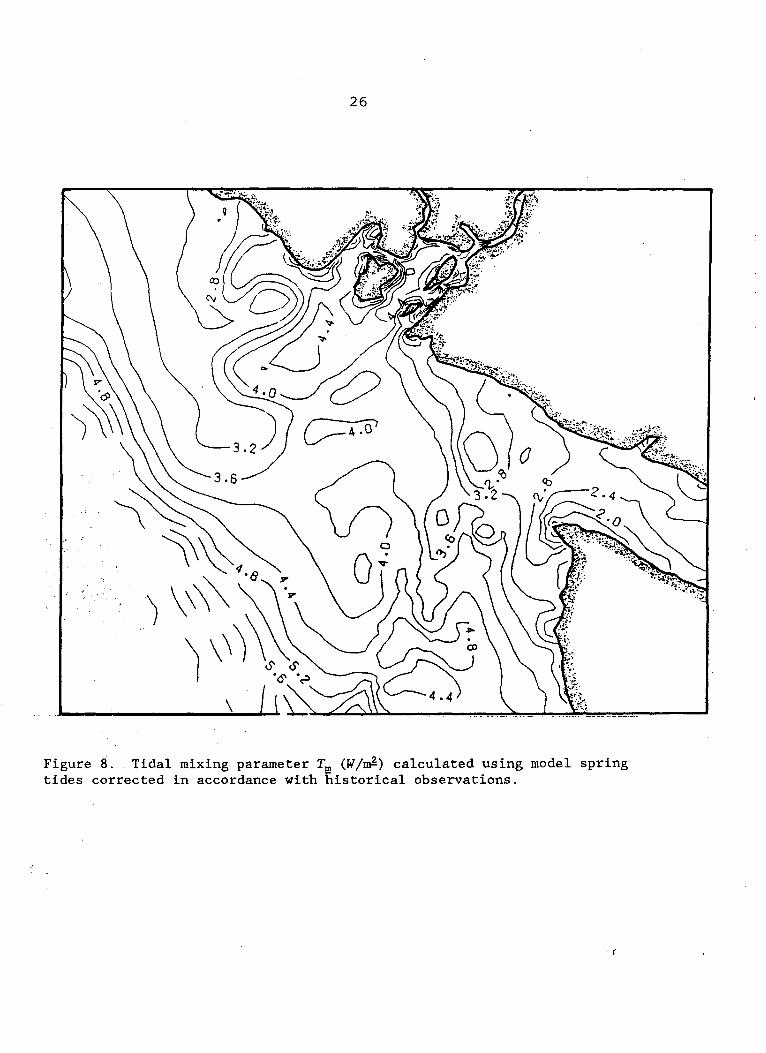
Figure 8. Tidal mixing parameter Tm (W/m£) calculated using model spring tides corrected in accordance with historical observations.

27
Using corrected model currents, a calculation was also performed to determine whether or not tidally mixed fronts might be important off the southwest coast of Vancouver Island. Such fronts are the surface signature of transition zones between stratified waters and tidally well-mixed waters, and are traditionally regions of plentiful nutrients. Figure 8 shows contours of the tidal mixing parameter Tm=loglO (h/Dt) ; where h= depth, and the tidal dissipation, Dt, is proportional to the root mean square spring tidal velocity. Around Georges Bank and in the North Sea, fronts lie along the Tm = 1.9 contour (Loder and Greenberg, 1986). As seen in Fig. 8, only along the shore northwest of Cape Flattery does Tm attain values this low. Satellite observations show patterns that may be fronts in this region, as well as in Juan de Fuca Strait, and off Cape Beale. Notice that the model also predicts relatively low Tm values in these two regions. However it is important to point out that the tidal currents are too small to permit the formation of fronts around the offshore fishing banks.
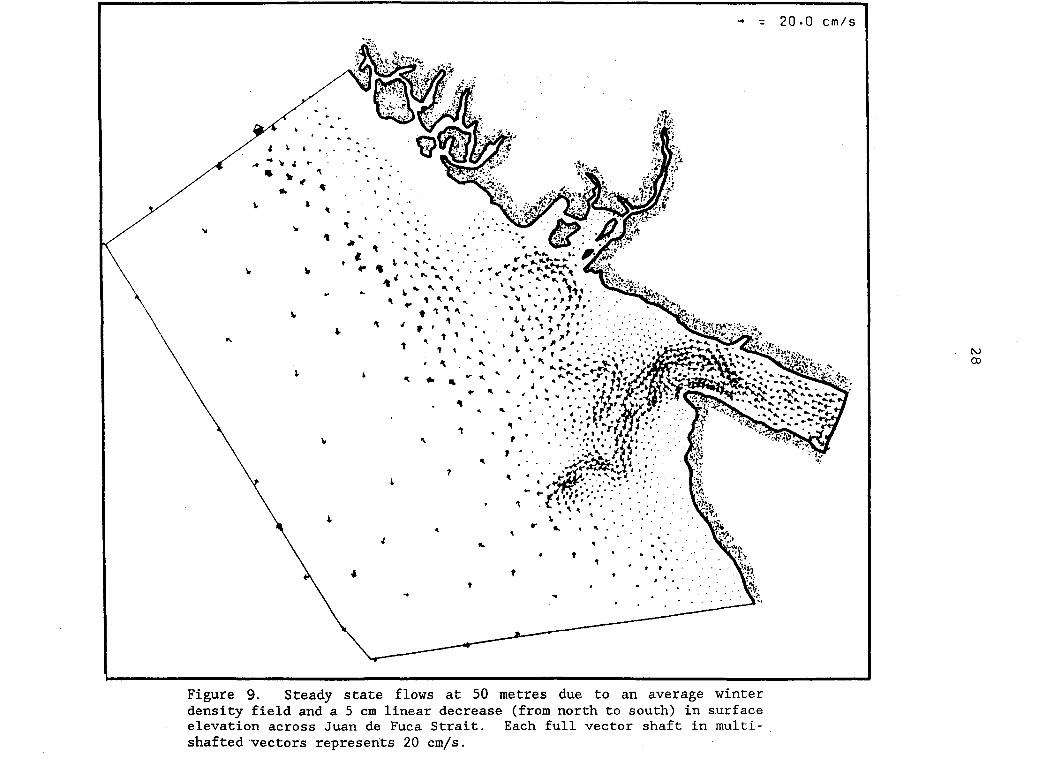
The 3-dimensional model is presently under development in collaboration with with Dan Lynch, Roy Walters, and Patrick Cummins. Using temperature and salinity observations from Rick Thomson's extensive La Perouse data set, a typical winter density field has'been calculated. This field can be combined with winds and appropriate inflows westard from Juan de Fuca Strait and northward along the Washington coast to diagnostically calculate a typical (non- tidal) winter 3D flow field. Figure 9 shows the 50 metre flows resulting from the average winter density field and Juan de Fuca inflow. Although there is an interesting counterclockwise circulation around the deep basin seaward of Barkley Sound and around La Perouse Bank, some problems are evident with the model results. Large confused flows beyond the shelf break and shelf currents that are generally too large by about 100% when compared to shelf observations, appear to be due to problems in the calculation of the average density field. Nevertheless, the fact that the homogeneous density plot comparable to Fig. 9 shows Juan de Fuca outflow following the canyon to the shelf break and then turning northward, demonstrates that the density field plays a significant role in the path of the Vancouver Island Coastal Current (Thomson et al., 1989). Work in the coming year will determine the source of the large (spurious) flows, concentrate on further development of the numerical techniques, compute seasonal density and flow fields, and further validate the model currents against observational data.
M. Foreman
~ = 20.0 cm/s
4 .. .. 'or 4 .. ,. II " .. • " ..
" .,. ... ., " ..
~
" f. " \r Ir ~ • l, '" 1\ ...............
,,~ . '" ... 1.
" ... .... ... ...
" , ... ... ... ... " " ... " t ., J 't 1.
" ~ ,
f 1 .... 1. 1 1 .. ... ". ~,:~~·.··:;~~:· ......... ~ ........ \ .. ~· .. ~;';.~::,'u
" ... ,,1\ ... CL ~ t _ .. I ~~~-.:.. _ _ .... ..... .=~.,~q.j._ I. to.
.. .. .. " .. ... ., ...
., " 'or '\ , , .. ., " l.
l1li •••
t • .
Figure 9. Steady state flows at 50 metres due to an average winter density field and a 5 cm linear decrease (from north to south) in surface elevation across Juan de Fuca Strait. Each full vector shaft in multishafted vectors represents 20 cm/s.
N CO

29
REFERENCES
Candela, J., R.C. Beardsley, and R. Limeburner. 1990. Removing tides from ship-mounted ADCP data, with application to the Yellow Sea. Proceedings of the IEEE Third Working Conference on Current Measurement, G.F. Appell and E.E. Woodward, Editors.
Foreman, M.G.G., and R.A. Walters. 1990. A finite element tidal model for the southwest coast of Vancouver Island. Atmosphere-Ocean, 28(3), 261-287.
Foreman, M.G.G., and H.J. Freeland. 1991. A comparison of techniques for tide removal from ship-mounted acoustic Doppler measurements along the southwest coast of Vancouver Island. Submitted to Journal of Geophysical Research.
Foreman, M.G.G., A.M. Baptista, and R.A. Walters. stuides of particle retention around bank. Submitted to Atmosphere-Ocean.
a 1991. Tidal model
shallow coastal
Freeland, H. J. and K. L. Denman. 1982. A topographically controlled upwelling center off the southwest coast of Vancouver Island .. Journal of Marine Research, 40, 1069-1093.
Loder, J.W., and D.A. Greenberg. 1986. fronts in the Gulf of Maine region. 6(3), 397-414.
Predicted positions of tidal Continental Shelf Research,
Thomson, R.E., B.M. Hickey, and P.H. Leblond. 1989. The Vancouver Island coastal current: Fisheries Barrier and conduit. In: Effects of ocean variability on recruitment and evaluation of parameters used in stock assessment models, R.J. Beamish and G.A. McFarlane (Eds) , Can. Spec Pub1. Fish. Aquatic Sci. 108, Ottawa, Onto

30
3.1.3 DRIFTER PROGRAM: UPSTREAM STUDIES IN QUEEN CHARLOTTE SOUND AND HECATE STRAIT.
In 1990 we worked in Queen Charlotte Sound and Hecate Strait, to the north of Vancouver Island and La Perouse Bank, concentrating on the outflow of water from these seas into the Pacific Ocean. For most of the summer a high pressure system sat over the region, with winds blowing steadily from the north. We contracted a drifter survey to Seakem Oceanography Ltd. who used our Loran-Cdrifters to study the currents, as part of a program funded by the Panel on Energy Research and Development (PERD) to assist in predicting the drift of oil spilled on the water. Members' of this team are Richard Thomson, Michael Woodward, Patrick Cummins, Michael Foreman, Falconer Henry and William Crawford, all at lOS.
The Seakem scientists set drifters near Cape St. James, and found a narrow outflow of surface water to the west past the Cape into the Pacific Ocean. As these waters pass the Cape, they are mixed and then likely sink below the surface waters of the Pacific, but the drifters remain at the surface, and flow toward the south with the coastal flow along the west coast of Moresby Island.
Drifters set further into Hecate Strait were caught up in a clockwise eddy around Middle Bank. None of these drifters floated into the Pacific, although several were retrieved before they approached the mouth of Queen Charlotte Sound. The flow on the west side of this eddy is upwind into the northerly winds. These drifters were drogued at 10 m below surface, and a test of two drifters, one drogued normally and one with the drogue at surface showed similar drifts.
Several satellite-tracked drifters were set on the south side of Queen Charlotte Sound by the Seakem charter vessel on its way north to Hecate Strait, once in early July and once in early August. Three departed Queen Charlotte Sound for the Pacific Ocean about 25 n. mi. to the northwest of Triangle Island. This outflow is not confined as close to shore as is the outflow near Cape St. James. However, some outflow through the channels between the Scott Islands is also expected.
The general pattern is of a southward drift along the eastern side of Hecate Strait, turning westward over Cook Bank and then out into the Pacific Ocean. This outflow is not the one observed at Brooks Peninsula in previous years. There is some evidence from previous studies reported by Dodimead (1980) of the outflow over Cook Bank. Our own study of summer currents in 1982 showed the currents on Cook Bank to flow west with winds from the north and east with winds from the south.
A 2-dimensionalwind-driven numerical model run by Charles Hannah shows, for steady winds from the north, an outflow past the Scott Islands, but not at Cape St. James. It does show the eddy around Middle Bank. When he reverses the winds in his model to represent winter conditions, the currents reverse. We have some evidence from early returns of sastellite-tracked drifters in January to March 1991 that the eddy over Middle Bank also reverses in winter, as expected from current meter

31
observations in 1983-4 and from other data. Thomson, 1990).
(Crawford, Tyler, and
Rick Thomson supervised the processing of infrared imagery by Borstad Associates. The imagery for the summer 1991 shows colder water outf10wing from the east side of Queen Charlotte Sound and Hecate Strait, with a prominent plume flowing to the southeast from Aristazaba1 Island and crossing Queen Charlotte Sound between Middle Bank and Goose Island Bank.
Plans for 1991
We hope to study currents in northern Hecate Strait and in Dixon Entrance as part of our second field year of observations for the PERD program. We have ship time booked for June-July and in January, but at present all ship time is under review due to shortage in funding and to the loss of the PARIZEAU to the east coast.
William Crawford Michael Woodward

32
3.1.4 Analysis of Sea Level. Alongshore Currents and Wind Stress off Vancouver Island
At the last La Perouse meeting we showed that there was a reasonable relationship between the filtered sea level heights (as measured at Bamfiel.d and Tofino), and alongshore currents on the continental shelf off the west coast of Vancouver Island (as observed at La Perouse Bank and off Estevan Point). Using the regression coefficients obtained, a time-series of hindcasted current velocities, based on Barnfield and Tofino sea level data, was produced. Some of the results of our initial analysis gave puzzling information. This lead to the examination of the original data sets. Subsequent to the correction of the sets a reanalysis of the data was made.
The following comprises the main results of the analysis:
I), Relationship between alongshore currents at La Perouse and Estevan
The correlation between the currents is moderately high and there is very little phase difference between the two sets of data. In detail, the relevant results are:
50 m: 100 m: 150 m:
No phase difference; Correlation r = 0.82 Some suggestion of La Perouse leading Estevan; r ~ 0.83 Although not significant at the 95% confidence level La Perouse leads Estevan by one day; r = 0.86.
Note that there is a tendency for the correlation to be larger with depths.
2) Relationship between alongshore currents at La Perouse and Estevan with sea level at Bamfield/Tofino
(Note that the variabilities of sea level at Barnfield and Tofino are identical).
The currents and sea level are fairly highly correlated with no phase difference for all depths. However, there is a possibility that
'sea level may lead the 50 m current by 1/2 day. The correlation coefficient is 0.89 for both the 50 m and 100 m currents (Fig. 10). It is smaller (0.79) for the 150 m current. Such close relationship between the currents and sea level has been observed elsewhere (e.g. Smith, 1974).
3) Relationship between alongshore currents at La Perouse and Estevan and alongshore wind stress (upwelling indices) calculated for (a) 48°N l25°W (off Cape Flattery) and (b) 5l o N 131° W (approximately between southern tip of Queen Charlotte Islands and northern tip of Vancouver Island.

33
La Perouse currents
(a) The correlation between wind stress and current is only moderate for the 50 m and 100 m currents (r = 0.72 and 0.73, respectively, Fig. 11) but for the 150 m, weak (r = 0.62). Wind stress leads the current by 2~ days for currents at all three depths.
(b) The correlation between wind stress and current is weaker than was the case for winds at (a) (0.58, 0.59, 0.57 for 50 m, 100 m and 150 m, respectively). Wind stress leads the current by 2~ - 3 days.
Estevan currents
(a) The correlation between wind stress and Estevan currents are similar to those for La Perouse (r =0.72,0.68 and 0.62 for 50 m, 100 m and 150 m, respectively). Wind stress leads by 2~ to 3 days; it is only 0.52 for 1560 m currents).
For the currents at all three depths, wind stress leads by 3~ days.
In most studies conducted elsewhere such as the continental shelf off the Oregon coast (e.g. Collins and Pattullo, 1970, Huyer et a1., 1978, etc.) the observed winds lead the currents from 0 to one day. Even when the closest location of 48°N 125°W (64 km from La Perouse) is used for comparison between wind stress and currents, the lead time is 2~ days. The reason for the relatively long lag is unclear at the moment; however we believe that this "excessive" lag may be attributable to the unrepresentativeness of the calculated wind stress data. Based on the detailed comparison of the measured and calculated winds in the vicinity, Thomson (1983) has already concluded that in the 1~ - 2 days period, computed winds are not useful indicators of oceanic wind variability.
s. Tabata H. Waddington
D. Ramsden

34
LAG (days)
1.0 5 4 3 2 1 -0+ 1 2 3 4 5 I I I I , , I I
0.9 -
0.8 r-48°N -
~ 0.7 f- IIHHIII z w
1IIIIIIfi 11111111 u ll. 0.6 l-ll. W a 0 ~f -z 0.5 f-
a ~ H~fnH -I 0.4 -w t-a: 51°N a: a
·0 0.3 I- -
0.2 t- -
0.1 I- -
0.0 I I I I I II J
Figure 10. Lagged correlation between 50-metre currents at La Perouse and alongshore wind stress at 48°N/125°W and 51°N/131°W. Positive lags represent wind stress leading currents. 95% confidence limit for each coefficient is indicated by vertical bars.

t-Z W (;) u::: u.. w o (;)
z o
LAG (days)
4 3 2 1 -0+ 1 1.0 , , ,
3.5
2 3 4 ,
-0.9 r- I I I I I I I I I I I I
0.8 r- I I 1_
LAG (days)
4 3 2 1 -0 + 1 2 3 4 1.0 I I' '"
- 0.9
~ 0.7 r-BAMFIELD
- - 0.7 TOFINO -J
W a: ~ 0.6 r- - - 0.6 (;)
0.5 L.--L' ----l1L--....l--I---L-_....l--'--<1_",,-1---1 L---LI----lI,---,--I~_-L__l ....... l___'J'___' 0.5
Figure 11.
Lagged correlation between 50-metre currents at La Perouse and sea level heights at Barnfield and Tofino. Positive lags represent sea level leading currents. 95% confidence limit for each coefficient is indicated by vertical bars.

36
3.2 BIOLOGICAL OCEANOGRAPHY PROGRAM
3.2.1 PROGRAM RATIONALE AND SAMPLING STRATEGY
The goals of the Biological Oceanography component of the La Perouse Proj ect (LPBP) are to describe and quantify seasonal and interannual variability in plankton biomass and community composition for the southern Vancouver Island outer coast, and to learn whether lower trophic level variability is transmitted up the food chain to commercially exploited .fish stocks.
Although the continental shelf and slope zone off Vancouver Island is relatively narrow, distinct oceanographic regions (based on water properties, plankton biomass and composition, bathymetry, and current pattern) have 'been identified in previous studies. The present sampling scheme for the LPBP is based on multiple sampling within the regions shown
. in Fig. 2b and described below.
Region A (outer bank edge. shelf break and slope). Currents are primarily parallel to the bottom contours and toward the SE in summer, NW in winter. Water properties are relatively offshore in character (high salinity, low surface nutrients and phytoplankton).
Regions B. D. and E (inner shelf banks and basins). Currents and water properties are strongly influenced by the discharge from Juan de Fuca Strait (averaging alongshore to the NW year round but probably with considerable and variable cross-shelf component). Salinity is re1at~ve1y low in the upper layer, nutrients and phytoplankton concentrations are often extremely high.
Region C (shelf region south of the major banks; Juan de Fuca canyon and gyre system). Currents show a strong cyclonic curvature. Upwelling of deep water along the canyon axis is very intense through late spring and summer. This region appears to be a maj or source for deep water entry onto the shelf. Nutrients and phytoplankton concentration are often high.
The present sampling grid (Fig. 2b)) includes 3 stations in Region C,4stations in Region A, . and 8 in Regions B, ti, andE (several of the latteta.re sited near reported herring aggregation~). The sta~ions are sampled opportunistically during lOS and PBS research cruises operating in the vicinity; routine samples consist of vertical or oblique net hauls (0.23 mm mesh) integrating zooplankton concentration over the entire water column above 250 m. The zooplankton samples are analyzed under contract (1985 and 1986 samples by Edward Anderson Marine Sciences, 1987 samples by Aquametrix, 1988-1990 samples by Sy-Tech Research) for total biomass, species composition, and size spectrum. Full data records are archived by Ocean Ecology Division, summary data lists (abundance of major taxa, biomass by major size category) are provided to PBS scientists involved wi th LPBP. The use of several stations within each region allows an estimate (and averaging out) of local patchiness.

37
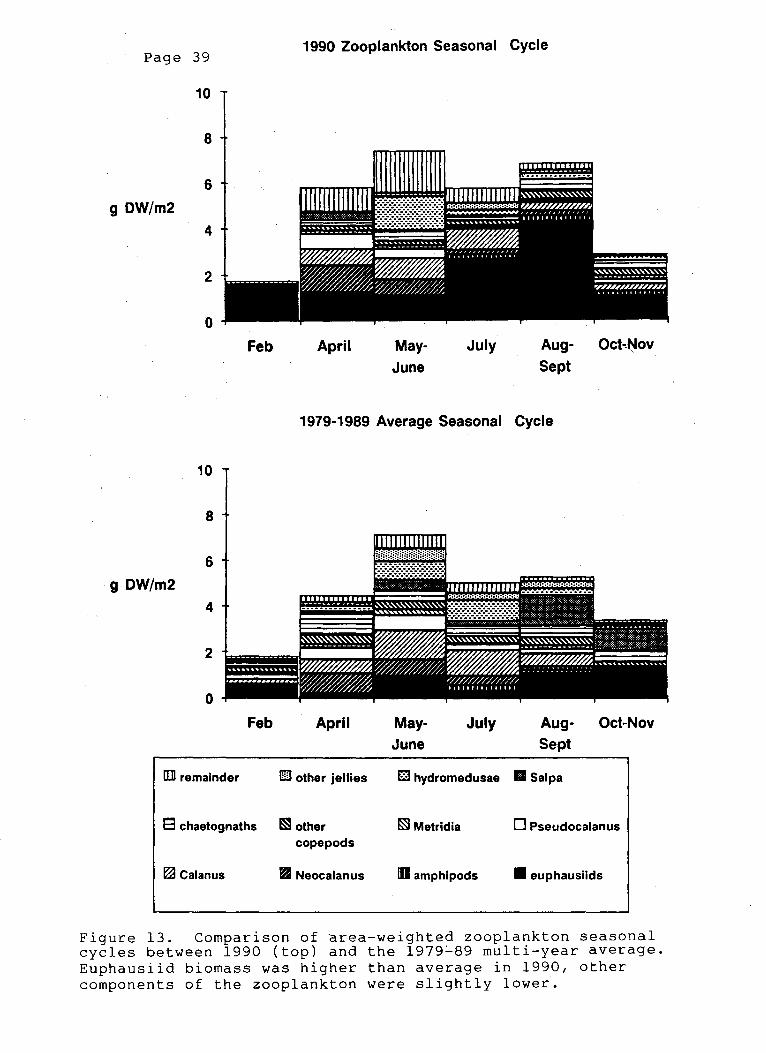
3.2.2 Seasonal cycle of plankton biomass and species composition in the La Perouse study area.
The major analysis effort in 1989-1990 was estimation of the "normal" seasonal cycle of water properties and plankton concentration using spatial and bimonthly time-period averages of samples collected between 1979-89. Knowledge of the average seasonal cycle is an essential first step toward examination of year-to-year anomalies in plankton productivity. Average zooplankton seasonal cycles for oceanographic subregions within the study area were reported in the 1989 La Perouse Project Annual Report; all regions showed a spring-summer maximum in zooplankton biomass but there were between-region differences in timing and in the relative ranking of zooplankton species. In general, peak biomass was lowest and earliest on the inner shelf banks, higher and more persistent in offshore and deep water location. Zooplankton biomass tended to decline in mid to late summer. Figure 12 shows the corresponding regional seasonal cycles of dissolved nutrients and upper layer phytoplankton biomass. In contrast to the zooplankton, nutrient and phytoplankton levels remain high or increase throughout the summer. This suggests sustained high input rates of nutrient-rich (upwelled) water and substantial advective export of phytoplankton and zooplankton biomass.
We can also now begin to compare the zooplankton seasonal cycle observed in a single year against the multi-year average (Fig. 13). Zooplankton samples were collected in February, April, June, July, August, and late October 1990. The annual cycle of total biomass was similar to the long-term average, but there appears to have been shifts in species mix: euphausiid biomass was higher in 1990, gelatinous zooplankton biomass was lower, and copepod and chaetognath biomass was slightly lower.
D.L. Mackas

NIT RAT E (aM) page 38
20
O' JF MA MJ J AS ON
20
JF MA MJ JASON
20
J F MA MJ J AS ON
20
JF MA MJ J AS ON
20
10
J F MA MJ J AS ON'
(I) JUAN DE FUCA STRAIT
(2) INNER SHELF
C H L A (m g . m- 3)
JF MA MJ J AS ON
0.1 :::
(3) SOUTHERN SHELF GYRE
(4) OUTER SHELF I
JF MA MJ J AS ON
J F MA MJ J AS ON
0.1 L-_:...---.l......;;;..----.-J
10
(5) SHELF BREAK I AND OFFSHORE
JF MA MJ J AS ON
JF MA MJ J AS ON
Figure 12. Seasonal cycles of dissolved nutrients (nitrate) and phytoplankton biomass (chlorophyll ~) in various oceanographic subregions of the La Perouse study area. Error bars show range of spatial averages within individual cruises. The entire region has sustained high summer levels of nutrients and phytoplankton; this provides a rich food supply for herbivorous zooplankton. Highest levels are observed relatively nearshore; the spatial gradient suggests a mix of seaward and alongshore transport from Juan de Fuca Strait and the inner shelf.
Page 39
10
8
6
g DW/m2
4
2
o Feb
10
8
6
g DW/m2
4
2
o Feb
[]I remainder
8 chaetognaths
~ Calanus
1990 Zooplankton Seasonal Cycle
April May
June
July Aug- Oc~~ov
Sept
1979-1989 Average Seasonal Cycle
April May- July Aug- Oct-Nov
June Sept
IiliJ other jellies t;:1 hydromedusae III Salpa
~ other r;:§I Metridia o Pseudocalanus cope pods
II Neocalanus !D amphipods • euphausiids
Figure 13. Comparison of area-weighted zooplankton seasonal cycles between 1990 (top) and the 1979~89 multi-year average. Euphausiid biomass was higher than average in 1990, other components of the zooplankton were slightly lower.
40
3.2.3 West coast phytoplankton productivity in 1990
The most extensive red tide on record for British Columbia occurred in August 1990. A massive bloom of Gonyaulax spinifera developed along the west coast of Vancouver Island extending from inner Juan de Fuca Strait to at least Brooks Peninsula, over 400 km away, and as far as. 100 km offshore. The bloom extended into Nootka and Barkley Sounds but no other inlets. In Barkley Sound, g. spinifera mixed with or was replaced by Prorocentrum micans. There are no previous records of g. spinifera blooming here.
We received samples from several sources and had them analyzed for dominant species. Surface cell concentrations reached 9 x 10⁷ cells /L. g. spinifera is not known to be toxic, and PSP toxin concentrations in shellfish in the area affected generally declined during the bloom. High mortality of shellfish was reported , especially for Barkley Sound, but the cause was believed to be low oxygen levels. Data from lighthouse monitoring stations (Fig. 14) indicated that temperatures were at least 2°C above normal during this period. An anomaly of 2°C corresponds to about 2 standard deviations, a significant departure from normal.
The warm conditions observed throughout most of 1990 did not result from the predicted 1990 El Nino, which itself did not materialize. However, as of April 1991 the Southern Oscillation Index (SIO) has again reached -1.4, considered a significant indicator of a possible El Nino. Numerical forecasts are mixed as to the likelihood of a 1991 El Nino, so as in 1990 we will have to wait until July to see if an El Nino is developing.
K. L .. Denman J. R. Forbes
H. J. Freeland

17
u 15 •
C . .-1
~ 13 :::l +J ro "QJ
0. E 11 QJ
I-
QJ
U ro -"-:::l
(J)
ro QJ (J)
9
7
Daily SSTs at Amphitrite Pt. up to 31 Dec. 1990
5 1 ...I'"UU'-" ...... 111:; ",;;:J OYI:;, O~I:; OIiIlUO", ~y~ ... e iii
Jan
1990
Feb Mar Apr May Jun Aug Sep Oct Nov Oec
Figure 14. Daily sea surface temperatur~s from Amphitrite Point lighthouse for 1990, plotted as departures from the smoothed annual cycle. The dotted line at 14.5 C is a qualitative indicator of threshold conditions for the red tide.
~ f-'

42
3.3 FISHERIES OCEANOGRAPHY PROGRAM
3.3.1 Pacific Hake Distribution and Recruitment
Pacific hake (Mer1uccius productus) is the most abundant species in waters off the west coast of Canada and is a maj or component of the groundfish fishery. The offshore stock is migratory and, after spawning off California and Mexico during the winter, moves northward to feed during the summer from northern California to Queen Charlotte Sound. Schools of adult hake first appear off Vancouver Island in late May and some remain until late November. The southward migration may be triggered by the onset of the fall transition.
Total reported catches in the Canadian zone averaged 78,281t over the five year period 1986-1990. The catch in 1990 decreased to 73,269 t from an all time high of 97,845 t in 1989. Participating countries in 1990 were Japan, Poland, and the USSR. In 1990, most hake was landed through a j oint venture 'with Canadian fisherman. The national fishery was eliminated with a small supplemental allocation given to Poland. A,sma11 domestic fishery lands hake to U.S. markets.
The proportion of the stock supporting the Canadian fishery is in good condi tion as the Canadian fishery continues to be supported by a series of strong year-classes, in particular, the 1984 ~nd 1980 year-classes. The stock overall remains in good condition as the 1984 and 1987 year-classes appear to be stronger than previously believed.
The objectives of this study are: (1) to determine the distribution and relative abundance of Pacific hake in Canadian waters on an annual basis; (2) to examine distribution in relation to oceanographic and biological features; (3) to determine biotic and abiotic factors controlling year-class success; and (4) to determine the impact of Pacific hake and other predators on the abundance of Pacific herring (with D. Ware and R. Tanasichuk).
Research on the distribution, abundance and biology of this stock has been conducted annually since 1977. The most recent survey was conducted in August 1990 and for the first time a hydroacoustic assessment was conducted north of 50 degrees N. Results indicate that hake were distributed from the Canada-U.S. border to Queen Charlotte Sound. As in past years, large concentrations were found in the basins adjacent to La Perouse Bank. North of La Perouse Bank, hake were found as small, dense schools along the 150-200 m isobath. A significant concentration was located in the Brooks Peninsula area. The biomass of hake found between the U.S./Can. border and 50 degrees N, assuming a target strength of -35 dB/kg, was 176,082 t. A further 141,256 t was found north of 50 degrees for a total for the Canadian zone of 317,338 t.
During 1990 the focus of work on the factors affecting the distribution of hake has been to examine the effect of physical and biological conditions on hake distribution. COMPUGRID software, a
43
Geographic Information System (GIS) was used to display and overlay the host of factors.
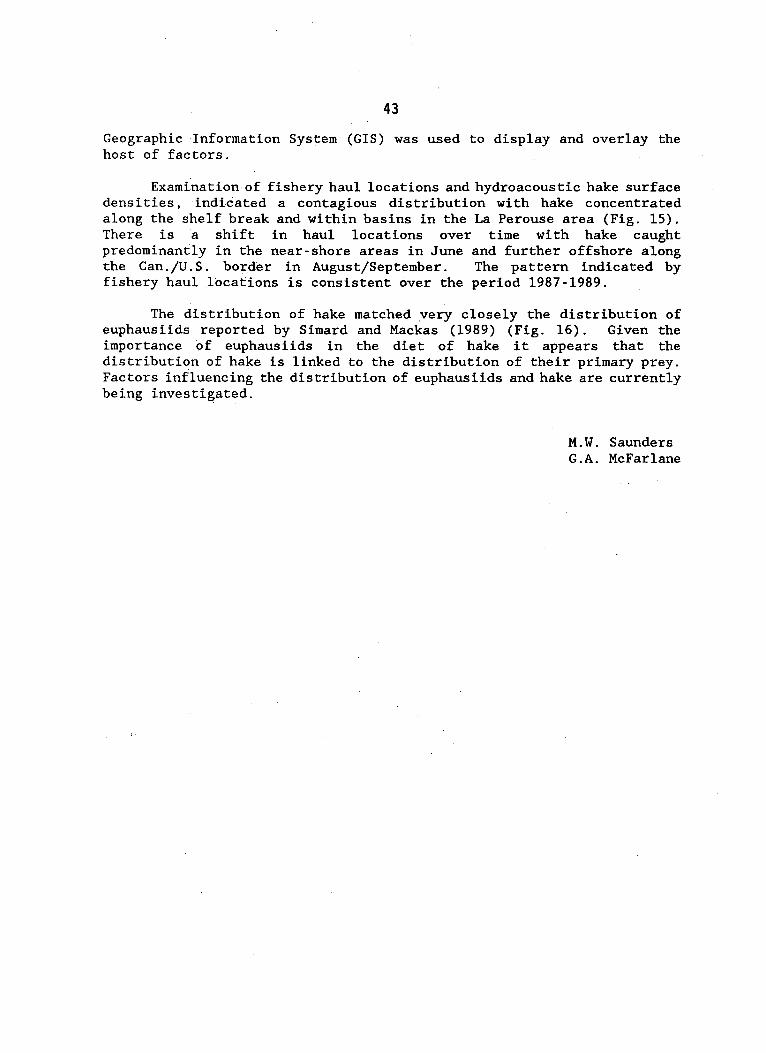
Examination of fishery haul locations and hydroacoustic hake surface densities, indicated a contagious distribution with hake concentrated along the shelf break and within basins in the La Perouse area (Fig. 15). There is a shift in haul locations over time with hake caught predominantly in the near-shore areas in June and further offshore along the Can./U. S. border in August/September. The pattern indicated by fishery haul locations is consistent over the period 1987-1989.
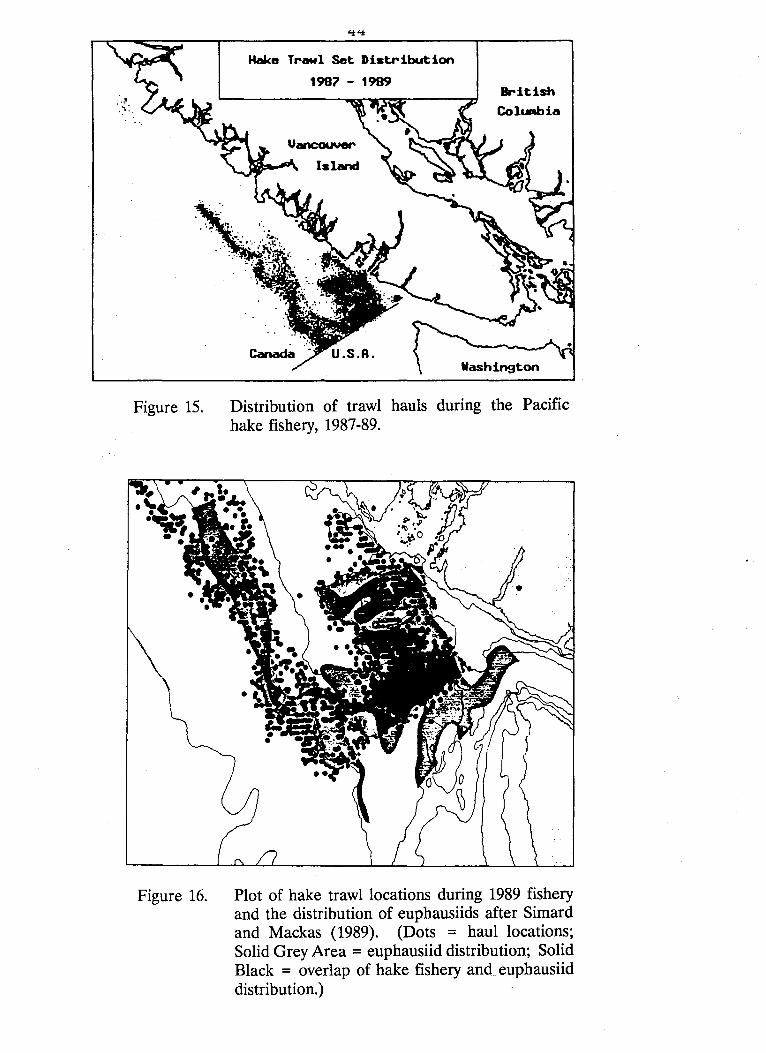
The distribution of hake matched very closely the distribution of euphausiids reported by Simard and Mackas (1989) (Fig. 16). Given the importance of euphausiids in the diet of hake it appears that the distribution of hake is linked to the distribution of their primary prey. Factors influencing the distribution of euphausiids and hake are currently being investigated.
M.W. Saunders G.A. McFarlane
... ~
Hake Trawl Set Distribution
British
CoIUlllbia
Washington
Figure 15. Distribution of trawl hauls during the Pacific hake fishery, 1987-89.
Figure 16. Plot of hake trawl locations during 1989 fishery and the distribution of euphausiids after Simard and Mackas (1989). (Dots = haul locations; Solid Grey Area = euphausiid distribution; Solid Black = overlap of hake fishery and euphausiid distribution.)

45
3.3.2 Herring Distribution. Mortality and Recruitment
An exploratory analysis of the existing oceanographic and fisheries data for the 1960-81 period (Ware and McFarlane 1986) at the onset of this project indicated that year-class strength of the lower west coast of Vancouver Island (LWCVI) herring stock was negatively correlated with both I} the biomass of hake in the Canadian zone and 2} sea surface temperature. These findings were recently corroborated by a more extensive analysis of herring recruitment and growth using the entire historical data base which extends back to the 1930s (Ware 1991).
Guided by these relationships, a program was designed to determine if the mortality of pre-recruit and adult herring was related to interannual variability in the spatial overlap of the herring and offshore predator distributions on the continental shelf, and by the abundance of alternative prey during the upwelling season (May to October). In midsu.mp1er, th,e LWCVI herring stock currently averages about 48 thousand ,tonnes. There are eight key predator species around the La Perouse Bank. In order of importance according to the size of the stocks and the amount of herring eaten these predators are: Pacific hake, chinook salmon, coho salmon, lingcod, Pacific cod, dogfish, sab1efish and halibut. Pacific hake account for 1/3 of all the predator-related herring mortality, which makes them the most important predator. This corroborates the statistical evidence noted above which found a significant negative correlation b,etween herring recruitment and hake biomass. Preliminary estimates also indicate that virtually all of the estimated natural mortality of the LW,CVI herring stock (average of 90,000 tonnes of all age,. groups) can be accounted for by predators. The mU1tispecies predator-prey model used to estimate the amount of herring consumed is outlined in section 3.3.6.
The two most abundant prey species of commercial-sized fish in the La Perouse Bank area areeuphausiids and herring. Euphausiids are the principal prey accounting for 21-63% of the mid-summer diet of the offshore predators; herring make up 12-71% of the diet. During the last 6 years euphausiids have constituted 59% (coefficient of variation of 3l%) and herring 33% (coefficient of variation of 57%) of the summer diet of
,Pacific hake.
1990 Multispecies Survey
A mU1tispecies trawl survey around La Perouse Bank has been conducted annually since 1985. The objectives of the survey are to: 1} determine the degree of overlap in the distribution of herring and their main predators, 2) measure the incidence of herring in the summer diet of the offshore predator complex, and 3) sample the herring concentrations and forecast recruitment to the spring roe herring fishery from the abundance of 2-yr old herring on the summer feeding grounds. The 1990 survey was conducted between August 15-21 by the charter trawler the "Howe Bay".
46
Distribution: The distribution of hake was typical for this time of year. The main body of fish was located near the Canada-U.S. border in Subarea 10; lesser concentrations were found midway between the 100 and 200 m isobaths in subareas 12 and 13; non-migratory resident hake were found in Trevor Channel in Barkley Sound (Subarea 1, Fig. 17).
The main concentrations of herring were also in their usual haunts on 40-mile and Swiftsure Banks (Subareas 6 and 9; Fig. 17). Moderate concentrations were found in Subareas 2, 3 and 4, and near the 100 m isobath in Subarea 14.
Predator Abundance Trends: The standardized catch rates (CPUE) of the dominant predator species over the duration of the La Perouse program and according to historical data from this area are shown in Figs. 18 and 19. The catch rates have been standardized to account for differences in the size of the midwater and bottom trawls used over the years. With respect to. the mid-water species; the relative abundance of hake and chinook in the survey area was above average in 1990, whereas the dogfish and. pollock CPUEs indicate a reduced abundance. Note the sharp recovery in chinook observed during the last two surveys.
For the principal groundfish species the 1990 bottom trawl survey indicates an increase in the abundance of sablefish, and a decline in lingcod· and 'Pacific cod (Fig. 19).
Herring Predation: Five thousand predator stomachs were examined at sea. Thirty percent of the hake diet (by weight), was herring; this figure is about average for this time of year. The amount of herring in the diet of dogfish and sablefish was also average. In contrast, lingcod contained more herring than usual, while chinook, and Pacific cod contained below average amounts.
Herring Recruitment Forecast: For the last 5 years the summer age composition of the LWCVI herring stock has been estimated from length frequency samples obtained by mid-water trawling summer feeding concentrations of herring. The proportion of 3-yr old fish (= recruit spawners) in the Barkley and Clayoquot Sounds spawning stock in the spring was forecast from the relative abundance of age 2+ fish encountered during the previous August trawl survey around La Perouse Bank (Fig. 20). To date, the forecasts have beert remarkably accurate and are currently being used by the PSARC herring stock assessment committee to estimate recruitment,
The size of the error between: 1) the unweighted forecast of the frequency of age 3 fish in the spawning stock and the observed frequency in the roe fishery,and 2) the error of the weighted forecast (which was obtained by weighting the frequency of each age-group by its estimated
·biomass in each subarea) was examined for the 1987-90 period. All else being equal, the weighted forecast should be more accurate. Indeed, we found that the average error of the weighted forecast (8%) was slightly lower than the unweighted forecast error (10%). However, since the
47
difference in the errors is so small, for the 1991 forecast we computed an unweighted estimate of the proportion of age-2+ fish in the pre-spawning adult component of the stock on Swiftsure and 40-mile Banks. The sampling data suggested that recruit spawners (age-3) should make up about 15% of the spawning stock by frequency in March 1991. A frequency this low implies that the 1988 yr-class is below average. This forecast was presented at the annual herring stock assessment meeting in September 1990 and was used to establish the 1991 roe fishery quota. Early signs from the Barkley Sound roe herring fishery confirm that recruitment was below average, as forecast.
D.M. Ware R.W. Tanasichuk

49000'-1 ( "',.. <0_0 '.0 . -; Co 0 0 . ,c;z 71 :J
48°30'
48°00'
, .....
/
I' , , "
14.1
..... , IOOOm
"-" '-")
,,\/ ,
\ 13.1 " , I ,
FISHING SUBAREAS I. BARKLEY SOUND 2.FIRING RANGE 3.S W CORNER 4. POTHOLES 5.12 MILE BANK 6.40 MILE BANK 7. FINGER BANK 8. BOTTLENECK 9.SWIFTSURE BANK 10. EDDY I I. WEST BANK 12. SOUTH SLOPE ! 3.CENTRAL SLOPE 14. NORTH SLOPE
\ \
'- - -" (_I
\ (oJ
50m I "-
' ..... "~- ..... \ - .....
"/2 ' / I ' ...
1, ..... 50m
\ '\ /
'" \
-I I
I ~ ""........ ,-J __ - ..... J I \ \ I \ 12.1 /
" / \.. ,
,./ I
-, ,.... "
, \ \
10.1
.... C I'
"
, I _--/- I I' ~
I ( I /
I \ 200m / I \ 1 I I I .... / / I I '" ./
I / I " I I 9 I \' I l) I • / ) \ I I
'1 J r-/IJ( r I I -./I.... ( r I
,I ( I I -...... I I
"j I I I ( ..... '" " I f
... ...1 ".-) \1' I 1/'
j I 200m 200m
I
I I
OOm , j2~0('()' 125°00'
Figure I7: Major concentratIons of herrIng (hatched areas) and hake (black areas) encountered by F/V HOWE BAY August 15-21, 1991.
~ OJ

Page 49
,......., CD 0 T"""
X .-C")
E -C> ~ "'-" ......... t::: 0 --W
I :t: c:: ::l
I ~
Q) c..
I
..c () +-' CO ()
"'C Q) N
"'C ~
CO "'C c:: CO +-' CI)
6000 HAKE CPUE
4000 JUNE--AUGUST (Midwater Tows)
3000
2000
1000
0
1100
1000
900 DOGFISH CPUE
800
700 JUNE--AUGUST (Midwater Tows)
800
600
400
300
200
100
0
400
300 POLLOCK CPUE JUNE--AUGUST (Midwater Tows)
200
100
0
40
30 CHINOOK CPUE JUNE--AUGUST (Midwater Tows)
20
10
89 70 71 72 73 74 76 78 77 78 79 80 81 82 83 84 86 86 87 88 89 90
YEAR
Figure 18. Pelagic fish catch-per-unit effort time series in La Perouse Bank area, summer surveys.

Page 50
x ..--... ('t)
E -~ "-" ......... t:::: o :::: w
I ~ c:: :::J
I L-
a> 0..
I
..c:: (,) ...... CO o ""0 a> N
"E CO
""0 c:: CO ......
C/)
600
400
300
200
100
22 21 20 19 18 17 16 15 14 13 12 11 10
9 8 7 6 5 4 3
SABLEFISH CPUE JUNE - -AUGUST (Bottom Tows)
67777 777 7 7 788 8 888 8 8 8 8 9 90123 4 5 6 7 8 901 2 345 6 7 890
LINGCOD CPUE JUNE--AUGUST (Bottom Tows)
2 T-'--.-.-.--r-.-.--r-r-.--r-.-.--.-.-.--.-.-.--r~
16
15
14
13
12
11
10 9
8
7
6
5
4
3
2
69 70 71 72 73 74 75 76 77 78 79 80 81 82 83 84 86 86 87 88 89 90
PACIFIC COD CPUE JUNE - -AUGUST (Bottom Tows)
1 e--t O~'--'-'-''-r-,-.--'-'-''-'-.--r-r-.--r-.-.--r-r~ "69 70 71 72 73 74 75 76 77 78 79 80 81 82 83 84 85 86 87 88 89 90
YEAR
Figure 19. Demersal fish catch-per-unit effort time series in La Perouse Bank area, August surveys.

51
o o 20 40 60 80 100
Figure 20. Relationship between weighted forecast and observed frequency (%) of age 3 herring in the lower west coast of Vancouver Island spawning stock (1987-90). The 1991 forecast is shown as a solid circle.
52
3.3.3 Pacific cod recruitment
The objective of this study is to explore how year-class success of Pacific cod (Gadus macrocephalus) is related to its reproductive biology. We are carrying out research on spawning migrations, the gonad maturation cycle, the time of spawning and the location of spawning grounds. We are also working on a statistical study of factors that influence the variability of year-class strength of the La Perouse stock of Pacific cod.
The research will involve comparing reproductive responses of Pacific cod to the same sets of physical oceanographic variables in two important fishery areas, La Perouse Bank and Hecate Strait. The La Perouse Bank stock is the most southerly stock of Pacific cod of the northeast Pacific Ocean large enough to be the target of a fishery, while the Hecate Strait stock is the most important in landings for the west coast of Canada. Our expectation is that the higher water temperatures in the La Perouse area as compared to Hecate Strait, and the differences in ocean currents, will cause differences in the reproductive responses of the cod.
Results of fecundity comparisons, and gonad condition
Relationships for fecundity at fish-length/weight were compared for six samples from Hecate Strait and La Perouse Bank (Foucher and Tyler 1990). Fecundity-at size was 5% to 20% higher in Hecate Strait, the larger differences being with the larger fish in the 60 to 90 cm length range. We suggest that the higher temperatures of the La Perouse area may cause the cod to put more of their energy budget into maintenance and less into reproductive output. A comparison with data reported from Hecate Strait by Thomson (1962) showed no significant differences with his data taken 25 years ago. Preliminary results from a dynamics model of stock-fecundity indicates that two stocks with these differences in fecundity-at-length can easily have effective spawning biomass differences ranging from 5 to 17 % when their length-frequenci~s and abundance indices are identical. Combining the multiplicative fecundity differences with the previously demonstrated presence of a critical stock size for reproductive output (Tyler and Crawford, In press), has implications for stock assessmment; namely that the stock with the lower fecundity-at-size could be over fished in years when the biggest fish dominated the stock, since it is precisely then that the two biomasses are not at all equivalent in terms of egg production.
Large fish with senescent gonads were noted in a sample of ovaries taken from pre-spawning cod from Amphitrite Bank, January 29, 1990. Nine percent of the sample were in the early ripening stage, 88 percent in the late ripening stage, and 3 percent in the running ripe stage (for description of stages see Bowden, Foucher, and Tyler 1990). Fourteen percent were in a senescent stage, with the ovary very firm, shrivelled and black in colour (Foucher and Tyler 1990). The senescent fish were in the 60 to 75 cm length range where-in all specimens would be mature. The black colour was melanin that is a product of previous spawning (Bowden et

53
al. 1990). This state was not observed in the many samples taken in Hecate Strait. It would seem that the fish were subjected to conditions in the La Perouse area that prevented reproduction by some individuals.
References
Al Tyler Ray Foucher
Claudia Hand
Bowden, D. G., R. P. Foucher and A. V. Tyler. 1990. A guide to ovarian histology of Pacific cod. Canadian Tech. Rep. Fish. Aquat. Sci. 1723: 44 p.
Foucher, R. P. and A. V. Tyler. 1990. Estimation of the fecundity of Pacific cod. Canadian MS Rep. Fish Aquatic Sci. 2088: 49 p.
Thomson, J.A. 1962. On the fecundity of Pacific cod (Gadus macrocephalus) from Hecate Strait, British Columbia. J. Fish. Res. Board Canada. 19 (3) : 497 - 500.
Tyler, A. V. and W' .R. Crawford. In press. Modeling of recruitment patte;ns of Pacific cod in Hecate Strait, British Columbia. Canadian J. Fish. Aquat. Sci.

54
3.3.4 Herrin~ ~rowth and size-at-age
We investigated the influences of bio1ogica1 and physical oceanographic factors on the growth of Pacific herring (C1upea harengus pallasi) populations which feed in the La Perouse Bank area. Biological
. data included herring size-at-age information, herring stock abundance estimates,· and euphausiid abundances estimated from vertical plankton hauls made seasonally over the La Perouse zooplankton sampling grid. Herring data related to Barkley Sound and northern Strait of Georgia spawners, fish which feed around La Perouse Bank over swnmer. The oceanographic data consisted of corrected Amphitrite Point lighthouse salinity and temperature data. These data were corrected to reflect oceanographic conditions on La Perouse Bank by calculating equations which described relationships between mean monthly temperature and salinity data from the lighthouse and a mooring near 40-Mi1e Bank (Fig. 2b).
Results of multiple. regression analyses showed that herring biomass and late swnmer (August-October) sea temperature negatively affected the
,.growth of juvenile and adult herring. Year-class strength and late swnmer sea temperatures during the first year of life .. accounted for 74 and 26% respectively of the explained variation (R2=0.81) in herrihg·size-at-age 4, when all fish have matured. We found that the combined biomass of Barkley Sound and northern Strait of Georgia adults and sea temperature accounted for similar proportions of the explained variation in growth rates of older fish; the multiple regression models accounted for about 70% of the variation in growth rates. Simple regression analysis showed that sea temperature late in the swnmer influenced euphausiid availability. We assume that temperature acts as a proxy variable in our multiple regressions and actually reflects euphausiid abundance. It is unknown whether temperature influences euphausiid abundance through their biology or by affecting the distribution of Pacific hake (Mer1uccius productus), the dominant predator in the area.
We developed a model which simulates seasonal herring growth (Fig. 21) . Fish increase in weight during a slow growth phase, which occurs between the onset of feeding (mid-March) and end of June, and then a fast growth phase (July to mid-October). These growth phases reflect seasonal variations in herring distribution, possibly due to the presence of hake. The risk of hake predation presumably restricts herring to 40-Mi1e and Swiftsure Banks and limits their access to adequate euphausiid concentrations. Herring move off the Banks later in swnmer to better feeding conditions because hake begin moving offshore. The negative growth phase, which occurs between mid-October and spawning, reflects weight loss due to starvation and gonad growth. The final weight loss, at the beginning of March, represents the loss of gonadal products at spawning.
We herring historic
intend to use the results of this work, which examined growth in over the roe fishery period (1975-present), to investigate growth and size-at-age trends (1929-65).
R.Tanasichuk D. Ware

150
140
130 .........
C'I 120 "-
I-- 110 :r: <.!)
w 100 ~
-.J 90 < I--
0 80 I--
70
60
~ ~ ~
I 1 1 1 1 1 1 1 1 1 I 1 1 1 1 1 1 1 1 1 I 1 1 1 1 1 1 1 1 1 I 1 1 1 1 1 1 1 1 1 I I. 1 1 1 1 1 1 I f I I I I I I I I I I I
0 10 20 30 40 50 60
WEEK Figure 21. Annual growth cycle: Observed (0) and predicted (p) weight by week for age 4 herring. Week 1 is the first week in March.
U1 U1
56
3.j.S Species and size composition of euphausiids as prey
Analyses of the diets of the more abundant fish species in the La Perouse Bank area (Tanasichuk et al. in press) showed that euphausiids are the most important prey item. However, more than one species of euphausiid occurs in the study area, and the species and size composition o~ euphausiids in fish stomachs has not been examined.
We monitored the species and size composition of euphausiids eaten by Pacific hake (Merluccius productus), the dominant fish species in the La'; Perouse Bank area over the summer feeding season. Samples were collected over the 1989 and 1990 hake fishing seasons by observers working ori' foreign processing trawlers. We examined fresh euphausiids in stomachs from hake coll'ected during multi-species fisheries surveys around La Perouse Bank, and up the west coast of Vancouver Island, in August 1989 and 1990. '
Species and size composition of macro-zooplankton in hake stomachs collected in 1989 are presented in Fig. 22. Hake fed on Thysanoessa spinifera exclusively until mid-August, mostly on Euphausia pacifica until ,mid-November, and then fed on both ~ spinifera and ~ pacifica. Pasiphea pacifica, a planktivorous decapod, occurred in the diet in late September. Samples collected in 1990 show similar trends in composition of plankton
,in h~ke stomachs. Seasonal length-frequency distributions suggest that .hake :ted on one' age-class of ~ spinifera and ~ pacifica in the summer and a younger age-class late in the year. ~ spinIfera dominated in hake stomachs collected over the August 1989 and 1990 surveys.
~ spinifera is the most importaritprey item for hake when their feeding rate is the highest, in early to mid- summer. Unfortunately, there is virtually no information on the biology of ~ spinifera. Therefore, the impact 'of variations in the physical oceanography of this region on the maj or prey' of the dominant fish species is unknown. A proj ect designed to examine the influence of physical oceanographic factors on the _population biology of ~ spinifera in Barkley Sound, next to the La Pexouse study area, began in March 1991.
R. Tanasichuk D. Ware
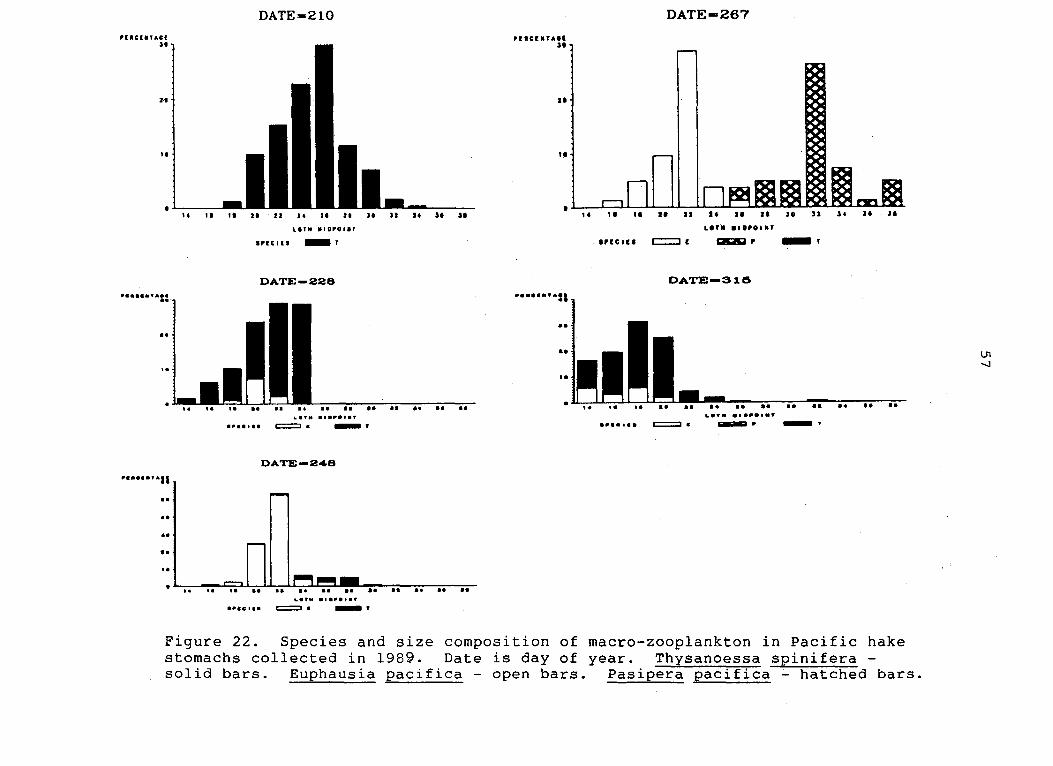
PIICl.TACl )I
2·1
II
....... " ..... ... ]
....... u·11 .. .. .. .. J
14 II
Figure
DATE=210
.. 21 U H 21 21 It n 54
LeTN .IDPOllr
.,rCI(1 -, DATE-228 -_.
•• .. •• .. • • _ •• po ••• r ....... =. -,
DATE-248
=1 II I~!!!-oo •• .. . . .. .. •• •• . .
.... rN .1 ...... ., ••• c .•• =. -, 22. Species and size
stomachs collected in 1989.
U II
PlaCIUAU n
II
"
I
.. •·••• .. ·:1
• •
.. ~
14
DATE-267
11 II II II .. .. II ~O H H
LIY" ."".,U
' .. IC '" c::::=J f ~ .. -, DATE-31&
---1 ____
I •
• .. .. •• .. oo •• • • •• • • .. • • •• • • ".1"" .I.~.I .. ........ = . -p _.
•• ••
composition of macro-zooplankton in Pacific Date is day of year. Thxsanoessa spinifera
solid bars. Euphausia pacifica open bars. Pasipera pacifica hatched
Ul -...J
hake
bars.

58
3.3.6 Multispecies predator-prey modelling
A mUltispecies predator-prey model is being developed to determine the impact of the offshore predator complex on the LWCVI euphausiid and herring stocks. Preliminary calculations indicate that the offshore predators eat about 94 thousand tonnes of herring annually, On average. This represents a herring stock production to biomass ratio (P/B) of about 1.9. About 30% of the annual herring losses are, estimated to occur inshore during the first 6 months of life. The remaining mortality occurs offshore on the continental shelf.
Preliminary results suggest that the estimated 350 thousand tonnes of fish in the La Perouse Bank area eat an equivalent biomass of euphausiids during the upwelling season (some 364 thousand tonnes). The average size of the euphausiid stocks around La Perouse Bank is uncertain, due to sampling problems such as net avoidance. If the euphausiid P/B ratio is about 6, which is suggested by studies in other areas, then the average biomass of the stock in recent years· is about 58 thousandtonnes.
With respect to the seasonality of the predation pattern, the model indicates that when the migratory hake arrive in the La Perouse area in June, the supply of euphausiids is adequate to satisfy most of the food demand of the predators. Consequently, herring predation is light and the' stock biomass increases because the daily growth rate exceeds the mortality rate. However, by mid-July the supply of euphausiids on the
. continental shelf has been significantly depleted by the predators so the predation rate on the alternate prey, herring, increases. Presumably in response to the reduced supply of euphausiids, their primary prey, the hake stock begins to migrate to the shelf break in August. This important
. shift in distribution matches the perceptions of the hake fleet, which has observed declining quantities of hake inshore in August.
The model will be expanded in 1991 to include all the major predators, the predation estimates will be refined, and the output will be validated against observational data.
'D. M. Ware

59
3.3.7 Production System Modelling
One objective of the La Perouse Program is to better understand the variability in fish production in the region. My doctorate research involves using simulation models and a holistic ecosystem approach to contribute to this obj ective. I am currently developing a model that simulates phytoplankton biomass as forced primarily by the interannual variability in the pattern, duration, and intensity of upwelling and downwelling. Data from the La Perouse Bank and the Washington mid-shelf regions are being used to test the efficacy of this model. Future research will expand the phytoplankton model to include major euphausiid population dynamics, in order to gain some insights into their interannual production variability.
In the second phase of the work I plan to link the phytoplankton/euphausiid model with a modified version of the La Perouse multispecies predator-prey model outlined in section 3.3.6. The principal reason for developing a whole system model is to be able to compare and contrast the current state of the La Perouse ecosystem, with the state the system was probably in when it was dominated by Pacific sardine in the 1920s and 1930s. An analysis of the response of the system when it is in these two different states might give some insights into how the system will respond to future changes in ocean climate, and species composition of the fish community.
c. Robinson

4.0 SUMMARY OF 1990 CTD SURVEYS
Cruise ·Ident. *
Cruise Ident. **
Date 1990
60
Participants
- ... -" - - - ... - - - :- ... - -............... -' ................................................................................................................................. -90-·10 Feb. 10 - Mar. 7 MCFarlane/Saunders
.90-11 90-01 Apr. 16 - May 4 Thomson/Denman/Mackas
90-01 May 7 - June 1 Tabata
90-12 June 11 - June 22 Thomson
90-15 90-04 July 16 - July 27 Denman
90-80 July 23 - Aug. 10 Hargreaves
90-81 Aug. 13 - Aug. 31 Saunders
;90-02 . Aug. 20 - Sept . 7 Tabata
90-14 90-06 Oct. 1 - Oct. 26 Thomson/Mackas/Denman
* Ocean Physics identification number.
** User identification number.
61
5.0 LA PEROUSE PUBLICATION LIST
Crawford, W.R. 1991. Tidal mixing and nutrient flux in the waters of southwest British Columbia. In: Proceedings of the International Conference on Tidal Hydrodynamics. B. Parker. [ed.J. (in press).
Crawford, W.R. and R.E. Thomson. 1991. western Canadian continental shelf.
. press) .
Physical oceanography of the Continental Shelf Research. (in
Foreman, M.G.G. 1991. Barotropic tides and tidal residuals for the southwest coast of Vancouver Island. In: Advances in Tidal Hydrodynamics, B. Parker [ed. J John Wiley and Sons. (in press).
Foreman, M. G. G., A.M. Baptista and R.A. Walters. 1991. Tidal model studies of particle retention around a shallow coastal bank. Atmos.-Ocean. (submitted).
Foreman, M.G.G. and H.J. Freeland. 1991. A comparison of techniques for tide removal from ship-mounted acoustic Doppler measurement along the southwest coast of Vancouver Island. J. Geophys. Res. - Oceans. (submitted) .
Hickey, B.M., R.E. Thomson, H. Yih, and P.H. LeBlond. 1991. Velocityand temperature fluctuations in a buoyantly-driven current off Vancouver Island. J. Geophys. Res. (in press).
Mackas, D.L. 1991. The seasonal cycle of zooplankton off southwestern British Columbia: 1979-1989. Can. J. Fish. Aquat. Sci. (submitted).
Tanasichuk, R.W., D.M. Ware, W. Shaw, and G.A. McFarlane. 1991. Variations in the diet, feeding periodicity and daily ration of Pacific hake (Merluccius productus) and spiny dogfish (Sgualus acanthias) off the southwest coast of Vancouver Island. Can. J. Fish. Aquat. Sci. (in press).
Ware, D.M. (in press). Climate, predators and prey: behaviour of a linked oscillating system. In: Long-term variability of pelagic fish populations and their environment. T. Kanasaki [ed.J. Pergamon Press.
Ware, D.M. and R.E. Thomson. 1991. What happened to biological productivity in the coastal upwelling domain in the 1920's and 30's? Can. J. Fish. Aquat. Sci. (in press).
Bowden, D.G., R.P. Foucher, and A.W. Tyler. 1990. A guide to the ovarian histology of Pacific cod. Can. Tech. Rep. Fish. Aquat. Sci. 1723: 44 p.

62
Crawford, W.R. and R.K. Dewey. 1990. Confidence limits for friction velocity determined from turbulence profiles in coastal waters. J. Atmos. Oceanic Techno1., 7(1): 50-57.
Foreman, M.G.G., A.M. Bapista, P.J. Turner and R.A. Walters. 1990. Lagrangian studies with a tidal model for the southwest coast of Vancouver Island. In: Computational Methods in Surface Hydrology, Proceedings of the Eighth International Conference on Computational Methods in Water Resources, Venice, June, 1990. G. Gambo1ati et al. [eds.] . Computational Mechanics Publications, Springer-Verlag, Berlin. pp. 177-182.
ForeIIian, M.G.G. and R.A. Walters. 1990. A finite-element tidal model for the southwest coast of Vancouver Island. Atmos.-Ocean 28(3): 261-287.
Foucher, R.P. and A.V. Tyler. cod in British Columbia. p.
1990a. Length-at-age by sex for P~cific Can. MS Rep. Fish. Aquat. Sci. 2086: 39
Foucher, R.P. and A.V. Tyler. 1990b. Pacific cod (Gadus macrocephalus). 2088: 4'9 p.
Estimation of the fecundity of Can. MS Rep. Fish. Aquat. Sci.
Kundu, P.K. and R.E. Thomson. 1990. Inertial oscillations observed near British Columbia. In: Special Volume of Pure and Applied Geophysics, 133. R. Hughes [ed.]. pp. 677-689.
Zellerer, R., D. Krauel and R. Thomson. 1990. Seasonal variability of 'ocean features at the entrance to Juan de Fuca Strait, Proc. 24th Annual CMOS Congress, p. 116.
Crawford, W.R. and R.K. Dewey. 1989. Turbulence and mixing: nutrients on the Vancouver Island Continental Shelf. Ocean 27(2): 428-442.
Sources of Atmos.
Denman, K.L., H.J. Freeland and D.L. Mackas. 1989. Comparisons of time scales for biomass transfer up the marine food web and coastal transport processes. In: Effects of ocean variability on recruitment and an evaluation of parameters used in stock assessment models. R.J. Beamish and G.A.McFar1ane [eds.]. Can. Spec. Pub1. Fish. Aquat. Sci. 108: 255-264.
Foreman, M.G.G. and R.F. Henry. 1989. The harmonic analysis of tidal model time series. Advances in Water Resources 12(3): 109-120.
Mackas, D.L., W.R. Crawford and P.P. Niiler. 1989. A performance comparison for two Lagrangian drifter designs. Atmos.-Ocean 27(2): 443-456.

63
Shaw, W., R. Tanasichuk, D.M. Ware, and G.A. McFarlane. 1989. Biological and species interaction survey of Pacific hake, spiny dogfish and Pacific herring off the southwest coast of Vancouver Island, August 1987. Can. MS Rep. Fish. Aquat. Sci. 2007: 149 p.
Shaw, W., R. Tanasichuk, D.M. Ware, and G.A. McFarlane. 1989. Biological and species interaction survey of Pacific hake, sablefish, spiny dogfish and Pacific herring off the southwest coast of Vancouver Island. FfV CALEDONIAN, August 12-25, 1986. Can. MS Rep. Fish. Squat. Sci. 2012: 134 p.
Simard, Y. and D.L. Mackas. 1989. Mesoscale aggregations of euphausiid sound scattering layers on the continental shelf of Vancouver Island. Can. J. Fish. Aquat. Sci. 46: 1238-1249.
Thomson, R.E., B.M. Hickey and P.H. LeBlond. 1989. The Vancouver Island Coastal Current: Fisheries barrier and conduit. In: Effects of ocean variability on recruitment and an evaluation of parameters used in stock assessment models. R.J. Beamish and G.A. McFarlane [eds.], Special Publication of Can. J. Fish. Aquat. Sci. 108: 265-296.
Ware, D.M. and G.A. McFarlane. 1989. Fisheries production domains in the northeast Pacific Ocean, p. 359-379. In: R.J. Beamish and G.A. McFarlane [eds]. Effects of ocean variability on recruitment and an evaluation of parameters used in stock assessment models. Can. Spec. Publ. Fish. Aquat. Sci. 108.
Crawford, W.R. 1988. The use of Loran-C drifters to locate eddies on the continental shelf. J. Atmos. Oceanic Technol. 5(5): 671-676.
Dewey, R.K. and W.R. Crawford. 1988. Bottom stress estimates from vertical dissipation rate profiles on the continental shelf. J. Phys. Oceanogr. 18(8): 1167-1177.
Dewey, R.K., P.H. LeBlond and W.R. Crawford. 1988. The turbulent bottom boundary layer and its influence on local dynamics over the continental shelf. Dynam. Atmos. Oceans 12: 143-172.
Foreman, M.G.G. 1988. A comparison of tidal models for the southwest coast of Vancouver Island. In: Computational Methods in Water Resources, Vol. 1, Modeling Surface and Sub-surface Flows, Proceedings of the Seventh Inter-national Conference, MIT, Boston, June, 1988. M.A. Celia et a1. [eds.]. Computational Mechanics Publications: Elsevier, pp. 231-236.
Thomson, R.E. and D. Ware. 1988. Oceanic factors affecting the fisheries. In: Report Sinclair et al. [eds.].
distribution and recruitment of west coast from the National Workshop on Recruitment. Can. Tech. Rep. Fish. Aquatic Sci. 1626: 31-64.

64
Crawford, W.R., W.S. Huggett and K. Lee. 1987. Water property observations from Queen Charlotte Sound, May and September, 1982. ·Can. Data Rep. of Hydrogr. and Ocean Sci. 50: 224 p.
Dewey,' R.K., W.R. Crawford, A.E. Gargett and N.S. Oakey. 1987. A microstructure instrument for profiling oceanic turbulence in coastal bottom boundary layers. J. Atmos. Oceanic Technol. 4(2): 288-297.
Shaw, W., R. Tanasichuk, D.M. Ware, D. Davenport, and G.A. McFarlane. 1987. Biological and species interaction survey of Pacific hake, sablefish, spiny dogfish, and Pacific herring off the southwest coast of Vancouver Island. F/V EASTWARD HO, August 10-22, 1985. Can. Data Rep. Fish. Aquat. Sci. 651: 159 p.
Emery, W.J., A.C. Thomas, M.J. Collins, W.R. Crawford and D.L. Mackas. , 1986a. An objective method for computing advective surface
velocities from sequential infrared satellite images. J. Geophys. Res. 91(C1l): 12,865-12,878.
Emery, W.J., A.C. Thomas, M.J. Collins, W.R. Crawford and D.L. Mackas. 1986b. Comparison between satellite image advective velocities, dynamic topography, and surface drifter trajectories. EOS Trans., Amer. Geophys. Union. 67(22): 498-499.
Ware, D.M. and G.A. McFarlane. 1986. Relative impact of Pacific hake, s'ab1efish and Pacific cod on west coast of Vancouver Island herring stocks. Symposium on Biological Interactions in the north Pacific Region and on Factors Affecting Recruitment, Dis tribution, and Abundance of non-anadromous species. Int. N. Pac. Fish. Comm. Bull. 47: 67-77.

65
6.0 LIST OF PARTICIPANTS
~. Brodeur, PBS, Post. Doc. Fellow R. Brown, Marine Fish Division, IDS W. Crawford, Tides and Currents Section, lOS K. Denman, Ocean Physics Division, IDS R. Forbes, Marine Fish Division, IDS M. Foreman, Ocean Physics Division, IDS B. Hargreaves, Salmon Dynamics, PBS D. Mackas, Marine Fish Division, IDS G.A. McFarlane, Marine Fish Division, PBS I. Perry, Marine Fish Division, PBS C. Robinson, Ph.D. Student, PBSjUBC M. Saunders, Marine Fish Division, PBS S. Tabata, Ocean Physics Divison, IDS R. Tanasichuk, Marine Fish Division, PBS R. Thomson, Ocean Physics Division, IDS A. Tyler, Marine Fish Division, PBS B. Waddell, Marine Fish Division, PBS D. Ware, Marine Fish Division, PBS M. Woodward, Tides and Currents Section, IDS

66
7.0 MISCELLANEOUS REFERENCES
Crawford, W.R. and R.E. Thomson. 1991. Physical oceanography of the western Canadian continental shelf. Cont. Shelf Res., in press.
Griffin, D.A. and P.H. LeBlond. 1990. Estuary/Ocean Exchange controlled by spring-neap .tidal mixing. Estuarine. Coastal and Shelf Science, 30, 275-297.
Healey, M.C., R.E. Thomson, and J.F.T. Morris. 1990. The distribution of commercial troll fishing vessels off southwest Vancouver Island in relation to fishing success and oceanic water properties and circulation, Can. J. Fish. Aquatic Sci., 47, 1846-1864.
Hickey, B.M., R.E. Thomson, H. Yih, and P. H, LeBlond. 1991. Velocity and temperature fluctuations in a buoyantly-driven current off Vancouver Island. J. Geophys. Res. (in press).
Kundu, P.K., and R.E. Thomson. 1990. Inertial oscillations observed near British Columbia. In, Special Volume of Pure and Applied Geophysics, 133, R. Hughes, Ed., 677-689.
Labrecque, A.J .M. 1990. Currents in the Juan de Fuca Strait, M. Sc. Thesis, Royal Roads Military College, 151 p.
Thomson, R.E., and D. Ware. 1988. Oce.anic factors affecting the distribution and recruitment of west coast fisheries, In, Report from the National Workshop on Recruitment, EDs Sinclair et al., Canadian Tech. Report Fish. Aquatic Sci., 1626: 31-64.
Thomson, R.E., B.M. Hickey and P.H. LeBlond. 1989. The Vancouver Island Coastal Current: Fisheries barrier and conduit, pp. 265-296, In Effects of ocean variability on recruitment and an evaluation of parameters used in stock assessment models, R.Beamish and G. McFarlane Eds., Special Publication of Fish. Aquatic Sci., 108, Ottawa.
Thomson, R.E., M.C. Healey, J.F.T. Morris, and G.A. Borstad. 1991. The distribution of commercial troll fishing vessels off southwest Vancouver Island in July 1988: Relation to physical oceanography, Can. J. Fish. Aquatic Sci. (in review).
Ware, D., and R.E. Thomson. 1986. La Perouse Project: First Annual Report, 1985. DFO ~eport. xxp.
Ware, D., and R.E. Thomson. 1987. La Perouse Project: Second Annual Report, 1986. DFO Report. 31p.
Ware, D., and R.E. Thomson. 1988. La Perouse Project: Third Annual Report, 1987. DFO Report. 64p.
Ware, D., and R.E. Thomson. 1989. La Perouse project: Fourth Annual Report, 1988. DFO Report. 72p.

67
Ware, D., and R.E. Thomson. 1990. La Perouse Project: Fifth Annual Report, 1989. DFO Report. 65p.
Ware, D .M., and R. E. Thomson. 1991. What happened to biological productivity in the coastal upwelling domain in the 1920s and 30s7 Can. J. Fish. Aquatic Sci. (in press).
Ze11erer, R. 1990. Seasonal variability of ocean features at the entrance to Juan de Fuca Strait, M.Sc. Thesis, Royal Roads Military College, Victoria, B.C.
Ze11erer, R., D. Krauel, and R. Thomson. 1990. Seasonal variability of ocean features at the entrance to Juan de Fuca Strait, Proc. 24th Annual CMOS Congress, p. 116.