avigating Iroubled Waters - Fisheries and Oceans Canada ...
396
Report of the Task Force on Atlantic Fisheries Michael J. L. Kirby Chairman 1* Task Force on, Atlantic Fish9ties Groupe d'etude des peones de I'Atlantique avigating Iroubled Waters t- , A New Policy for the l t At antic Fisheries
-
Upload
khangminh22 -
Category
Documents
-
view
0 -
download
0
Transcript of avigating Iroubled Waters - Fisheries and Oceans Canada ...
Report of the Task Force on Atlantic Fisheries
Michael J. L. Kirby Chairman
1* Task Force on, Atlantic Fish9ties
Groupe d'etude des peones de I'Atlantique
avigating Iroubled Waters
t- ,
A New Policy for the lt At antic Fisheries
I+ Task Force on Groupe d'etude Atlantic Fisheries des peches de l'Atlantique
Navigating Troubled Waters A New Policy for the Atlantic Fisheries
Report of the Task Force on Atlantic Fisheries
Michael J. L. Kirby Chairman
December 1982

© Minister of Supply and Services Canada 1983
Available in Canada through
Authorized Bookstore Agents and other bookstores
or by mail from
Canadian Government Publishing Centre Supply and Services Canada Ottawa, Canada K1A 0S9
Catalogue No. CP32-43/1983E
Canada: $10.00
ISBN 0-660-11318-X
Other countries: $12.00
Price subject to change without notice
Contents
Preface iii
Acknowledgements
Recommendations vii
I The Background
1. Introduction 3
2. Profile of the Atlantic Fishery 7
3. Myths and Realities 31
II The Industry Environment
4. The Economic Condition of Fishermen, their Households, Communities and Enterprises 47
5. The Economic Condition of the Processing Sector 81
6. Markets and Marketing 127
III Objectives and Key Issues
7. Objectives of Atlantic Fisheries Policy 185
8. Issues and Recommendations: An Overview 191
IV Issues and Recommendations
9. International Issues 197
10. The Harvesting Sector 207
11. Resource-short Plants 233
12. Utilization of the Northern Cod Stock 241
13. The Northern Fisheries 249
14. Quality 257
15. The Port Market 267
16. Improving Fish Plant Profitability 273
17. Marketing 289
18. Fishermen's Incomes 309
19. Financial Assistance 321
20. The Herring Seine Fleet 331
21. Dealing with Differing Views: Consultation and Decision-making Processes 339

ii
V The Future and Getting There
22. Implementation and Cost of the Recommendations 347
23. The Future Shape of the Atlantic Fishery 353
Appendices
1. Terms of Reference 363
2. Glossary of Terms and Abbreviations 365
3. Written Submissions 369
4. Consultations 373
5. Task Force Working Papers 379
iii
Preface
For all at last return to the sea—to Oceanus, the ocean river, like the overflowing stream of time, the beginning and the end.
The final words of Rachel Carson's The Sea Around Us.
For a variety of personal reasons, the sea and the people involved in the Atlantic fish- ery have long had a special place in the hearts of everyone who worked on the Task Force. We were all extremely pleased to have this opportunity to "return to the sea".
The sea has also enjoyed a special place in the Canadian psyche and way of life. Moreover, given Canada's geography, the economic potential of the resources in and under the sea ensures that it will forever remain of great significance to Canada.
Personal attachment to the region and the economic significance of the fishery com-bined to make the work of the Task Force both highly challenging and extremely satisfying. We thoroughly enjoyed it.
Although the Report bears the name of the chairman, who accepts full responsibility for its recommendations, the work of the Task Force would not have been possible without the assistance of many knowledgeable people concerned about the Atlantic fishery. Acknowledgement of their considerable contribution is given in detail under that heading.
The Task Force itself consisted primarily of 12 people, including myself as chairman. They were Roy Atkinson, Bruce Little, David McD. Mann, Arthur W. May, Rev. Desmond McGrath, Peter J. Nicholson, David E. Paterson, Victor Rabinovitch, Richard Roberts, Paul Sutherland and Betty Yolkouskie. To them must go the lion's share of the credit for meeting the almost impossible deadline of completing this study of the Atlantic fishing industry in nine months.
Why the need for such haste? Because the fishery, viewed from either an economic or a social perspective, is in serious trouble. Change in the way a great many things are now done is essential and must be undertaken as quickly as possible if the fishery is to survive.
iv
And survive it must, for the Atlantic fishery is a very people-oriented industry. It is a way of life that provides the lifeblood of thousands of individuals and hundreds of communities throughout the Atlantic region.
Any industry so economically and socially entwined in the fabric of a region is bound to be extraordinarily complex. This is why we consulted as extensively as we did and why members of the Task Force found the work so challenging. This is also why the debates among us were so spirited and why passions were so often aroused as we attempted to identify, study, then reach a measure of consensus among ourselves on issues that are of deep concern to all the people involved in the fishery.
In the end we have put forward recommendations that we believe will effect funda-mental changes in the Atlantic fishery if they are adopted — changes that will require considerable adjustment in the attitudes and traditions of those involved. We realize that this means that our recommendations will not be universally popular and will generate controversy. This is as it should be. Disagreement, if thoughtful, and constructive debate are both essential and inevitable in an open society that seeks humane, yet economically practical, solutions to complex social and economic problems.
We believe our Report and its recommendations come to grips with the major issues facing the fishery. We also believe that we have considered, without prejudice, every reasonably widely held point of view brought to our attention before we reached our conclusions. Our hope is that this same spirit of open-mindedness will be found among readers when they consider our recommendations and among decision makers who must decide what action to take as a result of them.
This is a time that calls for our best effort. The Atlantic fishery poses problems that require everyone involved in it to pull together to put it on a course that will lead to its long-run viability. Those of us who have been intimately involved with the prob-lem believe that the future is bright for the fishery and for the people in it, but only if there is an end to the parochialism and the we-versus-they antagonism that have spelled failure for almost all past efforts at co-operation.
But changing attitudes and traditions and creating a sense of common purpose are not things that can be achieved by law or regulation or government policy alone —they can only be achieved if everyone involved in one way or another in the fishery decides to change and to work together for the common good.
It is to these people — fishermen, plant workers, company managers and owners, federal and provincial ministers and officials — that we dedicate this Report. It can truly be said that the future of the fishery, and in many ways the future of the Atlan-tic region, is in their hands. We wish them well.
Michael J.L. Kirby Chairman November 1982

V
Acknowledgements
The Task Force is particulary grateful to Michael Calcutt for his efforts as our regis-trar. We also drew on the following people extensively for assistance: Ron Bulmer, Kieth Brickley, Nilo Cachero, Gordon Cummings, Tom Eisenhauer, Cheryl Fraser, Robert Green, Joshua John, Jim Jones, Ann Kern, Cliff Levelton, Robert MacKay, Gordon Neal, Scott Parsons, Gilles Quirouette and the staff of the Canadian Gov-ernment Printing Office, Gordon Slade and Mary Zamparo. Kathryn Randle and Joe Gough provided editorial services. Le Centre du Francais d'Ottawa provided translation and production services for the French edition of the Report.
The Task Force was particularly fortunate in having, for support staff in our offices in Ottawa, Halifax and St. John's, the following: Donna Stebbing, Donna Wren, Cora Crossman, Sheila Borge, Joanne Diraimo, Mary Lynn Olive, Gary Comrie and Patricia Elliott, as well as Katie Innes and Yvonne Rochon in the chairman's Fed-eral-Provincial Relations Office. The Administration and Finance Division of Privy Council Office also provided excellent support and services.
The Task Force would also like to acknowledge the contribution of the following people who, from time to time, provided both advice and assistance: Rollie Blan-chard, R.M. Bond, Tony Campbell, Jean Chabot, Cleo Cormier, Len Cowley, Dick Crouter, Nancy Dale, Tom Donahue, Fern Doucet, Larry Doucet, Diane Dufour, Eric Dunne, Clar Fisher, Gary Fletcher, Gemma Giovannini, Joe Godin, Mark Hemphill, Peter Hood, Tim Hsu, Jean Laperriere, Marcel Lebeau, Barry Muir, Joanne McLeod, Bill MacKenzie, Tom Shenstone, Carl Sollows, Bob Verge, Gary Vernon, Ed Walker, Tom Wise and Gillian Wogin.
Several firms and individuals also gave us valuable assistance in carrying out our studies of marketing and the economic condition of fishermen and processors. Among them were the following: Woods Gordon management consultants, The NewLantic Group, Thorne Stevenson Kellogg, Touche Ross, Leonard and Partners, Charles Steinberg, Michael Gardner of Gardner Pinfold and Associates and Tom Poetschke, formerly of ABT Associates Ltd. If we have omitted anyone, we apolo-gize.
We also want to thank the great many members and officials of fishermen's organi-zations, processors' organizations and provincial and federal government depart-ments with whom we consulted extensively. They took time from their busy schedules to meet with us, to provide us with ideas and information, to think about questions we had raised and to write to us.
vi
We particularly appreciated the letters we received from individual fishermen and concerned citizens. We were very much helped in our work by the more than 1000 fishermen who took the two to four hours required to participate in our survey of fishermen's income and expenses and by the officials of the Department of Fisheries and Oceans who carried out the survey interviews. We are also grateful to the many individuals in the processing sector who gave Woods Gordon the information they needed to carry out their study for us.
We realize that the people whom we met, telephoned, received letters from or who participated in our surveys will not all agree with all of our conclusions and, of course, they bear no responsibility for any of them. But we hope they will feel the time and effort they spent dealing with us was worthwhile.
Finally, we would like to pay special tribute to the late Kjell Henriksen, whose untimely death was a tragedy for the fishing industry. He was a source of wisdom, common sense and strength to the Task Force. He will be missed.
vii
Recommendations
The following objectives, stated below in order of priority, should guide Atlantic
fisheries policy:
Objective 1: The Atlantic fishing industry should be economically viable on an on-going basis, where to be viable implies an ability to survive downturns with only a normal business failure rate and without government assistance.
Objective 2: Employment in the Atlantic fishing industry should be maximized sub-ject to the constraint that those employed receive a reasonable income as a result of fishery-related activities, including fishery-related income transfer payments.
Objective 3: Fish within the 200-mile Canadian zone should be harvested and proc-essed by Canadians in firms owned by Canadians wherever this is con-sistent with Objectives 1 and 2 and with Canada's international treaty obligations.(p. 186)*
The Task Force on Atlantic Fisheries makes the following recommendations:
Chapter 9 1. Allocate non-surplus resources to foreigners as part of agreements for reciprocal
International fishing rights by fishing vessels across international boundaries (e.g., with
Issues Greenland in the Davis Strait). (p. 201)
2. Allocate resources that are currently surplus to Canadian harvesting capacity (e.g., squid) and a fixed amount of 'non-surplus' resources (e.g., cod) preferen-tially to those countries that maintain a satisfactory fisheries relationship with Canada (including fisheries trade and conservation). Allocations of non-surplus resources should be made after the fact — that is, in a subsequent year as a reward for satisfactory behaviour in the previous year, rather than as an incen-tive. In particular, the government should not negotiate access by foreign vessels to non-surplus resources in return for access to markets. (p. 201)
3. Pursue, on a priority basis, reductions in tariff and non-tariff barriers affecting trade in Canadian fishery products through multilateral negotiations within the framework of the General Agreement on Tariffs and Trade. (p. 201)
*Page numbers in parentheses indicate where the recommendations can be found in the text of the Report.

viii
4. Permit joint venture arrangements with foreign interests where necessary — that is, in the absence of Canadian solutions to financial equity, marketing and resource supply problems — and subject to Foreign Investment Review Agency conditions appropriate to the nature of the fishing industry. For example, the FIRA assessment will require particular care to avoid the loss to Canada of value-added fish products through the export of minimally processed products to the overseas facilities of the foreign investor. (p. 201)
5. Permit direct sales to foreign fishing vessels 'over-the-side' (that is, by fishermen selling their catch) and 'over-the-wharf(that is, by processors selling minimally processed product) only in predetermined and well-defined circumstances. Direct over-the-side sales should be permitted only where insufficient Canadian proc-essing capacity exists, or where there is no Canadian buyer for the quantity available at the negotiated price or at the domestic price generally recognized by fishermen and processors. Direct over-the-wharf sales should be permitted only where sufficient value has been added to the product by Canadians. This will require definition of specific allowable product forms. (p. 201)
Chapter 10 6. Continue and improve the process begun in 1981 by the Department of Fisheries The Harvesting and Oceans to identify fishermen as full-time or part-time for the purpose of Sector tailoring policies and programs for each group. (p. 222)
7. Adopt the following licensing principles: (a) The licence would pertain to the individual as a quasi-property right (the licence would be on the man, not the boat). (b) The licence would specify either a limitation on the catch (sometimes called an 'enterprise allocation' or a 'quota licence') or on the catching capacity of the fisherman's vessel and gear (sometimes called an 'effort-related' licence, as now exists in, for example, the lobster fishery). (c) The licence would be divis-ible and transferable (that is, it could be sold or traded) subject to certain condi-tions; the transfer process would be supervised by a quasi-judicial board. (p. 222)
8. Establish a quasi-judicial Atlantic Fisheries Licence Review Board that would act in a review and appeal capacity for the current licensing system, as well as for the system of enterprise allocations and quota licences. (p. 222)
9. Consolidate federal management of the fisheries in the Gulf of St. Lawrence by resumption of full federal responsibility for licensing and other aspects of marine fisheries management in Quebec. (p. 222)
Chapter 11 10. Establish specific allocations of fish for delivery to resource-short plants in the Resource-short off-peak season. The deliveries should be by a self-financing fishing company or Plants consortium. The only government contribution to this company or consortium
would be an allocation of fish. By a target date of 1987, only Canadian vessels should be permitted to catch these allocations. (p. 238)
11. Adopt the following criteria as the basis for selecting the plants that will qualify as resource-short. For purposes of the policy a plant will be defined as resource-short if:
(a) its principal supply of fish is from vessels of less than 65 feet;
(b) the ratio of the production of the plant during its six months of greatest throughput to its production during the balance of the year is greater than a specified threshold (e.g., 5 to 1); and
(c) the plant has installed, as of 1 November 1982, plate freezing and cold stor-age capacity and is capable, with at most minor modification, of winter operation.

ix
Chapter 12 Utilization of the Northern Cod Stock
It is recommended that preferential, though not exclusive, access to the spe-cial resource-short plant allocation should be reserved, with right of first refusal, for eligible plants adjacent to the northern cod stock on the east coast of Newfoundland (i.e., the shoreline of NAFO areas 2, 3K and 3L). The balance, plus any allocation refused by plants on the east coast of New-foundland, should be available with right of first refusal to resource-short plants in all other east coast areas. Any remaining allocation for which the right of first refusal was not exercised would be available for bid by any Atlantic coast processor. (pp. 238, 239)
12. Allocate the Canadian quota of northern cod by 1987 approximately as follows (initial 1982 allocations shown for comparison):
1982 1987
1. Inshore allowance 120,000 t 145,000 t
2. Existing trawler fleet' 87,250 145,000
3. Resource-short plants 5,250 50,000
4. Other fixed and mobile gear2 2,500 40,000
215,000 t 380,000 t
Vessels over 100 feet.
2 Allocation in 1982 for vessels 65 to 100 feet and in 1987 to these plus new 'Scandinavian-type' longliners.
Note: The 1987 allocations are indicative only. The projected 380,000 t Canadian quota is obviously subject to refine-ment. The allocations will be subject to adjustment for this reason, as well as in response to the evolution of allocation policy in consultation with the industry. (p. 245)
13. Conduct, through the Department of Fisheries and Oceans, an economic study of the feasibility and cost-benefit of freezing a portion of the summer inshore catch of northern cod for processing in the off-season. (p. 245)
Chapter 13 14. The governments of Canada, Quebec and Newfoundland and Labrador should
The Northern recognize the need for co-ordinated economic and social development initiatives
Fisheries in the coastal area north of approximately 50° latitude, and explore ways of jointly improving the socio-economic condition of the area. Federal co-ordinating responsibility would come under the purview of the Ministry of State for Eco-nomic Regional Development. (p. 253)
15. Amend the Saltfish Act to allow the Canadian Saltfish Corporation to buy, pro-cess and market fish and fish products in addition to saltfish in that part of the Great Northern Peninsula of Newfoundland north of 50° and in Labrador and the Quebec north shore of the Gulf. In particular, the Canadian Saltfish Corpo-ration might purchase and operate plants such as the one it operated in the sum-mer of 1982 at St. Anthony, though it would not have any monopoly on the pur-chase, processing or sale of uncured fish in this area. (p. 254)
Chapter 14 16. Implement, after a one-year trial period, dockside grading and final product
Quality grading concurrently, with the latter, including the determination of grades and labelling, being used as a tool of marketing strategy. (p. 262)
17. Implement at the federal level, and with some practical exceptions, mandatory bleeding, gutting, icing and washing of groundfish at sea, with simultaneous and matching provincial legislation applied at the point of dockside sale. (p. 262)
18. Prepare a detailed infrastructure development plan on a community by commu-nity basis to support quality enhancement. There should be special emphasis on the provision of adequate ice-making facilities. (p. 262)
x
Chapter 15 The Port Market
Chapter 16 Improving Fish Plant Profitability
19. Incorporate quality considerations in the proposed production bonus program for fishermen (see Recommendation 40, Chapter 18). (p. 262)
20. Prepare a detailed quality awareness and education program to ensure that within three years all participants in the industry are exposed to formal training in the principles, benefits and methods of treating fish as food. (p. 263)
21. Enforce universally the 130 mm otter trawler mesh size limit, and encourage the use of hook and line gear rather than gillnets and traps. (p. 263)
22. Processors should establish price differentials for landed quality, and cases where adequate differentials do not exist should be publicized. (p. 271)
23. Provincial governments that have not adopted collective bargaining legislation for inshore fishermen should do so. The federal government should support such collective bargaining by providing for it unequivocally, in all its forms, when new competition legislation is introduced. (p. 271)
24. The federal and provincial governments should study the concept of port market mediation commissions, port market authorities, or other institutions that may lead to greater order and efficiency in the port market. (p. 271)
25. Provincial governments should give high priority to up-grading the skills of fish plant managers and supervisors through vocational, technical and marketing training. Every effort should be made to foster a professional image of careers in the industry and to ensure that educational programs for management have a practical orientation and high performance standards. (p. 286)
26. The federal government should continue to re-orient its regional development assistance programming for the fish processing industry away from plant con-struction and expansion and toward improving the efficiency of assets now in place. Capital investment aimed at increasing productivity and obtaining higher yields should be supported. (p. 286)
27. The manpower training program of Employment and Immigration Canada should ensure that assistance is adequate to encourage training for skilled posi-tions in fish plants until such time as the industry is financially able to take full responsibility itself. (p. 286)
28. Future federal assistance to fish plants should require, as a pre-condition, that a productivity improvement study be carried out and a program of improvement be agreed to by plant management. (p. 286)
29. Fish processors and the federal government should explore all ways to encourage research and development in the industry and make every attempt to involve agencies such as the National Research Council in this endeavour. (p. 286)
30. The fish processing industry should develop a standard format for financial and cost accounting data so that common systems can be developed and performance standards established that are comparable throughout the industry. The federal government should be prepared to assist financially the development by industry of the necessary standards and systems. (p. 286)
31. The compilation and analysis of industry financial statements begun for the Task Force should be continued each year through co-operation between the Fisheries Council of Canada and the Department of Fisheries and Oceans. The federal and provincial governments and the processing industry should share the cost of the project each year. (p. 286)

xi
Chapter 17 32. License all processors of Atlantic groundfish and herring and exporters of whole Marketing or dressed fish, as a condition of selling their products internationally and inter-
provincially. (p. 303)
33. Require that, as final product grade standards are defined, licence holders grade products that are exported or sold inter-provincially. (p. 303)
34. Establish an Atlantic Fisheries Marketing Commission. This Commission would in turn create, initially, three product marketing councils for (a) fresh and frozen groundfish, (b) salted and dried groundfish, and (c) herring. (p. 303)
35. Each export licence holder should automatically be a member of the appropriate product marketing council. An executive committee of each council should be composed of all exporters, or consortia of exporters, accounting for more than specified percentage of sales, say 10 per cent. The chairman of a council should be selected by the federal government from a short list of nominees submitted by the members of the council. Each council would:
(a) undertake such analysis and activity as is necessary to establish marketing strategies and market development priorities for their products;
(b) identify market development and sales opportunities that cannot be readily addressed by the council members individually, and encourage and co-ordi-nate such initiatives as may be appropriate to exploit the opportunities;
(c) plan and undertake generic promotion;
(d) make recommendations to the Minister of Fisheries and Oceans on all matters affecting final product grade standards and labelling, including standards, practical enforcement procedures and penalties, and reporting conditions;
(e) make recommendations to the Minister of Fisheries and Oceans on any terms, conditions and eligibility criteria that may be associated with export licences for the council's products; and
(f) prepare reports and make recommendations to the Minister of Fisheries and Oceans on (i) the implications of the marketing strategy for final product grade standards and the promotion plan; and (ii) the implications of the marketing strategy for in-plant handling of fish, dockside grade standards and fishery management policies and regulations. (p. 303)
36. The Atlantic Fisheries Marketing Commission should be composed of members from the product marketing councils, provincial governments, fishermen's and processors' organizations and the federal government. The federal government would appoint a chairman from a short list of nominees submitted by the mem-bers of the Commission. The Commission should have an executive committee of about ten members, including the chairmen of the product marketing councils and representatives, elected annually, of the other member groups. The Commis-sion would be supported by a secretariat, headed by an executive director. The Commission would:
(a) provide secretariat and analytic services to the product marketing councils;
(b) co-ordinate activities among the product marketing councils, especially regarding conflicts in marketing strategies between products;
(c) advise the Minister of Fisheries and Oceans on the requirements for fisheries management and development policies that will promote more effective mar-keting;
xi i
(d) on the basis of the generic promotion proposals from the product marketing councils, recommend to the government the rate of assessment (by product) of a levy on domestically produced products and competing imports to finance the promotion program;
(e) seek provincial support for generic promotion and co-ordinate the support of governments for such promotion;
(f) assign promotion funds to the product marketing councils; and
(g) advise the Minister of Fisheries and Oceans on the desirability and the terms and conditions of all proposed direct sales to foreign fishing vessels (over-the-side and over-the-wharf) and arrange those sales that may be assigned to it by the Minister. (pp. 303, 304)
37. Enact legislation to give all necessary legal status and authority to the Atlantic Fisheries Marketing Commission. (p. 304)
38. Commit federal funding for a five-year campaign of generic promotion of Atlan-tic groundfish and herring products in North America and Europe to be carried out by the product marketing councils. The total federal contribution in 1982 dollars (of constant purchasing power) would be $25 million phased over five years. Thereafter, the federal funds would return to current levels of about $400,000. The industry levy (proposed in recommendation 36) would replace federal funds as processors become more profitable. During at least the initial five-year period, the Atlantic provinces will be invited to make a contribution and to ensure that any promotion activities undertaken by them will be co-ordinated with the plans of the Commission. (p. 304)
39. Provide up to $25 million for the food component of the Program for Export Market Development to be earmarked for Atlantic groundfish and herring exporters. The spending of these funds should be treated as a 'challenge grant', being conditional upon development of satisfactory promotional and marketing programs by the industry. Perhaps 80 per cent of these funds would be recover-able through the normal repayment processes of PEMD. The money would be dis-bursed over eight years for (a) assistance to exporters to diversify commercial markets; and (b) for the development of the marketing capability of Atlantic groundfish and herring exporters. (p. 304)
Chapter 18 40. Develop a 'production bonus' system to supplement fishermen's incomes by Fishermen's rewarding desirable fishing practices. This system would permit fishermen to Incomes earn cash credits, payable in the off-season, based on such factors as the gross
value of their landings, fish quality, season of catch, or gear used. It would be federally funded, with initial pilot testing during the 1985 fishing season. (p. 316)
41. Develop a gross income stabilization plan to smooth out the high and low points in individual gross revenues over a rolling five-year period. This plan would be based on participation by all fishermen, with funding from their contributions and from the federal government. Detailed analysis should enable a pilot pro-gram to be tested in 1985. (p. 316)
42. In the short term, as a transition measure, request that the Canada Employment and Immigration Commission amend the regulations governing the fishermen's unemployment insurance program to provide benefit entitlement based on the best 10 weeks fished for fishermen who fish at least 15 weeks. (p. 316)
Other changes in regulations should include (a) greater flexibility in defining the `fishing season' to allow those who fish exclusively during winter months to
qualify for benefits; (b) restrictions on the entrance requirements to the ut pro-gram, so that persons who fish less than 6 weeks will not qualify for benefits under the fishermen's program; and (c) revision of rules to permit boat-building during the benefit period for personal commercial use. Rules determining the net insurable earnings of boat captains should also be reviewed. (p. 316)
43. Adopt a 'sunset' provision in the ui regulations for self-employed fishermen so that the entire program will no longer be in force after April 1, 1988, provided that the production bonus scheme (recommendation 40) and the income stabili-zation scheme (recommendation 41) can be implemented fully as replacements, with general approval from participants in the industry. (p. 317)
44. The data base on the economic situation of individuals, households, enterprises and communities involved in the fishery must be improved and maintained. A survey of household income and expenses of fishermen along the lines conducted by the Task Force should be repeated regularly. Similar surveys are required with respect to fish plant workers. The enterprise cost and earnings surveys of the Department of Fisheries and Oceans should be placed on a consistent statis-tical basis for all Atlantic areas, and further data must be collected on vessel financing and loan repayment costs. Data collected by the Task Force on small fishing communities should be refined and updated. These statistical activities are necessary to ensure that an adequate information base is at hand for moni-toring the condition of the industry and for future policy studies at the micro-and macro-economic levels. (p. 317)
Chapter 19 45. Do not establish a new general program of financial assistance for either fisher- Financial men or processors. (p. 328) Assistance 46. Do not provide direct special assistance for vessel acquisition or replacement, but
ensure that vessels can be purchased from the most economical source, unhin-dered by tariff or other barriers. (p. 328)
47. Commend provincial loan boards for their efforts to continue to provide ade-quate capital funding for vessel purchase and repairs on terms appropriate to the financial conditions of fishermen. Initiate consultations between the federal and provincial governments on developing a uniform set of financial assistance poli-cies and a possible new form of lending institution for working capital. (p. 328)
Chapter 20 48. Implement immediately the assignment of transferable vessel quotas to herring The Herring seiners, with the initial allocation distributed on the basis of relative catches in Seine Fleet the past three years. The program would be managed by a Board elected by cur-
rent licence holders, with a federally appointed chairman. (p. 336)
49. Establish a five-year buy-back program for herring seiner vessel quotas funded by industry levies on domestic purchases and over-the-side sales. These quotas would be sold back to the remaining operators. As a starting point for discussion, a levy of $10 per tonne for domestic purchases and $25 per tonne for over-the-side sales is recommended. This, combined with fixed upper limits to over-the-side sales of 40 per cent of the seiner quota in 1983, declining to 20 per cent of the quota in 1987 (the last year of the program), would yield a total of almost $5 million over the period for buy-back purposes. The buy-back program would be managed by the same Board that manages the herring enterprise quota system. Provision should be made to ensure that, by 1987, all seiners are equipped with approved refrigeration systems. (p. 336)
50. Establish stringent measures to prevent mis-reporting of herring landings — for example, by requiring landings to be made only in the presence of a fisheries officer and by suspending or cancelling licences for mis-reporting. (p. 336)
xiv
51. Undertake a strictly controlled program to determine the feasibility, from both the economic and management point of view, of launching a big-boat (seiner or trawler) fishery for mackerel. (p. 336)
Chapter 21 52. Review membership on management advisory committees and, in the interest of
Consultation effective communication and serious pursuit of consensus, reduce numbers to the
and Decision - minimum necessary to ensure that essential interests are represented. Delegate
making greater responsibility to sub-committees to provide for greater efficiency and
Processes more effective representation. (p. 343)
53. Encourage organization of fishermen generally, as well as umbrella groupings that can represent the fisherman's viewpoint on region-wide and Atlantic-wide issues. (p. 343)
54. Make greater use of the Federal/Provincial Atlantic Fisheries Committee to develop policy, to harmonize programs and to resolve conflicts. This will prob-ably require the creation of a network of sub-committees on a continuing or ad hoc basis. An important specific function of the Committee should be a continu-ing review and assessment of fish processing capacity to curb the tendency toward excess. The Committee should also work to harmonize the various fed-eral and provincial subsidy and loan programs for fishermen. (p. 343)
55. Create an Atlantic Fisheries Consultative Group of knowledgeable and experienced individuals. The maximum size should be 10 to 12, with occasional rotation of members. The Group would operate informally, with a mandate to advise the Minister and senior officials on major strategic issues. (p. 343)
56. Create mechanisms for more effective interpretation of scientific material to the concerned public and greater contact between resource biologists and fishermen's groups. (p. 343)
57. Pursue means to communicate policy, policy changes, and the objectives of Canadian fisheries policy more effectively to the industry and to the public at large. (p. 343)

I The Background


3
1. Introduction
We have approached the study of the problems submitted to us for investigation with the hope of finding solutions . . . or of suggesting, at least, methods of permanent relief, rather than with the idea of providing temporary palliatives. Many of the matters . . . have already been made the subject of prolonged and exhaustive enquiries without final solutions being found for the problems involved. The difficulties and disabilities are so many, so varied and so intricate, that their complete and final removal will require from the department patient and perhaps prolonged endeavour.
Report of the Royal Commission on Maritime and Quebec Fisheries, 1928.
Background On January 8, 1982, fifty-four years after those words appeared in the report of a royal commission on fisheries, the Prime Minister announced the appointment of a Task Force on Atlantic Fisheries, whose primary mandate was to recommend "how to achieve and maintain a viable Atlantic fishing industry, with due consideration for the overall economic and social development of the Atlantic provinces." The full text of the Task Force's terms of reference appears in Appendix 1.
This Task Force represents the latest in a century-old stream of task forces, royal commissions, special inquiries, working groups and ad hoc committees that have studied the Atlantic fishery. The first Newfoundland Fisheries Commission was established 95 years ago in 1887. It was followed over the years by a series of other studies, including the royal commission of 1928, a royal commission in 1933, the Kent Commission in 1937, the Walsh Commission in 1953, the 1963 National Fish-eries Development Report, another royal commission in 1967, a Newfoundland Plan-ning Task Force Report in 1973, a Policy for Canada's Commercial Fisheries pub-lished by the federal government in 1976, a group of studies published by the Newfoundland government in 1978 called Setting a Course, a 1980 Newfoundland Royal Commission on Inshore Fisheries and many, many more. Leaving aside other task forces, and counting official commissions alone, well over 100 have looked at fisheries problems in Canada in the past 100 years.
What does this long list of studies signify? First, that governments have cared a lot about fisheries; second, that the industry has a long tradition of trouble; and third, that if this Task Force is to be any more successful than its predecessors, fundamen-tal change in the industry must take place now.
Merely putting bandaids on serious problems, or burying one's head in the sand (for example, by ignoring technological developments as was done by government in the 1930s when it tried to help inshore fishermen by discouraging trawlers), will con-demn the industry to its traditional cycle of a crisis, followed by a study and perhaps a subsidy, then partial recovery, then back to a crisis again.
Because of a strong belief that fundamental change is required, the Task Force has developed recommendations that are broad in scope and designed to start the indus-try down the road to long-term economic viability. We believe that our recommenda-tions will help the industry to pull through its current crisis and go on to long-term viability, provided that all participants in the fishery are willing to work together to achieve this goal.
Our proposals are not designed to address every problem the industry faces, only its major ones. We recognize that there are probably hundreds of little changes that could be made to improve the Atlantic fishery. But we believed it was best for us to focus our attention on a limited number of key problems in the hope that progress on these would be of greatest benefit to the fishery and those who work in it.

4 Task Force on Atlantic Fisheries
Because of the limited time available to the Task Force to carry out its work — a total of nine months from the first meeting of the Task Force to the time the Report was given to the government — we decided at the outset to limit our efforts to the groundfish and herring fisheries, as they are the sectors of the industry that are in the greatest trouble overall.
Neither did we examine in depth the current allocations of total allowable catch among the participants in the fishery (although this issue is addressed in part in some of the chapters of this Report) because this is an ongoing activity of the Department of Fisheries and Oceans and is already subject to an elaborate decision-making and consultation process. Nonetheless, our recommendations do have a bear-ing on factors that will determine future allocations.
It should also be noted at the outset that the fishery is a jurisdictional 'sandwich', with the resource, its management and harvesting coming under federal jurisdiction, as does inter-provincial and international trade in fisheries products. Between the time the fish are landed and when they are sold outside a province's boundaries, the provinces have authority over labour legislation, the buying and selling of fishermen's catches and the licensing of processors. Accordingly, this Report deals mainly, but not exclusively, with harvesting and marketing issues, because processing and port market issues are the responsibility of provincial governments. The meas-ures required to ensure fish plant viability by restructuring and refinancing the proc-essing companies are under active negotiation with financial institutions, the compa-nies concerned, and the provinces.
Not all our proposals are new — indeed some have been talked about in the industry for years. But the time has come to stop talking and to act, and to do so recognizing that there will be opposition to, as well as support for, each of the recommendations. This opposition should not be allowed to enable those concerned with fisheries issues once again to avoid facing up to the industry's problems and making some of the changes that are long overdue.
The Task Force and Its Method of Operation
The Task Force consisted of about a dozen full-time professional staff, borrowed primarily from various federal departments, but also including four people from out-side government. In addition, a number of consultants were employed to work on specific Task Force studies.
The Task Force operated in two ways: by conducting detailed studies of three major subjects and through an extensive program of consultation with those having an interest in the Atlantic fishery.
The three major studies were an income and expenditure survey of over 1000 fisher-men throughout the Atlantic provinces; a revenue and cost survey of some 100 plants representing about 85 per cent of the groundfish industry in Atlantic Canada; and an analysis of the potential world-wide market for groundfish and herring. These studies were the most extensive of their kind ever carried out on the Atlantic fishery and together they constitute the most comprehensive fact base ever assembled on the industry. The major results of these studies are contained in Chapters 4, 5 and 6.
The consultation program consisted of several phases. First, shortly after the work of the Task Force got under way in mid-February 1982, about 70 groups were invited to make written submissions and to meet with the Task Force if they wished to do so. This resulted in a significant number of written submissions, briefs and letters, including many from individual fishermen and others who took the time to submit their views on what needed to be done to cure the problems of the industry. (See Appendix 3 for a list of briefs received.)
Introduction 5
The second phase of our consultation program consisted of meetings with groups of fishermen, processors and representatives of provincial governments. Over 100 such meetings (see Appendix 4 for details) were held throughout the region.
The third phase was a second round of consultations held in mid-July at which the major fishermen's and processors' organizations and provincial governments were asked to comment on a paper entitled "Issues and Options" which the Task Force released on July 14. In addition, written comments on the paper were received from many other interested parties. The purpose of these meetings and the written com-ments was to determine whether the Task Force had correctly identified the major problems facing the industry; whether we had listed a full range of options for solv-ing these problems; and to find out which options were preferred by which organiza-tions and provincial governments.
These meetings were highly successful in that there was a virtually unanimous view that we had identified the key problems of the industry and broad agreement that we had listed a full range of options for solving them. As one would expect, there was a divergence of views on which options the Task Force ought to recommend, although there was consensus on the preferred options on a few issues.
The fourth and final phase of the consultative process was a review of the results of our three major studies with the Fisheries Council of Canada, major fishermen's organizations and unions, and provincial and federal government officials. In mid-September, these organizations reviewed drafts of Chapters 4, 5, 6 and part of Chap-ter 16 of this Report. As a result of these meetings, the version of these chapters pre-sented here represents a fact base that is regarded as accurate by all major partici-pants in the fishery.
Structure Chapter 2 presents a profile of the Atlantic fishing industry today and sets it in con- of the text by reviewing briefly the history of the industry since about 1970. Chapter 3 Report explores some of the folklore about the fishery, a folklore that mixes important ele-
ments of truth with misconceptions and unwarranted generalizations. We analyze the most prevalent of these folklore beliefs in order to separate myth from reality.
As already explained, Chapters 4, 5 and 6 describe in detail the current environment of the Atlantic fishing industry in terms of fishermen's incomes, the financial condi-tion of processors, and the prospects for marketing our fish, as determined by our three major studies.
In Chapter 7 we set out the objectives that the Task Force believes should apply to federal Atlantic fisheries policy. As with any set of objectives, they are subjective in nature and represent value judgements by the Task Force. Although we believe that there is a reasonable degree of consensus on the set of objectives we have chosen, there will be disagreement on the order in which we have ranked the three objectives.
Chapter 8 is a transition chapter. It shows why, on the basis of the industry environ-ment described in Chapters 4, 5 and 6 and the objectives in Chapter 7, the Task Force selected a set of thirteen specific problems for detailed study. As indicated ear-lier, there is general agreement in the industry that the correct set of problems was identified; no additional major problems were suggested during our consultations.
Each of the next thirteen chapters (9 through 21) analyzes a single (although broadly defined) problem. The structure of the chapters is identical. Each begins with a brief statement of the problem, follows this with background information about, and analysis of, the problem, then presents a set of options for solving the problem, along with the pros and cons of each option. Finally, each concludes with recommendations as to which option or combination of options should be imple-
6 Task Force on Atlantic Fisheries
Key Elements of the Report
mented and why. Again, there is general agreement on the range of options pre-sented but, because of the value judgements involved in choosing an option, and poss-ibly because of differing interpretations of the analytical evidence, there will be disagreement with some of the statements of pros and cons and, of course, with some of the recommendations.
We estimate the cost to the federal government of implementing the recommenda-tions and propose a timetable for implementation in Chapter 22. Finally, in Chapter 23, we describe what the Task Force believes the future shape of the Atlantic fishery would be if all the recommendations were adopted and given sufficient time to have their full effect on the industry.
A summary of the highlights and recommendations in this Report has been prepared and is available separately. A compilation of research and reference material will be published as Task Force working papers, a list of which appears in Appendix 5.
The Task Force believes that the three key elements of the Report are as follows: the three 'environment' chapters (4, 5 and 6), the objectives in Chapter 7, the options, in Chapters 9 to 21, and the recommendations, also in Chapters 9 through 21.
The environment chapters are important because each presents a fact base that we hope will force anyone debating fisheries policy in the near future to use a common set of data and factual analysis about the industry.
The options presented in Chapters 9 through 21 will, we believe, make it difficult for individuals or organizations who disagree with a particular recommendation to avoid answering the question, "What option would you recommend be implemented in order to solve the problem whose recommended solution you reject?". Our aim is to try to move public debate on fisheries policy away from political rhetoric, ideological slogans and myths and toward the substance of the issues and pragmatic options for solving the problems they raise.
The objectives in Chapter 7 and the recommendations in Chapters 9 through 21 reflect the opinion of the Task Force in trying to balance a large number of factors. Our approach to the recommendations was based primarily on pragmatism — what option will work in practice; what option will be capable of generating enough sup-port to be implemented successfully; and what option will move us toward the achievement of our objectives. In reaching our recommendations, we tried to be as free from ideology as possible. Nevertheless, it was inevitable that value judgements would enter into our recommendations. For this reason, we recognize that there are few people who will support the entire set of recommendations, just as there are few who will be opposed to all of them. We believe, however, that taken together as a package, the recommendations will move the fishery toward the achievement of our primary objective: long-run economic viability for all participants.

7
2. Profile of the Atlantic Fishery
. the sea there is swarming with fish, which can be taken not only with the net but in baskets let down with a stone, so that it sinks in the water. These same English say that they could bring so many fish that this kingdom would have no further need of Iceland . . .
Raimondo di Soncino, in a letter to the Duke of Milan informing him of John Cabot's discovery of North America, December 18, 1497.
Introduction The fishery has sustained, but rarely enriched, generations of Canadians living on the Atlantic coast. It was the raison d'être for the settlement of Newfoundland and it has been the economic backbone of hundreds of communities in the Maritimes, Newfoundland and Quebec for over two centuries.
People settled to fish or, if they settled for other reasons, they soon turned to fishing in conjunction with their other work, which usually involved the exploitation of their surrounding natural resource base. They did some farming (if the land would sup-port it), they cut some wood (if they had access to wood worth cutting), they hunted and trapped animals (if any were available). In effect, they cobbled together a living — or at least a sustenance — from whatever bounty was offered by the land and sea around them. It was not easy. They lived in a difficult environment and worked within an economic system that gave little power to workers or small producers in a natural resource-based economy.
From its beginnings, the fishery was the basis of a classic staples economy; for large parts of the east coast, fish was the only product sold to the outside world, the only substantial source of export income. The living provided by the fishery was continu-ally buffeted by the vagaries of nature and world markets. People whose existence depended upon the fishery took as a matter of course the roller coaster nature of the industry as boom and bust alternated every few years. Cyclical economic 'adjust-ment', to use a current term, was a fact of life.
Social adjustment too has been part of the fishery. The pursuit of fish governed the patterns of settlement in Newfoundland and Labrador, drawing people from the Avalon Peninsula up the northeast coast and into Labrador, tugging them westward along the south coast. In Nova Scotia, settlers from what is now Germany arrived expecting to carry on the farming traditions of their ancestors. Instead, they turned away from the land to the sea, transforming themselves into fishermen who created a new tradition, centred on Lunenburg.
They did not get rich. But as they adjusted, they survived, generation after genera-tion — a coastal people who knew the northwest Atlantic Ocean in all its moods. Along 28,000 miles of coastline they built a society, still largely centred on the fish-ery, in consonance with the different faces of nature — harsh one day, benevolent the next, but predictable never. They built a way of life with a value of its own that, in many places in late twentieth century North America, seems hard to find.
It is a society worth maintaining for many reasons — social, economic and political in the broadest sense of the word. It is part of the fabric of Canada, part of our his-tory as Canadians, part of our culture as residents of a country whose coastline, along three oceans, is one of the world's longest.
8 Task Force on Atlantic Fisheries
But this is not to say that this society should be maintained at all costs. There is a rural-romantic school of thought that tends to view fishing communities as unspoiled paradises whose very existence justifies their permanent survival. The Task Force has adopted a more balanced view; any society, by its nature, must change over time, but social or community change must be evolutionary rather than revolutionary. When we say the fishing communities of Canada's east coast should be maintained, it must be understood that, in our view, maintenance does not mean the automatic preservation of the status quo or the mummification of coastal communities as quaint tourist attractions.
The fishery and the communities that rely on it for their existence face serious prob-lems. The solution to these problems cannot be found in a static society or in a static fishing industry, forever dependent on the taxpayer for supplements to bring its meagre earnings up to subsistence level. Such an answer produces, at best, a shabby dignity for the people of the fishing communities of the east coast. The Task Force therefore rejected the 'rural-romantic' approach to the fishery.
Nor could the Task Force accept the view from the opposite extreme — the school of thought that suggests that the industry should be able to operate in a completely unfettered free market environment — for the result would be economic and social chaos. Our approach to the problems of the fishery lies between these two extremes, accepting neither the rural-romantic nor the pure free enterprise school of thought.
We were struck by the number of people who seem to believe that somehow the eco-nomic problems of the fishing industry and the social problems of fishing communi-ties can be neatly separated and shunted off into adjacent cubbyholes for examina-tion and solution. Almost from the beginning of our work, we rejected this notion.
To try to create an economically efficient industry as an end in itself without regard to social values, or to attempt to preserve a way of life without part of that life being meaningful, self-supporting work, is like trying to separate body and soul. Our approach therefore recognizes explicitly the inseparability of economic and social issues in the fishery.
The Newfoundland Fishermen, Food and Allied Workers Union sounded what we regard as the appropriate note in its brief to the Task Force:
Long-term government policy ... should provide in the overall for a rural society that can develop its own dynamic and be, in a qualitative sense, a society of consequence.
If the fishery attracted the first settlers to much of Canada's east coast, it has come to represent a bittersweet resource base for their descendants, a resource whose always-bright potential seems to remain just that — potential. There have been good years, to be sure, but they have been part of a cyclical boom and bust pattern that has not captured the potential of the resource with any semblance of stability.
The fishery today does not provide a good living for many of the people who partici-pate in it. As a generalization, it can be said that whether you are a fisherman with a boat of your own, a crew member on someone else's vessel, a worker in a processing plant or a shareholder in a large fishing company, at present you are unlikely to earn a decent return on either your labour or your capital.
Moreover, coastal communities offer few alternative sources of employment; as a result, many people have gone fishing who might otherwise have sought other — bet-ter-paying — jobs were they available. But going fishing has not solved their more fundamental problem of trying to earn a decent living.
This should not, and need not, be so.

Profile of the Atlantic Fishery 9
The fishery is a process by which fish are moved from the sea to the dinner plate of a consumer. At one end is the resource itself — the fish in the northwest Atlantic from the coast of Labrador to Georges Bank, the Bay of Fundy and the Gulf of St. Law-rence. At the other end is the market — the people who buy fish to eat.
In between is a troubled fishing industry — an industry that has failed to make all the connections work in a way that is in everyone's economic interest. The fishery is a chain with too many weak links.
The fishery confronts us with a disturbing paradox. On one doorstep, we have one of the world's great natural fisheries resource bases, one that has expanded dramati-cally since the extension of fisheries jurisdiction to 200 miles on January 1, 1977. The resource is manageable and it is being capably managed by Canadians.
On another doorstep is the United States, a major and accessible market for fish. Between the resource and the market is a Canadian fishing industry mired in finan-cial crisis, plagued by internal bickering, beset with uncertainty about the future, and divided on how to solve its problems.
The purpose of this Report is to try to set a course for everyone involved in the fish-ery — fishermen, plant workers, company owners and the federal and provincial gov-ernments — a course that will enable them to navigate successfully the troubled waters of the Atlantic fishery.
The Fishery Canada's position in the world of fisheries is a peculiar one. We have significant fish-
in an Atlantic ing industries on the Atlantic and Pacific coasts and in our freshwater lakes. Yet our
Perspective total catch from all three fisheries in 1979 accounted for less than two per cent of the 71 million tonne world catch of fish. We ranked fifteenth, behind the Philippines but ahead of North Korea. Our share of world production of processed fish was roughly the same; we ranked ninth in the world.
Canada's international reputation as a fishing nation rests on the fact that we are the world's biggest exporter of fish. The value of these exports was over $1 billion in 1981. (By comparison, Canadian wheat exports came to $3.7 billion.) Our position as a fish exporter is not, however, a dominant one; only eight per cent of fish sold on world markets in 1979 was Canadian. About 160 countries are in the business of exporting fish, although about 30 of these account for 85 per cent of all exports.
Despite Canada's position as a major exporter, the Atlantic fishery occupies only a small corner of the national economic picture. It accounts for a mere one per cent of the value added in commodity-producing industries in Canada. Fishermen and plant workers account for a mere three per cent of Canadian employment in those same industries.
Table 2.1
Relative Importance of the Fishing Industry to Provincial Economies
Contribution of fishing and fish processing to value added in commodity-producing industries, 1981
Fishermen and plant workers as a percentage of employment in all commodity-producing industries, 1981
Nfld. N.S. N.B. P.E.I. Que.
16%
55%
17%
17%
6%
12%
14%
29%
negligible
1%
Source: Department of Fisheries, and Oceans, Annual Statistical Review of Canadian Fisheries (hereafter cited as DFO
Annual Review); and Statistics Canada Catalogues (hereafter cited as SCC) 32-216 (Fish Products Industry), 71-201 (Historical Labour Force Statistics), 61-202 (System of National Accounts: Domestic Product by Industry), and 13-213 (Provincial Economic Accounts: Experimental Data).

10
Task Force on Atlantic Fisheries
For the five Atlantic coast provinces, however, the picture is much different, particu-larly in the case of Newfoundland and the Maritimes where it would be difficult to overstate the significance of the fishery. Table 2.1 sets out some of the key figures.
Newfoundland and Nova Scotia are, by far, the most important of the five Atlantic fishing provinces (see Table 2.2). Together, they account for about 80 per cent of the Atlantic coast fishery. Although Newfoundland is the leader in volume, Nova Scotia leads in terms of landed value, a result of its large scallop and lobster fisheries. The dominance of these two provinces in the groundfish sector — the major concern of the Task Force — is even more pronounced; they account for over 85 per cent of the catch in both volume and value.
The differing shares of volume and landed value (i.e., the revenue fishermen received at dockside) among provinces can be explained by the harvest mix. Lobster and scal-lops command a much higher price per pound than do groundfish and herring. The relationship can be seen in Table 2.3 and is illustrated in Figure 2.1.
Table 2.2
Landings and Landed Values by Main Species Group and Province, 1981
(volume: 000 t live weight; value: $ millions)
Pelagic & % of Groundfish Estuarial Shellfish Total Total
Vol. Val. Vol. Val. Vol. Val. Vol. Val. Vol. Val.
Nfld. 392 119 64 18 39 26 495 168 42% 30% N.S. 278 108 94 16 95 138 467 264 39% 47% N.B. 23 7 50 10 30 38 102 55 9% 10% Que. 63 24 9 4 16 19 88 47 7% 8% P.E.I. 23 6 6 2 9 22 38 32 3% 6%
Atlantic Coast 779 264 224 51 188 242 1191 565 100% 100%
Note: Some columns may not add due to rounding. Source: Economic Policy Branch, Department of Fisheries and Oceans.
Table 2.3
Atlantic Coast Catch—Volume and Landed Value, 1981
Volume Landed Value
(000 t) (%) ($ millions) (%) Cod 439 37 163 29 Other Groundfish 340 28 101 18 Herring 161 14 27 5 Lobsters 22 2 93 16 Scallops 90 7 100 18 All Other 139 12 81 14
Total 1191 100 565 100
Source: Economic Policy Branch, Department of Fisheries and Oceans.

Profile of the Atlantic Fishery 11
Figure 2.1 Atlantic Coast Catch — All Species, 1981
% of total
40%
Volume: 1,191,000 t Value: $565,000,000 30%
20%
10%
0% Cod Other Herring Lobster Scallops All Other
Groundfish
Volume Source: Table 2.3.
Value

12
Task Force on Atlantic Fisheries
The Groundfish Fishery
Lobster and scallops together account for less than 10 per cent of the landed quan-tity, but about one-third of the value of the catch. Groundfish and herring, on the other hand, constitute almost 80 per cent of the landed quantity, but only half of the landed value. The Newfoundland fishery is dominated by groundfish, while the other provinces have greater access to the more valuable species. Nova Scotia, in particu-lar, has benefited greatly from its access to the rich scallop grounds on Georges Bank. In 1981, for example, scallops accounted for only one-sixth of the volume of the Nova Scotia catch, but fully one-third of its landed value.
Within the region, the fishing industry is highly decentralized. Over 1300 communi-ties on the east coast depend on the fishery in some degree as a source of economic activity. About three-quarters of these are communities of 500 or fewer inhabitants.
Broadly speaking, there are three kinds of employment in the fishery. Inshore fisher-men work from smaller craft; trawlermen work in the offshore fleet of large trawlers; and plant workers — mainly women — process the fish.
About 700 processing facilities are located in 440 fishing communities throughout the region. The jobs provided by these plants employ about 21 per cent of the labour force in those communities. The figures are noticeably higher in the small communi-ties that are major trawler ports. There, the plants are larger and operate year round.
Because the Task Force devoted most of its attention to the groundfish fishery, a short description of this sector is useful. Two-thirds of the volume of the annual east coast catch is groundfish; this fishery is the foundation of the industry. Groundfish include several familiar species: cod, flounder (mainly yellowtail flounder, witch flounder and American plaice), redfish (known commercially as ocean perch), had-dock, pollock (Boston bluefish), and turbot (Greenland halibut). The name ground-fish reflects the fact that they feed just off the ocean floor. They inhabit much of the continental shelf.
The fish are caught by both inshore and offshore fishermen. Many of the groundfish species follow yearly patterns of movement. For example, cod — the most important of the groundfish — move inshore in many areas for the period from May to Sep-tember, thus providing the basis for the summer inshore fishery. In the autumn, they tend to move offshore where they are primarily accessible only to the trawler fleets.
The graphs in Figure 2.2 are designed to answer three questions: where the ground-fish are caught; how they are processed after they reach shore; and where they are sold. As already mentioned, Newfoundland and Nova Scotia are the two primary groundfish harvesting provinces (Figure 2.2a). The involvement of New Brunswick and Prince Edward Island in the groundfish fishery is relatively minor. Groundfish is a very important component of the Quebec fishery but it is of small scale compared with Newfoundland and Nova Scotia.
After the fish is landed, it is processed into a mixture of products for the market-place. Only about 35 to 40 per cent of a fish is flesh; the rest is bones, skin and offal. (See Appendix 2 for Glossary of technical terms.) As the fish is processed, therefore, its weight drops but the value of the catch increases. In 1981, 779,000 tonnes(t) of landed groundfish was processed into 270,000 t of groundfish products. The landed value of $264 million was transformed into $705 million worth of products.
Processing takes many forms. Most commonly, groundfish is frozen. In 1981, almost 60 per cent of the groundfish harvested went into frozen products, as can be seen in Figure 2.2b. Thirty-six per cent went into frozen fillets and 22 per cent into frozen blocks. The fillets are sold to the public in that form; the blocks undergo further processing when they are cut into fish sticks and other similar products. About one-

on
Newfoundland k r5
Nova Scotia
New Brunswick
Prince Edward Island
Landed Volume 779,000 t
Landed Value j $264,000,000
Quebec
,T
on
Frozen
Fillets Blocks
Other ) Dry Wet Salted
Fresh
Other
i oo
~
United States
Product Volume: 270,000 t Product Value: $705,000,000
Source: Economic Policy Branch, Department of Fisheries and Ocean.
Canada
Spain and Portugal
European Community
Caribbean/Latin America
Other
(a) Distributi by Province
(live weight)
(b) Disposition b: Product Compositi
(live weight equivalent
(c) Dispositi by Destinati
(product weigh
Profile of the Atlantic Fishery 13
Figure 2.2 Canadian Atlantic Groundfish Harvest: Distribution and Disposition, 1981
0
10
20
30
40
50
60 %

14
Task Force on Atlantic Fisheries
Diversity in the Atlantic Fishery
quarter of the groundfish catch is salted; it is first heavily salted, then depending on its ultimate moisture content, it is called either 'wet' or 'dry'. Salted fish is almost exclusively cod. Less than 10 per cent of the groundfish is sold as fresh fish, most in filleted form, but there is also an active trade in whole, gutted fresh fish trucked from western Nova Scotia to New England.
From the plants, the groundfish products go to market. In 1981, only one pound in five was consumed in Canada; the rest was exported. As Figure 2.2c makes clear, most of our fish goes to the United States, the destination for 57 per cent of our groundfish products. The rest was sold primarily to the European Economic Com-munity, Spain, Portugal, the Caribbean and Latin America. The great majority of saltfish is sold in the latter four markets.
Sales volumes for Canadian groundfish have risen markedly in recent years. The Canadian share of the vital U.S. market in particular has increased substantially. Between 1977 and 1981, Canada's share of U.S. imports of cod blocks rose from 21 to 34 per cent, and our share of their groundfish fillet imports rose from 41 per cent to almost 60 per cent.
The Atlantic fishery is an extraordinarily diverse industry. In each part of the region, the industry has been shaped by differing geography, climate and history, and it has adapted in different ways.
These differences are compounded by a variety of other factors. Fishermen fish from vessels of different sizes; they use different types of gear; they catch different species; they hold different types of fishing licences; they invest different amounts of time and money in the fishery; they earn different incomes and they earn it in different ways. Many of these factors are inter-related and lend themselves to innumerable combinations.
As we point out in Chapter 4, there is no such thing as an 'average fisherman', even when we examine only incomes and expenditure patterns. The concept breaks down even more when we try to sketch a profile of the average fisherman.
For most people unfamiliar with the Atlantic fishery, the term 'fisherman' evokes images of a lone figure in a small open boat heading out to sea early each morning to pursue the day's catch. In truth, the Atlantic fisherman defies such easy stereoty-ping. The stereotype may fit the inshore fisherman who owns and operates a small boat, but it cannot be stretched to fit a crewman on one of the huge steel stern trawl-ers that operate from several Newfoundland and Nova Scotia ports.
The size of a fisherman's boat is the most important factor in defining his lifestyle and income earning potential. An Atlantic fisherman may go to sea in a vessel rang-ing anywhere from a 15-foot dory to a 165-foot stern trawler. The size of the vessel determines the distance a fisherman will venture from shore and the length of time he, can spend at sea.
There are about 8300 vessels in the true inshore fleet, ranging from 20 to 35 feet. These boats are usually made of wood and are owned by individual fishermen. They usually fish within sight of land, are often operated by a single fisherman and can only go to sea during the warmer months. Despite their numbers, vessels between 20 and 35 feet account for only about 15 per cent of the groundfish catch.
The so-called nearshore fleet consists of about 5300 vessels in the 35 to 65-foot range. Most are built of wood, but many of the more modern boats in this class are of steel or fibreglass. The largest can stay at sea for up to five or six days and carry as many as six crewmen. Nearshore vessels are small enough that individual fisher-men can afford to own them. These vessels land over 35 per cent of the catch.
Profile of the Atlantic Fishery 15
There are about 75 vessels in the middle distance fleet, ranging from 65 to 100 feet. They are similar to the nearshore fleet, but fewer are owned by individual fishermen. Their catch does not contribute significantly to total Atlantic coast groundfish landings.
The offshore fleet of vessels over 100 feet is almost entirely owned by fish processing companies, due to the expense involved in operating a large vessel. A new stern trawler costs between $6 and $8 million. These ships typically spend 10 to 12 days at a time at sea and carry a crew of about 15. The offshore vessels fish year round and in fact have their best luck in the ice and gales 150 miles off northern Newfoundland and Labrador between January and March. There are fewer than 150 of them, but they catch almost 45 per cent of the landed volume of groundfish.
The people who go to sea on all these vessels are fishermen, but the work of an inshore fisherman differs greatly from the work of a crew member on a large steel trawler. The goals and lifestyles of these two men can be as different as the length of the vessels on which they go to sea.
Fishermen use numerous fishing methods and types of gear to secure their catch. The smaller inshore boats use such gear as handlines and jigs for cod; for lobster and crab they use traps. On the east coast of Newfoundland, inshore fishermen also catch cod in large netted enclosures from which the fish are dipped, using hand-held nets, into small boats. Medium sized vessels use longlines, gillnets, seines and otter trawls. The larger offshore vessels are scallop draggers and, for groundfish, stern trawlers and side trawlers.
Just as there are different kinds of boats and gear, there are different kinds of fishing licences. Every fisherman on the Atlantic coast must hold a personal fishing licence before he can engage in the commercial fishery. In addition, all vessels used in the fishery must be registered with the Department of Fisheries and Oceans (DFO).
In 1981 DFO issued 48,400 personal fishing licences in the Maritimes and Newfound-land. Most commercial fisheries are now subject to 'limited entry' licensing, intro-duced by the Department to keep the number of fishermen at a level that would per-mit those in the fishery to have a better chance at viability. If a fisherman wishes to catch such limited entry species as lobster, salmon, crab, scallops or herring, he needs additional licences that state specifically that he is allowed to fish that species. A fisherman may hold several of these limited entry licences in addition to his per-sonal fishing licence and a vessel registration.
Of the 48,400 fishermen licensed by DFO in 1981, half were classified as full-time fishermen and half as part-time fishermen. The terminology creates some confusion and cannot be used as the only indication of the amount of time, effort and invest-ment a fisherman devotes to the fishery. But in general, part-timers spend much more of their time in non-fishing jobs than do full-timers. Some part-timers are for-mer full-timers who have turned to other means of supporting their families but retain a part-time licence allowing them to use their boats and gear to supplement their incomes. There are more part-timers than full-timers in the younger and older age groups. This is because some fishermen first gain entry to the fishery through part-time work or retain a part-time licence for sentimental reasons (and the genera-tion of occasional income) after retirement.
In general, full-timers tend to invest more time and money in the fishery and have a more business-oriented approach to the industry; it is, after all, the source of three-quarters of their income. Part-timers are by definition seasonal fishermen, with a minimal investment in the fishery. (Further details on the distinction between full-timers and part-timers can be found in Chapter 4.)
16
Task Force on Atlantic Fisheries
There are also different ways in which a fisherman can draw his earnings from the fishery. If he is a crewman on a large trawler, for example, he may earn a daily wage, even if the trip is unsuccessful. But his most important source of income is his share of the catch. If he belongs to a union, the wage and the share will be deter-mined through collective bargaining. Crewmen on all groundfish trawlers, for exam-ple, are unionized.
The share system has many variations, but most are based on principles such as the following: First, a percentage of the revenues from a fishing trip goes to the owner to pay the cost of maintaining the vessel. The owner may be the skipper, an integrated processing company or an outside party. Expenses such as food are deducted in order to pay the vessel's creditors. The vessel's major creditor is often the processing com-pany to which it sells its catch. A further percentage is then paid as a bonus to the officers of the vessel, including the captain, mates and engineers, and to the cook. Finally, the amount remaining is divided equally among the vessel's entire crew. Under this system, a skipper-owner receives a share for vessel maintenance, his skip-per's bonus and a crew share. Officers receive their bonus and a crew share; crew-men receive only the crew share.
From this description it is clear that the diversity of licences, species, vessels, gear, levels of investment, and share arrangements belies any romantic stereotype of the Atlantic fisherman as a lone figure in an open boat. It also illustrates why it is impossible to describe the 'average fishermen'.
It should also be recalled that, as in any other area of human endeavour, there exists a wide range of skills. In short, there are good fishermen and poor fishermen. Year after year, the good fisherman will fish more skillfully and bring home bigger and better catches than the average. The poor fisherman will not. These differences are difficult to capture statistically, but in any fishing community, people know who the `highliners' are. They know that all fishermen are not alike.
There is no less diversity among processing companies. The 'Big 5' are the most vis-ible. These are National Sea Products, Fishery Products, H.B. Nickerson & Sons, The Lake Group, and Connors Bros. All are large, vertically integrated companies whose activities encompass fishing, processing and marketing. With the partial exception of Connors Bros., whose fishing operation is relatively small and special-ized, these firms own most of the offshore trawler fleet, which they use to supply fish to year-round processing plants. The trawlers not owned by the major companies are owned by smaller firms, which may operate only one or two trawlers to supply a single plant.
Smaller independent groundfish processors are the principal buyers of fish caught by inshore fishermen, although the large trawler-owning companies also operate several plants supplied exclusively by inshore fishermen. The smaller 'independents' own the majority of Atlantic coast fish plants. Many of those plants are small and operate for only part of the year.
By the late 1960s, it was becoming evident that over-fishing had arrived in the north-west Atlantic. It was a time when everyone in the fishery, Canadians and foreigners alike, was rapidly converting from salting the catch to processing and freezing it. Fleets from western Europe, which had resumed a centuries-old tradition of distant-water fishing by moving into the area during the 1950s, were followed during the next decade by their counterparts from eastern Europe. Their vessels froze the catch at sea, often after it was fully processed into fillets in huge factory trawlers. They fished around the clock, staying at sea for months at a time.
An Overview of Recent History
The last fifteen years

Profile of the Atlantic Fishery 17
From a level of around 1.5 million tonnes (t) in the mid-1950s, the total groundfish catch escalated swiftly, averaging over 2.7 million t annually in the four years between 1965 and 1968 (see Figure 2.3). All of the increase was taken by foreign fleets. The Canadian catch during this whole period ranged between 450,000 and 620,000 t a year. As a consequence, Canada's share of the groundfish caught dropped from about a third of the total to less than one-quarter.
Having scaled the peak of harvesting, the fishing industry — perhaps without recog-nizing it at the time — faced not successive peaks to scale, but the other side of the mountain. Catches dropped precipitously. By the early 1970s, the catch was hovering around the 2 million tonne level. But there was worse to come.
There had been warnings, mainly from the international scientific community, but they were heeded too late, and when they were, the first efforts to control the harvest were, at best, faltering. In 1972, the concept of the Total Allowable Catch (TAc) for each fish stock was introduced through the International Commission for the North-west Atlantic Fisheries (icNAF), a body composed of nations whose vessels fished the waters off Canada's east coast. A year later, the TACS were divided into national allo-cations. The TACS themselves were based on the objective of maximum sustainable yield (MsY).
Conceptually, MSY is far from perfect, but it was a good start. In practical terms, it failed miserably. The data on which MSY rested were incomplete; in some cases, they were suspected to be worthless. Each country had an incentive to under-report its catch. As a result, TACS were set too high and, even then, not policed effectively. The decline in stocks continued and accelerated. 'Pulse fishing' or 'raid fishing' became the modus operandi, especially of the foreign factory fleets, which would concentrate their effort in a single area over a short time and then, sated, move on to the next stock.
For the Canadian fleet of larger vessels, catch rates followed the total harvest down the steep slide. Modern stern trawlers, capable of catching fish more effectively than the older side trawlers, were not matching even the catches taken by side trawlers built 10 years before. The low point came in 1974 when the Canadian catch of groundfish dropped to 418,000 t. An even more telling indication of the decline could be found in the waters off Labrador and eastern Newfoundland, one geographical segment of the Canadian fishery. In 1968 alone, the Canadian catch of groundfish in that area had been 218,000 t; in 1973, 1974 and 1975 combined, it was 212,000 t.
Cause and effect were clear. The damage had been done and it was devastating. Though the Canadian groundfish catch began to climb after 1974, the total catch continued to fall until 1978 when it bottomed out at 1.1 million tonnes, down 60 per cent from the peak years in the 1960s.
Meanwhile, Canada had begun to assert its interests in international negotiations. In 1964, after years of failed negotiations, we declared a nine-mile exclusive fishing zone beyond the existing three-mile territorial sea. The Gulf of St. Lawrence was declared to be an exclusive Canadian fishing zone in 1970. In the Gulf, phasing-out agreements were negotiated with countries that had traditional fishing rights. The Seabed Committee of the United Nations was preparing for the third Law of the Sea Conference. By the time the Conference opened in 1973, Canada had established a leading position in international fisheries negotiations. The march to the 200-mile limit was under way.
The combination of obviously depleted stocks, evolving principles in the law of the sea and aggressive international action by Canada (for example, the 1975 closing of Canadian ports to the Soviet fleet) produced enough discipline that stocks began to rebuild and Canadian catches started to increase steadily.

18
Task Force on Atlantic Fisheries
Figure 2.3 Groundfish Harvest Northwest Atlantic 1960-1981
Foreign
Canadian
000 t
3000
2800
2600
2400
2200
2000
1800
1600
1400
1200
1000
900
800
700
600
500
400
300
200
100
011 01 02 63 64 65 66 67 68 69 70 71
78 1l ti()
8I
Note: This graph includes groundlish caught both inside and outside the 200-mile limit. Figures for the 1981 harvest by foreign vessels are not yet available.
Source: Department of Fisheries and Oceans.
Profile of the Atlantic Fishery
19
The events of 1977-1981
Between 1974 and 1981, the Canadian groundfish catch rose by 85 per cent to 779,000 t, an increase that is projected to continue through the mid-1980s and then level off.
It is too easy to treat the low point of 1974 as simply a resource crisis. It was that and more. The price of fuel had begun to increase dramatically in 1973, triggering an adverse economic consequences world-wide. The 1974 crisis was a three-part problem:
• the stock of fish in the sea had declined dramatically;
• the cost of catching the fish had risen dramatically; and
• markets for fish softened considerably.
Though we had less fish to sell, we still had trouble selling it. The cost-price squeeze was exacerbated by the scarcity of fish. The costs of sending out a vessel and running a plant had risen, but because the boats caught fewer fish and because the plants had fewer fish to process, the cost per pound of fish rose sharply. By contrast, the cost-price squeeze of 1982 has been, if anything, exacerbated by an abundance of fish. There is not enough demand for the large supply of Canadian groundfish at the price the industry needs to cover its costs.
The 1974 crisis was weathered, but at a cost to the federal treasury of about $140 million in special assistance over the succeeding three years. It was a salvage opera-tion in which a battered industry was hauled off the rocks, but neither repaired nor strengthened. Instead, it was sent out to meet a new — and more vigorous — chal-lenge, that of capturing the benefits expected to flow from the long-awaited 200-mile limit.
Canada extended its fisheries jurisdiction in 1977. The co-operation of almost all the nations fishing in the area was achieved through bilateral agreements that provided for access to allocations that were surplus to Canadian needs. The icing on the cake was the transformation of the ICNAF (which had been created in 1949) into the Northwest Atlantic Fisheries Organization, an organization that gave multilateral recognition to 200 miles and then some; it also recognized a Canadian 'special inter-est' in stocks beyond and adjacent to 200 miles.
Canadian management of fish stocks was implemented immediately and effectively. We built up the scientific competence. The Department of Fisheries and Oceans, the Canadian Armed Forces and the Ministry of Transport together provided the sur-veillance capability and the enforcement muscle. We arrested foreign vessels, won court cases and cancelled some licences. The objective was to hold the Canadian fleet stable while phasing down the foreign effort, so that as more and bigger fish came on stream, catch rates would increase.
Extended jurisdiction came into force on January 1, 1977 and was exercised effec-tively from day one.
In the months preceding the declaration of the 200-mile limit, there had been consid-erable cynicism. Many saw it as a false issue, an excuse for inaction on other fishery problems. Before the year was out, cynicism gave way to a boom mentality. By coin-cidence, 1977 was the year when market recovery from the 1974 low took hold.
By mid-1979, each of the Atlantic provinces and Quebec had worked up detailed fishery development plans, all overlapping, especially in the Gulf of St. Lawrence where each province had designs on the same fish. Under these plans, almost all development was to take place largely with federal dollars, mainly channelled through the Department of Regional Economic Expansion.

20
Task Force on Atlantic Fisheries
Provinces with no trawler fleets wanted them; provinces with trawlers wanted to add more and bigger vessels. Companies poised themselves for the growth in resources. Processing plants expanded; new ones were built. Fishermen who had left the indus-try since 1968 came back again; by 1980 fishermen were as numerous as they had been before. Banks loaned money with less than normal prudence. In 1979, while just about everybody — fishermen and processors alike — was having a good year, the seeds of crisis were already taking root.
The Department of Fisheries and Oceans, with overall fisheries management respon-sibility, was in the middle of every debate on what should happen next. Fishermen, processors and provincial governments exerted pressure in support of their objectives. While DFO was slowly tightening up the licensing regime with one hand (and preach-ing restraint), it was passing out subsidies for fishing vessel construction with the other, as were provincial loan boards. Attempts to discipline and harmonize federal and provincial spending and policies got nowhere.
Foreign vessel owners and assorted entrepreneurs were everywhere. The foreigners were kept at bay. Fisheries and Oceans minister Romeo LeBlanc's favorite line was that the "back door was not open to those who had just been put out the front door".
The pressure was enormous. The provincial governments in Newfoundland and Nova Scotia got together to promote a $900 million fleet development plan. The air was thick with charges that Canadians were prevented from getting the new freezer trawler technology to fish the rapidly growing northern cod stock and the unex-ploited stocks of squid and silver hake. A split developed between the provinces and the large companies based in Newfoundland and Nova Scotia, while all jockeyed for position on the issues of plant expansion and fleet replacement and enlargement.
The pressure, from both domestic and foreign sources, to use foreign vessels was irre-sistible. Canada tried every variety of arrangement conceivable, short of incorporat-ing the vessels in the Canadian fleet. There were 'developmental charters', resource-short plant programs, and sales over-the-side and over-the-wharf. The pressure to enter into arrangements that required no risk or capital investment by the Canadian industry continued.
The federal government was, and is, accused of over-regulating and stopping techno-logical development. In fact, vessel owners could get, and still can get, a freezer trawler as a replacement for a conventional wetfish trawler of similar catching capacity, and some did. But most wanted them as additional capacity, arguing that they were justified by the growth in conventional species to the north and by the apparent potential for Canadians to replace foreigners in the non-traditional offshore fisheries for squid, mackerel and silver hake, which required freezer trawlers.
Factory trawlers were harder to get, but could be had as replacements or by a con-sortium of more than one company. None was formed. Finally, in order to stem the debate and at last provide clear policy in an area that had become hopelessly con-fused, James McGrath, the fisheries minister of the day, rejected filleting of ground-fish at sea (i.e., the factory trawler) and decided that replacement vessels would have to be limited to 200 feet.
Rightly or wrongly, the federal government limited overall catching capacity. It allowed boats to be replaced as long as the new vessel was not more than 25 per cent longer than the old one; it allowed small vessels to be combined into a big one. But it did not allow additions, except to the small boat fleet in some areas. Indeed, there were no new trawler licences issued after 1973. It did not prevent freezing at sea from being introduced, but proponents in the industry complained that the rules amounted, in most instances, to effective prohibition.
Profile of the Atlantic Fishery
21
The 1981-82 crisis
Such was the fever that two major companies — Nickerson and National Sea —bought advertising space to trumpet their support for an expansion of both the inshore and offshore fleets. This was resisted; even so, by 1982 we wound up with a fleet that was still too big for the expanded resource. Still, all segments had shared in the growth, and the balance between fleet sectors was about as it had been 10 years before. The large trawlers lost ground in the Gulf, but gained much more on the Sco-tian Shelf and, particularly, in northern areas. The northeastward shift in the centre of gravity of the total groundfish resource and the new policies on quota allocations among fleets were nevertheless changing the economic geography of the offshore fishery (see Chapter 3).
Meanwhile, major efforts were being made to sort out the small boat fisheries, cul-minating in the 1981 categorization of fishermen as full-time or part-time. Attacks were mounted on other stubborn issues, such as quality, but were stymied by resist-ance in both government and industry. There were cases where governments were not willing to take on their constituencies by promoting unpopular programs.
In the middle of this, some provincial governments decided that they wanted more jurisdiction over the fishery. Nobody else in the industry agreed, but that didn't pre-vent a lot of recrimination, which an already fractious industry didn't need. In 1980, fisheries jurisdiction was one of the 12 items on the agenda of the September First Ministers Conference on the Constitution. During that summer, fisheries officials —both federal and provincial — devoted weeks to the question of which group of politicians would have the power to exercise jurisdiction over the fishery. To an industry faced with the emergence of a new round of problems, it appeared to be time that could have been better spent.
Today the fishing industry is in crisis. Its problems have taken many forms in the last few years. Work stoppages paralyzed the Newfoundland fishery in the summer of 1980. Herring prices collapsed in 1981. Trawler prices in Nova Scotia have been falling.
In the late summer of 1981, there were widespread closures of processing plants throughout the region, but mainly in Newfoundland and Nova Scotia; some 4000 people were without work. For the industry as a whole, the closures were a symptom of the myriad difficulties that converged during that period. Canada's Scandinavian competitors in the U.S. market gained an advantage when their currencies declined far more than Canada's against the U.S. dollar. At the same time, the U.S. market for fish softened suddenly. U.S. buyers of Canadian fish, faced with high interest rates, reduced their inventories, in effect forcing Canadian firms to hold higher inventories than usual. In turn, Canadian firms had to finance these stockpiles of fish at interest rates even higher than those in the United States. In response to bulging inventories and to a lack of fishing quotas for species that could be marketed economically, some of the trawler companies temporarily shut many of their plants and tied up their fleets.
The Lake Group and H.B. Nickerson & Sons found themselves in a financial crisis that, by November 1981, would lead them to request financial aid from the federal government. They were joined by many smaller companies and by joint appeals for assistance from fishermen's and processors' organizations. In the business commu-nity, there were fears of widespread failures. In the hundreds of communities that rely on the fishery, there were fears that shutdowns might be permanent; some took vigorous action to make their desires known to the companies and governments. Late in 1981, fisheries minister Romeo LeBlanc announced a program of stop-gap aid amounting to $15 million to help companies get through the worst of their inventory problems.

22
Task Force on Atlantic Fisheries
The difficulties facing processors went far beyond inventories. They constituted, rather, a financial crisis of severe proportions, the details of which are set out in Chapter 5. The crisis began in 1980, though its origins can be found earlier. To get a handle on the financial condition of the processors, the Task Force commissioned Woods Gordon management consultants to survey about 100 east coast firms, which process about 85 per cent of the groundfish catch.
The results are bleak:
• In 1978, the companies' net income was $29 million; by 1981, this profit had dis-appeared, to be replaced by losses of $57 million.
• Their working capital declined in the same period from a surplus of $41 million to minus $106 million; such a negative value is evidence of insolvency.
• Shareholders' equity dropped from $113 million in 1979 to $26 million in 1981.
• The debt/equity ratio, which measures the relationship between long-term debt and shareholders' equity, rose from about 1:1 in 1977 to almost 10:1 in 1981, a staggering increase for an indicator in which a value greater than 1:1 points to excessive dependence on debt financing.
• In 1977, the companies had a total debt load of $122 million, on which they paid $10 million a year in interest; in 1981, the debt load had grown more than four-fold to $520 million, and the annual interest burden had climbed seven-fold to $72 million.
Fearsome figures, indeed. But they should not mask the fact that some enterprises have been successful and that there are significant variations within the region. The problems in the processing sector are centred mainly on the northeast and south coasts of Newfoundland. The financial malaise is most severe in the frozen ground-fish and herring sectors of the industry; shellfish and saltfish continue to produce acceptable returns.
Many of the problems stem from a classic cost-price squeeze. The cost of producing each pound of fish has been rising rapidly in recent years, while the revenues earned from selling each pound of fish have remained almost flat.
The The fishermen of the east coast feel the effects of the crisis in different ways. Some
Fishermen are crew members on the offshore trawlers and smaller vessels run by the processing companies. Their incomes, indeed their jobs, are influenced by the financial health of the companies. Many more are independent fishermen who own their own boats and pursue the inshore fishery. They, no less than the major companies, are the operators of fishing enterprises that are feeling the cost-price squeeze.
To assess their financial condition, the Task Force carried out a comprehensive sur-vey of the incomes and expenditures of 1000 fishermen. Detailed results can be found in Chapter 4, but not surprisingly, it was found that most fishermen earn low incomes from their fishing activity.
Some of the key findings were as follows:
• The median net fishing income in 1981 for full-time fishermen was $6500; the highest incomes were found in western Nova Scotia, the lowest in northeast New-foundland and Labrador.
• Net incomes from fishing for full-time fishermen were four times greater than those of part-timers.
• Full-time fishermen earned about three-quarters of their total incomes from fish- ing; for part-timers, fishing accounted for only one-quarter of their total incomes.
The Processing Sector

Profile of the Atlantic Fishery
23
• Most part-timers used fishing to supplement their incomes from non-fishing sources; a small minority depended as much on fishing for their livelihood as did most full-time fishermen.
• For all fishermen, the money they received from non-fishing sources was a signifi- cant factor in their incomes; the most important was unemployment insurance.
• Folk mythology has it that fishermen benefit greatly from various types of 'income in kind', such as hunting and and gardening; these benefits were found to be insig-nificant in supplementing incomes earned.
• Incomes earned by other members of fishermen's households are vital to the finan-cial well-being of the household; the most common source of these incomes is employment in fish processing plants.
• Fishing enterprises are facing an earnings squeeze; net earnings are barely suffi-cient to pay back loans from provincial loan boards, leaving nothing to reward entrepreneurship or contribute to capital accumulation.
• There are approximately 1300 small fishing communities in Atlantic Canada. At least a third of the active labour force in these communities is engaged in fishing or fish processing work.
The immediate outlook for processors and fishermen alike in mid-1982 was not encouraging. No significant price increases were anticipated, yet costs continued to rise. The shortage of working capital remains a major concern. Weakening markets are projected for saltfish, herring prices are poor, and even scallops are showing signs of serious weakness. On the other hand, the lobster, crab and capelin fisheries were successful in most areas, and frozen groundfish prices were showing signs of strengthening.
The Expanding Harvest
The state of the Atlantic fishery in 1982 is not a story of unalloyed disaster. There are two very significant bright spots: the outlook for the harvest and the vast unex-ploited potential for improved quality and cost efficiency in the industry. Finding ways to capture this potential is a principal theme of the rest of this Report. Our comments on the resource will be almost perfunctory, because we believe its manage-ment is quite well in hand.
The volume and value of the Canadian groundfish harvest have risen steadily since the introduction of the 200-mile limit. The catch in 1981 reached 779,000 t, up from 470,000 t in 1976. The landed value of that catch was $264 million, up from $94 million in 1976. By 1987, Atlantic Canadian fishermen should be catching about 1.1 million tonnes of groundfish a year.
Cod is the single most important component of the groundfish catch, and its growth has led — and will continue to lead — the increase in the size of the groundfish catch. By 1987, the cod catch should be more than triple the 1976 harvest; the total groundfish catch will have more than doubled. This year, the cod harvest is approaching 500,000 t, a level it should surpass in 1983.
The Task Force has made projections of the Canadian groundfish catch for the next five years. Three aspects of this forecast stand out. First, we face the happy prospect of a 50 per cent increase in the groundfish catch between 1981 and 1987 (see Table 2.4 and Figure 2.4). Canada's Atlantic coast fishermen should be able to catch about 370,000 t of groundfish more than they did in 1981. Second, almost all of this increase will consist of cod. Third, most of the growth will take place off northeast Newfoundland.

24
Task Force on Atlantic Fisheries
Table 2.4
Estimated 1987 Canadian Catch of Groundfish Under Quota (000 t live weight)
Projections for 1987
Canadian Catch
TAC
Canadian Share of TAC
Estimated Canadian
Catch Change
1981-1987 1977 1981
North Newfoundland:
Cod 2GH 20 40% 8 8 Cod 2J, 3KL 80 154 400 95% 380 226 Redfish 2+3K 4 14 35 80% 20 6 Plaice 2+3K 7 7 10 100% 10 3 Witch 2J, 3KL 4 3 8 50% 3 Turbot 2+3KL 18 24 55 90% 35 11
Totals: 112 202 528 90% 456 254 South Newfoundland:
Cod 3N0 2 6 40 60% 24 18 Cod 3Ps 29 31 47 85% 40 9 Redfish 3LN 10 8 25 40% 8 Redfish 30 3 3 20 35% 3 Redfish 3P 15 9 18 90% 10 1 Plaice 3LNO 43 48 55 100% 55 7 Yellowtail 3LNO 11 14 19 100% 15 1 Witch 3NO 3 5 60% 1 1 Witch 3Ps 4 3 85% 1 1
Totals: 121 120 232 76% 157 37 Gulf:
Cod 4RS, 3Pn 55 85 125 100% 125 40 Cod 4T, 4Vn(January-April) 22 57 64 100% 64 7 Redfish 4RST 16 20 25 100% 25 5 Witch 4RS 3 1 3 100% 1 Plaice 4T 9 8 10 100% 8
Totals: 105 172 227 100% 223 51 Scotian Shelf/Georges Bank:
Cod 4Vn(May-December) 8 12 12 100% 12 Cod 4VsW 10 53 72 100% 72 19 Cod 4X 22 31 30 100% 30 -1 Cod 5 6 6 n.a. n.a. 15 9 Haddock 4VW 3 20 15 100% 15 -5 Haddock 4X 20 30 32 100% 32 2 Haddock 5 3 6 n.a. n.a. 10 4 Pollock 4VWX + 5 25 40 51 80% 40 Redfish 4VWX 15 18 30 85% 20 2 Flounder 4VWX 11 14 14 100% 14
Totals: 122 231 256* 94%* 260 29 Grand Totals by Species
Cod 234 436 810* 93%* 770 334 Haddock 26 56 47* 100%* 57 1 Pollock 25 40 51 80% 40 Redfish 62 72 153 73% 86 14 Flounder 95 96 127 95% 108 12 Turbot 18 24 55 90% 35 11
Total 460 725 1,243* 90%* 1,096 371
Note: Some columns may not add due to rounding.
* Totals do not include TACS and Canadian shares of Georges Bank cod and haddock. These TACS have not been projected for 1987. The estimated 1987 Canadian catches are projected in light of recent landings.

Profile of the Atlantic Fishery 25
Figure 2.4 Canadian Catch of Groundfish under Quota: Atlantic Coast
000 t live
weight 1200
1100
1000
900
800
700 Projected
600
Actual 500
400
Actual 300
200
100
1977
Cod
Other Groundfish
1981 1987
Source: Table 2.4.
26
Task Force on Atlantic Fisheries
The TAC estimates for 1987 are the latest available from Fisheries and Oceans (October 1982). These projections are subject to significant uncertainty and should not be used for detailed planning. The 1987 projected TAC for northern cod (400,000 t) assumes continuation of the policy followed since 1977 in which fishing mortality is conservatively targeted.
The estimated 1987 Canadian share of each TAC shown in Table 2.4 generally corre-sponds to the 1982 shares, except in northern and Gulf cod where the Canadian share is expected to increase. These estimates represent the Task Force view of a likely course of events and do not necessarily reflect the policy of the Government of Canada in respect of sharing of stocks subject to various international accords. For-eign by-catch provisions, which would be allowed in some stocks (e.g., plaice in NAFO
Area 3LNO; see map on p. 30), have not been shown. The figures are rounded.
Finally, the estimated 1987 Canadian catches are 'best guesses' by the Task Force, based on recent catches in the various stocks. It is assumed, for instance, that Canadian quotas of cod, haddock and pollock will be fully exploited in 1987. The largest uncertainty concerns the yearly variation in the inshore catch of northern cod. The catch of redfish and flounder may be less than quota, the latter due to poor catch rates in some stocks and the former due to uncertain market outlook.
Several further observations should be made concerning these projections for 1987. It cannot be over-emphasized that projecting fish landings, even from one year to the next, let alone five years into the future, is a very uncertain task. Many of the fish included in the 1987 projections have yet to be born. Environmental events of which we have only the vaguest understanding could easily make the estimates inaccurate.
TACS for several cod stocks, for example, are well above our current best estimate of the long-term average catch from the stock. For instance, the expected long-term yield from cod in the eastern Gulf ( NAFO Area 4RS3Pn) is 75,000 t, whereas the estimated 1987 TAC is 125,000 t. The difference arises because of the presence of a number of abnormally abundant 'year classes' at present. They indicate good fishing for several years, but this could be followed by many years of below average catches.
Not included in Table 2.4 are species not regulated by quota (e.g., halibut) and groundfish species of minor significance to Canada at present (e.g., grenadier, argen-tine). In total they may add about 50,000 t to the Canadian catch. For example, the most recent (October 1982) revisions to the statistics indicate that the 1981 Canadian groundfish catch was 779,000 t. This figure is 54,000 t higher than the number cited in the table and would include the minor species we mentioned.
The projected catch for 3NO cod presents a difference picture. The long-term yield of the stock has been estimated to be about 100,000 t, but the TAC projected for 1987 is only 40,000 t. Even this level will turn out to be too optimistic if international agreement is not reached to stop the over-fishing of this stock, which has occurred for several years on the 'tail' of the Grand Bank just outside the 200-mile limit.
Virtually every stock harbours its own peculiarities, many related to biology, some to the catchability of the fish at reasonable cost, some to market outlook, some to inter-national uncertainties. The projected catches from individual stocks in Table 2.4 are not unreasonable in the sense that, in the past, Canadians have in one year or another taken at least as high a percentage of their quota as has been assumed in arriving at the projections.
But in view of the multitude of peculiarities and uncertainties, it is unreasonable to expect that each fishery will, in any given year, proceed 'normally' (that is, exactly as forecast). For this reason the total catches projected are probably over-estimates, because fluctuations above the 'normal' are usually cut off by the quota being
Profile of the Atlantic Fishery 27
reached, whereas downward fluctuations have nothing to stop them. The major exception to this is northern cod. In that case, the inshore fishery is not limited by a quota for a variety of technical reasons. Because of the very large size of the north-ern cod TAC, fluctations in its annual yield are potentially of enormous significance to the fishery.
The projections in Table 2.4 point to an increase of about 370,000 t in the Canadian groundfish catch between 1981 and 1987. This 50 per cent increase is composed almost entirely of cod, the landings of which might grow by 330 to 335 thousand tonnes over the period. There is no significant change forecast in any other tradi-tional groundfish species. The growth in cod catches is concentrated in the northern cod stock (226,000 t), the eastern Gulf (40,000 t), the eastern Scotian Shelf (19,000 t) and the southern Grand Bank (18,000 t). The key is the inshore fishery for northern cod, which has been well below expectations in recent years but which is potentially explosive should there be a heavy and sustained inshore migration of fish in any year. The offshore winter fishery for northern cod has been extraordinarily dependable and, in the past two years, has yielded the highest catch rates ever experienced by Canadian trawlers.
This growth in the resource is not spread evenly across the Atlantic region. As illus-trated in Figure 2.5, the truly explosive growth is confined to one area, the waters off northeast Newfoundland. About 70 per cent of the increased catch is expected to be made off northeast Newfoundland and Labrador. This is almost entirely due to the growth in northern cod catches. Gulf cod should account for about another 12 per cent of growth. Increased cod and flounder catches south and southeast of New-foundland might contribute 10 per cent of the growth, although this will depend critically on some rebuilding of the cod stock on the southern Grand Bank. A recov-ery of this fishery would be of enormous benefit to the hard-pressed trawler plants on the south coast of Newfoundland. Unfortunately, it cannot happen quickly.
The Scotian Shelf-Georges Bank-Fundy zone has the lowest forecast growth among all regions. Many of the stocks may even decline slightly. Increased cod catches are projected for the eastern end of the Shelf, although these are above the long-term estimate of annual yield and thus may not be sustained. The western part of Nova Scotia and New Brunswick will have to depend on some modest growth in catches from Georges Bank. The 1982 cod catch in this area gives rise to optimism for the future and underlines the critical importance of the outcome of the Gulf of Maine boundary case now before the International Court of Justice. The inshore fishermen and processing plants in the western Maritimes are of course unable to benefit from the substantial stock growth east of Newfoundland, or even east of Halifax.
Task Force Throughout the Report, readers will find references to different areas of the Atlantic Analytical coast. From the beginning, the Task Force was particularly conscious of the fact that
Areas the Atlantic fishery is not homogeneous. There are wide differences among areas of the Atlantic coast, and we wanted our statistical base to reflect this diversity. We decided to gather our statistics, as much as possible, on the basis of 13 areas within the Atlantic fishery. These are set out in Table 2.5 and illustrated in the map on page 30.
There is nothing particularly scientific about the areas; they made sense to us and had the advantage of following the boundaries of fish stocks and of statistical collec-tion areas. Moreover, by adding groups of areas, all-province totals can be obtained. As our work progressed, we occasionally found it necessary to reduce the number of areas in presenting data; in some cases, this was done to preserve the confidentiality of commercially sensitive financial information; in others, it seemed more appropri-ate to aggregate the data.
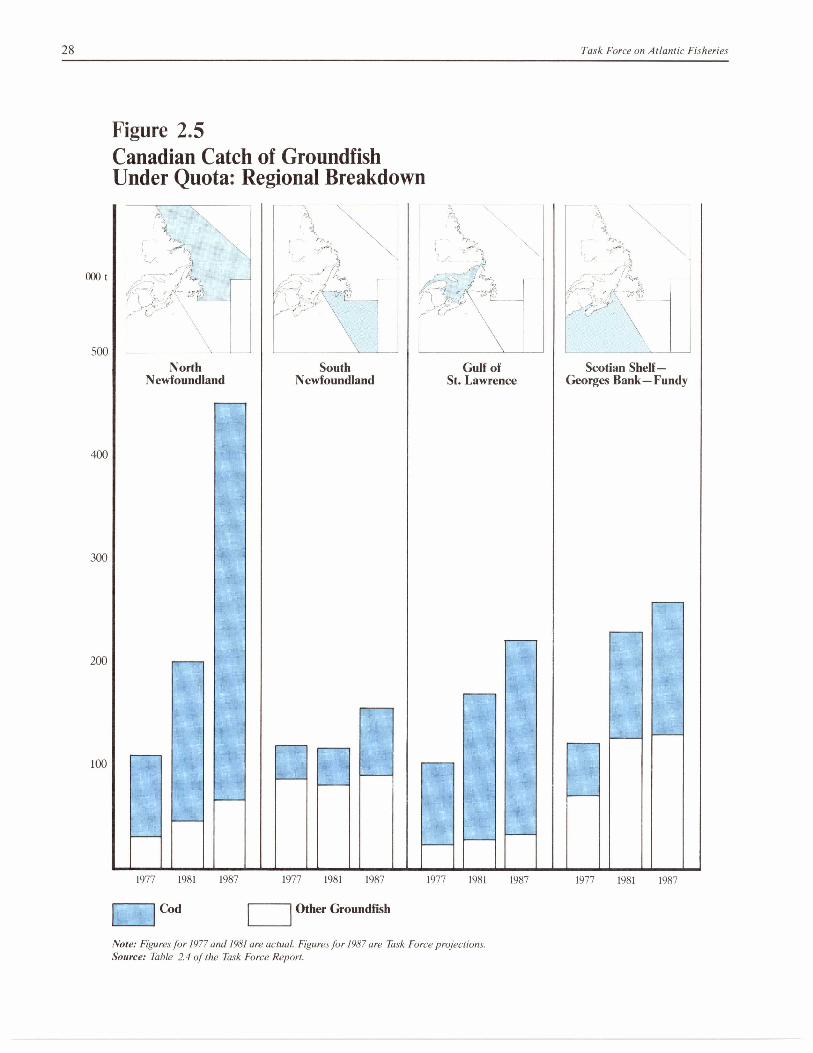
Note: Figures for 1977 and 1981 are actual. Figures for 1987 are Task Force projections. Source: Table 2.4 of the Task Force Report.
28 Task Force on Atlantic Fisheries
Figure 2.5 Canadian Catch of Groundfish Under Quota: Regional Breakdown
Nk‘=-1-'
""'
(,)
•
.Th \ ,
1 /
1
,i
:-
1
•
,
North Newfoundland
South Newfoundland
Gulf of St. Lawrence
Scotian Shelf— Georges Bank— Fundy
1977 1981
Cod
1987 1977 1981 1987 1977 1981 1987 1977 1981 1987
Other Groundfish
000 t
500
400
300
200
100
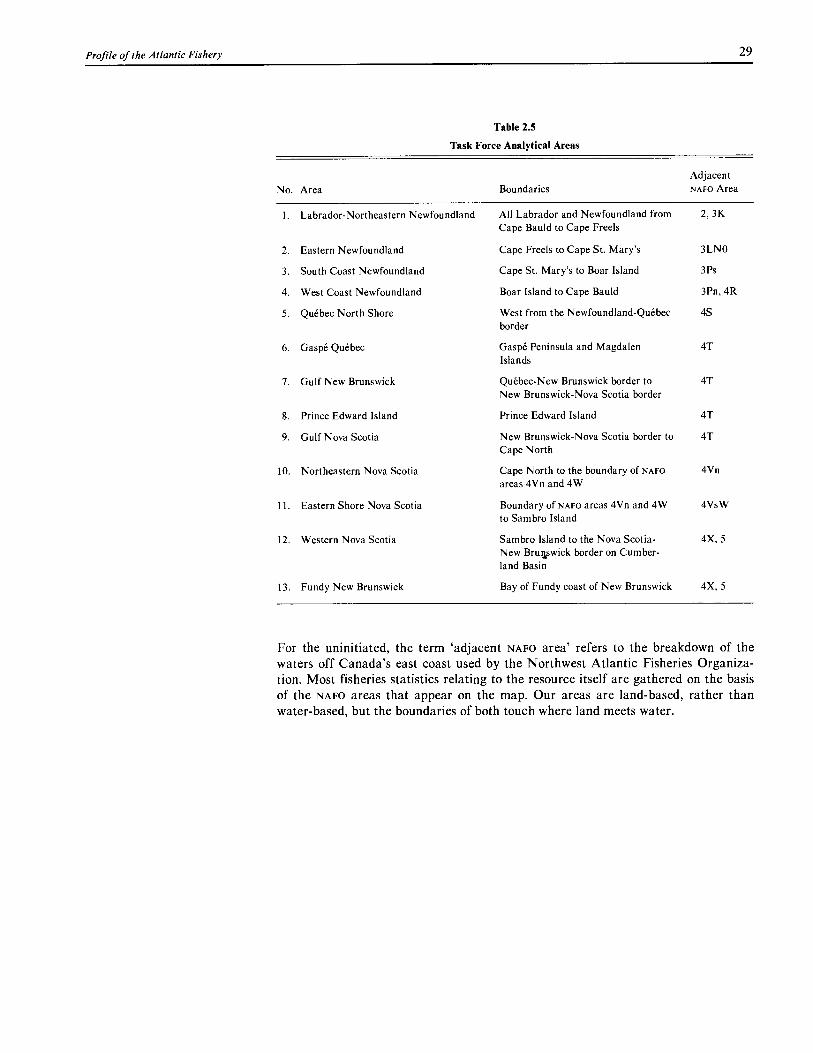
Profile of the Atlantic Fishery 29
Table 2.5
Task Force Analytical Areas
Adjacent Boundaries NAFO Area
All Labrador and Newfoundland from 2, 3K Cape Bauld to Cape Freels
Cape Freels to Cape St. Mary's 3LNO
Cape St. Mary's to Boar Island 3Ps
Boar Island to Cape Bauld 3Pn, 4R
West from the Newfoundland-Quebec 4S border
Gaspe Peninsula and Magdalen 4T Islands
Quebec-New Brunswick border to 4T New Brunswick-Nova Scotia border
Prince Edward Island 4T
New Brunswick-Nova Scotia border to 4T Cape North
Cape North to the boundary of NAFO 4Vn areas 4Vn and 4W
Boundary of NAFO areas 4Vn and 4W 4VsW to Sambro Island
Sambro Island to the Nova Scotia- 4X, 5 New Brunswick border on Cumber- land Basin
Bay of Fundy coast of New Brunswick 4X, 5
No. Area
1. Labrador-Northeastern Newfoundland
2. Eastern Newfoundland
3. South Coast Newfoundland
4. West Coast Newfoundland
5. Quebec North Shore
6. Gaspe Quebec
7. Gulf New Brunswick
8. Prince Edward Island
9. Gulf Nova Scotia
10. Northeastern Nova Scotia
11. Eastern Shore Nova Scotia
12. Western Nova Scotia
13. Fundy New Brunswick
For the uninitiated, the term 'adjacent NAFO area' refers to the breakdown of the waters off Canada's east coast used by the Northwest Atlantic Fisheries Organiza-tion. Most fisheries statistics relating to the resource itself are gathered on the basis of the NAFO areas that appear on the map. Our areas are land-based, rather than water-based, but the boundaries of both touch where land meets water.
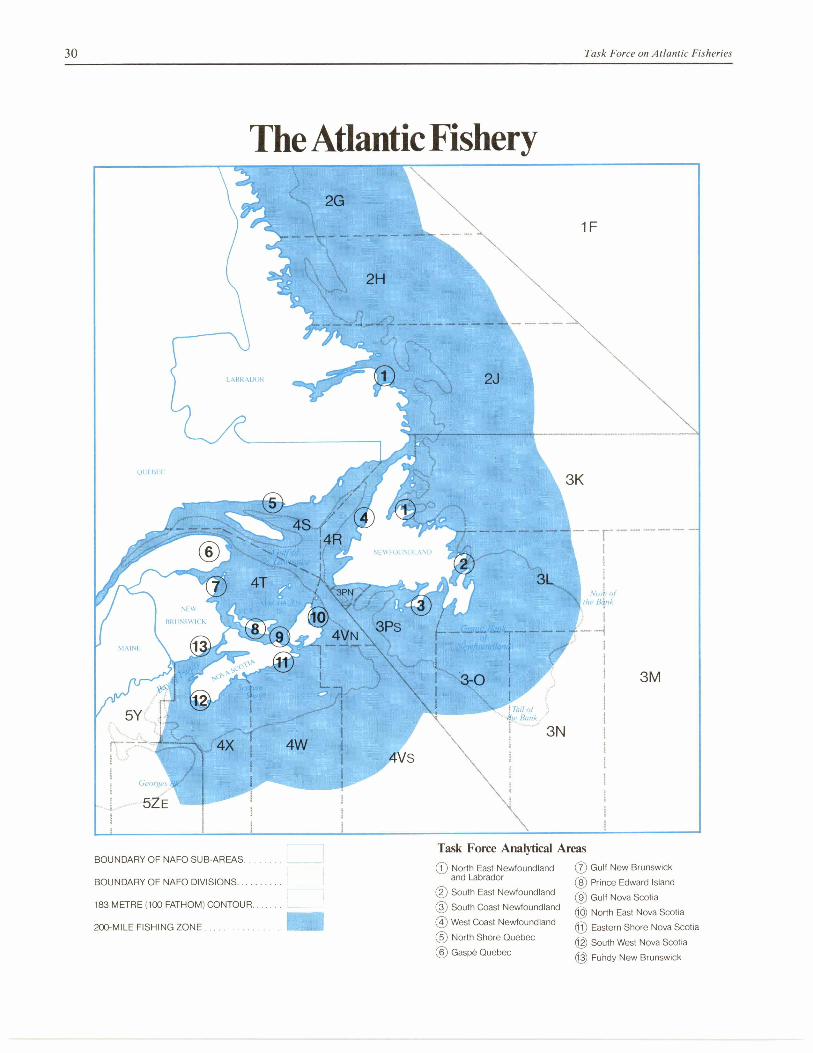
30
Task Force on Atlantic Fisheries
The Atlantic Fishery
3M
Task Force Analytical Areas BOUNDARY OF NAFO SUB-AREAS
BOUNDARY OF NAFO DIVISIONS
183 METRE (100 FATHOM) CONTOUR
200-MILE FISHING ZONE
® North East Newfoundland and Labrador
® South East Newfoundland
® South Coast Newfoundland
® West Coast Newfoundland
® North Shore Quebec
® Gaspe Quebec
0 Gulf New Brunswick
® Prince Edward Island
® Gulf Nova Scotia
0 North East Nova Scotia
0 Eastern Shore Nova Scotia
0 South West Nova Scotia
Fu'ndy New Brunswick
31
3. Myths and Realities
The great majority of mankind are satisfied with appearances, as though they were realities, and are often more influenced by the things that seem than by those that are.
Niccolo Machiavelli
There is always an easy solution to every human problem neat, plausible and wrong.
H.L. Mencken
Undisciplined Expansion
A folklore has developed around the Atlantic fishery, a folklore that mixes important elements of truth with misconceptions and unwarranted generalizations. Several of the widespread conceptions will be analyzed briefly to separate myth from reality. We place particular emphasis on the sources of conflict in the fishery, especially issues that centre on the so-called inshore-offshore conflict over resource allocations.
Some of the problems of the fishery have been the result of a too rapid expansion in the number of fishermen and vessels and in processing capacity following the exten-sion of fisheries jurisdiction in 1977. The numbers of licensed (though not necessarily active) fishermen in the Atlantic fishery as a whole increased by some 45 per cent, from about 36,500 to about 53,500, between 1974 and 1981. This was after a decline from about 49,000 in 1965. It is believed that present numbers are comparable to those prevailing before the drastic decline of the Newfoundland inshore fishery in the early 1970s. The number of processing facilities increased by 35 per cent, from 519 in 1977 to 700 in 1981. Between 1974 and 1980, freezing capacity increased by more than two and a half times in the Atlantic region as a whole.
This growth has been unevenly distributed. The expansion of plant capacity has occurred primarily on the east coast of Newfoundland and in western Nova Scotia. (The number of plants in Newfoundland grew from 147 to 255 between 1977 and 1981, although many of these were extremely small operations of limited capacity.) The growth in the number of fishermen has been concentrated in these same areas and on the Gulf coast of Newfoundland. The expansion has conformed generally to areas of actual and anticipated growth in the resource.
Numbers of plants and of fishermen can be misleading. The significant plant statis-tic is the total amount of capacity relative to peak landings. By this criterion, there are only a few areas of absolute excess capacity — in western Nova Scotia and southeastern Newfoundland — and in the latter area there is still too little capacity to handle effectively the potential catch from a heavy cod trap fishery.
There is nevertheless substantial under-utilization of capacity in the off-peak season. Plants should not be erected to handle a few weeks of peak catch, but plant capacity was built up rapidly between 1977 and 1979. In a number of cases this expansion was reasonable and was financed by the Department of Regional Economic Expan-sion with the support of the Department of Fisheries and Oceans. However, in the province of Newfoundland and Labrador, of 34 applications for assistance turned down by federal authorities, 22 plants were nevertheless built with provincial or bank support. Subsequent high interest rates and poor operating results have created a critical situation for many of these new facilities.

32
Task Force on Atlantic Fisheries
In assessing the number of fishermen, a distinction must be drawn between full-time fishermen and part-timers. Full-time fishermen land perhaps 80 per cent of the catch and are the group on which fisheries policy should focus primarily. The Department of Fisheries and Oceans has classified all fishermen, defining full-timers as those who fish the normal season in their locality and for their type of gear. Tull-time' should not be confused with 'year-round', nor should the number of fishing licences issued be confused with the number of fishermen who actually used their licences to go fishing. Our estimates indicate that there were 23,400 full-time and 17,455 part-time fishermen in the Atlantic region who used their fishing licences in 1981 (see Chapter 4).
In retrospect, the expansion in plant capacity and in the number of fishermen that has taken place since 1977 has been excessive in light of circumstances. But if inshore catches on the east coast of Newfoundland had measured up to reasonable expectations, if market prices had remained firm, and if interest rates had not sky-rocketed, this expansion of the fishery would be much less open to criticism today. It must further be acknowledged that the fishery is rife with incentives to expand. The most important of these are the common property nature of the resource, about which much more will be said in Chapter 10, and the chronic under-employment of labour on Canada's east coast. If ways are not found to deal more effectively with these problems, over-capacity will forever plague the fishery and rob it of vitality.
Will Fish The expansion of the fishery between 1977 and 1980 was based on the expectation, Stocks and the reality, of greatly increased Canadian catches as a result of the 200-mile Continue limit. An attitude quickly developed that any financial problem in the industry could to Expand? be solved by increasing production volume. The vexing problem of dividing quotas
among competing interests was also much easier as long as the size of the 'pie' con-tinued to grow.
A reliance on growth cannot, of course, be sustained indefinitely, and in many stocks the biological limits of prudent harvesting have been reached, or nearly so. Even in those areas where stocks are still rebuilding, fisheries managers have recently tended to downplay growth potential, perhaps in an attempt to purge the fishery of its volume mentality. Whatever quota growth may still be in the offing, it is certain there will not be enough to satisfy the demands of fishermen and processors; para-doxically, however, there will probably be more fish available than the existing mar-kets for Canadian fish will readily absorb. The industry will have to divert its pri-mary attention away from production and begin to focus some serious attention on marketing.
In view of existing excess capacity in both the harvesting and processing sectors, described more fully in Chapters 10 and 5 respectively, it is fortunate that there will be a great deal more fish available for Canadians to catch. The stock projections given in Chapter 2 indicate a growth in the catch of traditional groundfish species of some 370,000 t by 1987, an increase of almost 50 per cent over the 1981 Canadian catch. Other species such as squid and mackerel are clearly under-utilized and offer great potential given the proper harvesting methods and market development.
The most significant fact about the anticipated growth in groundfish catches is the unevenness of its distribution among species and areas. About 90 per cent of the growth is forecast to be cod and almost 70 per cent is expected to occur east of New-foundland and Labrador.
In view of this, the answer to the question — will fish stocks continue to expand? — is both yes and no. It depends on where you are and what you fish. Growth in stocks
Myths and Realities 33
can still solve some of the thorny problems of excess harvesting and processing capacity in the Atlantic fishery, provided brakes can be put on expansion now. But as the remainder of the Report shows, stock growth will not solve the industry's major problems.
We versus They A theme that will be returned to frequently in this Report is the atmosphere of dis-harmony that infects the fishery. One encounters it everywhere — between longlin-ers and draggers; between Gulf inshore fishermen and trawler operators; between the federal and provincial governments; between Newfoundland and Nova Scotia; between big companies and small companies; and even within the Department of Fisheries and Oceans, between one branch or region and another.
The fishery appears to be an industry particularly prone to conflict, much to the detriment of all who work in it. The reasons for the strife would require years of study by historians and sociologists to sort out fully, but it seems evident that the `common property' nature of the fishery is the fundamental cause. The subject of common property is treated in detail in Chapter 10. Here it is only necessary to point out that when everyone competes for a share of a common, but limited resource, the result is a zero-sum game; one man's gain is always another's loss. All of the con-flicts over allocations — whether between provinces or between inshore and offshore fleets or between individual fishermen — are of this type. And the conflict will become more intense when there is no longer any new growth to allocate.
Inter-governmental conflict in the fishery can often be traced to divided jurisdiction. Although the constitutional division leaves the federal government largely respon-sible for the harvesting sector and the provinces with responsibility for processing, the industry is in reality a tightly connected system, so that policies in one sector have an immediate effect in the other. Federal-provincial arguments over quota and licence allocations and the regulation of processing capacity are an outgrowth of the failure to develop effective means of harmonizing federal and provincial policies.
Ways are suggested later in the Report, particularly in Chapters 10 and 21, to deal more effectively with the common property problem and with federal-provincial con-sultations. But the we/they attitude will remain as long as individual participants in the fishery fail to see themselves as part of a larger economic system pitted against foreign competitors in the international seafood market. Canadians will fall far short of their potential as long as competitive energies are dissipated in domestic conflict.
Fishermen and processors have to recognize that each is economically dependent on the other. The responsibility for improving quality, for example, can no longer be passed off as the other guy's job. Fishermen and processors are equally responsible. The division of the income pie is another source of endless conflict, only part of which is justified by the need to maintain bargaining tension between buyer and seller. Fishermen's incomes must be adequate to finance better equipment and to create professional pride in their work. Processors have to be profitable if they are to attract better management and do a more effective job in the marketplace. The consequences of success or failure will be shared by both sides.
A recognition of this mutual interdependence and its practical translation into a more tolerant attitude in relations between fishermen and processors is one of the first requirements of a more successful industry. This problem cannot be resolved by government policy. Its resolution will require a fundamental change in attitude on the part of fishermen and processors alike.
34
Task Force on Atlantic Fisheries
Inshore Conflict in the fishery has been symbolized by the tug of war between the inshore versus and offshore sectors for allocations of the growth in fish stocks since 1977. Although Offshore the conflict has been real, the terms used to characterize it are misleading. At issue
is not the distance from land at which fish are caught, but rather the control of resource supply and the timing of its delivery to processors.
Integrated, trawler-owning companies (the 'offshore' sector) have sought security of year-round fish supply. This has led them to oppose larger allocations to independent fishermen (the 'inshore' sector) who are generally unable to deliver fish throughout the year because of environmental factors — the weather, ice conditions, fish migra-tions — and who are not obliged to deliver their catch to any particular plant.
Sometimes the inshore fishery is portrayed as the 'social' fishery while the offshore is thought to be economically efficient. No such general statement can be made. There are many situations where the reverse is true. For example, the inshore-based fishery in southwestern Nova Scotia is more successful economically than the trawler-based fishery on Newfoundland's south coast.
The inshore sector is itself ill-defined. For statistical purposes it is often taken to include all vessels under 65 feet, because with few exceptions only these are permit-ted to fish within less than 12 miles of shore. But many of these vessels are steel-hulled craft of over 60 feet that venture 100 miles or more offshore and can hardly be compared with the 25 to 30-foot open boats that always stay in sight of land. Ves-sels over 100 feet fall unambiguously into the offshore category, but many of these, including the ageing side trawlers based around the entrance to the Gulf, are unable to participate in the highly productive offshore cod fishery east of Newfoundland and Labrador because they cannot handle winter weather conditions in the area.
The terms inshore and offshore are therefore at most a useful shorthand for the more significant distinctions — those between seasonal and year-round operations; between independent and processor-owned vessels; between day boats and those that stay out for one or more nights. The correct interpretation will always depend on the context.
It is unproductive to continue to portray the allocations issue in terms of inshore ver-sus offshore, although the terms may continue to be used if the limitations are clearly understood. The fundamental issues relate to the economic and social conse-quences of quota allocations in various regions and to various types of fishing tech-nology. It is in this context that the inshore-offshore question will be treated throughout the Report.
The Atlantic The inshore-offshore conflict has centred on groundfish allocations to various types Groundfish of vessels, principally between trawlers over 100 feet and boats under 65 feet. These Management allocations are ultimately decided each year by the Minister of Fisheries and Oceans Plan after extensive consultations and are set out in a document called the Atlantic
Groundfish Management Plan. It is important to understand the objectives of the Plan and the allocation of fish resources that has resulted from its application.
The concept of the Management Plan was developed in 1976. The first comprehen-sive system of allocations was introduced in 1977 with the advent of the 200-mile limit. At that time, the amount of fish available to the offshore fleet had declined critically, due to the collapse of the redfish stock in the Gulf and to low quotas of other Gulf and Scotian Shelf stocks. The 1977 Plan had as its objective to spread the catching of the limited available quotas throughout as much of the year as possible. Management measures were applied principally to the trawler fleet in the form of

Myths and Realities 35
seasonal limitations on the catch and restrictions on 'by-catch' (that is, catches inci-dental to the main species sought). This process was extended to virtually all stocks in the late 1970s, and the development of an annual allocation plan is now a well established facet of Atlantic fisheries management.
The ultimate aim of allocating access to the resource should be to maximize net benefit. The notion of net benefit has not been clearly defined in fisheries policy, but undoubtedly implies a mix of social and economic benefits less costs. Although the measurement of these will always remain judgemental, the Task Force has sought to define the objectives of fisheries policy, and their order of priority, more clearly than in the past. These objectives are set out in Chapter 7. Net benefit should henceforth be judged against these objectives.
In practice, a variety of factors have had to be accommodated in allocating resources among competing fleets. These have included proximity of the fleet to the resource, community dependence, and the efficiency of fleet sectors. In the short term particu-larly, existing situations have necessitated greater emphasis on such factors as com-munity dependence and proximity. In the longer term, maximization of net benefit should become the primary criterion.
A great deal of public debate has occurred as conflicting interest groups jockeyed for the greatest shares of the available resource. This is understandable, because the resource allocation process involves the distribution of potential income from the fishery among various groups in society.
In terms of distribution, the allocation debate has centred during the past several years on (1) the inshore-offshore split in general; (2) access to the Gulf of St. Law-rence by large trawlers based outside the Gulf; and (3) inter-provincial rivalry, between Newfoundland and Nova Scotia, over where northern cod catches are to be landed. To a large extent, all these conflicts have focused on cod, specifically Gulf cod and northern cod.
The debate reached a peak in late 1980 as offshore operators, particularly in Nova Scotia, fought to retain some presence in the Gulf of St. Lawrence cod fishery. Although total offshore quotas were increasing each year, the growth was centred largely in stocks east and north of Newfoundland, primarily in northern cod, which gave trawlers based in Newfoundland a significant long-run advantage over those based in Nova Scotia. Meanwhile, total Gulf cod catches had increased substan-tially, from 84,000 t in 1977 to 142,000 t in 1981, whereas the catch from these stocks by trawlers fell from 24,700 t in 1978 to 11,680 t in 1981 as a result of restric-tions in the Management Plan.
The statistical evidence surrounding the inshore-offshore debate is a source of end-less controversy and varying interpretation. In 1976, just prior to the introduction of allocations under the annual Management Plan, the catch of groundfish by vessels over and under 100 feet was evenly split at 235,000 t each. Both sectors had seen their catches decline from the levels reached in the early 1970s. Between 1976 and 1981, the groundfish catch by vessels over 100 feet increased by 100,000 t (42 per cent); catches by those under 100 feet increased by 210,000 t (89 per cent).
The share of the total groundfish catch landed by trawlers has declined from its peak of 57 per cent in 1973 to about 43 per cent in 1981. However, Table 3.1 shows that if redfish is excluded, the trawler share has changed relatively little over the past decade. The redfish catch by trawlers declined from a high of 138,000 t in 1973 to only 57,000 t in 1981. This drop was due to a drastic decline in the Gulf redfish stock
36
Task Force on Atlantic Fisheries
Table 3.1
The Inshore-Offshore Split in Groundfish Catches (percentage of Canadian catch by vessels over 100 feet)
1971 1973 1975 1977 1978 1979 1980 1981
All Groundfish 47% 57% 50% 44% 45% 45% 41% 43% Excluding Redfish 41 43 37 38 39 39 38 39 Cod only 25 21 18 21 28 32 30 32
Source: Derived from Department of Fisheries and Oceans statistics.
after 1974 and to the recent weakness of the market for the species; it is not attribut-able to the Management Plan or to government quota allocation decisions.
The weakness in the market for redfish and the widespread re-orientation of the Canadian industry toward salted and frozen cod has resulted in demands by trawlers for a greater share of the TACS of cod, the species on which the inshore fishery has traditionally depended. The percentage of the total Canadian cod catch taken by ves-sels greater than 100 feet has increased steadily, from a low of 18 per cent in 1975 to 32 per cent in 1981. In absolute terms, the cod catch by this vessel class has increased more than five-fold since 1975 (from 27,000 t in 1975 to 139,000 t in 1981). The cod catch by vessels under 100 feet has meanwhile increased from 119,000 t in 1975 to 301,000 t in 1981.
These figures amply demonstrate the statistical smoke-screen that has caused so much confusion in the debate over the Groundfish Management Plan. To recapitu-late: the trawler share of groundfish catches has undoubtedly declined, but this has been largely due to a drop in redfish. The trawler cod catch has risen in percentage terms much more rapidly since 1975 than the inshore cod catch, but the latter has increased far more in absolute tonnage. Both fleet sectors have benefited from very significant overall growth.
The debate must therefore be about relative shares of growth and about its geo-graphical location. This requires a discussion of the allocation of Gulf cod and north-ern cod and the effect of the allocation on trawler fleets, particularly those based in the ports at the entry to the Gulf and on the south coast of Newfoundland.
Trawler It is generally accepted that there are insufficient resources available in the Gulf to Dependence support the fleet of vessels based there. These vessels are incapable of fishing the on The Gulf rebuilding stocks off Nova Scotia and Newfoundland, in part because they are ice-
bound in the winter months. They have been unable to participate fully in the benefits of stock recovery as a result of the 200-mile limit. In allocating access to Gulf groundfish, priority has therefore been given to vessels based in the Gulf.
As a result of this policy, Nova Scotia-based trawlers have been displaced from the Gulf of St. Lawrence to fish the more distant stocks off eastern Newfoundland and Labrador, as well as the rebuilding stocks on the Scotian Shelf. The offshore fleets based in Nova Scotia and Newfoundland consequently have less access to Gulf cod and other Gulf species than previously. Nonetheless, the decline in trawler catches of Gulf cod has been far more than offset by the increase in catches of northern cod and eastern Scotian Shelf cod (NAFO area 4VsW), as shown in Table 3.2.
The dependence of trawlers on the Gulf in the early 1970s was not based on the cod fishery, but rather on redfish. Between 1971 and 1976, the Atlantic coast trawler fleet took on average almost 35 per cent of its total groundfish catch from the Gulf. Seventy per cent of that Gulf catch was redfish. The trawler landings of Gulf redfish
Myths and Realities 37
Table 3.2
Trawler Catches of Cod (000 t live weight)
1971-76 Avg. 1977 1978 1979 1980 1981
Gulf 21.9 25.4 24.7 24.5 19.2 11.7 East Scotian Shelf 8.5 4.3 16.6 26.4 34.1 33.6 Northern Cod 4.0 6.9 20.7 44.3 50.3 67.7 Other Cod 11.1 14.6 19.8 26.0 23.2 25.7
Total Cod 45.5 50.3 81.8 122.1 126.8 138.7
Source: Derived from Department of Fisheries and Oceans statistics.
dropped from 107,000 t in 1973 to 6400 t in 1977. This is the most dramatic decline ever to have taken place in a Canadian trawler fishery. The stock is now rebuilding, but the long-run TAC is forecast to be in the range of only 25 to 30 thousand tonnes.
Cod allocations in the Gulf for trawlers not based there became an issue with the col-lapse of redfish stocks and the increase of the Gulf cod TAC after 1976. Trawlers based in Nova Scotia and on the south coast of Newfoundland had increased their catches, particularly in the eastern Gulf cod stock (NAFO Area 4RS3Pn), between 1976 and 1978 as a partial replacement for redfish. Many of these vessels were not capable of taking part in the newly developing offshore northern cod fishery. And even those that were equipped for the northern fishery still wished to maintain a strong presence in the Gulf because of its proximity to their home ports in Nova Scotia and southwestern Newfoundland.
It was clear from biological projections that the centre of gravity of the offshore fish-ery was shifting northeastward, pulled by the growing weight of northern cod, north-ern redfish, turbot and various species of flounder. Averaged over the period 1971-76, just over 30 per cent of the trawler catch came from waters east of Newfound-land. In 1979-80, 52 per cent of the Atlantic coast trawler catch came from this area, and the percentage is certain to increase. Nonetheless, there has also been a very significant increase in trawler catches on the Scotian Shelf, particularly of cod and haddock at the eastern end. Nova Scotia-based trawlers, for example, took about 84 per cent of their total catch within 250 miles (one day's steam) of home ports in 1980. In 1978, before they were banned from the Gulf, they took 83 per cent within 250 miles of home port.
Notwithstanding this, the struggle over Gulf cod allocations was, from the viewpoint of trawlers based in the western area of the Atlantic coast, an attempt to offset in some measure the northeasterly shift of offshore quotas, which they saw as inevitably weakening their competitive position. But from the perspective of fishermen and plant operators based in the Gulf, the trawlers had a mobility that would allow them to fish the growing stocks east of Newfoundland. Because the Gulf-based vessels didn't have this opportunity, they argued that Gulf stocks should be reserved for Gulf vessels. The government accepted this position. An exception was conceded in the case of the fleet of ageing side trawlers based in the so-called Gulf entrance ports such as Louisbourg and Petit de Grat in Nova Scotia and Burgeo, Ramea, Harbour Breton and Gaultois on the south coast of Newfoundland. The allocation of Gulf cod to trawlers based elsewhere has, since 1981, been restricted to vessels under 1050 horsepower, thus excluding the modern stern trawler fleet.
The decline in redfish stocks and the northeastward shift in the offshore resource base has placed these plants at a serious disadvantage in the emerging competitive
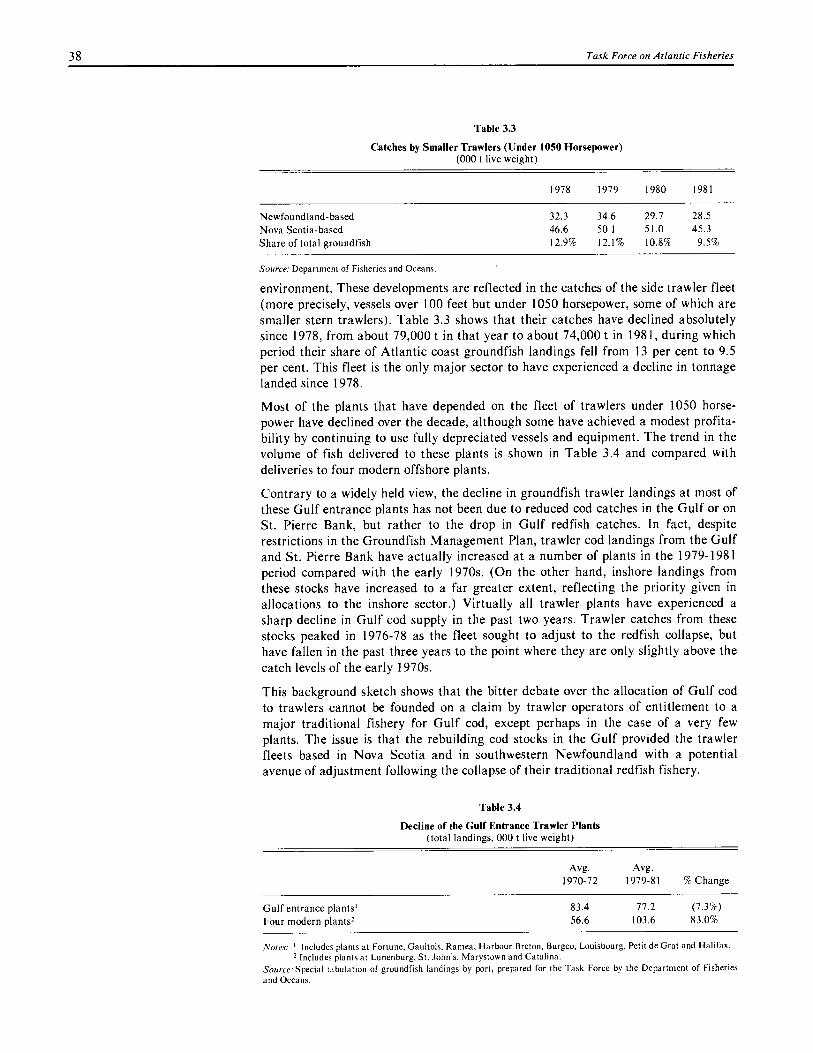
38
Task Force on Atlantic Fisheries
Table 3.3
Catches by Smaller Trawlers (Under 1050 Horsepower) (000 t live weight)
1978 1979 1980 1981
Newfoundland-based 32.3 34.6 29.7 28.5
Nova Scotia-based 46.6 50.1 51.0 45.3
Share of total groundfish 12.9% 12.1% 10.8% 9.5%
Source: Department of Fisheries and Oceans.
environment. These developments are reflected in the catches of the side trawler fleet (more precisely, vessels over 100 feet but under 1050 horsepower, some of which are smaller stern trawlers). Table 3.3 shows that their catches have declined absolutely since 1978, from about 79,000 t in that year to about 74,000 t in 1981, during which period their share of Atlantic coast groundfish landings fell from 13 per cent to 9.5 per cent. This fleet is the only major sector to have experienced a decline in tonnage landed since 1978.
Most of the plants that have depended on the fleet of trawlers under 1050 horse-power have declined over the decade, although some have achieved a modest profita-bility by continuing to use fully depreciated vessels and equipment. The trend in the volume of fish delivered to these plants is shown in Table 3.4 and compared with deliveries to four modern offshore plants.
Contrary to a widely held view, the decline in groundfish trawler landings at most of these Gulf entrance plants has not been due to reduced cod catches in the Gulf or on St. Pierre Bank, but rather to the drop in Gulf redfish catches. In fact, despite restrictions in the Groundfish Management Plan, trawler cod landings from the Gulf and St. Pierre Bank have actually increased at a number of plants in the 1979-1981 period compared with the early 1970s. (On the other hand, inshore landings from these stocks have increased to a far greater extent, reflecting the priority given in allocations to the inshore sector.) Virtually all trawler plants have experienced a sharp decline in Gulf cod supply in the past two years. Trawler catches from these stocks peaked in 1976-78 as the fleet sought to adjust to the redfish collapse, but have fallen in the past three years to the point where they are only slightly above the catch levels of the early 1970s.
This background sketch shows that the bitter debate over the allocation of Gulf cod to trawlers cannot be founded on a claim by trawler operators of entitlement to a major traditional fishery for Gulf cod, except perhaps in the case of a very few plants. The issue is that the rebuilding cod stocks in the Gulf provided the trawler fleets based in Nova Scotia and in southwestern Newfoundland with a potential avenue of adjustment following the collapse of their traditional redfish fishery.
Table 3.4
Decline of the Gulf Entrance Trawler Plants (total landings, 000 t live weight)
Avg. Avg. 1970-72 1979-81 % Change
Gulf entrance plants' 83.4 77.2 (7.3%)
Four modern plants' 56.6 103.6 83.0%
Notes: I Includes plants at Fortune, Gaultois, Ramea, Harbour Breton, Burgeo, Louisbourg, Petit de Grat and Halifax. 2 Includes plants at Lunenburg, St. John's, Marystown and Catalina.
Source: Special tabulation of groundfish landings by port, prepared for the Task Force by the Department of Fisheries and Oceans.
Myths and Realities 39
Having begun that adjustment in the mid-1970s, the avenue was blocked by alloca-tions policy, and some of the plants have not been in a position to make the invest-ment necessary to develop an alternative fishery for northern cod.
Not all Gulf entrance plants listed in Table 3.4 have experienced declines in produc-tion. Four of the eight included in the table increased their output between the 1970-72 and 1979-81 periods. These are plants that have been able to take some advan-tage of northern cod and of rebuilding cod and haddock stocks on the eastern Scotian Shelf. Nevertheless, their growth is dwarfed by the expansion of production by plants served by modern stern trawlers, which are able to exploit fully the northern cod stock.
It is clear that not all the Gulf entrance trawler plants will be able to replace their capital without an improved resource supply. Because present quotas are fully allocated, this improved supply can only be provided by a re-allocation of existing quotas, by a reduction in the number of plants to permit a better resource supply to those that remain, or by a share of growth in the TAC for stocks that are still rebuild-ing (e.g., northern cod).
A re-allocation of existing quota would largely shift the problem from one group of fishermen and communities to another, so that the solution must lie in some combi-nation of plant rationalization and reinvestment to enable participation in those fish-eries where growth is foreseen.
Does the The question is facetiously phrased, because the Task Force believes that the answer
Trawler is yes. Some trawler operators have nonetheless posed the question in light of what
Fleet Have they have perceived as a growing imbalance in allocations policy in favour of the
A Future? inshore sector. Others have questioned the effect of escalating fuel costs and the enormous capital cost of trawlers, factors that in the longer run seemed to favour a fishery carried out exclusively with smaller vessels and passive gear — longliners, for example. The Task Force agrees that continuing technological evolution in this latter direction is likely, but this does not imply the disappearance of trawlers from the Atlantic fishery.
The statistics cited earlier show that although trawlers may have lost some ground in several fisheries, they have nonetheless increased their total catches substantially since 1977. The offshore trawler is, and for some time will remain, a very productive and economically efficient fishing machine. No other practical method has been developed to fish year round throughout the Canadian zone, nor is there any other gear type that can exploit the large offshore stocks of redfish and flounder. These species could not be caught in quantities by inshore fishermen or by fixed gear even if trawlers were to disappear.
The economic performance of the trawler fleet has been questioned in view of the poor financial results of the major trawler operating companies (see Chapter 5). The causes of the financial woes of these companies are numerous and complex — and different in certain essential respects in the case of each company. The cost of fish landed by their trawlers does not, however, appear to be a significant cause of their distress. The average cost per pound landed by the fleets of the four major compa-nies — National Sea Products, Fishery Products, H.B. Nickerson & Sons and The Lake Group — is shown in Table 3.5.
Between 1977 and 1981, the average total landed cost increased by about 33 per cent, to 25.1 cents per pound. But if the general rate of inflation is subtracted, the real cost per pound was in fact lower in 1981 than in 1977. This is primarily a reflec-tion of much higher catch rates and larger quotas, leading to improved vessel utilization.

40 Task Force on Atlantic Fisheries
Table 3.5
Trend in the Landed Cost of Trawler Fish
1977 1978 1979 1980 1981
Landings (millions of lbs.)' 341 440 528 493 549 Total Cost (tt per lb.) 2 18.90 19.20 21.40 23.70 25.1¢ Deflated Total Cost (e/lb.) 18.90 18.1¢ 18.20 18.30 17.60
Notes: I Landings are given in common landed form — e.g., head-on, gutted for cod; live weight for redfish. 2 Cost is expressed in 1977 dollars using the GNE implicit price index as deflator (1977=100).
Source: Cost records of the four major trawler companies.
Offshore and Inshore Prices
The cost of fuel per pound landed has gone up sharply, from about 2.7 cents in 1977 to about 4.8 cents in 1981. Nevertheless, fuel still accounts for only about 20 per cent of total trawler costs, including interest and depreciation. The largest cost factor is payments to captain and crew, which now make up about 40 per cent of the total.
Trawlers land fish at an average cost per pound that is comparable to prices paid for inshore fish, although it should be noted that the cost figures in Table 3.5 make no allowance for a return on capital invested in the trawler fleet. The advantage of the trawler is the year-round supply of a mix of species that it delivers on a regular schedule to a plant. The disadvantages are the increasingly large amount of capital that must be tied up to acquire new trawlers and the inherently large fuel consump-tion of any fishing method that requires hunting for fish and then towing a large net through the water to catch it.
On balance, given (1) the successful rebuilding of Canadian groundfish stocks and corresponding high catch rates; (2) the introduction of enterprise allocations to the trawler fishery to permit much better use of capital invested in the fleet; (3) the fact that Canada's principal competitor, Iceland, has turned increasingly to trawlers and must therefore bear the cost structure of this technology; and (4) that there is no practical alternative method with the versatility and year-round capability of a stern trawler, it is safe to conclude that the trawler fleet will play an important part in the future of the groundfish fishery.
One of the most persistent misunderstandings that has grown out of the inshore-off-shore debate concerns the way in which offshore fish prices are determined. The mis-understanding is significant because it has led to the view, remarkably widely held, that offshore prices are kept deliberately low by the trawler companies in order to keep down the prices paid to independent inshore fishermen. This has added fuel to the already bitter debate between inshore and offshore interests. This issue is suf-ficiently important to justify a full explanation.
The price paid by plants for fish delivered by offshore trawlers owned by the same company is artificial, because seller and buyer are one and the same. Such a price is usually called a 'transfer price'. It is often argued that the price is therefore set unreasonably low, causing the trawlers to lose money, thereby establishing a low norm for inshore prices.
What is not understood is that offshore 'prices' are not really prices at all and bear almost no relation to the prices paid to independent fishermen. The captain and crew of offshore trawlers are paid according to what is called a lay arrangement', which is a negotiated agreement for sharing the value of the catch between the crew and ves-sel owner. The crew share is equal to the 'offshore price' (or a certain average per-centage of that price) mutliplied by the pounds landed. The details of the calculation differ between Newfoundland and the rest of the Atlantic coast, but the principle is the same throughout the region.
Myths and Realities 41
The essential point is that the `prices' are negotiated with the trawler unions with an implicit target annual income in mind. Trawlermen are, in effect, company employees, and the annual catches of vessels are relatively predictable. Thus the negotiated offshore price of fish is comparable to an hourly wage rate. There are dif-ferences, in that income doesn't depend directly on hours worked and is subject to the risk of the catch, but trawler prices are certainly not comparable to dockside prices paid to independent fishermen.
For example, a recent trawler contract in Newfoundland listed a price to fishermen for large cod of 5.9675 cents per pound. (In Nova Scotia, the analogous offshore `price' might be 16 cents, but the lay arrangement in that province stipulates a crew share of 37 per cent. This means that the fisherman would net 5.92 cents before bonuses and benefits. These bring the effective share to about 54 per cent.) The Newfoundland inshore price was 24 cents per pound for comparable fish. The inshore fisherman must pay all his vessel expenses, including his crew, from the price he receives. The offshore price represents, in effect, only a payment to captains and crew. The two prices are therefore fundamentally different.
The more significant issue — the effect of offshore prices on inshore prices — can now be placed in proper perspective. Inshore prices reflect conditions of supply and demand in the port market, whether these prices are negotiated, as in Newfound-land, or established competitively, as in other provinces. (No judgement is being made in this discussion about the adequacy of the prices or whether the port market functions as well as it could. This latter issue is discussed in Chapter 15.) Landings by offshore trawlers add to overall supply and therefore, in theory, place downward pressure on the price of inshore fish. But if trawlers were to disappear and the same amount of fish were to be landed instead by inshore vessels, there would be a similar effect on price. In fact, there would tend to be greater downward pressure, because the additional inshore supply would be landed largely in the peak inshore period when demand was already softening.
It is obvious that any effect of offshore landings on inshore prices must be very indi-rect, because only relatively few plants have any access at all to trawler fish. Inshore prices thus reflect the competition for supply among processors who are not supplied by trawlers. Trawler-fed plants purchase very little inshore fish and therefore are not an important direct factor in determining inshore prices. The trawler fish does of course end up competing with inshore fish in the final market. But roughly speaking, it is the total supply offered for sale that determines the final market price, not the original source of that supply.
The Whole Problem is. . .
There is an abundance of simple theories to explain the problems of the fishery. All contain an element of truth, but all are seriously incomplete.
Theories explaining the latest crisis in the Atlantic fishery reflect the particular per-spective of the proponent:
• Those with a financial orientation cite the effect of interest rate increases applied to very high capital debt undertaken when the industry expanded between 1977 and 1980 and to rapidly rising bank loans to finance larger inventories and accumulating losses.
• Plant and vessel operators usually focus on escalating operating costs — particu-larly the cost of fuel, wages and fishing gear.
• Marketers are pre-occupied with the sluggishness of prices which, for frozen groundfish products as a whole, have decreased in real terms since 1979.
42
Task Force on Atlantic Fisheries
• Many observers of the industry cite inadequate quality as the main source of mar-ket weakness and as an important contributor to high production costs.
• A number of government spokesmen have laid most of the blame on the export marketing performance of the private sector, citing a lack of discipline, reflected in excessive cut-throat competition and an inability to expand the market base beyond the United States. Poor management in the processing sector is also cited by many in government and some in the industry as well.
• Representatives of the processing industry as well as some fishermen's groups claim that the main culprit has been excessive regulation and the priority placed on social objectives by government.
All these factors have contributed to the current problems of the industry. The weight of the contribution varies with the circumstances of the individual business. This variability makes simple analysis impossible. Nevertheless, an abundance of firmly held simple theories exists, and will probably continue to do so as the different groups in the fishery seek to place all the blame for its problems on others. As with many political issues, where you stand depends on where you sit.
Many of the issues outlined above are treated in the next three chapters, where the results of several comprehensive studies undertaken for the Task Force are pre-sented. As the analyses show, none of the simple statements paraphrased above can adequately explain the problems of the Atlantic fishery, no matter how much some people would like them to.
By far the two most significant immediate causes of financial difficulty for proces-sors and fishermen are declining operating profit margins (that is, the difference between market price and the cost of direct inputs — fuel, wages, etc.) and much higher interest costs. Overall, each appears to be about equally responsible for the decline in profitability since 1978. But the relative effect varies widely between enterprises. The factors are analyzed in Chapters 4 and 5.
The perception that interest rates have been the villain principally responsible for the current crisis in the fishery is so widespread that the facts should be summarized here, even though they are analyzed in depth in Chapter 5. Based on a study of the financial results of about 100 processing plants, it is clear that higher interest costs have been a significant factor in the losses sustained, particularly in 1981. In 1978, interest costs amounted to only about 2 per cent of the value of industry sales; in 1981, it was 7.6 per cent of sales. The actual cost of interest paid by the plants stud-ied was about $14 million in 1978, ballooning to $72 million in 1981.
The increase was due partly to growth in the scale of the business, but principally to the compound effect of interest rates that doubled and loans that were substituted for either retained earnings or new equity investment as the industry expanded. The heavy use of debt, rather than equity, was common in many sectors of the economy during the 1978-1981 period, but was particularly significant in the fishery because of the rapid expansion following the extension of jurisdiction. The industry became hopelessly over-extended and thus was unprepared for the cost-price squeeze that cut operating profit margins almost in half between 1978 and 1980.
The companies that managed to stay profitable in 1981 were those that had kept loan balances in line, thus escaping the interest rate crunch. On the other hand, if the margin between the market price of fish and production costs had remained close to its 1978 level, most firms could have weathered the increase in interest rates. The 1981 crisis was caused by the simultaneous occurrence of falling operating profits, increasing bank loans and sharply higher interest rates. No single factor affords an adequate explanation.
Myths and Realities 43
The financial consequences of sub-par raw material quality are difficult to gauge. The most significant negative effects are higher production costs in the plant and a reduction in the amount of material that could potentially go into higher value prod-ucts. In future, improved overall quality is a prerequisite to expanding the market base for Canadian groundfish and fostering greater consumption. These issues are analyzed in Chapters 6, 14 and 16.
The marketing performance of Atlantic Canadian fish exporters has in many ways been remarkably good — after all, Canada did become the world's leading exporter of fish products in 1979. But the industry is still oriented more toward 'selling' than `marketing', and it is the latter skill that will increasingly be needed in the 1980s.
Although the problem is not universal, the shortcomings of management in the industry are widely recognized. The more pertinent question is why the management of an entire industry should be poorer than the industrial average. The seasonality of the industry and the remote location of many plants make it unusually difficult to attract and retain top-flight management. In addition, much of the management problem arises because the fishery is going through the difficult transition from a family-operated, traditional and relatively unsophisticated business to a modern, ver-tically integrated, technologically advanced business. Management methods have not caught up, even in the largest companies, although there are some signs of improvement.
The burden of regulation (or, more accurately, the absence of effective measures to deal with common property) and the extent of the social costs borne by the private sector as a result of government policies are impossible to assess quantitatively. These factors in the fishing business environment have undeniably limited efficiency. On the other hand, there are instances where the private sector appears to have taken advantage of governments' social concerns to become involved in marginal operations. Overall, the effect of regulation and the social burden is probably ref-lected more in the longstanding poor performance of the fishery relative to other Canadian resource industries than in the dramatic decline in profitability since 1978.


II The Industry Environment


47
4. The Economic Condition of Fishermen, their Households, Communities, and Enterprises
If the inshore fishermen were forced to abandon the fishery, they face the prospect of immediately accepting social assistance or immediately seeking employment outside the province and probably the nation. (. . .) Inability to participate in the fishery becomes inability to participate in the work of society.
Newfoundland and Labrador Royal Commission on the Inshore Fishery, 1981.
The Study of The search for an accurate picture of the average fisherman can be compared to the Incomes and quest for the Holy Grail. There is no such person as the 'average fisherman'. Even Expenditures so, a detailed analysis of average fishing revenues, operating costs, amounts of capi-
tal investment, earnings from non-fishing sources, household incomes and costs, and similar factors can still be useful for understanding Canada's east coast fishermen and the communities in which they live.
To obtain information for this study the Task Force undertook a detailed survey of incomes and expenditures of fishermen for the year 1981. A sample of 1300 people was selected randomly from among all holders of federal personal commercial fish-ing licences. The sample was selected to reflect the number of full-time and part-time licensees in 11 of the 13 Task Force analytical areas. The survey size was suffi-cient to enable valid analysis at the level of the analytical areas and at the larger aggregations of a province or region. The survey did not include fishermen in Quebec because of the different scheme of licence administration in that province and because its licence base was not available for sample selection.
The survey proved highly successful. The extensive questionnaire was completed through personal interviews conducted by staff from the Department of Fisheries and Oceans. They met with excellent co-operation from respondents, and a response rate of 88 per cent was obtained among those contacted.
A detailed analysis of survey results broken down by geographical area, fishing gear type, household data and other factors will be published separately from the Report in a Task Force working paper. At this point, we concentrate on that mythical, but still popular figure — the 'average fisherman'.
We also refer to other sources of useful information such as Statistics Canada publi-cations, unemployment insurance data, and studies on fish processing plants and fishing vessel enterprises carried out in recent years by the Department of Fisheries and Oceans. Some comparisons are made between 'average' statistics and variations such as high or low incomes, length of season, species fished, etc.
Note on statistics: Throughout this chapter, where statistics appear in the text, tables or graphs, and unless otherwise indicated, the source is the Task Force Survey of Fishermen's Incomes and Expenditures. Data analysis was conducted by Task Force staff and by staff from the Surveys Unit of the Department of Fisheries and Oceans. Data reported here have been weighted statistically to reflect the actual population of full-time and part-time fishermen living in each of the Task Force analytical areas. Weights were adjusted in areas 3 and 12 (south coast Newfoundland and western Nova Scotia respectively) to ensure the proper representation of trawler-based fishermen in the population.
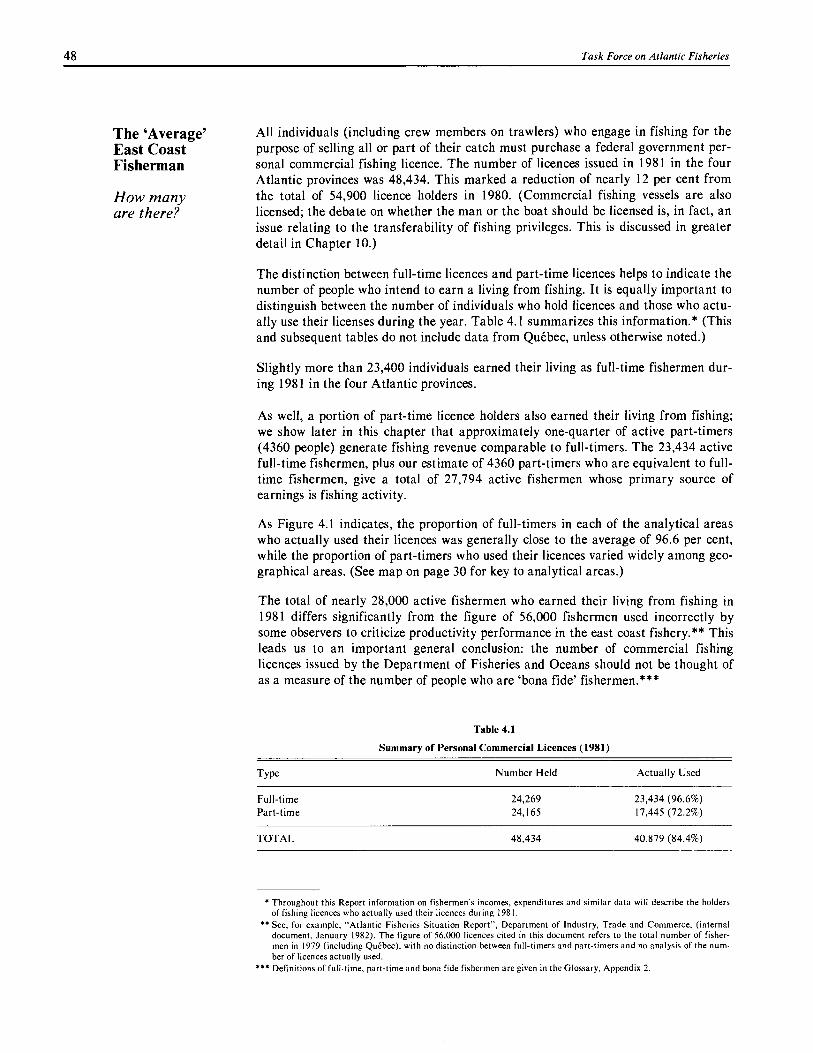
48
Task Force on Atlantic Fisheries
The 'Average' All individuals (including crew members on trawlers) who engage in fishing for the
East Coast purpose of selling all or part of their catch must purchase a federal government per- Fisherman sonal commercial fishing licence. The number of licences issued in 1981 in the four
Atlantic provinces was 48,434. This marked a reduction of nearly 12 per cent from
How many the total of 54,900 licence holders in 1980. (Commercial fishing vessels are also are there? licensed; the debate on whether the man or the boat should be licensed is, in fact, an
issue relating to the transferability of fishing privileges. This is discussed in greater detail in Chapter 10.)
The distinction between full-time licences and part-time licences helps to indicate the number of people who intend to earn a living from fishing. It is equally important to distinguish between the number of individuals who hold licences and those who actu-ally use their licenses during the year. Table 4.1 summarizes this information.* (This and subsequent tables do not include data from Quebec, unless otherwise noted.)
Slightly more than 23,400 individuals earned their living as full-time fishermen dur-ing 1981 in the four Atlantic provinces.
As well, a portion of part-time licence holders also earned their living from fishing; we show later in this chapter that approximately one-quarter of active part-timers (4360 people) generate fishing revenue comparable to full-timers. The 23,434 active full-time fishermen, plus our estimate of 4360 part-timers who are equivalent to full-time fishermen, give a total of 27,794 active fishermen whose primary source of earnings is fishing activity.
As Figure 4.1 indicates, the proportion of full-timers in each of the analytical areas who actually used their licences was generally close to the average of 96.6 per cent, while the proportion of part-timers who used their licences varied widely among geo-graphical areas. (See map on page 30 for key to analytical areas.)
The total of nearly 28,000 active fishermen who earned their living from fishing in 1981 differs significantly from the figure of 56,000 fishermen used incorrectly by some observers to criticize productivity performance in the east coast fishery.** This leads us to an important general conclusion: the number of commercial fishing licences issued by the Department of Fisheries and Oceans should not be thought of as a measure of the number of people who are 'bona fide' fishermen.***
Table 4.1
Summary of Personal Commercial Licences (1981)
Type Number Held Actually Used
Full-time 24,269 23,434 (96.6%) Part-time 24,165 17,445 (72.2%)
TOTAL 48,434 40,879 (84.4%)
* Throughout this Report information on fishermen's incomes, expenditures and similar data will describe the holders of fishing licences who actually used their licences during 1981.
** See, for example, "Atlantic Fisheries Situation Report", Department of Industry, Trade and Commerce, (internal document, January 1982). The figure of 56,000 licences cited in this document refers to the total number of fisher-men in 1979 (including Quebec), with no distinction between full-timers and part-timers and no analysis of the num-ber of licences actually used.
*** Definitions of full-time, part-time and bona fide fishermen are given in the Glossary, Appendix 2.

100% 95%
12 1 1 8 10 9 888Malett6.1026,
94% 61°0 100% 93%
97"o
93%
96".,
2 3 4
6?%
76%
7
The Economic Condition of Fishermen, their Households, Communities, and Enterprises 49
Figure 4.1
Full-Time and Part-Time Licences Issued, Number and Per Cent Used, by Analytical Area and Province
6,000
5.000
Full- 4 ,000
Time 3 ,000
2,000
poo
1,000
2,000
3 Part- "000
Time 4,000
5,000
6,000 I I I 1 Nova Scotia Newfoundland & Labrador
Licences Used
Licences Not Used
New Brunswick P.E.I.
Note: An average of 96.6% of:full-time licences held in /98/ were actually used for commercial fishing, with only small variations in use-patterns among geographical areas. An average of 72.2% of part-time licences were used and there were wide differences in use-patterns among various geographical areas.
0/ Per Cent of Total Licences Actually Used
Key to Analytical Area Numbers in Chapter 2.
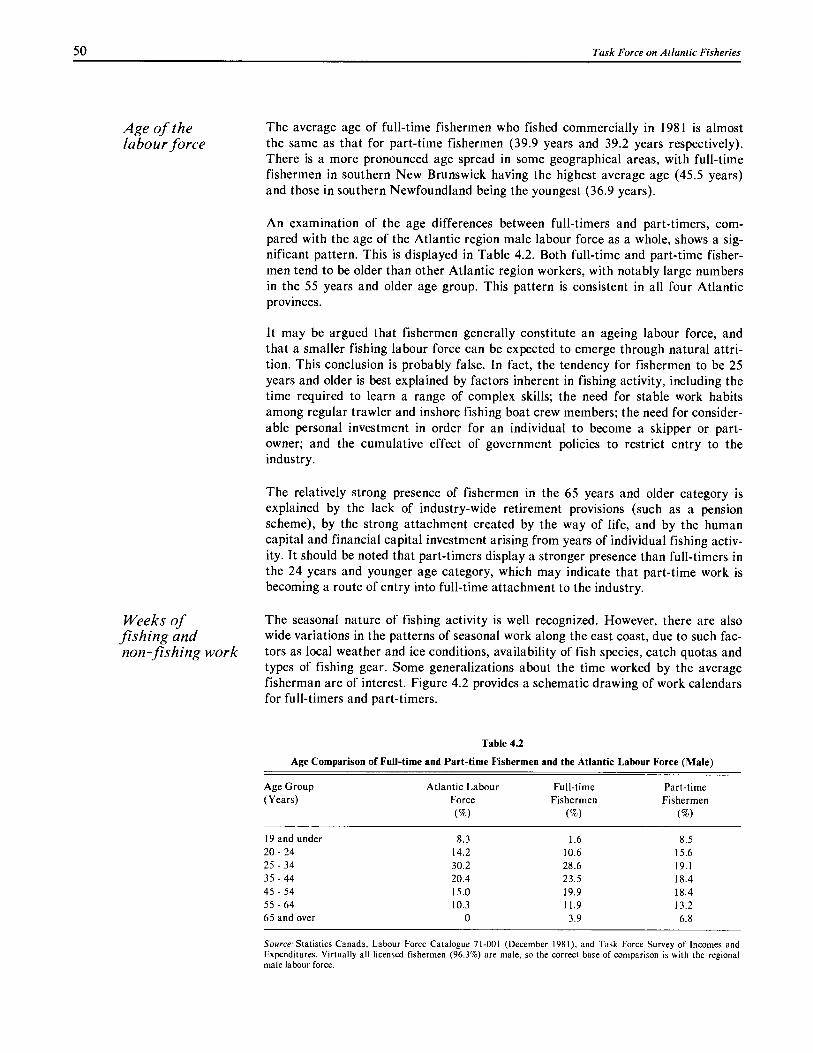
50
Task Force on Atlantic Fisheries
Age of the labour force
Weeks of fishing and non fishing work
The average age of full-time fishermen who fished commercially in 1981 is almost the same as that for part-time fishermen (39.9 years and 39.2 years respectively). There is a more pronounced age spread in some geographical areas, with full-time fishermen in southern New Brunswick having the highest average age (45.5 years) and those in southern Newfoundland being the youngest (36.9 years).
An examination of the age differences between full-timers and part-timers, com-pared with the age of the Atlantic region male labour force as a whole, shows a sig-nificant pattern. This is displayed in Table 4.2. Both full-time and part-time fisher-men tend to be older than other Atlantic region workers, with notably large numbers in the 55 years and older age group. This pattern is consistent in all four Atlantic provinces.
It may be argued that fishermen generally constitute an ageing labour force, and that a smaller fishing labour force can be expected to emerge through natural attri-tion. This conclusion is probably false. In fact, the tendency for fishermen to be 25 years and older is best explained by factors inherent in fishing activity, including the time required to learn a range of complex skills; the need for stable work habits among regular trawler and inshore fishing boat crew members; the need for consider-able personal investment in order for an individual to become a skipper or part-owner; and the cumulative effect of government policies to restrict entry to the industry.
The relatively strong presence of fishermen in the 65 years and older category is explained by the lack of industry-wide retirement provisions (such as a pension scheme), by the strong attachment created by the way of life, and by the human capital and financial capital investment arising from years of individual fishing activ-ity. It should be noted that part-timers display a stronger presence than full-timers in the 24 years and younger age category, which may indicate that part-time work is becoming a route of entry into full-time attachment to the industry.
The seasonal nature of fishing activity is well recognized. However, there are also wide variations in the patterns of seasonal work along the east coast, due to such fac-tors as local weather and ice conditions, availability of fish species, catch quotas and types of fishing gear. Some generalizations about the time worked by the average fisherman are of interest. Figure 4.2 provides a schematic drawing of work calendars for full-timers and part-timers.
Table 4.2
Age Comparison of Full-time and Part-time Fishermen and the Atlantic Labour Force (Male)
Age Group (Years)
Atlantic Labour Force
(%)
Full-time Fishermen
(%)
Part-time Fishermen
(%)
19 and under 8.3 1.6 8.5 20 - 24 14.2 10.6 15.6 25 - 34 30.2 28.6 19.1 35 - 44 20.4 23.5 18.4 45 - 54 15.0 19.9 18.4 55 - 64 10.3 11.9 13.2 65 and over 0 3.9 6.8
Source: Statistics Canada, Labour Force Catalogue 71-001 (December 1981), and Task Force Survey of Incomes and Expenditures. Virtually all licensed fishermen (96.3%) are male, so the correct base of comparison is with the regional male labour force.
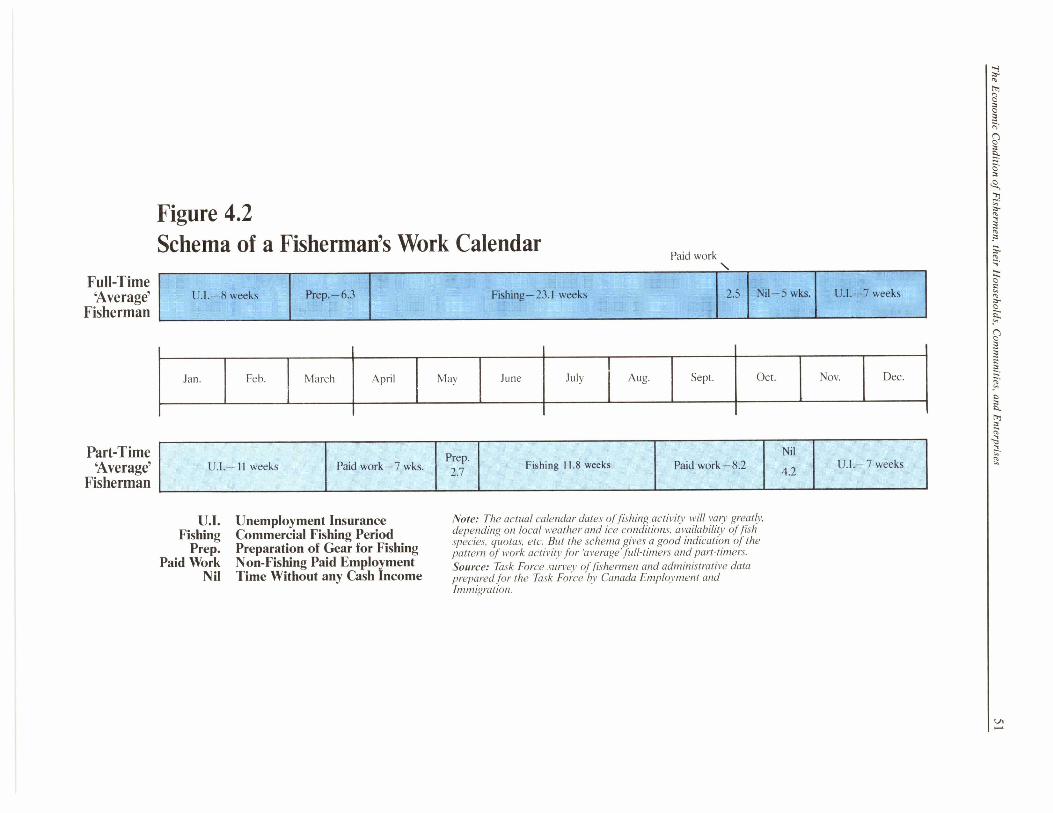
Figure 4.2 Schema of a Fisherman's Work Calendar
Paid work N
U.I.-8 weeks Prep.-6.3 Fishing-23.1 weeks 2.5 Ni1-5 wks. U.I.-7 weeks
Jan. Feb. March April May June July I Aug. Sept. Oct. Nov. Dec.
U.I.-11 weeks Paid work-7 wks . Prep.
2.7 Fishing 11.8 weeks Paid work-8.2
Nil
4.2 U.I.-7 weeks
Full-Time `Average'
Fisherman
Part-Time `Average'
Fisherman
U.I. Fishing
Prep. Paid Work
Nil
Unemployment Insurance Commercial Fishing Period Preparation of Gear for Fishing Non-Fishing Paid Employment Time Without any Cash Income
Note: The actual calendar dates of fishing activity will vary greatly, depending on local weather and ice conditions, availability of fish species, quotas, etc. But the schema gives a good indication of the pattern of work activity for 'average' full-timers and part-timers. Source: Task Force survey of fishermen and administrative data prepared for the Task Force by Canada Employment and Immigration.
The E
conomic C
onditio
n of F
i sherm
en, th
eir Househ
olds, Com
munities, and E
nterprises
52
Task Force on Atlantic Fisheries
Full-time licence holders put in an average of twice as many weeks at fishing as do part-timers (23.1 weeks compared with 11.8 weeks). To this total must be added the time spent preparing gear and vessels for the season. These periods are not 'paid work' in the sense of earning a regular wage, but they are a necessary activity for both skippers and crew members.* Full-time fishermen spend an average of 6.3 weeks in preparation work, while part-timers spend 2.7 weeks. (The variation in preparation time may be explained by differences in the amount, size and sophistica-tion of gear used by the two types of licence holders.) In total, therefore, the average full-time fisherman devotes 29.4 weeks to fishing work during the year. In compari-son, the average part-time fisherman devotes 14.5 weeks to fishing activity during the year.
Regional variations in seasonal fishing activity are significant. Among the full-tim-ers, the average number of fishing weeks is greatest in southern New Brunswick (33.3 weeks), followed by western Nova Scotia (30.3 weeks), and is lowest in north-east Newfoundland and Labrador (17.4 weeks). Taking preparation time into account, the average length of fishing activity is 41.7 weeks in southern New Bruns-wick and 34.9 weeks in western Nova Scotia, while in northeast Newfoundland and Labrador it is 23.5 weeks.
Among part-timers, the average number of fishing weeks is greatest in western Nova Scotia (16.4 weeks) and lowest in northeast New Brunswick (9 weeks). Taking preparation time into account, the period of involvement in fishing work for part-timers extends to 19.5 weeks in southwest Nova Scotia and 12.7 weeks in northeast New Brunswick.
Table 4.3 shows the proportion of full-timers and part-timers who worked varying lengths of time at fishing. One-quarter of full-timers worked 17 weeks or less; one-quarter worked between 17 and 22 weeks; one-quarter worked between 22 and 29 weeks; and the top quarter worked 29 weeks or longer. The top 10 per cent of full-timers worked 37 weeks or longer at fishing. The comparative figures for part-timers are also shown. Note that the top quarter of part-timers, who worked 18 weeks or more at fishing, put in amounts time similar to that put in by the second quarter of full-timers.
Some observers point to the seasonal nature of fishing activity and argue that fisher-men benefit from paid employment in other economic sectors during the year. This view (sometimes called "occupational pluralism") is not very accurate, and where it is, the secondary employment is of very limited financial significance to full-timers.
Among full-time fishermen, an average of 2.5 weeks of paid employment were worked outside the fishing sector during 1981. Among part-time fishermen, in con-
Table 4.3
Weeks Worked in Fishing By Full-Timers and Part-Timers (distribution by quarters and top 10%)
Portion of Licence Holders Full-Time Part-Time
25% (bottom quarter) 17 weeks 4 weeks 50% (median) 22 10 75% (third quarter) 29 18 90% (top decile) 37 23
* Fishermen who are partial or full owners of their vessels will put in somewhat longer preparation periods than crew members who have no ownership share. The averages reported here indicate the time spent overall in this activity.
The Economic Condition of Fishermen, their Households, Communities, and Enterprises 53
trast, paid employment outside the fishing industry was widespread. On average, part-timers worked on average 15.2 weeks in non-fishing jobs, and 4.2 of those non-fishing weeks were worked during the period of the fishing season itself. There are no significant geographic variations in these averages; this picture of non-fishing work time is consistent across the four provinces.
Income from There are striking differences between the incomes earned from fishing by full-tim- fishing work ers and part-timers. Table 4.4 summarizes average gross (pre-tax) revenues, total
operating costs and net incomes from fishing activities. Note that revenues are reported from all fishing sources, such as catch sales, sealing, all share payments (owner, skipper, crewman), trucking, and subsidies (rebates). Operating costs include direct expenditures such as fuel, bait, ice, or shares paid out, as well as over-head expenses such as seasonal housing, gear maintenance and insurance.
On average, the net fishing incomes earned by full-timers are more than four times greater than the net incomes of part-timers.
Taking into account the difference in the number of weeks of fishing activity by these two groups (23.1 weeks for full-timers, 11.8 weeks for part-timers), we find that full-timers net an average of $515 per week fished compared with $236 per week fished for part-timers. This significant gap is due partly to differences in vessel sizes and gear types, resulting in different catch rates for full-time and part-time fishermen. It is also due to the length of the fishing week reported by part-timers, which is often shorter than the fishing week for full-timers. Finally, it is due to the greater number of multiple licences and limited-entry' licences held by full-timers, who therefore gain wider access to high value species such as Georges Bank and Bay of Fundy scallops, shrimp or crab.
Table 4.5 shows the proportion of full-timers and part-timers who earned varying incomes from fishing (after costs were deducted). One quarter of full-timers earned $2731 or less; one-quarter earned between $2731 and $6500; one-quarter earned between $6500 and $14,680; and the top quarter of full-time fishermen earned above $14,680. The top 10 per cent of full-timers earned $23,350 or more. Comparative figures for part-timers are also shown. Note that the top quarter of part-timers, with fishing incomes of $3100 or more, earned incomes similar to those of the second quarter of full-timers.
Table 4.4
Revenues, Costs and Average Fishing Incomes
Full-Time Part-Time
Gross Revenues $22,452 $ 3,703 Total Costs 10,545 920
Net Income (before tax) $11,907 $ 2,783
Table 4.5
Net Fishing Income for Full-Timers and Part-Timers
Portion of Licence Holders Full-Time Part-Time
$ $ 25% (bottom quarter) 2,731 0 50% (median) 6,500 840 75% (third quarter) 14,680 3,100 90% (top decile) 23,350 6,000
54
Task Force on Atlantic Fisheries
Average net incomes vary considerably between geographical areas (as shown in Fig-ure 4.3 and 4.4). Full-time licence holders earn the highest net fishing incomes in western Nova Scotia ($28,766) and the lowest in northeast Newfoundland and Labrador ($4512). Part-time fishermen earn the highest net incomes in southern Newfoundland ($8107) and in western Nova Scotia ($5334), while the lowest net part-time incomes are earned in northeast Newfoundland and Labrador ($966). The high part-time incomes in southern Newfoundland are due to the availability of part-time deep-sea trawler work in that area.
The distribution of fishing income among fishermen in different geographical areas is highly significant. Figures 4.3 and 4.4 compare average net fishing income with median fishing income.* The bar graphs show that a majority of fishermen earn below the 'average' income level, whether this average is calculated on a region-wide basis or on a local basis. This fact should be underlined.
Fishing communities use the title `highliner' to identify individuals who earn top money and who are widely recognized as the most skillful at their trade.** Highlin-ers generally do quite well, and their earnings raise the average levels reported for fishermen as a group. But the majority of fishermen, whether full-timers or part-tim-ers, earn well below these average levels and are not at all near the highliner standard.
Income from In our brief description of weeks spent in fishing activity, we noted the importance of
non -fishing non-fishing employment for part-time licence holders. It is not surprising to learn
work that income earned from non-fishing jobs is particularly important to part-timers and of less importance to full-timers. Both types of fishermen benefit significantly from income transfers such as unemployment insurance, family allowance and pen-sion benefits. Table 4.6 presents a summary of non-fishing income.
Table 4.6
Average Incomes from Non-Fishing Sources
Full-Time Part-Time
Earnings $ 927 $6,203 Transfers 2,910 2,206
TOTAL $3,837 $8,409
Both full-time and part-time fishermen earned most of their non-fishing income from a variety of paid jobs such as construction, fish plant work, logging, mechanical maintenance, or store clerking. Teachers are strongly represented among part-time fishermen.
The most important source of income transfers is unemployment insurance ($2466 for full-timers and $1483 for part-timers), while family allowances, social assistance and pension benefits are of less significance. (Unemployment insurance is discussed in greater detail later in this chapter).
* A median is the exact half-way point in the population: 50 per cent fall below the median, and 50 per cent are above. In contrast, the average income figure can be skewed up or down by having in the sample a few incomes that are extremely high or extremely low. Thus the median is a better measure of what the 'average' fisherman earns.
** Throughout this chapter we have shown the performance and earnings of the top 10 per cent of full-time and part-time fishermen to give an indication of how the 'highliners' are doing on the east coast.
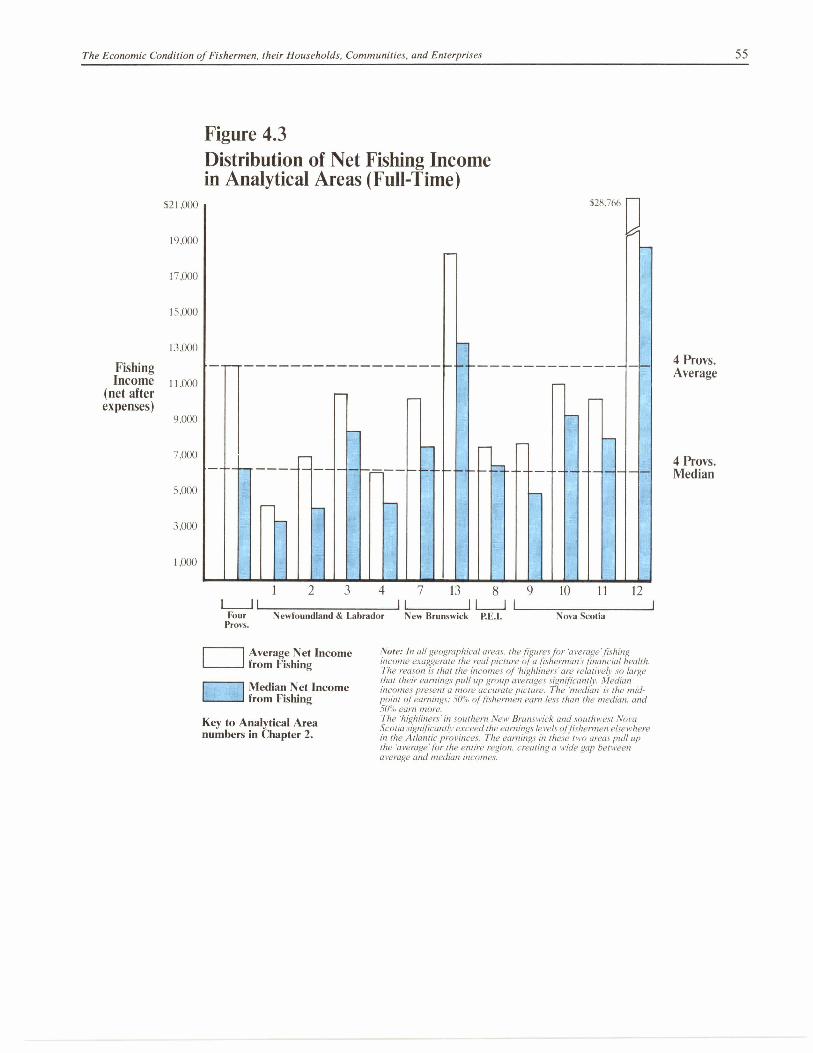
The Economic Condition of Fishermen, their Households, Communities, and Enterprises 55
Figure 4.3 Distribution of Net Fishing Income in Analytical Areas (Full-Time)
$21,000
19,000
17,000
15,000
13,000
Fishing Income 1 1 .000
(net after expenses)
9,000
7,000
5,000
3,000
1.000
4 Provs. Average
4 Provs. Median
uI Four
Provs.
1 4 7 11 8 9 ii I I____.1 1
Newfoundland & Labrador New Brunswick P.E.I.
10 11 12
Nova Scotia
Note: In all geographical areas, the figures for 'average' fishing income exaggerate the real picture of a fisherman's financial health. The reason is that the incomes of 'highliners' are relatively so large that their earnings pull up group averages significantly. Median incomes present a more accurate picture. The 'median' is the mid-point of earnings: 50% of fishermen earn less than the median, and 50% earn more. The 'highliners' in southern New Brunswick and southwest Nova Scotia significantly exceed the earnings levels of fishermen elsewhere in the Atlantic provinces. The earnings in these two areas pull up the 'average' for the entire region, creating a wide gap between average and median incomes.
Average Net Income from Fishing
Median Net Income from Fishing
Key to Analytical Area numbers in Chapter 2.

$13,000
11,000
9,000
7.000
5,000
3,000
1,000
Fishing Income
(net after expenses)
4 Provs. Average 4 Provs. Median
Task F
orce on A
tlantic F
isheries
Figure 4.4 Distribution of Net Fishing Income (Part-Time) in Analytical Areas
UUI Full- Part- time time
4 Provs. 4 Provs.
1 2 3 4 7 13 8 9 10 11 12 II I U 1
Newfoundland & Labrador New Brunswick P.E.I. Nova Scotia
Average Net Income from Fishing
Median Net Income from Fishing
Key to Analytical Area numbers in Chapter 2.
Note: The average net fishing income for full-timers is more than four times higher than the average for part-timers. And median full-time income is eight times higher than median part-time income from fishing. In each geographical area, part-time fishing incomes show wide differences between "average" levels and the levels earned by a majority of participants. This `highliner' effect indicates that some part-timers earn significant incomes from fishing, even though most do not.
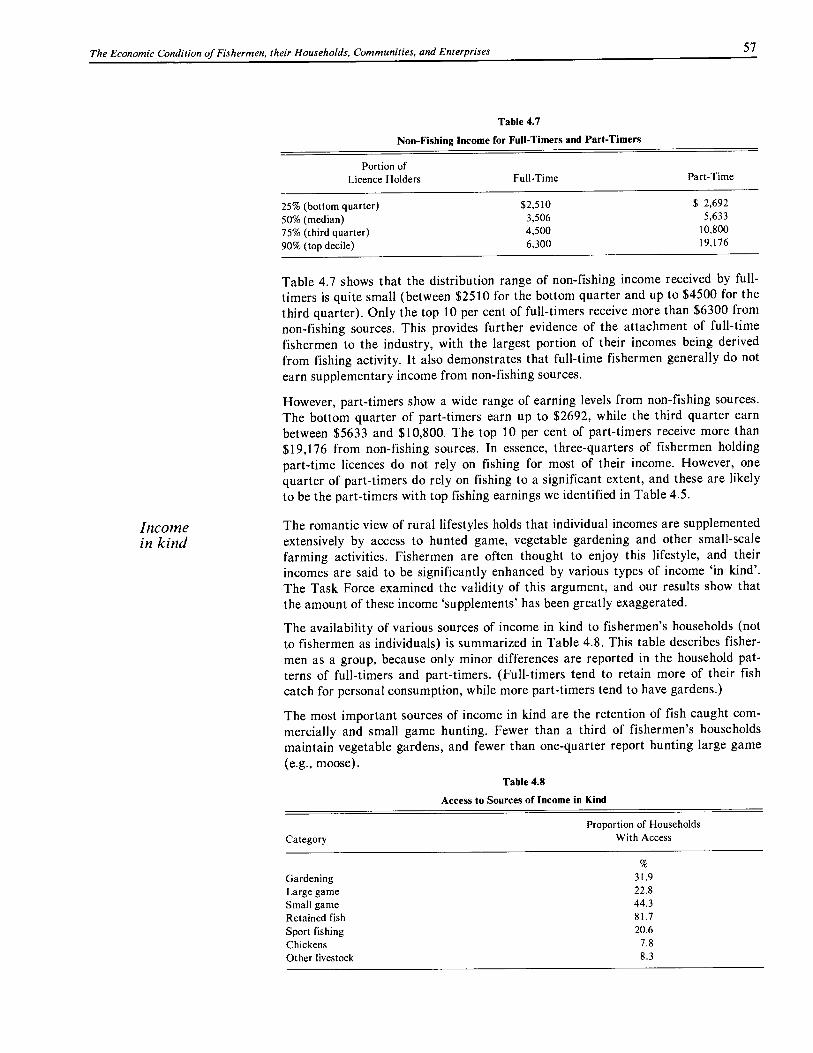
The Economic Condition of Fishermen, their Households, Communities, and Enterprises 57
Table 4.7
Non-Fishing Income for Full-Timers and Part-Timers
Portion of Licence Holders Full-Time Part-Time
25% (bottom quarter) $2,510 $ 2,692
50% (median) 3,506 5,633
75% (third quarter) 4,500 10,800
90% (top decile) 6,300 19,176
Table 4.7 shows that the distribution range of non-fishing income received by full-timers is quite small (between $2510 for the bottom quarter and up to $4500 for the third quarter). Only the top 10 per cent of full-timers receive more than $6300 from non-fishing sources. This provides further evidence of the attachment of full-time fishermen to the industry, with the largest portion of their incomes being derived from fishing activity. It also demonstrates that full-time fishermen generally do not earn supplementary income from non-fishing sources.
However, part-timers show a wide range of earning levels from non-fishing sources. The bottom quarter of part-timers earn up to $2692, while the third quarter earn between $5633 and $10,800. The top 10 per cent of part-timers receive more than $19,176 from non-fishing sources. In essence, three-quarters of fishermen holding part-time licences do not rely on fishing for most of their income. However, one quarter of part-timers do rely on fishing to a significant extent, and these are likely to be the part-timers with top fishing earnings we identified in Table 4.5.
Income The romantic view of rural lifestyles holds that individual incomes are supplemented
in kind extensively by access to hunted game, vegetable gardening and other small-scale farming activities. Fishermen are often thought to enjoy this lifestyle, and their incomes are said to be significantly enhanced by various types of income 'in kind'. The Task Force examined the validity of this argument, and our results show that the amount of these income 'supplements' has been greatly exaggerated.
The availability of various sources of income in kind to fishermen's households (not to fishermen as individuals) is summarized in Table 4.8. This table describes fisher-men as a group, because only minor differences are reported in the household pat-terns of full-timers and part-timers. (Full-timers tend to retain more of their fish catch for personal consumption, while more part-timers tend to have gardens.)
The most important sources of income in kind are the retention of fish caught com-mercially and small game hunting. Fewer than a third of fishermen's households maintain vegetable gardens, and fewer than one-quarter report hunting large game (e.g., moose).
Table 4.8
Access to Sources of Income in Kind
Category Proportion of Households
With Access
Gardening 31.9 Large game 22.8 Small game 44.3 Retained fish 81.7 Sport fishing 20.6
Chickens 7.8
Other livestock 8.3
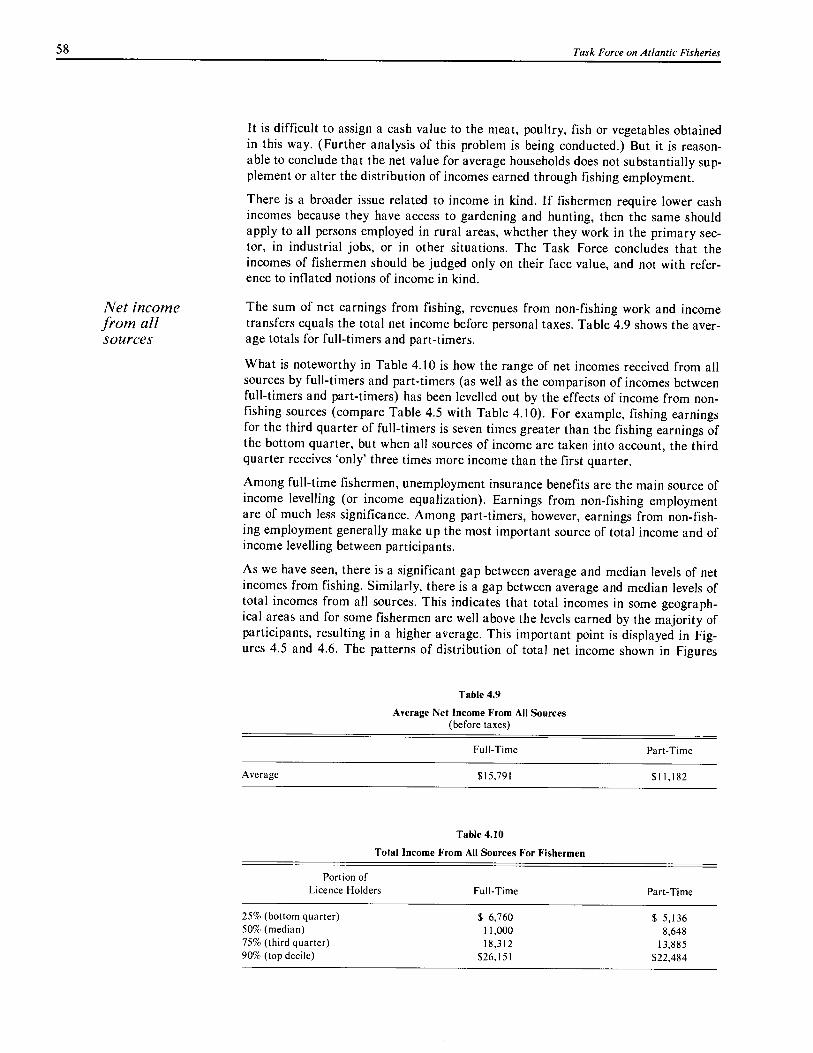
58
Task Force on Atlantic Fisheries
It is difficult to assign a cash value to the meat, poultry, fish or vegetables obtained in this way. (Further analysis of this problem is being conducted.) But it is reason-able to conclude that the net value for average households does not substantially sup-plement or alter the distribution of incomes earned through fishing employment.
There is a broader issue related to income in kind. If fishermen require lower cash incomes because they have access to gardening and hunting, then the same should apply to all persons employed in rural areas, whether they work in the primary sec-tor, in industrial jobs, or in other situations. The Task Force concludes that the incomes of fishermen should be judged only on their face value, and not with refer-ence to inflated notions of income in kind.
Net income from all sources
The sum of net earnings from fishing, revenues from non-fishing work and income transfers equals the total net income before personal taxes. Table 4.9 shows the aver-age totals for full-timers and part-timers.
What is noteworthy in Table 4.10 is how the range of net incomes received from all sources by full-timers and part-timers (as well as the comparison of incomes between full-timers and part-timers) has been levelled out by the effects of income from non-fishing sources (compare Table 4.5 with Table 4.10). For example, fishing earnings for the third quarter of full-timers is seven times greater than the fishing earnings of the bottom quarter, but when all sources of income are taken into account, the third quarter receives 'only' three times more income than the first quarter.
Among full-time fishermen, unemployment insurance benefits are the main source of income levelling (or income equalization). Earnings from non-fishing employment are of much less significance. Among part-timers, however, earnings from non-fish-ing employment generally make up the most important source of total income and of income levelling between participants.
As we have seen, there is a significant gap between average and median levels of net incomes from fishing. Similarly, there is a gap between average and median levels of total incomes from all sources. This indicates that total incomes in some geograph-ical areas and for some fishermen are well above the levels earned by the majority of participants, resulting in a higher average. This important point is displayed in Fig-ures 4.5 and 4.6. The patterns of distribution of total net income shown in Figures
Table 4.9
Average Net Income From All Sources (before taxes)
Full-Time Part-Time
Average $15,791 $11,182
Table 4.10
Total Income From All Sources For Fishermen
Portion of Licence Holders Full-Time Part-Time
25% (bottom quarter) $ 6,760 $ 5,136 50% (median) 11,000 8,648 75% (third quarter) 18,312 13,885 90% (top decile) $26,151 $22,484
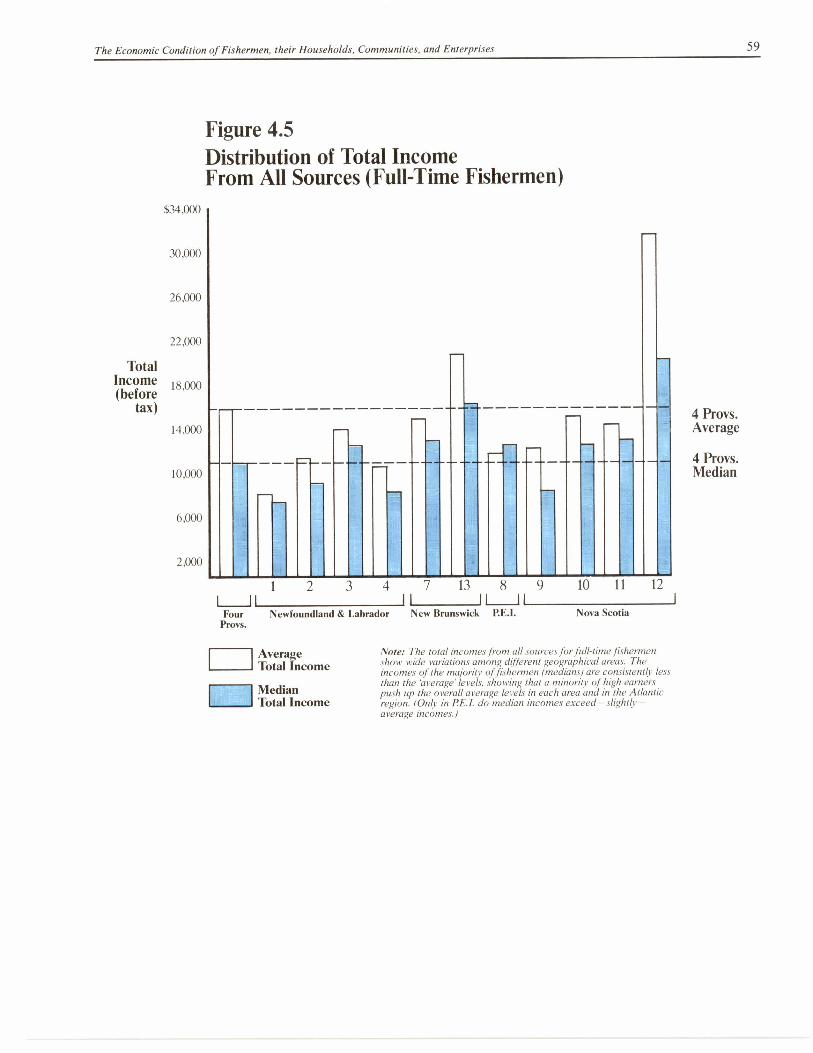
$34,000
30,000
26.000
22,000
18,000
14,000
10.000
6,000
2,000
Total Income (before
tax) 4 Provs. Average
4 Provs. Median
The Economic Condition of Fishermen, their Households, Communities, and Enterprises 59
Figure 4.5 Distribution of Total Income From All Sources (Full-Time Fishermen)
2 3 4 7 13 8 9
1_11 1I I! Four Newfoundland & Labrador New Brunswick P.E.1.
Provs.
10 11 12
Nova Scotia
Note: The total incomes from all sources for full-time fishermen show wide variations among different geographical areas. The incomes of the majority of fishermen (medians) are consistently less than the average' levels, showing that a minority of high earners push up the overall average levels in each area and in the Atlantic region. (Only in PEI. do median incomes exceed— slightly — average incomes.)
Average Total Income
Median Total Income
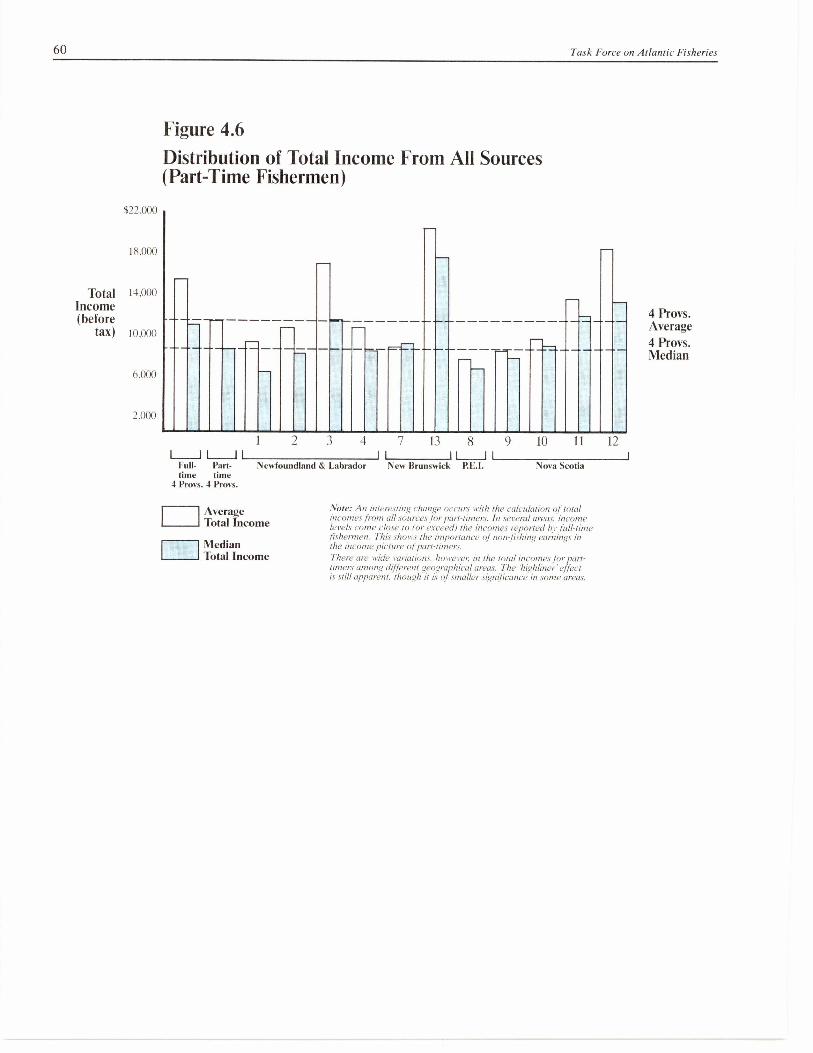
60 Task Force on Atlantic Fisheries
Figure 4.6 Distribution of Total Income From All Sources (Part-Time Fishermen)
4 Provs. Average 4 Provs. Median
522,000
18,000
Total 14,000 Income (before
tax) 10.000
6,000
2,000
2 3 4 7 13 8 9 10 11 12 I
it 1 L____I I l Full- Part- Newfoundland & Labrador New Brunswick P.E.I. Nova Scotia time time
4 Provs. 4 Provs.
:Vote: An interesting change occurs with the calculation of total incomes from all .sources for hart-tuners. Its several areas, income levels come close to for e.vceed) the incomes reported hr fishermen. This chows the importance of non fishing earnings its the income picture of pats-timers.
There are wide variations. hoverer in the total incomesjOr part-timers among different geographical areas. The 'highliner' effect is still apparent. though it is of .smaller .vignificance its some areas.
Average Total Income
Median Total Income

Full-Time Part-Time
$13,325 $ 9,699 2,466 1,483
$15,791 $11,182
Net Income before ui ui benefits
Total Net Income (before tax)
The Economic Condition of Fishermen, their Households, Communities, and Enterprises 61
4.5 and 4.6 are similar to the distribution patterns seen in Figures 4.3 and 4.4. Some levelling out between the extremes of fishing earnings does occur, however, for both full-time and part-time fishermen. This is shown in Table 4.10.
One important conclusion that can be drawn from Tables 4.9 and 4.10 is that a size-able majority of full-time fishermen on Canada's east coast have total incomes below the recognized poverty line for rural community residents. The low income total is even more acute in the case of part-time fishermen.
If these fishermen were the sole providers for their households, a major poverty prob-lem would clearly exist. In practice, however, the severity of this problem is reduced because other members of fishermen's households often bring in earnings from fish processing plants or other employment. These earnings, which are vital to the finan-cial well-being of households, are examined later in this chapter.
Unemployment Benefits received through the unemployment insurance program are a significant
insurance and source of cash income for fishermen in all geographical areas. However, not all fish-
fishermen's ermen claim ui benefits. In 1981, a total of 83 per cent of full-timers received unem-
incomes ployment insurance payments; among part-timers the total was 52 per cent.
On average, full-time fishermen received $2466 in tn benefits in 1981, while part-time fishermen received an average of $1483.
The difference is due partly to the much higher levels of weekly fishing earnings received by full-timers. It is also due to the number of part-timers who are engaged in regular year-round employment and hence do not claim unemployment insurance under either the regular ul program or the fishermen's special program. (This means that the average of all IA payments to part-timers is lowered, although the average of payments to those who claim IA is similar to payments made to full-timers who receive tn.) Table 4.11 indicates the relative importance of unemployment insurance benefits to the total incomes of full-time and part-time fishermen.
Clearly, In payments continue to play a significant role in the composition of incomes of both full-timers and part-timers. The relative importance of unemploy-ment insurance will vary with the level of earnings gained from fishing and non-fish-ing employment.
In northeast Newfoundland and Labrador, where earned incomes are lowest, ui pay-ments make up 32 per cent of average total net incomes for full-timers. In western Nova Scotia, by contrast, tit payments make up only 6 per cent of average total net incomes for full-timers.
Unemployment insurance payments are particularly important because of when they are made. They provide the primary source of cash income during the off-season and are vital for meeting household expenditures and preparing equipment for the new fishing season. Unemployment insurance is a key security tool for both household and fishing enterprise operations.
Table 4.11
Average Total Incomes and Unemployment Insurance
ui as a percentage of total income
16% 13%
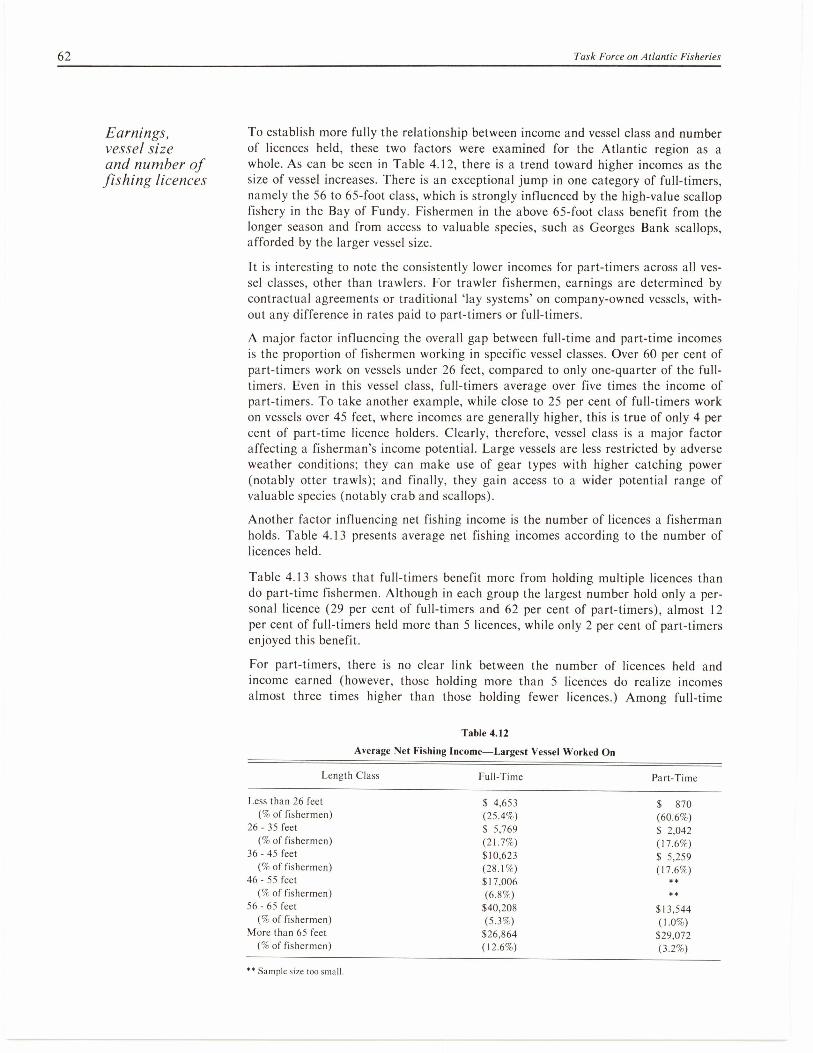
62
Task Force on Atlantic Fisheries
Earnings, To establish more fully the relationship between income and vessel class and number vessel size of licences held, these two factors were examined for the Atlantic region as a and number of whole. As can be seen in Table 4.12, there is a trend toward higher incomes as the fishing licences size of vessel increases. There is an exceptional jump in one category of full-timers,
namely the 56 to 65-foot class, which is strongly influenced by the high-value scallop fishery in the Bay of Fundy. Fishermen in the above 65-foot class benefit from the longer season and from access to valuable species, such as Georges Bank scallops, afforded by the larger vessel size.
It is interesting to note the consistently lower incomes for part-timers across all ves-sel classes, other than trawlers. For trawler fishermen, earnings are determined by contractual agreements or traditional lay systems' on company-owned vessels, with-out any difference in rates paid to part-timers or full-timers.
A major factor influencing the overall gap between full-time and part-time incomes is the proportion of fishermen working in specific vessel classes. Over 60 per cent of part-timers work on vessels under 26 feet, compared to only one-quarter of the full-timers. Even in this vessel class, full-timers average over five times the income of part-timers. To take another example, while close to 25 per cent of full-timers work on vessels over 45 feet, where incomes are generally higher, this is true of only 4 per cent of part-time licence holders. Clearly, therefore, vessel class is a major factor affecting a fisherman's income potential. Large vessels are less restricted by adverse weather conditions; they can make use of gear types with higher catching power (notably otter trawls); and finally, they gain access to a wider potential range of valuable species (notably crab and scallops).
Another factor influencing net fishing income is the number of licences a fisherman holds. Table 4.13 presents average net fishing incomes according to the number of licences held.
Table 4.13 shows that full-timers benefit more from holding multiple licences than do part-time fishermen. Although in each group the largest number hold only a per-sonal licence (29 per cent of full-timers and 62 per cent of part-timers), almost 12 per cent of full-timers held more than 5 licences, while only 2 per cent of part-timers enjoyed this benefit.
For part-timers, there is no clear link between the number of licences held and income earned (however, those holding more than 5 licences do realize incomes almost three times higher than those holding fewer licences.) Among full-time
Table 4.12
Average Net Fishing Income—Largest Vessel Worked On
Length Class Full-Time Part-Time
Less than 26 feet $ 4,653 $ 870 (% of fishermen) (25.4%) (60.6%)
26 - 35 feet $ 5,769 $ 2,042 (% of fishermen) (21.7%) (17.6%)
36 - 45 feet $10,623 $ 5,259 (% of fishermen) (28.1%) (17.6%)
46 - 55 feet $17,006 ** (% of fishermen) (6.8%) **
56 - 65 feet $40,208 $13,544 (% of fishermen) (5.3%) (1.0%)
More than 65 feet $26,864 $29,072 (% of fishermen) (12.6%) (3.2%)
** Sample size too small.

The Economic Condition of Fishermen, their Households, Communities, and Enterprises 63
Fishermen's Households
Number and size of households
Table 4.13
Average Net Fishing Income—Number of Licences Held
No. of Licences Held Full-Time Part-Time
1 $ 7,418 $ 1,925 (% of fishermen) (29.1%) (62.0%)
2 $ 5,901 $ 1,202 (% of fishermen) (16.1%) (21.5%)
3 $ 7,550 $ 3,694 (% of fishermen) (20.3%) (7.8%)
4 $10,498 $ 1,955 (% of fishermen) (12.2%) (3.4%)
5 $17,394 $ 2,233 (% of fishermen) (10.5%) (3.1%)
More than 5 $17,718 $ 6,073 (% of fishermen) (11.9%) (2.3%)
licence holders, however, it appears that multiple licences allow for flexibility in selecting fishing activities and also permit entry to the more lucrative restricted spe-cies fisheries. For full-timers who hold more than one licence, a pattern emerges; income increases in proportion to the number of licences held.
These results support the conclusion that the gap in incomes between full-time and part-time fishermen is a function of both the number of licences they hold and the class of vessel on which they work.
A total of 34,316 households in the Maritimes and Newfoundland had members who fished commercially in 1981. This total is made up of 20,028 households with full-time fishermen and 14,288 households with part-timers. The number of households is lower than the total of active fishermen (23,434 full-time and 17,445 part-time) because some households have more than one resident fisherman.
The average size of households is virtually identical for full-time and part-time fish-ermen (4.2 and 4.1 members respectively). There are some variations in this average between geographical areas. The largest households are in western Newfoundland (4.9 members) and the smallest are in central Nova Scotia (3.3 members). The size of a household refers to the total number of people living in the same residence; some household members are not 'dependents' in the sense that they are independent income earners. As we shall see, the earnings of other household members provide an important addition to incomes generated by fishing activities and are indispensable to the total revenue of fishing families.
In 1981, 143,221 people (including the fishermen themselves) in the Atlantic prov-inces were members of fishermen's households. Full-timers' households comprised 84,558 people, while 58,663 people were members of part-timers' households. Figure 4.7 shows the distribution of this population in each of the Task Force analytical areas. Not surprisingly, the distribution of fishing household population is similar to the distribution of active fishing licences shown in Figure 4.1. However, a somewhat larger average family size in Newfoundland contributes to raising the total in that province.
Occupations Of course, the main work performed by members of fishermen's households is fishing and earnings itself. Of the more than 143,000 people living in such households, 28.5 per cent of household fished commercially in 1981 using either part-time or full-time licences. However, members members of fishermen's households also pursued a wide range of non-fishing occupa-
tions, many of which provided additional household revenues.

Newfoundland & Labrador I I I u I
N ew Brunswick P.E.I. Nova Scotia
64
Task Force on Atlantic Fisheries
Figure 4.7 Total Membership of Fishermen's Households by Area
13,000
12,000
11,000
10,000
9,000
8,000
16.094 16,352
Full- 7,000 Time 6,000
5,000
4,000
3,000
2,000
1,000 1 7 13 9 10 11 12
1,000
2,000
3,000
4,000
5,000
6,000
Part- 7,000 Time 8,000
9,000
10,000
11,000
12,000
13,000
14,000
Note: A total of 84,558 people resided in full-time fishermen's households. The provincial breakdown was: 46,911 in Newfoundland; 8,080 in New Brunswick; 5,142 in Prince Edward Island; and 24,324 in Nova Scotia. A total of 58,663 people resided in part-time fishermen's households, with the following provincial breakdowns: 35,984 in Newfoundland, 9,386 in New Brunswick; 3,072 in Prince ,Edward Island; and 10,220 in Nova Scotia.

The Economic Condition of Fishermen, their Households, Communities, and Enterprises 65
Household members who did not earn any income were, in order of frequency, stu-dents, housewives, children, retired or unemployed. Among income-earning occupa-tions, the most frequently reported were fish plant work, store clerking, construction, secretarial work, teaching, nursing and public service (including municipal) employ-ment. Approximately 19 per cent of the non-fishing members of fishermen's households reported some type of paid employment.
The financial importance of non-fishing revenues brought in by members of fisher-men's households should be emphasized. These revenues consist of earnings from paid jobs and income transfers such as unemployment insurance and pension ben-efits. The existence of retired people, children and students among household mem-bers adds to the significance of transfer payments such as family allowance. Table 4.14 presents a summary of average non-fishing incomes for household members.
Table 4.14
Average Non-Fishing Incomes of Members of Fishermen's Households
Full-timer's Part-timer's household household
Non-fishing earnings $3,125 $3,259 Transfers 1,518 1,833
TOTAL $4,643 $5,092
These averages give a good indication of the supplementary financial role played by non-fishing incomes. Of course, actual household incomes of this kind vary from the average. They depend, for example, on the size of families, the number of employed members, and the types of jobs held.
There are also significant regional variations. Non-fishing income is lowest in the households of full-time fishermen in central Nova Scotia and southern New Bruns-wick. This is probably because of the shortage of employment opportunities in cen-tral Nova Scotia; in southern New Brunswick, it is probably because the earnings from normal fishing activity (and the length of the fishing season) reduce the need for other types of income-earning occupations. Non-fishing incomes are highest in northeast New Brunswick and eastern Newfoundland among full-time fishermen's households, likely because of the availability of fish processing plant employment in those areas.
Total A measure of the size of total household incomes is derived from the following reve- household nue items: net income from fishing activity; earnings from non-fishing employment; incomes transfer payments to fishermen; earnings by other household members; and transfer
payments to other household members. Table 4.15 shows the average household totals for full-timers and part-timers.
There are wide variations in total earnings between individual households and among households situated in different geographical areas. Average total household incomes for full-time fishermen are lowest in northeast Newfoundland and Labrador ($14,319) and highest in southwest Nova Scotia ($35,882). Among part-timers, average total household incomes are lowest in Prince Edward Island ($11,002) and highest in southern New Brunswick ($25,952).

66
Task Force on Atlantic Fisheries
Table 4.15
Total Household Incomes (before taxes)
Full-timer's Part-timer's Household Household
Average $21,900 $17,607
Table 4.16
Distribution of Total Household Incomes
Portion of Licence Holders Full-Time Part-Time
25% (bottom quarter) $10,410 $ 9,180 50% (median) 17,208 14,511 75% (third quarter) 25,040 23,673 90% (top decile) $37,140 $32,276
A realistic assessment of the financial condition of fishermen must focus on the dis-tribution of total household incomes. Table 4.16 shows how incomes from all sources are distributed among full-timers' and part-timers' households.
One-quarter of the households of full-timers have total incomes of $10,410 or less; one-quarter have incomes between $10,410 and $17,208; one-quarter have incomes between $17,208 and $25,040; and the top quarter earn above $25,040. The top 10 per cent of households of full-time fishermen have total incomes of $37,140 or more. Comparative figures for part-timers are also shown. Note that the households of full-time fishermen have incomes consistently higher than those of the households of part-timers.
At this point we should recall the discussion of poverty line income levels for rural households in Canada (see the discussion on Tables 4.9 and 4.10). Table 4.17 shows the accepted poverty line figures for 1981.
Given that the average size of an east coast fisherman's household is 4.1 people, it will be seen that almost one-third of the households of full-time fishermen have total incomes below Canada's official rural poverty line of $12,035 for a 4-person household. Among part-time fishermen, 40 per cent of households have total incomes below the rural poverty line.
The geographical distribution of low income households is also significant. Total household incomes for a high proportion of full-time and part-time fishermen in northeast Newfoundland and Labrador, eastern Newfoundland, Prince Edward Island, the Gulf side of Nova Scotia and central Nova Scotia are well below the pov-erty line line for rural Canada. Moreover, without regular supplementation of fishing
Table 4.17
Poverty Line For Rural Residents (1981)
Household Size
3 Persons 4 Persons 5 Persons
Poverty Line for Rural Residents $10,412 $12,035 $13,995
Source: National Council on Welfare, Measuring Poverty-1982 Poverty Lines and the Revised 1982 Poverty Lines (Ottawa: August 1982).

The Economic Condition of Fishermen, their Households, Communities, and Enterprises 67
incomes from non-fishing sources, it is clear that the majority of east coast fisher-men's households would be at or below the recognized poverty line (see Table 4.10).
Incomes and Many observers (and notably officials from the government of New Brunswick) have Employment underlined the importance of processing plant activities to the general economic sig- in Fish nificance of the fishing industry. For example, processing plants are the largest Processing source of non-fishing employment for members of fishermen's households. In the Plants Atlantic region as a whole, processing plants create as many jobs (and almost as
much income) as fishing itself.
Numbers of A fish processing plant may be a small installation with little more than a roof, a jobs and cutting table and a storage area where fish is landed, cleaned and filleted for several types of months during the year. Or it may be an integrated, multi-product, year-round plants facility on the scale of a large meat packing house. Fish plants can be categorized by
the type of processing they perform (such as filleting and freezing, canning, pickling, salting or smoking). They can be classified as seasonal or full-time, as offshore or inshore. And they can be categorized by their total labour force, production volumes, or freezing capacities.
In Table 4.18, the main fish processing plants in the Atlantic region are categorized by labour force size. Large plants are those that have in excess of 150 jobs during the year; medium plants have between 51 and 150 jobs; small plants have between 26 and 50 jobs; and very small plants have 25 or fewer jobs during the year. Larger plants will generally tend to have more year-round employment (and fewer seasonal jobs), more input of raw material from offshore vessels and greater production of frozen groundfish products.
As shown in Table 4.18, nearly 47,000 jobs were dependent on fish plant activity in 1980. In fact, this total is closer to 48,000 jobs if a number of very small installations and processing outlets are included. As well, the high labour turnover in some plants will mean that considerably more than 48,000 individuals will benefit from plant employment during the year.
A large share of fish plant jobs are seasonal in nature, so that if the number of 'per-son-years' of full-time employment is taken into account, the total number of posi-tions is estimated to be 31,247. This analytical concept is useful to show how large plants have lower levels of seasonal employment when compared with medium and small plants.
The seasonal nature of fish harvesting results in seasonal peaks in fish processing. But the economic effects on fishing communities is best assessed by measuring the total number of people who gain employment from processing activity, their average wages, and the additional income transfers (such as unemployment insurance) they gain as a result of their work in the fish processing sector.
Plant jobs, About 20 per cent of fishermen's households had one or more members working in
fishermen's fish plants in 1981. Newfoundland and New Brunswick consistently had the highest
households proportion of fishermen's households where one or more members held a fish plant
and incomes job. There is considerable variation between areas and between part-timers' and full- timers' households, however, as shown in Figure 4.8.
The direct link between plant employment and fishermen's households is strongest throughout Newfoundland, probably because of the large number of relatively iso-
* The UFO Shore Processing Capacity study, from which Table 4.18 is drawn, surveyed 538 of an estimated 757 process-ing facilities in the four Atlantic provinces and Quebec. It should be noted that the 219 facilities not surveyed are gener-ally very small in economic importance (e.g., smoking operations or retail outlets that also do filleting). These facilities may account for another 1000 jobs in all.

68
Task Force on Atlantic Fisheries
Table 4.18
Atlantic Region Fish Plants and Labour Force (1980)
Large Medium Small Very Small
(more than 150 jobs)
(51-150 jobs)
(26-50 jobs)
(25 jobs or fewer) Total
No. of Plants 88 107 115 228 538 (% of total) (16%) (20%) (21%) (43%) (100%)
No. of Jobs 30,352 9,532 4,258 2,661 46,803 (% of total) (65%) (20%) (9%) (6%) (100%)
No. of person-years 21,807 5,087 2,699 1,654 31,247 (% of total) (70%) (16%) (9%) (5%) (100%)
Ratio: Jobs/ Person-years 1.39 1.87 1.58 1.61 1.50
Source: Department of Fisheries and Oceans, Atlantic Shore Processing Capacity in 1980 (1981).
lated small fishing communities in the province. There is also a strong link between plant jobs and fishing households in northeast New Brunswick. This link is weakest in Nova Scotia; this is because plant jobs and fishing activity are more likely to be year-round in Nova Scotia than in the rest of the Atlantic region.
The financial contribution of plant employment is considerable. The average income earned by a fish plant worker who was also a member of a fisherman's household was $4520 in 1981. This total compares quite closely with information on average wages paid by H.B. Nickerson & Sons to all plant employees in the year 1980.*
This average income figure provides only an indication of the total value of plant employment to the economy. The incomes earned by individual workers will depend on local wage rates, the length of the employment period and the regularity of shifts in the plants.
Year-round operations and plants with union-negotiated collective agreements will generally provide the top rates of pay and the most stable employment. It should be noted, however, that fish plant hourly wage rates are significantly lower than hourly rates paid in other manufacturing industries in the Atlantic region. They are also lower than hourly rates in the food and beverage and meat processing sectors, whether in the Atlantic region or elsewhere in Canada. Table 4.19 illustrates this comparison.
Newfoundland and New Brunswick had the highest proportion of fishermen's households with at least one member holding a fish plant job. In southern New
Table 4.19
Comparison of Hourly Wage Rates (1981)
Nfld. N.S. N.B. Quebec
Fish processing $7.09 $6.43 $5.93 n/a Food & Beverage 7.30 6.61 6.55 $8.49 Meat Processing 8.59 Manufacturing 8.60 8.16 8.46 8.47
Source: Statistics Canada Catalogue 72-002 (February 1982).
* Information on plant worker earnings provided courtesy of H.B. Nickerson & Sons.

The Economic Condition of Fishermen, their Households, Communities, and Enterprises 69
Figure 4.8 Proportion of Fishermen's Household Members Holding Plant Jobs
35
30
20
15
10
10
15
zu
25
30
35
Full-Time
Part-Time
4 Provs. Average
4 Provs. Average
Newfoundland & Labrador New Brunswick RE.!. Nova Scotia
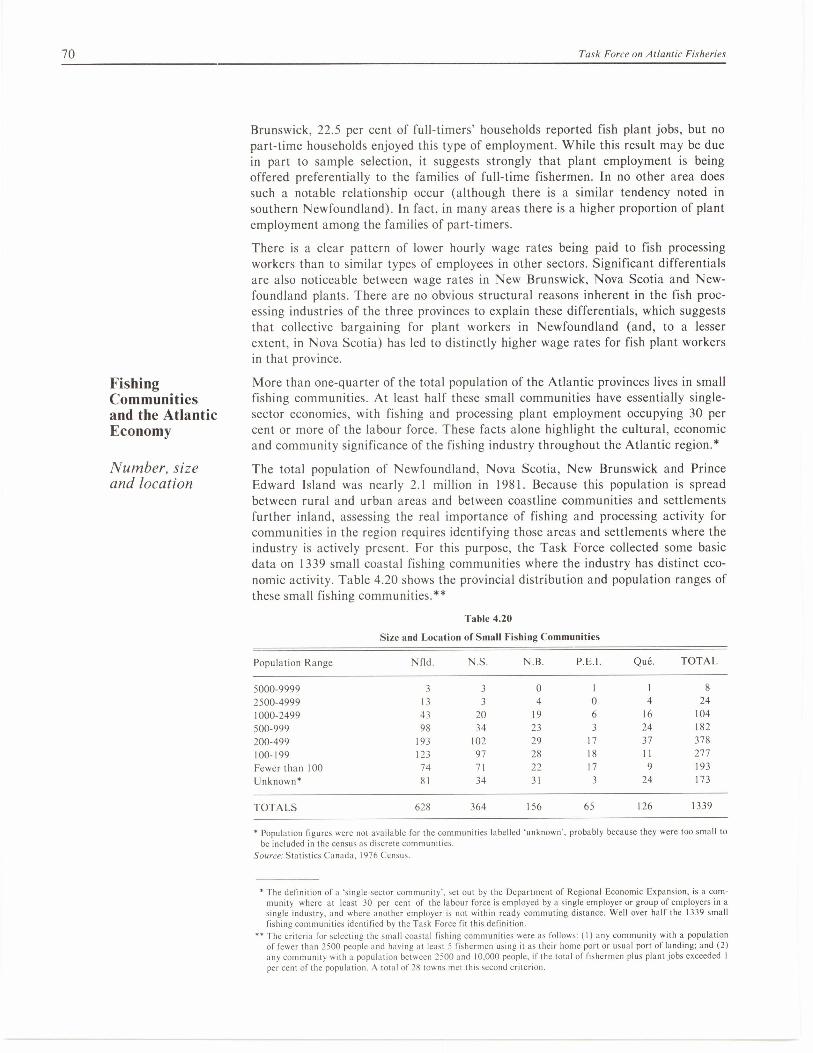
70
Task Force on Atlantic Fisheries
Brunswick, 22.5 per cent of full-timers' households reported fish plant jobs, but no part-time households enjoyed this type of employment. While this result may be due in part to sample selection, it suggests strongly that plant employment is being offered preferentially to the families of full-time fishermen. In no other area does such a notable relationship occur (although there is a similar tendency noted in southern Newfoundland). In fact, in many areas there is a higher proportion of plant employment among the families of part-timers.
There is a clear pattern of lower hourly wage rates being paid to fish processing workers than to similar types of employees in other sectors. Significant differentials are also noticeable between wage rates in New Brunswick, Nova Scotia and New-foundland plants. There are no obvious structural reasons inherent in the fish proc-essing industries of the three provinces to explain these differentials, which suggests that collective bargaining for plant workers in Newfoundland (and, to a lesser extent, in Nova Scotia) has led to distinctly higher wage rates for fish plant workers in that province.
Fishing More than one-quarter of the total population of the Atlantic provinces lives in small Communities fishing communities. At least half these small communities have essentially single- and the Atlantic sector economies, with fishing and processing plant employment occupying 30 per Economy cent or more of the labour force. These facts alone highlight the cultural, economic
and community significance of the fishing industry throughout the Atlantic region.*
Number, size The total population of Newfoundland, Nova Scotia, New Brunswick and Prince and location Edward Island was nearly 2.1 million in 1981. Because this population is spread
between rural and urban areas and between coastline communities and settlements further inland, assessing the real importance of fishing and processing activity for communities in the region requires identifying those areas and settlements where the industry is actively present. For this purpose, the Task Force collected some basic data on 1339 small coastal fishing communities where the industry has distinct eco-nomic activity. Table 4.20 shows the provincial distribution and population ranges of these small fishing communities.**
Table 4.20
Size and Location of Small Fishing Communities
Population Range Nfld. N.S. N.B. P.E.I. Que. TOTAL
5000-9999 3 3 0 1 1 8
2500-4999 13 3 4 0 4 24
1000-2499 43 20 19 6 16 104
500-999 98 34 23 3 24 182
200-499 193 102 29 17 37 378 100-199 123 97 28 18 11 277
Fewer than 100 74 71 22 17 9 193
Unknown* 81 34 31 3 24 173
TOTALS 628 364 156 65 126 1339
* Population figures were not available for the communities labelled 'unknown', probably because they were too small to be included in the census as discrete communities.
Source: Statistics Canada, 1976 Census.
* The definition of a 'single-sector community', set out by the Department of Regional Economic Expansion, is a com-munity where at least 30 per cent of the labour force is employed by a single employer or group of employers in a single industry, and where another employer is not within ready commuting distance. Well over half the 1339 small fishing communities identified by the Task Force fit this definition.
** The criteria for selecting the small coastal fishing communities were as follows: (I) any community with a population of fewer than 2500 people and having at least 5 fishermen using it as their home port or usual port of landing; and (2) any community with a population between 2500 and 10,000 people, if the total of fishermen plus plant jobs exceeded 1 per cent of the population. A total of 28 towns met this second criterion.
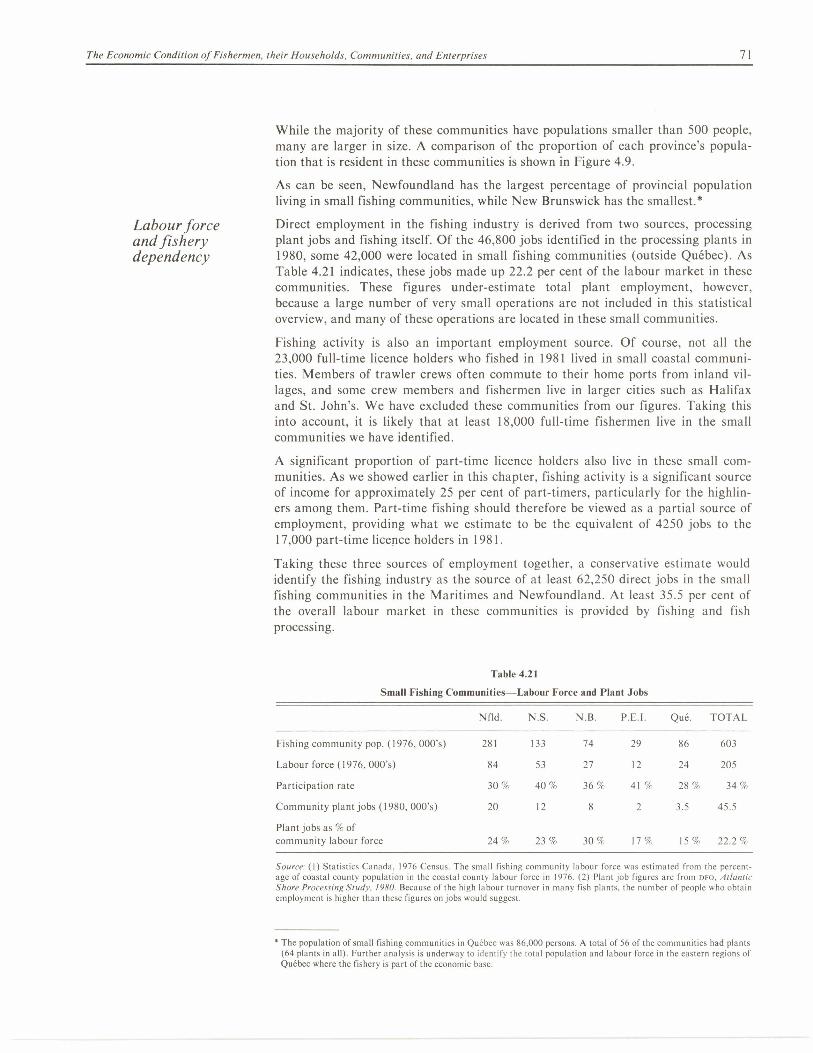
The Economic Condition of Fishermen, their Households, Communities, and Enterprises 71
While the majority of these communities have populations smaller than 500 people, many are larger in size. A comparison of the proportion of each province's popula-tion that is resident in these communities is shown in Figure 4.9.
As can be seen, Newfoundland has the largest percentage of provincial population living in small fishing communities, while New Brunswick has the smallest.*
Labour force Direct employment in the fishing industry is derived from two sources, processing and fishery plant jobs and fishing itself. Of the 46,800 jobs identified in the processing plants in dependency 1980, some 42,000 were located in small fishing communities (outside Quebec). As
Table 4.21 indicates, these jobs made up 22.2 per cent of the labour market in these communities. These figures under-estimate total plant employment, however, because a large number of very small operations are not included in this statistical overview, and many of these operations are located in these small communities.
Fishing activity is also an important employment source. Of course, not all the 23,000 full-time licence holders who fished in 1981 lived in small coastal communi-ties. Members of trawler crews often commute to their home ports from inland vil-lages, and some crew members and fishermen live in larger cities such as Halifax and St. John's. We have excluded these communities from our figures. Taking this into account, it is likely that at least 18,000 full-time fishermen live in the small communities we have identified.
A significant proportion of part-time licence holders also live in these small com-munities. As we showed earlier in this chapter, fishing activity is a significant source of income for approximately 25 per cent of part-timers, particularly for the highlin-ers among them. Part-time fishing should therefore be viewed as a partial source of employment, providing what we estimate to be the equivalent of 4250 jobs to the 17,000 part-time licence holders in 1981.
Taking these three sources of employment together, a conservative estimate would identify the fishing industry as the source of at least 62,250 direct jobs in the small fishing communities in the Maritimes and Newfoundland. At least 35.5 per cent of the overall labour market in these communities is provided by fishing and fish processing.
Table 4.21
Small Fishing Communities—Labour Force and Plant Jobs
Nfld. N.S. N.B. P.E.I. Que. TOTAL
Fishing community pop. (1976, 000's) 281 133 74 29 86 603
Labour force (1976, 000's) 84 53 27 12 24 205
Participation rate 30 % 40 % 36 % 41 % 28 % 34 %
Community plant jobs (1980, 000's) 20 12 8 2 3.5 45.5
Plant jobs as % of community labour force 24 % 23 % 30 % 17 % 15 % 22.2 %
Source: (1) Statistics Canada, 1976 Census. The small fishing community labour force was estimated from the percent-age of coastal county population in the coastal county labour force in 1976. (2) Plant job figures are from UFO, Atlantic Shore Processing Study, 1980. Because of the high labour turnover in many fish plants, the number of people who obtain employment is higher than these figures on jobs would suggest.
* The population of small fishing communities in Quebec was 86,000 persons. A total of 56 of the communities had plants (64 plants in all). Further analysis is underway to identify the total population and labour force in the eastern regions of Quebec where the fishery is part of the economic base.

60
50
40
% of Provincial Population
Living in Small Fishing 30
Communities
20
10
25
50
No. of Small 75 Communities
with Fish 100
Plants and 125 No. of
Plants in 150 Province
175
200
225
250
26
38
Nfld. Population
557,000
N.B, Population
677,250
P.E.I. Population
118,229
N.S. Population
828,571
133,000
Atlantic Average Population 2,181,825
517,000
113
204
55
113
281,000
180
228
72
Task Force on Atlantic Fisheries
Figure 4.9
Small Fishing Communities — Populations and Fish Plants
Communities
Plants
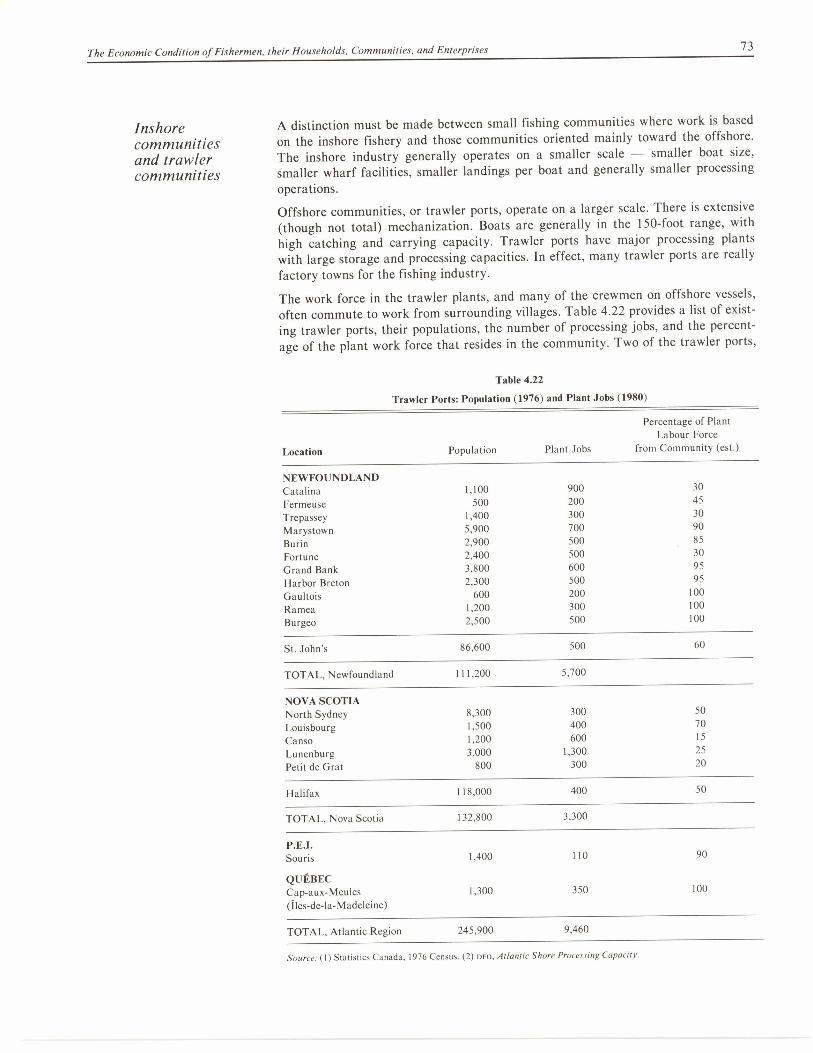
The Economic Condition of Fishermen, their Households, Communities, and Enterprises 73
Inshore A distinction must be made between small fishing communities where work is based
communities on the inshore fishery and those communities oriented mainly toward the offshore.
and trawler The inshore industry generally operates on a smaller scale — smaller boat size,
communities smaller wharf facilities, smaller landings per boat and generally smaller processing operations. Offshore communities, or trawler ports, operate on a larger scale. There is extensive (though not total) mechanization. Boats are generally in the 150-foot range, with high catching and carrying capacity. Trawler ports have major processing plants with large storage and processing capacities. In effect, many trawler ports are really factory towns for the fishing industry.
The work force in the trawler plants, and many of the crewmen on offshore vessels, often commute to work from surrounding villages. Table 4.22 provides a list of exist-ing trawler ports, their populations, the number of processing jobs, and the percent-age of the plant work force that resides in the community. Two of the trawler ports,
Table 4.22
Trawler Ports: Population (1976) and Plant Jobs (1980)
Location Population Plant Jobs
Percentage of Plant Labour Force
from Community (est.)
NEWFOUNDLAND Catalina 1,100 900 30
Fermeuse 500 200 45
Trepassey 1,400 300 30
Marystown 5,900 700 90
Burin 2,900 500 85
Fortune 2,400 500 30
Grand Bank 3,800 600 95
Harbor Breton 2,300 500 95
Gaultois 600 200 100
Ramea 1,200 300 100
Burgeo 2,500 500 100
St. John's 86,600 500 60
TOTAL, Newfoundland 111,200 5,700
NOVA SCOTIA North Sydney 8,300 300 50
Louisbourg 1,500 400 70
Canso 1,200 600 15
Lunenburg 3,000 1,300 25
Petit de Grat 800 300 20
Halifax 118,000 400 50
TOTAL, Nova Scotia 132,800 3,300
P.E.I. Souris 1,400 110 90
QUEBEC Cap-aux-Meules 1,300 350 100
(iles-de-la-Madeleine)
TOTAL, Atlantic Region 245,900 9,460
Source: (1) Statistics Canada, 1976 Census. (2) DFO, Atlantic Shore Processing Capacity.
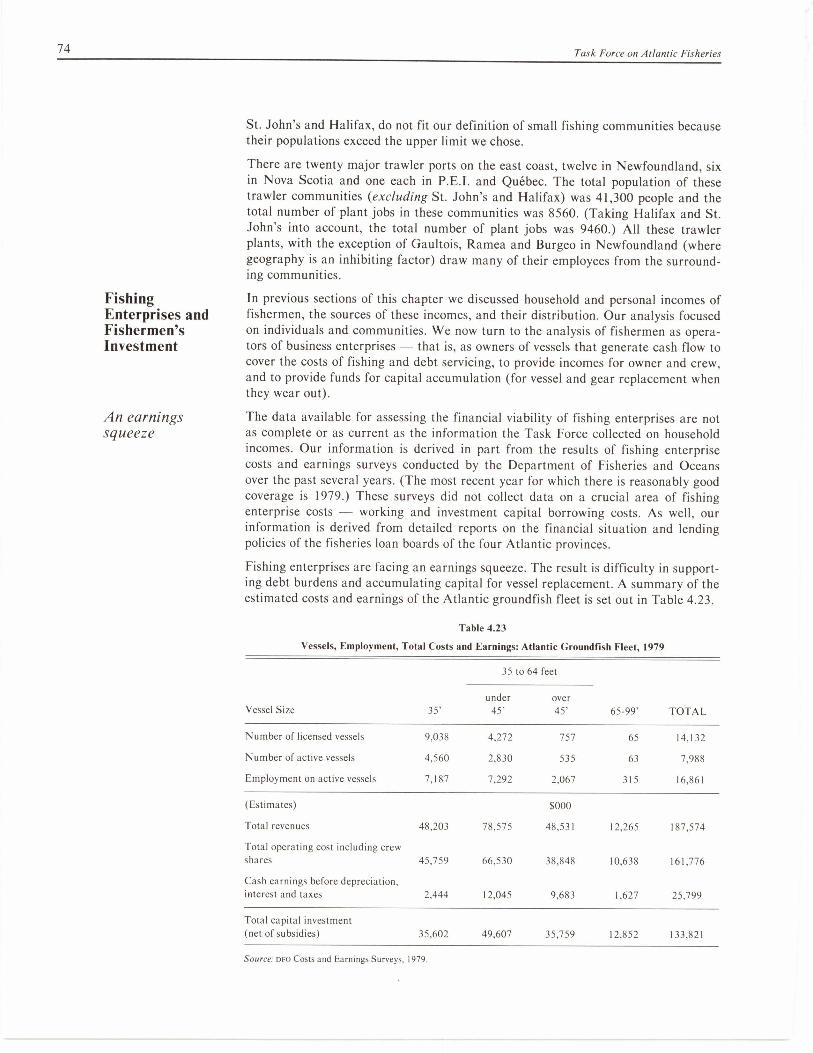
74 Task Force on Atlantic Fisheries
St. John's and Halifax, do not fit our definition of small fishing communities because their populations exceed the upper limit we chose.
There are twenty major trawler ports on the east coast, twelve in Newfoundland, six in Nova Scotia and one each in P.E.I. and Quebec. The total population of these trawler communities (excluding St. John's and Halifax) was 41,300 people and the total number of plant jobs in these communities was 8560. (Taking Halifax and St. John's into account, the total number of plant jobs was 9460.) All these trawler plants, with the exception of Gaultois, Ramea and Burgeo in Newfoundland (where geography is an inhibiting factor) draw many of their employees from the surround-ing communities.
Fishing In previous sections of this chapter we discussed household and personal incomes of Enterprises and fishermen, the sources of these incomes, and their distribution. Our analysis focused Fishermen's on individuals and communities. We now turn to the analysis of fishermen as opera- Investment tors of business enterprises - that is, as owners of vessels that generate cash flow to
cover the costs of fishing and debt servicing, to provide incomes for owner and crew, and to provide funds for capital accumulation (for vessel and gear replacement when they wear out).
An earnings The data available for assessing the financial viability of fishing enterprises are not squeeze as complete or as current as the information the Task Force collected on household
incomes. Our information is derived in part from the results of fishing enterprise costs and earnings surveys conducted by the Department of Fisheries and Oceans over the past several years. (The most recent year for which there is reasonably good coverage is 1979.) These surveys did not collect data on a crucial area of fishing enterprise costs - working and investment capital borrowing costs. As well, our information is derived from detailed reports on the financial situation and lending policies of the fisheries loan boards of the four Atlantic provinces.
Fishing enterprises are facing an earnings squeeze. The result is difficulty in support-ing debt burdens and accumulating capital for vessel replacement. A summary of the estimated costs and earnings of the Atlantic groundfish fleet is set out in Table 4.23.
Table 4.23
Vessels, Employment, Total Costs and Earnings: Atlantic Groundfish Fleet, 1979
35 to 64 feet
under over Vessel Size 35' 45' 45' 65-99' TOTAL
Number of licensed vessels 9,038 4,272 757 65 14,132
Number of active vessels 4,560 2,830 535 63 7,988
Employment on active vessels 7,187 7,292 2,067 315 16,861
(Estimates) $000
Total revenues 48,203 78,575 48,531 12,265 187,574
Total operating cost including crew shares 45,759 66,530 38,848 10,638 161,776
Cash earnings before depreciation, interest and taxes 2,444 12,045 9,683 1,627 25,799
Total capital investment (net of subsidies) 35,602 49,607 35,759 12,852 133,821
Source: DFO Costs and Earnings Surveys, 1979.
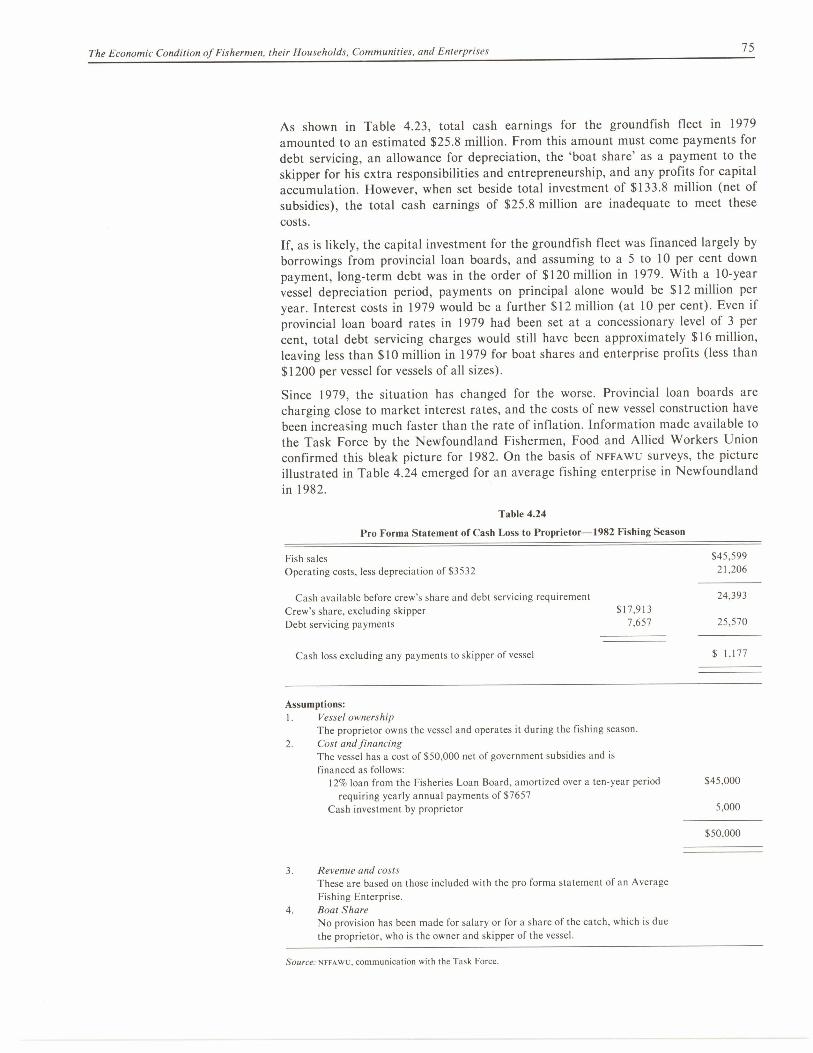
The Economic Condition of Fishermen, their Households, Communities, and Enterprises 75
As shown in Table 4.23, total cash earnings for the groundfish fleet in 1979 amounted to an estimated $25.8 million. From this amount must come payments for debt servicing, an allowance for depreciation, the 'boat share' as a payment to the skipper for his extra responsibilities and entrepreneurship, and any profits for capital accumulation. However, when set beside total investment of $133.8 million (net of subsidies), the total cash earnings of $25.8 million are inadequate to meet these costs.
If, as is likely, the capital investment for the groundfish fleet was financed largely by borrowings from provincial loan boards, and assuming to a 5 to 10 per cent down payment, long-term debt was in the order of $120 million in 1979. With a 10-year vessel depreciation period, payments on principal alone would be $12 million per year. Interest costs in 1979 would be a further $12 million (at 10 per cent). Even if provincial loan board rates in 1979 had been set at a concessionary level of 3 per cent, total debt servicing charges would still have been approximately $16 million, leaving less than $10 million in 1979 for boat shares and enterprise profits (less than $1200 per vessel for vessels of all sizes).
Since 1979, the situation has changed for the worse. Provincial loan boards are charging close to market interest rates, and the costs of new vessel construction have been increasing much faster than the rate of inflation. Information made available to the Task Force by the Newfoundland Fishermen, Food and Allied Workers Union confirmed this bleak picture for 1982. On the basis of NFFAWU surveys, the picture illustrated in Table 4.24 emerged for an average fishing enterprise in Newfoundland in 1982.
Table 4.24
Pro Forma Statement of Cash Loss to Proprietor-1982 Fishing Season
Fish sales $45,599 Operating costs, less depreciation of $3532 21,206
Cash available before crew's share and debt servicing requirement 24,393 Crew's share, excluding skipper $17,913
Debt servicing payments 7,657 25,570
Cash loss excluding any payments to skipper of vessel $ 1,177
Assumptions: 1. Vessel ownership
The proprietor owns the vessel and operates it during the fishing season. 2. Cost and financing
The vessel has a cost of $50,000 net of government subsidies and is financed as follows:
12% loan from the Fisheries Loan Board, amortized over a ten-year period $45,000 requiring yearly annual payments of $7657
Cash investment by proprietor 5,000
$50,000
3. Revenue and costs These are based on those included with the pro forma statement of an Average Fishing Enterprise.
4. Boat Share No provision has been made for salary or for a share of the catch, which is due the proprietor, who is the owner and skipper of the vessel.
Source: NFFAWU, communication with the Task Force.
76
Task Force on Atlantic Fisheries
Coping with No specific information is available from individual fishermen on how they are deal- the problem ing with this squeeze on earnings, but the following generalization can be made from
the enterprise earnings and loan board data we do have. To get into the business as a boat owner-operator, or to continue his business with a new vessel, a fisherman needs a 5 to 10 per cent down payment on a vessel. To come up with the $5000 down pay-ment on the 'average' vessel described by the NFFAWU, he may recruit some crew members as partners, or he may obtain a loan or silent partner investment from the local fish processor. He then acquires a federal government vessel subsidy and a boat loan from the provincial loan board for the remainder of the cost of the new vessel.
The earnings of the vessel, after expenses and crew shares, are barely sufficient to pay back the provincial loan. At best, the boat share goes to loan repayment, with nothing left to reward entrepreneurship or the skipper's skill. Indeed, the boat share may not even be adequate to meet loan board payments, and the owner-operator's loan either becomes overdue, or he meets his payments out of his own crew share. As a consequence of debt loads of this kind, the owner does not accumulate any capital (savings) to replace his vessel when the present one wears out. Moreover, the price of replacement vessels (even boats of the same size) has increased dramatically in recent years.
As well as failing to generate any surplus for capital investment, many fishing enter-prises do not even accumulate sufficient surplus to provide working capital to pay for fuel, repairs and maintenance, insurance, and gear upkeep at the start of the season. Many owner-operators must turn to the local fish processor for credit or pre-season advances. This dependence on the processor imposes additional costs on the fishing enterprise and further reduces cash flow, thus exacerbating the cycle of inadequate earnings, high debt, low equity, and insufficient capital accumulation.
Recent Although the pattern of business performance is in itself cause for concern, the situa- developments tion is being made more serious by recent changes in the availability of federal subsi- in loans and dies and provincial loans. subsidies
The growth in fishermen's debts to provincial loan boards has been the product of an increasing number of loans and an increase in the average amount of such loans. Over the five years between 1977 and 1982, the actual number of outstanding loans virtually doubled (4073 loans outstanding in 1977 and 7917 loans outstanding at the start of 1982). The average amount of these loans also doubled. During 1977-78, the average loan in the Atlantic provinces was $13,700, but by the start of fiscal year 1982-83 this average loan had increased to $28,100. Only in New Brunswick did the average amount of a fisheries loan stay fairly constant throughout the period.
The peak in the expansion of loan board activities came in the years immediately fol-lowing the extension of Canada's fisheries jurisdiction. Every province increased dramatically the amount of funding it made available for loans to fishermen during 1978 and 1979. The most extreme case was Nova Scotia which saw an 853 per cent
Provincial officials provided the Task Force with detailed figures on the operations of fisheries loan boards. Although there are some gaps in this information, and although different accounting procedures in the four provinces create some difficul-ties in comparing data, a general picture of the indebtedness of fishermen can be drawn. The amount of indebtedness has increased dramatically in the past five years. At the start of fiscal year 1977-78, the total amount of loans outstanding from the four fisheries loan boards was $55.9 million. This amount increased in each of the following years until, at the start of the 1982-83 fiscal year, total indebtedness stood at $219.4 million. Over the five-year period, total indebtedness had grown by 400 per cent.

The Economic Condition of Fishermen, their Households, Communities, and Enterprises 77
increase in loans issued between 1977 and 1978, followed by a further 73 per cent increase in 1979 (total loans in 1977-78, $3.1 million; total in 1979-1980, $52.5 mil-lion). At the time, interest rates for fisheries loans were at concessionary levels. In Newfoundland the rate was 3.5 per cent, in New Brunswick it was 5 per cent, and in Nova Scotia it was 7 per cent. Low down payments were also a feature of the period, with a 10 per cent down payment being the normal requirement. Only Prince Edward Island followed a consistent policy of setting interest rates and down pay-ment requirements close to commercial lending levels.
These loan board practices have changed considerably during the past two years. Nova Scotia reports that it has been charging interest in the range of 13 per cent during the past two years, while both Newfoundland and New Brunswick have increased their rates to 8 per cent (and Newfoundland increased its interest rate to 12 per cent in May 1982). Nova Scotia now requires a minimum down payment of 20 per cent, although in Newfoundland the down payment is still set at 10 per cent and in New Brunswick it is somewhat lower. Nova Scotia has dramatically reduced the funding available for fisheries loans during the past two years, from a high of $52.5 million in 1979-1980 to a total of $17.5 million in 1981-82. The other three provinces have reduced the rate of increase in the amounts available for new loans, but they have not cut back on loans in the way Nova Scotia has.
The general tightening in loan board policies comes at a time when many fishermen are encountering real difficulties meeting the terms of their earlier mortgages. There has been a major increase in the number of overdue loans during the past two years. In Nova Scotia, for example, during 1981-82, one-third of the loans on the books of the fisheries loan board were overdue. In Newfoundland, almost half the mortgages on loan board books are now overdue. New Brunswick also reports an increase in the number of overdue loans, although not nearly to the same extent as in Nova Scotia and Newfoundland. Officials of various loan boards have indicated that they expect the number of overdue loans to continue to increase during the current period. There is a general impression that fishermen are falling further and further behind in their loan payments. This is shown in Table 4.25.
What emerges from Table 4.25 is that payments being made by fishermen are declining steadily as a proportion of the amounts outstanding on loans. The amount of payments made by fishermen in Prince Edward Island provides the only exception to this generally gloomy picture.
The tightening of provincial loan board policies is paralleled by recent restrictions in federal government subsidies for boat purchases. The rate for DFO small boat subsi-dies is now 25 per cent, compared with 35 per cent in 1981, with upper limits of $125,000 for steel vessels and $100,000 for other boats. The number and amount of the subsidies since 1977 are shown in Table 4.26.
Table 4.25
Payments Made as a Percentage of Outstanding Loans (beginning of year)
76/77 77/78 78/79 79/80 80/81 81/82
Newfoundland 0.0 24.2 21.1 12.7 8.9 Nova Scotia 41.9 33.3 56.0 59.3 25.1 15.0 New Brunswick 10.1 16.8 16.1 14.1 13.5 10.7 Prince Edward Island 48.4 51.3 60.0 57.0 43.6 46.8
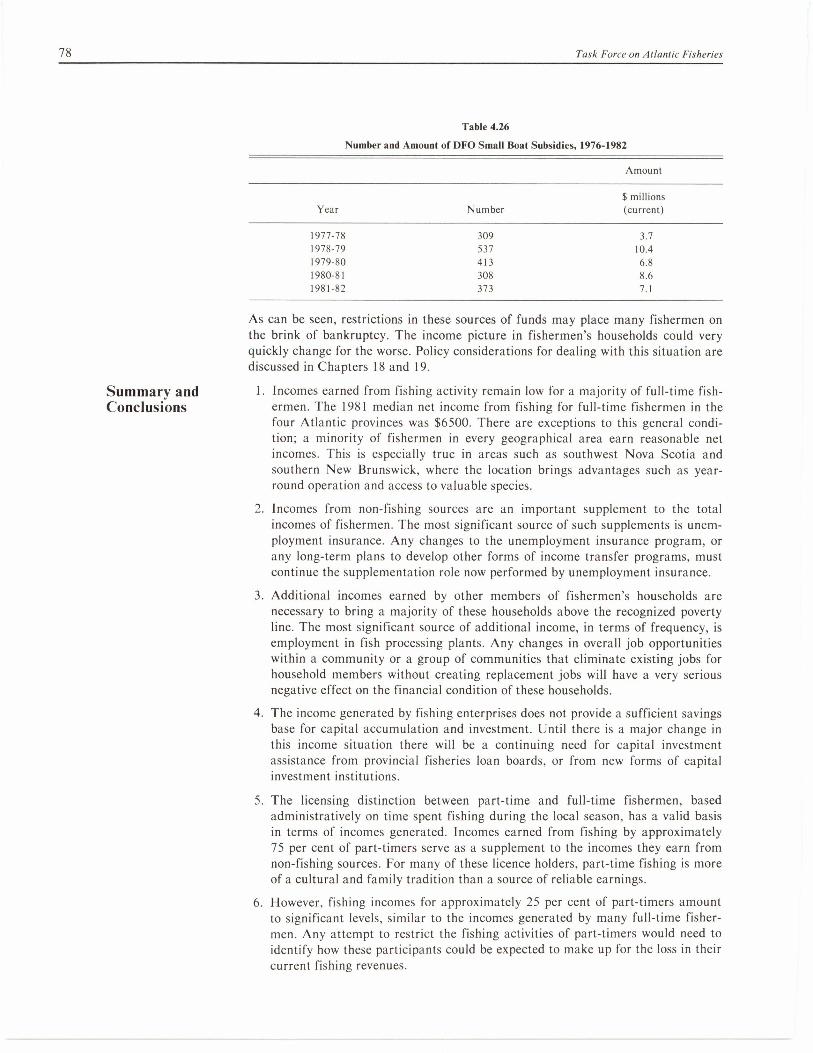
78
Task Force on Atlantic Fisheries
Table 4.26
Number and Amount of DFO Small Boat Subsidies, 1976-1982
Amount
$ millions Year Number (current)
1977-78 309 3.7 1978-79 537 10.4 1979-80 413 6.8 1980-81 308 8.6 1981-82 373 7.1
As can be seen, restrictions in these sources of funds may place many fishermen on the brink of bankruptcy. The income picture in fishermen's households could very quickly change for the worse. Policy considerations for dealing with this situation are discussed in Chapters 18 and 19.
Summary and 1. Incomes earned from fishing activity remain low for a majority of full-time fish- Conclusions ermen. The 1981 median net income from fishing for full-time fishermen in the
four Atlantic provinces was $6500. There are exceptions to this general condi-tion; a minority of fishermen in every geographical area earn reasonable net incomes. This is especially true in areas such as southwest Nova Scotia and southern New Brunswick, where the location brings advantages such as year-round operation and access to valuable species.
2. Incomes from non-fishing sources are an important supplement to the total incomes of fishermen. The most significant source of such supplements is unem-ployment insurance. Any changes to the unemployment insurance program, or any long-term plans to develop other forms of income transfer programs, must continue the supplementation role now performed by unemployment insurance.
3. Additional incomes earned by other members of fishermen's households are necessary to bring a majority of these households above the recognized poverty line. The most significant source of additional income, in terms of frequency, is employment in fish processing plants. Any changes in overall job opportunities within a community or a group of communities that eliminate existing jobs for household members without creating replacement jobs will have a very serious negative effect on the financial condition of these households.
4. The income generated by fishing enterprises does not provide a sufficient savings base for capital accumulation and investment. Until there is a major change in this income situation there will be a continuing need for capital investment assistance from provincial fisheries loan boards, or from new forms of capital investment institutions.
5. The licensing distinction between part-time and full-time fishermen, based administratively on time spent fishing during the local season, has a valid basis in terms of incomes generated. Incomes earned from fishing by approximately 75 per cent of part-timers serve as a supplement to the incomes they earn from non-fishing sources. For many of these licence holders, part-time fishing is more of a cultural and family tradition than a source of reliable earnings.
6. However, fishing incomes for approximately 25 per cent of part-timers amount to significant levels, similar to the incomes generated by many full-time fisher-men. Any attempt to restrict the fishing activities of part-timers would need to identify how these participants could be expected to make up for the loss in their current fishing revenues.

The Economic Condition of Fishermen, their Households, Communities, and Enterprises 79
7. Small fishing communities remain the focus of significant economic activity throughout the Atlantic region. A majority of these communities have single-sector economies based on fishing and fish processing. Changes in the amounts or patterns of either fish harvesting or fish processing in a community will thus have significant repercussions on the viability of that community.


81
5. The Economic Condition of the Processing Sector
We may define business in a broad, general way as the art of losing money.
Stephen Leacock
Introduction The fish processing industry on Canada's Atlantic coast is in financial crisis. The cri-sis does not affect every company or every area to the same degree, but no enterprise has been untouched by the negative economic developments in the industry since 1979. The dimensions of the financial decline have only recently become fully known as a result of an extensive survey and analysis undertaken for the Task Force by Woods Gordon management consultants. The purpose of this chapter is to summa-rize and interpret the Woods Gordon findings and to augment them with other data that deepen our understanding of the factors that have led the processing industry to its present condition.
The Woods Gordon study was based on a sample of some 100 processing enterprises that in 1981 had sales of $940 million. It thus covers about 80 per cent (by sales value) of the entire industry and is believed to account for an even higher percentage of the groundfish trade. The sample is described more fully in Annex A to this chapter.
In 1981, the enterprises surveyed incurred a consolidated loss of $57 million, follow-ing a loss of $22 million in 1980. The 70 enterprises in the sample that lost money in 1981 had total losses of $64 million, while the 26 that made money had total profits of only $6.2 million. The unprofitable enterprises accounted for 83 per cent of total 1981 sales in the sample.
The published financial results of National Sea Products Limited — the largest com-pany in the industry and the only one with publicly traded shares — are typical of, in fact slightly better than, the average performance of the industry (see Table 5.1).
The peak in 1978 and the subsequent decline typifies the overall performance of the industry. The small profit of National Sea Products in the first six months of 1982 is an encouraging sign of possible recovery in the industry, though the company has cautioned that a loss is expected in the third quarter.
Table 5.1
National Sea Products, 1977-1981 ($ millions)
Year Sales Growth In Sales (%)
Operating Income*
Net Income $ Millions % of Sales
1977 165 29.6 19.2 5.2 3.1 1978 217 31.5 21.0 10.6 4.9 1979 268 23.5 14.8 8.5 3.2 1980 274 2.2 (4.5) 2.5 0.9 1981 314 14.6 (7.9) (0.8) 0.0 1982** 163 7.7 1.2 2.6 1.6
* Operating income (or loss if bracketed) is income from fisheries activity after interest and depreciation, but before income from affiliates, taxes and extraordinary items.
** January to June. Source: National Sea Products Limited, Annual Reports.
82 Task Force on Atlantic Fisheries
The severity of the financial crisis became generally evident in mid-1981 with the temporary closure of a number of large fish plants, most served by offshore trawlers. Late in 1981 the federal government provided $15 million in assistance to the processing sector to help defray the cost of holding inventory and thereby alleviate the pressure for distress selling at sharply reduced prices. By year's end a number of companies had approached both federal and provincial governments for further financial assistance, generally in the form of loan guarantees. The financial position of many of these companies has deteriorated further in 1982.
The financial malaise is widespread, but it is most severe in the frozen goundfish and herring sectors. Saltfish and shellfish continue to provide generally acceptable returns, although weakness is evident in the saltfish market, and the lucrative Nova Scotia scallop fishery is experiencing reduced catches in the wake of recent heavy U.S. effort on Georges Bank. As always, there are isolated instances of success and failure in all fisheries and in all areas. But government policy must be concerned primarily with overall trends, rather than with the success or failure of individual enterprises.
Although it sounds simplistic to state, the present financial crisis is the result of costs rising more rapidly than revenues. In part, this reflects an imbalance of supply and demand in the market for Canadian fish and a corresponding weakness of average prices. A decline of fish stocks (with the exception of herring) is not a contributing factor as it was during the last downturn in 1974-75. The objective of the following analysis is to understand the nature of the present cost-price squeeze with the hope that remedies can be found that are more effective and enduring than steps that have been taken in the past.
Sources of The following analysis is based heavily on the Woods Gordon survey of processing Data enterprises. Comprehensive financial information on an individual company basis has
not previously been available for the east coast fish processing industry. From time to time studies have been made of the results of a small number of enterprises, usu-ally covering one or at most two years of financial data. With the principal exception of National Sea Products, the only publicly traded company in the Atlantic fishery, financial statements have not been provided to fisheries policy makers.
The Task Force believed it was essential to obtain reasonably comprehensive income and balance sheet information from a large number of companies over the period 1977-1981, the interval in which the industry sought to adapt to the 200-mile limit and to the rebuilding of fish stocks. With the co-operation of the Fisheries Council of Canada, the Task Force requested virtually all processors in eastern Canada to sub-mit their financial statements for 1977-1981, broken down plant by plant, to Woods Gordon. It was agreed that the results would remain confidential with Woods Gor-don, who were to analyze and report to the Task Force in a way that concealed the identity of respondents. Our analysis is based primarily on those reports.
Ninety-nine responses or 'records' are included in the Woods Gordon sample. With only a few exceptions, each response corresponds to a single plant. In a very few cases it was not possible to disaggregate the statements of firms operating more than one plant, and in others (e.g., National Sea Products) the generation of individual plant statements involved the allocation of certain aggregate data. In almost every case the disaggregation was done in part by Woods Gordon. In these cases, Woods Gordon ensured that the totals agreed with the company's actual audited statements. Many other returns were prepared by respondents' auditors. In total, 107 plants were covered. In what follows, no distinction will be made between a 'plant' and a 'record' in the Woods Gordon sample.

The Economic Condition of the Processing Sector 83
Plan of Presentation
The Basic Sample Data
Consolidated statements
Because not all plants were active over the five-year period, the number of records varies from year to year (e.g., 82 in 1977 and 96 in 1981). The breakdown of the sample by Task Force analytical area (see pp. 29-30 for map and definitions) and by province is shown in Table 5.2.
The representational validity of the sample was confirmed by comparison with Sta-tistics Canada and Fisheries and Oceans aggregate data for the Atlantic coast. Details are provided in Annex A. It appears from these comparisons that the plants sampled account for a disproportionate share of industry losses in 1979 and later. This is believed to be due to the relatively light coverage of shellfish processors in the sample. The latter are known to have been more profitable on average than ground-fish processors.
Annex A also provides details on other characteristics of the plants, such as degree of seasonality, volume of sales, product mix, and corporate affiliation.
The objective here is to present and analyze financial data at a macro level; the oper-ating costs of plants (the 'micro' data) are treated in Chapter 16. Accordingly, there is no analysis here of the effect on production costs of such factors as quality, season-ality and management, although their general effect, as reflected in financial state-ments, will be assessed at a gross level.
The analysis begins with a presentation of aggregated financial statement data to identify the main components of change over the period 1977-1981. These are cor-related with known factors in the fishery (e.g., market price trends) and in the economy (e.g., interest rates). The sample data are then analyzed with respect to the characteristics listed in Annex A (e.g., product mix, volume of sales, seasonality) and other factors often thought to explain company or plant financial performance. The objective is to identify, if possible, the correlates, if not the causes, of success and failure in the fish processing business.
Finally, the sample is divided into four groups of plants, characterized with respect to the 1977-1981 period as (1) very successful, (2) moderately successful, (3) in sharp decline, or (4) very unsuccessful. The distribution of various industry charac-teristics (product mix, for example) among the firms in these four categories is revealing, but few unequivocal conclusions can be drawn. We conclude the chapter by identifying the financial characteristics of a profitable industry and establishing a measure of the degree to which present performance falls short of these objectives.
The income statement of each company in the sample gives the annual dollar value of the items listed in Table 5.3, definitions of which are in Annex B to this chapter. The table shows 1977 and 1981 sample values as consolidated totals, which are not however strictly comparable because of the change in the number of reporting com-panies over the period.
Table 5.2
Distribution of Sample by Task Force Analytical Areas
Areas 1 2 3 4 5 6 7 13 8 9 10 11 12
# Plants 16 15 9 2 3 9 11 3 6 1 5 5 22
# Records 15 14 9 2 2 5 11 3 6 1 5 4 22 ■ J ■--,e.--J \--v----, ..—..—• l---v.---J
Provinces Nfld. Que. N.B. P.E.I. N.S.
# Records 40 7 14 6 32
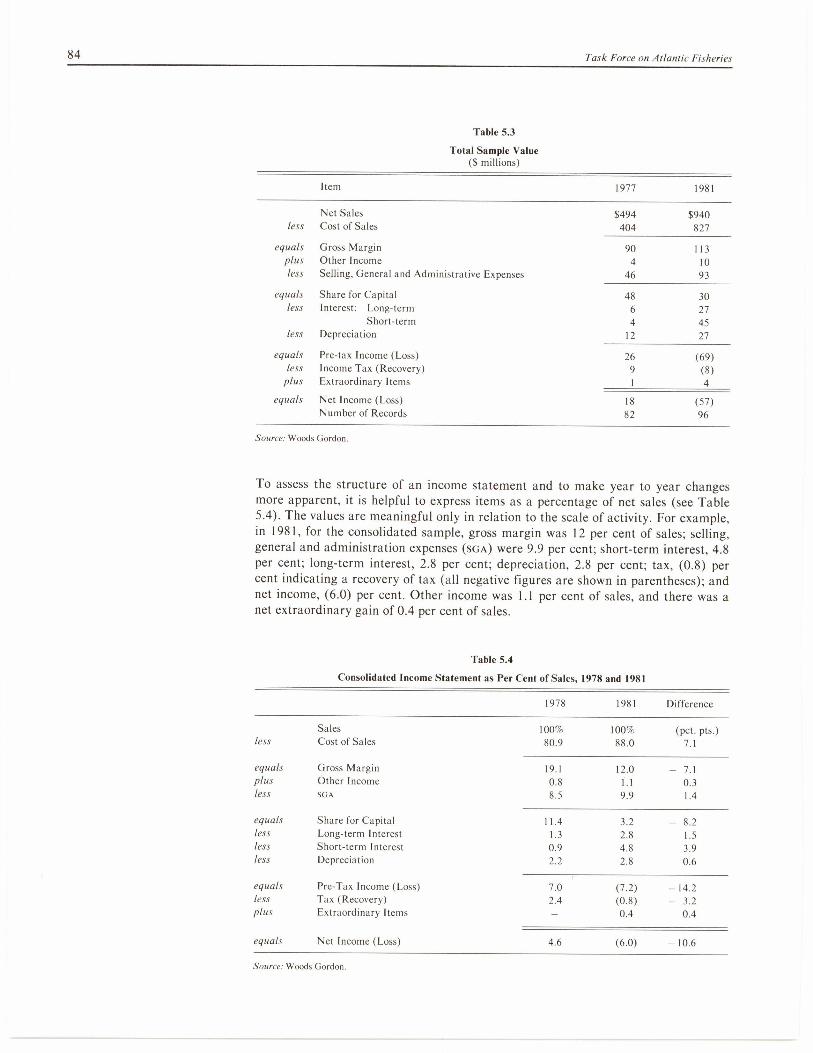
84 Task Force on Atlantic Fisheries
Table 5.3
Total Sample Value ($ millions)
Item 1977 1981
Net Sales $494 $940 less Cost of Sales 404 827
equals Gross Margin 90 113 plus Other Income 4 10 less Selling, General and Administrative Expenses 46 93
equals Share for Capital 48 30 less Interest: Long-term 6 27
Short-term 4 45 less Depreciation 12 27
equals Pre-tax Income (Loss) 26 (69) less Income Tax (Recovery) 9 (8)
plus Extraordinary Items 1 4 equals Net Income (Loss) 18 (57)
Number of Records 82 96
Source: Woods Gordon.
To assess the structure of an income statement and to make year to year changes more apparent, it is helpful to express items as a percentage of net sales (see Table 5.4). The values are meaningful only in relation to the scale of activity. For example, in 1981, for the consolidated sample, gross margin was 12 per cent of sales; selling, general and administration expenses (sGA) were 9.9 per cent; short-term interest, 4.8 per cent; long-term interest, 2.8 per cent; depreciation, 2.8 per cent; tax, (0.8) per cent indicating a recovery of tax (all negative figures are shown in parentheses); and net income, (6.0) per cent. Other income was 1.1 per cent of sales, and there was a net extraordinary gain of 0.4 per cent of sales.
Table 5.4
Consolidated Income Statement as Per Cent of Sales, 1978 and 1981
1978 1981 Difference
Sales 100% 100% (pct. pts.) less Cost of Sales 80.9 88.0 7.1
equals Gross Margin 19.1 12.0 - 7.1 plus Other Income 0.8 1.1 0.3 less SGA 8.5 9.9 1.4
equals Share for Capital 11.4 3.2 - 8.2 less Long-term Interest 1.3 2.8 1.5 less Short-term Interest 0.9 4.8 3.9 less Depreciation 2.2 2.8 0.6
equals Pre-Tax Income (Loss) 7.0 (7.2) - 14.2 less Tax (Recovery) 2.4 (0.8) - 3.2 plus Extraordinary Items 0.4 0.4
equals Net Income (Loss) 4.6 (6.0) - 10.6
Source: Woods Gordon.

The Economic Condition of the Processing Sector 85
Judged overall, 1978 was the most profitable year in the past five, 1981 the least. Between 1978 and the end of 1981, net income dropped by 10.6 percentage points of sales. Pre-tax income (the more accurate performance measure) declined by 14.2 percentage points of sales. The principal contributing factors were a decline of 7.1 points in gross margin (from 19.1 to 12 per cent) and an increase of 5.4 points in interest cost (1.5 points on long-term and 3.9 points on short-term). Depreciation and selling and administrative expenses increased between 1978 and 1981, but together contributed only 2 of the 14.2 points by which pre-tax income dropped.
The interpretation of income items expressed as a percentage of sales may be subject to confusion. Taking sales revenue as given at 100 per cent, expenses become the focus of attention. For example, Table 5.4 shows that the gross margin declined by 7.1 points, apparently because operating costs increased by 7.1 points. But it would be a mistake to conclude that the problem was purely one of cost. It could equally be argued that sales prices did not increase sufficiently, so that the 1981 volume of fish production yielded too little revenue. Had prices been better, 1981 operating costs would have been lower as a percentage of sales revenue. Similarly, long-term interest and administrative expenses would have been smaller as a proportion of sales.
To appreciate the respective roles of cost increases and price movement, we must examine the cost and market price per unit of production. The foregoing discussion of the income statement reveals mainly that margins in 1981 were too low and inter-est costs too high. The causes of this will be examined further in the next section.
The balance sheet provides a picture of the financial condition of an enterprise, frozen at a point in time — usually the company's financial year-end. Table 5.5 dis-plays year-end values for key items (defined in Annex B) for the consolidated sam-ple. It is based on the Woods Gordon survey, which compiled balance sheets for the years 1977 through 1981 for the sample plants.
Total assets, net fixed assets and loans might have been expected to increase between 1978 and 1981 due to both inflation and increased production as fish landings rose. But in fact the ratio of fixed assets to long-term debt deteriorated, pointing to an increase in the industry's already excessive reliance on debt rather than earnings or new investment (i.e., equity) to finance growth.
Because debt creates an obligation to make interest and principal payments at regu-lar intervals regardless of operating profit, relatively high debt places businesses like the fishery, which are subject to significant ups and downs, in a precarious position. Shareholders on the other hand can postpone their dividends during downturns, although on average they require a larger return on funds advanced than do lenders because of the added risk they bear.
Short-term bank financing of plants in the sample trebled between 1978 and 1981. Such loans are usually used to finance inventories and accounts receivable, but these items increased by only 42 per cent. The catastrophic drop in consolidated working capital was correlated with the extraordinary increase in short-term bank loans not nearly matched by increased current assets. These loans were required to meet cash obligations in the face of operating losses. The sample had a decline in equity of $67 million resulting from a net loss of $64.7 million (1979, 1980 and 1981) and a net out-flow of dividends of $2.3 million. Although some enterprises obtained infusions of new funds, the consolidated sample contributed a small net pay-out. Investors have found the fishing industry unattractive.

86 Task Force on Atlantic Fisheries
Table 5.5
Consolidated Balance Sheet Items 1978 and 1981
($ millions) 1978 1981 % Change
Total Assets 418.6 706.3 + 68.7 Net Fixed Assets 148.0 294.8 + 99.1 Long-term Debt 111.9 243.9 +118.0 Short-term Debt 87.2 276.0 +216.5 Working Capital 35.6 (106.1) -398.0 Equity 93.4 26.4 - 76.0 Equity/Assets (per cent) 22.3% 3.7%
Source: Woods Gordon.
Table 5.6 summarizes the consolidated financial results over the entire period 1977-1981. The data confirm the trend noted in Table 5.1 which showed the performance of National Sea Products. Sales of the aggregate sample advanced at an average compound annual rate of 17.5 per cent. But the cost of sales increased on average by 19.6 per cent. The decline between 1978 and 1980 was due mainly to falling gross margin. In 1981 there was a small recovery of margin, apparently due to slightly higher market returns and tighter cost control. But the recovery of margin was far more than offset by increased interest costs - from 4.5 per cent of sales in 1980 to 7.7 per cent of sales in 1981, an increase of $24 million. It should be noted that the growth of interest expenses is due primarily to an escalation of the short-term com-ponent, which in 1977 amounted to only 0.8 per cent of sales, compared with 4.8 per cent in 1981. This resulted from rate increases and from the escalation in bank loans already mentioned. (A more detailed analysis is presented in the next section.)
Selling, general and administrative expenses (sGA) have been kept reasonably in check at roughly 10 per cent of sales. This is one of the most stable ratios in the industry, both year to year and plant to plant. It may be expected to increase in the future as greater effort is put into promotion and marketing, product development, and financial management.
Table 5.6
Consolidated Financial Results, 1977-1981 ($ millions or % of sales)
1977 1978 1979 1980 1981
Sales $494 $642 $825 $848 $940 Gross Margin 18% 19% 16% 11% 12% SGA 9% 9% 9% 10% 10% Long-term Interest 1% I% 2% 2% 3% Short-term Interest 1% 1% 2% 2% 5% Pre-tax Income 6% 6% I% (4%) (7%) Net Income (Loss) $ 18 $ 29 $ 14 ($22) ($57) Total Assets $289 $419 $583 $668 $706 Net Fixed Assets $114 $148 $218 $272 $295 Long-term Debt $ 77 $112 $170 $226 $244 Short-term Debt $ 45 $ 87 $151 $206 $276 Working Capital $ 21 $ 36 $ 26 ($ 14) ($106) Equity $ 78 $ 93 $113 $ 88 $ 26 Equity/Assets 26.9% 22.3% 19.3% 13.3% 3.7% Current Ratio 1.19 1.19 1.10 0.96 0.75 Return on Assets* 6.4% 6.9% 2.4% Neg. Neg. Number of Records 82 88 93 98 96
* Defined as net income divided by total assets. Source: Woods Gordon.

The Economic Condition of the Processing Sector 87
Profitable and unprofitable plants
Of particular note among the balance sheet items is the ratio of equity to assets, which declined steadily from 26.9 per cent to a mere 3.7 per cent at the end of 1981. The all-Canada fish products industry average for the period 1970-79 was 33.4 per cent, while the comparable average for all food products was 44.7 per cent. As a whole, the east coast fish- processing industry has now, and has had for years, a grossly inadequate amount of equity. There are of course exceptions among firms, but they are rare.
The amount of fixed assets employed in the industry is in fact understated by the figures, because government capital grants (e.g., under DREE programs) have con-tributed to fixed capital additions but do not appear in the book value of fixed assets.* Thus the 'true' asset cost is higher than stated, and measures such as return on assets are in fact lower than shown in Table 5.6, which is based on book values.
The numbers of profitable and unprofitable plants in each year and their aggregated annual net income (profit or loss) are shown in Table 5.7.
The relative performance of profitable and unprofitable plants is shown in Table 5.8 which lists items from the aggregate income statement of each group, expressed as a percentage of sales.
The data in Table 5.8 show that between 1977 and 1979 the difference between prof-itable and losing plants is accounted for almost entirely by gross margin. Unprofit-able plants had, collectively, half the margin of profitable plants. For example, in 1979 the profitable plants had an average gross margin of 18 per cent of sales, corn-
Table 5.7
Profits and Losses, 1977-1981 (number of plants; $ millions)
1977 1978 1979 1980 1981
# Net Inc. #
Net Inc. #
Net Inc. #
Net Inc. #
Net Inc.
Profitable 68 $20 76 $31 66 $23 50 $ 8 26 $ 6
Unprofitable 14 ($2) 12 ($3) 27 ($9) 48 ($30) 70 ($63)
Sample 82 $18 88 $28 93 $14 98 ($22) 96 ($57)
Source: Woods Gordon.
Table 5.8
Performance Measures, Profits and Losses, 1977-1981 (per cent of sales, rounded)
1977 1978 1979 1980 1981
P* L* P L P L P L P L
Gross Margin 19 12 20 10 18 9 15 7 16 11
SGA 9 9 8 11 9 9 9 11 8 10
Interest 2 3 2 3 3 4 4 6 3 8
Pre-tax Income 6 (3) 8 (5) 6 (7) 0 (10) 5 (6)
* 'V refers to profitable plants in the year, I' to plants that lost money.
Source: Woods Gordon.
* Between April 1974 and April 1982, DREE grants to the east coast fishing industry under the Regional Development
Incentives Program totalled $21.6 million, while additional DREE expenditures under federal-provincial agreements and direct federal programming were $42.5 million. Apparent additions (book value) to the fixed assets of the sample firms between 1977 and 1981 totalled $262 million.

88 Task Force on Atlantic Fisheries
Analysis by area
pared with 9 per cent for the unprofitable plants. There was little difference between the two groups in respect of SGA or interest costs.
In 1980, SGA and interest joined margin as significant factors. In 1980, SGA and interest together totalled 17 per cent of the sales of unprofitable plants and only 13 per cent of the sales of those that made money. This gap widened considerably in 1981. The difference in margin was still a significant discriminating factor in 1981, although it was less important than formerly. Most of the plants that were added to the loss column in 1981 were unable to cover the sharp increase in short-term inter-est expenses. They had been on the brink of unprofitability in 1980. Many could again become profitable if gross margins continue to improve and interest rates con-tinue to moderate.
The small group of 26 plants that managed to remain profitable in 1981 succeeded largely because of their low interest costs. It may also be significant that these plants had additional 'other income' in 1981 equal to 2 per cent of their fisheries sales. This group has been consistently profitable. Their equity in 1981 was 42 per cent of assets, down only slightly from 48 per cent in 1978. Their current ratio (defined in Annex B) was a healthy 1.64:1, and their year-end bank loan balance was only 34 per cent of inventory and receivables, indicating a safe cash position. These plants clearly are able to survive even severe economic cycles in the fishery. Unfortunately they accounted for only 17 per cent of 1981 sales in the sample. A more detailed anal-ysis of the characteristics of successful and unsuccessful enterprises will be made later in this chapter.
Variations in plant profitability between geographical areas are shown in Table 5.9, where net income is presented as a percentage of sales. Task Force analytical areas were grouped by Woods Gordon to ensure confidentiality. (See page 30 for a map showing locations of analytical areas.)
Less confidence can be attached to area results than to the sample aggregate. More-over, some head office expenses and sales figures that could not be fully allocated to plants show up in one area whereas they actually refer to activity in other areas. The data for Task Force Analytical Areas (TAA) 1, (Labrador-northeast Newfoundland), 8 (Prince Edward Island), and 9-10-11 (Gulf Nova Scotia, northeast Nova Scotia, and eastern shore Nova Scotia) are believed to be less representative than the remainder. Also, TAA 4 (west coast Newfoundland) is not well represented in the sample.
Table 5.9
Regional Picture of Profitability, 1977-1981 (share of total sales and net income as % of sales*)
Areas 1977
Sales* N.I.* 1978
Sales N.I. 1979
Sales N.I. 1980
Sales N.I. 1981
Sales N.I.
1 5.4% 3% 6.6% 1% 6.8% (2%) 7.6% (5%) 8.0% (12%) 2 13.6 3 14.1 4 13.9 1 10.9 (4) 11.6 (6) 3-4 13.1 3 15.5 2 15.2 2 14.2 (6) 16.0 (13) 5-6 8.7 3 8.9 3 8.0 1 8.3 0 8.9 (2) 7 7.7 4 8.0 5 8.3 3 8.7 (1) 8.5 (0) 8 2.9 2 2.7 3 2.8 1 3.0 (2) 3.1 (5) 9-10-11 21.1 2 17.0 6 19.4 2 19.8 (4) 16.5 (10) 12-13 27.6 6 27.2 7 25.4 3 27.5 (1) 27.4 (1)
Total (%) 100% 4% 100% 4% 100% 2% 100% (3%) 100% (6%) Total ($M) $494 $18 $642 $29 $825 $14 $848 ($22) $940 ($57)
Source: Woods Gordon.
The Economic Condition of the Processing Sector 89
The most successful areas appear to be Gulf New Brunswick (7), western Nova Scotia-Fundy New Brunswick (12-13) and Quebec (5-6). TAA 12-13 is by a wide margin the most heavily weighted in the sample, although only a relatively small per-centage of all plants in that area are included. (However, the percentage of sales included in the sample is probably about 70 per cent of the area total.) A great many small enterprises in southwestern Nova Scotia, most specializing in salt and fresh fish, are omitted, and conclusions regarding their financial performance should not be drawn from this study. Similarly, the shellfish trade on Prince Edward Island and in the Northumberland Strait area is not well covered, nor is 'bloater' herring pro-duction in southeastern New Brunswick or the canned fish business generally. The regional breakdown of the sample is much more reliable with respect to the frozen groundfish trade.
The sample plants in northeast Newfoundland (TAA 1) did not perform well on aver-age at any time during the 1977-1981 period. (There are individual exceptions, a comment that applies to every general statement about the fish business.) There is considerable new investment in the area. The supply of fish has generally not been sufficient to sustain increased overhead. The fishery is highly seasonal as a result of weather and ice conditions and is based heavily on two species, cod and turbot.
Performance in eastern Newfoundland (Avalon Peninsula-Bonavista Bay, TAA 2) conformed fairly closely with the sample average; it was perhaps slightly poorer. The resource supply in this area, while still highly seasonal, is more dependable than in TAA 1 and includes a broader species mix, particularly capelin, crab and squid. (The latter is reflected in the high 1979 sales.) The companies in the area are generally of long standing and in many cases are extraordinarily well adapted to their social and commercial environment. Nonetheless, new investment in the area has been high, and dependence on frozen groundfish is heavy. The future of the groundfish sector will determine the fortunes of the Avalon-Bonavista area. If plants in the area are to survive to process the highly uncertain and sharply peaked volumes of pelagic species and squid, they must have a more secure base in groundfish. We return to this ques-tion in Chapter 11.
The sample enterprises in TAA 3-4 (south and west coast Newfoundland) are domi-nated by nine trawler plants on the south coast of Newfoundland. Their performance deteriorated critically in 1980 and 1981. In 1980, many plants were idled by a lengthy work stoppage, while several were closed voluntarily in in the second half of 1981 because no quotas of stocks remained that could be caught and marketed prof-itably. The south coast trawler plants have relied traditionally on redfish and floun-der, both of which faced extraordinarily weak markets in 1981. The redfish market continues to be poor because of an apparent decline in demand among traditional U.S. consumers and increased competition from Icelandic suppliers. Meanwhile, many vessels in the south coast fleet are obsolete side trawlers, unable to participate in the northern cod fishery, but lacking a suitable cod alternative because of reduced offshore quotas in the Gulf and on St. Pierre Bank. Between 1977 and 1981 the total catch of the side trawler fleet declined; it was the only major fleet sector on the east coast to experience a drop in landings.
The Quebec plants in the sample (TAA 5-6) appear to have fared better than average, principally because of much lower than average interest expenses — only 4 per cent of sales in 1981. Gross margin, however, was among the lowest of all regions in 1981 at 10 per cent. It appears that many of these enterprises depend on ageing assets that could not be replaced without much higher margins.
The Gulf area of New Brunswick (TAA 7), particularly around Caraquet-Shippegan, shows the most stable financial performance among the sample areas. In 1981, gross
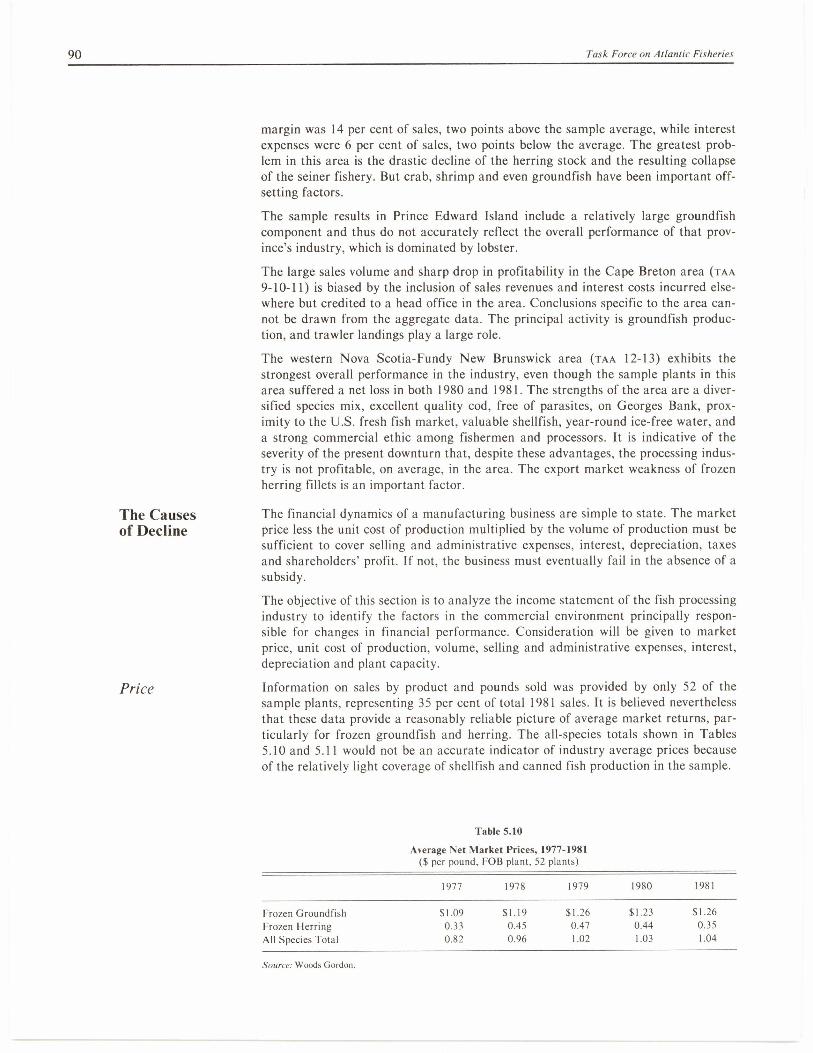
90
Task Force on Atlantic Fisheries
The Causes of Decline
Price
margin was 14 per cent of sales, two points above the sample average, while interest expenses were 6 per cent of sales, two points below the average. The greatest prob-lem in this area is the drastic decline of the herring stock and the resulting collapse of the seiner fishery. But crab, shrimp and even groundfish have been important off-setting factors.
The sample results in Prince Edward Island include a relatively large groundfish component and thus do not accurately reflect the overall performance of that prov-ince's industry, which is dominated by lobster.
The large sales volume and sharp drop in profitability in the Cape Breton area (TAA
9-10-11) is biased by the inclusion of sales revenues and interest costs incurred else-where but credited to a head office in the area. Conclusions specific to the area can-not be drawn from the aggregate data. The principal activity is groundfish produc-tion, and trawler landings play a large role.
The western Nova Scotia-Fundy New Brunswick area (TAA 12-13) exhibits the strongest overall performance in the industry, even though the sample plants in this area suffered a net loss in both 1980 and 1981. The strengths of the area are a diver-sified species mix, excellent quality cod, free of parasites, on Georges Bank, prox-imity to the U.S. fresh fish market, valuable shellfish, year-round ice-free water, and a strong commercial ethic among fishermen and processors. It is indicative of the severity of the present downturn that, despite these advantages, the processing indus-try is not profitable, on average, in the area. The export market weakness of frozen herring fillets is an important factor.
The financial dynamics of a manufacturing business are simple to state. The market price less the unit cost of production multiplied by the volume of production must be sufficient to cover selling and administrative expenses, interest, depreciation, taxes and shareholders' profit. If not, the business must eventually fail in the absence of a subsidy.
The objective of this section is to analyze the income statement of the fish processing industry to identify the factors in the commercial environment principally respon-sible for changes in financial performance. Consideration will be given to market price, unit cost of production, volume, selling and administrative expenses, interest, depreciation and plant capacity.
Information on sales by product and pounds sold was provided by only 52 of the sample plants, representing 35 per cent of total 1981 sales. It is believed nevertheless that these data provide a reasonably reliable picture of average market returns, par-ticularly for frozen groundfish and herring. The all-species totals shown in Tables 5.10 and 5.11 would not be an accurate indicator of industry average prices because of the relatively light coverage of shellfish and canned fish production in the sample.
Table 5.10
Average Net Market Prices, 1977-1981 ($ per pound, FOB plant, 52 plants)
1977 1978 1979 1980 1981
Frozen Groundfish $1.09 $1.19 $1.26 $1.23 $1.26 Frozen Herring 0.33 0.45 0.47 0.44 0.35 All Species Total 0.82 0.96 1.02 1.03 1.04
Source: Woods Gordon.

The Economic Condition of the Processing Sector 91
Table 5.11
Year to Year Change in Market Prices (Sample Plants) (per cent)
1977-78 1978-79 1979-80 1980-81
Frozen Groundfish 9.2% 5.9% —2.4% 2.4% Frozen Herring 36.4 4.4 — 6.4 — 20.5 All Species Total 17.0 6.3 1.0 1.0
Source: Table 5.10.
Fluctuations in market prices are part of the environment of the industry. Table 5.12 traces the Fish Products Industry Selling Price Index (all-Canada) for the past 20 years, comparing it with the total Food Products Index and the general rate of infla-tion as inferred from the implicit price index of Gross National Expenditure.
Figure 5.1 illustrates three significant market 'troughs' for the fishing industry — in 1967-68, 1974-75 and 1980-81. Not shown is an earlier downturn in 1958. Food and beverage prices, of which fish is only a small component, experienced the same downturn in 1967-68, a second in 1977 (while fish prices registered strong gains) and also showed weakness in 1981. Over the period, the fish products industry gained more than it lost against inflation when compared with food and beverages prices generally. Between 1968 and 1974, the fish products price index rose 125 per cent while general prices increased by just under 50 per cent, and all food and beverage products rose by 76 per cent. During the most recent round of fish price increases, in the period 1975-79, the index advanced 73 per cent compared with 38 per cent for general inflation.
The fish products index covers the whole Canadian fish industry and hence reflects some large price changes in Pacific salmon and roe herring, particularly in 1972-73 and 1979. Nonetheless, the trends displayed in Table 5.12, if not the precise percent-ages, are representative of gross price movement on the east coast. At the end of 1981, the Fish Products Selling Price Index stood at 326.4 compared with the Food and Beverages index at 282.7, the Consumer Price Index (Food Items) at 290.4, and the Gross National Expenditure index at 246.5. The poor performance of the fishing industry cannot therefore be blamed on weak prices over the past decade.
The extremely strong price performance of fish products between 1969 and 1978, interrupted only in 1974-75, compounded by the declaration of the 200-mile limit and the rapid increase in Atlantic coast landings, created extraordinary optimism in the industry, in governments and in the financial community. This optimism, together with the inevitable competition among stake holders to be first to take advantage of the 200-mile limit, accounts for the surge in investment and employ-ment in the fishery between 1977 and 1980. The new claimants on the fishing dollar — lenders, fishermen, plant workers and suppliers — represented costs that soon grew to offset extraordinary increases in market prices, leaving the industry floating once more in a sea of red ink.
It is apparent that the cyclical variations in fish prices are not markedly different from those of food products generally, even though the phasing and frequency of peaks and troughs may not coincide. The pattern of change over the past 20 years would suggest that the fish industry is poised for a price recovery in 1982 or 1983. Indeed, there were already encouraging signs in 1982 of a recovery from the extremely sluggish prices of 1980 and 1981. Unfortunately, however, there are no developments apparent in the industry that point to a significant or sustained advance in average selling prices (net of inflation), particularly for groundfish and herring products.

Figure 5.1 Annual Change in Real Market Price of All Canadian Fish Products (adjusted to subtract rate of inflation)
change 20
10
0
10
1965 1970
Source: fable .512 in the lask Force Report. derived from Statistics Canada clam.
Task F
orce on A
tlantic F
isheries
1975
1980

The Economic Condition of the Processing Sector 93
Table 5.12
Fish Prices, Food Prices and Inflation (% change, year to year)
Fish Products'
Food & Beverages 2
General Inflation'
Fish Products Less Inflation
1962 3.3% 2.2% 1.4% 1.9%
1963 3.7 3.8 1.9 1.8
1964 3.0 0.4 2.4 0.6
1965 3.8 1.1 3.3 0.5
1966 6.3 5.8 4.4 1.9
1967 1.9 0.7 4.0 - 2.1
1968 1.1 1.2 3.3 -2.2
1969 9.3 5.4 4.4 4.9
1970 12.2 2.6 4.6 7.6 1971 8.7 3.1 3.2 5.5
1972 16.0 9.0 5.0 11.0
1973 27.9 22.5 9.1 18.8
1974 14.2 18.1 15.3 -1.1
1975 0.5 10.0 10.7 -10.2 1976 17.7 1.4 9.5 8.2 1977 13.1 6.9 7.1 6.0
1978 13.3 11.2 6.4 6.9
1979 14.6 12.8 10.4 4.2 1980 1.7 10.6 10.6 -8.9 1981 9.1 8.5 10.7 - 1.6
Currency fluctuations
Source: 'Based on industry selling prices at plant (Statistics Canada Catalogue [hereafter cited as SCC] 62-01 1). 2 Excludes alcoholic beverages (SCC 62-011). 3 lnflation rate is the change in the implicit price index of Gross National Expenditure (SCC 11-003).
Three factors bear significantly on the question of price recovery: (1) the price of other protein sources; (2) the international value of the Canadian dollar; and (3) competition from other suppliers of fish on the world market. Table 5.13 compares the selling price indexes of fish, poultry and red meat between 1977 and 1981.
In four of the past five years fish prices advanced more rapidly than those for poultry (a close substitute); in three of the five they rose more than red meat prices. The price of these alternatives and of non-animal proteins limits the potential for fish price increases, at least in the market segments now occupied by Canadian products.
The value of the Canadian dollar relative to the currencies of our major fish markets (the United States, Portugal, the United Kingdom, the Federal Republic of Ger-
Table 5.13
Wholesale Prices of Fish, Poultry and Red Meat (% change)
Canada U.S.A.
Fish Poultry Meat Fish Poultry Meat
1977 13.1% -3.6% 0.2% 8.1% 4.3% -1.8% 1978 13.3 11.7 27.4 6.3 11.9 22.7
1979 14.6 9.3 16.1 22.7 - 2.8 11.6
1980 1.7 0.3 0.5 - 3.4 2.5 0.9
1981 9.1 16.6 5.1 1.9 0.0 1.3
Index (1971 = 100) 1981 326.4 279.0 256.2 275.4 172.0 169.4
Source: SCC 62 -011; and U.S. Department of Labor, Bureau of Labor Statistics.

94
Task Force on Atlantic Fisheries
many, Japan) and of competing suppliers (Norway, Iceland, Argentina) is a signifi-cant factor in the export price. Table 5.14 shows that after a steady decline between 1977 and 1979 against most currencies of importing countries, the Canadian dollar strengthened significantly between 1980 and 1981 and again between 1981 and mid-1982. Consequently, fish priced in Canadian dollars has become much more expen-sive for consumers in those countries.
For example, between 1979 and mid-1982 the Canadian dollar advanced more than 22 per cent against the West German deutsche mark. This has been at least as important a factor in the decline of the Canadian frozen herring fillet business as the recovery of the North Sea stocks of herring. Similarly, the Portuguese currency has been devalued continually in terms of the Canadian dollar, keeping downward pres-sure on the price and consumption of saltfish in Portugal. Canadian exporters are forced to accept either lower Canadian dollar prices or reduced demand for the product.
Meanwhile, other groundfish suppliers whose currencies have recently declined rela-tive to Canada's have become more price competitive. For example, between 1980 and 1981 the Canadian dollar advanced by 13.3 and 67.2 per cent against the Norwegian and Icelandic currencies respectively. This means that when Norway and Iceland were exporting cod to the United States or Europe, they could accept rela-tively lower prices than Canada while still maintaining the value of sales as expressed in their domestic currencies.
This reasoning may appear to suggest that exporting nations should continually devalue their currencies. While this may help the export sectors in the economy, it is always counterbalanced by the increased cost of imported goods. The population as a whole cannot be made better off by devaluation. Failure to appreciate this has led to the widespread but erroneous impression that Icelandic currency devaluations of recent years constitute a subsidy to that country's fishing industry. In the short run, the devaluation does result in a transfer of wealth from Icelandic consumers of imported goods to exporters of fish, but in a small economy such as Iceland's, largely dependent on one industry, the 'subsidy' is short-lived and is soon bid away in wages and in the higher cost of imported inputs to the fishery - fuel, for example. This has typically triggered another round of devaluation.
Table 5.14
Changing Relative Value of the Canadian Dollar (annual % change*)
Versus 1978 1979 1980 1981 1982
(June)
a) Major Importers U.S. dollar (6.7) (2.7) 0.2 (2.5) (6.0) U.K. pound (15.2) (11.9) (8.6) 12.0 8.7 West German deutsche mark (19.4) (11.0) (0.8) 21.2 1.8 Portugese escudo 2.3 8.7 2.5 19.9 25.7 Spanish peseta (6.3) (14.5) 7.0 25.5 11.0 Japanese yen
b) Major Competitors
(27.4) 2.0 3.7 (4.9) 8.1
Norwegian krone (8.3) (5.9) (2.2) 13.3 4.0 Icelandic kr6na 36.0 89.5 63.3 67.2 65.5 Argentine peso 100.0 126.0 3.0 94.0 416.0
* A bracketed value indicates a percentage drop in the value of the Canadian dollar against the currency in question. This benefits Canadian fish exporters. A percentage increase makes Canadian fish relatively more expensive.
Source: Bank of Canada Review.
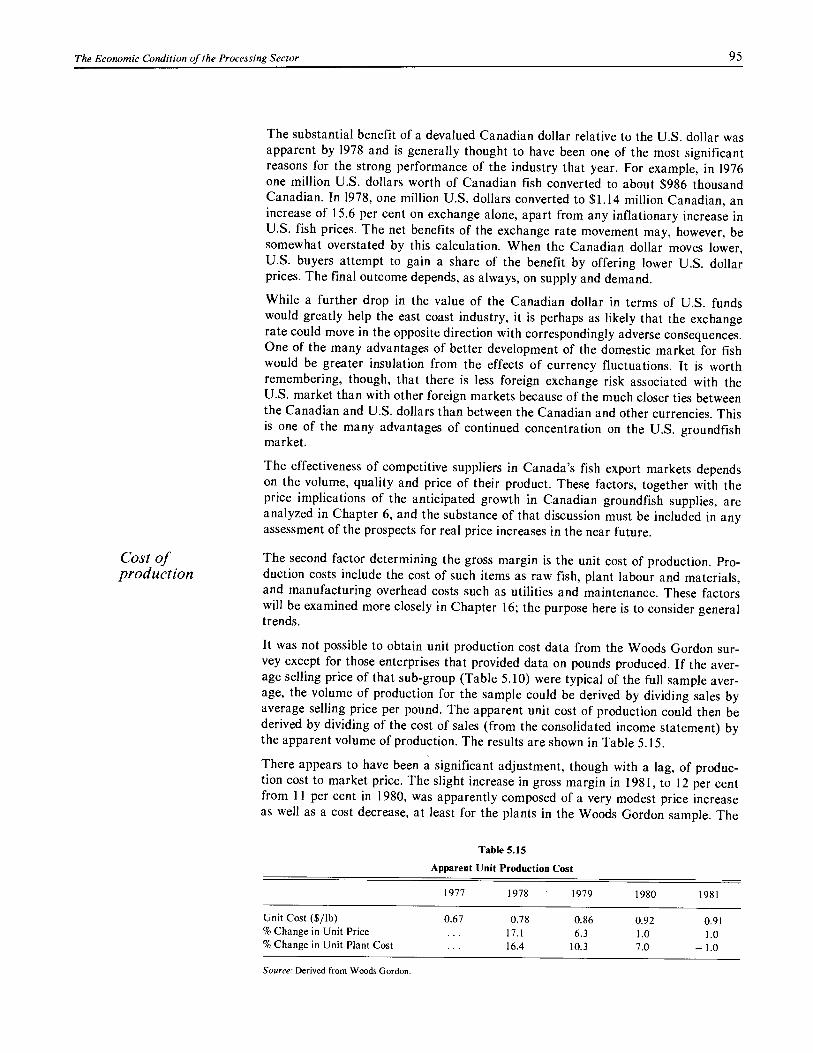
The Economic Condition of the Processing Sector 95
The substantial benefit of a devalued Canadian dollar relative to the U.S. dollar was apparent by 1978 and is generally thought to have been one of the most significant reasons for the strong performance of the industry that year. For example, in 1976 one million U.S. dollars worth of Canadian fish converted to about $986 thousand Canadian. In 1978, one million U.S. dollars converted to $1.14 million Canadian, an increase of 15.6 per cent on exchange alone, apart from any inflationary increase in U.S. fish prices. The net benefits of the exchange rate movement may, however, be somewhat overstated by this calculation. When the Canadian dollar moves lower, U.S. buyers attempt to gain a share of the benefit by offering lower U.S. dollar prices. The final outcome depends, as always, on supply and demand.
While a further drop in the value of the Canadian dollar in terms of U.S. funds would greatly help the east coast industry, it is perhaps as likely that the exchange rate could move in the opposite direction with correspondingly adverse consequences. One of the many advantages of better development of the domestic market for fish would be greater insulation from the effects of currency fluctuations. It is worth remembering, though, that there is less foreign exchange risk associated with the U.S. market than with other foreign markets because of the much closer ties between the Canadian and U.S. dollars than between the Canadian and other currencies. This is one of the many advantages of continued concentration on the U.S. groundfish market.
The effectiveness of competitive suppliers in Canada's fish export markets depends on the volume, quality and price of their product. These factors, together with the price implications of the anticipated growth in Canadian groundfish supplies, are analyzed in Chapter 6, and the substance of that discussion must be included in any assessment of the prospects for real price increases in the near future.
Cost of The second factor determining the gross margin is the unit cost of production. Pro- production duction costs include the cost of such items as raw fish, plant labour and materials,
and manufacturing overhead costs such as utilities and maintenance. These factors will be examined more closely in Chapter 16; the purpose here is to consider general trends.
It was not possible to obtain unit production cost data from the Woods Gordon sur-vey except for those enterprises that provided data on pounds produced. If the aver-age selling price of that sub-group (Table 5.10) were typical of the full sample aver-age, the volume of production for the sample could be derived by dividing sales by average selling price per pound. The apparent unit cost of production could then be derived by dividing of the cost of sales (from the consolidated income statement) by the apparent volume of production. The results are shown in Table 5.15.
There appears to have been a significant adjustment, though with a lag, of produc-tion cost to market price. The slight increase in gross margin in 1981, to 12 per cent from 11 per cent in 1980, was apparently composed of a very modest price increase as well as a cost decrease, at least for the plants in the Woods Gordon sample. The
Table 5.15
Apparent Unit Production Cost
1977 1978 1979 1980 1981
Unit Cost ($/lb) 0.67 0.78 0.86 0.92 0.91 % Change in Unit Price 17.1 6.3 1.0 1.0 % Change in Unit Plant Cost 16.4 10.3 7.0 —1.0
Source: Derived from Woods Gordon.
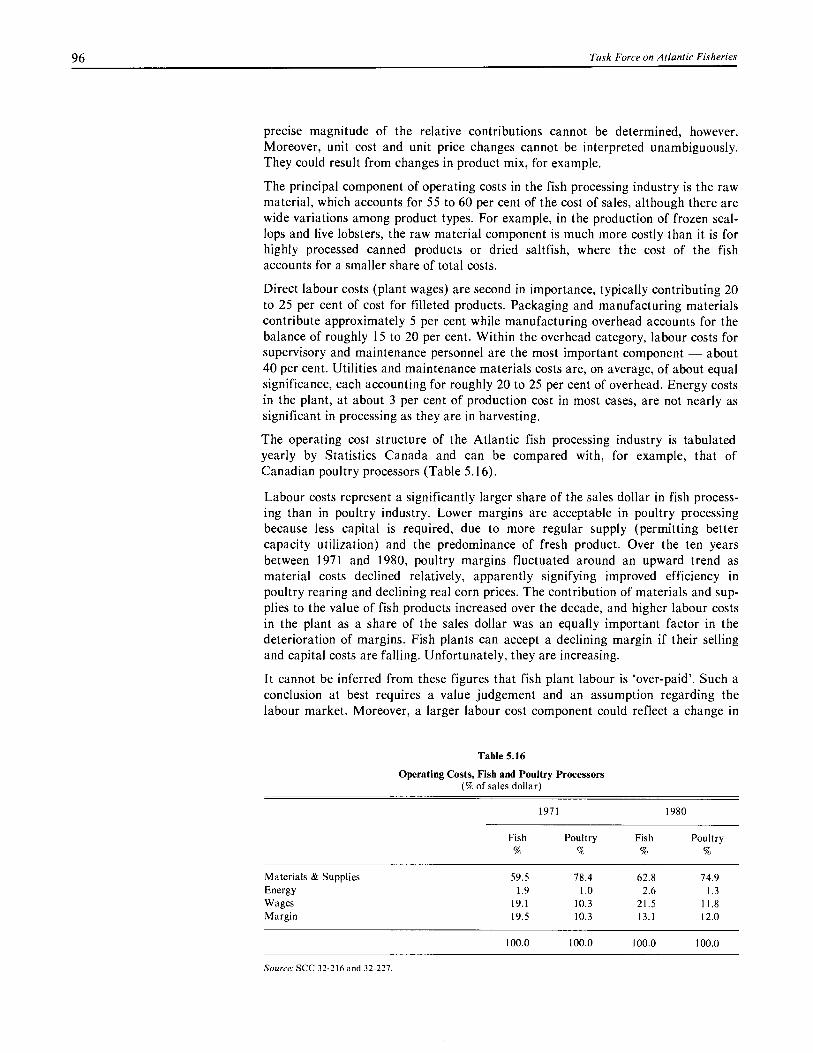
96
Task Force on Atlantic Fisheries
precise magnitude of the relative contributions cannot be determined, however. Moreover, unit cost and unit price changes cannot be interpreted unambiguously. They could result from changes in product mix, for example.
The principal component of operating costs in the fish processing industry is the raw material, which accounts for 55 to 60 per cent of the cost of sales, although there are wide variations among product types. For example, in the production of frozen scal-lops and live lobsters, the raw material component is much more costly than it is for highly processed canned products or dried saltfish, where the cost of the fish accounts for a smaller share of total costs.
Direct labour costs (plant wages) are second in importance, typically contributing 20 to 25 per cent of cost for filleted products. Packaging and manufacturing materials contribute approximately 5 per cent while manufacturing overhead accounts for the balance of roughly 15 to 20 per cent. Within the overhead category, labour costs for supervisory and maintenance personnel are the most important component — about 40 per cent. Utilities and maintenance materials costs are, on average, of about equal significance, each accounting for roughly 20 to 25 per cent of overhead. Energy costs in the plant, at about 3 per cent of production cost in most cases, are not nearly as significant in processing as they are in harvesting.
The operating cost structure of the Atlantic fish processing industry is tabulated yearly by Statistics Canada and can be compared with, for example, that of Canadian poultry processors (Table 5.16).
Labour costs represent a significantly larger share of the sales dollar in fish process-ing than in poultry industry. Lower margins are acceptable in poultry processing because less capital is required, due to more regular supply (permitting better capacity utilization) and the predominance of fresh product. Over the ten years between 1971 and 1980, poultry margins fluctuated around an upward trend as material costs declined relatively, apparently signifying improved efficiency in poultry rearing and declining real corn prices. The contribution of materials and sup-plies to the value of fish products increased over the decade, and higher labour costs in the plant as a share of the sales dollar was an equally important factor in the deterioration of margins. Fish plants can accept a declining margin if their selling and capital costs are falling. Unfortunately, they are increasing.
It cannot be inferred from these figures that fish plant labour is 'over-paid'. Such a conclusion at best requires a value judgement and an assumption regarding the labour market. Moreover, a larger labour cost component could reflect a change in
Table 5.16
Operating Costs, Fish and Poultry Processors (% of sales dollar)
1971 1980
Fish Poultry Fish Poultry
Materials & Supplies 59.5 78.4 62.8 74.9 Energy 1.9 1.0 2.6 1.3 Wages 19.1 10.3 21.5 11.8 Margin 19.5 10.3 13.1 12.0
100.0 100.0 100.0 100.0
Source: SCC 32-216 and 32-227.
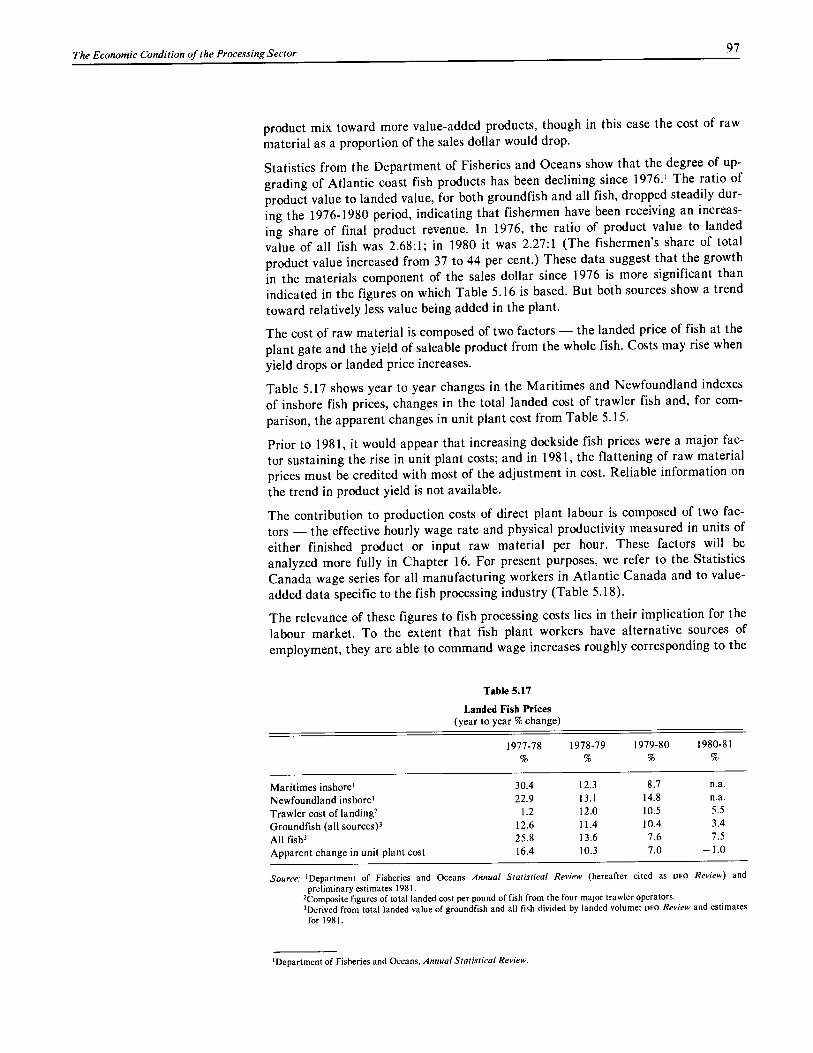
The Economic Condition of the Processing Sector 97
product mix toward more value-added products, though in this case the cost of raw material as a proportion of the sales dollar would drop.
Statistics from the Department of Fisheries and Oceans show that the degree of up-grading of Atlantic coast fish products has been declining since 1976.' The ratio of product value to landed value, for both groundfish and all fish, dropped steadily dur-ing the 1976-1980 period, indicating that fishermen have been receiving an increas-ing share of final product revenue. In 1976, the ratio of product value to landed value of all fish was 2.68:1; in 1980 it was 2.27:1 (The fishermen's share of total product value increased from 37 to 44 per cent.) These data suggest that the growth in the materials component of the sales dollar since 1976 is more significant than indicated in the figures on which Table 5.16 is based. But both sources show a trend toward relatively less value being added in the plant.
The cost of raw material is composed of two factors - the landed price of fish at the plant gate and the yield of saleable product from the whole fish. Costs may rise when yield drops or landed price increases.
Table 5.17 shows year to year changes in the Maritimes and Newfoundland indexes of inshore fish prices, changes in the total landed cost of trawler fish and, for com-parison, the apparent changes in unit plant cost from Table 5.15.
Prior to 1981, it would appear that increasing dockside fish prices were a major fac-tor sustaining the rise in unit plant costs; and in 1981, the flattening of raw material prices must be credited with most of the adjustment in cost. Reliable information on the trend in product yield is not available.
The contribution to production costs of direct plant labour is composed of two fac-tors - the effective hourly wage rate and physical productivity measured in units of either finished product or input raw material per hour. These factors will be analyzed more fully in Chapter 16. For present purposes, we refer to the Statistics Canada wage series for all manufacturing workers in Atlantic Canada and to value-added data specific to the fish processing industry (Table 5.18).
The relevance of these figures to fish processing costs lies in their implication for the labour market. To the extent that fish plant workers have alternative sources of employment, they are able to command wage increases roughly corresponding to the
Table 5.17
Landed Fish Prices (year to year % change)
1977-78 1978-79 1979-80 1980-81
Maritimes inshore' 30.4 12.3 8.7 n.a.
Newfoundland inshore' 22.9 13.1 14.8 n.a.
Trawler cost of landing 2 1.2 12.0 10.5 5.5
Groundfish (all sources) 3 12.6 11.4 10.4 3.4
All fish' 25.8 13.6 7.6 7.5
Apparent change in unit plant cost 16.4 10.3 7.0 -1.0
Source.- 'Department of Fisheries and Oceans Annual Statistical Review (hereafter cited as DFO Review) and
preliminary estimates 1981. 2Composite figures of total landed cost per pound of fish from the four major trawler operators. 3 Derived from total landed value of groundfish and all fish divided by landed volume; DFO Review and estimates
for 1981.
'Department of Fisheries and Oceans, Annual Statistical Review.

98 Task Force on Atlantic Fisheries
local industrial average. However, in many areas fish plant workers have few if any industrial alternatives unless they are prepared to leave their rural communities. The widespread unionization of plant workers has offset to a considerable degree their `captive' position in the labour market. Their wage bargaining is more closely attached to industrial norms than is the case for fishermen who either see themselves as small businessmen or who can, through skill and luck, increase their incomes by catching greater volumes. The plant worker is not always able to offset lower wage increases with more hours of work. For these reasons it is to be expected that plant wage rates will be less sensitive to fish market conditions than is the cost of raw material.
Hourly wages for fish cutters paid by the major groundfish processors in Newfound-land and Nova Scotia increased by between 45 and 50 per cent between 1977 and 1981 (from $4.25-4.30 in 1977 to $6.25-6.40 in 1981 contracts). This does not include benefits, overtime or payments under incentive programs. The latter are now reported to be widespread in the industry. The effective wage rate would therefore be considerably higher than the base rate. The Atlantic average manufacturing wage meanwhile increased by 43 per cent from $5.80 in 1977 to $8.30 in 1981. Fish plant wage contracts generally continued to advance by 10 to 12 per cent per year between 1979 and 1981. Contracts in 1982 typically call for an increase of 9 to 11 per cent over 1981.
The second factor influencing labour costs is labour productivity, which depends on the skill of management, on capital employed, on the size and quality of raw material and on the design of the plant, as well as on worker skill and motivation. More will be said on these issues in Chapter 16. From an aggregate point of view, Statistics Canada provides many years of data on production value added per wage dollar paid in the Atlantic coast fish processing industry (Table 5.20).
The physical volume of production per man-hour, or real productivity, can be inferred only indirectly, and therefore approximately, as in Table 5.19 which is based on data including all species on the Atlantic coast.
Physical productivity trends are subject to considerable uncertainty because they depend on, among other things, the product mix. The overall product mix did not in fact change significantly in the 1976-1981 interval. While frozen herring production, a high productivity item, decreased substantially, there were offsetting increases in capelin, squid (particularly in 1979), and wet saltfish, all inherently high produc-tivity items. When aggregated on an industry-wide basis, the figures in Table 5.19 are probably reasonable indicators of the trend.
Table 5.18
Manufacturing Wages, Fish Plant Wages and CPI (% increase)
1977-78 1978-79 1979-80 1980-81
Manufacturing Industries All Atlantic 5.5% 9.3% 8.8% 14.0%
Newfoundland 3.4 7.3 8.7 16.5
Nova Scotia 6.3 10.3 9.0 12.6 New Brunswick 5.8 8.8 9.3 14.0
Fish Plants (Atlantic) 9.0 12.7 9.3 n.a
Change in CPI 9.0 9.1 10.1 12.5
Source: Manufacturing Wages (SCC 72-002, 72-202 and 72-204); Fish Plants (SCC 32-216 [derived]); CPI (SCC 62-001).
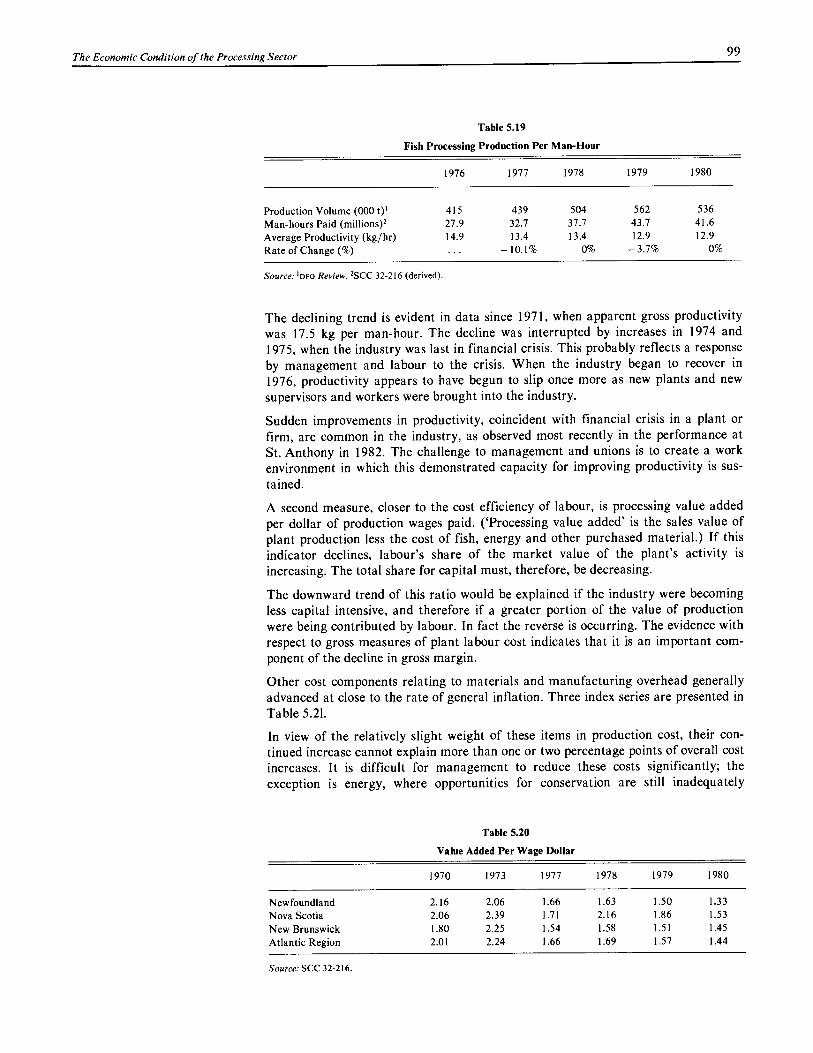
The Economic Condition of the Processing Sector 99
Table 5.19
Fish Processing Production Per Man-Hour
1976 1977 1978 1979 1980
Production Volume (000 t)' 415 439 504 562 536 Man-hours Paid (millions) 2 27.9 32.7 37.7 43.7 41.6 Average Productivity (kg/hr) 14.9 13.4 13.4 12.9 12.9 Rate of Change (%) ... - 10.1% 0% - 3.7% 0%
Source: IDFO Review. 2SCC 32-216 (derived).
The declining trend is evident in data since 1971, when apparent gross productivity was 17.5 kg per man-hour. The decline was interrupted by increases in 1974 and 1975, when the industry was last in financial crisis. This probably reflects a response by management and labour to the crisis. When the industry began to recover in 1976, productivity appears to have begun to slip once more as new plants and new supervisors and workers were brought into the industry.
Sudden improvements in productivity, coincident with financial crisis in a plant or firm, are common in the industry, as observed most recently in the performance at St. Anthony in 1982. The challenge to management and unions is to create a work environment in which this demonstrated capacity for improving productivity is sus-tained.
A second measure, closer to the cost efficiency of labour, is processing value added per dollar of production wages paid. (`Processing value added' is the sales value of plant production less the cost of fish, energy and other purchased material.) If this indicator declines, labour's share of the market value of the plant's activity is increasing. The total share for capital must, therefore, be decreasing.
The downward trend of this ratio would be explained if the industry were becoming less capital intensive, and therefore if a greater portion of the value of production were being contributed by labour. In fact the reverse is occurring. The evidence with respect to gross measures of plant labour cost indicates that it is an important com-ponent of the decline in gross margin.
Other cost components relating to materials and manufacturing overhead generally advanced at close to the rate of general inflation. Three index series are presented in Table 5.21.
In view of the relatively slight weight of these items in production cost, their con-tinued increase cannot explain more than one or two percentage points of overall cost increases. It is difficult for management to reduce these costs significantly; the exception is energy, where opportunities for conservation are still inadequately
Table 5.20
Value Added Per Wage Dollar
1970 1973 1977 1978 1979 1980
Newfoundland 2.16 2.06 1.66 1.63 1.50 1.33 Nova Scotia 2.06 2.39 1.71 2.16 1.86 1.53 New Brunswick 1.80 2.25 1.54 1.58 1.51 1.45 Atlantic Region 2.01 2.24 1.66 1.69 1.57 1.44
Source: SCC 32-216.

100
Task Force on Atlantic Fisheries
Table 5.21
Components of Material and Plant Overhead Costs (annual % increase)
1976-77 1977-78 1978-79 1979-80 1980-81
Packaging 2.5 1.3 7.0 12.7 11.2 Electrical Power (Atlantic region) 27.7 26.7 18.4 4.4 5.7 Manufactured Goods 7.9 9.2 14.4 13.4 10.1
Source: SCC 62-011.
exploited. While much of the effect of higher electrical power costs appears to have been absorbed before the 1980 downturn, it may be expected that a new burst of increases is imminent. The other principal component of overhead is supervisory and maintenance labour; our comments on manufacturing labour wages would largely apply to them as well.
In summary, gross margins have fallen sharply in all areas since 1978, principally because the market price of fish has failed to keep pace with general inflation (Table 5.12). Although there has been a lag in the response of production costs, unit cost increases were apparently held virtually to zero while market prices on average showed some improvement in 1981 (Table 5.15). There were many exceptions to the trend toward firmer prices — for example, flounder, redfish and herring fillet prices — and plants dependent on these products suffered severe losses in 1981. The princi-pal factor responsible for controlling cost increases was the cost of raw material, the dockside price of which did not increase appreciably on average in 1981 (Table 5.17). Other cost factors, particularly production labour, continued to advance; thus the apparent turnaround in unit production cost increases probably reflects, in addi-tion to raw material prices, tighter cost controls and greater efficiency in the indus-try. This encouraging trend appears to be continuing in 1982.
Volume If the unit cost of production increases more rapidly than average unit market prices, throughput profit margins per unit of product decline, while administrative expenses, deprecia-
tion and a portion of interest costs remain relatively fixed. One response is to try to increase volume to offset the decline in profit on each unit of production. This response is limited by the availability of fish, which in part explains the intense com-petition for supply, particularly when profit margins are declining and interest costs on new investment are high. The so-called 'volume mentality' may be a rational response for the individual producer, but when extended to the industry as a whole it results in excess supply of poor quality product, with the result that operating mar-gins are depressed further.
Table 5.22 shows the increase in fish landings for the period 1977-1981. The rate of increase in total throughput was declining at the same time as profit margins were declining. Herring production has decreased absolutely. Shellfish production has been volatile, principally due to a rapid build-up in 1979 and a subsequent decline in the catch of inshore squid. (Squid, surprisingly, is classified as a shellfish by biolo-gists.)
Groundfish volumes should continue to grow, but at a declining rate relative to the 1977-1980 period, through about 1987. No sustained growth in other landings is anticipated unless the squid and mackerel fisheries are developed better than at present. With the principal exception of northern cod, it follows that plants will not be able to depend on increased landings and throughput to offset lower unit margins.

The Economic Condition of the Processing Sector 101
Table 5.22
Growth of Throughput (% change in volume)
1977-78 1978-79 1979-80 1980-81 (est.)
Groundfish Landings 18.8 14.9 5.3 4.2
Pelagic Landings 9.2 -16.2 - 7.8 - 7.9
Shellfish Landings 13.6 19.6 -36.0 7.7
Total Landings 15.0 7.4 - 6.6 2.2
Selling, general and administrative expenses
Source: DFO Review and preliminary estimates for 1981.
Selling, general and administrative (sGA) expenses have remained relatively constant as a percentage of sales throughout the 1977-1981 period, although some increase was evident in the past two years. There is remarkably little variation in SGA
expenses either over time or among regions. Average values for different types of plant are given in Table 5.23.
The control of SGA expenses is evidently a factor influencing profitability, but the correlation is not particularly strong. Neither does there appear to be a significant difference between corporately owned and independent plants, except that the latter have controlled SGA more effectively since 1978. Administrative and selling cost economies that might arise from centralized corporate management are not evident from the comparison. On the other hand, it should be recognized that the 'Big 5' companies* have spent large sums on marketing and product development since 1977, and the expected payoff from these expenditures would be delayed.
There is a significant difference between year-round and seasonal plants, but it nar-rowed steadily over the period. The reasons for the convergence are unclear.
Finally, there is a stable difference of about two percentage points of sales between plants with 1981 sales under $5 million and those with sales in the $10 to $20 million range. Such an economy of scale is to be expected because of the structure of SGA
Table 5.23
Selling, General and Administrative Expenses (% of sales)
1977 1978 1979 1980 1981
Sample Average 9.3 8.5 8.8 9.7 9.9 Unprofitable Plants 8.8 10.6 9.1 10.7 10.2 Profitable Plants 9.4 8.3 8.8 8.6 8.1 Big 5 9.2 8.0 8.6 9.7 10.1 Independents 9.7 9.8 9.4 9.7 9.4 Year-round plants 7.1 7.4 8.1 8.7 9.0 Highly seasonal plants 13.5 13.3 11.7 12.2 11.5 Sales Under $5 million 10.3 10.5 10.5 11.1 10.9 Sales $10-20 million 8.0 8.2 8.6 9.2 9.2
Source: Woods Gordon.
* The five largest processing firms in the east coast fishery are National Sea Products, Fishery Products, H.B. Nickerson & Sons, Connors Bros. and The Lake Group.
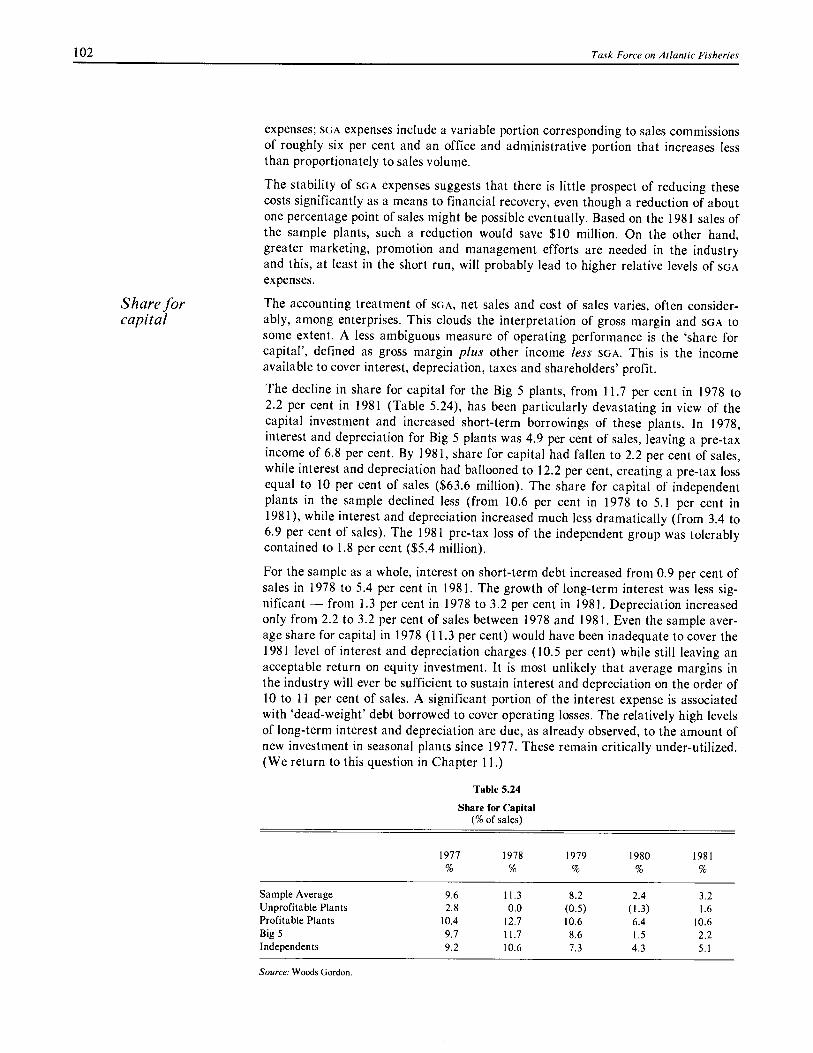
102 Task Force on Atlantic Fisheries
expenses; SGA expenses include a variable portion corresponding to sales commissions of roughly six per cent and an office and administrative portion that increases less than proportionately to sales volume.
The stability of SGA expenses suggests that there is little prospect of reducing these costs significantly as a means to financial recovery, even though a reduction of about one percentage point of sales might be possible eventually. Based on the 1981 sales of the sample plants, such a reduction would save $10 million. On the other hand, greater marketing, promotion and management efforts are needed in the industry and this, at least in the short run, will probably lead to higher relative levels of SGA
expenses.
Share for The accounting treatment of SGA, net sales and cost of sales varies, often consider- capital ably, among enterprises. This clouds the interpretation of gross margin and SGA to
some extent. A less ambiguous measure of operating performance is the 'share for capital', defined as gross margin plus other income less SGA. This is the income available to cover interest, depreciation, taxes and shareholders' profit.
The decline in share for capital for the Big 5 plants, from 11.7 per cent in 1978 to 2.2 per cent in 1981 (Table 5.24), has been particularly devastating in view of the capital investment and increased short-term borrowings of these plants. In 1978, interest and depreciation for Big 5 plants was 4.9 per cent of sales, leaving a pre-tax income of 6.8 per cent. By 1981, share for capital had fallen to 2.2 per cent of sales, while interest and depreciation had ballooned to 12.2 per cent, creating a pre-tax loss equal to 10 per cent of sales ($63.6 million). The share for capital of independent plants in the sample declined less (from 10.6 per cent in 1978 to 5.1 per cent in 1981), while interest and depreciation increased much less dramatically (from 3.4 to 6.9 per cent of sales). The 1981 pre-tax loss of the independent group was tolerably contained to 1.8 per cent ($5.4 million).
For the sample as a whole, interest on short-term debt increased from 0.9 per cent of sales in 1978 to 5.4 per cent in 1981. The growth of long-term interest was less sig-nificant - from 1.3 per cent in 1978 to 3.2 per cent in 1981. Depreciation increased only from 2.2 to 3.2 per cent of sales between 1978 and 1981. Even the sample aver-age share for capital in 1978 (11.3 per cent) would have been inadequate to cover the 1981 level of interest and depreciation charges (10.5 per cent) while still leaving an acceptable return on equity investment. It is most unlikely that average margins in the industry will ever be sufficient to sustain interest and depreciation on the order of 10 to 11 per cent of sales. A significant portion of the interest expense is associated with 'dead-weight' debt borrowed to cover operating losses. The relatively high levels of long-term interest and depreciation are due, as already observed, to the amount of new investment in seasonal plants since 1977. These remain critically under-utilized. (We return to this question in Chapter 11.)
Table 5.24
Share for Capital (% of sales)
1977 1978 1979 1980 1981
Sample Average 9.6 11.3 8.2 2.4 3.2 Unprofitable Plants 2.8 0.0 (0.5) (1.3) 1.6 Profitable Plants 10.4 12.7 10.6 6.4 10.6 Big 5 9.7 11.7 8.6 1.5 2.2 Independents 9.2 10.6 7.3 4.3 5.1
Source: Woods Gordon.
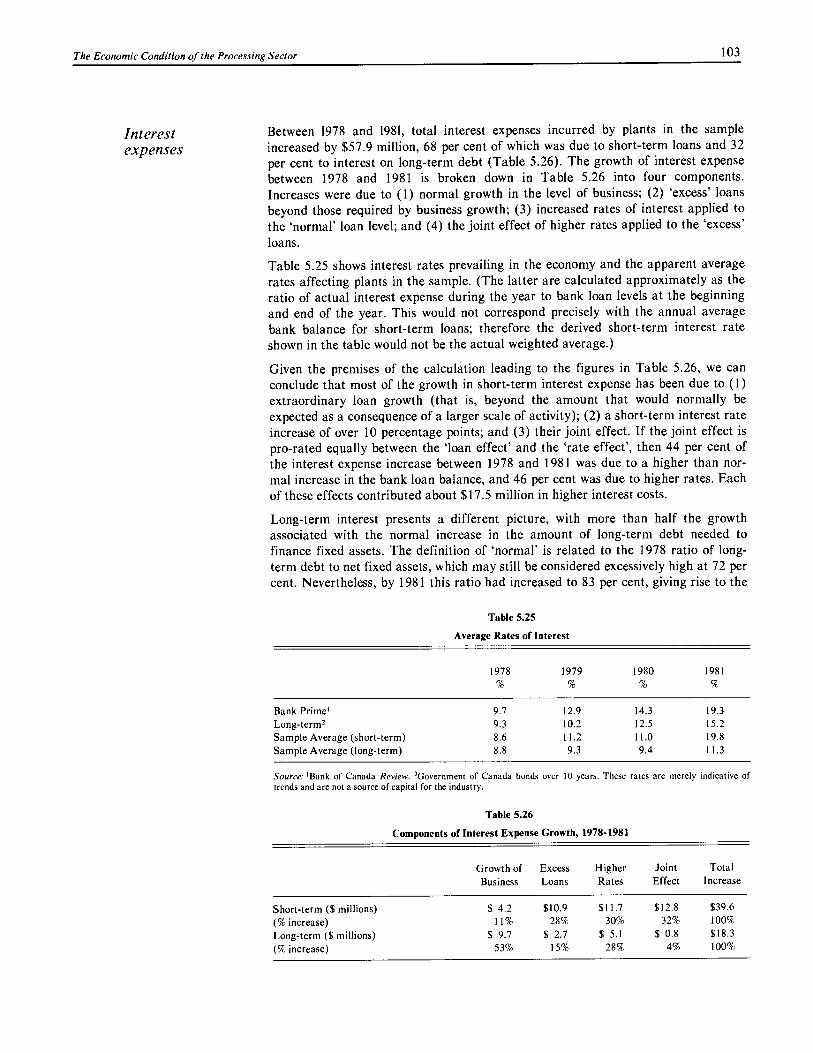
The Economic Condition of the Processing Sector 103
Interest expenses
Between 1978 and 1981, total interest expenses incurred by plants in the sample increased by $57.9 million, 68 per cent of which was due to short-term loans and 32 per cent to interest on long-term debt (Table 5.26). The growth of interest expense between 1978 and 1981 is broken down in Table 5.26 into four components. Increases were due to (1) normal growth in the level of business; (2) 'excess' loans beyond those required by business growth; (3) increased rates of interest applied to the 'normal' loan level; and (4) the joint effect of higher rates applied to the 'excess' loans.
Table 5.25 shows interest rates prevailing in the economy and the apparent average rates affecting plants in the sample. (The latter are calculated approximately as the ratio of actual interest expense during the year to bank loan levels at the beginning and end of the year. This would not correspond precisely with the annual average bank balance for short-term loans; therefore the derived short-term interest rate shown in the table would not be the actual weighted average.)
Given the premises of the calculation leading to the figures in Table 5.26, we can conclude that most of the growth in short-term interest expense has been due to (1) extraordinary loan growth (that is, beyond the amount that would normally be expected as a consequence of a larger scale of activity); (2) a short-term interest rate increase of over 10 percentage points; and (3) their joint effect. If the joint effect is pro-rated equally between the 'loan effect' and the 'rate effect', then 44 per cent of the interest expense increase between 1978 and 1981 was due to a higher than nor-mal increase in the bank loan balance, and 46 per cent was due to higher rates. Each of these effects contributed about $17.5 million in higher interest costs.
Long-term interest presents a different picture, with more than half the growth associated with the normal increase in the amount of long-term debt needed to finance fixed assets. The definition of 'normal' is related to the 1978 ratio of long-term debt to net fixed assets, which may still be considered excessively high at 72 per cent. Nevertheless, by 1981 this ratio had increased to 83 per cent, giving rise to the
Table 5.25
Average Rates of Interest
1978 1979 1980 1981
Bank Prime' 9.7 12.9 14.3 19.3 Long-term 2 9.3 10.2 12.5 15.2 Sample Average (short-term) 8.6 11.2 11.0 19.8 Sample Average (long-term) 8.8 9.3 9.4 11.3
Source: 'Bank of Canada Review. 2Government of Canada bonds over 10 years. These rates are merely indicative of trends and are not a source of capital for the industry.
Table 5.26
Components of Interest Expense Growth, 1978-1981
Growth of Excess Higher Joint Total Business Loans Rates Effect Increase
Short-term ($ millions) $ 4.2 $10.9 $11.7 $12.8 $39.6
(% increase) 11% 28% 30% 32% 100%
Long-term ($ millions) $ 9.7 $ 2.7 $ 5.1 $ 0.8 $18.3
(% increase) 53% 15% 28% 4% 100%

104 Task Force on Atlantic Fisheries
Processing capacity
`excess loan' contribution to increased long-term interest expense. The higher interest expense ($2.7 million) associated with this component is nevertheless very small when compared with short-term interest and other components of total cost.
The cause of the rapid increase in the short-term loan balance was the lack of earn-ings from 1979 through 1981, during which time the sample plants incurred a net loss of $65 million. Many plants suffered cash losses (after adding back deprecia-tion) during the period and therefore had to borrow to meet operating costs and to repay the current portion of principal due on long-term debt. Many companies, meanwhile, lacked the internally generated earnings to provide working capital to finance inventories and accounts receivable and thus were forced to push their line of bank credit to the limit. Normally this limit would be about 60 per cent of inventory and accounts receivable, but in some recent cases the ratio was allowed to go as high as 80 per cent. Adding together the effect of holding product in inventory and await-ing payment once a shipment is made, the fish processing industry must finance a delay of about 100 days on average between the time of production and the receipt of cash for sales.
The use of bank credit to cover cash losses compounds the problem of a financially weak company by adding to fixed interest expense and often creating further losses. Once companies become severely indebted, there is little prospect of recovery in the absence of dramatic price increases or a restructuring of debt. This is because the operating cost structure of the industry is determined, at a gross level, by the com-petitive or negotiated prices of fish and labour. These prices tend toward levels such that the average business can generate enough gross margin to pay average interest charges. When interest rates increase in real terms, as they have since 1978, gross margins in the industry must eventually increase to reflect the fundamental change in costs, but the increase would not normally be sufficient to offset the expense of excessive levels of dead-weight accumulated debt.
The medium- to long-term fixed cost structure of the processing industry is deter- mined primarily by the amount and age of fixed capital relative to the volume of pro- duction or, equivalently, to the pattern of asset utilization. It is widely believed, in
Table 5.27
Long-term Interest and Depreciation (% of sales, rounded)
1977 1978 1979 1980 1981
Increase 1978-81
(% points)
Sample Average 3 3 4 5 6 3 Profitable Plants 3 3 3 4 3 0 Unprofitable Plants 5 4 4 6 6 2 Big 5 4 4 4 6 6 2 Independents 3 3 3 4 4 1 Highly Seasonal Plants 4 3 3 5 6 3 Year-round Plants 4 4 5 5 6 2
Task Force Analytical Areas TAA 1 2 3 4 4 8 5 TAA 2 5 5 5 7 8 3 TAA 3-4 4 5 5 6 5 0 TAA 5-6 2 1 2 2 3 2 TAA 12-13 4 3 4 6 7 4
Source: Woods Gordon.

The Economic Condition of the Processing Sector 105
both the processing industry and government, that there is substantial excess capacity in the industry and that this excess causes a severe drain on the financial resources of the industry. To the degree that the financial cost of capacity is repre-sented by long-term interest and depreciation relative to the volume of business, the effect can be quantified (Table 5.27).
It is beyond question that the fixed charges of depreciation and long-term interest have contributed to the decline in profitability of the processing sector, particularly between 1979 and 1981. On the other hand it has not been a sharply differentiating factor between the profitable and unprofitable plants in any given year except 1981. Between 1978 and 1981, pre-tax profit (as a percentage of sales) for the sample decreased by 15 points, from 7 per cent to a loss of 8 per cent. Only three percentage points of the loss were due directly to a relative increase in interest and depreciation on fixed assets. Given that a substantial amount of new investment was, in any event, required to cope with stock recovery following the extension of fisheries jurisdiction, and in light of the sharp increase in the cost of money, it was inevitable that there would be some growth in the financial cost of fixed assets relative to sales.
The cost of interest and depreciation on fixed capital is most significant, and has increased most, on the northeast and east coast of Newfoundland (TAA 1-2) and in western Nova Scotia-Fundy New Brunswick (TAA 12-13). It is well known that these have been the areas of greatest investment since the 1977 declaration of the extended economic zone. The increase took place in eastern Newfoundland in anticipation of the rebuilding of the northern cod stock and the development of the inshore fishery for the so-called under-utilized species — squid, capelin and mackerel. Of these, only roe capelin has turned out to be a consistent earner.
Both 1980 and 1981 were considered failures for the inshore fishery in TAA 1 and 2 — 1980 because of a work stoppage in the inshore fishery and 1981 because of an exceptionally light cod catch. It is therefore to be expected that fixed costs as a per-centage of sales would be sharply higher owing to both stagnant market prices and unexpectedly low production volumes. On the other hand, had catches been greater, prices might have been even weaker. In any event, the value of sales for the sample plants in TAA 2 was actually 4.6 per cent lower in 1981 than in 1979.
In northeast Newfoundland-Labrador (TAA 1), 5 percentage points of the 14-point decline in pre-tax income between 1978 and 1981 were due to increased long-term interest and depreciation. Seven points were due to lower gross margins. In TAA 2, despite the disappointing sales of 1981, only 3 percentage points of the 14-point drop in pre-tax profit came from higher fixed expenses for long-term interest and depreciation. In western Nova Scotia-Fundy New Brunswick (TAA 12-13), the other area of heavy investment, these charges contributed 4 points of a 16-point drop in pre-tax income between 1978 and 1981. On the south and west coasts of Newfound-land (TAA 3-4), a 17-point drop in pre-tax income occurred, despite the fact that there was no relative growth of long-term interest and depreciation. Similarly, in Quebec (TAA 5-6) these costs were, both relatively and absolutely, of slight signifi-cance in accounting for poorer results.
The relative contribution to total costs of long-term interest and depreciation will diminish in many areas over the next five years. For new assets now in place, infla-tion will reduce the relative weight of both the annual increments of book value depreciation and interest payments at fixed rates. On the east coast of Newfound-land, and in other areas as well, increased volumes of cod and of the under-utilized species (assuming these can be processed in an orderly way in existing plants) will lower the ratio of fixed costs to sales for the investment made since 1978.

106 Task Force on Atlantic Fisheries
On the other hand, in Quebec, Cape Breton and on the south coast of Newfound-land, much of the capital stock needs replacement. Substantially higher gross mar-gins will be required to support this investment. The problem is particularly acute for operators of the ageing trawler fleet on Newfoundland's south coast and in the Gulf entry ports. It is also of serious concern in Quebec.
Processing plant over-capacity (or under-utilization) has been studied repeatedly for years. The low average utilization of many facilities, measured against a standard of year-round operations, is a matter of record. A 1967 study of processing capacity in Newfoundland by Professor S.S. Mensinkai, using data through 1963, estimated a utilization rate for freezing plants of only 37 per cent against a standard year of 250 eight-hour days. 2 An estimate made in 1974 indicated only 27 per cent utilization of physical capacity in the Atlantic region.' The problem is evidently not of recent origin.
Such figures are of limited significance because the effective capacity depends on the product mix and on the number of shifts assumed per month. Physical capacity can be doubled by operating two shifts per day, but this may not always be practical in view of labour availability, among other factors. The principal shortcoming of annual measures of capacity utilization is that they fail to take account of the seasonality of landings. Because the product is highly perishable, fish processing capacity must be geared to weekly or even daily peak landings, not to averages over long periods. The Mensinkai study of the situation in Newfoundland in the early 1960s concluded that "... the capacity of the industry in the province is excessive in relation to actual util-ization. A considerable part of the idle capacity, it is now clear, is due to the very nature of the industry."
The principal factor responsible for under-utilized processing capacity is the seasonal pattern of inshore landings, which peak sharply in most areas in June, July or August. For example, in July 1980, 41,000 t of groundfish were landed on the east coast of Newfoundland. Total groundfish landings for the six months January to April and November-December were 46,000 t, a monthly average of less than 20 per cent of the peak July catch. Squid and mackerel landings are usually even more con-centrated.
A recent study of processing capacity in relation to current and anticipated require-ments estimated a groundfish freezing capability on the east coast of Newfoundland of 15,500 t of product per month, assuming 26 days' operation on single shift. 4
Frozen groundfish production in July 1980 was 10,700 t (70 per cent of capacity), and the study projected landings by 1985 that would result in over 18,000 t of prod-uct in July. Such a volume might theoretically be handled by existing facilities through double shifting if the fish were delivered at a uniform rate.
But it is probably impractical for existing freezing plants to cope with a concentrated catch of this magnitude in view of variations in landings from day to day and from place to place. The summer inshore fishery in many areas cannot be relied upon to provide a uniform supply of raw material. Far better methods of distribution and handling than now exist would be required. Without a curb on the growth of peak landings, it is unlikely that present freezing facilities on the east coast of Newfound-
2 S.S. Mensinkai, Plant Location and Plant Size in the Fish Processing Industry of Newfoundland (Ottawa, 1969). 3 J.M. Fras, Overcapacity in the Fish Processing Industry in the Maritime Provinces: An Analysis (Ottawa: Fisheries and Marine Service, August 1974.) 4 Report of the DFO/DREE Working Group on Processing Capacity in Atlantic Canada (Ottawa, 1982).

The Economic Condition of the Processing Sector 107
land will be able to handle all future landings of summer cod. Salting provides an essential stabilizing outlet for short-term peaks, but the volume that can be accomodated this way appears limited by market prospects (see Chapter 6). Coping with the anticipated increase in the inshore catch of northern cod is one of the most vexing problems in the industry. Some measures to deal with it are proposed in Chapters 11 and 12.
The dilemma facing plant operators on Newfoundland's east coast, in parts of the Gulf and even in western Nova Scotia is the requirement to provide large peaking capacity without sufficient off-peak production to sustain a major freezing plant financially. Today such a plant, capable of processing 15,000 t of raw fish per year, would cost $7 to 10 million or more to construct. Yet without this capacity, it will not be possible to cope with increased inshore landings of northern cod or to have the onshore capability necessary for better development of the squid, mackerel and cape-lin fisheries.
The financial burden on resource-short plants is illustrated by the unusually high level of long-term interest and depreciation in TAA 1 and 2 (Table 5.27). Ultimately, a less seasonal fishery, with a more uniform annual supply of groundfish, is the most effective way to cope with excess freezing capacity and its associated costs. Ways of doing this are discussed in Chapter 11.
This is not to say that highly seasonal plants cannot be viable. In fact, Table 5.27 shows that the fixed cost of long-term interest and depreciation for such plants is no higher, relative to sales, than is the case for year-round plants. Lower annual throughputs are offset by lower capital investment. It should be recalled that a sig-nificant component of interest and depreciation in many year-round plants is associated with trawler fleets. The financial cost of excess (seasonal) capacity may be quite acceptable if the associated capital investment is sufficiently modest. The problem arises principally for the very large, new seasonal plant investments since 1977, which were predicated on much higher throughput than has yet materialized. Increased interest rates have compounded the difficulty.
A separate question, though clearly related to excess capacity, concerns the recent growth in the number of processing establishments. The number of federally regis-tered fish plants in Atlantic Canada increased from 519 in 1977 to 700 in 1981, a growth rate of 35 per cent. The largest increase occurred in Newfoundland, from 147 establishments in 1977 to 225 in 1981. The great majority of these additions were very small enterprises that add relatively little to capital-intensive capacity. The problem is focused in a few large plants.
It is characteristic of the industry that a very small percentage of plants accounts for the majority of capacity. Data collected by the Department of Fisheries and Oceans in 1980 on plate freezing capacity show that fewer than 10 per cent of the 538 plants surveyed account for at least 75 per cent of total capacity. For example, in TAA 1, seven plants, out of a total of 48, supplied over 90 per cent of plate freezing capabil-ity. On the west coast of Newfoundland, four plants provided over 90 per cent. In western Nova Scotia, 16 of 143 plants surveyed accounted for at least 90 per cent of capacity.
Freezing capacity tends to be both the limiting production factor in a frozen fish plant and the largest factor in capital cost; it follows that discussion of excess capacity should focus on the investment in relatively few plants. Other plants that do not freeze groundfish are frequently well adapted to seasonal activity and benefit from an extraordinarily low fixed component of total cost. Although their numbers and capacity contribute to statistics, their excess capacity is of little direct economic significance.

108 Task Force on Atlantic Fisheries
The existence of these plants may nevertheless be of considerable indirect impor-tance, in that they provide a widely dispersed employment base and frequently are run economically. On the other hand, the growing number of small plants, particu-larly the 'community stages' in Newfoundland, which function as feeders for freezing plants, are often a source of considerable inefficiency and quality deterioration.
These 'plants' typically begin as landing stages and evolve into filleting operations to provide local employment. A large freezing plant operator may be told by the local fishermen's committee that he will be provided with raw material only if a filleting line is set up in the local stage. The result is a great deal of extra handling of the fish and usually poorer productivity than would be achieved at the main freezing plant. In this way, the growing number of a certain type of small plant contributes to reduced operating margins in the industry.
Over-capacity has characterized the fish processing industry for many years. The seasonal pattern of landings is one reason for it. But the three studies cited earlier (Mensinkai, Fras, and DREE/DFO) all concluded that government capital assistance policy has also been a major factor in the persistence of over-capacity. Mensinkai makes the following observation:
Although the object of government in providing loans and other facilities has been to encourage a rapid growth of the industry and to provide additional employment opportunities for Newfoundland workers, there is need for revision of the present policy of granting loans to private firms.... The government should also reconsider the policy of leasing sub-plants at nominal rent... There does not seem to be much scope for the establishment of additional plants.
This observation was in relation to the situation in the early 1960s. The 1982 DREE/DFO report states:
In examining the reasons for such an increase in fish processing capacity, two factors emerge: federal and provincial government incentives to invest in the fish processing industry and the optimism within the industry that was generated by provincial governments following the extension of jurisdiction in 1977. The federal government, through DREE, has assisted 260 enterprises in the establishment of new capacity or the expansion of existing capacity since the inception of its Regional Development Incentives Act (RDIA) in 1969. The total assistance granted since 1969 is in excess of $46 million on a total eligible capital investment of $157 million. In addition to RDIA, other federal programs such as ARDA and various support programs such as Canada Works have contributed to the increase in fish processing capacity. In addition to federal programs, most provincial governments have assistance programs for the establishment of fish processing plants. The overall effect of these government support programs or subsidies has been to encourage investment in excess of the normal level.
It might be added parenthetically that it has been extraordinarily difficult to remove redundant or inefficient capacity from the industry because of the typically high degree of community dependence on fish plant income once a facility is established. In fact, the closing of any fish plant, large or small, inevitably becomes a major political issue as communities exert pressure on federal and provincial governments for financial assistance to keep their plant open. The frequency with which govern- ments have given in to this pressure has been a factor in sustaining the over-capacity problem.
The Correlates of Success and Failure
The foregoing analysis of aggregate results and general trends fails to bring together in a comprehensive way the myriad interacting factors contributing to the financial success or failure of a plant or company. Indeed it is impossible to reduce the condi-tions for profitability in the fish business to a short list of factors. There are successes and failures in every niche of the business, and no hypothesis yet tested has failed to

The Economic Condition of the Processing Sector 109
produce exceptions. This is to be expected; businesses exist in an environment where the mal-adapted eventually change or disappear, but many unusual species survive because of some subtle combination of traits uniquely suited to a particular part of the environment.
There is an additional factor in the fishery. Governments have been reluctant to per-mit business failures when many jobs would be lost or markets for fishermen seri-ously disrupted. Consequently a number of exceedingly weak businesses have been able to continue despite a financial condition that in another industry would have produced bankruptcy. This makes the financial results of the industry worse than they would otherwise be, but to what extent is difficult to say.
The smaller companies have operated in a less secure financial environment, being of less social importance than plants employing many workers. These smaller compa-nies have had to accept more conservative financing — less debt, more equity — and therefore have been far better equipped to withstand a period of falling margins and rising interest rates. Small firms that failed to make this adaptation would not, with few exceptions, be around today. This is one reason why the smaller, independent plants in the sample often out-performed the Big 5 in 1980 and 1981, despite the alleged advantages of the latter group.
The following analysis is at most indicative of broad tendencies. No conclusion can be applied without qualification to a single plant. Moreover, the sample was not large enough to permit consideration of more than two or three factors at once. For example, the analysis draws no inferences in respect of highly seasonal, independ-ently owned groundfish plants in the Gulf with sales of less than $4 million, but limits comparisons to one or two of these factors. Further study will be necessary to determine how factors interact to affect performance, and we strongly recommend that formal statistical factor analyses be made as the data sample is expanded.
It is also important to recognize that the past is not necessarily a reliable guide to the future. The economic environment of the Canadian fishery is changing continually. Enterprises that adapted well in the past may not be as well suited for the future. Changes in policies and in access to the resource can also have dramatic effects on individual plants or areas. These caveats must temper the interpretation of the results presented here.
The Woods Gordon sample was divided, on the basis of overall performance between 1977 and 1981, into four groups of plants judged to have been (1) very successful; (2) moderately successful; (3) in sharp decline; or (4) very unsuccessful. (Six plants could not be classified unambiguously, but their omission has no effect on the con-clusions.) Although the assignment of plants to categories was not made according to
Table 5.28
Profitability of the Plant Categories (number of plants)
1977 P* L* P
1978 L P
1979 L P
1980 L P
1981 L
Very successful 20 1 21 0 22 0 21 2 21 0 Moderately successful 20 3 24 0 23 2 22 3 4 21 Sharp decline 18 2 20 1 17 4 3 19 0 22 Very unsuccessful 9 6 8 10 3 18 1 21 0 23
Totals 67 12 73 11 65 24 47 45 25 66
P denotes plants that were profitable in the year, L those that had losses.
Source: Woods Gordon.
110 Task Force on Atlantic Fisheries
a specific financial criterion, there was remarkably little ambiguity in the categoriza-tion. Judgements were made on the basis of the stability and level of net income and margin throughout the period. The number of profitable and losing plant years for each group illustrates the nature of the categorization (Table 5.28).
The very successful group had only three losing years in a total of 108 plant-years, while the very unsuccessful group had 78 losing years in a total of 99. It is astonish-ing that several of the plants continued to operate. A large number of moderately successful plants became unprofitable in 1981, largely due to the effects of short-term interest expense. The total losses of this group in 1981 were nevertheless a mod-est $2.4 million on sales of $345 million.
The 22 plants in sharp decline represent one-half of the financial problem in the industry. Their position deteriorated from a profit of $10 million in 1978 on sales of $155 million to a loss of $30.5 million on sales of $219 million in 1981.
The other, and perhaps more intractable, half of the problem exists in the 23 plants that show chronic financial weakness. Even in 1978, these plants collectively lost $1.1 million on sales of $142 million, while the rest of the industry had its most suc-cessful year in a decade. In 1981, they lost $30 million on sales of $222 million. The two unprofitable categories had a combined 1981 loss of $60 million and accounted for 47 per cent of total sales in the sample. Their economic and social significance in the industry is enormous.
Before examining the characteristics of the four categories, it is helpful to summa-rize the key operating performance measures in 1978 and 1981 for several characteris-tics of the plants in the sample. Table 5.29 gives gross margin, interest expense and pre-tax income, all as a percentage of sales, for the sample plants sub-divided by area, species mix, size, seasonality, corporate organization, and the four categories of success.
Table 5.29 reveals a great deal about the structure of the industry and the anatomy of its financial decline. The areas of most serious financial distress are northeast Newfoundland (TAA 1), the south coast of Newfoundland (TAA 3) and eastern Nova Scotia (TAA 9-10-11). In each instance a greater than average decline in gross margin was combined with a steep rise in interest expense, most of it on short-term loans.
Product mix is a strongly differentiating factor, confirming the hypothesis that the decline has been most severe for plants specializing in frozen groundfish and herring.
Sales volume does not appear to be a significant determining factor of pre-tax income. Higher interest costs and slightly lower margins in the larger plants are off-set by relatively lower selling, general and administrative costs. Much of the interest cost increase for the larger plants is of recent origin and is associated with the burst of investment after 1977. This expense may be expected to decline relatively in the future.
Seasonality of operation is closely correlated with annual sales volume and exhibits a similar pattern of performance.
There is a marked difference between plants of the integrated companies and those of the independents. The Big 5 performed collectively as well as or slightly better than the independents in 1978, but had slipped dramatically by 1981 as a result of a larger drop in gross margin and a larger increase in interest expense. The greater decline in margin among the Big 5 is probably due to product mix. The integrated companies process relatively more frozen groundfish and relatively less saltfish than the independents in the sample. The difference in interest expense is due to the

The Economic Condition of the Processing Sector 111
Table 5.29
Performance and Plant Characteristics (% of sales, rounded)
Gross Margin Interest Pre-tax Income
Characteristic 1978 1981 1978 1981 1978 1981
1. Total sample
2. Task Force Analytical Area
% 19
% 12
% 2
% 8
% 7
% (7)
1 Labrador-northeastern Newfoundland 16 9 2 9 1 (13)
2 Southeastern Newfoundland 20 14 3 5 6 (7)
3-4 South & West Coast Newfoundland 18 11 3 10 3 (14)
5-6 Quebec 15 10 1 4 4 (5)
7 Gulf New Brunswick 18 14 2 6 8 (1)
8 Prince Edward Island 15 10 2 4 4 (5) 9-10-11 Gulf-northeastern Nova Scotia 18 11 3 12 8 (12)
12-13 Western Nova Scotia-Fundy New Brunswick 23 14 2 6 12 (4)
3. Principal Product Frozen groundfish 20 12 3 8 5 (9) Saltfish 15 13 0 3 5 1 Mixed species 18 11 2 9 8 (7) Herring 40 7 5 10 16 (20) Other 20 15 2 4 8 (1)
4. Sales Volume (1981) Under $4 million 24 13 2 4 9 (6) $4-8 million 21 13 2 6 6 (7) $8-14 million 18 11 2 8 7 (7)
Over $14 million 18 12 2 8 7 (7)
5. Seasonality Year-round 20 13 2 8 8 (7)
6-12 months 17 10 2 6 5 (7) Under 6 months 23 11 2 4 9 (7)
6. Corporate Organization Big 5 19 11 3 9 7 (10)
Independents 19 13 2 5 6 (2)
7. Four Performance Categories Very successful 21 16 1 4 13 5 Moderate success 20 14 2 7 9 (3) Sharp decline 22 11 3 12 8 (15) Very unsuccessful 12 6 2 9 (1) (15)
Source: Woods Gordon.
higher investment undertaken by the Big 5 after 1978 and to the financing, with-short-term loans, of the mounting losses of this group in 1980 and 1981.
The relative performance of the four categories of plant confirms their classification and points up the difficulties faced by the two unsuccessful groups, each of which had 1981 pre-tax losses equal to 15 per cent of sales.
Table 5.30 presents the data from a different perspective, classifying the four plant categories according to their characteristics. Inevitably, the characteristics that correlate best with high or low pre-tax income (e.g., product mix, geographical area) are also typical of the most and least successful plants. Nevertheless, successful and
112
Task Force on Atlantic Fisheries
unsuccessful plants can be found within any of the groups whose characteristics are given in Table 5.30. This substantiates the earlier remark that there is no cut and dried formula for success and no guarantees against failure.
The plants on Newfoundland's east coast tend to polarize toward the two extremes, with 55 per cent of them falling into one of the two low categories. Eight of the ten sample plants on the south coast are experiencing either sharp decline or chronic unprofitability. Almost two-thirds of Gulf plants are in the successful categories, though it should be recalled that some of these have depreciated capital to offset low margins. Future profitability could therefore decline in some cases. Only two of the 21 plants in the sample in western Nova Scotia-Fundy are in the chronically weak category, the lowest percentage among the five regions.
There are few very successful businesses among those specializing in frozen ground-fish production (eight per cent in the sample). Twenty-five of the 40 plants so classi-fied are either chronically weak or in sharp decline.
Saltfish specialists show the reverse performance, at least over the 1977-1981 period. This may be a consequence of the weeding out of poorer saltfish producers when the industry nearly collapsed in the late 1960s, as well as the near elimination of the Spanish and Portugese fleets from the Canadian cod fishery in 1977 and the subse-quent strength of demand and price facing world suppliers of saltfish. Saltfish opera-tions also are not capital intensive and so have been able to avoid much of the inter-est rate squeeze.
The number of specialized herring plants in the sample is too small to provide gen-eral conclusions. Very successful herring plants probably occupy a special product niche; the others are apt to be in sharp decline as a result of market price and resource supply factors.
Plants specialized in 'other' species typically process mostly shellfish. They experienced, as expected, above average performance, though not as strong overall as saltfish producers.
Mixed species plants are defined as those that do not have more than 75 per cent of sales arising from any one product type. They are evenly distributed on the spectrum of performance, reflecting the range of sub-specializations in the group — for exam-ple, the more successful probably have a large component of saltfish or shellfish.
Sales volume, as already noted, does not appear to correlate significantly with overall performance. Very few of the largest plants (sales over $14 million in 1981) are in either of the extreme categories. The larger intermediates (sales of $8 to 14 million) appear to be relatively successful, although there is a group of 7 that are chronically weak. The 16 plants with sales over $8 million that are in sharp decline or very unsuccessful constitute an extremely serious problem, because each is a cornerstone of a community economy.
There is no clear correlation between seasonality of operation and average perform-ance. Nevertheless, it appears to be significant that over 60 per cent of the year-round plants fall into the two successful categories, compared with only 30 per cent of those that operate six months or less. The effect of product mix may in fact be the underlying cause. For example, saltfish drying plants operate year round, while a number of frozen groundfish processors on the east coast of Newfoundland and in the Gulf are forced to be seasonal. But seasonality of operation does not, by itself, imply poor financial performance.
The break-down between plants of the Big 5 and independents reveals a dramatic difference consistent with the data in Table 5.29. The high proportion of chronically
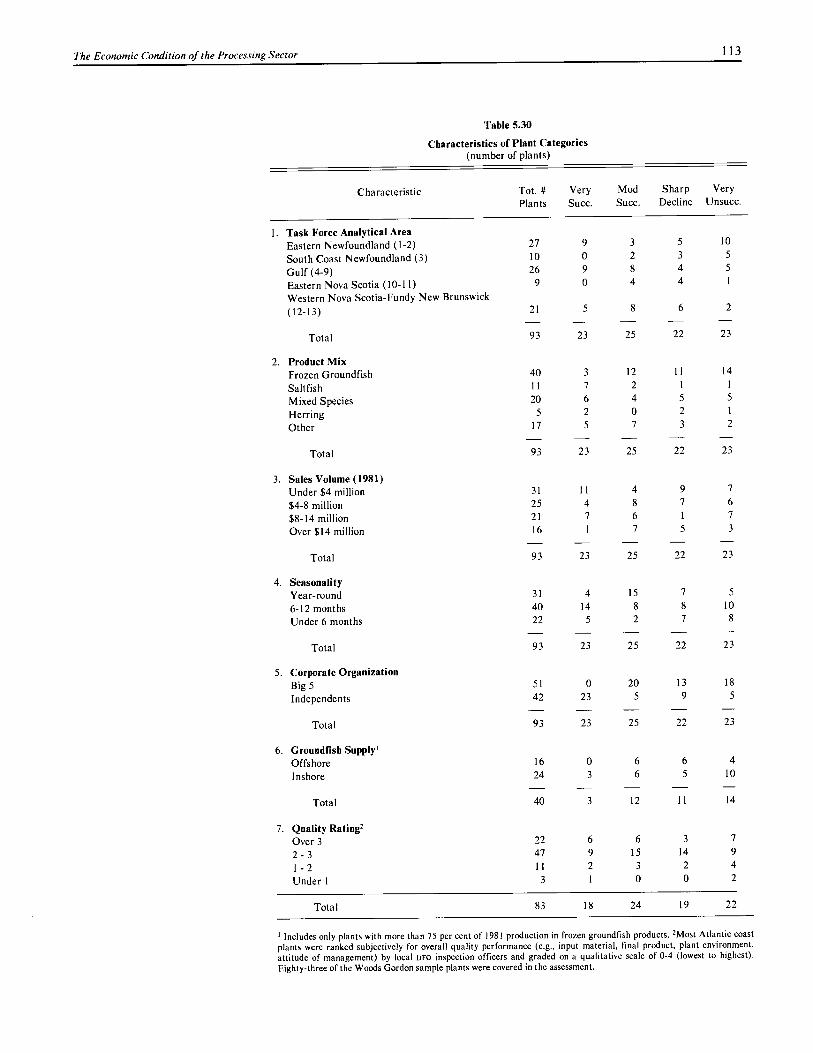
The Economic Condition of the Processing Sector 113
Table 5.30
Characteristics of Plant Categories (number of plants)
Characteristic Tot. # Plants
Very Succ.
Mod Succ.
Sharp Decline
Very Unsucc.
1. Task Force Analytical Area Eastern Newfoundland (1-2) 27 9 3 5 10
South Coast Newfoundland (3) 10 0 2 3 5
Gulf (4-9) 26 9 8 4 5
Eastern Nova Scotia (10-11) 9 0 4 4 1
Western Nova Scotia-Fundy New Brunswick (12-13) 21 5 8 6 2
Total 93 23 25 22 23
2. Product Mix Frozen Groundfish 40 3 12 11 14
Saltfish 11 7 2 1 1
Mixed Species 20 6 4 5 5
Herring 5 2 0 2 1
Other 17 5 7 3 2
Total 93 23 25 22 23
3. Sales Volume (1981) Under $4 million 31 11 4 9 7
$4-8 million 25 4 8 7 6
$8-14 million 21 7 6 1 7
Over $14 million 16 1 7 5 3
Total 93 23 25 22 23
4. Seasonality Year-round 31 4 15 7 5
6-12 months 40 14 8 8 10
Under 6 months 22 5 2 7 8
Total 93 23 25 22 23
5. Corporate Organization Big 5 51 0 20 13 18
Independents 42 23 5 9 5
Total 93 23 25 22 23
6. Groundfish Supply' Offshore 16 0 6 6 4
Inshore 24 3 6 5 10
Total 40 3 12 11 14
7. Quality Rating2 Over 3 22 6 6 3 7
2 - 3 47 9 15 14 9
1 - 2 11 2 3 2 4
Under 1 3 1 0 0 2
Total 83 18 24 19 22
I Includes only plants with more than 75 per cent of 1981 production in frozen groundfish products. 2Most Atlantic coast plants were ranked subjectively for overall quality performance (e.g., input material, final product, plant environment, attitude of management) by local DFO inspection officers and graded on a qualitative scale of 0-4 (lowest to highest). Eighty-three of the Woods Gordon sample plants were covered in the assessment.

114
Task Force on Atlantic Fisheries
weak plants in the Big 5 group has evidently been a severe drain on the resources and morale of these large companies. Very few independents are able to survive chronic losses. Much of the so-called social burden of the fishery rests with the group of very unsuccessful plants that over time have drifted into the orbit of what was perceived to be the strong sector of the industry — that is, the large, integrated companies. This sector is no longer strong, if it ever was, and evidently cannot continue, unaided, to shoulder the responsibility of chronic losers.
Among frozen groundfish processors there appears to be little systematic difference between those that are trawler-fed and those that are inshore-fed. The offshore plants include fewer of the chronically weak category.
The subjectivity of the quality ranking must be borne in mind when assessing the sig-nificance of the last item in Table 5.30. The 69 plants with rankings above 2 were split almost evenly between the successful and unsuccessful categories of plant. The lowest quality rankings are more predominant in the very unsuccessful group.
This small data sample indicates, at most, that while better quality does not guaran-tee success, extremely poor quality predisposes a plant to failure. Fisheries and Oceans inspection officers have observed that higher quality is usually associated with apparently superior plant management. Thus the correlation between quality and financial performance may be due more to better overall management than to the present market benefits of quality per se. It is nevertheless expected that in the future, the quality of input raw material and final product will be increasingly important factors in financial success (see Chapters 6, 14 and 16).
Targets for The specific means by which the fish processing industry is to recover financial a Profitable health are complex to describe. Many are treated in subsequent chapters. Much will Processing depend on the individual decisions and ingenuity of entrepreneurs, managers, plant Industry workers and fishermen. The prospects for success may be greater if there are achiev-
able targets to aim for. The Task Force can only suggest targets for the industry as a whole. Individuals will have to set their own targets, mindful of the aggregate goal. Some will already be exceeding any attainable set of all-industry targets. Others will not be able to meet certain industry financial targets because of the nature of their business. For example, if the business were more or less capital intensive than aver-age, interest and depreciation costs would diverge from average norms.
Performance The purpose of this section is to establish a set of target values for the financial indicators indicators that determine the value of the principal items on the consolidated income
statement and balance sheet of the industry. These target values would characterize a reasonably successful industry. The extent to which 1981 results deviate from the targets provides some measure of how much improvement will be required over the next few years. Full recovery cannot be achieved in any short span of time.
The target indicators are as follows:
1. Fixed Asset Turnover (T), defined as Sales (s) divided by Net Fixed Assets (NFA);
2. Equity to Fixed Asset Ratio (EE), defined as Shareholders' Equity (EQ) divided by Net Fixed Assets (NFA);
3. Debt Equity Ratio (DE), defined as Long-term Debt (LTD) divided by Share-holders' Equity;
4. Loan Ratio (L), defined as short-term bank loans (EL) divided by Inventory and Accounts Receivable (I&R);
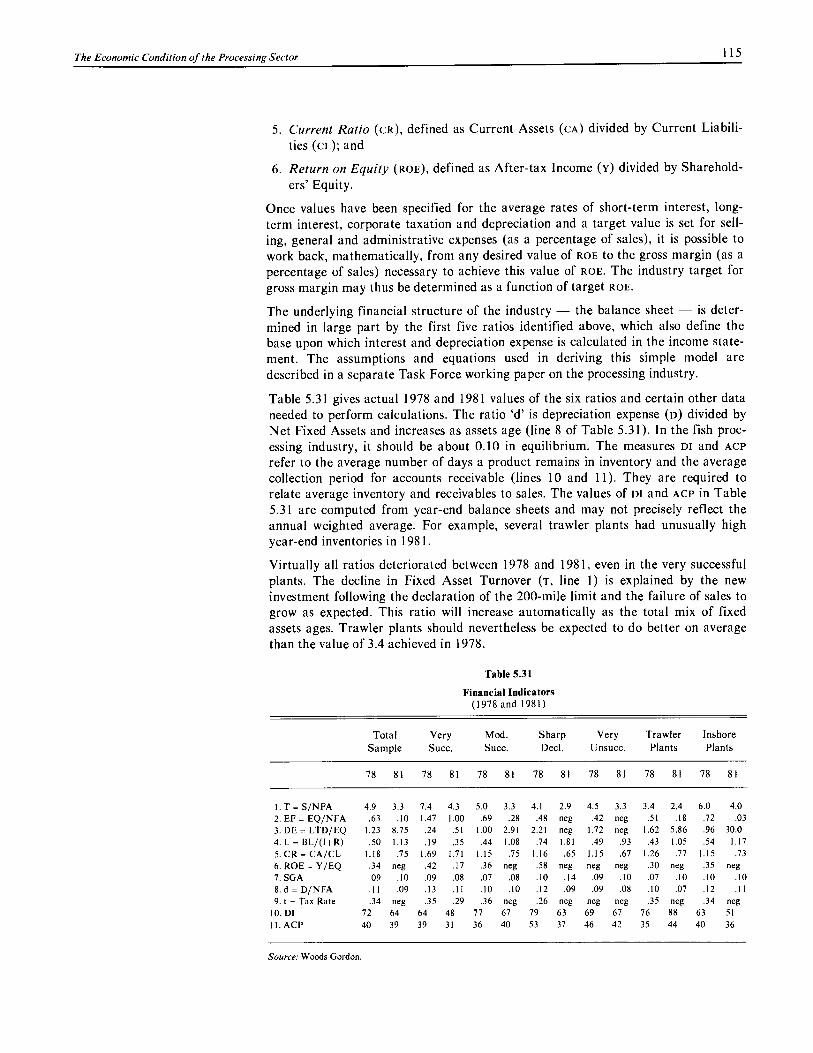
The Economic Condition of the Processing Sector 115
5. Current Ratio (cR), defined as Current Assets (CA) divided by Current Liabili-ties (CO; and
6. Return on Equity (RoE), defined as After-tax Income (y) divided by Sharehold-ers' Equity.
Once values have been specified for the average rates of short-term interest, long-term interest, corporate taxation and depreciation and a target value is set for sell-ing, general and administrative expenses (as a percentage of sales), it is possible to work back, mathematically, from any desired value of ROE to the gross margin (as a percentage of sales) necessary to achieve this value of ROE. The industry target for gross margin may thus be determined as a function of target ROE.
The underlying financial structure of the industry - the balance sheet - is deter-mined in large part by the first five ratios identified above, which also define the base upon which interest and depreciation expense is calculated in the income state-ment. The assumptions and equations used in deriving this simple model are described in a separate Task Force working paper on the processing industry.
Table 5.31 gives actual 1978 and 1981 values of the six ratios and certain other data needed to perform calculations. The ratio 'd' is depreciation expense (o) divided by Net Fixed Assets and increases as assets age (line 8 of Table 5.31). In the fish proc-essing industry, it should be about 0.10 in equilibrium. The measures DI and ACP
refer to the average number of days a product remains in inventory and the average collection period for accounts receivable (lines 10 and 11). They are required to relate average inventory and receivables to sales. The values of DI and ACP in Table 5.31 are computed from year-end balance sheets and may not precisely reflect the annual weighted average. For example, several trawler plants had unusually high year-end inventories in 1981.
Virtually all ratios deteriorated between 1978 and 1981, even in the very successful plants. The decline in Fixed Asset Turnover (T, line 1) is explained by the new investment following the declaration of the 200-mile limit and the failure of sales to grow as expected. This ratio will increase automatically as the total mix of fixed assets ages. Trawler plants should nevertheless be expected to do better on average than the value of 3.4 achieved in 1978.
Table 5.31
Financial Indicators (1978 and 1981)
Total Sample
Very Succ.
Mod. Succ.
Sharp Decl.
Very Unsucc.
Trawler Plants
Inshore Plants
78 81 78 81 78 81 78 81 78 81 78 81 78 81
1. T = S/NFA 4.9 3.3 7.4 4.3 5.0 3.3 4.1 2.9 4.5 3.3 3.4 2.4 6.0 4.0 2. EF = EQ/NFA .63 .10 1.47 1.00 .69 .28 .48 neg .42 neg .51 .18 .72 .03 3. DE = LTD/EQ 1.23 8.75 .24 .51 1.00 2.91 2.21 neg 1.72 neg 1.62 5.86 .96 30.0 4. L = BL/(I+R) .50 1.13 .19 .35 .44 1.08 .74 1.81 .49 .93 .43 1.05 .54 1.17 5. CR = CA/CL 1.18 .75 1.69 1.71 1.15 .75 1.16 .65 1.15 .67 1.26 .77 1.15 .73 6. ROE = Y/EQ .34 neg .42 .17 .36 neg .58 neg neg neg .30 neg .35 neg 7. SGA .09 .10 .09 .08 .07 .08 .10 .14 .09 .10 .07 .10 .10 .10 8. d = D/NFA .11 .09 .13 .11 .10 .10 .12 .09 .09 .08 .10 .07 .12 .11 9. t = Tax Rate .34 neg .35 .29 .36 neg .26 neg neg neg .35 neg .34 neg
10. DI 72 64 64 48 77 67 79 63 69 67 76 88 63 51 II. ACP 40 39 39 31 36 40 53 37 46 42 35 44 40 36
Source: Woods Gordon.

116 Task Force on Atlantic Fisheries
The 1981 ratio of Equity to Net Fixed Assets (EF, line 2) is one of the least satisfac-tory performance statistics in the industry. Equity has been severely eroded by losses from an already inadequate level in 1977 and 1978 for most groups of plants.
A target value for EF of at least 1.0 should be adopted; that is, on average, the share-holders in the industry would have equity at least equal to the net value of their fixed assets. This would be minimally adequate given that the industry is inherently cycli-cal. The average ratio of equity to net fixed assets for all food products industries in Canada was 1.38 in 1979.
The ratio of long-term debt to equity (DE, line 3) mirrors the decline in the equity base of the industry at the same time as expansion was being financed with long-term debt. By 1981 this ratio had reached unrealistic levels for many groups of com-panies. Only the very successful group had preserved a strong ratio. A target value of DE = 0.80 should be achievable on average. In 1979, the Canadian food products industry average for the ratio was 0.22. The combination of debt to equity of 0.80 and equity to fixed assets of 1.0 implies a ratio of 0.80 for long-term debt to net fixed assets. This is slightly higher than the sample average in 1978 and slightly lower than the 1981 average. This ratio should provide adequate asset security for the loans.
There has been extraordinary growth in the ratio of short-term loans to inventory and receivables (L, line 4) due to a requirement to finance operating losses and extend credit to the limit to finance inventory. Short-term loan balances must be brought back into line with former levels and should probably be reduced to approxi-mately 40 per cent of average inventory and receivables. The maximum credit banks are willing to extend is normally in the range of 60 per cent of inventory and so-called 'trade' receivables, though much higher ratios have been allowed. Some of the receivables of processing companies are associated with equipment and cash advances to fishermen, and these would not normally be included in the assets against which banks are prepared to lend. Processing firms must generate cash flow sufficient to reduce the requirement for short-term bank financing.
The sample average current ratio (cR, line 5) is unsustainable at any value less than 1.0, because this would imply that the firm lacks the assets to fulfill its short-term cash obligations. Working capital must be restored as earnings begin to accumulate and bank loans are brought back to appropriate levels. The target current ratio should not be less than 1.3.
Return on equity (ROE, line 6) was extraordinarily high in 1978, at 34 per cent for the sample. This reflects the unrealistically low average amount of equity in the industry even at that time. Return on total assets at 6.9 per cent was good, but not exceptionally so. The 10-year average return on assets in all food products industries in Canada (1970-79) was 5.9 per cent.
Risk in The target return on equity in fish processing must reflect the risk arising from the fish cycles inherent in the industry as well as from government policy, which looms par- processing ticularly important in the fishery. To achieve an adequate return over a period of industry years, investors will have to earn exceptional profits in good years to offset the inevi-
table downturns. This is true of most export-oriented industries, particularly those based on natural resources. Compared with forest products and minerals, for exam-ple, the fish processing industry has been unusual in not earning on the economic up-swing as much as it has lost on the down-swing. The years 1977-1981 have been no exception.
The average return on equity in fish processing would probably have to exceed the rate of return on riskless investments (bonds, for example) by at least 4 per cent if

The Economic Condition of the Processing Sector 117
the necessary new funds are to be attracted. A more precise value for the necessary risk premium cannot be estimated without several years' experience of actual performance in attracting and compensating new equity capital.
It is difficult to over-emphasize the need for a stronger equity base in the industry. Canadian fish processors have accumulated remarkably little equity when compared with the food processing industry generally. This is all the more remarkable given the high level of operating risk inherent in the fish business.
Risky businesses should be conservatively financed with relatively low levels of debt compared with shareholders' equity. This does not mean that equity holders deserve a lower return than debt holders on the funds they provide. On the contrary, a com-mon shareholder requires a risk premium. But shareholders must be prepared to postpone dividends during slumps in hope of recouping on the recovery. Lenders, on the other hand, expect regular interest payments regardless of the fortunes of the business. Inability to pay on time can result in bankruptcy. Thus an industry with variations in performance as strong as those in the fish processing industry should minimize the use of debt in order to minimize financial risk.
Table 5.32 illustrates the variability in several key performance measures for the Canada-wide fish processing industry. The data compare the fish, meat and all food products industries over the period 1970 to 1979. The measure of variability is the coefficient of variation, a number used by statisticians to indicate the scale of annual fluctuations relative to the long-term average value of the item in question. High values point to high operating risk.
The figures in Table 5.32 show that while the fish processing industry has achieved levels of average performance similar to those of the food products sector as a whole - with the important exception of return on total assets - the variability in the performance of fish processors is much greater than for either meat or all food processors. The variability in return on assets, for example, is almost five times greater for fish processors than for all food processors.
Establishing Table 5.33 contains target values for the six key indicators defined earlier and for targets the other items needed to complete the derivation of target income statements and
balance sheets. The target values are not claimed to be uniquely appropriate or to be the best attainable. In light of the 1978 performance data in Table 5.31, the targets should be achievable, although for some ratios this may require up to five years.
An industry with the average characteristics given in Table 5.33 would be reasonably stable, with enough margin of safety in its balance sheet to survive the industry's
Table 5.32
Comparative Operating Risk in Food Industries
Average Values 1970-79
Variability
All All Fish Meat Food Fish Meat Food
Gross margin (per cent of sales)
17.5% 10.5% 17.8% 14.8 7.5 4.6
Return on equity 13.2% 12.8% 13.2% 56.5 18.0 15.0 Return on assets 4.4% 5.9% 5.9% 58.3 14.8 12.8 Equity to assets 33.4% 46.6% 44.7% 9.4 5.7 6.4
Source: Data compiled for the Task Force by The NewLantic Group, derived from SCC 61-207.

118
Task Force on Atlantic Fisheries
Table 5.33
Financial Targets for the Industry
Sample Average Target Values
Ratio 1978 1981 Trawler
Plant Inshore Plant
1. Fixed Asset Turnover (T) 4.9 3.3 4.0 6.0 2. Equity/Assets (Er) 0.63 0.10 1.0 1.0 3. Debt/Equity (DE) 1.23 8.75 0.8 0.8 4. Loan Ratio (L) .50 1.13 .40 .40 5. Current Ratio (cR) 1.18 0.75 1.3 1.3 6. Return on Equity (ROE) .34 neg. .19* .19 7. sGA (% of Sales) .09 .10 .08 .09 8. Depreciation Rate (d) .11 .09 .10 .10 9. Tax Rate (t) .34 neg. .34 .34
10. Days in Inventory (Di) 72 64 70 70 11. Average Collection Period (Act) 40 39 35 35
* Assuming short - term interest at 15%.
downturns with only a moderate rate of business failure at the lower end of the performance spectrum. This, it will be noted, corresponds to the definition of eco-nomic viability adopted in our statement of objectives in Chapter 7. The target char-acteristics are meant to signify averages both over time and among businesses.
Two sets of target ratios are specified, one for trawler plants and the other for inshore-supplied plants. The former are more capital intensive, which implies a dif-ferent structure for the income statement and balance sheet. The target values are also oriented toward fresh and frozen groundfish plants. The method can be refined to apply to any other sub-group if sufficient data on financial structure are available.
An income statement can be derived from these targets once values are specified for the average rates of short-term and long-term interest. Two scenarios are presented in Table 5.34, one based on a short-term interest rate of 12 per cent, the second on 15 per cent. Long-term rates are assumed for purposes of the calculation to be two points below short-term, and return on equity is assumed to be four points above short-term interest rates, - that is, 16 and 19 per cent respectively. These must be viewed as minimally acceptable targets for ROE.
As an example of the calculation leading to the results in Table 5.34, consider short-term interest expense. This will be, by definition, the assumed interest rate multi-plied by the average bank loan balance. The latter is targeted at 40 per cent of aver-age inventory and receivables (line 4, Table 5.33). Inventory and receivables are related to annual sales by the average days an item remains in inventory and by the average collection period. Based on the targets in Table 5.33 (lines 10 and 11), the average value of inventory and receivables would be just under 25 per cent of annual sales. It follows from this chain of relationships that short-term interest expense would be 1.5 per cent of annual sales. For the total sample, this expense was 0.9 per cent of sales in 1978. The target model implies an increase of short-term interest roughly proportional to the increase in rates since 1978.
The income statement that would result for the total industry as a consequence of the targets in Table 5.33 is given as a percentage of sales in Table 5.34.
The target assumptions imply a gross margin requirement of 19.8 to 21.8 per cent for trawler-fed plants and of 17.3 to 18.7 per cent for inshore plants for the lower and higher interest rate assumptions of 12 and 15 per cent respectively.

The Economic Condition of the Processing Sector 119
Table 5.34
Target Income Statement (per cent of sales)
Item
Actual Total Sample
Interest at 15% Interest at 12% Trawler
Plant Inshore Plant
Trawler Plant
Inshore Plant 1978 1981
Sales 100.0 100.0 100.0 100.0 100.0 100.0
Cost of Sales 80.9 88.0 78.2 81.3 80.2 82.7
Gross Margin 19.1 12.0 21.8 18.7 19.8 17.3
SGA 8.5 9.9 8.0 9.0 8.0 9.0
Short-term Interest 0.9 4.8 1.5 1.5 1.2 1.2
Long-term Interest 1.3 2.8 2.6 1.7 2.0 1.3
Depreciation 2.2 2.8 2.5 1.7 2.5 1.7
Pre-tax Income 6.9 (7.3) 7.2 4.8 6.1 4.1
Tax (Recovery) 2.4 (1.2) 2.4 1.6 2.1 1.4
Net Income (Loss) 4.5 (6.1) 4.8 3.2 4.0 2.7
Return on Equity 33.6% neg. 19.0% 19.0% 16.0% 16.0%
The difference between the gross margin targets for the trawler plants and inshore plants arises in two ways: (1) from the higher long-term interest and depreciation expenses (relative to sales) of a trawler owner; and (2) from the higher level of equity to sales required to meet the target level of equity to fixed assets in the case of a trawler operator. Trawler plants have a lower ratio of sales to fixed assets than do inshore plants (Table 5.33, line 1). The purchaser of fish from an independent fisher-man, whether at a trawler port or not, must compensate the fisherman for his capital investment. The trawler owner internalizes this cost, but it shows up in a higher gross margin requirement to achieve any given target for return on equity.
The difference between the target income statement and the actual sample average in 1978 is due principally to the higher costs of interest even under the 12 per cent scenario. Increased interest rates imply a structural change in the income statement of even the most efficiently run business. If interest rates decline and target return on equity is reduced, lower gross margins can be accomodated.
The two target scenarios would imply an industry average gross margin in the 17 to 19 per cent range, with trawler plants as a group requiring slightly more than the average and inshore plants slightly less, all else being equal. (We repeat that these statements apply only on the average. Individual plants may require more or less depending on their capital structure and other overheads.) These are minimally acceptable average gross margin targets, assuming that the industry will be able to compete for private sector investment and to devote the necessary resources to pro-motion and other aspects of market development. The target margins must be achieved by a combination of higher average unit sales prices - to be accomplished by up-grading pack-mix to include a larger percentage of higher value products -and lower unit costs (see Chapter 16).
To achieve the target balance sheet ratios for equity to fixed assets and debt to equity and for the loan and current ratios will require a very significant addition of equity, some portion of the proceeds of which would be applied to reduce short-term bank loans to target levels.
120
Task Force on Atlantic Fisheries
The target for bank loan financing of inventory and receivables implies that the aver-age loan balance should be roughly 10 per cent of annual sales. For the total sample in 1981, this would have been $100 million, whereas the average of opening and clos-ing bank loans in 1981 was $240 million. Thus, to have achieved the target in 1981 would have required a reduction in consolidated bank loans of about $140 million. If the bank loan balance had been reduced by $140 million, with no other changes in current assets or current liabilities, the current ratio at the close of 1981 would have been close to the target of 1.3. Under the circumstances, the reductions in bank loans could not have been achieved without widespread bankruptcy or the conversion of short-term loans to long-term debt or equity.
The additional equity that would have been required to meet the target ratio of long-term debt to equity (0.80) in 1981 amounts to about $280 million, which would have brought the net equity in the total sample to $305 million. Such a level would also satisfy the target that equity should roughly equal net fixed assets. The industry is very far from being able to attract such an infusion of equity capital. The target can only be achieved over time and in response to demonstrated profitability.
Summary and 1 The financial decline in the Atlantic coast fish processing industry since 1978 Conclusions has affected all sectors and all geographic areas. The effects have been most
severe for plants specializing in frozen groundfish and herring products and for companies that borrowed heavily to finance expansion between 1978 and 1980.
2. Roughly half the decline has been due to reduced operating profit (gross mar-gin); slightly more than 40 per cent was attributable to increased interest and depreciation expenses and the remaining 5 to 10 per cent to relatively higher selling and administrative expenses.
3. Between 1978 and 1980, losses were caused principally by declining gross mar-gins, which occurred as market prices flattened while most components of cost continued to increase. The cost-price squeeze appears to have begun to turn around in 1981. Margins may be expected to continue to improve from the cycli-cal low in 1980. However, market price trends for groundfish and herring prod-ucts do not suggest sustained real price increases. Continued improvement in margins will depend on much greater cost efficiency and better utilization of raw material through higher quality and up-graded products.
4. Between 1980 and 1981, an increase of $25 million in short-term interest expense was almost entirely responsible for a further decline in pre-tax income in the consolidated sample of plants. Roughly half the plants in the sample lost money in 1980. In 1981, despite a slightly higher average gross margin, almost 70 per cent of the plants were losers.
5. The rapid increase in short-term interest expense was due to bank borrowing to finance mounting losses and to finance inventory levels in the absence of suffi-cient internally generated cash flow.
6. Many enterprises (accounting for perhaps 30 per cent or more of industry sales) have become so burdened with short-term, dead-weight debt as a result of developments in 1980-81 that they have no prospect of viability without financial restructuring.
7. The exchange rate of the Canadian dollar was a significant factor in the strong performance of Atlantic coast fish exports in 1978 and 1979 and the subsequent weakening in 1980 and 1981. The apparent improvement in 1982 is to a signifi-cant extent due to the recent devaluation of roughly 6 per cent against the U.S. dollar. A reversal of this trend would re-establish the cost-price crisis of 1980.
Factors responsible for the crisis
The Economic Condition of the Processing Sector 121
8. The cost of raw material has adjusted to the flattening of sales revenues. The other principal component of unit costs, plant labour, has not adjusted to the same extent. There does not appear to have been an increase in productivity commensurate with wage rate increases, though the latter have barely kept pace with inflation since 1979. Improving productivity emerges as one of the major challenges to management in processing plants.
9. Selling, general and administrative expenses (sGA) amount to about 10 per cent of industry sales. These expenses are lower, as a percentage of sales, for larger plants. There is little opportunity to reduce SGA by more than one or two per-centage points. The immediate need to expand marketing efforts and to up-grade management systems may cause SGA to increase slightly in the short run.
10. The significance of long-term interest and depreciation expense (5.7 per cent of total sales in 1981) will diminish over the next several years with the ageing of the new investment undertaken since 1978. In some areas, such as Quebec and the south coast trawler ports of Newfoundland, new investment will be needed, and long-term interest and depreciation expenses in these areas will increase relatively. Attracting the capital to finance the replacement of assets poses a great challenge to the fishing industry.
Excess 11. Over-capacity (or under-utilization) of assets is a longstanding phenomenon in
processing the processing sector. Other studies have concluded that much of the excess
capacity capacity is nevertheless required to cope with seasonal peaks in landings. Gov- ernment financial incentives for plant construction have also been a significant factor. The financial cost of excess capacity is measured approximately by long-term interest and depreciation as a percentage of sales. For many seasonal plants this cost is not excessive (for example, 3 per cent of sales on average in 1978). But it is an excessive cost for the new investments made since 1978 in seasonal, and under-utilized, plants. For plants on the east coast of Newfoundland (TAA 1 and 2), long-term interest and depreciation expenses were 7.7 per cent of sales in 1981. These plants require an off-season supply of fish to be viable.
Factors 12. The plants in the Woods Gordon sample may be divided into four roughly equal
in success groups, characterized as (1) very successful; (2) moderately successful; (3) in
and failure sharp decline; or (4) very unsuccessful. The latter two categories each account for 20 to 25 per cent of total sales in the sample. Many large plants fall into these two categories.
The categories are most clearly differentiated on the basis of product mix and corporate organization. Plants specialized in saltfish and shellfish have been most successful; those specialized in frozen groundfish and, more recently, her-ring are among the least successful.
The five large integrated companies own a disproportionate share of the unsuc-cessful plants. This is due partly to their concentration in the frozen groundfish trade, but it is also because the perceived strength of the large companies led them to acquire and to continue to operate facilities that a smaller enterprise probably would not have sustained.
Targets 13. Target values for a small number of key financial indicators can be defined. If
for a profitable these targets were achieved, they would imply a stable and profitable industry,
industry capable of attracting sufficient equity capital. A grossly inadequate equity base has plagued the fishing industry for many years. The financing of assets has depended far too much on debt. Financial risk in the industry is excessive. At a short-term interest rate of 15 per cent, and assuming a target return on equity of
Adjustments to the crisis
122
Task Force on Atlantic Fisheries
19 per cent, the industry would require an average gross margin of around 19 per cent (slightly higher for trawler plants, slightly lower for inshore-supplied plants). Lower interest rates (and reduced inflation) would lower the return required on equity and reduce the gross margin targets. Significantly higher returns would be required in good years to offset inevitable downturns.
The present financial structure of the industry is far from the proposed targets, but in light of the industry's 1978 performance, these targets should be attain-able in time. To have met the targets in 1981, the plants in the Woods Gordon sample collectively would have had to reduce the average short-term bank loan balance by $140 million and attract $280 million in equity capital. The principal financial challenge to the processing industry is to bring shareholders' equity to adequate levels. This will require sustained profitability. If this is to be accom-plished, there will have to be a dramatic departure from the "art" referred to in the quotation at the beginning of this chapter to the more rigorous application of modern management skills. We return to these questions in Chapter 16.
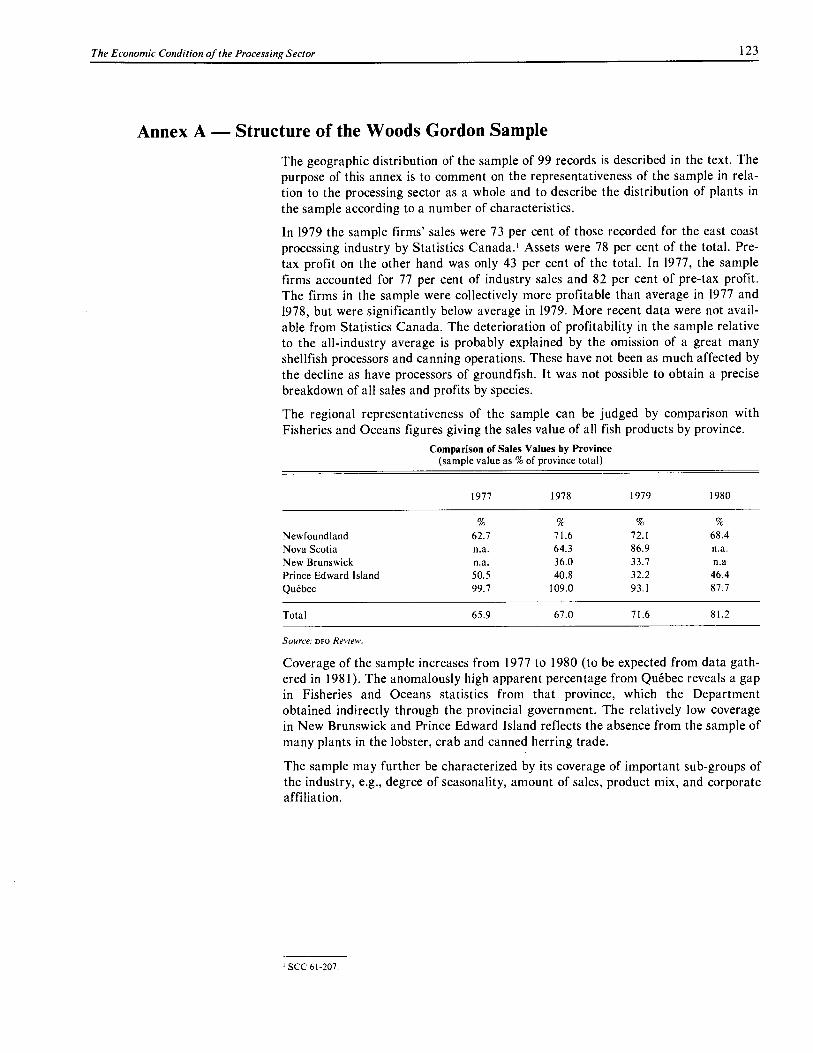
The Economic Condition of the Processing Sector 123
Annex A — Structure of the Woods Gordon Sample
The geographic distribution of the sample of 99 records is described in the text. The purpose of this annex is to comment on the representativeness of the sample in rela-tion to the processing sector as a whole and to describe the distribution of plants in the sample according to a number of characteristics.
In 1979 the sample firms' sales were 73 per cent of those recorded for the east coast processing industry by Statistics Canada.' Assets were 78 per cent of the total. Pre-tax profit on the other hand was only 43 per cent of the total. In 1977, the sample firms accounted for 77 per cent of industry sales and 82 per cent of pre-tax profit. The firms in the sample were collectively more profitable than average in 1977 and 1978, but were significantly below average in 1979. More recent data were not avail-able from Statistics Canada. The deterioration of profitability in the sample relative to the all-industry average is probably explained by the omission of a great many shellfish processors and canning operations. These have not been as much affected by the decline as have processors of groundfish. It was not possible to obtain a precise breakdown of all sales and profits by species.
The regional representativeness of the sample can be judged by comparison with Fisheries and Oceans figures giving the sales value of all fish products by province.
Comparison of Sales Values by Province (sample value as % of province total)
1977 1978 1979 1980
% % % % Newfoundland 62.7 71.6 72.1 68.4 Nova Scotia n.a. 64.3 86.9 n.a. New Brunswick n.a. 36.0 33.7 n.a Prince Edward Island 50.5 40.8 32.2 46.4 Quebec 99.7 109.0 93.1 87.7
Total 65.9 67.0 71.6 81.2
Source DFO Review.
Coverage of the sample increases from 1977 to 1980 (to be expected from data gath-ered in 1981). The anomalously high apparent percentage from Quebec reveals a gap in Fisheries and Oceans statistics from that province, which the Department obtained indirectly through the provincial government. The relatively low coverage in New Brunswick and Prince Edward Island reflects the absence from the sample of many plants in the lobster, crab and canned herring trade.
The sample may further be characterized by its coverage of important sub-groups of the industry, e.g., degree of seasonality, amount of sales, product mix, and corporate affiliation.
' SCC 61-207.
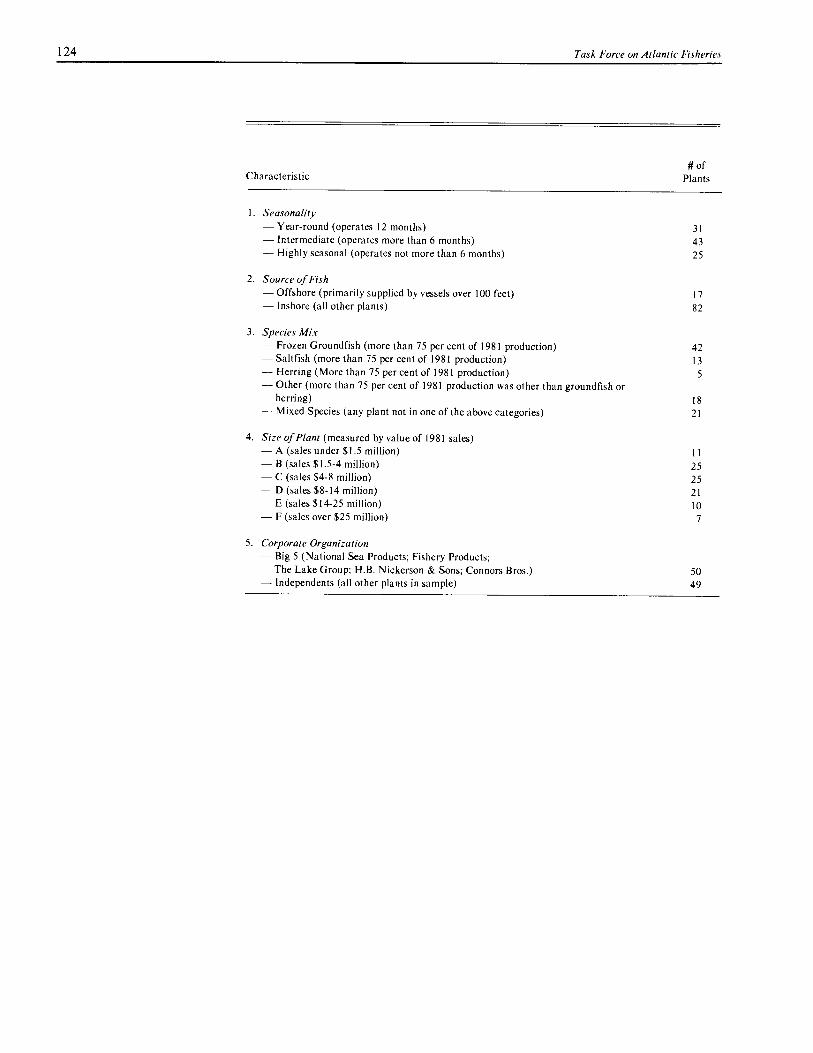
124
Task Force on Atlantic Fisheries
# of Characteristic Plants
1. Seasonality — Year-round (operates 12 months) 31 — Intermediate (operates more than 6 months) 43 — Highly seasonal (operates not more than 6 months) 25
2. Source of Fish — Offshore (primarily supplied by vessels over 100 feet) 17 — Inshore (all other plants) 82
3. Species Mix — Frozen Groundfish (more than 75 per cent of 1981 production) 42 — Saltfish (more than 75 per cent of 1981 production) 13 — Herring (More than 75 per cent of 1981 production) 5 — Other (more than 75 per cent of 1981 production was other than groundfish or
herring) 18 — Mixed Species (any plant not in one of the above categories) 21
4. Size of Plant (measured by value of 1981 sales) — A (sales under $1.5 million) 11 — B (sales $1.5-4 million) 25
C (sales $4-8 million) 25 — D (sales $8-14 million) 21 — E (sales $14-25 million) 10 — F (sales over $25 million) 7
5. Corporate Organization — Big 5 (National Sea Products; Fishery Products;
The Lake Group; H.B. Nickerson & Sons; Connors Bros.) 50 — Independents (all other plants in sample) 49

Total gross sales revenue less cost of transport, duties, rejected product, discounts, allowances, etc.
Cost of raw material, manfacturing labour, packaging and other materials consumed and plant overheads (e.g., utilities, maintenance) and changes in levels of inventory, at cost.
The difference between Net Sales and Cost of Sales. It is the most significant measure in the industry, being a reflection of the market value of the product in rela-tion to the direct cost of production. It provides the funds to pay taxes and suppliers of capital.
Income earned by companies from other than their fisheries activities e.g., interest on investments.
Cost of selling and marketing activity (e.g., commis-sions, salaries), executive and head office salaries, administrative salaries and supplies, etc.
The net income after deduction of Cost of Sales (Item 2) and SGA (Item 5) is sometimes called the 'share for capital'; from this balance must come interest, depreciation and any profit to shareholders.
Broken down between interest on loans due within a Short - term: year or less (short-term bank credit) and interest on $45.3 long-term loans or bonds, generally used to finance Long - term: fixed capital assets of long lifetime. $26.6
A non-cash accounting expense that reflects the wear-ing out with age of fixed assets. The original purchase cost of an asset divided by its expected useful lifetime is often entered as a depreciation expense each year. $26.7
Tax is charged on any profit after subtraction of depreciation. In 1978, the average tax on industry profit of $48 million was 33 per cent. The rate depends on the status of various 'write-offs' at any time. A negative value of tax — as shown by the bracketed fig-ure for 1981 — indicates a cash recovery of income tax corresponding to aggregate losses. ($ 7.9)
There may be gains or losses of a non-recurring type, e.g., insurance payment in excess of 'book value' of a sunken trawler. $ 4.2
1. Net Sales
2. Cost of Sales
3. Gross Margin
4. Other Income
5. Selling, General & Administrative Expenses (scA)
6. Share for Capital
7. Interest
8. Depreciation
9. Income Taxes
10. Extraordinary Items
$939.8
$827.4
$92.8
$29.7
The Economic Condition of the Processing Sector 125
Annex B — Definition of Financial Statement Items
I Income Statement
Total Sample Value, 1981
Item Definition ($ millions)
11. Net Income The 'bottom line': equal to the share for capital (Item 6) less Items 7-9 plus any extraordinary gain or less any extraordinary loss. A bracketed value indicates a net loss. ($ 56.9)

126 Task Force on Atlantic Fisheries
II Balance Sheet Total Sample Value, 1981
Item Definition ($ Millions)
1. Total Assets The accounting value of all items owned by the enter- prise including product inventory, accounts receivable, land, buildings, stocks and bonds, etc.
2. Net Fixed Assets The original purchase price, less accumulated depreciation, of land, buildings, machinery, vessels, etc.
3. Long-term Debt Debts owed with a pay-back period in excess of one year; typically incurred to finance acquisition of fixed assets and for which the assets usually provide secu-rity.
4. Bank Loans Funds borrowed from chartered banks with a term of less than one year, usually to finance the day to day operations of the business, particularly the cost of inventory and accounts receivable which generally pro-vide security for the loans.
5. Working Capital Working capital is equal to current assets less current liabilities. Current assets are those assets that can gen-erally be converted to cash within less than a year (e.g., accounts receivable, inventory of finished goods). Similarly, current liabilities are obligations that gener-ally must be paid within a year (e.g., accounts payable, short-term bank loans). Thus the working capital bal-ance measures the firm's ability to meet short-term obligations. Its principal components are inventories plus accounts receivable, less bank loans and accounts payable. A negative value, as in 1981, indicates techni-cal insolvency. The working capital position of a firm is often quoted in relative terms as the ratio of current assets to current liabilities (the 'Current Ratio', CR). A current ratio of less than 1.0 implies negative work-ing capital.
$706.3
$294.8
$243.9
$276.0
($106.1) CR = 0.74:1
6. Equity A derived item that balances the Assets and Liabilities sides of the balance sheet. It is the net worth of the company to its owners after deducting the value of total liabilities from total assets. The equity may be negative and indeed was for many fish companies at the end of 1981. The change in equity from one year to the next is composed of (I) net income (or loss), plus (2) any new investment by shareholders, less (3) any dividends paid or stock re-purchased. $26.4
127
6. Markets and Marketing
The demands of the consumer must continue to dictate the form in which fish are marketed. Consumption always regulates sales, and sales regulate not only production but the particular form of the product.
Royal Commission on the Maritime and Quebec Fisheries, 1928.
Introduction The declaration of the 200-mile limit in 1977 served to heighten interest in selling Canadian fish products. Unfortunately, however, this was not accompanied by recog-nition of the fundamental truth in the words of the 1928 Royal Commission just quoted. Their validity has not been adequately reflected in the actions of the majority of Atlantic fishermen, processors and government managers to this day. Despite the fact that the problem was identified at least 54 years ago, it is distressing to note that the conclusions of this Task Force are substantially similar to those of the Royal Commission and show that very little has been done to attack this basic problem of the Atlantic fishery. The traditional production or volume orientation of fishermen, processors and governments has been slow to change toward a market-driven approach. This failure of attitude and orientation is a significant contributor to the fishery's current problems.
Despite increased landings, production and sales over the past five years, unit costs have risen more rapidly than prices. In fact, real market prices have fallen during the last two to three years. The results, detailed in Chapter 5, have been substantial losses for fish processing companies, particularly in the frozen groundfish and her-ring segments of the industry.
The cost-price squeeze in these sectors is not unique to Canada. The Icelandic indus-try, for example, has lost money on its frozen groundfish business for the past two years. Nevertheless, changing international economic and trading conditions, as well as the growth of potentially exportable surpluses of traditional and under-utilized species, call for a greater orientation of the industry to the demands of the final product market. Other key factors reinforcing the need for this approach include Canada's increased dependence on export markets; growing protectionism in world markets; U.S. fisheries policy aimed at greater self-sufficiency; the possibility that rapidly growing supplies of cheaper groundfish species will increasingly be sub-stituted for cod; and the cost-price squeeze.
Canada has made significant strides in recent years, moving from fourth position in 1972 to become the world's leading exporter of fish and fishery products in 1979, a position we have maintained ever since. The total export value of Canadian fish products in 1981 was almost $1.6 billion.
Almost 80 per cent of Canadian fish production is exported. Canada's export mar-kets are, in order of importance, the United States (52 per cent); the European Eco-nomic Community (20 per cent); Japan (10 per cent); other European countries (10 per cent) and other countries (8 per cent). In 1981 over $360 million worth of fish products were imported into Canada, almost 60 per cent of which came from the United States.
In 1981 Canada exported 210,000 t of groundfish (valued at about $570 million); 74 per cent of this tonnage was destined for the U.S. market, 7.5 per cent went to the EEC, 11 per cent to Iberian markets (Portugal and Spain) and 7.6 per cent to other countries.
128
Task Force on Atlantic Fisheries
Canadian sales of Atlantic herring were 106,000 t in 1981 (valued at $193 million). The major markets were the EEC (35 per cent), the United States (25 per cent), Canada (14 per cent), Scandinavia (7.5 per cent), and Japan (7 per cent).
In 1981, the east coast cod catch amounted to 436,000 t. This is expected to increase by roughly 77 per cent, or 334,000 t, by 1987. Northern cod will account for 70 per cent of the anticipated growth. Landings of other groundfish species are not forecast to increase significantly. Canada's Atlantic herring catches are forecast to decline by approximately 17 per cent between 1982 and 1987.
Harvesting this increasing volume of cod and using it efficiently in product forms that provide better returns is the real marketing challenge facing the groundfish industry.
The purpose of this chapter is to establish the market fact base and background to the policy analysis and recommendations that follow. We address marketing performance, focusing on the role of market 'niches' and strategies. We examine the extent of fragmentation among Canadian exporters and among the buyers of our products, destructive price competition, and the issue of orderly marketing. We sum-marize a detailed review of the supply and demand forecasts for groundfish and her-ring over the next five years. We also discuss the effect of quality and promotion on a Canadian market-driven strategy. Finally, we summarize the analysis and present the principal conclusions that the Task Force has drawn from it.
Canada's The decade-long debate about the adequacy of the marketing of Atlantic Canadian Performance seafood products has been increasing in intensity in recent years. During its consulta- as a Fish tions the Task Force was struck by the fact that virtually every individual and organ- Marketer ization in the industry had well defined views on marketing, regardless of their mar-
keting expertise. Sometimes, the firmest opinion appeared to be held by those with the least knowledge.
The concept of a market segment or 'niche' is an important aid in understanding the marketing environment faced by east coast fish processors. In biology, a niche is a habitat that one species has dominated and from which it has excluded all others. A market 'niche' occurs wherever there is a group of buyers with an essentially com-mon set of requirements in terms of product specifications and consistency and sup-plier services. Differentiated products and marketing strategies based on branding and advertising are aimed at capturing market niches. The goal of each supplier is to dominate a particular niche or set of niches.
Five broad sets of questions serve as a guide in examining the structure, conduct and performance of Canada's fish marketing efforts. They are as follows:
1. What are the market niches served by the Atlantic industry and by our competi-tors? How big are they? Which, if any, are growing? How do they differ in terms of buyers' needs for a level of product quality, consistency and specific types of services?
2. To what extent are the products of the various Canadian and international com-petitors differentiated from each other on the basis of real differences, as opposed to marketing strategies based on artificial images or product 'personali-ties'? What role can 'branding', with its associated advertising, be expected to play in the development of new market niches for Canada's fish? Is this best approached on an industry-wide basis or on a corporate level?

Markets and Marketing 129
3. Can differences in products produced, marketing strategies, and net incomes be explained by the concentration or fragmentation of buyers or suppliers? Are there barriers, either created by our competitors or self-imposed, that have stopped the Canadian industry from serving higher priced and more profitable markets? Conversely, are there barriers that can be used to deter new entrants to the market niches that are now served or desired by Canadians?
4. In view of existing barriers, the degree of concentration of buyers and sellers in key market niches and the nature of east coast fish products, are there ways of assisting the industry to market its products more effectively?
5. Are there systematic ways of dealing with unplanned fluctuations in catch levels and undesirable quality variations in order to improve the earnings of the entire industry?
Groundfish In 1980 the export value of Canadian groundfish products was $460 million. Most of market it was shipped from the east coast. Cod accounted for 60 per cent of the exported overview worth. The domestic and U.S. markets are the major markets for Canadian cod and
other groundfish. Although these have always been the largest markets for Canadian groundfish, there have been increasing sales to Europe in recent years, particularly additional sales of fillets to the United Kingdom and of wet saltfish to Portugal (Table 6.1).
Together, Canada and the United States consume over 80 per cent of the Canadian groundfish sold, including 72 per cent of the cod. Canadian performance in the U.S. market has been extremely strong in recent years. Between 1977 and 1981 Canada's share of fillet imports to the United States increased from 41 per cent to 60 per cent (Table 6.2). The drop in U.S. imports of Canadian fillets in 1980 can be attributed largely to the work stoppage in the Newfoundland fishery. This drop does not mean that consumption declined; rather, U.S. inventories were reduced to cushion the effect.
The U.S. industry produces virtually no groundfish blocks. As a result, their process-ing industry, which makes fish sticks and fish portions, is totally dependent on imported blocks. Approximately 45 per cent of the imported blocks are made of cod. Alaska pollock accounts for 17 per cent and haddock for 10 per cent.
The decline in the imports of blocks after 1979 (Table 6.3) is a manifestation of two factors. There has been a strong shift in consumer preferences away from the 'heavy' breaded and battered products made from blocks and toward lighter, more 'natural'
Table 6.1
Markets for Canadian Groundfish (% of product weight)
Groundfish
1977 1980
Canada 29 22 U.S.A. 63 59 European Economic Community 1 6 Other Countries in Western Europe (especially Iberia) 1 7 Other Countries 6 6
100 100
000 tonnes 170 231

130
Task Force on Atlantic Fisheries
Table 6.2
U.S. Imports of Fillets by Country of Origin, 1977-1981 (% of total U.S. imports)
1977 1978 1979 1980 1981
% % % % % Canada 41 47 49 47 60 Iceland 26 27 32 34 25 Norway 7 6 3 5 3 Denmark 8 5 4 3 3 Japan 13 11 8 10 8 Others 6 4 3 2 2
100 100 100 100 100
Total (000 t) 142 148 152 133 155
Source: Fisheries of the United States, U.S. Department of Commerce.
products, primarily fresh and frozen fillets. In addition, the increasing reliance on lower quality pollock, whiting and hake has contributed to a rejection of this product form by retail consumers.
Canada's share of the U.S. block market rose from 21 per cent in 1977 to 34 per cent in 1981. Shipments increased from 36,000 t to 53,000 t in 1981. During the same period all other major suppliers of blocks saw their exports to the U.S. decline in both total shipments and market share.
In response to these changing market opportunities, the product mix of Canada's Atlantic groundfish industry changed over the period between 1977 and 1981. The major changes were an 11 percentage point shift toward the production of salted products and a 19 percentage point shift out of cod blocks and into fresh and frozen fillets (Table 6.4).
These data on shifts in the composition of products and changes in the countries in which they are sold indicate a substantial degree of flexibility in the industry. How-
Table 6.3
U.S. Imports of Blocks by Country of Origin, 1977-1981 (% of total U.S. block imports)
1977 1978 1979 1980 1981
Canada 21 25 30 36 34 Iceland 16 16 18 18 14 Republic of Korea' 11 13 16 12 12 Denmark 18 15 8 5 8 Norway 12 11 5 6 8 Argentina 2 N/A 7 7 5 3 Greenland 3 5 5 4 4 Others N/A 8 11 14 16
100 100 100 100 100
Total (000 t) 175 184 185 152 156
'Mostly Alaska Pollock. 2Mostly hake/whiting. Source: U.S. Department of Commerce, compiled by Marketing Directorate, Department of Fisheries and Oceans (here-after cited as Deo).
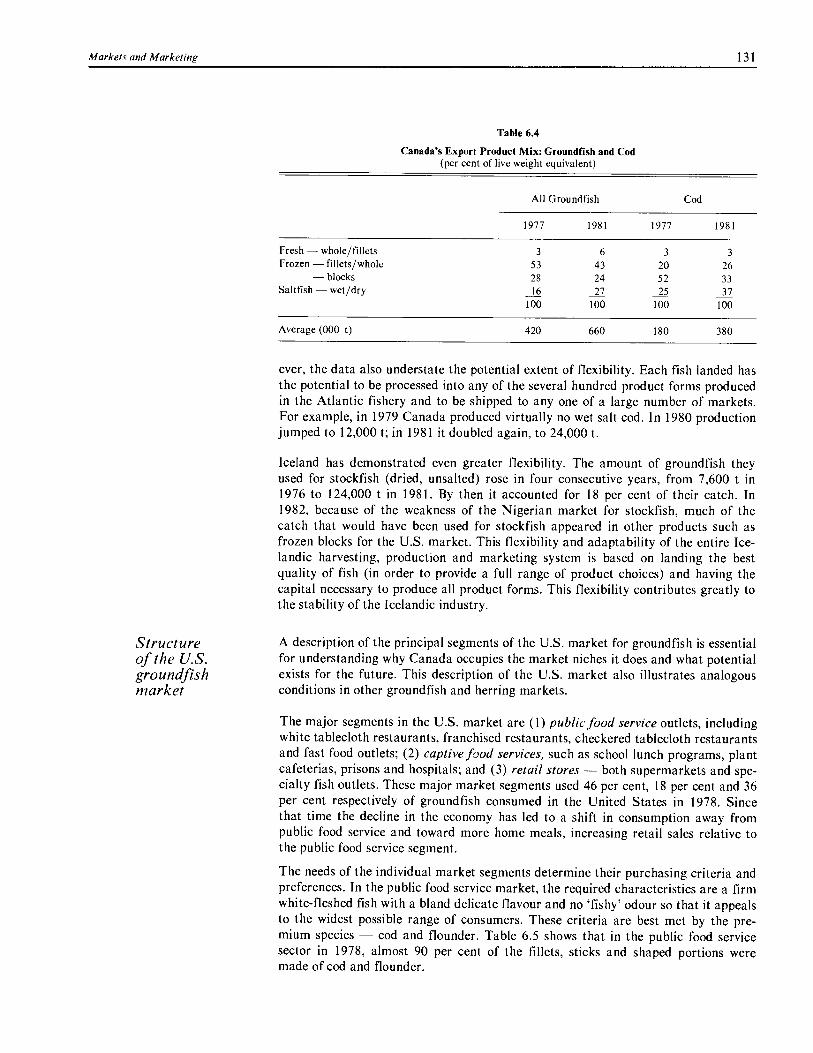
Markets and Marketing
131
Table 6.4
Canada's Export Product Mix: Groundfish and Cod (per cent of live weight equivalent)
All Groundfish Cod
1977 1981 1977 1981
Fresh — whole/fillets 3 6 3 3 Frozen — fillets/whole 53 43 20 26
— blocks 28 24 52 33 Saltfish — wet/dry 16 27 25 37
100 100 100 100
Average (000 t) 420 660 180 380
ever, the data also understate the potential extent of flexibility. Each fish landed has the potential to be processed into any of the several hundred product forms produced in the Atlantic fishery and to be shipped to any one of a large number of markets. For example, in 1979 Canada produced virtually no wet salt cod. In 1980 production jumped to 12,000 t; in 1981 it doubled again, to 24,000 t.
Iceland has demonstrated even greater flexibility. The amount of groundfish they used for stockfish (dried, unsalted) rose in four consecutive years, from 7,600 t in 1976 to 124,000 t in 1981. By then it accounted for 18 per cent of their catch. In 1982, because of the weakness of the Nigerian market for stockfish, much of the catch that would have been used for stockfish appeared in other products such as frozen blocks for the U.S. market. This flexibility and adaptability of the entire Ice-landic harvesting, production and marketing system is based on landing the best quality of fish (in order to provide a full range of product choices) and having the capital necessary to produce all product forms. This flexibility contributes greatly to the stability of the Icelandic industry.
Structure A description of the principal segments of the U.S. market for groundfish is essential of the U.S. for understanding why Canada occupies the market niches it does and what potential groundfish exists for the future. This description of the U.S. market also illustrates analogous market conditions in other groundfish and herring markets.
The major segments in the U.S. market are (1) public food service outlets, including white tablecloth restaurants, franchised restaurants, checkered tablecloth restaurants and fast food outlets; (2) captive food services, such as school lunch programs, plant cafeterias, prisons and hospitals; and (3) retail stores — both supermarkets and spe-cialty fish outlets. These major market segments used 46 per cent, 18 per cent and 36 per cent respectively of groundfish consumed in the United States in 1978. Since that time the decline in the economy has led to a shift in consumption away from public food service and toward more home meals, increasing retail sales relative to the public food service segment.
The needs of the individual market segments determine their purchasing criteria and preferences. In the public food service market, the required characteristics are a firm white-fleshed fish with a bland delicate flavour and no 'fishy' odour so that it appeals to the widest possible range of consumers. These criteria are best met by the pre-mium species — cod and flounder. Table 6.5 shows that in the public food service sector in 1978, almost 90 per cent of the fillets, sticks and shaped portions were made of cod and flounder.
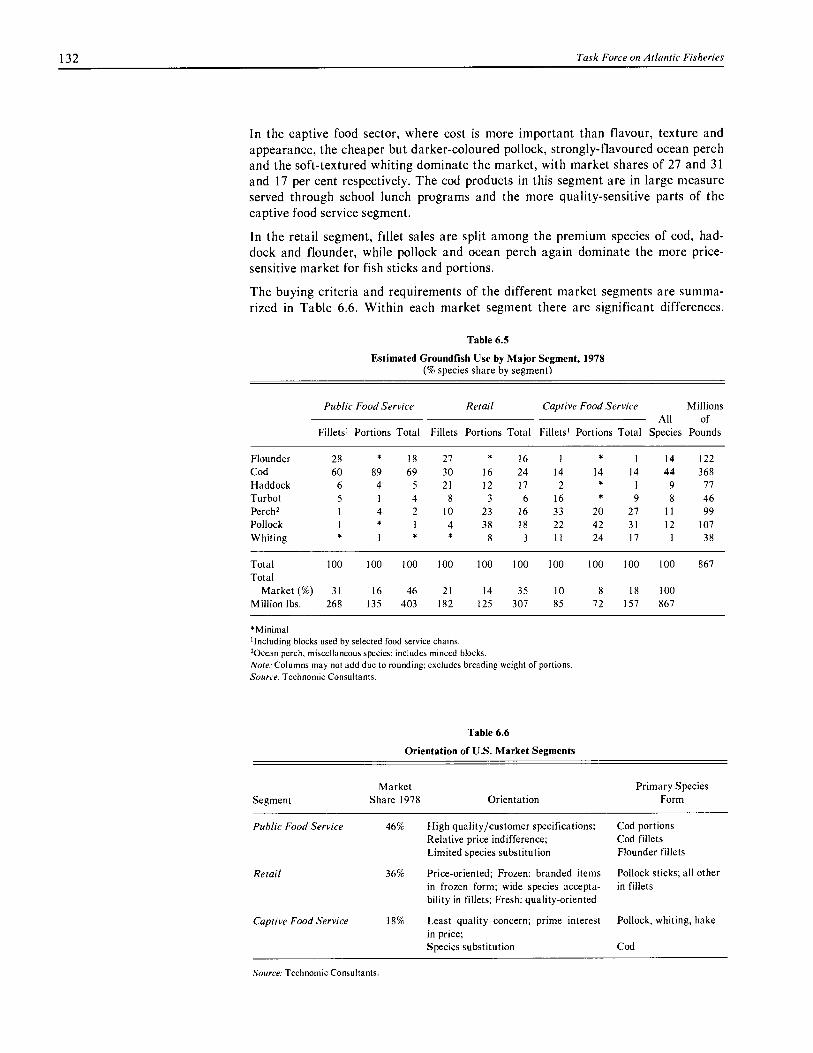
132
Task Force on Atlantic Fisheries
In the captive food sector, where cost is more important than flavour, texture and appearance, the cheaper but darker-coloured pollock, strongly-flavoured ocean perch and the soft-textured whiting dominate the market, with market shares of 27 and 31 and 17 per cent respectively. The cod products in this segment are in large measure served through school lunch programs and the more quality-sensitive parts of the captive food service segment.
In the retail segment, fillet sales are split among the premium species of cod, had-dock and flounder, while pollock and ocean perch again dominate the more price-sensitive market for fish sticks and portions.
The buying criteria and requirements of the different market segments are summa- rized in Table 6.6. Within each market segment there are significant differences.
Table 6.5
Estimated Groundfish Use by Major Segment, 1978 (% species share by segment)
Public Food Service Retail Captive Food Service All
Species
Millions of
Pounds Fillets' Portions Total Fillets Portions Total Fillets' Portions Total
Flounder 28 * 18 27 * 16 1 * 1 14 122 Cod 60 89 69 30 16 24 14 14 14 44 368 Haddock 6 4 5 21 12 17 2 * 1 9 77 Turbot 5 1 4 8 3 6 16 * 9 8 46 Perch 2 1 4 2 10 23 16 33 20 27 11 99 Pollock 1 * 1 4 38 18 22 42 31 12 107 Whiting 1 * * 8 3 11 24 17 1 38
Total 100 100 100 100 100 100 100 100 100 100 867 Total
Market (%) 31 16 46 21 14 35 10 8 18 100 Million lbs. 268 135 403 182 125 307 85 72 157 867
*Minimal.
'Including blocks used by selected food service chains.
2Ocean perch, miscellaneous species; includes minced blocks.
Note: Columns may not add due to rounding; excludes breading weight of portions.
Source: Technomic Consultants.
Table 6.6
Orientation of U.S. Market Segments
Segment Market
Share 1978 Orientation Primary Species
Form
Public Food Service 46% High quality/customer specifications; Cod portions Relative price indifference; Cod fillets Limited species substitution Flounder fillets
Retail 36% Price-oriented; Frozen: branded items in frozen form; wide species accepta-bility in fillets; Fresh: quality-oriented
Pollock sticks; all other in fillets
Captive Food Service 18% Least quality concern; prime interest in price;
Pollock, whiting, hake
Species substitution Cod
Source: Technomic Consultants.

Markets and Marketing 133
The companies that are most successful in supplying each niche or segment tend to specialize. For example, two Icelandic companies have specialized in serving a large but relatively narrow segment of the U.S. market, concentrating on a sub-segment of public food service. Their specialty has been franchised restaurants, such as Long John Silver, and more expensive 'white tablecloth' restaurants.
The significance of individual market segments and product forms for different spe-cies is shown in Table 6.7. For example retail sales, which account for 35 per cent of the total market, took 68 per cent of the haddock, 48 per cent of the perch and 41 per cent of the flounder. The 340,000 public eating places in the United States were particularly important markets for the premium species, using 75 per cent of the cod, 28 per cent of the haddock, 58 per cent of the flounder and 30 per cent of the turbot. These are the species exported primarily by Canada and Iceland to the United States. An estimated 150,000 captive food service outlets took substantial quantities of fillets of the so-called less desirable species such as pollock (46 per cent) and whit-ing (69 per cent).
Chain restaurants, which account for about 40 per cent of public food service fish sales, have very specific requirements for the fish they buy and the services they demand from their suppliers. An essential ingredient in the operation of a chain of franchised restaurants is developing and maintaining a consistent image or 'personal-ity' among different outlets in the chain and over time. This image pervades all aspects of the firm's operations, from the uniforms of the staff to the design of the building to the standardized preparation of the food. These initial investments are then supported by major advertising and promotion investments. In this setting two aspects of the quality of the fish served are critical: the fish must be of high quality (firm texture, free of bones, fresh taste, no off-odour) and it must be of high quality consistently. Consistent high quality is an essential element of the image of most suc-cessful chains, and they need it if they are to sustain the prices they charge.
Consistency is essential because these restaurants rely on repeat business; the fran-chised restaurants' strategy is to take the surprise out of dining out. Chain restau-rants and their customers are willing to pay a premium in exchange for a guarantee of consistently high quality product.
The larger franchised restaurants have detailed specifications for the fish products they purchase. Each shipment of fish from a supplier is subject to comprehensive testing to ensure compliance with these standards. Rejected shipments are immedi-ately returned. This creates another critical purchasing criterion — guaranteed sup-ply of a specified quality when needed. Particularly for seafood specialty restaurants, which sell a large proportion of the groundfish consumed through the public food service sector, a guaranteed year-round supply is essential. To cater to this need, sup-pliers must maintain large inventories and they must be close to the buyer. Serving the smaller, more expensive white tablecloth restaurants requires a widespread net-work of brokers who can make fast deliveries as required. Good distribution channels and continuity of supply are thus essential competitive factors that must be added to the ability to meet customer demands for high quality and consistency.
Canada's In 1979, Canada supplied 24 per cent of the groundfish flowing into the public food niches service segment of the U.S. market, 35 per cent of that going to the captive food ser- in the U.S. vice segment, and 43 per cent of groundfish products sold in the U.S. retail market. market
Within these segments, Canadian fish processors have specialized in the middle qual- ity, more price-sensitive parts of the market, which might be called the 'value-for- money' niche. It is composed of the middle to lower end of the public food service

134
Task Force on Atlantic Fisheries
Table 6.7
Estimated U.S. Groundtish Use by Product Type, 1978 (per cent of total market for each species)
Species
Fillets' Portions, Sticks
Total Millions All of
Markets Pounds
Public Food
Service Retail
Captive Food
Service Total
Public Food
Service Retail
Captive Food
Service Total
Flounder 58 41 1 100 * * * 100 122 Cod 43 14 3 60 32 5 3 40 100 378 Haddock 21 49 3 73 8 19 * 27 100 77 Turbot 28 30 30 89 2 9 * 11 100 46 Perch 2 2 19 28 49 6 29 15 51 100 99 Pollock 4 6 18 28 * 44 28 72 100 107 Whiting * 24 24 5 26 45 76 100 38 Total
Market (%) 31 21 10 62 16 14 8 38 100 867 Million lbs. 268 182 85 535 135 125 72 332 867
*Minimal. 'Including blocks used by selected food service chains. 2Ocean perch, miscellaneous species; includes minced blocks. Note: Columns may not add due to rounding; excludes breading weight of portions. Source: Technomic Consultants.
segment, the top end of the captive food service segment and the retail market. By contrast, Iceland's strategy has been to exploit the comparative advantages of its domestic fisheries policies and the quality-conscious attitudes of its fishermen, plant workers and management by focusing on the quality-sensitive top end of the public food service trade. Argentina and Korea sell mainly to the least quality-conscious and most price-sensitive sub-segments of the captive food service and retail markets.
The concentration of buyers in the Canadian-dominated parts of the market is rela-tively low, and outlets are geographically dispersed. Fish for these outlets tends to flow through brokers* who sell not only fish but also a variety of other foods to the same buyers. This helps to keep distribution costs low.
In these Canadian-dominated segments, buyers are interested in standard 'com-modity' products and will not pay higher prices for products of better or more con-sistent quality. Their orientation is toward lower costs and acceptable quality. Buyers will often substitute one groundfish species for another if the price is right par-ticularly buyers for captive food services. They may also substitute cheaper kinds of protein such as chicken, beef and pork, creating yet another kind of competition with Canadian groundfish products. Recent low prices for hake, Pacific pollock, whiting, chicken, beef and pork have increased this tendency to substitute, thus limiting the scope for increasing the price of Canadian groundfish. Increases in the value of the Canadian dollar against the currencies of our major competitors have also limited the profitability of selling into the markets or market segments to which Canadian processors have directed their marketing efforts. (See Tables 5.13 and 5.14, pp. 93-94.)
Iceland has followed a different strategy. Iceland's presence in the U.S. market for frozen cod fillets is sizeable; in 1978 it accounted for 30 per cent of cod supplies. Virtually all of that product went to the public food service sector, where it accounted for roughly 45 per cent of supplies. Iceland has also specialized in meeting the product
* A broker is a firm or individual who arranges for the sale of the product but does not normally take title to the product. They usually operate on commission. Brokers do not process or change the form of the product.

Markets and Marketing 135
Table 6.8
Groundfish Blocks: Buyers' Perceptions of Quality Differentials by Country of Origin
Country of Origin Block
Geometry Perceived
Quality of Fish Availability Cost
Iceland/Greenland High High High High
Scandinavia High High Very Low High
Canada Medium Medium High Medium
South America Low Low Very High Low
Japan/Korea Medium Low Medium Low
Source: Technomic Consultants.
and delivery needs of the franchised and white tablecloth restaurants by developing a broker network and providing customer services such as guaranteed supply, quality assurance and rapid delivery. This strategy has been supported by a substantial and continuing advertising program designed to differentiate its products and services from those of its major competitors.
As a result of this strategy, and the fact that it produces quality products, Iceland has succeeded in concentrating its presence in the high-quality, higher-price segment of the U.S. public food service market. It is estimated that in 1978, Iceland sold as much as 75 per cent of all frozen cod purchased by franchised and white tablecloth restaurants in the United States. This large market share — along with limited actual and potential direct competition, their program to establish differentiation based on quality and services, and their ability to restrict the total volume of Icelan-dic products sold in the United States — appears to have provided Iceland with some market power in this U.S. market segment. In other countries, such as the USSR, which took 15 per cent of Iceland's frozen groundfish in 1981, their strategy is based on other factors. This strategy of treating various national markets differently facili-tates building a 'quality image' in selected markets such as the United States.
The orientation of the different suppliers, as perceived by the buyers, is shown in Table 6.8, which provides an assessment of groundfish blocks.
The differences in the U.S. market segments served by Canada and Iceland have existed since at least the late 1960s. Throughout the period Iceland has received higher average prices in the U.S. market than have Canadian suppliers. There has been repeated debate as to why Icelandic and other Scandinavian suppliers of fillets were able to command higher prices than could Canadian producers.
Two major studies conducted in the early 1970s came to apparently different conclu-sions. One stated that the lower prices for Canadian products were in large measure the result of inferior quality.' The other concluded, on the basis of a survey, that U.S. customers were satisfied with Canadian quality and attributed the differences in prices to the fact that Canada and the Scandinavians serve different market seg-ments. 2 In particular, Coldwater of Iceland was identified as having developed a dis-tribution system to specialize in supplying the fast food sector of the public food ser-vice market. Canadians were reported not to be interested in this market segment. Today, Canadian processors are clearly interested in serving the higher priced, qual-
' J. John, "Atlantic Coast Groundfish Marketing", a background study prepared for the Department of Regional Eco-nomic Expansion, June 1970.
2 K. Brewer, "The Canadian East Coast Groundfish Industry", PhD thesis submitted to McGill University, 1972.
136 Task Force on Atlantic Fisheries
ity-conscious fast food market. However, they have succeeded in selling only 10 to 20 per cent of their fillet products to these customers.
A recent study for the Department of Fisheries and Oceans concluded that Canada's U.S. customers felt that 90 per cent of the product they received was 'grade A' (although the precise definition of this designation was not clear).' This degree of customer satisfaction helps to explain the rapid increase in Canada's sales to the United States; Canada's share of U.S. groundfish imports rose from 41 to 60 per cent for fillets and from 21 to 34 per cent for blocks between 1977 and 1981. How-ever, some U.S. buyers are still not fully satisfied with Canadian quality levels and consistency.
In effect, the 1968 situation continues today. In general, Canada and Iceland serve different customers and market segments with their own special needs. As a result, there are identifiable differences in final product standards, channels of distribution, services and guarantees provided by suppliers. This set of differences results in a higher price being paid by some customers for Icelandic premium frozen cod fillets.
Much has been made of the apparently substantial and enduring price differentials of 30 to 50 cents per pound, reported in the Boston Blue Sheet, for Icelandic and Canadian boneless cod fillets. However, the significance of this differential has tended to be over-stated. Top quality Canadian cod fillets, which are comparable to the Icelandic products, are sold direct to end users and are not traded on the open market. For this reason, the Blue Sheet does not reflect their price. Canada's traded products consist mainly of a full range of average quality products. By contrast, Ice-land sells only its top quality cod fillets in the U.S. market. As a result, the prices for Icelandic and Canadian products reported in the Boston Blue Sheet compare two distinctly different product lines.
There is nonetheless a price differential of about 15 to 20 cents per pound between similar Icelandic and Canadian cod fillets. This price spread appears to result from the four factors identified earlier: the additional services provided by Iceland (e.g., certainty of supply, based on the maintenance of large inventories, and guaranteed delivery of consistently high quality products); the program of advertising to dif-ferentiate their products and services from those of their competitors; the market power they derive from their dominant position in their market niche; and an ability to limit the volume of Icelandic product sold into that niche.
It should be noted, however, that despite the higher prices Iceland receives for its quality cod fillets, the higher cost of producing and marketing these products has resulted in losses for Iceland's processors. Among frozen fish processors there were no net profits over the period between 1975 and 1979. In 1979, net profits were .4 per cent of sales. There were losses amounting to 5.6 per cent of sales in 1980 and 5 per cent of sales in 1981. Another factor to be taken into account when interpreting the significance of the price differential on premium cod fillets is that in other fresh and frozen groundfish products, Canada's prices and quality are generally compa-rable to, and often higher than, those of our competitors, including Iceland.
The price received for top quality cod fillets sold to U.S. white tablecloth and fran-chised restaurants is closely linked to the volume of product supplied to that market niche. In this context, it is significant that the percentage of the Canadian cod catch that goes into top quality products remains relatively small. It is encouraging, how-
3 Longwoods Research Group Limited, "A Study to Determine the Impact of a Quality Grading Program for Groundfish in the U.S. Market", March 1981. Prepared for the Department of Fisheries and Oceans.
Markets and Marketing
137
ever, that a number of Canadian firms are now selling increasing quantities to pre-mium public food service outlets.
Given the enduring price differential for average quality cod fillets, why have Canadians not responded more aggressively to the apparent opportunity to supply higher priced products for franchised and white tablecloth restaurants? In part, this is because producing higher priced products entails higher costs and hence a more limited profit potential. However, the fact that Canadian processors produce rela-tively low volumes of the highest quality cod products is largely the result of barriers that are unrelated to marketing or profitability. These barriers are domestic in origin and are discussed in more detail in Chapters 14 and 15. The sources of the problems are complex and of long standing; they include factors such as the volume mentality; the skills of fishermen and processors, which often result in handling procedures that are not optimal for producing top quality food; the extreme seasonality of catches, including heavy catches of smaller fish during the warmest weather; and competition for fishermen's loyalty, which leads processors to pay top prices for landed fish regardless of quality.
Conclusion: To recap, Canadian groundfish processors have dominated a market niche that is market located between the premium quality segments — supplied by Iceland, Norway and structure the United States (in the case of fresh fillets) — and the lower quality species and and the products — supplied by Argentina and Korea. The premium suppliers serve the Canadian white tablecloth and franchised restaurants with the same premium groundfish spe- niche cies (halibut, haddock, sole, cod) that Atlantic Canada exports. The suppliers of less
desirable species (Alaskan pollock, South American hake and whiting) serve the retail, captive food service and the lower end of the public food service segments.
For the first group, the use of preferred species, combined with superior handling, ensures that a large proportion of their catch is made into top quality expensive products. These first-grade products are then directed to quality-sensitive markets where, in conjunction with superior customer services, they generate higher prices. The second group of competitors uses low-cost labour and efficient harvesting and freezing methods to supply very inexpensive foods.
Canadian processors have adopted, at least implicitly, a middle course, employing a volume strategy for harvesting and processing to minimize cost, and have supplied middle-priced premium species to the market segments that are more price-conscious than quality-conscious. There are significant exceptions to this conclusion. Many individual Canadian fishermen, processors and exporters have specialized success-fully in top quality cod products, and Canada also occupies premium quality, high price niches for several other species.
Nevertheless, it is fair to say that the bulk of Canadian groundfish exports are best characterized as commodity products. The blocks, fillet packs and saltfish of one Canadian processor are not substantially different from those of another. The processors all handle the same species and sell into the same market segments. There is relatively little advertising by individual firms because the buyers of Canadian products know that the products do not vary significantly. The larger buyers in the quality-sensitive markets conduct rigorous tests to ensure that the products received meet their specifications. As a result, advertising can have only a limited effect on these buyers.
On the other hand, significant and identifiable differences do exist in the products and services offered by the Scandinavians and Canada. Canada's ability to supply the higher priced cod market appears to be limited primarily by domestic factors that constrain its ability to supply sufficient volumes to meet the demand on a con-
138
Task Force on Atlantic Fisheries
sistent guaranteed year-round basis. However, even if Canadian suppliers are able to develop the ability to provide substantial additional volumes of quality cod products, Iceland's long established presence — and their marketing strategy — will make it extremely difficult for Canada to win a significant share of their market niche while maintaining acceptable profits.
In terms of overall marketing performance, Canadian groundfish exporters have had some remarkable achievements. In our major market, the United States, Canada's share of the fillets imported has risen from 41 to 60 per cent. This was accomplished by winning markets from all other exporters, including Iceland. Similarly, Canada's share of U.S. block imports has risen from 21 to 34 per cent. At the same time, the proportion of industry sales to Europe has grown by five percentage points, despite increasing trade barriers and adverse changes in exchange rates.
Nature of The purpose of this section is to describe the market structure within which Canada's the Market east coast groundfish processors operate. The discussion focuses primarily on the for Atlantic U.S. market as the principal outlet for Canadian products. We examine the concen- Groundfish tration of buyers and sellers and the position of principal competitors in significant
market niches. On this basis, we can assess the potential benefits of various market-ing strategies and the organizational structures required to implement them.
Concentration of sellers
Frozen groundfish
Fresh groundfish
Over the last decade, the size and alleged fragmentation of Atlantic seafood market-ing have been the subject of debate. Studies in the early 1970s concluded that Canadian firms were 'price-takers' in international markets, that the Canadian industry had insufficient forward integration into the U.S. market relative to our competitors, and that the buyers of Canadian products were relatively concentrated. 4
The studies just mentioned provided data on the concentration and organization of Canada's marketing efforts in the late 1960s that can be used to assess the extent of change since then. In 1968, approximately 45 to 50 sellers exported groundfish from Canada to the United States. These exporters sold mostly their own products but also sold the products of smaller processors. The six largest companies accounted for just over 50 per cent of total groundfish sales. The ten largest accounted for 70 per cent of sales.
Ten years later, in 1978, the concentration of production had increased, and more small firms were relying on the larger firms to market their products. 5 The top four firms (National Sea Products, Fishery Products, H.B. Nickerson & Sons and The Lake Group) marketed almost 70 per cent of all Atlantic Canadian groundfish and processed just under 63 per cent of the total. 6 The top four also marketed about 90 per cent of all frozen fillets produced and 85 per cent of the frozen blocks. (For the top eight firms, the figures were 98 and 96 per cent respectively.) The concentration in frozen groundfish products is higher than the concentration in total sales because the latter include substantial sales of saltfish by the Canadian Saltfish Corporation. In addition, a substantial proportion of Canada's dried saltfish and fresh fish sales are made by small and medium-size processors in southwest Nova Scotia.
The market for fresh groundfish has traditionally consisted of exports from Nova Scotia to the United States. This was the result of significant transportation advan- tages and the relatively consistent availability of products throughout the year.
J. John, K. Brewer, op. cit.
5 M. Shaffer and Associates, "Structure, Behaviour and Performance of the Atlantic Groundfish industry with Special Reference to the Quality Improvement Program", prepared for DFO, June 1981.
6 M. Shaffer and Associates, op. cit.

Markets and Marketing 139
Much of the product was supplied by a large number of small and medium-size independent processors and 'tailgate' processors who simply exported whole or headed and gutted fish. With declines in the price of frozen products, and better planning as a result of the enterprise quota experiment this year, the larger firms have been selling increasing volumes of fresh fish to U.S. and Canadian cities. The low capital requirements and the well developed U.S. auction system have resulted in low concentration among Canadian fresh fish exporters. This trade has for several years generated the highest profit margins in the groundfish business.
Saltfish The Canadian Saltfish Corporation (csc) is required to purchase all saltfish pro-duced by fishermen in Newfoundland, Labrador and Quebec on the north shore of the Gulf. By law, all production of saltfish by fishermen and processors in these areas must be sold through the csc. The csc is not, however, required to purchase saltfish from processors.
Until recently, the larger processing firms operating in this area have been reluctant to sell saltfish through the csc. Because all sales must be made through the csc, processors have not produced significant volumes of salted products. The result is that the presence of the 'Big 4' processors in saltfish production in Newfoundland is much less than in Nova Scotia.
In terms of marketing concentration, in 1981 the four largest saltfish exporters, including the csc, exported 73 per cent of all Atlantic Canadian saltfish. The eight largest exported 88 per cent of salted products. The top exporters in the wet saltfish market are not the same firms as the top exporters in the dry saltfish market, but the concentration of exporters is estimated at 89 per cent for wet and 75 per cent for dry saltfish.
Newfoundland: fresh and frozen
Newfoundland has experienced the most rapid growth in harvesting and processing of any Atlantic province since 1977, and its marketing arrangements for fresh and frozen products appear to have undergone the greatest evolution. At present, there are 220 fish processing licence holders in Newfoundland; 153 are for groundfish. Production in the plants owned by the four large firms (National Sea Products, Fish-ery Products, The Lake Group, H.B. Nickerson) accounts for approximately 80 per cent of Newfoundland's output of fresh and frozen products. The major firms also buy fish from other processors and/or market the products of other Newfoundland plants. Approximately 10 per cent of Newfoundland production and marketing is done by marketing consortia or groups composed of small firms.
A recent study by the Newfoundland Fishing Industry Advisory Board summarized developments in this way:
During the 1960s and the early 1970s most of the smaller plants sold all their groundfish products to one of the four major fish companies, either on consignment, deal-to-deal contract or a commission basis. Although not as dependent, the medium sized plants also sold a good portion of their groundfish to the same companies, especially their frozen cod blocks. However, they also sold direct to brokers, primarily in the U.S.A.
Over the past five years, but especially during the last two, most of the small and medium size plants have become less dependent upon the four major companies and are now marketing more of their own products either direct to end users or through brokers or commissioned agents. They still continue to use the major companies but usually only on a deal-to-deal basis or through co-packaging arrangements. At present over 40 medium and small fish plants (26 per cent) are either part of an existing or proposed marketing consortium or group or have
140
Task Force on Atlantic Fisheries
other organized marketing arrangements with major brokers or the initially integrated companies.'
Comparative size of sellers
Suppliers' share of market niches
In summary, Newfoundland's production and marketing of groundfish products is more highly concentrated than that of Atlantic Canada as a whole. However, there is a trend among smaller firms toward establishing export marketing consortia separate from the large firms; this ensures that these smaller producers will have access to an independent marketing capability.
Judging by the situation just described, it certainly cannot be concluded that the marketing efforts of the east coast groundfish industry are excessively fragmented. The largest Canadian firms have for some time been about the same size as compa-rable international competitors. However, Canadian firms tend to have wider prod-uct lines, encompassing more than groundfish. This can be an advantage in dealing with customers who appreciate one-stop shopping. But Canada's competitors, who exhibit large scale in a narrow line of products, may have advantages when dealing with customers with special needs and in achieving economies of scale in processing, advertising, transportation and inventory management.
National Sea Products, with sales of $314 million in 1981, is the largest seafood processor and sales organization in any of the North Atlantic countries. The market-ing organization resulting from the merger of the marketing activities of H.B. Nick-erson & Sons and National Sea Products will have sales more than twice those of Frionor, its next largest competitor. Fishery Products and The Lake Group are smaller than their international rivals and rank fifth and seventh respectively among comparable Canadian, Icelandic and Norwegian firms.
The size of Canada's groundfish processing and marketing organizations relative to similar competitors suggests that they should not be unduly handicapped by insuffi-cient scale. But much of the debate in recent years has focused on the higher concen-tration and greater co-ordination of export marketing in Iceland and Norway. In Ice-land, for example, just two organizations export all frozen groundfish. Frozen groundfish from Norway is exported primarily by three main groups, Frionor, Nes-tle-Findus (a multi-national firm) and the Nordic Group. Norway also has a large number of smaller independent traders and brokers who are permitted to sell in 'free markets'.
Iceland exports saltfish through one organization, the Icelandic Fish Producers. Norwegian saltfish is sold by a large number of exporters, but one organization, UNIDOS, is designated to deal in markets with single buyers (state buyers). Saltfish exporters co-ordinate their efforts through compulsory membership in the Saltfish Exporters Association. The Association in turn reports to a government-appointed export committee for saltfish, which licenses exporters.
Precise and comparable measures of the concentration and co-ordination of market-ing in these countries are not available. It is evident, however, that Iceland's market-ing is the most concentrated. In Norway, concentration is clearly less marked than in Iceland and is probably comparable to the Canadian situation. Norway does, how-ever, have substantially more institutional provisions for co-ordination and an ability to grant monopoly selling power in selected markets for particular products.
The debate on degrees of fragmentation has not dealt adequately with the relation-ship between profitability and concentration or market share.
7 Fishing Industry Advisory Board, "Present Markets Structure of the Newfoundland Fishing Industry", draft working paper, April 1982.

Markets and Marketing 141
The major structural consideration affecting the Canadian industry's profitability is the share of a given market niche it can win relative to its competitors. If Canada does not have a major share of the market niche, or if good substitute products are available, there is little if any chance of raising prices and profits by exercising mar-ket power.
At present, market niches in the groundfish trade are not well enough defined to per-mit definitive analysis. In addition, the exercise of market power is limited not only by the number of existing competitors but also by potential new entrants, so that measures of market share are at best indicative. Higher profits depend on the ability to restrict and regulate the amount of product sold into a market niche in order to raise prices. If this cannot be done effectively, or if new competitors can enter the niche easily, then higher long-run profits will not be feasible regardless of the market share held by one firm. Despite these difficulties, it is essential for Canadian proces-sors to identify and pursue the market opportunities that offer the best potential for improving their profitability.
U.S. frozen groundfish market
The Canadian share of total U.S. groundfish consumption rose from about 30 per cent in 1977 to about 37 per cent in 1981. Canada's largest market shares are in the lower end of the public food service trade, the top end of the captive food service market, and the retail segment. Within these niches, Canada probably supplies up to 50 per cent of the groundfish consumed.
There is substantial actual and potential competition from fresh groundfish supplied by the United States and Iceland and from substitute frozen species supplied by Japan, Korea and Argentina. More important, the strongest competition in these price-sensitive market segments comes from other less expensive proteins such as poultry, pork and hamburger. As a result, Canada's share of the protein consumed in these market segments is much lower than its share of the frozen groundfish market. In the U.S. block market, Canada again accounts for a large share — about 34 per cent in 1981.
Among retail branded products, Canada's direct presence in U.S. supermarkets and retail stores is negligible. U.S. firms are the principal competitors in this segment. In 1978, Mrs. Paul's Kitchen held 28 per cent of the market, followed by Gorton's/Bluewater with 21 per cent and Booth with 7 per cent. Since that time Mrs. Paul's share has declined as Gorton's has grown.
In assessing the financial strength and marketing expertise of these firms relative to that of Canadian processors, it is necessary to consider their ownership. Gorton's is owned by General Mills which had 1981 sales of $4.8 billion. Mrs. Paul's Kitchen was recently acquired by Campbell Soup, which had 1981 sales of $2.8 billion. Conagra, one of the fastest growing integrated food companies in the United States, is reportedly considering buying Booth. Other participants in U.S. retail sales include Stouffer's, owned by Nestle, which in 1981 had sales of $14.2 billion. Thus, in addition to their small share of the retail branded products niche, Canadian firms are also very small compared with the competition.
Iceland supplies a substantial majority, perhaps as high as 75 per cent, of the frozen fish required by white tablecloth and franchised restaurants. Other Scandinavian suppliers probably hold an additional 8 to 10 per cent of this market. Within this sub-segment Canada has traditionally been a major supplier only of flounder, a spe-cies not caught in large quantities by the Scandinavians. Other competition comes from fresh fish supplied by the U.S. domestic industry. In recent years, however, the Canadian share of this market has been increasing as Canadian processors have up-graded the quality of their product.

142 Task Force on Atlantic Fisheries
U.S. fresh groundfish market
Domestic groundfish market
Saltfish
Fresh Atlantic Canadian groundfish is sold primarily in the northeastern United States and eastern and central Canada. Virtually all of the U.S. domestic groundfish catch is sold as fresh fish. In 1981, these U.S. supplies accounted for approximately 90 per cent of all U.S. consumption of fresh groundfish. While Canada has supplied most of the U.S. imports of fresh groundfish, its market share is too small to enable it to exercise market power. U.S. suppliers of fresh groundfish include large numbers of highly competitive small companies and independent fishermen.
Canadian firms supply 84 per cent of our domestic fresh and frozen groundfish needs. Nearly 60 per cent of this amount goes to the food service segments, with 40 per cent going to retail sales. National Sea Products has the major share of the food service segment, followed by Fishery Products. At the retail level, three brands account for 80 per cent of frozen fish and seafood sales. These are Highliner (National Sea), Bluewater (Gorton's) and Rupert (B.C. Packers).
Canada and Norway are the only significant suppliers of dried saltfish, with world market shares of 38 per cent and 59 per cent respectively in 1981. The markets served are determined in large measure by the size of the fish available. Large fish are required for premium quality; most buyers are less interested in small fish.
The Canadian Saltfish Corporation, which controls about 50 per cent of dried salt-fish sales from Canada, receives roughly 60 per cent small fish (as defined by inter-national grading criteria) and, as a result, is constrained to sell primarily to the less developed countries. Its major market is the Carribean. In that market, it faces rela-tively minor competition from Norway and from other Canadian suppliers who sell volumes equal to between 10 and 20 per cent of Canadian dried saltfish production. The balance is produced primarily in Nova Scotia from large cod which yield pre-mium products that are sold by a small number of firms into specialty markets, prin-cipally in the United States. These markets are not served by the csc.
On this basis, it would appear that the csc has significant market power in its niches. The presence of several independent Canadian suppliers of dried saltfish does not appear to limit significantly the market power of either group, because they deal mainly in separate markets.
Wet saltfish production in Canada accounted for 21 per cent of the world trade in 1981. About 90 per cent of the 1981 Atlantic Canadian product was processed and sold by the four largest suppliers (Canadian Saltfish Corporation, National Sea Products, H.B. Nickerson & Sons, Pecheurs Unis du Quebec). In 1981, Portugal accounted for approximately 50 per cent of the world's imports of wet saltfish. Ice-land has 73 per cent of the Portugese market, and Canada has the remainder. In Spain, which accounted for about 15 per cent of world imports of wet saltfish, Canada has 12 per cent of the market. It does not appear that Canada has, or can be expected to have, a dominant position in the major markets for wet saltfish in the near future.
Summary
From the perspective of the domestic economy, the production and export of Atlantic groundfish products is highly concentrated. Over the past decade the degree of con-centration has increased significantly. Recent trends in Newfoundland toward the formation of small independent marketing consortia by independent processors may reduce concentration marginally.
Relative to its principal competitors, Canadian marketing is less concentrated than Iceland's, but about the same as Norway's. However, there are fewer institutional provisions for co-ordination among marketers in Canada. Canadian Atlantic ground-
Markets and Marketing 143
fish marketers do not have size disadvantages when compared with their competitors, except in the U.S. market for retail branded products, where they face world giants.
The extent to which Canadian efforts to compete within certain market niches are fragmented is the critical strategic consideration. In the high quality U.S. restaurant trade, Iceland dominates the market, and Canadian supplies are not yet a significant factor. This concentration may contribute to Iceland's higher prices and foster a desire among buyers to diversify their suppliers.
In the middle quality range of the public food service spectrum, in the captive food service sector and as a supplier to processors of retail products, Canada has the larg-est market share. There is, however, significant actual and potential competition from suppliers of the relatively less desirable groundfish species and from other low cost proteins, particularly poultry. This limits significantly the potential to raise prices and to earn higher profits.
The export of wet and dried saltfish products from Canada is highly concentrated in a very small number of firms. In dried saltfish, the primary competition comes from Norway. In wet saltfish, the major market is Portugal, and the dominant supplier, by a wide margin, is Iceland.
The second characteristic of market structure is the concentration of buyers. Like the foregoing description of seller concentration, the following description of the buyer's side of the groundfish trade treats each market separately.
In 1968, six U.S. buyers (wholesale processors, brokers, wholesale distributors, chains, etc.) bought 60 per cent of all U.S. imports of Canadian blocks and fillets. The top 20 buyers purchased 92 per cent. By 1980, the growth of independent retail and restaurant chains had increased the number of large buyers. In addition, the for-ward integration of the larger Atlantic Canadian processors into the U.S. market significantly reduced the concentration of U.S. buyers of groundfish blocks. There appears to be general agreement that buyer concentration in the U.S. market for frozen fillets and blocks is currently about 40 per cent for the top six customers.
As for buyer concentration among market sectors, products and species, the degree of concentration generally follows the pattern set out in Table 6.9.
This general information, together with our knowledge of Canada's share of the U.S. market, the availability of competitive species, the price sensitivity of buyers, and the concentration of exporters from Canada, suggests that the potential relative market power of fish processors in Atlantic Canada would be greatest for the products shown in Table 6.10.
Table 6.9
Relative Degree of U.S. Buyer Concentration
Degree of Concentration Market Sector Description
Highest
Lowest
Industrial
Retail
Food service (public) Food service (captive)
Wholesale processors of blocks, primarily in New England. Chain stores whose buying is concentrated primarily on the U.S. east coast Restaurant chains throughout the U.S. Institutions served by a large number of distribu-tors throughout the U.S.
Concentration of buyers of groundfish
U.S. fresh and frozen groundfish market
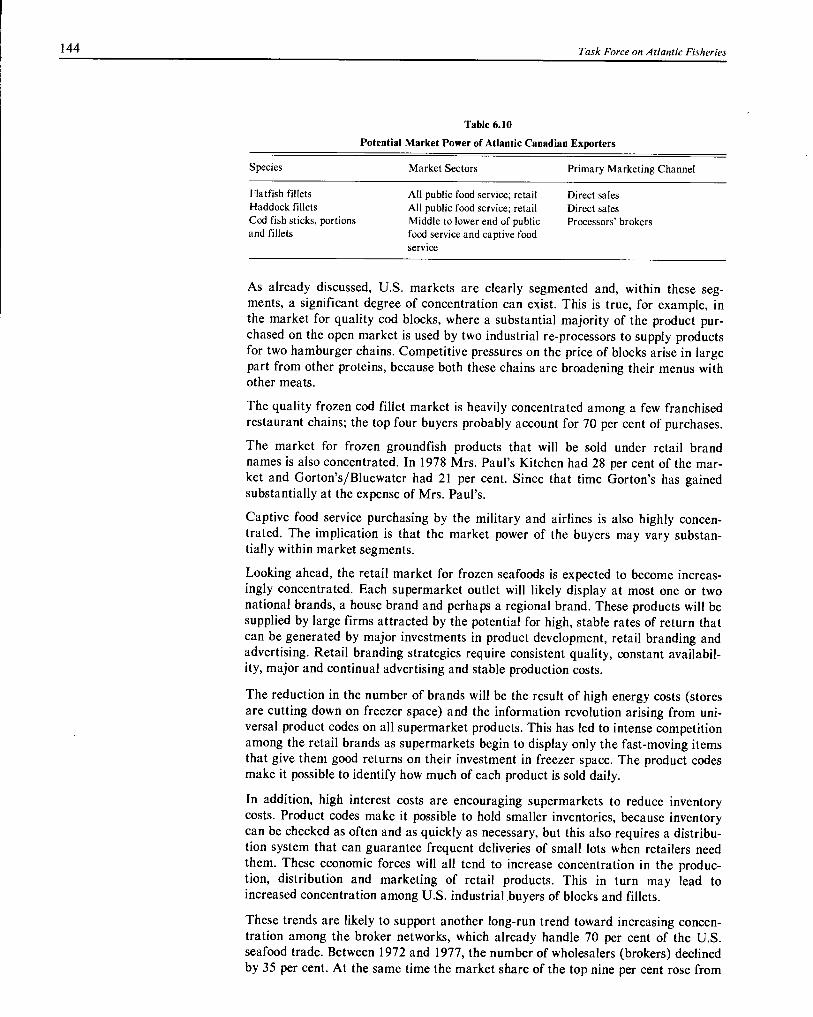
144 Task Force on Atlantic Fisheries
Table 6.10
Potential Market Power of Atlantic Canadian Exporters
Species Market Sectors Primary Marketing Channel
Flatfish fillets Haddock fillets Cod fish sticks, portions and fillets
All public food service; retail All public food service; retail Middle to lower end of public food service and captive food service
Direct sales Direct sales Processors' brokers
As already discussed, U.S. markets are clearly segmented and, within these seg-ments, a significant degree of concentration can exist. This is true, for example, in the market for quality cod blocks, where a substantial majority of the product pur-chased on the open market is used by two industrial re-processors to supply products for two hamburger chains. Competitive pressures on the price of blocks arise in large part from other proteins, because both these chains are broadening their menus with other meats.
The quality frozen cod fillet market is heavily concentrated among a few franchised restaurant chains; the top four buyers probably account for 70 per cent of purchases.
The market for frozen groundfish products that will be sold under retail brand names is also concentrated. In 1978 Mrs. Paul's Kitchen had 28 per cent of the mar-ket and Gorton's/Bluewater had 21 per cent. Since that time Gorton's has gained substantially at the expense of Mrs. Paul's.
Captive food service purchasing by the military and airlines is also highly concen-trated. The implication is that the market power of the buyers may vary substan-tially within market segments.
Looking ahead, the retail market for frozen seafoods is expected to become increas-ingly concentrated. Each supermarket outlet will likely display at most one or two national brands, a house brand and perhaps a regional brand. These products will be supplied by large firms attracted by the potential for high, stable rates of return that can be generated by major investments in product development, retail branding and advertising. Retail branding strategies require consistent quality, constant availabil-ity, major and continual advertising and stable production costs.
The reduction in the number of brands will be the result of high energy costs (stores are cutting down on freezer space) and the information revolution arising from uni-versal product codes on all supermarket products. This has led to intense competition among the retail brands as supermarkets begin to display only the fast-moving items that give them good returns on their investment in freezer space. The product codes make it possible to identify how much of each product is sold daily.
In addition, high interest costs are encouraging supermarkets to reduce inventory costs. Product codes make it possible to hold smaller inventories, because inventory can be checked as often and as quickly as necessary, but this also requires a distribu-tion system that can guarantee frequent deliveries of small lots when retailers need them. These economic forces will all tend to increase concentration in the produc-tion, distribution and marketing of retail products. This in turn may lead to increased concentration among U.S. industrial buyers of blocks and fillets.
These trends are likely to support another long-run trend toward increasing concen-tration among the broker networks, which already handle 70 per cent of the U.S. seafood trade. Between 1972 and 1977, the number of wholesalers (brokers) declined by 35 per cent. At the same time the market share of the top nine per cent rose from
Markets and Marketing 145
Domestic fresh and frozen groundfish market
International saltfish market
45 per cent to 60 per cent. These trends toward greater concentration in the retail and distribution elements of the business will add to the already high degree of con-centration in many segments. In this environment, Canadian processors do not appear to be in a position to exercise significant market power, despite the fact that they are highly concentrated in the domestic context.
In summary, the degree of concentration among U.S. buyers of groundfish products has declined in recent years. However, the market is highly segmented, and buyer concentration exists in key market niches. There are also trends that will likely lead to increasing concentration among suppliers of retail branded products and in distri-bution networks. Thus, Canada is bound to face a more concentrated U.S. market for groundfish.
Groundfish accounts for 40 per cent of Canadian fish consumption. About 60 per cent of all fish and frozen seafood is sold to the food service sector; 40 per cent is sold through retail outlets. Fresh fish is sold in equal amounts to the retail and food ser-vice sectors.
There does not appear to be any significant concentration of buying power in the food service industry in Canada. In the first class hotel dining rooms, which use most of the fresh fish, decisions on the menu, sources of supply and whether to use fresh or frozen products are left to individual chefs. The difference in buyer concentration in the public food service sector between Canada and the United States is the absence of large franchised restaurant chains. The major exception is McDonald's, which is the largest food service outlet in Canada and a significant user of cod blocks. There are no seafood specialty restaurants among the top 50 Canadian food service firms.
At the retail level in 1979, 72 per cent of frozen seafood was sold by the major chains, 19 per cent by the large independents and the remainder by smaller stores. Three brands control 80 per cent of the retail market for frozen fish (Highliner, Bluewater, Rupert). The heavy concentration of suppliers would appear to balance the concentration in the retail chains.
Canada's saltfish markets are more widely dispersed than its fresh and frozen groundfish markets. The concentration can be identified only be examining individual national markets. In the United States, there is marked buyer concentra-tion; a substantial proportion of the sales flows through a small number of broker/traders. In other national markets there is often heavy and growing concen-tration, frequently sponsored by the domestic government. For example, in Jamaica all imports of saltfish are made by a government trading agency, and in Portugal, wet saltfish is imported largely by a government agency.
The extent to which this buyer concentration confers market power is determined largely by the scope for sellers to operate in alternative national markets. Total world saltfish consumption appears to be declining, and this tends to limit the scope for selling in other markets. Thus the trend toward increased concentration among buy-ers is cause for concern.
The Conduct The structure of the groundfish market, which we have described in terms of the
of Canadian principal niches and the concentration of buyers and sellers, can be a basis for under-
Groundfish standing Canada's marketing performance. The purpose of this section is to analyze
Marketing the behaviour of Canadian sellers, principally in the U.S. market. The central issue concerns what has been called orderly (or disorderly) marketing. In particular, we examine the view that there is a great deal of destructive price competition among Canadian exporters.
146 Task Force on Atlantic Fisheries
The presence or absence and the possible causes of destructive price competition have been widely debated in the Canadian fishing industry for at least a decade. Fed-eral spokesmen have expressed concern that "disorderly marketing" and "lack of dis-cipline" among Canadian processors have led to unnecessarily low prices and hence to the loss of revenue and profits for the industry and the Canadian economy as a whole. Industry officials have tended to interpret price competition as a business adjustment that is needed to move the growing volume of Canadian fish in competi-tion with other low-cost suppliers of groundfish and poultry.
It is helpful to divide the problem into its short- and long-run elements — orderly selling and orderly marketing. Price competition is by nature a short-run phenome-non. It concerns prices set in the daily market and is determined largely by the volumes available, the market niches served and the selling practices typical of the market segments. Orderly marketing, by contrast, implies a long-term view, whereby problems are anticipated and plans are prepared and executed. Although the two issues are inter-related, it is useful to consider them separately before drawing con-clusions.
Destructive We use destructive price competition to mean an action taken by one or more price Canadian fish sellers that causes the available Canadian product to be sold at less competition than the profit-maximizing price. The definition recognizes, for example, that some defined processors may find it more profitable to sell products at lower prices in order to
avoid storage and interest costs. In this case, a lower price does not necessarily reflect a loss of profit or income and would not constitute destructive price competition.
In the U.S. market for Canadian fish products, the major potential sources of destructive price competition are as follows:
• insufficient information and expertise about prevailing and anticipated market conditions and prices for particular products in a market segment;
• market power on the part of buyers;
• a business strategy adopted by one Canadian supplier to win a share of the market from another Canadian supplier by price-cutting;
• organizational weaknesses in the Canadian distribution system; and
• a short-run financial crisis that results in unusually large amounts of inventory being sold in a very short period of time.
Insufficient information
Information problems that result in abnormally low prices can arise from four major sources, three of which have similar effects:
1. Single purchase agreements often involve substantial volumes of a variety of spe-cies in many different product forms and/or a variety of delivery or payment terms. As a result the 'price' reported for any one product can be misleading.
2. A Canadian seller who has poor quality control will not know with a high degree of certainty exactly what grade of product he is selling. Processors with a reputa-tion for poor quality control will face buyers who automatically discount their price below that paid to others because of the uncertainty or risk attached to the quality of the purchase.
3. A closely related problem arises when a product is sold as a particular grade and is subsequently reported by the buyer to be of a lower quality. The processor can either take back the product or negotiate a lower price. Because the costs of trav-elling to the location where the product is stored and testing the product can be

Markets and Marketing 147
substantial, it is common to negotiate a lower price by telephone without direct examination. If the buyer is not honest, this can lead to unnecessary price cuts.
4. Maximizing profits requires an ability to adapt and optimize the industry's prod-uct mix in the short run. This is a continual process that requires daily or weekly information, an ability to forecast conditions later in the season when products will reach the market, and instructions from the sales staff to the plant operators on the product mix and pack forms required. These procedures traditionally have not been well refined in the Atlantic fishing industry, largely because of the pro-duction constraints imposed by poor control over the volume, timing and quality of the supply of incoming raw material. The so-called production or volume orientation of the industry is another manifestation of this absence of input con-trol. In addition, with independent firms making product mix decisions, and in the absence of a co-ordinated planning process, it is impossible for Canadian firms to anticipate and plan for the optimum product mix. The time lag between the production decision and the resulting product arriving on the market —which can vary from six weeks to six months — can result in over- or under-sup-ply of particular product forms.
Imbalance of market power
In the first three cases, the basic prices offered are likely to be reported reasonably accurately among the community of buyers and sellers. But the qualifying conditions will not be reflected in these reports, so that the 'true' price of the sale is not accu-rately reported. As a result an incorrect price signal may be sent to other buyers and sellers. Unfortunately, the presence of instability in the setting of prices can be part of a process that may start mini-runs on the market. This is particularly true when a product is known to be in ample supply and when some processors are known to be in a weak financial position.
Insofar as the fourth factor, product mix optimization, is concerned, Figure 6.1 shows a substantial narrowing in recent times of the different prices per pound among Canadian commodity products (e.g., blocks, five-pound bone-in fillets). Because the production cost of each of these packs is roughly similar, the successful maximization of profit margins would lead to converging prices. This is indicated by the trend illustrated in Figure 6.1 and suggests that the industry's ability to optimize its product mix in the short run has improved. The full significance of this trend should be studied in greater depth.
It is evident, however, that an improved ability to co-ordinate production planning on an industry-wide basis could facilitate profit maximization.
Greater market power on the part of buyers can lead to permanently lower prices for fishery products. Our examination of the concentration of buyers and sellers con-cluded that in Canada's major market, U.S. buyer concentration has declined over the last decade while Canadian selling concentration has increased substantially. A Task Force study of this issue concluded that an imbalance of market power was not a significant problem in the U.S. market.
However, as already noted, in some market segments buyers are highly concentrated, and there are trends evident that could increase buyer concentration at both the retail and distribution levels. In some international markets there are single govern-ment buying agencies, although this is more prevalent in saltfish markets than in fresh or frozen groundfish markets. In these cases the balance of market power will tend to rest with the buyer. However, because many national markets are available, the extent of an individual buyer's ability to force lower prices is limited.

140
Figure 6.1 U.S. Mid-month Wholesale Prices for Cod Blocks and Fillets 1979 to 1982
Canada, 5 lb. boneless fillets •••MM•111 Canada, 5 lb. fillets, bone in
m•mm•oomme Average, all countries, cod blocks
130
120
MIR* • It as t 0 • 1
O. *
4111011111L • • #. **
• • •44% 4
4 11% • • • *., i • • , • ..... .
........ .._ • .4,, • • • I ... • •
•
IL • • • • • II■■■ • • • •
P •400111 ■ 1O ■■■111** .• 4/0
Jan. Apr. July Oct. J A J O J A J O J A J 0
1979 1980 1981 1982
Source: Department of Fisheries and Oceans Market Bulletins, as summarized from the Boston Blue Sheet.
Task F
orce on Atlantic F
isheries
110
100
90
80

Markets and Marketing 149
Competition for market share
Price competition to win market share is perhaps the only phenomenon that can truly be called 'destructive' price competition. It can arise in two very different ways. The first occurs as part of a business strategy to build a larger permanent position in a market. The seller may offer 'loss leaders' to gain a foothold, after which normal pricing would be re-established. To be successful and stable in the long run, the firm that initiates the price-cutting strategy must have an enduring structural advantage —such as absolutely lower costs due to superior resource access, technological advantages, or perhaps access to low-cost services supplied by a large parent firm.
Some of the potential margin arising from lower costs may be spent on market share expansion by long-run price reductions. This form of price competition was not found to have been a significant factor in rivalry between Canadian firms. However, Canada's superior resources and ready access to the U.S. market do permit it to har-vest and market groundfish much more cheaply than many traditional suppliers such as Spain and Portugal. This advantage has enabled Canadian suppliers to become the world's largest exporters of seafood.
The second form of price competition to increase market share occurs as part of the inevitable adjustment of price when supply exceeds demand in any market. Sellers will attempt to be first to get out of a falling market and in so doing may accelerate the drop in prices, perhaps under-shooting the price really needed to clear the market in an orderly way. This problem can be exacerbated by the information problems already described.
With regard to the first situation — price-cutting as a strategy to increase market share — it was not found to be significant in the Canadian herring and groundfish trade. This is not surprising, because any sustained effort by a major seller to cut prices would immediately be recognized and countered by the small number of other major sellers in this highly concentrated industry. The futility of the strategy is rec-ognized by all the major processors. A study conducted for the Task Force concluded that there was no evidence that destructive price competition was consciously used to shift market share among Canadian producers.
This is not to say that prices do not fall, particularly during the summer months, when catches are high. However this appears to be a rational process whereby prod-ucts are sold, at a time of low demand, to brokers, traders and clients who absorb the storage costs, interest charges and risks of future price changes. The frequently reported softening of prices in the U.S. market in the summer thus appears to be a reflection of the following factors:
• processors selling some of their products to intermediaries (traders, brokers) and final customers rather than holding it for future sale; and
• lower quality and a lower value product mix as a result of the large volumes of summer product.
The latter effect can be made worse if the Newfoundland inshore fishery experiences a glut year. The additional volume can cause substantially lower prices for the nar-row range of products that can be produced from this fish. The product mix options are restricted because the larger volume of fish must be processed quickly to mini-mize spoilage. This demands simple, easily produced products. In addition, the small average size of fish caught by this fishery and their inherent softness further limit the potential range of products.
The substantial drop in price for these products is due to the fact that all the buyers and sellers have expectations about the normal amount of fish and product forms that will be available and have made plans to accomodate this normal harvest. If the catch is substantially larger than planned, it takes time to adjust and to implement
150
Task Force on Atlantic Fisheries
Commodity price competition and advertising
programs to substitute the product (usually block or skin-on bone-in fillets) for other competitive products. This peak harvest must win a market share from other fish or from poultry suppliers who already have established programs to serve their market segments. The need for the glut to force its way quickly into the market leads to the drop in price, which can be substantial in one season.
Potential marketing solutions are to develop a larger 'trading' capacity to move the excess product or equivalent amounts into markets or segments not served by Canadians — in effect, disrupting the competitors' markets rather than existing Canadian markets. This may require medium-term initiatives to develop new prod-uct forms, trading ability and distribution channels. If the larger catch were an annual event (which it is not), marketing organizations could plan on buying product at a slightly lower price and putting it into new market segments, perhaps perma-nently displacing some pollock, hake or chicken in the diet of North Americans.
The Canadian industry, with notable exceptions, is an industry that specializes in providing large volumes of moderately priced commodity packs of medium and some lower quality products to food service and industrial buyers. The commodities sup-plied by one processor are not significantly different from those of another. As in all commodity markets, where products are not significantly differentiated, the primary competitive tool of the individual firm must be price. Price competition exists because no other form of competition is as effective in selling undifferentiated com-modities. Individual processors cannot gain by advertising their products to commer-cial buyers, because all are virtually identical. Nonetheless, advertising by the indus-try as a whole directed at expanding its share of market at the expense of foreign suppliers of groundfish and other proteins would be helpful.
Price competition is not necessarily bad if prices fall just enough to enable Canadian suppliers to displace other suppliers and capture a share of the market. Canadian processors have been quite successful in their niche; the volume of sales increased by almost 50 per cent between 1977 and 1981. They currently dominate the middle of the U.S. quality market and are expanding into Europe and into the U.S. retail prod-ucts market.
By selling large and growing quantities of product into a limited number of geo-graphic markets and market segments, Canadian sales have become relatively highly concentrated. This can give the impression that Canadians are tripping over each other and competing unnecessarily. If increasing volumes are to be sold without sig-nificant price declines, Canada will have to expand the share of groundfish against other meat proteins in the market niches it dominates and expand into new niches. Efforts to increase per capita consumption of Atlantic groundfish in its market seg-ments will require comprehensive efforts that include promotion, consumer educa-tion, improved quality and cost reductions.
Organization The increasing concentration of Canadian groundfish marketing over the past of Canadian decade has been marked by a substantial increase in forward integration, particu- distribution larly into the U.S. market. In 1968, National Sea Products was the only Canadian
firm with processing facilities in the United States, and only four firms had sales offices there. Now there are nine sales offices representing eight firms. The four major firms have established block re-processing plants or have expanded their exist-ing facilities in the American market. These processing facilities are made necessary by import tariffs. The major firms also opened eight new foreign sales and marketing offices in several other countries between 1977 and 1980. The present problems of the industry have, however, led to a reduction in the number of sales offices abroad. H.B. Nickerson & Sons, for example, recently closed its offices in Spain and West Germany.
Markets and Marketing 151
The international marketing and processing arms of the Canadian majors are play-ing a much more important role in the sales of the industry than in the past. In 1968 virtually all product (except that of Booth and Gorton's which were integrated with U.S.-owned processors) was sold to arm's length buyers, typically on consignment or at 'spot' prices. Only 22 per cent was sold to Canadian-owned distributing houses in the United States. By contrast, the Task Force estimated that in 1981 over 75 per cent of Canadian cod blocks marketed in the United States was shipped to a subsidi-ary of one of the Canadian majors. The Canadian firm sold approximately half the blocks to other processors.
Cod fillets are marketed in a similar manner, with an estimated 80 per cent being sold directly to the U.S. subsidiary of a Canadian processor. This product is then sold through a broad network of marketing participants (42 per cent through com-mission brokers, 20 per cent through institutions). The broker's transaction will typi-cally be negotiated from quotes or prices at the time of sale. Spot pricing arrange-ments appear to be used in about 50 per cent of the U.S. sales.
It can be argued that the potential for orderly selling by Canadians is weakened by the relatively heavy reliance on commission brokers who negotiate prices from quotes given by each of the four major companies. This could arise if the buyer in each community is able to play off the four brokers against each other during negotiations.
Additional limitations can arise from the number of links in the chain that carries the product from the processor to the final consumer. If, for example, the processor's prices drop, it does not necessarily result in declines in prices paid by final customers. Each level in the distribution chain can absorb part of the decline, with the result that there may be very little change at the retail level. This is seen in price move-ments and profit margins at the plant, wholesale and retail levels. These effects exist for virtually all food items. They have been eliminated only where the entire produc-tion, processing and delivery system is regulated through domestic marketing boards.
The foregoing concerns have led some to compare the Canadian system with Iceland's approach to its U.S. brokers, where there is only one broker in each com-munity; he is required to sell at the price specified by the Icelandic sales office. This improves control over one element of the distribution process.
The success of an orderly selling strategy to stabilize and raise prices would depend, in the short run, on the volumes of Canadian product to be sold and on the availabil-ity of other competing products. As already noted, Canada is the dominant ground-fish supplier in its market niche. However, in that niche, buyers are very price-sensi-tive, and substantial substitution takes place with other groundfish species and poultry. As a result, the ability to extract higher prices will be significantly limited. Indeed it can be argued that the relatively low Canadian prices have contributed sig-nificantly to the growth in the Canadian market share in recent years. In the medium term, the critical limiting factors are the possibility of new competition, par-ticularly from Alaska pollock and cod, and the increased use of chicken on public and captive food service menus.
There can be little doubt that Canada is significantly constrained in its ability to raise prices in its market niche while maintaining or increasing the volume of sales. It is also true that a greater degree of control over the pricing behaviour of the brokers, traders, wholesalers and retailers who handle Canadian products could improve the ability of marketers to ensure that price drops at the dockside or plant gate are transmitted through to the critical decision makers (consumers, menu plan-ners, re-processors) in a manner that will increase the volume of sales.
152 Task Force on Atlantic Fisheries
The utility of brokers and traders has been questioned by those who advocate full forward integration. But if traders and brokers did not exist, the same function would have to be served by a new organization; otherwise an existing market would disappear. The fundamental economic issue is the relative efficiency of different organizational means to get the job done. Brokers and traders serve the ultimate buyer by assembling the full range of products needed by the client, by assuring con-sistency of supply, by dealing with a wide range of suppliers and by providing the quality of products desired by the buyer at an acceptable price. For providing these services, brokers earn a commission or trading profit. In addition, because many buy-ers (e.g., smaller restaurants and retail stores) require small volumes of a variety of products, the breadth of the broker's product line enables him to keep distribution costs low. Traders serve a useful function by purchasing surplus products and selling them to remote markets through their widespread networks.
In summary, the extent of Canadian forward integration has increased substantially over the past decade. The system is at present undergoing changes as a result of the processors' financial problems. The relatively heavy reliance on commissioned brokers and traders limits the ability of the industry to enforce a pricing policy that will ensure that price cuts are passed through to key decision makers.
Distress The major source of destructive price competition identified in the Task Force stud- selling ies arose from financial pressures on the processing firms. This leads to what has
been called distress selling.
Processing firms would normally hold inventory for use in their U.S. re-processing facilities and for phased sales over the year. Many Canadian processors, as a result of losses in previous years, have severe working capital deficits (see Chapter 5). These problems have been exacerbated by high interest rates which, in addition to increasing interest expenses on loans to finance normal inventory, have led U.S. buy-ers to shift inventory back to Canadian processors.
To estimate the losses in revenues and profits as a result of distress selling, it is necessary to understand more precisely the structure of the market and its 'normal' operation. The fish products caught and consumed in the United States all manifest strong and poorly matched seasonal patterns. Virtually all ocean fisheries have sea-sonal peaks that result in catches being concentrated in different months of the year. The Icelandic cod catch is concentrated in the first portion of the year. The Norwe-gian cod catch is heavily concentrated in February and March. Fully 75 per cent of the Canadian catch is landed in the summer months. These seasonal peaks do not match consumption patterns. In North America, there is a major drop in consump-tion for all types of fish in the summer months, when Canadian catches are high. This forces processors to hold inventory. The mismatch in catching and consumption patterns creates an inevitable inventory cost that must be eventually paid for by con-sumers in the price of fish.
Holding inventory is a normal procedure, and all the participants in the market know and anticipate these seasonal fluctuations. If the product is offered at a price below the anticipated future price plus the cost of storage and interest (and a further adjustment for risk), re-processors, brokers or traders can be expected to purchase the product and hold it for future sale.
As noted in the previous section, this speculative process can reduce or eliminate the potential for substantial short-term decreases in selling prices to be passed on to final consumers. (Retailers are also reluctant to change prices for a short period.) Only if all participants in the system believe that there will be a sustained drop in price will the maximum price cut be passed on to the final consumer. When fluctuations in
Markets and Marketing 153
inventory holdings, variations in consumption patterns, and differences in the volumes of Canadian exports to the United States are compared, it is not surprising that this would result in some fluctuation over time in the prices paid to Canadian exporters.
A number of trends in the behaviour of the U.S. groundfish market are worth noting. The stability of prices has varied substantially over the past two decades. Pricing in the early 1960s was relatively stable over the year, despite high seasonality in catches and in shipments. A Task Force study showed that the variability of Canadian prices in the 1974-77 period was greater than in the 1978-1981 period. Current experience has demonstrated, however, that substantial fluctuations, particularly downward price movements, can result from the weakened financial position of the large processors. It is important to note, however, that Task Force estimates indicate that the dip in wholesale cod prices in the autumn of 1981 can be almost fully accounted for by the transfer of the costs of storage and interest charges from the processors to U.S. buyers. Because the buyers will have to absorb these costs, the wholesale price must drop.
Canadian processors appear to have become increasingly sensitive to the price differ-entials for different product forms in different markets. As recorded in Table 6.4, the result has been a continuing shift toward the production of fillet packs and saltfish and away from cod blocks. Figure 6.1 demonstrates that for commodity cod products sold in the U.S. market, processors have succeeded in fine-tuning their product mix and inventory management to the point that price differentials have virtually disap-peared. This will be reflected in a common return per pound of live fish. The pre-mium boneless five-pound packs are sold for fifteen to twenty cents per pound more. This sharpening of the responsiveness of production to short-run price signals helps to ensure maximum returns to the industry. It is also significant that during this period the sale of Canadian cod fillets increased by 35 per cent while cod block sales declined by 13 per cent. At the same time, sales of Icelandic cod fillets and blocks in the U.S. market declined by 16 and 29 per cent respectively.
The cost of distress selling
There have been recent examples where the price of cod blocks and flatfish fillets appear to have been discounted by more than the amount of inventory and carrying costs. No such significant examples were identified in herring markets.
The evidence suggests that the size of the processor involved and the volume of prod-uct sold at discount prices are directly related to the size of the price drop. This is not at all surprising. When a major supplier with large inventories is known to be liquidating holdings, other rational producers would also decide to sell off product in order to avoid losing valued customers or having to enter the market much later, thereby absorbing additional storage and inventory costs and perhaps facing still lower prices. The cumulative effect can be a rapid drop in prices. Price-cutting activ-ity by small processors is an annoyance to the more sophisticated or larger firms, as it forces them to hold their product until the smaller firms have sold their products. However, it does not appear to have had a significant effect on market prices.
The 1981 flatfish experience illustrates the potential problems. Two major processors catch and sell close to 80 per cent of Canada's total shipments of flounder fillets to the United States. In early 1981 the market price appeared to be stable at about $1.60 (U.S.) per pound in Boston. Because of the high cost of carrying large invento-ries and pressure from creditors to improve its cash flow position, one producer was required to sell its inventory rapidly in the U.S. market. The result was a price drop of some 25 cents per pound. The other major processor initially planned to hold its inventory until the price returned to its previous level. However, threatened with the
154 Task Force on Atlantic Fisheries
loss of customers, the company changed its strategy and entered the market gradually.
Meanwhile, substantial volumes of product had been acquired by relatively large numbers of distributors, traders, brokers and final buyers. It took a year before the original price level was re-established. The total loss of gross revenue to both firms has been estimated at about $3 million (U.S.). The net loss (after deducting savings in interest and storage charges) would be about $1.5 million on sales of about $56 million. The essential problem, however, was the processor's under-capitalization, which led to working capital problems and eventually to distress selling.
Similar situations have been identified with respect to cod blocks. An upper estimate of the losses in gross revenues in 1980 and 1981 is $2.4 million. The maximum in net revenue losses were estimated to be $2.2 million on sales of $193 million.
The Task Force has therefore concluded that the short-run problems of destructive price competition appear to have resulted from processors' financial problems. The problems are most severe when a large processor is required to sell substantial volumes of inventory quickly. If not corrected, the widespread deficiency of equity in the processing sector, documented in Chapter 5, will result in periodic bouts of dis-tress selling. The resulting net loss to the Canadian fishery has nevertheless been relatively small compared with total sales.
In summary, overcoming the short-term pricing and profit problems associated with orderly selling is a matter of
• optimizing the product and pack mix on a daily or weekly basis in response to existing and anticipated opportunities in the market;
• ensuring adequate information and expertise among Canadian sellers so that pro-duction mix decisions and asking prices are correct;
• ensuring adequate working capital and financial resources for processors; and
• having an adequate trading capacity, alternative product forms or non-traditional markets that can quickly absorb unexpected gluts, at reasonable prices, into mar-ket niches other than those already occupied by Canadian suppliers.
Recent experience suggests that the industry has substantially improved its ability to tune or adjust the product mix during the course of the season. Progress on the latter two needs — ensuring adequate financial resources for processors and having alter-native markets — has been slower.
Orderly marketing
Marketing, as opposed to selling, requires long-term planning and efforts to maxi-mize total returns to a firm or industry. Marketing must take into account the need to offer a spectrum of products to a large number of market segments in a manner that maximizes and equalizes the return from each segment. It includes consider-ations such as control of marketing channels, brand development, opening new geo-graphic markets, developing new products, overcoming barriers created by competi-tors, and setting up defences to protect profitable Canadian market niches.
The critical marketing issues for the medium term, as the available harvest grows, are finding ways to expand groundfish consumption in the target segments supplied by Canadians and diversifying the number of market segments served by Canada by broadening the existing base in the following respects:
1. against competing proteins such as chicken and pork, which share Canada's present market segments;
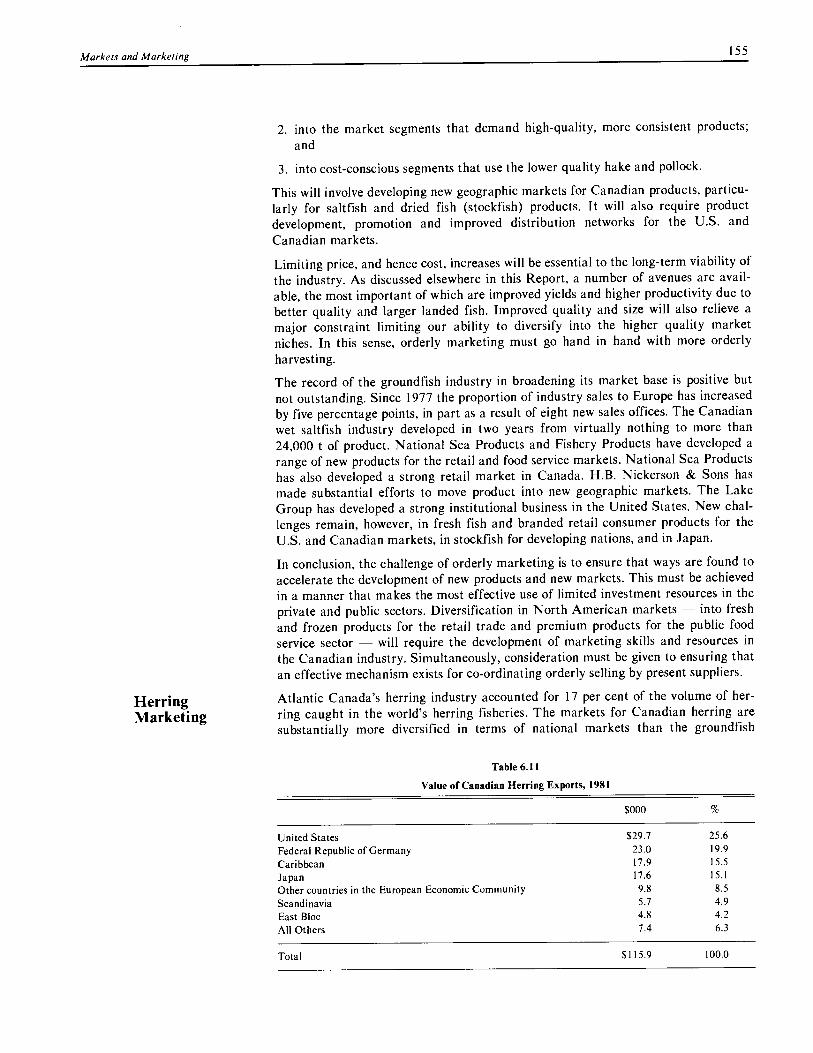
Markets and Marketing 155
Herring Marketing
2. into the market segments that demand high-quality, more consistent products; and
3. into cost-conscious segments that use the lower quality hake and pollock.
This will involve developing new geographic markets for Canadian products, particu-larly for saltfish and dried fish (stockfish) products. It will also require product development, promotion and improved distribution networks for the U.S. and Canadian markets.
Limiting price, and hence cost, increases will be essential to the long-term viability of the industry. As discussed elsewhere in this Report, a number of avenues are avail-able, the most important of which are improved yields and higher productivity due to better quality and larger landed fish. Improved quality and size will also relieve a major constraint limiting our ability to diversify into the higher quality market niches. In this sense, orderly marketing must go hand in hand with more orderly harvesting.
The record of the groundfish industry in broadening its market base is positive but not outstanding. Since 1977 the proportion of industry sales to Europe has increased by five percentage points, in part as a result of eight new sales offices. The Canadian wet saltfish industry developed in two years from virtually nothing to more than 24,000 t of product. National Sea Products and Fishery Products have developed a range of new products for the retail and food service markets. National Sea Products has also developed a strong retail market in Canada. H.B. Nickerson & Sons has made substantial efforts to move product into new geographic markets. The Lake Group has developed a strong institutional business in the United States. New chal-lenges remain, however, in fresh fish and branded retail consumer products for the U.S. and Canadian markets, in stockfish for developing nations, and in Japan.
In conclusion, the challenge of orderly marketing is to ensure that ways are found to accelerate the development of new products and new markets. This must be achieved in a manner that makes the most effective use of limited investment resources in the private and public sectors. Diversification in North American markets — into fresh and frozen products for the retail trade and premium products for the public food service sector — will require the development of marketing skills and resources in the Canadian industry. Simultaneously, consideration must be given to ensuring that an effective mechanism exists for co-ordinating orderly selling by present suppliers.
Atlantic Canada's herring industry accounted for 17 per cent of the volume of her- ring caught in the world's herring fisheries. The markets for Canadian herring are substantially more diversified in terms of national markets than the groundfish
Table 6.11
Value of Canadian Herring Exports, 1981
$000
United States $29.7 25.6 Federal Republic of Germany 23.0 19.9 Caribbean 17.9 15.5 Japan 17.6 15.1 Other countries in the European Economic Community 9.8 8.5 Scandinavia 5.7 4.9 East Bloc 4.8 4.2
All Others 7.4 6.3
Total $115.9 100.0
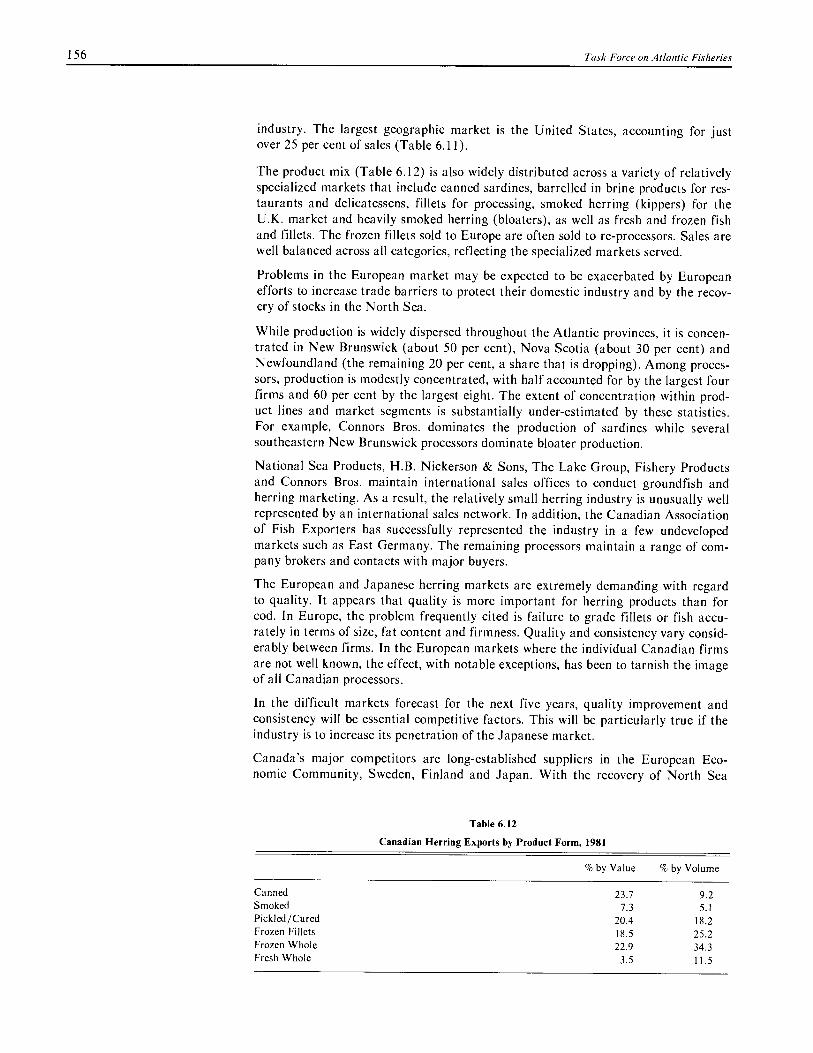
156
Task Force on Atlantic Fisheries
industry. The largest geographic market is the United States, accounting for just over 25 per cent of sales (Table 6.11).
The product mix (Table 6.12) is also widely distributed across a variety of relatively specialized markets that include canned sardines, barrelled in brine products for res-taurants and delicatessens, fillets for processing, smoked herring (kippers) for the U.K. market and heavily smoked herring (bloaters), as well as fresh and frozen fish and fillets. The frozen fillets sold to Europe are often sold to re-processors. Sales are well balanced across all categories, reflecting the specialized markets served.
Problems in the European market may be expected to be exacerbated by European efforts to increase trade barriers to protect their domestic industry and by the recov-ery of stocks in the North Sea.
While production is widely dispersed throughout the Atlantic provinces, it is concen-trated in New Brunswick (about 50 per cent), Nova Scotia (about 30 per cent) and Newfoundland (the remaining 20 per cent, a share that is dropping). Among proces-sors, production is modestly concentrated, with half accounted for by the largest four firms and 60 per cent by the largest eight. The extent of concentration within prod-uct lines and market segments is substantially under-estimated by these statistics. For example, Connors Bros. dominates the production of sardines while several southeastern New Brunswick processors dominate bloater production.
National Sea Products, H.B. Nickerson & Sons, The Lake Group, Fishery Products and Connors Bros. maintain international sales offices to conduct groundfish and herring marketing. As a result, the relatively small herring industry is unusually well represented by an international sales network. In addition, the Canadian Association of Fish Exporters has successfully represented the industry in a few undeveloped markets such as East Germany. The remaining processors maintain a range of com-pany brokers and contacts with major buyers.
The European and Japanese herring markets are extremely demanding with regard to quality. It appears that quality is more important for herring products than for cod. In Europe, the problem frequently cited is failure to grade fillets or fish accu-rately in terms of size, fat content and firmness. Quality and consistency vary consid-erably between firms. In the European markets where the individual Canadian firms are not well known, the effect, with notable exceptions, has been to tarnish the image of all Canadian processors.
In the difficult markets forecast for the next five years, quality improvement and consistency will be essential competitive factors. This will be particularly true if the industry is to increase its penetration of the Japanese market.
Canada's major competitors are long-established suppliers in the European Eco- nomic Community, Sweden, Finland and Japan. With the recovery of North Sea
Table 6.12
Canadian Herring Exports by Product Form, 1981
% by Value % by Volume
Canned 23.7 9.2 Smoked 7.3 5.1 Pickled/Cured 20.4 18.2 Frozen Fillets 18.5 25.2 Frozen Whole 22.9 34.3 Fresh Whole 3.5 11.5

Markets and Marketing 157
herring stocks, these processors are able to supply fresh and frozen herring at low cost to European markets previously served by Canadian suppliers.
Promotion and direct sales efforts aimed at restaurants and delicatessens in the United States and processors in Europe should improve sales potential. Special efforts in East Bloc countries have the potential to open up new volume markets, although direct over-the-side sales in the Bay of Fundy reduce the potential for the sale of processed product.
The essential problems of the industry are to find ways of reducing costs so that it can survive in a world of normal European prices. Increasing protectionism in Europe must be addressed. If substantial tariff increases come into effect, the ability of the industry to compete in the market will be seriously handicapped, regardless of the success of quality improvement and cost reduction measures.
Demand and Before presenting the supply and demand forecasts for groundfish and herring, it is Supply necessary to describe the major assumptions and policy options that can affect the
world catch, prices and access to target markets. First we examine the major interna-tional economic factors of concern to the fishery: (1) the international trading envi-ronment for the Canadian fishery as it relates to allocations in exchange for access to foreign markets, joint ventures and over-the-side sales; (2) the role of quality improvement and promotion in stimulating demand and expanding Canadian sales; (3) the level and stability of seafood consumption, particularly in developing coun-tries; and (4) potential new competition with Canadian seafood products. We go on to present the supply and demand picture that arises from these assumptions.
The economic, In broad terms, there are two major markets for fish products: the very rich coun- trading and tries and the very poor. The rich nations of North America, Europe and Japan con- marketing stitute a large stable market for premium products and species. These markets are environment served primarily by the commercial fishing nations of the North Atlantic.
Potential of the developing world
The poorer countries consume large volumes of fish, generally the less preferred spe-cies. These products are harvested by domestic industries and by the distant water fleets of the East Bloc, Argentina and Korea. The latter operate large and efficient fleets that play a major role in these fisheries; their presence is particularly impor-tant among the emerging nations that are developing sufficiently high per capita incomes to allow them to purchase animal and fish protein for food.
The demand for and price of quality fish products in the developed nations are quite stable relative to the markets in the newly developing nations. As the growth in world fish stocks continues over the next five to ten years, the available volume of premium species, such as those harvested by Canada, will have to seek commercial markets in the newly developed nations. The most evident manifestations are saltfish and stockfish. Iceland and Norway sold 40,000 t of stockfish (240,000 t live weight equivalent) to Nigeria in 1981, while 54,000 t of salted products were sold to Greece, Brazil and the Caribbean. In addition, there are markets in the Middle East for whole frozen mackerel and other lower quality species.
The expansion of sales into these countries can be hampered by problems arising from political and economic instability. Unfortunately, the present and medium-term outlook for these economies is increasingly gloomy. As a result, the international food production system, including fish products, can be expected to face an increas-ing number of severe shocks as imports are abruptly cut off or prices drop precipi-tously in these national markets.
A recent example is the decline of the Nigerian stockfish market due to foreign cur- rency problems. This led Iceland to redirect substantial volumes of its 1982 cod catch into frozen blocks. This in turn may cause a decline in the price of fish sticks

158
Task Force on Atlantic Fisheries
Foreign trade barriers
and portions produced from cod blocks in the U.S market. Barring a major reversal in the Nigerian situation, this can be expected to recur in 1983.
Sales to third world markets can, in special circumstances, be profitable if the sup-plying nation is able to react quickly as new opportunities occur. To date, the Canadian production system has been significantly more constrained and slower to react than those of Iceland and Norway, particularly in the production of stockfish. This has been largely the result of an absence of appropriate production technology and the necessary investment in equipment. Improvements in these areas will help the Canadian industry to take advantage of market opportunities.
Assumptions about the recovery of the world economy, the stability of the less devel-oped nations and the ability of the Canadian system to respond are also clearly rele-vant to the outlook for the sales of groundfish.
The trade barriers maintained by foreign governments, which impede Canadian access to traditional markets, represent commitments on the part of these govern-ments to their domestic producers or to their allies. In the short term, the removal of trade barriers is very difficult to achieve. Nonetheless, there is merit in pursuing the objective of liberalizing trade for its long-term benefits.
It is, however, unrealistic to expect foreign countries to reduce the protection out of good will toward Canada. Many countries expect to receive something — often in the form of concessions favourable to their domestic industries that will lose from trade liberalization — in return for removing trade barriers, even when the barriers are 'illegal' under the rules of international trade.
The process of reducing trade barriers, while often conceived of as a zero-sum game, is a mutually beneficial exchange of governmental undertakings. The objective is to achieve a balanced package — which is to say, any package that both sides consider balanced on the basis of their evaluation of its costs and benefits. There are always implicit links between the concessions made by each side to create the package. The traditional 'reward' for removing trade barriers is some form of improved access to the other country's domestic market.
Balancing benefits and costs within a domestic economy is very difficult if benefici-aries and losers are in different industries or locations. It is generally much easier to negotiate reciprocal concessions on similar products than to make cross-sectoral link-ages. However, most Canadian tariffs on fishery imports have been eliminated (or have been set at very low levels as part of our GATT obligations), and there are few other barriers to entry. Thus, Canada has little to offer in the fisheries sector when negotiating access to foreign markets. If there is to be any progress in this area, it will have to come in more general trade negotiations involving other sectors. This is not likely to yield results during the next decade. The result is that Canada cannot expect to achieve greater access to the U.S. market in exchange for improved access to Canada's market in the medium term.
Our other trading partners, such as the European Economic Community and the Iberian countries, have large fishing fleets. Following the world-wide move to 200-mile limits, many of these countries have found their access to fishing grounds severely restricted. Thus they have expressed an interest in the liberalization of Canada's rules for participation in Canadian fisheries and have suggested that they might be willing to offer improved access for Canadian fish products to their markets in exchange. Potential arrangements could take several forms:
• allocations of non-surplus Canadian stocks in return for preferred access to foreign markets;
Markets and Marketing 159
• foreign investment, including joint ventures, which would give long-term employ-ment to foreign capital, contribute marketing expertise, and create an interest in Canadian products in foreign countries; and
• arrangements with foreign fleets such as over-the-side sales by fishermen and over-the-wharf sales by processors.
The range of issues and options is discussed in Chapter 9 of this Report. It is suffi-cient to say here that the resolution of these matters will affect Canada's access to foreign markets; this should be taken into account in developing supply and demand forecasts. Improved access to foreign markets for Atlantic Canadian seafood prod-ucts must become goal of Canadian trade policy.
Quality and Providing good quality products to consumers is important for increasing groundfish marketing and herring consumption. Consistently high quality products are needed to reposition
and insulate the premium Canadian species from the rapid growth in the availability of the so-called less desirable species. Consistently high quality products will also assist in winning a share of the markets currently held by chicken, other proteins and the products of our Scandinavian competitors.
Without consistent products, the ability of Canadian firms to implement effective branding strategies and mass promotion will be limited. Year-round availability of a mix of groundfish species will be needed to develop the fresh fish market. Good dockside raw material quality is also necessary if costs are to be reduced. All these factors influence future trends in supply and demand.
Promotion and
The Canadian fish processing industry has been criticized for failing to advertise. advertising
This is cited as an example of its inadequate marketing orientation. Critics usually point to the amount of advertising by Icelandic companies in the U.S. market and by other food industries. A review of the situation reveals that the reluctance to adver-tise shown by most individual Canadian processors is in fact a rational response to market conditions.
Because Canadian firms produce relatively undifferentiated groundfish commodity products, it does not pay the individual producer to advertise; buyers already know that there is no difference between the products of different suppliers. Any growth in total sales as a result of advertising will thus be shared among all suppliers. This is called the 'free rider' problem.
By contrast, Iceland's position in the U.S. market is in a relatively narrow market niche, composed of franchised restaurant and fast food outlets that require high quality, guaranteed year-round availability and quick delivery. To differentiate their products and services from those of Canadian suppliers, it was necessary to advertise. In addition, their sales are heavily concentrated among a small number of buyers. Advertising helped to broaden their market base in order to reduce their vulnerabil-ity to these buyers' demands.
The advertising approach adopted by the egg, dairy and beef industries addresses the problem of undifferentiated products through generic advertising. In effect, the pro-ducers in these industries compete as a group against all other proteins for a share of consumers' purchases. The Canadian dairy industry has budgeted $27.9 million in 1982-83 for generic promotion, raising the necessary funds through a producer levy.
Advertising expenditures on butter and cheese promotion amount to $7.6 million for television, $5.6 million for the print media, and $1 million for production costs. An additional $2.5 million has been allocated for co-operative advertising that supports private brands. The generid promotion budget for cheese and butter is equal to approximately 2.5 per cent of the anticipated sales. The balance will be used to sup-
160
Task Force on Atlantic Fisheries
port fluid milk consumption. It is this route that Canadian groundfish producers must follow to promote their commodity products.
There are relatively few examples of group advertising by the Atlantic seafood indus-try. The examples include the now-defunct North Atlantic Seafood Association (NASA), November Fish and Seafood Month (sponsored by DFO), and Canadian trade fairs and missions. As in all marketing efforts, continuity and planning will greatly enhance the effectiveness of the activity. These characteristics have been missing from Canadian fish producers' efforts.
There are three major targets for a generic advertising program aimed at expanding the Canadian share of markets for fish. If the additional cost of production is moder-ate, Canadian sales can gain against the less desirable species by building on inher-ent consumer preferences for Canada's premium species. Competitors in the pre-mium quality market niches are vulnerable to advertising that focuses on the lower cost of Canadian products.
Most essential is the need to expand the number of people who east fish and the fre-quency with which they eat it. This will require a two-fold approach. First, recent consumer research indicates that consumer knowledge about seafood products is extremely limited when compared with their knowledge of other proteins. This con-tributes to a lack of confidence and reduces the probability that consumers will buy and prepare fish at home. This information gap can be addressed by advertising and promotion, an effort that will be greatly assisted by the growing tendency for con-sumers to look for low-calorie, low-cholesterol foods.
The second major approach must be through the food service industry and must focus on increasing the number of fish entrees offered on menus. This will require a combination of advertising to the trade, direct approaches by sales staff, and prod-ucts tailored to food service needs. The emphasis would be on the cost advantages of Canadian seafood products over beef, pork or chicken and its quality advantages (taste, texture, colour) over hake, pollock and whiting.
The appropriate size and potential effectiveness of a promotional program are dif-ficult to assess. Similar industries spend about 2 to 3 per cent of sales on advertising. This would amount to $10 or $15 million for Canadian groundfish. The current advertising budget for the industry is approximately $3.4 million, about half of which is spent in Canada.
National Sea Products is currently the industry's major advertiser; this is largely the result of its much heavier emphasis on consumer products, which creates a need for expensive consumer advertising. The advertising of private brands at the consumer and industrial levels will and should remain a significant activity. The missing ele-ment is industry-based generic advertising.
Evidence of the effectiveness of generic seafood advertising is limited. However, the November Fish and Seafood Month campaign, which has operated since 1978 with a budget of $300,000, is estimated to have increased consumption by 3 to 7 per cent during and immediately following the campaign. And there have certainly been suc-cesses in generic advertising in other food categories. Per capita consumption of cheese in Canada has increased by about 35 per cent since the 1977 introduction of generic advertising. Similarly, the precipitious decline in butter consumption was arrested in part through the use of generic advertising. Beef producers have recently organized a generic campaign to stimulate consumption of their products.
We thus conclude that a strong generic advertising and promotion effort by the groundfish industry can be effective in increasing consumption. The program should focus on consumers in Canada and on the institutional trade, particularly in the pub-
Markets and Marketing 161
A perspective on consumption
lic food service sector, in the United States. Annual budgets for groundfish generic advertising should be increased by $6 to $11 million per year. Our review suggests that the following distribution of that amount would be appropriate: United States, $5 million per year for 5 years; Canada, $3 million per year for 3 to 5 years; all other markets, $3 million per year for 5 years.
The ability of the industry and/or government to develop and implement an effective promotion program will have an effect on the size and composition of Canadian sales that must be considered when developing sales forecasts.
Although it may be difficult to change national eating habits, it is also true that, in large markets, very small changes in per capita consumption can have enormous implications. A one-pound (or half-kilo) per capita increase in groundfish consump-tion in the United State would absorb about 300,000 tonnes of live weight landings. U.S. per capita consumption of fish in 1980 was approximately 5.8 kg or 5.5 per cent of a per capita animal protein consumption of 105.8 kg per year. This fish included only 1.8 kg of groundfish per year (1.1 kg of fillets and 0.7 kg of block products).
A shift in U.S. per capita consumption of one-tenth of one per cent per year for five years toward groundfish and away from poultry, pork and beef would result in more than adequate demand to absorb all the additional groundfish forecast to be caught by Canadian fishermen. A shift of less than four-tenths of one per cent per year would absorb all of the world's forecast increase in supply.
It is evident that the U.S. market will not be able to absorb the entire forecast increase in catch. However, it is clear that a relatively small shift in consumption in favour of groundfish would absorb large amounts of fish. The policies recommended by the Task Force have as a principal objective the creation of an industry environ-ment and marketing initiatives in which consumption gains can be contemplated.
Supply and The supply and demand forecasts that follow are based on conservative assumptions Demand in respect of the factors just discussed. The forecasts assume no real change in the Forecasts price of seafood, in consumer tastes or in marketing efforts by Canadian and other
suppliers. In the concluding section, we set out three possible scenarios — pessimis-tic, best judgement and optimistic — for Canadian sales of groundfish by 1987.
World supply The world catch of all commercial fish rose dramatically between 1950 and 1970, from 21 to 70 million tonnes. Since the mid-1970s, the catch has been stable at just over 70 million t live weight. In 1980, Canada accounted for 1.8 per cent of world landings, placing it sixteenth among fishing nations.
World production of seafood commodities totalled 25 million t of product weight in 1979, 76 per cent for direct consumption, 24 per cent for fish meal. Canada, with 527,000 t of product, accounted for 2.1 per cent of total product, weight and ranked ninth in the world.
World exports of processed seafood products totalled 9.7 million t in 1979, up 31 per cent in volume and about 370 per cent in value since 1970. Canada ranked first with 471,000 million t, or 4.8 per cent of the global fishery export volume. Our exports were valued at $1.1 billion (U.S.), or 8 per cent of all seafood exports.
The world catch of groundfish actually declined between 1977 and 1981, from 10.3 to 9.8 million t. Improved conservation and newly developing or rebuilding fisheries suggest that the world supply of groundfish will increase by 15 per cent by 1987, an additional 1.4 million t of fish. This situation is summarized in Tables 6.13 and 6.14. Projected Canadian groundfish catches are shown in Table 6.15.

162 Task Force on Atlantic Fisheries
Table 6.13
World Groundfish Supply Outlook' (000 t live weight)
1977 1981 1987
Increase 1981-87
Volume
North Atlantic Species: Cod 2,272 2,160 2,475 315 15 Other 2,344 2,190 2,130 - 60 - 3
Total 4,616 4,350 4,665 255 5.8 Non-North Atlantic Species:
Pacific Code 117 140 180 40 28 Hake 1,319 1,300 2,250 950 73 Alaska Pollock 4,296 4,000 4,200 200 5
Total 5,732 5,440 6,630 1,190 22
Grand Total 10,348 9,790 11,235 1,445 15%
I Worldwide catch of major commercial species.
2 Assumes a modest 3 per cent growth.
Table 6.14
Groundfish Supply Projections For Major Regions' (000 t live weight)
1977 1981 1987
Increase 1981-87
Volume
Atlantic Canada 460 725 1,096 371 51 United States 221 310 400 90 29 Scandinavia 1,748 1,955 2,000 45 2 Japan 2,313 1,640 1,630 - 10 0 South America 514 710 1,050 340 48
Total + South Africa 5,283 5,342 6,176 834 16
I Total groundfish catch of major groundfish exporters and U.S.A. only.
Table 6.15
Atlantic Canada Groundfish Landings Forecast (000 t live weight)
1981 1987
Increase 1981-87
Volume
Cod 436 770 334 77 Flatfish 120 143 23 19 Redfish 72 86 14 19 Haddock 56 57 1 2 Pollock 40 40 0 0
Total 725 1,096 371 51%
Note: Further details can be found in Table 2.4, Chapter 2.
Markets and Marketing 163
The tabulated projection for 1987 is based on current resource estimates and on expected Canadian catches as a percentage of the forecast TAC. The calculation assumes, for example, that redfish catches will be only 73 per cent of the TAC. If the redfish market remains weak this would seem a reasonable assumption. The flatfish estimate includes a very modest increase in landings of turbot and flounder. The likelihood of this depends on technical and biological factors about which there is some doubt. Nevertheless, the total forecast of roughly one million tonnes landed in 1987 lies at the centre of the probable range.
The anticipated growth in the supply of cod is the most significant feature of the forecast. The growth in Canadian cod landings of roughly 334,000 t is composed largely of a projected increase of about 225,000 t of northern cod, assuming that Canada lands virtually all of the estimated 1987 TAC of 380,000 t. The 1981 Canadian catch of northern cod was 154,000 t.
Relatively little growth is forecast in the Scandinavian cod supply; indeed, Norway's catch may decline due to the exceptionally poor outlook for that country's principal cod stock. Only small increases are forecast for Icelandic cod supplies.
The projections in Table 6.16 show the potential cod supplies from Canada and its competitors. The table shows that between 1981 and 1987, Canada will account for most of the increase in cod supplies. But while the growth in Atlantic Canada's sup-ply is great in absolute tonnage, the antipicated net increase in world landings of Atlantic cod over the period is a more modest 230,000 t. Apart from the increase in Canadian landings, a decline of about 100,000 t is expected (although these forecasts are subject to considerable uncertainty). Nevertheless, as a species, cod does not appear to pose a problem of serious excess supply if appropriate production, market-ing and fishery management practices are followed.
Table 6.16
Atlantic Cod Catch Projections (000 t live weight)
1981 1982 1987
(Actual) (Estimated) (Projected)
Change 1981-87
Volume
Atlantic Canada 436 490 770 334 77 Iceland 460 400 500 40 9 Norway 324 324 320 - 6 - 1 Denmark 240 240 200 -40 -17 United States 68 68 120 52 76 Others 650 672 500 -150 -23
Total 2,178 2,194 2,390 230 10
Table 6.17
U.S. Per Capita Consumption of Fish (kg per capita per year)
1977 1978 1979 1980 1981
Fresh/Frozen Fillets 1.14 1.23 1.22 1.19 1.24 Sticks and Portions .92 .99 .98 .87 .79 Other 1.44 1.58 1.40 1.54 1.57
Canned 2.1 2.2 2.2 2.1 2.2
Cured .2 .2 .1 .1 .1
Total 5.8 6.1 5.9 5.8 5.9
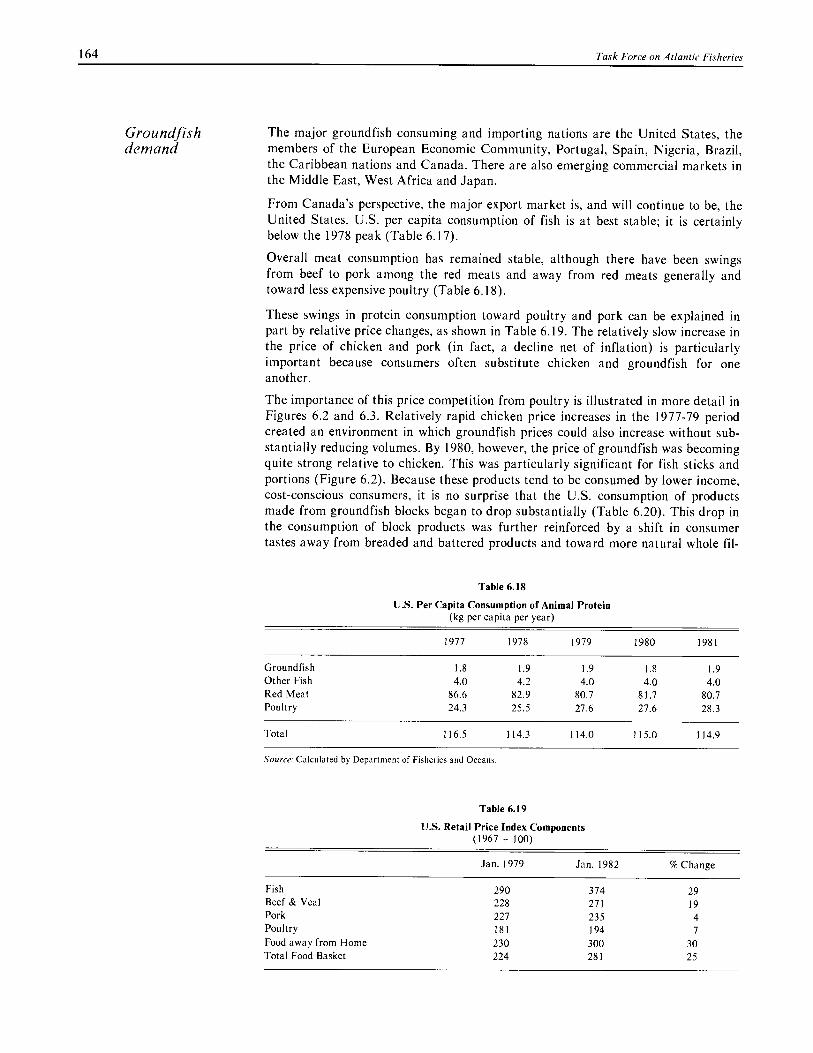
164
Task Force on Atlantic Fisheries
Groundfish The major groundfish consuming and importing nations are the United States, the demand members of the European Economic Community, Portugal, Spain, Nigeria, Brazil,
the Caribbean nations and Canada. There are also emerging commercial markets in the Middle East, West Africa and Japan.
From Canada's perspective, the major export market is, and will continue to be, the United States. U.S. per capita consumption of fish is at best stable; it is certainly below the 1978 peak (Table 6.17).
Overall meat consumption has remained stable, although there have been swings from beef to pork among the red meats and away from red meats generally and toward less expensive poultry (Table 6.18).
These swings in protein consumption toward poultry and pork can be explained in part by relative price changes, as shown in Table 6.19. The relatively slow increase in the price of chicken and pork (in fact, a decline net of inflation) is particularly important because consumers often substitute chicken and groundfish for one another.
The importance of this price competition from poultry is illustrated in more detail in Figures 6.2 and 6.3. Relatively rapid chicken price increases in the 1977-79 period created an environment in which groundfish prices could also increase without sub-stantially reducing volumes. By 1980, however, the price of groundfish was becoming quite strong relative to chicken. This was particularly significant for fish sticks and portions (Figure 6.2). Because these products tend to be consumed by lower income, cost-conscious consumers, it is no surprise that the U.S. consumption of products made from groundfish blocks began to drop substantially (Table 6.20). This drop in the consumption of block products was further reinforced by a shift in consumer tastes away from breaded and battered products and toward more natural whole fil-
Table 6.18
U.S. Per Capita Consumption of Animal Protein (kg per capita per year)
1977 1978 1979 1980 1981
Groundfish 1.8 1.9 1.9 1.8 1.9 Other Fish 4.0 4.2 4.0 4.0 4.0 Red Meat 86.6 82.9 80.7 81.7 80.7 Poultry 24.3 25.5 27.6 27.6 28.3
Total 116.5 114.3 114.0 115.0 114.9
Source: Calculated by Department of Fisheries and Oceans.
Table 6.19
U.S. Retail Price Index Components (1967 = 100)
Jan. 1979 Jan. 1982 % Change
Fish 290 374 29 Beef & Veal 228 271 19 Pork 227 235 4 Poultry 181 194 7 Food away from Home 230 300 30 Total Food Basket 224 281 25

• •
•o• •• • • • 4).
6 0*0000toomo _--N
140
120
100
Figure 6.2 U.S. Retail Prices for Frozen Fillets and Chicken
c/lb 200 Cod fillets
• • • • Flounder fillets Haddock fillets
Ocean Perch Whole Chicken
180
1 60
see • ••••, • • : • ••e• *
• • *
e• •• ....••• % • 0 * • • • 4.*•• .0• • • • e • e, • • • ----•-___ •
e ••/ • -l'•i •
• •9. • ••• •
• • •
•• •
• • ••
• ••
••••••• ••••••••• • •
A
0 J A
1982
Jan. Apr. July Oct. J A 1
1978
(1 J A
0
1977
1980
1981
.;3'il
yd
4dvil
l pu
n slin
tinn

120
100
160
140
Figure 6.3 U.S. Retail Prices for Fish Sticks, Portions and Whole Chicken 1977 = 100
Fish Sticks 11111■ Portions Whole Chicken
• • •
•
a• • • • • • • •• •
A •••••• / \ / \ / NN /N. / \
/ \ - / N / N
- - . / N / N / \
„z's
/ ■ to: - - - - / \ /
N ,...../
/
.......... ..
.. ...-•-•": •• '
\ \ \
/ / \
\ ------- \,
J
.--t• \ / \ /
''' / \ / --.....„."
Jan. Apr. July Oct. A
0
A
0
A .1
A
1977
1978
1979
1980
1981
1982
cilb. 200
180
Ta
sk Forc
e on A
tlan
tic F
isheries

Markets and Marketing 167
let products. On average, groundfish consumption is not significantly different from overall fish consumption patterns (Table 6.20). There is slow growth in the consump-tion of fillet products and a decline in the consumption of block products.
Imported groundfish products supply the majority of U.S. demand. In 1981, virtually 100 per cent of block supplies were imports, and fillet imports accounted for 69 per cent of total consumption, down from a peak of 72 per cent in 1977. The latter development reflects increases in U.S. production.
U.S. groundfish supplies (other than the Alaskan stocks) will be reaching their bio-logical sustainable yields in the near future. In the immediate future, increasing U.S. domestic supplies of fresh fish will have first priority in serving the growing demand for fresh fish. However, imports will likely continue to increase unless there is a major exploitation of Pacific resources.
The strongest growth has been in fresh groundfish fillets. This segment is served primarily by the U.S. east coast groundfish industry. Its landings grew by 35 per cent between 1976 and 1981, from 77,000 to 119,000 t. Imports of fresh Atlantic groundfish to supplement these U.S. landings were 28,000 t (live weight equivalent) in 1981. Canada's fresh groundfish exports grew by 48 per cent between 1978 and 1981, from 12,200 to 24,800 t, but remain relatively insignificant in the U.S. market. Forty-five per cent of Canada's fresh Atlantic groundfish exports were in the form of head-on fish that were processed further in the United States.
The second major growth segment in the U.S. market is premium frozen cod and flounder fillets, sold primarily through public food service outlets. Projecting for-ward to 1987, it is estimated that the consumption levels shown in Table 6.21 could be achieved with no major changes in price, consumer tastes or the structure of the industry.
This expected increase in demand would absorb, in live round weight fish, about 200,000 t. (We recall that the projected increase in the Canadian catch is 371,000 t, the net increase in North Atlantic groundfish catch is 210,000 t, and the increase in the worldwide groundfish catch is expected to be 1.3 million t.) It is significant that
Table 6.20
Estimated U.S. Consumption of Groundfish by Product Type (000 t product weight)
1977 1978 1979 1980 1981
Fillets'
Premium —Fresh 64 73 83 90 94 —Frozen 41 44 42 40 36 2
Sub-total 105 117 125 130 130
Other Frozen 103 109 108 105 115
Total Fillets 208 226 233 235 245
Blocks Premium Cod Blocks 62 61 54 44 47
Other 109 125 136 116 111
Sub-total 171 186 190 160 158
Total Consumption 379 412 423 395 403
I Includes round/dressed (e.g., headed and gutted or head-on and gutted). 2 Assumed supply shortage mainly from Scandinavia.
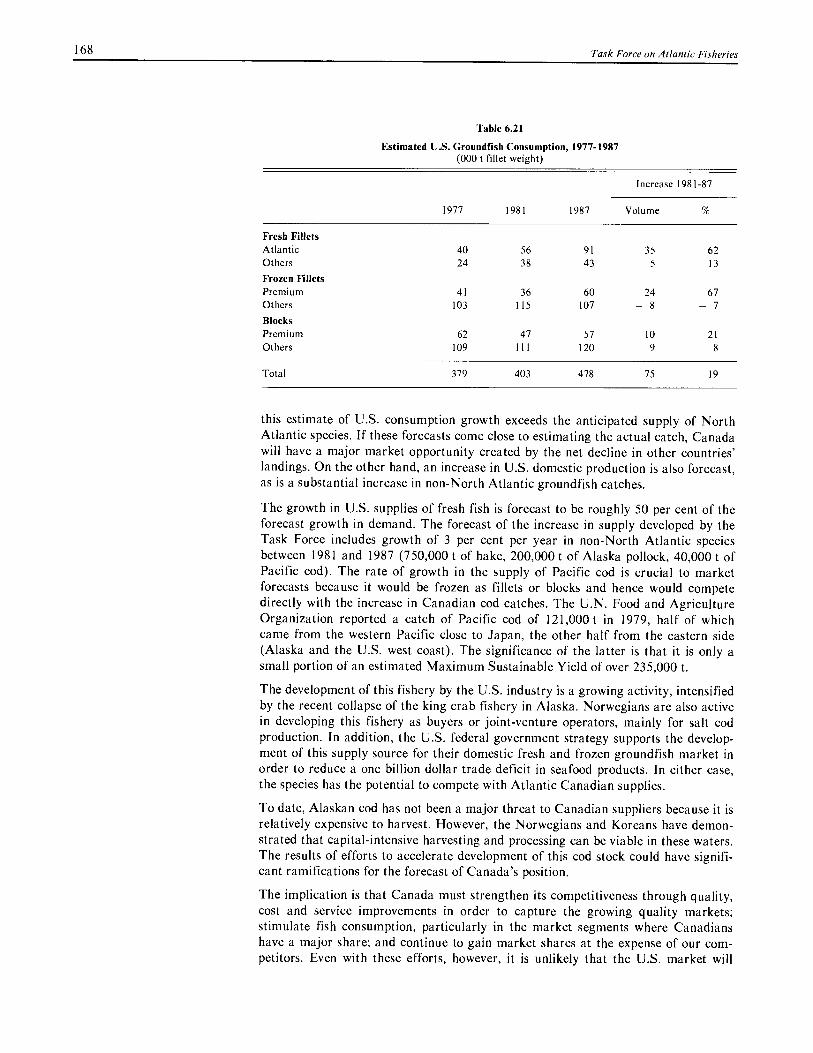
168 Task Force on Atlantic Fisheries
Table 6.21
Estimated U.S. Groundfish Consumption, 1977-1987 (000 t fillet weight)
1977 1981 1987
Increase 1981-87
Volume
Fresh Fillets
Atlantic 40 56 91 35 62 Others 24 38 43 5 13
Frozen Fillets
Premium 41 36 60 24 67 Others 103 115 107 — 8 — 7
Blocks
Premium 62 47 57 10 21 Others 109 1 1 1 120 9 8
Total 379 403 478 75 19
this estimate of U.S. consumption growth exceeds the anticipated supply of North Atlantic species. If these forecasts come close to estimating the actual catch, Canada will have a major market opportunity created by the net decline in other countries' landings. On the other hand, an increase in U.S. domestic production is also forecast, as is a substantial increase in non-North Atlantic groundfish catches.
The growth in U.S. supplies of fresh fish is forecast to be roughly 50 per cent of the forecast growth in demand. The forecast of the increase in supply developed by the Task Force includes growth of 3 per cent per year in non-North Atlantic species between 1981 and 1987 (750,000 t of hake, 200,000 t of Alaska pollock, 40,000 t of Pacific cod). The rate of growth in the supply of Pacific cod is crucial to market forecasts because it would be frozen as fillets or blocks and hence would compete directly with the increase in Canadian cod catches. The U.N. Food and Agriculture Organization reported a catch of Pacific cod of 121,000 t in 1979, half of which came from the western Pacific close to Japan, the other half from the eastern side (Alaska and the U.S. west coast). The significance of the latter is that it is only a small portion of an estimated Maximum Sustainable Yield of over 235,000 t.
The development of this fishery by the U.S. industry is a growing activity, intensified by the recent collapse of the king crab fishery in Alaska. Norwegians are also active in developing this fishery as buyers or joint-venture operators, mainly for salt cod production. In addition, the U.S. federal government strategy supports the develop-ment of this supply source for their domestic fresh and frozen groundfish market in order to reduce a one billion dollar trade deficit in seafood products. In either case, the species has the potential to compete with Atlantic Canadian supplies.
To date, Alaskan cod has not been a major threat to Canadian suppliers because it is relatively expensive to harvest. However, the Norwegians and Koreans have demon-strated that capital-intensive harvesting and processing can be viable in these waters. The results of efforts to accelerate development of this cod stock could have signifi-cant ramifications for the forecast of Canada's position.
The implication is that Canada must strengthen its competitiveness through quality, cost and service improvements in order to capture the growing quality markets; stimulate fish consumption, particularly in the market segments where Canadians have a major share; and continue to gain market shares at the expense of our com-petitors. Even with these efforts, however, it is unlikely that the U.S. market will
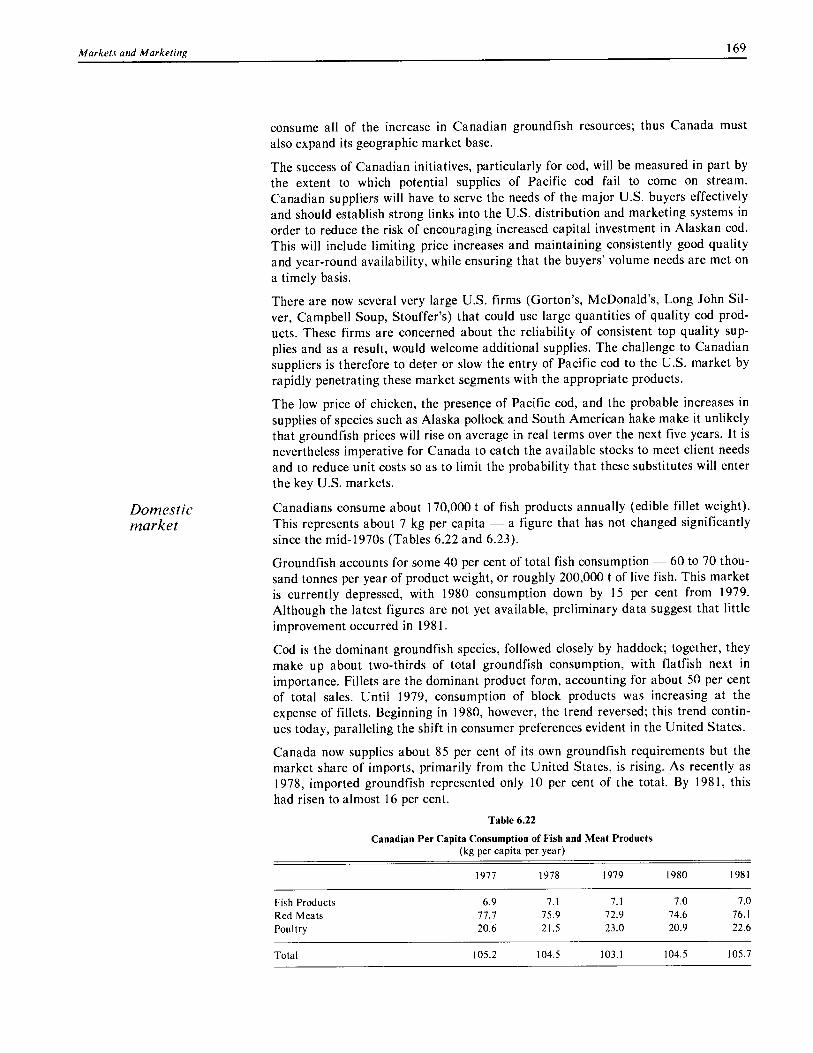
Markets and Marketing 169
Domestic market
consume all of the increase in Canadian groundfish resources; thus Canada must also expand its geographic market base.
The success of Canadian initiatives, particularly for cod, will be measured in part by the extent to which potential supplies of Pacific cod fail to come on stream. Canadian suppliers will have to serve the needs of the major U.S. buyers effectively and should establish strong links into the U.S. distribution and marketing systems in order to reduce the risk of encouraging increased capital investment in Alaskan cod. This will include limiting price increases and maintaining consistently good quality and year-round availability, while ensuring that the buyers' volume needs are met on a timely basis.
There are now several very large U.S. firms (Gorton's, McDonald's, Long John Sil-ver, Campbell Soup, Stouffer's) that could use large quantities of quality cod prod-ucts. These firms are concerned about the reliability of consistent top quality sup-plies and as a result, would welcome additional supplies. The challenge to Canadian suppliers is therefore to deter or slow the entry of Pacific cod to the U.S. market by rapidly penetrating these market segments with the appropriate products.
The low price of chicken, the presence of Pacific cod, and the probable increases in supplies of species such as Alaska pollock and South American hake make it unlikely that groundfish prices will rise on average in real terms over the next five years. It is nevertheless imperative for Canada to catch the available stocks to meet client needs and to reduce unit costs so as to limit the probability that these substitutes will enter the key U.S. markets.
Canadians consume about 170,000 t of fish products annually (edible fillet weight). This represents about 7 kg per capita — a figure that has not changed significantly since the mid-1970s (Tables 6.22 and 6.23).
Groundfish accounts for some 40 per cent of total fish consumption — 60 to 70 thou-sand tonnes per year of product weight, or roughly 200,000 t of live fish. This market is currently depressed, with 1980 consumption down by 15 per cent from 1979. Although the latest figures are not yet available, preliminary data suggest that little improvement occurred in 1981.
Cod is the dominant groundfish species, followed closely by haddock; together, they make up about two-thirds of total groundfish consumption, with flatfish next in importance. Fillets are the dominant product form, accounting for about 50 per cent of total sales. Until 1979, consumption of block products was increasing at the expense of fillets. Beginning in 1980, however, the trend reversed; this trend contin-ues today, paralleling the shift in consumer preferences evident in the United States.
Canada now supplies about 85 per cent of its own groundfish requirements but the market share of imports, primarily from the United States, is rising. As recently as 1978, imported groundfish represented only 10 per cent of the total. By 1981, this had risen to almost 16 per cent.
Table 6.22
Canadian Per Capita Consumption of Fish and Meat Products (kg per capita per year)
1977 1978 1979 1980 1981
Fish Products 6.9 7.1 7.1 7.0 7.0 Red Meats 77.7 75.9 72.9 74.6 76.1 Poultry 20.6 21.5 23.0 20.9 22.6
Total 105.2 104.5 103.1 104.5 105.7

170
Task Force on Atlantic Fisheries
Table 6.23
Canadian Consumption of Fish Products
(kg per capita per year)
1977 1978 1979 1980 1981
Seafish (est.)
Round/Dressed .98 .65 .74 1.21 1.21 Fillets/Blocks 2.73 2.86 3.00 2.79 2.90 Canned 1.58 1.80 1.75 1.46 N/A Others .18 .37 .30 .15 N/A
Sub-total 5.47 5.68 5.79 5.61 N/A Fresh Water Fish .20 .20 .20 .21 N/A Shellfish 1.19 1.22 1.16 1.17 1.01
Total 6.86 7.10 7.15 6.99 7.00
Over the past decade, fish prices have risen more rapidly than those for other sources of protein. For example, the industry's selling price for frozen cod fillets in 1980-81 was 3.3 times the price prevailing in 1971. Over the same period, the selling price of other proteins also increased, but by lesser amounts 2.1 times for veal, 2.3 times for beef, 2.4 times for pork and 2.7 times for chicken.
Despite the depression in plant gate prices since 1979, Canadian retail prices for fish have increased more rapidly than prices of other proteins, as reflected in a composite meat, fish and poultry index. They have also increased more rapidly than the average for food consumed away from home (Figure 6.4). Among the fish products moni-tored, frozen fish shows the fastest price rise, with retail prices advancing almost 20 per cent during the 18 months ending in December 1981 (Figure 6.5).
The Canadian market affords opportunities to supply greater quantities of both fresh fish and frozen fillets. The industry must make arrangements to supply fresh fish on a consistent basis and to persuade consumers, distributors, retailers and food service operators of its value. The fresh fish business requires premium quality products, consistent availability of a mix of species, if not of a particular species, and pre-packed product to overcome the reluctance of the major retail chains to pack fresh fish themselves.
The opportunities to develop the market for frozen fillets are more difficult to exploit. Frozen fillets are already in widespread distribution, whereas fresh fillets are not. The opportunity is two-fold:
• to increase the supply of better quality fillets to offer greater possibilities to the checkered and white tablecloth trade; and
• to ensure that distribution channels function effectively from coast to coast. Given effective distribution within Canada, the rising import trade through the Boston-based brokerage firms could be captured directly by the Canadian industry.
The market potential for blocks is less encouraging. The trend in this market is downward, and prospects for a significant upturn apparently depend on developing a product that uses blocks in other than breaded or battered form, or on producing a low-priced cod block that can displace pollock from the market for retail fish sticks and portions.
The forecast consumption of groundfish in Canada, assuming that present trends and conditions remain stable, is for an increase of about 20 per cent between 1981 and 1987, from a product weight of 63,000 t in 1981 to about 75,000 t in 1987. This growth would account for about 40,000 t of live weight landings.
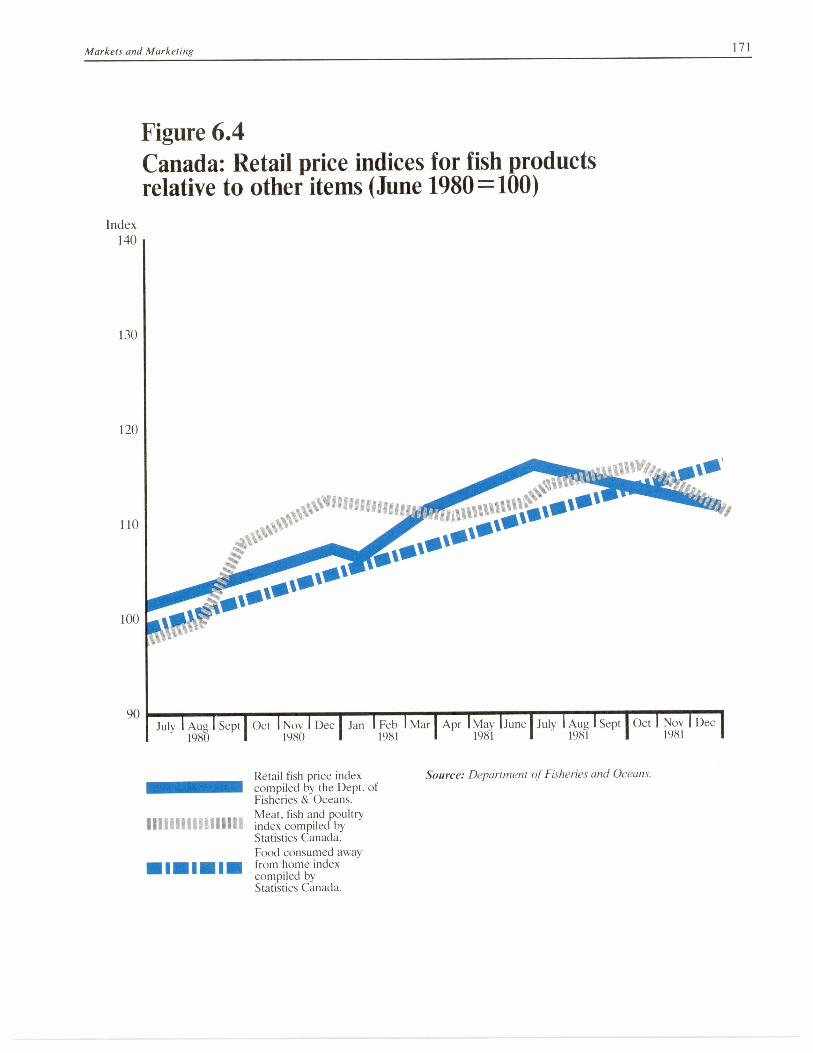
Markets and Marketing 171
Figure 6.4 Canada: Retail price indices for fish products relative to other items (June 1980 =100)
Index 140
130
120
110
100
90 July 1 Aug 1 Sept I Oct I Nov 1 Dec I Jan 1 Feb I Mar I Apr 1 May !June July I Aug I Sept I Oct I Nov Dec
1980 1980 1981 1981 1981 1981
■ I ■ I ■■
Retail fish price index compiled by the Dept. of Fisheries & Oceans. Meat, fish and poultry index compiled by Statistics Canada. Food consumed away from home index compiled by Statistics Canada.
Source: Department of Fisheries and Oceans.
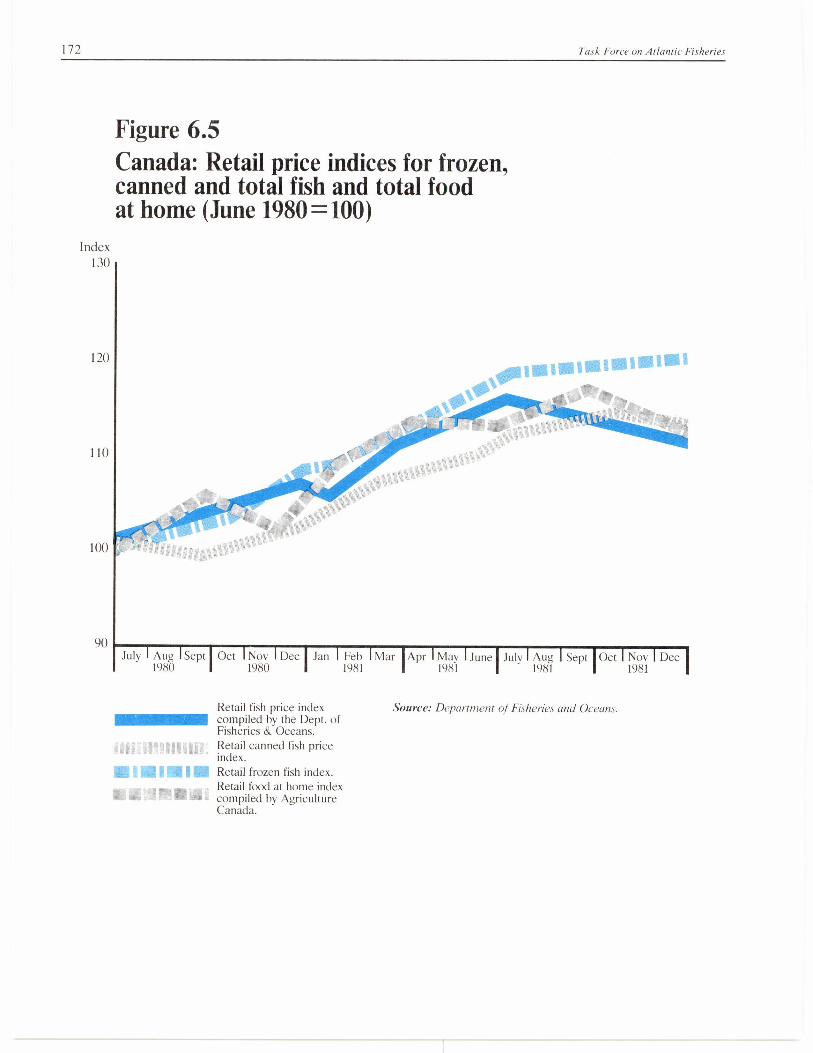
172 Task Force on Atlantic Fisheries
Figure 6.5 Canada: Retail price indices for frozen, canned and total fish and total food at home (June 1980=100)
Index 130
120
110
100
90 July Aug Sept Oct Nov Dec Jan Feb Mar Apr May June July Aug Sept Oct Nov Dec
1980 1980 1981 1981 1981 1981
Retail fish price index compiled by the Dept. of Fisheries & Oceans. Retail canned fish price index. Retail frozen fish index. Retail food at home index compiled by Agriculture Canada.
Source: Department of Fisheries and Oceans.
Markets and Marketing 173
European Economic Community
Total groundfish exports from Canada to the EEC increased from 4,000 t in 1977 to 16,000 t in 1981. The largest increase was in cod blocks, which accounted for almost 45 per cent of 1981 groundfish exports to the EEC. The second largest increase was in salt cod, which accounts for 32 per cent of exports to EEC countries.
By 1987, the estimated EEC demand for fresh and frozen groundfish imports, from all sources, will be about 255,000 t of product weight, an increase of about 40,000 t over 1981. Increases in France and the U.K. are expected to offset a slight decline in Germany. This growth would require a further 120,000 t of live weight landings.
With respect to the EEC, the major factors inhibiting Canada's ability to penetrate the market are as follows:
• poor price competitiveness and market access (due to tariffs and non-tariff barri-ers such as reference prices). The rising value of the Canadian dollar relative to European currencies compounds the difficulty;
• the substantially lower trade barriers and transportation costs that give Iceland, Norway and other competitors from the European Free Trade Association an advantage in obtaining a large share of the growing U.K. and French markets;
• a growing preference for fresh fish which is difficult to supply from Canada; and
• Canada's image as a residual supplier of products of inconsistent quality.
It is significant that several of Canada's disadvantages in exporting to the EEC are reversed when it comes to supplying the U.S. market. In light of forecasts that pre-dict increased consumer demand and a net decline in the supply of European cod, it is likely that there will be a realignment of market shares, with Canada becoming even more significant in the U.S. market and Norway and Iceland placing greater emphasis on European markets.
Salted World consumption of salted groundfish is about 300,000 t (product weight), with groundfish imports by consuming countries accounting for 200,000 t. Iceland, Canada, Norway
and the Faroes supply 95 per cent of the traded product (Table 6.24). The market for dried saltfish has been stable for the last five years. However, Canada may experience difficulties if the economies of importing nations continue to be unstable, and if consumer tastes in Canada's traditional Caribbean markets continue to turn against saltfish.
Between 1979 and 1981 world trade in saltfish increased by 25 per cent. Virtually all of this increase was accounted for by wet saltfish destined for Portugal. The Por-tugese industry has been short of domestic supply in the aftermath of the general extension of fisheries jurisdiction.
Canada's production of both wet and dry salted cod increased in recent years, with the majority of the increase going to the wet form (Table 6.24). This product is com-peting effectively with saltfish from Iceland, which produces only wet saltfish. While there is concern that lower labour rates in wet saltfish markets such as Portugal may facilitate the re-export of wet saltfish imports in dry form, Canada cannot afford to leave this trade exclusively to the competition.
Saltfish markets are very diverse. While four markets — Spain (wet and dry), Portu-gal (wet and dry), the U.S.A. (dry) and the Caribbean (dry) — account for 80 per cent of imports, the remaining 20 per cent is spread among more than 70 countries. The world demand for saltfish has probably peaked, largely due to changes in life-styles and taste preferences and to economic and currency problems in many import-ing countries. The competition among suppliers will thus be particularly keen in the coming years. New export opportunities may nevertheless exist for Canada during

174
Task Force on Atlantic Fisheries
Table 6.24
Principal Saltfish Exports (000 t product weight)
1977 1978 1979 1980 1981
Wet Iceland 34 37 41 50 56 Norway 20 25 23 17 18 Fa roes' 20 17 14 18 17 Canada 0 0 0 12 24
Sub-total 74 79 78 97 115 Dry
Iceland 4 4 2 2 I Norway 59 48 55 50 50 Fa roes 2 2 2 2 2 Canada 20 21 24 29 32
Sub-total 85 75 83 83 85
Total 159 154 161 180 200
'1977-79 estimate based on FAO production data.
Source: European Supplies Bulletin.
Stockfish
the next decade in a number of markets. Production costs meanwhile are escalating. Prospects for Canadian exports will depend on successful bilateral negotiations, joint ventures and more organized marketing.
Groundfish cured by drying — known as stockfish — has been a growth commodity for Iceland and Norway. In 1981 they divided production 40 per cent and 60 per cent respectively. Production more than tripled, from 15,600 t in 1977 to 48,500 t in 1981, using almost 300,000 t (live weight) of fish.
Nigeria consumed about 80 per cent of the world's traded stockfish in 1981, but its ability to import is unstable because their economy depends on world oil prices and on the volume of its oil exports. In 1982, stockfish imports are forecast to contract by at least 30 per cent. Production of stockfish will drop even more precipitously, because 35,000 t of product is already being held in inventory. This market develop-ment illustrates the hazards of forecasting in the world fish business. Stockfish for the Nigerian market alone accounted for an additional 200,000 t of live cod in 1981 compared with five years earlier. Moreover, it has been a very profitable product, substantially more so than frozen fillets.
In the medium term, Nigeria is a potential target market for the infant Canadian stockfish business. The total Nigerian market could grow by about 10,000 t a year over the next three years if that country's economic problems are resolved. This mar-ket would accept a wide range of species found in Canadian waters. Perhaps most important, stockfish can provide an outlet for lower quality fish. As well, Iceland and Norway do not enjoy significant transportation advantages over Canada insofar as Nigerian and other non-European markets are concerned.
The development of a commercially viable stockfish industry in Canada will help Canada take full advantage of emerging marketing opportunities. But equally impor-tant, it will also increase the flexibility of the Canadian fish processing industry by giving it another product and market that can be used to help the industry adjust to the changing economic and marketing environment. This kind of flexibility has been perhaps the most significant strength of the Scandinavian industries.
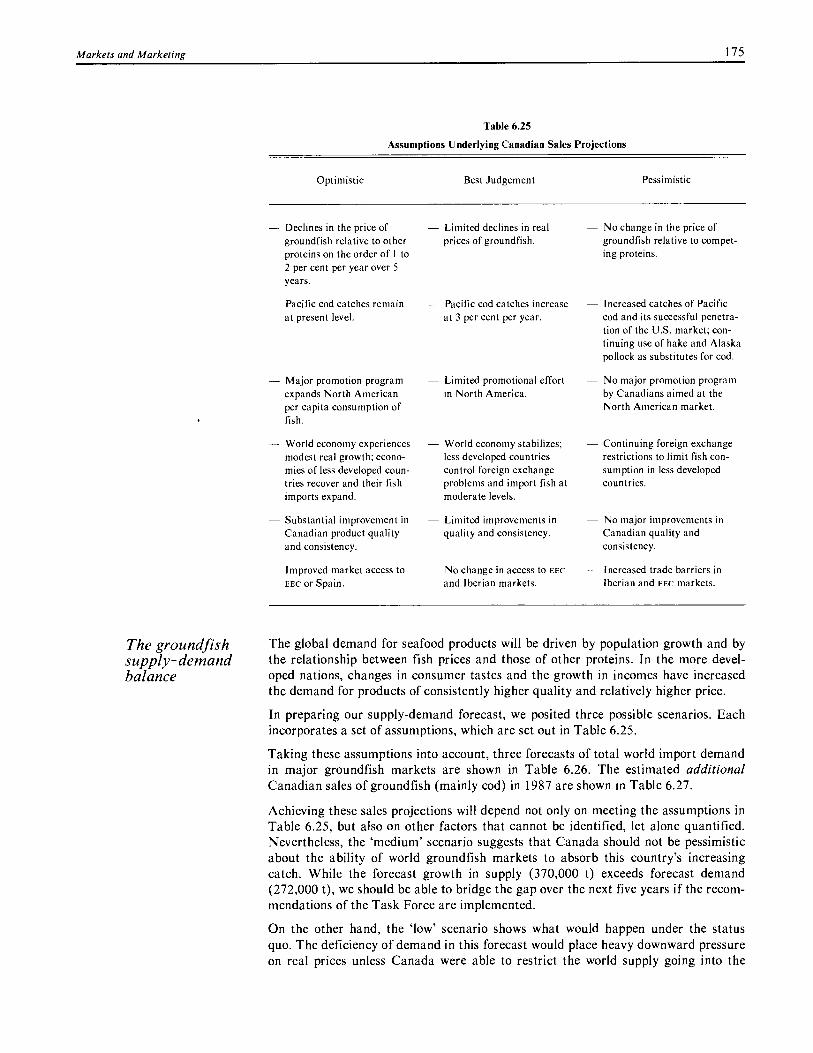
— Declines in the price of groundfish relative to other proteins on the order of I to 2 per cent per year over 5 years.
Pacific cod catches remain at present level.
— Limited declines in real prices of groundfish.
— Pacific cod catches increase at 3 per cent per year.
— No change in the price of groundfish relative to compet-ing proteins.
— Increased catches of Pacific cod and its successful penetra-tion of the U.S. market; con-tinuing use of hake and Alaska pollock as substitutes for cod.
— No major promotion program by Canadians aimed at the North American market.
— Major promotion program — Limited promotional effort expands North American in North America. per capita consumption of fish.
Markets and Marketing 175
Table 6.25
Assumptions Underlying Canadian Sales Projections
Optimistic
Best Judgement Pessimistic
World economy experiences World economy stabilizes; — Continuing foreign exchange modest real growth; econo- less developed countries restrictions to limit fish con- mies of less developed coun- control foreign exchange sumption in less developed tries recover and their fish problems and import fish at countries. imports expand. moderate levels.
— Substantial improvement in — Limited improvements in — No major improvements in Canadian product quality quality and consistency. Canadian quality and and consistency. consistency.
— Improved market access to — No change in access to EEC — Increased trade barriers in EEC or Spain. and Iberian markets. Iberian and EEC markets.
The groundfish The global demand for seafood products will be driven by population growth and by supply-demand the relationship between fish prices and those of other proteins. In the more devel- balance oped nations, changes in consumer tastes and the growth in incomes have increased
the demand for products of consistently higher quality and relatively higher price.
In preparing our supply-demand forecast, we posited three possible scenarios. Each incorporates a set of assumptions, which are set out in Table 6.25.
Taking these assumptions into account, three forecasts of total world import demand in major groundfish markets are shown in Table 6.26. The estimated additional Canadian sales of groundfish (mainly cod) in 1987 are shown in Table 6.27.
Achieving these sales projections will depend not only on meeting the assumptions in Table 6.25, but also on other factors that cannot be identified, let alone quantified. Nevertheless, the 'medium' scenario suggests that Canada should not be pessimistic about the ability of world groundfish markets to absorb this country's increasing catch. While the forecast growth in supply (370,000 t) exceeds forecast demand (272,000 t), we should be able to bridge the gap over the next five years if the recom-mendations of the Task Force are implemented.
On the other hand, the 'low' scenario shows what would happen under the status quo. The deficiency of demand in this forecast would place heavy downward pressure on real prices unless Canada were able to restrict the world supply going into the
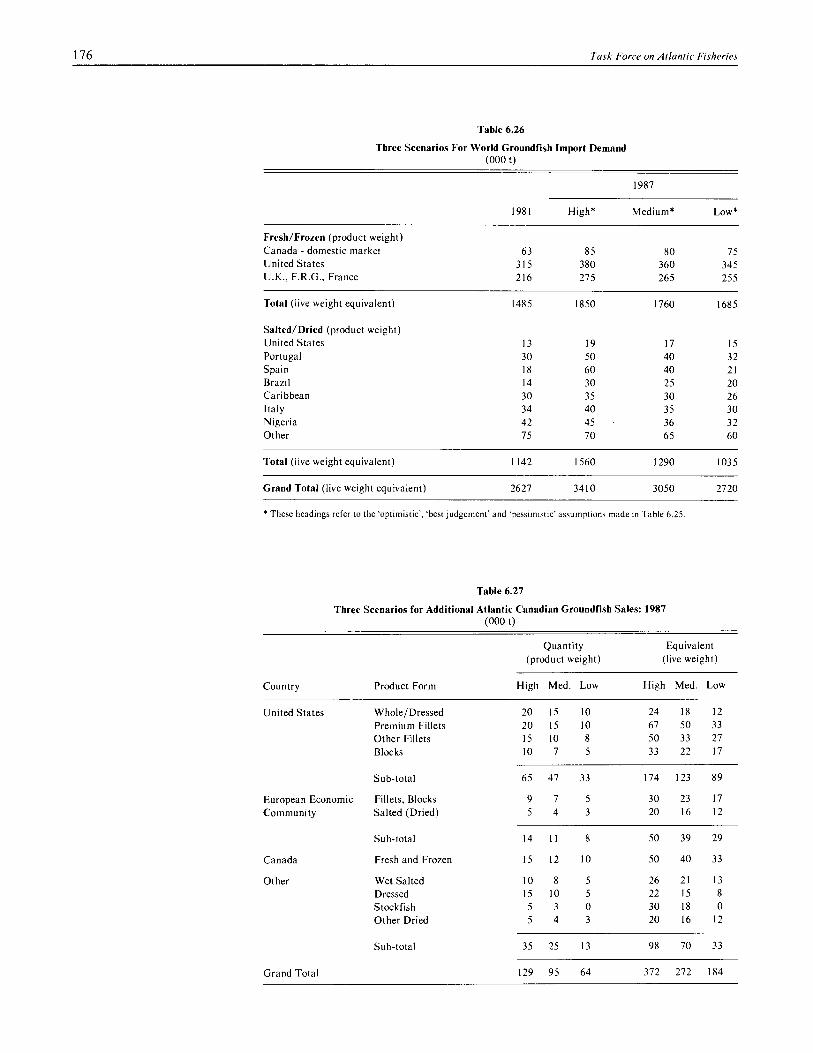
176
Task Force on Atlantic Fisheries
Table 6.26
Three Scenarios For World Groundfish Import Demand (000 t)
1981
1987
High* Medium* Low*
Fresh/Frozen (product weight) Canada - domestic market 63 85 80 75 United States 315 380 360 345 U.K., F.R.G., France 216 275 265 255
Total (live weight equivalent) 1485 1850 1760 1685
Salted/Dried (product weight) United States 13 19 17 15 Portugal 30 50 40 32 Spain 18 60 40 21 Brazil 14 30 25 20 Caribbean 30 35 30 26 Italy 34 40 35 30 Nigeria 42 45 36 32 Other 75 70 65 60
Total (live weight equivalent) 1142 1560 1290 1035
Grand Total (live weight equivalent) 2627 3410 3050 2720
* These headings refer to the 'optimistic', 'best judgement' and 'pessimistic' assumptions made in Table 6.25.
Table 6.27
Three Scenarios for Additional Atlantic Canadian Groundfish Sales: 1987 (000 t)
Quantity (product weight)
Equivalent (live weight)
Country Product Form High Med. Low High Med. Low
United States Whole/Dressed 20 15 10 24 18 12
Premium Fillets 20 15 10 67 50 33 Other Fillets 15 10 8 50 33 27
Blocks 10 7 5 33 22 17
Sub-total 65 47 33 174 123 89
European Economic Fillets, Blocks 9 7 5 30 23 17
Community Salted (Dried) 5 4 3 20 16 12
Sub-total 14 11 8 50 39 29
Canada Fresh and Frozen 15 12 10 50 40 33
Other Wet Salted 10 8 5 26 21 13
Dressed 15 10 5 22 15 8
Stockfish 5 3 0 30 18 0
Other Dried 5 4 3 20 16 12
Sub-total 35 25 13 98 70 33
Grand Total 129 95 64 372 272 184
Markets and Marketing 177
market niches we now occupy. This is most unlikely. The potential benefits of a uni-lateral supply restriction by Canada — for example, by lowering TACS — would at best be shared with our competitors; it is more likely, however, that our competitors would take steps that would dilute any potential benefit to Canada. This would be particularly likely at the lower end of the market spectrum where there is pressure from growing supplies of non-North Atlantic species and from chicken. If cod prices could be raised significantly in the short run it would accelerate the development of the Alaskan cod stock.
Our conclusion is that it is entirely feasible to market the forecast increase in Canadian groundfish landings at roughly constant real prices on average. This will not happen automatically. The conditions for success are nevertheless within our control. Stated simply, they are the basics of every successful business — cost effi-ciency, good quality, skillful marketing, aggressive management and a hospitable policy environment.
Herring Forecasts of herring stocks and harvests are inherently unreliable due to the biologi- Supply and cal characteristics of the species. Recent forecasts of world Atlantic herring landings
Demand suggest increases of about 50,000 t between 1981 and 1987. The major suppliers of Atlantic herring are the EEC countries, Canada, Sweden, Finland and the East Bloc countries.
Herring has traditionally been harvested intensively by Europeans for both food and fish meal. By the late 1970s, European resources were over-fished, leading to the clo-sure of the North Sea fishery and other high producing areas. In 1977, European fishing off the coast of North America was terminated. The European shortfall in supply considerably strengthened the demand, and the price, for Canadian herring. However, consumption in the U.K. and Germany began to fall as consumers resisted these price increases and began to substitute cheaper species — pilchard, mackerel — as they became available.
Herring fishing in the North Sea has resumed, and fresh local supplies are once again available in increasing quantities. In addition, the appreciation of the Canadian dollar relative to European currencies has made Canadian herring very expensive. As a result, Canadian herring is a secondary source, except where large herring is specifically required. Canada has therefore been supplying a shrunken share of the European frozen fillet market, and prices to Canadian processors have been depressed since 1980. Exports of cured herring have not dropped as sharply.
In future, Canada will be able to supply the European market only if production costs are sufficiently low to make our product price competitive and if EEC trade barriers are lowered. A resumption of over-fishing in Europe or a reduction in stocks for unpredictable biological reasons could also restore strong demand for Canadian herring, but these developments cannot be counted on.
The United States is the largest market for Canadian herring, accounting for about 30 per cent by value in 1981, followed by West Germany at 23 per cent. Japan uses Canadian Atlantic herring when domestic supplies are low and has provided a grow-ing market for whole frozen herring containing roe.
An admittedly speculative forecast of supply and demand for Atlantic Canadian her-ring is given in Table 6.28. The projected catch, which is declining, is shown balanced with demand. The cost-price squeeze is evidently the issue of greatest con-cern. Demand for Canadian herring at competitive prices should be adequate. The issue of harvesting costs is addressed in Chapter 19.
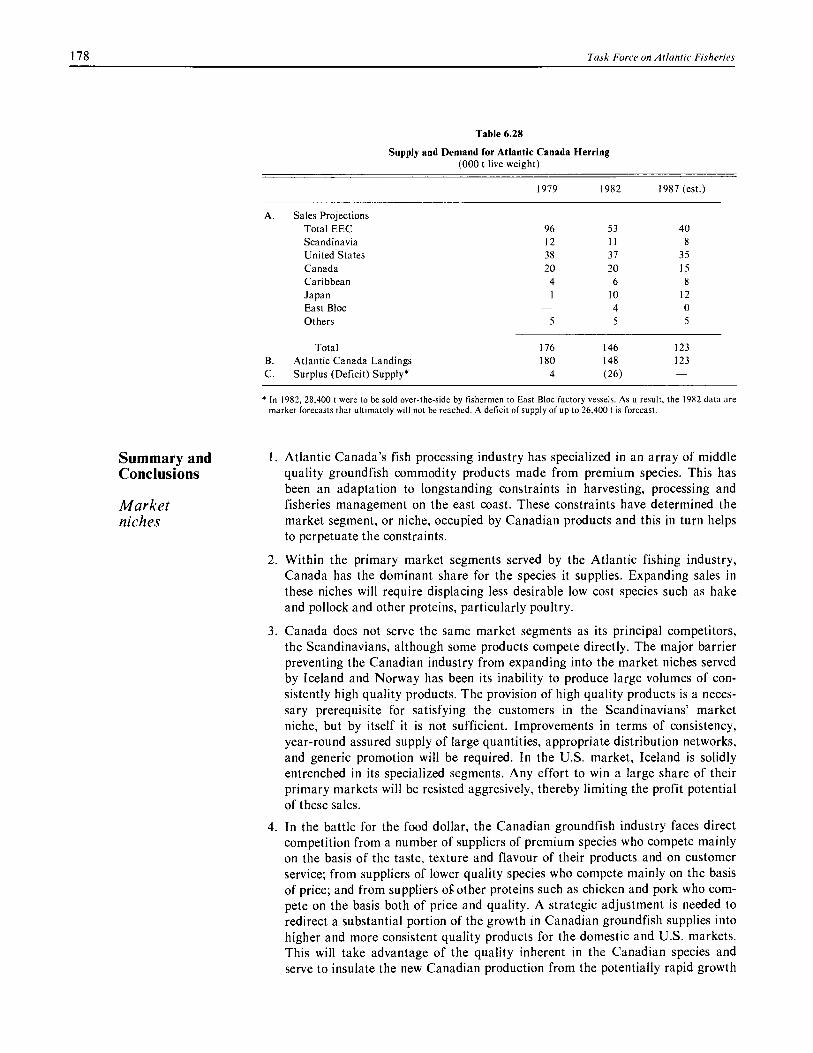
178
Task Force on Atlantic Fisheries
Table 6.28
Supply and Demand for Atlantic Canada Herring (000 t live weight)
1979 1982 1987 (est.)
A. Sales Projections Total EEC 96 53 40 Scandinavia 12 11 8 United States 38 37 35 Canada 20 20 15 Caribbean 4 6 8 Japan 1 10 12 East Bloc 4 0 Others 5 5 5
Total 176 146 123 B. Atlantic Canada Landings 180 148 123 C. Surplus (Deficit) Supply* 4 (26)
* In 1982, 28,400 t were to be sold over-the-side by fishermen to East Bloc factory vessels. As a result, the 1982 data are market forecasts that ultimately will not be reached. A deficit of supply of up to 26,400 t is forecast.
Summary and 1. Atlantic Canada's fish processing industry has specialized in an array of middle Conclusions quality groundfish commodity products made from premium species. This has
been an adaptation to longstanding constraints in harvesting, processing and Market fisheries management on the east coast. These constraints have determined the niches market segment, or niche, occupied by Canadian products and this in turn helps
to perpetuate the constraints.
2. Within the primary market segments served by the Atlantic fishing industry, Canada has the dominant share for the species it supplies. Expanding sales in these niches will require displacing less desirable low cost species such as hake and pollock and other proteins, particularly poultry.
3. Canada does not serve the same market segments as its principal competitors, the Scandinavians, although some products compete directly. The major barrier preventing the Canadian industry from expanding into the market niches served by Iceland and Norway has been its inability to produce large volumes of con-sistently high quality products. The provision of high quality products is a neces-sary prerequisite for satisfying the customers in the Scandinavians' market niche, but by itself it is not sufficient. Improvements in terms of consistency, year-round assured supply of large quantities, appropriate distribution networks, and generic promotion will be required. In the U.S. market, Iceland is solidly entrenched in its specialized segments. Any effort to win a large share of their primary markets will be resisted aggresively, thereby limiting the profit potential of these sales.
4. In the battle for the food dollar, the Canadian groundfish industry faces direct competition from a number of suppliers of premium species who compete mainly on the basis of the taste, texture and flavour of their products and on customer service; from suppliers of lower quality species who compete mainly on the basis of price; and from suppliers of other proteins such as chicken and pork who com-pete on the basis both of price and quality. A strategic adjustment is needed to redirect a substantial portion of the growth in Canadian groundfish supplies into higher and more consistent quality products for the domestic and U.S. markets. This will take advantage of the quality inherent in the Canadian species and serve to insulate the new Canadian production from the potentially rapid growth

Markets and Marketing 179
of the less desirable, but less costly, South American hake, Alaska pollock and whiting. Equally important, a more consistent supply of better quality products will be a valuable way of displacing other proteins, particularly poultry, from the diet of North Americans.
Market opportunities
5. The United States will remain Canada's leading export market. The U.S. and Canadian domestic markets offer strong potential for increased sales of premium quality groundfish products — specifically, fresh fillets and premium quality frozen fillets. The demand for blocks is declining, apparently as a result of shift-ing consumer tastes away from the battered and breaded products manufactured from them.
6. Price competition and tariff and non-tariff barriers to international trade con-strain Canada's opportunities to export to markets in the European Economic Community. Efforts to reduce foreign trade barriers to the export of Canadian groundfish and herring must be a major priority for Canada. Comparative advantage will probably lead Scandinavian suppliers to direct more of their product to European markets and Canada to take an even larger share of the U.S. groundfish market.
7. Market diversification (that is, broadening the Canadian market base) is required to avoid over-supplying existing markets and depressing prices in the middle quality value-for-money market segments that Canadian products primarily occupy. This will require promotion programs and consumer and dis-tributor education to expand North American per capita consumption against other proteins. Investment in new product forms for the retail and food service segments will also be needed. Greater investment will be required for programs to open up new geographic markets.
organization the past decade. The sale of frozen fillets and blocks and of wet and dry saltfish Marketing 8. The marketing of Atlantic groundfish has become increasingly concentrated over
is now heavily concentrated. The sale of herring products is less concentrated, while fresh groundfish sales are the least concentrated.
9. Atlantic Canada's seafood exporters are as large as their Scandinavian counter-parts. However, they remain small by comparison with the giant multi-national food companies that they would face in the U.S. retail market.
10. Concentration among U.S. buyers of groundfish products has declined in recent years. However, the market is clearly segmented and, within key sectors, high buyer concentration exists. Trends toward increased concentration in the manu-facture and marketing of retail branded products and in distribution networks may result in Canadian sellers facing a smaller number of powerful buyers and increased competition for firms attempting to enter the U.S. retail market.
11. The market strategies and forms of price competition used by the Canadian Marketing industry are largely determined by problems internal to the industry. The indus- behaviour try produces a very high proportion of standard commodity products. The mar-ket segments that use standard commodity products are price-sensitive, and buy-ers may often substitute other low-cost species (hake, Pacific pollock, whiting), while consumers will choose cheaper proteins such as chicken. This has led the industry to focus on high volume production, in an attempt to keep prices low so as to maintain its market share.
12. With undifferentiated products, advertising by an individual firm is not a realis-tic alternative to price competition. However, a generic advertising program would provide a cost-effective way to expand Canada's market share against the substitutes and increase per capita consumption of groundfish in North America.

180
Task Force on Atlantic Fisheries
13. The forward integration of Canadian processors into final markets and the expansion of their foreign sales networks has contributed to the recent rapid growth in sales. The forecast 50 per cent growth in Atlantic Canada's catch of cod and flatfish over the next five years will require further substantial invest-ments in marketing. Greater marketing effectiveness and lower product costs are essential.
14. Buffer markets should be developed to provide alternative outlets for lower qual-ity products and unanticipated gluts. Several different geographic markets are needed to guard against the instability inherent in the economies of consuming nations.
15. Despite the 40 per cent increase in Canadian sales of groundfish between 1977 and 1981, Canadian prices were found to be more stable than in the previous four-year period. However, distress selling arising from poor financial condition of processors was found to be the cause of the unnecessarily low prices that some processors accepted for some products from time to time. Although the losses have not been large, the frequency with which distress selling occurs has been increasing recently. There are other — less significant — examples of unneces-sarily low prices resulting from inadequate information or insufficient expertise to determine the appropriate price.
16. Further increases in the concentration of marketing and selling has some limited potential to reduce the cost and perhaps improve the performance of Canadian marketing. However, the extent to which prices and profits can be increased will be significantly constrained by competition from the alternatives — hake, Alaska pollock, whiting, Pacific cod and chicken. The industry's focus must be on providing better quality and service at present real prices in order to deter the development of these resources. In the short run, orderly selling will be largely a matter of refining the process for optimizing the proportions of raw material being directed into each product form.
17. During the next five years while Canadian landings of groundfish continue to expand, an unusually high degree of co-operation and co-ordination in marketing will be required among processors and the government to expand groundfish consumption in the market segments dominated by Canadian suppliers, to increase the number of U.S. market segments served, and to expand the number and diversify the geographic markets exploited. Co-ordination is required to reduce the possibility of over-supplying particular market segments, thus lower-ing prices unnecessarily.
18. Improved marketing and sales information is needed at all levels of the industry and in government to help plan an industry that is more finely attuned to the needs and opportunities of the marketplace.
Supply and 19. Between 1981 and 1987 the world supply of groundfish is forecast to increase by demand 15 per cent, from 9.8 to 11.2 million tonnes. Most of the growth will take place forecasts in the so-called less desirable species caught outside the North Atlantic. North
Atlantic species landings are forecast to increase by about 6 per cent between 1981 and 1987, an absolute growth of 255,000 t. An increase of 370,000 t, to roughly one million tonnes by 1987, is forecast for Atlantic Canada, indicating that other North Atlantic suppliers collectively will experience a net decline. Cod will account for about 90 per cent of Canada's supply growth.
20. Projecting present trends, and assuming no improvements in quality and market-ing or price and cost reductions, by 1987 there will be an increase in demand for Canadian groundfish in all markets of about 185,000 t, compared with an
Markets and Marketing 181
estimated increase in supply of 370,000 t. Virtually all of this growth is forecast to be in premium fresh and frozen fillets. Saltfish and herring markets are not expected to grow.
21. Forecasts of demand are very sensitive to changes in per capita consumption. U.S. per capita consumption of groundfish is currently estimated to be 1.8 kg, a mere 1.5 per cent of total animal protein consumption. Over five years, a shift of one-tenth of one per cent per year in the share of U.S. protein consumption going to Canadian groundfish would absorb all anticipated supply growth. The previous conclusions on quality improvement and generic promotion are closely linked to this potential for increasing per capita consumption in North America.
22. A 'medium' case scenario prepared by the Task Force — assuming some improved promotion, a slight decline in the average real unit price of groundfish products and quality up-grading — identified a new demand for Canadian groundfish of about 275,000 t by 1987. This forecast is below the anticipated supply growth in the 1981-87 period, but not significantly so given the inevitable degree of error in any such forecast. Under the same assumptions, there would be a slight shortfall in the demand for Canadian cod, the stock in which the most significant growth is forecast.
23. The Task Force has concluded that all of the forecast TAC of groundfish and her-ring can be harvested and marketed. Moreover, it must be harvested to establish and protect Canada's position in key markets from encroachment by competitive suppliers.


III Objectives and Key Issues


185
7. Objectives of Atlantic Fisheries Policy
It is essential that the Government of Canada establish an explicit, overall objective for the Canadian fisheries and that its Department of Fisheries and Oceans articulate that objective in terms sufficiently specific to allow both government and industry to plan and implement appropriate operational policies.
Fisheries Council of Canada, in a brief to the Task Force, 1982.
Introduction In the preceding three chapters we described the environment in which fishermen and processors are operating and the market outlook for the Atlantic fishing indus-try. It is against this background that specific decisions must be made about appro-priate public policies to deal with the problems facing the fishery. Chapters 9 through 21 present an analysis of what the Task Force has concluded are the major problems facing the Atlantic fishery, a range of options for solving these problems, and the recommendations by the Task Force on which options should be selected and implemented.
But the selection of a preferred option — a recommendation — can be made only after a decision on what the objectives of Atlantic fisheries policy ought to be. With-out a clear statement of objectives or goals, there is no way to choose among several options for solving the same problem. The statement of objectives provides a compass to tell the policy maker whether the recommended option moves the industry in the `right' direction.
A statement of objectives enunciates a direction for the industry. It must involve sub-jective judgements and hence will inevitably be controversial. In fact, the more oper-ational (and therefore the more definitive) a statement of objectives is, the more it will be vulnerable to attack, because the less it will be open to individual interpreta-tions by participants in the industry.
It is to avoid such attacks that the objectives of public policies are often stated in broad general terms that can have many meanings and hence appeal to the widest possible range of citizens. This is also why most of the statements of objectives sug-gested to the Task Force by the fishermen's and processors' organizations and pro-vincial governments with which we consulted were phrased in broad terms; other-wise, they would not have been acceptable to even the limited constitutency represented by the membership of each organization. As an example, consider the following proposed statement of objectives for the fishing industry that appeared in a recent government paper: "To maximize the returns to the fishing industry and to Canada from Canada's fisheries resources". Statements such as this were of little help in guiding the Task Force in its selection of recommended options because they were so general that they could not be used in any remotely operational way.
It is also true that most areas of public policy, particularly those as complex as the Atlantic fishery, are characterized by multiple and conflicting objectives. A decision maker is therefore constantly forced to make trade-offs among desirable and com-peting objectives. To be useful, multiple objectives should therefore be ranked in order of priority. Again, this problem can be eased by having a general statement of objectives that successfully buries within it the kind of trade-offs that decision mak-ers must make. But this merely hides the problem without solving it; it simply makes the trade-offs implicit rather than explicit.

186 Task Force on Atlantic Fisheries
The Task Force considered adopting a general statement of objectives that would mean all things to all people and thus garner a wide degree of support. We resisted this temptation in order to be consistent with our approach to this Report — an approach whereby we are trying to be as specific as possible throughout. For similar reasons, we have ranked our objectives in clear order of priority.
Having said this, however, we realize that there are those who will criticize our state-ment of objectives for being too vague. For example, the three objectives presented in the next section are not as detailed as the eight objectives proposed to the Task Force in the brief from the Government of Newfoundland (although they are consistent with the Newfoundland objectives). Nevertheless, we believe that our objectives indi-cate clearly the direction in which the Task Force believes the industry ought to develop in the years ahead and that they strike an appropriate balance between broad generalities and excessive detail.
The Objectives
Objective 1
The three objectives of Atlantic fisheries policy are stated below in order of priority. Following that, we discuss what the objectives mean and do not mean and the nature of the trade-offs that must be made among them. It will be noted that the statement of objectives says nothing about the appropriate role of government or the private sector. This issue is addressed in the next section.
Objective 1: The Atlantic fishing industry should be economically viable on an ongoing basis, where to be viable implies an ability to survive down-turns with only a normal business failure rate and without government assistance.
Objective 2: Employment in the Atlantic fishing industry should be maximized sub-ject to the constraint that those employed receive a reasonable income as a result of fishery-related activities, including fishery-related income transfer payments.
Objective 3: Fish within the 200-mile Canadian zone should be harvested and proc-essed by Canadians in firms owned by Canadians wherever this is con-sistent with Objectives 1 and 2 and with Canada's international treaty obligations.
The first objective reflects our belief that it is essential to develop an Atlantic fishing industry that does not require regular or periodic government subsidies in order to survive. Indeed, the Task Force was established because, in late 1981, it became clear that once again the industry would probably require a substantial infusion of public funds, as it had in 1968 and again in 1974-76, if it was to avoid almost total collapse. The federal government wanted to break this cycle of periodic bail-outs.
Without an economically viable industry, without an industry that is able to stand on its own feet, the fishery will be doomed to live in an environment of short-term deci-sion making, ad hoc government and industry policies, and great uncertainty — all of which will make it impossible for the industry to be internationally competitive and to develop to the maximum advantage (including the employment advantage) of those who live in Atlantic Canada. Economic viability must therefore be the primary concern of government policy makers.
It is also important to understand, however, what Objective 1 does not mean. It does not mean that every processing firm or harvesting enterprise now in the industry should become permanently economically viable. There will be casualties, there will be bankruptcies, and these should be allowed to occur. They are a normal part of the Canadian economic system.

Objectives of Atlantic Fisheries Policy 187
Objective 2
Neither does Objective 1 mean that the Task Force has accepted the objective pro-posed by some industry spokesmen, who said that the industry ought to be allowed to develop according to the criterion of pure economic efficiency. Although they argued that maximizing economic efficiency maximizes the economic value of the industry to Canada, this approach ignores the enormous cost, in human terms, that would result from such a policy.
As is the case with many theoretically sound economic policies, the social conse-quences of adopting a pure economic efficiency approach to the fishery are unaccept-able to the Task Force and, we believe, to most Canadians. This view is reflected in our second objective, which emphasizes the need for the fishery to employ as many people as possible, given that it is located in an economically disadvantaged region of Canada and that in large parts of that region the fishing industry is the only possible source of employment.
However, the constraint specified in Objective 2 means that the Task Force has explicitly rejected the rural-romantic school of social thought. This school argues that maximizing employment should be the primary objective of Atlantic fisheries policy, even if those employed receive incomes near the poverty line. Just as the Task Force believes that firms in the industry should not have to rely on government hand-outs on an ongoing basis, so we believe that fishermen and plant workers should earn incomes sufficient to ensure that they do not have to depend on social assistance pay-ments or live on the edge of poverty.
Objective 2 also reflects the Task Force view that, as much as possible, the present distribution of population dependent on the fishery, particularly in Newfoundland, should be maintained. There will have to be some exceptions where plant consolida-tion is absolutely essential in order to achieve Objective 1, but these consolidations should be seen as extremely exceptional, rather than as part of a heartless economic rationalization plan.
Clearly, Objectives 1 and 2 will often conflict with each other. In fact, this conflict is reflected in the plea, which the Task Force heard repeatedly during its consultations, for us to decide whether there should be an economic or a social fishery. As we explained in Chapters 2 and 3, this is a false distinction, because fisheries policy must reflect both economic and social realities.
Nevertheless, by stating Objectives 1 and 2 in order of priority, we hope we have given decision makers guidance when it comes to making trade-offs between them. If, for example, a firm can show that closing a processing plant is essential for the firm to remain viable, then this closing should be allowed even though it will cost plant workers their jobs, at least in that community. On the other hand, if a firm proposes to close a plant to increase profits when the firm would remain reasonably profitable, and hence economically viable, even if the plant stayed open, then this closure should be discouraged. This view is supported by the processing industry itself. The Fisheries Council of Canada brief to the Task Force stated, "There is a social dimension to the industry which will continue to modify strategies which could otherwise be based exclusively on economics."
The Task Force believes that this social dimension must take precedence when the issue at stake is increased profitability, but not when the issue is the continued eco-nomic viability of a firm. We recognize that, in practice, it will be difficult to deter-mine when a proposed corporate action meets the economic viability test as opposed to the profit maximizing test, and to that extent our objectives are not as operational as we (and many others) would have liked them to be.
188 Task Force on Atlantic Fisheries
For example, it may sometimes be possible for a new corporate entity, or new managers, to pick up all the elements of a failing operation and pull them together on a profitable basis. Economic viability is in part dependent on who the current owners are, the price at which they purchased the assets involved and so on. Enabling new owners to purchase assets at a bargain price could enable a corporate entity to be formed that would be economically viable, even though the same assets were not viable under the previous owners. Such situations must be dealt with on a case by case basis, and no statement of objectives can cover all such eventualities.
Nevertheless, we hope that by stating clearly the order of priority we attach to Objectives 1 and 2, and by illustrating the kind of trade-offs we would make between them, governments will have a sense of what the Task Force would view as the right decision to make in various situations.
The order of priority given to Objectives 1 and 2 is of fundamental significance because, if adopted by the federal government, it would be almost universally regarded as a definite change in government policy. Until now, it has appeared to most people familar with the Atlantic fishery that federal government decisions have been based on Objectives 1 and 2 being in reverse order of priority or, at most, equal in priority.
Finally, we should point out that the Task Force sees nothing wrong with a govern-ment, federal or provincial, deciding to subsidize a processing firm in order to keep a plant open if that government decides that this must be done for social (employment) policy reasons. In this case, government funding would be used to ensure that Objec-tives 1 and 2 are both met.
Objective 3
What the Task Force is strongly opposed to is pressure applied to firms (for example, by hinting that trawler licences or processing plant licences will be withdrawn) to keep a plant open for employment reasons (Objective 2), when from the point of view of the firm's economic viability (Objective 1), the plant should be closed. This amounts to interchanging the priority of Objectives I and 2 and putting the cost of this interchange, essentially a social policy cost, on the shoulders of the firm's share-holders rather than on the government. The Task Force believes that this is wrong.
Objective 3 will have the support of almost all the participants in the Atlantic fishing industry. Fishermen, plant workers, company management, provincial governments and the Task Force all share the view that fish inside the 200-mile limit are a Canadian resource that ought to be exploited wherever feasible by Canadians. Canadians ought to harvest the resource, and it ought to be processed by Canadian plant workers in Canadian-owned companies.
Again, however, the priority attached to this objective relative to Objectives 1 and 2 is significant. As we saw in Chapter 5, the Canadian fishing industry is in desperate need of new equity capital if it is to become economically viable. There are only four possible sources of such funds: Canadian private investors, the federal government, provincial governments, or foreign investors. If sufficient new private Canadian investment in the fishing industry cannot be obtained, and if both levels of govern-ment do not contribute enough equity to the industry to make it viable, then the Task Force believes that foreign investment should be allowed, subject of course to the rules of the Foreign Investment Review Agency. (In this case, the FIRA 'signifi-cant benefit to Canada' test will require careful assessment in order to avoid the loss to Canada of value-added fish products through the export of minimally processed products to the overseas facilities of the foreign investors.) In other words, if a trade-off has to be made between Objectives 1 and 3, it should be made in favour of Objec-tive 1.

Objectives of Atlantic Fisheries Policy 189
Many participants in the fishery would oppose such a trade-off. To them we reply that we share their concern about foreign investment in the Atlantic fishery and would favour Canadian investment, but if neither Canadian private investors nor governments will invest in the industry, foreign equity investment should be allowed.
The Role of In the previous section we deliberately avoided using the catch-phrases and slogans
Ideology relating to the roles of government and the private sector that were so often used by those with whom we consulted. We did this because it seems to us that the question of who does something must be distinguished from the question of why it is being
done.
The Task Force view is that the question of whether a particular activity is carried out by the public sector or the private sector is less important than the question of whether the activity moves the fishery toward the achievement of the three objectives we have set out. We are far more concerned with the extent to which the industry will achieve our three objectives in the future than we are with the degree of govern-ment involvement in the industry. Nevertheless, the Task Force does believe that when roughly the same degree of progress can be made toward fulfilling our objec-tives by using either public or private sector means, then the private sector route is much preferred.
Some may object that this is not a sufficiently strong defence of what many industry members call the 'free enterprise system'. Frankly, the Task Force does not under-stand what this phrase means in the context of the Atlantic fishing industry. The fact is that in order to avoid returning to the 'tragedy of the commons' situation, which everyone agrees resulted from unrestricted fishing in previous decades, government has to play a major role in the industry at least as the manager of the resource. In addition, the economic theory on which the free enterprise system rests includes the possibility of firms going out of business through bankruptcy. This feature of the the-ory seems to have been ignored by many of those who made the free enterprise argu-ment to us. It also seems to have been ignored by those who have sought government assistance in recent months and years. We therefore discounted much of the free enterprise rhetoric as just that — rhetoric.
Fishermen's organizations also relied on somewhat exaggerated descriptions of the industry in their presentations to us. The brief from the Newfoundland Fishermen, Food and Allied Workers Union, for example, contained the following quotation from a 1930s book by Thomas Lodge, Dictatorship in Newfoundland:
The cod fishery ... is almost unique as an industry in that it has somehow managed to throw ... very nearly the whole risks which capital normally takes, and on which it bases its abstract claim for reward, on the shoulders of the working class.
The brief goes on to say, "While some of the outward characteristics of that system may have altered, the attitudes spawned and nurtured throughout the history of the cod fishery remain very much in place in the 1980s."
This view of the extreme imbalance of power between the inshore fishermen and the processing companies is not nearly as relevant today as it was in the 1930s. The power of fishermen's organizations, particularly the NFFAWU, in terms of their ability to influence the development of the fishery, to protect the rights and, particularly, to enhance the incomes of fishermen, is substantial. In fact, it is because the Task Force believes in the value of this new balance of power that elsewhere in the Report we recommend that provincial legislation be changed to allow all fishermen to unionize.

190 Task Force on Atlantic Fisheries
These examples of statements made to the Task Force by processors' and fishermen's organizations are inaccurate descriptions of the current situation, but they are symp-tomatic of the fact that all participants in fisheries debates use exaggeration and slo-gans that obscure issues and discourage rational debate of fundamental problems. Government officials, for example, frequently warned us of the dangers of too much government 'intervention'. Aside from the irony of officials in departments of development (which presumably exist so that government can help industry and become involved, at least indirectly, in the marketplace) being opposed to interven-tion, it became clear as discussions proceeded that intervention was in some cases a synonym for permanent subsidies and in others a synonym for government equity participation or complete ownership.
As Objective 1 makes clear, the Task Force is opposed to government becoming involved in perpetual subsidy programs. If that is what intervention means, then we are opposed to it.
On the other hand, we find it impossible to oppose, purely on principle, government equity participation in the processing sector. Indeed, we have stated that Canadian equity is preferable to foreign equity. Therefore if intervention means government equity participation, then we are not opposed to it.
These observations have not been made merely to point up the inconsistency of argu-ments made to us or the speciousness of catch-phases and slogans, but rather to underscore a fundamental point: The Atlantic fishing industry is in very serious trouble; it must be put in a position where it can once again become economically viable. To do this will require pragmatic rather than ideological decisions about a series of extremely tough problems.
To the extent that those involved in the fishery reject certain options simply because they conflict with personal ideology — even though in most cases they have nothing better to propose than government assistance with no strings attached — the plight of the industry will be that much more difficult to remedy, and tough problems may become insoluble. Hence our plea for a pragmatic response, rather than an ideologi-cal response, to the issues, options and recommendations in the chapters that follow.

191
8. Issues and Recommendations: An Overview
When fish are counted, it's people that count. Any . . . plan in the fisheries has really one basic criterion of judgement: does it improve life?
Hon. Romeo LeBlanc, in a speech to the Atlantic Provinces Economic Council, October 22, 1974.
The Task Force approached its work in very much the spirit captured by the words of the former Minister of Fisheries quoted above. We believe that the fundamental reason for establishing the Task Force was the concern of the federal government for
the people of Atlantic Canada — the people who live in hundreds of communities scattered along the coastline of the Atlantic Ocean, the Bay of Fundy and the Gulf of St. Lawrence.
It was because of this concern for people that the Task Force travelled extensively throughout the region, not just to the urban centres, but to dozens of small com-munities as well, to listen to what people had to say about the problems of the fishery and their possible solutions. It was also because of this concern that deliberations on our recommendations usually came back to one issue: the need to preserve jobs with adequate incomes so that people in the fishery could continue to enjoy the unique lifestyle of rural Atlantic Canada.
Although this goal was uppermost in our minds, we also had to take into account that, in an era of restraint on government expenditures, our recommendations had to point the way toward an industry that would not require large amounts of ongoing government assistance. This has been a constraint on our possible recommendations.
From this starting point, we were able to develop the following structure, or policy framework, for our recommendations.
In Chapter 7 we presented our objectives for the fishery. To recap our argument:
• If preserving jobs in rural communities is of fundamental importance, but perma-nent public subsidies are not available to preserve every job in every community that is now dependent on the fishery, then an economically viable industry in both the harvesting and processing sectors must be the first priority objective; other-wise, employment in the fishery will be forever insecure and unstable.
• But economic viability must not be taken to mean maximum economic efficiency regardless of the social (employment) cost; hence our second objective should be to maximize the number of jobs in the fishery as long as the income received from these jobs can be considered reasonable.
• Finally, it was clear to us that employment would be maximized only if the indus-try were controlled, to the greatest degree practical, by Canadians. Fish are the perfect example of a resource that could be exported with little or no value added, but this would cost jobs in the processing sector. In fact, in the extreme case, fish could even be caught by foreign vessels, using foreign crews, thus eliminating jobs in the harvesting sector as well. These considerations led to our third objective —the `Canadianization' objective — and our strong stand on international issues, including over-the-side and over-the-wharf sales, contained in the recommenda-tions in Chapter 9.
With this set of objectives providing a framework for our recommendations, we turned our attention to how to achieve them. Our thinking went as follows:
Introduction
Rationale for the Recommendations
192 Task Force on Atlantic Fisheries
Processors
Fishermen
• If the industry is to be economically viable, it must be able to market its product at profitable prices; hence we started our analysis at the marketplace and worked backward toward the harvesting sector.
• Our study of the marketplace (Chapter 6) concluded that the projected growth in fish landings, particularly northern cod, could be marketed successfully provided that there was greater co-ordination of corporate marketing strategies and increased marketing efforts through, for example, generic promotion and the development of new markets. Hence the recommendations in Chapter 17.
• But as shown in Chapter 5, improved marketing efforts, by themselves, are clearly not sufficient to ensure economic viability. Much more must be done at both the processing and harvesting stages. In particular, the quality of the fish landed and the quality of product leaving the plant must be substantially improved so as to support and complement marketing initiatives. This consideration led us to the recommendations in Chapter 14.
• As the data in Chapter 5 make clear, improved quality and marketing are still not sufficient to make many plants (or companies) viable. The market prices of most groundfish and herring products are not expected to increase, in real terms, in the near future. Plant viability will therefore depend on greatly improved cost effi-ciency which, in turn, will require better management, higher quality raw material and less variability in the supply of fish. In short, plants will have to reduce their operating costs in a variety of ways, including those described in Chapter 16.
• The only way that some plants have any hope of becoming economically viable is by lengthening their operating season. This is particularly important for plants in northeast and eastern Newfoundland, where fish delivery is mostly seasonal. Delivery of fish to seasonal plants during the winter would (1) enable fixed over-head costs to be distributed across a larger quantity of fish; (2) increase the employment period for plant workers, thereby helping to increase their incomes; and (3) allow a more orderly (less seasonal) flow of products to the market. The recommendations on resource-short plants in Chapter 11 are aimed at achieving these goals.
• An appropriate allocation of the growth in the northern cod stock off Newfound-land (the largest and most rapidly increasing fish stock) is needed to spread the catch more evenly over the year and to make the recommendations in Chapter 11 feasible. It is also needed to support more productive harvesting techniques. Hence the recommendations in Chapter 12.
But fishermen, as well as processing plants, are in serious financial difficulty, as the data in Chapter 4 make all too clear. Fishermen also need to reduce their costs and increase the value of their catches in order to increase their net incomes. This led us to several conclusions:
• Fishermen's costs can be reduced significantly only if the regulations that con-strain technological efficiency are relaxed. But this will be pointless, indeed coun-terproductive, if removing constraints leads to another bout of fleet expansion. Fishermen must have an incentive to catch the allowable quotas at the least cost.
• Fish are common property, and a fisherman is now virtually forced into a race for the largest share of a quota before it is taken by his neighbours. Regulations have been progressively increased to control fishing capacity, but they have not been particularly successful in overcoming the costly effects of this race and they have stunted improved technological efficiency. Some type of 'quasi-property right', in the form of a 'quota licence' or 'boat quota', is required that would give each fish-
Issues and Recommendations: An Overview 193
erman an assured share of the quota or would define more precisely his rights to fishing capacity. Within limits, these rights could be traded or sold.
• A quasi-judicial authority would be needed to oversee and to ensure the fairness (real and perceived) of both the transfer of rights and the licensing system in general.
These first three conclusions form the basis of the recommendations in Chapter 10.
• Fishermen's costs can also be reduced by ensuring that they have access to ade-quate amounts of capital, on reasonable terms and conditions, for vessel replace-ment. As this has been the traditional responsibility of provincial loan boards, in Chapter 19 we urge them to review their current practices in light of fishermen's needs for access to capital.
• In many areas where the inshore fishery is held to a short season by weather and the migration of stocks, there is a continuing need for supplements to fishing incomes. In the short term, some modest changes to improve fishermen's unem-ployment insurance are needed as a transition measure until a better program for income stabilization and supplementation can be put into effect. Fishermen's unemployment insurance would then be replaced by a program that would com-bine income supplementation with a production bonus scheme to encourage desir-able goals in the fishery — for example, better quality of landed fish, off-peak fishing — as recommended in Chapter 18.
• Fishermen's incomes may also be increased in other ways, depending on the results of the port market studies called for in Chapter 15. If the port market functions properly, fishermen will receive a fair share of the final marketed value of fish products. Thus the benefits of better economic performance of the fishery as a whole will be shared by fishermen as well as by those in the processing sector.
All these changes are designed to make fishermen and processing plants economi-cally viable, provided they start on a sound footing. Unfortunately, as shown in Chapter 5, most of the trawler-based processing sector is now exceptionally weak financially. Without refinancing, some of these firms will not survive to benefit from the structural changes in the industry that are recommended by the Task Force.
To retain the potentially viable elements of these firms, and to avoid an unacceptable disruption of dependent communities, a significant infusion of new funds, probably in the form of equity, will be required. Because these funds should not be employed to bail out existing shareholders, and because sufficient new investment might not be attracted from private sources at this time, the federal government may well have to provide a significant portion of the new equity.
At the film, this Report was finalized, the exact manner in which new government funds will be used to assist the viable elements of existing firms was under active negotiation between the Task Force, the federal and provincial governments, the banks and the owners of the companies involved. The Report does not therefore con-tain specific recommendations with regard to the precise form that the restructuring of these companies should take. It is hoped, however, that the negotiations will have advanced sufficiently for the main results to be announced when the Report is released to the public.
But with the exception of the financial assistance required to restructure the viable parts of the existing offshore companies that are in trouble, the Task Force believes that if its recommendations are adopted, our first objective — the economic viability of the industry — can be met without ongoing government assistance. This is the rationale for our recommendations in Chapter 19.

194 Task Force on Atlantic Fisheries
The Task Force also dealt with two problems that, although they are very important, fall outside the major focus of the Report. The first is the problem of chronic low incomes for fishermen in northern areas — roughly, north of 50° latitude — which, the Task Force believes, requires the particular attention of government. Develop-ment of the fisheries resource for the maximum benefit of local residents may require that government assume ownership of some processing plants in the area —for example, at St. Anthony in northern Newfoundland. Hence the recommendations in Chapter 13.
The second is the problem faced by the herring fishermen in the Gulf of St. Law-rence and the Bay of Fundy. Our recommendations on how to deal with this problem are presented in Chapter 20. They reflect the approach the Task Force has taken to broader harvesting issues (Chapter 10) and the limited availability of government funds to finance licence buy-back at this time.
Making Finally, it must be emphasized that the effectiveness or impact of the recommenda- it Work tions in this Report depends on the willingness of fishermen, plant workers, proces-
sors and, not the least, federal and provincial governments to accept change. It depends on their willingness to do many things differently than they have been done in the past. It depends also on their willingness to change their attitudes to others in the fishery.
If the we/they mentality that dominates the attitude of all major groups in the fish-ery is maintained, if everyone continues to blame everyone else for the fishery's prob-lems and fails to accept some of the blame themselves, if the view prevails that any assistance to processors must be matched by assistance to fishermen and vice versa, if the degree of mistrust that so permeates the industry persists, then its problems will never be solved. The recommendations in Chapter 21 are designed to be the first small steps in the direction of helping to reduce the animosity and mistrust that run throughout the industry. But they are just that — small steps. The rest is up to the people in the fishery — the people who have been the major concern of the Task Force. If they decide that this time they will accept change, that they will set aside old differences and work together, then this industry can be made viable once more. If, as has happened so often in the past, the people employed in the fishery decide to resist change, then the boom and bust cycles that have so often occurred are doomed to be repeated.
The Atlantic fishing industry will pull through its current crisis only if everyone in the fishery pulls together. Pulling through, together must become the motto of the fishery in the months and years ahead.

IV Issues and Recommendations

197
9. International Issues
The development of the Canadian resource for and by Canadians should be a paramount principle of fisheries policy
Fisheries Association of Newfoundland and Labrador Ltd., in a brief to the Task Force.
The Problem
Background
Groundfish stocks overlapping and outside 200 miles
As a consequence of extended jurisdiction by coastal states, a number of 'distant water' fishing nations have been left with fleets of expensive, under-utilized vessels. These vessels, with few other fishing opportunities, create continuing conservation and allocation problems in stocks overlapping or outside the Canadian 200-mile zone.
Proposals have been made to use these vessels within the Canadian zone in ways that are attractive in the short term to various industry sectors but of questionable value in the longer run in light of the Task Force objectives. To the extent that these pro-posals are not accommodated, leverage of various kinds may be applied in an attempt to force Canadian authorities to accede to more favourable treatment of for-eign vessels. The pressure has included, for example, over-fishing outside 200 miles and trade barriers to Canadian fish products.
The policy issues involve the rules that should govern allocations of stocks within the 200-mile zone, foreign investment in the Atlantic fishery and over-the-side or over-the-wharf sales.
In the six years since the extension of fisheries jurisdiction to 200 miles, foreign fish-ing has been substantially reduced and replaced by Canadian effort, particularly with respect to groundfish species. The result has been a significant improvement in the catching performance of Canadian vessels. Several countries — including Spain and Portugal — and the European Economic Community have resisted this displace-ment of foreign effort. They have sought re-entry to the Canadian zone by offering a range of inducements — deliveries of fish to Canadian plants, for example — and by threatening (and, in the case of Spain, actually effecting) market closure if Canada does not grant cod allocations. Actions such as these, combined with the economic difficulties of the Canadian fishery and the need to penetrate new markets to sell our increased catches, threaten to reverse the `Canadianization' of the fishery.
Foreign vessels will continue to catch inside the 200-mile zone those species that are genuinely surplus to Canadian harvesting capacity (e.g., silver hake, grenadier) and relatively small quantities of other species such as redfish and turbot in some areas. This raises no particular problem as long as these stocks are not attractive to the Canadian fishing industry.
The core of the current international allocations problem, from a Canadian perspec-tive, is the susceptibility to over-fishing of groundfish outside the 200-mile limit. Fish stocks outside 200 miles on the Grand Banks and Flemish Cap are regulated by the Northwest Atlantic Fisheries Organization (NAFO). While Canada has a major say in how these stocks will be managed by NAFO, countries that are not members of NAFO (e.g., Spain) can and do carry out fishing operations beyond 200 miles without regard to internationally accepted conservation measures, resulting in over-fishing of these stocks (which on the Grand Banks extend inside the 200-mile zone as well).
Canada has not developed any stable fishery on Flemish Cap, where the stocks (cod, redfish and plaice) are entirely outside 200 miles, although Canadian vessels have
198 Task Force on Atlantic Fisheries
Policy choices
The Options
Option 1:
made large catches of redfish there from time to time. The reason has been the low catch rates, resulting from low stock abundance, which have prevented the develop-ment of a stable, economically viable Canadian fishery in the area.
The Grand Banks groundfish stocks, by contrast, are crucial to the very existence of the Canadian trawler fleet, especially that segment based in Newfoundland. All the stocks (cod, plaice, yellowtail, redfish, greysole and capelin are the major species) extend beyond 200 miles. The cod and capelin stocks have been reduced by over-fish-ing, despite the efforts of NAFO.
The fact that the Grand Banks stocks are of such significance to the Canadian fish-ery, yet do not enjoy the protection afforded to most other stocks by the 200-mile zone, is of serious concern. The stocks are susceptible to continuing real and threat-ened resource decline. In the case of cod and haddock, this has had several conse-quences: it has prevented the re-development of a significant Canadian fishery; it results in pressure for entry to the Canadian zone by foreign vessels; and it has in some cases resulted in trade barriers being created when such entry is denied.
Foreign participation in the fisheries inside 200 miles is subject to policy choice by Canada, within the constraints imposed by accepted international practice resulting from the developing Law of the Sea and Canada's treaty obligations. A planned and comprehensive policy is needed one that seeks to balance the objective of `Canadi-anization' of the fishery with the reality that Canada does not exercise jurisdiction outside 200 miles and that our industry is crucially dependent on maintaining (and increasing) exports. The issues to be addressed fall into three groups, although there is a high degree of inter-relationship and overlap among them. These are as follows:
1. issues surrounding the conservation and utilization of stocks overlapping and outside 200 miles as well as allocations to fleets from other countries from non-surplus stocks inside 200 miles (including allocations for 'good behaviour' and/or access to markets);
2. issues involving the use of foreign vessels and crews, including direct over-the-side or over-the-wharf sales, charters of foreign vessels by Canadian processors, fish delivery programs whereby foreign vessels with foreign crews deliver fish to Canadian plants; and
3. joint venture/foreign equity arrangements, which may or may not involve the use of foreign vessels or their assimilation into the Canadian fleet.
Severe limits on foreign participation
Do nothing to rebuild stocks overlapping and outside 200 miles and allow further stock declines, so that foreign fishing in the area becomes uneconomic, in the hope that when foreign effort falls off it will not re-appear as stocks rebound. Restrict foreign activity inside 200 miles to the fishing of surplus allocations only (that is, no other use of foreign vessels).
Pros
(a) rapid Canadianization of the fishery.
Cons
(a) additional resource declines, possibly severe, on the Grand Banks and Flemish Cap, with potentially _unacceptable economic consequences to the Canadian trawler fleet;

International Issues 199
(b) probable loss of some existing markets in Europe as well as loss of potential markets; and
(c) loss of opportunities to take advantage of foreign vessels to provide alternative markets in glut situations or where no Canadian processing capacity or market exists.
Option 2: Allocate surplus and non-surplus stocks in exchange for good behaviour within NAFO
and preferred access to markets
Pros
(a) improved conservation of stocks on the Grand Banks and Flemish Cap;
(b) improved market access; and
(c) availability of vessels for fish purchases or temporary processing capacity.
Option 3:
Cons
(a) leaves Canada open to 'blackmail' on both conservation of stocks and access to markets — the value of benefits might not be worth the costs in the end;
(b) foreign allocations constrain Canadian capacity to develop fisheries inside 200 miles and hence are inconsistent with the Task Force Canadianization objective;
(c) foreign allocations improve the prospects and economic performance of foreign fleets, thereby increasing their ability to fish within and outside the Canadian zone and retarding their decline;
(d) foreign allocations would be difficult to limit to a few countries and could result in demands that could not be met; and
(e) runs counter to and may abrogate GATT principles of seeking freer trade through mutual reductions in trade barriers, and leaves limited recourse if retaliatory trade measures are taken.
Allocate surplus and non-surplus stocks 'after the fact' to NAFO members who co-operate to advance Canadian fisheries objectives
As a matter of stated policy, Canada could favour, with both surplus and non-surplus allocations, those nations that are members of NAFO, support Canadian initiatives in NAFO, and maintain a satisfactory fisheries relationship with Canada (including trade). There would be no negotiation of allocations inside the Canadian zone. Canada would allocate surplus fish and a fixed total of non-surplus fish, in recogni-tion of existing and past performance rather than as leverage to improve future performance.
Pros
(a) improves prospects for conservation outside 200 miles, although it does not assure it;
(b) provides for improved market access in some countries, if not all — allocations can be targeted to countries where market prospects are most promising; and
(c) would ensure availability of vessels for direct purchases, glut situations or where no Canadian processing capacity or market exists.
Cons
(a) cannot satisfy all foreign fleet aspirations;

200 Task Force on Atlantic Fisheries
(b) rewards of allocations are likely to be small relative to the anticipated benefits;
(c) will be difficult to avoid negotiation of quantities to be allocated in direct pro-portion to benefits received by Canada;
(d) domestic fishing capacity would be constrained by the extent of the foreign allo-cations;
(e) once the policy is started, it will be difficult to stop or change it; and
(f) the amount of non-surplus foreign allocations will be controversial within Canada.
Option 4: Short and medium-term utilization of foreign vessels
Current arrangements in respect of direct over-the-side or over-the-wharf sales would be regularized and subject to clear guidelines. Arrangements for deliveries to resource-short plants would be formalized and put in place for a fixed period while Canadian capacity is developed. These arrangements would be tied in to the overall fisheries relationship (NAFO, market access, etc.) on a bilateral basis.
Pros
(a) special fisheries relationships could be developed with some countries;
(b) short to medium-term benefits to the Canadian industry could be realized; and
(c) the transitional reduction of foreign fleets would be eased.
Cons
(a) Canadianization of the fishery would be delayed, because additional dependency on foreign vessels would be created among Canadian beneficiaries; and
(b) the choosing of Canadian beneficiaries would be difficult — not all interests could be accomodated (e.g., through fish deliveries by foreign vessels).
Option 5: Joint ventures
Foreign investment would be permitted, in either harvesting or processing or both. Marketing ties might be cemented as a result, and technology and capital would be transferred to Canada. Investment would be subject to well-defined criteria, which would include assurance that the value added to products in Canada was maximized. Foreign vessels would be permitted as replacements, or to deliver fish to designated resource-short plants, under Canadian flag and using Canadian crews. Forward inte-gration by Canadians might be encouraged.
Pros
(a) provides for necessary equity investment in some large Canadian companies;
(b) provides for replacement of worn-out vessels at least cost;
(c) provides the means to deliver needed raw material to designated resource-short plants; and
(d) could result in direct links to markets, which would become dependent on Canadian supplies.
Cons
(a) Canadianization objective not met in its entirety;
International Issues 201
(b) possible pressures to export more semi-processed material to serve converting plants in other countries, with consequent loss of Canadian jobs;
(c) short- and medium-term loss of opportunities in Canadian shipyards; and
(d) possibility of retarding opportunities for development of ancillary industries (gear, electronics, etc.).
Recommendations 1. Allocate non-surplus resources to foreigners as part of agreements for reciprocal fishing rights by fishing vessels across international boundaries (e.g., with Greenland in the Davis Strait).
2. Allocate resources that are currently surplus to Canadian harvesting capacity (e.g., squid) and a fixed amount of 'non-surplus' resources (e.g., cod) preferen-tially to those countries that maintain a satisfactory fisheries relationship with Canada (including fisheries trade and conservation). Allocations of non-surplus resources should be made after the fact — that is, in a subsequent year as a reward for satisfactory behaviour in the previous year — rather than as an incentive. In particular, the government should not negotiate access by foreign vessels to non-surplus resources in return for access to markets.
3. Pursue, on a priority basis, reductions in tariff and non-tariff barriers affecting trade in Canadian fishery products through multilateral negotiations within the framework of the General Agreement on Tariffs and Trade.
4. Permit joint venture arrangements with foreign interests where necessary —that is, in the absence of Canadian solutions to financial equity, marketing and resource supply problems — and subject to Foreign Investment Review Agency conditions appropriate to the nature of the fishing industry. For example, the FIRA assessment will require particular care to avoid the loss to Canada of value-added fish products through the export of minimally processed products to the overseas facilities of the foreign investor.
5. Permit direct sales to foreign fishing vessels 'over-the-side' (that is, by fisher-men selling their catch) and `over-the-wharf (that is, by processors selling mini-mally processed product) only in predetermined and well-defined circumstances. Direct over-the-side sales should be permitted only where insufficient Canadian processing capacity exists, or where there is no Canadian buyer for the quantity available at the recognized price or at the domestic price generally recognized by fishermen and processors. Direct over-the-wharf sales should be permitted only where sufficient value has been added to the product by Canadians. This will require definition of specific allowable product forms.
Comment On international issues, the Canadian fishery is faced with an unusual set of circum- stances and a conundrum in two parts: (1) Despite the best efforts on international
Allocation stock management by NAFO, the activities of states that are not members of NAFO
of resources have resulted in cod stocks beyond 200 miles not being rebuilt. This has led to pres- sure from foreign governments to be allowed to fish, particularly for cod, within the Canadian zone. (2) Restrictive measures taken by Canada inside 200 miles to improve Canadian catch rates result in charges that there is a 'surplus' that is not being allocated as required under the Law of the Sea. If it were allocated it would make the results of the first problem even worse, because it removes the incentive to rebuild stocks in the international area and, at the same time, makes available to our competitors raw material to compete with Canadian products on world markets.
There is only one way to avoid the downward spiral that would be inevitable if pres- sures to allocate stocks to foreign fleets are not resisted. That is to pursue the `Canadianization' of fishing within the zone and, at the same time, to pursue market

202
Task Force on Atlantic Fisheries
Market access
development and expansion by conventional means rather than by way of allocations in return for market access. This is why we made Canadianization our third objec-tive for fisheries policy and why we recommend an after-the-fact approach to foreign allocations rather than offering allocations before the fact in the hope that adequate marketing benefits might ensue.
The Law of the Sea Convention, in our view, does not require the allocation of resources to other countries in situations where to do so would have an adverse eco-nomic effect on the Canadian fishing industry. Indeed, it would be nonsense if inter-national accords required nations to allocate to potential buyers fish that the buyers would then not have to purchase because they could catch it themselves.
Article 62 of the Law of the Sea Convention expressly provides that in giving other states access to its exclusive economic zone, the coastal state shall take into account all relevant factors, including the significance of the living resources of the area to the economy of the coastal state concerned. Article 61 provides that the coastal state may take the economic needs of coastal communities into account in determining appropriate conservation measures for the resources of the 200-mile zone.
We are therefore unable to support the view that because the fish is there it must be caught — if not by Canadians then by vessels from other countries. If we do not have a market for the species and it is genuinely surplus to our fishing economy, it should be allocated to other nations. Otherwise it should be stored in the cheapest manner possible, in the sea, until it can be profitably utilized.
On the issue of allocations of non-surplus resources in return for access to markets, our view that this practice should not be followed has widespread support within the industry. The allocation of non-surplus fish is expensive as well as unwise from a marketing point of view. One thousand tonnes of live cod yields about 20 person-years of direct employment in catching (by trawler) and processing. More labour is required for inshore harvesting. The marketed value of each 1000 tonnes of live cod is about $1 million.
Expanded market access for Canadian groundfish products is important. The strategy of several European fishing nations appears to be to limit or deny that mar-ket access to force Canada to concede quotas inside the 200-mile zone. Once foreign fleets are re-admitted on a significant scale it would be more difficult than it is today to force them out again. The foreign fleets will last at least another ten years if a way can be found to keep them viable, after which there would undoubtedly be pressure for continued or even increased allocations to support the replacement of vessels. We recognize the short-term advantages that might occur if Canada adopted an alloca-tions for access policy. But we believe that these advantages would be strictly short-term. We also have some suspicion that various fleets are seeking to enter into arrangements — be they joint ventures or over-the-side sales — at a loss in order to get a foot in the door, knowing that if sufficient dependency can be created, Canada will not be able to do without them.
Moreover, purchase guarantees by foreign countries in return for allocations are of no use if the price is inadequate. Governments in market economies cannot dictate prices to be paid by their private sector buyers. The governments can at best provide tariff concessions and can discriminte in favour of Canada in the use of non-tariff access controls. But such arrangements are entirely undependable in the long run and, in addition, they undermine the free trade principles of GATT.
Market access is inherently more uncertain and more subject to manipulation than catching the allocation of Canadian fish. Hence allocations for access is a one-sided bargain. That is why we have suggested that access to non-surplus allocations be

International Issues 203
strictly limited in total, be allocated unilaterally on the basis of 'good performance' and be offered to selected nations after the fact rather than in return for a promise of access to markets.
This leaves open the possibility of continuing to seek benefits, including greater access to markets, in return for allocations of surplus resources. This should nor-mally involve allocations from a surplus stock in exchange for sales of product from a species different from that being allocated — so that the foreign allocation does not end up competing with a Canadian product.
The problems posed by foreign fleets were clear in the early 1970s. The world as a whole had too much distant water fishing capacity. Extensions of jurisdiction meant that this capacity had to be reduced or used in different areas and ways. Some coun-tries (for example, the U.K.) have reduced their fleets; others have not.
Many developing countries have taken advantage of the fishing capacity and tech-nology available from distant water fishing states to enter into various forms of joint ventures to develop fisheries that they would not otherwise have pursued. This resulted in some changes in world trading patterns as new and substitute products entered world markets (e.g., South American hake substituting for cod). The same incentives available to developing countries (capital investment, assimilation of fleets, etc.) have also been available to Canada, but until now they have been rejected in an effort to pursue a strong Canadianization policy.
Foreign Since early 1973 the government has followed a policy whereby the fisheries minister
investment of the day has used the discretionary authority in the Fisheries Act to refuse to issue new licences for foreign-owned vessels or to vessels owned by companies that had any foreign shareholders. This policy was adopted in order to prevent foreign interests obtaining by the foreign investment route what had been denied them when fisheries jurisdiction was extended to 200 miles.
The question of whether foreign investment in the Canadian fishery, particularly in vessels, is now to be permitted, beyond the small amount already existing, is crucial to the future shape of the industry. In the absence of Canadian private or public equity investment, foreign capital will be required to salvage a large portion of the offshore processing sector and, possibly, to replace the fleet.
Foreign interests with processing facilities in other countries will be interested in investing in the Canadian fishery for two reasons. First, foreign investors will wish to obtain secure supplies of semi-processed material for production of consumer packs in their own secondary processing facilities. Thus, for example, the Japanese will want whole, frozen-at-sea squid and redfish; the West Germans will look for high quality cod blocks (preferably processed at sea in existing factory vessels), and the Portuguese and Spanish will take wet salted cod for drying at home and perhaps re-export. Second, investment in the Canadian fishery would help them to make more efficient use of their vessels, which are currently under-utilized. In both cases, there-fore, foreign investment could lead to a loss of employment in Canada.
What is clear, however, is that new equity is required, and that some up-grading of the fleet to include more freezing at sea will be necessary to supply certain products. It is also clear that foreign equity and equipment are available if Canada wishes to pursue this route instead of full Canadianization.
Some people will argue that the security of market access that would likely result from foreign investment and the benefits of a new infusion of equity into the offshore sector are worth the loss of value-added product and employment in Canada. But the Task Force believes that this should be permitted only after a careful evaluation of the costs and benefits of the new foreign investment.

204 Task Force on Atlantic Fisheries
Therefore, in light of our first objective for fisheries policy, we suggest that if this objective cannot be fully achieved without foreign investment, FIRA criteria be devel-oped for the kind of foreign investment that would be permitted in the Atlantic fish-ery. This implies that in cases where FIRA criteria are met, the minister would grant the required licences despite the policy that has been followed since 1973. We recom-mend strongly that FIRA criteria include assurances of maximum Canadian value-added and not permit the use of foreign-crewed vessels, as this is inconsistent with our employment-related objective. We are, moreover, attracted to the view that Canadian industry should be encouraged to 'integrate forward' by taking equity in processing, distribution and marketing operations in other countries. If this is to hap-pen, it may of course be necessary for Canada to reciprocate with policies that per-mit foreign investment here under appropriate conditions.
In considering the pros and cons of foreign investment and the criteria that might be established for it, it must be realized that preferred access to foreign markets may be opened to companies that happen to attract foreign investors; this may be seen as unfair by companies that are wholly Canadian-owned. On the other hand, easing the blanket prohibition on foreign investment in the fishery may be a valuable lever in negotiating the reduction or elimination of trade barriers for at least some compa-nies. On balance, the Task Force is not concerned about the appearance of unfair-ness in this case because foreign investment would be permitted only if it is necessary to achieve our first objective, economic viability.
Direct sales
With regard to direct sales to foreign fishing vessels by fishermen (over-the-side) or processors (over-the-wharf), the Task Force was struck by the bitterness and animosity between fishermen and processors that the issue has created. This conflict is not only counterproductive, but fails to recognize the mutual interdependence of the two sectors. (The reason for government involvement is that the foreign vessels participating in direct sales require a licence. They have also been known to press for and receive special allocations within the 200-mile zone as part of the deal.)
Fishermen argue that they should have the right to sell their catch to whoever offers the highest price — even if it is a foreign buyer, who will take the frozen raw material home to be processed, where it will then compete with Canadian products. Processors, while complaining about the lost income and throughput to their plants as a result of over-the-side sales, take the same position as fishermen if they can find a foreign vessel to purchase minimally processed fish over-the-wharf — "it's what the market wants," they say. Both sides ignore the employment benefits of process-ing value-added products in Canada and concentrate instead on the immediate direct benefits the seller, be he fisherman or processor, can gain.
It has been argued that the over-the-side sales issue has been blown out of all propor-tion, given that they make up only about 2 per cent of the catch. But these sales have in fact been of considerable significance in those fisheries (e.g., herring, mackerel) and areas where they have taken place, often at the expense of jobs and revenue in plants where the capacity exists to handle the catch. Once these direct sales are authorized in one area, it is very difficult not to allow them elsewhere, with the result that the processing sector loses further jobs and income, while fishermen's depend-ence on these sales increases.
Seen in this light, the recent rapid increase in over-the-side sales seems to us to be a most unhealthy trend. If prices to fishermen are inadequate in the Canadian market, then the alternative of the Fisheries Prices Support Board being funded to allow it to make 'deficiency payments' would be preferable to continuing to allow over-the-side sales.
International Issues 205
Our recommendation on direct sales recognizes that there are circumstances where they should be allowed to take place, but the rules of the game should be clearly spelled out in advance and strictly adhered to. In particular, over-the-side sales should not be used to exert price leverage in domestic port markets as they have been with, for example, Bay of Fundy herring. Neither should over-the-wharf sales of essentially unprocessed fish be allowed as they have been at some plants in Nova Scotia.
Finally, we believe that direct over-the-side and over-the-wharf sales should be allowed only after their market implications have been very carefully examined. For this reason we recommend that direct sales proposals be examined by the Atlantic Fisheries Marketing Commission proposed in Chapter 17.

207
10. The Harvesting Sector
The tragedy of the commons develops in this way. Picture a pasture open to all. It is to be expected that each herdsman will try to keep as many cattle as possible on the commons. . . The rational herdsman concludes that the only sensible course for him to pursue is to add another animal to his herd. And another, and another . . . But this is the conclusion reached by each and every rational herdsman sharing a commons. Therein is the tragedy. Each man is locked into a system that compels him to increase his herd without limit — in a world that is limited. Ruin is the destination toward which all men rush, each pursuing his own best interest in a society that believes in the freedom of the commons. Freedom in a commons brings ruin to all.
Garret Hardin, "The Tragedy of the Commons", Science magazine, 1968.
The Problem
Background
In some areas there is too much harvesting capacity, relative to current and anticipated resource availability, to generate adequate annual incomes and adequate returns on investment for fishermen. Present licensing and vessel replacement rules designed to control the tendency toward excess harvesting capacity are seen to be artifical and arbitrary and are often not successful. These regulations also inhibit the use of improved harvesting technology.
The policy issue is to find new ways to deal with the 'common property' problem in the fishery. This problem underlies most of the difficulties in the harvesting sector and is compounded by the split federal/provincial administration of fisheries in Quebec.
This chapter will deal almost exclusively with issues of primary concern to independ-ent groundfish fishermen — that is, owner-operators and their crews in vessels of less than 100 feet. The trawler fleet of vessels over 100 feet is effectively an extension of a certain group of processing plants. The policy issues affecting them are quite dif-ferent from those that dominate the inshore fishery. The main pre-occupation of trawler operators has been their share of the total catch, a subject discussed in Chap-ter 3. Allocation issues are also treated in Chapter 12 concerning northern cod. Once the total allocation to the trawler fleet is set, it appears, on the basis of the 1982 experience, that this sector can be largely self-regulating within a system of enter-prise allocations or 'company quotas'.
Catch In 1981, almost 780,000 t of groundfish were landed in Atlantic Canada by about and effort 37,000 fishermen licensed to fish groundfish. About half of these are full-time
groundfish fishermen (Table 10.1). Just under 43 per cent of the groundfish was landed by the roughly 150 offshore vessels over 100 feet in length, and about 57 per cent was landed by the remaining 17,800 inshore and nearshore vessels. Analysis of individual landings by vessels less than 100 feet suggests that about 90 per cent of the groundfish catch is caught by at most two-thirds of the vessels actually fishing for groundfish.
Vessels under 100 feet in length are generally grouped into three main fleet sectors: inshore (vessels less than 35 feet); nearshore (two sub-groups, vessels 35 to 45 feet and those 45 to 65 feet); and middle distance (vessels 65 to 100 feet).
For purposes of examining changes in the fleet structure for vessels of less than 100 feet, it was necessary to aggregate the figures for some of the Task Force analytical areas (see pp. 29-30 for map and description) to correspond with available statistical data as follows:
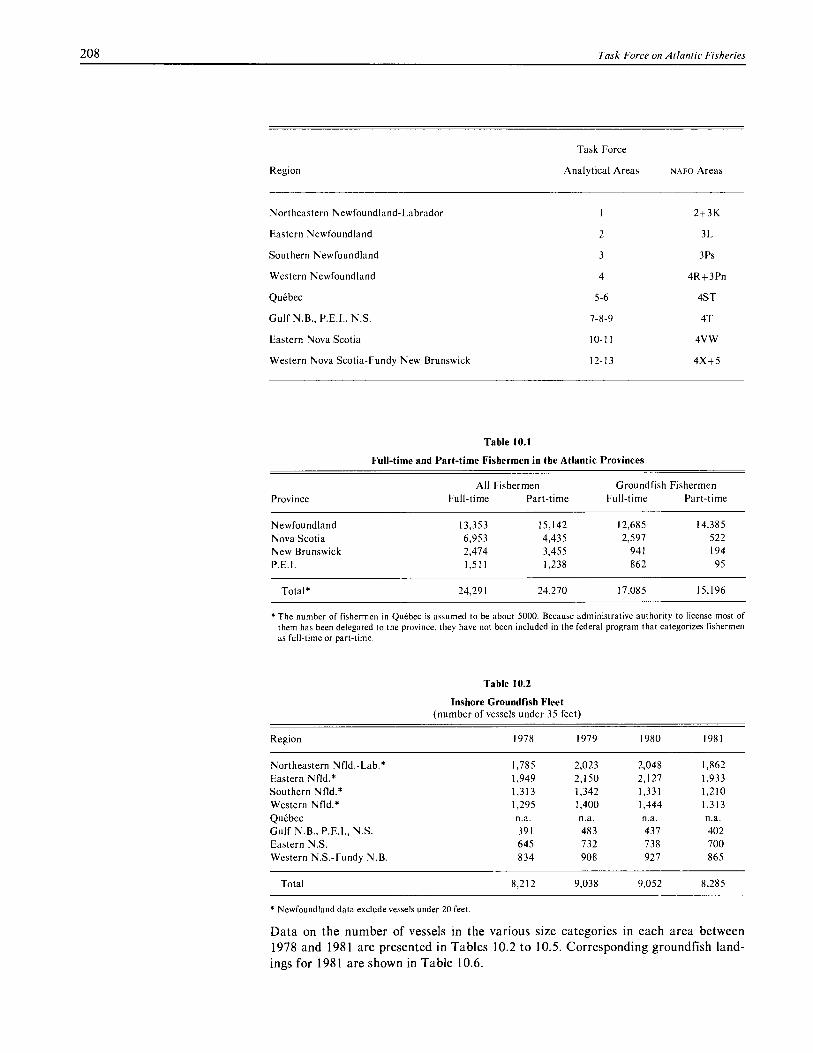
208
Task Force on Atlantic Fisheries
Task Force
Region
Analytical Areas NAFO Areas
Northeastern Newfoundland-Labrador 1 2+3K
Eastern Newfoundland 2 3L
Southern Newfoundland 3 3Ps
Western Newfoundland 4 4R+3Pn
Quebec 5-6 4ST
Gulf N.B., P.E.I., N.S. 7-8-9 4T
Eastern Nova Scotia 10-11 4VW
Western Nova Scotia-Fundy New Brunswick 12-13 4X+5
Table 10.1
Full-time and Part-time Fishermen in the Atlantic Provinces
All Fishermen Groundfish Fishermen Province Full-time Part-time Full-time Part-time
Newfoundland 13,353 15,142 12,685 14,385 Nova Scotia 6,953 4,435 2,597 522 New Brunswick 2,474 3,455 941 194 P.E.I. 1,511 1,238 862 95
Total* 24,291 24,270 17,085 15,196
* The number of fishermen in Quebec is assumed to be about 5000. Because administrative authority to license most of
them has been delegated to the province, they have not been included in the federal program that categorizes fishermen
as full-time or part-time.
Table 10.2
Inshore Groundfish Fleet (number of vessels under 35 feet)
Region 1978 1979 1980 1981
Northeastern Nfld.-Lab.* 1,785 2,023 2,048 1,862 Eastern Nfld.* 1,949 2,150 2,127 1,933 Southern Nfld.* 1,313 1,342 1,331 1,210 Western Nfld.* 1,295 1,400 1,444 1,313 Quebec n.a. n.a. n.a. n.a. Gulf N.B., P.E.I., N.S. 391 483 437 402 Eastern N.S. 645 732 738 700 Western N.S.-Fundy N.B. 834 908 927 865
Total 8,212 9,038 9,052 8,285
* Newfoundland data exclude vessels under 20 feet .
Data on the number of vessels in the various size categories in each area between 1978 and 1981 are presented in Tables 10.2 to 10.5. Corresponding groundfish land-ings for 1981 are shown in Table 10.6.

The Harvesting Sector 209
Table 10.3
Growth of Nearshore Groundfish Fleet (number of vessels)
1978-81
Region 1978 1979 1980 1981 % Change*
Vessels 35' — 45' Northeastern Nfld.-Lab. 152 229 248 248 63
Eastern Nfld. 125 208 248 248 98
Southern Nfld. 193 200 212 211 9
Western Nfld. 120 175 167 167 39
Quebec 191 209 216 197 3
Gulf N.B., P.E.1., N.S. 1,426 1,677 1,755 1,739 22
Eastern N.S. 172 211 264 286 66
Western N.S.-Fundy N.B. 998 1,035 1,006 1,134 14
Total 3,377 3,944 4,116 4,230 25
Vessels 45' — 65' Northeastern Nfld.-Lab. 152 165 172 167 10
Eastern Nfld. 147 163 178 173 18
Southern Nfld. 32 32 30 30 (6)
Western Nfld. 126 148 137 137 9
Quebec 165 186 190 186 13
Gulf N.B., P.E.1., N.S. 79 77 78 75 (5)
Eastern N.S. 21 22 24 34 62
Western N.S.-Fundy N.B. 137 154 176 194 42
Total 859 947 985 996 16
Grand Total 4,236 4,891 5,101 5,226 23
* Bracketed figures indicate a percentage decrease.
Table 10.4
Change in Size of Nearshore Groundfish Fleet, 1978-1981
Increase in Number % Increase (Decrease)
35' — 45' 45' — 65' 35' — 45' 45' — 65'
Northeastern Nfld.-Lab. 96 15 11.3 11.0
Eastern Nfld. 123 26 14.4 19.0
Southern Nfld. 18 (2) 2.1 (1.5)
Western Nfld. 47 11 5.5 8.0
Quebec 6 21 0.9 15.3
Gulf N.B., P.E.1., N.S. 313 (4) 36.7 (2.9)
Eastern N.S. 114 13 13.4 9.5
Western N.S.-Fundy N.B. 136 57 15.9 41.6
Total 853 137 100.0 100.0
During the period 1978-1981, the number of vessels of less than 35 feet engaged in the groundfish fisheries fluctuated between 8200 and 9000. (Vessels of less than 20 feet in Newfoundland are excluded, as their involvement in the groundfish fishery is marginal.) There has been no trend up or down in any area (Table 10.2). The num-ber of nearshore vessels (35 to 65 feet) increased by 25 per cent, from 4268 in 1978 to 5344 in 1981. Overall, the number of vessels of 35 to 45 feet increased from 3377 to 4230, and the number of vessels 45 to 65 feet increased from 891 to 1114 (Table 10.3). The largest increase in the smaller category occurred in the Gulf sector of New Brunswick, Nova Scotia and P.E.I. (313 vessels). In the larger category, the
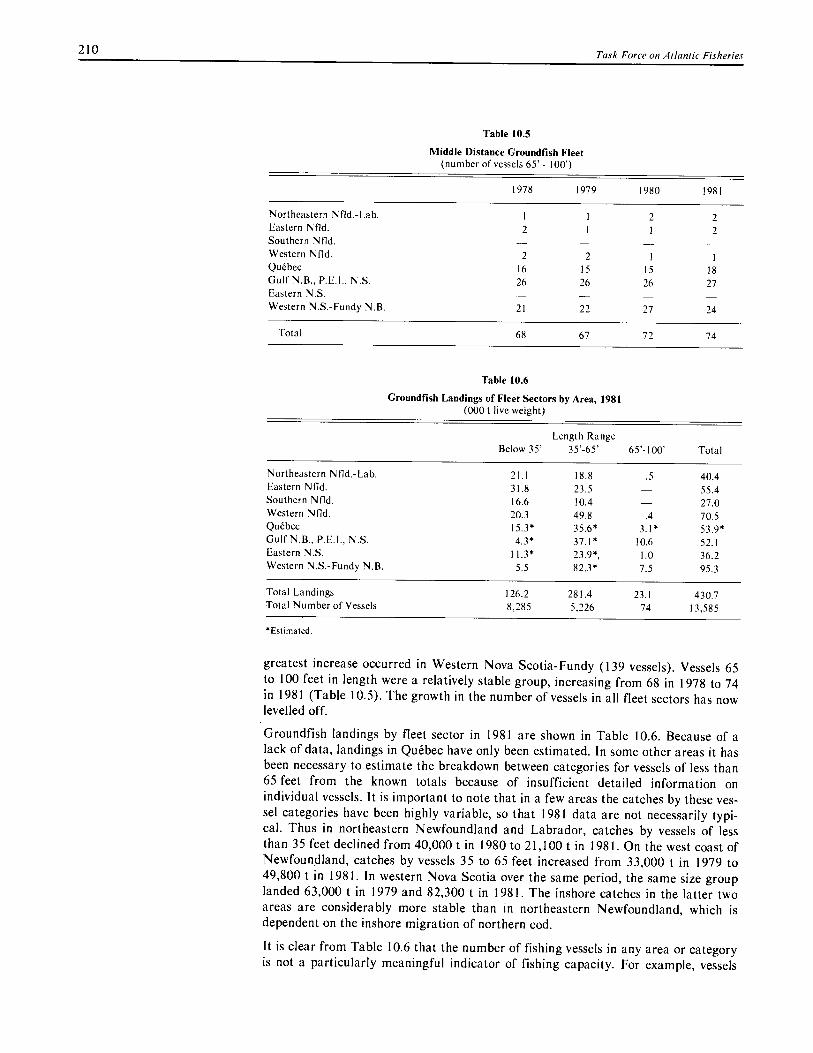
210 Task Force on Atlantic Fisheries
Table 10.5
Middle Distance Groundfish Fleet (number of vessels 65' - 100')
1978 1979 1980 1981
Northeastern Nfld.-Lab. 1 1 2 2 Eastern Nfld. 2 1 1 2 Southern Nfld. Western Nfld. 2 2 1 1 Quebec 16 15 15 18 Gulf N.B., P.E.I., N.S. 26 26 26 27 Eastern N.S. Western N.S.-Fundy N.B. 21 22 27 24
Total 68 67 72 74
Table 10.6
Groundfish Landings of Fleet Sectors by Area, 1981 (000 t live weight)
Below 35' Length Range
35'-65' 65'-100' Total
Northeastern Nfld.-Lab. 21.1 18.8 .5 40.4 Eastern Nfld. 31.8 23.5 55.4 Southern Nfld. 16.6 10.4 27.0 Western Nfld. 20.3 49.8 .4 70.5 Quebec 15.3* 35.6* 3.1 * 53.9* Gulf N.B., P.E.I., N.S. 4.3* 37.1* 10.6 52.1 Eastern N.S. 11.3* 23.9*, 1.0 36.2 Western N.S.-Fundy N.B. 5.5 82.3* 7.5 95.3
Total Landings 126.2 281.4 23.1 430.7 Total Number of Vessels 8,285 5,226 74 13,585
*Estimated.
greatest increase occurred in Western Nova Scotia-Fundy (139 vessels). Vessels 65 to 100 feet in length were a relatively stable group, increasing from 68 in 1978 to 74 in 1981 (Table 10.5). The growth in the number of vessels in all fleet sectors has now levelled off.
Groundfish landings by fleet sector in 1981 are shown in Table 10.6. Because of a lack of data, landings in Quebec have only been estimated. In some other areas it has been necessary to estimate the breakdown between categories for vessels of less than 65 feet from the known totals because of insufficient detailed information on individual vessels. It is important to note that in a few areas the catches by these ves-sel categories have been highly variable, so that 1981 data are not necessarily typi-cal. Thus in northeastern Newfoundland and Labrador, catches by vessels of less than 35 feet declined from 40,000 t in 1980 to 21,100 t in 1981. On the west coast of Newfoundland, catches by vessels 35 to 65 feet increased from 33,000 t in 1979 to 49,800 t in 1981. In western Nova Scotia over the same period, the same size group landed 63,000 t in 1979 and 82,300 t in 1981. The inshore catches in the latter two areas are considerably more stable than in northeastern Newfoundland, which is dependent on the inshore migration of northern cod.
It is clear from Table 10.6 that the number of fishing vessels in any area or category is not a particularly meaningful indicator of fishing capacity. For example, vessels
The Harvesting Sector 211
under 35 feet, which make up 60 per cent of the east coast total, took only 30 per cent of the 1981 catch. The issue of over-capacity therefore is not a question of the number of vessels per se. Over-capacity is a measure of the amount by which the actual catch of a vessel is below its potential catch. The principal issue is the eco-nomic consequences of the gap for fishermen. Analysis by the Department of Fisher-ies and Oceans shows that where over-capacity does exist, it is concentrated in the 35 to 65-foot category.
Given that current long-range stock projections indicate significant growth in only a few areas, particularly east of Newfoundland and in the northeastern Gulf, the present over-capacity in many fisheries is likely to persist unless the number of ves-sels is reduced. Area by area analysis by DFO of existing fishing capacity compared with projected quota growth points to a continuing over-capacity of 30 to 60 per cent through 1987. The principal exception is northeastern Newfoundland and Labrador, where the growth in northern cod may outstrip present capacity at the peak of the season.
It must be recalled, however, that the incomes of fishermen in this area are already the lowest in the Atlantic fishery, and the fleet of large gillnetters on the east coast of Newfoundland is in serious financial difficulty. Fishermen in this area face the same dilemma as processors. Large capacity is needed to handle the heavy inshore catch for three or four months in summer, but the vessels are then forced into idle-ness the rest of the year. Thus, while the growth in northern cod might require more inshore harvesting capacity if the catch continued to be squeezed into the summer peak, this would not help the financial problems of fishermen with larger inshore ves-sels. New fishing technologies are needed and are discussed further in Chapter 12.
Returning to the overall situation, DFO has estimated that 90 per cent of the ground-fish catch by vessels less than 65 feet is landed by roughly 60 per cent of the fleet. A similar distribution holds for each sub-sector of the fleet. However, there is some doubt that the potential represented by the remaining vessels will ever be fully util-ized as long as they are operated by their current owners. Analysis of the individual performance of a sample of fishermen over the period 1977-1981 shows a great deal of consistency — 'good' fishermen are consistently good and 'poor' fishermen are consistently poor.
These observations imply that any definition of over-capacity must be suitably quali-fied and may differ from one area to another. If that is so, then approaches to the problem may also differ. It is evident, for example, that any problems of viability in the less than 65 feet sector on the west coast of Newfoundland are likely to be related to the over-capacity that exists relative to catch quota limits. Issuing fewer licences could translate into better incomes for those who remained.
On the northeast and east coasts of Newfoundland, however, the issue of viability has little to do with the relation between fishing capacity and quotas, but rather is bound up with such factors as fish availability (due to seasonal migrations), existing harvesting technology and the short season that results. The inshore fishery for northern cod has, in fact, not been managed by quota. If the number of cod traps, for instance, were cut in half, the catch of the remainder would not double. In this fish-ery, the economic return to the individual fisherman is much more limited by the nature of the technology he employs than by the number of competing participants.
Common property
The most fundamental problems of fisheries management arise from the 'common property' nature of the resource. The fact that fish in the sea are not owned by individual fishermen, and that a fisherman cannot own an area of the sea as a farmer does a plot of ground, has two consequences: (1) people living in coastal areas feel an

212 Task Force on Atlantic Fisheries
entitlement to a share of the common property and therefore resist attempts by gov-ernment to limit participation or effort in the fishery — fishing is seen as a right, not a privilege; and (2) each fisherman is compelled to compete for a maximum share of the common resource to get as much as he can before the quota is caught by others.
This competition leads to excessive catching capacity and correspondingly higher costs and therefore to lower incomes for fishermen. Motivation to maximize one's share of the catch is particularly strong in fisheries that are limited by quota. The fisherman who does not join the race merely sacrifices his share to those who do. There is no incentive — in fact there is a disincentive — for an individual fisherman to behave responsibly, for example, by trying to spread his catch over a longer period or to catch in the off-peak season. Such behaviour only opens the way for others to get a larger share of the quota by catching all they can during the peak of the season. From the standpoint of the individual this is a rational response, but it is irrational when extended to the entire group of fishermen, most of whom ultimately end up worse off.
This situation has been called "the tragedy of the commons" by analogy with the problem of overgrazing by cattle on the common pastures of Europe in medieval times (see Glossary). In those days there was no incentive for an individual farmer to reduce the number of cattle he put out to graze on a community pasture, even though the total number of cattle grazing in the pasture would eventually become so large that none of them would have enough grass to survive. Everyone ended up worse off. The solution to this problem was to give individual property rights to spe-cific parts of the pasture land. The farmer could then plan the size of his herd according to its grazing pattern and the capacity of his pasture without fear that his plans would be undermined by others. Individual property rights are now almost uni-versal in agriculture, but the tragedy of the commons stubbornly persists in the fishery.
The common property problem in the fishery has been just as evident at the interna-tional as at the national level. When total allowable catches were introduced interna-tionally in the northwest Atlantic in the early 1970s, it was recognized that the ben-efits would not be realized unless the TACS were allocated on a country by country basis. Within countries they were further allocated among fleets. The incentive of the individual vessel within a fleet sector to maximize its catch has been coun-teracted in Canada by restrictions on technology and more and more complex fleet sub-allocations within the annual Groundfish Management Plan, which now specifies well over one hundred sub-quotas. The inevitable consequences have been severe restraints on technological efficiency improvements and a jungle of regulations.
The common property characteristic of the fishery has been studied extensively in academic and government circles over the past 30 years and has been identified as the most important contributing factor to inefficiency and instability in the industry. In the Final Report of the Commission on Pacific Fisheries Policy, Peter Pearse summed up the issues admirably in the following terms:
Unlike other natural resources, fish in the sea are not assigned through property rights or licences to any particular users ... In these circumstances, temporary profits will stimulate fishermen to expand their vessels' fishing capacity in order to increase their catch, and will attract new entrants into the fishery.
The central economic problem of the commercial fisheries is the chronic overcapacity of the fleets. ... This wasteful pattern of development reflects governments' failure, in spite of repeated attempts, to develop a policy that would encourage the industry to develop efficiently.
The Harvesting Sector 213
The perplexing phenomenon of excessive expansion of productive capacity ... can be observed in major fisheries throughout the world. In recent years, licensing systems in considerable variety have been designed to alleviate the problem, though few can be said to have had much beneficial effect. ... The fishing industry will always be in a precarious economic condition if the potentially substantial margin between its revenues and costs is allowed to be swallowed up in a wasteful expansion of fishing capacity and higher costs. The greatest single challenge is reorganizing the policy framework for the commercial fisheries to stop this treadmill of overcapacity, and further to reduce the present excess capacity, so that fishermen can receive reasonable returns and the people of Canada can begin to realize some of the substantial surplus that the fisheries are capable of yielding with a better fleet structure.
Pearse's comments, though made in the context of the Pacific coast fisheries, apply with equal force to the Atlantic fishery. The Economic Council of Canada expressed similar views in its 1981 report, Reforming Regulation. The Council emphasized the negative effects on efficiency, of the regulations that have been imposed by govern-ment in a largely futile attempt to control the consequences of common property in the fishery. Under present circumstances there is a persisting incentive to find ways to evade regulatory controls — and an inevitable reaction by fisheries managers to compensate by creating even more controls.
In addition to the perverse effects of competition among fishermen, the common property character of the resource leads to similarly counterproductive competition between processing companies for raw material and between provinces for employ-ment opportunities. Processors are motivated in the same way as fishermen to obtain a larger share of the catch or to protect their share from competitors. This volume orientation of processors leads to increases in capacity and a pre-occupation with throughput. Indeed, it is said that processors compete for fishermen rather than for fish. To compound the problem, governments offer various financial incentives to fishermen and processors in order to promote job creation, thus amplifying the inher-ent tendency toward over-capacity in both the harvesting and processing sectors.
In summary, the two principal economic consequences of common property are (1) a tendency toward excessive numbers of fishermen, the result being low average earn-ings; and (2) over-investment by fishermen in fishing vessels and gear in a futile attempt to gain a competitive edge in the race to catch a given quota. Unless these fundamental and universal tendencies can be curbed, it will never be possible for the fishery to provide stable and adequate average earnings.
Other negative consequences of the common property phenomenon include excessive government regulation of technical efficiency in an attempt to limit over-capitaliza-tion and to keep the race 'fair', and peaked landings resulting from the race to take each quota as soon as possible after the season opens. This intensifies the natural sea-sonality of the fishery and results in greater volumes than can be handled properly by vessels or by plants. Quality deterioration is inevitable. Fisheries close early. Ves-sels and plants lie idle. Added pressures are placed on the market. Finally, problems in enforcing the regulations arise because individuals have inadequate motivation to protect the resource.
Licensing and Because the policies of limited entry — and the licensing programs that give them
identification effect — have been implemented over a period of time and in response to different
of fishermen conditions in different fisheries, the rules that govern entry and transferability are not uniform. This is true between the administrative regions of the Department of Fisheries and Oceans and between fisheries within single regions. Consequently, fish-ermen perceive that there is unfairness and confusion about the administration of licensing.
214
Task Force on Atlantic Fisheries
Regardless of the relation between perceptions and reality, it is a fact that the absence of an open process for review and decisions on licensing matters has created mistrust and tension within the fishery.
There have been exceptions to this general statement — for example, the appeal pro-cess undertaken in Newfoundland when fishermen were categorized as full-time and part-time — but the fact that DFO does not have an ongoing quasi-judicial mech-anism, or independent referee, between those who administer licensing and the fish-ermen themselves is definitely viewed with great concern by most of the industry.
Fishermen believe that licensing decisions are influenced by politics, presumably because the minister is seen to be open to pressure from the many groups lobbying for changes in policy. There is also a tradition, particularly in areas where fishermen's organizations are weak, for individuals to lobby members of Parliament directly on licensing issues. Moreover, the fishery is the only common property resource in Canada that is not allocated, at least in part, by a quasi-judicial process. The common property of the airwaves, for instance, is regulated by the CRTC.
When a licence is issued, it confers, in effect, a perpetual benefit, because annual renewal of the licence is automatic as long as the licence is being used and the fish-ing regulations surrounding its use are obeyed. From time to time DFO attempts to reduce the number of licences in circulation in a given fishery by instituting 'partici-pation' rules, which require that a licence be withdrawn if it is not used within a specified period. Such attempts to withdraw licences are very unpopular with fisher-men, who point out that the licence holder may be forced to fish in order to maintain the privilege even though under the circumstances it may be uneconomic to do so. The participation requirement only adds unnecessary effort to the fishery and is one more illustration of the regulatory jungle existing in the fishery.
Nevertheless, the Department has from time to time adopted participation clauses in its regulations, usually after the fact. That is to say, at a point in time it has decided to cancel licences that have not been used for several years, either retiring them or making them available to others. Wherever this happens, charges of arbitrary gov-ernment action are made. The aim of removing excess potential fishing capacity is legitimate, but the means used is not generally accepted.
The number of licences in the groundfish fishery is currently frozen. In order to acquire a licence, a fisherman must usually purchase the assets of another fisherman. In theory the licence reverts to the Crown when a fisherman leaves the fishery, but in practice the government agrees, in fisheries where licence transfer is permitted, to issue the licence to the fisherman who is buying the assets. This usually means that he is 'buying' the licence as well.
Variations in the practice for permitting licence transfers have resulted in intermi-nable debate about whether the licence should be 'on the boat' or 'on the man'. Inter-preted literally, this is the wrong question. The issue is the right to transfer the fish-ing privilege. If a vessel is sold, or repossessed by a lender, does the licence go with it, does it remain with the original owner, or does it revert to the government as the issuer of the licence in the first place?
The Task Force believes that this debate has gone on long enough and should be resolved as follows: (1) the licence confers a privilege to fish; (2) the privilege should be conferred on a person or a company, not on a man-made object such as a vessel; (3) for purposes of surveillance and enforcement, the licence must designate the ves-sel that will be used, and it may be appropriate for the government to place restric-tions on the amount of catch associated with the licence or on the vessel and gear that may be used by the licensee; and (4) the vessel itself would not be permitted to

The Harvesting Sector 215
Fisheries administration in Quebec
continue to fish if it passed from the control of the licensed owner to someone else unless and until it was acquired by a new owner who had an appropriate licence.
In this sense the Task Force would suggest that the fishing privilege should be con-ferred on the man, not on the boat. While this may clarify the issue, it does not resolve the question of the conditions that ought to govern the transfer of the fishing privilege from one person to another. This more fundamental issue will be addressed below in the context of 'quota licences'.
While most fishermen support the principle of controlling fishing effort, few agree with the present vessel replacement policy, which effectively requires that a replace-ment vessel be no longer than, and have a fish hold no larger than, the original. There is no doubt that other criteria, such as tonnage or horsepower, should be con-sidered. Unfortunately, there does not yet exist an adequate data base relating fish-ing capacity to the physical characteristics of vessels, and such a data base will be very difficult to acquire, particularly because one of the most important variables determining catching capacity is the skill of the skipper. The regulation of tech-nology, about which fishermen rightly complain, is nevertheless inevitable as long as the government attempts to limit over-capacity in a common property context —that is, in the absence of some system of property rights as outlined below.
The effective matching of fishing effort to the resource, and the targeting of other policies and programs (for example, the income stabilization program discussed in Chapter 18), require a fair and practical means to distinguish the professional fisher-man from the casual participant — that is, to differentiate between the full-timer and the part-timer. At present, all fishermen have been categorized, through per-sonal fishing licences, as one or the other. In principle both groups have equal access to the resource and to the benefits of government programs to aid fishermen. How-ever, the fishery cannot possibly support all those who now claim to be fishermen. It might be able to support the half who have been classed as full-time, while still allowing the others some access to the fishery.
In 1922, by Order in Council, the province of Quebec was delegated the responsibil-ity to administer federal regulations in Quebec 'coastal waters'. The background to this arrangement was an apparent wish by the federal authorities to avoid a dual lic-ensing system, and a 1920 decision by the Judicial Committee of the Imperial Privy Council that, among other things, reaffirmed the public right of fishing in tidal waters (see Attorney General for Canada vs. Attorney General for Quebec et al [1921] 1 A.C. 413).
The 1920 decision affirmed, among other things, that there is a public right of fishing in tidal waters, including those that are navigable from the sea, and states,
As the public right was not proprietary the Dominion Parliament has in effect exclusive jurisdiction to deal with it . . . The public right of fishing does not, however, extend to fixing fishing engines to the soil.. .
The federal decision in 1922 to delegate the administration of fisheries in Quebec to the provincial government was therefore based on practical considerations, in that (1) almost all fishing in Quebec was done by means of "engines fixed to the soil" (e.g., staked eel traps, herring weirs, etc.); and (2) fishermen found themselves in a difficult situation because the federal government had jurisdiction over fisheries but the province had jurisdiction over the soil — that is, the setting of fixed gear in "tidal waters that are navigable as well".
It is important to note that this delegation remains the legal situation today. The precise boundary between federal and provincial jurisdiction at the coast has never been defined. The federal government has consistently taken the position that it is
216 Task Force on Atlantic Fisheries
the low water mark. In any event, over the years since 1922, the fisheries in Quebec have altered substantially in character, and there is now very little fishing done in Quebec fresh and tidal waters by "engines fixed to the soil".
During the period between 1922 and 1975, few difficulties were experienced with the arrangement, even though trawlers based in Quebec were licensed by both levels of government. However, from 1976 on, the province has from time to time exercised more authority over the administration of fisheries than appears to have been envisaged by the 1922 Order in Council. In fact this has occasionally extended to issuing licences in direct contravention of federal policy or regulations.
Initially, the federal government chose not to confront the province on this issue. Recently, however, it has asserted its authority in fisheries conducted by larger ves-sels. Federal licences are now required for (1) all groundfish fishing by vessels 35 feet or more in length; (2) shrimp fishing; (3) scallop fishing; (4) herring fishing with mobile gear; (5) sealing from vessels 35 feet or more; and (6) fishing outside the Gulf of St. Lawrence.
The Options
Identification of fishermen
The federal government has thus partially reasserted the means of control essential to fisheries management. However, this approach has had the drawback of com-plicating the administrative process and forcing fishermen to deal with both levels of government.
The following example illustrates the situation. A lobster fisherman using a vessel 35 feet or more in length who also fishes for herring and cod is required to deal with the government of Canada to register his vessel, to obtain a personal fishing licence and to obtain groundfish and herring licences. He must deal with the government of Que-bec to obtain a lobster licence. The government of Quebec may also insist on regis-tering the vessel and issuing other licences.
In addition to creating a nuisance and confusion for fishermen, the present situation complicates relations between the two levels of government and results in duplication of activities. It also prevents federal fisheries managers from being able to take deci-sions based on a knowledge of all the facts in marine fisheries, which are almost all inter-provincial in character. In a number of places in this Report, we note that data for Quebec are missing. These are usually the most basic and fundamental statistics. It is not clear whether they do not exist or are simply kept from federal authorities.
The principal focus of the foregoing discussion has been the negative aspects of com-mon property in the fishery. The options for addressing the fundamental problems of excess capacity and over-investment that result from the common property problem may be grouped into three categories: (1) the identification of fishermen; (2) the direct common property issues; and (3) the particular management problems created by the split administration of fisheries in Quebec.
The categorization of full- and part-time fishermen by DFO was begun in 1981 in the wake of the Levelton Commission on Atlantic licensing policy. A full-time fisherman is generally one who fishes the normal season in his local area. This will vary from place to place; because of local conditions, a full-time fisherman often does not fish year round. Indeed the normal fishing season in some areas is as short as three or four months.
Those fishermen who depend on the fishery for the major part of their income, while disagreeing in some instances with the criteria, agree that the Department's recent program of categorizing fishermen is a step in the right direction.
The basic criterion for categorization is simple. It is usually time fished during the season prevailing locally, subject to interpretation in individual cases by appeal com-

The Harvesting Sector 217
mittees drawn from the community at large. The policy and process are applied across the Atlantic region, though it appears to have received greater acceptance in Newfoundland than in the Maritimes.
There is not universal support for the principle of using time fished as the criterion for separating full-time fishermen from part-timers. Fishermen have not been ade-quately informed of the reasons for the initiative to separate full-timers from those who fish to augment other sources of income. There has been some concern among part-timers that their fishing privileges may be curtailed or removed. Some have also complained that the term 'part-time' carries a negative connotation. The Task Force has concluded that there are only two basic options for this issue: either to continue and improve the process of categorization already begun or to abandon it altogether.
Option 1:
Option 2:
Improved categorization
The rationale for separating full-time fishermen from those who fish to augment income would be further developed. Different criteria could be used in the identifica-tion process in different areas. The policy would build on the categorization process recently completed DFO. The advice of fishermen in the development of identification criteria would be an integral and continuing part of the process.
The onus might be placed on a fisherman to register as either a Registered Commer-cial Fisherman (full-time) or a Registered Fisherman (part-time) and to provide evi-dence of eligibility. This is similar to the practice followed in Norway. Appeals could be heard by the appeal committees already in existence, while the quasi-judicial lic-ensing board referred to below could provide a final level of appeal in different cases.
Pros
(a) some fair and practical distinction between full-time fishermen and persons who fish to augment income appears to be needed in most areas;
(b) permits better tailoring of licensing policy to local needs and conditions; and
(c) removes lingering uncertainty regarding the purpose of categorization.
Cons
(a) any system of categories, however carefully designed, will create some inequities for borderline cases.
Abandon categorization
No distinction would be drawn between full-time and part-time fishermen. No dif-ferentiation would be made with respect to either the rules governing access to the resource or access to programs benefiting fishermen.
Pros
(a) avoids making any difficult and potentially unpopular decisions regarding the entitlement of different groups of fishermen;
(b) reduces some administrative burden; and
(c) under a regime of quota licences (see below), the categorization of fishermen for purposes related to licensing becomes largely irrelevant. Allocation of access to the resource would be automatically controlled through the purchase, sale and trade of quota licences. (Of course, this is a relevant consideration only if such a system were put in place.)
218
Task Force on Atlantic Fisheries
Cons
(a) leaves the government with no basis on which to distinguish among fishermen for purposes of licensing policy.
Dealing with the common property problem
The Task Force has examined a wide range of approaches to dealing with the com-mon property problem. These include the following:
1. Laissez-faire: Only those regulations necessary for conservation purposes (TAcs, mesh sizes, open and closed areas and fishing times, minimum fish size regulations) would be imposed. This has been the approach followed in Iceland, Norway and, more recently, in the United States. It does nothing to inhibit over-capitalization, a problem acknowledged to be of growing significance in Scandinavia. This system would still require a considerable amount of regulation and differs from the present Canadian approach mainly in the absence of control on entry to the fishery and on the number and size of vessels. In the opinion of the Task Force, a laissez-faire sys-tem would only compound the economic problems of the harvesting sector by per-petuating the treadmill of over-capacity and increasing financial risk to fishermen and lending institutions.
2. Restrictions on fishing vessels: In addition to conservation regulations, there would be further restrictions on fishing gear (size of gillnets, number of traps, etc.) and on vessel replacement (foot-for-foot, ton-for-ton). This is the method now used by the federal government to deal with the common property problem. Experience in the Atlantic and in other fisheries has shown that fishermen will nevertheless find ways to obtain an advantage by building faster boats with greater catching power while still holding capacity within the replacement rules. The tragedy of the com-mons is not averted.
Comments made to the Task Force at meetings throughout the region confirm that attempts to control fishing capacity by restrictions on fishing vessels have probably been as unsuccessful in the Atlantic fishery as they have been in the Pacific fishery.
Peter Pearse dealt at length with the question of gear restrictions in his report on the Pacific fisheries. He concludes as follows:
Attempts to control the growth of the fleet by restricting one or more dimensions of fishing power when vessel owners have strong incentives to expand capacity generate ingenious innovations to circumvent the restrictions and thereby defeat their purpose. Additional restrictions must be added to plug the loopholes. But this becomes an exceedingly difficult and costly administrative task. The likelihood that such restrictive measures will be any more successful in the future than they have been in the past is very low.
3. Royalties on the catch: The imposition of landings charges, which tax surplus earnings from the fishery, would be set at a rate that increases with the size of the catch. They can be designed to remove most of the incentives and the financial abil-ity to expand fishing capacity. Economists who have evaluated this technique have concluded that it would be administratively very complex and would be no more effective in limiting the damaging consequences of common property than a system of 'quota licences'.
4. Quota licences: The terminology, introduced by Peter Pearse, refers to a system by which fishermen would be allocated individual annual catch quotas that, within certain limits, they could catch by whatever means they wished. The initial alloca-tion of these quotas might be based on recent historical catch performance. The quo-tas would normally be expressed as a percentage of the TAC for a given stock. They could be transferred or sold among fishermen subject to restrictions the government
The Harvesting Sector 219
might wish to impose. The set of inshore and offshore quota licences would be kept distinct. Once a fisherman had a guaranteed quota, he could then plan to catch it at least cost. He would no longer be impelled to invest in a more powerful and expen-sive vessel in order to compete in the race for a common quota. In essence, the quota licence gives a fisherman an individual property right to a certain amount of the pre-viously common property resource. It thus 'privatizes' the common property.
From this range of approaches, the Task Force selected two options.
Option 1: Status quo
Fishing effort would continue to be controlled by limited entry licensing, with restric-tions on licence transferability to allow for attrition in overcrowded fisheries and with restrictions on the fishing capacity of replacement vessels. Licence buy-back programs might be developed to reduce numbers of fishermen and fishing capacity, although for reasons explained in Chapter 20, the Task Force is strongly opposed to publicly funded licence buy-back programs. Licensing policy would likely have to distinguish increasingly between full-time and part-time fishermen.
Pros
(a) minimum disruption of existing management regime which, if not universally accepted, is at least broadly understood; and
(b) harvesting capacity would at least be frozen, and in some areas might be sub-stantially reduced, by a combination of non-transferability and buy-back of licences.
Cons
(a) stifles efficiency and technological development. Evidence from the Atlantic and other fisheries shows that it is very difficult to cut off the increase in capacity by any finite number of regulations when there is a competitive incentive to expand;
(b) therefore, fishing costs would continue to increase as fishermen attempted to gain individual advantage through replacement vessels that conform to the rules, but still have greater fishing capacity;
(c) fails to deal with perceived inequities in the licensing system;
(d) does nothing to curb the race by each fishermen to maximize his share of a given quota. This problem of disorderly harvesting becomes more widespread as more fisheries are brought under quota. There is increased pressure to extend quotas when they are reached in mid-season; and
(e) licence buy-back by the government is extraordinarily difficult to administer in practice — for example, what is the 'fair' value of a licence? — and the concept of publicly funded buy-back is questioned in principle in Chapter 20. Why should not those remaining in the fishery, who will benefit from the reduction in the number of competitors, be the ones to pay for the buy-out of licences? This is what would happen with a saleable quota licence system.
Option 2: Quota licences
Each fisherman would have a quota licence — a special form of private property that could be sold by the individual who owned it. For the largest vessels — for example, over 65 feet — the quota licence would consist of a set of fish quotas in various stocks (tonnages or percentage shares of the -rAc). They would be analogous to the
220 Task Force on Atlantic Fisheries
enterprise allocations that were introduced experimentally in 1982 for the offshore trawler fleet. For vessels under 35 feet it may not be practical to introduce a quota licence concept. For those between 35 and 65 feet it should be possible to assign individual boat quotas in some cases and in some fisheries — e.g., the otter trawl fisheries for vessels in the 60 to 65-foot range. An alternative that might be feasible for smaller boats would be to identify the licence with an entitlement to a certain amount of fishing capacity or catching potential. This is what now happens in the lobster fishery, for example, where each fisherman has a licence to use a given num-ber of traps. The licence holder could then fish with any vessel he chose, provided that the gear he used did not exceed his allowed capacity or catching potential.
The Task Force is not in a position to recommend precisely the details of how a quota licence policy should work in practice. The most appropriate methods of implementing such a policy can only be developed after a great deal of consultation, analysis and experience from pilot projects. But the Task Force is in a position to suggest that three principles should form the basis of any quasi-property rights or quota licence system. They are as follows:
1. the licence should pertain to the individual as a quasi-property right rather than to a vessel (i.e., the licence would be on the man, not the boat);
2. the licence should specify either a limitation on the catch or, if that were not fea-sible, on the catching potential of the fisherman's vessel and gear; and
3. the entitlement to fish quotas or to fishing capacity granted by the licence should be divisible and transferable (it could be sold or traded), subject to certain condi-tions, and should be supervised by a quasi-judicial board as described below.
Pros
(a) gives fishermen or companies a clear understanding of the amount of fish they will be allowed to catch, permitting them to make long-term, cost-minimizing investment decisions, thus reducing over-capacity by eliminating the pressure to over-capitalize;
(b) permits a fisherman who wishes to expand his operation to buy out all or part of the licence of another. The licence transfer and vessel replacement issue would be taken care of automatically, and excess capacity would gradually be squeezed out of the fishery;
(c) allows much greater freedom in the use of technology because government would not have to regulate access to common property. Fishermen would be motivated to employ the most economically efficient method, rather than the method of greatest physical productivity;
(d) permits those with a stake in the industry to pass it on to an heir or to receive a benefit from the sale value of their licence upon retirement;
(e) encourages more orderly harvesting by removing the incentive to race for max-imum share of a common quota;
(f) establishes, in effect, a one-licence concept. Fishermen could acquire quota in various species and fisheries — as long as some other licence holder was willing to sell, trade or rent — and thus could develop a more dependable mix of species in those areas where this is important; and
(g) eliminates the need for the participation clauses that are now a feature of many fisheries. If there were a market for quotas, no one would be motivated to 'sit on a licence' given that he could rent or sell all or part of the quota associated with it.

The Harvesting Sector 221
Cons
(a) unproven in practice; there may be unanticipated negative consequences. Pilot testing and extensive consultations can minimize this risk;
(b) perhaps impractical in certain fisheries and for boats below a given size;
(c) poses the very difficult problem of the initial allocation of these quota licences;
(d) results in a monetary value being tied explicitly to a licence through its sale value. While this constitutes some barrier to entry, the existing system of lim-ited entry licensing can bar access to the fishery entirely and arbitrarily; and
(e) tends, over time, to reduce the number of fishermen as fishermen choose to sell their quota licences. While this may remove persons from the fishery in areas where there are few employment alternatives, the choice is nevertheless volun-tary and, in most fisheries, should have the effect of improving the incomes of those who remain.
There are a number of other concerns regarding quota licences, but they are more accurately described as misunderstandings than as shortcomings of the concept. These are discussed in the commentary following the recommendations.
Option 3: An Atlantic fisheries licence review board
An Atlantic Fisheries Licence Review Board could be considered as a review and appeal mechanism for the current licensing system, as well as to meet the institu-tional needs of regulating enterprise allocations and quota licences. The Board would be external to the Department of Fisheries and Oceans and would be of a quasi-judi-cial nature. Its decisions would be subject to cabinet or ministerial review. The func-tions of the Board might be more or less broad. For example, the Board could:
• review all licence transfers (including sales) to determine compliance with estab-lished guidelines, and hear appeals;
• oversee the issuance of new licences or additional enterprise allocations subject to policy direction and guidelines issued by the Department of Fisheries and Oceans;
• maintain a public registry of all licences and the terms and conditions attached to licences; and
• advise the Department on the administration of licensing policy.
Pros
(a) imposes upon the licensing system an open and formal procedure of decision making in those areas that involve individuals. The policy role of the Depart-ment of Fisheries and Oceans would be to set overall allocations and to deter-mine the appropriate number of licences, but not to choose the individuals who were to receive new licences or quota licences; and thus
(b) removes the perception that the present licensing process may sometimes be arbitrary and unfair.
Cons
(a) subject to the risk of all institutions in the sense that it may add to bureaucratic overload and become a source of delay and inflexibility; and
(b) creates some potential confusion over the precise division of responsibility between the Department of Fisheries and Oceans and the Atlantic Fisheries

222
Task Force on Atlantic Fisheries
Licence Review Board, although a clear statement of this division as seen by the Task Force is given below.
Fisheries The continued division of responsibility for administration of the harvesting sector in
administration Quebec creates confusion among fishermen; both duplication and gaps in essential
in Quebec activities and in obtaining essential information; and dissatisfaction in other provin- cial governments as well as in the industry generally. The difficulty of obtaining the most basic information on Quebec fisheries itself leads to the conclusion that the status quo is not acceptable.
Recommendations 6. Continue and improve the process begun in 1981 by the Department of Fisheries and Oceans to identify fishermen as full-time or part-time for the purpose of tailoring policies and programs for each group.
7. Adopt the following licensing principles: (1) The licence would pertain to the individual as a quasi-property right (the licence would be on the man, not the boat). (2) The licence would specify either a limitation on the catch (sometimes called an 'enterprise allocation' or a 'quota licence') or on the catching capacity of the fisherman's vessel and gear (sometimes called an 'effort-related' licence, as now exists in, for example, the lobster fishery). (3) The licence would be div-isible and transferable (that is, it could be sold or traded) subject to certain con-ditions; the transfer process would be supervised by a quasi-judicial board.
8. Establish a quasi-judicial Atlantic Fisheries Licence Review Board that would act in a review and appeal capacity for the current licensing system, as well as for the system of enterprise allocations and quota licences.
9. Consolidate federal management of the fisheries in the Gulf of St. Lawrence by resumption of full federal responsibility for licensing and other aspects of marine fisheries management in Quebec.
Comment With regard to recommendation 6, analysis by the Task Force (presented in Chapter 4) confirmed that there are significant differences, in income and amount of time worked in the fishery, between full-time and part-time fishermen. It is also clear, however, that access to the fishery is important for a substantial proportion of part-timers. The part-time category recognizes the traditional attachment to the fishery of many people on the the Atlantic coast, even though they may not now be able or prepared to make fishing their main occupation. On the other hand, those who choose to remain part-time fishermen must be prepared to grant priority to full-time fisherman. For these reasons the Task Force considers it desirable to maintain and refine the full-time and part-time categories.
Given the difference in dependence on the fishery by part-timers and full-timers, we believe that there is a legitimate basis for differentiating between the groups in fish-eries policy and programs, including possible financial assistance programs (see Chapter 18). This could include, for example, restriction of certain 'high value' licences (lobster, crab, shrimp, salmon) to full-time fishermen, or limitations on the size of vessel and amount and kind of gear that part-timers could use. It could also include restricting the proposed income stabilization program to full-time fishermen. There must, of course, be a well-defined process for entry to each category and transfer between categories.
It is clear that policies directed toward full-time fishermen must take account of their effect on fishermen's incomes. In some areas, there is a close relationship between numbers of fishermen and annual income. In other areas there may be little or no connection. For example, on the coast of Labrador, reducing the number of fishermen would do little if anything to improve the incomes of those remaining, as
The Harvesting Sector 223
Dealing with common property
there is no problem of over-capacity in the inshore fishery and indeed the inshore fishery in that area is not limited by quota. On the other hand, certain fisheries, such as the small trawler (under 65 feet) otter trawl fishery on the west coast of New-foundland, are overcrowded, and a reduction in numbers would enable the remainder to generate higher incomes because the limited quota in that fishery would be shared among fewer vessels.
The Task Force attached great importance to the need to come to grips with the problems caused by the common property nature of the fishery. We believe that the resolution of these problems will be of enormous benefit to fishermen. Unfortunately, many of the issues surrounding the common property problem and its resolution are still not clearly understood, and the potential for dealing with them is not widely appreciated. We therefore believe it is important to review briefly the common prop-erty issue and to answer some of the questions frequently asked about the 'property rights' idea.
The fish in the sea are common property, like an open pasture for grazing cattle where there are no individual property owners, or a forest in which no individual or company owns exclusive timber cutting rights, or an ore body in which no one has sole mining rights. Within a total quota, defined by biologists to protect the resource, fishermen race against one another, each trying to maximize his share of the fixed quota of the common property resource before others exhaust it.
To get a bigger share, a fisherman is naturally motivated to get a bigger, faster (and more expensive) boat. There is nothing irrational in this. Every fisherman is thinking the same way — trying to catch as much as he can, as fast as he can, before the quota is used up by others. But the result is more and more fishing capacity trying to catch the same amount of fish. Costs go up; therefore fishermen's incomes go down.
Government has tried to control this race by (1) limiting the number who can enter each fishery, but this produces controversy over who should get a licence; and (2) regulating the size and number of fishing boats to keep the race 'fair' and to cut down on over-investment. This stifles improved efficiency, because a fisherman can-not change the size of his boat or take automatic advantage of improvements in gear because they are not permitted by the regulations.
Government measures have not been very effective in limiting over-investment or curbing the race to catch the maximum amount as quickly as possible. Fishermen have been ingenious in getting around the rules because the common property nature of the fishery motivates them to do so. The government has been able to respond only with more regulation.
These problems and the resulting snarl of regulations and licensing rules all stem from the common property nature of the fishery. The Task Force believes that they can be solved only by giving each fisherman some form of property right to a certain amount of fish, similar to timber rights or mining rights on Crown land. Ideally, the property right should give each fisherman an individual quota of fish that he would be allowed to catch. Peter Pearse, in his report on the Pacific fisheries, has called this a "quota licence". Within limits, a fisherman's quota could be traded or sold in whole or in part. The sum of the individual quotas would add up to the Total Allow-able Catch (TAc) of the fish stock in question.
Once a fisherman has a quota licence, there is no need to race to maximize his share of a common TAC. His incentive changes from racing to catch as much as possible as quickly as possible to catching his 'personal' quota at the least cost.
For technical and administrative reasons it may not always be feasible to assign a quota to each fisherman. This is likely to be particularly true for smaller boats. For

224
Task Force on Atlantic Fisheries
inshore vessels, say under 35 feet, it is unlikely that individual quota licences would be practical. Given the present system of monitoring landings, it would be impossible to keep accurate track of the individual catches of the more than 8000 craft under 35 feet. Even if that were possible, the relatively large year-to-year variations in catch per vessel in many inshore fisheries would make a system of individual boat quotas impractical, unless means were devised to permit the easy transfer of quota between fishermen as the season progressed and as the luck of individual fishermen waxed and waned.
For vessels between approximately 35 and 65 feet, it may prove practical in some fisheries to institute individual quotas by using quota licences. This should be most feasible for the otter trawlers in the 60 to 65-foot range, the landings of which are almost as easy to monitor as those of offshore trawlers.
An alternative that might be practical in some fleet sectors where boat quotas would be difficult to implement and enforce would be to define the 'quota licence' as an entitlement to a certain amount of catching capacity or capability, rather than as a quota of fish. This approach is used now to limit the number of lobster or crab traps that can be fished by a licence holder in these fisheries. The offshore scallop fleet is also managed by this kind of approach — known as 'effort limitation'; in the case of scallop fishing, the number of rakes is limited.
It would be possible to extend the concept of effort-related licences to the groundfish fishery by giving licences that specify the use of a certain number of hooks on a lon-gliner or a number of fathoms of gillnet. The appropriate measure for an otter trawler is harder to envisage, but it could relate to a combination of horsepower and hold capacity.
Considerable data relating catching capacity to various physical characteristics of vessel and gear would have to be collected and analyzed to develop a reliable index of catching capacity. But once developed, 'units' of capacity could be sold or traded, just as individual fish quotas could be.
A quota licence under this interpretation would entitle the holder to a certain amount of fishing capacity. The fisherman could not use a vessel of greater capacity than the licence specified. However, he could purchase from others the right to addi-tional capacity and then move to a more efficient vessel once he had acquired a suffi-cient number of 'capacity units'.
This effort-related approach to limiting catching capacity has the advantage that it does not require keeping track of individual landings; nor does it have the inflexibil-ity of boat quotas for small vessels. It provides a way to allow fishermen to move to more efficient vessels while, in theory, keeping total fishing capacity matched with the bounds imposed by the TAC. But it has the significant disadvantage of depending on the precise regulation of catching capacity, which is difficult in both theory and practice. For example, the same vessel would have a different catching capacity in different fishing areas. Thus the system would, at least, have to be managed within defined fishing areas (`sectors').
In fact, it has been precisely the inability to regulate catching capacity effectively that has led to the spiral of technological regulation that is now a major part of the problem in the harvesting sector. Under any system that tried to limit the amount of catching capacity an individual could use, the fisherman would still be motivated to maximize his catch, within the boundaries of regulation, because he would still be forced to compete for a common quota. Therefore the regulation of fishing effort or catching capacity does not address the root of the common property problem. Thus it is clearly second best when compared with a system of individual quotas.

The Harvesting Sector 225
The full potential of the quota licence concept therefore depends on finding a practi-cal and highly flexible way to employ transferable boat quotas. One idea, which at this time must be considered completely speculative, would be to develop a 'quota exchange' in each major port.
It is an idea worth describing in some detail, not because it is necessarily to be recommended (although the Task Force believes that it should be examined carefully by the Department of Fisheries and Oceans and by fishermen's organizations) but rather because it brings out many of the features of quota licences and demonstrates that there is plenty of scope for imagination in the way they are designed and applied.
Each fisherman participating in the quota exchange system would initially be assigned a set of individual quotas for the fisheries in which he was eligible to par-ticipate. This would start things off; thereafter, the system would work through trad-ing. (The method of assigning initial quotas is an extremely important issue, but is not related to the continuing operation of the scheme.)
A record would be kept of everyone's quotas, probably in a small computer with a terminal and operator at each port. As fish were landed, the amount would be sub-tracted at once from the individual's quota. The dockside grading system recom-mended by the Task Force (see Chapter 14) would facilitate record-keeping. Por-tions of quotas could be traded at any time among any of the fishermen holding quota licences in the area. The computer would contain a completely up to date record of everyone's position, and trades could be instantly 'negotiated' among fish-ermen with the help of the local computer terminal facility.
The system would be analogous to a stock exchange; the 'shares' would be the fish quotas of individuals. In areas where the scheme was in effect, it would achieve the same purpose as the 'one-licence' concept advocated by a number of fishermen's groups. A fisherman could, through the exchange, acquire or trade quota covering any species for which there was a willing buyer or seller.
The great advantage of the system is that it permits the flexibility needed to make a boat quota scheme practical. The necessary computer and communications tech-nology is widely available and relatively inexpensive. If fishermen in one local area were having a particularly good year, they could bid to buy quota, for that year, from others fishing the same stock but perhaps having poorer luck. This would have the added advantage of tending to stabilize incomes; the effects of low catches by certain fishermen in any year could be partly offset by 'renting' their extra quota to those who were doing well. Of course no one would be under any compulsion to sell, trade or rent quota.
It is very important to understand that the price of traded quota would be deter-mined entirely by transactions among fishermen in a given area. (Some restrictions on allowable transfers are suggested below.) All fishermen would begin with a fair allocation of quota that probably reflected in some way their catches in the past. After that, any transfers — temporary or permanent — would be at prices that ref-lected the value of extra quota to both buyer and seller. If dockside fish prices were relatively poor or if fish were very abundant, the value of extra quota would natu-rally be low. In other circumstances, the value would be relatively high. The essential point is that a fisherman would buy or sell units of quota only if he believed it was worth his while at the price offered.
Returning to the general concept of the quota licence, however it might be imple-mented, the benefits may be summarized as follows. A system of quota licences would lead to:
226 Task Force on Atlantic Fisheries
Proposed restrictions
• minimum cost harvesting — thus better incomes and a more internationally com-petitive fishing industry;
• more orderly harvesting — because there would no longer be an incentive to race, there would be fewer gluts and better co-ordination between the catch and plant capabilities and market demand. Fishermen would, of course, still fish at the peri-ods of greatest catch rate, so the seasonal peaks would be little affected in some fisheries — for example the cod trap fishery in Newfoundland;
• far less regulation of technology — fishermen would be left essentially free to choose the best means to catch their personal quota; and
• the automatic regulation of access to the fishery by purchase or trade in quota licences, subject to whatever limits government may decide, after consultation, to impose. At present access is limited, for example, by rules that may say that no new licences will be issued and therefore no new person can enter the fishery.
In this latter regard, the Task Force suggests that the following general restrictions on quota licences should be considered by government and fishermen:
1. The allowable catch from each fish stock should be divided initially by the Department of Fisheries and Oceans into an 'inshore' and an 'offshore' portion. The distinction is perhaps more accurately defined as being between independent and corporately-owned vessels. Each portion would be separately allocated into a set of inshore and offshore quota licences in those situations where the concept was acceptable and practical. (Most of the offshore quota was already divided, on a trial basis, in 1982 into 'quota licences' or 'enterprise allocations' held by the four major trawler operators. This experiment appears to have been very suc-cessful and should be extended to the rest of the trawler fleet in 1983 with a view to permanent incorporation, perhaps in 1984. The enterprise allocations might be established as percentages of the TAC in various stocks, and these percentages should be guaranteed for, say, at least a five-year period to permit better plan-ning of investment in fleet and marketing.)
2. Quota licences should not be transferable between the inshore and offshore groups. An inshore fisherman could not accumulate quota within his group, then acquire a large trawler and move into the offshore group carrying the accumulated quota with him. He could enter the offshore group only by acquir-ing quota from others already in that group.
3. The holder of an inshore quota licence should be required to be the operator of his vessel. This restriction would prevent (1) the accumulation of a fleet of ves-sels under a single owner or (2) the acquisition of inshore quota licences by proc-essing companies.
4. A quota licence is, by definition, associated with a particular fish stock and therefore with a particular geographical area. Thus quota licences, by their nature, cannot be transferred from one region to another. For example, a 100-tonne quota of cod in Western Nova Scotia could not be sold as a 100-tonne quota in the Gulf. The two fish stocks are separate, each with its own set of quota licences. To fish in the Gulf, one would have to acquire quota in the Gulf. For inshore fisheries, the location of the quota will largely determine where the fish is processed, because the smaller vessels are limited in their ability to carry fish caught from one stock to plants in distant areas. Offshore trawlers are much less limited in this regard and would normally fish from a set of quotas scattered throughout the Atlantic fishing area.
A number of objections to the concept of property rights or quota licences in the fish- ery have been raised. In the view of the Task Force, most of these objections rest on
The Harvesting Sector 227
misunderstandings. These ought to be resolved so that discussion can focus produc-tively on the true merits and shortcomings of the idea. In the following paragraphs we outline several of the most frequently raised objections and our response to them.
It is argued that because fish are the property of the Canadian people they should not be converted to a form of private property. Our response is that the existing sys-tem of limited entry licensing already restricts access to the fishery. Quota licences in fact would broaden access by allowing outsiders to 'buy in' if there were a willing seller. The licences would not be private property in the ordinary sense of a perpetual and unrestricted right. Government could attach terms and conditions as it does when it grants individuals or companies the right to use other resources owned by the Crown (for example, the terms and conditions attached to timber-cutting rights on Crown land). Some have worried that a system of quota licences would cause an exodus from the inshore fishery as many marginal fishermen sold out, and that this would severely disrupt the pattern of rural settlement. The Task Force acknowledges that there would probably be a gradual reduction in the number of inshore fishermen — a gradual rationalization of the inshore fishery similar to what has occurred in agriculture. But no one would be forced to sell out. Those who did could use the pro-ceeds of the sale of the quota to start a new life. Unless and until there were attrac-tive employment alternatives, the rationalization would take place slowly. This evolu-tionary, rather than revolutionary, change is one of the most attractive features of the quota licence concept. Moreover, those who remained in the fishery would be more prosperous, an important benefit in light of the data on fishermen's incomes presented in Chapter 4.
One of the most frequently expressed fears is that quota licences would become very expensive and therefore a barrier to new entrants. But the present system of limited entry already constitutes an inflexible administrative barrier to entry and to the transfer of licences. Therefore a quota licence system is less restrictive than what already exists in terms of limiting entry. In fact, the market in quota licences would ration entry to the fishery fairly. At present, in cases where no new licences are being issued, there is an impassable barrier to entry unless one is able to 'buy' someone else's licence and obtain approval for the transfer. In this sense there is already an informal market in licences. The price of quota licences would reflect only what they were worth to other fishermen. They are unlikely to become very expensive in the east coast groundfish fishery. Furthermore, they could be used to obtain loans (i.e., they could be borrowed against) like any other piece of property.
A related concern is the impression that the cost of buying quota licences would have to be included in the cost of fish and would thus weaken Canada's competitive posi-tion or cut down fishermen's net incomes. This argument is mistaken because it reverses cause and effect. The price received for Canadian fish products is deter-mined by supply and demand in our markets. This price has nothing directly to do with the cost of producing fish. The value of the quota licences would be determined by the supply and demand for them among fishermen. The demand for extra quota would depend on the profits that could be earned from fishing. Fishermen would only offer to pay for extra quota what it was worth to them.
The idea of quota licences in the fishery has sometimes been confused with egg or milk quotas in agriculture. The fact is that agricultural quotas and marketing boards serve an entirely different purpose. The agricultural system uses quotas to limit farm production in order to keep farm prices up in the domestic market. Thus they are part of a government supply management policy.
The upper limit on the supply of fish, on the other hand, is determined by biological considerations in the form of allowable catch quotas (the TAC). Prices for fish prod-

228 Task Force on Atlantic Fisheries
ucts are determined largely in the world market. The quota licence has nothing to do with market prices for fish products or with supply management. Its purpose is to create the conditions whereby fishermen can minimize their operating costs by over-coming the effects of the common property nature of the fisheries. The Economic Council of Canada, which has been critical of parts of the agricultural quota and marketing board system, has strongly endorsed the concept of quota licences, or "stinted rights" as the Council called them, in the fishery.
A philosophical objection sometimes heard to the concept of quota licences is that the seller of a quota licence would reap a windfall gain from a right given freely by the Crown. Such a benefit could occur for the first recipient of a quota licence because the rights would initially be given freely to existing fishermen. If a fisher-man sold out, he would receive 'a golden handshake' — the money he received for selling his quota — though the value of the handshake would depend on the worth of quota at the time. The same thing can happen now when a fishermen 'sells' his licence. In any event, subsequent holders of quota licences would have to buy from someone else and thus would not normally realize a significant net gain if they later sold out; that is, they might only recover on the sale the amount they paid to obtain the quota initially, or indeed they might recover less if the market for quota became `soft'.
The Task Force is well aware that fishermen have been generally sceptical of the idea of quota licences. This is understandable because it is a novel and far-reaching idea. Moreover, many of the concerns just outlined have not been answered clearly before. Some may still oppose the idea because it implies a limit on what they may see as a fundamental right to fish. Those who take such a view must, logically, also oppose the existing system of limited entry licensing, and often they do.
In his report on Pacific fisheries policy, Peter Pearse describes the ideological argu-ment over limited entry licensing and rights in the following apt terms:
... some fishermen insist that the government should fix the total catch and nothing else, leaving "free market forces" to sort out the efficient from the inefficient fishermen. According to this view, to attempt more than this would be to interfere with the free enterprise system as it applies to fishing.
This position contains a fundamental misunderstanding. The free enterprise system depends on someone having control over all of the factors of production, including natural resources, and ensuring that they are used in the most profitable way ... common property is repugnant to the principles of a market economy, and those that invoke the virtues of free enterprise should be the least satisfied with the free-for-all of open fisheries ... Nor, for that matter, does common property fit within classical socialism, which implies centralized ownership and control by the state with no competitive exploitation by independent fishermen. No more can be said for common property on political grounds than on economic or conservation grounds.
The need for some means of limiting access to the commercial fishery is, despite the occasional dissenter, generally accepted. What has not been well accepted, however, is the regulation that has been introduced to control the race for common property. Fishermen want an alternative. No one has offered a better alternative than quota licences.
The Task Force accepts that the implementation of a quota licence regime will be a complex and challenging task. For large, multi-vessel enterprises, catch limits on a stock by stock basis are undoubtedly the most effective approach, though some chronic symptoms of the common property phenomenon may persist — for example, mis-reporting of the area fished or the amount of catch. For smaller vessels, control on the basis of amount of catch will be more difficult to design and extremely dif-

The Harvesting Sector 229
Review board
ficult to enforce in the absence of general acceptance by the fishing community. For these vessels, a regime of licence quotas based on capacity to catch, however mea-sured, may be more practical.
The difficulties of instituting such a system will be considerable. There will be tech-nical problems of definition and initial assignment, as well as attitudinal problems that will have to be overcome. On balance, however, the Task Force believes strongly that the potential gains in the economic viability of the harvesting sector are worth the challenge, as long as it is accepted that the system does not necessarily have to be implemented in all fleet sectors or all areas. (There might be little to be gained, for example, from a system of quota licences in Labrador.) In the final analysis, fisher-men themselves will have to be convinced of the benefits before the system can be implemented effectively.
Another significant innovation recommended by the Task Force is the establishment of an Atlantic Fisheries Licence Review Board. The idea of a quasi-judicial body external to the Department of Fisheries and Oceans to oversee the licensing process builds on practices the Department has initiated over the past several years. External committees, both local and regional, have been organized on an ad hoc basis to deal with the issue of new licences in some fisheries and with the categorization of fisher-men. The Task Force considers that it would be highly desirable to formalize this process and to create an ongoing quasi-judicial body whose major function would be to act as arbiter and referee, within policy guidelines established by the Department. The division of responsibilities should be along the following lines:
Licensing and Allocation Responsibilities
Fisheries and Oceans
1. Establish Total Allowable Catch (TAC) each year.
2. Allocate TAC among fleet sectors.
3. Set fishing regulations, e.g., mesh sizes, seasons, closed areas, by-catch.
4. Establish the number of licences to be issued.
5. Renew licences annually.
6. Set criteria for enterprise allocations and quota licences, including criteria for sale or transfer.
7. Establish licence conditions and moni-tor performance against these conditions.
8. Administer 'routine' transfers of licences and enterprise allocations.
Licence Review Board
1. Establish initial allocations wherever enterprise allocations or quota licences are instituted.
2 Allocate increases (or decreases) if TAC is adjusted during year.
3. Decide who gets licences in new or expanded fisheries.
4. Hear and decide on appeals against departmental decisions on licence or allocation transfers and licence cancellation or suspension.
5. Decide on applications for substantial transfers of allocations or licences, e.g., where viability of a processing operation may be affected.
6. Advise DFO on licensing and allocations policy.
7. Maintain a public registry of licences and the terms and conditions attached to licences.
230 Task Force on Atlantic Fisheries
We do not see such a body taking over the ongoing and routine licensing functions of the Department such as the annual renewal of licences at DFO offices in fishing com-munities. Neither would it become involved in routine transfers under a quota licence regime. However, it would be informed of all such transactions and would monitor them against established criteria and guidelines. It would also rule on cases that are on the margin of established guidelines, that involve substantial changes in fishing or landing patterns, and whenever a decision of the Department is appealed. The significance of these changes in process would be that Licence Review Board proceedings would be open and its decisions would be public and accompanied by the reasons for them.
The Board should also decide who gets new licences as and when new fisheries are begun or existing ones are expanded. The quasi-judicial body would not be involved in the setting of the TAC or its annual allocation among fleet sectors, as these deci-sions are part of the responsibility of the managers of the resource, but it would be involved whenever a decision was made to expand the TAC in the middle of a fishing season. The Licence Review Board would decide who should get the new allocations.
In this regard, the Task Force has serious reservations about the way the TAC in some fisheries and in some areas has been expanded in the middle of the fishing sea-son in response to pressure from processors' and fishermen's organizations. To the extent that the resource managers give in to such pressure, they severely undermine the fundamental purpose of the TAC and intensify all the difficulties associated with the common property problem.
The members of the quasi-judicial board should be drawn from outside the fishing industry and would probably operate on a part-time basis, supported by perhaps three to five permanent staff. The Board would conduct public hearings on major issues such as the transfer of trawler fishing capacity between ports or large transfers of quotas between 'owners', and its decisions could be appealed to the Minister of Fisheries and Oceans or the Cabinet. Thus, the process by which fishing privileges are allocated would become more open and credible and, we believe, ultimately more efficient and responsive.
Although the Task Force favours establishing an independent Atlantic Fisheries Licence Review Board, its exact institutional structure is not as important as meeting the objective of fairness discussed in Chapter 23. It is essential that licensing deci-sions be subject to review and that the whole licensing process be fair and be seen to be fair. To this end, decisions regarding granting or withholding licences should be subject to open public review, with all interested parties free to make representations. Review board findings should also be public, with the reasons for decisions docu-mented and published. Needless to say, there must be a registry of licences, includ-ing any terms and conditions that may be attached to them, maintained and open for public scutiny.
Fisheries The continued division of responsibility for administration of the harvesting sector in administration Quebec creates (1) confusion among fishermen; (2) both duplication and gaps in in Quebec essential activities and in obtaining essential information; and (3) dissatisfaction in
other provincial governments as well as in the industry generally. The difficulty of obtaining the most basic information on the Quebec fisheries itself leads to the con-clusion that the status quo is not acceptable.
Our recommendation with regard to consolidating federal management of the fisher-ies in the Gulf of St. Lawrence reflects our concern about the duplication, confusion and lack of data available to us as a result of the delegation of fisheries administra-tion to Quebec. This situation has evolved out of a federal-provincial agreement dat-ing back to 1922, as subsequently interpreted and administered by the province. A

The Harvesting Sector 231
different approach is required for the management of modern fisheries that use highly mobile gear and where the stocks are being exploited by fishermen from five different provinces.
The assumption of full management responsibility by the federal government should also entail increasing federal fisheries visibility in the province through, for instance, establishing a research centre in the lower St. Lawrence area. A group should be set up within the federal government to carry out negotiations with the province of Que-bec on the transfer of responsibility and on related transitional arrangements.

233
11. Resource-short Plants
It is well known that seasonality of operations is a major factor limiting the viability of inshore plants. The 1980 report by the Economic Council of Canada, Newfoundland: From Dependency to Self-Reliance, noted that a plant's unit costs are roughly 30 per cent higher when it operates only six months of the year than if it operates continuously.
Independent Fish Producers Association of Newfoundland and Labrador, in a submission to the Task Force.
The Problem
Background
The highly peaked, seasonal nature of inshore catches of groundfish, squid and pelagic species, particularly on the east coast of Newfoundland, requires a large processing capacity, which is then under-utilized in the off-season. These under-util-ized facilities are referred to as 'resource-short' plants.
The capital cost of much of the seasonal plant capacity (basically freezer plants) constructed since 1977 is too great to be supported solely by the volume of fish sup-plied by the inshore fishery, which, for technical and biological reasons will always be limited to a relatively short season. At the same time, the rebuilding of the north-ern cod stock will require even greater peak-season processing capacity, resulting in even more serious under-utilization in the off-season if practical means are not devel-oped to spread the growth in production outside the June to August period.
The issue is to determine how to supply resource-short plants with fish in the off-season to improve their degree of utilization and thus their chances of economic viability.
We showed in Chapter 5 that the financial cost of plant under-utilization, or over-capacity, is greater on the east coast of Newfoundland and Labrador (Task Force analytical areas 1 and 2; see map on p. 30) than in any other part of the Atlantic coast. In 1981 the cost of interest on long-term debt and depreciation in those areas was 7.7 per cent of sales, compared with an average of 5.7 per cent for all the plants sampled in the Woods Gordon survey.
This high level of fixed costs in relation to production value is most serious for the larger inshore plants that expanded their capacity after 1977 in anticipation of the recovery of the inshore cod fishery and the development of the high volume inshore fisheries for squid, mackerel and capelin.
The fifteen or so larger inshore freezing plants on the east coast of Newfoundland have been referred to as resource-short plants, although the existence of under-util-ized processing capacity is far more widespread and is found in all areas where a sea-sonal fishery predominates. It is also a problem of long standing in the industry. Par-ticular attention has recently been focused on Newfoundland's east coast because of the relative severity of the cost of under-utilization there. This has been caused by the large amount of new investment and by the extreme peaking of the inshore cod catch, 70 to 80 per cent of which is typically landed between June and August.
Although there is substantial over-capacity if measured on a year-round basis, the plant system is usually fully taxed in mid-summer. The seasonal variation in fish landings is due to:
• biological factors, such as the inshore feeding migration of northern cod;
• environmental factors — weather and ice cover;

234
Task Force on Atlantic Fisheries
• behavioural factors — for example, unemployment insurance rules are believed to discourage off-peak fishing in some areas; and
• allocations policy — small craft generally cannot operate from November to April; thus a large allocation to this fleet sector ensures that the catch will be con-centrated in the summer months.
The excessive seasonality of the Atlantic fishery in general and of the eastern New-foundland fishery in particular has many adverse consequences for the industry, among them the following:
• over-capitalization in boats and plants that are designed for peak requirements far in excess of needs during the rest of the year;
• lower incomes for fishermen not able to catch enough in a short period to provide adequate annual earnings, effects that are evident in the income data in Chapter 4;
• poorer quality, due to handling difficulties, warm weather and large daily swings in deliveries to plants;
• reduced labour productivity and difficulty in retaining skilled workers in plants during the off-season;
• inventory build-up and related marketing difficulties due to the seasonal excess of production over market demand; and
• the cost (to governments) of maintaining dispersed harbour infrastructure to sup-port a very large fleet of small boats and of meeting the cost of unemployment insurance.
Despite these difficulties, we demonstrated in Chapter 5 that many of the seasonal plants are relatively successful because they are well adapted to their business envi-ronment. This requires that they be closely managed; that they have low capital investment and lower than average labour rates; and that they be able to augment groundfish supplies with higher margin species such as capelin and crab.
These ingredients of success cannot be generalized to all seasonal plants, at least some of which must have adequately large freezing capacity to serve the inshore northern cod fishery. There are not sufficient and dependable volumes of the high margin species to provide the cross-subsidization needed to make all of these plants viable. Even the landings from the inshore northern cod fishery have been undepend-able, with areas of good and bad landings scattered each year in a random patch-work along the east and northeast coast of Newfoundland and Labrador.
As a result, plant operators have entered each autumn since 1978 complaining of a critical shortage of raw material, at least in relation to the cost of their investment in plant and equipment. They point out, correctly, that much of this investment is nonetheless necessary to handle the large and unpredictable day to day volumes of the summer inshore fishery.
In 1979, the Department of Fisheries and Oceans authorized a special allocation of 12,000 t from the northern cod TAC to be set aside for resource-short plants on the Atlantic coast. The allocation stipulated 9000 t for inshore plants in Newfoundland, 2500 t for the Maritimes and 500 t for Quebec. About 7700 t of the total allocation was eventually caught by East German and Polish freezer trawlers.
The program was continued in amended form in 1980, this time restricted to New- foundland inshore freezing plants located adjacent to the northern cod stock (TARS 1 and 2). About 4500 t of a 10,000 t allocation was caught, almost entirely by foreign
235
vessels. The rationale for the 1980 program was based on the strike/lockout in the Newfoundland inshore fishery in 1980. This had left inshore plants critically short of fish because by the time the dispute was settled, the small boat fishery had largely ended. In the 1980 program, delivery was restricted to plants on the east coast of Newfoundland on the grounds that the fish would have been landed there had it not been for the work stoppage.
Ad hoc arrangements continued in 1981, again restricted to inshore plants adjacent to the northern cod stock, although this time it was said to be justified by the rela-tively poor inshore season which had left plants seriously short of material to process. About 4100 t of an allocation of 11,250 t were caught, all by Japanese and Portugese vessels. The low catch was due principally to the delay in approving the program and the resulting difficulty in making contracts with foreign vessels. Consequently a new allocation of 5250 t of northern cod was authorized in January 1982, of which some 3330 t were eventually delivered to resource-short plants on the east coast of New-foundland.
Since 1979, almost 20,000 t of northern cod has been landed under these arrange-ments. About 80 per cent of the fish has been made available to the Fisheries Asso-ciation of Newfoundland and Labrador which has distributed it, according to a for-mula agreed to by the Association, among the inshore freezing plants owned by its members. Since 1980, other frozen fish processors and saltfish processors in New-foundland have divided the remainder.
Because of the ad hoc nature of the program, it has not been possible to make the most suitable arrangements for vessels, nor have plants been able to plan with any degree of certainty on the extra winter production. In the absence of a policy regard-ing the amount of the allocation, its distribution and its harvesting method, there continues to be confusion and discord surrounding the delivery of fish to resource-short plants.
From a technical and financial standpoint, the program has been very successful. Most of the cod has been frozen at sea in a head-off, gutted form and later defrosted and processed ashore into fillet products, the quality of which has been reported to be excellent. The proportion of higher value products has been above the average for inshore plants.
The frozen raw material is easily transported and may be taken from storage as required. This permits a perfectly controlled supply of fish to the processing line, which leads to better yields and tighter labour cost management (see Chapter 16). In addition to providing better operating profit margins, the extra winter production may be viewed as being free of the expense of long-term interest and depreciation and a portion of general and administrative expenses. These costs are fixed and would therefore be incurred in any event. Thus the economic value of the fish to a plant with high fixed costs is very great.
The availability of fish for a permanent program of delivery to resource-short plants is limited by the growth in stocks and by the cost and method of harvesting. The principal groundfish stocks, with the exception of northern cod, some redfish and turbot, are not likely to provide surpluses beyond the needs of existing fleets. But the growth of northern cod, from an initial TAC of 230,000 t in 1982 to an estimate of at least 380 to 400 thousand tonnes in 1987, offers an opportunity for substantial deliv-eries to plants that now have no offshore supply. An eventual annual allocation for this purpose, rising to perhaps 50,000 t from a Canadian allocation of 380,000 t by 1987, may be possible (see Chapter 12). In fact, if the great majority of the growth in northern cod is not processed in the period between October and April and is instead forced into the summer peak, it will be necessary to add even more inshore
236
Task Force on Atlantic Fisheries
processing capacity on Newfoundland's east coast. Such added capacity would be of very doubtful economic viability and is thus inconsistent with the primary policy objective recommended by the Task Force.
The principal issue, therefore, is to develop the most appropriate means to harvest and distribute northern cod and lesser amounts of other species to certain plants that do not now have year-round offshore supply. There is not an unlimited amount of fish available, so a means of allocation among plants is needed. Harvesting might be carried out by either foreign or Canadian trawlers, but prices must be such as to make the plants viable. This supply of fish should not be subsidized.
An extremely important constraint is the fact that the catching period for northern cod is restricted to the months between November and April, because this is the time when northern cod may be fished most effectively offshore and when inshore plants would otherwise be idle. Therefore, a vessel dedicated to supplying a resource-short plant must have an alternative fishing activity from at least May through October. Foreign vessels might move to other waters during this period. This is ultimately their principal advantage. A Canadian wetfish trawler would require allocations of groundfish from offshore quotas other than northern cod, to be fished between April and October, if it were to be viable. But with few, and currently unattractive excep-tions, other stocks are fully utilized.
Fortunately, there are non-traditional fisheries that are in season between May and October, particularly that for offshore squid from July through October. This would require a freezer trawler, as squid must be frozen within a few hours of capture. A freezer trawler would also be able to purchase mackerel from independent fishermen between May and July in those situations where over-the-side sales were appropriate within the guidelines recommended by the Task Force in Chapter 9. This would pro-vide a Canadian alternative to the foreign vessels that have purchased fish over-the-side for the past several years. There would also be some additional quotas of redfish, turbot and cod from northern Labrador (NAFO Area 2GH) that could probably be made for such vessels, and these too are in season between May and October. A number of freezer trawlers with northern shrimp licences are already in the Canadian fleet and they would potentially be available to combine a winter fishery for northern cod with shrimp the rest of the year.
In summary, the freezer trawler has the advantages of (1) providing winter northern cod to resource-short plants in a stable (frozen) form that is easily transported, stored and processed in an orderly way; (2) not requiring allocations of traditional and fully-utilized groundfish species in the off-season between May and October; (3) providing a means to develop a Canadian offshore fishery for squid and other under-utilized species; and (4) providing the mobile freezing capability to purchase fish from independent fishermen in areas and for species where shore processing capabil-ity is inadequate.
The economic performance of a Canadian-owned and operated freezer trawler employed in this way has not been demonstrated in practice, although there is no reason to believe that an economically feasible fishing plan could not be developed. The fact remains that no Canadian company or organization has come forward with a comprehensive proposal to deliver fish to resource-short plants. Notwithstanding this, it is unacceptable to continue to approach this issue in an ad hoc way. A policy and program are needed.
The Options Having rejected a continuation of the arrangements of the past four years, we have
only two remaining alternatives for delivering winter fish to resource-short plants — either foreign vessels or Canadian vessels, in each case as part of a long-term pro-
237
gram with definite objectives and procedures. These procedures must include the fol-lowing elements:
• identification of the allocations to be used, with sufficient medium- to long-term certainty to permit adequate planning and to achieve a reasonable return on investment;
• criteria for selecting plants eligible to receive fish from the allocations; and
• a means to administer the program.
The remaining policy options therefore involve only the choice of harvesting method.
Permanent use of foreign vessels
This option would probably evolve into a long-term agreement with one or more ves-sel operators to deliver prescribed tonnages of fish at specific times. The possibility of Canadian vessel owners bidding on the 'contracts' would remain, but no govern-ment effort would be made to Canadianize the activity. The eligible recipient of the fish would negotiate terms and price with the plants to which the fish is being deliv-ered. No government subsidy, in the form of either cash payments or extra alloca-tions for the foreign vessels, would be provided.
Pros
(a) provides an orderly supply of high quality raw material, proven by experience;
(b) requires no new capital investment by Canadians;
(c) accommodates growth in northern cod without adding new Canadian offshore fishing effort; requires no allocation from stocks already being fully utilized; and
(d) affords an opportunity for preferential marketing arrangements between the Canadian recipients of the fish and foreign fishing companies and in this way achieves many of the objectives of those who advocate granting Canadian allo-cations in exchange for market access.
Cons
(a) creates dependence on a foreign-controlled source of supply that may be dis-rupted or eventually used to force concessions on access to other Canadian stocks;
(b) initial potential cost advantages could likely disappear once the foreign suppliers faced replacement of their existing, under-utilized, vessels;
(c) inhibits Canadian development of the capability to freeze fish at sea and there-fore to exploit under-utilized species; and
(d) displaces potential Canadian jobs in the offshore fishery.
Eventual use of Canadian vessels
It may be impractical to Canadianize the resource-short plant program fully within a year or two. This option would achieve a full Canadian capability within a pre-deter-mined timespan and permit foreign vessels to be used as part of a transitional phase. There are two sub-options, the first being the use of vessels of the major Canadian trawler owners; the second is to use a new fleet with the specific mandate to deliver fish to resource-short plants.
238
Task Force on Atlantic Fisheries
With the advent of enterprise allocations, the major trawler owners will eventually tailor their fleet size and fishing pattern to achieve maximum utilization of vessels servicing their own trawler plants. It is unlikely there would be excess winter capacity to deliver fish to plants of other companies unless a catching enterprise (harvesting company) were formed specifically for the purpose. This would be one possible form of the second sub-option.
More specifically, the second sub-option assumes that allocations of northern cod and other species sufficient to permit a year-round fishing plan for Canadian vessels would be made available. Bids to catch the fish and to deliver northern cod to eli-gible resource-short plants would be judged by the plant operators themselves and awarded to the best offer.
Initially, any vessel, foreign or Canadian, could participate. A timetable for full Canadianization would be established. There would be no cash subsidies provided by government, nor would there be extra allocations of fish beyond those explicitly set aside for the program. The objective would be to encourage formation of a Canadian harvesting company with appropriate enterprise allocations and a responsibility to implement the resource-short plant delivery program. Shareholders in this harvesting company might be existing trawler owners, plant operators or any other investor who met the criteria relating to foreign investment that should be developed as a conse-quence of recommendation 4 in Chapter 9.
Preliminary exploration of a concept similar to this was begun in 1981 by officials of the Department of Fisheries and Oceans along with a number of owners of resource-short plants and offshore vessels.
Pros
(a) maximizes Canadian employment and control of fish resources inside the 200-mile zone;
(b) affords opportunity of access to offshore fish supplies to other than existing trawler owners; and
(c) allows commercial criteria to determine the most effective means to achieve the goal of delivery to resource-short plants.
Cons
(a) requires that an economic fishing plan for May to October be created to com-plement the northern cod fishery. This will almost certainly require the acquisi-tion of freezer trawlers, the commercial performance of which remains in some doubt; and
(b) depends on investment by Canadians at a time when very large amounts of equity are needed throughout the fishery and confidence in the industry remains to be restored.
Recommendations 10. Establish specific allocations of fish for delivery to resource-short plants in the off-peak season. The deliveries should be by a self-financing fishing company or consortium. The only government contribution to this company or consortium would be an allocation of fish. By a target date of 1987, only Canadian vessels should be permitted to catch these allocations.
11. Adopt the following criteria as the basis for selecting the plants that will qualify as resource-short. For purposes of the policy a plant will be defined as resource-short if:

Resource-short Plants 239
(a) its principal supply of fish is from vessels of less than 65 feet;
(b) the ratio of the production of the plant during its six months of greatest throughput to its production during the balance of the year is greater than a specified threshold (e.g., 5 to 1); and
(c) the plant has installed, as of 1 November 1982, plate freezing and cold stor-age capacity and is capable, with at most minor modification, of winter operation.
It is recommended that preferential, though not exclusive, access to the special resource-short plant allocation be reserved, with right of first refusal, for eligible plants adjacent to the northern cod stock on the east coast of Newfoundland (i.e., the shoreline of NAFO areas 2, 3K and 3L). The balance, plus any allocation refused by plants on the east coast of Newfoundland, should be available with right of first refusal to resource-short plants in all other east coast areas. Any remaining alloca-tion for which the right of first refusal was not exercised would be available for bid by any Atlantic coast processor.
Comment The recommended policy follows from all three of the objectives the Task Force recommends for the fishery — economic viability, increased employment, and max-imum Canadian participation in the fishery.
In the transition period, advantage can be taken of foreign capability and immediate preparedness to deliver fish. We rejected the option of permanent foreign deliveries to resource-short plants principally because of the resulting dependence on supply that could not be controlled by Canada. Foreign vessels might be prepared, for a time, to land fish more cheaply than Canadians as long as they employed older ves-sels with few alternatives in other fisheries. This would not likely continue once dependence had been established and the foreign suppliers had to replace their vessels.
The criteria recommended by the Task Force to identify which plants should be eli-gible to receive fish from the special allocation set aside for the program must be finalized by the Department of Fisheries and Oceans in consultation with all those affected. In particular, criteria (a) and (b) in recommendation 11 must be refined by establishing precise quantitative definitions for the words "principal supply" and "specified threshold".
It should be noted that the criteria do not rule out resource-short plants that may be owned by trawler operating companies. The existing quotas assigned to these compa-nies are to supply their year-round, trawler-fed plants. Their inshore plants are sub-ject to the same economic difficulties as similar plants owned by those without trawl-ers; they should therefore be eligible to participate in the resource-short plant program if they have plants that satisfy the criteria. The enterprise allocations of trawler owners should be tailored solely to the requirements of their trawler-fed plants. Any entitlement in respect of their resource-short plants should probably be made separately and supplied by vessels mandated to deliver fish to resource-short plants.
It will obviously not be possible to provide fish to every under-utilized plant. The intent is to improve the viability of the larger capacity, inshore-supplied freezing plants that are needed to process the peak summer volumes of groundfish, squid and pelagic species, principally on the east coast of Newfoundland. There are roughly fif-teen such plants. The Task Force believes that these plants deserve priority of access to northern cod delivered under the proposed resource-short plant program because their under-utilization problem is a direct result of the large freezing capacity
240
Task Force on Atlantic Fisheries
required to handle the inshore fishery for northern cod and other species on the east coast of Newfoundland and Labrador.
Nevertheless, the Task Force recognizes that other plants in Atlantic Canada are also resource-short by the definition established in recommendation 11. Because fish within the 200-mile zone are a national resource, it follows that some portion of the resource-short plant allocation should be available to plants elsewhere than on the east coast of Newfoundland. The most appropriate division requires further investi-gation and consultation by the Department of Fisheries and Oceans.
By 1987, approximately 50,000 t of northern cod and lesser amounts of turbot, red-fish and possibly cod in NAFO area 2GH might be allocated under the program. The eligible plants would have the right of first refusal for the fish, but if for any reason their requirements, at prices acceptable to the catchers, fall short of the total alloca-tion, the balance should be made generally available for bids by other Atlantic coast processors.
An allocation as described would provide an average annual delivery of northern cod of 2500 to 3000 tonnes (live weight) to each eligible plant. Today, an inshore freez-ing plant on the east coast of Newfoundland might process about 5000 tonnes of cod or more between April and October. The addition of 2500 t would be very significant in terms of both employment generated and contribution to fixed overhead. Eventu-ally, a fleet of 10 to 15 freezer trawlers would be required to land 50,000 t of north-ern cod during the November to April period.
The Department of Fisheries and Oceans would call for proposals for the formation of a catching organization to take all or part of this allocation for the purpose of sup-plying resource-short plants. Existing companies, consortia or new enterprises would submit plans and proposals to the Atlantic Fisheries Licence Review Board for con-sideration. The Board would make its decision based on criteria such as the financial soundness of the applicants, the proposed technology to be used, catching and cold storage costs, and the degree of Canadianization. The selection would be made only after full public hearings, and the Board would be required to accompany its decision with the reasons for it.
Alternatively, the allocation could be assigned to a consortium of resource-short plants that would then receive bids to have the fish caught. This alternative would make it more difficult to create a new Canadian capability to harvest the fish because potential vessel owners would not have the required long-term assurance of a supply of fish to justify investment in vessels. This might be overcome by negotiation of long-term contracts with the resource-short plant consortium.
The price of the fish would be negotiated between the catching organization and the plants that would process it. The price would have to ensure the viability of the har-vesting organization and include a margin sufficient to permit replacement of ves-sels. No operating subsidies or extra allocations of fish should be made available. The harvesting organization would, of course, have to have sufficient allocations of species other than northern cod to permit a year-round fishing plan. Some of these species — for example, squid, redfish, mackerel — could be frozen at sea and mar-keted directly by the organization.
Disputes might arise regarding the ultimate disposition of the fish, particularly if one of the priority plants was unprepared to pay the price demanded by the catcher. Would such an impasse constitute effective forfeit of the right of first refusal by the eligible plant, or would the harvesting organization be required to lower its price in view of the mandate to supply the resource-short plant? General guidelines must be developed in respect of such issues. An arbitration procedure could be developed that could be administered by the quasi-judicial Board proposed in recommendation 8, Chapter 10.
241
12. Utilization of the Northern Cod Stock
The cod of 2J, 3KL, Produces excitement pell-mell, It's a fast-growing stock, Which all want to dock, Who will get it? Well, we're here to tell.
A Task Force Wit
The Problem
Background
The Total Allowable Catch of northern cod is forecast to increase by at least 170,000 t, or 75 per cent, between 1982 and 1987, with the Canadian quota projected to be at least 380,000 t in 1987. In the years ahead, most of the growth of groundfish inside 200 miles will occur in this stock.
Allocation of the increase in the northern cod stock will cause controversy, yet it represents the best remaining opportunity to achieve better incomes for fishermen and greater utilization of processing capacity. It has already been suggested (in Chapter 11) that an eventual allocation of up to 50,000 t of northern cod be made to a harvesting organization that will deliver fish to resource-short plants. It was also recommended in Chapter 9 that allocations to foreign fleets be minimized.
The policy issue is to determine the allocation of the remainder of the northern cod TAC among the principal fleet sectors.
The area from the Avalon Peninsula of Newfoundland north to mid-Labrador (NAFO
areas 2J, 3K and 3L; see map on page 30) is occupied by a large cod stock that was the basis for the original and continued settlement of most of the area. Once one of the world's richest fish stocks, northern cod was severely over-fished by foreign fleets in the late 1960s. The peak reported catch occurred in 1968 when a total of 783,000 t were taken, 85 per cent by foreign fleets. This is to be compared with a 1981 Canadian cod catch in all areas of the Atlantic coast of 432,000 t. The Canadian catch of northern cod in 1981 was 154,000 t.
By 1974, the effect of foreign over-fishing had reduced the inshore catch of northern cod to a minimum (about 35,000 t), and the total catch had fallen to 373,000 t, of which 90 per cent was landed by foreigners. The unmanageable assault of foreign fleets on this stock was a key element in Canada's decision to press for a 200-mile fisheries management zone.
Since 1977 the stock has been allowed to rebuild under Canadian management. The inshore catch has more than doubled to about 90,000 t in 1981 and could conceiv-ably double again if small boat effort were allowed to expand sufficiently. Inshore catches on the order of 160,000 t were recorded in the late 1950s when a large amount of fish was split and salted by fishermen themselves. It is unlikely that such large quantities of saltfish could be marketed profitably today. The freezing plants meanwhile could not properly handle a doubled inshore catch in the peak June to August period, particularly in light of the problems these plants are now having (see Chapter 11).
The northern cod winters in offshore spawning grounds, where it is available to trawlers. The Canadian offshore fishery in areas 2J, 3KL was relatively insignificant prior to 1967. In 1968 Canadian trawlers took 20,000 t while foreign vessels were catching 660,000 t. Since 1978 the Canadian offshore fishery has grown rapidly; in 1982 it is expected to land more than 90,000 t of northern cod. This is, by a wide margin, the most important trawler fishery on the Atlantic coast.
242 Task Force on Atlantic Fisheries
The Options
The northern cod undertakes a feeding migration to shore in the May-June period and is available to inshore boats from June to September. The fish move to deeper water offshore in the autumn, but do not reach maximum concentration until Janu-ary. The annual migration inshore is highly variable in its timing and extent. In some years the inshore fishery may be a virtual failure; in others the processing capacity cannot keep up with the supply during the seasonal peak. These fluctuations have been recorded for more than a century.
The cod trap fishery, lasting six to eight weeks, is the most highly variable in terms of quantity landed. The trap is a stationary type of gear that depends for its success on the course taken by the migrating cod. It tends to produce fish of small average size, because a proportionately larger number of young fish swim close to shore. Nonetheless, fish of acceptable size do come into traps and can be separated or culled from the under-sized fish as they are dip-netted out of the trap. When fisher-men were salting their own catch, this practice was standard. Unfortunately, some good habits such as culling have declined since the advent of the freezing plant. The quality of the flesh of trap cod is also reported to deteriorate rapidly if the fish is not handled carefully and processed promptly.
The rebuilding of the northern cod stock is expected to continue through 1987 when a Total Allowable Catch in the vicinity of 400,000 t or more is forecast. This level of harvest is almost certainly below the maximum sustainable yield from the stock. It is important to manage the fishery conservatively however, because this will increase the stability of catches, maintain high offshore catch rates and increase the probabil-ity of a successful inshore fishery.
By following a conservative rate of harvest (determined by a rule referred to by fish-eries managers as F 0 .1), the eventual long-term production of the stock is thought to be about 550,000 t annually. The forecast 1987 TAC of 400,000 t is 170,000 t above the initial 1982 level. It is 246,000 t above the actual Canadian catch in 1981.
As noted in Chapter 2, forecasts of any TAC in 1987 are highly speculative. The Task Force has adopted a conservative position and assumed a northern cod TAC in 1987 of 400,000 t, of which the Canadian allocation would be 380,000 t. We emphasize that the latter figure has been adopted only to provide a concrete illustration. It is not a recommendation of the Task Force, nor does it represent the policy of the Gov-ernment of Canada regarding the appropriate international division of the stock.
The central characteristic of the northern cod is its seasonal migratory behaviour which for generations has shaped the fishery, and indeed the society, of the east coast of Newfoundland and Labrador. Although measures to deal with seasonality are constrained by biological and environmental factors, there is a great deal of scope for policy choice through allocations and incentives to develop more economically appro-priate technology.
The problem of seasonality, and the closely related problem of plant under-utiliza-tion, are most severe on the east coast of Newfoundland. That is also where the greatest increase in fish landings will occur and therefore where the problem can be made less or more severe. The allocation of the anticipated 165,000 t or more of growth in the Canadian quota of northern cod between 1982 and 1987 will have a profoundly important bearing on the future of Canada's groundfish fishery.
The principal objective of this chapter is to recommend a target allocation of the TAC
of northern cod as forecast for 1987. The allocation of growth beyond 1987 should be made in light of events over the next few years. We already suggested in Chapter 11 that an eventual allocation of up to 50,000 t of northern cod be made to a harvest-ing organization that will deliver fish to resource-short plants. We also recommended
Utilization of the Northern Cod Stock 243
in Chapter 9 that allocations to foreign fleets be minimized. It remains to determine an appropriate allocation among the inshore fleet, existing trawler operators and any other new Canadian fleet component that might be introduced. We consider three options.
Option 1: Status quo
In 1982 the inshore fleet has an allowance of 120,000 t of northern cod, or about 55 per cent of the Canadian quota. Maintenance of this share of the forecast 1987 Canadian quota of 380,000 t would imply an allowance in that year of 210,000 t. Adding to this the 50,000 t assumed for the resource-short plant program would leave 110,000 t for all other Canadian vessels over 65 feet. In 1982, vessels over 65 feet were allocated 90,000 t.
Alternatively, if vessels over 65 feet were to maintain their current 42 per cent share of the Canadian quota in 1987, they would be allocated 160,000 t, leaving 170,000 t as an inshore allowance, assuming that 50,000 t were allocated to a resource-short plant program. The advantages and disadvantages of an inshore allowance of roughly double the recent landings of about 90,000 t are as follows, assuming that the existing catching methods — trap, gillnet and some hook and line — are not changed substantially.
Option 2:
Pros
(a) enables expansion of entry to the inshore fishery and some increases in the catch of existing vessels, though the latter prospect is limited by the nature of the gear employed and by environmental conditions.
Cons
(a) increases the peak inshore landings in the June to August period beyond the practical capability of existing freezing plants;
(b) increases the volume of fish of inferior quality and of small average size. The option of assigning much of the growth to saltfish is constrained by the size of the fish and by the inconsequential growth forecast for the saltfish market;
(c) increases the inventory storage and financing problems of processors, thus weak-ening Canada's position in the cod market; and
(d) increases the annual variability in Canada's cod supply as a result of the rela-tively larger component of the catch that would be subject to large year-to-year fluctuations. Such variability poses particularly serious problems for an orderly marketing strategy.
Freeze peak catch for later processing
The objective would be to preserve the existing inshore share of the catch without requiring the addition of new filleting plant capacity. On annual average, it might be planned to freeze up to 50,000 t of inshore northern cod in gutted form in between June and August and hold it in storage to be thawed and re-processed between Sep-tember and March. This would require a great deal of new cold storage, costing per-haps $25 million to construct at 1982 prices. New blast freezing and plate freezing facilities would also be needed in addition to the cold storage. These would have to be provided at public expense, although there is potential to use some existing facili-ties. The cost of providing frozen storage for this quantity of cod might nevertheless be less than the cost of building trawlers to catch it.
244 Task Force on Atlantic Fisheries
Pros
(a) accommodates the existing inshore pattern of landings and thus permits an expansion in the number of fishermen on the east coast of Newfoundland, as well as permitting larger catches by existing fishermen;
(b) avoids the need for new private sector processing plant capacity and provides existing plants with an orderly off-season supply of raw material; and
(c) provides overflow capacity for autumn landings of squid and mackerel.
Cons
(a) requires new freezing and cold storage facilities and the provision of handling infrastructure;
(b) capital continues to be under-utilized, particularly in light of anticipated wide fluctuations in the amount of inshore fish landed in excess of plant capacity. In some years, the new facilities might not be needed;
(c) increases the volume of fish of lower quality and smaller average size. Past experiments on the freezing of summer-caught inshore fish (trap cod) indicate a significant weight loss upon thawing and an apparently unavoidable texture deterioration even while the fish is in the frozen state. It is not clear whether better handling could significantly mitigate this effect; and
(d) reduces the viability of existing trawler fleets and associated plants, the utiliza-tion of which could be improved if they were allocated at least some of the extra fish that under this option would be reserved for the inshore sector to be frozen at the peak of the season.
Option 3: New fleet of 'Scandinavian-type' longliners
A potentially promising alternative to greatly increased catches by the present mix of inshore gear types is the mid- to offshore longliner. These vessels range up to 170 feet in length and have been used for decades by Norway and the Faroes off the Newfoundland coast. Quota restrictions have reduced their numbers to a handful. They report increasing catch rates during 1981 and 1982 as a result of successful stock rebuilding.
Vessels of this design in the 80 to 120-foot range can fish in all weather, although their gear may be hampered by ice. One such longliner, based in Nova Scotia, has been operating successfully on the Scotian Shelf for three years. A typical longliner would carry a crew of about 14 and would probably have to land roughly 2500 t of cod per year to be successful. Used vessels appear to be available in Norway and the Faroes for $1 to 2 million each.
There may be potential for converting some existing side trawlers to longlining. New construction would be more expensive, but proportionally less so than a wetfish trawler, owing to the much simpler gear and far lower power requirements. Such a vessel would land perhaps only half the annual catch of a modern stern trawler, but the fish would be of larger average size and of potentially superior quality.
A fleet of 15 of these longliners could eventually be allocated about 40,000 t of northern cod. Some might be independently owned by fishermen wishing to move up from 55 to 65-foot gillnetters or otter trawlers. There is excellent potential for a Gulf-Scotian Shelf fishery by vessels of this type, perhaps of smaller size (in the 80 to 100-foot range), though this could be developed only by replacing some of the existing fishing effort.
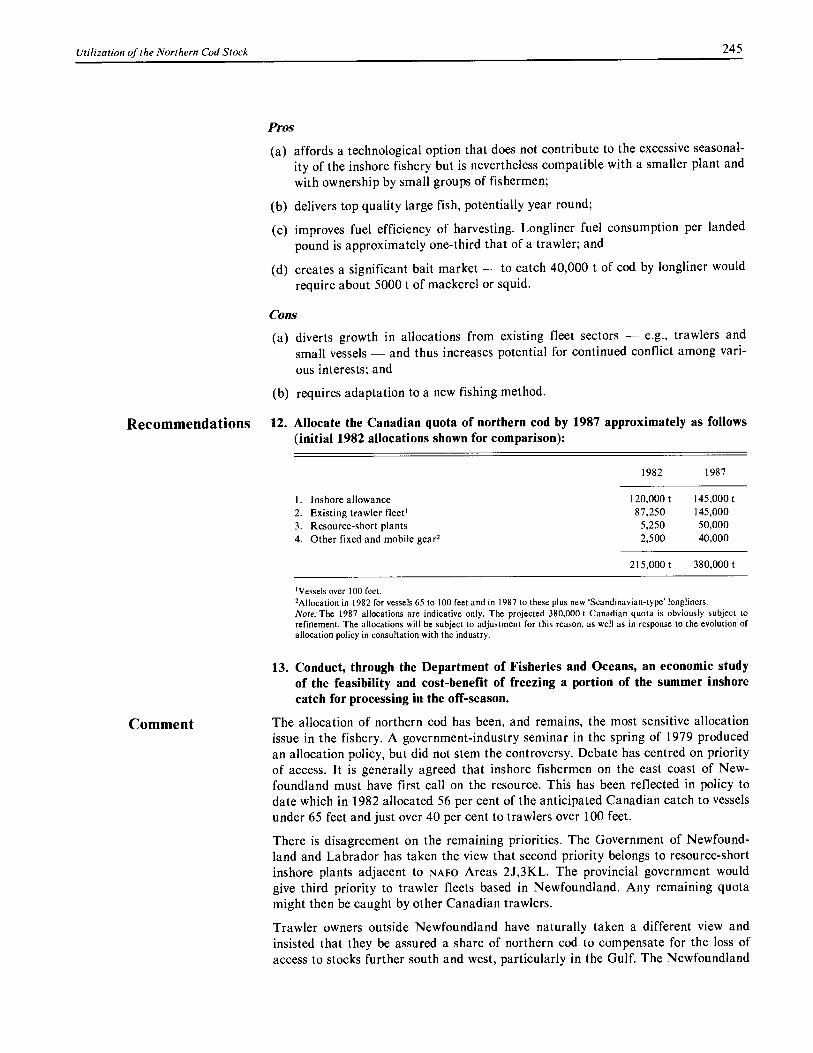
Utilization of the Northern Cod Stock 245
Pros
(a) affords a technological option that does not contribute to the excessive seasonal-ity of the inshore fishery but is nevertheless compatible with a smaller plant and with ownership by small groups of fishermen;
(b) delivers top quality large fish, potentially year round;
(c) improves fuel efficiency of harvesting. Longliner fuel consumption per landed pound is approximately one-third that of a trawler; and
(d) creates a significant bait market — to catch 40,000 t of cod by longliner would require about 5000 t of mackerel or squid.
Cons
(a) diverts growth in allocations from existing fleet sectors — e.g., trawlers and small vessels — and thus increases potential for continued conflict among vari-ous interests; and
(b) requires adaptation to a new fishing method.
Recommendations 12. Allocate the Canadian quota of northern cod by 1987 approximately as follows (initial 1982 allocations shown for comparison):
1982 1987
1. Inshore allowance 120,000 t 145,000 t
2. Existing trawler fleet' 87,250 145,000
3. Resource-short plants 5,250 50,000
4. Other fixed and mobile gear 2 2,500 40,000
215,000 t 380,000 t
'Vessels over 100 feet.
2Allocation in 1982 for vessels 65 to 100 feet and in 1987 to these plus new 'Scandinavian-type' longliners.
Note: The 1987 allocations are indicative only. The projected 380,000 t Canadian quota is obviously subject to refinement. The allocations will be subject to adjustment for this reason, as well as in response to the evolution of allocation policy in consultation with the industry.
Comment
13. Conduct, through the Department of Fisheries and Oceans, an economic study of the feasibility and cost-benefit of freezing a portion of the summer inshore catch for processing in the off-season.
The allocation of northern cod has been, and remains, the most sensitive allocation issue in the fishery. A government-industry seminar in the spring of 1979 produced an allocation policy, but did not stem the controversy. Debate has centred on priority of access. It is generally agreed that inshore fishermen on the east coast of New-foundland must have first call on the resource. This has been reflected in policy to date which in 1982 allocated 56 per cent of the anticipated Canadian catch to vessels under 65 feet and just over 40 per cent to trawlers over 100 feet.
There is disagreement on the remaining priorities. The Government of Newfound-land and Labrador has taken the view that second priority belongs to resource-short inshore plants adjacent to NAFO Areas 2J,3KL. The provincial government would give third priority to trawler fleets based in Newfoundland. Any remaining quota might then be caught by other Canadian trawlers.
Trawler owners outside Newfoundland have naturally taken a different view and insisted that they be assured a share of northern cod to compensate for the loss of access to stocks further south and west, particularly in the Gulf. The Newfoundland
246 Task Force on Atlantic Fisheries
Fishermen, Food and Allied Workers Union has agreed, stating that the Atlantic deep-sea fleet, regardless of its home port, should have second priority after inshore fishermen, and that resource-short plants should be supplied in the off-season from any remainder.
Even if there were consensus on priority of access, the issue of allocation would not be settled because there is no unambiguous way to determine, for example, when the requirements of a higher priority group are fully satisfied. Eventually, disagreement will centre on specific tonnages.
There must be a phased transition between the current allocation shares and those proposed for 1987 and beyond. Both the inshore allowance and the allocation to existing trawlers would be expected to reach their target levels before either the lon-gliners or the fleet supplying resource-short plants reached the allocations indicated in recommendation 12. These latter two categories, if their feasibility is proven, will require proportionally less of the early growth and more of the increase in 1986 and 1987. For 1983, an allocation of approximately 10,000 t to resource-short plants is probably all that will be available.
The Task Force recommends that the allowance to existing inshore vessels not be increased proportionally to the growth in the TAC. Proportional growth would imply increasing the inshore allowance by roughly 90,000 t over the next five years. If this growth were to be caught by vessels of the existing type, whose operation is limited largely to the June to August period, it would result in roughly 60,000 t of cod being added to the summer peak. The average summer rate of delivery to processing plants would be approximately doubled.
It is probably not feasible to cope with such an increase without substantial new processing capacity. Even in 1982, foreign vessels were used on the Avalon Peninsula to relieve a glut of inshore cod. In any event, a great deal more trucking of fish would be needed to cope with local gluts, and plants would have to operate almost constantly on double shift. Labour supply and cold storage availability would then become constraints. The necessary cost-cutting in plants, discussed in Chapter 16, would almost certainly not be achieved. Thus, a proportional increase in the inshore allowance would be inconsistent with the economic viability objective recommended by the Task Force.
Nor does the Task Force recommend a proportional increase in the allocation to existing trawler operators. The proposed increase of more than 65 per cent over the initial 1982 allocation to this group, together with a share of the growth in some other offshore stocks, ensures substantially larger supplies to existing trawler plants and, we believe, will make an important contribution to their economic viability.
As explained in the previous chapter, the extreme under-utilization of many large inshore freezing plants suggests that the wisest economic course is to apply a signifi-cant portion of the growth in northern cod to these idle assets to improve their pros-pects for viability. As we have said, the large capacity of these plants is essential dur-ing the inshore season in order to meet the Task Force objective of maximizing employment.
The feasibility of freezing and storing inshore cod for off-season processing is a tech-nical and economic question that deserves investigation. Work done in the past on the quality and cost implications of the procedure came to a negative conclusion, but cannot be considered to have been completely definitive. The Task Force believes that the technical and economic issues should be settled objectively once and for all through a study sponsored by the Department of Fisheries and Oceans.

Utilization of the Northern Cod Stock 247
The suitability of a fleet of large Scandinavian-type longliners operating from the east coast of Newfoundland has been vigorously debated. The issues centre on the economics of such vessels and their acceptability to Newfoundland crews. Such ves-sels have been operated off Newfoundland by Norwegians and Faroese for decades. The unanswered economic question is whether a year-round fishing plan for the ves-sels can be designed without impinging on stocks that are already fully utilized.
The possibility of longlining northern cod almost year round has been questioned but not settled. The feasibility of the technique during much of the year is, however, beyond doubt. Longlining was introduced on the east coast of Newfoundland in the early 1950s with considerable success. The method was abandoned and replaced with gillnetting only after foreign over-fishing had decimated the northern cod and reduced catch rates to uneconomic levels. An echo of this era remains in Newfound-land where the present day gillnet vessels are called longliners', because they are of the same basic design as the original longliners introduced from Nova Scotia.
The Department of Fisheries and Oceans plans to conduct an extensive experimental evaluation of a Scandinavian longliner on the east coast of Newfoundland. This may settle many of the issues, but continued attempts to develop a suitable longlining technology would be warranted whatever the outcome of the government's experiment.
The offshore longliner is a significant technical option because there appears to be no other intermediate gear type between the present inshore vessels and a large stern trawler that is capable of fishing northern cod. The small 65-foot otter trawlers that have been so productive elsewhere on the Atlantic coast would be severely limited by weather and by the unusually rough bottom conditions on the northern cod grounds. Trawling is also a technique that conflicts with existing types of inshore fixed gear, which remain anchored in the water and may be torn up by the towed net of the otter trawlers. The offshore longliner is not constrained by these factors.
The extreme seasonality and low annual productivity of the inshore fishery on the east coast of Newfoundland and Labrador is fundamentally a problem of technology. This constraint has stunted the economic development of this part of Canada for generations, despite the fact that it is adjacent to the most prolific cod fishery in the world. The situation can be altered fundamentally only by adopting a new tech-nology for harvesting northern cod.
The Task Force has placed what might appear to be unusually high priority on the development of a fleet of large longliners. This priority follows directly from our first two objectives. The longliner appears to be the only existing technology that is capa-ble of simultaneously improving the economic viability of the industry — for exam-ple, by supplying top quality, large fish year round — and maintaining a relatively high level of employment and providing a good annual income for fishermen.

249
13. The Northern Fisheries
In coastal Labrador, the fishery is the main source of activity by which money is generated into the local economies both through fishermen's incomes and those employed in the collection, handling and processing of the fish. Since coastal Labrador does not have any oil, mineral or other major natural resource development, our sole economic dependency at present is the fishery. It therefore warrants every measure of protection to ensure the long-term viability of the coastal communities.
Torngat Fish Producers Co-operative Society Limited, in a brief to the Task Force.
The Problem
Background
The northern extremity of the Canadian commercial fishery is in an area where weather and ice conditions, together with the migratory patterns of the various fish species, combine to produce a very short fishing season and high variability from year to year in fishing success. In northern Labrador, sea ice often persists until June; local freezing and bad weather prevent small boat operations as early as October.
The policy issue is to find measures to deal with chronic under-development and inst-ability of the fisheries economy in the northern part of the Canadian Atlantic region, defined roughly as the area north of 50° latitude and including the Great Northern Peninsula of Newfoundland, Labrador and the lower Quebec north shore of the Gulf.
In the area comprising the coast of Labrador and the Great Northern Peninsula of Newfoundland north of 50°, a population of roughly 24,400 people is scattered in some 69 coastal communities, many without road connections to each other or to the outside. The largest communities are St. Anthony and Port au Choix, on the east and west coasts respectively of the Great Northern Peninsula of Newfoundland, and Cartwright in Labrador. The most northerly communities (Nain, Hopedale, Mak-kovik, Davis Inlet) are populated mainly by native peoples. There are 46 fish plants (the majority very small) in 36 communities in the area providing processing employment to 2600 people and buying fish from about 3100 full-time and 2600 part-time fishermen.
The resource base along the shore consists of cod (June to September), salmon (July to August), seals (autumn and winter) and arctic char in northern Labrador. The shore-based fishery is carried on from small open boats. Offshore, and in the north-ern Gulf, the resource base also includes shrimp, redfish and turbot. With the excep-tion of Port au Choix, the resources fished offshore are delivered to more southerly areas and, in the case of Gulf shrimp, to Gaspe and northeastern New Brunswick. Off Labrador and northeastern Newfoundland, the northern cod stock is regenerat-ing rapidly and can provide a total catch of at least 380,000 t in 1987 (230,000 t in 1982). The Labrador shrimp fishery is likely to continue to develop as a freezer/fac-tory trawler fishery of 10 to 12 vessels with deliveries of frozen-at-sea product direct to refrigerated vessels for export.
The following data give the quantity and landed value of 1981 catches of groundfish (inshore), pelagics (including salmon) and shellfish (including offshore shrimp) off that part of the Great Northern Peninsula north of 50° and off Labrador:
250
Task Force on Atlantic Fisheries
Quantity (000 t) Landed value ($000)
Groundfish 48.3 16,900 Pelagics 6.4 4,400 Shellfish 9.6 10,800
Total 64.3 32,100
The importance of the fishery to the area is seen from the following data for 1981:
Landed value of inshore fish $32.1 million UI to fishermen $11.6 million Estimated plant worker payroll $ 7.8 million UI to plant workers $ 7.2 million
Total $65.7 million
These data compare with total income reported to Revenue Canada for income tax purposes in 1981 of $113.6 million.
The distribution of the population in the region is the given below. As can be seen, most of the communities have populations in the 100 to 300 range:
Population range No. of communities
fewer than 100 18 100 to 299 33 300 to 499 13 500 to 999 11 1000 to 2999 3 greater than 3000 1
Total 69
One indication of the area's under-development is the fact that only 33 of these com-munities have community water supplies.
In coastal Labrador, there are a number of small processing operations built with provincial funds and a number of private buying stations. All government facilities are leased to various private or community enterprises. Those that run on a commu-nity basis tend to break even, while the remainder lose money on annual operations; the losses are picked up by the provincial government. Two of the three large plants in northern Newfoundland (St. Anthony and Englee) would not have operated in 1982 without federal government assistance.
The lower north shore of Quebec has few processing operations. Fishermen produce salted cod in their own primitive premises (as they do in southern Labrador) and sell it to the Canadian Salt Fish Corporation, which takes it by boat to plants on the Great Northern Peninsula for further processing.
Catch data for the Quebec inshore fishery off the lower north shore (NAFO Area 4S) for 1981 is given below:
Quantity (000 t) Landed value ($000)
Groundfish 28.9 11,193
Pelagics 1.2 723 Shellfish 4.0 4,373
Total 34.1 16,289
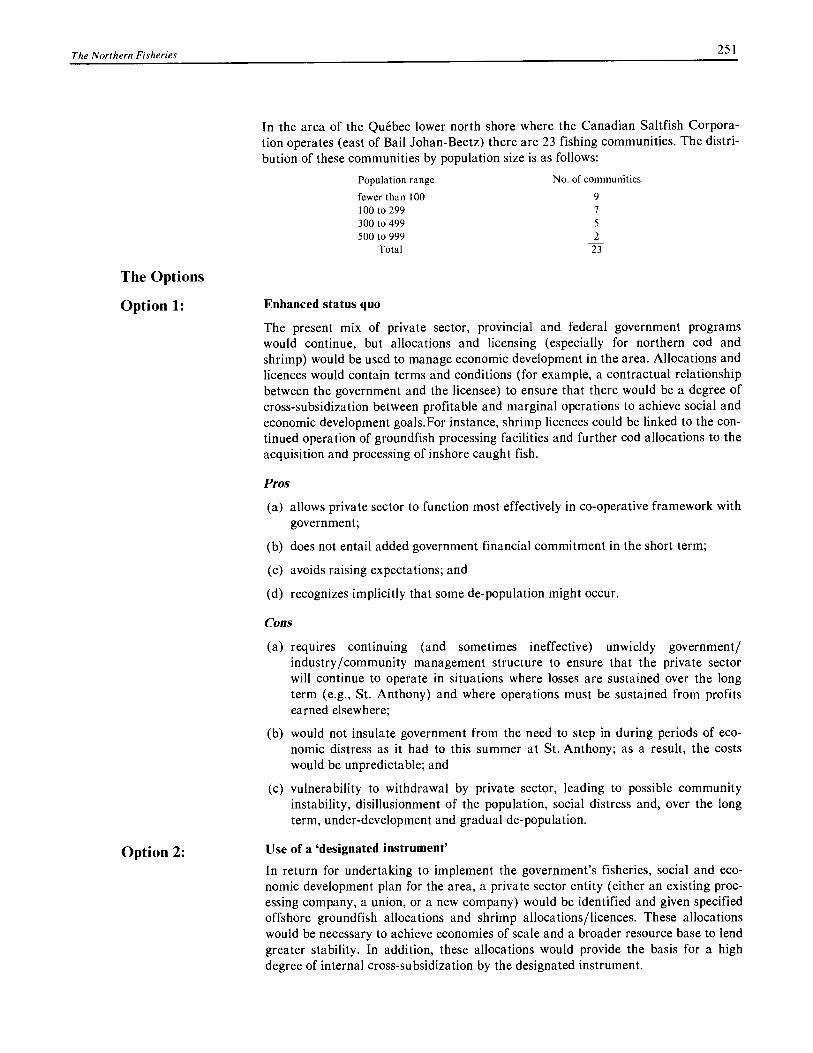
The Northern Fisheries 251
In the area of the Quebec lower north shore where the Canadian Saltfish Corpora- tion operates (east of Bail Johan-Beetz) there are 23 fishing communities. The distri- bution of these communities by population size is as follows:
Population range No. of communities
fewer than 100 9 100 to 299 7 300 to 499 5 500 to 999 2
Total 23
The Options
Option 1: Enhanced status quo
The present mix of private sector, provincial and federal government programs would continue, but allocations and licensing (especially for northern cod and shrimp) would be used to manage economic development in the area. Allocations and licences would contain terms and conditions (for example, a contractual relationship between the government and the licensee) to ensure that there would be a degree of cross-subsidization between profitable and marginal operations to achieve social and economic development goals.For instance, shrimp licences could be linked to the con-tinued operation of groundfish processing facilities and further cod allocations to the acquisition and processing of inshore caught fish.
Pros
(a) allows private sector to function most effectively in co-operative framework with government;
(b) does not entail added government financial commitment in the short term;
(c) avoids raising expectations; and
(d) recognizes implicitly that some de-population might occur.
Cons
(a) requires continuing (and sometimes ineffective) unwieldy government/ industry/community management structure to ensure that the private sector will continue to operate in situations where losses are sustained over the long term (e.g., St. Anthony) and where operations must be sustained from profits earned elsewhere;
(b) would not insulate government from the need to step in during periods of eco-nomic distress as it had to this summer at St. Anthony; as a result, the costs would be unpredictable; and
(c) vulnerability to withdrawal by private sector, leading to possible community instability, disillusionment of the population, social distress and, over the long term, under-development and gradual de-population.
Use of a 'designated instrument'
In return for undertaking to implement the government's fisheries, social and eco-nomic development plan for the area, a private sector entity (either an existing proc-essing company, a union, or a new company) would be identified and given specified offshore groundfish allocations and shrimp allocations/licences. These allocations would be necessary to achieve economies of scale and a broader resource base to lend greater stability. In addition, these allocations would provide the basis for a high degree of internal cross-subsidization by the designated instrument.
Option 2:

252
Task Force on Atlantic Fisheries
Option 3:
Pros
(a) consolidation of government financial support in a single entity;
(b) vehicle for subsidization of communities for the longer term;
(c) keeps federal government at arm's length from local problems; and
(d) allows for selective rationalization and abandonment of chronically unprofitable operations.
Cons
(a) selection of the private sector agent would be fraught with political difficulties;
(b) difficult to develop an environment with appropriate incentives for productivity improvement and use of local labour for fisheries service activities; and
(c) requires a specific contractual arrangement with the private sector entity to ensure an orientation to social and community development; otherwise manage-ment is likely to come from outide, reside temporarily in the area, and have no ongoing commitment to the community and fewer local imperatives for commu-nity development than are desirable.
As an alternative to a private sector designated instrument, an existing Crown agency, such as the Canadian Saltfish Corporation (csc), could be considered. The use of the csc as the government's designated agent for fisheries development in this area would require an amendment to the Saltfish Act to allow the Corporation to buy, process and market fish and fish products other than saltfish. Such operations would also be restricted to the area under discussion.
The designation of the csc as the entity responsible for being government's agent for development in the area would counteract the 'cons' described above.
A fisheries Crown corporation
Such a Crown corporation, set up with parallel federal and provincial legislation, along the lines of the Canadian Saltfish Corporation, would have exclusive buying rights in the area. It would be given allocations/licences for northern cod and shrimp which it could exploit as appropriate to generate revenues for social and economic development. It would operate, directly or through agents, all fish plants in the area. The agents could be existing private entreprises, including co-operatives, or be com-munity-owned. The extent of the corporation's social and economic goals, as well as its area of mandate, would be clearly spelled out in legislation.
Pros
(a) provides a public vehicle for capturing and reinvesting resource rents (economic surpluses) and for generating jobs and improved incomes;
(b) provides the potential to sustain local fisheries economic development programs, including the creation of jobs in the fisheries service sector; and
(c) major federal visibility.
Cons
(a) there could be pressure to expand the boundaries of jurisdiction of the corpora-tion to other parts of the Atlantic region and to create additional corporations for other under-developed areas;

The Northern Fisheries 253
(b) creates permanent dependence in the area on government;
(c) difficult to limit the financial risk borne by the government; and
(d) the private sector would perceive unfair competition and a conflict of interest in that the government, as regulator and allocator of resources, would be at the same time the beneficiary of resource rents or a direct operator in the business. This might make it more difficult to raise new private capital elsewhere in the industry. These perceptions could be mitigated by the creation of the quasi-judi-cial Atlantic Fisheries Licence Review Board proposed in Chapter 10.
Option 4: A fisheries -related northern development corporation
Such a corporation, modelled after the Cape Breton Development Corporation, would have a broad mandate to promote economic development in Labrador and the Great Northern Penninsula of Newfoundland north of 50°. It would be established jointly by the federal government and the province of Newfoundland and Labrador, and would have two interconnected areas of responsibility: policy and program co-ordination of existing federal (DEO, DRIE, CEIC and DINA) and provincial economic development initiatives in the area; and an operating mandate to manage specific allocations/licences of northern cod and shrimp and to engage in business activities in support of the economic development of the area, including, but not necessarily restricted to, the fishing industry. These business activities would include the mar-keting of fisheries products produced by co-operatives and other businesses wishing a marketing partner; the provision of investment and working capital loans at competi-tive rates; the running of fish plants in the absence of any viable corporate or com-munity operator; and the operation of fish collection and transportation facilities.
Pros
(a) provides a stable institution for planning social and economic development in the area and for ensuring local involvement and management;
(b) provides maximum flexibility to capture and reinvest the resource rents that can be expected from harvesting the shrimp and a portion of the northern cod adja-cent to the area for the benefit of the area; and
(c) provides the best vehicle for co-ordinating the operations of the fisheries economy of the area through the most appropriate mix of corporate, co-opera-tive and community ownership.
Cons
(a) there would be pressure to expand the area of mandate and to create additional similar corporations for other under-developed areas;
(b) creates a focal point for existing and continuing political pressure from within the area;
(c) creates permanent dependence in the area on government; and
(d) difficult to limit the financial risk borne by the government.
Recommendations 14. The governments of Canada, Quebec and Newfoundland and Labrador should recognize the need for co-ordinated economic and social development initiatives in this area and should explore ways of jointly improving the socio-economic condition of the area. Federal co-ordinating responsibility would come under the purview of the Ministry of State for Economic and Regional Development.

254
Task Force on Atlantic Fisheries
15. Amend the Saltfish Act to allow the Canadian Saltfish Corporation to buy, pro-cess and market fish and fish products in addition to saltfish in that part of the Great Northern Peninsula of Newfoundland north of 50° and in Labrador and the Quebec north shore of the Gulf. In particular, the Canadian Saltfish Corpo-ration might purchase and operate the plants such as the one it operated in the summer of 1982 at St. Anthony, though it would not have any monopoly on the purchase, processing or marketing of uncured fish in this area.
Comment The whole area of the Quebec lower north shore, the Great Northern Peninsula north of 50°, and Labrador is characterized by (1) low capital investment; (2) an untrained work force; (3) unstable local economies; (4) the transport out of the area of raw and semi-processed fish; (5) high transportation costs; (6) inadequate basic infrastructure (e.g., 3-phase power is not available in coastal Labrador); and (7) chronic dependence on government subsidies.
This area is one of four or five in the country that can truly be described as grossly under-developed; hence recommendation 14. If it is ever to emerge from the depen-dency trap, it will be only through government programs that generate jobs related to the exploitation of local resources. The only economic resource base in the area is the fishery. It holds job potential not only in fishing and fish processing, but also in boat repair, gear construction, and other service activities.
The key to economic development in the area is to ensure that the fishery is organ-ized for the benefit of local participants, and that cross-subsidization takes place internal to the local area. Thus, for example, profits from shrimp allocations might be used to cross-subsidize losses on groundfish plants, or revenues from possible over-the-side sales could be channelled into investments in shore processing facilities and infrastructure.
The problems could be addressed by one of three general approaches:
1. build on the present mix of private and public sector involvement;
2. foster the creation of a 'designated instrument' to push economic development in the area; or
3. create a Crown corporation as a development agency to use the fishery as the major element of an integrated plan to build a more viable economy in the area.
The Task Force favours the use of the Canadian Saltfish Corporation (csc) as the `designated instrument' for fisheries, economic, social and community development in the northern area of Newfoundland and Quebec. However, we do not recommend that it be given a monopoly over fish processing or marketing in this area.
The vulnerability of the area to outside decisions not in the best interests of the area became clear this spring with the closure of the plant in St. Anthony — a problem that was resolved only by federal government intervention to re-open the plant. This experience showed how well plants can be operated if all concerned appreciate that they are working for themselves and their community rather than for the benefit of a distant head office.
For example, at St. Anthony the quality of landings and production has been improved to the point where 80 per cent of output is in fillet packs, as compared with 50 per cent going into fillets last year. This was due to a number of factors, including improved management at the plant, excellent co-operation between union leaders and plant management, the use of quality buying practices and, most important, a
The Northern Fisheries 255
significant increase in productivity by plant workers. The result is that a plant that operated at a considerable loss in 1981 will come close to breaking even on opera-tions this year.
The close link between the management of St. Anthony Fisheries and the csc that existed this year should be strengthened and expanded by modifying the mandate of the Corporation in this area. By using the Corporation as a way of realizing, through agency arrangements, the potential for community ownership, the fishery resources adjacent to the area can be the basis for moving the area out of a dependency trap and onto a path of modest economic growth.
We favour a change in the mandate of the csc over the option of a more broadly based development corporation because the Saltfish Corporation is already operating in the area and because a new agency would take time to set up. Moreover, a new agency would create another level of bureaucracy that would have to co-ordinate (or be co-ordinated by) a multitude of federal and provincial agencies. We believe it would be preferable to use the present fisheries Crown corporation, with its existing expertise and presence in the area, to act as the agent for change, with its activities, and those of other federal and provincial agencies, co-ordinated by existing mechanisms.
We reject the view that the change in the mandate of the Canadian Saltfish Corpo-ration would result in its special role eventually creeping into other areas. Its role would be defined in legislation, and any expansion of the geographic area to which its enlarged mandate would apply would require amendments to that legislation.


257
14. Quality
There is no doubt that stronger measures have to be taken to improve the quality of our fish if we are to become more competitive in the markets and if we are to expect fish prices to improve.
Maritime Fishermen's Union, in a brief to the Task Force.
The Problem
Background
The quality of Atlantic Canadian groundfish and herring products has the reputation of being on average inferior and inconsistent compared with the products of Canada's principal competitors. In order to broaden Canada's market base — so as to avoid over-supplying existing markets for Canadian fish as production grows and thus only depress prices — a significant increase in the percentage of first quality product is essential. In addition, better quality raw material will significantly reduce direct operating costs in plants.
The policy issue is whether quality improvement is best achieved by government regulation and/or incentives or best left to individual processors and fishermen to achieve in a purely voluntary way.
Information given to the Task Force by one of the largest U.S. buyers illustrates the nature and scope of the quality problem. Over a recent 10-month period, this buyer rejected almost 25 per cent (by volume) of shipments of Canadian groundfish blocks. The reasons for rejection, and the percentage of shipments, were as follows:
Reason Per cent Presence of bones/fins 39 Off-odour 28 Bacteria 13 Parasites 7 Other 13
100
By comparison, the buyer rejected only 10 per cent of the blocks arriving from from Europe and none of those from Korea.
These data indicate that the quality problem is extensive and that it originates in both the raw material coming into the plant and in-plant workmanship and quality control. For example, the presence of bones and fins results from poor workmanship or from having to handle soft fish. Off-odour problems stem clearly from a failure of in-plant quality control between the holding room and the point where the blocks are packed.
Data gathered by the Department of Fisheries and Oceans in field testing of 'Icelan-dic-type' final product grade standards also shows the extent of the quality problem. While 27 per cent of groundfish samples were graded 'A', inconsistency between samples of the same lot led to only 15 per cent of the lots being graded 'A'. A further 10 per cent of the lots would have been rejected. There was also a high degree of variability between plants, which had overall grade 'A' sample percentages ranging from over 70 per cent to nil. There was no apparent difference in performance between plants handling inshore-caught fish and those dependent on trawlers.

258
Task Force on Atlantic Fisheries
The Task Force estimates that annual losses in gross groundfish market revenues of between $25 and $50 million are attributable to quality problems (including losses at the processor level due to waste), sub-optimal product mixes, and lower prices than those received by competitors, because buyers hedge against inconsistent quality. Similarly, processing costs could be lowered and waste reduced if the quality of raw material entering plants were improved.
Many have concluded that the economic recovery of the industry depends on a sig-nificant up-grading of fish quality — from the raw material to the finished product. Others are sceptical. They point to the fact that the alleged commercial advantages of improved quality have not filtered back to plants and fishermen in the form of price incentives. This could indicate that the net return to individual operators may not be sufficient to justify the additional effort and expense they would have to put into producing higher quality.
Some of these expenses are related to the trade-off between achieving higher throughput rates in plants or catch rates on vessels and the extra care in handling and workmanship needed to produce top quality, which will usually reduce those rates. Quality control and investment in new techniques (such as boxing and icing the fish on trawlers) impose additional costs in time and money.
In the short run at least, the cost of achieving much higher quality may appear to exceed the benefits. Moreover, the existing infrastructure of plants and vessels, com-bined with the heavy summer cod catches in many areas, puts constraints on rapid quality improvement, regardless of commitment to that goal.
In the medium to longer term, market forecasts indicate that the growth in ground-fish demand will be concentrated in premium products and fresh fish. Recognition of this development, together with the losses experienced in selling lower quality cod products, has already produced a significant change in practices and attitudes toward quality in the industry.
There are several interacting factors to consider in coming to grips with the quality problem. For instance, plant workmanship is related not only to worker skill (partly a function of seasonality) but also to the quality of the raw material delivered. It is difficult to cut a good fillet from a small, soft fish (the kind that is often caught in the warmer water of the peak summer season).
Inconsistency originates during transportation to the plant and while product is being held in the plant; fish of varying quality are mixed together, and it is expensive and difficult to separate them. These are areas where quality-conscious plant manage-ment can pay high dividends. Unfortunately, this problem is greatly complicated by the existence of a multitude of small fish-buying stations, making effective separa-tion of the catch by quality difficult, particularly at times of peak landings.
One of the most perplexing phenomena in the fishery is that the apparent market preference for high-quality fish fails to be transmitted effectively to fishermen in the form of appropriate price incentives. This systemic problem arises in large part from the volume orientation of processors. The under-utilization of processing capacity in many areas leads to intense competition for raw material between buyers, generating additional fixed overhead expenses.
Competition between buyers usually takes the form of attempts to assure the security of raw material supplies. Buyers compete by providing services to fishermen or by buying irrespective of quality by paying top quality prices for inferior quality fish. Buyers, acting individually, fail to exercise adequate discipline at dockside for fear of losing fishermen to their competitors.
Quality 259
Another factor that frustrates quality improvement is seasonality, which leads to short periods of extremely heavy supply (in the warmest weather) that neither boats nor plants are well-equipped to handle properly.
All provincial governments support measures to improve quality and have indicated a willingness to co-operate with DFO, especially in the area of improving the quality of landed fish. The province of Quebec has gone farthest, implementing a series of pilot projects on dockside grading.
The Task Force is also concerned about infrastructure support programs, including small craft harbours, inshore fish-handling facilities and, particularly, ice-supply programs. A detailed infrastructure development plan, on a community by commu-nity basis, is required if the greatest benefits are to be generated from limited federal funds.
The Options Four approaches can be applied, alone or in combination, to the quality problem: direct regulation; indirect intervention; restructuring; or incentives/subsidies.
1. Direct regulation requires measures with direct influence industry operations, such as the following:
• increased mesh sizes to allow for the capture only of larger fish;
• explicit limits to prevent the landing of smaller fish (these are part of Iceland's management program);
• mandatory on-board bleeding, gutting, washing and icing of fish (this might require some exceptions, such as in certain winter inshore fisheries where it is precluded by extreme cold and is not necessary in any event); and
• banning of fish forks and other abusive technology (as recommended by the 1928 Royal Commission on the Maritime and Quebec Fisheries).
2. Indirect intervention would rely on incentives and feedback mechanisms to stimulate improved quality such as the following:
• dockside grading to provide a framework for quality incentives in port market transactions and to give processors a measure of plant-entry quality control; and
• final product grading to generate quality awareness among processors, to pro-vide a quality control feedback mechanism for production and to improve the image and marketability of Canadian products.
3. An approach to quality enhancement that relied on fundamental restructuring might include such measures as the following:
• restructuring of the port markets to overcome the volume-oriented competi-tion between processors through the negotiation or imposition of price incen-tives for quality (see Chapter 15).
4. Incentives and subsidies to stimulate quality enhancement could include meas-ures such as the following:
• price subsidies for premium quality landed fish as an incentive for fishermen to handle their catches properly;
• vessel conversion subsidies to finance the up-grading of vessels to catch, handle and hold fish properly;

260 Task Force on Atlantic Fisheries
• infrastructure subsidies to provide adequate ice-making and unloading facili-ties; and
• modifications to the unemployment insurance program, such as basing ben-efits only on landings of the top grades of fish or giving incentives to catch in the off-peak season where possible.
Three options, in addition to those considered elsewhere in this Report, emerge as the most important. They are not mutually exclusive.
Option 1: Mandatory bleeding, gutting, washing and icing at sea
This would involve federal regulations requiring (with some exceptions, such as in certain winter fisheries) that all fish caught be bled, gutted, washed and iced at sea. Alternatively, or in addition, provincial regulations could be enacted prohibiting the dockside purchase of fish unless treated as above.
Pros
(a) should immediately improve the quality of landed fish.
Cons
(a) removes the need for buyers to pay quality price incentives;
(b) difficult to enforce at sea;
(c) could be costly for some vessels (though this could be addressed through boat conversion incentives) and would require exemptions in some fisheries such as inshore winter fisheries; and
(d) interpreted by many fishermen as fighting the quality problem on their backs alone.
Option 2: Dockside grading
This would involve grading of landed fish by government-certified industry buyers, with government inspectors acting only in an arbitration capacity and to spot-moni-tor the performance of industry graders. Grades would incorporate not only the physical characteristics of the fish (smell, texture), but also the method by which the fish were handled at sea.
Pros
(a) provides a common standard against which fishermen could negotiate and buy-ers would pay price differentials, based on objective quality criteria;
(b) could lead to improved product consistency if fish were sorted by grade at dock-side; and
(c) would provide plant management with a means to instill buying discipline.
Cons
(a) does not guarantee price differentials based on quality, as buyers could still pay A-level prices for B-graded fish.
Option 3: Final product grading
This would involve grading all products as they leave the plant gate. Grading would be the responsibility of certified company graders, subject to government checks. Failure to grade properly would result in fines or the loss of plant certification.

Quality 261
The concept of final product grading raises a number of fundamental marketing issues that require considerable elaboration. The essential question from a marketing perspective is whether final product grading will result in higher net market returns.
Buyers in certain market segments are willing to pay more for the confidence that graded products instil. At the trade level, this includes large retailers who want con-sistency and do not want to spend large amounts on testing for quality. At the final product level, it is cautious consumers. These market segments are relatively small, but they are growing; they constitute the market for fresh and high quality frozen fil-lets identified earlier. But the potential for grading or branding fresh fish appears to be limited.
Canada dominates the price-sensitive, value-for-money market. There have been no studies showing significant segmentation within this market that have identified use-ful grade standards that might increase the size of the total market or Canada's share of that market, or might allow an increase in prices.
Over 80 per cent of Atlantic groundfish products are sold by the four biggest compa-nies. Eleven firms sell over 95 per cent of the products. All these firms have brand names for both their premium and standard packs. Each brand has little effect on other Canadian brands, especially in United States and Canada. U.S. buyers who purchase from Canadian suppliers know the processors and their products and know the relative quality they get from each supplier. These buyers do not require final product grading on which to base purchasing decisions.
The major market growth that is foreseen will occur in high-quality products. Canadian grading will not affect this market, because buyers have their own specifi-cations and inspection systems.
It is clear to processors that most of the value-for-money market segments are stable or shrinking. But the growth in the quality products market is also evident to them, and they know that to get into this market they will have to improve their ability to meet customer specifications. Some processors may not know how to improve quality, but this is a management problem, not a marketing problem that can be addressed with final product grades. Moreover, for some processors, improving quality may not be a viable investment.
However, a comprehensive system that linked final product grades and dockside grading would be helpful if it were facilitated by the use of dockside incentives to reward quality harvesting and by improved in-plant handling practices. In the fore-seeable future, the focus should be on improving fishermen's and processors' ability to meet a particular buyer's standards, segmenting the quality market and keeping costs down. The major benefit of product grading is to refine the signals coming from the final market to processors and fishermen by means of quality price incen-tives at the dock. The design and management of final product grades should be heavily influenced by those responsible for marketing.
Whether the grades should actually be marked on product containers (as opposed to using codes) is, like the grade standards themselves, a critical issue related to market strategy. There are essentially two types of buyers. One is the sophisticated buyer who purchases Canadian products for further processing or who operates a large fast-food chain, and who has his own specifications and testing procedures. The other type is the less sophisticated buyer — the retail consumer or the single restaurant operator; it is for this buyer that final product grading is more useful because it imparts information and provides some assurance of consistency. This being the case, we would not see placing grade labels on all products, but only on specific products to further the objectives of our marketing strategy.
262
Task Force on Atlantic Fisheries
Alternatively, grade standards could be adopted to match customer specifications or to correspond to private brand label specifications. The important point is that final product grading be seen as a tool of marketing strategy.
To summarize the discussion, the advantages and disadvantages of final product grading are as follows:
Pros
(a) could increase consumption of Canadian fish in certain market segments if properly designed and handled;
(b) would provide feedback to plants on the quality of product being produced;
(c) would ensure consistency of product by grade;
(d) would provide the basis for a generic advertising campaign for Canadian fish and fish products (see Chapter 17); and
(e) would make dockside grading more acceptable to fishermen.
Cons
(a) a significant proportion of production is already produced to customer specifica-tions;
(b) introducing government grading will not affect those products that already exceed the standards. For those that fall below 'Grade A' a market prejudice, resulting in lower prices, may develop. This requires a sensitivity to market requirements in setting grades;
(c) increased costs for processors who do not already have adequate in-plant quality control and monitoring programs; and
(d) implementation of final product grading without simultaneous regulation of handling practices at sea (e.g., bleeding, gutting and icing) will be opposed by the majority of processors.
In addition to the foregoing options, measures to increase the size of landed fish, through either increased mesh sizes or the use of more selective gear such as long-lines rather than gillnets or traps, could be introduced. We favour this approach over setting minimum size limits for fish retained, because the latter approach could lead to a high degree of waste; under-sized fish will suffer significant mortality rates if they are dumped after capture.
Recommendations 16. Implement, after a one-year trial period, dockside grading and final product grading concurrently, with the latter, including the determination of grades and labelling, being used as a tool of marketing strategy.
17. Implement at the federal level, and with some practical exceptions, mandatory bleeding, gutting, icing and washing of groundfish at sea, with simultaneous and matching provincial legislation applied at the point of dockside sale.
18. Prepare a detailed infrastructure development plan on a community by commu-nity basis to support quality enhancement. There should be special emphasis on the provision of adequate ice-making facilities.
19. Incorporate quality considerations in the proposed production bonus program for fishermen (see Recommendation 40, Chapter 18).
Quality 263
20. Prepare a detailed quality awareness and education program to ensure that within three years all participants in the industry are exposed to formal training in the principles, benefits and methods of treating fish as food.
21. Enforce universally the 130 mm otter trawler mesh size limit, and encourage the use of hook and line gear rather than gillnets and traps.
There is compelling evidence that the quality of Canadian groundfish and herring products is inconsistent and of significantly lower average standard than the quality of our Scandinavian competitors' products. There are important exceptions to this general conclusion. Some Canadian product is equal to the world's best.
Quality is not an end in itself. It is a means to higher net market returns from the resource. Unfortunately, failure to improve quality will result in the increasing Canadian supplies being sold into existing market niches for our products. This would, at least in the short run, tend to depress prices for Canadian products, as these markets would require price reductions if they were to expand.
The Task Force is therefore convinced that improved quality is a sine qua non for the economic viability of the industry. On the other hand, quality improvement cannot be imposed heavy-handedly on the industry — rather, the industry has to be con-vinced that quality pays and that the benefits and costs of quality are shared fairly between fishermen and processors.
Achieving higher quality is largely a matter of reforming practices in all sectors of the industry. This requires significant attitudinal changes. From the very beginning of the industry in Canada, fish products have often been considered more as com-modities to be produced than as goods to be consumed — as a source of livelihood and not as a delicate and perishable food on a distant table. This attitude has plagued the industry for generations. It may even have been appropriate when costs were lower, when fish was cheap compared with meat and poultry, and when con-sumers either could not afford alternatives or were less discriminating. But a greater understanding of consumer wants is essential if quality is to be improved — and this is a change that is required of both fishermen and processors.
Dockside Results of a pilot project conducted by DFO in 1981, and preliminary results of an
grading expanded series of projects conducted this season, have demonstrated to our satisfac- tion that quality can pay. Dockside grading, with subsidized price incentives for pre-mium quality landed fish, has resulted in better quality landed fish, less processing waste, increased yields, and lower production costs. These results indicate that processors can pay quality premiums and still increase profits as a result of increased yields and higher labour productivity. Once these results are examined by the indus-try, we are confident that the demonstration effect can lead to improved quality throughout the industry.
The precondition for improved landed quality is, however, the implementation of dockside grading as the basis for dockside pricing that incorporates significant differ-entials based on quality. Dockside grading does not, by itself, change the way the port market operates; it simply provides information, based on accepted uniform standards, on the quality of fish landed. Thus, to be effective, dockside grading will require that processors exercise buying discipline — until now, a factor sadly lacking throughout the industry. The value of dockside grading will vanish if buyers bid away the quality price differentials by paying high quality prices for low quality landed fish.
As with other subjects the Task Force studied, several myths abound. Two are that trap-caught fish are of intrinsically inferior quality and that trawler-caught fish are of superior quality. In fact, the opposite can be the case; trap-caught fish, if bled,
Comment
264 Task Force on Atlantic Fisheries
gutted, washed and iced soon after being caught, can produce superior quality prod-uct — and bleeding and gutting on trap boats has been shown to be feasible, con-trary to popular belief. On the other hand, fish caught by wetfish trawlers, even if bled, gutted, boxed and iced properly, still deteriorates on long trips, and the first day's catch of a 15-day trip cannot be expected to yield much better than standard quality block.
Proper On the question of on-board bleeding and gutting, some would argue that this is not handling necessary if the fish are landed within a few hours of being caught, as is the case
with many inshore fisheries. The fact is that to produce prime quality product, fish should be bled while still alive, then gutted to remove stomach contents which can deteriorate the flesh quite rapidly due to biochemical reactions. If a fish is bled and then processed within hours of capture, gutting might not be necessary, but gutting does preserve the 'holding life' of the fish, a factor that is extremely important when fish are being landed in any quantity.
It is also extremely important to put fish on ice as soon as possible after it is caught, as this retards the process of rigor mortis. If the fish is not iced very quickly and kept chilled, rigor mortis sets in rapidly and the speed of this change, which is highly sen-sitive to the temperature at which the fish is kept, adversely affects the quality of the product that can be produced. The higher the temperature, the faster rigor mortis occurs, and when the fish pass too rapidly through rigor mortis, the fillets cut from them are typically soft and gaping.
Whether bleeding, gutting and icing of fish at sea should be made mandatory was one of the most difficult issues faced by the Task Force. On one hand, we are con-vinced that such practices should benefit both fishermen, through price premiums, and processors, through lower processing costs and improved market returns. But we are hesitant to recommend what really amounts to imposing sound business practices by regulation.
Nevertheless, our analysis of the port market, showing the tendency for processors to compete among themselves for security of supply and volume, rather than for qual-ity, indicates that present port market structures do not provide for adequate quality price premiums and buying discipline among processors. Positive steps are thus needed to improve the quality of landed fish. As a result, we are drawn reluctantly to the conclusion that bleeding, gutting, washing and icing at sea should be imposed by regulation, preferably by both federal government regulations relating to activities at sea, and provincial government rules applying at the point of dockside sale. There would have be some exceptions, however, as in the case of certain winter fisheries, as well as for such species as flounder and redfish which are not normally gutted at sea in any fishery.
Mandatory bleeding, gutting and icing at sea is supported by the governments of Newfoundland and Labrador, Nova Scotia, New Brunswick and Quebec. It is hoped that these provinces will also co-operate in introducing matching legislation to pro-hibit the purchase of catches that have not been handled in accordance with federal regulations.
Mandatory bleeding, gutting and icing at sea will, of course, reduce the incentives for processors to pay quality price premiums. This will require careful monitoring and, if necessary, the use of moral suasion and publicity to induce processors to adopt quality-based pricing practices. Where prices are bargained collectively, qual-ity-based price differentials can be negotiated.
Quality 265
Product grading
With respect to final product grading, the Task Force sees this as a logical extension of in-plant quality control. Indeed, as most processors claim to be packing to cus-tomer standards already, final product grading should not impose any significant additional costs. We feel that the advantages of final product grading outweigh the disadvantages by fostering quality consciousness, buying discipline and the market-ing benefits associated with brand identification and attachment. It is essential, how-ever, that final product grading, including the labelling of the grades, be developed in the context of a marketing strategy. Product grading will be of benefit to our cus-tomers if it is designed with sensitivity to their requirements. The concern expressed to us by some processors that final product grade labelling will enable buyers to force down the price of second-grade products is unconvincing. Ultimately, the price paid will depend on the supply and demand for products of any particular type and qual-ity. Intelligent grading merely facilitates the determination of quality by the pur-chaser. Without grading and labelling, the buyer eventually makes a determination of quality, although this may be after testing or in light of experience. From the buyer's viewpoint, the information and confidence provided by a grade label — or by a brand name — is worth something. Certainly, grade labelling, properly applied, could not diminish the value of Canadian fish products.
The cost of improving quality, in terms of effort and dollars, must be borne by every-one in the industry, not just fishermen. Enforcement of dockside and final product grading will be critical. For these programs to succeed, enforcement must be tough but fair. The regime for dockside grading and its enforcement must be worked out in conjunction with the provinces, all of which have indicated willingness to co-operate in developing the dockside grading approach.
To enforce final product grading, we favour a system of exporter licensing tied to the ability to do the grading (see Chapter 17). Should a plant not perform final product grading up to prescribed standards, its licence would be subject to suspension, in which case the plant could continue to process fish, but its products would have to be graded by another licensed company. Alternative enforcement mechanisms would be fines, which would have to be substantial if they were not to become simply a cost to the processor of regular non-compliance, or suspending a plant's operating certifi-cate, a penalty that fisheries authorities might be reluctant to impose, given the jobs at stake. This is why we chose the licensing of exporters as the preferred enforcement mechanism.
Our other recommendations with regard to quality, particularly those relating to infrastructure development and a quality awareness and education program, are meant to re-orient the industry away from volume considerations and move it toward greater emphasis on quality, particularly with regard to on-board and dockside han-dling. The proposed 'production bonus' (see Chapter 18) would be payable only for fish landed in top quality condition, according to the dockside grade standards.


267
15. The Port Market
. the price offish is central to all planning related to the fishing industry.
Newfoundland Fishermen, Food and Allied Workers Union, in a brief to the Task Force.
The Problem
Background
The port market is where the fisherman, as a seller of landed fish, meets the proces-sor, as a buyer of raw material. For the purposes of this chapter, the port market includes only the direct sales of fish by independent fishermen to processors, and not the exchanges that take place through over-the-side sales to foreign vessels or within co-operatives or vertically integrated processing companies. The latter transfers, however, have a significant influence on the interaction between the processing and harvesting sectors at the port market and may influence the quantities involved in dockside transactions.
The port market can be described as not being 'orderly'. Its structure, the behaviour of buyers and sellers, and the seasonality and common property nature of the resource inhibit the establishment of appropriate quality-based price differentials at dockside and the timely delivery of the optimum quantity and quality of fish.
The policy issue is whether new structures are required to make the port market more orderly, so as to generate better incomes for fishermen and greater net returns, through improved quality of raw material, to processors.
It should be noted that port market transactions fall under provincial jurisdiction, and any reform in this area would require the co-operation of the provinces.
The port market is the term used to refer to the roughly 1200 landing sites through-out Atlantic Canada where transactions to buy and sell fish take place between some 300 processing companies and about 20,000 active fishing enterprises under a wide range of competitive and market structure circumstances.
Factors affecting the performance of the port market in establishing prices and the quantity and quality of landed fish exchanged on a daily basis include the following:
1. Fish perishability reduces the fisherman's bargaining power because he does not have the time to 'shop around' for better prices and cannot hold his catch until prices go up;
2. Volume orientation of processors: As noted in Chapter 14, competition between processors usually takes the form of attempts to assure a steady supply of raw material from fishermen by providing services to fishermen or by buying irre-spective of quality. Another form of competition occurs when processors agree to buy low-margin fish (such as groundfish) in return for guaranteed deliveries of high-margin species (such as lobster). There is therefore little incentive in the port market for fishermen to land quality fish. In fact, the absence of buying dis-cipline among processors frequently means that they pay top-quality prices for second-quality raw material at the dockside.
3. Buying concentration: The four largest integrated companies account for about 40 per cent of groundfish landings through catches by company-owned trawlers and an additional 20 per cent through inshore purchases (that is, about 60 per cent of all groundfish landings, including about 33 per cent of all inshore pur-
268
Task Force on Atlantic Fisheries
chases). This concentration of buying power could explain why the volume orien-tation of processors is not affected by price competition among them, because the larger companies would assume a price leadership role, and the smaller com-panies would not have the resources to out-bid them. Moreover, at most inshore ports, there is only a single buyer, so that fishermen have no one else to sell to.
4. Fisherman-processor ties: Because few fishermen have alternative sources of investment and working capital, and because processors want to obtain security of supply, many fishermen obtain loans and advances from processors on the understanding that they will deliver their catch only to that processor. Processors who offer financing to fishermen may even go so far as to take an equity position in the fishing enterprise. This makes fishermen vulnerable to changes in the financial health of the processors to whom they are tied. Processors, on the other hand, are often unable to enforce their deals with fishermen and may be left with bad debts or without the hoped-for fish supply. These ties also tend to restrict competition in the port market and keep prices lower than they might otherwise be, although fishermen benefit in other ways.
5. Presence of part-timers: It is alleged that in some areas, part-time fishermen readily accept any price offered and, in glut situations, full-time fishermen lose the chance to sell their catch unless they agree to accept the lower price that part-timers are taking.
6. Collective bargaining: Only in Newfoundland does effective collective bargain-ing by inshore fishermen take place. Legislation has recently been passed in New Brunswick that would allow collective bargaining in that province. Collective bargaining is not specifically authorized in the other provinces. Collective bar-gaining does take place in Nova Scotia, as well as in Newfoundland, for trawler crews. Collective bargaining provides for a countervailing power in the port mar-ket in Newfoundland where remote port markets would otherwise be dominated by single buyers. Collective bargaining in Newfoundland also overcomes the dis-advantages to the full-time fishermen posed by buyer concentration and compe-tition from part-timers.
In addition to prices, the other important element influencing the performance of the port market is the daily or weekly pattern of deliveries. The port market structure does not provide for optimal levels of deliveries throughout the year. There are no incentives or other mechanisms to spread landings out beyond the peak of the season.
In fact, several forces tend to exaggerate seasonal peaks in deliveries. These forces include the unemployment insurance regulations, which base benefits entitlement on the last weeks fished (see Chapter 18), and the common property character of the fishery, which creates a race for the catch before the quota is exhausted. Indeed, as technology improves, this tendency will be aggravated, because quotas will be taken during a shorter period of time. However, divisible and tradeable enterprise quotas for larger vessels will mitigate this tendency, because each enterprise will know what its annual catch will be and can spread its effort over the year without having to worry about what others are catching.
For smaller vessels, mechanisms other than a regime of effort-related quota licences may be necessary to achieve a better pattern of landings. This is because such a sys-tem merely controls the overall fishing capability of the fleet and not each vessel's annual catch. These mechanisms would require agreement not only between fisher-men and processors, but among fishermen themselves, so that fishermen abiding by the rules would not have to worry about others gaining an unfair advantage by not
The Port Market 269
doing so. (The classic example of such an agreement is the layover program nego-tiated among fishermen's groups in the Pacific halibut fishery whereby there is an agreed time period between trips in order to spread out the season. Another example is the quarterly and trip-limit system in the scallop fishery, although the latter arrangements, worked out by fishermen, are imposed by regulation.)
The Options
Option 1: A port market authority
An agency would buy all fish delivered, paying prices according to quality grade, then sell the fish to processors. Price schedules would be determined either by negotiation between fishermen and processors or, failing agreement, by the port market authority. Such an authority would be analogous to provincial dairy commissions.
Pros
(a) would ensure that quality-based price differentials were maintained;
(b) would make fishermen less dependent on individual processors;
(c) would provide a means to implement enterprise allocations for even the small boat fleet, because all landings would be independently recorded; and
(d) could be used as a mechanism through which income stabilization support was provided to fishermen.
Cons
(a) would involve governments in day to day price-setting decisions;
(b) could require an entirely new means to distribute fish to processors in situations where daily landings cannot be sold to individual processors locally; and
(c) would involve a radical departure from current practices; it was apparent from our discussions with many groups that the system would not be acceptable at this time.
Option 2: Producer marketing boards
An agency would have the power to ensure that all fish are sold, by grade, at pre-scribed prices, with prices determined through negotiation with processors or, failing agreement, through binding arbitration. (The agency would be analogous to many non-supply management marketing boards in the agricultural sector, such as the Ontario Vegetable Marketing Board).
Pros
(a) ensures that quality-based price differentials are developed and maintained;
(b) legislation to create such agencies already exists in some provinces under agricultural marketing board statutes; and
(c) other benefits similar to the port marketing authority mentioned in Option 1.
Cons
(a) fishermen and processors unwilling to see key pricing decisions left to a third party arbitration process.
270 Task Force on Atlantic Fisheries
Option 3: Fish auctions
Daily fish auctions would be established using one or both of two approaches either an auction of fish actually landed at a market facility in designated ports or bidding by processors on the basis of catches reported by radio-telephone (`hails at sea').
An expert familiar with fish auctions elsewhere, Robert Blair, was commissioned by the province of Newfoundland in 1977 to study this option in the Newfoundland con-text. Blair's conclusion at that time was that such a system was not applicable to the Newfoundland situation, primarily because auctions work best when dealing with year-round supply for the fresh market and when the fish are landed at a central port for distribution to customers. Auctions would not work in the Newfoundland, where there were many landing sites with only a small number of buyers and some with just one. To require that landings be made at a smaller number of ports would be too dis-ruptive for the small boat fishery. Our review of Blair's analysis leads us to the con-clusion that the concept of fish auctions would still not be appropriate today, except perhaps in southwestern Nova Scotia.
Option 4: Extended collective bargaining
Collective bargaining for inshore fishermen would be extended to provinces where it is not already explicitly authorized.
Pros
(a) improves bargaining position of fishermen not only regarding prices, but also with respect to other terms and conditions of the fisherman's relationship with processors (seniority over part-time fishermen, contributions to welfare funds, etc.); and
(b) provides a framework for disciplined buying and selling by quality grade;
Cons
(a) prices negotiated collectively tend to be rigid and not responsive to changes in costs or final product markets within the contract period; and
(b) prices negotiated collectively tend to be uniform throughout the contract area, to the detriment of those fishermen who enjoy competitive advantages such as delivering direct to plants, or of plants that have the advantage of being close to transportation facilities to markets. By the same token, uniform prices tend to create higher costs for processors in remote areas operating under circumstances that may be marginal to begin with.
Option 5: A port market mediation commission
An agency would be established in each province to anticipate problems that might develop in the port markets, particularly glut situations and other problems associated with the seasonal flow of fish deliveries, and to seek solutions by mediat-ing negotiations between and among fishermen and processors.
For example, a port market mediation commission, in consultation with processors, fishermen's organizations and DFO, would determine whether the expected fishing effort and catch rates relative to the TAC in a particular fishery would mean that the quota would be taken earlier than usual; if so, it could seek agreement between the parties on some sort of layover program or daily quota arrangement.
Similarly, if two fisheries (e.g., cod and capelin) were occurring simultaneously in one area, causing some plants to refuse to accept the catches from one fishery, then
The Port Market 271
arrangements could be made to deliver these landings elsewhere as long as the prob-lem was anticipated early enough. In Newfoundland, the agency could be the exist-ing Fishing Industry Advisory Board with some increased powers. (This was recom-mended by the recent Newfoundland Royal Commission on the Inshore Fishery.)
Pros
(a) would provide a mechanism to spread out deliveries to the advantage of all par-ties; and
(b) would provide a focal point for the resolution of port market conflicts — an area heretofore ignored.
Cons
(a) might become a 'paper tiger' and detract from the eventual development of col-lective bargaining in areas where collective bargaining does not currently take place.
Recommendations 22. Processors should establish price differentials for landed quality, and cases where adequate differentials do not exist should be publicized.
23. Provincial governments that have not adopted collective bargaining legislation for inshore fishermen should do so. The federal government should support such collective bargaining by providing for it unequivocally, in all its forms, when new competition legislation is introduced.
24. The federal and provincial governments should study the concept of port market mediation commissions, port market authorities, or other institutions that may lead to greater order and efficiency in the port market.
Comment The Task Force sees the port market as the focus for many of the structural issues in the industry. In addition to the issue of quality, the orderly operation of the port market holds the key to the effective implementation and monitoring of quota licences (through the generation of reliable data), to better ways of delivering income supplementation and stabilization programs, and to improved consultation and less animosity and conflict between fishermen, processors and governments.
As explained in the previous chapter, price incentives are the only way to engender better performance and a better attitude toward quality, and governments should use their leverage to induce processors to pay quality-based price differentials.
One method of port market restructuring, and one that is strongly advocated by the NFFAWU, would be based roughly on the Norwegian system where, failing agreement between processors and fishermen on prices, the government steps in to pay the dif-ference between what an average processor can afford to pay to generate a reason-able profit and what the average fishermen requires to yield a reasonable return on investment and a decent income.
Apart from the definitional and data gathering problems, this approach is flawed because it would inevitably lead to a subsidy spiral, as it has in Norway. If net incomes are protected by the price subsidy, then there is no incentive to hold costs in line. Neither processors nor fishermen will be constrained to limit their increase in capacity, knowing that as their costs increase, the price subsidy will cover losses. The result is that the subsidy increases as the industry becomes less efficient in terms of cost per unit of output — exactly what has happened in Norway. It seems to us that there are better ways to improve fishermen's incomes, and these are discussed in Chapter 18.
272 Task Force on Atlantic Fisheries
Regarding the other approaches to port market reform, we see the creation of port market mediation commissions, with provincial co-operation, as the most promising in the short term. (However, this is unlikely to be effective without real collective bargaining as well.) The port market mediation commissions would be established in each province to anticipate problems that might develop in the port markets, particu-larly with regard to alleviating glut situations and other problems associated with the seasonal flow of fish deliveries, and to seek solutions through the mediation of negotiations between and among fishermen and processors. Over the longer haul, other options should also be pursued as appropriate under the circumstances in each province. They could include port market authorities in each province, which would buy all fish from fishermen at negotiated or prescribed prices and then sell the fish to processors.
We are also strongly of the view that collective bargaining should be encouraged —but not, as in the past, through public funding of fishermen's organizations. This kind of funding simply promotes organizational fragmentation and may preclude the emergence of effective leadership. Any doubt that may exist that collective bargain-ing is contrary to the federal Combines Investigation Act should be removed when new competition legislation is introduced.
Finally, the Task Force has concerns about collective agreements that contain fish prices that apply uniformly throughout the contract area. This uniformity works to the detriment of those fishermen who enjoy competitive advantages, such as delivery direct to plants, and to the detriment of those plants with competitive advantages because of their proximity to transportation facilities to get their products to markets.
The uniformity of contract prices throughout the contract period is also of concern to the Task Force. We would urge that unions and processor associations examine the feasibility of negotiating prices that vary throughout the year so as to provide incen-tives for fishermen to deliver fish in the 'shoulder seasons', thereby using the collec-tive bargaining mechanism to attack the seasonality problem facing the industry. In Iceland and Norway, for example, prices are negotiated quarterly.

273
16. Improving Fish Plant Profitability
In business, the earning of profit is something more than an incident of success. It is an essential condition of success. It is an essential condition of success because the continued absence of profit itself spells failure.
Justice Louis D. Brandeis
The Problem Average operating profits in the processing sector are too low, but the real selling price (net of inflation) of most east coast fish products is not expected to increase in the medium term. The industry must therefore reduce its costs and produce more high-value products.
Cost reductions cannot be achieved at the expense of reasonable earnings for fisher-men, whose incomes on average are barely adequate in many areas. Neither can cost-cutting be at the expense of plant wage rates which, relative to inflation and to other food products industry wages, are not excessive. Ways must therefore be found to increase operating efficiency so that average gross profit margins on the order of at least 17 to 19 per cent of sales value can be achieved.
While responsibility for improving plant efficiency must rest with plant managers, the policy issue is to design government policies and programs that would encourage improvements in plant efficiency.
Background The primary objective of this chapter is to extend the 'macro' analysis of processing sector economics in Chapter 5 to the 'micro' or plant level. More particularly, we will describe the operating performance improvements that will be needed to achieve the average gross margin target of at least 17 to 19 per cent of sales established in Chap-ter 5. We emphasize that this margin target is the minimum acceptable for an economically viable industry. To suggest how the industry might achieve these tar-gets, we describe the structure of operating costs in groundfish plants and analyze the principal components of those costs.
Less emphasis is placed on 'options' in this chapter than in the other twelve chapters in this section of the Report for two reasons. First, the efficient operation of a plant depends much more on strategic and day to day business decisions than on govern-ment programs aimed at the plant itself. The effects of government policy are more substantial in indirect, but nevertheless crucially important ways, including resource management, licensing, quota allocations, mesh size regulations, quality improve-ment programs, infrastructure support, unemployment insurance and so on. Many of these issues are dealt with in other chapters, but their effects on plant costs will also be discussed here. The implementation of the recommendations in other chapters will determine the feasibility of many of the measures that plant managers must imple-ment to achieve profitability.
Some government policies and programs do have direct effects on the micro-economics of the processing sector — for instance, capital grants and, occasionally, operating assistance, plant licensing in some provinces, and various federal and pro-vincial training programs. We comment on some of these in this chapter.
Second, the fact that many activities relating to fish processing fall within provincial jurisdiction limits the scope of initiatives that can be undertaken by the federal government without provincial concurrence. Consequently, this chapter is more analytical than normative.

274 Task Force on Atlantic Fisheries
Operating profit
Operating profit (or 'gross margin' as it was called in Chapter 5) lies at the heart of any business. It provides the funds to pay selling expenses, capital costs, taxes and a return to shareholders. We showed in Chapter 5 that net profit in the industry was eroded after 1978, first at the operating level. By 1981 these losses had created an enormous working capital deficit, with excessive short-term bank loans and balloon-ing interest expenses compounding the problem.
The crisis in the fishery was, and is, rooted in the operating profit which, at an aver-age of 12 per cent of sales in 1981, is completely inadequate to support the fish proc-essing industry. We suggested in Chapter 5 that the industry requires a gross margin in the neighbourhood of at least 18 per cent of sales averaged over good and bad years. Trawler owners must have somewhat higher margins to cover their higher capital investments.
The gross operating profit is equal to sales revenue less direct manufacturing costs. These costs include raw material; the direct labour required to handle and process the fish from wharf to freezer; the materials used in processing (e.g., packaging, additives); and manufacturing overhead expenses (wages and salaries of supervisory and maintenance personnel, repair and maintenance materials, utilities, taxes, rent-als, insurance, plant supplies). Interest, depreciation, office expenses and salaries are excluded. For trawler plants, the cost of raw material should exclude interest and depreciation on vessels.
The relative contributions of three of the four components of operating cost (fish, labour and materials), as reported in several studies, are shown in Table 16.1. The tabulated figures apply to frozen groundfish operations and are averages over many plants. There is considerable individual variation due to species and product mix, raw material cost, including the cost of transporting the fish to the plant, yield and labour productivity. Saltfish, shellfish and canning plants will have operating cost patterns quite different from those in Table 16.1.
The data in Table 16.1 show trend toward a greater relative weight for the direct labour component of cost between 1970 and 1982. Other indicators of this trend were noted in Chapter 5. Generally, raw material cost has about twice the weight of direct labour (less in flounder, more in haddock) and twelve times the contribution of packaging and additives. This identifies where greatest leverage might be exercized if costs were to be reduced.
Table 16.1
Components of Plant Operating Cost (relative weights, per cent)
Fish Labour Materials Total
Inbucon Study (1970)' 67.4% 25.2% 7.4% 100% TAP (1977-78) 2 64.6 30.0 5.5 100 Groundfish Average (FCC 1982) 3 62.0 32.9 5.1 100 Cod 63.6 32.0 4.4 100 Haddock 66.1 28.8 5.1 100 Pollock 58.8 34.3 6.9 100 Redfish 62.7 29.8 7.5 100 Flounder 56.7 38.6 4.7 100
Source: 'Inbucon Consultants, Report on a Productivity Study of the Fresh and Frozen Groundfish Industry on the East Coast (1970). 2 Data submitted to the Department of Fisheries and Oceans by companies receiving assistance under the Temporary Assistance Program (TAP). 3 Data assembled by the Fisheries Council of Canada, based on 170 million pounds of product, 1981-82. The individual species data are from the same compilation.
Improving Fish Plant Profitability 275
Manufacturing overhead is more difficult to quantify because there are large varia-tions between plants as well as inconsistent accounting procedures. Part of Woods Gordon's work for the Task Force was a detailed study of the 1981 accounts of 19 plants believed to be reasonably representative of the industry. An attempt was made to segregate items that constituted manufacturing overhead as defined above. On average, it was about 70 per cent of the direct labour cost in groundfish plants, although there were extraordinarily wide variations.* If the 70 per cent rule is used and the other three components of cost are taken from the 1982 groundfish plant average in Table 16.1, total operating cost would break down as follows: raw material, 50.4 per cent; direct labour, 26.7 per cent; materials, 4.1 per cent and manufacturing overhead, 18.7 per cent.
The Woods Gordon study of manufacturing overhead identified the following princi-pal components: supervisory and other labour, 40 per cent; utilities, 20 per cent; maintenance materials, 20 per cent; and all other items, including insurance, taxes, rentals, ice and miscellaneous supplies, 20 per cent. Probably about 40 per cent of these expenses vary with the volume of production. The remainder are fixed as long as the plant is operating at all.
Electrical energy use constitutes about three to four per cent of total plant operating costs — more if the freezing load is heavy. It might be easy to overlook such an item among the other, much larger, cost components, but it should be recalled that when applied to the entire industry, the cost of utilities constitutes almost 3 per cent of sales, or some $30 million annually. This is roughly equal to the amount spent on interest on long-term debt. As this illustration clearly shows, every opportunity must be taken to economize on each component of a firm's cost.
The most significant cost factors obviously are raw material and direct labour. There is relatively little that can be done by management to reduce packaging material costs or the fixed component of manufacturing overhead. Therefore, over 90 per cent of the manageable cost in the plant is composed of fish purchases and direct labour.
The cost of raw material per pound of finished product, usually called the processor's `flesh cost', is equal to the cost of fish as delivered to the plant divided by the yield of saleable product, typically from a gutted, head-on fish.
The cost of labour is also a ratio. It is equal to the average effective wage rate, expressed in dollars per hour, divided by physical productivity, measured in average pounds of final product per hour. Different skills are paid at different rates, and overtime and any incentive bonuses must be included, as well as an additional allow-ance of about 15 per cent of the wage rate for employee benefits. Productivity varies with the task and other factors that will be discussed later.
As an example of a cost and margin calculation, assume that fish is purchased at $0.23 per pound. The yield is 36 per cent. The effective labour rate is $6.00 per hour. Average productivity is 18.2 pounds per hour. Materials cost $0.05 per pound of product, and manufacturing overhead is 70 per cent of direct labour costs. The total cost is $1.25, composed of fish ($0.639), labour ($0.330), materials ($.051) and overhead ($0.231). If the selling price is $1.55 at the plant gate, the operating profit is $0.30 per pound or 19.4 per cent of sales.
* Manufacturing overhead contains some fixed cost items and therefore cannot, in theory, be proportional to a variable cost such as direct labour. The '70 per cent rule' is of use only in general analysis at an aggregate level.

276
Task Force on Atlantic Fisheries
Factors determining operating profit
The operating profit, or loss, from a pound of fish product is described by the follow-ing simple equation:
Operating Profit = p - (c/y + w/e + m + oh)
p = plant gate market price per pound of product c = cost per pound of raw material landed at the plant y = yield of final product from input raw material w = effective average wate rate ($ per hour) for plant workers e = average productivity (pounds of product per man-hour) in the plant m = cost of materials used per pound of product oh = manufacturing overhead per pound of product
Different products will have different profit margins due to varying market prices, yields, labour costs and so on. Every plant produces a mix of product types and seeks to direct its raw material into those packs that give the highest margin per input pound. This choice is constrained by such factors as the quality and size of the raw fish, by the rate at which the fish must be processed to avert spoilage, and by the marketing capabilities of the firm. The profitability is determined by both the unit margin on each product and the relative amount of each product that is produced. Total operating profit in a year depends as well on the volume that is processed.
It will be assumed that it is not within the power of plant managers to influence the unit market price or the marketability of fish products. Therefore the challenge of maximizing operating profit at the plant level becomes one of minimizing costs and achieving an optimal pack mix — that is, getting more raw material into high-margin products.
Among the myriad factors that bear on the problem, we focus on the following five, which the Task Force believes to be the most significant determinants of plant oper-ating performance: quality of raw material; average size of fish; plant management; variations in supply (daily and seasonal); and harvesting method. Such other factors as the productivity of capital employed in the plant, the skill of the labour force and the location of the plant are also of importance, often crucially so. Some of these must be taken as given in the short to medium term; others fall under the rubric of management and are implicit in the five principal factors.
The effect of these factors on the components of operating cost is displayed in Table 16.2 where an 'x' signifies a significant direct effect of a factor on a particular cost component. The factors are themselves interrelated. For example, the harvesting method — trawler, longliner, trap — is an important determinant of supply varia-tion, average fish size and raw material quality. Table 16.2 indicates only the direct effect of harvesting method on the landed cost of fish. The indirect effects — on yield and productivity, for instance — are included implicitly under other headings in the table. Similarly, daily and seasonal variations in fish supply to the plant place heavy constraints on management's options and thus affect quality. Management also has a responsibility to influence the size and quality of fish coming into the plant. Management may thus affect a cost element such as labour productivity directly through training, motivation and work scheduling, but also indirectly by screening out raw material that would depress productivity. What follows is a brief discussion of each of the effects identified in Table 16.2.
1. Fish cost: The cost of fish to the plant should reflect the quality and size of the fish, because greater market returns and lower processing costs are achieved with higher quality raw material and, up to a point, larger fish. Variations in raw material supply often affect dockside prices in times of glut and scarcity.

Improving Fish Plant Profitability 277
Table 16.2
Factors Affecting Operating Profit (an 'x' indicates a significant effect)
Fish Manage- Supply Harvest
Component Quality Size ment Variation Method
Raw fish cost (c) x x x x x
Yield (y) x x x
Wage Rate (w) x x
Productivity (e) x x x x Materials (m) x Manufacturing Overhead (oh) x x x
Product Mix x x x x
The cost of fish also depends on the method of harvesting. A cod trap, for example, may result in a low cost per pound of landed fish compared with a longliner, but this may be offset to some extent by the shortness of the trap season, which requires a larger unit margin for the fisherman.
Management can also influence the cost of fish landed at the plant gate through the unloading and transportation methods used. The cost of collection from many scat-tered landing sites may add one to three cents a pound (5 to 10 per cent) to the cost of fish at the plant gate, apart from any quality deterioration that occurs. A rational-ization of fishing ports into fewer, better equipped facilities would result in signifi-cant cost savings and quality improvement, although the Task Force recognizes that there is little that can be done in this regard in the short to medium term.
2. Yield: For a given species and product, the yield of saleable product from the raw fish depends on the quality of the incoming fish, the rate of throughput and on plant management. Yield does not depend significantly on fish size within a reasonable range. There is a trade-off between productivity and yield — that is, the faster ones cuts and trims, generally the lower the yield. The optimal combination is ultimately determined by the ratio of fish cost to plant wage rates. Furthermore, unusually large volumes delivered to the plant over short periods may require very rapid fillet-ing, often with low yields, to avoid spoilage.
Improved fish quality has an important effect on yield. Loss from spoilage is mini-mized, firm-textured fish is easier to cut cleanly, and trimming losses are reduced. Estimates of yield gain as a result of improved quality depend entirely on the con-text, but average improvements of two to five percentage points in cod might be achieved, depending on the base performance.
A yield improvement of three percentage points — from 33 to 36 per cent, for exam-ple — reduces the fish component of product cost by 8.3 per cent and increases prod-uct volume by 9.1 per cent. Optimizing yield is therefore a critical task of plant man-agement and is beyond doubt one of the two principal opportunities for significant cost improvements in the industry.
3. Productivity: The other opportunity is improved labour productivity, an area in which the competence of management is also of central importance. Productivity also depends on the quality of incoming fish and on the size and uniformity of the fish.
Within normal limits, a production line worker's movements do not vary to any great extent with the size of the fish being handled. A six-pound cod can be processed almost as quickly as a three-pound cod, but the product weight is double. Within reasonably wide operating limits, direct labour productivity will be strictly propor-
278
Task Force on Atlantic Fisheries
tional to average fish size. Productivity also improves if there is little variation in the size of the fish being processed. This is particularly important for machine cutting.
Better raw material quality contributes to higher productivity by streamlining the cutting and fillet trimming operations. It is difficult to cut a good fillet from a soft fish. Ragged fillets require more careful trimming. Soft fish makes the removal of bones more difficult and uncertain. The removal of parasites in the flesh also slows throughput. And because of these quality impediments, quality-control procedures must be more thorough and time-consuming. Finally, it is generally recognized —and it is not surprising — that plant morale depends on the quality of fish being processed. This psychological factor amplifies the influence of quality on productivity.
As a general rule, productivity will be adversely affected by large variations, either daily or seasonal, in raw material supply. In the latter case, the skill of the work force declines in the idle period, and to some extent skills must be resharpened each spring. Job attachment in seasonal work may also be low, resulting in high turnover rates and lower productivity during the learning period.
Large daily swings in production, which typically occur at the peak of the inshore season or when trawler arrivals are not synchronized, impede productivity by dis-rupting the rhythm of work and by making production scheduling much more dif-ficult. If workers are called in anticipation of a large volume that doesn't materialize, paid hours will inevitably be wasted. It has often been observed that labour effort is quite elastic, expanding or contracting to ensure that the required production is fitted into a full day.
It is the responsibility of management to ensure that productivity is improved by maintaining a good working environment, by providing training and supervision, by optimal production scheduling, and by adhering to well-negotiated contracts. There continue to be serious failings in all these areas.
Studies have repeatedly identified lagging productivity as one of the most serious and intractable problems in the industry. Most recently, the Royal Commission to Inquire into the Inshore Fishery of Newfoundland and Labrador (Phase II and III Report) claimed that productivity in Newfoundland plants was, on average, only about 43 per cent of a generally accepted standard based on industrial engineering time and motion methods. A similar study, cited by the Royal Commission, was con-ducted in 1968 by Inbucon consultants; it reported only a slightly higher productivity rate of 48 per cent. These reports on productivity are discouraging in themselves, but even more discouraging is that despite having been identified as a major problem years ago, there has been no apparent improvement. Indeed, productivity levels may have deteriorated.
If this situation cannot be substantially improved, there is no prospect of achieving sustained profitability. Better raw material quality, increased average fish size, and a more controlled and uniform supply of fish are needed and they are achievable.
The training and commitment of first-line supervisors is also essential. The ratio of supervisors to line workers should be on the order of one to fifteen or twenty. The Newfoundland Royal Commission reported that during the peak inshore season the ratio may fall as low as one to one hundred. Even the best-trained supervisor cannot be effective under such conditions.
Management must be prepared to diagnose productivity impediments systematically and to adopt industrial engineering techniques to overcome them. Government pro- grams might be designed to assist this activity so that their benefits can become

Improving Fish Plant Profitability 279
more widely known. Nevertheless, the primary responsibility and initiative rest with processors themselves.
The effects of higher productivity on operating costs are potentially great. A 20 per cent improvement in average industry throughput per man-hour would reduce direct labour costs by almost 17 per cent. This in turn would reduce total operating costs by roughly 4 to 5 per cent, apart from any associated reduction in manufacturing over-head. This improvement is not to be achieved by requiring individual workers to work more quickly (this can be accomplished through incentive schemes offering wage bonuses) but rather through policies to reduce the impediments to productivity already identified.
4. Wage rate: As shown in Table 16.2, both plant management and variations in supply affect the average hourly wage. Apart from negotiating contracts, which is not at issue here, management can influence the effective labour rate by controlling overtime and holiday work. This planning and production scheduling is made far more difficult by excessive variations in day to day fish supply and by the failure of some fishermen to schedule landings to avoid the need for Sunday plant shifts. To the extent that peak volumes have to be handled periodically, plants should switch to products that have inherently high throughput rates (e.g., split fish or skin-on, bone-in fillets) to minimize overtime and yield losses. This and other problems of opti-mizing product mix are susceptible to systematic analysis and planning, too little of which has been incorporated in industry practice.
5. Materials: Controlling packaging and materials costs is essentially a matter of co-ordinating longer run production planning with marketing. Virtually the only con-trollable factor, apart from intelligent purchasing, is packaging inventory, the opti-mal level of which must balance holding cost against the probability and cost of run-ning out of stock. For smaller plants, net savings might be achieved by consolidating purchase orders and placing them as a group. This is more practical if there is a common marketing activity and identical packaging, as is now occurring with a group of independent companies in Newfoundland.
6. Manufacturing overhead: Controlling manufacturing overhead is one of the most important responsibilities of management. The critical elements are supervisory and maintenance labour, maintenance materials and energy. All can be strongly influenced by good management.
Variations in the supply of raw material increase overhead per unit of production by requiring overtime, disrupting routines, placing peak loads on freezers (incurring maximum load utility charges), and forcing machinery to the limit. In the meantime, the large fixed component of overhead cost must still be borne in the idle periods. It is increasingly costly for seasonal plants to retain skilled maintenance and senior supervisory staff over the off-season. Moreover, these people have skills that are in high demand elsewhere in the economy.
7. Product mix: The final component of operating profit shown in Table 16.2 is product mix, the optimization of which is determined by management subject to the often severe constraints imposed by raw material quality, fish size and supply varia-tions. (Marketing factors are taken as given in this discussion.) Fish that is small or soft-textured cannot be turned into high-value products. Much will end up as blocks, for which the apparent demand is stagnant, unless Canadian cod block production costs can be reduced by amounts on the order of 30 per cent. This is unlikely.
The strong saltfish markets in Europe also place a high premium on large fish. This gives Iceland, whose harvesting policies assure a larger average cod size, the pre- eminent position. The effectiveness of saltfish production as an alternative to freez-

280
Task Force on Atlantic Fisheries
ing during peak inshore catch periods is limited by the small average size of much of this 'excess' supply, particularly from the cod trap fishery as now practised.
Up-grading the product mix of east coast groundfish processors is important not only because of the generally higher margins that can be obtained, but also because the growth opportunities in the market lie in higher quality products (see Chapter 6 for greater detail). Even if real unit prices do not increase for any product, higher aver-age real revenue can be achieved through up-grading the product mix. More gross income per tonne of raw material would then be available to distribute among all participants in the fishery.
Achieving Assessing the potential to improve operating profits in the processing sector requires an adequate that many of the factors just discussed be estimated in quantitative terms and corn- gross margin bined in a model of plant cost accounting. At the level of the entire industry, and in
the absence of reliable, comparable and comprehensive cost accounting data (which is collected by only a very few companies), it is possible to construct only very crude and simplistic models. Nevertheless, these may be adequate for purposes of gross estimation.
The following scenario illustrates a method of analysis and indicates at least one set of performance targets at the plant level. If these targets were achieved, the result would be a gross margin comparable to the target proposed in Chapter 5. Details and refinements of the model are described in a separate Task Force working paper on the processing sector.
The scenario deals only with cod production, although the assumptions regarding yield and productivity improvement would apply with equal effect to other ground-fish products. The model encompasses the cost components in Table 16.2 and a set of six typical products: blocks; standard 5-pound, skinless, bone-in fillets; premium 5-pound boneless fillets; fresh, bone-in fillets; premium wet salted fish; and standard wet salted fish.
Given values for the elements in the equation for calculating operating profit and an assumed mix of products, the operating income as a percentage of sales value can be calculated. Once a base case (status quo) is established, the components of cost and the product mix can be varied according to any set of assumptions or targets to gen-erate a new value for gross margin.
The base case cost component values and pack mix are given in Table 16.3. The data are rough estimates based on a wide variety of company records and on the views of plant operators. The numbers are not based on any comprehensive empirical study of average cod production costs in the industry. It is nevertheless believed that the data are sufficiently realistic to base a scenario on them.
These values are meant to approximate averages over the entire industry at 1981 lev-els. They are informed estimates derived from a number of sources, including com-pany records and reported averages for several companies. The productivity rates by product were derived indirectly from total direct labour cost data, assuming an aver-age effective wage rate, including overtime and benefits, of $6.00 per hour. (The industry average is now higher, perhaps closer to $7.00 per hour including benefits.) More confidence can be placed in the relative productivity between products than in the absolute values. The premium and standard saltfish data reflect estimated aver-ages over a range of sizes. The resulting margins by product and in total are given in Table 16.4. The cost calculation assumes manufacturing overhead at 70 per cent of direct labour cost.
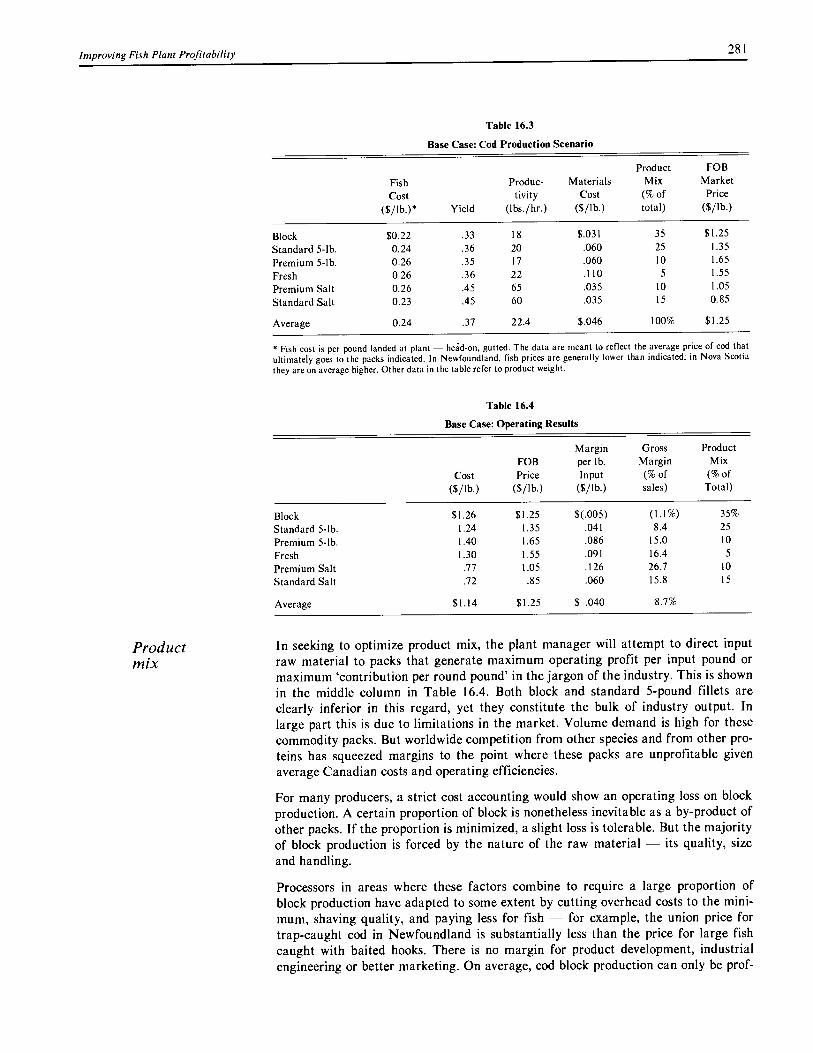
Improving Fish Plant Profitability 281
Table 16.3
Base Case: Cod Production Scenario
Product mix
Fish Cost
($/lb.)* Yield
Produc- tivity
(lbs./hr.)
Materials Cost
($/lb.)
Product Mix
(% of total)
FOB Market Price
($/lb.)
Block $0.22 .33 18 $.031 35 $1.25
Standard 5-lb. 0.24 .36 20 .060 25 1.35
Premium 5-lb. 0.26 .35 17 .060 10 1.65
Fresh 0.26 .36 22 .110 5 1.55
Premium Salt 0.26 .45 65 .035 10 1.05
Standard Salt 0.23 .45 60 .035 15 0.85
Average 0.24 .37 22.4 $.046 100% $1.25
* Fish cost is per pound landed at plant - head-on, gutted. The data are meant to reflect the average price of cod that ultimately goes to the packs indicated. In Newfoundland, fish prices are generally lower than indicated; in Nova Scotia they are on average higher. Other data in the table refer to product weight.
Table 16.4
Base Case: Operating Results
Cost ($/lb.)
FOB Price
($/lb.)
Margin per lb. Input
($/lb.)
Gross Margin (% of sales)
Product Mix (% of Total)
Block $1.26 $1.25 $(.005) (1.1%) 35% Standard 5-lb. 1.24 1.35 .041 8.4 25
Premium 5-lb. 1.40 1.65 .086 15.0 10
Fresh 1.30 1.55 .091 16.4 5 Premium Salt .77 1.05 .126 26.7 10 Standard Salt .72 .85 .060 15.8 15
Average $1.14 $1.25 $ .040 8.7%
In seeking to optimize product mix, the plant manager will attempt to direct input raw material to packs that generate maximum operating profit per input pound or maximum 'contribution per round pound' in the jargon of the industry. This is shown in the middle column in Table 16.4. Both block and standard 5-pound fillets are clearly inferior in this regard, yet they constitute the bulk of industry output. In large part this is due to limitations in the market. Volume demand is high for these commodity packs. But worldwide competition from other species and from other pro-teins has squeezed margins to the point where these packs are unprofitable given average Canadian costs and operating efficiencies.
For many producers, a strict cost accounting would show an operating loss on block production. A certain proportion of block is nonetheless inevitable as a by-product of other packs. If the proportion is minimized, a slight loss is tolerable. But the majority of block production is forced by the nature of the raw material - its quality, size and handling.
Processors in areas where these factors combine to require a large proportion of block production have adapted to some extent by cutting overhead costs to the mini-mum, shaving quality, and paying less for fish - for example, the union price for trap-caught cod in Newfoundland is substantially less than the price for large fish caught with baited hooks. There is no margin for product development, industrial engineering or better marketing. On average, cod block production can only be prof-
282 Task Force on Atlantic Fisheries
itable if raw fish costs are significantly reduced and plant productivity is improved. It is assumed that real increases in the market price of blocks are unlikely (see Chapter 6).
The next step up from the cod block is the standard five-pound bone-in pack. Beyond that is the 'commodity' five-pound boneless pack for the U.S. market. These are scarcely more profitable than blocks, but they must inevitably be counted upon to absorb a large proportion of Canadian cod volume in the price-sensitive, value-for-money market. This product range emerges as a key to industry viability. Real prices cannot be counted upon to improve, and therefore costs must be reduced through higher yields and greater plant productivity.
At first sight, the higher value packs would appear to afford a less painful route to profitability. For these products, margins are considerably better, particularly for large premium saltfish. Although a significant improvement in the percentage of higher value packs is needed, it will not come automatically. It depends, as noted earlier, on an improvement in average raw material quality, better handling, larger fish, more uniform supply, more sophisticated production planning and better floor supervision. Each of these requirements is a significant but not insurmountable hurdle.
Even if there were no operating impediments to up-grading products, market con-straints on the ability of Canadian processors to expand sales quickly in the higher quality market segments would remain. In the short run, forcing large volumes of the up-graded products to be produced would reduce their price and hence the associated margin. But at present, the market for premium Canadian cod products is reported to be under-supplied, so there is some room for immediate expansion. In the medium to longer term, the availability of more product of consistently high quality will expand fish consumption and therefore relieve the pressure on price.
Yield and productivity
What might nevertheless be achievable in the short to medium term as a result of better yields and productivity and product up-grading? In describing a scenario to compare with the base case illustrated in Tables 16.3 and 16.4, we will assume that:
• real product prices will not increase, except slightly in the case of premium saltfish as a consequence of an assumed increase in average fish size;
• real average prices to fishermen should increase on the assumption that there is sufficient quality improvement;
• real average plant wage rates should increase to give labour a share of the benefits of improved productivity; and
• radical changes in product mix are not feasible in the short to medium term.
If adequate gross margins are still to be achieved, it is clear that there must be sub-stantial improvements in yield and productivity.
The new scenario is set out in Table 16.5. (The new productivity figures are derived from Table 16.6.) The prices of raw material have been adjusted to reflect quality improvement of about 8 per cent on fish destined for fillet packs, 15 per cent for fish going to premium salt products and a reduction of 9 per cent on fish that ends up in blocks. These prices, it must be emphasized, are introduced only to develop the sce-nario. They do not represent the Task Force view on appropriate prices or on the required differential for improved quality. Moreover, they represent real price changes, net of inflation.
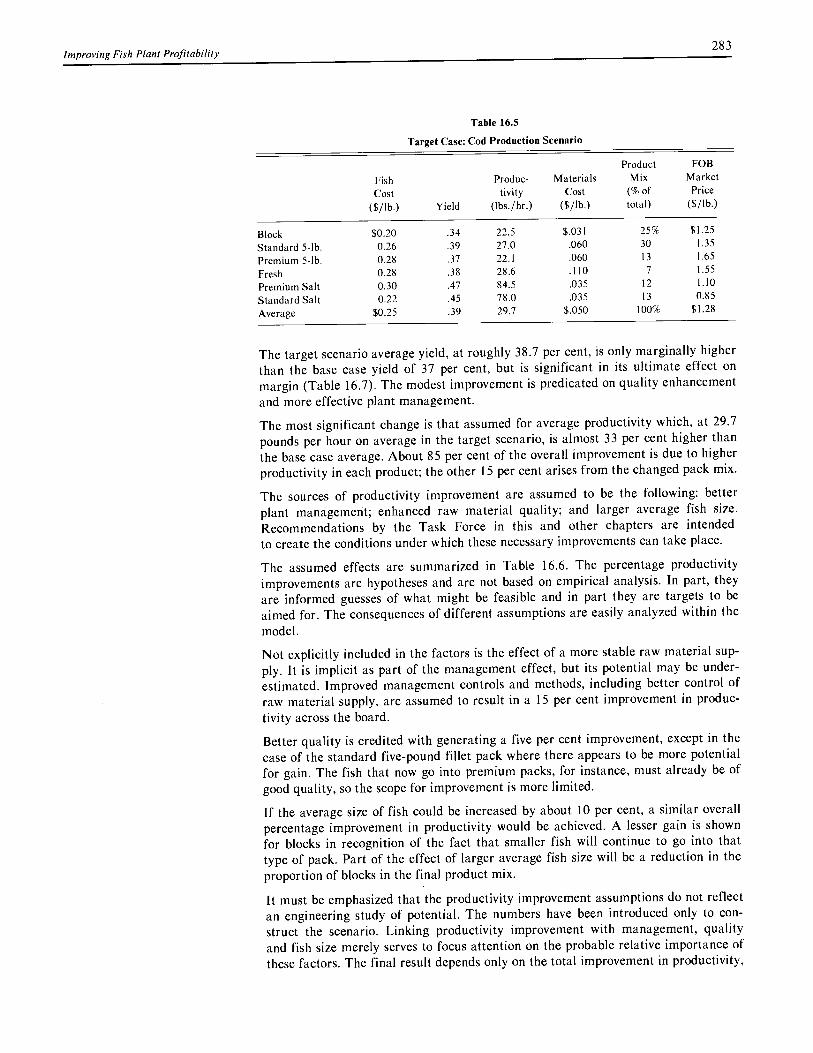
Improving Fish Plant Profitability 283
Table 16.5
Target Case: Cod Production Scenario
Product FOB
Fish Produc- Materials Mix Market
Cost tivity Cost (% of Price
($/lb.) Yield (lbs./hr.) ($/lb.) total) ($/lb.)
Block $0.20 .34 22.5 $.031 25% $1.25
Standard 5-1b. 0.26 .39 27.0 .060 30 1.35
Premium 5-1b. 0.28 .37 22.1 .060 13 1.65
Fresh 0.28 .38 28.6 .110 7 1.55
Premium Salt 0.30 .47 84.5 .035 12 1.10
Standard Salt 0.22 .45 78.0 .035 13 0.85
Average $0.25 .39 29.7 $.050 100% $1.28
The target scenario average yield, at roughly 38.7 per cent, is only marginally higher than the base case yield of 37 per cent, but is significant in its ultimate effect on margin (Table 16.7). The modest improvement is predicated on quality enhancement and more effective plant management.
The most significant change is that assumed for average productivity which, at 29.7 pounds per hour on average in the target scenario, is almost 33 per cent higher than the base case average. About 85 per cent of the overall improvement is due to higher productivity in each product; the other 15 per cent arises from the changed pack mix.
The sources of productivity improvement are assumed to be the following: better plant management; enhanced raw material quality; and larger average fish size. Recommendations by the Task Force in this and other chapters are intended to create the conditions under which these necessary improvements can take place.
The assumed effects are summarized in Table 16.6. The percentage productivity improvements are hypotheses and are not based on empirical analysis. In part, they are informed guesses of what might be feasible and in part they are targets to be aimed for. The consequences of different assumptions are easily analyzed within the model.
Not explicitly included in the factors is the effect of a more stable raw material sup-ply. It is implicit as part of the management effect, but its potential may be under-estimated. Improved management controls and methods, including better control of raw material supply, are assumed to result in a 15 per cent improvement in produc-tivity across the board.
Better quality is credited with generating a five per cent improvement, except in the case of the standard five-pound fillet pack where there appears to be more potential for gain. The fish that now go into premium packs, for instance, must already be of good quality, so the scope for improvement is more limited.
If the average size of fish could be increased by about 10 per cent, a similar overall percentage improvement in productivity would be achieved. A lesser gain is shown for blocks in recognition of the fact that smaller fish will continue to go into that type of pack. Part of the effect of larger average fish size will be a reduction in the proportion of blocks in the final product mix.
It must be emphasized that the productivity improvement assumptions do not reflect an engineering study of potential. The numbers have been introduced only to con-struct the scenario. Linking productivity improvement with management, quality and fish size merely serves to focus attention on the probable relative importance of these factors. The final result depends only on the total improvement in productivity,
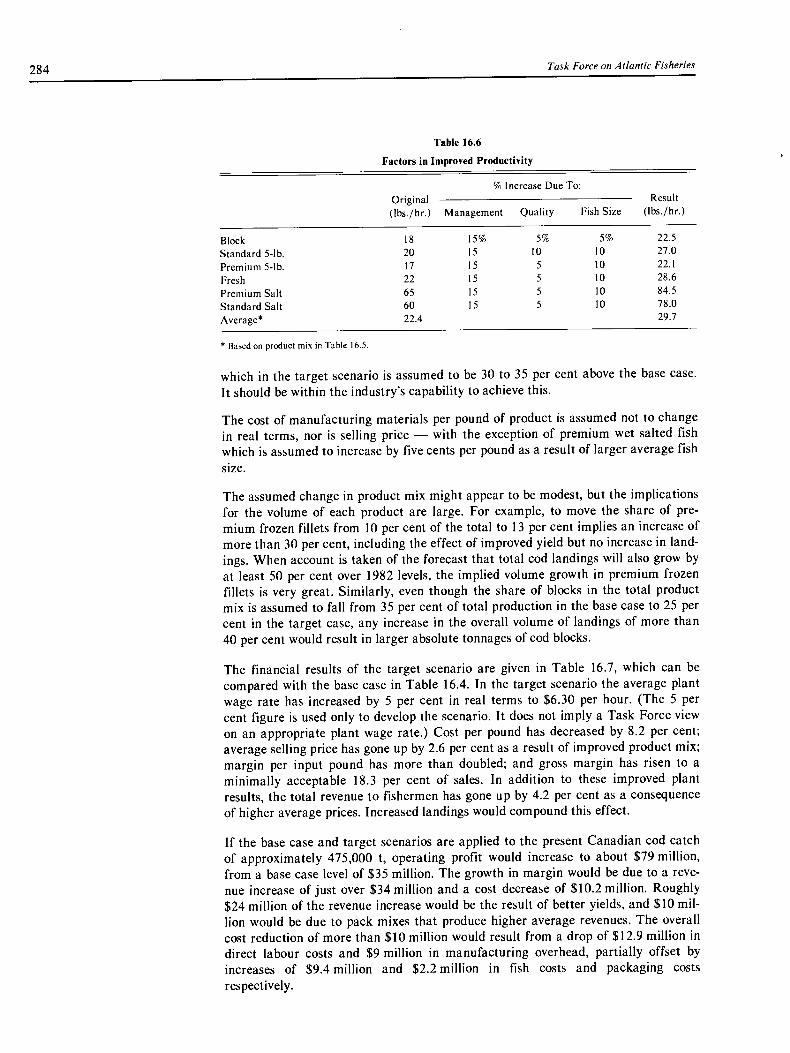
284 Task Force on Atlantic Fisheries
Table 16.6
Factors in Improved Productivity
Original (lbs./hr.)
% Increase Due To: Result
(lbs./hr.) Management Quality Fish Size
Block 18 15% 5% 5% 22.5
Standard 5-lb. 20 15 10 10 27.0
Premium 5-1b. 17 15 5 10 22.1
Fresh 22 15 5 10 28.6
Premium Salt 65 15 5 10 84.5
Standard Salt 60 15 5 10 78.0
Average* 22.4 29.7
* Based on product mix in Table 16.5.
which in the target scenario is assumed to be 30 to 35 per cent above the base case. It should be within the industry's capability to achieve this.
The cost of manufacturing materials per pound of product is assumed not to change in real terms, nor is selling price — with the exception of premium wet salted fish which is assumed to increase by five cents per pound as a result of larger average fish size.
The assumed change in product mix might appear to be modest, but the implications for the volume of each product are large. For example, to move the share of pre-mium frozen fillets from 10 per cent of the total to 13 per cent implies an increase of more than 30 per cent, including the effect of improved yield but no increase in land-ings. When account is taken of the forecast that total cod landings will also grow by at least 50 per cent over 1982 levels, the implied volume growth in premium frozen fillets is very great. Similarly, even though the share of blocks in the total product mix is assumed to fall from 35 per cent of total production in the base case to 25 per cent in the target case, any increase in the overall volume of landings of more than 40 per cent would result in larger absolute tonnages of cod blocks.
The financial results of the target scenario are given in Table 16.7, which can be compared with the base case in Table 16.4. In the target scenario the average plant wage rate has increased by 5 per cent in real terms to $6.30 per hour. (The 5 per cent figure is used only to develop the scenario. It does not imply a Task Force view on an appropriate plant wage rate.) Cost per pound has decreased by 8.2 per cent; average selling price has gone up by 2.6 per cent as a result of improved product mix; margin per input pound has more than doubled; and gross margin has risen to a minimally acceptable 18.3 per cent of sales. In addition to these improved plant results, the total revenue to fishermen has gone up by 4.2 per cent as a consequence of higher average prices. Increased landings would compound this effect.
If the base case and target scenarios are applied to the present Canadian cod catch of approximately 475,000 t, operating profit would increase to about $79 million, from a base case level of $35 million. The growth in margin would be due to a reve-nue increase of just over $34 million and a cost decrease of $10.2 million. Roughly $24 million of the revenue increase would be the result of better yields, and $10 mil-lion would be due to pack mixes that produce higher average revenues. The overall cost reduction of more than $10 million would result from a drop of $12.9 million in direct labour costs and $9 million in manufacturing overhead, partially offset by increases of $9.4 million and $2.2 million in fish costs and packaging costs respectively.

Improving Fish Plant Profitability 285
Table 16.7
Target Scenario: Operating Results
Conclusions
Cost ($/lb.)
FOB Price
($/lb.) Margin per
lb. Input
Gross Margin
(% of sales)
Product Mix (% of total)
Block $1.10 $1.25 $.083 12.4% 25%
Standard 5-lb. 1.12 1.35 .088 16.7 30
Premium 5-lb. 1.30 1.65 .129 21.1 13
Fresh 1.22 1.55 .125 21.2 7
Premium Salt .80 1.10 .141 27.3 12 Standard Salt .66 .85 .085 22.2 13
Average $1.05 $1.28 $.091 18.3% Base Case $1.14 $1.25 $.040 8.7%
The decline in labour costs and related overhead is due to increased productivity, resulting in a 19.2 per cent drop in hours worked, partly offset by a 5 per cent real increase in hourly wage rates. The reduction in total hours worked assumes no increase in landings. In fact, the Canadian cod catch should increase by more than 50 per cent between 1982 and 1987. Even if the higher productivity assumptions in Table 16.5 were realized, total plant hours would increase by almost 15 per cent over the base case because of the higher volume of cod to be processed.
If the increase in margin is sub-divided into portions that can be linked to improved quality, larger fish size and better management, we find that roughly 50 per cent of the improvement can be related to quality, almost 30 per cent to better management, and just over 20 per cent to larger fish size. These percentages depend on assump-tions in the scenario, but they still give some indication of relative effects.
The assumptions in the target scenario are not excessively ambitious, at least on the surface. The calculation shows that much better margins can be achieved in the groundfish trade, even if real prices do not increase, if yield and productivity are sig-nificantly improved. Moreover, the improvements assumed in the scenario are not unrealistically high.
If we accept that producers cannot count on higher real prices and that payments to cover the various production costs should not fall, then it is inevitable that viability can be achieved only through greater efficiency. In the fish processing business this means higher yields and better productivity in the plant.
The analysis of plant operating profit identified five principal determinants of performance — raw material quality; the size of fish; management in the plant; variations in fish supply; and harvesting method. With the exception of management, these factors are addressed in other chapters, and the effect on plant costs of several of the actions recommended in those chapters will be reviewed briefly in the com-ments following the recommendations.
The systematic improvement of the quality of management is not easily addressed by government policy and programs. Training programs, seminars and printed informa-tion are probably cost-effective aids, but they can never get to the root of the prob-lem. A policy environment that allows successful management to be duly rewarded and poor management to suffer the full consequences is probably the most construc-tive action government can take. Well-intentioned programs that subsidize new capi-tal assets or that seek to encourage people to undertake what is already in their best
286 Task Force on Atlantic Fisheries
interests may have the perverse effect of undermining management in the longer run and fostering excessive dependence on government.
Nevertheless, the fishery finds itself once more without the resources to undertake essential steps, let alone to invest in the management improvements that are the key to future success. There is also a widespread and traditional reluctance on the part of management in many processing companies to commit resources to overhead expenses such as the development of cost accounting systems, industrial engineering studies and supervisor training. Narrow and uncertain margins in the industry are partly to blame. But there is also a mistrust of analytical methods and systems. This is perhaps not surprising in an industry with little tradition of professional manage-ment. But these prejudices must be overcome if management is to fulfill its part of the responsibility for restoring profitability to the industry.
There is a constructive role for government. It is summarized in the following recom-mendations, which flow from the preceding analysis and from Chapter 5.
Recommendations 25. Provincial governments should give high priority to up-grading the skills of fish plant managers and supervisors through vocational, technical and marketing training. Every effort should be made to foster a professional image of careers in the industry and to ensure that educational programs for management have a practical orientation and high performance standards.
26. The federal government should continue to re-orient its regional development assistance programming for the fish processing industry away from plant con-struction and expansion and toward improving the efficiency of assets now in place. Capital investment aimed at increasing productivity and obtaining higher yields should be supported.
27. The manpower training program of Employment and Immigration Canada should ensure that assistance is adequate to encourage training for skilled posi-tions in fish plants until such time as the industry is financially able to take full responsibility itself.
28. Future federal assistance to fish plants should require, as a pre-condition, that a productivity improvement study be carried out and a program of improvement be agreed to by plant management.
29. Fish processors and the federal government should explore all ways to encour-age research and development in the industry and make every attempt to involve agencies such as the National Research Council in this endeavour.
30. The fish processing industry should develop a standard format for financial and cost accounting data so that common systems can be developed and performance standards established that are comparable throughout the industry. The federal government should be prepared to assist financially the development by industry of the necessary standards and systems.
31. The compilation and analysis of industry financial statements begun for the Task Force should be continued each year through co-operation between the Fisheries Council of Canada and the Department of Fisheries and Oceans. The federal and provincial governments and the processing industry should share the cost of the project each year.
Comment
The recommendations in other chapters of this Report have significant implications for processing sector viability because of their effect on the factors underlying higher yields and productivity. The performance levels used to develop the target scenario illustrated in Table 16.5 assume that, in addition to improved management, there
Improving Fish Plant Profitability 287
will be enhanced raw material quality, larger fish, less variation in the supply of fish to plants and improved harvesting methods.
Quality will be enhanced as a result of the Task Force recommendations in Chapter 14. An increase in the average size of fish will occur automatically as a result of further stock rebuilding, particularly in the western Gulf and northern cod stocks. This will be amplified by the Task Force recommendations on the utilization of northern cod, which will have the effect of reducing the relative proportion of cod trap landings and increasing hook and line catches, which result in larger fish.
The introduction of dockside grades will facilitate the maintenance of price differen-tials between large and small fish to reflect the effect of fish size on plant costs and revenues. The Department of Fisheries and Oceans should meanwhile devote greater effort to analyzing the factors that affect the average size of landed fish — in par-ticular, mesh regulations. If landed fish size is not increased significantly, a mini-mum fish size regulation, perhaps similar to that in force in Iceland, may have to be adopted.
Daily and seasonal variations in fish supply will be reduced as a result of the Task Force recommendations on the allocation of the northern cod stock and on the deliv-ery of off-season fish to resource-short plants. The implementation of enterprise allo-cations in the offshore fishery and the adoption of quota licences in the inshore sector should have a major effect on the timing of landings, because fishermen will no longer be compelled to race for a maximum share of the available quota. Far more orderly harvesting should be possible.
Ultimately, the quota licence concept will cause the inshore fleet to evolve in the most technologically efficient way. This will be guided by port market prices that reflect the needs of plants and the demands of the marketplace. Greater fleet effi-ciency will eventually permit lower real fish costs for plants while generating higher real incomes for fishermen.

289
17. Marketing
The codfish lays ten thousand eggs, The homely hen lays one. The codfish never cackles To tell you what she's done. And so we scorn the codfish, While the humble hen we prize, Which only goes to show you That it pays to advertise.
Anon.
The Problem In Chapter 6 we reviewed the issues surrounding markets for Canadian fishery prod-ucts, the organization of Canadian marketing and the supply and demand forecasts for Canadian fish products. We concluded that in order to provide profitable outlets for the growth in Canada's Atlantic groundfish stocks it will be necessary to:
• expand the per capita consumption of premium groundfish species relative to com-peting proteins in the North American market segments supplied by Canada;
• expand the number of market segments and geographic markets served;
• improve the consistency, availability and quality of Atlantic groundfish and her-ring products, as this is a prerequisite to expanding per capita consumption and the number of market segments served;
• ensure that processors and exporters have adequate financial resources to enable them to undertake larger investments in marketing;
• improve on a continuing basis the awareness and sensitivity of fishermen, proces-sors, federal and provincial governments to the needs of the final product market-place; and
• provide for better co-operation and co-ordination of market planning and sales efforts to ensure the maximum effectiveness of marketing investments, to strengthen the relationship between the final market and fisheries management, and, as stocks grow, to develop and implement initiatives that will prevent over-supplying market segments currently occupied by Canadian products.
The policy issue is what government policies or programs are required to achieve the results just enumerated.
Background The world supply of groundfish is expected to increase by 15 per cent between 1981 and 1987. Canadians can harvest perhaps 25 per cent of that growth and effectively
Diversifying all of the forecast growth in cod catches. By 1987, Canada's supply of Atlantic the Canadian groundfish is forecast to increase by about 50 per cent, including a 75 per cent market base increase in cod over the 1981 catch. The remainder of the growth in world supplies is
forecast to be primarily in the so-called less desirable species, such as South Ameri-can hake and Alaska pollock. These species compete with Canadian supplies in the most price-sensitive market segments — the captive food service segment, which includes school lunch programs, plant cafeterias, prisons and hospitals.
The forecast growth in the demand for groundfish in North America and Europe will occur mainly in the market for premium frozen fillets and premium quality fresh fish and fillets. Limited additional opportunities may exist in non-traditional markets such as Nigeria (for stockfish), Brazil (for saltfish) and the Middle East.
290
Task Force on Atlantic Fisheries
Canadian sales of frozen groundfish and herring have been heavily concentrated in Canada, the United States and, to a lesser degree, Europe. Within North America, a substantial majority of the supply of Canadian products goes to the middle quality and price-sensitive market segments.
The implication of this situation — the growth in world and Canadian supplies, cou-pled with the already large share held by Canada in its major market segments — is a need to undertake a systematic diversification and broadening of the market base for Canadian fish products. A critical part of the diversification will be to reposition the Canadian industry to capture market niches for higher quality products in North America and Europe in order to insulate the industry from the substantial forecast growth in foreign supplies of less desirable groundfish species.
Up-grading Canadian product quality will enable producers to take advantage of the forecast growth in the consumption of fresh fish and premium frozen fillets in North America and western Europe. Improved consistency of product will also be essential to satisfy the requirements of the large multi-national food conglomerates, which are increasing their presence in retail products.
In the short run, an active defence of Canada's rights under GATT and joint ventures with foreign firms would seem to offer the best possibilities for overcoming trade barriers. For the medium term, Canada must make trade liberalization in fish products a major priority in future GATT negotiations.
Potentially profitable but risky opportunities exist in countries such as Japan, West Germany, Nigeria and Brazil and in the Middle East. However, to capture these markets, custom-tailored strategies and specific investments are often required. For example, top quality frozen-at-sea products would assist in gaining access to markets in West Germany and Japan. Stockfish is required for Nigeria. However, Canada has very little capability to produce this product. Substantial investments in trans-portation and infrastructure (e.g., cold storage) are often required in the Middle East or South America before fish sales can improve.
An important benefit of a market diversification program that should be addressed specifically on an industry-wide basis is improving the ability of the system to deal with unanticipated peaks in the harvest. If channels can be opened into markets that are not now served by Canadians (e.g., the Third World, East Bloc countries) these markets could absorb unanticipated domestic gluts that might otherwise depress prices in existing markets.
There are many mechanisms and procedures for diversifying markets. Processing firms have opened nine sales offices outside North America over the last ten years, and many firms have longstanding relationships with foreign brokers. Several joint ventures using equity from abroad have been undertaken. Limited co-operative sales ventures in fringe markets have been undertaken through various industry associa-tions such as the Canadian Association of Fish Exporters (CAFE).
Federal government contributions to the market diversification effort are made through the Trade Commissioner Service, as well as through a wide range of fairs and missions. The Program for Export Market Development (PEMD) has a special food section that is extremely flexible and can support, on a shared-cost recoverable basis, virtually any reasonable industry-sponsored market development project. The Department of Fisheries and Oceans is involved in pilot projects such as stockfish production and fresh fish distribution. In addition DFO provides a wide range of information and market analysis, and arranges to put new buyers in touch with sell-ers. The Fisheries Prices Support Board can conduct state-to-state sales and in emer-gencies can buy and sell products. The essential feature of these government tools is

Marketing 291
their ability to be selective and to focus on the most promising opportunities. PEMD
has been particularly effective in achieving its goals, working co-operatively with the private sector and avoiding problems with countervailing policies or programs in the United States and other countries.
Unfortunately, the priority attached to market diversification, in both the public and private sectors, has not been high. In view of the financial difficulties of the process-ing industry, it is unlikely that they will have adequate internal financial resources for the risky investments needed to market the forecast production increases, particularly cod.
Within the industry, there has been no coherent longer term view that would allow priorities to be set and guidelines to be laid out so as to reduce duplication and improve the effectiveness of both private sector and government marketing projects. In the past, as a result of the absence of a group responsible for establishing indus-try-wide market development priorities and plans, there has been a tendency to undertake short-run projects rather than long-term commitments to developing selected markets, products and systems.
Expanding As shown in Chapter 6, groundfish consumption in North America accounts for less
per capita than 2 per cent of all animal protein consumed. Canadian groundfish supplies consti-
consumption tute about three-quarters of one per cent of North America protein consumption. A small shift in the amount of groundfish consumed in North America could readily create a seller's market for groundfish.
Any program to expand consumption must be centred on improved quality and con-sistency. It will be easier to persuade consumers to eat additional amounts of Canadian groundfish if they are offered firm, sweet, white, boneless products rather than average quality fish. If consumers sometimes encounter bones or soft, off-odour, dry fish, they may be reluctant to try it again. It must be recalled, however, that the majority of consumers and buyers in most market segments are not willing to pay significantly higher prices for better quality and consistency. Fortunately, as we showed in Chapter 16, improved efficiency yields, resulting from better quality fish, will facilitate major cost reductions.
The key purpose of improving product quality and consistency is to expand the num-ber of consumers of groundfish and the frequency with which they eat fish. One of the important side benefits of enhanced quality is that trimmings from the higher priced products or lower priced standard quality fish can be used for very inexpen-sive cod block products, which can compete on a price basis with Pacific pollock and South American hake.
Promotion and advertising
Promotion and advertising of Canadian groundfish species and products has been under-funded. As discussed in Chapter 6, this arose because the industry was con-fined to producing undifferentiated products and because there was no vehicle to finance and undertake industry-wide or generic promotion. Additional generic pro-motion worth roughly $6 to 10 million per year appears to be warranted, particularly during the next five years when groundfish and cod supplies can be expected to grow by 50 and 75 per cent respectively. These funds should be used to expand the con-sumption of fish in the market segments dominated by Canadian products.
To persuade consumers, generic promotion should argue the health benefits (low calorie, low cholesterol, few additives) of fish compared with beef, pork and chicken. Consumer education would be necessary to demonstrate handling and ease of prepa-ration, while showing the cost advantages of Canadian groundfish relative to Scan-dinavian products and the quality advantages relative to hake and Pacific pollock. In the food service industry, the major task would be to increase the number of ground-

292 Task Force on Atlantic Fisheries
fish entrées offered on menus at public and captive food service outlets. As the con-sistency and availability of higher quality Canadian products inceases, the focus of the promotion could shift to quality, with a more direct attack on the quality-sensi-tive market segments.
Past experience with generic promotion underlines two preconditions for success —the need for a stable multi-year budget and planning capability; and a commitment to the promotion program on the part of suppliers, including subsequent long-term follow-through.
Increases in North American consumption might also result if consumers found the product more convenient to use and less expensive. This would require changes in product forms to cater more specifically to the needs of different types of buyers. Product forms would include more individually quick-frozen fillets, fresh fish packed in trays, and prepared entrées such as fish in sauce.
In the retail fresh fish business, major improvements could flow from increasing the number of retail outlets. However, this will require a much improved distribution and transportation system to move fresh products quickly. Guarantees of sufficient volume and a reliable year-round supply are essential before retailers will make their investment.
In the United States, the retail effort is growing and sales are expanding. However, the number of committed distributors is limited. A substantial Canadian effort to improve distribution and to make appropriate products more readily available could be a major factor in expanding fresh fish consumption in the United States. At the same time, expanding total U.S. sales of fresh fish will be an important factor in minimizing potentially negative reactions from U.S. fishermen.
There are a number of short-term constraints to solving these problems. The Atlantic industry's ability to launch an effective generic advertising campaign has been lim-ited by its inability to raise funds from all the beneficiaries and by the absence of a stable budget and management focus to provide continuity and follow-through. In addition, the industry is not generally able to afford substantial expenditures on mar-ket development or improved distribution.
If these financial and management constraints can be overcome, then substantial improvements in per capita consumption of Canadian groundfish in North America should be possible.
Final In Chapter 14 we discussed the obstacles to producing a larger share of the highest product quality products. Delivering higher quality, more consistent products is one impor- grading tant element of a marketing strategy. This will encourage the consumption of more
Atlantic Canadian groundfish, at the expense of competing proteins, and eventually help to gain a larger share of the market segments now dominated by Scandinavian suppliers.
There is substantial agreement in the Canadian processing sector that a correctly conceived and implemented program of final product grading would contribute to increasing the quality and consistency of final products. The major issues are how to define the standards and how to enforce them.
With regard to enforcement, two avenues are available — direct financial incentives or fines, and regulation. With regard to incentives it should be noted that in the mar-ket segment where quality is most relevant (that is, top quality cod fillets for the U.S. franchised and white tablecloth restaurants), the wholesale price for top quality cod fillets has been 400 to 500 per pound higher than prices for average products. For the reasons noted in Chapter 14, the Canadian industry has not been able to
Marketing 293
respond with large volumes of the highest quality product. This 30 per cent price spread suggests that major, expensive financial incentives might be required to achieve the necessary transformation of the Canadian industry.
Keeping the present system, which relies on fines, would require changes to the Fish Inspection Act to increase and restructure the fines in order to create strong finan-cial disincentives to deliver inconsistent quality. An enforcement system based on fines runs the risk that fines will simply be treated as a cost of business. In addition, imposing fines can involve time-consuming and expensive legal procedures.
Regulations administered by the Department of Fisheries and Oceans can overcome these problems if they are based on ministerial authority to remove a plant's right to sell products for export or in other provinces. This is why the Task Force favours the licensing of exporters.
Financing As discussed in Chapter 5, many processors are experiencing severe financial dif-
and distress ficulties. One of the ways these difficulties are manifested is in a shortage of working
selling capital, which makes it difficult to hold normal levels of inventory. The result may be high volumes of sales over short time periods; this has the effect of depressing prices and transfering control of the annual supply from Canadian processors to brokers and traders. This can lead to lower earnings and profits.
The most general solution lies in replenishing the equity base of the industry in order to provide risk capital and to reduce the need for short-term bank financing.
The traditional solution to working capital problems and losses in the fishing indus-try has been cash injections from the Fishery Prices Support Board (FPSB) or from ad hoc assistance programs. The Board has the power to buy inventory at prescribed prices or to pay price subsidies for specified products. In the present international environment these price subsidies are becoming increasingly vulnerable to counter-vailing measures imposed by foreign governments.
When originally created, the FPSB had a separate allotment of funds, which it used as required. With the advent of the new federal Policy and Expenditure Management System, the funds for the FPSB were put into the government's 'economic develop-ment envelope'. This was done because the industry used the funds only occasionally. Particularly during a time of restraint, the government has been reluctant to tie up these funds in years when they were not required. Under the new system, the FPSB
consults with the industry and presents the government with a proposal for financial assistance. The proposal then 'competes' with other government priorities and proposals for funds from the economic development envelope.
The effect of these changes has been to convert the FPSB into a special-purpose con-sultative mechanism that canvasses the industry and prepares proposals for special forms of assistance. In light of the recommendations on consultation in Chapter 21, the Department of Fisheries and Oceans should probably undertake a full review of the role and functions of the FPSB. It may be appropriate to consider the use of a loan guarantee mechanism to ensure that adequate funds are available, at commercial rates, to cover processors' peak inventory requirements.
Developing a The production or volume orientation of Canadian harvesting and processing has
market-driven arisen for a variety of domestic reasons. These forces have tended to work together to
industry create barriers that have inhibited the creation of a strong market-driven industry.
The milieu has become self-reinforcing, and it is extremely difficult to effect changes. As an illustration, nothing could be more oriented toward serving the final product market than the development of final product grade standards. However, most Canadian research has been directed toward identifying the quality of products

294 Task Force on Atlantic Fisheries
produced in Canada, in each plant, by each company, and from the fish caught by different harvesting methods. Virtually nothing has been done to 'map' either the array of quality standards used or desired by customers or the precise quality charac-teristics of competitors' products. In particular, options such as using final product grade standards as a strategic marketing tool or permitting processors to register their own grade standards have not been examined fully.
The final product grading debate, in both government and the processing industry, has focused on the production side of the business, with occasional consultations with the marketers.The only major independent input from marketers to this debate was a study of the potential effect of a set of standards proposed earlier. That study con-cluded that the effect would be adverse, and the proposed grades have subsequently been modified.
The relevance of individual initiatives proposed by the Task Force for alleviating marketing problems will inevitably fade with time and changing circumstances. There is a requirement for a permanent institutional change to strengthen the role of marketing and marketers in the overall operation of the fishery. They must have more opportunities to influence and more authority to control relationships with cus-tomers, competitors, the production and harvesting sectors, and governments. This raises two issues: orderly selling and orderly marketing.
1. Orderly selling: This term has been used to describe selling activity within a period of one season or less. In that period, the opportunities available for varying product form or target markets are relatively limited. Typically, sales managers will forecast the coming season's catch, make judgements about the probable catch and the behaviour of competitors, assess the markets available, and lay rough plans for product mix and target markets. In some cases contracts will have to be signed, removing some of the uncertainty.
This forecasting requires an information base covering a wide variety of supply and demand factors. Much of this data comes from the Department of Fisheries and Oceans, Statistics Canada and international organizations. The information is assessed by the firms, and forecasts are often prepared by industry associations such as CAFE. Fisheries and Oceans also prepares forecasts for this purpose.
Firms with the flexibility to change their product mix use the prices paid for differ-ent products (often based on data from the Boston market) throughout the season to fine-tune their product mix in order to maximize their returns. The basic aim of orderly selling is to ensure production of a mix of products that will maximize profits for the firm when resource, production and competitive constraints are taken into account.
It has been suggested that Canadian processors could take advantage of their large share of some market segments to extract higher prices by restricting the flow of product to a given market and charging customers higher prices. In practice, how-ever, the absence of a practical way of restricting the flow of Canadian products to a particular market or buyer, while compensating those firms whose products would be diverted to less profitable markets or left in the sea, largely eliminates the possibility of attempting to exercise this kind of market power. In addition, suppliers of compet-ing groundfish, herring and other protein products could be relied on to supply any markets where Canadian groundfish suppliers attempted to drive up prices by restricting supply. This would limit the extent of the price rise and eliminate the ben-efits to Canadian suppliers. The exception may be where Canada has a substantial share of the total catch of a particular species for which there are no readily avail-able alternative supplies. Flatfish may fall into this category. Cod does not, and as supplies grow over the next five years, this possibility will be increasingly unlikely.
Marketing 295
On balance, the potential for exercising market power is very limited in markets for groundfish species. The prerequisites for orderly selling are thus assembling informa-tion on seasonal forecasts and ensuring the availability of appropriate, timely data on prices, catches and production to achieve optimal short-run product mixes. To be most effective, orderly selling must be supported by orderly harvesting.
2. Orderly marketing: Orderly marketing is concerned with the creation and mainte-nance of effective marketing management and market development in the medium and longer term.
Market development opportunities exist in conventional commercial markets, primarily in North America and western Europe, and in fringe markets, which could offer modest, albeit risky, direct commercial potential or act as buffer markets. The most important fringe markets are volume sales to new markets in eastern Europe, the Middle East and Africa, state-to-state sales, and over-the-side sales. Commercial opportunities were discussed earlier in the context of diversifying the Canadian market base and expanding per capita consumption in North America.
Recent Canadian industry attempts to develop sales and exploit fringe markets have met with limited success. For example, efforts to co-ordinate large volume sales to Africa have demonstrated that this type of market development activity requires sub-stantial investments, dedication, up-front funding and consistent effort over long periods of time. This cannot be accomplished effectively on an ad hoc basis. The options range from creating a Crown corporation to develop these markets to com-mitting public and private funds to strengthen either an existing industry group, such as CAFE, or an established trading house.
Another opportunity is the developing markets in some East Bloc and less developed countries, which prefer to purchase from official state organizations. In many of these instances, the buyer is a state agency. The existing mechanisms for selling to these markets are the Fisheries Prices Support Board, which by law is Canada's des-ignated instrument for state-to-state fisheries deals, or the Canada Commercial Cor-poration (ccc). The ccc can be used as either a direct sales arm or as a government contracting agent to provide an official link between the buyer and a Canadian pri-vate sector seller. In practice, neither the FPSB nor the ccc has attempted to develop markets for Canadian seafood products. They lack the expertise, specialized knowl-edge and motivation. While these qualities exist in the industry, no institution exists that would help to overcome the potential conflicts among private companies (of unequal capabilities and differing interests) trying to share market development tasks.
Another institutional weakness is the absence of a mechanism to deal with over-the-side sales, the marketing effects of which can be detrimental to shore-based proces-sors and to Canadian market development. The Newfoundland fishermen's union (NFFAwu) proposes that a fishermen's union should have the right and responsibility to perform this task. Giving the exclusive right to control over-the-side sales to a union or to the companies would substantially alter the balance of power between the two.
Existing ad hoc procedures, which confer major income benefits on preferred groups of fishermen somewhat arbitrarily, create escalating pressures to expand over-the-side sales. A more systematic process is required so that fishermen and processors can negotiate equitable solutions to the problem of inadequate processing capacity or insufficient market interest in certain species or in certain areas.

296 Task Force on Atlantic Fisheries
Marketing More generally, marketing is a management responsibility. It is a planning process as a that synchronizes the various activities of the business and in fact bears the major management tool responsibility for co-ordinating supply and demand within the industry.This planning
process must take place before the other activities — product design, production, promotion and sales — can be co-ordinated in a logical plan.
A successful firm must offer its buyers a package of products and services that induce them to make a voluntary payment — that is, to buy some product. The professional marketer's planning tasks involve research into the needs of each set of buyers, designing an offer of products and services to meet these needs, communicat-ing the offer effectively, and delivering the goods and services in the right place at the right time.
The fundamentals of marketing management are analysis, planning, implementation and control. Marketing should result in carefully formulated programs, not random actions. It must take place before selling and lead to carefully formulated plans and programs. It is essential to select target markets rather than attempt to win every market. As a result, marketers should spend a significant portion of their time trying to distinguish among potential market segments and developing plans that concen-trate on meeting the needs of those segments where the potential for success is greatest.
To be effective, marketers must have a precise definition of their objectives. In the fishery the debate has been about whether to attempt to sell the maximum possible volumes or whether to try to maximize profits. But in marketing, the focus should be on buyers' needs rather than on the supplying industry's preferences. Effective mar-keting must be buyer-oriented, not seller-oriented. The best marketing strategies are doomed to failure if the harvesting and processing sectors cannot deliver the goods and services that the marketers have promised.
The marketing element of the industry must have the strength to impose these requirements or to influence the other activities of the industry. Among the primary areas of concern are the following:
• the final product market, where marketers must be able to deal with their clients and compete with competitors — backed up by investments in product develop-ment, promotion, inventory, and distribution systems — by influencing demand, by expanding markets and by developing more control over critical competitive variables;
• the co-ordination of market development priorities and plans among members of the industry and between the industry and the wide array of federal and provincial government initiatives; and
• the absence of the necessary influence by marketers on production, harvesting methods and resource management, to ensure that the products that will maximize earnings and profits are available when needed.
The prerequisites for a market-driven industry are authority over the critical com-petitive variables — quality, consistency and continuity of supply. If these conditions can be met, the marketers will be able to implement effective programs, including product design, promotion, pricing and distribution.
With respect to increasing the influence of marketers over production and harvest-ing, most of the discussion of the past several years has centred on the need to reduce fragmentation by reducing the number of exporting groups. As noted in Chapter 6, there is already substantial concentration of Canadian sellers, although the degree of
Marketing 297
concentration for different market segments varies considerably for different parts of the industry.
Nonethless there are several arguments in favour of further consolidation of market-ing activities. These include additional cost savings through economies of scale (estimated at one per cent of sales); improved ability of the smaller number of exporters to co-ordinate orderly selling and more effective market development activ-ity; and a greater capacity for the marketing organization to force quality discipline on the production and harvesting sectors.
Several approaches have been suggested for consolidating marketing activities. These include single-desk marketing, a state-owned marketing company, and a government umbrella organization under which consolidation of marketing by smaller processors would take place.
Proposals for single-desk marketing usually suggest that it be an entity totally sepa-rated from the processors. It could be owned and operated by government, by the industry or by a combination of both. It would be given a monopoly on the sale of all, or a group of, seafood products destined for specific markets. The advantages cited include a broad portfolio of products; market power in the product markets; and a capacity to develop and enforce final product grade standards. The disadvantages include a size that may lead to bureaucratic rigidities; reduced innovation and extre-preneurial drive; reduced ability to serve the wide range of specialty markets cur-rently filled by smaller Canadian suppliers; loss of contact with processors and fishermen; and active resistance on the part of many of the processors.
The advantages and disadvantages of a state-owned trading company (along the lines of, for example, the Canadian Wheat Board) are essentially similar to those of single-desk selling, but also include the possibility of a conflict of interest between the government's role as marketer and its role as regulator and international negotia-tor. The private sector fears that this could lead to a systemic bias, which would seri-ously handicap the ability of the private firms to continue to be competitive. The dis-advantages of the single-desk and state-owned trading company approaches have generally been thought to outweigh the advantages.
Not as readily dismissed is the desirability of further reducing the number of export-ers and creating a central co-ordinating apparatus. The issues are the means to achieve the consolidation and the role of government in the operation of the resulting marketing system. At one end of the spectrum is a proposal for forced consolidation under a system of compulsory licensing of exporters, supervised by a body reporting to the Minister of Fisheries and Oceans. At the other end is a proposal for govern-ment incentives for voluntary consolidation along natural lines determined by the private sector and for co-ordination through an industry-owned organization. Pro-posals for financing the proposed organization, regardless of its make-up, usually involve a combination of government support and levies on the industry.
The Options In this section we present some conclusions and options for managing the diversifica-tion of the Atlantic fishery's market base, increasing per capita consumption of Canadian groundfish in North America, and strengthening the role of marketing in the operations and management of the Atlantic fishery. In practice, each issue involves a continuum of possibilities for government involvement — ranging from virtually no involvement to full control. This creates a complex set of policy choices, many of which are interdependent. The central issue in the debate, however, is the role of government in the management of the industry and in marketing in particular.
298
Task Force on Atlantic Fisheries
The Task Force reached the following conclusions:
1. Over the next five years, while groundfish stocks are growing rapidly and the herring industry is undergoing a transformation, it will be necessary to under-take a major advertising campaign (the Task Force estimates that expenditures of about $25 million will be necessary) to stimulate the consumption of Atlantic Canada's fish products. Funding for this program should be derived from an industry levy as soon as this is financially feasible.
2. An additional $25 million should be earmarked for investments in the develop-ment of new market segments and new geographic markets for groundfish and herring products and for developing the private sector capability to ensure the continued evolution of these new markets. The funds would be administered through the food section of the Program for Export Market Development.
3. The significance of improved final product quality and consistency to the market diversification strategy and to increasing per capita consumption requires that the most effective enforcement tools be used. As a result, all processors and exporters of whole or headed and gutted fish should be licensed and, as grade standards are defined, the licensed processors and exporters must be required to grade all product sold inter-provincially or internationally.
The organizational and management issue is to identify the most effective way of integrating generic promotion, market diversification, and final product quality into a coherent marketing strategy that results in the setting of standards for final prod-uct grading, state-to-state trading, over-the-side sales, and marketing in developing countries, and in strengthening the Canadian marketing capability.
Option 1• An export marketing organization
This would involve voluntary consolidation of export marketers into a consortium supported by government financial incentives. Incentives could include cost-sharing for legal fees and start-up costs, developing common labels, and a one-year promo-tion campaign for the new brand.
Co-ordination and planning would be achieved through a private sector export mar-keting organization, which would be incorporated as a non-profit corporation. The board of directors would be composed of six or seven exporters elected from the industry and one each from the Department of Fisheries and Oceans, External Affairs and/or Regional Industrial Expansion.
The activities of the export marketing organization would include:
• providing market research and intelligence on supply, demand, and the competi-tion; interpreting market needs and preferences with respect to quality standards for use by each firm and advising DFO on final product grade standards; forecast-ing potential difficulties in markets to enable early action to be taken; advising the federal government on the implications of the final market for resource manage-ment; compiling selling information for the co-ordination of product mix and pricing in export markets;
• generic promotion; co-ordination of government and industry participation in international and national food shows and special promotional events; manage-ment of a generic promotion program funded by governments and industry levies;
• selling of product surplus to the requirements of the commercial markets in desig-nated fringe markets that would not normally be profitable (e.g., East Bloc, less developed countries, state-to-state trading); the organization could also assemble

Marketing 299
products for CIDA, make sales for the Fisheries Prices Support Board, and be des-ignated as an agent of the Crown for state-to-state marketing.
The export marketing organization would be financed jointly by governments and industry. Operating costs are estimated at $600,000 to $800,000 per year plus the cost of generic promotion and losses on export sales of products surplus to commer-cial markets and when acting as an agent of the Crown. The operating losses of the sales department would be covered by the Fisheries Prices Support Board. The gen-eric promotion budget would be composed of the funds normally spent by the Department of Fisheries and Oceans, the Department of Regional Industrial Expan-sion and provincial governments, plus an augmented contribution. Industry's contri-bution for administration and promotion would come from a legislated levy on the amount of fish (defined as fish that can be used for human food) that enters the processor's plant.
Channels of communication would be informal, and the organization's authority would be largely persuasive. The exception would be generic promotion, where the organization would have direct control over its own budget. Reports would be pre-pared for its members and the government on market trends and their implications for government and industry. Informal contact between the private sector members on the board of directors would facilitate industry co-ordination of market develop-ment and sales. A promotion committee would co-ordinate the activities of the indus-try and the federal and provincial governments.
Pros (a) use of a voluntary consortium would give an opportunity for complementary
products, production and personnel to be assembled without the use of govern-ment coercion;
(b) the organization has support in the industry, which has recommended creation of a body of this type; and
(c) as an industry organization, it would be more likely to be able to work closely with individual firms on their confidential market development plans than would a government agency.
Cons (a) requires expenditure of government funds to encourage firms to do what is
already in their own best interests;
(b) minimal additional marketing consolidation would likely result from incentives for voluntary consolidation. This would be particularly true of the most frag-mented sectors — fresh fish and herring. This would work against the objective of co-ordinated market planning and sales;
(c) the conflict between the profit-maximizing goals of the individual firms and the development of an effective marketing presence in fringe markets such as East Bloc countries and less developed countries would make the organization's marketing mandate difficult to develop; and
(d) it would not be possible to give a processor's organization a significant role in the conduct of over-the-side sales.
Option 2• An Atlantic fisheries marketing commission
An Atlantic Fisheries Marketing Commission would be established. This Commis-sion would in turn create, initially, three product marketing councils for (a) fresh and frozen groundfish, (b) salted and dried groundfish, and (c) herring.

300
Task Force on Atlantic Fisheries
Each export licence holder would automatically be a member of the appropriate product marketing council. An executive committee of each council would be com-posed of all exporters, or consortia of exporters, accounting for more than some specified percentage of sales, say 10 per cent. The chairman of a council would be selected by the federal government from a short list of nominees submitted by the members of the council. Each council would:
(a) undertake the analysis and activities necessary to establish marketing strategies and market development priorities for their products;
(b) identify market development and sales opportunities that cannot be readily addressed by the council members individually and encourage and co-ordinate such initiatives as may be appropriate to exploit these opportunities;
(c) plan and undertake generic promotion;
(d) make recommendations to the Minister of Fisheries and Oceans on all matters affecting final product grade standards and labelling, including standards, prac-tical enforcement procedures and penalties, and reporting conditions;
(e) make recommendations to the Minister of Fisheries and Oceans on any terms, conditions and eligibility criteria that may be associated with export licences for the Council's products; and
(0 prepare reports and make recommendations to the Minister of Fisheries and Oceans on (i) the implications of the marketing strategy for final product grade standards and the promotion plan; and (ii) the implications of the marketing strategy for in-plant handling of fish, dockside grade standards and fisheries management policies and regulations.
The Atlantic Fisheries Marketing Commission would be composed of members from the product marketing councils, provincial governments, fishermen's and processors' organizations and the federal government. The federal government would select a chairman from a short list of nominees submitted by the members of the Commis-sion. The Commission would have an executive committee of about ten members including the chairmen of the product marketing councils and representatives, elected annually, of the other member groups. The Commission would be supported by a secretariat, headed by an executive director. The Commission would:
(a) provide secretariat and analytic services to the product marketing councils;
(b) co-ordinate activities among the product marketing councils, especially regard-ing conflicts in marketing strategies between products;
(c) advise the Minister of Fisheries and Oceans on the requirements for fisheries management and development policies that will promote more effective market-ing;
(d) on the basis of the generic promotion proposals from the product marketing councils, recommend to the government the rate of assessment (by product) of a levy on domestically produced products and competing imports to finance the promotion program;
(e) seek provincial support for generic promotion and co-ordinate the support of governments for such promotion;
(f) assign promotion funds to the product marketing councils; and
(g) advise the Minister of Fisheries and Oceans on the desirability and the terms and conditions of all proposed direct sales to foreign fishing vessels (over-the-
Marketing 301
side and over-the-wharf) and arrange those sales that may be assigned to it by the Minister.
The operating budget of the Commission would come from the federal government. Total operating costs might be in the range of $2 million per year, including a professional staff of 20 to 25. The generic promotion campaign would cost the fed-eral government roughly $5 million in 1983-84, rising to $8.6 million in 1984-85 and declining to present levels in 1988-89. The cost of the generic promotion program would fall more heavily on the federal government in the initial years. Starting with a 90:10 cost-sharing ratio in the first year, the ratio would change over time, so that by the fifth year the federal government contribution would return to its current level (roughly $400,000). The industry's share would be raised by a legislated levy on the processors. The amount of the levy would be determined by Commission on the basis of recommendations from the product marketing councils.
Under this approach, channels of communication and authority would be formalized. The influence of the industry on government and exporters would be largely based on suasion. The influence of the product marketing councils and the Commission over generic advertising and final product grade standards would be direct. Generic pro-motion would flow from planning and be conducted by the product market councils. The final product grade standards would be influenced through the ability of the councils and the Commission to recommend specific final product grades to the Minister of Fisheries and Oceans.
Pros
(a) an effective mechanism to develop strategies and co-ordinate marketing plan-ning for diversifying the Canadian market base;
(b) more effective promotion;
(c) representation of all the major sectors in the fishery on the Commission would increase awareness of the importance of serving the needs of final markets;
(d) the influence of the federal government would be greater than under the export marketing organization approach. This would enable the Commission to deal more effectively with the conflict between the dual roles of private sector mem-bers as profit-oriented firms and as members of an industry community. This would be particularly important in developing the co-operation needed to exploit fringe markets; and
(e) provides a forum for resolving the problem of over-the-side sales.
Cons
(a) co-ordination of industry and government marketing development activity would still rely heavily on persuasion and informal agreements;
(b) the large number of members would make it difficult to ensure co-operation in market planning;
(c) the structure may be unduly bureaucratic or rigid; and
(d) the Commission could become a politicized, which would hamper its effectiveness.
An Atlantic fisheries export marketing board
A forced consolidation of exporters would take place through restrictions on the number of export licences.
Option 3:

302
Task Force on Atlantic Fisheries
An Atlantic Fisheries Export Marketing Board would be created to supervise the conduct and behaviour of export licence holders and to undertake market research, product and market development and export selling. The Board members would be order in council appointments and would include representation from fishermen, processors, the provincial and federal governments.
The Board would play many of the same roles as an Atlantic Fisheries Marketing Commission, but with significantly expanded powers and authority. Its functions would include:
(a) licensing of exporters and precribing the conditions for the acquisition and retention of licences, including the requirement that they enforce final product grade standards;
(b) establishing final product grade standards;
(c) consulting with the industry on market development priorities and undertaking generic advertising to achieve those goals;
(d) developing markets for Canadian fish in countries not well covered by present Canadian exporters;
(e) purchasing and supplying all fish needs of the government of Canada;
(f) undertaking all state-to-state sales and developing these markets; and
(g) entering into joint ventures with private organizations or firms in Canada or abroad to promote and expand exports of Canadian fish products.
Financing for the Board would come from the federal government and could cost $1.5 to $2 million per year in operating expenses in addition to generic advertising expenditures.
The channels of communication would be more formal and the authority of the Board would be substantially greater than under either of the other two options. The licensing authority would ensure maximum co-ordination in the planning and con-duct of the private sector's marketing and sales. As under the other two options, annual reports to the Minister of Fisheries and Oceans could address the implica-tions of marketing requirements for resource management and allocations policy.
Pros
(a) maximum enforced co-ordination of marketing and sales efforts;
(b) representation of all sectors of the industry on the Board would facilitate under-standing of the role of markets and marketing;
(c) most effective control of final product quality; and
(d) most effective method to ensure development of non-commercial markets.
Cons
(a) would tend to lead to significant rigidities and bureaucracy that might be slow to adapt and exploit opportunities;
(b) conflict of interest between the power of the Board to license exporters and its power to engage in exporting;
(c) forced consolidation of exporters may cause problems of mismatch, loss of independence for small processors and will be resisted — similar to the disad-vantages of the Atlantic Fisheries Marketing Commission approach; and
Marketing 303
(d) substantially reduces the entrepreneurial vigour of the Canadian exporting activity and limits the ability to serve small speciality markets.
Recommendations 32. License all processors of Atlantic groundfish and herring and exporters of whole or dressed fish, as a condition of selling their products internationally and inter-provincially.
33. Require that, as final product grade standards are defined, licence holders grade products that are exported or sold inter-provincially.
34. Establish an Atlantic Fisheries Marketing Commission. This Commission would in turn create, initially, three product marketing councils for (a) fresh and frozen groundfish, (b) salted and dried groundfish, and (c) herring.
35. Each export licence holder should automatically be a member of the appropriate product marketing council. An executive committee of each council should be composed of all exporters, or consortia of exporters, accounting for more than some specified percentage of sales, say 10 per cent. The chairman of a council should be selected by the federal government from a short list of nominees sub-mitted by the members of the council. Each council would:
(a) undertake such analysis and activity as is necessary to establish marketing strategies and market development priorities for their products;
(b) identify market development and sales opportunities that cannot be readily addressed by the council members individually, and encourage and co-ordi-nate such initiatives as may be appropriate to exploit the opportunities;
(c) plan and undertake generic promotion;
(d) make recommendations to the Minister of Fisheries and Oceans on all matters affecting final product grade standards and labelling, including standards, practical enforcement procedures and penalties, and reporting conditions;
(e) make recommendations to the Minister of Fisheries and Oceans on any terms, conditions and eligibility criteria that may be associated with export licences for the council's products; and
(f) prepare reports and make recommendations to the Minister of Fisheries and Oceans on (i) the implications of the marketing strategy for final prod-uct grade standards and the promotion plan; and (ii) the implications of the marketing strategy for in-plant handling of fish, dockside grade standards and fishery management policies and regulations.
36. The Atlantic Fisheries Marketing Commission should be composed of members from the product marketing councils, provincial governments, fishermen's and processors' organizations and the federal government. The federal government would appoint a chairman from a short list of nominees submitted by the mem-bers of the Commission. The Commission should have an executive committee of about ten members, including the chairman of each product marketing coun-cil and representatives, elected annually, of the other member groups. The Com-mission would be supported by a secretariat, headed by an executive director. The Commission would:
(a) provide secretariat and analytic services to the product marketing councils;
(b) co-ordinate activities among the product marketing councils, especially regarding conflicts in marketing strategies between products;
304 Task Force on Atlantic Fisheries
(c) advise the Minister of Fisheries and Oceans on the requirements for fisher-ies management and development policies that will promote more effective marketing;
(d) on the basis of the generic promotion proposals from the product marketing councils, recommend to the government the rate of assessment (by product) of a levy on domestically produced products and competing imports to finance the promotion program;
(e) seek provincial support for generic promotion and co-ordinate the support of governments for such promotion;
(f) assign promotion funds to the product marketing councils; and
Comment
(g) advise the Minister of Fisheries and Oceans on the desirability and the terms and conditions of all proposed direct sales to foreign fishing vessels (over-the-side and over-the-wharf) and arrange those sales that may be assigned to it by the Minister.
37. Enact legislation to give all necessary legal status and authority to the Atlantic Fisheries Marketing Commission.
38. Commit federal funding for a five-year campaign of generic promotion of Atlan-tic groundfish and herring products in North America and Europe to be carried out by the three product marketing councils. The total federal contribution in 1982 dollars (of constant purchasing power) would be $25 million phased over five years. Thereafter, the federal funds would return to current levels of about $400,000. The industry levy (proposed in recommendation 36) would replace federal funds as processors become more profitable. During at least the initial five-year period, the Atlantic provinces will be invited to make a contribution and to ensure that any promotion activities undertaken by them will be co-ordinated with the plans of the Commission.
39. Provide up to $25 million for the food component of the Program for Export Market Development (PEMD) to be earmarked for Atlantic groundfish and her-ring exporters. The spending of these funds should be treated as a 'challenge grant', being conditional upon development of satisfactory promotional and mar-keting programs by the industry. Perhaps 80 per cent of these funds would be recoverable through the normal repayment processes of PEMD. The money would be disbursed over eight years for (a) assistance to exporters to diversify com-mercial markets; and (b) for the development of the marketing capability of Atlantic groundfish and herring exporters.
Market analysis has shown that the world supply of groundfish will increase by about 15 per cent between 1981 and 1987. Canadians will have approximately 25 per cent of that growth and effectively all the growth in cod catches.
Canadian sales of groundfish and herring are heavily concentrated in North America and Europe. Within these geographic markets Canada provides a majority of the supplies of its species to the middle quality and moderately price-sensitive market segments. The growth in world and Canadian supplies and the fact that Canada holds a large share of its major market segments make it clear that there must be a systematic diversification and broadening of the Canadian market base. Failure to do so will result in over-supplying existing Canadian market segments and lowering the price the industry gets for its products.
Up-grading the quality of a substantial proportion of Atlantic Canadian products will enable the industry to reduce its exposure to competition from growing foreign supplies of less desirable groundfish and capture more of the forecast growth in the

Marketing 305
consumption of fresh fish and premium frozen fillets. More consistent, higher quality products will also be important in expanding the number of people eating groundfish and the frequency with which they eat it. Improved consistency of final product quality will also be needed to meet the requirements of large multi-national food conglomerates, which are increasing their presence in retail products. One of the important side benefits of enhanced quality is that trimmings from the higher priced products or lower priced standard quality landed fish can be used for lower priced cod block products, which can compete on a price basis with Pacific pollock and South American hake.
The central requirement for expanding export sales is thus to improve final product quality and consistency in order to be able to serve a wider range of markets, win a large share of the forecast growth markets in premium fresh and frozen products, and increase the per capita consumption of groundfish and herring.
Improving the quality and consistency of Atlantic Canadian products in all phases of the industry, from harvesting to final product, is therefore critical to the industry's future.
For over a decade, prices paid in the U.S. market for premium quality Icelandic frozen cod fillets have been 15 to 30 per cent higher than those paid for average quality Canadian fillets. For the reasons discussed in Chapter 14, the Canadian har-vesting and processing sectors have faced internal barriers to quality improvement that have prevented Canada from supplying the large volumes of high quality prod-ucts demanded by franchised and white tablecloth restaurants. The financial incen-tives provided by these users have not been adequate to cause the Canadian industry as a whole to focus on top quality. Increasing the financial incentives would require either positive incentives, such as large government subsidies, or, on the negative side, changes in the Fish Inspection Act to increase and restructure fines in order to create strong disincentives to produce inconsistent quality. Enforcement based on fines may run the risk that the fines will be treated as a cost of business, and the potential for change will be blunted. In addition, the procedures for imposing fines can involve time-consuming and expensive legal processes.
Final product quality regulations administered by the Minister of Fisheries and Oceans can overcome the problems if the regulations are based on ministerial authority to remove a plant's right to sell products for export or in other provinces. This is why the Task Force has recommended the licensing of exporters as the preferred enforcement mechanism.
Promotion and advertising of Canadian groundfish products have been under-funded. This has arisen in part from the nature of the Canadian groundfish industry, in which a great deal of the production is of nearly identical commodity products such as cod blocks and five-pound frozen fillets. There is little to distinguish the commodity products of one processor from those of another. In the markets for such commodity products, the benefits of any advertising by one processor will be shared by competitors producing similar items. Thus, there is no incentive to advertise. Other industries in this position — the dairy industry, for example — do what is called 'generic' advertising.
Unfortunately, the Atlantic groundfish and herring industries have not developed an institution that would allow them either to manage a promotion campaign or to col-lect funds from all those who would benefit from such a campaign. The combined effect of the Task Force recommendations on generic promotion and final product grading should expand per capita consumption of groundfish and herring in North America in Canada's market niches.
306
Task Force on Atlantic Fisheries
Even if the proposed generic promotion and re-orientation of the industry toward higher average quality are successful, competition from the world's growing supply of groundfish and competing proteins is expected to keep prices from rising in real terms over the next five years. Thus, efficiency improvements leading to cost reduc-tions will be essential if financial health in the harvesting and processing sectors is to be achieved.
Geographic market diversification will be necessary over the next five years. Several co-ordinated initiatives will be needed. First, trade barriers in foreign markets must be attacked in the short run by actively defending Canada's rights under GATT. In the medium term, Canada must make trade liberalization in fish products a major priority at future GATT negotiations.
The second thrust must be expanded investment in marketing. More joint ventures between Canadian and foreign firms seem to offer the best possibilities for overcom-ing trade barriers. Although the industry has made substantial progress since 1977 in expanding its sales and marketing efforts overseas, the priority given market diver-sification for Atlantic groundfish and herring in the past, in both the public and private sectors, has not been high.
The present financial difficulties of the processing sector make it unlikely that it will have adequate financial resources for the risky investments needed now to market increases in groundfish supplies. The Task Force recommendations for federal finan-cial commitments to the Program for Export Market Development and generic promotion are intended to address this financial constraint.
The limited past experience with generic promotion suggests the preconditions for success: a stable multi-year budget and planning capability, and a commitment to the promotion program by suppliers, including long-term follow-through. Maximum bang for the promotional buck in terms of increasing sales depends on creating insti-tutions that can respond to these two problems.
The proposed Atlantic Fisheries Marketing Commission (AFMC) and its product marketing councils provide an institution in which these decisions can be taken within the context of a coherent marketing plan. The AFMC will also be in a position to ensure that the regulatory approach to final product grading remains relevant and is both strategically wise and flexible.
More generally, the Task Force is concerned that the relevance of its individual pro-posals for addressing problems in the final market will inevitably fade with time and changing circumstances. There is a requirement for a new institution that will strengthen the role of marketing and the ability of marketers to influence the pro-duction and harvesting sectors, governments and the relationship with their custom-ers and competitors. Current problems that require institutional solutions are (1) strengthening the industry's ability to develop new markets at the fringe of present experience in the less developed countries and East Bloc nations; and (2) ensuring equitable use of over-the-side sales where there is inadequate processing capacity or insufficient market interest in a particular species.
To be effective and relevant, marketing should be the key management function that synchronizes the various activities of the business and co-ordinates supply with demand. The industry must become primarily market-driven, not supply-driven as it is now.
To be effective in this task, marketers need a precise definition of their objectives. They must always be aware of buyers' needs rather than focusing on the industry's preferences. Effective marketing must be buyer-oriented, not seller-oriented. The

Marketing 307
best marketing strategies are doomed to failure if the harvesting and processing sectors cannot deliver the goods and services that marketers have promised.
Several approaches have been suggested for increasing government influence on the marketing activities of the industry. These include single-desk marketing, a state-owned marketing company, and a government umbrella organization under which consolidation of marketing by the smaller processors could occur. The disadvantages — bureaucratic rigidities, reduced innovation and entrepreneurial drive, a more lim-ited ability to serve the wide range of specialty markets addressed by small Canadian firms, and the active resistance of many processors to forced consolidation of marketing — have led the Task Force to conclude that the costs of compulsory con-solidation outweigh the potential benefits.
Not as readily dismissed is the desirability of further reducing the number of export-ers and creating some means for better co-ordination of broad marketing strategies.
The Atlantic Fisheries Marketing Commission is recommended because it provides the maximum opportunity for developing private sector marketing ability and for co-ordinating market planning and promotion with a minimum of government involve-ment. The industry will be free to develop its marketing strategies and to execute plans with government support but not government coercion.
The AFMC provides a co-operative forum and will be largely, but not totally, in the hands of industry marketers. The balance of representation from the processing sector, fishermen and the provinces would ensure the education and participation of all sectors of the industry in marketing activities. The AFMC will also strengthen the influence of marketers on all the other elements of the fishery. Because this influence is long overdue, and in light of the key advisory role proposed for the AFMC in several areas (e.g., direct sales, final product grading, exporter licensing and generic promo-tion), it is essential that establishment of the AFMC and the product marketing coun-cils be accomplished as soon as possible.
We reject concerns about expanding the role of government in the marketing of groundfish products. Marketing must be strengthened. The proposals of the Task Force support marketers and place responsibility for the future of the industry more firmly in their hands than at any time in the industry's history.
The Task Force has not recommended a direct selling role for the AFMC or an expanded sales role for existing government agencies such as the Fisheries Prices Support Board. We have concluded that the least expensive and most effective method of expanding Atlantic groundfish and herring sales is to co-operate with and reinforce existing private sector marketing organizations. The creation of an addi-tional selling organization would only serve to fragment present efforts and disrupt the efforts of the current participants in the system. Moreover, such an organization could always be established if the recommended changes do not prove sufficiently effective.


309
18. Fishermen's Incomes
Fishermen are not poor because they are fishermen. They are fishermen because they are poor.
W.C. MacKenzie
There is no way I could fish if my wife didn't hold a full-time job.
Northumberland Strait full-time fisherman, at a Task Force meeting.
Incomes earned from fishing activity remain low for a majority of full-time fisher-men. While earnings by other members of fishermen's households raise total income levels considerably, a significant proportion of the families of full-time and part-time fishermen have incomes near or below the poverty line for rural Canada. Regular supplementation of incomes from non-fishing sources is still necessary until adequate, stable incomes can be generated from fishing activity.
The current system of unemployment insurance (ui) is the only program providing significant income stability and supplementary revenues for fishermen. Some administrative difficulties, economic disincentives and gaps in coverage for self-employed fishermen exist in the In program. These difficulties can be alleviated as a short-term measure, but long-term program changes should also be considered. Alternative programs would be preferable to ui if they could achieve specific goals that would help to improve the economic viability of the fishery (increased produc-tivity, enhanced quality, reduced seasonality) while also achieving socio-economic goals (community maintenance, economic development).
The policy issue is what new or modified policies or programs are required to improve fishermen's incomes.
Fishermen's income problems also affect capital accumulation and investment. Fish-ing enterprises (each enterprise being made up of an individual fisherman's invest-ment in vessels, gear, shore facilities and operating capital) are facing major difficul-ties in meeting debt obligations. This aspect of fishermen's financial problems is examined separately in Chapter 19.
The second objective for Atlantic fisheries policy, set out by the Task Force in Chap-ter 7, is as follows:
The Problem
Background
Employment in the Atlantic fishing industry should be maximized subject to the constraint that those employed receive a reasonable income as a result of fishery-related activities, including fishery-related income transfer payments.
General issues The essential financial problem for many fishermen is that they are not now receiv-ing a "reasonable income" by any standard of measurement. Studies undertaken by the Task Force (and reported in detail in Chapter 4) demonstrate that a sizeable portion of the households of full-time fishermen on Canada's east coast have total incomes below the recognized poverty line for rural residents. Low incomes are even more apparent in the case of part-time fishermen.
Generalized poverty in fishing communities is avoided in several ways. Individual earnings from fishing are supplemented by income from non-fishing sources. The most significant supplementary source is unemployment insurance benefits, but other transfers, such as family allowances and pension benefits, are also important. While part-time fishermen earn most of their income from non-fishing jobs, full-timers

310
Task Force on Atlantic Fisheries
spend the largest portion of the calendar year in fishing or in preparing for fishing. Most full-time fishermen do not have the time or opportunity to generate significant additional income from non-fishing employment.
Most fishermen's households depend on a second income — whether earned by a non-fishing family member or by a second fisherman in the family. Again, these earnings are supplemented through transfers such as unemployment insurance and family allowance. Thus, the key to financial health in many fishermen's households is the availability of secondary employment, particularly in fish-processing plants, but in other occupations as well.
There is considerable variation between the incomes earned by individual fishermen and between the incomes of groups of fishermen based in different geographical areas. Fishing communities have traditionally used the term `highliner' to identify an individual who is a top earner and expert at his trade. The presence of highliners is seen in all geographical areas. But it must be emphasized that there is no indication that fishermen who are not highliners lack attachment to the industry or technical ability or a willingness to exert real effort.
Geographical areas on the southern extremes of Canada's Atlantic region benefit from advantageous weather and ice conditions and from access to a variety of high-value species such as Georges Bank scallops. However, this should not lead to the conclusion that people in the more isolated areas want to leave their communities or, indeed, that they ought to move. As a public policy, the importance of maintaining population in all parts of Canada where historic community settlements are located is self-evident. The fishing industry is the prime economic tool for achieving this social, community and cultural goal in Atlantic Canada.
There is a considerable element of instability in pursuing a living from fishing. Fish-ing is a hunting occupation, and the 'beast' that is chased may outwit its pursuers or may not appear at all. Difficult weather and ice conditions or unpredictable species behaviour will play havoc with the revenues of even the most skillful fishermen.
Inadequate incomes are a source of concern not only for households trying to make ends meet, but also because they preclude the accumulation of funds for investment in working and fixed capital. Fishermen are businessmen, and their enterprises (con-sisting of vessels, gear, shore facilities and trucks) are subject to a cost-revenue squeeze similar to that in the fish processing sector. The resulting failure to generate adequate earnings from fishing means that enterprises often cannot accumulate the cash reserves necessary for repairs, new gear and major investments.
Fishermen's Unemployment insurance is by far the most significant Canadian program to supple- unemployment ment the incomes of fishermen and to provide a small measure of revenue stability. insurance Unemployment insurance for self-employed fishermen has existed for twenty-five
years. During this period it has cushioned the financial effects of seasonal unemploy-ment, unstable fish stocks or bad weather, and has provided substantial cash trans-fers to the entire Atlantic region.
To illustrate the role of In payments in supplementing incomes, according to Reve-nue Canada data, between 1974 and 1979, unemployment insurance payments pro-vided between 19 and 22 per cent of average total income for Atlantic region fisher-men. In 1981, ui benefits provided 16 per cent of total income for full-time

Fishermen's Incomes
311
fishermen and 13 per cent of total income for part-timers according to data collected for the Task Force survey.
The role of ui payments in effecting regional income transfers is illustrated by the fact that in 1980, ut fishermen's benefits amounted to $33 million in Newfoundland, $7.2 million in Prince Edward Island, $16.2 million in Nova Scotia, $8.6 million in New Brunswick, and $7.1 million in Quebec.
As well, unemployment insurance benefits paid under the regular program (as dis-tinct from the fishermen's ui program) is an important source of income for workers in fish processing plants. Benefits totalled $63 million on the east coast in 1980.
Problems A number of problems have emerged in the current unemployment insurance pro- with the gram for fishermen. Several are economic in nature, while others are administrative. tit program ui benefits are based on average earnings during the qualification period. Because
fish catches decline as the season nears its end, average earnings will also decline if a fisherman continues to work to the end of his season. In effect, this constitutes an incentive to stop fishing 'prematurely'.
The unemployment season for fishermen is defined by regulation as being between November 1 and May 15. This provides a useful administrative rule of thumb, but it discriminates against a minority of fishermen whose normal fishing seasons are dur-ing the winter months (due to the locations of their fisheries). In other words, these winter fishermen are not eligible for unemployment insurance benefits during the period when they are unemployed — the summer months.
Criticism can also be made of the 'equity' implications in all unemployment insur-ance programs. Unemployment benefits are calculated to increase in proportion to average earnings during the qualification period. This raises a question of principle about the fishermen's program and the entire unemployment insurance system: should greater ui benefits be paid to individuals who have already earned higher incomes, or should the highest benefits be paid to those on the lower end of the income scale?
Some problems also arise from the wording of detailed ui regulations. For example, a fisherman receiving TA benefits is not allowed to work on construction of a boat, even though the vessel is intended for his own use. In other words, he is not allowed to use his time while unemployed to improve his main capital asset, the fishing vessel, and thereby improve his potential earning capacity.
The wording of the rules for determining the insurable earnings of boat captains is also a source of problems. These rules create financial disincentives for boat captains who may be judged to have lower earnings than their crew members for ui purposes. In some cases, therefore, captains will receive lower ui benefits than crew members.
Federal government costs for fishermen's ui are significant. Close to 90 per cent of fishermen's benefits paid in 1980 were covered by the government, compared with roughly 22 per cent of the benefits paid under the regular IA program.
The most significant administrative problems arise from potential abuses in report-ing. Because of the economic disincentives described above, it is always possible that fishermen and buyers will co-operate to juggle their reports of fish catches for ui purposes. For instance, catches may be reported in a different week than the week they were caught so as to increase In payments; catches may be 'shared' between fishermen so that each is recorded as having higher catches for ut purposes; or low catches may not be reported at all.

312
Task Force on Atlantic Fisheries
The Options
Income Stabilization
Option 1:
These problems with the unemployment insurance system should not be exaggerated. Some economic disincentives exist, but they are less important on the larger boats, where fishing must continue because of high overhead costs. Fixed gear fisheries are occasionally closed because the quota has been taken; this, rather than ui rules, may prevent late season fishing.
On the administrative side, the problems are remarkably few for a program the size of fishermen's ui. Changes can be made to reduce the potential for abuses in report-ing. The question of the financial cost to the federal government could be reviewed as a separate item under the general issue of financial transfers to economically deprived regions.
The main problem with the fishermen's unemployment insurance program goes beyond the technical shortcomings just discussed. ui is strongly supported by fisher-men because they feel it treats them "like other workers". They believe that they are entitled to ut benefits if they become unemployed, so long as they comply with essen-tially the same rules for qualification that apply to other Canadian employees. This argument has merit, but it is countered by an important observation: fishermen's ui is not an insurance program in the usual sense. A central function of the fishermen's ui program is to supplement the incomes of a group of workers whose industry does not generate reasonable levels of income for many participants.
Some improvement in fishermen's incomes has taken place during the past 10 years, particularly where measures for collective bargaining have been developed. Never-theless, the current level of incomes for many fishermen remains inadequate and unstable. Funds transferred to fishermen through the existing unemployment insur-ance program are vital to the achievement of the second objective set out by the Task Force — that those employed in the fishery receive "a reasonable income as a result of fishery-related activities".
Recognizing the importance of unemployment insurance payments, and rejecting any notion that the amount of this transfer should be reduced or eliminated, a basic question must be raised: Can a new program be developed for the fishing industry to stabilize and supplement incomes in a manner that is superior to the existing IA sys-tem? This is the practical policy question that is at the core of discussions on the merits or shortcomings of fishermen's ui.
Any new system would have to be at least as administratively efficient and as socially fair (in the distribution sense) as the current tit program. Most important, a replacement program would have to provide demonstrably greater incentives than exist under the current ui system for fishermen to increase productivity, improve the quality of the fish they land, or reduce seasonality if the expense and disruption of introducing a new program were to be justified.
The options described below deal with the issues of income stability and income sup-plementation separately. In addition to examining possible replacements for fisher-men's unemployment insurance, we look at amendments to the present ui system as one of the alternatives for consideration.
Catch insurance
A system to guard against severe declines in annual catches, catch insurance would be similar to crop insurance in the agricultural sector — that is, a scheme (likely compulsory) to insure against declines in resource availability or changes in the volumes of catches. 'Risk rating' could be done on the basis of individual enterprises, or groups of enterprises, in specific geographical areas. Baseline data on catches by
Fishermen's Incomes 313
gear type and species in clearly defined coastal areas would be measured over 3 to 5 years for all registered enterprises. This would establish an average base against which to measure deviations in catch.
Pros
(a) directly related to risks in species availability, weather effects, or other natural phenomena;
(b) could be extended to changes in catch arising from government management conservation policies; and
(c) would not interfere with changes in market conditions (e.g., prices).
Cons
(a) extremely difficult to conceptualize a practical working model. Data do not exist for predictable risks relating to species, areas of activity, and type of gear used. At present the only potential for practical application appears to lie with stationary types of gear — e.g., traps, weirs;
(b) feasibility studies in the past on this type of program have predicted high administrative costs, requiring continuing government subsidy; and
(c) difficult (and perhaps impossible) to adjudicate claims in order to assess whether reasonable efforts were made by a fishing enterprise that has reported a failure in catch.
Option 2• Fisheries Prices Support Board
This would involve expansion of the current FPSB, with improved funding. The Board would intervene in a more active and anticipatory manner than at present. Ad hoc deficiency payments in the event of price declines would be payable to fishermen, processors or both on the Board's advice, with the Board having access to its own revolving fund (as it did prior to 1981).
Pros
(a) protects fishermen's incomes (and processors' incomes) from unusually severe price declines; and
(b) because it is an ad hoc arrangement, it would avoid developing an industry dependence on a regular price subsidy.
Cons
(a) subject to threat of countervail tariff from the United States;
(b) decisions would be unpredictable (especially if its method of funding does not change), and therefore not a source of automatic stabilization; and
(c) likely to result in some transfer of subsidy to processors when given to fishermen or vice versa (i.e., when bargaining wages or fish prices, any subsidy given to one party in a negotiation may be bid away by the other depending on the supply of and demand for the item in question).
Option 3• Gross revenue stabilization
A fund would be set up to guard against severe declines in gross enterprise revenues (as reported for income tax purposes). In order to smooth out the peaks and troughs of gross revenues, a program would be designed (likely compulsory) to provide pay-
314
Task Force on Atlantic Fisheries
outs when average revenues declined by a fixed percentage. Benefit levels would depend on actual revenues of individual enterprises, or groups of enterprises, com-pared with moving five-year averages of gross revenues. Data similar to the base line data necessary for the 'catch insurance' option would have to be gathered.
Pros
(a) more sensitive to economic realities than a catch insurance scheme, because it could reflect major changes in either harvesting catch or market prices (both of which affect gross revenues);
(b) simpler in administration than a catch insurance scheme, because it would be based on individual revenues reported through the existing taxation system;
(c) could be largely self-financing through levies on fishermen's incomes in good years (although government subsidy of administration costs will be needed initially);
(d) avoids problems with net revenue stabilization schemes (which include an element of subsidy on capital cost and thus promote over-investment);
(e) administrative rules could be set to allow participation by bona-fide fishermen only (with minimum or fishing period income requirement);
(f) pay-outs could be set at levels low enough to avoid creating disincentives to fish, and pay-outs would not be included in average gross revenue calculations for future years; and
(g) basing pay-outs on a percentage of a rolling five-year average of gross incomes from fishing would simplify administration of claims procedures — a claimant would be obliged to explain a discrepancy from his average income in the past.
Income Supplementation
Option 1:
Cons
(a) baseline statistics (on individual incomes, species and regional variations, gear types) will require three to five years to establish; and
(b) verification of actual fishing effort will still be needed to adjudicate claims.
Taxation-based supplementation
In order to supplement incomes, a 'negative income tax scheme' could be designed to ensure that fishing incomes (or total incomes) meet some guaranteed annual level.
Pros
(a) tax-based income supplementation may be an efficient and fair development for welfare payment systems;
(b) income payments can be aimed at the most needy; and
(c) would replace unemployment insurance, at least so far as lit is used for income supplementation purposes.
Cons
(a) requires major changes in the filing of tax returns;
(b) requires other major administrative decisions concerning reward for financial incentives, accounting of capital assets for self-employed persons, frequency of payments, etc.;

Fishermen's Incomes 315
Option 2:
(c) scheme is really a welfare program; fishermen are strongly opposed to being considered welfare recipients; and
(d) the purpose of an income transfer scheme should be a reward for achieving selected industrial goals (productivity, quality, etc.), not just the payment of extra cash.
Production bonus (or production incentive) In order to supplement incomes while at the same time encouraging economically desirable fishing patterns and practices (such as fishing in the 'shoulder seasons' or delivering premium quality fish), a production bonus system could be designed. This system would award credits to each fishing enterprise based on the gross value of landings and also on fish quality, timing of catch, gear used, or other criteria. The credits would be converted to cash pay-outs in the off-season. (A sliding scale of cash values for credits could be implemented for purposes of equity.)
Pros (a) could be designed to provide supplementary cash payments to fishing enterprises
based on the total value of fish landed (price times quantity);
(b) could also reward other performance factors (quality, landings made in the off-peak season, location of landings, etc.);
(c) value of the bonus could be adjusted from time to time to meet various criteria (e.g., unusually high or low landings);
(d) could be used as an alternative to fishermen's ul, or as an addition to the estab-lished ui system;
(e) total landed value reported for purposes of calculating the bonus would also be reported for income tax purposes; this would assist in administration and in assuring the integrity of all statistical reporting;
(f) would not necessarily conflict with the expansion of voluntary bargaining between processors and fishermen; and
(g) could be implemented without interfering in provincial jurisdiction.
Cons (a) long-term funding requirements could escalate if the bonus scheme is
`successful';
(b) unless the licensing system puts a damper on new investment (as the quota licensing system described in Chapter 10 would do), the bonus could lead to additional fishing capacity and unnecessary capital investment;
(c) depending on the precise criteria used to calculate the bonus, the system would enhance the relative economic positions of different groups of fishermen (those who catch the most might get the highest bonus). Thus, pressure could grow on the government to bring all fishermen to the same starting point — e.g., by subsidizing new gear; and
(d) as with the options for catch insurance and gross revenue stabilization, this scheme would require a detailed, efficient data reporting network to be imple-mented fairly.
Option 3: Modest changes to unemployment insurance
Technical amendments to the existing ui program may remove some economic disincentives and administrative problems.
316
Task Force on Atlantic Fisheries
A change in the calculation of benefits to reflect best weeks fished, rather than the existing rule of last weeks fished, would provide an economic incentive to fish as long as possible. This incentive would be enhanced if the 'best weeks' policy applied only to fishermen who worked beyond a minimum period, such as a 15-week fishing period.
Changing the recognized dates of the 'fishing season' and the 'unemployment season' could give recognition to the winter fishing season in some areas. This is particularly important in areas where a winter inshore fishery is possible (e.g., southwestern Newfoundland and inland areas elsewhere in Canada).
Revision of the detailed regulations relating to such matters as building new boats for personal use, the minimum period of fishing time needed to qualify for fisher-men's ui, and the calculation of insurable earnings for boat captains would create greater fairness in the system.
Pros (a) proposed changes would build on an existing system and would not involve a
major increase in costs; and
(b) the changes would bring regulations into line with what fishermen and proces-sors would prefer, so as not to provide a disincentive to spread out the season.
Cons
(a) ut is not tailored to encourage industrial goals such as quality enhancement or off-season production;
(b) fishermen's ui already costs approximately $100 million; these changes, as a package, will add approximately $10 million to the program costs; and
(c) an income stabilization and supplementation system tailor-made to the fishing industry would be preferable.
Recommendations 40. Develop a production bonus system to supplement fishermen's incomes by rewarding desirable fishing practices. This system would permit fishermen to earn cash credits, payable in the off-season, based on such factors as the gross value of their landings, fish quality, season of catch, or gear used. It would be federally funded, with initial pilot testing during the 1985 fishing season.
41. Develop a gross income stabilization plan to smooth out the high and low points in individual gross revenues over a rolling five-year period. This plan would be based on participation by all fishermen, with funding from their contributions and from the federal government. Detailed analysis should enable a pilot program to be tested in 1985.
42. In the short term, as a transition measure, request that the Canada Employment and Immigration Commission amend the regulations governing the fishermen's unemployment insurance program to provide benefit entitlement based on the best 10 weeks fished for fishermen who fish at least 15 weeks. Other changes in regulations should include (a) greater flexibility in defining the 'fishing season' to allow those who fish exclusively during winter months to qualify for benefits; (b) restrictions on the entrance requirements to the ui program, so that persons who fish less than 6 weeks will not qualify for benefits under the fishermen's program; and (c) revision of rules to permit boat-building during the benefit period for personal commercial use. Rules determining the net insurable earnings of boat captains should also be reviewed.
Fishermen's Incomes 317
43. Adopt a 'sunset' provision in the ui regulations for self-employed fishermen so that the entire program will no longer be in force after April 1, 1988, provided that the production bonus scheme (recommendation 40) and the income stabili-zation scheme (recommendation 41) can be implemented fully as replacements, with general approval from participants in the industry.
44. The data base on the economic situation of individuals, households, enterprises and communities involved in the fishery must be improved and maintained. A survey of household income and expenses of fishermen along the lines conducted by the Task Force should be repeated regularly. Similar surveys are required with respect to fish plant workers. The enterprise cost and earnings surveys of the Department of Fisheries and Oceans should be placed on a consistent statis-tical basis for all Atlantic areas, and further data must be collected on vessel financing and loan repayment costs. Data collected by the Task Force on small fishing communities should be refined and updated. These statistical activities are necessary to ensure that an adequate information base is at hand for monitoring the condition of the industry and for future policy studies at the micro- and macro-economic levels.
Comment A variety of structural and operational changes in the fishing industry, as recom-mended by the Task Force, will contribute to the long-term improvement of fisher-men's incomes. Some examples of these changes stand out: improvements in the quality and consistency of the landed product should lead to quality-based price dif-ferentials being paid to fishermen; the improvement of marketing planning and oper-ations should lead to a more stable industry and the opportunity for fishermen to receive higher prices; and changes in licensing policy to a quota licence system should result in lower capital and operating costs as the incentive to race for the fish is reduced.
There is no automatic assurance that increases in the market value of fish products will be translated into increases in the prices paid for fish and hence increases in the incomes of fishermen. The achievement of the Task Force objective of a reasonable income for fishermen will rest in part on the collective ability of fishermen to obtain a fair share of the additional revenues generated through the sale of improved fish products. It will also rest on the willingness of buyers and processors in the industry to pass on these additional revenues to labour participants in the harvesting and processing sectors.
Reward Our recommendation on the development of a production bonus scheme for income
quality supplementation ties in with our broader goals of improving quality and reducing seasonality. The bonus proposal recognizes that income supplementation for fisher-men will remain a feature of this industry for many years to come.
Linking supplementation payments to the achievement of industry goals can help improve efficiency without placing the burden of such changes on the backs of only the fishermen. Fairness and realism will be necessary in setting out the goals that would be rewarded through production bonus payments. To do this effectively we must recognize once again the need for fishermen and processors to negotiate collec-tively and agree mutually to abide by the results of such negotiations.
Stabilize An effective revenue stabilization program to mitigate the effects of natural factors
incomes such as poor weather, stock failure, or market price slumps would contribute signifi- cantly to the Task Force objective of attaining reasonable incomes for fishermen. However, we recognize that this program proposal will be difficult to implement.
318
Task Force on Atlantic Fisheries
Many factors have prevented the adoption of fishing revenue stabilization programs until now, including the shortage of adequate local data on catches by species, the absence of effective supervision against abuse, and extreme variability between different species, geographical areas and types of fishing gear. However, similar difficulties confronted the creation of agricultural crop insurance schemes in the past and these were overcome. We are therefore optimistic that an effective revenue sta-bilization program can be developed for the fishery.
Continuing the existing unemployment insurance program is a necessary measure. It is possible that a production bonus scheme, together with a revenue stabilization pro-gram, will eventually eliminate the need for fishermen's unemployment insurance. This is purely speculative, however. Until experience is gained with the proposed new schemes, it will not be possible to assess whether ut for fishermen should continue. At present, the ut program must remain in place, and it should be improved by reducing irritants or disincentives that harm its effectiveness.
Modify The special unemployment insurance scheme for fishermen now has built-in disin- regulations centives and other gaps in coverage. The existing regulations provide for benefits
based on average weekly catches. As catches decline near the end of the season, aver-age weekly catches also decline, thereby reducing the fisherman's benefit entitle-ment. Our proposal for the '10 best weeks' would remove the disincentive to stop fishing after the peak of the season, as a fisherman's entitlement would be based on his 10 best weeks of catches (provided he fished at least 15 weeks) and would not be affected by lower catches near the end of the season.
Under the existing fishermen's unemployment insurance regulations, fishermen whose fishing season is during the winter months are denied unemployment insur-ance coverage, as the qualifying period currently lies, by definition, only between May and October.
Our other recommendations are of a more technical nature and concern the relation-ship between the fishermen's program and the general unemployment insurance program.
Household We have emphasized the significance of non-fishing incomes earned by members of incomes fishermen's households. Many of these non-fishing jobs consist of work in fish proc-
essing plants. One-quarter of the population in the four Atlantic provinces lives in small fishing communities, more than half of which have single-sector economies that are dependent almost entirely on fishing and fish processing. The closure of a processing plant can well mean the closing of a entire community, because fishing incomes alone often are not sufficient to support a family. Keeping open as many plants as possible is therefore important in order to meet the objectives of improving the income of fishermen's households and maximizing employment. However, as we have said repeatedly throughout the Report, plants should be kept open only if they can be made economically viable.
The predominant position that the fishing industry occupies in the economy and cul-ture of Atlantic Canada is a source of strength from the standpoint of labour market development and regional economic expansion. Strong personal attachments to a community and to an industry increase the effectiveness of vocational training and skills development, while also enhancing the value of production investments requir-ing a stable work force. More attention should therefore be given to developing a strategy that focuses on generating in the Atlantic provinces as many industrial linkages to the fishing industry, in all its phases, as possible.
Fishermen's Incomes 319
Number of fishermen
Some observers hold that the income problem in fishing is essentially one of too many fishermen chasing too few fish. This implies that reducing the number of fish-ermen would lead to greater per capita incomes for those who remain. There is some validity in this statement, which is one reason (though certainly not the principal reason) why the Task Force recommended a system of quasi-property rights or quota licences in the fishery (see Chapter 10). However, a reduction in the number of fishermen will not in itself ensure that reasonable incomes will be earned by the remaining participants.
Reducing the number of part-timers, for example, will not have a substantial effect on the income levels of other fishermen because catches by part-time licence holders are low. As a group, they receive only 13 per cent of the total gross revenues gener-ated by fishing. Therefore even if we could be certain that their current catches would be distributed uniformly among all full-timers, there will not be that much extra fish available for distribution.
A significant new income problem would also be created if the activities of part-time fishermen were severely restricted or if they were eliminated from the industry. Although most part-timers make their main living outside the fishery, approximately 25 per cent of part-time licence holders earn fishing incomes on a level similar to average full-time incomes. From a social and community standpoint, it would be essential to show how those part-timers whose incomes depend significantly on fish-ing would make up for the loss of fishing revenues before their ability to earn such revenues could be restricted in the future.
If a reduction were to occur in the number of full-time fishermen, it would only have a positive effect on general income levels if the extra catch were distributed among the remaining fishermen in an appropriate manner. The reduction would have little effect on the distribution of incomes if the additional catch were taken mainly by large offshore vessels or by individual highliners who were already earning reason-able incomes. In other words, the problem of low incomes will not be solved simply by reducing the number of fishermen. Solutions must be linked to fair distribution of the catch among current (and future) participants and to the payment of adequate prices to these participants.
The Task Force does not believe that income supplementation or income stabiliza-tion schemes intended for full-time fishermen should also be extended to part-time licence holders. Limits must be set on the cost of such schemes, and they should not be used to encourage the entry of more participants to the industry.
One important measure of reasonable income for fishermen is whether revenues will be sufficient to repay previous capital loans and to accumulate savings for new investments in the fishery. Recent indications are that the ability of fishermen to obtain credit and make capital investments (in new vessels, for example) is deteri-orating as a consequence of the poor overall financial condition of the industry. A credit squeeze on fishermen is occurring through the tightening of loan and repay-ment provisions imposed by provincial loan boards, and through the effects of the rapid increase in costs for vessels and gear. This credit squeeze worsens the already significant effect of low incomes on the capitalization of fishing enterprises. This problem is examined further in Chapter 19.
In summary, the income problem for fishermen is two-sided. Inadequate revenues lead to inadequate household incomes. Households therefore become dependent on transfer payments and on secondary employment to make ends meet. Inadequate revenues also result in inadequate capital accumulation or savings. Fishing enter-prises therefore become dependent on government subsidies and loans to invest in vessels, and on working capital advances from processors to 'gear up'.

320
Task Force on Atlantic Fisheries
Inadequate revenues are the linch-pin in the dependency trap that ensnares a great portion of Canada's east coast fishermen. The recommendations in this chapter are designed to attack this fundamental problem, through ui changes in the short term and new production bonus and income stabilization schemes in the long run. Recom-mendations in other chapters deal less directly with the income problem by advocat-ing policies to improve the economic performance of the entire fishing industry.
321
19. Financial Assistance
The business leaders who clamour for government to let business alone would die of fright if any government took them at their word.
Eugene Forsey
A few years ago, I was longlining for codfish and landing the gutted fish for 14 cents a pound. The government announced a subsidy of 2 cents per pound on gutted fish to be paid to the fishermen. The price of fish immediately dropped to 12 cents per pound. Who got the subsidy?
The government, several years ago, announced a subsidy to be paid to fishermen which was 35 per cent of the cost of new boat construction. The price of boats immediately went up 50 per cent. Who got the subsidy?
The government offered a 50 per cent subsidy to anyone who would buy a fibreglass box for carrying fish. Before and after the period of the subsidy the boxes were selling for $350 each, during the subsidy period, they sold for $650 each. Who got the subsidy?
Gregory R. Thompson, a New Brunswick fisherman, in a brief to the Task Force.
The Problem The combination of an historically weak financial structure, severe losses in 1980 and 1981, and excessive borrowing to finance expansion and to cover losses has left the processing sector in an exceptionally weak financial position. Although the prob-lem is industry-wide, it is most severe among the offshore groundfish processors, in particular the large companies with extensive operations in Newfoundland. Unless financial assistance is made available, a number of major companies will go bankrupt.
Fishermen are also having financial problems. In some cases their incomes have not been sufficient to repay their vessel loans, to acquire new gear, or to maintain ade-quate levels of working capital.
Replacement of both large and small vessels by some of the present owners will be difficult in view of their poor financial condition. Dependence on credit from either provincial loan boards or processors will remain the major factor in the capital financing of fishermen.
The policy issue is whether special new programs should be established to provide financial assistance to fishermen and/or processing companies.
Background Historically, the processing sector has had a weak capital structure; this has left it unable to absorb the heavy losses sustained in downturns such as those that occurred
The in 1966 and 1974, as well as in 1981-82. In 1982, several small companies went
processors bankrupt. A number of the remainder, including three of the largest, are insolvent. They would be bankrupt now were it not for the forebearance of the Bank of Nova Scotia, which has been sensitive to the social importance of the fishery and, as a result, has shown considerable restraint during this difficult period.
Even many of those processors that have remained profitable (although only margin-ally so) have found their operations constrained by tighter borrowing restrictions. A few plants have been closed indefinitely, and a larger number have suspended opera-tions for periods of varying duration. The exceptions to the rule of financial distress are generally small firms with diversified product lines, although there are exceptions in every category (recall, for example, the data presented in Chapter 5).
322
Task Force on Atlantic Fisheries
Improvements in the efficiency of processing plants are vital if profit margins are to reach the target levels identified in Chapter 5. In Chapter 16 we identified the extent of the performance improvement that is needed at the plant level and recommended methods of restoring profitability.
Poor management has repeatedly been identified as a major problem in both large and small firms. It is said to be extremely difficult to attract good professional managers to the fishery. Less frequently mentioned is the fact that, with few excep-tions, the companies are family-owned and are disinclined to place responsibility in the hands of outsiders or to reward it appropriately. Solving the management prob-lem does not require recruiting scores of MBAS; much can be done through internal development of existing personnel resources. Significant progress can be achieved by encouraging promising employees to pursue educational and training programs offered by governments and universities. Further encouragement to existing and prospective employees must be offered through the establishment of compensation plans that adequately reward able employees.
Virtually all of the approximately 150 trawlers under Canadian flag are owned by processing companies, most of them by the four largest firms. The fleet contains a large number of ageing and/or obsolete vessels that must be replaced during the next five years to maintain catching capacity and to accomodate the growth in the TAC.
Side trawlers are the obvious examples, but many of the stern trawlers are now approaching the age when they must be replaced.
The preferred vessel is a 45-metre, 2500 horsepower stern trawler reinforced for operation in ice. Equipped with elaborate electronics suites, such vessels cost nearly $10 million to build in Canada. New vessels built abroad can be obtained for about $7 million, with serviceable used vessels going for around $3 to 5 million. Interest has also been expressed in freezer trawlers of roughly 75 metres. These would be even more expensive to build, but used vessels are available from the large foreign fleets left partly idle as a result of the expansion of fisheries jurisdiction by Canada and other countries.
The newly instituted system of enterprise allocations has allowed the companies to design fishing plans to maximize efficiency, rather than to catch fish as quickly as possible; this reduces the total number of boats required. The industry requirement for new trawlers will nonetheless be substantial — as many as five boats a year for the next few years. Some companies do not have the financial resources to undertake such a modernization program. However, if the financial structure of these compa-nies can be restored to good health, they should be able to finance new trawlers with-out a special trawler subsidy program.
The As to the fishermen, problems related to income adequacy, supplementation and sta-
fishermen bilization were addressed in Chapter 18, where we made recommendations for initia- tives to meet these income concerns. As we pointed out in Chapter 4, however, inade-quate personal and household incomes are only part of the financial problem facing fishermen today. The other part of the problem is their inability to accumulate or gain access to capital for new investment. The corollary to this observation is that unless the capital problems are solved in the short term, personal income levels will suffer over the long term. We will then be faced with solving severe (and costly) problems with fishermen's incomes.
There are two facets to the capital problem. One concerns the long-term investment necessary for boats and gear; the other relates to the annual working capital needed to keep fishing enterprises operating. Both stem from the inability of fishing enter-prises to generate adequate surpluses (after expenses, crew shares and loan repay-ments) to accumulate reserves for new capital investment in boats and gear.

Financial Assistance 323
It should be noted that this problem does not necessarily originate in the number of enterprises in the fishing sector (although in some cases it does) because of two factors:
1. As in any other business, some enterprises will be consistently more successful than others. As indicated in Chapter 10, catch distributions show that 90 per cent of the groundfish catch for vessels under 65 feet is being caught by between 55 and 65 per cent of the vessels. In other words, removing the 35 to 45 per cent of vessels that are least productive would have little effect on the remainder, because only 10 per cent of the catch would be available for redistribution.
2. For the large number of fixed gear groundfish and herring enterprises, individual catches depend on the quantity and distribution of fish that migrate inshore, not on inter-vessel competition. For these enterprises, annual catches can only be improved by up-grading technology — and this requires yet more capital investment.
In recent years, provincial governments have become increasingly active in the area of capital investment for vessels, by either increasing credit through their loan boards or (as in the last year or so) restricting the availability of credit. Some provincial governments have also linked loans to requirements that the new vessels be con-structed in the province issuing the loan. This has reduced competition between boat yards, with the result that vessel acquisition costs have risen.
Provincial involvement in this area is understandable in view of their concerns about creating economic development jobs in the fishery and in boat yards. This makes it difficult to advance specific proposals for federal action regarding the creation of new credit facilities or mechanisms. This is because such initiatives could result in pressure to transfer provincial loan liabilities to the federal government, or could expose any federal program to disruption as a result of unrestrained supplementary measures on the part of the provinces.
With regard to working capital for fishermen, this is an area related primarily to the port market and hence to provincial jurisdiction. As we pointed out in Chapter 15, processor/fisherman ties, in the form of working capital advances and supplies on credit, are a significant factor in the performance of the port market. Although there is no documentary information available, we suspect that this provision of working capital through the port market is neither efficient nor, to be blunt, free of subterfuge.
The inability to raise working capital through the port market arises from the rea-sons for its existence in the first place: processors use the provision of credit to com-pete for, and to seek some certainty over, the suppply of raw material delivered by fishermen. This leads to poor lending discipline and the absence of any rationing of credit on the basis of ability to repay. Thus, instead of only the most efficient fisher-men obtaining credit, all do. This tendency is reinforced by the fact that the proces-sor/lender is part of the community and is subject to social pressures to advance credit, even when his business instincts may tell him not to.
The working capital advanced in this market is often repayable in kind, that is, in fish deliveries. This fact, coupled with the desire to present the most favourable pic-ture to the tax authorities, opens the door to potential subterfuge in which processors and fishermen are partners. The Task Force was told repeatedly, at meetings throughout the Atlantic region, about how abuses can occur. A fisherman delivers 10,000 lbs. of fish, but sales of only 8000 lbs. are recorded. Delivery dates are recorded in the manner that maximizes ui benefits. Not everyone engages in these practices, however — only "the other guy".
324 Task Force on Atlantic Fisheries
This process leads to under the table transactions, using money that could otherwise be used above the table in the form of increased fish prices. It can also create a dependency relationship akin to the old 'truck system' or 'tied labour'.
The Options
Option 1:
Option 2:
The status quo
No special programs for the fishery would be introduced. The more efficient compa-nies have demonstrated an ability to earn a profit under even the most difficult con-ditions and require no assistance. Other operators have problems of a temporary nature that can be overcome by additional long-term debt financing. They would be able to obtain financial assistance under the Enterprise Development Program of the Department of Regional Industrial Expansion, as several have done already. The remainder would either struggle along until the market for fish strengthened, deriv-ing what benefit they could from some of the new policies recommended by the Task Force, or close their doors.
Pros
(a) minimum immediate cost to government, as assistance is provided in the form of loan insurance, not direct expenditures;
(b) minimizes government long-term financial investment in the fishery; and
(c) does not reward, or appear to reward, mismanagement.
Cons
(a) bankruptcy will be inevitable for several firms, including some large ones. Several communities will lose, at least temporarily, their sole major employer. Bankrupt fish plants almost invariably re-open, usually because government steps in with special assistance. The period when production is interrupted is very disruptive to communities and to markets;
(b) bankruptcy risks the loss of important assets from the fishery, such as vessels and machinery, as well as loss of experienced people; and
(c) indirect costs of this option, in terms of unemployment insurance and welfare, are high.
A special program for Newfoundland
The financial crisis is at its worst in Newfoundland and Labrador, particularly in the larger, trawler-operating companies that have relied almost exclusively on frozen groundfish. Without some sort of assistance, failures among these companies are inevitable.
There are two distinct Newfoundland problems: the overall under-development of the northern part of the province and the near collapse of the trawler companies on the south coast. We discussed the problems of northern Newfoundland and Labrador in Chapter 13. On the south coast, a rationalization of the industry is essential. Negotiations involving the companies, financial institutions and both levels of gov-ernment are now underway; their goal is to achieve restructuring of the industry, to take place in a manner that will result in the closure of those plants that are least efficient while strengthening the remainder. The result will be a fishery with a group of enterprises that have some prospect of being viable.

Financial Assistance 325
Pros
(a) deals directly with two problems in which the government is already involved —The Lake Group Ltd. and the Fishery Products plant in St. Anthony;
(b) permits a direct approach to the solution of special problems, at less cost than an industry-wide assistance program; and
(c) eliminates the risk, noted in Option 1, that important assets might be lost through bankruptcy.
Option 3:
Cons
(a) likely to provoke opposition from other provinces, each of which has similar problems, but in a much more limited number of communities than in New-foundland; and
(b) will be perceived in the rest of the industry as a bail-out of incompetence.
A working capital assistance program
In recent years, severe losses have depleted the working capital of most processors, leaving many of them in deficit positions — in other words, insolvent. Even some successful operators have found that banks have refused to extend lines of credit to levels reached in prior years, a circumstance that has prevented them from reaching their sales targets. It has been suggested that a government guarantee of working capital loans, perhaps by the Fisheries Prices Support Board, would be of great assistance, particularly if the rate of interest were subsidized.
Pros
(a) would remove a financial constraint that is hampering some companies, espe-cially if loan interest rates were subsidized; and
(b) relatively low cost, using guarantees rather than direct payments, although interest subsidies would prove expensive.
Cons
(a) while it may be particularly severe in the fishery, the shortage of working capi-tal is an almost universal problem of Canadian business at this time; establish-ment of such a program for this industry alone would generate immediate demands for similar programs from other sectors, especially if loan interest rates were subsidized;
(b) administration of such program would be difficult, as determining the proper amount of guaranteed loans would require negotiations with borrowers and lenders; FPSB does not have the expertise or staff to handle such a program; and
(c) most important, such a program would not contribute much to a long-term solu-tion to the industry's problems.
An Atlantic fisheries renewal board
In 1980 the Canadian Industrial Renewal Board (ciRB) was created to deal with the special problems of the textile and clothing industries. It drew together in one agency, under the direction of a private/public sector board, programs of the depart-ments of Industry, Trade and Commerce, Regional Economic Expansion and Employment and Immigration. The objective was to provide an integrated program for restructuring these industries to allow them to succeed in an increasingly com-petitive international environment.
Option 4:
326 Task Force on Atlantic Fisheries
The CIRB'S method of operation is first to provide a grant to cover up to 75 per cent of the cost of a comprehensive audit, by outside consultants, of the applicant's facili-ties, operating methods and business strategy. If it is satisfied that the audit indicates that the applicant will be viable in the future, CIRB can then make further grants of up to 75 per cent of the cost of capital expenditures required to allow the company to carry out its strategy. CIRB will not bail out losers. It supports only companies in whom it has some confidence.
A similar program could be developed to meet the special needs of the fishery, com-bining the programs of the same three departments that are involved in CIRB with a component from the Department of Fisheries and Oceans. The first step in the assist-ance process would remain the same: a comprehensive audit to determine the needs and potential success of the applicant. The second step, the actual assistance, would have to differ, however. Capital expenditure requirements of the processing plants are not large, especially in view of existing excess processing capacity. What is needed is working capital, and a general strengthening of the balance sheet. An Atlantic Fisheries Renewal Board could provide both, in the form of long-term, low-or no-interest loans to replenish working capital. It could also finance trawler con-struction where required.
Such a program would not improve the industry's situation to the same degree as a major injection of equity. However, in today's environment, soft loans are an attrac-tive form of quasi-equity. Assistance would be confined to those applicants whose plans offered some hope of successful financial recovery.
Pros
(a) a program tailored to the specific needs of the fishery — and therefore more likely to achieve the desired result — could be developed by the departments concerned; and
(b) the two-step assistance process would force upon management a detailed review of their operations and methods.
Cons
(a) extremely costly, unless severe restraints are placed . on lending; demand for loans could easily reach $200 million;
(b) establishment of a new agency will take time; it would take a minimum of six to twelve months before it commences operation. Given the time required to per-form the audits, no loans would reach the companies before twelve to eighteen months had passed; and
(c) may generate demands for further special agencies to deal with the problems of other industries.
Option 5: Designation under the Industry and Labour Adjustment Program
The Industry and Labour Adjustment Program (ILAP) of the departments of Indus-try and Commerce and Employment and Immigration was established to assist industries and communities hard-hit by downturns in certain industries, such as the automobile industry, which have caused exceptionally high levels of unemployment in specific communities and industries. While some studies, especially for marketing purposes, can be funded under ILAP, the main form of assistance is the provision of interest-free loans for up to 50 per cent of the capital cost of expansion and/or diver-sification proposals submitted by applicants. Applicants must satisfy the Enterprise

Financial Assistance 327
Development Board, which administers the program, that the project could not be undertaken without ILAP assistance.
As in the case of the CIRB, the ILAP regulations do not meet the needs of the fishery. If it were designated for assistance, a special set of regulations for the fishery, allow-ing loans for working capital purposes, would be required. The regulations should require that, as a condition of assistance, a comprehensive audit of a company's oper-ations be performed.
Given satisfactory audit results, assistance would then be provided in the form of long-term, no-interest loans for capital expenditures or working capital purposes.
Pros
(a) same 'pros' as an Atlantic Fisheries Renewal Board;
(b) as ILAP is an existing program, there will be no lengthy delay while an organiza-tion is established; and
(c) avoids the creation of another government agency.
Cons
(a) extremely costly, as in the case of an Atlantic Fisheries Renewal Board;
(b) less likely than a separate agency to be perceived by the industry as a program for its special benefit; and
(c) may generate demands to extend ILAP to other industries.
Option 6• Government equity investment
A major investment of new equity capital would strengthen the industry's balance sheet by reducing debt and improve the income statement by reducing interest charges. It is unlikely, given the fishery's checkered financial history and contentious regulatory environment, that sufficient private Canadian capital can be attracted to the industry at this time. The alternative sources are foreign investors and govern-ments. Foreign investors are believed to be interested, although the potential size and terms of the investment are not known. The issue of foreign ownership was discussed fully in Chapter 9.
Government might provide equity via an Atlantic Fisheries Renewal Board whose regulations could permit the purchase of preferred and/or common shares, rather than, or in addition to, granting loans. The response to such a program would depend on the governing rules. There is little distinction, for example, between a preferred share and a quasi-equity instrument such as an interest-free long-term bond. Com-mon shares, unlike preferred shares, give the investor a true ownership interest, with voting rights on management decisions. Applicants for capital, faced with a program that offered a choice between interest-free loans, dividend-bearing preferred shares or common shares, would unquestionably opt entirely for debt. The entrepreneur will resist sharing ownership in his enterprise unless there is absolutely no alternative.
Pros
(a) provides a source of equity to the industry.
Cons
(a) anathema to businessmen, who will only seek government equity as an alterna-tive to bankruptcy; and
328 Task Force on Atlantic Fisheries
(b) there is a subtle, but important, distinction between loans and equity. A loan is an arm's length transaction, from which the lender can withdraw if the bor-rower fails to meet his payments. Purchase of equity, in whatever form, is an investment implying a long-term commitment by the investor. This distinction may be more apparent than real where government provides the funds, but loans rather than equity do allow, at least in theory, an opportunity to withdraw from a situation that is no longer viable.
The policy issue is whether special new programs should be established to provide financial assistance to fishermen and/or processing companies. The Task Force recommendations are as follows:
Recommendations 45. Do not establish a new general program of financial assistance for either fisher-men or processors.
46. Do not provide direct special assistance for vessel acquisition or replacement, but ensure that vessels can be purchased from the most economical source, unhindered by tariff or other barriers.
47. Commend provincial loan boards for their efforts to continue to provide ade-quate capital funding for vessel purchase and repairs on terms appropriate to the financial conditions of fishermen. Initiate consultations between the federal and provincial governments on developing a uniform set of financial assistance policies and a possible new form of lending institution for working capital.
Comment The financial crisis in the processing sector was the problem that precipitated the lat- est round of special government attention to the fishery and led to the establishment of the Task Force. This Report makes clear that the fishery has a multitude of inter-locking problems crying out for solution. The most important of these in the immedi-ate future is the near collapse of several major processors with extensive operations in Newfoundland. If they were forced out of business, the effect on fishermen, plant workers, communities, indeed the Atlantic economy, would be devastating.
Restoring the financial health of those processors in the worst difficulty will require a large injection of new equity capital. Additional debt at market rates of interest will not solve the problem, as the companies are unable at this time to support the burden of interest and principal payments on their existing debts. It seems inevitable that the 'dead-weight' debt burden of some processors will have to be reduced by having financial institutions write off bad debts. In combination with new capital, this should allow some companies to become viable.
The new capital may have to be provided by governments, either directly or via guar-antees of loans at appropriately low rates of interest. Attracting equity capital from the Canadian private sector at this time will be difficult in light of the recent performance of the fishery, although every effort should be made to encourage such investment. Foreign investors, particularly those already in the fishing business, have continued to express an interest in investing in the industry, presumably because they are more concerned about a secure supply of fish than with immediate profits. These investors may have to be allowed to invest in the industry if it is to become viable (see Comment section in Chapter 9).
However, rebuilding the finances of the processors will be futile unless, once re-financed, they can achieve profitable operations. Continued losses will simply dissi-pate the new capital and drive the companies back to the brink of bankruptcy. Some reduction of the over-capacity in the industry is inevitable. Furthermore, the new investment in plant facilities made since 1977 must be optimally employed before further construction takes place.
Financial Assistance 329
A number of plants appear unlikely to be profitable under any foreseeable circum-stances and they will have to be closed. Some multi-plant operators own plants that may be individually viable but cannot support the overhead of the parent company. Mergers appear to be essential to reduce overhead, despite the fact that recent his-tory (as shown by the data in Chapter 5) has demonstrated that sheer size is not the key to profitability in the fishery. On the other hand, the problems of the large com-panies have not been due solely to size per se. A number of complex factors have combined to create the crisis, including the severe slump in the frozen groundfish business on which these companies are particularly dependent, the large investments undertaken by them since 1977, and the difficulties they have encountered in creat-ing the management systems needed to cope with very rapid growth in their scale of activity.
An essential element in restoring profitability must be a stable regulatory environ-ment in which to plan for the future. A step in this direction was made in 1982 with the establishment of enterprise allocations for the four major trawler companies, which has allowed more efficient fleet operations. What is required, however, are quota allocations extending at least five years into the future to allow a reasonable period for the allocation of scarce capital and manpower and to generate a reason-able investment climate.
There is an understandable reluctance in government to establish programs to assist specific industries. They are costly to start with, and tend to become more so over time as reasons are found to expand them. Nonetheless, they exist because some industries would disappear without them, with serious economic and social consequences.
In the case of the fishery, most of the companies find their profits and finances under pressure, but their general condition does not differ greatly from that of many Canadian industries that have felt the effects of the recession and high interest rates. The Task Force has therefore concluded that any ongoing program to provide finan-cial assistance specifically to the fishery cannot be justified at this time.
On the other hand, the Task Force is engaged in negotiations that are expected to lead to a restructuring of those offshore processing companies that are virtually insolvent at the present time. The restructuring of the assets of these companies into a viable company (or companies) may only be able to be achieved with an infusion of government funds, most likely by way of goverment equity. But this assistance should be a one-time effort only, after which the resulting entity should stand on its own, including the ability to finance new trawler purchases without special govern-ment assistance. The anticipated restructuring will do much to correct the weak financial condition of the processing sector apparent in the industry statistics pre-sented in Chapter 5.
Similarly, although fishermen are feeling the effects of the same conditions affecting processors, they are not in a significantly worse position than comparable groups like farmers. They are not prosperous at this time, but skillful operators who have avoided burdening themselves with excessive debt will emerge intact from the latest crisis. Therefore a special federal program does not appear to be justified, particu-larly in light of the fact that a price subsidy mechanism, the Fisheries Prices Support Board, already exists and can be used in extreme circumstances.
Part of our concern over the financing of fishing enterprises arises from inadequate knowledge of the extent of financial involvement by processors in the inshore ground-fish fleet. The fact that we do not know the degree to which processors — large and small — exert financial control over fishing vessels not registered in their names cre-
330
Task Force on Atlantic Fisheries
ates doubts in our minds as to who would actually benefit from any program of capi-tal assistance to fishermen.
Control of processors over fishing enterprises can occur in the form of direct equity, through financing down payments on vessels, or through making conditional sales agreements. These kinds of processor-fisherman deals, along with those related to the provision of working capital (for gear, bait, repairs, etc.), tend to tie fishermen to individual processors, restricting the fisherman's freedom to seek the best price in the port market and making him vulnerable to adverse turns in the financial health of the processor. On the other hand, the arrangements between fishermen and proces-sors are usually informal deals rather than legally binding contracts, so that there is a risk that a processor will be unable to recover his loan if a fisherman decides not to pay or to take his fish elsewhere.
With the 'independence' of the fisherman in question, any program of financial relief might simply make it possible for him to meet his obligations to his creditors, includ-ing the processors, without actually strengthening his 'bottom line' take-home earn-ings position. It could be argued that financial or capital assistance would at least forestall bankruptcy, but it is very difficult to be selective in helping those in need and at the same time be fair to those who are managing to stay afloat.
For all these reasons, the Task Force has concluded that no new programs of finan- cial assistance should be put in place at this time.
Various long-term alternatives can be devised to reduce the problems of inadequate access by fishermen to investment and working capital. One solution may be the creation of a 'one-stop shopping' credit facility or a fishermen's bank, capitalized by the industry as a means of promoting savings. Such a fishermen's bank could be operated on a compulsory deposit basis; fishermen would have to maintain a savings account over a period of time to obtain access to credit. Other alternatives might lie in the area of port market reform (see Chapter 15) or in greater provincial involve-ment in supplying working capital advances.
For the immediate future, however, it is difficult to see how fishermen's enterprises can be adequately capitalized without continued reasonable access to provincial loan board funding. Provincial governments have used the loan boards as the focus for their activity in the harvesting side of the fishery. Dependency on these boards by fishermen is real and understandable. Having created this dependency, a responsibil-ity rests with the provinces to ensure that fishermen's borrowing requirements can continue to be met.
331
20. The Herring Seine Fleet
History indicates that herring stocks . . . have been shown to be very unpredictable. They seem to run in cycles, showing strong year-classes for years, then, without too much warning, drastically decreasing to extremely low levels. This, of course, creates havoc with existing capacity, both harvesting and processing .. .
The Problem
Background
The Options
Option 1:
New Brunswick Fish Packers' Association, in a brief to the Task Force.
The herring resource on the Atlantic coast is no longer able to support the purse seine fleet at its current size (63 vessels and an additional three licences from recently sunk vessels). The quotas in the Gulf and adjacent to Newfoundland have fallen to very low levels, and there is no prospect of supporting a seine fishery there in the foreseeable future. The total Atlantic fleet must be reduced by at least some 20 to 25 vessels so that the remainder can be viable.
The policy issue is how best to accomplish this reduction.
In order to maintain and replace the existing seiner fleet, there would need to be her-ring catches with an approximate annual landed value of $30 million. The anticipated value of seiner herring catches from the Bay of Fundy in 1982 will approach $12 million, including the benefits from over-the-side sales to foreign ves-sels. Other species, such as mackerel, capelin and squid, if available to the purse seiners, might provide another $5 million, but even that would not permit viable operations or allow for the replacement of the present fleet. The Georges Bank her-ring stock has long-term potential, but will take many years to rebuild.
The resource shortage is more acute in the Gulf than in the Bay of Fundy. The 17 Gulf seiners, 80 per cent of which exceed 90 feet (most without the refrigeration capacity needed to land top quality herring), face an 80 per cent drop in their local herring resource and, during the past few years, have not been competitive in exploit-ing herring on the Scotian Shelf or in the Bay of Fundy. Substituting species such as capelin and mackerel, or converting vessels to catch other species, may partly allevi-ate the resource problem, but the present Gulf fleet cannot be viable in the forecast cost/price situation.
Under current cost/price relationships, and with the objective of pursuing a herring food fishery, the 'ideal' vessel equipped to land top quality herring might range from 65 to 75 feet.
Twenty-nine of the 32 vessels under 65 feet, and 26 of the 34 vessels over 65 feet, are at least 10 years old. Only 12 newer vessels are equipped with refrigerated sea water systems. Most of the smaller vessels have no refrigeration capacity. Although it is impossible to generate specific data because of the commplexity and variety of fish-erman-processor ties, it is estimated that 65 to 75 per cent of the herring seine vessels are partially or wholly owned or controlled (through loans) by processing companies. Ten vessels are owned outright.
Replacement costs approach $1 million each for seiners under 65 feet, $1.5 million for seiners 65 to 100 feet, and over $3 million for seiners 100 feet and over.
Free fishing
There would be free fishing for the TAC which, in 1982, is set at 60,000 t for seiners in the Bay of Fundy and 3000 t for seiners in the Gulf. The advantage would go to

332
Task Force on Atlantic Fisheries
vessels with the highest catching capability and the most secure market (particularly those vessels in which processors have a substantial stake). Those forced out of the industry would be the smaller vessels, a higher proportion of which have no processor ties. Once the fleet was reduced to viable numbers, boat quotas could be introduced to restore order to the fishery.
Pros
(a) the most efficient vessels (in terms of cost per unit of output) would likely sur-vive, although these may include older vessels that are already fully paid for, but that might not be able to deliver top quality product; and
(b) apart from decisions regarding TACS and allocations between seiners and small boat fishermen, this option involves the minimum degree of government inter-vention.
Cons
(a) processors would favour their own boats through their buying practices, leading to concentration of the survivors in the hands of the processors;
(b) with the herring quota for seiners available almost exclusively in the Bay of Fundy, Gulf-based vessels would have very little chance of surviving;
(c) would result in a disorderly race for the fish and, consequently, gluts at plants and poor quality product for the duration of the free fishing period;
(d) would be opposed by fishermen with independently owned and less productive boats; and
(e) provides no compensation for the losers.
Option 2• Transferable boat quotas
Individual boat quotas would be assigned now, but the quotas could be bought and sold, so that the more productive operators could buy out the quotas of marginal operations.
Pros
(a) results in most efficient units remaining in the fishery and, over time, would probably result in a smaller fleet of viable vessels;
(b) provides compensation, in the form of revenues from the sale of boat quotas, to those leaving the fishery; and
(c) self-rationalizing process that avoids need for government compensation and requires only nominal government intervention in the initial assignment of boat quotas.
Cons
(a) given the high level of provincial loan backing, provinces (New Brunswick and Nova Scotia) might enter a bidding war in order to acquire quotas for vessels on which they hold mortgages;
(b) would, in the absence of some limiting regulations, result in a high level of con-centration in the hands of processors, because of their greater access to cash to buy quotas;
(c) adds to the cost structure of the survivors an amount equal to the price of quota purchases; and
The Herring Seine Fleet
333
(d) experience has shown that in the herring fishery boat quotas are difficult to enforce.
A variation of this option would be to use an existing vessel operators' association, or create a new one, to manage an enterprise quota system (including, but not neces-sarily, initial allocations). Such an association could decide on issues of transferabil-ity, including questions of eligibility to own quotas and how the quotas of those leav-ing the fishery would be re-assigned. This approach has the advantage of leaving it up to the fishermen to determine how their fishery is to be controlled, but it is not likely to be favoured by processors who have a substantial stake in the primary sector but who, based on the criterion of outright ownership alone, would have few votes in any owners' association. This proposal has been advanced by Southwest Seiners Ltd. and the Atlantic Herring Fishermen's Marketing Co-operative Ltd., representing Bay of Fundy herring seiner operators.
An alternative to devolving outright control to an organization would be to establish a board with elected representatives of boat owners (including processor boat own-ers), but chaired by a federal fisheries official.
Option 3: Access to Gulf mackerel for seiners
There is a very large potential summer mackerel fishery in the Gulf that, to date, large seiners have not been permitted to exploit on a commercial scale. The fishery would probably have to be supported by freezer trawlers, which would purchase the seiner catch over-the-side and freeze it immediately for export. Some of the catch might be landed ashore by the seiners depending on the distance between a plant and where the fish was caught.
Pros
(a) potentially alleviates economic situation for a few Gulf-based seiners; and
(b) allows for fuller development of the mackerel resource.
Cons
(a) purse seining is an unselective fishing technology and could lead to resource declines before experience was gained in managing a mackerel purse seine fish-ery;
(b) threatens to weaken market prices for inshore mackerel fishermen because of the much higher volumes and lower unit costs of seiners;
(c) any mackerel fishing in the Gulf by large seiners would be bitterly opposed by local fishermen; and
(d) would be dependent on over-the-side sales to foreign vessels until Canada acquired freezer trawlers (because mackerel must be frozen quickly after catch-ing).
Option 4: A government-funded buy-back program
There are significant arguments for and against the principle of a government buy-back of herring seiner licences, apart from the practical consideration of rapid effort reduction. In the context of the Atlantic herring fishery, the principle of buy-back may be justified because:
1. the government controls entry to the fishery, seeking to ensure viability for the average vessel by matching the number of licences to the resource, and therefore
334
Task Force on Atlantic Fisheries
would be seen by some to have acquired some responsibility if the number turns out to be wrong after the fact;
2. resource projections, on which investment decisions by fishermen may have been made, are the exclusive responsibility of the government. The herring projections have turned out to be wrong by a very wide margin in the Gulf, leaving a great deal of investment without hope of viability (e.g., the TAC was projected in 1978 to be 83,000 t; it is now projected to be 36,000 t in the long run);
3. the government has decided that the quota that is available on the New Bruns-wick side of the Gulf should be reserved for the inshore (gillnet) fishermen. This policy alters the recent pattern of sharing the quota between seiners and gillnet-ters and leaves the Gulf seiners without any part of their principal traditional fishery. This may be seen by some to create an obligation for government to compensate those who are hurt by this change in policy;
4. biological advice suggests there could be a seiner mackerel fishery in the Gulf of a size sufficient to support a few vessels, yet the government is reluctant to per-mit such a fishery to start prior to reduction of the seiner fleet; and
5. there are numerous precedents for a government licence buy-back in other Canadian fisheries.
There are important counter-arguments to the buy-back principle, among them the following:
1. the government has been extremely careful to limit entry to the herring purse seine fishery and has not allowed any increase in the number of licences since 1971, well before the current decline could have been foreseen;
2. the government's liability for incorrect resource projections is surely limited. Scientific estimates will always be subject to error, indeed possibly fairly wide margins of error, particularly for single stocks and, more particularly, for a pelagic species such as herring which is notorious for wide fluctuations in abun-dance. These risks are well known to the herring industry and should be taken into account by investors, be they fishermen or processors;
3. compensation to a specific group harmed by government policies or by what some people may regard as government misjudgements, raises a broad issue of principle: if a buy-back program is instituted for this reason, then any person who alleges damages resulting from changes in government policy or poor fore-casts might claim equal entitlement to a `buy-out' — i.e., to compensation; and
4. in the current economic climate, with the high level of bankruptcies in other sec-tors, public compensation to herring seiners would inevitably raise questions of fairness and calls for similar measures for small businessmen and farmers who are all facing the prospect of business failure.
If it were decided to proceed with a buy-back, it should be directed at retiring all the licences in the Gulf and some Bay of Fundy licences. The basis for a minimum offer of payment by government could be as follows: (1) the industrial equivalent of sever-ance pay to be paid to captain and crew members of each vessel (e.g., 2 per cent of average annual earnings for each year of service on the vessel); and (2) payment of a `boat severance', calculated from the total crew severance pay-out, equal to the boat share of a typical earnings payout (a typical share arrangement is 45 per cent for the crew and 55 per cent for the boat). This offer would result in a total payout of $60,000 for an average large seiner and $18,000 for a small seiner. Of course, more generous terms for a buy-out proposal could be offered.
The Herring Seine Fleet 335
The buy-back would apply only to the licence, not to the vessel, which would remain the responsibility of the owner and mortgagee. At the time the buy-back was announced, the government would stipulate that if insufficient numbers agreed to be bought out within a given period (a year or less), there would be a period of free fish-ing to effect the sort-out.
As well, it would be vital to adopt regulations concerning technical equipment that would be mandatory aboard all seining vessels to enhance the quality of the product (e.g., refrigerated sea water). All vessel owners planning to participate in the 'free fishing period' would know in advance the investment in technology required to be allowed to fish.
Pros
(a) quickly reduces capacity' to the point where the fleet could be further rational-ized, without adverse consequences, by a system of transferable boat quotas;
(b) provides compensation for owners and crew who wish to leave and who other-wise, facing bankruptcy, would obtain nothing; and
(c) consistent with the precedent of buy-back established for Atlantic coast lobster and salmon and Pacific coast halibut and salmon fisheries.
Cons
(a) it is unlikely that many seiner owners would be induced to sell out at the mini-mum offer described above, preferring to take their chances in the fishery;
(b) difficult to ensure targeting on the right vessels, although regulations on manda-tory equipment for quality enhancement would help weed out some vessels;
(c) very difficult for owners of vessels with large mortgages to accept a buy-out of licence, as this would deprive them of the means to repay the debt. They would be in a weak bargaining position in attempting to sell the vessel to a licensed survivor. (The world market for seiners is very depressed.) It would be impos-sible to sell many of the vessels to the east coast herring fishery if a maximum length of, say, 75 feet were placed on future vessels; and
(d) a buy-out in the herring fishery may make it difficult to reduce effort in other fisheries without similar compensation.
Option 5: A buy-back funded by industry levies
The Southwest Seiners Ltd. and the Atlantic Herring Fishermen's Marketing Co-operative Ltd., representing Bay of Fundy seiner operators, have proposed a five-year buy-back program funded by industry levies on over-the-side sales and domestic pur-chases — in other words, landings charges. Over-the-side sales would also be phased out over the period, but the specific quantities or proportion of the TAC to be sold over-the-side to foreigners would be laid down in advance. This buy-back program, according to the joint proposal, would be managed by the two organizations. It would not apply to the Gulf seiners. The government would make a commitment that no new herring seine licences would be issued in the future.
Pros
(a) would achieve, over a period of five years, a reduction in fleet capacity accelerated by buy-back, without involving direct government compensation (although technically, government funding would be involved, as the govern-ment would collect the levies and then transfer these levies to the account of the organization managing the problem or to those bought out);
336
Task Force on Atlantic Fisheries
(b) would provide a better planning environment for processors, on the basis of cer-tainty as to the level of competition from over-the-side sales; and
(c) if linked to a transferable boat quota scheme, would provide a fisherman wishing to leave the industry with an additional source of compensation — either some other operator wishing to buy the quota, or the buy-back program. It would also provide an additional source of quota for those wishing to expand. The net result should be that the buy-back program would be a stabilizing influence on the quota market.
Cons
(a) does not deal with the problem of Gulf seiners.
Recommendations 48. Implement immediately the assignment of transferable vessel quotas to seiners, with the initial allocation distributed on the basis of relative catches in the past three years. The program would be managed by a board elected by current licence holders, with a federally appointed chairman.
Comment
49. Establish a five-year buy-back program for boat quotas funded by industry levies on domestic purchases and over-the-side sales. These quotas would be sold back to the remaining operators. As a starting point for discussion, a levy of $10 per tonne for domestic purchases and $25 per tonne for over-the-side sales is recommended. This, combined with fixed upper limits to over-the-side sales of 40 per cent of the seiner quota in 1983, declining to 20 per cent of the quota in 1987 (the last year of the program), would yield a total of almost $5 million over the period for buy-back purposes. The buy-back program would be managed by the same board that manages the herring enterprise quota system. Provision should be made to ensure that, by 1987, all seiners are equipped with approved refrigeration systems.
50. Establish stringent measures to prevent mis-reporting of landings — for exam-ple, by requiring landings to be made only in the presence of a fisheries officer and by suspending or cancelling licences for mis-reporting.
51. Undertake a strictly controlled program to determine the feasibility, from both the economic and management point of view, of launching a big-boat (seiner or trawler) fishery for mackerel.
In the present economic climate, we cannot see any justification for a publicly funded licence or quota buy-back program when other businesses in other sectors are going bankrupt without compensation. The only alternative we can see for the rationalization of the herring seine fleet is to introduce a system of transferable boat quotas — this despite the enforcement problems and the difficulties in controlling the extent of interest that individual processors could accumulate in the quotas. This can be augmented by a buy-back program for boat quotas funded by industry levies as described in recommendation 49. We feel that this approach is preferable to a free fishing regime, because those who sell out will get at least some compensation by selling their quota to other operators or to the buy-back program.
This approach is the same as the quasi-property rights (quota licences) system described in Chapter 10. Such a system need not allow for totally unrestricted trad-ing in enterprise or boat quotas — indeed, for public policy reasons it may be desir-able to restrict holdings of quotas so that no person, including processors, could own or have an interest in more than a fixed percentage of the TAC. The reason for this restriction would be to provide an adequate degree of port market competition so as

The Herring Seine Fleet 337
to ensure reasonable prices to fishermen. Such a restriction might be very difficult to enforce, however, as processors could use third parties to circumvent the rules.
The nature of the rationalization will depend on initial allocations. In the past, boat quotas in the Bay of Fundy have been distributed on a uniform basis. If this were continued under a transferable boat quota regime, the big new boats (with high capi-tal burdens) would not likely survive for very long, although there might be room for a few of them (those with refrigerated sea water equipment) to operate as collector vessels. If the initial allocation were more nearly based on catching capability, the older part of the fleet would have lower quotas and would soon be forced to drop out.
The initial allocations provide the opportunity for establishing a bias toward the kind of fleet ultimately desired. The Task Force sees the 'ideal' fleet as one comprising vessels in the 65 to 75-foot range, equipped with refrigerated sea water or equivalent features to ensure quality landings. Vessels of this size, with lower capital costs than the larger vessels, appear to be more likely to be viable business propositions.
Therefore the Task Force would favour a system whereby vessel quotas, for both the Bay of Fundy and the Gulf, were distributed on the basis of reported relative catches over the past three years, as we believe this will lead to the proper type of fleet fairly quickly and that it is an equitable or fair initial allocation under current circumstances.
Although the original proposal for a buy-back funded by levies on catches was advanced to us only with respect to the Bay of Fundy (as it was proposed to the Task Force in a joint submission by Southwest Seiners Ltd. and the Atlantic Fishermen's Herring Co-operative Limited), we feel that it should apply to Gulf-based seiners as well, for the following reasons:
1. herring licences were originally issued on an Atlantic-wide basis, and some Gulf-based seiners have a history of fishing in the Bay of Fundy;
2. thus some Gulf-based seiners would qualify for Bay of Fundy boat quotas and their catches would be subject to the levies on catches, as would their catches in the Gulf; and
3. this being the case, the Gulf-based vessels would contribute to the buy-back fund and should benefit from it in proportion to their quotas (which would be very small in any event, given the low seiner allocations in the Gulf).
With regard to the possible employment of some of the purse seine vessels now in the herring fleet in fishing for mackerel, the Task Force is of the view that, while the mackerel fishery may provide an attractive alternative for these vessels, such an option must be tested very carefully. We are concerned, in particular, over the effects the purse seine fishery would have on the inshore fishery, as well as whether such a fishery could develop markets in a conventional way rather than selling the catch over-the-side. Hence, we recommend that the feasibility of developing a mack-erel fishery be examined through a small-scale experimental fishery, with no long-term commitments being made until the results can be evaluated.


339
21. Dealing with Differing Views: Consultation and Decision-making Processes
If ever a time for consultation and co-operation was needed, it is surely 1982. Government must, in co-operation with processors and fishermen, rid itself of this 'wedge' which keeps all the participants at arm's length when discussing fisheries-related issues.
New Brunswick Fish Packers Association, in a brief to the Task Force.
The Problem
Background
Evolution of consultative processes
It is difficult to consult adequately and effectively with the myriad interests in the Atlantic fishery. Although a great deal of consultative activity, formal and informal, is an integral part of the Atlantic fisheries scene, there remains widespread criticism that such consultation is not as effective as it should be and that, on some important issues, it does not take place at all. The Department of Fisheries and Oceans is some-times accused of being secretive and arbitrary and of taking decisions without ade-quate knowledge or advice from knowledgeable sources (that is, processors and fish-ermen). Provincial governments complain that they are treated as merely one of many interest groups rather than as another level of government.
The policy issue is whether new consultative and decision-making processes are needed for the Atlantic fisheries.
Over the past decade the Atlantic fishing industry has seen the introduction of vessel registration, limited entry licensing mechanisms, total allowable catch and fleet allo-cation regulations, and stringent conservation regulations backed up by more effec-tive enforcement — all in the context of an historically unstable industry, and one that has been an employer of last resort. It would be understatement to say that as the industry experienced the resource and financial crises of the mid-1970s, and the recovery coincident with the extension of fisheries jurisdiction to 200 miles, it did not have the sophistication to analyze and respond adequately to the significant new policy issues that surfaced. Neither was it equipped to react effectively to the rate of change taking place in the fisheries world generally in the late 1970s.
This was especially true of fishermen's organizations which, with a few notable exceptions, were notoriously unable to analyze, consult and advise on behalf of their sector. In the absence of this capability there has been (and remains) a profound tendency for individual fishermen to 'take on' bureaucratic systems directly or via politicians or the media. Thus the evolution of the consultative process mirrors the belated evolution of the industry itself, from a relatively unsophisticated commodity producer to the world's leading seafood exporter.
Existing mechanisms for consultation have evolved in response to specific issues or requirements. A multitude of more or less active structures exists at various levels, from local groups to Atlantic region-wide organizations. It is not always clear, how-ever, how (or whether) the deliberations of these various groups reach upward to the appropriate decision-making levels within the Department of Fisheries and Oceans, and downward to those whose lives will be affected by the decisions.
Apart from the various ongoing management advisory committees, which are all spe-cies-oriented, the Department from time to time conducts region-wide 'seminars' (in effect, policy conferences) on significant issues. Again, these are usually oriented toward a given species (i.e., a specific fishery) or focused on a single issue (for exam-ple, a seminar was recently held on international fisheries issues). Participants repre-sent provinces and general community interests as well as the fishing industry.
340
Task Force on Atlantic Fisheries
An ongoing Federal-Provincial Atlantic Fisheries Committee at the deputy minister level provides a mechanism for addressing federal-provincial and inter-provincial issues. The Atlantic Council of Ministers, which meets from time to time, provides a means to deal with policies and programs at the political level on an 'as required' basis.
The departmental mechanism through which all Atlantic multi-regional issues filter en route to the deputy minister and minister is the Atlantic Directors-General Com-mittee. This group is chaired by the Assistant Deputy Minister, Atlantic Fisheries and includes the Assistant Deputy Minister, Economic Development and Marketing. It meets every 6 to 8 weeks.
Scientific Prior to the extension of fisheries jurisdiction, scientific advice on fisheries manage- advice ment in the northwest Atlantic (for those species exploited by other countries as well
as by Canada) was formulated by the International Commission for the Northwest Atlantic Fisheries (icNAF). Canadian scientists were a signficiant and highly credible part of this structure and exerted major influence on the advice given.
Following the extension of fisheries jurisdiction, departmental scientists recom-mended the creation of the Canadian Atlantic Fisheries Scientific Advisory Commit-tee (cAvsAc), which has played an increasingly important role in assisting in the for-mulation of stock management objectives and in advising on the status of stocks. The consequence of adhering to scientific advice since 1975 has been the general rebuild-ing of stocks over the period. The success of this rebuilding program has been acknowledged to be outstanding by everyone with whom the Task Force consulted.
There now exists a well-established process for formulating scientific advice, which includes peer review within the department's Atlantic scientific community. Provi-sion is also made for including data and analysis from sources outside the Depart-ment. On receipt of stock management advice, usually formulated in response to spe-cific objectives or specific questions, the relevant documentation is made available to the industry and to provincial governments as background to the consultative pro-cess. It is, of necessity, highly technical, and the recipients are not always well equipped to understand all the implications of what is being advised or to debate the merits of taking the advice as given or in modified form.
Debates concerning the adequacy of scientific assessments, whether well-informed or not, are not uncommon. Almost without exception, controversies that have occurred since 1977 around the issue of scientific advice have had as a significant feature one or more industry groups arguing for more fish or one group attempting to restrain another. This is not to say that the scientific process itself is without fault — the best example being the over-estimate of the herring stock in the Gulf as noted in Chapter 20.
There is also much criticism that departmental scientists are not sufficiently 'visible' or in full posession of all the facts. Both criticisms carry some justification, although with regard to the latter the industry itself, which freely admits mis-reporting essen-tial information in some circumstances, must shoulder some of the blame.
Nevertheless, by and large, the scientific advisory process is, and is seen to be, com-petent, credible and free from manipulative interference. From time to time there are individual criticisms about the objectivity and independence, not to mention the adequacy and the quality, of the advice. But to the extent that such criticism has any basis in fact, it would appear to be extremely exceptional rather than the rule.

Dealing with Differing Views: Consultation and Decision-making Processes 341
However, there remain problems of communication and interpretation of scientific advice to the interested public. This led the New Brunswick Fish Packers Associa-tion to say in their brief to the Task Force, "There seems to be a great deal of suspi-cion in relation to the data presented ... Co-operation between DFO biologists and fishermen is a key to future accurate stock projections."
Involvement of The processing sector of the industry is well organized in each province as well as
fishermen and under the umbrella of the Fisheries Council of Canada (Fcc). The largest companies
processors are individually capable of responding quickly and effectively to any policy or pro- gram change relevant to their perceived interests, as are the various provincial organ-izations and the FCC. Government can deal efficiently and effectively with profes-sional processing sector spokesmen to obtain views that are clear and representative of a wide body of opinion. Moreover, the industry organizations are empowered to commit themselves on behalf of their members.
The same cannot be said of the harvesting sector. The problem of fragmentation among Atlantic Canadian fishermen remains a major stumbling block to effective communication and consultation. Progress is being made, but it is slow and uneven. Some organizations (including the Newfoundland Fishermen, Food and Allied Workers Union) are well equipped to argue the interests of their members, to follow through on commitments and to communicate the rationale for decisions taken jointly with government or in various advisory committees. At the other extreme, `representatives' of groups seem to function only in times of local crisis and can do little more than commit themselves as individuals in any discussion. The consequence often is that DFO appears to adopt a paternalistic approach and attempts to do for fishermen what they cannot do for themselves — that is, represent their own inter-ests. The result is occasionally commendable, sometimes pathetic, and always awk-ward, if not inappropriate.
One of the earliest impressions gained by the Task Force was the diversity that exists in terms of the capability of fishermen's organizations to represent fishermen's inter-ests and the widespread incapacity to do so effectively (although there are a very few highly effective exceptions). Insufficient organization of fishermen, as well as a mul-tiplicity of unconnected and unco-ordinated organizations, remains the major stum-bling block to effective input from fishermen to fisheries policy. It is, for example, ridiculous that about 60 herring seiners are represented by 3 separate associations. Even where effective organization appears to exist, there remain significant problems of membership knowledge of and commitment to what may be said by spokesmen for the organization.
Federal- Jurisdiction over the fishery is split between the federal and provincial governments. provincial The federal government is responsible for the management of the resource, harvest-
consultation ing and inter-provincial and international trade. Provinces have jurisdiction over the type, number and location of processing plants. This can lead, and indeed has led in the past few years, to situations where plants have been built against the advice of federal resource managers and without federal financial assistance. Ultimately, how-ever, the federal government ends up with the problem of being asked to provide the raw material to make the entity viable, even where it has advised against construc-tion in the first place.
342 Task Force on Atlantic Fisheries
The Options
Option 1:
The fishery should ideally be managed as an integrated system from the resource through to harvesting, processing and marketing — and on a region-wide basis. Unfortunately, the current constitutional division of powers makes this impossible. In these circumstances, the matching of harvesting capability with the available resource, with processing capacity and with market requirements demands frequent and effective collaboration between both levels of government, as well as with fisher-men and processors.
Formal mechanisms exist at the ministerial and deputy minister levels for federal-provincial consultation. By and large, these mechanisms have served well over a long period of time, although there have been lapses, some notable, involving battles over the allocation of resources or jurisdiction. Nevertheless, there would appear to be merit in strengthening these consultative mechanisms, so that each level of govern-ment is at least fully aware of the plans, policies and attitudes of the other, and to provide the institutional means to debate and assess issues and to attempt to develop consensus on them. This should extend to federal-provincial and inter-provincial review of proposed processing capacity increases before licences are issued by the provinces.
Provincial governments are represented on all, or virtually all, management advisory committees and are members of international delegations when direct provincial interests are at stake. In practice this means most of the time, although not all prov-inces participate in all such meetings.
Status quo
This would mean a continuation of existing mechanisms and committee structures with such adjustments as seem appropriate from time to time to meet changing cir-cumstances.
Option 2: Adjusted status quo
Attempt to refine the present consultative structures and processes primarily to improve the effectiveness of communication 'up' to those who make decisions and `down' to those who are affected by them. Streamline the process (reduce size and freqency of meetings) and seek ways to make 'representatives' more responsible and responsive to those they represent.
Create a new group to cut across species and geographic lines and to advise the Min-ister and the Department of Fisheries and Oceans on broad policy directions and strategic issues.
Option 3: Delegation of responsibility
There are various ways in which DFO might delegate some of the authority and responsibility now exercised by the federal government to other levels of government or to the industry itself.
Various schemes have been put forward for the exercise of greater authority (though not necessarily greater responsibility or jurisdiction) by provincial governments. These usually envisage provincial allocations and greater provincial authority in lic-ensing fishermen, while leaving the federal government with responsibility for research, enforcement, setting TAGS and so on.
Dealing with Differing Views: Consultation and Decision-making Processes 343
There have also been suggestions that the U.S. system of fisheries management councils could usefully be adapted to Atlantic Canada. This would mean a delega-tion of the authority to manage the fisheries to an appointed body, representative of all interested groups, with the federal government maintaining a 'residual veto' in certain areas (e.g., foreign allocations).
It has also been suggested that fishermen should play a much greater role in deci-sions that affect their daily lives, and that mechanisms could be created to place much more responsibility for the management of harvesting upon the fishermen themselves. Thus the Eastern Fishermen's Federation has advanced the concept of `co-management', which was not described in detail by the organization, but which would appear to envisage a veto by fishermen over any change in policy or programs that they perceive to be inimical to their interests. It would also appear to involve a commitment by governments to adopt policies advanced by fishermen's organiza-tions, or at least to be more responsive to them than they now appear to be.
Recommendations It is recommended that steps be taken by DFO, in concert with industry organiza-tions, provincial departments of fisheries, and other federal departments as appro-priate, to formalize and streamline the processes for consultation and communica-tion on fisheries policy and programs. The following are our specific recommendations:
Comment
52. Review membership on management advisory committees and, in the interest of effective communication and serious pursuit of consensus, reduce numbers to the minimum necessary to ensure that essential interests are represented. Dele-gate greater responsibility to sub-committees to provide for greater efficiency and more effective representation.
53. Encourage organization of fishermen generally, as well as umbrella groupings that can represent the fisherman's viewpoint on region-wide and Atlantic-wide issues.
54. Make greater use of the Federal-Provincial Atlantic Fisheries Committee to develop policy, to harmonize programs and to resolve conflicts. This will prob-ably require the creation of a network of sub-committees on a continuing or ad hoc basis. An important specific function of the Committee should be a continu-ing review and assessment of fish processing capacity lo curb the tendency toward excess. The Committee should also work to harmonize the various fed-eral and provincial subsidy and loan programs for fishermen.
55. Create an Atlantic Fisheries Consultative Group of knowledgeable and experienced individuals. The maximum size should be 10 to 12, with occasional rotation of members. The Group would operate informally, with a mandate to advise the Minister and senior officials on major strategic issues.
56. Create mechanisms for more effective interpretation of scientific material to the concerned public and greater contact between resource biologists and fisher-men's groups.
57. Pursue means to communicate policy, policy changes, and the objectives of Canadian fisheries policy more effectively to the industry and to the public at large.
There is no doubt that the existing consultative process needs streamlining. The size of some groups would indicate that various interests believe that sheer numbers rather than well-reasoned argument will carry the day. The process is extremely demanding of the time and energies of senior DFO officers and is expensive, as DFO
pays for meeting rooms, translation, and often for the attendance of fishermen.
344 Task Force on Atlantic Fisheries
The consultative process more often involves arbitration of competing interests than searches for better ways to manage the fishery. It is thus fractious by nature, and results are bound to be uneven. Unfortunately there appear to be too many mech-anisms of this sort as opposed to genuine policy review mechanisms, although DFO is to be commended on its policy seminars as a means of placing issues in longer-term perspective and forcing rational discussion. There is, however, a need for an ongoing mechanism to identify and develop strategic issues. This is the rationale for the pro-posed Atlantic Fisheries Consultative Group.
The delegation of federal management responsibility to provincial governments and the idea of provincial allocations were dealt with extensively by both levels of govern-ment in the constitutional discussions that took place during the summer of 1980. The Task Force did not devote much time to re-examining these ideas, but notes that they are almost universally rejected within the fishing industry, as they were by the federal government in 1980. If the Atlantic fishery is difficult to manage now, it would be almost impossible if it were broken down into five separate sub-regions on the basis of political geography.
We were unable to generate any enthusiasm for a consultative and decision-making model based on the U.S. Regional Council system. It is apparently a system that is appropriate, if not inevitable, in the U.S. jurisdictional context, where states exercise fisheries management authority within three miles. It is of dubious relevance to the Canadian scene, where it would make the decision-making process more complicated than it is now, without contributing anything more to the substance of the issues or any better means for special interests to be heard.
The idea of 'co-management' has not been developed in detail by those who advocate it and appears for the moment to be more of a catch-phrase than a well thought out proposal of substance. The idea is nevertheless intriguing if it means that fishermen's organizations might take more responsibility for the development of and follow-through on policies in the harvesting sector.

V The Future and Getting There


347
22. Implementation and Cost of the Recommendations
Nothing is administratively impossible.
C.D. Howe
Nobody ever accomplished anything by pussy-footing.
Donald Gordon
Introduction With the delivery of its Report, the Task Force has discharged its mandate to recommend to the government a set of policies to achieve and maintain a viable Atlantic fishing industry. We are fully aware that many of the actions recommended will still require extensive consultation and study prior to, and in the course of, implementation.
We are also aware of the risk that once the Report has been received, and the initial glare of publicity has faded, the commitment to implementation may fade as well. Indeed, we are reminded of the statement by the 1928 Royal Commission on the fishery, quoted at the beginning of Chapter 1, that the complete and final removal of the disabilities afflicting the fishery "will require from the department patient and perhaps prolonged endeavour". Many of the recommendations in that report addressed issues that plague the fishery to this day, issues that have not been resolved in over half a century. Clearly, a more steadfast commitment to change is needed this time.
Responsibility for implementing the recommendations in this Report rests primarily with the Government of Canada and, within the government, mainly with the Department of Fisheries and Oceans. The willingness to accept change and to shape it creatively must nevertheless come from the individual fishermen, plant workers and owners who, collectively, are the fishing industry and whose co-operation is a prerequisite for the successful implementation of the program the Task Force has proposed.
We recognize that the interests of different groups in the fishery will inevitably lead them to oppose some of our recommendations and, therefore, that no set of recom-mendations that deals fully and realistically with the problems of the industry could attract full and unequivocal support. We believe, nevertheless, that our recommenda-tions constitute a balanced package, the elements of which are mutually reinforcing. The package is also balanced in the sense that it apportions fairly the burden of adjustment to change. It is therefore of utmost importance that this balance be pre-served in implementation. If this does not happen, the internal coherence of the recommendations will be lost, and an opportunity to foster greater unity of purpose in the industry will have been squandered.
The Task Force has made 57 recommendations. Some of them endorse and urge pri-ority for activities already underway; for example, many of the recommendations on quality enhancement are already at some stage of implementation in the Department of Fisheries and Oceans.
Other recommendations propose further consultation and study of an issue but stop short of suggesting what the outcome should be. The recommendations on port mar-ket institutions, the feezing of inshore northern cod for later processing, and the potential of a large seiner fishery for mackerel are three examples in this category.

348
Task Force on Atlantic Fisheries
A third group of recommendations sets a clear new direction but acknowledges that there must be consultation regarding the timing and specific methods of implementa-tion. Among examples are the recommendations on quota licences, delivery of fish to resource-short plants, and a gross revenue stabilization scheme for fishermen.
Finally, there are a number of recommendations that in the view of the Task Force can and should be implemented quickly, without extensive additional consultations. Examples include several recommendations to improve fish plant profitability, some immediate reforms to fishermen's unemployment insurance, and the earmarking of funds for fish export market development under the government's Program for Export Market Development.
A number of recommendations will require new legislation. Legislative drafting must begin well before an anticipated implementation date, given the length of the federal legislative agenda.
Legislation would be required to amend the Saltfish Act to broaden the mandate of the Canadian Saltfish Corporation to permit it to deal in species and products in addition to saltfish north of 50° in Newfoundland and Labrador and the Quebec north shore (recommendation 15). Amendments to the Fisheries Act would be needed to establish the proposed Atlantic Fisheries Licensing Review Board (recom-mendation 8). New legislation may also be necessary to establish the proposed Atlantic Fisheries Marketing Commission and its related powers, including authority to establish the levies needed to fund the industry share of the cost of generic promo-tion (recommendations 34-37). Legislation will be needed to impose the levy on her-ring landings required to fund the proposed licence buy-back (recommendation 49). Amendments to the Fish Inspection Act may also be necessary to provide for the lic-ensing of exporters (recommendation 32).
Timetable for The following comments convey the view of the Task Force on the broad issues of Implementation implementation and its timeframe. Although they follow the order of Chapters 9
through 21, not every recommendation is treated in the commentary.
The Task Force would expect the spirit of recommendations 1 and 2 dealing with foreign allocations to be reflected at once in government policy. The issues were explored fully at an industry-government seminar held in•September 1982 at Oak Island, Nova Scotia.
The Task Force attaches urgency to determining the criteria for judging the accepta-bility of joint ventures with foreign interests (recommendation 4). The immediate need for new equity investment in the fishery has been clearly identified, and the guidelines for foreign participation must be plainly spelled out.
It is also urgent that criteria be developed in consultation with fishermen and proces-sors regarding the circumstances in which over-the-side and over-the-wharf sales could be permitted (recommendation 5). These criteria should govern policy for the 1983 fishing season.
With regard to the key recommendation on licensing principles (recommendation 7), the Task Force would expect that enterprise allocations for the trawler fleet (vessels over 100 feet) would be continued in 1983 with a view to their permanent incorpora-tion within a year or two. We believe that the quota licence concept should be extended in 1984, on a pilot basis at least, to the middle distance groundfish fleet of vessels 65 to 100 feet.
Implementation and Cost of the Recommendations 349
The application of quota licences or a system based on a measure of fishing capacity to vessels under 65 feet must first be discussed extensively with fishermen to identify more clearly the benefits and risks and the practical limits of implementation. New options may emerge. To afford adequate time for a complete airing of this very sig-nificant concept, the Task Force would not foresee trial implementation on a wide scale in the inshore fishery before 1985. There might nevertheless be specific fisher-ies in which fishermen themselves may wish to have an earlier trial.
The legislation necessary to establish the Atlantic Fisheries Licence Review Board (recommendation 8) should be given priority. The Board will be needed to deal with, among other things, the enterprise allocations regime for trawlers, which even in 1983 should be well advanced.
Immediate discussions with the province of Quebec are necessary to determine the detailed steps that will be required by the federal government to consolidate its man- agement responsibilities for the marine fisheries in that province (recommendation 9).
Recommendations 10 and 11 on a resource-short plant policy should be implemented at once. An allocation of 10,000 t of northern cod has been earmarked for the pro-gram in 1983. Therefore, criteria for the eligibility of plants must be decided quickly in consultation with the industry and the provinces. The development of Canadian harvesting capability to take over the delivery program entirely, not later than 1987, requires that early attention be given to a fishing plan to occupy the vessels profit-ably between May and October when they would not normally be able to fish north-ern cod.
The Department should develop a long-term allocation plan for northern cod, begin-ning with the 1983 fishing season, that will dovetail with the approximate 1987 allo-cation target in recommendation 12. This will require a timetable for the increase of allocations to resource-short plants and for the introduction of Scandinavian-type longliners.
Evaluation of the large longliner technology should be given high priority. Even if the vessels appear promising, it would take several years to build the fleet to the roughly 40,000 t capacity suggested in recommendation 12. Private sector initiatives to test the longliner concept should be supported.
The Task Force recommendation to improve development of the fisheries economy in the area north of 50° latitude (recommendation 15) requires that legislative priority be given to amending the Saltfish Act to permit the Canadian Saltfish Corporation to buy, process and sell other than salt groundfish north of 50°. Meanwhile, exten-sive consultation will be required with the governments of Quebec and Newfound-land and Labrador and with fishermen and processors in the area to determine the most effective way for the new activities of the Corporation to foster fisheries-based development.
The Task Force attaches great importance and urgency to its recommendations on quality. The departmental timetable for implementation of its Quality Improvement Program has been discussed extensively with the industry and if possible should be accelerated. This would include a timetable for dockside and final product grading.
The Department should immediately re-initiate discussions with the provincial gov-ernments regarding simultaneous implementation of mandatory bleeding, gutting, washing and icing of groundfish at sea. Consultations should be held at the same time with fishermen to determine any exceptions that may be warranted. Mandatory gutting, bleeding, washing and icing should be in place not later than the 1984 season (recommendation 17).
350
Task Force on Atlantic Fisheries
Cost Implications
The collection and analysis of financial information on the processing sector, begun by the Task Force, should become a routine matter of co-operation between the Fish-eries Council of Canada and the Department of Fisheries and Oceans. Provincial governments should also be invited to take part. The development of standard for-mats and systems for financial and cost accounting data in the industry (recommen-dation 30) should begin in 1983 in co-operation and consultation with processors' organizations.
The Task Force believes that its recommendations concerning an Atlantic Fisheries Marketing Commission (AFMC) and associated product marketing councils require immediate attention from the Department and the industry. Several other recom-mendations in the Report require the advice of the AFMC—for example, those involv-ing final product grade standards, exporter licences, over-the-side and over-the-wharf sales, and generic promotion. A number of these issues are proceeding on their own tight timetables, so it is essential that the Commission be in place as soon as possible to exercise its intended influence.
The amendments to fishermen's unemployment insurance (recommendation 42) should be capable of rapid implementation, because only a change of regulation is required. For example, the proposal to include in the program fishermen whose nor-mal season is in winter should be in place for the 1983 winter fishery.
Recommendations 40 and 41 concerning a production bonus and an income stabili-zation plan for fishermen will require a great deal of research and data collection and extensive consultation with fishermen. Processors would also be affected. Progress with these two ideas will be a prerequisite to recommendation 43, which suggests that they might replace the fishermen's ui program in 1988.
The course recommended by the Task Force to deal with severe excess capacity in the herring seine fleet breaks a great deal of new gound. It calls for immediate assignment of transferable boat quotas and a novel licence buy-back program funded by a levy on both domestic landings and over-the-side sales. Because of the extraor-dinarily perplexing nature of the seiner problem, the Task Force urges that its recommendations be discussed urgently, but thoroughtly, with all those affected before a policy is implemented. It is important that the issue be resolved and a clear direction set, preferably before the start of the 1983 Bay of Fundy fishery.
The Task Force has considered carefully the issue of implementation, mindful that the failure to give it adequate attention has been the undoing of many previ-ous studies.
We have estimated the additional financial resources that would be required from the federal government to implement our recommendations over the years 1983 to 1987.
The cost estimates are of two types—those associated with annual operating costs of government such as salaries and regular program payments, and those for capital spending, grants and contributions.
The additional annual recurring cost to the federal government of the recommended activities would be approximately $25 million. Approximately 190 new positions in the public service would be created, most associated with the assumption of fisheries management in Quebec and with the dockside and final product grading program.
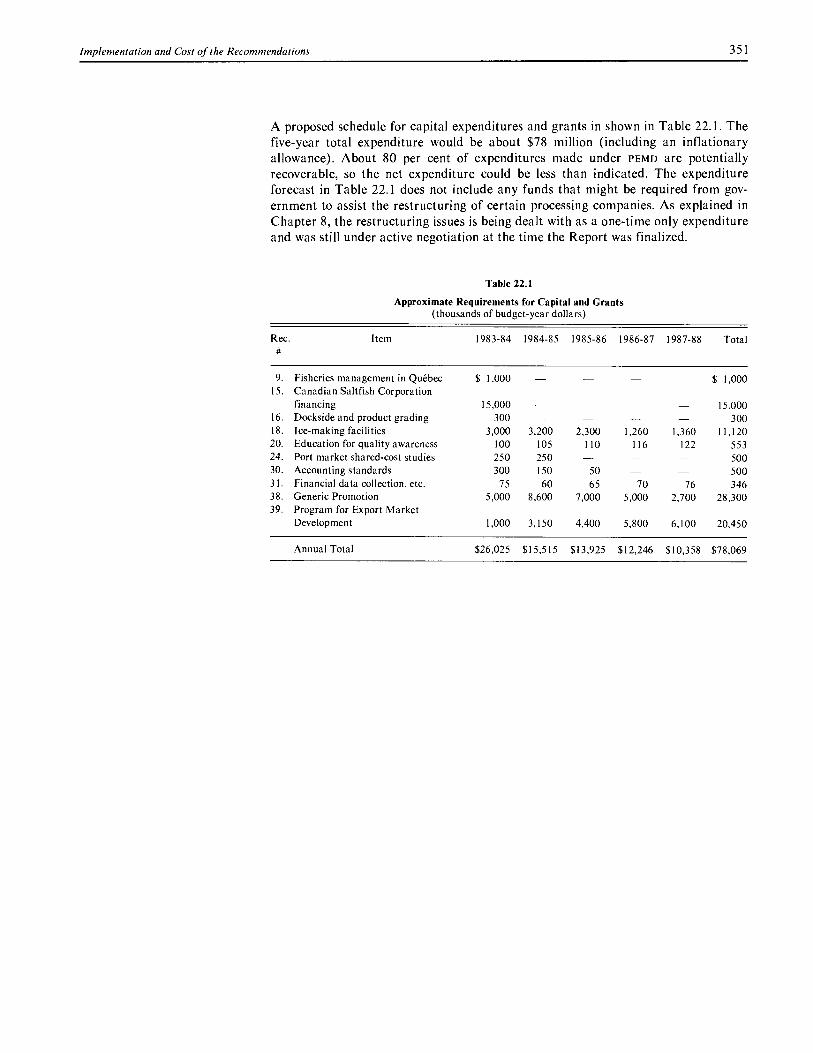
Implementation and Cost of the Recommendations 351
A proposed schedule for capital expenditures and grants in shown in Table 22.1. The five-year total expenditure would be about $78 million (including an inflationary allowance). About 80 per cent of expenditures made under PEMD are potentially recoverable, so the net expenditure could be less than indicated. The expenditure forecast in Table 22.1 does not include any funds that might be required from gov-ernment to assist the restructuring of certain processing companies. As explained in Chapter 8, the restructuring issues is being dealt with as a one-time only expenditure and was still under active negotiation at the time the Report was finalized.
Table 22.1
Approximate Requirements for Capital and Grants (thousands of budget-year dollars)
Rec. Item 1983-84 1984-85 1985-86 1986-87 1987-88 Total #
9. Fisheries management in Quebec $ 1,000 $ 1,000 15. Canadian Saltfish Corporation
financing 15,000 15,000 16. Dockside and product grading 300 300 18. Ice-making facilities 3,000 3,200 2,300 1,260 1,360 11,120 20. Education for quality awareness 100 105 110 116 122 553 24. Port market shared-cost studies 250 250 500 30. Accounting standards 300 150 50 500 31. Financial data collection, etc. 75 60 65 70 76 346 38. Generic Promotion 5,000 8,600 7,000 5,000 2,700 28,300 39. Program for Export Market
Development 1,000 3,150 4,400 5,800 6,100 20,450
Annual Total $26,025 $15,515 $13,925 $12,246 $10,358 $78,069


353
23. The Future Shape of the Atlantic Fishery
The Task Force is to report . . . on how to achieve and maintain a viable Atlantic fishing industry, with due consideration for the overall economic and social development of the Atlantic provinces.
Terms of Reference, Task Force on Atlantic Fisheries, January 8, 1982.
Task Force In chapters 9 through 21 we presented recommendations for dealing with the major
Recommendations problems facing the Atlantic groundfish and herring industries. In this chapter, we
and Objectives indicate how these recommendations will help to achieve the three objectives set out in Chapter 7. We then go on to discuss the importance of fairness, both real and per-ceived, in the content and application of fisheries policies. We also comment on the changes in attitude that will be required of everyone involved in the fishery if the policy changes we recommend are to be implemented successfully.
Economic As stated in Chapter 7, the first objective of fisheries policy should be to ensure the
viability economic viability of the industry. The Task Force recommendations make progress toward this objective in a variety of ways.
The marketing recommendations (Chapter 17), which call for the creation of an Atlantic Fisheries Marketing Commission, would help to expand the market for Atlantic groundfish through increased promotion designed to broaden Canada's market base and increase per capita consumption of fish products in Canada and elsewhere. The market would also be enlarged by a significantly expanded Program for Export Market Development and, most important, through better planning and co-ordination of the marketing efforts of Canadian processing companies selling abroad.
The quality improvement recommendations on dockside and final product grading (Chapter 14) and the system to license exporters, which will help to enforce product quality standards, are designed to strengthen prices for Canadian fish products in the marketplace. These, combined with the marketing recommendations, should help to ensure that the products produced by Canadian processors can be sold at adequately profitable prices.
But these improvements alone will not ensure the economic viability of the industry. In addition to expanding markets and getting the best possible prices in the market-place, processing companies must achieve significant operating efficiencies. The cost reductions outlined in Chapter 16 will be further enhanced by the savings that will result from implementing recommendations in other chapters of the Report. For example, plants will get better fillet yields as the quality of fish arriving at the plants improves. More efficient utilization of plants and improved productivity of plant workers will result when seasonality is reduced by spreading production over a longer period. This is one of the aims of the proposed program for resource-short plants.
Better professional management of processing firms and better training of fishermen, plant workers and mid-level management should improve the efficiency with which companies and individual plants operate. Reducing excess capital in plants and ves-sels by restructuring the industry and making enterprise allocations a permanent fea-ture of the offshore fleet will also reduce firms' costs.
Finally, the economic viability of the processing sector will be strengthened by allow- ing foreign equity investment if no other source of new equity can be found. As we make clear at several places in the Report, new equity investment is essential to the

354
Task Force on Atlantic Fisheries
Maximum employment
future of the offshore industry. But this investment can only be attracted and retained if adequate profits are earned.
The second objective of fisheries policy is to maximize employment, subject to the constraint that those employed receive a reasonable income from their work in the fishery. Total employment in the fishery, in both the harvesting and processing sec-tors, is already as large as one can expect in the foreseeable future; but many of the present participants in the fishery can expect to work longer and earn more as they catch and process increased quantities of fish.
The fact that the number of people employed in the fishery should decline slowly over time was recognized both implicitly and explicitly in many of the briefs to the Task Force, as well in a number of other recent studies of the Atlantic fishery.
For example, the 1978 Government of Newfoundland publication, Setting a Course, made the following observation:
[By 1985] the manpower required by the inshore sector will be considerably lower than at present. This projection is based on the assumption that near-shore fishermen should earn an average of $7,500 per annum in constant 1977 dollars if they are to receive a reasonable level of income for their investment and effort. It follows that if more effort is involved, average earnings would be less and the viability of this sector reduced.
The challenge is to devise policies that will not cause the present number employed in the fishery to drop rapidly, but allow it to decline slowly over time, thus helping to ensure reasonable incomes for those who remain and giving adequate time for other employment opportunities to be found for those who choose to leave. Some decline in the number of plant workers will occur, as some plants will inevitably have to be closed as part of the restructuring of the offshore processing companies, while the institution of a system of quota licences would result, over time, in some reduction in the number of fishermen.
However, in both cases, the incomes of those remaining in the fishery will rise. Lengthening the time during which seasonal processing plants operate — a result of the Task Force recommendations regarding the supply of fish to resource-short plants — would be of significant benefit to plant workers' incomes. More generally, the forecast 50 per cent increase in total groundfish landings by 1987 implies a sub-stantial increase in the total hours worked in plants as a whole. We expect this to result in an increase in the average yearly hours worked per employee and hence in an increase in the average annual income for plant workers.
The proposed changes to fishermen's unemployment insurance and the implementa-tion of a production bonus scheme would significantly increase the incomes of full-time fishermen by changing the incentives so that fishermen are rewarded for fishing longer seasons and delivering better quality fish.
In addition, the quota licence system would enable fishermen to obtain more economically efficient vessels, while simultaneously freeing them from a great deal of the regulatory burden to which they are now subjected. This would allow more technological innovation and hence a reduction in harvesting costs. These proposals were designed to offer incentives to fishermen to increase their incomes by trading up or down to more productive and cost-efficient vessels. As with the plant workers, fishermen too will benefit from the continued growth in catches, provided their num-bers do not increase to swallow up the potential benefits of greater average landings per fisherman. Our recommendations on quota licences should ensure that the num-ber of fishermen eventually is better matched to the size of the resource.

The Future Shape of the Atlantic Fishery 355
The proposals with direct effects on fishermen are designed to increase the value of catches and reduce costs, thus increasing net incomes. However, there will be those who argue that our recommendations do not go nearly far enough toward solving the current net income problems of fishermen, particularly those who now earn the low-est incomes.
These people will argue that our failure to recommend the implementation of a port market institution, such as that proposed by the Newfoundland Fishermen, Food and Allied Workers Union — which would result in fish prices paid to fishermen being subsidized whenever market-determined prices are low relative to fishermen's har-vesting costs, in much the same way that prices farmers receive for certain of their products are subsidized — means that once again an inquiry into the fishery has been concerned only with the financial problems of processors and has ignored the financial problems of fishermen.
We cannot agree with this criticism. To have followed this approach would have been to neglect the fundamental position of the Task Force: that an economically viable industry, one that does not have to depend on ongoing government subsidies, should be the primary objective of fisheries policy. We reject it also because there already exists a mechanism, the Fisheries Prices Support Board, that can be used to subsidize prices paid to fishermen whenever this is absolutely necessary. A new mechanism is thus unnecessary, as well as unwise.
In addition, it must be emphasized that the Task Force believes that the best solution to the fishermen's income problem is through a two-pronged approach: a gross income stabilization plan to smooth out highs and lows in a fisherman's gross reve-nue over a rolling five-year period, and a production bonus system, which would enable a fisherman to supplement his income if he improves the quality of his catch (by using more appropriate gear and properly handling fish at sea) and catches fish in the off-peak season. As these programs come into effect, they will have a signifi-cant effect on the incomes of all fishermen. Moreover, they will be more difficult to implement if a price subsidy program is put in place first.
There will also be criticism of the fact that the proposals for restructuring the off-shore processing sector, which we hope can be announced at the same time the Report is made public, would result in much greater financial assistance going to processors than to fishermen (some will say "bail-out", despite that fact that some of the present shareholders may not be involved in the restructured industry). This, 'we versus they' view is typical of the attitudes that prevade the fishery, but it is irrele-vant. Saving the offshore industry, and the jobs of the plant workers, trawler crews and fishermen that go with it, is obviously of fundamental importance given our first two objectives. Moreover, inshore fishermen, as well as those employed directly by the processing sector, clearly benefit from a strengthened processing sector, a fact all too often ignored by some spokesmen for fishermen's organizations.
The Task Force believes that the best ultimate guarantee of better incomes for fish-ermen and plant workers is a more economically viable industry in which all partici-pants have adequate and balanced bargaining power. Virtually all the recommenda-tions in the Report are directed at improving the economic health of the industry as a whole, thereby improving the returns to fishermen, plant workers and investors.
Maximum The extent to which our third objective — Canadianization of the Atlantic fishery — Canadian is achieved will depend on the success the industry has in attracting new Canadian participation equity investment, from either private or government sources, and on the willingness
of government to resist the temptation to trade allocations within the Canadian 200-mile limit for access to foreign markets.
356
Task Force on Atlantic Fisheries
The allocation of northern cod reserved for delivery to resource-short plants offers a major opportunity for further Canadian development of a freezer trawler fleet that would then be available to exploit under-utilized species such as squid.
Canadianization will also depend on creating practical alternatives to the use of for-eign vessels as markets for over-the-side and over-the-wharf sales. Canadianization also requires that higher foreign price offers not be used as the sole justification for permitting over-the-side sales.
In summary, the shape of the industry that would result from implementing our recommendations would be as follows:
The Objective of Fairness
• The offshore industry would have fewer processing plants.
• The inshore processing sector would continue to have a large number of individual (usually owner-operated) enterprises, although over time there would probably be fewer than at present. The marketing activities of this sector would be better co-ordinated, although this would be achieved by voluntary rather than compulsory action. Several of the larger, resource-short seasonal plants would operate nearly year round, as they would have access to landings of offshore fish in the winter.
• The harvesting sector would have a new market-like licensing mechanism as a result of introducing a quota licence scheme that would offer incentives to fisher-men to harvest their catch in the most economically efficient way. Fishermen's incomes would rise as a result of the proposed changes to the unemployment insur-ance program, the introduction of a production bonus scheme and a gross income stabilization plan, and increased groundfish landings.
• The industry as a whole would be less seasonal, better managed than it is now, less regulated, particularly with regard to technology, and, therefore, more profitable.
• The quality of fish would be improved by better handling from the time it is caught until it is sold in processed form. This, along with marketing initiatives, would result in higher prices, expanded markets and lower plant processing costs.
• The role of government in the processing sector would be increased selectively through the expanded role of the Canadian Saltfish Corporation and, if necessary, through equity participation in the offshore processing sector.
It should not be necessary to state that one objective of public policy must be that it is fair, and is seen to be fair, by those to whom it is applied. But the fact is that the degree of mistrust, indeed animosity, that exists among the participants in this indus-try fishermen, processors, provincial governments and the federal government alike — is such that it is almost impossible to persuade participants that any govern-ment decision is fair. In such a climate, the degree of co-operation among all partici-pants in the fishery required to implement our recommendations will be almost impossible to achieve.
Before discussing how to change this climate, we must make clear that the charges of unfairness are made not only against the federal government. In fact, the fishery seems to abound with individuals and organizations who spend most of their time putting the blame for the industry's problems on everyone else while accepting none of it themselves.
For example, in presentations to the Task Force, processors' organizations repeatedly emphasized the need for improved quality, but they were generally opposed to the licensing of exporters and strongly opposed to final product labelling. Those who argued this way are saying, in effect, that the quality problem lies with fishermen, not with the processing companies. They take this position despite the fact that Task

The Future Shape of the Atlantic Fishery 357
Force data show that 40 per cent of the cod blocks that were rejected by a large U.S. buyer were rejected because they had bones in them — hardly the fisherman's fault.
To cite another instance, federal government spokesmen put much of the blame for excess capacity in the processing sector on provincial government licensing policies and cheap loans, "greedy" processors and irresponsible lending by banks — a posi-tion that, while true in part, neglects the role played by the federal government itself in financing many of those plants.
The federal government also appears to mistrust the processing sector completely, particularly the owners of the large offshore companies, and seems to believe that they are largely responsible for their own financial problems. The view of processors is exactly the opposite: they mistrust the federal government and blame it for many of their current problems.
Provincial governments say that the excess capacity in the processing sector is the result of federal harvesting policies, particularly regarding the allocation of the TAC.
They also take the view that now that the plants have been built, it is up to the fed-eral government to make certain they have enough fish to be economically viable. When this does not happen, the provinces argue that they should have jurisdiction over harvesting, as if in some magic way this would create enough fish to supply all the plants they have licensed.
Many fishermen, meanwhile, believe that governments, both federal and provincial, neither grasp nor adequately respond to their views. Governments are perceived as remote and not truly understanding of a fisherman's very difficult life at sea. Com-pany lobbyists, comfortable with the language and style of bureaucrats, are thought by fishermen to have undue influence on the policy and regulation-making processes. The fishermen feel that they always get the worst part of any new policy, even those that have been designed specifically to help them.
In this acrimonious climate, the Task Force believed that if its three policy objectives were to be achieved, then our recommendations would have to accomplish two addi-tional goals: first, the recommendations would have to place the onus for change as equally as possible on all participants in the fishery; and second, the recommenda-tions would have to propose decision-making systems that would be seen to be fair by everyone involved in the fishery.
It was with the first of these goals in mind that the Task Force recommended, for example, both dockside grading, which mainly affects fishermen, and final product grading, which affects processors. We also recommended that severe restrictions be placed on both over-the-side and over-the-wharf sales — again, a balanced package.
It was to meet the second goal that we recommended the creation of a quasi-judicial body to oversee the licence transfer process, to issue licences and to issue increased allocations when the managers of the resource, the Department of Fisheries and Oceans, decide such an increase is biologically and economically warranted. This should help greatly to de-politicize the allocations process.
The proposed marketing organization should also help to reduce the degree of mis-trust among fishermen, governments and processors with respect to marketing. With common information about the market widely available, much of the misinformation and mistrust associated with marketing activities should be eliminated. People will, we hope, be more realistic in their comments on the marketing problem if they have adequate information about it.
Several other proposals would also improve the perceived fairness of government decisions by reducing the degree of regulation in the fishery and hence the apparent

358 Task Force on Atlantic Fisheries
Conclusion
arbitrariness of the rules under which fishermen operate. For example, the quota licence system would reduce the need for much of the technology regulation that now exists. The recommended change with regard to establishing enterprise allocations for a prolonged period is also designed to ensure fairness in government decisions by removing some of the apparent ad hockery in the current allocations system.
Making fisheries policy less subject to ad hoc decision making than it now appears to be is of vital importance. Stability in policy is needed to provide an adequate plan-ning environment for fishermen and processors alike. Without greater certainty with regard to what fisheries policies are or will be, the new investment the fishery needs will almost certainly not materialize.
Of equal, if not greater importance is the fact that sudden changes in fisheries policy and ad hoc government decisions'create the appearance, if not the reality, of unfair-ness. There is no doubt that this has been a major contributing factor in the develop-ment of the climate that now pervades the industry.
This problem can be ameliorated in large part by providing those who will be affected by a policy decision with the rationale for it — why the policy will solve the problem and, if possible, how the policy change will safeguard their interests — and by improving the consultative activities of the Department of Fisheries and Oceans. The only truly effective means of making a policy acceptable to those affected by it is to present reasonable arguments to persuade them of the need for it and to involve them in its formulation.
All the steps just described will help to reduce mistrust among participants in the industry. But no matter how hard the government tries to be balanced and fair in its approach, it will not succeed if fishermen and processors are determined to continue accusing the government of bias or if they continue to put the onus on government for solving problems, such as quality, that they should be solving on their own.
Improving the climate of co-operation and confidence in the industry will require strong leadership from processors' and fishermen's organizations, as well as changes in attitude among all participants in the fishery, including government. This recom-mendation will probably be the one that is most difficult to implement.
As explained throughout the Report, the longstanding problems of the Atlantic fish-ery stem from a wide variety of sources, the most notable of which are the common property nature and seasonality of the fishery, the fact that product quality has sometimes been unsatisfactory and that marketing has been inadequate, and the fact that plant and company management needs to be improved. But in addition to these problems, the 1982 crisis in the Atlantic fishery has three specific roots. In order of importance, they are:
1. the optimism following the extension of fisheries jurisdiction in 1977, which led to financial over-extension, chiefly over-capitalization, by fishermen and proces-sors, aided and abetted by both levels of government, and whose effects were made much worse by general economic reverses;
2. resistance to change and adjustment, following the establishment of the 200-mile zone, in a tradition-bound industry that has been at least as much a part of the culture of the Atlantic region as it has been a business; and
3. the current politics of the fishery — federal, provincial and internal to the indus-try itself — which inhibits change, shelters the less efficient, and leads partici-pants to pick sides and fight for turf.

The Future Shape of the Atlantic Fishery 359
The recommendations in this Report have been aimed primarily at the first and, to a much lesser extent, the third of these problems. The second problem is not one that can be solved by changes in public policy. Yet it is perhaps the most crucial obstacle to be overcome if our recommendations are to be implemented successfully.
This obstacle will be overcome only if the leaders of both fishermen's and processors' organizations are willing to make a genuine contribution to this effort. If they are not, in a few years' time another financial crisis will hit the industry, another task force or royal commission will be set up to find a long-term solution to the problem, and the cycle of the last 100 years will start all over again.
However, if the leaders of fishermen's and processors' organizations are willing to make the effort to help implement new policies—in short, to make change possible—then the Task Force believes that this Report provides an effective chart for navigat-ing the troubled waters of the Atlantic fishery.


Appendices

363
Appendix 1—Terms of Reference
1. The Task Force will proceed on an urgent basis, and shall periodically report to the ad hoc Committee of Ministers on the Atlantic Fisheries.
2. The Task Force will inquire into and report upon the current conditions and future direction of the Atlantic Coast fisheries, and, without limiting the gener-ality of the foregoing, inquire into and report upon:
(a) industry and corporate structure, with particular attention to questions of:
• fleet and plant processing capacity
• marketing
• management
• harvesting
• product quality and inventory
• financial arrangements
• seasonality
• industry and corporate returns and their distribution
(b) government policy and regulation, particularly with respect to the following:
• federal policies and regulations, particularly as they relate to quotas
• federal-provincial interaction/overlap
(c) social context of the Atlantic fisheries, with particular attention to:
• employment effects, both direct and indirect
• income level protection and stabilization for inshore and offshore fisher-men
• community maintenance
3. The Task Force is to report to the ad hoc Committee of Ministers on how to achieve and maintain a viable Atlantic fishing industry, with due consideration for the overall economic and social development of the Atlantic provinces.
To this effect the Task Force shall present options with corresponding organiza-tional and financial implications, and in particular with respect to the following:
(a) alternative models for the structure of the fishing industry, including har-vesting, processing and marketing;
(b) degrees of private sector involvement versus public sector involvement by the federal or provincial governments;
(c) federal policies, regulations, and program activities;
(d) federal-provincial relations and external relations; and
(e) alternative sources of employment.

365
Appendix 2—Glossary of Terms and Abbreviations
Bleeding and Gutting: One of the sequence of events in the proper on-board handling of groundfish. While the fish is still alive, it should be bled (by cutting its throat) to reduce the chance of blood spots and bruising. Once bled, it should be dressed by slitting its belly and removing the stomach and other organs so as to retard the pro-cess of decomposition. The fish should then be washed and put on ice, preferably in boxes.
Block: A 16-pound frozen slab of fish fillets, 2 1/2 inches thick, 10 inches wide and 19 inches long. The fillets are packed into metal containers with these dimensions, placed on the shelves of refrigeration units called plate freezers and frozen. Once frozen into blocks they are removed, boxed, and kept in cold storage for shipping and later use. The blocks are cut by band saws into fish sticks or other shaped portions, which are then often battered, cooked and refrozen for retail sale.
Boston Blue Sheet: The U.S. government report on fish prices in the Boston market. The data are gathered through a telephone survey, and the report is printed on blue paper.
By - catch: The catch of one species when the target species is another. By-catch regulations are set to limit catches of the non-target species for conservation pur-poses. For example, on the Scotian Shelf, once the haddock quota is reached, vessels fishing for cod are allowed to have only 10 per cent of their catch on board as had-dock.
Enterprise: We use the term 'fishing enterprise' to mean the sum of an individual fisherman's investment in vessels, gear, shore facilities and operating capital.
Factory Trawler: A vessel similar to a freezer trawler (see below), except that the catch is usually processed (e.g., filleted) at sea and frozen in final product form. It is a floating fish plant.
Freezer Trawler: A fishing vessel that can freeze the catch on board. The technology was developed by Europeans to permit fishing in distant waters without the need to salt the catch. The fish are typically headed and gutted, then frozen in large blocks, to be thawed and filleted later. There is only one freezer trawler currently engaged in the Canadian east coast groundfish fishery.
Full- time, part - time and bona -fide fishermen: Every person who intends to fish commercially must purchase a personal fishing licence from the Department of Fish-eries and Oceans. Full-time licences are issued to those who normally fish all or most of the season available to them in their localities. Those who fish for shorter periods are eligible for part-time licences. Bona-fide fishermen is the term used by the Task Force to denote all fishermen who actually use their licences in any given year at a level similar to a full-time fisherman. (By this definition, about 25 per cent of part-timers are bona fide fishermen.)
Gillnet: A long retangular net, usually anchored near the ocean bottom, which cat-ches fish by entangelement or snaring at the gills. If the nets are not tended fre-quently, fish die in them and quality deteriorates. If the net becomes separated from its surface buoy it can continue to 'fish' indefinitely without being retrieved — this is called 'ghost-fishing'.
366
Task Force on Atlantic Fisheries
Groundfish: The collective term used to describe species that feed near the ocean bottom; the principal species include cod, haddock, redfish, pollock, turbot and a var-iety of species of flatfish (e.g., flounder, sole).
High liners: Fishermen who earn top money and who are recognized as the most skillful at their trade. For analytical purposes, the Task Force defined `highliners' as those in the top 10 per cent of fishing income earners.
Longline: A line of baited hooks, anchored to the ocean bottom and retrieved at intervals by a vessel called a longliner. (In Newfoundland, a longliner is the term usually applied to a vessel under 65 feet that uses gillnets. Newfoundlanders refer to the longline method as fishing with "baited hook".) Longlining is an energy-efficient catching method that typically yields large fish of high quality, but catch rates may be low.
NAFO Areas: The waters off Canada's east coast were divided by the International Commission on the Northwest Atlantic Fisheries (1cNAF) into a set of zones defined by an alpha-numeric code. For example, the Gulf Coast of Newfoundland borders on Area 4R; eastern Newfoundland and southern Labrador are adjacent to Areas 2J, 3K and 3L (see map on page 30). Fish stocks and quotas are defined with reference to these areas. Following the extension of fisheries jurisdiction, ICNAF was replaced by NAFO — the Northwest Atlantic Fisheries Organization.
Northern Cod: The popular term for the population of cod found from the northern half of the Grand Bank to the Hamilton Inlet Bank off Labrador (NAFO Areas 2J, 3KL). It is by a wide margin the largest fish stock off Canada's east coast and is potentially the largest cod population in the world. The Total Allowable Catch (rrAc) for northern cod in 1982 is 230,000 t, projected to increase to at least 400,000 t by 1987. In 1968 the foreign catch from the stock exceeded 800,000 t, an amount sig-nificantly above the sustainable harvest.
Offal: Waste material (guts, blood, head, tail, bones, skin) resulting from the dress-ing and processing of fish. Offal is often reduced, through grinding, oil separation and cooking, into fish meal and oil and sold for agricultural and industrial purposes.
Pelagic Species: Fish that swim near the surface, usually in large schools. Principal species in Canadian waters are herring, mackerel and capelin.
Round Weight: A term used loosely in the industry with reference to the weight of fish as purchased from a vessel. If the species is cod, it will usually be gutted with head on. If it is flounder it may only have its tail cut (`bob-tailing'). If it is redfish, herring or mackerel, the round weight is the live, gut-in weight. Fisheries statistics may also use the term 'round weight'. In this case, it always refers to the live weight of the fish and never to its gutted weight. Use of the term round weight is often con-fusing because it is ambiguous.
Saltfish: Fish cured by use of salt; depending on final moisture content, it may be `wet' or 'dry'.
Seine: A net that is towed in a circle to surround a school of fish. It is used primarily in the herring fishery and also for mackerel and capelin. The vessel is called a seiner.
Stock: Term used to refer to a population of fish of one species that congregates and/or migrates within a given geographical area. Thus, there may be several stocks of fish for each species. The fish in each stock are genetically distinct, despite the fact that they belong to the same species, and thus each stock can be managed independently, because fish from one stock do not mix with those of another.
Glossary 367
Stockfish: Fish cured by drying only.
Tonne (metric ton): One thousand kilograms (2,204 lbs). The standard unit of volume in fisheries statistics. It is abbreviated t.
Total Allowable Catch (TAC): For each distinct stock of fish, an annual determina-tion of a total catch level is made by biologists according to management criteria that seek to ensure the size and stability of the fish population and rapid rebuilding if the stock has been depressed.
Tragedy of the Commons: Originally, the title of an article by Garret Hardin in a 1968 issue of Science magazine. Used here to refer to the fact that because fish are common property, rational or 'normal' behaviour by fishermen — that is, to try to maximize their share of the catch before someone else gets it — leads to adverse consequences for the resource as a whole. See Chapter 10.
Trap: Any of a variety of devices that lead fish into empoundment, after which they can be scooped live with dip nets. The cod trap is the main traditional gear on New-foundland's east coast. It yields large volumes but only for a few weeks in mid-sum-mer, when the fish 'strike' inshore in pursuit of capelin for food. Trap fish tend to be small, and the combination of high daily volumes, warm weather and certain physio-logical characteristics of cod at that time of year often combine to produce signifi-cant quality problems.
Wetfish Trawler: An offshore fishing vessel that preserves its catch for up to two weeks by stowage in ice.
Yield: This is usually the ratio of final product weight to round weight as purchased by a plant. For cod fillets cut from a head-on, gutted fish, the yield typically ranges from 33 to 42 per cent. The yield is one of the most critical cost factors in the fish business. For example, if cod is purchased from a fisherman for 264 per pound and if the fillet yield is low at 33 per cent, the actual raw material cost of the fillet flesh (disregarding the small residual value of the skeleton and minced flesh) would be 78.84 per pound. A high yield (say, 42 per cent) results in a fillet cost of 61.94 per pound, a difference of 16.94 per pound. High yield results from high quality raw material and from good plant workmanship.
Abbreviations Used
CAFE Canadian Association of Fish Exporters CAFSAC Canadian Atlantic Fisheries Scientific Advisory Committee CSC Canadian Saltfish Corporation DFO Department of Fisheries and Oceans DREE Department of Regional Economic Expansion FAO United Nations Food and Agriculture Organization FCC Fisheries Council of Canada FJRA Foreign Investment Review Agency FPSB Fisheries Prices Support Board ICNAF International Commission for the Northwest Atlantic Fisheries MSY Maximum Sustainable Yield NAFO Northwest Atlantic Fisheries Organization NFFAWU Newfoundland Fishermen, Food and Allied Workers Union PEMD Program for Export Market Development RDIA Regional Development Incentives Act SGA Selling, General and Administrative Expenses TAA Task Force Analytical Area TAC Total Allowable Catch

369
Appendix 3—Written Submissions to the Task Force
Allen Abbott; Chance Harbour, New Brunswick
Aquaculture Association of Nova Scotia
Association des Capitaines-proprietaires de bateaux de 45 pieds et plus de la Gaspe-sie; Gaspe, Quebec
Association Cooperative des Pecheurs de l'Ile Limitee; Lameque, New Brunswick
Association des Pecheurs cotiers de la moyenne cote nord; Riviere-au-Tonnerre, Quebec
Associated Freezers of Canada Limited; Dartmouth, Nova Scotia
Atlantic Herring Fishermen's Marketing Co-operative Ltd.; Yarmouth, Nova Scotia
Atlantic Provinces Chamber of Commerce, New Brunswick Section; Moncton, New Brunswick
David Boyde; Durrell, Newfoundland
Burin Peninsula Fisheries Improvement Committee; Burin Peninsula, Newfoundland
Ronald W. Burton; Halifax, Nova Scotia
Coline Campbell, MP (South West Nova), Nova Scotia
Canada Development Corporation; Toronto, Ontario
Canadian Brotherhood of Railway, Transport and General Workers; Halifax, Nova Scotia
Canadian Export Association; Ottawa, Ontario
Canadian Saltfish Corporation; St. John's, Newfoundland
Cheticamp Fishermen's Co-op Society Ltd.; Cheticamp, Nova Scotia
Clare Fishermen's Association; Meteghan, Nova Scotia
Clouston Foods Canada Limited; Lachine, Quebec
Winston Combden; Joe Batt's Arm, Newfoundland
Combined Fishermen's Committee; Straitview, Noddy Bay, Hay Cove and L'Anse-aux-Meadows, Newfoundland
Connors Bros., Limited; Black's Harbour, New Brunswick
F. Greig Crockett; St. John's, Newfoundland
Hon. John C. Crosbie, PC, MP (St. John's West), Newfoundland
Marcel Daneau, Centre quebecois de Relations internationales, University Laval; Quebec, Quebec
Captain Claude Darrach; Herring Cove, Nova Scotia
Lawrence Day, Extension Department, St. Francis Xavier University; Sydney, Nova Scotia (on behalf of Cape Breton fishermen)
Hon. Pierre De Bane, PC, MP (Matane), Quebec
370
Task Force on Atlantic Fisheries
Joyce Dobson; Ellershouse, Nova Scotia
Earle Brothers Fisheries, Ltd.; Carbonear, Newfoundland
Eastern Fishermen's Federation; Halifax, Nova Scotia
Economic Expansion Commission of the Peninsula Inc.; Tracadie, New Brunswick
Raymond Elliott; St. Anthony, Newfoundland
Eric King Fisheries Limited; Burnt Islands, Newfoundland
Fisheries Association of Newfoundland and Labrador Ltd.; St. John's, Newfoundland
Fishermen's Association of Crabbs River; Newfoundland
Fishermen's Committee; Griquet, Newfoundland
Fisheries Council of Canada; Ottawa, Ontario
Fogo Island Co-Operative Society Ltd.; Fogo Island, Newfoundland
Town of Fortune; Fortune, Newfoundland
Gilesporte Fishermen's Committee; Durrell, Newfoundland
Government of New Brunswick, Department of Fisheries; Fredericton, New Brunswick
Government of Newfoundland and Labrador, Department of Fisheries; St. John's, Newfoundland
Government of Nova Scotia, Department of Fisheries; Halifax, Nova Scotia
Government of Prince Edward Island, Department of Fisheries; Charlottetown, Prince Edward Island
Halifax Board of Trade
R.W. Heber; Dartmouth, Nova Scotia
Bart Higgins and Charlene Liska; Paradise River, Labrador
Eugene Hiscock, MHA, Newfoundland and Labrador
Eric Horwood; Twillingate, Newfoundland
Independent Fish Producers Association of Newfoundland and Labrador; St. John's, Newfoundland
Ingonish Harbour Fishermen's Association; Ingonish, Victoria County, Nova Scotia
Joint Town & Community Council, Burin Peninsula; Marystown, Newfoundland
J. Anthony Koslow; Dalhousie University, Halifax, Nova Scotia
Labrador Inuit Association; Nain, Labrador
The Lake Group Ltd.; St. John's, Newfoundland
Edward Levin; Mahone Bay, Nova Scotia
Lismore Community Concern Committee; Lismore, Nova Scotia
Lower North Shore Fishermen's Association; Lourdes de Blanc Sablon, Quebec
Maritime Fishermen's Union; Shediac, New Brunswick
Hon. James McGrath, PC, MP (St. John's East), Newfoundland
Written Submissions to the Task Force 371
Harry Meade; Grand Bank, Newfoundland
National Sea Products Limited; Halifax, Nova Scotia
Stephen A. Neary, MHA, Leader of the Opposition, and Beaton Tulk, MHA, New-foundland and Labrador
New Brunswick Fish Packers' Association; Moncton, New Brunswick
Newfoundland Boat Builders' Association; Dunville, Newfoundland
Newfoundland Fishermen, Food and Allied Workers Union; St. John's, Newfoundland
Newfoundland-Labrador Federation of Co-operatives; St. John's, Newfoundland
Newfoundland and Labrador Fishing Industry Advisory Board; St. John's, Newfoundland
Nova Scotia Fisheries Advisory Council; Halifax, Nova Scotia
Nova Scotia Research Foundation; Dartmouth, Nova Scotia
Ocean Harvesters Limited; Harbour Grace, Newfoundland
Prince Edward Island Fishermen's Association Ltd.; Charlottetown, Prince Edward Island
Prince Edward Island Seafood Processors' Association; Charlottetown, Prince Edward Island
Prince Edward Island Women in Support of Fishing; Prince Edward Island
Joseph Reddigan; Calvert, Newfoundland
Restigouche Salmon Net Fishermen's Association; Restigouche, New Brunswick
Dave Rooney, MP (Bonavista-Trinity-Conception), Newfoundland
Salt Codfish Processors Association Limited; St. John's, Newfoundland
Seafood Producers Association of Nova Scotia; Dartmouth, Nova Scotia
Peter R. Sinclair, Memorial University, St. John's, Newfoundland
Southside Hills Corporation Limited; St. John's, Newfoundland
Southwest Seiners Limited; Pubnico, Yarmouth County, Nova Scotia
Southern Shore, Southern Avalon, Carmelita, St. Mary's Bay North and Upper Trinity South Development Associations; Newfoundland
Gregory R. Thompson; Dipper Harbour, New Brunswick
Torngat Fish Producers Co-Operative Society Ltd.; Happy Valley, Labrador
Harold Turner; Glace Bay, Nova Scotia
United Maritime Fishermen Co-op; Moncton, New Brunswick
Voluntary Planning, Fisheries Sector Committee; Halifax, Nova Scotia
A.T. White; Seal Cove, White Bay, Newfoundland

373
Appendix 4—Task Force Consultations
Date
(1982) Name of Organization/Individual
Location of Meeting
January 29
February 17
February 18
February 18
February 19
February 19
February 24
February 26
March 1
March 4
March 4
March 4
March 5
March 5
March 5
March 5
March 12
March 12
March 18
March 19
March 19
March 19
March 20
March 22
March 22
March 22
March 22
March 22
March 23
March 23
March 23
Eastern Fishermen's Federation
Cape Breton Fishermen (4th Fisheries Residential Leadership Seminar sponsored by St. Francis Xavier University Extension Department)
Government of Newfoundland and Labrador
Ad Hoc Group of Processors' and Fishermen's Representatives
Newfoundland Fishermen, Food and Allied Workers Union (NFFAWU)
Fishery Products Limited
Canso Seafoods Limited
Federal-Provincial Atlantic Fisheries Committee
Fisheries Council Of Canada
Fisheries Association of Newfoundland and Labrador
Salt Codfish Processors Association
Independent Fish Producers Association of Newfoundland and Labrador
The Lake Group (plant tour)
The Lake Group (plant tour)
National Sea Products Limited (plant tour)
H.B. Nickerson & Sons Ltd.
Eastern Fishermen's Federation
Fisheries Council of Canada
Fishing Industry Advisory Board
The Lake Group Limited
Fishery Products Limited
National Sea Products Limited
Quality Control Seminar
Association des Pecheurs proprietaires des Iles de la Madeleine
Association des pecheurs hauturiers non-proprietaires
Processors' Representatives
New Brunswick Fish Packers' Association
Maritime Fishermen's Union
United Maritime Fishermen Co-op
Prince Edward Island Fishermen's Association
Prince Edward Island Seafood Processors' Association
Government of Prince Edward Island
Halifax, N.S.
Sydney, N.S.
St. John's, Nfld.
St. John's, Nfld.
St. John's, Nfld.
St. John's, Nfld.
Canso, N.S.
Ottawa, Ont.
Ottawa, Ont.
St. John's, Nfld.
St. John's, Nfld.
St. John's, Nfld.
Grand Bank, Nfld.
Fortune, Nfld.
Arnolds Cove, Nfld.
Halifax, N.S.
Waverley, N.S.
Dartmouth, N.S.
St. John's, Nfld.
St. John's, Nfld.
St. John's, Nfld.
St. John's, Nfld.
Memramcook, N.B.
Cap-aux-Meules, Quebec
Cap-aux-Meules, Quebec
Moncton, N.B.
Moncton, N.B.
Moncton, N.B.
Charlottetown, P.E.I.
Charlottetown, P.E.I.
Charlottetown, P.E.I.
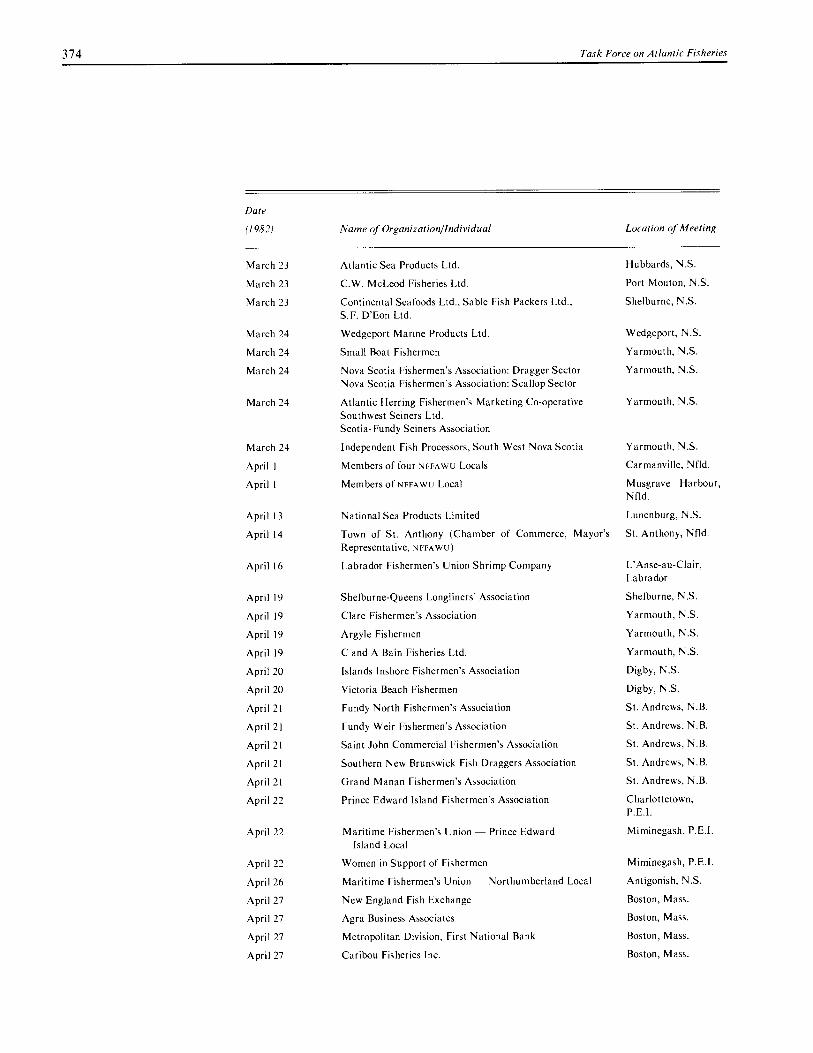
374
Task Force on Atlantic Fisheries
Date
(1982)
March 23
March 23
March 23
March 24
March 24
March 24
March 24
March 24
April 1
April I
April 13
April 14
April 16
April 19
April 19
April 19
April 19
April 20
April 20
April 21
April 21
April 21
April 21
April 21
April 22
April 22
Name of Organization/Individual
Atlantic Sea Products Ltd.
C.W. McLeod Fisheries Ltd.
Continental Seafoods Ltd., Sable Fish Packers Ltd., S.F. D'Eon Ltd.
Wedgeport Marine Products Ltd.
Small Boat Fishermen
Nova Scotia Fishermen's Association: Dragger Sector Nova Scotia Fishermen's Association: Scallop Sector
Atlantic Herring Fishermen's Marketing Co-operative Southwest Seiners Ltd. Scotia-Fundy Seiners Association
Independent Fish Processors, South West Nova Scotia
Members of four NFFAWU Locals
Members of NFFAWU Local
National Sea Products Limited
Town of St. Anthony (Chamber of Commerce, Mayor's Representative, NFFAWU)
Labrador Fishermen's Union Shrimp Company
Shelburne-Queens Longliners' Association
Clare Fishermen's Association
Argyle Fishermen
C and A Bain Fisheries Ltd.
Islands Inshore Fishermen's Association
Victoria Beach Fishermen
Fundy North Fishermen's Association
Fundy Weir Fishermen's Association
Saint John Commercial Fishermen's Association
Southern New Brunswick Fish Draggers Association
Grand Manan Fishermen's Association
Prince Edward Island Fishermen's Association
Maritime Fishermen's Union — Prince Edward Island Local
Location of Meeting
Hubbards, N.S.
Port Mouton, N.S.
Shelburne, N.S.
Wedgeport, N.S.
Yarmouth, N.S.
Yarmouth, N.S.
Yarmouth, N.S.
Yarmouth, N.S.
Carmanville, Nfld.
Musgrave Harbour, Nfld.
Lunenburg, N.S.
St. Anthony, Nfld.
L'Anse-au-Clair, Labrador
Shelburne, N.S.
Yarmouth, N.S.
Yarmouth, N.S.
Yarmouth, N.S.
Digby, N.S.
Digby, N.S.
St. Andrews, N.B.
St. Andrews, N.B.
St. Andrews, N.B.
St. Andrews, N.B.
St. Andrews, N.B.
Charlottetown, P.E.I.
Miminegash, P.E.I.
April 22 Women in Support of Fishermen
April 26 Maritime Fishermen's Union — Northumberland Local
April 27 New England Fish Exchange
April 27 Agra Business Associates
April 27 Metropolitan Division, First National Bank
April 27 Caribou Fisheries Inc.
Miminegash, P.E.I.
Antigonish, N.S.
Boston, Mass.
Boston, Mass.
Boston, Mass.
Boston, Mass.
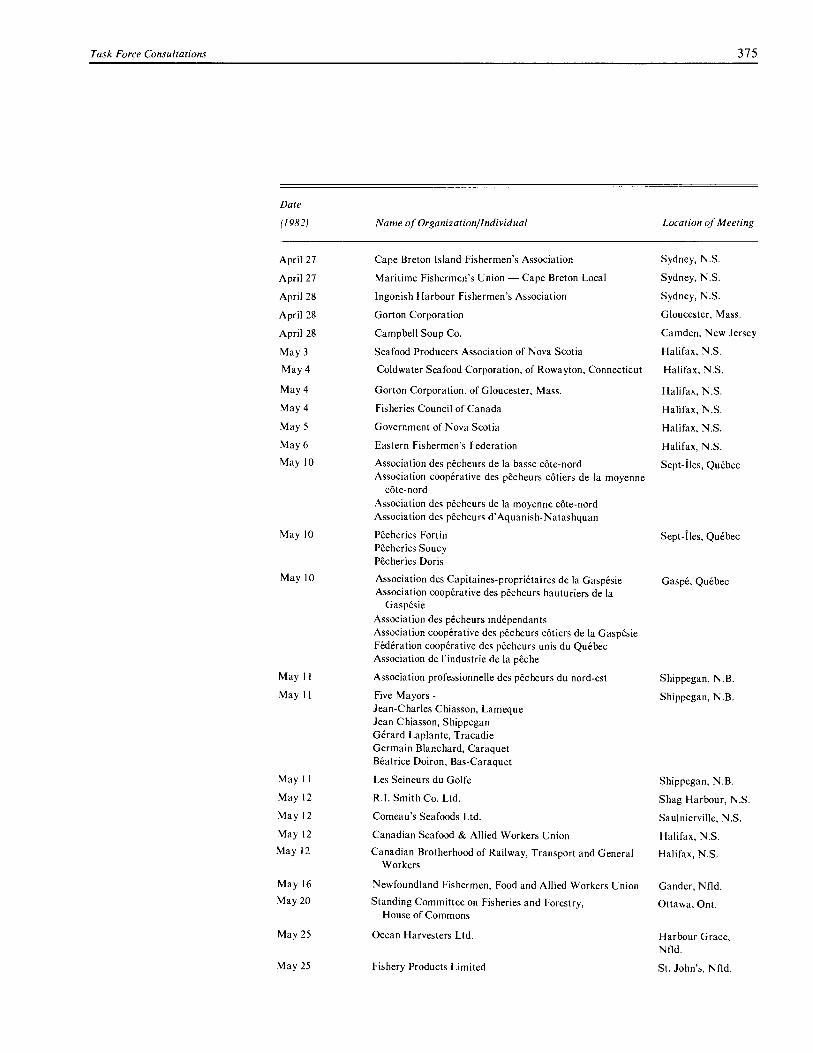
Task Force Consultations
375
Date
(1982) Name of Organization/Individual
Location of Meeting
April 27
April 27
April 28
April 28
April 28
May 3
May 4
May 4
May 4
May 5
May 6
May 10
May 10
May 10
May 11
May 11
May 11
May 12
May 12
May 12
May 12
May 16
May 20
May 25
May 25
Cape Breton Island Fishermen's Association
Maritime Fishermen's Union — Cape Breton Local
Ingonish Harbour Fishermen's Association
Gorton Corporation
Campbell Soup Co.
Seafood Producers Association of Nova Scotia
Coldwater Seafood Corporation, of Rowayton, Connecticut
Gorton Corporation, of Gloucester, Mass.
Fisheries Council of Canada
Government of Nova Scotia
Eastern Fishermen's Federation
Association des pecheurs de la basse cote-nord Association cooperative des pecheurs cotiers de la moyenne
cote-nord Association des pecheurs de la moyenne cote-nord Association des pecheurs d'Aquanish-Natashquan
Pecheries Fortin Pecheries Soucy Pecheries Doris
Association des Capitaines-proprietaires de la Gaspesie Association cooperative des pecheurs hauturiers de la
Gaspesie Association des pecheurs independants Association cooperative des pecheurs cOtiers de la Gaspesie Federation cooperative des pecheurs unis du Quebec Association de l'industrie de la peche
Association professionnelle des pecheurs du nord-est
Five Mayors - Jean-Charles Chiasson, Lameque Jean Chiasson, Shippegan Gerard Laplante, Tracadie Germain Blanchard, Caraquet Beatrice Doiron, Bas-Caraquet
Les Seineurs du Golfe
R.I. Smith Co. Ltd.
Comeau's Seafoods Ltd.
Canadian Seafood & Allied Workers Union
Canadian Brotherhood of Railway, Transport and General Workers
Newfoundland Fishermen, Food and Allied Workers Union
Standing Committee on Fisheries and Forestry, House of Commons
Ocean Harvesters Ltd.
Fishery Products Limited
Sydney, N.S.
Sydney, N.S.
Sydney, N.S.
Gloucester, Mass.
Camden, New Jersey
Halifax, N.S.
Halifax, N.S.
Halifax, N.S.
Halifax, N.S.
Halifax, N.S.
Halifax, N.S.
Sept-Iles, Quebec
Sept-Iles, Quebec
Gaspe, Quebec
Shippegan, N.B.
Shippegan, N.B.
Shippegan, N.B.
Shag Harbour, N.S.
Saulnierville, N.S.
Halifax, N.S.
Halifax, N.S.
Gander, Nfld.
Ottawa, Ont.
Harbour Grace, Nfld.
St. John's, Nfld.

376
Task Force on Atlantic Fisheries
Date
(1982)
Name of Organization/Individual
Location of Meeting
May 25
May 26
May 26
May 26
June 1
June 2
June 2
June 2
June 2
June 3
June 3
June 3
June 3
June 9
June 10
June 11
June 16
June 29
July 5
July 8
July 8
July 16
July 17
July 17
July 18
July 18
July 19
St. John's, Nfld.
Tors Cove, Nfld.
St. John's, Nfld.
St. John's, Nfld.
Montreal, Quebec
Port-aux-Basques, Nfld.
Port-aux-Basques, Nfld.
Port-aux-Basques, Nfld.
Port-aux-Basques, Nfld.
Port-aux-Basques, Nfld.
Port-aux-Basques, Nfld.
Port-aux-Basques, Nfld.
Port-aux-Basques, Nfld.
Whitbourne, Nfld.
The Lake Group
Tors Cove Fisheries Ltd.
Fisheries Association of Newfoundland and Labrador
National Sea Products Limited
Pecheurs unis du Quebec
Michael Best
Gerald Farrell, Deputy Mayor, and Ward Skinner, of Isle-aux-Morts
Freeman Green, Isle-aux-Morts
Sydney Scott, President of Local 1252, NFFAWU,
Isle-aux-Morts
Calvin Mitchell, Southwest Coast Development Association
Al Evans
William Seaward
Eric King and Fraser Borden, Eric King Fisheries Ltd.
Southern Shore, Southern Avalon, Carmelita, St. Mary's Bay North and Upper Trinity South Development Associations
Joint Town and Community Council, Burin Peninsula Southern Coast District Labour Council Burin Peninsula Fisheries Improvement Committee Fortune Bay Economic Development Association
Government of Newfoundland and Labrador
Government of New Brunswick
Richard Cashin, NFFAWU
Eastern Fishermen's Federation
St. Anthony Fisheries Ltd.
Ron White Seafoods Ltd.
Government of Quebec
Quebec processors' representatives
Quebec fishermen's representatives
Fogo Island Co-operative Society Ltd. Fogo Island Development Association
Mayor of St. Anthony, Chamber of Commerce and local executive of NFFAWU
Fisheries Association of Newfoundland and Labrador Independent Fish Producers' Association of Newfoundland
and Labrador Salt Codfish Processors Association
Marystown, Nfld.
Ottawa, Ont.
Halifax, N.S.
Ottawa, Ont.
Smiths Cove, N.S.
St. Anthony, Nfld.
Sandy Cove, Nfld.
Montreal, Quebec
Montreal, Quebec
Montreal, Quebec
Seldom, Nfld.
St. Anthony, Nfld.
St. John's, Nfld.
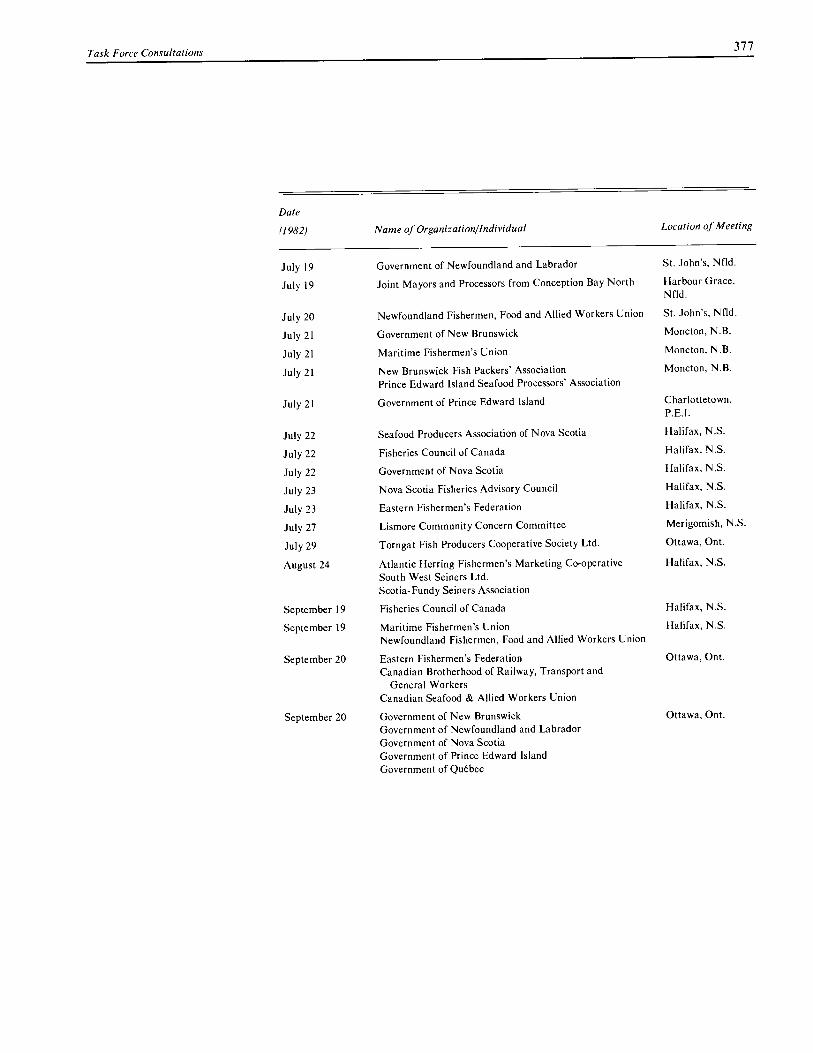
Task Force Consultations 377
Date
(1982)
Name of Organization/Individual
July 19
Government of Newfoundland and Labrador
July 19
Joint Mayors and Processors from Conception Bay North
July 20 Newfoundland Fishermen, Food and Allied Workers Union
July 21
Government of New Brunswick
July 21
Maritime Fishermen's Union
July 21 New Brunswick Fish Packers' Association
Prince Edward Island Seafood Processors' Association
July 21
Government of Prince Edward Island
July 22 Seafood Producers Association of Nova Scotia
July 22
Fisheries Council of Canada
July 22
Government of Nova Scotia
July 23
Nova Scotia Fisheries Advisory Council
July 23
Eastern Fishermen's Federation
July 27
Lismore Community Concern Committee
July 29 Torngat Fish Producers Cooperative Society Ltd.
August 24
Atlantic Herring Fishermen's Marketing Co-operative South West Seiners Ltd. Scotia-Fundy Seiners Association
September 19
Fisheries Council of Canada
September 19
Maritime Fishermen's Union Newfoundland Fishermen, Food and Allied Workers Union
September 20
Eastern Fishermen's Federation Canadian Brotherhood of Railway, Transport and
General Workers Canadian Seafood & Allied Workers Union
September 20 Government of New Brunswick Government of Newfoundland and Labrador Government of Nova Scotia Government of Prince Edward Island Government of Quebec
Location of Meeting
St. John's, Nfld.
Harbour Grace, N fld.
St. John's, Nfld.
Moncton, N.B.
Moncton, N.B.
Moncton, N.B.
Charlottetown, P.E.I.
Halifax, N.S.
Halifax, N.S.
Halifax, N.S.
Halifax, N.S.
Halifax, N.S.
Merigomish, N.S.
Ottawa, Ont.
Halifax, N.S.
Halifax, N.S.
Halifax, N.S.
Ottawa, Ont.
Ottawa, Ont.


379
Appendix 5—Task Force Working Papers
Survey of Fishermen's Incomes and Expenditures
Further information available from the Department of Fisheries and Oceans.
The Processing Sector
1. Opportunity? An Analysis of the Problems of the Atlantic Canadian Processing Industry (The NewLantic Group, July 1982)
2. Financial Performance Targets for the Fish Processing Industry
3. The Labour Content of Fish
4. The Economics of the East Coast Wetfish Trawler
Marketing
1. Market and Supply Forecasts to 1987
2. International Trade Policy: Issues and Options
3. (a) Industry Structure
• commodity flows
• elasticity of demand
• structure of U.S. market
• concentration and scale in groundfish markets
(b) Industry Behaviour and Performance
• role and potential of increased scale and concentration in marketing
• counterproductive price competition
• seasonality
• quality
• promotion
• market signals
(c) Conclusions
4. Marketing Strategy and Organization in the Atlantic Fishery
• marketing scenarios to 1987
• competitor analysis
• marketing systems options
• marketing systems evaluation
• appendices