Cultural Factors Affecting English Proficiency in Rural Areas
Upload
khangminh22Category
view
1download
0
Report No. 1261
Waters Proficiency
Testing Program
Round No. 275
- Hardness -
July 2021
Acknowledgments PTA wishes to gratefully acknowledge the technical assistance provided for this program by Dr M Buckley-Smith, Global Proficiency Ltd (New Zealand). Also our thanks go to Global Proficiency Ltd (New Zealand) and to Global Proficiency Pty Ltd (Australia) for the supply and distribution of the samples.
© Copyright Proficiency Testing Australia, 2021
PO Box 7507 Silverwater NSW 2128 Australia

SD 9.17.13
CONTENTS
1. Foreword ........................................................................................................................ 1
2. Program Features and Design ........................................................................................ 1
3. Statistical Format ............................................................................................................ 2
4. PTA and Technical Adviser's Comments ........................................................................ 4
5. Outlier Results ...............................................................................................................21
6. References ....................................................................................................................22
APPENDIX A – Results and Data Analysis
Total Suspended Solids (TSS) ............................................................................................ A1
Dissolved Calcium ............................................................................................................... A5
Dissolved Magnesium ......................................................................................................... A9
Total Hardness as CaCO3 ................................................................................................. A13
Calcium Hardness as CaCO3 ............................................................................................ A17
APPENDIX B – Sample Homogeneity and Stability
Homogeneity and Stability Testing ...................................................................................... B1
APPENDIX C – Documentation
Instructions to Participants .................................................................................................. C1
Method Codes ..................................................................................................................... C3
Results Sheet ...................................................................................................................... C5

1
SD 9.17.13
1. Foreword
This report summarises the results of a proficiency testing program on the determination of Hardness in waters, including Total Suspended Solids, Calcium, Magnesium, Total Hardness as CaCO3 and Calcium Hardness as CaCO3 in waters. This is round 275 in a planned series of programs involving the analysis of chemical and physical parameters of waters. This program is accredited to ISO/IEC 17043:2010 “Conformity assessment - General requirements for proficiency testing” by International Accreditation New Zealand (IANZ). The exercise was conducted in April 2021 by Proficiency Testing Australia (PTA). The main aim of the program was to assess laboratories’ abilities to competently perform the prescribed analyses. The Program Coordinator was Mrs D Mihaila and the Technical Adviser was Dr M Buckley-Smith, Global Proficiency Ltd (New Zealand). This report was authorised by Mrs K Cividin, PTA Quality Manager.
2. Program Features and Design 2.1 Each laboratory was randomly allocated a unique code number for the program to
ensure confidentiality of results. Reference to each laboratory in this report is by code number only.
2.2 Laboratories were provided with the "Instructions to Participants" and "Results Sheet"
(see Appendix C). Laboratories were requested to perform the tests according to their routine methods.
2.3 Participants were provided with two bottles (labelled PTA 1 and PTA 2) containing
water samples for analysis of Total Suspended Solids, Dissolved Calcium, Dissolved Magnesium, Total Hardness as CaCO3 and Calcium Hardness as CaCO3.
2.4 A total of 22 laboratories received samples, comprising:
- 18 Australian participants; and
- 4 overseas participants, including:
- Brunei Darussalam (1), Indonesia (1), Papua New Guinea (1), Qatar (1). Of these 22 laboratories, one was unable to submit results by the due date. 2.5 Results (as reported by participants) with corresponding summary statistics (i.e.
number of results, median, normalised interquartile range, uncertainty of the median, robust coefficient of variation, minimum, maximum and range) are presented in Appendix A (for each sample and for each of the analyses performed).
2.6 A robust statistical approach, using z-scores, was utilised to assess laboratories’
testing performance (see Section 3). Robust z-scores and ordered z-score charts relevant to each test are presented in Appendix A.

2
SD 9.17.13
The document entitled Guide to Proficiency Testing Australia, 2019 (reference [1]) defines the statistical terms and details the statistical procedures referred to in this report.
2.7 A tabulated listing of laboratories (by code number) identified as having outlier results
can be found on page 21. 2.8 Prior to sample distribution, a number of randomly selected samples were analysed
for homogeneity and stability. Based on the results of this testing (see Appendix B) it was considered that the samples utilised for this program were homogeneous and stable. As such, any results later identified as outliers could not be attributed to any notable sample variability.
3. Statistical Format
For each test, where appropriate, the following information is given:
- a table of results and calculated z-scores;
- a list of summary statistics; and
- ordered z-score charts.
3.1 Outlier Results and Z-scores In order to assess laboratories’ testing performance, a robust statistical approach,
using z-scores, was utilised. Z-scores give a measure of how far a result is from the consensus value (i.e. the median), and gives a "score" to each result relative to the other results in the group.
A z-score with an absolute value less than or equal to 2.0 is considered to be satisfactory, whereas, a z-score with an absolute value greater than or equal to 3.0 is considered to be an outlier and is marked by the symbol “§”. Laboratories are also encouraged to review results which have an absolute z-score value between 2.0 and 3.0 (i.e. 2.0 < |z-score| < 3.0). These are considered to be questionable results.
Each determination was examined for outliers with all methods pooled. The table on
page 21 summarises the outlier results detected. 3.2 Results Tables and Summary Statistics The tables in Appendix A contain the results returned by each laboratory, including
the code number for the method used and the robust z-score calculated for each result.
Results have been entered exactly as reported by participants. That is, laboratories
which did not report results to the precision (i.e. number of significant figures) requested on the Results Sheet have not been rounded to the requested precision before being included in the statistical analysis.

3
SD 9.17.13
A list of summary statistics appears at the bottom of each of the results tables and consists of:
- No. of Results: the total number of results for that test/sample;
- Median: the middle value of the results;
- Normalised IQR: the normalised interquartile range of the results;
- Uncertainty of the Median: a robust estimate of the standard deviation of the Median;
- Robust CV: the robust coefficient of variation expressed as a percentage, i.e. 100 x Normalised IQR / Median;
- Minimum: the lowest laboratory result;
- Maximum: the highest laboratory result; and
- Range: the difference between the Maximum and Minimum.
The median is a measure of the centre of the data. The normalised IQR is a measure of the spread of the results. It is calculated by multiplying the interquartile range (IQR) by a correction factor, which converts the IQR to an estimate of the standard deviation. The IQR is the difference between the upper and lower quartiles (i.e. the values above and below which a quarter of the results lie, respectively). For normally distributed data, the uncertainty of the median is approximated by:
√𝜋
2 ×
𝑛𝑜𝑟𝑚𝐼𝑄𝑅
√𝑛
𝑛 = number of results. Please see reference [1] for further details on these robust summary statistics.
3.3 Ordered Z-score Charts The charts in Appendix A indicate each laboratory's robust z-score, in order of
magnitude, marked with its laboratory code number. From these charts, each laboratory can readily compare its performance relative to the other laboratories.
These charts contain solid lines at +3.0 and -3.0, so that outliers are clearly
identifiable as those laboratories whose "bar" extends beyond these "cut-off" lines. The y-axis of these charts has been limited, so very large z-scores appear to extend beyond the chart boundary.

4
SD 9.17.13
4. PTA and Technical Adviser’s Comments 4.1 Metrological Traceability and Measurement Uncertainty of Assigned Values
Consensus values (median) derived from participants’ results are used in this program. These values are not metrologically traceable to an external reference. Sample preparation was undertaken according to Global Proficiency Ltd’s Standard Operating Procedures to ensure samples were fit-for-purpose, homogeneous and stable. Solutions were homogeneous, and medians obtained from this proficiency round were in consistent agreement with the expected levels (dope concentration), as shown in Table 1. As the assigned value for each analyte in this program is the median of the results submitted by the participants, the uncertainty of the median for each analyte has been calculated and is presented in Table 1 below.
Table 1. Comparison of expected levels (dope concentration) and proficiency medians. The values of the calculated uncertainty of the median are also presented.
Analyte Sample Dope
Concentration (mg/L)
Median (mg/L)
Uncertainty of the Median
(mg/L)
Total Suspended Solids (TSS)
PTA 1 80 72.00 0.96
PTA 2 30 27.00 0.65
Dissolved Calcium
PTA 1 33 24.83 0.28
PTA 2 17 12.95 0.19
Dissolved Magnesium
PTA 1 20 18.45 0.15
PTA 2 6 5.685 0.066
Total Hardness as
CaCO3
PTA 1 164.8 138.0 0.9
PTA 2 67.2 56.40 0.81
Calcium Hardness as
CaCO3
PTA 1 82.4 62.25 1.43
PTA 2 42.4 32.78 0.64
Overall, the performance of participants in this round was good, with robust CVs below 10% for all analytes. Median recoveries were 90% for TSS (both samples), 75-76% for Calcium, 92-94% for Magnesium, compared with doping concentrations. Calculated Total Hardness was 83% for both samples, and Calcium Hardness was 75-77% of expected results, based on doping concentration.

5
SD 9.17.13
4.2 Analysis of Round 275 Results 4.2.1 Total Suspended Solids (TSS) Table 2 compares the TSS medians and robust CVs from this round to those obtained in previous PTA rounds. CVs for both samples were comparable to previous rounds CVs as well as to published precision information (10%-33%) in APHA 2540 D (Total Suspended Solids Dried at 103°C - 105°C) [2]. Both samples were manufactured from food grade diatomaceous earth. Table 2. Comparison of current round variability and proficiency median of TSS testing with the results of the previous two rounds.
Round Sample Median (mg/L)
Robust CV (%) Participants
This study PTA 1 72.00 4.6 19
PTA 2 27.00 8.4 19
Report 1198 PTA 1 81.50 3.7 16
PTA 2 31.90 11.2 16
Report 1133 PTA 1 63.50 5.0 26
PTA 2 25.00 10.0 26
Bias / Accuracy The TSS testing was successfully performed, with satisfactory results (|z-score| ≤ 2.0) ranging between 67.0 – 77.9 mg/L for sample PTA 1 and 22.5 – 31.2 mg/L for sample PTA 2. Out of 19 participants, two questionable results (2.0 < |z-score| < 3.0) were reported for sample PTA 1 (laboratory codes 644 and 669) and two questionable results were reported for sample PTA 2 (laboratory codes 644 and 646). One outlier result (|z-score| ≥ 3.0) was obtained for sample PTA 1, requiring follow-up action by laboratory code 591. One outlier result was also obtained for sample PTA 2, requiring follow-up action by laboratory code 222. For those laboratories concerned with their TSS testing, APHA 2020 B recommends carrying out method blanks with the dilution water used, and duplicate analyses for TSS testing. Duplicate determinations should agree within 5% of their average weight. If a measured volume is pipetted onto the seated glass-fibre filter, APHA 2540 D recommends pipetting from the approximate midpoint of the container but not in the vortex created by the magnetic stirrer, to get a more homogeneous sample [2]. Subsampling is a major source of error in this testing. The data sets formed normal distributions (Figures 1 and 2). All laboratories used the method APHA 2540 D for TSS analysis in this round.

6
SD 9.17.13
Figure 1. Spread of results for TSS testing of sample PTA 1, with a median of 72.00 mg/L.
Figure 2. Spread of results for TSS testing of sample PTA 2, with a median of 27.00 mg/L.
0
1
2
3
4
5
6
7
8
9
53 56 59 62 65 68 71 74 77 80 83 86 89 92
Fre
qu
en
cy
Results (mg/L)
Total Suspended Solids (TSS) - Sample PTA 1
APHA 2540 D.
0
1
2
3
4
5
6
7
8
9
10
15.5 18 20.5 23 25.5 28 30.5 33 35.5 38 40.5 43
Fre
qu
en
cy
Results (mg/L)
Total Suspended Solids (TSS) - Sample PTA 2
APHA 2540 D.
7
SD 9.17.13
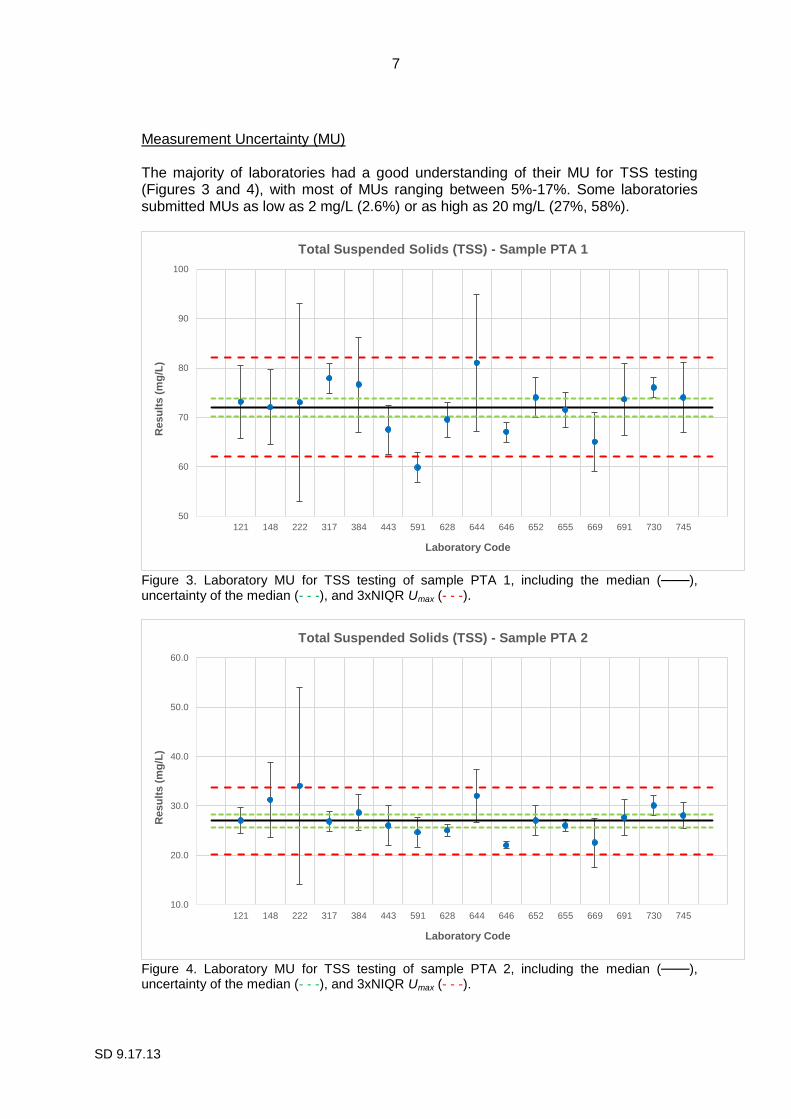
Measurement Uncertainty (MU) The majority of laboratories had a good understanding of their MU for TSS testing (Figures 3 and 4), with most of MUs ranging between 5%-17%. Some laboratories submitted MUs as low as 2 mg/L (2.6%) or as high as 20 mg/L (27%, 58%).
Figure 3. Laboratory MU for TSS testing of sample PTA 1, including the median (───), uncertainty of the median (- - -), and 3xNIQR Umax (- - -).
Figure 4. Laboratory MU for TSS testing of sample PTA 2, including the median (───), uncertainty of the median (- - -), and 3xNIQR Umax (- - -).
50
60
70
80
90
100
121 148 222 317 384 443 591 628 644 646 652 655 669 691 730 745
Resu
lts (
mg
/L)
Laboratory Code
Total Suspended Solids (TSS) - Sample PTA 1
10.0
20.0
30.0
40.0
50.0
60.0
121 148 222 317 384 443 591 628 644 646 652 655 669 691 730 745
Resu
lts (
mg
/L)
Laboratory Code
Total Suspended Solids (TSS) - Sample PTA 2

8
SD 9.17.13
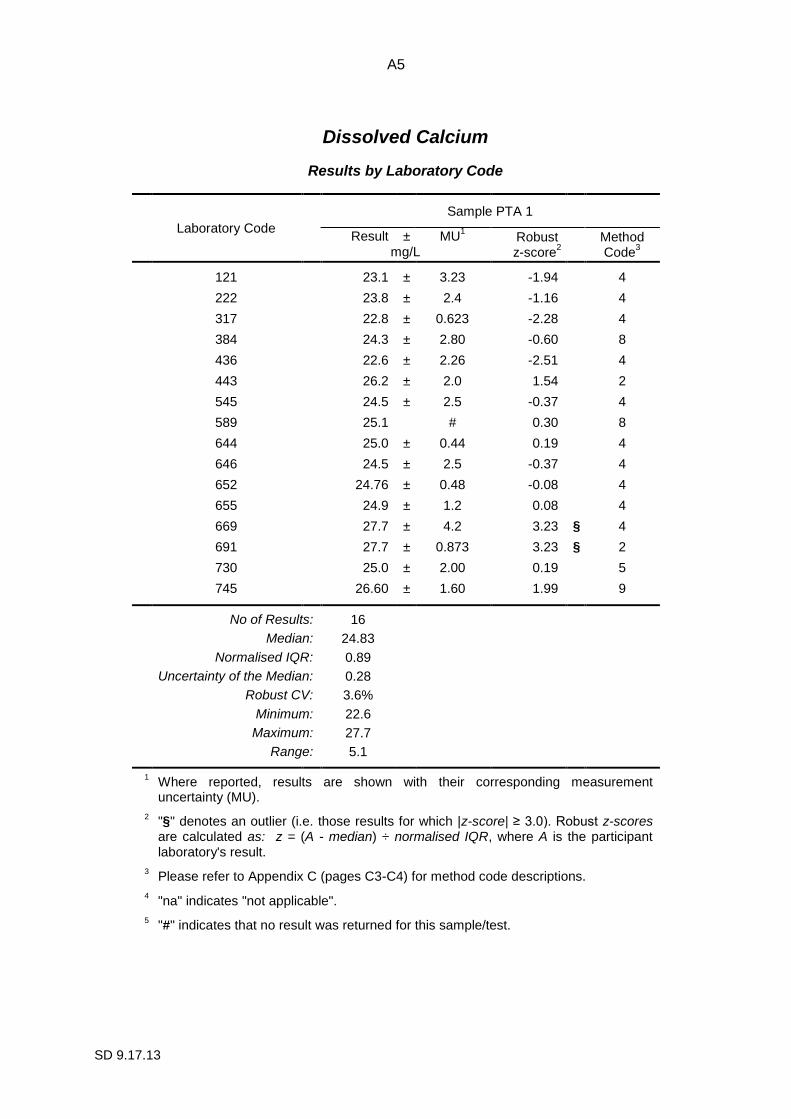
Two laboratories reported MUs that were considerably larger than 3*NIQR in this round (laboratory codes 222 and 644) and may wish to reassess their MU if this occurs over successive proficiency rounds. Over or under-estimation of MU occurs most often when laboratories use a fixed MU rather than a proportional one (laboratory codes 222, 591 and 730). Laboratory codes 317, 591, 646, 669 and 730 may wish to reassess their MU calculation [3] if their MU does not encompass the assigned value in successive proficiency rounds, as they may have relied too heavily of in-house repeatability. 4.2.2 Dissolved Calcium Table 3 compares the Dissolved Calcium medians and robust CVs from this round to those obtained in previous PTA rounds. Results were comparable to those seen previously, and well within the published precision for method APHA 3120 B ICP (Inductively Coupled Plasma / Atomic Emission Spectrometry), which indicated that laboratories should be able to achieve CVs of 11.3% for Calcium at the concentrations used in this round. Flame Atomic Absorption/Emission Spectrometry (Flame AAS/AES) method APHA 3111 indicated laboratories should be able to achieve precision of 4.2% for Calcium at 5.0 mg/L. Method APHA 3500-Ca B (EDTA Titrimetric) indicated laboratories should be able to achieve CVs of 9.2% [2]. Table 3. Comparison of current round variability and proficiency median of Dissolved Calcium testing with the results of the previous two rounds.
Round Sample Median (mg/L)
Robust CV (%) Participants
This study PTA 1 24.83 3.6 16
PTA 2 12.95 4.7 16
Report 1198 PTA 1 79.45 5.8 16
PTA 2 21.85 6.2 16
Report 1133 PTA 1 37.30 5.9 28
PTA 2 76.35 5.2 28
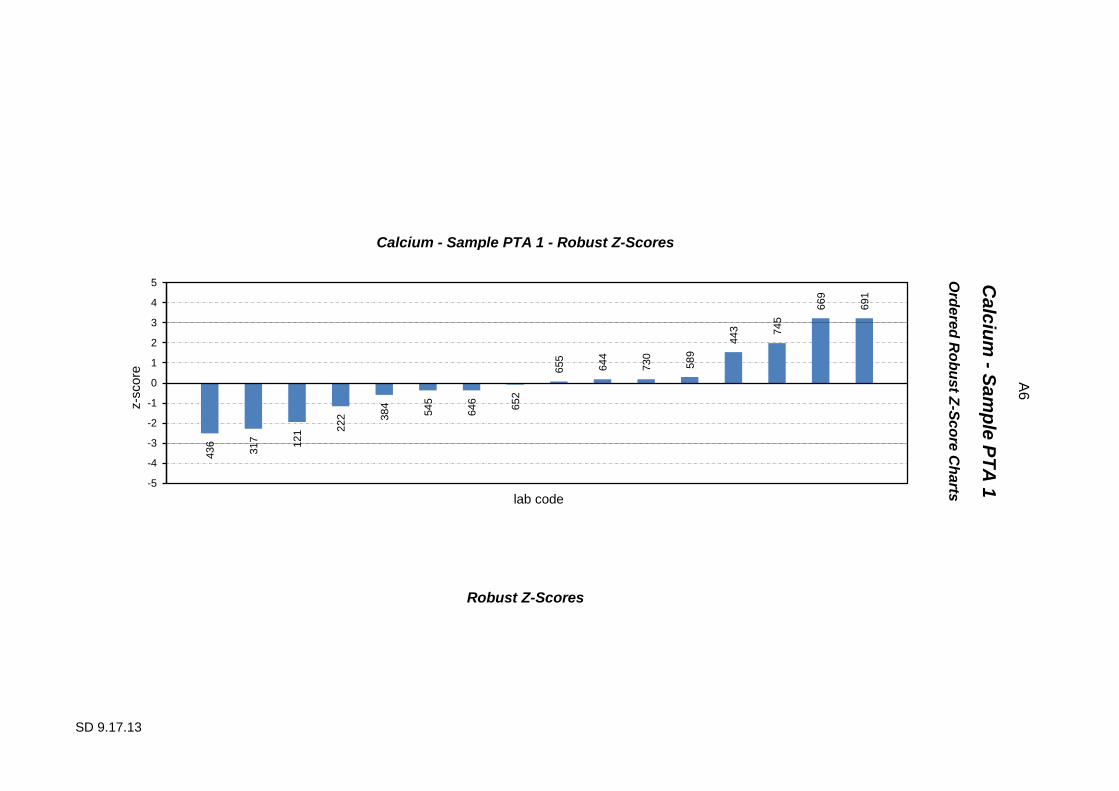
Bias / Accuracy The Dissolved Calcium testing was successfully performed, with satisfactory results (|z-score| ≤ 2.0) ranging between 23.1 – 26.60 mg/L for sample PTA 1 and 11.9 – 13.54 mg/L for sample PTA 2. Out of 16 participants, two questionable results (2.0 < |z-score| < 3.0) were reported for sample PTA 1 (laboratory codes 317 and 436) and two questionable results were reported for sample PTA 2 (laboratory codes 436 and 669). Two outlier results (|z-score| ≥ 3.0) were obtained for sample PTA 1, requiring follow-up action by laboratory codes 669 and 691. No outlier results were obtained for sample PTA 2. Laboratories that have concern about their ICP testing are recommended to follow the Quality Control (QC) procedures detailed in APHA 3020 [2] and US EPA [4], including carrying the reagent blank and instrument quality control samples through the entire

9
SD 9.17.13
sample preparation procedure. The QC sample should be a certified aqueous reference standard from an outside source (independent from calibration standards), remembering to use the same acid matrix as the calibration standards. The data sets formed normal distributions with no notable bias attributable to any one method (Figures 5 and 6). The method most frequently used for Dissolved Calcium in this round was APHA 3120 B (ICP) with 63% of participants.
Figure 5. Spread of results for Dissolved Calcium testing of sample PTA 1, with a median of 24.83 mg/L.
Figure 6. Spread of results for Dissolved Calcium testing of sample PTA 2, with a median of 12.95 mg/L.
0
1
2
3
4
5
6
7
8
9
20.6 21.8 23 24.2 25.4 26.6 27.8 29
Fre
qu
en
cy
Results (mg/L)
Calcium - Sample PTA 1
APHA 3500 – Ca B.
APHA 3120 B.
APHA 3125 B.
APHA 3111 B.
APHA 3111 D.
0
1
2
3
4
5
6
7
8
9
9.5 10.5 11.5 12.5 13.5 14.5 15.5
Fre
qu
en
cy
Results (mg/L)
Calcium - Sample PTA 2
APHA 3500 – Ca B.
APHA 3120 B.
APHA 3125 B.
APHA 3111 B.
APHA 3111 D.

10
SD 9.17.13
Measurement Uncertainty (MU) The majority of laboratories had a very good understanding of their MU for Calcium testing (Figures 7 and 8), with the bulk of MUs ranging between 4%-14%. Laboratory codes 317, 655 and 691 may wish to reassess their MU calculation if their MU does not encompass the assigned value in successive proficiency rounds [3].
Figure 7. Laboratory MU for Dissolved Calcium testing of sample PTA 1, including the median (───), uncertainty of the median (- - -), and 3xNIQR Umax (- - -).
Figure 8. Laboratory MU for Dissolved Calcium S testing of sample PTA 2, including the median (───), uncertainty of the median (- - -), and 3xNIQR Umax (- - -).
18
20
22
24
26
28
30
32
121 222 317 384 436 443 545 644 646 652 655 669 691 730 745
Resu
lts (
mg
/L)
Laboratory Code
Calcium - Sample PTA 1
10
12
14
16
18
121 222 317 384 436 443 545 644 646 652 655 669 691 730 745
Resu
lts (
mg
/L)
Laboratory Code
Calcium - Sample PTA 2

11
SD 9.17.13
4.2.3 Dissolved Magnesium Table 4 compares the Dissolved Magnesium medians and robust CVs from this round to those obtained in previous PTA rounds. Results in this round were less varied than seen previously. Published precision data for APHA 3120 B (ICP) indicated laboratories should be able to achieve CVs of 6.1% - 6.2% for Magnesium at the concentrations used in this study. Flame AAS/AES method APHA 3111 indicated that laboratories should be able to achieve precision of 10.5% for Magnesium [2]. Table 4. Comparison of current round variability and proficiency median of Magnesium testing with the results of the previous two rounds.
Round Sample Median (mg/L)
Robust CV (%) Participants
This study PTA 1 18.45 2.7 16
PTA 2 5.685 3.7 16
Report 1198 PTA 1 29.10 7.1 16
PTA 2 4.965 7.4 16
Report 1133 PTA 1 6.962 6.8 28
PTA 2 15.25 6.0 28
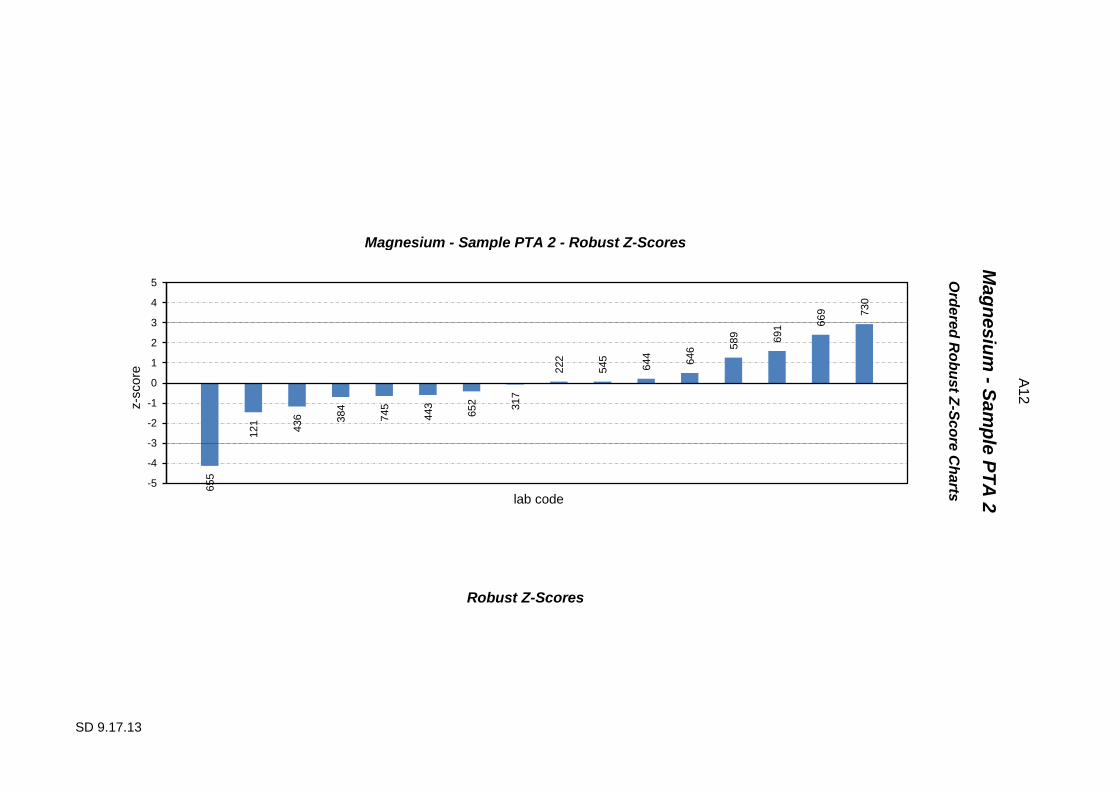
Bias / Accuracy The Dissolved Magnesium testing was successfully performed, with satisfactory results (|z-score| ≤ 2.0) ranging between 17.5 – 18.7 mg/L for sample PTA 1 and 5.38 – 6.02 mg/L for sample PTA 2. Out of 16 participants, one questionable result (2.0 < |z-score| < 3.0) was reported for sample PTA 1 (laboratory code 589) and two questionable results were reported for sample PTA 2 (laboratory codes 669 and 730). Three outlier results (|z-score| ≥ 3.0) were obtained for sample PTA 1, requiring follow-up action by laboratory codes 669, 691 and 730. One outlier result was obtained for sample PTA 2, requiring follow-up action by laboratory code 655. As mentioned previously for ICP methods in the Dissolved Calcium section, the QC procedures recommended in APHA [2] and US EPA [4] are a good place to start troubleshooting for laboratories concerned about their z-scores. US EPA method 200.7 for ICP-AES indicates that better control of the nebulizer argon flow rates with the use of mass flow controllers, improves instrument stability and precision. The method also gives recommendations for dealing with spectral interferences, physical interferences, chemical interferences, and memory interferences [4]. Laboratory code 691 used EDTA Titrimetric method to calculate the magnesium concentration from the difference between hardness and calcium as CaCO3, and as a result, has overestimated it’s calcium concentration and underestimated it’s magnesium concentration for sample PTA 1. Their pH may not have been sufficiently high to precipitate all of the magnesium, or there may have been a problem with their choice of indicator [2].

12
SD 9.17.13
The data sets formed normal distributions with no notable bias attributable to any one method (Figures 9 and 10). The method most frequently used for Dissolved Magnesium in this round was APHA 3120 B with 63% of participants.
Figure 9. Spread of results for Dissolved Magnesium testing of sample PTA 1, with a median of 18.45 mg/L.
Figure 10. Spread of results for Dissolved Magnesium testing of sample PTA 2, with a median of 5.685 mg/L.
0
1
2
3
4
5
6
7
8
9
15 16 17 18 19 20 21 22
Fre
qu
en
cy
Results (mg/L)
Magnesium - Sample PTA 1
APHA 3500 – Mg B.
APHA 3120 B.
APHA 3125 B.
APHA 3111 B.
0
1
2
3
4
5
6
7
8
9
10
4.3 4.6 4.9 5.2 5.5 5.8 6.1 6.4 6.7
Fre
qu
en
cy
Results (mg/L)
Magnesium - Sample PTA 2
APHA 3500 – Mg B.
APHA 3120 B.
APHA 3125 B.
APHA 3111 B.

13
SD 9.17.13
Measurement Uncertainty (MU) Most laboratories had a good understanding of their MU for Magnesium testing (Figures 11 and 12), with most of the MUs ranging between 4.8%-11%. Some laboratories submitted a MU as low as 0.29 mg/L (1.6%) or as high as 1 mg/L (18%).
Figure 11. Laboratory MU for Dissolved Magnesium testing of sample PTA 1, including the median (───), uncertainty of the median (- - -), and 3xNIQR Umax (- - -).
Figure 12. Laboratory MU for Dissolved Magnesium testing of sample PTA 2, including the median (───), uncertainty of the median (- - -), and 3xNIQR Umax (- - -).
14.0
16.0
18.0
20.0
22.0
24.0
121 222 317 384 436 443 545 644 646 652 655 669 691 730 745
Resu
lts (
mg
/L)
Laboratory Code
Magnesium - Sample PTA 1
4
4.5
5
5.5
6
6.5
7
121 222 317 384 436 443 545 644 646 652 655 669 691 730 745
Resu
lts (
mg
/L)
Laboratory Code
Magnesium - Sample PTA 2

14
SD 9.17.13
If laboratory codes 317, 655, 691 and 730 find that their MU doesn’t encompass the median in successive rounds, they are recommended to reassess their MU calculation [3]. Using a fixed MU for both samples (laboratory code 443) is more likely to over or under-estimate the MU, than the use of a proportional (%) MU. 4.2.4 Total Hardness as CaCO3 Table 5 compares the Total Hardness as CaCO3 medians and robust CVs from this round to those obtained in previous PTA rounds. Results were comparable to those seen previously. The published precision for APHA 2340 C (EDTA Titrimetric Method), indicated laboratories using this method should be able to achieve CVs around 2.9%. However, the influence of the majority of laboratories using ICP and Flame AAS/AES methods to directly measure the Calcium and Magnesium concentrations (methods with published precision CVs ranging between 6.1% - 11.3%) indicates that wider CVs would be acceptable for Hardness by calculation (APHA 2340 B) from results of these methods. Table 5. Comparison of current round variability and proficiency median of Total Hardness as CaCO3 testing with the results of the previous two rounds.
Round Sample Median (mg/L)
Robust CV (%) Participants
This study PTA 1 138.0 2.1 17
PTA 2 56.40 4.7 17
Report 1198 PTA 1 316.0 5.9 16
PTA 2 75.50 5.9 16
Report 1133 PTA 1 122.9 3.9 26
PTA 2 253.0 4.5 26
Bias / Accuracy The Total Hardness as CaCO3 testing was successfully performed, with satisfactory results (|z-score| ≤ 2.0) ranging between 135 – 143 mg/L for sample PTA 1 and 51.9 – 60.8 mg/L for sample PTA 2. Out of 17 participants, three questionable results (2.0 < |z-score| < 3.0) were reported for sample PTA 1 (laboratory codes 121, 436 and 730) and two questionable results were reported for sample PTA 2 (laboratory codes 436 and 655). Two outlier results (|z-score| ≥ 3.0) were obtained for sample PTA 1, requiring follow-up action by laboratory codes 317 and 669. No outlier results were obtained for sample PTA 2. As none of the outlier results were due to typographical or calculation errors, the additional feedback for laboratories who obtained questionable or outlier results for their Calcium and Magnesium testing will prove helpful for laboratories needing to follow up on their Total Hardness calculations.

15
SD 9.17.13
The data sets formed normal distributions with no notable bias attributable to any one method (Figures 13 and 14). The majority of participants (59%) used the method APHA 2340 B (Hardness by Calculation).
Figure 13. Spread of results for Total Hardness as CaCO3 testing of sample PTA 1, with a median of 138.0 mg/L.
Figure 14. Spread of results for Total Hardness as CaCO3 testing of sample PTA 2, with a median of 56.40 mg/L.
0
1
2
3
4
5
6
7
8
9
120 125 130 135 140 145 150 155 160
Fre
qu
en
cy
Results (mg/L)
Total Hardness as CaCO3 - Sample PTA 1
APHA 3500 – Ca B.
APHA 3120 B.
APHA 3125 B.
APHA 2340 B.
APHA 2340 C.
0
1
2
3
4
5
6
7
47 49 51 53 55 57 59 61 63
Fre
qu
en
cy
Results (mg/L)
Total Hardness as CaCO3 - Sample PTA 2
APHA 3500 – Ca B.
APHA 3120 B.
APHA 3125 B.
APHA 2340 B.
APHA 2340 C.
16
SD 9.17.13
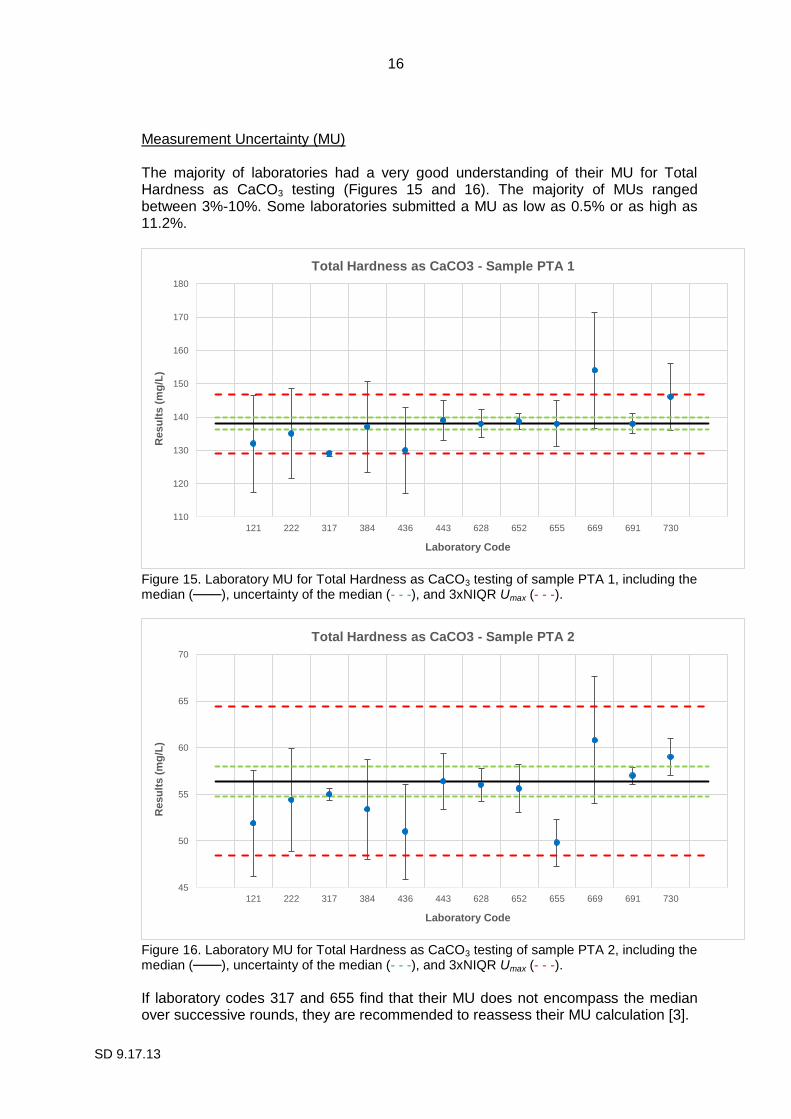
Measurement Uncertainty (MU) The majority of laboratories had a very good understanding of their MU for Total Hardness as CaCO3 testing (Figures 15 and 16). The majority of MUs ranged between 3%-10%. Some laboratories submitted a MU as low as 0.5% or as high as 11.2%.
Figure 15. Laboratory MU for Total Hardness as CaCO3 testing of sample PTA 1, including the median (───), uncertainty of the median (- - -), and 3xNIQR Umax (- - -).
Figure 16. Laboratory MU for Total Hardness as CaCO3 testing of sample PTA 2, including the median (───), uncertainty of the median (- - -), and 3xNIQR Umax (- - -).
If laboratory codes 317 and 655 find that their MU does not encompass the median over successive rounds, they are recommended to reassess their MU calculation [3].
110
120
130
140
150
160
170
180
121 222 317 384 436 443 628 652 655 669 691 730
Resu
lts (
mg
/L)
Laboratory Code
Total Hardness as CaCO3 - Sample PTA 1
45
50
55
60
65
70
121 222 317 384 436 443 628 652 655 669 691 730
Resu
lts (
mg
/L)
Laboratory Code
Total Hardness as CaCO3 - Sample PTA 2

17
SD 9.17.13
4.2.5 Calcium Hardness as CaCO3 Table 6 compares the Calcium Hardness as CaCO3 medians and robust CVs from this round to those obtained in previous PTA rounds. Results were comparable to those seen previously. Published precision for the methods used to determine the calcium concentration ranged from CVs of 4.2% for Flame AAS/AES, to 11.3% for ICP AES. APHA 3500-Ca B (EDTA Titrimetric Method) indicated laboratories should be able to achieve CVs of 9.2% [2]. Table 6. Comparison of current round variability and proficiency median of Calcium Hardness as CaCO3 testing with the results of the previous two rounds.
Round Sample Median (mg/L)
Robust CV (%) Participants
This study PTA 1 62.25 6.4 12
PTA 2 32.78 5.4 12
Report 1198 PTA 1 197.0 5.3 13
PTA 2 55.00 5.0 13
Report 1133 PTA 1 93.25 5.2 24
PTA 2 190.0 4.8 24
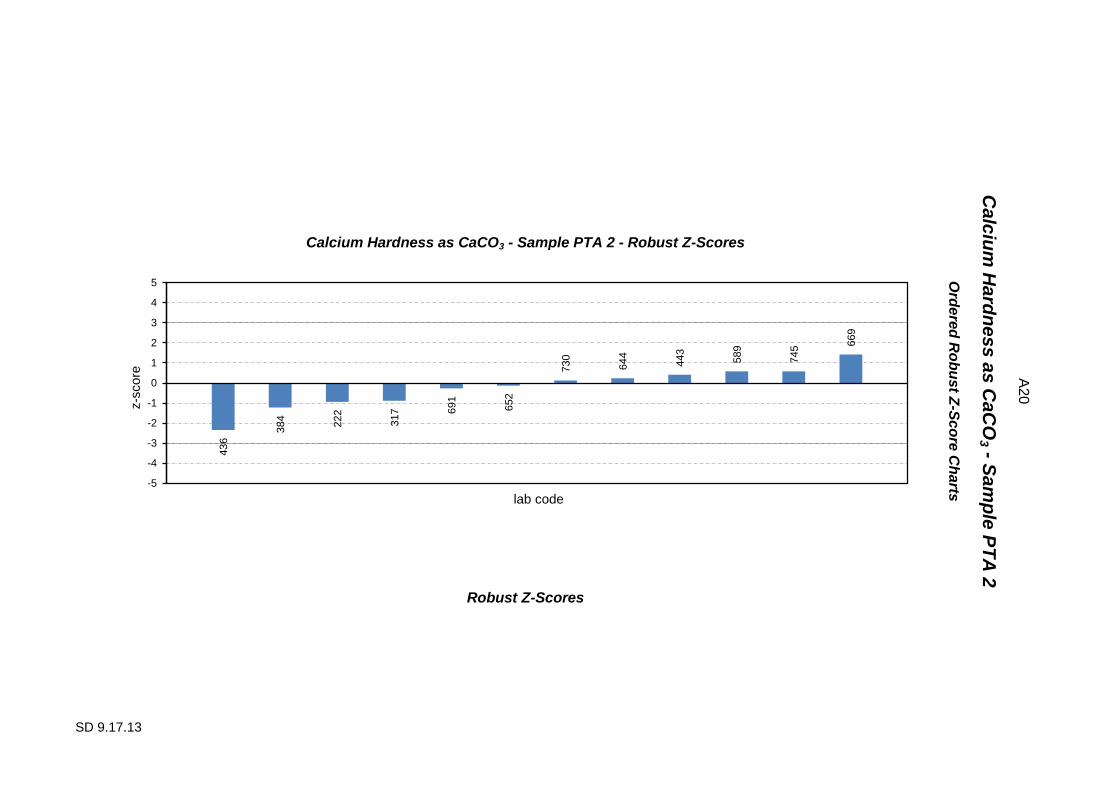
Bias / Accuracy The Calcium Hardness as CaCO3 testing was successfully performed, with satisfactory results (|z-score| ≤ 2.0) ranging between 56.3 – 69.2 mg/L for sample PTA 1 and 30.6– 35.3 mg/L for sample PTA 2. Out of 12 participants, one questionable result (2.0 < |z-score| < 3.0) was reported for sample PTA 2 (laboratory code 436). No questionable results were reported for sample PTA 1. No outlier results (|z-score| ≥ 3.0) were obtained for either of the samples PTA 1 or PTA 2. The data sets formed normal distributions with no notable bias attributable to any one method (Figures 17 and 18). The majority of laboratories (67%) used the method APHA 2340 B (Hardness by Calculation).

18
SD 9.17.13
Figure 17. Spread of results for Calcium Hardness as CaCO3 testing of sample PTA 1, with a median of 62.25 mg/L.
Figure 18. Spread of results for Calcium Hardness as CaCO3 testing of sample PTA 2, with a median of 32.78 mg/L.
0
1
2
3
4
5
6
52 56 60 64 68 72 76
Fre
qu
en
cy
Results (mg/L)
Calcium Hardness as CaCO3 - Sample PTA 1
APHA 3500 – Ca B.
APHA 3120 B.
APHA 3125 B.
APHA 2340 B.
0
1
2
3
4
5
27.4 28.6 29.8 31 32.2 33.4 34.6 35.8 37
Fre
qu
en
cy
Results (mg/L)
Calcium Hardness as CaCO3 - Sample PTA 2
APHA 3500 – Ca B.
APHA 3120 B.
APHA 3125 B.
APHA 2340 B.

19
SD 9.17.13
Measurement Uncertainty (MU) The majority of laboratories had a very good understanding of their MU for Calcium Hardness as CaCO3 testing (Figures 19 and 20), with most of the MUs ranging between 3.2%-10%. Some laboratories submitted a MU as low as 1.1% or as high as 11.5%.
Figure 19. Laboratory MU for Calcium Hardness as CaCO3S testing of sample PTA 1, including the median (───), uncertainty of the median (- - -), and 3xNIQR Umax (- - -).
Figure 20. Laboratory MU for Calcium Hardness as CaCO3 testing of sample PTA 2, including the median (───), uncertainty of the median (- - -), and 3xNIQR Umax (- - -). Laboratory codes 317 and 691 may wish to reassess their MU calculation if their MU does not encompass the assigned value in successive proficiency rounds [3].
40.0
50.0
60.0
70.0
80.0
222 317 384 436 443 652 669 691 730
Resu
lts (
mg
/L)
Laboratory Code
Calcium Hardness as CaCO3 - Sample PTA 1
25.0
30.0
35.0
40.0
222 317 384 436 443 652 669 691 730
Resu
lts (
mg
/L)
Laboratory Code
Calcium Hardness as CaCO3 - Sample PTA 2
20
SD 9.17.13
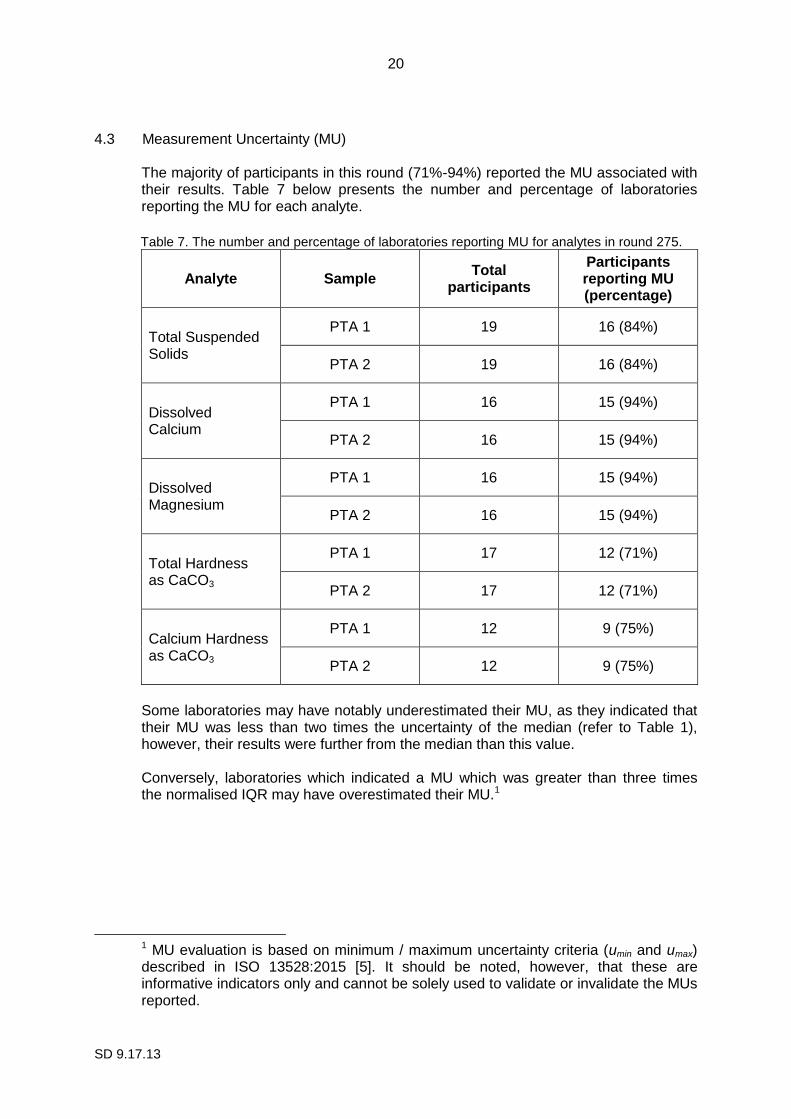
4.3 Measurement Uncertainty (MU)
The majority of participants in this round (71%-94%) reported the MU associated with their results. Table 7 below presents the number and percentage of laboratories reporting the MU for each analyte.
Table 7. The number and percentage of laboratories reporting MU for analytes in round 275.
Analyte Sample Total
participants
Participants reporting MU (percentage)
Total Suspended Solids
PTA 1 19 16 (84%)
PTA 2 19 16 (84%)
Dissolved Calcium
PTA 1 16 15 (94%)
PTA 2 16 15 (94%)
Dissolved Magnesium
PTA 1 16 15 (94%)
PTA 2 16 15 (94%)
Total Hardness as CaCO3
PTA 1 17 12 (71%)
PTA 2 17 12 (71%)
Calcium Hardness as CaCO3
PTA 1 12 9 (75%)
PTA 2 12 9 (75%)
Some laboratories may have notably underestimated their MU, as they indicated that their MU was less than two times the uncertainty of the median (refer to Table 1), however, their results were further from the median than this value. Conversely, laboratories which indicated a MU which was greater than three times the normalised IQR may have overestimated their MU.1
1 MU evaluation is based on minimum / maximum uncertainty criteria (umin and umax) described in ISO 13528:2015 [5]. It should be noted, however, that these are informative indicators only and cannot be solely used to validate or invalidate the MUs reported.

21
SD 9.17.13
4.4 Analysis of Results by Method Groups
In order for methods to be grouped for analysis, PTA requires at least 11 sets of results from the same method group. Please note that for TSS all laboratories used the method APHA 2540 D in this round. Therefore, the analysis presented in section 4.2.1 is also representative for this method. For all other analytes / methods, as there were less than 11 results submitted for each method, reliable conclusions cannot be drawn from analysing grouped methods on this occasion. Therefore, results from all method groups have been pooled for analysis.
5. Outlier Results
Laboratories reporting results that have been identified as outliers are listed in Table 8 below. Table 8. Laboratory results identified as outliers for each analysis performed.
Lab Code
Analysis
Total Suspended
Solids
Dissolved Calcium
Dissolved Magnesium
Total Hardness as
CaCO3
Calcium Hardness as
CaCO3
PTA 1 PTA 2 PTA 1 PTA 2 PTA 1 PTA 2 PTA 1 PTA 2 PTA 1 PTA 2
222 §
317 §
591 §
655 §
669 § § §
691 § §
730 §
Note: 1. A “§” indicates the occurrence of a z-score outlier result (i.e. those results for which
|z-score| ≥ 3.0).
22
SD 9.17.13
6. References
[1] Guide to Proficiency Testing Australia, 2019 (This document can be found on the PTA website, www.pta.asn.au)
[2] APHA Standard Methods for the examination of water and wastewater, 2017, 23rd Edition.
[3] EURACHEM / CITAC Guide CG 4 (2012). Quantifying Uncertainty in Analytical Measurement; S. Ellison & A. Williams (Eds), Third Edition, Section 7.8, pg 20. https://www.eurachem.org/images/stories/Guides/pdf/QUAM2012_P1.pdf.
[4] US EPA method 200.7 Determination of metals and trace elements in water and wastes by Inductively Coupled Plasma-Atomic Emission Spectrometry https://www.epa.gov/sites/production/files/2015-06/documents/epa-200.7.pdf
[5] ISO 13528:2015 Statistical methods for use in proficiency testing by interlaboratory comparisons.

SD 9.17.13
APPENDIX A
Results and Data Analysis Total Suspended Solids (TSS) ............................................................................................ A1
Dissolved Calcium ............................................................................................................... A5
Dissolved Magnesium ......................................................................................................... A9
Total Hardness as CaCO3 ................................................................................................. A13
Calcium Hardness as CaCO3 ............................................................................................ A17

SD 9.17.13
Total Suspended Solids (TSS) Results
Samples PTA 1 and PTA 2

A1
SD 9.17.13
Total Suspended Solids (TSS)
Results by Laboratory Code
Laboratory Code
Sample PTA 1
Result ± MU1 Robust
z-score2
Method Code
3 mg/L
121 73.1 ± 7.31 0.33 1
148 72.0 ± 7.60 0.00 1
190 72 # 0.00 1
222 73 ± 20 0.30 1
317 77.9 ± 3.00 1.77 1
384 76.6 ± 9.65 1.38 1
443 67.5 ± 5.0 -1.35 1
545 70 # -0.60 1
589 69.5 # -0.75 1
591 59.8 ± 3.00 -3.66 § 1
628 69.5 ± 3.57 -0.75 1
644 81 ± 13.8 2.70 1
646 67.0 ± 2.0 -1.50 1
652 74 ± 4 0.60 1
655 71.5 ± 3.6 -0.15 1
669 65.0 ± 6.0 -2.10 1
691 73.6 ± 7.22 0.48 1
730 76.0 ± 2.00 1.20 1
745 74 ± 7.03 0.60 1
No of Results: 19
Median: 72.00
Normalised IQR: 3.34
Uncertainty of the Median: 0.96
Robust CV: 4.6%
Minimum: 59.8
Maximum: 81
Range: 21.2
1
Where reported, results are shown with their corresponding measurement uncertainty (MU).
2 "§" denotes an outlier (i.e. those results for which |z-score| ≥ 3.0). Robust z-scores are calculated as: z = (A - median) ÷ normalised IQR, where A is the participant laboratory's result.
3 Please refer to Appendix C (pages C3-C4) for method code descriptions.
4 "na" indicates "not applicable".
5 "#" indicates that no result was returned for this sample/test.

SD 9.17.13
Total Suspended Solids - Sample PTA 1 - Robust Z-Scores
Ord
ere
d R
ob
ust Z
-Sc
ore
Ch
arts
To
tal S
us
pe
nd
ed
So
lids
- Sa
mp
le P
TA
1
A2
Robust Z-Scores
591
669
646
443
589
628
545
655
148
190
222
121
691
652
745
730
384
317
644
-5
-4
-3
-2
-1
0
1
2
3
4
5
z-s
core
lab code

A3
SD 9.17.13
Total Suspended Solids (TSS)
Results by Laboratory Code
Laboratory Code
Sample PTA 2
Result ± MU1 Robust
z-score2
Method Code
3 mg/L
121 27.0 ± 2.70 0.00 1
148 31.2 ± 7.60 1.86 1
190 27 # 0.00 1
222 34 ± 20 3.10 § 1
317 26.8 ± 2.00 -0.09 1
384 28.6 ± 3.60 0.71 1
443 26.0 ± 4.0 -0.44 1
545 25 # -0.88 1
589 25.5 # -0.66 1
591 24.6 ± 3.00 -1.06 1
628 25.0 ± 1.28 -0.88 1
644 32 ± 5.4 2.21 1
646 22.0 ± 0.7 -2.21 1
652 27 ± 3 0.00 1
655 26.0 ± 1.3 -0.44 1
669 22.5 ± 5.0 -1.99 1
691 27.6 ± 3.59 0.27 1
730 30.0 ± 2.00 1.33 1
745 28 ± 2.66 0.44 1
No of Results: 19
Median: 27.00
Normalised IQR: 2.26
Uncertainty of the Median: 0.65
Robust CV: 8.4%
Minimum: 22.0
Maximum: 34
Range: 12.0
1
Where reported, results are shown with their corresponding measurement uncertainty (MU).
2 "§" denotes an outlier (i.e. those results for which |z-score| ≥ 3.0). Robust z-scores are calculated as: z = (A - median) ÷ normalised IQR, where A is the participant laboratory's result.
3 Please refer to Appendix C (pages C3-C4) for method code descriptions.
4 "na" indicates "not applicable".
5 "#" indicates that no result was returned for this sample/test.

SD 9.17.13
Total Suspended Solids - Sample PTA 2 - Robust Z-Scores
Ord
ere
d R
ob
ust Z
-Sc
ore
Ch
arts
To
tal S
us
pe
nd
ed
So
lids
- Sa
mp
le P
TA
2
A4
Robust Z-Scores
646
669
591
545
628
589
443
655
317
121
190
652
691
745
384
730
148
644
222
-5
-4
-3
-2
-1
0
1
2
3
4
5
z-s
core
lab code

SD 9.17.13
Dissolved Calcium Results
Samples PTA 1 and PTA 2
A5
SD 9.17.13
Dissolved Calcium
Results by Laboratory Code
Laboratory Code
Sample PTA 1
Result ± MU1 Robust
z-score2
Method Code
3 mg/L
121 23.1 ± 3.23 -1.94 4
222 23.8 ± 2.4 -1.16 4
317 22.8 ± 0.623 -2.28 4
384 24.3 ± 2.80 -0.60 8
436 22.6 ± 2.26 -2.51 4
443 26.2 ± 2.0 1.54 2
545 24.5 ± 2.5 -0.37 4
589 25.1 # 0.30 8
644 25.0 ± 0.44 0.19 4
646 24.5 ± 2.5 -0.37 4
652 24.76 ± 0.48 -0.08 4
655 24.9 ± 1.2 0.08 4
669 27.7 ± 4.2 3.23 § 4
691 27.7 ± 0.873 3.23 § 2
730 25.0 ± 2.00 0.19 5
745 26.60 ± 1.60 1.99 9
No of Results: 16
Median: 24.83
Normalised IQR: 0.89
Uncertainty of the Median: 0.28
Robust CV: 3.6%
Minimum: 22.6
Maximum: 27.7
Range: 5.1
1
Where reported, results are shown with their corresponding measurement uncertainty (MU).
2 "§" denotes an outlier (i.e. those results for which |z-score| ≥ 3.0). Robust z-scores are calculated as: z = (A - median) ÷ normalised IQR, where A is the participant laboratory's result.
3 Please refer to Appendix C (pages C3-C4) for method code descriptions.
4 "na" indicates "not applicable".
5 "#" indicates that no result was returned for this sample/test.
SD 9.17.13
Calcium - Sample PTA 1 - Robust Z-Scores
Ord
ere
d R
ob
ust Z
-Sc
ore
Ch
arts
Ca
lciu
m - S
am
ple
PT
A 1
A6
Robust Z-Scores
436
317
121
222
384
545
646
652
655
644
730
589
443
745
669
691
-5
-4
-3
-2
-1
0
1
2
3
4
5
z-s
core
lab code

A7
SD 9.17.13
Dissolved Calcium
Results by Laboratory Code
Laboratory Code
Sample PTA 2
Result ± MU1 Robust
z-score2
Method Code
3 mg/L
121 11.9 ± 1.67 -1.72 4
222 12.4 ± 1.3 -0.90 4
317 12.5 ± 0.591 -0.74 4
384 12.2 ± 1.40 -1.23 8
436 11.5 ± 1.15 -2.37 4
443 13.4 ± 2.0 0.74 2
545 13.1 ± 1.3 0.25 4
589 13.5 # 0.90 8
644 13.1 ± 0.23 0.25 4
646 12.9 ± 1.3 -0.08 4
652 13.03 ± 0.51 0.13 4
655 12.0 ± 0.60 -1.55 4
669 14.2 ± 2.1 2.04 4
691 12.9 ± 0.475 -0.08 2
730 13.0 ± 2.00 0.08 5
745 13.54 ± 0.81 0.96 9
No of Results: 16
Median: 12.95
Normalised IQR: 0.61
Uncertainty of the Median: 0.19
Robust CV: 4.7%
Minimum: 11.5
Maximum: 14.2
Range: 2.7
1
Where reported, results are shown with their corresponding measurement uncertainty (MU).
2 "§" denotes an outlier (i.e. those results for which |z-score| ≥ 3.0). Robust z-scores are calculated as: z = (A - median) ÷ normalised IQR, where A is the participant laboratory's result.
3 Please refer to Appendix C (pages C3-C4) for method code descriptions.
4 "na" indicates "not applicable".
5 "#" indicates that no result was returned for this sample/test.

SD 9.17.13
Calcium - Sample PTA 2 - Robust Z-Scores
Ord
ere
d R
ob
ust Z
-Sc
ore
Ch
arts
Ca
lciu
m - S
am
ple
PT
A 2
A8
Robust Z-Scores
436
121
655
384
222
317
646
691
730
652
545
644
443
589
745
669
-5
-4
-3
-2
-1
0
1
2
3
4
5
z-s
core
lab code

SD 9.17.13
Dissolved Magnesium Results
Samples PTA 1 and PTA 2

A9
SD 9.17.13
Dissolved Magnesium
Results by Laboratory Code
Laboratory Code
Sample PTA 1
Result ± MU1 Robust
z-score2
Method Code
3 mg/L
121 18.0 ± 1.98 -0.92 4
222 18.3 ± 1.8 -0.31 4
317 17.5 ± 0.328 -1.93 4
384 18.6 ± 1.06 0.31 8
436 18.0 ± 1.80 -0.92 4
443 18.0 ± 1.0 -0.92 3
545 18.4 ± 1.8 -0.10 4
589 19.5 # 2.14 8
644 18.6 ± 0.82 0.31 4
646 18.7 ± 0.9 0.51 4
652 18.65 ± 0.29 0.41 4
655 18.3 ± 0.92 -0.31 4
669 20.6 ± 2.7 4.38 § 4
691 16.7 ± 1.22 -3.56 § 3
730 20.0 ± 2.00 3.16 § 5
745 18.50 ± 1.04 0.10 8
No of Results: 16
Median: 18.45
Normalised IQR: 0.49
Uncertainty of the Median: 0.15
Robust CV: 2.7%
Minimum: 16.7
Maximum: 20.6
Range: 3.9
1
Where reported, results are shown with their corresponding measurement uncertainty (MU).
2 "§" denotes an outlier (i.e. those results for which |z-score| ≥ 3.0). Robust z-scores are calculated as: z = (A - median) ÷ normalised IQR, where A is the participant laboratory's result.
3 Please refer to Appendix C (pages C3-C4) for method code descriptions.
4 "na" indicates "not applicable".
5 "#" indicates that no result was returned for this sample/test.

SD 9.17.13
Magnesium - Sample PTA 1 - Robust Z-Scores
Ord
ere
d R
ob
ust Z
-Sc
ore
Ch
arts
Ma
gn
es
ium
- Sa
mp
le P
TA
1
A10
Robust Z-Scores
691
317
121
436
443
222
655
545
745
384
644
652
646
589
730
669
-5
-4
-3
-2
-1
0
1
2
3
4
5
z-s
core
lab code

A11
SD 9.17.13
Dissolved Magnesium
Results by Laboratory Code
Laboratory Code
Sample PTA 2
Result ± MU1 Robust
z-score2
Method Code
3 mg/L
121 5.38 ± 0.59 -1.46 4
222 5.7 ± 0.6 0.07 4
317 5.67 ± 0.261 -0.07 4
384 5.54 ± 0.316 -0.69 8
436 5.44 ± 0.54 -1.17 4
443 5.56 ± 1.0 -0.60 3
545 5.70 ± 0.57 0.07 4
589 5.95 # 1.27 8
644 5.73 ± 0.25 0.21 4
646 5.79 ± 0.29 0.50 4
652 5.598 ± 0.315 -0.42 4
655 4.82 ± 0.24 -4.13 § 4
669 6.19 ± 0.80 2.41 4
691 6.02 ± 0.496 1.60 3
730 6.30 ± 0.20 2.94 5
745 5.55 ± 0.31 -0.64 8
No of Results: 16
Median: 5.685
Normalised IQR: 0.209
Uncertainty of the Median: 0.066
Robust CV: 3.7%
Minimum: 4.82
Maximum: 6.30
Range: 1.48
1
Where reported, results are shown with their corresponding measurement uncertainty (MU).
2 "§" denotes an outlier (i.e. those results for which |z-score| ≥ 3.0). Robust z-scores are calculated as: z = (A - median) ÷ normalised IQR, where A is the participant laboratory's result.
3 Please refer to Appendix C (pages C3-C4) for method code descriptions.
4 "na" indicates "not applicable".
5 "#" indicates that no result was returned for this sample/test.
SD 9.17.13
Magnesium - Sample PTA 2 - Robust Z-Scores
Ord
ere
d R
ob
ust Z
-Sc
ore
Ch
arts
Ma
gn
es
ium
- Sa
mp
le P
TA
2
A12
Robust Z-Scores
655
121
436
384
745
443
652
317
222
545
644
646
589
691
669
730
-5
-4
-3
-2
-1
0
1
2
3
4
5
z-s
core
lab code

SD 9.17.13
Total Hardness as CaCO3 Results
Samples PTA 1 and PTA 2

A13
SD 9.17.13
Total Hardness as CaCO3
Results by Laboratory Code
Laboratory Code
Sample PTA 1
Result ± MU1 Robust
z-score2
Method Code
3 mg/L
121 132 ± 14.5 -2.02 6
190 138 # 0.00 6
222 135 ± 13.5 -1.01 6
317 129 ± 0.704 -3.04 § 6
384 137 ± 13.7 -0.34 6
436 130 ± 13 -2.70 6
443 139 ± 6.0 0.34 7
502 141 # 1.01 2
589 143 # 1.69 6
628 138 ± 4.24 0.00 7
644 140 # 0.67 6
652 138.6 ± 2.4 0.20 4
655 138 ± 6.9 0.00 4
669 154 ± 17.3 5.40 § 6
691 138 ± 2.96 0.00 7
730 146.0 ± 10.00 2.70 5
745 143 # 1.69 6
No of Results: 17
Median: 138.0
Normalised IQR: 3.0
Uncertainty of the Median: 0.9
Robust CV: 2.1%
Minimum: 129
Maximum: 154
Range: 25
1
Where reported, results are shown with their corresponding measurement uncertainty (MU).
2 "§" denotes an outlier (i.e. those results for which |z-score| ≥ 3.0). Robust z-scores are calculated as: z = (A - median) ÷ normalised IQR, where A is the participant laboratory's result.
3 Please refer to Appendix C (pages C3-C4) for method code descriptions.
4 "na" indicates "not applicable".
5 "#" indicates that no result was returned for this sample/test.

SD 9.17.13
Total Hardness as CaCO3 - Sample PTA 1 - Robust Z-Scores
Ord
ere
d R
ob
ust Z
-Sc
ore
Ch
arts
To
tal H
ard
ne
ss a
s C
aC
O3 - S
am
ple
PT
A 1
A14
Robust Z-Scores
317
436
121
222
384
190
628
655
691
652
443
644
502
589
745
730
669
-5
-4
-3
-2
-1
0
1
2
3
4
5
z-s
core
lab code

A15
SD 9.17.13
Total Hardness as CaCO3
Results by Laboratory Code
Laboratory Code
Sample PTA 2
Result ± MU1 Robust
z-score2
Method Code
3 mg/L
121 51.9 ± 5.71 -1.69 6
190 60 # 1.35 6
222 54.4 ± 5.5 -0.75 6
317 55.0 ± 0.646 -0.52 6
384 53.4 ± 5.34 -1.12 6
436 51.0 ± 5.10 -2.02 6
443 56.4 ± 3.0 0.00 7
502 58.0 # 0.60 2
589 58.3 # 0.71 6
628 56.0 ± 1.72 -0.15 7
644 57 # 0.22 6
652 55.60 ± 2.57 -0.30 4
655 49.8 ± 2.5 -2.47 4
669 60.8 ± 6.8 1.65 6
691 57.0 ± 0.926 0.22 7
730 59.0 ± 2.00 0.97 5
745 56.7 # 0.11 6
No of Results: 17
Median: 56.40
Normalised IQR: 2.67
Uncertainty of the Median: 0.81
Robust CV: 4.7%
Minimum: 49.8
Maximum: 60.8
Range: 11.0
1
Where reported, results are shown with their corresponding measurement uncertainty (MU).
2 "§" denotes an outlier (i.e. those results for which |z-score| ≥ 3.0). Robust z-scores are calculated as: z = (A - median) ÷ normalised IQR, where A is the participant laboratory's result.
3 Please refer to Appendix C (pages C3-C4) for method code descriptions.
4 "na" indicates "not applicable".
5 "#" indicates that no result was returned for this sample/test.

SD 9.17.13
Total Hardness as CaCO3 - Sample PTA 2 - Robust Z-Scores
Ord
ere
d R
ob
ust Z
-Sc
ore
Ch
arts
To
tal H
ard
ne
ss a
s C
aC
O3 - S
am
ple
PT
A 2
A16
Robust Z-Scores
655
436
121
384
222
317
652
628
443
745
644
691
502
589
730
190
669
-5
-4
-3
-2
-1
0
1
2
3
4
5
z-s
core
lab code

SD 9.17.13
Calcium Hardness as CaCO3 Results
Samples PTA 1 and PTA 2

A17
SD 9.17.13
Calcium Hardness as CaCO3
Results by Laboratory Code
Laboratory Code
Sample PTA 1
Result ± MU1 Robust
z-score2
Method Code
3 mg/L
222 59.4 ± 6.0 -0.72 6
317 56.9 ± 0.623 -1.35 6
384 60.7 ± 6.98 -0.39 6
436 56.3 ± 5.63 -1.50 6
443 65.5 ± 4.0 0.82 2
589 62.8 # 0.14 6
644 62.5 # 0.06 6
652 61.84 ± 1.20 -0.10 4
669 69.2 ± 7.8 1.75 6
691 69.2 ± 2.41 1.75 2
730 62.0 ± 2.00 -0.06 5
745 66.4 # 1.05 6
No of Results: 12
Median: 62.25
Normalised IQR: 3.97
Uncertainty of the Median: 1.43
Robust CV: 6.4%
Minimum: 56.3
Maximum: 69.2
Range: 12.9
1
Where reported, results are shown with their corresponding measurement uncertainty (MU).
2 "§" denotes an outlier (i.e. those results for which |z-score| ≥ 3.0). Robust z-scores are calculated as: z = (A - median) ÷ normalised IQR, where A is the participant laboratory's result.
3 Please refer to Appendix C (pages C3-C4) for method code descriptions.
4 "na" indicates "not applicable".
5 "#" indicates that no result was returned for this sample/test.

SD 9.17.13
Calcium Hardness as CaCO3 - Sample PTA 1 - Robust Z-Scores
Ord
ere
d R
ob
ust Z
-Sc
ore
Ch
arts
Ca
lciu
m H
ard
ne
ss a
s C
aC
O3 - S
am
ple
PT
A 1
A18
Robust Z-Scores
436
317
222
384
652
730
644
589
443
745
669
691
-5
-4
-3
-2
-1
0
1
2
3
4
5
z-s
core
lab code

A19
SD 9.17.13
Calcium Hardness as CaCO3
Results by Laboratory Code
Laboratory Code
Sample PTA 2
Result ± MU1 Robust
z-score2
Method Code
3 mg/L
222 31.1 ± 3.2 -0.94 6
317 31.2 ± 0.591 -0.89 6
384 30.6 ± 3.52 -1.22 6
436 28.6 ± 2.86 -2.35 6
443 33.5 ± 3.0 0.41 2
589 33.8 # 0.58 6
644 33.2 # 0.24 6
652 32.55 ± 1.27 -0.13 4
669 35.3 ± 4.0 1.42 6
691 32.3 ± 1.03 -0.27 2
730 33.0 ± 2.00 0.13 5
745 33.8 # 0.58 6
No of Results: 12
Median: 32.78
Normalised IQR: 1.78
Uncertainty of the Median: 0.64
Robust CV: 5.4%
Minimum: 28.6
Maximum: 35.3
Range: 6.7
1
Where reported, results are shown with their corresponding measurement uncertainty (MU).
2 "§" denotes an outlier (i.e. those results for which |z-score| ≥ 3.0). Robust z-scores are calculated as: z = (A - median) ÷ normalised IQR, where A is the participant laboratory's result.
3 Please refer to Appendix C (pages C3-C4) for method code descriptions.
4 "na" indicates "not applicable".
5 "#" indicates that no result was returned for this sample/test.
SD 9.17.13
Calcium Hardness as CaCO3 - Sample PTA 2 - Robust Z-Scores
Ord
ere
d R
ob
ust Z
-Sc
ore
Ch
arts
Ca
lciu
m H
ard
ne
ss a
s C
aC
O3 - S
am
ple
PT
A 2
A20
Robust Z-Scores
436
384
222
317
691
652
730
644
443
589
745
669
-5
-4
-3
-2
-1
0
1
2
3
4
5
z-s
core
lab code

SD 9.17.13
APPENDIX B
Sample Homogeneity and Stability Homogeneity and Stability Testing ...................................................................................... B1

B1
SD 9.17.13
Homogeneity and Stability Testing Samples for this program were obtained from Global Proficiency Ltd, New Zealand. As such, all samples were subjected to rigorous quality control and homogeneity / stability testing. A random selection of ten samples was chosen from sample PTA 1 for homogeneity and stability testing. Seven samples were stored chilled and the remaining three were subjected to 35ºC for three days for an accelerated ageing stability trial. The samples were then analysed in duplicate by R J Hill Laboratories Ltd, New Zealand. TSS was tested by filtration using Whatman 934 AH, Advantec GC-50 or equivalent filters (nominal pore size 1.2 - 1.5μm), gravimetric determination - APHA 2540 D (modified) 23rd ed. 2017. Dissolved Calcium and Magnesium were tested by sample filtration through 0.45μm membrane filter and preservation with nitric acid - APHA 3030 B 23rd ed. 2017, analysed by ICP-MS, screen level. APHA 3125 B 23rd ed. 2017. Hardness was calculated by Global Proficiency using APHA 2340 B 23rd ed. 2017.
The results of homogeneity and stability testing are presented in Tables B1 and B2 below. Sample PTA 2 was assumed to behave the same as PTA 1 based on identical manufacture and handling procedures. Please note that the mean results for these tests are not intended to be used as reference values. PTA 1 stability samples showed no notable differences when compared to homogeneity samples. From statistical analyses based on the results of this testing and rigorous quality control, it was considered that samples PTA 1 and PTA 2 were sufficiently homogeneous and stable, so that any results later identified as outliers should not be attributed to any notable sample variability. Table B1. Homogeneity and stability testing of PTA 1 samples.
Round 275 TSS Dissolved
Calcium Dissolved
Magnesium Hardness
Dup 1 Dup 2 Dup 1 Dup 2 Dup 1 Dup 2 Dup 1 Dup 2
PTA 1: H1 80.8 89.5 24.27 23.55 19.0 18.3 138.74 134.33
PTA 1: H2 76.6 85.3 24.11 24.89 19.3 20.0 139.84 144.39
PTA 1: H3 81.6 91.5 24.26 23.84 19.2 19.2 139.53 138.57
PTA 1: H4 76.8 82.3 23.66 24.62 19.0 20.0 137.51 143.91
PTA 1: H5 74.6 83.9 24.37 24.49 19.3 19.6 140.51 141.89
PTA 1: H6 79.6 85.7 24.74 24.19 19.4 19.5 141.74 140.54
PTA 1: H7 73.4 74.8 24.66 24.15 19.6 19.3 142.32 139.89
PTA 1: S1 78.2 86.4 23.74 25.36 19.5 19.6 139.73 143.89
PTA 1: S2 72.4 78.3 24.25 23.79 19.5 19.2 141.06 138.30
PTA 1: S3 80.8 89.5 24.17 23.54 19.6 19.2 140.98 137.83
RSD 6.67% 1.95% 1.88% 1.74%
Table B2. Homogeneity and stability testing of PTA 2 samples.
Round 275 TSS Dissolved
Calcium Dissolved
Magnesium Hardness
PTA 2: H1 30.0 13.05 6.1 57.58
PTA 2: S1 28.3 12.43 5.7 54.54

SD 9.17.13
APPENDIX C
Documentation
Instructions to Participants .................................................................................................. C1
Method Codes ..................................................................................................................... C3
Results Sheet ...................................................................................................................... C5

C1
SD 9.17.13
PROFICIENCY TESTING AUSTRALIA
WATERS PROFICIENCY TESTING PROGRAM
CHEMICAL ANALYSIS ROUND 275 APRIL, 2021
Hardness
INSTRUCTIONS TO PARTICIPANTS
**Please record (on the Results Sheet) the approximate temperature of the samples upon receipt**
Please note the following before commencing the analysis of the samples.
1. Sample Information
i) Two bottles labelled PTA 1 and PTA 2, supplied by Global Proficiency Ltd. The bottles contain approximately 870 mL of artificial water for analysis of Hardness and Total Suspended Solids. These samples are ready-to-test.
ii) The sample must be thoroughly mixed prior to analysis.
iii) It is recommended that analysis for Total Suspended Solids (TSS) be carried out prior to removing aliquots for other analyses.
iv) If other analytes are to be measured prior to TSS, the samples must be well mixed prior to removing aliquots to be used for the other analyses.
Please Note: Where possible, the proficiency testing sample should be treated as a routine laboratory sample.
2. Sample Preparation
Note: The Residue sample colours are white and yellowish. Caution: Analysis must begin immediately after bottle is opened.
i) Record bottle ID number and mix thoroughly.
ii) Test according to your normal laboratory methods.
Please report results for the ready-to-test sample in mg/L. 3. Tests Requested
i) Total Suspended Solids
ii) Dissolved Calcium
iii) Dissolved Magnesium
iv) Total Hardness as CaCO3
v) Calcium Hardness as CaCO3
If unable to perform all the above please note this on your Results Sheet.

C2
SD 9.17.13
4. Safety
i) Samples are for laboratory use only.
ii) Participants should have sufficient experience and training to take the necessary precautions when handling the samples and reagent chemicals and during disposal.
iii) Use of safety glasses, gloves, and fume hoods, where appropriate during the determinations, is recommended.
5. Reporting
i) Report results using three significant figures (e.g.: 1.23, 12.3, 123).
ii) Report results in milligrams per litre (mg/L).
iii) Do not correct results for recovery.
iv) Select the appropriate method code for each test from the Method Code Table and record it on the Results Sheet.
v) Calculate the measurement uncertainty (MU) for each reported result. All estimates of MU must be given as a 95% confidence interval (coverage factor k ≈ 2) and reported in milligrams per litre (mg/L).
6. Testing should commence as soon as possible after receiving the samples and results reported
NO LATER THAN 14 MAY 2021 to:
Delfina Mihaila Proficiency Testing Australia PO Box 7507 SILVERWATER NSW 2128 AUSTRALIA Phone: +612 9736 8397 Email: [email protected]
7. For this program your laboratory has been allocated the code number shown on the attached
Results Sheet. All reference to your laboratory in reports associated with the program will be through this code number, thus ensuring the confidentiality of your results.
8. The expected concentration ranges of each of tests are given in the following table.
Analysis Range
Total Suspended Solids 20 - 100 mg/L
Calcium 10 - 100 mg/L
Magnesium 4 - 40 mg/L
Total Hardness as CaCO3 40 - 400 mg/L
Calcium Hardness as CaCO3 25 - 250 mg/L

C3
SD 9.17.13
Method Codes to be used for the Results Sheet
ANALYSIS METHOD
REFERENCE
METHOD DESCRIPTION COD
E
Total Suspended Solids Dissolved Calcium Dissolved Magnesium Total Hardness as CaCO3 Calcium Hardness
as CaCO3
APHA SM
APHA 2540 D. Total Suspended Solids Dried at 103°C - 105°C
1
APHA 3500-Ca B. EDTA Titrimetric Method
2
APHA 3500-Mg B. Calculation Method
3
APHA 3120 B. Inductively Coupled Plasma (ICP) Method
4
APHA 3125 B. Inductively Coupled Plasma – Mass Spectrometry (ICP-MS) Method
5
APHA 2340 B. Hardness by Calculation
6
APHA 2340 C. EDTA Titrimetric Method
7
APHA 3111 B. Direct Air-Acetylene Flame Method
8
APHA 3111 D. Direct Nitrous Oxide–Acetylene Flame Method
9
APHA 3111 E. Extraction/Nitrous Oxide–Acetylene Flame Method
10
ASTM
ASTM D0511-09 Test Methods for Calcium and Magnesium In Water
11
ASTM D5673-10 Test Method for Elements in Water by Inductively Coupled Plasma\Mass Spectrometry
12
ASTM D5907-10 Test Methods for Filterable Matter (Total Dissolved Solids) and Nonfilterable Matter (Total Suspended Solids) in Water
13
ASTM D511 – 14 Test Methods for Calcium and Magnesium In Water. Test Method A—Complexometric Titration
14
ASTM D511 – 14 Test Methods for Calcium and Magnesium In Water. Test Method B—Atomic Absorption Spectrometric
15
ASTM D1126-12 Standard Test Method for Hardness in Water
16

C4
SD 9.17.13
Method Codes to be used for the Results Sheet - Continued
ANALYSIS METHOD
REFERENCE METHOD DESCRIPTION CODE
Total Suspended Solids Dissolved Calcium Dissolved Magnesium Total Hardness as CaCO3 Calcium Hardness
as CaCO3
US EPA
US EPA 0130.1 Hardness, Total - Colorimetric, Automated EDTA
17
US EPA 0130.2 Hardness, Total - Titrimetric, EDTA
18
US EPA 0160.2 Residue, Non-Filterable & Total Suspended Solids
19
US EPA 200.7 ICP-AES
20
US EPA 0215.1 Calcium - AA, Direct Aspiration
21
US EPA 0215.2 Calcium - Titrimetric, EDTA
22
US EPA 0242.1 Magnesium - AA, Direct Aspiration
23
ISO
ISO 11885:2007 Water quality — Determination of selected elements by ICP-OES
24
ISO 6058:1984 Water quality — Determination of calcium content — EDTA titrimetric method
25
ISO 6059:1984 Water quality — Determination of the sum of calcium and magnesium — EDTA titrimetric method
26
Other AS 2134.1 Flame atomic absorption spectrometry
27
AS 3550.4 Determination of solids - Gravimetric method
28
In-house ICP Method 29
In-house Ion Chromatography Method 30
Other (please specify) 31
Method Reference Key
i) APHA SM APHA “Standard Methods for the Examination of Water and Wastewater” (18, 19, 20, 21, 22 and 23 Edition).
ii) ASTM ASTM International www.astm.org .
iii) AS Australian Standards www.saiglobal.com .
iv) ISO International Organization for Standardization https://www.iso.org
v) USEPA U.S Environmental Protection Agency, http://www.epa.gov.

C5
SD 9.17.13
PROFICIENCY TESTING AUSTRALIA
WATERS PROFICIENCY TESTING PROGRAM
CHEMICAL ANALYSIS ROUND 275
HARDNESS
APRIL 2021
RESULTS SHEET (mg/L)
Laboratory
Code
*Approximate temperature of samples upon receipt:
ANALYSIS
SAMPLE PTA 1 SAMPLE PTA 2 METHOD
CODE Result (mg/L)
±MU (mg/L)
Result (mg/L)
±MU (mg/L)
Total Suspended Solids
Dissolved Calcium
Dissolved Magnesium
Total Hardness as CaCO3
Calcium Hardness as CaCO3
Please note: Where possible, proficiency testing samples should be treated as a routine laboratory sample.
i) For each sample only a single result is requested.
ii) Report results using three significant figures (e.g.: 1.23, 12.3, 123).
iii) Report results in milligrams per litre (mg/L).
iv) Do not correct results for recovery.
v) MU* Laboratories Measurement Uncertainty (MU) if known for the result. Please report in milligrams per litre (mg/L).
DATE: ______________________ SIGNATURE: _______________________________
Return results NO LATER THAN 14 MAY 2021 to: Delfina Mihaila Proficiency Testing Australia PO Box 7507 Phone: +61 2 9736 8397 SILVERWATER NSW 2128 AUSTRALIA Email: [email protected]
INSTRUCT WATERS PROF TEST PROG 275

SD 9.17.13
- End of Report -
Copyright © 2022 FDOKUMEN