Organisation of Multi-Mycotoxin Proficiency Tests - MDPI
16
toxins Article Organisation of Multi-Mycotoxin Proficiency Tests: Evaluation of the Performances of the Laboratories Using the Triple A Rating Approach Emmanuel K. Tangni * , Bart Huybrechts, Julien Masquelier and Els Van Hoeck Citation: Tangni, E.K.; Huybrechts, B.; Masquelier, J.; Van Hoeck, E. Organisation of Multi-Mycotoxin Proficiency Tests: Evaluation of the Performances of the Laboratories Using the Triple A Rating Approach. Toxins 2021, 13, 591. https://doi.org/ 10.3390/toxins13090591 Received: 30 June 2021 Accepted: 19 August 2021 Published: 24 August 2021 Publisher’s Note: MDPI stays neutral with regard to jurisdictional claims in published maps and institutional affil- iations. Copyright: © 2021 by the authors. Licensee MDPI, Basel, Switzerland. This article is an open access article distributed under the terms and conditions of the Creative Commons Attribution (CC BY) license (https:// creativecommons.org/licenses/by/ 4.0/). Organic Contaminants and Additives, Scientific Directorate of Chemical and Physical Health Risks, Sciensano, Leuvensesteenweg 17, 3080 Tervuren, Belgium; [email protected] (B.H.); [email protected] (J.M.); [email protected] (E.V.H.) * Correspondence: [email protected] Abstract: In accordance with the International Standard Organization ISO 17043, two proficiency tests (PTs) for the simultaneous determination of aflatoxins (AFB 1 , AFB 2 , AFG 1 , AFG 2 ); deoxynivalenol; fumonisins FB 1 , FB 2, and B 3 ; ochratoxin A, the T-2 toxin; and the HT-2 toxin were conducted in 2019 and 2020 using cornflakes and rusk flours that were prepared in house. The homogeneity and the stability of these materials were verified according to the criteria laid down in ISO 13528 using randomly selected samples. Most of the targeted toxins were found to be homogenously distributed in both materials with no significant changes during the timescale of the PTs. Next, the materials were distributed to approximately 25 participating laboratories from Europe, Canada, and the United States. The obtained datasets were computed using robust statistics. The outliers were checked and removed, and the toxin concentrations were assigned as the consensus value of the results of the participants at Horwitz ratios <1.2. The z scores were generated for all mycotoxins, and the results were pooled to calculate the relative sum of squared z scores (SZ2) indexes and were clustered according to the triple A rating. Overall, at least 80% of the participating laboratories achieved good and acceptable performances. The most frequent categories assigned to good performances (SZ2 ≤ 2) were AAA (51%) and BAA (13%). Clusters of BBA + CBA (6%) included laboratories reporting acceptable z scores <90% of the total z scores for less than 90% or 50% of the mycotoxins targeted in the 2 matrices. The triple A rating seems to be appropriate in evaluating the performances of laboratories involved in multi-mycotoxin analyses. Accredited and non-accredited analytical methods achieved good and acceptable performances. Keywords: proficiency testing; performances; triple A; reference materials; mycotoxins; cereals Key Contribution: Two incurred mycotoxin contaminated reference materials based on cornflakes and rusk flours were successfully prepared and used for the organization of two international proficiency tests. The present paper reports for the first time the use of the Triple A approach in the field of multi mycotoxin determination by combining sequences of individual z scores for several mycotoxins to acknowledge the overall laboratory performance. 1. Introduction The occurrence of mycotoxins is widespread throughout the world. The Food and Agriculture Organization (FAO) previously estimated that 25% of the global food crop could be contaminated with mycotoxins. More recent evaluation of the exceedances of the limits set by the European Union (EU) and Codex Alimentarius concluded that the occur- rences of mycotoxins were much higher and reached up to 60–80% [1]. Furthermore, several studies have evidenced a higher frequency of finding more than one mycotoxin in food and feed due to the co-existence of fungi that simultaneously produce several mycotoxins [2,3]. Toxins 2021, 13, 591. https://doi.org/10.3390/toxins13090591 https://www.mdpi.com/journal/toxins
-
Upload
khangminh22 -
Category
Documents
-
view
1 -
download
0
Transcript of Organisation of Multi-Mycotoxin Proficiency Tests - MDPI

toxins
Article
Organisation of Multi-Mycotoxin Proficiency Tests: Evaluationof the Performances of the Laboratories Using the Triple ARating Approach
Emmanuel K. Tangni * , Bart Huybrechts, Julien Masquelier and Els Van Hoeck
�����������������
Citation: Tangni, E.K.; Huybrechts,
B.; Masquelier, J.; Van Hoeck, E.
Organisation of Multi-Mycotoxin
Proficiency Tests: Evaluation of the
Performances of the Laboratories
Using the Triple A Rating Approach.
Toxins 2021, 13, 591. https://doi.org/
10.3390/toxins13090591
Received: 30 June 2021
Accepted: 19 August 2021
Published: 24 August 2021
Publisher’s Note: MDPI stays neutral
with regard to jurisdictional claims in
published maps and institutional affil-
iations.
Copyright: © 2021 by the authors.
Licensee MDPI, Basel, Switzerland.
This article is an open access article
distributed under the terms and
conditions of the Creative Commons
Attribution (CC BY) license (https://
creativecommons.org/licenses/by/
4.0/).
Organic Contaminants and Additives, Scientific Directorate of Chemical and Physical Health Risks, Sciensano,Leuvensesteenweg 17, 3080 Tervuren, Belgium; [email protected] (B.H.);[email protected] (J.M.); [email protected] (E.V.H.)* Correspondence: [email protected]
Abstract: In accordance with the International Standard Organization ISO 17043, two proficiency tests(PTs) for the simultaneous determination of aflatoxins (AFB1, AFB2, AFG1, AFG2); deoxynivalenol;fumonisins FB1, FB2, and B3; ochratoxin A, the T-2 toxin; and the HT-2 toxin were conducted in2019 and 2020 using cornflakes and rusk flours that were prepared in house. The homogeneity andthe stability of these materials were verified according to the criteria laid down in ISO 13528 usingrandomly selected samples. Most of the targeted toxins were found to be homogenously distributedin both materials with no significant changes during the timescale of the PTs. Next, the materialswere distributed to approximately 25 participating laboratories from Europe, Canada, and the UnitedStates. The obtained datasets were computed using robust statistics. The outliers were checkedand removed, and the toxin concentrations were assigned as the consensus value of the results ofthe participants at Horwitz ratios <1.2. The z scores were generated for all mycotoxins, and theresults were pooled to calculate the relative sum of squared z scores (SZ2) indexes and were clusteredaccording to the triple A rating. Overall, at least 80% of the participating laboratories achievedgood and acceptable performances. The most frequent categories assigned to good performances(SZ2 ≤ 2) were AAA (51%) and BAA (13%). Clusters of BBA + CBA (6%) included laboratoriesreporting acceptable z scores <90% of the total z scores for less than 90% or 50% of the mycotoxinstargeted in the 2 matrices. The triple A rating seems to be appropriate in evaluating the performancesof laboratories involved in multi-mycotoxin analyses. Accredited and non-accredited analyticalmethods achieved good and acceptable performances.
Keywords: proficiency testing; performances; triple A; reference materials; mycotoxins; cereals
Key Contribution: Two incurred mycotoxin contaminated reference materials based on cornflakesand rusk flours were successfully prepared and used for the organization of two internationalproficiency tests. The present paper reports for the first time the use of the Triple A approach in thefield of multi mycotoxin determination by combining sequences of individual z scores for severalmycotoxins to acknowledge the overall laboratory performance.
1. Introduction
The occurrence of mycotoxins is widespread throughout the world. The Food andAgriculture Organization (FAO) previously estimated that 25% of the global food cropcould be contaminated with mycotoxins. More recent evaluation of the exceedances of thelimits set by the European Union (EU) and Codex Alimentarius concluded that the occur-rences of mycotoxins were much higher and reached up to 60–80% [1]. Furthermore, severalstudies have evidenced a higher frequency of finding more than one mycotoxin in food andfeed due to the co-existence of fungi that simultaneously produce several mycotoxins [2,3].
Toxins 2021, 13, 591. https://doi.org/10.3390/toxins13090591 https://www.mdpi.com/journal/toxins

Toxins 2021, 13, 591 2 of 16
The co-occurrence of mycotoxins and related interactive toxic effects, even at low concen-trations, have raised concerns about the health hazards related to contaminated food andfeed [4–6]. In addition, mycotoxin contaminated feed may release their toxic substances ortheir bio-transformed metabolites into animal tissue, offal, milk, and eggs and thus mayobviously increase the consumer’s exposure [7]. Contamination removal via food process-ing has not been fully achieved [8]. Even in developed countries, agricultural products arestill contaminated with mycotoxins, and climate changes have amplified and facilitated theappearance and dissemination of the regulated mycotoxins and the so-called “emergingmycotoxins” [9]. In Europe, regulatory maximum limits (MLs) or guideline levels werefixed for the presence of aflatoxin B1 (AFB1), total aflatoxins (AFB1+AFB2+AFG1+AFG2),citrinin (CIT), deoxynivalenol (DON), fumonisins B1 and B2 (FB1, FB2), patulin (PAT),ochratoxin A, T-2 toxin (T-2), the HT-2 toxin (HT-2), and zearalenone (ZEN) in food, foodsupplements, and feed commodities [10–12]. The development of analytical methodsis a prerequisite for the measurement of mycotoxin co-contamination in food and feed,for control purposes, and for maintaining regulatory safety compliance [13–15]. It alsoallows the performance of toxico-kinetic profiling studies [16]. Moreover, the marketabilityof food products is critically based on reliable measurements of food quality and safetyrequirements [17]. Reliable analytical results are therefore essential for legislation imple-mentation, quality and safety assurance of food and feed, risk assessment, and worldwidetrade transactions. In accordance with the recommendations of the International Stan-dard Organization ISO 17025 [18] and the EC regulations [19], all laboratories involvedin official control analyses must provide evidence of their analytical competence throughtheir successful participation in proficiency testing (PT). International PT providers such asthe Food Analysis Performance Assessment Scheme (FAPAS), Bureau Interprofessionneld’Etudes Analytiques (BIPEA), the Joint Research Centre (JRC-European Commission),Monitoring and Quality Assurance (MoniQA) have often proposed suitable PTs for sin-gle or a limited number of relevant mycotoxins. Few multi-mycotoxin PT schemes thatinclude most of the regulated mycotoxins (AFB1, AFB2, AFG1, AFG2, OTA, DON, T-2,HT-2, ZEN, FB1 ,and FB2 exist [20]. Within the frame of the EC-funded MoniQA project,an international PT was based on spiked maize flours [20]. Moreover, participation in aPT enables the laboratories to detect and remedy shortcomings in their procedures [21,22].If suitable multi-analyte reference materials are consequently needed, as stated by Solfrizzoet al. [20] and Tangni et al. [23], then adequate methodology for acknowledging the overalllaboratory performances with several z scores generated for the targeted compounds andmerits of the matrices to be applied [24]. The sum of ranking differences (SRD), princi-pal component analysis (PCA), hierarchical cluster analysis, Youden plots, rescaled sumof z scores (RSZ), relative laboratory performance (RLP), sum of the squared z scores(SZ2), and the triple A approaches have already been applied for comparing the multi-analyte results reported during proficiency tests for polycyclic aromatic hydrocarbons [25]and pesticide residues [24,26]. Guidelines, tools, and results for the performance evaluationof analytical methods intended for the quantitative and semi-quantitative determinationof multi-mycotoxins are often based on the individual z scores obtained by participatinglaboratories [23,27–29]. Recently, FAPAS organized a multi-mycotoxin in oat flour andstated that the consideration of a set or sequence of z scores over time provides more usefulinformation than a single z score [29]. The present study aimed at organizing two interna-tional proficiency tests and at assessing the performances of the participating laboratoriesby means of combining the well-established z score values using the triple A approachagainst the relative sum of squared z scores index.
2. Results and Discussion2.1. PT Test Materials
Cornflakes (maize product) and rusk (wheat product) were incurred contaminatedwith several mycotoxins such as AFB1, AFB2, AFG1, AFG2, OTA, FB1, FB2, FB3, DON, T2,HT2, and ZEN at various concentrations. The homogeneity was evaluated (Tables 1 and 2).

Toxins 2021, 13, 591 3 of 16
It should be noted that the concentration of AFB2 and AFG2 in the cornflake materialwere very close to the LOQs of the laboratories, i.e., 0.1 µg/kg for AFB2 and 0.5 µg/kg forAFG2. Although ZEN is a relevant toxin for corn-based matrices, it was not homogeneouslydistributed in the test materials. In the rusk test material, AFG2, FB2, and FB3 were alsopresent at very low concentrations: <0.5 µg/kg for AFG2 and 100 µg/kg for FB2 and FB3.
Table 1. Statistical evaluation for the homogeneity testing of cornflake flour (PT-2019).
AFB1 AFG1 AFB1 + AFG1 DON OTA FB1 FB2 FB3 Sum FBs T2 HT2 Sum (T2, HT2)
“Sufficient homogeneity”Ssam 2.4 2.6 1.6 1.5 2.2 1.1 1.6 1.1 1.1 2.6 2.7 2.6
Ssam/0.3σp 0.4 0.34 0.2 0.3 0.3 0.2 0.2 0.2 0.2 0.4 0.4 0.4Ssam < 0.3σp Pass Pass Pass Pass Pass Pass Pass Pass Pass Pass Pass Pass
“Adequate homogeneity”σ2
all (µg/kg) 0.46 0.20 0.71 20.52 0.98 13.98 1.47 4.11 15.10 5.16 2.39 7.55San (µg/kg) 0.70 0.30 0.70 17.96 1.34 9.06 1.22 2.45 10.05 7.55 2.96 10.14
c 0.81 0.15 1.34 1030.8 3.26 420.5 5.15 35.42 495.1 96.62 17.80 190.5ssam/sqrt(c) 0.00 0.00 0.00 0.24 0.00 0.07 0.09 0.07 0.05 0.00 0.42 0.15
S2sam < c Pass Pass Pass Pass Pass Pass Pass Pass Pass Pass Pass Pass
Table 2. Statistical evaluation for the homogeneity testing of rusk flour (PT-2020).
AFB1 AFB2 AFG1 AFB1 + AFB2 + AFG1 DON OTA FB1 T2 HT2 Sum (T2 HT2)
“Sufficient homogeneity”Ssam 1.9 2.7 1.8 1.8 4.0 2.4 1.9 1.1 2.0 1.2
Ssam/0.3σp 0.28 0.40 0.27 0.27 0.78 0.36 0.29 0.19 0.30 0.21Ssam < 0.3σp Pass Pass Pass Pass Pass Pass Pass Pass Pass Pass
“Adequate homogeneity”σ2
all (µg/kg) 0.83 0.04 0.43 1.26 34.15 0.48 1.89 18.11 4.55 21.40San (µg/kg) 0.74 0.08 0.38 1.10 96.64 0.58 2.16 11.59 5.30 15.53
Cssam/sqrt(c) 0.30 0.00 0.21 0.26 0.00 0.26 0.00 0.13 0.00 0.13
S2sam < c Pass Pass Pass Pass Pass Pass Pass Pass Pass Pass
c = critical value; San2 = analytical variance, S2
sam = sampling variance, σp = fitness-for-purpose based standard deviation, σ2all = allowed
sampling variance. Homogeneity test: c = critical value = F1 × σ2all + F2 × S2
an (if S2sam < c), the test for homogeneity has been passed
(F1 = 1.79 and F2 = 0.86).
In accordance with the requirements of IUPAC [21] and ISO 13528 [30], the twocandidate materials were adequately homogenous enough to run and were allowed theassignment of the targeted mycotoxins concentrations. The condition for “sufficient ho-mogeneity” is that the true between-sample variability (σsam) does not exceed 0.3 × σp.The standard deviation (SD) of the 12 averaged results includes contributions from thebetween-sample variability and from the analytical variability san; therefore, if this SD is<0.3 × σp, then the material is certainly sufficiently homogenous; otherwise (>0.3 × σp),the critical value test was applied.
Afterwards, the stability of the materials was also evaluated. The results are givenin Table 3, illustrating that both PT materials were found to be adequately stable at +4 ◦C,as recommended.
2.2. Participants
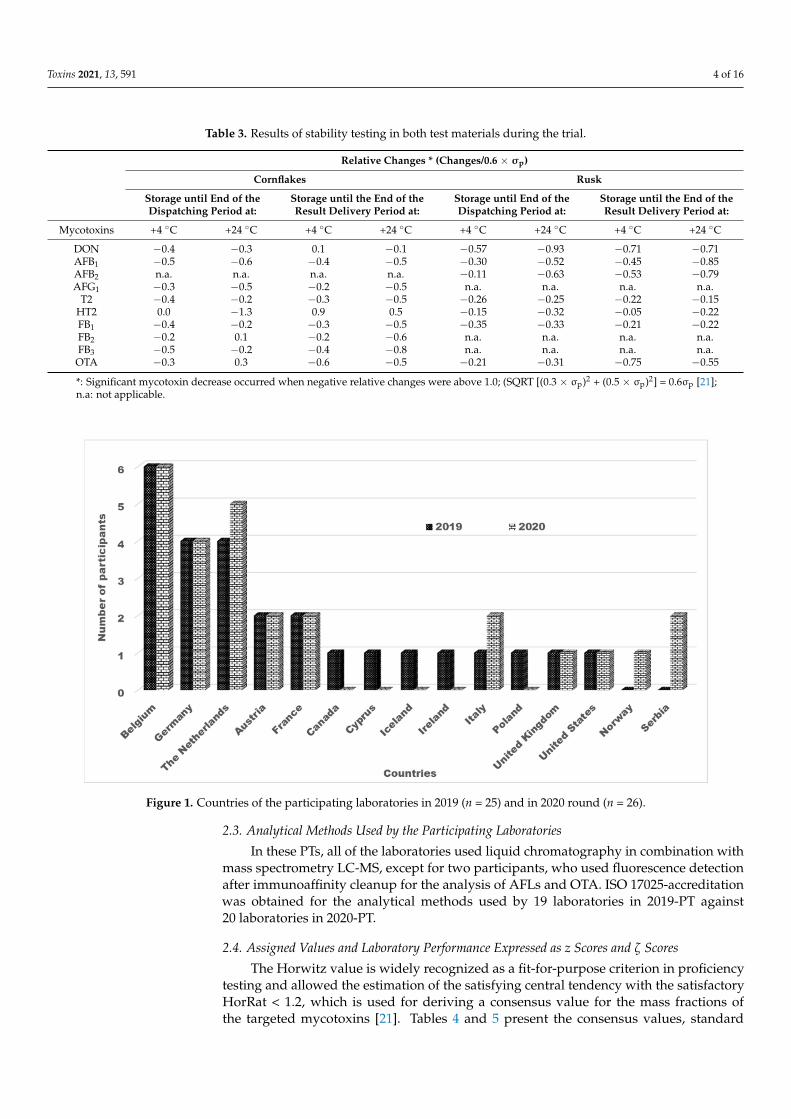
In 2019, 25 laboratories subscribed to participate in the PT (Figure 1), but one partici-pant did not submit results within the requested deadline, and one laboratory reportedresults using two different methods. In total, 25 results were used for the robust statis-tics. Of the participating laboratories, nineteen laboratories were ISO 17025 accredited.The participants were from Europe, the United States, and Canada (Figure 1). In 2020,26 laboratories (20 of which used ISO 17025 accredited methods) participated in the PT andreported their results. They were from Europe and the United States, as summarized inFigure 1.
Toxins 2021, 13, 591 4 of 16
Table 3. Results of stability testing in both test materials during the trial.
Relative Changes * (Changes/0.6 × σp)
Cornflakes Rusk
Storage until End of theDispatching Period at:
Storage until the End of theResult Delivery Period at:
Storage until End of theDispatching Period at:
Storage until the End of theResult Delivery Period at:
Mycotoxins +4 ◦C +24 ◦C +4 ◦C +24 ◦C +4 ◦C +24 ◦C +4 ◦C +24 ◦C
DON −0.4 −0.3 0.1 −0.1 −0.57 −0.93 −0.71 −0.71AFB1 −0.5 −0.6 −0.4 −0.5 −0.30 −0.52 −0.45 −0.85AFB2 n.a. n.a. n.a. n.a. −0.11 −0.63 −0.53 −0.79AFG1 −0.3 −0.5 −0.2 −0.5 n.a. n.a. n.a. n.a.
T2 −0.4 −0.2 −0.3 −0.5 −0.26 −0.25 −0.22 −0.15HT2 0.0 −1.3 0.9 0.5 −0.15 −0.32 −0.05 −0.22FB1 −0.4 −0.2 −0.3 −0.5 −0.35 −0.33 −0.21 −0.22FB2 −0.2 0.1 −0.2 −0.6 n.a. n.a. n.a. n.a.FB3 −0.5 −0.2 −0.4 −0.8 n.a. n.a. n.a. n.a.OTA −0.3 0.3 −0.6 −0.5 −0.21 −0.31 −0.75 −0.55
*: Significant mycotoxin decrease occurred when negative relative changes were above 1.0; (SQRT [(0.3 × σp)2 + (0.5 × σp)2] = 0.6σp [21];n.a: not applicable.
Figure 1. Countries of the participating laboratories in 2019 (n = 25) and in 2020 round (n = 26).
2.3. Analytical Methods Used by the Participating Laboratories
In these PTs, all of the laboratories used liquid chromatography in combination withmass spectrometry LC-MS, except for two participants, who used fluorescence detectionafter immunoaffinity cleanup for the analysis of AFLs and OTA. ISO 17025-accreditationwas obtained for the analytical methods used by 19 laboratories in 2019-PT against20 laboratories in 2020-PT.
2.4. Assigned Values and Laboratory Performance Expressed as z Scores and ζ Scores
The Horwitz value is widely recognized as a fit-for-purpose criterion in proficiencytesting and allowed the estimation of the satisfying central tendency with the satisfactoryHorRat < 1.2, which is used for deriving a consensus value for the mass fractions ofthe targeted mycotoxins [21]. Tables 4 and 5 present the consensus values, standard

Toxins 2021, 13, 591 5 of 16
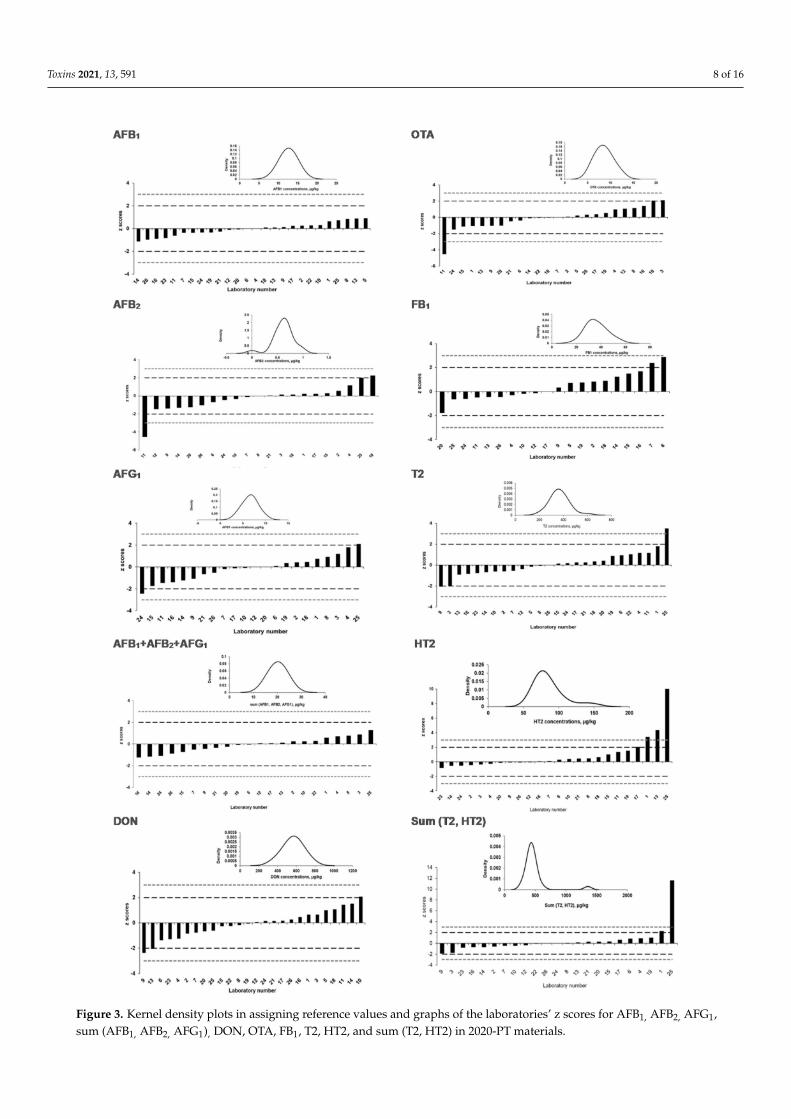
uncertainties, and relevant statistical parameters for both PT rounds. The consensus valuesare the result of the straightforward calculation of the median in which all participants hadthe same status, and outliers are excluded. Nevertheless, the disadvantages are that theconsensus values are dependent of the participant’s results. A low number of participantsmay increase the uncertainty on the consensus with the consequence of lowering thecorresponding z scores [21]. The resulting z scores and ζ scores for each mycotoxin aresummarized in Tables 4 and 5 for both PT rounds. Figures 2 and 3 displayed individualz-score results and kernel density plots in assigning the reference values of the mycotoxinsfor the 2019-PT and 2020-PT materials.
Table 4. Summary of statistical evaluations for the test materials and for laboratory performances (2019).
AFB1 AFB2 AFG1 AFG2 Sum AFs DON FB1 FB2 FB1 + FB2 FB3 OTA T2 HT2 T2 + HT2
Calculations—Uncensored datasetntot 24 19 23 13 21 25 23 22 21 10 24 24 23 22
MEDtot(µg/kg) 6.2 0.5 2.7 0.2 9.2 380.0 223.3 26.1 245.4 54.7 13.5 73.8 35.5 107.0
MADtot(µg/kg) 0.2 0.1 0.4 0.1 1.0 32.7 45.8 4.4 47.6 6.8 1.6 9.5 4.5 19.5
Calculations—Reference datasetnref 24 15 23 10 21 22 23 17 21 10 23 22 21 19
MEDref(µg/kg) 6.2 0.5 2.7 0.3 9.2 376.6 223.3 25.7 245.4 54.7 13.5 73.8 35.5 105.9
MADref(µg/kg) 0.2 0.1 0.4 0.1 1.0 29.0 45.8 3.3 47.6 6.8 1.5 8.6 4.5 17.8
σrob (µg/kg) 0.4 0.1 0.6 0.1 1.5 43.0 67.9 4.9 70.6 10.0 2.1 12.7 6.7 26.4σp (µg/kg) 1.4 0.1 0.6 0.1 2.0 69.8 44.8 5.7 48.5 12.0 3.0 16.2 7.8 23.3
HorRat 0.3 1.3 1.0 1.3 0.7 0.6 1.5 0.9 1.5 0.8 0.7 0.8 0.9 1.1Vass (µg/kg) 6.2 - 2.7 - 9.2 376.6 - 25.7 - 54.7 13.5 73.8 35.5 105.9
u (µg/kg) 0.1 - 0.1 - 0.3 9.2 - 1.2 - 3.2 0.4 2.7 1.5 6.1Z score results
ntot 24 23 21 25 22 10 24 24 23 22Acceptable 100.0% 100.0% 100.0% 88.0% 77.3% 100% 95.8% 87.5% 91.3% 86.4%
Questionable 0.0% 0.0% 0.0% 0.0% 9.1% 0% 0.0% 4.2% 0.0% 9.1%Unacceptable 0.0% 0.0% 0.0% 12.0% 13.6% 0% 4.2% 8.3% 8.7% 4.5%
Zeta score resultsntot 21 20 15 21 18 8 18 21 20 13
Acceptable 90.5% 90.0% 86.7% 81.0% 88.9% 88% 94.4% 85.7% 75.0% 100.0%Questionable 0.0% 0.0% 0.0% 0.0% 0.0% 13% 0.0% 4.8% 0.0% 0.0%Unacceptable 9.5% 10.0% 13.3% 19.0% 11.1% 0% 5.6% 9.5% 25.0% 0.0%
Assigned values Vass are the medians of the reference results; σp: standard deviation for proficiency assessment. The uncertainties ofthe consensus values did not exceed 0.7 × σp, so statistical evaluation is appropriate. ND: non detected, level below limit of detection;*: no statistical assessment available.
In 2019, an assigned value was attributed to AFB1, AFG1, sum (AFB1, AFG1), DON,FB2, FB3, OTA, T2, HT2, and sum (T2, HT2). In contrast, no assigned value (Horrat > 1.2)was attributed to FB1 and sum (FB1, FB2).
AFB2 and AFG2 were present at very low levels, i.e., 0.1 µg/kg for AFB2 and 0.5 µg/kgfor AFG2. For these toxins, no laboratory reported a false positive result (i.e., erroneousreported concentration above LOQs).
For all of the targeted compounds, most of the participants obtained acceptablez scores for all of the mycotoxins (i.e., 77.3% to 100% of the participants). However,unacceptable DON results were obtained by 12.0% of the participants. Questionable zscores were obtained by 4.2% to 9.1% of the participants for T2, FB2, and sum (T2, HT2).It should be noticed that under the “normal” and “Gaussian” distribution hypothesis,the percentages of questionable or unacceptable results should be approximately 5% and0.25%, respectively [21]. The cause analyses pertaining to an unacceptable z score werenot performed by the PT provider but was considered to be the responsibility of theparticipating laboratories.

Toxins 2021, 13, 591 6 of 16
Table 5. Summary of statistical evaluations for the test materials and for laboratory performances (2020).
AFB1 AFB2 AFG1 Sum AFs DON FB1 OTA T2 HT2 T2 + HT2
Calculations—Uncensored datasetntot 26 21 22 22 26 20 25 26 24 23
MEDtot (µg/kg) 12.8 0.6 6.7 20.4 574.0 34.7 8.4 364.9 77.8 439.7MADtot (µg/kg) 0.97 0.08 1.1 2.1 65.0 4.85 1.9 47.9 8.2 49.3
Calculations—Reference datasetnref 26 20 21 22 26 19 23 25 20 22
MEDref (µg/kg) 12.8 0.6 6.8 20.4 574.0 33.4 8.4 360.0 76.5 437.4MADref (µg/kg) 1.0 0.1 1.0 2.1 65.0 4.8 1.8 41.0 7.6 41.8σrob (µg/kg) 1.4 0.1 1.5 3.1 96.4 7.1 2.7 60.8 11.2 61.9σp (µg/kg) 2.8 0.1 1.5 4.5 99.8 7.3 1.8 67.2 16.8 79.2
HorRat 0.5 0.7 1.0 0.7 1.0 1.0 1.0 0.9 0.7 0.8Vass (µg/kg) 12.8 0.6 6.8 20.4 574.0 33.4 8.4 360.0 76.5 437.4
u (µg/kg) 0.28 0.02 0.32 0.66 18.9 1.6 0.6 12.2 2.5 13.2Z score results
ntot 26 21 22 22 26 20 25 26 24 23Acceptable 100.0% 90.5% 90.9% 100.0% 92.3% 90.0% 84.0% 96.2% 79.2% 91.3%
Questionable 0.0% 4.8% 9.1% 0.0% 7.7% 10.0% 8.0% 0.0% 0.0% 4.3%Unacceptable 0.0% 4.8% 0.0% 0.0% 0.0% 0.0% 8.0% 3.8% 12.5% 4.3%
Zeta score resultsntot 25 20 21 17 25 19 24 25 23 16
Acceptable 88.0% 70.0% 71.4% 88.2% 84.0% 94.7% 83.3% 84.0% 82.6% 75.0%Questionable 12.0% 20.0% 9.5% 11.8% 12.0% 0.0% 4.2% 8.0% 4.3% 6.3%Unacceptable 0.0% 10.0% 19.0% 0.0% 4.0% 5.3% 12.5% 8.0% 13.0% 18.8%
Assigned values Vass are the medians of the reference results; σp: standard deviation for proficiency assessment. The uncertainties of theconsensus values did not exceed 0.7 × σp, so statistical evaluation is appropriate. ND: non detected, level below limit of detection; *: nostatistical assessment available.
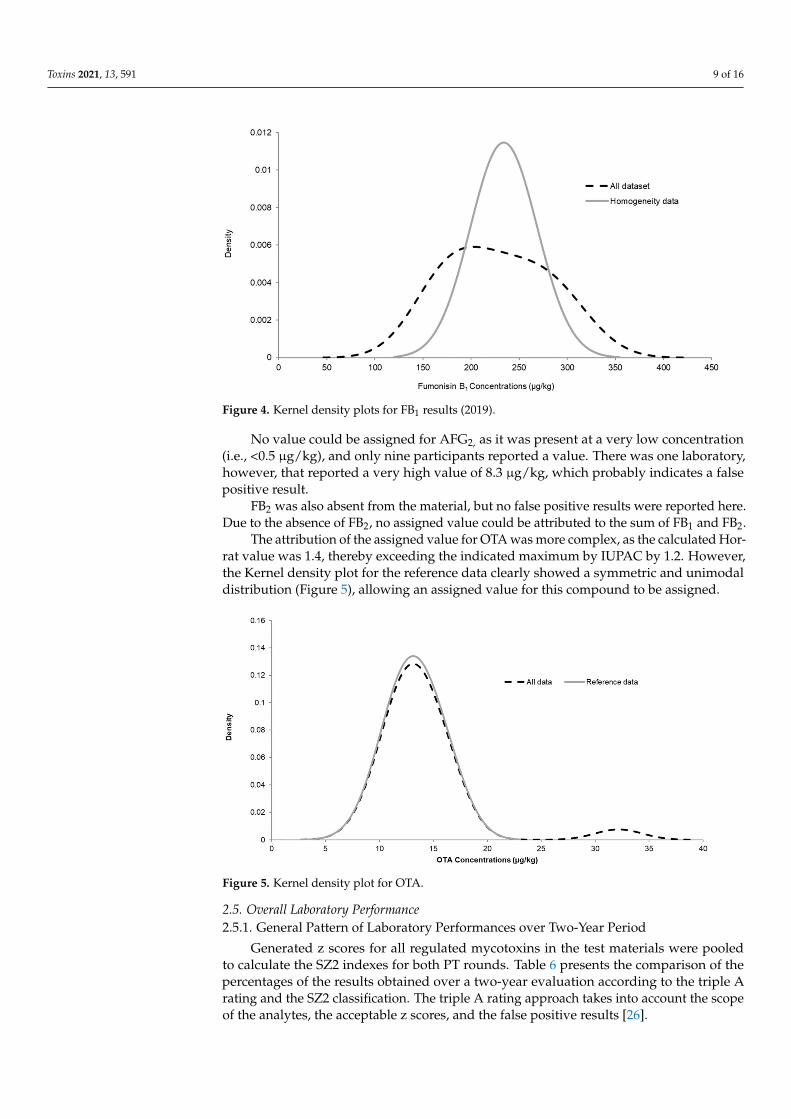
No assigned value could be attributed to FB1 due the very wide distribution ofthe results provided by participants (Figure 4). One possible hypothesis would be theexistence of two populations within the results. A wide distribution of the Kernel-plotmight be due to two peaks that are more or less merged. Most of the laboratories used anisotopically labelled standard for each individual toxin in order to compensate for matrixattenuation or matrix enhancement, the latter usually being the case with FBs. Therefore,an incorrect correction for this enhancement might quickly lead to an overestimation of theFBs concentrations. By comparing the data with the reported methodology, a small trendcould be revealed that the laboratories that did not use a 13C-labelled internal standardreported higher values compared to the results obtained during the homogeneity study.
As FB1 was present at a much higher concentration than FB2, the former dictates theresults of the sum. As such, no assigned value could be attributed to the sum. Very few FB3results (n = 10) with a large variation did not allow an assigned value for FB3 to be derivedwere reported by the participants. Note that there is no EU legislation for this component.
For all of the targeted compounds, acceptable ζ scores were achieved by 75.0% to 94.4%of the participants. However, 19.7% of the results were reported without measurementuncertainty (MU). Hence, no ζ score was calculated for these participants. Due to theimportance of a correct estimation of the MU for compliance evaluation, more effortsshould be devoted to the determination of the MU.
In the PT organized in 2020, assigned values were attributed to AFB1, AFG1, AFB2,the sum of the aflatoxins, DON, FB1, HT2, T2, sum (T2, HT2), and OTA, while no valuewas attributed to AFG2, FB2 and the sum of FB1 and FB2.
For both PTs, most of the laboratory performances were acceptable. Nevertheless,some extreme values for the ζ scores were observed and were often associated withrelatively low claimed measurement uncertainties.

Toxins 2021, 13, 591 7 of 16
Figure 2. Kernel density plots in assigning reference values and graphs of the laboratories’ z scores for AFB1, AFG1, sum(AFB1, AFG1), DON, OTA, FB2, FB3, T2, HT2, and sum (T2, HT2) in 2019-PT materials.
Toxins 2021, 13, 591 8 of 16
Figure 3. Kernel density plots in assigning reference values and graphs of the laboratories’ z scores for AFB1, AFB2, AFG1,sum (AFB1, AFB2, AFG1), DON, OTA, FB1, T2, HT2, and sum (T2, HT2) in 2020-PT materials.
Toxins 2021, 13, 591 9 of 16
Figure 4. Kernel density plots for FB1 results (2019).
No value could be assigned for AFG2, as it was present at a very low concentration(i.e., <0.5 µg/kg), and only nine participants reported a value. There was one laboratory,however, that reported a very high value of 8.3 µg/kg, which probably indicates a falsepositive result.
FB2 was also absent from the material, but no false positive results were reported here.Due to the absence of FB2, no assigned value could be attributed to the sum of FB1 and FB2.
The attribution of the assigned value for OTA was more complex, as the calculated Hor-rat value was 1.4, thereby exceeding the indicated maximum by IUPAC by 1.2. However,the Kernel density plot for the reference data clearly showed a symmetric and unimodaldistribution (Figure 5), allowing an assigned value for this compound to be assigned.
Figure 5. Kernel density plot for OTA.
2.5. Overall Laboratory Performance2.5.1. General Pattern of Laboratory Performances over Two-Year Period
Generated z scores for all regulated mycotoxins in the test materials were pooledto calculate the SZ2 indexes for both PT rounds. Table 6 presents the comparison of thepercentages of the results obtained over a two-year evaluation according to the triple Arating and the SZ2 classification. The triple A rating approach takes into account the scopeof the analytes, the acceptable z scores, and the false positive results [26].

Toxins 2021, 13, 591 10 of 16
Table 6. Results of triple A rating according to SZ2 classification over two PTs.
SZ2Evaluation
Triple A RatingOverall
AAA BAA ABA BBA CBA BAB
2019-PTGood 11 (44%) 5 (20%) 0 0 0 0 16 (64%)
Acceptable 0 0 4 (16%) 0 0 0 4 (16%)Unacceptable 0 0 3 (12%) 1 (4%) 1 (4%) 0 5 (20%)
2020-PTGood 18 (69%) 2 (8%) 1 (4%) 0 0 1 (4%) 22 (85%)
Acceptable 0 0 1 (4%) 0 0 0 1 (4%)Unacceptable 0 0 2 (7%) 1 (4%) 0 0 3 (11%)
CombinedRounds
Good 29 (57%) 7 (13%) 1 (2%) 0 0 1 (2%) 38 (74%)Acceptable 0 0 5 (10%) 0 0 0 5 (10%)Unacceptable 0 0 5 (10%) 2 (4%) 1 (2%) 0 8 (16%)
Good: Good performance; Acceptable: acceptable performance; Unacceptable: unacceptable performance.
Overall good and acceptable performances were achieved by 80% of the participantsin 2019 and 89% of the participants in 2020. Therefore, participating laboratories haveproven their competence in measuring the mycotoxins targeted in cornflake and ruskflours and may hence ascertain their accreditation to ISO 17025. Most frequent categoriesassigned to the participants in this cluster were AAA (57%) and BAA (13%). Note thatlaboratories in these two categories reported acceptable z scores >90% of the total numberand no false positives. Most of the participating laboratories in the ABA category (10%)reported acceptable z scores that ranged between 50% and 90% of those of the total numberof z scores. Underperformance was also noted for the laboratories in this cluster, with highunacceptable z scores or a high number of questionable z scores. The cluster of unacceptableperformances includes categories BBA+CBA (6%). Some laboratories reported less than50% of the mycotoxins targeted for the two matrices.
2.5.2. Accreditation Status and Related Trends on Performance Evaluation
Most of the participants used LC-MS/MS, but not all of the analytical methods wereaccredited. Based on the accreditation status of the analytical methods, the laboratoryperformances were evaluated for both of the PT rounds, as summarized in Figure 6.
Most analytical methods were accredited, being 76% (in 2019) and 77% (in 2020).The triple A rating showed that good and acceptable performances were achieved eitherwith accredited or non-accredited analytical methods. It could be expected that laboratoriesusing accredited methods would perform better, as their results are regularly subjected tothird-party scrutiny [31]. It is worth mentioning that most of the non-accredited laboratorieswould be very much aware of the quality requirements in their own sector and may beworking to standards that mimic accreditation. Non-accredited laboratories may well haveaccreditation as a goal for the near future. Moreover, they are trying to comply with theexisting scheme’s performance criterion, as postulated by Thompson et al. [31].
2.6. Conclusion and Output
Efforts from some participants are needed in the estimation and reporting of the MUof their analytical method to allow the assignment of compliance towards the maximalaccepted limits and the calculation of the ζ scores in inter-comparison laboratory trials.
For the participants, the provision of the PTs contributed to ascertaining and main-taining laboratory accreditation that is recognized all over the world.
The triple A approach seems to be adequate in evaluating the performance of labora-tories participating in multi-mycotoxin PTs. Moreover, its combination with the sum ofsquared of z scores seems to be a sufficient evaluation tool for assessing performances.
Most of the analytical methods used in the PTs were accredited, but no clear differenceswere observed in the results obtained from the laboratories with or without accreditation.

Toxins 2021, 13, 591 11 of 16
Reference materials can be certified through this exercise and may increase the avail-ability of such metrological tools, enabling the control of regulated mycotoxins throughoutthe world, pending additional long term stability monitoring.
Figure 6. Laboratory performances according to the accreditation status of their analytical method.
3. Materials and Methods3.1. Preparation of Candidate Reference Materials
In 2019, the test material was made of cornflakes, i.e., an unflavoured plain breakfastcereal product consisting of small toasted flakes of corn. In 2020, the candidate materialwas made of rusk, i.e., crispy and golden wheat bread. Both of these test materials werepurchased in Belgian supermarkets.
The PT allowed the evaluation of the determination of the following toxins: AFB1,AFB2, AFG1, AFG2, OTA, FB1, FB2, DON, T2, HT2. In addition, three sums of mycotoxins

Toxins 2021, 13, 591 12 of 16
were included: the sum of the fumosinins, the sum of the aflatoxins, and the sum of T2 andHT2 toxin.
The test materials were prepared in-house by mixing incurred batches with blankor contaminated filling flour. Mycotoxin contaminated materials were produced by inoc-ulating and fermenting cereal grains with selected fungi [32]. The fermented materialswere sterilized, dried, finely ground, and homogenized. Homogenization was carefullyperformed as described by Tangni et al. [23]. The bulk materials were divided by scaleusing a Retsch rotary sample divider PT100 to create individual subsamples (approximately55.0 ± 0.5 g), which were dispensed into aluminum foil laminate sachets that were thenvacuum sealed and numbered. Random sampling using computer-generated numberswas conducted to allocate the test materials for homogeneity testing, stability testing,and participant distribution. Surplus contingency samples were left for future use as aquality control reference material. All of the packed samples were stored at +4 ◦C prior totheir distribution to the participant laboratories.
3.2. Homogeneity Testing
The homemade candidate materials were tested for homogeneity following the recom-mended procedures of the International Harmonized Protocol for the Proficiency Testing ofAnalytical Chemistry Laboratories [21]. The homogeneity data were statistically computedand assessed to ensure that any “questionable” and “unacceptable” laboratory perfor-mances could not be attributed to any significant sample variability of the PT materials.
Briefly, two test portions of twelve randomly selected samples were extracted andanalyzed through liquid chromatography-tandem mass spectrometry (LC-MS/MS) underrepeatability conditions (i.e., same laboratory, same analyst, same method, and sameequipment) using the analytical ISO 17025-accredited method [23]. The data were testedfor precision using analysis of variance to estimate the sampling and analytical variances.The test for “adequate” homogeneity was conducted as recommended by Fearn andThompson [33] and the ISO 13528 [30].
3.3. Stability Testing
The short-term stability study of the targeted toxins in the materials was checkedthroughout the duration and ranged between sample distribution and the data submittingdeadline (end of analyses, 10 weeks). A total of three test material sachets were randomlyselected at the start of the dispatching, which were kept at −20 ◦C (used as referencetemperature), +4 ◦C, and +24 ◦C (chosen as recommended and challenge temperatures,respectively). Mycotoxin analyses were performed in duplicate under repeatability condi-tions that were similar to those used for homogeneity testing [23]. The stability per analytewas evaluated by comparing the mean of the results at a given storage temperature andduration (Xi) with the mean of the results of the homogeneity testing or with the toxinloads determined at the start of stability experiment (X0), using the following criterionfor σp [21].
|Xi− X0| ≤ SQRT[(0.3× σp)2 + (0.5× σp)2] = 0.6× σp (1)
3.4. Proficiency Test Management
Based on ISO 17043, the technical inputs of each PT round were provided by anadvisory board led by senior scientists from Sciensano. They were involved in the samplepreparation, homogeneity and stability testing, administrative work (invitation, correspon-dences, shipping), statistical analyses, and reporting work according to the establishedtime schedule. A draft report was submitted to the participants with the request to verifytheir reported data and to send their feedback comments within one month.
3.4.1. Participants
Local governmental, private, academic, commercial food testing laboratories andindustry quality control units around the world were invited to participate in the PT

Toxins 2021, 13, 591 13 of 16
rounds. Invitations were sent by e-mail with the request to fill in the participation formmentioning the PT item, the analytes to be tested, the participation fee, and the timescale.
Each participant was given a laboratory number, which assigned according to the regis-tration ranking. Laboratory codes were confidentially communicated to the correspondingparticipant and were used throughout the PT round to preserve the confidentiality of theprovided results.
3.4.2. Distribution of PT Items
Each participant received the receipt form to confirm the arrival, the test material sam-ples, and an enclosed letter with instructions pertaining to sample handling. The reportingform (protected Excel® file) was emailed after confirming the good status of the samplearrival. Each participant received one package (55.0 ± 0.5 g of sample), and reporting theresults of the extraction and analysis of one sample was recommended. Results in µg/kgand the measurement uncertainty (MU(k = 2)) were reported. The participants were alsoasked to answer a few questions pertaining to the method(s) used.
3.4.3. Applied Analytical Methods by Participants
Participant laboratories used their own routine analytical methods for the targetedmycotoxins. The test materials had to be re-homogenized before the routine analysis.The laboratories were given 6 weeks after the receipt of the PT items to finish the analyseswith a warning of the deadline for results submission.
3.5. Statistical and Performance Evaluation
The assigned and uncertainties measurement values for mycotoxins in the PT materialswere determined by the consensus of the participants’ results. The robust statistic approachis a convenient modern method of handling results when they are expected to follow anear-normal distribution. Medians of all results (MEDtot) were calculated, and resultsranging from 50% to 150% MEDtot were used as reference dataset. Otherwise, they wereconsidered as outliers. The median of reference data set (MEDref) and median absolutedifference (MAD) were used as robust estimators. Kernel density plots were built to checka convincing central tendency. A satisfactory HorRat value (<1.2) was used to assignthe MEDref as “consensus” or “reference” value for the targeted analyte. The modifiedHorwitz equation was used to establish the standard deviation for proficiency testing (σp),calculated using the equation as described by Thompson [34].
3.5.1. Single Analyte Performance Assessment
Individual laboratory performances were rated by a z score (Equation (2)) andζ-score (Equation (3)) in accordance to the ISO procedure 13528 [30] and the InternationalHarmonized Protocol described by Thompson et al. [21].
z score =Xlab −Vass
σp(2)
ζ score = (Xlab −Vass)/√
ure f2 + ulab
2 (3)
where Xlab is the individual measurement result supplied by the participating laboratory,Vass is the assigned value, σp is the standard deviation for proficiency assessment, uref is thestandard uncertainty for the assigned value, and ulab is the reported standard uncertaintyon the reported value by the participating laboratory.
The z score compares the participant’s deviation from the reference value with re-gard to the standard deviation accepted for the proficiency test. The ζ score states if thelaboratory result agrees with the assigned value within the uncertainty claimed by thelaboratory. The z scores are interpreted as acceptable ( | z | ≤ 2), questionable (2 < | z | < 3),and unacceptable ( | z | ≥ 3). Likewise, the ζ scores are also interpreted as acceptable when| ζ | ≤ 2, questionable for 2 < | ζ | < 3, and unacceptable when | ζ | ≥ 3.
Toxins 2021, 13, 591 14 of 16
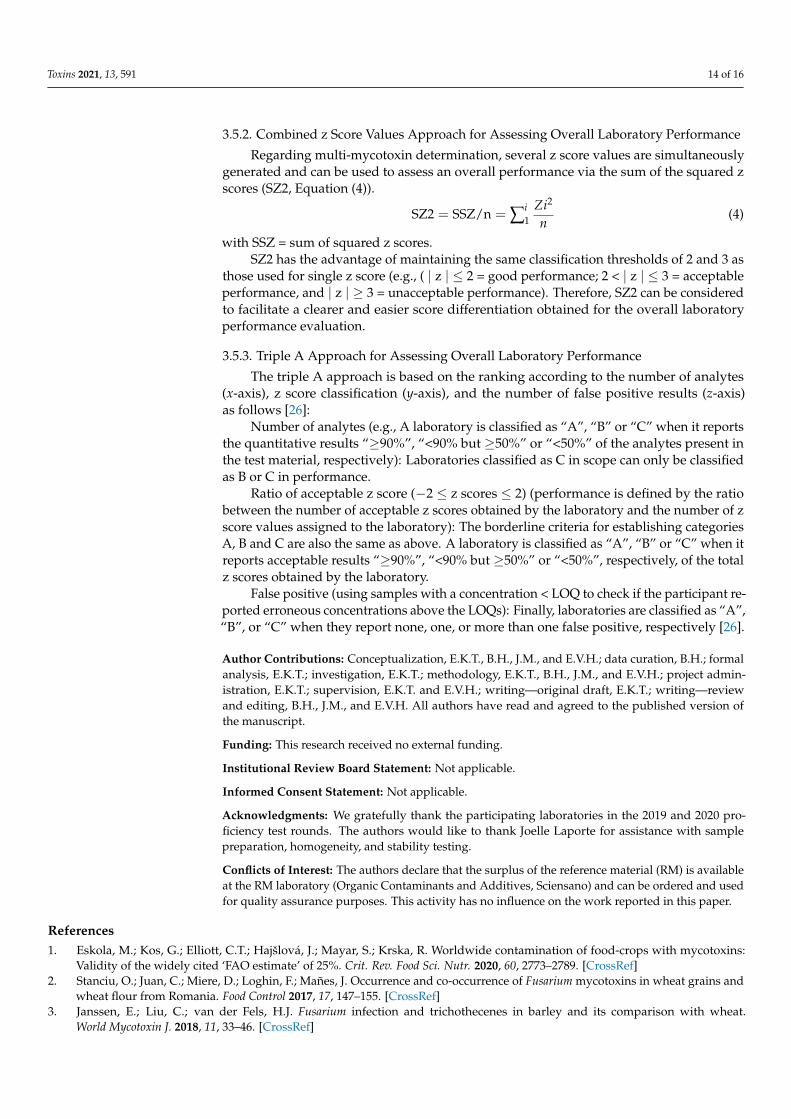
3.5.2. Combined z Score Values Approach for Assessing Overall Laboratory Performance
Regarding multi-mycotoxin determination, several z score values are simultaneouslygenerated and can be used to assess an overall performance via the sum of the squared zscores (SZ2, Equation (4)).
SZ2 = SSZ/n = ∑i1
Zi2
n(4)
with SSZ = sum of squared z scores.SZ2 has the advantage of maintaining the same classification thresholds of 2 and 3 as
those used for single z score (e.g., ( | z | ≤ 2 = good performance; 2 < | z | ≤ 3 = acceptableperformance, and | z | ≥ 3 = unacceptable performance). Therefore, SZ2 can be consideredto facilitate a clearer and easier score differentiation obtained for the overall laboratoryperformance evaluation.
3.5.3. Triple A Approach for Assessing Overall Laboratory Performance
The triple A approach is based on the ranking according to the number of analytes(x-axis), z score classification (y-axis), and the number of false positive results (z-axis)as follows [26]:
Number of analytes (e.g., A laboratory is classified as “A”, “B” or “C” when it reportsthe quantitative results “≥90%”, “<90% but ≥50%” or “<50%” of the analytes present inthe test material, respectively): Laboratories classified as C in scope can only be classifiedas B or C in performance.
Ratio of acceptable z score (−2 ≤ z scores ≤ 2) (performance is defined by the ratiobetween the number of acceptable z scores obtained by the laboratory and the number of zscore values assigned to the laboratory): The borderline criteria for establishing categoriesA, B and C are also the same as above. A laboratory is classified as “A”, “B” or “C” when itreports acceptable results “≥90%”, “<90% but ≥50%” or “<50%”, respectively, of the totalz scores obtained by the laboratory.
False positive (using samples with a concentration < LOQ to check if the participant re-ported erroneous concentrations above the LOQs): Finally, laboratories are classified as “A”,“B”, or “C” when they report none, one, or more than one false positive, respectively [26].
Author Contributions: Conceptualization, E.K.T., B.H., J.M., and E.V.H.; data curation, B.H.; formalanalysis, E.K.T.; investigation, E.K.T.; methodology, E.K.T., B.H., J.M., and E.V.H.; project admin-istration, E.K.T.; supervision, E.K.T. and E.V.H.; writing—original draft, E.K.T.; writing—reviewand editing, B.H., J.M., and E.V.H. All authors have read and agreed to the published version ofthe manuscript.
Funding: This research received no external funding.
Institutional Review Board Statement: Not applicable.
Informed Consent Statement: Not applicable.
Acknowledgments: We gratefully thank the participating laboratories in the 2019 and 2020 pro-ficiency test rounds. The authors would like to thank Joelle Laporte for assistance with samplepreparation, homogeneity, and stability testing.
Conflicts of Interest: The authors declare that the surplus of the reference material (RM) is availableat the RM laboratory (Organic Contaminants and Additives, Sciensano) and can be ordered and usedfor quality assurance purposes. This activity has no influence on the work reported in this paper.
References1. Eskola, M.; Kos, G.; Elliott, C.T.; Hajšlová, J.; Mayar, S.; Krska, R. Worldwide contamination of food-crops with mycotoxins:
Validity of the widely cited ‘FAO estimate’ of 25%. Crit. Rev. Food Sci. Nutr. 2020, 60, 2773–2789. [CrossRef]2. Stanciu, O.; Juan, C.; Miere, D.; Loghin, F.; Mañes, J. Occurrence and co-occurrence of Fusarium mycotoxins in wheat grains and
wheat flour from Romania. Food Control 2017, 17, 147–155. [CrossRef]3. Janssen, E.; Liu, C.; van der Fels, H.J. Fusarium infection and trichothecenes in barley and its comparison with wheat.
World Mycotoxin J. 2018, 11, 33–46. [CrossRef]

Toxins 2021, 13, 591 15 of 16
4. Speijers, G.J.H.; Speijers, M.H.M. Combined toxic effects of mycotoxins. Toxicol. Lett. 2004, 153, 98. [CrossRef] [PubMed]5. Krska, R.; Schubert-Ullrich, P.; Molinelli, A.; Sulyok, M.; Susan, M.; Crews, C. Mycotoxin analysis: An update. Food Addit. Contam.
2008, 25, 152–163. [CrossRef]6. Bryła, M.; Waskiewicz, A.; Ksieniewicz-Wozniak, E.; Szymczyk, K.; Jedrzejczak, R. Modified Fusarium mycotoxins in cereals and
their products—Metabolism, occurrence, and toxicity: An updated review. Molecules 2018, 23, 963. [CrossRef] [PubMed]7. Tangni, E.K.; Masquelier, J.; van Hoeck, E. Determination of ochratoxin A in edible pork offal: Intra-laboratory validation study
and estimation of the daily intake via kidney consumption in Belgium. Mycotoxin Res. 2021, 37, 79–87. [CrossRef] [PubMed]8. Karlovsky, P.; Suman, M.; Berthiller, F.; de Meester, J.; Eisenbrand, G.; Perrin, I.; Oswald, I.P.; Speijers, G.; Chiodini, A.;
Recker, T.; et al. Impact of food processing and detoxification treatments on mycotoxin contamination. Mycotoxin Res. 2016, 32,179–205. [CrossRef] [PubMed]
9. Tirado, M.C.; Clarke, R.; Jaykus, L.A.; McQuatters-Gollop, A.; Frank, J.M. Climate change and food safety: A Review. Food Res. Int.2010, 43, 1745–1765. [CrossRef]
10. European Commission. Commission Recommendation of 17 August 2006 on the presence of deoxynivalenol, zearalenone,ochratoxin A, T-2 and HT-2 and fumonisins in products intended for animal feeding. Off. J. Eur. Union 2006, L229, 7–9.
11. EFSA Panel on Contaminants in the Food Chain. Scientific Opinion on the risks to human and animal health related to thepresence of beauvericin and enniatins in food and feed. EFSA J. 2014, 12, 3802. [CrossRef]
12. EFSA Panel on Contaminants in the Food Chain. Risk assessment of ochratoxin A in food. EFSA J. 2020, 18, e06113.13. Sulyok, M.; Berthiller, F.; Krska, R.; Schuhmacher, R. Development and validation of a liquid chromatography/tandem mass
spectrometric method for the determination of 39 mycotoxins in wheat and maize. Rapid Commun. Mass Spectrom. 2006, 20,2649–2659. [CrossRef] [PubMed]
14. Sulyok, M.; Berthiller, F.; Krska, R.; Schuhmacher, R. Liquid chromatography/tandem mass spectrometric multimycotoxinmethod comprising 87 analytes and its application to moldy food samples. Anal. Bioanal. Chem. 2007, 389, 1505–1523. [CrossRef]
15. Mol, H.G.; Zomer, P.; García-López, M.; Fussell, R.J.; Scholten, J.; de Kok, A.; Wolheim, A.; Anastassiades, M.;Lozano, A.; Fernandez Alba, A. Identification in residue analysis based on liquid chromatography with tandem massspectrometry: Experimental evidence to update performance criteria. Anal. Chim. Acta 2015, 873, 1–13. [CrossRef]
16. Meerpoel, C.; Vidal, A.; Huybrechts, B.; Tangni, E.K.; de Saeger, S.; Croubels, S.; Devreese, M. Comprehensive toxicokineticanalysis reveals major interspecies differences in absorption, distribution and elimination of citrinin in pigs and broiler chickens.Food Chem. Toxicol. 2020, 141, 111365. [CrossRef]
17. Guo, Z.; Li, X.; Li, H. Certified Reference Materials and Metrological Traceability for Mycotoxin Analysis. J. AOAC Int. 2019, 102,1695–1707. [CrossRef]
18. ISO. ISO 17025 General Requirement for the Competence of Testing and Calibration Laboratories; International Organization forStandardization (ISO): Geneva, Switzerland, 2017.
19. European Commission. European Regulation 882/2004 of the European Parliament and of the Council of 29 April 2004 on officialcontrols performed to ensure the verification of compliance with feed and food law, animal health and animal welfare rules.Off. J. 2004, L191, 1–59.
20. Solfrizzo, M.; de Girolamo, A.; Lattanzio, V.M.T.; Visconti, A.; Stroka, J.; Alldrick, A.; van Egmond, H.P. Results of a proficiencytest for multi-mycotoxin determination in maize by using methods based on LC-MS/MS. Qual. Assur. Saf. Crop. Foods 2013, 5,15–48. [CrossRef]
21. Thompson, M.; Ellison, S.L.R.; Wood, R. The International Harmonized Protocol for the proficiency testing of analytical chemistrylaboratories (IUPAC Technical Report). Pure Appl. Chem. 2006, 78, 45–196. [CrossRef]
22. ISO 17043. Conformity Assessment—General Requirements for Proficiency Testing; International Organization for Standardization(ISO): Geneva, Switzerland, 2010.
23. Tangni, E.K.; Debongnie, P.; Huybrechts, B.; van Hove, F.; Callebaut, A. Towards the development of innovative multi-mycotoxinreference materials as promising metrological tool for emerging and regulated mycotoxin analyses. Mycotoxin Res. 2017, 33, 15–24.[CrossRef]
24. Medina-Pastor, P.; Mezcua, M.; Rodriguez-Toreblanca, C.; Fernandez-Alba, A.R. Laboratory assessment by combined z scorevalues in profiency tests: Experience gained through the European Union proficiency tests for pesticide residues in fruits andvegetables. Anal. Bioanal. Chem. 2010, 397, 3061–3070. [CrossRef]
25. Škrbic, B.; Héberger, K.; Ðurišic-Mladenovic, N. Comparison of multianalyte proficiency test results by sum of ranking differences,principal component analysis, and hierarchical cluster. Anal. Bioanal. Chem. 2013, 405, 8363–8375. [CrossRef]
26. Valverde, A.; Fernandez-Alba, A.R.; Ferrer, C.; Aguilera, A. Laboratory Triple-A Rating: A New approach to evaluate performance-underperformance of laboratories participating in EU Proficiency Tests for multi-residue analysis of pesticides in fruits andvegetables. Food Contr. 2016, 63, 255–258. [CrossRef]
27. Pascale, M.; de Girolamo, A.; Lippolis, V.; Stroka, J.; Mol, H.G.J.; Lattanzio, V.M.T. Performance evaluation of LC-MS methods formultimycotoxin determination. J. AOAC Int. 2019, 102, 1708–1720. [CrossRef]
28. Bessaire, T.; Mujahid, C.; Mottier, P.; Desmarchelier, A. Multiple Mycotoxins Determination in Food by LC-MS/MS:An International Collaborative Study. Toxins 2019, 11, 658. [CrossRef] [PubMed]
29. FAPAS—Food Analysis Performance Assessment Scheme. Food Chemistry Proficiency Test Report 04409 (2021) Multi Mycotoxins inOat Flour; Fera Science Ltd.: National Agri-Food Innovation Campus, York, UK, 2021; p. 64.

Toxins 2021, 13, 591 16 of 16
30. ISO. ISO 13528 Statistical Methods for Use in Proficiency Testing by Interlaboratory Comparisons; International Organization forStandardization (ISO): Geneva, Switzerland, 2015.
31. Thompson, M.; Kenneth Mathieson, K.; Owen, L.; Damant, A.P.; Wood, R. The relationship between accreditation status andperformance in a proficiency test. Accred. Qual. Assur. 2009, 14, 73–78. [CrossRef]
32. Han, Z.; Tangni, E.K.; Huybrechts, B.; Munaut, F.; Scauflaire, J.; Wu, A.; Callebaut, A. Screening survey of co-production offusaric acid, fusarin C and fumonisins B1, B2 and B3 by Fusarium strains grown in maize grains. Mycotoxin Res. 2014, 30, 231–240.[CrossRef]
33. Fearn, T.; Thompson, M.A. New test for “sufficient” homogeneity. Analyst 2001, 126, 1414–1417. [CrossRef] [PubMed]34. Thompson, M. Recent trends in inter-laboratory precision at ppb and sub-ppb concentrations in relation to fitness for purpose
criteria in proficiency testing. Analyst 2000, 125, 385. [CrossRef]