Toxicopathological studies on the effects of T-2 mycotoxin and ...
Upload
khangminh22Category
view
0download
0
The New Zealand Mycotoxin Surveillance Program 06-14 Report Series
FW0617 Risk Profile Mycotoxin in the New Zealand Food Supply
MPI Technical Report – Paper No: 2016/21
Prepared for MPI by Peter Cressey & Dr Barbara Thomson
(ESR) and John Reeve (MPI)
ISBN No: 978-1-77665-289-1 (online) ISSN No: 2253-3923 (online)
May 2006

Ministry for Primary Industries {Name of paper in here} 1
Disclaimer
While every effort has been made to ensure the information in this publication is accurate, the
Ministry for Primary Industries does not accept any responsibility or liability for error of fact,
omission, interpretation or opinion that may be present, nor for the consequences of any decisions
based on this information.
Requests for further copies should be directed to:
Publications Logistics Officer
Ministry for Primary Industries
PO Box 2526
WELLINGTON 6140
Email: [email protected]
Telephone: 0800 00 83 33
Facsimile: 04-894 0300
This publication is also available on the Ministry for Primary Industries website at
http://www.mpi.govt.nz/news-and-resources/publications/
© Crown Copyright - Ministry for Primary Industries

2 {Name of paper in here} Ministry for Primary Industries
Scientific Interpretive Summary
This SIS is prepared by MPI risk assessors to provide context to the following report for MPI risk managers and external readers
The New Zealand Mycotoxin Surveillance Program 06-14 Report Series
FW0617 Risk Profile Mycotoxin in the New Zealand Food Supply
These reports are the outputs of MPIs ongoing mycotoxin surveillance programme. The nine reports form a series detailing the research undertaken over the last eight years to characterise and quantify the risk to the New Zealand public through the presence of mycotoxins in the food supply. The nine reports are:
Risk Profile: Mycotoxin in Foods 2006
Aflatoxins in Maize Products 2008
Aflatoxins and Ochratoxin A in Dried Fruits and Spices 2009
Aflatoxins in Nuts and Nut Products 2010
Dietary Exposure to Aflatoxins 2011
Ochratoxin A in Cereal Products, Wine, Beer and Coffee 2011
Trichothecene Mycotoxins in Cereal Products 2014
Dietary Exposure to Ochratoxin A and Trichothecene Mycotoxins 2014
Risk Profile: Mycotoxin in Foods 2014
Risk Profile Mycotoxin in the New Zealand Food Supply 2006 This report compiles the likely risks of the various categories of mycotoxins and previous occurrence data for New Zealand foods. This provides a single resource from which risk ranking future work on mycotoxins can be undertaken. The report highlighted that Aflatoxins, Ochratoxin A and Trichothecenes had significant health concerns and data gaps on occurrence data prevented accurate risk assessments from being completed. Other categories of mycotoxins, such as fumonisins and ergot alkaloids were prioritised as less of a dietary risk.

RISK PROFILE: MYCOTOXINS IN THE NEW ZEALAND
FOOD SUPPLY
Prepared as part of a New Zealand Food Safety Authority contract for scientific services
by
Peter Cressey Dr Barbara Thomson
April 2006
Institute of Environmental Science & Research Limited Christchurch Science Centre Location address: 27 Creyke Road, Ilam, Christchurch Postal address: P O Box 29 181, Christchurch, New Zealand Website: www.esr.cri.nz
A CROWN RESEARCH INSTITUTE

Client Report FW0617
RISK PROFILE: MYCOTOXINS IN THE NEW ZEALAND
FOOD SUPPLY
Dr Stephen On Food Safety Programme Leader
Peter Cressey Dr Lou Gallagher Project Leader Peer Reviewer
Risk Profile: Mycotoxins in the New Zealand April 2006 Food Supply

DISCLAIMER This report or document (“the Report”) is given by the Institute of Environmental Science and Research Limited (“ESR”) solely for the benefit of the New Zealand Food Safety Authority (“NZFSA”), Public Health Services Providers and other Third Party Beneficiaries as defined in the Contract between ESR and the NZFSA, and is strictly subject to the conditions laid out in that Contract. Neither ESR nor any of its employees makes any warranty, express or implied, or assumes any legal liability or responsibility for use of the Report or its contents by any other person or organisation.
Risk Profile: Mycotoxins in the New Zealand April 2006 Food Supply

CONTENTS
SUMMARY ........................................................................................................................... i
GLOSSARY OF TERMS, ABBREVIATIONS AND ACRONYMS .............................iii
1 INTRODUCTION .................................................................................................... 1
1.1 Main Information Sources ..................................................................................... 3
2 AFLATOXINS.......................................................................................................... 4
2.1 Hazard Identification ............................................................................................. 4 2.1.1 Structure and nomenclature ........................................................................... 4 2.1.2 Occurrence ..................................................................................................... 5 2.1.3 Sampling for aflatoxin analysis ..................................................................... 5
2.2 Hazard Characterisation: Adverse Health Effects ................................................. 6 2.2.1 Conditions ...................................................................................................... 6 2.2.2 Toxicity .......................................................................................................... 6 2.2.3 Toxicological assessment .............................................................................. 7 2.2.4 Proposed mechanisms of carcinogenicity...................................................... 8 2.2.5 Carcinogenic potency of AFB1 ...................................................................... 8
2.3 Exposure Assessment........................................................................................... 11 2.3.1 Aflatoxins in the New Zealand food supply ................................................ 11 2.3.2 Aflatoxins in the Australian food supply..................................................... 12 2.3.3 Overseas Context ......................................................................................... 14 2.3.4 New Zealand estimates of dietary exposure ................................................ 22 2.3.5 Overseas estimates of dietary exposure ....................................................... 23
2.4 Risk Characterisation........................................................................................... 27 2.4.1 Adverse health effects in New Zealand ....................................................... 27 2.4.2 Adverse health effects overseas ................................................................... 28
2.5 Risk Management Information ............................................................................ 31 2.5.1 Relevant food controls: New Zealand ......................................................... 31 2.5.2 Relevant food controls: overseas ................................................................. 31 2.5.3 Influence of food processing on aflatoxin levels ......................................... 34
2.6 Conclusions.......................................................................................................... 35 2.6.1 Description of risks to New Zealand consumers ......................................... 35 2.6.2 Commentary on risk management options .................................................. 37 2.6.3 Data gaps...................................................................................................... 37
3 OCHRATOXIN A (OTA) ...................................................................................... 38
3.1 Hazard identification............................................................................................ 38 3.1.1 Structure and nomenclature ......................................................................... 38 3.1.2 Occurrence ................................................................................................... 38
3.2 Hazard Characterisation: Adverse Health Effects ............................................... 39 3.2.1 Conditions .................................................................................................... 39 3.2.2 Toxicity ........................................................................................................ 39 3.2.3 Toxicological assessment ............................................................................ 40
3.3 Exposure Assessment........................................................................................... 40 3.3.1 OTA in the New Zealand food supply......................................................... 40 3.3.2 OTA in the Australian food supply.............................................................. 41
Risk Profile: Mycotoxins in the New Zealand April 2006 Food Supply
3.3.3 Overseas Context ......................................................................................... 41 3.3.4 New Zealand estimates of dietary exposure ................................................ 44 3.3.5 Overseas estimates of dietary exposure ....................................................... 45
3.4 Risk Characterisation........................................................................................... 46 3.4.1 Adverse health effects in New Zealand ....................................................... 46 3.4.2 Adverse health effects overseas ................................................................... 46
3.5 Risk Management Information ............................................................................ 47 3.5.1 Relevant food controls: New Zealand ......................................................... 47 3.5.2 Relevant food controls: overseas ................................................................. 47 3.5.3 Influence of processing on OTA levels ....................................................... 50
3.6 Conclusions.......................................................................................................... 51 3.6.1 Description of risks to New Zealand consumers ......................................... 51 3.6.2 Commentary on risk management options .................................................. 52 3.6.3 Data gaps...................................................................................................... 52
4 TRICHOTHECENES ............................................................................................ 53
4.1 Hazard identification............................................................................................ 53 4.1.1 Structure and nomenclature ......................................................................... 53 4.1.2 Occurrence ................................................................................................... 54
4.2 Hazard Characterisation: Adverse Health Effects ............................................... 56 4.2.1 Conditions .................................................................................................... 56 4.2.2 Toxicity ........................................................................................................ 57 4.2.3 Toxicological assessment ............................................................................ 58
4.3 Exposure Assessment........................................................................................... 59 4.3.1 Trichothecenes in New Zealand cereal grains ............................................. 59 4.3.2 Trichothecenes in the New Zealand food supply......................................... 60 4.3.3 Trichothecenes in Australian cereal grains.................................................. 61 4.3.4 Overseas context .......................................................................................... 62 4.3.5 New Zealand estimates of dietary exposure ................................................ 64 4.3.6 Overseas estimates of dietary exposure ....................................................... 64
4.4 Risk Characterisation........................................................................................... 67 4.4.1 Adverse health effects in New Zealand ....................................................... 67 4.4.2 Adverse health effects overseas ................................................................... 67
4.5 Risk Management Information ............................................................................ 68 4.5.1 Relevant food controls: New Zealand ......................................................... 68 4.5.2 Relevant food controls: overseas ................................................................. 68 4.5.3 Influence of processing on trichothecene levels .......................................... 71
4.6 Conclusions.......................................................................................................... 72 4.6.1 Description of risks to New Zealand consumers ......................................... 72 4.6.2 Commentary on risk management options .................................................. 73 4.6.3 Data gaps...................................................................................................... 73
5 FUMONISINS......................................................................................................... 74
5.1 Hazard Identification ........................................................................................... 74 5.1.1 Structure and nomenclature ......................................................................... 74 5.1.2 Occurrence ................................................................................................... 74
5.2 Hazard Characterisation: Adverse Health Effects ............................................... 75 5.2.1 Conditions .................................................................................................... 75 5.2.2 Toxicity ........................................................................................................ 75 5.2.3 Toxicological assessment ............................................................................ 76
Risk Profile: Mycotoxins in the New Zealand April 2006 Food Supply
5.3 Exposure Assessment........................................................................................... 76 5.3.1 Fumonisins in the New Zealand food supply .............................................. 77 5.3.2 Fumonisins in the Australian food supply ................................................... 77 5.3.3 Overseas context .......................................................................................... 77 5.3.4 New Zealand estimates of dietary exposure ................................................ 79 5.3.5 Overseas estimates of dietary exposure ....................................................... 80
5.4 Risk Characterisation........................................................................................... 81 5.4.1 Adverse health effects in New Zealand ....................................................... 81 5.4.2 Adverse health effects overseas ................................................................... 81
5.5 Risk Management Information ............................................................................ 84 5.5.1 Relevant food controls: New Zealand ......................................................... 84 5.5.2 Relevant food controls: overseas ................................................................. 84 5.5.3 Influence of processing on fumonisin levels ............................................... 86
5.6 Conclusions.......................................................................................................... 87 5.6.1 Description of risks to New Zealand consumers ......................................... 87 5.6.2 Commentary on risk management options .................................................. 88 5.6.3 Data gaps...................................................................................................... 88
6 ZEARALENONE ................................................................................................... 89
6.1 Hazard identification............................................................................................ 89 6.1.1 Structure and nomenclature ......................................................................... 89 6.1.2 Occurrence ................................................................................................... 90
6.2 Hazard Characterisation: Adverse Health Effects ............................................... 90 6.2.1 Conditions .................................................................................................... 90 6.2.2 Toxicity ........................................................................................................ 90 6.2.3 Toxicological assessment ............................................................................ 91
6.3 Exposure Assessment........................................................................................... 91 6.3.1 Zearalenone in New Zealand cereals ........................................................... 91 6.3.2 Zearalenone in the New Zealand food supply ............................................. 92 6.3.3 Zearalenone in Australian cereals................................................................ 92 6.3.4 Zearalenone in the Australian food supply .................................................. 93 6.3.5 Overseas context .......................................................................................... 93 6.3.6 New Zealand estimates of dietary exposure ................................................ 97 6.3.7 Overseas estimates of dietary exposure ....................................................... 98
6.4 Risk Characterisation........................................................................................... 99 6.4.1 Adverse health effects in New Zealand ....................................................... 99 6.4.2 Adverse health effects overseas ................................................................... 99
6.5 Risk Management Information .......................................................................... 100 6.5.1 Relevant food controls: New Zealand ....................................................... 100 6.5.2 Relevant food controls: overseas ............................................................... 100 6.5.3 Influence of processing on fumonisin levels ............................................. 102
6.6 Conclusions........................................................................................................ 104 6.6.1 Description of risks to New Zealand consumers ....................................... 104 6.6.2 Commentary on risk management options ................................................ 104 6.6.3 Data gaps.................................................................................................... 104
7 ERGOT ALKALOIDS......................................................................................... 105
7.1 Hazard Identification ......................................................................................... 105 7.1.1 Structure and nomenclature ....................................................................... 106 7.1.2 Occurrence ................................................................................................. 106
Risk Profile: Mycotoxins in the New Zealand April 2006 Food Supply

7.2 Hazard Characterisation: Adverse Health Effects ............................................. 107 7.2.1 Conditions .................................................................................................. 107 7.2.2 Toxicity ...................................................................................................... 107 7.2.3 Toxicological assessment .......................................................................... 108
7.3 Exposure Assessment......................................................................................... 108 7.3.1 Ergot in the New Zealand food supply ...................................................... 108 7.3.2 Ergot in the Australian food supply........................................................... 108 7.3.3 Overseas context ........................................................................................ 109 7.3.4 New Zealand estimates of dietary exposure .............................................. 110 7.3.5 Overseas estimates of dietary exposure ..................................................... 110
7.4 Risk Characterisation......................................................................................... 111 7.4.1 Adverse health effects in New Zealand ..................................................... 111 7.4.2 Adverse health effects overseas ................................................................. 111
7.5 Risk Management Information .......................................................................... 112 7.5.1 Relevant food controls: New Zealand ....................................................... 112 7.5.2 Relevant food controls: overseas ............................................................... 112 7.5.3 Influence of processing on fumonisin levels ............................................. 113
7.6 Conclusions........................................................................................................ 114 7.6.1 Description of risks to New Zealand consumers ....................................... 114 7.6.2 Commentary on risk management options ................................................ 114 7.6.3 Data gaps.................................................................................................... 115
8 PATULIN .............................................................................................................. 116
8.1 Hazard Identification ......................................................................................... 116 8.1.1 Structure and nomenclature ....................................................................... 116 8.1.2 Occurrence ................................................................................................. 116
8.2 Hazard Characterisation: Adverse Health Effects ............................................. 117 8.2 Hazard Characterisation: Adverse Health Effects ............................................. 117
8.2.1 Toxicity ...................................................................................................... 117 8.2.2 Toxicological assessment .......................................................................... 117
8.3 Exposure Assessment......................................................................................... 118 8.3.1 Patulin in New Zealand apple-based foods................................................ 118 8.3.2 Patulin in Australian apple-based foods .................................................... 119 8.3.3 Overseas context ........................................................................................ 119 8.3.4 New Zealand estimates of dietary exposure .............................................. 121 8.3.5 Overseas estimates of dietary exposure ..................................................... 121
8.4 Risk Characterisation......................................................................................... 123 8.5 Risk Management Information .......................................................................... 123
8.5.1 Relevant food controls: New Zealand ....................................................... 123 8.5.2 Relevant food controls: overseas ............................................................... 124 8.5.3 Influence of processing on patulin levels .................................................. 126
8.6 Conclusions........................................................................................................ 127 8.6.1 Description of risks to New Zealand consumers ....................................... 127 8.6.2 Commentary on risk management options ................................................ 127 8.6.3 Data gaps.................................................................................................... 128
9 RANKING RISKS ASSOCIATED WITH DIETARY MYCOTOXIN EXPOSURE IN NEW ZEALAND...................................................................... 129
10 REFERENCES ..................................................................................................... 133
Risk Profile: Mycotoxins in the New Zealand April 2006 Food Supply

APPENDIX 1: FUNGAL SPECIES PRODUCING MYCOTOXINS DISCUSSED IN THIS DOCUMENT ............................................ 163
Risk Profile: Mycotoxins in the New Zealand April 2006 Food Supply

LIST OF TABLES Table 1: Potency estimates for risk of primary liver cancer in humans from aflatoxin
exposure based on epidemiological data, with reference to hepatitis B status .....10 Table 2: Aflatoxins in New Zealand foods .........................................................................11 Table 3: Aflatoxins in Australian foods (1983-1997).........................................................13 Table 4: Worldwide data on occurrence of aflatoxins in food............................................15 Table 5: Overseas estimates of dietary exposure to aflatoxins ...........................................24 Table 6: Incidence of liver cancer, hepatitis B and hepatitis C in New Zealand................27 Table 7: Estimated dietary exposure to aflatoxins from consumption of maize and
peanuts under various scenarios for the GEMS/Food European diet ...................32 Table 8: Distribution of aflatoxins between maize wet milling fractions...........................35 Table 9: OTA in New Zealand foods..................................................................................41 Table 10: Worldwide data on occurrence of OTA in food ...................................................42 Table 11: Overseas estimates of dietary exposure to OTA...................................................45 Table 12: Regulatory limits for OTA in various countries (food regulations only) .............48 Table 13: Trichothecene production by Fusarium species in New Zealand crops...............54 Table 14: Acute toxicity (LD50) of trichothecenes in experimental animals ........................58 Table 15: Trichothecenes in New Zealand cereal grains ......................................................60 Table 16: Trichothecenes in New Zealand foods..................................................................61 Table 17: Worldwide data on occurrence of trichothecenes in cereal crops ........................62 Table 18: Overseas estimates of dietary exposure to trichothecenes (DON, NIV, T2,
HT2)......................................................................................................................64 Table 19: Regulatory limits for trichothecenes in various countries (food regulations
only) ......................................................................................................................69 Table 20: FB1 in Australian maize and maize-based foods ..................................................77 Table 21: Worldwide data on occurrence of fumonisins in non-maize food........................78 Table 22: Overseas estimates of dietary exposure to fumonisins .........................................80 Table 23: Regulatory limits for fumonisins in various countries (food regulations
only) ......................................................................................................................84 Table 24: Distribution of zearalenone contamination of New Zealand maize .....................92 Table 25: Zearalenone New Zealand maize-based foods .....................................................92 Table 26: Worldwide data on occurrence of zearalenone in food ........................................93 Table 27: Estimated average dietary exposure to zearalenone for five New Zealand
population age-sex groups ....................................................................................97 Table 28: Overseas estimates of dietary exposure to zearalenone........................................98 Table 29: Regulatory limits for zearalenone in various countries (food regulations
only) ....................................................................................................................100 Table 30: Worldwide data on occurrence of ergot or ergot alkaloids in foods...................109 Table 31: Alkaloid composition of ergot in foods ..............................................................110 Table 32: Patulin in New Zealand apple products ..............................................................118 Table 33: Worldwide data on occurrence of patulin in food ..............................................119 Table 34: Estimated dietary exposure to patulin in New Zealand ......................................121 Table 35: Overseas estimates of dietary exposure to patulin..............................................122 Table 36: Regulatory limits for patulin in various countries (food regulations only) ........124 Table 37: Risk ranking information for mycotoxins in the New Zealand food supply ......131
Risk Profile: Mycotoxins in the New Zealand April 2006 Food Supply

LIST OF FIGURES Figure 1: Risk Management Framework...............................................................................1 Figure 2: Structure of aflatoxins............................................................................................4 Figure 3: Structure of OTA .................................................................................................38 Figure 4: Structure of type A and B trichothecenes ............................................................54 Figure 5: Structure of major fumonisins .............................................................................74 Figure 6: Structure of zearalenone and its major metabolites .............................................89 Figure 7: Rye heads showing ergot sclerotia.....................................................................105 Figure 8: Structure of ergot alkaloids................................................................................106 Figure 9: Structure of patulin ............................................................................................116
Risk Profile: Mycotoxins in the New Zealand April 2006 Food Supply
Risk Profile: Mycotoxins in the New Zealand i April 2006 Food Supply
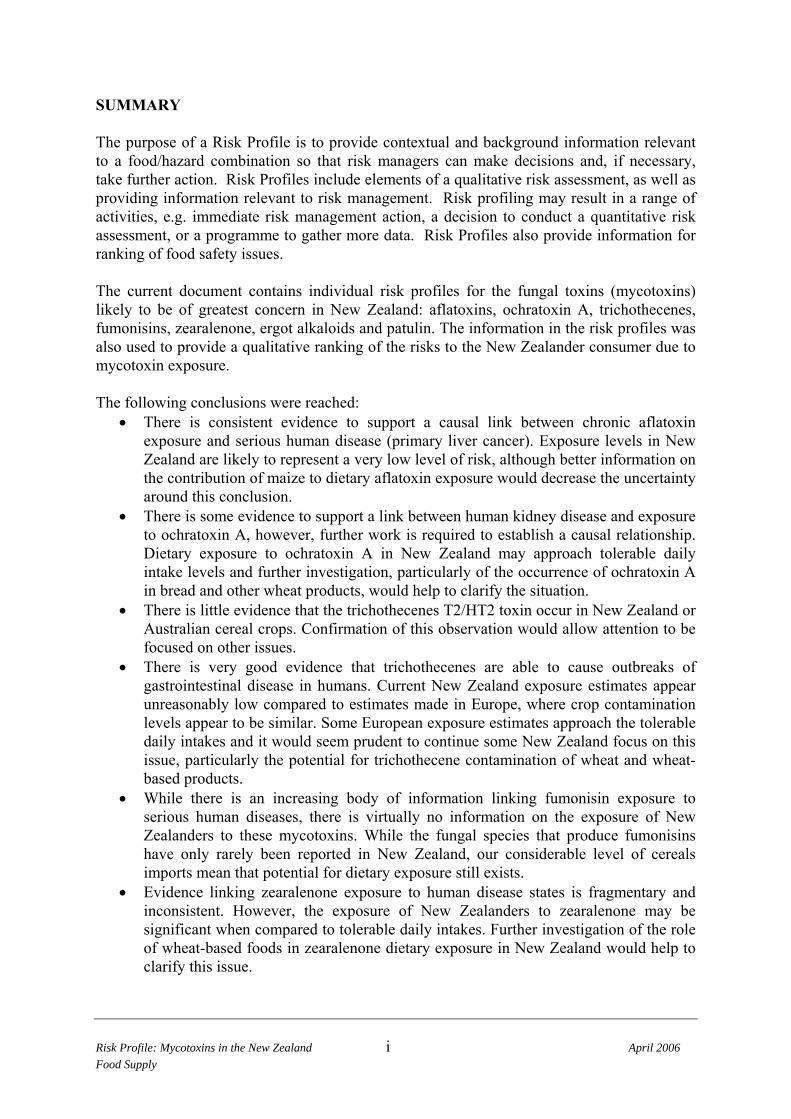
SUMMARY The purpose of a Risk Profile is to provide contextual and background information relevant to a food/hazard combination so that risk managers can make decisions and, if necessary, take further action. Risk Profiles include elements of a qualitative risk assessment, as well as providing information relevant to risk management. Risk profiling may result in a range of activities, e.g. immediate risk management action, a decision to conduct a quantitative risk assessment, or a programme to gather more data. Risk Profiles also provide information for ranking of food safety issues. The current document contains individual risk profiles for the fungal toxins (mycotoxins) likely to be of greatest concern in New Zealand: aflatoxins, ochratoxin A, trichothecenes, fumonisins, zearalenone, ergot alkaloids and patulin. The information in the risk profiles was also used to provide a qualitative ranking of the risks to the New Zealander consumer due to mycotoxin exposure. The following conclusions were reached:
• There is consistent evidence to support a causal link between chronic aflatoxin exposure and serious human disease (primary liver cancer). Exposure levels in New Zealand are likely to represent a very low level of risk, although better information on the contribution of maize to dietary aflatoxin exposure would decrease the uncertainty around this conclusion.
• There is some evidence to support a link between human kidney disease and exposure to ochratoxin A, however, further work is required to establish a causal relationship. Dietary exposure to ochratoxin A in New Zealand may approach tolerable daily intake levels and further investigation, particularly of the occurrence of ochratoxin A in bread and other wheat products, would help to clarify the situation.
• There is little evidence that the trichothecenes T2/HT2 toxin occur in New Zealand or Australian cereal crops. Confirmation of this observation would allow attention to be focused on other issues.
• There is very good evidence that trichothecenes are able to cause outbreaks of gastrointestinal disease in humans. Current New Zealand exposure estimates appear unreasonably low compared to estimates made in Europe, where crop contamination levels appear to be similar. Some European exposure estimates approach the tolerable daily intakes and it would seem prudent to continue some New Zealand focus on this issue, particularly the potential for trichothecene contamination of wheat and wheat-based products.
• While there is an increasing body of information linking fumonisin exposure to serious human diseases, there is virtually no information on the exposure of New Zealanders to these mycotoxins. While the fungal species that produce fumonisins have only rarely been reported in New Zealand, our considerable level of cereals imports mean that potential for dietary exposure still exists.
• Evidence linking zearalenone exposure to human disease states is fragmentary and inconsistent. However, the exposure of New Zealanders to zearalenone may be significant when compared to tolerable daily intakes. Further investigation of the role of wheat-based foods in zearalenone dietary exposure in New Zealand would help to clarify this issue.

Risk Profile: Mycotoxins in the New Zealand ii April 2006 Food Supply
• Ergotism represents a serious and real human health risk, however, in the context of current agricultural and food manufacturing practices, the dietary risk appears to be extremely low.
• While toxicological experiments have raised concerns about patulin exposure, there is no evidence linking patulin exposure to human disease. However, high levels of patulin contamination are indicative of poor manufacturing practice and a level of ongoing monitoring is probably justified.
Ranking of risk across different mycotoxins will involve a degree of subjectivity, as there is not absolute measure for the relative seriousness of different health effects. However, the proximity of estimates of OTA exposure to critical exposure limits suggests that improved estimates of New Zealand exposure should be ranked highly. The seriousness of the health outcomes resulting from aflatoxin exposure and the relatively high weight of evidence supporting a casual role suggest that further work on sources of dietary exposure (e.g. maize) should also be ranked highly.

Risk Profile: Mycotoxins in the New Zealand iii April 2006 Food Supply
GLOSSARY OF TERMS, ABBREVIATIONS AND ACRONYMS AFB1, AFB2, AFG1, AFG2, AFM1 Aflatoxin B1, aflatoxin B2, etc. AMBS Australian Market Basket Survey. The previous name for the Australian Total
Diet Survey Codex the Codex Alimentarius Commission was created in 1963 by FAO and
WHO to develop food standards, guidelines and related texts such as codes of practice under the Joint FAO/WHO Food Standards Programme
DON Deoxynivalenol DAS Diacetoxyscirpenol ESR Institute of Environmental Science and Research Limited FAO the Food and Agriculture Organization of the United Nations FB1, FB2, FB3 Fumonisin B1, fumonisin B2, fumonisin B3 Food Standards Code the Australia New Zealand Food Standards Code. The Code is the official
legal document that is given legal force via State, Territory, Commonwealth and New Zealand food legislation.
GAP Good Agricultural Practice is the nationally authorised safe uses of pesticides
under actual conditions necessary for effective and reliable pest control. GAP encompasses a range of pesticide applications up to the highest authorised use, applied in a manner which leaves a residue which is the smallest practicable.
HACCP Hazard Analysis Critical Control Point. The systematic identification and
management of risks associated with the manufacture, distribution and use of food ingredients
HT2 HT-2 toxin IUPAC The International Union of Pure and Applied Chemistry (IUPAC) is an
international non-governmental organisation devoted to the advancement of chemistry.
JECFA the Joint FAO/WHO Expert Committee on Food Additives NIV Nivalenol NZFSA New Zealand Food Safety Authority

Risk Profile: Mycotoxins in the New Zealand iv April 2006 Food Supply
NZTDS New Zealand Total Diet Survey OTA Ochratoxin A PTWI Provisional Tolerable Weekly Intake is the end-point used by JECFA for
food contaminants such as heavy metals with cumulative properties. A PTWI is an estimate of the amount of a substance (contaminant) in food or drinking water that can be ingested weekly over a lifetime without appreciable health risk
T2 T-2 toxin TDI Tolerable Daily Intake is the end-point used by JECFA and other bodies for
food contaminants with non-cumulative properties. A TDI is an estimate of the amount of a substance (contaminant) in food or drinking water that can be ingested daily over a lifetime without appreciable health risk.
Water activity Water activity reflects the active part of moisture content or the part which,
under normal circumstances, can be exchanged between the product and its environment
WHO World Health Organization.

1 INTRODUCTION The purpose of a Risk Profile is to provide contextual and background information relevant to a food/hazard combination so that risk managers can make decisions and, if necessary, take further action. The place of a risk profile in the risk management process is described in “Food Administration in New Zealand: A Risk Management Framework for Food Safety” (Ministry of Health/Ministry of Agriculture and Forestry, 2000). Figure 1 outlines the risk management process.
Figure 1: Risk Management Framework
Figure reproduced from “Food Administration in New Zealand. A risk management framework for food safety” (Ministry of Health/Ministry of Agriculture and Forestry, 2000). In more detail, the four step process is: 1. Risk evaluation • identification of the food safety issue • establishment of a risk profile • ranking of the food safety issue for risk management • establishment of risk assessment policy • commissioning of a risk assessment • consideration of the results of risk assessment
Risk Profile: Mycotoxins in the New Zealand 1 April 2006 Food Supply

Risk Profile: Mycotoxins in the New Zealand 2 April 2006 Food Supply
2. Risk management option assessment • identification of available risk management options • selection of preferred risk management option • final risk management decision 3. Implementation of the risk management decision 4. Monitoring and review. The Risk Profile informs the overall process, and provides an input into ranking the food safety issue for risk management. Risk Profiles include elements of a qualitative risk assessment. However, in many cases a full exposure estimate will not be possible, due to data gaps, particularly regarding the level of hazard in individual foods. The Risk Profiles also provide information relevant to risk management. Based on a Risk Profile, decisions are made regarding whether to conduct a quantitative risk assessment, or take action, in the form of gathering more data, or immediate risk management activity. This Risk Profile concerns seven mycotoxins or groups of mycotoxins (aflatoxins, ochratoxin A, trichothecenes, fumonisins, zearalenone, ergot alkaloids and patulin). An initial screening exercise was carried out which concluded that there was evidence that these mycotoxins were:
• A potential or actual human health risk in New Zealand or other countries; and • Present in the New Zealand food supply.
Information on fungal species responsible for the production of each mycotoxin is reviewed in the relevant section, but has also been summarised in Appendix 1, for easy reference.
The sections in this Risk Profile are organised as much as possible as they would be for a conventional qualitative risk assessment, as defined by Codex (1999). Hazard identification, including: • A description of the chemical(s). • A description of the food group. Hazard characterisation, including: • A description of the adverse health effects caused by the chemical. • Dose-response information for the chemical in humans, where available. Exposure assessment, including: • Data on the occurrence of the hazard in the New Zealand food supply. • Data on the consumption of the food group by New Zealanders. • Qualitative estimate of exposure to the chemical (if possible). • Overseas data relevant to dietary exposure to the chemical. Risk characterisation:
Risk Profile: Mycotoxins in the New Zealand 3 April 2006 Food Supply
• Information on the number of cases of adverse health effects resulting from exposure to
the chemical with particular reference to the identified food (based on surveillance data) or the risk associated with exposure (based on comparison of the estimated exposure with exposure standards).
• Qualitative estimate of risk, including categorisation of the level of risk associated with the chemical in the food.
Risk management information • A description of the food industry sector, and relevant food safety controls. • Information about risk management options. Conclusions and recommendations for further action 1.1 Main Information Sources Information on the toxicology of and exposure to mycotoxins has been reviewed or otherwise considered by a number of groups. These assessments were major resources for the current project. Sources included:
• JECFA (the Joint FAO/WHO Expert Committee on Food Additives). Assessment reports were accessed at: http://www.inchem.org/
• SCF (the EU Scientific Committee on Food). Opinions were accessed at: http://europa.eu.int/comm/food/fs/sc/scf/index_en.html
• IARC (the International Agency for Cancer Research). Monographs were accessed from ESR’s standing collection. Summaries can be accessed at: http://www.inchem.org/
The European Union under their scientific co-operation programme (SCOOP) have carried out assessments of food contamination and dietary exposure to various mycotoxins within Europe and Scandinavia. Reports of co-operation on aflatoxins, ochratoxin A, Fusarium toxins (trichothecenes, fumonisins, zearalenone), and patulin were obtained from a number of web and retail sources. Reports on surveys carried out by the UK Food Standards Agency (FSA) and, before them, the Ministry of Agriculture, Fisheries and Food were also used extensively and can be accessed at: http://www.foodstandards.gov.uk/ More recent and additional information than that included in these resources was located by general searching of the World Wide Web (internet) and use of specific citation databases, including:
• PubMed. Accessed at: http://www.ncbi.nlm.nih.gov/entrez/query.fcgi?DB=pubmed • Scopus. Accessed at: http://www.scopus.com/scopus/home.url

2 AFLATOXINS 2.1 Hazard Identification Aflatoxins are secondary metabolites produced by three species of Aspergillus mould: A. flavus, A.. parasiticus and A. nomius (JECFA, 1998). A. flavus occurs in all tropical and subtropical regions and is particularly associated with peanuts and other nuts, maize and other oilseeds. A. parasiticus is less widely distributed and is usually only associated with peanuts (Pitt and Tomaska, 2001). 2.1.1 Structure and nomenclature While the aflatoxins comprise a group of about 20 related compounds, the four major naturally-occurring compounds are aflatoxins B1, B2, G1 and G2. The ‘B’ and ‘G’ refer to the blue and green fluorescent colours produced by these compounds under UV light, while the subscripts ‘1’ and ‘2’ refer to major and minor components respectively (Pitt and Tomaska, 2001). The ‘2’ compounds are dihydro derivatives of the major (‘1’) metabolites. Chemical structures are shown in Figure 2. Aflatoxins M1 and M2 are hydroxylated metabolites of the respective ‘B’ aflatoxins produced when ruminant animals consume aflatoxin-contaminated feed. The ‘M’ aflatoxins may be excreted in milk (Pitt and Tomaska, 2001). Aflatoxins are fat soluble (lipophilic). Reference of ‘aflatoxins’ or ‘total aflatoxins’ can be taken to refer to the sum of B and G aflatoxins.
Figure 2: Structure of aflatoxins
Reproduced from Eaton and Groopman, (1994)
Risk Profile: Mycotoxins in the New Zealand 4 April 2006 Food Supply

Risk Profile: Mycotoxins in the New Zealand 5 April 2006 Food Supply
2.1.2 Occurrence A. flavus produces only ‘B’ aflatoxins (AFB1 and AFB2), with only about 40% of isolates producing toxins. A. parasiticus produces both ‘B’ (AFB1 and AFB2) and ‘G’ (AFG1 and AFG2) aflatoxins, with virtually all isolates producing toxins (Klich and Pitt, 1988). The situation for A. nomius appears to be similar to that for A. parasiticus. Aflatoxin B1 is the most commonly occurring aflatoxin in foods and is also the compound which has been most thoroughly studied in toxicological studies. A. flavus occurs widely in the environment, but A. parasiticus is considerably less common. However, some regional specificities exist and A. parasiticus is commonly isolated from peanuts in the United States, South Africa and Australia. Fungal infection and consequent aflatoxin contamination can occur in field crops prior to harvest or during post-harvest storage if the moisture content of the crop exceeds critical values for fungal growth (JECFA, 1998). Fungal growth and subsequent toxin production are favoured by factors which place the host plant under stress such as high temperature, drought, and high insect activity. Aflatoxin contamination is most commonly associated with peanuts and peanut products, dried fruit, tree nuts, spices, figs, crude vegetable oils, cocoa beans, maize, rice, cottonseed and copra (JECFA, 1998). Consumption of aflatoxin-contaminated feed by animals can lead to occurrence of aflatoxins (mainly the hydroxylated metabolite AFM1) in meat, eggs and milk. Most of these crops are not grown in New Zealand. Surveillance of fungal infections of New Zealand grown grain found no Aspergillus species (Sayer and Lauren, 1991). This is consistent with expert opinion, that aflatoxigenic species of Aspergillus are unlikely to occur in New Zealand (Pitt JI, personal communication). 2.1.3 Sampling for aflatoxin analysis The distribution of aflatoxins throughout any contaminated product can be very uneven. Even contamination of the occasional nut or grain, less than 1 in 10,000 in a lot sample, can lead to a significant average level of contamination in the product. FAO in their paper on aflatoxins in peanuts and corn (FAO, 1993) note that only a small percentage of kernels are contaminated, and these may amount to no more than 0.03% of kernels when the lot concentration in peanuts is 5 µg/kg aflatoxin. Shotwell et al. (1974) reported finding over 400,000 μg/kg aflatoxin in individual contaminated corn kernels. The process of testing a lot for aflatoxins involves three main steps; sampling the bulk lot of product, sub-sampling to provide a sample for analysis, and analytical determination (including sample extraction and clean-up). The uneven distribution makes sampling difficult, especially sub-sampling within the laboratory, if the final result is to give an estimation of the true level of contamination in the original product. Once a food has been ground and mixed, such as during processing into flour, the distribution of aflatoxins becomes more uniform and sample sizes can be smaller (Love, 1999). If the effect of non-

Risk Profile: Mycotoxins in the New Zealand 6 April 2006 Food Supply
homogeneity is to be minimised, lot samples must be large and broken down in such a manner that the final test sample will contain a representative portion of every item. Variability in test results can be reduced by (Whitaker and Park, 1994): • Taking large lot samples (30 kg is recommended by the EU for lots of greater than 50
tonnes. • Comminute whole sample before subsampling. • Increase size of subsample. • Increase number of analytical replicates. • Use more precise quantification method (HPLC, rather than TLC). 2.2 Hazard Characterisation: Adverse Health Effects The aflatoxins vary in their toxicity with AFB1 generally agreed to be the most toxic compound. AFG1 appears to be toxicologically similar to AFB1, although it has been tested much less extensively. Aflatoxin M1, the hydroxylated metabolite of AFB1 appears to be approximately an order of magnitude less toxic than AFB1 (Cullen et al., 1987). The following discussion of adverse effects and toxicology generally relate to AFB1 unless stated otherwise. 2.2.1 Conditions AFB1 has been demonstrated to exhibit both acute and chronic toxicity in a wide range of animal species (Eaton and Groopman, 1994). The liver is the principal target organ for acute (and chronic) toxicity. Effects on the lung, myocardium and kidneys have also been reported in some studies. Acute toxicity in humans has occasionally been reported in Africa and Asia following consumption of contaminated rice, maize or peanuts. Symptoms include vomiting, diarrhoea, abdominal pain and fever. Chronic effects of aflatoxins in humans mainly relate to effects on the liver including primary liver cancer (PLC), chronic hepatitis, jaundice, hepatomegaly and cirrhosis. Most investigative studies have concentrated on the association between AFB1 ingestion and primary liver cancer (JECFA, 1998). 2.2.2 Toxicity 2.2.2.1 Acute toxicity Acute toxicity of AFB1 has been determined in a wide range of animal species (summarised in Cullen and Newberne, 1994). LD50, the lethal dose for 50% of test subjects, values ranged from 0.3 mg/kg body weight (rabbit, intraperitoneal) to 18 mg/kg body weight (rat or chicken, oral). In all species symptoms included acute liver haemorrhagic necrosis, while bile duct hyperplasia was also a common symptom. While no estimates of acute human toxicity are available, estimates of sub-chronic human toxicity can be derived from limited cases of aflatoxicosis outbreaks. • In 1974 contaminated corn caused illness in 397 people in a cluster of villages in
Northwest India (Krishnamachari et al., 1975). Of those affected 108 died, mainly from gastrointestinal haemorrhage. Levels of aflatoxin in the corn were found to be in the

Risk Profile: Mycotoxins in the New Zealand 7 April 2006 Food Supply
range 0.25 to 15 mg/kg. The daily exposure to aflatoxin was estimated to be at least 55 μg/kg body weight for an unknown number of days. A 10-year follow-up found that survivors recovered fully with no long-term ill effects (FDA, 1992).
• In 1982 an outbreak of aflatoxicosis occurred in Kenya (Ngindu et al., 1982). There were 20 hospital admissions with a 60% case fatality rate. Aflatoxin exposure was estimated to be at least 38 μg/kg body weight for an unknown number of days.
• In a deliberate suicide attempt, a laboratory worker self-administered 12 μg/kg body weight of aflatoxin B1 for two days followed by 11 μg/kg body weight of AFB1 for fourteen days after an interval of six months. Except for transient rash, nausea and headaches there were no ill effects and a 14-year follow-up, including tests for liver function, demonstrated no long-term effects (FDA, 1992).
• A further outbreak of aflatoxicosis occurred in Kenya in 2004, due to aflatoxin contamination of stored maize. A total of 317 cases were reported, with 125 fatalities (Azziz-Baumgartner et al., 2005). Samples of maize were analysed and found to contain AFB1 at levels up to 8 mg/kg. No estimate of dietary exposure was made.
2.2.2.2 Chronic toxicity Aflatoxins are capable of causing liver cancer in most species studied and have been classified as human carcinogens (IARC, 1993). Non-cancer chronic effects reported in humans include kwashiorkor (protein-energy malnutrition), Reye’s syndrome and cirrhosis (Hall and Wild, 1994). However, these effects have not been reported as consistently as carcinogenic effects. Oral administration of mixtures of aflatoxins or AFB1 in a range of animal species has caused hepatocellular and/or cholangiocellular liver tumours in all species tested except mice (IARC, 1993; JECFA, 1998). There is some evidence to suggest that humans are at lower risk of adverse outcomes through exposure to aflatoxins than other species and there is some disagreement in epidemiological studies as to whether aflatoxin exposure represents a cancer risk in isolation from other risk factors, such as hepatitis B (JECFA, 1998). 2.2.3 Toxicological assessment JECFA reviewed the toxicity of aflatoxins most recently in 1998. They concluded that aflatoxins were human liver carcinogens and that AFB1 was the most potent of the carcinogens, with aflatoxin M1 (AFM1) being approximately one order of magnitude less toxic. The potency of aflatoxins in hepatitis B positive individuals is substantially higher than in those not carrying the disease. ANZFA (1999; now known as FSANZ) reviewed aflatoxin toxicity and concurred with the conclusions of JECFA. IARC (International Agency for Research on Cancer) concluded that there was sufficient evidence in humans for the carcinogenicity of naturally occurring mixtures of aflatoxins and for AFB1 (IARC, 1993). IARC uses the classification of “sufficient evidence of carcinogenicity” (Group 1) when it considers a causal relationship has been established

Risk Profile: Mycotoxins in the New Zealand 8 April 2006 Food Supply
between exposure to the agent and human cancer, and that there can be reasonable confidence that this association is not the result of chance, bias or confounding (IARC, 1993). Additional information has been reviewed more recently without any amendment to the earlier opinion (IARC, 2002). 2.2.4 Proposed mechanisms of carcinogenicity While a definitive mechanism for aflatoxin carcinogenesis in humans has not been determined, considerable research has been carried out with suggestive results. Aflatoxins are categorised as ‘bulky mutagens’: a classification which includes polycyclic aromatic hydrocarbons and aromatic amines. Literature suggests that such mutagens cause a cell to become tumourigenic by reacting directly with DNA to form DNA adducts. These adducts or their breakdown products are responsible for generating mutations efficiently through mechanisms such as adduct-induced base ionization, adduct-induced base wobble, and adduct-induced base rotation (Loechler, 1994). AFB1 is metabolised in the liver by cytochrome P450 enzymes to the 8,9-epoxide, amongst other species. While shortlived, the epoxide is extremely reactive and is believed to be the principal mediator of cellular injury (McLean and Dutton, 1995). The epoxide can form adducts with a range of cellular macromolecules, including DNA, RNA and proteins. The p53 tumour suppressor gene has been found to be mutated in a majority of human cancers, with a wide variation in the number and type of mutations between cancers of different tissues (Greenblatt et al., 1994). A particular example of this has been found in liver cancer subjects from regions of high aflatoxin exposure, involving a G→T transversion at the third base of codon 249 of the gene. Two independent studies in Africa (Bressac et al., 1991) and China (Hsu et al., 1991) reported this gene mutation to be present in approximately 50% of hepatocellular carcinomas (HCC) examined. No such codon 249 mutations were found in HCCs in Britain, an area of low aflatoxin exposure (Challen et al., 1992). Subsequent studies have generally confirmed these trends (see review in Jackson and Groopman, 1999). These ecological observations have been supported by in vitro mutagenesis studies in bacteria (Foster et al., 1983) and human cancer cell lines (Aguilar et al., 1993), which have shown that exposure to aflatoxins causes almost exclusive G→T transversion at the third base of codon 249. Several studies which examined both codon 249 mutations and biomarkers of aflatoxin exposure in HCC cases failed to find a significant association between the occurrence of aflatoxin-DNA or aflatoxin-albumin adducts and codon 249 mutations (Hsieh and Atkinson, 1995; Soini et al., 1996; Lunn et al., 1997). However, it should be noted that the presence of aflatoxin adducts is an indication of recent aflatoxin exposure and the significance of these results is uncertain. 2.2.5 Carcinogenic potency of AFB1 The carcinogenic potency of a chemical describes the mathematical relationship between exposure and response. While in simple cases this may relate to the slope of the dose-response curve, when derived from epidemiological studies the potency may include
Risk Profile: Mycotoxins in the New Zealand 9 April 2006 Food Supply
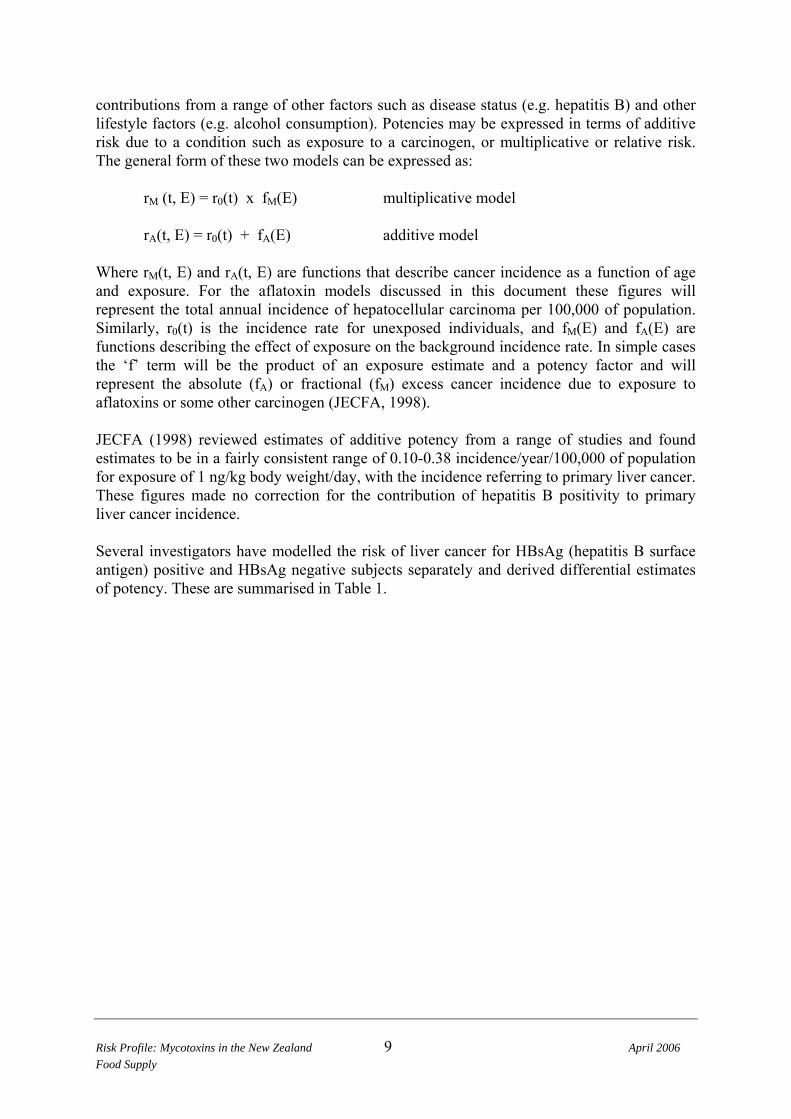
contributions from a range of other factors such as disease status (e.g. hepatitis B) and other lifestyle factors (e.g. alcohol consumption). Potencies may be expressed in terms of additive risk due to a condition such as exposure to a carcinogen, or multiplicative or relative risk. The general form of these two models can be expressed as: rM (t, E) = r0(t) x fM(E) multiplicative model rA(t, E) = r0(t) + fA(E) additive model Where rM(t, E) and rA(t, E) are functions that describe cancer incidence as a function of age and exposure. For the aflatoxin models discussed in this document these figures will represent the total annual incidence of hepatocellular carcinoma per 100,000 of population. Similarly, r0(t) is the incidence rate for unexposed individuals, and fM(E) and fA(E) are functions describing the effect of exposure on the background incidence rate. In simple cases the ‘f’ term will be the product of an exposure estimate and a potency factor and will represent the absolute (fA) or fractional (fM) excess cancer incidence due to exposure to aflatoxins or some other carcinogen (JECFA, 1998). JECFA (1998) reviewed estimates of additive potency from a range of studies and found estimates to be in a fairly consistent range of 0.10-0.38 incidence/year/100,000 of population for exposure of 1 ng/kg body weight/day, with the incidence referring to primary liver cancer. These figures made no correction for the contribution of hepatitis B positivity to primary liver cancer incidence. Several investigators have modelled the risk of liver cancer for HBsAg (hepatitis B surface antigen) positive and HBsAg negative subjects separately and derived differential estimates of potency. These are summarised in Table 1.

Risk Profile: Mycotoxins in the New Zealand 10 April 2006 Food Supply
Table 1: Potency estimates for risk of primary liver cancer in humans from aflatoxin exposure based on epidemiological data, with reference to hepatitis B status
Model type Potency (incidence per 100,000 for exposure to 1 ng/kg body weight/day of
aflatoxin) (upper 95th % CL)
Source Population
Reference
HBsAg +ve HBsAg -ve Additive 0.50 (0.77) 0.036 (0.079) China (Guangxi
Province) Croy and Crouch, 1991 (in JECFA, 1998)
Additive 0.43 (0.64) 0.031 (0.06) China (Guangxi Province)
Wu-Williams et al., 1992
Additive 0.33 0.013 China (Guangxi Province)
Bowers et al., 1993
Multiplicative (background rate = 2.8)
0.094 (0.19) 0.0037 (0.006) China (Guangxi Province)
Wu-Williams et al., 1992
Multiplicative (background rate = 3.4)
0.046 (0.08) 0.0018 (0.0032) China (Guangxi Province)
Hosenyi, 1992
Multiplicative (background rate = 3.4)
0.11 0.011 China (Shanghai)
Qian et al., 1994
Multiplicative (background rate = 3.4)
0.37 0.0082 Taiwan Wang et al., 1996
CL = Confidence Limit Estimates of carcinogenic potency from the studies summarised in Table 1 are consistent in suggesting approximately 10-30 times greater potency of aflatoxins in subjects who are HBsAg positive, independent of model type. JECFA considered available potency information and chose potency values of 0.3 cancers/year per 100,000 population per ng aflatoxin/kg body weight/day for HBsAg+ individuals with an uncertainty range of 0.05 to 0.5, and a potency of 0.01 cancers/year per 100,000 population per ng aflatoxin/kg body weight/day for HbsAg- individuals with an uncertainty range of 0.002 to 0.03 (JECFA, 1998). These cancer potencies are based on epidemiological studies conducted in Asia and Africa. Gorelick et al. (1994) and others have questioned the applicability of these figures to populations in developed countries. They compared liver cancer rates between high and low aflatoxin-contamination areas of the United States and derived a lower potency estimate of 0.003 cancers/year per 100,000 population per ng aflatoxin/kg body weight/day (Gorelick et al., 1994). This estimate of potency does not consider the impact of hepatitis B status, but notes that incidence of hepatitis B is much lower in the United States than in Asia and Africa. Carcinogenic potency has also been determined by a number of investigators using animal models. The estimates (extrapolated to humans using a body weight to the 0.75 power scaling factor) range from 0.05 per 100,000 per year per 1 ng AFB1/kg body weight/day (Syrian golden hamster; Moore et al., 1982) to 37 per 100,000 per year per 1 ng AFB1/kg body

Risk Profile: Mycotoxins in the New Zealand 11 April 2006 Food Supply
weight/day (Fischer 344 rat; Cullen et al., 1987). All of the estimates of potency derived from animal studies are greater than the potencies derived for HBsAg negative humans from epidemiological studies. The most likely explanation is that these differences are due to genuine lower sensitivity in humans, compared to animal species, explained in part by more efficient DNA repair mechanisms (JECFA, 1998). 2.3 Exposure Assessment 2.3.1 Aflatoxins in the New Zealand food supply Table 2 summarises available information on levels of aflatoxin in food available in New Zealand. The method of analysis was thin layer chromatography (TLC).
Table 2: Aflatoxins in New Zealand foods
Year Food Samples
tested Results
Number positive (percent, range μg/kg aflatoxins
measured)
Reference
Surveys 1977 Peanut kernels
Barley Rice Other*
16 8 5 9
2 (13%, 5-6 AFB1) ND ND ND
Stanton, 1977
1991 Peanuts# Peanut butter Tree nuts Popcorn Figs
10 3 4 1 3
4 (40%, 30-200 Total) ND ND ND ND
Lake et al., 1991
1999 Peanut confectionery Peanut sauces Peanut butter Raw peanuts
87 49 17 2
9 (10%, 3-200 Total) 12 (24%, 1-13 Total) 6 (35%, 1-9 Total) 1 (50%, 26 Total)
Stanton, 1999
2000 Corn (maize) snacks Maize products Breakfast cereals Other cereals, flour and rice Pasta, noodles, biscuits Peanuts Tree nuts and oilseeds Pulses Dried fruit
24 7 25 24 10 34 27 14 35
ND ND ND ND ND ND ND ND ND
Stanton, 2000a
Import Monitoring§ 1996 Peanuts 46 6 (13%, 3-87 Total) 1997 Peanuts
Pistachios 169 2
12 (7%, 7-118 Total) ND
1998 Peanuts Pistachios
67 8
1 (1.5%, 15 Total) ND

Risk Profile: Mycotoxins in the New Zealand 12 April 2006 Food Supply
Year Food Samples tested
Results Number positive (percent, range μg/kg aflatoxins
measured)
Reference
1999 Peanuts Peanut butter Pistachios
100 7 13
6 (6%, 10-355 Total) 2 (29%, 4-20 Total) 1 (8%, 40-245 Total)
2000 Peanuts Peanut butter
103 19
10 (10%, 2-250 Total) ND
2001 Peanuts Peanut butter Pistachios
96 27 16
2 (2%, 7-40 Total) ND
3 (19%, 7-305 Total)
2002 Peanuts Peanut butter Pistachios
144 46 18
7 (5%, 1-445 Total) ND
1 (6%, 8 Total)
2003 Peanuts Peanut butter Pistachios
103 25 28
7 (7%, 6-384 Total) ND ND
2004 Peanuts Peanut butter Pistachios
121 36 34
22 (18%, 1-645 Total) 3 (8%, 2-8 Total)
6 (18%, 1-157 Total)
AFB1 = aflatoxin B1 Total = aflatoxins B1 + B2 + G1 + G2 ND = Not detected. Limit of detection = 1 μg/kg for most studies, except Stanton (1977) which had limits of detection in the range 2-4 μg/kg * One sample of each of peanut butter, soya beans, soya bean oil, sunflower seed oil, wheat flour, soya flour, wholemeal flour, pearl barley and whole millet # Includes two samples rejected at border inspection § Import monitoring data is expressed in terms of lots or consignments. Testing of a lot for aflatoxin may involve testing of up to 22 individual samples. Data reported here only applies to testing carried out by ESR. Concentrations reported are from individual subsamples. Aflatoxins have not been detected in foods available on the New Zealand market, other than peanuts and peanut products. However, this observation should be treated with some caution since relatively small numbers of non-peanut foods have been examined. In particular, import testing of pistachios has regularly detected aflatoxin-positive shipments, but no retail surveillance has been carried out for this commodity. Raw milk samples are analysed for AFM1 as part of the NZFSA’s Dairy residue Monitoring Programme (http://www.nzfsa.govt.nz/consumers/food-safety-topics/chemicals-in-food/residues-in-food/dairy-residue-monitoring-programme.htm). Results available from 2002/2003 and 2003/2004 show positive detection of AFM1 in one sample out of 250, at a level above the limit of detection, but below the default maximum residue limit of 0.1 mg/kg. 2.3.2 Aflatoxins in the Australian food supply A significant proportion of food imported into New Zealand originate in Australia. FSANZ (then ANZFA) reviewed risks associated with aflatoxins in foods (ANZFA, 1999). Information relevant to the current risk profile is summarised in Table 3.

Risk Profile: Mycotoxins in the New Zealand 13 April 2006 Food Supply
Table 3: Aflatoxins in Australian foods (1983-1997)
Food Samples tested
Results Number positive (percent, maximum
μg Total aflatoxins /kg)
Data source
Almonds 70 1 (1%, 12) AGAL Almonds 135 ND AMDC Cashews 109 ND AGAL Cashews 223 1(0.5%, 30) AMDC Cereals 147 ND AGAL Cereals 248 41 (17%, 12) AMDC Coffee, tea 624 ND AGAL Coffee, tea 17 ND AMDC Confectionery 29 1 (3%, 143) AGAL Dairy products 16 ND AGAL Dairy products 227 10 (4%, 2) AMDC Fruit (fresh and dried)
93 ND AGAL
Fruit (fresh and dried)
20 2 (10%, 4) AMDC
Hazelnuts 55 ND AGAL Hazelnuts 100 1 (1%, 20) AMDC Maize 89 53 (65%, 295) AMDC Maize meal 4 4 (100%, 120) AMDC Maize – corn flakes
265 1 (0.4%, 3) AMDC
Miscellaneous foods
90 14 (16%, 169) AGAL
Miscellaneous foods
1035 246 (24%, 40) AMDC
Miscellaneous nuts
121 9 (7%, 104) AGAL
Miscellaneous nuts
496 98 (20%, 1085) AMDC
Peanuts 1135 98 (9%, 819) AGAL Peanuts 11956 4100 (34%, 4000) AMDC Pistachios 494 26 (5%, 710) AGAL Pistachios 54 3 (6%, 40) AMDC Satay products 65 34 (52%, 128) AGAL Satay products 20 10 (50%, 29) AMDC Walnuts 52 ND AGAL Walnuts 162 12 (7%, 5) AMDC ND = Not detected, AGAL = Australian Government Analytical Laboratories, AMDC = Australian Mycotoxin Data Centre Maize, peanuts and peanut products were the most commonly contaminated foods, of those analysed. While it is not known what the intended use of the maize samples was (human or animal nutrition), the frequency of aflatoxin contamination of maize appears to be high, although there is little evidence of aflatoxin in processed maize products (corn flakes). These

Risk Profile: Mycotoxins in the New Zealand 14 April 2006 Food Supply
results are consistent with reports that the dry milling process, which produces corn flakes, results in a 90-94% decrease in the levels of aflatoxin in corn (JECFA, 1998). The low incidence of aflatoxin in corn flakes may be due to the processing steps reducing toxin levels to an undetectable amount, rather than absence of the toxins in the intact kernels. The incidence of aflatoxins in peanut products (satay products) is higher than in peanuts. This may be due to lower grade nuts being used for further processing. The 20th Australian Total Diet Survey (FSANZ, 2002) analysed breads, biscuits, rice, oats, processed wheat bran, breakfast cereals (including infant cereal), instant coffee, peanut butter, almonds and milk chocolate for aflatoxins, with aflatoxins not being detected in any food above the limit of reporting of 1 μg/kg. Klieber (2001) examined the aflatoxin content of chilli and paprika products available in Australia. Of 90 samples of chilli powder, paprika powder, crushed chilli, whole chilli, minced chilli and chilli sauce, 91% contained total aflatoxin at levels greater than 5 μg/kg. Maximum levels of 89 μg/kg were detected in paprika powder. 2.3.3 Overseas Context An enormous body of information is available on the incidence and levels of aflatoxins in a variety of commodities and processed foods in a variety of countries. Results of representative surveys are given in Table 4.

Table 4: Worldwide data on occurrence of aflatoxins in food
Country Year Food Aflatoxin measured
Samples positive/total (%) Concentration (range, mean or
maximum; μg/kg)
Reference
Canada 1998-2002 Beer AFB1 12/304 (4) Range = 0.0007 – 0.23 Mably et al. (2005) Cyprus 1992-96 Corn/maize AFB1 2/170 (1) Max = 1 Ioannou-Kakouri et al.,
1999 Cyprus 1992-96 Barley AFB1 0/127 (0) Ioannou-Kakouri et al.,
1999 Cyprus 1992-96 Wheat AFB1 0/55 (0) Ioannou-Kakouri et al.,
1999 Cyprus 1992-96 Rice AFB1 0/56 (0) Ioannou-Kakouri et al.,
1999 Cyprus 1992-96 Breakfast cereals and others AFB1 0/78 (0) Ioannou-Kakouri et al.,
1999 Cyprus 1992-96 Coffee beans AFB1 0/171 (0) Ioannou-Kakouri et al.,
1999 Cyprus 1992-96 Cocoa products AFB1 0/10 (0) Ioannou-Kakouri et al.,
1999 Cyprus 1992-96 Raisins AFB1 0/22 (0) Ioannou-Kakouri et al.,
1999 Cyprus 1992-96 Figs and figpie AFB1 4/24 (17) Range = 1.4 – 6 Ioannou-Kakouri et al.,
1999 Cyprus 1992-96 Dates AFB1 0/5 (0) Ioannou-Kakouri et al.,
1999 Cyprus 1992-96 Beans, broad beans, chick
peas, lentils AFB1 0/390 (0) Ioannou-Kakouri et al.,
1999 Cyprus 1992-96 Sunflower and pine seeds AFB1 0/8 (0) Ioannou-Kakouri et al.,
1999 Cyprus 1992-96 Pumpkin seeds AFB1 0/190 (0) Ioannou-Kakouri et al.,
1999 Cyprus 1992-96 Sesame seeds AFB1 4/211 (2) Max = 2 Ioannou-Kakouri et al.,
1999 Cyprus 1992-96 Sesame products AFB1 5/130 (4) Max = 1 Ioannou-Kakouri et al., Risk Profile: Mycotoxins in the New Zealand 15 April 2006 Food Supply

Risk Profile: Mycotoxins in the New Zealand 16 April 2006 Food Supply
Country Year Food Aflatoxin measured
Samples positive/total (%) Concentration Reference (range, mean or
maximum; μg/kg) 1999
Cyprus 1992-96 Pepper, turmeric and others AFB1 1/6 Max = <0.4 Ioannou-Kakouri et al., 1999
Cyprus 1992-96 Desiccated coconut AFB1 0/71 (0) Ioannou-Kakouri et al., 1999
Cyprus 1992-96 Almond, cashew, hazelnut AFB1 0/1107 (0) Ioannou-Kakouri et al., 1999
Cyprus 1992-96 Walnut AFB1 6/560 (1) Range = <0.4 – 0.2 Ioannou-Kakouri et al., 1999
Cyprus 1992-96 Chestnut AFB1 10/118 (8) Max = <0.4 Ioannou-Kakouri et al., 1999
Cyprus 1992-96 Brazil nut AFB1 10/51 (20) Range = 8.3 - 20 Ioannou-Kakouri et al., 1999
Cyprus 1992-96 Pistachio AFB1 53/856 (6) Range = 1.4 - 206 Ioannou-Kakouri et al., 1999
Cyprus 1992-96 Peanut AFB1 179/1860 (10) Range = <0.4 – 700 Ioannou-Kakouri et al., 1999
Cyprus 1992-96 Peanut butter AFB1 21/74 (28) Range = 1.2 - 73 Ioannou-Kakouri et al., 1999
Cyprus 1992-96 Nut products AFB1 0/12 Ioannou-Kakouri et al., 1999
Cyprus 1992-96 Raw milk AFM1 3/71 (4) Range = 0.03 – 0.04 Ioannou-Kakouri et al., 1999
Cyprus 1992-96 Pasteurised milk AFM1 9/31 (29) Range = 0.01 – 0.04 Ioannou-Kakouri et al., 1999
Cyprus 1992-96 Baby milk, evaporated milk (imported)
AFM1 0/10 (0) Ioannou-Kakouri et al., 1999
Japan 1988-92 Peanut butter Total 3/4 (75) Range = 0.7 – 2 Taguchi et al., 1995 Japan 1988-92 Peanuts Total 1/34 (3) Max = 0.1 Taguchi et al., 1995 Japan 1988-92 Tree nuts (almond, cashew,
macadamia, pistachio, walnut)
Total 0/68 (0) Taguchi et al., 1995
Japan 1988-92 Nutmeg Total 2/3 (67) Range = 0.4 – 1.0 Taguchi et al., 1995

Risk Profile: Mycotoxins in the New Zealand 17 April 2006 Food Supply
Country Year Food Aflatoxin measured
Samples positive/total (%) Concentration Reference (range, mean or
maximum; μg/kg) Japan 1988-92 Pepper (black, white) Total 1/17 (6) Max = 0.6 Taguchi et al., 1995 Japan 1988-92 Pepper (red) Total 1/2 (50) Max = 0.8 Taguchi et al., 1995 Japan 1988-92 Other spices (garlic, ginger,
mustard) Total 0/9 (0) Taguchi et al., 1995
Japan 1988-92 Cereals (corn products, rice, wheat, buckwheat, Job’s tears)
Total 0/9 (0) Taguchi et al., 1995
Japan 1988-92 Bean products Total 0/5 (0) Taguchi et al., 1995 Japan 1988-92 Cheese Total 0/41 (0) Taguchi et al., 1995 Japan 1988-92 Beef Total 0/3 (0) Taguchi et al., 1995 UK 1994 Herbs and spices (Pepper,
cinnamon, coriander, turmeric, cumin, cardamom, mixed, oregano, pimento, fennel, tarragon)
Total 0/67 (0) MAFF, 1994a
UK 1994 Herbs and spices Total Chilli 13/33 (39) Curry powder 10/29 (34)
Cayenne 4/8 (50) Paprika 1/9 (11) Ginger 3/8 (38) Fenugreek 1/2 (50)
Max = 47.5 Max = 5.2
Max = 14.8 Max = 1.8 Max = 8.4 Max = 2.5
MAFF, 1994a
UK 1994-95 Peanuts Total 5/47 (11) Max = 105 MAFF, 1996a UK 1994-95 Peanut butter Total 13/42 (31) Max = 21 MAFF, 1996a UK 1994-95 Other nut butters Total 0/12 (0) MAFF, 1996a UK 1994-95 Pistachios Total 8/43 (19) Max = 175 MAFF, 1996a UK 1994-95 Brazil and other nuts Total 0/13 (0) MAFF, 1996a UK 1994-95 Figs and fig products Total Figs 1/29 (3)
Dried figs 16/20 (80) Fig paste 9/10 (90)
Max = 16 Max = 89 Max = 76
MAFF, 1996a
UK 1995 Milk AFM1 Full fat (Summer) 21/48 (44)
Skim/semi-skim (Summer) 18/38 (47)
Max = 0.22 Max = 0.03 Max = 0.02 Max = 0.03
MAFF, 1995a

Risk Profile: Mycotoxins in the New Zealand 18 April 2006 Food Supply
Country Year Food Aflatoxin measured
Samples positive/total (%) Concentration Reference (range, mean or
maximum; μg/kg) Full fat (Winter) 31/40 (78) Skim/semi-skim (Winter) 19/36 (53)
UK 1995 Milk products AFM1 Dried milk 0/31 (0) Infant formula 4/62 (6)
Plain yoghurt 4/13 (31) Fruit yoghurt 2/17 (12)
Max = 0.05 Max = 0.04 Max = 0.03
MAFF, 1995a
UK 1995 Cheese AFM1 Cheddar 4/12 (33) Leicester 7/13 (54)
Cheshire 10/13 (77) Lancashire 10/11 (91) Wensleydale 9/11 (82) Double Gloucester 9/13 (69)
Max = 0.09 Max = 0.09 Max = 0.17 Max = 0.21 Max = 0.22 Max = 0.13
MAFF, 1995a
UK 1996 Farm milk AFM1 Winter 11/40 (28) Summer 2/39 (5)
Max = 0.09 Max = 0.03
MAFF, 1996b
UK 1996 Retails foods (dried apricots, beer, desiccated coconut, fresh coconut, currants, dates, olives, raisins, sultanas)
Total 0/161 (0) MAFF, 1997
UK 1996 Cereals (barley, oats, rye, wheat)
Total 0/74 (0) MAFF, 1997
UK 1998-99 Maize, raw Total Country of origin: France 15/97 (15) Argentina 12/37 (32)
Other European 3/5 (60)
Max = 6.0
Max = 29.1 Max = 4.9
MAFF, 1999a
UK 2000 Rice Total 17/100 (17) Range = 0.2 - 1.8 FSA, 2002a UK 2000-01 Tree nuts (almonds, Brazil
nuts, cashews, chestnuts, hazelnuts, pecans, pinenuts, walnuts)
Total 0/33 (0) FSA, 2002b
UK 2000-01 Pistachios Total 8/52 (15) Max = 106.9 FSA, 2002b UK 2000-01 Peanuts Total 3/19 (16) Max = 70.9 FSA, 2002b UK 2000-01 Peanut butter Total 22/55 (40) Max = 11.2 FSA, 2002b

Risk Profile: Mycotoxins in the New Zealand 19 April 2006 Food Supply
Country Year Food Aflatoxin measured
Samples positive/total (%) Concentration Reference (range, mean or
maximum; μg/kg) UK 2000-01 Other nut butters Total 2/7 (29) Max = 4.8 FSA, 2002b UK 2001 Milk AFM1 Retail conventional 0/40 (0)
Retail organic 0/10 (0) Farm-gate conventional 3/40 (8) Farm-gate organic 0/10 (0)
Range = 0.01 – 0.021
FSA, 2001
UK 2003 Baby foods, various Total 1/169 (0.5) Max = 0.05 FSA, 2004 UK 2003 Maize-based retail foods
(sweetcorn, corn on the cob, baby food, corn oil, cornflour, polenta, maize meal, maize pasta, maize-based snacks, tortillas)
Total 1/292 (0.3) Max = 0.38 FSA, 2005
UK 2004 Spices Total Paprika 26/26 (100) Chilli powder 29/31 (94) Cayenne pepper 4/4 (100)
Range = 0.4 – 5.7 Range = 0.6 – 14.6 Range = 0.2 – 7.0
FSA, 2005a
USA 1986 Shelled corn/maize Total Southeast 19/59 (32) Corn belt 0/31 (0) Virginia-Maryland 2/8 (25)
Arkansas-Texas 3/23 (13) Rest of USA 0/27 (0)
Mean = 70, Max = 364
Mean = 12, Max = 20 Mean = 11, Max = 12
Wood, 1989
USA 1986 Milled corn/maize products Total Southeast 17/61 (28) Corn belt 2/22 (9) Virginia-Maryland 0/4 (0) Arkansas-Texas 0/8 (0)
Rest of USA 0/44 (0)
Mean = 21, Max = 53 Mean = 8, Max = 8
Wood, 1989
USA 1986 Manufactured corn-based products
Total 0/23 (0) Wood, 1989
USA 1986 Almond Total Domestic 1/26 (4) Imported 1/5 (20)
Max = 6 Max = 10
Wood, 1989
USA 1986 Almond butter and spread Total 0/5 (0) Wood, 1989 USA 1986 Brazil nut (imported) Total 6/12 (50) Mean = 20, Max = 42 USA 1986 Cashew Total 0/3 Wood, 1989 USA 1986 Cashew, coconut, hazelnut, Total 0/24 Wood, 1989

Risk Profile: Mycotoxins in the New Zealand 20 April 2006 Food Supply
Country Year Food Aflatoxin measured
Samples positive/total (%) Concentration Reference (range, mean or
maximum; μg/kg) pinenut, walnut candy (imported)
USA 1986 Hazelnut Total 0/1 (0) Wood, 1989 USA 1986 Macadamia Total 0/1 (0) Wood, 1989 USA 1986 Pecan Total Domestic 0/35 (0)
Imported 3/17 (18)
Mean = 135, Max = 334
Wood, 1989
USA 1986 Pistachio Total Domestic 7/22 (32) Imported 10/21 (48)
Mean = 58, Max = 252 Mean = 41, Max = 133
Wood, 1989
USA 1986 Pistachio candy (imported) Total 1/1 (100) Max = 78 Wood, 1989 USA 1986 Walnut Total Domestic 2/27 (7)
Imported 2/4 (50) Mean = 35, Max = 41
Mean = 4, Max = 8 Wood, 1989
USA 1986 Peanuts, in shell Total 0/9 (0) Wood, 1989 USA 1986 Peanuts, shelled Total 6/55 (11) Mean = 68, Max = 329 Wood, 1989 USA 1986 Peanut butter Total Domestic 17/104 (16)
Imported 1/3 (33) Mean = 14, Max = 27
Max = 43 Wood, 1989
USA 1986 Peanut paste (imported) Total 3/4 (75) Mean = 9, Max = 11 Wood, 1989 USA 1986 Peanut candy (imported) Total 10/18 (55) Mean = 10, Max = 20 Wood, 1989 USA 1986 Peanut oil (crude) Total 5/8 (62) Mean = 246, Max =
310 Wood, 1989
USA 1986 Peanut products Total 1/6 (17) Max = 2 Wood, 1989 USA 1986 Fluid milk and milk
products Total 0/182 (0) Wood, 1989
USA 1986 Barley Total 0/3 Wood, 1989 USA 1986 Canned corn, mixed
vegetables Total 0/10 Wood, 1989
USA 1986 Melon seed (imported) Total 2/4 (50) Mean = 26, Max = 29 Wood, 1989 USA 1986 Pumpkin seed (imported) Total 0/6 (0) Wood, 1989 USA 1986 Sesame seed (imported) Total 0/20 (0) Wood, 1989 USA 1986 Various herbs and spices
(imported) Total 0/59 (0) Wood, 1989
USA 1986 Chilli powder (imported) Total 9/12 (75) Mean = 10, Max = 30 Wood, 1989 USA 1986 Ginger (imported) Total 1/3 (33) Max = 2 Wood, 1989
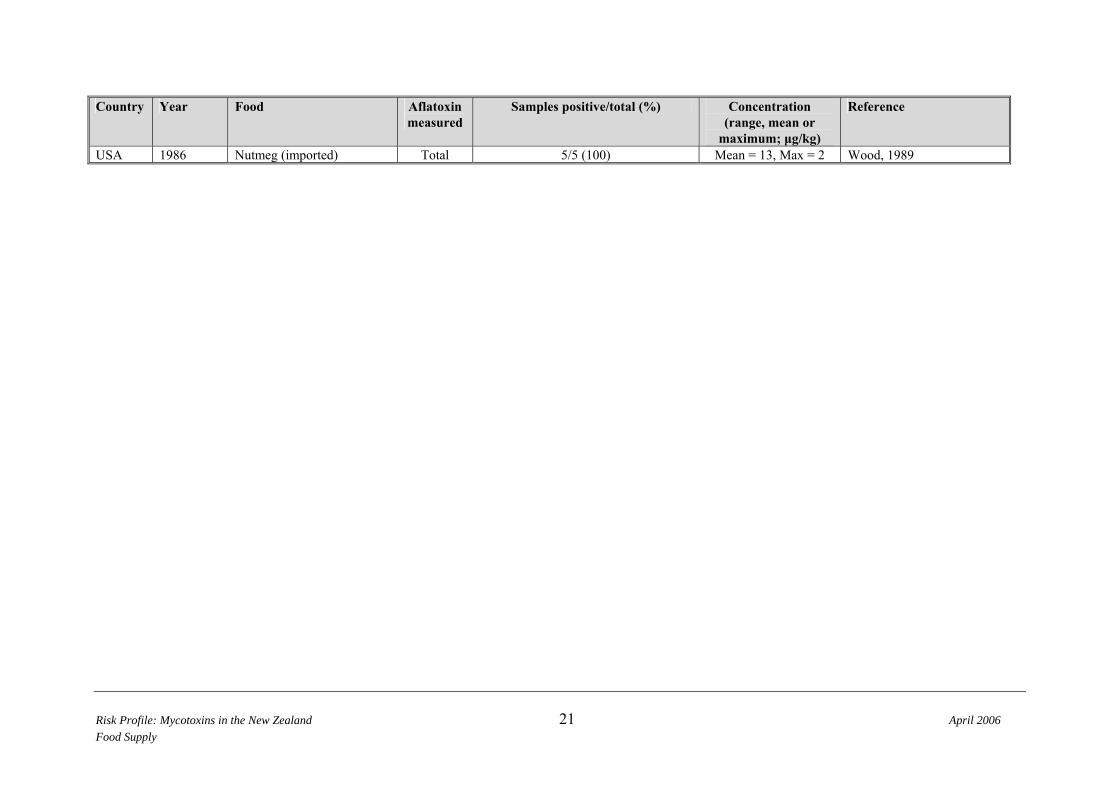
Risk Profile: Mycotoxins in the New Zealand 21 April 2006 Food Supply
Country Year Food Aflatoxin measured
Samples positive/total (%) Concentration (range, mean or
maximum; μg/kg)
Reference
USA 1986 Nutmeg (imported) Total 5/5 (100) Mean = 13, Max = 2 Wood, 1989
There is evidence that aflatoxins present in animal feed can be transmitted to human foods, such as eggs and meat. Oliveira et al. (2000) fed laying hens AFB1 contaminated feed (300 or 500 μg AFB1/kg feed) for eight weeks. AFB1 was detected at levels in the range 0.05 – 0.16 μg/kg in eggs from the high dose group only. Wolzak et al. (1985) fed hens a diet containing 3310 μg AFB1/kg and 1680 μg AFB2/kg of feed for 28 days. Aflatoxin content of eggs reached a maximum after 4-5 days with a mean combined residue content of less than 0.5 μg/kg. No aflatoxin residues were detected in eggs 5-7 days after withdrawal of contaminated feed. In contrast, Zaghini et al. (2005) fed hens a diet containing 2.5 mg/kg (2500 μg/kg) of AFB1 and detected no residues of AFB1 or AFM1 in eggs after 2 and 3 weeks. Oliveira et al. (2003) fed quail relatively low doses of AFB1 (25, 50 or 100 μg/kg of feed for 90 days. Aflatoxin residues in eggs were in the range 0.01 – 0.08 μg AFB1/kg, 0.03 – 0.37 μg AFM1/kg, 0.01 – 1.03 μg AFB2a/kg and 0.01 –0.03 μg aflatoxicol/kg. Laying hens and male broiler were fed diets containing 50 μg AFB1/kg (Micco et al., 1988). AFB1 was detected in the liver, kidney, thigh muscle and skin of some birds, while AFM1 was detected in liver, kidney and thigh. Some differences in residues patterns were observed between broilers and layers. Bintvihok et al. (2002) fed quail, ducks, hens and broilers a diet containing 3 mg/kg (3000 μg/kg) of AFB1 for 7 days. Free and conjugated AFB1 and ‘other’ aflatoxins (AFM1, AFB2a, AFP1, AFQ1, AFR0) were detected in liver sample from all species, with free AFB1 levels in the range 0.13 – 7.83 μg/kg. Free AFB1 was only detected in the muscle tissue from quail, while other aflatoxins were detected in muscle of all species at levels of free aflatoxins in the range 0.11 – 0.82 μg/kg. Aflatoxins can occur in meat and meat products either due to consumption of aflatoxin-contaminated feed or due to direct growth of the fungi on meat. Aziz and Youssef (1991) reported the presence of A. flavus and A. parasiticus on Egyptian meat products (beefburger, hotdog, kubeba, sausage, luncheon meat) and the occurrence of AFB1 and AFB2 in some samples of meat products at levels in the range 2 – 150 μg/kg. Stubblefield et al. (1991) detected AFB1 and AFM1 in livers of pigs fed aflatoxin-contaminated corn (12 of 160 samples) at levels of 0.02 – 0.24 μg/kg and 0.03 – 0.44 μg/kg respectively. No aflatoxin residues were detected in associated muscle tissue samples. While there is evidence that aflatoxin residues can be transmitted to foods of animal origin, the resultant residue concentrations are generally low. Animal feeding practices in New Zealand will mean that the potential for aflatoxins residues in stock animals is extremely low. The diverse nature of ingredients used in the poultry feed industry mean that there is some potential for aflatoxin residues in poultry feed and, consequently, in eggs and poultry meat, although concentrations will be very low. Overseas data suggests that there is potential for New Zealanders to be occasionally exposed to aflatoxins through consumption of a range of foods, other than peanuts. 2.3.4 New Zealand estimates of dietary exposure Thomson (1996) estimated the chronic exposure of New Zealanders to total aflatoxins, through consumption of peanuts and peanut butter, at 0.0001 μg/kg body weight/ day.
Risk Profile: Mycotoxins in the New Zealand April 2006 Food Supply
22

Risk Profile: Mycotoxins in the New Zealand April 2006 Food Supply
23
Peanuts are consumed at a relatively low level by New Zealanders (2.7 g/person/day; ANZFA, 2001b). New Zealand imported approximately 5,400 tonnes of peanuts in the year to September 2005, principally from Australia (59%) and China (36%). 2.3.5 Overseas estimates of dietary exposure Table 5 summarises results of overseas studies, which have derived estimates of dietary exposure to aflatoxins. There is a significant divide between estimates of aflatoxin exposure in developing countries, where estimates may be as high as several hundred ng/kg body weight/day, and developed countries, where estimates are generally less than 5 ng/kg body weight/day (0.005 μg/kg body weight/day) and often less than 1 ng/kg body weight/day (0.001 μg/kg body weight/day). An estimate of New Zealand exposure is similar to estimates for European countries, Australia and temperate regions of the United States (0.0001 μg/kg body weight/day or 0.1 ng/kg body weight/day; Thomson, 1996). The estimates of aflatoxin exposure for different regions of the United States (Stoloff, 1983) clearly demonstrates the impact of the ecology of aflatoxigenic fungi. In the USA, maize may be grown either in sub-tropical regions (Southeast) or temperate (North and West). Maize grown in the Southeast is susceptible to aflatoxin contamination and the population in this area are potentially exposed to high levels of aflatoxins. Maize from the temperate regions of the North and West is rarely, if ever, contaminated with aflatoxin and the contribution of maize to total aflatoxin exposure in these regions is minimal (Stoloff, 1983).

Table 5: Overseas estimates of dietary exposure to aflatoxins
Country Year Population group Exposure
(ng/kg bw/day, total aflatoxin unless otherwise
stated)
Main foods contributing Reference
Australia 1994 Mean energy intake Adult male (75 kg bw) Adult female (59 kg bw) Boy, 12 years (40 kg bw) Girl, 12 years (42 kg bw) Toddler, 2 years (12 kg bw) 95th percentile energy intake Adult male (75 kg bw) Adult female (59 kg bw) Boy, 12 years (40 kg bw) Girl, 12 years (42 kg bw) Toddler, 2 years (12 kg bw)
0.2 0.2 0.3 0.1 0.2
0.2 0.3 0.5 0.2 0.3
Aflatoxins only detected in peanut butter
Marro, 1996
Australia 1996 Mean energy intake Adult male (75 kg bw) Adult female (59 kg bw) Boy, 12 years (40 kg bw) Girl, 12 years (42 kg bw) Toddler, 2 years (12 kg bw) 95th percentile energy intake Adult male (75 kg bw) Adult female (59 kg bw) Boy, 12 years (40 kg bw) Girl, 12 years (42 kg bw) Toddler, 2 years (12 kg bw)
1.1 1.2 2.4 1.0 1.6
1.8 1.9 3.8 1.5 1.9
Aflatoxins only detected in peanut butter
Hardy, 1998
Australia 2001 Mean population (60 kg body weight) 95th percentile consumer
0.2
3.4
Only peanuts considered Pitt and Tomaska, 2001
Risk Profile: Mycotoxins in the New Zealand April 2006 Food Supply
24

Risk Profile: Mycotoxins in the New Zealand April 2006 Food Supply
25
Country Year Population group Exposure (ng/kg bw/day, total
aflatoxin unless otherwise stated)
Main foods contributing Reference
Australia 2000-2001 Same as for Hardy (1998), with addition of infant diet
No aflatoxins detected in any food tested
No aflatoxins detected in any food tested
FSANZ, 2002
Belgium 1997 Average inhabitant (60 kg bw) 0.2 (AFB1) 0.055 (AFM1)
Nuts (peanuts, pistachios) Milk and milk products, cheese
SCOOP, 1997a
China 1980-1997 0-91 (AFB1) Not specified Chen, 1997 (in JECFA, 1998) China 1990 Standard man, 18-45 years, 60
kg body weight 0-10 (AFB1)
AFM1 was not detected in any food tested
Cereals composite Chen and Gao, 1993
China (Southern Guangxi)
1978-84 Not stated 11.7-2027 (AFB1) Maize Yeh et al., 1989
China (Fusui County)
Not stated Adult males Adult females
200 (AFB1) 8 (AFB1)
Maize Wang et al., 2001
Denmark 1997 Average adult (70 kg bw) <0.1 (AFM1) Milk and milk products SCOOP, 1997a France 1997 Adult (60 kg bw) 1.3 (AFB1)
Cereals and cereal products SCOOP, 1997a
France 2000-2001 Adult, 15+ years, mean 95th percentile Child, 3-14 years, mean 95th percentile Adult, 15+ years, mean 95th percentile Child, 3-14 years, mean 95th percentile
0.12 (Total) 0.35 (Total) 0.32 (Total) 0.89 (Total) 0.09 (AFM1) 0.21 (AFM1) 0.22 (AFM1) 0.55 (AFM1)
Eggs and egg products
Cereals and cereal products
Ultra-fresh dairy products
Ultra-fresh dairy products
Lelbanc et al., 2005
Gambia 1988 Not stated 4-115 (AFB1) Not specified Wild et al., 1992 (in IARC, 1993)
Germany 1997 Adult (75.9 kg bw) Child (13.5 kg bw) Adult (75.9 kg bw) Child (13.5 kg bw)
0.03 (AFB1) 0.3 (AFB1)
0.04 (AFM1) 0.2 (AFM1)
Nuts and nut products
Milk, cheese
SCOOP, 1997a

Risk Profile: Mycotoxins in the New Zealand April 2006 Food Supply
26
Country Year Population group Exposure (ng/kg bw/day, total
aflatoxin unless otherwise stated)
Main foods contributing Reference
India (Southern)
NS Rural 1-5 years 5-12 years 12-18 years >18 years
6-101 (Total) 5-80 (Total)
18-63 (Total) 4-57 (Total)
Maize Vasanthi et al., 1997
Kenya 1969-1970 Not stated 3.5-14.8 (AFB1 + AFB2) Not specified Peers and Linsell, 1973 Korea 2002 Adult (55 kg) 1.2-5.8 (AFB1) Rice Park et al., 2004 Mozambique 1969-1974 Not stated 38.6-184 (AFB1) Maize, peanuts Van Rensburg et al., 1985 Netherlands 1997 Adult (50 kg bw)
Infant (15 kg bw)
0.37 (AFB1)
0.046 (AFM1) 0.19 (AFM1)
Peanuts and figs and their products Pasteurised and unpasteurised milk
SCOOP, 1997a
Swaziland 1972-73 Not stated 5.1-43.1 (AFB1) Not specified Peers et al., 1976 (in IARC, 1993)
Swaziland 1982-83 Not stated 11.4-159 (AFB1) 20-297 (Total)
Maize Peers et al., 1987
Sweden 1996-1998 Adult average (18-74 years) High (95th percentile) consumer
0.8 2.1
Pistachios, Brazil nuts Thuvander et al., 2001
Thailand 1969-70 Three households in each of three areas in each of three seasons
0-151 (AFB1) <1-213 (Total)
Not specified Shank et al., 1972
Transkei* 1976-77 Not stated 16.5 (AFB1) Maize, peanuts Van Rensburg et al., 1985 UK 1997 Adult (70.1 kg) 0.03 (AFB1)
0.06 (AFM1) Peanuts and figs and their products
Not specified SCOOP, 1997a
USA 1910-1934 1935-1959
Southeast total population North and West total population Southeast total population North and West total population
221 (AFB1) 0.22 (AFB1) 121 (AFB1) 0.34 (AFB1)
Maize Stoloff, 1983
USA 1960-79 Not stated 2.7 (AFB1) Not specified Bruce, 1990 * Transkei was incorporated into South Africa in 1994

Risk Profile: Mycotoxins in the New Zealand 27 April 2006 Food Supply
2.4 Risk Characterisation 2.4.1 Adverse health effects in New Zealand No cases of acute aflatoxicosis have been reported in New Zealand. While it is not possible to definitively identify cases of chronic adverse affects from exposure to aflatoxins, it is pertinent to consider New Zealand’s rates of primary liver cancer and the prevalence of hepatitis B and C infection, as these factors have all shown inter-relations in the major epidemiological studies carried out in relation to aflatoxin exposure overseas (Table 6).
Table 6: Incidence of liver cancer, hepatitis B and hepatitis C in New Zealand
Year Liver cancer * Hepatitis B# Hepatitis C# New
cases Rate
(per 100,000) New cases
Rate (per 100,000)
New cases
Rate (per 100,000)
1995 114 Non-Maori 1.8 Maori 11.0
125 3.3 (European 1.8, Maori 8.6,
Pacific Islanders 1.5)
88 2.4 (European 2.5, Maori 2.5,
Pacific Islanders 0.5) 1996 131 Non-Maori 2.5
Maori 7.1 104 2.8
(European 1.5, Maori 6.3, Pacific Islanders 4.5)
59 1.6 (European 1.4, Maori 0.8)
1997 153 Non-Maori 2.6 Maori 8.9
138 3.7 (European 1.5, Maori 8.0,
Pacific Islanders 9.0)
92 2.5 (European 1.9, Maori 2.5)
1998 143 Non-Maori 2.3 Maori 8.0
88 2.4 (European 1.5, Maori 4.6,
Pacific Islanders 4.5)
102 2.7 (European 2.5, Maori 2.1)
1999 NA NA 94 2.5 (European 1.4, Maori 4.2,
Pacific Islanders 4.0)
96 2.6 (European 2.4, Maori 2.3,
Pacific Islanders 0.5) 2000 NA NA 79 2.1
(European 1.1, Maori 3.0, Pacific Islanders 4.5)
80 2.1 (European 1.3, Maori 1.5,
Pacific Islanders 0.5) 2001 NA NA 56 1.5
(European 0.7, Maori 2.7, Pacific Islanders 4.0)
59 1.6 (European 1.2, Maori 1.3)
NA Not available * New Zealand Health Information Service, 1999; 2000; 2001; 2002 # From Episurv database (Liz Sneyd, ESR Keneperu Science Centre, personal communication) Hepatitis B notifications have declined from about 600 per year in the mid-1980s to the most recently reported incidence of 30 in 2005 (http://www.nzpho.org.nz/view_data.asp#NotifiableDisease). This decline has been influenced by the introduction of immunisation for infants of HBsAg (a surface antigen of the Hepatitis B virus)-positive mothers (1985), followed by immunisation of all neonates (1988) (MoH, 2002). Blakely et al. (1999) examined the HBsAg status of 193 confirmed cases of hepatocellular carcinoma (HCC) in New Zealand between 1987 and 1994. It was found that 77% of Maori, 80% of Pacific Island, and 89% of Asian HCC cases were HBsAg positive, while only 6% of European HCC cases were HBsAg positive. This explained between 78 (Maori) and 92% (Asian) of the excess risk of HCC compared to the rate in Europeans.

Risk Profile: Mycotoxins in the New Zealand 28 April 2006 Food Supply
2.4.2 Adverse health effects overseas 2.4.2.1 Incidence of primary liver cancer Liver cancer is the fifth most frequently occurring cancer worldwide (Bosch et al., 1999). Rates of liver cancer in developing countries are generally two to three times higher than in developed countries. Regions with the highest age-adjusted incidence rates are; East Asia (27.6-36.6 per 100,000 of population), sub-Saharan Africa (20.8-38.1 per 100,000 of population) and some countries in West Africa (30-48 per 100,00 of population). The areas of lowest liver cancer risk are reported to be Northern Europe, Australia, New Zealand and the Caucasian populations of North and South America with rates for males below 5.0 per 100,00 of population (Bosch et al., 1999). 2.4.2.2 Epidemiological studies A number of epidemiological studies have been conducted, mainly in Asia, to examine links between primary liver cancer (PLC) or hepatocellular carcinoma (HCC), hepatitis B and aflatoxin exposure. While PLC may involve cell types other than the hepatocytes, it can generally be assumed that PLC and HCC are synonymous. HBsAg refers to a surface antigen of the hepatitis B virus. These studies are summarised below. China (Guangxi Province) Yeh et al. (1989) followed a cohort of 7917 men aged 25-64 in southern Guangxi province, China. Hepatitis B status of members of the cohort was determined by testing for the HBsAg surface antigen. Average aflatoxin exposures were determined on a commune by commune basis from staple food monitoring. A positive linear relationship was observed between regional aflatoxin exposure and mortality due to PLC. Prevalence of HBsAg was high and homogeneous across the study areas (21-25%). China Campbell et al. (1990) conducted a cross-sectional study of risk factors for PLC over 48 survey sites in the People’s Republic of China. The survey sites represented an approximately 600-fold range in aflatoxin exposure, 39-fold range in PLC mortality rates, and a 28-fold range in HBsAg carrier prevalence. Aflatoxin exposure was estimated from urinary aflatoxin metabolite levels. The study showed no association between aflatoxin exposure and PLC mortality. China (Shanghai) An ongoing prospective cohort study in Shanghai, China of 18,244 middle-aged men examined urinary levels of AFB1 and its metabolites, and DNA-aflatoxin adducts (Ross et al., 1992; Qian et al., 1994, Yuan et al., 1995). Two assessment points in the study have so far been reported, with liver cancer cases being matched with liver cancer-negative controls from the study group and compared for hepatitis B status and urinary aflatoxin level. At the first assessment point (after 35,299 person years) it was concluded that up to 50% of liver cancer cases may be due to aflatoxin exposure.

Risk Profile: Mycotoxins in the New Zealand 29 April 2006 Food Supply
At the second assessment point (Qian et al., 1994) a highly significant association was found between the presence of at least one urinary aflatoxin metabolite, HBsAg positivity and PLC risk. Risk was particularly elevated in subjects with both biomarkers, but the number of subjects was quite small. Considerable debate has followed publication of this study (see JECFA, 1998 for a summary) and it should be noted that there was no dose-dependent association between dietary aflatoxin exposure estimates and either PLC risk or urinary metabolite status. Gambia Wild et al. (1993) collected blood samples from 117 Gambian children aged 3-4 over a one month period. Bloods were analysed for aflatoxin-albumin adducts as a marker of aflatoxin exposure, markers of hepatitis B infection , and liver enzymes as markers of liver damage. A significant positive correlation between aflatoxin adduct levels and liver damage biomarker levels was found, even after exclusion of subjects positive for hepatitis B. Thailand Srivatanakul et al (1991) conducted a case-control study to assess risk factors for PLC in Thailand, using aflatoxin-albumin adduct as a biomarker of aflatoxin exposure. Hepatitis B was the predominant risk factor, with neither aflatoxin adduct nor hepatitis C being significantly associated with cancer risk. This study has been criticised for lacking sufficient statistical power to detect aflatoxin or hepatitis C as independent risk factors (JECFA, 1998). Taiwan Hatch et al. (1993) conducted a survey over eight regions of Taiwan, which provided a significant range of estimates of aflatoxin exposure and rates of PLC. It was concluded that aflatoxins had an independent role in PLC in Taiwan. Wang et al (1996) conducted a case-control study on the effect of aflatoxin on PLC in Taiwan. Fifty-six cases of PLC were matched with 220 healthy controls and blood and urine samples analysed for aflatoxin and hepatitis biomarkers. HBsAg carriers had significantly increased cancer risk and, after adjustment for HBsAg status, there was a significantly elevated cancer risk for subjects with high levels of urinary aflatoxin metabolites. Sudan Omer et al. (1998) conducted a small case-control study (24 cases and 34 controls) to determine risk factors for hepatocellular carcinoma (HCC). Peanut butter and peanuts were collected from two regions of Sudan (West Sudan, high levels of contamination, and Central Sudan, lower levels of contamination). HCC was weakly, but significantly, associated with AFB1 index (an indicator of exposure), with an odds ratio (OR) of 1.5. The study showed no association between HCC and hepatitis virus infection.

Risk Profile: Mycotoxins in the New Zealand 30 April 2006 Food Supply
United States Hoque et al. (1999) examined sera and tissue samples from 23 patients with hepatocellular carcinoma for biomarkers of hepatitis virus and aflatoxin exposure. Aflatoxin-DNA and aflatoxin-lysine adducts were detected in some patients. However, the small size of the study and the lack of suitable controls means that few conclusions can be drawn. Conclusions In reviewing these studies and other information on molecular biomarkers the JECFA committee concluded that “exposure to aflatoxins appears to present an additional risk which is enhanced by simultaneous exposure to hepatitis B virus, and possibly hepatitis C virus. This relationship, which may affect not only carcinogenic potency but also metabolism, biochemistry and pharmacology of the aflatoxins, and other multiple etiological agents for primary liver cancer, makes it difficult to interpret the epidemiological studies in the context of the risk of primary liver cancer from aflatoxins” (JECFA, 1998). However, the strength of evidence as evaluated by IARC (1993; 2002) clearly demonstrates an independent causal association between aflatoxin exposure and human liver cancer incidence. 2.4.2.3 Risk assessments and other activity overseas JECFA The latest assessment of aflatoxins carried out by the Joint FAO/WHO Expert Committee on Food Additives (JECFA) summarised recent studies relevant to aflatoxins in foods (JECFA, 1998). The assessment made the following comments: • The committee considered that the weight of scientific evidence supports a conclusion
that aflatoxins should be treated as carcinogenic food contaminants, the intake of which should be reduced to levels as low as reasonably achievable.
• The potency of aflatoxins in HbsAg+ (hepatitis B surface antigen) individuals is substantially higher than the potency in HbsAg- individuals.
• Vaccination against hepatitis B will reduce the prevalence of carriers, which would reduce the potency of aflatoxins in vaccinated populations and reduce liver cancer risks.
• Analysis of the application of hypothetical standards (10 μg/kg or 20 μg/kg aflatoxin in food) to model populations with a low prevalence of HBsAg+ individuals and/or with a low mean intake of aflatoxin (less than 1 ng/kg body weight/day) is unlikely to exhibit a detectable difference in population risk.
• The committee has previously noted that reductions can be achieved through avoidance measures such as improved farming and proper storage practice and through enforcing standards for food or feed within countries and across borders.
FSANZ/ANZFA FSANZ (then ANZFA) carried out an assessment of aflatoxins in food in 1999 (ANZFA, 1999). It was concluded that “while most problems associated with aflatoxins are associated with peanuts, several varieties of tree nuts may also be contaminated on occasions”.

Risk Profile: Mycotoxins in the New Zealand 31 April 2006 Food Supply
European Commission The European Commission carried out a risk assessment of aflatoxins under their tasks for scientific co-operation (SCOOP) programme (SCOOP, 1997a). The study found that: • Aflatoxins are found in a wider range of foods than traditionally thought. • The estimation of dietary intake is limited by different approaches to obtaining
consumption data and indicators of total dietary intake of aflatoxins depend completely on the number and types of individual foods considered within the summation.
2.5 Risk Management Information 2.5.1 Relevant food controls: New Zealand 2.5.1.1 Establishment of regulatory limits The New Zealand Food Regulations 1984 specify a limit for total aflatoxin contamination of ‘peanut butter, shelled nuts, and the nut portion of products containing nuts’ of 0.015 ppm (15 ppb) and a limit of 0.005 ppm in ‘all other foods’. The Australia New Zealand Food Standards Code, which has replaced the New Zealand Food Regulations 1984, specifies a maximum limit for total aflatoxins in peanuts and tree nuts of 0.015 ppm, but includes no provisions for other foods. The New Zealand (Mandatory) Food Standard 1997 prescribes imported peanut and pistachio nuts, peanut butter and nutmeg; requiring their testing at time of import for the presence of mycotoxins (fungal toxins). Love (2000) reviewed New Zealand import testing procedures for peanuts and compared them to several other countries, concluding that advantages of the New Zealand system were “Its ability to reject almost all shipments with levels of aflatoxin above 15 µg/kg, and the increased ability to identify hot spots in a damaged shipment because of the number of sites checked”. 2.5.2 Relevant food controls: overseas 2.5.2.1 Establishment of regulatory limits In 2003 approximately 100 countries reported having mycotoxin regulations in place (van Egmond and Jonkers, 2003). Aflatoxins are by far the most commonly regulated mycotoxins. Regulatory limits may be expressed in terms of AFB1, in terms of total aflatoxins or occasionally in terms of the sum of AFB1 and AFG1 (van Egmond and Jonkers, 2003). For regulatory limits expressed in terms of AFB1 limits range from 1 to 20 μg/kg, with the most common limit being 2 μg/kg. This limit applies to most foods for direct human consumption within EU and associated countries (29 countries). The next most common limit for AFB1 is 5 μg/kg (21 countries). The range of regulatory limits for total aflatoxins found was 0-35 μg/kg, with a median of 10 μg/kg (van Egmond and Jonkers, 2003). The EU limit of 2 μg/kg for AFB1 is also expressed

Risk Profile: Mycotoxins in the New Zealand 32 April 2006 Food Supply
as 4 μg/kg total aflatoxins and this was the most common regulatory limit for total aflatoxins (29 countries), followed by 20 μg/kg (17 countries). Regulatory limits for AFM1 were reported from 60 countries (van Egmond and Jonkers, 2003) with the most common limit being 0.05 μg/kg (34 countries, including EU and associated countries), followed by 0.5 μg/kg (22 countries). JECFA examined the impact of several regulatory scenarios on the dietary exposure to aflatoxins from consumption of maize and peanuts. The scenarios were assessed in terms of contamination profiles of commodities from three sources: Europe, USA and China. Exposure estimates were derived for all five GEMS/Food Regional Diets (Europe, Africa, Middle East, Latin America, East Asia. Results for the European diet are summarised in Table 7.
Table 7: Estimated dietary exposure to aflatoxins from consumption of maize and peanuts under various scenarios for the GEMS/Food European diet
Aflatoxin exposure if samples exceeding stated aflatoxin level are
excluded (ng/person/day) >10 μg/kg >15 μg/kg >20 μg/kg None Total aflatoxins European residue levels
6.5 6.5 7 67
USA residue levels
8.0 9.5 12 117
AFB1 European residue levels
18 18 18.5 49
Chinese residue levels
42 45 50 162
From JECFA (1998) The JECFA analysis concluded that the most significant effect on aflatoxin intake was the limiting of contamination to less than 20 μg/kg. Minor further reductions can be achieved by decreasing the limit level to 15 or 10 μg/kg. 2.5.2.2 Codes of Practice Codes of Practice for prevention and reduction of aflatoxin contamination have been formulated by the Codex Alimentarius Commission (Codex) and are available at the following sites: Peanuts (http://www.codexalimentarius.net/download/standards/10084/CXC_055_2004e.pdf) Tree nuts (http://www.codexalimentarius.net/download/standards/10221/CXP_059e.pdf) Feed for milk producing animals (http://www.codexalimentarius.net/download/standards/331/CXP_045e.pdf) In addition Codex have also prepared a general standard for prevention and reduction of mycotoxin contamination of cereals (http://www.codexalimentarius.net/download/standards/406/CXC_051e.pdf).

Risk Profile: Mycotoxins in the New Zealand 33 April 2006 Food Supply
2.5.2.3 Management of aflatoxin formation in crops The level of aflatoxins in a food crop and the resulting food products may be influenced at a number of steps in the process from paddock to plate (Park et al., 1999), including: • Pre-harvest. Development of cultivars with improved resistance to fungal infection and
management of risk factors (water stress, insect infestation, fungal levels). • Harvesting. Minimisation of physical damage and harvesting at correct moisture content. • Post-harvest procedures. Physical separation of infected grains (usually on the basis of
colour) can substantially decrease the level of contamination. • Storage. Accumulation of moisture, heat, and physical damage can increase fungal
infestation and consequent aflatoxin formation. • Processing. 2.5.2.4 Post-harvest treatment to reduce aflatoxin levels A number of techniques have been investigated to reduce aflatoxin contamination in food and feed. Techniques include: Mechanical segregation. Most of the aflatoxin contamination associated with maize may be found in a relatively small number of kernels. Separation of infected from non-infected kernels on the basis of appearance does not appear to have received much attention for maize, but has been applied with some success to peanuts and Brazil nuts (Phillips et al., 1994). Density segregation. Flotation and density segregation of maize has demonstrated a noticeable reduction in aflatoxin contamination (Huff and Hagler, 1985). While this technique is compatible with wet milling of maize, it is unlikely to be practical for maize destined for dry milling. Thermal inactivation. Aflatoxins are heat stable and are not completely destroyed by boiling or autoclaving (Phillips et al., 1994). Roasting has been shown to decrease, but not eliminate, aflatoxin contamination in maize. Irradiation. Gamma irradiation did not degrade aflatoxin in peanut meal, while exposure to sunlight for 14 hours resulted in destruction of approximately 50% of aflatoxin B1 in naturally contaminated groundnut flakes (Shantha et al., 1986). However, exposure to UV light appears to activate aflatoxins as mutagens (Phillips, 1984). Solvent extraction. A number of solvent systems, including binary and tertiary systems, are capable of extracting aflatoxins from contaminated meal with minimal effect on protein content or nutritional quality. However, these techniques appear to be impractical and cost prohibitive for large scale detoxification (Phillips et al., 1994). Ammoniation. Treatment with ammonia (ammonium hydroxide or ammonia gas) has been shown to reduce aflatoxin levels in maize by more than 99% (Brekke et al., 1977). Ammoniation of maize is permitted in the United States in states were aflatoxin contamination of maize may be severe (Texas, North Carolina, Georgia and Alabama only), and in Mexico (Phillips et al., 1994). The products of ammoniation have been shown to be significantly less toxic than AFB1.
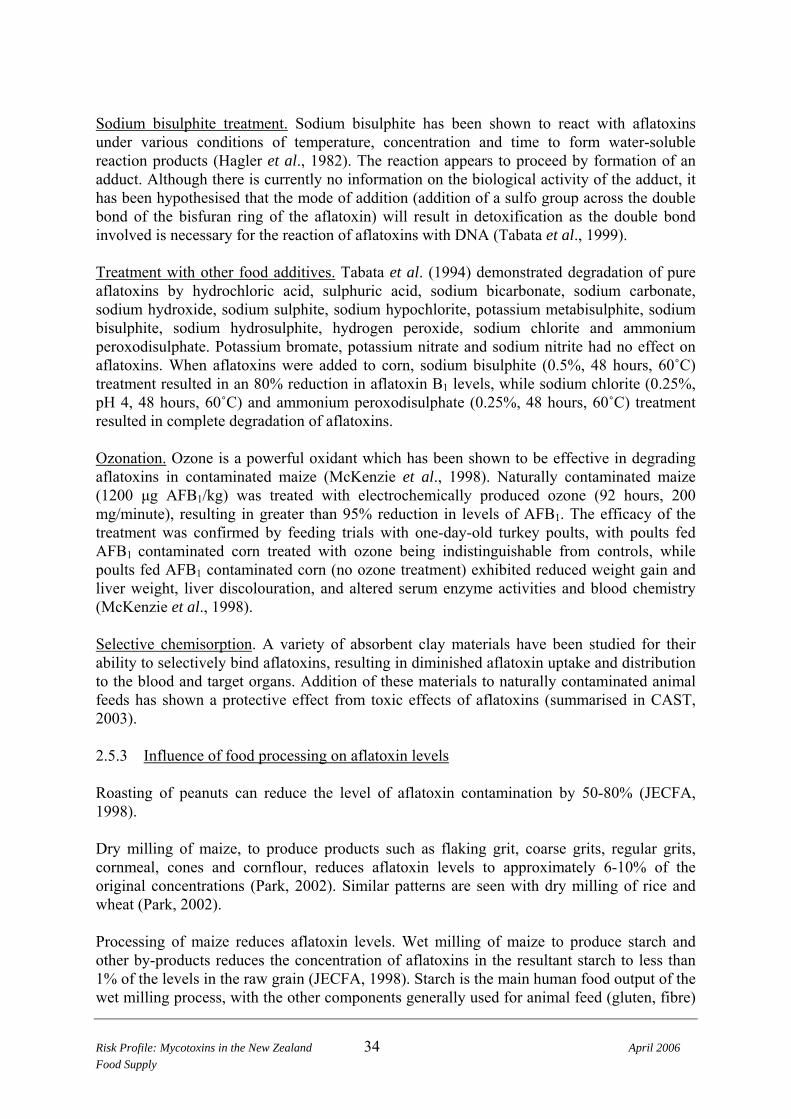
Risk Profile: Mycotoxins in the New Zealand 34 April 2006 Food Supply
Sodium bisulphite treatment. Sodium bisulphite has been shown to react with aflatoxins under various conditions of temperature, concentration and time to form water-soluble reaction products (Hagler et al., 1982). The reaction appears to proceed by formation of an adduct. Although there is currently no information on the biological activity of the adduct, it has been hypothesised that the mode of addition (addition of a sulfo group across the double bond of the bisfuran ring of the aflatoxin) will result in detoxification as the double bond involved is necessary for the reaction of aflatoxins with DNA (Tabata et al., 1999). Treatment with other food additives. Tabata et al. (1994) demonstrated degradation of pure aflatoxins by hydrochloric acid, sulphuric acid, sodium bicarbonate, sodium carbonate, sodium hydroxide, sodium sulphite, sodium hypochlorite, potassium metabisulphite, sodium bisulphite, sodium hydrosulphite, hydrogen peroxide, sodium chlorite and ammonium peroxodisulphate. Potassium bromate, potassium nitrate and sodium nitrite had no effect on aflatoxins. When aflatoxins were added to corn, sodium bisulphite (0.5%, 48 hours, 60˚C) treatment resulted in an 80% reduction in aflatoxin B1 levels, while sodium chlorite (0.25%, pH 4, 48 hours, 60˚C) and ammonium peroxodisulphate (0.25%, 48 hours, 60˚C) treatment resulted in complete degradation of aflatoxins. Ozonation. Ozone is a powerful oxidant which has been shown to be effective in degrading aflatoxins in contaminated maize (McKenzie et al., 1998). Naturally contaminated maize (1200 μg AFB1/kg) was treated with electrochemically produced ozone (92 hours, 200 mg/minute), resulting in greater than 95% reduction in levels of AFB1. The efficacy of the treatment was confirmed by feeding trials with one-day-old turkey poults, with poults fed AFB1 contaminated corn treated with ozone being indistinguishable from controls, while poults fed AFB1 contaminated corn (no ozone treatment) exhibited reduced weight gain and liver weight, liver discolouration, and altered serum enzyme activities and blood chemistry (McKenzie et al., 1998). Selective chemisorption. A variety of absorbent clay materials have been studied for their ability to selectively bind aflatoxins, resulting in diminished aflatoxin uptake and distribution to the blood and target organs. Addition of these materials to naturally contaminated animal feeds has shown a protective effect from toxic effects of aflatoxins (summarised in CAST, 2003). 2.5.3 Influence of food processing on aflatoxin levels Roasting of peanuts can reduce the level of aflatoxin contamination by 50-80% (JECFA, 1998). Dry milling of maize, to produce products such as flaking grit, coarse grits, regular grits, cornmeal, cones and cornflour, reduces aflatoxin levels to approximately 6-10% of the original concentrations (Park, 2002). Similar patterns are seen with dry milling of rice and wheat (Park, 2002). Processing of maize reduces aflatoxin levels. Wet milling of maize to produce starch and other by-products reduces the concentration of aflatoxins in the resultant starch to less than 1% of the levels in the raw grain (JECFA, 1998). Starch is the main human food output of the wet milling process, with the other components generally used for animal feed (gluten, fibre)

Risk Profile: Mycotoxins in the New Zealand 35 April 2006 Food Supply
or for further processing (germ for oil extraction).Table 8 summarises results of three studies looking at the partitioning of aflatoxins between mill fractions during the wet milling process.
Table 8: Distribution of aflatoxins between maize wet milling fractions
Fraction Percentage of total aflatoxins Yahl et al. (1971) Bennett and Anderson (1978) Romer (1984) Steep water and solubles
42 40 50
Fibre 30 38 28 Gluten 17 13 11 Germ 10 6 11 Starch 1 1 0.2 Extrusion cooking of maize flour in the presence of sodium metabisulphite has been reported to decrease AFB1 levels by 10-25% (Cazzaniga et al., 2001). Of three factors studied (extrusion cooking temperature, moisture content of flour and presence of additive) only the presence of the additive, sodium metabisulphite, had a significant effect on AFB1 levels. Production of tortillas, tortilla chips and corn chips involves an alkaline cooking process (nixtamalisation). This process has been shown to remove 30-85% of aflatoxin (Torres et al., 2001). Domestic cooking of spices and herbs naturally contaminated with AFB1 (microwaving or heating in a gas oven) did not result in reduction of AFB1 levels (MAFF, 1994a). Fermentation can result in decreases in aflatoxin contamination and Chu et al. (1975) demonstrated a 70-80% reduction in AFB1 levels through the beer brewing process. AFM1 was found to be associated with the casein fraction of milk and is stable during the pasteurisation process (Wiseman et al., 1983). The production of butter results in very low levels of AFM1 in the butter, with the majority appearing in the buttermilk or rinse water (Wiseman and Marth, 1983). Production of cheese from AFM1-contaminated milk results in concentration of the AFM1, with levels in the cheese approximately 3-6 times those in the milk (van Egmond, 1983). 2.6 Conclusions 2.6.1 Description of risks to New Zealand consumers There is consistent epidemiological evidence linking aflatoxin exposure to human primary liver cancer. Plausible mechanisms for carcinogenesis have been proposed and there is some biochemical data to support these hypotheses. However, the cancer risk due to aflatoxin is substantially increased in the presence of other liver diseases (hepatitis B, hepatitis C) and there are some questions concerning aflatoxin exposure as an independent risk factor. Studies indicate that aflatoxigenic Aspergillus species are not present in New Zealand crops (Sayer and Lauren, 1991) and it is generally believed that these toxins only form in tropical
Risk Profile: Mycotoxins in the New Zealand 36 April 2006 Food Supply
or sub-tropical situations. The major potential sources of aflatoxin exposure for the general New Zealand population are probably imported maize and peanuts and their products. The majority of maize imports into New Zealand are from Australia and are not subject to testing for aflatoxins. Australian data suggest that maize in Australia is frequently contaminated with aflatoxins. This is consistent with a large body of information from a variety of countries. Processing of maize, by dry or wet milling, results in a substantial decrease in aflatoxin levels. Other processes, such as extrusion cooking and alkaline steeping produce further decreases in aflatoxin levels. Very limited analyses of maize and maize-based products available on the New Zealand market revealed no aflatoxins, at a limit of detection of 1 μg total aflatoxin/kg (Stanton, 2000a). This is consistent with Australian data, which only reported one detection of aflatoxins amongst 265 analyses of corn flakes (ANZFA, 1999). Importations of peanuts and peanut products into New Zealand continue to show a proportion of contaminated shipments However, import testing procedures will reduce the proportion of contaminated shipments that reach the retail market. Love (2000) reviewed New Zealand testing procedures and compared them to several other countries, concluding that advantages of the New Zealand system were “Its ability to reject almost all shipments with levels of aflatoxin above 15 µg/kg, and the increased ability to identify hot spots in a damaged shipment because of the number of sites checked”. While a proportion of aflatoxin-contaminated product will inevitably make its way onto the New Zealand retail market, this is likely to be a relatively rare occurrence. In a limited survey of peanuts from retail outlets (34 samples), none were found to contain detectable levels of aflatoxin. Estimates of the aflatoxin exposure of New Zealanders suggest that it is at the lower end of the range of international estimates – probably in the range 0.1-2.5 ng/kg bw/day, and is similar to estimates for European countries and temperate areas of North America. Based on the consensus carcinogenic potency values from epidemiological studies adopted by JECFA (0.01 cancers/year per 100,000 population per ng aflatoxin/kg body weight/day for HbsAg negative individuals), this level of exposure would result in an excess liver cancer risk of 0.0005-0.01 cancers/100,000 population/year compared to current rates of liver cancer in New Zealand of 2-11/100,000/year, depending on ethnicity. The risk for hepatitis B positive individuals will be approximately 30 times higher. It should be noted that the single estimate made of aflatoxin exposure in New Zealand may be an underestimate, due to the paucity of data on aflatoxin-contamination of maize imported into New Zealand and the possible contribution of foods of animal origin. A recent exposure assessment carried out for the French population suggested that eggs and egg products were a major source of aflatoxin exposure (Leblanc et al., 2005).

Risk Profile: Mycotoxins in the New Zealand 37 April 2006 Food Supply
2.6.2 Commentary on risk management options The current import monitoring regime is the only feasible risk management strategy available to New Zealand and assessments carried out suggest that the current approach offers a high level of protection with respect to importation of aflatoxin-contaminated peanuts and pistachios. No controls exist for aflatoxin contamination of other imported foods, such as maize. 2.6.3 Data gaps A wider survey of maize and maize product imported into New Zealand would give more statistical certainty to the negative findings of Stanton (2000a). Information on aflatoxin contamination in animal feed would also provide important information for assessment of aflatoxin exposure in New Zealand.

3 OCHRATOXIN A (OTA) 3.1 Hazard identification Ochratoxin A (OTA) is produced by Aspergillus ochraceus and a related Aspergillus species, A. carbonarius, as well as some isolates of A. niger, and by Penicillium verrucosum (JECFA, 2001a). These organisms differ in their geographical distribution and ecological niche, in the commodities affected, and at the point at which they are likely to infect commodities. 3.1.1 Structure and nomenclature OTA contains a chlorinated isocoumarin moiety linked via a carboxyl group to L-phenylalanine. Ochratoxin B (a dechlorinated analogue of OTA) and ochratoxin C (an ethyl ester of OTA) have also been detected, but OTA is by far the major contaminant found in crop plants (Walker, 1999)
Figure 3: Structure of OTA
3.1.2 Occurrence P. verrucosum is a cool climate organism (0-31˚C, optimum 20˚C), occurring only in cool temperate regions, and is able to grow at water activities as low as 0.8 (Pitt and Hocking, 1997). It is the source of OTA formation in stored cereals and cereal products in European countries and Canada. Due to the high stability of OTA this can also result in the presence of OTA in animals fed contaminated cereals. P. verrucosum does not occur in the tropics (JECFA, 2001a). A. ochraceus grows at moderate temperatures (8-37˚C, optimum 24-31˚C) and at water activities above 0.8 (optimum 0.95-0.99) (Pitt and Hocking, 1997). It occurs occasionally on a wide range of stored food products, but is seldom the cause of substantial concentrations of OTA (JECFA, 2001a). A. carbonarius grows at high temperatures (max 40˚C, optimum 32-35˚C) and is associated with maturing fruit, particularly grapes. It is the major source of OTA in fresh grapes, dried vine fruits and wine (JECFA, 2001a).
Risk Profile: Mycotoxins in the New Zealand 38 April 2006 Food Supply

Risk Profile: Mycotoxins in the New Zealand 39 April 2006 Food Supply
OTA contamination is principally found in cereals, but can also occur in coffee, cocoa, nuts, dried vine fruits, grape juice and wine, beer, and pork and pork products made from animals fed OTA contaminated feed (Walker, 1999). Sayer and Lauren (1991) did not report isolation of any of these OTA-forming fungal species from New Zealand grain sampled at harvest. However, no information was found on occurrence of these fungal species on stored grain in New Zealand. Similarly, no information was found on Aspergillus infection of grapes or other fruits in New Zealand. However, it has been reported that bunch rot of vines due to A. niger probably occurs in New Zealand, but hasn’t been officially reported (http://www.hortnet.co.nz/publications/hortfacts/hf905020.htm). 3.2 Hazard Characterisation: Adverse Health Effects 3.2.1 Conditions OTA is principally nephrotoxic. Consumption of OTA-contaminated barley in Europe has been associated with a major renal disease of pigs, known as porcine nephropathy (CAST, 2003). While not conclusively established, OTA has been strongly implicated in a human kidney disease known as Balkan endemic nephropathy (BEN; CAST, 2003). OTA is common in foods from BEN affected areas (former Yugoslavia, Bulgaria and Romania). Further weight is added to this hypothesis by the fact that OTA is also carcinogenic in rats and mice and patients with BEN frequently exhibit kidney tumours (urothelial urinary tract tumours) (CAST, 2003; Pfohl-Leszkowicz et al., 2002). The disease has a slow progressive course leading to renal failure. While populations in BEN unaffected areas are also exposed to OTA, there is evidence to suggest that exposure frequency and blood OTA levels are higher in those suffering BEN (Pfohl-Leszkowicz et al., 2002). It has been proposed that BEN may have a multi-nephrotoxin aetiology, with OTA, citrinin and as-yet uncharacterized Penicillium-nephrotoxins being involved (Pfohl-Leszkowicz et al., 2002). Scott (2005) has summarised epidemiological studies in Bulgaria, Croatia, Romania, Spain, the Czech Republic, Turkey, Italy, Egypt, Algeria and Tunisia that demonstrate higher levels of blood OTA in patients with kidney and urinary disorders than healthy controls. However, it was noted that these associations do not necessarily constitute a causal relationship. 3.2.2 Toxicity 3.2.2.1 Acute toxicity No cases of acute human ochratoxicosis have been reported (JECFA, 2001a). The LD50 following oral administration in laboratory animals ranges from 0.2 mg/kg body weight in dogs to 46-58 mg/kg body weight in mice (JECFA, 2001a). In rats, neonates are more sensitive than adults (JECFA, 2001a), while females are more sensitive than males (Pfohl-Leszkowicz et al., 2002).

Risk Profile: Mycotoxins in the New Zealand 40 April 2006 Food Supply
3.2.2.2 Chronic toxicity OTA is nephrotoxic in all mammalian species tested, with the main target being the renal proximal tubule, where OTA exerts both cytotoxic and carcinogenic effects (JECFA, 2001a). In rodents, the doses causing carcinogenicity were higher than those resulting in nephrotoxicity. OTA is genotoxic both in vitro and in vivo, however the mechanism is uncertain and it is not known whether it exerts its genotoxicity through direct interaction with DNA or via a reactive metabolite (JECFA, 2001a). OTA can cross the placenta and is embryotoxic and teratogenic in rodent species. It is also immunosuppressive in rodents, inhibiting proliferation of B and T lymphocytes. All of these effects occur only at doses much higher than those causing nephrotoxicity (JECFA, 2001a). 3.2.3 Toxicological assessment JECFA have concluded that the adverse effect occurring at the lowest dose in animal species was nephrotoxicity and that this was also likely to be true in humans (JECFA, 2001a). JECFA established a Provisional Tolerable Weekly Intake (PTWI) for OTA of 112 ng/kg body weight/week (16 ng/kg body weight/day), based on renal function deterioration in pigs with a lowest observed effect level of 0.008 mg/kg body weight/day (JECFA, 1991). Due to the fact that a no observed effects level dose was frequently not observed a higher than usual safety factor of 500 was applied in deriving the PTWI. The PTWI was subsequently rounded down to 100 ng/kg body weight/week (14 ng/kg body weight/day; JECFA, 1995a). Other toxicological evaluations have focused on carcinogenic endpoints, based on long-term rodent studies. A Canadian risk assessment derived Provisional Tolerable Daily Intakes (PTDIs) for OTA in the range 1.2-5.7 ng/kg body weight/day, equating to an excess lifetime cancer risk of 1:100,000 (see Kuiper-Goodman, 1996 for a summary). The Nordic Council of Ministers used a similar approach in establishing a Tolerable Daily Intake (TDI) for OTA of 5 ng/kg body weight/day (Kuiper-Goodman, 1996). The EU Scientific Committee on Food concluded that it would be prudent to reduce exposure to OTA as much as possible to ensure that exposures are towards the lower end of the range of tolerable daily intakes derived by various organizations (SCF, 1998). IARC have concluded that there is sufficient evidence for the carcinogenicity of OTA in experimental animals and have classified it as a possible human carcinogen (Group 2B; IARC, 1993). 3.3 Exposure Assessment 3.3.1 OTA in the New Zealand food supply Only a single study was identified which examined the OTA content of foods in New Zealand (Stanton, 2000b). Table 9 summarises the results of this study.

Risk Profile: Mycotoxins in the New Zealand 41 April 2006 Food Supply
Table 9: OTA in New Zealand foods
Product type Number analysed No. samples with
OTA (percentage)
Mean * (μg/kg)
Range of positives (μg/kg)
Breakfast cereals 22 6 (27) 0.10 0.1 - 0.77 Cereals 26 10 (38) 0.13 0.1 - 0.85 Wheat products 10 0 (0) 0.0 Maize products 9 0 (0) 0.0 Pulses 14 2 (14) 0.05 0.1, 0.60 Coffee, milo, cocoa 23 17 (74) 1.04 0.3 - 3.5 Dried fruit 35 16 (46) 1.54 0.2 - 22 Wine, grape juice, beer
18 2 (12) 0.04 0.03, 0.67
Pâté 3 0 (0) 0.0 From Stanton, 2000b * mean calculated assuming that ‘not detected’ results were equal to zero While some of the cereals and cereal products (breakfast cereals) containing OTA were of New Zealand manufacture, this does not preclude the inclusion of imported grain. The foods containing the highest levels of OTA (coffee, dried fruit) were imported. However, the two wines in which OTA was detected were manufactured in New Zealand. 3.3.2 OTA in the Australian food supply The 20th Australian Total Diet Survey analysed bread, biscuits, rice, oats, processed wheat bran, breakfast cereals, instant coffee, peanut butter, almonds and milk chocolate for OTA. OTA was not detected in any samples at a limit of reporting of 0.001 mg/kg (FSANZ, 2002). However, results from other survey work (see Tables 9 and 10) suggest that this limit of detection is too high to produce meaningful results. Hocking et al. (2003) detected OTA is 90/601 (15%) of Australian wines. However, 85% of positive detections were at concentrations less than 0.2 μg/l, and only one result exceeded 0.5 μg/l. OTA contamination of cereals in Australia is not believed to be a problem (Webley and Jackson, 1998). However, no survey data were located to support this opinion. The lack of any other significant information on OTA in Australian foods has been confirmed by Pitt and Tomaska (2002). 3.3.3 Overseas Context An enormous body of information is available on the incidence and levels of OTA in a variety of commodities and processed foods overseas. Much of this has been summarised by JECFA (2001a). The majority of these data (85%) are from European studies. Table 10 is a reproduction of the summary of these studies compiled by JECFA (2001a).

Table 10: Worldwide data on occurrence of OTA in food
Food Years
(Range) Countries Samples
tested Weighted mean
OTA concentration
(μg/kg)
Maximum level of OTA (μg/kg)
Beer 1993-1999 Canada, Denmark, United Kingdom, Spain, Europe, Italy, Japan, Germany
660 0.025 0.65
Cereals (all) 2700 0.94 - Barley 1990-1999 Germany, Norway, USA, United Kingdom,
Uruguay, Finland, Canada 350 0.53 33
- Maize 1991-1999 Germany, United Kingdom, Croatia, Brazil, Uruguay
95 7.5 614
- Oats 1986-1999 Sweden, Norway, Denmark, Finland, United Kingdom, Germany
280 0.44 56.6
- Rice 1993-1998 Uruguay, United Kingdom, Dubai, Germany 45 0.06 0.28 - Rye 1986-1999 Sweden, Norway, Denmark, United Kingdom,
Germany 790 1.2 121
- Wheat 1986-1999 Germany, Netherlands, Norway, Sweden, Brazil, USA, Finland, Denmark, Dubai, United Kingdom, Uruguay
1200 0.38 430
Cereal products
1994-1999 United Kingdom, Tunisia, Dubai, Canada, Germany
1500 0.19 29.8
Cocoa and chocolate
1993-1998 Netherlands, Uruguay, United Kingdom, Germany 270 0.18 2.4
Coffee, green and roasted
1900 0.86
- green 1995-1999 USA, United Kingdom, Sweden, Germany 130 1.0 27.3 - roasted 1993-1999 Netherlands, USA, Denmark, United Kingdom,
Canada, Dubai, Spain, Switzerland, Brazil, 1700 0.76 12.1
Risk Profile: Mycotoxins in the New Zealand April 2006 Food Supply
42

Risk Profile: Mycotoxins in the New Zealand April 2006 Food Supply
43
Food Years (Range)
Countries Samples tested
Weighted mean OTA
concentration (μg/kg)
Maximum level of OTA (μg/kg)
Germany - instant 1995-1999 USA, United Kingdom, Canada, Sweden, Spain,
Brazil, Germany 290 1.4 9.5
Dried vine fruit
1993-1999 Uruguay, USA, United Kingdom, Germany 860 2.3 53.6
Grape juice 1994-1998 United Kingdom, Germany, Japan 68 0.44 5.3 Pig kidney 1995-1999 Denmark, Germany, France 380 0.12 14.7 Products of animal origin
1993-1999 Uruguay, Denmark, United Kingdom, Germany, France
810 0.052
Wine, all 1800 0.32 - red wine 1992-1999 Netherlands, United Kingdom, Italy, France,
Germany 1300 0.4 15.6
- white wine 1992-1999 Netherlands, United Kingdom, Italy, Germany 260 0.1 8.9

It should be noted that the studies summarised by JECFA differed considerably in limits of quantitation (LOQ) (0.001-50 μg/kg). It is not surprising that studies with high detection limits 5-50 μg/kg generally failed to detect OTA (JECFA, 2001a). Most studies (95%) used the same analytical methodology (liquid chromatography with fluorescence detection) with LOQs generally less than 0.5 μg/kg. The balance used thin layer chromatography (TLC) with LOQs greater than or equal to 5 μg/kg. Average levels of OTA in coffee and dried fruits are very similar between the overseas summary (JECFA, 2001a) and analyses of New Zealand foods. This is not surprising, as the sources of these products are likely to be similar in both cases. OTA levels in cereals, wine and meat products appear to be lower in New Zealand (Stanton, 2000b) than in the international summary of JECFA (2001a). Results for these products will reflect contamination in the New Zealand environment and, initially, suggesting that contamination of foods with OTA may be less in New Zealand than in Europe. Although, the small number of samples analysed in New Zealand and the wide diversity of results reported for Europe suggest that any conclusions should be drawn with caution. OTA has the potential to be retained by animals consuming OTA-contaminated feed and transmitted to foods of animal origin. Skaug (1999) detected OTA in 6/40 conventional cow’s milk samples (range 0.011-0.058 μg/l) and 5/47 organic milk samples (range 0.015-0.028 μg/l). OTA was not detected in 20 infant formula samples. Laciaková et al. (2001) detected OTA in hens eggs. However, this was due to penetration of the toxin through the egg shell, rather than transmission from the hen. There is no evidence to suggest that OTA-contaminated feed can result in residues in the meat of ruminant animals (cattle, sheep, goats, horses). Meat products from pigs consuming OTA-contaminated feed have been shown to contain OTA and a survey of 325 pigmeat products (mainly sausages) found OTA in 18% of samples at concentrations in the range 0.1-3.4 μg/mg (Gareis, 1996). Higher levels are found in pig kidneys and in pig blood (SCOOP, 1997b). Jørgensen (1998) detected OTA in pork (82% of samples, maximum 1.3 μg/kg), duck (58%, 0.09 μg/kg), duck liver (57%, 0.16 μg/kg), goose (42%, 0.10 μg/kg), goose liver (33%, 0.06 μg/kg) turkey (59%, 0.11 μg/kg), turkey liver (18%, 0.28 μg/kg), and chicken (55%, 0.18 μg/kg). 3.3.4 New Zealand estimates of dietary exposure Thomson (1996) estimated New Zealand exposure to OTA to be 2.4 ng/kg body weight/day. This was based on Danish data for OTA concentrations in cereals and it should be viewed as speculative only. It is uncertain whether this exposure assessment will under- or over-estimate the true situation. Exclusion of foods such as dried fruit, wine and coffee will lead to under-estimation, while use of European contamination concentration data may potentially lead to over-estimation. Import data for the year ending September 2005 showed that New Zealand imports significant quantities of dried fruit, particularly apples (402 tonnes; 67% from China, 21% from Chile), apricots (2021 tonnes; 77% from Turkey), grapes (8,630 tonnes; 61% from
Risk Profile: Mycotoxins in the New Zealand April 2006 Food Supply
44

Turkey, 14% from USA), dates (1117 tonnes; 88% from Iran), figs (208 tonnes; 83% from Turkey) and prunes (948 tonnes; 80% from USA). Unroasted coffee (6774 tonnes) is imported from a range of countries, including Vietnam (36%), Colombia (13%), Papua New Guinea (12%) and Brazil (11%), while roasted coffee (1371 tonnes) is principally imported from Australia (73%). New Zealand’s wine imports (53,000 tonnes) are dominated by product from Australia (73%) and South Africa (10%). 3.3.5 Overseas estimates of dietary exposure Table 11 summarises results of overseas studies which have derived estimates of dietary exposure to OTA.
Table 11: Overseas estimates of dietary exposure to OTA
Country Year Population group Estimated
dietary exposure
(ng OTA/kg bw/day)
Main contributing
food(s)
Reference
Canada Not specified 1.1-4.5 Cereal, pig meat
Kuiper-Goodman et al, 1996
Denmark 1997 Adult, 70 kg body weight 2.0 Rye bread, wheat bread
SCOOP, 1997b
Europe NR 3.5 CCFAC, 1998 France 1997 Adult, 60 kg body weight 1.5 Bread SCOOP, 1997b France 2000-
2001 Adult, 15+ years, mean 95th percentile Child, 3-14 years, mean 95th percentile
2.2 3.6 4.1 7.8
Bread, pasta, biscuits, cakes
Leblanc et al., 2005
Germany 1997 Adult, 75.9 kg body weight 0.9 Wheat bread, beer, roasted
coffee
SCOOP, 1997b
Italy 1997 Adult, 60 kg body weight 4.6 Cereals SCOOP, 1997b Netherlands 1997 Adult, 70 kg body weight 2.0 Wheat SCOOP, 1997b Spain 1997 Adult, 70 kg body weight 0.7 Wheat SCOOP, 1997b Sweden 1997 Adult, 70 kg body weight 1.5 Wheat SCOOP, 1997b United Kingdom
NR 50 volunteers 0.26-3.54 Not specified Gilbert et al, 2001
United Kingdom
1997 Adult, 70.1 kg body weight 1.4 Wheat SCOOP, 1997b
OTA was not detected in any of the food samples analysed in the 20th Australian Total Diet Survey (FSANZ, 2002). However, as previously mentioned the limits of detection were insufficiently low for meaningful analysis of this contaminant. Pitt and Tomaska (2002) estimated Australian exposure to OTA, based on an assumption that cereals would not contribute to OTA exposure and using European exposure estimates for wine, dried fruit and coffee, at 0.24 ng/kg body weight/day (about 10% of the New Zealand estimate).
Risk Profile: Mycotoxins in the New Zealand April 2006 Food Supply
45

All estimates in Table 11 are from developed countries and show exposure to OTA being dominated by contamination of cereals and cereal products. These exposure estimates are similar to the speculative estimate made for New Zealand (Thomson, 1996). This is not surprising as the New Zealand estimate was based on European food concentration data. Pitt and Tomaska (2002) concluded that, in the absence of exposure from OTA contaminated cereals, dried vine fruits are the major contributors to dietary OTA exposure. 3.4 Risk Characterisation 3.4.1 Adverse health effects in New Zealand No cases of human ochratoxicosis have been reported in New Zealand and no reports were identified linking kidney disease in New Zealand to exposure to fungal toxins. The incidence of renal disease in New Zealand is apparently increasing, with 447 new cases reported in 2004 compared to 248 in 1994 and 117 in 1984 (http://www.anzdata.org.au/anzdata/AnzdataReport/28thReport/files/AppendixIII.pdf). The incidence of new patients entering treatment for end stage renal failure in New Zealand (11/100,000 in 2004) is similar to Australia (9.5/100,000 in 2004). Ochratoxicosis is not listed amongst causes of kidney disease in New Zealand or Australia (http://www.anzdata.org.au/anzdata/AnzdataReport/28thReport/files/Ch02NewPatients.pdf). In New Zealand, diabetic nephropathy is the most common type of end stage renal disease (ESRD) (40%), followed by glomerulonephritis (24%) and hypertension (16%). 3.4.2 Adverse health effects overseas Limited data are available for overseas populations. In 1999 the USA reported over 89,000 new recipients of care for end stage renal disease (ESRD) or approximately 30 cases/100,000 of population (http://kidney.niddk.nih.gov/statistics/statistics.htm), with the primary causes of disease being the same as for the New Zealand population (diabetes, hypertension, glomerulonephritis). No mention is made of fungal toxins in the US summary. In areas of Croatia and Bulgaria where Balkan Endemic Nephropathy occurs the age adjusted incidence has been reported to be as high as 500/100,000 (Pfohl-Leszkowicz et al., 2002). The incidence of urothelial tumours in these regions was also high (40-70/100,000 compared to high incidence areas of Italy with rates of 2-6/100,000). 3.4.2.1 Risk assessments and other activity overseas JECFA JECFA most recently reviewed information on OTA in 2001 (56th meeting; JECFA, 2001a). The previously determined PTWI was confirmed at this meeting and concluded that the mechanisms by which OTA causes nephrotoxicity and carcinogenicity are unknown, but that carcinogenicity appeared to follow after nephrotoxicity. JECFA encouraged further studies into fungal ecology, OTA exposure and epidemiological investigations of the role of OTA in chronic kidney disease.
Risk Profile: Mycotoxins in the New Zealand April 2006 Food Supply
46

European Commission The EU Scientific Committee on Food most recently considered OTA in 1998 (SCF, 1998). The opinion expressed summarised tolerable threshold limits derived by other organizations, noting that higher limits were derived using nephrotoxicity as an endpoint than those based on carcinogenicity. The Committee noted an increasing concern about the genotoxicity of OTA and concluded that it would be prudent to reduce exposure to OTA as much as possible. Canada Kuiper-Goodman et al. (1996) reported the outcomes of a risk assessment based on the carcinogenicity of OTA and derived exposure limits for an excess cancer risk of 1 in 100,000 in the range 1.2-5.7 ng OTA/kg body weight/day. Codex Codex, through the 31st meeting of the Codex Committee on Food Additives and Contaminants (CCFAC, 1998), reviewed a position paper on OTA (prepared by Sweden) and concluded that:
• Levels of OTA need to be as low as technically feasible; • A Code of Practice for reduction of OTA in cereals should be established; • A Codex maximum limit for OTA in cereals of 5 μg/kg be established; and • Codex should establish sampling plans and methods of analysis for OTA in cereals.
3.5 Risk Management Information 3.5.1 Relevant food controls: New Zealand 3.5.1.1 Establishment of regulatory limits New Zealand does not currently have regulatory limits for OTA. 3.5.2 Relevant food controls: overseas 3.5.2.1 Establishment of regulatory limits Regulations for the 25 countries (counting the EU as a single country) which reported regulation of OTA in foods (but not feeds) are given in Table 12 (van Egmond and Jonker, 2003).
Risk Profile: Mycotoxins in the New Zealand April 2006 Food Supply
47

Table 12: Regulatory limits for OTA in various countries (food regulations only)
Country Commodity description Regulatory
limit (μg/kg)
Bulgaria Dried vine fruits Cereals and processed products thereof for direct human consumption Cereals to be subject to sorting, or other physical treatment, before human consumption Spices Green coffee beans Roasted coffee Beer Grape juice
5 3 5
10 8 4
0.2 3
Cuba Coffee, cereals 5 Czech Republic Child and baby nourishment
Flours and cereal products Foodstuffs, type A (not specified) Foodstuffs, type B (not specified)
1 3 5 10
Denmark Pig kidney - viscera condemned - whole carcass condemned
10 25
Estonia Pig liver Cereal, cereal flours, cereal groats and flakes, past products, ordinary baker’s wares, fine baker’s wares, isolates, concentrates and hydrolysates of cereals protein
10 5
EU Raw cereal grains (including raw rice and buckwheat) All products derived from cereals (including processed cereal products and cereal grains intended for direct human consumption) Dried vine fruits (currants, raisins and sultanas)
5 3
10 Greece Coffee, raw and processed 20 Hungary Cereals (including rice and Fagopyrum sp.
Every cereal product including milled products and those cereal products used for direct human consumption Raisin (currant, sultana), roasted coffee and coffee products, other plant originated foods Green/unroasted coffee
5 3
10
15 Indonesia Coffee Not
detectable
Risk Profile: Mycotoxins in the New Zealand April 2006 Food Supply
48
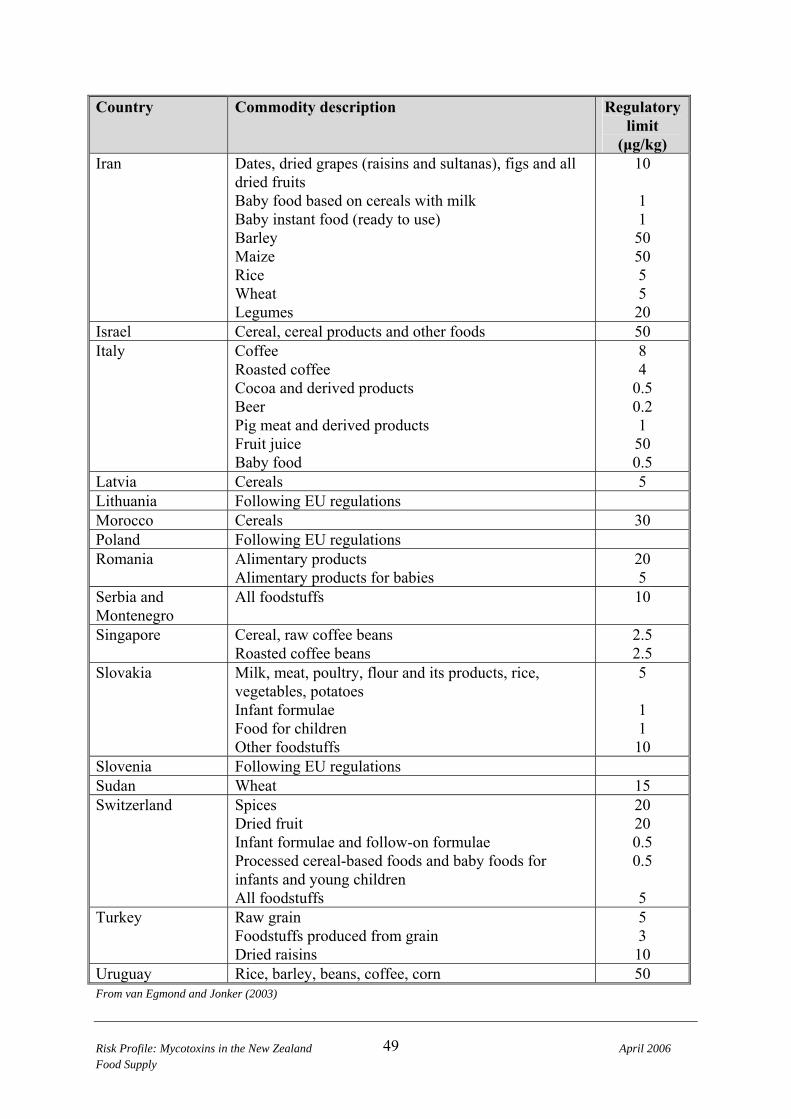
Risk Profile: Mycotoxins in the New Zealand April 2006 Food Supply
49
Country Commodity description Regulatory limit
(μg/kg) Iran Dates, dried grapes (raisins and sultanas), figs and all
dried fruits Baby food based on cereals with milk Baby instant food (ready to use) Barley Maize Rice Wheat Legumes
10 1 1 50 50 5 5 20
Israel Cereal, cereal products and other foods 50 Italy Coffee
Roasted coffee Cocoa and derived products Beer Pig meat and derived products Fruit juice Baby food
8 4
0.5 0.2 1 50 0.5
Latvia Cereals 5 Lithuania Following EU regulations Morocco Cereals 30 Poland Following EU regulations Romania Alimentary products
Alimentary products for babies 20 5
Serbia and Montenegro
All foodstuffs 10
Singapore Cereal, raw coffee beans Roasted coffee beans
2.5 2.5
Slovakia Milk, meat, poultry, flour and its products, rice, vegetables, potatoes Infant formulae Food for children Other foodstuffs
5 1 1 10
Slovenia Following EU regulations Sudan Wheat 15 Switzerland Spices
Dried fruit Infant formulae and follow-on formulae Processed cereal-based foods and baby foods for infants and young children All foodstuffs
20 20 0.5 0.5
5
Turkey Raw grain Foodstuffs produced from grain Dried raisins
5 3 10
Uruguay Rice, barley, beans, coffee, corn 50 From van Egmond and Jonker (2003)

3.5.2.2 Codes of Practice Codex have developed a draft Code of Practice for the prevention of OTA contamination in cereals (http://www.who.int//fsf/Chemicalcontaminants/ochratoxin00_17.pdf). The Code identifies grain storage moisture content as the critical variable in control of OTA contamination and recommends a range of practices based on GAP at the preharvest, harvest, preservation (drying), storage and transport stages). These practices are generally targeted at minimising plant stress, minimising physical and insect damage, eliminating fungal vectors, achieving rapid and effective grain drying and maintaining the grain in a dry environment, free of mould and insects. 3.5.2.3 Management of OTA formation in crops Control of OTA production in foods depends on the crop type and its location, as these factors will influence which fungal species is likely to grow and produce toxins (JECFA, 2001a). A. ochraceus occurs primarily in stored foods, while A. carbonarius and A. niger appear to be saprophytes occurring on fruit, that can gain entry due to the fruit being damaged. Little information is available on P. verrucosum, but it is generally believed to be a storage fungus. Management of A. carbonarius and A. niger in fruit crops is dependent upon minimizing physical damage, specifically:
• Control of pathogenic fungi; • Control of mechanical damage, from pruning, leaf reduction and harvesting; and • Control of splitting.
3.5.2.4 Management of OTA formation during crop storage OTA formation in cereals is principally due to infection with P. verrucosum. Control of OTA formation in stored grain is principally achieved by reducing grain moisture content and preventing the grain from becoming wet again. A moisture content below 17-19% (equivalent to a water activity of 0.8 or less) will prevent OTA formation by A. ochraceus (JECFA, 2001a). Fumigants, added to grain stores to control insect pests will, in some cases, also achieve control of fungal growth. However, many of the fumigants that are effective in this respect are being phased out due to environmental or human toxicity concerns (JECFA, 2001a). 3.5.3 Influence of processing on OTA levels 3.5.3.1 Wheat OTA tends to be concentrated in the outer bran layers of cereals (Scudamore, 2005). Wheat cleaning, including abrasive scouring, was shown to remove 44% of OTA (Scudamore et al., 2003). Straight run white flour contained about 75% less OTA than the parent wheat. However, breadbaking had little additional impact on OTA levels.
Risk Profile: Mycotoxins in the New Zealand April 2006 Food Supply
50

Scudamore et al. (2004) examined the impact of extrusion on OTA contaminated whole wheat flour. Even under the harshest extrusion conditions examined OTA reduction was no greater than 40%. 3.5.3.2 Barley OTA levels increase during the malting of barley, with increases as high as 20 times being reported. However only 20% of the OTA in the malt remains in the finished beer (Scudamore, 2005). These results are similar to those reported by Baxter et al. (2001) of 13 to 32% of the OTA in the malt surviving in the beer. 3.5.3.3 Coffee Coffee is processed by two main methods to the point where the bean can be roasted. Natural processing usually involves drying of the fruit (usually in the sun, but occasionally mechanically) to produce ‘cherry coffee’. The coffee can be stored in the cherry form or shelled and stored as green coffee. Wet processing involves mechanical removal of the skin and most of the mesocarp, followed by fermentation to remove remaining mesocarp (Frank, 1999). OTA production occurs only during drying of green coffee beans, due to growth of A. carbonarius, A. ochraceus or A. niger (Bucheli and Taniwaki, 2002). Rapid and effective drying will prevent or minimize OTA production (Taniwaki et al., 1999). OTA production in coffee can be controlled by application of Good Manufacturing Practice (GMP). Storage of properly dried green coffee does not appear to result in any further development of OTA. Despite the demonstrated thermal stability of OTA, roasting of coffee has been shown to result in up to 100% reduction in OTA levels from those in the green coffee (Bucheli and Taniwaki, 2002), although results are extremely variable with some researchers reporting little decrease in OTA levels during roasting (Viani, 1996). Blanc et al. (1998) carried out experiments on three tonnes of naturally OTA-contaminated green coffee and demonstrated that roasting reduced OTA levels to about 16% of the levels in the green coffee, while soluble coffee manufacture further reduced the level of contamination down to about 13%. 3.6 Conclusions 3.6.1 Description of risks to New Zealand consumers Evidence for a role for OTA in the causation of human kidney disease is suggestive, but not conclusive. The progression of the condition known as Balkan Endemic Nephropathy (BEN) is similar to effects observed in laboratory animals exposed to OTA. Diets in BEN-affected areas are known to be heavily contaminated with OTA. New Zealand does not exhibit regions of endemic kidney disease and the general incidence of kidney disease in New Zealand, although rising, is not high. Major causes of kidney disease in New Zealand are well characterised, and do not include food contaminants. The study of Stanton (2000b) demonstrated the presence of OTA in the New Zealand food supply. While many of the contaminated foods available in New Zealand are likely to be
Risk Profile: Mycotoxins in the New Zealand April 2006 Food Supply
51

imported (e.g. coffee/cocoa/milo, dried fruits) the study of Stanton indicates that New Zealand-produced cereals and fruits may also contain OTA. The limited results available suggest that contamination of the New Zealand food supply is at a level similar to or lower than that reported for European countries (SCOOP, 1997b) and similar non-European countries (USA, Canada; JECFA, 2001a). Exposure estimates for OTA carried out overseas have generally identified cereals in general and wheat in particular as the major contributors to OTA exposure. Although no OTA analyses have been carried out on New Zealand breads, Stanton (2000b) detected OTA in 6/14 (43%) of wheaten or rye flour samples analysed, suggesting that wheat products may be a significant contributor to OTA exposure in New Zealand. However, OTA concentrations found in New Zealand foods are not high by international standards and the exposure of New Zealanders to OTA is likely to be similar to or lower than for many European countries and, hence, within currently agreed tolerable limits. While the study of Stanton (2000b) examined the OTA content of New Zealand retail flours, the OTA content of bread was not examined. As bread is the major wheat-based food consumed in New Zealand, information on the OTA content of retail breads would be of interest. New Zealand’s temperate climate means that in some seasons wheat may be harvested at higher than optimum moisture contents and these conditions would increase the risk of OTA formation. 3.6.2 Commentary on risk management options New Zealand does not currently exercise direct risk management measures to control the entry of OTA into the human food chain. Control of OTA in New Zealand produced food is likely to occur as a consequence of GAP and GMP practices, designed to achieve other quality and safety objectives. 3.6.3 Data gaps The major data gap at present is the establishment of a definitive link between OTA exposure and adverse human health effects, although expert bodies such as JECFA and SCF feel that there is sufficient evidence to recommend that exposure be kept as low as possible. In New Zealand information on OTA contamination in bread is not currently available.
Risk Profile: Mycotoxins in the New Zealand April 2006 Food Supply
52

4 TRICHOTHECENES 4.1 Hazard identification The trichothecenes are a family of approximately 150 structurally related compounds produced by fungi of the genera Fusarium, Cephalosporium, Myrothecium, Stachybotrys, Trichoderma and others. Trichothecenes of significance in food are produced by Fusarium species, including F. poae, F. sporotrichioides, F. acuminatum, F. graminearum, F. culmorum, F. crookwellense, F. avenaceum and F. equiseti (CAST, 2003). The toxins in this group that have received the most attention are deoxynivalenol (DON), nivalenol (NIV), T-2 toxin (T2) and HT-2 toxin (HT2), with lesser attention paid to diacetoxyscirpenol (DAS) and other trichothecene toxins. Focus on these toxins has been due to the fact that they are the major toxins formed in foods and/or there is evidence for their involvement in human disease. The current analysis will focus on DON, NIV, T2 and HT2. Trichothecenes have been reported in cereal grain crops worldwide (Schothorst and van Egmond, 2004). 4.1.1 Structure and nomenclature The trichothecenes are sesquiterpenoids possessing a tetracyclic 12,13-epoxytrichothecene skeleton. They can be conveniently divided into four categories according to similarity of functional groups (Ueno, 1977). The first class is characterised by a functional group other than a ketone at C-8 (type A) and include T2 and HT2. The second category of trichothecenes has a carbonyl function at C-8 (type B) typified by DON and NIV. The third category is characterised by a second epoxide group at C-7,8 or C-9,10 (type C), and the fourth contains a macrocyclic ring system between C-4 and C-15 with two ester linkages (type D). Type C and type D trichothecenes are not normally associated with food. Structural summaries are reproduced in Figure 4 from a WHO summary (WHO, 1990).
Risk Profile: Mycotoxins in the New Zealand April 2006 Food Supply
53
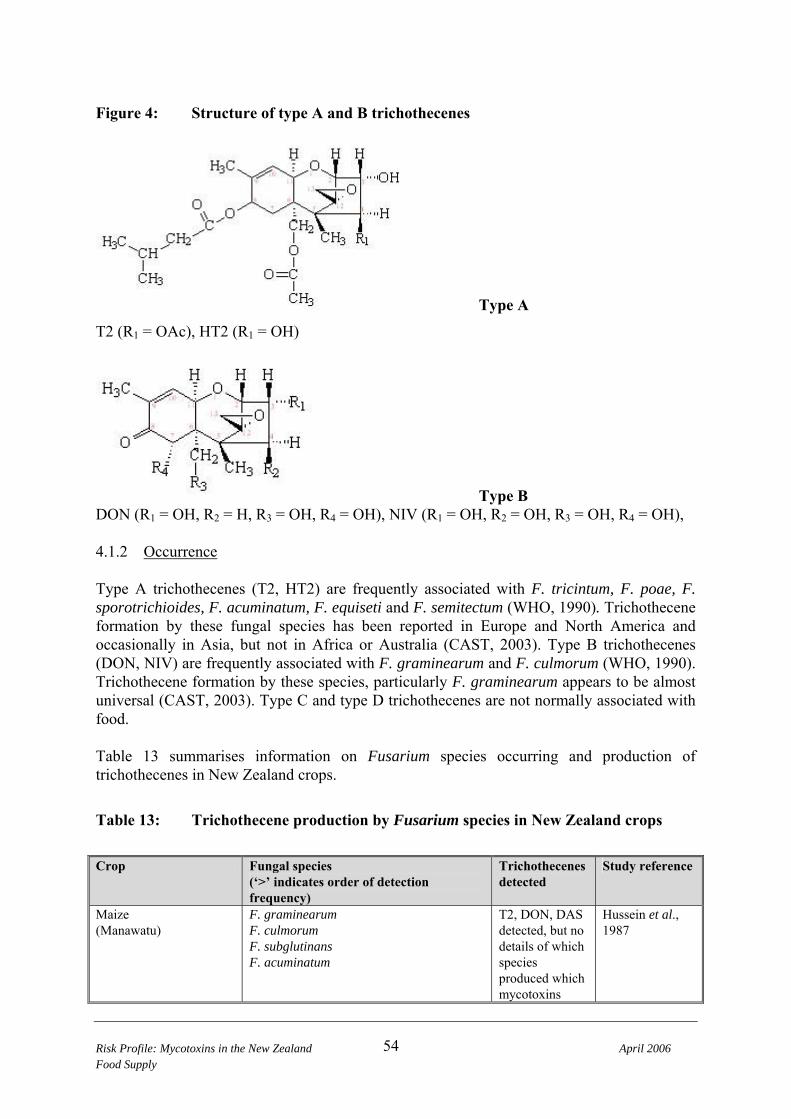
Figure 4: Structure of type A and B trichothecenes
Type A
T2 (R1 = OAc), HT2 (R1 = OH)
Type B DON (R1 = OH, R2 = H, R3 = OH, R4 = OH), NIV (R1 = OH, R2 = OH, R3 = OH, R4 = OH), 4.1.2 Occurrence Type A trichothecenes (T2, HT2) are frequently associated with F. tricintum, F. poae, F. sporotrichioides, F. acuminatum, F. equiseti and F. semitectum (WHO, 1990). Trichothecene formation by these fungal species has been reported in Europe and North America and occasionally in Asia, but not in Africa or Australia (CAST, 2003). Type B trichothecenes (DON, NIV) are frequently associated with F. graminearum and F. culmorum (WHO, 1990). Trichothecene formation by these species, particularly F. graminearum appears to be almost universal (CAST, 2003). Type C and type D trichothecenes are not normally associated with food. Table 13 summarises information on Fusarium species occurring and production of trichothecenes in New Zealand crops.
Table 13: Trichothecene production by Fusarium species in New Zealand crops
Crop Fungal species
(‘>’ indicates order of detection frequency)
Trichothecenes detected
Study reference
Maize (Manawatu)
F. graminearum F. culmorum F. subglutinans F. acuminatum
T2, DON, DAS detected, but no details of which species produced which mycotoxins
Hussein et al., 1987
Risk Profile: Mycotoxins in the New Zealand April 2006 Food Supply
54
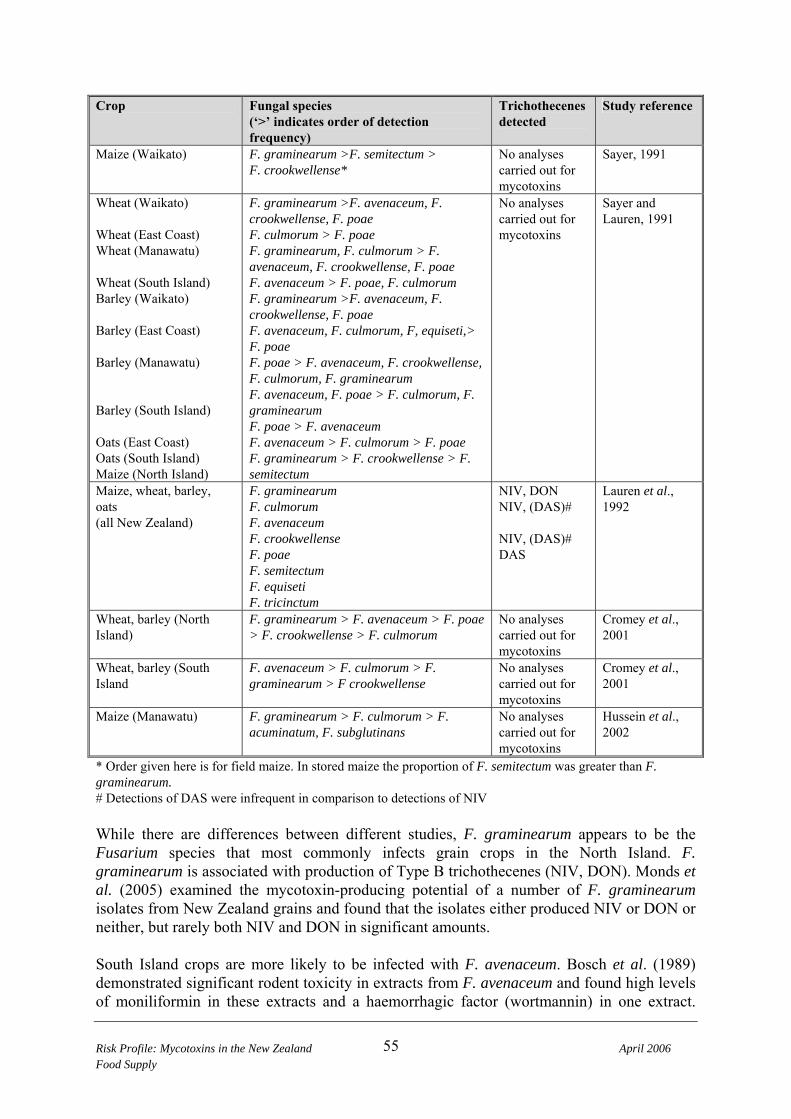
Risk Profile: Mycotoxins in the New Zealand April 2006 Food Supply
55
Crop Fungal species (‘>’ indicates order of detection frequency)
Trichothecenes Study reference detected
Maize (Waikato) F. graminearum >F. semitectum > F. crookwellense*
No analyses carried out for mycotoxins
Sayer, 1991
Wheat (Waikato) Wheat (East Coast) Wheat (Manawatu) Wheat (South Island) Barley (Waikato) Barley (East Coast) Barley (Manawatu) Barley (South Island) Oats (East Coast) Oats (South Island) Maize (North Island)
F. graminearum >F. avenaceum, F. crookwellense, F. poae F. culmorum > F. poae F. graminearum, F. culmorum > F. avenaceum, F. crookwellense, F. poae F. avenaceum > F. poae, F. culmorum F. graminearum >F. avenaceum, F. crookwellense, F. poae F. avenaceum, F. culmorum, F, equiseti,> F. poae F. poae > F. avenaceum, F. crookwellense, F. culmorum, F. graminearum F. avenaceum, F. poae > F. culmorum, F. graminearum F. poae > F. avenaceum F. avenaceum > F. culmorum > F. poae F. graminearum > F. crookwellense > F. semitectum
No analyses carried out for mycotoxins
Sayer and Lauren, 1991
Maize, wheat, barley, oats (all New Zealand)
F. graminearum F. culmorum F. avenaceum F. crookwellense F. poae F. semitectum F. equiseti F. tricinctum
NIV, DON NIV, (DAS)# NIV, (DAS)# DAS
Lauren et al., 1992
Wheat, barley (North Island)
F. graminearum > F. avenaceum > F. poae > F. crookwellense > F. culmorum
No analyses carried out for mycotoxins
Cromey et al., 2001
Wheat, barley (South Island
F. avenaceum > F. culmorum > F. graminearum > F crookwellense
No analyses carried out for mycotoxins
Cromey et al., 2001
Maize (Manawatu) F. graminearum > F. culmorum > F. acuminatum, F. subglutinans
No analyses carried out for mycotoxins
Hussein et al., 2002
* Order given here is for field maize. In stored maize the proportion of F. semitectum was greater than F. graminearum. # Detections of DAS were infrequent in comparison to detections of NIV While there are differences between different studies, F. graminearum appears to be the Fusarium species that most commonly infects grain crops in the North Island. F. graminearum is associated with production of Type B trichothecenes (NIV, DON). Monds et al. (2005) examined the mycotoxin-producing potential of a number of F. graminearum isolates from New Zealand grains and found that the isolates either produced NIV or DON or neither, but rarely both NIV and DON in significant amounts. South Island crops are more likely to be infected with F. avenaceum. Bosch et al. (1989) demonstrated significant rodent toxicity in extracts from F. avenaceum and found high levels of moniliformin in these extracts and a haemorrhagic factor (wortmannin) in one extract.

There have been no reports of significant trichothecene production by F. avenaceum isolates in New Zealand. F. avenaceum is the most common Fusarium species infecting crops in Northern Europe and has been reported to produce the mycotoxins moniliformin, beauvericin and enniatins (Morrison et al., 2002). Other species common in New Zealand grain are known trichothecene producers, including F. culmorum (DON, NIV), F. poae (HT2, T2, DAS, NIV), and F. crookwellense (NIV, DAS). The study of Hussein et al. (1987) is unique in reporting detection of T2. Although T2 has been looked for, it has not been detected in subsequent studies and there must be some questions regarding these early findings. 4.2 Hazard Characterisation: Adverse Health Effects A number of incidents of human toxicosis have been associated with trichothecene contaminated foods. However, it should be noted that in most cases the implicated food may contain more than one known mycotoxin and may potentially contain other, as yet uncharacterized, toxins. In 1987, an outbreak of acute disease affecting approximately 50,000 people in the Kashmir Valley of India was attributed to consumption of bread made from rain-damaged wheat (Bhat et al., 1989). The wheat contained DON (0.34-8.4 mg/kg in 11 of 24 samples), acetylDON (0.6-2.4 mg/kg in 4 of 24 samples), NIV (0.03-0.1 mg/kg in 2 of 24 samples) and T2 (0.55-4.0 mg/kg in 3 of 24 samples). Cases exhibited mainly minor gastrointestinal symptoms (abdominal pain, diarrhoea, bloody stool and vomiting) for approximately two days. Onset of disease occurred approximately 15 minutes to one hour after consumption of bread. It was noted that samples were not collected until four months after the outbreak. 4.2.1 Conditions 4.2.1.1 Deoxynivalenol (DON) No human deaths attributed to DON have been reported (JECFA, 2001b). The acute effects are similar to microbial food poisoning (nausea, vomiting, diarrhea, abdominal pain, headaches, dizziness and fever). The condition is sometimes known as red mould toxicosis (JECFA, 2001b). A number of epidemiological studies in China have associated consumption of DON-contaminated maize or wheat to chronic conditions such as oesophageal cancer, gastric cancer and endemic osteoarthritis (JECFA, 2001b). There was consistent evidence of higher levels of DON in grains in affected areas compared to control areas. IARC classified DON in 1993 as not classifiable as to its carcinogenicity to humans (Group 3; IARC, 1993). Subsequent chronic rodent studies support its non-carcinogenicity (Iverson et al., 1995).
Risk Profile: Mycotoxins in the New Zealand April 2006 Food Supply
56

4.2.1.2 Nivalenol (NIV) No data are currently available on human health effects of NIV. 4.2.1.3 T-2 toxin (T2) T2 has been implicated in a condition called alimentary toxic aleukia (ATA), incidents of which were reported in the former USSR during the period 1931-1947 following consumption of mouldy over-wintered wheat (JECFA, 2001c). Moulds were reported to be F. poae and F. sporotrichioides. The symptoms included necrotic lesions of the oral cavity, oesophagus and stomach and pronounced leucopenia (low white blood cell count) and resulted in high mortality rates. An outbreak occurred in China of 97 cases following consumption of rice infected by F. heterosporum and F. graminearum (Wang et al., 1993). Symptoms included nausea, dizziness, vomiting, abdominal distention and pain, chills and diarrhea. Onset of disease occurred approximately 10-30 minutes after consumption of rice. T2 was detected in three rice samples at levels of 0.18-0.42 mg/kg. No analyses were conducted for other mycotoxins. IARC categorised T2 in 1993 as not classifiable as to its carcinogenicity to humans (Group 3; IARC, 1993). 4.2.1.4 HT-2 toxin (HT2) No reports were found linking exposure to HT2 to human disease. However, HT2 is a major metabolite of T2 and the two toxins are generally considered together when being evaluated (JECFA, 2001c; SCF,2001). 4.2.2 Toxicity 4.2.2.1 Acute toxicity As outlined above, trichothecenes have been implicated in a number of outbreaks of acute human toxicosis. Table 14 summarises LD50 information for the major trichothecenes.
Risk Profile: Mycotoxins in the New Zealand April 2006 Food Supply
57

Table 14: Acute toxicity (LD50) of trichothecenes in experimental animals
Trichothecene Species Route of administration
LD50 (mg/kg body weight)
DON Mouse Oral 46-78 DON Mouse Intraperitoneal,
subcutaneous 43-77
DON Chicken Oral 140 DON Duck Subcutaneous 27 NIV Mouse Oral 39 NIV Mouse Intraperitoneal,
subcutaneous, intravenous
5-10
NIV Rat Oral 19.5 NIV Rat Subcutaneous 0.9 T2 Mouse Oral 10 T2 Mouse Intraperitoneal,
subcutaneous, intravenous
0.4-14
T2 Rat Intraperitoneal, subcutaneous, intravenous, intramuscular
0.47-2.2
T2 Guinea pig Intraperitoneal, subcutaneous, intravenous
1-2
T2 Rabbit Intramuscular 1.1 T2 Chicken Oral 1.8-6.3 T2 Pig Intravenous 1.2 HT2 Mouse Intraperitoneal,
subcutaneous 6.5-10
HT2 Rat Subcutaneous 1 HT2 Chicken Oral 7.2 Short term animal exposure to DON is characterised by reduced feed consumption and vomiting (hence the alternative name, vomitoxin) (JECFA, 2001b). 4.2.2.2 Chronic toxicity The main toxic effect of trichothecenes is their ability to bind to ribosomes and inhibit protein synthesis (SCF, 2002). Trichothecenes have an inhibitory effect on RNA and DNA synthesis and exert toxic effects on cell membranes. Trichothecenes are also immunotoxic, although effects on the immune system are strongly dose dependent and they may be immunostimulatory at low concentrations (Pestka et al., 2004). 4.2.3 Toxicological assessment JECFA have established a Provisional Maximum Tolerable Daily Intake (PMTDI) for DON of 1 μg/kg body weight/day, based on a NOEL of 100 μg/kg body weight/day in a 2-year Risk Profile: Mycotoxins in the New Zealand April 2006 Food Supply
58

mouse feeding study (JECFA, 2001b). Although it was recognised that DON can cause acute human illness, JECFA concluded that there was insufficient information to establish an acute exposure limit. The EU Scientific Committee on Food came to the same conclusions in establishing a temporary TDI (t-TDI) for DON (SCF, 1999). This t-TDI was subsequently upgraded to a full TDI (SCF, 2002). The EU Scientific Committee on Food noted that only LOAELs were available from long-term studies on NIV and used a lowest LOAEL of 0.7 mg/kg body weight/day, for growth retardation and leucopenia in mice, and a safety of 1000 to derive a temporary TDI (t-TDI) for NIV of 0.7 μg/kg body weight/day (SCF, 2000a). JECFA concluded that the toxic effects of T2 and HT2 could not be differentiated and included HT2 in the PMTDI established for T2 (JECFA, 2001c). JECFA concluded that the single long term study available was not suitable for establishing a tolerable intake and based their assessment on critical effects (immunotoxicity and haematotoxicity) in several short-term studies on pigs. The lowest LOEL of 0.029 mg/kg body weight/day for changes in white and red blood cell counts was considered to be close to a NOEL, due to the subtlety and reversible of effects seen. A safety factor of 500 was applied to derive a PMTDI of 0.06 μg/kg body weight/day for T2 and HT2 (JECFA, 2001c). The EU Scientific Committee on Food came to the same conclusions in establishing a temporary TDI (t-TDI) for T2 and HT2 combined of 0.06 μg/kg body weight/day (SCF, 2001). 4.3 Exposure Assessment 4.3.1 Trichothecenes in New Zealand cereal grains Table 15 summarised published information on trichothecenes in New Zealand grain crops. Trichothecene mycotoxins are common contaminants in New Zealand-grown cereals, particularly those grown in the North Island.
Risk Profile: Mycotoxins in the New Zealand April 2006 Food Supply
59

Table 15: Trichothecenes in New Zealand cereal grains Crop Year Location Mycotoxin Proportion positive Maximum
Concentration (mg/kg)
Reference
DON NIV Maize 1984 Manawatu DON
DAS T2
11/20 6/20#
13/20§
0.3 Hussein et al., 1989
Maize 1987-1989 Waikato Manawatu Gisborne
NIV/DON NIV/DON NIV/DON
38/38 19/19 16/34
3.5 1.7
0.97
1.9 1.95 3.6
Lauren et al., 1991
Maize 1992-1994 Waikato, Bay of Plenty, Manawatu, Gisborne
NIV/DON 605/616 8.5 7.0 Lauren et al., 1996
Wheat 1986-1989 Waikato Manawatu Gisborne
NIV/DON NIV/DON NIV/DON
48/48 30/36
3/6
11.95 2.31
1.27 0.78 0.09
Lauren et al., 1991
Wheat 1998-2000 Wairarapa, Manawatu, Rangatikei
NIV DON
12/15 14/15
3.25
0.57 Cromey et al., 2002
Wheat 1998-2000 Wairarapa, Manawatu, Rangatikei
NIV* DON*
12/54 12/54
1.82
0.93 Cromey et al., 2002
Barley 1987-1989 Waikato Manawatu Gisborne
NIV/DON NIV/DON NIV/DON
17/18 14/23
2/3
1.0 0.09 0.08
0.53 0.22 0.03
Lauren et al., 1991
Oats 1989 Gisborne NIV/DON 2/3 0.08 0.61 Lauren et al., 1991
NIV = nivalenol DON = deoxynivalenol T2 = T2 toxin DAS = diacetoxyscirpenol # DAS concentrations in the range 0.01-0.9 mg/kg were reported § T2 Concentrations in the range 0.005-0.2 mg/kg were reported * Results were only reported for samples with combined NIV + DON levels greater than 0.5 mg/kg Maximum levels of DON and NIV were particularly high in the study of Lauren et al. (1996). It was noted that during the study period the weather was generally cooler than average, with 1991/92 particularly being characterized by a cold, wet summer and late harvest. Lauren et al. (1991) also examined 102 samples of wheat, 41 samples of barley and 26 samples of oats from South Island sites (Canterbury, South Otago and Southland). While results for these sites were not given in detail, the authors noted that: • The incidence of trichothecenes in South Island grain crops was low (20%). • Only DON and NIV-type trichothecenes were detected. • The level of contamination never exceeded 0.1 mg/kg. 4.3.2 Trichothecenes in the New Zealand food supply Lauren and Veitch (1996) carried out a survey of NIV and DON in maize-based foods available in New Zealand. Results are summarised in Table 16.
Risk Profile: Mycotoxins in the New Zealand April 2006 Food Supply
60

Table 16: Trichothecenes in New Zealand foods
Food Number of samples
Number of samples positive (range, mg/kg)
NIV* DON* Breakfast cereals 20 3 (0.07-0.08) 2 (0.10-0.11) Extruded snack foods 20 1 (0.05) ND Maize meal products (flours, grits)
17 6 (0.06-0.65) 8 (0.05-0.41)
Breads 16 2 (0.06-0.20) 2 (0.04-0.05) Masa flour products (corn chips, taco shells)
24 2 (0.03-0.05) 1 (0.09)
Snack bars 13 3 (0.03-0.06) ND Maize oil 8 ND ND Miscellaneous products (corn syrup, brewing sugar)
6 ND ND
Total 124 17 (13.7%) 13 (10.5%) NIV = nivalenol DON = deoxynivalenol ND = not detected at detection limit of 0.05 mg/kg * Where samples were analysed in duplicate, with one result being positive and the other not detected, results have been reported here as the mean, with not detected results assigned a concentration of zero. Hence, some results reported here are below the limit of detection for single results. The majority of food samples tested did not contain detectable amounts of DON or NIV and concentrations, when detected, were generally lower than those detected in New Zealand-grown maize. Both food processing and introduction of imported maize may have an influence on trichothecene levels in processed foods. 4.3.3 Trichothecenes in Australian cereal grains Relatively little information was available on trichothecenes in Australian grain. Blaney et al. (1987) examined wheat from southern Queensland – a wheat growing region that was considered to be more likely to suffer rain damage and fungal infection. In 1983, 1291 samples of wheat were examined with 62 found to contain greater than 0.2% of ‘pink grain’ – an indicator of fungal infection. In 1984 and 1985, only general purpose (GP) graded wheat was examined (60 and 80 samples respectively). Eleven lines of wheat from the 1983 harvest and two from the 1984 harvest, containing elevated proportions of pink grains, were analysed and found to contain DON in the range 0.02 to 11.7 mg/kg. The remaining wheat samples were pooled on the basis of grade and receiving depot to give 37 pooled wheat samples across the three harvest years (1983, 1984 and 1985). DON was detected in 31/37 pooled wheat samples at concentrations ranging from a trace (<0.01 mg/kg) to 1.7 mg/kg. The highest DON levels were consistently found in GP grade wheat. Australian wheat imported into New Zealand is predominantly Australian Standard White (ASW), with lesser amount of Prime Hard (PH). Following a wet harvest in 1983, Tobin (1988) sampled 12 wheat lines from the Northern Rivers area of New South Wales and found 11 samples were positive for DON, with an average concentration of 1.8 mg/kg and a maximum concentration of 6.7 mg/kg. Tobin also analysed grain responsible for vomiting and feed refusal in pigs and found DON at a level of
Risk Profile: Mycotoxins in the New Zealand April 2006 Food Supply
61

3.7 mg/kg. Three samples of triticale were taken from a single crop over a three week period when harvesting had been disrupted by rain. The samples contained 1.1, 11.2 and 9.0 mg DON/kg respectively. Samples of barley exhibiting Fusarium head blight were taken from farms where DON-positive wheat samples had been obtained. No toxin was detected in the barley samples. 4.3.4 Overseas context JECFA (2001b; c) have consolidated a large amount of information on DON, T2 and HT2 in food commodities. Summary results are included in Table 17.
Table 17: Worldwide data on occurrence of trichothecenes in cereal crops
Commodity Mycotoxin Number of countries
Number of individual samples
represented
Weighted mean
(Maximum; mg/kg)*
Percentage of samples <
LOD or LOQ*
Barley DON 11 1,778 0.72 (34) 41 Barley T2 6 372 0.0046 (0.31) 91 Barley HT2 4 364 0.0044 (0.29) 92 Maize DON 17 5,719 0.18 (19) 52 Maize T2 9 1,239 0.0032 (2.4) 97 Maize HT2 5 292 0.0029 (0.23) 98 Oats DON 7 834 0.09 (2.6) 32 Oats T2 4 758 0.021 (0.53) 71 Oats HT2 4 758 0.035 (2.0) 67 Popcorn DON 2 50 0.31 (4.5) 92 Rice DON 4 203 0.15 (9.5) 80 Rice T2 2 125 0.0007 (0.019) 95 Rice HT2 1 26 ND Rye DON 4 295 0.07 (1.3) 51 Rye T2 3 83 0.0002 (0.017) 99 Rye HT2 3 87 0.00001 (0.023) 99 Sorghum DON 1 15 ND 100 Triticale DON 1 10 0.09 (0.20) 20 Wheat DON 18 14,200 0.39 (30) 38 Wheat T2 10 2,564 0.0016 (0.8) 96 Wheat HT2 3 1,740 0.0019 (0.31) 90 Other cereals DON 2 254 0.05 (2.3) 55 * In calculating means, results below the LOD/LOQ were assigned a concentration of zero There have also been a number of reports of trichothecene occurrence in processed foods, which were not summarised by JECFA (2001b, c). Papadopoulou-Bouraoui et al. (2004) found DON in 87% of 313 European retail beer samples, with contamination in the range 4-57 μg/l. Molto et al. (2000) analysed Argentinean beer for a range of trichothecenes. DON was detected in 44% of beer samples, with toxin levels in the range 4-221 μg/l. No other trichothecenes were detected. Suga et al. (2005) detected DON in Japanese domestic beer samples in the range 0.5-1.4 μg/kg. HT2 and NIV Risk Profile: Mycotoxins in the New Zealand April 2006 Food Supply
62

were detected in malt, but not in beer. Ruprich and Ostry (1995) detected DON in 77% of 77 Czech beer samples, with concentrations in the range 7-70 μg/l. Schollenberger et al. (2005a) analysed 101 commercially available German bread samples. DON was the most commonly detected trichothecene, detected in 92% of bread samples with a median concentration of 134 μg/kg (range 15-690 μg/kg) in positive samples. NIV, T2, HT2 and 3-acetyl-DON were also detected, but less frequently (1-8% of samples) and at lower levels (median concentrations in the range 4-25 μg/kg). DON levels were associated with a greater proportion of wheat in wheat-rye mixes and median DON levels in bread from organically grown cereals were lower than breads from conventionally grown cereals. Cirillo et al. (2003) found DON in 84% of 2002 Italian processed foods, including breads, pasta, breakfast cereals, biscuits and baby foods. Concentrations were in the range 7-930 μg/kg. Pacin et al. (1997) examined Argentinean wheat, wheat flour and bakery products for the presence of DON. The prevalence of contamination was essentially the same between the raw wheat and the bakery products (approximately 93%), although the average concentration in the wheat (1800 μg/kg) was significantly higher than that in the flour (1300 μg/kg) and the bakery products (460 μg/kg). A survey of retail corn-based foods did not detect trichothecenes (DON, NIV) in sweet corn, corn oil, popcorn and a range of corn-containing pre-prepared meal. Trichothecenes were detected in some samples of polenta, cornflour, taco shells/tortilla chips and breakfast cereals (FSA, 2005). Schollenberger et al. (2005b) detected trichothecenes in several non-cereal foods, including potato products, pumpkin seeds, sunflower seeds and hazelnuts, with T2 and HT2 being the main toxins detected. A survey of ‘ethnic’ foods available in the UK detected trichothecenes in a range of retail foods including rice, wheat noodles, bread (chapattis, nan), chilli powder, curry powder, ginger, garlic, curry paste and chilli sauce (MAFF, 1994b). El-Banna et al. (1983) demonstrated that DON in chicken feed ration (4-5 mg/kg) was not transferred to the eggs or tissues of chickens receiving the feed. Similarly, DON and its de-epoxy derivative were not detected in eggs from hens fed a DON-contaminated maize-based diet (11.9 mg DON/kg) for 16 weeks (Valenta and Danicke, 2005). Sypecka et al. (2004) reported some transmission of DON to the eggs of hens fed naturally-contaminated wheat (up to 10 mg/kg of feed), although rates of transmission were extremely low. Beasley and Lambert (1990) reviewed information on metabolism of trichothecenes by animals. The toxins are rapidly eliminated and residues in animals tissues were either not detected or only detected at very low levels. Withdrawal of contaminated feed results in rapid clearance of residues from tissues. While making direct comparisons is somewhat problematic, DON contamination levels in New Zealand cereals are not inconsistent with those encountered overseas.
Risk Profile: Mycotoxins in the New Zealand April 2006 Food Supply
63

4.3.5 New Zealand estimates of dietary exposure Based on the food concentration data of Lauren and Veitch (1996; see Table 16), Thomson (1996) estimated dietary exposure of New Zealanders to DON and NIV at 5.6 ng/kg body weight/day for each mycotoxin. This estimate was based solely on consumption of maize products. Maize is not a highly consumed food in New Zealand (3.2 g/person/day; ANZFA, 2001b) and the exposure estimates of Thomson are likely to be underestimates. No estimates for T2 and HT2 exposure in New Zealand were found. 4.3.6 Overseas estimates of dietary exposure A summary of exposure estimates for DON, NIV, T2 and HT2 is given in Table 18.
Table 18: Overseas estimates of dietary exposure to trichothecenes (DON, NIV, T2, HT2)
Country Population group Mean exposure
(μg/kg body weight/day)
Reference
Deoxynivalenol (DON) TDI = 1.0 μg/kg body weight/day African diet Adult, 60 kg 0.78 JECFA, 2001b Latin American diet
Adult, 60 kg 1.2 JECFA, 2001b
European diet Adult, 60 kg 1.4 JECFA, 2001b Middle Eastern diet
Adult, 60 kg 2.4 JECFA, 2001b
Far Eastern diet Adult, 60 kg 1.6 JECFA, 2001b France Adult, 15+ years
Child, 3-14 years 0.28 0.45
Leblanc et al., 2005
Austria Total population, 75 kg 0.29-0.66 SCOOP, 2003 Belgium Adolescent, 13-18 years, 60 kg 0.25-1.26 SCOOP, 2003 Denmark Total population, 70 kg 0.17-0.21 SCOOP, 2003 Finland Adult, 77.1 kg 0.14-0.25 SCOOP, 2003 France Adult, 66.4 kg
Male, 73.9 kg Female, 60.1 kg Child, 31.6 kg
0.46-0.89 0.44-0.88 0.48-0.90 0.73-1.51
SCOOP, 2003
Germany Total population, 70 kg Infant, 4 months, 10 kg
0.27-0.38 0.51-0.60
SCOOP, 2003
Netherlands Total population, 65.8 kg Child, 1-4 years, 13.8 kg Child, 1-6 years, 17.1 kg
0.34 0.85 0.76
SCOOP, 2003
Norway Male, 81 kg Female, 66 kg Infant, 6 months, 8 kg
0.34-0.61 0.30-0.53 0.29-0.44
SCOOP, 2003
Portugal Total population, 65 kg 0.36-1.00 SCOOP, 2003 Sweden Adult, 75 kg 0.08-0.13 SCOOP, 2003
Risk Profile: Mycotoxins in the New Zealand April 2006 Food Supply
64
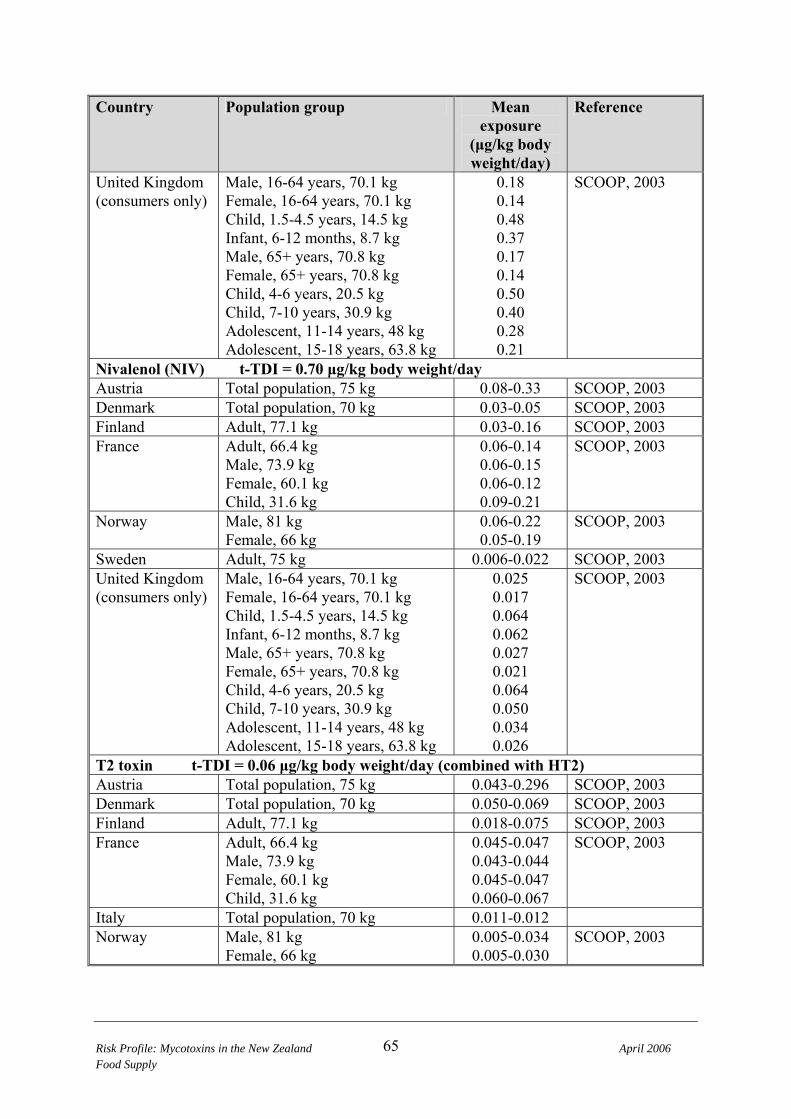
Risk Profile: Mycotoxins in the New Zealand April 2006 Food Supply
65
Country Population group Mean Reference exposure
(μg/kg body weight/day)
United Kingdom (consumers only)
Male, 16-64 years, 70.1 kg Female, 16-64 years, 70.1 kg Child, 1.5-4.5 years, 14.5 kg Infant, 6-12 months, 8.7 kg Male, 65+ years, 70.8 kg Female, 65+ years, 70.8 kg Child, 4-6 years, 20.5 kg Child, 7-10 years, 30.9 kg Adolescent, 11-14 years, 48 kg Adolescent, 15-18 years, 63.8 kg
0.18 0.14 0.48 0.37 0.17 0.14 0.50 0.40 0.28 0.21
SCOOP, 2003
Nivalenol (NIV) t-TDI = 0.70 μg/kg body weight/day Austria Total population, 75 kg 0.08-0.33 SCOOP, 2003 Denmark Total population, 70 kg 0.03-0.05 SCOOP, 2003 Finland Adult, 77.1 kg 0.03-0.16 SCOOP, 2003 France Adult, 66.4 kg
Male, 73.9 kg Female, 60.1 kg Child, 31.6 kg
0.06-0.14 0.06-0.15 0.06-0.12 0.09-0.21
SCOOP, 2003
Norway Male, 81 kg Female, 66 kg
0.06-0.22 0.05-0.19
SCOOP, 2003
Sweden Adult, 75 kg 0.006-0.022 SCOOP, 2003 United Kingdom (consumers only)
Male, 16-64 years, 70.1 kg Female, 16-64 years, 70.1 kg Child, 1.5-4.5 years, 14.5 kg Infant, 6-12 months, 8.7 kg Male, 65+ years, 70.8 kg Female, 65+ years, 70.8 kg Child, 4-6 years, 20.5 kg Child, 7-10 years, 30.9 kg Adolescent, 11-14 years, 48 kg Adolescent, 15-18 years, 63.8 kg
0.025 0.017 0.064 0.062 0.027 0.021 0.064 0.050 0.034 0.026
SCOOP, 2003
T2 toxin t-TDI = 0.06 μg/kg body weight/day (combined with HT2) Austria Total population, 75 kg 0.043-0.296 SCOOP, 2003 Denmark Total population, 70 kg 0.050-0.069 SCOOP, 2003 Finland Adult, 77.1 kg 0.018-0.075 SCOOP, 2003 France Adult, 66.4 kg
Male, 73.9 kg Female, 60.1 kg Child, 31.6 kg
0.045-0.047 0.043-0.044 0.045-0.047 0.060-0.067
SCOOP, 2003
Italy Total population, 70 kg 0.011-0.012 Norway Male, 81 kg
Female, 66 kg 0.005-0.034 0.005-0.030
SCOOP, 2003

Risk Profile: Mycotoxins in the New Zealand April 2006 Food Supply
66
Country Population group Mean Reference exposure
(μg/kg body weight/day)
United Kingdom (consumers only)
Male, 16-64 years, 70.1 kg Female, 16-64 years, 70.1 kg Child, 1.5-4.5 years, 14.5 kg Infant, 6-12 months, 8.7 kg Male, 65+ years, 70.8 kg Female, 65+ years, 70.8 kg Child, 4-6 years, 20.5 kg Child, 7-10 years, 30.9 kg Adolescent, 11-14 years, 48 kg Adolescent, 15-18 years, 63.8 kg
0.011 0.006 0.014 0.012 0.008 0.005 0.015 0.001 0.009 0.008
SCOOP, 2003
HT2 toxin t-TDI = 0.06 μg/kg body weight/day (combined with T2) Austria Total population, 75 kg 0.11-0.37 SCOOP, 2003 Finland Adult, 77.1 kg 0.019-0.079 SCOOP, 2003 France Adult, 66.4 kg
Male, 73.9 kg Female, 60.1 kg Child, 31.6 kg
0-0.030 0-0.030 0-0.028 0-0.044
SCOOP, 2003
Norway Male, 81 kg Female, 66 kg
0.030-0.038 0.026-0.034
SCOOP, 2003
United Kingdom (consumers only)
Male, 16-64 years, 70.1 kg Female, 16-64 years, 70.1 kg Child, 1.5-4.5 years, 14.5 kg Infant, 6-12 months, 8.7 kg Male, 65+ years, 70.8 kg Female, 65+ years, 70.8 kg Child, 4-6 years, 20.5 kg Child, 7-10 years, 30.9 kg Adolescent, 11-14 years, 48 kg Adolescent, 15-18 years, 63.8 kg
0.012 0.006 0.018 0.016 0.009 0.006 0.019 0.015 0.010 0.009
SCOOP, 2003
TDI = Tolerable Daily Intake t-TDI = temporary Tolerable Daily Intake The European scientific co-operation (SCOOP, 2003) consolidated national European data on levels of trichothecenes in foods and estimates of dietary exposure. In most cases, the mean estimates of dietary exposure were within the tolerable daily intake (TDI) for DON and NIV. Exposure to T2 and HT2 exceeded the TDI in several countries. In most cases bread, or wheat or flour, was the main contributor to exposure to DON and NIV, although in the UK estimates breakfast cereals often made a greater contribution than bread. For T2 and HT2 toxins, rye, durum (pasta) wheat, oats and beer (barley) were also major contributors in some countries. Estimates of exposure to DON and NIV are generally much higher than the tentative estimate made for New Zealand (Thomson, 1996). This will, at least in part, be due to the fact that the New Zealand estimate was based solely on contamination in maize – a food that is not eaten in large amounts in New Zealand.

4.4 Risk Characterisation 4.4.1 Adverse health effects in New Zealand No cases of trichothecene intoxication have been reported in New Zealand. DON has been implicated in oesophageal and gastric cancer overseas. These cancers are moderately common in New Zealand, with approximately 200 and 350 new registrations per year, respectively (2000 year, NZHIS, 2004). However, it should be noted that the link between trichothecene exposure and cancer is not proven and IARC concluded that there was inadequate evidence for carcinogenicity of DON and NIV in humans and animals (Group 3; IARC, 1993). It was also concluded that there was no data available to assess the carcinogenicity of T2 toxin in humans and limited evidence for its carcinogenicity in animals (Group 3; IARC, 1993). 4.4.2 Adverse health effects overseas 4.4.2.1 Epidemiological studies Ecological studies have been carried out in the Transkei (now part of South Africa) and China on the relationship between trichothecenes and oesophageal cancer (see IARC, 1993 for summaries), but results were generally inconclusive. 4.4.2.2 Risk assessments and other activity overseas JECFA DON, T2 and HT2 have been assessed by the Joint FAO/WHO Expert Committee on Food Additives (JECFA, 2001b;c). The assessment of DON recognised that DON is capable of causing outbreaks of acute illness in humans, but that animal studies did not suggest that DON was a carcinogenic hazard. JECFA recommended that the combined effects of different trichothecenes should be investigated and that, as the trichothecenes have similar toxic properties, toxic equivalency factors should be developed. It was recommended that further information was required in most areas (epidemiology, genotoxicity, exposure, effect of processing, and prevention of Fusarium plant diseases). The assessment of T2 and HT2 concluded that there was substantial evidence for the immunotoxicity and haematotoxicity of T2, but that there was a need to reduce the uncertainty around its carcinogenicity. Further information was also felt to be necessary on levels in foods and dietary exposure outside of Europe.
Risk Profile: Mycotoxins in the New Zealand April 2006 Food Supply
67
SCF The EU Scientific Committee on Food have produced Opinions for DON, NIV, T2 and HT2 (SCF, 1999; 2000a; 2001; 2002). SCF concluded that for DON general toxicity and immunotoxicity were the critical effects, with no indication of carcinogenicity. The Committee also suggested that further information of the relationship between DON, 3-acetyl-DON and 15-acetyl-DON were important, to determine whether these compound should be assessed separately or grouped with DON for assessment. SCF concluded that for NIV general toxicity and immunotoxicity/haematotoxicity were the critical effects. However, further long-term toxicological studies and exposure estimates are required for NIV. SCF concluded that for T2 general toxicity, haematotoxicity and immunotoxicity were the critical effects. It was suggested that further information on metabolism and toxicokinetics, as well as exposure, were required. SCF also considered DON, NIV, T2 and HT2 jointly and concluded that dose additivity, but also antagonism were observed for combinations of trichothecenes and concluded that the available data did not support establishment of a group TDI. 4.5 Risk Management Information 4.5.1 Relevant food controls: New Zealand 4.5.1.1 Establishment of regulatory limits Trichothecenes are not currently regulated in New Zealand. 4.5.2 Relevant food controls: overseas 4.5.2.1 Establishment of regulatory limits Table 19 summarises the reported regulatory positions on trichothecenes (van Egmond and Jonker, 2003). It should be noted that the limits reported here include a mixture of regulatory maximum permitted limits and guideline levels.
Risk Profile: Mycotoxins in the New Zealand April 2006 Food Supply
68

Table 19: Regulatory limits for trichothecenes in various countries (food regulations only)
Country Commodity description Trichothecene Regulatory limit (mg/kg)
Armenia All foods Wheat Barley
T2 DON DON
0.1 0.7 1.0
Belarus Wheat Barley Infant foods Grain, flour, groats Infant food
DON DON DON
T2 T2
0.7 1.0
Not allowed Unknown
Not allowed Bulgaria Processed cereal products
Cereals, subject to further treatment Maize and maize products Processed cereal products
DON DON DON
T2
1.0 2.0 1.0 0.1
Canada Domestic, uncleaned soft wheat Soft wheat flour (adult food) Soft wheat flour (infant food)
DON DON DON
2.0 1.2 0.6
China Wheat and wheat flour, maize and maize flour
DON 1.0
Cuba Imported cereals DON 0.3 Czech Republic
Corn, rice, maize Flour
DON DON
2.0 1.0
Estonia Wheat and wheat products Barley and barley products Cereal and cereal products
DON DON
T2
0.7 1.0 0.1
European Union
Cereal products, as consumed Flour, used as raw material
DON DON
0.5 0.75
Hungary Milled cereal products Edible bran Milled cereal products
DON DON
T2
1.0 1.2 0.3
Iran Wheat, barley, maize, rice DON 1.0 Japan Wheat and wheat products DON 1.1 Latvia Cereals
Cereals DON
T2 1.0 0.1
Moldova Wheat and wheat flour Barley and barley flour Cereals and cereal flour
DON DON
T2
0.7 1.0 0.1
Russian Federation
Wheat Barley Barley
DON DON
T2
0.7 1.0 0.1
Singapore Cereal and grain products Wheat, maize, rice Wheat, rice for production of children’s food Maize for production of children’s food
DON T2 T2 T2
Not given 0.02
0.0005 0.001
Switzerland Cereal grains DON 1.0 Risk Profile: Mycotoxins in the New Zealand April 2006 Food Supply
69

Risk Profile: Mycotoxins in the New Zealand April 2006 Food Supply
70
Country Commodity description Trichothecene Regulatory limit (mg/kg)
Ukraine Wheat of other than strong, hard varieties, flour, bread Grain-based and fruit-vegetable-dairy mix baby foods Wheat of strong, hard varieties Grains, flour, etc.
DON
DON
DON T2
0.5
0.2
1.0 0.1
USA Finished wheat products for human consumption
DON 1.0
Uruguay Wheat flour and by-products DON 1.0 From van Egmond and Jonkers (2003) While trichothecene concentrations in food are not currently regulated in New Zealand, it is interesting to note that many of the maximum concentrations reported for New Zealand cereals in Table 14 for DON would exceed most regulatory limits reported in Table 19. 4.5.2.2 Codes of practice and related initiatives Codex have produced a Code of Practice for prevention and reduction of mycotoxin contamination in cereals, with specific annexes relating to OTA, zearalenone, fumonisins and trichothecenes (http://www.codexalimentarius.net/download/standards/406/CXC_051e.pdf). Recommended practices cover planting, preharvest, harvest, storage and transport. The Code also discusses a HACCP approach to control of mycotoxin contamination of grains. The Food and Agriculture Organization of the United Nations (FAO) in collaboration with the International Atomic Energy Agency (IAEA) have produced a manual on the application of HACCP in mycotoxin prevention and control (ftp://ftp.fao.org/docrep/fao/005/y1390e/y1390e00.pdf). European efforts in this area are ongoing through a collaborative effort known as the Mycotoxin Prevention Cluster, with a specific project aimed at prevention of Fusarium mycotoxins entering the animals and human food chains (http://www.mycotoxin-prevention.com/Project2.htm). This project has five major tasks: • Development of critical control systems; • Pre-harvest biocontrol; • Post harvest control; • Decontamination using microbial inoculants for prevention of entry into animal
production systems; and • Decontamination using physicochemical means. 4.5.2.3 Management of trichothecene formation in crops Preharvest measures to control Fusarium infection can also reduce the formation of trichothecenes (JECFA, 2001b). Control measures include culture techniques, breeding and growing of resistant cultivars and use of fungicides or biological control agents (JECFA, 2001b).

Cultural control measures include: • Crop rotation, particularly rotation involving non-host crops. Maize-wheat rotation can
lead to increased incidence of Fusarium diseases, such as head blight (Cromey, 2002a); • Removal or ploughing in of crop debris, which may serve as a reservoir for inoculum; • Effective weed control to remove a potential reservoir for inoculum; • Irrigation to reduce water stress and severity of disease, although overhead irrigation has
been shown to increase the severity of disease (JECFA, 2001b). Differences in cultivar susceptibility to Fusarium has been recognised for over 100 years. However, few reports of complete immunity exist (JECFA, 2001b). Fungicides vary considerably in their ability to control Fusarium species and to inhibit trichothecene production. Edwards et al. (2001) demonstrated that, while tebuconazole and metconazole were effective in reducing infection and DON levels, azoxystrobin had less effect on infection and resulted in a slight increase in DON levels relative to controls. Similar results have been reported for fungicide treatment of wheat in New Zealand (Cromey et al., 2002b). 4.5.3 Influence of processing on trichothecene levels The influence of various food processing procedures on trichothecene levels has been reviewed (Hazel and Patel, 2004). Infected grains may be shriveled and lower in weight than healthy grain. While some studies have reported as much as a 74% decrease in DON levels after sorting, infected grains may be indistinguishable from healthy grains and routine grain cleaning can result in reductions of no better than 20% (Scott et al., 1984). 4.5.3.1 Wet milling Wet milling of maize to produce starch and glucose syrups results in concentration of water-soluble trichothecenes in the steep water. Lauren and Ringrose (1997) conducted wet milling trials on naturally-contaminated maize and found levels of DON and NIV in solid fractions (germ, fibre and gluten) 5-10 times lower than in the grain entering the wet milling process. 4.5.3.2 Dry milling Dry milling of maize and wheat results in highest levels of trichothecenes in germ and bran fractions and reduced levels, relative to the whole grain, in the starchy endosperm (Hazel and Patel, 2004). However, for wheat, the distribution of trichothecenes between milling fractions has been reported to depend on the degree of fungal penetration into the grain, which in turn is dependent on the susceptibility of the cultivar to infection (Nowicki et al., 1988).
Risk Profile: Mycotoxins in the New Zealand April 2006 Food Supply
71
4.5.3.3 Cooking Breadbaking is a major use for wheat and the fermentation processes involved can result in metabolism of many compounds. Investigations on the influence of breadbaking on the DON content of wheat have shown equivocal results, ranging from significant increases in DON levels (Young et al., 1984) to decreases of up to 60% (see Hazel and Patel, 2004 for a review). Yeast in liquid culture does not metabolise DON (Boswald et al., 1995), however, there is some evidence that Lactobacilli, also involved in the fermentation process, may metabolise trichothecenes (El-Nezami et al.,2002). DON has been shown to be stable at extrusion temperatures. Accerbi et al. (1999) demonstrated a modest reduction in DON levels upon extrusion, but a more dramatic reduction when extrusion was combined with soaking of grain in sodium bisulphate. Sodium bisulphate removes DON by formation of sulphonate salts. These salts are stable under acid conditions, but may revert to parent DON under alkaline conditions (Cazzaniga et al., 2001). 4.5.3.4 Brewing The brewing process involves both steps with the potential to decrease trichothecene levels (steeping) and steps with the potential to increase trichothecene levels (germination, mashing). It has been concluded that the overall brewing process has little impact on trichothecene levels (Scott, 1996). While the initial stages of grain treatment (seed cleaning, milling) are likely to result in some decrease in trichothecene levels of grain products, a range of food processing steps (cooking, fermentation, extrusion) cannot be viewed as likely to have a consistent impact on the trichothecene levels of contaminated grain. Boiling in water will usually result in a significant decrease in trichothecene levels, due to the water solubility of these compounds. For example boiling of pasta has been reported to result in loss of 50% of DON content (Nowicki et al., 1988). The limited impact of food processing on trichothecene levels has been confirmed by a recent UK survey of cereal products at retail, with 298 of 377 containing detectable trichothecenes (FSA, 2003). 4.6 Conclusions 4.6.1 Description of risks to New Zealand consumers Trichothecene mycotoxins have been associated with outbreaks of acute human illness, including outbreaks with high rates of mortality (alimentary toxic aleukia). The critical toxicological effects are similar for all trichothecenes (general toxicity, immunotoxicity, haematotoxicity). While some epidemiological studies have attempted to relate trichothecene exposure to oesophageal cancer, gastric cancer and endemic osteoarthritis, the evidence is inconclusive. Test on laboratory animals generally do not suggest that the trichothecenes are carcinogenic. While no cases of trichothecene intoxication have been documented in New Zealand, the symptoms of acute intoxication mean that cases are likely to be ascribed to microbial sources.
Risk Profile: Mycotoxins in the New Zealand April 2006 Food Supply
72

Fusarium species have been found in a range of New Zealand cereal crops and production of trichothecene mycotoxins by these fungal species has been demonstrated. A survey of maize-based consumer foods in New Zealand found occasional occurrence of DON and NIV. While some early New Zealand surveys reported detection of T2 toxin, later work did not report detection of the toxin or its major causative organism (F. sporotrichioides). Although no regulatory limits for trichothecenes are in place in New Zealand, concentration of DON detected in New Zealand grown cereals would occasionally exceed regulatory limits adopted in other countries. International estimates of trichothecene exposure have generally identified wheat and wheat products as the major contributors to exposure. Wheat is the most commonly consumed cereal in New Zealand, with most New Zealand-produced wheat grown in the South Island. Available survey data suggest that the prevalence and concentration of trichothecenes in South Island cereals is generally low (Lauren et al., 1991; Sayer and Lauren, 1991). The balance of the wheat consumed in New Zealand is from Australia and is from ASW (Australian Standard White) or Prime Hard grade. The limited information available suggests that trichothecene contamination is rare in Australian wheat, other than the General Purpose grade (Blaney et al., 1987). While there is a lack of data on trichothecenes in New Zealand wheat, oat and barley-based foods, it appears likely that the exposure of New Zealanders to trichothecenes will be similar to or less than that of European countries and less than internationally determined Tolerable Daily Intakes. 4.6.2 Commentary on risk management options Trichothecenes are not currently regulated in New Zealand. Agronomic research conducted in New Zealand demonstrates a good awareness of the deleterious effects of Fusarium infection and the connection between Fusarium infection and trichothecene production. 4.6.3 Data gaps New Zealand specific information on trichothecenes in New Zealand wheat-based and barley-based (beer) foods would help to confirm the circumstantial evidence suggesting that contamination in these products is likely to be low. It is also important to confirm that T2 toxin (and HT2 toxin) are not issues in the New Zealand context.
Risk Profile: Mycotoxins in the New Zealand April 2006 Food Supply
73

5 FUMONISINS 5.1 Hazard Identification Fumonisins are mycotoxins produced predominantly by Fusarium verticillioides (F. moniliforme) and F. proliferatum. These fungal species are endemic in maize worldwide, but are rarely found in other crops (Pitt and Tomaska, 2001). The fungi grow optimally at about 25ºC and will grow at temperatures up to 32-37ºC (Pitt and Tomaska, 2001). While at least six fumonisins are known, fumonisin B1 and B2 (FB1, FB2) are the most important. 5.1.1 Structure and nomenclature Fumonisins consist of a 20 carbon aliphatic chain with two ester linked hydrophilic polyol side chains. Structural details for FB1 – FB4 are shown in Figure 5.
Figure 5: Structure of major fumonisins
Fumonisin B1: R1= OH; R2= OH; R3= OH; Fumonisin B2: R1= H; R2= OH; R3= OH; Fumonisin B3: R1= OH; R2= OH; R3= H; Fumonisin B4: R1= H; R2= OH; R3= H
Fumonisins C1-C4 are identical to the corresponding B fumonisin, except the aliphatic carbon chain does not have the terminal methyl group on the right hand end (Soriano and Dragacci, 2004). 5.1.2 Occurrence F. verticillioides and F. proliferatum are amongst the most common fungi associated with maize worldwide and can be recovered from most maize kernels, even when the kernels appear healthy (WHO, 2000). F. verticillioides is considered to be the major cause of Fusarium kernel rot in maize, a significant plant disease occurring in warm, dry weather (JECFA, 2001d). Fusarium kernel rot, and associated fumonisin synthesis, is also strongly associated with insect damage of kernels, as this provides an entry point for the fungus (WHO, 2000). Thin kernel pericarp (greater susceptibility to insect injury), propensity to kernel splitting, and previous infection with other Fusarium species, such as F. graminearum, all increase the risk of F. verticillioides infection and fumonisin formation (WHO, 2000). F. verticillioides is widespread in the tropics and humid temperate zones, but is uncommon in cooler temperate zones (Pitt and Hocking, 1997). Surveys of Fusarium species in New
Risk Profile: Mycotoxins in the New Zealand April 2006 Food Supply
74

Zealand maize are supportive of this observation, as the fungus is only rarely isolated (Sayer, 1991; Sayer and Lauren, 1991; Hussein et al., 2002). F. proliferatum has not been reported in New Zealand maize. Although fumonisin-producing fungi appear to be relatively rare in New Zealand, Mirocha et al. (1992) found FB1 in New Zealand pasture grasses, at concentration in the range 1-9 mg/kg. The pastures analysed were associated with an idiopathic disease of wapiti (elk) and wapiti hybrids grazed on the pastures. 5.2 Hazard Characterisation: Adverse Health Effects Incidents of human toxicosis have been associated with fumonisin contaminated foods. However, it should be noted that in most cases the implicated food may contain more than one known mycotoxin and may potentially contain other, as yet uncharacterized, toxins. 5.2.1 Conditions An outbreak of acute mycotoxicosis occurred in southern India in 1995 due to consumption of rain-damaged, mouldy sorghum and maize. FB1 was the most common mycotoxin in both crops, with concentration up to 8 mg/kg in sorghum and 65 mg/kg in maize. However, a relatively high concentration of aflatoxin B1 was also detected in the maize (Shetty and Bhat, 1997). Cases exhibited gastrointestinal symptoms, including abdominal pain, borborygmi (rumbling stomach) and diarrhoea. Similar symptoms were observed in laying hens and 1-day-old cockerels fed contaminated maize and fed their normal diet with addition of 8 or 16 mg/kg of FB1 (JECFA, 2001d). High concentrations of FB1 in the diet have been correlated with oesophageal and liver cancer, and neural tube defects (WHO, 2000; JECFA, 2001d). Studies in South Africa, China, Iran, Northern Italy, Kenya, Zimbabwe, USA, and Brazil found differences in the fumonisin content of staple foods between areas with high rates of oesophageal cancer and areas with low rates. However, populations in high incidence regions were often also exposed to higher levels of other mycotoxins, as well as suffering a range of micronutrient deficiencies (JECFA, 2001d). Associations to liver cancer have been observed in China and South Africa, while associations to neural tube defects have been noted in South Africa, China and the USA (JECFA, 2001d). 5.2.2 Toxicity 5.2.2.1 Acute toxicity No studies have been published on the acute toxicity of single doses of FB1 in laboratory animals. Available evidence suggests that it is not acutely toxic (JECFA, 2001d).
Risk Profile: Mycotoxins in the New Zealand April 2006 Food Supply
75

5.2.2.2 Chronic toxicity Short-term and chronic toxicity in experimental animals due to FB1 is primarily due to its ability to interfere with synthesis of complex glycol-shingolipids, through inhibition of the enzyme ceramide synthase. This has effects on cellular processes such as cell growth, cell differentiation and morphology, endothelial cell permeability and apoptosis (cell death; SCF, 2000b). This mode of action is believed to explain most of the toxic effects exhibited by FB1, including hepatotoxicity and nephrotoxicity and tumour formation in the liver and kidneys (JECFA, 2001d). Two species-specific disease have been linked to FB1 exposure: • Equine leukoencephalomalacia (ELEM) affects horses, ponies, donkeys and mules,
causing liquefaction of the brain. Fumonisin-contaminated feed has been implicated in the disease and the symptoms were reproduced by intravenous administration of FB1 to horses (JECFA, 2001d)
• Porcine pulmonary oedema (PPO) is believed to be induced by cardiovascular dysfunction, followed by acute left-side heart failure. Hepatotoxicity occurs concurrently with PPO. PPO has been reproduced by intravenous administration of purified FB1, but not by oral administration (JECFA, 2001d).
Ability of cells to avoid apoptotis is critical in the development of cancer and it has been hypothesized that the ability of FB1 to induce apoptotis may select for cell resistant to apoptotis (Jones et al., 2001). It has also been suggested that compensatory cell proliferation, in response to apoptosis, will support an increased risk of tumour formation (Howard et al., 2001). 5.2.3 Toxicological assessment JECFA have evaluated fumonisins (JECFA, 2001d) and concluded that nephrotoxicity, observed in several species of rat was the most sensitive toxic effect for pure FB1, with an NOEL of 0.2 mg/kg body weight/day. A group Provisional Maximum Tolerable Daily Intake (PMTDI) for FB1, FB2 and FB3, singly or in combination, of 2 μg/kg body weight/day was assigned (safety factor of 100). The EU Scientific Committee on Food came to identical conclusions (SCF, 2000b) in assigning a TDI for FB1 of 2 μg/kg body weight/day, also taking into account data on equine leukoencephalomalacia (ELEM) with an NOAEL of 0.2 mg/kg body weight. The Committee also noted that there was not adequate evidence that FB1 is genotoxic. IARC considered the available information on FB1 (IARC, 2002) and concluded that there was sufficient evidence for the carcinogenicity of FB1 in experimental animals, but that there was inadequate evidence for its carcinogenicity in humans. FB1 was classified as a possible human carcinogen (Group 2B). 5.3 Exposure Assessment Although F. verticillioides and F. proliferatum are known to cause diseases in crops other than maize (sorghum, rice), fumonisin mycotoxins occurrence is most commonly reported in maize.
Risk Profile: Mycotoxins in the New Zealand April 2006 Food Supply
76
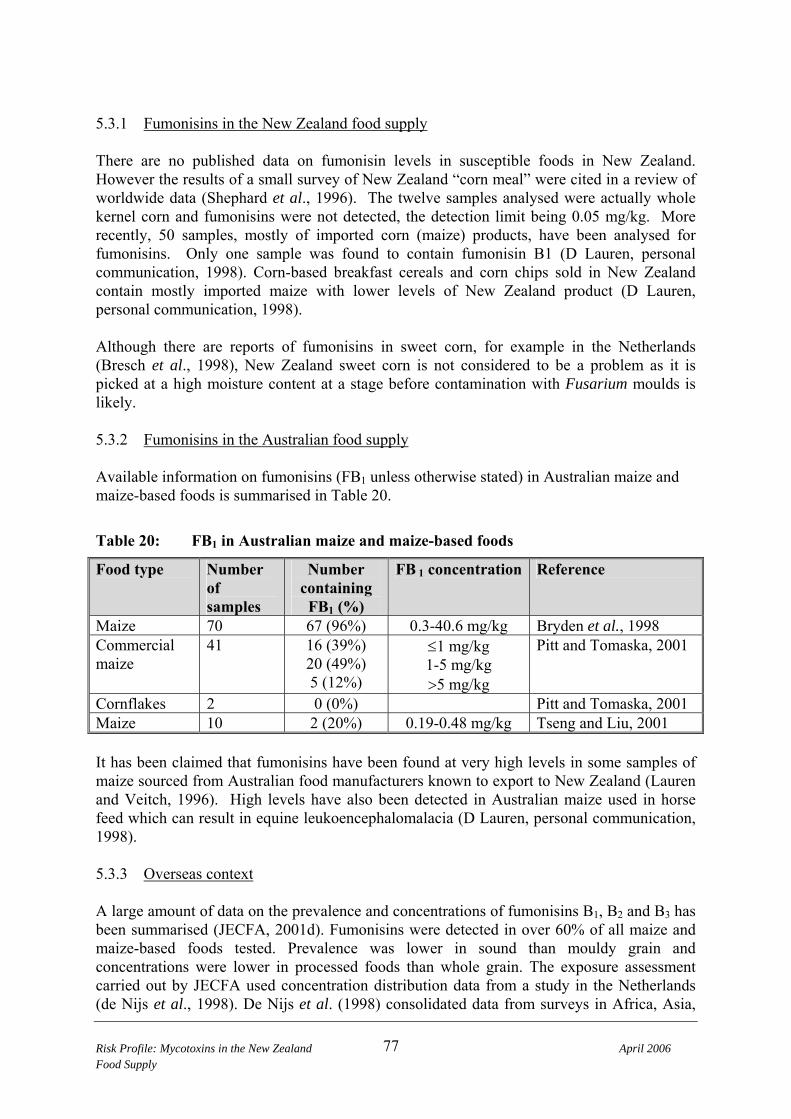
5.3.1 Fumonisins in the New Zealand food supply There are no published data on fumonisin levels in susceptible foods in New Zealand. However the results of a small survey of New Zealand “corn meal” were cited in a review of worldwide data (Shephard et al., 1996). The twelve samples analysed were actually whole kernel corn and fumonisins were not detected, the detection limit being 0.05 mg/kg. More recently, 50 samples, mostly of imported corn (maize) products, have been analysed for fumonisins. Only one sample was found to contain fumonisin B1 (D Lauren, personal communication, 1998). Corn-based breakfast cereals and corn chips sold in New Zealand contain mostly imported maize with lower levels of New Zealand product (D Lauren, personal communication, 1998). Although there are reports of fumonisins in sweet corn, for example in the Netherlands (Bresch et al., 1998), New Zealand sweet corn is not considered to be a problem as it is picked at a high moisture content at a stage before contamination with Fusarium moulds is likely. 5.3.2 Fumonisins in the Australian food supply Available information on fumonisins (FB1 unless otherwise stated) in Australian maize and maize-based foods is summarised in Table 20.
Table 20: FB1 in Australian maize and maize-based foods
Food type Number of samples
Number containing FB1 (%)
FB 1 concentration Reference
Maize 70 67 (96%) 0.3-40.6 mg/kg Bryden et al., 1998 Commercial maize
41 16 (39%) 20 (49%) 5 (12%)
≤1 mg/kg 1-5 mg/kg >5 mg/kg
Pitt and Tomaska, 2001
Cornflakes 2 0 (0%) Pitt and Tomaska, 2001 Maize 10 2 (20%) 0.19-0.48 mg/kg Tseng and Liu, 2001 It has been claimed that fumonisins have been found at very high levels in some samples of maize sourced from Australian food manufacturers known to export to New Zealand (Lauren and Veitch, 1996). High levels have also been detected in Australian maize used in horse feed which can result in equine leukoencephalomalacia (D Lauren, personal communication, 1998). 5.3.3 Overseas context A large amount of data on the prevalence and concentrations of fumonisins B1, B2 and B3 has been summarised (JECFA, 2001d). Fumonisins were detected in over 60% of all maize and maize-based foods tested. Prevalence was lower in sound than mouldy grain and concentrations were lower in processed foods than whole grain. The exposure assessment carried out by JECFA used concentration distribution data from a study in the Netherlands (de Nijs et al., 1998). De Nijs et al. (1998) consolidated data from surveys in Africa, Asia,
Risk Profile: Mycotoxins in the New Zealand April 2006 Food Supply
77

Europe and North and South America to produce a composite distribution with prevalence of 93%, median FB1 level of 0.42 mg/kg and a mean FB1 level of 1.36 mg/kg for all maize samples (positive and negative). The EU Scientific Co-operation collected information on fumonisins in various foods (SCOOP, 2003). For maize, 66% of samples were positive for FB1 and 51% were positive for FB2. Assuming that samples where the toxin was not detected contained true zero concentrations, the weighted average concentration of FB1 in maize was 0.35 mg/kg. While the vast majority of data available relate to fumonisins in maize and foods derived from maize, other foods have occasionally been analysed for fumonisins. Table 21 summarises data for studies of non-maize foods.
Table 21: Worldwide data on occurrence of fumonisins in non-maize food
Food Country Number of samples positive/total samples (%)
Range Reference
Asparagus Italy Composite of 25 samples affected by crown rot
Stem 0.46 mg/kg FB1 0.06 mg/kg FB2 Results on dry weight basis
Logrieco et al., 1998
Asparagus Germany 9/10 (90% of F. proliferatum infected spears)
0.036-4.5 mg/kg FB1 Results on a dry weight basis
Seefelder et al., 2002
Asparagus China 24/30 (80%) 0.024-0.67 mg/kg FB1 0.017-0.138 mg/kg FB2 Results on dry weight basis
Liu et al., 2005
Barley UK 0/5 (0.0%) Patel et al., 1997 Beans Botswana 0/5 Siame et al., 1998 Beer Canada 11/41 (27%) 0.4-103 μg/l FB1
0.45-12 μg/l FB2 Scott and Lawrence, 1995
Beer Canada 22/46 (48%) 0.2-52.8 μg/l FB1 0.4-11.5 μg/l FB2
Scott et al., 1997
Beer Spain 14/32 (44%) 4.8-85.5 μg/l Fumonisins
Torres et al., 1998
Beer USA 25/29 (86%) <0.3-13.5 μg/l Fumonisins
Hlywka and Bullerman, 1999
Milk (raw) USA 1/165 (0.6%) 1.3 μg/l FB1 Maragos and Richard, 1994
Milk (raw) Denmark 0/42 (0.0%) Sørensen and Elbæk, 2005
Oats UK 0/5 (0.0%) Patel et al., 1997 Peanuts Botswana 0/15 Siame et al., 1998 Risk Profile: Mycotoxins in the New Zealand April 2006 Food Supply
78

Rice UK 0/5 (0.0%) Patel et al., 1997 Rice USA 8/20 (40%) 0.5-4.3 mg/kg FB1
ND-1.2 mg/kg FB2 ND-0.6 mg/kg FB3
Abbas et al., 1998
Rice Korea 5/88 (5.7%) Park et al., 2005 Sorghum (meal)
Botswana 2/2 (100%) 0.02-0.02 mg/kg FB1 Doko et al., 1996
Sorghum (grain)
Burundi 0/5 (0.0%) Munimbazi and Bullerman, 1996
Sorghum (meal)
Burundi 1/1 (100%) 28.8 mg/kg FB1 Munimbazi and Bullerman, 1996
Sorghum India Normal 2/43 (3.6%) Rain-affected 25/25 (100%)
0.15-0.51 mg/kg FB1 0.07-7.9 mg/kg FB1
Shetty and Bhat, 1997
Sorghum (mouldy)
India 20/20 (100%) 0.14-7.8 mg/kg FB1 Bhat et al., 1997
Sorghum Botswana 3/20 (15%) 0.02-0.06 mg/kg FB1 Siame et al., 1998 Sorghum syrup USA 1/35 (2.8%) 0.12 mg/kg FB1 Trucksess et al.,
2000 Soya UK 0/5 (0.0%) Patel et al., 1997 Wheat UK 0/5 (0.0%) Patel et al., 1997 Wheat (emmer, spelt, T.monococcum)
Italy 5/8 (63%) 0.02-0.07 mg/kg FB1 Castoria et al., 2005
Little information is available concerning fumonisin residues in foods of animal origin. Malmauret et al. (2002) compared the contaminant content of organic and conventional foods and did not detect fumonisin in any of twelve samples (six organic, six conventional) of each of beef, pork, poultry and eggs. However, it is unknown what the contamination status of the animal feed was. Leblanc et al. (2005) reported detection of FB1 in 3/6 samples of poultry offal, at concentrations in the range 0.09-0.12 mg/kg. Scott et al. (1994) studied transmission of FB1 in four cows dosed either orally (1.0 and 5.0 mg FB1/kg body weight) or intravenously (0.05 and 0.20 mg FB1/kg body weight) with pure FB1. No residues of FB1 or its metabolite AP1 were detected in milk. Richard et al. (1996) fed two Jersey cows a diet containing approximately 75 mg/kg of fumonisins for 14 days. The cows consumed an average of 3 mg FB1/kg body weight/day. No FB1 residues were detected in milk. 5.3.4 New Zealand estimates of dietary exposure Both Thomson (1996) and Lake and Stanton (1998) discussed the potential for fumonisin exposure in New Zealand, but did not estimate dietary exposure due to the general lack of concentration data.
Risk Profile: Mycotoxins in the New Zealand April 2006 Food Supply
79

5.3.5 Overseas estimates of dietary exposure National estimates of fumonisin exposure are summarised in Table 22.
Table 22: Overseas estimates of dietary exposure to fumonisins
Country Population group Estimated Fumonisin exposure (μg /kg body weight/day)
Reference
Mean High percentile (percentile)
Africa Adult, based on GEMS/Food regional diet
2.4 FB1 7.3 FB1 (90) JECFA, 2001d
Argentina Male, 1-5 years, 14 kg Male, 6-10 years, 25 kg Male, 11-14 years, 40 kg Male, 15-25 year, 61 kg Male, 26-55 years, 78 kg Male, 55+ years, 80 kg Female, 1-5 years, 14 kg Female, 6-10 years, 24 kg Female 11-14 years, 40 kg Female, 15-25 years, 56 kg Female, 25-55 years, 58 kg Female, 55+ years, 60 kg
0.6 FB1 0.0 0.0 0.1 0.1 0.0 0.5 0.0 0.0 0.1 0.1 0.0
Solovey et al., 1999
Austria Total population 0.077 FB1 0.27 FB1 (95) SCOOP, 2003 Belgium All, 13-18 years 0.016 FB1 0.11 FB1 (95) SCOOP, 2003 Europe Adult, based on
GEMS/Food regional diet 0.2 FB1 0.6 FB1 (90) JECFA, 2001d
Far East Adult, based on GEMS/Food regional diet
0.7 FB1 JECFA, 2001d
France Total population Adult, male Adult, female Child, all
0.22 FB1 0.23 FB1 0.21 FB1 0.36 FB1
SCOOP, 2003
France Child, 3-14 years Adult, 15+ years
0.046 FB1 + FB2 0.014 FB1 + FB2
Leblanc et al., 2005
Germany Total population, >4 years 0.13 FB1 SCOOP, 2003 Italy Total population
Consumers only 0.047 FB1 0.52 FB1
SCOOP, 2003
Latin America
Adult, based on GEMS/Food regional diet
1.0 FB1 2.9 FB1 (90) JECFA, 2001d
Middle Eastern
Adult, based on GEMS/Food regional diet
1.1 FB1 3.3 FB1 (90) JECFA, 2001d
Netherlands Adult Child, 1-4 years Child, 1-6 years
0.003 FB1 0.0 FB1 0.0 FB1
SCOOP, 2003
Norway Population, male Consumers, male Population, female Consumers, female
0.0001 FB1 0.0003 FB1 0.0001 FB1 0.0003 FB1
SCOOP, 2003
Switzerland Total population 0.03 JECFA, 2001d UK Total population 0.03 JECFA, 2001d
Risk Profile: Mycotoxins in the New Zealand April 2006 Food Supply
80

Risk Profile: Mycotoxins in the New Zealand April 2006 Food Supply
81
Country Population group Estimated Fumonisin exposure (μg /kg Reference body weight/day)
USA Maize consumers 0.08 Humphreys et al., 2000
It should be noted that no exposure estimates were available from developing countries, other than those formulated using the GEMS/Food regional diets. In parts of Africa and Central America maize will constitute a major part of the diet in these populations. 5.4 Risk Characterisation 5.4.1 Adverse health effects in New Zealand No cases of fumonisin intoxication have been reported in New Zealand. FB1 has been implicated in human oesophageal cancer. This cancer is moderately common in New Zealand, with approximately 200 new registrations per year (2000 year, NZHIS, 2004). 5.4.1.1 Risk assessments and other activities Lake and Stanton (1998) reviewed fumonisins as a food safety issue in New Zealand and concluded that “the risk to New Zealanders from fumonisins is likely to be slight, this conclusion is based on circumstantial information. A limited survey to provide reliable data is recommended”. 5.4.2 Adverse health effects overseas 5.4.2.2 Epidemiological studies Ecological studies have been carried out in the Transkei (South Africa), China and Northern Italy on the relationship between fumonisins and oesophageal cancer (see IARC, 1993 or JECFA, 2001d for summaries). Interpretation of these studies is complicated by the fact that study populations were often exposed to multiple mycotoxins, as well as suffering from multiple nutritional deficiencies (JECFA, 2001d). Transkei Regions of the Transkei have very high rates of oesophageal cancer. People in these regions eat a diet based on maize porridge. Sydenham et al. (1990) analysed mouldy and apparently healthy corn from areas with high and low rates of oesophageal cancer. Mouldy corn from the low incidence area contained higher levels of trichothecenes, moniliformin and zearalenone, while mouldy corn from the high cancer incidence area had higher levels of fumonisins (FB1, FB2). Apparently healthy corn from the high incidence area also had higher levels of fumonisins than corn from the low incidence area. These observations were confirmed by Rheeder et al. (1992). China Maize is consumed as a staple in counties of Henan province. Oesophageal cancer rates have been reported to be 4-5 times higher in some counties than in others. Mouldy and apparently healthy maize from high incidence areas were found to have average FB1 concentrations of
74 and 35.3 mg/kg respectively (Chu and Li, 1994). Yoshizawa et al. (1994) analysed maize samples from high (Linxian county) and low (Shangqiu county) areas for oesophageal cancer. Mean levels of fumonisins in positive samples were similar (FB1 Linxian 0.87 mg/kg and Shangqiu 0.89 mg/kg, FB2 Linxian 0.45 mg/kg and Shangqiu 0.33 mg/kg) although the prevalence of fumonisin contamination was almost twice as high in the high cancer incidence area (48%) than the low cancer incidence area (25%). Ueno et al. (1997) compared the mycotoxin content of maize between an area with a high rate of primary liver cancer (Haimen) and an area with a low rate (Penlai). While the prevalence and concentrations of fumonisins were higher in maize in the high incidence area than the low incidence area, prevalence and concentrations of other mycotoxins (aflatoxin B1, deoxynivalenol and nivalenol) were also higher in the high risk area for primary liver cancer. Northern Italy Pordenone province in Northeastern Italy has some of the highest rates of oral, pharyngeal and oesophageal cancer in Europe (WHO, 2000). A case-control study was carried out involving 282 upper digestive tract cancer patients and 505 hospital controls (Franceschi et al., 1990). Highly significant associations were found between frequent maize consumption and oral, pharyngeal and oesophageal cancers (odd ratios 3.3, 3.2 and 2.8 respectively), although the effect was only evident in individuals who reported heavy drinking. Although fumonisin levels in maize were not measured as part of this study, significant levels of FB1 have been reported in Italian polenta (0.15-3.76 mg/kg; WHO, 2000). USA Missimer et al. (2006) carried out a population based case-control study to investigate a possible connection between consumption of fumonisin-contaminated corn and an increased prevalence of neural tube defects (NTD) along the Texas-Mexico border. Fumonisin exposure, as assess by maternal serum sphinganine to sphingosine ratio or by maternal recollection of tortilla consumption, was associated with an increased odds ratio of having a NTD affected pregnancy. Odds ratios increased with increasing exposure, with the exception of the highest exposure class. The investigators suggested that at the high exposure level foetal death may have been more likely to occur. 5.4.2.2 Risk assessments and other activity overseas JECFA As previously stated in section 5.2.3, JECFA have allocated a group Provisional Maximum Tolerable Daily Intake for the total of FB1, FB2 and FB3 of 2 μg/kg body weight/day. JECFA recommended further research requirement in laboratory animals and also recommended that “the relationship between the intake of fumonisin and human disease in areas where nixtamalised maize-products comprise a large portion of the diet should be investigated. Particular emphasis should be placed on diseases of the liver and kidney and other diseases suspected of being associated with intake of fumonisin B1, such as nasopharyngeal and oesophageal cancers and neural tube defects”.
Risk Profile: Mycotoxins in the New Zealand April 2006 Food Supply
82

SCF The EU Scientific Committee on Food have produced an Opinion for FB1, recommending collection of data on the occurrence of FB1 contamination of foodstuffs in Europe (SCF, 2000b). The Committee did not recommend monitoring for residues of FB1 in animal products, as there was no indication of significant carry-over. The Committee welcomed further studies on the kinetics of FB1 in humans, including transplacental transfer in humans or non-human primates and studies giving further information on cardiovascular toxicity. SCF did not give an opinion on fumonisins other than FB1. USA Humphreys et al. (2001) carried out a quantitative risk assessment for FB1 and FB2 in US corn. Corn consumption was estimated from 3-day food consumption surveys, while the fumonisin content of corn was estimated from FDA surveillance data. The investigators examined two management approaches, limiting corn consumption and limiting fumonisin contamination. The model used demonstrated that limiting corn consumption was a more effective means of avoiding fumonisin toxicity than limiting the fumonisin level in the corn. Nordic countries (Denmark, Norway, Sweden, Finland, Iceland) The Nordic evaluation concluded that there was insufficient information to carry out a complete risk assessment, but recommended that human dietary exposure to fumonisins should be less than 1 μg/kg body weight/day (Petersen and Thorup, 2001). Surveillance reported in this study reported detection of FB1 and FB2 in a range of corn-based foods, but not in corn starch, corn-on-the-cob or sweet corn, with concentrations in the range 0.001-1.03 mg FB1/kg and 0.007-0.243 mg FB2/kg.
Risk Profile: Mycotoxins in the New Zealand April 2006 Food Supply
83

5.5 Risk Management Information 5.5.1 Relevant food controls: New Zealand 5.5.1.1 Establishment of regulatory limits Fumonisins are not currently regulated in New Zealand. 5.5.2 Relevant food controls: overseas 5.5.2.1 Establishment of regulatory limits Table 23 summarises the reported regulatory positions on fumonisins for eight countries (van Egmond and Jonkers, 2003). It should be noted that the limits reported here include a mixture of regulatory maximum permitted limits and guideline levels.
Table 23: Regulatory limits for fumonisins in various countries (food regulations only)
Country Commodity description Fumonisin Regulatory limit
(μg/kg) Bulgaria Maize and processed products thereof FB1 + FB2 1000 Cuba Maize, rice FB1 1000 France Cereals and cereal products FB1 1000 (Target)
3000 (Maximum) Iran Maize FB1 + FB2 1000 Singapore Corn and corn products FB1 Not given Switzerland Maize FB1 + FB2 1000 Taiwan Maize products FB1 Not stated USA Degermed, dry milled corn products FB1 + FB2 +
FB3
2000 (Guide)
From van Egmond and Jonker (2003) 5.5.2.2 Codes of practice and related initiatives Codex have produced a Code of Practice for prevention and reduction of mycotoxin contamination in cereals, with specific annexes relating to OTA, zearalenone, fumonisins and trichothecenes (http://www.codexalimentarius.net/download/standards/406/CXC_051e.pdf). Recommended practices cover planting, preharvest, harvest, storage and transport. The fumonisin specific annex identifies time of harvest as a critical factor in preventing fumonisin formation in maize, with recommendations that maize be harvested in cooler months. The Code also discusses a HACCP approach to control of mycotoxin contamination of grains. The Food and Agriculture Organization of the United Nations (FAO) in collaboration with the International Atomic Energy Agency (IAEA) have produced a manual on the application of HACCP in mycotoxin prevention and control
Risk Profile: Mycotoxins in the New Zealand April 2006 Food Supply
84

(ftp://ftp.fao.org/docrep/fao/005/y1390e/y1390e00.pdf). European efforts in this area are ongoing through a collaborative effort known as the Mycotoxin Prevention Cluster, with a specific project aimed at prevention of Fusarium mycotoxins entering the animals and human food chains (http://www.mycotoxin-prevention.com/Project2.htm). This project has five major tasks: • Development of critical control systems; • Pre-harvest biocontrol; • Post harvest control; • Decontamination using microbial inoculants for prevention of entry into animal
production systems; and • Decontamination using physicochemical means. 5.5.2.3 Management of fumonisin formation in crops Preharvest measures to control Fusarium infection can also reduce the formation of fumonisins (JECFA, 2001d). Control measures include culture techniques, breeding and growing of resistant cultivars and use of fungicides or biological control agents (JECFA, 2001d). Cultural control measures include: • Crop rotation, particularly rotation involving non-host crops. Maize-wheat rotation can
lead to increased incidence of Fusarium diseases, such as head blight; • Removal or ploughing in of crop debris, which may serve as a reservoir for inoculum; • Effective weed control to remove a potential reservoir for inoculum; • Irrigation to reduce water stress and the severity of disease, although overhead irrigation
has been shown to increase the severity of disease (JECFA, 2001d). Differences in cultivar susceptibility to Fusarium has been demonstrated. However, there appears to be a strong cultivar-location interaction and when maize cultivars that accumulated low amounts of fumonisin were grown in other areas they accumulated increased amount of fumonisin (Duvick, 2001). A number of factors may contribute to cultivar resistance to fumonisin accumulation, including:
• Inhibition of fungal invasion (kernel hardness, silk composition, inhibitory compounds, etc.);
• Presence of fumonisin degrading enzymes; • Mechanical barriers or engineered resistance to insect attack (Duvick, 2001).
Maize hybrid have been produced by genetic modification techniques to introduce an endotoxin originally found in Bacillus thuringiensis. These ‘Bt-maize’ hybrids have been shown to accumulate lower amounts of fumonisin than conventional equivalents under conditions of natural and manual insect infestation (Munkvold et al., 1999; Hammond et al., 2004)
Risk Profile: Mycotoxins in the New Zealand April 2006 Food Supply
85

5.5.2.3 Control of fumonisins post-harvest Fumonisin formation post-harvest can be controlled by:
• Prevention of fungal growth and fumonisin production. Fungal species are unable to grow at water activities below 0.65-0.7 (approximately 14-15% grain moisture). Drying of freshly-harvested grain is an effective means of controlling fungal growth and consequent fumonisin production (JECFA, 2001d). Application of propionates controlled growth of Fusarium isolates, although the degree of control depended on the form and concentration of the propionate, the grain water activity, the storage temperature and the Fusarium isolate (Marin et al., 1999). However, none of the treatments had any effect on FB1 production by F. verticillioides, while for F. proliferatum FB1 production generally decreased with increasing concentration of propionate.
• Segregation of high risk material. Maize screenings (broken grains and non-grain material) may contain significantly higher concentrations of fumonisin than whole grains (JECFA, 2001d).
• Chemical and physical decontamination. Ammoniation under conditions of high temperature or pressure has been shown to reduce the concentration of fumonisins in maize by 79%, leaving no mutagenic activity (Park et al., 1992). Reaction with fructose (to block the amine group) has been shown to eliminate the toxicity of FB1 to rats (Lu et al., 1997). Irradiation of maize with 15 kGy of gamma-irradiation sterilized the grain, but only reduced fumonisin levels by approximately 20% (Visconti et al., 1996).
5.5.3 Influence of processing on fumonisin levels 5.5.3.1 Dry milling Katta et al. (1997) monitored the Fusarium and fumonisin content of milling fractions from dry milling of naturally fumonisin-contaminated maize. Mill streams of significance for human food (cornmeal, flour and grits) showed greatly reduced concentrations of FB1 compared to the whole grain, while the bran fraction showed elevated FB1 concentration compared to the whole grain. This is consistent with FB1 contamination being associated with the surface and near-surface regions of the grain. Brera et al. (2004) found similar results, with the concentration of fumonisin in the flour at approximately 9% of the concentration in the whole grain, while concentrations in bran were approximately 160% of the levels in whole grain. 5.5.3.2 Wet milling Bennett et al. (1996) demonstrated that starch produced by wet milling of fumonisin-contaminated maize (initial contamination level 13.9 mg FB1/kg) was free of detectable FB1. The steep water and process water contained 22% of the recoverable toxin, while the germ, fibre and gluten all contained fumonisins at concentrations lower than the whole grain. 5.5.3.3 Nixtamalisation Nixtamalisation or ‘masa-type’ processes involves alkaline cooking and heating of maize for the production of tortillas and related products (Saunders et al., 2001). The initial stage of the
Risk Profile: Mycotoxins in the New Zealand April 2006 Food Supply
86
process involves cooking the maize in a lime solution and overnight steeping. This product is then washed and drained to produce nixtamal, before grinding to produce masa, and sheeting, cutting and cooking to produce tortillas or chips. The initial nixtamalisation process has been shown to reduce fumonisin contamination by 40-80% (Dombrink-Kurtzman et al., 2000; Saunders et al., 2001; Voss et al., 2001). Some of the fumonisin is converted to hydrolysed fumonisin, which is almost as toxic as the parent toxin, however, overall toxin levels are substantially reduced. The subsequent processing steps (masa production, tortilla production) have negligible impact on fumonisin levels (Saunders et al., 2001). 5.5.3.4 Cooking, canning and extrusion Fumonisins are quite heat stable. Significant reductions in fumonisin levels can be achieved by increasing the temperature and/or time of heating. However, the increases necessary to achieve substantial reductions are generally beyond normal commercial processing parameters (Saunders et al., 2001). Castelo et al. (1998) demonstrated decreases of 10-15% of fumonisin levels during canning (121ºC) of corn products, but no significant loss of fumonisins during baking of corn muffins at 204ºC for 20 minutes. Roasting of cornmeal at 218ºC for 15 minutes resulted in almost complete loss of fumonisins, presumably due to the significantly higher internal temperatures reached in the food. Piñeiro et al. (1999) reported a 70-80% reduction in fumonisin levels during frying of polenta or autoclaving of cornmeal. The influence of extrusion on fumonisins has been reviewed by Castells et al. (2005). Various studies have reported decreases in fumonisin concentration following extrusion of maize flour or meal in the range 26-99%. Fumonisin inactivation is increased at higher temperatures and at slower screw speeds. 5.5.3.5 Fermentation Naturally fumonisin-contaminated corn was yeast fermented for ethanol production (Bothast et al., 1992). Fermentation caused little degradation of FB1, with most of the toxin from the original grain being recovered from the distillers’ grains, thin stillage and distillers’ solubles fractions. No toxin was detected in the ethanol or centrifuge solids. Detection of fumonisins in beer (see Table 26) also suggests that fumonisins are resistant to fermentative degradation. 5.6 Conclusions 5.6.1 Description of risks to New Zealand consumers There is consistent epidemiological evidence to suggest that dietary exposure to fumonisins can cause adverse health outcomes in humans. The most likely human health endpoints are liver and oesophageal cancers and neural tube defects, although overt nephrotoxicity appears to be the most sensitive endpoint in laboratory animals. Acute mycotoxicosis resulting in general gastrointestinal symptoms has also been reported.
Risk Profile: Mycotoxins in the New Zealand April 2006 Food Supply
87

While Fusarium species capable of fumonisin production (F. verticillioides, F. proliferatum) have occasionally been found in New Zealand cereal crops (Sayer and Lauren, 1991; Sayer, 1991; Lauren and Di Menna, 1999), these fungal species appear to be relatively rare in New Zealand crops. Limited surveillance of New Zealand maize did not detect fumonisins, although fumonisins have been detected on imported corn. The available evidence suggests that New Zealanders will primarily be exposed to fumonisins through consumption of imported corn. As New Zealanders are generally low level consumers of maize products the risk due to fumonisin exposure in New Zealand is likely to be low. Some of the processes used on maize (extrusion, nixtamalisation) will tend to further decrease the fumonisin content of the food in New Zealand. While indications are that New Zealanders exposure to fumonisins will be very low, there is insufficient New Zealand specific information on the fumonisin content of available foods to define the level of risk. 5.6.2 Commentary on risk management options Fumonisins are not currently regulated in New Zealand. Agronomic research conducted in New Zealand demonstrates a good awareness of the deleterious effects of Fusarium infection, but without specific reference to fumonisins. This is little evidence to suggest that fumonisin-producing Fusarium species occur commonly in New Zealand. 5.6.3 Data gaps General information on the fumonisin content of the New Zealand food supply.
Risk Profile: Mycotoxins in the New Zealand April 2006 Food Supply
88

6 ZEARALENONE 6.1 Hazard identification Zearalenone is a nonsteroidal estrogenic mycotoxin produced by several Fusarium species that proliferate in poorly stored grains, oilseeds and hay. Fusarium infection tends to develop during prolonged cool, wet, growing and harvest seasons (Krska, 1999). Zearalenone occurs in both temperate and warm regions of the world in cereal crops such as corn or maize, barley, oats, wheat, rice and sorghum but also in bread and bananas. The highest incidence rates have been in North America, and central and northern Europe although the occurrence of zearalenone has also been reported in Egypt, South Africa, Italy South America and New Zealand (Krska, 1999). Zearalenone is stable during storage and milling and processing or cooking of food and does not degrade at high temperatures. In mammals, zearalenone is metabolised to the stereoisomers, α- and β- zearalenol and α- and β- zearalenol (Figure 6). The α- isomer of zearalanol, zeranol, has been used as a growth promoter in beef cattle and feedlot lambs in the United States and Canada (Kuiper-Goodman et al., 1987; IARC, 1993) but is not registered for veterinary use in New Zealand (NZFSA, 2006). 6.1.1 Structure and nomenclature The IUPAC chemical name for zearalenone, with the molecular formula C18H22O5, is (3S,11E)-3,4,5,6,9,10-Hexahydro-14,16-dihydroxy-3-methyl-1H-2-benzoxacyclotetradecin-1,7(8H)-dione although it may also be known as 6-(10-hydroxy-6-oxo-trans1-undecenyl)-β-resorcyclic-μ-lactone. Zearalenone shows some structural similarities to the female sex hormone, 17β-estradiol, with two distally located oxygen-containing groups. The chemical structure of zearalenone and the mammalian metabolites zearalenol and zearalanol are shown in Figure 6.
Figure 6: Structure of zearalenone and its major metabolites
Risk Profile: Mycotoxins in the New Zealand April 2006 Food Supply
89
(α, β)-zearalenol zearalenone
O
CH3OOH
OH OH
O
CH3OOH
OH OH
O
CH3OOH
OH O
(α, β)-zearalanol

6.1.2 Occurrence Fusarium taxonomy is complex and some early identifications have been questioned. Zearalenone is now regarded as being produced by F. graminearum, F. culmorum, F. cerealis, F. equiseti, F. crookwellense and F. semitectum (CAC, 2000; Yiannikouris and Jouany, 2002). Other species have been reported to produce zearalenone, however, they appear to be less important with respect to formation of zearalenone in crops (Pitt and Hocking, 1997). All these Fusarium species been detected in New Zealand food crops, except F. cerealis, with F.graminearum seemingly the most prevalent species in the North Island and F. culmorum the most prevalent species in the South Island (Table 13). 6.2 Hazard Characterisation: Adverse Health Effects 6.2.1 Conditions Zearalenone has been implicated in several incidents of adverse human health effects but on the present evidence base, the impact on human health is speculative. Elevated levels of zearalenone have been measured in cancerous and abnormal endometrial tissue compared with normal endometrial tissue from 49 women (Tomaszewski et al., 1998) suggesting a possible link between zearalenone and human endometrial tissue growth. However, in this study, zearalenone was not detected in a further 13 abnormal cases so there is some inconsistency with the observations. Zearalenone or zearalanol was suspected to be a causative agent of precocious puberty after being found in the blood of Puerto Rican girls aged between six months to eight years with early sexual development and who had been exposed to contaminated food (Sàenz de Rodriguez, 1984). Early breast development has also been reported from Hungary where zearalenone was detected in the serum of 5 out of 36 affected subjects and in foods consumed by the subjects (Szuets et al., 1997), implicating zearalenone as a possible causative agent. Zearalenone was found together with other Fusarium mycotoxins in a condition known as “scabby grain toxicosis” reported in China but the significance of this finding is not clear (Peraica et al., 1999). 6.2.2 Toxicity 6.2.2.1 Acute toxicity There have been no reports of acute human toxicity caused by zearalenone. Zearalenone has low acute toxicity after either oral or interperitoneal administration in mice, rats and guinea pigs, with LD50 values ranging from >500 to >20,000 (JECFA 2000, SCF 2000c).
Risk Profile: Mycotoxins in the New Zealand April 2006 Food Supply
90

6.2.2.2 Chronic toxicity The health concerns of exposure to zearalenone relate to its estrogenic activity via estrogen receptor binding. Estrogenicity in the order of 1-50% of the endogenous hormone 17β-estradiol has been reported from receptor binding, cell proliferation and in vivo assays (Kiang et al., 1978, IEH, 2000, Soto et al., 1995, Welshons et al., 1990, Hobson et al., 1977). Estrogen mimicking environmental compounds have been implicated in a range of possible human health effects including reproductive effects (sperm count and quality, cryptorchidism, hypospadias, precocious puberty), neurobehavioural and increased incidence of hormonal cancers. Two global reviews (WHO, 2002; IUPAC/SCOPE, 2003) have concluded that there is no conclusive evidence that low level exposure to such compounds causes human disease. Zearalenone was found to be negative in genotoxicity tests except for chromosomal aberrations at very high concentrations (JECFA 2000, SCF 2000c). 6.2.3 Toxicological assessment JECFA (2000) established a Provisional Maximum Tolerable Daily Intake for zearalenone of 0.5 μg/kg body weight/day based on a dose that had no observed hormonal effects in pigs, the most sensitive species, and a safety factor of 100. SCF (2000c) used the same animal NOEL, but applied a larger safety factor of 200 to derive a temporary Tolerable Daily Intake (t-TDI) of 0.2 μg/kg body weight/day. IARC evaluation assigned zearalenone to Group 3 (not classifiable as to their carcinogenicity to humans) because of inadequate evidence in humans and limited evidence in experimental animals (IARC, 1993). 6.3 Exposure Assessment 6.3.1 Zearalenone in New Zealand cereals In New Zealand, the climate is generally favourable for the growth of Fusarium species. Zearalenone has been found in several investigations: a preliminary investigation of wheat (Agnew et al., 1986), a small study of maize (Hussein et al., 1989), and a large survey of the occurrence of Fusarium mycotoxins in cereals grown in New Zealand in 1986-1989 (Lauren et al., 1991). Lauren et al. (1991) reported finding zearalenone in the majority of maize samples (76%), but at concentrations less than 0.5 mg/kg. In the same study, wheat, barley and oats from six regions in New Zealand showed contamination rates of 32%, 18% and 34% respectively with maximum concentrations of 0.46, 0.17 and 0.09 mg/kg. Samples of commercially grown hybrids of maize taken at harvest from several North Island sites from 1992 to 1994 were analysed for Fusarium mycotoxins including zearalenone (Lauren et al., 1996). Results are summarised in Table 24. Two factors contributing to higher contamination levels were the late harvesting of crops and the use of hybrids that were more susceptible to accumulation of zearalenone.
Risk Profile: Mycotoxins in the New Zealand April 2006 Food Supply
91

Table 24: Distribution of zearalenone contamination of New Zealand maize
Year No. samples % of samples with zearalenone (mg/kg) <0.4 0.4 – 1.0 1.0 – 2.0 >2.0 Max. level
1992 178 67 17 8 7 10.5 1993 162 81 14 3 2 2.7 1994 176 93 3 2 2 6.1 6.3.2 Zearalenone in the New Zealand food supply
A preliminary survey of maize-based foods, mainly cornflakes, was conducted by HortResearch (The Horticulture and Food Research Institute of New Zealand Ltd.) for samples collected in 1993. The range in seven samples (five positives) was from 0.16 to 0.30 mg/kg with a mean concentration of 0.22 mg/kg. A more extensive survey in 1995 examined 124 maize-based foods and found a much lower incidence of contamination (7.2%) (Lauren and Veitch, 1996). Results are presented in Table 25.
Table 25: Zearalenone New Zealand maize-based foods
Food category No. samples No. positives Mean1
(mg/kg) Range
(mg/kg) Breakfast Foods 20 5 0.084 0.05-0.12 Extruded snack foods 20 1 0.14 0.14 Flours; grits 17 2 0.22 0.12-0.30 Breads 16 2 0.10 0.06-0.14 Masa flour products 24 0 - < 0.05 Corn (maize) oils & snack bars 21 0 - < 0.05 Corn syrups & liquid brewing sugar
6 0 - < 0.05
1 mean of positive values 6.3.3 Zearalenone in Australian cereals Zearalenone intoxication of pigs fed contaminated maize and sorghum has been reported in Australia, with maximum levels of 8 mg/kg detected in the maize (Blaney et al., 1984). Williams et al. (1988) reported using wheat naturally contaminated with Fusarium graminearum containing 4 mg zearalenone/kg and 23 mg DON/kg in pig feeding trails. Blaney et al. (1987) examined wheat from southern Queensland – a wheat growing region that was considered to be more likely to suffer rain damage and fungal infection. In 1983, 1291 samples of wheat were examined with 62 found to contain greater than 0.2% of ‘pink grain’ – an indicator of fungal infection. In 1984 and 1985, only general purpose (GP) graded wheat was examined (60 and 80 samples respectively). Eleven lines of wheat from the 1983 harvest and two from the 1984 harvest, containing elevated proportions of pink grains, were analysed and found to contain zearalenone in the range <0.01 to 0.43 mg/kg. The remaining wheat samples were pooled on the basis of grade and receiving depot to give 37 pooled wheat samples across the three harvest years (1983, 1984 and 1985). Zearalenone was detected in
Risk Profile: Mycotoxins in the New Zealand April 2006 Food Supply
92

4/37 pooled wheat samples at concentrations in the range 0.01 to 0.10 mg/kg. All four samples were GP grade wheat. It should be noted that Australian wheat imported into New Zealand is predominantly Australian Standard White (ASW), with lesser amount of Prime Hard (PH). 6.3.4 Zearalenone in the Australian food supply Bryden et al. (1995) detected zearalenone in 14 of 40 retail food samples, including breakfast cereals, snack foods, popcorn, cornflour, maize meal and corn kernels. Results were in the range 0.01-0.068 mg/kg, with a mean for positive results of 0.023 mg/kg. 6.3.5 Overseas context Internationally, there have been many reports of the occurrence of zearalenone in food and feeds from a wide range of countries with the highest prevalence of the toxin occurring in cereals, namely, barley, corn or maize, oats, rice, sorghum and wheat. For reviews see Price and Fenwick (1985), Pohland and Wood (1987), Kuiper-Goodman et al. (1987), JECFA (2000) and SCOOP (2003). The highest concentrations are generally found in corn or maize and lower concentrations in barley, oats, rice and wheat. Zearalenone is also found in grain products such as flour, pasta, pizza, malt, infant foods and breakfast cereals. A collation of the prevalence of zearalenone in foods from temperate climates is shown in Table 26. Although this list is not exhaustive, it provides a wide range of data for comparison with concentrations reported in New Zealand foods (Table 25). Not included are the occasional occurrences in beans, oilseeds, spices and nuts (JECFA, 2000). Where multiple entries are available, a weighted average has been calculated from the mean concentration and corresponding number of positive results. The means cited are calculated from positive samples only. The prevalence and concentrations reported in New Zealand wheat, barley, maize, oats and corn are moderately high compared with international levels.
Table 26: Worldwide data on occurrence of zearalenone in food
Food Country Incidence +ve/total samples
Mean (mg/kg)
Maximum (mg/kg)
Reference
Canada 3/210 5/7
41/180
0.013 0.17
≤0.0003
0.021 NR NR
JECFA, 2000
Czechoslovakia 58% NR 0.26 JECFA, 2000 Finland
2/30 5/20
0.026 0.031
0.030 0.053
JECFA, 2000 SCOOP, 2003
Germany NR 0/14
24/46
0.003-0.036 0
0.024
0.31 0
0.32
JECFA, 2000
Barley
Japan 7/17 13/18 29/31
1/1
4.16 0.024 0.024 0.004
15.3 0.097 0.39
0.004
JECFA, 2000 JECFA, 2000
Risk Profile: Mycotoxins in the New Zealand April 2006 Food Supply
93

Risk Profile: Mycotoxins in the New Zealand April 2006 Food Supply
94
Food Country Incidence +ve/total samples
Mean (mg/kg)
Maximum Reference (mg/kg)
Korea 0/30 20/39 21/28 10/30
0 0.29 0.11
0.036
0 1.42 1.28 0.17
JECFA, 2000 Park et al.,2002
Netherlands 6/7 0.007 0.009 JECFA, 2000 Sweden, Norway
23/329 0.018 NR JECFA, 2000
USA 1/1 <0.019 <0.019 JECFA, 2000 Argentina 677/2271 0.16 2.0 JECFA, 2000 Austria 83/198 0.088 0.34 SCOOP, 2003 Brazil 15/364 NR 9.8 JECFA, 2000 Brazil 65/214 0.16 0.72 Vargas et al.,2001Bulgaria 0/264 0 0 JECFA, 2000 Canada 374/2225
2/19 0/6
2.74 NR 0
141.0 NR 0
JECFA, 2000
China 17/47 5/5
0.044 NR
0.17 NR
JECFA, 2000
Czechoslovakia 7% 0.11 NR JECFA, 2000 France 246/280 0.13 1.82 SCOOP, 2003 Germany 6/7 0.012 0.035 JECFA, 2000 Hungary 17% 0.03 0.079 JECFA, 2000 Italy 14/15 0.046 0.15 JECFA, 2000 Italy 45/48 0.67 6.49 SCOOP, 2003 Korea 9/61 0.14 0.39 JECFA, 2000 Korea 4/18 0.005 0.006 Park et al.,2002 Netherlands 1/1 0.68 NR JECFA, 2000 UK 128/139 0.12 0.58 SCOOP, 2003 USA NR
16/628 37/351
0.90 NR 0.50
NR 0.50 NR
JECFA, 2000
Corn/maize
Yugoslavia 3/100 5.1 10.0 JECFA, 2000 Canada 15/154 0.025 0.18 JECFA, 2000 Iran 19/19 0.38 0.89 Oveisi et al., 2005Italy 16/53 0.045 0.099 SCOOP, 2003 Korea 9/47 0.022 0.084 Park et al.,2002 UK 4/8 0.012 0.017 SCOOP 2003
Cornflour
USA 3/11 0.038 0.10 JECFA, 2000 Canada 1/1 0.01 0.01 JECFA, 2000 Norway 33/50 0.005 0.014 SCOOP, 2003
Cornflakes
UK 7/15 0.046 0.17 SCOOP, 2003 USA 7/8 0.012 0.020 JECFA, 2000 Corn cereals Canada 0/60 0 0 JECFA, 2000 Canada 1/1 0.025 0.025 JECFA, 2000 Iran 19/19 0.83 1.47 Oveisi et al., 2005UK 27/54 0.038 0.086 SCOOP 2003
Corn snacks
USA 1/14 0.01 0.01 JECFA, 2000 Austria 3/192 0.027 0.030 SCOOP, 2003 Canada 0/NR 0 0 JECFA, 2000 Finland 3/21
30/30 0.063 0.64
0.086 1.31
JECFA, 2000 SCOOP 2003
Germany 4/14 0.007 0.011 JECFA, 2000
Oats
Netherlands 3/4 0.017 0.029 JECFA, 2000

Risk Profile: Mycotoxins in the New Zealand April 2006 Food Supply
95
Food Country Incidence +ve/total samples
Mean (mg/kg)
Maximum Reference (mg/kg)
Sweden, Norway Norway
14/233 8/22
0.026 0.0003
NR 0.002
JECFA, 2000 SCOOP, 2003
UK 0/4 0 <0.008 SCOOP, 2003 USA 1/1 0.018 0.018 JECFA, 2000 India 0/30 0 0 JECFA, 2000 Germany 0/3 0 0 SCOOP 2003 Russia 0/280 0 0 JECFA, 2000 Papua, New Guinea
1/1 3.06 3.06 JECFA, 2000
UK 0/100 0 0 SCOOP, 2003
Rice
Uruguay 3/42 NR >0.2 Piñeiro et al., 1996
Canada 0/1 0 0 JECFA, 2000 Denmark 2/30 0.001 0.002 Rasmussen et al.,
2003 Germany 17/37
2/3 0.016 0.013
0.10 0.024
JECFA, 2000 SCOOP 2003
Finland 0/12 0 0 SCOOP 2003 Korea 3/5 0.002 0.004 JECFA, 2000 Netherlands 1/4 0.011 NR JECFA, 2000
Rye
Sweden, Norway Norway
0/31 0/4
0 0
0 0
JECFA, 2000 SCOOP 2003
Brazil 0/12 0 0 JECFA, 2000 Canada 19/193 0.011 0.033 JECFA, 2000 China 13/36 <0.01 NR JECFA, 2000 Denmark 10/30 0.001 0.002 Rasmussen et al.,
2003 Germany
208/500 1/5
0.085 0.072
8.04 0.072
JECFA, 2000 SCOOP, 2003
Finland 2/40 1/39
0.022 0.001
0.032 0.001
JECFA, 2000 SCOOP, 2003
France 72/72 0.011 0.052 SCOOP, 2003 India 0/30 0 0 JECFA, 2000 Japan 9/26 0.38 1.69 JECFA, 2000 Korea 2/10 0.008 0.040 JECFA, 2000 Netherlands 7/13 0.045 0.17 JECFA, 2000 Russia 5/191 NR NR JECFA, 2000 Sweden, Norway Norway
7/101 9/35
0.005 0.003
NR 0.013
JECFA, 2000 SCOOP 2003
Taiwan 9/22 0.016 0.032 JECFA, 2000 UK 14/41 0.007 NR JECFA, 2000 Uruguay 5/106 NR >0.2 Piñeiro et al.,
1996
Wheat
USA 19/42 NR 11.1 JECFA, 2000 China 0/4 0 0 JECFA, 2000 Germany 1/4 0.013 0.013 SCOOP 2003 Japan 3/27 0.003 0.006 JECFA, 2000
Wheat flour
USA 2/17 0.013 0.014 JECFA, 2000 Bread -white
UK 1/40 0.016 0.016 SCOOP, 2003

Risk Profile: Mycotoxins in the New Zealand April 2006 Food Supply
96
Food Country Incidence +ve/total samples
Mean (mg/kg)
Maximum Reference (mg/kg)
Egypt 0/6 0 0 JECFA, 2000 Korea 0/37 0 0 Park et al.,2002
Dried fruit and vegetables Uruguay 7/253 NR >0.2 Piñeiro et al.,
1996 Uruguay 0/58 0 0 Piñeiro et al.,
1996 Meat products
Canada 0/34 0 0 JECFA, 2000 Canada 9/60
59/181 0.004 0.013
NR 0.035
JECFA, 2000 Lombaert et
al.,2003 Germany 4/171 0.011 0.014 SCOOP 2003 Japan 0/27 0 0 JECFA, 2000
Infant foods
UK 2/34 0.012 0.012 SCOOP, 2003 NR = no result available, High levels of zearalenone have been reported in African beer (up to 4.6 mg/kg; JECFA, 2000), however, studies carried out in Korea and Canada, analysing local and imported beers, did not detect any residues of zearalenone or its metabolites (Shim et al., 1997; Scott et al., 1993). Very high levels of zearalenone have also been reported for moldy bananas from India (17 mg/kg) and tomatoes from Egypt (80 mg/kg) (JECFA, 2000). However, these results do not appear to be representative of contamination in the products in general. Zearalenone and its metabolites (α- and β-zearalenol) can be transmitted to the milk of cows, sheep and pigs, although these observations come from studies where animals were fed elevated levels of zearalenone and residues have not been detected in a single study of normal retail milk samples (country of survey not stated; JECFA, 2000). In contrast, El-Hoshy (1999) reported detection of zearalenone in 20% of randomly sampled Egyptian raw milk samples (range 0.003-0.010 mg/kg) and 15% of pasteurised milk samples (range 0.001-0.007 mg/kg). Zearalenone was also detected in condensed milk, milk powder, and hard and soft cheeses. Sypecka et al. (2004) fed hens a diet naturally contaminated with zearalenone at 0.5 mg/kg. No residues of zearalenone or its metabolites were detected in eggs. Dänicke et al. (2002) also did not find zearalenone or its metabolites in eggs or muscle of hens fed contaminated maize with a zearalenone content of 1.58 mg/kg. Zearalenone and its metabolites are able to be transmitted to organ and muscle meats, with the liver being the main organ of accumulation (JECFA, 2000). Chickens fed 100 mg zearalenone/kg for eight days had 0.059-0.103 mg zearalenone/kg in muscle and up to 0.68 mg zearalenone/kg in liver (JECFA, 2000). El-Hoshy (1999) found residues of zearalenone in 20% of fresh and 24% of frozen meat samples and in 25%, 25%, 15% and 20% of minced meat, sausage, beef burger and luncheon samples from Egypt. Mean zearalenone levels were typically 0.005-0.009 mg/kg. Since grain feeding of ruminant animals is not usual in New Zealand, domestic meat and milk supplies are unlikely to be a significant source for the New Zealand consumer. Feeding of contaminated grain to poultry may result in some transmission of zearalenone residues into
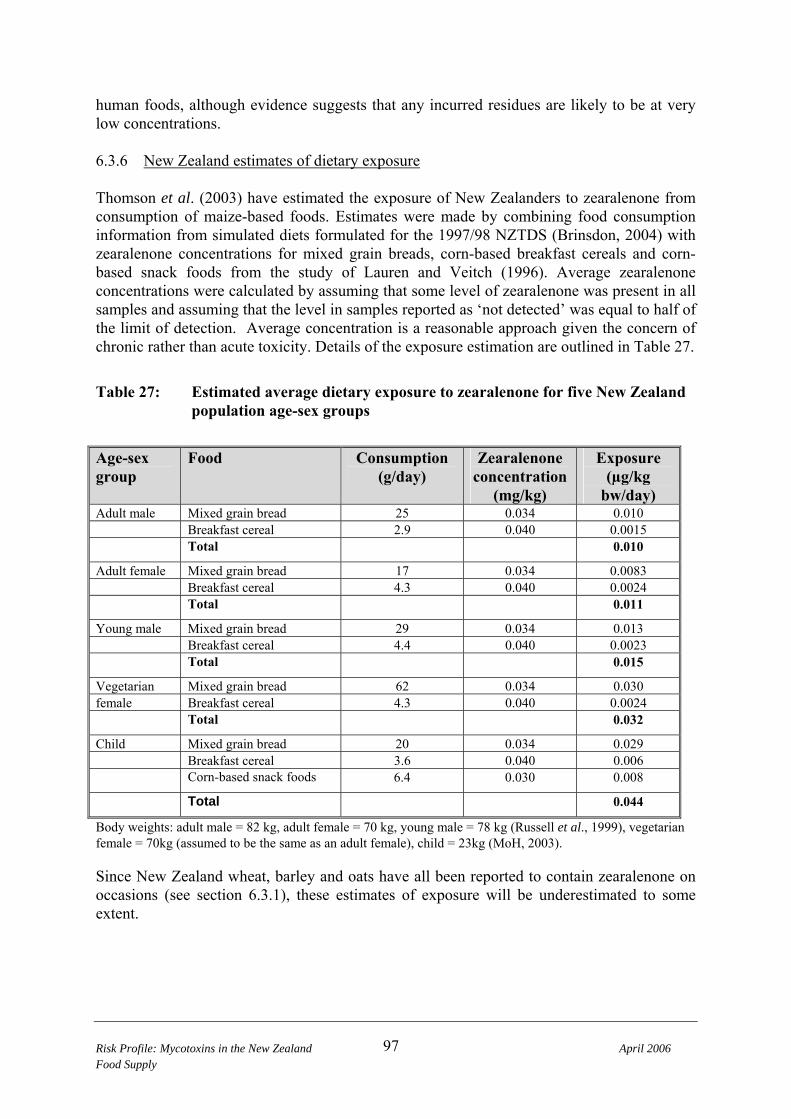
human foods, although evidence suggests that any incurred residues are likely to be at very low concentrations. 6.3.6 New Zealand estimates of dietary exposure Thomson et al. (2003) have estimated the exposure of New Zealanders to zearalenone from consumption of maize-based foods. Estimates were made by combining food consumption information from simulated diets formulated for the 1997/98 NZTDS (Brinsdon, 2004) with zearalenone concentrations for mixed grain breads, corn-based breakfast cereals and corn-based snack foods from the study of Lauren and Veitch (1996). Average zearalenone concentrations were calculated by assuming that some level of zearalenone was present in all samples and assuming that the level in samples reported as ‘not detected’ was equal to half of the limit of detection. Average concentration is a reasonable approach given the concern of chronic rather than acute toxicity. Details of the exposure estimation are outlined in Table 27.
Table 27: Estimated average dietary exposure to zearalenone for five New Zealand population age-sex groups
Age-sex group
Food Consumption (g/day)
Zearalenone concentration
(mg/kg)
Exposure (µg/kg
bw/day) Adult male Mixed grain bread 25 0.034 0.010 Breakfast cereal 2.9 0.040 0.0015 Total 0.010
Adult female Mixed grain bread 17 0.034 0.0083 Breakfast cereal 4.3 0.040 0.0024 Total 0.011
Young male Mixed grain bread 29 0.034 0.013 Breakfast cereal 4.4 0.040 0.0023 Total 0.015
Vegetarian Mixed grain bread 62 0.034 0.030 female Breakfast cereal 4.3 0.040 0.0024 Total 0.032
Child Mixed grain bread 20 0.034 0.029 Breakfast cereal 3.6 0.040 0.006 Corn-based snack foods 6.4 0.030 0.008
Total 0.044
Body weights: adult male = 82 kg, adult female = 70 kg, young male = 78 kg (Russell et al., 1999), vegetarian female = 70kg (assumed to be the same as an adult female), child = 23kg (MoH, 2003). Since New Zealand wheat, barley and oats have all been reported to contain zearalenone on occasions (see section 6.3.1), these estimates of exposure will be underestimated to some extent.
Risk Profile: Mycotoxins in the New Zealand April 2006 Food Supply
97

6.3.7 Overseas estimates of dietary exposure A summary of overseas exposure estimates for zearalenone is given in Table 28.
Table 28: Overseas estimates of dietary exposure to zearalenone
Country Population group Mean exposure
(µg/kg body weight/day)
Reference
t-TDI = 0.2 or 0.5 µg/kg body weight/day African diet Adult, 60 kg 0.041 JECFA, 2000 European diet Adult, 60 kg 0.025 JECFA, 2000 Far Eastern diet Adult, 60 kg 0.056 JECFA, 2000 Latin American diet
Adult, 60 kg 0.036 JECFA, 2000
Middle Eastern diet
Adult, 60 kg 0.059 JECFA, 2000
Austria Adults, 75 kg 0.028 SCOOP, 2003 Canada Adults, 60 kg <0.016 JECFA, 2000 Denmark 0.02 SCF, 2000c Finland Adult, 77.1 kg 0.027 SCOOP, 2003 France Adult, 66.4 kg
Male, 73.9 kg Female, 60.1 kg Child, 3-15 yrs, 31.6 kg
0.027 0.029 0.024 0.042
SCOOP, 2003
France Adult, 15+ years 0.033 Leblanc et al., 2005 France Child, 3-14 years 0.066 Leblanc et al., 2005 Italy Adults, 70kg 0.0008 SCOOP, 2003 Netherlands Adults, 65.8 kg
Child, 1-4 years, 13.8 kg Child, 1-6 years, 17.1 kg
0.021 0.046 0.050
SCOOP, 2003
Norway Male, 81 kg Female, 66 kg Infant, 6 months, 8 kg
0.008 0.007
0.012-1.51
SCOOP, 2003
Norway 0.02 SCF, 2000c Portugal Total population, 65 kg 0.004 SCOOP, 2003 United Kingdom Adult male, 70.1 kg
Adult female, 70.1 kg Infant, 6-12 mths, 8.7 kg Child, 4-6 yrs, 20.5 kg
0.014 0.013 0.050 0.055
SCOOP, 2003
USA 0.03 SCF, 2000c The New Zealand average exposure estimates of 0.01 µg/kg bw/day for adults are comparable with average intake estimates for Norway and the UK and similar, but perhaps slightly lower than those for a number of other temperate western countries (Austria, Canada, Denmark, Finland, France and the Netherlands).
Risk Profile: Mycotoxins in the New Zealand April 2006 Food Supply
98
The higher intake by children compared with adults, and the level of exposure of New Zealand children, is consistent with findings for British, French and Dutch children (SCOOP, 2003). Whilst maize and maize products were significant sources of zearalenone for consumers in the UK and Italy, wheat bread was a significant contributor to intake of zearalenone for adults (and children) from Austria, France and Germany. The exclusion of wheat products in the New Zealand estimate may result in an underestimation of average intake. 6.4 Risk Characterisation 6.4.1 Adverse health effects in New Zealand No cases of human adverse health effects attributable to zearalenone exposure have been reported in New Zealand. 6.4.1.1 Risk assessment and other activities In a risk assessment covering a range of natural and synthetic dietary estrogenic compounds, zearalenone was shown to be the most estrogenic compound (Thomson et al., 2003). However, a lack of information on blood levels resulting from dietary exposure precluded an assessment of zearalenone’s contribution to total dietary estrogenic exposure. 6.4.2 Adverse health effects overseas A causative role of zearalenone in human health outcomes has not been established. 3.4.2.3 Risk assessments and other activity overseas JECFA JECFA concluded that hormonal effects were the most critical for zearalenone (JECFA, 2000). Hepatocellular adenomas and pituitary cancers observed in long-term rodent studies were concluded to be a consequence of the estrogenic activity of zearalenone, rather than any overt genotoxicity. SCF The EU Scientific Committee on Food considered zearalenone, as part of a wider consideration of Fusarium toxins (SCF, 2000). The Committee concurred with the conclusions reached by JECFA, but suggested that further work was required on no hormonal effect levels in pigs, on the potential genotoxicity of zearalenone, on blood levels in humans with known dietary intake, and on differences in metabolism between species.
Risk Profile: Mycotoxins in the New Zealand April 2006 Food Supply
99

Canada Kuiper-Goodman et al. (1987) reported the outcomes of a risk assessment for zearalenone. A safety limit was calculated, based on estrogenicity (0.1 μg/kg body weight/day) and based on tumourigenicity in rats and mice (0.05 μg/kg body weight/day for an excess risk level of one in 106). The authors recommended that, on the basis of the risk assessment, no immediate regulatory action was necessary, but that zearalenone exposure should be kept as low as technologically possible. It was also recommended that data on zearalenone contamination of non-maize foods be collected and that further information on genotoxicity and comparative metabolism be sought. Codex Codex, through the 32st meeting of the Codex Committee on Food Additives and Contaminants (CAC, 2000), reviewed a position paper on zearalenone (prepared by Norway) and concluded that:
• The best way to protect consumers from the toxic effects of zearalenone is to reduce fungal infection of cereals and consequent toxin production,
• Codex should continue work on development of a Code of Practice for reducing levels of mycotoxins in cereals, and
• There was still a requirement to establish maximum zearalenone limits for risk products intended for high risk consumers.
6.5 Risk Management Information 6.5.1 Relevant food controls: New Zealand 6.5.1.1 Establishment of regulatory limits Zearalenone is not currently regulated in New Zealand. 6.5.2 Relevant food controls: overseas 6.5.2.1 Establishment of regulatory limits In 2003, at least 17 countries reported having regulatory limits for zearalenone in food (van Egmond and Jonkers, 2003). Table 29 summarises the reported regulatory positions on zearalenone for different foods in different countries.
Table 29: Regulatory limits for zearalenone in various countries (food regulations only)
Country Commodity description Regulatory limit (mg/kg) Armenia All foods 1.0 Austria Wheat, rye, durum wheat 0.06 Belarus Barley, wheat, maize 1.0 Bulgaria Processed cereal products 0.1 Colombia sorghum 1.0
Risk Profile: Mycotoxins in the New Zealand April 2006 Food Supply
100

Risk Profile: Mycotoxins in the New Zealand April 2006 Food Supply
101
Country Commodity description Regulatory limit (mg/kg) Egypt Wheat, barley, maize, cereal flours
and products, confectionery products, legume vegetables, fats, oils
1.0
France Cereal and cereal products Vegetable oils
0.05 0.2
Hungary Milled cereal product, cereal constituent of muesli
0.1
Indonesia Maize Not detectable Iran Barley
Maize, rice, wheat 0.4 0.2
Italy Baby food Cereals and cereal products
0.02 0.1
Mexico Wheat and wheat flour, barley and barley flour, maize and maize flour
1.0
Morocco Cereals, vegetable oils 0.2 Russian Federation Wheat, barley, maize, corn 1.0 Serbia and Montenegro
Corn 1.0
Ukraine Grain-based baby foods Grains, beans, sunflower press, flour, bread, all nuts, all seeds, vegetable oil, wheat middlings
0.04 1.0
Uruguay Corn, barley 0.2 From van Egmond and Jonkers (2003) 6.5.2.2 Codes of practice and related initiatives Codex have produced a Code of Practice for prevention and reduction of mycotoxin contamination in cereals, with specific annexes relating to OTA, zearalenone, fumonisins and trichothecenes (http://www.codexalimentarius.net/download/standards/406/CXC_051e.pdf). Recommended practices cover planting, preharvest, harvest, storage and transport. The zearalenone specific annex identifies monitoring of establishment of Fusarium infection during cereal flowering and winnowing of grain at harvest or later, to remove small, shriveled grains as specific GAP measures. The Code also discusses a HACCP approach to control of mycotoxin contamination of grains. The Food and Agriculture Organization of the United Nations (FAO) in collaboration with the International Atomic Energy Agency (IAEA) have produced a manual on the application of HACCP in mycotoxin prevention and control (ftp://ftp.fao.org/docrep/fao/005/y1390e/y1390e00.pdf). European efforts in this area are ongoing through a collaborative effort known as the Mycotoxin Prevention Cluster, with a specific project aimed at prevention of Fusarium mycotoxins entering the animals and human food chains (http://www.mycotoxin-prevention.com/Project2.htm). This project has five major tasks: • Development of critical control systems; • Pre-harvest biocontrol; • Post harvest control;

• Decontamination using microbial inoculants for prevention of entry into animal production systems; and
• Decontamination using physicochemical means. 6.5.2.3 Management of zearalenone formation in crops Preharvest measures to control Fusarium infection can also reduce the formation of zearalenone (JECFA, 2000). Zearalenone production appears to be favoured by wet, cool weather. Control measures include culture techniques, breeding and growing of resistant cultivars and use of fungicides or biological control agents (JECFA, 2000). Cultural control measures include: • Crop rotation, particularly rotation involving non-host crops. Maize-wheat rotation can
lead to increased incidence of Fusarium diseases, such as head blight; • Removal or ploughing in of crop debris, which may serve as a reservoir for inoculum; • Effective weed control to remove a potential reservoir for inoculum; • Irrigation to reduce water stress and the severity of disease, although overhead irrigation
has been shown to increase the severity of disease. 6.5.2.3 Control of zearalenone post-harvest Zearalenone can be formed in crops during storage , as well as in the field (JECFA, 2000). Formation during storage is assisted by elevated grain moisture levels due to incorrect harvest time or improper grain drying. Storage of grain under modified atmospheres (20-60% carbon dioxide with 5 or 20% oxygen) resulted in complete inhibition of zearalenone production. However, lower carbon dioxide concentrations were required to achieve complete inhibition at lower oxygen levels (Paster et al. (1991). Gamma-irradiation of wheat or flour at dose levels of 6 kGy completely eliminated fungal flora. Irradiation at 4 kGy resulted in a decrease in Fusarium toxin levels, while irradiation at 8kGy resulted in elimination of toxins (Aziz et al., 1997). 6.5.3 Influence of processing on fumonisin levels 6.5.3.1 Dry milling In studies on naturally contaminated yellow corn, cleaning prior to milling only removed 3-10% of zearalenone. Highest zearalenone levels were found in the mill fractions associated with the outer grain layers (germ, degermer fines, bran meal and hulls) while the starchy milling fractions (grits, meal, flour) contained only 10-22% of the total zearalenone (Bennett et al., 1976). When wheat containing 2.05 mg zearalenone/kg was experimentally milled, break and reduction flour contained decreased concentrations of zearalenone (0.7-1.1 mg/kg), while concentrations were higher in bran, middlings and shorts (2.6-4.8 mg/kg) (Lee et al., 1987). L’vova et al. (1998) reported that milling of zearalenone-contaminated wheat resulted in 83% of the mycotoxin being found in the bran, while only 17% was found in the flour.
Risk Profile: Mycotoxins in the New Zealand April 2006 Food Supply
102

Feedmilling of barley results in approximately 85% of zearalenone being removed with the screenings and hull fractions. Only 3% of initial zearalenone passed into the barley groats (L’vova et al., 1998). 6.5.3.2 Wet milling Lauren and Ringrose (1997) the wet milling fractions of maize for zearalenone contamination. The aqueous fractions (light steep liquid and corn steep liquor) contained detectable amounts of zearalenone. Zearalenone concentrations in the solid products of the wet milling process (germ, fibre, gluten) were 2-3 times those in the raw maize. Elevated levels of zearalenone were also found in animal feed products and maize oil. 6.5.3.3 Cooking Breadmaking reduces zearalenone levels by 23-34% compared to the feed flour (L’vova et al., 1998). Instant noodle manufacture reduced zearalenone levels by 48-62% (Ryu et al., 2002), while biscuit production reduced levels by 16-27% (Ryu et al., 2002). While no studies of the impact of maize nixtamalisation (alkaline cooking) on zearalenone levels were identified, Lauren and Smith (2001) demonstrated that heating of zearalenone-contaminated maize for up to 12 days at 110ºC, following sodium bicarbonate treatment, had no impact on zearalenone content. Roasting of zearalenone contaminated wheat or barley produced reduction in zearalenone levels by 90% following heating at 220ºC for 25 minutes (Yumbe-Guevara et al., 2003). Extrusion cooking of corn grits at temperatures in the range 120-160ºC resulted in reductions in zearalenone concentrations in the range 66-83%. The moisture content of the grits (18-26%) had no significant effect on zearalenone reduction (Ryu et al., 1999). 6.5.3.4 Fermentation Fermentation of corn with Saccharomyces uvarum for 5 days at 32ºC resulted in little destruction of zearalenone (Bennett et al., 1981). Additional evidence for the ability of zearalenone to survive the fermentation process comes from its occurrence in native beers from southern Africa (JECFA, 2000). Ethanol produced from fermentation and distillation of contaminated maize did not contained detectable zearalenone (Bennett et al., 1981).
Risk Profile: Mycotoxins in the New Zealand April 2006 Food Supply
103

6.6 Conclusions 6.6.1 Description of risks to New Zealand consumers The link between zearalenone exposure and human health effects is currently speculative. Although zearalenone has been clearly demonstrated to have significant estrogenic activity, the significance of this activity at dietary concentrations in uncertain. There is clear evidence of the presence of Fusarium fungi that are known to produce the mycotoxin zearalenone, occurring in both the North and South Islands of New Zealand. The work of Lauren and Veitch (1996) demonstrated the presence of zearalenone in New Zealand corn based foods. International data show that the prevalence and concentrations of zearalenone in food are highly variable. The results available suggest that the prevalence and concentrations reported in the New Zealand foods are moderately high compared with that reported for temperate countries (JECFA, 2000; SCOOP 2003; Vargas et al (2001); Park et al, (2002); Rasmussen et al,2003) . Initial estimates of dietary exposure to zearalenone in New Zealand suggest that exposure to well below internationally agreed tolerable daily intake levels. However, it should be noted that exposure estimates in New Zealand are based solely on the presence of the toxin in maize-based foods. Wheat-based foods are consumed in much higher amounts in New Zealand and occurrence of zearalenone has been reported in New Zealand-grown wheat (Lauren et al., 1991). 6.6.2 Commentary on risk management options New Zealand does not currently regulate the level of zearalenone in food, in contrast to a number of other countries. The concentrations found in New Zealand foods (Lauren and Veitch, 1996) were below any of these regulatory limits with the exception of a corn meal that would exceed the limit specified by Italy and Uruguay for cereal products and corn respectively. New Zealand does not currently exercise direct risk management measures to control the entry of zearalenone into the human food chain. Control of zearalenone is likely to occur as a consequence of GAP and GMP practices, designed to achieve other quality and safety objectives. 6.6.3 Data gaps The major data gap at present is the establishment of a definitive link between zearalenone exposure and adverse human health effects, although expert bodies such as JECFA and SCF feel that there is sufficient evidence to recommend that exposure be kept as low as possible and further work be undertaken to elucidate the toxicity to humans. In New Zealand information on zearalenone contamination in wheat, wheat-based products and infant cereals is currently limited .
Risk Profile: Mycotoxins in the New Zealand April 2006 Food Supply
104
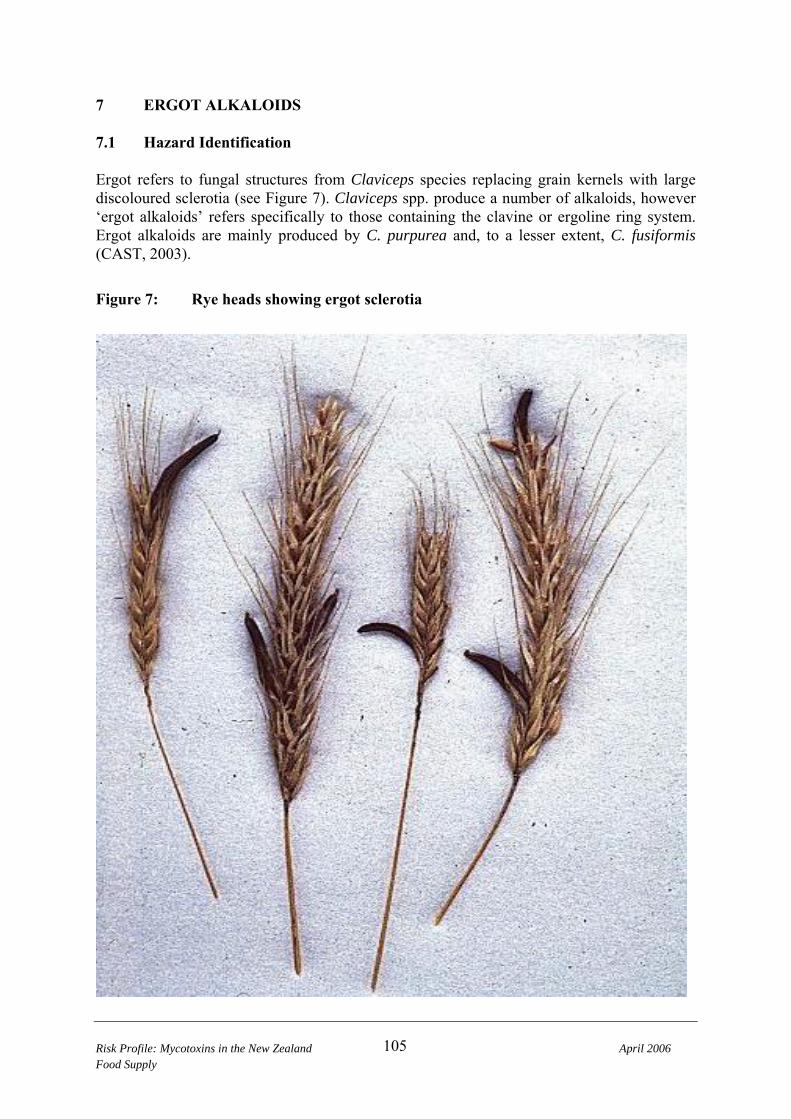
7 ERGOT ALKALOIDS 7.1 Hazard Identification Ergot refers to fungal structures from Claviceps species replacing grain kernels with large discoloured sclerotia (see Figure 7). Claviceps spp. produce a number of alkaloids, however ‘ergot alkaloids’ refers specifically to those containing the clavine or ergoline ring system. Ergot alkaloids are mainly produced by C. purpurea and, to a lesser extent, C. fusiformis (CAST, 2003).
Figure 7: Rye heads showing ergot sclerotia
Risk Profile: Mycotoxins in the New Zealand April 2006 Food Supply
105

7.1.1 Structure and nomenclature Ergot alkaloids are derivatives of lysergic acid and can be divided into three main groups:
• Group I: Derivatives of lysergic acid (ergotamine, alpha-ergocryptinine, ergocristine, ergosine, ergocornine, ergometrine);
• Group II: Derivatives of isolysergic acid (ergocristinine, ergometrinine, ergosinine, ergocorninine, alpha-ergocryptinine, ergotamine);
• Group III: Derivatives of dimethylergolin (clavines; agrocalvine, elymoclavine, chanoclavine, penniclavine, setoclavine)
The basic skeletal structures for the ergoline and clavinet ergot alkaloids are shown in Figure 8.
Figure 8: Structure of ergot alkaloids
Reproduced from WHO (1990) 7.1.2 Occurrence Sclerotia are compact hyphal structures that develop in the colonies of many fungal genera (WHO, 1990). Sclerotia formed by Claviceps spp. are unique in terms of size (up to several centimetres in length), colouration, and content of highly biologically active alkaloids. Host plants for Claviceps species mainly belong to the grass family. C. purpurea has a particularly wide host range. The cereals most commonly colonised by C. purpurea are rye, wheat, triticale, barley, oats and sorghum. The ergot of C. purpurea contains group I and II ergolines. C. fusiformis is a parasite of pearl millet in Africa and East Asia and its ergot contains mainly group III ergolines (WHO, 1990). Ergot alkaloids have been isolated from Aspergillus, Rhizopus and Penicillium fungi and from some higher plants (WHO, 1990). However, it is not known whether these sources represent human exposure routes.
Risk Profile: Mycotoxins in the New Zealand April 2006 Food Supply
106

Incidence of C. purpurea appears to be related to high humidity and low maximum temperatures in midsummer (Webster, 1980). These conditions probably cause an extension of the period during which cereals are susceptible to infection. In New Zealand, C. purpurea has been reported on barley, rye and wheat, as well as a large number of non-food crops (Pennycook, 1989). In the middle of the last century in New Zealand, ergot was reported to be rarely found on wheat, oats or two-row malting barley (Neill, 1941). Six-row barley was reported to be heavily ergotised in some areas, while rye was little grown in New Zealand. Two- and six-row barley refer to the number of rows of barley grains that make up the plant head (see http://dev.gramene.org/species/hordeum/barley_intro.html for more detail). 7.2 Hazard Characterisation: Adverse Health Effects 7.2.1 Conditions Ergotism has been known to man for centuries and numerous epidemics occurred in Europe between the 9th and 18th centuries, where it was known as St. Anthony’s fire (WHO, 1990). Two types of disease may occur:
• Gangrenous ergotism. The affected part (arm or leg) shrinks, becoming mummified and dry, with the gangrene gradually spreading. The gangrenous form of ergotism is probably caused by the vasoconstrictive properties of Group I and II alkaloids (ergotamine-like). Symptoms include edema, pruritis, necrotic extremities, prickling sensations and severe muscular pain (CAST, 2003).
• Convulsive ergotism. The whole body is attacked by general convulsions, returning at intervals of a few days. The convulsive form of ergotism appears to be caused by Group III alkaloids produced by C. fusiformis. Symptoms include tingling under the skin, pruritis, numbness of extremities, muscle cramps, convulsions and hallucinations (CAST, 2003).
7.2.2 Toxicity 7.2.2.1 Acute toxicity No information was available on the acute toxicity of individual ergot alkaloids or of the ergot complex (WHO, 1990). 7.2.2.2 Chronic toxicity Limited experimental studies have been carried out on animals and usually involve feeding of whole ergot, rather than individual ergolines (WHO, 1990). Study results reported include:
• Cattle. Feed containing more than 10 g ergot/kg (1%) commonly produced lameness in cattle, sometimes leading to gangrene. Cattle fed 1 mg ergotamine tartrate/kg body weight became ill in 1-2 days and four of six died within 10 days. Symptoms included anorexia, hyperventilation, cold extremities, salivation and tongue necrosis. Post-mortem examination found extensive intestinal inflammation (WHO, 1990).
• Sheep. Four lambs were fed 0.12 to 0.75 g ergot/kg body weight for two months. Lambs on higher doses became ill within 2-6 days, with symptoms including diarrhea,
Risk Profile: Mycotoxins in the New Zealand April 2006 Food Supply
107
edema of the hind legs and tail and lameness. Post-mortem examination found inflammation and necrosis of the forestomach and intestinal mucosa (WHO, 1990).
• Swine. A diet containing 40 g ergot/kg (4%) was well tolerated. Depression of growth rate was observed with diets containing 100 g ergot/kg (10%) (WHO, 1990). Diets containing 0, 1 or 10g ergot/kg (0.05, 0.6 or 4.66 mg total alkaloids /kg) fed ad libitum to 12 pigs produced no symptoms of ergot poisoning or carryover of alkaloids into meat. Reduced feed intake and reduced body weight gain were observed at the highest dose level (Mainka et al., 2005a).
• Primates. Male rhesus monkeys were dosed with either ergot from C. fusiformis or ergoline extract from the ergot, for up to one month. No effect was observed exception for animals receiving intraperitoneal doses of 5.4-11.1 mg ergoline/kg body weight. Within 10 minutes of dosing animals exhibited symptoms of drowsiness, hyperexcitation, redness of face, and loss of response to thermal and tactile stimuli in the hind limbs and tail (WHO, 1990).
Poultry appear to be relatively unaffected by ergot exposure. Mainka et al. (2005b) confirmed this observation in a study of the impact of ergot contaminated feed on the performance and health of piglets and chickens. The critical level of ergot alkaloid exposure for piglets was in the range 5.6 to 11.1 mg total alkaloid/kg diet, with feed intake and live weight gains significantly decreased. In chickens, inflammation of the proximal duodenum was observed at dose levels of 2.8 and 11.1 mg total alkaloid/kg diet, but live performance was unaffected. 7.2.3 Toxicological assessment The EU Scientific Panel on Contaminants in the Food Chain have carried out an assessment of the risks of ergot in animal feed (SPCFC,2005). In addition to conclusions relevant to animal health and welfare, they concluded that levels of ergot alkaloids in animal tissues was unlikely to be a significant source of human exposure. 7.3 Exposure Assessment 7.3.1 Ergot in the New Zealand food supply No information was identified on the incidence or concentrations of ergot or ergot alkaloids in New Zealand cereals. 7.3.2 Ergot in the Australian food supply No information was identified on the incidence or concentrations of ergot or ergot alkaloids in Australian cereals. The lack of any such information was confirmed by an ANZFA toxicological review (http://www.foodstandards.gov.au/_srcfiles/P158_FAR.pdf). Considerable information is available on sorghum ergot, caused by C. africana and C. sorghi, but it is uncertain whether this plant disease has any relevance for human health.
Risk Profile: Mycotoxins in the New Zealand April 2006 Food Supply
108
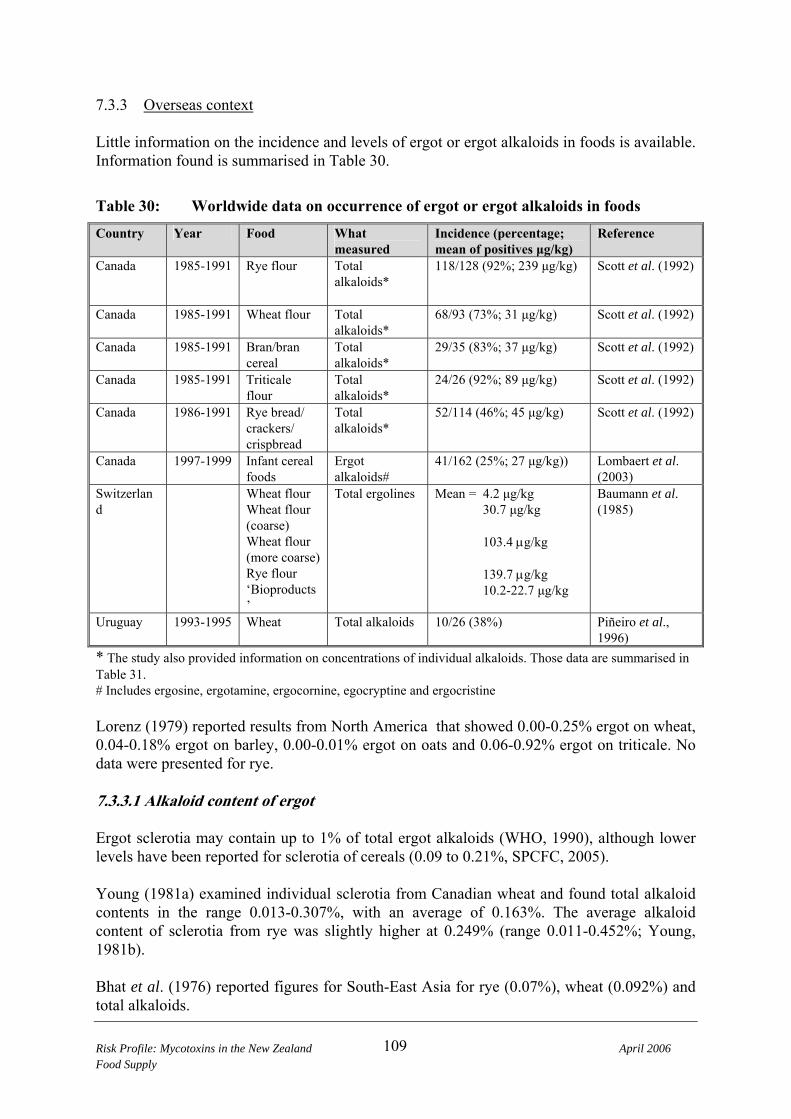
7.3.3 Overseas context Little information on the incidence and levels of ergot or ergot alkaloids in foods is available. Information found is summarised in Table 30.
Table 30: Worldwide data on occurrence of ergot or ergot alkaloids in foods
Country Year Food What measured
Incidence (percentage; mean of positives μg/kg)
Reference
Canada 1985-1991 Rye flour Total alkaloids*
118/128 (92%; 239 μg/kg) Scott et al. (1992)
Canada 1985-1991 Wheat flour Total alkaloids*
68/93 (73%; 31 μg/kg) Scott et al. (1992)
Canada 1985-1991 Bran/bran cereal
Total alkaloids*
29/35 (83%; 37 μg/kg) Scott et al. (1992)
Canada 1985-1991 Triticale flour
Total alkaloids*
24/26 (92%; 89 μg/kg) Scott et al. (1992)
Canada 1986-1991 Rye bread/ crackers/ crispbread
Total alkaloids*
52/114 (46%; 45 μg/kg) Scott et al. (1992)
Canada 1997-1999 Infant cereal foods
Ergot alkaloids#
41/162 (25%; 27 μg/kg)) Lombaert et al. (2003)
Switzerland
Wheat flour Wheat flour (coarse) Wheat flour (more coarse) Rye flour ‘Bioproducts’
Total ergolines Mean = 4.2 μg/kg 30.7 μg/kg 103.4 μg/kg 139.7 μg/kg 10.2-22.7 μg/kg
Baumann et al. (1985)
Uruguay 1993-1995 Wheat Total alkaloids 10/26 (38%) Piñeiro et al., 1996)
* The study also provided information on concentrations of individual alkaloids. Those data are summarised in Table 31. # Includes ergosine, ergotamine, ergocornine, egocryptine and ergocristine Lorenz (1979) reported results from North America that showed 0.00-0.25% ergot on wheat, 0.04-0.18% ergot on barley, 0.00-0.01% ergot on oats and 0.06-0.92% ergot on triticale. No data were presented for rye. 7.3.3.1 Alkaloid content of ergot Ergot sclerotia may contain up to 1% of total ergot alkaloids (WHO, 1990), although lower levels have been reported for sclerotia of cereals (0.09 to 0.21%, SPCFC, 2005). Young (1981a) examined individual sclerotia from Canadian wheat and found total alkaloid contents in the range 0.013-0.307%, with an average of 0.163%. The average alkaloid content of sclerotia from rye was slightly higher at 0.249% (range 0.011-0.452%; Young, 1981b). Bhat et al. (1976) reported figures for South-East Asia for rye (0.07%), wheat (0.092%) and total alkaloids. Risk Profile: Mycotoxins in the New Zealand April 2006 Food Supply
109
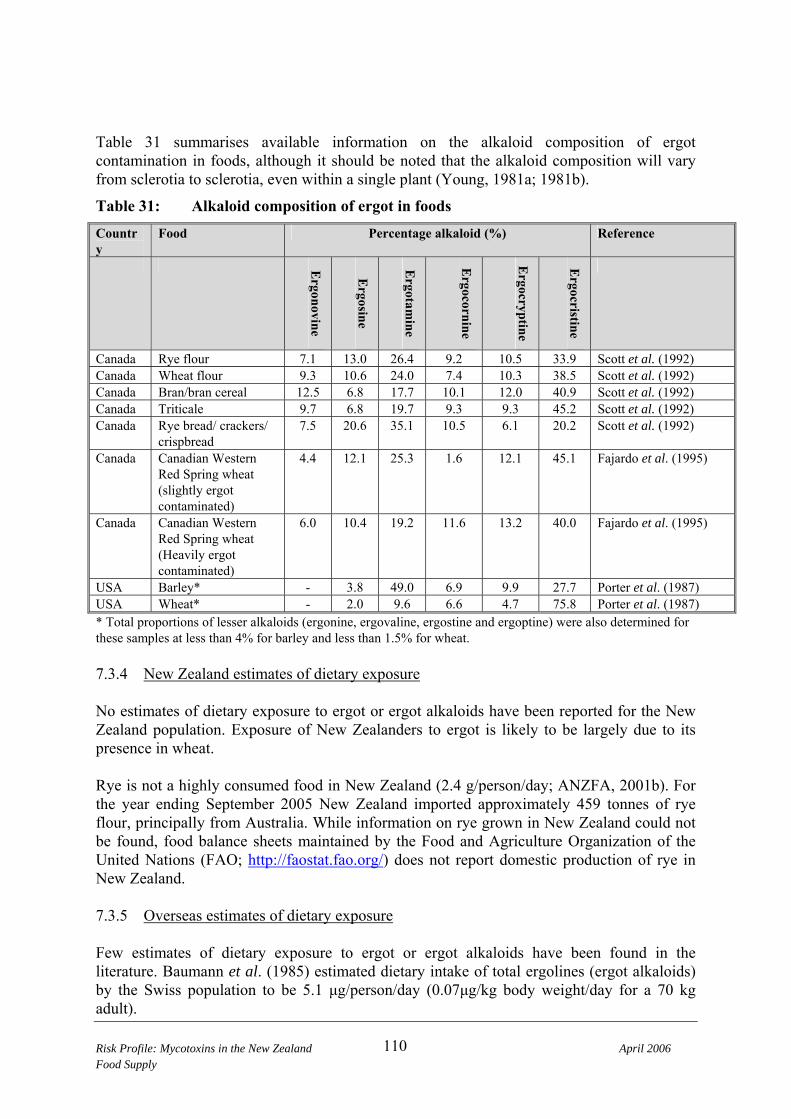
Table 31 summarises available information on the alkaloid composition of ergot contamination in foods, although it should be noted that the alkaloid composition will vary from sclerotia to sclerotia, even within a single plant (Young, 1981a; 1981b).
Table 31: Alkaloid composition of ergot in foods
Country
Food Percentage alkaloid (%) Reference
Ergonovine
Ergosine
Ergotam
ine
Ergocornine
Ergocryptine
Ergocristine
Canada Rye flour 7.1 13.0 26.4 9.2 10.5 33.9 Scott et al. (1992) Canada Wheat flour 9.3 10.6 24.0 7.4 10.3 38.5 Scott et al. (1992) Canada Bran/bran cereal 12.5 6.8 17.7 10.1 12.0 40.9 Scott et al. (1992) Canada Triticale 9.7 6.8 19.7 9.3 9.3 45.2 Scott et al. (1992) Canada Rye bread/ crackers/
crispbread 7.5 20.6 35.1 10.5 6.1 20.2 Scott et al. (1992)
Canada Canadian Western Red Spring wheat (slightly ergot contaminated)
4.4 12.1 25.3 1.6 12.1 45.1 Fajardo et al. (1995)
Canada Canadian Western Red Spring wheat (Heavily ergot contaminated)
6.0 10.4 19.2 11.6 13.2 40.0 Fajardo et al. (1995)
USA Barley* - 3.8 49.0 6.9 9.9 27.7 Porter et al. (1987) USA Wheat* - 2.0 9.6 6.6 4.7 75.8 Porter et al. (1987) * Total proportions of lesser alkaloids (ergonine, ergovaline, ergostine and ergoptine) were also determined for these samples at less than 4% for barley and less than 1.5% for wheat. 7.3.4 New Zealand estimates of dietary exposure No estimates of dietary exposure to ergot or ergot alkaloids have been reported for the New Zealand population. Exposure of New Zealanders to ergot is likely to be largely due to its presence in wheat. Rye is not a highly consumed food in New Zealand (2.4 g/person/day; ANZFA, 2001b). For the year ending September 2005 New Zealand imported approximately 459 tonnes of rye flour, principally from Australia. While information on rye grown in New Zealand could not be found, food balance sheets maintained by the Food and Agriculture Organization of the United Nations (FAO; http://faostat.fao.org/) does not report domestic production of rye in New Zealand. 7.3.5 Overseas estimates of dietary exposure Few estimates of dietary exposure to ergot or ergot alkaloids have been found in the literature. Baumann et al. (1985) estimated dietary intake of total ergolines (ergot alkaloids) by the Swiss population to be 5.1 μg/person/day (0.07μg/kg body weight/day for a 70 kg adult). Risk Profile: Mycotoxins in the New Zealand April 2006 Food Supply
110

ANZFA (now FSANZ) reported results from a study by the Denmark National Food Agency that estimated average population dietary exposure to ergot alkaloids at 5.7 μg/person/day (0.08 μg/kg body weight/day for a 70 kg adult; http://www.foodstandards.gov.au/_srcfiles/P158_FAR.pdf). 7.4 Risk Characterisation 7.4.1 Adverse health effects in New Zealand No cases of human adverse health effects attributable to ergot exposure have been reported in New Zealand. 7.4.2 Adverse health effects overseas While outbreaks of ergotism occurred on a regular basis during the middle ages, such outbreaks have been reasonably rare in recent times. Two documented outbreaks of ergotism occurred during the second half of the twentieth century and are summarised in the following sections. 7.4.2.1 Ethiopia An outbreak of ergotism occurred in the Wollo region of Ethiopia in 1978 (Demeke et al., 1979; King, 1979). Locally grown barley became heavily contaminated with wild oats (70%). Ergometrine was detected in sclerotia from the crop. A total of 93 cases of ergotism were reported in addition to 47 deaths reported to be due to ergotism (case fatality rate = 47/140 = 34%). Examination of 44 cases revealed dry gangrene of one or more limbs (7.5%), feeble or absent peripheral pulses (36.5%), swelling of limbs (11.2%), desquamation of skin (12.8%) and loss of one or more limbs (21.5%). No estimate of the level of exposure to ergot was made. 7.4.2.2 India Several outbreaks of illness associated with consumption of ergot-contaminated bajra (pearl millet) in the state of Rajasthan have been reported since 1958, with the most recent occurring in 1975 (Krishnamachari and Bhat, 1976). In total, 78 persons from 21 villages reported symptoms of nausea, vomiting and giddiness. Symptoms developed within 1-2 hours of consuming the contaminated meal and lasted for 24-48 hours. Contamination was due to C. fusiformis and resulted in ergot levels in grain of 15-174 g/kg, equating to ergoline levels of 15-199 mg/kg. Although there were insufficient data to determine a no effect level, the authors concluded that an exposure of 28 μg ergoline/kg body weight would be non-toxic. 7.4.2.3 Risk assessments and other activity overseas ANZFA/FSANZ
Risk Profile: Mycotoxins in the New Zealand April 2006 Food Supply
111

FSANZ (then ANZFA) carried out a risk assessment of ergot, as part of their larger review of standards for non-metal contaminants: (http://www.foodstandards.gov.au/_srcfiles/P158_FAR.pdf) The risk assessment made a conservative exposure assessment, based on a 95th percentile consumption level for wheat and a proposed regulatory limit for ergot of 0.05% in cereal grains, yielding an estimate of 3 μg total alkaloids/kg body weight/day. It was concluded that this level of exposure was well below the no effect level reported by Krishnamachari and Bhat (1976; 28 μg/kg body weight). It is worth noting that the no effect level was derived for clavine-type alkaloids, while alkaloids likely to occur in Australian and New Zealand foods are much more likely to be of the ergometrine type. Also, as noted in section 7.4.2.2, the level of Krishnamachari and Bhat (1976) of 28 μg/kg body weight is not a true no effect level. SPCFC (EU Scientific Panel on Contaminants in the Food Chain) While the focus of this risk assessment was animal health, several points pertinent to human risk assessment were made:
• The alkaloid content of sclerotia is sufficiently variable that no relationship between the amount of ergot and the total alkaloid concentration can be established.
• The available data do not allow identifying marker ergot alkaloids that could be monitored in all feed (food) materials as indicators for ergot contamination.
• The limited available data do not allow an estimate of carry-over rates to animal products (edible tissues, milk and eggs), however, there is no evidence that ergot alkaloids accumulate in edible tissues (muscle meats, offals).
• Levels of alkaloids measured in animal tissues indicate that these are unlikely to be an important source of human exposure.
7.5 Risk Management Information 7.5.1 Relevant food controls: New Zealand 7.5.1.1 Establishment of regulatory limits Standard 1.4.1 of the Joint Australia New Zealand Food Standards Code defines a maximum limit (ML) for ergot in cereal grains of 500 mg/kg (0.05%). 7.5.2 Relevant food controls: overseas 7.5.2.1 Establishment of regulatory limits In 2003, only three countries (Canada, Australia and New Zealand) reported having regulatory limits for ergot in food (van Egmond and Jonkers, 2003). The joint New Zealand and Australian regulatory limit is summarised in section 7.5.1.1. In Canada the ergot content of grains is regulated by the Canadian Grain Commission, with limits for various grades of wheat in the range 0.01-0.10%, rye (0.05-0.33%) and barley (0.05% to no limit) (http://www.grainscanada.gc.ca/views/ergot/ergot99-e.htm).
Risk Profile: Mycotoxins in the New Zealand April 2006 Food Supply
112

7.5.2.2 Management of ergot formation in crops Open-pollinated crops , such as rye, are much more susceptible to infection by Claviceps spp. than close-pollinated crops, such as wheat (CAST, 2003). Increased use of hybrid (male sterile) wheat may increase the risk of infection in this crop. Grass weeds in proximity to cereal crops may act as reservoirs for Claviceps infection. Management practices for the control of ergot in grain crops, summarised by the UK Home-Grown Cereals Authority (HGCA) include:
• Crop rotation between cereal and non-cereal crops. • Use of clean (non-ergot contaminated) seed. • Avoid growing susceptible crops or varieties in ergot problem areas. • Control grass weed that may act as hosts for Claviceps. • Harvest any heavily contaminated areas separately and decontaminate or dispose of
affected grain. From: http://www.hgca.com/research/topicsheets/topicsheet56.html 7.5.2.3 Control of ergot post-harvest Ergot sclerotia are considerably more fragile than the grains of the infected plants. The sclerotia tend to break up during harvest and about half of the ergot will be lost during harvest and threshing (Lorenz, 1979). Intact sclerotia are generally larger than cereal grains and will be removed by the grain cleaning procedures at mills, including sieves and separators. Lorenz (1979) reported that up to 82% of ergot can be removed by grain cleaning. The lower density of sclerotia can be used to separate them from grain by flotation in solutions such as 20% sodium chloride or 32% potassium chloride (Lorenz, 1979) or by use of an air-screen cleaner (Adam et al., 2004). 7.5.3 Influence of processing on fumonisin levels 7.5.3.1 Dry milling Shuey et al. (1973) milled wheat containing 0.3-15.0% added ergot. For low ergot contamination levels (0.3% of grain weight) approximately 93% of the ergot was found in the bran and shorts (mainly made up of fine ground bran and germ), with only 7% in the flour. For high contamination wheat (15.0% ergot) 87% was in the bran and shorts, with the remaining 13% in the flour. Fajardo et al. (1995) carried out milling trials on Canadian wheat containing 0.004% or 0.03% naturally-occurring ergot. Analysis of mill streams for individual ergot alkaloids gave results qualitatively similar to those of Shuey et al. (1973), with highest alkaloid concentrations in non-flour fractions. Wheat ergot levels of 0.3% were not visibly noticeable in the resultant flour. However, flour made from wheat with 1.5 or 3.0% ergot had the appearance of having been mixed with ground pepper (Lorenz, 1979).
Risk Profile: Mycotoxins in the New Zealand April 2006 Food Supply
113

7.5.3.2 Breadbaking and cooking Consistent results showing a reduction in naturally-occurring ergot alkaloid concentrations in food products produced by baking or other cooking processes have been achieved. Scott and Lawrence (1982) reported reductions of 59-100% in levels of individual ergot alkaloids during baking of whole wheat bread and reductions of 50-85% in baking of rye bread. Fajardo et al. (1995) reported alkaloid reduction in the crust of remix bread of 25-55%. Higher concentrations of ergot alkaloids were detected in the crumb, which was ascribed to the lower baking temperatures encountered in the crumb compared to the crust. Baking of pancakes made from triticale flour, naturally contaminated with ergot, resulted in decreases of levels of individual alkaloids in the range 25-74% (Scott and Lawrence, 1982). Production of noodles from ergot contaminated flour resulted in a decrease in alkaloid levels of 11-46%. Cooking resulted in a further slight decrease in ergot alkaloid levels (Fajardo et al., 1995). Similar results were obtained with spaghetti manufacture and cooking. 7.6 Conclusions 7.6.1 Description of risks to New Zealand consumers Ergot is known to cause serious human disease. However, outbreaks of ergotism have become increasingly rare in modern times. There have been no documented cases of human ergotism in New Zealand. Infection of cereals by Claviceps purpurea has been reported in New Zealand, although a report in the 1940s stated that its occurrence was rare in wheat, oats and two-row barley. Rye is the cereal most often affected by ergot. There appears to be very little rye grown in New Zealand. Rye flour is imported, predominantly from Australia and, to a lesser extent, Germany. However, there is no recent information on the occurrence of ergot in New Zealand grown or imported cereals. The majority of cereals imported into New Zealand come from Australia, but no information on ergot in Australian crops was found. Harvesting and cleaning of grain prior to milling will remove the majority of the ergot present in the crop and further processing (e.g. breadbaking) will tend to decrease ergot levels further. Exposure of New Zealanders to ergot and the alkaloids contained within the ergot sclerotia is likely to be very low. Good Agricultural Practice and modern grain handling practices are likely to provide a high level of risk management. 7.6.2 Commentary on risk management options Under the Food Standards Code the maximum limit for ergot in cereal grains is set at 500 mg/kg (0.05%). While this standard would provide a high level of consumer protection, there is no evidence to suggest that the Standard is being actively enforced.
Risk Profile: Mycotoxins in the New Zealand April 2006 Food Supply
114

7.6.3 Data gaps Data on the occurrence of ergot and ergot alkaloids in New Zealand and Australian cereals is not available.
Risk Profile: Mycotoxins in the New Zealand April 2006 Food Supply
115

8 PATULIN 8.1 Hazard Identification Patulin, 4-hydroxy-4H-furo[3,2c]pyran-2(6H)-one is a bicyclic lactone metabolite of several species of Penicillium, Byssochlamys and Aspergillus moulds. Of the fungi producing patulin Penicillium expansum is probably the most commonly encountered species and is often isolated from decaying apples. 8.1.1 Structure and nomenclature The chemical structure of patulin is shown in Figure 98.
Figure 9: Structure of patulin
8.1.2 Occurrence Patulin in commercial apple products is principally due to soft rot caused by Penicillium expansum (Pitt and Hocking, 1997). The toxin is produced over the temperature range 0-25ºC, with optimum production at 25ºC. Production of patulin by P. expansum requires a minimum water activity of 0.95 and an acidic environment (pH 3.2-3.8). Patulin is also relatively heat stable. Production of patulin by P. griseofulvum, P. roqueforti, and P. funiculosum has been reported (Pitt and Hocking, 1997), as well as P. claviforme, P. urticae and P.patulum (Drusch and Ragab, 2003). Isolates of Byssochlamys nivea and B. fulva have been shown to produce patulin under experimental conditions, but there are no reports of production of patulin in commercial fruit juices due to Byssochlamys infection (Pitt and Hocking, 1997). Patulin has been shown to be produced by isolates of Aspergillus clavatus (Pitt and Hocking, 1997) and A. giganteus (Drusch and Ragab, 2003).
Risk Profile: Mycotoxins in the New Zealand April 2006 Food Supply
116

8.2 Hazard Characterisation: Adverse Health Effects No reports were located of adverse health effects in humans due to patulin exposure. Patulin was trialled as an antibiotic for use against the common cold in the 1940s. The authors of the study reported that no ill effects were observed, but the report is unclear as to the clinical tests applied (Hopkins, 1943). 8.2.1 Toxicity 8.2.1.1 Acute toxicity The acute oral toxicity of patulin, as assessed by LD50, has been determined in the mouse (17-48 mg/kg body weight), the rat (28-118 mg/kg body weight) and the hamster (32 mg/kg body weight) (JECFA, 1995b). Toxic signs include agitation, convulsions, dyspnea, pulmonary congestion and edema, and ulceration, hyperaemia and distension of the gastrointestinal tract. 8.2.1.2 Chronic toxicity JECFA reviewed toxicological information on patulin in 1995 (JECFA, 1995b). In short-term animal toxicology studies, patulin caused gastrointestinal hyperaemia (increased blood supply to part of the body, without haemorrhage), distension, haemorrhage and ulceration. A 13 week toxicity study in rats showed a compound-related impairment of kidney function and villous hyperaemia of the duodenum, with a NOEL of 0.8 mg/kg body weight/day. In reproductive toxicity studies no reproductive or teratogenic effects were observed, but patulin was embryotoxic at high doses. Doses at which embryotoxicity was observed were high enough to cause overt maternal toxicity. Although experimental data are variable, JECFA assessed patulin to be genotoxic, but not carcinogenic. Patulin exhibited immunosuppressive properties in both in vitro and in vivo studies, but the dose levels required for these effects to be observed were higher than the NOEL observed in short and long-term studies (JECFA, 1995b). In a long-term carcinogenicity and toxicity study in rats a NOEL for the most sensitive endpoint (decrease in body weight gain in males) of 0.1 mg/kg body weight was observed when animals were dosed three times per week. At the highest dose level of 1.5 mg/kg body weight there was a significantly increased mortality in both male and female treated rats (Becci et al., 1981). 8.2.2 Toxicological assessment JECFA have evaluated patulin (JECFA, 1990; 1995b) and concluded that the most sensitive toxicological endpoint was body weight gain in a long-term rat study with a NOEL of 0.1 mg/kg body weight three times per week (equates to 42 μg/kg body weight/day). A safety factor of 100 was applied to derive a Provisional Maximum Tolerable Daily Intake of 0.4 μg/kg body weight/day.
Risk Profile: Mycotoxins in the New Zealand April 2006 Food Supply
117

The EU Scientific Committee on Food issued a minute statement on patulin agreeing with the JECFA and IARC assessments and endorsing the PMTDI derived by JECFA (http://europa.eu.int/comm/food/food/chemicalsafety/contaminants/out55_en.pdf). The US Food and Drug Administration independently reviewed the available toxicological data, but concurred with the JECFA decision to establish a PTDI of 0.43 μg/kg body weight/day (http://www.cfsan.fda.gov/~dms/patubckg.html). IARC have reviewed information on the carcinogenicity of patulin and concluded that there was inadequate evidence for the carcinogenicity of patulin in experimental animals and that no evaluation could be made of the carcinogenicity of patulin to humans (Group 3; IARC, 1986). 8.3 Exposure Assessment 8.3.1 Patulin in New Zealand apple-based foods Two surveys have been carried out to determine the prevalence and concentrations of patulin in apple products available for retail purchase in New Zealand (Wilson, 1981; Stanton, 1998). Results are summarised in Table 32.
Table 32: Patulin in New Zealand apple products
Risk Profile: Mycotoxins in the New Zealand April 2006 Food Supply
118
Food Number of samples
Number positive (%)
Range of positive results
(μg/kg)
Reference
Apple juice 20 3 (15%) 106-216 Wilson, 1981 Apple and apple-based juice
35 6 (17%) 10-58 Stanton, 1998
Apple and apple-based juice concentrates
7 7 (100%) 12-95 Stanton, 1998
Apple drinks and alcoholic beverages
6 0 (0%) Stanton, 1998
Apple-based foods 37 0 (0%) Stanton, 1998 New Zealand production of apple juice is dominated by one manufacturer (Enzafoods New Zealand Limited; http://www.enzafoods.co.nz/). However, apple juice available to the consumer will include product from a number of other smaller manufacturers. New Zealand also imports significant quantities of apple juice (approximately 8,000 tonnes in the year to the end of September 2005), with over 80% of imports from China and approximately 10% from each of Australia and South Africa. Routine regulatory testing of imported apple juice for patulin is not carried out.

8.3.2 Patulin in Australian apple-based foods Patulin is a common contaminant of apple juice and apple-based products in Australia. Watkins et al. (1990) examined 113 samples of apple juice, purchased in Victoria and representing 29 different brands, for the presence of patulin. Patulin was detected in 74 samples (65%), representing 23 different brands, at concentrations in the range 6-629 μg/l. Burda (1992) examined apple, pear and mixed fruit products marketed in New South Wales. Patulin was detected in 148 of 258 juice and juice concentrate samples (57%), at concentrations in the range 5-1130 μg/l, and 18 of 70 non-juice apple-based samples (26%; sauces, purees, pulps and jellies), with concentrations in the range 5-32 μg/kg. The 1996 Australian Market basket survey examined nine infant strained apple samples for the presence of patulin (Hardy, 1998). All samples were negative for the presence of patulin. 8.3.3 Overseas context Table 33 summarises results of a number of international surveys of patulin in apple-based products.
Table 33: Worldwide data on occurrence of patulin in food
Risk Profile: Mycotoxins in the New Zealand April 2006 Food Supply
119
Country Product Samples positive/Total samples (%)
Range of positive results
Reference
(μg/l or μg/kg)
Belgium Apple juices Imported 12/14 (86) Domestic 23/29 (79)
Imported 1/2 (50) Domestic 2/5 (40)
2.5-10.6 2.9-38.8
Cider 6.1 2.8
Tangni et al., 2003
Brazil Apple juice Other juices Fruit
1/30 (3) 0/57 (0) 0/38 (0)
17 De Sylos and Rodriguez-Amaya, 1999
Germany Apple juice Other fruit juices Apple pulp Other fruit pulp and syrup
13/14 (93) 5/5 (100)
0/1 (0) 1/2 (50)
0.7-26 0.1-5.2
0.8
Rychlik and Schieberle, 1999
Europe Apple juice Apple juice concentrate Cider Pear juice Grape juice Other juices Apple puree Other purees Baby food
2659/4633 (57) 1128/1175 (96)
126/339 (37) 17/100 (17)
128/324 (40) 5/174 (3) 7/97 (7) 0/50 (0)
43/312 (14)
0.03-1150 5-1227 2-1604 0.03-91 3-750 2-32.4 0.2-86
0.2-68
SCOOP, 2002
Italy Apple products 11/44 (25) 1.4-74.2 Ritieni, 2003

Risk Profile: Mycotoxins in the New Zealand April 2006 Food Supply
120
Country Product Samples positive/Total samples (%)
Range of positive results
Reference
(μg/l or μg/kg)
Italy Apple juice Pear juice Other juices Fruit purees Apple Apple vinegar
Conventional 16/33 (48) Organic 12/24 (50)
Conventional 1/7 (14) Organic 4/8 (50)
Conventional 8/45 (18) Organic 6/12 (50)
Conventional 1/15 (7) Organic 9/25 (36)
Conventional 7/13 (54) Organic 3/9 (33)
Conventional 0/2 (0) Organic 2/6 (33)
0.5-53.4 0.5-69.3
1.1 0.5-61 0.5-1.7
0.5-13.5 0.7
0.5-13.0 0.5-81.7 0.5-50.8
0.5-4.2
Piemontese et al., 2005
Japan Apple juice 15/76 (20) 1-45 Ito et al., 2004 Japan Apple and mixed juices Imported 6/45 (13)
Domestic 3/143 (2) 6-10 6-15
Watanabe and Shimizu, 2005
South Africa
Apple and mixed juices Whole fruit products Infant fruit juices Infant fruit purees
8/31 (26) 2/12 (17) 6/10 (60)
0/7 (0)
5-45 10
5-20
Leggott and Shephard, 2001
Spain Apple juice Apple food for children
82/100 (82) 0/12 (0)
0.5-170 Prieta et al., 1994
Sweden Blueberry soup Thuvander et al., 2001 Peach/pear juice
Apple juice
0/42 (0) 0/19 (0)
5/39 (13)
NR Turkey Apple juice 215/215 (100) 7-375 Gokmen and
Acar, 1998 Turkey Apple juice 27/45 (60) 19.1-732.8 Yurdun et al.,
2001 UK Apple juice 17/62 (27) 10-94 MAFF, 1993 UK Baby juices/drinks
Jam and jelly spreads Chutneys Apple purees and sauces Pie fillings Dried fruit Other dried fruit products Baby apple desserts Baby apple purees Baby cereal/savoury Baby foods, dried
1/11 (9) 0/14 (0) 0/9 (0)
0/13 (0) 0/10 (0) 0/8 (0) 0/5 (0) 0/9 (0) 0.3 (0) 0/4 (0)
0/10 (0)
10 MAFF, 1994c
UK Apple juice, cloudy Apple juice, clear
38/113 (34) 27/78 (35)
10-497 NR
MAFF, 1994d
UK Apple juice 64/185 (35) 10-490 MAFF, 1995b UK Fruit juices
Tomato products 0/128 (0) 0/26 (0)
MAFF, 1995c
UK Apple juice 62/173 (36) 10-184 MAFF, 1996c

Risk Profile: Mycotoxins in the New Zealand April 2006 Food Supply
121
Country Product Samples positive/Total samples (%)
Range of positive results
Reference
(μg/l or μg/kg)
UK Apple juice, from concentrate Apple juice, directly produced
38/101 (38)
110/199 (55)
5-30
5-171
MAFF, 1999c
NR = not reported All overseas studies confirm that patulin is a frequent contaminant of apple juice and apple products. Some European studies have reported detection of patulin in other fruit juices (e.g. pear, grape). Occurrence of patulin in New Zealand apple products is within the range of overseas observations. 8.3.4 New Zealand estimates of dietary exposure Stanton (1998) estimated dietary exposure to patulin for five age-gender groups using median patulin concentration data from New Zealand and food consumption data from the Australian Market Basket Survey. It is interesting to not the relatively small differences between average consumption levels for apple juice and extreme (95th percentile) consumption levels. Results are summarised in Table 34.
Table 34: Estimated dietary exposure to patulin in New Zealand
Age group
Weight
(kg)
Consumption of Apple Juices
Estimated patulin intakes (μg/kg bw/day)
(g/person/day) Average Extreme* Average Extreme* Infant, 9 months 9.2 32.0 37.9 0.017 0.020 Toddler, 2 years 12.4 123.9 144.7 0.050 0.059 Boy/girl, 12 years 40 74.4 112.5 0.009 0.014 Adult male 77 59.4 96.1 0.004 0.006 Adult female 59 47.7 79.2 0.004 0.007
PMTDI = 0.4 μg/kg bw/day (400 ng/kg bw/day) * 95th percentile Estimated patulin dietary exposure in New Zealand is well below the PMTDI of 0.4 μg/kg body weight/day. 8.3.5 Overseas estimates of dietary exposure Table 35 summarises a number of estimates of dietary exposure to patulin that have been derived overseas.

Table 35: Overseas estimates of dietary exposure to patulin
Risk Profile: Mycotoxins in the New Zealand April 2006 Food Supply
122
Country Foods included Population group* Mean estimated dietary exposure
Reference
(μg/kg bw/day) Austria Apple juice, grape
juice Child, 3-19 years
Adult, 25+ years
Elderly, 74+ years
Mean = 0.015-0.023 P95 = 0.043- 0.083 Mean = 0.002-0.007 P95 = 0.016-0.036
Mean = 0.003-0.012 P95 = 0.017-0.042
SCOOP, 2002
Belgium Apple juice, grape juice
Teenagers, 14-18 years Mean = 0.0007-0.001 P95 = 0.004-0.009
SCOOP, 2002
Belgium Apple juice, cider Child, 10 kg bw Adult, 60 kg bw
0.03 0.18
Tangni et al., 2003
France Apple juice, apple puree, cider
All children
All adults
Mean = 0.005 P95 = 0.023
Mean = 0.001 P95 = 0.006
SCOOP, 2002
France Alcoholic beverages, soft drinks, compote and stewed fruit, fruits, cakes
Child, 3-14 years
Adult, 15+ years
Mean = 0.03 P95 = 0.11
Mean = 0.018 P95 = 0.057
Leblanc et al., 2005
Germany Apple, pear and grape juices, apple puree and compote, canned tomato
Child, 1-6 years
Child, 6-14 years
Adult, 14+ years
Mean = 0.025-0.051 P95 = 0.026-0.176
Mean = 0.010 P95 = 0.029
Mean = 0.002 P95 = 0.006
SCOOP, 2002
Italy Fruit juice (apple, pear), baby food, preserved fruit, apple, pear, peach
All population Mean = 0.093 P95 = 0.39
SCOOP, 2002
Italy Apple, pear and other juices, fruit purees, apples, apple vinegar
Child, 1-10 years
Adolescent, 10-18 years
Adults, 18-64 years
Elderly, 65+ years
Conventional 0.003 Organic 0.014
Conventional 0.0009 Organic 0.004
Conventional 0.0003 Organic 0.001
Conventional 0.0002 Organic 0.0009
Piemontese et al., 2005
Norway Apple juice, apple nectar, apple cider
Average person 0.001 SCOOP, 2002
Portugal Apple juice, pear juice
Total population 0.294 SCOOP, 2002
Spain Fruit juices Total population 0.0001-0.0003 SCOOP, 2002 Sweden Fruit soups, juices Child, 7-14 years Mean = 0.005-0.008
P95 = 0.013-0.024 Thuvander et al., 2001
Sweden Purees and soups, apple juice, mixed juices
Child, 7-14 years
Adult, 15-74 years
Adult, 19-74 years
Mean = 0.005 P95 = 0.012
Mean = 0.002 P95 = 0.006
Mean = 0.001 P95 = 0.001
SCOOP, 2002
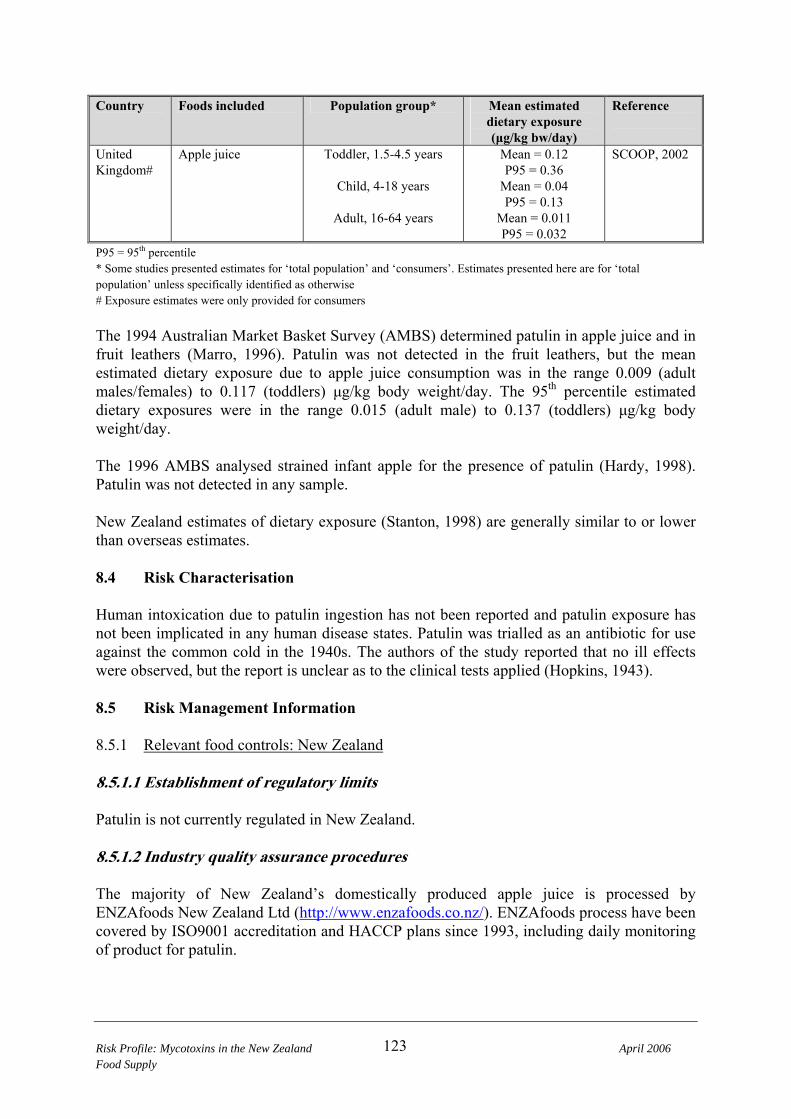
Risk Profile: Mycotoxins in the New Zealand April 2006 Food Supply
123
Country Foods included Population group* Mean estimated dietary exposure
Reference
(μg/kg bw/day) United Kingdom#
Apple juice Toddler, 1.5-4.5 years
Child, 4-18 years
Adult, 16-64 years
Mean = 0.12 P95 = 0.36
Mean = 0.04 P95 = 0.13
Mean = 0.011 P95 = 0.032
SCOOP, 2002
P95 = 95th percentile * Some studies presented estimates for ‘total population’ and ‘consumers’. Estimates presented here are for ‘total population’ unless specifically identified as otherwise # Exposure estimates were only provided for consumers The 1994 Australian Market Basket Survey (AMBS) determined patulin in apple juice and in fruit leathers (Marro, 1996). Patulin was not detected in the fruit leathers, but the mean estimated dietary exposure due to apple juice consumption was in the range 0.009 (adult males/females) to 0.117 (toddlers) μg/kg body weight/day. The 95th percentile estimated dietary exposures were in the range 0.015 (adult male) to 0.137 (toddlers) μg/kg body weight/day. The 1996 AMBS analysed strained infant apple for the presence of patulin (Hardy, 1998). Patulin was not detected in any sample. New Zealand estimates of dietary exposure (Stanton, 1998) are generally similar to or lower than overseas estimates. 8.4 Risk Characterisation Human intoxication due to patulin ingestion has not been reported and patulin exposure has not been implicated in any human disease states. Patulin was trialled as an antibiotic for use against the common cold in the 1940s. The authors of the study reported that no ill effects were observed, but the report is unclear as to the clinical tests applied (Hopkins, 1943). 8.5 Risk Management Information 8.5.1 Relevant food controls: New Zealand 8.5.1.1 Establishment of regulatory limits Patulin is not currently regulated in New Zealand. 8.5.1.2 Industry quality assurance procedures The majority of New Zealand’s domestically produced apple juice is processed by ENZAfoods New Zealand Ltd (http://www.enzafoods.co.nz/). ENZAfoods process have been covered by ISO9001 accreditation and HACCP plans since 1993, including daily monitoring of product for patulin.

8.5.2 Relevant food controls: overseas 8.5.2.1 Establishment of regulatory limits Table 36 summarises the reported regulatory positions on patulin (van Egmond and Jonker, 2003).
Table 36: Regulatory limits for patulin in various countries (food regulations only)
Risk Profile: Mycotoxins in the New Zealand April 2006 Food Supply
124
Country Commodity description Regulatory limit (μg/kg)
Armenia Tomato paste, apple 5 Belarus Mushrooms, fruits, vegetables 50 Bulgaria Fruit juices and nectars, fruit concentrates 50 China Semi-finished products (juice or paste) 100
50 Fruit juice or jam, fruit wine, canned products, hawthorn strip (cake)
Codex Alimentarius
Apple juice and apple ingredients in other beverages 50
Cuba Fruits 50 Czech Republic* Child nourishment
Baby nourishment Foodstuff type A Foodstuff type B
30 20 50 100
Estonia Fresh or frozen fruits and vegetables, including berries and mushrooms, tinned apples, tomatoes and seabuck thorns, apple and seabuck thorn jam, juices, drinks, concentrates and nectars; salted, pickled, leavened or otherwise processed fruits, vegetables and mushrooms
50
European Union Fruit juices and nectars, in particular, apple juice, and fruit juice ingredients in other beverages Concentrated fruit juice after reconstitution Spirit drinks, cider and other fermented drinks derived from apples or containing apple juice Solid apple products, including apple compote, apple puree intended for direct consumption Apple juice and solid apple products for infants and young children
50
50 50
Other baby food
25
10
10 Hungary Products of fruits and vegetables 50 Iran Fruit juices, nectars and fruit drinks 50 Israel Apple juice 50 Korea, Republic of Apple juice, apple juice concentrate 50 Latvia Apple, tomato juice 50 Lithuania Juice 25 Moldova Juices, canned vegetables, fruits 50 Morocco Apple juice 50 Poland Apple juice, apple products 30

Risk Profile: Mycotoxins in the New Zealand April 2006 Food Supply
125
Commodity description Regulatory limit (μg/kg)
Romania Fruit juice 50 Russian Federation Bottled, canned or potted vegetables, fruit, berries;
juices, beverages or concentrate of vegetables, berries (canned); jams, confitures, syrups, fruit and berries mashed with sugar, fruit or berry concentrates with sugar
50
Serbia and Montenegro
Apple juice 50
Singapore Apple and apple juice 50 Slovakia Milk, meat, poultry, flour and its products, rice,
vegetables, potatoes Infant formulae Food for children Other foodstuffs
50
20 30 100
South Africa All foodstuffs 50 Switzerland Fruit juices 50 Taiwan Apple juice NS Turkey Fruit juice 50 Ukraine Vegetable and fruit-berry preserves and mixes for
babyfood, fish preserves for babyfood Vegetables, including potatoes, fruit and grapes, berries; vegetable, fruit, berry preserves in cans and jars
20
50
USA Apple juice, apple juice concentrate, and apple juice component of a food that contains apple juice as an ingredient
50
Uruguay Fruit juice 50 From van Egmond and Jonker (2003) * Type A and B foodstuffs not specified The most commonly adopted regulatory limit for patulin in apple juice is 50 μg/kg. This is also the maximum level proposed by Codex (Standard 235-2003; http://www.codexalimentarius.net/download/standards/10095/CXS_235e.pdf). 8.5.2.2 Codex Code of Practice Codex have formulated a Code of Practice (CoP) for the prevention and reduction of patulin in apple juice and apple juice ingredients (CAC/RCP 50-2003; http://www.codexalimentarius.net/download/standards/405/CXC_050e.pdf). The CoP makes recommendation on practice based on Good Agricultural Practice (GAP) and Good Manufacturing Practice (GMP). Recommendations based on GAP cover the areas of preharvest, harvesting and transportation of fruit, post-harvest handling and storage practices of fruit for the fresh fruit market, and post-storage grading of fruit for the fresh market or juice manufacture. Recommendations based on GMP cover the areas of transportation, checking and pressing of fruit, packaging and final processing of juice, quality assessment of juice.

8.5.3 Influence of processing on patulin levels Moake et al. (2005) identified three areas of the juice production process where there was potential to decrease the level of patulin contamination:
• The quality of the fruit and processing prior to pressing, including storage; • Juice clarification; and • Pasteurisation and further processing.
Several studies have made specific estimates of patulin reduction during food processing. Normally fungal growth and patulin production is associated with damaged fruit and reductions in patulin contamination can be achieved through exclusion of damaged fruit from further processing or removal of damaged portions of the fruit. Lovett et al. (1975) showed that removal of obviously rotten portions of apples resulted in removal of 93-99% of patulin in the resulting apple juice. Beretta et al. (2000) compared the patulin content of rotten and apparently sound areas of individual apples. The concentration of patulin in the rotten areas was 5-3000 times higher than in the apparently sound portion of the apple. This difference increased if the peel was excluded from the sound material. Jackson et al. (2003) detected patulin in cider pressed from fresh ground-harvested apples (range 40.2 – 374 μg/l), but not in cider pressed from fresh tree-picked apples. Tree-picked apples were stored for 4-6 weeks at 0-2ºC, subsamples were either culled (damaged and rotten fruit removed) or not culled. Patulin was not detected in cider pressed from culled, stored apples, but was detected in unculled, stored apples at levels in the range 1.0-64.0 μg/l (Jackson et al., 2003). Washing of ground-harvested apples, with either potable water or chlorine solutions (100 or 200 ppm) resulted in reductions in the patulin content of the resulting ciders of between 10 and 100%. In some experiments chlorine washing was more effective, but in other experiments chlorine washes were no more effective than a potable water wash (Jackson et al., 2003). Sydenham et al. (1997) demonstrated that the patulin level of fruit stored in uncontrolled conditions increased over the course of 33 days. Washing the fruit in water decreased the contamination level, white sorting and removal of rotten or damaged fruit decreased the contamination level further (by approximately 40% after 7 days and by approximately 80% at day 33). Moodley et al (2002) examined the impact of different packaging materials (polyethylene or polypropylene) and modified atmospheres on the fungal growth and patulin production. Polypropylene did not inhibit fungal growth of patulin production. Polyethylene packaging significantly inhibited fungal growth and patulin production. This effect was further enhanced by increasing carbon dioxide to nitrogen ratios. Bissesseur et al. (2001) examined the impact of various clarification methods (filtration, centrifugation, fining with bentonite, enzymic treatment with pectinase) on the patulin level of juice produced from artificially contaminated apple pulp. Clarification techniques, in combination with pressing, resulted in reduction of toxin levels of between 70 and 90%, with centrifugation being most effective and filtration being least effective. However, pressing alone was responsible for a 50% reduction in patulin levels. Examination of combinations of clarification methods showed that pressing, followed by centrifugation and fining was most effective in reducing the patulin level of the final juice.
Risk Profile: Mycotoxins in the New Zealand April 2006 Food Supply
126
Activated carbon was examined for its ability to absorb patulin from apple juice (Leggott et al., 2001). Activated carbon was able to remove up to 80% of the patulin present. Removal was lee in a high Brix apple juice (20º) than a low Brix apple juice (12º). Temperature had relatively little effect on patulin removal. Moake et al. (2005) have reviewed studies that considered the impact of pasteurisation on the level of patulin contamination. While patulin is unstable at high pH, it is relatively stable to thermal degradation at the acidic pH usual in fruit juices. Production of alcoholic cider from patulin-contaminated apple juice has been shown to result in degradation of patulin to non-detectable levels (Moss and Long, 2002). Three commercial strains of Saccharomyces cerevisiae were shown to degrade patulin during active fermentation, but not when growing aerobically. 8.6 Conclusions 8.6.1 Description of risks to New Zealand consumers Patulin has not been linked to actual cases of adverse health effects in human. It has been administered to humans as a potential antibiotic for use against the common cold. Stanton (1998) detected patulin in New Zealand apple juices at frequencies and concentrations consistent with those found overseas. Estimates of dietary exposure in New Zealand were similar to or less than estimates made in other developed countries. The major apple juice manufacture in New Zealand (ENZAfoods) have quality assurance systems in place to control patulin contamination. However, a significant amount of apple juice available in New Zealand will be from small manufacturers or imported, principally from China. Little is known about patulin control systems in apple juice from these sources. While patulin in apple juice may indicate poor manufacturing practice (e.g. use of ground harvested apples for juice manufacture), there is little evidence to indicate that it constitutes a human health risk. 8.6.2 Commentary on risk management options Patulin contamination of apple juice is largely controllable by good manufacturing practice (GMP) and there is good evidence that GMP is employed by the major New Zealand manufacturer. However, there is currently no risk management applied to the large amount of imported apple juice. Application of a regulatory limit is the most obvious management measure for this product.
Risk Profile: Mycotoxins in the New Zealand April 2006 Food Supply
127

8.6.3 Data gaps Internationally, there is a need for further information on associations or lack of associations between patulin exposure and human disease. Information on patulin in New Zealand consumer products is now dated and makes no distinctions between the various sources of apple juice.
Risk Profile: Mycotoxins in the New Zealand April 2006 Food Supply
128

9 RANKING RISKS ASSOCIATED WITH DIETARY MYCOTOXIN EXPOSURE IN NEW ZEALAND
While it is not possible to attribute individual cases of human disease in New Zealand, information is available from which to consider the relative importance of risks due to various mycotoxins in New Zealand. Such a ranking exercise needs to consider:
• The likely adverse health effects due to exposure to each mycotoxin, and the seriousness of those effects.
• The weight of evidence for a causative role of the mycotoxin in the adverse health effect observed.
• The exposure level or dose at which the mycotoxin can exert its toxic effects. A surrogate for this exposure level is the tolerable daily intake or equivalent for each mycotoxin.
• The proximity of New Zealand exposure estimates to tolerable limits and the need for sufficient data to make those estimates realistic. This would include information on imported foods.
Table 37 summarises information reviewed in this risk profile relevant to risk ranking. While the information in Table 37 contains considerable uncertainties the following general comments can be made:
• There is consistent evidence to support a causal link between chronic aflatoxin exposure and serious human disease (primary liver cancer). Exposure levels in New Zealand are likely to represent a very low level of risk, although better information on the contribution of maize to dietary aflatoxin exposure would decrease the uncertainty around this conclusion.
• There is some evidence to support a link between human kidney disease and exposure to ochratoxin A. However, further work is required to establish a causal relationship. Dietary exposure to ochratoxin A in New Zealand may approach tolerable daily intake levels and further investigation, particularly of the occurrence of ochratoxin A in bread and other wheat products, would help to clarify the situation.
• This is little evidence that T2/HT2 toxins occur in New Zealand or Australian cereal crops. Confirmation of this observation would allow attention to be focused on other issues.
• There is very good evidence that trichothecenes are able to cause outbreaks of gastrointestinal disease in humans. Current New Zealand exposure estimates appear unreasonably low compared to estimates made in Europe, where crop contamination levels appear to be similar. Some European exposure estimates approach the tolerable daily intakes and it would seem prudent to continue some New Zealand focus on this issue, particularly the potential for trichothecene contamination of wheat and wheat-based products.
• While there is an increasing body of information linking fumonisin exposure to serious human diseases, there is virtually no information on the exposure of New Zealanders to these mycotoxins. While the fungal species that produce fumonisins have only rarely been reported in New Zealand, our considerable level of cereals imports mean that potential for dietary exposure still exists.
• Evidence linking zearalenone exposure to human disease states is fragmentary and inconsistent. However, the exposure of New Zealanders to zearalenone may be significant when compared to tolerable daily intakes. Further investigation of the role
Risk Profile: Mycotoxins in the New Zealand April 2006 Food Supply
129

Risk Profile: Mycotoxins in the New Zealand April 2006 Food Supply
130
of wheat-based foods in zearalenone dietary exposure in New Zealand would help to clarify this issue.
• Ergotism represents a serious and real human health risk. However, in the context of current agricultural and food manufacturing practices, the dietary risk appears to be extremely low.
• While toxicological experiments have raised concerns about patulin exposure, there is no evidence linking patulin exposure to human disease. However, high levels of patulin contamination are indicative of poor manufacturing practice and a level of ongoing monitoring is probably justified.
Ranking of risk across different mycotoxins will involve a degree of subjectivity, as there is not absolute measure for the relative seriousness of different health effects. However, the proximity of estimates of OTA exposure to critical exposure limits suggests that improved estimates of New Zealand exposure should be ranked highly. The seriousness of the health outcomes resulting from aflatoxin exposure and the relatively high weight of evidence supporting a casual role suggest that further work on sources of dietary exposure (e.g. maize) should also be ranked highly.

Table 37: Risk ranking information for mycotoxins in the New Zealand food supply
Risk Profile: Mycotoxins in the New Zealand April 2006 Food Supply
131
Mycotoxin Human health effects
Animal health effects
Weight of evidence$
Critical exposure limit
(μg/kg body weight/day)
New Zealand dietary exposure
Major contributing foods
μg/kg body weight/day
Aflatoxins Primary liver cancer
Hepatocellular and/or cholangiocellular liver tumours
Medium-high 0.01* 0.0001# Peanuts, maize
Ochratoxin A Nephrotoxicity Nephrotoxicity Medium-low 0.0012-0.014 0.0024§ Bread, cereals, dried fruit, wine
Deoxynivalenol Gastrointestinal symptoms
General toxicity, haematotoxicity, immunotoxicity
High 1.0 0.006# (0.1-0.8)¥
Maize, wheat, beer
Nivalenol - General toxicity, haematotoxicity, immunotoxicity
High 0.7 0.006# (0.01-0.2)¥
Maize, wheat, beer
T2/HT2 toxin Gastrointestinal symptoms, haematotoxicity
General toxicity, haematotoxicity, immunotoxicity
High 0.06 - (0.0-0.08)¥
Maize, wheat, beer
Fumonisins Gastrointestinal symptoms, oesophageal cancer, liver cancer, neural tube defects
Nephrotoxicity, carcinogenicity
Medium 2.0 - (0.0001-0.2)¥
Maize
Zearalenone Early puberty, hormone-dependent cancers
Hormonal effects Low 0.2-0.5 0.01-0.04# Maize, wheat

Risk Profile: Mycotoxins in the New Zealand April 2006 Food Supply
132
Mycotoxin Human health effects
Animal health effects
Weight of evidence$
Critical exposure limit
(μg/kg body weight/day)
New Zealand dietary exposure
μg/kg body weight/day
Major contributing foods
Ergot alkaloids Ergotism (gangrenous or convulsive)
High 28¤ (0.07-0.08)¥ Rye, wheat, barley, triticale
Patulin - Reduced weight gain, immunotoxicity
Low 0.4 0.004-0.05 Apple juice and apple products
$ The weight of evidence assessment is subjective, but is based on the strength and consistency of associations between mycotoxin exposure and specified human disease. The consistency between human and animal disease associations is also considered. A definitive cause and effect relationship between the toxin and human disease (e.g. ergotism) is classified as a high weight of evidence, while failure to identify a human disease state (e.g. patulin) is classified as a low weight of evidence. * No tolerable exposure limit has been set for aflatoxin. Using the JECFA estimate for cancer potency, this exposure level would result in 1 excess cancer per million of population. Although a ‘one in a million’ cancer risk should not be considered to represent an acceptable level of protection for New Zealand it has been used as a benchmark level of risk by the US Environmental Protection Agency for assessing environmental carcinogens. # The available New Zealand estimate of exposure may be an underestimate, as not all potentially contaminated foods were considered. § Exposure estimate not based on New Zealand data. ¥ Range of typical exposures from temperate developed countries ¤ The basis for this no effect level is not well defined and is derived from a study of human toxicity due to C. fusiformis infection of pearl millet. The relevance of these data to C. purpurea infection and the different range of alkaloids produced by C. purpurea is uncertain.

10 REFERENCES Aalbersberg B, Dolodolotawake U, Thaman B. (2002) Chemical contaminants in food in Pacific Island countries. Proceedings of the Second International Total Diet Workshop, Brisbane. Geneva: World Health Organization. Abbas HK, Cartwright RD, Shier WT, Abouzied MM, Bird CB, Rice LG, Ross PF, Scumbato GL, Meredith FI. (1998) Natural occurrence of fumonisins in rice with Fusarium sheath rot disease. Plant Disease; 82(1): 22-25. Abdulkadar AHW, Al-Ali, A, Al-Jedah JH. (2002) Occurrence of aflatoxin in commodities imported into Qatar, 1997-2000. Food Additives and Contaminants; 19(7): 666-670. Accerbi M, Rinaldi VEA, Ng PKW. (1999) Utilization of highly deoxynivalenol-contaminated wheat via extrusion processing. Journal of Food Protection; 62(12): 1485-1487. Adam KM, Misra MK, Thoreson DR. (2004) Removal of ergot from barley by density separation. Applied Engineering in Agriculture; 20(1): 39-43. Agnew MP, Poole PR, Lauren DR, Ledgard, SF. (1986). Presence of zearalenone and trichothecene mycotoxins in Fusarium-infected New Zealand grown wheat. New Zealand Veterinary Journal; 34: 176-177. Aguilar F, Hussain SP, Cerutti P. (1993) Aflatoxin B1 induces the transversion of G→T in codon 249 of the p53 tumor suppressor gene in human hepatocytes. Proceedings of the National Academy of Science; 90(18): 8586-8590. Ali N, Sardjono, Yamashita A, Yoshizawa T. (1998) Natural co-occurrence of aflatoxins and Fusarium mycotoxins (fumonisins, deoxynivalenol, nivalenol and zearalenone) in corn from Indonesia. Food Additives and Contaminants; 15(4): 377-384. Ali N, Hashim NH, Yoshizawa T. (1999) Evaluation and application of a simple and rapid method for the analysis of aflatoxins in commercial foods from Malaysia and the Philippines. Food Additives and Contaminants; 16(7): 273-280. ANZFA. (1999) Aflatoxins in food: A toxicological review and risk assessment. Canberra: ANZFA. ANZFA. (2001a) The 19th Australian Total Diet Survey. Canberra: Australia New Zealand Food Authority. ANZFA. (2001b) Raw commodity consumption figures. Canberra: Australia New Zealand Food Authority. Arim RH. (1995) Present status of the aflatoxin situation in the Philippines. Food Additives and Contaminants; 12(3): 291-296. Aziz NH, Youssef YA. (1991) Occurrence of aflatoxins and aflatoxin-producing moulds in fresh and processed meat in Egypt. Food Additives and Contaminants; 8(3): 321-331.
Risk Profile: Mycotoxins in the New Zealand April 2006 Food Supply
133
Aziz NH, Attia E-SA, Farag SA. Effect of gamma-irradiation on the natural occurrence of Fusarium mycotoxins in wheat, flour and bread. Die Nahrung; 41(1): 34-37. Azziz-Baumgartner E, Lindblade K, Gieseker K, Rogers HS, Kieszak S, Njapau H, Schleicher R, McCoy LF, Misore A, DeCock K, Rubin C, Slutsker L. (2005) Case-control study of an acute aflatoxicosis outbreak, Kenya, 2004. Environmental Health Perspectives; 113(12): 1779-1783. Baxter ED, Slaiding IR, Kelly B. (2001) Behaviour of ochratoxin A in brewing. Journal of the American Society of Brewing Chemists; 59: 98-100. Beasley VR, Lambert JJ. (1990) The apparently minimal hazard posed to human consumers of products from animals fed trichothecene-contaminated grains. Veterinary and Human Toxicology; 32(Supplement): 27-39. Becci PJ, Hess FG, Johnson WD, Gallo MA, Babish JG, Dailey RE, Parent RA. (1981) long-term carcinogenicity and toxicity studies of patulin in the rat. Journal of Applied Toxicology; 1(5): 256-261. Bennett GA, Peplinski AJ, Brekke OL, Jackson LK. (1976) Zearalenone: distribution in dry-milled fractions of contaminated corn. Cereal Chemistry; 53: 299-307. Bennett GA, Anderson RA. (1978) Distribution of aflatoxin and/or zearalenone in wet-milled corn products: a review. Journal of Agricultural and Food Chemistry; 26(5): 1055-1060. Bennett GA, Lagoda AA, Shotwell OL, Hesseltine CW. (1981) Utilization of zearalenone-contaminated corn for ethanol production. Journal of the American Oil Chemists Society; 58: 974-976. Bennett GA, Richard JL, Eckhoff SR. (1996) Distribution of fumonisins in food and feed products prepared from contaminated corn. Advances in Experimental and Medical Biology; 392: 317-322. Beretta B, Gaiaschi A, Galli CL, Restani P. (2000) Patulin in apple-based foods: occurrence and safety evaluation. Food Additives and Contaminants; 17(5): 399-406. Bhat RV, Roy DN, Tulpule PG. (1976) The nature of alkaloids of ergoty pearl millet or bajra and its comparison with alkaloids of ergoty rye and ergoty wheat. Toxicology and Applied Pharmacology; 36(1): 11-17. Bhat RV, Ramakrishna Y, Sashidhar RB, Munshi KL. (1989) Outbreak of trichothecene mycotoxicosis associated with consumption of mould-damaged wheat products in Kashmir Valley, India. Lancet; 333(8628): 35-37. Bhat RV, Shetty PH, Amruth RP, Sudershan RV. (1997) A foodborne disease outbreak due to the consumption of moldy sorghum and maize containing fumonisin mycotoxins. Journal of Toxicology: Clinical Toxicology; 35(3): 249-255.
Risk Profile: Mycotoxins in the New Zealand April 2006 Food Supply
134
Bintvihok A, Thiengnin S, Doi K, Kumagai S. (2002) residues of aflatoxins in the liver, muscle and eggs of domestic fowls. Journal of Veterinary Medical Science; 64(11): 1037-1039. Bissesseur J, Permaul K, Odhav B. (2001) Reduction of patulin during apple juice clarification. Journal of Food Protection; 64(8): 1216-1219. Blakely TA, Bates MN, Baker MG, Tobias M. (1999) Hepatitis B carriage explains the excess rate of hepatocellular carcinoma for Maori, Pacific Island and Asian people compared to Europeans in New Zealand. International Journal of Epidemiology; 20: 204-210. Blanc M, Pittet A, Munoz-Box R, Viani R. (1998) Behavior of ochratoxin A during green coffee roasting and soluble coffee manufacture. Journal of Agricultural and Food Chemistry; 46: 673-675. Blaney BJ, Bloomfield RC, Moore CJ. (1984) Zearalenone intoxication of pigs. Australian veterinary Journal; 61(1): 24-27. Blaney BJ, Moore CJ, Tyler Al. (1987) The mycotoxins – 4-deoxynivalenol, zearalenone and aflatoxin – in weather-damaged wheat harvested 1983-1985 in south-eastern Queensland. Australian Journal of Agricultural Research; 38(6): 993-1000. Bosch U, Mirocha CJ, Abbas HK, di Menna M. (1989) Toxicity and toxin production by Fusarium isolates from New Zealand. Mycopathologia; 108: 73-79. Bosch FX, Ribes J, Borras J. (1999) Epidemiology of primary liver cancer. Seminars in Liver Disease; 19(3): 271-285. Boswald C, Engelhardt G, Vogel H, Wallnofer PR. (1995) Metabolism of zearalenone and DON by yeast strains of technological relevance. Natural Toxins; 3: 138-144. Bothast RJ, Bennett GA, Vancauwenberge JE, Richard JL. (1992) Fate of fumonisin B1 in naturally contaminated corn during ethanol fermentation. Applied and Environmental Microbiology; 58(1): 233-236. Bowers JC, Brown B, Springer J, Tollefson L, Lorentzen R, Henry S. (1993) Risk assessment for aflatoxin: an evaluation based on the multistage model. Risk Analysis; 13: 637-642. Brekke OL, Sinnhuber RO, Peplinski AF, Wales JH, Putnam GB, Lee DJ, Ciegler A. (1977) Aflatoxin in corn: Ammonia inactivation and bioassay with rainbow trout. Applied and Environmental Microbiology; 34: 34-37. Brera C, Debegnach F, Grossi S, Miraglia M. (2004) Effect of industrial processing on the distribution of fumonisin B1 in dry milling corn fractions. Journal of Food Protection; 67(6): 1261-1266. Bresch H, Majerus P, Urbanek N. (1998) Concentration of fumonisin in sweet corn samples between 1993 and 1998. Deutsche Lebensmittel-Rundschau; 94: 80-83.
Risk Profile: Mycotoxins in the New Zealand April 2006 Food Supply
135

Bressac B, Kew M, Wans J, Ozturk M. (1991) Selective G to T mutations of p53 gene in hepatocellular carcinoma from southern Africa. Nature; 350(6317): 429-431. Brinsdon S. (2004) Simulated typical diets for the 2003/04 New Zealand Total Diet Survey. A report for the New Zealand Food Safety Authority. Available at http://nzfsa.govt.nz/science-technology/research-projects/total-diet-survey/index.htm Bruce RD. (1990) Risk assessment for aflatoxin: II. Implications of human epidemiology data. Risk Analysis; 10(4): 561-569. Bryden WL, Salahifar H, Burgess LW. (1995) Zearalenone contamination of maize-based human foods. Proceedings of the Nutrition Society of Australia; 19: 45. Bryden WL, Shanks GJ, Ravindran G, Summerell BA, Burgess LW. (1998). Occurrence of Fusarium moniliforme and fumonisins in Australian maize in relation to animal disease. In: (Eds: Garland T, Barr AC.) Toxic Plants and Other Natural Toxicants. CABI Publishing; pp. 474-478. Bucheli P, Taniwaki MH. (2002) Review: Research on the origin, and on the impact of post-harvest handling and the manufacturing on the presence of ochratoxin A in coffee. Food Additives and Contaminants; 19(7): 655-665. Burda K. (1992) Incidence of patulin in apple, pear, and mixed fruit products marketed in New South Wales. Journal of Food Protection; 55(10): 796-798. CAC (Codex Alimentarius Commission). (2000). Position paper on zearalenone. CX/FAC 00/19. Rome: Codex Alimentarius Commission. Campbell TC, Chen JS, Liu CB, Li JY, Parpia B. (1990) Non-association of aflatoxin with primary liver cancer in a cross-sectional ecological survey in the People’s Republic of China. Cancer Research; 50(21): 6882-6893. CAST (Council for Agricultural Science and Technology). (2003) Mycotoxins. Risks in Plant, Animal and Human Systems. http://www.cast-science.org/pubs/mycotoxins.pdf. Castells M, Marín S, Sanchis V, Ramos AJ. (2005) Fate of mycotoxins in cereals during extrusion cooking: A review. Food Additives and Contaminants; 22(2): 150-157. Castelo MM, Sumner SS, Bullerman LB. (1998) Stability of fumonisins in thermally processed corn products. Journal of Food Protection; 61(8): 1030-1033. Castoria R, Lima G, Ferracane R, Ritieni A. (2005) Occurrence of mycotoxin in Farro samples from southern Italy. Journal of Food Protection; 68(2): 416-420. Cazzaniga D, Basilico JC, González RJ, Torres RL, de Greef DM. (2001) Mycotoxins inactivation by extrusion cooking of corn flour. Letters in Applied Microbiology; 33: 144-147.
Risk Profile: Mycotoxins in the New Zealand April 2006 Food Supply
136

CCFAC. (1998) Position paper on ochratoxin A. Codex Committee on Food Additives and Contaminants, 31st Session. CX/FAC 99/14. Challen C, Lunec J, Warren W, Collier J, Bassendine MF. (1992) Analysis of the p53 tumor-suppressor gene in hepatocellular carcinomas from Britain. Hepatology; 16(6): 1362-1366. Chen J, Gao J. (1993) The Chinese Total Diet Study in 1990. Part I. Chemical contaminants. Journal of the AOAC International; 76(6): 1193-1205. Chu FS, Chang CC, Ashoor SH, Prentice N. (1975) Stability of aflatoxin B1 and ochratoxin A in brewing. Applied Microbiology; 29(3): 313-316 Chu FS, Li GY. (1994) Simultaneous occurrence of fumonisin B1 and other mycotoxins in moldy corn collected from the People’s Republic of China in regions with high incidence of esophageal cancer. Applied and Environmental Microbiology; 60(3): 847-852. Cirillo T, Ritieni A, Galvano F, Amodio Cocchieri R. (2003). Natural co-occurrence of deoxynivalenol and fumonisins B1 and B2 in Italian marketed foodstuffs. Food Additives and Contaminants; 20(6): 566-571. Codex. (1999) Draft principles and guidelines for the conduct of microbiological risk assessment. Report of the thirty first session of the Codex Committee on Food Hygiene. ALINORM 99/13A. Rome: Codex Alimentarius Commission. Cromey MG, Parkes RA, Fraser PM. (2001) Fusarium levels in grain harvested from New Zealand wheat and barley crops in 2000. New Zealand Plant Protection; 54: 193-197. Cromey MG, Shorter SC, Lauren DR, Sinclair KI. (2002a) Cultivar and crop management influences on fusarium head blight and mycotoxins in spring wheat (Triticum aestivum) in New Zealand. New Zealand Journal of Crop and Horticultural Science; 30: 235-247. Cromey MG, Parkes RA, Sinclair KI, Lauren DR, Butler RC. (2002b) Effects of fungicides applied at anthesis on fusarium head blight and mycotoxins in wheat. New Zealand Plant Protection; 55: 341-346. Cullen JM, Ruebner BH, Hsieh LS, Hyde DM, Hsieh DP. (1987) Carcinogenicity of dietary aflatoxin M1 in male Fischer rats compared to aflatoxin B1. Cancer Research; 47: 1913-1917. Cullen JM, Newberne PM. (1994) Acute hepatotoxicity of aflatoxins. In: Eaton Dl, Groopman JD (eds). The Toxicology of Aflatoxins. Human Health, Veterinary and Agricultural Significance. San Diego: Academic Press; 3-26. Dänicke S, Ueberschär K-H, Halle I, Matthes S, Valenta H, Flachowsky G. (2002) Effects of addition of a detoxifying agent to laying hen diets containing uncontaminated or Fusarium toxin-contaminated maize on performance of hens and on carryover of zearalenone. Poultry Science; 81(11): 1671-1680.
Risk Profile: Mycotoxins in the New Zealand April 2006 Food Supply
137

Demeke T, Kidane Y, Wuhib E. (1979) Ergotism – a report on an epidemic, 1977-78. (1979) Ethiopian Medical Journal; 17(4): 107-113. De Nijs M, van Egmond HP, Nauta M, Rombouts FM, Notermans SHW. (1998) Assessment of human exposure to fumonisin B1. Journal of Food Protection; 61(7): 879-884. De Sylos CM, Rodriguez-Amaya DB. (1999) Incidence of patulin in fruits and fruit juices marketed in Campinas, Brazil. Food Additives and Contaminants; 16(2): 71-74. Di Menna ME, Lauren DR, Poole PR, Mortimer PH, Hill RA, Agnew MP. (1987) Zearalenone in New Zealand pasture herbage and the mycotoxin-producing potential of Fusarium species from pasture. New Zealand Journal of Agricultural Research; 30: 499-504. Doko MB, Canet C, Brown N, Sydenham EW, Mpuchane S, Siame BA. (1996) Natural co-occurrence of fumonisin and zearalenone in cereals and cereal-based foods from eastern and southern Africa. Journal of Agricultural and Food Chemistry; 44: 3240-3243. Dombrink-Kurtzman MA, Dvorak TJ, Barron ME, Rooney LW. (2000) Effect of nixtamalization (alkaline cooking) on fumonisin-contaminated corn for production of masa and tortilla. Journal of Agricultural and Food Chemistry; 48(11): 5781-5786. Drusch S, Ragab W. (2003) Mycotoxins in fruits, fruit juices, and dried fruits. Journal of Food Protection; 66(8): 1514-1527. Duvick J. (2001) Prospects for reducing fumonisin contamination of maize through genetic modification. Environmental Health Perspectives; 109(Supplement 2): 337-342. Eaton DL, Groopman JD. (1994) The toxicology of aflatoxins: Human health, veterinary and agricultural significance. San Diego: Academic Press. Edwards SG, Pirgozliev SR, Hare MC, Jenkinson P. (2001) Quantification of trichothecene-producing Fusarium species in harvested grain by competitive PCR to determine efficacies of fungicides against fusarium head blight of winter wheat. Applied and Environmental Microbiology; 67(4): 1575-1580. El-Banna AA, Hamilton RM, Scott PM, Trenholm HL. (1983) Nontransmission of deoxynivalenol (vomitoxin) to eggs and meat in chickens fed deoxynivalenol-contaminated diets. Journal of Agricultural and Food Chemistry; 31(6): 1381-1384. El-Hoshy SM. (1999) Occurrence of zearalenone in milk, meat and their products with emphasis on influence of heat treatments on its level. Archiv fur Lebensmittelhygiene; 50(6): 140-143. El-Nezami HS, Chrevatidis A, Auriola S, Salminen S, Mykkanen H. (2002) Removal of common Fusarium toxins in vitro by strains of Lactobacilli and Propionibacterium. Food Additives and Contaminants; 19(7): 680-686.
Risk Profile: Mycotoxins in the New Zealand April 2006 Food Supply
138
Eppley RM. (1966) A versatile procedure for assay and preparatory separation of aflatoxin from peanut products. Journal of the Association of Official Analytical Chemists; 49: 1218-1223. Espinosa ET, Askar KA, Torres LRN, Olvera RM, Santa Anna JPC. (1995) Quantification of aflatoxins in corn distributed in the city of Monterey, Mexico. Food Additives and Contaminants; 12(3): 383-386. Fajardo JE, Dexter JE, Roscoe MM, Nowicki TW. (1995) Retention of ergot alkaloids in wheat during processing. Cereal Chemistry; 72(3): 291-298. FAO. (1993) Sampling plans for aflatoxin analysis in peanuts and corn. FAO Food and Nutrition Paper 55. Rome: FAO. FDA (US Food and Drug Administration). (1992) Foodborne pathogenic microorganisms and natural toxins handbook. Aflatoxins. http://www.cfsan.fda.gov/~mow/chap41.html Foster PL, Eisenstadt E, Miller JH. (1983) Base substitution mutations induced by metabolically activated aflatoxin B1. Proceedings of the National Academy of Sciences; 80(9): 2695-2698. Franceschi S, Bidoli E, Barón AE, La Vecchia C. (1990) Maize and risk of cancers of the oral cavity, pharynx and esophagus in Northeastern Italy. Journal of the National Cancer Institute; 82(17): 1407-1411. Frank JM. (1999) HACCP and its mycotoxin control potential: ochratoxin A (OTA) in coffee production. Proceedings of the 17th International Conference of the International Committee on Food Microbiology and Hygiene, Veldhoven, The Netherland; pp. 122-125. FSA (Food Standards Agency). (2001) Survey of milk for mycotoxins. Food Survey Information Sheet 17/01. http://www.foodstandards.gov.uk/science/surveillance/fsis2001/milk-myco. FSA (Food Standards Agency). (2002a) Survey of retail rice for a range of mycotoxins. Food Survey Information Sheet 22/02. http://www.foodstandards.gov.uk/multimedia/pdfs/22rice.pdf. FSA (Food Standards Agency). (2002b) Survey of nuts, nut products and dried tree fruits for mycotoxins. Food Survey Information Sheet 21/02. http://www.foodstandards.gov.uk/multimedia/pdfs/21nuts.pdf. FSA (Food Standards Agency). (2004) Survey of baby foods for mycotoxins. Food Survey Information Sheet 68/04. http://www.foodstandards.gov.uk/multimedia/pdfs/fsis6804.pdf. FSA (Food Standards Agency). (2005a) Survey of maize-based retail products for mycotoxins. Food Survey Information Sheet 72/05. http://www.foodstandards.gov.uk/multimedia/pdfs/fsis7205.pdf.
Risk Profile: Mycotoxins in the New Zealand April 2006 Food Supply
139

FSA (Food Standards Agency). (2005) Survey of cereal products for trichothecenes and zearalenone. Food Survey Information Sheet 35/03. http://www.foodstandards.gov.uk/multimedia/pdfs/35cereal.PDF. FSANZ (2002) The 20th Australian Total Diet Survey. Canberra: FSANZ. Gareis M. (1996) Fate of ochratoxin A on processing of meat products. Food Additives and Contaminants; 13(Supplement): 35-37. Gilbert J, Brereton P, MacDonald S. (2001) Assessment of dietary exposure to ochratoxin A in the UK using a duplicate diet approach and analysis of urine and plasma samples. Food Additives and Contaminants; 18(12): 1088-1093. Gokmen V, Acar J. (1998) Incidence of patulin in apple juice concentrates produced in Turkey. Journal of Chromatography A; 815(1): 99-102. Gorelick NJ, Bruce RD, Hoseyni MS. (1994) Human risk assessment based on animal data: inconsistencies and alternatives. In: Eaton DL, Groopman JD (eds). The Toxicology of Aflatoxins. Human Health, Veterinary and Agricultural Significance. San Diego: Academic Press; 493-511. Greenblatt MS, Bennett WP, Hollstein M, Harris CC. (1994) Mutations in the p53 tumor suppressor gene: clues to cancer etiology and molecular pathogenesis. Cancer Research; 54(18): 4855-4878. Hagler WM, Hutchins JE, Hamilton PB. (1982) Destruction of aflatoxin in corn with sodium bisulfite. Journal of Food Protection; 45: 1287-1291. Hall AJ, Wild CP. (1994) Epidemiology of aflatoxin-related disease. In: Eaton DL, Groopman JD (eds). The Toxicology of Aflatoxins. Human Health, Veterinary and Agricultural Significance. San Diego: Academic Press; 233-258. Hammond BG, Campbell KW, Pilcher CD, Degooyer TA, Robinson AF, McMillen BL, Spangler SM, Riordan SG, Rice LG, Richard JL. (2004) Lower fumonisin mycotoxin levels in the grain of Bt corn grown in the United States in 2000-2002. Journal of Agricultural and Food Chemistry; 52(5): 1390-1397. Hardy B. (1998) The Australian Market Basket Survey 1996. Melbourne: Information Australia. Hatch MC, Chen CJ, Levin B, Ji BT, Yang GY, Hsu SW, Wang LW, Santella RM. (1993) Urinary aflatoxin levels, hepatitis B virus infection and hepatocellular carcinoma in Taiwan. International Journal of Cancer; 54: 931-934. Hazel CM, Patel S. (2004) Influence of processing on trichothecene levels. Toxicology Letters; 153: 51-59. Hennigen MR, Dick T. (1995) Incidence and abundance of mycotoxins in maize in Rio Grande do Sul, Brazil. Food Additives and Contaminants; 12(5): 677-681.
Risk Profile: Mycotoxins in the New Zealand April 2006 Food Supply
140

Hlywka JJ, Bullerman LB. (1999) Occurrence of fumonisin B1 and B2 in beer. Food Additives and Contaminants; 16(8): 319-324. Hobson W, Bailey J, Fuller GB. (1977). Hormone effects of zearalenone in non-human primates. Journal of Toxicology and Environmental Health; 3: 43-57. Hocking AD, Varelis P, Pitt JI, Cameron SF, Leong S-L. (2003) Occurrence of ochratoxin A in Australian wine. Australian Journal of Grape and Wine Research; 9(1): 72-78. Hoque A, Patt YZ, Yoffe B, Groopman JD, Greenblatt MS, Zhang YJ, Santella RM. (1999) Does aflatoxin B1 play a role in the etiology of hepatocellular carcinoma in the United States? Nutrition and Cancer; 35(1): 27-33. Hopkins WA. (1943) Patulin in the common cold. IV. Biological properties: Extended trial in the common cold. Lancet; 242(6273): 631-634. Hoseyni MS. (1992) Risk assessment for aflatoxin: III. Modelling the relative risk of hepatocellular carcinoma. Risk Analysis; 12: 123-126. Howard PC, Warbritton A, Voss KA, Lorentzen RJ, Thurman JD, Kovach RM, Bucci TJ. (2001) Compensatory regeneration as a mechanism for renal tubule carcinogenesis of fumonisin B1 in the F344/N/Nctr BR rat. Environmental Health Perspectives; 102 (Supplement 2): 309-314. Hsieh DPH, Atkinson DN. (1995) Recent aflatoxin exposure and mutation at codon 249 of the human p53 gene: lack of association. Food Additives and Contaminants; 12(3): 421-424. Hsu IC, Metcalf RA, Sun T, Welsh JA, Wang NJ, Harris CC. (1991) Mutational hotspot in the p53 gene in human hepatocellular carcinomas. Nature; 350(6317): 427-428. Huff WE, Hagler WM. (1985) Density segregation of corn and wheat naturally contaminated with aflatoxin, deoxynivalenol and zearalenone. Journal of Food Protection; 48: 416-420. Humphreys SH, Carrington C, Bolger M. (2001) A quantitative risk assessment for fumonisins B1 and B2 in US corn. Food Additives and Contaminants; 18(3): 211-220. Hussein HM, Baxter M, Andrew IG, Franich RA. (1987) Fusarium mycotoxins in New Zealand maize. New Zealand Veterinary Journal; 35: 155. Hussein HM, Franich RA, Baxter M, Andrew IG. (1989) Naturally occurring Fusarium toxins in New Zealand maize. Food Additives and Contaminants; 6(1): 49-58. Hussein HM, Christensen MJ, Baxter M. (2002) Occurrence and distribution of Fusarium species in maize fields in New Zealand. Mycopathologia; 156: 25-30. IARC. (1986) Some naturally occurring and synthetic food components, furocoumarins and ultraviolet radiation. IARC Monographs on the Evaluation of Carcinogenic Risks to Humans. Volume 40. Lyon, France: IARC.
Risk Profile: Mycotoxins in the New Zealand April 2006 Food Supply
141

IARC. (1993) Some naturally occurring substances: Food items and constituents, heterocyclic aromatic amines and mycotoxins. IARC Monographs on the Evaluation of Carcinogenic Risks to Humans. Volume 56. Lyon, France: IARC. IARC. (2002) Some traditional herbal medicines, some mycotoxins, naphthalene and styrene. IARC Monographs on the Evaluation of Carcinogenic Risks to Humans. Volume 82. Lyon, France: IARC. IEH (Institute for Environment and Health). (2000). Phytoestrogens in the human diet. Web Report W3. http://www.le.ac.uk/ieh/webpub/webpub.html Ioannou-Kakouri E, Aletrari M, Christou E, Hadjioannou-Ralli A, Koliou A, Akkelidou D. (1999) Surveillance and control of aflatoxins B1, B2, G1, G2, and M1 in foodstuffs in the Republic of Cyprus: 1992-1996. Journal of the AOAC International; 82(4): 883-892. Ito R, Yamazaki H, Inoue K, Yoshimura Y, Kawaguchi M, Nakazawa H. (2004) Development of liquid chromatography-electrospray mass spectrometry for the determination of patulin in apple juice: investigation of its contamination levels in Japan. Journal of Agricultural and Food Chemistry; 52: 7464-7468. IUPAC/SCOPE (2003). Implications of Endocrine Active substances for humans and wildlife – a SCOPE/IUPAC project. Pure and Applied Chemistry; 75(11-12). Iverson F, Armstrong C, Nera E, Truelove J, Fernie S, Scott P, Stapley R, Hayward S, Gunner S. (1995) Chronic feeding study of deoxynivalenol in B6C3F1 male and female mice. Teratogenesis, Carcinogenesis and Mutagenesis; 15: 283-306. Jackson LS, Beacham-Bowden T, Keller SE, Adhikari C, Taylor KT, Chirtel SJ, Merker RI. (2003) Apple quality, storage, and washing treatments affect patulin levels in apple cider. Journal of Food Protection; 66(4): 618-624. Jackson PE, Groopman JD. (1999) Aflatoxin and liver cancer. Baillière’s Clinical Gastroenterology; 13(4): 545-555. JECFA. (1990) Patulin. Safety evaluation of certain food additives and contaminants. WHO Food Additive Series 26. Geneva: World Health Organization. JECFA. (1991) Ochratoxin A. Safety evaluation of certain food additives and contaminants. WHO Food Additive Series 28. Geneva: World Health Organization. JECFA. (1995a) Ochratoxin A. Safety evaluation of certain food additives and contaminants. WHO Food Additive Series 35. Geneva: World Health Organization. JECFA. (1995b) Patulin. Safety evaluation of certain food additives and contaminants. WHO Food Additive Series 35. Geneva: World Health Organization. JECFA. (1998) Aflatoxins. Safety Evaluation of Certain Food Additives and Contaminants. WHO Food Additive Series 40. Geneva: World Health Organization.
Risk Profile: Mycotoxins in the New Zealand April 2006 Food Supply
142

JECFA. (Joint FAO/WHO Expert Committee) (2000) Zearalenone. Safety evaluation of certain food additives. WHO Food Additives Series 44. Geneva: World Health Organisation. JECFA. (2001a) Ochratoxin A. Safety Evaluation of Certain Food Additives and Contaminants. WHO Food Additive Series 47. Geneva: World Health Organization. JECFA (Joint FAO/WHO Expert Committee on Food Additives). (2001b) Deoxynivalenol. Safety evaluation of certain food additives and contaminants. WHO Food Additive Series 47. Geneva: World Health Organization. JECFA (Joint FAO/WHO Expert Committee on Food Additives). (2001c) T-2 and HT-2 toxins. Safety evaluation of certain food additives and contaminants. WHO Food Additive Series 47. Geneva: World Health Organization. JECFA (Joint FAO/WHO Expert Committee on Food Additives). (2001d) Fumonisins. Safety evaluation of certain food additives and contaminants. WHO Food Additive Series 47. Geneva: World Health Organization. Jones C, Ciacci-Zanella JR, Zhang Y, Henderson G, Dickman M. (2001) Analysis of fumonisin B1-induced apoptosis. Environmental Health Perspectives; 109(Supplement 2): 315-320. Jørgensen K. (1998) Survey of pork, poultry, coffee, beer and pulses for ochratoxin A. Food Additives and Contaminants; 15(5): 550-554. Katta SK, Cagampang AE, Jackson LS, Bullerman LB. (1997) Distribution of Fusarium molds and fumonisins in dry-milled corn fractions. Cereal Chemistry; 74: 858-863. Kiang DT, Kennedy BJ, Pathre SV, Mirocha CJ. (1978). Binding characteristics of zearalenone analogs to oestrogen receptors. Cancer Research; 38: 3611-3615. King B. (1979) Outbreak of ergotism in Wollo, Ethiopia. Lancet; 313(8131): 1411. Klich MA, Pitt JI. (1988) Differentiation of Aspergillus flavus from A.parasiticus and closely related species. Transactions of the British Mycological Society; 91: 99-108. Klieber A. (2001) Aflatoxin contamination and its management in chilli and paprika products in Australia. Food Australia; 53(3): 90-92. Kpodo K, Thrane U, Hald B. (2000) Fusaria and fumonisins in maize from Ghana and their co-occurrence with aflatoxins. International Journal of Food Microbiology; 61(2-3): 147-157. Krishnamachari KAVR, Bhat RV, Nagarajan V, Tilak TBG. (1975) Investigations into an outbreak of hepatitis in parts of Western India. Indian Journal of Medical Research; 63(7): 1036-1044.
Risk Profile: Mycotoxins in the New Zealand April 2006 Food Supply
143

Krishnamachari KAVR, Bhat RV. (1976) Poisoning by ergoty bajra (pearl millet) in man. Indian Journal of Medical Research; 64(11): 1624-1628. Krska R. (1999) Mycotoxins of growing interest. Zearalenone. Proceedings of Third Joint FAO/WHO/UNEP International Conference on Mycotoxins. Available at ftp://ftp.fao.org/es/esn/food/myco5d.pdf Kuiper-Goodman T, Scott PM, Watanabe H. (1987). Risk assessment of the mycotoxin zearalenone. Regulatory Toxicology and Pharmacology; 7(3): 253-306. Kuiper-Goodman T. (1996) Risk assessment of ochratoxin A: an update. Food Additives and Contaminants; 13 Supplement: 53-57. Laciaková A, Máté D, Pipová M, Pástorová B, Laciak V, Bakošová A. Prevalence of microscopic filamentous fungi in poultry processing plant and concentration of aflatoxin B1 and ochratoxin A in eggs. Bulletin of the Veterinary Institute in Pulawy; 45(1): 99-104. Lake RJ, Jamieson EJ, North MT, Stanton DW. (1991) Aflatoxins in food: A review and survey. DSIR Chemistry Paper No. CD 9029. Christchurch: Department of Scientific and Industrial Research. Lake R, Stanton D. (1998) review of fumonisins as a food safety issue for New Zealand. ESR Client Report FW9859. Christchurch: ESR. Lauren DR, Agnew MP, Smith WA, Sayer ST. (1991) A survey of the natural occurrence of Fusarium mycotoxins in cereals grown in New Zealand in 1986-1989. Food Additives and Contaminants; 8(5): 599-605. Lauren DR, Sayer ST, di Menna ME. (1992) Trichothecene production by Fusarium species isolated from grain and pasture throughout New Zealand. Mycopathologia; 120: 167-176. Lauren DR, Veitch JH. (1996) Survey of mycotoxins in grain-based foods. Final Report to Ministry of Health. HortResearch Client Report No 96/33. Hamilton: HortResearch. Lauren DR, Ringrose MA. (1997) Determination of the fate of three Fusarium mycotoxins through wet-milling of maize using an improved HPLC analytical technique. Food Additives and Contaminants; 14: 435-443. Lauren DR, DiMenna ME. (1999) Fusaria and Fusarium mycotoxins in leaves and ears of maize plants.2. A time course study made in the Waikato region, New Zealand, in 1997. New Zealand Journal of Crop and Horticultural Science; 27: 215-223. Lauren DR, Smith WA. (2001) Stability of the Fusarium mycotoxins nivalenol, deoxynivalenol and zearalenone in ground maize under typical cooking environments. Food Additives and Contaminants; 18(1): 1011-1016. Lauren DR, Gensen DJ, Smith WA, Dow, BW, Sayer ST. (1996) Mycotoxins in New Zealand maize: a study of some factors influencing contamination levels in grain. New Zealand Journal of Crop and Horticultural Science; 24: 13-20.
Risk Profile: Mycotoxins in the New Zealand April 2006 Food Supply
144

Leblanc JC, Tard A, Volatier JL, Verger P. (2005) Estimated dietary exposure to principal food mycotoxins from the first French Total Diet Study. Food Additives and Contaminants; 22(7): 652-72. Lee U-S, Jang H-S, Tanaka T, Oh Y-J, Cho C-M, Ueno Y. (1987) Effect of milling on decontamination of Fusarium mycotoxins nivalenol, deoxynivalenol, and zearalenone in Korean wheat. Journal of Agricultural and Food Chemistry; 35: 126-129. Leggott NL, Shephard GS. (2001) Patulin in South African commercial apple products. Food Control; 12: 73-76. Leggott NL, Shephard GS, Stockenström S, Staal E, van Scalkwyk DJ. (2001) The reduction of patulin in apple juice by three different types of activated carbon. Food Additives and Contaminants; 18(9): 825-829. Liu C, Liu F, Xu W, Kofoet A, Humpf HU, Jiang S. (2005) Occurrence of fumonisins B1 and B2 in asparagus from Shandong province, PR China. Food Additives and Contaminants; 22(7): 673-676. Loechler EL. (1994) Mechanisms by which aflatoxins and other bulky carcinogens induce mutations. In: Eaton DL, Groopman JD (eds). The Toxicology of Aflatoxins. Human Health, Veterinary and Agricultural Significance. San Diego: Academic Press; 149-178. Logrieco A, Doko B, Moretti A, Frisullo S, Visconti A. (1998) Occurrence of fumonisins B1 and B2 in Fusarium proliferatum infected asparagus plants. Journal of Agricultural and Food Chemistry; 46: 5201-5204. Lombaert GA, Pellaers P, Roscoe V, Mankotia M, Neil R, Scott PM. (2003) Mycotoxins in infant cereal foods from the Canadian retail market. Food Additives and Contaminants; 20(5): 494-504. Lorenz K. (1979) Ergot on cereal grains. CRC Critical Reviews in Food Science and Nutrition; 11: 311-354. Love JL. (1999) Sampling and assessment of foods for aflatoxin and ochratoxin contamination. ESR Client Report FW9942. Christchurch: ESR. Love JL. (2000) Sampling of peanuts and acceptance probabilities. ESR Client Report FW0062. Christchurch: ESR. Lovett J, Thompson RG, Boutin BK. (1975) Trimming as a means of removing patulin from fungus rotten apples. Journal of the AOAC International; 58: 909-911. Lu Z, Dantzer WR, Hopmans EC, Prisk V, Cunnik JE, Murphy PA, Hendricks S. (1997) Reaction with fructose detoxifies fumonisin B1 while stimulating liver-associated natural killer cell activity in rats. Journal of Agricultural and Food Chemistry; 45: 803-809.
Risk Profile: Mycotoxins in the New Zealand April 2006 Food Supply
145

Lunn RM, Zhang YJ, Wang LY, Chen CJ, Lee PH, Lee CS, Tsai WY, Santella RM. (1997) p53 mutations, chronic hepatitis B virus infection, and aflatoxin exposure in hepatocellular carcinoma in Taiwan. Cancer Research; 57(16): 3471-3477. L’vova LS, Kizlenko OI, Shul’gina AP, Orlova NY, Omel’chenko MD. (1998) Distribution of zearalenone in milling products of Fusarium-infected wheat and barley. Applied Biochemistry and Microbiology; 34(5): 512-515. Mably M, Mankotia M, Cavlovic P, Tam J, Wong L, Pantazopoulos P, Calway P, Scott PM. (2005) Survey of aflatoxins in beer sold in Canada. Food Additives and Contaminants; 22(12): 1252-1257. Mainka S, Danicke S, Bohme H, Ueberschär K-H, Polten S, Hüther L. (2005a) The influence of ergot contaminated feed on growth and slaughtering performance, nutrient digestibility and carry over of ergot alkaloids in growing-finishing pigs. Archives of Animal Nutrition; 59(6): 377-395. Mainka S, Danicke S, Bohme H, Wolff J, Matthes S, Flachowsky G. (2005b) Comparative studies on the effect of ergot contaminated feed on performance and health of piglets and chickens. Archives of Animal Nutrition; 59(2): 81-98. MAFF. (1993) Patulin in apple juice: 1993 survey. Food Surveillance Information Sheet No. 16. London: MAFF. MAFF. (1994a) Survey of aflatoxins in herbs and spices. Food Surveillance Information Sheet No. 22. London: MAFF. MAFF. (1994b) Survey of ‘ethnic’ foods for mycotoxins. Food Surveillance Information Sheet No. 37. London: MAFF. MAFF. (1994c) Survey of baby foods for mycotoxins. Food Surveillance Information Sheet No. 68. London: MAFF. MAFF. (1994d) 1994 survey of apple juice for patulin. Food Surveillance Information Sheet No. 36. London: MAFF. MAFF. (1995a) Survey of aflatoxin M1 in retail milk and milk products. Food Surveillance Information Sheet No. 64. London: MAFF. MAFF. (1995b) 1995 survey of apple juice for patulin. Food Surveillance Information Sheet No. 74. London: MAFF. MAFF. (1995c) Survey of fruit juices and tomato products for patulin. Food Surveillance Information Sheet No. 63. London: MAFF. MAFF. (1996a) Aflatoxin surveillance of retail and imported nuts, nut products, dried figs and fig products. Food Surveillance Information Sheet No. 81. London: MAFF.
Risk Profile: Mycotoxins in the New Zealand April 2006 Food Supply
146

MAFF. (1996b) Survey of aflatoxin M1 in farm gate milk. Food Surveillance Information Sheet No. 78. London: MAFF. MAFF. (1996c) 1996 survey of apple juice for patulin. Food Surveillance Information Sheet No. 97. London: MAFF. MAFF. (1997) Survey of aflatoxins and ochratoxin A in cereals and retail products. Food Surveillance Information Sheet No. 130. London: MAFF. MAFF. (1999a) Survey of aflatoxins, ochratoxin A, fumonisins and zearalenone in raw maize. Food Surveillance Information Sheet No. 192. London: MAFF. MAFF. (1999b) 1998 survey of apple juice for patulin. Food Surveillance Information Sheet No. 173. London: MAFF. Malmauret L, Parent-Massin D, Hardy J-L, Verger P. (2002) Contaminants in organic and conventional foodstuffs in France. Food Additives and Contaminants; 19(6): 524-532. Maragos CM, Richard JL. (1994) Quantitation and stability of fumonisins B1 and B2 in Milk. Journal of the AOAC International; 77(5): 1162-1167. Marín S, Sanchis V, Sanz D, Castel I, Ramos AJ, Canela R, Magan N. (1999) Control of growth and fumonisin B1 production by Fusarium verticillioides and Fusarium proliferatum isolates in moist maize with propionate preservatives. Food Additives and Contaminants; 16(12): 555-563. Marro N. (1996) The 1994 Australian Market Basket Survey. Canberra: Australian Government Publishing Service. McKenzie KS, Kubena LF, Denvir AJ, Rogers TD, Hitchens GD, Bailey RH, Harvey RB, Buckley SA, Phillips TD. (1998) Aflatoxicosis in turkey poults is prevented by treatment of naturally contaminated corn with ozone generated by electrolysis. Poultry Science; 77: 1094-1102. McLean M, Dutton MF. (1995) Cellular interactions and metabolism of aflatoxin: an update. Pharmacology and Therapeutics; 65(2): 163-192. Micco C, Miraglia M, Onori R, Brera C, Mantovani A, Ioppolo A, Stasolla D. (1988) Long-term administration of low doses of mycotoxins to poultry. 1. Residues of aflatoxin B1 and its metabolites in broilers and laying hens. Food Additives and Contaminants; 5(3): 303-308. Ministry of Health/Ministry of Agriculture and Forestry. (2000) Food Administration in New Zealand: A Risk Management Framework for Food Safety. Wellington: Joint Ministry of Health and Ministry of Agriculture and Forestry Food Harmonisation Project. Mirocha CJ, MacIntosh CG, Mirza UA, Xie W, Xu Y, Chen J. (1992) Occurrence of fumonisin in forage grass in New Zealand. Applied and Environmental Microbiology; 58(9): 3196-3198.
Risk Profile: Mycotoxins in the New Zealand April 2006 Food Supply
147
Missmer SA, Suarez L, Felkner M, Wang E, Merrill AH, Rothman KJ, Hendricks KA. (2006) Exposure to fumonisins and the occurrence of neural tube defects along the Texas-Mexico border. Environmental Health Perspectives; 114(2): 237-241. Moake MM, Padilla-Zakour OI, Worobo RW. (2005) Comprehensive review of patulin control methods in foods. Comprehensive Reviews in Food Science and Food Safety; 4(1): 8-21. MoH. (2002) Immunisation Handbook 2002. Wellington: Ministry of Health (for electronic access to this document refer to http://moh.govt.nz). MoH. (2003) NZ Food NZ Children: Key results of the 2002 National Children’s Nutrition Survey. Wellington: Ministry of Health. Molto G, Samar MM, Resnik S, Martinez EJ, Pacin A. (2000) Occurrence of trichothecenes in Argentinean beer: a preliminary exposure assessment. Food Additives and Contaminants; 17(9): 809-813. Monds RD, Cromey MG, Lauren DR, di Menna M, Marshall J. (2005) Fusarium graminearum, F. cortaderiae and F. pseudograminearum in New Zealand: molecular phylogenetic analysis, mycotoxin chemotypes and co-existence of species. Mycological Research; 109(4): 410-420. Moodley RS, Govinden R, Odhav B. (2002) The effect of modified atmospheres and packaging on patulin production in apples. Journal of Food Protection; 65(5): 867-871. Moore MR, Pitot HC, Miller EC, Miller JA. (1982) Cholangiocellular carcinoma incidence in Syrian hamsters administered aflatoxin B1 in large doses. Journal of the National Cancer Institute; 68: 271-278. Morrison E, Kosiak B, Ritieni A, Astveit AH, Uhlig S, Bernhoft A. (2002) Mycotoxin production by Fusarium avenaceum strains isolated from Norwegian grain and the cytotoxicity of rice culture extracts to porcine kidney epithelial cells. Journal of Agricultural and Food Chemistry; 50(10): 3070-3075. Moss MO, Long MT. (2002) Fate of patulin in the presence of the yeast Saccharomyces cerevisiae. Food Additives and Contaminants; 19(4): 387-399. Munimbazi C, Bullerman LB. (1996) Molds and mycotoxins in foods in Burundi. Journal of Food Protection; 59: 869-875. Munkvold GP. (1999) Comparison of fumonisin concentrations in kernels of transgenic Bt maize hybrids and nontransgenic hybrids. Plant Disease; 83(2): 130-138. Neill JC. (1941) Ergot. New Zealand Journal of Science and Technology; 23: 130A-137A. New Zealand Health Information Service. (1999) Cancer: New registrations and deaths, 1995. Wellington: Ministry of Health.
Risk Profile: Mycotoxins in the New Zealand April 2006 Food Supply
148

New Zealand Health Information Service. (2000) Cancer: New registrations and deaths, 1996. Wellington: Ministry of Health. New Zealand Health Information Service. (2001) Cancer: New registrations and deaths, 1997. Wellington: Ministry of Health. New Zealand Health Information Service. (2002) Cancer: New registrations and deaths, 1998. Wellington: Ministry of Health. Ngindu A, Johnson BK, Kenya PR, Ngira JA, Ocheng DM, Nandwa H, Omondi TN, Jansen AJ, Ngare W, Kaviti JN, Gatei D, Siongok TA. (1982) Outbreak of acute hepatitis caused by aflatoxin poisoning in Kenya. Lancet; 8285: 1346-1348. Nowicki TW, Gaba DG, Dexter JE, Matsuo RR, Clear RM. (1988) Retention of DON in wheat during processing and cooking of spaghetti and noodles. Journal of Cereal Science; 8: 189-202. NZFSA (New Zealand Food Safety Authority) (2006) Agricultural compounds and veterinary medicines. http://www.nzfsa.govt.nz/acvm. Oliveira CA, Rosmaninho JF, Castro AL, Butkeraitis P, Reis TA, Correa B. (2003) Aflatoxin residues in eggs of laying Japanese quail after long-term administration of rations containing low levels of aflatoxin B1. Food Additives and Contaminants; 20(7): 648-653. Oliveira CA, Kobashigawa E, Reis TA, Mestieri L, Albuquerque R, Correa B. (2000) Aflatoxin B1 residues in eggs of laying hens fed a diet containing different levels of the mycotoxin. Food Additives and Contaminants; 17(6): 459-462. Omer RE, Baller MI, van’t Veer P, Hoogenboom RLAP, Poman THG, Alink GM, Idris MO, Kadaru AMY, Kok FJ. (1998) Aflatoxin and liver cancer in Sudan. Nutrition and Cancer; 32(3): 174-180. Oveisi MR, Hajimahmoodi M, Memarian S, Sadeghi N, Shoeibi S. (2005). Determination of zearalenone in corn flour and a cheese snack product using high-performance liquid chromatography with fluorescence detection. Food Additives and Contaminants; 22(5): 443-448. Pacin AM, Resnik SL, Neira MS, Molto G, Martinez E. (1997) Natural occurrence of deoxynivalenol in wheat, wheat flour and bakery products from Argentina. Food Additives and Contaminants; 14(4): 327-331. Papadopoulou-Bouraoui A, Vrabcheva T, Valzacchi S, Stroka J, Anklam E. (2004) Screening survey of deoxynivalenol in beer from the European market by an enzyme-linked immunosorbent assay. Food Additives and Contaminants; 21(6): 607-617. Park DL, Rua SM, Mirocha CJ, El-Sayad AMA, Weng CY. (1992) Mutagenic potential of fumonisin contaminated corn following ammonia decontamination procedure. Mycopathologia; 117: 105-108.
Risk Profile: Mycotoxins in the New Zealand April 2006 Food Supply
149

Park DL, Njapau H, Boutrif E. (1999) Minimising risks posed by mycotoxins utilising the HACCP concept. Proceedings of the Third Joint FAO/WHO/UNEP International Conference on Mycotoxins, Tunis, Tunisia. MYC-CONF/99/8b. http://www.fao.org/es/ESN/mycoto/papers%5Cmyco8b.pdf. Park DL. (2002) Effect of processing on aflatoxin. Advances in Experimental Medicine and Biology; 504: 173-179. Park JW, Kim EK, Shon DH, Kim YB. (2002) Natural co-occurrence of aflatoxin B1, fumonisin B1 and ochratoxin A in barley and corn foods from Korea. Food Additives and Contaminants; 19(11): 1073-1080. Park JW, Kim EK, Kim YB. (2004) Estimation of the daily exposure of Koreans to aflatoxin B1 through food consumption. Food Additives and Contaminants; 21(1): 70-75. Park JW, Choi S-Y, Hwang H-J, Kim Y-B. (2005) Fungal mycoflora and mycotoxins in Korean polished rice destined for humans. International Journal of Food Microbiology; 103: 305-314. Paster N, Blumenthal-Yonassi J, Barkai-Golan R, Menasherov M. (1991) Production of zearalenone in vitro and in corn grains stored under modified atmospheres. International Journal of Food Microbiology; 12(2-3): 157-165. Patel S, Hazel CM, Winterton AG, Gleadle AE. (1997) Surveillance of fumonisins in UK maize-based foods and other cereals. Food Additives and Contaminants; 14(2): 187-191. Peers FG, Linsell CA. (1973) Dietary aflatoxins and liver cancer. British Journal of Cancer; 27: 473-484. Peers F, Bosch X, Kaldor J, Linsell A, Pluijmen M. (1987) Aflatoxin exposure, hepatitis B virus infection and liver cancer in Swaziland. International Journal of Cancer; 39: 545-553. Pennycook SR. (1989) Fungal plant diseases recorded in New Zealand. Part II. Plant Diseases Recorded in New Zealand 2: 5-502 Auckland: Plant Diseases Division, DSIR Peraica M, Radic B, Lucic A, Pavlovic M. (1999) Toxic effects of mycotoxins in humans. Bulletin of the World Health Organization; 77(9): 754-766. Pestka JJ, Zhou H-R, Moon Y, Chung YJ. (2004) Cellular and molecular mechanisms for immune modulation by deoxynivalenol and other trichothecenes: unraveling a paradox. Toxicology Letters; 153: 61-73. Petersen A, Thorup I. (2001) Preliminary evaluation of fumonisins by the Nordic countries and occurrence of fumonisins (FB1 and FB2) in corn-based foods on the Danish market. Food Additives and Contaminants; 18(3): 221-226. Pfohl-Leszkowicz A, Petkova-Bocharova T, Chernozemsky IN, Castegbaro M. (2002) Balkan endemic nephropathy and associated urinary tract tumours: a review on aetiological
Risk Profile: Mycotoxins in the New Zealand April 2006 Food Supply
150

causes and the potential role of mycotoxins. Food Additives and Contaminants; 19(3): 282-302. Phillips TD, Clement BA, Parl DL. (1994) Approaches to reduction of aflatoxins in foods and feeds. In: Eaton DL, Groopman JD (eds). The Toxicology of Aflatoxins. Human Health, Veterinary and Agricultural Significance. San Diego: Academic Press; 383-406. Piemontese L, Solfrizzo M, Visconti A. (2005) Occurrence of patulin in conventional and organic fruit products in Italy and subsequent exposure assessment. Food Additives and Contaminants; 22(5): 437-442. Piñeiro M, Dawson R, Costarrica ML. (1996) Monitoring program for mycotoxin contamination in Uruguayan food and feeds. Natural Toxins; 4: 242-245. Piñeiro M, Miller D, Silva G, Musser S. (1999) Effect of commercial processing on fumonisin concentration of maize-based foods. Mycotoxin Research; 15: 2-12. Pitt JI, Hocking AD. (1996) Current knowledge of fungi and mycotoxins associated with food commodities in Southeast Asia. In: Highley E, Johnson GI. (eds). Mycotoxin Contamination in Grains. Canberra: Australian Centre for International Agricultural Research; 5-10. Pitt JI, Hocking AD. (1997) Fungi and Food Spoilage. London: Blackie Academic and Professional. Pitt JI, Tomaska L. (2001) Are mycotoxins a health hazard in Australia? 1. Aflatoxins and Fusarium toxins. Food Australia; 53(12): 535-539. Pitt JI, Tomaska L. (2002) Are mycotoxins a health hazard in Australia? 2. Ochratoxin A. Food Australia; 54(1,2): 39-43. Pohland A, Wood GE. (1987) Occurrence of mycotoxins in food. In: Krogh P (ed). Mycotoxins in Food. London: Academic Press; pp 35-64. Price KR, Fenwick GR. (1985). Naturally occurring oestrogens in foods - A review. Food Additives and Contaminants; 2: 73-106. Prieta J, Moreno MA, Díaz S, Suárez G, Domínguez L. (1994) Survey of patulin in apple juice and children’s apple food by the diphasic dialysis membrane procedure. Journal of Agricultural and Food Chemistry; 42: 1701-1703. Qian GS, Ross RK, Yu MC, Yuan JM, Gao YT, Henderson BE, Wogan GN, Groopman JD. (1994) A follow-up study of urinary markers of aflatoxin exposure and liver cancer risk in Shanghai, People’s Republic of China. Cancer Epidemiology Biomarkers and Prevention; 3(1): 3-10. Rasmussen PH, Ghorbani F, Berg T. (2003) Deoxynivalenol and other Fusarium toxins in wheat and rye flours on the Danish market. Food Additives and Contaminants; 20(4): 396-404.
Risk Profile: Mycotoxins in the New Zealand April 2006 Food Supply
151

Resnik S, Neira S, Pacin A, Martinez E, Apro N, Latreite S. (1996) A survey of the natural occurrence of aflatoxins and zearalenone in Argentine field maize: 1983-1994. Food Additives and Contaminants; 13(1): 115-120. Rheeder JP, Marasas WFO, Thiel PG, Sydenham EW, Shephard GS, van Schalkwyk DJ. (1992) Fusarium moniliforme and fumonisins in corn in relation to human esophageal cancer in Transkei. Phytopathology; 82: 353-357. Richard JL, Meerdink G, Maragos CM, Tumbleson M, Bordson G, Rice LG, Ross PF. (1996) Absence of detectable fumonisins in the milk of cows fed fusarium proliferatum (Matsushima) Nirenberg culture material. Mycopathologia; 133(2): 123-126. Ritieni A. (2003) Patulin in Italian commercial apple products. Journal of Agricultural and Food Chemistry; 51: 6086-6090. Romer T. (1984) Detecting mycotoxins in corn and corn-milling products. Feedstuffs; 56: 22-23. Ross RK, Yuan JM, Yu MC, Wogan GN, Qian GS, Tu JT, Groopman JD, Gao YT, Henderson BE. (1992) Urinary aflatoxin biomarkers and risk of hepatocellular carcinoma. Lancet; 339 (8799): 943-946. Ruprich J, Ostry V. (1995) Determination of the mycotoxin deoxynivalenol in beer by commercial ELISA tests and estimation of the exposure dose from beer for the population in the Czech Republic. Central European Journal of Public Health; 3(4): 224-229. Russell DG, Parnell WR, Wilson NC et al. (1999) NZ Food: NZ People. Key results of the 1997 National Nutrition Survey. Wellington: Ministry of Health. Rychlik M, Schieberle P. (1999) Quantification of the mycotoxin patulin by a stable isotope assay. Journal of Agricultural and Food Chemistry; 47: 3749-3755. Ryu D, Hanna MA, Bullerman LB. (1999) Stability of zearalenone during extrusion of corn grits. Journal of Food Protection; 62: 1482-1484 Ryu D, Jackson LS, Bullerman LB. (2002) Effects of processing on zearalenone. Advances in Experimental Medicine and Biology; 504: 205-216. Saenz de Rodriguez CA. (1984). Environmental hormone contamination in Puerto Rico. New England Journal of Medicine: 310: 1741-1742. Saunders DS, Meredith FI, Voss KA. (2001) Control of fumonisins: Effects of processing. Environmental Health Perspectives; 109(Supplement 2): 333-336. Sayer ST. (1991) Fusarium infection in some Waikato maize. New Zealand Journal of Crop and Horticultural Science; 19: 149-155.
Risk Profile: Mycotoxins in the New Zealand April 2006 Food Supply
152

Sayer ST, Lauren DR. (1991) Fusarium infection in New Zealand grain. New Zealand Journal of Crop and Horticultural Science; 19: 143-148. SCF (EU Scientific Committee on Food). (1998) Opinion of the Scientific Committee on Food on ochratoxin A. http://europa.eu.int/comm/food/fs/sc/scf/out14_en.html SCF (EU Scientific Committee on Food). (1999) Opinion of the Scientific Committee on Fusarium toxins. Part 1: Deoxynivalenol (DON). http://europa.eu.int/comm/food/fs/sc/scf/out44_en.html. SCF (EU Scientific Committee on Food). (2000a) Opinion of the Scientific Committee on Fusarium toxins. Part 4: Nivalenol. http://europa.eu.int/comm/food/fs/sc/scf/out74_en.pdf. SCF (EU Scientific Committee on Food). (2000b) Opinion of the Scientific Committee on Fusarium toxins. Part 3: Fumonisin B1 (FB1). http://europa.eu.int/comm/food/fs/sc/scf/out73_en.pdf. SCF (EU Scientific Committee on Food) (2000c) Opinion of the Scientific Committee on Food on Fusarium toxins Part 2: Zearalenone. . http://europa.eu.int/comm/food/fs/sc/scf/out65_en.pdf SCF (EU Scientific Committee on Food). (2001) Opinion of the Scientific Committee on Fusarium toxins. Part 5: T-2 toxin and HT-2 toxin. http://europa.eu.int/comm/food/fs/sc/scf/out88_en.pdf. SCF (EU Scientific Committee on Food). (2002) Opinion of the Scientific Committee on Fusarium toxins. Part 6: Group evaluation of T-2 toxin, HT-2 toxin, nivalenol and deoxynivalenol. http://europa.eu.int/comm/food/fs/sc/scf/out123_en.pdf. Schollenberger M, Drochner W, Rüfle M, Suchy S, Terry-Jara H, Müller H-M. (2005a) Trichothecene toxins in different groups of conventional and organic bread of the German market. Journal of Food Composition and Analysis; 18: 69-78. Schollenberger M, Müller H-M, Rüfle M, Suchy S, Panck S, Drochner W. (2005b) Survey of Fusarium toxins in foodstuffs of plant origin marketed in Germany. International Journal of Food Microbiology; 97: 317-326. Schothorst RC, van Egmond HP. (2004) Report from SCOOP task 3.2.10 “collection of occurrence data of Fusarium toxins in food and assessment of dietary intake by the population of EU member states” subtask: trichothecenes. Toxicology Letters; 153: 133-143. SCOOP (European Commission Scientific Co-operation). (1997a) Risk assessment of aflatoxins. Reports on tasks for scientific cooperation. Report of experts participating in Task 3.2.1. Report EUR 17526. Luxembourg: Office for Official Publications of the European Communities. SCOOP (European Commission Scientific Co-operation). (1997b) Assessment of dietary intake of ochratoxin A by the population of EU Member States. Reports on tasks for
Risk Profile: Mycotoxins in the New Zealand April 2006 Food Supply
153

scientific cooperation. Report of experts participating in Task 3.2.2. Accessed at: http://www.cfsan.fda.gov/~dms/patubckg.html. SCOOP (European Commission Scientific Co-operation). (2002) Assessment of dietary intake of patulin by the population of EU Member States. Reports on tasks for scientific cooperation. Report of experts participating in Task 3.2.8. Report EUR 17523. Luxembourg: Office for Official Publications of the European Communities. SCOOP (European Commission Scientific Co-operation). (2003) Collection of occurrence data of Fusarium toxins in food and assessment of dietary intake by the population of EU Member States. Reports on tasks for scientific cooperation. Report of experts participating in Task 3.2.10. Accessed at: http://europa.eu.int/comm/food/fs/scoop/task3210.pdf. Scott PM, Lawrence GA. (1982) Losses of ergot alkaloids during making of bread and pancakes. Journal of Agricultural and Food Chemistry; 30: 445-450. Scott PM, Kanhere SR, Dexter JE, Brennan PW, Trenholm HL. (1984) Distribution of trichothecenes mycotoxin deoxynivalenol in hard red spring wheat. Food Additives and Contaminants; 1: 313-323. Scott PM,. Lombaert GA, Pellaers P, Bacler S, Lappi J. (1992) Ergot alkaloids in grain foods sold in Canada. Journal of the AOAC International; 75(5): 773-779. Scott PM, Kanhere SR, Weber D. (1993) Analysis of Canadian and imported beers for Fusarium mycotoxins by gas chromatography-mass spectrometry. Food Additives and Contaminants; 10(4): 381-389. Scott PM, Delgado T, Prelusky DB, Trenholm HL, Miller JD. (1994) Determination of fumonisins in milk. Journal of Environmental Science and Health B; 29(5): 989-998. Scott PM, Lawrence GA. (1995) Analysis of beer for fumonisins. Journal of Food Protection; 58(12): 1379-1382. Scott PM. (1996) Mycotoxins transmitted into beer from contaminated grains during brewing. Journal of the AOAC international; 79(4): 875-882. Scott PM, Yeung JM, Lawrence GA, Prelusky DB. (1997) Evaluation of enzyme-linked immunosorbent assay for analysis of beer for fumonisins. Food Additives and Contaminants; 14(5): 445-450. Scott PM. (2005) Biomarkers of human exposure to ochratoxin A. Food Additives and Contaminants; Supplement 1: 99-107. Scudamore KA. (2005) Prevention of ochratoxin A in commodities and likely effects of processing fractionation and animal feeds. Food Additives and Contaminants; Supplement 1: 17-25.
Risk Profile: Mycotoxins in the New Zealand April 2006 Food Supply
154

Scudamore KA, Banks J, MacDonald SJ. (2003) Fate of ochratoxin A in the processing of whole wheat grains during milling and bread production. Food Additives and Contaminants; 20(12): 1153-1163. Scudamore KA, Banks J, Guy RCE. (2004) Fate of ochratoxin A in the processing of whole wheat grain during extrusion. Food Additives and Contaminants; 21(5): 488-497. Seefelder W, Gossmann M, Humpf HU. (2002) Analysis of fumonisin B(1) in Fusarium proliferatum-infected asparagus spears and garlic bulbs from Germany by liquid chromatography- electrospray ionization mass spectrometry. Journal of Agricultural and Food Chemistry; 50(10): 2778-2781. Shank RC, Gordon JE, Wogan GN, Nodasuta A, Subhamani B. (1972) Dietary aflatoxins and human liver cancer. III. Field Survey of rural Thai families for ingested aflatoxins. Food and Cosmetic Toxicology; 10: 71-84. Shantha T, Sreenivasa M, Rati ER, Prema V. (1986) Detoxification of groundnut seeds by urea and sunlight. Journal of Food Safety; 7: 225-232. Shetty PH, Bhat RV. (1997) Natural occurrence of fumonisin B1 and its co-occurrence with aflatoxin B1 in Indian sorghum, maize, and poultry feeds. Journal of Agricultural and Food Chemistry; 45(6): 2170-2173. Shephard GS, Thiel PG, Stockenström S, Sydenham EW. (1996) Worldwide survey of fumonisin contamination of corn and corn-based products. Journal of AOAC International; 79: 671-687. Shim W-B, Kim J-C, Seo J-A, Lee Y-W. (1997) Natural occurrence of trichothecenes and zearalenone in Korean and imported beers. Food Additives and Contaminants; 14(1): 1-5. Shotwell OL, Goulden ML, Hesseltine CW. (1974) Aflatoxin: Distribution in contaminated corn. Cereal Chemistry; 51: 492-499. Shuey WC, Connelly FJ, Maneval RD. (1973) Distribution of ergot in mill streams. Northwestern Miller; 280(3): 10-15. Siame BA, Mpuchane SF, Gashe BA, Allotey J, Teffera G. (1998) Occurrence of aflatoxins, fumonisin B1, and zearalenone in foods and feeds in Botswana. Journal of Food Protection; 61(12): 1670-1673. Sinha KK, Sinha AK. (1991) Monitoring and identification of aflatoxins in wheat, gram and maize flours in Bihar state (India). Food Additives and Contaminants; 8(4): 453-457. Skaug MA. (1999) Analysis of Norwegian milk and infant formulas for ochratoxin A. Food Additives and Contaminants; 16(2) 75-78. Soini Y, Chia SC, Bennett WP, Groopman JD, Wang JS, DeBenedetti VM, Cawley H, Welsh JA, Hansen C, Bergasa NV, Jones EA, DiBisceglie AM, Trivers GE, Sandoval CA, Calderon IE, Munoz Espinosa LE, Harris CC. (1996) An aflatoxin-associated mutational hotspot at
Risk Profile: Mycotoxins in the New Zealand April 2006 Food Supply
155

codon 249 in the p53 tumor suppressor gene occurs in hepatocellular carcinomas from Mexico. Carcinogenesis; 17(5): 1007-1012. Solovey MMS, Somoza C, Cano G, Pacin A, Resnik S. (1999) A survey of fumonisins, deoxynivalenol, zearalenone and aflatoxins in corn-based food products in Argentina. Food Additives and Contaminants; 16(8): 325-329. Sørensen LK, Elbæk TH. (2005) Determination of mycotoxins in bovine milk by liquid chromatography tandem mass spectrometry. Journal of Chromatography B; 820: 183-196. Soriano JM, Dragacci S. (2004) Occurrence of fumonisins in foods. Food Research International; 37: 985-1000. Soto AM, Sonnenschein C, Chung KL, Fernandez MF, Olea N, Serrano FO. (1995). The E-screen assay as a tool to identify estrogens: an update on estrogenic environmental pollutants. Environmental Health Perspectives; 103 (Suppl 7): 113-122. Srivatanakul P, Parkin DM, Khlat M, Chenvidhya D, Chotiwan P, Insiripong SL, Abbé KA, Wild CP. (1991) Liver cancer in Thailand. II. A case-control study of hepatocellular carcinoma. International Journal of Cancer; 48: 329-332. Stanton DW. (1977) A survey of some foods for aflatoxins. Food Technology in New Zealand;12:25. Stanton DW. (1998) Risk assessment of patulin in the NZ food supply. ESR Client Report FW97/53. Auckland: ESR. Stanton DW. (1999) Aflatoxins in peanut products. ESR Client Report FW0032. Auckland: ESR. Stanton DW. (2000a) Aflatoxins in foods. ESR Client Report FW0031. Auckland: ESR. Stanton DW. (2000b) Survey of susceptible foods for ochratoxin A. ESR Client Report FW0030. Auckland: ESR. Stoloff L. (1983) Aflatoxin as a cause of primary liver-cell cancer in the United States: A probability study. Nutrition and Cancer; 5: 165-185. Stubblefield RD, Honstead JP, Shotwell OL. (1991) An analytical survey of aflatoxins in tissues from swine grown in regions reporting 1988 aflatoxin-contaminated corn. Journal of the AOAC International; 74(6): 897-899. Suga K, Mochizuki N, Harayama K, Yamashita H. (2005) Analysis of trichothecenes in malt and beer by liquid chromatography tandem mass spectrometry. Journal of the American Society of Brewing Chemistry; 63(1): 1-4. Sydenham EW, Thiel PG, Marasas WFO, Shephard GS, van Schalkwyk DJ, Koch KR. (1990) Natural occurrence of some Fusarium mycotoxins in corn from low and high
Risk Profile: Mycotoxins in the New Zealand April 2006 Food Supply
156

esophageal cancer prevalence areas of the Transkei, Southern Africa. Journal of Agricultural and Food Chemistry; 38: 1900-1903. Sydenham EW, Vismer HF, Marasas WF, Brown NL, Schlechter M, Rheeder JP. (1997) The influence of deck storage and initial processing on patulin levels in apple juice. Food Additives and Contaminants; 14(5): 429-434. Sypecka Z, Kelly M, Brereton P. (2004) Deoxynivalenol and zearalenone residues in eggs of laying hens fed with a naturally contaminated diet: effects on egg production and estimation of transmission rates from feed to eggs. Journal of Agricultural and Food Chemistry; 52(17): 5463-5471. Szuets P, Mesterhazy A, Falkay GY, Bartok T. (1997) Early telarche symptoms in children and their relations to zearalenone contamination in foodstuffs. Cereal Research Communications; 25(3/1):429-436. Tabata S, Kamimura H, Ibe A, Hashimoto H, Iida M, Tamura Y, Nishima T. (1993) Aflatoxin contamination of foods and foodstuffs in Tokyo: 1986-1990. Journal of AOAC International; 76(1): 32-35. Tabata S, Kamimura H, Ibe A, Hashimoto H. (1994) Degradation of aflatoxins by food additives. Journal of Food Protection; 57(1): 42-47. Tabata S, Kamimura H, Nishijima M, Tanabe S. (1999) A study of the conversion of aflatoxin B1 by treatment with sodium hydrogen sulfite. Journal of the Food Hygienic Society of Japan; 40(6): 431-437. Taguchi S, Fukushima S, Sumimoto T, Yoshida S, Nishimune T. (1995) Aflatoxins in foods collected in Osaka, Japan, from 1988 to 1992. Journal of AOAC International; 78(2): 325-327. Tangni EK, Theys R, Mignolet E, Maudoux M, Michelet JY, Larondelle Y. (2003) Patulin in domestic and imported apple-based drinks in Belgium: occurrence and exposure assessment. Food Additives and Contaminants; 20(5): 482-489. Taniwaki MH, Pitt JI, Urbano GR, Teixeira AA, Leitã0 MFF. (1999) Fungi producing ochratoxin A in coffee. Proceedings of the 18th ASIC Coffee Conference, Helsinki, Finland; pp. 239-247. Thomson BM. (1996) Potential dietary carcinogens. ESR Client Report FW9619. Christchurch: ESR. Thomson BM, Cressey PJ, Shaw IC. (2003) Dietary exposure to xenoestrogens in New Zealand. Journal of Environmental Monitoring; 5:229-235. Thuvander A, Möller T, Enghardt-Barbieri H, Jansson A, Salomonsson A-C, Olsen M. (2001) Dietary intake of some important mycotoxins by the Swedish population. Food Additives and Contaminants; 18(8): 696-706.
Risk Profile: Mycotoxins in the New Zealand April 2006 Food Supply
157

Tobin NF. (1988) Presence of deoxynivalenol in Australian wheat and triticale – New South Wales Northern rivers region, 1983. Australian Journal of Experimental Agriculture; 28: 107-110. Tomaszewski J, Miturski R, Semczuk A, Kotarski J, Jakowicki J. (1998) Tissue zearalenone concentration in normal, hyperplastic human endometrium. Ginekologia Polska; 69(5): 363-366. Tomlins KI, Jewers K, Coker RD, Nagler MJ. (1989) A bi-directional HPTLC development method for the detection of low level of aflatoxin in maize extracts. Chromatographia; 27: 49-52. Torres MR, Sanchis V, Ramos AJ. (1998) Occurrence of fumonisins in Spanish beers analyzed by an enzyme-linked immunosorbent assay method. International Journal of Food Microbiology; 39: 139-143. Torres P, Guzman-Ortiz M, Ramirez-Wong B. (2001) Revising the role of pH and thermal treatments in aflatoxin content reduction during the tortilla and deep frying processes. Journal of Agricultural and Food Chemistry; 49: 2825-2829. Trucksess MW, Cho T-H, Ready DE. (2000) Liquid chromatographic method for fumonisin B1 in sorghum syrup and corn-based breakfast cereals. Food Additives and Contaminants; 17(2): 161-166. Tseng T-C, Liu C-Y. (2001) Occurrence of fumonisin B1 in maize imported into Taiwan. International Journal of Food Microbiology; 65: 23-26. Tutelyan VA, Eller KI, Sobolev VS. (1989) A survey using normal phase high performance liquid chromatography of aflatoxins in domestic and imported foods in the USSR. Food Additives and Contaminants; 6: 459-465. Trucksess MW, Wood GE. (1994) recent methods of analysis for aflatoxins in foods and feeds. In: Eaton DL, Groopman JD (eds). The Toxicology of Aflatoxins. Human Health, Veterinary and Agricultural Significance. San Diego: Academic Press; 409-431. Ueno Y. (1977) Trichothecenes: overview address. In (Eds: Rodricks JV, Hesseltine CW, Mehlman MA): Mycotoxins in Human and Animal Health. Park Forest South, Illinois: Pathotox Publishers; pp. 189-228. Ueno Y, Iijima K, Wang S-D, Sugiura Y, Sekijima M, Tanaka T, Chen C, Yu S-Z. (1997) Fumonisins as a possible contributory risk factor for primary liver cancer: A 3-year study of corn harvested in Haimen, China by HPLC and ELISA. Food and Chemical Toxicology; 35: 1143-1150. Valenta H, Danicke S. (2005) Study on the transmission of deoxynivalenol and de-epoxy-deoxynivalenol into eggs of laying hens using a high-performance liquid chromatography-ultraviolet method with clean-up by immunoaffinity columns. Molecular Nutrition and Food Research; 49(8): 779-785.
Risk Profile: Mycotoxins in the New Zealand April 2006 Food Supply
158

Van Egmond HP. (1983) Mycotoxins in dairy products. Food Chemistry; 11(4): 289-307. Van Egmond HP, Jonker MA. (2003) Worldwide regulation of mycotoxins in food and feed in 2003. Accessed at ftp://ftp.fao.org/docrep/fao/007/y5499e/y5499e00.pdf. Van Rensburg SJ, Cook-Mozaffari P, Van Schalkwyk DJ, Van Der Watt JJ, Vincent TJ, Purchase IF. (1985) Hepatocellular carcinoma and dietary aflatoxin in Mozambique and Transkei. British Journal of Cancer; 51: 713-726. Vargas EA, Preis RA, Castro L, Silva CM. (2001) Co-occurrence of aflatoxins B1, B2, G1, G2, zearalenone and fumonisin B1 in Brazilian corn. Food Additives and Contaminants; 18(11): 981-986. Vasanthi S, Bhat RV, Subbulakshmi G. (1997) Aflatoxin intake from maize-based diets in a rural population in Southern India. Journal of the Science of Food and Agriculture; 73(2): 226-230. Viani R. (1996) Fate of ochratoxin A (OTA) during processing of coffee. Food Additives and Contaminants; 13(Supplement): 29-33. Visconti A, Solfrizzo M, Doko MB, Boenke A, Pascale M. (1996) Stability of fumonisins at different storage periods and temperatures in gamma-irradiated maize. Food Additives and Contaminants; 13: 929-938. Voss KA, Poling SM, Meredith FI, Bacon CW, Saunders DS. (2001) fate of fumonisins during the production of fried tortilla chips. Journal of Agricultural and Food Chemistry; 49(6): 3120-3126. Walker R. (1999) Mycotoxins of growing interest. Ochratoxins. Proceedings of the Third Joint FAO/WHO/UNEP International Conference on Mycotoxins, Tunis. ftp://ftp.fao.org/es/esn/food/myco5b.pdf. Wang ZG, Feng JN, Tongh Z. (1993) Human toxicosis caused by moldy rice contaminated with Fusarium and T-2 toxin. Biomedical and Environmental Science; 6(1): 65-70. Wang DS, Liang YX, Nguyen TC, Le DD, Tanaka T, Ueno Y. (1995) Natural co-occurrence of Fusarium toxins and aflatoxin B1 in corn for feed in north Vietnam. Natural Toxins; 3(6): 445-449. Wang LY, Hatch M, Chen CJ, Lenin B, You SL, Lu SN, Wu MH, Wu WP, Wang LW, Wang Q, Huang GT, Yang PM, Lee HS, Santella RM. (1996) Aflatoxin exposure and the risk of hepatocellular carcinoma in Taiwan. International Journal of Cancer; 67(5): 620-625. Wang JS, Huang T, Su J, Liang F, Wei Z, Liang Y, Luo H, Kuang SY, Qian GS, Sun G, He X, Kensler TW, Groopman JD. (2001) Hepatocellular carcinoma and aflatoxin exposure in Zhuqing village, Fusui County, People’s Republic of China. Cancer Epidemiology, Biomarkers & Prevention; 10: 143-146.
Risk Profile: Mycotoxins in the New Zealand April 2006 Food Supply
159

Watanabe M, Shimizu H. (2005) Detection of patulin in apple juices marketed in the Tohoku district, Japan. Journal of Food Protection; 68(3): 610-612. Watkins KL, Fazekas G, Palmer MV. (1990) Patulin in Australian apple juice. Food Australia; 42(9): 438-439. Webley DJ, Jackson KL. (1998) Mycotoxins in cereals – a comparison between North America, Europe and Australia. Proceedings of the Australian Postharvest Technical Conference, 1998. http://sgrl.csiro.au/aptc1998/16_webley_jackson.pdf. Webster J. (1980) Introduction to Fungi. Second Edition. Oxford: Cambridge University Press. Welshons WV, Rottinghaus GE, Nonneman DJ, Dolan-Timpe M, Ross FP. (1990). A sensitive bioassay for the detection of dietary estrogens in animal feeds. Journal of Veterinary Diagnostic Investigation; 2: 268-273. Whitaker TB, Park DL. (1994) Problems associated with accurately measuring aflatoxin in food and feeds: Errors associated with sampling, sample preparation, and analysis. In: Eaton DL, Groopman JD (eds). The Toxicology of Aflatoxins. Human Health, Veterinary and Agricultural Significance. San Diego: Academic Press; pp 433-450. WHO. (1990) Selected mycotoxins: Ochratoxins, trichothecenes, ergot. Environmental Health Criteria 105. Geneva: World Health Organization. WHO. (2000) Fumonisin B1. Environmental Health Criteria 219. Geneva: World Health Organization. WHO (World Health Organization). (2002) Global assessment of the state-of-the science of endocrine disruptors. Damstra T, Barlow S, Bergman A, Kavlock R, Van der Kraak G. (Eds.) Geneva: WHO. Wild CP, Fortuin M, Donato F, Whittle HC, Hall AJ, Wolf CR, Montesano R. (1993) Aflatoxin, liver enzymes and hepatitis B virus infection in Gambian children. Cancer Epidemiology Biomarkers and Prevention; 2: 555-561. Williams KC, Blaney BJ, Magee MH. (1988) responses of pigs fed wheat naturally infected with Fusarium graminearum and containing the mycotoxins 4-deoxynivalenol and zearalenone. Australian Journal of Agricultural Research; 39(6): 1095-1105. Wilson DM, Payne GA. (1994) Factors affecting Aspergillus flavus group infection and aflatoxin contamination of crops. In: Eaton DL, Groopman JD (eds). The Toxicology of Aflatoxins. Human Health, Veterinary and Agricultural Significance. San Diego: Academic Press; pp 309-325. Wilson RD. (1981) Surveying some apple juices for patulin. Food Technology in New Zealand; 16: 27-31.
Risk Profile: Mycotoxins in the New Zealand April 2006 Food Supply
160

Wiseman DW, Marth EH. (1983) Stability of aflatoxin M1 during manufacture and storage of a butter-like spread, non-fat dried milk and dried buttermilk. Journal of Food Protection; 46(7): 633-636. Wiseman DW, Applebaum RS, Brackett RE, Marth EH. (1983) Distribution and resistance to pasteurization of aflatoxin M1 in naturally contaminated whole milk, cream and skim milk. Journal of Food Protection; 46(6): 530-532. Wolzak A, Pearson AM, Coleman TH, Pestka JJ, Gray JI. (1985) Aflatoxin deposition and clearance in the eggs of laying hens. Food and Chemical Toxicology; 23(12): 1057-1061. Wood GE. (1989) Aflatoxins in domestic and imported foods and feeds. Journal of the Association of Official Analytical Chemists; 72(4): 543-548. Wu-Williams AH, Zeise L, Thomas D. (1992) Risk assessment for aflatoxin B1: a modelling approach. Risk Analysis; 12: 559-567. Yahl KR, Watson SA, Smith RJ, Barabolok R. (1971) Laboratory wet-milling of corn containing high levels of aflatoxin and a survey of commercial wet-milling products. Cereal Chemistry; 48: 385-391. Yeh FS, Yu MC, Mo CC, Luo S, Tong MJ, Henderson BE. (1989) Hepatitis B virus, aflatoxin, and hepatocellular carcinoma in Southern Guangxi, China. Cancer Research; 49: 2506-2509. Yiannikouris A, Jouany J-P. (2002) Mycotoxins in feed and their fate in animals: A review. Animal Research; 51: 81-99. Yoshizawa T, Yamashita A, Luo Y. (1994) Fumonisin occurrence in corn from high- and low-risk areas for human esophageal cancer in China. Applied and Environmental Microbiology; 60(5): 1626-1629. Yoshizawa T, Yamashita A, Chokethaworn N. (1996) Occurrence of fumonisins and aflatoxins in corn from Thailand. Food Additives and Contaminants; 13(2): 163-168. Young JC. (1981a) Variability in the content and composition of alkaloids found in Canadian ergot. II. Wheat. Journal of Environmental Science and Health B; 16(4): 381-393. Young JC. (1981b) Variability in the content and composition of alkaloids found in Canadian ergot. I. Rye. Journal of Environmental Science and Health B; 16(1): 83-111. Young JC, Fulcher RG, Hayhoe JH, Scott PM, Dexter JE. (1984) Effects of milling and baking on DON content of Canadian wheats. Journal of Agricultural and Food Chemistry; 32: 659-664. Yuan JM, Ross RK, Stanczyk FZ, Govindaragan S, Gao YT. (1995) A cohort study of serum testosterone and hepatocellular carcinoma in Shanghai, China. International Journal of Cancer; 63: 491-493.
Risk Profile: Mycotoxins in the New Zealand April 2006 Food Supply
161

Yumbe-Guevara BE, Imoto T, Yoshizawa T. (2003) Effects of heating procedures on deoxynivalenol, nivalenol and zearalenone levels in naturally contaminated barley and wheat. Food Additives and Contaminants; 20(12): 1132-1140. Yurdun T, Omurtag GZ, Ersoy O. (2001) Incidence of patulin in apple juices marketed in Turkey. Journal of Food Protection; 64(11): 1851-1853. Zaghini A, Martelli G, Roncada P, Simioli M, Rizzi L. (2005) Mannanoligosaccharides and aflatoxin B1 in feed for laying hens: effects on egg quality, aflatoxin B1 and M1 residues in eggs, and aflatoxin B1 levels in liver. Poultry Science; 84(6): 825-832.
Risk Profile: Mycotoxins in the New Zealand April 2006 Food Supply
162

APPENDIX 1: FUNGAL SPECIES PRODUCING MYCOTOXINS DISCUSSED IN THIS DOCUMENT
Risk Profile: Mycotoxins in the New Zealand April 2006 Food Supply
163
Genus Species Major mycotoxin(s) produced
Other mycotoxin(s) reported
Aspergillus flavus AFB1, AFB2 parasiticus AFB1, AFB2, AFG1,
AFG2
nomius AFB1, AFB2, AFG1, AFG2
ochraceus OTA carbonarius OTA
niger OTA Penicillium verrucosum OTA expansum PAT Fusarium graminearum DON, NIV, ZEA
culmorum DON, NIV, ZEA crookwellense NIV, ZEA equiseti ZEA, T2, HT2 cerealis ZEA semitectum ZEA T2 poae T2, HT2, NIV sporotrichioides T2, HT2 ZEA acuminatum T2, HT2 ZEA verticillioides FB1, FB2 FB3 proliferatum FB1, FB2, FB3
Claviceps purpurea Ergot alkaloids (group I and II)
fusiformis Ergot alkaloids (group III)
AFB1, AFB2, AFG1, AFG2 aflatoxins B1, B2, G1, G2 OTA ochratoxin A PAT patulin DON deoxynivalenol NIV nivalenol T2 T-2 toxin HT2 HT-2 toxin ZEA zearalenone FB1, FB2, FB3 fumonisin B1, B2, B3
Copyright © 2022 FDOKUMEN