Minimising the delta test for variable selection in regression problems
Upload
khangminh22Category
view
1download
0
Novel Approaches to M
inimising M
ycotoxin Contamination • M
ar Rodriguez Jovita and Félix Núñez
Novel Approaches to Minimising Mycotoxin Contamination
Printed Edition of the Special Issue Published in Toxins
www.mdpi.com/journal/toxins
Mar Rodriguez Jovita and Félix NúñezEdited by

Novel Approaches to Minimising Mycotoxin Contamination

Novel Approaches to Minimising Mycotoxin Contamination
Special Issue Editors
Mar Rodríguez Jovita Felix N unez
MDPI • Basel • Beijing • Wuhan • Barcelona • Belgrade • Manchester • Tokyo • Cluj • Tianjin
Special Issue EditorsMar Rodríguez Jovita University of Extremadura Spain
Felix N u nez
Universidad de Extremadura Spain
Editorial Office
MDPI
St. Alban-Anlage 66
4052 Basel, Switzerland
This is a reprint of articles from the Special Issue published online in the open access journal Toxins
(ISSN 2072-6651) (available at: https://www.mdpi.com/journal/toxins/special issues/approach
minising mycotoxin).
For citation purposes, cite each article independently as indicated on the article page online and as
indicated below:
LastName, A.A.; LastName, B.B.; LastName, C.C. Article Title. Journal Name Year, Article Number,
Page Range.
ISBN 978-3-03928-937-0 (Pbk)
ISBN 978-3-03928-938-7 (PDF)
c© 2020 by the authors. Articles in this book are Open Access and distributed under the Creative
Commons Attribution (CC BY) license, which allows users to download, copy and build upon
published articles, as long as the author and publisher are properly credited, which ensures maximum
dissemination and a wider impact of our publications.
The book as a whole is distributed by MDPI under the terms and conditions of the Creative Commons
license CC BY-NC-ND.

Contents
About the Special Issue Editors . . . . . . . . . . . . . . . . . . . . . . . . . . . . . . . . . . . . . vii
Mar Rodrıguez and Felix Nunez
Novel Approaches to Minimizing Mycotoxin ContaminationReprinted from: Toxins 2020, 12, 216, doi:10.3390/toxins12040216 . . . . . . . . . . . . . . . . . . 1
Khayalethu Ntushelo, Lesiba Klaas Ledwaba, Molemi Evelyn Rauwane, Oluwafemi Ayodeji Adebo and Patrick Berka Njobeh
The Mode of Action of Bacillus Species against Fusarium graminearum, Tools for Investigation, and Future ProspectsReprinted from: Toxins 2019, 11, 606, doi:10.3390/toxins11100606 . . . . . . . . . . . . . . . . . . 5
Jaqueline Moraes Bazioli, Joao Raul Belinato, Jonas Henrique Costa, Daniel Yuri Akiyama, Joao Guilherme de Moraes Pontes, Katia Cristina Kupper, Fabio Augusto, Joao Ernesto de Carvalho and Taıcia Pacheco Fill
Biological Control of Citrus Postharvest PhytopathogensReprinted from: Toxins 2019, 11, 460, doi:10.3390/toxins11080460 . . . . . . . . . . . . . . . . . . 19
Shiau-Wei Chen, Han-Tsung Wang, Wei-Yuan Shih, Yan-An Ciou, Yu-Yi Chang, Laurensia Ananda, Shu-Yin Wang and Jih-Tay Hsu
Application of Zearalenone (ZEN)-Detoxifying Bacillus in Animal Feed Decontamination through FermentationReprinted from: Toxins 2019, 11, 330, doi:10.3390/toxins11060330 . . . . . . . . . . . . . . . . . . 41
Chaoqi Liu, Juan Chang, Ping Wang, Qingqiang Yin, Weiwei Huang, Xiaowei Dang, Fushan Lu and Tianzeng Gao
Zearalenone Biodegradation by the Combination of Probiotics with Cell-Free Extracts of Aspergillus oryzae and Its Mycotoxin-Alleviating Effect on Pig Production PerformanceReprinted from: Toxins 2019, 11, 552, doi:10.3390/toxins11100552 . . . . . . . . . . . . . . . . . . 53
Jean Claude Assaf, Sahar Nahle, Ali Chokr, Nicolas Louka, Ali Atoui and Andre El Khoury
Assorted Methods for Decontamination of Aflatoxin M1 in Milk Using Microbial AdsorbentsReprinted from: Toxins 2019, 11, 304, doi:10.3390/toxins11060304 . . . . . . . . . . . . . . . . . . 69
Eva Cebrian, Mar Rodrıguez, Belen Peromingo, Elena Bermudez and Felix Nunez
Efficacy of the Combined Protective Cultures of Penicillium chrysogenum andDebaryomyces hansenii for the Control of Ochratoxin A Hazard in Dry-Cured HamReprinted from: Toxins 2019, 11, 710, doi:10.3390/toxins11120710 . . . . . . . . . . . . . . . . . . 93
Juan Manuel Quiles, Tiago de Melo Nazareth, Carlos Luz, Fernando Bittencourt Luciano,
Jordi Manes and Giuseppe Meca
Development of an Antifungal and Antimycotoxigenic Device Containing Allyl Isothiocyanatefor Silo FumigationReprinted from: Toxins 2019, 11, 137, doi:10.3390/toxins11030137 . . . . . . . . . . . . . . . . . . 107
Kalliopi Mylona, Esther Garcia-Cela, Michael Sulyok, Angel Medina and Naresh Magan
Influence of Two Garlic-Derived Compounds, Propyl Propane Thiosulfonate (PTS) and PropylPropane Thiosulfinate (PTSO), on Growth and Mycotoxin Production by Fusarium Species InVitro and in Stored CerealsReprinted from: Toxins 2019, 11, 495, doi:10.3390/toxins11090495 . . . . . . . . . . . . . . . . . . 121
v

Marta Oleszek, Łukasz Pecio, Solomiia Kozachok, Zaneta Lachowska-Filipiuk, Karolina Oszust and Magdalena Frąc
Phytochemicals of Apple Pomace as Prospect Bio-Fungicide Agents against Mycotoxigenic Fungal Species—In Vitro ExperimentsReprinted from: Toxins 2019, 11, 361, doi:10.3390/toxins11060361 . . . . . . . . . . . . . . . . . . 137
Johanna Alberts, Gerd Schatzmayr, Wulf-Dieter Moll, Ibtisaam Davids, John Rheeder,
Hester-Mari Burger, Gordon Shephard and Wentzel Gelderblom
Detoxification of the Fumonisin Mycotoxins in Maize: An Enzymatic ApproachReprinted from: Toxins 2019, 11, 523, doi:10.3390/toxins11090523 . . . . . . . . . . . . . . . . . . 151
Sebastian Fruhauf, Barbara Novak, Veronika Nagl, Matthias Hackl, Doris Hartinger,
Valentina Rainer, Silvia Labudova, Gerhard Adam, Markus Aleschko, Wulf-Dieter Moll,
Michaela Thamhesl and Bertrand Grenier
Biotransformation of the Mycotoxin Zearalenone to its Metabolites Hydrolyzed Zearalenone(HZEN) and Decarboxylated Hydrolyzed Zearalenone (DHZEN) Diminishes its EstrogenicityIn Vitro and In VivoReprinted from: Toxins 2019, 11, 481, doi:10.3390/toxins11080481 . . . . . . . . . . . . . . . . . . 167
Huiting Wang, Jin Mao, Zhaowei Zhang, Qi Zhang, Liangxiao Zhang, Wen Zhang and Peiwu Li
Photocatalytic Degradation of Deoxynivalenol over Dendritic-Like α-Fe2O3 under Visible Light IrradiationReprinted from: Toxins 2019, 11, 105, doi:10.3390/toxins11020105 . . . . . . . . . . . . . . . . . . 189
Paloma Patricia Casas-Junco, Josue Raymundo Solıs-Pacheco, Juan Arturo Ragazzo-Sanchez, Blanca Rosa Aguilar-Uscanga, Pedro Ulises Bautista-Rosales and Montserrat Calderon-Santoyo
Cold Plasma Treatment as an Alternative for Ochratoxin A Detoxification and Inhibition of Mycotoxigenic Fungi in Roasted CoffeeReprinted from: Toxins 2019, 11, 337, doi:10.3390/toxins11060337 . . . . . . . . . . . . . . . . . . 199
Yuanxiao Liu, Mengmeng Li, Ke Bian, Erqi Guan, Yuanfang Liu and Ying Lu
Reduction of Deoxynivalenol in Wheat with Superheated Steam and Its Effects onWheat QualityReprinted from: Toxins 2019, 11, 414, doi:10.3390/toxins11070414 . . . . . . . . . . . . . . . . . . 207
Marta Garcıa-Dıaz, Belen Patino, Covadonga Vazquez and Jessica Gil-Serna
A Novel Niosome-Encapsulated Essential Oil Formulation to Prevent Aspergillus flavus Growthand Aflatoxin Contamination of Maize Grains During StorageReprinted from: Toxins 2019, 11, 646, doi:10.3390/toxins11110646 . . . . . . . . . . . . . . . . . . 221
vi
About the Special Issue Editors
Mar Rodríguez Jovita graduated in Veterinary Science from the University of Extremadura (Spain, 1988). She obtained her Ph.D. in Food Science and Technology from the University of Extremadura (1995), and continued as a Postdoctoral Fellow in the Department of Molecular Biology of Institute of Food Research of Reading (U.K., 1997–1998). In addition, she has been a visiting researcher at the University of Davis-California (USA, 2004). She is currently a senior researcher in the Meat and Meat Products Research Institute. All her research has mainly focused on the technological and toxicological evaluation of microorganisms in meat products, the molecular techniques for their detection, and identification and production of toxins and the procedures for their prevention and/or elimination.
Felix N unez graduated in Veterinary Science from the University of Extremadura (Spain, 1988), and obtained his Ph.D. in Food Science and Technology from the University of Extremadura (1995). He continued his formation as a Postdoctoral Fellow in the Department of Food Science and Human Nutrition at the Michigan State University (USA, 1996–1997). He is currently a senior researcher in the Meat and Meat Products Research Institute and the coordinator of the Ph.D. Programme in Food Science at the University of Extremadura. His research interests are mainly focused on the biocontrol of toxigenic microorganisms in dry-cured foods from animal origin, including protective cultures and antifungal proteins.
vii

toxins
Editorial
Novel Approaches to MinimizingMycotoxin Contamination
Mar Rodríguez * and Félix Núñez *
Food Hygiene and Safety, Meat and Meat Products Research Institute, Faculty of Veterinary Science,University of Extremadura, Avda. de las Ciencias, s/n, 10003 Cáceres, Spain* Correspondence: [email protected] (M.R.); [email protected] (F.N.)
Received: 17 January 2020; Accepted: 26 March 2020; Published: 29 March 2020
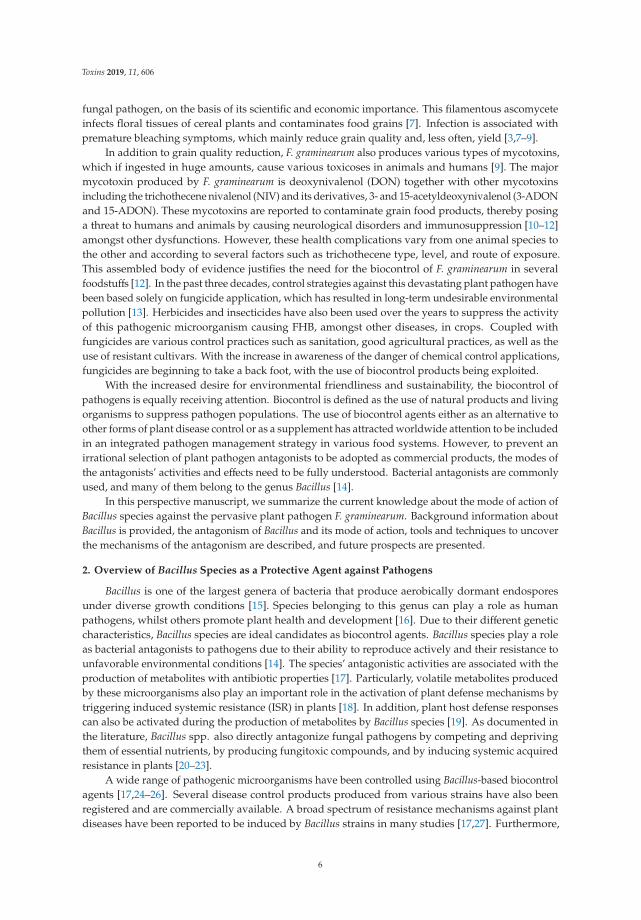
Contamination of foods and agricultural commodities by various types of toxigenic fungi isa concerning issue for human and animal health. Molds naturally present in foods can producemycotoxins and contaminate foodstuffs under favorable conditions of temperature, relative humidity,pH, and nutrient availability. Mycotoxins are, in general, stable molecules, which are difficult to removefrom foods once they have been produced. Therefore, the prevention of mycotoxin contamination isone of the main goals of the agriculture and food industries.
Chemical control or decontamination techniques may be quite efficient. However, themore sustainable and restricted use of fungicides, the lack of efficiency in some foods, and theconsumer demand for chemical residue-free foods require new approaches to control this hazard.Therefore, food safety demands permanent research efforts for exploring new strategies to reducemycotoxin contamination.
This Special Issue contains original contributions and reviews that advance the knowledge aboutthe most current promising approaches to minimize mycotoxin contamination, including biologicalcontrol agents (BCAs), phytochemical antifungal compounds, enzyme detoxification, and the useof novel technologies. Most of the studies focus on Fusarium toxins, but the toxicity of aflatoxinsand ochratoxin A is also addressed. In addition, a few studies are focused on the control of plantpathogenic fungi.
Several studies examined the potential of biological control strategies as alternative methods inboth plant pathogenic and mycotoxigenic fungi. Within the group of articles about biological controlstrategies, Ntushelo et al. [1] reported that Bacillus species adopt various mechanisms, includingthe production of bioactive compounds, to inhibit the growth of the mycotoxin-producing plantpathogenic fungus Fusarium graminearium and provided a perspective of the techniques used to studyantagonist metabolites. Moraes-Bazioli et al. [2] review the potential of BCAs, including bacteria,yeasts, and natural plant products for the control of Penicillium digitatum, Penicillium italicum, andGeotrichum citriaurantii, which are responsible for postharvest citrus diseases. Zearalenone (ZEA) is anestrogenic mycotoxin which can cause loss in animal production. Chen et al. [3] selected a Bacillusstrain with a strong esterase activity that exhibited a high ZEA detoxification capability in maizeusing a fermentation process to validate their potential application in the feed industry. In the samesense, Liu et al. [4] tested the combination of probiotic strains from Bacillus subtilis and Candida utiliswith cell-free extracts from Aspergillus oryzae to degrade ZEA. Interestingly, the authors showed theBCA effect of alleviating the negative impact of ZEA on normal growth performance in pig keeping.Aflatoxin M1 (AFM1) is secreted in the milk of lactating mammals through the ingestion of feedstuffcontaminated by aflatoxin B1, being a health concern for dairy industries and consumers of dairyproducts. Assaf et al. [5] review AFM1 decontamination methods including different bio-adsorbentssuch as bacteria, yeasts, or mixtures of both. The efficiency of these decontamination methods inaddition to their plausible experimental variants, advantages, limitations, and prospective applicationsare broadly discussed. Ochratoxin A (OTA) is the mycotoxin most commonly found in meat products,
Toxins 2020, 12, 216; doi:10.3390/toxins12040216 www.mdpi.com/journal/toxins1

Toxins 2020, 12, 216
which contribute significantly to human exposure to this toxin. Cebrian et al. [6] propose the useof a combined protective culture containing selected strains of P. chrysogenum in combination withDebaryomyces hansenii as a promising strategy to reduce OTA production by P. nordicum in dry-curedhams. The efficacy of BCAs was tested in dry-cured hams under industrial ripening, resulting in asignificant reduction of OTA contamination.
Three papers are focused on exploring phytochemical compounds as potential antifungal agents,two of them dealing with the use of garlic-derived compounds to control toxigenic molds in cerealsand the other one with apple pomace. Quiles et al. [7] evaluate the antifungal activity of allylisothiocyanate against aflatoxigenic Aspergillus flavus and ochratoxigenic Penicillium verrucosum oncereals in small-scale silos, obtaining a significant reduction of the A. flavus and P. verrucosum growthas well as an important reduction of the OTA. Mylona et al. [8] reported that the efficacy of treatmentwith propyl propane thiosulfonate and propyl propane thiosulfinate to reduce Fusarium growth andmycotoxin production was dependent on the specific “Fusarium species-toxin” pathosystem and the aw
of cereals. The work of Oleszek et al. [9] showed that apple pomace could be a good source of naturalbio-fungicides inhibiting the growth of crop pathogens, mycotoxigenic molds, being the strongestantifungal activity exerted by a fraction containing phloridzin.
The use of mycotoxin-degrading methods is a promising approach to control this hazard and tocounteract their toxic effects in livestock. With respect to enzymatic detoxification, Alberts et al. [10]developed an innovative method using the commercial fumonisin esterase FumD to reduce fumonisinB in whole maize, resulting in the formation of the hydrolyzed breakdown product, HFB1, associatedwith the aqueous phase to be discarded. Fruhauf et al. [11] concluded that the cleavage of ZEA by thezearalenone-lactonase Zhd101p reduces its estrogenicity in piglets, providing an important basis forthe further evaluation of ZEA-degrading enzymes.
Finally, four papers explore the effectiveness of new technologies in preventing or reducingmycotoxin contamination of foods and feeds. Wang et al. [12] synthesized a light-responsivedendritic-like α-Fe2O3 that showed good activity for the photocatalytic degradation of deoxynivalenol(DON) in aqueous solution under visible light irradiation with a significant decrease of the toxicity ofthis mycotoxin. Casas-Junco et al. [13] propose a treatment of OTA-contaminated roasted coffee withcold plasma, achieving a decrease of OTA concentration and a reduction in toxicity of the treated coffee.Liu et al. [14] proved that the treatment of wheat kernels with superheated steam is an effective methodto reduce the content of DON by thermal degradation, and the reduction rate increased significantlywith the steam temperature. In addition, the treatment improves the qualities of crisp biscuits madefrom processed wheat. García-Díaz et al. [15] proposed a novel niosome-based encapsulated essentialoil product applied to polypropylene bags that significantly reduced the development of A. flavus andaflatoxin contamination in maize up to 75 days. Thus, the correct application of this product may be asustainable way to avoid the occurrence of aflatoxins in stored maize.
Therefore, the results contained in this Special Issue represent several interesting advances indifferent methodologies for the control of mycotoxins in food and feeds, providing useful informationfor the development of further research in this field.
Funding: This research received no external funding.
Acknowledgments: The editors are grateful to all the authors who contributed their work to this Special Issue.Special thanks go to the rigorous evaluations of all of the submitted manuscripts by the expert peer reviewers whocontributed to this Special Issue. Lastly, the valuable contributions, organization, and editorial support of theMDPI management team and staff are greatly appreciated.
Conflicts of Interest: The authors declare no conflict of interest.
References
1. Ntushelo, K.; Ledwaba, L.K.; Rauwane, M.E.; Adebo, O.A.; Njobeh, P.B. The mode of action of Bacillus speciesagainst Fusarium graminearum, tools for investigation, and future prospects. Toxins 2019, 11, 606. [CrossRef][PubMed]
2

Toxins 2020, 12, 216
2. Moraes-Bazioli, J.; Belinato, J.R.; Costa, J.H.; Akiyama, D.Y.; de Moraes Pontes, J.G.; Kupper, K.C.; Augusto, F.;de Carvalho, J.E.; Pacheco-Fill, T. Biological control of citrus postharvest phytopathogens. Toxins 2019, 11,460. [CrossRef] [PubMed]
3. Chen, S.; Wang, H.; Shih, W.; Ciou, Y.; Chang, Y.; Ananda, L.; Wang, S.; Hsu, J. Application of Zearalenone(ZEN)-Detoxifying Bacillus in animal feed decontamination through fermentation. Toxins 2019, 1, 330.[CrossRef] [PubMed]
4. Liu, C.; Chang, J.; Wang, P.; Yin, Q.; Huang, W.; Dang, X.; Lu, F.; Gao, T. Zearalenone biodegradation by thecombination of probiotics with cell-free extracts of Aspergillus oryzae and its mycotoxin-alleviating effect onpig production performance. Toxins 2019, 11, 552. [CrossRef] [PubMed]
5. Assaf, J.C.; Nahle, S.; Louka, N.; Chokr, A.; Atoui, A.; El Khoury, A. Assorted methods for decontaminationof aflatoxin. Toxins 2020, 11, 304. [CrossRef] [PubMed]
6. Cebrián, E.; Rodríguez, M.; Peromingo, B.; Bermúdez, E.; Núñez, F. Efficacy of the combined protectivecultures of Penicillium chrysogenum and Debaryomyces hansenii for the control of Ochratoxin A hazard indry-cured ham. Toxins 2019, 11, 710. [CrossRef] [PubMed]
7. Quiles, J.M.; de Melo Nazareth, T.; Luz, C.; Luciano, F.B.; Mañes, J.; Meca, G. Development of an antifungaland antimycotoxigenic device containing allyl isothiocyanate for silo fumigation. Toxins 2019, 11, 137.[CrossRef] [PubMed]
8. Mylona, K.; Garcia-Cela, E.; Sulyok, M.; Medina, A.; Magan, N. Influence of two garlic-derived compounds,propyl propane thiosulfonate (PTS) and propyl propane thiosulfinate (PTSO), on growth and mycotoxinproduction by Fusarium species in vitro and in stored cereals. Toxins 2019, 11, 495. [CrossRef] [PubMed]
9. Oleszek, M.; Pecio, Ł.; Kozachok, S.; Lachowska-Filipiuk, Z.; Oszust, K.; Frac, M. Phytochemicals of applepomace as prospect bio-fungicide agents against mycotoxigenic fungal species—in vitro experiments. Toxins2019, 11, 361. [CrossRef] [PubMed]
10. Alberts, J.; Schatzmayr, G.; Moll, W.D.; Davids, I.; Rheeder, J.; Burger, H.M.; Shephard, G.; Gelderblom, W.Detoxification of the fumonisin mycotoxins in maize: An enzymatic approach. Toxins 2019, 11, 523. [CrossRef][PubMed]
11. Fruhauf, S.; Novak, B.; Nagl, V.; Hackl, M.; Hartinger, D.; Rainer, V.; Labudová, S.; Adam, G.; Aleschko, M.;Moll, W.-D.; et al. Biotransformation of the mycotoxin zearalenone to its metabolites hydrolyzed zearalenone(HZEN) and decarboxylated hydrolyzed zearalenone (DHZEN) diminishes its estrogenicity in vitro andin vivo. Toxins 2019, 11, 481. [CrossRef] [PubMed]
12. Wang, H.; Mao, J.; Zhang, Z.; Zhang, Q.; Zhang, L.; Zhang, W.; Li, P. Photocatalytic degradation ofdeoxynivalenol over dendritic-like α-Fe2O3 under visible light irradiation. Toxins 2019, 11, 105. [CrossRef][PubMed]
13. Casas-Junco, P.P.; Solís-Pacheco, J.R.; Ragazzo-Sánchez, J.A.; Aguilar-Uscanga, B.R.; Bautista-Rosales, P.U.;Calderón-Santoyo, M. Cold plasma treatment as an alternative for ochratoxin a detoxification and inhibitionof mycotoxigenic fungi in roasted coffee. Toxins 2019, 11, 337. [CrossRef] [PubMed]
14. Liu, Y.; Li, M.; Bian, K.; Guan, E.; Liu, Y.; Lu, Y. Reduction of deoxynivalenol in wheat with superheatedsteam and its effects on wheat quality. Toxins 2019, 11, 414. [CrossRef] [PubMed]
15. García-Díaz, M.; Patiño, B.; Vázquez, C.; Gil-Serna, J. A novel niosome-encapsulated essential oil formulationto prevent Aspergillus flavus growth and aflatoxin contamination of maize grains during storage. Toxins 2019,1, 646. [CrossRef] [PubMed]
© 2020 by the authors. Licensee MDPI, Basel, Switzerland. This article is an open accessarticle distributed under the terms and conditions of the Creative Commons Attribution(CC BY) license (http://creativecommons.org/licenses/by/4.0/).
3


toxins
Perspective
The Mode of Action of Bacillus Species againstFusarium graminearum, Tools for Investigation,and Future Prospects
Khayalethu Ntushelo 1,*, Lesiba Klaas Ledwaba 1,2, Molemi Evelyn Rauwane 1,
Oluwafemi Ayodeji Adebo 3 and Patrick Berka Njobeh 3
1 Department of Agriculture and Animal Health, Science Campus, University of South Africa,Corner Christiaan De Wet and Pioneer Avenue, Private Bag X6, Florida 1709, Guateng, South Africa;[email protected] (L.K.L.); [email protected] (M.E.R.)
2 Agricultural Research Council-Vegetable and Ornamental Plants, Private Bag X293,Pretoria 0001, Tshwane, South Africa
3 Department of Biotechnology and Food Technology, University of Johannesburg, Corner Siemert and LouisaStreet, Doornfontein 2028, Gauteng, South Africa; [email protected] (O.A.A.); [email protected] (P.B.N.)
* Correspondence: [email protected]; Tel.: +27-011-471-3648
Received: 5 August 2019; Accepted: 23 August 2019; Published: 18 October 2019
Abstract: Fusarium graminearum is a pervasive plant pathogenic fungal species. Biological controlagents employ various strategies to weaken their targets, as shown by Bacillus species, which adoptvarious mechanisms, including the production of bioactive compounds, to inhibit the growthof F. graminearum. Various efforts to uncover the antagonistic mechanisms of Bacillus againstF. graminearum have been undertaken and have yielded a plethora of data available in the currentliterature. This perspective article attempts to provide a unified record of these interesting findings.The authors provide background knowledge on the use of Bacillus as a biocontrol agent as wellas details on techniques and tools for studying the antagonistic mechanism of Bacillus againstF. graminearum. Emphasizing its potential as a future biological control agent with extensive use,the authors encourage future studies on Bacillus as a useful antagonist of F. graminearum and otherplant pathogens. It is also recommended to take advantage of the newly invented analytical platformsfor studying biochemical processes to understand the mechanism of action of Bacillus against plantpathogens in general.
Keywords: Bacillus; Fusarium graminearum; antagonism; mode of action
Key Contribution: This article reports the overall mode of action of the bacteria Bacillus against themycotoxin-producing plant pathogenic fungus Fusarium graminearium and provides a perspective ofthe techniques used to study antagonist metabolites. The goal is to illustrate research done so far andrecommend study directions for the future.
1. Introduction
Biotic stresses such as plant pests and pathogens are the major factors threatening global cropproduction. Proliferation in plants of these pathogens can cause devastating epidemics, which can causesevere food shortages especially in countries with limited resources. The current state of crop lossesdue to pathogenic diseases is alarming, with an estimated 8–40% of crop yield losses caused by plantpathogens worldwide [1,2]. One of such prominent pathogens of health and economic importance isFusarium graminearum. This fungus is a known causative agent of Fusarium head blight (FHB), which isan economically important cereal crop disease that accounts for worldwide losses estimated between20 and 100% [3–6]. According to Dean et al. [7], F. graminearum is ranked the fourth most important plant
Toxins 2019, 11, 606; doi:10.3390/toxins11100606 www.mdpi.com/journal/toxins5
Toxins 2019, 11, 606
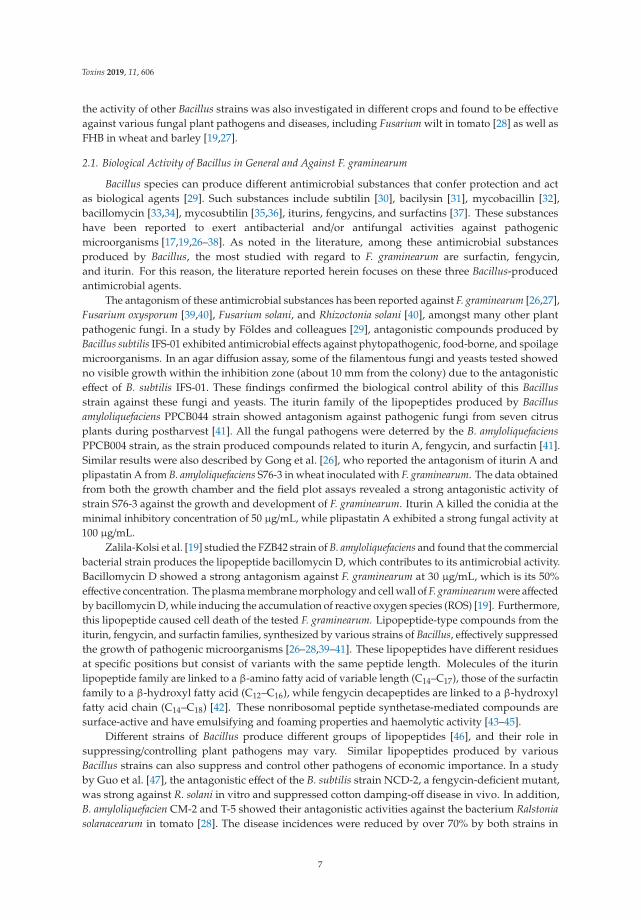
fungal pathogen, on the basis of its scientific and economic importance. This filamentous ascomyceteinfects floral tissues of cereal plants and contaminates food grains [7]. Infection is associated withpremature bleaching symptoms, which mainly reduce grain quality and, less often, yield [3,7–9].
In addition to grain quality reduction, F. graminearum also produces various types of mycotoxins,which if ingested in huge amounts, cause various toxicoses in animals and humans [9]. The majormycotoxin produced by F. graminearum is deoxynivalenol (DON) together with other mycotoxinsincluding the trichothecene nivalenol (NIV) and its derivatives, 3- and 15-acetyldeoxynivalenol (3-ADONand 15-ADON). These mycotoxins are reported to contaminate grain food products, thereby posinga threat to humans and animals by causing neurological disorders and immunosuppression [10–12]amongst other dysfunctions. However, these health complications vary from one animal species tothe other and according to several factors such as trichothecene type, level, and route of exposure.This assembled body of evidence justifies the need for the biocontrol of F. graminearum in severalfoodstuffs [12]. In the past three decades, control strategies against this devastating plant pathogen havebeen based solely on fungicide application, which has resulted in long-term undesirable environmentalpollution [13]. Herbicides and insecticides have also been used over the years to suppress the activityof this pathogenic microorganism causing FHB, amongst other diseases, in crops. Coupled withfungicides are various control practices such as sanitation, good agricultural practices, as well as theuse of resistant cultivars. With the increase in awareness of the danger of chemical control applications,fungicides are beginning to take a back foot, with the use of biocontrol products being exploited.
With the increased desire for environmental friendliness and sustainability, the biocontrol ofpathogens is equally receiving attention. Biocontrol is defined as the use of natural products and livingorganisms to suppress pathogen populations. The use of biocontrol agents either as an alternative toother forms of plant disease control or as a supplement has attracted worldwide attention to be includedin an integrated pathogen management strategy in various food systems. However, to prevent anirrational selection of plant pathogen antagonists to be adopted as commercial products, the modes ofthe antagonists’ activities and effects need to be fully understood. Bacterial antagonists are commonlyused, and many of them belong to the genus Bacillus [14].
In this perspective manuscript, we summarize the current knowledge about the mode of action ofBacillus species against the pervasive plant pathogen F. graminearum. Background information aboutBacillus is provided, the antagonism of Bacillus and its mode of action, tools and techniques to uncoverthe mechanisms of the antagonism are described, and future prospects are presented.
2. Overview of Bacillus Species as a Protective Agent against Pathogens
Bacillus is one of the largest genera of bacteria that produce aerobically dormant endosporesunder diverse growth conditions [15]. Species belonging to this genus can play a role as humanpathogens, whilst others promote plant health and development [16]. Due to their different geneticcharacteristics, Bacillus species are ideal candidates as biocontrol agents. Bacillus species play a roleas bacterial antagonists to pathogens due to their ability to reproduce actively and their resistance tounfavorable environmental conditions [14]. The species’ antagonistic activities are associated with theproduction of metabolites with antibiotic properties [17]. Particularly, volatile metabolites producedby these microorganisms also play an important role in the activation of plant defense mechanisms bytriggering induced systemic resistance (ISR) in plants [18]. In addition, plant host defense responsescan also be activated during the production of metabolites by Bacillus species [19]. As documented inthe literature, Bacillus spp. also directly antagonize fungal pathogens by competing and deprivingthem of essential nutrients, by producing fungitoxic compounds, and by inducing systemic acquiredresistance in plants [20–23].
A wide range of pathogenic microorganisms have been controlled using Bacillus-based biocontrolagents [17,24–26]. Several disease control products produced from various strains have also beenregistered and are commercially available. A broad spectrum of resistance mechanisms against plantdiseases have been reported to be induced by Bacillus strains in many studies [17,27]. Furthermore,
6
Toxins 2019, 11, 606
the activity of other Bacillus strains was also investigated in different crops and found to be effectiveagainst various fungal plant pathogens and diseases, including Fusarium wilt in tomato [28] as well asFHB in wheat and barley [19,27].
2.1. Biological Activity of Bacillus in General and Against F. graminearum
Bacillus species can produce different antimicrobial substances that confer protection and actas biological agents [29]. Such substances include subtilin [30], bacilysin [31], mycobacillin [32],bacillomycin [33,34], mycosubtilin [35,36], iturins, fengycins, and surfactins [37]. These substanceshave been reported to exert antibacterial and/or antifungal activities against pathogenicmicroorganisms [17,19,26–38]. As noted in the literature, among these antimicrobial substancesproduced by Bacillus, the most studied with regard to F. graminearum are surfactin, fengycin,and iturin. For this reason, the literature reported herein focuses on these three Bacillus-producedantimicrobial agents.
The antagonism of these antimicrobial substances has been reported against F. graminearum [26,27],Fusarium oxysporum [39,40], Fusarium solani, and Rhizoctonia solani [40], amongst many other plantpathogenic fungi. In a study by Földes and colleagues [29], antagonistic compounds produced byBacillus subtilis IFS-01 exhibited antimicrobial effects against phytopathogenic, food-borne, and spoilagemicroorganisms. In an agar diffusion assay, some of the filamentous fungi and yeasts tested showedno visible growth within the inhibition zone (about 10 mm from the colony) due to the antagonisticeffect of B. subtilis IFS-01. These findings confirmed the biological control ability of this Bacillusstrain against these fungi and yeasts. The iturin family of the lipopeptides produced by Bacillusamyloliquefaciens PPCB044 strain showed antagonism against pathogenic fungi from seven citrusplants during postharvest [41]. All the fungal pathogens were deterred by the B. amyloliquefaciensPPCB004 strain, as the strain produced compounds related to iturin A, fengycin, and surfactin [41].Similar results were also described by Gong et al. [26], who reported the antagonism of iturin A andplipastatin A from B. amyloliquefaciens S76-3 in wheat inoculated with F. graminearum. The data obtainedfrom both the growth chamber and the field plot assays revealed a strong antagonistic activity ofstrain S76-3 against the growth and development of F. graminearum. Iturin A killed the conidia at theminimal inhibitory concentration of 50 μg/mL, while plipastatin A exhibited a strong fungal activity at100 μg/mL.
Zalila-Kolsi et al. [19] studied the FZB42 strain of B. amyloliquefaciens and found that the commercialbacterial strain produces the lipopeptide bacillomycin D, which contributes to its antimicrobial activity.Bacillomycin D showed a strong antagonism against F. graminearum at 30 μg/mL, which is its 50%effective concentration. The plasma membrane morphology and cell wall of F. graminearum were affectedby bacillomycin D, while inducing the accumulation of reactive oxygen species (ROS) [19]. Furthermore,this lipopeptide caused cell death of the tested F. graminearum. Lipopeptide-type compounds from theiturin, fengycin, and surfactin families, synthesized by various strains of Bacillus, effectively suppressedthe growth of pathogenic microorganisms [26–28,39–41]. These lipopeptides have different residuesat specific positions but consist of variants with the same peptide length. Molecules of the iturinlipopeptide family are linked to a β-amino fatty acid of variable length (C14–C17), those of the surfactinfamily to a β-hydroxyl fatty acid (C12–C16), while fengycin decapeptides are linked to a β-hydroxylfatty acid chain (C14–C18) [42]. These nonribosomal peptide synthetase-mediated compounds aresurface-active and have emulsifying and foaming properties and haemolytic activity [43–45].
Different strains of Bacillus produce different groups of lipopeptides [46], and their role insuppressing/controlling plant pathogens may vary. Similar lipopeptides produced by variousBacillus strains can also suppress and control other pathogens of economic importance. In a studyby Guo et al. [47], the antagonistic effect of the B. subtilis strain NCD-2, a fengycin-deficient mutant,was strong against R. solani in vitro and suppressed cotton damping-off disease in vivo. In addition,B. amyloliquefacien CM-2 and T-5 showed their antagonistic activities against the bacterium Ralstoniasolanacearum in tomato [28]. The disease incidences were reduced by over 70% by both strains in
7

Toxins 2019, 11, 606
comparison to the control. On the other hand, crude lipopeptide extracts of B. amyloliquefaciens SS-12.6successfully suppressed leaf spot disease severity on sugar beet plants [48]. These studies showedsignificant antagonism of the various Bacillus strains against various pathogens. Many studies havereported the success of Bacillus as a biological control agent against F. graminearum in various cropsand diseases. However, the potential of these biocontrol agents has not been fully exploited to controlother pathogens. Therefore, different strains of Bacillus species should be studied further as potentialbiocontrol agents against other pathogenic microorganisms.
2.2. Surfactins, Fengycins, and Iturins in Bacillus Species
The production of surfactins, fengycins, and iturins by various strains of B. subtilis has beenreported by numerous researchers [49–58], and a crude lipopeptide mixture of the supernatant ofB. subtilis was once found to contain these polypeptides [59]. The main congener structures of thesecyclic lipopeptide families are shown in Figure 1. Among the most studied in the surfactin familyare surfactin linchenysin, pumilacidin WH1, and fungin; for the iturin family, the various iturinisomers—bacillomycins, mycosubtilin—are the best known, while for fengycin, the main compoundsare feycin, plipastatin, and agrastatin 1 [60]. An overview of the activity of these three lipopeptidesagainst fungi, with emphasis on F. graminearum, is provided in the following sections of this review.
Figure 1. Congener structures of the cyclic lipopeptides; surfactin, iturin A, and fengycin. source: [61].
2.2.1. Surfactins
Surfactins are natural lipopeptides that have been reported to possess antifungal activity [42,61].They include β-hydoxy hepta cyclic depsipeptides with possibile alanine, valine, leucine, or isoleucineamino acid variations at positions 2, 4, and 7 in the cyclic depsipeptide moiety and C13 to C16
variation in the β-hydroxy fatty acid chains [62–64]. Surfactin is amphiphilic, with a polar aminoacid head and a hydrocarbon chain. This molecular structure makes surfactin a strong biosurfactant,which is at the basis of its antifungal properties. It is assumed that its antibiotic properties aredue to its ability to produce selective cationic channels in the membrane phospholipid bilayer [65].Several studies have been conducted to determine the effect of surfactin on fungi. Qi et al. [66] found anew surfactin, WH1fungin (Figure 2), which induces apoptosis in fungal cells. The same surfactin hasalso been reported in other studies as an oral immunoadjuvant that could be used for the developmentof vaccines [67,68]. Surfactin was also found to be effective against the plant pathogenic fungusColletotrichum gloeosporiodes [57]. Another surfactin, Leu7-surfactin, produced by Bacillus mojavensis,was found to be effective against Fusarium verticillioides [69]. A similar inhibitory activity of surfactinwas discovered against F. graminearum [17], F. oxysporum [70], and Fusarium moniliforme (presently
8

Toxins 2019, 11, 606
F. verticillioides) [71]. This effect on F. graminearum can be culture condition-dependent [17,19], with ironconcentration being the most important determinant [19].
Figure 2. Structure of WH1fungin; source: [72].
2.2.2. Fengycin
The antimicrobial activity of Bacillus-produced lipopeptides is based on their chemistry. This isalso the case with fengycin, which is a cyclic lipodecapeptide that contains a β-hydroxy fatty acid witha side chain consisting of 16–19 carbon atoms [73]. Fengycin is particularly active against filamentousfungi and inhibits the functions of the enzymes phospholipase A2 and aromatase [73]. It has variousisoforms, which differ in length and branching of the β-hydroxy fatty acid moiety, as well as in theamino-acid composition of the peptide ring [50]. For instance, position 6 d-alanine (as in fengycin A)can be replaced by d-valine (as in fengycin B) [73,74]. Fengycin A presents 1 d-Ala, 1 l-Ile, 1 l-Pro,1 d-allo-Thr, 3 l-Glx, 1 d-Tyr, 1 l-Tyr, 1 d-Orn, whereas in fengyicn B, d-Ala is replaced by d-Val.
Fengycin affects the integrity of biological membranes in a molar-ratio-dependent manner.The effects of fengycin on biological membranes depend on the concentration, but ultimately highconcentrations completely disrupt membranes [75]. Fengycins are elicitors of plant defense [76] andhave been found to be effective against many fungi including Magnaporthe grisea [77], Plasmodiophorabrassicae [78], Botryosphaeria dothidea [79], C. gloeosporiodes [57], and a number of other fungi [80].A cluster of fengycin homologues were found to be effective against F. verticillioides [80], F. solani [81],F. solani f. sp. radicicola [80], F. oxysporum [25,39], F. oxysporum f. sp. spinaciae [27], fumonisin productionby F. verticillioides [82] and proliferation of F. graminearum [17,27,80,83–85]. On F. graminearum, fengycincauses structural deformations of the hyphae and suppresses in planta proliferation and mycotoxinproduction [27,84], permeabilization of hyphae [85], and in planta arrest of ear rot developmentof maize [83]. The study of Liu et al. [86] also revealed that fengycin could block the growth ofF. graminearum, disrupt cell membrane structure increasing permeability, and create primary lesions inthe membrane of fungal cells, thus compromising cell integrity. While the efficacy of fengycin cannotbe disputed, its effect on F. graminearum can be concentration-dependent [80,86].
9

Toxins 2019, 11, 606
2.2.3. Iturin
Iturins exhibit strong fungitoxic properties by forming ion-conducting pores upon contact withfungal membranes. These amphiphilic compounds possess a heptapeptide backbone connected to aC13-to-C17 β-amino fatty acid chain [56,87]. Iturins vary in structure, their differences consisting in thetype of amino acid residues and in the length and branching of the fatty acid chain. Some examplesinclude iturins A, C, D, and E, bacillomycins D, F, and L, bacillopeptin, and mycosubtilin, all of whichare arranged in an lddlldl configurational sequence [88]. Length and fatty acid chain branchingheterogeneity is clearly demonstrated by iturin A, which has up to 8 isomers with between the 10 to14 carbons and branching with n-, iso-, or anteiso configurations of the fatty acid chain [89]. Membersof the iturin family bacillomycin and bacillopeptin have different amino acids at the third, fourth,and fifth positions. Mycosubtilin, a B. subtilis-produced iturin family member, targets, through itssterol group, ergosterol present in the membranes of sensitive fungi [90]. Bacillomycin L is presumedto act by inducing membrane permeabilization and disruption, as well as by targeting intercellularstructrues [91]. Iturins have been found to be effective against a number of plant pathogenic fungi,which include Botrytis, Penicillium, Monilinia [92], R. solani [93], Colletotricum [94], F. oxysporum [95–97],and F. graminearum [19,26].
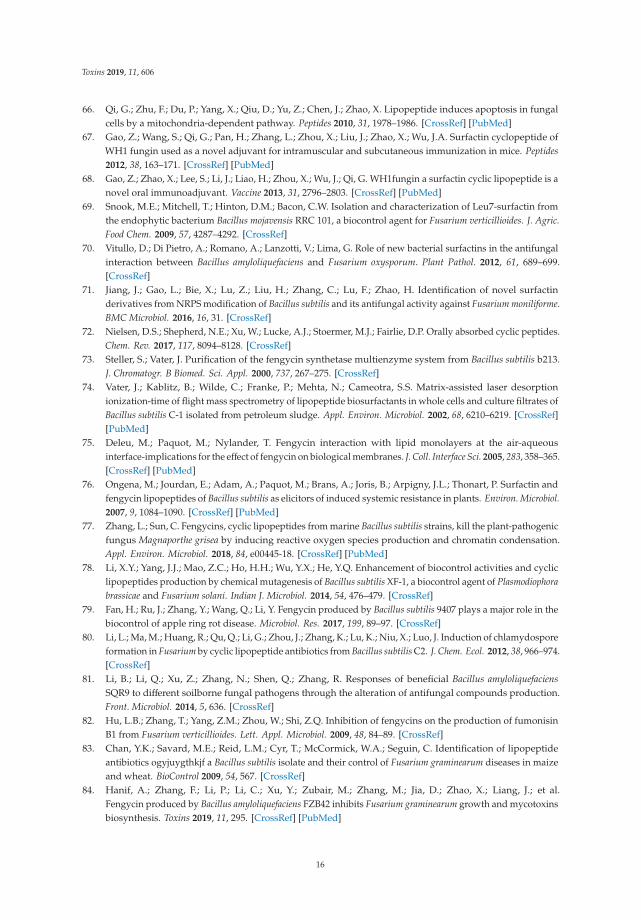
On F. graminearum, iturin causes morphological distortions in conidia and hyphae and severedamage to the plasma membrane, which lead to leakage of the cell contents [26]. Figure 3 illustratesthe effects of iturin on F. graminearum conidia. Co-cultured with Bacillus, F. graminearum is not able todecrease the germination ability of wheat seed [19].
Intact cell Disrupted cell
membrane
F. graminearum
Bacillus strain
Compromised F. graminearum
Lipopeptides: Surfactin,
Fengycin, Iturins
Figure 3. Graphical illustration of Fusarium graminearum cell disruption by Bacillus.
3. Techniques Applied to Establish Potential Modes of Action of Bacillus againstFusarium graminearum
The effect of an organism or a substance against the growth of a target organism is traditionallystudied by means of bioassays. In a bioassay, the organism is grown in the presence of the antagonist,and its growth monitored over time in comparison to that of an experimental control. Characteristically,a zone of growth inhibition is formed around the inhibited microbe. Various bioassays have beenconducted to assess the effect of B. subtilis on the growth of F. graminearum. Notable is the studyof Zhao et al. [27], which clearly demonstrated an antagonism of Bacillus against F. graminearum,whose mechanism still remains not fully elucidated. If a polypeptide is suspected to be a growthdeterrent against target microorganisms, genes (their presence or relative expression) which code forthe polypeptide can be detected in the growth culture by means of the polymerase chain reaction (PCR)technique. This was the case in the studies of Arrebola et al. [41], Velho et al. [98], and He et al. [99].
The questions needing answers would then be: What are the antagonistic compounds and howdo these antagonistic compounds inhibit growth? Studies based on bioassays analyze the growthmedium in which the antagonistic microbe and its target are grown. As part of the biochemicalanalysis, this growth medium is compared with a control growth medium, and inhibitory compounds
10

Toxins 2019, 11, 606
are detected. Detection is done using techniques such as liquid chromatography–mass spectrometry(LC–MS). Examples of these studies are those which were conducted to detect and/or analyzesurfactin, fengycin, and iturin produced by Bacillus against various plant pathogenic fungi [77,100–107].Two initial scenarios may require this type of testing. The first is when the presence of a specificcompound responsible for the antagonistic effect is supposed. This is a targeted analysis, which seeks toconfirm the presence of the ‘suspected’ compound. Alternatively, if the presence of a specific moleculeis not presumed, an untargeted analysis to assess culture conditions in comparison to the control isperformed. A target analysis follows this untargeted analysis. Studying the antagonistic effect ofBacillus against F. graminearum for the protection of durum wheat, Zalisa-Kolsi et al. [19] performed anin vitro bioassay, which was followed by an in planta growth inhibitory test. Similarly, in studyingthe effect of three Bacillus strains against Fusarium, Dunlap et al. [17] followed a radial diffusion assaywith analysis of candidate lipopeptides using high-performance liquid chromatography (HPLC) anda matrix-assisted laser desorption/ionization time-of-flight (MALDI-TOF) system. Zhao et al. [27]performed a similar experiment and discovered an antagonistic effect of B. subtilis strain SG6 onF. graminearum, as many other similar studies [26,108].
4. Tools for the Detection of Surfactin, Fengycin, and Iturin Genes in Bacillus Strains and Culturewith Biological Activity against Fusarium graminearum
Genomic analysis of Bacillus has shown that these bacteria possess genes which code formetabolites associated with biological control [38,109–113]. Genetic information made available bygenomic sequencing has led to a better understanding of Bacillus biocontrol features. Chen et al. [112]characterized the genome of the Bacillus velezensis LM2303 strain, known for its strong biocontrolpotential against F. graminearum. This strain presented the largest number of biocontrol genes and geneclusters when compared with strains studied earlier. Thirteen biosynthetic gene clusters associatedwith biocontrol activity were identified using an integrated approach of genome mining and chemicalanalysis, including the three antifungal metabolites fengycin B, iturin A, and surfactin A [112].Another strain, B. velezensis LM2303, which has antimicrobial activity against F. graminearum inaddition to other plant pathogenic fungi, also presented a plethora of genes encoding antimicrobialcompounds. These findings demonstrated the value of genomic analysis in both biocontrol straincharacterization and understanding of the basis of biocontrol activity. A plethora of co-culturingstudies have utilized PCR to detect genes involved in biological control in culture, to later identify thebasis of their biological control activity. However, biological control genes are sometimes detectedin pure Bacillus strains undergoing characterization [46]. The study by Adeniji et al. [46] analyzedseven isolates of Bacillus with bio-suppressive effects against F. graminearum and found them to havevaluable gene clusters encoding biocontrol agents. The fingerprint of the combination of genesdetected by PCR indicates that strain differentiation and selection are important to identify thestrain demonstrating the highest antimicrobial activity as a candidate biocontrol agent. Studies toidentify surfactin, fengycin, and iturin in culture are routinely carried out and have uncovered amyriad of antimicrobial substances able to act against plant pathogenic fungi, including F. graminearum.These studies make use of combined chromatography and mass spectrometry to identify the compoundswhich have antagonistic activity. Using reverse-phase high-performance liquid chromatography andelectrospray ionization mass spectrometry (RP-HPLC/ESI–MS) analyses, Gong et al. [26] identifiediturin and surfactin in a culture of B. amyloliquefaciens isolated from wheat infected with F. graminearum.Further characterization of iturin showed that it causes leakage and/or inactivation of F. graminearumcellular contents. Using thin-layer chromatography–bioautography, Lee et al. [96] identified iturin A ina butanol extract of a culture of B. amyloliquefaciens strain DA12, which was found to be active againstF. graminearum. The same study also attributed this activity to volatile heptanones, some of which weredetected using gas chromatography–mass spectrometry (GC–MS). A similar study was performedusing ultra-high-performance liquid chromatography coupled with mass spectrometry (UHPLC–MS)to confirm the presence of fengycin B, iturin A, and surfactin A in B. velezensis [112]. Also, the study of
11

Toxins 2019, 11, 606
Adeniji et al. [46] used electrospray ionization–quadrupole mass spectrometry (ESI–Q-ToF-MS) to detectsurfactin, fengycin, and iturin in the F. graminearum-supressing B. velezensis strain NWUMFkBS10.5.The power of these analytical techniques lies on their sensitivity and accuracy of detection, and theirapplication is critical for, amongst other things, the detection of toxins in food to ensure compliancewith food safety standards based on critical threshold values. Moreover, their application to detectbioactive components of Bacillus against F. graminearum is particularly relevant.
5. Future Prospects and Conclusions
The evidence that Bacillus species can act as biocontrol agents against F. graminearum encouragesthe exploitation of Bacillus in crop protection and their potential use for organic farming to supplementthe despised control measures that pose various environmental hazards and health risks. Ideally,their use may completely replace the current strategies for the control of F. graminearum in wheat andother crops. This is supported by various studies conducted to assess the suitability of Bacillus to controlwheat diseases, in particular FHB. The biofungicide, B. subtilis strain QST 713 suspension concentrate(Serenade®ASO) was tested against yellow rust in wheat and showed promising applicability forthe control of this fungal infection. However, control tests proved that this biofungicide can be moreeffective as part of an integrated control strategy than as a standalone remedy [114]. Further work is,therefore, necessary to design an integrated control strategy which utilizes Serenade®ASO togetherwith other organic disease control methods. B. amyloliquefaciens CC09 was also reported to have greatpotential as a biocontrol agent for wheat powdery mildew [115]. The same CC09 strain was found to beeffective against take-all disease caused by Gaeumannomyces graminis and against a myriad of symptomscaused by Bipolaris sorokiniana. This strain effectively colonized the wheat tissue and was foundto express genes encoding iturin A synthetase, thereby gaining the name “potential vaccine” [116].Through its ability to also form spores, Bacillus can be an effective biological control agent againstF. graminearum in wheat. With spore formation, Bacillus can overwinter and protect wheat againstFHB over several growing seasons. Although the use of biocontrol agents must be extensively tested,ensuring they have a reasonable shelf life, compatibility with other treatments and affordability mustbe ascertained. Such is not the case with Bacillus, which seems to have passed many of these hurdles tobecome an effective commercial biocontrol product against F. graminearum. This is evident in availablepatents registered, such as those for Bacillus species against FHB in cereals [117,118]. The widespreadadoption of these patented products to control FHB can benefit organic farming with a healthier andmore sustainable wheat product.
Massive screening of various Bacillus strains against a wide array of crop pathogens is stillnonetheless necessary to identify new antagonistic species. Furthermore, the application of new toolsand techniques for assessing the efficacy of biocontrol agents against crop pathogens can accelerate thediscovery of new biocontrol strains of Bacillus. Equally important is the study of the mechanism ofaction of Bacillus against F. graminearum, which should be analyzed more accurately using the new toolsof genome-wide studies and the sensitive and accurate platforms of metabolomics. High-resolutiontechniques of chromatography and mass spectrometry can make the detection of new antagonisticmolecules possible even at traceable levels. Specifically, if explored extensively, Bacillus may replacein the control F. graminearum most of the current widely applied control agents, such as fungicides,and cultural practices which impact negatively on health and the environment.
Author Contributions: Conceptualization, K.N.; writing, K.N., L.K.L., M.E.R., O.A.A., P.B.N.; editing, K.N., L.K.L.,M.E.R., O.A.A., P.B.N.; supervision, K.N., P.B.N.
Funding: This study was funded by the National Research Foundation of South Africa under grant numberReference: TTK170413227119.
Conflicts of Interest: The authors declare no conflict of interest.
12

Toxins 2019, 11, 606
References
1. Savary, S.; Ficke, A.; Aubertot, J.N.; Hollier, C. Crop losses due to diseases and their implications for globalfood production losses and food security. Food Secur. 2012, 4, 519–537. [CrossRef]
2. Savary, S.; Willocquet, L.; Pethybridge, S.J.; Esker, P.; McRoberts, N.; Nelson, A. The global burden ofpathogens and pests on major food crops. Nat. Ecol. Food Evol. 2019, 3, 430–439. [CrossRef] [PubMed]
3. McMullen, M.P.; Jones, R.; Gallenberg, D. Scab of wheat and barley: A re-emerging disease of devastatingimpact. Plant Dis. 1997, 81, 1340–1348. [CrossRef] [PubMed]
4. Manning, B.; Southwell, R.; Hayman, P.; Moore, K. ‘Fusarium head blight in Northern NSW; NSW Agriculture:Orange, Australia, 2000.
5. Nganje, W.E.; Bangsund, D.A.; Leistritx, F.L.; Wilson, W.W.; Tlapo, N.M. Regional economic impacts ofFusarium head blight in wheat and barley. Rev. Agric. Econ. 2004, 26, 332–347. [CrossRef]
6. Dweba, C.C.; Figlan, S.; Shimelis, H.A.; Motaung, T.E.; Sydenham, S.; Mwadzingeni, L.; Tsilo, T.J. Fusariumhead blight of wheat: Pathogenesis and control strategies. Crop Prot. 2017, 91, 114–122. [CrossRef]
7. Dean, R.; van Kan, J.A.L.; Pretorius, Z.A.; Hammond-Kosack, K.E.; Di Pietro, A.; Spanu, P.D.; Rudd, J.J.;Dickman, M.; Kahmann, R.; Ellis, J.; et al. The top-10 fungal pathogens in molecular plant pathology.Plant Pathol. 2012, 13, 414–430.
8. Pestka, J.J.; Smolinski, A.T. Deoxynivalenol: Toxicology and potential effects on humans. J. Toxicol. Environ.Heal. B Crit. Rev. 2005, 8, 39–69. [CrossRef]
9. Mahmoud, A.F. Genetic variation and biological control of Fusarium graminearum isolated from wheat inAssiut-Egypt. Plant Pathol. 2015, 32, 145–156. [CrossRef]
10. Desjardins, A.E.; Hohn, T.M.; McCormick, S.P. Trichothecene biosynthesis in Fusarium species: Chemistry,genetics, and significance. Microbiol. Mol. Biol. Rev. 1993, 157, 595–604.
11. Desjardins, A.E.; Hohn, T.M. Mycotoxins in plant pathogenesis. Mol. Plant Microbe Interact. 1997, 10, 147–152.[CrossRef]
12. Goswami, R.S.; Kistler, H.C. Heading for disaster: Fusarium graminearum on cereal crops. Mol. Plant Pathol.2004, 5, 515–525. [CrossRef] [PubMed]
13. Zhang, Y.J.; Yu, J.J.; Zhang, Y.N.; Zhang, X.; Cheng, C.J.; Wang, J.X.; Hollomon, D.W.; Fan, P.S.; Zhou, M.G.Effect of carbendazim resistance on trichothecene production and aggressiveness of Fusarium graminearum.Mol. Plant Microbe Interact. 2009, 22, 1143–1150. [CrossRef] [PubMed]
14. Shafi, J.; Tian, H.; Ji, M. Bacillus species as versatile weapons for plant pathogens: A review. Biotechnol. Biotech.Equip. 2017, 31, 446–459. [CrossRef]
15. Zeigler, D.R.; Perkins, J.B. The genus Bacillus. In Practical Handbook of Microbiology; Goldman, E.,Green, L.H., Eds.; CRC Press: Boca Raton, FL, USA, 2018; pp. 309–326.
16. Chitlaru, T.; Altboum, Z.; Reuveny, S.; Shafferman, A. Progress and novel strategies in vaccine developmentand treatment of Anthrax. Immunol. Rev. 2011, 239, 221–236. [CrossRef]
17. Dunlap, C.A.; Schisler, D.A.; Price, N.P.; Vaughn, S.F. Cyclic lipopeptide profile of three Bacillus subtilisstrains; antagonists of Fusarium head blight. J. Microbiol. 2011, 49, 603–609. [CrossRef]
18. Compant, S.; Duffy, B.; Nowak, J.; Clement, C.; Barka, E.A. Use of plant growth promoting bacteria forbiocontrol of plant diseases: Principles, mechanisms of action, and future prospects. Appl. Environ Microbiol.2005, 71, 4951–4959. [CrossRef]
19. Zalila-Kolsi, I.; Mahmoud, A.B.; Ali, H.; Sellami, S.; Nasfi, Z.; Tounsi, S.; Jamoussi, K. Antagonist effects ofBacillus spp. strains against Fusarium graminearum for protection of durum wheat (Triticum turgidum L. subsp.durum). Microbiol. Res. 2016, 192, 148–158. [CrossRef]
20. Whipps, J.M. Microbial interactions and biocontrol in the rhizosphere. J. Exp. Bot. 2001, 511, 487–511.[CrossRef]
21. Cawoy, H.; Debois, D.; Franzil, L.; De Pauw, E.; Thonart, P.; Ongena, M. Lipopeptides as main ingredients forinhibition of fungal phytopathogens by Bacillus subtilis/amyloliquefaciens. Microb. Biotechnol. 2015, 8, 281–295.[CrossRef]
22. Khan, N.; Maymon, M.; Hirsch, A.M. Combating Fusarium infection using Bacillus-based antimicrobials.Microorganisms 2017, 5, 75. [CrossRef]
23. Radhakrishnan, R.; Hashem, A.; Abd Allah, E.F. Bacillus: A biological tool for crop improvement throughbio-molecular changes in adverse environments. Front. Physiol. 2017, 8, 667. [CrossRef] [PubMed]
13

Toxins 2019, 11, 606
24. Ayed, H.B.; Hmidet, N.; Béchet, M.; Chollet, M.; Chataigné, G.; Leclère, V.; Jacques, P.; Nasri, M. Identificationand biochemical characteristics of lipopeptides from Bacillus mojavensis A21. Process Biochem. 2014, 49, 1699–1707.[CrossRef]
25. Cao, Y.; Xu, Z.; Ling, N.; Yuan, Y.; Yang, X.; Chen, L.; Shen, B.; Shen, Q. Isolation and identification oflipopeptides produced by B. subtilis SQR 9 for suppressing Fusarium wilt of cucumber. Sci. Hortic. 2012,135, 32–39. [CrossRef]
26. Gong, A.D.; Li, H.P.; Yuan, Q.S.; Song, X.S.; Yao, W.; He, W.J.; Zhang, J.B.; Liao, Y.C. Antagonistic mechanismof iturin A and plipastatin A from Bacillus amyloliquefaciens S76-3 from wheat spikes against Fusariumgraminearum. PLoS ONE 2015, 10, e0116871. [CrossRef] [PubMed]
27. Zhao, Y.; Selvaraj, J.N.; Xing, F.; Zhou, L.; Wang, Y.; Song, H.; Tan, X.; Sun, L.; Sangare, L.; Folly, Y.M.E.; et al.Antagonistic action of Bacillus subtilis strain SG6 on Fusarium graminearum. PLoS ONE 2014, 9, e92486.[CrossRef]
28. Tan, S.; Dong, Y.; Liao, H.; Huang, J.; Song, S.; Xu, Y.; Shen, Q. Antagonistic bacterium Bacillus amyloliquefaciensinduces resistance and controls the bacterial wilt of tomato. Pest Manag. Sci. 2013, 69, 1245–1252.
29. Földes, T.; Bánhegyi, I.; Herpai, Z.; Varga, L.; Szigeti, J. Isolation of Bacillus strains from the rhizosphere ofcereals and in vitro screening for antagonism against phytopathogenic, food-borne pathogenic and spoilagemicro-organisms. J. Appl. Microbiol. 2000, 89, 840–846. [CrossRef]
30. Gross, E.; Kiltz, H.H.; Nebelin, E.; Subtilin, V.I. Die Struktur des Subtilins. Hoppe-Seyler Z. Physiol. Chem.1973, 354, 810–812.
31. Walker, J.E.; Abraham, E.P. The structure of bacilysin and other products of Bacillus subtilis. Biochem. J. 1970,118, 563–570. [CrossRef]
32. Sengupta, S.; Banerjee, A.B.; Bose, S.K. γ-Glutamyl and D-or L-peptide linkages in mycobacillin, a cyclicpeptide antibiotic. Biochem. J. 1971, 121, 839–846. [CrossRef]
33. Besson, F.; Peypoux, F.; Michel, G.; Delcambe, L. The structure of bacillomycin L, an antibiotic from Bacillussubtilis. Eur. J. Biochem. 1977, 77, 61–67. [CrossRef] [PubMed]
34. Peypoux, F.; Marion, D.; Maget-Dana, R. Structure of bacillomycin F, a new peptidolipid antibiotic of theiturin group. Eur. J. Biochem. 1985, 153, 335–340. [CrossRef] [PubMed]
35. Peypoux, F.; Michel, G.; Delcambe, L. The structure of mycosubtilin, an antibiotic isolated from Bacillussubtilis. Eur. J. Biochem. 1976, 63, 391–398. [CrossRef] [PubMed]
36. Peypoux, F.; Pommier, M.T.; Marion, D.; Ptak, M.; Das, B.C.; Michel, G. Revised structure of mycosubtilin,a peptidolipid antibiotic from Bacillus subtilis. J. Antibiot. 1986, 39, 636–641. [CrossRef] [PubMed]
37. Zeriouh, H.; Romero, D.; Garcia-Gutierrez, L.; Cazorla, F.M.; de Vicente, A.; Perez-Garcia, A. The iturin-likelipopeptides are essential components in the biological control arsenal of Bacillus subtilis against bacterialdiseases of cucurbits. Mol. Plant Microbe Interact. 2011, 24, 1540–1552. [CrossRef] [PubMed]
38. Dunlap, C.A.; Bowman, M.J.; Schisler, D.A. Genomic analysis and secondary metabolite production in Bacillusamyloliquefaciens AS 43.3: A biocontrol antagonist of Fusarium head blight. Biol. Control 2013, 64, 166–175.[CrossRef]
39. Yuan, J.; Raza, W.; Huang, Q.; Shen, Q. The ultrasound-assisted extraction and identification of antifungalsubstances from B. amyloliquefaciens strain NJN-6 suppressing Fusarium oxysporum. J. Basic Microbiol. 2012,52, 721–730. [CrossRef]
40. Kumar, P.; Dubey, R.C.; Maheshwari, D.K. Bacillus strains isolated from rhizosphere showed plant growthpromoting and antagonistic activity against phytopathogens. Microbiol. Res. 2012, 167, 493–499. [CrossRef]
41. Arrebola, E.; Jacobs, R.; Korsten, L. Iturin A is the principal inhibitor in the biocontrol activity of Bacillusamyloliquefaciens PPCB004 against postharvest fungal pathogens. J. Appl. Microbiol. 2010, 108, 386–395.[CrossRef] [PubMed]
42. Stein, T. Bacillus subtilis antibiotics: Structure, syntheses and specific functions. Mol. Microbiol. 2005, 56, 845–857.[CrossRef]
43. Roongsawang, N.; Washio, K.; Morikawa, M. Diversity of nonribosomal peptide synthetases involved in thebiosynthesis of lipopeptide biosurfactants. Int. J. Mol. Sci. 2011, 12, 141–172. [CrossRef] [PubMed]
44. Deleu, M.; Razafindralambo, H.; Popineau, Y.; Jacques, P.; Thonard, P.; Paquot, M. Interfacial and emulsifyingproperties of lipopeptides from Bacillus subtilis. Coll. Surf. A Physicochem. Eng. Asp. 1999, 152, 3–10. [CrossRef]
45. Peypoux, F.; Bonmatin, J.; Wallach, J. Recent trends in the biochemistry of surfactin. Appl. Microbiol. Biotechnol.1999, 51, 553–563. [CrossRef] [PubMed]
14

Toxins 2019, 11, 606
46. Adeniji, A.A.; Aremu, O.S.; Babalola, O.O. Selecting lipopeptide-producing, Fusarium-suppressing Bacillusspp.: Metabolomic and genomic probing of Bacillus velezensis NWUMFkBS10. 5. MicrobiologyOpen 2019,8, e00742. [CrossRef] [PubMed]
47. Guo, Q.; Dong, W.; Li, S.; Lu, X.; Wang, P.; Zhang, X.; Wang, Y.; Ma, P. Fengycin produced by Bacillussubtilis NCD-2 plays a major role in biocontrol of cotton seedling damping-off disease. Microbiol. Res. 2014,169, 533–540. [CrossRef]
48. Nikolic, I.; Beric, T.; Dimkic, I.; Popovic, T.; Lozo, J.; Fira, D.; Stankovic, S. Biological control of Pseudomonassyringae pv. aptata on sugar beet with Bacillus pumilus SS-10.7 and Bacillus amyloliquefaciens (SS-12.6 andSS-38.4) strains. J. Appl. Microbiol. 2019, 126, 165–176.
49. Winkelmann, H.; Allgaier, H.; Lu, R.; Jung, G. Iturin AL—A new long chain iturin A possessing an unusualhigh content of C16 β amino acids. J. Antibiot. 1983, 11, 1451–1457. [CrossRef]
50. Vanittanakom, N.; Loeffler, W.; Koch, U.; Jung, G. Fengycin—A novel antifungal lipopeptide antibioticproduced by Bacillus subtilis F-29-2. J. Antibiot. 1986, 7, 888–901. [CrossRef]
51. Vollenbroich, D.; Ozel, M.; Vater, J.; Kamp, R.M.; Pauli, G. Mechanism of inactivation of enveloped virusesby the biosurfactant surfactin from Bacillus subtilis. Biologicals 1997, 25, 289–297. [CrossRef]
52. Vollenbroich, D.; Pauli, G.; Ozel, M.; Vater, J. Antimycoplasma properties and application in cell culture ofsurfactin, a lipopeptide antibiotic from Bacillus subtilis. Appl. Environ. Microbiol. 1997, 63, 44–49.
53. Kracht, M.; Rokos, H.; Ozel, M.; Kowall, M.; Pauli, G.; Vater, J. Antiviral and hemolytic activities of surfactinisoforms and their methyl ester derivatives. J. Antibiot. 1999, 52, 613–619. [CrossRef] [PubMed]
54. Kim, S.Y.; Kim, J.M.; Kim, S.H.; Bae, H.J.; Yi, H.; Yoon, S.H.; Koo, B.S.; Kwon, M.; Cho, J.Y.; Lee, C.E.; et al.Surfactin from Bacillus subtilis displays anti-proliferative effect via apoptosis induction, cell cycle arrest andsurvival signalling suppression. FEBS Lett. 2007, 581, 865–871. [CrossRef] [PubMed]
55. Nagorska, K.; Bikowski, M.; Obuchowki, M. Multicellular behaviour and production of a wide variety oftoxic substance support usage of Bacillus subtilis as powerful biocontrol agent. Acta. Biochim. Pol. 2007,54, 495–508. [PubMed]
56. Ongena, M.; Jacques, P. Bacillus lipopeptides: Versatile weapons for plant disease biocontrol. Trends Microbiol.2008, 16, 115–124. [CrossRef]
57. Kim, P.I.; Ryu, J.; Kim, Y.H.; Chi, Y.T. Production of biosurfactant lipopeptides iturin A, fengycin andsurfactin from Bacillus subtilis CMB32 for control of Colletotrichum gloeosporides. J. Microbiol. Biotechnol. 2010,20, 138–145.
58. Geetha, L.; Manonmani, A.M.; Paily, K.P. Identification and characterization of a mosquito pupicidalmetabolite of Bacillus subtilis subsp. subtilis strain. Appl. Microbiol. Biotechnol. 2010, 86, 1737–1744. [CrossRef]
59. Pathak, K.V.; Keharia, H. Identification of surfactins and iturins produced by potent fungal antagonist,Bacillus subtilis K1 isolated from aerial roots of banyan (Ficus benghalensis) tree using mass spectrometry.3 Biotech. 2014, 4, 283–295. [CrossRef]
60. Beltran-Gracia, E.; Macedo-Raygoza, G.; Villafaña-Rojas, J.; Martinez-Rodriguez, A.; Chavez-Castrillon, Y.Y.;Espinosa-Escalante, F.M.; Di Mascio, P.; Ogura, T.; Beltran-Garcia, M.J. Production of lipopeptides byfermentation processes: Endophytic bacteria, fermentation strategies and easy methods for bacterial selection.In Fermentation Processes, 1st ed.; Menestrina, G., Serra, M.D., Jozala, A.F., Eds.; Intech Open Science: London,UK, 2017; pp. 260–271.
61. Geissler, M.; Oellig, C.; Moss, K.; Schwack, W.; Henkel, M.; Hausmann, R. High-performance thin-layerchromatography (HPTLC) for the simultaneous quantification of the cyclic lipopeptides surfactin, iturin Aand fengycin in culture samples of Bacillus species. J. Chromatogr. B 2017, 1044, 214–224. [CrossRef]
62. Peypoux, F.; Bonmatin, J.M.; Labbe, H.; Grangemard, I.; Das, B.C.; Ptak, M.; Wallach, J.; Michel, G. [Ala4]surfactin, a novel isoform from Bacillus subtilis studied by mass and NMR spectroscopies. Eur. J. Biochem.1994, 224, 89–96. [CrossRef]
63. Kowall, M.; Vater, J.; Kluge, T.; Stein, P.; Ziessow, D. Separation and characterization of surfactin isoformsproduced by Bacillus subtilis OKB 105. J. Coll. Interface Sci. 1998, 204, 1–8. [CrossRef]
64. Hue, N.; Serani, L.; Laprevote, O. Structural investigation of cyclic peptidolipids from Bacillus subtilis byhigh energy tandem mass spectrometry. Rapid Commun. Mass Spectrom. 2001, 15, 203–209. [CrossRef]
65. Sheppard, J.D.; Jumarie, C.; Cooper, D.G.; Laprade, R. Ionic channels induced by surfactin in planar lipidbilayer membranes. Biochim. Biophys. Acta 1991, 1064, 13–23. [CrossRef]
15
Toxins 2019, 11, 606
66. Qi, G.; Zhu, F.; Du, P.; Yang, X.; Qiu, D.; Yu, Z.; Chen, J.; Zhao, X. Lipopeptide induces apoptosis in fungalcells by a mitochondria-dependent pathway. Peptides 2010, 31, 1978–1986. [CrossRef] [PubMed]
67. Gao, Z.; Wang, S.; Qi, G.; Pan, H.; Zhang, L.; Zhou, X.; Liu, J.; Zhao, X.; Wu, J.A. Surfactin cyclopeptide ofWH1 fungin used as a novel adjuvant for intramuscular and subcutaneous immunization in mice. Peptides2012, 38, 163–171. [CrossRef] [PubMed]
68. Gao, Z.; Zhao, X.; Lee, S.; Li, J.; Liao, H.; Zhou, X.; Wu, J.; Qi, G. WH1fungin a surfactin cyclic lipopeptide is anovel oral immunoadjuvant. Vaccine 2013, 31, 2796–2803. [CrossRef] [PubMed]
69. Snook, M.E.; Mitchell, T.; Hinton, D.M.; Bacon, C.W. Isolation and characterization of Leu7-surfactin fromthe endophytic bacterium Bacillus mojavensis RRC 101, a biocontrol agent for Fusarium verticillioides. J. Agric.Food Chem. 2009, 57, 4287–4292. [CrossRef]
70. Vitullo, D.; Di Pietro, A.; Romano, A.; Lanzotti, V.; Lima, G. Role of new bacterial surfactins in the antifungalinteraction between Bacillus amyloliquefaciens and Fusarium oxysporum. Plant Pathol. 2012, 61, 689–699.[CrossRef]
71. Jiang, J.; Gao, L.; Bie, X.; Lu, Z.; Liu, H.; Zhang, C.; Lu, F.; Zhao, H. Identification of novel surfactinderivatives from NRPS modification of Bacillus subtilis and its antifungal activity against Fusarium moniliforme.BMC Microbiol. 2016, 16, 31. [CrossRef]
72. Nielsen, D.S.; Shepherd, N.E.; Xu, W.; Lucke, A.J.; Stoermer, M.J.; Fairlie, D.P. Orally absorbed cyclic peptides.Chem. Rev. 2017, 117, 8094–8128. [CrossRef]
73. Steller, S.; Vater, J. Purification of the fengycin synthetase multienzyme system from Bacillus subtilis b213.J. Chromatogr. B Biomed. Sci. Appl. 2000, 737, 267–275. [CrossRef]
74. Vater, J.; Kablitz, B.; Wilde, C.; Franke, P.; Mehta, N.; Cameotra, S.S. Matrix-assisted laser desorptionionization-time of flight mass spectrometry of lipopeptide biosurfactants in whole cells and culture filtrates ofBacillus subtilis C-1 isolated from petroleum sludge. Appl. Environ. Microbiol. 2002, 68, 6210–6219. [CrossRef][PubMed]
75. Deleu, M.; Paquot, M.; Nylander, T. Fengycin interaction with lipid monolayers at the air-aqueousinterface-implications for the effect of fengycin on biological membranes. J. Coll. Interface Sci. 2005, 283, 358–365.[CrossRef] [PubMed]
76. Ongena, M.; Jourdan, E.; Adam, A.; Paquot, M.; Brans, A.; Joris, B.; Arpigny, J.L.; Thonart, P. Surfactin andfengycin lipopeptides of Bacillus subtilis as elicitors of induced systemic resistance in plants. Environ. Microbiol.2007, 9, 1084–1090. [CrossRef] [PubMed]
77. Zhang, L.; Sun, C. Fengycins, cyclic lipopeptides from marine Bacillus subtilis strains, kill the plant-pathogenicfungus Magnaporthe grisea by inducing reactive oxygen species production and chromatin condensation.Appl. Environ. Microbiol. 2018, 84, e00445-18. [CrossRef] [PubMed]
78. Li, X.Y.; Yang, J.J.; Mao, Z.C.; Ho, H.H.; Wu, Y.X.; He, Y.Q. Enhancement of biocontrol activities and cycliclipopeptides production by chemical mutagenesis of Bacillus subtilis XF-1, a biocontrol agent of Plasmodiophorabrassicae and Fusarium solani. Indian J. Microbiol. 2014, 54, 476–479. [CrossRef]
79. Fan, H.; Ru, J.; Zhang, Y.; Wang, Q.; Li, Y. Fengycin produced by Bacillus subtilis 9407 plays a major role in thebiocontrol of apple ring rot disease. Microbiol. Res. 2017, 199, 89–97. [CrossRef]
80. Li, L.; Ma, M.; Huang, R.; Qu, Q.; Li, G.; Zhou, J.; Zhang, K.; Lu, K.; Niu, X.; Luo, J. Induction of chlamydosporeformation in Fusarium by cyclic lipopeptide antibiotics from Bacillus subtilis C2. J. Chem. Ecol. 2012, 38, 966–974.[CrossRef]
81. Li, B.; Li, Q.; Xu, Z.; Zhang, N.; Shen, Q.; Zhang, R. Responses of beneficial Bacillus amyloliquefaciensSQR9 to different soilborne fungal pathogens through the alteration of antifungal compounds production.Front. Microbiol. 2014, 5, 636. [CrossRef]
82. Hu, L.B.; Zhang, T.; Yang, Z.M.; Zhou, W.; Shi, Z.Q. Inhibition of fengycins on the production of fumonisinB1 from Fusarium verticillioides. Lett. Appl. Microbiol. 2009, 48, 84–89. [CrossRef]
83. Chan, Y.K.; Savard, M.E.; Reid, L.M.; Cyr, T.; McCormick, W.A.; Seguin, C. Identification of lipopeptideantibiotics ogyjuygthkjf a Bacillus subtilis isolate and their control of Fusarium graminearum diseases in maizeand wheat. BioControl 2009, 54, 567. [CrossRef]
84. Hanif, A.; Zhang, F.; Li, P.; Li, C.; Xu, Y.; Zubair, M.; Zhang, M.; Jia, D.; Zhao, X.; Liang, J.; et al.Fengycin produced by Bacillus amyloliquefaciens FZB42 inhibits Fusarium graminearum growth and mycotoxinsbiosynthesis. Toxins 2019, 11, 295. [CrossRef] [PubMed]
16

Toxins 2019, 11, 606
85. Wang, J.; Liu, J.; Chen, H.; Yao, J. Characterization of Fusarium graminearum inhibitory lipopeptide fromBacillus subtilis IB. Appl. Microbiol. Biotechnol. 2007, 76, 889–894. [CrossRef] [PubMed]
86. Liu, Y.; Lu, J.; Sun, J.; Bie, X.; Lu, Z. Membrane disruption and DNA binding of Fusarium graminearum cellinduced by C16-Fengycin A produced by Bacillus amyloliquefaciens. Food Cont. 2019, 102, 206–213. [CrossRef]
87. Aranda, F.J.; Teruel, J.A.; Ortiz, A. Further aspects on the haemolytic activity of the antibiotic lipopeptideiturin A. Biochem. Biophys. Acta 2005, 1713, 51–56. [CrossRef]
88. Bland, J.M. The first synthesis of a member of the iturin family, the antifungal cyclic lipopeptide, iturin-A2.J. Org. Chem. 1996, 61, 5663–5664. [CrossRef]
89. Isogai, A.; Takayama, S.; Murakoshi, S.; Suzuki, A. Structure of β-amino acids in antibiotics iturin A.Tetrahedron Lett. 1982, 23, 3065–3068. [CrossRef]
90. Nasir, M.N.; Besson, F. Interactions of the antifungal mycosubtilin with ergosterol-containing interfacialmonolayers. Biochim. Biophys. Acta 2012, 1818, 1302–1308. [CrossRef]
91. Zhang, B.; Dong, C.; Shang, Q.; Han, Y.; Li, P. New insights into membrane-active action in plasma membraneof fungal hyphae by the lipopeptide antibiotic bacillomycin L. Biochim. Biophys. Acta 2013, 1828, 2230–2237.[CrossRef]
92. Calvo, H.; Mendiara, I.; Arias, E.; Blanco, D.; Venturini, M.E. The role of iturin A from B. amyloliquefaciensBUZ-14 in the inhibition of the most common postharvest fruit rots. Food Microbiol. 2019, 82, 62–69. [CrossRef]
93. Zohora, U.S.; Ano, T.; Rahman, M.S. Biocontrol of Rhizoctonia solani K1 by iturin A producer Bacillus subtilisRB14 seed treatment in tomato plants. Adv. Microbiol. 2016, 6, 424–431. [CrossRef]
94. Arroyave-Toro, J.J.; Mosquera, S.; Villegas-Escobar, V. Biocontrol activity of Bacillus subtilis EA-CB0015 cellsand lipopeptides against postharvest fungal pathogens. Biol. Control 2017, 114, 195–200. [CrossRef]
95. Fujita, S.; Yokota, K. Disease suppression by the cyclic lipopeptides iturin A and surfactin from Bacillus spp.against Fusarium wilt of lettuce. J. Gen. Plant Pathol. 2019, 85, 44–48. [CrossRef]
96. Lee, T.; Park, D.; Kim, K.; Lim, S.M.; Yu, N.H.; Kim, S.; Kim, H.Y.; Jung, K.S.; Jang, J.Y.; Park, J.C.; et al.Characterization of Bacillus amyloliquefaciens DA12 showing potent antifungal activity against mycotoxigenicFusarium species. Plant Pathol. J. 2017, 33, 499–507. [CrossRef] [PubMed]
97. Cao, Y.; Pi, H.; Chandrangsu, P.; Li, Y.; Wang, Y.; Zhou, H.; Xiong, H.; Helmann, J.D.; Cai, Y. Antagonism oftwo plant-growth promoting Bacillus velezensis isolates against Ralstonia solanacearum and Fusarium oxysporum.Sci. Rep. 2018, 8, 4360. [CrossRef] [PubMed]
98. Velho, R.V.; Medina, L.F.C.; Segalin, J.; Brandelli, A. Production of lipopeptides among Bacillus strainsshowing growth inhibition of phytopathogenic fungi. Folia Microbiol. 2011, 56, 297–303. [CrossRef] [PubMed]
99. He, Y.; Zhu, M.; Huang, J.; Hsiang, T.; Zheng, L. Biocontrol potential of a Bacillus subtilis strain BJ-1 againstthe rice blast fungus Magnaporthe oryzae. Can. J. Plant Pathol. 2019, 41, 47–59. [CrossRef]
100. Koumoutsi, A.; Chen, X.H.; Henne, A.; Liesegang, H.; Hitzero th, G.; Franke, P.; Vater, J.; Borriss, R.Structural and functional characterization of gene clusters directing nonribosomal synthesis of bioactivecyclic lipopeptides in Bacillus amyloliquefaciens strain FZB42. J. Bacteriol. 2004, 186, 1084–1096. [CrossRef]
101. Nanjundan, J.; Ramasamy, R.; Uthandi, S.; Ponnusamy, M. Antimicrobial activity and spectroscopiccharacterization of surfactin class of lipopeptides from Bacillus amyloliquefaciens SR1. Microb. Pathog. 2019,128, 374–380. [CrossRef]
102. Ding, L.; Guo, W.; Chen, X. Exogenous addition of alkanoic acids enhanced production of antifungallipopeptides in Bacillus amyloliquefaciens Pc3. Appl. Microbiol. Biotechnol. 2019, 103, 5367–5377. [CrossRef]
103. Saechow, S.; Thammasittirong, A.; Kittakoop, P.; Prachya, S.; Thammasittirong, S.N.R. Antagonistic activityagainst dirty panicle rice fungal pathogens and plant growth-promoting activity of Bacillus amyloliquefaciensBAS23. J. Microbiol. Biotechnol. 2018, 28, 1527–1535. [CrossRef]
104. Sa, R.B.; An, X.; Sui, J.K.; Wang, X.H.; Ji, C.; Wang, C.Q.; Li, Q.; Hu, Y.R.; Liu, X. Purification and structuralcharacterization of fengycin homologues produced by Bacillus subtilis from poplar wood bark. Australas.Plant Pathol. 2018, 47, 259–268. [CrossRef]
105. Zouari, I.; Jlaiel, L.; Tounsi, S.; Trigui, M. Biocontrol activity of the endophytic Bacillus amyloliquefaciens strainCEIZ-11 against Pythium aphanidermatum and purification of its bioactive compounds. Biol. Control 2016,100, 54–62. [CrossRef]
106. Kaur, P.K.; Joshi, N.; Singh, I.P.; Saini, H.S. Identification of cyclic lipopeptides produced by Bacillus vallismortisR2 and their antifungal activity against Alternaria alternata. J. Appl. Microbiol. 2017, 122, 139–152. [CrossRef][PubMed]
17

Toxins 2019, 11, 606
107. Ji, S.H.; Paul, N.C.; Deng, J.X.; Kim, Y.S.; Yun, B.S.; Yu, S.H. Biocontrol activity of Bacillus amyloliquefaciensCNU114001 against fungal plant diseases. Mycobiology 2013, 41, 234–242. [CrossRef]
108. Palyzová, A.; Svobodová, K.; Sokolová, L.; Novák, J.; Novotný, C. Metabolic profiling of Fusarium oxysporumf. sp. conglutinans race 2 in dual cultures with biocontrol agents Bacillus amyloliquefaciens, Pseudomonasaeruginosa, and Trichoderma harzianum. Folia Microbiol. 2019. [CrossRef]
109. Blom, J.; Rueckert, C.; Niu, B.; Wang, Q.; Borriss, R. The complete genome of Bacillus amyloliquefaciens subsp.plantarum CAU B946 contains a gene cluster for non-ribosomal synthesis of Iturin A. J. Bacteriol. 2012, 194,1845–1846. [CrossRef] [PubMed]
110. Chen, X.H.; Koumoutsi, A.; Scholz, R.; Eisenreich, A.; Schneider, K.; Heinemeyer, I.; Morgenstern, B.;Voss, B.; Hess, W.R.; Reva, O.; et al. Comparative analysis of the complete genome sequence of theplant growth–promoting bacterium Bacillus amyloliquefaciens FZB42. Nat. Biotechnol. 2007, 25, 1007–1014.[CrossRef]
111. Chen, L.; Heng, J.; Qin, S.; Bian, K. A comprehensive understanding of the biocontrol potential of Bacillusvelezensis LM2303 against Fusarium head blight. PLoS ONE 2018, 13, e0198560. [CrossRef]
112. Deng, Y.; Zhu, Y.; Wang, P.; Zhu, L.; Zheng, J.; Li, R.; Ruan, L.; Peng, D.; Sun, M. Complete genome sequenceof Bacillus subtilis BSn5, an endophytic bacterium of Amorphophallus konjac with antimicrobial activity for theplant pathogen Erwinia carotovora subsp. carotovora. J. Bacteriol. 2011, 193, 2070–2071. [CrossRef]
113. Deng, Q.; Wang, R.; Sun, D.; Sun, L.; Wang, Y.; Pu, Y.; Fang, Z.; Xu, D.; Liu, Y.; Ye, R.; et al. Complete genome ofBacillus velezensis CMT-6 and comparative genome analysis reveals lipopeptide diversity. Biochem. Genet. 2019.[CrossRef]
114. Reiss, A.; Jørgensen, L.N. Biological control of yellow rust of wheat (Puccinia striiformis) with Serenade®
ASO (Bacillus subtilis strain QST713). Crop Prot. 2017, 93, 1–8. [CrossRef]115. Cai, X.C.; Liu, C.H.; Wang, B.T.; Xue, Y.R. Genomic and metabolic traits endow Bacillus velezensis CC09 with
a potential biocontrol agent in control of wheat powdery mildew disease. Microbiol. Res. 2017, 196, 89–94.[CrossRef] [PubMed]
116. Kang, X.; Zhang, W.; Cai, X.; Zhu, T.; Xue, Y.; Liu, C. Bacillus velezensis CC09: A potential ‘vaccine’ forcontrolling wheat diseases. Mol. Plant Microbe Interact. 2018, 31, 623–632. [CrossRef] [PubMed]
117. Schisler, D.A.; Khan, N.I.; Boehm, M.J. Ohio State University Research Foundation and US Departmentof Agriculture. Bacillus species NRRL B-30212 for reducing Fusarium head blight in cereals. U.S. Patent7,001,755, 21 February 2006.
118. Da Luz, W.C. Empresa Brasileira de Pesquisa Agropecuaria EMBRAPA, Biocontrol of plant diseases causedby Fusarium species with novel isolates of Pantoea agglomerans. U.S. Patent 7,118,739, 10 October 2006.
© 2019 by the authors. Licensee MDPI, Basel, Switzerland. This article is an open accessarticle distributed under the terms and conditions of the Creative Commons Attribution(CC BY) license (http://creativecommons.org/licenses/by/4.0/).
18

toxins
Review
Biological Control of CitrusPostharvest Phytopathogens
Jaqueline Moraes Bazioli 1,2, João Raul Belinato 1, Jonas Henrique Costa 1,
Daniel Yuri Akiyama 1, João Guilherme de Moraes Pontes 1, Katia Cristina Kupper 3,
Fabio Augusto 1, João Ernesto de Carvalho 2 and Taícia Pacheco Fill 1,*
1 Institute of Chemistry, Universidade Estadual de Campinas, CP 6154, 13083-970 Campinas, SP, Brazil2 Faculty of Pharmaceutical Sciences, Universidade Estadual de Campinas, 13083-859 Campinas, SP, Brazil3 Instituto Agronômico de Campinas (IAC), 13490-970 Cordeiropolis, SP, Brazil* Correspondence: [email protected]; Tel.: +55-19-3521-3092
Received: 11 July 2019; Accepted: 25 July 2019; Published: 6 August 2019
Abstract: Citrus are vulnerable to the postharvest decay caused by Penicillium digitatum, Penicilliumitalicum, and Geotrichum citri-aurantii, which are responsible for the green mold, blue mold, and sourrot post-harvest disease, respectively. The widespread economic losses in citriculture caused by thesephytopathogens are minimized with the use of synthetic fungicides such as imazalil, thiabendazole,pyrimethanil, and fludioxonil, which are mainly employed as control agents and may have harmfuleffects on human health and environment. To date, numerous non-chemical postharvest treatmentshave been investigated for the control of these pathogens. Several studies demonstrated that biologicalcontrol using microbial antagonists and natural products can be effective in controlling postharvestdiseases in citrus, as well as the most used commercial fungicides. Therefore, microbial agentsrepresent a considerably safer and low toxicity alternative to synthetic fungicides. In the presentreview, these biological control strategies as alternative to the chemical fungicides are summarizedhere and new challenges regarding the development of shelf-stable formulated biocontrol productsare also discussed.
Keywords: biological control; post-harvest phytopathogen; Penicillium digitatum; Penicillium italicum;Geothrichum citri-aurantii
Key Contribution: This review demonstrates the potential of alternative methods for the control ofdiseases that occur in the postharvest of citrus.
1. Introduction
Citrus is one of the most produced fruit genus. Grown in more than 100 countries, this groupis composed by several species, including oranges, tangerines, mandarins, grapefruits, lemons, andlimes [1]. The impact of citrus agroindustry in the international economy is huge. Besides their valueas commodities, they also provide employment in many segments involved in its production cycle:harvesting, handling, transportation, and storage. In 2017, the global orange production reached47.6 million metric tons (tons) and is expected to expand 4.2 million in 2018/2019 due to favorableweather in Brazil and United States, two of the most important orange producers in the world [2].
Over 20 different kinds of postharvest diseases have been reported in citrus and they are the maincause of fruit spoilage, resulting in massive economic losses [3]. Moreover, fungal growth in fruitmay lead to production of mycotoxins, including potential carcinogenic agents such as citrinin andpatulin [4], as well as tremorgenic compounds, for example tryptoquivalines [5], therefore representinga threat to human and animal life.
Toxins 2019, 11, 460; doi:10.3390/toxins11080460 www.mdpi.com/journal/toxins19

Toxins 2019, 11, 460
Green mold, blue mold, and sour rot, caused by Penicillium digitatum, P. italicum, andGeotrichum citri-aurantii, respectively, are the main citrus postharvest diseases [6]. P. digitatum,alone, is responsible for approximately 90% of total postharvest losses [7]. The fruits are contaminatedthrough skin postharvest damage during their picking, packaging, storage, and transportation [3].
The interaction between citrus fruit and these phytopathogens is not fully understood, but somefactors are known to affect this interaction in order to increase the fungus pathogenicity. P. digitatumand P. italicum are known to secrete organic acids during infection, leading to an optimal pH for its cellwall-degrading enzymes, such as polygalacturonases (PG) [8,9]. Moreover, P. digitatum also producecatalase during infection, an antioxidant enzyme that decomposes hydrogen peroxide, the main defensemechanism in citrus [10].
In order to deal with these fungi, chemical fungicides have been the main focus of research overthe past decades. P. digitatum and P. italicum can be efficiently controlled by imazalil, thiabendazole,or pyrimethanil, but these fungicides are not effective against sour rot. For the control of G. citri-aurantii,guazatine, and propiconazole can be applied, although they are not allowed in some producingcountries such as Brazil [11]. However, widespread use of chemical fungicides has caused theproliferation of resistant strains of these phytophatogens, compromising the effectiveness of thesetreatments [12]. Furthermore, concerns about environmental contamination and risks associated tohuman health have been raised around the accumulation of their residues in food.
Finding commercially viable, effective, alternative control methods has been a leading challengefor researchers, especially for controlling G. citri-aurantii, since there are fewer options available ofacceptable chemical fungicides. Many alternatives have been proposed, including the application ofantagonistic microorganisms and natural antimicrobial substances. Natural antimicrobial substances,especially plant extracts, are considered relatively safe, presenting low toxicity and high decomposabilitydue to their natural origin, raising particular interest for use in these natural products [13].
Thus, the application of biocontrol agents has been an alternative for synthetic chemical fungicides.However, more research is necessary to understand their mechanism of action and effectiveness indifferent infection levels; this knowledge is crucial to implement their use as practical control agents.Therefore, the use of alternative postharvest biological control methods, both non-polluting andpossessing low toxicity are reviewed here, highlighting advances presented in the literature in therecent years.
2. Alternative Control Methods
2.1. Microrganisms
Besides fungicides, other agricultural practices such as irradiation application (light emitting diode,gamma radiation, or UV radiation) [14–17], thermotherapy [18–20], biocontrol agents (BCA) [21–23],and salt solution [24,25] may be used to control postharvest diseases. In the past thirty years, there havebeen extensive research activities to explore and develop strategies based on microbial antagonists tobiologically control postharvest pathogens [26–30]. This section focuses on the natural products andBCA described to be effective to control postharvest diseases.
BCA have been used in post-harvested fruits and its mechanism of action is poorly described in theliterature for the majority of microorganisms (either bacteria or yeasts). However, it is supposed thatmore than one control mechanism could be acting simultaneously over the host-pathogen-antagonistand environment interactions [30]; others include: antibiosis [30,31], competition for nutrients orspace [32], induction of resistance in citrus fruits [33,34], secretion of specific enzymes [35], stimulationof ROS in host tissues [36], mycoparasitism, and biofilm formation [37,38].
The use of yeasts as antagonists has been extensively studied, due to their high inhibitory capacityand the ability to colonize surfaces for a long period. The so-called “killer yeasts” yeast strains havethe ‘killer’ phenotype (K+) and can produce the “killer proteins” that are potential antifungal agents;this feature is a biological advantage against others competing microbial [39–41]. Ferraz et al. reported
20
Toxins 2019, 11, 460
that Rhodotorula minuta, Candida azyma, and Aureobasidium pullulans presented killer activity against thecitrus pathogen G. citri-aurantii, deforming fungal hyphae and suppressing pathogen development [11].Saccharomyces cerevisiae is another example of yeast that often presents killer activity [40,42–44].
Besides yeasts, bacteria are also promising BCA: Bacillus [45,46], Lactobacillus [47,48], andStreptomyces sp. [49,50] genus have been studied as BCA against citrus pathogens. Bacteria ofBacillus genus can act as antagonist through antibiotics or volatile organic compound (VOC) productionthat can induce the increase of plants resistance. Leelasuphakul et al. verified that strains ofBacillus subtilis found in soil were able to delay the spore germination of Penicillium digitatum by theaction of water-soluble antibiotic secondary metabolites, proteins, enzymes, and VOC production [45].As for Lactobacillus, metabolites such as 3-phenyllactic acid and allyl phenylacetate isolated fromL. plantarum IMAU10014 had their antifungal activities against Penicillium digitatum observed in vitroby Wang et al. [47]. Finally, Streptomyces sp. had been tested in vitro and in vivo against P. digitatum andother pathogens [49,50]. Metabolites from Streptomyces RO3 cultures with molecular masses higherthan 2000 Da showed fungicidal action and in vivo tests indicated that the green mold disease incidencedecreased when treated with Streptomyces RO3 metabolites [49].
Among the alternatives reported in the literature, the induction of host resistance to pathogen bymicroorganisms with ‘killer’ activity has been pointed as a promising option for plant disease control,since they are active against a broad spectrum of pathogens and are safer than other alternatives [41,51].For example, Parafati et al. related that the yeasts Wickerhamomyces anomalus, Metschnikowia pulcherrima,and A. pullulans increased the activities of peroxidase and superoxide dismutase in mandarins,reducing the incidence and severity of blue mold on these fruits [52]. Unfortunately, the activities andmechanisms of interaction of most ‘killers’ have not yet been well elucidated [11,41,44], being an openresearch field.
Another gap in the search for BCA against citrus pathogens is that the majority of the studiesfocuses only in P. digitatum and the other citrus pathogens such as P. italicum and G. citri-aurantii are lessstudied and also represent a problem for citriculture. As mentioned before, there are few fungicidesactive against sour rot and other approaches such as BCA could be explored to discover alternativemethods to control this phytopathogen. However, few BCA are reported to control this disease. Onepossibility to solve this problem could be the evaluation of BCA already pointed as active againstP. digitatum or other phytopathogens to control G. citri-aurantii.
Table 1 lists some known biocontrol agents and their mode of action against P. digitatum, P. italicum,and G. citri-aurantii.
21
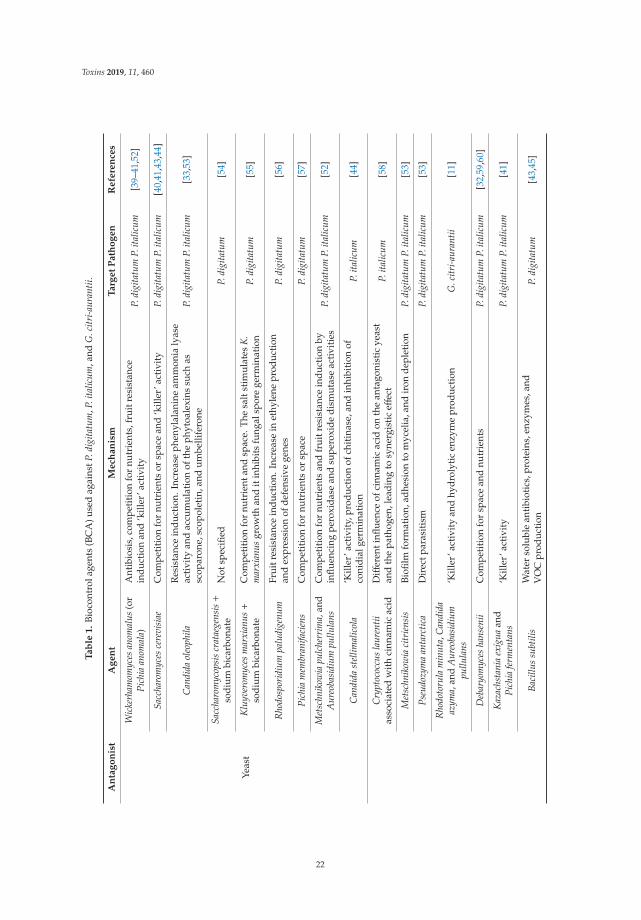
Toxins 2019, 11, 460
Ta
ble
1.
Bioc
ontr
olag
ents
(BC
A)u
sed
agai
nstP
.dig
itatu
m,P
.ita
licum
,and
G.c
itri-a
uran
tii.
An
tag
on
ist
Ag
en
tM
ech
an
ism
Ta
rge
tP
ath
og
en
Re
fere
nce
s
Yeas
t
Wic
kerh
amom
yces
anom
alus
(or
Pich
iaan
omal
a)A
ntib
iosi
s,co
mpe
titi
onfo
rnu
trie
nts,
frui
tres
ista
nce
indu
ctio
nan
d‘k
iller
’act
ivit
yP.
digi
tatu
mP.
italic
um[3
9–41
,52]
Sacc
haro
myc
esce
revi
siae
Com
peti
tion
for
nutr
ient
sor
spac
ean
d‘k
iller
’act
ivit
yP.
digi
tatu
mP.
italic
um[4
0,41
,43,
44]
Can
dida
oleo
phila
Res
ista
nce
indu
ctio
n.In
crea
seph
enyl
alan
ine
amm
onia
lyas
eac
tivi
tyan
dac
cum
ulat
ion
ofth
eph
ytoa
lexi
nssu
chas
scop
aron
e,sc
opol
etin
,and
umbe
llife
rone
P.di
gita
tum
P.ita
licum
[33,
53]
Sacc
haro
myc
opsi
scr
atae
gens
is+
sodi
umbi
carb
onat
eN
otsp
ecifi
edP.
digi
tatu
m[5
4]
Klu
yver
omyc
esm
arxi
anus+
sodi
umbi
carb
onat
eC
ompe
titi
onfo
rnu
trie
ntan
dsp
ace.
The
salt
stim
ulat
esK
.m
arxi
anus
grow
than
dit
inhi
bits
fung
alsp
ore
germ
inat
ion
P.di
gita
tum
[55]
Rho
dosp
orid
ium
palu
dige
num
Frui
tres
ista
nce
indu
ctio
n.In
crea
sein
ethy
lene
prod
ucti
onan
dex
pres
sion
ofde
fens
ive
gene
sP.
digi
tatu
m[5
6]
Pich
iam
embr
anifa
cien
sC
ompe
titi
onfo
rnu
trie
nts
orsp
ace
P.di
gita
tum
[57]
Met
schn
ikow
iapu
lche
rrim
a,an
dA
ureo
basi
dium
pullu
lans
Com
peti
tion
for
nutr
ient
san
dfr
uitr
esis
tanc
ein
duct
ion
byin
fluen
cing
pero
xida
sean
dsu
pero
xide
dism
utas
eac
tivi
ties
P.di
gita
tum
P.ita
licum
[52]
Can
dida
stel
limal
icol
a‘K
iller
’act
ivit
y,pr
oduc
tion
ofch
itin
ase,
and
inhi
biti
onof
coni
dial
germ
inat
ion
P.ita
licum
[44]
Cry
ptoc
occu
sla
uren
tiias
soci
ated
wit
hci
nnam
icac
idD
iffer
enti
nflue
nce
ofci
nnam
icac
idon
the
anta
goni
stic
yeas
tan
dth
epa
thog
en,l
eadi
ngto
syne
rgis
tic
effec
tP.
italic
um[5
8]
Met
schn
ikow
iaci
trie
nsis
Biofi
lmfo
rmat
ion,
adhe
sion
tom
ycel
ia,a
ndir
onde
plet
ion
P.di
gita
tum
P.ita
licum
[53]
Pseu
dozy
ma
anta
rctic
aD
irec
tpar
asit
ism
P.di
gita
tum
P.ita
licum
[53]
Rho
doto
rula
min
uta,
Can
dida
azym
a,an
dA
ureo
basi
dium
pullu
lans
‘Kill
er’a
ctiv
ity
and
hydr
olyt
icen
zym
epr
oduc
tion
G.c
itri-a
uran
tii[1
1]
Deb
aryo
myc
esha
nsen
iiC
ompe
titi
onfo
rsp
ace
and
nutr
ient
sP.
digi
tatu
mP.
italic
um[3
2,59
,60]
Kaz
achs
tani
aex
ígua
and
Pich
iafe
rmen
tans
‘Kill
er’a
ctiv
ity
P.di
gita
tum
P.ita
licum
[41]
Baci
llus
subt
ilis
Wat
erso
lubl
ean
tibi
otic
s,pr
otei
ns,e
nzym
es,a
ndV
OC
prod
ucti
onP.
digi
tatu
m[4
3,45
]
22
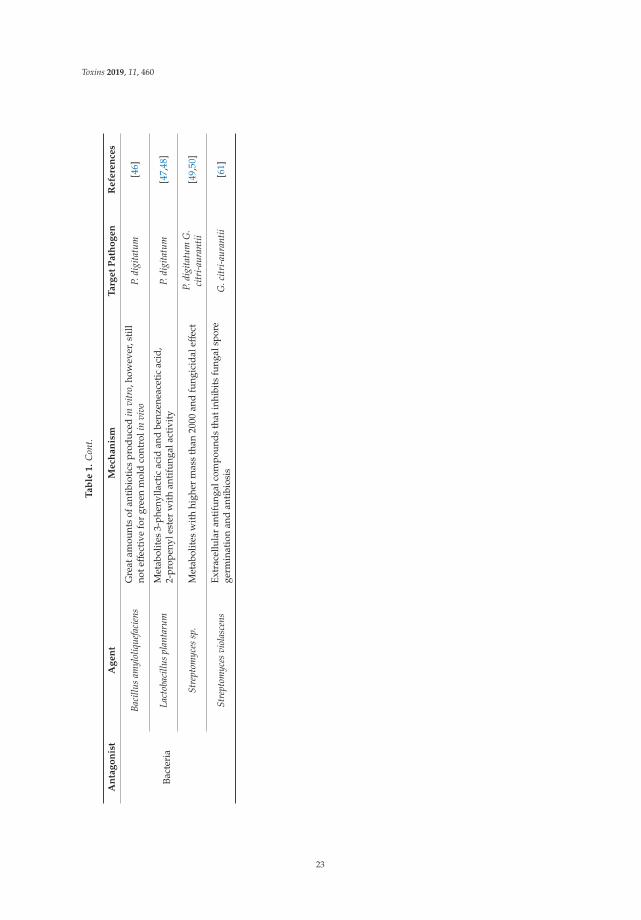
Toxins 2019, 11, 460
Ta
ble
1.
Con
t.
An
tag
on
ist
Ag
en
tM
ech
an
ism
Ta
rge
tP
ath
og
en
Re
fere
nce
s
Bact
eria
Baci
llus
amyl
oliq
uefa
cien
sG
reat
amou
nts
ofan
tibi
otic
spr
oduc
edin
vitr
o,ho
wev
er,s
till
noteff
ecti
vefo
rgr
een
mol
dco
ntro
lin
vivo
P.di
gita
tum
[46]
Lact
obac
illus
plan
taru
mM
etab
olit
es3-
phen
ylla
ctic
acid
and
benz
enea
ceti
cac
id,
2-pr
open
yles
ter
wit
han
tifu
ngal
acti
vity
P.di
gita
tum
[47,
48]
Stre
ptom
yces
sp.
Met
abol
ites
wit
hhi
gher
mas
sth
an20
00an
dfu
ngic
idal
effec
tP.
digi
tatu
mG
.ci
tri-a
uran
tii[4
9,50
]
Stre
ptom
yces
viol
asce
nsEx
trac
ellu
lar
antif
unga
lcom
poun
dsth
atin
hibi
tsfu
ngal
spor
ege
rmin
atio
nan
dan
tibi
osis
G.c
itri-a
uran
tii[6
1]
23

Toxins 2019, 11, 460
2.2. Natural Products
Besides BCA, the use of chemicals isolated from natural sources may be an interesting approachto control P. digitatum; these include alkaloids [62], chitosan [26,63–66], carvacrol and thymol [67],citral [68], citronellal [69], and several other compounds isolated from essential oils (EOs) and plantextracts [22,70,71].
Olmedo et al. assessed the antifungal activity of six β-carboline alkaloids (harmine, harmol,norharmane, harmane, harmaline, and harmalol) against P. digitatum and Botrytis cinerea. They observedthat harmol is more active than harmaline and harmalol, due to the differences in properties such asaromaticity, acidity, planarity, and polarity [62]. Table 2 shows some plant natural products that havebeen currently studied as control strategies against P. digitatum, P. italicum, and G. citri-aurantii; liststhat are more extensive can be found in [22,71].
The natural products highlighted in Table 2 are summarized in Figure 1. The global Venndiagram (Figure 1) displays natural products activity distribution against P. italicum, P. digitatum,and G. citri-aurantii. The Venn diagram clearly indicates a significant number of natural productsactive against P. digitatum and P. italicum; however, few natural products have been studied to controlG. citri-aurantii.
Figure 1. Venn diagram comparing the number of active natural products against the differentpostharvest citrus pathogens.
24

Toxins 2019, 11, 460
Ta
ble
2.
Nat
ural
prod
ucts
extr
acte
din
plan
tsas
cont
rols
trat
egie
sag
ains
tP.d
igita
tum
,P.i
talic
um,a
ndG
.citr
i-aur
antii
.
Pla
nt/
Fru
itP
ath
og
en
(s)
Ex
tra
ct/M
eth
od
Na
tura
lP
rod
uct
sD
eta
ils
Re
fere
nce
s
Chi
nese
prop
olis
P.ita
licum
1)Et
hyla
ceta
te(3
times
);2)
chlo
rofo
rm;
3)et
hano
land
wat
er;
4)m
etha
nol
Pino
cem
brin
Pino
cem
brin
acts
agai
nstP
.ita
licum
thro
ugh
inhi
biti
onon
resp
irat
ion
and
inte
rfer
ence
ofen
ergy
hom
eost
asis
[72]
Citr
usau
rant
ium
P.di
gita
tum
P.ita
licum
Hyd
rodi
still
atio
n(p
eels
,lea
ves,
and
flow
ers)
α-t
erpi
neol
,ter
pine
n-4-
ol,
linal
ool,
and
limon
ene
Esse
ntia
loils
(EO
s)of
flow
ers
and
leav
esre
duce
dth
egr
owth
ofpa
thog
en,w
hile
EOof
peel
sw
asin
acti
ve[7
3]
Citr
uset
icul
ate
Blan
coP.
digi
tatu
m-
Cit
ral
Ant
ifung
alac
tivity
ofci
tral
was
test
edin
vitr
oan
din
vivo
and
com
bine
dw
ith
the
wax
show
edpo
tent
ialf
orco
ntro
lapp
licat
ions
[68]
Cit
rus
frui
tsP.
italic
umP.
digi
tatu
mC
omm
erci
alpr
oduc
tO
ctan
alO
ctan
alin
hibi
tsth
efu
ngal
myc
elia
lgro
wth
[74]
Cit
rus
frui
tsP.
italic
umC
omm
erci
alpr
oduc
tC
itra
lC
itra
linh
ibit
sth
em
ycel
ialg
row
thof
P.ita
licum
caus
ing
disr
upti
onof
cell
mem
bran
ein
tegr
ity
[75]
Citr
uspa
radi
seM
acf.
(Gra
pefr
uit
frui
t)P.
digi
tatu
m-
Chi
tosa
nan
dsa
licyl
icac
id
Chi
tosa
nco
mbi
ned
wit
hsa
licyl
icac
idha
dbe
tter
trea
tmen
tofg
reen
mol
dth
anth
ese
isol
ated
com
poun
ds,w
itho
utco
mpr
omis
ing
the
qual
ity
offr
uit.
[26]
Citr
ussi
nens
isO
sbec
kP.
digi
tatu
mC
omm
erci
alpr
oduc
tC
itro
nella
l
Cit
rone
llalw
asab
leto
inhi
bits
pore
sge
rmin
atio
nan
dm
ycel
ialg
row
th.J
usta
sci
tral
,the
com
poun
dco
mbi
ned
wit
hw
axre
duce
dth
ein
cide
nce
rate
[69]
Lam
inac
eae
spp.
P.di
gita
tum
P.ita
licum
-C
arva
crol
and
thym
ol
The
mec
hani
sms
that
have
been
prop
osed
for
thes
eco
mpo
unds
are:
1)m
orph
olog
ical
defo
rmat
ion
and
dete
rior
atio
nof
the
coni
dia
and
hyph
ae;2
)hyd
roxy
lgro
upan
dsy
stem
sw
ithde
loca
lized
elec
tron
sha
sim
port
antr
ole
for
anti
mic
robi
aleff
ect
[69]
25

Toxins 2019, 11, 460
Ta
ble
2.
Con
t.
Pla
nt/
Fru
itP
ath
og
en
(s)
Ex
tra
ct/M
eth
od
Na
tura
lP
rod
uct
sD
eta
ils
Re
fere
nce
s
Pega
num
harm
ala
L.(h
arm
alse
eds)
P.ita
licum
Etha
nol
Har
min
e,ha
rmal
ine,
and
tetr
ahyd
roha
rmin
e(T
HH
)
Har
mal
extr
acts
show
edst
rong
anti
fung
alac
tivi
tyag
ains
tP.i
talic
uman
dit
sac
tivi
tyis
rela
ted
toal
kalo
ids
harm
ine,
harm
alin
ee
THH
[76]
Pega
num
harm
ala
L.P.
digi
tatu
mC
omm
erci
alpr
oduc
tH
arm
ol,h
arm
alin
e,ha
rmal
ol,h
arm
ane,
and
norh
arm
ane
Itw
aste
sted
the
anti
fung
alac
tivi
tyof
β-ca
rbol
ines
agai
nstP
.dig
itatu
man
dBo
tryt
isci
nere
a.H
arm
olsh
owed
high
esta
ntif
unga
lac
tivi
tyaf
ter
24h.
[63]
Pim
pine
llaan
isum
and
Car
umca
rvi
P.di
gita
tum
Hyd
rodi
still
atio
n(s
eeds
)
tran
s-an
etho
le,e
stra
gole
(ani
seoi
l),c
umin
alde
hyde
,an
dpe
rilla
ldeh
yde
(bla
ckca
raw
ay)
EOw
ere
able
invi
tro
ofre
duce
the
germ
inat
ion,
the
myc
elia
lgro
wth
ofpa
thog
enan
dth
ein
cide
nce
ofdi
seas
esy
mpt
oms
[77]
Popu
lus×
eura
mer
ican
acv
.‘N
eva’
(pop
lar
buds
)
P.ita
licum
Dic
hlor
omet
hane
Flav
onoi
dsof
pino
cem
brin
,chr
ysin
,and
gala
ngin
Ant
ifun
galc
ompo
unds
from
popl
arbu
dsac
tive
frac
tion
,ide
ntifi
edby
HPL
C–M
S,ha
dan
tifu
ngal
effec
tin
the
fung
alhy
phae
anal
yzed
bysc
anni
ngel
ectr
onm
icro
scop
yan
dtr
ansm
issi
onel
ectr
onm
icro
scop
yim
ages
[78]
Puni
caG
rana
tum
P.di
gita
tum
Etha
nol/w
ater
(4:1
)Ph
enol
icco
mpo
unds
wit
ha
prev
alen
ceof
puni
cala
gins
Pom
egra
nate
peel
extr
acth
asa
broa
dra
nge
ofan
tifu
ngal
acti
vity
[13]
Ram
ulus
cinn
amom
iP.
digi
tatu
mP.
italic
umG
.ci
tri-a
uran
tii
Ethy
lace
tate
and
n-bu
than
olC
inna
mic
acid
and
cinn
amal
dehy
de
Thro
ugh
1 H-N
MR
-bas
edm
etab
olom
ics
itw
asid
enti
fied
the
extr
acts
rela
ted
toan
tifun
gala
ctiv
ityof
Ram
ulus
cinn
amom
iaft
er4,
8,an
d12
h.T
hean
tifu
ngal
mec
hani
smof
cinn
amal
dehy
deit
was
also
anal
yzed
by1 H
-NM
R
[79]
Ros
mar
inus
offici
nalis
L.P.
digi
tatu
mH
ydro
dist
illat
ion
(for
EO)a
ndm
etha
nol
Flav
onoi
ds,p
olyp
heno
ls,
and
esse
ntia
loils
EOac
tin
the
fung
alce
llsby
disr
upti
ngth
em
embr
ane
perm
eabi
lity
and
the
osm
otic
bala
nce
[80]
Salv
iafr
utic
osa
Mill
.P.
digi
tatu
mEt
hyla
ceta
teC
arno
sic
acid
,car
noso
l,an
dhi
spid
ulin
Com
poun
dsth
atha
vean
tifu
ngal
prop
erti
es,
acco
rdin
gto
its
com
posi
tion
s,st
ruct
ures/a
ctiv
ity,
and
liter
atur
e[8
1]
26
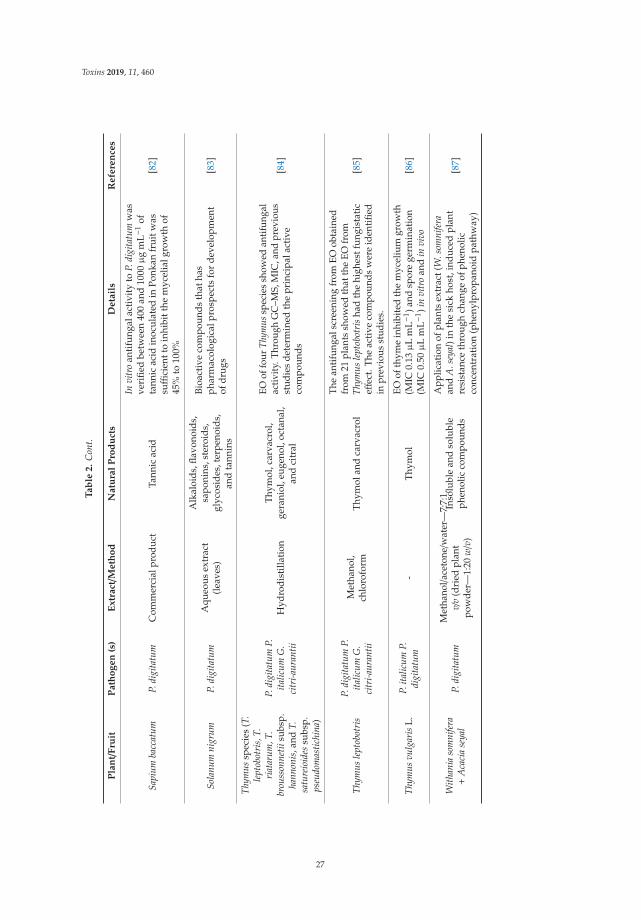
Toxins 2019, 11, 460
Ta
ble
2.
Con
t.
Pla
nt/
Fru
itP
ath
og
en
(s)
Ex
tra
ct/M
eth
od
Na
tura
lP
rod
uct
sD
eta
ils
Re
fere
nce
s
Sapi
umba
ccat
umP.
digi
tatu
mC
omm
erci
alpr
oduc
tTa
nnic
acid
Invi
tro
anti
fung
alac
tivi
tyto
P.di
gita
tum
was
veri
fied
betw
een
400
and
1000
μg
mL−
1of
tann
icac
idin
ocul
ated
inPo
nkan
frui
twas
suffi
cien
tto
inhi
bitt
hem
ycel
ialg
row
thof
45%
to10
0%
[82]
Sola
num
nigr
umP.
digi
tatu
mA
queo
usex
trac
t(l
eave
s)
Alk
aloi
ds,fl
avon
oids
,sa
poni
ns,s
tero
ids,
glyc
osid
es,t
erpe
noid
s,an
dta
nnin
s
Bioa
ctiv
eco
mpo
unds
that
has
phar
mac
olog
ical
pros
pect
sfo
rde
velo
pmen
tof
drug
s[8
3]
Thym
ussp
ecie
s(T
.le
ptob
otri
s,T.
riat
arum
,T.
brou
sson
netii
subs
p.ha
nnon
is,a
ndT.
satu
reio
ides
subs
p.ps
eudo
mas
tichi
na)
P.di
gita
tum
P.ita
licum
G.
citr
i-aur
antii
Hyd
rodi
still
atio
nTh
ymol
,car
vacr
ol,
gera
niol
,eug
enol
,oct
anal
,an
dci
tral
EOof
four
Thym
ussp
ecie
ssh
owed
antif
unga
lac
tivity
.Thr
ough
GC
–MS,
MIC
,and
prev
ious
stud
ies
dete
rmin
edth
epr
inci
pala
ctiv
eco
mpo
unds
[84]
Thym
usle
ptob
otri
sP.
digi
tatu
mP.
italic
umG
.ci
tri-a
uran
tii
Met
hano
l,ch
loro
form
Thym
olan
dca
rvac
rol
The
anti
fung
alsc
reen
ing
from
EOob
tain
edfr
om21
plan
tssh
owed
that
the
EOfr
omTh
ymus
lept
obot
ris
had
the
high
estf
ungi
stat
iceff
ect.
The
activ
eco
mpo
unds
wer
eid
entifi
edin
prev
ious
stud
ies.
[85]
Thym
usvu
lgar
isL.
P.ita
licum
P.di
gita
tum
-Th
ymol
EOof
thym
ein
hibi
ted
the
myc
eliu
mgr
owth
(MIC
0.13
μL
mL−
1 )and
spor
ege
rmin
atio
n(M
IC0.
50μ
Lm
L−1 )i
nvi
tro
and
invi
vo[8
6]
With
ania
som
nife
ra+
Aca
cia
seya
lP.
digi
tatu
mM
etha
nol/a
ceto
ne/w
ater
—7:
7:1,
v/v
(dri
edpl
ant
pow
der—
1:20
w/v
)
Inso
lubl
ean
dso
lubl
eph
enol
icco
mpo
unds
App
licat
ion
ofpl
ants
extr
act(
W.s
omni
fera
and
A.s
eyal
)in
the
sick
host
,ind
uced
plan
tre
sist
ance
thro
ugh
chan
geof
phen
olic
conc
entr
atio
n(p
heny
lpro
pano
idpa
thw
ay)
[87]
27

Toxins 2019, 11, 460
Garlic [88], neem [89], Withania somnifera L. and Acacia seyal L. [87], mustard, and radish [90] alsohave been reported as effective in controlling P. digitatum. Recently, Zhu et al. reported the antifungalactivity of tannic acid on P. digitatum. In vivo tests showed significant decrease of disease signals ofP. digitatum by inhibiting its mycelial growth and spore germination. Storage tests shown that tanninsreduce the severity of green mold on citrus by 70%. The authors suggest that antifungal activitymechanism of tannic acid is related to the disruption of the cell walls and the plasmatic membrane,causing leakage of intracellular contents such as sugars [82].
Extracts from chili peppers and ginger were also proposed to control or inhibit postharvest diseasesin citrus [91]. Singh et al. tested different concentrations of the plant extracts of the Zingier officinale L.(Ginger) and Capsicum frutescence L. (Chilly) against P. digitatum, Aspergillus niger, and Fusarium sp.isolated from naturally infected citrus. P. digitatum, specifically, had a reduction on colony developmentwith inhibition zones of 51.5%, 69.2%, 74%, and 83.1% for Zingier officinale L. extract, and 56.4%,64,1%, 76.6%, and 100% for Capsicum frutescence L. at concentration of 500, 1000, 2000, and 3000 ppm,respectively [91].
Besides the above-mentioned natural products used against P. digitatum, synergism betweencompounds have also been tested. Shi et al. studied the effects of chitosan and salicylic acid (SA),both isolated and mixed, on the control of green mold decay in grapefruit. The results showed thatcombination of chitosan with SA was effective to control green mold than either compound alone(significant efficacy of biocontrol agents against green mold decay induced by SA application in citrusfruits have previously been studied) [26]. Furthermore, significant reduction on lesion diameter anddisease incidence was observed. Additionally, it was observed that treatment with chitosan/SA blendsincreased the content on ascorbic acid and total soluble solids in the fruits, providing a longer shelflife [26].
P. italicum causes the blue mold decay and represents one of the most problematic postharvestcitrus infection, compromising fruit integrity during storage and transportation [92]. Currently,the blue mold is primarily controlled by the synthetic fungicide applications, such as thiabendazoleand imazalil [44]. Regarding Imazalil-resistant biotypes P. digitatum is more common, whereas resistantP. italicum is rare [93].
Plant extracts studied as an alternative or complementary control agents to currently usedfungicides may be attractive because of their potential antifungal activity, non-phytotoxicity andbiodegradability [94–97]. Askarne et al. evaluated the antifungal activity of 50 species of plantscollected in different regions of southern Morocco. In vitro antifungal activity showed that amongthem, Anvillea radiata and Thymus leptobotrys completely inhibited mycelial growth of P. italicum atconcentrations of 10% m/v [98]. In addition, Asteriscus graveolens, Bubonium odorum, Ighermia pinifolia,Inula viscosa, Halimium umbellatum, Hammada scoparia, Rubus ulmifolius, Sanguisorba minor, andCeratonia siliqua were also effective against P. italicum with inhibition of mycelial growth greaterthan 75%. The species on in vitro studies were also tested in vivo against the blue mold in citrus.The incidence of blue mold was significantly reduced to 5 and 25% when oranges were treated withaqueous extracts of H. umbellatum and I. viscosa (compared to 98% in the control), indicating theantifungal potential of these materials against P. italicum.
Kanan and Al-Najar reported the effective in vitro and in vivo antifungal activity of fenugreek(Trigonella foenum-graecum L.), harmal seeds (Peganum harmala L.), garlic cloves (Allium sativum L.),cinnamon bark (Cinnamomum cassia L.), sticky fleabane leaves (Inula viscose L.), nightshade leaves, andfruits (Solanum nigrum L.) against P. italicum isolates. Cinnamon, garlic, and sticky fleabane methanolicfractions resulted in complete inhibition of this pathogen [76].
The high antifungal activity against P. italicum of crude extracts cinnamon, as well as thecorresponding methanolic, hexanic, and aqueous fractions was related to the high content ofcinnamaldehyde, eugenol, cinnamic acid, flavonoids, alkaloids, tannins, anthraquinones, and phenoliccompounds, some of them reported before as active antifungal agents. Among them, eugenoland cinnamaldehyde have been consistently reported to be the main antifungal components of
28
Toxins 2019, 11, 460
cinnamon [79,99], representing potential, environmentally benign candidates for postharvest diseasecontrol. In addition, harmal extract was pointed also as highly effective extract against P. italicum in vitro.The activity of the harmal crude extracts may be related to the content of alkaloids such as harmine,harmaline, and tetrahydroharmine besides phenolic compounds that can alter the permeability offungal cells [76]. The exact mechanism of action of phenols has not yet been determined; however,it is already known that they can inactivate essential enzymes and disrupt function of the geneticmaterial [100].
Several studies have reported natural antifungal compounds against P. italicum produced bydifferent sources. Essential oils, for instance, represent a low-toxic effects alternative and are reportedto possess strong inhibitory effects on crop contaminated by P. italicum [74]. Among the majorvolatile constituents are limonene, β-linalool, α-terpineol, citral, and octanal, the latter reportedlyexhibits antifungal activity against some postharvest pathogens such as P. digitatum, P. italicum, andP. ulaiense [101,102]. Regarding the mode of action, Tao et al. attributed its activity against mycelialgrowth of P. italicum and P. digitatum to the disruption of the cell membrane integrity and leakage of ionsand other cell contents [74]. A similar mechanism of activity against postharvest citrus pathogens wasattributed to citral, present in citrus EO that is able to alter the morphology of P. italicum hyphae [75].
Chinese propolis has been pointed as active against blue mold and the flavonoid pinocembrin(5,7-dihydroxyflavanone) was identified as one of its main active antifungal constituents. Peng et al.studied the inhibitory effect of this compound on P. italicum with particular attention to its response tothe mycelial growth and energy metabolism by interfering in energy homeostasis and cell membranedamage of the pathogen. They observed that mycelial growth and spore germination were nearlycompletely inhibited with inhibitive percentage up to 93 and 97%, respectively, for pinocembrinconcentrations of 400 mg/L [72].
Figure 2 shows the structures of the above mentioned antifungal compounds found in naturalextracts and essential oils.
Sour rot of citrus, caused by Geotrichum citri-aurantii, represents another potentially devastatingstorage disease [103]. Pathogenicity of Geotrichum citri-aurantii on citrus fruit involves secretionof extracellular endo-polygalacturonases (PG) that aid in the rapid breakdown of infected tissuesfacilitating the disease [104]. The usual fungicides, with the partial exception of sodium o-phenylphenate(SOPP) and propiconazole [105], cannot actively controlled this disease. Yin et al. revealed the first timethat cytosporone B—a compound isolated from the endophytic fungus Cytospora sp. and presenting awide range of antitumor and antimicrobiotic activities—has a promising effect on the control of citrusdecay caused by this pathogen, being comparable to that of fungicide prochloraz. Its mechanismof action is suggested to be related to the alteration of the morphology of pathogen cells, causingdistortion of the mycelia and loss of membrane integrity [106].
Talibi et al. demonstrated that methanolic extracts Cistus villosus, C. siliqua, and H. umbellatumsuccessfully reduced the disease incidence in vitro caused by G. citri-aurantii with no phytotoxic effectsrecorded on citrus; on the other hand, ethyl acetate extracts of A. radiata, C. villosus, and C. siliqua provedto be the best inhibitors of mycelial growth [107]. Other studies concerning the antifungal properties oforganic extracts of plants include materials from Cistus L. species [108] and from extremophile plantsfrom the Argentine Puna [109]. Incidence of sour rot was described to reduce significantly when fruitswere treated with Cistus populifolius and Cistus ladanifer methanol extracts [108].
Zhou et al. also reported citral, octanal, andα-terpineol to have strong inhibition on G. citri-aurantii,being the former the most potent among them. They induced a decrease on the total lipid content ofthe cells, indicating the destruction of cellular membranes, disruption of cell membrane integrity, andleakage of cell components [110].
Liu et al. studied the antifungal activity of thyme (Thymus sp.) EO against postharvest sour roton citrus fruit. It was shown that G. citri-aurantii cells treated with thyme EO showed morphologyalteration (collapsed mycelia and arthroconidia structures); additionally, a marked enlargement of
29

Toxins 2019, 11, 460
hypha wall thickness was observed [111]. Those effects can be assigned specially to the presence ofthymol (a volatile terpenoid ubiquous in plants with strong, widespread antifungal activities).
Figure 2. Chemical structures of some antifungal compounds active against P. digitatum and P. italicumfound in essential oils and natural extracts.
Regnier et al. screened 59 commercially available EO, as well as their major components,to determine their effects on mycelial growth of G. citri-aurantii [6]. Lemong (Cymbopogon citratus)was found to be the most cost-effective option; it was also found that a blend of the lemongrass andspearmint (Mentha spicata) EO could be an alternative for effective multi-target protection againstG. citri-aurantii, P. digitatum, and P. italicum [6].
Xu et al. found that cassia (Cassia sp.) EOs have the ability to control postharvest pathogens anddiseases, but their poor solubility in water might prevent its effective use. In order to circumventthis problem, they presented an aqueous microemulsion formulation of cassia EO with ethanolas co-surfactant and Tween 20 as surfactant as antifungal agent against G. citri-aurantii. Bothin vitro and in vivo assays showed that cassia EO had stronger activity when encapsulated in themicroemulsion [112].
30

Toxins 2019, 11, 460
The structure of some compounds above listed with activity against G. citri-aurantii are shown inFigure 3.
Figure 3. Chemical structures of compound found on plant extracts and essential oils with activityagainst G. citri-aurantii.
Considering that most plant-derived compounds are usually much less toxic to humans and faunain general, as well as generally environmentally-friend when compared to fungicides, they shouldbe considered safer and may represent a promising alternative to the existing chemical pesticides inthe control of fungal diseases. However, it should be noted that there is a lack of studies concerningnon-chemical postharvest treatment against G. citri-aurantii and very little research has been carriedout to investigate the use of natural products to control citrus sour rot; therefore, special attentiontowards this pathogen is needed. Despite the promising antifungal activity of organic extracts ofplants, the active antifungal compounds are frequently not identified; the knowledge of the substancesaccountable for the antifungal activity is fundamental to formulate viable commercial products anddevelop advanced biofungicides formulations as alternatives to synthetic fungicides to control thecitrus postharvest diseases.
2.3. Commercial Biofungicides
Biofungicide is the general name given to microorganisms and naturally occurring compoundsthat possess the ability to control plant diseases [113]. Although the mechanisms of biocontrol inpostharvest diseases have not been fully explained in many cases, effective colonization of wounds andcompetition for nutrients appear to be significant factors for many antagonists. Many microorganismshave shown good potential as basis for commercial biocontrol products due to their efficacy againstfungal pathogens in field conditions. Although much research is being conducted in this area, a limitednumber of biofungicides are available commercially [114–116].
Several commercial biological control formulations based on Trichoderma harzianum, A. pullulans,Bacillus subtilis, Streptomyces griseoviridis, and Gliocladium virens [113,117] have been reported forapplication against different plant fungal pathogens. Most studies have focused on application ofindividual biocontrol agents without evaluating their combination with other microorganisms or evenwith chemical components. Nevertheless, combination BCA that are compatible with each other couldoffer a new and effective approach improving plant diseases control [114,118].
The major drawback in the commercialization of bioproducts based on BCA is the advancementin the production of shelf-stable formulated products that maintain biocontrol activity similar to thatof the fresh cells. Although biofungicides have good action background against host pathogens, thereare limitations to their use and effectiveness in the field. Growing demand and interest in bioproductshave led to many marketable brands but the absence of field application reliability of biofungicideshas been a significant obstacle in the adoption of these approaches. Despite the remarkable resultsobtained with biofungicides in the laboratory experiments, some failed to provide consistent disease
31

Toxins 2019, 11, 460
control in field conditions. Thus, these factors are potential contributors to the low dissemination ofthese products on the market [113,115,116].
Although a reasonable number of studies take into account the exploration of new bioactivecompounds that may specifically act against citrus phytopathogens, few products come tocommercialization and are widely marketed. In addition to the above problems, the workflowthat starts with the discovery of the bioactive compound to the effective elaboration of the final productis still quite complex and is usually a long, iterative process that involves several steps. Figure 4 showsa usual workflow that could be involved in the development of a postharvest biofungicide.
Figure 4. Outline flow of development of a postharvest biocontrol agent. Reprinted from [119].Copyright 2012, Springer Nature.
According to Nunes, biocontrol agent development is comprised of two main steps: discovery andcommercial development. Summarizing the required phases, the first one concerns the isolation andefficacy of the laboratory-based compounds to pilot tests. In this phase must be included evaluation ofthe action mechanism of the microorganisms, growth media required, improvements in biocontrolactivity, and legal procedures involving the patent for the employment of the microorganism as abiopesticide. The commercial development of BCA involves steps including scale-up production,product formulation, biosafety of the microorganism, and registration [119]. The detailed workflowwill not be discussed in detail but can be found in previous papers [116,119–121].
Indeed, the complex workflow is a weak point for the development of new products based onbiomolecules. Moreover, the high cost of the production and the regulatory barriers to BCA registrationin different countries do not encourage their dissemination and recurring issues that need to beovercome [119–122]. To date, four commercially biofungicides, based on microorganisms, were foundfor the control of postharvest citrus fruit. The yeast Metschnikowia fructicola, for instance, was reportedas an efficient biological control agent of postharvest diseases of fruits and vegetables, and it is the basesof the commercial formulated product “Shemer” [122]. Its effect has been reported as a good controlof decay in oranges being equivalent to oranges treated with the chemical fungicide, imazalil [123].Nevertheless, just a few antagonists have achieved the commercial development stage as commercialproducts. Some of these biofungicides are represented in Table 3.
32
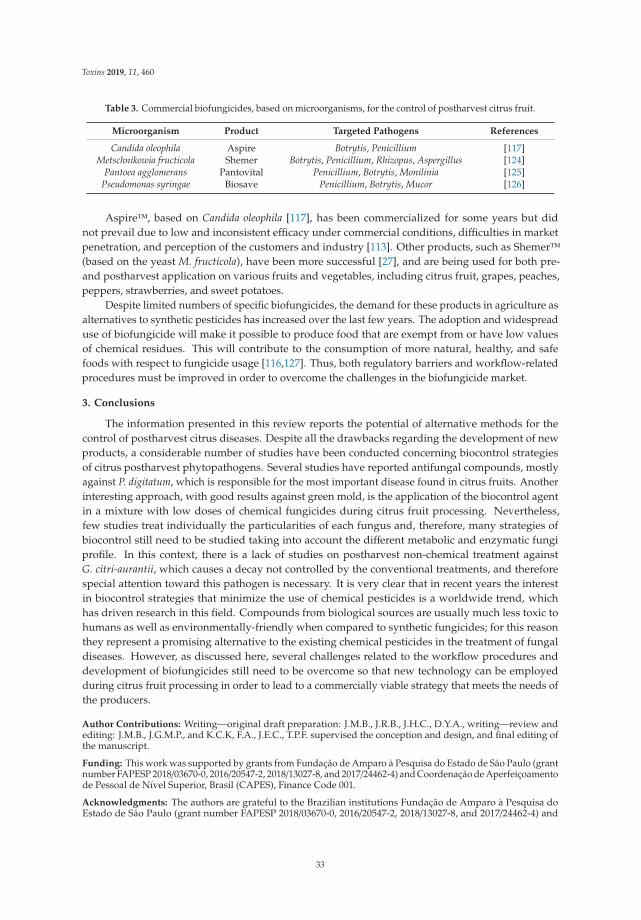
Toxins 2019, 11, 460
Table 3. Commercial biofungicides, based on microorganisms, for the control of postharvest citrus fruit.
Microorganism Product Targeted Pathogens References
Candida oleophila Aspire Botrytis, Penicillium [117]Metschnikowia fructicola Shemer Botrytis, Penicillium, Rhizopus, Aspergillus [124]
Pantoea agglomerans Pantovital Penicillium, Botrytis, Monilinia [125]Pseudomonas syringae Biosave Penicillium, Botrytis, Mucor [126]
Aspire™, based on Candida oleophila [117], has been commercialized for some years but didnot prevail due to low and inconsistent efficacy under commercial conditions, difficulties in marketpenetration, and perception of the customers and industry [113]. Other products, such as Shemer™(based on the yeast M. fructicola), have been more successful [27], and are being used for both pre-and postharvest application on various fruits and vegetables, including citrus fruit, grapes, peaches,peppers, strawberries, and sweet potatoes.
Despite limited numbers of specific biofungicides, the demand for these products in agriculture asalternatives to synthetic pesticides has increased over the last few years. The adoption and widespreaduse of biofungicide will make it possible to produce food that are exempt from or have low valuesof chemical residues. This will contribute to the consumption of more natural, healthy, and safefoods with respect to fungicide usage [116,127]. Thus, both regulatory barriers and workflow-relatedprocedures must be improved in order to overcome the challenges in the biofungicide market.
3. Conclusions
The information presented in this review reports the potential of alternative methods for thecontrol of postharvest citrus diseases. Despite all the drawbacks regarding the development of newproducts, a considerable number of studies have been conducted concerning biocontrol strategiesof citrus postharvest phytopathogens. Several studies have reported antifungal compounds, mostlyagainst P. digitatum, which is responsible for the most important disease found in citrus fruits. Anotherinteresting approach, with good results against green mold, is the application of the biocontrol agentin a mixture with low doses of chemical fungicides during citrus fruit processing. Nevertheless,few studies treat individually the particularities of each fungus and, therefore, many strategies ofbiocontrol still need to be studied taking into account the different metabolic and enzymatic fungiprofile. In this context, there is a lack of studies on postharvest non-chemical treatment againstG. citri-aurantii, which causes a decay not controlled by the conventional treatments, and thereforespecial attention toward this pathogen is necessary. It is very clear that in recent years the interestin biocontrol strategies that minimize the use of chemical pesticides is a worldwide trend, whichhas driven research in this field. Compounds from biological sources are usually much less toxic tohumans as well as environmentally-friendly when compared to synthetic fungicides; for this reasonthey represent a promising alternative to the existing chemical pesticides in the treatment of fungaldiseases. However, as discussed here, several challenges related to the workflow procedures anddevelopment of biofungicides still need to be overcome so that new technology can be employedduring citrus fruit processing in order to lead to a commercially viable strategy that meets the needs ofthe producers.
Author Contributions: Writing—original draft preparation: J.M.B., J.R.B., J.H.C., D.Y.A., writing—review andediting: J.M.B., J.G.M.P., and K.C.K, F.A., J.E.C., T.P.F. supervised the conception and design, and final editing ofthe manuscript.
Funding: This work was supported by grants from Fundação de Amparo à Pesquisa do Estado de São Paulo (grantnumber FAPESP 2018/03670-0, 2016/20547-2, 2018/13027-8, and 2017/24462-4) and Coordenação de Aperfeiçoamentode Pessoal de Nível Superior, Brasil (CAPES), Finance Code 001.
Acknowledgments: The authors are grateful to the Brazilian institutions Fundação de Amparo à Pesquisa doEstado de São Paulo (grant number FAPESP 2018/03670-0, 2016/20547-2, 2018/13027-8, and 2017/24462-4) and
33

Toxins 2019, 11, 460
Coordenação de Aperfeiçoamento de Pessoal de Nível Superior, Brasil (CAPES), Finance Code 001 for thefinancial support.
Conflicts of Interest: The authors declare no conflict of interest.
References
1. Ismail, M.; Zhang, J. Post–harvest citrus diseases and their control. Outlooks Pest Manag. 2004, 15, 29–35.[CrossRef]
2. USDA/FAS. Citrus: World Markets and Trade. United States Department of Agriculture. Foreing AgriculturalService, February, p. 1–13, 2019. Available online: https://www.fas.usda.gov/data/citrus-world-markets-and-trade (accessed on 30 May 2019).
3. Chen, J.; Shen, Y.; Chen, C.; Wan, C. Inhibition of key citrus postharvest fungal strains by plant extractsin vitro and in vivo: A review. Plants 2019, 8, 26. [CrossRef]
4. Dukare, A.S.; Paul, S.; Nambi, V.E.; Gupta, R.K.; Singh, R.; Sharma, K.; Vishwakarma, R.K. Exploitation ofmicrobial antagonists for the control of postharvest diseases of fruits: A review. Crit. Rev. Food Sci. Nutr.2019, 59, 1498–1513. [CrossRef] [PubMed]
5. Ariza, M.R.; Larsen, T.O.; Duus, J.Ø.; Barrero, A.F. Penicillium digitatum metabolites on synthetic media andcitrus fruits. J. Agric. Food Chem. 2002, 50, 6361–6365. [CrossRef] [PubMed]
6. Regnier, T.; Combrinck, S.; Veldman, W.; Du Plooy, W. Application of essential oils as multi-target fungicidesfor the control of Geotrichum citri-aurantii and other postharvest pathogens of citrus. Ind. Crops Prod. 2014,61, 151–159. [CrossRef]
7. Zhu, C.; Sheng, D.; Wu, X.; Wang, M.; Hu, X.; Li, H.; Yu, D. Identification of secondary metabolite biosyntheticgene clusters associated with the infection of citrus fruit by Penicillium digitatum. Postharvest Biol. Technol.2017, 134, 17–21. [CrossRef]
8. Barmore, C.R.; Brown, G.E. Polygalacturonase from citrus fruit infected with Penicillium italicum. Phytopathol.1981, 71, 328–331. [CrossRef]
9. Prusky, D.; McEvoy, J.L.; Saftner, R.; Conway, W.S.; Jones, R. Relationship between host acidification andvirulence of Penicillium spp. on apple and citrus fruit. Phytopathology 2004, 94, 44–51. [CrossRef] [PubMed]
10. Macarisin, D.; Cohen, L.; Eick, A.; Rafael, G.; Belausov, E.; Wisniewski, M.; Droby, S. Penicillium digitatumsuppresses production of hydrogen peroxide in host tissue during infection of citrus fruit. Phytopathology2007, 97, 1491–1500. [CrossRef] [PubMed]
11. Ferraz, L.P.; Cunha, T.; Silva, A.C.; Kupper, K.C. Biocontrol ability and putative mode of action of yeastsagainst Geotrichum citri-aurantii in citrus fruit. Microbiol. Res. 2016, 188, 72–79. [CrossRef]
12. Palou, L.; Smilanick, J.L.; Droby, S. Alternatives to conventional fungicides for the control of citrus postharvestgreen and blue moulds. Stewart Postharvest Rev. 2008, 4, 1–16. [CrossRef]
13. Li Destri Nicosia, M.G.; Pangallo, S.; Raphael, G.; Romeo, F.V.; Strano, M.C.; Rapisarda, P.; Droby, S.; Schena, L.Control of postharvest fungal rots on citrus fruit and sweet cherries using a pomegranate peel extract.Postharvest Biol. Technol. 2016, 114, 54–61. [CrossRef]
14. Ballester, A.R.; Lafuente, M.T. LED Blue light-induced changes in phenolics and ethylene in citrus fruit:Implication in elicited resistance against Penicillium digitatum infection. Food Chem. 2017, 218, 575–583.[CrossRef] [PubMed]
15. Kim, J.J.; Ben-Yehoshua, S.; Shapiro, B.; Henis, Y.; Carmeli, S. Accumulation of scoparone in heat-treatedlemon fruit inoculated with Penicillium digitatum Sacc. Plant Physiol. 1991, 97, 880–885. [CrossRef] [PubMed]
16. Jeong, R.D.; Chu, E.H.; Lee, G.W.; Cho, C.; Park, H.J. Inhibitory effect of gamma irradiation and its applicationfor control of postharvest green mold decay of Satsuma mandarins. Int. J. Food Microbiol. 2016, 234, 1–8.[CrossRef] [PubMed]
17. Olmedo, G.M.; Cerioni, L.; González, M.M.; Cabrerizo, F.M.; Volentini, S.I.; Rapisarda, V.A. UVAphotoactivation of harmol enhances its antifungal activity against the phytopathogens Penicillium digitatumand Botrytis cinerea. Front. Microbiol. 2017, 8, 347. [CrossRef] [PubMed]
18. Nunes, C.; Usall, J.; Manso, T.; Torres, R.; Olmo, M.; García, J.M. Effect of high temperature treatments ongrowth of Penicillium spp. and their development on ‘Valencia’ oranges. Food Sci. Technol. Int. 2007, 13,63–68. [CrossRef]
34
Toxins 2019, 11, 460
19. Fatemi, S.; Borji, H. The effect of physical treatments on control of Penicillium digitatum decay orange cv.Valencia during storage period. Afr. J. Agric. Res. 2011, 6, 5757–5760. [CrossRef]
20. Mulas, M. Combined effects of fungicides and thermotherapy on post-harvest quality of horticulturalcommodities. In Fungicides—Beneficial and Harmful Aspects; Thajuddin, N., Ed.; IntechOpen: London, UK,2011; pp. 133–166.
21. Abraham, A.O.; Laing, M.D.; Bower, J.P. Isolation and in vivo screening of yeast and Bacillus antagonists forthe control of Penicillium digitatum of citrus fruit. Biol. Control 2010, 53, 32–38. [CrossRef]
22. Talibi, I.; Boubaker, H.; Boudyach, E.H.; Aoumar, A.A.B. Alternative methods for the control of postharvestcitrus diseases. J. Appl. Microbiol. 2014, 117, 1–17. [CrossRef]
23. Mohammadi, P.; Tozlu, E.; Kotan, R.; Senol Kotan, M. Potential of some bacteria for biological controlof postharvest citrus green mould caused by Penicillium digitatum. Plant Protect. Sci. 2017, 53, 134–143.[CrossRef]
24. Youssef, K.; Sanzani, S.M.; Ligorio, A.; Ippolito, A.; Terry, L.A. Sodium carbonate and bicarbonate treatmentsinduce resistance to postharvest green mould on citrus fruit. Postharvest Biol. Technol. 2014, 87, 61–69.[CrossRef]
25. Fallanaj, F.; Ippolito, A.; Ligorio, A.; Garganese, F.; Zavanella, C.; Sanzani, S.M. Electrolyzed sodiumbicarbonate inhibits Penicillium digitatum and induces defence responses against green mould in citrus fruit.Postharvest Biol. Technol. 2016, 115, 18–29. [CrossRef]
26. Shi, S.; Wang, F.; Lu, Y.; Deng, J. Combination of chitosan and salicylic acid to control postharvest greenmold caused by Penicillium digitatum in grapefruit fruit. Sci. Hortic. 2018, 233, 54–60. [CrossRef]
27. Droby, S.; Wisniewski, M.; Macarisin, D.; Wilson, C. Twenty years of postharvest biocontrol research: Is ittime for a new paradigm? Postharvest Biol. Technol. 2009, 52, 137–145. [CrossRef]
28. Sharma, R.R.; Singh, D.; Singh, R. Biological control of postharvest diseases of fruits and vegetables bymicrobial antagonists: A review. Biol. Control. 2009, 50, 205–221. [CrossRef]
29. Spadaro, D.; Gullino, M.L. State of the art and future prospects of the biological control of postharvest fruitdiseases. Int. J. Food Microbiol. 2004, 91, 185–194. [CrossRef]
30. Nunes, C.A.; Manso, T.; Lima-Costa, M.E. Postharvest biological control of citrus fruits. Tree For. Sci. Biotechnol.2009, 2, 116–126.
31. Waewthongrak, W.; Pisuchpen, S.; Leelasuphakul, W. Effect of Bacillus subtilis and chitosan applicationson green mold (Penicilium digitatum Sacc.) decay in citrus fruit. Postharvest Biol. Technol. 2015, 99, 44–49.[CrossRef]
32. Droby, S.; Chalutz, E.; Wilson, C.L.; Wisniewski, M. Characterization of the biocontrol activity of Debaryomyceshansenii in the control of Penicillium digitatum on grapefruit. Can. J. Microbiol. 1989, 35, 794–800. [CrossRef]
33. Droby, S.; Vinokur, V.; Weiss, B.; Cohen, L.; Daus, A.; Goldschmidt, E.E.; Porat, R. Induction of resistance toPenicillium digitatum in grapefruit by the yeast biocontrol agent Candida oleophila. Phytopathology 2002, 92,393–399. [CrossRef] [PubMed]
34. Lu, L.; Lu, H.; Wu, C.; Fang, W.; Yu, C.; Ye, C.; Shi, Y.; Yu, T.; Zheng, X. Rhodosporidium paludigenum inducesresistance and defense-related responses against Penicillium digitatum in citrus fruit. Postharvest Biol. Technol.2013, 85, 196–202. [CrossRef]
35. Bar-Shimon, M.; Yehuda, H.; Cohen, L.; Weiss, B.; Kobeshnikov, A.; Daus, A. Characterization of extracellularlytic enzymes produced by the yeast biocontrol agent Candida oleophila. Curr. Genet. 2004, 45, 140–148.[CrossRef] [PubMed]
36. Macarisin, D.; Droby, S.; Bauchan, G.; Wisniewski, M. Superoxide anion and hydrogen peroxide in the yeastantagonist–fruit interaction: A new role for reactive oxygen species in postharvest biocontrol? PostharvestBiol. Technol. 2010, 58, 194–202. [CrossRef]
37. Castoria, R.; Caputo, L.; De Curtis, F.; De Cicco, V. Resistance of postharvest biocontrol yeasts to oxidativestress: A possible new mechanism of action. Phytopathology 2003, 93, 564–572. [CrossRef]
38. Benhamou, N. Potential of the mycoparasite, Verticillium lecanii, to protect citrus fruit against Penicilliumdigitatum, the causal agent of green mold: A comparison with the effect of chitosan. Phytopathology 2004, 94,693–705. [CrossRef]
35
Toxins 2019, 11, 460
39. Aloui, H.; Licciardello, F.; Khwaldia, K.; Hamdi, M.; Restuccia, C. Physical properties and antifungal activityof bioactive films containing Wickerhamomyces anomalus killer yeast and their application for preservation oforanges and control of postharvest green mold caused by Penicillium digitatum. Int. J. Food Microbiol. 2015,200, 22–30. [CrossRef]
40. Platania, C.; Restuccia, C.; Muccilli, S.; Cirvilleri, G. Efficacy of killer yeasts in the biological control ofPenicillium digitatum on Tarocco orange fruits (Citrus sinensis). Food Microbiol. 2012, 30, 219–225. [CrossRef]
41. Comitini, F.; Mannazzu, I.; Ciani, M. Tetrapisispora phaffii killer toxin is a highly specific β-glucanase thatdisrupts the integrity of the yeast cell wall. Microb. Cell Fact. 2009, 8, 55. [CrossRef]
42. Perez, M.F.; Contreras, L.; Garnica, N.M.; Fernández-Zenoff, M.V.; Farías, M.E.; Sepulveda, M.; Ramallo, J.;Dib, J.R. Native killer yeasts as biocontrol agents of postharvest fungal diseases in lemons. PLoS ONE 2016,11, e0165590. [CrossRef]
43. Kupper, K.C.; Cervantes, A.L.L.; Klein, M.N.; Silva, A.C. Avaliação de microrganismos antagônicos,Saccharomyces cerevisiae e Bacillus subtilis para o controle de Penicillium digitatum. Rev. Bras. Frutic. 2013, 35,425–436. [CrossRef]
44. Cunha, T.; Ferraz, L.P.; Wehr, P.P.; Kupper, K.C. Antifungal activity and action mechanisms of yeasts isolatesfrom citrus against Penicillium italicum. Int. J. Food Microbiol. 2018, 276, 20–27. [CrossRef] [PubMed]
45. Leelasuphakul, W.; Hemmanee, P.; Chuenchitt, S. Growth inhibitory properties of Bacillus subtilis strainsand their metabolites against the green mold pathogen (Penicillium digitatum Sacc.) of citrus fruit.Postharvest Biol. Technol. 2008, 48, 113–121. [CrossRef]
46. Calvo, H.; Marco, P.; Blanco, D.; Oria, R.; Venturini, M.E. Potential of a new strain of Bacillus amyloliquefaciensBUZ-14 as a biocontrol agent of postharvest fruit diseases. Food Microbiol. 2017, 63, 101–110. [CrossRef][PubMed]
47. Wang, H.K.; Yan, Y.H.; Wang, J.M.; Zhang, H.P.; Qi, W. Production and characterization of antifungalcompounds produced by Lactobacillus plantarum IMAU10014. PLoS ONE 2012, 7, e29452. [CrossRef][PubMed]
48. Matei, A.; Cornea, C.P.; Matei, S.; Matei, G.M.; Rodino, S. Comparative antifungal effect of lactic acid bacteriastrains on Penicillium digitatum. Bull. UASVM Food Sci. Technol. 2015, 72, 226–230. [CrossRef]
49. Maldonado, M.C.; Orosco, C.E.; Gordillo, M.A.; Navarro, A.R. In vivo and in vitro antagonism of Streptomycessp. RO3 against Penicillium digitatum and Geotrichum candidum. Afr. J. Microbiol. Res. 2010, 4, 2451–2456.
50. Najmeh, S.; Hosein, S.B.G.; Sareh, S.; Bonjar, L.S. Biological control of citrus green mould, Penicillium digitatum,by antifungal activities of Streptomyces isolates from agricultural soils. Afr. J. Microbiol. Res. 2014, 8, 1501–1509.[CrossRef]
51. Walling, L.L. Induced resistance: From the basic to the applied. Trends Plant Sci. 2001, 6, 445–447. [CrossRef]52. Parafati, L.; Vitale, A.; Restuccia, C.; Cirvilleri, G. The effect of locust bean gum (LBG)-based edible coatings
carrying biocontrol yeasts against Penicillium digitatum and Penicillium italicum causal agents of postharvestdecay of mandarin fruit. Food Microbiol. 2016, 58, 87–94. [CrossRef] [PubMed]
53. Liu, Y.; Yao, S.; Deng, L.; Ming, J.; Zeng, K. Different mechanisms of action of isolated epiphytic yeasts againstPenicillium digitatum and Penicillium italicum on citrus fruit. Postharvest Biol. Technol. 2019, 152, 100–110.[CrossRef]
54. Pimenta, R.S.; Silva, J.F.M.; Coelho, C.M.; Morais, P.B.; Rosa, C.A.; Corrêa, A., Jr. Integrated control ofPenicillium digitatum by the predacious yeast Saccharomycopsis crataegensis and sodium bicarbonate on oranges.Braz. J. Microbiol. 2010, 41, 404–410. [CrossRef] [PubMed]
55. Geng, P.; Chen, S.; Hu, M.; Haq, M.R.; Lai, K.; Qu, F.; Zhang, Y. Combination of Kluyveromyces marxianusand sodium bicarbonate for controlling green mold of citrus fruit. Int. J. Food Microbiol. 2011, 151, 190–194.[CrossRef] [PubMed]
56. Lu, L.; Xu, S.; Zeng, L.; Zheng, X.; Yu, T. Rhodosporidium paludigenum induced resistance in Ponkan mandarinagainst Penicillium digitatum requires ethylene-dependent signaling pathway. Postharvest Biol. Technol. 2014,97, 93–101. [CrossRef]
57. Spadaro, D.; Droby, S. Unraveling the mechanisms used by antagonistic yeast to control postharvestpathogens on fruit. Acta Hortic. 2016, 1144, 63–70. [CrossRef]
58. Li, J.; Li, H.; Ji, S.; Chen, T.; Tian, S.; Qin, G. Enhancement of biocontrol efficacy of Cryptococcus laurentii bycinnamic acid against Penicillium italicum in citrus fruit. Postharvest Biol. Technol. 2019, 149, 42–49. [CrossRef]
36

Toxins 2019, 11, 460
59. Chalutz, E. Postharvest biocontrol of green and blue mold and sour rot of citrus fruit by Debaryomyces hansenii.Plant Dis. 1990, 74, 134–137. [CrossRef]
60. Hernández-Montiel, L.G.; Ochoa, J.L.; Troyo-Diéguez, E.; Larralde-Corona, C.P. Biocontrol of postharvestblue mold (Penicillium italicum Wehmer) on Mexican lime by marine and citrus Debaryomyces hansenii isolates.Postharvest Biol. Technol. 2010, 56, 181–187. [CrossRef]
61. Choudhary, B.; Nagpure, A.; Gupta, R.K. Biological control of toxigenic citrus and papaya-rotting fungiby Streptomyces violascens MT7 and its extracellular metabolites. J. Basic Microbiol. 2015, 55, 1343–1356.[CrossRef]
62. Olmedo, G.M.; Cerioni, L.; González, M.M.; Cabrerizo, F.M.; Rapisarda, V.A.; Volentini, S.I. Antifungalactivity of β-carbolines on Penicillium digitatum and Botrytis cinerea. Food Microbiol. 2017, 62, 9–14. [CrossRef]
63. Lu, L.; Yang, Y.L.J.; Azat, R.; Yu, T.; Zheng, X. Quaternary chitosan oligomers enhance resistance andbiocontrol efficacy of Rhodosporidium paludigenum to green mold in satsuma orange. Carbohydr. Polym. 2014,113, 174–181. [CrossRef] [PubMed]
64. Shao, X.; Cao, B.; Xu, F.; Xie, S.; Yu, D.; Wang, H. Effect of postharvest application of chitosan combined withclove oil against citrus green mold. Postharvest Biol. Technol. 2015, 99, 37–43. [CrossRef]
65. Tayel, A.A.; Moussa, S.H.; Salem, M.F.; Mazrou, K.E.; El-Tras, W.F. Control of citrus molds using bioactivecoatings incorporated with fungal chitosan/plant extracts composite. J. Sci. Food Agric. 2016, 96, 1306–1312.[CrossRef] [PubMed]
66. El Guilli, M.; Hamza, A.; Clément, C.; Ibriz, M.; Barka, E.A. Effectiveness of postharvest treatment withchitosan to control citrus green mold. Agriculture 2016, 6, 12. [CrossRef]
67. Pérez-Alfonso, C.O.; Martínez-Romero, D.; Zapata, P.J.; Serrano, M.; Valero, D.; Castillo, S. The effects ofessential oils carvacrol and thymol on growth of Penicillium digitatum and P. italicum involved in lemon decay.Int. J. Food Microbiol. 2012, 158, 101–106. [CrossRef] [PubMed]
68. Fan, F.; Tao, N.; Jia, L.; He, X. Use of citral incorporated in postharvest wax of citrus fruit as a botanicalfungicide against Penicillium digitatum. Postharvest Biol. Technol. 2014, 90, 52–55. [CrossRef]
69. Wu, Y.; OuYang, Q.; Tao, N. Plasma membrane damage contributes to antifungal activity of citronellal againstPenicillium digitatum. J. Food Sci. Technol. 2016, 53, 3853–3858. [CrossRef]
70. Sivakumar, D.; Bautista-Baños, S. A review on the use of essential oils for postharvest decay control andmaintenance of fruit quality during storage. Crop Prot. 2014, 64, 27–37. [CrossRef]
71. Solgi, M.; Ghorbanpour, M. Application of essential oils and their biological effects on extending the shelf-lifeand quality of horticultural crops. Trakia J. Sci. 2014, 12, 198–210.
72. Peng, L.; Yang, S.; Cheng, Y.J.; Chen, F.; Pan, S.; Fan, G. Antifungal activity and action mode of pinocembrinfrom propolis against Penicillium italicum. Food Sci. Biotechnol. 2012, 21, 1533–1539. [CrossRef]
73. Trabelsi, D.; Hamdane, A.M.; Said, M.B.; Abdrrabba, M. Chemical composition and antifungal activity ofessential oils from flowers, leaves and peels of Tunisian Citrus aurantium against Penicillium digitatum andPenicillium italicum. J. Essent. Oil Bear Plants 2016, 19, 1660–1674. [CrossRef]
74. Tao, N.; Jia, L.; Zhou, H.; He, X. Effect of octanal on the mycelial growth of Penicillium italicum and P. digitatum.World J. Microbiol. Biotechnol. 2014, 30, 1169–1175. [CrossRef] [PubMed]
75. Tao, N.; OuYang, Q.; Jia, L. Citral inhibits mycelial growth of Penicillium italicum by a membrane damagemechanism. Food Control 2014, 41, 116–121. [CrossRef]
76. Kanan, G.J.M.; Al-Najar, R.A.-W.K. In vitro and in vivo activity of selected plant crude extracts and fractionsagainst Penicillium italicum. J. Plant Prot. Res. 2009, 49, 341–352. [CrossRef]
77. Aminifard, M.H.; Bayat, H. Antifungal activity of black caraway and anise essential oils againstPenicillium digitatum on blood orange fruits. Int. J. Fruit Sci. 2018, 18, 307–319. [CrossRef]
78. Yang, S.; Liu, L.; Li, D.; Xia, H.; Su, X.; Peng, L.; Pan, S. Use of active extracts of poplar buds againstPenicillium italicum and possible modes of action. Food Chem. 2016, 196, 610–618. [CrossRef] [PubMed]
79. Wan, C.; Li, P.; Chen, C.; Peng, X.; Li, M.; Chen, M.; Wang, J.; Chen, J. Antifungal activity of Ramuluscinnamomi explored by 1H-NMR based metabolomics approach. Molecules 2017, 22, 2237. [CrossRef]
80. Hendel, N.; Larous, L.; Belbey, L. Antioxidant activity of rosemary (Rosmarinus officinalis L.) and its in vitroinhibitory effect on Penicillium digitatum. Int. Food Res. J. 2016, 23, 1725–1732.
81. Exarchou, V.; Kanetis, L.; Charalambous, Z.; Apers, S.; Pieters, L.; Gekas, V.; Goulas, V. HPLC-SPE-NMRCharacterization of major metabolites in Salvia fruticosa Mill. extract with antifungal potential: Relevance ofcarnosic acid, carnosol, and hispidulin. J. Agric. Food Chem. 2015, 63, 457–463. [CrossRef]
37
Toxins 2019, 11, 460
82. Zhu, C.; Lei, M.; Andargie, M.; Zeng, J.; Li, J. Antifungal activity and mechanism of action of tannic acidagainst Penicillium digitatum. Physiol. Mol. Plant Pathol. 2019, 107, 46–50. [CrossRef]
83. Musto, M.; Potenza, G.; Cellini, F. Inhibition of Penicillium digitatum by a crude extract from Solanum nigrumleaves. Biotechnol. Agron. Soc. Environ. 2014, 18, 174–180.
84. Boubaker, H.; Karim, H.; El Hamdaoui, A.; Msanda, F.; Leach, D.; Bombarda, I.; Vanloot, P.; Abbad, A.;Boudyach, E.H.; Aoumar, A.A.B. Chemical characterization and antifungal activities of four Thymus speciesessential oils against postharvest fungal pathogens of citrus. Ind. Crops Prod. 2016, 86, 95–101. [CrossRef]
85. Ameziane, N.; Boubaker, H.; Boudyach, H.; Msanda, F.; Jilal, A.; Benaoumar, A.A. Antifungal activity ofMoroccan plants against citrus fruit pathogens. Agron. Sustain. Dev. 2007, 27, 273–277. [CrossRef]
86. Vitoratos, A.; Bilalis, D.; Karkanis, A.; Efthimiadou, A. Antifungal activity of plant essential oils againstBotrytis cinerea, Penicillium italicum and Penicillium digitatum. Not. Bot. Horti Agrobot. 2013, 41, 86–92.[CrossRef]
87. Mekbib, S.B.; Regnier, T.J.C.; Korsten, L. Control of Penicillium digitatum growth on citrus fruit using twoplant extracts and their mode of action. Phytoparasitica 2007, 35, 264–276. [CrossRef]
88. Obagwu, J.; Korsten, L. Control of citrus green and blue molds with garlic extracts. Eur. J. Plant Pathol. 2003,109, 221–225. [CrossRef]
89. Mossini, S.A.G.; Arrotéia, C.C.; Kemmelmeier, C. Effect of neem leaf extract and neem oil on Penicilliumgrowth, sporulation, morphology and Ochratoxin A production. Toxins 2009, 1, 3–13. [CrossRef]
90. Baviskar, R.N. Anti-fungal activity of Launea pinnatifida and Argimone maxicana against post-harvestfungal pathogens in Apple fruits. Int. J. of Life Sciences 2014, 2, 346–349.
91. Singh, H.; Al-samarai, G.; Syarhabil, M. Exploitation of natural products as an alternative strategy to controlpostharvest fungal rotting of citrus. IJSR 2012, 2, 1–4. [CrossRef]
92. Palou, L. Penicillium digitatum, Penicillium italicum (Green Mold, Blue Mold). In Postharvest Decay; AcademicPress: Cambridge, MA, USA, 2014; pp. 45–102.
93. Holmes, G.J.; Eckert, J.W. Sensitivity of Penicillium digitatum and P. italicum to postharvest citrus fungicidesin California. Phytopathol. 1999, 89, 716–721. [CrossRef]
94. Du Plooy, W.; Regnier, T.; Combrinck, S. Essential oil amended coatings as alternatives to synthetic fungicidesin citrus postharvest management. Postharvest Biol. Technol. 2009, 53, 117–122. [CrossRef]
95. Tripathi, P.; Dubey, N.K.; Shukla, A.K. Use of some essential oils as post-harvest botanical fungicides in themanagement of grey mould of grapes caused by Botrytis cinerea. World J. Microbiol. Biotechnol. 2008, 24, 39–46.[CrossRef]
96. Fawcett, C.H.; Spencer, D.M. Plant chemotherapy with natural products. Annu. Rev. Phytopathol. 1970, 8,403–418. [CrossRef]
97. Tripathi, P.; Dubey, N.K. Exploitation of natural products as an alternative strategy to control postharvestfungal rotting of fruit and vegetables. Postharvest Biol. Technol. 2004, 32, 235–245. [CrossRef]
98. Askarne, L.; Talibi, I.; Boubaker, H.; Boudyach, E.H.; Msanda, F.; Saadi, B.; Serghini, M.A.; Aoumar, A.A.B.In vitro and in vivo antifungal activity of several Moroccan plants against Penicillium italicum, the causalagent of citrus blue mold. Crop Prot. 2012, 40, 53–58. [CrossRef]
99. Jham, G.N.; Dhingra, O.D.; Jardim, C.M.; Valente, V.M.M. Identification of the major fungitoxic componentof cinnamon bark oil. Fitopatol. Bras. 2005, 30, 404–408. [CrossRef]
100. Telezhenetskaya, M.V.; D’yakonov, A.L. Alkaloids of Peganum harmala. Unusual reaction of peganine andvasicinone. Chem. Nat. Compd. 1991, 27, 471–474. [CrossRef]
101. Scora, K.M.; Scora, R.W. Effect of volatiles on mycelium growth of Penicillium digitatum, P. italicum, andP. ulaiense. J. Basic Microbiol. 1998, 38, 405–413. [CrossRef]
102. Droby, S.; Eick, A.; Macarisin, D.; Cohen, L.; Rafael, G.; Stange, R.; McColum, G.; Dudai, N.;Nasser, A.; Wisniewski, M.; et al. Role of citrus volatiles in host recognition, germination and growth ofPenicillium digitatum and Penicillium italicum. Postharvest Biol. Technol. 2008, 49, 386–396. [CrossRef]
103. Mercier, J.; Smilanick, J.L. Control of green mold and sour rot of stored lemon by biofumigation with Muscodoralbus. Biol. Control 2005, 32, 401–407. [CrossRef]
104. Nakamura, M.; Suprapta, D.N.; Iwai, H.; Arai, A.K. Comparison of endo-polygalacturonase activities ofcitrus and non-citrus races of Geotrichum candidum, and cloning and expression of the corresponding genes.Mol. Plant Pathol. 2001, 2, 265–274. [CrossRef] [PubMed]
38

Toxins 2019, 11, 460
105. McKay, A.H.; Förster, H.; Adaskaveg, J.E. Efficacy and application strategies for propiconazole as a newpostharvest fungicide for managing sour rot and green mold of citrus fruit. Plant Dis. 2012, 96, 235–242.[CrossRef] [PubMed]
106. Yin, C.; Liu, H.; Shan, Y.; Gupta, V.K.; Jiang, Y.; Zhang, W.; Tan, H.; Gong, L. Cytosporone B as a biologicalpreservative: Purification, fungicidal activity and mechanism of action against Geotrichum citri-aurantii.Biomolecules 2019, 9, 125. [CrossRef] [PubMed]
107. Talibi, I.; Askarne, L.; Boubaker, H.; Boudyach, E.H.; Msanda, F.; Saadi, B.; Aoumar, A.A.B. Antifungalactivity of Moroccan medicinal plants against citrus sour rot agent Geotrichum candidum. Lett. Appl. Microbiol.2012, 55, 155–161. [CrossRef] [PubMed]
108. Karim, H.; Boubaker, H.; Askarne, L.; Talibi, I.; Msanda, F.; Boudyach, E.H.; Saadi, B.; Aoumar, A.A.B.Antifungal properties of organic extracts of eight Cistus L. species against postharvest citrus sour rot.Lett. Appl. Microbiol. 2015, 62, 16–22. [CrossRef] [PubMed]
109. Sayago, J.E.; Ordoñez, R.M.; Kovacevich, L.N.; Torres, S.; Isla, M.I. Antifungal activity of extracts ofextremophile plants from the Argentine Puna to control citrus postharvest pathogens and green mold.Postharvest Biol. Technol. 2012, 67, 19–24. [CrossRef]
110. Zhou, H.; Tao, N.; Jia, L. Antifungal activity of citral, octanal and α-terpineol against Geotrichum citri-aurantii.Food Control 2014, 37, 277–283. [CrossRef]
111. Liu, X.; Wang, L.P.; Li, Y.C.; Yu, T.; Zheng, X.D. Antifungal activity of thyme oil against Geotrichum citri-aurantiiin vitro and in vivo. J. Appl. Microbiol. 2009, 107, 1450–1456. [CrossRef]
112. Xu, S.-X.; Li, Y.-C.; Liu, X.; Mao, L.-J.; Zhang, H.; Zheng, X.-D. In vitro and in vivo antifungal activity ofa water-dilutable cassia oil microemulsion against Geotrichum citri-aurantii. J. Sci. Food Agric. 2012, 92,2668–2671. [CrossRef]
113. Spadaro, D.; Droby, S. Development of biocontrol products for postharvest diseases of fruit: The importanceof elucidating the mechanisms of action of yeast antagonists. Trends Food Sci. Technol. 2016, 47, 39–49.[CrossRef]
114. Alamri, S.A. The synergistic effect of two formulated biofungicides in the biocontrol of root and bottom rotof lettuce. Biocontrol Sci. 2014, 19, 189–197. [CrossRef] [PubMed]
115. Janisiewicz, W.J.; Jeffers, S.N. Efficacy of commercial formulation of two biofungicides for control of bluemold and gray mold of apples in cold storage. Crop Prot. 1997, 16, 629–633. [CrossRef]
116. Abbey, J.A.; Percival, D.; Abbey, L.; Asiedu, S.K.; Prithiviraj, B.; Schilder, A. Biofungicides as alternative tosynthetic fungicide control of grey mould (Botrytis cinerea)—Prospects and challenges. Biocontrol Sci. Technol.2019, 29, 241–262. [CrossRef]
117. Liu, J.; Sui, Y.; Wisniewski, M.; Droby, S.; Liu, Y. Review: Utilization of antagonistic yeasts tomanagepostharvest fungal diseases of fruit. Int. J. Food Microbiol. 2013, 167, 153–160. [CrossRef] [PubMed]
118. Zamanizadeh, H.R.; Hatami, N.; Aminaee, M.M.; Rakhshandehroo, F. Application of biofungicides in controlof damping disease off in greenhouse crops as a possible substitute to synthetic fungicides. Int. J. Environ.Sci. Technol. 2011, 8, 129–136. [CrossRef]
119. Nunes, C.A. Biological control of postharvest diseases of fruit. Eur. J. Plant Pathol. 2012, 133, 181–196.[CrossRef]
120. Mari, M.; Di Francesco, A.; Bertolini, P. Control of fruit postharvest diseases: Old issues and innovativeapproaches. Stewart Postharvest Rev. 2014, 1, 1–4. [CrossRef]
121. Anuagasi, C.L.; Okigbo, R.N.; Anukwuorji, C.A.; Okereke, C.N. The impact of biofungicides on agriculturalyields and food security in Africa. IJAT 2017, 13, 953–978.
122. Piombo, E.; Sela, N.; Wisniewski, M.; Hoffmann, M.; Gullino, M.L.; Allard, M.W.; Levin, E.; Spadaro, D.;Droby, S. Genome sequence, assembly and characterization of two Metschnikowia fructicola strains used asbiocontrol agents of postharvest diseases. Front. Microbiol. 2018, 9, 593. [CrossRef]
123. Wisniewski, M.; Macarisin, D.; Droby, S. Challenges and opportunities for the commercialization ofpostharvest biocontrol. In Proceedings of the VI International Postharvest Symposium, Antalya, Turkey, 8–12 April2009; International Society for Horticultural Science: Leuven, Belgium, 2010; Volume 877, pp. 1577–1582.[CrossRef]
124. Kurtzman, C.P.; Droby, S. Metschnikowia fructicola, a new ascosporic yeast with potential for biocontrol ofpostharvest fruit rots. Syst. Appl. Microbiol. 2001, 24, 395–399. [CrossRef]
39

Toxins 2019, 11, 460
125. Viñas, I.; Usall, J.; Teixidó, N.; Sanchis, V. Biological control of major postharvest pathogens on apple withCandida sake. Int. J. Food Microbiol. 1998, 40, 9–16. [CrossRef]
126. Fravel, D.R.; Larkin, R.P. Availability and application of biocontrol products. In Biological and Cultural Testsfor Control of Plant Diseases; Canaday, C.H., Ed.; APS Press: St. Paul, MN, USA, 1996; Volume 11, pp. 1–7.
127. Souza, J.R.B.; Kupper, K.C.; Augusto, F. In vivo investigation of the volatile metabolome ofantiphytopathogenic yeast strains active against Penicillium digitatum using comprehensive two-dimensionalgas chromatography and multivariate data analysis. Microchem. J. 2018, 141, 204–209. [CrossRef]
© 2019 by the authors. Licensee MDPI, Basel, Switzerland. This article is an open accessarticle distributed under the terms and conditions of the Creative Commons Attribution(CC BY) license (http://creativecommons.org/licenses/by/4.0/).
40

toxins
Article
Application of Zearalenone (ZEN)-DetoxifyingBacillus in Animal Feed Decontaminationthrough Fermentation
Shiau-Wei Chen 1, Han-Tsung Wang 1, Wei-Yuan Shih 2, Yan-An Ciou 1, Yu-Yi Chang 3,
Laurensia Ananda 3, Shu-Yin Wang 3 and Jih-Tay Hsu 1,*
1 Department of Animal Science and Technology, National Taiwan University, No. 50, Lane 155, Sec 3,Keelung Rd, Taipei 10673, Taiwan; [email protected] (S.-W.C.); [email protected] (H.-T.W.);[email protected] (Y.-A.C.)
2 Animal Resource Center, National Taiwan University, No. 118, Lane 155, Sec 3, Keelung Rd, Taipei 10673,Taiwan; [email protected]
3 Graduate Institute of Biotechnology, Chinese Culture University, No. 55, Hwa-Kang Rd, Taipei 11114,Taiwan; [email protected] (Y.-Y.C.); [email protected] (L.A.); [email protected] (S.-Y.W.)
* Correspondence: [email protected]; Tel.: +886-2-3366-4153
Received: 27 May 2019; Accepted: 6 June 2019; Published: 8 June 2019
Abstract: Zearalenone (ZEN) is an estrogenic mycotoxin which can cause loss in animal production.The aim of this study was to screen Bacillus strains for their ZEN detoxification capability anduse a fermentation process to validate their potential application in the feed industry. In thehigh-level ZEN-contaminated maize (5 mg·kg−1) fermentation test, B2 strain exhibited the highestdetoxification rate, removing 56% of the ZEN. However, B2 strain was not the strain with thehighest ZEN detoxification in the culturing media. When B2 grew in TSB medium with ZEN, it hadhigher bacterial numbers, lactic acid, acetic acid, total volatile fatty acids, and ammonia nitrogen.The ZEN-contaminated maize fermented by B2 strain had better fermentation characteristics (lacticacid > 110 mmol·L−1; acetic acid < 20 mmol·L−1; pH < 4.5) than ZEN-free maize. Furthermore, B2 alsohad detoxification capabilities toward aflatoxins B1, deoxynivalenol, fumonisin B1, and T2 toxin.Our study demonstrated differences in screening outcome between bacterial culturing conditions andthe maize fermentation process. This is important for the feed industry to consider when choosinga proper method to screen candidate isolates for the pretreatment of ZEN-contaminated maize.It appears that using the fermentation process to address the ZEN-contaminated maize problem inanimal feed is a reliable choice.
Keywords: zearalenone; biological detoxification; Bacillus; fermentation
Key Contribution: Our study showed differences in screening outcome between the culture mediummethod and the maize fermentation process. In the high-level ZEN-contaminated maize fermentationtest, the isolate B2 strain was stimulated by ZEN and exhibited the highest detoxification rate to ZEN(56%) with multiple detoxification capabilities toward other mycotoxins.
1. Introduction
Zearalenone (ZEN) is a nonsteroidal estrogenic mycotoxin produced by Fusarium species on cerealcrops grown in warm, humid climates. Its contamination mostly occurs in preharvest periods ratherthan in storage periods [1]. Maize is susceptible to Fusarium infection and contamination by ZEN [2,3].ZEN is classified as an endocrine disruptor, due to its estrogenic activity, which can disrupt the estrouscycles in animals [4]. Swine are more sensitive to ZEN effects than other species [2,5]. ZEN in diet as
Toxins 2019, 11, 330; doi:10.3390/toxins11060330 www.mdpi.com/journal/toxins41

Toxins 2019, 11, 330
low as 1 ppm may lead to hyperestrogenic syndrome in gilts [5]. In addition, ZEN and its metabolitesmay affect humans through egg, milk, or meat. The potential threats of ZEN should not be ignored.
The mycotoxin’s structure plays a key role in its toxicity [2,6]. When the lactone ring of ZEN iscleaved by esterase or lactonohydrolase, its ability to bind to estrogen receptors is compromised [7].Various strategies have been developed to detoxify mycotoxins, but most of them have showndisadvantages in animal feed applications [6,8]. Several studies have suggested that biologicaldetoxification is effective, specific, and safe in the decontamination of animal feed [1,6,9]. Biologicaldetoxification depends on microorganism enzyme action to degrade mycotoxins and microbial cellwalls to adsorb mycotoxins. In recent years, the mycotoxin detoxification ability of Bacillus spp. hasbeen noticed. Bacillus spp. is Gram-positive, spore-forming bacteria. Many Bacillus spp. have beenproposed for their qualified presumption of safety (QPS) status by the EFSA such as B. amyloliquefaciens,B. licheniformis, and B. subtilis. They are often utilized to produce enzymes or used as microbial feedadditives [10]. With all these characteristics, Bacillus spp. are one of the safe and perfect candidates toact as a ZEN detoxification agent in animal feed.
Fermented liquid feed (FLF) is widely used in the animal industry and has many advantages.It can be produced by fermentation of the complete feed or by fermentation of cereals before beingincorporated with other feed ingredients [11]. FLF has been shown to improve the growth performanceof pigs and to decrease the incidence of enteric diseases in pigs by lowering enteric pathogennumbers [11,12]. The objective of this study was to screen ZEN-detoxifying Bacillus (ZDB) strains andput the candidate strains through fermentation of ZEN-contaminated maize to evaluate their fieldapplication potential for animal feed.
2. Results
2.1. Screening of Bacillus Strains for ZEN Detoxification Potential
In this study, 106 isolates were successfully isolated from fermented soybean products, soil,sewage, rumen fluid, and ruminant feces. All isolates were included in the ZEN detoxificationcapability test. The results showed that 14 isolates had a markedly greater ZEN detoxification abilitythan the others (Table 1). Out of these 14 isolates, seven isolates were from fermented soybean products,one from sewage, and the remaining from soil. The 16S rRNA gene sequence analysis indicated thatthese 14 isolates shared the highest identities with Bacillus spp. In the enterotoxin detection assays,nine out of the 14 strains were identified as enterotoxin producers. The five non-enterotoxin-producingZEN-detoxifying Bacillus (ZDB) strains were kept for further study (Table 1).
Table 1. The characteristics of 14 isolates isolated from different sources with ZEN detoxification ability.
Strains SourceEnterotoxins b Emetic Toxin
Code c 16S rDNA Sequencing(Identify%)Nhe A Nhe B Hbl L2 Cereulide
Isolate 1 Fermented soybean product − − − − B1 B. subtilis (99)Isolate 2 Fermented soybean product + − − −Isolate 3 Fermented soybean product − − − − B2 B. subtilis (99)Isolate 4 Fermented soybean product + − − −Isolate 5 Fermented soybean product − − − − B3 B. subtilis (99)Isolate 6 Fermented soybean product − − − − B4 Bacillus sp. (100)Isolate 7 Fermented soybean product + − − −Isolate 8 Sewage + − − −Isolate 9 Soil + − − −Isolate 10 Soil + − − −Isolate 11 Soil + − − −Isolate 12 Soil + + − −Isolate 13 Soil − − − − B5 Bacillus sp. (100)Isolate 14 Soil + − − −
a Enterotoxins included nonhemolytic enterotoxin A (Nhe A), nonhemolytic enterotoxin B (Nhe B), and hemolysinBL (HBL). The “−” and “+” represent negative and positive response, respectively. b Five nontoxic ZEN-detoxifyingBacillus (ZDB) strains were selected for further study.
42
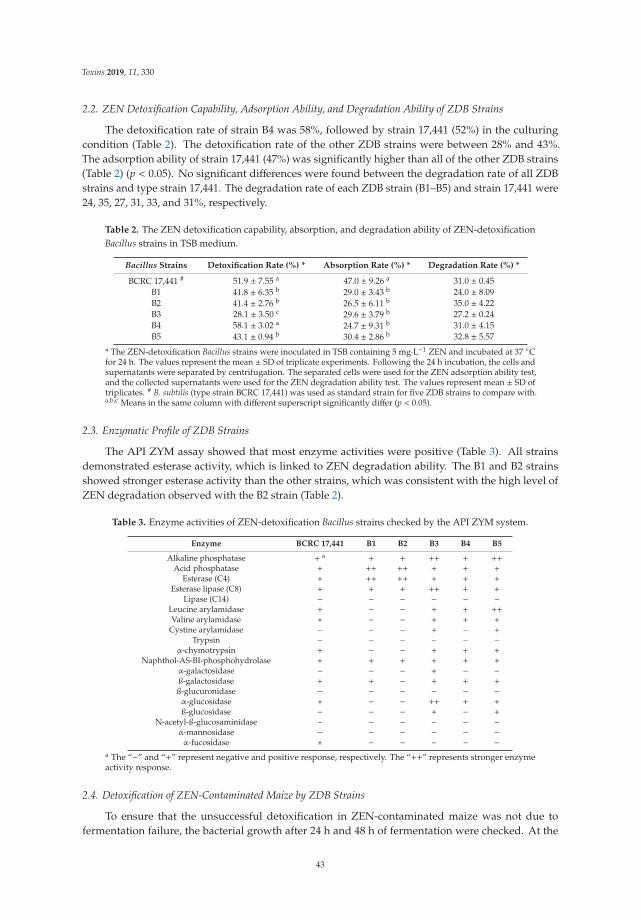
Toxins 2019, 11, 330
2.2. ZEN Detoxification Capability, Adsorption Ability, and Degradation Ability of ZDB Strains
The detoxification rate of strain B4 was 58%, followed by strain 17,441 (52%) in the culturingcondition (Table 2). The detoxification rate of the other ZDB strains were between 28% and 43%.The adsorption ability of strain 17,441 (47%) was significantly higher than all of the other ZDB strains(Table 2) (p < 0.05). No significant differences were found between the degradation rate of all ZDBstrains and type strain 17,441. The degradation rate of each ZDB strain (B1–B5) and strain 17,441 were24, 35, 27, 31, 33, and 31%, respectively.
Table 2. The ZEN detoxification capability, absorption, and degradation ability of ZEN-detoxificationBacillus strains in TSB medium.
Bacillus Strains Detoxification Rate (%) * Absorption Rate (%) * Degradation Rate (%) *
BCRC 17,441 # 51.9 ± 7.55 a 47.0 ± 9.26 a 31.0 ± 0.45B1 41.8 ± 6.35 b 29.0 ± 3.43 b 24.0 ± 8.09B2 41.4 ± 2.76 b 26.5 ± 6.11 b 35.0 ± 4.22B3 28.1 ± 3.50 c 29.6 ± 3.79 b 27.2 ± 0.24B4 58.1 ± 3.02 a 24.7 ± 9.31 b 31.0 ± 4.15B5 43.1 ± 0.94 b 30.4 ± 2.86 b 32.8 ± 5.57
* The ZEN-detoxification Bacillus strains were inoculated in TSB containing 5 mg·L−1 ZEN and incubated at 37 ◦Cfor 24 h. The values represent the mean ± SD of triplicate experiments. Following the 24 h incubation, the cells andsupernatants were separated by centrifugation. The separated cells were used for the ZEN adsorption ability test,and the collected supernatants were used for the ZEN degradation ability test. The values represent mean ± SD oftriplicates. # B. subtilis (type strain BCRC 17,441) was used as standard strain for five ZDB strains to compare with.a,b,c Means in the same column with different superscript significantly differ (p < 0.05).
2.3. Enzymatic Profile of ZDB Strains
The API ZYM assay showed that most enzyme activities were positive (Table 3). All strainsdemonstrated esterase activity, which is linked to ZEN degradation ability. The B1 and B2 strainsshowed stronger esterase activity than the other strains, which was consistent with the high level ofZEN degradation observed with the B2 strain (Table 2).
Table 3. Enzyme activities of ZEN-detoxification Bacillus strains checked by the API ZYM system.
Enzyme BCRC 17,441 B1 B2 B3 B4 B5
Alkaline phosphatase + a + + ++ + ++Acid phosphatase + ++ ++ + + +
Esterase (C4) + ++ ++ + + +Esterase lipase (C8) + + + ++ + +
Lipase (C14) − − − − − −Leucine arylamidase + − − + + ++Valine arylamidase + − − + + +
Cystine arylamidase − − − + − +Trypsin − − − − − −
α-chymotrypsin + − − + + +Naphthol-AS-BI-phosphohydrolase + + + + + +
α-galactosidase − − − + − −ß-galactosidase + + − + + +ß-glucuronidase − − − − − −α-glucosidase + − − ++ + +ß-glucosidase − − − + − +
N-acetyl-ß-glucosaminidase − − − − − −α-mannosidase − − − − − −α-fucosidase + − − − − −
a The “−” and “+” represent negative and positive response, respectively. The “++” represents stronger enzymeactivity response.
2.4. Detoxification of ZEN-Contaminated Maize by ZDB Strains
To ensure that the unsuccessful detoxification in ZEN-contaminated maize was not due tofermentation failure, the bacterial growth after 24 h and 48 h of fermentation were checked. At the
43

Toxins 2019, 11, 330
beginning, the total number of bacteria was approximately 105 to 106 cfu·mL−1. After 24 h, the bacterialnumber increased to 109 cfu·mL−1, except for strain B1 (Table 4). After 48 h, the bacterial numberof most strains slightly decreased and remained at 108 to 109 cfu·mL−1 (Table 4). All of the ZDBstrains significantly reduced the ZEN content in maize after fermentation (Table 4). The B2 strainhad the highest detoxification rate, removing 56% of the ZEN from the maize (p < 0.05). Conversely,strain 17,441 had the lowest detoxification rate. Among all ZDB strains, B2 strain showed the bestdetoxification capability, and it was selected for further research. The gyrB gene sequencing identifiedthe B2 strain as B. subtilis.
Table 4. The bacterial count and detoxification rate of ZEN-detoxifying Bacillus strains inZEN-contaminated (5 mg·kg−1) maize after 24 h and 48 h fermentation.
Bacillus StrainsBacterial Count (log CFU mL−1) Detoxification of ZEN
in Maize after 48 h (%)24 h 48 h
BCRC 17,441 9.67 ± 0.561 a 8.69 ± 0.499 a 32.7 ± 10.42 b,c
B1 6.32 ± 0.922 b 7.09 ± 0.379 b 49.0 ± 9.43 a,b
B2 9.44 ± 0.175 a 9.20 ± 0.153 a 55.8 ± 6.20 a
B3 9.11 ± 0.494 a 8.81 ± 0.438 a 31.4 ± 10.96 c
B4 8.21 ± 1.861 a 8.79 ± 0.358 a 49.2 ± 8.46 a,b
B5 9.32 ± 0.210 a 9.19 ± 0.516 a 38.3 ± 3.57 b,c
The values represent mean ± SD of triplicate experiments. a,b,c Means in the same column with different superscriptsignificantly differ (p < 0.05).
2.5. The Effect of ZEN on B2 Strain Growth in TSB Medium
The B2 strain was inoculated in TSB with or without ZEN to explore the influence of ZEN on itsgrowth and metabolism. All parameters were increased significantly when B2 strain was inoculated inTSB with ZEN, including bacterial number, pH, NH3-N, lactic acid, acetic acid, and total VFAs (Table 5).The results indicated that the growth rate of B2 strain was stimulated by ZEN, and the production ofmetabolites was enhanced.
Table 5. The characteristics of B2 strain in culture medium (TBS) without or with ZEN (5 mg·L−1) after24 h incubation.
Measurement −ZEN +ZEN
Bacterial count (log CFU mL−1) (8 h) 10.4 ± 0.60 11.8 ± 0.58 *Bacterial count (log CFU mL−1) (24 h) 10.3 ± 0.05 11.3 ± 0.14 *
pH 4.77 ± 0.042 5.64 ± 0.056 *NH3-N (mmol L−1) 11.33 ± 0.891 27.57 ± 1.819 *
Lactic acid (mmol L−1) 208.2 ± 8.02 284.8 ± 20.02 *Acetic acid (mmol L−1) 5.22 ± 0.269 11.55 ± 1.030 *Total VFAs (mml L−1) 5.88 ± 0.325 12.41 ± 1.042 *
The values represent mean ± SD of quadruplicate experiments. * Significant difference (p < 0.05).
2.6. The Effect of ZEN on Fermentation Characteristics of B2 Strain in Maize
There was no statistically significant difference in the bacterial number of B2 strain betweenZEN-free and ZEN-contaminated maize during 48 h and 72 h of fermentation (Table 6). After 48 h,the lactic acid concentration of fermented product from ZEN-contaminated maize was significantlyhigher than ZEN-free maize, resulting in a lower pH (Table 6) (p < 0.05). After 72 h, fermented ZEN-freemaize product had significantly less NH3-N and more acetic acid (Table 6). Overall, the fermentedproduct of ZEN-contaminated maize had better fermentation characteristics (lactic acid> 110 mmol·L−1;acetic acid < 20 mmol·L−1; pH < 4.5) after 72 h of fermentation than ZEN-free maize.
44

Toxins 2019, 11, 330
Table 6. The fermented characteristics of B2 strain in ZEN-contaminated (5 mg·kg−1) maize after 48 hand 72 h fermentation.
Measurement −ZEN +ZEN
Bacterial count (log CFU·mL−1) (48 h) 8.65 ± 0.334 8.99 ± 0.289Bacterial count (log CFU·mL−1) (72 h) 8.84 ± 0.186 8.50 ± 0.327
pH (48 h) 4.58 ± 0.022 * 4.46 ± 0.070pH (72 h) 4.35 ± 0.068 4.41 ± 0.079
NH3-N (mmol·L−1) (48 h) 6.03 ± 0.372 6.10 ± 0.259NH3-N (mmol·L−1) (72 h) 5.97 ± 0.230 6.65 ± 0.269 *
Lactic acid (mmol·L−1) (48 h) 67.8 ± 13.51 96.8 ± 8.88 *Lactic acid (mmol·L−1) (72 h) 88.8 ± 12.26 111.9 ± 15.33Acetic acid (mmol·L−1) (48 h) 21.3 ± 0.18 19.0 ± 1.02Acetic acid (mmol·L−1) (72 h) 21.6 ± 0.82 * 19.4 ± 0.62
The values represent mean ± SD of quadruplicate experiments. * Significant difference (p < 0.05).
2.7. Other Mycotoxins’ (AFB1, DON, FB1, and T2 Toxin) Detoxification
Figure 1 illustrates that B2 strain significantly reduced the AFB1, DON, FB1, and T2 toxin contentin TSB medium after 24 h cultivation (p < 0.05). The detoxification rates of AFB1, DON, FB1, and T2toxin were 3.8, 25.0, 39.5, and 9.5%, respectively. The results showed that B2 strain had detoxificationcapability toward multiple mycotoxins.
Figure 1. The mycotoxins detoxification of B2 strain in culturing condition. The values representthe mean ± SD of the quadruplicate experiments. Asterisks indicate that the residual percentage issignificantly different among treatments (p < 0.05).
3. Discussion
The extreme weather conditions caused by global warming increase the risk of mycotoxincontamination of cereal crops. In some regions, the impact of ZEN on agriculture is the second highestimpacting factor after aflatoxins [13]. It is virtually impossible to avoid the production of mycotoxins.Therefore, it is necessary to develop an effective detoxification strategy for mycotoxin-contaminatedfood or feed [3]. During the past decades, some microorganisms and their enzymes have been verifiedto detoxify ZEN, including fungi, yeast, and bacteria [14–23]. However, most of these microorganismsare not allowed for application in food and feedstuff. There are still some doubts surrounding thetoxicity of microbial detoxification products and undesirable side effects from fermentation involvingnon-native microorganisms [24]. Based on this reason, the present study aimed to screen Bacillus spp.which are commonly applied in animal feed.
Bacillus spp. can form endospores which can resist unfavorable environment conditions suchas heat, chemicals, and radiation [25]. In this study, all samples were cultured for 72 h in TSB withpolymyxin B and isolated after heat treatment. Because of the endospore formation, Bacillus spp.
45
Toxins 2019, 11, 330
should survive after these treatments. Based on 16S rRNA gene sequence analysis, 14 isolates withbetter ZEN detoxification ability were identified as Bacillus spp. (Table 1).
Generally, there are two mechanisms through which microbes detoxify ZEN: degradation andadsorption. In the present study, all of the tested ZDB strains demonstrated esterase activity (Table 3),which is linked to their ZEN degradation ability. The B2 strain was one of stronger detoxifyingstrains (Table 2), and its detoxification rate was the highest out of all of the strains when testedwith the ZEN-contaminated maize (Table 4). Previous research indicated that the efficiency of theZEN degradation ability of Bacillus also depends on the initial ZEN concentration [26]. When theinitial ZEN concentration was 0.02 and 5 mg L−1, the degradation rate was found to be 100 and 18%,respectively [27]. In the present study, the initial ZEN concentration was 5 mg·L−1 for all experiments.The degradation rates of the ZDB strains were between 24 and 35 % which is greater than previouslyreported (Table 2). According to Reddy et al., the amounts of ZEN in grain ranges from a few μg·kg−1
to thousands of μg kg−1 worldwide [13]. The ZDB strains of the present study performed well athigher level ZEN contamination (mg·kg−1).
All of the ZDB strains tested in this study were able to adsorb ZEN (Table 2). Previous research hassuggested that the adsorption mechanism of Bacillus is similar to that of Lactobacillus because both areGram-positive bacteria and have the same cell wall characteristics [27]. ZEN is mainly adsorbed by thesurface hydrophobicity and the carbohydrate components of the Lactobacillus cell wall [28]. Therefore,ZEN adsorption by ZDB strains may rely on the same components. The high concentration of ZENpromotes the bacterial cell wall to contact with ZEN, which increases ZEN adsorption [29]. Althoughhigh concentration of ZEN was used in ZEN adsorption test, the ZEN adsorption rate of ZDB strainswere still low. The data suggested that poor adsorption capacity of the ZDB strains may favor contactof ZEN with enzymes. In fact, adsorption of ZEN by microorganisms does not really remove the ZEN,which may be released back into the digestive tract when the digestive fluid continues to flush thebacterial surface [30]. It is worth noting that the ZEN detoxification capability of strain 17,441 in TSBwas the second highest (52%) in the culturing condition (Table 2). Strain 17,441 also demonstratedthe greatest adsorption capability (Table 2). However, strain 17,441 exhibited a lower detoxificationrate than the other ZDB strains in the ZEN-contaminated maize detoxification experiment (Table 4).Therefore, the detoxification capability of a given strain in culturing condition is not necessarily thesame as in the feedstuff fermentation process.
Suitable microorganisms must be easily applied in feed, and their detoxifying action must be fastenough in complex environments, e.g., the gastrointestinal tract or feed pretreatment. The pH has asignificant impact on ZEN degradation [26], and the gastrointestinal tract environment may not besuitable for certain microorganisms and their enzymatic reactions. Moreover, previous research hasfound that acid-treated Bacillus adsorbed less ZEN than untreated cells [27], implying that low pH sites,such as the gastrointestinal tract, are unfavorable for the microbial degradation and adsorption of ZEN.ZEN is absorbed by intestinal epithelium within 30 min after entering the duodenum [31]. Becauseintestinal absorption is quick, ZEN detoxification must take place rapidly or be accomplished beforefeeding [6]. Therefore, application of the microbial fermentation process for animal feed detoxificationcould be a suitable strategy.
The fermentation process can cause loss of nutrients. Some studies suggest that FLF shouldbe produced by fermenting the cereal ingredient instead of the complete feed [11,12]. Furthermore,fermentation of cereals often leads to a more rapid fermentation than compound feed. In the presentstudy, maize contaminated with high level of ZEN (5 mg·kg−1) was used as a substrate, and ZDBstrains grew normally and retained their detoxification capacity (Table 4).
In order to control the growth of pathogenic bacteria, FLF should have a pH below 4.5 [32,33].FLF should contain at least 75 mmol·L−1 lactic acid to avoid the growth of Salmonella spp. [33] andabove 100 mmol·L−1 to decrease the number of enterobacteria [11]. FLF also has beneficial effect ondaily gain, feed intake, and feed efficiency. However, a high concentration of acetic acid would makethe FLF less palatable [33]. The acetic acid concentration of FLF should less than 40 mmol·L−1 [33].
46

Toxins 2019, 11, 330
In the present study, both the fermentation products of ZEN-free maize and ZEN-contaminated maizehad good fermentation characteristics (lactic acid > 110 mmol·L−1; acetic acid < 20 mmol·L−1; pH < 4.5)after 72 h of fermentation. The results indicated that the B2 strain may be a suitable candidate for ZENdetoxification by fermentation.
Bacteria have developed complicated regulation systems to obtain nutrients from a wide range ofsources. In B. subtilis, catabolite control protein A (ccpA) and codY are the major global regulatorsof transcription connected with carbon metabolism involving in the synthesis of lactic acid andacetic acid [34,35]. In the present study, the presence of ZEN significantly increased the lactic acidconcentration in B2 strain (Tables 5 and 6). It is speculated that ZEN may have affected ccpA andcodY of B2 strain, which needs further investigation. A significant increase in NH3-N concentration(Tables 5 and 6) may imply that ZEN also affects protein metabolism in B2 strain. When B2 strain wasinoculated in TSB with ZEN, the bacterial number was increased significantly (Table 5). It is worthnoting that ZEN can be a potential growth promoter for B2 strain.
From a practical perspective, animal feed may not be only contaminated by one kind ofmycotoxin [3]. The additive or synergistic interactions of co-occurring mycotoxins might leadto unpredictable toxicity [36]. An appropriate detoxification strategy should be able to detoxifymultiple mycotoxins. The B2 strain has been confirmed to have the ability to detoxify AFB1, DON,FB1, and T2, which is very appealing.
4. Conclusions
Overall, the B2 strain may be a suitable candidate for ZEN detoxification by fermentation beforefeeding because it demonstrated strong esterase activity and exhibited the highest detoxificationcapability in maize with a high level of ZEN (5 mg·kg−1 maize).
5. Materials and Methods
5.1. Chemicals
HPLC grade methanol and acetonitrile were purchased from Sigma-Aldrich (St. Louis, MO,USA), chloroform and polymyxin B from Merck (Darmstadt, Germany), ZEN from Enzo Biochem(Farmingdale, NY, USA), aflatoxin B1 (AFB1), deoxynivalenol (DON), fumonisin B1 (FB1) and T2 toxinfrom Sigma-Aldrich (St. Louis, MO, USA), and tryptic soy broth (TSB) and tryptic soy agar (TSA) fromAcumedia (Lansing, MI, USA).
5.2. Isolation of Bacillus Strains
In this study, fermented soybean products, soil, sewage, rumen fluid, and ruminant feces werecollected for the isolation of ZEN-detoxification Bacillus (ZDB). One gram of each sample was suspendedin 10 mL TSB containing polymyxin B (100,000 IU L−1) and incubated for 72 h at 37 ◦C. All of thecultured samples were heated in a water bath for 15 min at 80 ◦C and then spread on TSA withpolymyxin B and incubated at 37 ◦C for 24 h. Individual colonies from each plate were collected forfurther screening.
5.3. Screening of ZEN Detoxification Potential Strains
All isolates were inoculated at 1% (v/v) in TSB containing 5 mg L−1 ZEN for 24 h at 37 ◦C. Then,samples were centrifuged for 20 min at 8000× g at 4 ◦C; the supernatants were collected and extractedwith an equal volume of chloroform and sonicated for 30 min. The organic phase was separated bycentrifugation (500× g for 10 min at 25 ◦C) and dried with nitrogen gas at 63.5 ◦C. The residues werere-dissolved in 1 mL methanol and concentrated to 1/5 of the original volume by centrifugal vacuumconcentrator (5301 VacuFuge, Eppendorf®, Hamburg, Germany) at 60 ◦C, then filtered through a0.22 μm nylon syringe filter before loaded into HPLC (LC-2000Plus, JASCO, Tokyo, Japan) with afluorescence detector (excitation and emission wavelengths were 274 and 440 nm) and the Luna®5 μm
47
Toxins 2019, 11, 330
C18(2) 100-Å, LC column (250 × 4.6 mm) (Phenomenex, Torrance, CA, USA) to detect residual ZEN.The mobile phase was acetonitrile solution (50:50, v/v).
5.4. Bacterial Strain Identification
The Bacillus isolates were identified through 16S rRNA gene sequencing. DNA was extracted fromeach isolate using the DNeasy plant mini kit (Qiagen, Valencia, CA, USA). The PCR products weresequenced using the BigDye terminator v3.1 cycle sequencing kit (Applied Biosystems, Foster City, CA,USA), and sequencing was performed on a DNA Analyzer (3730XL, Applied Biosystems, Foster City,CA, USA). The sequences (approximately 1500 bp) were compared with 16S rRNA gene sequences inthe NCBI GenBank database using basic local alignment search tool (BLAST). The candidate strain wasfurther identified by sequence analysis of gyrB gene sequence (approximately 1200 bp) [37].
5.5. Bacillus-Related Enterotoxin Detection
Nonhemolytic enterotoxin A (Nhe A), and nonhemolytic enterotoxin B (Nhe B) were detectedby the Bacillus Diarrhoeal Enterotoxin Visual Immunoassay (BDE VIA™) (TECRA International PtyLtd, Chatswood, Australia). Nhe B and hemolysin BL (HBL) were detected by the Duopath®CereusEnterotoxins kit (EMD Millipore, Merck KGaA, Darmstadt, Germany). Cereulide was detected by theSinglepath®Emetic Tox. Mrk. Kit (EMD Millipore, Merck KGaA, Darmstadt, Germany).
5.6. ZEN Detoxification Capability Test in Culturing Condition (TSB Medium)
The ZDB strains were inoculated at 1% (v/v) in TSB containing 5 mg L−1 ZEN at 37 ◦C for 24 h.After that, samples were centrifuged (8000× g for 20 min at 4 ◦C) and supernatants were collected forthe residual ZEN analysis. The ZEN detoxification of the ZDB strains was compared to a strain ofB. subtilis (BCRC 17,441) from the Bioresource Collection and Research Center, Food Industry Researchand Development Institute (Taiwan) to assess their relative detoxification capabilities [27].
5.7. ZEN Adsorption Ability and ZEN Degradation Ability
The ZDB strains were inoculated at 1% (v/v) in TSB at 37 ◦C for 24 h. Following the incubation,the cells and supernatants were separated by centrifugation (8000× g for 20 min at 4 ◦C). The cells wereused for the ZEN adsorption ability test, and the supernatants were used for the ZEN degradation test.The separated cells were resuspended in 10 mL PBS containing ZEN (5 mg·L−1) and incubated withconstant shaking at 150 rpm. After 30 min, the culture was centrifuged (8000× g for 20 min at 4 ◦C),and the supernatants were collected and analyzed for residual ZEN. The ZEN degradation test wascarried out by adding ZEN to the collected supernatants (at a final concentration of 5 mg L−1) andincubated in a rotary shaking incubator (150 rpm) at 37 ◦C. After 24 h, the supernatant was analyzedfor residual ZEN.
5.8. Enzymatic Profile of ZDB Strains
The API ZYM system (bioMérieux, Marcy l’Etoile, France) was used for the assay of enzymaticactivities of the ZDB strains. After subcultured twice, the cells of each ZDB strain were collected throughcentrifugation (8000× g for 20 min) and resuspended in API suspension medium with turbidity adjustedto 5–6 McFarland. All detection tests were performed according to the manufacturer’s instructions.
5.9. Detoxification of ZEN-Contaminated Maize by ZDB Strains
ZEN (5 mg·kg−1) was added to 20 g of sterile ZEN-free maize, and then 60 mL of sterile distilledwater was added. The inoculum of the candidate strain was added at 1% (v/v) and incubated at37 ◦C for 48 h. After 24 and 48 h, samples were collected for monitoring bacterial number and ZENdetoxification activity. Bacterial counts were performed with TSA plating at 37 ◦C for 24 h. Finally,
48

Toxins 2019, 11, 330
all fermentation residues were collected, freeze-dried, and analyzed for residual ZEN according toOk et al. [38].
5.10. The Effect of ZEN on the Candidate Strain (B2 Strain) Growth in TSB Medium
The candidate strain (B2 strain) was inoculated at 1% (v/v) in TSB with or without ZEN (at a finalconcentration of 5 mg·L−1), and incubated at 37 ◦C for 24 h. After 8 h and 24 h, samples were collectedfor checking bacterial numbers. At the end of incubation, the supernatants were collected and analyzedfor the pH, NH3-N, lactic acid, acetic acid, and total volatile fatty acids (VFAs). Bacterial count was doneas previously. The pH value was measured with a pH meter (pH 22, Horiba, Kyoto, Japan). The NH3-Nconcentration was determined as described by Chaney and Marbach [39]. The lactic acid concentrationwas determined by L-lactic acid assay kit (LC2653, Randox, Crumlin, UK). Acetic acid and total VFAswere analyzed using gas chromatography (GC7820A, Agilent, Santa Clara, CA, USA) with a flameionization detector and the Nukol™ capillary GC column (size × I.D. 30 m × 0.25 mm, df 0.25 μm)(SUPELCO, Bellefonte, PA, USA). The carry gas was helium gas. The crotonic acid (25 g·L−1) was usedas an internal standard.
5.11. The Effect of ZEN on Fermentation Characteristics of the Candidate Strain (B2) in Maize
The candidate strain (B2 strain) was inoculated at 1% (v/v) in ZEN-free maize or ZEN-contaminatedmaize (at a final concentration of 5 mg·kg−1) added 60 mL of sterile distilled water. The fermentationprocess was under aerobic conditions at 37◦C for 72 h. After 48 h and 72 h, samples were collected foran analysis of bacterial count and pH value. After then, the supernatants were collected for analysis ofNH3-N, lactic acid, and acetic acid.
5.12. Other Mycotoxin (AFB1, DON, FB1 and T2 Toxin) Detoxification Test
The candidate strain (B2 strain) was inoculated at 1% (v/v) in individual TSB containing AFB1(5 μg·L−1), DON (400 μg·L−1), FB1 (500 μg·L−1), or T2 toxin (100 μg·L−1), respectively. After incubatedat 37 ◦C for 24 h, samples were centrifuged (8000× g for 20 min at 4 ◦C) and supernatants were collectedfor the residual mycotoxins analysis. Residual AFB1, DON, FB1, and T2 toxin were performed byusing enzyme-linked immunosorbent assay kit (Vaccigen, New Taipei, Taiwan).
5.13. Statistical Analysis
The data of the effect of ZEN on the candidate strain (B2 strain) growth in TSB, fermentationcharacteristics in maize experiments, and mycotoxin (AFB1, DON, FB1, and T2 toxin) detoxificationcapability test were analyzed via t-test analysis. The data of ZDB strains’ ZEN detoxification capability,adsorption ability, degradation ability, and detoxification of ZEN-contaminated maize experimentwere analyzed by the general linear model procedure of SAS, Version 9.4 and expressed as the means± standard deviation (SD) (SAS Institute Inc., Cary, NC, USA). Statistical differences were determinedby Duncan’s multiple range test, and significance was defined as p < 0.05.
Author Contributions: The authors’ responsibilities were as follows: Conceptualization, S.-W.C. and J.-T.H.;Methodology, S.-W.C. and J.-T.H.; Software, S.-W.C. and J.-T.H.; Validation, S.-W.C. and J.-T.H.; Formal Analysis,S.-W.C., H.-T.W., W.-Y.S., Y.-A.C., Y.-Y.C. and J.-T.H.; Investigation: S.-W.C., H.-T.W., W.-Y.S., Y.-A.C., Y.-Y.C.and J.-T.H.; Resources, H.-T.W., S.-Y.W. and J.-T.H.; Data Curation, S.-W.C. and J.-T.H.; Writing-Original DraftPreparation, S.-W.C., L.A. and J.-T.H.; Writing-Review & Editing; J.-T.H.; Visualization, S.-W.C. and J.-T.H.;Supervision, J.-T.H.; Project Administration, J.-T.H.; Funding Acquisition, S.-Y.W. and J.-T.H.
Funding: This research received no external funding.
Acknowledgments: The authors would like to thank all of their colleagues for their contributions to this research.We are grateful to Chong-Zhi Bai, Wei-Chen Chen, Yu-Chih, Huang, Zhi-Hong Liu, Chen Syu and Show-ShowYang for their help in the sample collection. We would also like to express our gratitude to Dr. Hsin Tsai forinvaluable guidance.
Conflicts of Interest: The authors declare no conflict of interest.
49

Toxins 2019, 11, 330
References
1. Zinedine, A.; Soriano, J.M.; Moltó, J.C.; Mañes, J. Review on the toxicity, occurrence, metabolism, detoxification,regulations and intake of zearalenone: An oestrogenic mycotoxin. Food Chem. Toxicol. 2007, 45, 1–18.[CrossRef] [PubMed]
2. Chaytor, A.C.; Hansen, J.A.; van Heugten, E.; See, M.T.; Kim, S.W. Occurrence and decontamination ofmycotoxins in swine feed. Asian-Australas. J. Anim. Sci. 2011, 24, 723–738. [CrossRef]
3. Schatzmayr, G.; Streit, E. Global occurrence of mycotoxins in the food and feed chain: Facts and figures.World Mycotoxin J. 2013, 6, 213–222. [CrossRef]
4. Kowalska, K.; Habrowska-Górczynska, D.E.; Piastowska-Ciesielska, A.W. Zearalenone as an endocrinedisruptor in humans. Environ. Toxicol. Pharmacol. 2016, 48, 141–149. [CrossRef] [PubMed]
5. Coulombe, R.A., Jr. Biological action of mycotoxins. J. Dairy Sci. 1993, 6, 880–891. [CrossRef]6. Schatzmayr, G.; Zehner, F.; Täubel, M.; Schatzmayr, D.; Klimitsch, A.; Loibner, A.P.; Binder, E.M.
Microbiologicals for deactivating mycotoxins. Mol. Nutr. Food Res. 2006, 50, 543–551. [CrossRef][PubMed]
7. Vekiru, E.; Hametner, C.; Mitterbauer, R.; Rechthaler, J.; Adam, G.; Schatzmayr, G.; Krska, R.; Schuhmacher, R.Cleavage of zearalenone by Trichosporon mycotoxinivorans to a novel nonestrogenic metabolite. Appl. Environ.Microbiol. 2010, 76, 2353–2359. [CrossRef] [PubMed]
8. Huwig, A.; Freimund, S.; Käppeli, O.; Dutler, H. Mycotoxin detoxication of animal feed by differentadsorbents. Toxicol. Lett. 2001, 122, 179–188. [CrossRef]
9. Upadhaya, S.D.; Park, M.A.; Ha, J.K. Mycotoxins and their biotransformation in the rumen: A review.Asian-Australas. J. Anim. Sci. 2010, 23, 1250–1260. [CrossRef]
10. EFSA. Introduction of a Qualified Presumption of Safety (QPS) approach for assessment of selectedmicroorganisms referred to EFSA. EFSA J. 2007, 587, 1–16. [CrossRef]
11. Missotten, J.A.M.; Michiels, J.; Degroote, J.; De Smet, S. Fermented liquid feed for pigs: An ancient techniquefor the future. J. Anim. Sci. Biotechnol. 2015, 6, 4. [CrossRef] [PubMed]
12. Canibe, N.; Jensen, B.B. Fermented liquid feed-microbial and nutritional aspects and impact on entericdiseases in pigs. Anim. Feed Sci. Technol. 2012, 173, 17–40. [CrossRef]
13. Reddy, K.R.N.; Salleh, B.; Saad, B.; Abbas, H.K.; Abel, C.A.; Shier, W.T. An overview of mycotoxincontamination in foods and its implications for human health. Toxin Rev. 2010, 29, 3–26. [CrossRef]
14. El-Sharkawy, S.; Abul-Hajj, Y.J. Microbial cleavage of zearalenone. Xenobiotica 1988, 18, 365–371. [CrossRef][PubMed]
15. Kakeya, H.; Takahashi-Ando, N.; Kimura, M.; Onose, R.; Yamaguchi, I.; Osada, H. Biotransformation of themycotoxin, zearalenone, to a non-estrogenic compound by a fungal strain of Clonostachys sp. Biosci. Biotechnol.Biochem. 2002, 66, 2723–2726. [CrossRef] [PubMed]
16. Molnar, O.; Schatzmayr, G.; Fuchs, E.; Prillinger, H. Trichosporon mycotoxinivorans sp. nov., a new yeast speciesuseful in biological detoxification of various mycotoxins. Syst. Appl. Microbiol. 2004, 27, 661–671. [CrossRef]
17. Varga, J.; Péteri, Z.; Tábori, K.; Téren, J.; Vágvölgyi, C. Degradation of ochratoxin A and other mycotoxins byRhizopus isolates. Int. J. Food Microbiol. 2005, 99, 321–328. [CrossRef]
18. Altalhi, A.D.; El-Deeb, B. Localization of zearalenone detoxification gene(s) in pZEA-1 plasmid of seudomonasputida ZEA-1 and expressed in Escherichia coli. J. Hazard Mater. 2009, 161, 1166–1172. [CrossRef]
19. Yu, Y.; Qiu, L.; Wu, H.; Tang, Y.; Yu, Y.; Li, X.; Liu, D. Degradation of zearalenone by the extracellular extractsof Acinetobacter sp. SM04 liquid cultures. Biodegradation 2011, 22, 613–622. [CrossRef]
20. Cserháti, M.; Kriszt, B.; Krifaton, C.; Szoboszlay, S.; Háhn, J.; Tóth, S.; Nagy, I.; Kukolya, J.Mycotoxin-degradation profile of Rhodococcus strains. Int. J. Food Microbiol. 2013, 166, 176–185. [CrossRef]
21. Kosawang, C.; Karlsson, M.; Vélëz, H.; Rasmussen, P.H.; Collinge, D.B.; Jensen, B.; Jensen, D.F. Zearalenonedetoxification by zearalenone hydrolase is important for the antagonistic ability of Clonostachys rosea againstmycotoxigenic Fusarium graminearum. Fungal Biol. 2014, 118, 364–373. [CrossRef] [PubMed]
22. Sun, X.; He, X.; Xue, K.; Li, Y.; Xu, D.; Qian, H. Biological detoxification of zearalenone by Aspergillus nigerstrain FS10. Food Chem. Toxicol. 2014, 72, 76–82. [CrossRef] [PubMed]
23. Tan, H.; Hu, Y.; He, J.; Wu, L.; Liao, F.; Luo, B.; He, Y.; Zuo, Z.; Ren, Z.; Zhong, Z.; et al. Zearalenonedegradation by two Pseudomonas strains from soil. Mycotoxin Res. 2014, 30, 191–196. [CrossRef] [PubMed]
50
Toxins 2019, 11, 330
24. Shetty, P.H.; Jespersen, L. Saccharomyces cerevisiae and lactic acid bacteria as potential mycotoxindecontaminating agents. Trends Food Sci. Technol. 2006, 17, 48–55. [CrossRef]
25. Setlow, P. Spores of Bacillus subtilis: Their resistance to and killing by radiation, heat and chemicals. J. Appl.Microbiol. 2006, 101, 514–525. [CrossRef] [PubMed]
26. Wang, G.; Yu, M.; Dong, F.; Shi, J.; Xu, J. Esterase activity inspired selection and characterization of zearalenonedegrading bacteria Bacillus pumilus ES-21. Food Control 2017, 77, 57–64. [CrossRef]
27. Tinyiro, S.E.; Wokadala, C.; Xu, D.; Yao, W. Adsorption and degradation of zearalenone by Bacillus strains.Folia Microbiol. 2011, 56, 321–327. [CrossRef]
28. El-Nezami, H.; Polychronaki, N.; Lee, Y.K.; Haskard, C.; Juvonen, R.; Salminen, S.; Mykkänen, H. Chemicalmoieties and interactions involved in the binding of zearalenone to the surface of Lactobacillus rhamnosusstrains GG. J. Agric. Food Chem. 2004, 52, 4577–4581. [CrossRef]
29. Sangsila, A.; Faucet-Marquis, V.; Pfohl-Leszkowicz, A.; Itsaranuwat, P. Detoxification of zearalenone byLactobacillus pentosus strains. Food Control 2016, 62, 187–192. [CrossRef]
30. Dalié, D.K.D.; Deschamps, A.M.; Richard-Forget, F. Lactic acid bacteria-potential for control of mould growthand mycotoxins: A review. Food Control 2010, 21, 370–380. [CrossRef]
31. Olsen, M.; Malmlöf, K.; Pettersson, H.; Sandholm, K.; Kiessling, K.H. Plasma and urinary levels of zearalenoneand alpha-zearalenol in a prepubertal gilt fed zearalenone. Acta Pharmacol. Toxicol. 1985, 56, 239–243.[CrossRef]
32. Van Winsen, R.L.; Lipman, L.J.A.; Biesterveld, S.; Urlings, B.A.P.; Snijders, J.M.A.; Van Knapen, F. Mechanismof Salmonella reduction in fermented pig feed. J. Sci. Food Agric. 2001, 81, 342–346. [CrossRef]
33. Missotten, J.A.M.; Goris, J.; Michiels, J.; Van Coillie, E.; Herman, L.; De Smet, S.; Dierick, N.A.; Heyndrickx, M.Screening of isolated lactic acid bacteria as potential beneficial strains for fermented liquid pig feed production.Anim. Feed Sci. Tech. 2009, 150, 122–138. [CrossRef]
34. Sonenshein, A.L. Control of key metabolic intersections in Bacillus subtilis. Nat. Rev. Microbiol. 2007, 5,917–927. [CrossRef] [PubMed]
35. Shivers, R.P.; Dineen, S.S.; Sonenshein, A.L. Positive regulation of Bacillus subtilis ackA by CodY and CcpA:Establishing a potential hierarchy in carbon flow. Mol. Microbiol. 2006, 62, 811–822. [CrossRef]
36. Grenier, B.; Oswald, I. Mycotoxin co-contamination of food and feed: Meta-analysis of publications describingtoxicological interactions. World Mycotoxin J. 2011, 4, 285–313. [CrossRef]
37. Wang, L.T.; Lee, F.L.; Tai, C.J.; Kasai, H. Comparison of gyrB gene sequences, 16S rRNA gene sequences andDNA-DNA hybridization in the Bacillus subtilis group. Int. J. Syst. Evol. Microbiol. 2007, 57, 1846–1850.[CrossRef]
38. Ok, H.E.; Choi, S.W.; Kim, M.; Chun, H.S. HPLC and UPLC methods for the determination of zearalenone innoodles, cereal snacks and infant formula. Food Chem. 2014, 163, 252–257. [CrossRef]
39. Chaney, A.L.; Marbach, E.P. Modified reagents for determination of urea and ammonia. Clin. Chem. 1962, 8,130–132.
© 2019 by the authors. Licensee MDPI, Basel, Switzerland. This article is an open accessarticle distributed under the terms and conditions of the Creative Commons Attribution(CC BY) license (http://creativecommons.org/licenses/by/4.0/).
51


toxins
Article
Zearalenone Biodegradation by the Combination ofProbiotics with Cell-Free Extracts of Aspergillusoryzae and Its Mycotoxin-Alleviating Effect on PigProduction Performance
Chaoqi Liu 1, Juan Chang 1, Ping Wang 1, Qingqiang Yin 1,*, Weiwei Huang 1, Xiaowei Dang 2,
Fushan Lu 3 and Tianzeng Gao 4
1 College of Animal Science and Veterinary Medicine, Henan Agricultural University, Zhengzhou 450002,China; [email protected] (C.L.); [email protected] (J.C.);[email protected] (P.W.); [email protected] (W.H.)
2 Henan Delin Biological Product Co. Ltd., Xinxiang 453000, China; [email protected] Henan Puai Feed Co. Ltd., Zhoukou 466000, China; [email protected] Henan Guangan Biotechnology Co., Ltd., Zhengzhou 450001, China; [email protected]* Correspondence: [email protected]
Received: 6 September 2019; Accepted: 18 September 2019; Published: 20 September 2019
Abstract: In order to remove zearalenone (ZEA) detriment—Bacillus subtilis, Candida utilis, andcell-free extracts from Aspergillus oryzae were used to degrade ZEA in this study. The orthogonalexperiment in vitro showed that the ZEA degradation rate was 92.27% (p < 0.05) under the conditionsthat Candida utilis, Bacillus subtilis SP1, and Bacillus subtilis SP2 were mixed together at 0.5%, 1.0%,and 1.0%. When cell-free extracts from Aspergillus oryzae were combined with the above probioticsat a ratio of 2:1 to make mycotoxin-biodegradation preparation (MBP), the ZEA degradation ratereached 95.15% (p < 0.05). In order to further investigate the MBP effect on relieving the negativeimpact of ZEA for pig production performance, 120 young pigs were randomly divided into 5 groups,with 3 replicates in each group and 8 pigs for each replicate. Group A was given the basal diet with86.19 μg/kg ZEA; group B contained 300 μg/kg ZEA without MBP addition; and groups C, D, and Econtained 300 μg/kg ZEA added with 0.05%, 0.10%, and 0.15% MBP, respectively. The results showedthat MBP addition was able to keep gut microbiota stable. ZEA concentrations in jejunal contentsin groups A and D were 89.47% and 80.07% lower than that in group B (p < 0.05), indicating thatMBP was effective in ZEA biodegradation. In addition, MBP had no significant effect on pig growth,nutrient digestibility, and the relative mRNA abundance of estrogen receptor alpha (ERα) genes inovaries and the uterus (p > 0.05).
Keywords: Zearalenone; biodegradation; probiotics; cell-free extracts of Aspergillus oryzae; pigproduction performance
Key Contribution: The combination of beneficial microbes and cell-free extracts from A. oryzae wasprepared to degrade ZEA effectively in vitro. Its addition in pig diets could alleviate ZEA negativeeffect on pig production performances.
1. Introduction
Zearalenone (ZEA) is one of the nonsteroidal estrogenic mycotoxins produced by Fusarium speciesto cause reproduction disorders in female animals such as abortion, false estrus, and so on [1]. Someof ZEA derivatives competitively bind estrogen receptors in the uterus and ovaries for reducing theability of estrogen to bind receptors [2,3]. Long-term exposure to low doses of ZEA could alter estrogen
Toxins 2019, 11, 552; doi:10.3390/toxins11100552 www.mdpi.com/journal/toxins53

Toxins 2019, 11, 552
receptor beta genes and induce epigenetic modification to inhibit the development of the ovary [4].However, the relative transactivation activity of ZEA for estrogen receptor alpha was higher thanestrogen receptor beta [5]. In sorghum, maize, wheat, rice, barley, and other crops and their sidelineproducts, ZEA can be detected in their natural state during storage, transportation, and processing [6].It was reported that ZEA was present in 92% of maize, 88% of maize silage, and 97% of small grainssamples with a range of 141.30–253.07 μg/Kg [7–9]. Another report showed that the incidences andmaximal levels of ZEA in raw cereal grains were 46% and 3049 μg/kg respectively, according to theglobal occurrence data reported during the past 10 years [10]. Generally, pigs are more sensitive toZEA than other animals. Therefore, it is necessary to take some methods to eliminate ZEA in theanimal feeding process, especially for female pigs.
In order to reduce ZEA detriment, many countries and organizations in the world have limitedthe maximal ZEA contents in food, feed, and cereals. For example, Australia allows a maximal ZEAcontent of 50 μg/Kg in cereals. ZEA content in cereals and cereal products is not allowed to exceed100 μg/Kg in Italy. The maximal ZEA content in vegetable oil and cereals is 200 μg/Kg in France [11].The maximal ZEA content in swine diets is 250 μg/Kg in China and Europe. Even so, ZEA content oftenexceeds these thresholds because of the different environments and inadequate storage conditions.
In order to detoxify ZEA, some physical, chemical, and biological methods have been conducted[12–15]. Some reports have shown that ZEA biological degradation is more effective than othermethods [16,17]. There were some reports about ZEA biodegradation by microorganisms includingSaccharomyces cerevisiae [18], Bacillus subtilis (B. subtilis) ANSB01G [19], and Lactobacillus plantarum [20].In this study, B. subtilis SP1, B. subtilis SP2, Candida utilis (C. utilis), and cell-free extracts of Aspergillusoryzae (A. oryzae) were selected and combined together to determine the effect on ZEA detoxificationand pig production performance, which will supply a new feed additive for safe animal feedingand production.
2. Results
2.1. The Probiotics for ZEA Degradation
In order to obtain the optimal ratio of probiotics for ZEA degradation, an orthogonal design wasused in this experiment. Table 1 indicates that the biggest ZEA degradation rate in the nine treatmentswas 92.27% (p < 0.05) under the conditions that Candida utilis, Bacillus subtilis SP1, and Bacillus subtilisSP2 were mixed together at a ratio of A1B2C2 (i.e., 0.5%, 1.0%, and 1.0%, respectively). The analysisshowed that the optimal addition ratio of C. utilis, B. subtilis SP1, and B. subtilis SP2 was A1B1C3
(i.e., 0.50%, 0.50%, and 1.50%). However, further ZEA degradation experiments indicated that A1B2C2
was better than A1B1C3. Table 2 indicated that that the constructed model was accurate and acceptable(p < 0.01). Among the three strains of microbes, C. utilis had a significant effect on the model for ZEAdegradation (p < 0.01), followed by B. subtilis SP1 and B. subtilis SP2 (p > 0.05).
54
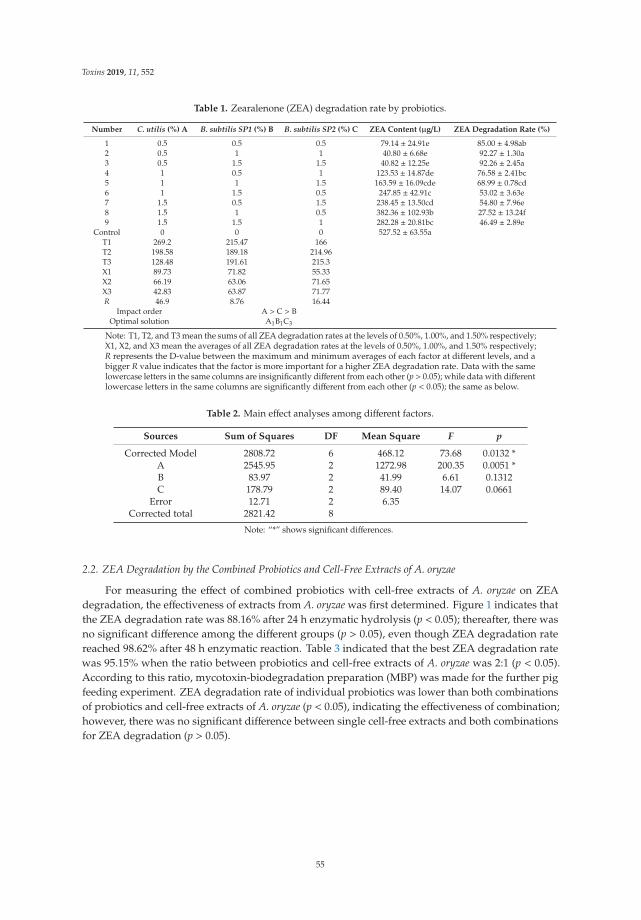
Toxins 2019, 11, 552
Table 1. Zearalenone (ZEA) degradation rate by probiotics.
Number C. utilis (%) A B. subtilis SP1 (%) B B. subtilis SP2 (%) C ZEA Content (μg/L) ZEA Degradation Rate (%)
1 0.5 0.5 0.5 79.14 ± 24.91e 85.00 ± 4.98ab2 0.5 1 1 40.80 ± 6.68e 92.27 ± 1.30a3 0.5 1.5 1.5 40.82 ± 12.25e 92.26 ± 2.45a4 1 0.5 1 123.53 ± 14.87de 76.58 ± 2.41bc5 1 1 1.5 163.59 ± 16.09cde 68.99 ± 0.78cd6 1 1.5 0.5 247.85 ± 42.91c 53.02 ± 3.63e7 1.5 0.5 1.5 238.45 ± 13.50cd 54.80 ± 7.96e8 1.5 1 0.5 382.36 ± 102.93b 27.52 ± 13.24f9 1.5 1.5 1 282.28 ± 20.81bc 46.49 ± 2.89e
Control 0 0 0 527.52 ± 63.55aT1 269.2 215.47 166T2 198.58 189.18 214.96T3 128.48 191.61 215.3X1 89.73 71.82 55.33X2 66.19 63.06 71.65X3 42.83 63.87 71.77R 46.9 8.76 16.44
Impact order A > C > BOptimal solution A1B1C3
Note: T1, T2, and T3 mean the sums of all ZEA degradation rates at the levels of 0.50%, 1.00%, and 1.50% respectively;X1, X2, and X3 mean the averages of all ZEA degradation rates at the levels of 0.50%, 1.00%, and 1.50% respectively;R represents the D-value between the maximum and minimum averages of each factor at different levels, and abigger R value indicates that the factor is more important for a higher ZEA degradation rate. Data with the samelowercase letters in the same columns are insignificantly different from each other (p > 0.05); while data with differentlowercase letters in the same columns are significantly different from each other (p < 0.05); the same as below.
Table 2. Main effect analyses among different factors.
Sources Sum of Squares DF Mean Square F p
Corrected Model 2808.72 6 468.12 73.68 0.0132 *A 2545.95 2 1272.98 200.35 0.0051 *B 83.97 2 41.99 6.61 0.1312C 178.79 2 89.40 14.07 0.0661
Error 12.71 2 6.35Corrected total 2821.42 8
Note: “*” shows significant differences.
2.2. ZEA Degradation by the Combined Probiotics and Cell-Free Extracts of A. oryzae
For measuring the effect of combined probiotics with cell-free extracts of A. oryzae on ZEAdegradation, the effectiveness of extracts from A. oryzae was first determined. Figure 1 indicates thatthe ZEA degradation rate was 88.16% after 24 h enzymatic hydrolysis (p < 0.05); thereafter, there wasno significant difference among the different groups (p > 0.05), even though ZEA degradation ratereached 98.62% after 48 h enzymatic reaction. Table 3 indicated that the best ZEA degradation ratewas 95.15% when the ratio between probiotics and cell-free extracts of A. oryzae was 2:1 (p < 0.05).According to this ratio, mycotoxin-biodegradation preparation (MBP) was made for the further pigfeeding experiment. ZEA degradation rate of individual probiotics was lower than both combinationsof probiotics and cell-free extracts of A. oryzae (p < 0.05), indicating the effectiveness of combination;however, there was no significant difference between single cell-free extracts and both combinationsfor ZEA degradation (p > 0.05).
55
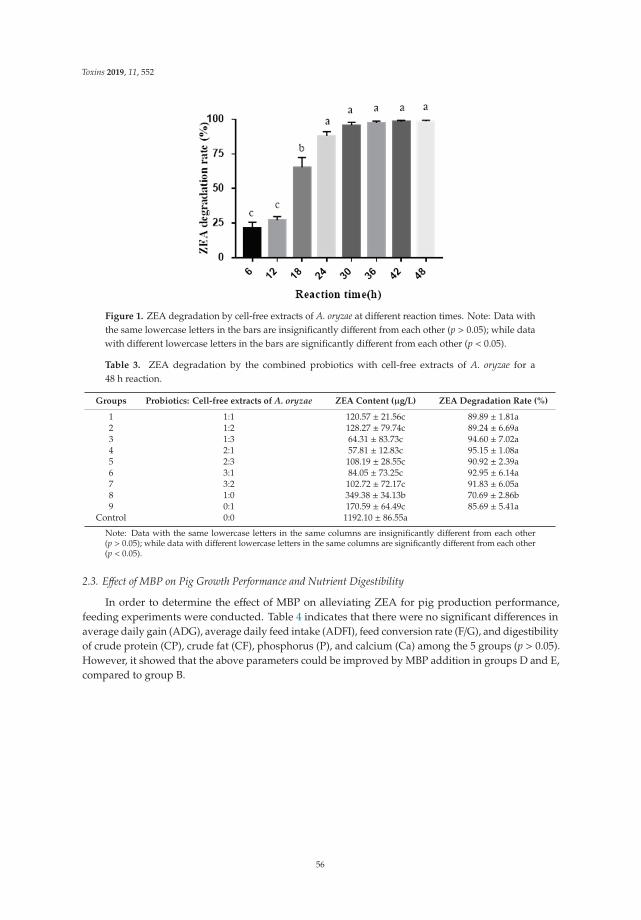
Toxins 2019, 11, 552
Figure 1. ZEA degradation by cell-free extracts of A. oryzae at different reaction times. Note: Data withthe same lowercase letters in the bars are insignificantly different from each other (p > 0.05); while datawith different lowercase letters in the bars are significantly different from each other (p < 0.05).
Table 3. ZEA degradation by the combined probiotics with cell-free extracts of A. oryzae for a48 h reaction.
Groups Probiotics: Cell-free extracts of A. oryzae ZEA Content (μg/L) ZEA Degradation Rate (%)
1 1:1 120.57 ± 21.56c 89.89 ± 1.81a2 1:2 128.27 ± 79.74c 89.24 ± 6.69a3 1:3 64.31 ± 83.73c 94.60 ± 7.02a4 2:1 57.81 ± 12.83c 95.15 ± 1.08a5 2:3 108.19 ± 28.55c 90.92 ± 2.39a6 3:1 84.05 ± 73.25c 92.95 ± 6.14a7 3:2 102.72 ± 72.17c 91.83 ± 6.05a8 1:0 349.38 ± 34.13b 70.69 ± 2.86b9 0:1 170.59 ± 64.49c 85.69 ± 5.41a
Control 0:0 1192.10 ± 86.55a
Note: Data with the same lowercase letters in the same columns are insignificantly different from each other(p > 0.05); while data with different lowercase letters in the same columns are significantly different from each other(p < 0.05).
2.3. Effect of MBP on Pig Growth Performance and Nutrient Digestibility
In order to determine the effect of MBP on alleviating ZEA for pig production performance,feeding experiments were conducted. Table 4 indicates that there were no significant differences inaverage daily gain (ADG), average daily feed intake (ADFI), feed conversion rate (F/G), and digestibilityof crude protein (CP), crude fat (CF), phosphorus (P), and calcium (Ca) among the 5 groups (p > 0.05).However, it showed that the above parameters could be improved by MBP addition in groups D and E,compared to group B.
56
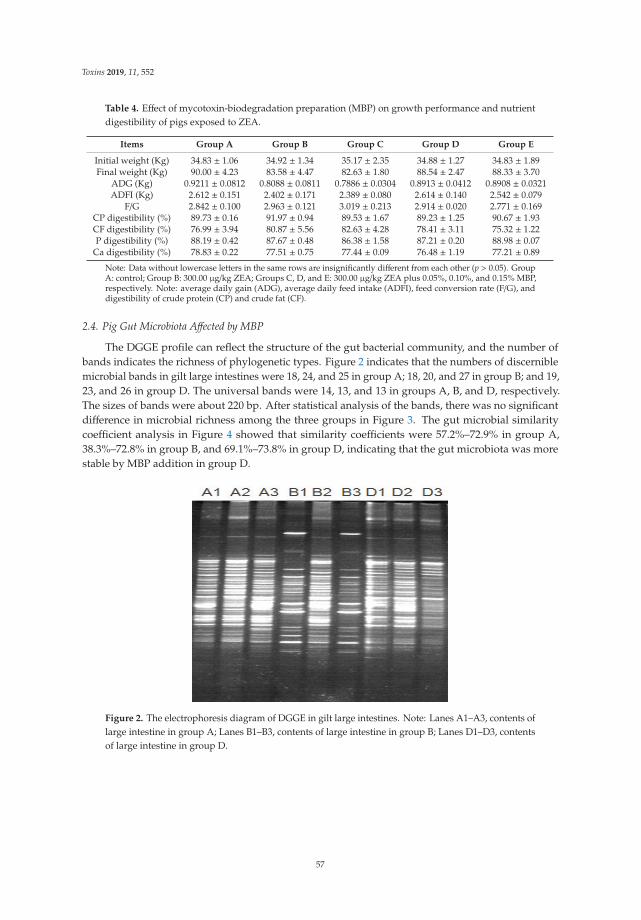
Toxins 2019, 11, 552
Table 4. Effect of mycotoxin-biodegradation preparation (MBP) on growth performance and nutrientdigestibility of pigs exposed to ZEA.
Items Group A Group B Group C Group D Group E
Initial weight (Kg) 34.83 ± 1.06 34.92 ± 1.34 35.17 ± 2.35 34.88 ± 1.27 34.83 ± 1.89Final weight (Kg) 90.00 ± 4.23 83.58 ± 4.47 82.63 ± 1.80 88.54 ± 2.47 88.33 ± 3.70
ADG (Kg) 0.9211 ± 0.0812 0.8088 ± 0.0811 0.7886 ± 0.0304 0.8913 ± 0.0412 0.8908 ± 0.0321ADFI (Kg) 2.612 ± 0.151 2.402 ± 0.171 2.389 ± 0.080 2.614 ± 0.140 2.542 ± 0.079
F/G 2.842 ± 0.100 2.963 ± 0.121 3.019 ± 0.213 2.914 ± 0.020 2.771 ± 0.169CP digestibility (%) 89.73 ± 0.16 91.97 ± 0.94 89.53 ± 1.67 89.23 ± 1.25 90.67 ± 1.93CF digestibility (%) 76.99 ± 3.94 80.87 ± 5.56 82.63 ± 4.28 78.41 ± 3.11 75.32 ± 1.22P digestibility (%) 88.19 ± 0.42 87.67 ± 0.48 86.38 ± 1.58 87.21 ± 0.20 88.98 ± 0.07
Ca digestibility (%) 78.83 ± 0.22 77.51 ± 0.75 77.44 ± 0.09 76.48 ± 1.19 77.21 ± 0.89
Note: Data without lowercase letters in the same rows are insignificantly different from each other (p > 0.05). GroupA: control; Group B: 300.00 μg/kg ZEA; Groups C, D, and E: 300.00 μg/kg ZEA plus 0.05%, 0.10%, and 0.15% MBP,respectively. Note: average daily gain (ADG), average daily feed intake (ADFI), feed conversion rate (F/G), anddigestibility of crude protein (CP) and crude fat (CF).
2.4. Pig Gut Microbiota Affected by MBP
The DGGE profile can reflect the structure of the gut bacterial community, and the number ofbands indicates the richness of phylogenetic types. Figure 2 indicates that the numbers of discerniblemicrobial bands in gilt large intestines were 18, 24, and 25 in group A; 18, 20, and 27 in group B; and 19,23, and 26 in group D. The universal bands were 14, 13, and 13 in groups A, B, and D, respectively.The sizes of bands were about 220 bp. After statistical analysis of the bands, there was no significantdifference in microbial richness among the three groups in Figure 3. The gut microbial similaritycoefficient analysis in Figure 4 showed that similarity coefficients were 57.2%–72.9% in group A,38.3%–72.8% in group B, and 69.1%–73.8% in group D, indicating that the gut microbiota was morestable by MBP addition in group D.
Figure 2. The electrophoresis diagram of DGGE in gilt large intestines. Note: Lanes A1–A3, contents oflarge intestine in group A; Lanes B1–B3, contents of large intestine in group B; Lanes D1–D3, contentsof large intestine in group D.
57

Toxins 2019, 11, 552
Figure 3. Microbial richness calculated by the number of bands in the electrophoresis diagram of DGGE.
Figure 4. The microbial similarity coefficients in different samples.
2.5. The Vulvar Area and Serum Parameters
Gilt vulvar area can reflect the effect of ZEA on female pig reproduction status. The effect of MBPon alleviating gilt vulvar area caused by ZEA in Figure 5 showed that, during the first 15 d, the vulvararea in group A increased slightly, while the other groups increased greatly, especially for group B.Fifteen days later, the vulvar area in each group increased slightly, and the order of vulvar area was:group B > group C > groups D and E > group A, indicating the effectiveness of MBP for weakeningZEA detriments.
Figure 5. Effect of MBP on gilt vulvar representation.
58

Toxins 2019, 11, 552
In addition, ZEA or MBP had no significant effect on serum biochemical parameters such as ureanitrogen (UN), total cholesterol (TC), glucose (GLU), triglyceride, high-density lipoprotein (HDL),low-density lipoprotein (LDL), total protein (TP), albumin (ALB), globulin (GLO), albumin and globulinratio (A/G), alanine aminotransferase (ALT), aspartate aminotransferase (AST), alkaline phosphatase(ALP), immunoglobulin G (IgG), immunoglobulin M (IgM), glutathione peroxidase (GSH-Px), andestradiol (E2). It can be concluded that ZEA or MBP could not cause significant effects on the normalphysiological and metabolic status of pigs in this study.
2.6. The Relative Organ Weight and ERα mRNA Abundance in Ovaries and the Uterus
ZEA may influence the relative organ weight and ERα mRNA abundance for female pigs.However, Table 5 shows that there was no significant difference for relative organ weight and ERαmRNA abundance in ovaries and the uterus among groups A, B, and D (p > 0.05), which showed that300.00 μg/kg ZEA in pig diets was not enough to cause significant changes in relative organ weightand ERα mRNA abundance in ovaries and the uterus, even though MBP addition could alleviate ZEAhazards to some extent.
Table 5. Effect of MBP on serum E2 content, relative organ weight, and ERα mRNA in ovaries andthe uterus.
Items Group A Group B Group D
Heart (g/Kg) 3.241 ± 0.100 3.177 ± 0.311 3.616 ± 0.194Liver (g/Kg) 15.97 ± 1.81 16.33 ± 0.80 18.67 ± 1.67
Spleen (g/Kg) 1.365 ± 0.249 1.605 ± 0.041 1.703 ± 0.164Kidney (g/Kg) 2.960 ± 0.172 2.967 ± 0.221 3.432 ± 0.496Uterus (g/Kg) 1.245 ± 0.752 1.932 ± 0.587 1.673 ± 0.318
Serum E2 (pg/ml) 109.03 ± 8.29 112.48 ± 15.75 103.88 ± 5.06ERα mRNA abundance in ovaries 0.7899 ± 0.1021 1.171 ± 0.141 1.171 ± 0.122ERα mRNA abundance in uterus 1.010 ± 0.086 1.111 ± 0.153 1.071 ± 0.191
Note: Data without lowercase letters in the same rows are insignificantly different from each other (p > 0.05).
2.7. ZEA Concentrations in Serum, Relative Tissues, and Gut
In order to realize the status of ZEA metabolism and deposit for pigs, the ZEA distribution wasmeasured. Table 6 shows that residual ZEA in serum, longissimus dorsi, uterus, and liver in groups A,B, and D was not detected. ZEA concentrations in jejunal contents in groups A and D were 89.47% and80.07% lower than that in group B (p < 0.05). ZEA concentrations in the large intestine in groups A andD were 68.57% (p < 0.05) and 12.79% (p > 0.05) lower than that in group B, respectively, indicating theeffectiveness of MBP for ZEA degradation.
Table 6. Effect of MBP on ZEA concentrations in pig serum, tissues, and gut (μg/Kg).
Items Group A Group B Group D
Serum — — —Longissimus dorsi — — —
Uterus — — —Liver — — —
Contents in jejunum 11.64 ± 0.27b 110.54 ± 16.19a 22.03 ± 8.20bContents in large intestine 43.45 ± 2.44b 138.23 ± 4.67a 120.55 ± 18.87a
Note: Data with the same lowercase letters in the same rows are insignificantly different from each other (p > 0.05);while data with different lowercase letters in the same rows are significantly different from each other (p < 0.05).“—” indicates no detection.
59

Toxins 2019, 11, 552
3. Discussion
As one of the most ubiquitous mycotoxins, ZEA has caused serious harm to animals and humansand has led to a great waste of food resources every year [21]. There are two ways to solve this problem.One way is to inhibit ZEA production from microbes, which is hard to conduct due to the difficultcontrol of ZEA-excreting microbes in the environment; another way is to eliminate ZEA harm toanimals and humans by chemical, physical, and biodegradable methods [12–15]. Although physicaland chemical methods can eliminate ZEA harm, they also reduce the nutritional value of food andpollute the environment. Many researchers have indicated that ZEA biodegradation or absorption bymicrobes and mycotoxin-degrading enzymes is the most effective method [16,17,22,23].
It was found that the peroxiredoxin gene from Acinetobacter sp. SM04 was cloned in Escherichiacoli BL21 to excrete one recombinant protein for ZEA detoxification [24]. Saccharomyces cerevisiae and B.subtilis have been found to be able to degrade ZEA around 90% [25,26]. Broomyces pink and B. subtiliswere reported to open the ZEA lactone ring to form nontoxic compounds by hydrolyzing lactonebonds [27,28]. In order to increase the ZEA degradation rate, two strains of B. subtilis and one strain ofC. utilis with good ZEA degradation abilities have been selected and combined with ZEA degradationenzymes from A. oryzae in this study.
A. oryzae is one kind of microbe that produces complex enzymes, which will help to increasenutrient availability and degrade mycotoxins. It was found that A. oryzae could convert ZEA into othermetabolites and reduce the toxicity of toxins [29]. Another report showed that the deoxynivalenoldegradation rate was over 92% after A. oryzae was inoculated with corn culture medium for 21 d [30]. Inthis research, cell-free extracts of A. oryzae could degrade ZEA by 98.62% after 48 h enzymatic reaction,which was better than the previous report. When cell-free extracts of A. oryzae were combined with theprobiotics, the ZEA degradation rate was higher than the individual, indicating that there was a goodcooperation between them. This result corresponds with the previous report for aflatoxin removal [31].Generally, the probiotics are able to regulate gastrointestinal microbiota for animal health, except forits ZEA-removing ability. Therefore, the combination of beneficial bacteria and A. oryzae extracts willhave great applications in the fields of animal production and food and feed processing.
ZEA is widely distributed in all kinds of grain crops and feedstuffs. The prevention and removal ofZEA pollution of grain has become a hotspot for researchers. It was found that the growth performanceof weaned piglets fed with 1000 μg/Kg ZEA diet for 24 d and the young gilts fed with 1.5–2.0 mg/kgZEA diet for 28 d had no significant changes [32,33]. In this study, after feeding with 300 μg/Kg ZEAdiet for 60 d, ADG, ADFI, F/G, and nutrient digestibility of young pigs had no significant differenceregardless of MBP addition or not. It is possible that this concentration of ZEA added in the diet wasnot enough to retard pig growth even though it may influence reproduction for female pigs.
This study showed that MBP addition was able to increase gut microbial similarity coefficients tohelp maintain gut microbial balance for pig health, in agreement with the former research, in which itwas reported that Saccharomyces cerevisiae subsp. boulardii strain had the potential as feed additives tomodulate bacterial populations associated with gut health for piglets [34].
After the diets contaminated with ZEA are fed to animals, ZEA will have three metabolic pathways:(1) ZEA is absorbed in the gut and remains in the animal’s body; (2) it is degraded by the gut microbesand enzymes; and (3) some ZEA will be discharged with the feces. It was found that the residualamount of ZEA in gilt livers increased significantly when dietary ZEA contents were 500 or 2000μg/Kg [35]. However, ZEA was not detected in serum, longissimus dorsi, the uterus, and liver inthis study, inconsistent with the above. This may be due to the low ZEA content (300 μg/Kg) in pigdiets. This research showed that ZEA concentrations in jejunal contents in group B was significantlyhigher than that in group A and group D, indicating that part of ZEA was eliminated by MBP in thegastrointestinal tract, which proved the effectiveness of MBP for degrading ZEA in pig guts.
Serum ALT, AST, and ALP are important indicators to measure the degree of liver lesions. SerumIgG and IgM are the main factors that participate in the humoral immune response. Their normallevels in this study indicated that liver cells and immune systems have not been damaged by ZEA at
60
Toxins 2019, 11, 552
300 μg/Kg dosage. The previous report showed that long-term exposure to a low dose of ZEA had nosignificant negative effect on serum ALT, AST, ALP, and E2 levels in pigs [36], which is in agreementwith this study. The organ indexes of heart, liver, kidney, and spleen were not significantly changed byfeeding the weaned piglets with 316 μg/Kg ZEA diets [37], which corresponds with this study. Thereason may be due to the low ZEA dose in pig diets.
The chemical structure of ZEA is the same as estrogen; therefore, ZEA can competitively bindestrogen receptors to cause reproduction disorders, in which the red and swelling vulva of femalepig is the common apparent symptom. This research showed that 300 μg/Kg ZEA could cause a redand swelling vulva; however, MBP addition was able to alleviate the symptoms, in agreement withthe previous research with Bacillus addition [38]. It was found that MBP was better than only Bacillussubtilis for degrading ZEA and keeping the microbiota stable in the pig gut [38].
It was found that the relative expression of estrogen receptor gene ERα mRNA in the ZEA groupwas significantly higher than that in control group [39]. Another research study showed that the serumE2 of females was significantly decreased by the addition of 1.05 mg/kg ZEA in diets [32]. Generally,ZEA could cause DNA double-strand breaks and affect the proliferation of granulosa cells, and theaddition of an estrogen receptor antagonist could improve this symptom, indicating that ZEA coulddamage granulosa cells through the estrogen receptor pathway [40]. It was reported that the relativeexpression levels of ERα genes in brain, liver, and gonads were not significantly affected by low dosesof ZEA, but they were significantly affected by high doses of ZEA. This process changed the HPG axisby altering gene expression of the steroid hormone-encoding gene to affect reproductive function [41].In this study, the relative expression of estrogen receptor gene ERα mRNA in ovaries and the uteruswas not significantly different among the three groups, which does not correspond with the aboveresults. The reason may be due to the low levels of ZEA in the diet in this study.
4. Conclusions
The combination of beneficial microbes (B. subtilis SP1, B. subtilis SP2, C. utilis) and cell-free extractsfrom A. oryzae could degrade ZEA effectively in vitro. MBP addition could alleviate ZEA negativeeffects in gilts by decreasing vulvar swelling, improving ZEA degradation in the jejunum, and keepingnormal growth performance and gut microbiota stable.
5. Materials and Methods
5.1. Probiotics and Experimental Materials
B. subtilis SP1, B. subtilis SP2, C. utilis, and A. oryzae with high ZEA-degrading ability werepurchased from China General Microbiological Culture Collection Center (CGMCC, Beijing, China).ZEA was purchased from Sigma-Aldrich (St. Louis, MO., USA) and diluted in methanol as stocksolution (100μg/mL). PBS buffer was prepared according to the previous protocol [42]. The compositionsof media for B. subtilis, C. utilis, and A. oryzae incubations were prepared according to the publishedprotocols [43,44]. Then, three kinds of probiotics were harvested and stored at 4 ◦C.
5.2. Degradation of ZEA by Probiotic Incubation
The visible counts of three kinds of microbes were adjusted to 1.0 × 10⁸ CFU/mL, respectively.The orthogonal design (5 mL reaction system) with three factors (B. subtilis SP1, B. subtilis SP2, andC. utilis) and three levels (25, 50, and 75 μL) were used to investigate the effect of beneficial microbeson degrading ZEA. Each group contained 1 μg/mL ZEA. The contents of ZEA in the samples weredetermined by enzyme-linked immunosorbent assay (ELISA) according to Huang’s report [44], whichwas highly consistent with high-performance liquid chromatography (HPLC). ZEA degradation rateswere calculated according to the following formula: ZEA degradation rate = (1 − ZEA concentration intreatment/ZEA concentration in control) × 100%. All experiments were conducted in triplicate.
61

Toxins 2019, 11, 552
5.3. Preparation of Cell-Free Extracts from A. oryzae
A. oryzae was inoculated in solid medium at 30 ◦C for 3 d. After incubation, 15 g solid incubationwas mixed with 300 mL physiological saline and put in a rotary shaker at 180 rpm for 2 h. The mixturewas filtered with eight-layer gauze, centrifuged at 10,000 g for 10 min, passed through Whatman No.4filter paper (20 to 25 μm pore diameters), and filtered with 0.22 μm Minisart High-flow filter (SartoriusStedim Biotech Gmbh, Goettingen, Germany). Finally, it was stored at 4 ◦C for further use.
The final volumes of 60 mL filtrates with an initial ZEA concentration of 1 μg/mL in 250 mLconical flasks were incubated at 37 ◦C in a rotary shaker at 180 rpm, and the samples were collectedafter 0, 6, 12, 18, 24, 30, 36, 42, and 48 h incubation, respectively. The ZEA degradation rates weremeasured at different times. The ZEA degradation activity (31.0 U/L) from cell-free extracts of A. oryzaewas determined with the previous protocol [42] and modified as the following: the amount of enzymethat could degrade 1 ng ZEA per min at pH 7.0 and 37 ◦C was defined as one unit.
5.4. ZEA Degradation by Probiotics Combined with Cell-Free Extracts of A. oryzae
The probiotics for degrading ZEA were added in YPD medium at the above ratio. The probioticsand cell-free extracts from A. oryzae were mixed at the volume ratios of 1:1, 1:2, 1:3, 2:1, 2:3, 3:1, 3:2, 1:0,and 0:1 as treatment groups. The final volume of the reaction system was adjusted to 3 mL with YPDmedium. All the groups received 30 μL ZEA (100 μg/mL), were incubated at 37 ◦C in a rotary shaker at180 rpm for 48 h, and were finally put in boiling water for 30 min to terminate the reaction.
5.5. Animals and Management
A total of 120 young pigs (Duroc × Landrace × Yorkshire) at the ages of 78–84 d were randomlydivided into 5 groups, with 3 replicates in each group and 8 pigs (half male and half female) in eachreplicate. All animals used in this experiment were managed according to the guidelines of AnimalCare and Use Ethics Committee in Henan Agricultural University (SKLAB-B-2010-003-01). The pigswere provided with a corn/soybean basal diet formulated to meet pig nutrient requirements accordingto the NRC (2012) [45]. The diets and water were provided ad libitum. The total experimental periodwas 60 d. After the feeding experiment, three gilts from groups A, B, and D were slaughtered forfurther analyses, respectively. Body weight and feed intake were recorded. ZEA used in animal feedingexperiments was purchased from Wuhan 3B Scientific Corporation (Wuhan, China). The experimentaldesigns were as follows:
Group A: Basal diet with 86.19 μg/kg ZEAGroup B: Basal diet containing 300.00 μg/kg ZEAGroup C: Basal diet containing 300.00 μg/kg ZEA and 0.05% MBPGroup D: Basal diet containing 300.00 μg/kg ZEA and 0.10% MBPGroup E: Basal diet containing 300.00 μg/kg ZEA and 0.15% MBP
5.6. Nutrient Digestibility Measurement
Fecal samples were taken without contamination from each of 5 pigs in each group for 3 d at theend of the experiment. The individual fecal sample was mixed, selected, and stored at −20 and 4 ◦C,respectively. The fecal samples stored at −20 ◦C were dried to determine nutrient digestibility. CP, CF,Ca, and P in diets and feces were measured with Kjeldahl, ether extract, potassium permanganate(KMnO4), and ammonium molybdate ((NH4)6Mo7O24) protocols, respectively [46]. The insoluble ashof hydrochloric acid in feed and feces was used as an indicator to calculate the nutrient digestibilitywith the following formula: Nutrient digestibility = (nutrient content in diets − nutrient content infeces)/nutrient content in diets × 100%.
62
Toxins 2019, 11, 552
5.7. Vulvar Area Measurement of Gilts
From the beginning of the experiment, vulvar areas of gilts were observed every day, and six giltsin each group were selected and measured at 15, 30, 45, and 60 d. The measurement method was basedon a previous report, the vulvar area = π × vulvar width × vulvar length/4 [38].
5.8. Serum Parameter Determination
Blood samples were taken from the anterior vena cava of three pigs in each group. After theblood was tilted at room temperature for 3 h, the serum was collected by Transferpettor and storedin a centrifuge tube at −20 ◦C for further analysis. The serum biochemical parameters such as UN,TC, GLU, triglycerides, HDL, LDL, TP, ALB, GLO, A/G, ALT, AST, ALP, IgG, and IgM were measuredwith a 7600-020 Automatic Analyzer (Hitachi Ltd., Tokyo, Japan) in the Biochemical Laboratory ofZhengzhou University, Zhengzhou, China. The concentrations of GSH-Px and E2 were respectivelymeasured by ELISA quantification kits (Nanjing Jiancheng Bioengineering Institute, Nanjing, China).
5.9. Relative Organ Weight and ERα mRNA Abundance in Ovaries and the Uterus
After the feeding experiment, 3 gilts from 3 representative groups (groups A, B, and D) wereselected and slaughtered, respectively. The gut contents were taken and frozen for further gutmicrobiota analysis, and the organs were taken and weighed. The formula for calculating the organindex was as follows: organ index = organ weight (g)/living weight (Kg). Some parts of ovaries andthe uterus were stored in liquid nitrogen for mRNA abundance analyses.
In order to measure the expression levels of ERα in ovaries and the uterus, the total RNA wasextracted by using RNAiso Plus kits (TaKaRa, Dalian, China). The result was checked with 1% agarosegel electrophoresis. The reaction system for cDNA consisted of 2 μL 4 × gDNA wiper Mix, 4 μL RNAtemplate, and 2 μL RNase-free water. It was kept at 42 ◦C for 2 min, mixed with 2 μL 5×HiScript®IIqRTSuperMixII (Vazyme Biotech Co., Ltd., Nanjing, China), and then kept at 25 ◦C for 10 min, 50 ◦C for30 min, and 85 ◦C for 5 min. The cDNA samples were stored at−20 ◦C for further use. The qPCR reactionconsisted of 10.0μL AceQ® qPCR SYBR® Green Master Mix, 0.4μL ROX, 0.4μL Primer F (10μM), 0.4μLPrimer R (10μM), 2.0μL cDNA, and 6.8μL RNase-free water (Vazyme Biotech Co., Ltd., Nanjing, China).The primers for ERα and glyceraldehyde-3-phosphate dehydrogenase (GAPDH) genes were as follows:Forward 5′-GACAGGAACCAGGGCAAGT-3′, Reverse 5′-ATGATGGATT TGAGGCACAC-3′ for ERα;Forward 5′-ATGGTGAAGGTCGGAGTGAA-3′, Reverse 5′-CGTGGGTGGAATCATACTGG-3′ forGAPDH. The thermal program of qPCR consisted of 1 cycle at 95 ◦C for 10 min, 40 cycles of 95 ◦C for15 s, 57 ◦C for 30 s, and then stored at 37 ◦C for 30 s. Gene-specific amplification was determined by amelting curve analysis and agarose gel electrophoresis. The cycle threshold value was analyzed (iQ5detection System) and transformed to a relative quantity using the 2−ΔΔCT method with the highestquantity scaled to 1 [47]. GAPDH gene was used as the reference gene for stability of expression tostandardize the relative expression of the gene investigated.
5.10. DNA Extraction of Gut Bacteria and PCR-DGGE
About 1.0 g of gut sample from the large intestine was defrosted, put into a 10 mL centrifugetube, washed with 5 mL PBS, and centrifuged at 500 g at 4 ◦C for 5 min to collect the supernatantaccording to the previous protocol [48]. The washing step was repeated 3 times. The supernatantsfrom 3 washing steps were mixed together and centrifuged at 8000 g for 5 min to collect the pellet. Thebacterial DNA was extracted with MiniBEST Bacterial Genomic DNA Extraction Kit (TaKaRa, Dalian,China), dissolved in 100 μL TE, and stored at −20 ◦C as the template for PCR amplification.
The primers of V3 regions of bacterial 16S rRNA genes [49] were F341:CGCCCGCCGCGCGCGGCGGGCGGGGCGGGGGCACGGGGGGCC TACGGGAGGCAGCAG, andR518: ATTACCGCGGCTGCTGG. The PCR system (50 μL) consisted of 25 μL Taq Master Mix, 5 μLextracted gut DNA, 1 μL primer F341-GC (10 μM), 1 μL R518 (10 μM), and 18 μL RNase-free water
63
Toxins 2019, 11, 552
(Beijing Comwin Biotech Co., Ltd. Beijing, China). The program consisted of initial DNA denaturationat 95 ◦C for 5 min, 35 cycles of 95 ◦C for 30 s, 55 ◦C for 30 s, 72 ◦C for 40 s, and a final extension at 72 ◦Cfor 10 min. The PCR products were detected by 1.5% agarose gel electrophoresis (Beijing SolarbioScience & Technology Co., Ltd., Beijing, China).
The PCR products were separated in 8% polyacrylamide gel containing a 35% to 60% gradient ofurea and formamide increasing in the direction of electrophoresis. Electrophoresis was initiated byprerunning at a voltage of 200 V for 10 min and then at a constant voltage of 90 V for 14 h at 60 ◦C. Afterelectrophoresis, the gel was stained with 0.5 μg/mL ethidium bromide for 30 min and then washedwith deionized water for 10 min.
DGGE gels were analyzed using the software of Quantity One 4.6.6 (BioRad, California, USA,2017). Microbial similarity coefficients (SC) between DGGE profiles were determined as follows:SC = 2 × J/(Nx + Ny), where Nx is the number of DGGE bands in lane x, Ny represents the number ofDGGE bands in lane y, and J is the number of common DGGE bands [50].
5.11. Determination of ZEA Content in Serum and Tissues
Longissimus dorsi, liver, and uterus tissues were ground into powder with liquid nitrogen. Atotal of 1 mL serum or 5 g samples were added to 25 mL 70% methanol, shaken for 3 min, centrifugedat 10,000 g for 5 min, then 1 mL supernatant was mixed with 1 mL deionized water for furtherdetermination. The ZEA contents in all samples were measured by RIDASCREEN® FAST ZEA SC testkit (R-Biopharm, Darmstadt, Germany).
5.12. Statistical Analyses
The experimental data were analyzed as a single factor design by analysis of variance (ANOVA)using IBM SPSS-Statistics Program 20.0 (IBM, New York, NY, USA, 2012), and they are expressed asmeans and standard errors (SEs). The means were evaluated with Tukey’s multiple range test, anddifferences were considered statistically significance at p < 0.05.
Author Contributions: C.L. and Q.Y. conceived and designed the experiments; W.H., C.L. and T.G. performedthe experiments; J.C. and P.W. analyzed the data; X.D. and F.L. contributed reagents/materials/analysis tools; C.L.and Q.Y. wrote the paper.
Funding: This research was funded by the Natural Science Foundation of Henan Province (182300410029), andthe Henan Key Scientific and Technological Project (171100110500).
Conflicts of Interest: The authors declare that there are no conflicts of interest associated with this research.
References
1. Caldwell, R.W.; Tuite, J.; Stob, M.; Baldwin, R. Zearalenone production by Fusarium species. Appl. Microbiol.1970, 20, 31–34. [PubMed]
2. Takemura, H.; Shim, J.Y.; Sayama, K.; Tsubura, A.; Zhu, B.T.; Shimoi, K. Characterization of the estrogenicactivities of zearalenone and zeranol in vivo and in vitro. J. Steroid Biochem. Mol. Biol. 2007, 103, 170–177.[CrossRef] [PubMed]
3. Gajecka, M. The effect of low-dose experimental zearalenone intoxication on the immunoexpression ofestrogen receptors in the ovaries of pre-pubertal bitches. Pol. J. Vet. Sci. 2012, 15, 685–691. [CrossRef][PubMed]
4. Benzoni, E.; Minervini, F.; Giannoccaro, A.; Fornelli, F.; Vigo, D.; Visconti, A. Influence of in vitro exposureto mycotoxin zearalenone and its derivatives on swine sperm quality. Reprod. Toxicol. 2008, 25, 461–467.[CrossRef] [PubMed]
5. Kuiper, G.G.J.M.; Lemmen, J.G.; Carlsson, B.; Corton, J.C.; Safe, S.H.; van der Saag, P.T.; van derBurg, B.; Gustafsson, J.A. Interaction of estrogenic chemicals and phytoestrogens with estrogen receptor β.Endocrinology 1998, 139, 4252–4263. [CrossRef]
6. Aiko, V.; Mehta, A. Occurrence, detection and detoxification of mycotoxins. Toxicol. Appl. Pharm. 2015, 50,943–954. [CrossRef] [PubMed]
64

Toxins 2019, 11, 552
7. Kosicki, R.; Blajet-Kosicka, A.; Grajewski, J.; Twaruzek, M. Multiannual mycotoxin survey in feed materialsand feedstuffs. Anim. Feed Sci. Technol. 2016, 215, 165–180. [CrossRef]
8. Phuong, N.H.; Thieu, N.Q.; Ogle, B.; Pettersson, H. Aflatoxins, fumonisins and zearalenone contaminationof maize in the southeastern and central highlands provinces of Vietnam. Agriculture 2015, 5, 1195–1203.[CrossRef]
9. Oliveiraa, M.S.; Rochaa, A.; Sulyok, M.; Krskab, R.; Mallmann, C.A. Natural mycotoxin contamination ofmaize (Zea mays L.) in the south region of Brazil. Food Control 2017, 73, 127–132. [CrossRef]
10. Lee, H.J.; Ryu, D. Worldwide occurrence of mycotoxins in cereals and cereal-derived food products: Publichealth perspectives of their co-occurrence. J. Agric. Food Chem. 2017, 65, 7034–7051. [CrossRef]
11. FAO. Worldwide Regulations for Mycotoxins in Food and Feed in 2003; FAO Food and Nutrition Paper No. 81;Food and Agriculture Organization of the United Nations: Rome, Italy, 2004.
12. Zinedine, A.; Soriano, J.M.; Molto, J.C.; Manes, J. Review on the toxicity, occurrence, metabolism, detoxification,regulations and intake of zearalenone: An oestrogenic mycotoxin. Food Chem. Toxicol. 2007, 45, 1–18.[CrossRef] [PubMed]
13. Bordini, J.G.; Borsato, D.; Oliveira, A.S.; Ono, M.A.; Zaninelli, T.H.; Hirooka, E.Y.; Ono, E.Y.S. In vitrozearalenone adsorption by a mixture of organic and inorganic adsorbents: Application of the Box Behnkenapproach. World Mycotoxin J. 2015, 8, 291–299. [CrossRef]
14. Markovic, M.; Dakovic, A.; Rottinghaus, G.E.; Kragovic, M.; Petkovic, A.; Krajisnik, D.; Milic, J.; Mercurio, M.;de Gennaro, B. Adsorption of the mycotoxin zearalenone by clinoptilolite and phillipsite zeolites treatedwith cetylpyridinium surfactant. Colloid Surf. B 2017, 151, 324–332. [CrossRef] [PubMed]
15. Wang, L.; Wang, Y.; Shao, H.L.; Luo, X.H.; Wang, R.; Li, Y.F.; Li, Y.N.; Luo, Y.P.; Zhang, D.J.; Chen, Z.X. In vivotoxicity assessment of deoxynivalenol-contaminated wheat after ozone degradation. Food Addit. Contam. A2017, 34, 103–112. [CrossRef] [PubMed]
16. Yu, Y.S.; Qiu, L.P.; Wu, H.; Tang, Y.Q.; Yu, Y.G.; Li, X.F.; Liu, D.M. Degradation of zearalenone by theextracellular extracts of Acinetobacter sp. SM04 liquid cultures. Mycotoxin Biodegr. 2011, 22, 613–622.[CrossRef] [PubMed]
17. Kriszt, R.; Krifaton, C.; Szoboszlay, S.; Cserhati, M.; Kriszt, B.; Kukolya, J.; Czeh, A.; Feher-Toth, S.; Torok, L.;Szoke, Z.; et al. A new zearalenone mycotoxin biodegradation strategy using non-pathogenic Rhodococcuspyridinivorans K408 strain. PLoS ONE 2012, 7, e43608. [CrossRef] [PubMed]
18. Tang, Y.Q.; Xiao, J.M.; Chen, Y.; Yu, Y.G.; Xiao, X.L.; Yu, Y.S.; Wu, H. Secretory expression and characterizationof a novel peroxiredoxin for zearalenone detoxification in Saccharomyces cerevisiae. Microbiol. Res. 2013, 168,6–11. [CrossRef]
19. Lei, Y.P.; Zhao, L.H.; Ma, Q.G.; Zhang, J.Y.; Zhou, T.; Gao, C.Q.; Ji, C. Degradation of zearalenone in swinefeed and feed ingredients by Bacillus subtilis ANSB01G. World Mycotoxin J. 2014, 7, 143–151. [CrossRef]
20. Zhao, L.; Jin, H.T.; Lan, J.; Zhang, R.Y.; Ren, H.B.; Zhang, X.B.; Yu, G.P. Detoxification of zearalenone by threestrains of Lactobacillus plantarum from fermented food in vitro. Food Control 2015, 54, 158–164. [CrossRef]
21. Guo, J.; Zhang, L.S.; Wang, Y.M.; Yan, C.H.; Huang, W.P.; Wu, J.; Yuan, H.T.; Lin, B.W.; Shen, J.L.; Peng, S.Q.Study of embryo toxicity of Fusarium mycotoxin butenolide using a whole rat embryo culture model. Toxicol.In Vitro 2011, 25, 1727–1732. [CrossRef]
22. Wang, M.; Yin, L.; Hu, H.; Selvaraj, J.N.; Zhou, Y.; Zhang, G. Expression, functional analysis and mutationof a novel neutral zearalenone-degrading enzyme. Int. J. Biol. Macromol. 2018, 118, 1284–1292. [CrossRef][PubMed]
23. Pereyra, C.M.; Cavaglieri, L.R.; Chiacchiera, S.M.; Dalcero, A. The corn influence on the adsorption levels ofaflatoxin B1 and zearalenone by yeast cell wall. J. Appl. Microbiol. 2013, 114, 655–662. [CrossRef] [PubMed]
24. Yu, Y.; Wu, H.; Tang, Y.; Qiu, L. Cloning, expression of a peroxiredoxin gene from Acinetobacter sp. SM04 andcharacterization of its recombinant protein for zearalenone detoxification. Microbiol. Res. 2012, 167, 121–126.[CrossRef] [PubMed]
25. Zhang, H.; Dong, M.; Yang, Q.; Apaliya, M.T.; Li, J.; Zhang, X. Biodegradation of zearalenone by Saccharomycescerevisiae: Possible involvement of ZEN responsive proteins of the yeast. J. Proteom. 2016, 143, 416–423.[CrossRef]
26. Cho, K.J.; Kang, J.S.; Cho, W.T.; Lee, C.H.; Ha, J.K.; Bin, S.K. In vitro degradation of zearalenone by Bacillussubtilis. Biotechnol. Lett. 2010, 32, 1921–1924. [CrossRef]
65

Toxins 2019, 11, 552
27. El-Sharkawy, S.; Abul-Hajj, Y.J. Microbial cleavage of zearalenone. Xenobiotica 1988, 18, 365–371. [CrossRef][PubMed]
28. Lei, Y.P. Mechanism of Degrading ZEA by ANSB01G Strain and Its Application Effect in Animal Production.Ph.D. Thesis, China Agricultural University, Beijing, China, 2014.
29. Brodehl, A.; Moller, A.; Kunte, H.J.; Koch, M.; Maul, R. Biotransformation of the mycotoxin zearalenone byfungi of the genera Rhizopus and Aspergillus. FEMS Micobiol. Lett. 2014, 359, 124–130. [CrossRef] [PubMed]
30. Tran, S.T.; Smith, T.K. Conjugation of deoxynivalenol by Alternaria alternate (54028 NRRL), Rhizopusmicrosporusvar. rhizopodiformis (54029 NRRL) and Aspergillus oryzae (5509 NRRL). Mycotoxin Res. 2014, 30, 47–53.[CrossRef] [PubMed]
31. Zuo, R.Y.; Chang, J.; Yin, Q.Q.; Wang, P.; Yang, Y.R.; Wang, X.; Wang, G.Q.; Zheng, Q.H. Effect of the combinedprobiotics with aflatoxin B1-degrading enzyme on aflatoxin detoxification, broiler production performanceand hepatic enzyme gene expression. Food Chem. Toxicol. 2013, 59, 470–475. [CrossRef]
32. Jiang, S.; Yang, Z.; Yang, W.; Gao, J.; Liu, F.; Chen, C.; Chi, F. Physiopathological effects of zearalenone inpost-weaning female piglets with or without montmorillonite clay adsorbent. Livest. Sci. 2010, 131, 130–136.[CrossRef]
33. Oliver, W.T.; Miles, J.R.; Diaz, D.E.; Dibner, J.J.; Rottinghaus, G.E.; Harrell, R.J. Zearalenone enhancesreproductive tract development, but does not alter skeletal muscle signaling in prepubertal gilts. Anim. FeedSci. Technol. 2012, 174, 79–85. [CrossRef]
34. Brousseau, J.P.; Talbot, G.; Beaudoin, F.; Lauzon, K.; Roy, D.; Lessard, M. Effects of probiotics Pediococcusacidilactici strain MA18/5M and Saccharomyces cerevisiae subsp. boulardii strain SB-CNCM I-1079 on fecal andintestinal microbiota of nursing and weanling piglets. J. Anim. Sci. 2015, 93, 5313–5326. [CrossRef] [PubMed]
35. Wang, D.F.; Zhou, H.L.; Hou, G.Y.; Qi, D.S.; Zhang, N.Y. Soybean isoflavone reduces the residue of zearalenonein the muscle and liver of prepubertal gilts. Animal 2013, 7, 699–703. [CrossRef] [PubMed]
36. Gajecki, M. Evaluation of selected serum biochemical and haematological parameters in gilts exposed to 100ppb of zearalenone. Pol. J. Vet. Sci. 2015, 18, 865–872.
37. Marin, D.E.; Pistol, G.C.; Neagoe, I.V.; Calin, L.; Taranu, I. Effects of zearalenone on oxidative stress andinflammation in weanling piglets. Food Chem. Toxicol. 2013, 58, 401–408. [CrossRef] [PubMed]
38. Zhao, L.H.; Lei, Y.P.; Bao, Y.H.; Jia, R.; Ma, Q.G.; Zhang, J.Y.; Chen, J.; Ji, C. Ameliorative effects of Bacillussubtilis ANSB01G on zearalenone toxicosis in pre-pubertal female gilts. Food Addit. Contam. A 2015, 34,617–625. [CrossRef] [PubMed]
39. Niu, Q.S. Effect of Fusarium Toxins on Hematological Values, Development of Reproductive Organs, andExpression of Estrogen Receptor Genes in Post-Weaning Gilts. Ph.D. Thesis, Shandong AgriculturalUniversity, Taian, China, 2015.
40. Liu, X.L.; Wu, R.Y.; Sun, X.F.; Cheng, S.F.; Zhang, R.Q.; Zhang, T.Y.; Zhang, X.F.; Zhao, Y.; Shen, W.; Li, L.Mycotoxin zearalenone exposure impairs genomic stability of swine follicular granulosa cells in vitro. Int. J.Biol. Sci. 2018, 14, 294–305. [CrossRef]
41. Muthulakshmi, S.; Hamideh, P.F.; Habibi, H.R.; Maharajan, K.; Kadirvelu, K.; Mudili, V. Mycotoxinzearalenone induced gonadal impairment and altered gene expression in the hypothalamic-pituitary-gonadalaxis of adult female zebrafish (Danio rerio). J. Appl. Toxicol. 2018, 38, 1388–1397. [CrossRef]
42. Cao, H.; Liu, D.L.; Mo, X.M.; Xie, C.F.; Yao, D.L. A fungal enzyme with the ability of aflatoxin B1 conversion:Purification and ESI-MS/MS identification. Microbiol. Res. 2011, 166, 475–483. [CrossRef]
43. Yin, Q.Q.; Fan, G.G.; Chang, J.; Zuo, R.Y.; Zheng, Q.H. Effect of the combined probiotics on inhibitingpathogenic Escherichia coli proliferation. Adv. Mater. Res. 2012, 343, 802–808.
44. Huang, W.W.; Chang, J.; Wang, P.; Liu, C.Q.; Yin, Q.Q.; Zhu, Q.; Lu, F.S.; Gao, T.Z. Effect of the combinedcompound probiotics with mycotoxin-degradation enzyme on detoxifying aflatoxin B1 and zearalenone.J. Toxicol. Sci. 2018, 43, 377–385. [CrossRef] [PubMed]
45. National Research Council (NRC). Nutrient Requirements of Swine, 11th rev. ed.; National Academic Press:Washington, DC, USA, 2012.
46. Jurgens, M.H. Animal Feeding and Nutrition, 8th ed.; Kendall/Hunt Publishing Company: Dubuque, IA, USA,1997.
47. Livak, K.J.; Schmittgen, T.D. Analysis of relative gene expression data using real-time quantitative PCR andthe 2 −ΔΔCT method. Methods 2001, 25, 402–408. [CrossRef] [PubMed]
66

Toxins 2019, 11, 552
48. Maibach, R.C.; Dutly, F.; Altwegg, M. Detection of Tropheryma whipplei DNA in feces by PCR using a targetcapture method. J. Clin. Microbiol. 2002, 40, 2466–2471. [CrossRef] [PubMed]
49. Liu, C.Q.; Zhu, Q.; Chang, J.; Yin, Q.Q.; Song, A.D.; Li, Z.T.; Wang, E.Z.; Lu, F.S. Effects of Lactobacillus caseiand Enterococcus faecalis on growth performance, immune function and gut microbiota of suckling piglets.Arch. Anim. Nutr. 2017, 71, 120–133. [CrossRef] [PubMed]
50. Konstantinov, S.R.; Zhu, W.Y.; Williams, B.A.; Tamminga, S.; de Vos, W.M.; Akkermans, A.D.L. Effect offermentable carbohydrates on piglet faecal bacterial communities as revealed by denaturing gradient gelelectrophoresis analysis of 16S ribosomal DNA. FEMS Microbiol. Ecol. 2003, 43, 225–235. [CrossRef]
© 2019 by the authors. Licensee MDPI, Basel, Switzerland. This article is an open accessarticle distributed under the terms and conditions of the Creative Commons Attribution(CC BY) license (http://creativecommons.org/licenses/by/4.0/).
67


toxins
Review
Assorted Methods for Decontamination of AflatoxinM1 in Milk Using Microbial Adsorbents
Jean Claude Assaf 1,2,3,*, Sahar Nahle 1,2,3, Ali Chokr 2,3, Nicolas Louka 1, Ali Atoui 2 and
André El Khoury 1
1 Centre d’Analyses et de Recherche (CAR), Unité de Recherche Technologies et Valorisationagro-Alimentaire (UR-TVA), Faculté des Sciences, Université Saint-Joseph de Beyrouth, Campus des scienceset technologies, Mar Roukos, Matn 1104-2020, Lebanon ; [email protected] (S.N.);[email protected] (N.L.); [email protected] (A.E.K.)
2 Research Laboratory of Microbiology, Department of Life and Earth Sciences, Faculty of Sciences I, LebaneseUniversity, Hadat Campus, Beirut P.O Box 5, Lebanon; [email protected] (A.C.); [email protected] (A.A.)
3 Platform of Research and Analysis in Environmental Sciences (PRASE), Doctoral School of Sciences andTechnologies, Lebanese University, Hadat Campus, Beirut P.O. Box 6573/14, Lebanon
* Correspondence: [email protected]; Tel.: +961-70-891-797
Received: 10 April 2019; Accepted: 15 May 2019; Published: 29 May 2019
Abstract: Aflatoxins (AF) are carcinogenic metabolites produced by different species of Aspergilluswhich readily colonize crops. AFM1 is secreted in the milk of lactating mammals through theingestion of feedstuffs contaminated by aflatoxin B1 (AFB1). Therefore, its presence in milk, evenin small amounts, presents a real concern for dairy industries and consumers of dairy products.Different strategies can lead to the reduction of AFM1 contamination levels in milk. They includeadopting good agricultural practices, decreasing the AFB1 contamination of animal feeds, or usingdiverse types of adsorbent materials. One of the most effective types of adsorbents used for AFM1decontamination are those of microbial origin. This review discusses current issues about AFM1decontamination methods. These methods are based on the use of different bio-adsorbent agents suchas bacteria and yeasts to complex AFM1 in milk. Moreover, this review answers some of the raisedconcerns about the binding stability of the formed AFM1-microbial complex. Thus, the efficiency ofthe decontamination methods was addressed, and plausible experimental variants were discussed.
Keywords: decontamination; mycotoxins; Aflatoxin M1; milk; binding; stability
Key Contribution: This review tackles current issues about AFM1 decontamination methodsusing different bio-adsorbents such as bacteria, yeasts or mixtures of both. The efficiency of thesedecontamination methods in addition to their plausible experimental variants, advantages, limitationsand prospective applications were broadly discussed.
1. Introduction
Aflatoxins (AF) are secondary metabolites produced by several Aspergillus species, mainly byAspergillus flavus and A. parasiticus [1–4]. The AF contamination of food and feed after mold colonizationmay occur at any stage extending from pre-harvest to consumption [5,6]. Thus, this can cause the director indirect contamination of different food commodities including cereals, corn, rice, and peanuts.Humid and warm environments are suitable for mold growth and AF production [7,8]. The group ofAF includes more than 20 known metabolites; the most important are the naturally occurring ones suchas B1, B2, G1, and G2 [9–11]. The toxicity of AF varies, but AFB1 remains the most toxic for humansand animals [12–14]. Briefly, after ingestion and absorption by an animal’s gastrointestinal tract, AFB1is then transformed in the liver into AFM1 and aflatoxin M2 (AFM2) [15–18]. It is noteworthy to
Toxins 2019, 11, 304; doi:10.3390/toxins11060304 www.mdpi.com/journal/toxins69
Toxins 2019, 11, 304
mention that milk and its derivatives are widely consumed not only by adults but, more importantly,by infants [19]. Interestingly, Williams et al. reported that more than 4.5 billion people worldwide areat risk of exposure to foodstuffs contaminated with different levels of AF [20]. Upon investigation ofits toxicity, the International Agency for Research on Cancer (IARC) has classified AFM1 as a group1 human carcinogen [21–23]. The secretion of AFM1 in milk varies widely according to differentfactors including animal species, season and milking time, level of AFB1 intake, and volume of milkproduced by the mammal in question [24–26]. Once in milk, AFM1 is not degraded and can resistdifferent industrial treatments including milk sterilization or pasteurization, in addition to any otherheat treatments [27–31]. For this reason, AFM1 contamination remains a serious problem, not only inproduced milk but also in all its derived products including cheese, yoghurt, cream, and powderedmilk [32,33]. Due to AF’s harmful effects, several countries and international organizations havestrictly regulated AF levels in feed and food [34,35]. Thus, the highest acceptable level of AFM1 inmilk ranges between 0.05 μg/kg and 0.5 μg/kg, as established, respectively, by the European Union(EU) and the Food and Drug Administration (FDA) [36,37]. Therefore, the adopted AFM1 limit inmilk (0.5 μg/kg) settled up in the USA, Brazil, Japan, and India is less restrictive compared to othercountries such as France, Germany, Belgium, Australia, and Turkey (0.05 μg/kg) [38]. Importantly,the stricter the regulatory limits, the more food commodities are wasted, which results in a highereconomic loss [39,40]. Accordingly, these regulations depend on several factors including the economicdevelopment level of each country, limits of consumption, and risk of exposure to AFM1 [41]. Moreover,the trade of any AF-contaminated products was also prohibited [40]. The implementation of GoodAgricultural Practices (GAP) remains the best way to limit AF contamination in food and feedstuffbut cannot guarantee their absolute prevention [42–44]. In addition, innovative technologies to cutpre- and post-harvest exposure to AF are strongly recommended. Some of these technologies includeozone fumigation [45], irradiation biological [46,47], and chemical agents [40,48,49]. Highly promisingtechniques such as using the biofilms of probiotic bacteria [50], chitin, and treated crustacean shells [51]are under rigorous investigation. Furthermore, the use of different biotransforming agents such asmicroorganisms and their purified enzymatic products can lead to the catabolization, cleaving, ortransformation of the AF molecule to less or non-toxic metabolites [52]. Similarly, several clay materialsincluding bentonite, hydrated sodium calcium aluminosilicate (HSCAS), zeolite, and activated charcoalhave shown varying abilities to reduce AF in contaminated feedstuff [52]. Up until now, the moststudied methods to mitigate AF contamination are mainly based on using biological adsorbents suchas bacteria and yeasts [52–54].
This review aims to critically discuss different methods for AFM1 decontamination by microbialadsorption. Therefore, various treatments used for AFM1 decontamination by yeasts or bacteria willbe broadly scrutinized, and some experimental variants will be highlighted in order to help researchersin improving the commonly used methods.
2. Toxic Effects of AFM1
Amongst all mycotoxins, AF present a high risk on the human health due to consumption of foods,including milk and dairy products, contaminated with their derivatives such as AFM1 [55,56]. Hence,the potential existence of AFM1 in milk, even in minor quantities, remains a worldwide alarmingissue due to the consumption of wide range of contaminated dairy products [38]. Accordingly, theInternational Agency for Research on Cancer (IARC), following investigations on its toxicity, shiftedAFM1 classification from group 2B to group 1 human carcinogens [22,57].
Briefly, AFB1 is initially absorbed by the gastrointestinal tract before being metabolized in theliver [58,59]. Within 15 min after ingestion, AFM1 could be detected in the blood of the lactatinganimal before being secreted in its milk and urine [15,58,60]. The biotransformation of AFB1 in theanimal liver is carried out by cytochrome P450 enzymes, thus metabolizing AFB1 into hydroxylatedAFM1 and AFB1 reactive epoxides [61,62]. While AFM1 is less toxic than AFB1, it is still highlyharmful for humans and animal species [16,63]. As the major organ targeted by AFM1 is the liver, it is
70

Toxins 2019, 11, 304
considered a hepatotoxic metabolite [64,65]. In addition, other damaging effects including immunitysuppression, reduced milk production, and lower oxygen supply to body tissues may be caused byAFM1 [66–68]. The toxicity of AF, including AFM1, and its impact on its host is sex, age, species,and nutritional-behavior dependent [20,69]. It is important to highlight that breast-feeding is alwaysencouraged for infants due to its nutritional qualities and is even recommended by the WHO for sixmonths after birth [70]. Surprisingly, current studies on AFM1 in human breast milk conducted byRadonic et al. on samples from Serbia revealed alarming contamination levels [71]. Tests conducted on60 samples showed that around 85% of colostrum and the totality of collected breast milk samples(four-to-eight months after delivery) were found highly contaminated with AFM1 in concentrationsbeyond tolerable levels [71]. Results of this study and other studies demonstrate the need to raiseawareness about AFM1 presence in human milk [72].
3. Effective Strategies for AFM1 Reduction
3.1. Biological Control and Clay-Based Decontamination Methods
Strategies leading directly or indirectly to AFM1 reduction in milk vary from adopting goodagricultural practices to using innovative detoxification methods [51,73,74]. Better management andmonitoring of pre- and post-harvest conditions is an essential step to reduce AF contamination [5,75].Several advanced techniques utilize biological methods such as bacteria, yeasts, and atoxigenic strainsto reduce AF contamination in the field and during storage [76,77]. Thus, these “biocontrol” methodslead to the inhibition of fungal growth and AF production [52,78]. In addition, different types ofmineral clays have been tested for their capability to bind AF in animal feeds [79,80]. These adsorbents,such as activated carbon (charcoal), zeolite, saponite-rich bentonite, and HSCAS, are able to bind AF,thus reducing AFB1 absorption in the gastrointestinal track and its carry-over as AFM1 in milk [52,81].For example, the inclusion of HSCAS in dairy feed has resulted in the reduction of up to 50% ofthe concentration of AFM1 secreted in milk [82]. Furthermore, a recent study conducted by Carraroet al. revealed that bentonite was also effective in reducing AFM1 contamination in milk to levelsbelow the European tolerable limits. Hence, the remaining residual bentonite amounts (0.4%) were inlow quantities and showed no harmful effects on human health [83]. There are several limitations ofusing mineral adsorbents in beverages; they may affect its quality, color, texture, and various otherphysicochemical properties [54]. Therefore, due to their limitations, several mineral binders are keptfor medical usage only [84]. In addition to their effect on food quality, many of these adsorbents arenon-specific, non-environmental friendly, and even toxic at high concentration levels [54,85]. All theseissues have led researchers to move toward more specific, non-toxic adsorbents, namely microbialones such as Lactic Acid Bacteria (LAB) and yeasts [86–88].
3.2. Microbial Decontamination of AFM1
The use of probiotic yeasts and LAB to bind AF in contaminated liquid foods has been widelystudied [89–93]. These biological adsorbents may be usually found in different foods includingseveral dairy products such as milk. Their safe status, in addition to the high capability to bindmycotoxins, has lead researchers to test the ability of these adsorbents to bind AFM1 in milk and otherliquids [86,90,94]. Consequently, AFM1 binding was reported to be rapid, and the binding percentagevaried when changing different factors such as incubation time, temperature, pH, AFM1, and microbialconcentrations [38,95]. The use of heat-killed cells is actually more favorable for milk decontaminationthan viable cells due to the contribution of the latter in product spoilage [86]. In order to assess thebinding capability of these adsorbents without interference with the food matrix effect, AFM1 bindingassays are initially conducted in buffer solutions such as phosphate-buffered saline (PBS) [74,96,97].The efficiency of AFM1 binding by microbial adsorbents is detailed in this section.
71

Toxins 2019, 11, 304
Ta
ble
1.
Sum
mar
yof
stud
ies
eval
uati
ngA
FM1
bind
ing
bydiff
eren
tbac
teri
alst
rain
s.
Ty
pe
Str
ain
[AF
M1]—
[Cell
s]S
olu
tio
nT
reatm
en
tIn
cub
ati
on
Tim
e(3
7◦ C
)C
en
trif
ug
al
Fo
rce
(g/r
pm
)In
itia
lB
ind
ing
(%)
Fin
al
Bin
din
g(%
)R
efe
ren
ceBacteria
L.rh
amno
sus
GG
[50μ
g/L]
—[1
010]
PBS
Via
ble
18h
10m
in—
3000
g55
.62±0
.2aλ
51.3
2±0
.3a’
*
[59]
L.rh
amno
sus
GG
[50μ
g/L]
—[1
010]
PBS
90◦ C
—1
h18
h10
min
—30
00g
63.0
8±0
.3a
59.6
7±0
.4a’
*
L.rh
amno
sus
GG
[100
μg/
L]—
[5×1
08 ]PB
SV
iabl
e18
h10
min
—30
00g
1.38±0
.2λ
0.51±0
.23*
L.ac
idop
hilu
sN
CC
36[5
μg/
L]—
[107 ]
PBS
Via
ble
0h
15m
in—
3000
g3.
44±3
.04β
-
[77]
L.ac
idop
hilu
sN
CC
36[5
μg/
L]—
[108 ]
PBS
Via
ble
0h
15m
in—
3000
g22
.23±1
0.76
β-
L.ac
idop
hilu
sN
CC
36[5
μg/
L]—
[108 ]
PBS
Via
ble
24h
15m
in—
3000
g22
.24±4
.67
-
L.ac
idop
hilu
sN
CC
36[2
0μ
g/L]
—[1
08 ]PB
SV
iabl
e0
h15
min
—30
00g
24.7
8±1
.39
-
L.ac
idop
hilu
sN
CC
36[2
0μ
g/L]
—[1
08 ]PB
SV
iabl
e24
h15
min
—30
00g
23.1
0±5
.19
-
L.ac
idop
hilu
sN
CC
36[5
μg/
L]—
[108 ]
PBS
90◦ C
—50
min
0h
15m
in—
3000
g26
.38±4
.99
-
L.ac
idop
hilu
sN
CC
36[5
μg/
L]—
[108 ]
PBS
90◦ C
—50
min
24h
15m
in—
3000
g25
.29±5
.03
-
L.ac
idop
hilu
sN
CC
36[2
0μ
g/L]
—[1
08 ]PB
S90◦ C
—50
min
0h
15m
in—
3000
g26
.22±4
.93
-
L.ac
idop
hilu
sN
CC
36[2
0μ
g/L]
—[1
08 ]PB
S90◦ C
—50
min
24h
15m
in—
3000
g24
.50±4
.40
-
L.ac
idop
hilu
sN
CC
36[5
μg/
L]—
[108 ]
Rec
onst
itut
edsk
imm
ilkH
eat-
kille
d4
h15
min
—18
00g
23.7
3±2
.52
-
L.ac
idop
hilu
sN
CC
36[1
0μ
g/L]
—[1
08 ]R
econ
stit
uted
skim
milk
Hea
t-ki
lled
4h
15m
in—
1800
g24
.13±4
.67
-
L.ac
idop
hilu
sN
CC
36[2
0μ
g/L]
—[1
08 ]R
econ
stit
uted
skim
milk
Hea
t-ki
lled
4h
15m
in—
1800
g25
.07±7
.96
-
L.ac
idop
hilu
sN
CC
36[5
μg/
L]—
[108 ]
Rec
onst
itut
edsk
imm
ilkV
iabl
e4
h15
min
—18
00g
22.7
0±3
.36
-
L.rh
amno
sus
[5μ
g/L]
—[1
08 ]PB
SV
iabl
e0
h15
min
—30
00g
20.2
1±6
.16
-
L.rh
amno
sus
[5μ
g/L]
—[1
08 ]PB
SV
iabl
e24
h15
min
—30
00g
22.1
6±7
.14
-
L.rh
amno
sus
[20μ
g/L]
—[1
08 ]PB
SV
iabl
e0
h15
min
—30
00g
22.8
8±7
.11
-
L.rh
amno
sus
[20μ
g/L]
—[1
08 ]PB
SV
iabl
e24
h15
min
—30
00g
21.6
4±1
.66
-
L.rh
amno
sus
[5μ
g/L]
—[1
08 ]PB
S90◦ C
—50
min
0h
15m
in—
3000
g23
.37±4
.81
-
L.rh
amno
sus
[5μ
g/L]
—[1
08 ]PB
S90◦ C
—50
min
24h
15m
in—
3000
g24
.16±3
.33
-
L.rh
amno
sus
[20μ
g/L]
—[1
08 ]PB
S90◦ C
—50
min
0h
15m
in—
3000
g27
.78±7
.50
-
72

Toxins 2019, 11, 304
Ta
ble
1.
Con
t.
Ty
pe
Str
ain
[AF
M1]—
[Cell
s]S
olu
tio
nT
reatm
en
tIn
cub
ati
on
Tim
e(3
7◦ C
)C
en
trif
ug
al
Fo
rce
(g/r
pm
)In
itia
lB
ind
ing
(%)
Fin
al
Bin
din
g(%
)R
efe
ren
ceBacteria
L.rh
amno
sus
[20μ
g/L]
—[1
08 ]PB
S90◦ C
—50
min
24h
15m
in—
3000
g26
.69±5
.48
-[7
7]L.
rham
nosu
s[5
μg/
L]—
[108 ]
Rec
onst
itut
edsk
imm
ilkH
eat-
kille
d4
h15
min
—18
00g
25.1
3±6
.19
-
Bacteria
L.rh
amno
sus
[10μ
g/L]
—[1
08 ]R
econ
stit
uted
skim
milk
Hea
t-ki
lled
4h
15m
in—
1800
g22
.86±9
.33
-
[77]
L.rh
amno
sus
[10μ
g/L]
—[1
08 ]R
econ
stit
uted
skim
milk
Hea
t-ki
lled
4h
15m
in—
1800
g22
.86±9
.33
-
L.rh
amno
sus
[20μ
g/L]
—[1
08 ]R
econ
stit
uted
skim
milk
Hea
t-ki
lled
4h
15m
in—
1800
g26
.27±1
.92
-
L.rh
amno
sus
[5μ
g/L]
—[1
08 ]R
econ
stit
uted
skim
milk
viab
le4
h15
min
—18
00g
21.7
4±3
.56
-
B.bi
fidum
Bb13
[5μ
g/L]
—[1
08 ]PB
SV
iabl
e0
h15
min
—30
00g
23.4
8±6
.12
-
B.bi
fidum
Bb13
[5μ
g/L]
—[1
08 ]PB
SV
iabl
e24
h15
min
—30
00g
26.6
5±2
.60
-
B.bi
fidum
Bb13
[20μ
g/L]
—[1
08 ]PB
SV
iabl
e0
h15
min
—30
00g
24.7
7±4
.35
-
B.bi
fidum
Bb13
[20μ
g/L]
—[1
08 ]PB
SV
iabl
e24
h15
min
—30
00g
26.3
3±1
.82
-
B.bi
fidum
Bb13
[5μ
g/L]
—[1
08 ]PB
S90◦ C
—50
min
0h
15m
in—
3000
g27
.74±2
.97
-
B.bi
fidum
Bb13
[5μ
g/L]
—[1
08 ]PB
S90◦ C
—50
min
24h
15m
in—
3000
g25
.12±5
.33
-
B.bi
fidum
Bb13
[20μ
g/L]
—[1
08 ]PB
S90◦ C
—50
min
0h
15m
in—
3000
g28
.97±3
.49
-
B.bi
fidum
Bb13
[20μ
g/L]
—[1
08 ]PB
S90◦ C
—50
min
24h
15m
in—
3000
g27
.31±1
.82
-
B.bi
fidum
Bb13
[5μ
g/L]
—[1
08 ]R
econ
stit
uted
skim
milk
Hea
t-ki
lled
4h
15m
in—
1800
g25
.41±4
.60
-
B.bi
fidum
Bb13
[10μ
g/L]
—[1
08 ]R
econ
stit
uted
skim
milk
Hea
t-ki
lled
4h
15m
in—
1800
g25
.64±3
.18
-
B.bi
fidum
Bb13
[20μ
g/L]
—[1
08 ]R
econ
stit
uted
skim
milk
Hea
t-ki
lled
4h
15m
in—
1800
g27
.31±1
.82
-
L.pl
anta
rum
[150
μg/
L]—
[1010
]PB
SV
iabl
e15
min
15m
in—
1800
g5.
60±0
.45
bA3.
71±0
.02
b’*
[69]
L.pl
anta
rum
[150
μg/
L]—
[1010
]PB
S10
0◦ C
—1
h15
min
15m
in—
1800
g13
.11±0
.89
b8.
229±0
.03
b’*
73
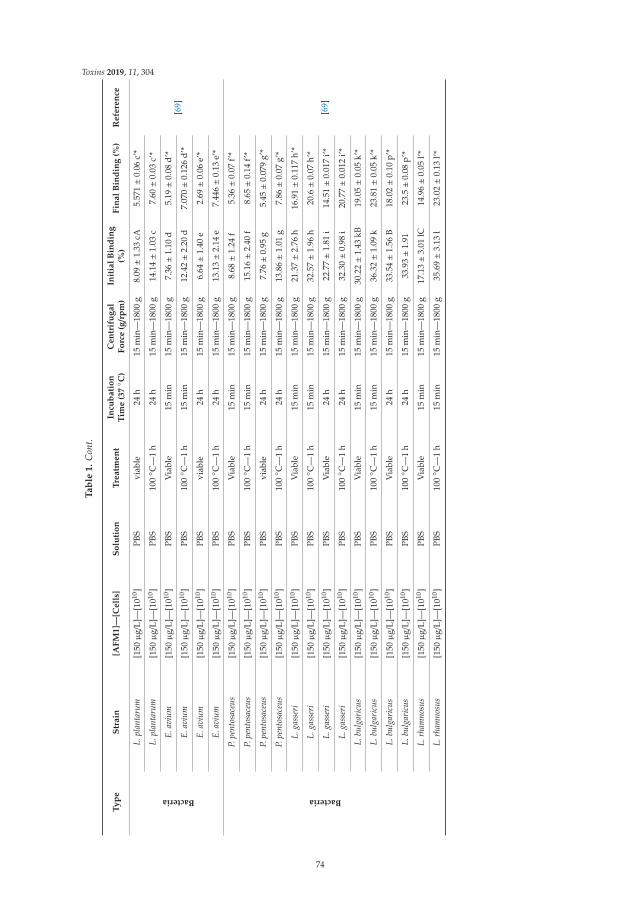
Toxins 2019, 11, 304
Ta
ble
1.
Con
t.
Ty
pe
Str
ain
[AF
M1]—
[Cell
s]S
olu
tio
nT
reatm
en
tIn
cub
ati
on
Tim
e(3
7◦ C
)C
en
trif
ug
al
Fo
rce
(g/r
pm
)In
itia
lB
ind
ing
(%)
Fin
al
Bin
din
g(%
)R
efe
ren
ceBacteria
L.pl
anta
rum
[150
μg/
L]—
[1010
]PB
Svi
able
24h
15m
in—
1800
g8.
09±1
.33
cA5.
571±0
.06
c’*
[69]
L.pl
anta
rum
[150
μg/
L]—
[1010
]PB
S10
0◦ C
—1
h24
h15
min
—18
00g
14.1
4±1
.03
c7.
60±0
.03
c’*
E.av
ium
[150
μg/
L]—
[1010
]PB
SV
iabl
e15
min
15m
in—
1800
g7.
36±1
.10
d5.
19±0
.08
d’*
E.av
ium
[150
μg/
L]—
[1010
]PB
S10
0◦ C
—1
h15
min
15m
in—
1800
g12
.42±2
.20
d7.
070±0
.126
d’*
E.av
ium
[150
μg/
L]—
[1010
]PB
Svi
able
24h
15m
in—
1800
g6.
64±1
.40
e2.
69±0
.06
e’*
E.av
ium
[150
μg/
L]—
[1010
]PB
S10
0◦ C
—1
h24
h15
min
—18
00g
13.1
3±2
.14
e7.
446±0
.13
e’*
Bacteria
P.pe
ntos
aceu
s[1
50μ
g/L]
—[1
010]
PBS
Via
ble
15m
in15
min
—18
00g
8.68±1
.24
f5.
36±0
.07
f’*
[69]
P.pe
ntos
aceu
s[1
50μ
g/L]
—[1
010]
PBS
100◦ C
—1
h15
min
15m
in—
1800
g15
.16±2
.40
f8.
65±0
.14
f’*
P.pe
ntos
aceu
s[1
50μ
g/L]
—[1
010]
PBS
viab
le24
h15
min
—18
00g
7.76±0
.95
g5.
45±0
.079
g’*
P.pe
ntos
aceu
s[1
50μ
g/L]
—[1
010]
PBS
100◦ C
—1
h24
h15
min
—18
00g
13.8
6±1
.01
g7.
86±0
.07
g’*
L.ga
sser
i[1
50μ
g/L]
—[1
010]
PBS
Via
ble
15m
in15
min
—18
00g
21.3
7±2
.76
h16
.91±0
.117
h’*
L.ga
sser
i[1
50μ
g/L]
—[1
010]
PBS
100◦ C
—1
h15
min
15m
in—
1800
g32
.57±1
.96
h20
.6±0
.07
h’*
L.ga
sser
i[1
50μ
g/L]
—[1
010]
PBS
Via
ble
24h
15m
in—
1800
g22
.77±1
.81
i14
.51±0
.017
i’*
L.ga
sser
i[1
50μ
g/L]
—[1
010]
PBS
100◦ C
—1
h24
h15
min
—18
00g
32.3
0±0
.98
i20
.77±0
.012
i’*
L.bu
lgar
icus
[150
μg/
L]—
[1010
]PB
SV
iabl
e15
min
15m
in—
1800
g30
.22±1
.43
kB19
.05±0
.05
k’*
L.bu
lgar
icus
[150
μg/
L]—
[1010
]PB
S10
0◦ C
—1
h15
min
15m
in—
1800
g36
.32±1
.09
k23
.81±0
.05
k’*
L.bu
lgar
icus
[150
μg/
L]—
[1010
]PB
SV
iabl
e24
h15
min
—18
00g
33.5
4±1
.56
B18
.02±0
.10
p’*
L.bu
lgar
icus
[150
μg/
L]—
[1010
]PB
S10
0◦ C
—1
h24
h15
min
—18
00g
33.9
3±1
.91
23.5±0
.08
p’*
L.rh
amno
sus
[150
μg/
L]—
[1010
]PB
SV
iabl
e15
min
15m
in—
1800
g17
.13±3
.01
lC14
.96±0
.05
l’*
L.rh
amno
sus
[150
μg/
L]—
[1010
]PB
S10
0◦ C
—1
h15
min
15m
in—
1800
g35
.69±3
.13
l23
.02±0
.13
l’*
74

Toxins 2019, 11, 304
Ta
ble
1.
Con
t.
Ty
pe
Str
ain
[AF
M1]—
[Cell
s]S
olu
tio
nT
reatm
en
tIn
cub
ati
on
Tim
e(3
7◦ C
)C
en
trif
ug
al
Fo
rce
(g/r
pm
)In
itia
lB
ind
ing
(%)
Fin
al
Bin
din
g(%
)R
efe
ren
ceBacteria
L.rh
amno
sus
[150
μg/
L]—
[1010
]PB
SV
iabl
e24
h15
min
—18
00g
27.7
9±2
.67
mC
16.5
1±0
.05
m’*
[69]
L.rh
amno
sus
[150
μg/
L]—
[1010
]PB
S10
0◦ C
—1
h24
h15
min
—18
00g
45.6
7±1
.65
m22
.45±0
.063
m’*
B.la
ctis
[150
μg/
L]—
[1010
]PB
SV
iabl
e15
min
15m
in—
1800
g16
.89±2
.01
n13
.34±0
.115
n’*
B.la
ctis
[150
μg/
L]—
[1010
]PB
S10
0◦ C
—1
h15
min
15m
in—
1800
g36
.56±2
.46
n23±0
.22
n’*
B.la
ctis
[150
μg/
L]—
[1010
]PB
SV
iabl
e24
h15
min
—18
00g
23.6
2±4
.13
o13
.71±0
.29
o’*
B.la
ctis
[150
μg/
L]—
[1010
]PB
S10
0◦ C
—1
h24
h15
min
—18
00g
35.8
4±3
.85
o21
.22±0
.316
o’*
L.rh
amno
sus
stra
inG
G[1
50μ
g/L]
—[1
010]
skim
milk
Via
ble
≈16
h15
min
—35
00g
18.8±1
.9pD
-
[78]
L.rh
amno
sus
stra
inG
G[1
50μ
g/L]
—[1
010]
skim
milk
100◦ C
—1
h≈1
6h
15m
in—
3500
g26
.6±3
.2pE
-
L.rh
amno
sus
stra
inG
G[1
50μ
g/L]
—[1
010]
full
crea
mm
ilkV
iabl
e≈1
6h
15m
in—
3500
g26
.0±1
.5qD
-
L.rh
amno
sus
stra
inG
G[1
50μ
g/L]
—[1
010]
full
crea
mm
ilk10
0◦ C
—1
h≈1
6h
15m
in—
3500
g36
.6±1
.1qE
-
LAB
pool
(L.d
elbr
ueck
iisp
p.Bu
lgar
icus
,L.
rham
nosu
san
dB.
lact
is)
[0.5
μg/
L]—
[1010
]U
HT
skim
milk
100◦ C
—1
h30
min
15m
in—
1800
g11
.5±2
.3-
[66]
LAB
pool
(L.d
elbr
ueck
iisp
p.Bu
lgar
icus
,L.
rham
nosu
san
dB.
lact
is)
[0.5
μg/
L]—
[1010
]U
HT
skim
milk
100◦ C
—1
h60
min
15m
in—
1800
g11
.7±4
.4-
[66]
Res
ults
are
the
aver
age±S
Dfo
rtr
iplic
ates
sam
ple.
Two-
way
AN
OV
Aw
asco
nduc
ted
.Ind
icat
esa
sign
ifica
ntbi
ndin
gd
iffer
ence
s(p<
0.05
)bet
wee
n:(*
)Ini
tial
and
final
bind
ing
%of
viab
leor
heat
-kill
edba
cter
ia.(
a,b,
c,d
,e,f
,g,h
,I,j
,k,l
,m,n
,o,p
,q,r
,s,t
,q)v
iabl
ean
dhe
at-k
illed
bact
eria
befo
rew
ashi
ng.(
a’,b
’,c’
,d’,
e’,f
’,g’
,h’,
i’,j’,
k’,l
’,m
’,n’
,o’)
viab
lean
dhe
at-k
illed
bact
eria
afte
rw
ashi
ng.(
A,B
,C,D
,E)b
acte
ria
trea
ted
atdiff
eren
tinc
ubat
ion
tim
e.(λ
,β)b
acte
ria
trea
ted
atdiff
eren
tAFM
1co
ncen
trat
ion.
75
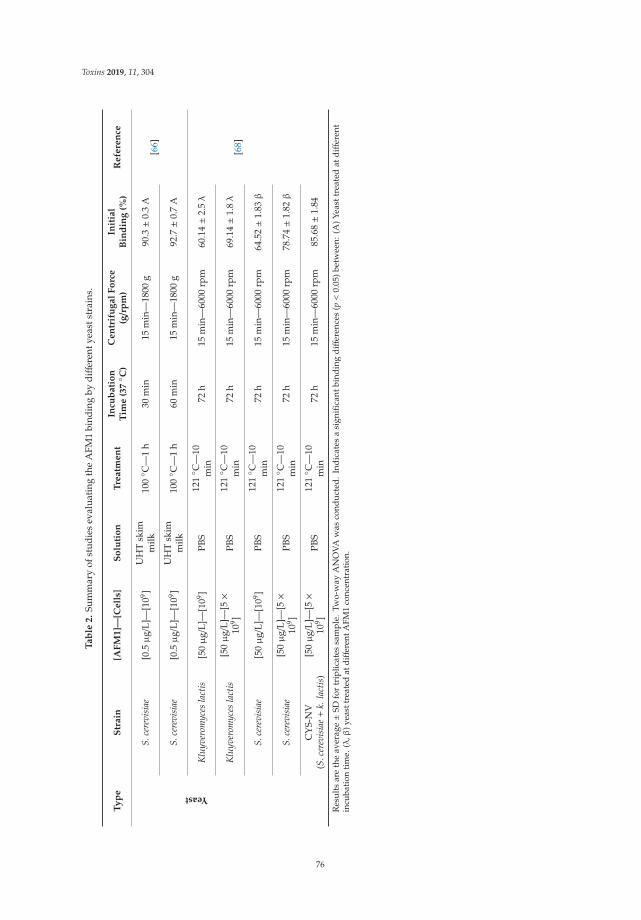
Toxins 2019, 11, 304
Ta
ble
2.
Sum
mar
yof
stud
ies
eval
uati
ngth
eA
FM1
bind
ing
bydiff
eren
tyea
stst
rain
s.
Ty
pe
Str
ain
[AF
M1]—
[Cell
s]S
olu
tio
nT
reatm
en
tIn
cub
ati
on
Tim
e(3
7◦ C
)C
en
trif
ug
al
Fo
rce
(g/r
pm
)In
itia
lB
ind
ing
(%)
Refe
ren
ceYeast
S.ce
revi
siae
[0.5μ
g/L]
—[1
09 ]U
HT
skim
milk
100◦ C
—1
h30
min
15m
in—
1800
g90
.3±0
.3A
[66]
S.ce
revi
siae
[0.5μ
g/L]
—[1
09 ]U
HT
skim
milk
100◦ C
—1
h60
min
15m
in—
1800
g92
.7±0
.7A
Klu
yver
omyc
esla
ctis
[50μ
g/L]
—[1
09 ]PB
S12
1◦ C
—10
min
72h
15m
in—
6000
rpm
60.1
4±2
.5λ
[68]
Klu
yver
omyc
esla
ctis
[50μ
g/L]
—[5×
109 ]
PBS
121◦ C
—10
min
72h
15m
in—
6000
rpm
69.1
4±1
.8λ
S.ce
revi
siae
[50μ
g/L]
—[1
09 ]PB
S12
1◦ C
—10
min
72h
15m
in—
6000
rpm
64.5
2±1
.83β
S.ce
revi
siae
[50μ
g/L]
—[5×
109 ]
PBS
121◦ C
—10
min
72h
15m
in—
6000
rpm
78.7
4±1
.82β
CY
S-N
V(S
.cer
evis
iae+
k.la
ctis
)[5
0μ
g/L]
—[5×
109 ]
PBS
121◦ C
—10
min
72h
15m
in—
6000
rpm
85.6
8±1
.84
Res
ult
sar
eth
eav
erag
e±S
Dfo
rtr
iplic
ates
sam
ple
.Tw
o-w
ayA
NO
VA
was
cond
uct
ed.
Ind
icat
esa
sign
ifica
ntbi
ndin
gd
iffer
ence
s(p<
0.05
)bet
wee
n:(A
)Yea
sttr
eate
dat
diff
eren
tin
cuba
tion
tim
e.(λ
,β)y
east
trea
ted
atdiff
eren
tAFM
1co
ncen
trat
ion.
76

Toxins 2019, 11, 304
Ta
ble
3.
Sum
mar
yof
stud
ies
eval
uati
ngA
FM1
bind
ing
bya
mix
ture
ofye
asts
and
bact
eria
lstr
ains
.
Ty
pe
Str
ain
[AF
M1]—
[Cell
s]S
olu
tio
nT
reatm
en
tIn
cub
ati
on
Tim
e(3
7◦ C
)C
en
trif
ug
al
Fo
rce
(g/r
pm
)In
itia
lB
ind
ing
(%)
Refe
ren
ce
MixtureLA
Bpo
ol+
S.ce
revi
siae
[0.5
μg/
L]—
[1010
]LA
Bpo
ol+
[109 ]S
.cer
evis
iae
UH
Tsk
imm
ilk10
0◦ C
—1
h30
min
15m
in18
00g
91.7±0
.5A
[66]
LAB
pool+
S.ce
revi
siae
[0.5
μg/
L]—
[1010
]LA
Bpo
ol+
[109 ]S
.cer
evis
iae
UH
Tsk
imm
ilk10
0◦ C
—1
h60
min
15m
in18
00g
100.
0±0
.0A
CPY
S-N
V(B
.bifi
dum+
L.ac
idop
hilu
s+
L.Pl
anta
rum+
S.ce
revi
siae+
k.la
ctis
)
[50μ
g/L]
—[5×1
09 ]PB
S12
1◦ C
—10
min
(b)—
20m
in(y
)72
h-
87.9
2±1
.10
[68]
CPY
S-N
V(B
.bifi
dum+
L.ac
idop
hilu
s+
L.Pl
anta
rum+
S.ce
revi
siae+
k.la
ctis
)
[50μ
g/L]
—[5×1
09 ]sk
imm
ilk12
1◦ C
—10
min
(b)
121◦ C
—20
min
(y)
12h
-80
.56±2
.19
B
[50μ
g/L]
—[5×1
09 ]sk
imm
ilk12
1◦ C
—10
min
(b)
121◦ C
—20
min
(y)
24h
-86
.64±1
.5B
[50μ
g/L]
—[5×1
09 ]sk
imm
ilk12
1◦ C
—10
min
(b)
121◦ C
—20
min
(y)
48h
-88
.6±1
.3C
[50μ
g/L]
—[5×1
09 ]sk
imm
ilk12
1◦ C
—10
min
(b)
121◦ C
—20
min
(y)
72h
-90
.88±1
.09
C
Res
ults
are
the
aver
age±S
Dfo
rtr
iplic
ates
sam
ple.
Two-
way
AN
OVA
was
cond
ucte
d.In
dica
tes
asi
gnifi
cant
bind
ing
diff
eren
ces
(p<
0.05
)bet
wee
n:(A
,B,C
)cel
lstr
eate
dat
diff
eren
tin
cuba
tion
tim
e.(b
):Ba
cter
ials
trai
ns(y
):Ye
asts
trai
ns.
77
Toxins 2019, 11, 304
Tables 1–3 represent a summary of the literature using bacteria, yeasts, or a mixture of them forAFM1 decontamination. In addition, the stability of the formed complex in milk or in PBS before(Initial) and after (Final) washing is also highlighted.
3.2.1. Binding Efficiency of Bacterial Strains
AFM1 binding efficiency by different bacterial strains is shown in Table 1. Kabak et al. reportedthat the binding of AFM1 by viable Lactobacillus and Bifidobacterium strains in PBS depends on the AFM1contamination level and incubation time. In addition, they indicated that heating the bacterial pelletsdid not improve their ability to remove AFM1 from PBS [98]. These findings were not consistent withBovo et al. (2015), who reported that AFM1 bound by heat-killed E. avium, L. plantarum, P. pentosaceus,B. lactis, and L. gasseri was significantly greater than the amount bound by viable cells [91]. In fact,these results were in accordance with another study conducted by Assaf et al. in which the percentageof AFM1 bound by L. rhamnosus GG in PBS increased significantly, reaching up to 63.08% after heattreatment [74]. This binding increase was explained by the fact that AFM1 may adhere to bacterialcells via electrostatic bonding, thus suggesting that AFM1 is bound to cell wall components, namelypolysaccharides and peptidoglycans [99,100]. Furthermore, during heat treatment, the cell wallcomponents are affected by the denaturation of proteins, resulting in an increase in the hydrophobicnature of the cell’s surface in addition to a possible formation of Maillard reaction products [101].Hence, this denaturation allows AFM1 to bind to bacterial cell wall components that were not accessiblewhen cells were intact [101]. A change in LAB concentration was sufficient to result in a variation ofthe amount of bound AFM1. According to Kabak et al., a reduction of the bacterial concentrationresulted in a significant decrease of bound AFM1 in PBS [102]. This observation was congruent with anAssaf et al. finding, where the binding of AFM1 to L. rhamnosus GG greatly increased after increasingthe bacterial concentration [74]. Besides, Kabak et al. mentioned that the amount of eliminated AFM1was not affected by the contamination level of AFM1 in PBS [102].
However, similar findings in milk have been reported by Pierides et al., who demonstratedthat heat-killed L. rhamnosus GG were able to more efficiently remove AFM1 than viable cells [103].Accordingly, AFM1 removal in full cream milk (36.6%) was higher compared to skim milk (26.6%),though both were lesser than in PBS. In this regard, the same researchers justified the lower AFM1removal in milk compared to PBS by the decrease in the availability of free AFM1 possibly associatedwith casein and other milk contents [103]. In addition, in 2013, Corassin et al. demonstrated that byusing a pool of LAB in ultra-high temperature processing (UHT) skim milk, the bound amount ofAFM1 has not significantly improved even after an increase in the incubation time [86]. These findingssuggested that the binding process of AFM1 with LAB is completed in a fast manner.
3.2.2. Binding Efficiency of Yeast Strains
Upon using different type of yeast strains to bind AFM1 (Table 2), Corassin et al. reported thatthe binding of AFM1 by Saccharomyces cerevisiae in UHT skim milk was significantly higher (up to92.7%) compared to the binding by LAB pool (up to 11.7%) [86]. Furthermore, in 2018, Abdelmotilibet al. stated that the combination of non-viable yeast strains (Kluyveromyces lactis and S. cerevisiae)had a higher AFM1 removal effect (85.68%) compared to separate yeast strains (up to 78.74%) [90].Furthermore, the study showed that the removal of AFM1 by Kluyveromyces lactis increased significantlywith an increasing yeast concentration [90].
3.2.3. Binding Efficiency of Bacteria and Yeasts Mixed Pools
Upon using a combination of bacterial strains (L. Plantarum, L. acidophilus, and B. bifidum) andyeast strains (Kluyveromyces lactis and S. cerevisiae) (Table 3), Abdelmotilib et al. demonstrated that thismixture showed the highest binding of AFM1 in a PBS medium (87.92%) [90]. Similarly Corassin etal. revealed that the amount of AFM1 bound by a mixture of LAB pool and S. cerevisiae in UHT skimmilk was significantly higher, reaching up to 100% after 60 min of incubation [86]. In fact, this increase
78
Toxins 2019, 11, 304
in the mixture’s ability to remove AFM1 compared to bacteria or yeast strains was explained by theadditive effect of both S. cerevisiae and LAB pool, making more accessible sites available for AFM1fixation. After increasing the total microbial cell concentration in milk by forming a mixed pool ofstrains, the possible increase in AFM1 retention among microbial cells was not taken into considerationas a potential cause for this binding increase and should be further studied.
3.2.4. AFM1/Microbial Complex Binding Stability
Few studies assessed the stability of the AFM1/microbial complex after successive washing steps(Final binding). In this regard, in 2008, Kabak et al. reported that the binding of AFM1 to bacterialcells was partially reversible, and small amounts of AFM1 (up to 8.54%) were released back intothe PBS solution [98]. Furthermore, Bovo et al. revealed that some AFM1 were released back intoPBS after several washes but with greater percentages (up to 87%) [91]. Likewise, our observationindicated that after five successive washes, the percentage binding of AFM1 to viable and heat-treatedL. rhamnosus GG decreased (up to 4.3%) [74]. Several investigators showed that the binding betweenAFM1 and bacteria is partially reversible, suggesting the implication of non-covalent bonds such ashydrogen bonds and van der Waals interactions [104,105]. A potential clarification of this variation inthe released amounts of AFM1 can be explained by the difference in the binding sites between strainsor to cross-linked interactions between AFM1 molecules and different microbes [106]. It is noteworthyto mention that the stability of the formed AFM1/microbial complex remains crucial; thus, a stablecomplex ensures a safe excretion of mycotoxins from the human body [38,107].
3.3. Plausible Experimental Variants
Depending on the performed experiments, the AFM1 binding assays using LAB or yeasts haveshown some unexplained differences in the percentage of bound AFM1. In this section, we will tryto explain the plausible causes of these differences and actions that could be taken in order to betterclarify and analyze the given results.
3.3.1. Applied Heat Treatment
The heat treatment of bacteria, yeasts, or mixtures is not performed in a similar way (Tables 1–3).Hence, some tests are conducted by heating bacteria at 90–100 ◦C, while others are conducted byautoclaving at 121 ◦C. In both terms, the bacteria are heat-killed, but the effect of exerted heat on cellwall components (proteins, peptidoglycan, etc.) and their structures are not taken into consideration.However, depending on heating time, type, and temperature, reversible or irreversible denaturationevents may take place [108]. Possibly, a reversible thermal denaturation of proteins or other cellwall components will cause their renaturation after heating [109]. Thus, this may cause an absenceof significant changes in AFM1 binding after heat treatment, as shown by Kabak et al. (Table 1).Nevertheless, in another scenario, a variation of the heat rate may cause an irreversible denaturation ofproteins and other cell wall components in addition to increasing the number of dissociated electrostaticbonds [74,109,110]. Consequently, it will affect the fixation of AFM1 on its binding sites in the cell wall.These results may explain some of the findings in which an increase in AFM1 binding was observedafter heat treatment (Tables 1–3). In addition, heating may affect this binding through the formation ofMaillard reaction products between proteins, polysaccharides, and peptides [101,111].
3.3.2. Working Temperature
In the conducted experiments for AFM1 binding by microbial adsorbents, the incubationtemperature of AFM1-microbial suspension is clearly indicated (Tables 1–3). On the other hand,there is a lack of information regarding the working temperature of the carried out experiment thatis usually not similar to the fixed incubation temperature of the suspended complex (e.g., 37 ◦C).Microbial pellets, PBS, and milk may have been stored cold before conducting the binding assay thatmay take place at room temperature. In addition, for heat-killed bacteria, the temperature of the
79
Toxins 2019, 11, 304
bacterial pellets may not directly return to room temperature before being suspended in contaminatedmilk or PBS. Since we are dealing with an electrostatic type of bonding, a variation in the temperaturemay affect the binding of AFM1 to microbial cells [112]. Thus, for more accuracy, it may be better toindicate the working temperature for the performed assay.
3.3.3. Washing Steps
Testing the stability of the formed AFM1/microbial complex after successive washes was notalways considered to be critical, and, for this reason, it was not conducted in all experiments (Tables 1–3).Due to the formation of electrostatic bonds, which are weak-to-intermediate in strength (hydrogen andvan der Waals), it could be assumed that a certain amount of bound AFM1 may return to suspension(up to 87%) [74,91]. Nevertheless, electrostatic bonding may not be the only reason behind this decreasein bound AFM1 after washing steps. Accordingly, some AFM1 may be retained among bacteria oryeasts even without binding [74]. Therefore, conducting several washes until complete stabilization inthe amount of bound AFM1 may be necessary to make appropriate assumptions regarding the actualbinding percentage.
3.3.4. Filtration Step
The use of a filtration step to separate microbial adsorbents from AFM1 was not quite favorabledue to the retention of some AFM1 that may take place in the filter even without the presence of anyadsorbents [74]. Thus, the filtration of a suspension of AFM1 and bacteria may increase the retentionof AFM1 in the filter due to membrane pore blockage by the bacteria and the formation of a cakelayer. Furthermore, in order to avoid any malfunctions in High Performance Liquid Chromatography(HPLC), some manufacturer’s instruction manuals [113] recommend filtering all samples before AFquantification [114–117]. In addition, it is worth mentioning that the use of a filtration step forsupernatant samples after AFM1 binding may entail errors in the real amount of bound AFM1 [74].For this reason, it might be better to keep controls for filtration steps at different AFM1 concentrations.In addition, these controls will help in sorting between retained AFM1 in filtration step and unrecoveredAFM1 from milk following its clean-up by an immunoaffinity column (IAC). Furthermore, in orderto reduce AFM1 retention in the filter, selecting the most appropriate filter membrane (membranematerials, pore size, etc.) may be crucial.
3.3.5. Centrifugation Step
In an AFM1 binding assay, the centrifugation steps are usually conducted to separate bacteria oryeasts from the containing medium (milk, PBS, etc.) [74,103]. For this reason, not much attention wasgiven for the effect of centrifugal speed on AFM1 binding. Therefore, different speeds were used in theconducted experiments (Tables 1–3). We highlighted in our previous study that the centrifugationstep is implicated in the binding of AFM1 to microbial adsorbents via increasing the contact amongthem [74]. For this reason, the centrifugation speed and time may affect the amount of bound AFM1,even without changes in other experimental conditions. Hence, the implication of the centrifugationstep in AFM1 binding should not be ignored, and further studies may be needed.
3.3.6. Presence of an S-layer
The bacterial S-layer (surface layer) is a layer of thickness between 5 and 25 nm that forms theoutermost cell envelope which covers the entire bacteria [118,119]. This layer is composed of proteins orglycoproteins arranged in different shapes in oblique, square, or hexagonal lattice symmetry [120,121].In addition, the S-layer pore sizes range between 2 and 8 nm in diameter [118,122]. It is possible thatthis layer acts as a barrier against the entry of AFM1 and binding to the LAB cell wall peptidoglycansor polysaccharides. The potential role of the S-layer in the adsorption or retention of AFM1 should beelucidated after its extraction. It is important to mention that not all LAB have an S-layer [123]. A clear
80

Toxins 2019, 11, 304
indication of its presence or absence gives a better understanding of the cell wall structure that mayaffect the binding of AFM1.
3.3.7. Detection and Quantification Techniques
To quantify AFM1 in milk, it is always essential to properly manipulate the samples and choosethe appropriate detection method. The reversed-phase HPLC method is a widely used technique for itsdetection [114–117]. Other commonly known methods are the enzyme linked immune-sorbent assay(ELISA) and thin-layer chromatography (TLC) [49]. Both the ELISA and TLC methods are cost-effectiveand easy to handle. For these reasons, they are mainly used as AFM1 screening methods [124].However, although the use of reverse phase HPLC is more expensive and requires skilled staff, itremains highly accurate with higher sensitivity and specificity [114]. The detection of AFM1 by HPLCis still of great importance due to its high sensitivity, accuracy, reliability, and possibility for columnre-usage [114]. In contrast to ELISA, the HPLC method requires a clean-up of AFM1 from milk byusing an IAC [116]. Along these lines, various experimental variants may occur at any stage, fromsample handling to extraction, detection, or quantification of residual AFM1.
These inaccuracies are not only limited to the binding of AFM1 by microbial adsorbents but mayextend to binding of different types of mycotoxins including aflatoxin B1, ochratoxin A, patulin, andother toxins following similar procedures [106,108,125,126].
4. Advantages and Limitations
The mechanism of AFM1 decontamination by LAB, yeasts, or mixtures present different advantagesover other chemical, physical, or biological methods. This section highlights several advantages of thepreviously discussed methods in addition to different limitations which may act as a barrier towardtheir industrial commercialization and that need to be further investigated.
4.1. Advantages of Microbial Decontamination
4.1.1. Reduction of AFM1 Bioaccessibility
The use of microbial adsorbents to complex AFM1 may provide an additional strategy to reduceits bioavailability [38]. Hence, a decrease in the amount of free AFM1 for intestinal adsorption willoccur. Serrano-Nino et al. revealed that the bioaccessibility of AFM1 in an in vitro digestive modelwas reduced after AFM1 binding by microbial probiotic strains [127]. Accordingly, B. bifidum NRRLB-41410 and L. acidophilus NRRL B-4495 were able to reduce the relative bioaccessibility of AFM1 by45.17% and 32.20%, respectively. Moreover, tests conducted on mice revealed that the concurrentadministration of Lactobacillus plantarum MON03 (LP) with AFM1 strongly reduced the adverse effectsof AFM1 [128]. Therefore, there were no significant differences in tested parameters compared to thecontrol mice [128]. In addition, several studies revealed that the binding of AF to LAB strains increasedwhen simulated in a gastrointestinal environments. As a result of the exposure of LAB cells to bile, analteration of proteins and phospholipids of the cell envelope may take place, resulting in increasedbinding [18,89,129,130].
4.1.2. Adsorption Specificity and Effectiveness
The use of either physical methods, such as heating and irradiation [131,132], or chemical methods,including solvent extraction, ammoniation, and ozone treatment [133–136], for AFM1 removal havemany limitations. These detoxification methods are expensive, time consuming, and may causesignificant nutritional losses compared to the microbial methods. Thus, microbial decontamination isfound to be more effective and highly specific [137]. As observed in Tables 1–3, the binding of LABwith AFM1 varied not only between species but also within different strains of the same species, whichis an additional indicator of the specificity of this type of binding. Hence, the additional confirmationof AFM1 binding specificity that is supposed to be exerted in specific sites of the microbial cell wall
81

Toxins 2019, 11, 304
including polysaccharides and peptidoglycan, in addition to its binding mechanisms, needs to befurther investigated.
4.1.3. Consumer Product Safety
The use of several probiotics that are “Generally Recognized as Safe” (GRAS) microorganisms forthe milk detoxification of AFM1 has made this process safer. It is worth mentioning that probioticscan exert beneficial effects on the host, including consumers of milk and dairy products [138].The above-discussed methods suggest that supplementing milk with probiotics may be a suitablesolution for AFM1 removal in dairy products. In addition, the microbial control of AF productionby LAB probiotic strains conferred better protection to milk and other contaminated dairy productsduring the storage period [52]. Different LAB such as L. plantarum, L. fermentum, and L. rhamnosusare known to be widely used as microbial inoculants for fermentation purposes including milkfermentation [139–141]. Therefore, the use of such microbial binders that are commonly found in dairyproducts and used in their processing is highly preferable. On the other hand, when using chemical orphysical agents, some residues may be left in milk that will negatively affect the organoleptic quality ofmilk, putting the safety of the consumers at risk. Thus, using microbial adsorbents for the eliminationof AFM1 from liquids such as milk remains a highly promising strategy.
4.2. Limitations of Microbial Decontamination
4.2.1. Microbial Supplementation Limits and Conditions
It is important to indicate that adding microbial agents to milk is acceptable to a certain limit.Current US standards require coliforms no greater than 10 cfu/mL in grade ‘A’ pasteurized fluid milkand a total plate counts of less than 20,000 cfu/mL [142]. Therefore, researchers must be aware ofthis issue that would be better if taken into consideration when performing the binding assays andfixing the needed microbial concentration. In addition, legislation concerning the total amount ofdead and viable bacteria in milk and milk products varies regionally, and respecting these norms is amain concern for the safety of the consumers of dairy products. Adding different amounts of viableLAB, yeasts, or a mixture of both to milk is not quite favorable due to their uncontrolled proliferation.For example, yeasts such as Kluyveromyces sp. and Saccharomyces sp. usually cause milk spoilage byfermenting milk lactose [143].
4.2.2. Removal of Supplemented Microorganisms
If the concentrations of microbial agents necessary for AFM1 decontamination surpass the allowedlimits, then they cannot remain in milk and a treatment for their removal is required. The removalof LAB or yeasts that were previously supplemented into milk using a filtration step is not easy toachieve due to several limiting factors. Within the required milk treatment for microbial removal, lowmembrane selectivity may take place in addition to its high operating costs [144]. Furthermore, sizesimilarities between different milk components such as microbial adsorbents and fat can make thisprocess harder to accomplish at low cost, and additional steps may be required. Thus, a proportion of thenative milk fat globules which are similar in size to bacteria must be removed by centrifugal separationbefore conducting a microfiltration step [144]. It appears that this removal process is expensive, andimportant milk components may be lost, which means that they have to be re-supplemented later dueto their significance to consumers.
4.2.3. Binding Reversibility
As previously reported in this review, the binding of AFM1 to microbial adsorbents is partiallyreversible. Hence, the non-covalent type of binding between microbial binders and AFM1 may bea main concern related to its industrial application. Since milk contamination by AFM1 and itsmaximum tolerable limits are not similar worldwide, the amount of supplemented yeasts, bacteria,
82
Toxins 2019, 11, 304
or mixture of both in AFM1-contaminated milk needs to be regularly assessed. Thus, estimating theamounts of needed adsorbents is hard to achieve due to the partial reversibility of this type of bonding.Additionally, the stability of AF binding in milk or other liquids may differ according to differentenvironmental condition including storage time, pH, milk temperature, and concentration of the usedmicrobial adsorbents [145]. It remains tough to continuously monitor the amounts of free AFM1 andestimate the concentration of microbial agents in an unstable environment, especially when microbialadditives bound to AFM1 are destined to be retained in milk.
5. Prospective Industrial Applications
Numerous microbial adsorbents have been tested in order to determine their potential ability tobind AF in milk and other dairy products, but, so far, researchers have not been able to commerciallyimplement a fully reliable method. For this reason, several prospective methods for industrialapplications are discussed in this section.
5.1. Microbial Fixation on Support or Membrane
The proposed method reported by Foroughi et al. in 2018 consists of immobilizing yeast suchas Saccharomyces cerevisiae on perlite support to detoxify AFM1-contaminated milk [146]. The resultsshowed a significant reduction in AFM1 concentration for all tested milk samples with various initialAFM1 contents. The highest reduction of AFM1 obtained was 81.3% after 80 min of milk circulationin the biofilter. This study revealed the high capability of immobilized yeast cells to detoxify AFM1without any changes of its physicochemical properties. These promising results may be used foradditional research such as fixing effective quantities of LAB, yeasts, or mixtures on a support ormembrane that may be used to detoxify AFM1 by passing contaminated liquids through or over it. Theformation of customized biofilters or cartridges containing these biological adsorbents may be moresuitable for industrial application. Therefore, microbial cell immobilization is a remarkable methodthat may lead to different practical applications addressing not only AFM1 contamination in dairyproducts but also mycotoxins decontamination in beverages.
5.2. Microbial Biofilm Formation
A potential solution to the retention of microbial agents used for AFM1 decontamination in milkwas shown in a study conducted by Assaf et al. in 2019 [50]. Tests were carried out to examine theability of biofilm formed by probiotic LAB strains in tubes or in plates to eliminate AFM1. Hence, L.rhamnosus GG biofilm was able to significantly remove (up to 60.74%) AFM1 from contaminated wholemilk. In addition, no significant difference in milk protein content was observed after AFM1 binding.Therefore, passing contaminated milk through or over the resultant biofilm for AFM1 decontaminationcould be a direct application of this method. It is important to mention that probiotic LAB and yeastsare able to form biofilms on different type of surfaces [147]. As such, their emerging applications inmycotoxin decontamination should be further elucidated.
5.3. Customized Rotating Mixer
As previously shown, an increase of AFM1 exposure to microbial adsorbents may affect theamount of AFM1 bound by LAB [74]. Thus, the binding of AFM1 to heat-killed L. rhamnosus GGincreased when coupled to a mixing step such as pipetting [74]. For this reason, it may be suitable to usea customized rotating mixer that can increase the contact between AFM1 and microbial binders, thusdecreasing the amount of microbial inoculum needed and the decontamination time. This proceduremay be coupled with a filtration step to remove the supplemented microbial agents. Noting that evenwithout any microbial supplementation, the increase of contact between AFM1 and milk componentsincluding LAB and proteins such as casein may result in an increase in the binding of free AFM1,thereby decreasing AFM1 bioavailability in contaminated milk [148–150].
83
Toxins 2019, 11, 304
6. Conclusions
Among all mycotoxins, the group of aflatoxins has received much attention due to their severeimpact on human and animal health. In fact, numerous studies have investigated various microbialagents for their potential to bind AFM1. In this review, we aimed to investigate AFM1 decontaminationmethods by using microbial adsorbents and to emphasize the role of different experimental variants oncomplex binding and stability. Accordingly, this work highlights several experimental parameters thatshould be taken into consideration to optimize the binding of AFM1 in milk and other liquids. Thedecontamination of AFM1 using microbial adsorbents is still under vigorous investigation, and a betterunderstanding of its binding mechanism and stability is needed. In addition, considerable testing ofthe physiochemical properties of milk after decontamination needs to be elucidated. Further studieson using these agents for AFM1 decontamination are still needed before the industrial implementationof the developed methods on milk products. This review highlights the use of different AFM1decontamination methods and their plausible inaccuracies, thus answering some essential questionsfor a better understanding and improvement of these methods.
Author Contributions: Conceptualization, J.C.A.; Methodology, J.C.A., A.C., N.L., A.A. and A.E.K.; Software, S.N.;Validation, J.C.A., A.C., N.L., A.A. and A.E.K. Formal Analysis, J.C.A., A.C., N.L., A.A. and A.E.K.; Investigation,J.C.A., A.C., N.L., A.A. and A.E.K.; Resources, J.C.A.; Data Curation, J.C.A and S.N.; Writing-Original DraftPreparation, J.C.A.; Writing-Review & Editing, J.C.A, A.C., N.L., A.A. and A.E.K.; Visualization, J.C.A., S.N., A.C.,N.L., A.A. and A.E.K; Supervision, A.C., N.L., A.A. and A.E.K.; Project Administration, J.C.A., A.C., N.L., A.A.and A.E.K; Funding Acquisition, A.A. and A.E.K.
Funding: This research and the APC were funded by the research council and the research and analysis center(CAR) at the Faculty of Sciences in Saint-Joseph University (USJ) and the Lebanese University through a grantnumber [5531/4].
Acknowledgments: This work was supported by the research council and the research and analysis center (CAR)at the Faculty of Sciences in Saint-Joseph University (USJ) and the Lebanese University.
Conflicts of Interest: The author declares no conflict of interest.
References
1. Bhatnagar, D.; Cary, J.W.; Ehrlich, K.; Yu, J.; Cleveland, T.E. Understanding the genetics of regulation ofaflatoxin production and Aspergillus flavus development. Mycopathologia 2006, 162, 155–166. [CrossRef]
2. McLean, M.; Dutton, M.F. Cellular interactions and metabolism of aflatoxin: An update. Pharmacol. Ther.1995, 65, 163–192. [CrossRef]
3. Dutton, M.F.; Healthcote, J. The structure, biochemical properties and origins of aflatoxin B2a nd G2a.Chem. Ind. 1968, 418–421.
4. Marin, S.; Ramos, A.J.; Cano-Sancho, G.; Sanchis, V. Mycotoxins: Occurrence, toxicology, and exposureassessment. Food Chem. Toxicol. 2013, 60, 218–237. [CrossRef]
5. Torres, A.M.; Barros, G.G.; Palacios, S.A.; Chulze, S.N.; Battilani, P. Review on pre- and post-harvestmanagement of peanuts to minimize aflatoxin contamination. Food Res. Int. 2014, 62, 11–19. [CrossRef]
6. Barkai-Golan, R.; Paster, N. Mouldy fruits and vegetables as a source of mycotoxins: Part 1. World Mycotoxin J.2008, 1, 147–159. [CrossRef]
7. Rustom, I.Y.S. Aflatoxin in food and feed: Occurrence, legislation and inactivation by physical methods.Food Chem. 1997, 59, 57–67. [CrossRef]
8. Villers, P. Aflatoxins and safe storage. Front. Microbiol. 2014, 5, 1–6. [CrossRef] [PubMed]9. Alshannaq, A.; Yu, J. Occurrence, Toxicity, and Analysis of Major Mycotoxins in Food. Environ. Res.
Public Health 2017, 14, 632. [CrossRef]10. Laciaková, A.; Ciconová, P.; Mate, D.; Laciak, V. Aflatoxins and possibilities for their biological detoxification.
Med. Weter. 2008, 64, 276–279.11. Mahmood Fashandi, H.; Abbasi, R.; Mousavi Khaneghah, A. The detoxification of aflatoxin M1 by
Lactobacillus acidophilus and Bifidobacterium spp.: A review. J. Food Process. Preserv. 2018, 42, 1–10.[CrossRef]
84

Toxins 2019, 11, 304
12. Yu, J.; Payne, G.A.; Campbell, B.C.; Guo, B.; Cleveland, T.E.; Robens, J.F.; Keller, N.P.; Bennett, J.W.;Nierman, W.C. Mycotoxin production and prevention of aflatoxin contamination in food and feed.Aspergilli Genom. Med. Asp. Biotechnol. Res. Methods 2007, 457–472. [CrossRef]
13. Sklan, D.; Klipper, E.; Friedman, A.; Shelly, M.; Makovsky, B. The Effect of Chronic Feeding ofDiacetoxyscirpenol, T-2 Toxin, and Aflatoxin on Performance, Health, and Antibody Production in Chicks.J. Appl. Poult. Res. 2001, 10, 79–85. [CrossRef]
14. Dhanasekaran, D.; Shanmugapriya, S. Aflatoxins and Aflatoxicosis in Human and Animals. In Aflatoxins—Biochemistry and Molecular Biology; InTechOpen: London, UK, 2011; pp. 222–254.
15. Battacone, G.; Nudda, A.; Cannas, A.; Borlino, A.C.; Bomboi, G.; Pulina, G. Excretion of Aflatoxin M1 in Milkof Dairy Ewes Treated with Different Doses of Aflatoxin B1. J. Dairy Sci. 2003, 86, 2667–2675. [CrossRef]
16. Kumar, P.; Mahato, D.K.; Kamle, M.; Mohanta, T.K. Aflatoxins: A Global Concern for Food Safety, HumanHealth and Their Management. Front. Microbiol. 2017, 7, 1–10. [CrossRef] [PubMed]
17. Oatley, J.T.; Rarick, M.D.; Ji, G.E.; Linz, J.E. Binding of Aflatoxin B 1 to Bifidobacteria In Vitro. J. Food Prot.2016, 63, 1133–1136. [CrossRef]
18. Peltonen, K.D.; El-Nezami, H.; Haskard, C.; Ahokas, J.; Salminen, S. Aflatoxin B1 Binding by Dairy Strains ofLactic Acid Bacteria and Bifidobacteria. Dairy Sci. 2001, 84, 2152–2156. [CrossRef]
19. Adejumo, O.; Atanda, O.; Raiola, A.; Somorin, Y.; Bandyopadhyay, R.A. Correlation between aflatoxin M1content of breast milk, dietary exposure to aflatoxin B1 and socioeconomic status of lactating mothers inOgun State, Nigeria. Food Chem. Toxicol. 2013, 56, 171–177. [CrossRef] [PubMed]
20. Williams, J.H.; Phillips, T.D.; Jolly, P.E.; Stiles, J.K.; Jolly, C.M.; Aggarwal, D. Human aflatoxicosis indeveloping countries: A review of toxicology, exposure, potential health consequences, and interventions.Am. J. Clin. Nutr. 2018, 80, 1106–1122. [CrossRef]
21. Darwish, W.S.; Ikenaka, Y.; Nakayama, S.M.M.; Ishizuka, M. An Overview on Mycotoxin Contamination ofFoods in Africa. Toxicology 2014, 76, 789–797. [CrossRef]
22. Angelis, I. De Aflatoxin M1 absorption and cytotoxicity on human intestinal in vitro model. Toxicon 2006, 47,409–415.
23. Marchese, S.; Polo, A.; Ariano, A.; Velotto, S.; Costantini, S.; Severino, L. Aflatoxin B1 and M1: Biologicalproperties and their involvement in cancer development. Toxins (Basel) 2018, 10, 1–19. [CrossRef]
24. Quinn, G.; Gary, P.J.; Damiano, C.; Teehan, G. Treatment of Resistant Hypertension: An Update in DeviceTherapy. In ERRATUM; InTechOpen: London, UK, 2018; pp. 1–11.
25. Britzi, M.; Friedman, S.; Miron, J.; Solomon, R.; Cuneah, O.; Shimshoni, A.J.; Soback, S.; Ashkenazi, R.;Armer, S.; Shlosberg, A. Carry-Over of Aflatoxin M1 in Cows in Mid- and Late-Lactation. Toxins 2013, 5,173–183. [CrossRef] [PubMed]
26. Jalili, M.; Scotter, M. A review of aflatoxin M1 in liquid milk. Iran. J. Health Saf. Environ. 2015, 2, 283–295.27. Sweeney, M.J.; Dobson, A.D.W. Mycotoxin production by Aspergillus, Fusarium and Penicillium species.
Food Microbiol. 1998, 43, 141–158. [CrossRef]28. Creppy, E.E. Update of survey, regulation and toxic effects of mycotoxins in Europe. Toxicology 2002, 127,
19–28. [CrossRef]29. Park, D.L. Effect of Processing on Aflatoxin. Adv. Exp. Med. Biol. 2002, 504, 173–179. [PubMed]30. Motawee, M. Reduction of Aflatoxin M1 Content during Manufacture and Storage of Egyptian Domaiti
Cheese. Vet. Med. 2013, 2013, 11. [CrossRef]31. Galvano, F.; Galofaro, V.; Galvano, G. Occurrence and stability of aflatoxin M1 in milk and milk products a
worldwide review. Food Prot. 1996, 59, 1079–1090. [CrossRef]32. Bovo, F.; Ganev, K.C.; Mousavi, A.; Portela, B.; Cruz, A.G.; Granato, D.; Corassin, C.H.; Augusto, C.;
Oliveira, F.; Sant, A.S. The occurrence and effect of unit operations for dairy products processing on the fateof aflatoxin M1: A review. Food Control 2016, 68, 310–329.
33. Motawee, M.; Meyr, K.; Bauer, J. Incidence of Aflatoxins M1 and B1 in raw milk ans some dairy products InDamietta. Agric. Sci. 2001, 29, 719–725.
34. Jonker, M.A.; Schothorst, R.C.; Egmond, H.P. van Regulations relating to mycotoxins in food Perspectives ina global and European context. Anal. Bioanal. Chem. 2007, 389, 147–157.
35. Juan, A.; Ritieni, J.M. Determination of trichothecenes and zearalenones in grain cereal, flour and bread byliquid chromatography tandem mass spectroscopy. Food Chem. 2012, 134, 2389–2397. [CrossRef] [PubMed]
85

Toxins 2019, 11, 304
36. Food and Drug Administration (FDA). Compliance Program Guidance Manual; FDA: Silver Spring, MD,USA, 2005.
37. European Commission. Commission Regulation (EC) No. 1881/2006 of 19 December 2006. Off. J. Eur. Union2006, 364, 5.
38. Ismail, A.; Akhtar, S.; Levin, R.E.; Ismail, T.; Riaz, M.; Amir, M. Aflatoxin M1: Prevalence and decontaminationstrategies in milk and milk products. Crit. Rev. Microbiol. 2015, 42, 418–427. [CrossRef]
39. Hm, M.; Raghava, S.; Umesha, S. Mycotoxins in Food and Agriculture-Challenges and Opportunities; MedCraveGroup LLC: Oklahoma, OK, USA, 2017.
40. Udomkun, P.; Nimo, A.; Nagle, M.; Müller, J.; Vanlauwe, B.; Bandyopadhyay, R. Innovative technologies tomanage aflatoxins in foods and feeds and the profitability of applicatione—A review. Food Control 2017, 76,127–138. [CrossRef]
41. Kendra, D.F.; Dyer, R.B. Opportunities for biotechnology and policy regarding mycotoxin issues ininternational trade. Food Microbol. 2007, 119, 147–151. [CrossRef]
42. Karlovsky, P.; Suman, M.; Berthiller, F.; Meester, J. De; Eisenbrand, G.; Perrin, I.; Oswald, I.P.; Speijers, G.Impact of food processing and detoxification treatments on mycotoxin contamination. Mycotoxin Res. 2016,32, 179–205. [CrossRef]
43. Kabak, B.; Dobson, A.D.W. Strategies to Prevent Mycotoxin Contamination of Food and Animal Feed: AReview. Food Sci. Nutr. 2006, 46, 593–619. [CrossRef]
44. Waliyar, F.; Osiru, M.; Ntare, B.R.; Kumar, K.V.K.; Sudini, H.; Traore, A.; Diarra, B. Post-harvest managementof aflatoxin contamination in groundnut. World Mycotoxin J. 2014, 8, 245–252. [CrossRef]
45. Palou, L.; Crisosto, C.H.; Smilanick, J.L.; Adaskaveg, J.E.; Zoffoli, J.P. Effects of continuous 0.3 ppm ozoneexposure on decay development and physiological responses of peaches and table grapes in cold storage.Postharvest Biol. Technol. 2002, 24, 39–48. [CrossRef]
46. Kanapitsas, A.; Batrinou, A.; Aravantinos, A.; Markaki, P. Effect of γ-radiation on the production of aflatoxinB1 by Aspergillus parasiticus in raisins (Vitis vinifera L.). Radiat. Phys. Chem. 2015, 106, 327–332. [CrossRef]
47. Markov, K.; Mihaljevic, B.; Domijan, A.M.; Pleadin, J.; Delaš, F.; Frece, J. Inactivation of aflatoxigenic fungiand the reduction of aflatoxin B1 invitro and in situ using gamma irradiation. Food Control 2015, 54, 79–85.[CrossRef]
48. Barra, P.; Etcheverry, M.; Nesci, A. Efficacy of 2,6-di (t-butyl)-p-cresol (BHT) and the entomopathogenicfungus Purpureocillium lilacinum, to control Tribolium confusum and to reduce aflatoxin B1 in stored maize.Stored Prod. Res. 2015, 64, 72–79. [CrossRef]
49. Magan, N.; Olsen, M. Mycotoxins in Food: Detection and Control. Food Sci. Technol. 2005, 40, 337–342.50. Assaf, J.C.; EL Khoury, A.; Chokr, A.; Louka, N.; Atoui, A. A novel method for elimination of aflatoxin M1 in
milk using Lactobacillus rhamnosus GG biofilm. Dairy Technol. 2019, 70, 1–9. [CrossRef]51. Assaf, J.C.; El Khoury, A.; Atoui, A.; Louka, N.; Chokr, A. A novel technique for aflatoxin M1 detoxification
using chitin or treated shrimp shells: In vitro effect of physical and kinetic parameters on the binding stability.Appl. Microbiol. Biotechnol. 2018, 102, 6687–6697. [CrossRef]
52. Giovati, L.; Magliani, W.; Ciociola, T.; Santinoli, C.; Conti, S.; Polonelli, L. AFM1 in Milk: Physical, Biological,and Prophylactic Methods to Mitigate Contamination. Toxins (Basel) 2015, 7, 4330–4349. [CrossRef]
53. Wu, Q.; Jezkova, A.; Yuan, Z.; Pavlikova, L.; Dohnal, V.; Kuca, K. Biological degradation of aflatoxins.Drug Metab. 2009, 41, 1–7. [CrossRef]
54. Jard, G.; Liboz, T.; Mathieu, F.; Guyonvarch, A.; Lebrihi, A. Review of mycotoxin reduction in food and feed:From prevention in the field to detoxification by adsorption or transformation. Food Addit. Contam. Part A2011, 28, 1590–1609. [CrossRef]
55. Stoloff, L.; Van Egmond, H.P.; Park, D.L. Rationales for the establishment of limits and regulations formycotoxins. Food Addit. Contam. ISSN 2015, 8, 213–221. [CrossRef] [PubMed]
56. Wood, G.E. Mycotoxins in Foods and Feeds in the United States. Food Drug Adm. 2018, 70, 3941–3949.[CrossRef] [PubMed]
57. Vouk, V.B. Methods for Assessing the Effects of Mixtures of Chemicals Scope 30 SGOMSEC 3; Wiley: New York,NY, USA, 1989; Volume 27, ISBN 0471911232.
58. Fallah, A.A. Assessment of aflatoxin M1 contamination in pasteurized and UHT milk marketed in centralpart of Iran. Food Chem. Toxicol. 2010, 48, 988–991. [CrossRef] [PubMed]
86

Toxins 2019, 11, 304
59. Liew, W.P.P.; Nurul-Adilah, Z.; Than, L.T.L.; Mohd-Redzwan, S. The binding efficiency and interaction ofLactobacillus casei Shirota toward aflatoxin B1. Front. Microbiol. 2018, 9, 1–12. [CrossRef]
60. Urine, H.; Zhang, L.; Hu, X.; Xiao, Y.; Chen, J.; Xu, Y.; Fremy, J.; Chu, F.S. Correlation of Dietary Aflatoxin BILevels with Excretion of Aflatoxin M. Cancer Res. 1987, 47, 1848–1852.
61. Kuilman, M.E.M.; Maas, R.F.M. Cytochrome P450-mediated metabolism and cytotoxicity of aflatoxin B1 inbovine hepatocytes. Toxicol. Vitr. 2000, 14, 321–327. [CrossRef]
62. Murphy, P.A.; Hendrich, S.; Landgren, C.; Bryant, C.M. Food mycotoxins: An update. J. Food Sci. 2006, 71,51–65. [CrossRef]
63. Li, H.; Xing, L.; Zhang, M.; Wang, J.; Zheng, N. The Toxic Effects of Aflatoxin B1 and Aflatoxin M1 on Kidneythrough Regulating L-Proline and Downstream Apoptosis. Biomed. Res. Int. 2018, 2018, 1–11. [CrossRef]
64. Sun, Z.; Lu, P.; Gail, M.H.; Pee, D.; Zhang, Q.; Ming, L.; Wang, J.; Wu, Y.; Liu, G.; Wu, Y.; et al. IncreasedRisk of Hepatocellular Carcinoma in Male Hepatitis B Surface Antigen Carriers with Chronic Hepatitis WhoHave Detectable Urinary Aflatoxin Metabolite M1. Hepatology 1999, 30, 379–383. [CrossRef] [PubMed]
65. Lu, H.; Li, Y. Effects of bicyclol on aflatoxin B1 metabolism and hepatotoxicity in rats. Acta Pharmacol. Sin.2002, 23, 942–945. [PubMed]
66. Aydin, A. Determination of Aflatoxin B1 levels in powdered red pepper. Food Control 2007, 18, 1015–1018.[CrossRef]
67. Aydin, A.; Gunsen, U. Total Aflatoxin, Aflatoxin B1 and Ochratoxin A Levels in Turkish Wheat Flour.Food Drug Anal. 2008, 16, 48–53.
68. Ajani, J.; Chakravarthy, D.V.S.; Tanuja, P.; Vali Pasha, K. Aflatoxins. Indian J. Adv. Chem. Sci. 2014, 3, 49–60.69. Zheng, Z.; Zhang, T. Recent Trends in Microbiological Decontamination of Aflatoxins in Foodstuffs.
In Aflatoxins-Recent Advances and Future Prospects; InTechOpen: London, UK, 2013; pp. 59–92.70. Brundtland, H.; Bellamy, C. Global strategy for infant and young child feeding. In WHO; WHO Library:
Geneva, Switzerland, 2003; pp. 1–30.71. Radonic, J.R.; Tanackov, S.D.K.; Mihajlovic, I.J.; Zorica, S.; Miloradov, M.B.V.; Škrinjar, M.M.; Turk, M.M.
Occurrence of aflatoxin M1 in human milk samples in Vojvodina, Serbia: Estimation of average daily intakeby babies. J. Environ. Sci. Health Part B 2016, 52, 59–63. [CrossRef] [PubMed]
72. Mohammed, S.; Munissi, J.E.; Nyandoro, S. Aflatoxin M1 in raw milk and aflatoxin B1 in feed from householdcows in Singida, Tanzania. Food Addit. Contam. 2016, 9, 85–90. [CrossRef] [PubMed]
73. Bata, Á.; Lásztity, R. Detoxification of mycotoxin-contaminated food and feed by microorganisms. Trends FoodSci. Technol. 1999, 10, 223–228. [CrossRef]
74. Assaf, J.C.; Atoui, A.; El Khoury, A.; Chokr, A.; Louka, N. A comparative study of procedures for binding ofaflatoxin M1 to Lactobacillus rhamnosus GG. Brazilian J. Microbiol. 2017, 49, 120–127. [CrossRef]
75. Choudhary, A.K.; Kumari, P. Management of Mycotoxin Contamination in Preharvest and Post HarvestCrops: Present Status and Future Prospects. J. Phytol. 2010, 2, 37–52.
76. Atehnkeng, J.; Ojiambo, P.S.; Cotty, P.J.; Bandyopadhyay, R. Field efficacy of a mixture of atoxigenicAspergillus flavus Link: FR vegetative compatibility groups in preventing aflatoxin contamination in maize(Zea mays L.). Biol. Control 2014, 72, 62–70. [CrossRef]
77. Dorner, J.W.; Cole, R.J. Effect of application of nontoxigenic strains of Aspergillus flavus and A. parasiticus onsubsequent aflatoxin contamination of peanuts in storage. J. Stored Prod. Res. 2002, 38, 329–339. [CrossRef]
78. Abdallah, M.; Ameye, M.; De Saeger, S.; Audenaert, K.; Haesaert, G. Biological Control of MycotoxigenicFungi and Their Toxins: An Update for the Pre-Harvest Approach. In Mycotoxins—Socio-Economic and HealthImpact as Well as Pre- and Postharvest Management Strategies; InTechOpen: London, UK, 2018.
79. Di Gregorio, M.C.; De Neeff, D.V.; Jager, A.V.; Corassin, C.H.; Carão, Á.C.D.P.; De Albuquerque, R.; DeAzevedo, A.C.; Oliveira, C.A.F. Mineral adsorbents for prevention of mycotoxins in animal feeds. Toxin Rev.2014, 33, 125–135. [CrossRef]
80. Grenier, B.; Applegate, T.J. Reducing the Impact of Aflatoxins in Livestock and Poultry; Perdue UniversityEducation Store: Lafayette, IN, USA, 2013; pp. 1–7.
81. Phillips, T.D.; Clement, B.A.; Park, D.L. Approaches to Reduction of Aflatoxin in Foods and Feeds. In TheToxicology of Aflatoxins: Human Health, Veterinary, and Agricultural Significance; David, L., Eaton, J.D.G., Eds.;Academic Press: Cambridge, MA, USA, 1994; pp. 383–406.
87

Toxins 2019, 11, 304
82. Galvano, F.; Pietri, A.; Bertuzzi, T.; Fusconi, G.; Galvano, M.; Piva, A.; Piva, G. Reduction of Carryoverof Aflatoxin from Cow Feed to Milk by Addition of Activated Carbons. J. Food Prot. 1996, 59, 551–554.[CrossRef]
83. Carraro, A.; De Giacomo, A.; Giannossi, M.L.; Medici, L.; Muscarella, M.; Palazzo, L.; Quaranta, V.; Summa, V.;Tateo, F. Clay minerals as adsorbents of aflatoxin M1 from contaminated milk and effects on milk quality.Appl. Clay Sci. 2014, 88–89, 92–99. [CrossRef]
84. Devreese, M.; Antonissen, G.; De Backer, P.; Croubels, S. Efficacy of active carbon towards the absorption ofdeoxynivalenol in pigs. Toxins (Basel) 2014, 6, 2998–3004. [CrossRef] [PubMed]
85. Maxim, L.D.; Niebo, R.; McConnell, E.E. Bentonite toxicology and epidemiology—A review. Inhal. Toxicol.2016, 28, 591–617. [CrossRef]
86. Corassin, C.H.; Bovo, F.; Rosim, R.E.; Oliveira, C.A.F. Efficiency of Saccharomyces cerevisiae and lactic acidbacteria strains to bind aflatoxin M1 in UHT skim milk C.H. Food Control 2013, 31, 80–83. [CrossRef]
87. Färber, P.; Brost, I.; Adam, R.; Holzapfel, W. HPLC based method for the measurement of the reductionof aflatoxin B1 by bacterial cultures isolated from different African foods. Mycotoxin Res. 2000, 16, 141.[CrossRef] [PubMed]
88. Khaneghah, A.M.; Chaves, R.D.; Akbarirad, H. Detoxification of Aflatoxin M1 (AFM1) in Dairy BaseBeverages (Acidophilus Milk) by Using Different Types of Lactic Acid Bacteria-Mini Review. Curr. Nutr.Food Sci. 2017, 13, 78–81. [CrossRef]
89. El-Nezami, H.; Kankaanpää, P.; Salminen, A.J. Physicochemical alterations enhance the ability of dairy strainsof lactic acid bacteria to remove aflatoxin from contaminated media. Food Prot. 1998, 61, 466–468. [CrossRef]
90. Abdelmotilib, N.M.; Hamad, G.; Salem, E.G. Aflatoxin M1 Reduction in Milk by a Novel Combination ofProbiotic Bacterial and Yeast Strains. Nutr. Food Saf. 2018, 8, 83–99. [CrossRef]
91. Bovo, F.; Corassin, C.H.; Rosim, R.E. Efficiency of Lactic Acid Bacteria Strains for Decontamination ofAflatoxin M1 in Phosphate Buffer Saline Solution and Skimmed milk. Food Bioprocess. Technol. 2015, 6,2230–2234. [CrossRef]
92. Var, I.; Kabak, B.; Brandon, E.F.A.; Blokland, M.H. Effects of probiotic bacteria on the bioaccessibilityof aflatoxin B1 and Ochratoxin A using an in vitro digestion model under fed conditions. Environ. Sci.Health B-Pestic. 2009, 44, 472–480.
93. Patel, A.; Shah, N.; Shukla, D. Biological Control of Mycotoxins by Probiotic Lactic Acid Bacteria.In Proceedings of the Dynamism in Dairy Industry and Consumer Demands, Gujarat, India,4–5 February 2017.
94. Patel, A.; Sv, A.; Shah, N.; Verma, K.D. Lactic acid bacteria as metal quenchers to improve food safety andquality. AgroLife Sci. 2017, 6, 146–154.
95. El-Nezami, H.; Mykkänen, H.; Haskard, C.; Salminen, S.; Salminen, E. Lactic acid bacteria as a tool forenhancing food safety by removal of dietary toxin. In Lactic Acid Bacteria: Microbiological and FunctionalAspects; Lahtinen, S., Ouwehand, A.C., Salminen, S., von Wright, A., Eds.; CRC Press: New York, NY, USA,2004; pp. 397–406.
96. Perczak, A.; Golinski, P.; Bryła, M.; Waskiewicz, A. The efficiency of lactic acid bacteria against pathogenicfungi and mycotoxins. Arh. Hig. Rada Toksikol. 2018, 69, 32–45. [CrossRef] [PubMed]
97. Piotrowska, M. The adsorption of ochratoxin a by lactobacillus species. Toxins (Basel) 2014, 6, 2826–2839.[CrossRef] [PubMed]
98. Taylor, P.; Kabak, B.; Var, I. Factors affecting the removal of aflatoxin M 1 from food model by Lactobacillusand Bifidobacterium strains Factors affecting the removal of aflatoxin M 1 from food model by Lactobacillusand Bifidoba. Environ. Sci. Health Part B 2008, 3, 617–624.
99. Hosono, A.; Yoshimura, A.; Otani, H. Desmutagenic property of cell walls of Streptococcus faecalis on themutagenicities induced by amino acid pyrolysates. Milchwissenschaft 1988, 43, 168–170.
100. Rajendran, R.; Ohta, Y. Binding of heterocyclic amines by lactic acid bacteria from miso, a fermented Japanesefood. Microbiology 1998, 44, 109–115. [CrossRef]
101. Haskard, C.A.; El-nezami, H.S.; Kankaanpa, P.E.; Salminen, S.; Ahokas, J.T. Surface Binding of Aflatoxin B1by Lactic Acid Bacteria. Appl. Environ. Microbiol. 2001, 67, 3086–3091. [CrossRef]
102. Taylor, P.; Kabak, B.; Var, I. Factors affecting the removal of aflatoxin M1 from food model by Lactobacillusand Bifidobacterium strains. J. Environ. Sci. Health Part B 2008, 43, 37–41.
88
Toxins 2019, 11, 304
103. Pierides, M.; El-nezami, H.; Peltonen, K.; Salminen, S. Ability of Dairy Strains of Lactic Acid Bacteria to BindAflatoxin M 1 in a Food Model. Food Prot. 2000, 63, 645–650. [CrossRef]
104. Yiannikouris, A.; Poughon, L.; Franc, J.; Dussap, C.; Jeminet, G. Chemical and Conformational Study of theInteractions Involved in Mycotoxin Complexation with B–D-Glucans. Biomacaromolecules 2006, 7, 1147–1155.[CrossRef]
105. Shetty, P.H.; Jespersen, L. Saccharomyces cerevisiae and lactic acid bacteria as potential mycotoxindecontaminating agents. Trends Food Sci. Technol. 2006, 17, 48–55. [CrossRef]
106. Sajid, M.; Mehmood, S.; Niu, C.; Yuan, Y.; Yue, T. Effective Adsorption of Patulin from Apple Juice by UsingNon-Cytotoxic Heat-Inactivated Cells and Spores of Alicyclobacillus Strains. Toxins (Basel) 2018, 10, 344.[CrossRef]
107. Ismail, A.; Levin, R.E.; Riaz, M.; Akhtar, S.; Gong, Y.Y.; de Oliveira, C.A.F. Effect of different microbialconcentrations on binding of aflatoxin M1 and stability testing. Food Control 2017, 73, 492–496. [CrossRef]
108. Zhong, L.; Carere, J.; Lu, Z.; Lu, F.; Zhou, T. Patulin in Apples and Apple-Based Food Products: The Burdensand the Mitigation Strategies. Toxins (Basel) 2018, 10, 475. [CrossRef]
109. Tsong, T.Y.; Gross, C.J. Reversibility of Thermally Induced Denaturation of Cellular Proteins. Ann. N. Y.Acad. Sci. 1994, 720, 65–78. [CrossRef] [PubMed]
110. Schön, A.; Clarkson, B.R.; Jaime, M.; Freire, E. Temperature Stability of Proteins: Analysis of IrreversibleDenaturation Using Isothermal Calorimetry. Proteins 2018, 85, 2009–2016. [CrossRef]
111. Teodorowicz, M.; Van Neerven, J.; Savelkoul, H. Food processing: The influence of the maillard reaction onimmunogenicity and allergenicity of food proteins. Nutrients 2017, 9, 835. [CrossRef]
112. Zinedine, A.; Faid, M.; Benlemlih, M. In Vitro Reduction of Aflatoxin B1 by Strains of Lactic Acid BacteriaIsolated from Moroccan Sourdough Bread. Int. J. Agric. Biol. 2005, 7, 67–70.
113. Application note 102. Separation and Quantitation of Aflatoxins M1 and M2 Using TFA Derivatization and HPLC;Sigma-Aldrich Co.: Missouri, USA, 1996.
114. Turnera, W.; Nicholas, S.; Piletskyb, S.A. Analytical methods for determination of mycotoxins: A review.Anal. Chim. Acta 2009, 632, 168–180. [CrossRef] [PubMed]
115. Espinosa-calderón, A.; Contreras-medina, L.M.; Muñoz-huerta, R.F.; Millán-almaraz, J.R.; Gerardo, R.;González, G.; Torres-pacheco, I. Methods for Detection and Quantification of Aflatoxins. In Aflatoxins—Detection, Measurement and Control; InTechOpen: London, UK, 2011; pp. 110–128.
116. Chun, S.; Yuan, Y.; Eremin, S.A.; Jong, W. Detection of aflatoxin M1 in milk products from China by ELISAusing monoclonal antibodies. Food Control 2009, 20, 1080–1085.
117. Adibpour, N.; Soleimanian-Zad, S.; Sarabi-Jamab, M.; Tajalli, F. Effect of storage time and concentration ofaflatoxin m1 on toxin binding capacity of L. acidophilus in fermented milk product. J. Agric. Sci. Technol.2016, 18, 1209–1220.
118. Schuster, B.; Pum, D.; Sleytr, U.B. S-layer stabilized lipid membranes (Review). Eur. PMC Funders Gr. 2010, 3,1–19. [CrossRef]
119. Sleytr, U.B.; Messner, P.; Pum, D.; Sára, M. Crystalline bacterial cell surface layers (S layers): Fromsupramolecular cell structure to biomimetics and nanotechnology. Angew. Chem. Int. Ed. 1999, 38, 1034–1054.[CrossRef]
120. Sleytr, U.B.; Schuster, B.; Egelseer, E.; Pum, D. S-layers: Principles and applications. FEMS Microbiol. 2014,38, 823–864. [CrossRef] [PubMed]
121. Rodrigues-Oliveira, T.; Belmok, A.; Vasconcellos, D.; Schuster, B.; Kyaw, C.M. Archaeal S-layers: Overviewand current state of the art. Front. Microbiol. 2017, 8, 1–17. [CrossRef] [PubMed]
122. Pum, D.; Sleytr, U.B. S-layer Proteins for Assmebling Ordered Naanoparticle Arrays. In Nanobioelectronics—forElectronics, Biology, and Medicine; Springer: New York, NY, USA, 2007.
123. Fagan, R.P.; Fairweather, N.F. Biogenesis and functions of bacterial S-layers. Nat. Rev. Microbiol. 2014, 12,211–222. [CrossRef]
124. Manetta, A.C. Aflatoxins: Their Measure and Analysis. In Aflatoxins—Detection, Measurement and Control;InTechOpen: London, UK, 2011; pp. 93–106.
125. Fuchs, S.; Sontag, G.; Stidl, R.; Ehrlich, V.; Kundi, M.; Knasmüller, S. Detoxification of patulin and ochratoxinA, two abundant mycotoxins, by lactic acid bacteria. Food Chem. Toxicol. 2008, 46, 1398–1407. [CrossRef]
126. Rushing, B.R.; Selim, M.I. Aflatoxin B1: A review on metabolism, toxicity, occurrence in food, occupationalexposure, and detoxification methods. Food Chem. Toxicol. 2018, 124, 81–100. [CrossRef]
89

Toxins 2019, 11, 304
127. Serrano-niño, J.C.; Cavazos-garduño, A.; Hernandez-mendoza, A.; Applegate, B.; Ferruzzi, M.G. Assessmentof probiotic strains ability to reduce the bioaccessibility of aflatoxin M1 in artificially contaminated milkusing an in vitro digestive model. Food Control 2013, 31, 202–207. [CrossRef]
128. Salah-Abbès, J.B.; Abbès, S.; Jebali, R.; Haous, Z.; Oueslati, R. Potential preventive role of lactic acidbacteria against Aflatoxin M1 immunotoxicity and genotoxicity in mice. J. Immunotoxicol. 2015, 12, 107–114.[CrossRef] [PubMed]
129. Begley, M.; Gahan, C.G.M.; Hill, C. The interaction between bacteria and bile. FEMS Microbiol. Rev. 2005, 29,625–651. [CrossRef]
130. Zhao, L.; Wei, J.; Zhao, H.; Zhu, B.; Zhang, B. Detoxification of cancerogenic compounds by lactic acidbacteria strains. Crit. Rev. Food Sci. Nutr. 2018, 58, 2727–2742.
131. Aziz, N.H.; Moussa, L.A.A. Influence of gamma-radiation on mycotoxin producing moulds and mycotoxinsin fruits. Food Control 2002, 13, 281–288. [CrossRef]
132. Arzandeh, S.; Jinap, S. Effect of initial aflatoxin concentration, heating time and roasting temperature onaflatoxin reduction in contaminated peanuts and process optimisation using response surface modelling. Int.J. Food Sci. Technol. 2011, 46, 485–491. [CrossRef]
133. Lee, L.S.; Cucullu, A.F. Conversion of Aflatoxin B 1 to Aflatoxin D 1 in Ammoniated Peanut and CottonseedMeals. J. Agric. Food Chem. 1978, 26, 881–884. [CrossRef] [PubMed]
134. Norred, W.P.; Morrissey, R.E. Effects of long-term feeding of ammoniated, aflatoxin-contaminated corn toFischer 344 rats. Toxicol. Appl. Pharmacol. 1983, 70, 96–104. [CrossRef]
135. Rickman, J.C.; Barret, D.M.; Bruhn, C.M. Effect of different ozone treatments on aflatoxin degradation andphysicochemical properties of pistachios. J. Sci. Food Agric. 2007, 87, 940–944.
136. Zhu, Y.; Hassan, Y.I.; Watts, C.; Zhou, T. Innovative technologies for the mitigation of mycotoxins in animalfeed and ingredients-A review of recent patents. Anim. Feed Sci. Technol. 2016, 216, 19–29. [CrossRef]
137. Wang, L.; Wu, J.; Liu, Z.; Shi, Y.; Liu, J.; Xu, X.; Hao, S.; Mu, P.; Deng, F.; Deng, Y. Aflatoxin B1 Degradationand Detoxification by Escherichia coli CG1061 Isolated from Chicken Cecum. Front. Pharmacol. 2019, 9, 1–9.[CrossRef] [PubMed]
138. Sánchez, B.; Delgado, S.; Blanco-Míguez, A.; Lourenço, A.; Gueimonde, M.; Margolles, A. Probiotics, gutmicrobiota, and their influence on host health and disease. Mol. Nutr. Food Res. 2017, 61, 1–15. [CrossRef]
139. Santiago-López, L.; Hernández-Mendoza, A.; Mata-Haro, V.; Vallejo-Córdoba, B.; Wall-Medrano, A.;Astiazarán-García, H.; Estrada-Montoya, M.; González-Córdova, A. Effect of Milk Fermented withLactobacillus fermentum on the Inflammatory Response in Mice. Nutrients 2018, 10, 1039. [CrossRef][PubMed]
140. Giraffa, G.; Chanishvili, N.; Widyastuti, Y. Importance of lactobacilli in food and feed biotechnology.Res. Microbiol. 2010, 161, 480–487. [CrossRef]
141. Swain, M.R.; Anandharaj, M.; Ray, R.C.; Parveen Rani, R. Fermented Fruits and Vegetables of Asia: APotential Source of Probiotics. Biotechnol. Res. Int. 2014, 2014, 1–19. [CrossRef]
142. Martin, N.H.; Boor, K.J.; Wiedmann, M. Symposium review: Effect of post-pasteurization contamination onfluid milk quality. J. Dairy Sci. 2017, 101, 861–870. [CrossRef]
143. Zeinab, A.M.; Elgadi, W.S.A.G.; Dirar, H.A. Isolation and Identification of Lactic Acid Bacteria and Yeastfrom Raw Milk in Khartoum State (Sudan). Res. J. Microbiol. 2008, 3, 163–168.
144. Muir, D.D. The Stability and Shelf Life of Milk and Milk Products; Woodhead Publishing Limited: Sawston, UK,2011; ISBN 9781845697013.
145. Marrez, D.A.; Shahy, E.M.; El-Sayed, H.S.; Sultan, Y.Y. Detoxification of Aflatoxin B1 in milk using lactic acidbacteria. J. Biol. Sci. 2018, 18, 144–151. [CrossRef]
146. Foroughi, M.; Sarabi Jamab, M.; Keramat, J.; Foroughi, M. Immobilization of Saccharomyces cerevisiae onPerlite Beads for the Decontamination of Aflatoxin M1 in Milk. J. Food Sci. 2018, 83, 2008–2013. [CrossRef]
147. Gu, H.; Ren, D. Materials and surface engineering to control bacterial adhesion and biofilm formation: Areview of recent advances. Front. Chem. Sci. Eng. 2014, 8, 20–33. [CrossRef]
148. Brackett, R.E.; Marth, E.H. Association of Aflatoxin M1 with Casein. Z. Leb. Unters. Forsch. 1982, 174,439–441. [CrossRef]
90
Toxins 2019, 11, 304
149. Cattaneo, T.M.P.; Marinoni, L.; Iametti, S.; Monti, L. Behavior of Aflatoxin M1 in dairy wastes subjected todifferent technological treatments: Ricotta cheese production, ultrafiltration and spray-drying. Food Control2013, 32, 77–82. [CrossRef]
150. Granados-Chinchilla, F. Insights into the Interaction of Milk and Dairy Proteins with Aflatoxin M1. InMilk Proteins—From Structure to Biological Properties and Health Aspects; InTechOpen: London, UK, 2016;pp. 265–286.
© 2019 by the authors. Licensee MDPI, Basel, Switzerland. This article is an open accessarticle distributed under the terms and conditions of the Creative Commons Attribution(CC BY) license (http://creativecommons.org/licenses/by/4.0/).
91


toxins
Article
Efficacy of the Combined Protective Cultures ofPenicillium chrysogenum and Debaryomyces hanseniifor the Control of Ochratoxin A Hazard inDry-Cured Ham
Eva Cebrián, Mar Rodríguez *, Belén Peromingo, Elena Bermúdez and Félix Núñez
Food Hygiene and Safety, Meat and Meat Products Research Institute, Faculty of Veterinary Science,University of Extremadura, Avda. de las Ciencias, s/n, 10003 Cáceres, Spain; [email protected] (E.C.);[email protected] (B.P.); [email protected] (E.B.); [email protected] (F.N.)* Correspondence: [email protected]
Received: 1 November 2019; Accepted: 3 December 2019; Published: 5 December 2019
Abstract: The ecological conditions during the ripening of dry-cured ham favour the development ofmoulds on its surface, being frequently the presence of Penicillium nordicum, a producer of ochratoxinA (OTA). Biocontrol using moulds and yeasts usually found in dry-cured ham is a promising strategyto minimize this hazard. The aim of this work is to evaluate the effect of previously selectedDebaryomyces hansenii and Penicillium chrysogenum strains on growth, OTA production, and relativeexpression of genes involved in the OTA biosynthesis by P. nordicum. P. nordicum was inoculatedagainst the protective cultures individually and combined on dry-cured ham for 21 days at 20 ◦C.None of the treatments reduced the growth of P. nordicum, but all of them decreased OTA concentration.The lower production of OTA could be related to significant repression of the relative expressionof otapksPN and otanpsPN genes of P. nordicum. The efficacy of the combined protective cultureswas tested in 24 dry-cured hams in industrial ripening (an 8 month-long production). OTA wasdetected in nine of the 12 dry-cured hams in the batch inoculated only with P. nordicum. However,in the batch inoculated with both P. nordicum and the combined protective culture, a considerablereduction of OTA contamination was observed. In conclusion, although the efficacy of individual useP. chrysogenum is great, the combination with D. hansenii enhances its antifungal activity and could beproposed as a mixed protective culture to control the hazard of the presence of OTA in dry-cured ham.
Keywords: Penicillium nordicum; biocontrol agents; dry-cured ham; ochratoxin A (OTA)
Key Contribution: The use of a combined protective culture containing selected strains ofP. chrysogenum CECT 20922 in combination with D. hansenii FHSCC 253H could be a promisingstrategy to reduce OTA production by P. nordicum in dry-cured hams.
1. Introduction
The ecological conditions reached during the ripening of dry-cured ham favour the growth ofmoulds on their surface, mainly belonging to the genera Penicillium and Aspergillus [1,2]. The presenceof moulds is valuable due to their contribution to proteolytic and lipolytic changes observed duringthe ripening [3], and consequently, to the development of required sensory characteristics of dry-curedham [4,5]. However, most of the moulds isolated in these products are potentially toxigenic [1,6,7].
Ochratoxin A (OTA) is the mycotoxin most commonly found in meat products, which contributesignificantly to human exposure to this toxin [8,9]. OTA has nephrotoxic, immunosuppressive, genotoxic,carcinogenic, teratogenic and neurotoxic effects [10,11] and, it has been classified by the International Agencyfor Research on Cancer (IARC) as a possible human carcinogen in the 2B category [12].
Toxins 2019, 11, 710; doi:10.3390/toxins11120710 www.mdpi.com/journal/toxins93

Toxins 2019, 11, 710
The presence of OTA in dry-cured ham could be a consequence of the growth ofAspergillus westerdijkiae [13], Penicillium verrucosum and Penicillium nordicum [2,14–16]. Among them,P. nordicum is the most common ochratoxigenic mould isolated from dry-cured meats [2,15,17], due toits special adaptation to protein and NaCl-rich foods [2,16,18,19].
Due to the risk to human health, the European Union has set the maximum level permissible ofOTA for different foodstuffs such as cereals, wine, fruits, coffee or baby foods, although not in meatproducts [20]. In addition, Italy has established the maximum guide value for OTA in pork and porkproducts at 1 μg/kg [21]. Therefore, it is important to implement strategies to control the growth ofochratoxigenic moulds and the production of this mycotoxin.
There are several effective antifungal treatments, including physical methods and chemicalpreservatives, but most of them are not adequate for mould-ripened foods, such as dry-cured ham,since they are non-selective and can interfere with the ripening, altering the sensory characteristics [22].Thus, the use of microorganisms usually found in this type of foods as bioprotective agents has beenproposed as a promising strategy to control toxigenic moulds in dry-cured meat products [23–32].
Yeasts are interesting as antagonistic microorganisms since they are part of the natural microbiotaof dry-cured meat products, are phenotypically adapted to this environment and contribute to thedevelopment of sensory characteristics [4,33–35]. Debaryomyces hansenii is the predominant yeastspecies throughout the processing of dry-cured meat products [35,36], and some autochthonous strainshave been proposed as biological control of OTA in these foods [24,27–32,37]. In this sense, D. hanseniiFHSCC 253H isolated from dry-cured ham is able to reduce the production of OTA by P. verrucosumon this food [30]. Moreover, the species D. hansenii has been included in the European QualifiedPresumption of Safety (QPS) list as a safe microorganism.
On the other hand, non-toxigenic moulds producers of antifungal proteins could be considered fortheir use as protective cultures in dry-cured meat products [38]. These antifungal proteins probably giveproducer moulds a selective advantage to compete with other moulds in its ecological niche [38]. In thissense, Penicillium chrysogenum CECT 20922, isolated from dry-cured ham and producer of the antifungalprotein PgAFP [39], is able to reduce OTA contamination in dry-cured ham [40]. The protective effectof D. hansenii against OTA-producer moulds in meat substrates has been attributed to a combinationof competition for space and nutrients, production of soluble metabolites [28], and interfering thesecondary metabolism [41], mainly by the reduction relative expression of the OTA biosyntheticgenes [30]. Meanwhile, the preventive activity of P. chrysogenum has been linked to the productionof antifungal protein PgAFP [40], nutrient competition and hampering the secondary metabolismof P. nordicum [41]. Then, the combined use of these bicontrol agents on dry-cured ham could havean additive or synergistic effect against the growth of P. nordicum and OTA contamination, but this facthas not been demonstrated yet. Therefore, it is necessary to evaluate the implantation of these potentialprotective microorganisms in combined cultures in the presence of toxigenic moulds in dry-cured hamduring the ripening process. In addition, the effect of these biocontrol agents over toxigenic mouldgrowth and accumulation of mycotoxins should be also evaluated.
Although the biosynthetic pathway of OTA has not been fully clarified, two genes have beendescribed as required by P. nordicum for the biosynthesis of OTA, the polyketide synthetase gene(otapksPN), and the non-ribosomal peptide synthetase gene (otanpsPN) [42]. Therefore, these two genescan be used as a target for the study of gene expression in P. nordicum [43]. Finally, among the genes ofinterest for endogenous control is the gene β-tubulin that encodes a globular protein that is the maincomponent of the microtubules of fungal cells [7,44].
The main objective of the present work is to evaluate the effect of D. hansenii FHSCC 253H andP. chrysogenum CECT 20922 as a combined protective culture in the growth of P. nordicum FHSCCIB4, the OTA production and the expression of genes involved in the biosynthetic pathway of thismycotoxin in dry-cured ham.
94
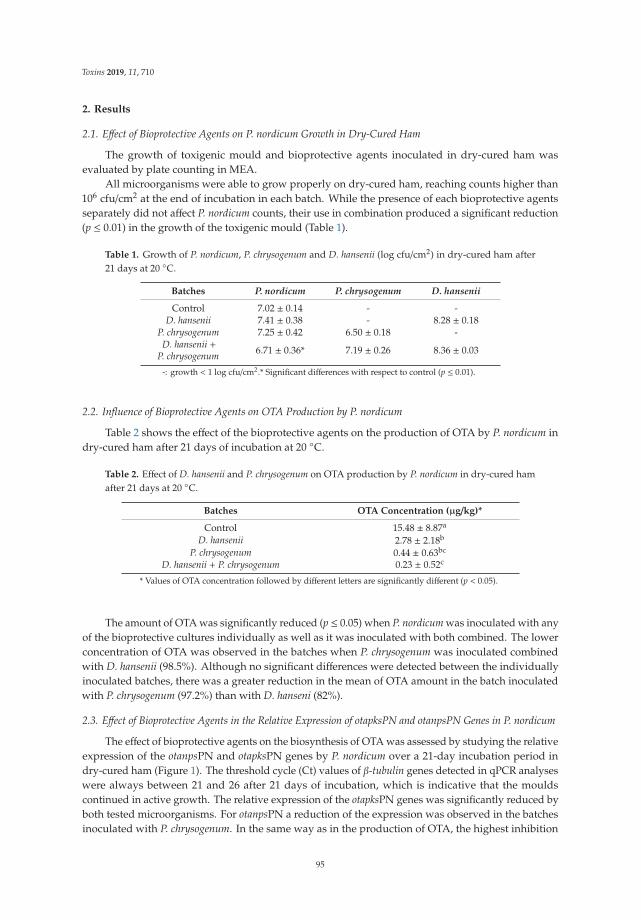
Toxins 2019, 11, 710
2. Results
2.1. Effect of Bioprotective Agents on P. nordicum Growth in Dry-Cured Ham
The growth of toxigenic mould and bioprotective agents inoculated in dry-cured ham wasevaluated by plate counting in MEA.
All microorganisms were able to grow properly on dry-cured ham, reaching counts higher than106 cfu/cm2 at the end of incubation in each batch. While the presence of each bioprotective agentsseparately did not affect P. nordicum counts, their use in combination produced a significant reduction(p ≤ 0.01) in the growth of the toxigenic mould (Table 1).
Table 1. Growth of P. nordicum, P. chrysogenum and D. hansenii (log cfu/cm2) in dry-cured ham after21 days at 20 ◦C.
Batches P. nordicum P. chrysogenum D. hansenii
Control 7.02 ± 0.14 - -D. hansenii 7.41 ± 0.38 - 8.28 ± 0.18
P. chrysogenum 7.25 ± 0.42 6.50 ± 0.18 -D. hansenii +
P. chrysogenum 6.71 ± 0.36* 7.19 ± 0.26 8.36 ± 0.03
-: growth < 1 log cfu/cm2.* Significant differences with respect to control (p ≤ 0.01).
2.2. Influence of Bioprotective Agents on OTA Production by P. nordicum
Table 2 shows the effect of the bioprotective agents on the production of OTA by P. nordicum indry-cured ham after 21 days of incubation at 20 ◦C.
Table 2. Effect of D. hansenii and P. chrysogenum on OTA production by P. nordicum in dry-cured hamafter 21 days at 20 ◦C.
Batches OTA Concentration (μg/kg)*
Control 15.48 ± 8.87a
D. hansenii 2.78 ± 2.18b
P. chrysogenum 0.44 ± 0.63bc
D. hansenii + P. chrysogenum 0.23 ± 0.52c
* Values of OTA concentration followed by different letters are significantly different (p < 0.05).
The amount of OTA was significantly reduced (p ≤ 0.05) when P. nordicum was inoculated with anyof the bioprotective cultures individually as well as it was inoculated with both combined. The lowerconcentration of OTA was observed in the batches when P. chrysogenum was inoculated combinedwith D. hansenii (98.5%). Although no significant differences were detected between the individuallyinoculated batches, there was a greater reduction in the mean of OTA amount in the batch inoculatedwith P. chrysogenum (97.2%) than with D. hanseni (82%).
2.3. Effect of Bioprotective Agents in the Relative Expression of otapksPN and otanpsPN Genes in P. nordicum
The effect of bioprotective agents on the biosynthesis of OTA was assessed by studying the relativeexpression of the otanpsPN and otapksPN genes by P. nordicum over a 21-day incubation period indry-cured ham (Figure 1). The threshold cycle (Ct) values of β-tubulin genes detected in qPCR analyseswere always between 21 and 26 after 21 days of incubation, which is indicative that the mouldscontinued in active growth. The relative expression of the otapksPN genes was significantly reduced byboth tested microorganisms. For otanpsPN a reduction of the expression was observed in the batchesinoculated with P. chrysogenum. In the same way as in the production of OTA, the highest inhibition
95

Toxins 2019, 11, 710
level of both gene expressions was observed when P. chrysogenum was inoculated individually or incombination with D. hansenii.
Figure 1. Relative expression of the otanpsPN and otapksPN genes in P. nordicum inoculated in dry-curedham without bioprotective cultures (control) with D. hansenii and P. chrysogenum individually, or bothcombined after incubation for 21 days at 20 ◦C. Significant differences of the gene expression of eachbatch compared to control are indicated by asterisk: * p ≤ 0.05; ** p ≤ 0.01.
2.4. Effect of Combined Protective Cultures on OTA Contamination in Dry-Cured Ham Inoculated withP. nordicum in Small Scale Manufacture
Table 3 shows the results of OTA concentration at the end of the processing of the 24 dry-curedhams. In the control batch, 9 of 12 hams were contaminated with OTA, and 6 of them showedOTA levels ranged from 7.71 to 1620 μg/kg, above the guide value permitted for pork meat andderived products in Italy [21]. However, the amount of OTA was substantially lower in the batchinoculated with the combined bioprotective culture. In this batch, 8 of 12 samples OTA was no detected(<0.58 ppb), and the 4 OTA-contaminated hams did not exceed levels of 11.73 μg/kg.
Table 3. Levels of ochratoxin A (OTA) detected in samples of dry-cured ham.
BatchesSample Reference of
Dry-Cured HamAverage OTA
Concentration (μg/kg)
P. nordicum
1 0.392 7.713 1226.924 -5 1275.556 176.867 -8 -9 0.5810 284.1311 1620.0012 0.67
96

Toxins 2019, 11, 710
Table 3. Cont.
BatchesSample Reference of
Dry-Cured HamAverage OTA
Concentration (μg/kg)
P. nordicum + P. chrysogenum+ D. hansenii
13 11.7314 3.6715 -16 -17 9.6818 -19 -20 -21 -22 -23 -24 6.48
-: levels less than the limit of detection.
3. Discussion
In this work, the use of D. hansenii and P. chrysogenum strains isolated from dry-cured ham asbiocontrol agents were evaluated. Although both strains used had proved their ability to reduce theconcentration of OTA on dry-cured meat products individually, their potential synergistic effect hadnot yet been tested.
Both bioprotective agents, whether inoculated individually or combined, grew satisfactorily in thepresence of P. nordicum on dry-cured ham in environmental conditions similar to those reached duringthe usual processing (Table 1). However, despite this strong growth, only when the bioprotectiveagents were used in combination, a statistically significant decrease in P. nordicum counts was observed.However, even in the batch inoculated with D. hansenii and P. chrysogenum, the count reached byP. nordicum was above the level estimated to be required for the accumulation of OTA in dry-curedham [15]. This same strain of D. hansenii also failed to decrease the growth of the P. verrucosumproducer of OTA in dry-cured ham incubated in similar conditions to those described in the presentwork [30]. However, in different culture media, this strain was able to delay the germination ofP. nordicum spores [24] and decrease the growth rate of P. verrucosum [30] in the range of 0.90–0.97 aw.This antifungal activity has been linked mainly to the competition for nutrients and the production ofyeast metabolites [28]. The discrepancies in the antifungal activity of D. hansenii between that studiescan likely be attributed to the different moulds tested [28] and the diverse environmental conditions,such as substrate or aw [24,31].
Regarding P. chrysogenum CECT 20922, its inoculation did not have any noticeable influence on thetotal count of ochratoxigenic moulds observed throughout the ripening of dry-cured hams [40]. On thecontrary, this P. chrysogenum strain reduced the levels of aflatoxigenic Aspergillus flavus in dry-curedham [45] to non-detectable levels. Given that the antagonistic activity of P. chrysogenum CECT 20922has been related with the production of the antifungal protein PgAFP [40], the differences in efficiencyagainst different moulds in a similar substrate may be due to the greater sensitivity of A. flavus thanOTA-producing moulds, such as P. nordicum and P. verrucosum, to PgAFP [46].
Concerning the production of OTA by P. nordicum, both bioprotective agents tested,used individually or combined, were effective in decreasing the concentration of this mycotoxin.However, in the batch inoculated with D. hansenii, the reduction of OTA amount is insufficientto meet the Italian guideline value of 1 μg/kg for pork derived products [21]. The maximumreduction was obtained with P. chrysogenum alone or in combination with D. hansenii. In these batches,the concentration of OTA is lower than 1 μg/kg, and they may be regarded as safe according to Italianregulation [21]. In addition, the study carried out in the dry-cured hams confirms the antifungaleffect of the combined culture of P. chrysogenum and D. hansenii. In the batch inoculated with both
97
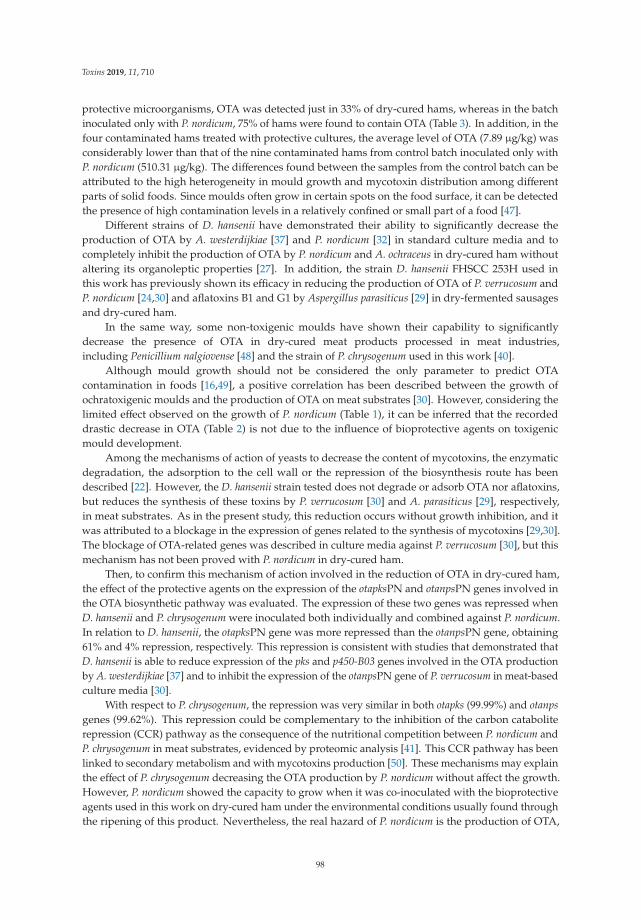
Toxins 2019, 11, 710
protective microorganisms, OTA was detected just in 33% of dry-cured hams, whereas in the batchinoculated only with P. nordicum, 75% of hams were found to contain OTA (Table 3). In addition, in thefour contaminated hams treated with protective cultures, the average level of OTA (7.89 μg/kg) wasconsiderably lower than that of the nine contaminated hams from control batch inoculated only withP. nordicum (510.31 μg/kg). The differences found between the samples from the control batch can beattributed to the high heterogeneity in mould growth and mycotoxin distribution among differentparts of solid foods. Since moulds often grow in certain spots on the food surface, it can be detectedthe presence of high contamination levels in a relatively confined or small part of a food [47].
Different strains of D. hansenii have demonstrated their ability to significantly decrease theproduction of OTA by A. westerdijkiae [37] and P. nordicum [32] in standard culture media and tocompletely inhibit the production of OTA by P. nordicum and A. ochraceus in dry-cured ham withoutaltering its organoleptic properties [27]. In addition, the strain D. hansenii FHSCC 253H used inthis work has previously shown its efficacy in reducing the production of OTA of P. verrucosum andP. nordicum [24,30] and aflatoxins B1 and G1 by Aspergillus parasiticus [29] in dry-fermented sausagesand dry-cured ham.
In the same way, some non-toxigenic moulds have shown their capability to significantlydecrease the presence of OTA in dry-cured meat products processed in meat industries,including Penicillium nalgiovense [48] and the strain of P. chrysogenum used in this work [40].
Although mould growth should not be considered the only parameter to predict OTAcontamination in foods [16,49], a positive correlation has been described between the growth ofochratoxigenic moulds and the production of OTA on meat substrates [30]. However, considering thelimited effect observed on the growth of P. nordicum (Table 1), it can be inferred that the recordeddrastic decrease in OTA (Table 2) is not due to the influence of bioprotective agents on toxigenicmould development.
Among the mechanisms of action of yeasts to decrease the content of mycotoxins, the enzymaticdegradation, the adsorption to the cell wall or the repression of the biosynthesis route has beendescribed [22]. However, the D. hansenii strain tested does not degrade or adsorb OTA nor aflatoxins,but reduces the synthesis of these toxins by P. verrucosum [30] and A. parasiticus [29], respectively,in meat substrates. As in the present study, this reduction occurs without growth inhibition, and itwas attributed to a blockage in the expression of genes related to the synthesis of mycotoxins [29,30].The blockage of OTA-related genes was described in culture media against P. verrucosum [30], but thismechanism has not been proved with P. nordicum in dry-cured ham.
Then, to confirm this mechanism of action involved in the reduction of OTA in dry-cured ham,the effect of the protective agents on the expression of the otapksPN and otanpsPN genes involved inthe OTA biosynthetic pathway was evaluated. The expression of these two genes was repressed whenD. hansenii and P. chrysogenum were inoculated both individually and combined against P. nordicum.In relation to D. hansenii, the otapksPN gene was more repressed than the otanpsPN gene, obtaining61% and 4% repression, respectively. This repression is consistent with studies that demonstrated thatD. hansenii is able to reduce expression of the pks and p450-B03 genes involved in the OTA productionby A. westerdijkiae [37] and to inhibit the expression of the otanpsPN gene of P. verrucosum in meat-basedculture media [30].
With respect to P. chrysogenum, the repression was very similar in both otapks (99.99%) and otanpsgenes (99.62%). This repression could be complementary to the inhibition of the carbon cataboliterepression (CCR) pathway as the consequence of the nutritional competition between P. nordicum andP. chrysogenum in meat substrates, evidenced by proteomic analysis [41]. This CCR pathway has beenlinked to secondary metabolism and with mycotoxins production [50]. These mechanisms may explainthe effect of P. chrysogenum decreasing the OTA production by P. nordicum without affect the growth.However, P. nordicum showed the capacity to grow when it was co-inoculated with the bioprotectiveagents used in this work on dry-cured ham under the environmental conditions usually found throughthe ripening of this product. Nevertheless, the real hazard of P. nordicum is the production of OTA,
98
Toxins 2019, 11, 710
and this was reduced in the presence of D. hansenii and P. chrysogenum used either individually orcombined. This reduction is related to the repression of the otapksPN and otanpsPN genes involvedin the biosynthetic pathway of this mycotoxin. In addition, the efficacy of the bioprotective agentsagainst the production of OTA by P. nordicum, on dry-cured hams processed in the usual environmentalconditions set in the meat industries has been demonstrated. In conclusion, the use of D. hanseniiFHSCC 253H and P. chrysogenum CECT 20922 could be proposed as an innovative combined protectiveculture for the prevention of OTA hazard in dry-cured ham.
4. Materials and Methods
4.1. Microorganisms
In this study the OTA-producer P. nordicum FHSCC IB4, the antifungal D. hansenii FHSCC 253H,both from the the Food Hygiene and Safety Culture Collection at the University of Extremadura(Cáceres, Spain), and the PgAFP-producer P. chrysogenum CECT 20922, from the Spanish Type CultureCollection (Valencia, Spain) were used. All three strains were isolated from dry-cured ham [16,28,38].The ability of P. nordicum to produce OTA [16] and the antifungal activity of D. hansenii [24,28–30] andP. chrysogenum [40,41] have been previously assessed.
4.2. Preparation of Mould and Yeast Inocula
P. nordicum and P. chrysogenum were grown on potato dextrose agar (PDA) (Scharlab S.L.,Sentmenat, Spain) at 25 ◦C for 7 days. Conidia were collected by adding 4 mL of saline phosphatebuffer (PBS) and scraping the surface with a sterile glass rod. The spores were quantified by usinga Thoma counting chamber Blaubrand® (Brand, Bremen, Germany), and adjusted to 105 spores/mLand used as inoculum.
The inocula of D. hansenii was obtained by inoculating 100 μL from a culture preserved at−80 ◦C inYES broth (Scharlab S.L., Sentmenat, Spain). It was incubated for 72 h at 150 rpm and 25 ◦C. The culturewas centrifuged at 3500 rpm for 5 min, and the concentrated cells were resuspended in PBS. The yeastsuspensions were counted by using the Thoma chamber and adjusted to 106 yeasts/mL to be usedas inoculum.
4.3. Preparation of the Dry-Cured Ham Portions
Pieces of dry-cured ham were cut into cubes of approximately 3 × 3 × 3 cm. To reduce microbialcontamination of pieces, they were firstly submerged in ethanol for 30 s, and the surface was disinfectedin a laminar flow hood with ultraviolet light for 2 h. After this time, each of the blocks was immersedin sterile distilled water for few seconds to be rehydrated. Then, the aw of pieces was 0.88.
4.4. Experimental Setting
Four different batches were prepared: the control batch, inoculated only with P. nordicum, one batchinoculated with P. nordicum and D. hansenii¸ one batch inoculated with P. nordicum and P. chrysogenum,and one batch inoculated with P. nordicum, D. hansenii and P. chrysogenum.
Fifty μL of each microorganism was inoculated on the surface of dry-cured ham using a Drigalskispreader previously sterilized. When the piece of ham was inoculated with several microorganisms,we waited 10 min between each strain inoculation to allow the absorption.
The inoculated dry-cured ham cubes were incubated at 20 ◦C for 21 days in plastic containerspreviously sterilized. To simulate the dehydration that occurs during the ripening of dry-cured ham,a relative humidity of 94% was maintained inside the container by depositing 400 mL of oversaturatedK2SO4 solution at the bottom of the containers. The experiment was carried out in quintupled.
99

Toxins 2019, 11, 710
4.5. Evaluation of Mould and Yeast Growth
At the end of incubation time, an area of approximately 5 cm2 of the surface of each dry-curedham piece was homogenized with 45 mL of 0.1% peptone water (Panreac Quimica S.L.U., Barcelona,Spain) in a filter bag BagPage (Interscience, Saint Nom, France) using a Stomacher (Stomacher® 400Circulator, Seward, Worthing, UK). After performing decimal dilutions, the growth of the inoculatedmicroorganisms was determined by plating in malt extract agar (MEA, Scharlab S.L., Sentmenat,Spain), and incubating at 25 ◦C for 7 days. The colonies of each strain were distinguished by theirmorphology, even the two species of mould presented clear differences in colour and size. P. nordicumshowed a whitish colour with smaller colonies, while P. chrysogenum colonies were green and larger.The sampling was carried out in duplicate.
4.6. Extraction and Quantification of Ochratoxin A
4.6.1. OTA Extraction
OTA was extracted following the QueChERS methodology [51] with modifications. Briefly, 3 gfrom the surface of each dry-cured ham cube was mixed with 2 mL of water acidified with 0.1% aceticacid and shaken for 30 s. Then, 2 mL acetonitrile acidified with 0.1% acetic acid was added andshaken for 1 min. Thereupon, 0.4 g NaCl and 1.6 g MgSO4 were added and shaken manually for 30 s.The samples were centrifuged for 5 min at 5000 rpm, and an aliquot of 1 mL supernatant was filteredthrough a 0.45 μm pore size nylon membrane (MSI, Omaha, NE, USA), placed in a vial and analyzedby HPLC-FLD.
4.6.2. OTA Quantification
OTA quantification was performed in Agilent 1260 Infinity (Agilent Technologies, Santa Clara,CA, USA) equipment coupled to a fluorescence (FLD) detector (Agilent Technologies, Santa Clara,CA, USA). The column Zorbax SB C18 (2.1 mm × 50 cm × 1.8 μm; Agilent Technologies, Santa Clara,CA, USA) was used. The mobile phase was acetonitrile:water:acetic acid (50:100:1 v/v/v) with a flowrate of 0.1 mL/min. FLD detection was performed using 330 and 450 nm excitation and emissionwavelengths, respectively. The calibration curve of OTA by HPLC-FLD revealed a linear relationship(r2 ≥ 0.99) between detector response and OTA standard (Sigma-Aldrich Co., San Luis, MO, USA)amounts between 0.5 and 50 ng/mL. The limit of detection (LOD) obtained in this study was 0.58 μg/kg,and the quantification limit (LOQ) was 1.94 μg/kg.
4.7. Relative Gene Expression
4.7.1. RNA Extraction
The mycelia were removed from half the surface of the dry-cured ham cubes and frozen quicklyin liquid nitrogen, it was stored at −80 ◦C until the extraction of RNA. RNA was extracted using thecommercial kit RNeasy® plant mini kit (QIAGEN, Madrid, Spain) [52]. For this, the mycelia weremixed with 500 μL of lysis solution buffer containing 10 μL of β-mercaptoethanol and then processedaccording to the manufacturer’s instructions. Once the process was completed, the RNA obtained wasdiluted in 50 μL of RNAse-free water. The RNA samples obtained were treated with the commercialkit DNase I, RNase-free (Thermo Fisher Scientific, Waltham, MA, USA), to eliminate the possibleresidual genomic DNA. Finally, the concentration and purity (A260/A280 ratio) of the RNA obtainedwas measured in a NanoDrop 2000c spectrophotometer (Thermo Fisher Scientific, Waltham, MA, USA).
4.7.2. Reverse Transcription Reaction
For the synthesis of the cDNA from the RNA obtained the commercial kit "PrimeScriptTM
RT Reagent" (Takara Bio Inc., Kusatsu, Japan) was used following the manufacturer’s indications.The cDNA synthesis reaction was performed on a Mastercycler thermocycler (Eppendorf AG, Hamburg,
100
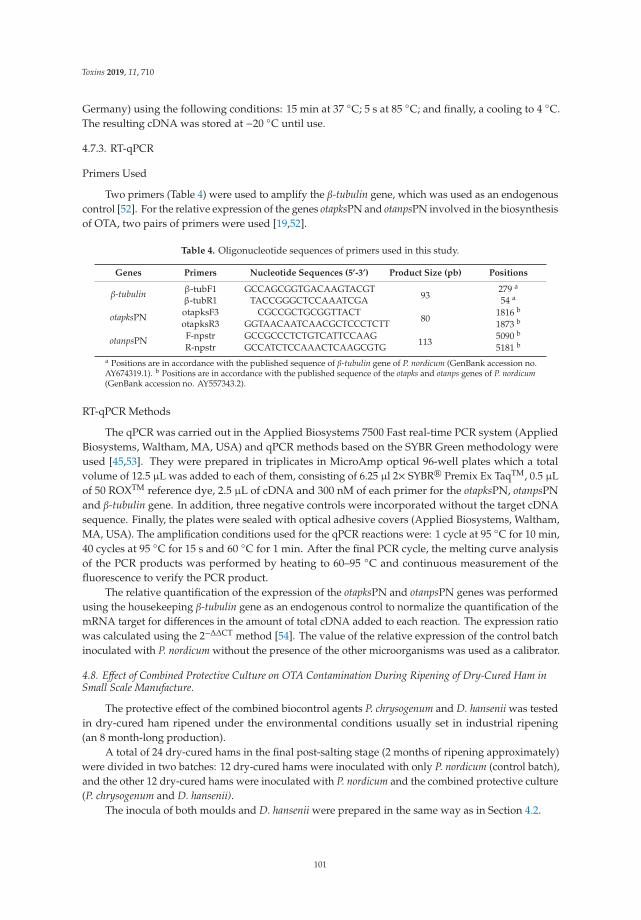
Toxins 2019, 11, 710
Germany) using the following conditions: 15 min at 37 ◦C; 5 s at 85 ◦C; and finally, a cooling to 4 ◦C.The resulting cDNA was stored at −20 ◦C until use.
4.7.3. RT-qPCR
Primers Used
Two primers (Table 4) were used to amplify the β-tubulin gene, which was used as an endogenouscontrol [52]. For the relative expression of the genes otapksPN and otanpsPN involved in the biosynthesisof OTA, two pairs of primers were used [19,52].
Table 4. Oligonucleotide sequences of primers used in this study.
Genes Primers Nucleotide Sequences (5’-3’) Product Size (pb) Positions
β-tubulin β-tubF1 GCCAGCGGTGACAAGTACGT93
279 a
β-tubR1 TACCGGGCTCCAAATCGA 54 a
otapksPN otapksF3 CGCCGCTGCGGTTACT80
1816 b
otapksR3 GGTAACAATCAACGCTCCCTCTT 1873 b
otanpsPN F-npstr GCCGCCCTCTGTCATTCCAAG113
5090 b
R-npstr GCCATCTCCAAACTCAAGCGTG 5181 b
a Positions are in accordance with the published sequence of β-tubulin gene of P. nordicum (GenBank accession no.AY674319.1). b Positions are in accordance with the published sequence of the otapks and otanps genes of P. nordicum(GenBank accession no. AY557343.2).
RT-qPCR Methods
The qPCR was carried out in the Applied Biosystems 7500 Fast real-time PCR system (AppliedBiosystems, Waltham, MA, USA) and qPCR methods based on the SYBR Green methodology wereused [45,53]. They were prepared in triplicates in MicroAmp optical 96-well plates which a totalvolume of 12.5 μL was added to each of them, consisting of 6.25 μl 2× SYBR® Premix Ex TaqTM, 0.5 μLof 50 ROXTM reference dye, 2.5 μL of cDNA and 300 nM of each primer for the otapksPN, otanpsPNand β-tubulin gene. In addition, three negative controls were incorporated without the target cDNAsequence. Finally, the plates were sealed with optical adhesive covers (Applied Biosystems, Waltham,MA, USA). The amplification conditions used for the qPCR reactions were: 1 cycle at 95 ◦C for 10 min,40 cycles at 95 ◦C for 15 s and 60 ◦C for 1 min. After the final PCR cycle, the melting curve analysisof the PCR products was performed by heating to 60–95 ◦C and continuous measurement of thefluorescence to verify the PCR product.
The relative quantification of the expression of the otapksPN and otanpsPN genes was performedusing the housekeeping β-tubulin gene as an endogenous control to normalize the quantification of themRNA target for differences in the amount of total cDNA added to each reaction. The expression ratiowas calculated using the 2−ΔΔCT method [54]. The value of the relative expression of the control batchinoculated with P. nordicum without the presence of the other microorganisms was used as a calibrator.
4.8. Effect of Combined Protective Culture on OTA Contamination During Ripening of Dry-Cured Ham inSmall Scale Manufacture.
The protective effect of the combined biocontrol agents P. chrysogenum and D. hansenii was testedin dry-cured ham ripened under the environmental conditions usually set in industrial ripening(an 8 month-long production).
A total of 24 dry-cured hams in the final post-salting stage (2 months of ripening approximately)were divided in two batches: 12 dry-cured hams were inoculated with only P. nordicum (control batch),and the other 12 dry-cured hams were inoculated with P. nordicum and the combined protective culture(P. chrysogenum and D. hansenii).
The inocula of both moulds and D. hansenii were prepared in the same way as in Section 4.2.
101
Toxins 2019, 11, 710
For the inoculation, each piece was immersed for 30 s in 25 liters solution with P. nordicum for thecontrol batch, and with P. nordicum, P. chrysogenum and D. hansenii for the other batch. The dry-curedhams were hung up and ripened in two different maturation chambers for 6 months. During thefirst month, the temperature progressively increased from 4 to 15 ◦C and the relative humidity (RH)decreased from 80% to 75%. From the second to sixth month of ripening, the temperature was gentlyincreased from 15 to 22 ◦C, and the RH was lowered below 70% at the end of the maturing. At the endof the processing, the dry-cured hams lost approximately 35% of their initial weight.
Sampling, Extraction and Quantification of OTA
Sampling was done at the end of ripening (an 8 month-long production). For that purpose,25 cm2 surface areas showing fungal growth and 1 cm of depth were obtained of each dry-curedham. The procedure of extraction and quantification of OTA was carried out as described above inSection 4.6.
4.9. Statistical Analysis
All data were analyzed by IBM SPSS v.22 (Chicago, IL, USA, 2013). The data normality testwas performed by Shapiro–Wilks. All data sets failed the normality test; a variable transformationwas performed to improve normality or homogenize the variances. Without success, the analysis ofnon-parametric data was performed using the Kruskal–Wallis test to determine significant differencesbetween the means. Subsequently, those samples that differed had the U Mann–Whitney test appliedto compare the mean values obtained. Statistical significance was set at p ≤ 0.05.
Author Contributions: The authors F.N and M.R. conceived, proposed the idea and designed the study. E.C. andB.P. performed the experiments and analyzed the data. E.C. and F.N. writing—original draft preparation. E.B.,M.R. and F.N. writing—review and editing, F.N and M.R funding acquisition.
Funding: This work has been financed by the Spanish Ministry of Economy and Competitiveness, Government ofExtremadura and FEDER (AGL2016-80209-P and GR18056). B. Peromingo are recipient of pre-doctoral fellowships(BES-2014-069484) from the Spanish Ministry of Economy and Competitiveness.
Acknowledgments: The authors acknowledge the technical support pro-vided by the Facility of Innovation andAnalysis in Animal Source Foodstuffs (SiPA) of SAIUEx.
Conflicts of Interest: The authors declare no conflict of interest.
References
1. Núñez, F.; Rodríguez, M.M.; Bermúdez, M.E.; Córdoba, J.J.; Asensio, M.A. Composition and toxigenicpotential of the mould population on dry-cured Iberian ham. Int. J. Food Microbiol. 1996, 32, 185–197.[CrossRef]
2. Battilani, P.; Pietri, A.; Giorni, P.; Formenti, S.; Bertuzzi, T.; Toscani, T.; Virgili, R.; Kozakiewicz, Z.Penicillium populations in dry-cured ham manufacturing plants. J. Food Prot. 2007, 70, 975–980. [CrossRef][PubMed]
3. Martín, A.; Córdoba, J.J.; Núñez, F.; Benito, M.J.; Asensio, M.A. Contribution of a selected fungal populationto proteolysis on dry-cured ham. Int. J. Food Microbiol. 2004, 94, 55–66. [CrossRef] [PubMed]
4. Martín, A.; Córdoba, J.J.; Aranda, E.; Córdoba, M.G.; Asensio, M.A. Contribution of a selected fungalpopulation to the volatile compounds on dry-cured ham. Int. J. Food Microbiol. 2006, 110, 8–18. [CrossRef][PubMed]
5. Perrone, G.; Rodriguez, A.; Magistà, D.; Magan, N. Insights into existing and future fungal and mycotoxincontamination of cured meats. Curr. Opin. Food Sci. 2019, 29, 20–27. [CrossRef]
6. Núñez, F.; Westphal, C.D.; Bermúdez, E.; Asensio, M.A. Production of secondary metabolites by someterverticillate penicillia on carbohydrate-rich and meat substrates. J. Food Prot. 2007, 70, 2829–2836. [CrossRef]
7. Rodríguez, A.; Rodríguez, M.; Martín, A.; Delgado, J.; Córdoba, J.J. Development of a multiplex real-timePCR to quantify aflatoxin, ochratoxin A and patulin producing molds in foods. Int. J. Food Microbiol. 2012,155, 10–18. [CrossRef]
102

Toxins 2019, 11, 710
8. Mitchell, N.J.; Chen, C.; Palumbo, J.D.; Bianchini, A.; Cappozzo, J.; Stratton, J.; Ryu, D.; Wu, F. A riskassessment of dietary ochratoxin A in the United States. Food Chem. Toxicol. 2017, 100, 265–273. [CrossRef]
9. Sirot, V.; Fremy, J.-M.; Leblanc, J.-C. Dietary exposure to mycotoxins and health risk assessment in the secondFrench total diet study. Food Chem. Toxicol. 2013, 52, 1–11. [CrossRef]
10. Bezerra da Rocha, M.E.; Oliveira Freire, F.C.; Feitosa Maia, E.F.; Florindo Guedes, M.I.; Rondina, D.Mycotoxins and their effects on human and animal health. Food Control 2014, 36, 159–165. [CrossRef]
11. Malir, F.; Ostry, V.; Pfohl-Leszkowicz, A.; Malir, J.; Toman, J. Ochratoxin A: 50 years of research. Toxins 2016,8, E191. [CrossRef] [PubMed]
12. IARC (International Agency for Research on Cancer). OchratoxinA Some Naturally Occurring Substances:Food Items and Constituents, Heterocyclic Aromatic Amines and Mycotoxins. In Monographs on the Evaluationof Carcinogenic Risk to Humans; IARC: Lyon, France, 1993; Volume 56, pp. 489–521.
13. Vipotnik, Z.; Rodríguez, A.; Rodrigues, P. Aspergillus westerdijkiae as a major ochratoxin A risk in dry-curedham based-media. Int. J. Food Microbiol. 2017, 241, 244–251. [CrossRef] [PubMed]
14. Iacumin, L.; Chiesa, L.; Boscolo, D.; Manzano, M.; Cantoni, C.; Orlic, S.; Comi, G. Moulds and ochratoxin Aon surfaces of artisanal and industrial dry sausages. Food Microbiol. 2009, 26, 65–70. [CrossRef]
15. Rodríguez, A.; Rodríguez, M.; Martín, A.; Delgado, J.; Córdoba, J.J. Presence of ochratoxin A on the surface ofdry-cured Iberian ham after initial fungal growth in the drying stage. Meat Sci. 2012, 92, 728–734. [CrossRef][PubMed]
16. Sánchez-Montero, L.; Córdoba, J.J.; Peromingo, B.; Álvarez, M.; Núñez, F. Effects of environmental conditionsand substrate on growth and ochratoxin A production by Penicillium verrucosum and Penicillium nordicum:Relative risk assessment of OTA in dry-cured meat products. Food Res. Int. 2019, 121, 604–611. [CrossRef]
17. Sonjak, S.; Licen, M.; Frisvad, J.C.; Gunde-Cimerman, N. Salting of dry-cured meat. A potential causeof contamination with the ochratoxin A-producing species Penicillium nordicum. Food Microbiol. 2011, 28,1111–1116. [CrossRef]
18. Delgado, J.; da Cruz Cabral, L.; Rodríguez, M.; Rodríguez, A. Influence of ochratoxin A on adaptation ofPenicillium nordicum on a NaCl-rich dry-cured ham-based medium. Int. J. Food Microbiol. 2018, 272, 22–28.[CrossRef]
19. Rodríguez, A.; Medina, Á.; Córdoba, J.J.; Magan, N. The influence of salt (NaCl) on ochratoxin A biosyntheticgenes, growth and ochratoxin A production by three strains of Penicillium nordicum on a dry-cured ham-basedmedium. Int. J. Food Microbiol. 2014, 178, 113–119. [CrossRef]
20. The Commission of the European Communities. Commission Regulation (EC) 1881/2006 of 19 December2006 setting maximum levels for certain contaminants in foodstuffs. Off. J. Eur. Union 2006, L364, 5–24.
21. Ministerio Della Sanità. Circolare 09/06/1999, n. 10. Direttive in materia di controllo ufficiale suiprodotti alimentari: Valori massimi ammissibili di micotossine nelle derrate alimentari di origine nazionale,comunitaria e Paesi terzi. Gazz. Uff. della Repubb. Ital. 1999, 135, 52–57.
22. Asensio, M.A.; Núñez, F.; Delgado, J.; Bermúdez, E. Control of toxigenic molds in food processing. In MicrobialFood Safety and Preservation Techniques; Rai, V.R., Bai, A.J., Eds.; CRC Press (Taylor and Francis): Boca Raton,FL, USA, 2014; pp. 329–357.
23. Álvarez, M.; Rodríguez, A.; Peromingo, B.; Núñez, F.; Rodríguez, M. Enterococcus faecium: A promisingprotective culture to control growth of ochratoxigenic moulds and mycotoxin production in dry-fermentedsausages. Mycotoxin Res. 2019. [CrossRef]
24. Andrade, M.J.; Thorsen, L.; Rodríguez, A.; Córdoba, J.J.; Jespersen, L. Inhibition of ochratoxigenic moulds byDebaryomyces hansenii strains for biopreservation of dry-cured meat products. Int. J. Food Microbiol. 2014, 170,70–77. [CrossRef] [PubMed]
25. Cebrián, E.; Núñez, F.; Alía, A.; Bermúdez, E.; Rodríguez, M. Effect of Staphylococcus xylosus on the growth oftoxigenic moulds in meat substrates. Report of the IVth Workshop of the Spanish National Network onMycotoxins and Toxigenic Fungi and Their Decontamination Processes (MICOFOOD), Pamplona, Spain,29–31 May 2019. Toxins 2019, 11, 415. [CrossRef]
26. Delgado, J.; Peromingo, B.; Rodríguez, A.; Rodríguez, M. Biocontrol of Penicillium griseofulvum to reducecyclopiazonic acid contamination in dry-fermented sausages. Int. J. Food Microbiol. 2019, 293, 1–6. [CrossRef]
27. Iacumin, L.; Manzano, M.; Andyanto, D.; Comi, G. Biocontrol of ochratoxigenic moulds (Aspergillus ochraceusand Penicillium nordicum) by Debaryomyces hansenii and Saccharomycopsis fibuligera during speck production.Food Microbiol. 2017, 62, 188–195. [CrossRef]
103
Toxins 2019, 11, 710
28. Núñez, F.; Lara, M.S.; Peromingo, B.; Delgado, J.; Sánchez-Montero, L.; Andrade, M.J. Selection andevaluation of Debaryomyces hansenii isolates as potential bioprotective agents against toxigenic penicillia indry-fermented sausages. Food Microbiol. 2015, 46, 114–120. [CrossRef]
29. Peromingo, B.; Andrade, M.J.; Delgado, J.; Sánchez-Montero, L.; Núñez, F. Biocontrol of aflatoxigenicAspergillus parasiticus by native Debaryomyces hansenii in dry-cured meat products. Food Microbiol. 2019, 82,269–276. [CrossRef]
30. Peromingo, B.; Núñez, F.; Rodríguez, A.; Alía, A.; Andrade, M.J. Potential of yeasts isolated from dry-curedham to control ochratoxin A production in meat models. Int. J. Food Microbiol. 2018, 268, 73–80. [CrossRef]
31. Simoncini, N.; Virgili, R.; Spadola, G.; Battilani, P. Autochthonous yeasts as potential biocontrol agents indry-cured meat products. Food Control 2014, 46, 160–167. [CrossRef]
32. Virgili, R.; Simoncini, N.; Toscani, T.; Camardo Leggieri, M.; Formenti, S.; Battilani, P. Biocontrol of Penicilliumnordicum growth and ochratoxin A production by native yeasts of dry cured ham. Toxins 2012, 4, 68–82.[CrossRef]
33. Andrade, M.J.; Córdoba, J.J.; Casado, E.M.; Córdoba, M.G.; Rodríguez, M. Effect of selected strains ofDebaryomyces hansenii on the volatile compound production of dry fermented sausage “salchichón”. Meat Sci.2010, 85, 256–264. [CrossRef] [PubMed]
34. Cano-García, L.; Belloch, C.; Flores, M. Impact of Debaryomyces hansenii strains inoculation on the quality ofslow dry-cured fermented sausages. Meat Sci. 2014, 96, 1469–1477. [CrossRef] [PubMed]
35. Núñez, F.; Rodríguez, M.M.; Córdoba, J.J.; Bermúdez, M.E.; Asensio, M.A. Yeast population during ripeningof dry-cured Iberian ham. Int. J. Food Microbiol. 1996, 29, 271–280. [CrossRef]
36. Andrade, M.J.; Rodríguez, M.; Casado, E.M.; Bermúdez, E.; Córdoba, J.J. Differentiation of yeasts growing ondry-cured Iberian ham by mitochondrial DNA restriction analysis, RAPD-PCR and their volatile compoundsproduction. Food Microbiol. 2009, 26, 578–586. [CrossRef]
37. Gil-Serna, J.; Patiño, B.; Cortés, L.; González-Jaén, M.T.; Vázquez, C. Mechanisms involved in reductionof ochratoxin A produced by Aspergillus westerdijkiae using Debaryomyces hansenii CYC 1244. Int. J. FoodMicrobiol. 2011, 151, 113–118. [CrossRef]
38. Acosta, R.; Rodríguez-Martín, A.; Martín, A.; Núñez, F.; Asensio, M.A. Selection of antifungalprotein-producing molds from dry-cured meat products. Int. J. Food Microbiol. 2009, 135, 39–46. [CrossRef]
39. Rodríguez-Martín, A.; Acosta, R.; Liddell, S.; Núñez, F.; Benito, M.J.; Asensio, M.A. Characterization of thenovel antifungal protein PgAFP and the encoding gene of Penicillium chrysogenum. Peptides 2010, 31, 541–547.[CrossRef]
40. Rodríguez, A.; Bernáldez, V.; Rodríguez, M.; Andrade, M.J.; Núñez, F.; Córdoba, J.J. Effect of selectedprotective cultures on ochratoxin A accumulation in dry-cured Iberian ham during its ripening process.LWT—Food Sci. Technol. 2015, 60, 923–928. [CrossRef]
41. Delgado, J.; Núñez, F.; Asensio, M.A.; Owens, R.A. Quantitative proteomics of Penicillium nordicum profilesand ochratoxin A repression by protective cultures. Int. J. Food Microbiol. 2019, 305, 108243. [CrossRef]
42. Karolewiez, A.; Geisen, R. Cloning a part of the ochratoxin A biosynthetic gene cluster of Penicillium nordicumand characterization of the ochratoxin polyketide synthase gene. Syst. Appl. Microbiol. 2005, 28, 588–595.[CrossRef]
43. Bernáldez, V.; Córdoba, J.J.; Andrade, M.J.; Alía, A.; Rodríguez, A. Selection of reference genes to quantifyrelative expression of ochratoxin A-related genes by Penicillium nordicum in dry-cured ham. Food Microbiol.2017, 68, 104–111. [CrossRef]
44. Vela-Corcía, D.; Romero, D.; De Vicente, A.; Pérez-García, A. Analysis of β-tubulin-carbendazim interactionreveals that binding site for MBC fungicides does not include residues involved in fungicide resistance.Sci. Rep. 2018, 8, 1–12. [CrossRef]
45. Bernáldez, V.; Rodríguez, A.; Martín, A.; Lozano, D.; Córdoba, J.J. Development of a multiplex qPCR methodfor simultaneous quantification in dry-cured ham of an antifungal-peptide Penicillium chrysogenum strainused as protective culture and aflatoxin-producing moulds. Food Control 2014, 36, 257–265. [CrossRef]
46. Delgado, J.; Acosta, R.; Rodríguez-Martín, A.; Bermúdez, E.; Núñez, F.; Asensio, M.A. Growth inhibition andstability of PgAFP from Penicillium chrysogenum against fungi common on dry-ripened meat products. Int. J.Food Microbiol. 2015, 205, 23–29. [CrossRef]
104

Toxins 2019, 11, 710
47. Galaverna, G.; Dall’Asta, C. Sampling Techniques for the Determination of Mycotoxins in Food Matrices.In Comprehensive Sampling and Sample Preparation; Pawliszyn, J., Ed.; Academic Press: Oxford, UK, 2012;pp. 381–403.
48. Bernáldez, V.; Córdoba, J.J.; Rodríguez, M.; Cordero, M.; Polo, L.; Rodríguez, A. Effect of Penicilliumnalgiovense as protective culture in processing of dry-fermented sausage “salchichón”. Food Control 2013, 32,69–76. [CrossRef]
49. Gil-Serna, J.; Patiño, B.; Cortés, L.; González-Jaén, M.T.; Vázquez, C. Aspergillus steynii andAspergillus westerdijkiae as potential risk of OTA contamination in food products in warm climates.Food Microbiol. 2014, 46, 168–175. [CrossRef]
50. Fasoyin, O.E.; Wang, B.; Qiu, M.; Han, X.; Chung, K.R.; Wang, S. Carbon catabolite repression gene creAregulates morphology, aflatoxin biosynthesis and virulence in Aspergillus flavus. Fungal Genet. Biol. 2018, 115,41–51. [CrossRef]
51. Kamala, A.; Ortiz, J.; Kimanya, M.; Haesaert, G.; Donoso, S.; Tiisekwa, B.; De Meulenaer, B. Multiple mycotoxinco-occurrence in maize grown in three agro-ecological zones of Tanzania. Food Control 2015, 54, 208–215.[CrossRef]
52. Bernáldez, V.; Córdoba, J.J.; Magan, N.; Peromingo, B.; Rodríguez, A. The influence of ecophysiologicalfactors on growth, aflR gene expression and aflatoxin B1 production by a type strain of Aspergillus flavus.LWT—Food Sci. Technol. 2017, 83, 283–291. [CrossRef]
53. Rodríguez, A.; Rodríguez, M.; Luque, M.I.; Justesen, A.F.; Córdoba, J.J. Quantification of ochratoxinA-producing molds in food products by SYBR Green and TaqMan real-time PCR methods. Int. J. FoodMicrobiol. 2011, 149, 226–235. [CrossRef]
54. Livak, K.J.; Schmittgen, T.D. Analysis of relative gene expression data using real-time quantitative PCR andthe 2(−ΔΔCT) method. Methods 2001, 25, 402–408. [CrossRef]
© 2019 by the authors. Licensee MDPI, Basel, Switzerland. This article is an open accessarticle distributed under the terms and conditions of the Creative Commons Attribution(CC BY) license (http://creativecommons.org/licenses/by/4.0/).
105


toxins
Article
Development of an Antifungal andAntimycotoxigenic Device Containing AllylIsothiocyanate for Silo Fumigation
Juan Manuel Quiles 1,†, Tiago de Melo Nazareth 1,2,†, Carlos Luz 1,
Fernando Bittencourt Luciano 2, Jordi Mañes 1 and Giuseppe Meca 1,*
1 Laboratory of Food Chemistry and Toxicology, Faculty of Pharmacy, University of Valencia, Av. VicentAndrés Estellés s/n, 46100 Burjassot, Spain; [email protected] (J.M.Q.); [email protected] (T.d.M.N.);[email protected] (C.L.); [email protected] (J.M.)
2 School of Life Sciences, Pontifícia Universidade Católica do Paraná, Rua Imaculada Conceição 1155,Curitiba 80215-901, Brazil; [email protected]
* Correspondence: [email protected]; Tel.: +34-963-544-959; Fax: +34-963-549-54† Authors have contributed equally to the study and should be considered co-first authors.
Received: 29 January 2019; Accepted: 23 February 2019; Published: 1 March 2019
Abstract: The aims of this study were to evaluate the antifungal activity of the bioactive compoundallyl isothiocyanate (AITC) against Aspergillus flavus (8111 ISPA) aflatoxins (AFs) producer andPenicillium verrucosum (D-01847 VTT) ochratoxin A (OTA) producer on corn, barley, and wheat.The experiments were carried out initially in a simulated silo system for laboratory scale composedof glass jars (1 L). Barley and wheat were contaminated with P. verrucosum and corn with A. flavus.The cereals were treated with a hydroxyethylcellulose gel disk to which 500 μL/L of AITC wereadded; the silo system was closed and incubated for 30 days at 21 ◦C. After that, simulated silos of100 L capacity were used. Barley, wheat, and corn were contaminated under the same conditionsas the previous trial and treated with disks with 5 mL of AITC, closed and incubated for 90 daysat 21 ◦C. In both cases, the control test did not receive any antifungal treatment. The growth of theinoculated fungi and the reduction in the formation of AFs and OTA were determined. In the labscale silo system, complete inhibition of fungal growth at 30 days has been observed. In corn, thereduction of aflatoxin B1 (AFB1) was 98.5%. In the 100 L plastic drums, a significant reduction in thegrowth of A. flavus was observed, as well as the OTA formation in wheat (99.5%) and barley (92.0%).
Keywords: Aspergillus flavus; Penicillium verrucosum; AITC; fungal growth reduction; mycotoxin reduction
Key Contribution: The application of an allyl isothiocyanate device, as an antifungal system, to beapplied in the storage of corn, wheat, and barley, to reduce the mycotoxigenic fungal growth and themycotoxin biosynthesis.
1. Introduction
AFs are the foremost harmful category of mycotoxins naturally produced by Aspergillus speciessuch as Aspergillus nomius, Aspergillus flavus, and Aspergillus parasiticus during pre- or postharvest ofcrops [1,2]. The most important and toxic aflatoxins are the AFB1, AFB2, AFG1, and AFG2 [3]. Amongthese compounds, the AFB1 has been classified in Group 1 of the risk of the carcinogen molecules bythe International Agency for Research on Cancer [4], and it has been implicated with the developmentof human hepatic and extra hepatic carcinogenesis [5]. Human exposure to AFs could be due tothe intake of contaminated food or by the consumption of milk, meat, and eggs from animals thatconsumed contaminated feed [6]. The occurrence of AFs in foods from in the Spanish market has been
Toxins 2019, 11, 137; doi:10.3390/toxins11030137 www.mdpi.com/journal/toxins107
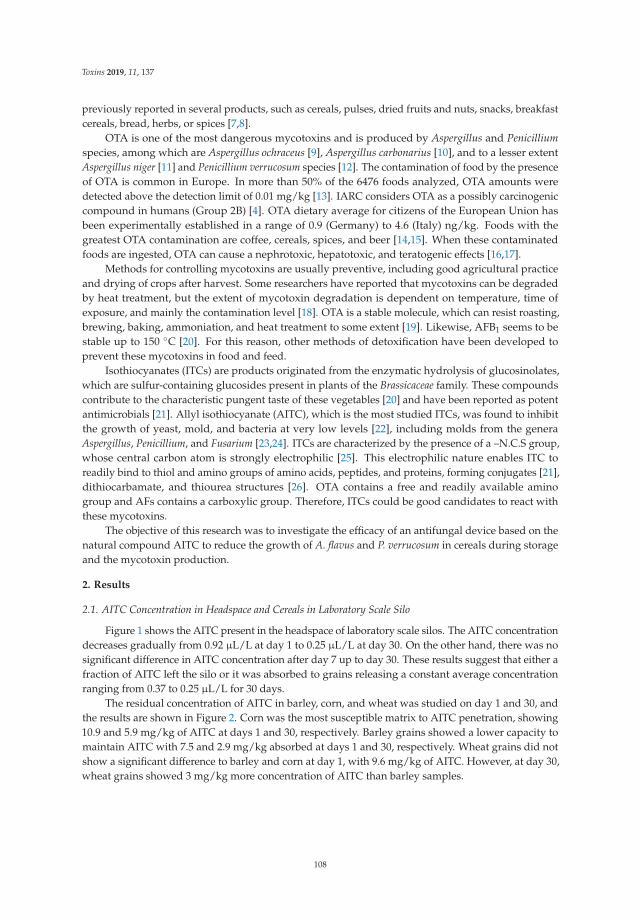
Toxins 2019, 11, 137
previously reported in several products, such as cereals, pulses, dried fruits and nuts, snacks, breakfastcereals, bread, herbs, or spices [7,8].
OTA is one of the most dangerous mycotoxins and is produced by Aspergillus and Penicilliumspecies, among which are Aspergillus ochraceus [9], Aspergillus carbonarius [10], and to a lesser extentAspergillus niger [11] and Penicillium verrucosum species [12]. The contamination of food by the presenceof OTA is common in Europe. In more than 50% of the 6476 foods analyzed, OTA amounts weredetected above the detection limit of 0.01 mg/kg [13]. IARC considers OTA as a possibly carcinogeniccompound in humans (Group 2B) [4]. OTA dietary average for citizens of the European Union hasbeen experimentally established in a range of 0.9 (Germany) to 4.6 (Italy) ng/kg. Foods with thegreatest OTA contamination are coffee, cereals, spices, and beer [14,15]. When these contaminatedfoods are ingested, OTA can cause a nephrotoxic, hepatotoxic, and teratogenic effects [16,17].
Methods for controlling mycotoxins are usually preventive, including good agricultural practiceand drying of crops after harvest. Some researchers have reported that mycotoxins can be degradedby heat treatment, but the extent of mycotoxin degradation is dependent on temperature, time ofexposure, and mainly the contamination level [18]. OTA is a stable molecule, which can resist roasting,brewing, baking, ammoniation, and heat treatment to some extent [19]. Likewise, AFB1 seems to bestable up to 150 ◦C [20]. For this reason, other methods of detoxification have been developed toprevent these mycotoxins in food and feed.
Isothiocyanates (ITCs) are products originated from the enzymatic hydrolysis of glucosinolates,which are sulfur-containing glucosides present in plants of the Brassicaceae family. These compoundscontribute to the characteristic pungent taste of these vegetables [20] and have been reported as potentantimicrobials [21]. Allyl isothiocyanate (AITC), which is the most studied ITCs, was found to inhibitthe growth of yeast, mold, and bacteria at very low levels [22], including molds from the generaAspergillus, Penicillium, and Fusarium [23,24]. ITCs are characterized by the presence of a –N.C.S group,whose central carbon atom is strongly electrophilic [25]. This electrophilic nature enables ITC toreadily bind to thiol and amino groups of amino acids, peptides, and proteins, forming conjugates [21],dithiocarbamate, and thiourea structures [26]. OTA contains a free and readily available aminogroup and AFs contains a carboxylic group. Therefore, ITCs could be good candidates to react withthese mycotoxins.
The objective of this research was to investigate the efficacy of an antifungal device based on thenatural compound AITC to reduce the growth of A. flavus and P. verrucosum in cereals during storageand the mycotoxin production.
2. Results
2.1. AITC Concentration in Headspace and Cereals in Laboratory Scale Silo
Figure 1 shows the AITC present in the headspace of laboratory scale silos. The AITC concentrationdecreases gradually from 0.92 μL/L at day 1 to 0.25 μL/L at day 30. On the other hand, there was nosignificant difference in AITC concentration after day 7 up to day 30. These results suggest that either afraction of AITC left the silo or it was absorbed to grains releasing a constant average concentrationranging from 0.37 to 0.25 μL/L for 30 days.
The residual concentration of AITC in barley, corn, and wheat was studied on day 1 and 30, andthe results are shown in Figure 2. Corn was the most susceptible matrix to AITC penetration, showing10.9 and 5.9 mg/kg of AITC at days 1 and 30, respectively. Barley grains showed a lower capacity tomaintain AITC with 7.5 and 2.9 mg/kg absorbed at days 1 and 30, respectively. Wheat grains did notshow a significant difference to barley and corn at day 1, with 9.6 mg/kg of AITC. However, at day 30,wheat grains showed 3 mg/kg more concentration of AITC than barley samples.
108
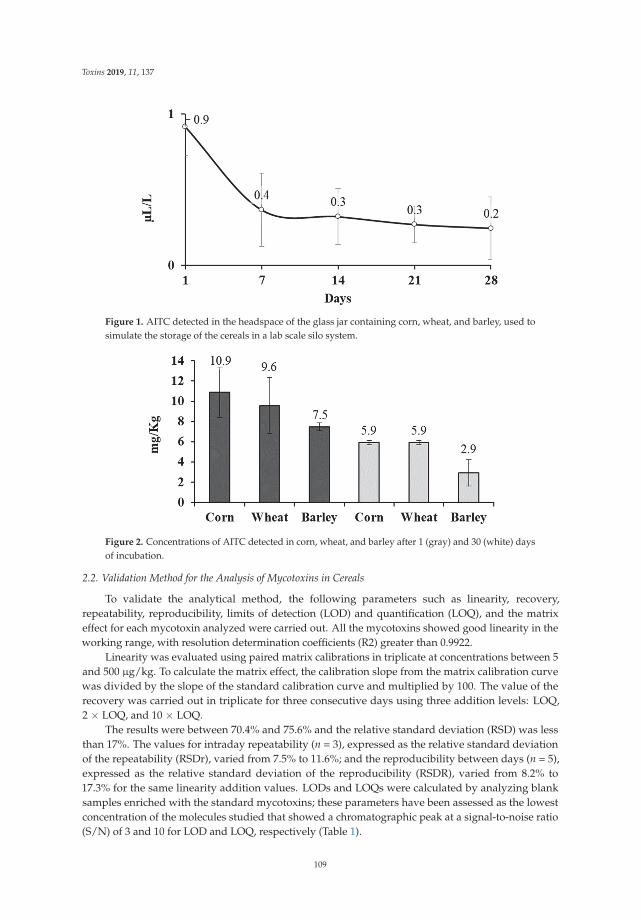
Toxins 2019, 11, 137
Figure 1. AITC detected in the headspace of the glass jar containing corn, wheat, and barley, used tosimulate the storage of the cereals in a lab scale silo system.
Figure 2. Concentrations of AITC detected in corn, wheat, and barley after 1 (gray) and 30 (white) daysof incubation.
2.2. Validation Method for the Analysis of Mycotoxins in Cereals
To validate the analytical method, the following parameters such as linearity, recovery,repeatability, reproducibility, limits of detection (LOD) and quantification (LOQ), and the matrixeffect for each mycotoxin analyzed were carried out. All the mycotoxins showed good linearity in theworking range, with resolution determination coefficients (R2) greater than 0.9922.
Linearity was evaluated using paired matrix calibrations in triplicate at concentrations between 5and 500 μg/kg. To calculate the matrix effect, the calibration slope from the matrix calibration curvewas divided by the slope of the standard calibration curve and multiplied by 100. The value of therecovery was carried out in triplicate for three consecutive days using three addition levels: LOQ,2 × LOQ, and 10 × LOQ.
The results were between 70.4% and 75.6% and the relative standard deviation (RSD) was lessthan 17%. The values for intraday repeatability (n = 3), expressed as the relative standard deviationof the repeatability (RSDr), varied from 7.5% to 11.6%; and the reproducibility between days (n = 5),expressed as the relative standard deviation of the reproducibility (RSDR), varied from 8.2% to17.3% for the same linearity addition values. LODs and LOQs were calculated by analyzing blanksamples enriched with the standard mycotoxins; these parameters have been assessed as the lowestconcentration of the molecules studied that showed a chromatographic peak at a signal-to-noise ratio(S/N) of 3 and 10 for LOD and LOQ, respectively (Table 1).
109

Toxins 2019, 11, 137
Table 1. LODs, LOQs, recovery, and matrix effect (ME) (%) for AFB1, AFB2, AFG1, AFG2, and OTA incorn, wheat, and barley.
Mycotoxin LOD (μg/Kg) LOQ (μg/Kg) Recovery (%) ME (%)
AFB1 0.08 0.27 70.4 78.2AFB2 0.08 0.27 64.2 76.5AFG1 0.16 0.53 62.8 65.3AFG2 0.30 1.00 66.1 60.9OTA 0.05 0.17 75.6 89.7
2.3. Fungal Growth and Mycotoxin Production in Lab Scale Silo System
The results of A. flavus and P. verrucosum growth on barley, corn, and wheat at days 1 and 30are shown in Figure 3. At day 1, AITC treatment demonstrated a significant reduction in the fungalpopulation of corn, wheat, and barley, reducing in 1.5, 1, and 1.2 log CFU/g, respectively. After 30days of storage, the fungus growth in the control groups remained stable. However, the treatmentreduced the population of fungi in wheat and barley to levels below our limit of detection, while in thecorn the reduction was of 4.4 log CFU/g.
Figure 3. Growth, in lab scale silo system, of the A. flavus in corn and of P. verrucosum in wheat andbarley exposed to the vapor of the AITC after 1 and 30 days of incubation. Samples control (dark gray)and treated samples (clear gray). Significantly different from untreated cereal, p ≤ 0.05 (*).
110
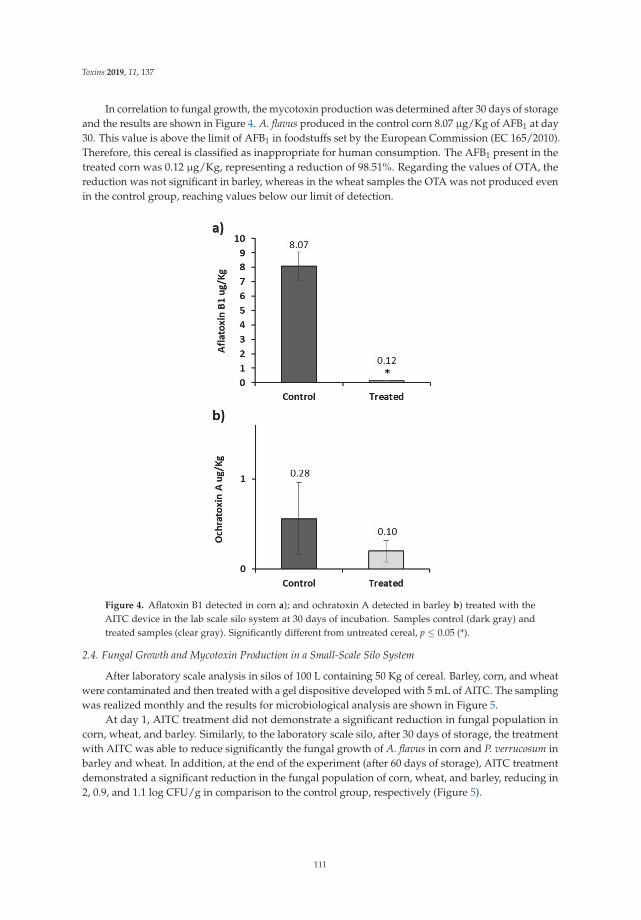
Toxins 2019, 11, 137
In correlation to fungal growth, the mycotoxin production was determined after 30 days of storageand the results are shown in Figure 4. A. flavus produced in the control corn 8.07 μg/Kg of AFB1 at day30. This value is above the limit of AFB1 in foodstuffs set by the European Commission (EC 165/2010).Therefore, this cereal is classified as inappropriate for human consumption. The AFB1 present in thetreated corn was 0.12 μg/Kg, representing a reduction of 98.51%. Regarding the values of OTA, thereduction was not significant in barley, whereas in the wheat samples the OTA was not produced evenin the control group, reaching values below our limit of detection.
Figure 4. Aflatoxin B1 detected in corn a); and ochratoxin A detected in barley b) treated with theAITC device in the lab scale silo system at 30 days of incubation. Samples control (dark gray) andtreated samples (clear gray). Significantly different from untreated cereal, p ≤ 0.05 (*).
2.4. Fungal Growth and Mycotoxin Production in a Small-Scale Silo System
After laboratory scale analysis in silos of 100 L containing 50 Kg of cereal. Barley, corn, and wheatwere contaminated and then treated with a gel dispositive developed with 5 mL of AITC. The samplingwas realized monthly and the results for microbiological analysis are shown in Figure 5.
At day 1, AITC treatment did not demonstrate a significant reduction in fungal population incorn, wheat, and barley. Similarly, to the laboratory scale silo, after 30 days of storage, the treatmentwith AITC was able to reduce significantly the fungal growth of A. flavus in corn and P. verrucosum inbarley and wheat. In addition, at the end of the experiment (after 60 days of storage), AITC treatmentdemonstrated a significant reduction in the fungal population of corn, wheat, and barley, reducing in2, 0.9, and 1.1 log CFU/g in comparison to the control group, respectively (Figure 5).
111

Toxins 2019, 11, 137
Figure 5. Growth, in small-scale silo system, of the A. flavus in corn and of P. verrucosum in wheat andbarley exposed to the vapor of the AITC after 1, 30, and 60 days of incubation. Control (dark gray) andtreated samples (light gray). Significantly different from untreated cereal, p ≤ 0.05 (*).
Along with the fungal growth, the production of mycotoxins was determined at days 30 and 60 ofstorage (Figure 6). No AFs could be detected in corn contaminated with A. flavus. In the samples ofwheat and barley contaminated with P. verrucosum, the OTA reduction was 90.0% and 99.5% for day 30and 78.2% and 92.0% for day 60, respectively.
112

Toxins 2019, 11, 137
Figure 6. Ochratoxin A detected in wheat and barley treated with the AITC device in the small-scalesilo system at 30 and 60 days of incubation. Samples control (dark gray) and treated samples (lightgray). Significantly different from untreated cereal, p ≤ 0.05 (*).
3. Discussion
Similarities and differences were identified comparing the results of the lab scale silo system withthe results of small-scale silo system. Microbiologically, the exposure to AITC of cereals contaminatedwith A. flavus (corn) and P. verrucosum (wheat and barley) reduced, in all experiments, significantly thefungal population after 30 days. However, due to the lower concentration of AITC (50 μL/L) and themicro atmospheres generated by small-scale silo system, the AITC device could not completely inhibitthe fungal growth when compared to the lab scale silo system results. In other words, a lower dose ofAITC and higher headspace in the small silo system did not reduce the fungal population to the valuesbelow to our limit of detection (1.2 logs CFU/g). These results suggest that the effect of AITC is dosedepending. In addition, the higher the grain volume, the higher should be the AITC concentration toachieve a total inhibitory effect.
Regarding the production of mycotoxins, differences between the two tests were observed,probably since a moderate inoculum was used to replicate actual contamination conditions of the field.Another difference among the experiments was the reduction of the potential maximum concentrationof AITC in the headspace (500 μL/L in the lab silo and 50 μL/L in the small silo) due to issues ofscaling and safety of the compound. Even so, in all analysis, a significant reduction in mycotoxinproduction could be observed among the control and the treated samples when both AFB1 and OTAcould be produced in matrices.
In the small-scale system, there was an increasing concentration of mycotoxins over time, even inthe treated samples. These results could be explained by the presence of the fungal population in thecereals, which allows the mycotoxin production.
113

Toxins 2019, 11, 137
In particular, A. flavus and P. verrucosum depend on oxygen to grow. In our experiment, theheadspace in the lab scale silo system and small-scale silo system was around 50% and 20%, respectively.The lower concentration of free oxygen could reduce the regular growth of A. flavus and consequently,avoid the AFB1 production in the small-scale system. Moreover, the cereals in the small-scale systemwere not autoclaved, which increased the competitiveness among microorganisms by nutrients.
The application of the AITC to reduce the growth of the fungi mycotoxin producer has beenstudied previously by other authors. Manyes et al. studied the capacity of AITC produced by thevolatilization of a standard solution of the oriental mustard essential oil to prevent the growth of thefungi A. parasiticus and Penicillium expansum [27]. In that study, Petri dishes were inoculated with themycotoxigenic fungi A. parasiticus (producer of AFs) and P. expansum (producer of patulin), and theinhibition of micellar growth was observed when they were deposited in the center of the petri dishwith 25 μL and 50 μL of AITC, respectively.
Okano et al. assessed the capacity of the AITC obtained by a commercial mustard seed extract toreduce the aflatoxins production by A. flavus during the corn storage [28], in a simulated silo condition.The AITC concentration in the headspace of the model system used by the authors reached the highestvalue of 54.6 μg/L on the day 14 of incubation and remaining stable until 21.8 μg/L until the end ofthe incubation period. Also, the AITC reduced completely the visible growth of A. flavus and the AFsproduction in both sterilized and unsterilized corn
Delaquis et al. evaluated the capacity of the AITC to reduce the growth of A. flavus and P. expansumat concentrations of 0.1 μL/L [29]. The experimental model used was the one used in this study. In thatcase, 2 L flasks were used and inocula of 105 conidia/mL were placed in the presence of differentamounts of AITC. These antifungal properties of the AITC were also confirmed by Suhr and Nielsenwho inoculated pieces of bread with 106 spores/mL of Penicillium roqueforti, Penicillium corylophilum,and A. flavus and arranged them in closed systems in the presence of mustard essential oil (99% ofAITC) [30]. Fungal growth inhibition was observed at concentrations of 1 μL/L. Other studies on thefungicidal activity of AITC against food-disrupting fungi observed the ability of the compound topenetrate the matrix and extend its effect over time. Winther and Nielsen showed that cheeses treatedwith AITC could absorb this compound, increasing its useful life from 4 to 28 weeks [31].
Quiles et al. developed an active packaging dispositive based on the AITC to reduce thesporulation of A. parasiticus and AFs production in fresh pizza doughs during 30 days of inoculation [32].The antifungal activity of the AITC was compared with untreated samples (fresh pizza doughs withoutany preservative treatment) and with samples treated with sodium propionate, the classical preservativeused in bakery products. After 30 days, the growth of A. parasiticus was inhibited with the treatment ofAITC at 5 μL/L and 10 μL/L. The reduction of AFs was total at the dose of 10 μL/L.
Nazaret et al. evaluated the capacity of AITC to reduce the production of AFs, beauvericin andenniatin, by A. parasiticus and Fusarium poae in wheat flour [24]. The analysis of the results showedthat the AITC concentration of 0.1 μL/L reduced by 23% the production of the mycotoxins. Also, theapplication of the AITC at 10 μL/L completely reduced the biosynthesis of the mycotoxins studiedduring 30 days of incubation.
Tracz et al. evaluated the capacity of AITC at 50, 100, or 500 μL/L to avoid mycotoxin productionin corn kernels [33]. Both treatments were able to avoid the production of 12 mycotoxins, includingAFB1 and Ochratoxin. Saladino et al. analyzed the fungal growth and AFB1 reduction by AITC (0.5, 1,or 5 μL/L) in loaf bread [34]. As result, the treatments of 1 and 5 μL/L reduced the AFB1 concentrationby above 60%. Our results corroborate with these studies, since the AITC at 50 μL/L demonstrated afungicide and antimicotoxigenic effect, inhibiting the AFB1 and OTA synthesis and the fungal growthof A. parasiticus and P.verrucosum in our small-scale assays.
4. Conclusions
The results obtained in this study showed the capacity of the AITC to reduce the growth of thefungi A. flavus and P. verrucosum in corn, wheat, and barley. The volatilization of the AITC in the
114

Toxins 2019, 11, 137
headspace of the lab scale silo system was enough to avoid the A. flavus and P. verrucosum growth inall cereals tested. Moreover, the treatment with AITC device was able to reduce the AFB1 and OTAproduction in corn and barley, respectively.
In the small-scale silo system, a significant reduction of the A. flavus and P. verrucosum growth wasobserved as well as an important reduction of the OTA produced by P. verrucosum. The application ofthe device based on the AITC could be an alternative method to reduce the growth of fungi mycotoxinproducer in cereals during the storage phase.
For further studies, the tests carried out in this work will be staggered for 200-ton real silos withnaturally contaminated barley and treated with AITC release devices.
5. Material and Methods
5.1. Chemicals and Microbial Strains
AFB1, AFB2, OTA (98% purity), AITC, and formic acid (HCOOH) were obtained fromSigma–Aldrich (St. Louis, MO, USA). Methanol and acetonitrile have been obtained by Fisher Scientific(Hudson, NH, USA). Deionized water (<18 MΩ cm resistivity) was produced by a water purificationsystem (Millipore, Bedford, MA, USA). All the chromatographic solvents were filtered through a0.22 μm membrane filter Scharlau (Barcelona, Spain). Barley, wheat, and corn were provided by TotAgro (Barcelona, Spain). The peptone water and dextrose potato agar culture medium were obtainedfrom Liofilchem (Teramo, Italy). The strains of A. flavus ITEM 8111 were provided by the MicrobialCulture Collection of Institute of Sciences and of Food Production (ISPA, Bari, Italy) whereas theP. verrucosum VTT D-01847, was obtained from the VTT Culture Collection (Espoo, Finland).
5.2. Laboratory Scale Silo System and Antifungal Treatment with the AITC Device
The silo simulation was carried out as shown in Figure 7. Glass jars of 1 L containing 300 g ofcereals were contaminated with 104 conidia/g of P. verrucosum (barley and wheat) and A. flavus (corn).The cereals were stored for three days to allow fungal adaptation, and treated with 500 μL/L (in therelation of volume of the jar) of AITC into a gel device.
Figure 7. Lab scale silo system used for the treatment of corn, wheat and barley contaminated withA. flavus and P. verrucosum, and treated with the AITC device.
115
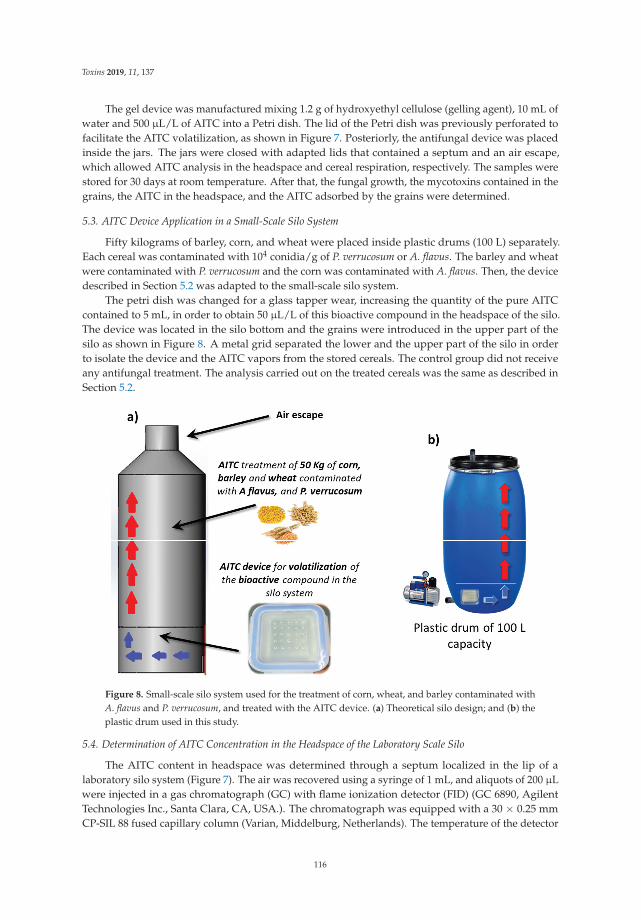
Toxins 2019, 11, 137
The gel device was manufactured mixing 1.2 g of hydroxyethyl cellulose (gelling agent), 10 mL ofwater and 500 μL/L of AITC into a Petri dish. The lid of the Petri dish was previously perforated tofacilitate the AITC volatilization, as shown in Figure 7. Posteriorly, the antifungal device was placedinside the jars. The jars were closed with adapted lids that contained a septum and an air escape,which allowed AITC analysis in the headspace and cereal respiration, respectively. The samples werestored for 30 days at room temperature. After that, the fungal growth, the mycotoxins contained in thegrains, the AITC in the headspace, and the AITC adsorbed by the grains were determined.
5.3. AITC Device Application in a Small-Scale Silo System
Fifty kilograms of barley, corn, and wheat were placed inside plastic drums (100 L) separately.Each cereal was contaminated with 104 conidia/g of P. verrucosum or A. flavus. The barley and wheatwere contaminated with P. verrucosum and the corn was contaminated with A. flavus. Then, the devicedescribed in Section 5.2 was adapted to the small-scale silo system.
The petri dish was changed for a glass tapper wear, increasing the quantity of the pure AITCcontained to 5 mL, in order to obtain 50 μL/L of this bioactive compound in the headspace of the silo.The device was located in the silo bottom and the grains were introduced in the upper part of thesilo as shown in Figure 8. A metal grid separated the lower and the upper part of the silo in orderto isolate the device and the AITC vapors from the stored cereals. The control group did not receiveany antifungal treatment. The analysis carried out on the treated cereals was the same as described inSection 5.2.
Figure 8. Small-scale silo system used for the treatment of corn, wheat, and barley contaminated withA. flavus and P. verrucosum, and treated with the AITC device. (a) Theoretical silo design; and (b) theplastic drum used in this study.
5.4. Determination of AITC Concentration in the Headspace of the Laboratory Scale Silo
The AITC content in headspace was determined through a septum localized in the lip of alaboratory silo system (Figure 7). The air was recovered using a syringe of 1 mL, and aliquots of 200 μLwere injected in a gas chromatograph (GC) with flame ionization detector (FID) (GC 6890, AgilentTechnologies Inc., Santa Clara, CA, USA.). The chromatograph was equipped with a 30 × 0.25 mmCP-SIL 88 fused capillary column (Varian, Middelburg, Netherlands). The temperature of the detector
116
Toxins 2019, 11, 137
arrived at 200 ◦C with a gradient of temperature that starts at 60 ◦C. This temperature was maintainedfor 1 min and increased 8 ◦C per min up to 100 ◦C, then maintained for 5 min and finally increased in15 ◦C per min up to 200 ◦C. The gas utilized as the carrier was H2 at 5 mL/min. The ionization wasrealized with H2 at 40 mL/min and purified air at 450 mL/min.
5.5. Determination of AITC Concentration in the Cereals of the Laboratory Scale Silo
Extraction of AITC from cereals samples was conducted as described by Tracz et al. with somemodifications [33]. Five g samples were weighed into 15 mL polyethylene tubes to which 10 mL ofmethanol was added. The mixture was shaken for 30 min in a water bath (40 ◦C) and for 10 min in anultrasonic bath. The samples were centrifuged at 4000 g for 5 min at 20 ◦C. The supernatant (8 mL)was collected and filtered through a 0.22 μm nylon membrane. 20 μL were injected in the LC system,1220-Infinity (Agilent, Santa Clara, CA, USA) coupled with a diode array detector (LC-DAD) at 236 nm.A Gemini C18 column (Phenomenex, Torrance, CA, USA) 4.6 × 150 mm, 3 μm particle size at 30 ◦Cwas used as a stationary phase. The isocratic mobile phase consisted of water/acetonitrile (60:40, v/v)with a flow rate of 1 mL/min.
5.6. Mycotoxin Extraction and LC-MS/MS Analysis of Corn, Barley, and Wheat
The extraction of mycotoxins was carried out following the method described by Serrano et al.with some modifications [35]. Each cereal sample was crushed using a food grinder (Oster ClassicGrinder 220e240 V, 50/60 Hz, 600 W, Oster, Valencia, Spain). The resulting particles were mixed, andthree 5 g aliquots of each sample were taken in 50 mL plastic falcon tubes. 25 mL of methanol wasadded to each of these tubes and the samples were homogenized for 3 min by Ultra Ika T18 ultraturrax(Staufen, Germany) at 10,000 rpm. The extract was centrifuged at 4000 rpm during 5 min at 5 ◦C, andthe supernatant was transferred to a plastic flask and evaporated to dryness with a Büchi RotavaporR-200 (Postfach, Switzerland). The obtained residue was resuspended in 5 mL of methanol, transferredto a 15 mL plastic falcon tube and evaporated with nitrogen gas stream using a multi-sample TurbovapLV evaporator (Zymark, Hopkinton, MA, USA). Finally, the residue was reconstituted in 1 mL ofmethanol, filtered through a 13 mm/0.22 μm filter and transferred to a 1 mL glass chromatography vial.The liquid-chromatography system consisted of an LC-20AD pump coupled to a 3200QTRAP massspectrometer (Applied Biosystems, Foster City, CA, USA) using an ESI interface in positive ion mode.The mycotoxins were separated on a Gemini NX C18 column (150 × 2.0 mm I.D, 3.0 mm, Phenomenex,Palo Alto, CA, USA). The mobile phases were the solvent A (5 mM ammonium formate and 0.1%formic acid in water) and solvent B (5 mM ammonium formate and 0.1% formic acid in methanol) at aflow rate of 0.25 mL/min. The elution was carried out using a linear gradient from 0 to 14 min. Theinjection volume set was of 20 mL, the nebulizer, the auxiliary and the auxiliary gas were set at 55, 50,and 15 psi respectively. The capillary temperature and the ion spray voltage were of 550 ◦C and 5500V, respectively. The ions transitions used for the mycotoxin identification and quantification were: m/z313.1/241.3 and 284.9 for AFB1, m/z 315.1/259.0 and 286.9 for AFB2, m/z 329.0/243.1 and 311.1 forAFG1, m/z 331.1/313.1 and 245.1 for AFG2, m/z 404.3/102.1 and 358.1 for OTA.
5.7. Determination of the Fungal Population
After the incubation time, 10 g of each sample was transferred to a sterile plastic bag containing90 mL of sterile peptone water (Oxoid, Madrid, Spain) and homogenized with a stomacher (IUL,Barcelona, Spain) during 30 s. The suspensions formed were serially diluted in sterile plastic tubescontaining 0.1% of peptone water. After that, aliquots of 0.1 mL were plated on Petri dishes containingacidified potato dextrose agar (pH 3.5) (Insulab, Valencia, Spain) and the plates were incubated at25 ◦C for 7 d before microbial counting. The results were expressed in logs of colony-forming unit/gof cereal (log CFU/g). All analyses were conducted in triplicate.
117
Toxins 2019, 11, 137
5.8. Statistical Analysis
The Prism version 3.0 software (GraphPad corporation1, La Jolla, CA, USA, 1989) for Windowswas used for the statistical analysis of data. The experiments were realized in triplicate and thedifferences among groups were analyzed by Student’s t-test. The level of significance considered wasp ≤ 0.05.
Author Contributions: The authors (J.M.Q. and T.d.M.N.) consider that the first two authors should be regardedas joint first authors. F.B.L., J.M., and G.M. conceived and proposed the idea. J.M.Q. and G.M. designed the study.J.M.Q., C.L., and T.d.M.N. performed the experiments and analyzed the data. J.M.Q. wrote the paper. T.d.M.N.contributed to the writing of the manuscript.
Funding: This research was funded by [European Commission] grant number [GA 678781], by [Spanish Ministryof Economy and Competitiveness] grant number [AGL2016-77610R] by [Generalitat Valenciana] grant number[Prometeo (2018/126)] and by [Brazilian National Council for Scientific and Technological Development] grantnumber [CNPq Project 400896/2014-1].
Acknowledgments: The research was supported by the European Project (H2020-Research and InnovationAction) MycoKey “Integrated and innovative key actions for mycotoxin management in the food and feed chain”GA 678781, the Spanish Ministry of Economy and Competitiveness (AGL2016-77610R), the project Prometeo(2018/126) of Generalitat Valenciana, the Brazilian National Council for Scientific and Technological Development(CAPES/CNPq Project 400896/2014-1) and the pre-PhD program of University of Valencia (Atracció de Talent).
Conflicts of Interest: The authors declare that have no conflict of interest.
References
1. Majeed, S.; Iqbal, M.; Asi, M.R.; Iqbal, S.Z. Aflatoxins and ochratoxin A contamination in rice, corn and cornproducts from Punjab, Pakistan. J. Cereal Sci. 2013, 58, 446–450. [CrossRef]
2. Iqbal, S.Z.; Asi, M.R.; Ariño, A.; Akram, N.; Zuber, M. Aflatoxin contamination in different fractions of ricefrom Pakistan and estimation of dietary intakes. Mycotoxin Res. 2012, 28, 175–180. [CrossRef] [PubMed]
3. Pittet, A. Natural occurrence of mycotoxins in foods and feeds—An updated review. Rev. Med. Vet. 1998,149, 479–492.
4. IARC-International Agency for Research on Cancer. Monographs on the evaluation of carcinogenic risks tohumans. In A Review of Biological Agents for Human Carcinogens; IARC-International Agency for Research onCancer: Lyon, France, 2012.
5. Iqbal, S.Z.; Asi, M.R.; Ariño, A. Aflatoxins. In Brenner’s Encyclopedia of Genetics, 2nd ed.; Science Direct:London, UK, 2013; pp. 43–47.
6. Hammami, W.; Fiori, S.; Al Thani, R.; Ali Kali, N.; Balmas, V.; Migheli, Q.; Jaoua, S. Fungal and aflatoxincontamination of marketed spices. Food Control 2014, 37, 177–181. [CrossRef]
7. Blesa, J.; Soriano, J.M.; Moltó, J.C.; Mañes, J. Limited survey for the presence of aflatoxins in foods from localmarkets and supermarkets in Valencia, Spain. Food Addit. Contam. 2004, 21, 165–171. [CrossRef] [PubMed]
8. Van de Perre, E.; Jacxsens, L.; Lachat, C.; El Tahan, F.; De Meulenaer, B. Impact of maximum levels inEuropean legislation on exposure of mycotoxins in dried products: Case of aflatoxin B1 and ochratoxin A innuts and dried fruits. Food Chem. Toxicol. 2015, 75, 112–117. [CrossRef] [PubMed]
9. Van der Merwe, K.J.; Steyn, P.S.; Fourie, L. Mycotoxins. II. The constitution of ochratoxins A, B, and C,metabolites of Aspergillus ochraceus Wilh. J. Chem. Soc. Perkin 1965, 7083–7088. [CrossRef]
10. Téren, J.; Varga, J.; Hamari, Z.; Rinyu, E.; Kevei, F. Immunochemical detection of ochratoxin A in blackAspergillus strains. Mycopathologia 1996, 134, 171–176. [CrossRef] [PubMed]
11. Abarca, M.L.; Bragulat, M.R.; Castellá, G.; Cabañes, F.J. Impact of some environmental factors on growthand ochratoxin A production by Aspergillus niger and Aspergillus welwitschiae. Int. J. Food Microbiol. 2018, 291,10–16. [CrossRef] [PubMed]
12. Schmidt-Heydt, M.; Bode, H.; Raupp, F.; Geisen, R. Influence of light on ochratoxin biosynthesis byPenicillium. Mycotoxin Res. 2010, 26, 1–8. [CrossRef] [PubMed]
13. Wolff, J.; Bresch, H.; Cholmakov-Bodechtel, C.; Engel, G.; Garais, M.; Majerus, P.; Rosner, H.; Scheuer, R.Ochratoxin A: Contamination of foods and consumer exposure. Arch. Lebensmittelhyg. 2000, 51, 81–128.
14. Petzinger, E.; Weidenbach, A. Mycotoxins in the food chain: The role of ochratoxins. Livestock Prod. Sci. 2002,76, 245–250. [CrossRef]
118

Toxins 2019, 11, 137
15. Rizzo, A.; Eskola, M.; Atroshi, F. Ochratoxin a in Cereals, Foodstuffs and Human Plasma. Eur. J. Plant Pathol.2002, 108, 631–637. [CrossRef]
16. Denli, M.; Perez, J.F. Ochratoxins in feed, a risk for animal and human health: Control strategies. Toxins 2010,2, 1065–1077. [CrossRef] [PubMed]
17. Reddy, L.; Bhoola, K. Ochratoxins-food contaminants: Impact on human health. Toxins 2010, 2, 771–779.[CrossRef] [PubMed]
18. Jackson, L.S.; Katta, S.K.; Fingerhut, D.D.; DeVries, J.W.; Bullerman, L.B. Effects of baking and frying on thefumonisin B1 content of corn-based foods. J. Agric. Food Chem. 1997, 45, 4800–4805. [CrossRef]
19. Meca, G.; Blaiotta, G.; Ritieni, A. Reduction of ochratoxin A during the fermentation of Italian red wineMoscato. Food Control 2010, 21, 579–583. [CrossRef]
20. Engel, E.; Baty, C.; Le Corre, D.; Souchon, I.; Martin, N. Flavor-active compounds potentially implicated incooked cauliflower acceptance. J. Agric. Food Chem. 2002, 50, 6459–6467. [CrossRef] [PubMed]
21. Luciano, F.B.; Holley, R.A. Enzymatic inhibition by allyl isothiocyanate and factors affecting its antimicrobialaction against Escherichia coli O157:H7. Int. J. Food Microbiol. 2009, 131, 240–245. [CrossRef] [PubMed]
22. Isshiki, K.; Tokuoka, K.; Mori, R.; Chiba, S. Preliminary examination of allyl-isothiocyanate vapor for foodpreservation. Biosci. Biotechnol. Biochem. 1992, 56, 1476–1477. [CrossRef]
23. Manyes, L.; Luciano, F.B.; Mañes, J.; Meca, G. In vitro antifungal activity of allyl isothiocyanate (AITC)against Aspergillus parasiticus and Penicillium expansum and evaluation of the AITC estimated daily intake.Food Chem. Toxicol. 2015, 83, 293–299. [CrossRef] [PubMed]
24. Nazareth, T.M.; Bordin, K.; Manyes, L.; Meca, G.; Mañes, J.; Luciano, F.B. Gaseous allyl isothiocyanate toinhibit the production of aflatoxins, beauvericin and enniatins by Aspergillus parasiticus and Fusarium poaein wheat flour. Food Control 2016, 62, 317–321. [CrossRef]
25. Zhang, Y. Cancer-preventive isothiocyanates: Measurement of human exposure and mechanism of action.Mutat. Res. 2004, 555, 173–190. [CrossRef] [PubMed]
26. Cejpek, K.; Valusek, J.; Velísek, J. Reactions of allyl isothiocyanate with alanine, glycine, and several peptidesin model systems. J. Agric. Food Chem. 2000, 48, 3560–3565. [CrossRef] [PubMed]
27. Okano, K.; Ose, A.; Takai, M.; Kaneko, M.; Nishioka, C.; Ohzu, Y.; Odano, M.; Sekiyama, Y.; Mizukami, Y.;Nakamura, N.; et al. Inhibition of aflatoxin production and fungal growth on stored corn by allyl isothiocyanatevapor. J. Food Hyg. Soc. Jpn. 2015, 56, 1–7. [CrossRef] [PubMed]
28. Delaquis, P.J.; Sholberg, P.L. Antimicrobial activity of gaseous allyl isothiocyanate. J. Food Prot. 1997, 60, 943.[CrossRef]
29. Suhr, K.I.; Nielsen, P.V. Antifungal activity of essential oils evaluated by two different application techniquesagainst rye bread spoilage fungi. J. Appl. Microbiol. 2003, 94, 665–674. [CrossRef] [PubMed]
30. Winther, M.; Nielsen, P.V. Active packaging of cheese with allyl isothiocyanate, an alternative to modifiedatmosphere packaging. J. Food Prot. 2006, 69, 2430–2435. [CrossRef] [PubMed]
31. Quiles, J.M.; Manyes, L.; Luciano, F.; Manes, J.; Meca, G. Antimicrobial compound allylisothiocyanate againstthe Aspergillus parasiticus growth and its aflatoxins production in pizza crust. Food Chem. Toxicol. 2015, 83,222–228. [CrossRef] [PubMed]
32. Tracz, B.L.; Bordina, K.; Nazareth, T.M.; Costa, L.B.; Macedo, R.E.F.; Meca, G.; Luciano, F.B. Assessmentof allyl isothiocyanate as a fumigant to avoid mycotoxin production during corn storage. LWT 2017, 75,692–696. [CrossRef]
33. Saladino, F.; Quiles, J.M.; Luciano, F.B.; Mañes, J.; Fernandez-Franzón, M.; Meca, G. Shelf life improvementof the loaf bread using allyl, phenyl and benzyl isothiocyanates against Aspergillus parasiticus. LWT 2017, 78,208–214. [CrossRef]
34. Serrano, A.B.; Font, G.; Mañes, J.; Ferrer, E. Emerging Fusarium mycotoxins in organic and conventionalpasta collected in Spain. Food Chem. Toxicol. 2013, 51, 259–266. [CrossRef] [PubMed]
35. Pitt, J.I.; Hocking, A.D. Fungi and FoodSpoilage; Blackie Academic and Professional: London, UK, 1997;Volume II.
© 2019 by the authors. Licensee MDPI, Basel, Switzerland. This article is an open accessarticle distributed under the terms and conditions of the Creative Commons Attribution(CC BY) license (http://creativecommons.org/licenses/by/4.0/).
119


toxins
Article
Influence of Two Garlic-Derived Compounds, PropylPropane Thiosulfonate (PTS) and Propyl PropaneThiosulfinate (PTSO), on Growth and MycotoxinProduction by Fusarium Species In Vitro and inStored Cereals
Kalliopi Mylona 1,†, Esther Garcia-Cela 1, Michael Sulyok 2, Angel Medina 1 and
Naresh Magan 1,*
1 Applied Mycology Group, Environment and AgriFood Theme, Cranfield University,Cranfield MK43 0AL, UK
2 Institute of Bioanalytics and Agro-Metabolomics, Department of Agrobiotechnology (IFA-Tulln),University of Natural Resources and Life Sciences, Vienna, Konrad Lorenzstr. 20, A-3430 Tulln, Austria
* Correspondence: [email protected]† Present address: Centre for Agriculture, Food and Environmental Management (CAFEM) School of Life and
Medical Sciences, University of Hertfordshire College Lane, Hatfield, Hertfordshire AL10 9AB, UK.
Received: 29 July 2019; Accepted: 24 August 2019; Published: 27 August 2019
Abstract: Two garlic-derived compounds, Propyl Propane Thiosulfonate (PTS) and Propyl PropaneThiosulfinate (PTSO), were examined for their efficacy against mycotoxigenic Fusarium species(F. graminearum, F. langsethiae, F. verticillioides). The objectives were to assess the inhibitory effect ofthese compounds on growth and mycotoxin production in vitro, and in situ in artificially inoculatedwheat, oats and maize with one isolate of each respectively, at different water activity (aw) conditionswhen stored for up to 20 days at 25 ◦C. In vitro, 200 ppm of either PTS or PTSO reduced fungalgrowth by 50–100% and mycotoxin production by >90% depending on species, mycotoxin and aw
conditions on milled wheat, oats and maize respectively. PTS was generally more effective thanPTSO. Deoxynivalenol (DON) and zearalenone (ZEN) were decreased by 50% with 80 ppm PTSO.One-hundred ppm of PTS reduced DON and ZEN production in wheat stored at 0.93 aw for 20 days,although contamination was still above the legislative limits. Contrasting effects on T-2/HT-2 toxincontamination of oats was found depending on aw, with PTS stimulating production under marginalconditions (0.93 aw), but at 0.95 aw effective control was achieved with 100 ppm. Treatment of storedmaize inoculated with F. verticilliodies resulted in a stimulation of total fumonsins in most treatments.The potential use of such compounds for mycotoxin control in stored commodities is discussed.
Keywords: Fusarium; mycotoxins; garlic-derived extracts; green chemistry; fungi; EU limits; abioticfactors; storage; wheat; maize; oats
Key Contribution: PTSO was more effective than PTS in inhibiting Fusaria in vitro. In vitro efficacyfor control of growth/mycotoxin production was influenced by water activity. In situ efficacy by thesegarlic-derived compounds was less effective as in in vitro studies. At times, lower doses triggeredmycotoxin production in situ.
1. Introduction
There has been interest in the use of essential oils (EOs) and extracts derived from plants tocontrol food spoilage microorganisms, especially mycotoxigenic moulds, as an alternative to traditional
Toxins 2019, 11, 495; doi:10.3390/toxins11090495 www.mdpi.com/journal/toxins121

Toxins 2019, 11, 495
preservatives based on aliphatic acids [1]. However, an important aspect to consider when utilizingnatural plant extracts for control of mycotoxigenic spoilage fungi is whether they are classed asfood grade. In addition, many studies have studied effects on germination and growth of spoilagemycotoxigenic fungi, while neglecting impacts on mycotoxin production, especially in situ.
Onion and garlic, both members of the Allium family, have received attention as extracts from thesetwo plant species have been found to have significant antimicrobial properties [1]. Their antifungalefficacy has been studied despite the relative instability of some of their compounds or their strongodour. Yin and Tsao [2] found garlic, out of seven Allium plants, to be the most effective againstthree Aspergillus species. Some inter-species differences in efficacy were previously noted, with higherconcentrations of plant extracts required for control of Aspergillus flavus and Aspergillus fumigatusthan Aspergillus niger. Yoshida et al. [3] suggested that the antifungal activity of garlic was due to thecompounds allicin and ajoene. Benkeblia [4] observed growth inhibition of A. niger and Penicilliumcyclopium by red onion and garlic EOs, while higher concentrations (200–500 mL/L) of green andyellow onion EOs were required for control the fungal pathogen Fusarium oxysporum. Singh andSingh [5] studied the effect of Allium sativum extracts and other plant extracts on the growth of A. flavusand aflatoxin production, but only in liquid cultures. Addition of the extract at the beginning of theincubation period showed 85% inhibition in mycelial biomass and complete inhibition of aflatoxinproduction. However, a later addition only gave marginal control of toxin biosynthesis. Liquid culturesystems are relatively artificial as the aim should be to try and develop intervention strategies tocontrol mycotoxigenic fungi under similar conditions found in different agrifood commodities orunder simulated nutritional conditions relevant to where the target control measures are going tobe instituted.
In the last decade, some compounds have been extracted from Allium sativus and been successfullyutilised as antimicrobial preservatives in a number of products, especially in cheese production and asa fruit coating. The two extracted compounds being used are propyl propane thiosulfonate (PTS) anorganosulphate, and propyl propane thiosulfinate (PTSO). Formulations of these compounds are nowcommercially available as Proallium, especially as a coating for extension of fruit shelf-life. While theyare considered effective anti-microbials, very little detailed information is available on the efficacy ofthese compounds against mycotoxigenic fungi, either in vitro or in situ.
Previous studies to compare some EOs and antioxidants to control P. verrucosum and ochratoxin A(OTA) production showed that of those tested only resveratrol was effective at controlling populations ofthe mycotoxigenic species and inhibiting OTA production in stored wheat grain under different storageconditions [6]. Environmental factors were also shown to have a significant influence on the relativecontrol achieved. In addition, this study showed that sometimes under sub-optimal concentrations ofthese compounds, some stimulation of toxin production occurred despite growth being significantlyreduced. This has been suggested to be due to a combination of water and physiological stress causedby the antifungal agent itself which may stimulate secondary metabolite production as a defenceresponse [7–10].
Some very early studies suggested thiosulfinates had potential applications as anti-microbials,although very focused on their use in post-harvest grain preservation [11]. Some extracts of garlic andonion have been shown to have promising efficacy against Aspergillus and Penicillium species and insome cases mycotoxin production. However, very limited information is available on the efficacy ofsuch EOs on Fusarium species. In addition, such compounds have rarely been assessed on naturallycontaminated grains where a range of different species may be encountered.
The objectives of this study were to study the effect of two garlic-derived compounds (PTS, PTSO)for the control of (a) fungal growth and (b) mycotoxin production by Fusarium graminearum(Deoxynivalenol, Zearalenone; wheat), F. langsethiae (T-2/HT-2 toxins; oats) and F. verticilioides(Fumonisins; maize) for the first time. Experiments were initially conducted in vitro for a preliminaryassessment of these two compounds to determine the effective concentrations for control of growthand mycotoxin production. Subsequently, in situ experiments were carried out with inoculation of
122

Toxins 2019, 11, 495
wheat, oats and maize with the relevant mycotoxigenic species and treatment with each of these twocompounds based on in vitro results and stored at 25 ◦C under different moisture content conditionsfor up to 20 days to examine effects on mycotoxin production.
2. Results
2.1. In Vitro Efficacy of PTS and PTSO Garlic-Derived Compounds against Fungal Growth
Figure 1 shows the effect of 0–200 ppm PTS and PTSO on the in vitro radial growth rates ofF. graminearum, F. verticillioides and F. langsethiae. Both PTS and PTSO had very good inhibitory effectson the growth of the isolate of each of these species studied and this increased with concentration.Complete inhibition of the growth of F. langsethiae was observed with 100 ppm PTS and of F. verticillioideswith 200 ppm. Growth of F. graminearum was significantly inhibited, although complete inhibition wasnot achieved in the range of concentrations examined. Two hundred ppm PTSO completely inhibitedthe growth of F. langsethiae and was very effective against F. graminearum and F. verticillioides. PTS wasalways more effective than PTSO when applied at the same concentration against the same fungalspecies. Table 1 shows the concentration necessary for effective dose (ED) 50 and 90% control of growthof the three Fusarium species.
Figure 1. Effect of 0–200 ppm (a) Propyl Propane Thiosulfonate (PTS) and (b) Propyl PropaneThiosulphonate (PTSO) on the in vitro (2% wheat agar medium) on the radial growth rate (n = 6) of anisolate of F. graminearum, F. langsethiae and F. verticillioides. Vertical bars indicate the standard error ofthe means. For PTS effects on growth: F. graminearum: H (4, N = 30) = 26.612, p < 0.001; F. langsethiae:H (4, N = 30) = 27.647, p < 0.001; F. verticillioides: H (4, N = 30) = 26.522, p < 0.001; for fungal species:H (2, N = 90) = 3.176, p = 0.2004. For PTSO effects on growth: F. graminearum: H (4, N = 30) = 27.451,p < 0.001; F. langsethiae: H (4, N = 30) = 27.877, p < 0.001; fungal species: H (2, N = 90) = 12.926,p = 0.002.
Table 1. Effective dose of PTS and PTSO for 50% and 90% control (ED50; ED90 values) of growth, whencompared to the untreated control, for inhibition of F. graminearum, F. langsethaie and F. verticillioides on2% milled wheat agar medium at 25 ◦C.
Treatment (ppm) PTS PTSO
Species ED50 ED90 ED50 ED90
F. graminearum 33 144 52 186F. langsethiae 12 80 21 113
F. verticilloides0 64 172 >200 >200
123

Toxins 2019, 11, 495
The statistical analyses (ANOVA) showed that the effect of PTS and PTSO concentration washighly significant on the growth of the isolate of each Fusarium species, with significant intra-isolatedifferences for growth rate in the presence of the either of these two compounds.
Additional studies were carried out to assess the efficacy of the two compounds at different wateractivity (aw) levels on growth of the three Fusarium species. Figure 2 shows an example of the effect of0–100 ppm PTSO on the growth of F. graminearum and F. langsethiae on wheat agar media modifiedto three different aw levels. The radial growth of both isolates of the two species was significantlyinhibited as the PTSO concentration was increased and water stress was imposed (0.94, 0.92 aw), whencompared to the unmodified control medium. The maximum percentage (%) inhibition was observedat the highest PTSO concentration and 0.995 aw (~83% for F. graminearum and ~90% for F. langsethiae).ANOVA showed that the effects of either PTS or PTSO concentration, aw and fungal species werehighly significant on the log-transformed radial growth rate data, while the effects of the interactionsbetween these factors were not significant.
Figure 2. Effect of 0–100 ppm Propyl Propane Thiosulfinate (PTSO) on the radial growth rates (n =6) of an isolate of (a) F. graminearum and (b) F. langsethiae in vitro (2% wheat agar medium) in relationto water activity (aw). Vertical bars indicate the standard error of the means. Statistical analyses for(a) F. graminearum: H (4, N = 30) = 27.451, p < 0.001; and for (b) F. langsethiae: H (4, N = 30) = 27.877,p < 0.001.
Table 2 summarises the effective dose (ED50) concentrations of PTSO only for the isolates ofF. graminearum, F. langsethiae and F. verticillioides used in this study grown on wheat agar media modifiedto different aw levels and 25 ◦C. Overall, lower concentrations of each compound were required for 50%inhibition of growth of the isolate of F. langsethiae than for the isolates of the other two Fusarium species.
Table 2. Effective dose ED50 values (ppm) of PTSO for 50% inhibition of the growth of F. graminearum,F. verticillioides and F. langsethiae on wheat agar media of different water activities (aw) at 25 ◦C.
Treatments F. graminearum F. verticillioides F. langsethiae
PTSO (0.98 aw) 42 189 9.5PTSO (0.94 aw) 36 >100 50PTSO (0.92 aw) 37 >100 32
2.2. Effects of the Compounds on In Vitro Mycotoxin Inhibition
Figure 3 shows the effect of different concentrations of PTS and PTSO on fumonisins B1 andB2 (FB1 and FB2) production by the isolate of F. verticillioides on wheat-based medium at 25 ◦C.Two-hundred ppm of PTS inhibited FB1 and FB2 toxins by up to 90%. For PTSO, the production of both
124
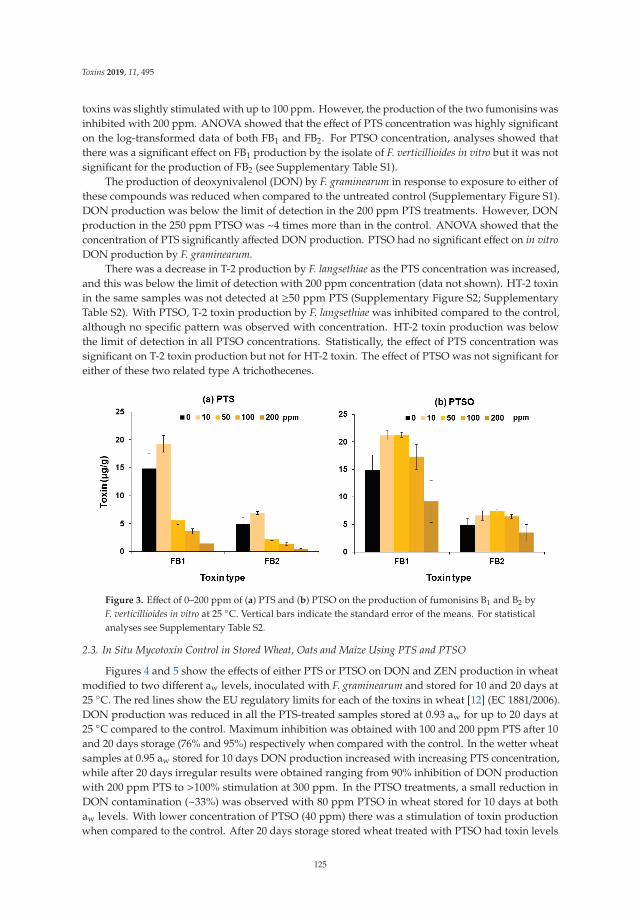
Toxins 2019, 11, 495
toxins was slightly stimulated with up to 100 ppm. However, the production of the two fumonisins wasinhibited with 200 ppm. ANOVA showed that the effect of PTS concentration was highly significanton the log-transformed data of both FB1 and FB2. For PTSO concentration, analyses showed thatthere was a significant effect on FB1 production by the isolate of F. verticillioides in vitro but it was notsignificant for the production of FB2 (see Supplementary Table S1).
The production of deoxynivalenol (DON) by F. graminearum in response to exposure to either ofthese compounds was reduced when compared to the untreated control (Supplementary Figure S1).DON production was below the limit of detection in the 200 ppm PTS treatments. However, DONproduction in the 250 ppm PTSO was ~4 times more than in the control. ANOVA showed that theconcentration of PTS significantly affected DON production. PTSO had no significant effect on in vitroDON production by F. graminearum.
There was a decrease in T-2 production by F. langsethiae as the PTS concentration was increased,and this was below the limit of detection with 200 ppm concentration (data not shown). HT-2 toxinin the same samples was not detected at ≥50 ppm PTS (Supplementary Figure S2; SupplementaryTable S2). With PTSO, T-2 toxin production by F. langsethiae was inhibited compared to the control,although no specific pattern was observed with concentration. HT-2 toxin production was belowthe limit of detection in all PTSO concentrations. Statistically, the effect of PTS concentration wassignificant on T-2 toxin production but not for HT-2 toxin. The effect of PTSO was not significant foreither of these two related type A trichothecenes.
Figure 3. Effect of 0–200 ppm of (a) PTS and (b) PTSO on the production of fumonisins B1 and B2 byF. verticillioides in vitro at 25 ◦C. Vertical bars indicate the standard error of the means. For statisticalanalyses see Supplementary Table S2.
2.3. In Situ Mycotoxin Control in Stored Wheat, Oats and Maize Using PTS and PTSO
Figures 4 and 5 show the effects of either PTS or PTSO on DON and ZEN production in wheatmodified to two different aw levels, inoculated with F. graminearum and stored for 10 and 20 days at25 ◦C. The red lines show the EU regulatory limits for each of the toxins in wheat [12] (EC 1881/2006).DON production was reduced in all the PTS-treated samples stored at 0.93 aw for up to 20 days at25 ◦C compared to the control. Maximum inhibition was obtained with 100 and 200 ppm PTS after 10and 20 days storage (76% and 95%) respectively when compared with the control. In the wetter wheatsamples at 0.95 aw stored for 10 days DON production increased with increasing PTS concentration,while after 20 days irregular results were obtained ranging from 90% inhibition of DON productionwith 200 ppm PTS to >100% stimulation at 300 ppm. In the PTSO treatments, a small reduction inDON contamination (~33%) was observed with 80 ppm PTSO in wheat stored for 10 days at bothaw levels. With lower concentration of PTSO (40 ppm) there was a stimulation of toxin productionwhen compared to the control. After 20 days storage stored wheat treated with PTSO had toxin levels
125
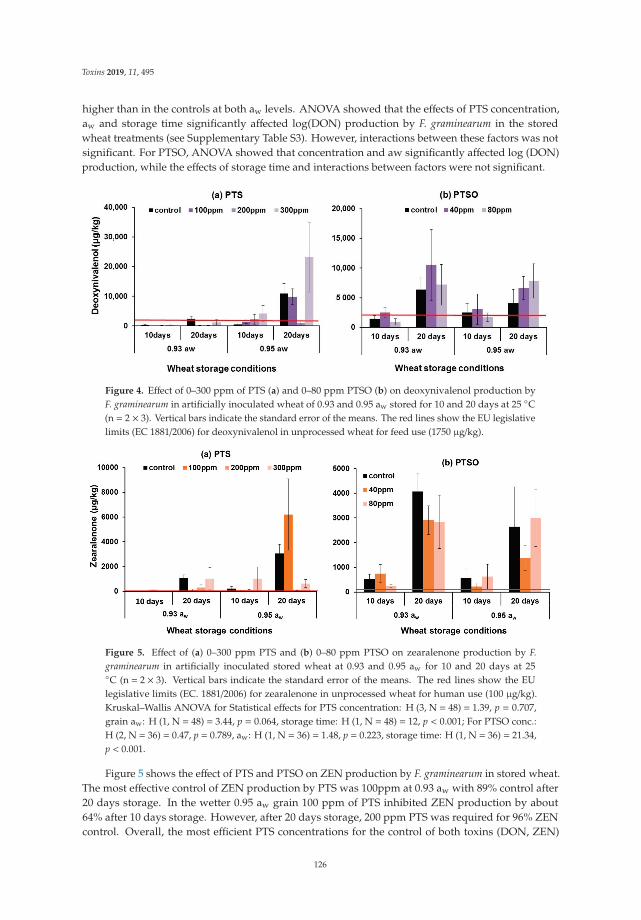
Toxins 2019, 11, 495
higher than in the controls at both aw levels. ANOVA showed that the effects of PTS concentration,aw and storage time significantly affected log(DON) production by F. graminearum in the storedwheat treatments (see Supplementary Table S3). However, interactions between these factors was notsignificant. For PTSO, ANOVA showed that concentration and aw significantly affected log (DON)production, while the effects of storage time and interactions between factors were not significant.
Figure 4. Effect of 0–300 ppm of PTS (a) and 0–80 ppm PTSO (b) on deoxynivalenol production byF. graminearum in artificially inoculated wheat of 0.93 and 0.95 aw stored for 10 and 20 days at 25 ◦C(n = 2 × 3). Vertical bars indicate the standard error of the means. The red lines show the EU legislativelimits (EC 1881/2006) for deoxynivalenol in unprocessed wheat for feed use (1750 μg/kg).
Figure 5. Effect of (a) 0–300 ppm PTS and (b) 0–80 ppm PTSO on zearalenone production by F.graminearum in artificially inoculated stored wheat at 0.93 and 0.95 aw for 10 and 20 days at 25◦C (n = 2 × 3). Vertical bars indicate the standard error of the means. The red lines show the EUlegislative limits (EC. 1881/2006) for zearalenone in unprocessed wheat for human use (100 μg/kg).Kruskal–Wallis ANOVA for Statistical effects for PTS concentration: H (3, N = 48) = 1.39, p = 0.707,grain aw: H (1, N = 48) = 3.44, p = 0.064, storage time: H (1, N = 48) = 12, p < 0.001; For PTSO conc.:H (2, N = 36) = 0.47, p = 0.789, aw: H (1, N = 36) = 1.48, p = 0.223, storage time: H (1, N = 36) = 21.34,p < 0.001.
Figure 5 shows the effect of PTS and PTSO on ZEN production by F. graminearum in stored wheat.The most effective control of ZEN production by PTS was 100ppm at 0.93 aw with 89% control after20 days storage. In the wetter 0.95 aw grain 100 ppm of PTS inhibited ZEN production by about64% after 10 days storage. However, after 20 days storage, 200 ppm PTS was required for 96% ZENcontrol. Overall, the most efficient PTS concentrations for the control of both toxins (DON, ZEN)
126

Toxins 2019, 11, 495
was 100 ppm PTS in the 0.93 aw stored wheat, and 200 ppm for the wetter stored wheat (0.95 aw).PTSO at 40 and 80 ppm reduced ZEN contamination of stored wheat inoculated with F. graminearumat both 0.93 and 0.95 aw by 30–60% after 20 days storage. Statistically, the Kruskal–Wallis analyses(non-parametric analyses) showed that there was no significant effect of PTS concentration or grain aw
on ZEN production, while storage time was highly significant. For PTSO, concentration or storage aw
were not significant for ZEN production, while storage time was highly significant.Figure 6 shows the T-2 + HT-2 toxins in stored oats inoculated with F. langsethiae and treated with
0–300 ppm PTS and 0–80 ppm PTSO for up to 20 days. The red line shows the indicative directivewith regard to limits more commonly established in Europe for the sum of T-2 + HT-2 toxins [13](EC 165/2013). In all cases, the toxin levels produced were below the indicative levels suggested by theEU. Statistical analyses showed that the effects of PTS concentration, and storage time had no significanteffect on log(T-2+HT-2) toxin contamination of stored oats by F. langsethiae (see Supplementary Table S3)The effect of aw, and interaction between aw × storage time were significant. For PTSO, ANOVAshowed that concentration and aw had significant effects on the production of these two toxins whilethe effect of storage time and interactions between the factors were not significant.
Figure 6. Effect of (a) 0–300 ppm aqueous PTS and (b) 0–16 ppm PTSO on T-2+HT-2 toxin productionby F. langsethiae in artificially inoculated oats of 0.93 and 0.95 aw and stored for 10 and 20 days at 25◦C. Vertical bars indicate the standard error of the means. The red lines show the EU recommendedfor maximum limits (EC. 165/2013) for sum T-2 and HT-2 toxin in unprocessed oat for human use(1000 μg/kg).
Figure 7 shows the effect of treatments on the production of total fumonisins B1 + B2 (FUMs)in maize rewetted to 0.91 and 0.94 aw and inoculated with F. verticillioides spores and treated with0–300 ppm PTS, Only PTS was studied in these assays because of the limited efficacy of PTSO incontrolling FUMs production in vitro (see Figure 3). The red line shows the EU legislative limitsestablished for the sum of FUMs in maize. At 0.91 aw PTS was effective with up to 80% control achievedafter 20 days with 200–300 ppm treatment. This was also below the relevant EU limit. However,in wetter maize stored at 0.94 aw most treatments were ineffective in controlling FUMs contamination.Indeed there was a stimulation in FUMs, especially with 100–200 ppm PTS, regardless of aw or storagetime. There was a statistically significant effect of PTS concentration, maize aw and storage time on thelogarithm of total FUMs production (see Supplementary Table S3). The interaction of aw×storage timeand aw × PTS concentration were also significant. However, the interactions of PTS × storage timeand interaction between all three factors was not significant. For PTSO, none of the single factors orinteracting factors were significant except for aw × storage time was significant.
127

Toxins 2019, 11, 495
Figure 7. Effect of 0–300 ppm aqueous PTS on total fumonisins production by F. verticillioides inartificially inoculated maize stored at 0.91 and 0.94 aw for 10 and 20 days at 25 ◦C. Vertical bars indicatethe standard error of the means. The red lines show the EU legislative limits (EC. 1881/2006) forfumonisins (FB1 + FB2) in unprocessed maize for human use (2000 μg/kg).
3. Discussion
3.1. In Vitro Efficacy of PTS and PTSO
This is the first study to evaluate the efficacy of the garlic-derived compounds PTS and PTSO forcontrol of fungal growth and mycotoxin production by isolates of the three important mycotoxigenicFusarium species in vitro. The present study has shown that solutions of either PTS or PTSO were effectiveat inhibiting the in vitro growth of each isolate of the three Fusarium species studied. The inhibitoryeffect increased with concentration and generally, the level of inhibition was species-dependent. F.langsethiae was the most sensitive Fusarium species to both compounds with complete inhibition ofgrowth with 100 and 200 ppm of PTS and PTSO respectively.
Our results suggest that there is differential sensitivity of Fusarium species to PTS and PTSO.Thus, higher ED50 concentrations of the two garlic-derived compounds were required for the isolate ofF. verticilloides when compared to F. gaminearum and F. langshetiae. Previously, 200 ppm of star aniseextract was needed to inhibit growth of F. verticillioides completely when compared to effects on F. solani,F. oxysporum and F. graminearum where only 100 ppm was required [14]. Similarly, Morcia et al. [15]observed lower ED50 values of seven EOs were needed in the case of F. langsethiae when comparedto effects on F. graminearum and F. sporotrichioides. However, most of these studies did not assessinteractions with water availability which is critical for determining efficacy, especially in relation totoxin control [14–22]. It is also difficult to compare the dose-effect relationships obtained betweenspecies across the studies because different times and doses, and different matrices were used, oftennutritionally unrelated to the commodity in which in situ control was required.
In addition, different EO extracts have different active ingredients and thus do not have the sameefficacy against the same species. For example, the effect of EOs belonging to five botanical families(Umbeliferae, Labiateae, Compositeae, Rosaceae and Lauraceae) against F. moniliforme (=F. verticillioides)was evaluated [16]. Growth was completely inhibited with 500 ppm of anise, thyme and cinnamon,2000 ppm of marigold, and 3000 ppm of the other extracts examined. Overall, no significant differencesbetween these botanical families were found. Also, complete inhibition of this Fusarium species wasachieved with 600 ppm of thyme, 800 ppm of basil and lemongrass and 1000–2500 ppm of ginger [17,18].These differences could be due to the different tolerances between strains, but also because of thedifferent compositions and purity of EOs obtained from the different plants. Elhouiti et al. [23] studiedthe chemical composition of leaves and flowers of Rhanterium adpressum, harvested at different timesover three years. They observed that the percentage of the leading chemical groups changed according
128

Toxins 2019, 11, 495
to the month of extraction. Also, the EOs produced by the flower had better inhibitory activity thanthe leaf extracts (MICs, 6–10 ppm vs 11–14 ppm) against F. culmorun and F. graminearum respectively.Kurita and Koike et al. [24] pointed out that the magnitude of the antifungal effect was related tothe functional groups and they proposed a scale of antifungal potency of chemical groups from thebest to worst being phenols > alcohols > aldehydes > ketones > ethers > hydrocarbons. However,these previous studies did not evaluate the impact that changing water availability might have on therelative control achieved.
In terms of control of mycotoxin production, both PTS and PTSO reduced DON, ZEN, T-2, HT-2and FUMs production by the relevant Fusarium species when compared to the controls. There weresome differences in efficacy between PTS and PTSO. The latter compound only controlled FB1 andFB2 production at 200 ppm, with >4 times the amount of PTS required, compared to PTSO to obtainthe same inhibitory effects. Generally, PTS was more effective in controlling mycotoxin productionthan PTSO, except in the case of T-2 toxin where the latter compound was more effective at <200 ppm.Similarly, HT-2 toxin was completely inhibited at all PTSO concentrations, while for PTS ≥50 ppmwas required. It was also generally observed that higher PTS concentrations (200 ppm) completelyinhibited the production of all toxins, except in the case of the FUMs.
Previous studies have suggested that complete inhibition of FUMs could be achieved with6 ppm of 3-carene, D-limonene and B-ocimene [21]. Also, ginger EOs inhibited FB1 (2500 ppm),FB2 (2000 ppm) and DON (2000 ppm) production [17,22]. Lower doses of extracts of R. adpressum(0.25 ppm) significantly inhibited production of type B tricothecenes (3-acetyl deoxynivalenol, 15-acetyldeoxynivalenol and fusarenon X) [23]. Morcia et al. [15] reported that the seven EOs (cuminaldehyde,cinnamaldehyde, lemon oil, citral, limonene, bergamot and citroneall) had a variable effect on thebiosynthesis of T-2 and HT-2 by F. langsethiae and F. sporotrichioides. 0.1 mL of bergamoil/mL reducedT-2 and HT-2 toxin produced by the former species but stimulated production by the latter species.However, again, few of these studies included the impact of aw stress on the efficacy of the EOs.
3.2. In Situ Efficacy of PTS and PTSO against Mycotoxin Production in Stored Grain
The aw levels chosen for the wheat, oats and maize storage studies was based on the marginal andoptimum aw levels for growth and mycotoxin production by the isolates of these three species fromprevious studies [25–27]. Drier conditions of <0.90 aw are considered very marginal for colonisation byFusarium species of wheat, oats or maize. Treatment of wheat with 100 ppm of PTS resulted in 76–94%control of DON, depending on the storage aw. Better results were obtained in the 0.93 aw treatmentwhere colonisation was slower than in the 0.95 aw treatment. PTS was also effective in controllingZEN production, by reducing the production to below or near the applicable EU limits after both 10and 20 days storage respectively. However, it should be noted that under some storage conditionsintermediate PTS concentrations stimulated mycotoxin production.
Overall, PTS was not efficient in controlling the production of T-2 and HT-2 toxins in artificiallyinoculated oats at 0.93 aw, particularly in samples stored for 20 days. In contrast, at 0.95 aw reasonablygood control with 100 ppm PTS for T-2 and HT-2 production was achieved after 10 days storage,and with 200 ppm after 20 day storage. For control of FUMs, 300 ppm PTS was necessary in storedmaize at 0.91 aw and 0.94 aw resulting in 39–80% inhibition when compared to the control samples.The control achieved was below the EU legislative limits but only in the 0.91 aw treatments. In moistmaize, much higher concentrations would be required to try and control FUMs to below the EUlegislative limits, especially if destined for feed use.
Treatment of wet grain with PTSO was generally capable of reducing mycotoxin contaminationafter storage at 0.93–0.95 aw for 10–20 days compared to the untreated control samples. Thus, wherewater ingress might occur in a silo this compound would be effective at controlling toxin contaminationin stored cereals produced by Fusaria, in the short to medium term. DON contamination in wheattreated with 80 ppm PTSO and stored for 10 days had 1/3rd less toxin than the control, which was alsobelow the relevant EU limits. However, this treatment was not efficient for extended storage beyond
129
Toxins 2019, 11, 495
20 days with the exception of ZEN, which was more effectively reduced, even after 20 days storage.Better control was observed with 40 ppm PTSO (48–60%) in relatively moist wheat stored at 0.95 aw.However, all the treatments contained ZEN levels above the applicable EU limits.
Overall, PTSO was more efficient in controlling the production of T-2/HT-2 toxins by F. langsethiaein oats, with as little as 16 ppm required. This treatment was generally more effective against HT-2toxin (8–78%) than T-2 toxin (18–42%) and this may be important, as often T-2 toxin is converted rapidlyto HT-2 toxin and thus control of this toxin is important.
Previously, Soliman et al. [16] examined the efficacy of low concentrations (0.1–2.0 ppb) of themore efficient EOs tested in vitro (anise, cinnamon, spearmint and thyme) on FUMs contaminationof stored wheat over 8 week storage periods. They claimed that low doses (0.1 ppb) completelyinhibited the biosynthesis of FUMs after 2 weeks. Thyme EO was shown to have the highestanti-mycotoxigenic activity and the best control of growth. Although water availability was notconsidered, the concentrations appear to be very low for achieving control. In addition, F. verticillioidescolonisation is more important in maize where it is primarily responsible for FUM contamination.Venkatesh et al. [21] suggested that use of guggul EO at 10 ppm treatment of maize at 28 ◦C for 10 daysreduced FUMs from 42.5 to 2.6 ppm; with complete inhibition of FB1 achieved with 200 ppm of staranise or 50 ppb of allyl isothiocyanate [14,28]. Allyl isothiocyanate was found to inhibit the productionof FB1 by F. verticilloides [2,28].
These cereals are naturally contaminated with a mixture of toxigenic fungi as part of the mycobiota.Thus, the differential effect on different Fusarium species would also apply to other toxigenic speciessuch as Penicillium verrucosum (ochratoxin A producer) or Aspergillus species. Thus, considerationshould be given to changes in the ratio of mycotoxins which might occur when treated with differentpreservatives. Recently, Giorni et al. [29] showed that in ripening maize co-inoculated with mixtures ofF. graminearum, F. verticillioides and Aspergillus flavus influenced the relative contamination of the maizecobs with deoxynivalenol, FUMs and aflatoxins. Interactions between non-toxigenic mycobiota andhas also been shown to influence the relative contamination with different mycotoxins in both wheatgrain and in grape-based matrices [30].
The in situ storage studies have been done for a maximum of 20 days. For longer term storageperiods of 6–9 months it may be necessary to use a slightly increased treatment concentration of suchcompounds for ensuring that control can be maintained. This would have an impact on the relativeeconomic costs of treatment which would have to be considered in the context of the overall inputsinto management of grain for food and feed use post-harvest.
4. Conclusions
This was the first detailed examination of these two compounds for control of growth andmycotoxin contamination by Fusarium species in vitro and in artificially inoculated stored wheat, oatsand maize under different temporal and water availability conditions. Overall, in vitro efficacy shouldinclude important parameters such as water availability, temperature and perhaps pH stress to identifythe most effective candidates for control of colonisation, and more importantly, mycotoxin production.Potential efficacy was demonstrated and identified against isolates of three different Fusarium species.However, efficacy in situ was not as effective as that observed in vitro. In addition, the efficacy of thetreatments depended on the specific “Fusarium species-toxin” pathosystem. Differences were observedwith regard to the production of different mycotoxins by an isolate of a single fungal species wheninoculated into naturally contaminated cereals. However, the right concentrations need to be usedfor effective control to be achieved. This depended on the water availability and the mycotoxigenicspecies involved.
Both garlic-derived compounds tested in this study (PTS and PTO) are liquids and water solubleand can thus be applied to grain prior to storage for post-harvest control of spoilage mycotoxigenic fungi.Garlic extracts have been approved for use as a pesticide (although currently under re-evaluation) andcommercial products are available based on such extracts. Certainly, the use of odourless versions of
130
Toxins 2019, 11, 495
these compounds could be effectively used for food applications. In addition, the existing compoundscould also be used for animal feed applications where often moist grain needs to be preserved for theshort to medium term prior to use.
5. Materials and Methods
5.1. Preparation of Stock Solutions of Chemical Compounds
Stock solutions of the following compounds were prepared in sterile distilled water.(a) Propyl propane thiosulfonate (PTS): This organosulfonate compound is obtained from the
decomposition of initial compounds present in garlic bulbs (Allium sativum) and was kindly providedby DOMCA SA, Granada, Spain. A stock solution of 5000 ppm was prepared by dissolving 1.1 g PTS(90% PTS, Domca, S.A., Granada, Spain) (Mousala SL., 2006) into a 200 mL container containing 200 mLof sterile distilled water and vigorously shaking. Due to the oily nature of PTS the stock solution hadthe appearance of a stable water emulsion. A second stock solution of 20000 ppm was prepared bydissolving 2.2 g PTS into 100 mL of a mixture of ethanol:H2O (80:20). This solution was clear.
(b) Propyl propane thiosulfinate (PTSO): A stock solution of 10000 ppm was prepared by dissolving1.1 g PTSO (90% PTSO, Domca, S.A., Granada, Spain) (Mousala SL., 2006) into a 100 mL containercontaining 100 mL sterile distilled water and vigorously shaking. Due to the oily nature of PTSO thestock solution had the appearance of a water emulsion. A second stock solution of 20,000 ppm wasprepared as for PTS.
5.2. In Vitro Studies: Fungal Species, Media, Inoculation and Measurements of Growth and Mycotoxin Production
Fusarium graminearum isolate L1-2/2D (wheat; DON, ZEN), F. langsethiae strain 2004/59 (oats;T-2 + HT-2) and F. verticillioides isolate MPVP 294 (maize; FUMS) were used in this study. The strainswere all maintained on Malt Extract Agar (MEA) media (OXOID, malt extract, 30; mycological peptone,5; agar, 15 g/L). These isolates were kindly supplied by Prof. S. Edwards, Harper Adams Universityand Prof. P. Battilani, Catholic University of Italy, Piacenza, Italy). They have all been examinedpreviously for mycotoxin production and shown to be high producers of the respective mycotoxins inprevious studies [31,32].
For the in vitro trials a 2% milled wheat medium was prepared by adding 2% milled wheat and 2%agar (OXOID Ltd, Basingstoke, England) to water to obtain the basal medium. For the initial screening,concentrations of PTS and PTSO in the range 10–200 ppm were used by adding the necessary stocksolutions to the molten cooled medium, shaking vigorously and then pouring the media into 9 cmPetri plates (15 mL per plate). The basal 2% media had a water activity (aw) value of 0.995. This basalmedium was modified by replacing water with different amounts of mixtures of glycerol/water solutionto the milled cereal + agar to obtain the target aw values of 0.92, 0.94 and 0.98 (20.7, 15.4 and 4.9 gglycerol/50 mL of water, respectively) without diluting the nutritional status of the media. These aw
levels represent the range over which these Fusaria can effectively grow [33]. The media were allchecked with an Aqualab TE4 to confirm the actual aw levels were achieved.
Agar plugs (4 mm diameter) cut from the margin of 10-day-old cultures with a sterile cork borer,were used as an inoculum for the in vitro trials. Three replicate per treatment and replicate plates werecentrally inoculated with the inoculum agar plugs. All experiments were repeated once. Each aw
treatment and replicates were stored in separate polyethylene bags to maintain the environmentalconditions over the experimental period.
The treatments and replicates were all incubated at 25 ◦C for 10 days, or until the Petri disheswere completely colonised by the fungi. Each concentration of the PTS and PTSO treatments were keptseparately in polyethylene bags to avoid cross-contamination. Two diameters of the colonies formed(at right angles of each other) were measured daily and compared against the diameters of the controls.From these data the relative growth rates were calculated and the effect of different concentrations was
131
Toxins 2019, 11, 495
calculated. The percentage inhibition of mycelial growth of the Fusarium species was determined ateach different chemical compound concentration and the different water activities.
For mycotoxin analyses on the tenth day of incubation, agar plugs (5, 5-mm diameter) were cutout from each of the replicate plates diagonally across the colony. The agar plugs were placed in 2-mLsafe-lock Eppendorf®tubes (Eppendorf AG, Hamburg, Germany), their weight was recorded andfrozen at −40 ◦C for subsequent toxin analysis. The extraction and analysis of the relevant toxins foreach fungal species were performed according to the methods described later.
5.3. In Situ Studies with Stored Cereal Grain
Fungal inoculum: Cultures of the above fungal species were prepared on MEA and incubatedat 25 ◦C for 10 days. A Tween 80 solution was prepared by addition of one drop of Tween 80(ACROS organics) in 100 mL sterile water. Spore suspensions were prepared by gently scraping theculture surface with a sterile spatula and transferring the spores into sterile 25 mL Universal glassvials containing the water + Tween 80 solution. The spore suspensions were filtered through glasswool in order to remove any mycelial fragments. The spore concentration was determined using ahaemocytometer (Olympus BX40 microscope, Microoptical Co.; slide Marienfeld superior, Germany;microscope glass cover slips, No 3, 18 × 18mm, Chance Proper LTD, Smethwick, UK) and adjusted bydilution to 107 spores/mL. Naturally contaminated wheat, oats and maize were artificially inoculatedwith these suspensions for the in situ storage experiments.
Grain equilibration: Water adsorption curves were prepared for each grain type. The amount ofwater required to accurately modify these cereals to 0.91, 0.94 (maize) and 0.93 and 0.95 aw (wheat, oats)was determined from these curves. Initially, each grain type (approx. 1 kg) was taken from a 25-kgbag and placed in a Duran bottle (2.5 L). The initial moisture content was known from the moistureadsorption curves. The grain was randomly divided into batches of 100 g in Duran flasks (1 L). Thesewere labeled for each treatment condition and the required amounts of sterile water added to each oneincluding the treatment PTS or PTSO stock solution, shaken vigorously and sealed. They were placedat 4◦C to equilibrate overnight. The treatments were then inoculated with 1-mL spore suspensioncontaining ~105 spores/mL of the individual Fusarium species and thoroughly mixed using a rollermixer in order for the spores to become dispersed throughout the grain mass. For each grain type, 15 gwas weighed into surface sterilized 40 mL vials (Chromacol Ltd., London, UK) with microporous lids toobtain six replicates per aw treatment and stored in sandwich boxes for up to 20 days. The equilibriumrelative humidity (ERH) was maintained by including 2 × 500 mL of a glycerol-water solution inbeakers to maintain the treatment aw levels. The experiments were carried out twice with six replicatesper treatment.
For each experiment, after 10 and 20 days storage, three replicates were destructively removedfrom storage chambers and frozen at −20 ◦C for subsequent toxin analysis. Grain samples wereoven-dried for 24–48 h at 60 ◦C, milled and then extracted and analysed as described later.
5.4. Mycotoxin Analyses
5.4.1. Equipment Description
High performance liquid chromatography (HPLC) were used to quantify DON, T-2 and HT-2from media. In addition, liquid chromatography tandem mass spectrometry (LC-MS/MS) wereused to quantify FUMS from media and Fusarium toxins from grains. HPLC used consisted of anAgilent 1200 Series system equipped with a UV diode array detector (DAD) set at 220.4 nm (AgilentTechnologies, Palo Alto, CA, USA). The column used for the chromatographic separation was aPhenomenex® Gemini C18, 150 mm × 4.6 mm, 3 μm (Phenomenex, Macclesfield, UK) preceded by aPhenomenex® Gemini 3 mm guard cartridge and the column temperature was set at 25 ◦C. LC-MS/MSused consisted of an QTrap 5500 LC-MS/MS System (Applied Biosystems, Foster City, CA, USA)equipped with a TurboIonSpray electrospray ionization (ESI) source and an 1290 Series HPLC System
132

Toxins 2019, 11, 495
(Agilent, Waldbronn, Germany). Chromatographic separation was performed at 25 ◦C on a Gemini®
C18-column, 150 × 4.6 mm i.d., 5 μm particle size, equipped with a C18 4 × 3 mm i.d. security guardcartridge (all from Phenomenex, Torrance, CA, USA).
5.4.2. In Vitro Extraction and Analysis
Agar plugs were removed from media and placed in the 2-mL safe-lock Eppendorf®tubes. Afterthat, the weight of the agar plugs were register.
Deoxynivalenol
The extraction was performed using 1-mL acetonitrile:water (AcN:H2O) (84:16), the mixture morecommonly used for trichothecenes extraction [34] and the tubes were shaken in an orbital shaker at200 rpm in the dark for 60 min at 25 ◦C. The extract was transferred to a new tube and oven-driedovernight at 60 ◦C. Subsequently, it was redissolved in 1 mL 90:10 (H2O: AcN) and vortexed for a fewseconds. The cleaning step involved the addition of 150 mg/mL Alumina directly into the redissolvedextract followed by vortexing the mixture for 15 s. The treated extract was then filtered through a0.22 μm Millipore filter (Minisart, Sartorius, Germany) into an amber silanised LC vial and insertedinto the LC-DAD for analysis. The chromatographic analysis was performed in the gradient mode,using water (solvent A) and acetonitrile (solvent B). The starting composition of the mobile phase was5% B, at a flow rate of 0.5 mL/min held for 2 min. The composition was then gradually changed to25% B over 15 min and maintained for further 3 min. Then it increased gradually to 30% B over 3 minat the same flow rate. The composition was then changed to 99% B during 1 min with a flow rate of1 mL/min in this case, in order to achieve a fast cleaning step and maintained at 99% B for 4 moreminutes. Afterwards the composition of the mobile phase was changed linearly to 5% B in 1 min at aflow rate of 1 mL/min and held for 4 min for further cleaning. In the last step, the composition wasmaintained at 5% B, but the flow rate changed to 0.5 mL/min for 1 min, in order to be the same as thestarting composition of the mobile phase for the following chromatographic run. The injection volumewas 50 μL. The total time for the analysis of each sample was 35 min. DON was eluted from the columnat 16.2 min. The LOD was 4 μg/kg. The mean recovery for DON using this method was 63.2 ± 2.8%.
T-2 and HT-2
Extraction method used was Medina et al. [32] with modifications. The extraction was performedusing 1 mL acetonitrile:water (AcN:H2O) (84:16) and the tubes were shaken for 1 h at 150 rpm at 25 ◦Cin the dark in an orbital shaker. The samples were then centrifuged at 1150× g for 15 min. The extractwas filtered through a 0.2 μm Millipore filter (Minisart, Sartorius) directly into an HPLC silanisedamber vial and injected in the chromatograph. The analysis was performed in the gradient modewith a mobile phase of AcN:H2O at a flow rate of 1 mL/min and the conditions were 3 min 30% AcN,changed linearly to 55% AcN over 18 min, changed to 99% AcN in 1 min and held to 99% AcN for5 min. The LOD was 4 and 5 μg/kg for T-2 and HT-2. The mean recoveries for this method were99 ± 1.53% for T-2 toxin and 101.28 ± 3.11% for HT-2 toxin.
Fumonisins
The extraction was performed using 1 mL of extraction solvent AcN:H2O:Acetic acid (79:20:1)and the tubes were shaking 250 rpm in the dark for 1 h. The extracts were filtered through a 0.22 μmMillipore filter (Minisart, Sartorius) into new tubes, and dried in an oven at 60 ◦C for 24 h. The driedextracts were redissolved in a mixture of AcN:H2O (1:1) containing 1% acetic acid. The individualfumonisins were quantified using LC-MS/MS according to the method of Vishwanath et al. [35]. LODwas 25 μg/kg with a recovery rate of 57% (FB1) and 70% (FB2).
133

Toxins 2019, 11, 495
5.4.3. In Situ Extraction and Analysis
The initial mycotoxin contamination levels were quantified and this was taken into account whencalculating the results of the treatments and appropriately corrected. The mean contamination levelswere: DON, 0.233 μg/kg; T-2 toxin, 9.07 μg/kg (no HT-2 toxin present); ZEN, 8.42 μg/kg, and FB1
0.14 μg/kg. The grain samples were oven-dried at 60 ◦C for 24–48 h and then milled in a smalllaboratory blender (Waring Commercial, Christison, UK). Samples were analysed for Fusarium toxinsby LC-MS/MS at the Centre for Analytical Chemistry, Department of Agrobiotechnology (IFA-Tulln,Tulln, Austria), University of Natural Resources and Life Sciences, Vienna, Austria. The analysiswas performed according to the methods described by Sulyok et al. and Vishwanath et al. [35,36].The accuracy of the method was externally checked by participation in proficiency testing organisedby the Bureau Inter Professionel d’Etudes Analytiques (BIPEA; Gennevilliers, France). Z-scores were0.4 and 0.62 for DON in two wheat samples, −0.8 and −1.09 for ZON in two wheat samples and 1.36and 1.55 for FB1 and FB2, respectively in a sample of maize.
5.5. Statistical Analysis
All experiments have been performed in triplicate and repeated once. Data were analysed withMicrosoft Office Excel 2007 and with the package STATISTICA 9 (StatSoft®, Inc. 2010. STATISTICA(data analysis software system), version 9.1. www.statsoft.com, (Tulsa, OK, USA). The standard errorof the mean was calculated in all trials and it is denoted with vertical bars in the figures.
Datasets were tested for normality and homoscedasticity using the Shapiro–Wilk and Levene test,respectively. When data failed the normality test, variable transformation was performed to try toimprove normality or homogenise the variances. If still not normally distributed, it was analysedusing the Kruskal–Wallis test by ranks.
Supplementary Materials: The following are available online at http://www.mdpi.com/2072-6651/11/9/495/s1,Figure S1: Effect of 0–250 ppm PTSO and PTS on in vitro DON production by F. graminearum in wheat agar mediaat 25 ◦C, Figure S2: Effect of 0–250 ppm (a) PTSO and (b) PTS on the production of T-2 and HT-2 toxins byF. langsethiae in vitro at 25 ◦C, Table S1: One-way ANOVA for the effect of different PTS and PTSO concentrationson in vitro fumonisins (B1 and B2) production by F. verticillioides, Table S2: Kruskal-Wallis ANOVA by ranks for theeffect of PTSO concentration and substrate water activity on the production of T-2 and HT-2 toxins by F. langsethiae,Table S3: Summary of statistical P-values of effects of (a) PTS and (b) PTSO on mycotoxin contamination ofstored cereals.
Author Contributions: K.M. and E.G.-C. carried out the practical work and statistical analyses, M.S. carriedout some of the mycotoxin analyses in naturally contaminated cereals and with preservatives. A.M. and N.M.supervised the research work and wrote the draft and final manuscript.
Funding: Parts of this work were funded by the European Union via the FP7 MYCORED Project (Grant AgreementNo. 222690).
Acknowledgments: The authors would like to thank S. Edwards, Harper Adams University and P. Battilani,Catholic University of Italy, Piacenza, Italy) for supplied the strains.
Conflicts of Interest: The authors declare no conflict of interest.
References
1. Prakash, B.; Mishra, P.K.; Kedia, A.; Dwivedy, A.K.; Dubey, N.K. Efficacy of some essential oil components asfood preservatives against food contaminating molds, aflatoxin b1 production and free radical generation.J. Food Qual. 2015, 38, 231–239. [CrossRef]
2. Yin, M.; Tsao, S. Inhibitory effect of seven Allium plants upon three Aspergillus species. Int. J. Food Microbiol.1999, 49, 49–56. [CrossRef]
3. Yoshida, S.; Kasuga, S.; Hayashi, N.; Ushiroguchi, T.; Matsuura, H.; Nakagawa, S. Antifungal Activity ofAjoene Derived from Garlic. Appl. Environ. Microbiol. 1987, 53, 615–617.
4. Benkeblia, N. Antimicrobial activity of essential oil extracts of various onions (Allium cepa) and garlic (Alliumsativum). LWT - Food Sci. Technol. 2004, 37, 263–268. [CrossRef]
134

Toxins 2019, 11, 495
5. Singh, I.; Singh, V.P. Effect of plant extracts on mycelial growth and aflatoxin production by Aspergillus flavus.Indian J. Microbiol. 2005, 45, 139–142.
6. Aldred, D.; Cairns-Fuller, V.; Magan, N. Environmental factors affect efficacy of some essential oils andresveratrol to control growth and ochratoxin A production by Penicillium verrucosum and Aspergilluswesterdijkiae on wheat grain. J. Stored Prod. Res. 2008, 44, 341–346. [CrossRef]
7. Magan, N.; Aldred, D. Post-harvest control strategies: Minimizing mycotoxins in the food chain. Int. J.Food Microbiol. 2007, 119. [CrossRef]
8. Garcia, D.; Garcia-Cela, E.; Ramos, A.J.; Sanchis, V.; Marín, S. Mould growth and mycotoxin production asaffected by Equisetum arvense and Stevia rebaudiana extracts. Food Control 2011, 22, 1378–1384. [CrossRef]
9. Garcia-Cela, E.; Gil-Serna, J.; Marin, S.; Acevedo, H.; Patino, B.; Ramos, A.J. Effect of preharvest anti-fungalcompounds on Aspergillus steynii and A. carbonarius under fluctuating and extreme environmental conditions.Int. J. Food Microbiol. 2012, 159, 167–176. [CrossRef]
10. Magan, N.; Hope, R.; Colleate, A.; Baxter, E. Relationship Between Growth and Mycotoxin Production byFusarium species, Biocides and Environment. Eur. J. Plant Pathol. 2002, 108, 685–690. [CrossRef]
11. Small, L.D.; Bailey, J.H.; Cavallito, C.T. Alkyl thiosulfinates. J. Am. Chem. Soc. 1947, 69, 1710–1713. [CrossRef]12. European Commission. Commission Regulation (EC) No. 1881/2006 of 19 December 2006, Setting maximum
levels for certain contaminants in foodstuffs. Off. J. Eur. Union 2006, 364, 5–24.13. European Commission. Commission Recommendation No 2013/165/EU of 27 March 2013 on the presence of
T-2 and HT-2 toxin in cereals and cereal products. Off. J. Eur. Union 2013, 91, 12–15. [CrossRef]14. Aly, S.E.; Sabry, B.A.; Shaheen, M.S.; Hathout, A.S. Assessment of antimycotoxigenic and antioxidant activity
of star anise (Illicium verum) in vitro. J. Saudi Soc. Agric. Sci. 2016, 15, 20–27. [CrossRef]15. Morcia, C.; Tumino, G.; Ghizzoni, R.; Bara, A.; Salhi, N.; Terzi, V.; Morcia, C.; Tumino, G.; Ghizzoni, R.;
Bara, A.; et al. In vitro evaluation of sub-lethal concentrations of plant-derived antifungal compounds onFUSARIA growth and mycotoxin production. Molecules 2017, 22, 1271. [CrossRef]
16. Soliman, K.; Badeaa, R. Effect of oil extracted from some medicinal plants on different mycotoxigenic fungi.Food Chem. Toxicol. 2002, 40, 1669–1675. [CrossRef]
17. Yamamoto-Ribeiro, M.M.G.; Grespan, R.; Kohiyama, C.Y.; Ferreira, F.D.; Mossini, S.A.G.; Silva, E.L.; deAbreu Filho, B.A.; Mikcha, J.M.G.; Machinski Junior, M. Effect of Zingiber officinale essential oil on Fusariumverticillioides and fumonisin production. Food Chem. 2013, 141, 3147–3152. [CrossRef]
18. Nguefack, J.; Leth, V.; Amvam Zollo, P.H.; Mathur, S.B. Evaluation of five essential oils from aromatic plantsof Cameroon for controlling food spoilage and mycotoxin producing fungi. Int. J. Food Microbiol. 2004,94, 329–334. [CrossRef]
19. Xing, F.; Hua, H.; Selvaraj, J.N.; Zhao, Y.; Zhou, L.; Liu, X.; Liu, Y. Growth inhibition and morphologicalalterations of Fusarium verticillioides by cinnamon oil and cinnamaldehyde. Food Control 2014, 46, 343–350.[CrossRef]
20. Sumalan, R.-M.; Alexa, E.; Poiana, M.-A. Assessment of inhibitory potential of essential oils on naturalmycoflora and Fusarium mycotoxins production in wheat. Chem. Cent. J. 2013, 7, 32. [CrossRef]
21. Venkatesh, H.N.; Sudharshana, T.N.; Abhishek, R.U.; Thippeswamy, S.; Manjunath, K.; Mohana, D.C.Antifungal and antimycotoxigenic properties of chemically characterised essential oil of Boswellia serrataRoxb. ex Colebr. Int. J. Food Prop. 2017, 1–13. [CrossRef]
22. Ferreira, F.M.D.; Hirooka, E.Y.; Ferreira, F.D.; Silva, M.V.; Mossini, S.A.G.; Machinski, M., Jr. Effect of Zingiberofficinale Roscoe essential oil in fungus control and deoxynivalenol production of Fusarium graminearumSchwabe in vitro. Food Addit. Contam. Part A 2018, 35, 2168–2174. [CrossRef]
23. Elhouiti, F.; Tahri, D.; Takhi, D.; Ouinten, M.; Barreau, C.; Verdal-Bonnin, M.-N.; Bombarda, I.; Yousfi, M.Variability of composition and effects of essential oils from Rhanterium adpressum Coss. & Durieu againstmycotoxinogenic Fusarium strains. Arch. Microbiol. 2017, 199, 1345–1356. [CrossRef]
24. Kurita, N.; Koike, S. Synergistic antimicrobial effect of ethanol, sodium chloride, acetic acid and essential oilcomponents. Agric. Biol. Chem. 1983, 47, 67–75. [CrossRef]
25. Marin, S.; Magan, N.; Ramos, A.J.; Sanchis, V. Fumonisin-producing strains of Fusarium: A review of theirecophysiology. J. Food Prot. 2004, 67, 1792–1805. [CrossRef]
26. Hope, R.; Aldred, D.; Magan, N. Comparison of the effect of environmental factors on deoxynivalenolproduction by F. culmorum and F. graminearum on wheat grain. Lett. Appl. Microbiol. 2005, 40, 295–300.[CrossRef]
135
Toxins 2019, 11, 495
27. Medina, A.; Magan, N. Water availability and temperature affects production of T-2 and HT-2 by Fusariumlangsethiae strains from north European countries. Food Microbiol. 2011, 28, 392–398. [CrossRef]
28. Tracz, B.L.; Bordin, K.; de Melo Nazareth, T.; Costa, L.B.; de Macedo, R.E.F.; Meca, G.; Luciano, F.B.dAssessment of allyl isothiocyanate as a fumigant to avoid mycotoxin production during corn storage. LWT2017, 75, 692–696. [CrossRef]
29. Giorni, P.; Bertuzzi, T.; Battilani, P. Impact of fungi co-occurrence on mycotoxin contamination in maizeduring the growing season. Front. Microbiol. 2019, 10, 1265. [CrossRef]
30. Magan, N.; Aldred, D.; Hope, R.; Mitchell, D. Environmental factors and interactions with mycoflora of grainand grapes: effects on growth and deoxynivalenol and ochratoxin production by Fusarium culmorum andAspergillus carbonarius. Toxins 2010, 2, 353–366. [CrossRef]
31. Mylona, K.; Sulyok, M.; Magan, N. Fusarium graminearum and Fusarium verticillioides colonisation of wheatand maize, environmental factors, dry matter losses and mycotoxin production relevant to the EU legislativelimits. Food Addit. Contam. 2012, 29, 1118–1128. [CrossRef]
32. Medina, A.; Valle-Algarra, F.M.; Jiménez, M.; Magan, N. Different sample treatment approaches for theanalysis of T-2 and HT-2 toxins from oats-based media. J. Chromatogr. B 2010, 878, 2145–2149. [CrossRef]
33. Sanchis, V.; Magan, N. Mycotoxins in food: Detection and control. In Environmental Profiles for Growth andMycotoxin Production; Magan, N., Olsen, M., Eds.; Woodhead Publishing: Cambridge, UK, 2004; pp. 174–189.
34. Krska, R.; Welzig, E.; Boudra, H. Analysis of Fusarium toxins in feed. Anim. Feed Sci. Technol. 2007,137, 241–264. [CrossRef]
35. Vishwanath, V.; Sulyok, M.; Labuda, R.; Bicker, W.; Krska, R. Simultaneous determination of 186fungal and bacterial metabolites in indoor matrices by liquid chromatography/tandem mass spectrometry.Anal. Bioanal. Chem. 2009, 395, 1355–1372. [CrossRef]
36. Sulyok, M.; Berthiller, F.; Krska, R.; Schuhmacher, R. Development and validation of a liquidchromatography/tandem mass spectrometric method for the determination of 39 mycotoxins in wheat andmaize. Rapid Commun. Mass Spectrom. 2006, 20, 2649–2659. [CrossRef]
© 2019 by the authors. Licensee MDPI, Basel, Switzerland. This article is an open accessarticle distributed under the terms and conditions of the Creative Commons Attribution(CC BY) license (http://creativecommons.org/licenses/by/4.0/).
136

toxins
Article
Phytochemicals of Apple Pomace as ProspectBio-Fungicide Agents against Mycotoxigenic FungalSpecies—In Vitro Experiments
Marta Oleszek 1,*, Łukasz Pecio 2, Solomiia Kozachok 2,3, Zaneta Lachowska-Filipiuk 1,
Karolina Oszust 1 and Magdalena Frac 1
1 Institute of Agrophysics, Polish Academy of Sciences, Doswiadczalna 4, 20-290 Lublin, Poland;[email protected] (Z.L.-F.); [email protected] (K.O.); [email protected] (M.F.)
2 Institute of Soil Science and Plant Cultivation, State Research Institute, Czartoryskich 8, 24-100 Puławy,Poland; [email protected] (Ł.P.); [email protected] (S.K.)
3 I. Horbachevsky Ternopil National Medical University, Maidan Voli 1, 46001 Ternopil, Ukraine* Correspondence: [email protected]
Received: 10 May 2019; Accepted: 18 June 2019; Published: 20 June 2019
Abstract: The phytochemical constituents of apple waste were established as potential antifungalagents against four crops pathogens, specifically, Botrytis sp., Fusarium oxysporum, Petriella setifera,and Neosartorya fischeri. Crude, purified extracts and fractions of apple pomace were tested in vitroto evaluate their antifungal and antioxidant properties. The phytochemical constituents of thetested materials were mainly represented by phloridzin and quercetin derivatives, as well aspreviously undescribed in apples, monoterpene–pinnatifidanoside D. Its structure was confirmedby 1D- and 2D-nuclear magnetic resonance (NMR) spectroscopic analyses. The fraction containingquercetin pentosides possessed the highest antioxidant activity, while the strongest antifungalactivity was exerted by a fraction containing phloridzin. Sugar moieties differentiated the antifungalactivity of quercetin glycosides. Quercetin hexosides possessed stronger antifungal activity thanquercetin pentosides.
Keywords: mycotoxins; Fusarium sp., Botrytis sp., apple pomace; phloridzin; quercetin glycosides;pinnatifidanoside D
Key Contribution: The results of the study showed that apple pomace could be a good source of naturalbio-fungicide agents against mycotoxigenic fungal species, such as Botrytis sp., Fusarium oxysporum,Petriella setifera and Neosartorya fischeri.
1. Introduction
Billions of tons of agricultural waste are generated every year. A substantial part of them causespollution problems, when they are not managed properly [1]. Apples are one of the crops with the largestannual production worldwide. Poland is one of the major producers of apples, with ca. 3.6 millionmetric tons of apples produced every year [2]. On the other hand, crop residues are a rich source ofbiologically active compounds and may become the important raw materials for obtaining variousvaluable by-products [3]. Apple pomace consists of apple skin, seeds, and flash, and represents about25% of a fruit’s fresh weight [4]. The main bioactive compounds of apple processing by-productsare, in particular, flavonoids (phloretin and quercetin glycosides, flavone derivatives and catechins)as well as organic acids [5,6]. Their applications have been addressed to exploit antioxidant andpharmacological properties. Kołodziejczyk et al. [7] stated that polyphenols from industrial pomacewere good antimicrobial agents against human pathogens such as Salmonella spp., Escherichia coli and
Toxins 2019, 11, 361; doi:10.3390/toxins11060361 www.mdpi.com/journal/toxins137
Toxins 2019, 11, 361
Listeria spp. Two main flavonoids of apple, phloretin and quercetin, have previously been isolated fromapple fruits and tested against various fungi [8,9]. However, to the best of our knowledge, there is a lackof evidence on the usage of phytochemicals of industrial pomaces, particularly from apples, as naturalbio-pesticides or bio-fungicides for organic farming [1]. There is a wide variety of chemically synthetizedpesticides [10], but their application leads to a resistance and causes the selection of less-sensitiveisolates [11]. Resistance to antimicrobial agents is consistently increasing and becoming a global problem.Moreover, many industrial fungicides are harmful to humans and detrimental to animal health [9].For this reason, there is an urgent need to find new or more efficient, safe and ecologically friendlyantifungal agents, especially against toxigenic fungi, that could be applied in organic farming [12].
A set of the following fungi: Botrytis sp., Fusarium oxysporum, Petriella setifera and Neosartorya fischeriis posing a worldwide threat in farming, gardening and food processing. Fusarium species may causeplant diseases of both underground and aboveground parts and can produce mycotoxins [10,13].Botrytis sp. is an important pathogen in many economically important crops [14]. Additionally,P. setifera was classified as a potential plant pathogen [15]. The economic importance of this pathogen isconnected with forest and especially with oak trees [16]. The other relevant magnitude of Petriella sp. isparticipation in wood decay as soft rot fungi or sometimes as brown rot fungi [17,18]. On the other hand,contamination by heat-resistant fungi such as N. fischeri is a major problem for the fruit-processingindustry in many countries, due to mycotoxins such as verruculogen and fumitremorgins [19].
Data from the literature proved that flavonoids participate in the reaction against pathogen,both as components of plants tissues, but also when they are applied externally [12,20–22]. Sanzaniet al. [20] showed that quercetin is very effective in reduction of Penicilium expansum growth andpatulin accumulation in stored apples. The inhibited effect of low concentration of quercetin andrutin was observed also in vitro on F. oxysporum [21]. Parvez et al. [23] proved inhibitory effect ofquercetin-3-O-glucoside (isoquercitrin) and quercetin-3-methyl ether, as well as its glycosides, on theconidial germination of Neurospora crassa.
Therefore, the aim of the presented study was to determine the antifungal and antioxidant activityof apple pomace’s crude and purified extracts, chromatographic fractions and to evaluate their suitabilityas a source of natural bio-fungicides against Botrytis sp., Fusarium oxysporum, Petriella setifera andNeosartorya fischeri. For antifungal activity determination, a new, fast and simple instrumental methodutilising BIOLOG MT2 Plates® was applied and optimised in the place of conventional hole-platemethod [10]. Phytochemical constituents of the studied object were established by means of ultra highperformance liquid chromatography-photodiode array detection-mass spectrometry (UHPLC-PDA-MS)analysis. Furthermore, for the first time, the undescribed constituent of apple-monoterpenepinnatifidanoside D was isolated and structurally elucidated.
2. Results and Discussion
Among all identified compounds, hyperoside, quercitrin and phloridzin were the most abundantin crude extract (CE) and purified extract (PE); (Table 1, Figure S1–S6. These results were in accordancewith previous study [24–26]. Additionally, other flavonoids such as isoquercetin, rutin, reynoutrin,quercetin-3-O-pentosyls, avicularin, quercitrin and quercetin were determined. Furthermore, onemonoterpene, not detected previously in apples-pinnatifidanoside D was isolated and structurallyelucidated by extensive 1D and 2D nuclear magnetic resonance (NMR) spectroscopic analyses(Figure S7–S15). Characteristic data of this compound are as follows: pinnatifidanoside D: whiteamorphous solid; ultraviolet (UV) Λmax (UPLC-PDA) 240 nm; electrospray ionization-in-sourcecollision-induced dissociation mass spectrometry (ESI-isCID MS) (% of base peak) m/z 541 [M +Na]+
(22), 519 [M + H]+ (16), 387 [M – 132 + H]+ (27), 225 [M – 132 – 162 + H]+ (13), 207 [M – 132 – 162 –18 +H]+ (100), 189 [M – 132 – 162 – 2 × 18 +H]+ (13), 161 (11), 149 (17), 123 (37); 1H-NMR (500 MHz,MeOH-d4), δH 5.89 (1H, t-like, J = 1.3 Hz, H-4), 5.85 (2H, m, H-7, 8), 4.43 (1H, qd, J = 6.4, 1.9 Hz, H-9),4.35 (1H, d, J = 7.8 Hz, H-1′), 4.28 (1H, d, J = 7.5 Hz, H-1′’), 4.06 (1H, dd, J = 11.3, 1.8 Hz, H-6a’), 3.86(1H, dd, J = 11.5, 5.3 Hz, H-5a”), 3.69 (1H, dd, J = 11.3, 4.8 Hz, H-6b’), 3.49 (1H, ddd, J = 10.1, 8.7, 5.3 Hz,
138

Toxins 2019, 11, 361
H-4′’), 3.35 (2H, m, H-4′, 5′), 3.34 (1H, m, H-3′), 3.31 (1H, t, J = 8.8 Hz, H-3′’), 3.22 (1H, dd, J = 9.0,7.5 Hz, H-2′’), 3.18 (1H, t-like, J = 8.4 Hz, H-2′), 3.18 (1H, t, J = 10.8 Hz, H-5b”), 2.51 (1H, d, J = 16.9Hz, H-2a), 2.16 (1H, d, J = 16.9 Hz, H-2b), 1.92 (3H, d, J = 1.4 Hz, H-13), 1.29 (3H, d, J = 6.4 Hz, H-10),1.04 (3H, s, H-11), 1.03 (3H, s, H-12); 13C-NMR (125 MHz, MeOH-d4), δC 201.2 (C-3), 167.2 (C-5), 134.9(C-8), 131.7 (C-7), 127.2 (C-4), 105.6 (C-1′’), 102.6 (C-1′), 80.0 (C-6), 77.9 (C-3′), 77.7 (C-3′’), 76.9 (C-9), 76.8(C-5′), 75.2 (C-2′), 74.8 (C-2′’), 71.3 (C-4′), 71.2 (C-4′’), 69.8 (C-6′), 66.9 (C-5′’), 50.8 (C-2), 42.5 (C-1), 24.7(C-12), 23.5 (C-11), 19.7 (C-13).
In turn, pinnatifidanoside D was the main component of fraction 1 (F1). This compound has beenisolated for the first time from Crataegus pinnatifida [27]. Li et al. [27] stated also that pinnatifidanosideD exhibited small antiplatelet aggregation activity.
The LH20 fractions F2 and F3 contained many unknown compounds of various structures. Theiridentification was left for separate investigation. Analysing the UV-spectres, tandem mass spectrometry(MS/MS) fragmentation pattern and literature data allows us to identify the main components of theF4, F5 and F6. The major compound of F4 was phloridzin, flavonoid belonging to chalcones group.Fractions F5 and F6 consisted of quercetin derivatives, while F5 contained mostly quercetin withhexoside moieties, and F6 included mainly quercetin with pentoside moieties (Table 1).
Table 1. Quantification of compounds in crude and purified extracts, as well as selected fractions ofapple pomace.
Rt
(min)Compound
MW(g mol−1)
% w/w (Relative)
1 CE PE F1 F4 F5 F6
3.77Pinnatifidanoside D
(vomifoliol-9-O-[β-D-Xyl(1→6)-β-D-Glc])
518 0.11(14)
1.23(16)
5.9(100) - - -
6.29 Hyperoside (Q-3-O-β-D-Gal) 464 0.16(21)
1.55(20) - - 33.4
(43)1.91(3)
6.33 Rutin (Q-3-O-α-L-Rha(1→6)-β-D-Glc) 610 * * - 2.3
(5) - -
6.64 Isoquercetin(Q-3-O-β-D-Glc) 464 0.02
(3)0.25(3) - - 5.2
(7) -
7.20 Reynoutrin (Q-3-O-β-D-Xyl) 434 0.05(6)
0.52(7) - - - 20.17
(32)
7.53 Q-3-O-pentosyl 434 - 0.05(1) - - - 1.82
(3)
7.91 Avicularin (Q-3-O-α-L-Ara) 434 0.1(13)
1.02(13) - - 3.5
(5)34.10(53)
8.19 Q-3-O-pentosyl 434 0.02(2)
0.16(2) - - - 5.86
(9)
8.47 Quercitrin(Q-3-O-α-L-Rha) 448 0.15
(19)1.58(20) - - 34.9
(45) -
10.31 Phloridzin(phloretin-2′-O-β-D-Glc) 436 0.17
(22)1.29(17) - 44.7
(95) - -
12.53 Quercetin 302 * 0.09(1) - - - -
Total, % w/w 0.77 7.75 5.9 47.00 77.04 63.861 CE—crude extract; PE—purified extract; F—LH20 fractions; Q—quercetin; *—traces; Rt—retention time;MW—molecular weight.
The presence of phloretin and quercetin derivatives (glucoside, galactoside, xyloside, arabinoside,rhamnoside) in apples and their residues, particularly skins, has already been well recognised andconfirms the results of the present study [24,25,28]. Moreover, many previous reports have also shown
139

Toxins 2019, 11, 361
the presence of procyanidin B, epicatechins and chlorogenic acid as the major phenolic compounds inapple [29–32]. Tested crude extract did not contain catechins, probably because they are sensitive tooxidation by heat and light [33]. For the further investigation of antioxidants and antifungal activity,the LH20 fractions with established composition (F1, F4–F6) were selected.
The results of reducing power and radical-scavenging activity showed that apple pomace containedstrong antioxidants. The antioxidant activity of the CE was low, due to the high content of the polarfraction (PF) containing mainly simple sugars, which do not exhibit antioxidant properties (Table 2).Nevertheless, the PE presented much higher values of the tested parameters. When it comes to LH20fractions, values of EC50 and IC50 decreased along with subsequent fraction number. At the sametime, F5 and F6 were not significantly different in terms of IC50 value of radical scavenging activity.The antioxidant activity depends on the structure of compounds, primarily the presence of hydroxyl,4-oxo and catechol group as well as 2–3 double bond [34]. For this reason, the F4, containing mainlyphloridzin, exhibited lower antioxidant properties (higher EC50 and IC50) than F5 and F6, whichincluded quercetin derivatives. Quercetin is known as a strong antioxidant, mainly due to the presenceof catechol group in ring B [35].
Table 2. Antioxidant activity of tested samples.
SampleReducing Power EC50
(μg mL−1)Radical-Scavenging Activity
IC50 (μg mL−1)
CE >1500 >1500PE 298.33 ± 5.84 444.65 ± 10.57PF >1500 >1500F1 460.60 ± 28.84 1117.21 ± 59.10F4 137.38 ± 1.61 188.54 ± 7.95F5 100.83 ± 1.62 105.92 ± 1.23F6 93.94 ± 2.68 107.22 ± 1.77
Ascorbic acid 27.82 ± 0.07 73.61 ± 6.351 CE—crude extract; PE—purified extract; PF—polar fraction; F—LH-20 subfraction.
Microbiological assays showed that apple pomace contained compounds with antifungal activity(Figure 1). In the case of P. setifera all tested formulations caused inhibition of the mycelium growtheven at quite low doses. The exception was F6, which exhibited antifungal properties only at thehighest concentration of 500 μg mL−1. The CE of apple pomace caused also inhibition of the growth ofBotrytis sp. at concentration in the range of 5–100 μg mL−1, it stimulated the growth of F. Oxysporumand did not influence significantly the growth of N. fischeri.
Generally, the purification of crude extract increased its antifungal activity or weakened itsstimulating effect, though the differences between CE and PE was not significant. Among all fractions,F1 showed no significant influence on N. fischeri, Botrytis sp., F. oxysporum, even regardless of thedose. Its effect on P. setifera was negative, but it was also independent from the concentration. On thecontrary, F4 exhibited the strongest activity against all fungal strains. Moreover, it can be noticed,that A1/A0 absorbance ratios in the case of higher concentrations of F4 were below 100% (Figure 1).It means that absorbance for the control (the solution of tested substance without fungi) was higherthan absorbance for tested sample (solution of tested substance with fungi). It can be supposed thatsuch a low absorbance ratio was due to the fact that fungi intensively utilized the tested sample.Consequently, the concentration of the tested sample was decreased and its influence on the value ofabsorbance of the tested sample was reduced. To confirm this supposition, the ratio of absorbance at490 nm and 750 nm was measured (A490/A750); (Table 3).
140

Toxins 2019, 11, 361
Figure 1. The impact of the apple pomace crude extract, purified extract and its fractions on thegrowth of fungi: (a) Neosartoria fischeri, (b) Botrytis sp., (c) Fusarium oxysporum, (d) Petriella setifera.The concentrations of solutions was 0, 5, 50, 100, 500 μL ml−1. A1/A0—the ratio of absorbance for testedsamples with fungi and absorbance for adequate control (sample alone, without fungi), CE—crudeextract, PE—purified extract, PF—polar fraction and F—LH20 subfraction. Bars represent the mean of24 replicates ± standard deviation.
The absorbance at 490 nm reflects the respiration rate, so also substrate use, while the value ofabsorbance at 750 nm informs us about biomass/turbidity production (growth pattern) [36]. Accordingto the above, A490/A750 ratio much higher than 1 indicates stressful metabolic situation, when a smallbiomass (low absorbance at 750 nm) yielding high respiration rates (high absorbance at 490 nm).The highest values of A490/A750 were noted for the highest concentration of F4: 1.44, 1.20 and 1.26 forF. oxysporum, Botrytis sp., P. setifera, respectively (Table 3). In the case of N. fischeri, this ratio was 1.03,and no significant drop of A1/A0 below 100% was observed (Figure 1a).
The main compound of F4—phloridzin plays a major role in apple in the resistance to fungalinfection. It is metabolized to phloretin and then, to the next oxidation products such as o-quinone,which are fungitoxic [37–39]. Antifungal activity of phloridzin and its aglycone, phloretin, waspreviously described [8,40]. The first report on the antifungal activity of phloretin against plantpathogenic fungi was done by Shim et al. [8], who investigated the influence of phloretin isolated fromapple against B. cinerea, F. oxysporum and five other fungi. The results showed that phloretin could beused as biopesticide for control of rice blast as well as tomato late blight.
The F5 and F6 consisted of quercetin derivatives (Table 1). Quercetin, similarly to phloretin, affectsthe resistance of plants to fungal diseases. Lee et al. [41] observed the increase in concentration ofquercetin glycosides in onion infected by F. oxysporum. Sanzani et al. [20] stated that quercetin in appleis responsible for the resistance on P. expansum and inhibition of patulin synthesis. For this reason,it can be considered as a natural compound to be used as alternative strategy to chemical fungicides inpost-harvest control of P. expansum infections [9].
141
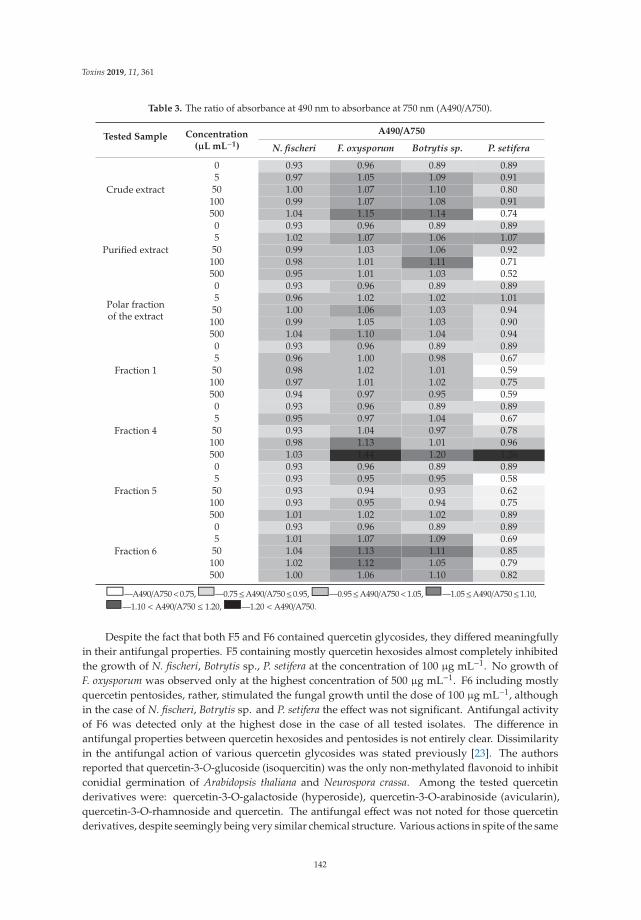
Toxins 2019, 11, 361
Table 3. The ratio of absorbance at 490 nm to absorbance at 750 nm (A490/A750).
Tested Sample Concentration(μL mL−1)
A490/A750
N. fischeri F. oxysporum Botrytis sp. P. setifera
Crude extract
0 0.93 0.96 0.89 0.895 0.97 1.05 1.09 0.91
50 1.00 1.07 1.10 0.80100 0.99 1.07 1.08 0.91500 1.04 1.15 1.14 0.74
Purified extract
0 0.93 0.96 0.89 0.895 1.02 1.07 1.06 1.07
50 0.99 1.03 1.06 0.92100 0.98 1.01 1.11 0.71500 0.95 1.01 1.03 0.52
Polar fractionof the extract
0 0.93 0.96 0.89 0.895 0.96 1.02 1.02 1.01
50 1.00 1.06 1.03 0.94100 0.99 1.05 1.03 0.90500 1.04 1.10 1.04 0.94
Fraction 1
0 0.93 0.96 0.89 0.895 0.96 1.00 0.98 0.67
50 0.98 1.02 1.01 0.59100 0.97 1.01 1.02 0.75500 0.94 0.97 0.95 0.59
Fraction 4
0 0.93 0.96 0.89 0.895 0.95 0.97 1.04 0.67
50 0.93 1.04 0.97 0.78100 0.98 1.13 1.01 0.96500 1.03 1.44 1.20 1.26
Fraction 5
0 0.93 0.96 0.89 0.895 0.93 0.95 0.95 0.58
50 0.93 0.94 0.93 0.62100 0.93 0.95 0.94 0.75500 1.01 1.02 1.02 0.89
Fraction 6
0 0.93 0.96 0.89 0.895 1.01 1.07 1.09 0.69
50 1.04 1.13 1.11 0.85100 1.02 1.12 1.05 0.79500 1.00 1.06 1.10 0.82
—A490/A750<0.75, —0.75≤A490/A750≤0.95, —0.95≤A490/A750<1.05, —1.05≤A490/A750≤1.10,—1.10 <A490/A750 ≤ 1.20, —1.20 <A490/A750.
Despite the fact that both F5 and F6 contained quercetin glycosides, they differed meaningfullyin their antifungal properties. F5 containing mostly quercetin hexosides almost completely inhibitedthe growth of N. fischeri, Botrytis sp., P. setifera at the concentration of 100 μg mL−1. No growth ofF. oxysporum was observed only at the highest concentration of 500 μg mL−1. F6 including mostlyquercetin pentosides, rather, stimulated the fungal growth until the dose of 100 μg mL−1, althoughin the case of N. fischeri, Botrytis sp. and P. setifera the effect was not significant. Antifungal activityof F6 was detected only at the highest dose in the case of all tested isolates. The difference inantifungal properties between quercetin hexosides and pentosides is not entirely clear. Dissimilarityin the antifungal action of various quercetin glycosides was stated previously [23]. The authorsreported that quercetin-3-O-glucoside (isoquercitin) was the only non-methylated flavonoid to inhibitconidial germination of Arabidopsis thaliana and Neurospora crassa. Among the tested quercetinderivatives were: quercetin-3-O-galactoside (hyperoside), quercetin-3-O-arabinoside (avicularin),quercetin-3-O-rhamnoside and quercetin. The antifungal effect was not noted for those quercetinderivatives, despite seemingly being very similar chemical structure. Various actions in spite of the same
142
Toxins 2019, 11, 361
aglycone may result from the fact that glycosides rarely were metabolized to aglycone, but very oftento higher molecules by glycosylation, sulfonation or methylation [42,43]. Simultaneously, a wide rangeof metabolic activity towards flavonoids exists in different fungal strains [43]. Generally, it is widelyknown that bioactive action of compounds depends on their structures and the bioactivity of flavonoidsis ascribed to their aglycone moiety [43,44]. Nonetheless, there is a plethora of studies reporting astronger antifungal effect of substituted flavonoids than unsubstituted ones [23,44]. The result of thepresent study showed also that antifungal activity do not always go hand in hand with antioxidantactivity, because both properties depend on different structural conditions of the compounds.
Gauthier et al. [45] reported that antifungal activity of flavonoids directly resulted from their abilityto combine irreversibly with nucleophilic aminoacids in fungal proteins. Moreover, they inhibit proteinsto form several hydrogen and ionic bonds and disturb three-dimensional structure transporters [12].As was mentioned by Lourenço et al. [12], flavonoids may be of interest in the agriculture as they canenhance the activity of pesticides, as well as reverse resistance to synthetic preparations.
In conclusion, the results of the study showed that apple pomace could be a good sourceof natural bio-fungicides, due to inhibition of mycotoxigenic fungal growth. The crude extract,contained mainly polar compounds like sugars, as well as phloridzin and quercetin glycosides, but alsomonoterpene—pinnatifidanoside D, which was for the first time isolated from apple waste. The effectof crude extract and its fractions was similar towards all tested fungi species. The strongest antifungalactivity was exhibited by fraction F4 containing phloridzin, while the highest antioxidant activity wasshowed by fraction F6 containing mainly quercetin pentosides. Sugar moiety significantly determinesthe antifungal activity of quercetin glycosides. Despite the same aglycone of constituents of F5 and F6,they differed in their antifungal properties. Both antioxidant and antifungal activities of fraction F1,containing pinnatifidanoside D, were rather low. That means that the screening of proper bioactivityfor this poorly studied compound is required. The antifungal and antioxidant effects did not go handin hand, probably because of the differences in structural conditions of the compounds determiningthese properties.
3. Materials and Methods
3.1. Materials
3.1.1. Apple Pomace
The tested material—apple pomace—was supplied from local apple juice-processing factory.Raw material was lyophilised, powdered and subjected to extraction. The CE of apple pomace, PE andF1-F6 obtained by gel-filtration of the PE using Sephadex LH20 were tested as potential bio-fungicidesagainst four selected fungi: Botrytis sp., F. oxysporum, P. setifera and N. fischeri.
3.1.2. Fungal Strains and Culture Conditions
Four fungal isolates were taken for the experiments. Three isolates (Botrytis sp., F. oxysporum,P. setifera) were selected from the Laboratory of Molecular and Environmental Microbiology (LMEM),Institute of Agrophysics, Polish Academy of Sciences (Lublin, Poland) and one strain (N. fischeri G90/14)was obtained from the National Institute of Technology and Evaluation, Biological Research Centre,NITE (NBRC). Botrytis sp. G669/16 and F. oxysporum G648/16 were isolated from strawberry, whileP. setifera G11/16 was obtained from compost for agricultural usage. All strains were cultured on 90 mmPetri dishes with potato dextrose agar (PDA) at 27 ◦C for 5 days in the dark prior to DNA isolation.The isolates from (LMEM) collection were identified on the basis of the D2 domain of large-subunitribosomal DNA (D2 LSU rDNA) or internal transcribed spacer 1 rRNA (ITS1) sequencing (ThermoFisher Scientific, United States) according to methodology [18,46]. The following universal primersD2LSU2_F (5′-AGA CCG ATA GCG AAC AAG-3′) and D2LSU2_R (5′-CTT GGT CCG TGT TTCAAG-3′) [18] and ITS1 (5′-TCC GTA GGT GAA CCT GCG G-3′) and ITS2 (5′-GCT GCG TTC TTC
143

Toxins 2019, 11, 361
ATC GAT GC-3′) [47], were used for D2 LSU and ITS1, respectively. The run was performed in finalvolume of 20 μL using a Veriti 96-Well Fast Thermal Cycler (Applied Biosystems, Foster City, CA,USA) in the following conditions: 95 ◦C for 10 min, then 35 cycles at 95 ◦C for 15 s, 53 ◦C for 20 s and72 ◦C for 20 s and followed by a final step at 72 ◦C for 5 min. Nucleotide sequences of the strains weredeposited in the National Centre for Biotechnology Information (NCBI) under the following accessionnumbers: KX639294.1, KX639319.1, MG594608, respectively. The fourth isolate N. fischeri obtainedfrom the NBRC collection was designed as isolate number NBRC 31895. Prior to antifungal analysis,strains were cultured for 14 days on 90 mm Petri dishes with potato dextrose agar (PDA) in the dark at27 ◦C to obtain conidial spores. Next, the cultures were harvested into sterile BagPage® membranefilters containing IF-FF liquid and processed using an Ultra Turax IKA® homogenizer for 30 s andthen filtered to extricate spores. Spores of each strain were used to set up 75% transmittance inoculummeasured with a turbidimeter (Biolog®) to serve as inoculum for 96-well MT2 microplates (Biolog®)to analyze antifungal activity.
3.2. Extract Preparation and Fractionation
The CE was obtained according to the method described by Oleszek and Krzeminska [48]. Briefly,30 g of powdered, dried material was defatted with chloroform in a Soxhlet apparatus, and thenextracted (3 × 300 mL, 20 min. each) by sonication with 70% aq. MeOH at room temperature in thedark place. The CE was concentrated using the rotary evaporator under reduced pressure (at 40 ◦C)and freeze-dried to yield 9.95 g (33.17% of the dry plant material).
In the next step, the CE was dissolved in Milli-Q water and purified on a short self-packed RP-C18
column (60 mm × 100 mm, 75 μm, Cosmosil 75C18-PREP). The polar fraction (PF) of CE, includedsugars and simple organic acids and was eluted by acidified water (0.1% formic acid, v/v), whilepurified extract (PE) containing plant specific metabolites was eluted with methanol-water (95:5, v/v)solution. Obtained solutions were evaporated, suspended in t-butanol-water solution and freeze-driedto obtain 9.11 g of PF, and 0.84 g of PE. Afterwards, the PE was fractionated on a Sephadex LH-20(40–120 μm) glass column (95 cm × 3.2 cm) and connected to a Gilson prep-HPLC (high-performanceliquid chromatography) system with ELS™ II detector. The separation was achieved by the flow ofacidified 95% MeOH (0.1% formic acid) at a flow rate of 2.4 mL min−1 [49]. Six LH-20 fractions werecollected according to the ELS chromatogram, evaporated and freeze-dried to obtain: F1 (0.18 g),F2 (0.17 g), F3 (0.01 g), F4 (0.03 g), F5 (0.06 g), F6 (0.03 g); (Figure S16). The fractions were kept atfreezer for further analysis.
3.3. Phytochemical Analysis
3.3.1. Identification and Quantification of Individual Compounds in Crude, Purified Extracts and ItsFractions
The CE and PE, as well as LH20 fractions (F1-F6) were analysed by Waters ACQUITY UPLCsystem (Waters Corp., Milford, MA, USA) equipped with a binary pump system, sample manager,column manager, and MS and PDA detectors (Waters Corp). For acquisition and data processing,Waters MassLynx software v.4.1 was used. The separation was carried out on the ACQUITY UPLCBEH C18 column (100 mm × 2.1 mm, 1.7 μm, Waters Corp., Milford, MA, USA) at temperature of 40 ◦Cand flow rate adjusted to 400 μL min−1. The injection volume of the sample was 2.5 μL. The mobilephase was composed of 0.1% (v/v) formic acid in Milli-Q water (solvent A) and acetonitrile with0.1% (v/v) formic acid (solvent B). Gradient program was as follows: 0–1.5 min, 10% B; 1.5–15.0 min,10–25% B; 15.0–15.10 min, 25–100% B; 15.1–16.6 min, 100% B; 16.6–16.7 min, 100–10% B; 16.7–20.0 min,10% B. The MS analyses were carried out on a Waters ACQUITY TQD (tandem quadrupole detector)(Waters Corp) equipped with a Z-spray electrospray interface. The parameters for ESI source were:capillary voltage 2.8 kV, cone voltage 45 V, desolvation gas N2 800 L h−1, cone gas N2 100 L h−1, sourcetemp. 140 ◦C, desolvation temp. 350 ◦C.
144
Toxins 2019, 11, 361
Peaks were assigned based on their retention times, mass to charge ratio (m/z), andESI-MS/MS fragmentation pattern, as well as their comparison to the previously isolated standards,Department of Biochemistry and Crop Quality, IUNG. The individual compounds were quantifiedby the external standard method using the calibration curves of pinnatifidanoside D (240 nm,0.010–0.482 μmol/mL), rutin (355 nm, 0.008–0.410 μmol/mL) for quercetin glycosides calculation, withfive different concentration levels (R2 ranged between 0.9923 and 0.9997). The molar concentrationwas plotted against peak area. Due to the lack of a phloridzin standard, structurally similar(αS)-4′-O-β-D-glucopyranosyl-α,2′,4-trihydroxydihydrochalcone with 436 MW, previously isolatedfrom lentil root [50], was used for constructing the calibration curve at 284 nm (0.002–0.401 μmol/mL).
3.3.2. Isolation Process of Pinnatifidanoside D
LH20 F1 was subjected to semi-preparative HPLC, equipped with a Gilson 321 pump, a GilsonGX-271 liquid handler with a 2 mL sample loop and a Gilson Prep ELS™ II detector. PinnatifidanosideD (9.1 mg) was isolated in an isocratic mode using CH3CN:H2O:FA (13:87:0.1, v/v), at 4 mL min−1,on Atlantis Prep T3 at 40 ◦C.
3.3.3. Nuclear Magnetic Resonance (NMR) Analysis
The pure isolates were analysed at 25 ◦C in methanol-d4 using Bruker Ascend III HD 500 MHzNMR spectrometer (Bruker BioSpin GmbH-Rheinstetten, Germany). Standard 1D (1H, 13C) and 2D(gCOSY, TROESY, gHSQC, gHMBC) pulse programs were used for data acquisition. NMR data wasprocessed using Topspin 3.2 pl7.
3.3.4. Antioxidant Activity
Antioxidant activity of CE, PE, F1 and F4–F6, such as reducing power and DPPH radical-scavengingactivity, was determined according to the methods described by Oleszek and Kozachok [51]. Briefly,tested samples were dissolved in methanol in the range of concentrations from 0 to 1500 μg mL−1.For reducing power analysis, phosphate buffer (2.5 mL, 0.2 M and pH 6.6) and potassium ferricyanide[K3Fe(CN)6] (2.5 mL, 1%, w/v) were adjusted to 1 mL of the solution of tested samples. Next, thesamples were incubated at 50◦C for 30 min., after which trichloroacetic acid (TCA); (2.5 mL, 10%, w/v)was added. The obtained solutions (2.5 mL) were mixed with deionised water (2.5 mL) and ferricchloride (FeCl3); (0.5 mL, 0.1%, w/v). The absorbance was measured at 700 nm. The results wereexpressed as EC50, which was the concentration that gave absorbance equal to 0.5. Ascorbic acid wasused as the reference sample.
Radical-scavenging activity was determined by the reaction of the solutions of the samples(3‘mL) with 1,1-diphenyl-2-picrylhydrazyl (DPPH) radical (1 mL, 0.1 mM). Purple radical solution wasdiscoloured and the colour change was stated by measurement of the absorbance at 517 nm. DPPHradical-scavenging activity was calculated according to the following formula:
%Inhibition = [(A0 − A1)/A0] × 100 (1)
where: A0 was the absorbance for the reference sample (DPPH solution) and A1 was the absorbancefor the tested sample. The results were presented as IC50, which was the concentration, whichcorresponded to 50% of inhibition.
The values of EC50 and IC50 were expressed as means ± standard deviations from three replicates.The significance of differences between tested samples were evaluated by the Tukey post-hoc test atp < 0.05.
3.3.5. Antifungal Activity
Antifungal activity analysis was performed using 96-well MT2 microplates (Biolog®, Hayward,CA, USA) according to the method of Frac et al. [10] with modifications. The aqueous solutions of
145
Toxins 2019, 11, 361
tested samples were prepared in the concentrations of 0, 5, 50, 100 and 500 μg mL−1. One hundredmicroliters of each solution was added to each well inoculated previously with 50 μL (containingca. 5–17.5 × 10⁴ spores) of the fungal mycelium suspended in filamentous fungi inoculating fluid(IF-FF) (Biolog®, Hayward, CA, USA). Before inoculation, the suspension was standardized for eachisolates into 75% transmittance (1–3.5 × 10⁶ spores/mL, depending on the fungal strain). Wells filledwith each tested solution or water with the IF-FF fluid without fungus were used as the controls.Three experimental replicates for each test were used. The MT2 plates were inoculated with 100 μLof inoculum per well. The plates were incubated at 26 ◦C for 8 days. The absorbance was measuredevery day at the wavelength of 490 nm as mitochondrial activity (substrate utilization) and 750 nmas mycelial growth (growth pattern) using microstation (Biolog®). The results were expressed as theratio of absorbance for tested samples with fungi and absorbance for adequate control (sample alone,without fungi); (A1/A0). Moreover, the ratio of absorbance at 490 nm and at 750 nm (A490/A750),indicating the metabolic intensity compared to biomass production, were analysed to better explainthe metabolisms of tested fungi [36].
For data analysis, the mean value of all days was taken and expressed as means ± standarddeviations from 24 replicates (3 replicates for each of 8 days). The significance of differences betweentested formulations and control were evaluated by Tukey’s post-hoc test at p < 0.05.
Supplementary Materials: The following are available online at http://www.mdpi.com/2072-6651/11/6/361/s1,Figure S1: LC-DAD and MS/ES- chromatograms of crude extract from apple pomace, Figure S2: LC-DAD andMS/ES- chromatograms of purified extract from apple pomace, Figure S3: LC-DAD and MS/ES- chromatograms offraction 1 from apple pomace, Figure S4: LC-DAD and MS/ES- chromatograms of fraction 4 from apple pomace;Figure S5: LC-DAD and MS/ES- chromatograms of fraction 5 from apple pomace, Figure S6: LC-DAD andMS/ES- chromatograms of fraction 6 from apple pomace, Figure S7: 1H and 13C NMR data of pinnatifidanosideD. Figure S8: 1H NMR (500 MHz) spectrum of pinnatifidanoside D, in MeOH-d4, 25 ◦C, Figure S9: 13C NMR(125 MHz) spectrum of pinnatifidanoside D, in MeOH-d4, 25 ◦C, Figure S10: 1H-1H 2D COSY NMR (500 MHz)spectrum of pinnatifidanoside D, in MeOH-d4, 25 ◦C, Figure S11: 1H-1H 2D NOESY NMR (500 MHz) spectrum ofpinnatifidanoside D, in MeOH-d4, 25 ◦C, Figure S12: 1H-13C HSQC NMR (500 MHz) spectrum of pinnatifidanosideD, in MeOH-d4, 25 ◦C, Figure S13: 1H-13C H2BC NMR (500 MHz) spectrum of pinnatifidanoside D, in MeOH-d4,25 ◦C, Figure S14: 1H-13C HSQC-TOCSY NMR (500 MHz) spectrum of pinnatifidanoside D, in MeOH-d4, 25 ◦C,Figure S15: 1H-13C HMBC NMR (500 MHz) spectrum of pinnatifidanoside D, in MeOH-d4, 25 ◦C. Figure S16:LH-20 chromatogram of plant specific metabolites fraction from apple pomace.
Author Contributions: Conceptualization, M.O. and M.F.; Methodology, M.O., Ł.P., K.O. and M.F.; FormalAnalysis, M.O.; Investigation, M.O., Ł.P., S.K., Z.L.-F. and K.O.; Data Curation, M.O.; Writing-Original DraftPreparation, M.O.; Writing-Review & Editing, M.O., Ł.P., S.K., K.O. and M.F.; Visualization, M.O.; Supervision,M.O. and M.F.; Funding Acquisition, M.F.
Funding: “This research was co-funded by The National Centre for Research and Development in frame of theproject BIOSTRATEG, grant number BIOSTRATEG3/344433/16/NCBR/2018.
Acknowledgments: The authors wish to thank Wiesław Oleszek for numerous helpful advice and valuablecomments on the manuscript. The authors would like to express their thanks also to Jerzy Zuchowski for providingus with (αS)-4′-O-β-D-glucopyranosyl-α,2′,4-trihydroxydihydrochalcone standard.
Conflicts of Interest: The authors declare no competing of interest.
References
1. Santana-Méridas, O.; González-Coloma, A.; Sánchez-Vioque, R. Agricultural Residues as a Source of BioactiveNatural Products. Phytochem. Rev. 2012, 11, 447–466. [CrossRef]
2. Heidorn, E.; Utvik, K.; Gengler, C.; Alati, K.; Collet, D.; Attivissimo, V.; Colantonio, M. Agriculture, Forestry andFishery Statistics 2017 Edition; Forti, R., Ed.; European Commission: Luxemburg, Belgium, 2017. [CrossRef]
3. Górnas, P.; Mišina, I.; Olšteine, A.; Krasnova, I.; Pugajeva, I.; Lacis, G.; Siger, A.; Michalak, M.; Soliven, A.;Seglin, a, A. Phenolic Compounds in Different Fruit Parts of Crab Apple: Dihydrochalcones as PromisingQuality Markers of Industrial Apple Pomace By-Products. Ind. Crops Prod. 2015, 74, 607–612. [CrossRef]
4. Waldbauer, K.; McKinnon, R.; Kopp, B. Apple Pomace as Potential Source of Natural Active Compounds.Planta Med. 2017, 83, 994–1010. [CrossRef] [PubMed]
146

Toxins 2019, 11, 361
5. Bhushan, S.; Kalia, K.; Sharma, M.; Singh, B.; Ahuja, P.S. Processing of Apple Pomace for Bioactive Molecules.Crit. Rev. Biotechnol. 2008, 28, 285–296. [CrossRef] [PubMed]
6. Sánchez-Rabaneda, F.; Jáuregui, O.; Lamuela-Raventós, R.M.; Viladomat, F.; Bastida, J.; Codina, C. QualitativeAnalysis of Phenolic Compounds in Apple Pomace Using Liquid Chromatography Coupled to MassSpectrometry in Tandem Mode. Rapid Commun. Mass Spectrom. 2004, 18, 553–563. [CrossRef] [PubMed]
7. Kołodziejczyk, K.; Sójka, M.; Abadias, M.; Viñas, I.; Guyot, S.; Baron, A. Polyphenol Composition, AntioxidantCapacity, and Antimicrobial Activity of the Extracts Obtained from Industrial Sour Cherry Pomace.Ind. Crops Prod. 2013, 51, 279–288. [CrossRef]
8. Shim, S.-H.; Jo, S.-J.; Kim, J.-C.; Choi, G.-J. Control Efficacy of Phloretin Isolated from Apple Fruits AgainstSeveral Plant Diseases. Plant Pathol. J. 2010, 26, 280–285. [CrossRef]
9. Sanzani, S.M.; Schena, L.; Nigro, F.; de Girolamo, A.; Ippolito, A. Effect of Quercetin and Umbelliferone onthe Transcript Level of Penicillium expansum Genes Involved in Patulin Biosynthesis. Eur. J. Plant Pathol.2009, 125, 223–233. [CrossRef]
10. Frac, M.; Gryta, A.; Oszust, K.; Kotowicz, N. Fast and Accurate Microplate Method (Biolog MT2) for Detectionof Fusarium Fungicides Resistance/Sensitivity. Front. Microbiol. 2016, 7, 1–16. [CrossRef]
11. Becher, R.; Hettwer, U.; Karlovsky, P.; Deising, H.B.; Wirsel, S.G.R. Adaptation of Fusarium graminearum toTebuconazole Yielded Descendants Diverging for Levels of Fitness, Fungicide Resistance, Virulence, andMycotoxin Production. Phytopathology 2010, 100, 444–453. [CrossRef]
12. Lourenço, R.M.D.C.; Melo, P.; da Silva, S.; de Almeida, A.B.A. Flavonoids as Antifungal Agents. In AntifungalMetabolites from Plants; Razzaghi-Abyaneh, M., Rai, M., Eds.; Springer: Berlin, Germany, 2013; pp. 1–469.
13. Upasani, M.L.; Gurjar, G.S.; Kadoo, N.Y.; Gupta, V.S. Dynamics of Colonization and Expression ofPathogenicity Related Genes in Fusarium oxysporum f. sp. ciceri during Chickpea Vascular Wilt DiseaseProgression. PLoS ONE 2016, 11, e0156490. [CrossRef] [PubMed]
14. Wang, H.-C.; Li, L.C.; Cai, B.; Cai, L.T.; Chen, X.J.; Yu, Z.H.; Zhang, C.Q. Metabolic Phenotype Characterizationof Botrytis cinerea, the Causal Agent of Gray Mold. Front. Microbiol. 2018, 9, 1–9. [CrossRef] [PubMed]
15. Oszust, K.; Panek, J.; Pertile, G.; Siczek, A.; Oleszek, M.; Frac, M. Metabolic and Genetic Properties ofPetriella setifera Precultured on Waste. Front. Microbiol. 2018, 9, 1–10. [CrossRef] [PubMed]
16. Kwasna, H.; Łakomy, P.; Łabedzki, A. Morphological characteristics and DNA sequence analysis of Petriellasetifera and Oidiodendron setiferum from twigs of diseased oak. Acta Mycol. 2005, 40, 267–275. [CrossRef]
17. Schwarze, F.W. Wood Decay Under the Microscope. Fungal Biol. Rev. 2007, 21, 133–170. [CrossRef]18. Pertile, G.; Panek, J.; Oszust, K.; Siczek, A.; Frac, M. Intraspecific Functional and Genetic Diversity of
Petriella setifera. PeerJ 2018, 6, e4420. [CrossRef] [PubMed]19. Frac, M.; Jezierska-Tys, S.; Yaguchi, T. Occurrence, Detection, and Molecular and Metabolic Characterization
of Heat-Resistant Fungi in Soils and Plants and Their Risk to Human Health. Adv. Agron. 2015, 132, 161–204.[CrossRef]
20. Sanzani, S.M.; Girolamo, A.; Schena, L.; Solfrizzo, M.; Ippolito, A.; Visconti, A. Control of Penicillium expansumand Patulin Accumulation on Apples by Quercetin and Umbelliferone. Eur. Food Res. Technol. 2009, 228,381–389. [CrossRef]
21. Steinkellner, S.; Mammerler, R. Effect of Flavonoids on the Development of Fusarium oxysporum f. sp.lycopersici. J. Plant Interact. 2007, 2, 17–23. [CrossRef]
22. Naseer, R.; Sultana, B.; Khan, M.Z.; Naseer, D.; Nigam, P. Utilization of Waste Fruit-Peels to Inhibit AflatoxinsSynthesis by Aspergillus flavus: A Biotreatment of Rice for Safer Storage. Bioresour. Technol. 2014, 172, 423–428.[CrossRef]
23. Parvez, M.M.; Tomita-Yokotani, K.; Fujii, Y.; Konishi, T.; Iwashina, T. Effects of Quercetin and Its SevenDerivatives on the Growth of Arabidopsis thaliana and Neurospora crassa. Biochem. Syst. Ecol. 2004, 32,631–635. [CrossRef]
24. Dick, A.J.; Redden, P.R.; DeMarco, A.C.; Lidster, P.D.; Grindley, T.B. Flavonoid Glycosides of Spartan ApplePeel. J. Agric. Food Chem. 1987, 35, 529–531. [CrossRef]
25. Lu, Y.; Foo, L.Y. Identification and Quantification of Major Polyphenols in Apple Pomace. Food Chem. 1997,59, 187–194. [CrossRef]
26. Vasantha Rupasinghe, H.P.; Kean, C. Polyphenol Concentrations in Apple Processing By-Products DeterminedUsing Electrospray Ionization Mass Spectrometry. Can. J. Plant Sci. 2008, 88, 759–762. [CrossRef]
147

Toxins 2019, 11, 361
27. Li, L.Z.; Gao, P.Y.; Song, S.J.; Yuan, Y.Q.; Liu, C.T.; Huang, X.X.; Liu, Q.B. Monoterpenes and Flavones fromthe Leaves of Crataegus pinnatifida with Anticoagulant Activities. J. Funct. Foods 2015, 12, 237–245. [CrossRef]
28. Oleszek, W.; Lee, C.Y.; Jaworski, A.W.; Price, K.R. Identification of Some Phenolic Compounds in Apples.J. Agric. Food Chem. 1988, 36, 430–432. [CrossRef]
29. Walker, A.A. Note on the Polyphenol Content of Ripening Apples. N. Z. J. Sci. 1963, 6, 492–494.30. Ingle, M.; Hyde, J. The Effect of Bruising on Discoloration and Concentration of Phenolic Compounds in
Apple Tissue. Proc. Am. Soc. Hortic. Sci. 1968, 93, 738–745.31. Vamos-Vigyazo, L.; Gajzago, I. Studies on the Enzymatic Browning and the Polyphenol–polyphenol Oxidase
Complex of Apple Cultivars. Confructa 1976, 21, 24–31.32. Burda, S.; Oleszek, W.; Lee, C.Y. Phenolic Compounds and Their Changes in Apples during Maturation and
Cold Storage. J. Agric. Food Chem. 1990, 38, 945–948. [CrossRef]33. Gadkari, P.V.; Kadimi, U.S.; Balaraman, M. Catechin Concentrates of Garden Tea Leaves (Camellia Sinensis
L.): Extraction/Isolation and Evaluation of Chemical Composition. J. Sci. Food Agric. 2014, 94, 2921–2928.[CrossRef] [PubMed]
34. Heim, K.E.; Tagliaferro, A.R.; Bobilya, D.J. Flavonoid Antioxidants: Chemistry, Metabolism andStructure-Activity Relationships. J. Nutr. Biochem. 2002, 13, 572–584. [CrossRef]
35. Brett, A.M.O.; Ghica, M.-E. Electrochemical Oxidation of Quercetin. Electroanalysis 2003, 15, 1745–1750.[CrossRef]
36. Pinzari, F.; Ceci, A.; Abu-Samra, N.; Canfora, L.; Maggi, O.; Persiani, A. Phenotype MicroArrayTM Systemin the Study of Fungal Functional Diversity and Catabolic Versatility. Res. Microbiol. 2016, 167, 710–722.[CrossRef]
37. Noveroske, R.L.; Kui, J.; Williams, E.B. Oxidation of Phloridzin and Phloretin Related to Resistance of Malusto Venturia Inaequalis. Phytopathology 1964, 54, 92–97.
38. Gessler, C.; Patocchi, A.; Sansavini, S.; Tartarini, S.; Gianfranceschi, L. Venturia Inaequalis Resistance inApple. CRC. Crit. Rev. Plant Sci. 2006, 25, 473–503. [CrossRef]
39. Gosch, C.; Halbwirth, H.; Stich, K. Phloridzin: Biosynthesis, Distribution and Physiological Relevance inPlants. Phytochemistry 2010, 71, 838–843. [CrossRef] [PubMed]
40. Baldisserotto, A.; Malisardi, G.; Scalambra, E.; Andreotti, E.; Romagnoli, C.; Vicentini, C.B.; Manfredini, S.;Vertuani, S. Synthesis, Antioxidant and Antimicrobial Activity of a New Phloridzin Derivative forDermo-Cosmetic Applications. Molecules 2012, 17, 13275–13289. [CrossRef] [PubMed]
41. Lee, J.H.; Lee, S.J.; Park, S.; Jeong, S.W.; Kim, C.Y.; Jin, J.S.; Jeong, E.D.; Kwak, Y.S.; Kim, S.T.; Bae, D.W.; et al.Determination of Flavonoid Level Variation in Onion (Allium Cepa L.) Infected by Fusarium oxysporum UsingLiquid Chromatography–tandem Mass Spectrometry. Food Chem. 2012, 133, 1653–1657. [CrossRef]
42. Das, S.; Rosazza, J.P. Microbial and Enzymatic Transformations of Flavonoids. J. Nat. Prod. 2006, 69, 499–508.[CrossRef] [PubMed]
43. Gonzales, G.B.; Smagghe, G.; Wittevrongel, J.; Huynh, N.T.; Van Camp, J.; Raes, K. Metabolism of Quercetinand Naringenin by Food-Grade Fungal Inoculum, Rhizopus azygosporus Yuan et Jong (ATCC 48108). J. Agric.Food Chem. 2016, 64, 9263–9267. [CrossRef] [PubMed]
44. Mierziak, J.; Kostyn, K.; Kulma, A. Flavonoids as Important Molecules of Plant Interactions with theEnvironment. Molecules 2014, 19, 16240–16265. [CrossRef] [PubMed]
45. Gauthier, L.; Atanasova-Penichon, V.; Chéreau, S.; Richard-Forget, F. Metabolomics to Decipher the ChemicalDefense of Cereals against Fusarium graminearum and Deoxynivalenol Accumulation. Int. J. Mol. Sci. 2015,16, 24839–24872. [CrossRef] [PubMed]
46. Oszust, K.; Pawlik, A.; Siczek, A.; Janusz, G.; Gryta, A.; Bilinska-Wielgus, N.; Frac, M. Efficient CellulasesProduction by Trichoderma atroviride G79/11 in Submerged Culture Based on Soy Flour-Cellulose-Lactose.BioResources 2017, 12, 8468–8489. [CrossRef]
47. White, T.J.; Bruns, T.; Lee, S.J.W.T.; Taylor, J.L. Amplification and direct sequencing of fungal ribosomal RNAgenes for phylogenetics. PCR Protoc. A Guide Methods Appl. 1990, 18, 315–322.
48. Oleszek, M.; Krzeminska, I. Enhancement of biogas production by co-digestion of maize silage with commongoldenrod rich in biologically active compounds. BioResources 2017, 12, 704–714. [CrossRef]
49. Kozachok, S.; Pecio, Ł.; Kolodziejczyk-Czepas, J.; Marchyshyn, S.; Nowak, P.; Mołdoch, J.; Oleszek, W.γ-Pyrone Compounds: Flavonoids and Maltol Glucoside Derivatives from Herniaria glabra L. Collected inthe Ternopil Region of the Ukraine. Phytochemistry 2018, 152, 213–222. [CrossRef]
148

Toxins 2019, 11, 361
50. Zuchowski, J.; Pecio, Ł.; Reszczynska, E.; Stochmal, A. New Phenolic Compounds from the Roots of Lentil(Lens culinaris). Helv. Chim. Acta 2016, 99, 674–680; [CrossRef]
51. Oleszek, M.; Kozachok, S. Antioxidant Activity of Plant Extracts and Their Effect on Methane Fermentationin Bioreactors. Int. Agrophysics 2018, 32, 395–401. [CrossRef]
© 2019 by the authors. Licensee MDPI, Basel, Switzerland. This article is an open accessarticle distributed under the terms and conditions of the Creative Commons Attribution(CC BY) license (http://creativecommons.org/licenses/by/4.0/).
149


toxins
Article
Detoxification of the Fumonisin Mycotoxins in Maize:An Enzymatic Approach
Johanna Alberts 1,*, Gerd Schatzmayr 2, Wulf-Dieter Moll 2, Ibtisaam Davids 1,3, John Rheeder 1,
Hester-Mari Burger 1, Gordon Shephard 1 and Wentzel Gelderblom 1,4
1 Mycotoxicology Research Group, Institute of Biomedical and Microbial Biotechnology, Cape PeninsulaUniversity of Technology, Bellville 7535, South Africa
2 BIOMIN Research Center, BIOMIN, Technopark 1, 3430 Tulln, Austria3 Department of Biomedical Science, University of the Western Cape, Bellville 7535, South Africa4 Department of Biochemistry, Stellenbosch University, Stellenbosch 7600, South Africa* Correspondence: [email protected]
Received: 31 July 2019; Accepted: 23 August 2019; Published: 10 September 2019
Abstract: Enzymatic detoxification has become a promising approach for control of mycotoxinspostharvest in grains through modification of chemical structures determining their toxicity. Inthe present study fumonisin esterase FumD (EC 3.1.1.87) (FUMzyme®; BIOMIN, Tulln, Austria),hydrolysing fumonisin (FB) mycotoxins by de-esterification, was utilised to develop an enzymaticreduction method in a maize kernel enzyme incubation mixture. Efficacy of the FumD FB reductionmethod in “low” and “high” FB contaminated home-grown maize was compared by monitoringFB1 hydrolysis to the hydrolysed FB1 (HFB1) product utilising a validated LC-MS/MS analyticalmethod. The method was further evaluated in terms of enzyme activity and treatment duration byassessing enzyme kinetic parameters and the relative distribution of HFB1 between maize kernelsand the residual aqueous environment. FumD treatments resulted in significant reduction (≥80%) in“low” (≥1000 U/L, p < 0.05) and “high” (100 U/L, p < 0.05; ≥1000 U/L, p < 0.0001) FB contaminatedmaize after 1 h respectively, with an approximate 1:1 μmol conversion ratio of FB1 into the formationof HFB1. Enzyme kinetic parameters indicated that, depending on the activity of FumD utilised,a significantly (p < 0.05) higher FB1 conversion rate was noticed in “high” FB contaminated maize.The FumD FB reduction method in maize could find application in commercial maize-based practicesas well as in communities utilising home-grown maize as a main dietary staple and known to beexposed above the tolerable daily intake levels.
Keywords: fumonisin; enzymatic detoxification; fumonisin esterase FumD; enzyme kinetics; maize
Key Contribution: A fumonisin B (FB) reduction method was developed for whole maize utilizingfumonisin esterase FumD (BIOMIN; Tulln; Austria). Depending on the enzyme activity and durationof treatment; reduction of FB in maize could be achieved ≥80% with an approximate 1:1 μmolarconversion ratio of FB1 to hydrolysed FB1 (HFB1). The FumD FB reduction method could findapplication in populations exposed to maize containing FB above international regulatory levels aswell as in industrial processes utilising high FB contaminated maize.
1. Introduction
The lack of effective and environmentally safe chemical control methods against fungal infectionand mycotoxin production in maize initiated investigations into biologically safe alternatives toprevent these contaminants from entering the food chain [1]. Methods involve the applicationof natural resources, including plant material, microbial cultures, genetic material, clay mineralsand enzymes [2–11]. Enzymatic degradation of mycotoxins in food sources, postharvest, is a new
Toxins 2019, 11, 523; doi:10.3390/toxins11090523 www.mdpi.com/journal/toxins151

Toxins 2019, 11, 523
research approach, providing many opportunities for novel initiatives to improve the safety of foodwith respect to mycotoxin reduction [1,12]. The focus is on targeted modification of the chemicalstructures by enzymatic cleavage or conversion of chemical bonds/groups that play a key role duringcytotoxicity [13,14]. Detoxification of the fumonisins is achieved by enzymatic deamination of thefree amino group at C-2 and de-esterification of the ester bonds at C-14 and C-15. A knowledgebase on reduction of mycotoxin concentrations by bacterial and fungal cultures has been establishedover the years [14–17]. This information was further developed by identifying microbial enzymesresponsible for detoxification, characterization of genes encoding the enzymes, expression of genesin food-grade microorganisms, and development of culture and recombinant enzyme preparationsfor commercial application. Microorganisms and enzymes capable of degrading fumonisin B1 (FB1)include carboxylesterase and amino oxidase enzymes of Exophiala spinifera ATCC 74269, Rhinocladiellaatrovirens ATCC 74270 as well as carboxylesterase and aminotransferase enzymes of Bacterium ATCC55552 and Sphingopyxis macrogoltabida MTA144 [14–19].
Recently, a commercial fumonisin esterase FumD (EC 3.1.1.87) (FUMzyme®; BIOMIN, Tulln,Austria) capable of effectively hydrolysing the tricarballylic acid groups of FB1 yielding hydrolysed FB1
(HFB1), was introduced. The enzyme activity is specific and irreversible, while HFB1 exhibited less toxiceffects when evaluated in pig intestine, as indicated by disruption of the sphinganine/sphingosine ratiosin the liver and plasma, induction of an intestinal immune response, the absence of hepatotoxicity, andchanges in intestinal morphology [20]. FUMzyme® has been regarded safe for humans, animals and theenvironment by the European Food Safety Authority (EFSA) [21]. Although enzymatic detoxificationhas become a promising approach and found application in the animal feed industry [21–24], a broaderapplication to safeguard human food still has to be investigated. Such an approach could add value tocommercial maize-based manufacturing processes during which the fumonisins are concentrated incertain products and co-products, as well as in subsistence farming communities where people areexposed to unacceptable levels of the fumonisins in their staple diet.
The present study describes the development of a FumD FB reduction method utilisinghome-grown maize batches containing “low” and “high” levels of FB. The efficacy of the reductionmethod was determined by monitoring the extent of FB1 hydrolysis and the formation of HFB1 inresidual maize kernels and enzyme solutions utilising a validated LC-MS/MS analytical method.The FumD FB reduction method was optimized in terms of enzyme activity and treatment durationconsidering specific enzyme kinetic parameters to evaluate differences between maize samples withvarying FB levels. Distribution of HFB1 between the kernel and aqueous phase was also recorded.
2. Results
2.1. Validation of The Extraction and Chromatographic Quantification Methods
The method validation parameters are summarised in Tables 1 and 2. The lower limit ofquantification (LOQ) for each fumonisin was determined from a signal to noise (s/n) ratio of at least fivetimes the response compared to the blank response. Analyte responses were identifiable, discrete andreproducible. LOQ values for the individual fumonisins ranged between 2.8–3.5 μg/kg. Linearity (r2) ofthe fumonisin calibration curve was >0.998. Selectivity of the method was confirmed by demonstratingno interfering peaks at LOQ for each of the fumonisins. Accuracy was determined by replicate analysisof samples containing known amounts of analyte, resulting in means within 15% from the theoreticalvalues. Recoveries were calculated by comparison of the response obtained for each mycotoxin withthat of known spiked concentrations in blank maize, expressed as a percentage. The recoveries forthe individual fumonisins ranged from 79–84% and were consistent and reproducible. Fumonisinconcentrations in the FAPAS quality control reference maize samples were always within the stipulatedranges for each fumonisin (data not shown).
152
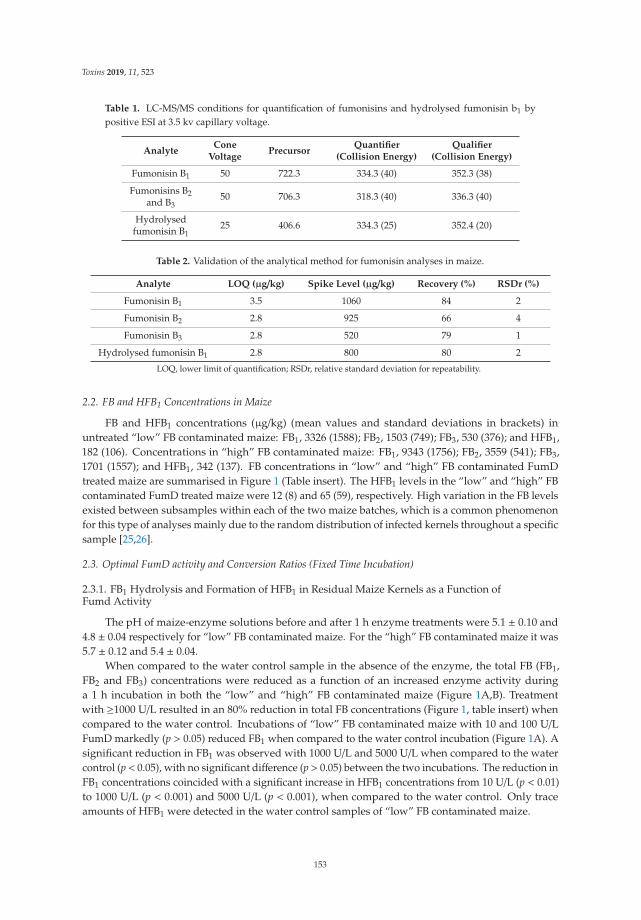
Toxins 2019, 11, 523
Table 1. LC-MS/MS conditions for quantification of fumonisins and hydrolysed fumonisin b1 bypositive ESI at 3.5 kv capillary voltage.
AnalyteCone
VoltagePrecursor
Quantifier(Collision Energy)
Qualifier(Collision Energy)
Fumonisin B1 50 722.3 334.3 (40) 352.3 (38)
Fumonisins B2and B3
50 706.3 318.3 (40) 336.3 (40)
Hydrolysedfumonisin B1
25 406.6 334.3 (25) 352.4 (20)
Table 2. Validation of the analytical method for fumonisin analyses in maize.
Analyte LOQ (μg/kg) Spike Level (μg/kg) Recovery (%) RSDr (%)
Fumonisin B1 3.5 1060 84 2
Fumonisin B2 2.8 925 66 4
Fumonisin B3 2.8 520 79 1
Hydrolysed fumonisin B1 2.8 800 80 2
LOQ, lower limit of quantification; RSDr, relative standard deviation for repeatability.
2.2. FB and HFB1 Concentrations in Maize
FB and HFB1 concentrations (μg/kg) (mean values and standard deviations in brackets) inuntreated “low” FB contaminated maize: FB1, 3326 (1588); FB2, 1503 (749); FB3, 530 (376); and HFB1,182 (106). Concentrations in “high” FB contaminated maize: FB1, 9343 (1756); FB2, 3559 (541); FB3,1701 (1557); and HFB1, 342 (137). FB concentrations in “low” and “high” FB contaminated FumDtreated maize are summarised in Figure 1 (Table insert). The HFB1 levels in the “low” and “high” FBcontaminated FumD treated maize were 12 (8) and 65 (59), respectively. High variation in the FB levelsexisted between subsamples within each of the two maize batches, which is a common phenomenonfor this type of analyses mainly due to the random distribution of infected kernels throughout a specificsample [25,26].
2.3. Optimal FumD activity and Conversion Ratios (Fixed Time Incubation)
2.3.1. FB1 Hydrolysis and Formation of HFB1 in Residual Maize Kernels as a Function ofFumd Activity
The pH of maize-enzyme solutions before and after 1 h enzyme treatments were 5.1 ± 0.10 and4.8 ± 0.04 respectively for “low” FB contaminated maize. For the “high” FB contaminated maize it was5.7 ± 0.12 and 5.4 ± 0.04.
When compared to the water control sample in the absence of the enzyme, the total FB (FB1,FB2 and FB3) concentrations were reduced as a function of an increased enzyme activity duringa 1 h incubation in both the “low” and “high” FB contaminated maize (Figure 1A,B). Treatmentwith ≥1000 U/L resulted in an 80% reduction in total FB concentrations (Figure 1, table insert) whencompared to the water control. Incubations of “low” FB contaminated maize with 10 and 100 U/LFumD markedly (p > 0.05) reduced FB1 when compared to the water control incubation (Figure 1A). Asignificant reduction in FB1 was observed with 1000 U/L and 5000 U/L when compared to the watercontrol (p < 0.05), with no significant difference (p > 0.05) between the two incubations. The reduction inFB1 concentrations coincided with a significant increase in HFB1 concentrations from 10 U/L (p < 0.01)to 1000 U/L (p < 0.001) and 5000 U/L (p < 0.001), when compared to the water control. Only traceamounts of HFB1 were detected in the water control samples of “low” FB contaminated maize.
153

Toxins 2019, 11, 523
p
Figure 1. Fumonisin B (FB1, FB2, FB3) and hydrolysed fumonisin B1 (HFB1) concentrations (μg/kg)maize as a function of fumonisin esterase FumD activity (0, 10, 100, 1000 and 5000 U/L) after 1 htreatment. (A) “Low” and (B) “High” FB contaminated maize. Values represent means of three to fivereplications of experiments and error bars indicate standard deviations. The statistical analyses arebased on natural log (ln) transformations. The *, **, *** and # indicate significant (p < 0.05) differencesof means from the water control (0 U/L) treatments. Table insert: % total reduction of the total FB as afunction of enzyme actvity after 1 h in “low” and “high” FB contaminated maize. Standard deviationsare in brackets.
In “high” FB contaminated maize, a significant reduction in FB1 was observed at FumD activitiesof 100 U/L (p < 0.05), 1000 U/L (p < 0.0001) and 5000 U/L (p < 0.0001) when compared to the watercontrol with no significant (p > 0.05) differences between the different incubations (Figure 1B). Thetotal FB concentrations (Figure 1B Table insert) were again reduced by ≥80% at the two highest FumDconcentrations. Incubation with 10 U/L FumD only markedly reduced the FB1 concentration whileincubation with 1000 U/L resulted in 79% reduction in FB1, and 82% reduction in total FB concentrations,respectively. The reduction in FB1 again coincided with a significant (p < 0.0001) increase in HFB1
concentrations with treatments ≥100 U/L, while only trace amounts of HFB1 were detected in thewater control.
2.3.2. FB1 Hydrolysis and Formation of Hfb1 in the Residual Solutions as a Function of Fumd Activity
Residual water control samples obtained from the “low” FB contaminated maize contained highFB and low HFB1 concentrations (Figure 2A). FumD reduced (p < 0.05) FB as a function of increasedenzyme activity. The reduction in FB1 coincided with a significant increase in HFB1 from 10 U/L(p < 0.01) reaching a maximum at 100 U/L with no further increase >100 U/L. Treatment with 10 U/Lresulted in an almost complete removal of FB1, with almost no FB1 detected ≥100 U/L. Completereduction of FB2 and FB3 was also observed ≥10 U/L. A similar trend was observed in residual watercontrol and enzyme solutions of the “high” FB contaminated maize, although FB1 was only completelyremoved >1000 U/L (Figure 2B). Total reduction of FB2 and FB3 was observed with ≥100 U/L FumDactivity. A significant (p < 0.05) increase in HFB1 was noticed ≥10 U/L, reaching a maximum at 100 U/L.
154

Toxins 2019, 11, 523
Figure 2. FB (FB1, FB2, FB3) and hydrolysed fumonisin B1 (HFB1) concentrations in residual watercontrol and enzyme solutions as a function of fumonisin esterase FumD activity (0, 10, 100, 1000 and5000 U/L) after 1 h treatment. (A) “Low” and (B) “High” FB contaminated maize. Values representmeans of three to five replications of experiments and error bars indicate standard deviations. Thestatistical analyses are based on natural log (ln) transformations. The *, ** and # indicate significant(p < 0.05) differences of means from the respective water control (0 U/L) treatments.
2.3.3. FB1 Hydrolysis Relative to the Formation of HFB1
When considering the total mean FB1 levels in the incubation mixtures (levels in residual maizekernels plus residual solutions expressed in micromoles), it was markedly to significantly (p < 0.05)higher in “high” FB contaminated maize although it varied when utilizing the different enzymeincubations (Table 3). Although the mean FB1 converted were similar between both samples treatedwith the various FumD activities, the % FB1 (μmol) loss was significantly (p < 0.05) higher in “low”FB contaminated maize at the two lower enzyme activities with no difference when using higherFumD activities (≥1000 U/L). Overall, FumD significantly (p < 0.05) increased the mean total HFB1
levels in both samples as a function of the enzyme activity reaching a maximum level ≥100 U/L. Whenconsidering the FB1:HFB1 conversion ratio, FumD resulted in a markedly lower conversion at 10 U/Lin “low” as compared to “high” FB contaminated maize. The FB1:HFB1 conversion ratios were similarwith 100 U/L, reaching approximately a 1:1 ratio at ≥1000 U/L, implying maximum conversion.
2.3.4. Relative HFB1 Distribution in Residual Maize Kernels and Solutions FollowingFumD Incubations
The total HFB1 in the incubation mixture increased significantly (p < 0.05) in incubation ≥100 U/LFumD activities with no difference at higher enzyme activities and/or between the “low” and “high”FB contaminated maize samples. The % HFB1 accumulation in the “low” FB contaminated maizeincreased as a function of increased FumD activity reaching a maximum level at the 1000 U/L (Table 4).A similar response was noticed in the “high” FB contaminated maize showing a typical dose responseeffect with a significant (p < 0.05) higher level obtained with 5000 U/L FumD activity. Maximum levelswhen considering the % total mean HFB1 were noticed in the residual solution up to 100 U/L FumD,which markedly and significantly decreased in the “low” and “high” FB contaminated samples athigher FumD activities, respectively.
155

Toxins 2019, 11, 523
Table 3. Comparative FB1 conversion relative to HFB1 formation between “low” and “high” FBcontaminated maize during 1 h incubation with different FumD activities.
FumDAactivity (U/L)
Total Mean μmolFB1 in Incubation
Mixture *
Mean μmolFB1 Converted
Mean μmol FB1
Loss (%)
Total Mean μmolHFB1 in Incubation
Mixture
FB1:HFB1 μmolConversion Ratio
“Low” FB Contaminated Maize
0 ** 1.15 ± 0.55 - - 0.02 ± 0.01 42.75 ± 12.14
10 0.27 ± 0.14 ab 0.88 ± 0.14 a 76.58 ± 11.90 abc 0.13± 0.05 a 7.22 ± 2.40 a
100 0.18 ± 0.16 ac 0.98 ± 0.16 a 84.73 ± 14.14 ab 0.94 ± 0.62 b 2.52 ± 0.84 ab
1000 0.07 ± 0.03 c 1.09 ± 0.03 ab 94.32 ± 2.91 a 0.99 ± 0.60 b 1.30 ± 0.58 bc
5000 0.06 ± 0.05 c 1.09 ± 0.05 ab 94.64 ± 3.98 ab 1.02 ± 1.00 b 0.66 ± 0.32 c
“High” FB Contaminated Maize
0 ** 1.74 ± 1.32 - - 0.16 ± 0.10 10.23 ± 3.96
10 0.97 ± 0.50 b 0.76 ± 0.50 a 55.04 ± 17.68 c 0.24 ± 0.15 a 3.4 ± 1.73 abd
100 0.71 ± 0.37 b 1.02 ± 0.37 a 58.84 ± 21.59 c 1.17 ± 0.53 b 1.38 ± 0.72 bc
1000 0.21 ± 0.16 ac 1.52 ± 0.16 b 87.75 ± 9.31 ab 1.96 ± 0.89 b 0.93 ± 0.46 c
5000 0.13 ± 0.07 ac 1.61 ± 0.07 b 92.61 ± 4.09 ab 1.68 ± 0.66 b 1.11 ± 0.54 cd
The statistical analyses are based on natural log (ln) transformations. Values represent means ± standard deviationsof three to five replications of experiments. Statistical differences (p < 0.05) in a column for FumD activities withinand between the “low” and “high” FB contaminated maize are indicated with different letters. * Combined FB1levels in maize and residual enzyme solution. ** Shaded areas represent the water control treatment (0 U/L). HFB1levels were corrected accordingly in the presence of the enzyme.
Table 4. Distribution of HFB1 between residual maize and the solution following FumD treatment of“low” and “high” FB contaminated maize for 1 h.
FumDActivity
(U/L)
Total Mean HFB1
(μmol) in 100 gResidual Maize Kernels
Total Mean HFB1
(μmol) in 200 mLResidual Solution
Mean μmol HFB1
in Residual MaizeKernels (%)
Mean μmol HFB1
in ResidualSolution (%)
“Low” FB Contaminated Maize
10 0.01 ± 0.01 a 0.13 ± 0.04 a 5.65 ± 3.47 a 94.35 ± 3.47 a
100 0.07 ± 0.06 b 0.87 ± 0.58 b 7.35 ± 3.28 a 92.65 ± 3.28 a
1000 0.15 ± 0.11 b 0.83 ± 0.50 b 15.82 ± 4.48 b 84.18 ± 4.48 b
5000 0.19 ± 0.22 b 0.83 ± 0.78 b 16.25 ± 3.86 b 83.75 ± 3.86 b
“High” FB Contaminated Maize
10 0.00 a 0.24 ± 0.14 a 0.48 ± 0.58 a 99.52 ± 0.60 a
100 0.08 ± 0.06 b 1.09 ± 0.48 b 6.75 ± 2.24 b 93.25 ± 2.24 b
1000 0.19 ± 0.09 bc 1.77 ± 0.86 b 10.68 ± 4.33 b 89.32 ± 4.33 b
5000 0.50 ± 0.17 c 1.17 ± 0.65 b 32.90 ± 11.85 c 67.10 ± 11.90 c
The statistical analyses are based on natural log (ln) transformations. Values represent means ± standard deviationsof three to five replications of experiments. Statistical differences (p < 0.05) in a column of the % HFB1 distributionwithin “low” and “high” FB contaminated maize are indicated with different letters.
2.4. Comparative Enzyme Kinetics of FB1 Conversion as a Function of Time and FumD Activity
2.4.1. FB1 Leaching into the Aqueous Phase (Water Control Treatment)
The total mean baseline FB1 levels, i.e., total FB1 (μmol) in the “low” and “high” FB contaminatedmaize incubation mixtures as a function of the different incubation times (10 min, 1 h, 4 h and 24 h) aresummarised in Figure 3. A significantly (p < 0.05) higher total FB1 was noticed in the total incubationmixture utilising the “high” FB contaminated maize at each time point (Figure 3A). FB1 leaching from“low” FB contaminated maize, reached saturation after 1 h as, despite that different samples wereused, no further increase was noticed in the samples incubated for 4 and 24 h (Figure 3B). In contrast,
156
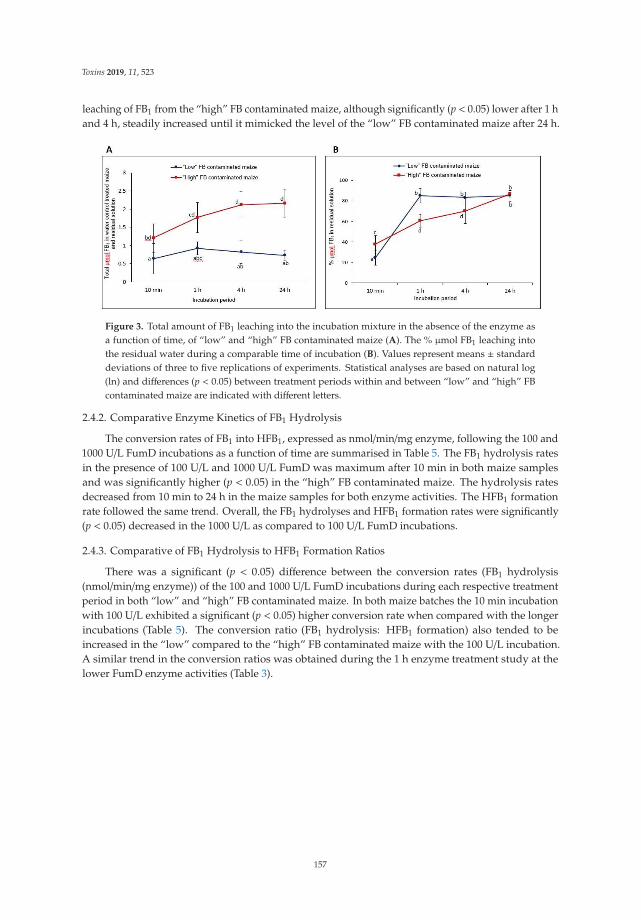
Toxins 2019, 11, 523
leaching of FB1 from the “high” FB contaminated maize, although significantly (p < 0.05) lower after 1 hand 4 h, steadily increased until it mimicked the level of the “low” FB contaminated maize after 24 h.
Figure 3. Total amount of FB1 leaching into the incubation mixture in the absence of the enzyme asa function of time, of “low” and “high” FB contaminated maize (A). The % μmol FB1 leaching intothe residual water during a comparable time of incubation (B). Values represent means ± standarddeviations of three to five replications of experiments. Statistical analyses are based on natural log(ln) and differences (p < 0.05) between treatment periods within and between “low” and “high” FBcontaminated maize are indicated with different letters.
2.4.2. Comparative Enzyme Kinetics of FB1 Hydrolysis
The conversion rates of FB1 into HFB1, expressed as nmol/min/mg enzyme, following the 100 and1000 U/L FumD incubations as a function of time are summarised in Table 5. The FB1 hydrolysis ratesin the presence of 100 U/L and 1000 U/L FumD was maximum after 10 min in both maize samplesand was significantly higher (p < 0.05) in the “high” FB contaminated maize. The hydrolysis ratesdecreased from 10 min to 24 h in the maize samples for both enzyme activities. The HFB1 formationrate followed the same trend. Overall, the FB1 hydrolyses and HFB1 formation rates were significantly(p < 0.05) decreased in the 1000 U/L as compared to 100 U/L FumD incubations.
2.4.3. Comparative of FB1 Hydrolysis to HFB1 Formation Ratios
There was a significant (p < 0.05) difference between the conversion rates (FB1 hydrolysis(nmol/min/mg enzyme)) of the 100 and 1000 U/L FumD incubations during each respective treatmentperiod in both “low” and “high” FB contaminated maize. In both maize batches the 10 min incubationwith 100 U/L exhibited a significant (p < 0.05) higher conversion rate when compared with the longerincubations (Table 5). The conversion ratio (FB1 hydrolysis: HFB1 formation) also tended to beincreased in the “low” compared to the “high” FB contaminated maize with the 100 U/L incubation.A similar trend in the conversion ratios was obtained during the 1 h enzyme treatment study at thelower FumD enzyme activities (Table 3).
157
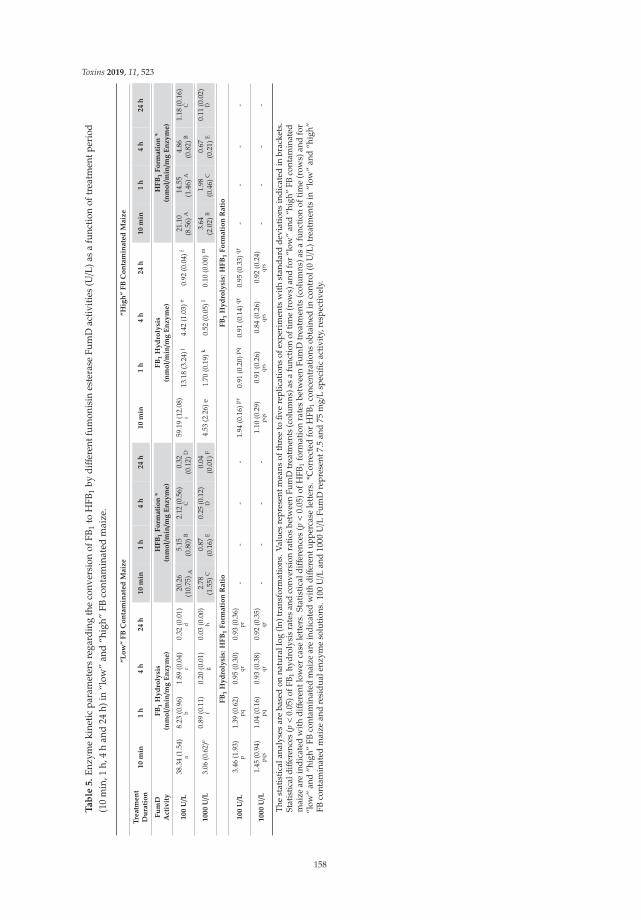
Toxins 2019, 11, 523
Ta
ble
5.
Enzy
me
kine
ticpa
ram
eter
sre
gard
ing
the
conv
ersi
onof
FB1
toH
FB1
bydiff
eren
tfum
onis
ines
tera
seFu
mD
activ
ities
(U/L
)as
afu
nctio
nof
trea
tmen
tper
iod
(10
min
,1h,
4h
and
24h)
in“l
ow”
and
“hig
h”FB
cont
amin
ated
mai
ze.
“L
ow
”F
BC
on
tam
inate
dM
aiz
e“H
igh
”F
BC
on
tam
inate
dM
aiz
e
Tre
atm
en
tD
ura
tio
n10
min
1h
4h
24
h10
min
1h
4h
24
h10
min
1h
4h
24
h10
min
1h
4h
24
h
Fu
mD
Act
ivit
yF
B1
Hy
dro
lysi
s(n
mo
l/m
in/m
gE
nzy
me)
HF
B1
Fo
rmati
on
*(n
mo
l/m
in/m
gE
nzy
me)
FB
1H
yd
roly
sis
(nm
ol/
min/m
gE
nzy
me)
HF
B1
Fo
rmati
on
*(n
mo
l/m
in/m
gE
nzy
me)
100
U/L
38.3
4(1
.54)
a8.
23(0
.96)
b1.
89(0
.04)
c0.
32(0
.01)
d20
.26
(10.
75) A
5.15
(0.8
0)B
2.12
(0.5
6)C
0.32
(0.1
2)D
59.1
9(1
2.08
)i
13.1
8(3
.24)
j4.
42(1
.03)
e0.
92(0
.04)
f21
.10
(8.5
6)A
14.5
5(1
.46)
A4.
86(0
.82)
B1.
18(0
.16)
C
1000
U/L
3.06
(0.6
2)e
0.89
(0.1
1)f
0.20
(0.0
1)g
0.03
(0.0
0)h
2.78
(1.5
5)C
0.87
(0.1
6)E
0.25
(0.1
2)D
0.04
(0.0
1)F
4.53
(2.2
6)e
1.70
(0.1
9)k
0.52
(0.0
5)l
0.10
(0.0
0)m
3.64
(2.0
2)B
1.98
(0.4
6)C
0.67
(0.2
1)E
0.11
(0.0
2)D
FB
1H
yd
roly
sis:
HF
B1
Fo
rmati
on
Rati
oF
B1
Hy
dro
lysi
s:H
FB
1F
orm
ati
on
Rati
o
100
U/L
3.46
(1.9
3)p
1.39
(0.6
2)pq
0.95
(0.3
0)qr
0.93
(0.3
6)pr
--
--
1.94
(0.1
6)pr
0.91
(0.2
0)pq
0.91
(0.1
4)qr
0.95
(0.3
3)qr
--
--
1000
U/L
1.45
(0.9
4)pq
s1.
04(0
.16)
pq0.
93(0
.38)
qr0.
92(0
.35)
qr-
--
-1.
10(0
.29)
pqs
0.91
(0.2
6)qr
s0.
84(0
.26)
qrs
0.92
(0.2
4)qr
s-
--
-
The
stat
istic
alan
alys
esar
eba
sed
onna
tura
llog
(ln)
tran
sfor
mat
ions
.Val
ues
repr
esen
tmea
nsof
thre
eto
five
repl
icat
ions
ofex
peri
men
tsw
ithst
anda
rdde
viat
ions
indi
cate
din
brac
kets
.St
atis
tical
diff
eren
ces
(p<
0.05
)ofF
B 1hy
drol
ysis
rate
san
dco
nver
sion
ratio
sbe
twee
nFu
mD
trea
tmen
ts(c
olum
ns)a
sa
func
tion
oftim
e(r
ows)
and
for
“low
”an
d“h
igh”
FBco
ntam
inat
edm
aize
are
indi
cate
dw
ith
diff
eren
tlow
erca
sele
tter
s.St
atis
tica
ldiff
eren
ces
(p<
0.05
)ofH
FB1
form
atio
nra
tes
betw
een
Fum
Dtr
eatm
ents
(col
umns
)as
afu
ncti
onof
tim
e(r
ows)
and
for
“low
”an
d“h
igh”
FBco
ntam
inat
edm
aize
are
indi
cate
dw
ith
diff
eren
tupp
erca
sele
tter
s.*C
orre
cted
for
HFB
1co
ncen
trat
ions
obta
ined
inco
ntro
l(0
U/L
)tre
atm
ents
in“l
ow”
and
“hig
h”FB
cont
amin
ated
mai
zean
dre
sidu
alen
zym
eso
luti
ons.
100
U/L
and
1000
U/L
Fum
Dre
pres
ent7
.5an
d75
mg/
Lsp
ecifi
cac
tivi
ty,r
espe
ctiv
ely.
158

Toxins 2019, 11, 523
3. Discussion
Bioremediation, utilising enzymes for detoxification and/or degradation of environmentalchemicals has become an intuitive way to reduce the risk of exposure in animals and humans.A popular approach is to use enzymes that can bind with high affinity toxic compounds and catalyzetheir hydrolysis, thereby abandoning or reducing their toxicity [27]. The present study establishedan enzymatic method for FB reduction utilizing fumonisin esterase FumD in whole maize intendedfor human consumption. The method involved treatment of “low” and “high” FB contaminatedhome-grown maize with varying FumD activities in solution as a function of time. FumD has beenproved effective as a feed enzyme when incorporated into ground maize at a concentration of 40 U/kgfeed [23]. In the current method, FumD was applied to whole maize, therefore the accessibility of FBwould be expected to require higher FumD activities and longer incubation times for reduction thanwith ground maize. However, a major advantage of the current FumD FB reduction method is thatthe bulk of the residual enzyme and hydrolysed less toxic HFB1 product are not associated with thetreated maize kernels, which could find application when considering the reduction of FBs in foodintended for human consumption.
Despite the fact FumD treatments were performed in the current reduction method at sub-optimalpH (approximately pH 5 to 5.5) and ambient temperature (±23 ◦C) conditions [optimal enzyme activityis obtained at pH 8 and 30 ◦C [14], effective hydrolysis of FB was observed in both maize batches.Treatment with 1000 U/L FumD effectively hydrolysed FB in “low” and “high” FB contaminated maizeresulting in ≥80% reduction in the total FB levels after 1 h while lower enzyme activities (≤100 U/L)were less effective. At lower enzyme activities large variations in the FB levels and hydrolyses rateswere noticed, which could be related to (i) sample variation within maize batches, (ii) enzyme and/orsubstrate availability as a function of time, and (iii) the formation of partially hydrolysed FB (PHFB) [28],which will be present as transient intermediates to the completely hydrolysed molecule at high enzymeactivities. A significant (p < 0.05) decrease of FB1 reduction in the “low” FB contaminated maize wasnoticed already at 10 U/L FumD compared to the 100 U/L in the “high” FB contaminated maize. Thesedifferences could be related to the FumD activities applied, FB1 availability at the kernel/aqueousinterphase and the formation of PHFB, and will be discussed below.
When considering differences in the formation of HFB1 into the residual enzyme solution,maximum levels were already noticed from 100 U/L FumD activity. This suggests that some of thehydrolysed product is retained within the maize matrix as well as the possible formation of PHFB1.This became apparent as, although HFB1 was mainly associated (>90%) with the residual enzymesolution at low enzyme activities (10 and 100 U/L), it tends to accumulate in the “high” and to a lesserextent in the “low” FB contaminated maize kernels at incubations using increased FumD activities(≥1000 U/L). This could be ascribed to the formation of HFB1 and PHFB1 in the inner layers of themaize kernel matrix as compared to the “low” FB contaminated maize, where it mainly occurred onthe surface.
As mentioned above, differences occurred in the extent of FB1 hydrolysis between the two sampleswhen considering the % FB1 loss in the maize as well as the FB1 hydrolysis to HFB1 formation ratio inthe incubation mixture, specifically at the lower FumD enzyme activities. These differences were alsonoticed when considering the enzyme kinetics of FB1 hydrolysis and HFB1 formation rates at 100 and1000 U/L FumD activities, which were significantly (p < 0.05) increased in the “high” FB contaminatedmaize. The higher FB1 conversion rate obtained with the 100 U/L FumD activity as compared to the1000 U/L enzyme activity is related, as mentioned above, to FB availability and/or the limitation thereofwhen utilising excess enzyme activities.
The level of FB contamination determined the hydrolysis rate implying that fungal infiltrationand FB production inside the kernel are key rate limiting factors. This became evident as Fusarium spp.infects maize with the fumonisins concentrated in the pericarp and embryo of the maize kernel [29],while in damaged kernels the fungus is likely to penetrate deeper into the kernel, contaminatingthe endosperm [30–32]. It is known that leaching of substances from the maize endosperm occurs
159
Toxins 2019, 11, 523
during absorption of water while damage to the kernel pericarp increases leaching early during waterabsorption [33].
Differences in FB1 hydrolysis rates between the “low” and “high” FB contaminated maize batchesare therefore likely to depend on the leaching of FB1 from the maize kernel and the interaction ofFumD at the kernel outer layer/aqueous inter phase. This became apparent when considering the %FB1 hydrolysis in the “low” FB contaminated sample that reached a maximum already after 100 U/Lcompared to the “high” FB contaminated maize reaching a maximum at 1000 U/L. This implies that theFB1 became depleted as a substrate for the enzyme much earlier. This was also evident as leaching ofFB1 into the water control was faster from the “low” FB contaminated maize at 1 and 4 h of incubationcompared to a more gradual effect considering the “high” FB contaminated maize. The gradualincreased leaching of FB1 from the “high” FB contaminated maize could be related to the extentof fungal damage of the kernels that will determine the diffusion rate of FB1 from the inner layers.Therefore, the higher initial (10 min) conversion rate of FB1 in the “high” as compared to “low” FBcontaminated maize is facilitated by the accessibility of FB1 associated with the inner as well as outerlayers. The location of FB1 in the kernel and the leaching rate into the aqueous enzyme-solution couldtherefore affect the efficacy of FB conversion rates and substrate to product ratios as noticed in thecurrent study. However, the efficacy of FumD is not only determined by the concentration of FB1
leaching into the aqueous phase but could also depend on the enzyme penetration into the endospermwhich could explain the differences in FB conversion rates between “low” and “high” FB contaminatedmaize. This became evident as an increased % of HFB1 was noticed in the maize kernels when utilisinghigher FumD activities. Therefore, depending on the extent of fungal damage and FB contaminationto the maize pericarp/endosperm, a specific FumD activity seems to be required for maximum FB1
hydrolysis, yielding a 1:1 FB1 hydrolysis to HFB1 formation ratio. This would become importantwhen considering the application of the enzyme in different technological approaches utilising maizesamples with varying FB contamination levels.
From a technological perspective, enzymatic detoxification of FB has been utilised effectively inthe animal feed industry [21,22,24], while very little is known about possible applications to reduceexposure in humans. In this regard, commercial maize-based manufacturing processes, including drymilling and ethanol production are challenged with maintaining regulatory levels for FB in productsand co-products [29,34]. During dry milling the FB mycotoxins are known to be ± 3-fold concentratedin the surface layers and are mainly confined to the total hominy feed fractions, which are mainly usedin animal feed or non-food products [29]. As most micronutrients are concentrated in total hominy feedand a large portion of maize grain is lost in this fraction [35], FB decontamination could be of value withrespect to human food. It could also find application during ethanol production, as the co-products wetand dry distillers’ grains and solubles, containing high levels of FB, are increasingly being marketed asprotein-rich and cost-saving inclusion in livestock and poultry feed [34]. Therefore, possible economicadvantages of the FumD FB reduction method for commercial maize-based manufacturing processesshould be further investigated.
The FumD FB reduction method in maize could also find application in communities utilisinghome-grown maize as a main dietary staple and known to be exposed above the tolerable daily intakelevels, i.e., a PMTDI of 2 μg/kg/bw/day [36,37]. To decrease the risk of FB exposure, culturally sensitive,practical and biologically based methods of reduction are relevant and need to be implemented [1].In the current study, the “low” FB contaminated maize contained FB levels below the regulatorymaximum levels for fumonisins in maize (total FB1 and FB2 4000 μg/kg) set by the Codex AlimentariusCommission [38], while the high FB contaminated samples exceeded that. These maize batcheswere therefore ideal to evaluate the newly designed FumD FB reduction method, which could findapplication in maize subsistence farming communities where exposure to high levels of FB is the normon a daily basis [37,39]. Of interest is that the bulk of HFB1 resides into the aqueous phase, whichwill further minimize exposure to, not only FB1, but also to the less toxic breakdown product, HFB1.
160

Toxins 2019, 11, 523
However, increased amounts (up to 32%) of HFB1 accumulated in “high” FB contaminated maize inthe presence of increased FumD activities.
Recently a practical and culturally sensitive maize hand-sorting and water wash interventionmethod resulted in 84% reduction of FB1 levels [40]. In the current study, the 1000 U/L FumD treatmentresulted in access of 80% reduction in total FBs in both “low” and “high” FB contaminated samples.However, as only approximately 10% of FB is removed from the maize kernels during the water washprocedure [41], the newly developed FumD FB reduction method could effectively be applied to furtherreduce FB exposure prior to food preparation.
4. Conclusions
The present study developed an innovative FumD FB reduction method in whole maize. Themethod is suitable for direct application in the food chain postharvest, resulting in the reduction of FB1
with the formation of the hydrolysed breakdown product, HFB1, mainly associated with the aqueousphase to be discarded. Reduction of FB in contaminated maize could have a positive impact on foodsafety and security as well as having economic benefits during manufacturing processes.
5. Materials and Methods
5.1. Chemicals
Methanol, acetonitrile, formic acid (HPLC grade) and Whatman filter paper were obtained fromMerck (Kenilworth, NJ, USA). Water for all experiments was successively purified by reverse osmosisfollowed by Milli-Q water purification (Millipore, Burlington, MA, USA).
5.2. Fumonisin Standard Solutions
Pure analytical standards of FB1, FB2, FB3 and HFB1 (purity > 97%) were prepared at the Instituteof Biomedical and Microbial Biotechnology of the Cape Peninsula University of Technology, SouthAfrica, according to the methods of Cawood et al. [42] and Gelderblom et al. [13]. Stock solutionsof the individual purified fumonisin standards were prepared (1 mg/mL in acetonitrile-H2O (1:1))and aliquots used to prepare an evaporated working solution containing the fumonisin standards atindividual concentrations of 5 μg/mL. For compiling matrix-matched calibration curves, five workingstandard dilutions were prepared with blank maize matrix extract as solvent, as described below.
5.3. Maize Sample Collection
Home-grown maize was collected in the Centane, Mnquma Local Municipality (areas of theformer Transkei region) of the Eastern Cape Province, South Africa from households of subsistencemaize farmers. “Good” home-grown whole maize was collected directly from visibly healthy batchesdestined for human consumption. “Mouldy” home-grown whole maize was collected directly from“mouldy” batches destined for chicken/livestock feed. The “good” and “mouldy” maize batches werelabelled “low” and “high” FB contamination, respectively. Each maize batch was thoroughly mixedand kept at 4 ◦C until analysed. Control maize containing no fumonisins, was obtained from theSouthern African Grain Laboratory (Pretoria, South Africa) and used for the preparation of a maizeextract used for matrix-matched calibration curves.
5.4. FumD Enzyme Preparation
A fumonisin esterase, designated FumD (EC 3.1.1.87; FUMzyme®), was obtained from BIOMIN(Tulln, Austria) with a specific activity of 13,400 U/g. One unit is the enzymatic activity definedto release 1 μmol tricarballylic acid per minute from 100 μM FB1 in 20 mM Tris-HCl buffer pH 8.0containing 0.1 mg/mL bovine serum albumin at 30 ◦C. A stock enzyme solution (400 U/mL) wasprepared in the Tris-HCl buffer and used in all experiments.
161
Toxins 2019, 11, 523
5.5. The FumD FB Reduction Method
Enzyme solutions utilised were prepared in distilled water from the FumD stock solution. Maizekernels (100 g) of the “low” and “high” FB contaminated maize batches were weighed in Erlenmeyerflasks (500 mL) and enzyme solution added (200 mL), obtaining a maize to solvent ratio of 1:2. Sampleswere mixed at 80 rpm on a shaker (New Brunswick Scientific, Edison Township, NJ, USA) at ambienttemperature (± 23 ◦C) for different incubation periods. The residual enzyme solution was decantedand stored at −20 ◦C until analysed, while the residual maize kernels were dried onto laboratory papertowels at ambient temperature for 48 h. Residual maize kernel samples were ground in a laboratorymill (Falling Number AB, Stockholm, Sweden) to a fine meal and kept in airtight containers at −20 ◦Cuntil analysed. Three to five replicates were included for each treatment.
5.6. FumD Incubation Protocols
To obtain the optimal enzyme activity required for FB hydrolysis the maize samples were incubatedwith different FumD activities (10, 100, 1000 and 5000 U/L) for 1 h as described above. The pH values ofthe maize-enzyme solutions were determined before and after the incubation treatment. In a follow-upexperiment two FumD activities (100 and 1000 U/L) were used, and incubations were carried out overvarying time periods including 10 min, 1 h, 4 h and 24 h to investigate the FB hydrolysis kinetics.Reference water control incubations were included in each experiment. All samples were processedand stored as described above.
5.7. Analyses of FB and HFB1 Concentrations in Maize and Residual Solutions
FB1, FB2, FB3 and HFB1 concentrations were determined in the (i) untreated “low” and “high” FBcontaminated maize batches (five replicates), (ii) the water control and enzyme treated residual maizekernel samples, and (iii) residual water control and enzyme solutions (3–5 replicate experiments).
5.7.1. Extraction Methods
FB and HFB1 were extracted from maize according to the method of Sewram et al. [43] with minormodifications. Briefly, 100 mL of extraction solvent [methanol: acetonitrile: water (25:25:50; v/v/v)]was added to ground maize kernels (10 g) and placed on a shaker (80 rpm) for 20 min. The extractswere subsequently centrifuged (4000× g) in a refrigerated Sorvall RC-3B centrifuge (DuPont, Norwalk,CT, USA) at 4 ◦C for 10 min. The supernatant (20 ml) was diluted (1:1) with methanol:water (25:75),filtered (Whatman No 4 filter paper) and filtrates analyzed by direct injection into the LC-MS/MS.FAPAS (London, UK) quality control reference maize samples (Cat no T22123QC), containing themycotoxins in known concentration ranges were included. For analyses of the residual solutions,samples were filtered (Whatman No 4 filter paper) and filtrates analysed directly by LC-MS/MS.Matrix-matched standard solutions for calibration curves were prepared utilising an extract preparedfrom control maize.
5.7.2. Chromatographic Quantification of FB and HFB1
Quantification of FB and HFB1 in maize extracts and residual enzyme solutions was performedby the Mass Spectrometry Unit of the Central Analytical Facility of Stellenbosch University, SouthAfrica. The mycotoxins were separated on a reversed-phase BEH C18 column (2.1 × 100 mm; particlesize 1.7 μm) (Waters, Milford, MA, USA) and analysed with positive electrospray ionisation (EI) inthe multiple reaction monitoring (MRM) mode in a Waters Acquity Ultra high performance LiquidChromatograph (UPLC) coupled to a Tandem Quadrupole Mass spectrometer (Waters Xevo TQ MS).Eluent A was water and eluent B was methanol, both containing 0.1% formic acid. The chromatographicmethod held the initial mobile phase composition (15% B) constant for 2 min, followed by a lineargradient to 100% B within 3 min. This final condition was held for 3.30 min, followed by 8 minof column re-equilibration at 15% B. The flow rate of the mobile phase was 0.35 ml/min. For each
162
Toxins 2019, 11, 523
compound, one precursor and two product ions were monitored, one product ion for quantificationand one for confirmation. A calibration curve consisting of five matrix-matched standards for eachmycotoxin was used for quantification.
5.7.3. Validation of the Extraction and FB Quantification Methods
The extraction and chromatographic methods were validated by determining the LOQ, linearity(r2) of the calibration curve, selectivity, accuracy, and % recovery according to guidelines of the UnitedStates Department of Health and Human Services, Food and Drug Administration [44].
5.8. Statistical Analyses
The NCSS Version 11 software [45] was used for statistical analysis. Data were subjected tonatural log (ln) transformation of all variables and analysed within a generalised linear model ANOVA.Multiple comparisons were analysed using the Tukey-Kramer’s multiple comparison procedure. Thismethod provides joint simultaneous confidence intervals for all pairwise differences between themeans; and also provides the multiple comparison p-value. Generally, p < 0.05 was used as statisticalsignificance. In addition, the size of the F-ratios was used to measure relative sizes of differences.
Author Contributions: Data curation, J.A. and W.G.; Formal analysis, J.A. and I.D.; Funding acquisition, J.A.;Methodology, J.A., G.S., W.-D.M., J.R., H.-M.B., G.S. and W.G.; Resources, G.S., W.-D.M., J.R. and H.-M.B.;Supervision, J.A.; Validation, J.A.; Writing—original draft, J.A. and I.D.; Writing—review & editing, J.A., G.S.,W.-D.M., J.R., H.-M.B., G.S. and W.G.
Funding: This research was funded by the South African Maize Trust (Project MTM 13/04).
Acknowledgments: The authors thank the South African Maize Trust for their financial support of research onenzymatic methods for reduction of mycotoxin concentrations in maize.
Conflicts of Interest: The authors declare no conflict of interest.
References
1. Alberts, J.F.; van Zyl, W.H.; Gelderblom, W.C.A. Biologically based methods for control offumonisin-producing Fusarium species and reduction of the fumonisins. Front. Microbiol. 2016, 7, 548.[CrossRef] [PubMed]
2. Yates, I.E.; Meredith, F.; Smart, W.; Bacon, C.W.; Jaworski, A.J. Trichoderma viride suppresses fumonisin B1
production by Fusarium moniliforme. J. Food Prot. 1999, 62, 1326–1332. [CrossRef] [PubMed]3. Bacon, C.W.; Yates, I.E.; Hinton, D.M.; Meredith, F. Biological control of Fusarium moniliforme in maize.
Environ. Health Perspect. 2001, 109, 325–332.4. Duvick, J. Prospects for reducing fumonisin contamination of maize through genetic modification. Environ.
Health Perspect. 2001, 109, 337–342.5. Duvick, J.; Maddox, J.; Gilliam, J. Composition and methods for fumonisin detoxification. Patent No
US6538177, 25 March 2003.6. Cleveland, T.E.; Dowd, P.F.; Desjardins, A.E.; Bhatnagar, D.; Cotty, P.J. United States Department
of Agriculture-Agricultural Research Service research on pre-harvest prevention of mycotoxins andmycotoxigenic fungi in US crops. Pest. Manag. Sci. 2003, 59, 629–642. [CrossRef] [PubMed]
7. Cavaglieri, L.; Passone, A.; Etcheverry, M. Screening procedures for selecting rhizobacteria with biocontroleffects upon Fusarium verticillioides growth and fumonisin B1 production. Res. Microbiol. 2004, 155, 747–754.[CrossRef] [PubMed]
8. Samapundo, S.; De Meulenaer, B.; Osei-Nimoh, D.; Lamboni, Y.; Debevere, J.; Devlieghere, F. Can phenoliccompounds be used for the protection of corn from fungal invasion and mycotoxin contamination duringstorage? Food Microbiol. 2007, 24, 465–473. [CrossRef]
9. Dalie, D.K.; Deschamps, A.M.; Atanasova-Penichon, V.; Richard-Forget, F. Potential of Pediococcus pentosaceus(L006) isolated from maize leaf to suppress fumonisin-producing fungal growth. J. Food Prot. 2010, 73,1129–1137. [CrossRef]
163

Toxins 2019, 11, 523
10. Bacon, C.W.; Hinton, D.M. In planta reduction of maize seedling stalk lesions by the bacterial endophyteBacillus mojavensis. Can. J. Microbiol. 2011, 57, 485–492. [CrossRef]
11. Mitchell, N.J.; Xue, K.S.; Lin, S.; Marroquin-Cardona, A.; Brown, K.A.; Elmore, S.E.; Tang, L.; Romoser, A.;Gelderblom, W.C.A.; Wang, J.; et al. Calcium montmorillonite clay reduces AFB1 and FB1 biomarkers in ratsexposed to single and co-exposures of aflatoxin and fumonisin. J. Appl. Toxicol. 2014, 34, 795–804. [CrossRef]
12. Alberts, J.F.; Lilly, M.; Rheeder, J.P.; Burger, H.M.; Shephard, G.S.; Gelderblom, W.C.A. Technological andcommunity-based methods to reduce mycotoxin exposure. Food Control. 2017, 73, 101–109. [CrossRef]
13. Gelderblom, W.C.A.; Cawood, M.E.; Snyman, S.D.; Vleggaar, R.; Marasas, W.F.O. Structure-activityrelationships of fumonisins in short-term carcinogenesis and cytotoxicity assays. Food Chem. Toxicol.1993, 31, 407–414. [CrossRef]
14. Heinl, S.; Hartinger, D.; Thamhesl, M.; Kunz-Vekiru, E.; Krska, R.; Schatzmayr, G.; Moll, W.; Grabherr, R.Degradation of fumonisin B1 by the consecutive action of two bacterial enzymes. J. Biotechnol. 2010, 145,120–129. [CrossRef] [PubMed]
15. Duvick, J.; Rood, T.; Maddox, J.; Gilliam, J. Detoxification of mycotoxins in planta as a strategy for improvinggrain quality and disease resistance: Identification of fumonisin-degrading microbes from maize. In MolecularGenetics of Host-Specific Toxins in Plant Disease, Developments in Plant Pathology; Kohmoto, K., Yoder, O.C., Eds.;Springer International Publishing AG: Basel, Switzerland, 1998; Volume 13, pp. 369–381.
16. Duvick, J.; Rood, T.; Wang, X. Fumonisin detoxification enzymes. Patent No US5716820, 10 February 1998.17. Blackwell, B.A.; Gilliam, J.T.; Savard, M.E.; Miller, D.; Duvick, J.P. Oxidative deamination of hydrolysed
fumonisin B1 (AP1) by cultures of Exophiala spinifera. Nat. Toxins 1999, 7, 31–38. [CrossRef]18. Hartinger, D.; Schwartz, H.; Hametner, C.; Schatzmayr, G.; Haltrich, D.; Moll, W.D. Enzyme characteristics
of aminotransferase FumI of Sphingopyxis sp. MTA144 for deamination of hydrolyzed fumonisin B1. Appl.Microbiol. Biotechnol. 2011, 91, 757–768. [CrossRef]
19. Moll, D.; Hartinger, D.; Grießler, K.; Binder, E.M.; Schatzmayr, G. Method for the production of an additivefor the enzymatic decomposition of mycotoxins, additive, and use thereof. Patent No US8703460B2,22 April 2014.
20. Oswald, I.P.; Grenier, B.; Schatzmayr, G.; Moll, W. Enzymatic detoxification of mycotoxins: Hydrolysis offumonisin B1 strongly reduced the toxicity for piglets. In World Nutrition Forum, Nutri Economics: BalancingGlobal Nutrition and Productivity; Binder, E.M., Ed.; Anytime Publishing: Leicestershire, UK, 2012; pp. 263–271.
21. BIOMIN. Available online: https://www.BIOMIN.net/en/home/ (accessed on 12 July 2019).22. Masching, S.; Naehrer, K.; Schwartz-Zimmermann, H.E.; Sãrãndan, M.; Schaumberger, S.; Dohnal, I.; Nagl, V.;
Schatzmayr, D. Gastrointestinal degradation of fumonisin B1 by carboxylesterase FumD prevents fumonisininduced alteration of sphingolipid metabolism in turkey and swine. Toxins 2016, 8, 84. [CrossRef] [PubMed]
23. Grenier, B.; Bracarense, A.F.L.; Schwartz, H.E.; Lucioli, J.; Cossalter, A.; Moll, W.-D.; Schatzmayr, G.;Oswald, I.P. Biotransformation approaches to alleviate the effects induced by Fusarium mycotoxins in Swine.J. Agric. Food Chem. 2013, 61, 6711–6719. [CrossRef]
24. Grenier, B.; Schwartz, H.E.; Gruber-Dorninger, C.; Dohnal, I.; Aleschko, M.; Schatzmayr, G.; Moll, W.-D.;Applegate, T.J. Enzymatic hydrolysis of fumonisins in the gastrointestinal tract of broiler chickens. Poult Sci.2017, 96, 4342–4351. [CrossRef]
25. Mogensen, J.M.; Sørensen, S.M.; Sulyok, M.; van der Westhuizen, L.; Shephard, G.S.; Frisvad, J.C.; Thrane, U.;Krska, R.; Nielsen, K.F. Single-kernel analysis of fumonisins and other fungal metabolites in maize fromSouth African subsistence farmers. Food Addit. Contam. 2011, 28, 1724–1734. [CrossRef]
26. Janse van Rensburg, J.; Flett, B.C.; Mc Laren, N.W.; Mc Donald, A.H. Sampling variation in the quantificationof fumonisins in maize samples. S. Afr. J. Plant. & Soil 2011, 28, 90–96.
27. Febbraio, F. Biochemical strategies for the detection and detoxification of toxic chemicals in the environment.World J. Biol. Chem. 2017, 8, 13–20. [CrossRef] [PubMed]
28. Hahn, I.; Nagl, V.; Schwartz, H.E.; Varga, E.; Schwartz, C.; Slavik, V.; Reisinger, N.; Malachová, A.; Cirlini, M.;Generotti, S.; et al. Effects of orally administered fumonisin B1 (FB1), partially hydrolysed FB1, hydrolysedFB1 and N-(1-deoxy-D-fructos-1-yl) FB1 on the sphingolipid metabolism in rats. Food Chem. Toxicol. 2015, 76,11–18. [CrossRef] [PubMed]
29. Burger, H.-M.; Shephard, G.S.; Louw, W.; Rheeder, J.P.; Gelderblom, W.C.A. The mycotoxin distribution inmaize milling fractions under experimental conditions. Int. J. Food Microbiol. 2013, 165, 57–64. [CrossRef][PubMed]
164
Toxins 2019, 11, 523
30. Brera, C.; Debegnach, F.; Grossi, S.; Miraglia, M. Effect of industrial processing on the distribution offumonisin B1 in dry milling corn fractions. J. Food Prot. 2004, 67, 1261–1266. [CrossRef] [PubMed]
31. Duncan, K.E.; Howard, R.J. Biology of maize kernel infection by Fusarium verticillioides. Mol. Plant. MicrobeInteract. 2010, 23, 6–16. [CrossRef] [PubMed]
32. Kent, N.L.; Evers, D. Dry Milling. In Kent’s Technology of Cereals. An Introduction for Students of Food Scienceand Agriculture, 5th ed.; Rosenstrater, K., Evers, A., Eds.; Woodhead Publishing: Cambridge, UK, 2017;pp. 421–514.
33. Bruggink, H.; Kraak, H.L.; Dijkema, M.H.G.E.; Bekendam, J. Some factors influencing electrolyte leakagefrom maize (Zea mays L.) kernels. Seed Sci. Res. 1991, 1, 15–20. [CrossRef]
34. Wu, F.; Munkvold, G.P. Mycotoxins in Ethanol Co-products: Modeling Economic Impacts on the LivestockIndustry and Management Strategies. J. Agric. Food Chem. 2008, 56, 3900–3911. [CrossRef]
35. Ranum, P.; Pena-Rosas, J.P.; Garcia-Casal, M.N. Global maize production, utilization, and consumption. Ann.N. Y. Acad. Sci. 2014, 1312, 105–112. [CrossRef]
36. Burger, H.-M.; Lombard, M.J.; Shephard, G.S.; Danster-Christians, N.; Gelderblom, W.C.A. Development andevaluation of a sensitive mycotoxin risk assessment model (MYCORAM). Toxicol. Sci. 2014, 141, 387–397.[CrossRef]
37. Shephard, G.S.; Burger, H.-M.; Rheeder, J.P.; Alberts, J.F.; Gelderblom, W.C.A. The effectiveness of regulatorymaximum levels for fumonisin mycotoxins in commercial and subsistence maize crops in South Africa. FoodControl. 2019, 97, 77–80. [CrossRef]
38. FAO. Maximum Levels of Fumonsisin in Maize and Maize Products, Codex Alimentarius Commission,Geneva. Available online: http://www.fao.org/news/story/en/item/238558/icode/ (accessed on 30 May 2019).
39. Alberts, J.; Rheeder, J.; Gelderblom, W.; Shephard, G.; Burger, H.-M. Rural subsistence maize farming inSouth Africa: Risk assessment and intervention models for reduction of exposure to mycotoxins. Toxins2019, 11, 334. [CrossRef]
40. Van der Westhuizen, L.; Shephard, G.S.; Burger, H.M.; Rheeder, J.P.; Gelderblom, W.C.; Wild, C.P.; Gong, Y.Y.Fumonisin B1 as a urinary biomarker of exposure in a maize intervention study among South Africansubsistence farmers. Cancer Epidemiol. Prev. Biomark. 2011, 20, 483–489. [CrossRef]
41. Van der Westhuizen, L.; Shephard, G.S.; Rheeder, J.P.; Burger, H.-M.; Gelderblom, W.C.A.; Wild, C.P.;Gong, Y.Y. Optimising sorting and washing of home-grown maize to reduce fumonisin contamination underlaboratory-controlled conditions. Food Control. 2011, 22, 396–400. [CrossRef]
42. Cawood, M.E.; Gelderblom, W.C.A.; Vleggaar, R.; Behrend, Y.; Thiel, P.; Marasas, W.F.O. Isolation of thefumonisins: A quantitative approach. J. Agric. Food Chem. 1991, 39, 1958–1962. [CrossRef]
43. Sewram, V.; Shephard, G.S.; Marasas, W.F.O.; De Castro, M.F.P.M. Improving extraction of fumonisinmycotoxins from Brazilian corn-based infant foods. J. Food Prot. 2003, 66, 854–859. [CrossRef]
44. United States Department of Health and Human Services, Food and Drug Administration (US FDA). USAGuidance for Industry. Bioanalytical Method Validation. Available online: https://www.fda.gov/regulatory-information/search-fda-guidance-documents/bioanalytical-method-validation-guidance-industry (accessedon 30 May 2019).
45. NCSS 11 Statistical Software. Available online: http://ncss.com/software/ncss (accessed on 30 May 2019).
© 2019 by the authors. Licensee MDPI, Basel, Switzerland. This article is an open accessarticle distributed under the terms and conditions of the Creative Commons Attribution(CC BY) license (http://creativecommons.org/licenses/by/4.0/).
165

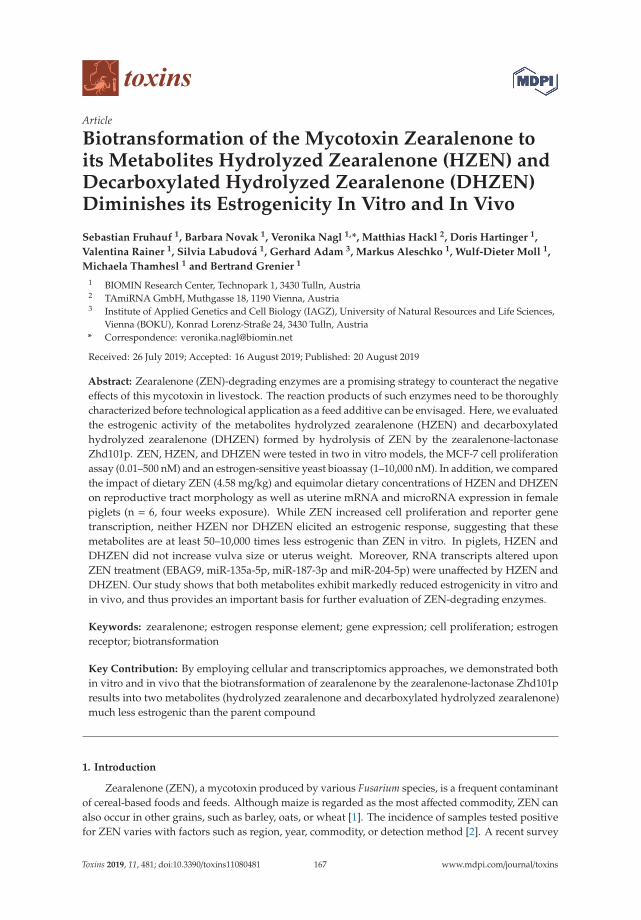
toxins
Article
Biotransformation of the Mycotoxin Zearalenone toits Metabolites Hydrolyzed Zearalenone (HZEN) andDecarboxylated Hydrolyzed Zearalenone (DHZEN)Diminishes its Estrogenicity In Vitro and In Vivo
Sebastian Fruhauf 1, Barbara Novak 1, Veronika Nagl 1,*, Matthias Hackl 2, Doris Hartinger 1,
Valentina Rainer 1, Silvia Labudová 1, Gerhard Adam 3, Markus Aleschko 1, Wulf-Dieter Moll 1,
Michaela Thamhesl 1 and Bertrand Grenier 1
1 BIOMIN Research Center, Technopark 1, 3430 Tulln, Austria2 TAmiRNA GmbH, Muthgasse 18, 1190 Vienna, Austria3 Institute of Applied Genetics and Cell Biology (IAGZ), University of Natural Resources and Life Sciences,
Vienna (BOKU), Konrad Lorenz-Straße 24, 3430 Tulln, Austria* Correspondence: [email protected]
Received: 26 July 2019; Accepted: 16 August 2019; Published: 20 August 2019
Abstract: Zearalenone (ZEN)-degrading enzymes are a promising strategy to counteract the negativeeffects of this mycotoxin in livestock. The reaction products of such enzymes need to be thoroughlycharacterized before technological application as a feed additive can be envisaged. Here, we evaluatedthe estrogenic activity of the metabolites hydrolyzed zearalenone (HZEN) and decarboxylatedhydrolyzed zearalenone (DHZEN) formed by hydrolysis of ZEN by the zearalenone-lactonaseZhd101p. ZEN, HZEN, and DHZEN were tested in two in vitro models, the MCF-7 cell proliferationassay (0.01–500 nM) and an estrogen-sensitive yeast bioassay (1–10,000 nM). In addition, we comparedthe impact of dietary ZEN (4.58 mg/kg) and equimolar dietary concentrations of HZEN and DHZENon reproductive tract morphology as well as uterine mRNA and microRNA expression in femalepiglets (n = 6, four weeks exposure). While ZEN increased cell proliferation and reporter genetranscription, neither HZEN nor DHZEN elicited an estrogenic response, suggesting that thesemetabolites are at least 50–10,000 times less estrogenic than ZEN in vitro. In piglets, HZEN andDHZEN did not increase vulva size or uterus weight. Moreover, RNA transcripts altered uponZEN treatment (EBAG9, miR-135a-5p, miR-187-3p and miR-204-5p) were unaffected by HZEN andDHZEN. Our study shows that both metabolites exhibit markedly reduced estrogenicity in vitro andin vivo, and thus provides an important basis for further evaluation of ZEN-degrading enzymes.
Keywords: zearalenone; estrogen response element; gene expression; cell proliferation; estrogenreceptor; biotransformation
Key Contribution: By employing cellular and transcriptomics approaches, we demonstrated bothin vitro and in vivo that the biotransformation of zearalenone by the zearalenone-lactonase Zhd101presults into two metabolites (hydrolyzed zearalenone and decarboxylated hydrolyzed zearalenone)much less estrogenic than the parent compound
1. Introduction
Zearalenone (ZEN), a mycotoxin produced by various Fusarium species, is a frequent contaminantof cereal-based foods and feeds. Although maize is regarded as the most affected commodity, ZEN canalso occur in other grains, such as barley, oats, or wheat [1]. The incidence of samples tested positivefor ZEN varies with factors such as region, year, commodity, or detection method [2]. A recent survey
Toxins 2019, 11, 481; doi:10.3390/toxins11080481 www.mdpi.com/journal/toxins167

Toxins 2019, 11, 481
reports a ZEN occurrence of 88% in finished feed, maize, and maize silage samples collected at a globalscale [3]. Although median ZEN concentrations of 0.02 mg/kg were found, individual samples reachedlevels of up to 11.19 mg/kg.
ZEN acts as xenoestrogen by activation of estrogen receptors α (ERα, full agonist) and β (ERβ,partial agonist) [4]. Subsequently, ERα and ERβ translocate to the nucleus, bind to estrogen responseelements (ERE, 15-bp palindrome motif) in the promotor regions of target genes and induce theirtranscription [5]. In vitro, this leads to a dose-dependent proliferation of estrogen-dependent cells,such as the human breast cancer cell line MCF-7, upon ZEN treatment [6]. In vivo, ZEN evokessymptoms of hyperestrogenism. In pigs, the species considered to be most sensitive to this mycotoxin,clinical signs include swelling and reddening of the vulva, metaplasia of uterus, ovarian atrophy,enlargement of the mammae in both females and males, decreased testes weight, depressedspermatogenesis and libido, reduced fertility or delivery of stillborn, and weak piglets [1,4]. Alteration ofhematological and biochemical measures, gene expression and subpopulations of immunocompetentcells in tissues have been observed after ZEN exposure in piglets and prepubertal gilts, albeitwith limited reproducibility between studies [7]. Recently, the effect of ZEN on the expression ofmicroRNAs has caught scientific interest [8–11]. MicroRNAs represent a class of small non-codingRNAs, that negatively regulate gene expression. They can serve as indicators for pathological processesin organs, and possess considerable potential as biomarkers [12]. Very recently it has been shownthat ZEN affects uterine expression of certain microRNAs in pigs, among them ssc-miR-424-5p,ssc-miR-450a, ssc-miR-450b-5p, ssc-miR-450c-5p, ssc-miR-503, and ssc-miR-542-3p [11]. This effect waspartly attributed to estrogen receptor (ER) activation, but further molecular targets of this mycotoxin,such as G protein-coupled estrogen receptor 1 [13] or the pregnane X receptor [14], need to beconsidered in this context. An overview of the manifold modes of action of ZEN are provided inseveral comprehensive reviews [1,4,6,15,16].
Due to its frequent occurrence and impairment of animal health, effective strategies for the controlof ZEN are required. Many countries worldwide introduced guidance levels for ZEN in the feed.Within the European Union, recommended guidance levels for ZEN in compound feed for pigs rangefrom 100 μg/kg (piglets, gilts) to 250 μg/kg (sows, fattening pigs) [17]. Yet, these regulations do notaccount for the presence of multiple (modified) mycotoxins in feed, which might potentiate the effectsof ZEN [18]. Prevention of fungal growth and toxin formation by application of good agriculturalpractices represents a key strategy in mycotoxin reduction management [19]. Since those preharvestmeasures are often insufficient to completely eliminate mycotoxins in crops, different postharvesttechniques for removal of ZEN have been tested. Technological possibilities include physical andchemical methods, such as UV irradiation, gamma radiation or application of ozone and peroxide, andare able to degrade ZEN to a certain extent [20]. However, their application is hampered by factors suchas the formation of unknown metabolites, nutrient losses, impairment of palatability, and cost-efficientapplication under field conditions [21]. Feed additives, that either adsorb or biotransform mycotoxinsin the gastrointestinal tract (GIT) of animals and, thus, reduce their bioavailability and/or toxicity, seemto be more applicable in practice. Certain materials (e.g. bentonites, diatomites, zeolites, or yeasts)show remarkable adsorption efficiencies for aflatoxin B1, whereas binding of ZEN is comparativelylow [22,23]. Modifications in the adsorbents’ surface might lead to improved binding capacitiesfor ZEN [20], but the limited specificity of these products and the potential binding of nutrients orveterinary drugs [24] is still a major disadvantage. Hence, the biological transformation of ZEN to non-or less toxic metabolites via microorganisms or enzymes might represent a more suitable option for thefeed and livestock industry.
Several fungi and bacteria originating from soil or the GIT of animals are able to transform ZENin vitro [1,21]. One of the first studies in this field described the reduction of ZEN to α-zearalenol(α-ZEL) and to a lesser extent to β-zearalenol (β-ZEL) by rumen protozoa [25]. Since α-ZEL has a higherbinding affinity to ERs than ZEN [26], this reaction cannot be considered as detoxification. Similarly,a transformation of ZEN to zearalenone-glucosides or zearalenone-sulfate, e.g. by Thamnidium elegans,
168

Toxins 2019, 11, 481
Mucor bainieri or various Rhizopus spp. [27,28], might not be useful for further exploitation as afeed additive, as zearalenone-glucosides and zearalenone-sulfate are hydrolyzed during porcinedigestion, which results in the release and subsequent systemic absorption of ZEN [29]. For manyother microorganisms reported to degrade ZEN, neither the formed metabolites nor their toxicity or theresponsible catabolic pathways have been elucidated in detail [1,21,30]. Two important exceptions haveto be mentioned in this regard. First, Trichosporon mycotoxinivorans can cleave the lactone ring between C5and C6 of the ZEN molecule, thus, producing the non-estrogenic ZOM-1 [31]. Second, Gliocladium roseumNRRL 1859 and Clonostachys rosea (synonym of G. roseum) IFO 7063 are capable of hydrolyzing theester bond of the lactone ring of ZEN [32,33]. The lactonohydrolase mediating this reaction wasfurther characterized, and the encoding gene (zhd101) was cloned [34]. Although the resultingmetabolites had been postulated and partly confirmed before [32,33], the entire reaction mechanismwas unveiled only in 2015 [30]. In this study, Vekiru et al. produced the zearalenone-lactonase Zhd101pfrom a codon-optimized version of the gene zhd101, and identified hydrolyzed zearalenone (HZEN,(E)-2,4-dihydroxy-6-(10-hydroxy-6-oxo-1-undecen-1-yl)benzoic acid) as a primary reaction product.This intermediate partly decarboxylates spontaneously to the previously described decarboxylatedhydrolyzed zearalenone (DHZEN, (E)-1-(3,5-dihydroxy-phenyl)-10-hydroxy-1 -undecen-6-one,Figure 1) [30,33]. For the technological application of the zearalenone-lactonases as a feed additive,estrogenicity assessment of its metabolites HZEN and DHZEN is essential. So far, only one in vitroreport on the estrogenicity of DHZEN is available, showing markedly reduced estrogenic potency inan MCF-7 proliferation assay [32]. In contrast, data on HZEN are completely lacking.
Figure 1. Structures of zearalenone (ZEN) and its metabolites hydrolyzed zearalenone (HZEN) anddecarboxylated hydrolyzed zearalenone (DHZEN) produced by the zearalenone-lactonase Zhd101p(modified based on [30]).
Therefore, the aim of our study was to assess the estrogenicity of HZEN and DHZEN in vitro andin vivo, with ZEN serving as a reference. To this end, appropriate amounts of HZEN and DHZENwere produced, and subsequently tested in the MCF-7 proliferation assay as well as in a yeast bioassay.Furthermore, we evaluated the estrogenic potency of HZEN and DHZEN in prepubertal gilts based onmorphological changes of the reproductive tract and alterations of mRNA and microRNA expressionin uterus tissue. By generating data on the comparative estrogenicity of ZEN, HZEN, and DHZEN,our results contribute significantly to the risk assessment of this ZEN-degrading enzyme approach andits (potential) use as a feed additive.
2. Results
2.1. In Vitro Experiments
First, a proliferation assay with the human breast cancer cells MCF-7 was conducted. For thatpurpose, MCF-7 cells were treated with ZEN, HZEN, and DHZEN at concentrations of 0.01 to 500 nM.Cell proliferation was measured by the WST-1 assay (see Section 5.1.3). After 144 h of incubation, ZENsignificantly stimulated the proliferation of human breast cancer cells at concentrations of 10, 100,and 500 nM. For comparison also ß-estradiol (E2, 10 nM) was tested, which increased cell proliferationto 226.9 ± 52% compared to the cell control. In contrast, neither HZEN nor DHZEN showed increasedin cell proliferation (Figure 2).
169
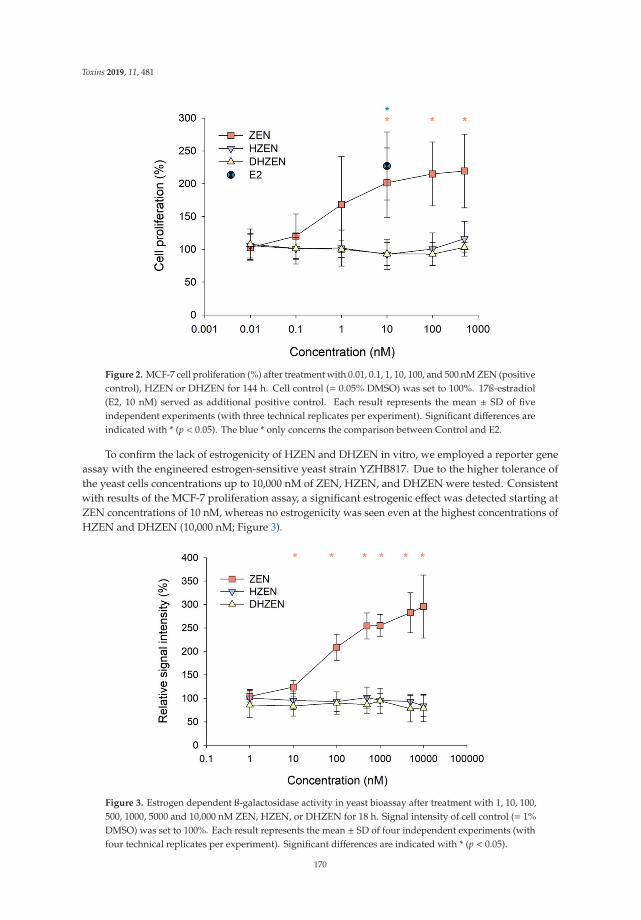
Toxins 2019, 11, 481
Figure 2. MCF-7 cell proliferation (%) after treatment with 0.01, 0.1, 1, 10, 100, and 500 nM ZEN (positivecontrol), HZEN or DHZEN for 144 h. Cell control (= 0.05% DMSO) was set to 100%. 17ß-estradiol(E2, 10 nM) served as additional positive control. Each result represents the mean ± SD of fiveindependent experiments (with three technical replicates per experiment). Significant differences areindicated with * (p < 0.05). The blue * only concerns the comparison between Control and E2.
To confirm the lack of estrogenicity of HZEN and DHZEN in vitro, we employed a reporter geneassay with the engineered estrogen-sensitive yeast strain YZHB817. Due to the higher tolerance ofthe yeast cells concentrations up to 10,000 nM of ZEN, HZEN, and DHZEN were tested. Consistentwith results of the MCF-7 proliferation assay, a significant estrogenic effect was detected starting atZEN concentrations of 10 nM, whereas no estrogenicity was seen even at the highest concentrations ofHZEN and DHZEN (10,000 nM; Figure 3).
Figure 3. Estrogen dependent ß-galactosidase activity in yeast bioassay after treatment with 1, 10, 100,500, 1000, 5000 and 10,000 nM ZEN, HZEN, or DHZEN for 18 h. Signal intensity of cell control (= 1%DMSO) was set to 100%. Each result represents the mean ± SD of four independent experiments (withfour technical replicates per experiment). Significant differences are indicated with * (p < 0.05).
170
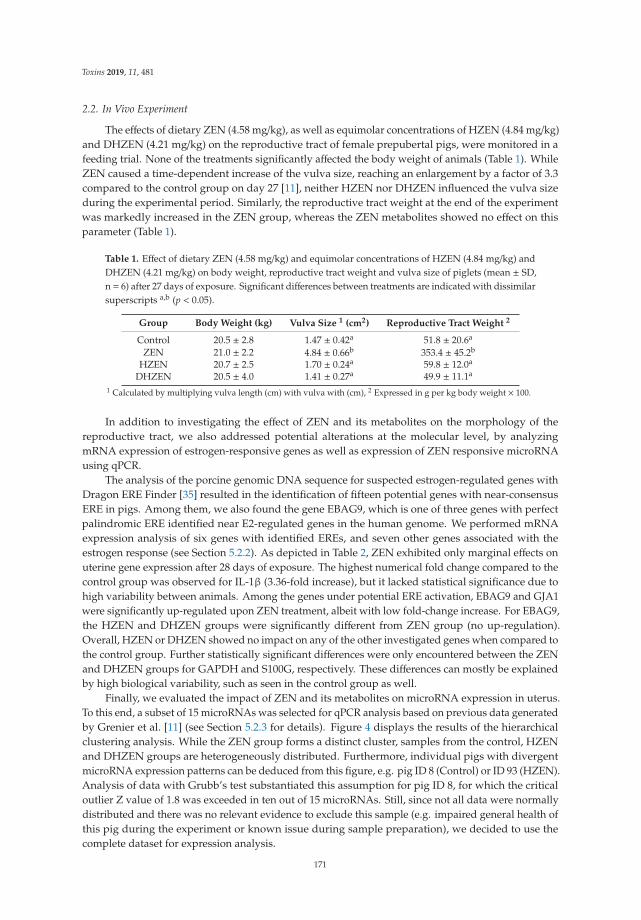
Toxins 2019, 11, 481
2.2. In Vivo Experiment
The effects of dietary ZEN (4.58 mg/kg), as well as equimolar concentrations of HZEN (4.84 mg/kg)and DHZEN (4.21 mg/kg) on the reproductive tract of female prepubertal pigs, were monitored in afeeding trial. None of the treatments significantly affected the body weight of animals (Table 1). WhileZEN caused a time-dependent increase of the vulva size, reaching an enlargement by a factor of 3.3compared to the control group on day 27 [11], neither HZEN nor DHZEN influenced the vulva sizeduring the experimental period. Similarly, the reproductive tract weight at the end of the experimentwas markedly increased in the ZEN group, whereas the ZEN metabolites showed no effect on thisparameter (Table 1).
Table 1. Effect of dietary ZEN (4.58 mg/kg) and equimolar concentrations of HZEN (4.84 mg/kg) andDHZEN (4.21 mg/kg) on body weight, reproductive tract weight and vulva size of piglets (mean ± SD,n = 6) after 27 days of exposure. Significant differences between treatments are indicated with dissimilarsuperscripts a,b (p < 0.05).
Group Body Weight (kg) Vulva Size 1 (cm2) Reproductive Tract Weight 2
Control 20.5 ± 2.8 1.47 ± 0.42a 51.8 ± 20.6a
ZEN 21.0 ± 2.2 4.84 ± 0.66b 353.4 ± 45.2b
HZEN 20.7 ± 2.5 1.70 ± 0.24a 59.8 ± 12.0a
DHZEN 20.5 ± 4.0 1.41 ± 0.27a 49.9 ± 11.1a
1 Calculated by multiplying vulva length (cm) with vulva with (cm), 2 Expressed in g per kg body weight × 100.
In addition to investigating the effect of ZEN and its metabolites on the morphology of thereproductive tract, we also addressed potential alterations at the molecular level, by analyzingmRNA expression of estrogen-responsive genes as well as expression of ZEN responsive microRNAusing qPCR.
The analysis of the porcine genomic DNA sequence for suspected estrogen-regulated genes withDragon ERE Finder [35] resulted in the identification of fifteen potential genes with near-consensusERE in pigs. Among them, we also found the gene EBAG9, which is one of three genes with perfectpalindromic ERE identified near E2-regulated genes in the human genome. We performed mRNAexpression analysis of six genes with identified EREs, and seven other genes associated with theestrogen response (see Section 5.2.2). As depicted in Table 2, ZEN exhibited only marginal effects onuterine gene expression after 28 days of exposure. The highest numerical fold change compared to thecontrol group was observed for IL-1β (3.36-fold increase), but it lacked statistical significance due tohigh variability between animals. Among the genes under potential ERE activation, EBAG9 and GJA1were significantly up-regulated upon ZEN treatment, albeit with low fold-change increase. For EBAG9,the HZEN and DHZEN groups were significantly different from ZEN group (no up-regulation).Overall, HZEN or DHZEN showed no impact on any of the other investigated genes when compared tothe control group. Further statistically significant differences were only encountered between the ZENand DHZEN groups for GAPDH and S100G, respectively. These differences can mostly be explainedby high biological variability, such as seen in the control group as well.
Finally, we evaluated the impact of ZEN and its metabolites on microRNA expression in uterus.To this end, a subset of 15 microRNAs was selected for qPCR analysis based on previous data generatedby Grenier et al. [11] (see Section 5.2.3 for details). Figure 4 displays the results of the hierarchicalclustering analysis. While the ZEN group forms a distinct cluster, samples from the control, HZENand DHZEN groups are heterogeneously distributed. Furthermore, individual pigs with divergentmicroRNA expression patterns can be deduced from this figure, e.g. pig ID 8 (Control) or ID 93 (HZEN).Analysis of data with Grubb’s test substantiated this assumption for pig ID 8, for which the criticaloutlier Z value of 1.8 was exceeded in ten out of 15 microRNAs. Still, since not all data were normallydistributed and there was no relevant evidence to exclude this sample (e.g. impaired general health ofthis pig during the experiment or known issue during sample preparation), we decided to use thecomplete dataset for expression analysis.
171

Toxins 2019, 11, 481
Table 2. Effect of dietary ZEN (4.58 mg/kg) and equimolar amounts of HZEN (4.84 mg/kg) and DHZEN(4.21 mg/kg) on gene expression in the uterus (d28, n = 6). Fold changes in treatment groups areexpressed relative to the control group. Normalized Ct values (ΔCt-values) were used for statisticalanalysis. Significant differences between groups are indicated with dissimilar superscripts a,b (p < 0.05).
Gene Name Protein Name
Relative Gene Expression Mean (and Range)Fold-Change Compared to Control
Control ZEN HZEN DHZEN
EBAG9Receptor-binding cancerantigen expressed on SiSo cells
1.00 a
(0.61–1.65)1.47 b
(1.01–2.16)1.04 a
(0.67–1.61)1.05 a
(0.92–1.20)
OVGP1Oviduct-specific glycoproteinor mucin-9
1.00(0.54–1.85)
2.19(1.03–4.70)
1.35(0.68–2.67)
1.79(1.07–3.00)
IGFBP4Insulin-like growthfactor-binding protein 4
1.00(0.59–1.71)
0.57(0.29–1.15)
1.16(0.70–1.94)
1.23(0.93–1.63)
GJA1Gap junction alpha-1 proteinor connexin 43
1.00 a
(0.62–1.62)1.93 b
(1.48–2.52)1.12 a,b
(0.65–1.93)1.26 a,b
(0.98–1.62)
GAPDHGlyceraldehyde 3phosphatedehydrogenase
1.00 a,b
(0.46–2.15)1.97 a
(1.15–3.37)1.08 a,b
(0.48–2.43)0.92 b
(0.58–1.45)
C3 Complement component 3 1.00(0.41–2.42)
0.78(0.40–1.53)
0.86(0.44–1.69)
1.40(1.11–1.76)
S100GS100 calciumbinding proteinor calbindin D9K
1.00 a,b
(0.13–7.72)0.22 a
(0.02–2.44)2.48 a,b
(1.68–3.66)4.32 b
(2.18–8.54)
CLU Clusterin or apolipoprotein J 1.00(0.53–1.90)
1.27(0.65–2.50)
0.85(0.53–1.35)
1.02(0.73–1.44)
ODC Ornithine decarboxylase 1.00(0.55–1.82)
0.95(0.71–1.28)
0.95(0.62–1.45)
1.09(0.89–1.33)
ESR1 Estrogen receptor alpha 1.00(0.57–1.74)
1.11(0.73–1.68)
1.18(0.66–2.10)
1.24(1.06–1.45)
ESR2 Estrogen receptor beta 1.00(0.39–2.54)
1.22(0.33–4.51)
0.40(0.09–1.90)
1.62(0.53–4.94)
IL-1β Interleukin 1 beta 1.00(0.26–3.90)
3.36(0.47–24.12)
1.23(0.43–3.52)
1.83(1.12–3.01)
IL-6 Interleukin 6 1.00(0.56–1.78)
0.89(0.34–2.36)
1.40(0.85–2.30)
1.90(1.25–2.92)
Figure 4. Hierarchical clustering analysis (average Pearson correlation coefficients) of microRNAexpression in uterus of piglets exposed to uncontaminated feed (Control), ZEN (4.58 mg/kg), HZEN(4.84 mg/kg), or DHZEN (4.21 mg/kg) for 28 days (n = 6). The top row gives the treatment group, eachcolumn represents one pig. Each row represents one microRNA. Red rectangles indicate upregulation,blue rectangles indicate down regulation of the respective microRNA.
172

Toxins 2019, 11, 481
As shown in Table 3, seven of the selected microRNAs were significantly altered by the differentdietary treatments. Compared to the control group, ZEN caused a significant decrease in the expressionof miR-135a-5p, miR-187-3p, and miR-204-5p. In contrast, those microRNAs were unaffected inHZEN or DHZEN exposed animals. ZEN also caused numerical down-regulation of miR-129-5p andmiR-149-5p, which reached statistical significance only compared to the HZEN and/or DHZEN group.None of the selected microRNAs were significantly up-regulated upon ZEN treatment, althoughthe expression of the microRNA members of the miR-503 cluster (e.g. miR-424-5p, miR-450a-5p,miR-450b-5p, miR-450c-5p, miR-542-3p, or miR-503) showed a numerical increase of up to 4.5-fold.In the case of the miR-503 cluster, the only statistically significant difference was detected for miR-450c-5pbetween the ZEN and DHZEN group. In Figure 5, Ct normalized values of four miRNAs are depictedto provide a better overview of the inter-individual variance of microRNA expression, and thus thepotential inter-individual difference in response to the administered substances. Similar to the mRNAanalysis, neither HZEN nor DHZEN caused significant alterations of any investigated microRNAscompared to the control group.
Table 3. Effect of dietary ZEN (4.58 mg/kg) and equimolar amounts of HZEN (4.84 mg/kg) and DHZEN(4.21 mg/kg) on microRNA expression in the uterus (d 28, n = 6). Fold changes in treatment groups areexpressed relative to the control group. Normalized Ct values (ΔCt-values) were used for statisticalanalysis. Significant differences between groups are indicated with dissimilar superscripts a,b (p < 0.05).
microRNA
Relative microRNA Expression Mean (and Range)Fold-Change Compared to Control
Control ZEN HZEN DHZEN
miR-11.00(0.47–2.11)
1.27(0.72–2.22)
1.89(0.63–5.66)
1.03(0.67–1.60)
miR-129-5p1.00 a,b
(0.45–2.24)0.42 a
(0.18–0.99)1.44 b
(0.40–5.21)1.19 b
(0.78–1.82)
miR-135a-5p1.00 a
(0.32–3.11)0.12 b
(0.02–0.68)0.94 a
(0.21–4.27)1.01 a
(0.63–1.62)
miR-143-5p1.00 a
(0.47–2.14)2.78 b
(1.44–5.36)1.45 a,b
(0.38–5.48)0.96 a
(0.65–1.43)
miR-149-5p1.00 a,b
(0.46–2.18)0.37 a
(0.19–0.74)1.77 b
(0.59–5.31)1.11 a,b
(0.76–1.63)
miR-181c-5p1.00(0.40–2.52)
0.40(0.17–0.96)
1.12(0.30–4.24)
1.14(0.70–1.87)
miR-187-3p1.00 a
(0.44–2.29)0.11 b
(0.03–0.48)0.81 a
(0.23–2.85)0.70 a
(0.42–1.16)
miR-204-5p1.00 a
(0.45–2.22)0.29 b
(0.13–0.66)1.58 a
(0.54–4.65)0.99 a
(0.66–1.47)
miR-2061.00(0.36–2.79)
1.34(0.45–4.04)
1.88(0.61–5.81)
0.88(0.56–1.39)
miR-424-5p1.00(0.47–2.15)
3.69(1.31–10.41)
1.86(0.63–5.47)
0.95(0.57–1.57)
miR-450a-5p1.00(0.50–1.98)
4.25(1.45–12.42)
2.11(0.72–6.21)
0.92(0.60–1.42)
miR-450b-5p1.00(0.48–2.09)
3.63(1.34–9.84)
2.00(0.68–5.86)
0.94(0.61–1.44)
miR-450c-5p1.00 a,b
(0.49–2.06)4.52 a
(1.60–12.75)2.36 a,b
(0.78–7.12)0.84 b
(0.54–1.30)
miR-503-5p1.00(0.53–1.89)
3.36(1.29–8.74)
1.16(0.38–3.51)
0.87(0.49–1.54)
miR-542-3p1.00(0.47–2.12)
3.45(1.20–9.89)
2.19(0.72–6.63)
0.88(0.54–1.42)
173

Toxins 2019, 11, 481
Figure 5. Normalized Ct-values of miR-187-3p, miR-135a-3p, miR-143-5p, and miR-503-5p in the uterustissue of piglets exposed to uncontaminated feed (Control), ZEN, HZEN, or DHZEN (d28, n = 6).Individual symbols represent individual pigs. Significant differences between groups are indicatedwith dissimilar superscripts a,b (p < 0.05).
3. Discussion
Due to the limitations of traditional physical and chemical strategies for the detoxification ofmycotoxins, biodegradation of mycotoxins by microorganisms and/or enzymes is an attractive approachto reduce the negative effects of mycotoxins. Several microorganisms capable of detoxification of ZENand other mycotoxins have been previously reported [1,20]. However, for application as a feed additive,feed safety issues have to be sufficiently addressed. From a technological point of view, preparationof microorganisms with good stability during storage and high activity in the gastrointestinal tractis difficult. In comparison, enzymatic degradation using highly specific enzymes should be moreeffective. An example is the zearalenone-lactonase Zhd101p, which degrades ZEN to HZEN as theprimary reaction product. HZEN is unstable and partially decarboxylates to DHZEN. To evaluate thetechnological potential of the zearalenone-lactonase as a feed additive, the present study aimed toinvestigate the estrogenic activity of its reaction products HZEN and DHZEN in vitro and in vivo.
ER-positive MCF-7 cells are widely used in endocrine research, e.g. to determine the estrogenicactivity of substances (proliferation assay, also known as E-screen) or to study potential remedies forestrogen-related diseases, such as breast cancer. Various studies have demonstrated a dose-dependentpro-proliferative effect of ZEN in this cell line (e.g. [32,36–38]). Likewise, ZEN increased cell proliferationof MCF-7 cells in our experiment, which became statistically significant at a concentration of 10 nM(201.4 ± 53.0% compared to the control set to 100%). At higher ZEN concentrations, a saturation incell proliferation at approximately 220% was observed, which is in line with previous studies, whichreport a plateau at around 170% [38] to 220% [32]. In contrast, neither HZEN nor DHZEN affected
174
Toxins 2019, 11, 481
cell proliferation in the tested concentration range, indicating that these metabolites are at least 50 ×less estrogenic than ZEN (500 nM HZEN showed no effect, whereas 10 nM ZEN showed a significanteffect). Higher concentrations were not tested, since ZEN starts to impair cell viability in breast cancercell lines at 1000–25,000 nM [36,37,39]. So far, only one report is available on the estrogenicity of one ofthose ZEN metabolites: Kakeya et al. [32] showed that DHZEN has no impact on cell proliferation ofMCF-7 cells up to a concentration of 100 nM. Thus, we could not only confirm these results but extendthem to HZEN, which was identified as the primary reaction product of the zearalenone-lactonaseonly a few years ago [30].
The MCF-7 proliferation assay only provides information on whether a substance evokes thecellular response known to be induced by estrogens, whereas definite conclusions on the underlyingmechanisms cannot be drawn [40]. Hence, we used a yeast bioassay to investigate specifically theeffect of ZEN, HZEN, and DHZEN on ER activation and subsequent transcription of the reporter geneGAL7-lacZ. Moreover, this yeast bioassay provides several additional advantages, e.g. much easier toperform, no cell culture equipment is needed, the concentration range of test substances is broader,and it has a comparably low turnover time (incubation with test substances takes 18 h as comparedto 144 h for MCF-7 proliferation assay). In the present study, ZEN significantly increased the lacZactivity at 10 nM (124.1 ± 13.8% compared to the control set to 100%). In the MCF-7 proliferationassay, estrogenicity of ZEN was detected at the same concentration. It has been reported that yeastbioassays can be less sensitive than the MCF-7 proliferation assay [40], but this was not observed inour study. In line with results of the MCF-7 proliferation assay, HZEN and DHZEN did not activatethe GAL7-lacZ reporter gene in the yeast bioassay, even at the highest concentration tested (10,000 nM).Given the tested concentration range, HZEN and DHZEN can be considered as at least 1000 times lessestrogenic than ZEN in this assay.
Collectively, our in vitro data showed that neither HZEN nor DHZEN have any measurable effecton MCF-7 cell proliferation or yeast reporter gene transcription in the tested concentration range,indicating a low or even absent intrinsic estrogenic activity of those metabolites. The highest levelsused (500/10,000 nM) correspond to 168/3364 ng/mL for HZEN, 146/2924 ng/mL for DHZEN and159/3184 ng/mL for ZEN. To compare with in vivo exposure, these concentrations were checked againstlevels of ZEN found in biological samples (ZEN was used as a reference, given no toxicokinetic dataare available for HZEN or DZHEN). For instance, one of the highest tissue levels of ZEN measured inpigs was reported by Doell et al. [41], who found on average 5.3 ng/g ZEN in the liver after dietaryadministration of 0.42 mg/kg ZEN. This tissue concentration is approximately by a factor 30/600 lowerthan the highest toxin level used in our in vitro experiments. In addition, the aforementioned tissueconcentration represents a sum value of free and glucuronidated ZEN. The glucuronidation rate in liveraccounts for at least 62% [42] and ZEN-glucuronides lack substantial estrogenic activity [43], furtherstrengthening the assumption that HZEN and DHZEN do not exhibit estrogenic activity at practicallyrelevant concentrations in vivo. However, as emphasized by Andersen et al. [40], the estrogenic activityof a substance in an intact organism cannot be directly deduced from in vitro results. Importantfactors that need to be considered in this regard comprise the substance’s absorption, distribution,metabolism and excretion (ADME), its ability to enter target cells and the concentration of endogenousestrogens. To underline this, differences in the intrinsic activity between ZEN, α-ZEL, and β-ZELare well documented [4], whereas variations in plasma protein binding among these substances andamong species were unraveled only recently [44]. Hence, to indirectly account for all these factors,we evaluated the estrogenic activity of HZEN and DHZEN also in an in vivo experiment in pigs.
Prepubertal female pigs were exposed to 4.58 mg/kg ZEN and equimolar concentrations of HZENand DHZEN, respectively, in order to identify potential adverse health effects of ZEN metabolites atrelatively high dietary levels. This concentration clearly exceeds the EU recommendations for ZENin feed [17], but might still be encountered under unfavorable conditions, where up to 11.19 mg/kgZEN was found in an individual feed sample [3]. In our experiment, the effect of ZEN treatment onvulva size enlargement and reproductive tract weight increase was prominent. This was expected,
175

Toxins 2019, 11, 481
as already exposure to 1.3 mg/kg ZEN for 24 d was shown to significantly affect reproductive tractmorphology [45]. In contrast to ZEN, neither HZEN nor DHZEN caused alterations in any of theclinical parameters assessed, suggesting that both metabolites lack relevant estrogenic activity in vivo.To substantiate this assumption, we next focused on potential changes on the molecular level. Sincepreviously reported data of this animal experiment showed that ZEN had no influence on the plasmametabolome [46], we examined the impact of different treatments on the target organ uterus using atranscriptomics approach.
The classical mechanism, in which ligand-bound ERs interact directly with estrogen responseelements (EREs) to activate the transcription of genes, is called the genomic response. Althoughless extensively studied than E2, ZEN has been shown to induce an estrogenic response via thismechanism [47], and therefore, we first investigated the expression of several genes with identified orpotential EREs in their DNA sequences. As in the human homolog, a perfect ERE palindrome wasfound in the porcine gene sequence of EBAG9. The ERE of the human homolog is recognized by ERswith high specificity in vitro [48]. Although a significant increase was observed for the transcription ofthis gene after ZEN ingestion, the effect seems small (1.5-fold change) given the high concentrationof ZEN used. In contrast, EBAG9 expression in HZEN and DHZEN groups were not different fromthe control group. Similar to EBAG9, little effect was seen on the expression of GJA1, for whicha potential ERE was identified. GJA1 has been already reported as highly regulated by E2 in ratendometrium [49]. In addition, the authors mentioned that the expression of the C3 complement andthe ODC genes were augmented in the uterus of rodents exposed to endocrine disruptors. Basedon our results, which show no significant impact of ZEN on the uterine expression of C3 and ODC,we cannot confirm these findings in pigs for this xenoestrogen. Interestingly, the uterine transcriptionof GAPDH, which is frequently used for qPCR normalization, was affected by ZEN treatment (however,GAPDH transcription in the liver and jejunum was not affected, data not shown). Thus, GAPDH wasexcluded from the list of housekeeping genes we used. This effect was already described in 1998 byZou and Ing [50] in the endometrium of ewes exposed to E2, and it emphasizes the need to selectsuitable reference genes for each analysis of mRNA expression. Although our initial hypothesis on theactivation of genes carrying ERE motifs upon ZEN exposure is not conclusive, activation of GREB1containing ERE in its promoter was very recently demonstrated on MCF-7 cells treated with ZEN [51].In this study, authors used chromatin immunoprecipitation to show that ZEN induced the recruitmentof ERα DNA-binding at chromatin sites. It is plausible that the genes we selected are carrying elementsthat may not represent binding sites in vivo, possibly because of chromatin accessibility [48].
In line with that, we also extended our analysis to genes otherwise associated with the response toestrogens. Several studies showed that the gene S100G, better known to encode the protein Calbindin-D9k (CaBP-9k), is a potent biomarker for screening estrogen-like environmental chemicals [49,52].In pigs, E2 treatment induced an increase in CaBP-9k mRNA levels, while exposure to progesteronecaused a decline in the expression [53]. It seems that CaBP-9k expression is also fluctuating dependingon the serum estrogen levels [52]. In our experiment, none of the treatments induced significantalterations in uterine CaBP-9k expression compared to the control group. Yet, the opposite effectsseen between the piglets fed ZEN and DHZEN deserve further investigations. As briefly discussedin Grenier et al. [11], the lack of effects observed on the ERα is in agreement with Oliver et al. [54],who analyzed the gene and protein expression of ERs in the uterus of piglets exposed to 1.5 mg/kg ofZEN for four weeks. However, Oliver et al. reported a two-fold increase in the mRNA level of ERβ inthose animals, which could not be confirmed in the present experiment.
Another transcriptomics approach we implemented in the present study is the targeted analysisof selected microRNAs. Unlike mRNA analysis focusing on the direct activation of gene transcription,this approach gives information on post-transcriptional gene regulation. Indeed, changes in microRNAlevels (both in blood and tissue) have been reported for certain estrogen-associated diseases in humans,such as breast cancer [55]. In vitro experiments, e.g. in MCF-7 cells, underlined the role of microRNAsnot only in estrogen signaling, but also in mediating the effects of different endocrine disruptors [55].
176

Toxins 2019, 11, 481
Since 2015, several reports on the impact of ZEN on microRNA expression have become available,addressing changes in microRNAs levels in the porcine liver and intestine [9], porcine pituitary glandand its consequences for gonadotropin regulation [10], murine Leydig cell line TM3 [8], as well asporcine uterus and serum [11]. Based on results obtained in the latter, we selected 15 microRNAs andevaluated their response to ZEN, HZEN, and DHZEN treatment by qPCR.
As shown in Table 3, seven of the selected microRNAs were significantly altered by the differentdietary treatments. Compared to the control group, ZEN caused a significant decrease in the expressionof miR-135a-5p, miR-187-3p, and 204-5p. In contrast, those microRNAs were unaffected in HZEN orDHZEN exposed animals. Previous literature studies identified binding sites for ERα in the microRNAgene hsa-miR-135a2, and subsequent in vitro experiments showed up-regulation of miR-135a-5p(previous name: miR-135a) in E2-treated MCF-7 and ZR-75-1 cells [56,57]. Hence, our in vivo findingson decreased miR-135a-5p levels after ZEN exposure were surprising. Yet, direct comparisons ofin vivo and in vitro results on the microRNA response after exposure to ER agonists should be donewith caution. First, most of the in vitro studies use cancer cell lines and among those studies, conflictingresults on the microRNA response were obtained due to differences in methodology and potentialtime-dependent effects [55]. Also, the vast majority of in vitro studies only investigate the role ofsingle microRNAs, which does not reflect the interplay of various microRNAs or potential regulatoryfeedback-loops. As a consequence, it remains challenging to determine the specific role of an individualmicroRNA in the complex estrogen response (which is not solely limited to ERα and ERβ activation)and related diseases. For example, miR-135a-5p was reported to promote, as well as to decrease, breastcancer cell migration [58,59]. Likewise, miR-204-5p (previous name: miR-204) has been addressed bothas oncogene and tumor suppressor, and is e.g. aberrantly expressed in endometrial carcinoma [60].In ovariectomized mice, uterine expression of miR-204 was decreased after E2 treatment [61]. This effectwas counteracted by pre-treatment with ER antagonists, which indicates that microRNA deregulationwas mediated via the ER pathway.
Although miR-135a-5p, miR-187-3p, and 204-5p have been associated with estrogen signalingor related diseases, they do not seem to represent the key players in estrogen signaling [5,55]. In thisregard, members of the miR-503 cluster (a set of two or more microRNAs transcribed from physicallyadjacent microRNA genes) were suggested to have a more prominent role, with miR-503 itself beingaddressed as “candidate master regulator of the estrogen response” [62]. Although a numericalincrease was seen in the present study for the microRNAs belonging to this cluster (e.g. miR-424-5p,miR-450a-5p, miR-450b-5p, miR-450c-5p, miR-542-3p, or miR-503), no significant (p < 0.05) effect wasseen in the uterus of pigs exposed to ZEN, and only some of these microRNAs showed a trend (p < 0.1)towards increased expression. This can be explained by a high inter-individual variance in expressionlevel, with certain pigs being very responsive (up to 8-12-fold increase). Although this increases thevariability within the group, the same consistent effect was seen across these six microRNAs (similaraverage in expression around 3.5-4.0-fold increase). These results are yet not as pronounced as seenfor these microRNAs when using an untargeted RNA sequencing approach [11]. Since samples werederived from the same feeding trial, these differences in effect intensity and significance might be dueto different approaches used for microRNA quantification (qPCR and RNA sequencing). Overall, noneof the investigated microRNAs were significantly altered upon HZEN or DHZEN treatment comparedto the control group. A numerical increase of certain microRNAs (e.g. miR-450c-5p or miR-542-3p)was observed after HZEN treatment, which most likely is irrelevant at practically relevant metaboliteconcentrations. Still, follow-up studies should address this aspect, as well as the time-dependenteffects of ZEN on the microRNA expression. Already now, generated results can serve for predictionand subsequent experimental verification of new mRNA targets of ZEN.
Key steps in the development of mycotoxin-degrading enzymes are the identification of enzymeswith a certain degradation potential, the characterization of the produced metabolites as well as theelucidation of their toxicities [19]. All those conditions have now been met for the zearalenone-lactonaseZhd101p. For the technological application of this enzyme as a feed additive, further challenges
177

Toxins 2019, 11, 481
must be met, above all the fast and efficient degradation of ZEN in vivo. In addition, the enzyme’ssafety (for workers, target species, consumers, and environment) and its storage stability must bedemonstrated [63]. To the best of our knowledge, no ZEN-degrading enzyme has fulfilled all thosecriteria so far and received EU authorization [64]. Hence, further research efforts are needed todevelop a safe and effective ZEN-degrading enzyme to be used as a feed additive. Furthermore,ZEN poses not only a risk for animal health, but is also of concern for humans [20]. In future, theenzyme technology might be evaluated for its application in human nutrition, e.g. during foodprocessing [65]. Importantly, such developments should never indirectly promote the productionof unsafe raw materials, but rather be considered complementary to measures for the reduction ofmycotoxin formation pre- and postharvest [66].
4. Conclusions
HZEN and DHZEN exhibited markedly diminished estrogenic activity compared to ZEN inboth the MCF-7 proliferation assay and the yeast bioassay. In vivo, these metabolites did not causemorphological changes in the reproductive tract in prepubertal gilts. Conclusions on their moleculareffects are hampered by the limited impact observed for ZEN, especially on mRNA level. Still,for transcripts altered upon ZEN treatment (EBAG9, miR-135a-5p, miR-187-3p, and miR-204-5p),neither HZEN nor DHZEN showed an effect. Hence, our data indicate that cleavage of ZEN by thezearalenone-lactonase Zhd101p reduces its estrogenicity in vitro and in vivo. Our study represents animportant step in the safety evaluation of ZEN-hydrolyzing enzymes.
5. Materials and Methods
5.1. In Vitro Experiments
5.1.1. Chemicals, Reagents and Materials
Solid ZEN was obtained from Fermentek LTD (Israel, purity 99.2%), while β-estradiol (E2) waspurchased from Sigma-Aldrich (St. Louis, MO, USA). Further chemicals and reagents used for HZENand DHZEN production comprise acetonitrile (ACN, chromasolv for HPLC, ≥ 99.9%, Sigma-Aldrich,St. Louis, MO, USA), hydrochloric acid 37% (puriss. p.a) and tris base (both Sigma-Aldrich, St. Louis,MO, USA).
For MCF-7 experiments, charcoal-stripped fetal bovine serum and dimethylsulfoxid (DMSO, bothSigma-Aldrich, St. Louis, MO, USA), fetal bovine serum (FBS) and insulin-transferrin-selenium-Asupplement (ITS, both Thermo Fisher Scientific, Waltham, MA, USA), L-glutamine (Sigma-Aldrich,St. Louis, MO, USA) as well as RPMI 1640 with phenol red and RPMI 1640 without phenol red (bothSigma-Aldrich, St. Louis, MO, USA) were used. Cell proliferation reagent WST-1 was obtained fromRoche (Mannheim, Germany).
For the yeast bioassay, chemicals and reagents include α-D-(+)-Glucose (water free, 96%) and2-mercaptoethanol (both Sigma-Aldrich, St. Louis, MO, USA), 2-nitrophenyl-B-D-galactopyranosid(ONPG) (Roth, Karlsruhe, Germany), amino acid drop out mix (adenine, arginine-hydrochloride,aspartic acid, glutamic acid monosodium salt monohydrate, histidine monohydrochloride, isoleucine,leucine, lysine, methionine, phenylalanine, serine, threonine, tyrosine, uracil, valine, all amino acidsin L-form and purchased from Sigma-Aldrich, St. Louis, MO, USA), magnesium sulfate, sodiumcarbonate anhydrous, sodium dihydrogen phosphate monohydrate, sodium phosphate (dibasic) andpotassium chloride (all Sigma-Aldrich, St. Louis, MO, USA), Y-PER Yeast Protein Extraction Reagent(Sigma Aldrich, St. Louis, MO, USA), and yeast nitrogen base (Invitrogen, Carlsbad, CA, USA).
5.1.2. Production of HZEN and DHZEN
Production and purification of HZEN and DHZEN for in vitro and in vivo experiments weredone according to Vekiru et al. [30] with slight modifications. Briefly, multiple batches of 50 mg ZEN
178
Toxins 2019, 11, 481
each were weighed in glass bottles and dissolved in 50 mL of ACN. Afterwards, 1 L of Tris-HCl buffer(pH value 7.5, 30 ◦C) and 1.2 mg of a codon-optimized version of the ZEN-lactonase (Zhd101p) ofGliocladium roseum were added. For the production of HZEN, solutions were incubated on a magneticstirrer for 38 h at 30 ◦C. For DHZEN production half of the HZEN solution was used. Decarboxylationof HZEN was achieved by adding HCl to the HZEN solution to yield a final pH value of 3, and furtherincubation for 10 h at 50 ◦C. Both solutions, HZEN and DHZEN, were concentrated by solid phaseextraction and purified by preparative HPLC as described by Vekiru et al. [30]. Purity (HZEN: 95%,no residual ZEN detected, DHZEN: 98%, no residual ZEN or HZEN detected) and quantity of ZENmetabolites were assessed by LC-UV-MS/MS as described by Hahn et al. [67].
5.1.3. MCF-7 Proliferation Assay
The human breast adenocarcinoma cell line MCF-7 was purchased from the German Collectionof Microorganisms and Cell Cultures (DSMZ, No. ACC 115, Braunschweig, Germany) and grownin RPMI 1640 with phenol red supplemented with 10% FBS, 1% insulin-transferrin-selenium-Asupplement, 1% L-glutamine, and 1% sodium pyruvate at 37 ◦C and 5% CO2. Three days prior to theexperiment, cultivation medium was replaced by the hormone-free medium (RPMI 1640 without phenolred, supplemented with 10% charcoal-stripped FBS, 1% insulin-transferrin-selenium-A supplement,1% L-glutamine, and 1% sodium pyruvate). Approximately 5000 cells/well were seeded in hormone-freemedium (200 μL/well) into a 96-well microplate and cultivated at 37 ◦C and 5% CO2 for 48 h.
In total, MCF-7 cells were subjected to eight different treatments. In five independent experiments,the effects of ZEN and its metabolites on cell proliferation were tested in six concentrations (0.01, 0.1,1, 10, 100, and 500 nM) and compared to a negative (solvent) and positive (10 nM E2) control group.To this end, stock solutions of ZEN, HZEN, and DHZEN (in DMSO) were diluted with hormone-freemedium to the respective concentrations. The DMSO concentration was kept constant at 0.05% in alldilutions, and thus was also used as a negative control.
After 144 h of incubation with different substances, the cell proliferation assay WST-1 (4-[3-(4-iodophenyl)-2-(4-nitrophenyl)-2H-5-tetrazolio]-1,3-benzene disulfonate) was performed accordingto the manufacturer’s instructions. Briefly, supernatants were discarded and cells were incubatedwith a 10% WST-1 solution in the hormone-free medium at 37 ◦C and 5% CO2 for a maximum of 4 h.Absorbance (A450) was measured by a microplate reader (Synergy HT, Biotek, Winooski, VT, USA).The development of formazan dye correlates to the number of metabolically active cells in the culture.
5.1.4. Yeast Bioassay
The yeast strain YZHB817 is a derivative of the yeast two-hybrid strain PJ69-4A [68] in which thegenes encoding the ABC transporter proteins Pdr5 and Snq2 were deleted to reduce efflux and increasenet ZEN uptake [69]. The GAL7-promoter dependent lacZ reporter gene expression is activated by ahybrid protein consisting of amino-acids 1-848 of the yeast Gal4p (activator of galactose utilizationgenes, DNA binding domain) and amino-acids 282-595 of the human ERα providing the hormonedependent activation domain. This chimeric protein is expressed behind the constitutive ADH1promoter on the centromeric plasmid (CEN4 TRP1) pTK103 [70].
A single colony of YZHB817 grown on an SC-TRP agar plate was used to inoculate 25 mL SC-TRPmedium (prepared according to Sherman [71]) and incubated overnight at 28 ◦C, 200 rpm. Dilutions ofZEN, HZEN, and DHZEN were prepared in SC-TRP medium resulting in the following concentrationlevels: 0, 1, 10, 100, 500, 1000, 5000, 10,000 nM. The DMSO concentration was kept constant at 1%in all dilutions. For substance testing, the yeast was diluted to an OD of 0.1 measured at 600 nmand 100 μL aliquots were transferred into U-bottom 96-well plates. After centrifugation (15 min,2250 rcf, 12 ◦C) the supernatant was discarded. Next, 100 μL aliquots of the diluted samples weretransferred into U-bottom 96-well plates containing the YZHB817 cells. All samples were tested inquadruplicate per plate, and the experiment was repeated four times. The plates were covered with
179

Toxins 2019, 11, 481
a sterile BREATHseal™ (Greiner Bio-One, Kremsmünster, Austria) and incubated at 28 ◦C, 70% RH,800 rpm for 18 h.
For detection of ß-galactosidase expression, the reaction reagent was prepared as follows: Y-Per,Z-buffer 10 × (60 mM Na2HPO4 × 7 H2O, 40 mM NaH2PO4 × H2O, 10 mM KCl, 1 mM MgSO4,50 mM 2-mercaptoethanol, pH 7.0) and ONPG-stock (8 mg/mL 2-Nitrophenyl β-D-galactopyranoside)were mixed at a ratio of 0.45/0.275/0.275. Subsequently, 35 μL of this reagent was added to each welland mixed. The plates were incubated for 10 min at 37 ◦C until the samples turned slightly yellow.The reaction was stopped by the addition of 25 μL of 2 M Na2CO3 per well. The plates were centrifugedfor 15 min at 2250 rcf, 12 ◦C and 60 μL of the supernatants were transferred into flat bottom 96-wellplates. Finally, the absorbance was measured at 420 nm.
5.2. In Vivo Experiment
5.2.1. Animals and Study Design
The animal experiment was conducted at the Center for Animal Nutrition (Waxenecker KEG,Austria) and approved by the Institutional Ethical Committee and the Lower Austrian RegionGovernment, Group Agriculture and Forestry, Department of Agricultural Law (LF1-TVG-39/017-2015).All experimental procedures were carried out in accordance with the European Guidelines for theCare and Use of Animals for Research Purposes [72] and the Austrian Animal Experimentation Act2012. The approval dates for the animal experiment were 30.6.2015 (Institutional Ethical Committee)and 29.07.2015 (Lower Austrian Region Government, Group Agriculture and Forestry, Department ofAgricultural Law (LF1-TVG-39/017-2015).
As described in Grenier et al. [11], female weaned piglets (sow: Landrace × Large White, boar:Pietrain, 30 ± 2 days old) were obtained from a local producer and allowed to acclimatize for sevendays. Piglets (n = 24) were housed on slatted floor pens under controlled environmental conditions,and their general health status was monitored daily. To compare the effects of ZEN and equimolarconcentrations of its metabolites, piglets were exposed to one of the four experimental diets (n = 6):i) uncontaminated feed (Control), ii) feed containing 4.58 mg/kg ZEN (ZEN), iii) feed containing4.84 mg/kg HZEN (HZEN), or iv) feed containing 4.21 mg/kg DHZEN (DHZEN). Experimental dietsand water were provided ad libitium for 28 days. Individual bodyweight, vulva length and vulvawidth of piglets were monitored in regular intervals during the experimental period. As presented indetail in Grenier et al. [11], animals were euthanized at day 28, the reproductive tract was dissectedand weighed, and uterus samples were collected for qPCR analysis (mRNA, microRNA).
For homogenous distribution of HZEN and DHZEN within the feed, lyophilizates (Section 5.1.2)were first mixed with maltodextrin (proportion 1:8 and 1:6, respectively). Subsequently, these premixeswere added to the basal feed at an inclusion rate of 0.9%. Concentrations of final diets were confirmedby LC-UV-MS/MS. The absence of any natural and significant contaminations with mycotoxins inthe basal feed, as well as the procedure for artificial ZEN contamination of the diet, is described inGrenier et al. [11].
5.2.2. qPCR Analysis of mRNAs From Genes with Potential ERE or Associated with EstrogenResponse
E2-liganded ERs bind with the highest affinity to EREs (15-bp palindromes) composed ofPuGGTCA motifs separated by three variable bp [73]. To a lesser extent than the extensive work doneby Bourdeau et al. [48] in human and mouse, we tried to identify near-consensus ERE sequences in pigbased on human E2-responsive genes. Sixty genes were pulled out from the list of Bourdeau et al. [48]on the E2-upregulated genes (experimentally validated in humans), and the respective sequences ofthese genes in pigs were obtained (from Ensembl database, https://www.ensembl.org/index.html).Subsequently, each genomic DNA sequence was analyzed with the program Dragon ERE Finderversion 2 [35] in order to identify potential EREs. In addition to this hypothesis of ZEN activating
180
Toxins 2019, 11, 481
genes carrying ERE on their sequences, we also selected a few genes (Table 4) showing growingevidence in the literature that they are responsive to estrogenic compounds, such as the gene S100G(also known as CaBP-9k). We did not find any potential ERE motifs on the DNA sequences of thosegenes. The expression of other genes such as ERα, ERβ, and the two pro-inflammatory cytokines IL-1βand IL-6 was also evaluated via RT-qPCR.
Beforehand, isolation of total RNA was done approximately from 30 mg of uterus tissue, disruptedvia bead-beating and RNA was extracted with the miRNeasy Mini Kit (Qiagen, Hilden, Germany)according to the manufacturer’s recommendations. The total RNA was used for first-strand cDNAsynthesis using Maxima H Minus First Strand cDNA synthesis kit including dsDNase (ThermoFisher Scientific, Waltham, MA, USA) according to standard procedures. A few primers were usedfrom literature but most of them were designed with the software Primer3 ([74], https://primer3plus.com/primer3web/primer3web_input.htm), and pre-experimentally validated. In addition, due to adifferential effect of the ZEN treatment on the expression of housekeeping genes, we used the softwareGeNorm [75] to select among six candidates (ActB, GAPDH, HPRT1, RPL4, RPL32, and TBP) themost stable ones for data normalization (Table 4). All qRT-PCR reactions were conducted on theMastercycler ep Realplex (Eppendorf, Hamburg, Germany) using SYBR green chemistry (Kapa SYBRFast Universal, Sigma-Aldrich, St. Louis, MO, USA). The thermal cycle conditions were as follows:1 cycle of pre-incubation at 95 ◦C for 3 min, 40 cycles of amplification (95 ◦C for 10 sec, 60 ◦C for20 sec, and 72 ◦C for 20 sec), and melting curve program included at the end of the run. Relative geneexpression was calculated using the 2ΔΔCt method with the geometric mean of the Cts from the fourhousekeeping genes serving for normalization (subtracting the Ct-values of individual target genesfrom the Ct-value of the housekeeping genes of the same sample (ΔCt-values). Next, the mean ΔCtfor each experimental group and target gene was calculated, and subsequently used for statisticalevaluation and expressing the fold change (= 2ΔΔCt value).
5.2.3. qPCR Analysis of microRNAs
To compare the effects of ZEN and its metabolites on uterine microRNA expression, microRNAspreviously described to be altered by ZEN exposure [11] were chosen for targeted qPCR analysis. Intotal, 15 microRNAs were selected based on expression patterns (magnitude of log2 fold changesupon ZEN treatment, average tags per million count) observed after sequencing of uterus tissue.The panel included eight microRNAs up-regulated upon ZEN exposure (ssc-miR-1, ssc-miR-143-3p,ssc-miR-424-5p, ssc-miR-450a, ssc-miR-450b-5p, ssc-miR-450c-5p, ssc-miR-503, and ssc-miR-542-3p) andseven down-regulated microRNAs (ssc-miR-129a, ssc-miR-135, ssc-miR-149, ssc-miR-181c, ssc-miR-187,ssc-miR-204-5p and ssc-miR-206).
The extraction of RNA was done as described in the above section for mRNA. Synthesis of cDNAand PCR amplification was performed as described in Grenier et al. [11]. The method to calculatethe fold change is the same as for the mRNA, the 2ΔΔCt method. Normalization of the Ct values wasperformed with the reference U6 snRNA, subtracting the Ct-values of individual microRNAs from theCt-value of U6 snRNA of the same sample (ΔCt-values).
181

Toxins 2019, 11, 481
Table 4. Nucleotide sequence of primers for real-time qPCR.
Gene Name Primer Sequence Amplicon Size Ensembl Access #
Housekeeping Genes
HPRT1 1 F (300 nM) GGACTTGAATCATGTTTGTGR (300 nM) CAGATGTTTCCAAACTCAAC 91 bp ENSSSCG00000034896
RPL32 1 F (300 nM) AGTTCATCCGGCACCAGTCAR (300 nM) GAACCTTCTCCGCACCCTGT 92 bp ENSSSCG00000035811
RPL4 1 F (300 nM) CAAGAGTAACTACAACCTTCR (300 nM) GAACTCTACGATGAATCTTC 122 bp ENSSSCG00000004945
TBP 1 F (300 nM) AACAGTTCAGTAGTTATGAGCCAGAR (300 nM) AGATGTTCTCAAACGCTTCG 153 bp ENSSSCG00000037372
Genes with Identified ERE Motif
EBAG9 F (300 nM) GCACAGGTTTCTCTAGTAGGCTR (300 nM) TCCCTGTCTGCTATCTTCTGC 175 bp ENSSSCG00000006024
OVGP1 F (300 nM) GGGTCGGCTATGATGATGACAR (300 nM) CCGGTGAAGGAGTTGAGCTA 198 bp ENSSSCG00000006791
IGFBP4 F (300 nM) CATCCCCATCCCTAACTGCGR (300 nM) CTCACTCTCGGAAGCTGTCG 185 bp ENSSSCG00000017472
GJA1 F (300 nM) TCTGAGTGCCTGAACTTGCTR (300 nM) CAGCGGTGGAATAGGCTTGA 154 bp ENSSSCG00000004241
GAPDH 1,2 F (300 nM) AGGGGCTCTCCAGAACATCATCCR (300 nM) TCGCGTGCTCTTGCTGGGGTTGG 446 bp ENSSSCG00000000694
C3 2 F (300 nM) GGGCAGATCTTGAGTGTCCGR (300 nM) ATGCTGGATGAACTGAGCCC 179 bp ENSSSCG00000013551
Other Genes Associated With Estrogenic Response or Inflammation
S100G F (300 nM) GGAGTTGAACTTGGACGTGCR (300 nM) CGCATCCCTTCCAGTCCTTA 184 bp ENSSSCG00000012147
CLU F (300 nM) CCATGACATGTTCCAGCCCTR (300 nM) TCTGAGAGGAATTGCTGGCC 239 bp ENSSSCG00000009668
ODC F (300 nM) CGGCGATTGGATGCTCTTTGR (300 nM) AAGTCGTGGTTCCGGATCTG 144 bp ENSSSCG00000027121
ESR1 F (300 nM) CCTGGAGAATGAGCCGAGCR (300 nM) CTTCCCTTGTCACTGGTGCT 92 bp ENSSSCG00000025777
ESR2 F (300 nM) TGCAGTGATTATGCGTCAGGAR (300 nM) CAGCTTTTACGCCGGTTCTT 149 bp ENSSSCG00000005109
IL-1β F (300 nM) CCATAGTACCTGAACCCGCCR (300 nM) GCTGGTGAGAGATTTGCAGC 165 bp ENSSSCG00000039214
IL-6 1 F (300 nM) GGCAAAAGGGAAAGAATCCAGR (300 nM) CGTTCTGTGACTGCAGCTTATCC 87 bp ENSSSCG00000020970
1 The primers for these genes were already published in Nygard et al. [76], Grenier et al. [77], and Gessner et al. [78],and for the other genes, the primers were designed for the present study. 2 ERE motif was found in the humanC3 and GAPDH sequences [48] but not in pig. In addition, we assessed GAPGH as both housekeeping gene andpotential ERE gene. HPRT1, Hypoxanthine Phosphoribosyltransferase 1, RPL, Ribosomal Protein L, TBP, TATA-BoxBinding Protein, GAPDH, Glyceraldehyde 3-phosphate dehydrogenase.
5.3. Statistics
Data from the MCF-7 proliferation assay and the yeast bioassay were expressed relative tothe negative control, which was set to 100%. Statistical analysis was performed with SigmaPlot(Version 12.5, from Systat Software, Inc., San Jose, CA, USA). Since data were not normally distributed(Shapiro-Wilk test, p< 0.05), a nonparametric Kruskal-Wallis test (Dunn’s multiple comparison post-hoctest) was conducted to assess the effects between different concentrations to the cell control.
Data from the feeding trial (body weight, reproductive tract weigh, vulva size, mRNA,and microRNA expression) were analyzed with IBM SPSS Statistics (Version 22, Armonk, NY, USA).If data were normally distributed (Shapiro-Wilk test, p > 0.05), a one-way ANOVA was conductedto assess the effects of treatment diets on dependent variables. When main effects were significant,differences between means were examined via Tukey post-hoc analysis (assumption of homogeneityof variances met, Levene’s test, p > 0.05) or Games-Howell test (no homogeneity of variance). Datathat were not normally distributed were analyzed with the non-parametric Kruskal-Wallis test(Dunn-Bonferroni post-hoc test). Differences between means were considered significant at p < 0.05.
182
Toxins 2019, 11, 481
GraphPad Prism version 8 for Windows (GraphPad Software, La Jolla California USA) was used forrunning the Grubbs’ outlier test and generating figures.
Author Contributions: Conceptualization, B.G., M.T., V.N., and W.-D.M.; methodology, B.G., B.N., G.A., M.H.,S.F., S.L., and V.R.; validation, B.G., B.N., G.A., M.H., S.F., S.L., and V.R.; formal analysis, B.G., B.N., M.H., S.F., andV.N.; resources, S.L. and V.R.; writing—original draft preparation, B.G., B.N., D.H., S.F., and V.N.; writing—reviewand editing, all; supervision, B.G., M.A., M.T., and W.-D.M.; funding acquisition, D.H., and V.N.
Funding: This research received funding from the Austrian Research Promotion Agency (ÖsterreichischeForschungsförderungsgesellschaft FFG, grant numbers 872270 and 866384).
Acknowledgments: The GAL4-hER hybrid gene cloned into pTK103 was isolated from pHCA/GAL4(848)ER(G)was kindly provided by Prof. Didier Picard (University of Geneva, Switzerland). We would like to thank SusannaSkalicky (TAmiRNA GmbH) for technical support during microRNA qPCR analysis. We owe sincere gratitude toElisavet Kunz-Vekiru for purification and quantification of HZEN and DHZEN. In addition, we are grateful forthe practical assistance of Roger Berrios, Barbara Doupovec and Ines Taschl during the animal experiment. Finally,we want to thank Christiane Gruber for careful proofreading of the manuscript.
Conflicts of Interest: S.F., B.N., V.N., D.H., V.R., S.L., M.A., M.T., W.-D.M. and B.G. are employed by BIOMINHolding GmbH, that operates the BIOMIN Research Center and is a producer of animal feed additives. M.H.is co-founder of TAmiRNA and employed by this company. This, however, did not influence the design of theexperimental studies or bias the presentation and interpretation of results.
References
1. Zinedine, A.; Soriano, J.M.; Molto, J.C.; Mañes, J. Review on the toxicity, occurrence, metabolism, detoxification,regulations and intake of zearalenone: An oestrogenic mycotoxin. Food Chem. Toxicol. 2007, 45, 1–18.[CrossRef]
2. Rodrigues, I.; Naehrer, K. Prevalence of mycotoxins in feedstuffs and feed surveyed worldwide in 2009 and2010. Phytopathol. Mediterr. 2012, 51, 175–192.
3. Kovalsky, P.; Kos, G.; Nährer, K.; Schwab, C.; Jenkins, T.; Schatzmayr, G.; Sulyok, M.; Krska, R. Co-Occurrenceof Regulated, Masked and Emerging Mycotoxins and Secondary Metabolites in Finished Feed and Maize—AnExtensive Survey. Toxins 2016, 8, 363. [CrossRef] [PubMed]
4. Fink-Gremmels, J.; Malekinejad, H. Clinical effects and biochemical mechanisms associated with exposure tothe mycoestrogen zearalenone. Anim. Feed Sci. Technol. 2007, 137, 326–341. [CrossRef]
5. Vrtacnik, P.; Ostanek, B.; Mencej-Bedrac, S.; Marc, J. The many faces of estrogen signaling. Biochem. Med.2014, 24, 329–342. [CrossRef]
6. Kowalska, K.; Habrowska-Górczynska, D.E.; Piastowska-Ciesielska, A.W. Zearalenone as an endocrinedisruptor in humans. Environ. Toxicol. Pharmacol. 2016, 48, 141–149. [CrossRef] [PubMed]
7. Hennig-Pauka, I.; Koch, F.-J.; Schaumberger, S.; Woechtl, B.; Novak, J.; Sulyok, M.; Nagl, V. Current challengesin the diagnosis of zearalenone toxicosis as illustrated by a field case of hyperestrogenism in suckling piglets.Porc. Health Manag. 2018, 4, 18. [CrossRef] [PubMed]
8. Wang, M.; Wu, W.; Li, L.; He, J.; Huang, S.; Chen, S.; Chen, J.; Long, M.; Yang, S.; Li, P. Analysis of themiRNA Expression Profiles in the Zearalenone-Exposed TM3 Leydig Cell Line. Int. J. Mol. Sci. 2019, 20, 635.[CrossRef] [PubMed]
9. Brzuzan, P.; Wozny, M.; Wolinska-Nizioł, L.; Piasecka, A.; Florczyk, M.; Jakimiuk, E.; Góra, M.; Łuczynski, M.;Gajecki, M. MicroRNA expression profiles in liver and colon of sexually immature gilts after exposure toFusarium mycotoxins. Pol. J. Vet. Sci. 2015, 18, 29–38. [CrossRef]
10. He, J.; Zhang, J.; Wang, Y.; Liu, W.; Gou, K.; Liu, Z.; Cui, S. MiR-7 Mediates the Zearalenone SignalingPathway Regulating FSH Synthesis and Secretion by Targeting FOS in Female Pigs. Endocrinology 2018, 159,2993–3006. [CrossRef]
11. Grenier, B.; Hackl, M.; Skalicky, S.; Thamhesl, M.; Moll, W.-D.; Berrios, R.; Schatzmayr, G.; Nagl, V. MicroRNAsin porcine uterus and serum are affected by zearalenone and represent a new target for mycotoxin biomarkerdiscovery. Sci. Rep. 2019, 9, 9408. [CrossRef] [PubMed]
12. Schraml, E.; Hackl, M.; Grillari, J. Micrornas and toxicology: A love marriage micrornas in liquid biopsies areminimal-invasive biomarkers for tissue-specific toxicity. Toxicol. Rep. 2017, 4, 634–636. [CrossRef] [PubMed]
183

Toxins 2019, 11, 481
13. He, J.; Wei, C.; Li, Y.; Liu, Y.; Wang, Y.; Pan, J.; Liu, J.; Wu, Y.; Cui, S. Zearalenone and alpha-zearalenol inhibitthe synthesis and secretion of pig follicle stimulating hormone via the non-classical estrogen membranereceptor GPR30. Mol. Cell. Endocrinol. 2018, 461, 43–54. [CrossRef] [PubMed]
14. Ayed-Boussema, I.; Pascussi, J.M.; Maurel, P.; Bacha, H.; Hassen, W. Zearalenone activates pregnane Xreceptor, constitutive androstane receptor and aryl hydrocarbon receptor and corresponding phase I targetgenes mRNA in primary cultures of human hepatocytes. Environ. Toxicol. Pharmacol. 2011, 31, 79–87.[CrossRef] [PubMed]
15. Gajecka, M.; Zielonka, Ł.; Gajecki, M. Activity of Zearalenone in the Porcine Intestinal Tract. Molecules 2016,22, 18. [CrossRef] [PubMed]
16. Zheng, W.; Wang, B.; Li, X.; Wang, T.; Zou, H.; Gu, J.; Yuan, Y.; Liu, X.; Bai, J.; Bian, J.; et al. ZearalenonePromotes Cell Proliferation or Causes Cell Death? Toxins 2018, 10, 184. [CrossRef] [PubMed]
17. European Commission. Commission recommendation of of 17 august 2006 on the presence of deoxynivalenol,zearalenone, ochratoxin a, t-2 and ht-2 and fumonisins in products intended for animal feeding. Off. J.Eur. Union 2006, L 229, 7–9.
18. Alassane-Kpembi, I.; Schatzmayr, G.; Taranu, I.; Marin, D.; Puel, O.; Oswald, I.P. Mycotoxins co-contamination:Methodological aspects and biological relevance of combined toxicity studies. Crit. Rev. Food Sci. Nutr. 2017,57, 3489–3507. [CrossRef]
19. Jard, G.; Liboz, T.; Mathieu, F.; Guyonvarc’H, A.; Lebrihi, A. Review of mycotoxin reduction in food andfeed: From prevention in the field to detoxification by adsorption or transformation. Food Addit. Contam.Part A 2011, 28, 1590–1609. [CrossRef]
20. Rogowska, A.; Pomastowski, P.; Sagandykova, G.; Buszewski, B. Zearalenone and its metabolites: Effect onhuman health, metabolism and neutralisation methods. Toxicon 2019, 162, 46–56. [CrossRef]
21. Ji, C.; Fan, Y.; Zhao, L. Review on biological degradation of mycotoxins. Anim. Nutr. 2016, 2, 127–133.[CrossRef]
22. Di Gregorio, M.C.; De Neeff, D.V.; Jager, A.V.; Corassin, C.H.; Carão, Á.C.D.P.; De Albuquerque, R.; DeAzevedo, A.C.; Oliveira, C.A.F. Mineral adsorbents for prevention of mycotoxins in animal feeds. Toxin Rev.2014, 33, 1–11. [CrossRef]
23. Fruhauf, S.; Schwartz, H.; Ottner, F.; Krska, R.; Vekiru, E. Yeast cell based feed additives: Studies on aflatoxinB1and zearalenone. Food Addit. Contam. Part A 2012, 29, 217–231. [CrossRef]
24. De Baere, S.; De Mil, T.; Antonissen, G.; Devreese, M.; Croubels, S. In vitro model to assess the adsorption oforal veterinary drugs to mycotoxin binders in a feed- and aflatoxin B1-containing buffered matrix. Food Addit.Contam. Part A 2018, 35, 1–11. [CrossRef] [PubMed]
25. Kiessling, K.H.; Pettersson, H.; Sandholm, K.; Olsen, M. Metabolism of aflatoxin, ochratoxin, zearalenone,and three trichothecenes by intact rumen fluid, rumen protozoa, and rumen bacteria. Appl. Environ. Microbiol.1984, 47, 1070–1073. [PubMed]
26. Fitzpatrick, D.; Picken, C.; Murphy, L.C.; Buhr, M. Measurement of the relative binding affinity of zearalenone,α-zearalenol and β-zearalenol for uterine and oviduct estrogen receptors in swine, rats and chickens:An indicator of estrogenic potencies. Comp. Biochem. Physiol. Part C Comp. Pharmacol. 1989, 94, 691–694.[CrossRef]
27. El-Sharkawy, S.; Abul-Hajj, Y. Microbial Transformation of Zearalenone, I. Formation of Zearalenone-4-O-β-glucoside. J. Nat. Prod. 1987, 50, 520–521. [CrossRef]
28. Brodehl, A.; Möller, A.; Kunte, H.-J.; Koch, M.; Maul, R. Biotransformation of the mycotoxin zearalenoneby fungi of the genera Rhizopus and Aspergillus. FEMS Microbiol. Lett. 2014, 359, 124–130. [CrossRef][PubMed]
29. Binder, S.B.; Schwartz-Zimmermann, H.E.; Varga, E.; Bichl, G.; Michlmayr, H.; Adam, G.; Berthiller, F.Metabolism of Zearalenone and Its Major Modified Forms in Pigs. Toxins 2017, 9, 56. [CrossRef] [PubMed]
30. Vekiru, E.; Frühauf, S.; Hametner, C.; Schatzmayr, G.; Krska, R.; Moll, W.; Schuhmacher, R. Isolation andcharacterisation of enzymatic zearalenone hydrolysis reaction products. World Mycotoxin J. 2016, 9, 353–363.[CrossRef]
31. Vekiru, E.; Hametner, C.; Mitterbauer, R.; Rechthaler, J.; Adam, G.; Schatzmayr, G.; Krska, R.; Schuhmacher, R.Cleavage of Zearalenone by Trichosporon mycotoxinivorans to a Novel Nonestrogenic Metabolite.Appl. Environ. Microbiol. 2010, 76, 2353–2359. [CrossRef] [PubMed]
184

Toxins 2019, 11, 481
32. Kakeya, H.; Takahashi-Ando, N.; Kimura, M.; Onose, R.; Yamaguchi, I.; Osada, H. Biotransformationof the Mycotoxin, Zearalenone, to a Non-estrogenic Compound by a Fungal Strain of Clonostachys sp.Biosci. Biotechnol. Biochem. 2002, 66, 2723–2726. [CrossRef]
33. El-Sharkawy, S.; Abul-Hajj, Y.J. Microbial cleavage of zearalenone. Xenobiotica 1988, 18, 365–371. [CrossRef]34. Takahashi-Ando, N.; Ohsato, S.; Shibata, T.; Hamamoto, H.; Yamaguchi, I.; Kimura, M. Metabolism of
Zearalenone by Genetically Modified Organisms Expressing the Detoxification Gene from Clonostachysrosea. Appl. Environ. Microbiol. 2004, 70, 3239–3245. [CrossRef] [PubMed]
35. Bajic, V.B.; Tan, S.L.; Chong, A.; Tang, S.; Ström, A.; Gustafsson, J.-A.; Lin, C.-Y.; Liu, E.T. Dragon ERE Finderversion 2: A tool for accurate detection and analysis of estrogen response elements in vertebrate genomes.Nucleic Acids Res. 2003, 31, 3605–3607. [CrossRef]
36. Tatay, E.; Espín, S.; García-Fernández, A.-J.; Ruiz, M.-J. Estrogenic activity of zearalenone, α-zearalenoland β-zearalenol assessed using the e-screen assay in mcf-7 cells. Toxicol. Mech. Methods 2018, 28, 239–242.[CrossRef]
37. LeComte, S.; Lelong, M.; Bourgine, G.; Efstathiou, T.; Saligaut, C.; Pakdel, F. Assessment of the potentialactivity of major dietary compounds as selective estrogen receptor modulators in two distinct cell models forproliferation and differentiation. Toxicol. Appl. Pharmacol. 2017, 325, 61–70. [CrossRef]
38. Hessenberger, S.; Botzi, K.; Degrassi, C.; Kovalsky, P.; Schwab, C.; Schatzmayr, D.; Schatzmayr, G.;Fink-Gremmels, J. Interactions between plant-derived oestrogenic substances and the mycoestrogenzearalenone in a bioassay with MCF-7 cells. Pol. J. Vet. Sci. 2017, 20, 513–520. [CrossRef] [PubMed]
39. Khosrokhavar, R.; Rahimifard, N.; Shoeibi, S.; Hamedani, M.P.; Hosseini, M.-J. Effects of zearalenone andα-Zearalenol in comparison with Raloxifene on T47D cells. Toxicol. Mech. Methods 2009, 19, 246–250.[CrossRef] [PubMed]
40. Andersen, H.R.; Andersson, A.-M.; Arnold, S.F.; Autrup, H.; Barfoed, M.; Beresford, N.A.; Bjerregaard, P.;Christiansen, L.B.; Gissel, B.; Hummel, R.; et al. Comparison of Short-Term Estrogenicity Tests for Identificationof Hormone-Disrupting Chemicals. Environ. Health Perspect. 1999, 107, 89–108. [CrossRef]
41. Doll, S.; Dänicke, S.; Ueberschär, K.-H.; Valenta, H.; Schnurrbusch, U.; Ganter, M.; Klobasa, F.; Flachowsky, G.Effects of graded levels of Fusarium toxin contaminated maize in diets for female weaned piglets.Arch. Anim. Nutr. 2003, 57, 311–334. [CrossRef]
42. Zöllner, P.; Jodlbauer, J.; Kleinova, M.; Kahlbacher, H.; Kuhn, T.; Hochsteiner, W.; Lindner, W. ConcentrationLevels of Zearalenone and Its Metabolites in Urine, Muscle Tissue, and Liver Samples of Pigs Fed withMycotoxin-Contaminated Oats. J. Agric. Food Chem. 2002, 50, 2494–2501. [CrossRef] [PubMed]
43. Frizzell, C.; Uhlig, S.; Miles, C.O.; Verhaegen, S.; Elliott, C.T.; Eriksen, G.S.; Sørlie, M.; Ropstad, E.; Connolly, L.Biotransformation of zearalenone and zearalenols to their major glucuronide metabolites reduces estrogenicactivity. Toxicol. In Vitro 2015, 29, 575–581. [CrossRef] [PubMed]
44. Faisal, Z.; Lemli, B.; Szerencsés, D.; Kunsági-Máté, S.; Bálint, M.; Hetényi, C.; Kuzma, M.; Mayer, M.; Poór, M.Interactions of zearalenone and its reduced metabolites α-zearalenol and β-zearalenol with serum albumins:Species differences, binding sites, and thermodynamics. Mycotoxin Res. 2018, 34, 269–278. [CrossRef][PubMed]
45. Jiang, S.; Yang, Z.; Yang, W.; Yao, B.; Zhao, H.; Liu, F.; Chen, C.; Chi, F. Effects of feeding purified zearalenonecontaminated diets with or without clay enterosorbent on growth, nutrient availability, and genital organs inpost-weaning female pigs. Asian-Aust. J. Anim. Sci. 2010, 23, 74–81. [CrossRef]
46. Grenier, B.; Nagl, V.; Lutz, A.; Aleschko, M.; Schatzmayr, G.; Moll, W.-D.; Thamhesl, M. Targeted approachesfor zen biomarker discovery in prepubertal gilts. In Proceedings of the 10th World Mycotoxin Forum,Amsterdam, The Netherlands, 12–14 March 2018.
47. Li, Y.; Burns, K.A.; Arao, Y.; Luh, C.J.; Korach, K.S. Differential Estrogenic Actions of Endocrine-DisruptingChemicals Bisphenol A, Bisphenol AF, and Zearalenone through Estrogen Receptor α and β in Vitro.Environ. Health Perspect. 2012, 120, 1029–1035. [CrossRef] [PubMed]
48. Bourdeau, V.; Deschênes, J.; Métivier, R.; Nagai, Y.; Nguyen, D.; Bretschneider, N.; Gannon, F.; White, J.H.;Mader, S. Genome-Wide Identification of High-Affinity Estrogen Response Elements in Human and Mouse.Mol. Endocrinol. 2004, 18, 1411–1427. [CrossRef]
49. Jung, E.-M.; An, B.-S.; Yang, H.; Choi, K.-C.; Jeung, E.-B. Biomarker Genes for Detecting Estrogenic Activity ofEndocrine Disruptors via Estrogen Receptors. Int. J. Environ. Res. Public Health 2012, 9, 698–711. [CrossRef]
185

Toxins 2019, 11, 481
50. Zou, K.; Ing, N.H. Oestradiol up-regulates oestrogen receptor, cyclophilin, and glyceraldehyde phosphatedehydrogenase mRNA concentrations in endometrium, but down-regulates them in liver. J. Steroid Biochem.Mol. Boil. 1998, 64, 231–237. [CrossRef]
51. LeComte, S.; DeMay, F.; Pham, T.H.; Moulis, S.; Efstathiou, T.; Chalmel, F.; Pakdel, F. Deciphering theMolecular Mechanisms Sustaining the Estrogenic Activity of the Two Major Dietary Compounds Zearalenoneand Apigenin in ER-Positive Breast Cancer Cell Lines. Nutrients 2019, 11, 237. [CrossRef]
52. Vo, T.T.B.; Jeung, E.-B. An Evaluation of Estrogenic Activity of Parabens Using Uterine Calbindin-D9k Genein an Immature Rat Model. Toxicol. Sci. 2009, 112, 68–77. [CrossRef] [PubMed]
53. Krisinger, J. Porcine calbindin-D9k gene: Expression in endometrium, myometrium, and placenta in theabsence of a functional estrogen response element in intron A. Boil. Reprod. 1995, 52, 115–123. [CrossRef][PubMed]
54. Oliver, W.; Miles, J.; Diaz, D.; Dibner, J.; Rottinghaus, G.; Harrell, R. Zearalenone enhances reproductive tractdevelopment, but does not alter skeletal muscle signaling in prepubertal gilts. Anim. Feed Sci. Technol. 2012,174, 79–85. [CrossRef]
55. Klinge, C.M. miRNAs regulated by estrogens, tamoxifen, and endocrine disruptors and their downstreamgene targets. Mol. Cell. Endocrinol. 2015, 418, 273–297. [CrossRef] [PubMed]
56. Kim, K.; Madak-Erdogan, Z.; Ventrella, R.; Katzenellenbogen, B.S. A microrna196a2* and tp63 circuitregulated by estrogen receptor-α and erk2 that controls breast cancer proliferation and invasivenessproperties. Horm. Cancer 2013, 4, 78–91. [CrossRef] [PubMed]
57. Ferraro, L.; Ravo, M.; Nassa, G.; Tarallo, R.; De Filippo, M.R.; Giurato, G.; Cirillo, F.; Stellato, C.; Silvestro, S.;Cantarella, C.; et al. Effects of Oestrogen on MicroRNA Expression in Hormone-Responsive Breast CancerCells. Horm. Cancer 2012, 3, 65–78. [CrossRef] [PubMed]
58. Tribollet, V.; Barenton, B.; Kroiss, A.; Vincent, S.; Zhang, L.; Forcet, C.; Cerutti, C.; Périan, S.; Allioli, N.;Samarut, J.; et al. miR-135a Inhibits the Invasion of Cancer Cells via Suppression of ERRα. PLoS ONE 2016,11, e0156445. [CrossRef]
59. Chen, Y.; Zhang, J.; Wang, H.; Zhao, J.; Xu, C.; Du, Y.; Luo, X.; Zheng, F.; Liu, R.; Zhang, H.; et al. miRNA-135apromotes breast cancer cell migration and invasion by targeting HOXA10. BMC Cancer 2012, 12, 111.[CrossRef]
60. Guo, S.; Yang, J.; Wu, M.; Xiao, G. Clinical value screening, prognostic significance and key pathwayidentification of miR-204-5p in endometrial carcinoma: A study based on the Cancer Genome Atlas (TCGA),and bioinformatics analysis. Pathol. Res. Pr. 2019, 215, 1003–1011. [CrossRef]
61. Nothnick, W.B.; Healy, C. Estrogen induces distinct patterns of microRNA expression within the mouseuterus. Reprod. Sci. 2010, 17, 987–994. [CrossRef]
62. Baran-Gale, J.; Purvis, J.E.; Sethupathy, P. An integrative transcriptomics approach identifies miR-503 as acandidate master regulator of the estrogen response in MCF-7 breast cancer cells. RNA 2016, 22, 1592–1603.[CrossRef] [PubMed]
63. EFSA Panel on Additives and Products or Substances used in Animal Feed (FEEDAP). Scientific OpinionGuidance for the preparation of dossiers for technological additives. EFSA J. 2012, 10, 2528. [CrossRef]
64. Reg (EC) No 1831/2003. European Union Register of Feed Additives. Edition 6/2019 (272). Appendixes 3e,4–26 June 2019. Available online: https://ec.europa.eu/food/safety/animal-feed/feed-additives_en (accessedon 7 August 2019).
65. Hartinger, D.; Moll, W.-D. Fumonisin elimination and prospects for detoxification by enzymatictransformation. World Mycotoxin J. 2011, 4, 271–283. [CrossRef]
66. Alberts, J.; Lilly, M.; Rheeder, J.; Burger, H.; Shephard, G.S.; Gelderblom, W. Technological and community-based methods to reduce mycotoxin exposure. Food Control 2017, 73, 101–109. [CrossRef]
67. Hahn, I.; Kunz-Vekiru, E.; Twaruzek, M.; Grajewski, J.; Krska, R.; Berthiller, F. Aerobic and anaerobic in vitrotesting of feed additives claiming to detoxify deoxynivalenol and zearalenone. Food Addit. Contam. Part A2015, 32, 922–933. [CrossRef] [PubMed]
68. James, P.; Halladay, J.; Craig, E.A. Genomic Libraries and a Host Strain Designed for Highly EfficientTwo-Hybrid Selection in Yeast. Genetics 1996, 144, 1425–1436. [PubMed]
69. Mitterbauer, R.; Weindorfer, H.; Safaie, N.; Krska, R.; Lemmens, M.; Ruckenbauer, P.; Kuchler, K.; Adam, G.A Sensitive and Inexpensive Yeast Bioassay for the Mycotoxin Zearalenone and Other Compounds withEstrogenic Activity. Appl. Environ. Microbiol. 2003, 69, 805–811. [CrossRef] [PubMed]
186

Toxins 2019, 11, 481
70. Bachmann, H. Phenotypic Detection of Zearalenone in Saccharomyces Cerevisiae. Master’s Thesis, Universityof Natural Resources and Life Sciences, Vienna (BOKU), Vienna, Austria, 2001.
71. Sherman, F. Getting started with yeast. Methods Enzymol 2002, 350, 3–41. [PubMed]72. European Commission. Directive 2010/63/eu of the European Parliament and of the Council of of 22
September 2010 on the Protection of Animals Used for Scientific Purposes. Off. J. Eur. Union 2010, L 276,33–79.
73. Klinge, C.M. Estrogen receptor interaction with estrogen response elements. Nucleic Acids Res. 2001, 29,2905–2919. [CrossRef]
74. Untergasser, A.; Cutcutache, I.; Koressaar, T.; Ye, J.; Faircloth, B.C.; Remm, M.; Rozen, S.G. Primer3—Newcapabilities and interfaces. Nucleic Acids Res. 2012, 40, e115. [CrossRef] [PubMed]
75. Vandesompele, J.; De Preter, K.; Pattyn, F.; Poppe, B.; Van Roy, N.; De Paepe, A.; Speleman, F. Accuratenormalization of real-time quantitative RT-PCR data by geometric averaging of multiple internal controlgenes. Genome Boil. 2002, 3, research0034.1.
76. Nygard, A.-B.; Jorgensen, C.B.; Cirera, S.; Fredholm, M. Selection of reference genes for gene expressionstudies in pig tissues using SYBR green qPCR. BMC Mol. Boil. 2007, 8, 67. [CrossRef] [PubMed]
77. Grenier, B.; Loureiro-Bracarense, A.-P.; Lucioli, J.; Pacheco, G.D.; Cossalter, A.-M.; Moll, W.-D.; Schatzmayr, G.;Oswald, I.P.; Loureiro-Bracarense, A. Individual and combined effects of subclinical doses of deoxynivalenoland fumonisins in piglets. Mol. Nutr. Food Res. 2011, 55, 761–771. [CrossRef] [PubMed]
78. Gessner, D.K.; Fiesel, A.; Most, E.; Dinges, J.; Wen, G.; Ringseis, R.; Eder, K. Supplementation of a grape seedand grape marc meal extract decreases activities of the oxidative stress-responsive transcription factors nf-κband nrf2 in the duodenal mucosa of pigs. Acta Vet. Scand. 2013, 55, 18. [CrossRef]
© 2019 by the authors. Licensee MDPI, Basel, Switzerland. This article is an open accessarticle distributed under the terms and conditions of the Creative Commons Attribution(CC BY) license (http://creativecommons.org/licenses/by/4.0/).
187

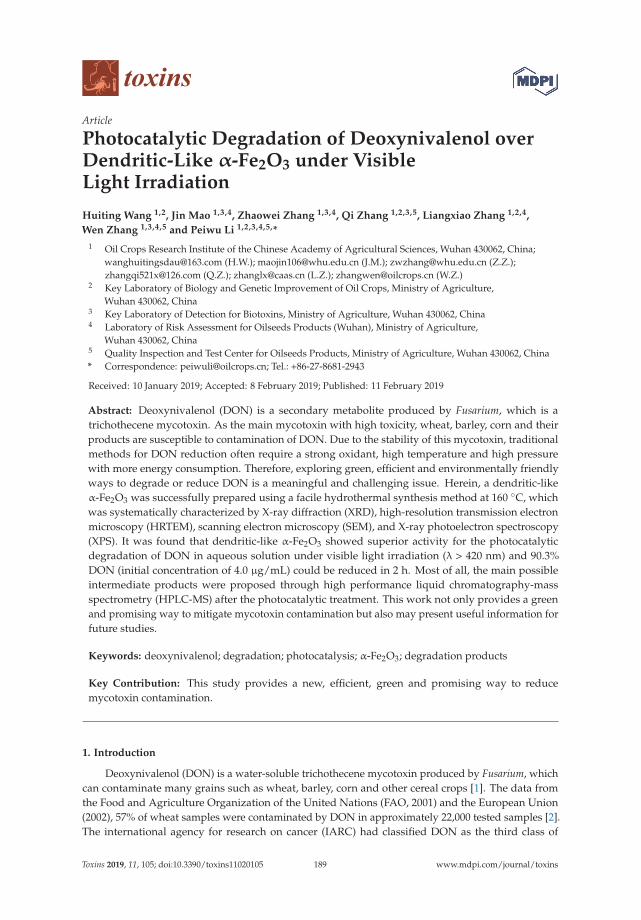
toxins
Article
Photocatalytic Degradation of Deoxynivalenol overDendritic-Like α-Fe2O3 under VisibleLight Irradiation
Huiting Wang 1,2, Jin Mao 1,3,4, Zhaowei Zhang 1,3,4, Qi Zhang 1,2,3,5, Liangxiao Zhang 1,2,4,
Wen Zhang 1,3,4,5 and Peiwu Li 1,2,3,4,5,*
1 Oil Crops Research Institute of the Chinese Academy of Agricultural Sciences, Wuhan 430062, China;[email protected] (H.W.); [email protected] (J.M.); [email protected] (Z.Z.);[email protected] (Q.Z.); [email protected] (L.Z.); [email protected] (W.Z.)
2 Key Laboratory of Biology and Genetic Improvement of Oil Crops, Ministry of Agriculture,Wuhan 430062, China
3 Key Laboratory of Detection for Biotoxins, Ministry of Agriculture, Wuhan 430062, China4 Laboratory of Risk Assessment for Oilseeds Products (Wuhan), Ministry of Agriculture,
Wuhan 430062, China5 Quality Inspection and Test Center for Oilseeds Products, Ministry of Agriculture, Wuhan 430062, China* Correspondence: [email protected]; Tel.: +86-27-8681-2943
Received: 10 January 2019; Accepted: 8 February 2019; Published: 11 February 2019
Abstract: Deoxynivalenol (DON) is a secondary metabolite produced by Fusarium, which is atrichothecene mycotoxin. As the main mycotoxin with high toxicity, wheat, barley, corn and theirproducts are susceptible to contamination of DON. Due to the stability of this mycotoxin, traditionalmethods for DON reduction often require a strong oxidant, high temperature and high pressurewith more energy consumption. Therefore, exploring green, efficient and environmentally friendlyways to degrade or reduce DON is a meaningful and challenging issue. Herein, a dendritic-likeα-Fe2O3 was successfully prepared using a facile hydrothermal synthesis method at 160 ◦C, whichwas systematically characterized by X-ray diffraction (XRD), high-resolution transmission electronmicroscopy (HRTEM), scanning electron microscopy (SEM), and X-ray photoelectron spectroscopy(XPS). It was found that dendritic-like α-Fe2O3 showed superior activity for the photocatalyticdegradation of DON in aqueous solution under visible light irradiation (λ > 420 nm) and 90.3%DON (initial concentration of 4.0 μg/mL) could be reduced in 2 h. Most of all, the main possibleintermediate products were proposed through high performance liquid chromatography-massspectrometry (HPLC-MS) after the photocatalytic treatment. This work not only provides a greenand promising way to mitigate mycotoxin contamination but also may present useful information forfuture studies.
Keywords: deoxynivalenol; degradation; photocatalysis; α-Fe2O3; degradation products
Key Contribution: This study provides a new, efficient, green and promising way to reducemycotoxin contamination.
1. Introduction
Deoxynivalenol (DON) is a water-soluble trichothecene mycotoxin produced by Fusarium, whichcan contaminate many grains such as wheat, barley, corn and other cereal crops [1]. The data fromthe Food and Agriculture Organization of the United Nations (FAO, 2001) and the European Union(2002), 57% of wheat samples were contaminated by DON in approximately 22,000 tested samples [2].The international agency for research on cancer (IARC) had classified DON as the third class of
Toxins 2019, 11, 105; doi:10.3390/toxins11020105 www.mdpi.com/journal/toxins189
Toxins 2019, 11, 105
carcinogens (not classifiable) in 2002 [3,4]. The contamination of DON can cause enormous economiclosses of agriculture and bring serious threats to the health of human beings and animals. It was foundthat exposure to excessive DON could cause many adverse reactions, including dizziness, nausea andvomiting [5,6]. Therefore, attention has been paid to reduce or mitigate DON using different strategies.
Traditional strategies including physical, chemical and biological ways have been developed toeliminate DON in agro-food and the aqueous environment. The physical ways included washing,density screening, heating, adsorption [7–9]. For instance, Pronyk et al. reported that 52% of DONcould be reduced after 6 min thermal degradation at 185 ◦C [10]. Some chemical reagents, such as ozone(O3), sodium carbonate (Na2CO3), sodium bicarbonate (NaHCO3) and sodium bisulfite (NaHSO3) havebeen used to remove DON [11]. Ozone treatment has been widely applied in agro-product processingto degrade mycotoxins. Ozone could effectively reduce 53% of DON in wheat in 4 h [12]. In addition,biological technologies have also been applied in DON detoxification [13,14]. Yang demonstrated thatthe Lactobacillus plantarum JM113 could efficiently reduce DON, which was due to the high antioxidantactivity of Lactobacillus plantarum JM113. [15]. However, due to the stability of DON in agro-foodand the environment, these methods often need a strong oxidant, high temperature and more energyconsumption. Therefore, exploring the green, efficient, large-scale and environmentally friendly waysto reduce DON is a meaningful and challenging topic.
In recent years, there has been a growing interest in photocatalytic degradation technology oforganic pollutants. Compared to above-mentioned ways, photocatalytic degradation has severaladvantages: environmental-friendly, low cost, and mild conditions [16]. Bai et al. have successfullyproved that graphene/ZnO hybrids showed the ability to degrade DON under UV light irradiation [17].However, UV light accounts for only a small percentage (4%) of solar energy compared to visiblelight (43%) [18]. Consequently, in order to utilize solar energy more efficiently, it is necessary todevelop a visible light responding catalyst for DON degradation. It was found that microcystin-LRcould be removed over magnetically N-doped TiO2 nanocomposite under visible light irradiation [19].Our previous studies also presented that two kinds of visible light responding catalysts show highactivities for the degradation of aflatoxin B1 under visible light irradiation [20,21]. However, to ourknowledge, there are only a few reports about the photocatalytic degradation of DON under visiblelight irradiation.
As an earth-abundant, visible light responding and nontoxic semiconductor material, hematiteα-Fe2O3 with a suitable band gap of ~2.4 eV has received the most attention. Recently, α-Fe2O3
nanomaterials with different microstructures, particular shapes and particle sizes have been appliedto degrade organic pollutants under visible light irradiation, such as methylene blue dye, eosin Y,rhodamine B dyes, tetracycline [22–24]. Herein, a visible light responding catalyst, dendritic-likeα-Fe2O3 was prepared facilely by a simple one-step hydrothermal synthesis method at 160 ◦C. Undervisible light irradiation (>420 nm), the dendritic-like α-Fe2O3 showed superior performance fordegradation of DON in aqueous solution compared with commercial α-Fe2O3. In addition, thepossible degradation products after 120 min photoreaction were analyzed and proposed by HPLC-MS.
2. Results and Discussion
2.1. Crystal Phase and Morphology Analyses
To analyze the crystal phase and crystallinity of the as-prepared product, the XRD pattern of theas-prepared catalyst was presented. As shown in Figure 1a, the XRD pattern of the as-prepared α-Fe2O3
was consistent with JCPDS No. 01-089-0596, which was a pure phase of rhombohedral α-Fe2O3.In addition, the representative crystal planes of the rhombohedral α-Fe2O3 were labeled in the pattern.These planes were ascribed to (012), (104), (110), (113), (024), (116), (122), (214) and (300), respectively.No other peaks were found, indicating that the as-prepared α-Fe2O3 was pure. Furthermore, thestrong and steep peaks indicated that the as-prepared α-Fe2O3 was of high crystallinity. The XPSwas used to estimate the surface chemical compositions and valence state of the as-prepared α-Fe2O3.
190

Toxins 2019, 11, 105
From Figure 1b, it was found that Fe and O existed in the as-prepared α-Fe2O3. In Figure 1c, there aretwo peaks at 711.18 eV and 724.78 eV, which are consistent with Fe 2p3/2 and Fe 2p1/2 respectively.The two peaks are characteristic peaks of the Fe3+ state in Fe2O3 [25]. The O 1s spectrum showed onepeak (529.85 eV in Figure 1d), corresponding to oxygen atoms of the α-Fe2O3. From the above XRDand XPS results, it could be concluded that the as-prepared product was a pure α-Fe2O3.
Figure 1. (a) XRD pattern of the as-prepared α-Fe2O3; (b) XPS spectra of the as-prepared α-Fe2O3;High-resolution XPS spectra of Fe (c) and O element (d).
Figure 2. SEM images (a,b), HRTEM images (c,d) of the prepared α-Fe2O3.
The microstructure and morphology of the as-prepared α-Fe2O3 were investigated by SEM andHRTEM, which are presented in Figure 2. The as-prepared α-Fe2O3 in the SEM image (Figure 2a,b)was a uniform dendritic-like three-dimensional microstructure. The dendritic-like microstructurehad branches that stretched in different directions. As shown in Figure 2c, it was found that theα-Fe2O3 showed the average length of about 2 μm and the average width of the α-Fe2O3 was about500 nm. In Figure 2d, the distances of the lattice in α-Fe2O3 were 0.27 nm, which was consistent with
191

Toxins 2019, 11, 105
the (014) plane in rhombohedral α-Fe2O3 structure. The above SEM and HRTEM indicate that theuniform and regular dendritic-like microstructural α-Fe2O3 was successfully prepared through thefacile hydrothermal method.
2.2. Photocatalytic Activity
The photocatalytic activities of the dendritic-like α-Fe2O3 were estimated by the degradationrate of DON in aqueous solution. From Figure 3a, it could be found that the intensity of DONdecreased significantly with time over dendritic-like α-Fe2O3 under visible light irradiation. Thisindicated that the dendritic-like α-Fe2O3 had superior photocatalytic activity under the visible lightirradiation. In Figure 3b, the blank line revealed that the DON could not be degraded under visiblelight obviously without a photocatalyst or in the presence of photocatalyst without visible light, whichindicated that the catalysts and visible light were necessary for the photocatalytic degradation of DON.In addition, after the suspension was stirred with a magnetic stirring apparatus for 1 h in the dark,the content of a DON standard was reduced slightly. It was found that the dendritic-like α-Fe2O3
could adsorb more DON than that of commercial α-Fe2O3, which may enhance the photocatalyticdegradation activity. As expected, the dendritic-like α-Fe2O3 (the blue line in Figure 3b) showed greatlya higher photocatalytic efficiency with a degradation rate of 90.3% in 2 h than that of commercialα-Fe2O3 (46.7%). There are two reasons why the dendritic-like α-Fe2O3 had better photocatalyticperformance. Firstly, as the three-dimensional nanomaterial, the dendritic-like α-Fe2O3 is difficult toform aggregation compared with commercial α-Fe2O3. In addition, the unique morphology of bionicdendritic a-Fe2O3 tends to increase the absorption of the sunlight and provides more charge transferpathways and more active sites to improve the efficiency of photocatalytic activities [25].
Figure 3. (a) HPLC chromatogram of DON photodegradation over dendritic-like α-Fe2O3 with differenttimes (b) Photocatalytic degradation of DON over dendritic-like α-Fe2O3, commercial α-Fe2O3 undervisible light and blank control.
2.3. Degradation Products Analysis
Generally, the photocatalytic degradation products of organic compounds are determined by thekind and quantity of active radicals production during the photoreaction, which may be different inthe presence of different catalysts or with different irradiation time [26]. During the photoreaction overα-Fe2O3, the electrons could be excited and transferred from the valence band (VB) to the conductionband (CB), leaving holes in the VB, which can oxidize the hydroxide ions into hydroxyl radicals (•OH).In addition, in the CB of the α-Fe2O3, the transferred electrons reacted with dissolved oxygen to formsuperoxide radical anions (•O2
−). Then, a number of active radicals such as •O2− and •OH could
react with the active site of DON and form the intermediate products [27,28]. To identify the possibleintermediate products of DON, the intermediates after photocatalytic treatment were investigatedby HPLC-MS. As shown in Figure 4 the total ion chromatograms (TIC) also revealed that the DONobviously reduced after 2 h photodegradation. A comparison between the initial TIC with that of afterphotodegradation revealed that two obvious peaks, P1 (m/z 209.17) and P2 (m/z 227.0), appearedafter the photocatalysis treatment, which may be the intermediate products of DON. The m/z value of
192
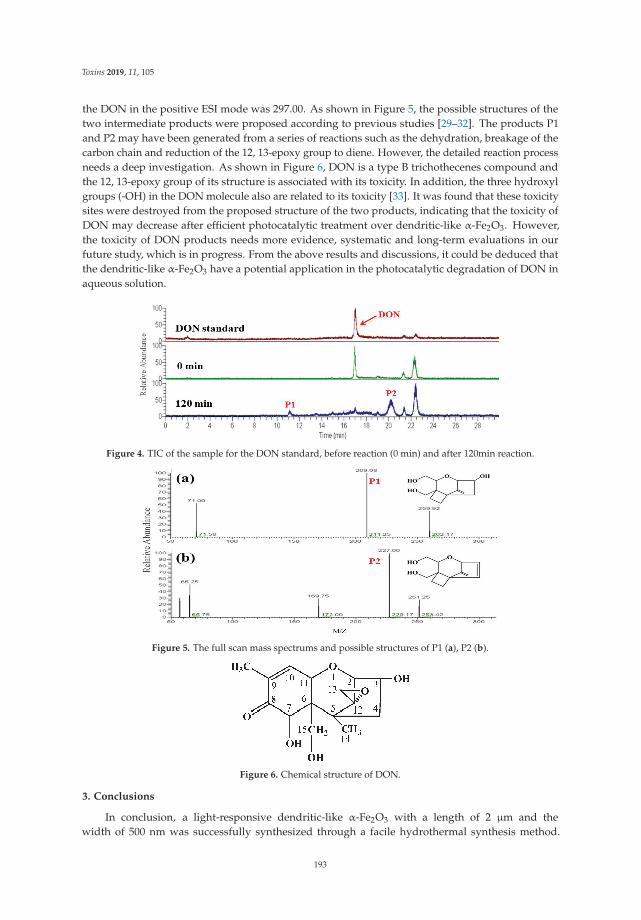
Toxins 2019, 11, 105
the DON in the positive ESI mode was 297.00. As shown in Figure 5, the possible structures of thetwo intermediate products were proposed according to previous studies [29–32]. The products P1and P2 may have been generated from a series of reactions such as the dehydration, breakage of thecarbon chain and reduction of the 12, 13-epoxy group to diene. However, the detailed reaction processneeds a deep investigation. As shown in Figure 6, DON is a type B trichothecenes compound andthe 12, 13-epoxy group of its structure is associated with its toxicity. In addition, the three hydroxylgroups (-OH) in the DON molecule also are related to its toxicity [33]. It was found that these toxicitysites were destroyed from the proposed structure of the two products, indicating that the toxicity ofDON may decrease after efficient photocatalytic treatment over dendritic-like α-Fe2O3. However,the toxicity of DON products needs more evidence, systematic and long-term evaluations in ourfuture study, which is in progress. From the above results and discussions, it could be deduced thatthe dendritic-like α-Fe2O3 have a potential application in the photocatalytic degradation of DON inaqueous solution.
Figure 4. TIC of the sample for the DON standard, before reaction (0 min) and after 120min reaction.
Figure 5. The full scan mass spectrums and possible structures of P1 (a), P2 (b).
Figure 6. Chemical structure of DON.
3. Conclusions
In conclusion, a light-responsive dendritic-like α-Fe2O3 with a length of 2 μm and thewidth of 500 nm was successfully synthesized through a facile hydrothermal synthesis method.
193
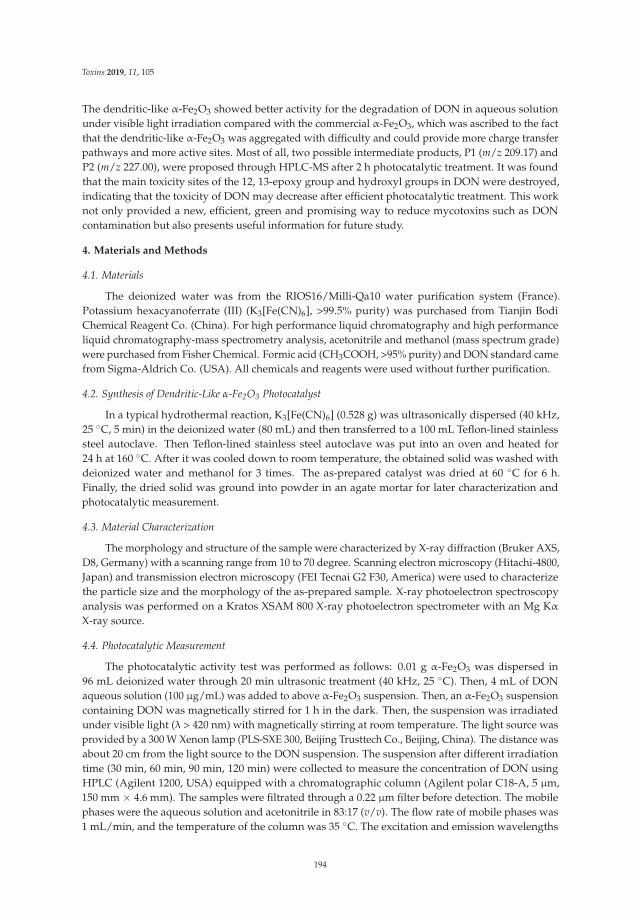
Toxins 2019, 11, 105
The dendritic-like α-Fe2O3 showed better activity for the degradation of DON in aqueous solutionunder visible light irradiation compared with the commercial α-Fe2O3, which was ascribed to the factthat the dendritic-like α-Fe2O3 was aggregated with difficulty and could provide more charge transferpathways and more active sites. Most of all, two possible intermediate products, P1 (m/z 209.17) andP2 (m/z 227.00), were proposed through HPLC-MS after 2 h photocatalytic treatment. It was foundthat the main toxicity sites of the 12, 13-epoxy group and hydroxyl groups in DON were destroyed,indicating that the toxicity of DON may decrease after efficient photocatalytic treatment. This worknot only provided a new, efficient, green and promising way to reduce mycotoxins such as DONcontamination but also presents useful information for future study.
4. Materials and Methods
4.1. Materials
The deionized water was from the RIOS16/Milli-Qa10 water purification system (France).Potassium hexacyanoferrate (III) (K3[Fe(CN)6], >99.5% purity) was purchased from Tianjin BodiChemical Reagent Co. (China). For high performance liquid chromatography and high performanceliquid chromatography-mass spectrometry analysis, acetonitrile and methanol (mass spectrum grade)were purchased from Fisher Chemical. Formic acid (CH3COOH, >95% purity) and DON standard camefrom Sigma-Aldrich Co. (USA). All chemicals and reagents were used without further purification.
4.2. Synthesis of Dendritic-Like α-Fe2O3 Photocatalyst
In a typical hydrothermal reaction, K3[Fe(CN)6] (0.528 g) was ultrasonically dispersed (40 kHz,25 ◦C, 5 min) in the deionized water (80 mL) and then transferred to a 100 mL Teflon-lined stainlesssteel autoclave. Then Teflon-lined stainless steel autoclave was put into an oven and heated for24 h at 160 ◦C. After it was cooled down to room temperature, the obtained solid was washed withdeionized water and methanol for 3 times. The as-prepared catalyst was dried at 60 ◦C for 6 h.Finally, the dried solid was ground into powder in an agate mortar for later characterization andphotocatalytic measurement.
4.3. Material Characterization
The morphology and structure of the sample were characterized by X-ray diffraction (Bruker AXS,D8, Germany) with a scanning range from 10 to 70 degree. Scanning electron microscopy (Hitachi-4800,Japan) and transmission electron microscopy (FEI Tecnai G2 F30, America) were used to characterizethe particle size and the morphology of the as-prepared sample. X-ray photoelectron spectroscopyanalysis was performed on a Kratos XSAM 800 X-ray photoelectron spectrometer with an Mg Kα
X-ray source.
4.4. Photocatalytic Measurement
The photocatalytic activity test was performed as follows: 0.01 g α-Fe2O3 was dispersed in96 mL deionized water through 20 min ultrasonic treatment (40 kHz, 25 ◦C). Then, 4 mL of DONaqueous solution (100 μg/mL) was added to above α-Fe2O3 suspension. Then, an α-Fe2O3 suspensioncontaining DON was magnetically stirred for 1 h in the dark. Then, the suspension was irradiatedunder visible light (λ > 420 nm) with magnetically stirring at room temperature. The light source wasprovided by a 300 W Xenon lamp (PLS-SXE 300, Beijing Trusttech Co., Beijing, China). The distance wasabout 20 cm from the light source to the DON suspension. The suspension after different irradiationtime (30 min, 60 min, 90 min, 120 min) were collected to measure the concentration of DON usingHPLC (Agilent 1200, USA) equipped with a chromatographic column (Agilent polar C18-A, 5 μm,150 mm × 4.6 mm). The samples were filtrated through a 0.22 μm filter before detection. The mobilephases were the aqueous solution and acetonitrile in 83:17 (v/v). The flow rate of mobile phases was1 mL/min, and the temperature of the column was 35 ◦C. The excitation and emission wavelengths
194
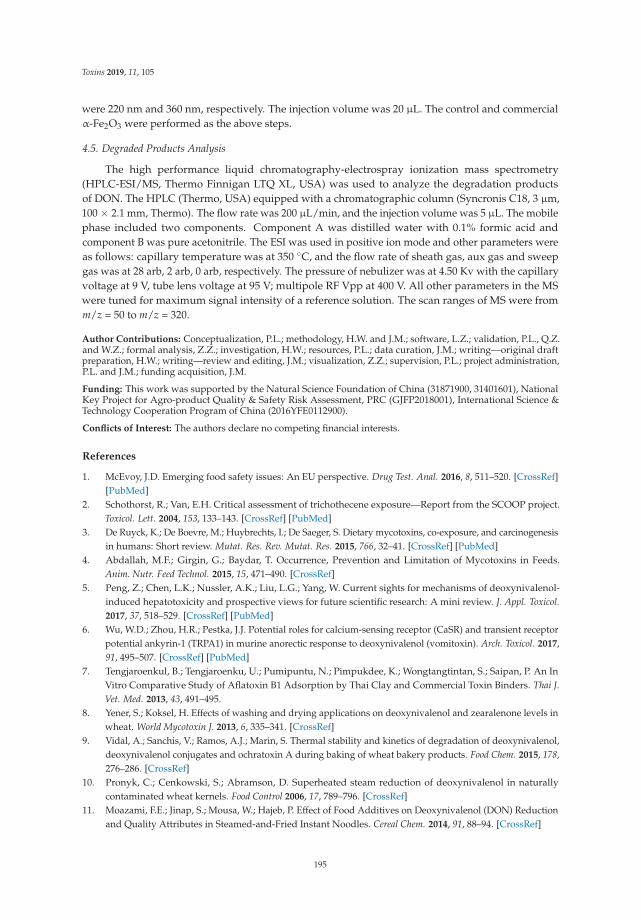
Toxins 2019, 11, 105
were 220 nm and 360 nm, respectively. The injection volume was 20 μL. The control and commercialα-Fe2O3 were performed as the above steps.
4.5. Degraded Products Analysis
The high performance liquid chromatography-electrospray ionization mass spectrometry(HPLC-ESI/MS, Thermo Finnigan LTQ XL, USA) was used to analyze the degradation productsof DON. The HPLC (Thermo, USA) equipped with a chromatographic column (Syncronis C18, 3 μm,100 × 2.1 mm, Thermo). The flow rate was 200 μL/min, and the injection volume was 5 μL. The mobilephase included two components. Component A was distilled water with 0.1% formic acid andcomponent B was pure acetonitrile. The ESI was used in positive ion mode and other parameters wereas follows: capillary temperature was at 350 ◦C, and the flow rate of sheath gas, aux gas and sweepgas was at 28 arb, 2 arb, 0 arb, respectively. The pressure of nebulizer was at 4.50 Kv with the capillaryvoltage at 9 V, tube lens voltage at 95 V; multipole RF Vpp at 400 V. All other parameters in the MSwere tuned for maximum signal intensity of a reference solution. The scan ranges of MS were fromm/z = 50 to m/z = 320.
Author Contributions: Conceptualization, P.L.; methodology, H.W. and J.M.; software, L.Z.; validation, P.L., Q.Z.and W.Z.; formal analysis, Z.Z.; investigation, H.W.; resources, P.L.; data curation, J.M.; writing—original draftpreparation, H.W.; writing—review and editing, J.M.; visualization, Z.Z.; supervision, P.L.; project administration,P.L. and J.M.; funding acquisition, J.M.
Funding: This work was supported by the Natural Science Foundation of China (31871900, 31401601), NationalKey Project for Agro-product Quality & Safety Risk Assessment, PRC (GJFP2018001), International Science &Technology Cooperation Program of China (2016YFE0112900).
Conflicts of Interest: The authors declare no competing financial interests.
References
1. McEvoy, J.D. Emerging food safety issues: An EU perspective. Drug Test. Anal. 2016, 8, 511–520. [CrossRef][PubMed]
2. Schothorst, R.; Van, E.H. Critical assessment of trichothecene exposure—Report from the SCOOP project.Toxicol. Lett. 2004, 153, 133–143. [CrossRef] [PubMed]
3. De Ruyck, K.; De Boevre, M.; Huybrechts, I.; De Saeger, S. Dietary mycotoxins, co-exposure, and carcinogenesisin humans: Short review. Mutat. Res. Rev. Mutat. Res. 2015, 766, 32–41. [CrossRef] [PubMed]
4. Abdallah, M.F.; Girgin, G.; Baydar, T. Occurrence, Prevention and Limitation of Mycotoxins in Feeds.Anim. Nutr. Feed Technol. 2015, 15, 471–490. [CrossRef]
5. Peng, Z.; Chen, L.K.; Nussler, A.K.; Liu, L.G.; Yang, W. Current sights for mechanisms of deoxynivalenol-induced hepatotoxicity and prospective views for future scientific research: A mini review. J. Appl. Toxicol.2017, 37, 518–529. [CrossRef] [PubMed]
6. Wu, W.D.; Zhou, H.R.; Pestka, J.J. Potential roles for calcium-sensing receptor (CaSR) and transient receptorpotential ankyrin-1 (TRPA1) in murine anorectic response to deoxynivalenol (vomitoxin). Arch. Toxicol. 2017,91, 495–507. [CrossRef] [PubMed]
7. Tengjaroenkul, B.; Tengjaroenku, U.; Pumipuntu, N.; Pimpukdee, K.; Wongtangtintan, S.; Saipan, P. An InVitro Comparative Study of Aflatoxin B1 Adsorption by Thai Clay and Commercial Toxin Binders. Thai J.Vet. Med. 2013, 43, 491–495.
8. Yener, S.; Koksel, H. Effects of washing and drying applications on deoxynivalenol and zearalenone levels inwheat. World Mycotoxin J. 2013, 6, 335–341. [CrossRef]
9. Vidal, A.; Sanchis, V.; Ramos, A.J.; Marin, S. Thermal stability and kinetics of degradation of deoxynivalenol,deoxynivalenol conjugates and ochratoxin A during baking of wheat bakery products. Food Chem. 2015, 178,276–286. [CrossRef]
10. Pronyk, C.; Cenkowski, S.; Abramson, D. Superheated steam reduction of deoxynivalenol in naturallycontaminated wheat kernels. Food Control 2006, 17, 789–796. [CrossRef]
11. Moazami, F.E.; Jinap, S.; Mousa, W.; Hajeb, P. Effect of Food Additives on Deoxynivalenol (DON) Reductionand Quality Attributes in Steamed-and-Fried Instant Noodles. Cereal Chem. 2014, 91, 88–94. [CrossRef]
195

Toxins 2019, 11, 105
12. Wang, L.; Wang, Y.; Shao, H.L.; Luo, X.H.; Wang, R.; Li, Y.F.; Li, Y.N.; Luo, Y.P.; Zhang, D.J.; Chen, Z.X. In vivotoxicity assessment of deoxynivalenol-contaminated wheat after ozone degradation. Food Addit. Contam. A2017, 34, 103–112. [CrossRef] [PubMed]
13. Niderkorn, V.; Morgavi, D.P.; Pujos, E.; Tissandier, A.; Boudra, H. Screening of fermentative bacteria for theirability to bind and biotransform deoxynivalenol, zearalenone and fumonisins in an in vitro simulated cornsilage model. Food Addit. Contam. 2007, 24, 406–415. [CrossRef]
14. Vanhoutte, I.; De Mets, L.; De Boevre, M.; Uka, V.; Di Mavungu, J.D.; De Saeger, S.; De Gelder, L.;Audenaert, K. Microbial Detoxification of Deoxynivalenol (DON), Assessed via a Lemna minor L. Bioassay,through Biotransformation to 3-epi-DON and 3-epi-DOM-1. Toxins 2017, 9, 63. [CrossRef] [PubMed]
15. Yang, X.; Li, L.; Duan, Y.; Yang, X. Antioxidant activity of Lactobacillus plantarum JM113 in vitro andits protective effect on broiler chickens challenged with deoxynivalenol. J. Anim. Sci. 2017, 95, 837–846.[CrossRef] [PubMed]
16. Bhatkhande, D.S.; Pangarkar, V.G.; Beenackers, A.A.C.M. Photocatalytic degradation for environmentalapplications—A review. J. Chem. Technol. Biotechnol. 2002, 77, 102–116. [CrossRef]
17. Bai, X.J.; Sun, C.P.; Liu, D.; Luo, X.H.; Li, D.; Wang, J.; Wang, N.X.; Chang, X.J.; Zong, R.L.; Zhu, Y.F.Photocatalytic degradation of deoxynivalenol using graphene/ZnO hybrids in aqueous suspension.Appl. Catal. B-Environ. 2017, 204, 11–20. [CrossRef]
18. Yamaguchi, Y.; Usuki, S.; Yamatoya, K.; Suzuki, N.; Katsumata, K.; Terashima, C.; Fujishima, A.; Kudo, A.;Nakata, K. Efficient photocatalytic degradation of gaseous acetaldehyde over ground Rh-Sb co-doped SrTiO3
under visible light irradiation. RSC Adv. 2018, 8, 5331–5337. [CrossRef]19. Pelaez, M.; Baruwati, B.; Varma, R.S.; Luque, R.; Dionysiou, D.D. Microcystin-LR removal from aqueous
solutions using a magnetically separable N-doped TiO2 nanocomposite under visible light irradiation.Chem. Commun. 2013, 49, 10118–10120. [CrossRef] [PubMed]
20. Mao, J.; Zhang, Q.; Li, P.W.; Zhang, L.X.; Zhang, W. Geometric architecture design of ternary compositesbased on dispersive WO3 nanowires for enhanced visible-light-driven activity of refractory pollutantdegradation. Chem. Eng. J. 2018, 334, 2568–2578. [CrossRef]
21. Mao, J.; Zhang, L.X.; Wang, H.T.; Zhang, Q.; Zhang, W.; Li, P.W. Facile fabrication of nanosized graphiticcarbon nitride sheets with efficient charge separation for mitigation of toxic pollutant. Chem. Eng. J. 2018,342, 30–40. [CrossRef]
22. Lassoued, A.; Lassoued, M.S.; Dkhil, B.; Ammar, S.; Gadri, A. Photocatalytic degradation of methylene bluedye by iron oxide (α-Fe2O3) nanoparticles under visible irradiation. J. Mater. Sci.-Mater. Electron. 2018, 29,8142–8152. [CrossRef]
23. Gobouri, A.A. Ultrasound enhanced photocatalytic properties of α-Fe2O3 nanoparticles for degradation ofdyes used by textile industry. Res. Chem. Intermed. 2016, 42, 5099–5113. [CrossRef]
24. Li, R.; Liu, J.; Jia, Y.; Zhen, Q. Photocatalytic Degradation Mechanism of Oxytetracyclines Using Fe2O3-TiO2
Nanopowders. J. Nanosci. Nanotechnol. 2017, 17, 3010–3015. [CrossRef]25. Jiang, Z.F.; Jiang, D.L.; Wei, W.; Yan, Z.X.; Xie, J.M. Natural carbon nanodots assisted development of
size-tunable metal (Pd, Ag) nanoparticles grafted on bionic dendritic α-Fe2O3 for cooperative catalyticapplications. J. Mater. Chem. A 2015, 3, 23607–23620. [CrossRef]
26. Huang, J.H.; Cheng, W.J.; Shi, Y.H.; Zeng, G.M.; Yu, H.B.; Gu, Y.L.; Shi, L.X.; Yi, K.X. Honeycomb-like carbonnitride through supramolecular preorganization of monomers for high photocatalytic performance undervisible light irradiation. Chemosphere 2018, 211, 324–334. [CrossRef] [PubMed]
27. Abd Mutalib, M.; Aziz, F.; Jamaludin, N.A.; Yahya, N.; Ismail, A.F.; Mohamed, M.A.; Yusop, M.Z.M.;Salleh, W.N.W.; Jaafar, J.; Yusof, N. Enhancement in photocatalytic degradation of methylene blue byLaFeO3-GO integrated photocatalyst-adsorbents under visible light irradiation. Korean J. Chem. Eng. 2018,35, 548–556. [CrossRef]
28. Li, H.T.; Wang, M.; Wei, Y.P.; Long, F. Noble metal-free NiS2 with rich active sites loaded g-C3N4 for highlyefficient photocatalytic H-2 evolution under visible light irradiation. J. Colloid Interface Sci. 2019, 534, 343–349.[CrossRef]
29. Juan-Garcia, A.; Juan, C.; Manyes, L.; Ruiz, M.J. Binary and tertiary combination of alternariol,3-acetyl-deoxynivalenol and 15-acetyl-deoxynivalenol on HepG2 cells: Toxic effects and evaluation ofdegradation products. Toxicol. In Vitro 2016, 34, 264–273. [CrossRef]
196
Toxins 2019, 11, 105
30. Juan-Garcia, A.; Juan, C.; Konig, S.; Ruiz, M.J. Cytotoxic effects and degradation products of three mycotoxins:Alternariol, 3-acetyl-deoxynivalenol and 15-acetyl-deoxynivalenol in liver hepatocellular carcinoma cells.Toxicol. Lett. 2015, 235, 8–16. [CrossRef]
31. Bretz, M.; Beyer, M.; Cramer, B.; Knecht, A.; Humpf, H.U. Thermal degradation of the Fusarium mycotoxindeoxynivalenol. J. Agric. Food Chem. 2006, 54, 6445–6451. [CrossRef]
32. Sun, C.; Ji, J.; Wu, S.L.; Sun, C.P.; Pi, F.W.; Zhang, Y.Z.; Tang, L.L.; Sun, X.L. Saturated aqueous ozonedegradation of deoxynivalenol and its application in contaminated grains. Food Control 2016, 69, 185–190.[CrossRef]
33. Pestka, J.J. Deoxynivalenol: Toxicity, mechanisms and animal health risks. Anim. Feed Sci. Technol. 2007, 137,283–298. [CrossRef]
© 2019 by the authors. Licensee MDPI, Basel, Switzerland. This article is an open accessarticle distributed under the terms and conditions of the Creative Commons Attribution(CC BY) license (http://creativecommons.org/licenses/by/4.0/).
197

toxins
Article
Cold Plasma Treatment as an Alternative forOchratoxin A Detoxification and Inhibition ofMycotoxigenic Fungi in Roasted Coffee
Paloma Patricia Casas-Junco 1, Josué Raymundo Solís-Pacheco 2, Juan Arturo Ragazzo-Sánchez 1,
Blanca Rosa Aguilar-Uscanga 2,
Pedro Ulises Bautista-Rosales 3 and Montserrat Calderón-Santoyo 1,*
1 Laboratorio Integral de Investigación en Alimentos, Tecnológico Nacional de México/Instituto Tecnológicode Tepic, Av. Tecnológico #2595, Col. Lagos del Country, C.P. 63175 Tepic, Nayarit, Mexico;[email protected] (P.P.C.-J.); [email protected] (J.A.R.-S.)
2 Laboratorio de Microbiología Industrial, Centro Universitario de Ciencias Exactas e Ingeniería, Universidadde Guadalajara, Boulevard Marcelino García Barragán #1421, Col. Olímpica,C.P. 44430 Guadalajara, Jalisco, Mexico; [email protected] (J.R.S.-P.);[email protected] (B.R.A.-U.)
3 Centro de Tecnología de Alimentos, Universidad Autónoma de Nayarit, Ciudad de la Cultura“Amado Nervo”, C.P. 63155 Tepic, Nayarit, Mexico; [email protected]
* Correspondence: [email protected] or [email protected];Tel.: +52-311-211-9400 (ext. 232)
Received: 23 May 2019; Accepted: 5 June 2019; Published: 13 June 2019
Abstract: Ochratoxin A (OTA) produced by mycotoxigenic fungi (Aspergillus and Penicillium spp.) isan extremely toxic and carcinogenic metabolite. The use of cold plasma to inhibit toxin-producingmicroorganisms in coffee could be an important alternative to avoid proliferation of mycotoxigenicfungi. Roasted coffee samples were artificially inoculated with A. westerdijikiae, A. steynii, A. versicolor,and A. niger, and incubated at 27 ◦C over 21 days for OTA production. Samples were cold plasmatreated at 30 W input power and 850 V output voltage with helium at 1.5 L/min flow. OTA productionin coffee was analyzed by high performance liquid chromatography coupled to a mass spectrometer(HPLC-MS). After 6 min of treatment with cold plasma, fungi were completely inhibited (4 logreduction). Cold plasma reduces 50% of OTA content after 30 min of treatment. Toxicity was estimatedfor extracts of artificially contaminated roasted coffee samples using the brine shrimp (Artemia salina)lethality assay. Toxicity for untreated roasted coffee was shown to be “toxic”, while toxicity for coldplasma treated coffee was reduced to “slightly toxic”. These results suggested that cold plasma maybe considered as an alternative method for the degradation and reduction of toxin production bymycotoxigenic fungi in the processing of foods and feedstuffs.
Keywords: roasted coffee; mycotoxigenic fungi; ochratoxin A; cold plasma; detoxification; brineshrimp bioassay
Key Contribution: Cold plasma technology emerges as a convenient alternative to detoxify coffeeproducts. Total inhibition of A. niger and 50% OTA detoxification were achieved after 6 and 30 minexposures to cold plasma, respectively.
Toxins 2019, 11, 337; doi:10.3390/toxins11060337 www.mdpi.com/journal/toxins199

Toxins 2019, 11, 337
1. Introduction
Ochratoxins belong to a family of structurally related, secondary fungal metabolites producedby various Penicillium and Aspergillus strains. Among them, ochratoxin A (OTA) is reputed to beimportant mycotoxin in coffee. OTA possesses properties such as nephrotoxicity, carcinogenicity,and teratogenicity and is classified as carcinogenic for humans (group 2B) [1,2]. According to theCommission of European Communities 2006, the maximum accepted levels for OTA are 5 μg/kg inroasted coffee beans and ground roasted coffee, and 10 μg/kg in soluble coffee. Some studies haverevealed that the roasting treatment of green coffee at 200 ◦C for 20 min reduced the OTA levels by only0–12% [3]. OTA binds to the plasma proteins [4], and then OTA could be bound to the coffee proteins.Changes to OTA during heat treatment have been studied; a partial isomerization of OTA in positionC3 into a diastereomer occurred at high temperatures [5]. Therefore, the relative OTA thermo-stabilitycould cause toxicological problems during the consumption of coffee products.
Several strategies are available for the detoxification of mycotoxins and inhibition of fungi growth,which include methods such as thermal inactivation, irradiation, ultrasound treatment, and biologicalcontrol agents [6]. Although these are widely used methods, they are time consuming and result inreductions in the nutritional quality of food products, variations in sensorial characteristics, and highercosts can occur.
Cold plasma is an innovative technology with potential for the inactivation of various pathogenicand spoilage microorganisms and the detoxification of foods [7]. Cold plasma is the fourth state ofmatter, being an ionized gas containing a rich mixture of reactive neutral species, energetic chargedparticles, UV photons, and intense transient electric fields, which can interact simultaneously andsynergistically with the food [8]. Ionization is the first important step for plasma chemistry. Plasmachemistry depends on several factors such as feed gas composition, relative humidity, the powersupplied, and treatment time [9]. Various studies have shown the potential of cold plasma to inactivatetoxigenic fungi, leading to the detoxification of hazelnuts, peanuts, pistachios, and nuts [6,10], datepalm fruits [11], and groundnuts [9]. Solís-Pacheco et al. [12] carried out a study on the sterilizationof cinnamon and camomile to eliminate fungi and yeasts by the use of cold plasma. These authorsobtained reductions higher than 1.0 log CFU/g at 750 and 850 V for chamomile and 0.68 ± 0.18 logCFU/g for cinnamon at 850 V after 10 min of treatment. They concluded that the best treatment toobtain significant reductions of yeast and mold counts in chamomile and cinnamon samples withthe lowest degradation of antioxidant compounds was the application of plasma energy at 750 Vfor 10 min.
Therefore, the objective of this study was to explore cold plasma as a technology to inhibit toxigenicfungi and to detoxify OTA in roasted coffee, as well as to demonstrate the reduction in toxicity for thecold plasma treated samples.
2. Results
2.1. Inhibition of Fungal Spores in Roasted Coffee by Cold Plasma Treatment
A complete inhibition of A. westerdijikiae, A. steynii, A. versicolor, and A. niger spores was achieved(4 log reduction) after 6 min exposure to cold plasma treatment (p < 0.05) (Figure 1; Table S1).Méndez-Vilas [13] reported damage in the microbial cellular membrane due to its interaction withactive species and a subsequent loss of cytoplasmic material as the final cause of microorganism death.Additionally, DNA molecules—highly sensitive to ions, neutral species, and UV light—can be alteredwhen these active species penetrate and reach the nucleus [14,15].
200

Toxins 2019, 11, 337
A.westerdijikiae A.versicolor A.steynii A.niger
Figure 1. Logarithmic survival curves of A. westerdijikiae, A. steynii, A. versicolor, and A. niger spores onroasted coffee samples cold plasma treated (30 W input power, 850 V output voltage, He-air mixture at1.5 L/min).
2.2. Effect of Cold Plasma on Detoxification of OTA Produced in Roasted Coffee by Mycotoxigenic Fungi
OTA production in roasted coffee artificially contaminated and incubated over 21 days wasdetermined as follows: A. westerdijikiae 96.45 μg/kg, A. steynii 67.79 μg/kg, A. niger 91.03 μg/kg, andA. versicolor 76.74 μg/kg. After 30 min of cold plasma exposure, OTA was reduced by approximatively50% (p < 0.05) (Table 1; Table S1). These results suggest the application of cold plasma may have astrong potential not only in mycotoxin degradation, but also in fungi control, and subsequently in thereduction of toxin production by mycotoxigenic fungi, thus suggesting this process can be effectivelyused in industrial food production. Despite an absence of OTA total reduction, the achieved reductionof 50% could be high enough to meet the requirements stablished by the European Union legislationwhich established the maximum accepted levels for OTA at 5 μg/kg for roasted coffee beans andground roasted coffee and 10 μg/kg for soluble coffee [16]. Therefore, this technique can be promisingfor mycotoxin detoxification in the coffee industry as an alternative to preventing or eliminating OTAand toxigenic fungi.
Table 1. Effect of cold plasma applied for different periods of time on ochratoxin A (OTA) detoxificationof roasted coffee.
ExposureTime (min)
OTA (μg/kg)
A.westerdijikiae
Reduction(%)
A. steynii Reduction(%)
A. niger Reduction(%)
A. versicolor Reduction(%)
0 96.45 ± 3.08 a 67.69 ± 3.66 a 91.03 ± 12.06 a 76.741 ± 10.12 a
1 89.86 ± 4.43 a 6.83 64.57 ± 1.92 ab 4.61 87.31 ± 3.56 a 4.09 76.61 ± 1.91 a 0.174 81.34 ± 16.91 ab 15.67 59.07 ± 4.97 bc 12.73 72.81 ± 1.99 b 20.02 75.44 ± 10.96 a 1.698 77.17 ± 14.79 bac 19.99 55.17 ± 1.63 dc 18.50 71.77 ± 1.28 b 21.16 69.19 ± 22.76 a 9.8412 73.62 ± 8.43 bac 23.67 49.48 ± 5.49 de 26.90 69.50 ± 2.86 b 23.65 68.36 ± 2.38 a 10.9116 62.89 ± 22.09 bdc 34.80 43.48 ± 1.75 ef 35.37 66.4 ± 1.99 cb 27.06 67.08 ± 8.85 a 12.5920 51 ± 5.26 bdc 47.12 41.42 ± 0.69 f 38.31 65.37 ± 9.97 cb 28.19 63.67 ± 1.29 a 17.0224 54.39 ± 1.08 dc 43.61 38.28 ± 1.59 fg 43.45 63.76 ± 3.40 cb 29.96 63.28 ± 13.36 a 17.5330 38 ± 4.20 d 60.60 31.39 ± 0.03 g 52.86 54.34 ± 0.85 c 40.31 51.18 ± 6.64 a 33.31
Values followed by the same letter in the columns are not significantly different.
The effect of cold plasma on OTA detoxification could be attributed to the reactive gas speciesgeneration of such ions as (H3O+, O+, O−, OH−, N2
+), molecular species (O3, H2O2), and reactiveradicals (O•, OH•, NO•), as well as to UV irradiation and etching [7,17]. These species could promote
201
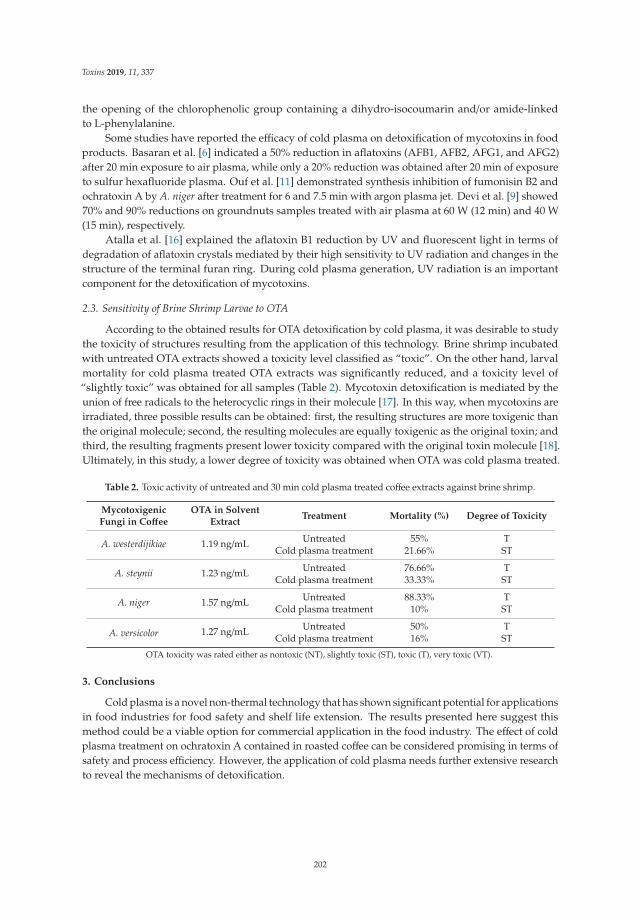
Toxins 2019, 11, 337
the opening of the chlorophenolic group containing a dihydro-isocoumarin and/or amide-linkedto L-phenylalanine.
Some studies have reported the efficacy of cold plasma on detoxification of mycotoxins in foodproducts. Basaran et al. [6] indicated a 50% reduction in aflatoxins (AFB1, AFB2, AFG1, and AFG2)after 20 min exposure to air plasma, while only a 20% reduction was obtained after 20 min of exposureto sulfur hexafluoride plasma. Ouf et al. [11] demonstrated synthesis inhibition of fumonisin B2 andochratoxin A by A. niger after treatment for 6 and 7.5 min with argon plasma jet. Devi et al. [9] showed70% and 90% reductions on groundnuts samples treated with air plasma at 60 W (12 min) and 40 W(15 min), respectively.
Atalla et al. [16] explained the aflatoxin B1 reduction by UV and fluorescent light in terms ofdegradation of aflatoxin crystals mediated by their high sensitivity to UV radiation and changes in thestructure of the terminal furan ring. During cold plasma generation, UV radiation is an importantcomponent for the detoxification of mycotoxins.
2.3. Sensitivity of Brine Shrimp Larvae to OTA
According to the obtained results for OTA detoxification by cold plasma, it was desirable to studythe toxicity of structures resulting from the application of this technology. Brine shrimp incubatedwith untreated OTA extracts showed a toxicity level classified as “toxic”. On the other hand, larvalmortality for cold plasma treated OTA extracts was significantly reduced, and a toxicity level of“slightly toxic” was obtained for all samples (Table 2). Mycotoxin detoxification is mediated by theunion of free radicals to the heterocyclic rings in their molecule [17]. In this way, when mycotoxins areirradiated, three possible results can be obtained: first, the resulting structures are more toxigenic thanthe original molecule; second, the resulting molecules are equally toxigenic as the original toxin; andthird, the resulting fragments present lower toxicity compared with the original toxin molecule [18].Ultimately, in this study, a lower degree of toxicity was obtained when OTA was cold plasma treated.
Table 2. Toxic activity of untreated and 30 min cold plasma treated coffee extracts against brine shrimp.
MycotoxigenicFungi in Coffee
OTA in SolventExtract
Treatment Mortality (%) Degree of Toxicity
A. westerdijikiae 1.19 ng/mL Untreated 55% TCold plasma treatment 21.66% ST
A. steynii 1.23 ng/mL Untreated 76.66% TCold plasma treatment 33.33% ST
A. niger 1.57 ng/mL Untreated 88.33% TCold plasma treatment 10% ST
A. versicolor 1.27 ng/mL Untreated 50% TCold plasma treatment 16% ST
OTA toxicity was rated either as nontoxic (NT), slightly toxic (ST), toxic (T), very toxic (VT).
3. Conclusions
Cold plasma is a novel non-thermal technology that has shown significant potential for applicationsin food industries for food safety and shelf life extension. The results presented here suggest thismethod could be a viable option for commercial application in the food industry. The effect of coldplasma treatment on ochratoxin A contained in roasted coffee can be considered promising in terms ofsafety and process efficiency. However, the application of cold plasma needs further extensive researchto reveal the mechanisms of detoxification.
202

Toxins 2019, 11, 337
4. Materials and Methods
4.1. Biological Materials
Roasted ground coffee was procured from a local market in Nayarit, Mexico. Coffee samples wereautoclaved for 20 min at 121 ◦C and 15 psi, and dried in a laminar flow hood (CFLV-120, NOVATECH)for 1 h.
OTA producing strains of A. westerdijikiae (KP329736.1), A. steynii (FM956458.1), A. niger(JN226991.1), and A. versicolor (NR131277.1) were isolated from roasted coffee (Coffea arabica L.)from a coffee-growing region of Nayarit, Mexico [19]. Individual fungal cultures were grown on potatodextrose agar (PDA) for 7 days at 28 ◦C. Spore suspension was prepared by flooding the myceliasurface with 10 mL of sterile distilled water. The suspension was filtered and the spores counted usinga Neubauer camera. The suspension was adjusted to a final value of 5 × 10⁵ spores mL−1.
4.2. Plasma Generator
The plasma apparatus was designed and built at the Laboratory of Plasma Physics of theNational Nuclear Research Institute in Toluca, Mexico. The plasma reactor was described bySolis-Pacheco et al. [12].
4.3. Inhibition of Toxigenic Fungi Using Cold Plasma Treatment on Roasted Coffee
Samples of 0.5 g of sterilized roasted coffee were inoculated with 5 μL of a spore’s suspension(5 × 10⁵ spores g−1) and rested for 30 min to facilitate proper attachment of spores on coffee particles.Samples were allowed to dry in a laminar flow hood. Afterwards, the samples were exposed to plasmausing commercial helium gas (Praxair, Mexico) at a constant flow of 1.5 L/min, applied at 850 volts fordifferent periods of time (0, 1, 2, 4, 5, 6, 8, 10, 12, 14, 16, and 18 min). Before and after plasma treatment,the enumeration of fungi (log CFU/g) were determined. The samples were diluted in 1 mL of 0.1%peptone water and homogenized for 10 s. Decimal dilutions were performed and pour plated withpotato dextrose agar (PDA, Bioxon, Mexico) containing 2% ampicillin (Bayer, México) and 0.6% Bengalrose (Analytyka, Mexico). All plates were incubated at 28 ◦C for 48 h. Fungi colonies were enumeratedand results reported in log CFU/g of sample. Each experiment was conducted in triplicate, and thewhole analysis was performed in duplicate.
4.4. OTA Production by Mycotoxigenic Fungi and Detoxification by Cold Plasma
Isolated fungi were inoculated in the center of a plate containing PDA medium and incubated at27 ◦C for 5 days. One gram of roasted coffee was added to 3 mL of distilled water and autoclaved for15 min at 121 ◦C and 15 psi. After cooling, samples were inoculated with 3 agar disks taken from theperiphery of the colony [20]. Once inoculated, the roasted coffee samples were incubated at 27 ◦C for21 days. The exposure times of cold plasma for detoxification of OTA in the samples of coffee were 0, 1,4, 8, 12, 16, 20, 24, and 30 min, using commercial helium gas at 1.5 L/min, 30 W input power, and avoltage of 850 V.
4.5. OTA Detection by HPLC-MS
At the end of the plasma treatment, extraction was carried out in an alkaline solvent (pH 9.4)consisting of 3% sodium bicarbonate in methanol/water (20/80, v/v), and the suspension washomogenized for 50 min at 60 ◦C. The extract was centrifuged (model EBA 21, Heittich) at 1036.39× gfor 5 min. Ten milliliters of filtered extract were diluted in 40 mL phosphate buffer (pH 7.0, 0.1 M).The mixture was purified using an immunoaffinity column (Ochrastar R) purchased from RomerLabs (Tulin, Austria). OTA was eluted by 6 mL of methanol and evaporated to dryness in a rotaryevaporator [21]. The residue was re-suspended in 1 mL of the mobile phase (water/acetonitrile, 50:50).Quantification was done by HPLC-MS (Agilent Technologies). The operating conditions were as
203

Toxins 2019, 11, 337
follows: mobile phase of 5 mM ammonium acetate/acetonitrile (65/35, v/v) at 40 ◦C with a flow rate of0.2 mL/min for 4 min run. A column Agilent Technologies Zorbax SB-C18 (2.1 × 50 mm id: 1.8 μm) wasused. The detection of OTA was performed in a HPLC-MS system model 6120 series LC quadrupoleequipped with an electrospray ion (ESI) MS (Agilent Technologies) in ionization mode and positivemode (capillary 3500 V, nebulizer 25 psi (nitrogen), under dry gas nitrogen at 9 L/min, at 350 ◦C, and thefragmentor voltage set at 95 V; ion monitoring SIM selected, m/z 404 (OTA). A standard curve preparedwith different OTA concentrations (1, 3, 5, 7, and 21 μg/mL) in acetonitrile was used to determine OTAin coffee samples (Figure 2).
Figure 2. OTA standard curve (1–21 ng/mL) (a), OTA chromatogram (0.021 ng/mL) by HPLC-MS (b).
4.6. Brine Shrimp Bioassay
Brine shrimp eggs (Artemia salina) were incubated in artificial seawater illuminated by artificiallight (60 W lamp) and gently aerated for 24 h at 28 ◦C. Afterwards, the nauplii (larvae) were collectedby pipette from the lighted side, whereas their shells were left in the dark side. The test samples(extract from roasted coffee inoculated with toxigenic fungi) were prepared in acetonitrile-water (50:50).The actual concentrations of the whole solutions were determined by HPLC-MS analyses (quantitationbased on OTA as internal standard) and considered with the data evaluation. Filter paper disks(d = 0.5 cm) were submerged in microtubes containing 30 μL of OTA extracts and air-dried. Then,each disc was transferred into a 6-well microtitrate plate containing artificial sea water (2 mL) and10 nauplii; plates were maintained at room temperature for 48 h under light and dead larvae werecounted by examination under a binocular stereoscope. Discs submerged in acetonitrile-water solvent(50:50) were used as controls. Mortality was determined according to Equation (1).
% deaths =Dead nauplii in the biossay
Nauplii used in the biossay−Dead nauplii in the control× 100 (1)
OTA toxicity was rated as follows: 0–9% mortality, nontoxic (NT); 10–49% mortality, slightly toxic(ST); 50–89% mortality, toxic (T); 90–100% mortality, very toxic (VT) [22].
4.7. Statistical Analysis
Statistical analysis was performed using STATISTICA version 9.0. Analysis of variance (ANOVA)and multiple comparison procedures (least significant difference–LSD) test were conducted to determinewhether there were significant differences (p < 0.05) among treatments for spores’ inhibition orOTA detoxification.
Supplementary Materials: The following are available online at http://www.mdpi.com/2072-6651/11/6/337/s1,Table S1: raw data.
Author Contributions: P.P.C.-J. performed the experiment and wrote the manuscript. J.R.S.-P. contributed tosupervision and experiments design. J.A.R.-S. contributed to data analysis and the manuscript writing. B.R.A.-U.contributed to supervision and manuscript review. P.U.B.-R. contributed to supervision. M.C.-S. contributed toresearch design, supervision, and manuscript revision and final editing.
204
Toxins 2019, 11, 337
Funding: This research was funded by Tecnologico Nacional de Mexico through the project 5851.16-P andCONAHCYT through the fellowship 374701 granted to P. P. Casas Junco.
Conflicts of Interest: The authors declare no conflict of interest. The funders had no role in the design of thestudy; in the collection, analyses, or interpretation of data; in the writing of the manuscript, or in the decision topublish the results.
References
1. Nganou Donkeng, N.; Durand, N.; Tatsadjieu, N.L.; Metayer, I.; Montet, D.; Mbofung, C.M. Fungal llora andochratoxin a associated with coffee in Cameroon. Br. Microbiol. Res. J. 2014, 4, 1–17. [CrossRef]
2. Group 2B: Possibly carcinogenic to humans. In Monographs on the Evaluation of Carcinogenic Risks of Chemicalsto Humans; International Agency for Research on Cancer (IARC): Lyon, France, 1993; Volume 56, pp. 245–395.
3. Tsubouchi, H.; Yamamoto, K.; Hisada, K.; Sakabe, Y.; Udagawa, S.-i. Effect of roasting on ochratoxin A levelin green coffee beans inoculated with Aspergillus ochraceus. Mycopathologia 1987, 97, 111–115. [CrossRef]
4. Il’ichev, Y.V.; Perry, J.L.; Simon, J.D. Interaction of ochratoxin A with human serum albumin. Preferentialbinding of the dianion and pH effects. J. Phys. Chem. B 2002, 106, 452–459. [CrossRef]
5. Suárez-Quiroz, M.; Louise, B.D.; Gonzalez-Rios, O.; Barel, M.; Guyot, B.; Schorr-Galindo, S.; Guiraud, J.P. Theimpact of roasting on the ochratoxin A content of coffee. Int. J. Food Sci. Technol. 2005, 40, 605–611. [CrossRef]
6. Basaran, P.; Basaran-Akgul, N.; Oksuz, L. Elimination of Aspergillus parasiticus from nut surface with lowpressure cold plasma (LPCP) treatment. Food Microbiol. 2008, 25, 626–632. [CrossRef] [PubMed]
7. Pankaj, S.; Keener, K.M. Cold plasma: Background, applications and current trends. Curr. Opin. Food Sci.2017, 16, 49–52. [CrossRef]
8. Guo, J.; Huang, K.; Wang, J. Bactericidal effect of various non-thermal plasma agents and the influence ofexperimental conditions in microbial inactivation: A review. Food Control 2015, 50, 482–490. [CrossRef]
9. Devi, Y.; Thirumdas, R.; Sarangapani, C.; Deshmukh, R.; Annapure, U. Influence of cold plasma on fungalgrowth and aflatoxins production on groundnuts. Food Control 2017, 77, 187–191. [CrossRef]
10. Siciliano, I.; Spadaro, D.; Prelle, A.; Vallauri, D.; Cavallero, M.C.; Garibaldi, A.; Gullino, M.L. Use of coldatmospheric plasma to detoxify hazelnuts from aflatoxins. Toxins 2016, 8, 125. [CrossRef] [PubMed]
11. Ouf, S.A.; Basher, A.H.; Mohamed, A.A.H. Inhibitory effect of double atmospheric pressure argon coldplasma on spores and mycotoxin production of Aspergillus niger contaminating date palm fruits. J. Sci.Food Agric. 2015, 95, 3204–3210. [CrossRef] [PubMed]
12. Solís-Pacheco, J.R.; Aguilar-Uscanga, B.R.; Villanueva-Tiburcio, J.E.; Macías-Rodríguez, M.E.; Viveros-Paredes, J.M.;González-Reynoso, O.; Peña-Eguiluz, R. Effect and mechanism of action of non-thermal plasma in the survivalof Escherichia coli, Staphylococcus aureus and Saccharomyces cerevisiae. J. Microbiol. Biotechnol. Food Sci. 2017, 7,143–144. [CrossRef]
13. Méndez-Vilas, A. Microbial Pathogens and Strategies for Combating Them: Science, Technology and Education;Formatex Research Center: Badajoz, Spain, 2013.
14. Jalili, M.; Jinap, S.; Noranizan, M. Aflatoxins and ochratoxin a reduction in black and white pepper bygamma radiation. Radiat. Phys. Chem. 2012, 81, 1786–1788. [CrossRef]
15. Moreau, M.; Lescure, G.; Agoulon, A.; Svinareff, P.; Orange, N.; Feuilloley, M. Application of the pulsedlight technology to mycotoxin degradation and inactivation. J. Appl. Toxicol. 2013, 33, 357–363. [CrossRef][PubMed]
16. Commission Regulation (EC) No 1881/2006 of 19 December 2006 Setting Maximum Levels forCertain Contaminants in Foodstuffs. Available online: https://www.ecolex.org/es/details/legislation/commission-regulation-ec-no-18812006-setting-maximum-levels-for-certain-contaminants-in-foodstuffs-lex-faoc068134/? (accessed on 7 July 2018).
17. Park, B.J.; Takatori, K.; Sugita-Konishi, Y.; Kim, I.-H.; Lee, M.-H.; Han, D.-W.; Chung, K.-H.; Hyun, S.O.;Park, J.-C. Degradation of mycotoxins using microwave-induced argon plasma at atmospheric pressure.Surf. Coat. technol. 2007, 201, 5733–5737. [CrossRef]
18. Atalla, M.; Hassanein, N.; El-Beih, A.; Youssef, Y. Effect of fluorescent and UV light on mycotoxin productionunder different relative humidities in wheat grains. Int. J. Agric. Biol. 2004, 6, 1006.
205

Toxins 2019, 11, 337
19. Casas-Junco, P.P.; Ragazzo-Sánchez, J.A.; de Jesus Ascencio-Valle, F.; Calderón-Santoyo, M. Determination ofpotentially mycotoxigenic fungi in coffee (Coffea arabica L.) from Nayarit. Food Sci. Biotechnol. 2018, 27,891–898. [CrossRef] [PubMed]
20. Tournas, V.; Stack, M.; Mislivec, P.; Koch, H.; Bandler, R. Yeasts, Molds and Mycotoxins, Chap. 18.US Food and Drug Administration, Bacteriological Analytical Manual (BAM). pp. 259–268. Availableonline: http://www.fda.gov/Food/FoodScienceResearch/LaboratoryMethods/ucm071435.htm (accessed on2 May 2018).
21. Mounjouenpou, P.; Durand, N.; Guyot, B.; Guiraud, J.P. Effect of operating conditions on ochratoxin Aextraction from roasted coffee. Food Addit. Contam. 2007, 24, 730–734. [CrossRef] [PubMed]
22. Harwing, J.; Scott, P.M. Brine shrimp (Artemia salina L.) larvae as a screening system for fungal toxins.Appl. Environ. Microbiol. 1971, 21, 1011–1016.
© 2019 by the authors. Licensee MDPI, Basel, Switzerland. This article is an open accessarticle distributed under the terms and conditions of the Creative Commons Attribution(CC BY) license (http://creativecommons.org/licenses/by/4.0/).
206

toxins
Article
Reduction of Deoxynivalenol in Wheat withSuperheated Steam and Its Effects on Wheat Quality
Yuanxiao Liu, Mengmeng Li, Ke Bian *, Erqi Guan, Yuanfang Liu and Ying Lu
National Engineering Laboratory for Wheat and Corn Further Processing, Henan University of Technology,Zhengzhou 450001, China* Correspondence: [email protected]
Received: 16 May 2019; Accepted: 15 July 2019; Published: 16 July 2019
Abstract: Deoxynivalenol (DON) is the most commonly found mycotoxin in scabbed wheat. In orderto reduce the DON concentration in scabbed wheat with superheated steam (SS) and explore thefeasibility to use the processed wheat as crisp biscuit materials, wheat kernels were treated with SSto study the effects of SS processing on DON concentration and the quality of wheat. Furthermore,the wheat treated with SS were used to make crisp biscuits and the texture qualities of biscuits weremeasured. The results showed that DON in wheat kernels could be reduced by SS effectively. Besides,the reduction rate raised significantly with the increase of steam temperature and processing timeand it was also affected significantly by steam velocity. The reduction rate in wheat kernels andwheat flour could reach 77.4% and 60.5% respectively. In addition, SS processing might lead to partialdenaturation of protein and partial gelatinization of starch, thus affecting the rheological propertiesof dough and pasting properties of wheat flour. Furthermore, the qualities of crisp biscuits wereimproved at certain conditions of SS processing.
Keywords: deoxynivalenol; wheat; superheated steam; wheat quality; crisp biscuit
Key Contribution: Deoxynivalenol in wheat could be reduced by SS treatment effectively althoughthe qualities of wheat may be damaged for some degree. The wheat treated with SS could still beused as the materials of crisp biscuits with good quality.
1. Introduction
Head blight is a kind of fungal disease affecting wheat plant throughout the world. Both theyield and the quality of wheat are seriously affected by this disease. What’s worse, Fusarium fungi inwheat grains can produce many kinds of mycotoxins, among which deoxynivalenol (DON) is the mostcommonly found [1]. In 2017, the DON levels in 48 wheat samples harvested in Brazil range from1329 to 3937 μg/kg and the average level is 2398 μg/kg [2]. Survey of 54 wheat samples in SoutheastRomania in 2009 indicated that 66% of the samples were positive with DON with the average level of4772 μg/kg [3]. In 2014, a three-year survey of the occurrence of DON in wheat in some regions ofJiangsu Province, China indicated that DON was found in 74.4% of samples at levels ranging from14.52 to 41,157.13 μg/kg [4]. Besides, a survey of the global occurrence of deoxynivalenol in foodcommodities and exposure risk assessment in humans in the last decade showed that the problem ofDON contamination in wheat is becoming more and more terrible [5]. Since wheat grains are commonmaterials of foods and feeds, DON in wheat may be toxic to humans and animals. High concentrationof DON has acute toxic effects, such as vomiting and diarrhea, on humans and animals. Meanwhile,taking in DON for a long period may do harm to the immune system, hematopoietic system, stomach,bone marrow and lymphoid tissues [6]. Scientists all over the world have done much research into thedegradation and reduction methods of DON, such as heat treatment [7], activated carbon adsorption [8],ozone fumigation [9], ray irradiation [10], alkali steeping [11] and biodegradation [12]. However, many
Toxins 2019, 11, 414; doi:10.3390/toxins11070414 www.mdpi.com/journal/toxins207

Toxins 2019, 11, 414
of these methods are hard to apply in wheat processing up to now. Therefore, it is meaningful toexplore new means for reducing DON in wheat and their application in food processing.
Superheated steam (SS) is a kind of steam with temperature above the saturation point of water atgiven pressure. Compared to hot air, SS has some advantages, including higher drying rate, oxygen-freeenvironment, free of pollution and energy conservation [13]. For these features, SS has been used inthe drying of wood [14], paper [15], coal [16], sludge [17], etc. In recent years, researchers have tried toapply SS to the processing of food products. They mainly focus on the drying of foodstuffs, such aspotato slices [18], oat groats [19], carrot [20], pork [21], beet, etc. What’s more, drying of beet with SShas been applied into some factories in the world [13]. Meanwhile, researchers have also studied theapplication of SS in food sterilization [22], toxin degradation [23] and enzymatic inactivation [24].
DON can be damaged when temperature is high enough and many studies on the stability ofDON during different kinds of heat treatment have been carried out [25–28]. Therefore, SS may bean available way to reduce the content of DON in scabbed wheat. Besides, much of DON can bereduced when wheat kernels are milled into wheat flour. With the combination of wheat milling andSS treatment, a lot of DON in wheat flour may be reduced. Wheat protein may be partially denaturedat high temperature, thus leading to the weakening of gluten strength. As a result, the scabbed wheatprocessed with SS can be milled into low-gluten wheat flour, which is fit to make crisp biscuits andcakes. The objectives of this study were to: (i) investigate the application of SS (with temperatureabove 185 ◦C) to reduce the content of DON in scabbed wheat; (ii) explore the effect of SS on wheatquality; (iii) understand the effect of SS on the quality of crisp biscuits.
2. Results and Discussion
2.1. Reduction of Deoxynivalenol
2.1.1. Steam Temperature
In order to study the effect of steam temperature on DON reduction, the other two factors wereset as follows: processing time, 6 min; steam velocity, 3 m/s. Both the concentration of DON inwheat kernels and wheat flour reduced significantly with the increase of steam temperature (Figure 1).This was because that the increase of temperature led to the stability weakening of DON. Sincethe surrounding environment of wheat kernels was oxygen-free during SS processing, oxidationcould hardly occur. Therefore, large quantities of heat might be the primary factor leading to DONdegradation. Charlene, Wolf and Wolf-Hall has drawn the similar conclusion [29–31]. In all theexperiments, the reduction rate of DON in wheat kernels was always higher than that of wheat flour.The highest reduction rate of DON in wheat kernels was 77.4%, while it was only 60.5% for wheat flour.This phenomenon might due to the fact that DON was mainly distributed in the pericarp of wheatgrain and heat was transferred from the outer surface to the inner endosperm. As a result, the DON inthe endosperm couldn’t absorb as much heat as that in the bran of wheat. Since high temperaturemight do much harm to grain quality, the steam temperature used in practical application should bedetermined based on the real content of DON in wheat and the changes of wheat quality.
208
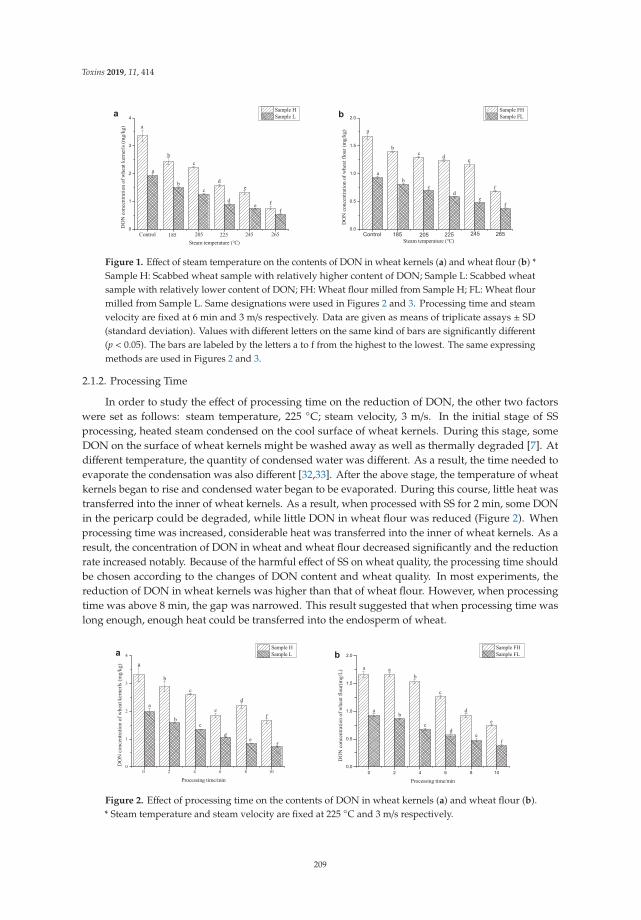
Toxins 2019, 11, 414
Figure 1. Effect of steam temperature on the contents of DON in wheat kernels (a) and wheat flour (b) *Sample H: Scabbed wheat sample with relatively higher content of DON; Sample L: Scabbed wheatsample with relatively lower content of DON; FH: Wheat flour milled from Sample H; FL: Wheat flourmilled from Sample L. Same designations were used in Figures 2 and 3. Processing time and steamvelocity are fixed at 6 min and 3 m/s respectively. Data are given as means of triplicate assays ± SD(standard deviation). Values with different letters on the same kind of bars are significantly different(p < 0.05). The bars are labeled by the letters a to f from the highest to the lowest. The same expressingmethods are used in Figures 2 and 3.
2.1.2. Processing Time
In order to study the effect of processing time on the reduction of DON, the other two factorswere set as follows: steam temperature, 225 ◦C; steam velocity, 3 m/s. In the initial stage of SSprocessing, heated steam condensed on the cool surface of wheat kernels. During this stage, someDON on the surface of wheat kernels might be washed away as well as thermally degraded [7]. Atdifferent temperature, the quantity of condensed water was different. As a result, the time needed toevaporate the condensation was also different [32,33]. After the above stage, the temperature of wheatkernels began to rise and condensed water began to be evaporated. During this course, little heat wastransferred into the inner of wheat kernels. As a result, when processed with SS for 2 min, some DONin the pericarp could be degraded, while little DON in wheat flour was reduced (Figure 2). Whenprocessing time was increased, considerable heat was transferred into the inner of wheat kernels. As aresult, the concentration of DON in wheat and wheat flour decreased significantly and the reductionrate increased notably. Because of the harmful effect of SS on wheat quality, the processing time shouldbe chosen according to the changes of DON content and wheat quality. In most experiments, thereduction of DON in wheat kernels was higher than that of wheat flour. However, when processingtime was above 8 min, the gap was narrowed. This result suggested that when processing time waslong enough, enough heat could be transferred into the endosperm of wheat.
Figure 2. Effect of processing time on the contents of DON in wheat kernels (a) and wheat flour (b).* Steam temperature and steam velocity are fixed at 225 ◦C and 3 m/s respectively.
209

Toxins 2019, 11, 414
2.1.3. Steam Velocity
In order to study the effect of steam velocity on the reduction of DON, the other two factorswere set as follows: steam temperature, 225 ◦C; processing time, 6 min. Steam velocity had greateffects on the heat transfer efficiency of SS, thus affecting the reduction of DON significantly. Differentvariation trends of DON concentration in wheat kernels and wheat flour were observed when steamvelocity was increased. For wheat kernels, when steam velocity was increased from 1 m/s to 3 m/s,the concentration of DON in wheat kernels decreased significantly (Figure 3); when steam velocitywas increased from 3 m/s to 5 m/s, the DON concentration increased. However, for wheat flour, DONconcentration decreased significantly when steam velocity was increased from 1 m/s to 5 m/s. Theseresults indicated that high velocity of SS might enhance the transfer of heat from the surface of wheatto the inner endosperm. However, when steam velocity was increased to 5 m/s, the reduction rate ofDON in wheat flour was much higher than that of wheat kernels. Since more energy will be consumedwhen steam velocity was increased, both energy conservation and DON content should be taken intoconsideration when choosing the optimum steam velocity.
The above results showed that steam temperature, processing time and steam velocity all hadsignificant influence on the reduction of DON. Meanwhile, wheat quality may also be affected negatively.Therefore, under the condition that safety is insured, lower steam temperature, less time and suitablesteam velocity should be used during SS processing. Compared to the research by Pronky [7], thereduction rate of DON in wheat was increased from 52% to 77.4% by improving the conditions of SSprocessing in this research. Besides, SS processing might be a more effective method to reduce DONcompared to other methods of treatment, such as cooking, baking and extrusion [25–28]. However, noinstrument exists now for the processing of wheat with SS in the industry.
Figure 3. Effect of steam velocity on the contents of DON in wheat kernels (a) and wheat flour (b).* Steam temperature and processing time are fixed at 225 ◦C and 6 min respectively.
2.2. Rheological Properties of Dough
Wheat flour milled with Sample L was used to study the effects of SS processing on rheologicalproperties of dough. Rheological properties of dough are closely related to the quality of food madewith wheat flour. Rheological properties obtained from Chopin Mixolab are positively correlatedwith those obtained from Brabender Farinograph [34]. Therefore, rheological qualities determined byChopin Mixolab can reflect the quality of wheat flour very well. Water absorption increased significantlywith the increase of steam temperature, processing time and steam velocity (Table 1). This might dueto the increased content of damaged starch in wheat caused by heat during SS processing [35]. Forall the samples, the development time and stability decreased significantly when wheat kernels wereprocessed with SS. This phenomenon resulted from the denaturation of gliadin and glutenin in wheatat high temperature, which made them unable to form gluten network with enough strength. Besides,SS processing also led to the aggregation of gluten proteins, which decreased the strength of doughobviously [36]. Sulfydryl and disulfide bond in wheat protein are the two most important groups forthe formation of gluten matrix. However, they were easy to be changed during SS processing. Firstly,
210
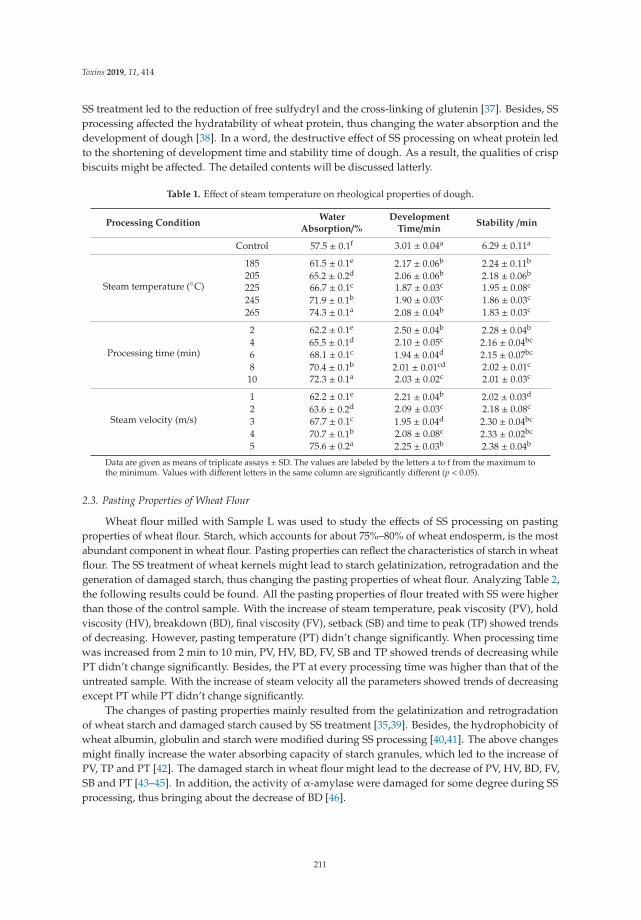
Toxins 2019, 11, 414
SS treatment led to the reduction of free sulfydryl and the cross-linking of glutenin [37]. Besides, SSprocessing affected the hydratability of wheat protein, thus changing the water absorption and thedevelopment of dough [38]. In a word, the destructive effect of SS processing on wheat protein ledto the shortening of development time and stability time of dough. As a result, the qualities of crispbiscuits might be affected. The detailed contents will be discussed latterly.
Table 1. Effect of steam temperature on rheological properties of dough.
Processing ConditionWater
Absorption/%Development
Time/minStability /min
Control 57.5 ± 0.1f 3.01 ± 0.04a 6.29 ± 0.11a
Steam temperature (◦C)
185 61.5 ± 0.1e 2.17 ± 0.06b 2.24 ± 0.11b
205 65.2 ± 0.2d 2.06 ± 0.06b 2.18 ± 0.06b
225 66.7 ± 0.1c 1.87 ± 0.03c 1.95 ± 0.08c
245 71.9 ± 0.1b 1.90 ± 0.03c 1.86 ± 0.03c
265 74.3 ± 0.1a 2.08 ± 0.04b 1.83 ± 0.03c
Processing time (min)
2 62.2 ± 0.1e 2.50 ± 0.04b 2.28 ± 0.04b
4 65.5 ± 0.1d 2.10 ± 0.05c 2.16 ± 0.04bc
6 68.1 ± 0.1c 1.94 ± 0.04d 2.15 ± 0.07bc
8 70.4 ± 0.1b 2.01 ± 0.01cd 2.02 ± 0.01c
10 72.3 ± 0.1a 2.03 ± 0.02c 2.01 ± 0.03c
Steam velocity (m/s)
1 62.2 ± 0.1e 2.21 ± 0.04b 2.02 ± 0.03d
2 63.6 ± 0.2d 2.09 ± 0.03c 2.18 ± 0.08c
3 67.7 ± 0.1c 1.95 ± 0.04d 2.30 ± 0.04bc
4 70.7 ± 0.1b 2.08 ± 0.08c 2.33 ± 0.02bc
5 75.6 ± 0.2a 2.25 ± 0.03b 2.38 ± 0.04b
Data are given as means of triplicate assays ± SD. The values are labeled by the letters a to f from the maximum tothe minimum. Values with different letters in the same column are significantly different (p < 0.05).
2.3. Pasting Properties of Wheat Flour
Wheat flour milled with Sample L was used to study the effects of SS processing on pastingproperties of wheat flour. Starch, which accounts for about 75%–80% of wheat endosperm, is the mostabundant component in wheat flour. Pasting properties can reflect the characteristics of starch in wheatflour. The SS treatment of wheat kernels might lead to starch gelatinization, retrogradation and thegeneration of damaged starch, thus changing the pasting properties of wheat flour. Analyzing Table 2,the following results could be found. All the pasting properties of flour treated with SS were higherthan those of the control sample. With the increase of steam temperature, peak viscosity (PV), holdviscosity (HV), breakdown (BD), final viscosity (FV), setback (SB) and time to peak (TP) showed trendsof decreasing. However, pasting temperature (PT) didn’t change significantly. When processing timewas increased from 2 min to 10 min, PV, HV, BD, FV, SB and TP showed trends of decreasing whilePT didn’t change significantly. Besides, the PT at every processing time was higher than that of theuntreated sample. With the increase of steam velocity all the parameters showed trends of decreasingexcept PT while PT didn’t change significantly.
The changes of pasting properties mainly resulted from the gelatinization and retrogradationof wheat starch and damaged starch caused by SS treatment [35,39]. Besides, the hydrophobicity ofwheat albumin, globulin and starch were modified during SS processing [40,41]. The above changesmight finally increase the water absorbing capacity of starch granules, which led to the increase ofPV, TP and PT [42]. The damaged starch in wheat flour might lead to the decrease of PV, HV, BD, FV,SB and PT [43–45]. In addition, the activity of α-amylase were damaged for some degree during SSprocessing, thus bringing about the decrease of BD [46].
211

Toxins 2019, 11, 414
Table 2. Effect of steam temperature on pasting properties of wheat flour.
ProcessingCondition
PV/mPa·s HV/mPa·s BD/mPa·s FV/mPa·s SB/mPa·s TP/min PT/ ◦C
Control 2707 ± 11 c 1797 ± 23 d 910 ± 23 a 3026 ± 34 c 1229 ± 11 b 6.34 ± 0.09 a 67.7 ± 0.1 b
Steamtemperature
(◦C)
185 3281 ± 64 a 2390 ± 69 a 891 ± 4 a 3874 ± 49 a 1484 ± 20 a 6.20 ± 0.10 ab 84.4 ± 0.6 a
205 3201 ± 13 ab 2284 ± 30 ab 917 ± 17 a 3857 ± 21 a 1574 ± 9 a 6.13 ± 0.02 bc 84.4 ± 0.5 a
225 3032 ± 41 b 2247 ± 17 b 785 ± 25 b 3818 ± 13 a 1571 ± 30 a 6.00 ± 0.10 bc 84.0 ± 1.2 a
245 2835 ± 112 c 2203 ± 48 b 632 ± 64 c 3663 ± 122 a 1460 ± 74 a 5.97 ± 0.05 c 83.6 ± 0.6 a
265 2486 ± 134 d 1974 ± 81 c 512 ± 53 d 3275 ± 165 b 1301 ± 84 b 5.94 ± 0.09 c 84.0 ± 0.1 a
Processingtime(min)
2 3214 ± 2 a 2339 ± 21 a 875 ± 23 ab 3880 ± 4 a 1541 ± 24 a 6.17 ± 0.05 ab 83.9 ± 1.2 a
4 3217 ± 26 a 2377 ± 18 a 840 ± 8 b 3924 ± 43 a 1547 ± 25 a 6.17 ± 0.05 ab 84.4 ± 0.5 a
6 2961 ± 30 b 2244 ± 9 b 717 ± 40 c 3652 ± 88 b 1408 ± 79 b 6.07 ± 0.09 b 83.9 ± 1.2 a
8 2567 ± 21 d 2005 ± 23 c 563 ± 2 d 3414 ± 25 c 1410 ± 49 b 5.80 ± 0.10 c 83.5 ± 0.5 a
10 1944 ± 10 e 1533 ± 1 e 412 ± 11 e 2576 ± 4 e 1044 ± 5 d 5.57 ± 0.05 d 84.0 ± 0.1 a
Steamvelocity
(m/s)
1 3255 ± 38 a 2345 ± 17 a 910 ± 34 a 3842 ± 64 a 1497 ± 62 a 6.11 ± 0.03 b 84.2 ± 0.5 a
2 3162 ± 12 b 2286 ± 34 ab 876 ± 40 a 3811 ± 72 ab 1526 ± 97 a 6.09 ± 0.08 bc 84.2 ± 0.9 a
3 2966 ± 6 c 2225 ± 51 b 741 ± 57 b 3723 ± 26 b 1498 ± 77 a 6.07 ± 0.09 bc 84.4 ± 0.5 a
4 2707 ± 17 d 2115 ± 31 c 592 ± 52 c 3506 ± 3 c 1391 ± 32 ab 5.97 ± 0.14 bc 84.4 ± 0.6 a
5 2493 ± 23 e 2008 ± 10 d 485 ± 13 d 3282 ± 10 d 1274 ± 1 b 5.90 ± 0.04 c 84.0 ± 0.1 a
PV, peak viscosity: the highest viscosity of sample after heating up and before cooling down; HV, hold viscosity: theminimum viscosity of sample during cooling down; BD, breakdown: the value of PV minus HV; FV, final viscosity:the viscosity of sample at the ending of test; SB, setback: the value of FV minus HV; TP, time to peak: the time whenthe viscosity reaches PV; PT, pasting temperature: the time when the viscosity of sample begins to increase. Dataare given as means of triplicate assays ± SD. The values are labeled by the letters a to f from the maximum to theminimum. Values with different letters in the same column are significantly different (p < 0.05).
2.4. Quality of Crisp Biscuits
Crisp biscuits made with Sample L were used to study the effects of SS processing on the qualitiesof crisp biscuits. Although the qualities of wheat were affected by SS greatly, the wheat processed bySS was still suitable for making some kinds of food products, such as biscuits, cakes and pastries. Inthis study, crisp biscuits were chosen as the final products to study whether the wheats processed bySS were suitable for making food products or not.
The effects of steam temperature on the qualities of biscuits were as follows (Tables 3 and 4).The hardness and working value of biscuits showed trends of decreasing with the increase of steamtemperature, although they decreased non-significantly during some ranges. The above resultsindicated that the increase of steam temperature improved the crisping of crisp biscuits. However,when the temperature excessed 225 ◦C, the color of biscuit surfaces began to darken and the number ofcracks increased.
The effects of processing time on the qualities of biscuits were as follows (Tables 3 and 5). Thehardness and working value of biscuits showed trends of decreasing with the increase of processingtime. However, when processing time was too long (≥8 min), the color of biscuit surfaces began todarken and the number of cracks increased.
The effects of steam velocity on the qualities of biscuits were as follows (Tables 3 and 6). Thehardness and working value of biscuits showed trends of decreasing with the increase of steam velocity,although they decreased non-significantly during some ranges. However, when steam velocity reached4 m/s, the color of biscuit surfaces began to darken and the number of cracks increased.
The variations of biscuit quality were closely related to the changes of dough rheology and flourpasting properties. To some degree, the shortening of dough stability time made the wheat flourmore suitable for making crisp biscuits. However, short time of stability was still needed. Besides, SSprocessing of wheat kernels at high temperature or for long time might result in the color change ofwheat flour, which had negative effects on biscuit color. Therefore, suitable conditions for processingwheat kernels should be considered to avoid the deterioration of biscuit quality to the greatest extent.
212

Toxins 2019, 11, 414
Table 3. Effect of steam temperature on texture properties of biscuits.
Processing Condition Hardness/g Working Value /g·sControl 2101 ± 186 a 3896 ± 152 a
Steam temperature (◦C)
185 2093 ± 90 a 3859 ± 22 a
205 1823 ± 95 b 1942 ± 253 b
225 1552 ± 94 c 1516 ± 117 bc
245 1466 ± 112 cd 1213 ± 88 c
265 1253 ± 78 d 1175 ± 69 c
Processing time (min)
2 1708 ± 26 b 2657 ± 178 b
4 1563 ± 38 bc 2325 ± 60 bc
6 1396 ± 105 cd 1750 ± 20 cd
8 1295 ± 98 d 1623 ± 14 d
10 1497 ± 87 bcd 1425 ± 30 d
Steam velocity (m/s)
1 1898 ± 166 a 2556 ± 129 b
2 1879 ± 3 ab 2009 ± 111b cd
3 1656 ± 68 bc 2377 ± 6 bc
4 1482 ± 76 cd 1744 ± 1 cd
5 1254 ± 103 d 1505 ± 6 d
Data are given as means of triplicate assays ± SD. The values are labeled by the letters a to f from the maximum tothe minimum. Values with different letters in the same column are significantly different (p < 0.05).
Table 4. Effect of steam temperature on apparent condition of biscuits.
SteamTemperature/◦C Control 185 205 225 245 265
Apparentcondition
Table 5. Effect of processing time on apparent condition of biscuits.
ProcessingTime/min
Control 2 4 6 8 10
Apparentcondition
Table 6. Effect of steam velocity on apparent condition of biscuits.
SteamVelocity/(m/s)
Control 1 2 3 4 5
Apparentcondition
3. Conclusions
SS had proven to be an effective method to reduce the content of DON in wheat and wheat flour.DON on the surface of wheat kernels could be washed as well as thermally degraded, while DON
213

Toxins 2019, 11, 414
in the inner of wheat kernels could be reduced by thermal degradation. With the increase of steamtemperature and processing time, the reduction rate increased significantly. Stem velocity also hadsignificant influence on the reduction rate. In this research, the reduction rate of DON could reach 77.4%for wheat kernels, while it was 60.4% for wheat flour. Besides reducing DON in wheat, superheatedsteam also had great effects on wheat quality, thus affecting the qualities of food made from wheatflour. During SS processing, protein denaturation and starch gelatinization occurred in wheat. Thedegree of protein denaturation and starch gelatinization depended on the conditions of SS processing.As a result, the water absorption of dough was increased, while the development time and stabilitywere decreased. In addition, the pasting properties of wheat flour were affected significantly due tothe increase of damaged starch, the gelatinization of starch and the passivation of α-amylase. What’smore, the qualities of crisp biscuits made with SS-processed wheat could be improved under certainconditions. Last but not least, if we want to use SS treatment in the industry, we just need to combine asteam generator with a heater to produce SS and the residual can be recycled by a centrifuge fan. Thedevice is quite easy to design and manufacture. Therefore, for scabbed wheats, superheated steamprocessing could be an effect way to reduce DON as well as improving the qualities of crisp biscuitsmade from processed wheat and it is likely to be used in practical production. In further research,we will aim at the analysis of DON degradation products and the toxicity of degradation products.Besides, the mechanism of the quality change of wheat will also be studied further.
4. Materials and Methods
4.1. Materials and Reagents
Scabbed wheat with about 3.8 mg/kg of DON (Sample H) was harvested on a farmland of XinyangCity, Henan Province. Scabbed wheat with about 2.3 mg/kg of DON (Sample L) was harvested on afarmland of Nanyang City, Henan Province. All samples were cleaned and stored at 10 ◦C and nomore than 50% of relative humidity before experiments.
4.2. Determination of Moisture Content
Moisture content of wheat and wheat flour were tested according to AACC (American Associationof Cereal Chemists) Method 44-15A.
4.3. Tempering of Wheat
Tempering of wheat was conducted according to AACC Method 26-10A.
4.4. Superheated Steam Processing
The power was connected and the device was turned on in advance. When beginning theexperiment, 200 g of wheat kernels were placed on the screen mesh of a sieve with 1.98 mm of aperture.Steam temperature was changed from 185 ◦C to 265 ◦C (185 ◦C, 205 ◦C, 225 ◦C, 245 ◦C and 265 ◦C)to study the effect of steam temperature on experimental results. Processing time was changed from2 min to 10 min (2 min, 4 min, 6 min, 8 min and 10 min) to study the effect of processing time onexperimental results. Steam velocity was changed from 1 m/s to 5 m/s (1 m/s, 2 m/s, 3m/s, 4 m/sand 5 m/s) to study the effect of steam velocity on experimental results. Put the screen mesh withwheat kernels into the processing chamber of SS device (Figure 4). During processing, steam passedthrough the wheat kernels in the processing chamber. At the beginning of processing, steam condensedon the surface of wheat kernels and then the condensed water and the water in wheat kernels wasevaporated. When the processing procedure was finished, wheat kernels were moved out of theprocessing chamber as quickly as possible and weighed immediately. For each condition, about 3000 gof sample is needed which equaled to 15 times of SS processing. The processed wheat kernels werecooled at room temperature on the screen mesh. After cooling, mix the samples processed at the samecondition. The processed samples were moved into airtight bags and stored at room temperature for
214

Toxins 2019, 11, 414
no more than 24 h before smashing and milling. Then, 100g of processed wheat kernels were smashed(4.5) to determine the moisture and DON concentration and others were milled into wheat flour (4.6).
Figure 4. Schematic diagram of superheated steam device (1, Steam generator; 2, Heater; 3, Thermostat;4, Processing chamber; 5, Centrifugal fan; 6, Pressure gauge; 7, 8, 9, Thermometer; 10, Flowmeter.).
4.5. Wheat Smashing
200 g of wheat kernels were smashed in the high-speed universal grinder for about 45 s. Fracturedsamples were sifted with a sieve with mesh number of 40 and the undersized parts were collected. Theoversized parts were put in the grinder and smashed for 20 s again. Sift the fractured materials with asieve with mesh number of 40 and collect the undersized parts. Then the undersized parts were mixedand stored at room temperature.
4.6. Wheat Milling
Wheat kernels were milled according to AACC Method 26–31 and Bühler model MLU-202 wasused as the milling instrument. The feed rate was adjusted to 80 g/min. The sifters of the flour millwere cleaned thoroughly between of milling of two different samples. After milling, the wheat flourwas moved into airtight bags and stored in the refrigerator at 4 ◦C.
4.7. Extraction and Purification of DON
The extraction and purification of DON were conducted according to the method as follows [9].Extraction of DON: Weigh 25 g of smashed wheat (or 20 g of wheat flour) in a beaker. 100 mL of
extracting solution (Vacetonitrile/Vwater = 84/16) was added into the beaker. After then, the sample andsolution were stirred with a magnetic stirrer for 20 min.
Purification of DON: After the above steps, keep the beaker still for at least 5 min, and then 5 mLof the supernatant was transferred into a SPE (Solid Phase Extraction) column to wipe off some of theimpurities in the DON solution. 4 mL of the purified solution was transferred into a tube and driedwith nitrogen. The residue was re-dissolved with 2 mL of mobile phase (Vacetonitrile/Vwater = 16/84).All the re-dissolved solution was transferred into a centrifuge tube and centrifuged at the speed of12,000 r/min. Then, the supernatant was transferred into a vial through a filter membrane with 0.22 μmof pore size. All the samples were stored at 4 ◦C in a dark environment.
4.8. Preparation of Standard Solution of DON
Stock solution of DON (100 mg/L, 1 mL) was transferred into a test tube (10 mL). Thesolution was dried with nitrogen gas and the remained DON was re-dissolved with mobile phase(Vacetonitrile/Vwater = 16/84). The DON solution was diluted successively to get DON solution with thefollowing concentration: 0.1 mg/L, 0.2 mg/L, 0.5 mg/L, 1 mg/L, 2 mg/L, 5 mg/L and 10 mg/L.
215

Toxins 2019, 11, 414
4.9. HPLC Analysis
DON contents were determined by high performance liquid chromatography (HPLC) withSymmetry C18 column (250 mm × 4.6 mm i.d., 5-μm particle size) and ultraviolet (UV) detector. TheHPLC conditions were optimized based on the method of Cui [47]. The mobile phase was preparedfrom acetonitrile and water (Vacetonitrile/Vwater = 16/84). The flow rate was 600 μL/min. The absorbanceof DON at 218 nm was monitored and the full running time was 10 min. The retention time (RT) ofDON was about 7.6 min and the limit of quantification (LOD) for DON was 0.03 μg/mL.
4.10. Determination of Dough Rheological Properties
Rheological properties were analyzed with Chopin Mixolab and AACC Method 54–60 was usedas reference.
4.11. Analysis of Pasting Properties
Pasting properties were determined with Rapid Viscosity Analyzer (RVA) according to AACCMethod 76-21.
4.12. Manufacturing of Crisp Biscuits
The method of making crisp biscuits was modified according to LS/T 3206-1993. The detailedsteps were as follows: Powdered sugar (28.5 g), sodium bicarbonate (0.6 g), and salt (0.3 g) were mixedin 5 mL of water and stirred to accelerate dissolution. 33 g of shortening was melted by hot-water bathand added into the above solution. The above ingredients were stirred until they formed emulsion.100 g of wheat flour was added into the emulsion. Then all the ingredients were mixed by doughmixer to accelerate the formation of dough. The dough was kept still for nearly 10 min until it was notsticky. After this, the dough was tableted until the thickness reached about 3.5 mm–4 mm. Then it wasmolded and baked for 10 min.
4.13. Texture Analysis
Texture properties of biscuits were determined with TA-XT2i texture analyzer (STABLE MICROSYSTEM). The main parameters were set as follows: 5 mm/s of pre-test speed, 1 mm/s of test speed,4 mm of target displacement and 5 g of trigger force.
4.14. Apparent Conditions of Biscuits
Crisp biscuits were taken photos of to observe the apparent conditions of crisp biscuits.
4.15. Statistical Analysis
Data are shown as the mean± SD of at least three parallel experiments. One-way ANOVA (analysesof variance) approach was used to compare values among more than two different experimentalgroups. Duncan multiple comparison method was used and p values less than 0.05 were consideredstatistically significant. Statistics were analyzed with SPSS 16.0 (SPSS Institute, CHI, USA). All thediagrams were drawn with Origin 8.5 (OriginLab Corporation, MA, USA).
Author Contributions: Author contributions: conceptualization, K.B. and E.G.; methodology, K.B., E.G. and Y.L.;software, Y.L.; validation, K.B.; formal analysis: Y.L.; investigation: Y.L. and M.L. data curation, Y.L. and M.L.;supervision, K.B.; funding acquisition, K.B.; writing—original draft preparation, Y.L.; writing—review and editing,M.L., K.B. and Y.L.; funding acquisition, K.B.
Funding: This research was funded by the National Modern Agricultural Industry Technology System ConstructionProgram under Grant [grant numbers: CARS-03], National Natural Science Foundation of China (NSFC) grantnumbers: 31801654], Scientific Research Fund of Henan University of Technology [grant numbers: 2017QNJH15]and Major Science and Technology Project of Henan province [grant numbers: 141100110900].
216

Toxins 2019, 11, 414
Conflicts of Interest: The authors declare no conflicts of interest. The funders had no role in the design of thestudy; in the collection, analyses, or interpretation of data; in the writing of the manuscript, or in the decision topublish the results.
References
1. Marin, S.; Ramos, A.J.; Cano-Sancho, G.; Sanchis, V. Mycotoxins: Occurrence, toxicology, and exposureassessment. Food Chem. Toxicol. 2013, 60, 218–237. [CrossRef] [PubMed]
2. Rocha, D.F.D.L.; Oliveira, M.D.S.; Furlong, E.B.; Junges, A.; Paroul, N.; Valduga, E.; Toniazzo, G.B.; Zeni, J.;Cansian, R.L. Evaluation of the TLC quantification method and occurrence of deoxynivalenol in wheat flourof Southern Brazil. Food Addit. Contam. Part A 2017. [CrossRef] [PubMed]
3. Tabuc, C.; Marin, D.; Guerre, P.; Sesan, T.; Bailly, J.D. Moldsand mycotoxin content of cereals in southeasternRomania. J. Food Prot. 2009, 72, 662–665. [CrossRef] [PubMed]
4. Ji, F.; Xu, J.H.; Liu, X.; Yin, X.C.; Shi, J.R. Natural occurrence of deoxynivalenol and zearalenone in wheatfrom Jiangsu province, China. Food Chem. 2014, 157, 393–397. [CrossRef] [PubMed]
5. Mishra, S.; Srivastava, S.; Dewangan, J.; Dikakar, A.; Rath, S.K. Global occurrence of deoxynivalenol in foodcommodities and exposure risk assessment in humans in the last decade: A survey. Crit. Rev. Food Sci. Nutr.2019, 14, 1–29. [CrossRef] [PubMed]
6. Larsen, J.C.; Hunt, J.; Perrin, I.; Ruckenbauer, P. Workshop on trichothecenes with a focus on DON: Summaryreport. Toxicol. Lett. 2004, 153, 1–22. [CrossRef]
7. Pronyk, C.; Cenkowski, S.; Abramson, D. Superheated steam reduction of deoxynivalenol in naturallycontaminated wheat kernels. Food Control 2006, 17, 789–796. [CrossRef]
8. Huwig, A.; Freimund, S.; Käppeli, O.; Dulter, H. Mycotoxin detoxication of animal feed by differentadsorbents. Toxicol. Lett. 2001, 122, 179–188. [CrossRef]
9. Li, M.M.; Guan, E.Q.; Bian, K. Effect of ozone treatment on deoxynivalenol and quality evaluation of ozonisedwheat. Food Addit. Contam. Part A 2015, 32, 544–553. [CrossRef]
10. O’Neill, K.; Damoglou, A.P.; Patterson, M.F. The stability of deoxynivalenol and 3-acetyl deoxynivalenol togamma irradiation. Food Addit. Contam. 1993, 10, 209–215. [CrossRef]
11. Young, J.C. Reduction in levels of deoxynivalenol in contaminated corn by chemical and physical treatment.J. Agric. Food Chem. 1986, 34, 465–467. [CrossRef]
12. Shima, J.; Takase, S.; Takahashi, Y.; Iwai, Y.; Fujimoto, H.; Yamazaki, M.; Ochi, K. Novel detoxification of thetrichothecene mycotoxin deoxynivalenol by a soil bacterium isolated by enrichment culture. Appl. Environ.Microbiol. 1997, 63, 3825–3830. [PubMed]
13. Sehrawat, R.; Nema, P.K.; Kaur, B.P. Effect of superheated steam drying on properties of foodstuffs andkinetic modeling. Innov. Food Sci. Emerg. Technol. 2016, 34, 285–301. [CrossRef]
14. Johansson, A.; Fyhr, C.; Rasmuson, A. High temperature convective drying of wood chips with air andsuperheated steam. Int. J. Heat Mass Transfer 1997, 40, 2843–2858. [CrossRef]
15. Douglas, W.J.M. Drying Paper in Superheated Steam. Dry. Technol. 1994, 12, 1341–1355. [CrossRef]16. Stokie, D.; Meng, W.W.; Bhattacharya, S. Comparison of Superheated Steam and Air Fluidized-Bed Drying
Characteristics of Victorian Brown Coals. Energy Fuels 2013, 27, 6598–6606. [CrossRef]17. Hoadley, A.F.; Qi, Y.; Nguyen, T.; Hapgood, K.; Desai, D.; Pinches, D. A field study of lignite as a drying aid
in the superheated steam drying of anaerobically digested sludge. Water Res. 2015, 82, 58–65. [CrossRef]18. Iyota, H.; Nishimura, N.; Onuma, T.; Nomura, T. Drying of Sliced Raw Potatoes in Superheated Steam and
Hot Air. Dry. Technol. 2001, 19, 1411–1424. [CrossRef]19. Head, D.S.; Cenkowski, S.; Arntfield, S.; Henderson, K. Superheated steam processing of oat groats. Food Sci.
Technol. 2010, 43, 690–694. [CrossRef]20. Tatemoto, Y.; Michikoshi, T. Drying Characteristics of Carrots Immersed in a Fluidized Bed of Fluidizing
Particles Under Reduced Pressure. Dry. Technol. 2014, 32, 1082–1090. [CrossRef]21. Sa-Adchom, P.; Swasdisevi, T.; Nathakaranakule, A.; Soponronnarit, S. Mathematical model of pork slice
drying using superheated steam. J. Food Eng. 2011, 104, 499–507. [CrossRef]22. Hu, Y.M.; Nie, W.; Hu, X.Z.; Li, Z.G. Microbial decontamination of wheat grain with superheated steam.
Food Control 2016, 62, 264–269. [CrossRef]
217

Toxins 2019, 11, 414
23. Cenkowski, S.; Pronyk, C.; Zmidzinska, D.; Muir, W.E. Decontamination of food products with superheatedsteam. J. Food Eng. 2007, 83, 68–75. [CrossRef]
24. Prachayawarakorn, S.; Prachayawasin, P.; Soponronnarit, S. Heating process of soybean using hot-air andsuperheated-steam fluidized-bed dryers. Food Sci. Technol. 2006, 39, 770–778. [CrossRef]
25. Kushiro, M. Effects of milling and cooking processes on the deoxynivalenol content in wheat. Int. J. Mol. Sci.2008, 9, 2127–2145. [CrossRef] [PubMed]
26. Scott, P.M.; Kanhere, S.R.; Lau, P.Y.; Dexer, J.E.; Greenhalgh, R. Effects of experimental flour milling andbreadbaking on retention of deoxynivalenol (vomitoxin) in hard red spring wheat. Cereal Chem. 1984, 60,421–424.
27. Yumbe-Guevara, B.E.; Imoto, T.; Yoshizawa, T. Effects of heating procedures on deoxynivalenol, nivalenoland zearalenone levels in naturally contaminated barley and wheat. Food Addit. Contam. Part A 2003, 20,1132–1140. [CrossRef]
28. Accerbi, M.; Rinaldi, V.E.; Ng, P.K. Utilization of Highly Deoxynivalenol-Contaminated Wheat via ExtrusionProcessing. J. Food Prot. 1999, 62, 1485. [CrossRef]
29. Wolf, C.E.; Bullerman, L.B. Heat and pH alter the concentration of deoxynivalenol in an aqueous environment.J. Food Prot. 1998, 61, 365–367. [CrossRef]
30. Vidal, A.; Sanchis, V.; Ramos, A.J. Thermal stability and kinetics of degradation of deoxynivalenol,deoxynivalenol conjugates and ochratoxin A during baking of wheat bakery products. Food Chem. 2015, 178,276–286. [CrossRef]
31. Wolf-Hall, C.E.; Hanna, M.A.; Bullerman, L.B. Stability of deoxynivalenol in heat-treated foods. J. Food Prot.1999, 62, 962. [CrossRef] [PubMed]
32. Nathakaranakule, A.; Kraiwanichkul, W.; Soponronnarit, S. Comparative study of different combinedsuperheated-steam drying techniques for chicken meat. J. Food Eng. 2007, 80, 1023–1030. [CrossRef]
33. Taechapairoj, C.; Dhuchakallaya, I.; Soponronnarit, S.; Wetchacama, S.; Prachayawarakorn, S. Superheatedsteam fluidised bed paddy drying. J. Food Eng. 2003, 58, 67–73. [CrossRef]
34. Xhabiri, G.Q.; Durmishi, N.; Idrizi, X.; Ferati, I.; Hoxha, I. Rheological qualities of dough from mixture offlour and wheat bran and possible correlation between Brabender and Mixolab Chopin equiments. MOJ FoodProcess. Technol. 2016, 2, 42. [CrossRef]
35. Jovanovich, G.; Lupano, C.E. Correlation between Starch Damage, Alveograph Parameters, Water Absorptionand Gelatinization Enthalpy in Flours Obtained by Industrial Milling of Argentinian Wheats. J. Food Technol.2003, 1, 167–171.
36. Mann, J.; Schiedt, B.; Baumann, A.; Conde-Petit, B.; Vilgis, T.A. Effect of heat treatment on wheat doughrheology and wheat protein solubility. Food Sci. Technol. Int. 2014, 20, 341–351. [CrossRef]
37. Wang, J.S.; Wei, Z.Y.; Li, L.; Bian, K.; Zhao, M.M. Characteristics of enzymatic hydrolysis of thermal-treatedwheat gluten. J. Cereal Sci. 2009, 50, 205–209. [CrossRef]
38. Bucsella, B.; Takács, Á.; Vizer, V.; Schwendener, U.; Tömösközi, S. Comparison of the effects of different heattreatment processes on rheological properties of cake and bread wheat flours. Food Chem. 2016, 190, 990–996.[CrossRef]
39. Kim, W.; Choi, S.G.; Kerr, W.L.; Johonson, J.W.; Gainse, C.S. Effect of heating temperature on particle sizedistribution in hard and soft wheat flour. J. Cereal Sci. 2004, 40, 9–16. [CrossRef]
40. Barlow, K.K.; Buttrose, M.S.; Simmonds, D.H.; Vesk, M. The nature of the starch-protein interface in wheatendosperm. Cereal Chem. 1973, 50, 443–454.
41. Seguchi, M. Oil-binding ability of heat-treated wheat starch. Cereal Chem. 1984, 61, 248–250.42. Neill, G.; Almuhtaseb, A.H.; Tra, M. Optimisation of time/temperature treatment, for heat treated soft wheat
flour. J. Food Eng. 2012, 113, 422–426. [CrossRef]43. Barrera, G.N.; Bustos, M.C.; Iturriaga, L.; Flores, S.K.; León, A.E.; Ribotta, P.D. Effect of damaged starch on
the rheological properties of wheat starch suspensions. J. Food Eng. 2013, 116, 233–239. [CrossRef]44. Wu, F.F.; Li, J.; Yang, N.; Chen, Y.S.; Jin, Y.M.; Xu, X.M. The roles of starch structures in the pasting properties
of wheat starch with different degrees of damage. Starch 2017. [CrossRef]45. Saxena, D.C.; Rao, P.H. Effect of damaged starch on the pasting characteristics and tandoori roti making
quality of whole wheat flour. Sci. Aliments 2000, 20, 591–602. [CrossRef]
218
Toxins 2019, 11, 414
46. Noda, T.; Ichinose, Y.; Takigawa, S.; Matsuura-Endo, C.; Abe, H.; Saito, K.; Hashimoto, N.; Yamauchi, H. Thepasting properties of flour and starch in wheat grain damaged by α-amylase. Food Sci. Technol. Int. Tokyo2003, 9, 387–391. [CrossRef]
47. Cui, L.; Selvaraj, J.N.; Xing, F.G.; Zhao, Y.J.; Zhou, L.; Liu, Y. A minor survey of deoxynivalenol in Fusarium,infected wheat from Yangtze-Huaihe river basin region in China. Food Control 2013, 30, 469–473. [CrossRef]
© 2019 by the authors. Licensee MDPI, Basel, Switzerland. This article is an open accessarticle distributed under the terms and conditions of the Creative Commons Attribution(CC BY) license (http://creativecommons.org/licenses/by/4.0/).
219

toxins
Article
A Novel Niosome-Encapsulated Essential OilFormulation to Prevent Aspergillus flavus Growthand Aflatoxin Contamination of Maize GrainsDuring Storage
Marta García-Díaz, Belén Patiño, Covadonga Vázquez and Jessica Gil-Serna *
Department of Genetics, Physiology and Microbiology, Faculty of Biology, University Complutense of Madrid,Jose Antonio Novais 12, 28040 Madrid, Spain; [email protected] (M.G.-D.); [email protected] (B.P.);[email protected] (C.V.)* Correspondence: [email protected]
Received: 18 October 2019; Accepted: 5 November 2019; Published: 6 November 2019
Abstract: Aflatoxin (AF) contamination of maize is a major concern for food safety. The use ofchemical fungicides is controversial, and it is necessary to develop new effective methods to controlAspergillus flavus growth and, therefore, to avoid the presence of AFs in grains. In this work, we testedin vitro the effect of six essential oils (EOs) extracted from aromatic plants. We selected those fromSatureja montana and Origanum virens because they show high levels of antifungal and antitoxigenicactivity at low concentrations against A. flavus. EOs are highly volatile compounds and we havedeveloped a new niosome-based encapsulation method to extend their shelf life and activity. Thesenew formulations have been successfully applied to reduce fungal growth and AF accumulation inmaize grains in a small-scale test, as well as placing the maize into polypropylene woven bags tosimulate common storage conditions. In this latter case, the antifungal properties lasted up to 75 daysafter the first application.
Keywords: essential oils; Satureja montana; Origanum virens; Aspergillus flavus; aflatoxin; corn; nanoparticles
Key Contribution: A safe, ecofriendly, novel strategy was developed to prevent aflatoxin contaminationof maize during storage. This method uses niosome-encapsulated EOs extracted from Satureja montanaand Origanum virens and is able to control Aspergillus flavus growth for long periods.
1. Introduction
Aflatoxins (AFs) are secondary metabolites produced primarily by Aspergillus flavus and Aspergillusparasiticus. Aflatoxin B1, B2, G1, and G2 (AFB1, AFB2, AFG1, and AFG2) are the most important ones,with AFB1 being the most toxic naturally occurring human carcinogen [1,2]. The International Agencyfor Research on Cancer (IARC) has classified the “naturally occurring mixes of aflatoxins” as Group 1carcinogens in humans [3].
AFs contaminate a variety of staple crops including cereals (maize, sorghum, barley, oat, rye, rice,and wheat), soya, dry nuts (nuts, pistachios, almonds, and hazelnuts), cottonseed, coffee, cacao, andspices [4].
According to the Food and Agriculture Organization of the United Nations (FAO) [5], maizeis one of the most important cereals, with an annual worldwide production of 1134 million tons in2017, and most of it is intended for direct human and animal consumption. Moreover, maize and itsderivatives are considered the main source of AFs worldwide [6]. For all these reasons, the EuropeanUnion established strict regulations regarding maximum permitted AF levels for maize [7].
Toxins 2019, 11, 646; doi:10.3390/toxins11110646 www.mdpi.com/journal/toxins221

Toxins 2019, 11, 646
The impact of AF contamination of agri-food products is significant. It causes important economiclosses because infected products cannot be sold and the contamination also raises veterinary and healthcosts. Establishing adequate controls to avoid AFs in the food chain is thus essential [8].
Different strategies to prevent AF contamination have been proposed to reduce fungal developmentin the field or during storage. Applying good agricultural practices and maintaining adequate humidityand temperature in silos are indispensable in reducing fungal growth and, therefore, mycotoxincontamination [9]. Chemical compounds are useful in preventing fungal growth and, for a long time,have been widely used both in the field and during storage to prevent mycotoxin contamination [10].However, synthetic fungicides are in the spotlight and consumers are now demanding safer foodstuffsthat are produced using sustainable and ecofriendly methods. The indiscriminate use of chemicalfungicides has important drawbacks, including residue on grain that threatens human and animalhealth or causes extensive environmental contamination [11]. Moreover, the indiscriminate use offungicides has caused an increased number of resistant isolates, which makes it very difficult toeffectively control fungal growth [12].
The risks of using synthetic chemicals have increased public awareness and demand for safer andecofriendly products and, in this context, natural plant extracts are now considered good alternatives.Essential oils (EOs) extracted from aromatic plants have demonstrated strong antibacterial, antifungal,and food preservative properties, together with low toxicity, fewer environmental effects, and widerpublic acceptance [13]. Many EO-based formulations are listed on the generally recognized as safe(GRAS) list, fully approved by the Food and Drug Administration, and are currently commerciallyavailable as food preservatives and/or agricultural supplements [14]. Several EOs have been reportedto not only reduce growth in toxigenic fungal species, but also to interfere to some extent in mycotoxinbiosynthesis. Da Silva et al. [15] reported that Rosmarinus officinalis EO has a strong effect againstFusarium verticillioides, as it showed the ability to rupture the cell wall and inhibit the production offumonisins. Aspergillus flavus growth and its ability to produce AFs were also significantly affected bytreatment with Origanum virens and Ageratum conyzoides EOs in corn and soybeans [16], and usingMentha spicata EO in chickpeas [17].
Therefore, the use of EOs to prevent fungal growth during maize storage could be a sustainablesolution to minimize food losses owing to mycotoxin contamination. However, their direct applicationin food products seems to be limited because of their high volatility, low water solubility, andsusceptibility to oxidation [18]. To solve these problems, various encapsulation techniques have beendeveloped that can preserve EOs through a physical or chemical interaction with a matrix that maintainsthe compounds for a longer time [19]. Encapsulation of EOs also increases stability against oxidation,which helps to prolong their antimicrobial activity [18,20]. Different methods of encapsulation havealso been demonstrated to enhance the antifungal and antiaflatoxigenic properties when applied tocontrol A. flavus [21].
These encapsulation particles form a protective film that isolates the nucleus that containsthe active agent. The composition of the particles should be carefully chosen depending on theencapsulated compound. To date, several natural and synthetic matrices have been successfully usedto encapsulate EOs including polyethylene, carbohydrates, proteins, lipids, and gum [22]. The choiceof the encapsulation material is a crucial step in developing an appropriate application method for EOs.Different parameters should be taken into account such as the polarity, solubility, and volatility of theactive compounds, as well as the composition of the food matrix [23]. Niosomes are lipid-based systems,composed by non-toxic self-assembly vesicles, with a single or multiple layered structure, which areable to encapsulate hydrophobic and hydrophilic compounds [24]. Niosomes are biodegradable, easilystored and handled, and present low toxicity, which are important advantages for their application inthe food industry [24].
The aim of this work was to evaluate the in vitro antifungal and antitoxigenic effects of differentaromatic plant EOs and to design an effective niosome-based encapsulation protocol to avoid AFcontamination during maize storage.
222
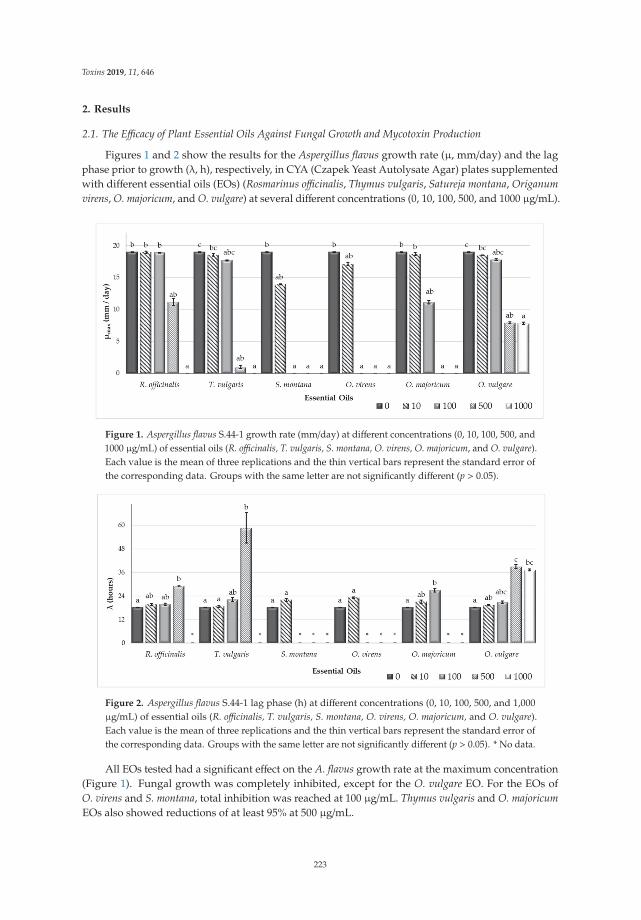
Toxins 2019, 11, 646
2. Results
2.1. The Efficacy of Plant Essential Oils Against Fungal Growth and Mycotoxin Production
Figures 1 and 2 show the results for the Aspergillus flavus growth rate (μ, mm/day) and the lagphase prior to growth (λ, h), respectively, in CYA (Czapek Yeast Autolysate Agar) plates supplementedwith different essential oils (EOs) (Rosmarinus officinalis, Thymus vulgaris, Satureja montana, Origanumvirens, O. majoricum, and O. vulgare) at several different concentrations (0, 10, 100, 500, and 1000 μg/mL).
Figure 1. Aspergillus flavus S.44-1 growth rate (mm/day) at different concentrations (0, 10, 100, 500, and1000 μg/mL) of essential oils (R. officinalis, T. vulgaris, S. montana, O. virens, O. majoricum, and O. vulgare).Each value is the mean of three replications and the thin vertical bars represent the standard error ofthe corresponding data. Groups with the same letter are not significantly different (p > 0.05).
Figure 2. Aspergillus flavus S.44-1 lag phase (h) at different concentrations (0, 10, 100, 500, and 1,000μg/mL) of essential oils (R. officinalis, T. vulgaris, S. montana, O. virens, O. majoricum, and O. vulgare).Each value is the mean of three replications and the thin vertical bars represent the standard error ofthe corresponding data. Groups with the same letter are not significantly different (p > 0.05). * No data.
All EOs tested had a significant effect on the A. flavus growth rate at the maximum concentration(Figure 1). Fungal growth was completely inhibited, except for the O. vulgare EO. For the EOs ofO. virens and S. montana, total inhibition was reached at 100 μg/mL. Thymus vulgaris and O. majoricumEOs also showed reductions of at least 95% at 500 μg/mL.
223

Toxins 2019, 11, 646
The lag phase got longer as the EO concentration increased (Figure 2). It was not possible tocalculate the lag phase when the EO treatment completely inhibited growth in the plates.
Aflatoxin production (AFB1, AFB2, AFG1 y AFG2) was significantly reduced compared with thecontrol group in all treatments at the highest concentration tested (1000 μg/mL). No AFs were detectedat these concentrations (Table 1) in any case, except for the O. vulgare EO treatment, which achievedreductions of more than 97% in all toxins.
Table 1. Aflatoxin (AF) concentration (B1, B2, G1, and G2) in Czapek Yeast Autolysate Agar (CYA)plates supplemented with different concentrations (0, 10, 100, 500, and 1000 μg/mL) of essential oils(EOs) (R. officinalis, T. vulgaris, S. montana, O. virens, O. majoricum, and O. vulgare). Each value is themean of three replications ± standard error. Groups with the same letter are not significantly different(p > 0.05). ND: non detected.
EOs μg/mL AFB1 (μg/g agar)AFB2 (μg/g
agar)AFG1 (μg/g
agar)AFG2 (μg/g
agar)
R. officinalis
0 10.754 ± 0.925 c 0.201 ± 0.021 c 0.485 ± 0.055 c 0.088 ± 0.014 b
10 5.205 ± 1.033 bc 0.1 ± 0.022 bc 0.213 ± 0.045 bc ND a
100 5.223 ± 0.171 abc 0.11 ± 0.006 bc 0.216 ± 0.012 abc ND a
500 1.09 ± 0.152 ab 0.017 ± 0.002 ab 0.058 ± 0.007 ab ND a
1000 ND a ND a ND a ND a
T. vulgaris
0 10.754 ± 0.925 b 0.201 ± 0.021 b 0.485 ± 0.055 b 0.088 ± 0.014 b
10 7.04 ± 0.977 b 0.122 ± 0.019 ab 0.256 ± 0.059 ab ND a
100 5.994 ± 0.554 ab 0.117 ± 0.019 ab 0.264 ± 0.069 ab ND a
500 ND a ND a ND a ND a
1000 ND a ND a ND a ND a
S. montana
0 10.754 ± 0.925 b 0.201 ± 0.021 b 0.485 ± 0.055 b 0.088 ± 0.014 b
10 8.27 ± 0.686 ab 0.151 ± 0.011 ab 0.314 ± 0.029 ab ND a
100 ND a ND a ND a ND a
500 ND a ND a ND a ND a
1000 ND a ND a ND a ND a
O. virens
0 10.754 ± 0.925 b 0.201 ± 0.021 bc 0.485 ± 0.055 b 0.088 ± 0.014 b
10 10.52 ± 1.334 b 0.245 ± 0.039 c 0.508 ± 0.065 b ND a
100 0.033 ± 0.044 ab 0.003 ± 0 ab 0.004 ± 0.002 ab ND a
500 ND a ND a ND a ND a
1000 ND a ND a ND a ND a
O. majoricum
0 10.754 ± 0.925 b 0.201 ± 0.021 ab 0.485 ± 0.055 b 0.088 ± 0.014 b
10 10.939 ± 0.21 b 0.234 ± 0.008 b 0.611 ± 0.057 b ND a
100 7.999 ± 0.628 ab 0.186 ± 0.022 ab 0.375 ± 0.028 ab ND a
500 0.003 ± 0 a ND a ND a ND a
1000 0.008 ± 0.008 a ND a ND a ND a
O. vulgare
0 10.754 ± 0.925 c 0.201 ± 0.021 b 0.485 ± 0.055b 0.088 ± 0.014 b
10 10.143 ± 0.86 bc 0.192 ± 0.015 b 0.475 ± 0.056 b ND a
100 7.867 ± 0.409 abc 0.168 ± 0.015 ab 0.466 ± 0.08 ND500 0.738 ± 0.08 ab 0.012 ± 0.002 a 0.043 ± 0.003 ND1000 0.298 ± 0.068 a 0.004 ± 0.003 a 0.014 ± 0.004 ND
AFB1 production was significantly affected at 500 μg/mL, with reductions of nearly 100% in all ofthe EOs tested. The same results were obtained when O. virens and S. montana EOs were applied at100 μg/mL.
AFB2 production was also significantly reduced by least 90% compared with the control platesafter treatment with R. officinalis, T. vulgaris, O. vulgare, and O. majoricum EOs at 500 μg/mL. The mosteffective treatments, reaching complete inhibition of AFB2 production at 100 μg/mL, were O. virens andS. montana EOs.
224
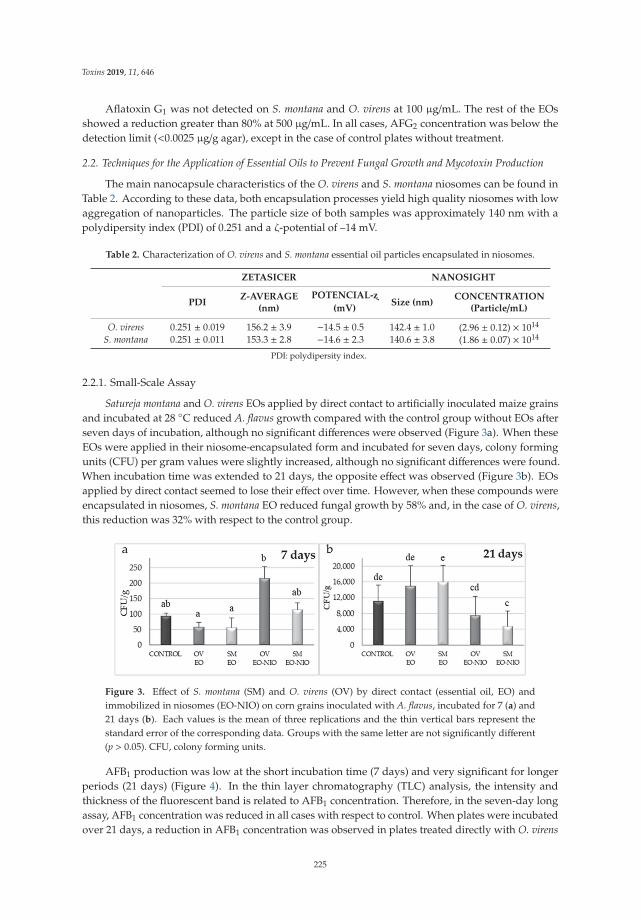
Toxins 2019, 11, 646
Aflatoxin G1 was not detected on S. montana and O. virens at 100 μg/mL. The rest of the EOsshowed a reduction greater than 80% at 500 μg/mL. In all cases, AFG2 concentration was below thedetection limit (<0.0025 μg/g agar), except in the case of control plates without treatment.
2.2. Techniques for the Application of Essential Oils to Prevent Fungal Growth and Mycotoxin Production
The main nanocapsule characteristics of the O. virens and S. montana niosomes can be found inTable 2. According to these data, both encapsulation processes yield high quality niosomes with lowaggregation of nanoparticles. The particle size of both samples was approximately 140 nm with apolydipersity index (PDI) of 0.251 and a ζ-potential of –14 mV.
Table 2. Characterization of O. virens and S. montana essential oil particles encapsulated in niosomes.
ZETASICER NANOSIGHT
PDIZ-AVERAGE
(nm)
POTENCIAL- (mV) Size (nm)
CONCENTRATION(Particle/mL)
O. virens 0.251 ± 0.019 156.2 ± 3.9 −14.5 ± 0.5 142.4 ± 1.0 (2.96 ± 0.12) × 1014
S. montana 0.251 ± 0.011 153.3 ± 2.8 −14.6 ± 2.3 140.6 ± 3.8 (1.86 ± 0.07) × 1014
PDI: polydipersity index.
2.2.1. Small-Scale Assay
Satureja montana and O. virens EOs applied by direct contact to artificially inoculated maize grainsand incubated at 28 ◦C reduced A. flavus growth compared with the control group without EOs afterseven days of incubation, although no significant differences were observed (Figure 3a). When theseEOs were applied in their niosome-encapsulated form and incubated for seven days, colony formingunits (CFU) per gram values were slightly increased, although no significant differences were found.When incubation time was extended to 21 days, the opposite effect was observed (Figure 3b). EOsapplied by direct contact seemed to lose their effect over time. However, when these compounds wereencapsulated in niosomes, S. montana EO reduced fungal growth by 58% and, in the case of O. virens,this reduction was 32% with respect to the control group.
Figure 3. Effect of S. montana (SM) and O. virens (OV) by direct contact (essential oil, EO) andimmobilized in niosomes (EO-NIO) on corn grains inoculated with A. flavus, incubated for 7 (a) and21 days (b). Each values is the mean of three replications and the thin vertical bars represent thestandard error of the corresponding data. Groups with the same letter are not significantly different(p > 0.05). CFU, colony forming units.
AFB1 production was low at the short incubation time (7 days) and very significant for longerperiods (21 days) (Figure 4). In the thin layer chromatography (TLC) analysis, the intensity andthickness of the fluorescent band is related to AFB1 concentration. Therefore, in the seven-day longassay, AFB1 concentration was reduced in all cases with respect to control. When plates were incubatedover 21 days, a reduction in AFB1 concentration was observed in plates treated directly with O. virens
225

Toxins 2019, 11, 646
EO as well as both EO niosome-encapsulated. However, no differences were found after S. montanaEO application.
Figure 4. Effect of S. montana (SM) and O. virens (OV) by direct contact (EO) and encapsulatedin niosomes (EO-NIO) on aflatoxin (AF) B1 concentration of corn grains inoculated with A. flavus,incubated for 7 and 21 days. The standard corresponds to the application of purified AFB1 (0.05 mg/mL).
2.2.2. Polypropylene Woven Bags Assays
Figure 5 shows the results in CFU/g of A. flavus inoculated corn stored in polypropylene wovenbags at all incubation times and after treatment with EOs encapsulated in niosomes.
After 45, 60, and 75 days of incubation, both of the EOs encapsulated in niosomes were able tocontrol fungal growth, with a maximum reduction of up to 79% and 69% for S. montana and O. virensEOs, respectively. However, this effect seems to be lost over time and no significant differences withrespect to the control group were found after 90 days of incubation.
Figure 5. Effect of S. montana (NIO-SM) and O. virens (NIO-OV) EO encapsulated in niosomes onA. flavus growth in corn grains incubated for 45, 60, 75, and 90 days. Each value is the mean of threereplications and the thin vertical bars represent the standard error of the corresponding data. Groupswith the same letter are not significantly different (p > 0.05).
The results regarding AFB1 detected on inoculated control bags or after niosome-encapsulatedEO treatments are shown in Figure 6. The band intensity of each treatment was apparently lower withrespect to their corresponding control in all cases except for NIO-OV after 90 days of incubation whena slight increase in production was detected. Treatment using niosome-encapsulated S. montana EOwas the most effective to control AFB1 production by A. flavus.
Temperature and humidity were recorded during the experiment with ranges of 25–27 ◦C and75–85%, respectively.
226

Toxins 2019, 11, 646
Figure 6. AFB1 detection by thin layer chromatography (TLC) in polypropylene woven bags inoculatedwith A. flavus after S. montana (NIO-SM) and O. virens (NIO-OV) niosome treatment of corn incubatedfor 45, 60, 75, and 90 days. The intensity and thickness of the fluorescent band are related to theconcentration of toxin. The standard corresponds to the application of purified AFB1 (0.05 mg/mL).
3. Discussion
Aflatoxin (AF) presence poses a high risk to food security and most countries have establishedmaximum levels of these contaminants allowed in food products [3]. Appropriate control mechanismsare needed to keep these toxins from entering the food chain. In recent years, essential oils (EOs) havecome to be considered as a safe, ecofriendly, renewable, and easily biodegradable option to be used as afood supplement [13]. Moreover, many EOs have been described as potent antifungal compounds thatare able to interfere in mycotoxin synthesis [15,25–27]. In this work, we selected EOs extracted fromRosmarinus officinalis, Thymus vulgaris, Satureja montana, Origanum virens, O. majoricum, and O. vulgareto determine if they were able to control Aspergillus flavus growth and if they reduced AF productionby this fungus. To some extent, all of the EOs tested modified the fungal growth rate and extendedthe lag phase at high concentrations. However, at lower doses, the EOs extracted from S. montanaand O. virens were the most effective at reducing both fungal growth and AF production, and theywere selected to perform subsequent studies. Chromatographic characterization of the EOs usedin this study were carried out in the Agricultural Research Centre of Albaladejito (data not shown)and the results revealed that S. montana and O. virens EOs are highly rich in carvacrol and thymol,respectively. These compounds have been reported to be able to interact with the cell membrane,disrupt cell permeability, and produce cell death [28]. Pure extracts of both carvacrol and thymolhave been reported to inhibit the growth of important mycotoxin-producing species such as A. niger,A. flavus, A. ochraceus, and F. graminearum [29,30].
Different authors consider that EO-based formulations could be safe, ecofriendly preservatives toavoid post-harvest losses due to mycotoxin contamination [14]. Therefore, taking into account thepotent antifungal properties of EOs, many studies have focused on developing successful applicationprotocols to minimize their drawbacks, which limit their direct use in food products [18] and, therefore,it is essential to protect them to extend their shelf life and activity [19]. The controlled liberationof EOs and their encapsulation in nanoparticles made of different materials are considered a goodoption [19,23]. These technologies attempt to reduce the rapid loss of their active principles. In general,EOs are a complex mix of lipophilic compounds and, therefore, lipid nanoparticle systems such asliposomes are the most appropriate [23,31]. In our study, the small-scale experiments showed that theeffectiveness of EOs to control A. flavus growth diminished over time. However, when both EOs wereencapsulated in niosomes, a significant reduction in fungal viable counts with respect to the untreatedcontrol group were found even after 21 days of incubation. Hence, it seems that the niosome-basednanoparticles were able to reduce the loss of the EOs’ active principles and produce a controlled releaseof their compounds. Similar results were obtained in the larger-scale experiments using maize stored inpolypropylene woven bags. This type of storage is very common in African countries because it offerslow-cost protection for grain from pests. However, a higher contamination by toxigenic fungi andmycotoxins in the grains has been reported owing to the change in moisture content, which increasesthe relative humidity inside the bags [32]. Even under the worst conditions for maize storage, both ofthe EOs encapsulated in niosomes were able to control fungal development, significantly reducingaflatoxin levels, and their effect was extended for up to 75 days. Hence, these promising approaches
227

Toxins 2019, 11, 646
might be useful to prevent AF contamination under more appropriate storage conditions such as PICS(Purdue improved crop storage) bags or directly in silos.
The use of EOs in the agri-food industry is not a safety concern because several studies haveensured that they are safe as food additives and many of them are included in the GRAS list [14].However, data are scarce regarding the effects that vesicle materials might have on human healthand it is essential to carry out ecotoxicity studies to assess the impact of encapsulation matrices [19].The niosome vesicles used in this work are commercially available and their non-toxic properties havebeen fully demonstrated. Moreover, they have been approved as a good option for the development ofnanoparticles to improve medical therapies, including the controlled delivery of drugs or even vaccineantigens [24].
EO-based formulations need to overcome several tests before their application in food systems,as some active components can interact with food matrix components [14,33]. AFs often occur in maize,one of the most important basic cereal products worldwide for food and feeds [6]. In the present work,S. montana and O. virens EOs encapsulated in niosomes were directly applied to control A. flavus growthand its mycotoxigenic potential in artificially contaminated maize as a preliminary step to optimizingtheir application. EOs’ release was effective over time in both small-scale tests and simulated storageconditions and, therefore, no interactions with the components of the maize seemed to occur. It wouldbe interesting to apply this newly developed technology to other food matrices often contaminatedwith AFs to confirm that this effect could be extrapolated to other products.
4. Conclusions
In this work, we proposed a novel niosome-based EO product that was successfully appliedin polypropylene woven bags simulating common storage conditions of maize. The involvementof the company Nanovex Biotechnologies S.L. guarantees a correct and standardized encapsulationprotocol and the reduction of problems that might arise during product formulation. The presence ofencapsulated EOs in the bags significantly reduced A. flavus development and the effect was observeduntil 75 days after inoculation. The effect of this formulation could be easily maximized by applyingthe products regularly during maize storage, that is, every 45 days. Regularly scheduled application,together with good agricultural practices and the maintenance of adequate storage conditions, may bea sustainable way to avoid the occurrence of aflatoxins in stored maize.
5. Materials and Methods
5.1. Fungal Strains and Essential Oils
All Aspergillus flavus strains used in this study were able to produce aflatoxins from group B (AFB1
and AFB2) and G (AFG1 and AFG2) and were isolated from wheat from Morocco (S.44-1) and maizefrom Spain (A7). The correct identification of these isolates was confirmed using species-specific PCRprotocols [34].
The strains were stored as a spore suspension at −80 ◦C in 15% glycerol (Panreac, Barcelona, Spain)until required. They were subcultured on potato dextrose agar (PDA, Pronadisa, Spain) and incubatedat 28 ◦C for four days. The spore suspensions were prepared in sterile saline solution (9 g/L sodiumchloride) (Merck, Darmstadt, Germany) supplemented by Tween 80 0.5% (Panreac, Spain). The sporeconcentration was determined using a Thoma counting chamber (Marienfeld, Lauda-Königshofen,Germany) and adjusted to a final concentration of 102 or 106 spores/mL depending on the assay.
The EOs tested were extracted from rosemary (Rosmarinus officinalis L.), thyme (Thymus vulgaris L.),savory (Satureja montana L.), and three species of oregano (Origanum virens Hoffmanns. & Link,O. majoricum Camb., and O. vulgare L.). The EOs were provided by The Agricultural Research Centreof Albaladejito (Cuenca, Spain). Each species was processed in batches of 100–150 g of plant aerialparts, following the methodology proposed by the European Pharmacopoeia by hydrodistillation, in aClevenger-type apparatus for 2 h. These EOs were analyzed in gas chromatograph equipped with a
228

Toxins 2019, 11, 646
flame ionization detector (FID) and capillary column VF-5 of 60 mm × 0.25 mm, 5% phenyl methylsiloxane. A temperature gradient of 70 to 240 ◦C was applied, with an increase of 3 ◦C per minute,maintaining the final temperature for 2 min. For the identification of the EO components, the relativeretention times of standards and the corresponding Kovats indices were used. The quantification ofthe components was performed according to the areas of their chromatographic peaks.
These compounds were filtered (pore size 0.2 μm) (Fisherbrand, Shanghai, China) and stored at−20 ◦C in amber glass vials (Thermo Scientific, Madrid, Spain) until required.
5.2. Effectiveness of Plant Essential Oils on Fungal Growth and Aflatoxin Production
The effect of EOs at different concentrations on A. flavus S.44-1 growth and its ability to produceAFs were evaluated on CYA medium (45.5 g/L of modified Czapek–Dox agar (Pronadisa, Spain), 5 g/Lof yeast extract (Pronadisa, Spain)). EOs were diluted in polyethylene glycol 400 (PEG (Acros, Geel,Belgium)) and added to the medium to obtain final concentrations of 10, 100, 500, and 1000 μg/mL.The same amount of PEG was included in the control plates instead of EO. CYA plates supplementedwith EOs were inoculated with 1.5 μL (4 mm of diameter) of a 106 spores/mL suspension on the centerof the plate, and incubated at 28 ◦C for five days. All the conditions were tested in triplicate.
Fungal colony diameters were measured daily in two directions at right angles to each otheruntil the medium was fully colonized (five days). Growth parameters were calculated from a linearmodel obtained by plotting the diameter (mm) against time (day). The parameters determined wereλ, representing the lag phase (days prior to mycelial growth), and μmax, representing the maximumgrowth rate (mm/day), for control plates and each EO concentration tested.
AFs were extracted from the plates after six days of incubation, as described elsewhere [35]. Threeagar plugs were removed from the centre, medium, and outer edge of the colony and toxins wereextracted with 1 mL of methanol (Merck, Spain). Samples were stored at−20 ◦C until analysis. AFs weremeasured by high performance liquid chromatography (HPLC) using the protocol described below.
5.3. Effect of Satureja Montana and Origanum Virens Essential Oils Encapsulated in Niosomes on FungalGrowth and Aflatoxin Contamination
5.3.1. Procedure for Microencapsulation of Essential Oils
EOs extracted from S. montana and O. virens were encapsulated in non-ionic surfactant-based lipidvesicles (niosomes). These particles were prepared by Nanovex Biotechnologies S.L. (Oviedo, Spain)starting from 40 mL of each type of EO. Niosomes were obtained using the thin film hydration (TFH)method with homogenization and sonication to obtain niosomes with a good polydipersity index (PDI)and a particle size between 100 and 200 μm, with an EO concentration of 12 μL/mL.
The characterization of the niosomes was performed with a Zetasizer Nano ZS particle sizeanalyzer (Malvern Panalytical Ltd., Malvern, UK), which uses dynamic light scattering (DLS) todetermine particle size, and the M3-PALS technique to calculate the ζ-potential.
A nanoparticle tracking analysis (NTA) was performed using a nano sight particle trackinganalyzer (Malvern Panalytical Ltd., Malvern, UK) to determine concentration and size distribution.
5.3.2. Effect of Niosome-Encapsulated Essential Oils on Fungal Growth and Aflatoxin Production onMaize Grains
Previously autoclaved maize grains were inoculated with A. flavus, strain A7. Then, 100 g of cornwas immersed for 2 h in 100 mL of spore suspension 104 spores/mL to obtain a final concentration of102 spores/g. Subsequently, the effect of niosome-encapsulated EOs was tested in a small-scale testin Petri dishes as well as in polypropylene woven bags simulating real storage conditions. At thebeginning of the experiments, grain moisture was measured using a Hygropalm HP23A (Rotronic,Bassersdorf, Switzerland) and water activity was 0.95 in all cases.
229
Toxins 2019, 11, 646
Small-Scale Assays
Ninety millimeter Petri dishes were filled with crystalized potassium sulphate (Acros, Spain) tomaintain aw at 0.97 [36]. A 50 mm Petri dish containing 7 g of inoculated maize was placed inside thelarger one. Satureja montana and O. virens EOs were applied directly to the grains or encapsulated inniosomes at 500 μg/g. Control assays, mock-inoculated with water, were also included. Incubationwas performed at 28 ◦C and the effect of niosome-encapsulated EOs or those directly applied on maizegrains was evaluated at 7 and 21 days.
After the incubation period, a sample of 3.5 g was taken from each treatment and a viable countwas performed using serial decimal dilutions and inoculation on Rose Bengal with Chloramphenicolmedium. Plates were incubated in darkness at 28 ◦C for two days. The fungal growth of maize grainwas expressed as colony forming units per gram of maize (CFU/g).
Afterwards, another sample of 3.5 g was taken from each treatment, and shaken for 20 min with35 mL of chloroform for AF extraction. AFB1 was measured by thin layer chromatography (TLC),as described below.
Polypropylene Woven Bag Assays
One-hundred grams of inoculated maize was placed in small polypropylene woven bags.Subsequently, niosome-encapsulated EOs (S. montana and O. virens) were added at a dose of 500 μg/gand mixed. Bags were incubated at room temperature in darkness for 90 days in independent plasticboxes for each treatment (40 × 40 × 30 cm). Inoculated maize grains without EOs were used as control.Temperature and relative humidity were registered using a data logger El-USB-1 (Easylog; LASCARelectronic, Salisbury, UK) every 8 h until the end of the assay.
After the incubation period, the bags were cut open and the maize was diluted in 900 mL of sterilesaline solution (9 g/L) containing 0.05% Tween 80. The mixes were incubated in an orbital shaker(140 rpm) at 4 ◦C for 60 min to release spores. Then, serial decimal dilutions and culture in Rose Bengalwith Chloramphenicol were used to estimate fungal growth as CFU per gram of maize.
A sample of 14 g of corn was taken from each beaker, and shaken for 20 min with 35 mL ofchloroform for AFB1 extraction and subsequent evaluation by TLC, as described below.
5.4. Detection of Mycotoxins
5.4.1. Detection of Mycotoxins by High Performance Liquid Chromatography (HPLC)
After AFB1 extraction with methanol, mycotoxin measurements were performed in the“Laboratorio Arbitral Agroalimentario” (Madrid, Spain) following its standardized protocols. AF wasmeasured by HPLC on a reverse phase C18 column (Inertsil ODS3; 5 μm, 4.6 mm× 250 mm; GL Sciences,Tokio, Japan) at 40 ◦C in a Waters chromatograph 515 HPLC coupled with a fluorescence detector 474(Waters, Milford, MA, USA) at excitation and emission wavelengths of 362 and 435 nm, respectively.The mobile phase contained water, methanol, and acetonitrile (60:20:20), and the flow rate was 1 mL/min.AF was eluted and quantified by comparison with a calibration curve generated from AF standards(OEKANAL®, Sigma–Aldrich, Steinheim, Germany). The detection limit of the technique was 2.5 ng/g.
5.4.2. Detection of Mycotoxins by Thin Layer Chromatography
After AFB1 extraction with chloroform, samples were filtered using 0.45 μm syringe filters(Fisherbrand, Spain) and an aliquot of 1 mL was evaporated in a vacuum concentrator, Eppendorf™Concentrator Plus with Pump and GB Plug (Fisher Scientific, Madrid, Spain).
Silica gel 60 chromatography plates (Merck, Germany) were used, and AFB1 presence wasdetermined according to the protocols described elsewhere [37,38].
230

Toxins 2019, 11, 646
Samples and AF standards were re-suspended with 500 μL toluene/acetonitrile (95:5) (Panreac,Spain). Then, 10 μL of each sample was spotted on the plate. Toluene/acetone/acetonitrile (1:1:1 (LabKem,Barcelona, Spain)) was used as a mobile phase. Toxins were visualized under ultraviolet light (Spectronics,Westbury, NY, USA).
5.5. Statistical Analysis
Statistical analysis was performed on the effect of EOs encapsulated in niosomes with StatsGraphicsCenturion XVII V.17.2.04 program (Statpoint Technologies Inc., Warrenton, VA, USA). The Shapiro–Wilkand Levene tests were used to check normality and homoscedasticity, respectively. Data were analysedusing analysis of variance (ANOVA).
When data did not meet normality and homoscedasticity criteria, a non-parametric Kruskall–Wallistest was performed. These analyses were performed using the software InfoStat/E 2011 (FCA, Córdoba,Argentina). This was necessary in the case of the fungal growth and aflatoxin production variablesindicated in Section 5.2 of Material and Methods.
In all cases, the significance level was set at p < 0.05.
Author Contributions: All authors conceived the experimental design. M.G.-D., J.G.-S., and B.P. helped withlaboratory analysis. M.G.-D. and J.G.-S. performed statistical analysis and wrote the original draft. B.P. and C.V.reviewed and edited the manuscript. All authors read and approved the final version of the document.
Funding: This research was supported by the Spanish Ministry of Science and Innovation, grant number AGL2014-53928-C2-2-R, and Marta García-Díaz was funded through an FPI fellowship by the Spanish Ministry ofScience and Innovation (BES-2015-074533).
Acknowledgments: The authors would like to thank the Agricultural Research Centre of Albaladejito forsupplying the purified essential oils, as well as “Laboratorio Arbitral Agroalimentario” for the measurements ofmycotoxins using HPLC. Nanovex Biotechnologies was our partner in the process of encapsulating essential oils.
Conflicts of Interest: The authors declare no conflict of interest.
References
1. Kensler, T.W.; Roebuck, B.D.; Wogan, G.N.; Groopma, J.D. Aflatoxin: A 50-year odyssey of mechanistic andtranslational toxicology. Toxicol. Sci. 2011, 120, S25–S48. [CrossRef] [PubMed]
2. Alshannaq, A.; Yu, J.H. Occurrence, toxicity, and analysis of major mycotoxins in food. Int. J. Environ. Res.Public Health 2017, 14, 632. [CrossRef] [PubMed]
3. Wu, F.; Stacy, S.L.; Kensler, T.W. Global risk assessment of aflatoxins in maize and peanuts: Are regulatorystandards adequately protective? Toxicol. Sci. 2013, 135, 251–259. [CrossRef] [PubMed]
4. Gil-Serna, J.; Vázquez, C.; Patiño, B. Mycotoxins/Toxicology. In Encyclopedia of Food Microbiology; AcademicPress: Cambridge, MA, USA, 2014.
5. Food and Agriculture Organization of the United Nations, Statistic Division. Available online: http://www.fao.org/faostat/en/#data/QC (accessed on 18 September 2019).
6. Battilani, P.; Toscano, P.; van der Fels-Klerx, H.J.; Jeggieri, M.C.; Brera, C.; Rortais, A.; Goumperis, T.;Robinson, T. Aflatoxin B1 contamination in maize in Europe increases due to climate change. Sci. Rep. 2016,6, 24328. [CrossRef] [PubMed]
7. European Commission. Regulation N◦ 165/2010 amending Regulation (EC) No 1881/2006 setting maximumlevels for certain contaminants in foodstuffs as regards aflatoxins. Off. J. Eur. Union 2010, 50, 8–12.
8. Hussein, H.S.; Brasel, J.M. Toxicity, metabolism, and impact of mycotoxins on humans and animals. Toxicology2001, 167, 101–134. [CrossRef]
9. Chulze, S. Strategies to reduce mycotoxin levels in maize during storage: A review. Food Addit. Contam.2010, 27, 651–657. [CrossRef]
10. Lagogianni, C.S.; Tsisigiannis, D.I. Effective chemical management for prevention of aflatoxins in maize.Phytopathol. Mediterr. 2018, 57, 186–197.
11. Ji, C.; Fan, J.; Zhao, L. Review on biological degradation of mycotoxins. Anim. Nutr. 2016, 2, 127–133.[CrossRef]
231

Toxins 2019, 11, 646
12. Da Cruz Cabral, L.; Pinto, V.F.; Patriarca, A. Application of plant derived compounds to control fungalspoilage and mycotoxin production in foods. Int. J. Food Microbiol. 2013, 166, 1–14. [CrossRef]
13. Pandey, A.K.; Kumar, P.; Singh, P.; Tripathi, N.N.; Bajpai, V.K. Essential oils: Sources of antimicrobials andfood preservatives. Front. Microbiol. 2017, 7, 2161. [CrossRef] [PubMed]
14. Kumar-Dwivedy, A.; Kumar, M.; Updhyay, N.; Prakash, B.; Kishore-Dubey, N. Plant essential oils againstfood borne fungi and mycotoxins. Curr. Opin. Food Sci. 2016, 11, 16–21. [CrossRef]
15. Da Silva, N.; Polis, L.; Faggion, J.; Yumie, C.; Galerani, S.A.; Grespan, R.; Botiao, S.; Augusto, C.; Abreu, B.A.;Machinski, M. Antifungal activity and inhibition of fumonisin production by Rosmarinus officinalis L. essentialoil in Fusarium verticillioides (Sacc.) Nirenberg. Food Chem. 2015, 166, 330–336. [CrossRef] [PubMed]
16. Esper, R.H.; Gonçalez, E.; Marques, M.O.M.; Felicio, R.C.; Felicio, J.D. Potential of essential oils for protectionof grains contaminated by aflatoxin produced by Aspergillus flavus. Front. Microbiol. 2014, 5, 269. [CrossRef][PubMed]
17. Kedia, A.; Kumar-Dwivedy, A.; Kumar-Jha, D.; Dubey, N.K. Efficacy of Mentha spicata essential oil insuppression of Aspergillus flavus and aflatoxin contamination in chickpea with particular emphasis to modeof antifungal action. Protoplasma 2016, 253, 647–653. [CrossRef]
18. Ribeiro-Santos, R.; Andrade, M.; Sanches-Silva, A. Application of encapsulated essential oils as antimicrobialagents in food packaging. Food Sci. 2017, 14, 78–84. [CrossRef]
19. Mäes, C.; Bouquillon, S.; Fauconnier, M.L. Encapsulation of essential oils for the development of biosourcedpesticides with controlled release: A review. Molecules 2019, 24, 2539. [CrossRef]
20. Donsí, F.; Annunziata, M.; Sessa, M.; Ferrari, G. Nanoencapsulation of essential oils to enhance theirantimicrobial activity in foods. LWT Food Sci. Technol. 2011, 44, 1908–1914. [CrossRef]
21. Nesci, A.; Passone, M.A.; Barra, P.; Girardi, N.; García, D.; Etcheverry, M. Prevention of aflatoxin contaminationin stored grains using chemical strategies. Curr. Opin. Food Sci. 2016, 11, 56–60. [CrossRef]
22. Da Silva, P.T.; Fries, L.L.M.; de Menezes, C.R.; Holken, A.T.; Schwan, C.L.; Wigmann, E.F.; Bastos, J.D.O.; daSilva, C.D.B. Microencapsulation: Concepts, mechanisms, methods and some applications in food technology.Cienc. Rural 2014, 44, 1304–1311. [CrossRef]
23. Prakash, B.; Kujur, A.; Yadav, A.; Kumar, A.; Singh, P.P.; Dubey, N.K. Nanoencapsulation: An efficienttechnology to boost the antimicrobial potential of plant essential oils in food system. Food Control 2018, 89,1–11. [CrossRef]
24. Amoabediny, G.; Haghiralsadat, F.; Naderinezhad, S.; Helder, M.N.; Kharanaghi, E.A.; Arough, J.M.;Zandieh-Doulabi, B. Overview of preparation methods of polymeric and lipid-based (niosome, solid lipid,liposome) nanoparticles: A comprehensive review. Int. J. Polym. Mater. Polym. Biomater. 2018, 67, 383–400.[CrossRef]
25. Císarová, M.; Tancinová, D.; Medo, J.; Kacaniová, M. The in vitro effect of selected essential oils on thegrowth and mycotoxin production of Aspergillus species. J. Environ. Sci. Health Part B 2016, 51, 668–674.[CrossRef] [PubMed]
26. Perczak, A.; Gwiazdowska, D.; Marchwinska, D.; Jus, K.; Gwiazdowski, R.; Waskiewicz, A. Antifungal activityof selected essential oils against Fusarium culmorum and F. graminearum and their secondary metabolites inwheat seeds. Arch. Microbiol. 2019, 201, 1085–1097. [CrossRef]
27. Wang, L.; Jiang, N.; Wang, D.; Wang, M. Effects of essential oil citral on the growth, mycotoxin biosynthesisand transcriptomic profile of Alternaria alternate. Toxins 2019, 11, 553. [CrossRef]
28. Prakash, B.; Kedia, A.; Mishra, P.K.; Dubey, N.K. Plant essential oils as food preservatives to control moulds,mycotoxin contamination and oxidative deterioration of agri-food commodities—Potentials and challenges.Food Control 2015, 47, 381–391. [CrossRef]
29. Abbaszadeh, S.; Sharifzadeh, A.; Shokri, H.; Khosravi, A.R.; Abbaszadeh, A. Antifungal efficacy of thymol,carvacrol, eugenol and menthol as alternative agents to control the growth of food-relevant fungi. J. Mycol.Med. 2014, 24, 51–56. [CrossRef]
30. Gao, T.; Zhou, H.; Zhow, W.; Hu, L.; Chen, J.; Shi, Z. The fungicidal activity of thymol against Fusariumgraminearum via inducing lipid peroxidation and disrupting ergosterol biosynthesis. Molecules 2016, 21, 770.[CrossRef]
31. Zeisig, R.; Cammerer, B. Liposomes in the food industry. In Nano-and Microencapsulation for Foods; Vilstrup, P.,Ed.; Leatherhead: London, UK, 2001; pp. 101–109.
232
Toxins 2019, 11, 646
32. Maina, A.W.; Wagacha, J.M.; Mwaura, F.B.; Muthomi, J.W.; Woloshuk, C.P. Postharvest practices of maizefarmers in Kaiti district, Kenya and the impact of hermetic storage on populations of Aspergillus spp. andaflatoxin contamination. J. Food Res. 2016, 5, 53–66. [CrossRef]
33. Perricone, M.; Arace, E.; Corbo, M.R.; Sinigaglia, M.; Bevilacqua, A. Bioactivity of essential oils: A review ontheir interaction with food components. Front. Microbiol. 2015, 6, 76. [CrossRef]
34. González-Salgado, N.; González-Jaén, M.T.; Vázquez, C.; Patiño, B. Highly sensitive PCR-based detectionmethod specific for Aspergillus flavus in wheat flour. Food Addit. Contam. 2008, 25, 758–764. [CrossRef][PubMed]
35. Bragulat, M.R.; Abarca, M.L.; Cabañes, F.J. An easy screening method for fungi producing ochratoxin A inpure culture. Int. J. Food Microbiol. 2001, 71, 139–144. [CrossRef]
36. Bernáldez-Rey, M.V. Desarrollo de Métodos de RT-PCR en Tiempo Real Para la Cuantificación de MohosToxigénicos Viables en Alimentos. Ph.D. Thesis, University of Extremadura, Badajoz, Spain, 2016.
37. Scott, P.M.; Lawrence, J.W.; van Walbeek, W. Detection of mycotoxins by thin-layer chromatography:Application to screening of fungal extracts. Appl. Microbiol. 1970, 20, 839–842. [PubMed]
38. Gimeno, A.; Martins, M.L. Rapid thin layer chromatography determination of patulin, citrinin, and aflatoxinin apples and pears, and their juices and jams. J. Assoc. Off. Anal. Chem. 1983, 66, 85–91.
© 2019 by the authors. Licensee MDPI, Basel, Switzerland. This article is an open accessarticle distributed under the terms and conditions of the Creative Commons Attribution(CC BY) license (http://creativecommons.org/licenses/by/4.0/).
233


MDPISt. Alban-Anlage 66
4052 BaselSwitzerland
Tel. +41 61 683 77 34Fax +41 61 302 89 18
www.mdpi.com
Toxins Editorial OfficeE-mail: [email protected]
www.mdpi.com/journal/toxins


MDPI St. Alban-Anlage 66 4052 Basel Switzerland
Tel: +41 61 683 77 34 Fax: +41 61 302 89 18
www.mdpi.com ISBN 978-3-03928-938-7
Copyright © 2022 FDOKUMEN