Toxicopathological studies on the effects of T-2 mycotoxin and ...
38
RESEARCH ARTICLE Toxicopathological studies on the effects of T-2 mycotoxin and their interaction in juvenile goats Shivasharanappa Nayakwadi 1,2 *, Ramith Ramu 3 , Anil Kumar Sharma 1,4 , Vivek Kumar Gupta 5 , K. Rajukumar 6 , Vijay Kumar 1 , Prithvi S. Shirahatti 7 , Rashmi L. 8 , Kanthesh M. Basalingappa ID 9 1 Central Institute for Research on Goats (CIRG), Makhdoom, Mathura, India, 2 Animal Science Section, ICAR-Central Coastal Agricultural Research Institute, Ela, Goa, India, 3 Division of Biotechnology and Bioinformatics, Department of Water & Health Sciences–Faculty of Life Sciences, JSS Academy of Higher Education and Research (Deemed to be University), Mysuru, India, 4 Division of Pathology, Mycotic and Mycotoxic Diseases Laboratory, Indian Veterinary Research Institute, Izatnagar, India, 5 CADRAD, ICAR– Indian Veterinary Research Institute, Izatnagar, India, 6 ICAR–National Institute of High Security Animal Diseases, Bhopal, India, 7 Department of Biotechnology, Teresian College, Siddhartha Nagara, Mysuru, India, 8 Karnataka Veterinary Animal Fisheries University, Bidar, Karnataka, India, 9 Division of Molecular Biology, Department of Water & Health Sciences–Faculty of Life Sciences, JSS Academy of Higher Education and Research (Deemed to be University), Mysuru, India * [email protected], [email protected] Abstract Food and feeds contaminated with mycotoxins have been a threat to the rearing industry by causing some of the most fatal toxic reactions not only in the farm animals but also in humans who consume them. Toxicity to juvenile goats was induced by feed contamination with T-2 toxin (at 10 and 20 ppm dosage; group I and II, respectively). The toxicity impact was assessed on days 15 and 30 post treatment with respect to growth performance, oxida- tive stress, apoptotic studies and detailed pathomorphology. The study revealed that apart from the obvious clinical toxicosis (weakness, lethargy, and retardation in growth), the toxin fed groups also exhibited significant haematological (reduced hemoglobin, total leukocyte and thrombocyte counts) and biochemical changes (increased levels of oxidative stress markers with concomitant decrease in levels of serum and tissue catalase and superoxide dismutase). The pathomorphological and histological alterations suggested that the liver and intestine were the most affected organs. Ultra-structurally, varying degrees of degener- ation, cytoplasmic vacuolations and pleomorphic mitochondria were observed in the hepato- cytes and the enterocytes of the intestine. Kidney also revealed extensive degeneration of the cytoplasmic organelles with similar condensation of the heterochromatin whereas the neuronal degeneration was characterized by circular, whirling structures. In addition, the central vein and portal triad of the hepatocytes, cryptic epithelial cells of the intestine, MLNs in the lymphoid follicles, PCT and DCT of the nephronal tissues and the white pulp of the spleen exhibited extensive apoptosis. In this study, it was also observed that the expression of HSPs, pro-apoptotic proteins and pro-inflammatory cytokines were significantly upregu- lated in response to the toxin treatment. These results suggest that the pathogenesis of T-2 toxicosis in goats employs oxidative, apoptotic and inflammatory mechanisms. PLOS ONE PLOS ONE | https://doi.org/10.1371/journal.pone.0229463 March 26, 2020 1 / 38 a1111111111 a1111111111 a1111111111 a1111111111 a1111111111 OPEN ACCESS Citation: Nayakwadi S, Ramu R, Kumar Sharma A, Kumar Gupta V, Rajukumar K, Kumar V, et al. (2020) Toxicopathological studies on the effects of T-2 mycotoxin and their interaction in juvenile goats. PLoS ONE 15(3): e0229463. https://doi.org/ 10.1371/journal.pone.0229463 Editor: Natarajan Aravindan, University of Oklahoma Health Sciences Center, UNITED STATES Received: October 21, 2019 Accepted: February 6, 2020 Published: March 26, 2020 Peer Review History: PLOS recognizes the benefits of transparency in the peer review process; therefore, we enable the publication of all of the content of peer review and author responses alongside final, published articles. The editorial history of this article is available here: https://doi.org/10.1371/journal.pone.0229463 Copyright: © 2020 Nayakwadi et al. This is an open access article distributed under the terms of the Creative Commons Attribution License, which permits unrestricted use, distribution, and reproduction in any medium, provided the original author and source are credited. Data Availability Statement: All relevant data are within the paper.
-
Upload
khangminh22 -
Category
Documents
-
view
3 -
download
0
Transcript of Toxicopathological studies on the effects of T-2 mycotoxin and ...

RESEARCH ARTICLE
Toxicopathological studies on the effects of
T-2 mycotoxin and their interaction in juvenile
goats
Shivasharanappa Nayakwadi1,2*, Ramith Ramu3, Anil Kumar Sharma1,4, Vivek Kumar
Gupta5, K. Rajukumar6, Vijay Kumar1, Prithvi S. Shirahatti7, Rashmi L.8, Kanthesh
M. BasalingappaID9
1 Central Institute for Research on Goats (CIRG), Makhdoom, Mathura, India, 2 Animal Science Section,
ICAR-Central Coastal Agricultural Research Institute, Ela, Goa, India, 3 Division of Biotechnology and
Bioinformatics, Department of Water & Health Sciences–Faculty of Life Sciences, JSS Academy of Higher
Education and Research (Deemed to be University), Mysuru, India, 4 Division of Pathology, Mycotic and
Mycotoxic Diseases Laboratory, Indian Veterinary Research Institute, Izatnagar, India, 5 CADRAD, ICAR–
Indian Veterinary Research Institute, Izatnagar, India, 6 ICAR–National Institute of High Security Animal
Diseases, Bhopal, India, 7 Department of Biotechnology, Teresian College, Siddhartha Nagara, Mysuru,
India, 8 Karnataka Veterinary Animal Fisheries University, Bidar, Karnataka, India, 9 Division of Molecular
Biology, Department of Water & Health Sciences–Faculty of Life Sciences, JSS Academy of Higher
Education and Research (Deemed to be University), Mysuru, India
* [email protected], [email protected]
Abstract
Food and feeds contaminated with mycotoxins have been a threat to the rearing industry by
causing some of the most fatal toxic reactions not only in the farm animals but also in
humans who consume them. Toxicity to juvenile goats was induced by feed contamination
with T-2 toxin (at 10 and 20 ppm dosage; group I and II, respectively). The toxicity impact
was assessed on days 15 and 30 post treatment with respect to growth performance, oxida-
tive stress, apoptotic studies and detailed pathomorphology. The study revealed that apart
from the obvious clinical toxicosis (weakness, lethargy, and retardation in growth), the toxin
fed groups also exhibited significant haematological (reduced hemoglobin, total leukocyte
and thrombocyte counts) and biochemical changes (increased levels of oxidative stress
markers with concomitant decrease in levels of serum and tissue catalase and superoxide
dismutase). The pathomorphological and histological alterations suggested that the liver
and intestine were the most affected organs. Ultra-structurally, varying degrees of degener-
ation, cytoplasmic vacuolations and pleomorphic mitochondria were observed in the hepato-
cytes and the enterocytes of the intestine. Kidney also revealed extensive degeneration of
the cytoplasmic organelles with similar condensation of the heterochromatin whereas the
neuronal degeneration was characterized by circular, whirling structures. In addition, the
central vein and portal triad of the hepatocytes, cryptic epithelial cells of the intestine, MLNs
in the lymphoid follicles, PCT and DCT of the nephronal tissues and the white pulp of the
spleen exhibited extensive apoptosis. In this study, it was also observed that the expression
of HSPs, pro-apoptotic proteins and pro-inflammatory cytokines were significantly upregu-
lated in response to the toxin treatment. These results suggest that the pathogenesis of T-2
toxicosis in goats employs oxidative, apoptotic and inflammatory mechanisms.
PLOS ONE
PLOS ONE | https://doi.org/10.1371/journal.pone.0229463 March 26, 2020 1 / 38
a1111111111
a1111111111
a1111111111
a1111111111
a1111111111
OPEN ACCESS
Citation: Nayakwadi S, Ramu R, Kumar Sharma A,
Kumar Gupta V, Rajukumar K, Kumar V, et al.
(2020) Toxicopathological studies on the effects of
T-2 mycotoxin and their interaction in juvenile
goats. PLoS ONE 15(3): e0229463. https://doi.org/
10.1371/journal.pone.0229463
Editor: Natarajan Aravindan, University of
Oklahoma Health Sciences Center, UNITED
STATES
Received: October 21, 2019
Accepted: February 6, 2020
Published: March 26, 2020
Peer Review History: PLOS recognizes the
benefits of transparency in the peer review
process; therefore, we enable the publication of
all of the content of peer review and author
responses alongside final, published articles. The
editorial history of this article is available here:
https://doi.org/10.1371/journal.pone.0229463
Copyright: © 2020 Nayakwadi et al. This is an open
access article distributed under the terms of the
Creative Commons Attribution License, which
permits unrestricted use, distribution, and
reproduction in any medium, provided the original
author and source are credited.
Data Availability Statement: All relevant data are
within the paper.

Introduction
Mycotoxins viz.,aflatoxins, zearelenone, ochratoxins, fumonisins, citrinins and trichothecenes
are the secondary metabolites produced by fungi responsible for mycotoxicosis in animals.
Recent studies have reported the consequences of food contamination with mycotoxins, which
are known to pose a major problem not only in animals but also to humans, causing significant
economic and international trade implications [1]. As a result of the mycotoxin contamination
in animal feed, there is reduced feed intake and at times feed refusal, reduced body weight due
to inefficient of feed conversions, immune- suppression leading to frequent diseases, reduced
reproductive ability [2–5]. Trichothecenes are a class of mycotoxins that are identified as a
major threat to animals and healthcare. Most toxic trichothecenes are deoxynivalenol (DON),
nivalenol (NIV), HT-2, diacetoxyscirpenol (DAS) and T-2 toxin[6]. Of these, T-2 toxin, mainly
produced by Fusarium species, is the most deadly toxin with cytotoxic potential. This toxin
has been considered to elicit fatal reactions among the animals and humans upon consump-
tion [7]. The production of toxins by the fungi occur at ambient temperature of 0–32˚C and
moisture content [8,9]. Frequently contaminated grains are corn, wheat, rye, oats and barley.
Studies have shown that T-2 toxicity leads to reduced feed consumption and milk production,
absence of estrus cycle, gastroenteritis, intestinal hemorrhages and necrosis in cattle [10–17],.
The T-2 toxicity has also been well studied in laboratory animals such as sheep[18,19], pigs[20]
and poultry[21]. However, toxicity in goat husbandry is not much explored.
It is observed that the presence of antioxidant scavengers increase the toxicity of the
mycotoxins, suggesting that the toxicity is probably augmented by the presence of oxidative
stress. Heat shock proteins (HSPs) play a pivotal role in rendering a protective shield towards
oxidative damage induced by the mycotoxins. Studies have confirmed the induction of high
ROS generation by T-2 toxin, which in turn increases the levels of Hsp70. Therefore, the
existence of an intricate relationship between oxidative stress and HSPs can be used as a
potent biomarker for assessing oxidative stress [22–24]. Oxidative stress decides the apoptotic
fate of the cell by eliciting a cascade of pro-apoptotic pathways. In addition, T-2 toxins are
known to induce the expression of various pro-inflammatory cytokines following a tropical
application in rats [25] and increased the expression of IL-12 and TNF-α with a corresponding
decrease in the expression of IL-1β in mouse peritoneal macrophages and lymph node T cells
[26]. In addition, in previous findings this toxin has been observed to increase the expression
of IL-2 and reduce IFN-γ expression in pigs [27]. T-2 toxin is known to induce apoptosis in
lymphoid and hematopoietic tissues, intestinal crypt epithelial cells, spleen as well as the brain
[28–31].
With this background, the present study is to ascertain T-2 toxin-induced pathology in
goats. In addition, the study aims at the assessment of expression of various HSPs as oxidative
damage indicators, pro-apoptotic genes and pro-inflammatory cytokines in goats in order to
understand the molecular mechanism of T-2 toxicity.
Materials and methods
Production and analysis of T-2 toxin
Pure culture of Fusarium sporotrichioides var. sporotrichioides (MTCC-1894) was procured
from the Institute of Microbial Technology (IMTC), Chandigarh, India. T-2 mycotoxin was
produced by fermentation of maize and wheat mixture as per the method described in AOAC
international [32]. The generated toxin was analyzed and quantified by thin layer chromatog-
raphy and spectrophotometry at the Animal Feed Analytical and Quality Control Laboratory
(AFAQCL), Veterinary College and Research Institute, Namakkal, Tamil Nadu, India.
PLOS ONE Toxicopathological studies on the effects of T-2 mycotoxin
PLOS ONE | https://doi.org/10.1371/journal.pone.0229463 March 26, 2020 2 / 38
Funding: The entire work was not funded by any
agency.
Competing interests: The authors have declared
that no competing interests exist.
Experimental animals
A total of eighteen goats (Barbari breed) between 2–3 months age were used in this study. All
the procedures in the trial were carried out under strict guidelines with the recommendations
and prior approval by the Institute’s Animal Ethics committee (IAEC) of ICAR-Central Insti-
tute for Research on Goats (CIRG), Mathura and Committee for the Purpose of Control and
Supervision of Experiments on Animals (CPCSEA), New Delhi (India) (number: 207\GO/cb/
2000/CPCSEA dt:1.6.2000). The animals were examined and treated for internal and external
parasites and maintained under standard conditions. After an acclimatization period of one
week, the toxin was administered orally by mixing with the feed along with a control group.
These animals were kept under optimum housing conditions and provided ad libitum feed
and fresh drinking water. After the trial, the goats were euthanized by intravenous administra-
tion of 20% sodium pentobarbital into the jugular vein with minimal pain and suffering. Dur-
ing the course of the experiment, no animals died prior to euthanization [33].
Experimental diet
Feed pellets as well as ground feed were procured from the Feed Processing Unit, C.I.R.G,
Makhdoom and were tested negative for the presence of mycotoxin contamination (Aflatoxin
B1, Ochratoxin A, citrinin and T-2 toxin) The inoculum containing known amounts of T-2
toxin was added and thoroughly mixed with the basal ration in proportion to deliver the set
dosage (10 and 20 ppm). From the diet, aliquots were taken and quantified by TLC and spec-
trophotometric analysis for assuring the correct concentration.
Experimental design
Juvenile goats were randomly divided into three groups consisting of six animals each and
weighed to give an average initial mean body weight and tags were marked for identification.
Feed containing T-2 toxin levels of 10 ppm and 20 ppm (mg/kg of feed) were prepared. The
details of the experimental design are given in (Table 1).
Parameters studied
a. Clinical signs. Careful observation of the animals in the study was conducted to evalu-
ate the development of any clinical conditions or mortality. Body weight of individual animal
was recorded on day 0, 5, 10, 15 and 20, 25 and 30 post-treatment in all the groups.
b. Hematology. Blood was drawn from the jugular vein from all the goats of different
groups on day 0, 5, 10, 15 and 20, 25 and 30 in vials containing Ethylene diamine tetra acetate
(1mg/ml of blood). Hemoglobin concentration (Hb), packed cell volume (PCV), total erythro-
cyte count (TEC), total leukocyte counts (TLC), differential leukocyte counts (DLC) and total
Table 1. Experimental design of T-2 toxicosis in goats.
Details Group I (10 ppm) Group II (20 ppm) Group III (control)
Age of goats (kids) 2–3 months 2–3 months 2–3 months
No. of animals 06 06 06
Duration of the experiment 30 days 30 days 30 days
Dose of toxin 10 ppm (mg/kg of feed) 20 ppm (mg/kg of feed) Toxin free feed
Route of administration Oral (Mixed with feed) Oral (Mixed with feed) Oral (Feed free from mycotoxins)
Sacrifice intervals 15th and 30th day of the trial
No. of animals sacrificed at each interval 03 03 03
https://doi.org/10.1371/journal.pone.0229463.t001
PLOS ONE Toxicopathological studies on the effects of T-2 mycotoxin
PLOS ONE | https://doi.org/10.1371/journal.pone.0229463 March 26, 2020 3 / 38

thrombocyte count (TTC) were carried out by automatic blood analyzer(Sysmex XE-5000
hematology analyzer, Sysmex, Kobe, Japan) as per the manufacturer’s instructions.
c. Estimation of oxidative stress enzymes. The method to evaluate oxidative stress were
TBRS activity (Thiobarbituric acid ‘TBA’ method), Superoxide dismutase (SOD) and catalase
in liver, kidney, small intestine, spleen, mesenteric lymph node (MLN) and brain tissue
homogenates for all the animals on 15th and 30th day according to the method described by
Shivasharanappa [34]
Pathomorphological studies
Gross pathology. Post euthanization procedure on the 15th and 30th day, the visceral
organs was carefully evaluated for the development of lesions. The weights of these organs
were also tabulated as relative organ weight.
Histopathology. Pieces of the tissues from liver, intestines, MLN, kidneys, spleen and
brain (less than 5 mm thickness) were collected and fixed in 10% neutral buffered formalin
solution. After 48 hours of fixation, the tissues were processed and stained by hematoxylin and
eosin method [35].
Ultra-structural changes. Approximately 1-2mm sized tissue pieces from liver, kidney,
small intestine and brain were collected and fixed in chilled 2.5% glutaraldehyde for 6–8 h at
4o C. Tissue samples were washed twice (20 min each) in chilled 0.1 M phosphate buffer and
then fixed in 1% osmium tetroxide for 2 h at 4o C. The tissues were rinsed thrice in 0.1 M phos-
phate buffer at 4o C and dehydrated in ascending grades of acetone (30%, 50%, 70%, 90%,
100% and dry acetone) for 15 min each. The tissue samples were cleared twice in toluene at
room temperature and infiltrated in toluene and resin in the ratio 3:1, 2:2, 1:3 and pure resin
for one hour. The tissue samples were embedded in Araldehyte media and kept at 37˚C for 24
h and then incubated at 45o C for 2 days for polymerization. The polymerized blocks were
trimmed and ultra-sections of 500 nm were cut employing ultra tome microscope (Ultra-cut
UCT, Leica, Germany), mounted on copper grids and stained with uranyl acetate [36] and fol-
lowed by lead citrate[37].The sections were washed and allowed to dry on a filter paper in a
covered Petri dish. The grids were mounted to be viewed under the electron microscope (Phil-
ips, CM-10, Holland). Processing, section cutting, staining and examination of grids were car-
ried out at High Security Animal Disease Laboratory (HSADL), Bhopal. India.
Apoptosis by TUNEL (TdT-mediated dUTP Nick-End Labeling) assay
Apoptosis was studied using Dead End™ Colorimetric TUNEL System (Promega) assay in
liver, intestines, kidney, spleen, mesenteric LN and brain. After the staining, the TUNEL-posi-
tive cells were counted under the scanning confocal microscope to evaluate apoptosis of the
cells.
RNA isolation and cDNA synthesis. The apoptosis genes such as Bcl-2, Bax and caspase-
3, Heat shock protein (HSP) genes viz. HSP-72, 90 and 27 and pro-inflammatory genes (IL-1,
IL-6, TNF-α) in different tissues such as liver, intestine, kidney, spleen, mesenteric LN and
brain were used to isolate RNA. RNeasy Lipid Mini Kit (Qiagen, Hilden, Germany) was used
to extract total RNA from the tissue samples. The concentration and quality was evaluated
using Nano Drop 2000 spectrophotometer (Thermo Fischer Scientific Inc, Carlsbad, CA,
USA). Complementary DNA (cDNA) synthesis was performed using the Superscript First
Strand Synthesis System for RT-PCR (Invitrogen, Carlsbad, CA, USA). PCR amplification was
carried out using the cycling conditions as follows: an initial 10 min activation and denatur-
ation step at 95˚C, followed by 40 cycles of 15s at 95˚C and 30 s, 72˚C for 1 min and finally
72˚C for 5 min.
PLOS ONE Toxicopathological studies on the effects of T-2 mycotoxin
PLOS ONE | https://doi.org/10.1371/journal.pone.0229463 March 26, 2020 4 / 38

Differential expression of HSPs (HSP-72, 90 and 27), apoptosis (Bcl-2, Bax and Caspase
3) genes and pro-inflammatory cytokines (IL-1, IL-6 and TNF-α) using qRT-PCR. The
reaction mixture containing 1X SYBR1Green (PE Applied Biosystems), 5mM MgCl2, buffer,
0.5μM primer, 1 U Taq, 0.3 mM dNTP and 50 ng cDNA was subjected to the PCR reaction
using the cycler conditions mentioned above. Real-time RT-PCR amplifications were per-
formed in an ABI-Prism 7000 Sequence Detection System (PE Applied Biosystems). The levels
of gene expression were determined using the comparative Ct method. A normalization factor
was used to determine the expression level of each gene in each sample against the control. All
target gene transcriptions were expressed as n-fold difference relative to the control.
Statistical analysis
The data was statistically analyzed using analysis of variance (ANOVA) and significance levels
were kept at 1 and 0.5 percent. For the analysis of qPCR products, the data obtained were ana-
lyzed by using the 2–(ΔΔCt) method. Finally, the mean relative expression for each group was
statistically analyzed by one way ANOVA [least significance difference (LSD) and Duncan’s
Test] for ‘T’ distribution (P value) using SPSS (21.0) Software.
Results
Clinical signs
The administration of the toxin to goats exhibited varying degree of pathological symptoms
including weakness, lethargy, growth retardation, feed refusal and reduced movement. How-
ever, diarrhea was the most consistent symptom observed right from the 20th day post treat-
ment in both the toxin treated groups. 4 goats from group I and 6 from group II showed
diarrhea with soiled hindquarters. Goats from the group III remained void of these clinical
symptoms. Also, in group II extensive pathological lesions were seen in the lumen and aboma-
sum of the GI system. Further, ruminal epithelium exhibited peeling whereas abomasum
showed congestion in response to the toxin treatment on 15th and 30th day. However, no sig-
nificant histological changes were seen in group I on 15th and 30th day.
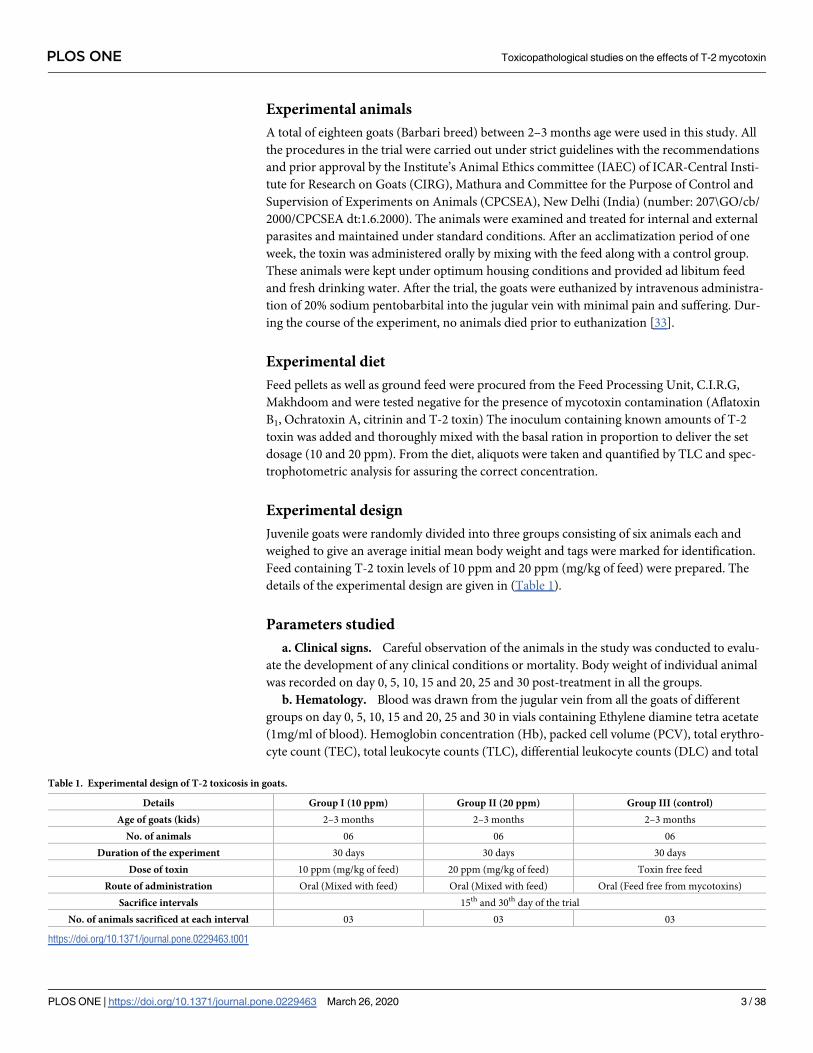
Body weight
The body weights recorded at 0, 5, 10, 15, 20, 25 and 30th day post feeding of the toxin are
given in (Table 2). 15 days onwards, the mean body weights in the toxin fed groups exhibited
lower weight-gain than in the control group, which were found to be dose- and duration-
dependent. On 15th and 30th day, group II showed significantly lower body weight-gain when
compared to other groups. In the control group, there was a progressive body weight-gain
with respect to time contrary to those in the toxin fed groups. No mortality was observed dur-
ing the experimental period.
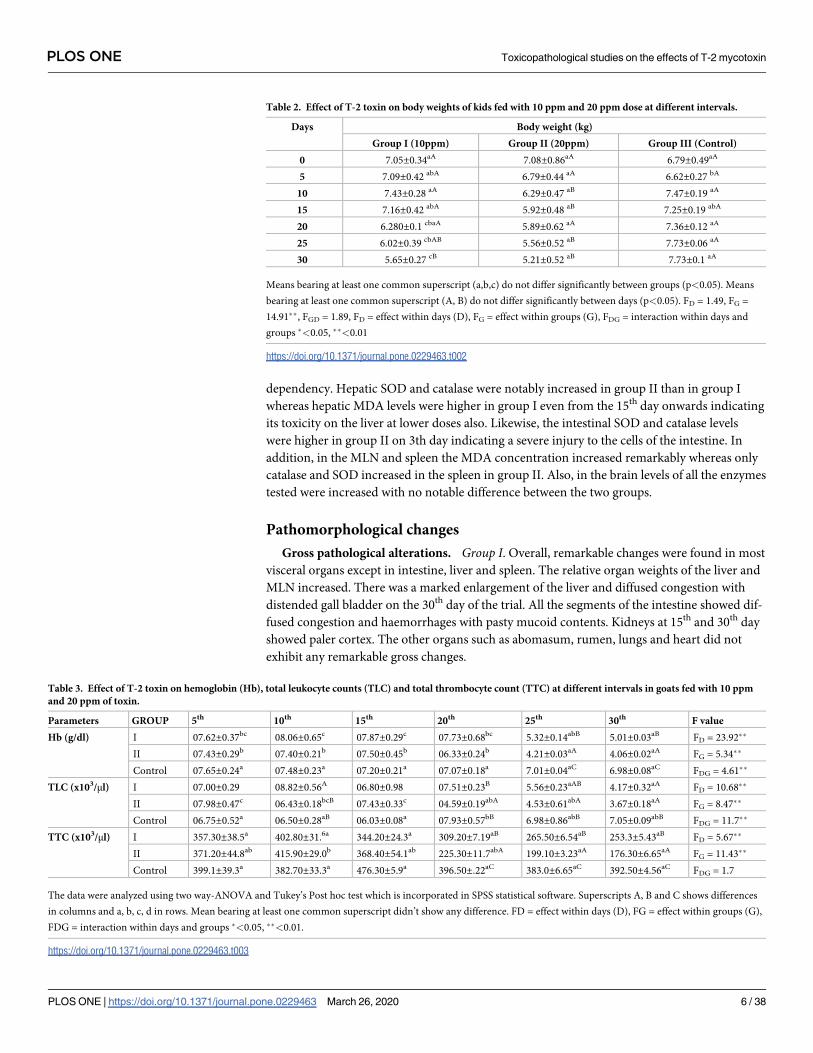
Haematological changes
The hematological parameters are tabulated in (Table 3). There was a significant reduction in
hemoglobin, total leukocyte counts and total thrombocyte counts in toxin treated groups in
comparison with those of the control group in a dose- and time-dependent manner. There
was a significant reduction in total platelet count particularly in group II on the 25th day.
Oxidative stress enzymes
The antioxidant enzyme values are tabulated in (Table 4). The antioxidant enzymes were
remarkably enhanced in the tissue homogenates around the 30th day suggesting its time
PLOS ONE Toxicopathological studies on the effects of T-2 mycotoxin
PLOS ONE | https://doi.org/10.1371/journal.pone.0229463 March 26, 2020 5 / 38
dependency. Hepatic SOD and catalase were notably increased in group II than in group I
whereas hepatic MDA levels were higher in group I even from the 15th day onwards indicating
its toxicity on the liver at lower doses also. Likewise, the intestinal SOD and catalase levels
were higher in group II on 3th day indicating a severe injury to the cells of the intestine. In
addition, in the MLN and spleen the MDA concentration increased remarkably whereas only
catalase and SOD increased in the spleen in group II. Also, in the brain levels of all the enzymes
tested were increased with no notable difference between the two groups.
Pathomorphological changes
Gross pathological alterations. Group I. Overall, remarkable changes were found in most
visceral organs except in intestine, liver and spleen. The relative organ weights of the liver and
MLN increased. There was a marked enlargement of the liver and diffused congestion with
distended gall bladder on the 30th day of the trial. All the segments of the intestine showed dif-
fused congestion and haemorrhages with pasty mucoid contents. Kidneys at 15th and 30th day
showed paler cortex. The other organs such as abomasum, rumen, lungs and heart did not
exhibit any remarkable gross changes.
Table 3. Effect of T-2 toxin on hemoglobin (Hb), total leukocyte counts (TLC) and total thrombocyte count (TTC) at different intervals in goats fed with 10 ppm
and 20 ppm of toxin.
Parameters GROUP 5th 10th 15th 20th 25th 30th F value
Hb (g/dl) I 07.62±0.37bc 08.06±0.65c 07.87±0.29c 07.73±0.68bc 5.32±0.14abB 5.01±0.03aB FD = 23.92��
II 07.43±0.29b 07.40±0.21b 07.50±0.45b 06.33±0.24b 4.21±0.03aA 4.06±0.02aA FG = 5.34��
Control 07.65±0.24a 07.48±0.23a 07.20±0.21a 07.07±0.18a 7.01±0.04aC 6.98±0.08aC FDG = 4.61��
TLC (x103/μl) I 07.00±0.29 08.82±0.56A 06.80±0.98 07.51±0.23B 5.56±0.23aAB 4.17±0.32aA FD = 10.68��
II 07.98±0.47c 06.43±0.18bcB 07.43±0.33c 04.59±0.19abA 4.53±0.61abA 3.67±0.18aA FG = 8.47��
Control 06.75±0.52a 06.50±0.28aB 06.03±0.08a 07.93±0.57bB 6.98±0.86abB 7.05±0.09abB FDG = 11.7��
TTC (x103/μl) I 357.30±38.5a 402.80±31.6a 344.20±24.3a 309.20±7.19aB 265.50±6.54aB 253.3±5.43aB FD = 5.67��
II 371.20±44.8ab 415.90±29.0b 368.40±54.1ab 225.30±11.7abA 199.10±3.23aA 176.30±6.65aA FG = 11.43��
Control 399.1±39.3a 382.70±33.3a 476.30±5.9a 396.50±.22aC 383.0±6.65aC 392.50±4.56aC FDG = 1.7
The data were analyzed using two way-ANOVA and Tukey’s Post hoc test which is incorporated in SPSS statistical software. Superscripts A, B and C shows differences
in columns and a, b, c, d in rows. Mean bearing at least one common superscript didn’t show any difference. FD = effect within days (D), FG = effect within groups (G),
FDG = interaction within days and groups �<0.05, ��<0.01.
https://doi.org/10.1371/journal.pone.0229463.t003
Table 2. Effect of T-2 toxin on body weights of kids fed with 10 ppm and 20 ppm dose at different intervals.
Days Body weight (kg)
Group I (10ppm) Group II (20ppm) Group III (Control)
0 7.05±0.34aA 7.08±0.86aA 6.79±0.49aA
5 7.09±0.42 abA 6.79±0.44 aA 6.62±0.27 bA
10 7.43±0.28 aA 6.29±0.47 aB 7.47±0.19 aA
15 7.16±0.42 abA 5.92±0.48 aB 7.25±0.19 abA
20 6.280±0.1 cbaA 5.89±0.62 aA 7.36±0.12 aA
25 6.02±0.39 cbAB 5.56±0.52 aB 7.73±0.06 aA
30 5.65±0.27 cB 5.21±0.52 aB 7.73±0.1 aA
Means bearing at least one common superscript (a,b,c) do not differ significantly between groups (p<0.05). Means
bearing at least one common superscript (A, B) do not differ significantly between days (p<0.05). FD = 1.49, FG =
14.91��, FGD = 1.89, FD = effect within days (D), FG = effect within groups (G), FDG = interaction within days and
groups �<0.05, ��<0.01
https://doi.org/10.1371/journal.pone.0229463.t002
PLOS ONE Toxicopathological studies on the effects of T-2 mycotoxin
PLOS ONE | https://doi.org/10.1371/journal.pone.0229463 March 26, 2020 6 / 38

Table 4. Effect of T-2 toxin on oxidative stress enzymes in various organs.
Organ Enzymes (Days) Groups F value
10ppm (Group I) 20ppm (Group II) Control (III)
Liver CAT (103/U) 15 1756.50±3.15aB 1684.2±9.45bB 1629.2±1.95cB FG = 226.4��
FD = 305.7��
FDG = 88.85��30 1843.90±5.70bA 1939.4±17.8aA 1659.3±1.9cA
SOD (U/g) 15 77.10±1.25bB 86.6±2.30aB 73.2±0.55bB FG = 72.32��
30 106.60±4.05aA 118.8±1.6aA 82.9±0.80bA FD = 187.0��
FDG = 17.0��
LPO (nM) 15 56.00±2.65aB 63.4±4.15a 33.9±1.4b FG = 90.9��
30 78.80±4.40aA 80.9±4.15a 29.8±0.5b FD = 20.2��
FDG = 9.45�
Intestine CAT (103/U) 15 1578.30±4.95bB 1804.6±5.8aB 1436.3±2.4cB FG = 566.0��
30 2037.70±6.5aA 1949.8±24.8bA 1619.3±4cA FD = 854.9��
FDG = 121.8��
SOD (U/g) 15 85.90±0.35bB 110.8±1.55aB 76.5±0.45c FG = 422.6��
30 106.30±2.05bA 134.4±2.15aA 78.6±1.65c FD = 123.5��
FDG = 30.9��
LPO (nM) 15 57.40±3.10bB 96.3±3.6a 48.1±2.55b FG = 206.5��
30 98.40±2.0aA 113.7±4.0a 41.7±1.9b FD = 51.0��
FDG = 32.1��
MLN CAT (103/U) 15 1602.80±9.4bB 1649±4.65aB 1366.1±3.4cB FG = 1009.6��
30 1665.20±8.7bA 1751.8±6.05aA 1482.4±3.2cA FD = 331.1��
FDG = 10.5�
SOD (U/g) 15 74.80±2.45aB 78.6±0.85aA 45.6±2.15b FG = 266.5��
30 86.0±1.55aA 70.5±1.05bB 52.2±0.9c FD = 11.3�
FDG = 24.9��
LPO (nM) 15 56.4±1.45B 58.6±1.05B 50.9±3.7 FG = 30.3��
30 70.4±2.45aA 79.4±3.45aA 50.3±1.35b FD = 35.0��
FDG = 8.7�
Kidneys CAT (103/U) 15 1717.60±15.20b 1789.4±7.2aA 1571.6±2.4bA FG = 78.8��
30 1717.00±6.40a 1651.5±3.8bB 1590.6±1.35cB FD = 150.7��
FDG = 41.9��
SOD (U/g) 15 74.80±2.45b 116.4±3.00a 71.2±1.1c FG = 292.6��
30 84.60±2.25b 135.3±3.5a 66.5±2.1c FD = 15.6��
FDG = 11.7��
LPO (nM) 15 60.50±3.9 61.4±2.5 49.6±4.35 FG = 16.95��
30 73.50±2.55 61.9±4.35 48.1±6.2 FD = 0.8
FDG = 3.88
Spleen CAT (103/U) 15 1431.20±1.65cB 1766.3±4.45aB 1573.8±2.5bB FG = 1904.4��
FD = 944.3��
FDG = 197.6��30 1642.80±3.55bA 1829.3±8.55aA 1630.2±1.4bA
SOD (U/g) 15 67.30±0.95bB 81.3±1.95a 56.9±2.6b FG = 78.7��
30 73.40±1.00bA 89.3±0.95a 65.3±3.05b FD = 22.5��
FDG = 0.22
LPO (nM) 15 70.40±2.75b 91.4±1.75aB 74.9±2.75b FG = 65.99��
30 74.40±4.80b 122.2±3.8aA 81.25±2.05b FD = 27.5��
FDG = 10.6�
(Continued)
PLOS ONE Toxicopathological studies on the effects of T-2 mycotoxin
PLOS ONE | https://doi.org/10.1371/journal.pone.0229463 March 26, 2020 7 / 38

Group II. At the 30th day post toxin exposure, liver was found enlarged with rounded edges,
diffused congestion and distended gall bladder. The intestine and liver were the most affected
organs in this group. Mesenteric lymph nodes were enlarged and oedematous and the brain
revealed meningeal vessels engorgement.
Histological alterations
Extent, severity and type of lesions differed among the groups based on the type of organ
involved, dose and duration of toxin feeding. Liver and intestines were the most severely
affected organs exhibiting remarkable histological alterations. These lesions were broadly clas-
sified as vascular and cellular changes in all the organs. Overall scoring of histological lesions
was also done for the other organs mentioned above. The histopathological changes observed
in various organs of the different groups are given in (Table 5).
Liver. Group I. Varying degree of degenerative and necrotic lesions were seen in the
hepatic parenchyma. Hepatocytes on the 15th day exhibited swollen and granular cytoplasm.
Bi-nucleated hepatocytes having karyomegaly were observed at various instances whereas a
few cells also exhibited degeneration and necrosis of the eosinophilic granular cytoplasm and
nuclear condensation (Fig 1).
30th day post toxin treatment showed extensive lesions characterized by degeneration of the
hepatocytes towards the portal triad. Hepatic artery and portal veins along with the other
blood vessels were swollen and dilated. Hyperplasia of the bile duct was also visible along with
cell necrosis consistently present on the 30th day. In one case, diffused type of coagulative
necrosis of hepatocytes (individual cell necrosis) with dark pyknotic nucleus was seen scattered
in the parenchyma along with diffuse fatty changes in large number of hepatocytes (Fig 2).
Group II. This group exhibited the maximum severity of lesions of the hepatocytes right
from the 15th day showing engorgement and sinusoidal congestion in all the experimental ani-
mals. Visible centrilobular necrosis was found along with hypertrophy of the bile duct and
dead cell debris accumulation in the lumen leading to peri-billiary fibrosis (Fig 3).
By the 30th day, all these features were observed in all the animals in the study. Extensive
cell necrosis was seen with distinct and dark nucleus as well as eosinophilic cytoplasm called
‘Ghost hepatocytes’ (Fig 4).
Intestines. Group I. The segments of the intestine namely duodenum, ilium and jejunum
showed characteristic lesions led by cellular and vascular alteration by 15th day post toxin
Table 4. (Continued)
Organ Enzymes (Days) Groups F value
10ppm (Group I) 20ppm (Group II) Control (III)
Brain CAT (103/U) 15 1626.60±12.90bB 1717.7±5.6aB 1564.9±2.75cA FG = 1675.2��
FD = 9.84�
30 1717.50±5.80bA 1909.7±1.4aA 1329.2±1.6cB FDG = 610��
SOD (U/g) 15 72.40±0.75bB 94.2±1.00a 65.1±2.2b FG = 115.9��
30 82.20±0.70abA 88.30±1.05a 74.2±2.1b FD = 14.2��
FDG = 19.23�
LPO (nM) 15 79.90±3.25b 99.40±1.65a 77.9±3.8b FG = 33.9��
30 82.40±5.40b 108.30±2.25a 79.3±2.45b FD = 2.7
FDG = 0.81
The data were analysed using one way ANOVA, two way ANOVA and independent t test wherever applicable. Superscripts A, B and C shows differences in columns
and a, b, c, d in rows. Mean bearing at least one common superscript didn’t show any difference. FD = effect within days (D), FG = effect within groups (G), FDG =
interaction within days and groups �<0.05, ��<0.01. CAT (103/U)—Catalase, SOD-Superoxide Dismutase, LPO-lipid peroxidation (nM of MDA/g of tissue).
https://doi.org/10.1371/journal.pone.0229463.t004
PLOS ONE Toxicopathological studies on the effects of T-2 mycotoxin
PLOS ONE | https://doi.org/10.1371/journal.pone.0229463 March 26, 2020 8 / 38
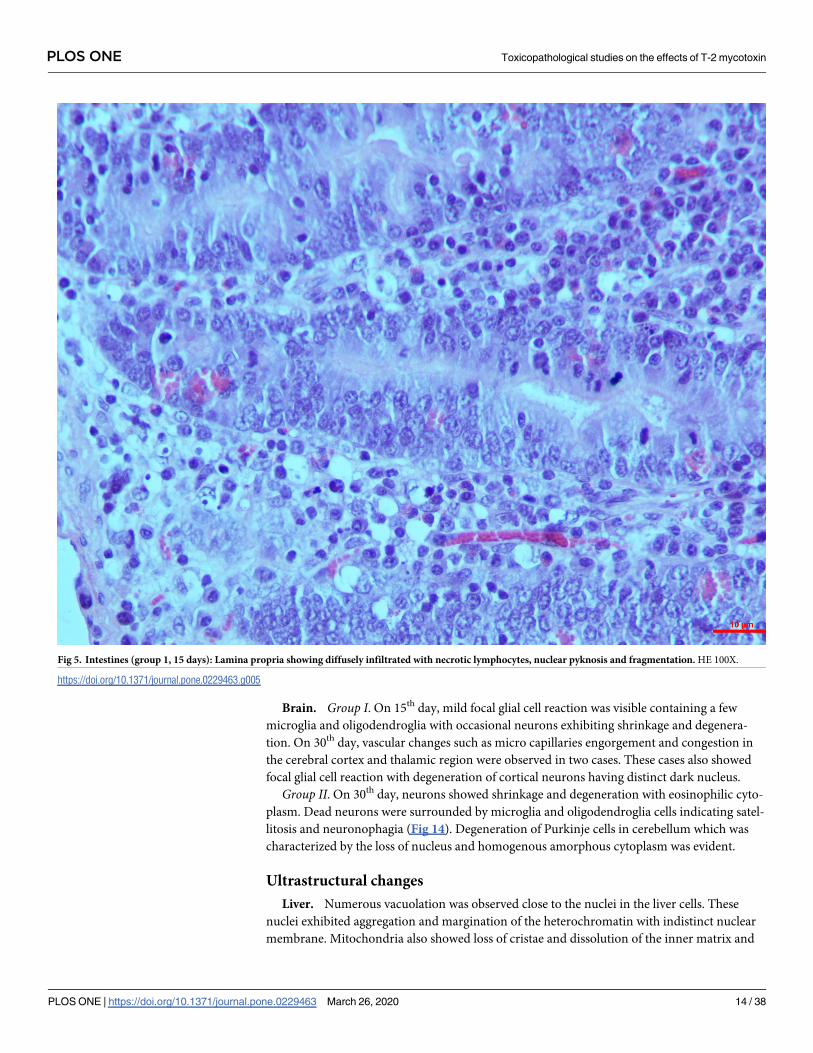
induction. Hyperplasia of the crypt epithelium was moderate whereas less evident lymphatic infil-
trations were seen in the lamina propria with scarce vascular swelling in the mucosa (Fig 5).
Studies on the 30th day revealed the progression of these lesions and necrosis to severity.
The cryptic cell hyperplasia led to necrosis of the epithelial cells of the crypt with infiltrated
lamina propria exhibiting necrotic variations like nuclear pyknosis and fragmentation. The graded
score for the crypt epithelial necrosis was significantly higher (3.0 ± 0.00) than on the 15th day
(1.7 ± 0.33) and also than that in controls (0.3 3± 0.33) whereas that of the necrotic lymphocytes
in villous epithelium, Peyer’s patches and lamina propria did not vary between groups.
Group II. Lesions were severe on both 15th and 30th days after toxin administration in this
group. Similar vascular engorgement in the lamina propria, infiltration of the lymphoid cells
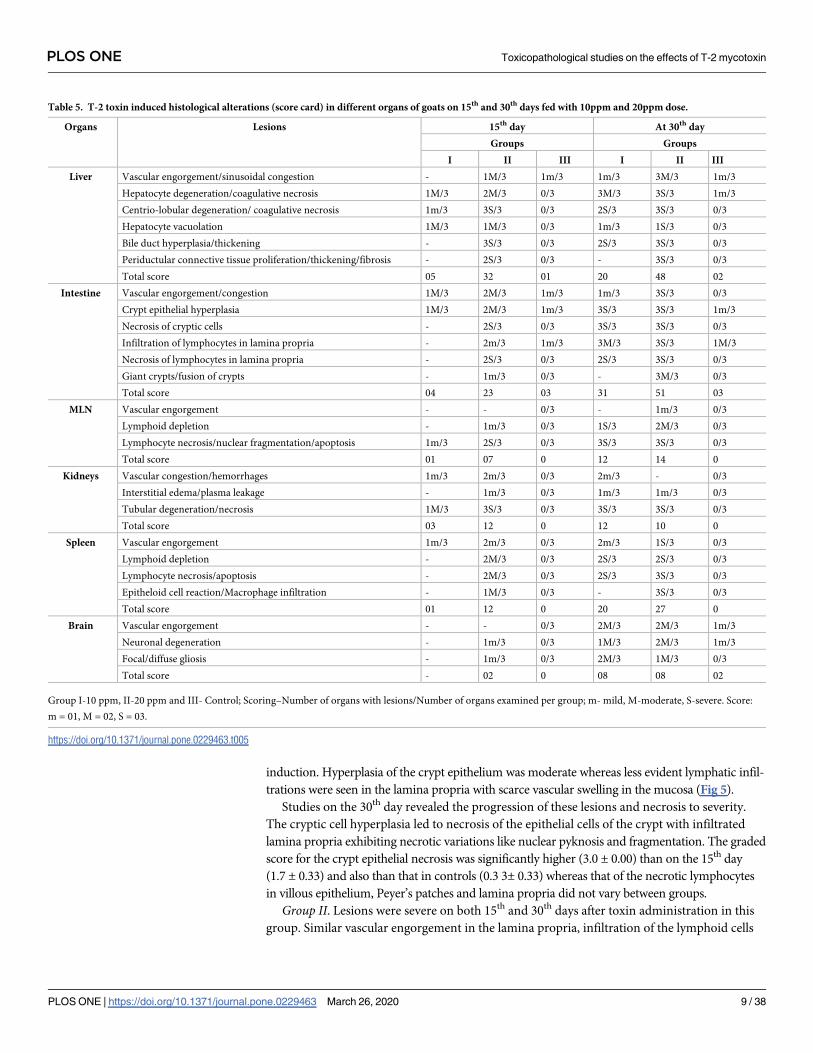
Table 5. T-2 toxin induced histological alterations (score card) in different organs of goats on 15th and 30th days fed with 10ppm and 20ppm dose.
Organs Lesions 15th day At 30th day
Groups Groups
I II III I II III
Liver Vascular engorgement/sinusoidal congestion - 1M/3 1m/3 1m/3 3M/3 1m/3
Hepatocyte degeneration/coagulative necrosis 1M/3 2M/3 0/3 3M/3 3S/3 1m/3
Centrio-lobular degeneration/ coagulative necrosis 1m/3 3S/3 0/3 2S/3 3S/3 0/3
Hepatocyte vacuolation 1M/3 1M/3 0/3 1m/3 1S/3 0/3
Bile duct hyperplasia/thickening - 3S/3 0/3 2S/3 3S/3 0/3
Periductular connective tissue proliferation/thickening/fibrosis - 2S/3 0/3 - 3S/3 0/3
Total score 05 32 01 20 48 02
Intestine Vascular engorgement/congestion 1M/3 2M/3 1m/3 1m/3 3S/3 0/3
Crypt epithelial hyperplasia 1M/3 2M/3 1m/3 3S/3 3S/3 1m/3
Necrosis of cryptic cells - 2S/3 0/3 3S/3 3S/3 0/3
Infiltration of lymphocytes in lamina propria - 2m/3 1m/3 3M/3 3S/3 1M/3
Necrosis of lymphocytes in lamina propria - 2S/3 0/3 2S/3 3S/3 0/3
Giant crypts/fusion of crypts - 1m/3 0/3 - 3M/3 0/3
Total score 04 23 03 31 51 03
MLN Vascular engorgement - - 0/3 - 1m/3 0/3
Lymphoid depletion - 1m/3 0/3 1S/3 2M/3 0/3
Lymphocyte necrosis/nuclear fragmentation/apoptosis 1m/3 2S/3 0/3 3S/3 3S/3 0/3
Total score 01 07 0 12 14 0
Kidneys Vascular congestion/hemorrhages 1m/3 2m/3 0/3 2m/3 - 0/3
Interstitial edema/plasma leakage - 1m/3 0/3 1m/3 1m/3 0/3
Tubular degeneration/necrosis 1M/3 3S/3 0/3 3S/3 3S/3 0/3
Total score 03 12 0 12 10 0
Spleen Vascular engorgement 1m/3 2m/3 0/3 2m/3 1S/3 0/3
Lymphoid depletion - 2M/3 0/3 2S/3 2S/3 0/3
Lymphocyte necrosis/apoptosis - 2M/3 0/3 2S/3 3S/3 0/3
Epitheloid cell reaction/Macrophage infiltration - 1M/3 0/3 - 3S/3 0/3
Total score 01 12 0 20 27 0
Brain Vascular engorgement - - 0/3 2M/3 2M/3 1m/3
Neuronal degeneration - 1m/3 0/3 1M/3 2M/3 1m/3
Focal/diffuse gliosis - 1m/3 0/3 2M/3 1M/3 0/3
Total score - 02 0 08 08 02
Group I-10 ppm, II-20 ppm and III- Control; Scoring–Number of organs with lesions/Number of organs examined per group; m- mild, M-moderate, S-severe. Score:
m = 01, M = 02, S = 03.
https://doi.org/10.1371/journal.pone.0229463.t005
PLOS ONE Toxicopathological studies on the effects of T-2 mycotoxin
PLOS ONE | https://doi.org/10.1371/journal.pone.0229463 March 26, 2020 9 / 38

like macrophages, lymphocytes and plasma cells in the inter-cryptic spaces and cell necrosis
were observed on the 15th day (Fig 6).
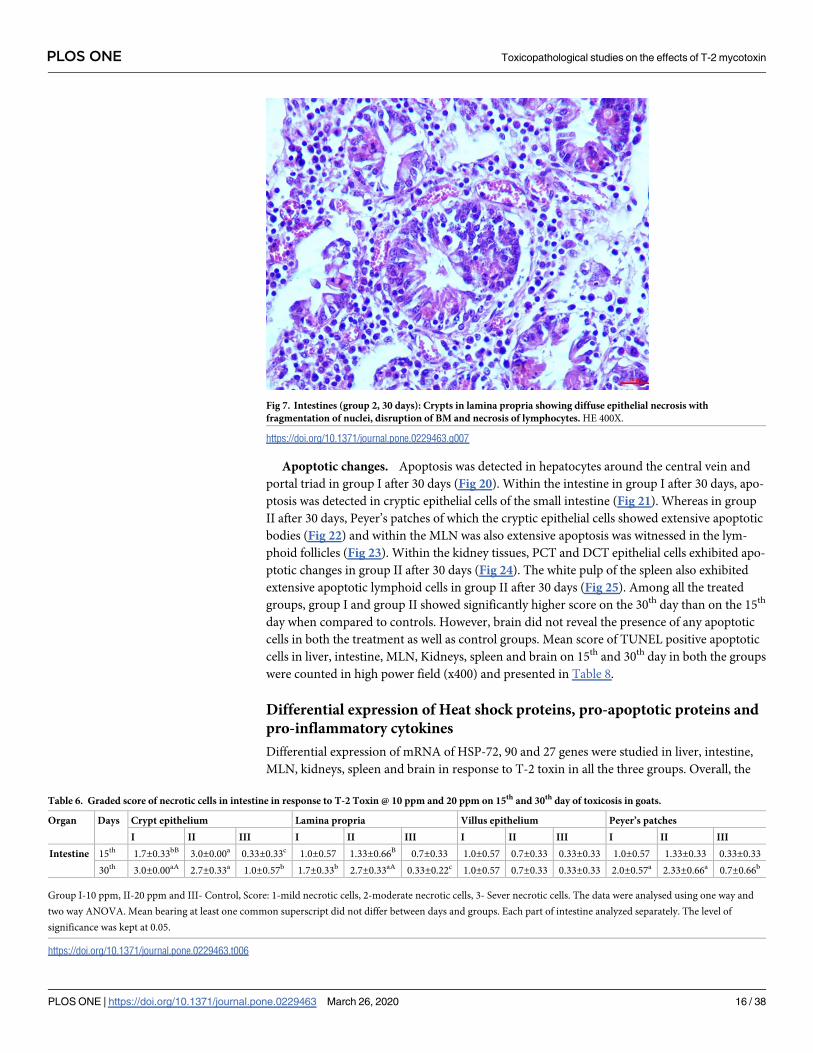
They were progressive and became severe by the 30th day showing lymphocytolysis or
depletion in the Peyer’s patches along with necrotic fragmentation of nucleus and aggregation
of the lymphoid cells in the lamina propria. In addition, the epithelial cells were diffused show-
ing fragmented nuclei, infiltration and necrosis of the lymphocytes and disruption of the base-
ment membrane were the visible features on the 30th day (Fig 7). The dead eosinophilic debris
replaced the necrosed crypt epithelium with complete loss of cryptic architecture. The graded
mean score of necrotic cells in lamina propria on the 30th day (2.7±0.33) was significantly
higher when compared with that on the 15th day (1.33±0.66) and also than that in controls.
But the score of necrosis in cryptic cells, villous epithelium and Peyer’s patches did not differ
significantly between days (Table 6).
Mesenteric lymph nodes. Group I. The histological changes were time-dependent, which
means that the microscopic changes on the 15th day were less intense when compared to that
Fig 1. Liver (group 1, 15 days): epithelial hyperplasia with bile ducts having degeneration of hepatocytes. HE 400X.
https://doi.org/10.1371/journal.pone.0229463.g001
PLOS ONE Toxicopathological studies on the effects of T-2 mycotoxin
PLOS ONE | https://doi.org/10.1371/journal.pone.0229463 March 26, 2020 10 / 38

of the 30th day. On the 15th day, mild depletion of the lymphoid follicles were seen with a scat-
tered necrosis in the lymphoid cells whereas the changes on the 30th day included a widespread
reduction in the cortical follicle and necrosis of the lymphocytes (Fig 8).
Group II. In the higher dosage treated group on 15th day, inter-follicular space exhibited
moderate vascular swelling. In two of the animals, in the cortical zone infiltration of the polyg-
onal cells was observed coupled with foamy cytoplasm similar to the epithelioid cells and mac-
rophages. These changes progressed to severity on the 30th day showing severe depletion of the
lymphoid cells and lymphocytolysis (Fig 9). These changes were characterized by scattered
necrotic cells of the lymphocytes and macrophages in the lymphoid follicle of the cortex ren-
dering it a starry sky appearance. All the three cases examined revealed signs of lymphoid
depletion and infiltration in the polygonal cells to a large extent through the entire paracortical
zone resembling epithelioid cells and macrophages. The graded score of necrotic cells was sig-
nificantly higher in group II on 15th day (2.7±0.33) than in group I (1.00±0.00) and also than
that in controls (0.7±0.33).
Fig 2. Liver (group 1, 30 days): individual cell necrosis with dark pyknotic nucleus in the parenchyma with diffuses fatty changes of hepatocytes. HE 100X.
https://doi.org/10.1371/journal.pone.0229463.g002
PLOS ONE Toxicopathological studies on the effects of T-2 mycotoxin
PLOS ONE | https://doi.org/10.1371/journal.pone.0229463 March 26, 2020 11 / 38

Kidneys. Group I. The histological changes in the kidney on 15th day were not remarkable
but the pathology progressed over time. On the 30th day, features such as vascular engorge-
ment, degeneration of the PCT and DCT with intact glomeruli were visible. Epithelial cells of
the DCT showed detachment along with the degeneration of the vacuoles and occurrence of
granular pink matter in the lumen. Similar to the other organs, the lesion progressed to necro-
sis in the kidney as well, with degeneration of the PCT and DCT along with the epithelial cell
accumulation (Fig 10).
Group II. Characteristic epithelial cell damage showing eosinophilic granular cytoplasm
was seen on the 15th day. Epithelial cells were swollen with haemorrhages in the interstitial
cells in two of the cases. Likewise, complete epithelial destruction leading to its accumulation
in the lumen was seen on the 30th which included loss of nuclei and brush border (Fig 11).
Spleen. Group I. The parenchyma cells of the spleen exhibited observable red pulp because
of the engorgement of the sinusoid. Lymphocytes were slightly depleted in the marginal zone
Fig 3. Liver (group 2, 15 days): Hypertrophy peri-billiary hyperplasia/fibrosis with bile ducts having cell debris and diffuse centrilobular necrosis of hepatocytes.
HE 100X.
https://doi.org/10.1371/journal.pone.0229463.g003
PLOS ONE Toxicopathological studies on the effects of T-2 mycotoxin
PLOS ONE | https://doi.org/10.1371/journal.pone.0229463 March 26, 2020 12 / 38

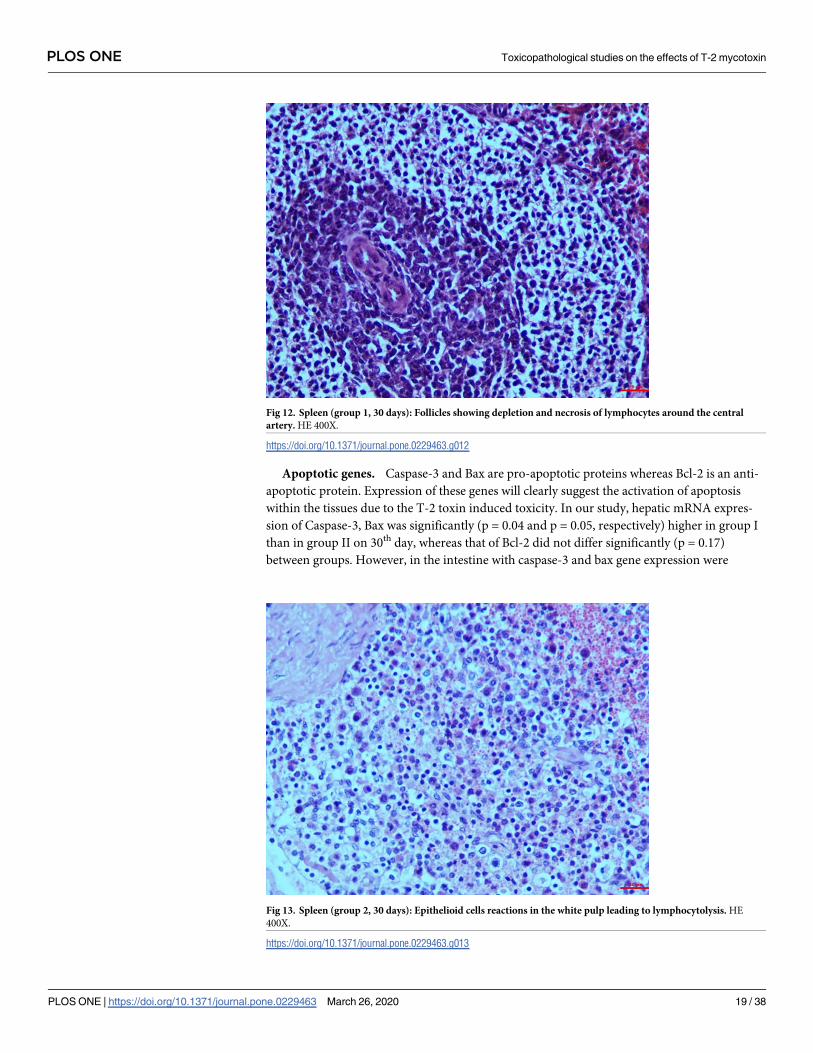
of the pulp. On the 30th day however, moderate depletion of the follicles and necrosis of the
lymphocytes in the spleen was seen around the central artery (Fig 12). The graded mean score
of lymphoid depletion (2.7±0.33) and necrosis (2.00±0.57) on 30th day was significantly higher
than that in controls (0.33±0.33). Although there was little difference in the score between
intervals in the toxin treated groups.
Group II. On the contrary to group I, group II showed severe depletion in the lymphoid
cells right from the day 15 around the marginal and parafollicular zones. Two of the cases
exhibited moderate necrosis also. Conversely, on the 30th day there was severe depletion in the
lymphoid cells, thickening of the capsules and congestion in the sinusoid. It was also notably
that prominent epithelioid cells reacted in the white pulp leading to lymphocytolysis. These
cells were pleomorphic, large resembling macrophages in white pulp (Fig 13). Graded score of
lymphoid depletion and necrosis of lymphoid cells was significantly higher on 15th and 30th
day when compared to that in controls. There was no difference between intervals but higher
score was recorded in toxicated groups than in the control group (Table 7).
Fig 4. Liver (group 2, 30 days): Hepatocytes showing distinct dark nucleus and homogeneous deep eosinophilic cytoplasm called as ‘Ghost hepatocytes’. HE 400X.
https://doi.org/10.1371/journal.pone.0229463.g004
PLOS ONE Toxicopathological studies on the effects of T-2 mycotoxin
PLOS ONE | https://doi.org/10.1371/journal.pone.0229463 March 26, 2020 13 / 38
Brain. Group I. On 15th day, mild focal glial cell reaction was visible containing a few
microglia and oligodendroglia with occasional neurons exhibiting shrinkage and degenera-
tion. On 30th day, vascular changes such as micro capillaries engorgement and congestion in
the cerebral cortex and thalamic region were observed in two cases. These cases also showed
focal glial cell reaction with degeneration of cortical neurons having distinct dark nucleus.
Group II. On 30th day, neurons showed shrinkage and degeneration with eosinophilic cyto-
plasm. Dead neurons were surrounded by microglia and oligodendroglia cells indicating satel-
litosis and neuronophagia (Fig 14). Degeneration of Purkinje cells in cerebellum which was
characterized by the loss of nucleus and homogenous amorphous cytoplasm was evident.
Ultrastructural changes
Liver. Numerous vacuolation was observed close to the nuclei in the liver cells. These
nuclei exhibited aggregation and margination of the heterochromatin with indistinct nuclear
membrane. Mitochondria also showed loss of cristae and dissolution of the inner matrix and
Fig 5. Intestines (group 1, 15 days): Lamina propria showing diffusely infiltrated with necrotic lymphocytes, nuclear pyknosis and fragmentation. HE 100X.
https://doi.org/10.1371/journal.pone.0229463.g005
PLOS ONE Toxicopathological studies on the effects of T-2 mycotoxin
PLOS ONE | https://doi.org/10.1371/journal.pone.0229463 March 26, 2020 14 / 38

looked like an empty vacuole in group II after 30 days (Fig 15). While the cross sections in
group II after 30 days showed severe hyperplasticity of the collagen (Fig 16).
Small intestine. Heterochromatin exhibited condensation, margination and clumping
with indistinct nuclear membrane. Enterocytes showed consistent variations in both the
groups on the 30th day. Degenerated and pleomorphic mitochondria with loss of cristae and
dissolution of inner matrix was also observed (Fig 17).
Kidneys. Mitochondria and nucleus showed extensive degeneration on the 30th day. Epi-
thelial cells were also affected showing loss of cristae leading to empty space and rendering the
mitochondria pleomorphic. Condensation and margination of heterochromatin with indis-
tinct nuclear membrane were also evident as shown in Fig 18 in the higher dose group i.e.
group II after 30 days ().
Brain. Neuronal degeneration was the most consistent finding noticed in group II on 30th
day. It was characterized by presence of circular, whirling dark structures in the brain (Fig 19).
Fig 6. Intestines (group 2, 15 days): Lamina propria showing depletion/lymphocytolysis in Peyer’s patches. HE 400X.
https://doi.org/10.1371/journal.pone.0229463.g006
PLOS ONE Toxicopathological studies on the effects of T-2 mycotoxin
PLOS ONE | https://doi.org/10.1371/journal.pone.0229463 March 26, 2020 15 / 38
Apoptotic changes. Apoptosis was detected in hepatocytes around the central vein and
portal triad in group I after 30 days (Fig 20). Within the intestine in group I after 30 days, apo-
ptosis was detected in cryptic epithelial cells of the small intestine (Fig 21). Whereas in group
II after 30 days, Peyer’s patches of which the cryptic epithelial cells showed extensive apoptotic
bodies (Fig 22) and within the MLN was also extensive apoptosis was witnessed in the lym-
phoid follicles (Fig 23). Within the kidney tissues, PCT and DCT epithelial cells exhibited apo-
ptotic changes in group II after 30 days (Fig 24). The white pulp of the spleen also exhibited
extensive apoptotic lymphoid cells in group II after 30 days (Fig 25). Among all the treated
groups, group I and group II showed significantly higher score on the 30th day than on the 15th
day when compared to controls. However, brain did not reveal the presence of any apoptotic
cells in both the treatment as well as control groups. Mean score of TUNEL positive apoptotic
cells in liver, intestine, MLN, Kidneys, spleen and brain on 15th and 30th day in both the groups
were counted in high power field (x400) and presented in Table 8.
Differential expression of Heat shock proteins, pro-apoptotic proteins and
pro-inflammatory cytokines
Differential expression of mRNA of HSP-72, 90 and 27 genes were studied in liver, intestine,
MLN, kidneys, spleen and brain in response to T-2 toxin in all the three groups. Overall, the
Fig 7. Intestines (group 2, 30 days): Crypts in lamina propria showing diffuse epithelial necrosis with
fragmentation of nuclei, disruption of BM and necrosis of lymphocytes. HE 400X.
https://doi.org/10.1371/journal.pone.0229463.g007
Table 6. Graded score of necrotic cells in intestine in response to T-2 Toxin @ 10 ppm and 20 ppm on 15th and 30th day of toxicosis in goats.
Organ Days Crypt epithelium Lamina propria Villus epithelium Peyer’s patches
I II III I II III I II III I II III
Intestine 15th 1.7±0.33bB 3.0±0.00a 0.33±0.33c 1.0±0.57 1.33±0.66B 0.7±0.33 1.0±0.57 0.7±0.33 0.33±0.33 1.0±0.57 1.33±0.33 0.33±0.33
30th 3.0±0.00aA 2.7±0.33a 1.0±0.57b 1.7±0.33b 2.7±0.33aA 0.33±0.22c 1.0±0.57 0.7±0.33 0.33±0.33 2.0±0.57a 2.33±0.66a 0.7±0.66b
Group I-10 ppm, II-20 ppm and III- Control, Score: 1-mild necrotic cells, 2-moderate necrotic cells, 3- Sever necrotic cells. The data were analysed using one way and
two way ANOVA. Mean bearing at least one common superscript did not differ between days and groups. Each part of intestine analyzed separately. The level of
significance was kept at 0.05.
https://doi.org/10.1371/journal.pone.0229463.t006
PLOS ONE Toxicopathological studies on the effects of T-2 mycotoxin
PLOS ONE | https://doi.org/10.1371/journal.pone.0229463 March 26, 2020 16 / 38

mRNA expression of all three HSPs in the organs tested was significantly upregulated in group
II when compared to group I, suggesting that the higher dose has led to increased expression
of these genes as a result of stress exerted by the toxin (Table 9). Specifically, the expression of
HSPs in the liver, intestine and MLN was higher in group II than in group I (Fig 1a). On the
contrary, in the kidney expression of HSP-90 was significantly (p = 0.51) upregulated in group
II compared to the group I, whereas HSP-72 and HSP-27 did not differ significantly (p = 0.51
Fig 8. Mesenteric lymph nodes (group 1, 30 days): Widespread depletion in cortical follicles with diffuse necrosis
of lymphocytes/lymphocytolysis. HE 400X.
https://doi.org/10.1371/journal.pone.0229463.g008
Fig 9. Mesenteric lymph nodes (group 2, 30 days): Lymphoid depletion and infiltration of large polygonal
epithelioid cells and macrophages. HE 400X.
https://doi.org/10.1371/journal.pone.0229463.g009
PLOS ONE Toxicopathological studies on the effects of T-2 mycotoxin
PLOS ONE | https://doi.org/10.1371/journal.pone.0229463 March 26, 2020 17 / 38

and -27 p = 0.27, respectively) between groups. Meanwhile, expression of HSP-72 and HSP-27
mRNA in the spleen was significantly high (p< 0.05) in group II than in group I. The expres-
sion of HSP-72 mRNA increased in group II than in group I on the 30th day. The expression
of HSPs mRNA in brain did not differ between groups but showed up regulation than the con-
trol group.
Fig 10. Kidney (group 1, 30 days): Epithelial cells of DCT showing detachment, degeneration of vacuoles and
occurrence of granular pink matter in the lumen. HE 400X.
https://doi.org/10.1371/journal.pone.0229463.g010
Fig 11. Kidney (group 2, 30 days): Degeneration of PCT and DCT showing loss of nuclei and brush borders. HE
400X.
https://doi.org/10.1371/journal.pone.0229463.g011
PLOS ONE Toxicopathological studies on the effects of T-2 mycotoxin
PLOS ONE | https://doi.org/10.1371/journal.pone.0229463 March 26, 2020 18 / 38
Apoptotic genes. Caspase-3 and Bax are pro-apoptotic proteins whereas Bcl-2 is an anti-
apoptotic protein. Expression of these genes will clearly suggest the activation of apoptosis
within the tissues due to the T-2 toxin induced toxicity. In our study, hepatic mRNA expres-
sion of Caspase-3, Bax was significantly (p = 0.04 and p = 0.05, respectively) higher in group I
than in group II on 30th day, whereas that of Bcl-2 did not differ significantly (p = 0.17)
between groups. However, in the intestine with caspase-3 and bax gene expression were
Fig 12. Spleen (group 1, 30 days): Follicles showing depletion and necrosis of lymphocytes around the central
artery. HE 400X.
https://doi.org/10.1371/journal.pone.0229463.g012
Fig 13. Spleen (group 2, 30 days): Epithelioid cells reactions in the white pulp leading to lymphocytolysis. HE
400X.
https://doi.org/10.1371/journal.pone.0229463.g013
PLOS ONE Toxicopathological studies on the effects of T-2 mycotoxin
PLOS ONE | https://doi.org/10.1371/journal.pone.0229463 March 26, 2020 19 / 38

significantly higher in group II than in group I (p = 0.001 and p = 0.05, respectively) and the
expression of Bcl-2 was upregulated in group I than in group II (p = 0.05). On the contrary, the
expression of caspase-3 was significantly higher in group II (p = 0.03) and the expression of Bax
and Bcl-2 were significantly higher in group I than in group II within the MLNs (p = 0.57 and
p = 0.04, respectively). Meanwhile, within the kidney, caspase-3 was significantly higher in
group II (p = 0.04), whereas Bax was higher in group I (p = 0.03). Within the spleen, the expres-
sion of Bax and Bcl-2 was significantly higher in group I (p = 0.05) with no significant change in
caspase-3 expression, whereas the expression of caspase-3 was significantly higher (p = 0.05) in
group I within the brain. Collectively, it was observed that, T-2 toxin at most instances induced
the expression of caspase-3 as well as Bax, with little or no significant changes in Bcl-2, indicat-
ing the induction of apoptosis within all the organs studied. (Table 10).
Pro-inflammatory cytokines (IL-1α, IL-6 and TNF-α). Various locally produced pro-
inflammatory stimuli such as IL-1, IL-6 and TNF-α can invade into the circulation and induce
Table 7. Graded score lymphoid depletion and necrosis of lymphoid cells (lymphocytolysis) in response to T-2 toxin @ 10 ppm and 20 ppm on 15th and 30th day.
Organ Days Lymphoid depletion Lymphoid necrosis (lymphocytolysis)
I II III I II III
Spleen 15th 1.33±0.33b 3.0±0.00a 0.7±0.33c 1.0±0.57b 2.7±0.33a 0.7±0.33b
30th 2.7±0.33a 2.7±0.33a 0.33±0.33b 2.0±0.57a 3.0±0.00a 0.33±0.33b
MLN 15th 1.0±0.00b 2.7±0.33a 0.7±0.33b 1.33±0.7b 2.7±0.33a 0.33±0.33c
30th 2.0±0.57a 3.0±0.00a 0.7±0.33b 2.33±0.7a 3.0±0.00a 0.33±0.33b
Peyer’s patches 15th 1.0±0.00a 1.7±0.33a 0.33±0.33b 0.7±0.33bB 1.7±0.33aB 0.33±0.33b
30th 2.7±0.33a 2.7±0.33a 0.33±0.33b 2.0±0.57aA 3.0±0.00aA 0.7±0.33b
Group I-10ppm, II-20ppm and III- Control, Score: 1-mild depletion, 2-moderate depletion, 3- severe depletion. 1-mild necrotic cells, 2-moderate necrotic cells, 3-
severe necrotic cells. The data were analysed using one way and two way ANOVA. Mean bearing at least one common superscript did not differ between days and
groups. Each organ and parameter analyzed separately between groups and days. The level of significance was kept at 0.05.
https://doi.org/10.1371/journal.pone.0229463.t007
Fig 14. Brain (group 2, 30 days): Neurons showing shrinkage and degeneration with eosinophilic cytoplasm
indicating satellitosis. HE 400X.
https://doi.org/10.1371/journal.pone.0229463.g014
PLOS ONE Toxicopathological studies on the effects of T-2 mycotoxin
PLOS ONE | https://doi.org/10.1371/journal.pone.0229463 March 26, 2020 20 / 38

a systemic response against the oxidative stress induced by the exposure to the toxin. Thus, in
our study we assessed the levels of these mediators in various organs. It was observed that the
hepatic expression of IL-1α, IL-6 (p = 0.04; p = 0.05, respectively) were significantly upregu-
lated in group II, whereas the expression of TNF-α (p = 0.05) was upregulated in group I as
against the that of the intestine where IL-1α expression was upregulated in group I but the
expression of IL-6 and TNF-α were upregulated in group II. Similarly, only TNF- α (p = 0.04)
significantly increased in group I within MLNs and IL-6 and TNF-α (p = 0.004 and p = 0.05)
both varied in the kidneys. However, the expression of only IL-1α significantly (p = 0.05)
increased in the group II animals within the spleen and brain whereas the expression of IL-6
and TNF-α did not exhibit much variation in the spleen and brain tissues. (Table 11).
Discussion
In the present study, the experimental animals showed clinical symptoms such as diarrhea,
feed refusal, lethargy and weakness after 15 days of toxin feeding at 10 and 20 ppm toxicity lev-
els. The clinical signs exhibited by the animals in the present study were similar to those
reported earlier by various workers in calves [38,39], sheep [18] and pigs[20]. Also, [18]
reported that the lambs exposed to the T-2 toxin at a concentration of 0.6 mg/kg body weight
for about 21 days exhibited periodic bouts of diarrhea and infection with Eimeria species,
which are the clear symptoms of toxicosis. In addition, characteristics such as lethargy and
feed refusal observed during the toxicosis might be due to the impairment in the central ner-
vous system [40]. In some of the other studies, features of low feed consumption to complete
feed refusal, reduced feed conversions for nutrient absorption, bloody diarrhea, reduction in
Fig 15. Liver (group 2, 30 days): Mitochondrial degeneration with loss of cristae and formation of empty spaces in
the cytoplasm of hepatocytes. Uranyl acetate and lead citrate 200X.
https://doi.org/10.1371/journal.pone.0229463.g015
PLOS ONE Toxicopathological studies on the effects of T-2 mycotoxin
PLOS ONE | https://doi.org/10.1371/journal.pone.0229463 March 26, 2020 21 / 38

milk production and absence of oestrus cycles were observed in the cattle with T-2 toxicosis
[16,38]. In addition, findings from the studies of [19] suggest that T-2 toxicosis in sheep (aged
1.5–3 yrs) showed similar clinical symptoms as stated above. The complete feed refusal
resulted in reduced body weight and in turn caused damage to the organs such as kidney, liver,
GI and lymphoid tissues [41]. Studies have also suggested that T-2 toxicosis-induced diarrhea
reduces the absorptive lining on the intestine and a corresponding reduction in the protein
synthesis [10,42]. All these changes might have led to a significant reduction in the body
weight of the experimental goats over a period of one month.
In our study, the dose- and duration-dependent reduction in the hemoglobin concentration
(greater at a high concentration) was observed, which is probably due to its role on hematopoi-
esis and inhibition of protein synthesis and is well studied in several animal models such as
rats, mice, guinea pigs, rabbits and cats [43,44]. The inhibition of hemoglobin synthesis can be
due to the reduced uptake of 59Fe by the erythrocytes which in turn lead to a reduced Hb pro-
duction [45,46]. In agreement with several other studies, severe leucopenia was also observed
in our study in the toxin treated groups around the 30th day [41,47], along with increased mye-
loid to erythroid ratios in lambs at a toxin concentration of 0.6 mg/kg body weight and 0.3
mg/kg body weight per day fed in a protein low diet for 21 days [18]. Along with its effects on
the hemoglobin content, the total platelet count was also reduced in our study on the 25th day
of toxin exposure, which might be a resultant of the direct effect on the platelet progenitor dif-
ferentiation and cytotoxicity [48]. Decreased platelet count was also reported in rabbits fed
0.5mg/kg T-2 toxin contaminated feed [47].
Group II on the 30th day exhibited significantly higher hepatic SOD and catalase enzymes,
suggesting the release of ROS, along with an increase in the hepatic LPO activity in group I in
Fig 16. Liver (group 2, 30 days): Hyperplasticity in the collagen fibers of liver. Uranyl acetate and lead citrate
1000X.
https://doi.org/10.1371/journal.pone.0229463.g016
PLOS ONE Toxicopathological studies on the effects of T-2 mycotoxin
PLOS ONE | https://doi.org/10.1371/journal.pone.0229463 March 26, 2020 22 / 38

the 15th day as well. [49]Reported that lipid peroxidation is not involved in T-2 toxin cytotoxic-
ity. In contrast, [50] reported that T-2 toxin and deoxynivalenol (DON) stimulated lipid per-
oxidation in the liver of rats. These results suggest a direct effect of the toxin on the hepatic
tissues at relatively lower doses administered for longer duration. It is a general understanding
that oxidative stress is a resultant of either the generation of greater amount of ROS or reduced
production of antioxidants within the cells [51,52]. Macromolecules critical to life namely the
nucleic acids, lipids and proteins are the major targets of ROS, which further lead to tissue
injury [53]. Oxidative damage around the 30th day post toxin exposure also led to severe histo-
logical alterations in the intestine including tissue necrosis of the epithelial lining and the lym-
phocytes in the lamina propria.
Apart from the generation of ROS, lipid peroxidation is also targeted by the toxin. However,
reports on the T-2 toxin induced lipid peroxidation in animals are contradicting. [49] reported
that lipid peroxidation is not involved in T-2 toxin cytotoxicity, whereas [50] reported that T-2
toxin and deoxynivalenol (DON) stimulated lipid peroxidation in the liver of rats. Some of the
other studies report an increase in the lipid peroxide levels in the organs such as kidney, liver,
thymus, bone marrow and spleen upon a single oral dose treatment of T-2 toxin @ 2 or 3.6
mg/kg body weight [48,53]. Similar to our findings, [33] reported an increase in the melonal-
dehyde, SOD and catalase enzymes in the liver and kidney tissue homogenates of the experi-
mental rabbits after oral feeding of AFB1 @ 0.5ppm, ochratoxin @ 1ppm and in combination
in rabbits on 30th and 60th day. Lipid peroxidation caused by T-2 toxin in liver and kidneys has
been identified as an important underlying mechanism of T-2 toxin-induced cell injury, DNA
damage and apoptosis [54]. On the contrary, the studies carried out by [55] demonstrated a
Fig 17. Small intestine (group 2, 30 days): Heterochromatin showing condensation, margination and clumping
with indistinct nuclear membrane in enterocytes. Uranyl acetate and lead citrate 1000X.
https://doi.org/10.1371/journal.pone.0229463.g017
PLOS ONE Toxicopathological studies on the effects of T-2 mycotoxin
PLOS ONE | https://doi.org/10.1371/journal.pone.0229463 March 26, 2020 23 / 38

marked reduction of SOD and catalase activity along with a concomitant increase in the LPO
levels in the liver and kidney tissues after oral treatment of T-2 toxin @ 0.5ppm, 0.75ppm and
1ppm in rats.
Considering the fact that any foreign particle from the feeds should enter the body through
the GI system, it was evaluated in this study. The lesions were observed on 15 and 30th day
showing mild crypt epithelial hyperplasia, infiltration of lymphocytes and vascular engorgement
in the mucosa which progressed to severe necrosis of crypt epithelia, lymphocytes in lamina
propria, infiltration of epitheliod cells, macrophages and plasma cells in group II on 30th day.
Similar lesions in gastrointestinal system have been described in various livestock species by sev-
eral workers in trichothecenes toxicity [11–15,38]. Such lesions also caused damage to the
actively dividing cells lining the intestinal mucosa and leukocytes, suggesting the effects of the
toxin on the intestinal cells [8]. Yet another study examined the T-2 toxicosis in piglets which
showed congestion, hemorrhages and necrosis of the mucosal cells of GI and a direct effect on
the lymphocytes and lymph nodes of the immune system. In a similar study on the pigs, [56]
showed an increased endothelial lymphocytes and plasma cells of the epithelium along with a
reduced number of goblets and underdeveloped glycocalyx in the epithelium of the intestine.
In the present study, the graded mean score of necrotic cells in crypt epithelium was signifi-
cantly higher in group II but villous epithelium and LP did not show severe necrosis with low
mean score of necrotic cells, which suggested that the cryptic epithelial cells were the primary
targets for T-2 toxin exposure in intestine as this region consisted actively dividing cells [20].
Examination of the Peyer’s patched showed severely diffused lymphocytes and depletion of the
lymphoid in the higher dosage group, which is in agreement with the histological findings
from the study on piglets treated with T-2 toxin @ 1.5mg, 2mg and 2.5mg/kg of BW [8].
Fig 18. Kidney (group 2, 30 days): Epithelial cells showing loss of cristae leading to mitochondria pleomorphic.
Uranyl acetate and lead citrate 500X.
https://doi.org/10.1371/journal.pone.0229463.g018
PLOS ONE Toxicopathological studies on the effects of T-2 mycotoxin
PLOS ONE | https://doi.org/10.1371/journal.pone.0229463 March 26, 2020 24 / 38

In addition, the epithelium of the intestine also revealed severe apoptotic modifications
with a marked increase in the TUNEL positive cells in group II on the 30th day, which are also
in agreement with the studies of Quiroga et al. [20] that described similar apoptotic changes in
Fig 19. Brain (group 2, 30 days): Degeneration of neurons by formation of circular, whirling dark structures
called as myelin figures. Uranyl acetate and lead citrate 1000X.
https://doi.org/10.1371/journal.pone.0229463.g019
Fig 20. Liver (group 1, 30 days): Apoptosis in hepatocytes around central vein and portal triad. DAB 400X.
https://doi.org/10.1371/journal.pone.0229463.g020
PLOS ONE Toxicopathological studies on the effects of T-2 mycotoxin
PLOS ONE | https://doi.org/10.1371/journal.pone.0229463 March 26, 2020 25 / 38
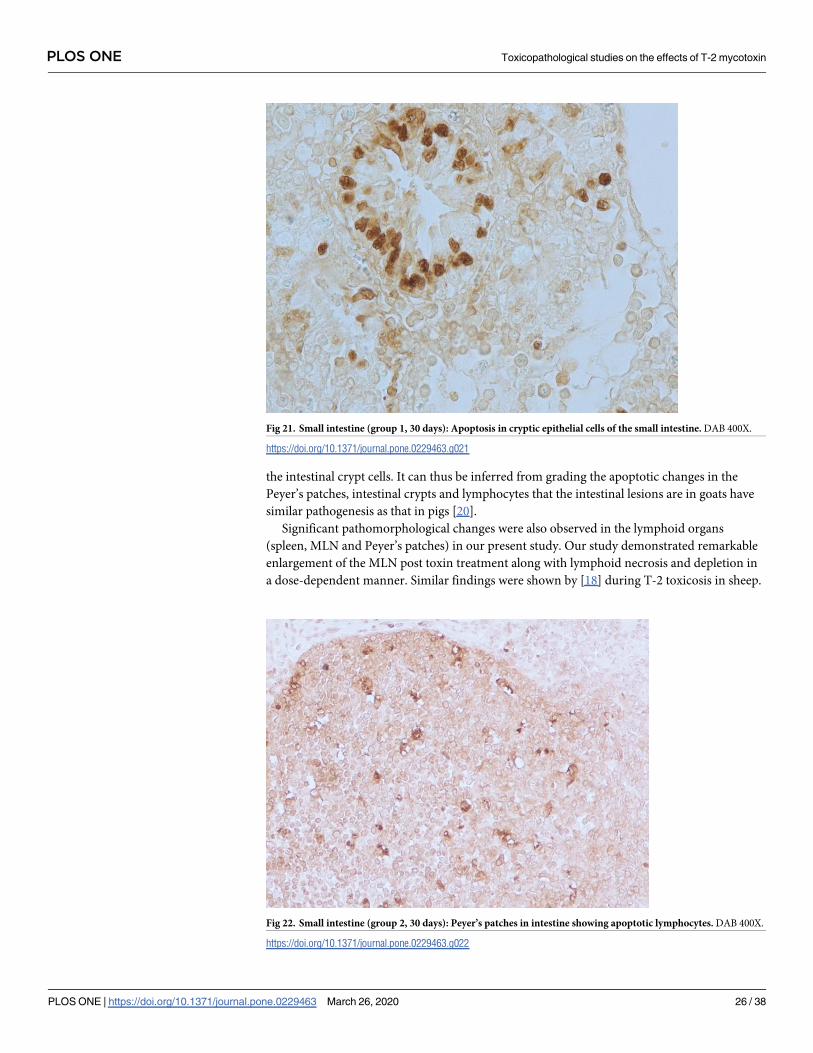
the intestinal crypt cells. It can thus be inferred from grading the apoptotic changes in the
Peyer’s patches, intestinal crypts and lymphocytes that the intestinal lesions are in goats have
similar pathogenesis as that in pigs [20].
Significant pathomorphological changes were also observed in the lymphoid organs
(spleen, MLN and Peyer’s patches) in our present study. Our study demonstrated remarkable
enlargement of the MLN post toxin treatment along with lymphoid necrosis and depletion in
a dose-dependent manner. Similar findings were shown by [18] during T-2 toxicosis in sheep.
Fig 21. Small intestine (group 1, 30 days): Apoptosis in cryptic epithelial cells of the small intestine. DAB 400X.
https://doi.org/10.1371/journal.pone.0229463.g021
Fig 22. Small intestine (group 2, 30 days): Peyer’s patches in intestine showing apoptotic lymphocytes. DAB 400X.
https://doi.org/10.1371/journal.pone.0229463.g022
PLOS ONE Toxicopathological studies on the effects of T-2 mycotoxin
PLOS ONE | https://doi.org/10.1371/journal.pone.0229463 March 26, 2020 26 / 38

They study demonstrated depletion of lymphocytes in the medullary and paracortical areas
and germinal centers, presence of numerous pyknotic cells in the MLN and hypocellularity in
the germinal centers of spleen and were similar to T-2 toxicosis in sheep [18], piglets [20] and
AFB1and ochratoxin toxicity in rabbits [33]. In support to these findings, [43] demonstrated
higher concentrations of the toxin in the lymphoid organs as early as 3 h after the intra-aortal
administration in the experimental pigs. Such a fast penetration could be attributed to its lipo-
philic nature facilitating it to surpass the blood-brain barrier [9].
Fig 23. Mesenteric lymph nodes (group 2, 30 days): Apoptotic lymphocytes in the follicles of MLN. DAB 400X.
https://doi.org/10.1371/journal.pone.0229463.g023
Fig 24. Kidney (group 2, 30 days): PCT and DCT showing apoptotic epithelial cells. DAB 400X.
https://doi.org/10.1371/journal.pone.0229463.g024
PLOS ONE Toxicopathological studies on the effects of T-2 mycotoxin
PLOS ONE | https://doi.org/10.1371/journal.pone.0229463 March 26, 2020 27 / 38

In addition to the lymphoid organs, kidneys have shown marked pathomorphological
changes including degeneration of the epithelial lining of proximal and distal convoluted
tubules, interstitial engorgement, renal tubular necrosis and accumulation of the pink stained
material in the lumen. The dose- and duration-dependent modifications in the kidney tissues
indicate the effect of toxin on these tissues. The harmful effects of the toxin is either via the
generation of oxidative stress, as observed by the increased stress enzymes, or because of the
renal damage rendered during the biotransformation of the toxin and its excretion as observed
in the studies conducted by Konigs et al [57] and Wu et al [58].
Besides these organs, T-2 toxicosis has also affected the brain tissues demonstrated by a
varying degree of characteristic lesions including engorgement of the vascular tissues, Purkinje
and cortical cell neuronal degenerations, focal glial reaction and satellitosis in both the toxin
treated groups on 30th day. Along with these characteristics, enhanced lipid peroxidation and
greater levels of oxidative stress enzymes in the brain tissues. However, TUNEL assay could
not detect apoptosis in the brain cells. Effects of T-2 toxicosis on the neuronal cells in the brain
have not been well studied. The neurological effects of the T-2 toxins are thought to be a result
Fig 25. Spleen (group 2, 30 days): Apoptotic lymphocytes in white pulp area of spleen. DAB 400X.
https://doi.org/10.1371/journal.pone.0229463.g025
PLOS ONE Toxicopathological studies on the effects of T-2 mycotoxin
PLOS ONE | https://doi.org/10.1371/journal.pone.0229463 March 26, 2020 28 / 38

of either the metabolic changes in the biogenic mono amines [59] or changes in the permeabil-
ity of amino acids across the blood-brain barriers [60].
Further, at the cellular level the modifications varied with respect to the organs, namely,
liver, intestine, kidneys and brain. The nuclear membrane remained indistinct along with loss
of cristae and inner matrix leading to valuolation of the mitochondria, hyperplasia and dilation
of the rough endoplasmic reticulum and condensation of the heterochromatin. Brain showed
myelin figures due to neuronal degeneration in both the toxicated groups on 30th day. Overall,
the results of the study showed that mitochondria was the most affected organelle rendering
the pleomorphic (variable sizes and shapes–dumb bell, curved, rounded) mitochondria into
opaque structure in the hepatocytes, enterocytes and epithelial cells of kidney tubules. Afla-
toxin B1 and ochratoxin treatment in rabbits also revealed similar structural changes reported
by [33]. In addition, treatment of ochratoxin (OTA) and citrinin (CTN) to the laboratory rats
[61] revealed severe ultrastructural changes in the epithelial cells of PCT characterized by
extensive loss of the brush border, cytoplasmic vacuolations and degeneration of nuclei with
indistinct nuclear membranes and loss of nucleoli and pleomorphic mitochondria in rats
treated with OTA @ 0.75 ppm and CTN @ 15 ppm and in combination. The present study is
in agreement with these studies and several others suggesting that toxins indeed has the ability
to cause cytotoxic effects in rats, rabbits and poultry [33,62,63].
The mechanism of apoptosis induction is via mitochondrial or non-mitochondrial mecha-
nisms. Although not clear, it is expected to be via triggering the activation of stress-activated
kinases c-Jun N-terminal kinase 1 (JNK1) and/or p38 MAPK (Mitogen activated protein
kinases) [23,64]. In our study, extensive apoptosis was observed in the higher dose group in all
the organs tested. Liver exhibited apoptotic cells in lower dose group also, whereas in the intes-
tinal crypt epithelial cells apoptosis was observed at the higher dose group only. Similarly, the
lymphoid and the kidney cells also showed significant apoptosis in a dose-dependent manner.
Table 8. Mean score (mean±SEM) of TUNEL positive (apoptotic) cells in different tissues in T-2 toxin induced apoptosis in toxicated and control groups on 15th
and 30th days.
Organs/tissues (Days) Groups F value
10ppm (Group I) 20ppm (Group II) Control (III)
Liver 15 10.58±3.3aB 5.33±1.6aB 1.64±0.52b FG = 36.78��
FD = 13.78��
30 27.7±3.7aA 21.7±2.5aA 1.2±0.42b FDG = 3.68��
Intestine 15 4.7±1.17bB 16.6±2.6aB 1.8±0.32b FG = 73.69��
FD = 50.56��
30 20.7±2.2bA 40.7±4.2aA 1.2±0.30c FDG = 14.18��
MLN 15 4.8±0.9abB 6.1±1.1aB 1.8±0.6b FG = 39.64��
FD = 41.13��
FDG = 17.3��30 10.5±2.1bA 22.2±1.9aA 2.1±0.9c
Kidneys 15 3.7±1.2bB 9.2±1.3aB 0.9±0.3b FG = 33.8��
FD = 29.2��
30 14.7±1.4bA 21.7±3.6bA 1.22±0.43c FDG = 7.38��
Spleen 15 4.6±0.19abB 7.1±1.2aB 3.1±0.7b FG = 14.3��
FD = 13.08��
30 12.5±1.3aA 9.3±1.4aA 2.9±0.9b FDG = 6.39��
The data were analyzed using one way-ANOVA, two way-ANOVA and independent (t) test, wherever applicable. Superscripts A, B shows differences in columns and a,
b, c in rows. Mean bearing at least one common superscript didn’t show any difference. FD = effect within days (D), FG = effect within groups (G), FDG = interaction
within days and groups �<0.05, ��<0.01.
https://doi.org/10.1371/journal.pone.0229463.t008
PLOS ONE Toxicopathological studies on the effects of T-2 mycotoxin
PLOS ONE | https://doi.org/10.1371/journal.pone.0229463 March 26, 2020 29 / 38

T-2 induced apoptosis has been characterized by some of the previous studies suggesting its
effects on the thymic and splenic lymphocytes, bone marrow and gastric mucosa, gastric glan-
dular epithelium and intestinal crypt cell epithelium in mice [23,29,65]particularly in the skin
[25]kidney and brain [66].
Crypt epithelial cells of the duodenum and lymphoid tissues have shown extensive apopto-
sis in previous studies as a result of the toxin treatment to the laboratory mice [65,67,68]. Large
Table 9. Effect of T-2 toxin on expression of Heat shock protein (HSP) genes in different tissues in 10ppm and
20ppm groups on 30th day.
Tissues Genes Groups Fold change (2-ΔΔct) ±SEM P value
Liver HSP-72 10ppm 11.93±0.34� 0.05
20ppm 21.50±2.22�
HSP-90 10ppm 4.63±0.79# 0.05
20ppm 23.85±4.24#
HSP-27 10ppm 7.93±0.85$ 0.05
20ppm 21.01±0.95$
Intestine HSP-72 10ppm 17.19±0.19� 0.05
20ppm 38.66±3.94�
HSP-90 10ppm 14.44±1.69# 0.05
20ppm 23.25±2.53#
HSP-27 10ppm 5.24±0.55$ 0.05
20ppm 8.95±0.67$
MLN HSP-72 10ppm 4.85±0.53� 0.05
20ppm 12.13±1.53�
HSP-90 10ppm 1.76±0.25# 0.05
20ppm 4.98±1.03#
HSP-27 10ppm 3.91±0.21 0.82
20ppm 3.87±0.9
kidneys HSP-72 10ppm 4.13±1.84� 0.05
20ppm 11.33±2.2�
HSP-90 10ppm 4.00±0.64 0.51
20ppm 3.74±0.37
HSP-27 10ppm 4.29±0.98 0.27
20ppm 5.51±0.59
Spleen HSP-72 10ppm 5.58±0.18� 0.05
20ppm 17.71±2.64�
HSP-90 10ppm 1.35±0.36 0.12
20ppm 1.82±0.59
HSP-27 10ppm 5.11±1.51$ 0.05
20ppm 3.38±0.69$
Brain HSP-72 10ppm 1.7±0.56 0.13
20ppm 4.08±0.79
HSP-90 10ppm 2.76±1.84 0.13
20ppm 5.68±1.07
HSP-27 10ppm 1.44±0.38 0.08
20ppm 2.62±0.24
The relative fold change (2-ΔΔct) expressions of 10 ppm and 20 ppm groups were compared relative to control on 30th
day using Mann–Whitney U-test as implemented in version 16.0 of the SPSS software. The level of significance was
set at P < 0.05.
https://doi.org/10.1371/journal.pone.0229463.t009
PLOS ONE Toxicopathological studies on the effects of T-2 mycotoxin
PLOS ONE | https://doi.org/10.1371/journal.pone.0229463 March 26, 2020 30 / 38

intestinal crypts showed relatively lesser apoptosis in comparison to the small intestine proba-
bly because the small intestine encounters the toxin and its metabolites more frequently during
the mucosal absorption and biliary excretion [10]. With respect to the lymphoid tissues, in a
previous study on the laboratory mice it was observed that the degree of apoptosis varied in
the different organs but were extensively affect in all the organs studied [68]. Similarly, in
the present study the toxin affected all the lymphoid organs at varying degree in a dose
dependent manner. Hepatocytes were also significantly affected and graded in our study.
Table 10. Effect of T-2 toxin on expression of apoptotic genes in different tissues in 10 ppm and 20 ppm groups on 30th day.
Tissues Genes Groups Fold change (2-ΔΔct) ±SEM P value
Liver Caspase 3 10ppm 24.31±1.14� 0.04
20ppm 12.15±0.57�
Bax 10ppm 3.85±0.91# 0.05
20ppm 9.34±1.52#
Bcl2 10ppm 0.47±0.11 0.17
20ppm 1.18±0.40
Intestine Caspase 3 10ppm 33.52±0.54�� 0.001
20ppm 67.04±1.08��
Bax 10ppm 12.42±0.45# 0.05
20ppm 35.83±4.33#
Bcl2 10ppm 2.73±0.91$ 0.05
20ppm 1.89±0.16$
MLN Caspase 3 10ppm 20.87±2.3� 0.05
20ppm 41.74±4.6�
Bax 10ppm 43.06±5.52# 0.05
20ppm 13.44±2.26#
Bcl2 10ppm 3.00±0.34$ 0.05
20ppm 0.67±0.16$
kidneys Caspase 3 10ppm 10.02±0.49� 0.04
20ppm 32.78±5.44�
Bax 10ppm 8.82±1.65# 0.03
20ppm 4.11±0.83#
Bcl2 10ppm 3.13±0.24 0.57
20ppm 1.01±0.26
Spleen Caspase 3 10ppm 24.97±9.2 0.08
20ppm 15.24±1.15
Bax 10ppm 21.96±3.56# 0.05
20ppm 13.73±0.88#
Bcl2 10ppm 11.44±3.1$ 0.05
20ppm 2.7±0.57$
Brain Caspase 3 10ppm 4.27±0.60� 0.05
20ppm 1.96±0.20�
Bax 10ppm 1.40±0.43 0.5
20ppm 1.97±0.22
Bcl2 10ppm 1.6±0.67 0.67
20ppm 0.31±0.07
The relative fold change (2-ΔΔct) expressions of 10 ppm and 20 ppm groups were compared relative to control on 30th day using Mann–Whitney U-test as implemented
in version 16.0 of the SPSS software. The level of significance was set at P < 0.05.
https://doi.org/10.1371/journal.pone.0229463.t010
PLOS ONE Toxicopathological studies on the effects of T-2 mycotoxin
PLOS ONE | https://doi.org/10.1371/journal.pone.0229463 March 26, 2020 31 / 38
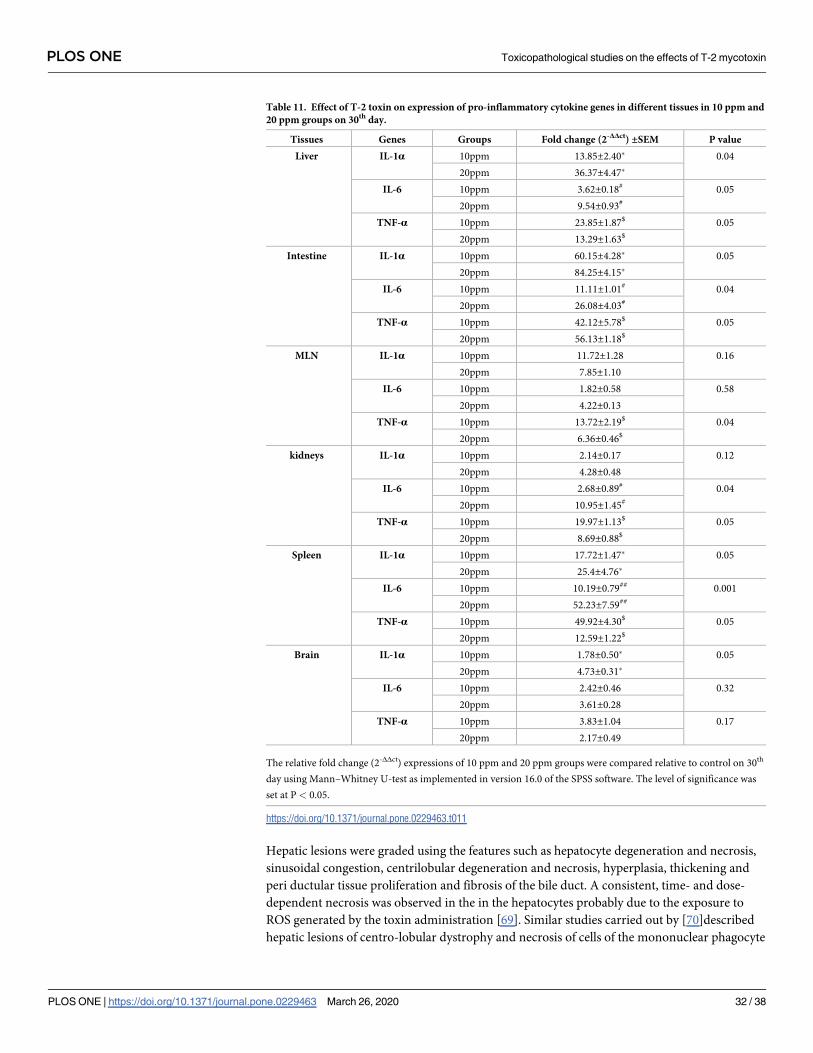
Hepatic lesions were graded using the features such as hepatocyte degeneration and necrosis,
sinusoidal congestion, centrilobular degeneration and necrosis, hyperplasia, thickening and
peri ductular tissue proliferation and fibrosis of the bile duct. A consistent, time- and dose-
dependent necrosis was observed in the in the hepatocytes probably due to the exposure to
ROS generated by the toxin administration [69]. Similar studies carried out by [70]described
hepatic lesions of centro-lobular dystrophy and necrosis of cells of the mononuclear phagocyte
Table 11. Effect of T-2 toxin on expression of pro-inflammatory cytokine genes in different tissues in 10 ppm and
20 ppm groups on 30th day.
Tissues Genes Groups Fold change (2-ΔΔct) ±SEM P value
Liver IL-1α 10ppm 13.85±2.40� 0.04
20ppm 36.37±4.47�
IL-6 10ppm 3.62±0.18# 0.05
20ppm 9.54±0.93#
TNF-α 10ppm 23.85±1.87$ 0.05
20ppm 13.29±1.63$
Intestine IL-1α 10ppm 60.15±4.28� 0.05
20ppm 84.25±4.15�
IL-6 10ppm 11.11±1.01# 0.04
20ppm 26.08±4.03#
TNF-α 10ppm 42.12±5.78$ 0.05
20ppm 56.13±1.18$
MLN IL-1α 10ppm 11.72±1.28 0.16
20ppm 7.85±1.10
IL-6 10ppm 1.82±0.58 0.58
20ppm 4.22±0.13
TNF-α 10ppm 13.72±2.19$ 0.04
20ppm 6.36±0.46$
kidneys IL-1α 10ppm 2.14±0.17 0.12
20ppm 4.28±0.48
IL-6 10ppm 2.68±0.89# 0.04
20ppm 10.95±1.45#
TNF-α 10ppm 19.97±1.13$ 0.05
20ppm 8.69±0.88$
Spleen IL-1α 10ppm 17.72±1.47� 0.05
20ppm 25.4±4.76�
IL-6 10ppm 10.19±0.79## 0.001
20ppm 52.23±7.59##
TNF-α 10ppm 49.92±4.30$ 0.05
20ppm 12.59±1.22$
Brain IL-1α 10ppm 1.78±0.50� 0.05
20ppm 4.73±0.31�
IL-6 10ppm 2.42±0.46 0.32
20ppm 3.61±0.28
TNF-α 10ppm 3.83±1.04 0.17
20ppm 2.17±0.49
The relative fold change (2-ΔΔct) expressions of 10 ppm and 20 ppm groups were compared relative to control on 30th
day using Mann–Whitney U-test as implemented in version 16.0 of the SPSS software. The level of significance was
set at P < 0.05.
https://doi.org/10.1371/journal.pone.0229463.t011
PLOS ONE Toxicopathological studies on the effects of T-2 mycotoxin
PLOS ONE | https://doi.org/10.1371/journal.pone.0229463 March 26, 2020 32 / 38

system in rabbits treated with oral dose of 1, 2, 4, 6, 8, 10 or 15 mg/kg body mass of T-2 for 24
to 48 hours.
In addition to the characteristic ultra-structural modifications, toxin treatment also induces
activation of heat shock proteins, which are generated by the cells in response to stress, injury
and hyperthermia. They are a class of highly conserved stress response proteins expressed
ubiquitously in the cells at basal levels under normal conditions. They play the role of molecu-
lar chaperons and assist proteins to fold, prevent aggregation of proteins and channelize the
unfolded proteins for degradation [71]. They also have a prime role in protecting the cells
against oxidative damage by enhancing the protein activity and endogenous antioxidant stabil-
ity [72].
In the present study, expression of HSP-72,90 and 27 were significantly upregulated in all
the organs tested at the toxin concentration of 10 ppm and 20 ppm on 30th day. However, the
mRNA expression of hepatic, intestinal and MLN were the highest in group II on the 30th day,
which was in line with the study on the mRNA expression in rats using microarray analysis
[66]. Kidney tissue homogenate also exhibited significant up regulation of HSP-72 whereas the
other HSPs tested (HSP-90 and HSP-27) were not significantly varying. On the contrary, the
expression of HSP-72 and HSP-27 were increased in the spleen tissues of the higher dose
group whereas that in the brain did not differ remarkably between the two groups but was
higher than the control. Previous studies have confirmed the elevated ROS- induced oxidative
stress to the cells by the treatment of Zearalenone, citrinin and T-2 toxins [23–25,73]. These
studies reveal a strong relationship of oxidative stress and HSPs thus indicating its use as a bio-
marker to assess oxidative damage to the cells.
Likewise, the expression of pro-apoptotic genes such as Caspase 3 and Bax were also evalu-
ated in the liver, kidney, MLN, intestine, spleen and brain tissues. The expression was signifi-
cantly higher than the control group in all the organs tested. However, the anti-apoptotic gene
(Bcl-2) expression was lower than the control in both the toxin treated groups. Overall, the
extensive apoptotic changes induced by T-2 toxin might be due to the significant up regulation
of pro-apoptotic genes such as Caspase 3 and Bax as well as reduced expression of anti-apopto-
tic gene Bcl-2 in different organs. Previous studies have substantiated the present findings sug-
gesting that the toxin treatment regulated the expression of apoptosis-related genes like
caspase-2 and insulin-like growth factor binding protein-3, trigger apoptosis by releasing cyto-
chrome c, and activate caspase-9, -7, and -3 [66,74,75]. Caspase-3 induces apoptosis by activat-
ing a cascade of proteins ultimately resulting in cell death [76].Likewise, the Bcl-2 to Bax ratio
is a deciding factor of the fate of cell. Therefore, our study showing significant increase in the
Caspase-3 along with a concomitant decrease in the Bcl-2 to Bax ratio suggest the intricate
linkage of these two signals in the induction of apoptosis.
Exposure to the trichothecene class of toxins has both immune-stimulatory and suppressive
potential based on the dosage, duration and frequency. They target the immune cells such as
lymphocytes, macrophages and monocytes leading to the expression of cytokines, chemokines
and pro-inflammatory genes [77]. Further, at a greater concentration range they lead to apo-
ptosis of the leukocytes and a corresponding immune suppression. These toxins bind to the
ribososmes and activate mitogen-activated protein kinases (MAPKs) along with the regulation
of immune and inflammatory genes. Stimulation of mononuclear phagocytes by low doses or
concentrations of trichothecenes elicit expression of inflammation-related genes in vivo and in
vitro including cyclooxygenase-2 (COX-2), pro-inflammatory cytokines and numerous che-
mokines [78].
Likewise, the pro-inflammatory cytokines, namely, IL-1α, IL-6 and TNF-α were signifi-
cantly up in both the groups when compared to the control group on 30th day. It was observed
that the expression was more in higher dose exposed animals, which was in agreement with
PLOS ONE Toxicopathological studies on the effects of T-2 mycotoxin
PLOS ONE | https://doi.org/10.1371/journal.pone.0229463 March 26, 2020 33 / 38

the earlier studies [78]. Similar studies by [79] reported up regulation of pro-inflammatory
cytokines such as IL-1β, IL-6, and TNF-α mRNA in the peritoneal macrophages of mice after
exposure to TLR agonists (LPS and DON) and after 16h. Studies have affirmed the up regula-
tion of pro-inflammatory cytokines via the MAPK pathway [80]. Our results uphold these
findings because of the significant up regulation of IL-1α and IL-6 mRNA in spleen whereas
only IL-1α expression was up regulated in the brain in the group treated with the higher con-
centration of the toxin. On the contrary, all the organs exhibited a significant increase in the
TNF-α gene expression in the lower concentration treated group. TNF-α in responsible for
the induction of apoptosis via Fas mediated cascade for the initiation of apoptosis and thus
increase in its concentration indicates the activation of this pathway as a result of the toxin
treatment.
Infiltration of the lymphocytes and macrophages in the intestinal lamina propria observed
in the present study has a strong link to the generation of inflammatory cytokines. This indi-
cates that these cytokines are indeed responsible for the inflammatory response by these cells.
Such vascular changes induced chronic anorexia and reduced weight gain, immuno-suppres-
sion and tissue injury [81]. Even in the present study, these features were observed in the labo-
ratory mice. Similar findings were elaborated in a recent study on piglets showing DON
toxicity caused Salmonella infection, which in turn led to inflammatory responses [82]. The
intestinal epithelial cells were made vulnerable for the pathogen attack because of immuno-
suppression. Therefore, the lesions observed in our study can be substantiated as a resultant of
the inflammation caused by the toxin.
Therefore, the present study establishes a positive association among oxidative stress and
the gene markers of stress such as HSPs, the apoptosis inducer genes like Caspase-3 and cyto-
kines by the administration of T-2 toxin. Hence, both oxidative, apoptotic and inflammatory
mechanisms are responsible for the pathogenesis of this toxicosis in goats.
Conclusion
The present study demonstrates a complex relation between HSPs, pro-apoptotic proteins and
pro-inflammatory cytokines because of T-2 toxin treatment. This is the first study establishing
the effects of T-2 toxin-induced toxicity and pathological changes in juvenile goats. The study
shows that T-2 toxin exerts toxic effects through a cumulative effect of oxidative, apoptotic and
inflammatory pathways. This study provides a basis for understanding the toxicity, which can
be further extrapolated for other animals as well.
Acknowledgments
The authors are thankful to the Director, Indian Veterinary Research Institute, Izatnagar,
India, Director, Central Institute for Research on Goats, Mathura and Joint Director, HSADL,
Bhopal, India for providing necessary facilities to carry out the work.
Author Contributions
Conceptualization: Anil Kumar Sharma.
Data curation: Rashmi L.
Formal analysis: K. Rajukumar.
Methodology: Ramith Ramu, Vijay Kumar.
Project administration: Anil Kumar Sharma.
Resources: Vivek Kumar Gupta.
PLOS ONE Toxicopathological studies on the effects of T-2 mycotoxin
PLOS ONE | https://doi.org/10.1371/journal.pone.0229463 March 26, 2020 34 / 38

Software: Vijay Kumar.
Supervision: Shivasharanappa Nayakwadi, Anil Kumar Sharma.
Validation: Vivek Kumar Gupta.
Visualization: K. Rajukumar.
Writing – original draft: Shivasharanappa Nayakwadi, Ramith Ramu.
Writing – review & editing: Shivasharanappa Nayakwadi, Prithvi S. Shirahatti, Rashmi L.,
Kanthesh M. Basalingappa.
References
1. FAO/WHO Expert Committee on Food Additives, Evaluation of certain mycotoxins in food. Fifty-sixth
report of the Joint. World Health Organ Tech Rep Ser.2002; 906: 1–62.
2. Fink GJ, Malekinejad H. Biochemical mechanisms and clinical effects associated with exposure to the
mycoestrogenzearalenone. In: Morgavi DP, Riley RT. (Eds.), Fusarium and their toxins: Mycology,
occurrence, toxicity, control and economic impact. Anim Feed Sci Technol. 2007.
3. Morgavi D, Riley RT. An historical overview of field disease outbreaks known or suspected to be caused
by consumption of feeds contaminated with Fusarium toxins. In: Morgavi DP, Riley RT. (Eds.), Fusar-
ium and their toxins: Mycology, occurrence, toxicity, control and economic impact. Anim. Feed Sci.
Technol. 2007.
4. Pestka JJ. Deoxynivalenol: toxicity, mechanisms and health risks. In: Morgavi DP, Riley RT. (Eds),
Fusarium and their toxins: Mycology, occurrence, toxicity, control and economic impact. Anim. Feed
Sci. Technol. 2007.
5. Voss KA, Haschek WM. Fumonisins: toxicokinetics, mechanism of action and toxicity. In: Morgavi DP.,
Riley RT. (Eds.), Fusarium and their toxins: Mycology, occurrence, toxicity, control and economic
impact. Anim. Feed Sci. Technol. 2007.
6. Frisvad JC, Thrane U, Samson RA, Pitt JI. Important mycotoxins and thefungi which produce them. In:
Advances in Food Mycology, Hocking AD, Pit JI, Samson RA, Thrane U. (Eds.), Springer, New York,
USA. 2006;3–31
7. Joseph R, Derbyshire M, Stroka J, Emons H, Anklam E. Trichothecenes:reference materials and
method validation. ToxicolLett. 2004; 153: 123–132.
8. Jaradat ZW. T-2 mycotoxin in the diet and its effects on tissues. In: Reviews in Foodand Nutrition Toxic-
ity, Watson RR, Preedy VR. (Eds). Volume 4. CRCPress. 2005; 173–212.
9. SCF (Scientific Committee on Food). Opinion of the Scientific Committee on Food on Fusarium Toxins.
Part 5: T-2 Toxin and HT-2 Toxin. 2001.
10. Mann DD, Buening GM, Hook B, Osweiler GD. Effects of T-2 mycotoxin on bovine serum proteins. J
Am Vet Med Assoc. 1983; 44: 1757–1759.
11. Wannemacher RW, Brunner DL, Neufeld HA. Toxicity of trichothecenes and other related mycotoxins
in laboratory animals. In: Smith J.E. and Henderson R.S. (Eds.), "Mycotoxins and Animal Foods." CRC
Press, Inc., Boca Raton FL. 1991. pp. 499–552.
12. Hsu IC, Smalley CB, Strong FM, Ribelin WE. Identification of T-2 toxin in moldy corn associated with a
lethal toxicosis in dairy cattle. Appl Microbiol.1972; 24: 684–690. PMID: 4640734
13. Mirocha CJ. Metabolism and residue of trichothecene toxins in animal and plant systems. In: Steyn P.S.
and Vleggier R., eds; Mycotoxins and phytotoxins, Elsevier, Amsterdem, 1976. p.409.
14. Petrie L, Robb J, Stewart AF. The identification of T-2 toxin and its association with a haemorrhagic syn-
drome in cattle. Vet Rec. 1977; 101: 326–326. https://doi.org/10.1136/vr.101.16.326 PMID: 929903
15. Helferich WG, Garrett WN, Hsieh DPH, Baldwin RL. Feedlot performance and tissue residues of cattle
consuming diets containing aflatoxins. J Anim Sci. 1986; 62: 691–696. https://doi.org/10.2527/jas1986.
623691x PMID: 3700268
16. Kegl T, Vanyi A. T-2 fusariotoxicosis in a cattle stock. Magyar AllatorvosokLapja.1991; 46: 467–471.
17. Cheeke PR. Mycotoxins in cereal grains and supplements. In: Cheeke P.R. (Ed.), Danville, IL: Inter-
state Publishers, Inc, 1998. 87–136.
18. Friend SCE, Hancock DS, Schiefer HB and Babiuk LA. Experimental T-2 toxicosis in sheep. Can J
Comp Med. 1983; 47: 291. PMID: 6640413
PLOS ONE Toxicopathological studies on the effects of T-2 mycotoxin
PLOS ONE | https://doi.org/10.1371/journal.pone.0229463 March 26, 2020 35 / 38
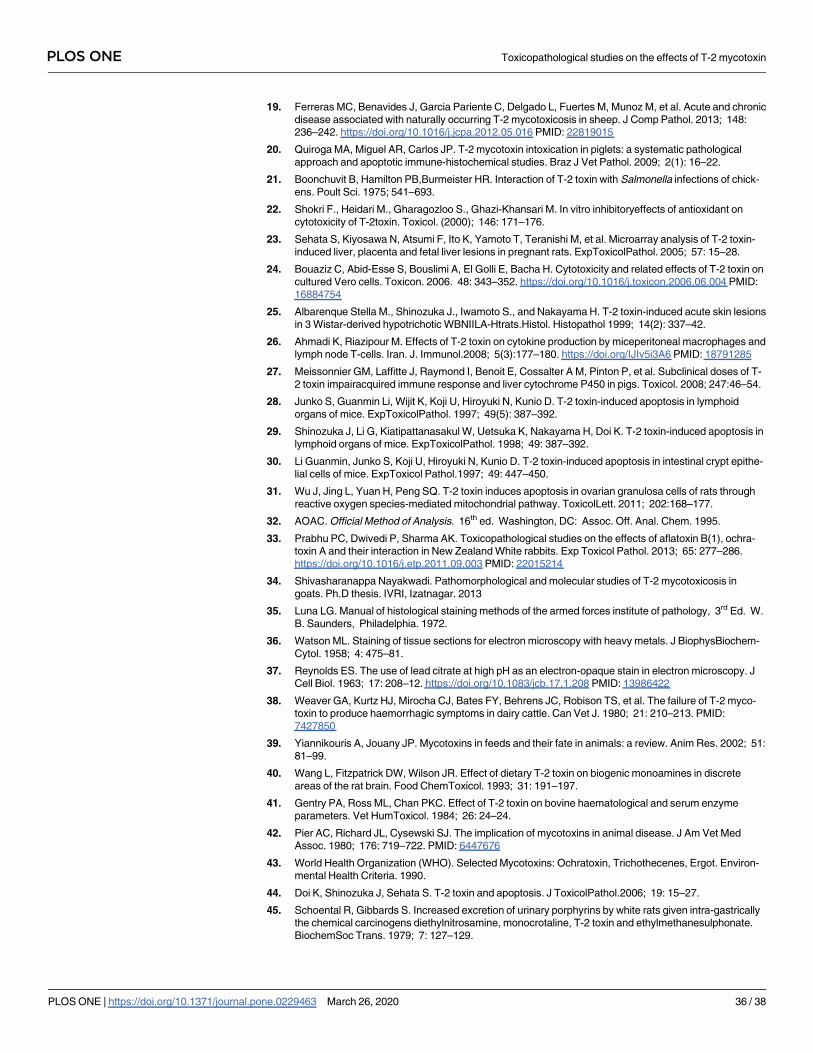
19. Ferreras MC, Benavides J, Garcia Pariente C, Delgado L, Fuertes M, Munoz M, et al. Acute and chronic
disease associated with naturally occurring T-2 mycotoxicosis in sheep. J Comp Pathol. 2013; 148:
236–242. https://doi.org/10.1016/j.jcpa.2012.05.016 PMID: 22819015
20. Quiroga MA, Miguel AR, Carlos JP. T-2 mycotoxin intoxication in piglets: a systematic pathological
approach and apoptotic immune-histochemical studies. Braz J Vet Pathol. 2009; 2(1): 16–22.
21. Boonchuvit B, Hamilton PB,Burmeister HR. Interaction of T-2 toxin with Salmonella infections of chick-
ens. Poult Sci. 1975; 541–693.
22. Shokri F., Heidari M., Gharagozloo S., Ghazi-Khansari M. In vitro inhibitoryeffects of antioxidant on
cytotoxicity of T-2toxin. Toxicol. (2000); 146: 171–176.
23. Sehata S, Kiyosawa N, Atsumi F, Ito K, Yamoto T, Teranishi M, et al. Microarray analysis of T-2 toxin-
induced liver, placenta and fetal liver lesions in pregnant rats. ExpToxicolPathol. 2005; 57: 15–28.
24. Bouaziz C, Abid-Esse S, Bouslimi A, El Golli E, Bacha H. Cytotoxicity and related effects of T-2 toxin on
cultured Vero cells. Toxicon. 2006. 48: 343–352. https://doi.org/10.1016/j.toxicon.2006.06.004 PMID:
16884754
25. Albarenque Stella M., Shinozuka J., Iwamoto S., and Nakayama H. T-2 toxin-induced acute skin lesions
in 3 Wistar-derived hypotrichotic WBNIILA-Htrats.Histol. Histopathol 1999; 14(2): 337–42.
26. Ahmadi K, Riazipour M. Effects of T-2 toxin on cytokine production by miceperitoneal macrophages and
lymph node T-cells. Iran. J. Immunol.2008; 5(3):177–180. https://doi.org/IJIv5i3A6 PMID: 18791285
27. Meissonnier GM, Laffitte J, Raymond I, Benoit E, Cossalter A M, Pinton P, et al. Subclinical doses of T-
2 toxin impairacquired immune response and liver cytochrome P450 in pigs. Toxicol. 2008; 247:46–54.
28. Junko S, Guanmin Li, Wijit K, Koji U, Hiroyuki N, Kunio D. T-2 toxin-induced apoptosis in lymphoid
organs of mice. ExpToxicolPathol. 1997; 49(5): 387–392.
29. Shinozuka J, Li G, Kiatipattanasakul W, Uetsuka K, Nakayama H, Doi K. T-2 toxin-induced apoptosis in
lymphoid organs of mice. ExpToxicolPathol. 1998; 49: 387–392.
30. Li Guanmin, Junko S, Koji U, Hiroyuki N, Kunio D. T-2 toxin-induced apoptosis in intestinal crypt epithe-
lial cells of mice. ExpToxicol Pathol.1997; 49: 447–450.
31. Wu J, Jing L, Yuan H, Peng SQ. T-2 toxin induces apoptosis in ovarian granulosa cells of rats through
reactive oxygen species-mediated mitochondrial pathway. ToxicolLett. 2011; 202:168–177.
32. AOAC. Official Method of Analysis. 16th ed. Washington, DC: Assoc. Off. Anal. Chem. 1995.
33. Prabhu PC, Dwivedi P, Sharma AK. Toxicopathological studies on the effects of aflatoxin B(1), ochra-
toxin A and their interaction in New Zealand White rabbits. Exp Toxicol Pathol. 2013; 65: 277–286.
https://doi.org/10.1016/j.etp.2011.09.003 PMID: 22015214
34. Shivasharanappa Nayakwadi. Pathomorphological and molecular studies of T-2 mycotoxicosis in
goats. Ph.D thesis. IVRI, Izatnagar. 2013
35. Luna LG. Manual of histological staining methods of the armed forces institute of pathology, 3rd Ed. W.
B. Saunders, Philadelphia. 1972.
36. Watson ML. Staining of tissue sections for electron microscopy with heavy metals. J BiophysBiochem-
Cytol. 1958; 4: 475–81.
37. Reynolds ES. The use of lead citrate at high pH as an electron-opaque stain in electron microscopy. J
Cell Biol. 1963; 17: 208–12. https://doi.org/10.1083/jcb.17.1.208 PMID: 13986422
38. Weaver GA, Kurtz HJ, Mirocha CJ, Bates FY, Behrens JC, Robison TS, et al. The failure of T-2 myco-
toxin to produce haemorrhagic symptoms in dairy cattle. Can Vet J. 1980; 21: 210–213. PMID:
7427850
39. Yiannikouris A, Jouany JP. Mycotoxins in feeds and their fate in animals: a review. Anim Res. 2002; 51:
81–99.
40. Wang L, Fitzpatrick DW, Wilson JR. Effect of dietary T-2 toxin on biogenic monoamines in discrete
areas of the rat brain. Food ChemToxicol. 1993; 31: 191–197.
41. Gentry PA, Ross ML, Chan PKC. Effect of T-2 toxin on bovine haematological and serum enzyme
parameters. Vet HumToxicol. 1984; 26: 24–24.
42. Pier AC, Richard JL, Cysewski SJ. The implication of mycotoxins in animal disease. J Am Vet Med
Assoc. 1980; 176: 719–722. PMID: 6447676
43. World Health Organization (WHO). Selected Mycotoxins: Ochratoxin, Trichothecenes, Ergot. Environ-
mental Health Criteria. 1990.
44. Doi K, Shinozuka J, Sehata S. T-2 toxin and apoptosis. J ToxicolPathol.2006; 19: 15–27.
45. Schoental R, Gibbards S. Increased excretion of urinary porphyrins by white rats given intra-gastrically
the chemical carcinogens diethylnitrosamine, monocrotaline, T-2 toxin and ethylmethanesulphonate.
BiochemSoc Trans. 1979; 7: 127–129.
PLOS ONE Toxicopathological studies on the effects of T-2 mycotoxin
PLOS ONE | https://doi.org/10.1371/journal.pone.0229463 March 26, 2020 36 / 38

46. Faifer GC, Godoy HM. Acute effect of T-2 toxin on radioactive iron incorporation into circulating erythro-
cytes in mice. Toxicol.1991; 5: 169–174.
47. Gentry PA, Cooper ML. Effect of Fusarium T-2 toxin on haematological and biochemical parameters in
the rabbit. Can J Comp Med. 1981; 45: 400–405. PMID: 7337872
48. EC (European commission). Opinion of the Scientific Committee on Food on Fusarium-toxins Part 5: T-
2toxin and HT-2 toxin. 2001.
49. Schuster A, Hunder G, Fichtl B, Forth W. Role of lipid peroxidation in the toxicity of T-2 toxin. Toxi-
con.1987; 25 (12): 1321–1328. https://doi.org/10.1016/0041-0101(87)90010-9 PMID: 3438921
50. Segal R, Milo Goldzweig I, Joffe AZ, Yagen B. The hemolytic activity of T2 toxin. ToxicolApplPharmacol.
1983; 70: 343–348.
51. Chaudhari M, Jayaraj R, Bhaskar ASB, Rao PVL. Oxidative stress inductionby T-2 toxin causes DNA
damage and triggers apoptosis via caspase pathway inhuman cervical cancer cells. Toxicol. 2009a;
262: 153–161.
52. Chaudhari M, Jayaraj R, Santhosh SR. Rao PVL. Oxidative damage andgene expression profile of anti-
oxidant enzymes after T-2 toxin exposure in mice. JBiochemMolToxicol. 2009b; 23: 212–221.
53. Rocha O, Ansari K, Doohan FM. Effects of trichothecenesmycotoxins on eukaryotic cells: a review.
Food AdditContam. 2005; 22: 369–378.
54. Atroshi FE, Rizzo A, Biese I, Veijalainen P, Antila E, Westermarck T. T-2 toxin-induced DNA damage in
mouse livers: The effect of pre-treatment with coenzyme Q and α-tocopherol. Mol Aspects Med. 1997;
18 (1): 255–258.
55. Sachin RS. Experimental reproductive toxicity and teratogenicity of t-2 toxin in Wistar rats with its effect
on offsprings up to f-2 generation. Ph.D thesis. IVRI, Izatnagar. 2012.
56. Obremski K, Zielonka L, Gajecka M, Jakimiuk E, Bakula T, Baranowski M, et al. Histological estimation
of the small intestine wall after administration of feed containing deoxynivalenol, T-2 toxin and zearale-
none in the pig. Pol J Vet Sci. 2008; 11:339–345. PMID: 19227132
57. Konigs M, Mulac D, Schwerdt G, Gekle M, Humpf HU. Metabolism and cytotoxic effects of T-2 toxin and
its metabolites on human cells in primary culture. Toxicol. 2009; 258: 106–115.
58. Wu Q, Dohnal V, Huang L, Kuca K, Yuan Z. Metabolic pathways of trichothecenes. Drug Metab Rev.
2010; 42: 250–267. https://doi.org/10.1080/03602530903125807 PMID: 19678805
59. Boyd KE, Fitzpatrick DW, Wilson JR, Wilson LM. Effect of T-2 toxin on brain biogenic monoamines in
rats and chickens. Can J Vet Res. 1988; 52: 181–185. PMID: 2453262
60. Wang J., Fitzpatrick D.W. and Wilson J.R. Effect of T-2 toxin on blood-brain barrier permeability mono-
amine oxidase activity and protein synthesis in rats.Food Chem. Toxicol.1998; 36: 955–961. https://doi.
org/10.1016/s0278-6915(98)00079-9 PMID: 9771558
61. Manojkumar. Toxicopathology of simultaneous feeding of ochratoxin A and citrinin in rabbits. M.V.Sc,
IVRI, Deemed University. 2007.
62. Prasanna K. Molecular Pathology of ochratoxicosis in rats and detection of the toxin by enzyme-linked
immunosorbent assay. Ph.D. thesis, submitted to Deemed University, IVRI, Izatnagar, U.P., India.
2003
63. Dwivedi P, Burns RB, Maxwell MH. Ultrastructural study of the liver and kidney in ochratoxicosis A in
young broiler chicks. Res Vet Sci. 1984; 36: 104–116. PMID: 6709970
64. Yang GH, Jarvis BB, Chung YJ, Pestka JJ. Apoptosis induction by satratoxins and other trichothecene-
mycotoxins: Relationship to ERK, p38 MAPK, and SAPK/JNK activation. ToxicolApplPharmacol. 2000;
164: 149–160.
65. Shifrin VI, Anderson P. Trichothecenemycotoxins trigger aribotoxic stress response that activates c-Jun
N-terminal kinase and p38mitogen-activated protein kinase and induces apoptosis. J Biol Chem.1999;
274: 13985–13992. https://doi.org/10.1074/jbc.274.20.13985 PMID: 10318810
66. Li G, Shinozuka J, Uetsuka K, Nakayama H, Doi K. T-2 toxin-induced apoptosis in Peyer’s patches of
mice. J ToxicolPathol.1997; 10: 59–61.
67. Sehata S, Kiyosawa N, Atsumi F, Ito K, Yamoto T, Teranishi M, et al. Morphological and microarray
analysis of T-2 toxin-induced rat fetal brain lesion. Food ChemToxicol. 2004; 42: 1727–1736.
68. Li G, Shinozuka J, Uetsuka K, Nakayama H, Doi K. T-2 toxin-induced apoptosis in intestinal crypt epi-
thelial cells of mice. ExpToxicolPathol. 1997; 49: 447–450.
69. Nagata T, Suzuki H, Ishigami N, Shinozuka J, Uetsuka K, Nakayama H, et al. Development of apoptosis
and changes in lymphocyte subsets in thymus, mesenteric lymph nodes and Peyer’s patches of mice
orally inoculated with T-2 toxin. ExpToxicolPathol. 2001; 53(4): 309–315.
70. Mates JM. Effects of antioxidant enzymes in the molecular control of reactive oxygen species toxicol-
ogy. Toxicol. 2000; 153(1–3): 83–104.
PLOS ONE Toxicopathological studies on the effects of T-2 mycotoxin
PLOS ONE | https://doi.org/10.1371/journal.pone.0229463 March 26, 2020 37 / 38

71. Glavits R, Vanyi A, Fekete S, Tamas J. Acute toxicologicalexperiment of T-2 toxin in rabbits. Acta
VetHung. 1989; 37: 75–79.
72. Hartl FU. Molecular chaperones in cellular protein folding. Nature. 1996; 381:571–579. https://doi.org/
10.1038/381571a0 PMID: 8637592
73. Polla BS, Kantengwa S, Francois D. Mitochondria are selective targets forthe protective effects of heat
shock against oxidative injury. Proc. Natl. Acad. Sci.U.S.A. 1996; 93: 6458–6463. https://doi.org/10.
1073/pnas.93.13.6458 PMID: 8692837
74. Hassen W, El Golli E, Baudrimont I, Mobio TA, Ladjimi M, Creppy EE, et al. Cytotoxicity and HSP-70
induction in Hep G2 cells in response to Zearalenone and cytoprotection by sub-lethal heat shock. Toxi-
cology. 2005; 207: 293–301. https://doi.org/10.1016/j.tox.2004.10.001 PMID: 15596259
75. Nagase M, Alam MM, Tsushima A, Yoshizawa T, Sakato N. Apoptosis induction by T-2 toxin: activation
of caspase9,caspase-3, and DFF-40/CAD through cytosolic release ofcytochrome c in HL-60 cells.
Biosci. Biotechnol. Biochem.2001; 65: 1741–1747. https://doi.org/10.1271/bbb.65.1741 PMID:
11577712
76. Nagase M, Shiota T, Tsushima A, Murshedul AM, Fukuoka S, Yoshizawa T, et al. Molecular mecha-
nism ofsatratoxin-induced apoptosis in HL-60 cells: activation of caspase8and caspase-9 is involved in
activation of caspase-3. Immunol.Lett.2002; 84: 23–27. https://doi.org/10.1016/s0165-2478(02)00127-
x PMID: 12161280
77. Wang GY, Zhang JW, Lu QH, Xu RZ, Dong QH. Berbamine induces apoptosis in human hepatoma cell
line SMMC7721 by loss in mitochondrial transmembranepotentialand caspase activation.J.ZhejiangU-
niv.Sci. 2007; 8(4):248–255.
78. Pestka JJ, Zhou HR, Moon Y, Chung YJ. Cellular and molecular mechanisms for immune modulation
by deoxynivalenol and other trichothecenes: unraveling a paradox. ToxicolLett. 2004; 153(1): 61–73.
79. Wong SS, Zhou HR, Marin-Martinez ML, Brooks K, Pestka JJ. Modulation of IL-1beta, IL-6 and TNF-
alpha secretion and mRNA expression by the trichothecenevomitoxin in the RAW 264.7 murine macro-
phage cell line. Food ChemToxicol. 1998; 36(5): 409–419.
80. Pestka JJ, Zhou H. Toll-like receptor priming sensitizes macrophages to pro inflammatory cytokine
gene induction by deoxynivalenol and other toxicants. Toxicological Sciences. 2006; 92(2): 445–455
https://doi.org/10.1093/toxsci/kfl012 PMID: 16687389
81. Pestka JJ. Mechanisms of deoxynivalenol-induced gene expression and apoptosis.FoodAdditContam
Part AChem Anal Control Expo Risk Assess. 2008; 25(9): 1128–1140.
82. Vandenbroucke V, Croubels S, Martel A, Verbrugghe E, Goossens J, Van Deun K, et al. The mycotoxin
deoxynivalenol potentiates intestinal inflammation by Salmonella typhimurium in porcine ileal loops.
PLoS One. 2011; 6: e23871. https://doi.org/10.1371/journal.pone.0023871 PMID: 21909370
PLOS ONE Toxicopathological studies on the effects of T-2 mycotoxin
PLOS ONE | https://doi.org/10.1371/journal.pone.0229463 March 26, 2020 38 / 38