literatura e heavy metal: uma análise do diálogo presente ...
Upload
khangminh22Category
view
3download
0
96
Lakes, reservoirs and ponds, vol. 8(2):96-110, 2014 ©Romanian Limnogeographical Association
HEAVY METAL CONTAMINATION OF WATER IN NEGOMBO LAGOON AND INTERCONNECTED WATER
SOURCES
C.M. Kanchana.N.K.CHANDRASEKARA1,4, K.D.N. WEERASINGHE2, Sumith PATHIRANA3 , Ranjana U.K. PIYADASA1
1Department of Geography, University of Colombo, Colombo-03, postal code 1490, phone 0094772947002, Sri Lanka.
2Department of Agricultural Engineering, Faculty of Agriculture, University of Ruhuna, Mapalana, Kamburupitiya, Sri Lanka
3Department of Biological and Environmental Sciences, Qatar University, Qatar. 4 School of Environment, Science and Engineering, Southern Cross University, Australia
(Visiting student), Email [email protected]
Abstract Water quality in natural lagoons that are located within close proximity to human settlements is generally at contamination risk due to increasing anthropogenic activities. The Negombo lagoon situated in the Gampaha District in Sri Lanka is a lagoonal estuary. It receives surface water runoff mainly from Dandugamoya, Ja-ela, Hamilton and Dutch canals. During the recent past, it has been noted by several researches that there is increasing evidence in anthropogenic activities in Negombo lagoon and surrounding areas. The present study was carried out to assess the contamination levels of heavy metals of water in the Negombo lagoon and interconnected water sources. Sampling was carried out in 19 locations; 6 in the Negombo lagoon and 13 from the interconnected sources (5 samples from Hamilton canal, 2 samples each from Dutch canal, Dandugamoya and Ja-Ela and one sample each from Kelani estuary and Ocean-Negombo). The data collection was conducted during relatively wet (May) and relatively dry (September) months in 2013. Water samples were analysed in the laboratory as per the standards methods of American Public Health Association (APHA manual) by using the Atomic Absorption Spectrophotometer. The tests were carried out to detect heavy metals: cadmium (Cd), chromium (Cr), copper (Cu), Lead (Pb), manganese (Mn), and zinc (Zn) in water. Data analysis was accomplished using ArcGIS (version 9.3) software package along with Microsoft Excel. Standards for inland water and drinking water of Sri Lanka were used to determine the threshold levels of heavy metals. The results show that concentrations of Cr, Cu, Mn and Zn of all water bodies were below the threshold level of human consumption and quality standards for inland waters in Sri Lanka. The Cd and Pb levels of water in Negombo lagoon and Hamilton canal were comparatively high. Furthermore the Cd and Pb levels of Dandugamoya, Ja-ela and Dutch canals were below

97
the maximum permissible levels in both relatively wet and relatively dry periods. Concentration of Cd and Pb in Negombo lagoon and Hamilton canal showed seasonal oscillation with the rainfall. Both the parameters demonstrate a negative relationship with precipitation. Comparatively a high Cd and Pb concentrations was observed during the dry period. In conclusion, the Cd and Pb levels were high in the lagoon and Hamilton canal while the concentration of Cd and Pb were below the threshold level in Dandugamoya, Ja-ela and Dutch canal waters. The findings were important as the study indicates the spatial and seasonal variations of presence of heavy metals in the lagoonal water and which probably links to anthropogenic activities. Keywords: Heavy metals, water quality, lagoon, anthropogenic influence, Sri Lanka
1. INTRODUCTION
Estuaries receive different types of contaminants due to anthropogenic
influences from both point and non-point sources. Among them, heavy
metal contamination in aquatic systems has received considerable attention
due to their toxicity, durability and their special depositional properties (Li
Xiangdong et al., 2000, Loska & Wiechuła, 2003 and Liang et al, 2004),
Toxic metals include mercury (Hg), lead (Pb), cadmium (Cd), chromium
(Cr), and copper (Cu) (EPA, 2006). Sources of toxic substances comprise
surface water from municipal and industrial discharges, runoff (e.g., from
lawns, streets, and farmlands), atmospheric deposition and geological
weathering or agricultural, residential waste products (Cheung et al, 2003
and EPA, 2006, Demirak et al., 2006). Heavy metals can be effectively
accumulated in plants and animals, transferred to human bodies by food
chains and their levels can be increased by biological enrichment. Hg, Cr,
Cd, Cu and Pb in environmental water system may pose high toxicities on
the aquatic organisms, (Zhou et al, 2008). Agusa et al (2007) emphasized
large emission and contaminations of trace elements are of concern at
present in Asian developing countries because of the rapid economic growth
and increasing population in recent years.
Contamination of heavy metals in estuaries, lakes, rivers and coastal
waters are prominent in the present world and number of evidences can be
highlighted as examples from different parts of the world. For example
concentrations of Pb, Zn and Cu are elevated in the sediments of the Pearl
River estuary in South China compared with their national background
levels (Li Xiangdong et al, 2000). The Ria of Huelva, in South-western
Spain, has been identified as one of the most heavy metal contaminated
estuaries in the world (Sainz et al, 2003 and Vicente-Martorell et al 2009).

98
Another study on Ganga plain in Uttar Pradesh in India found that the
impact of anthropogenic agents of heavy metals in its soils was very high.
The high contamination was due to random dumping of hazardous waste
and free discharge of effluents by number of industries over the of years.
The results further indicated that the soil on the river plain is moderately
contaminated with Cu, considerably contaminated with Pb and Zn and
heavily contaminated with Cr (Gowd Srinivasa et al, 2010). Urbanization
and industrial growth have contributed to high accumulation of potentially
toxic heavy metals (Cd, Cu, Pb, and Zn) in surface sediments from 35 park
public lakes throughout Shanghai (Yang Jing et al, 2014). Therefore, more
studies are needed to explore the existing condition of estuaries in areas
where anthropogenic activities are high. Even though the effect of
anthropogenic activities on estuarine health is increasingly high in many
developing countries, there are only a few scientific researches available to
study on that. Negombo lagoon in Sri Lanka which is situated in an area
with immense anthropogenic pressure is one of such that suffers from
inappropriate land use and unsustainable activities in the surroundings.
Anthropogenic activities and the development of urban centres on both sides
of the Negombo Lagoon are prominent causes for this stress (Katupotha,
2012). The landless poor have reclaimed land for construction of
unauthorized dwellings (Conservation Management plan, 1994). This has
affected the hydraulic regime of the lagoon causing the problem of
increasing sedimentation. The establishment of an Industrial City in Ekala
and a Free Trade Zone in Katunayake may also have direct and indirect
impacts on the water quality of the Negombo lagoon (Conservation
Management plan, 1994 and Silva, 1996). In addition, large quantities of
solid and liquid waste are being dumped at various locations in the lagoon
resulting in degradation of aquatic environment (Hettiarachchi &
Samarawickrama, 2011). As a result, the water quality of Negombo lagoon
has deteriorated over the last few decades (Wijesekara & Kudahetti, 2011).
Most of the people in the Negombo area fulfil their potential requirements
using fishery resources in the Negombo estuary. However, insignificant
attention has been given to study heavy metal pollution in the estuary.
Hence, the necessity of the regular monitoring of heavy metal pollution in
Negombo estuary is timely important as there are multiple sources of heavy
metal contamination in the vicinity of the estuary (Indrajith et al., 2008).
Therefore the purpose of this study is to identify, measure and map the
spatial distribution of heavy metal contamination of water in Negombo
lagoon and interconnected water sources.

99
1.2 STUDY AREA
The study was conducted in the Negombo lagoon locates in the
Gampaha District of Sri Lanka (Figure 1). It is a highly dynamic estuarine
ecosystem that is regularly affected by tides and river flow. The lagoon is a
part of a unique hydrological system which includes the Muthurawajawela
marsh, Attanagalu oya, Hamilton and Dutch canals and adjacent coastal
belt. Extent of the lagoon is about 3200 hectare and is connected to the
Indian Ocean by narrow canals to the north, near Negombo town
(Environmental Profile, 1991). The lagoon is approximately 12.5 km in
length (Hettiarachchi & Samarawickrama, 2011). The width of the lagoon is
about 3-4km. Tidal waves from the Ocean flow into the lagoon twice a day
(Conservation management plan, 1994). Fresh water enters from the
southern end of the lagoon through the Dandugam oya, Ja-Ela (Attanagalu
oya) and several streams from Muthurajawela marsh (Environmental
profile, 1991, Hettiarachchi & Samarawickrama, 2011)
Figure 1: Location of the Negombo lagoon and inter connected water sources

100
2. METHODOLOGY
Sampling was carried out in 19 locations from the Negombo lagoon,
Dandugamoya, Ja-Ela Hamilton, Dutch canal, Kelani estuary and Ocean at
the outlet of the Negombo estuary. Details of the sampling sites are
presented in Figure-1 and Table-1. Locations of the sampling sites were
identified using a ‘Magellan eXplorist 610 handheld’ GPS (Global
Positioning Systems) receiver. The sampling was conducted during
relatively wet (May) and relatively dry (September) periods in 2013 during
low tide. A standard Ruttner water sampler was used to collect undisturbed
water samples and add analytical grade HNO3 to keep pH<2. The tests were
carried out to detect heavy metals: cadmium (Cd), chromium (Cr), copper
(Cu), lead (Pb), manganese (Mn), and zinc (Zn) in the water. Water samples
were analysed in the laboratory as per the standards methods of American
Public Health Association (APHA) manual: 20th Edition by using the
Atomic Absorption Spectrophotometer (AA 6300, Shimadzu).
Table-1: Details of samples
Toxic metal and organic pollutants are found in low concentrations
in water on the order of parts-per-billion (ppb) and parts-per-trillion levels
(ppt) (EPA, 2006) and results of the concentrations of heavy metals were
measured in ppb. Proposed Ambient water quality standards for inland
waters (Central Environmental Authority-CEA, 2001) were used to
determine the threshold levels of heavy metals.
A pilot survey was carried out to identify the crucially impacted
heavy metals in December 2012 and May 2013. The heavy metal analyses
were repeated in September 2013 only for the above parameters which
Water source Name of the
samples No of
samples
Dandugam oya DN1-DN2 2
Dutch Canal D1-D2 2
Hamilton canal H1-H5 5
Ja-ela J1-J2 2
Kelani river outlet K1 1
Negombo lagoon L1-L6 6
Ocean-Negombo outlet
O1 1
Total 19
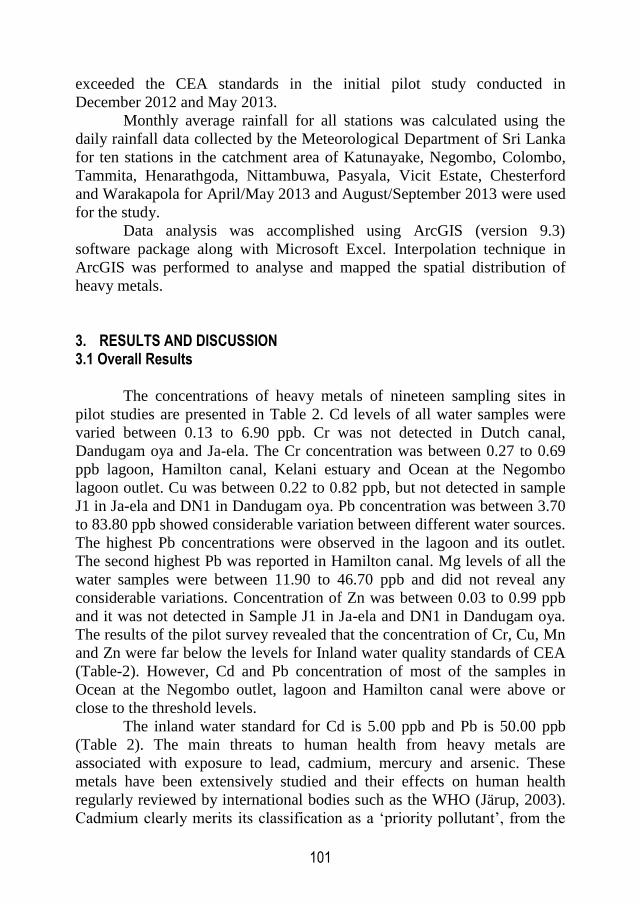
101
exceeded the CEA standards in the initial pilot study conducted in
December 2012 and May 2013.
Monthly average rainfall for all stations was calculated using the
daily rainfall data collected by the Meteorological Department of Sri Lanka
for ten stations in the catchment area of Katunayake, Negombo, Colombo,
Tammita, Henarathgoda, Nittambuwa, Pasyala, Vicit Estate, Chesterford
and Warakapola for April/May 2013 and August/September 2013 were used
for the study.
Data analysis was accomplished using ArcGIS (version 9.3)
software package along with Microsoft Excel. Interpolation technique in
ArcGIS was performed to analyse and mapped the spatial distribution of
heavy metals.
3. RESULTS AND DISCUSSION 3.1 Overall Results
The concentrations of heavy metals of nineteen sampling sites in
pilot studies are presented in Table 2. Cd levels of all water samples were
varied between 0.13 to 6.90 ppb. Cr was not detected in Dutch canal,
Dandugam oya and Ja-ela. The Cr concentration was between 0.27 to 0.69
ppb lagoon, Hamilton canal, Kelani estuary and Ocean at the Negombo
lagoon outlet. Cu was between 0.22 to 0.82 ppb, but not detected in sample
J1 in Ja-ela and DN1 in Dandugam oya. Pb concentration was between 3.70
to 83.80 ppb showed considerable variation between different water sources.
The highest Pb concentrations were observed in the lagoon and its outlet.
The second highest Pb was reported in Hamilton canal. Mg levels of all the
water samples were between 11.90 to 46.70 ppb and did not reveal any
considerable variations. Concentration of Zn was between 0.03 to 0.99 ppb
and it was not detected in Sample J1 in Ja-ela and DN1 in Dandugam oya.
The results of the pilot survey revealed that the concentration of Cr, Cu, Mn
and Zn were far below the levels for Inland water quality standards of CEA
(Table-2). However, Cd and Pb concentration of most of the samples in
Ocean at the Negombo outlet, lagoon and Hamilton canal were above or
close to the threshold levels.
The inland water standard for Cd is 5.00 ppb and Pb is 50.00 ppb
(Table 2). The main threats to human health from heavy metals are
associated with exposure to lead, cadmium, mercury and arsenic. These
metals have been extensively studied and their effects on human health
regularly reviewed by international bodies such as the WHO (Järup, 2003).
Cadmium clearly merits its classification as a ‘priority pollutant’, from the

102
human health perspective and broader ecosystem viewpoint (Campbell &
Peter, 2006). Cadmium has been identified as a significant pollutant
considering its high toxicity and high solubility in water (Das et al., 1997).
Therefore, a repeat analysis was carried out to identify the dynamics
and spatial variation of Cd and Pb during relatively a dry period in
September 2013. May was considered as relatively a wet month as the
average of all ten weather stations was 303.15mm and September was
considered as relatively a dry month as the average rainfall was 125.89mm.
Table 2: Concentration of heavy metals of pilot survey in December 2012 and May 2013
Name of the sample
Heavy metal types and concentrations (ppb)
Cadmium (Cd)
Chromium (Cr)
Copper (Cu)
Lead (Pb)
Manganese (Mn)
Zinc (Zn)
O1 3.70 0.69 0.24 83.80 22.50 0.91
L1 4.80 0.48 0.71 41.30 20.30 0.62
L2 4.60 0.61 0.23 51.40 21.30 0.83
L3 2.50 0.55 0.76 44.50 46.70 0.54
L4 6.90 0.49 0.74 45.80 26.40 0.51
L5 2.80 0.38 0.82 37.30 42.10 0.31
L6 4.30 0.27 0.44 48.20 17.10 0.47
K1 0.13 0.27 0.29 10.80 13.00 0.11
H1 0.16 0.32 0.46 4.80 25.00 0.54
H2 0.99 0.29 0.28 30.60 27.80 0.32
H3 1.50 0.34 0.33 36.50 21.20 0.25
H4 1.89 0.52 0.22 15.00 22.50 0.35
H5 0.18 0.28 0.65 3.70 16.10 0.33
D1 0.85 ND 0.24 4.70 20.90 0.06
D2 0.13 ND 0.52 6.30 17.40 0.99
J1 0.15 ND ND 4.40 19.30 ND
J2 0.47 ND 0.80 22.00 11.90 0.05
DN1 0.15 ND ND 16.30 11.50 ND
DN2 0.52 ND 0.38 10.10 16.30 0.03
Thresholds levels for Inland water
quality standards (ppb)
5.00 50.00 100.00 50.00 1000.00 1000.00
Detection limit (Furnace -ppb)
0.02 0.25 0.10 0.25 0.03 0.02
*ND – Not Detected

103
3.2 Cadmium and Lead
Concentrations of Cd and Pb in all 19 samples for both May and
September 2013 are shown in the Figure 2 and 3. Water in lagoon,
Hamilton canal and the Ocean close to the Negombo outlet showed high Cd
and Pb levels while other sources recorded low Cd and Pb concentrations
(Table 2, Figure 2 and 3).
Figure 2 : Concentration of Cadmium (Cd)
Figure 3 : Concentration of Lead (Pb)
Deviation of the concentration levels of Cd and Pb from the inland
water standards in May and September are revealed in figure 4, 5, 6 and 7.
Cd concentration of the sample L4 (6.90 ppb) in the East end of the lagoon
was exceeding the threshold level (5.00 ppb) of the inland water standard
during relatively wet period in May.

104
Figure 4 : Deviation of Cd concentration from standard water quality level in May 2013
Figure 5 : Deviation of Cd concentration from standard water quality level in September 2013
Figure 6 : Deviation of Pb concentration from standard water quality level in May 2013

105
Figure 7 : Deviation of Pb concentration from standard water quality level in September 2013
Three samples namely L2, L4 and L5 taken during relatively dry
season of September were 5.01 ppb, 5.54 ppb and 5.08 ppb respectively and
were exceeding the standard threshold level (Figure 2, 4 and 5).
Results revealed that there are spatial and seasonal variations of Cd
levels. Spatially the highest Cd levels were recorded in the Northern and
Eastern regions of the lagoon during the wet period (Figure 8A). However,
the highest Cd levels were observed in Southern and Eastern region during
the dry period (Figure 8B). Therefore, seasonal variations can be observed
in the spatial distribution of Cd. Concentration of Cd in Eastern half of the
lagoon remained constant while the concentration of Cd in Northern and
Southern regions fluctuated with the rainfall changes. Cd level of the lagoon
was associated with the freshwater flow and the annual rainfall pattern
during the wet period in May. Therefore, the concentrations of Cd in the wet
period of the Southern and Western segments of the lagoon are
comparatively low due to fresh water influence from Dandugam oya and Ja-
ela (Figure 8A). During the dry period, the influence of the sea is prominent
and the concentration of Cd in water pushed towards the lagoon inlet
(Figure 8B). Indrajith et al, 2008 reported that the Cd levels of lagoon water
varied between 0.60 – 2.10µgL-1 (ppb) according to their study in 2003.
However, the present study identified an increasing trend of Cd levels in
lagoon water with ranges of 2.50 – 6.90 ppb and 1.53 – 5.53 ppb in dry and
wet periods respectively (Figure 2).
Source: Field survey, 2012

106
Figure 8: Spatial variation of Cadmium in lagoon water
Cd concentration of Hamilton canal was low during the wet period
in May. It was above the inland water quality standards (5.84 ppb) in sample
H1 which is close to the Kelani estuary. Sample H3 also recorded 4.65 ppb
and it was also close to the threshold limit. Sample in the Kelani estuary
(K1) showed a low Cd concentration of 0.13 ppb during the wet period
while the same sample recorded 3.37 ppb during the dry period. Almost
similar conditions were observed in both wet and dry periods at the sample
located in Negombo outlet (O1). However, careful assessments are needed
to identify the temporal changes.
Concentrations of Pb in wet season of the lagoon were between
37.30 - 51.40 ppb. It was 50.50-89.20 ppb during the dry period (Figure 3).
The inland water standard for Pb is 50.00 ppb (Table-2). Only one sample
(L2) in the northern segment of the lagoon was exceeded the standard limit
of Pb during the wet period and rest of the samples were close to the
threshold limit (Figure 3 and 6). However, all the samples in the lagoon
exceeded the standard limit for Pb in the dry season (Figure 3 and 7).
According to Indrajith et al, 2008 the Pb levels of lagoon water varied
between 1.00 – 5.70 µgL-1 (ppb) according to their findings in 2003. Those
were below the inland water standards. The present study indicates that Pb
concentration of the lagoon water were exceeded the threshold limit of
inland water standards (Figure 3 and 7).
Spatially, high Pb concentrations were observed in Eastern half and
Northern tip of the lagoon in wet period (Figure 9 A) which agrees with the
findings of Indrajith et al, 2008. The highest Pb levels 65 -90 ppb were
A B

107
identified in North West and South East region of the lagoon (Figure 9 B).
North region is being polluted due to various anthropogenic activities such
as solid waste dumping, waste from industries, slaughter houses, shrimp
farms and hatcheries and boat yards. Due to discharge of burned and
unburned fuel from motor boats, the estuarine water is contains high level of
Pb. East region receives effluents from mainly Katunayake industrial
processing zone, hotels and a housing scheme (Indrajith et al, 2008).
Figure 9: Spatial variation of Lead in lagoon water
.
Pb concentrations of Hamilton canal, Kelani estuary and Ja-ela have
seasonal variation with the rainfall pattern (Figure 3). Pb levels were low
during the wet period; however sample H2 and H3 showed relatively high
concentration in May. Levels of Pb in H1 and H3 exceeded the standard
limit while H2 remained close to the threshold limit. The samples located in
Kelani estuary recorded low concentration (10.8ppb) of Pb in the wet period
and the same sample showed comparatively high concentration (41.40 ppb)
in dry period. One sample in Ja-ela close to the lagoon (J2) recorded 22 ppb
in wet period while it was 35.80 ppb in dry period. Silva, 1996 has been
reported that most of the effluent originating from Ekala trade processing
zone which is not properly treated discharges directly or indirectly into
Dandugam oya and Ja-ela. It was observed almost similar condition of Pb in
both wet and dry periods at the sample O1 located in the Ocean Negombo
outlet (Figure 3, 6 and 7). The concentrations were comparatively high.
A B

108
4. CONCLUSIONS
Concentrations of Cr, Cu, Mn and Zn of all water bodies connected
to Negombo lagoon are in accepted levels for human consumption
according to inland water quality standards for Sri Lanka. Nevertheless, Cd
and Pb levels of water in Negombo lagoon as well as Hamilton canal are
comparatively high with elevated Cd concentration in eastern half of the
lagoon and a relatively low level in western part. . The elevated Cd level in
the Northern quarter during the dry period can be attributed to the oceanic
influence, while during the wet period due to freshwater influence of
Dandugam oya and Ja-ela can be attributed to the southern quarter.
Analogically, Pb levels of the entire lagoon water are increased
during the dry period and they were above the standard limits of the inland
water standards. Concentration of both Pb and Cd in Negombo lagoon and
Hamilton canal showed a negative relationship with rainfall while exhibiting
a seasonal oscillation with the rainfall. Cd and Pb concentration in the
Ocean at the Negombo outlet showed an analogical situation in both
relatively wet and relatively dry periods. However the Cd and Pb levels of
Dandugamoya, Ja-ela and Dutch canals were below the threshold levels in
both relatively wet and relatively dry periods.
REFERENCES Agusa T, Kunito T, Agus S, Monirith I, Kan-Atireklap S, Iwata H, Ismail A,
Sanguansin J, Muchtar M, Tana S.T. & Tanabe S. 2007, Exposure assessment
for trace elements from consumption of marine fish in Southeast Asia,
Environmental Pollution 145, 766-777, Science direct, Elsevier Ltd.
Campbell G. & Peter C. 2006, Cadmium—A Priority Pollutant, Research front-
essay, Environ. Chem, 3, 387–388, CSIRO publishing.
Central Environmental Authority-CEA. 2001, Proposed ambient water quality
standards for inland waters Sri Lanka.
Cheung K.C., Poon B.H.T., Lan C.Y. & M.H. Wong. 2003, Assessment of metal
and nutrient concentrations in river water and sediment collected from the cities
in the Pearl River Delta, South China, Chemosphere, 52, 1431–1440, Science
direct, Elsevier Ltd.
Conservation management plan, Muthurajawela marsh and Negombo lagoon.
1994, Central environmental Authority (Sri Lanka) and Euroconsult (the
Netherlands)
Das P, Samantaray S. & Rout G.R. 1997, Studies on cadmium toxicity in plants: a
review, Environmental Pollution,98:1, 29-36, Elsevier Ltd.
109
Demirak A, Yilmaz F., Tuna A. L. & Ozdemir N. 2006, Heavy metals in water,
sediment and tissues of Leuciscus cephalus from a stream in southwestern
Turkey, Chemosphere, 52, 1451–1458.
Environmental profile of Muturajawela and Negombo lagoon. 1991, Grater
Colombo economic commission, EUROCONSULT, the Nethrlands.
Environmental Protection Agency (EPA). 2006, Voluntary estuary monitoring
manual, Chapter 12: Contaminants and toxic chemicals heavy metals,
Pesticides, PCBs, and PAHs http://www.epa.gov/owow/estuaries/monitor/,
20.04.2014
Gowd Srinivasa S., Reddy Ramakrishna M & Govil P.K. 2010, Assessment of
heavy metal contamination in soils at Jajmau (Kanpur) and Unnao industrial
areas of the Ganga Plain, Uttar Pradesh, India, Journal of Hazardous Materials,
174,113–121, Science directs, Elsevier Ltd.
Hettiarachchi S.S.L & Samarawickrama S.P. 2011, Environment management of
lagoons for sustaining multiple uses- case study Negombo lagoon, Engineer,
Journal of the institution of engineers, XXXIV(1), 43-55. Sri Lanka.
Indrajith H.A.P, Pathirane K.A.S & Pathirane A. 2008, Heavy metal levels in two
food species from Negombo estuary, Sri Lanka: Relationships with body size,
Journal of Sri Lanka Aquatic Science, 13,6 -81,Sri Lanka association of
fisheries and aquatic resources.
Järup L. 2003, Hazards of heavy metal contamination, British Medical Bulletin,
68,167–182, The British Council.
Li Xiangdong, Wai W.H. Onyx, Li Y.S., Coles J., Barry Ramsey H.M. & Thornton
I. 2000, Heavy metal distribution in sediment profiles of the Pearl River estuary,
South China, Applied Geochemistry, 15, 567-581, PERGAMON, Elsevier
Science Ltd.
Liang L.N., Hu J.T., Chen D.Y., Zhou Q.F, He B. & Jiang G.B. 2004, Primary
Investigation of Heavy Metal Contamination Status in Molluscs Collected from
Chinese Coastal Sites, Bull. Environ. Contam. Toxicol., 72, 937–944,Springer-
Verlag New York.
Loska K. & Wiechuła D. 2003, Application of principal component analysis for the
estimation of source of heavy metal contamination in surface sediments from
the Rybnik Reservoir, Chemosphere, 51, 723–733, Elsevier Ltd.
Sainz A., Grande J.A. & de la Torre M.L. 2004, Characterisation of heavy metal
discharge into the Ria of Huelva, Environment International, 30, 557– 566,
Science directs, Elsevier Ltd.
Silva E.I.L. 1996, Negombo lagoon, Water quality of Sri Lanka, a review on twelve
water bodies, 44-63. Institute of fundamental studies. Hantana road, Kandy, Sri
Lanka.
Vicente-Martorell Juan J, Galindo-Rian María D., García-Vargas M & Granado-
Castro María D. 2009, Bioavailability of heavy metals monitoring water,
sediments and fish species from a polluted estuary, Journal of Hazardous
Materials, 162, 823–836, Science directs, Elsevier Ltd.

110
Yang J., Meng Z.X., Duan P.Y., Liu Z.L., Chen L. & Cheng H. 2014, Spatial
distributions and sources of heavy metals in sediment from public park in
Shanghai, the Yangtze River Delta, Applied Geochemistry, 44, 54–60, Science
directs, Elsevier Ltd.
Zhou Q, Zhang J, Fu J, Shi Jianbo & Jiang G. 2008, Bio monitoring: An appealing
tool for assessment of metal pollution in the aquatic ecosystem, Analytica
chimica acta, 606, 135–150, Elsevier Ltd.
Katupotha J. 2012, Anthropogenic impacts on urban coastal lagoons in the
Western and North-western coastal zones of Sri Lanka, Proceeding of
international forestry and environment symposium, University of Sri
Jayawardhanapura, Sri Lanka. 58
Wijesekara R.S & Kudahetti C.W. 2011, Water quality study in the shallow aquifer
system of the Attanagalu oya basin, Proceedings of the workshop on challenges
in groundwater management in Sri Lanka, Ministry of Irrigation and water
resource management, water resource board and dam safety and water resources
planning project Colombo, Sri Lanka, 5-8.
Copyright © 2022 FDOKUMEN