Bioactive compound content, antioxidant activity, deoxynivalenol and heavy metal contamination of...
37
1 FOOD CHEMISTRY 2012; 135: 39-46 Bioactive compound content, antioxidant activity, deoxynivalenol and heavy metal contamination of pearled wheat fractions. Running title: Functional compounds and contaminants in pearled wheat fractions Authors: Valentina Sovrani a , Massimo Blandino a *, Valentina Scarpino a , Amedeo Reyneri a , Jean Daniel Coïsson b , Fabiano Travaglia b , Monica Locatelli b , Matteo Bordiga b , Rosa Montella b , Marco Arlorio b . Affiliation: a Dipartimento di Agronomia, Selvicoltura e Gestione del Territorio, Università di Torino, via Leonardo Da Vinci 44, 10095 Grugliasco (TO), Italy. b Dipartimento di Scienze del Farmaco, Università del Piemonte Orientale “A. Avogadro”, Largo Donegani 2, 28100, Novara (NO), Italy. * Corresponding author: Tel: +39-011-6708895; fax +39-011-6708798. E-mail address: [email protected] Keywords: wheat, pearling, antioxidant activity, bioactive compounds,
-
Upload
independent -
Category
Documents
-
view
1 -
download
0
Transcript of Bioactive compound content, antioxidant activity, deoxynivalenol and heavy metal contamination of...

1
FOOD CHEMISTRY 2012; 135: 39-46
Bioactive compound content, antioxidant activity,
deoxynivalenol and heavy metal contamination of
pearled wheat fractions.
Running title: Functional compounds and contaminants in pearled wheat
fractions
Authors: Valentina Sovrania, Massimo Blandinoa*, Valentina Scarpinoa, Amedeo
Reyneria, Jean Daniel Coïssonb, Fabiano Travagliab, Monica Locatellib, Matteo
Bordigab, Rosa Montellab, Marco Arloriob.
Affiliation:
a Dipartimento di Agronomia, Selvicoltura e Gestione del Territorio, Università di
Torino, via Leonardo Da Vinci 44, 10095 Grugliasco (TO), Italy.
b Dipartimento di Scienze del Farmaco, Università del Piemonte Orientale “A.
Avogadro”, Largo Donegani 2, 28100, Novara (NO), Italy.
* Corresponding author: Tel: +39-011-6708895; fax +39-011-6708798.
E-mail address: [email protected]
Keywords: wheat, pearling, antioxidant activity, bioactive compounds,

2
deoxynivalenol, heavy metals.
Abbreviations: Cd, cadmium; DF, dietary fibre; DON, deoxynivalenol; dw, dry
weight; FPA, free phenolic acids; Pb, lead; TAA, total antioxidant activity; TE,
trolox equivalents.
3
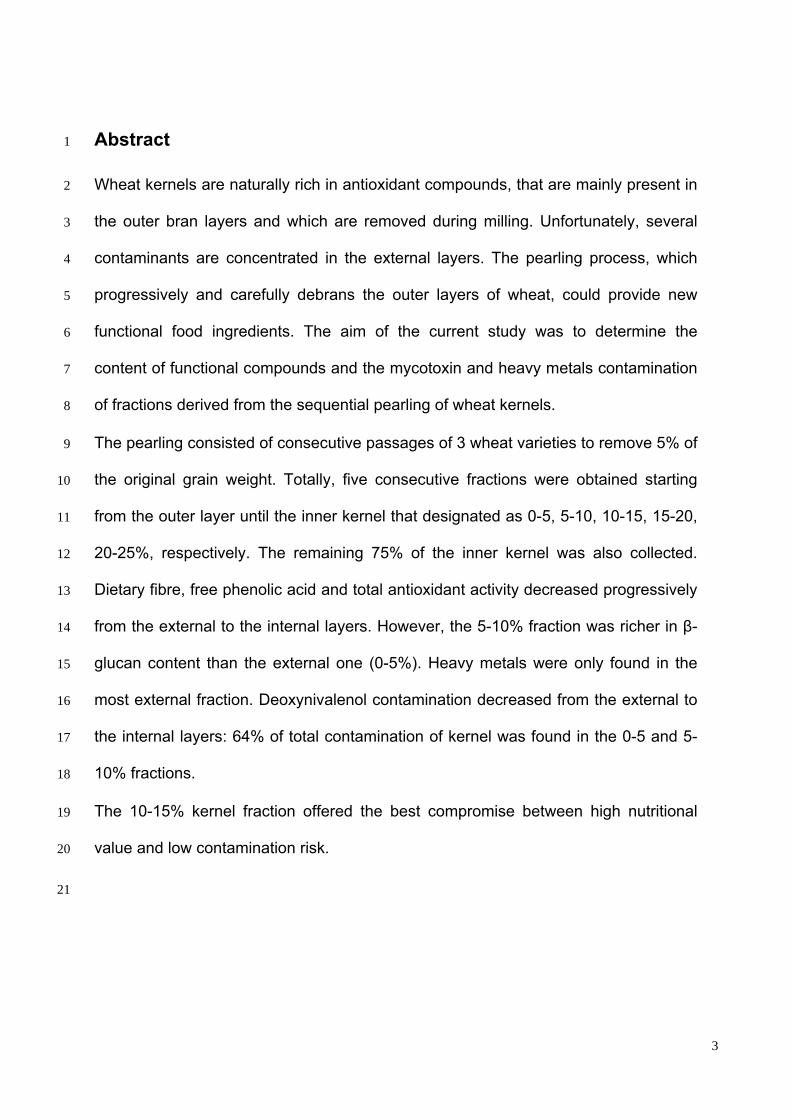
Abstract 1
Wheat kernels are naturally rich in antioxidant compounds, that are mainly present in 2
the outer bran layers and which are removed during milling. Unfortunately, several 3
contaminants are concentrated in the external layers. The pearling process, which 4
progressively and carefully debrans the outer layers of wheat, could provide new 5
functional food ingredients. The aim of the current study was to determine the 6
content of functional compounds and the mycotoxin and heavy metals contamination 7
of fractions derived from the sequential pearling of wheat kernels. 8
The pearling consisted of consecutive passages of 3 wheat varieties to remove 5% of 9
the original grain weight. Totally, five consecutive fractions were obtained starting 10
from the outer layer until the inner kernel that designated as 0-5, 5-10, 10-15, 15-20, 11
20-25%, respectively. The remaining 75% of the inner kernel was also collected. 12
Dietary fibre, free phenolic acid and total antioxidant activity decreased progressively 13
from the external to the internal layers. However, the 5-10% fraction was richer in β-14
glucan content than the external one (0-5%). Heavy metals were only found in the 15
most external fraction. Deoxynivalenol contamination decreased from the external to 16
the internal layers: 64% of total contamination of kernel was found in the 0-5 and 5-17
10% fractions. 18
The 10-15% kernel fraction offered the best compromise between high nutritional 19
value and low contamination risk. 20
21
4
1. Introduction 22
Increasing demands about healthier foods has intensified the interest of consumers 23
in phytonutrients (Liyana-Pathirana, Dexter & Shahidi, 2006). The addition of 24
antioxidants to food systems may increase the nutritional profile and the shelf life of 25
products, and thus reduce waste and nutritional loss by inhibiting and delaying 26
oxidation. Recently, much attention has been paid to replacing synthetic antioxidants 27
with natural alternatives. Cereals are an important source of bioactive compounds 28
and some of them, such as phenolic compounds (phenolic acids, lignans and 29
flavonoids) show a marked antioxidant activity (Liyana-Pathirana & Shahidi, 2006). 30
The increased consumption of plant-derived phenolics has been associated with a 31
reduced risk of degenerative and chronic diseases (Dykes & Rooney, 2007). 32
Moreover, a diet containing cereals improve the content of other bioactive 33
compounds, such as dietary fibre (DF) and micronutrients (Hemery, Rouau, Lullien-34
Pellrin, Barron & Abecassis, 2007). 35
The protective effects of cereal fibres depend on their solubility: soluble fibre, 36
particulary β-glucans, can reduce blood cholesterol, while insoluble fibres shorten the 37
transit time through the intestinal tract, decreasing the contact between carcinogens 38
and the epithelial cells in the colon (Fardet, Rock & Rémésy, 2008). 39
Whole wheat flour is richer in protein, phenolic acids and DF than commercial white 40
flour; thus, whole grain flour results in higher antioxidant activity than the refined flour 41
(Liyana-Pathirana & Shahidi, 2007), since bran fractions are removed in traditional 42
milling operations. Unfortunately, the outer layers of the wheat kernel are also the 43
most subjected portions into contamination by natural, such as mycotoxins, 44
principally deoxynivalenol (DON), or synthetic contaminants, such as heavy metals 45
cadmium (Cd) and lead (Pb), and pesticides (Cheli et al., 2010). Thus, whole flour 46

5
chances more than white flour to cross the limits established by law for both natural 47
and synthetic contaminants. Moreover, whole grain foods are not so attractive to 48
consumers, because the higher bran content in whole grain flour reduces the sensory 49
value of the end-use products: the high fibre content is the main cause of the 50
negative technological properties of whole grain bread, with a reduction in loaf 51
volume, an increase in crumb firmness and a dark color (Zhang & Moore, 1999). 52
Therefore, a grain fractionation technology is needed in order to separate efficiently 53
the negative and positive aspects. This will let to produce new flour mixes and 54
ingredients with technologically optimized functional and nutritional attributes. 55
The pearling (debranning) of wheat, before roller milling, is becoming increasingly 56
accepted by wheat millers as a means of improving milling performance, since it 57
sequentially removes the outer kernel bran layers through an abrasive scouring and 58
increases the efficiency of the milling process (Dexter & Wood, 1996). The average 59
concentrations of DON and heavy metals are more efficiently reduced by pearling 60
than by milling (Cheli et al., 2010). Nevertheless, this process, which involves the 61
external layer of kernels, is responsible for the loss of high nutritional content. A 62
previous study demonstrated that the phenolic content, which is closely highly 63
correlated to the total antioxidant activity (TAA), progressively decreases as the 64
pearling progresses through the aleurone layer into the inner parts of the kernel 65
(Liyana-Pathirana et al., 2006). In fact, the typical grain fraction removed by pearling 66
(before milling) contains more than 40% of the total phenolic content of the whole 67
kernel (Beta, Nam, Dexter & Sapirstein, 2005). 68
However, the degree of pearling could be efficiently modulated in order to separate 69
the external bran fractions, which are characterized by a high sanitary risk and 70
coarse fibre, from the cereal fractions with potential high health benefits. An 71
6
alternative strategy to the use of whole flour, in order to maximize health benefits of 72
wheat-based products, could be to enrich conventional flour with wheat bran 73
fractions, obtained from sequential pearling, as they are characterized by a higher 74
antioxidant activity and phytonutrient content, but lower risk from the contaminant 75
content (Hemery et al., 2007). For this purpose, it is necessary to evaluate not only 76
the distribution of the phytonutrients and TAA in wheat grain in more detail, but also 77
the content of the contaminants in different and deeper pearled fractions. 78
The aim of this study was to determine the wheat kernel pearled fractions, obtained 79
from progressive pearling, with the highest nutritional value, considering the free 80
phenolic acids (FPA), DF and β-glucan contents and TAA, and the lowest natural and 81
synthetic contaminant contents, in order to use them as functional food ingredients. 82
83

7
2. Materials and methods 84
2.1 Wheat grain pearling 85
Three commercial winter wheat varieties (Triticum aestivum L.), Bolero, Bologna and 86
Taylor, were collected from homogeneous lots of each cultivar, cultivated in the 87
2010-2011 growing season in Alessandria (44° 57’ N, 8° 29’ E; altitude of 121 m; in 88
a deep and acid loamy soil - Aquic Frugiudalf) and stored in vertical silos. All the 89
compared cvs were seeded after an autumn ploughing (30 cm) and disk harrowing to 90
prepare a proper seedbed. Planting was held in 12 cm wide rows at the end of 91
October at a seeding rate of 450 seeds m-2. For Bologna and Taylor cvs, a total of 92
180 kg N ha-1 was applied to wheat fields as granular ammonium nitrate fertilizer. On 93
the other hand, field cultivated with cv Bolero received a total of 140 kg N ha-1. The 94
amount of ammonium nitrate was split equally between tillering and stem elongation 95
stages for each cv. None fungicide was applied at wheat heading to control Fusarium 96
Head Blight (FHB). Wheat fields were harvested in early-mid July with a combine-97
harvester and kernels of each cv were stored separately. The wheat varieties were 98
characterized by hardness, color and technological qualities (Tab. 1), on the basis of 99
the ISQ method for quality classification of common wheat, proposed by Foca et al. 100
(2007). As far as FHB infection and DON contamination is concerned, Bologna cv is 101
classified as moderately resistant, while cv Bolero and Taylor are classified as 102
moderately susceptible (Mayerle, Pancaldi, Haidukowski, Pascale & Ravaglia, 2007). 103
Moreover, the environmental conditions from anthesis to harvest observed in the 104
growing area were slightly favorable to FHB and to DON contamination. 105
Six fractions of kernels from each variety were obtained through incremental 106
pearling, following the approach proposed by Beta et al. (2005). The pearling 107

8
consisted of consecutive passages of wheat and pearled wheat in an abrasive-type 108
grain testing mill (TM-05C model, Satake, Tokyo, Japan) at a constant speed of 55 109
Hz. The pearling process was monitored by time control. After each assay, the 110
laboratory pearler was thoroughly cleaned by means of dust aspiration and 111
compressed air, to minimize equipment contamination. Initially, a 500 g portion of 112
each unprocessed wheat was sub-sampled from a 5 kg sample, and the remaining 113
4.5 kg was pearled. Starting from unprocessed grain, kernels were initially pearled to 114
remove 5% of the original grain weight, and this resulted in a first fraction (0-5%). 115
The remaining kernels were then pearled to remove a second fraction of 5% (5-10%). 116
The pearling process was continued until a third, fourth and fifth fraction (designed 117
10-15%, 15-20%, 20-25%, respectively) plus a residual 75% of the kernel (25-118
100%), were collected. 119
A total of seven samples were obtained from each variety: the whole unprocessed 120
wheat and the 0-5%, 5-10%, 10-15%, 15-20%, 20-25%, 25-100% fractions, obtained 121
through the pearling process. The whole wheat samples and the residual 75% of the 122
unprocessed kernels were milled using a laboratory centrifugal mill (ZM-100; Retsch, 123
Haan, Germany) with a 1 mm opening. Then, both the milled and pearled samples 124
(500 g) were ground to pass through a 0.5 mm screen and stored at -25°C before the 125
chemical analyses. 126
127
2.2. Chemicals 128
Total Dietary Fibre and Mixed-Linkage β-Glucan kits for enzymatic determinations 129
were supplied by Megazyme (Megazyme International Ireland Ltd, Wicklow, Ireland). 130
Methanol (HPLC grade) and formic acid (50%, LC–MS grade) were purchased from 131
Sigma–Aldrich (Milan, Italy). Water was obtained from Milli-Q instrument (Millipore 132

9
Corp., Bedford, MA, USA). Antibody-based immunoaffinity columns were supplied by 133
VICAM (Waters Corporation, Watertown, MA, USA). All the other chemicals and 134
solvents were of a reagent-grade level and were also purchased from Sigma–Aldrich 135
(Milan, Italy). 136
137
2.3 Chemical analyses 138
2.3.1. Proximate composition analysis 139
The moisture, protein, ash, total DF and β-glucan contents were determined on 140
ground whole kernels and their pearled fractions. The moisture content, determined 141
in order to express the results on a dry weight (dw) basis, was obtained using a 142
Sartorius MA30 thermo-balance (Sartorius AG, Goettingen, Germany). The total 143
nitrogen content and total protein content (conversion factor: 5.70) were obtained 144
according to the Kjeldahl method, using Kjeltec system I (Tecator, Sweden). The ash 145
coBontent was determined in a muffle furnace according to the AOAC (1990) 146
procedure. The total dietary fibre was measured using the Megazyme total dietary 147
fibre analysis kit, according to the enzymatic-gravimetric method proposed by 148
Prosky, Asp, Schweizer, DeVries, and Furda (1988); the determination was 149
performed employing the Fibertec 1023 system (FOSS Italia S.p.A., Padova, Italy). β-150
glucan determination was performed using the Megazyme mixed-linkage β-glucan 151
assay kit, according to the instructions provided by the producer. 152
153
2.3.2. Extraction of free phenolic acids (FPA) 154
Prior to the extraction of the FPA, samples were ground in a oscillatory mill (Mixer 155
Mill MM440, Retsch GmbH, Hann, Germany) and sieved to obtain fine flours 156

10
(particle size < 250 μm). Fifty milligrams of each sample were suspended in 1 mL of 157
a MeOH/H2O 80:20 (v/v) mixture, vortexed for 10 seconds and then extracted in an 158
ultrasonic bath (Bransonic 1510, output 42 kHz, Branson Ultrasonics, USA) for 2 159
minutes. The extracts were centrifuged at 14000 rpm for 1 min (Microcentrifuge 5417 160
R, Eppendorf Italia, Milan, Italy) and pellets were extracted another two times, 161
according to the method described above. Supernatants were collected and used for 162
the chromatographic analyses. All the samples were extracted in triplicate. 163
164
2.3.3. Determination of free phenolic acids by means of RP-HPLC/DAD 165
Phenolic acid separation was performed using the Shimadzu LC-20 A Prominence 166
HPLC system (Shimadzu Italia, Milan, Italy) equipped with an LC-20AB pump 167
system, a SIL-20-A auto-injector, a CTO-20A column oven, and a SPD-M20A diode 168
array detector. The used column was an Ascentis RP-amide (150 x 2,1 mm i.d., with 169
a particle size of 3 μm, Supelco, Bellefonte, PA, USA) which was maintained at 27 170
°C. The mobile phase consisted of water/formic acid 0.1% (v/v) (eluent A) and 171
methanol/formic acid 0.1% (v/v) (eluent B), and the following elution programme was 172
used: isocratic 2.5% B (10 min), from 2.5% to 12% B (25 min), from 12% to 100% B 173
(31 min), from 100% to 2.5% B (2 min), isocratic 2.5% B (5 min), The total running 174
time was 73 min and was conducted at a constant flow-rate of 400 μL/min. 175
Chromatograms were recorded at two different wavelengths (280 and 330 nm). 176
The phenolic acids were tentatively identified through a comparison with the retention 177
times and UV-vis spectra of individual standard molecules (gallic acid, protocatechuic 178
acid, syringic acid, p-hydroxybenzoic acid, caffeic acid, chlorogenic acid, ellagic acid, 179
ferulic acid); the quantification was performed on the basis of calibration curves (6 180
different concentration levels; linearity range: 0.5 – 5.5 µg mL-1) obtained using the 181
11
corresponding standards. The previously described phenolic extracts were directly 182
injected into the chromatographic system (injection volume: 15 μL). 183
184
2.3.4. Determination of the total antioxidant activity (TAA) 185
The TAA was determined adapting the classical DPPH radical scavenging method 186
(Locatelli, Gindro, Travaglia, Coisson, Rinaldi & Arlorio, 2009) to the QUENCHER 187
approach (direct measurement of antioxidant activity on solid samples suggested by 188
Gökmen, Serpen and Fogliano, 2009). Exactly 10 milligrams of ground whole kernels 189
and pearled fractions (particle size < 250 μm) were weighted, then 700 µL of 190
methanol and 700 µL of a DPPH• methanolic solution 100 μM were added. The 191
samples were vortex-mixed and the reaction was then carried out in the dark under 192
stirring at 20 °C and 1000 rpm (Thermomixer comfort, Eppendorf, Milan, Italy) for 25 193
min. The samples were promptly centrifuged for 1 min at 14000 rpm (Microcentrifuge 194
5417 R, Eppendorf Italia, Milan, Italy) and the absorbance at 515 nm was then 195
measured after exactly 30 min of reaction (on attainment of the steady state), using a 196
Kontron UVIKON 930 Spectrophotometer (Kontron Instruments, Milan, Italy). A 197
control solution (700 µL of methanol and 700 µL of DPPH• methanolic solution 100 198
μM) was tested under the same conditions, in order to calculate the DPPH• inhibition 199
percentage of the samples. The final results were expressed as mmol of trolox 200
equivalents (TE) per kg of sample (dw) through a calibration curve (linearity range: 201
4–60 nM; r2 = 0.982). 202
203
2.3.5. DON contamination 204
The DON content was analysed using a high performance liquid chromatography 205
(HPLC-MS-MS) method (range 20-1000 μg kg-1). Samples of 25 g each were 206

12
extracted with 100 mL of water in a blender at a high speed for 30 minutes; the entire 207
extract was then filtered and collected. Antibody-based immunoaffinity columns 208
(DON testTM WB Columns VICAM) were utilised for cleanup of the sample extracts. 209
Before the sample was loaded, the column was conditioned with 1 mL of deionized 210
water. 1 mL of the sample was loaded on the previously conditioned immunoaffinity 211
column at a rate of approximately 1-2 drops s-1. The column was washed with 5 mL 212
of distilled water. DON was eluted from the column with 2 mL of methanol. DON was 213
quantified by the injection of 10 μL of diluted eluate into the HPLC-MS-MS system, 214
which consisted of a Varian 212-LC Chromatography Pump and a 310-MS TQ Mass 215
Spectrometer. The analytical column was a reverse Varian Polaris C18-A (100 x 2.00 216
mm, 3 μm) while the mobile phase was a mixture of methanol and water fed at a flow 217
rate of 0.2 mL min-1. 218
219
2.3.6. Heavy metal content 220
The Cd and Pb analyses were performed according to the method of the Italian 221
Organization for Standardization (UNI EN 14083, 2003). Aliquots of the samples (500 222
mg on a dry-matter basis) were dissolved in 5 mL of concentrated nitric acid and 2 223
mL of 30% v/v hydrogen peroxide, then heated under reflux in a stoppered quartz 224
vessel placed in a microwave oven. The solution was diluted to 25 mL in a volumetric 225
flask with ultra-pure water. Samples were analysed by graphite furnace atomic-226
absorption spectrometry (GFAAS; Analyst 700, Perkin Elmer Corporation, USA). All 227
the metal concentrations were determined by autosampler injection of the aqueous 228
solution into a graphite furnace. 229
230

13
2.4. Statistical analysis 231
All the analyses were performed in triplicate, with the exception of the heavy metal 232
content, performed in one replicate. The results are reported as the mean of the 233
three replicates; the coefficients of variation were < 10%. The analysis of variance 234
(One-way ANOVA) was applied for each variety to compare the protein, total DF, β-235
glucan, FPA, ash and DON contents and the TAA in the whole grain and in the 236
different pearled fractions. The residual normal distribution was verified using the 237
Kolmogorov-Smirnov test, while variance homogeneity was verified using the Levene 238
test. Multiple comparison tests were performed according to the Student-Newman-239
Keuls test on treatment means. The SPSS for Windows statistical package, Version 240
17.0 (SPSS Inc., Chicago) was used for the statistical analysis. 241
242
14
3. Results 243
3.1. Bioactive compounds in the whole kernel 244
The protein, ash, total fibres, β-glucan and FPA contents, and the TAA determined 245
for the grain whole kernels are reported in Table 1. Except for the TAA, ANOVA 246
showed significant differences (P<0.05) between the wheat varieties used in this 247
study. According to the ISQ quality classification, the grain protein content of Bolero 248
cultivar was significantly lower than that of the Bologna and Taylor cultivars, 249
respectively. The total DF was significantly higher in the Bolero and Taylor cvs than 250
in the Bologna one. Compared to the other two varieties, Bolero showed significantly 251
lower and higher contents of β-glucans and FPA, respectively. 252
253
3.2. Bioactive compounds of the pearled fractions 254
The bioactive compounds content in the fractions obtained from the sequential wheat 255
pearling is reported in Tables 2 and 3. ANOVA showed highly significant differences 256
(P<0.001) for the proteins, total fibre and β-glucan content, and for the TAA 257
determined in the different pearled fractions (Tab. 2). 258
The 10-15% fraction showed the highest protein content in all three varieties, while 259
the concentration significantly decreased towards both the internal and the external 260
layers. Only for the Bolero cultivar, there were no significant differences between the 261
5-10% and 10-15% fractions. The Bolero cv showed a significantly higher protein 262
concentration in the more external layers (0-5%) than endosperm (25-100%), while 263
no significant differences were observed between the 0-5% and 25-100% fractions of 264
the Bologna and Taylor cultivars. 265
15
The total DF was predominant in the outermost layers (0-5%) for all three varieties. 266
Each successive pearling passage significantly decreased the fibre content towards 267
the inner layer. The 5-10% fractions of Bolero, Bologna and Taylor cultivars showed 268
a 37%, 35%, and 33% reduction in DF content compared to the corresponding 0-5% 269
fractions, respectively. The fibre content of Bolero cultivar in the 10-15% and 15-20% 270
fractions was 3.2 and 2.7 times higher than that of endosperm (25-100% fraction), 271
respectively. On the other hand, on average, the 10-15% and 15-20% fractions of the 272
Bologna and Taylor cvs had a 4.3 and 3.4 times higher content of total fibre than the 273
25-100% fraction, respectively. The 5-10% fraction contained the highest β-glucan 274
concentration for all of the three varieties tested. In the next inner pearling passage 275
(fraction 10-15%), a significant reduction in the β-glucan contents by 12%, 22% and 276
12% was perceived for the Bolero, Bologna and Taylor cvs, respectively. The β-277
glucan content significantly decreased from this fraction to the inner layers at each 278
subsequent pearling. Moreover, the outer fraction (0-5%) in all three varieties showed 279
a significantly lower concentration of β-glucans than the 10-15% fractions. Cv. Bolero 280
showed a significantly higher β-glucan content in the 15-20% fractions than in the 0-281
5% one, while the outermost layer of the Bologna cv showed a significantly lower 282
concentration of these compounds. No significant differences were observed for the 283
Taylor cv between the 0-5 and 15-20% fractions. 284
The highest TAA for the Bologna and Taylor cvs, was found in the outermost 0-5% 285
fraction, then TAA decreased significantly after each progressive pearling towards 286
the inner layers. On average, for these varieties, TAA was 14%, 23%, 41%, 56% and 287
87% lower than the 0-5% fraction, for the 5-10%, 10-15%, 15-20%, 20-25% and 25-288
100% fractions, respectively. The pearling passage between the 10-15% and 15-20% 289
fractions resulted in the first important loss of TAA. On the other hand, there were no 290
16
significant differences in TAA values between the 0-5% and 5-10% fractions of the 291
Bolero cv. Then, from the 5-10% fraction, TAA decreased significantly after each 292
progressive pearling towards the inner layers. 293
The content of some phenolic acids (ferulic, chlorogenic, p-hydroxybenzoic, syringic, 294
protocatechuic and caffeic acid) present in the pearled wheat fractions in their free 295
form is reported in table 3. Among the standard molecules employed for the 296
chromatographic analysis, ellagic acid was not clearly recognized in the samples, 297
while gallic acid was only identified in the 0-5% fraction (30, 26 and 48 μg kg-1 for the 298
Bolero, Bologna and Taylor cvs, respectively). Ferulic acid was the predominant 299
phenolic acid, followed by chlorogenic and caffeic acids. p-Hydroxybenzoic, syringic 300
and protocatechuic acids were found in lower concentrations and were not detected 301
in all the pearled fractions. 302
ANOVA showed highly significant differences (P<0.001) for all the free phenolic acids 303
detected in the different wheat fractions. The total FPA content for the three varieties 304
decreased from the outer fractions to the endosperm. The total FPA content for 305
Bologna cv significantly decreased at each successive pearling from the outer 306
fractions towards the inner layers. Each pearling fraction for Taylor cv showed a 307
significantly different total FPA concentration, with the exception of the 15-20% and 308
20-25% fractions. On the other hand, no significant differences were observed 309
between the 0-5% and 5-10%, or between the 15-20% and 20-25% fractions 310
obtained from Bolero cv. On average, the free ferulic acid and the total FPA were 311
27% and 30% lower in the 10-15% fraction than in the 0-5% one, respectively. 312
313
3.3. Ash, heavy metals and DON contamination of pearled fractions 314
17
The ash, heavy metal and DON contents of in the wheat fractions are reported in 315
Table 4. ANOVA showed highly significant differences (P<0.001) for the ash content 316
and the DON contamination. 317
The highest ash content for the Bolero and Taylor cvs was found in the 5-10% 318
fraction, followed by the 0-5% one, then ash decreased significantly after each 319
progressive pearling towards the inner layers. The ash concentration in the 0-5% and 320
5-10% fractions was not significantly different for the Bologna variety. The ash 321
content of the three varieties was on average 5.4, 5.6, 4.5, 3.5 and 2.9 times higher 322
in the 0-5%, 5-10%, 10-15%, 15-20% and 20-25% fractions compared to the 323
endosperm residue (25-100%), respectively. 324
Among the heavy metals, Pb was not found in any of the pearled wheat fractions, 325
while Cd concentration was only detected in the outermost layer (0-5%) of the 326
Bologna and Taylor cvs. 327
Kernels from the Bolero and Taylor varieties resulted to be contaminated by DON, 328
while the data for the Bologna cv were always below the detection limit. The highest 329
DON contamination in both varieties was found in the outermost fraction (0-5%), and 330
the DON content then decreased significantly after each progressive pearling 331
towards the inner layers. On average, the DON content decreased by 49, 19, 9, 5 332
and 4 times in the 0-5%, 5-10%, 10-15%, 15-20% and 20-25% fractions compared to 333
the endosperm residue (25-100%), respectively. 334
335
18
4. Discussion 336
The presented data have shown clearly how the concentration of bioactive 337
compounds is greater in the outer layers of wheat grain, but their distribution in each 338
pearled fraction is different considering the classes of nutrients. 339
Shetlar, Rankin, Luman and France (1947) reported that outer pericarp, the inner 340
pericarp, the testa and the aleurone layer, respectively represents 3.9, 0.9, 0.7, and 341
9.0% of the kernel weight. Therefore, according also to data reported by Bottega, 342
Caramanico, Lucisano, Mariotti, Franzetti and Pagani (2009); Jerkovic, Kriegel, 343
Brander, Atwell, Roberts and Willows (2010) and Singh and Singh (2010), pearling 344
up 5% level on average removed most of the outer pericarp, while at 5-10% and 10-345
15% level the aleurone layers were removed. 346
The protein content is higher in the 10-15% fraction for all three varieties, confirming 347
data reported by Jerkovic et al. (2010), who found a much greater concentration and 348
diversity of protein functions in the microdissected intermediate layers (testa and 349
nucellar tissue), corresponding to this pearled fraction, than in the other bran layers. 350
Sequential pearling has shown that, in common wheat, the total DF decreased 351
progressively from the external to internal layers. This reduction was higher in the 352
hard varieties (cvs Bologna and Taylor) than soft one (cv Bolero). In common wheat 353
bran, the values for total DF was almost 4 times higher that of the whole grain (Sidhu, 354
Al-Hooti & Al-Saqer, 1999). Dexter and Wood (1996) reported that the pearling of 355
common wheat reduces the insoluble and soluble fibre content compared to 356
unprocessed grain by 57% and 30%, respectively. The outermost tissues are rich in 357
insoluble DF, while the aleurone layer in particular results in a high soluble DF 358
content (Parker, Ng & Waldron, 2005). Moreover, the fibre present in the most 359
external bran layers is relatively coarse, whereas the fibre near the aleurone layer is 360

19
finer (Noort, van Haaster, Hemery, Schols & Hamer, 2010). 361
The β-glucans, components of the soluble fibre, were higher in the middle fractions 362
(5-20%), and peaked in the 5-10% pearled fraction, while lower in the more external 363
layers (0-5%) had a lower β-glucan content. Several authors have reported that the 364
aleurone layer in common wheat contains higher levels of β-glucans than whole grain 365
(Hemery et al., 2007). A reduction of 12% in the β-glucan content of unprocessed 366
wheat grain has been observed after pearling processes (Dexter & Wood, 1996). 367
Barley is rich in β-glucans and the highest concentration of β-glucans was found in 368
the middle fractions, followed by bran, while the lowest content were found in the 369
flour (Sullivan, O’Flaherty, Brunton, Gee, Arendt & Gallagher, 2010). 370
The sequential removal of the external layers through pearling resulted in a decrease 371
in FPA with concurrent lower TAA values. The highest observed concentration of 372
FPA in the outer kernel fractions (0-15%) confirms the data reported by Beta et al. 373
(2005) on the concentration of the total phenol compounds in the wheat kernel. 374
Liyana-Pathirana et al. (2006) reported that total bran-rich fractions possess higher 375
total phenolic compounds and TAA than starch-rich fractions. Some authors have 376
shown that the aleurone layer is richer in antioxidant compounds than the other bran 377
tissues, mainly due to its high content of phenolic acids (Buri, von Reding & Gavin, 378
2004). This diversity in the phenolic composition between the bran layers probably 379
reflects differences in the biosynthetic and turnover mechanism, related to 380
arabinoxylan synthesis, as suggested by Parker et al. (2005). Liyana-Pathirana and 381
Shahidi (2006) reported that soft wheat has a higher total phenolic content and TAA 382
than hard wheat. In agreement with these results, in the present study it has been 383
found that Bolero, a soft variety, has a higher total FPA content than the Bologna 384
(medium hard) and Taylor (hard) cvs. 385

20
Fardet et al. (2008) reported that ferulic acid represents approximately 46-67% of the 386
total phenolic acids in wheat, and that it is found associated with polysaccharides, 387
mainly arabinoxylans, in aleurone cell walls. Our results show that ferulic acid 388
occurred in about 65% of the total FPA analyzed. Liyana-Pathirana and Shahidi 389
(2007) reported that although ferulic acid is dominant in cereal grains, caffeic acid 390
shows a higher antioxidant activity. This information explains the similar TAA levels 391
of the three varieties examined, although Bolero has a higher total FPA and ferulic 392
acid content, while Taylor, with a lower total FPA content, showed a 4-times higher 393
caffeic acid concentration. Moreover, many insoluble components of foods may exert 394
antioxidant properties and esterified phenolic acids in particular can contribute to the 395
total antioxidant activity of cereals (Serpen, Gökmen, Pellegrini & Fogliano, 2008). 396
The direct procedure used in this work to determine TAA allowed the contribution of 397
both the soluble (e.g. free phenolic acids) and insoluble (e.g. bound phenolic acids) 398
antioxidants to be measured. Moreover, the use of an aqueous methanolic solution 399
(methanol/water 50:50, v/v) to perform the DPPH• method (so adding to the solid 400
samples 700 µL of water and 700 µL of DPPH• methanolic solution; see Materials 401
and methods section) allowed to obtain a TAA about 20% greater than that obtained 402
by the method using pure methanol as solvent. These additional results (data not 403
shown) confirm that the use of water as one of the solvents in the mixture helps 404
radicals to diffuse better into the particles of the sample, thus increasing the 405
interaction between the radicals and the antioxidants (Gökmen et al., 2009). Even if 406
an increase of TAA was observed employing aqueous methanolic solutions, the 407
relative antioxidant activity of the samples confirmed results obtained using pure 408
methanol, thus indicating a general TAA decrease during the progressive pearling 409
process. 410

21
The outermost kernel layers had the highest DON contamination which decreased 411
from the external to the internal layers. According to Lancova et al. (2008), the levels 412
of DON in bran can be two or more times higher than in whole wheat kernels, 413
indicating the concentration of this mycotoxin in the outer part of the kernel. In both 414
laboratory studies and industrial milling systems, the application of pearling before 415
milling has led to flours with lower DON contents (Cheli et al., 2010). Our data 416
confirm that DON decreases moving from the external to the internal layers following 417
a biphasic behavior: a high reduction was observed in the first pearling steps and this 418
was followed by a slower decrease. The residual grain after pearling of the first two 419
outer fractions (0-5 and 5-10%) contained around 64% of the total DON quantity of 420
the whole grains tested in this study. In previous experiment the DON contamination 421
was reduced after a 10% grain mass loss in durum wheat of 15% (Cheli et al., 2010) 422
and 45% (Rios, Pinson-Gadais, Abecassis, Zakhia-Rozis & Lullien-Pellerin, 2009). 423
For barley, a grain mass loss of 15%, reduced the DON contamination of 34% 424
(House, Nyachoti & Abramson, 2003) and in common wheat, with a 18% of mass 425
removal, DON contamination was reduced of 42% (Trenholm, Charmley, Prelusky & 426
Warner, 1991). 427
Moreover, heavy metals were only found in the most external fraction. Milling 428
reduced heavy metal contents in flour or semolina and increased their contents in the 429
by-products, derived principally from the pericarp layers (Oliver, Gore, Moss & Tiller, 430
1993). In the study of Cubadda, Raggi, Zanasi and Carcea (2003) the milling of 431
durum wheat determined an average reduction of 31% and 12% for Cd and Pb, 432
respectively. Cheli et al. (2010) reported that although no significant differences were 433
found between unprocessed wheat and pearled wheat, either in conventional milling 434
or in pearling before milling, Cd and Pb were concentrated in shorts and flour shorts. 435

22
The external pearled wheat fractions also resulted in the highest ash content. House 436
et al. (2003) and Rehman, Ahmand, Bhatti, Shafique, Ud Din and Murtaza (2006) 437
reported a 29% and 19% lower ash content after removal of 15% of the mass grain of 438
barley and wheat, respectively. Dexter and Wood (1996) reported that the pearling 439
process on durum wheat significantly reduced the ash content by 36% and 16% in 440
pearled kernels and semolina, respectively. 441
In addition, Laca, Mousia, Diaz, Webb, and Pandiella (2006) and Bottega et al. 442
(2009) established that the number of bacteria and moulds present in wheat grains, 443
and located in the outer pericarp, can be conspicuously reduced by pearling. 444
The TAA, the β-glucan, the total FPA and the DON contents (mean values of the 445
three wheat cultivars) are summarised in Fig. 1, with the objective of showing the 446
kernel fractions that offer the best compromise between high nutritional value and 447
low contamination risk. The 10-15% pearled fraction has shown to greatly reduce the 448
DON content, compared to the outer fractions, and has not been contaminated by 449
heavy metals. At the same time, this pearled fraction preserved an acceptable high 450
nutritional content, since it maintained high protein and β-glucan concentrations, and 451
the loss of total FPA content and TAA was not so high compared to the richer 452
external layers. Moreover, the total DF in this pearled fraction remained high, while 453
only the coarse fibre was removed with the outermost bran layer (Esposito, Arlotti, 454
Bonifati, Napolitano, Vitale & Fogliano, 2005). This could constitute an important 455
technological aspect, since bread containing coarse particle size bran is considered 456
less acceptable in sensory quality than breads containing medium-fine particle size 457
bran (Zhang & Moore, 1999). As far as the major chemical components of wheat 458
kernel is concerned, Bottega et al. (2009) and Singh and Singh (2010) reported that 459
pearling level lower than 10% guaranteed low starch and protein losses in the waste 460

23
and, at the same time, noticeably reduced the detrimental components of kernel 461
(ash, microbial contamination). 462
On the basis of the data collected, it is possible to state that the sequential pearling 463
of wheat kernels confirms to be an interesting dry-fraction technology, which can 464
produce bran fractions with high concentration in aleurone and intermediate material 465
rich in phytochemicals. This material can be used to transform a flour by-product into 466
a high nutritional value food ingredient (Hemery et al., 2007). The present study can 467
be considered as a first contribution towards individuating the most useful pearled 468
grain fractions for this purpose, although more research, also using the measurement 469
of biochemical markers found in wheat grain tissue (Hemery et al., 2009) is still 470
necessary. 471
472

24
5. Conclusion 473
Our study has confirmed the results of other previous reports, that investigated the 474
content of various contaminants and bioactive compounds in pearled wheat fractions 475
separately. Among the wheat varieties and the pearled fractions compared in this 476
experiment, the kernel fraction that offers the best compromise between high 477
nutritional value and low contamination risk is the 10-15% fraction. Furthermore, in 478
grain lots with a low contaminant presence in the outer part of the grains, the 5-10% 479
fraction could also be separated and recovered. On the basis of these results, the 480
pearling process could be an important way of valorizing the wheat bran layers of 481
kernel, as a natural source of bioactive compounds, separated from detrimental 482
components, in order to develop nutritionally enhanced ingredients and products. In 483
fact, the wheat bran layers, instead of being totally rejected or maintained as 484
happens in the traditional milling process for refined or whole flour, respectively, 485
could be progressively and carefully separated, through the pearling process. The 486
most external fractions, with higher risks because of the presence of natural and 487
synthetic contaminants, could then be discarded, while the fractions with a low 488
sanitary impact, but high nutritional value, could be reinserted into the flour or used 489
as a functional ingredient. 490
The replacement of wheat flour with the selected pearling fraction could be an 491
important way of enriching wheat-based products in bioactive compounds and of 492
reducing the sanitary risks associated to the use of bran layers. 493
494
25
Acknowledgements 495
The authors would like to thank Claudio Bongiovanni, Fabiana Serafino, Silvia Tosco, 496
Andrea Maffia (Molini Bongiovanni, Cambiano, TO, Italy) and Davide Gullino for their 497
expert technical assistance. 498
The research was conducted with the financial support of the European Union, Italian 499
Economy and Finance Ministry and the Regione Piemonte, as a part of 500
the NUTRATEC project. 501
502

26
6. References 503
AOAC (1990). Official Methods of Analysis (15th ed.). Arlington, VA: Association of 504
Official Analytical Chemists. 505
Beta, T., Nam, S., Dexter, J. E., & Sapirstein, H. D. (2005). Phenolic content and 506
antioxidant activity of pearled wheat and roller-milled fractions. Cereal Chemistry, 507
82, 390-393. 508
Bottega, G., Caramanico, R., Lucisano, M., Mariotti, M., Franzetti, L., & Pagani, M.A. 509
(2009). The debranning of common wheat (Triticum aestivum L.) with innovative 510
abrasive rolls. Journal of Food Engineering, 94, 75-82. 511
Buri, R. C., von Reding, W., & Gavin, M. H. (2004). Description and characterization 512
of wheat aleurone. Cereal Foods World, 49, 274-282. 513
Cheli, F., Campagnoli, A., Ventura, A., Brera, C., Berdini, C., Palmaccio, E., & 514
Dell’Orto, V. (2010). Effects of industrial processing on the distribution of 515
deoxynivalenol, cadmium and lead in durum wheat milling fractions. LWT-Food 516
Science and Technology, 43, 1050-1057. 517
Cubadda, F., Raggi, A., Zanasi, F., & Carcea, M. (2003). From durum wheat to 518
pasta: effect of technological processing on the levels of arsenic, cadmium, lead 519
and nickel-a pilot study. Food Additives and Contaminants, 20, 353-360. 520
Dexter, J. E., & Wood, P. J. (1996). Recent applications of debranning of wheat 521
before milling. Trends in Food Science & Technology, 7, 35-41. 522
Dikes, L., & Rooney, L.W., (2007). Phenolic compounds in cereal grains and their 523
health benefits. Cereal Foods World, 3(52), 105-111. 524
Esposito, F., Arlotti, G., Bonifati, A. M., Napolitano, A., Vitale, D., & Fogliano, V. 525
(2005). Antioxidant activity and dietary fibre in durum wheat bran by-products. 526
Food Research International, 38, 1167-1173. 527

27
Fardet, A., Rock, E., & Rémésy, C. (2008). Is the in vitro antioxidant potential of 528
whole- grain cereals and cereal products well reflected in vivo? Journal of Cereal 529
Science, 48, 258-276. 530
Foca, G., Ulrici, A., Corbellini, M., Pagani, M. A., Lucisano, M., Franchini G. C., & 531
Tassi, L. (2007). Reproducibility of the Italian ISQ method for quality classification 532
of bread wheats: an evaluation by expert assessors. Journal of the Science of 533
Food and Agriculture, 87, 839-846. 534
Gökmen, V, Serpen, A., & Fogliano, V. (2009). Direct measurement of the total 535
antioxidant capacity of foods: The “QUENCHER” approach. Trends in Foods 536
Science & Technology, 20, 278–288. 537
Hemery, Y., Rouau, X., Lullien-Pellrin, V., Barron, C., & Abecassis, J. (2007). Dry 538
process to develop wheat fractions and products with enhanced nutritional quality. 539
Journal of Cereal Science, 46, 327-347. 540
Hemery, Y., Lullien-Pellrin, V., Rouau, X., Abecassis, J., Samsom, M-F., Åman, P., 541
von Reding, W., Spoerndli, C. & Barron, C. (2009). Biochemical markers: efficient 542
tools for the assessment of wheat grain tissue proportions in milling fractions. 543
Journal of Cereal Science, 49, 55-64. 544
House, J.D., Nyachoti, C. M., & Abramson, D. (2003). Deoxynivalenol removal from 545
barley intended as swine feed through the use of an abrasive pearling procedure. 546
Journal of Agricultural and Food Chemistry, 51, 5172-5175. 547
Italian Organization for Standardization (UNI EN), 2003. Method 14083. Foodstuff – 548
determination of trace elements - determination of Pb, Cd, chromium and 549
molybdenum by graphite furnace atomic absorption spectrometry (GFAAS) after 550
pressure digestion. Milano. Italy: Ente Nazionale Italiano di Unificazione. 551
28
Jerkovic, A., Kriegel, A. M., Brander, J. R., Atwell, B. J., Roberts, T. H., & Willows, R. 552
D. (2010). Strategic distribution of protective proteins within bran layers of wheat 553
protects the nutrient-rich endosperm. Plant Physiology, 152, 1459-1470. 554
Laca, A., Mousia, Z., Diaz, M., Webb, C., & Pandiella, S.S. (2006). Distribution of 555
microbial contamination within cereal grains. Journal of Food Engineering, 72, 556
332-338. 557
Lancova, K., Hajslova, J., Kostelanska, M., Kohoutkova, J., Nedelnik, J., Moravcova, 558
H., & Vanova, M. (2008). Fate of trichothecene mycotoxin during the processing: 559
milling and baking. Food Additives and Contaminants, 25, 650-659. 560
Liyana-Pathirana, C. M., Dexter, J., & Shahidi, F. (2006). Antioxidant properties of 561
wheat as affected by pearling. Journal of Agricultural and Food Chemistry, 54, 562
6177-6184. 563
Liyana-Pathirana, C. M., & Shahidi, F. (2006). Antioxidant properties of commercial 564
soft and hard winter wheats (Triticum aestivum L.) and their milling fractions. 565
Journal of the Science of Food and Agriculture, 86, 477-485. 566
Liyana-Pathirana, C. M., & Shahidi, F. (2007). The antioxidant potential of milling 567
fractions from breadwheat and durum. Journal of Cereal Science, 45, 238-247. 568
Locatelli, M., Gindro, R., Travaglia, F., Coïsson, .J. D., Rinaldi, M., & Arlorio, M. 569
(2009). Study of the DPPH-scavenging activity: Development of a free software for 570
the correct interpretation of data. Food Chemistry, 114, 889–897. 571
Mayerle, M., Pancaldi, D., Haidukowski, M., Pascale, M., & Ravaglia, S. (2007). 572
Fusariosi e grano tenero: quali sono le varietà più resistenti. L’Informatore Agrario, 573
32, 45-49. 574

29
Noort, M. W. J., van Haaster, D., Hemery, Y., Schols, H. A., & Hamer, R. J. (2010). 575
The effect of particle size of wheat bran fractions on bread quality – Evidence for 576
fibre-protein interactions. Journal of Cereal Science, 52, 59-64. 577
Oliver, D. P., Gore, P. J., Moss, H. J., & Tiller, K. G. (1993). Cadmium in wheat-grain 578
and milling products from some Australian flour mills. Australian Journal of 579
Agricultural Research, 44, 1-11. 580
Parker, M. L., Ng, A., & Waldron, K. W. (2005). The phenolic acid and polysaccharide 581
composition of cell walls of bran layers of mature wheat (Triticum aestivum L. cv 582
Avalon) grains. Journal of the Science of Food and Agriculture, 85, 2539-2547. 583
Prosky, L., Asp, N. G., Schweizer, T. F., DeVries, J. W., & Furda, I. (1988). 584
Determination of insoluble, soluble and total dietary fibre in foods and food 585
products: interlaboratory study. Journal of the Association of Official Analytical 586
Chemists, 71, 1017–1023. 587
Rehman, S.U, Ahmad, M. M., Bhatti, I. A., Shafique, R., Ud Din, G. M., & Murtaza, M. 588
A. (2006). Effect of pearling on physic-chemical rheological characteristics and 589
phytate content of wheat-sorghum flour. Pakistan Journal of Botany, 38, 711-719. 590
Rios, G., Pinson-Gadais, L., Abecassis, J., Zakhia-Rozis, N., & Lullien-Pellerin, V. 591
(2009). Assesment of dehulling efficiency to reduce deoxynivalenol and Fusarium 592
level in durum wheat grains. Journal of Cereal Science, 49, 387-392. 593
Serpen, A., Gökmen, V., Pellegrini, N., & Fogliano, V. (2008). Direct measurement of 594
the total antioxidant capacity of cereal products. Journal of Cereal Science, 48, 595
816–820. 596
Shetlar, M. R., Rankin, G. T., Lyman, J. F., & France, W. G. (1947). Investigation of 597
the proximate chemical composition of the separate bran layers of wheat. Cereal 598
Chemistry, 24, 111-122. 599

30
Sidhu, J. S., Al-Hooti, S. N., & Al-Saqer, J. M. (1999). Effect of adding wheat bran 600
and germ fractions on the chemical composition of high-fiber toast bread. Food 601
Chemistry, 67, 365-371. 602
Singh, S., & Singh, N. (2010). Effect of debranning on the physico-chemical, cooking, 603
pasting and textural properties of common and durum wheat varieties. Food 604
Research International, 43, 2277-2283. 605
Sullivan, P., O’Flaherty, J., Brunton, N., Gee, V. L., Arendt, E., & Gallagher, E. 606
(2010). Chemical composition and microstructure of milled barley fractions. 607
European Food Research and Technology, 230, 579-595. 608
Trenholm, H. L., Charmley, L. L., Prelusky, D. B., & Warner, R. M. (1991). Two 609
physical methods for the decontamination of four cereals contaminated with 610
deoxynivalenol and zearalenone. Journal of Agricultural and Food Chemistry, 39, 611
356-360. 612
Zhang, D., & Moore, W. R. (1999). Wheat bran particle size effects on bread baking 613
performance and quality. Journal of the Science of Food and Agriculture, 79, 805-614
809. 615
616

31
Figures 617
Fig. 1. 618
TAA and FPA, β-glucan and DON contents in pearled wheat fractions. The reported 619
data are mean values of the three wheat varieties. 620
0
1
2
3
4
5
6
7
0-5% 5-10% 10-15% 15-20% 20-25% 25-100%
TAA (mmol TE kg
-1)
0
200
400
600
800
1000
0-5% 5-10% 10-15% 15-20% 20-25% 25-100%
FPA (total, µg kg
-1)
0.0
0.4
0.8
1.2
1.6
2.0
2.4
0-5% 5-10% 10-15% 15-20% 20-25% 25-100%
ß-glucans (%)
Pearled fractions
0
400
800
1200
1600
2000
0-5% 5-10% 10-15% 15-20% 20-25% 25-100%
DON (µg kg
-1)
Pearled fractions621
622
The error bars indicate the standard deviation between the wheat varieties. 623
624
625

32
626

33
Tables 627
Tab. 1. 628
Technological characteristics and protein, ash, DF, β-glucan and FPAa contents and TAA levels of wheat varieties. 629
Variety hardness ISQb Colour
Bolero soft wheat for biscuits white 12.6 c 1.8 ab 11.9 a 0.5 b 17.4 a 1.3 aBologna medium-hard superior breadmaking wheat red 13.7 b 1.6 b 10.2 b 0.7 a 14.8 b 1.3 aTaylor hard improver wheat red 14.7 a 1.9 a 12.0 a 0.6 a 13.9 b 1.5 a
P (F)
semc 0.050.430.09 0.05 0.12 0.03
(%) (%)
< 0.001
FPA
(mg kg-1)
0.003
(%) (%)Proteins Ashes DF β-glucans TAA
(mmol TE kg-1)
0.013 0.015 0.038 0.126
630
Results are expressed on a dw basis for whole kernel. Means followed by different letters are significantly different (the level of significance is shown in the 631
table). 632
a total: sum of FPA determined by means of RP-HPLC/DAD 633
b Foca et al., 2007 634
c sem: standard error of mean 635
636
637
638
639
640
34
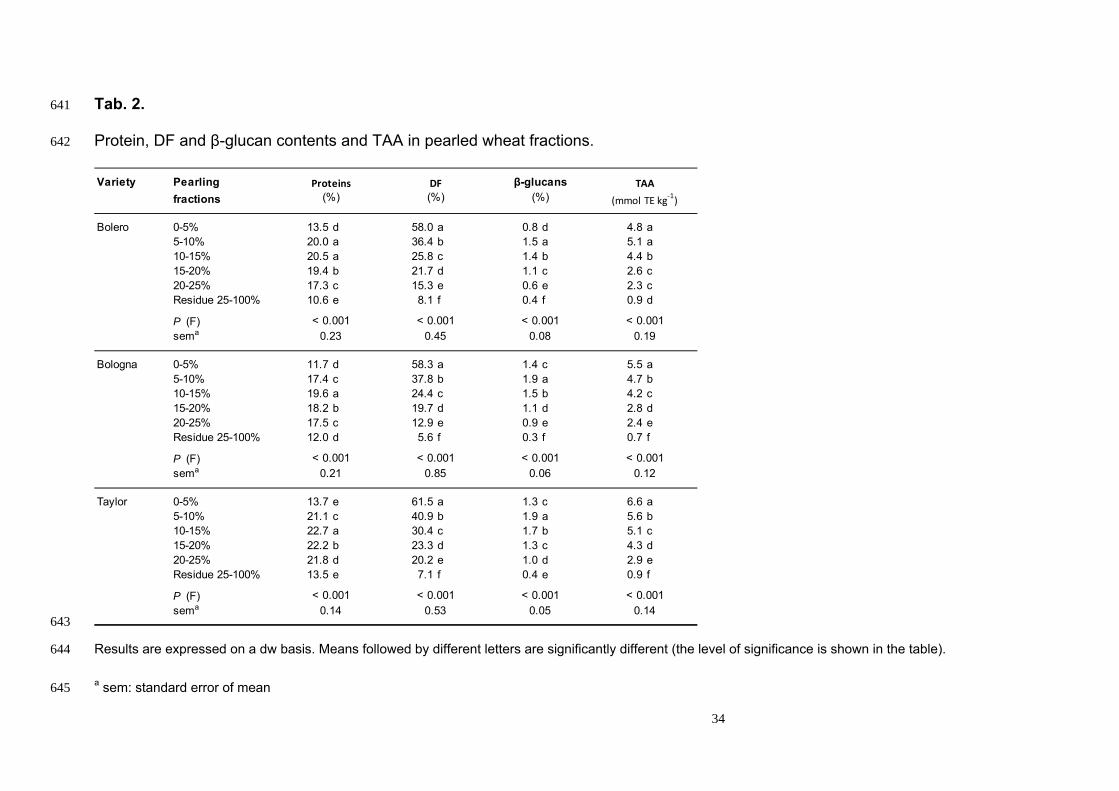
Tab. 2. 641
Protein, DF and β-glucan contents and TAA in pearled wheat fractions. 642
Variety Pearling
fractions
Bolero 0-5% 13.5 d 58.0 a 0.8 d 4.8 a5-10% 20.0 a 36.4 b 1.5 a 5.1 a10-15% 20.5 a 25.8 c 1.4 b 4.4 b15-20% 19.4 b 21.7 d 1.1 c 2.6 c20-25% 17.3 c 15.3 e 0.6 e 2.3 cResidue 25-100% 10.6 e 8.1 f 0.4 f 0.9 d
P (F)sema
Bologna 0-5% 11.7 d 58.3 a 1.4 c 5.5 a5-10% 17.4 c 37.8 b 1.9 a 4.7 b10-15% 19.6 a 24.4 c 1.5 b 4.2 c15-20% 18.2 b 19.7 d 1.1 d 2.8 d20-25% 17.5 c 12.9 e 0.9 e 2.4 eResidue 25-100% 12.0 d 5.6 f 0.3 f 0.7 f
P (F)sema
Taylor 0-5% 13.7 e 61.5 a 1.3 c 6.6 a5-10% 21.1 c 40.9 b 1.9 a 5.6 b10-15% 22.7 a 30.4 c 1.7 b 5.1 c15-20% 22.2 b 23.3 d 1.3 c 4.3 d20-25% 21.8 d 20.2 e 1.0 d 2.9 eResidue 25-100% 13.5 e 7.1 f 0.4 e 0.9 f
P (F)sema
< 0.001
β-glucansDF(%) (%) (%)
TAA
< 0.001
(mmol TE kg‐1)
< 0.001
Proteins
< 0.001
< 0.001
0.23
< 0.001
< 0.001
0.19
0.120.06
0.45
0.21
< 0.001
< 0.001
0.14
< 0.001
< 0.001
0.08
0.85
0.14 0.53 0.05
< 0.001
643
Results are expressed on a dw basis. Means followed by different letters are significantly different (the level of significance is shown in the table). 644
a sem: standard error of mean 645

35
Tab. 3. Free phenolic acida content in pearled wheat fractions. 646
Variety Pearling
fractions
Bolero 0-5% 959 a 620 a 95 c 60 b 77 a 65 a 12 a5-10% 876 a 517 b 188 a 78 a 57 b 29 b 6 b10-15% 718 b 435 b 160 b 67 b 38 c 14 c 4 c15-20% 483 c 313 c 105 c 36 c 29 d nd d nd d20-25% 396 c 260 c 82 d 32 c 23 e nd d nd dResidue 25-100% 94 d 53 d 29 e 4 d 8 f nd d nd d
P (F)
semb
Bologna 0-5% 788 a 538 a 71 b 67 a 43 a 25 a 18 a5-10% 572 b 403 b 80 a 36 b 27 b 11 b 14 b10-15% 500 c 394 b 46 c 22 c 24 b nd c 13 c15-20% 395 d 326 b 32 d 15 d 18 c nd c 5 d20-25% 261 e 215 c 22 e 8 e 13 d nd c 3 eResidue 25-100% 23 f 23 d nd nd f nd e nd c nd f
P (F)
semb
Taylor 0-5% 999 a 464 a 57 b 211 a 146 a 67 a 6 a5-10% 773 b 411 ab 75 a 171 b 85 b 26 b 4 b10-15% 626 c 345 bc 73 a 124 c 57 c 24 bc 3 cd15-20% 511 d 289 cd 60 b 88 d 49 c 21 c 4 bc20-25% 416 d 234 d 52 b 66 e 41 c 20 c 3 dResidue 25-100% 68 e 43 e 13 c 5 f 7 d nd d nd e
P (F)
semb
< 0.001< 0.001< 0.001
3.832.1
syringic p -hydroxybenzoiccaffeic
< 0.001
0.51.8 0.5
< 0.001< 0.001 < 0.001
0.63.1
1.5
< 0.001
1.8
< 0.001
< 0.001
total protocatechuic
< 0.001
3.8
< 0.001
5.5
< 0.001
39.4
< 0.001
chlorogenicferulic
(μg kg-1)(μg kg-1) (μg kg-1)(μg kg-1)(μg kg-1)(μg kg-1) (μg kg-1)
< 0.001
156.0
< 0.001< 0.001< 0.001< 0.001
46.2 0.46.4 1.7
< 0.001 < 0.001
10.2
3.129.929.1
647
Results are expressed on a dw basis. Means followed by different letters are significantly different (the level of significance is shown in the table). 648

36
a total: sum of FPA determined by RP-HPLC/DAD. nd: not detected 649
b sem: standard error of mean 650
651
37
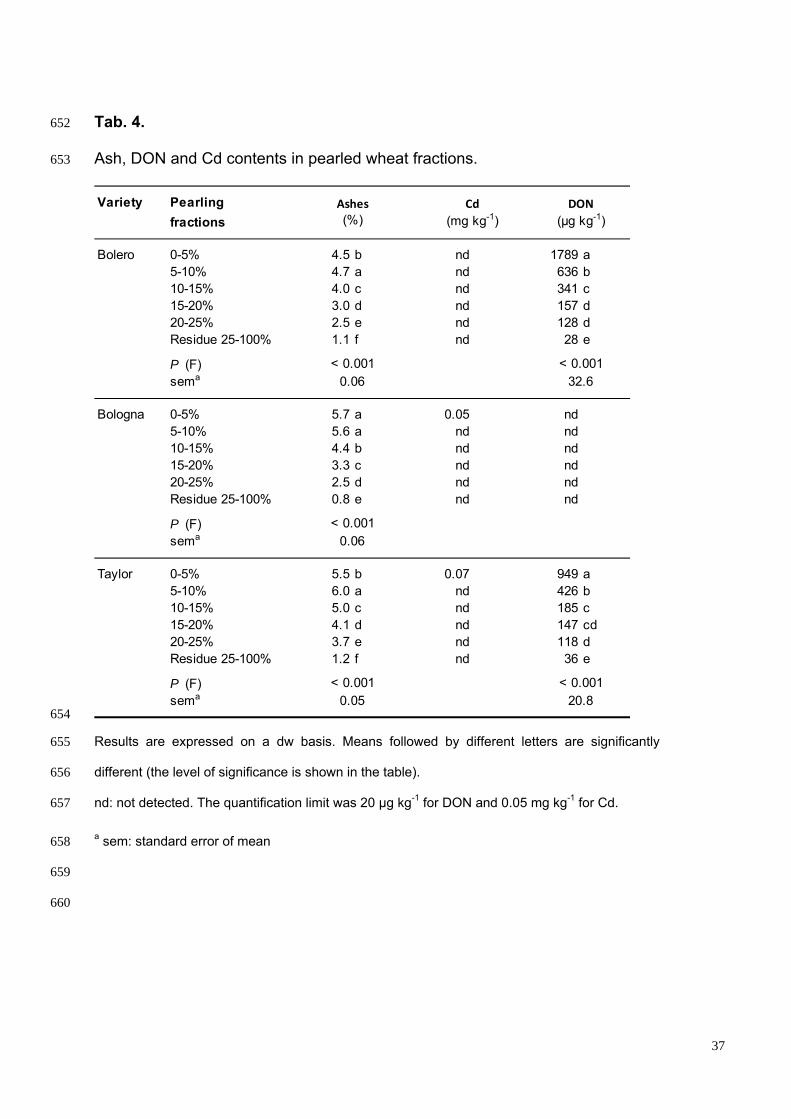
Tab. 4. 652
Ash, DON and Cd contents in pearled wheat fractions. 653
Variety Pearling
fractions
Bolero 0-5% 4.5 b nd 1789 a5-10% 4.7 a nd 636 b10-15% 4.0 c nd 341 c15-20% 3.0 d nd 157 d20-25% 2.5 e nd 128 dResidue 25-100% 1.1 f nd 28 e
P (F)sema
Bologna 0-5% 5.7 a 0.05 nd5-10% 5.6 a nd nd10-15% 4.4 b nd nd15-20% 3.3 c nd nd20-25% 2.5 d nd ndResidue 25-100% 0.8 e nd nd
P (F)sema
Taylor 0-5% 5.5 b 0.07 949 a5-10% 6.0 a nd 426 b10-15% 5.0 c nd 185 c15-20% 4.1 d nd 147 cd20-25% 3.7 e nd 118 dResidue 25-100% 1.2 f nd 36 e
P (F)sema
Ashes Cd
20.8< 0.001
0.05
DON(μg kg-1)
< 0.00132.6
< 0.001
< 0.001
(mg kg-1)
< 0.001
(%)
0.06
0.06
654
Results are expressed on a dw basis. Means followed by different letters are significantly 655
different (the level of significance is shown in the table). 656
nd: not detected. The quantification limit was 20 µg kg-1 for DON and 0.05 mg kg-1 for Cd. 657
a sem: standard error of mean 658
659
660