antimicrobial activity of methanol extract and fractions of ...
318
i AGBOKE, AYODEJI AKEEM PG/Ph.D/10/57874 ANTIMICROBIAL ACTIVITY OF METHANOL EXTRACT AND FRACTIONS OF MORINGA OLEIFERA LAM. ROOT BARK ON CLINICAL ISOLATES OF METHICILLIN RESISTANT STAPHYLOCOCCUS AUREUS FACULTY OF PHARMACEUTICAL SCIENCES DEPARTMENT OF PHARMACEUTICS Ebere Omeje Digitally Signed by: Content manager’s Name DN : CN = Webmaster’s name O= University of Nigeria, Nsukka OU = Innovation Centre
-
Upload
khangminh22 -
Category
Documents
-
view
0 -
download
0
Transcript of antimicrobial activity of methanol extract and fractions of ...
i
AGBOKE, AYODEJI AKEEM PG/Ph.D/10/57874
ANTIMICROBIAL ACTIVITY OF METHANOL EXTRACT AND FRACTIONS OF MORINGA OLEIFERA LAM. ROOT BARK ON
CLINICAL ISOLATES OF METHICILLIN RESISTANT STAPHYLOCOCCUS AUREUS
FACULTY OF PHARMACEUTICAL SCIENCES
DEPARTMENT OF PHARMACEUTICS
Ebere Omeje Digitally Signed by: Content manager’s Name
DN : CN = Webmaster’s name
O= University of Nigeria, Nsukka
OU = Innovation Centre

ii
ANTIMICROBIAL ACTIVITY OF METHANOL EXTRACT AND FRACTIONS OF MORINGA OLEIFERA LAM. ROOT
BARK ON CLINICAL ISOLATES OF METHICILLIN RESISTANT STAPHYLOCOCCUS AUREUS
BY
AGBOKE, AYODEJI AKEEM PG/Ph.D/10/57874
DEPARTMENT OF PHARMACEUTICS
FACULTY OF PHARMACEUTICAL SCIENCES
UNIVERSITY OF NIGERIA, NSUKKA
FEBRUARY 2015
CERTIFICATION
This is to certify that Agboke Ayodeji Akeem, a postgraduate student in the Department
of Pharmaceutics with the Reg. No. PG/Ph.D/10/57874 has satisfactorily completed the
degree of Doctor of Philosophy (Ph.D) in Pharmaceutical Microbiolgy and that the work

iii
embodied in this thesis is original and has not been submitted in part or full for any other
diploma or degree of this or other university.
..……………………… ………………………….. Prof. A. A. Attama Prof. K. C. Ofokansi Supervisor Head of Department

iv
DEDICATION
This thesis is dedicated to God Almighty, my other half, Pastor (Mrs.) Abimbola
Labake Agboke and my children (Precious, Gift and Emmanuel) for their moral support and
encouragement.

v
ACKNOWLEDGEMENT
I owe my immeasurable appreciation to Almighty God for His wisdom, love, mercy,
presence, guidance and provision throughout the period of this work. I also wish to express my
profound gratitude to my supervisor Prof. A. A. Attama for his care, concern and direction that was
needed for the successful completion of the work. My profound appreciation goes to the Head of
Department of Pharmaceutics, Prof. K. C. Ofokansi and Prof. V. C. Okore also of Pharmaceutics
for their encouragement and contributions to this study. Let me use this opportunity to appreciate
the Dean of Pharmaceutical Sciences, University of Nigeria Nsukka, Prof. Emmanuel Ibezim, Prof.
S. I. Ofoefule and Prof. C. O. Ezugwu (Faculty Rep., SPGS) for their encouragement and support.
My thanks also go to my professional colleagues in the Faculty of Pharmaceutical Sciencess
U.N.N; Dr. M. A. Momoh, Dr. Paul Akpa, Dr. Petra Nnamani, Dr. E. O. Omeje, Pharm. John
Ogbonna, Pharm. Frank Kenechukwu, Prof. J. Onyechi, Dr. N. Obitte, Dr. Agubata, Mr. Chijioke
Muogbo. I thank Prof. Paul A. Nwafor of Faculty of Pharmacy, University of Uyo for his
contribution to the toxicology aspect of the study. I thank my beloved wife Pastor (Mrs) Abimbola
Agboke, all members, workers and ministers of The Redeemed Christian Church of God, Chapel of
Light Parish and the leadership of Akwa Ibom Province 2, for their prayers. Surely God will reward
all of you. I remain grateful to my friends and well wishers of Faculty of Pharmacy, University of
Uyo, Dr. M. O. Adedokun, Dr. Stephen Majekodunmi, Pharm. Clement Jackson, Pharm.
Olorunshola Samuel, Dr. U .S. Ekong, Dr. (Mrs) Peace Ubulom, Dr. C. Udobi and my Ag Head of
Dept., Pharm. (Mrs.) E. I. Akpabio, Ag. Dean of Pharmacy, Dr. A.C. Igboasoiyi for their
encouragement and support. I also thank Mr. Fadare Olatomide of Central Science Lab., O. A. U.
Ile-Ife for his assistance in the GC-MS analysis.
February 2015

vi
TABLE OF CONTENTS
TITLE PAGE -- -- -- -- -- -- -- -- -- -- i
CERTIFICATION -- -- -- -- -- -- -- -- -- ii
DEDICATION -- -- -- -- -- -- -- -- -- -- iii
ACKNOWLEDGEMENT-- -- -- -- -- -- -- -- -- iv
TABLE OF CONTENTS -- -- -- -- -- -- -- -- v
LIST OF TABLES-- -- -- -- -- -- -- -- -- vi
LIST OF FIGURES -- -- -- -- -- -- -- -- -- vii
ABSTRACT -- -- -- -- -- -- -- -- -- -- viii
CHAPTER ONE
1.0. INTRODUCTION -- -- -- -- -- -- -- -- 1
1.1. History -- -- -- -- -- -- -- -- -- -- 2
1.2. Morphology -- -- -- -- -- -- -- -- -- 3
1.3. Taxonomic classification -- -- -- -- -- -- -- 5
1.4. Synonyms -- -- -- -- -- -- -- -- -- 5
1.5. Range and habitat -- -- -- -- -- -- -- -- 6
1.6. Geographical sources -- -- -- -- -- -- -- -- 7
1.7. Ethnomedical uses -- -- -- -- -- -- -- -- 8
vii
1.7.1 Moringa leaves -- -- -- -- -- -- -- -- -- 8
1.7.2 Moringa flowers -- -- -- -- -- -- -- -- -- 9
1.7.3. Moringa pods -- -- -- -- -- -- -- -- -- 9
1.7.4. Moringa seeds -- -- -- -- -- -- -- -- -- 9
1.7.5. Moringa roots, bark and gum -- -- -- -- --- -- -- 9
1.7.6. Moringa oil -- -- -- -- -- -- -- -- -- 10
1.8 Uses in Ayurvedic medicine -- -- -- -- -- -- -- 10
1.9 Uses in Siddha-- -- -- -- -- -- -- -- -- 10
1.10 Pharmacological properties -- -- -- -- -- -- -- 10
1.10.1 Antihypertensive, diuretic and cholesterol lowering activites - - -- 10
1.10.2 Antispasmodic, antiulcer and hepatoprotective activities-- -- -- -- 11
1.10.3 Antibacterial and antifungal activities -- -- -- -- -- -- 12
1.10.4 Antitumor and anticancer activities -- -- -- -- -- -- 13
1.10.5 Coagulant activities -- -- -- -- -- -- -- -- 13
1.10.6 Moringa seeds as biosorbent -- -- -- -- -- -- -- 14
1.10.7 Other diverse activities -- -- -- -- -- -- -- -- 15
1.11 Non- pharmacological uses -- -- -- -- -- -- -- -- 16
1.12 Phytochemisty -- -- -- -- -- -- -- -- -- 17
1.13 Bacteriology of staphylococci -- -- -- -- -- -- -- 20
1.13.1 Taxonomy-- -- -- -- -- -- -- -- -- 20
1.13.2 Identification of staphylococci in the clinical laboratory-- -- -- -- 21
1.13.3 Epidemiology of S. aureus Infections-- -- -- -- -- -- 23
1.13.4 Clinical manifestations of S. aureus-- -- --- -- -- -- 24
1.13.5 Pathogenesis of S. aureus Infections -- -- -- -- -- -- 24
viii
1.13.6 Infections Associated with Medical Devices-- -- -- -- -- 25
1.13.7 Virulence factors of S. aureus -- -- -- -- -- -- -- 25
1.13.8 Membrane damaging toxins -- -- -- -- -- -- -- 28
1.13.9 Other extracelluar proteins -- -- -- -- -- -- -- 32
1.14 Coagulase Negative Staphylococci (CNS) -- -- -- -- -- 33
1.15 Antimicrobial Resistance. -- -- -- -- -- -- -- -- 35
1.15.1 Mechanism of Bacterial Resistance -- - -- -- -- -- -- 36
1.15.2 Intrinsic resistance-- -- -- -- -- -- -- -- -- 37
1.15.3 Acquired resistance -- - -- -- -- -- -- -- -- 37
1.15.4 Prevention of antimicrobial access to their targets -- -- -- -- 38
1.16 Selected antimicrobial agents according to mechanisms of Action-- -- -- 41
1.16.1 Bacterial cell wall biosynthesis-- -- -- -- -- -- -- 43
1.16.2 Nucleic acid biosynthesis-- -- -- -- -- -- -- -- 47
1.16.3 Rifamycins, RNA transcription -- -- -- -- -- -- -- 49
1.16.4 Protein biosynthesis -- -- -- -- -- -- -- -- 49
1.16.4.1 Inhibitors of 30S subunit -- -- -- -- -- -- -- 50
1.16.4.2 Inhibitors of 50S subunit-- -- -- -- -- -- -- 53
1.16.5 Miscellaneous targets-- -- -- -- -- --- -- -- 58
1.16.5.1 Follic acid metabolism: sulphonamedes and trimethoprim -- -- -- 58
1.16.5.2 Cell membrane disruptors -- -- -- -- -- -- -- 60
1.17 Methicillin Resistant Staphylococcus aureus (MRSA) -- -- -- -- 61
1.17.1 Brief timeline-- -- -- -- -- -- -- -- -- 62
1.17.2 Methicillin-- -- -- -- -- -- -- -- -- -- 63
1.17.3 Mechanism of resistance-- -- -- -- -- -- -- -- 63

ix
1.17.4 Detection of resistance-- -- -- -- -- -- -- -- 65
1.17.5 Phenotypic detection systems-- -- -- -- -- -- -- 66
1.17.6 Genotypic detection system-- -- -- -- -- -- -- 70
1.17.7 Interpretation of genotypic detection methods-- -- -- -- -- 73
1.18 Evolution of methicillin-resistant S. aureus clones-- -- -- -- 73
1.19 Historical origins and mechanisms of evolution of MRSA-- -- -- 75
1.20 Treatment options-- -- -- -- -- -- -- -- -- 77
1.20.1 Cytotoxic effect of commonly available antimicrobial agents-- -- -- 78
1.20.2. Plants and plant product as sources of antimicrobial agents-- -- -- 78
1.21 Future prospects-- -- -- -- -- -- -- -- -- 79
1.21.1 Antimicrobial drugs--- -- -- -- -- -- -- -- 79
1.21.2 Vaccines and new approaches to combatting nosocomial infections -- -- 80
1.22 Antimicrobial evaluation of a new agent-- -- -- -- -- -- 81
1.22.1 Strip- agar – diffusion -- -- -- -- -- -- -- -- 81
1.22.2 Ditch agar diffusion -- - -- -- -- -- -- -- -- 82
1.22.3 Determination of minimal inhibitory concentration (MIC) of extracts -- -- 82
1.22.4 Determination of minimal biocidal concentration (MBC) of extracts -- -- 83
1.23 Aim of the Study-- -- -- -- -- --- -- -- -- 84
1.24 Objectives of the Study -- -- -- -- -- -- -- -- 84
CHAPTER TWO
2.0. MATERIALS AND METHODS -- -- -- -- -- -- -- 85
2.1. Materials -- -- -- -- -- -- -- -- -- -- 85
2.1.1 Sample Collection -- -- -- -- -- -- -- -- -- 85

x
2.1.2 Media -- -- -- -- -- -- -- -- -- -- 85
2.1.3 Reagents -- -- -- -- -- -- -- -- -- -- 85
2.1.4 Solvents -- -- -- -- -- -- -- -- -- -- 86
2.1.5 Equipments -- -- -- -- -- -- -- -- -- 86
2.1.6 Animals -- -- -- -- -- -- -- -- -- -- 86
2.2 METHODS -- -- -- -- -- -- -- -- -- 86
2.2.1 Collection, authentication and processing of plant materials -- -- -- 86
2.2.2 Extraction of root extract-- -- -- -- -- -- -- -- 87
2.2.3 Fractionation of methanol crude extract using column chromatography
- -- -- -- -- -- -- -- -- -- -- 87
2.2.4 Qualitative phytochemical analysis -- -- -- -- -- -- -- 87
2.2.5 Media preparation -- -- -- -- -- -- -- -- 93
2.2.6 Standardization of inoculums-- -- -- -- -- -- -- 93
2.2.7 Characterization of the clinical isolates-- -- -- -- -- -- 93
2.2.8 Antimicrobial susceptibility testing-- - -- -- -- -- 94
2.2.9 Penicilin-binding protein (PBP2ˈ) latex agglutination test for MRSA
confirmation-- -- -- ---- -- -- -- -- -- 95
2.3 Determination of MIC and MBC of the extracts and fractions on
MRSA clinical Isolates -- -- -- -- -- ---- -- -- 96
2.3.1 Preparation of stock solution-- -- -- -- -- -- -- 96
2.3.2 Preparation of extract and fractions solutions for agar dilution MIC tes - -- 96
2.3.3 Determination of MIC of methanol extract and fractions -- -- -- -- 97
2.3.4 Determination of MBC of methanol extract and fractions -- -- -- -- 97
2.3.5 GC-MS Determination of bioactive components of methanol extract
fractions -- -- - -- -- -- -- -- -- -- -- 99
xi
2.3.6 Identification of compounds in methanol extract fractions -- -- -- 99
2.3.7 Structures of some compouds identified in methanol extract fractions -- -- 100
2.4 Preliminary toxicology evaluation of the methanol crude extract
and n-hexane extract fraction-- -- -- -- -- -- -- 100
2.4.1 Acute toxicity study -- -- -- -- -- -- -- -- 100
2.4.2 Sub-acute toxicity study-- ---- -- -- -- -- -- 100
2.5 Stastical analysis -- -- -- -- -- -- -- -- -- 102
CHAPTER THREE
3.0 RESULTS AND DISCUSSIONS-- -- -- -- -- -- -- 103
3.1 Results-- -- -- -- -- -- -- -- -- -- -- 103
3.1.1 The Percentage yield of the methanol extracts and fractions -- -- -- 103
3.1.2 Qualitative phytochemical analysis of the extracts and fractions-- -- -- 105
3.2 Characterization of clinical isolates-- -- -- -- -- --- 106
3.3 Antimicrobial susceptibility test-- -- -- -- --- -- 107
3.4 Penicilin-binding protein (PBP2') latex agglutination test results -- -- 109 3.5 Prevalence rate of clinical isolates of S.aureus, MSSA, MRSA -- - 109
3.6 Results of the MIC and MBC of the extracts and fractions on MRSA clinical isolates- -- -- -- -- -- -- -- - -- 112 3.7 GC-MS identification of bioactive compounds of methanol
extract fractions- -- -- -- -- -- --- -- 120
3.8 Structure of some phytochemical compounds identified in
Moringa oleifera root bark -- -- -- -- -- -- -- -- 127

xii
3.9. Preliminary evaluation of toxicity of crude methanol extract and
n-hexane extract fraction-- --- -- -- -- -- -- -- -- 130
3.9.1 Acute toxicity test of crude methanol extract extract and n-hexane
extract fraction -- -- -- -- -- -- -- -- -- 130
3.9.2 Sub-acute toxicity study of crude methanol extract and n-hexane
extract fraction of M. oleifera root--- -- -- -- -- -- -- 130
3.9.3 Effects of graded doses of crude methanol extract and n-hexane
extract fraction on body weights of rats-- ---- -- -- -- -- 131
3.10 Discussion -- -- -- -- -- -- -- -- -- 138
3.10.1 Percentage yield of extracts and fractions-- - -- -- -- -- 138
3.10.2 Qualitative phytochemical analysis of methanol extract and fractions -- 138
3.10.3 Prevalence rate of clinical isolates of S. aureus -- -- -- -- -- 140
3.10.4 Antimicrobial susceptibility pattern of clinical isolates -- ---- 141
3.10.5 Penicilin – binding protein (PBP2') latex agglutination test -- -- -- 143
3.11 MIC and MBC of methanol extract and fractions -- -- -- -- 144
3.11.1 MIC and MBC of methanol crude extract -- -- -- -- -- 145
3.11.2 MIC and MBC of ethyl acetate fraction-- -- -- -- -- 145
3.11.3 MIC and MBC of n-hexan extract fraction -- -- -- -- -- 146
3.11.4 MIC and MBC of Dichloromethane fraction -- -- -- -- -- 146
3.11.5 MIC and MBC of Methanol fraction -- -- -- -- -- -- 147
3.12 GC-MS identification of bioactive compounds of methanol extract fractions -- -- -- -- -- -- -- -- -- 147

xiii
3.12.1 Gas chromatography-mass spectrometry (GC-MS)
of ethyl acetate fraction -- -- -- -- -- -- -- -- 149
3.12.2 Gas chromatography-mass spectrometry (GC-MS)
of dichloromethane fraction -- -- -- -- -- -- -- 149
3.12.3 Gas chromatography-mass spectrometry (GC-MS) of n-hexane fraction -- -- -- -- -- -- -- -- 150
3.12.4 Gas chromatography-mass spectrometry (GC-MS)
of methanol fraction -- -- -- -- -- -- -- -- 150
3.12.5 Structure of some phytochemical compounds identified in
Moringa oleifera root bark -- - -- -- -- -- -- -- 150
3.13 Acute toxicity test of crude methanol extract and n-hexane
extract fraction-- -- -- -- -- -- -- -- 151
3.13.1 Sub-acute toxicity study of the crude methanol extract and n-hexane
extract fraction -- -- -- -- --- -- --- -- 151
3.13.2 Effects of graded doses of crude methanol extract and n-hexane
extract fraction on body weights of rats -- -- ---- -- -- -- 151
CHAPTER FOUR
4.0 CONCLUSIONS AND RECOMMENDATIONS -- -- --- -- 152
4.1 Conclusions -- -- -- -- -- -- -- -- -- 152
4.2 Recommendations -- - -- -- -- -- -- -- -- 154
4.3 Contributions to knowledge -- -- -- -- -- -- -- 155
References -- -- -- -- --- -- -- -- -- -- -- 156
Apendices -- -- -- -- -- -- -- -- -- -- -- 198

xiv
LIST OF TABLES
Table 1 Preparation of extract and fractions concentration for agar dilution MIC tests-- -98
Table 2 The percentage yield of crude methanol extracts and fractions of
M. oleifera root bark-- -- -- -- -- -- -- -- 104
Table 3 Results of Phytochemical Analysis of crude methanol extracts and fractions- - -- -- -- ---- -- -- -- 105 Table 4 Antimicrobial susceptibility test -- -- -- -- -- - 108
Table 5 Penicilin-binding protein (PBP2') latex agglutination test -- -- -- 110
Table 6 Prevalence rate of clinical isolates of Staphylococcus aureus --- - 111
Table 7 MIC and MBC of crude methanol extract in mg/ml -- -- -- -- 115
Table 8 MIC and MBC of ethyl acetate fraction in mg/ml -- -- -- -- 116
Table 9 MIC and MBC of n-hexane fraction in mg/ml -- -- -- -- 117
Table 10 MIC and MBC of dichloromethane fraction in mg/ml -- -- -- 118
Table 11 MIC and MBC of methanol fraction in mg/ml -- -- -- 119
Table 12 Acute toxicity test of crude methanol extract and
n-hexane extract fraction-- -- -- -- -- -- --- -- 132
Table 13 Effects of the graded doses of crude methanol extract and
n-hexane fraction on haematological parameters of rats -- -- -- 135
Table 14 Effects of the graded doses of crude methanol extract and
n-hexane extract fraction on biochemical parameters of rat--- -- 136
Table 15 Effects of graded doses of crude methanol extract and
n-hexane extract fraction on body weights of rats -- -- -- -- 137

xv
LIST OF FIGURES
Fig. 1 Compuond leaf; paler lower surfaces of leaflets of Moringa oleifera -- -- -- 4
Fig.2 Flower panicle of Moringa oleifera targets for antimicrobial agents. -- -- ---4
Fig. 3 Summary of the resistance mechanisms to the main antibiotimicrobial classes - - 40
Fig. 4 Structures of some representatives of the discussed antimicrobial classes - - - 43
Fig. 5 Inhibitor of β-lactams and the glycopeptides -- -- -- -- --- --44
Fig. 6 Inhibitors of nucleic acid biosynthesis -- -- -- -- -- --48
Fig. 7 The process of protein biosynthesis inhibition -- -- ---- -- - --51
Fig. 8 Sulphonamides and trimethoprim inhibit distinct steps in folate metabolism --61
Fig. 9 Evolution of MRSA clones in Latin American countries -- -- -- --76
Fig. 10 MS Fragment of ethyl acetate fraction composition -- -- -- -123
Fig. 11 MS Fragment of dichloromethane fraction composition -- -- -- -124
Fig. 12 MS Fragment of n-hexane fraction composition -- -- -- -- -125
Fig. 13 MS Fragment of methanol fraction composition -- -- -- -- -126
Fig. 14 Structure of some components identified in methanol extract fractions -- -143
Fig. 15 Determination of LD50 value of methanol extract of M. oleifera root bark in rats -147
Fig. 16 Determination of LD50 value of n-hexane extract of M. oleifera root bark in rats -151

xvi
APPENDICES
Appendix 1: Identification of methicillin resistant S. aureus (MRSA)- -- -- - - - - 198
Appendix 2: Effect of methanol crude extract extracts on methicillin-resistant S. aureus—199
Appendix 3: Effect of ethyl acetate fraction methicillin-resistant S. aureus (MRSA) -- 200
Appendix 4: Effect of dichloromethane fraction on methicillin-resistant S. aureus --- ------201
Appendix 5: Effect of n-hexane extract fraction on methicillin-resistant S. aureus--- 202
Apendix 6: Effect of methanol fraction on methicillin-resistant S. aureus-- -- -- 203
Appendix 7: GC-MS report and activity of components of ethyl acetate fraction ----- 204
Appendix 8: A GC-MS report of dichloromethane fraction -- -- -- -- 207
Appendix 9: Activity of components identified in the sample of dichloromethane fraction-209
Appendix 10: A GC-MS report of n-hexane fraction ------ -- -- -- -- -214
Appendix 11: Activity of components identified in the sample n-hexane fraction -- 215
Appendix 12: A GC-MS report of methanol fraction-- -- -- -- 218
Appendix 13: Activity of components identified in the methanol fraction --- -- 218
Appendix 14: All statistical analysis with spss version 17 software -- -- -- 220
xvii
ABSTRACT
Development of antimicrobial resistance by bacteria is now a world wide health issue, as
infection is one of the leading causes of death in the world today. This fact is also as a result
of the emergence of multiple antibiotic resistant bacteria known as methicillin resistant
Staphylococcus aureus (MRSA) with potential of cross resistance to other antibiotics of
choice like vancomycin. MRSA is often referred to as a potential killer and one of the tree top
superbugs in hospitals multidrug resistant organisms (MDRO). The aim of this study was to
evaluate the phytochemical components and antimicrobial activity of methanol extract and
fractions of Moringa oleifera root bark as possible remedy for MRSA infections.
Staphylococcus aureus isolates from 3 different hospitals in South-east geopolitical region of
Nigeria were confirmed by coagulase/staphylase test using Oxoid® reagents kits (DR0595A).
The characterised S. aureus isolates were further identified as Methicillin resistant
staphylococcus aureus by disc diffusion method as recommended by the Clinical Laboratory
Standards Institute (CLSI), using standard antibiotic discs containing oxacillin (5 µg/ml),
vancomycin (30 µg/ml), cephalexin (30 µg/ml), levofloxacin (5 µg/ml), ciprofloxacin (5
µg/ml), tetracycline (30 µg/ml), cotrimoxazole (25 µg/ml), gentamicin (30 µg/ml),
clindamycin (2 µg/ml) and rifampicin (5 µg/ml). Methicillin resistant staphylococcus aureus
confirmation was done using Oxoid® DR0900 penicillin binding protein (pbp2ˈ) latex
agglutination test kits. Pulverised Moringa oleifera root bark was defatted with n-hexane to
yield hexane fraction (HEF). The dried marc was extracted with methanol using Soxhlet
extractor to obtain crude methanol extract (ME). Methanol extract was adsorbed on Silical gel
(60-200 mesh) and eluted in succession to obtain dichloromethane fraction (DMF), ethyl
acetate fraction (EAF) and methanol fraction (MEF). Qualitative phytochemical analyses of
the extracts were carried out using standard procedures. The antimicrobial activities of ME,
HEF, DMF, EAF and MEF were evaluated on the MRSA, the minimum inhibitory
xviii
concentrations (MICs) and minimum bactericidal concentrations (MBCs) were recorded and
compared with the standard disc antimicrobial test results. The extract fractions were analysed
using gas chromatographic-mass spectrometry (GC-MS) for their bioactive compounds. The
preliminary acute toxicity and sub-acute toxicity of ME and HEF were evaluated. Statistical
analysis was done with ANOVA followed by Duncan post Hoc test using SPSS v 17 software.
Characterised clinical isolates yielded 58 S. aureus strains. Antibiotic susceptibility tests
indicated varied percentages of MRSA that were resistant to various antibiotics thus: oxacillin
(62.1 ± 3.2%), vancomycin (60.4 ± 3.8%), cephalexin (55.2 ± 1.2%), levofloxacin (56.9 ±
2.2%), ciprofloxacin (56.9 ± 0.9%), tetracycline (65.5 ± 2.3%), cotrimoxazole (68.9 ± 0.8%),
gentamicin (67.2 ± 1.3%), clindamycin (62.1 ± 3.3%) and rifampicin (62.1 ± 4.1%). Latex
agglutination test confirmed 39 strains of the clinical isolates to be MRSA. The S. aureus
isolates resistant to all the antibiotics including vancomycin at 30 µg/ml were sensitive to the
extract and all its fractions: ME: MIC (3.0 ± 0.1 to 5.0 ± 0.5 mg/ml) and MBC (3.0 ± 0.1 to
6.0 ± 0.5 mg/ml); EAF: MIC (5.0 ± 1.1 to 8.0 ± 0.5 mg/ml) and MBC (5.0 ± 0.5 to 8.0 ± 0.5
mg/ml); DMF MIC (8.0 ± 1.1 to 10 ± 0.5 mg/ml) and MBC (8.0 ± 0.5 to 10 ± 0.5 mg/ml);
HEF: MIC (7.0 ± 0.5 to 8 ± 1.1 mg/ml) and MBC (7.0 ± 0.5 to 9 ± 0.5 mg/ml), MEF: MIC
(9.0 ± 1.1 to 10.0 ± 0.5 mg/ml) and MBC (9.0 ± 0.5 to 10.0 ± 0.5 mg/ml). Phytochemical
analysis of the extracts showed the presence of alkaloids, glycosides, steroids, terpenoids,
flavonoids, saponins, tannins, resins, reducing sugars, proteins, fats and oil and carbohydrates.
GC-MS analysis revealed over 100 distinct compounds, some of which are stigmasterol
(C29H48O), eugenol (C10H12O2), oxime (C3H7NO ) and ergosta-4, 22-dien-3-one (C28H44O).
The oral acute toxicity test showed the LD50 of ME as 3663.96 mg/kg and HEF as
1934.15mg/kg, with no significant change (P > 0.05) in the hematological, serum biochemical
parameters and weight of the rats.

1
CHAPTER ONE
1.0 Introduction
In the last few decades there has been an exponential growth in the field of herbal
medicine. It is getting popularized in developing and developed countries owing to its natural
origin and lesser side effects [1]. Herbal drugs constitute a major share of all the officially
recognized systems of health in India viz. Ayurveda, Yoga, Unani, Siddha, Homeopathy and
Naturopathy, except Allopathy. More than 70% of India's 1.1 billion population still use these
non-allopathic systems of medicine [2].
In many developing countries, a large proportion of the population relies on traditional
practitioners and their armamentarium of medicinal plants in order to meet health care needs.
Although modern medicines may exist side-by-side with such traditional practice, herbal
medicines have often maintained their popularity for historical and cultural reasons. Such
products have become more widely available commercially, especially in developed
countries. Use of herbal medicines in developed countries has expanded sharply in the latter
half of the twentieth century. In India, herbal drugs are an integral part of the Indian system
of medicine (Ayurveda), which is an ancient and mainstream system [3].
The evaluation of various plant products according to their traditional uses and
medicinal value based on their therapeutic efficacy leads to the discovery of newer and recent
drugs for treatingvarious ailments. This fact forms the basis for the development of new
drugs from various plant sources. One of such plants of medicinal value is Moringa olifera,
belonging to the family Moringaceae, commonly known as ‘sahajan’ in Hindi, Horse radish
in English. It is a small, fast, growing, evergreen, or deciduous tree that usually grows up to
10 or 12 m in height. It is distributed among Sub Himalayan Tracts, Assam, Bengal and
Peninsular India [4]. Various properties are attributed to it like antispasmodic, diuretic,
expectorant and abortifacient [5].

2
1.1 History of Moringa oleifera
It is a small or medium-sized tree, attractive enough to be a focal point in the tropics
and sub-tropics owing to its creamy – white, sweetly scented flowers and light –green,
tripinnately compound foliage [1-3]. It is a native to India, occurring wild in the sub-
Himalayan regions of Northern India and cultivated throughout the country. It is commonly
known as Sajina, sajna (Bengali); horseradish tree, drumstick tree (English); Sahinjan,
mungna (Hindi); murinna, muringa, tishnagandha (Malyalam); sevaga, segata (Marathi);
Sohanjana (Punjabi); Sobhanjana, sigru, murungi, dvishiguru (Sanskrit) and Sehjan(Urdu) in
varied Indian languages and regions [4,5]. It also thrives well in Pakistan, Bangladesh, Sri
Lanka, tropical Africa, Arabia, Philippines, Cambodia and Central, North and South America
[6-10]. Described as “one of the most amazing trees God has created”, almost every part of
drumstick viz. bark, root, fruit, flowers, leaves, seed and gum is a rich repository of proteins,
vitamins and minerals including potassium, calcium, phosphorus, iron, folic acid as well as β
carotene. Leaves can be eaten fresh, cooked or stored as dry powder for many months
without refrigeration, without loss of nutritional value. Almost all the parts of this plant have
been used for various ailments in the indigenous medicine of South Asia [11, 12]. The named
varieties of moringa include Jaffna or Yazhpanam, grown in various parts of South India,
(producing 60-90 cm long pods), Chavakacheri murungai, (producing pods 90-120 cm long),
Chemmurungai (with red tipped fruits), Kadumurungai, Palmurungai, Puna murungai (with
thick pulp and bitter taste), Kodikkal Murungai etc. [13,14].
The Horticultural College & Research Institute of Tamil Nadu Agricultural University
has released two improved annual moringa varieties (PKM1, PKM2) within a span of 10
years, for commercial cultivation [15, 16]. The folklore claims and ancient literature report
moringa to be an abortifacient antidote, antirheumatic, bactericide, diuretic, ecbolic, emetic,
expectorant, purgative, rubefacient, stimulant, tonic, vermifuge and vesicant [17-20].

3
(Pharma Products Pvt Ltd, Thayavur, India) and Livospin (Herbals APS Pvt. Ltd., Patna,
India), which are available for a variety of ailments [21]. Ayurvedic preparations include
Ratnagiri Rasa, Sarasvata Ghrta, Sudarsana churna, Sarsapadi Pralepa, Visatimduka Taila etc
[4, 5].
Leaves of moringa are applied as poultice to sores and in treatment of anemia and
menstrual irregularities. Young leaf paste with curd, is used internally for stomachache while
externally for sprains. Leaf juice or bark paste is used as a drink for constipation and piles
[22, 23]. The root juice is applied externally as rubefacient or counter irritant, in hiccups,
lumbago, enlarged spleen or liver. Bark, leaves and roots are acrid and pungent, taken to
promote digestion. A reddish gum exuded from the bark possess anti diarrhoeal,
emmenagogue, antiscorbic and abortifacient properties. According to Materia Medica, a
compound spirit made from equal parts of roots of Moringa and orange peel acts as
carminative and stimulant in nervous debility, paralytic afflictions, epilepsy and hysteria [24-
26]. Not only this, moringa is glorified as a ‘traditional mother care plant’, for the leaves are
highly nutritious for pregnant women [27].
Until now, only a very few attempts have been made to compile the myriad of potential
uses of this “miracle tree”. In view of a number of recent findings of ethnopharmacological
importance, an updated appraisal was much needed. So, the present research is an attempt to
explore the claims so far and prepare the ground for development of effective novel herbal
formulations of M. oleifera. in the treatment of infections caused by much dreaded Methicilin
resistant Staphylococcus aureus [25-27].
1.2 Morphology
Moringa oleifera is a small, fast-growing evergreen or deciduous tree that usually
grows as high as 9 m, with a soft and white wood and corky and gummy bark. Roots have the
taste of horseradish. Leaves are longitudinally cracked leaves, 30-75 cm long main axis and

4
Fig. 1 Compound leaf; paler lower surfaces of leaflets of Moringa oleifera
Fig. 2 Flower panicle Moringa oleifera
5
its branch jointed, glandular at joints, leaflets are glabrous and entire. The leaflets are finely
hairy, green and almost hairless on the upper surface, paler and hairless beneath, with red-
tinged mid-veins, with entire (not toothed) margins, and are rounded or blunt-pointed at the
apex and short-pointed at the base. The twigs are finely hairy and green. Flowers are white,
scented in large axillary down panicles, pods are pendulous, ribbed, seeds are 3-angled [4, 6].
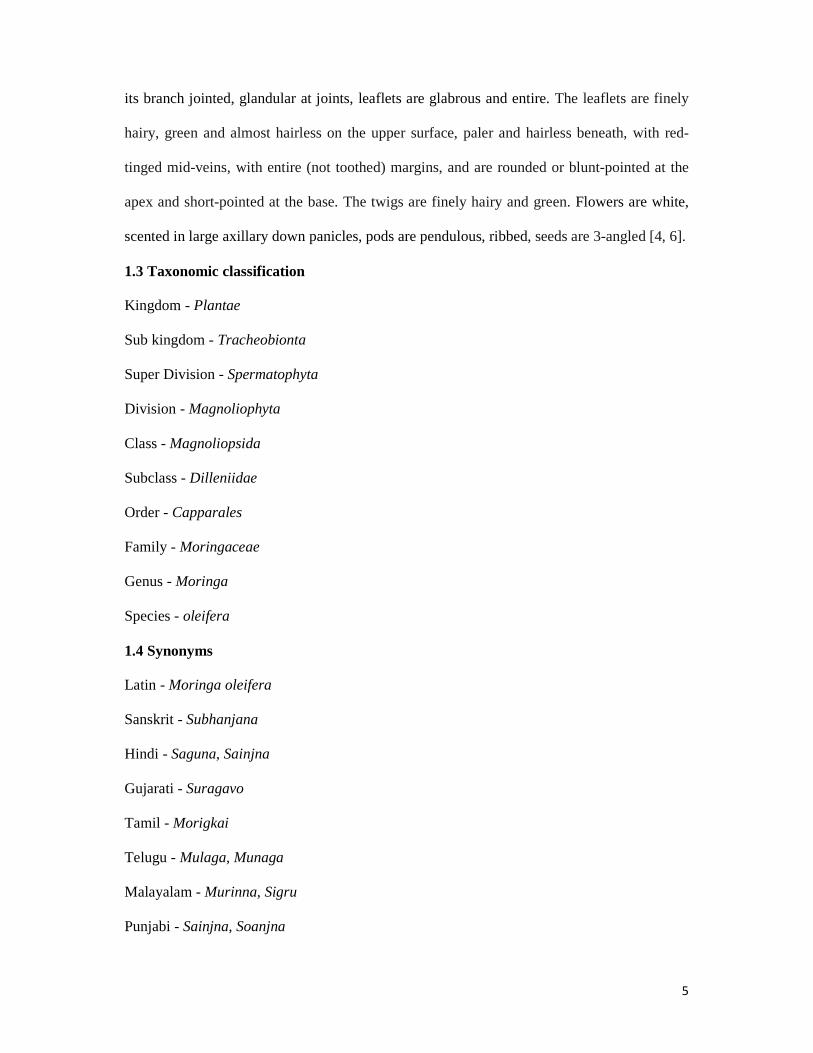
1.3 Taxonomic classification
Kingdom - Plantae
Sub kingdom - Tracheobionta
Super Division - Spermatophyta
Division - Magnoliophyta
Class - Magnoliopsida
Subclass - Dilleniidae
Order - Capparales
Family - Moringaceae
Genus - Moringa
Species - oleifera
1.4 Synonyms
Latin - Moringa oleifera
Sanskrit - Subhanjana
Hindi - Saguna, Sainjna
Gujarati - Suragavo
Tamil - Morigkai
Telugu - Mulaga, Munaga
Malayalam - Murinna, Sigru
Punjabi - Sainjna, Soanjna
6
Unani - Sahajan
Ayurvedic - Akshiva, Haritashaaka, Raktaka, Tikshnagandhaa
Arabian - Rawag
French - Moringe à graine ailée, Morungue
Spanish - Ángela, Ben, Moringa
Portuguese - Moringa, Moringueiro
Chinese - Laken
English - Drumstick tree, Horseradish tree, Ben tree
Yoruba - Ewe igbale, ewe ile, adagba maloye, igi agunmaniye
Igbo - Okwe oyibo, odudu oyibo, okochi egbu
Hausa - Zogale, bagagruwa maka [4-7].
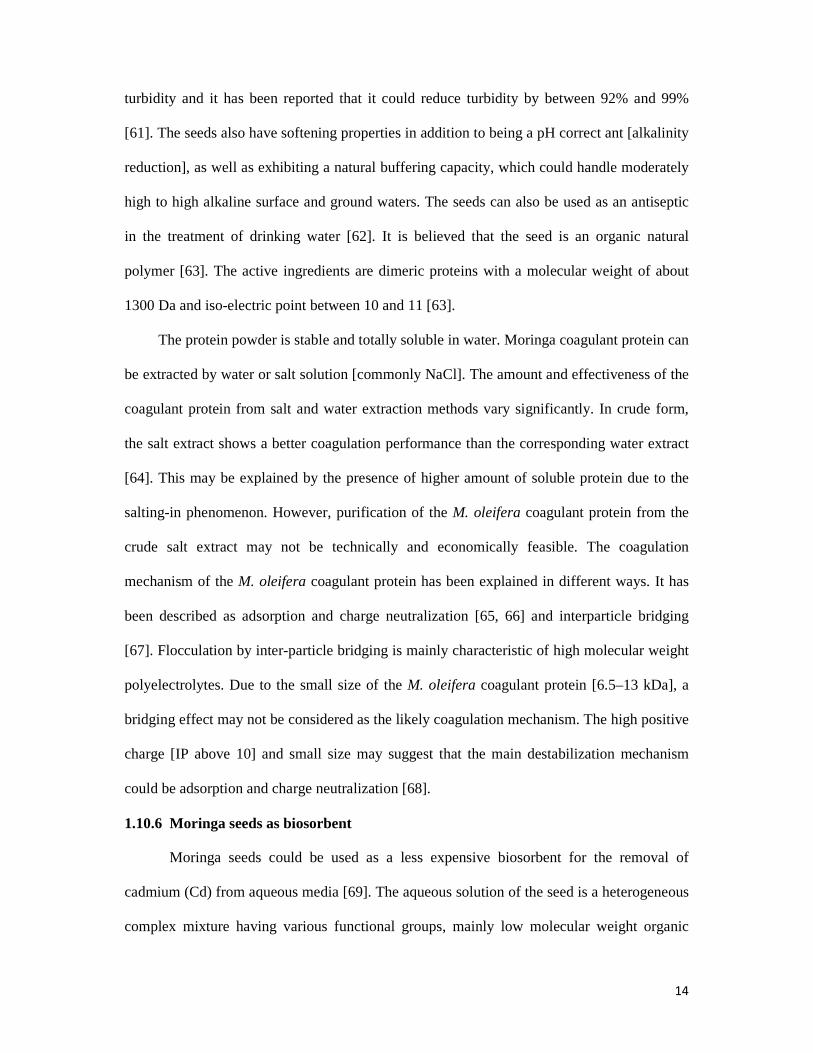
1.5 Range and habitat
The moringa tree is grown mainly in semiarid, tropical, and subtropical areas,
corresponding in the United States to USDA hardiness zones 9 and 10. It grows best in dry
sandy soil and tolerates poor soil, including coastal areas. As with all plants, optimum
cultivation depends on producing the right environment for the plant to thrive. Moringa is a
sun and heat-loving plant, and thus does not tolerate freeze or frost. Moringa is particularly
suitable for dry regions, as it can be grown using rainwater without expensive irrigation
techniques. The following conditions are reported to be ideal for cultivation of M. oleifera [8-
10].
Parameter Requirement/Range
Climate
Grows best in tropical or sub-tropical
Altitude/ Height
0 – 2000 meters

7
Rainfall
250 – 2000 mm.
Irrigation needed for leaf production if rainfall < 800 mm
Soil Type
Loamy, sandy or sandy-loam
Soil pH
pH 5 – 9
1.6 Geographical sources
The tree is wild in the Sub-Himalayan tracts from Chenab to Oudh. It grows at
elevations from sea level to 1400 m. It is very commonly cultivated near houses in Assam,
Bengal and peninsular India. It is a prolific coppice [4]. It is also cultivated in north-eastern
Pakistan, north-eastern Bangladesh, Sri Lanka, West Asia, the Arabian Peninsula, East and
West Africa, throughout the West Indies and southern Florida, in Central and South America
from Mexico to Peru, as well as in Brazil and Paraguay [6].
As of 2010, cultivation in Hawaii, for commercial distribution in the United States, is in
its early stages.[9] "India is the largest producer of moringa, with an annual production of 1.1
to 1.3 million tones of tender fruits from an area of 380 km². Among the states, Andhra
Pradesh leads in both area and production (156.65 km²) followed by Karnataka (102.8 km²)
and Tamil Nadu (74.08 km²). In other states, it occupies an area of 46.13 km². Tamil Nadu is
the pioneering state in·so·much as it has varied genotypes from diversified geographical areas
and introductions from Sri Lanka.[9 -10]
Moringa is grown in home gardens in Odisha and as living fences in Southern India and
Thailand, where it is commonly sold in local markets.[11] In the Philippines, it is commonly
grown for its leaves which are used in soup. Moringa is also actively cultivated by the World
Vegetable Center in Taiwan, a center for vegetable research with a mission to reduce poverty
and malnutrition in developing countries through improved production and consumption of

8
vegetables. Tamil nadu, Southern India has Moringa in its folk stories and use in home
gardens. In Haiti it is grown as wind breaks and to help reduce soil erosion [11-12].
1.7 Ethnomedical uses
Moringa oleifera has an impressive range of medicinal uses with high nutritional value and
medicinal benefits. Different parts of Moringa contain a profile of important minerals and are
good source of protein, vitamins, beta-carotene, amino acids and various phenolics. Moringa
provides a rich and rare combination of zeatin, quercetin, beta-sitosterol, caffeoylquinic acid
and kaempferol [13]
Moringa can act as cardiac and circulatory stimulants, possess antitumor, antipyretic,
antiepileptic, antiinflammatory, antiulcer, antispasmodic, diuretic, antihypertensive,
cholesterol lowering, antioxidant, antidiabetic, hepatoprotective, antibacterial and antifungal
activities, and are being employed for the treatment of different ailments in the indigenous
system of medicine.
1.7.1 Moringa leaves [14, 15]
Leaves rubbed against the temple can relieve headaches and stop bleeding from a shallow
cut. There is an anti-bacterial and anti-inflammatory effect when applied to wounds or insect
bites, extracts can be used against bacterial or fungal skin complaints. The Leaf tea treats
gastric ulcers and diarrhea, eating Moringa food products is good for those suffering from
malnutrition due to the high protein and fibre content. Leaves of this plant treat fevers,
bronchitis, eye and ear infections and inflammation of the mucus membrane.
The iron content of the leaves is high, and they are reportedly prescribed for anemia in the
Philippines. Dried Moringa leaves treat diarrhoea in Malawi, Africa. The powder ground
from the seeds is also used in the treatment of scurvy skin diseases (common bacterial
infections of the skin).

9
1.7.2 Moringa flowers
Flower juice improves the quality and flow of mothers’ milk when breast feeding, it is also
useful for urinary problems as it encourages urination. In Haiti, villagers boil Moringa
flowers in water and drink the tea as a powerful cold remedy.
1.7.3 Moringa pods
If eaten raw, pods act as a de-wormer and treat liver and spleen problems and pains of the
joints. Due to high protein and fibre content pods can play a useful part in treating
malnutrition and diarrhoea.
1.7.4 Moringa seeds
Used for their antibiotic and anti-inflammatory properties to treat arthritis, rheumatism, gout,
cramp, sexually transmitted diseases and boils. The seeds are roasted, pounded, mixed with
coconut oil and applied to the problem area. Seed oil can be used for the same ailments.
Roasted seeds and oil can encourage urination and can also be used as a relaxant for epilepsy.
Moringa seeds are effective against skin-infecting bacteria Staphylococcus aureus and
Pseudomonas aeruginosa. They contain the potent antibiotic and fungicide terygospermin
[16].
1.7.5 Moringa roots bark and gum
The roots and the bark have all of the properties described above but are more concentrated,
therefore much more care should be taken if using them as medicines. Roots bark are used for
cardiac and circulatory problems, as a tonic and for inflammation. The bark is an appetizer
and digestive.
In Senegal and India, roots are pounded and mixed with salt to make a poultice for treating
rheumatism and articulars pains. This poultice is also used to relieve lower back or kidney
pain, an alkaloid spirachin (a nerve paralysant) has been found in the roots.
The gum is diuretic, astringent and abortifacient and is used against asthma.
10
1.7.6 Moringa oil
Oil of Ben is used for hysteria, scurvy, prostate problems and bladder troubles. Villagers in
Oman use Moringa oil to treat stomach disorders. They also use it in perfume and hair oil.
1.8 Uses in ayurvedic medicine
Uses every part of the Moringa tree and considers it one of the most valuable and useful
plants. The ayurvedic medicine of India has many uses for moringa tree products, such as a
natural antibiotic, an aid in childbirth, for treating liver disorders, and many other uses.
1.9 Uses in Siddha medicine
In Siddha medicine says that the leaves are full of medicinal properties. The drumstick seeds
are used as a sexual virility drug for treating erectile dysfunction in men and also in women
for prolonging sexual activity [17-21].
1.10 Pharmacological properties
Moringa oleifera also has numerous medicinal uses, which have long been recognized in the
Ayurvedic and Unani systems of medicine [22]. The medicinal attributes and
pharmacological activities ascribed to various parts of moringa are detailed below.
1.10.1 Antihypertensive, diuretic and cholesterol lowering activities
The widespread combination of diuretic along with lipid and blood pressure lowering
constituents make this plant highly useful in cardiovascular disorders. Moringa leaf juice is
known to have a stabilizing effect on blood pressure [The Wealth of India, 1962; [23]. Nitrile,
mustard oil glycosides and thiocarbamate glycosides have been isolated from Moringa
leaves, which were found to be responsible for the blood pressure lowering effect [23]. Most
of these compounds, bearing thiocarbamate, carbamate or nitrile groups, are fully acetylated
glycosides, which are very rare in nature [24]. Bioassay guided fractionation of the active
ethanol extract of Moringa leaves led to the isolation of four pure compounds, niazinin A,
niazinin B, niazimicin and niazinin A B which showed a blood pressure lowering effect in

11
rats mediated possibly through a calcium antagonist effect [25]. Activity-guided fractionation
of the ethanol extract of pods of M. oleifera has led to the isolation of thiocarbamate and
isothiocyanate glycosides which are known to be the hypotensive principles [25]. Methyl
phydroxybenzoate and β-sitosterol investigated in the pods of M. oleifera have also shown
promising hypotensive activity [26], Moringa roots, leaves, flowers, gum and the aqueous
infusion of seeds have been found to possess diuretic activity [27,28] and such diuretic
components are likely to play a complementary role in the overall blood pressure lowering
effect of this plant. The crude extract of Moringa leaves has a significant cholesterol lowering
action in the serum of high fat diet fed rats which might be attributed to the presence of a
bioactive phytoconstituent, i.e. β-sitosterol [29]. Moringa fruit has been found to lower the
serum cholesterol, phospholipids, triglycerides, low density lipoprotein [LDL], very low
density lipoprotein [VLDL] cholesterol to phospholipid ratio, atherogenic index lipid and
reduced the lipid profile of liver, heart and aorta in hypercholesteremic rabbits and increased
the excretion of fecal cholesterol [30].
1.10.2 Antispasmodic, antiulcer and hepatoprotective activities
M. oleifera roots have been reported to possess antispasmodic activity [31]. Moringa
leaves have been extensively studied pharmacologically and it has been found that the
ethanol extract and its constituents exhibit antispasmodic effects possibly through calcium
channel blockade [32-35]. The antispasmodic activity of the ethanol extract of M. oleifera
leaves has been attributed to the presence of 4-[α-[L-rhamnosyloxy] benzyl]-o-methyl
thiocarbamate [trans], which forms the basis for its traditional use in diarrhea [35]. Different
constituents provide pharmacological basis for the traditional uses of this plant in
gastrointestinal motility disorder [36].The methanol fraction of M. oleifera leaf extract
showed antiulcerogenic and hepatoprotective effects in rats. Aqueous leaf extracts also
showed antiulcer effect [37] indicating that the antiulcer component is widely distributed in
12
this plant. Moringa roots have also been reported to possess hepatoprotective activity. The
aqueous and alcohol extracts from Moringa flowers were also found to have a significant
hepatoprotective effect which may be due to the presence of quercetin, a well known
flavonoid with hepatoprotective activity [38].
1.10.3 Antibacterial and antifungal activities
Moringa roots have antibacterial activity [39] and are reported to be rich in
antimicrobial principles. These are reported to contain an active antibiotic principle,
pterygospermin, which has powerful antibacterial and fungicidal effects. A similar compound
is found to be responsible for the antibacterial and fungicidal effects of its flowers [40]. The
root extract also possesses antimicrobial activity attributed to the presence of 4-α-L-
rhamnosyloxybenzyl isothiocyanate [41]. The aglycone of deoxy-niazimicine [N-benzyl, S-
ethyl thioformate] isolated from the chloroform fraction of an ethanol extract of the root bark
was found to be responsible for the antibacterial and antifungal activities [42]. The bark
extract has been shown to possess antifungal activity [43], while the juice from the stem bark
showed antibacterial effect against Staphylococcus aureus [44]. The fresh leaf juice was
found to inhibit the growth of microorganisms [Pseudomonas aeruginosa and Staphylococcus
aureus], pathogenic to man [45].
The seeds also possess antimicrobial properties [46, 47] reported that a recombinant protein
in the seed is able to flocculate Gram-positive and Gram-negative bacterial cells. In this case,
microorganisms can be removed by settling in the same manner as the removal of colloids in
properly coagulated and flocculated water [47]. On the other hand, the seeds may also act
directly upon microorganisms and result in growth inhibition. Antimicrobial peptides are
thought to act by disrupting the cell membrane or by inhibiting essential enzymes. It was
reported that the seeds could inhibit the replication of bacteriophages [47-49].

13
The antimicrobial effects of the seeds are attributed to the compound 4[α-L-rhamnosyloxy]
benzyl isothiocynate [49].
1.10.4 Antitumor and anticancer activities
Makonnen et al [31] found Moringa leaves to be a potential source for antitumor
activity. O-Ethyl- 4-[α-L-rhamnosyloxy]benzylcarbamate together with 4[α-L-
rhamnosyloxy]-benzylisothiocyanate, niazimicin and 3-O-[6′-O-oleoyl-α-D-glucopyranosyl]-
β-sitosterol have been tested for their potential antitumor promoting activity using an in vitro
assay which showed significant inhibitory effects on Epstein–Barr virus-early antigen.
Niazimicin has been proposed to be a potent chemo preventive agent in chemical
carcinogenesis [50]. The seed extracts have also been found to be effective on hepatic
carcinogen metabolizing enzymes, antioxidant parameters and skin papillomagenesis in mice
[51]. A seed ointment had a similar effect to neomycin against Staphylococcus aureus
pyodermia in mice [31, 52]. It has been found that niaziminin, a thiocarbamate from the
leaves of M. oleifera, exhibits inhibition of tumor-promoter-induced Epstein–Barr virus
activation. On the other hand, among the isothiocyanates, naturally occurring 4-[4′-O-acetyl-
α-i-rhamnosyloxybenzyl], significantly inhibited tumor-promoter induced Epstein–Barr virus
activation, suggesting that the isothiocyano group is a critical structural factor for activity
[53].
1.10.5 Coagulant activities
Moringa seeds are one of the best natural coagulants discovered so far [54]. Crushed
seeds are a viable replacement of synthetic coagulants [55]. In Sudan, seed crude extract is
used instead of alum by rural women to treat the highly turbid Nile water because of a
traditional fear of alum causing gastrointestinal disturbances and Alzheimer’s disease [56-
59]. The seeds are very effective for high turbidity water and show similar coagulation effects
to alum [60]. The coagulation effectiveness of M. oleifera varies depending on the initial
14
turbidity and it has been reported that it could reduce turbidity by between 92% and 99%
[61]. The seeds also have softening properties in addition to being a pH correct ant [alkalinity
reduction], as well as exhibiting a natural buffering capacity, which could handle moderately
high to high alkaline surface and ground waters. The seeds can also be used as an antiseptic
in the treatment of drinking water [62]. It is believed that the seed is an organic natural
polymer [63]. The active ingredients are dimeric proteins with a molecular weight of about
1300 Da and iso-electric point between 10 and 11 [63].
The protein powder is stable and totally soluble in water. Moringa coagulant protein can
be extracted by water or salt solution [commonly NaCl]. The amount and effectiveness of the
coagulant protein from salt and water extraction methods vary significantly. In crude form,
the salt extract shows a better coagulation performance than the corresponding water extract
[64]. This may be explained by the presence of higher amount of soluble protein due to the
salting-in phenomenon. However, purification of the M. oleifera coagulant protein from the
crude salt extract may not be technically and economically feasible. The coagulation
mechanism of the M. oleifera coagulant protein has been explained in different ways. It has
been described as adsorption and charge neutralization [65, 66] and interparticle bridging
[67]. Flocculation by inter-particle bridging is mainly characteristic of high molecular weight
polyelectrolytes. Due to the small size of the M. oleifera coagulant protein [6.5–13 kDa], a
bridging effect may not be considered as the likely coagulation mechanism. The high positive
charge [IP above 10] and small size may suggest that the main destabilization mechanism
could be adsorption and charge neutralization [68].
1.10.6 Moringa seeds as biosorbent
Moringa seeds could be used as a less expensive biosorbent for the removal of
cadmium (Cd) from aqueous media [69]. The aqueous solution of the seed is a heterogeneous
complex mixture having various functional groups, mainly low molecular weight organic

15
acids (amino) Kumar et al. [70]. These amino acids have been found to constitute a
physiologically active group of binding agents, working even at a low concentration, which
because of the ability to interact with metal ions is likely to increase the sorption of metal
ions [70]. The proteineous amino acids have a variety of structurally related pH dependent
properties, generating a negatively charged atmosphere and play an important role in the
binding of metals [70, 71].
1.10.7 Other diverse activities
Moringa oleifera has also been reported to exhibit other diverse activities. Aqueous
leaf extracts regulate thyroid hormone and can be used to treat hyperthyroidism and exhibit
an antioxidant effect [72-74]. A methanol extract of M. oleifera leaves conferred significant
radiation protection to the bone marrow chromosomes in mice [72]. Moringa leaves are
effective for the regulation of thyroid hormone status [74]. A recent report showed that M.
oleifera leaf may be applicable as a prophylactic or therapeutic anti-HSV [Herpes simplex
virus type 1] medicine and may be effective against the acyclovir-resistant variant [75]. The
flowers and leaves also are considered to be of high medicinal value with antihelmintic
activity [76]. An infusion of leaf juice was shown to reduce glucose levels in rabbits [77]. M.
oleifera is coming to the forefront as a result of scientific evidence that Moringa is an
important source of naturally occurring phytochemicals and this provides a basis for future
viable developments. Different parts of M. oleifera are also incorporated in Kumar et al. [70]
various marketed health formulations. The seeds have specific protein fractions for skin and
hair care. Two new active components for the cosmetic industry have been extracted from oil
cake Purisoft® consists of peptides of the Moringa seed. It protects the human skin from
environmental influences and combats premature skin aging. With dual activity, antipollution
and conditioning/strengthening of hair, the M. oleifera seed extract is a globally acceptable
innovative solution for hair care [77, 78].

16
1.11 Non- pharmacological uses
Moringa oleifera possesses a multitude of non – pharmacological uses as well. The
defatted seed meal is an excellent additive in sheep diet as it is reported to improve rumen
fermentation [79]. Milk production in cows was found to increase on administration of
Moringa as a protein supplement with low quality diets [80].
Biodiesel derived from M. oleifera oil by alkali-catalyzed transesterification with
methanol is reported to be an acceptable substitute for petrodiesel. Its cetane number was
found to be [81], the highest reported for a biodiesel fuel with much better oxidative stability
[82, 83].
The seeds serve as one of the best natural coagulants for water treatment and a cheap and
feasible alternate to the synthetic ones. The seed extract is an effective natural clarification
agent for highly turbid and untreated pathogenic surface water [84-86].
Ben oil, a non drying oil obtained from the seeds is employed in the manufacture of
perfumes, hairdressings etc and as a lubricant for fine machinery. As it is resistant to
rancidity, it is extensively used in the ‘enfleurage’ process whereby delicate fragrances are
extracted from flower petals [87]. The chemical properties of protein fraction of M. oleifera
permit their use in a wide variety of skin care, hair care and cosmetic formulations such as
purisoft, puricare etc. [88].
Shelled moringa seeds possess potential to eliminate toxic metals such as cadmium from
water resources. The sorption was found to occur due to amino acid-Cd interactions, as
revealed by Fourier transform infrared spectrometry [89]. The bark too has an excellent bio-
sorbent property for removal of heavy metal ions from waste water or effluents [90].
Similar investigations have revealed the removal of zinc ions and sodium lauryl sulphate (up
to 80 %) from aqueous solutions [91, 92].

17
1.12 Phytochemistry
Moringa oleifera is rich in compounds containing the simple sugar, rhamnose and a
fairly unique group of compounds called glucosinolates and isothiocyanates [92-95]. The
stem bark has been reported to contain two alkaloids, namely moringine and moringinine
[96]. Vanillin, β-sitosterol [97], sitostenone, 4-hydroxymellin and octacosanoic acid have
been isolated from the stem of M. oleifera [98]. Purified, whole-gum exudate from M.
oleifera has been found to contain L-arabinose, galactose, glucuronic acid, and L-rhamnose,
mannose and xylose, while a homogeneous, degraded-gum polysaccharide consisting of L-
arabinose, D-galactose, D-glucuronic acid, L-rhamnose, D-mannose has been obtained on
mild hydrolysis of the whole gum with acid. Flowers contain nine amino acids, sucrose, D-
glucose, traces of alkaloids, wax, quercetin and kaempferat; the ash is rich in potassium and
calcium. They have also been reported to contain some flavonoid pigments such as alkaloids,
kaempherol, rhamnetin, isoquercitrin and kaempferitrin [98-102]. Antihypertensive
compounds thiocarbamate and isothiocyanate glycosides have been isolated from the acetate
phase of the ethanol extract of moringa pods [103]. The cytokinins have been shown to be
present in the fruit. A new O-ethyl-4-(ά-L-rhamnosyloxy)benzyl carbamate together with
seven known bioactive compounds, 4(ά-L-rhamnosyloxy)-benzyl isothiocyanate3,
niazimicin4, 3-O-(6′-O-oleoyl-D-glucopyranosyl)-β sitosterol [103,104], β-sitosterol-3-O-D-
glucopyranoside, niazirin, β-sitosterol and glycerol-1-(9-octadecanoate)have been isolated
from the ethanol extract of the Moringa seed [105]. Lately, interest has been generated in
isolating hormones/growth promoters from the leaves of M. oleifera. Nodulation of black-
gram (Vigna munga L.) has been shown to increase vigorously with the application of an
aqueous-ethanol extract of M. oleifera leaves, although the nature of the active ingredient is
still unknown. Moringa leaves act as a good source of natural antioxidant due to the presence
of various types of antioxidant compounds such as ascorbic acid, flavonoids, phenolics and
18
carotenoids [105-110]. The high concentrations of ascorbic acid, oestrogenic substances and
β-sitosterol [111], iron, calcium, phosphorus, copper, vitamins A, B and C, α-tocopherol,
riboflavin, nicotinic acid, folic acid, pyridoxine, β-carotene, protein, and in particular
essential amino acids such as methionine, cystine, tryptophan and lysine present in Moringa
leaves and pods make it a virtually ideal dietary supplement [112-114].
The composition of the sterols of Moringa seed oil mainly consists of campesterol,
stigmasterol, β-sitosterol, avenasterol and clerosterol accompanied by minute amounts of 24
methylenecholesterol, campestanol, stigmastanol and isoavenasterol. The sterol composition
of the major fractions of Moringa seed oil differs greatly from those of most of the
conventional edible oils. The fatty acid composition of M. oleifera seed oil reveals that it falls
in the category of high oleic oils (67.90 % –76.00 %) among the other component fatty acids.
Moringa oleifera is also a good source of different tocopherols the concentration of those is
reported to be 98.82–134.42, 27.90–93.70 and 48.00– 71.16 mg/kg, respectively [115-118].
Shanker et al. [119] isolated nitrile glycosides (niaziridin & niazirin) from the leaves, pods
and bark of Moringa oleifera by reverse phase HPLC. Forty four compounds from the
essential oil isolated from the leaves of Moringa oleifera by GC-MS analysis [120].
Yammuenart et al. [121] isolated seven compounds, β-sitosterol-3-O-β-D-glucopyranoside,
β-sitosterol, linoleic sitosteroate, linoleic acid, 1,2,3-triolein, a mixture of 1,3-dilinoleoyl-2-
olein, 1,3-dioleoyl-2-linolein and 1,2,3-trilinolein and isothiocyanatomethylbenzene from the
ethylene chloride extract of Moringa oleifera [122].
Sashidhara et al [123] from the roots of Moringa oleifera isolated and characterized
aurantiamide acetate 4 and 1, 3-dibenzyl urea. Both these compounds were isolated for the
first time from this genus [123]. Ogunbinu et al. [124] isolated monoterpenoid compounds
(81.8 %) from the essential oil of Moringa oleifera extracted by hydrodistillation and
analysed by GC and GC-MS. The oil consists of alpha-phellandrene with highest percentage

19
(25.2 %) along with p-cymene (24.9%) [125]. Singh et al. [126] reported presence of gallic
acid, chlorogenic acid, ellagic acid, ferulic acid, kaempferol, quercetin and vanillin from the
aqueous extracts of leaves, fruits and seeds of Moringa oliefera. All compounds were
analyzed by HPLC and MS/MS techniques. Verma et al. [127-128] reported presence of
phenolic acids like gallic acid, chlorogenic acid, ellagic acid, ferulic acid and flavonoids like
kaempferol, quercetin and rutin from the leaves of Moringa oleifera by HPLC techniques.
Makkar and Becker [129] investigated various phytochemicals present in the leaves of
ethanolic extract of Moringa oleifera by GC-MS. The leaves contain fifteen components. The
major compounds were hexadecanoic acid, ethyl palmitate, palmitic acid ethyl ester, 2, 6-
dimethyl-1, 7-octadiene-3-ol, 4-hexadecen-6-yne, 2-hexanone, 3-cyclohexyliden-4-ethyl -
E2-dodecenylacetate, hi-oleic safflower oil. The major compounds from the seeds were
roridin E, veridiflorol, 9-octadecenoic acid. Presnt in the flowers were, 9-octadecen –1- ol,
cis - 9 – octadecen – 1 –ol, oleol, satol, ocenol, sipo, decanoic acid, dodecanal were identified
as major compounds [130-135].
The seeds also contain Moringyne, 4-(α-L-rhamnosyloxy) benzyl isothiocyanate &
several amino acids [135-138]. The roots also contain benzyl isothiocyanate. The plant also
contains antibacterial principles such as spirochin and pterygospermin, which are effective
against both gram negative and gram positive bacteria [139]. The gum contains
aldotriouronic acid which is obtained from the acid hydrolysis of gum and is characterized as
O-(β-D-glucopyranosyluronic acid) (1→6)-β-D-galactopyranosyl (1→6)-D-galactose. The
leaves contain aspartic acid, glutamic acid, glycine, threonine, alanine, valine, leucine,
isoleucine, histidine, lysine, phenylalanine, tryptophan, cysteine and methionine [139-143].
The stem contains 4-hydroxy mellein, vanillin, octacosonoic acid, β-sitosterol and β-
sitosterone [144] & Kaempferol-3-rutinoside was identified in flowers [145].
20
1.13 Bacteriology of staphylococci
Bacteria in the genus Staphylococcus are pathogens of man and other mammals [146].
Traditionally they were divided into two groups on the basis of their ability to clot blood
plasma (the coagulase reaction). The coagulase-positive staphylococci constitute the most
pathogenic species S aureus. The coagulase-negative staphylococci (CNS) are now known to
comprise over 30 other species [147]. The CNS are common commensals of skin, although
some species can cause infections. It is now obvious that the division of staphylococci into
coagulase positive and negative is artificial and indeed, misleading in some cases. Coagulase
is a marker for S aureus but there is no direct evidence that it is a virulence factor. Some
natural isolates of S. aureus are defective in coagulase. Nevertheless, the term is still in
widespread use among clinical microbiologists [147].
Staphylococcus aureus expresses a variety of extracellular proteins and
polysaccharides, some of which are correlated with virulence. Virulence results from the
combined effect of many factors expressed during infection [146]. Antibodies will neutralize
staphylococcal toxins and enzymes, but vaccines are not available. Both antibiotic treatment
and surgical drainage are often necessary to cure abscesses, large boils and wound infections
[147,148]. Staphylococci are common causes of infections associated with indwelling
medical devices. These are difficult to treat with antibiotics alone and often require removal
of the device [149]. Some strains that infect hospitalized patients are resistant to most of the
antibiotics used to treat infections; vancomycin being the only remaining drug of choice has
started to have resistance to some new resistant strains [150-153].
1.13.1 Taxonomy
DNA-ribosomal RNA (rRNA) hybridization and comparative oligonucleotide
analysis of 16S rRNA has demonstrated that staphylococci form a coherent group at the
21
genus level. This group occurs within the broad bacillus-lactobacillus-streptococcus cluster
defining Gram-positive bacteria with a low G + C content of DNA [152].
At least 30 species of staphylococci have been recognized by biochemical analysis
and in particular by DNA-DNA hybridization. Eleven of these can be isolated from humans
as commensals [153]. Staphylococcus aureus (snares) and S. epidermidis (snares, skin) are
common commensals and also have the greatest pathogenic potential. S. saprophyticus (skin)
is also a common cause of urinary tract infection. Staphylococcus haemolyticus, S. simulans,
S. cohnii, S. warneri and S. lugdunensis can also cause infections in man [154].
1.15.1 Identification of staphylococci in the clinical laboratory
(a) Isolation
The presence of staphylococci in a lesion might first be suspected after examination
of a direct Gram stain. However, small numbers of bacteria in blood preclude microscopic
examination and require culturing first [155-158].
The organism is isolated by streaking material from the clinical specimen (or from a
blood culture) onto solid media such as blood agar, triptich soy agar or heart infusion agar.
Specimens likely to be contaminated with other microorganisms can be plated on mannitol
salt agar containing 7.5% sodium chloride, which allows the halo-tolerant staphylococci to
grow [158].
Ideally a gram stain of the colony should be performed and tests made for catalase and
coagulase production, allowing the coagulase-positive S. aureus to be identified quickly
[159]. Another very useful test for S. aureus is the production of thermostable
deoxyribonuclease. Staphylococcus aureus can be confirmed by testing colonies for

22
agglutination with latex particles coated with immunoglobulin G and fibrinogen which bind
protein A and the clumping factor, respectively, on the bacterial cell surface [160]. These are
available from commercial suppliers (e.g., Staphaurex). The most recent latex test (Pastaurex)
incorporates monoclonal antibodies to serotype 5 and 8 capsular polysaccharide in order to
reduce the number of false negatives. (Some recent clinical isolates of S. aureus lack
production of coagulase and/or clumping factor, which can make identification difficult.)
[161].
The association of S. epidermidis (and to a lesser extent of other coagulase-negative
staphylococci) with nosocomial infections associated with indwelling devices means that
isolation of these bacteria from blood is likely to be important and not due to chance
contamination, particularly if successive blood cultures are positive. Nowadays, identification
of S epidermidis and other species of Staphylococcus is performed using commercial biotype
identification kits, such as API Staph Ident, API Staph-Trac, Vitek GPI Card and Microscan
Pos Combo. These comprise preformed strips containing test substrates [161-163].
(b) Structure
Staphylococci are Gram-positive cocci about 0.5 – 1.0 μm in diameter. They grow in
clusters, pairs and occasionally in short chains [155]. The clusters arise because staphylococci
divide in two planes. The configuration of the cocci helps to distinguish micrococci and
staphylococci from streptococci, which usually grow in chains. Observations must be made
on cultures grown in broth, because streptococci grown on solid medium may appear as
clumps. Several fields should be examined before deciding whether clumps or chains are
present [156].

23
(c) Catalase Test
The catalase test is important in distinguishing streptococci (catalase-negative)
staphylococci which are catalase positive. The test is performed by flooding an agar slant or
broth culture with several drops of 3% hydrogen peroxide. Catalase-positive cultures bubble
at once. The test should not be done on blood agar because blood itself will produce bubbles
[157].
1.13.3 Epidemiology of Staphylococcus aureus infections
Staphylococcus aureus is a major cause of nosocomial and community-acquired
infections, it is necessary to determine the relatedness of isolates collected during the
investigation of an outbreak [162]. Typing systems must be reproducible, discriminatory,
easy to interpret and to use. The traditional method for typing S. aureus is phage-typing. This
method is based on a phenotypic marker with poor reproducibility. It does not type many
isolates (20% in a recent survey at the Center for Disease Control and Prevention), and it
requires maintenance of a large number of phage stocks and propagating strains and
consequently can be performed only by specialist reference laboratories [163].
Many molecular typing methods have been applied to the epidemiological analysis of S
aureus, in particular, of methicillin-resistant strains (MRSA). Plasmid analysis has been used
extensively with success, but suffers the disadvantage that plasmids can easily be lost and
acquired and is thus inherently unreliable [164]. Methods designed to recognize restriction
fragment length polymorphisms (RFLP) using a variety of gene probes, including rRNA
genes (ribotyping), have had limited success in the epidemiology of MRSA [165]. In this
technique the choice of restriction enzyme used to cleave the genomic DNA, as well as the
probes, is crucial. Random primer PCR offers potential for discriminating between strains but

24
a suitable primer has yet to be identified for S. aureus. The method currently regarded as the
most reliable is pulsed field gel electrophoresis, where genomic DNA is cut with a restriction
enzyme that generates large fragments of 50-700 kb [166].
1.13.4 Clinical manifestations of S. aureus
Staphylococcus aureus is notorious for causing boils, furuncles, styes, impetigo and
other superficial skin infections in humans. It may also cause more serious infections,
particularly in persons debilitated by chronic illness, traumatic injury, burns or
immunosuppression [167]. These infections include pneumonia, deep abscesses,
osteomyelitis, endocarditis, phlebitis, mastitis and meningitis, and are often associated with
hospitalized patients rather than healthy individuals in the community. Staphylococcus
aureus and S. epidermidis are common causes of infections associated with indwelling
devices such as joint prostheses, cardiovascular devices and artificial heart valves [168].
1.13.5 Pathogenesis of S. aureus infections
Staphylococcus aureus expresses many cell surface-associated and extracellular
proteins that are potential virulence factors. For the majority of diseases caused by this
organism, pathogenesis is multifactorial. Thus, it is difficult to determine precisely the role of
any given factor. This also reflects the inadequacies of many animal models for
staphylococcal diseases [169].
However, there are correlations between strains isolated from particular diseases and
expression of particular factors, which suggests their importance in pathogenesis. With some
toxins, symptoms of a human disease can be reproduced in animals with pure proteins. The
application of molecular biology has led to recent advances in the understanding of
pathogenesis of staphylococcal diseases [170]. Genes encoding potential virulence factors

25
have been cloned and sequenced and proteins purified. This has facilitated studies at the
molecular level on their modes of action, both in in vitro and in model systems. In addition,
genes encoding putative virulence factors have been inactivated, and the virulence of the
mutants compared to the wild-type strain in animal models. Any diminution in virulence
implicates the missing factor. If virulence is restored when the gene is returned to the mutant
then “Molecular Koch's Postulates” have been fulfilled. Several virulence factors of S aureus
have been confirmed by this approach [171].
1.13.6 Infections associated with medical devices
Infections associated with indwelling medical devices ranging from simple
intravenous catheters to prosthetic joints and replacement heart valves can be caused by S
aureus and S epidermidis. Very shortly after biomaterial is implanted in the human body it
becomes coated with a complex mixture of host proteins and platelets [174]. In one model
system involving short-term contact between biomaterial and blood, fibrinogen was shown to
be the dominant component and was primarily responsible for adherence of S aureus in
subsequent in vitro assays. In contrast, with material that has been in the body for longer
periods (e.g human intravenous catheters) the fibrinogen is degraded and no longer promotes
bacterial attachment. Instead, fibronectin, which remains intact, becomes the predominant
ligand promoting attachment [176].
1.13.7 Virulence factors of Staphylococcus aureus.
The receptor which promotes attachment to collagen is particularly associated with
strains that cause osteomyelitis and septic arthritis. Interaction with collagen may also be
important in promoting bacterial attachment to damaged tissue where the underlying layers
have been exposed [172].

26
Evidence that these staphylococcal matrix-binding proteins are virulence factors has
come from studying defective mutants in vitro adherence assays and in experimental
infections. Mutants defective in binding to fibronectin and to fibrinogen have reduced
virulence in a rat model for endocarditis, suggesting that bacterial attachment to the sterile
vegetations caused by damaging the endothelial surface of the heart valve is promoted by
fibronectin and fibrinogen. Similarly, mutants lacking the collagen-binding protein have
reduced virulence in a mouse model for septic arthritis. Furthermore, the soluble ligand-
binding domain of the fibrinogen, fibronectin and collagen-binding proteins expressed by
recombinant methods strongly blocks interactions of bacterial cells with the corresponding
host protein [173-175].
(a) Adherence to endothelial cells
Staphylococcus aureus can adhere to the surface of cultured human endothelial cells
and become internalized by a phagocytosis-like process [177]. It is not clear if attachment
involves a novel receptor or a known surface protein of S aureus. Some researchers think that
S. aureus can initiate endocarditis by attaching to the undamaged endothelium. Others feel
that trauma of even a very minor nature is required to promote attachment of bacteria [178].
(b) Avoidance of host defenses
Staphylococcus aureus expresses a number of factors that have the potential to interfere with
host defense mechanisms. However, strong evidence for a role in virulence of these factors is
lacking [176].

27
(c) Capsular polysaccharide
The majority of clinical isolates of S. aureus express a surface polysaccharide of
either serotype 5 or 8. This has been called a microcapsule because it can be visualized only
by electron microscopy after antibody labeling [177], unlike the copious capsules of other
bacteria which are visualized by light microscopy. S. aureus isolated from infections
expresses high levels of polysaccharide but rapidly loses it upon laboratory subculture [179].
The function of the capsule is not clear, it may impede phagocytosis, but in in vitro tests this
was only demonstrated in the absence of complement. Conversely, comparing wild-type and
a capsule defective mutant strain in an endocarditis model suggested that polysaccharide
expression actually impeded colonization of damaged heart valves, perhaps by masking
adhesins [180].
(d) Protein A
Protein A is a surface protein of S. aureus which binds immunoglobulin G molecules
by the Fc region. In serum, bacteria will bind IgG molecules the wrong way round by this
non-immune mechanism. In principle this will disrupt opsonization and phagocytosis. Indeed
mutants of S aureus lacking protein A are more efficiently phagocytozed in vitro, and studies
with mutants in infection models suggest that protein A enhances virulence [181].
(e) Leukocidin
Staphyloccocus aureus can express a toxin that specifically acts on
polymorphonuclear leukocytes. Phagocytosis is an important defense against staphylococcal
infection so leukocidin should be a virulence factor. This toxin is discussed in more detail in
the next section [182].

28
(f) Damage to the host
Staphylococcus aureus can express several different types of protein toxins which are
probably responsible for symptoms during infections. Some damage the membranes of
erythrocytes, causing hemolysis; but it is unlikely that hemolysis is relevant in vivo [183].
The leukocidin causes membrane damage to leukocytes and is not hemolytic. Systemic
release of α-toxin causes septic shock, while enterotoxins and TSST-1 cause toxic shock
[184].
1.13.8 membrane damaging toxins
(a) α-toxin
The best characterized and most potent membrane-damaging toxin of S. aureus is α-
toxin. It is expressed as a monomer that binds to the membrane of susceptible cells. Subunits
then oligomerize to form hexameric rings with a central pore through which cellular contents
leak [185]. Susceptible cells have a specific receptor for α-toxin which allows low
concentrations of toxin to bind, causing small pores through which monovalent cations can
pass. At higher concentrations, the toxin reacts non-specifically with membrane lipids,
causing larger pores through which divalent cations and small molecules can pass. However,
it is doubtful if this is relevant under normal physiological conditions [184-186].
In humans, platelets and monocytes are particularly sensitive to α-toxin. They carry high
affinity sites which allow toxin to bind at concentrations that are physiologically relevant. A
complex series of secondary reactions ensue, causing release of eicosanoids and cytokines
which trigger production of inflammatory mediators. These events cause the symptoms of
septic shock that occur during severe infections caused by S. aureus [187]. The notion that α-
toxin is a major virulence factor of S. aureus is supported by studies with the purified toxin in

29
animals and in organ culture. Also, mutants lacking α-toxin are less virulent in a variety of
animal infection models [187].
(b) β-toxin
β -toxin is a sphingomyelinase which damages membranes rich in this lipid. The classical
test for β-toxin is lysis of sheep erythrocytes. The majority of human isolates of S. aureus do
not express β-toxin. A lysogenic bacteriophage is inserted into the gene that encodes the
toxin. This phenomenon is called negative phage conversion. Some of the phages that
inactivate the β-toxin gene carry the determinant for an enterotoxin and staphylokinase. In
contrast the majority of isolates from bovine mastitis express β-toxin, suggesting that the
toxin is important in the pathogenesis of mastitis. This is supported by the fact that β-toxin-
deficient mutants have reduced virulence in a mouse model for mastitis [187-190].
(c) δ-toxin
The δ-toxin is a very small peptide toxin produced by most strains of S. aureus. It is also
produced by S. epidermidis and S. lugdunensis. The role of δ-toxin in disease is unknown
[188].
(d) γ-toxin and leukocidin
The γ-toxin and the leukocidins are two-component protein toxins that damage
membranes of susceptible cells. The proteins are expressed separately but act together to
damage membranes. There is no evidence that they form multimers prior to insertion into
membranes. The γ-toxin locus expresses three proteins. The B and C components form a
leukotoxin with poor hemolytic activity, whereas the A and B components are hemolytic and
weakly leukotoxic [189]. The classical Panton and Valentine (PV) leukocidin is distinct from

30
the leukotoxin expressed by the γ-toxin locus. It has potent leukotoxicity and, in contrast to γ-
toxin, is non-hemolytic. Only a small fraction of S. aureus isolates (2% in one survey)
express the PV leukocidin [190], whereas 90% of those isolated from severe dermonecrotic
lesions express this toxin. This suggests that PV leukocidin is an important factor in
necrotizing skin infections [190].
PV-leukocidin causes dermonecrosis when injected subcutaneously in rabbits.
Furthermore, at a concentration below that causing membrane damage, the toxin releases
inflammatory mediators from human neutrophils, leading to degranulation. This could
account for the histology of dermonecrotic infections (vasodilation, infiltration and central
necrosis) [189-190].
(e) Super antigens: enterotoxins and toxic shock syndrome toxin (TSST)
Staphylococcus aureus can express two different types of toxin with superantigen
activity, enterotoxins, of which there are six serotypes (A, B, C, D, E and G) and toxic shock
syndrome toxin (TSST-1) [191]. Enterotoxins cause diarrhea and vomiting when ingested and
are responsible for staphylococcal food poisoning. When expressed systemically,
enterotoxins can cause toxic shock syndrome (TSS) - indeed enterotoxins B and C cause 50%
of non-menstrual TSS [192]. TSST-1 is very weakly related to enterotoxins and does not
have emetic activity. TSST-1 is responsible for 75% of TSS, including all menstrual cases.
TSS can occur as a sequel to any staphylococcal infection if an enterotoxin or TSST-1 is
released systemically and the host lacks appropriate neutralizing antibodies [193]. Tampon-
associated TSS is not a true infection, being caused by growth of S aureus in a tampon and
absorption of the toxin into the blood stream. TSS came to prominence with the introduction
of super-absorbent tampons; and although the number of such cases has decreased

31
dramatically, they still occur despite withdrawal of certain types of tampons from the market
[194].
Super antigens stimulate T cells non-specifically without normal antigenic
recognition. Up to one in five T cells may be activated, whereas only 1 in 10,000 are
stimulated during antigen presentation. Cytokines are released in large amounts, causing the
symptoms of TSS. Superantigens bind directly to class II major histocompatibility complexes
of antigen-presenting cells outside the conventional antigen-binding grove. This complex
recognizes only the Vβ element of the T cell receptor. Thus any T cell with the appropriate
Vβ element can be stimulated, whereas normally antigen specificity is also required in
binding super antigens and the non-specific stimulation of T cells [194-196].
(f) Epidermolytic (exfoliative) toxin (ET)
This toxin causes the scalded skin syndrome in neonates, with widespread blistering and
loss of the epidermis. There are two antigenically distinct forms of the toxin, ETA and ETB
[197]. There is evidence that these toxins have protease activity. Both toxins have a sequence
similarity with the S. aureus serine protease, and the three most important amino acids in the
active site of the protease are conserved. Furthermore, changing the active site of serine to a
glycine completely eliminated toxin activity [198]. However, ETs do not have discernible
proteolytic activity but they do have esterase activity. It is not clear how the latter causes
epidermal splitting. It is possible that the toxins target a very specific protein which is
involved in maintaining the integrity of the epidermis [199].
32
1.13.9 Other extracellular proteins
(a) Coagulase
Coagulase is not an enzyme. It is an extracellular protein which binds to prothrombin
in the host to form a complex called staphylothrombin [200]. The protease activity
characteristic of thrombin is activated in the complex, resulting in the conversion of
fibrinogen to fibrin. This is the basis of the tube coagulase test, in which a clot is formed in
plasma after incubation with the S. aureus broth-culture supernatant [201]. Coagulase is a
traditional marker for identifying S. aureus in the clinical microbiology laboratory. However,
there is no evidence that it is a virulence factor, although it is reasonable to speculate that the
bacteria could protect themselves from host defenses by causing localized clotting. Notably,
coagulase deficient mutants have been tested in several infection models but no differences
from the parent strain were observed [202].
There is some confusion in the literature concerning coagulase and clumping factor,
the fibrinogen-binding determinant on the S aureus cell surface [200]. This is partly due to
loose terminology, with the clumping factor sometimes being referred to as bound coagulase.
Also, although coagulase is regarded as an extracellular protein, a small fraction is tightly
bound on the bacterial cell surface where it can react with prothrombin [202]. Finally, it has
recently been shown that the coagulase can bind fibrinogen as well as thrombin, at least when
it is extracellular [203]. Genetic studies have shown unequivocally that coagulase and
clumping factor are distinct entities. Specific mutants lacking coagulase retain clumping
factor activity, while clumping factor mutants express coagulase normally [203].
33
(b) Staphylokinase
Many strains of S. aureus express a plasminogen activator called staphylokinase. The
genetic determinant is associated with lysogenic bacteriophages [204]. A complex formed
between staphylokinase and plasminogen activates plasmin-like proteolytic activity which
causes dissolution of fibrin clots. The mechanism is identical to streptokinase, which is used
in medicine to treat patients suffering from coronary thrombosis [205]. As with coagulase
there is no evidence that staphylokinase is a virulence factor, although it seems reasonable to
imagine that localized fibrinolysis might aid in bacterial spreading [206].
(c) Enzymes
Staphylococcus aureus can express proteases, a lipase, a deoxyribonuclease (DNase)
and a fatty acid modifying enzyme (FAME). The first three probably provide nutrients for the
bacteria, and it is unlikely that they have anything but a minor role in pathogenesis. However,
the FAME enzyme may be important in abscesses, where it could modify anti-bacterial lipids
and prolong bacterial survival. The thermostable DNase is an important diagnostic test for
identification of S aureus. [204]
1.14 Coagulase negative staphylococci (CNS)
Staphylococci other than S. aureus can cause infections in man. S epidermidis is the
most important coagulase-negative staphylococcus (CNS) species and is the major cause of
infections associated with prosthetic devices and catheters [207]. CNS also causes peritonitis
in patients receiving continuous ambulatory peritoneal dialysis and endocarditis in those with
prosthetic valves. These infections are not usually nosocomially acquired. Other species such
as S. haemolyticus, S. warneri, S. hominis, S. capitis, S. intermedius, S. schleiferi and S.
simulans are infrequent pathogens. S. lugdunesis is a newly recognized species. It is probably

34
more pathogenic than are other CNS species, with cases of endocarditis and other infections
being reported. It is likely that the incidence of infections caused by these organisms is
underestimated because of difficulties in identification [205-208]. Diagnosis of CNS
infections is difficult. Infections are often indolent and chronic with few obvious symptoms.
This is due to the smaller array of virulence factors and toxins compared to those in the case
of S aureus. S epidermidis is a skin commensal and is one of the most common contaminants
of samples sent to the diagnostic laboratory, while S lugdunensis is often confused with S
aureus. Precise identification of CNS species requires the use of expensive test kits, such as
the API-Staph [209].
In contrast to S. aureus, little is known about mechanisms of pathogenesis of S.
epidermidis infections. Adherence is obviously a crucial step in the initiation of foreign body
infections [210]. Much research has been done on the interaction between S. epidermidis and
plastic material used in implants, and a polysaccharide adhesion (PS/A) has been identified
[211]. Mutants lacking PS/A are less virulent in an animal model for foreign body infection,
and immunization with purified PS/A is protective. Bacteria-plastic interactions are probably
important in colonization of catheters through the point of entry [212]. However, host
proteins are quickly deposited on implants. S. epidermidis does not bind to fibrinogen but
most isolates bind fibronectin, albeit less avidly than S. aureus. However, it is not known if a
protein analogous to the fibronectin binding protein of S. aureus is involved [213].
A characteristic of clinical isolates of S. epidermidis is the production of “slime.” This is
a controversial topic. Some feel that slime is an in vitro manifestation of the ability to form a
biofilm in vivo, for example on the surface of a prosthetic device, and is thus a virulence
marker [214]. In vitro, slime is formed during growth in broth as a biofilm on the surface of
the growth vessel. The composition of this slime is probably influenced by the growth

35
medium. One study with defined medium showed that the slime was predominantly secreted
teichoic acid, a polymer normally found in the cell wall of staphylococci. Some
polysaccharides in slime from bacteria grown on solid medium are derived from the agar
[213-215].
1.15 Antimicrobial resistance
Biological resistance refers to changes that result in the organism being less
susceptible to a particular antimicrobial agent than has been previously observed. When
antimicrobial susceptibility has been lost to such an extent that the drug is no longer effective
for clinical use, the organism is then said to have achieved clinical resistance. It is important
to note that often, biologic resistance and clinical resistance do not necessarily coincide.
From a clinical laboratory and public health perspective it is important to realize that biologic
development of antimicrobial resistance is an ongoing process, while clinical resistance is
dependent on current laboratory methods and established cut-offs. Our inability to reliably
detect all these processes with current laboratory procedures and criteria should not be
perceived as evidence that they are not occurring [216].
Many plasmid-encoded determinants have recently become inserted into the
chromosome at a site associated with the methicillin resistance determinant. There may be an
advantage to the organism having resistance determinants in the chromosome because they
will be more stable.There are essentially four mechanisms of resistance to antibiotics in
bacteria: (1) enzymatic inactivation of the drug, (2) alterations to the drug target to prevent
binding, (3) accelerated drug efflux to prevent toxic concentrations accumulating in the cell,
and (4) a by-pass mechanism whereby an alternative drug-resistant version of the target is
expressed [215].

36
Hospital strains of S. aureus are often resistant to many different antibiotics. Indeed
strains resistant to all clinically useful drugs, apart from the glycopeptides vancomycin and
teicoplanin, have been described [214-216]. The term MRSA refers to methicillin resistant
staphylococcus aureus. Plasmid-associated vancomycin resistance has been detected in some
enterococci and the resistance determinant has been transferred from enterococci to S. aureus
in the laboratory and may occur naturally [217]. Staphylococcus epidermidis nosocomial
isolates are also often resistant to several antibiotics including methicillin. In addition, S.
aureus expresses resistance to antiseptics and disinfectants, such as quaternary ammonium
compounds, which may aid its survival in the hospital environment [218]. Since the
beginning of the antibiotic era S. aureus has responded to the introduction of new drugs by
rapidly acquiring resistance by a variety of genetic mechanisms including (1) acquisition of
extrachromosomal plasmids or additional genetic information in the chromosome via
transposons or other types of DNA insertion and (2) by mutations in chromosomal genes
[219].
1.15.1 Mechanism of bacterial resistance
The history of human kind can be regarded from a medical point of view as a struggle
against infectious diseases. Infections were the leading cause of death worldwide at the
beginning of the 20th century. Since the discovery of penicillin by Alexander Fleming in
1929 and the first introduction of the sulpha drugs by Domagk in 1932, the number of new
antimicrobials available has increased tremendously between 1940 and 1960. ‘The era of
antibiotics’ led to optimism till the early 1970s that infectious diseases can be controlled and
prevented and mankind felt confident that modern medicine would prevail. However,
infections are still the second-leading cause of death worldwide, causing over 13 million
deaths each year. This fact is the result of the emergence of new diseases, the re-emergence

37
of diseases once controlled and more specifically of the development of antimicrobial
resistance [220-222].
Bacteria have a remarkable ability to adapt to adverse environmental conditions,
which is an example of the ancient law of nature of ‘survival of the fittest’. It appears that the
emergence of antimicrobial resistant bacteria is inevitable to most every new drug and it is
recognized as a major problem in the treatment of microbial infections in hospitals and in the
community [223].
1.15.2 Intrinsic resistance
Bacteria may be inherently resistant to an antimicrobial. This passive resistance is a
consequence of general adaptive processes that are not necessary linked to a given class of
antimicrobials. An example of natural resistance is Pseudomonas aeruginosa, whose low
membrane permeability is likely to be a main reason for its innate resistance to many
antimicrobials [224]. Other examples are the presence of genes affording resistance to self-
produced antibiotics, the outer membrane of Gram-negative bacteria, absence of an uptake
transport system for the antimicrobial or general absence of the target or reaction hit by the
antimicrobial [225].
1.15.3 Acquired resistance
Active resistance, the major mechanism of antimicrobial resistance, is the result of a
specific evolutionary pressure to develop a counterattack mechanism against an antimicrobial
or class of antimicrobials so that bacterial populations previously sensitive to antimicrobials
become resistant [226]. This type of resistance results from changes in the bacterial genome.
Resistance in bacteria may be acquired by a mutation and passed vertically by selection to
daughter cells. More commonly, resistance is acquired by horizontal transfer of resistance
genes between strains and species. Exchange of genes is possible by transformation,
transduction or conjugation [227].
38
The major mechanisms of active antimicrobial resistance (Figure 1) are (1) prevention
of accumulation of antimicrobials either by decreasing uptake or increasing efflux of the
antimicrobial from the cell via a collection of membrane-associated pumping proteins, (2)
qualitative drug target site alteration, which reduces the affinity for antimicrobials either by
mutation or by target modification, or quantitative drug target alteration by overproduction of
the target and (3) inactivation of antibiotics either by hydrolysis or by modification [226-
228].
1.15.2 Prevention of antimicrobial access to their targets
(a) Permeability barriers
The cytoplasmic membrane is a barrier to hydrophilic compounds. Entry of cytoplasmatically
targeted compounds is usually through carrier-mediated transport mechanisms or via
channels in the outer membrane of Gram-negative bacteria formed by porins (e.g. OprD
porin). Antibacterial compounds transported in this way may be subject to resistance by loss
of non-essential transporters, by lack of porins or by mutations that are able to modify the
structure of these channels and thus decreasing the influx [229]. Some microbes possess
impermeable cell membranes that prevent drug influx as exemplified by P. aeruginosa.
Furthermore, many large molecule antimicrobials are naturally inactive against certain groups
of bacteria because they simply cannot pass into the bacterial cell [230].
(b) Efflux pumps
Increasing the efflux also plays a role, especially with hydrophobic compounds that
presumably enter the cell via diffusion [229-231]. At the same speed where these
antimicrobials are entering the cell, efflux mechanisms are pumping them out again, before
they reach their target [232]. A mutation resulting in over expression of a multidrug efflux
pump leads to resistance to a wide variety of structurally unrelated antimicrobials [233].
39
Multidrug resistance proteins (MDRs) or multidrug efflux pumps are widespread in bacteria
[234].
(c) Alteration of drug target
Natural variations or acquired changes in the target sites of antimicrobials that prevent
drug binding or action is a common mechanism of resistance. Target site changes often result
from spontaneous mutation of a bacterial gene on the chromosome and selection in the
presence of the antimicrobial [235,236].
They are grouped into five families based on their mechanisms and primary sequence
homologies. The major facilitator super family (MFS), the resistance-nodulation-division
(RND) family, the small multidrug resistance (SMR) family and the multidrug and toxic
compounds extrusion (MATE) family are secondary transporters using either proton motive
force (PMF) or sodium ion motive force (only for the MATE proteins) to expel
antimicrobials from cells. Members of the ATP-binding cassette (ABC) super family are
primary transporters using energy liberated by ATP hydrolysis [237].
(d) Antibiotic inactivation
Some bacteria produce modifying enzymes that reside within or near the cell surface
(Figure 3), which selectively target and inactivate the drug. Enzymatic inactivation either by
hydrolysis or by modification (group transfer and redox mechanisms) is a major mechanism
of resistance to natural antibiotics in pathogenic bacteria [238]. The resistant isolates in most
cases inherit the antibiotic resistance genes on resistance (R) plasmids.
These resistance determinants are most probably acquired by pathogenic bacteria
from a pool of resistance genes in other microbial genera, including antibiotic producing
organisms. No enzymes that hydrolyse or modify manmade antimicrobials have been found
[239].
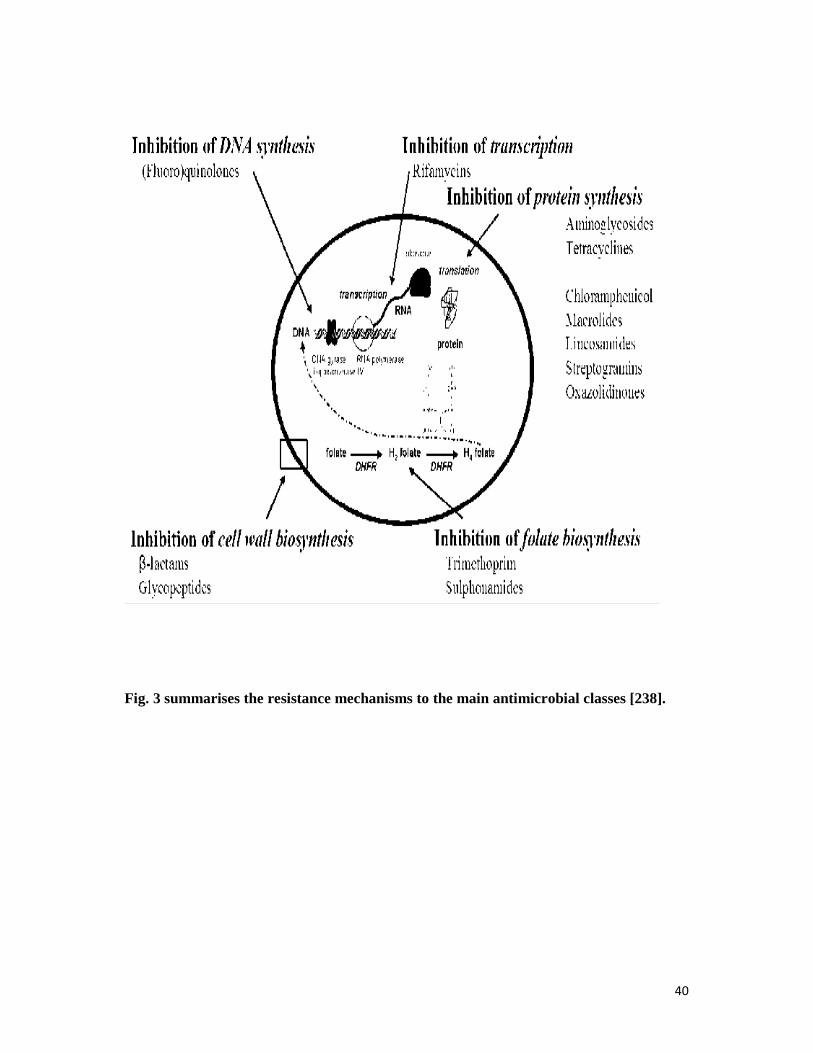
40
Fig. 3 summarises the resistance mechanisms to the main antimicrobial classes [238].
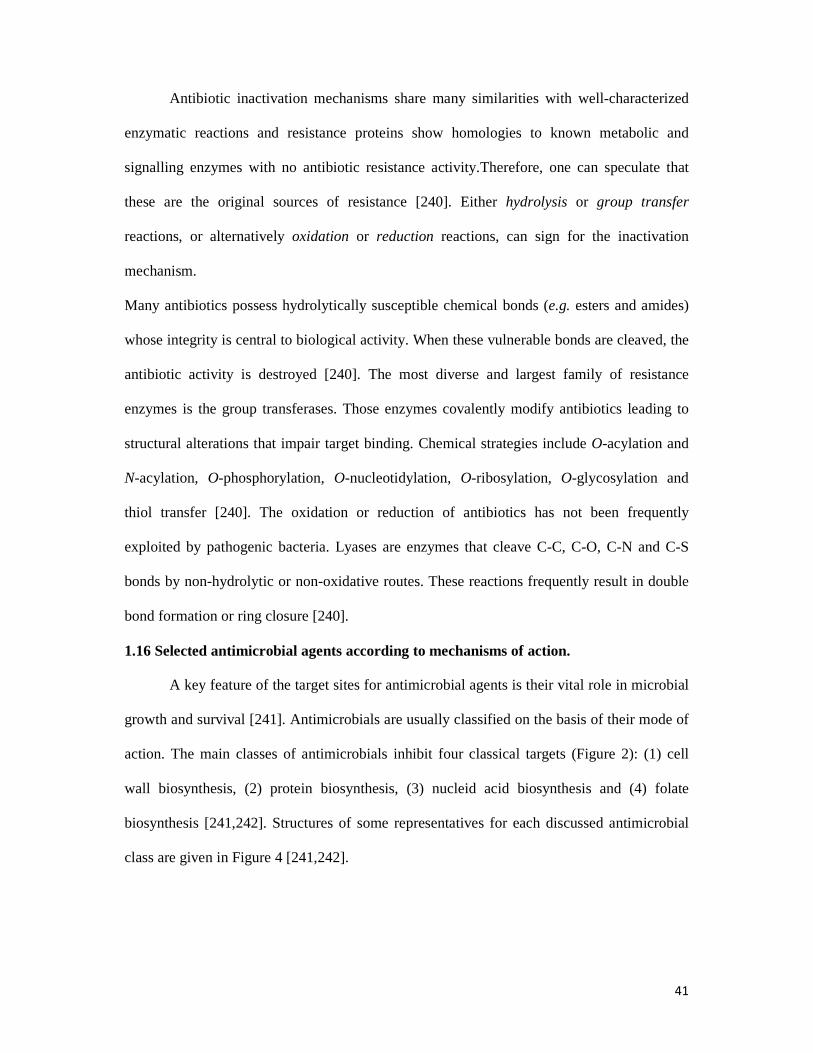
41
Antibiotic inactivation mechanisms share many similarities with well-characterized
enzymatic reactions and resistance proteins show homologies to known metabolic and
signalling enzymes with no antibiotic resistance activity.Therefore, one can speculate that
these are the original sources of resistance [240]. Either hydrolysis or group transfer
reactions, or alternatively oxidation or reduction reactions, can sign for the inactivation
mechanism.
Many antibiotics possess hydrolytically susceptible chemical bonds (e.g. esters and amides)
whose integrity is central to biological activity. When these vulnerable bonds are cleaved, the
antibiotic activity is destroyed [240]. The most diverse and largest family of resistance
enzymes is the group transferases. Those enzymes covalently modify antibiotics leading to
structural alterations that impair target binding. Chemical strategies include O-acylation and
N-acylation, O-phosphorylation, O-nucleotidylation, O-ribosylation, O-glycosylation and
thiol transfer [240]. The oxidation or reduction of antibiotics has not been frequently
exploited by pathogenic bacteria. Lyases are enzymes that cleave C-C, C-O, C-N and C-S
bonds by non-hydrolytic or non-oxidative routes. These reactions frequently result in double
bond formation or ring closure [240].
1.16 Selected antimicrobial agents according to mechanisms of action.
A key feature of the target sites for antimicrobial agents is their vital role in microbial
growth and survival [241]. Antimicrobials are usually classified on the basis of their mode of
action. The main classes of antimicrobials inhibit four classical targets (Figure 2): (1) cell
wall biosynthesis, (2) protein biosynthesis, (3) nucleid acid biosynthesis and (4) folate
biosynthesis [241,242]. Structures of some representatives for each discussed antimicrobial
class are given in Figure 4 [241,242].

42
Fig. 4 Structures of some representatives for the discussed antimicrobial classes.

43
1.16.1 Bacterial cell wall biosynthesis
Bacterial cells are surrounded by a cell wall or layers of peptidoglycan. This is a
mesh-like carbohydrate polymer, which provides the mechanical support necessary to protect
themselves from osmolysis [243]. Peptidoglycan is composed of linear chains of β-(1,4)-N-
acetyl hexosamine units joined by peptide cross-links. The peptidoglycan undergoes cross-
linking of the glycan strands by the action of transglycosidases and of the peptide strands by
the action of transpeptidases, also called penicillin-binding proteins (PBPs) [244]. Inhibitors
of one of both enzymes, active in the last stage of cell wall biosynthesis, fall into two major
classes withrespect to their mechanism of action, the β-lactams and the glycopeptides (Figure
5) [243, 244].
The cell wall (peptidoglycan matrix) surrounding bacterial cells are a mesh-like
carbohydrate polymer with glycan strands connected bypeptide cross-links.
Transglycosylases catalyse cross-linking of the glycan strands, and the peptide strands
undergo cross-linking by the action of transpeptidases. Transpeptidases are inactivated by β-
lactams and glycopeptides. Glycopeptides also inhibit transglycosylase activity. Interference
with cross-linking results in cell lysis and death. M: N-acetylmuramic acid; G: N-acetyl-D-
glucosamine [264].
i β-lactam antibiotics
The primary targets of the β-lactam agents are the PBPs. Upon nucleophilic attack on the β-
lactam ring by the side chain oxygen atom of a serine residue at the active site of the enzyme,
a relatively stable lethal covalent penicilloyl-enzyme complex is formed in which the serine
is covalently acylated by the hydrolysed β-lactam leading to inactivation of the enzyme and
blocking of the normal transpeptidation reaction [243-246]. This results in weakly cross-
linked peptidoglycan and eventually cell lysis and death [242, 243].

44
Fig. 5 Inhibitor of β-lactams and the glycopeptides
45
Resistance to β-lactam antibiotics
(a) Antibiotic inactivation.
The β-Lactamases are hydrolytic enzymes that disrupt the amide bond of the characteristic β-
lactam ring, before the antibiotic can get to the site of cell wall synthesis, rendering the
antimicrobial ineffective [246]. β-Lactamase expression is a principle mechanism of Gram-
negative resistance [246]. There are four classes of β-lactamases: three serine-dependent
enzyme classes (A, C and D) and one metal-dependent class (B) [247]. Of particular concern
are the enzymes able to target the expanded spectrum β-lactams, such as the AmpC enzymes,
the so-called extended spectrum β-lactamases (ESBL) and the carbapenemases [247].
(b) Target site alteration
There is several penicillin-binding protein (PBP)-mediated mechanisms of β-lactam
resistance, including acquisition of a ‘new’ less-sensitive enzyme, mutation of an endogenous
PBP to lessen the reaction with β-lactams (while maintaining some transpeptidase activity) or
upregulation of PBP expression [248]. PBP alteration is a principle mechanism of Gram-
positive resistance [247]. The most important example is the acquisition and expression of the
mecA gene by S. aureus, encoding a new low-affinity PBP, PBP2a (also called PBP2́). This
gene is found on a mobile element, the staphylococcal cassette chromosome mec (SCCmec),
carrying additional antibiotic (non-β-lactam) resistance genes [249]. Alterations in or
overproduction of other PBPs are also possible [250].
(c) Decreased permeability and increased efflux
Reduced outer membrane permeability to β-lactams as a result of porin loss or changes in
porin structure can promote resistance to these agents [251]. A major contribution to
antibiotic resistance in Gram-negative species is the presence of broad-specificity drug-efflux
pumps. One of the best characterized of these is the drug efflux system MexAB-OprM of P.
aeruginosa [251-253]. To overcome resistance, semisynthetic β-lactamase resistant β-lactams

46
were developed [252,253]. β-Lactamase susceptible β-lactams can be co-administered with β-
lactamase inhibitors, such as clavulanic acid, sulbactam and tazobactam [251,254]. A number
of β-lactam compounds that bind strongly to low-affinity PBPs have been designed as well as
agents that potentiate the activity of existing β-lactams against low-affinity PBP-producing
organisms [255]. Dual action hybrid antimicrobials were designed by fusing β-lactams to
other antimicrobials, harnessing the enzymatic action of β-lactamases, which on their turn
release the second antimicrobial [254 - 256].
ii Glycopeptides
Glycopeptides bind highly specific, non-covalently to the D-Ala -4-D-Ala-5- termini of the
UDP-muramylpentapeptide peptidoglycan precursors. Through this binding, the bound
glycopeptide acts as a steric impediment. The substrates are kept away from transglycosidase
(chain elongation) and transpeptidase (crosslinking). This substrate sequestration leads to the
failure of peptidoglycan cross-links, making the cell wall susceptible to osmolysis [254-257].
Whereas binding to the D-Ala-4-D-Ala-5- peptide motif is crucial for antimicrobial activity,
the mode of action is still more sophisticated and dimerization and membrane anchoring have
been suggested [256]. This stabilizes the binding to the new depsipeptide or facilitates a new
mechanism of action, namely the active site inhibition of transglycosylase activity [257].
Resistance to glycopeptides
(a) Target site alteration and impermeability
The most frequent cause of resistance in enterococci (vancyomycin resistant enterococci,
VRE) is the acquisition of one of two related gene clusters, vanA or vanB, located on
transposable elements [255]. This results in synthesis of peptidoglycan by an alternative
pathway, which produces modified peptidoglycan precursors ending in D-Ala-4-D-Lac-5- or
D-Ala-4-D-Ser-5- instead of D-Ala-4-D-Ala-5- and concomitantly eliminates precursors
ending in D-Ala-4-D-Ala-5 [258]. This causes loss of binding affinity [259]. The VanA

47
phenotype shows resistance to glycopeptide drugs, vancomycin and teicoplanin, while the
VanB phenotype is resistant to vancomycin, but remains susceptible to teicoplanin [260].
Sequestration of the agent in a modified wall structure or in the medium has been noticed.
Vancomycin resistant Staphylococcus aureus (VRSA) strains typically generate multilayered,
thickened cell walls as if more sites for stoichiometric binding of drugs are the cause of
reduced susceptibility [258-260]. The second-generation semi-synthetic lipoglycopeptides
oritavancin, telavancin and dalbavancin as well as chlorobiphenyl vancomycin analogues
retain activity against these resistant strains [260].
1.16.2 Nucleic acid biosynthesis
Two classes of antimicrobials are known to interfere with nucleic acid biosynthesis, (fluoro)
quinolones and rifamycins [241,242].
i. Quinolones
In order to fit inside the bacterium, the DNA is negatively supercoiled and is arranged
around an RNA core. The topological stress during transcription or DNA replication is
relieved and the positive supercoils are removed by a type II topoisomerase, known as DNA
gyrase, which makes double-stranded breaks in the DNA and reduces the linking number by
two [260]. Following DNA synthesis, the daughter chromosomes are unlinked by another
type II topoisomerase, topoisomerase IV, in a process called decatenation [260,261]. (Fluoro)
quinolones inhibit DNA synthesis and at higher concentrations they also inhibit RNA
synthesis [262]. They interact with the complexes formed between DNA and the DNA gyrase
or topoisomerase IV creating conformational changes that result in inhibition of the normal
enzyme activity. DNA gyrase seems to be the primary target for Gram-negative organisms,
while topoisomerase IV is the primary target in Gram-positive organisms [262-263]. There
are two steps to quinolone action: formation of bacteriostatic drug-enzyme-DNA complexes,
followed by the release of lethal doublestranded DNA breaks (Figure 6) [264].

48
Fig. 6 Inhibitors of nucleic acid biosynthesis

49
(Fluoro) quinolones and rifamycins interfere with nucleic acid biosynthesis. (Fluoro)
quinolones inhibit DNA synthesis by interacting with DNA gyrase and topoisomerase IV
resulting in inhibition of normal enzyme activity. Rifamycins act as allosteric inhibitors of the
bacterial DNA-dependent RNA polymerase resulting in inhibition of transcription [264].
1.16.3 Rifamycins, RNA transcription
Transcription is an essential process for decoding genetic information from DNA to
mRNA in all organisms. The RNA polymerase of bacteria, composed of different subunits
with a stoichiometry of α2ββ’ω to form the core enzyme, catalyses transcription [266].
Rifampicin, important in combination therapy in the treatment of Mycobacterium
tuberculosis infections, inhibits bacterial DNA-dependent RNA polymerase by binding to the
β-subunit of the enzyme, encoded by rpoB, at an allosteric site. It apparently blocks the entry
of the first nucleotide, which is necessary to activate the polymerase, thereby blocking
mRNA synthesis [266-268].
Resistance to rifamycins, RNA transcription inhibitors
(i) Antibiotic inactivation
A number of mechanisms (uncharacterised kinase, ADP-ribosyl transferase (ARR),
glycosylation, monooxygenase) can modify the hydroxyl group at position 23 of rifampicin
and presumably interfere with binding to RNA polymerase [267, 268].
(ii) Target site alteration
Resistance due to modification of the β-subunit of the enzyme through chromosomal
mutations in rpoB in M. tuberculosis arises with a high frequency [267].
1.16.4 Protein biosynthesis
Protein biosynthesis is catalysed by ribosomes and cytoplasmic factors. The bacterial
70S ribosome is composed of two ribonucleoprotein subunits, the 30S and 50S subunits
[269].

50
The smaller 30S subunit is made up of 16S rRNA and about 21 ribosomal proteins
(S1 to S21), while the larger 50S subunit consists of two RNA molecules, 5S rRNA and 23S
rRNA and over 36 ribosomal proteins (L1 to L36). The catalytic ribozyme domain of the 23S
rRNA possesses peptidyl transferase activity and catalyses peptide bond formation [270].
Antimicrobials inhibit protein biosynthesis by targeting the 30S or 50S subunit of the
bacterial ribosome (Figure 7).
1.16.4.1 Inhibitors of 30S Subunit
(a) Aminoglycosides
Aminoglycosides interact with the conserved sequences of the 16S rRNA of the 30S
subunit near the A site through hydrogen bonds. They cause misreading and premature
termination of translation of mRNA. The aberrant proteins may be inserted into the cell
membrane leading to altered permeability and further stimulation of aminoglycoside transport
[267-271].
Resistant to Aminoglycosides
(i) Antibiotic inactivation
Inactivation by covalent modification of the key hydroxyl and amine groups on the
aminoglycoside antibiotics is the most significant form of acquired resistance in both Gram-
negative and Gram-positive bacteria [272]. There are three types of
aminoglycosidemodifying enzymes (AMEs), each with many variants: aminoglycoside
acetyltransferases (AAC), aminoglycoside phosphotransferases (kinases) (APH) and
aminoglycoside adenylyltransferases (ANT) [271-273].
(ii) Target site alteration
Many aminoglycoside producing organisms express rRNA methylases
(aminoglycoside resistance family of methyltransferases), which modify the 16S rRNA
molecule at specific positions critical for the tight binding of the drug.

51
Fig. 7 The process of protein biosynthesis inhibition

52
This is highlighted by the finding of the rmtA, rmtB and armA genes [273] causing a
post transcriptional 16S rRNA methylation.
Aminoglycoside resistance can also occur by point mutations in the rrs gene,
encoding the 16S rRNA of the 30S subunit, or by mutations in the rpsL gene, encoding the
30S ribosomal protein S12.These ribosomal mutations are clinically relevant only for
streptomycin in M. tuberculosis [272-274].
(iii) Decreased permeability and increased efflux
Finally, aminoglycoside concentrations can be decreased inside a target cell by reduction of
drug uptake, activation of drug efflux pump or both [273]. The most successful approach to
combat resistance is by development of aminoglycosides that lack sites of inactivation, as
exemplified by amikacin, which is protected from attack by steric hindrance due to the
presence of a side chain [275]. The second approach is the design of inhibitors of the three
classes of aminoglycoside-modifying enzymes. Inhibitor design can be targeted at the
aminoglycoside, cofactor binding sites or both [275].
(b) Tetracyclines
Tetracyclines can be divided into two types based on their mode of action [276]. Typical
tetracyclines, such as tetracycline, chlortetracycline, doxycycline or minocycline, act upon
the conserved sequences of the 16S rRNA of the 30S ribosomal subunit to prevent binding of
tRNA to the A site [276, 277]. Some other tetracycline derivatives, such as chelocardin,
thiatetracycline, anhydrotetracycline, have been shown to act by inserting into the
cytoplasmic membrane [278]. Thirty-eight acquired genetically mobile tetracycline (tet) and
oxitetracycline (otr) resistance (Tcr) genes are known, including genes coding for energy-
dependent.

53
Resistance to tetracycline
Alteration of porin proteins, e.g. OmpF, or other outer membrane proteins limits the
diffusion of tetracycline into the periplasm in Gram-negative bacteria [278]. About 60% of all
tet and otr genes code for energy-dependent membrane-associated transporters belonging to
the MFS, which export tetracycline out of the cell at a rate equal to or greater than its uptake
[278,279]. On the other hand, ribosomal protection proteins promote GTP dependent release
of tetracyclines from the ribosomal A site leading to dissociation of the antibiotic-target
interaction [279,280]. Three classes of ribosome protection resistance genes have been
described, tet (M), tet (O) and tet (Q) genes [278]. Resistance can also arise by point mutation
in ribosomal RNA [30]. Finally, the tet (X) gene encodes an NADPH requiring
oxidoreductase, which oxidizes tetracycline antibiotics. The antibiotic undergoes non-
enzymatic rearrangement into unstable products that polymerise into a black product after
several hours [278,279]. A new generation of tetracyclines, the 9-glycinyltetracyclines or
glycylcyclines (tigecycline, 9-t-butylglycylamido-minocycline) have been developed.
Glycylcyclines have a higher binding affinity for ribosomes than earlier tetracyclines.
Furthermore, the Tet efflux proteins fail to recognise glycylcyclines or are unable to transfer
glycylcyclines [280]. A number of tetracycline efflux pump inhibitors have been discovered
that might be used in combination with earlier tetracyclines.
1.16.4.2 Inhibitors of 50S subunit
(a) Chloramphenicol
Chloramphenicol interacts with the conserved sequences of the peptidyl transferase
cavity of the 23S rRNA of the 50S subunit. It inhibits protein synthesis by preventing binding
of tRNA to the A site of the ribosome. It interacts with various nucleotides of the peptidyl
transferase cavity of the 23S rRNA through hydrogen bonds [280].
54
Resistance to chloramphenicol
Antibiotic Inactivation
The inactivation of chloramphenicol is accomplished by the chloramphenicol
acetyltransferases (CAT) by transferring the acetyl group from acetyl CoA, resulting in a
lower affinity of the antibiotic for the rRNA [280]. Hereto, florfenicol was developed to
overcome CAT-mediated resistance.
(b) Macrolides
Macrolides affect the early stage of protein synthesis, namely translocation, by targeting the
conservedsequences of the peptidyl transferase centre of the 23S rRNA of the 50S ribosomal
subunit [280]. This results in a premature detachment of incomplete peptide chains [280].
Although compounds of considerable structural variety, macrolides, lincosamides and
streptogramins B (MLSB antibiotics) show a similar mechanistic action [280].
Resistance to macrolides
(i) Target site alteration
Any discussion of mechanisms of resistance to macrolide antimicrobials must include
the lincosamide and streptogramin B families as well. This type of cross-resistance has
therefore been referred to as MLSB resistance [281,282] and is generally the result of target
site alteration. The latter results from a post-transcriptional modification of the 23S rRNA
component of the 50S ribosomal subunit involving methylation or dimethylation of A2058
(E. coli numbering) in the peptidyl transferase functional domain. This is catalysed by
adenine-specific N-methyltransferases (methylases, MTases) specified by the erm class of
genes, frequently plasmid encoded [280,281]. This modification reduces the affinity of the
rRNA for the antimicrobials but does not interfere with protein biosynthesis [279]. Mutations
in 23S rRNA close to the sites of methylation can also lead to macrolide resistance [278,281].

55
In addition to multiple mutations in the 23S rRNA, mutations in the L4 and L22 50S
ribosomal proteins have also been seen [282,283].
(ii) Antibiotic inactivation
Macrolides can also be inactivated by specific enzymes inside the cell, such as
proteins that cleave the macrocycle ester, encoded by ereA and ereB genes. Phosphorylation
by MPHs (macrolide kinases) encoded by mphA and mphB from E. coli and mphBM (mphC)
from S. aureus and macrolide glycosylation by the product of the mtg gene [282,283] are also
possible.
(iii) Decreased permeability and increased efflux
Finally, macrolide entrance into bacterial cell can be prevented by changes in the
permeability of the membrane or the cell wall. The active extrusion of antimicrobials from
the bacterial cell by the action of efflux pumps, encoded by mef genes, has also been
observed [283, 284]. The ketolide telithromycin retains activity against isolates resistant by
target modification [284]. Activity of the existing antimicrobial drugs can also be restored by
the design of inhibitors of the Erm MTases [285].
(c) Lincosamides
Lincosamides interact with the conserved sequences of the 23S rRNA of the 50S
subunit [286]. They act by affecting the process of peptide chain initiation and may also
stimulate dissocation of peptidyl-tRNA from ribosomes. In contrast with macrolides,
lincosamides are direct peptidyltransferase inhibitors [287].
Resistance to lincosamides
(i) Target site alteration
The main type of resistance is the MLSB resistance [288]. Recently, methylation of 23S
rRNA at A2503 by the cfr gene product has been seen. Cfr causes resistance by inhibiting
ribose methylation at nucleotide C2498. The phenotype was named PhLOPSA [289].

56
Mutations in the 23S rRNA and in L4 and L22 ribosomal protein genes likewise have been
found [290].
(ii) Antibiotic inactivation and efflux
As inactivation mechanism, three lincosamide O-nucleotidyltransferase genes, linA, linA’
and linB [291] have been characterized. Alternatively, efflux of the antibiotic is the main
resistance mechanism in Gram-negative bacteria [292]. No specific mechanisms to overcome
the ever increasing resistance have been developed, beside the use of combinations of
different antibiotics or of antibiotics with non-antibiotic antimicrobials [293].
(d) Streptogramins
Streptogramins act by binding to the conserved sequences of the 23S rRNA of the 50S
subunit and byinterfering with peptidyltransferase activity [294]. Type A streptogramins
block the substrate site of the peptidyl transferase centre, thus preventing the earliest event of
elongation [293]. Type B streptogramins block peptide bond synthesis and cause a premature
release of incomplete peptide chains [293]. The synergism between types A and B
streptogramins is due to induction by type A streptogramins of conformational changes in
ribosomes that significantly increase the ribosome affinity for type B streptogramins
[293,294].
Resistance to streptogramins
Resistance to streptogramin combinations requires resistance specifically to the SA
component, but it is augmented by the presence of mechanisms conferring SB resistance
[295].
(i) Target site alteration
The main type of resistance is the MLSB resistance. Type A streptogramins are not
affected by this altered residue and the efficacy of the synergistic combination is thus retained
[291-293]. Also, modification of 23 rRNA ribosomal proteins, such as ribosomal protein L4,

57
due to point mutations and small deletions or insertions has been described. Low-level
resistance has been reported resulting from mutations in rplV, which encodes ribosomal
protein L22 [294].
(ii) Antibiotic inactivation
The streptogramin acetyltransferases (VATs) inactivate the type A streptogramins by
O-acetylation. Five acetyltransferases, encoded by vat (A), vat (B) and vat (C) and by vat (D)
and vat (E), have been seen [291, 294]. The producer of the type A streptogramin
virginiamycin M1 protects itself by reducing a critical ketone group, thereby generating an
inactive compound. This reduction is NADPH-dependent and regiospecific [292]. Specific
resistance to type B streptogramins is mediated by lyases, encoded by vgb (A) and vgb (B),
which inactivate the compounds via an elimination mechanism [293, 294].
(iii) Decreased uptake and increased efflux
Alternatively, streptogramin uptake into the periplasm is impaired among most Gram-
negative organisms owing to the impermeable Gram-negative outer membrane (intrinsic
resistance) [294]. Active efflux of type A streptogramins is due to ATP-binding cassette
proteins encoded by plasmid-borne vga (A) and vga (B) genes [21]. Efflux of type B
streptogramins is due to the presence of another ATP-binding transporter encoded by the
msrA, msrSA, msrB and msrC genes [294].
(e) Oxazolidinones
Oxazolidinones inhibit formation of the 70S initiation complex by binding to the P
site at the 50S ribosomal subunit near to the interface with the 30S subunit, thereby blocking
the first peptide-bond forming step [295]. If the 70S initiation complex is already formed,
they inhibit translocation of peptidyl-tRNA from the A site to the P site during formation of
the peptide bond [296]. Recently it was shown that they also inhibit fMet-tRNA binding to

58
the P site [294]. As the action mechanism of oxazolidinones is unique, no cross-resistance
between oxazolidinones and other protein synthesis inhibitors has been observed [294].
Resistance to Oxazolidinones
(i) Target site alteration
Resistance arises by spontaneous mutations in chromosomal genes encoding 23S
rRNA, resulting in decreased affinity for binding, or in protein L4 [294]. Also
posttranscriptional modification of the target site is a possible cause of resistance. Linezolid
resistance is determined by the presence of the cfr gene. Cfr methyltransferase modifies
adenosine at position 2503 in 23S rRNA. The natural function of cfr likely involves
protection against natural antibiotics whose site of action overlaps that of linezolid [295].
1.16.5 Miscellaneous targets
1.16.5.1 Folic acid metabolism: sulphonamides and trimethoprim
Each of these drugs inhibits distinct steps in folic acid metabolism (Figure 8). A
combination of sulpha drugs and trimethoprim acting at distinct steps on the same
biosynthetic pathway shows synergy and a reduced mutation rate for resistance [295].
Sulphonamides inhibit dihydropteroate synthase in a competitive manner with higher affinity
for the enzyme than the natural substrate, p-aminobenzoic acid. Agents such as trimethoprim
act at a later stage of folic acid synthesis and inhibit the enzyme dihydrofolate reductase
[295].
Resistance to sulphonamides and trimethoprim
(i) Target site alteration
Mutations in the d (h)fr gene producing single amino acid substitution in the
dihydrofolate reductase are responsible for trimethoprim resistance. Changes in both the
promoter and coding regions of the dhfr gene have been found [296]. Overexpression or
metabolic bypass of the target has also been observed.

59
Fig. 8 Sulphonamides and trimethoprim inhibit distinct steps in folate
Metabolism

60
1.16.5.2 Cell membrane disruptors
(i) Polymyxin antibiotics
Cationic cyclic peptides with a fatty acid chain attached to the peptide, such as
polymyxins, attack the cytoplasmic membrane of Gram-positive and Gram-negative bacteria
and the outer membrane of Gram-negative bacteria. They bind to phospholipids in the
cytoplasmic membrane, causing loss of membrane integrity, leakage of cytoplasmic contents
and finally cell death [295, 296].
Resistance to polymyxin antibiotics
The key initial interaction between the polymyxins and lipopolysaccharides can be blocked
by modification of the phosphate esters linked to the diglucosamine components of lipid A
[297].
(ii) Lipopeptides: Daptomycin
Daptomycin has a unique mode of action and involves a calcium-dependent insertion
of the lipid side chain into the Gram-positive cell membrane. After this, several molecules
come together to form oligomers that disrupt the cell membrane without entering the
cytoplasm of the cell. This ion-conduction structure results in potassium efflux and associated
membrane depolarisation. This disruption of the bacterial cell membrane function also
appears to trigger inhibition of DNA, RNA and protein synthesis resulting in cell death [295,
296]. The synthesis of lipotheichoic acid, found in Gram-positive organisms, is also inhibited
by daptomycin [36]. Due to its unique mode of action, there is generally no crossresistance
[297]. Spontaneous acquisition of resistance to daptomycin occurs rarely [296].
Resistance to lipopeptides: Daptomycin
i. Impermeability
The failure to cross the outer membrane of Gram-negative bacteria to reach the inner
cell membrane target is likely to explain the lack of daptomycin activity against gram

61
negative bacteria (intrinsic resistance) [297]. Correlation with vancomycin and daptomycin
resistance linked to the thickness of the cell wall suggests that prior use of vancomycin may
predispose to decreased daptomycin susceptibility [296].
This overview has given insight in the many therapeutic possibilities that exist for treatment
of bacterial infections and in the continuous battle between resistance development and
overriding mechanisms.
1.17 Methicillin resistant Staphylococcus aureus (MRSA)
Staphylococcus aureus is responsible for a broad range of clinical infections, most
notable of which are cases of bacteremia and endocarditis [298]. Staphylococcus aureus is an
important cause of serious infections in both hospitals and the community. Methicillin-
resistant Staphylococcus aureus (MRSA) were first reported in 1961 and the first hospital
outbreak of MRSA was reported in 1963 [297]. When MRSA strains first appeared, they
occurred predominantly in the healthcare setting. Cases of community-associated MRSA
(CA-MRSA) infections were first reported in the late 1980s and early 1990s [296]. Health
care-associated MRSA (HA-MRSA) is particularly efficient at developing resistance to
antimicrobial agents. Methicillin resistance among staphylococci has steadily increased
worldwide, especially among cases acquired in hospitals. It is associated with longer hospital
stay and more infections in intensive care units and leads to more antibiotic administration
[298]. Asymptomatically colonized patients and health care workers are the major sources of
methicillin-resistant Staphylococcus aureus (MRSA) in the hospital environment [298].
MRSA-infected patients in burns units are particularly problematic because the big
surface area of denuded skin can produce a large inoculum of organisms that can be easily
transmitted to other patients via the hands of health care workers. Extensive skin lesions also
result in heavy shedders of MRSA [297]. The commonest site of MRSA carriage is the
anterior nares. A significant risk factor for acquisition of MRSA is the duration of hospital
62
stay. Prolonged stay in the hospital is likely with patients in orthopedics and dermatology
wards, which may result in high rates of carriage observed in these patients [296].
HACO (Health care associated MRSA with a community onset) refers to community
onset for a person associated with a hospital environment, e.g., a person living in a residential
home, a health care worker, a dialysis patient, or an individual with a history of
hospitalization within the previous year [298]. Risk factors associated with MRSA
bacteremia include the following: residence in an extended care facility, prior antibiotic
exposure, insulin dependent diabetes, prolonged hospitalization, urinary catheterization,
nasogastric tube placement, prior surgery, and having an underlying disease [299]. The
elderly population (≥ 65 years old) is at a significantly higher risk of death due to MRSA
bacteremia than are younger populations.
MRSA bacteremia has been associated with an increased risk of acute renal failure,
longer hospital and intensive-care-unit stays, development of ventilator dependency, and
increased hospital costs. Fatality rates for patients that develop MRSA bacteremia are
estimated to be between 23 % and 54 %. Nosocomial MRSA is remarkable for its clonal
pattern of spread. Currently, 5 major MRSA clones account for approximately 70 % of
MRSA isolates in hospitals in the United States, South America, and Europe [298,299].
1.17.1 Brief timeline [298-300].
1940 Penicillin introduced
1942 Penicillin-resistant Staphylococcus aureus appears
1959 Methicillin introduced; most S aureus strains in both hospital and community settings
are penicillin resistant
1961 Methicillin-resistant S aureus appears
1963 First hospital outbreak of methicillin-resistant S aureus
1996 Vancomycin-resistant S aureus (VRSA) reported in Japan
63
1.17.2 Methicillin
Meticillin or methicillin is a narrow spectrum beta-lactam antibiotic of the penicillin
class developed in 1959 that was previously used to treat infections caused by beta-lactamase
producing Staphylococcus aureus [300]. Methicillin is no longer manufactured because the
more stable and similar penicillins such as oxacillin, flucloxacillin and dicloxacillin are used
medically [301]. The presence of the ortho-dimethoxyphenyl group directly attached to the
side chain carbonyl group of the penicillin nucleus facilitates the β-lactamase resistance.
Methicillin has recently been renamed meticillin to comply with European law, which
requires the use of the recommended international non-proprietary name (rINN).
International convention has now renamed this agent as meticillin [300].
1.17.3 Mechanism of resistance:
Penicillin-resistant strains of S. aureus appeared as early as the 1940s, but for many
years these remained susceptible to ß-lactamase-stable penicillins [299, 300]. Then, in the
mid-1980s, S. aureus strains emerged that were resistant to the ß-lactamase-stable penicillins.
These strains were termed “methicillin resistant S. aureus” (MRSA), because methicillin was
initially used to detect their resistance to ß-lactamase-stable penicillins (oxacillin, methicillin,
nafcillin) [300]. Even though the drug methicillin is no longer the agent of choice for
treatment, the acronym MRSA continues to be used. Later use of oxacillin as an alternative to
methicillin in susceptibility tests resulted in the term ‘oxacillin-resistant S. aureus’ (ORSA)
[299].
These designations are used interchangeably in the literature and are synonymous. In
S. aureus, resistance to penicillins occurs through two mechanisms: the production of the ß-
lactamase enzyme and the presence of the mecA gene [301]. Majority of S. aureus strains
today produce ß-lactamase and are thus resistant to penicillin. Some of these strains produce
excessive amounts of ß-lactamase, which makes them appear borderline resistant to oxacillin.
64
These strains are termed borderline oxacillinresistant S. aureus (BORSA) and they can be
difficult to differentiate from classic MRSA [300].
Methicillin-resistant isolates with alterations to existing PBPs have been described.
These isolates have been termed ‘moderately resistant S. aureus (MODSA). They are not
frequently reported, the resistance is low-level and their clinical significance is unclear [302].
Methicillin resistance in S. aureus is primarily mediated by the mecA gene, which codes for
the modified penicillin-binding protein 2a (PBP2a or PBP2ʹ) [303]. PBP2́ is located in the
bacterial cell wall and has a low binding affinity for β-lactams. Although all cells in a
population of S.aureus may carry the mecA gene, often only a few of the cells will express
the gene [304].
Thus, both resistant and nonresistant bacteria can exist in the same culture. mecA
expression can be constitutive or inducible [305]. mecA is carried on a mobile genetic
element, the staphylococcal cassette chromosome mec (SCCmec), and at least five types of
SCCmec elements have been reported. Characteristics shared by all SCCmec elements are
carriage of the mec and ccr (cassette chromosome recombinases) gene complexes and
integration in the S. aureus genome at the 3' end of an open reading frame (orfX) with an
unknown function [306].
Four and five types of mec and ccr genes have been identified, respectively, and
SCCmec elements can be differentiated based on various combinations of these alleles [306].
MRSA infections in patients without any established risk factors too is on the rise in the
community where skin and soft-tissue infection, necrotizing fasciitis and serious necrotizing
pneumonia have been reported to cause epidemics[307].
These infections have been attributed to dissemination of genetically distinct clonal
strains, which contain Panton-Valentine leukocidin (lukS-PV and lukF-PV) and possesses
different staphylococcal cassette chromosome mec (SCCmec) genetic elements (type IV a–d

65
and type V). SCCmec types I to IV are annotated primarily by using the multiplex PCR.
Isolates that are nontypeable (NT) by this method are further investigated by PCR to assess
the ccrA, ccrB, and ccrC recombinase genes and the mec class or by multiplex PCR to
distinguish SCCmec subtypes IVa to IVh [306]. These strains tend to be more susceptible to
antimicrobial agents compared with the SCCmec type’s I–III. On the other hand, HA-MRSA
strains mainly harbor SCCmec types I, II, and III and in contrast to CA-MRSA strains tend to
be multidrug resistant with hallmark resistance to fluoroquinolones [307].
1.17.4 Detection of resistance
Several organizations have recommended that patients be screened upon admission to
hospitals and persons identified as colonizers are placed on contact isolation. Nasal
colonization has been shown to be predictive of the likelihood of patients to develop an
infection. Active surveillance cultures from patients for carriage of MRSA facilitate an early
contact isolation (and even treatment), thus preventing spread in the hospital and reducing
costs. The accurate and early determination of methicillin resistance is of key importance in
the prognosis of infections caused by S. aureus. Strains that possess mecA gene are either
heterogeneous or homogeneous in their expression of resistance [307,308]. The
heterogeneous expression occasionally results in minimal inhibitory concentrations that
appear to be borderline and consequently the isolates may be interpreted as susceptible.
MRSA strains expressing heterogeneous resistance (a predominantly low-level resistance
population coexisting with a small proportion of highly resistant cells) are often mistaken for
methicillin-sensitive S. aureus (MSSA) by conventional culture and represent a hidden
reservoir in hospitals [308]. The presence of both resistant and nonresistant bacteria, along
with the fact that the resistant bacteria often grow more slowly, can make it difficult to detect
methicillin resistance. Their detection using methicillin and oxacillin is aided by following

66
changes [309]: Neutral pH, incubation temperature of 33 oC – 5 oC, Mueller-Hinton agar or
broth infused with 2 % - 4 % NaCl, and 24-h incubation time.
Several selective media have been used for screening MRSA, such as mannitol salt agar with
oxacillin, Oxacillin blood agar and CHROM agar. Occasionally, heteroresistant mecA-
positive strain is not detected due to low expression of resistance. Oxacillin agar screen
generally does not detect borderline resistant strains [310].
1.17.5 Phenotypic detection systems
Phenotypic expression of resistance can vary depending on the growth conditions (e.g.
temperature, osmolarity and culture medium supplements such as NaCl or sucrose), making
susceptibility testing by standard microbiological methods potentially difficult.
(a) Agar dilution test
A minimum of four to five colonies isolated from an overnight growth are transferred
to sterile saline. The suspension is adjusted to a 0.5 McFarland standard (108 cfu/ml) and spot
inoculated on Mueller-Hinton agar plates supplemented with 2 % NaCl and containing 2.56 –
0.125 μg oxacillin/ml in serial doubling dilutions. The oxacillin Mueller-Hinton plates are
incubated at 35 oC for 24 h. MIC of ≥ 4 μg/ml is considered resistant and MIC of ≤ 2 is
considered susceptible [310].
(b) Broth microdilution
This involves the use of Mueller-Hinton broth with 2 % NaCl, an inoculum density of 5 x 10⁵
cfu/ml and incubation at 33 oC–35 oC for 24 h.[308 - 310].
Breakpoint methods
Breakpoint methods include both agar and broth methods and are essentially similar to
dilution MIC methods but test only the breakpoint concentration (2 mg/L oxacillin, 4 mg/L
methicillin).[310].

67
(c) Disc diffusion test
A direct colony suspension of each S. aureus isolate is prepared to a 0.5 McFarland
standard and plated on Mueller-Hinton agar containing 2-4 % NaCl. An oxacillin (1 μg) disk
is placed on the surface and incubated at 35 oC for 24 h [310]. Oxacillin disk is more resistant
to degradation in storage and more likely to detect heteroresistant strains. The zone of
inhibition must be read with transmitted light and not reflected light. Zone diameter of ≤ 10
mm is considered as resistant, ≥ 13 mm as susceptible whereas 11-12 mm is considered as
intermediate. If intermediate results are obtained for S. aureus, testing for mecA, PBP2a,
[310]. Cefoxitin disk test, Oxacillin MIC test or Oxacillin-salt agar screen test may be
performed. Any discernable growth within the zone of inhibition when seen using transmitted
light is indicative of oxacillin resistance [310]. It may be possible that some of the oxacillin
disk test positive isolates are hyperbeta-lactamase producers, thereby accounting for non-
mecA-mediated methicillin resistance [311].
In disc diffusion tests, hyper-producers of penicillinase may show small methicillin
or oxacillin zones of inhibition, whereas most true methicillin-/oxacillin-resistant isolates
give no zone. A 5μg methicillin disk can also be used but is not a popular choice. Zone
diameter of ≤ 9 mm is considered resistant, ≥ 14 mm is considered resistant whereas a
diameter of 10-13 mm is considered intermediate [310, 311].
(d) Etest oxacillin MIC test
The inoculum is standardized to 0.5 McFarland turbidity and plated on Mueller-Hinton agar
supplemented with 2 % NaCl [310]. Etest strips are placed and incubation at 35 oC for 24 h.
The Etest has an advantage over other MIC methods in that it is as easy to set up as a disc
diffusion test [311].
68
(e) Oxacillin screen agar
Mueller-Hinton agar (MHA) plates containing 4 % NaCl and 6 μg/ml of oxacillin are
inoculated with 10 μL of 0.5 Mc Farland suspension of the isolate by streaking in one
quadrant and incubated at 35 oC for 24 h. Plates are observed carefully in transmitted light for
any growth. [311].
Any growth after 24 h is considered oxacillin resistant. Induction with oxacillin requires an
extended period for full expression. Hence, oxacillin-containing media achieve sufficiently
high sensitivities only after 48 h of incubation [312].
(f) Cefoxitin disc diffusion test
Cefoxitin, which is a potent inducer of the mecA regulatory system, is being widely
used as a surrogate marker for detection of mecA gene-mediated methicillin resistance.
MRSA strains exhibiting inducible resistance to methicillin grow much more readily in the
presence of cefoxitin than oxacillin [312], due to an enhanced induction of PBP 2a by
cefoxitin. CLSI has recommended cefoxitin disc diffusion method for the detection of
MRSA. A 0.5 Mc Farland standard suspension of the isolate is made and lawn culture done
on MHA plate. A 30 μg cefoxitin disc is placed and plates are incubated at 37 OC for 18 h and
zone diameters are measured [312].
The zone diameter must be measured in reflected light. An inhibition zone diameter of
≤ 21 mm is reported as methicillin resistant and ≥ 22 mm is considered as methicillin
susceptible. In one study a 10 μg cefoxitin disk has been shown to be superior to the 30 μg
disk with IsoSensitest agar and semiconfluent growth. Recent studies indicate that disc
diffusion testing using cefoxitin disc is far superior to most of the phenotypic methods like
oxacillin disc diffusion and oxacillin screen agar testing and is recommended by CLSI.
Cefoxitin will detect only MRSA with a mecA-mediated resistance mechanism [311].
69
(g) Chromogenic media for MRSA
Currently available chromogenic media for MRSA detection include ChromID, MRSA
Select, CHROMagar MRSA, Chromogenic MRSA/Denim Blue agar, ORSAB (oxacillin
resistance screening agar base), MRSA Ident agar and Chromogen oxacillin S. aureus
medium. [311].
The chromogen in Chrom-ID targets the α-glucosidase enzyme of S. aureus, and the
inhibition of competing flora is brought about by the incorporation of cefoxitin (4 mg/liter),
resulting in green-colored colonies of MRSA. ORSAB, a modified version of mannitol salt
agar, is made selective by the addition of oxacillin (2 mg/liter) to inhibit MSSA and
polymyxin to suppress gram-negative bacteria [311]. This medium incorporates aniline blue
as a PH indicator, giving MRSA colonies a characteristic blue color. Colonies of MRSA on
MRSA Ident agar are dusky pink or ruby-colored due to a chromogenic phosphatase substrate
and an antibiotic supplement including cefoxitin [311].
Chromogen oxacillin S. aureus medium characterizes MRSA colonies by a pink-
mauve color. MRSA Select incorporates a cephamycin derivative and characterizes MRSA
colonies by a pink color [310]. CHROMagar contains cefoxitin (6 mg/liter) and a chromogen
that also results in rose to mauve MRSA colonies [310]. The chromogen in Chromogenic
MRSA or Denim Blue agar detects phosphatase activity in S. aureus strains and, coupled
with a selection with cefoxitin, produces denim blue colonies of MRSA. The currently
available chromogenic media for MRSA detection show almost uniformly high specificities
after 24 h of incubation, although sensitivities tend to vary widely both between media and
between studies. Prolonging incubation time to 48 h can improve sensitivities; however,
specificities are adversely affected, necessitating confirmatory tests before reporting MRSA
[312].

70
(h) Quenching fluorescence method
With the Crystal MRSA method (Becton Dickinson) inhibition of growth of an isolate
by oxacillin is indicated by the quenching of fluorescence of an oxygen-sensitive fluorescent
indicator by oxygen remaining in the broth. The method is reasonably reliable but requires
several hours of incubation [312].
(i) The 3M™ BacLite™ Rapid MRSA test
It is a rapid culture-based test that detects ciprofloxacin-resistant MRSA. The test
measures adenylate kinase (AK) activity, an enzyme in cells that regulates adenosine
triphosphate (ATP) AK catalyzes the conversion of adenosine diphosphate (ADP) to ATP. In
the assay, AK detection is combined with selective broth enrichment [312]. Magnetic
microparticles coupled with a mouse anti-S. aureus monoclonal antibodies are used to
capture MRSA. Lysostaphin is added to lyse the S. aureus and release AK. ADP is provided
as the substrate for the enzyme activity and production of ATP [311]. The ATP is detected by
the addition of firefly luciferin and luciferase, allowing a reaction that emits light when
MRSA is present in the sample. This assay yields results in five hours. Few false positives
due to methicillin resistant coagulase-negative staphylococci (CNS) misidentified as MRSA
have been encountered [312].
1.17.6 Genotypic detection system
(a) PBP2́ latex agglutination kit
The method involves extraction of PBP2´ from suspensions of colonies and detection
by latex agglutination [312]. The kit contains latex particles sensitized with a monoclonal
antibody against PBP2ʹ. Visible agglutination indicates a positive result and the presence of
PBP2́, the mecA gene product [312]. The test is rapid (10 minutes for a single test) and very
sensitive and specific with S. aureus, but may not be reliable for colonies grown on media
containing NaCl. Isolates producing small amounts of PBP2́ may give weak agglutination

71
reactions or agglutinate slowly. Reactions tend to be stronger if PBP2ʹ production is induced
by growth in the presence of penicillin. Rare isolates may give negative reactions [312].
(b) Molecular methods
Detection of mecA gene by PCR is considered as the gold standard. DNA extraction
is performed on the isolate and mecA gene is amplified using specific primers [312]. The
master mix containing PCR buffer, dNTP mix, primer, Taq DNA polymerase, and MgCl2 and
template DNA is subjected to hot start PCR. This is followed by 30 cycles of denaturation at
94 OC for 45 seconds, annealing at 50 oC for 45 s, and extension at 72 oC for 1 minute and
final extension step at 72 oC for 3 min [312]. PCR products are visualized on 2 % agarose gel
with ethidium bromide dye under UV transilluminator. Another method that is designed to
detect MRSA directly from clinical samples uses a frontend immunocapture of S. aureus
followed by MRSA detection using a multiplex PCR that detects S. aureus-specific femA and
mecA. Staphylococcus aureus-specific targets used in various user-defined molecular assays
for detection of MRSA [312]:
• nuc Encodes heat-stable DNA nuclease gene
• femA, femB Encode enzymes important in cross-linking peptidoglycan
• spa Encodes S. aureus-specific protein A [312].
(c) The hyplex StaphyloResist™ and hyplex StaphyloResist™ plus
are qualitative multiplex PCR assays for the direct detection of clinically relevant
staphylococci from swabs of the nose, skin, wounds, and endotracheal specimens[313]. The
assay consists of PCR modules that contain labeled oligonucleotide primers, enabling
simultaneous and specific amplification of different staphylococcal DNA regions in a single
PCR reaction [313]. The PCR is followed by recerse hybridization procedures using single-
stranded specific probes immobilized on microtitre plates. Hybridization of PCR products
with specific probes is detected using the ELISA principle [313].
72
(d) The Genotype MRSA direct
In GenoType MRSA Direct, the IDI-MRSA, and the GeneXpert MRSA assay, the
MRSA detection is based on the detection of a single amplicon, which includes the right
junction of the SCCmec downstream of the mecA gene and a part of the adjacent S. aureus-
specific orfX gene [313].
The Genotype MRSA Direct targets SCCmec types I to V in a multiplex PCR using
biotinylated primers followed by a reverse hybridization step. An updated version of the
assay, the Genoquick MRSA dipstick assay, does away with the reverse line hybridization
step to reduce the total assay time from 4 h to 2 h 20 min [313].
(e) The GenoQuick™ MRSA assay.
This is a direct test for MRSA from swabs of the nose, throat, skin, and wounds that
uses a dipstick for qualitative detection of amplicons [313]. Following DNA extraction and
conventional PCR, the single stranded amplicon hybridizes with a fluorescein labeled probe
included in the mastermix. The amplicon-probe complex is selectively labeled with gold and
generated a band on the dipstick that is inserted in a tube that contains the amplicon. The
assay aslo has an amplification control dipstick. It takes approximately 2 h and 20 min to
perform [312].
(f) The BD GeneOhm™ MRSA assay (also called IDI-MRSA).
It is a multiplex assay comprised of six primers that amplify target sequences near the
insertion site of SCCmec. Amplified targets within SCCmec and orfX genes are detected with
four molecular beacons [312]. This assay has an internal control not found in MRSA. The
fluorescence emitted by each beacon is measured and interpreted. Results are displayed as
postive, negative or unresolved. It can differentiate MRSA from MSSA and mecA positive
CNS in clinical sample [313].

73
1.17.7 Interpretation of genotypics detection methods
The detection of mecA gene or its product, penicillin binding proteins (PBP2́), is
considered the gold standard for MRSA confirmation [312]. Isolates of S. aureus that carry
mecA gene or that produce PBP2ʹ should be reported as MRSA and isolates lacking mecA
gene or not producing PBP2ʹ should be reported as methicillin susceptible [312] For MRSA
strains, other beta-lactam agents such as penicillins, β-lactam/β-lactamase inhibitor
combinations, cephems and carbapenem must be reported as resistant or not reported at all
even though they may appear susceptible in vitro [313]. This is because most MRSA
infections have responded poorly or convincing data to prove their clinical efficacy are
unavailable [313]. For oxacillin susceptible S. aureus isolates, results for parenteral and oral
cephems, β-lactam/ β-lactamase inhibitor combinations and carbapenems the results should
be reported as routine interpretative criteria. Certain rare isolates of S. aureus that are mecA
& PBP2̍ negative but have oxacillin MIC ≥ 4 μg/ml should be reported as oxacillin resistant
[314]. Penicillin resistant but oxacillin susceptible strains produce β-lactamase and should be
tested using 10 unit penicillin disk and not ampicillin disk. A positive β-lactamase test
predicts resistance to all β-lactamase labile penicillins such as ampicillin, amoxicillin,
carbenicillin, ticarcillin and piperacillin [312]. For oxacillin resistant S. aureus penicillin
susceptibility should not be reported or reported as resistant. The results of oxacillin
resistance can be applied to other penicillinase-stable penicillins such as cloxacillin,
dicloxacillin and flucloxacillin. Cloxacillin disks should not be used to detect MRSA because
they may not detect oxacillin resistance [314].
1.18 Evolution of methicillin-resistant Staphylococcus aureus clones
Methicillin-resistant Staphylococcus aureus (MRSA) clones have emerged to cause a
global public health concern [313-315]. Several major pandemic MRSA clones have been
identified around the world, but despite one such clone having originated in Brazil, the

74
molecular epidemiology of MRSA in Latin America is largely unknown [316]. MRSA clones
(bacterial strains descended from a common ancestor) diversify through point mutations,
recombination, or the acquisition/deletion of mobile genetic elements, giving rise to extensive
genomic and phenotypic diversity [317]. Discriminating and reproducible typing methods are
needed to study the epidemiology of MRSA. Frequently used methods include ribotyping,
pulsed-field gel electrophoresis (PFGE), andpolymerase chainreaction (PCR) with repetitive
element primers, but thesemethods are inherently prone to produce different results in
different laboratories due to the highly variable, rapidly evolving bacterial genome regions
that they target. PFGE has commonly been used in studies of MRSA epidemiology in Latin
America, to show the relatedness of isolates from recent outbreaks [315, 316]. However, the
technique is not well-suited to long-term global epidemiology, which requires a highly
discriminatory procedure to decipher gene variations that accumulate slowly. Newer
molecular typing methods, including multilocus enzyme electrophoresis (MLEE) and
multilocus sequence typing (MLST), are highly discriminatory and easily reproducible [316].
MLST is used to characterize isolates of bacteria and distinguish between clones by targeting
the sequences of internal fragments of housekeeping genes, where genetic variations develop
gradually [315, 316]. MLST allows related strains recovered in different countries to be
readily identified. When MLST results are analyzed using an algorithm known by the
acronym BURST (Based Upon Related Sequence Types), groups of isolates with a defined
level of similarity in allelic profile can be discerned among large MLST datasets, and a
dendrogram can be constructed [316]. BURST has been useful in studying the evolutionary
history of MRSA, to predict the ancestral allelic profile (genotype) of each clonal complex
(CC), and the pattern of evolutionary descent of all isolates in the group [316].

75
1.19 Historical origins and mechanisms of evolution of MRSA
The first MRSA clones had similar genetic and phenotypic properties to methicillin-
susceptible Staphylococcus aureus (MSSA) clones that were epidemic in the early 1960s in
Europe. The initial appearance of MRSA resulted from the acquisition by successful MSSA
clones of mecA, the gene that encodes a penicillin-binding protein conferring resistance to
methicillin, from an unknown heterologous source. The mobile genetic element that carries
mecA, called the staphylococcal cassette chromosome mec (SCCmec) has five forms (I, II,
III, IV and V), which have arisen by the horizontal transfer of mecA in independent events
[317,318].
The five major lineages of MRSA (CC5, CC8, CC22, CC45 and CC30) circulate
internationally and cause most nosocomial MRSA infections worldwide [318, 319] within
each lineage, putative evolutionary pathways have been proposed by an earlier researchers
[318, 319] and were based on sequence types (ST) and characterized by MLST. A relatively
small number of pandemic MRSA clones have caused a majority of MRSA infections. Five
predominant clones (Brazilian, Iberian, Hungarian, pediatric and New York/Japan (NYJ)
clones) were identified among 3000 MRSA strains collected in surveillance studies and
outbreak investigations from 1994 to 2000 (the CENMET initiative); PFGE was used to
characterize these strains. These five clones accounted for 68 % of isolates. The authors
hypothesized that these major clones have a unique ability to cope with changing clinical
environments (Figure. 9) [320].

76
Fig. 9 Evolution of MRSA clones in Latin American countries: time line to show where
and when clones were isolated. [318-320].
B = Brazilian MRSA clone and variants; C = Cordobes/Chilean MRSA clone; CA =
CMRSA-6 (Canadian MRSA clone); H = Hungarian MRSA clone; I = Iberian-relatedMRSA
clone;
M = Mexican MRSA clone; MW2 = MW2-related MRSA clone; NY/J = New York/Japan-
related MRSA clone; P = pediatric-related MRSA clone; O = Oceania Southwest Pacific
MRSA clone; U = Uruguayan hospital MRSA clone; UR6 = Uruguayan community outbreak
MRSA clone; U3 = USA-300 MRSA clone; U8 = USA-800 MRSA clone ; W= Western
Australia 1 MRSA clone [319, 320, 321].
*First identification of Brazilian MRSA isolates with vancomycin and teicoplanin
heterogeneous resistance (1996–1998) [321].

77
1.20 Treatment options
Daptomycin is an acidic lipopeptide with a mode of action requiring calcium.
Daptomycin has recently demonstrated significantly better bactericidal activity than
vancomycin against S. aureus and enterococci and has activity against a small number of
glycopeptide-intermediate S. aureus strains and vancomycin resistant enterococcus [324].
Mupirocin is a bacteriostatic antibiotic used exclusively as a topical agent. It exerts its
antimicrobial effect by specifically and irreversibly binding to bacterial isoleucyl tRNA
synthetase, thus preventing protein synthesis. It has been used widely for the clearance of
nasal methicillin-resistant S. aureus (MRSA) carriage during outbreaks and has been
recommended for the decolonisation of methicillin-sensitive S. aureus (MSSA) in healthcare
personnel. Intranasal application of mupirocin ointment is effective in reducing surgical site
infections and the likelihood of bronchopulmonary infection [323, 325].
Recently, there have been reports of vancomycin failure due to either relative vancomycin
resistance or MRSA infections in sites that have poor vancomycin penetration [324]. Few
other drugs including linezolid (a synthetic oxazolidinone), tigecycline (a derivative of
minocycline), and daptomycin (a cyclic lipopeptide) appear promising in treatment.
Daptomycin should be avoided in the treatment of MRSA-associated pneumonia because it is
inactivated by pulmonary surfactant [325]. For initial empiric therapy, oral trimethoprim-
sulfamethoxazole is a good choice. Other alternatives include minocycline, clindamycin, or a
macrolide antibiotic, depending on local susceptibility patterns. Staphylococci may develop
resistance during prolonged treatment with quinolones [325]. Therefore isolates initially
susceptible may become resistant within three to four days after initiation of therapy.
Rifampicin should not be used alone for treatment. Macrolide resistance in S. aureus may be
inducible or constitutive and the former can be detected by D-test. [324,325].
78
1.20.1 Cytotoxic effect of commonly available antimicrobial agents
A major problem encountered with antibiotics in clinical use is drug resistance, which
mostly leads to treatment failure [325]. Other problems with antibiotics include toxicity high
cost, low cost efficacy, etc. This necessitates a continuous search for new antimicrobial
agents [324]. Medicinal plants have no doubt remained the major sources of traditional
medicine worldwide [325].
1.20.2. Plants and plant product as sources of antimicrobial agents
Plants with their wide variety of chemical constituents offer a promising source of new
antimicrobial agents, with general as well as specific antimicrobial activity [326, 327]. There
are several reports on the presence of anti-microbial compounds in various plant parts like
leaves, bark, fruit, root and flowers [327]. A number of plants have been screened for their
antimicrobial properties especially due to the presence of phenolic compounds like
flavonoids. Antimicrobial properties of medicinal plants are being increasingly reported from
different parts of the world. In recent years, secondary plant metabolites, previously with
unknown pharmacological activities, have been extensively investigated as a source of
medicinal agents [327].
Generally, medicinal herbs are moving from fringe to mainstream use with a
greater number of people seeking for remedies and health approaches free from side effects
caused by synthetic chemicals., Recently, considerable attention has been paid to eco-friendly
and bio-friendly plants, which can prevent and cure different human diseases [328].
According to the World Health Organization reports, the use of traditional medicine in the
first world countries is on the rise due to failure of conventional medicine that can cure
chronic diseases, emergence of multi-drug resistant pathogens and parasites, adverse effects
of chemical drugs, increasing cost and information of herbal medicine. Accordingly, attention
of scientists and researchers have been attracted towards developing new antibiotics that will

79
curtail the increasing drug resistance among microorganisms [329], reported that plants used
for traditional medicine generally contain a number of compounds which may be a potential
natural natural antimicrobial combination and which may serve as an alternative, effective,
cheap and safe antimicrobial agents for treatment of common microbial infections [330].
Antimicrobial potentiality of different medicinal plants is extensively studied all over the
world. However, only a few studies have been carried out in a systematic manner [330].
1.21 Future prospects
Through proper and adequate research into mechanisms of resistance, development of
antimicrobials with specific target of resistant genes and advance study of biotechnology of
natural products. There is hope for combating the revenge mechanism of bacteria called
resistance.
1.21.1 Antimicrobial drugs
Ever since the first use of penicillin, S. aureus has shown a remarkable ability to
adapt. Resistance has developed to new drugs within a short time of their introduction. Some
strains are now resistant to most conventional antibiotics. [331]. It is worrisome that there do
not seem to be any new antibiotics on the horizon. Any recent developments have been
modifications to existing drugs [331]. The original strategy used by the pharmaceutical
industry to find antimicrobial drugs was to screen natural products and synthetic chemicals
for antimicrobial activity, after which the mechanism of action was then investigated [332].
New approaches are being adopted to find the next generation of antimicrobials.
Potential targets such as enzymes involved in an essential function (e.g., in cell division) are
identified based on knowledge of bacterial physiology and metabolism [332]. Screening
methods are then developed to identify inhibitors of a specific target molecule. In addition,
with detailed molecular knowledge of the target molecule, specific inhibitors can be designed

80
[333]. To prevent the emergence and dissemination of resistant bacteria, continuing efforts to
develop new antibacterial agents are warranted. Although this is not an easy assignment,
there is still hope and many new avenues are being explored. Indeed, the recent advance in
bacterial genomics has changed the antibacterial therapeutic environment from target-poor to
target-rich; hence many potential targets are awaiting researchers [293-298].
1.21.2 Vaccines and new approaches to combatting nosocoial infections
No vaccine is currently available to combat staphylococcal infections. There may now
be a case for considering methods to prevent disease, particularly in hospitalized patients
[334]. Hyperimmune serum from human volunteer donors or humanized monoclonal
antibodies directed towards surface components (e.g., capsular polysaccharide or surface
protein adhesions) could both prevent bacterial adherence and also promote phagocytosis of
bacterial cells [334, 335]. Indeed a prototype vaccine based on capsular polysaccharide from
S aureus has been administered to volunteers to raise hyperimmune serum, which could be
given to patients in hospital before surgery. A vaccine based on fibronectin binding protein
induces protective immunity against mastitis in cattle and might also be used as a vaccine in
humans. [335].
When the molecular basis of the interactions between the bacterial surface proteins
and the host matrix protein ligands are known it might be possible to design compounds that
block the interactions and thus prevent bacterial colonization. These could be administered
systemically or topically [336]. Continuous development of novel antibacterial is mandatory.

81
1.22 Antimicrobial evaluation of a new agent
When a new antimicrobial agent is discovered, there is the need to evaluate it for the
following reasons [337-339].
(a) To estimate the potency. This gives an idea of its basic value. A good result here
makes further test worthwhile. The activity of the new agent is compared to that of a
standard antimicrobial agent.
(b) To determine it’s spectrum of activity. Knowledge of the range of microorganisms
which an antimicrobial agent can kill (or inhibit) helps one to determine its indications. An
agent with a narrow spectrum of activity may be used as antiseptic or as a chemotherapeutic
agent for infections while that with a wide range may be used as disinfectant. It is also to be
determined whether the activity is microbiocidal or microbiostatic “Microbiostatic effect is
unsuitable as disinfectant but may be used as antiseptic, preservative or in chemotherapy.
(c) To determine the efficacy and limitations of the new antimicrobial substance. This
includes test that will determine whether it is more potent than existing standard agent
example phenol coefficient activity when in the type of environment in which it will be used
and whether it is toxic.
(d) This can be done qualitatively and quantitatively by the following methods [340]
1.22.1 Strip- agar – diffusion
A strip of sterile filter paper is dipped into the anti-microbial agent using a sterile
forceps. Excess solution is allowed to drip off and the filter paper placed onto the surface of
a nutrient agar medium (poured into a plate) at the side of the plate each of the cultures of
organisms being used is streak at right angles to the strip of filter paper. The plate is
incubated. The degree of sensitivity of the organisms to the agent is reflected by the length
of streak showing no growth [341].
82
1.22.2 Ditch agar diffusion
This is a similar method to the strip agar diffusion method. Here, a ditch is cut into the
agar and the solution of the bacteriostatic agent is poured into the ditch, streaks of various
organisms are made and the plate incubated. The temperature of incubation depends on
whether the organisms are bacteria, yeast or fungi. Hence these are kept separately since the
optimum temperature for them are different, 37 OC for bacteria and 25 OC for fungi and
yeast [342].
1.22.3 Determination of minimal inhibitory concentration (MIC) of extracts
The minimum inhibitory concentration of an antimicrobial substance is the least
concentration that inhibits the growth of the test organism. This can be conducted using
different methods as indicated below [343].
(a) Broth dilution method
Serial dilution of the agent whose biostatic activity is to be determine are made in an
appropriate nutrient medium to get different concentrations. These are then inoculated with
the test organism and incubated. The highest dilution (or lowest concentration) of the agent
which prevents microbial growth is then taken as the minimum inhibitory concentration
(MIC). Optimum temperature and time of incubation (48 hrs for bacteria and several days for
fungi) are used. Organic matter may be added to the medium. Age of the culture and number
of viable cell contained can also affect results. An inoculum containing 105 viable cell / ml is
normally used [344].
(b) Agar dilution method
Serial dilution of the agent whose biostatic activity is to be determined are prepared
and added separately to molten double strength agar medium and mixed well. The agar

83
dilutions obtained are poured into sterile dishes, allowed to solidity and dried. The agar
surface of each dish is inoculated with the organisms and incubated. This method is suitable
for substances which produce turbid solution in broth. The microbial growth is visually
examined for growth [344].
(c) Agar diffusion method
This is generally preferred to serial dilution method because of the ease which
quantitative result can be obtained. It cannot be used when the test substance dose not readily
diffuse through the gel. About 0.1 ml of the culture is added to the tubes containing the
molten nutrient agar (45 OC). This is poured into a sterile petri-dish and mixed thouroughly,
the agar is left for 10 mins to set. The dish is divided into four quadrants and cut is made in
the center of each and the discs are removed. Four different dilution of the bacteriostatic
solution are prepared and two to four drops of each are added in each cup. The plate is
allowed to stand for some time at room temperature for prediffusion to occur and then
incubated at 37 OC for 24 h for bacteria and at 25 OC for 48- 96 h for fungi and yeast [344].
The inhibition zone diameter is calculated by subtracting the diameter of cork borer from the
measured zones of inhibition.
1.24.4 Determination of minimal biocidal concentration (MBC) of extracts
The MBC is defined as the minimal concentration of a biocide, which kills off all the
cells in a microbial population. This can be considered to as an extension of the MIC
procedures. Hence, MBC can be derived from the broth dilution method of agar dilution
method of determining MIC. In either method, the MIC procedure is first completed. The
tubes or agar plates showing no growth in the MIC tests are used for the determination of
MBC [344].
84
(a) Broth dilution method
In this method, a loopful of the reaction mixture is transferred from each tube to
corresponding containers of fresh nutrient broth, acting as the cell recovery medium. The
newly inoculated broth medium is incubated for 48 h at temperature between 32 oC and 35
oC. The absence of growth in the recovery medium is evidence of total cell death. The
minimal concentration of the antimicrobial agent that produces total cell death is taken as the
MBC [344].
(b) Agar dilution method
Similar to broth dilution method, in this test, discs are cut from each agar plate and
transferred into corresponding containers of the fresh nutrient medium. The media are also
incubated at temperature between 32 oC and 35 oC for 48 h, at the end of incubation,
microbial growth can be ascertained in the usual way (turbidity of the medium or acid-base
reaction). The absence of growth in the recovery medium is evidence of total cell death. The
minimal concentration of the antimicrobial agent that produces total cell death is taken as the
MBC. [344].
1.23 Aim of the study
The aim of this study was to evaluate the phytochemical components and
antimicrobial activity of methanol extract and fractions of Moringa oleifera root bark as an
alternative source of antimicrobial agent for the treatment of MRSA infections.
1.24 Objectives of the study
The objectives of the study are to evaluate the antimicrobial activity of the methanol
extract and fractions of Moringa oleifera root bark on clinical isolates of MRSA, to extract
and identify phytochemical components of antimicrobial activity from the plant and to
elucidate the structure of the antimicrobial active compounds of methanol extract and
fractions of Moringa oleifera root bark.

85
CHAPTER TWO
2.0. MATERIALS AND METHODS
2.1. MATERIALS
2.1.1. Sample collection
This study was conducted from September 2012 to June 2013 at 3 different hospitals in
the South-East region of Nigeria. The hospitals are Bishop Shanahan Hospital, Nsukka,
University of Nigeria Teaching Hospital, Ituku/Ozalla, Enugu State and Federal Medical
Centre, Abakaliki, Ebonyi State. A sample size of 2,372 hospitalized patients with skin,
throat, open wound, Ear/Nasal infections and Abscess were enrolled for this study. Samples
were taken from sputum, open wound, abscess, ear and nasal swab from male and female
wards in the orthopedic and intensive care departments of the hospitals. 1,230 samples were
taken from University of Nigeria Teaching Hospital, 200 samples from Bishop Shanahan
hospital and 942 samples from Federal Medical Centre, Ebonyi. The samples were distributed
according to their clinical specimens as sputum (376), skin swab (327), absces swab (466),
open wound swab (762) and ear/nasal swab (441).
2.1.2. Media
Nutrient Agar (Fluka) Sigma Aldrich UK, Mueller-Hinton Agar (MHA), Oxoid Ltd, England,
Mannitol Salt Agar (MSA), Oxoid Ltd, England.
2.1.3. Reagents
Penicillin binding protein 2 prime (PBP2ˈ) test kits lot. no. 130422, Oxoid Ltd, Japan,
staphylase test kit (Oxoid Ltd, Wade Road, Basingstoke, Hants, RG24, UK), Oxoid
antimicrobial susceptibility test discs. Hydrogen peroxide (H2O2), Dimethylsulfoxide
(DMSO), distilled water, silical gel (60-200 mesh), (Titan Biotech Ltd, India). 0.5 McFarland
turbidity standard.
86
2.1.4. Solvents
Methanol, (Sigma Aldrich, U.K), n-hexane, (Sigma Aldrich, U.K), ethyl acetate, (Sigma
Aldrich U.K), dichloromethane (Sigma Aldrich, U.K).
2.1.5. Equipment
Soxhlet extractor, glass chromatographic column, autoclave, refrigerator, weighing
balance, incubator, antibiotic disc dispensers, GC-MS equipment with Agilent technologies
7890B for GC systems and Agilent technologies 5975 series for MS system.
2.1.6. Animals
Wistar strain albino rats of both sexes that weighed between 80 -150 g which were bred in
the animal house of the Department of Pharmacology, University of Nigeria, Nsukka. The
animals were housed in standard environmental conditions with 12 h light-dark cycle. The
animals were divided into extract treated groups and the control groups. All the animals were
starved for 12 h, but were allowed free access to water, before commencement of the
experiments [345].
2.2. METHODS
2.2.1. Collection, authentication and processing of plant materials
The root of Moringa oleifera was collected from Nsukka Local Government Area,
Enugu State, Nigeria. The plant materials were identified and authenticated by a Botanist at
the Biological Science Department, University of Nigeria, Nsukka. Taxonomic identity of the
plant was authenticated by Mrs. Immanuela Udoma of the Department of Pharmacognosy,
Faculty of Pharmacy, University of Uyo, Uyo. The plant materials were air-dried in the
laboratory for four weeks. The dried samples were ground to coarse powder with a
mechanical grinder; the powder was stored for future use.

87
2.2.2. Extraction of root extract
The pulverized root of Moringa oleifera (3 kg) was defatted with 10 litres of n-hexane
by cold merceration over night to yield hexane extract fraction (HEF). The marc was dried
and extracted with 20 litres of methanol for 4 hours using Soxhlet extraction technique to
yield crude methanol extract (ME) using established standard procedures [347 - 349].
The crude methanol extract (ME) and hexane extract fraction (HEF) were concentrated
in-vacuo using rotary evaporator and yielded percentage was calculated. The dried extracts
were stored in amber coloured bottles and kept in the refrigerator until use.
2.2.3. Fractionation of crude methanol extract using column chromatography
Crude methanol extract (ME) (850.60 g) was adsorbed on silica gel (60-200 mesh) in
a glass column, was then eluted in succession with dichloromethane, ethyl acetate and
washed finally with methanol to yield dichloromethane fraction (DF), ethyl acetate fraction
(EAF) and methanol fraction (MF). These extract fractions were air dried at room
temperature for 24 h and the percentage yeilds of the fractions were calculated.
2.2.4. Qualitative phytochemical analysis
The hexane extract fraction (HEF), crude methanol extract (ME) and its fractions of Moringa
oleifera root bark was subjected to phytochemical tests using established standard procedures
[347 - 349].
1. Test for carbohydrate
Molisch test
The extract/fraction (0.1 g) was boiled with 2 ml of distilled water and filtered. To the filtrate,
few drops of naphthol solution in ethanol (Molisch’s reagent) were added. Concentrated
sulphuric acid was then gently poured down the side of the test tube to form a lower layer. A
purple interfacial ring indicates the presence of carbohydrate.

88
2. Test for alkaloids
Twenty ml of 3 % sulphuric acid in 50 % ethanol was added to 2 g of the extract and
heated on a boiling water bath for 10 min, cooled and filtered. A 2 ml volume of the filtrate
was tested with a few drops of Mayer’s reagent (potassium mercuric iodide solution),
Dragendorff’s reagent (bismuth potassium iodide solution), Wagner’s reagent (iodine in
potassium iodide solution), and picric acid solution (1 %). The remaining filtrate was placed
in 100 ml separatory funnel and made alkaline with dilute ammonia solution. The aqueous
alkaline solution was separated and extracted with two 5 ml portions of dilute sulphuric acid.
The extract was tested with a few drops of Mayer’s, Wagner’s, Dragendorff’s reagents and
picric acid solution. Alkaloids give milky precipitate with few drops of Mayer’s reagent;
reddish brown precipitate with few drops of Wagner’s reagent; yellowish precipitate with few
drops of picric acid and brick red precipitate with few drops of Dragendorff’s reagent.
3. Test for reducing sugar
Five ml of a mixture of equal parts of Fehling’s solution I and II were added to 5 ml
of aqueous extract and then heated on a water bath for 5 min. A brick red precipitate shows
the presence of reducing sugar.
4. Test for glycosides
Five ml of dilute sulphuric acid was added to 0.1 g of the extract in a test tube and
boiled for 15minutes on a water bath, then cooled and neutralized with 20 % potassium
hydroxide solution. 10 ml of a mixture of equal parts of Fehling’s solution I and II was added
and boiled for 5 min. A more dense brick red precipitate indicates the presence of glycoside.

89
5. Test for saponins
Twenty ml of distilled water was added to 0.25 g of the extract and boiled on a hot water bath
for 2 min. The mixture was filtered while hot and allowed to cool and filtrate was used for the
following tests.
(a) Frothing test
Five ml of the filtrate was diluted with 15 ml of distilled water and shaken vigorously.
A stable froth (foam) upon standing indicates the presence of saponins.
(b) Emulsion test
To the frothing solution was added 2 drops of olive oil and the contents shaken
vigorously. The formation of emulsion indicates the presence of saponins.
(c) Fehling’s test
To 5 ml of the filtrate was added 5 ml of Fehling’s solution (equal parts of Fehling’s
solution 1 and 11) and the contents were heated on a water bath. A reddish precipitate which
turns brick red on further heating with sulphuric acid indicates the presence of saponins.
6. Test for tannins/polyphenols
One g of the powered material was boiled with 20 ml of water, filtered and used for
the following test.
(a) Ferric chloride test
To 3 ml of the filtrate, few drops of ferric chloride were added. A greenish black precipitate
indicates the presence of tannins.

90
(b) Lead acetate test
To a little of the filtrate was added lead acetate solution. A reddish colour indicates
the presence of tannins.
7. Test for flavonoid
Ten ml of ethyl acetate was added to 0.2 g of the extract and heated on a water bath
for 3 min. The mixture was cooled, filtered and the filtrate was used for the following tests.
(a) Ammonium test
Four ml of filtrate was shaken with 1 ml of dilute ammonia solution. The layers were
allowed to separate and the yellow colour in the ammoniacal layer indicates the presence of
flavonoids.
(b) 1 % Aluminium chloride solution test.
Another 4 ml portion of the filtrate was shaken with 1 ml of 1 % Aluminium chloride
solution. The layers were allowed to separate. A yellow colour in the Aluminium chloride
layer indicates the presence of flavonoids.
8. Test for resins
(a) Precipitation test
The extract (0.2 g) was extracted with 15 ml of 96 % ethanol. The alcoholic extract
was poured into 20 ml of distilled water in a beaker to obtain a precipitate indicating the
presence of resins.

91
(b) Colour test
The extract (0.2 g) was extracted with chloroform and the extract was concentrated to
dryness. The residue was redissolved in 3 ml of acetone and another 3 ml concentrated
hydrochloric acid was added. This mixture was heated in a water bath for 30 minutes. A
pink colour which changes to magenta red indicates the presence of resins.
9. Test for proteins
Twenty ml of distilled water was added to 0.5 g of the extract and the filtrate was used for the
following tests.
(a) Millon’s test
To a little portion of the filtrate in a test tube, two drops of Million’s reagent were
added. A white precipitate indicates the presence of proteins.
(b) Xanthoproteic reaction test
Five ml of the filtrate was heated with few drops of concentrated nitric acid. A
yellow colour which changes to orange on addition of an alkali (dilute Sodium hydroxide)
indicates the presence of protein.
(c) Picric acid test
To a little portion of the filtrate was added a few drop of picric acid. A yellow
precipitate indicates the presence of proteins.
(d) Biuret test
A crystal of copper sulphate was added to 2 ml of the filtrate, and then 2 drops of potassium
hydroxide solution was added. A purple or pink colour shows the presence of proteins.
92
10. Test for fats and oil
The extract (0.1 g) was pressed between filter paper and the paper was observed. A
control was also prepared by placing 2 drops of olive oil on filter paper. Translucency of the
filter paper indicates the presence of fats and oil.
11. Test for steroids and terpenoids
Nine ml of ethanol was added to 1 g of the extract and refluxed for few minutes and
filtered. The filtrate was concentrated to 2.5 ml on a boiling water bath. 5 ml of hot distilled
water was added to the concentrated solution, the mixture was allowed to stand for 1 hour
and the waxy matter was filtered off. The filtrate was extracted with 2.5 ml of chloroform
using separating funnel. To 0.5 ml of the chloroform extract in a test tube was carefully
added 1ml of concentrated sulphuric acid to form a lower layer. A reddish brown interface
shows the presence of steroids.
Another 0.5 ml of the chloroform extract was evaporated to dryness on a water bath and
heated with 3ml of concentrated sulphuric acid for 10 min on a water bath. A grey colour
indicates the presence of terpenoids.
12. Test for acidic compounds
The extract (0.1 g) was placed in a clear dry test tube and sufficient water added. This
was warmed in a hot water bath and then cooled. A piece of water-wetted litmus paper was
dipped into the filtrate and the colour change on the litmus paper was observed. Acidic
compounds turn blue litmus paper red.

93
2.2.5. Media preparation
The media used for culturing and sub culturing of the Clinical isolates were prepared
according to manufacturer’s Protocols.
2.2.6. Standardization of inoculum
The inocula were prepared from the stock cultures, which were maintained on nutrient
agar slant at 4 OC and subcultured onto nutrient broth using sterilized wire loop. The density
of suspension inoculated onto the media for susceptibility test was determined by comparison
with 0.5 McFarland standard of barium sulphate solution [344].
2.2.7. Characterization of the clinical isolates
The clinical isolates obtained from the clinical samples collected were characterised
as described.
1. Cultural characterization
The cultural characteristics of the isolates were based on their shapes, opacity, pigments,
surface texture, edge, water emulsification [350].
2. Microscopic characterization
Gram staining reaction and their appearance based on shape, arrangement and spore
formation. [350].
3. Biochemical tests
Catalase Test: The test was performed by covering an agar slant culture of the isolate
with several drops of 3 % hydrogen peroxide [351]. Mannitol Salt Agar (MSA) Test: The
plates were prepared with 7.5 % NaCl [1.28 M, approx 8.5 × isotonic (physiological) saline]
and mannitol agar was prepared according to the manufacturer’s protocol followed by
inoculation of the isolates.

94
4. Slide coagulase/staphylase test
The test was carried out according to manufacturer’s protocol, using the Oxoid
staphylase tests kits.
Test and control reagents were shook vigorously to obtain a homogenous suspension
in order to avoid trapping of reagent cells in the dropping pipette; with the loop 1 to 3 of the
suspected colonies was smeared on a test circle and control circle on the reaction card. 1
drop of the test reagent was added to the test circle and 1 drop of control reagent was also
added to the control circle, the contents of the test circle and the content of the control circle
were mixed separately with the sterile loop and observed for agglutination while mixing. The
reaction cards were disposed safely into disinfectant after recording the test result. A positive
result is obtained if clumping of the test cell suspensions occurs during mixing. This indicates
the presence of Staphylococcus aureus. Results cannot be interpreted if there is any clumping
of the control cell suspension. In these cases, cultural purity and identity should be checked.
Limitations of the test
Occasional false positive results may be found with strains of Staphylococcus sciuri.
Other rarely isolated staphylococci may also give positive Staphylase results. Suspected
isolates should be identified by biochemical tests.
2.2.8. Antimicrobial susceptibility testing
A standard disc diffusion technique for antimicrobial susceptibility testing was
performed as recommended by the Clinical Laboratory Standards Institute (CLSI) [352] on
Mueller Hinton agar. Standard antibiotics disks (Oxoid, Ltd) set were oxacillin (5 µg),
vancomycin (30 µg), cephalexin (30 µg), levofloxacin (5 µg), ciprofloxacin (5 µg),
tetracycline (30 µg), cotrimoxazole (25 µg), gentamycin (30 µg), clindamycin (2 µg),
rifampicin (5 µg).

95
A direct colony method {preferred method for staphylococci}(CLSI) [352] was used,
pure isolated colonies were taken from Mueller Hinton agar into sterile broth tubes and a
suspension equivalent to a 0.5 McFarland standard was prepared and used to inoculate the
test media. The discs were applied to the plate within 15 minutes of inoculation and incubated
for 24 hours at 35 OC (methicillin resistant staphylococci may not be detected at temperatures
above 35 OC) [352].
2.2.9. Penicilin-binding protein (PBP2̍ ) latex agglutination test for MRSA
confirmation
(a) Preparation of culture
The PBP2̍ test should be performed only on Staphylococcus species (Gram+positive
cocci). A coagulase test confirming the isolates used for this test to be S. aureus was done
prior to the PBP2̍ test. A pure clinical isolates of S. aureus were used for this test. MRSA
strain ATCC® 43300 (Oxoid Culti – Loops C9022) was used as positive control.
(b) Test method
(i) The PBP2̍ extraction procedure as recommended by the Manufacturer Oxoid,
Four drops of Extraction Reagent 1 was added to a micro centrifuge tube, an approximately
1.5 x 10⁹ (3-5 μl) cells was then suspended into the micro centrifuge tube to obtain a very
turbid suspension. The tube was placed into a water bath at temperature over 95 oC and
allowed to heat for three minutes, it was removed and allowed to cool to room temperature
before adding a drop of extraction reagent 2 and the mixture was vigorously shook to obtain
homogenous mixture. The mixture was centrifuged at 3000 rpm at 15 cm rotation radius for 5
min to obtain a supernatant solution containing the extracted PBP2ʹ for MRSA.

96
(ii) Latex agglutination procedure
For each supernatant to be tested, one circle of the test card was labeled ‘T’ for testing
with Test Latex and another with ‘C’ for Control Latex. The latex reagent was properly
mixed by inversion several times and a drop of test Latex or Control Latex was added to each
labeled circle accordingly. 50 μl of supernatant was placed on the Test circle and the Control
circle and mixed thoroughly with the latex with the aid of the provided sterile plastic mixing
stick. The mixing was done for three minutes and observed for agglutination under normal
lighting conditions. The results of the Test and Control reactions were recorded before
disposing the reaction card safely into disinfectant. If agglutination is seen with test but not
with Control Latex within three minutes PBP2ʹ is positive (MRSA), if no agglutination in
either latex test and control test within 3 minutes PBP2́ is negative (MSSA). If agglutination
is seen in the latex test and the control test within 3 minutes Intermediate VISA (Vancomycin
intermediate S. aureus.) is positive.
2.3 Determination of MIC and MBC of the extracts and fractions on MRSA
clinical isolates.
2.3.1 Preparation of stock solution
Stock solution (50 mg/ml) of the plant extracts were prepared by dissolving 1250 mg
extracts and fractions in 25 ml of sterile water and DMSO (dimethyl sulfoxide) diluted in 1:5
(DMSO:Water). The DMSO is an organic solvent that aid the dissolution of organic
substance that will not dissolve easily in water alone. The water and DMSO dilution was
carried out to avoid the interference of DMSO with original activity of the extract [352].
Twenty five ml of stock is prepared to allow for 5 ml overage. Dimethyl sulfoxide has been
shown to improve the efficiency of fungicides, to possess anti-inflammatory effects, as well
as additional non-specific biological effects and it is for this reason that control experiments
were conducted in all cases to account for additive effects, if any.

97
2.3.2. Preparation of extract and fractions solutions for agar dilution MIC test
The different concentrations of the crude methanol extract and fractions prepared for the MIC
and MBC tests were shown in table 1. Twenty ml volume of Muller Hinton Agar (MHA) was
used in 9 cm Petri dishes for agar dilution MICs. Dilution schemes using formula
C1V1 = C2V2 are given in the Table [352].
C1 = Stock concentration of the extract and fractions = 50 mg/ml
V1 = Volume of the extract and fractions in the agar dilution = to be determined
C2 = Concentration of the extract and fraction in agar dilution (1 mg/ml – 10 mg/ml)
V2 = Volume of reaction mixture in MHA plate = 20 ml
2.3.3. Determination of MIC of methanol extract and fractions
By means of a sterile calibrated micro pipette, 0.002 ml of the MRSA clinical isolates
suspension was streaked with a sterile loop on the surface of the MHA and allowed for 10
minutes for complete absorption of the inoculum by the medium. The plates were incubated
in an inverted position at 37 Oc for 24 h before taking the results. The least concentration that
inhibits the growth of the organism is taken as the MIC (minimal inhibitory concentration).
The control plate without antimicrobial agents was also incubated [344].
2.3.4. Determination of MBC of methanol extract and fractions
The value of MBC is an extension of MIC. The agar plates showing no growth in the
MIC tests were used for the determination of the MBC. Discs were cut from the agar plate of
the MIC concentration and two preceding concentrations and transferred into the
corresponding containers of the fresh Muller Hinton broth (recovery medium). The media
were also incubated at 35 OC for 48h. At the end of incubation the media were observed for
any visible growth or turbidity. The absence of growth in the recovery medium is evidence of
total cell death. The minimal concentration of the antimicrobial agent that produces total cell
death is taken as the MBC [344].

98
Table 1: Preparation of extract and fractions concentrations for agar dilution MIC test
S/N C1 (mg/ml ) V1 (ml) C2 (gm/ml) Volume of
MHA (ml)
V2 (ml)
Volume of reaction
mixture
1 50 4.00 10 16.00 20
2 50 3.60 9 16.40 20
3 50 3.20 8 16.80 20
4 50 2.80 7 17.20 20
5 50 2.40 6 17.60 20
6 50 2.00 5 18.00 20
7 50 1.60 4 18.40 20
8 50 1.20 3 18.80 20
9 50 0.80 2 19.20 20
10 50 0.40 1 19.60 20
99
2.3.5. Gas Chromatography–Mass Spectrometry (GC-MS) determination of bioactive
components of methanol extract fractions
Gas chromatography-mass spectrometry was performed on the methanol (MEF), ethyl
acetate (EAF), n-hexane (HEF) and dichloromethane (DF) fractions of the Moringa oleifera
root bark. This is to identify the constituents of these fractions. The GC-MS analysis of the
extract fractions were performed on an Agilent technologies model 7890 Series GC System
equipped with an Agilent technologies 5975 MS detector (EI mode, 70 eV). A column type
DB-5 (5 % phenyl methylsiloxane) with a length of 30 m, an inside diameter of 0.25 µm and
a film thickness of 320 μm was used. The temperature of the column was programmed to
increase after 5 min from 50 oC to 280 oC at the rate of 5 oC/min after which the run was left
for 9 min at 280 oC. Helium was used as a carrier gas at a flow rate of 1.4 ml/min. The
injector and detector temperatures were 300 oC and 250 oC, respectively. The components in
the extract samples under investigation were identified by comparing on the basis of gas
chromatographic retention indices, mass spectra from National institute of standards and
technology (NIST) Standard Reference Database 1A (NIST/EPA/NIH Mass Spectral
Database (NIST 11) and NIST Mass Spectral Search Program (Version 2.0 g), Agilent
Technologies, Inc. ChemStation Version) [353 - 357].
2.3.6 Identification of components in methanol extract fractions
The constituents of the methanol extract fractions were identified by comparison of
their mass spectra with those in the MS library (Wiley7Nist) incorporated in the HP
Enhanced ChemStation software and those in literature [356-360].
100
2.3.7 Structures of some compounds identified in methanol extract fractions
The structure of some distinct bioactive compound identified from (MS report) in
Moringa oleifera lam. Fam. Moringaceae root bark with reference to Chem.spider,
Pub.chem, NIST, Look.chem and Chem.book data bases were reported [360-364].
2.4 Preliminary toxicological evaluation of the crude methanol extract (ME) and n-
hexane extract (HE) fraction
2.4.1. Acute Toxicity Study
Acute oral toxicity study was performed in accordance to OECD guidelines (Orga-
nization of Economic Cooperation and Development) 423 guide-line (Acute toxic class
method) [345]. The acute oral toxicity of the extracts was determined using Miller and
Tainter method [365]. Toxicity assay was performed in male albino Wistar rats (80-150g),
the rats were randomly divided into 6 groups with 6 animals in each group. The animals were
kept fasting overnight provided only water, after which the methanol extract of the roots was
administered orally with increasing doses (50 mg/kg, 250 mg/kg, 500 mg/kg, 1000 mg/kg,
5000 mg/kg, 10 g/kg body weight) by intra-gastric tube to determine the safe dose. The
control group (group 7) was treated with orally administered distillated water (2 ml/kg) only.
The animals were observed continuously for 1h, then frequently for 4h and later at the end of
24 h for general behavioral, neurological and autonomic profile.
2.4.2. Sub-acute toxicity study
The animals were divided into four groups with control, given daily oral graded doses
of the extracts 50 mg/kg, 250 mg/kg, 500 mg/kg, 1000 mg/kg bodyweight [366]. The
experiment was carried out for 21 days, with oral administration of methanolic extract and n-
hexane extract fraction. At the end of 21 days, the animals were deprived of food overnight
101
and sacrificed by cervical decapitation for hematological, liver and biochemical parameters.
This experiment was repeated thrice for confirmation of results.
(a) Haematological parameters
A 2.0 ml portion of the blood samples collected in EDTA (Ethylene diamine
tetraacetic acid) was used. The samples were mixed in a Roller mixer at the rate of 30 per
minute for 5 min. The following blood parameters white blood cell (WBC), red blood cells
count (RBC), haemoglobin count (HGB), mean concentration volume (MCV), platelet
counts (PLT), and mean packed volume (MPV), were determined using an automated
haematological analyzer machine (Abacus Junior, Model S/N 111244).
(b) Effect on the liver enzymes
A 3 ml volume of the sample collected in a serum extractor was used for the study.
The sample was allowed to stand undisturbed for 1 h away from sunlight. This was followed
by spinning for 5 min, to separate the serum from the clotted red cells. The resulting
supernatant was used for the assessment of liver integrity. Using a 3.2 microlitre automated
pipette, a sample was dropped on the sample spot of each liver function test kit and tested for
the following enzymes, alanine aminotransferase (ALT), aspatate aminotransferase (AST),
alkaline phosphatase (ALP). Bilirubin concentration was also analysed using a Reflotron-Plus
machine (Model: SN747461 Germany).
(c) Biochemical parameters of the kidney
The effects of the preparations on certain biochemical parameters of the kidney were
compared with those of the control. Serum from the blood of each rat was collected into
lithium heparin bottles, mixed properly and used for the following kidney indices urea and
creatinin within 24 hours of collection using the following procedure.

102
(d) Urea concentration
Three different test tubes (labelled as A, B and C) were used for the test. To the test tubes,
10 μl of sample, calculated standard of a known urea and blank (distilled water) were added
respectively. This was followed by addition of 100 μl of reagent (sodium nitroprusside), mixing
thoroughly by shaking and incubating at 37oC for 10 min. About 2.5 ml of diluted phenol and sodium
hypochlorite mixture added into the tubes, mixed and incubated for another 15 min. The
absorbances of the A and B against the C were taken using the spectrophotometer at a wavelength
of 500 nm and the concentration of the urea calculated as follows:
2.5. Statistical analysis
Results were expressed as mean ± SD and differences between sets obtained were
determined using ANOVA followed by Duncan post Hoc Test with the use of SPSS v 17
software. Differences were considered significant at p < 0.05.

103
CHAPTER THREE
3.0 RESULTS AND DISCUSSION
3.1. Results
3.1.1 The percentage yield of the methanol extracts and fractions
The percentage yield of the crude extracts and fractions are as presented in Table 2.
The total amount of crude extract obtained shows that methanol was quantitatively a
good solvent for the plant while n-hexane extract fraction had the lowest yield. The
percentage yield of the extracts and fractions is in the order of n-hexane extract fraction
(HEF) 68.80 ± 13.7 g (2.29 %) < methanol crude extract 850.60 ± 20.8 g (28.35 %) and
fractions of Methanol crude are in the order of ethyl acetate fraction 50.90 ± 8.7 g (5.98 %)
< dichloromethane fraction 150.70 ± 9.5 g (17.71 %) < methanol fraction 350.60 ± 14.8g
(31.21 %). There was significant (p < 0.05) difference in the percentage yield of the various
fractions, methanol fraction having the highest yield of 31.21 % and n–hexane, the lowest
yield of 2.29 %.
3.1.2 Qualitative phytochemical analysis of the extracts and fractions
The results of the qualitative phytochemical analyses of methanol crude extract and
fractions as presented in Table 3, showed that for crude methanol extract (ME), alkaloids
were abundantly present, proteins and carbohydrates present in high concentrations, tannins,
resins, glycosides, steroids, flavoinoids, reducing sugars, fats and oil, sapponins are all
present in moderately high concentrations with terpenoids present in low concentrations. The
fractions of the extracts showed varying concentrations of phytochemical constituents; n-
hexane fraction is very rich in steroids, terpenoids, fats and oils are abundantly present in the
fraction.
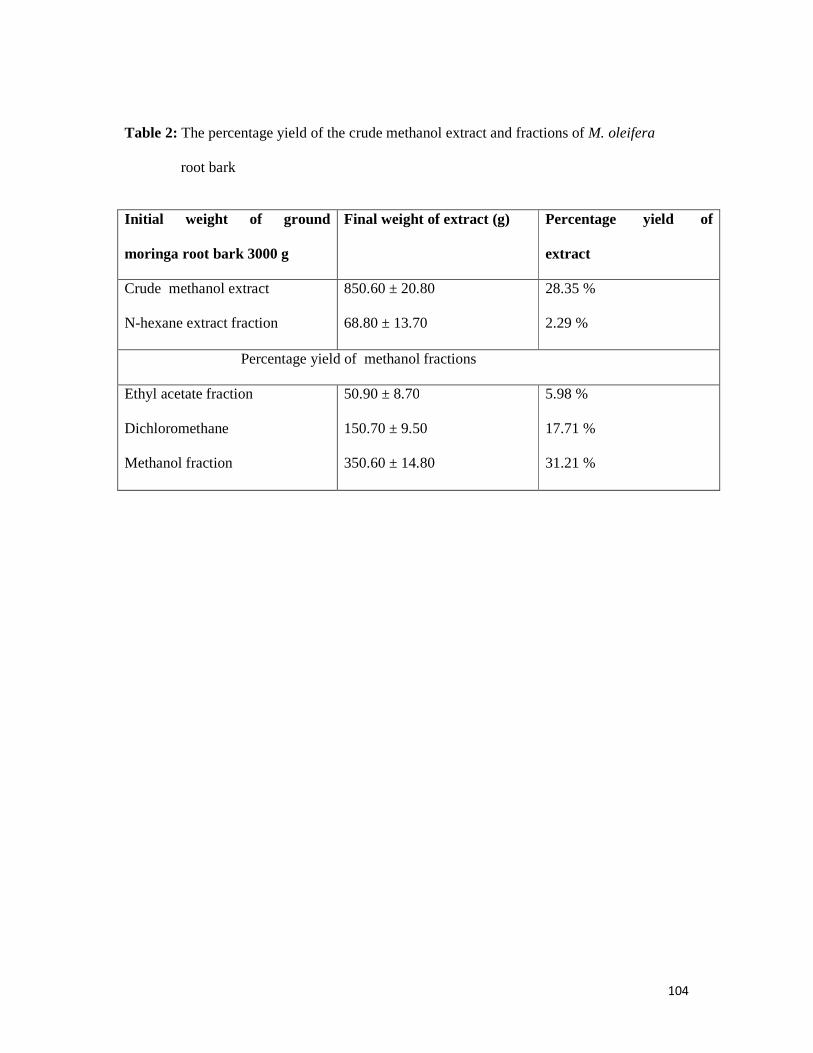
104
Table 2: The percentage yield of the crude methanol extract and fractions of M. oleifera
root bark
Initial weight of ground
moringa root bark 3000 g
Final weight of extract (g)
Percentage yield of
extract
Crude methanol extract
N-hexane extract fraction
850.60 ± 20.80
68.80 ± 13.70
28.35 %
2.29 %
Percentage yield of methanol fractions
Ethyl acetate fraction
Dichloromethane
Methanol fraction
50.90 ± 8.70
150.70 ± 9.50
350.60 ± 14.80
5.98 %
17.71 %
31.21 %

105
Table 3: Results of phytochemical analysis of the crude methanol extracts and fractions
Chemical constituent
Test Crude methanol extract (ME)
N-hexane fraction (HEF)
Dichloromethane fraction (DF)
Ethyl acetate fraction (EF)
Methanol fraction (MF)
Alkaloids
Dragendorff’s reagent Mayer’s reagent Wagner’s reagent
++++ - + - ++
Glycosides
Fehling’s solution I and II
+ + - - + +
Steroids
General Test + + + + + + + + + -
Terpenoids
General Test + + + + + + -
Flavonoids
Ammonium Test 1 % Aluminium Chloride solution Test.
+ + - + ++++ +
Saponins
Frothing Test Emulsion Test Fehling’s Test
+ + - - _ +
Tannins
Ferric chloride Test Lead Acetate Test
+ + - - _ ++
Resins
Precipitation Test Colour Test
++ + + + + ++ _ +
Reducing Sugar
Fehling’s solution I and II
++ - - _ ++
Proteins Millon’s Test Xanthoproteic Reaction Test Picric Acid Test Biuret Test
+++ - _ _ +
Fats and Oil
General filter paper Test
++ ++++ ++ _ _
Carbohydrate
Molisch’s +++ - - + ++
Key: (-): Not present. (+): Present in small concentration. (++): Present in moderately high concentration. (+++): Present in very high concentration. (++++): Abundantly present
106
Dichloromethane fraction is rich in resins with moderate concentration of steroids and
fats and oil, ethyl acetate fraction is rich in flavonoids which is abundantly present, with low
concentrations of steroids, terpenoids and carbohydrates, methanol fractions is with moderate
concentrations of alkaloids, tannins, resins, glycosides, saponin and low concentration of
flavonoids and no steroids and terpenoids present in the fraction.
3.2 Characterisation of clinical isolates The characterisation of the 2,372 isolates was done in sequence to eliminate the
unwanted isolates and to confirm the S. aureus isolates. The clinical isolates were separated
into two major groups, cocci and non-cocci isolates by cultural and microscopic characters
with gram staining reaction given 1,860 (78.41 %) of the isolates suspected to be
staphylococci.
A total of 1860 clinical isolates suspected to be staphylococci were subjected to
catalase test, catalase positive organisms further revealed 839 out of the 1860 isolates to be
staphylococci 45.1 % of the suspected clinical isolates subjected to the test.
The mannitol salt agar test revealed 218 of the clinical isolates which represent 25.98 % of
the catalase positive to be S. aureus grew in 7.5 % Nacl and fermented the Mannose sugar
giving a yellow acidic color.
The coagulase test confirmed 58 (26.6 %) clinical isolates to be S. aureus, 7 from
sputum, 10 from skin swab, 11 from abscess, 19 from open wound and 11 from ear/nasal
swab.

107
3.3 Antimicrobial susceptibility test
The antimicrobial susceptibility test was done to check the susceptibility pattern of the
isolates to various antibiotics disc used in the study as shown in Table 4. The results showed
susceptibility and resistant pattern of the antibiotics disc used on the 58 clinical isolates of
Staphylococcua aureus. It was observed that out of 58 clinical isolates of S.aureus tested for
resistance, 39 isolates showed resistance in varying degree to the antibiotics, while 19 of the
isolates were sensitive to all the antibitotics. MSSA 32.75 % and MRSA 67.24 %. Cephalexin
having the highest 26.00 ± 1.00 (44.82 %) and tetracycline, the lowest 18.33 ± 0.58 (31.03
%) susceptibility. However, there was no significant (p > 0.05) difference in susceptibility
between cephalexin and levofloxacin and also in the resitance pattern. There was also
significant (p < 0.05) difference among the various antimicrobials resistance, tetracycline
having the highest 39.67 ± 0.58 (68.97 %) and cephalexin, the least 32.33 ± 0.58 (55.18 %)
resistance. Cotrimoxazole had similar resistance to tetracycline (p > 0.05) also with resitance
of 67.25 %. Oxacillin has 37.93 % sensitivity, 62.07 % resistance and vancomycin has 39.65
% sensitivity and 60.35 % resitance by the isolates.
Vancomycin has been the drug of choice for MRSA infections until the first S. aureus
isolate with reduced sensitivity to vancomycin (vancomycin intermediate Staphylococcus
aureus (VISA)) was reported in Japan in 1997 [3]. This result has shown that most of the
MRSA isolates used in this study are vancomycin resistant. Hospital acquired MRSA (HA-
MRSA) and they are also multidrug resistant as seen in the susceptibility pattern in table 4,
with over 60% of the S. aureus resisting vancomycin.

108
Table 4: Antimicrobial susceptibility test
S/N Antimicrobial MSSA % MSSA MRSA % MRSA
1 Oxacilin 5 µg/ml 22.3 ± 0.5 37.93 36.0 ± 0.5 62.07
2 Vancomycin 30 µg/ml 23.0 ± 1.0 39.65 35.6 ± 1.1 60.35
3 Cephalexin 30 µg/ml 26.0 ± 1.0 44.82 32.3 ± 0.5 55.18
4 Levofloxacin 5 µg/ml 25.3 ± 0.5 43.10 32.6 ± 0.5 56.90
5 Ciprofloxacin 5 µg/ml 21.0 ± 0.5 34.48 37.6 ± 0.5 65.52
6 Tetracycline 30 µg/ml 18.3 ± 0.5 31.03 39.6 ± 0.5 68.97
7
Cotrimoxazole
25µg/ml
20.0 ± 0.5 32.75 39.3 ± 0.5 67.25
8 Gentamycin 30µg/ml 21.3 ± 1.0 37.93 36.3 ± 0.5 62.07
9 Clindamycin 2 µg/ml 21.3 ± 0.5 36.20 37.3 ± 0.5 63.79
10 Rifampicin 5µg/ml 21.3 ± 0.5 37.93 36.3 ± 0.5 62.07
Values were expressed as Mean ± SD, N = 3
MSSA – Methicilin sensitive S. aureus
MRSA – Methicilin resitant S. aureus

109
3.4 Penicilin-binding protein (PBP2̍) latex agglutination test results
The Clincal isolates were subjected to latex agglutination test and the results are as
presented in Table 5.
The 39 Clinical isolates of S. aureus with varying percentages of resistance to the 10
antibiotics used for the susceptibility study were subjected to PBP2ˈ latex agglutination test
and result gave different types of resistance strains as indicated by latex agglutination test
into VISA and MRSA. The results confirmed 39 strains of the isolates as MRSA or VISA.
3.5 Prevalence of clinical isolates of MSSA and MRSA
The prevalence of the S. aureus isolates of the different specimen are presented in
Table 6 and it shows the number of staphylase positive and degrees of occurrence of the
MSSA and MRSA from different source of the clinical isolates, staphylase positive S. aureus,
MSSA and MRSA prevalence is as follow: Open wound (coagulase positive 19, MSSA 5,
MRSA 14), greater than Abscess (coagulase positive 11, MSSA 3, MRSA 8), greater than
Ear/Nasal swab (coagulase positive 11, MSSA 4, MRSA 7), greater than Skin swab
(coagulase positive 10, MSSA 4, MRSA 6), greater than Sputum (coagulase positive 7,
MSSA 3, MRSA 4). The results shows open wound as a source with highest prevalence and
sputum with lowest prevalence of the S.aureus and the MRSA.

110
TABLE 5

111
Table 6: Prevalence of clinical isolates of MSSA and MRSA
Samples Staphylase
positive
S. aureus
MSSA % MSSA Latex test MRSA % MRSA
Sputum
Skin swab
Abscess
Open wound
Ear/Nasal
Total
7
10
11
19
11
58
3
4
3
5
4
19
5.17
6.89
5.17
8.62
6.89
32.74
4 PBP2́+ve
6 PBP2́ +ve
8 PBP2́+ve
14 PBP2́+ve
7 PBP2́ +ve
39 PBP2́+ve
4
6
8
14
7
39
6.89
10.34
13.79
24.13
12.06
67.21

112
3.6 Results of the MIC and MBC of the extracts and fractions on MRSA clinical
isolates.
The results of the MIC and MBC of the extracts and fractions are presented in tables
7, 8, 9, 10 and 11 respectively.
The MIC and MBC as displayed in table 7, showed that the methanol crude extract is
highly effective against all the 39 MRSA clinical isolates, with MIC ranging from
(3.0 ± 0.1 - 5.0 ± 0.5) and MBC ranging from (4.0 ± 0.5 - 5.6 ± 1.1). The least MIC is seen in
clinical isolate OW 36 (3.0 ± 0.1) an isolate from the open wound and highest MIC is seen in
EN 208 (5.0 ± 0.5) an isolate from Ear/Nasal swab. The least MBC is seen in AB20 (4.0 ±
0.5) an isolate from abscess and highest MBC (5.6 ± 1.1) is seen with OW 940, OW 1104 AB
1009 and AB 1956 isolates fron open wound and abscess respctively. There is no significance
difference (P < 0.05) in the activities of the extract against the isolates except some
differences in between the isolates that is observed at the lower MIC and MBC and higher
MIC and MBC.
As shown in Table 8, the ethyl acetate fraction (EF) showed better activity next to the
methanol crude extract than remaining fractions, possibly because of the presence of high
concentration of flavonoids which has been shown to enhance antimicrobial property of a
plant [13]. The MIC and minimal MBC as displayed in the table shows that the ethyl acetate
fraction is also effective against all the 39 MRSA clinical isolates, with MIC ranging from
(3.5 ± 0.3 - 6.6 ± 0.5) and MBC ranging from (4.3 ± 0.5 -7.5 ± 0.5). The least MIC is seen in
clinical isolate OW 947 (3.5 ± 0.3) an isolate from open wound and highest MIC (7.5 ± 0.5)
is seen in OW53, AB61, EN127 and AB187 isolates from open wound, abscess and ear/nasal.
The least MBC is seen in OW 819 (4.3 ± 0.5) an isolate from open wound and highest MBC
is seen in EN 127 (6.6 ± 0.5) isolates from ear/nasal swab. There is no significance difference
(p < 0.5) in the response of the isolates to the extract.

113
The MIC and MBC as displayed in Table 9 showed the results of the antibacterial
activity of the hexane extract fraction (HEF) against the MRSA clinical isolates. The MIC
and MBC as displayed in the table showed that the HEF is also effective against all the 39
MRSA clinical isolates, with MIC ranging from (5.3 ± 1.5 - 7.6 ± 0.5 ) and MBC ranging
from (5.6 ± 1.1 - 8.8 ± 0.5). The least MIC is seen in clinical isolate AB20 (5.6 ± 1.1) an
isolate from absces and highest MIC AB570 (7.6 ± 0.5) was also from abscess. The least
MBC is seen in OW 123 (5.6 ± 1.1) an isolate from open wound and highest MBC is seen in
SP 651 (8.8 ± 0.5) isolate from sputum. There is no significance difference (P < 0.5) in the
activities of the extract.
The MIC and MBC as displayed in Table 10, showed the results of the
antibacterial activity of the dichloromethane fraction (DMF) against the MRSA clinical
isolates. DMF shows activity against all the MRSA isolates. The MIC and MBC as displayed
in the table shows that DMF is also effective against all the 39 MRSA clinical isolates, with
MIC ranging from (6.3 ± 1.1 - 9.3 ± 0.5) and MBC ranging from (7.5 ± 1.0 - 9.7 ± 1.1). The
least MIC is in clinical isolate SS8 (6.3 ± 1.1) an isolate from sputum and highest MICs in
AB 841 and OW 1827 (9.3 ± 0.5) were isolates from abscess and open wound. The least
MBC is seen in SS8 (7.5 ± 1.0) an isolate from abscess and highest MBC is seen in AB 187
and OW 940 (9.7 ± 1.1) isolate from abscess and open wound. There is no significance
difference (P < 0.5) in the activities of the extract against the MRSA.
From Table 11, the results of the antibacteriail activity of MF against the MRSA
clinical isolates. MF showed activity against some of the MRSA clinical isolates but not all,
some resisted the MF fraction at the concentration range of 1mg/ml -10mg/ml used for this
study. The methanol fraction MIC ranges from (8.3 ± 1.1- 9.8 ± 1.1) and MBC ranging from
(9.3 ± 0.5 - 10 ± 1.1) in the isolates that are susceptible to the fraction. The least MIC is in
clinical isolate SS8 (8.3 ± 1.1) an isolate from sputum and highest MICs in OW 578 and OW

114
947 (9.8 ± 1.1) were isolates from open wound. The least MBC is seen in SS235 (9.3 ± 0.5)
an isolate from sputum and highest MBC was seen in AB20, OW30, OW36, OW1104 and
EN127 (10 ± 0.5) isolate from abscess, open wound and ear/nasal swab. At the concentration
range of 1 mg/ml to 10 mg/ml used for this study the following isolates were not inhibited by
the MF: MRSA isolates with MIC but no MBC (EN38, EN 208), (OW 53, OW 154, OW 947,
OW 1420,), SP 651. These isolates are, 2 from ear/nasal swab, 4 from open wound and 1
from sputum. MRSA isolates with complete resistance to MF: (EN 390, EN 831), (AB 600,
AB 1009), (SS 310), (SP 1172), (OW 620, OW 940) 2 from ear/nasal swab, 2 from abscess, 1
from skin swab, 1 from sputum, 2 from open wound.
This result showed MF as the least potent of the fraction with weak antibacterial activity
generally against all the isolates considered for the study.

115
Table 7: MIC and MBC of methanol crude extract in mg/ml
Values were expressed as Mean ± SD, N = 3
Key:
SP: Sputum
SS: Skin swab
AB: Abscess
OW: Open wound
EN: Ear/Nasal
S/
N
Clinical
isolates
MIC MBC S/N Clinical
isolates
MIC MBC
1 SP4 4.3 ± 0.5 5.0 ± 0.5 21 EN390 4.3 ± 0.5 5.3 ± 1.1
2 SS8 3.3 ± 0.5 5.3 ± 1.1 22 SS310 3.3 ± 0.3 4.6 ± 0.5
3 AB20 3.3 ± 0.5 4.0 ± 0.5 23 OW417 3.0 ± 0.3 4.3 ± 0.3
4 SP22 4.6 ± 0. 5 4.3 ± 0.5 24 AB570 3.3 ± 0.1 3.6 ± 0.5
5 OW30 4.0 ± 0.5 4.6 ± 0.5 25 OW578 3.3 ± 0.5 4.3 ± 1.0
6 SS33 4.3 ± 0.5 5.3 ± 1.0 26 AB600 3.0 ± 0.5 5.3 ± 1.0
7 EN35 4.0 ± 0.5 5.3 ± 0.5 27 OW620 3.3 ± 0.3 5.0 ± 0.5
8 OW36 3.0 ± 0.1 4.6 ± 0.5 28 SP651 3.3 ± 0.3 4.3 ± 0.5
9 EN38 3.3 ± 0.1 5.3 ± 0.3 29 OW819 3.0 ± 0.1 4.3 ± 0.5
10 SS42 3.3 ± 0.3 4.6 ± 0.5 30 EN831 3.0 ± 0.3 4.6 ± 1.0
11 OW53 3.3 ± 0.5 4.6 ± 0.5 31 AB841 3.6 ± 0.5 4.6 ± 0.5
12 SS57 4.3 ± 0.5 5.0 ± 1.0 32 OW940 4.0 ± 0.5 5.6 ± 0.3
13 AB61 3.3 ± 0.3 4.3 ± 0.5 33 OW947 4.3 ± 0.3 5.3 ± 0.3
14 EN62 3.3 ± 0.5 4.6 ± 0.3 34 AB1009 3.6 ± 0.3 5.6 ± 1.0
15 OW123 3.3 ± 0.5 5.3 ± 1.0 35 OW1104 4.0 ± 0.5 5.6 ± 0.5
16 EN127 4.0 ± 0.3 4.3 ± 0.5 36 SP1172 4.3 ± 0.3 5.3 ± 1.0
17 OW154 4.3 ± 0.5 5.3 ± 0.5 37 OW1420 3.6 ± 0.1 4.3 ± 0.3
18 AB187 4.3 ± 0.3 5.6 ± 1.1 38 OW1827 3.6 ± 0.3 5.0 ± 0.5
19 EN208 5.0 ± 0.5 5.3 ± 0.5 39 AB1956 4.6 ± 0.5 5.6 ± 1.1
20 SS235 4.6 ± 0.3 5.3 ± 0.5
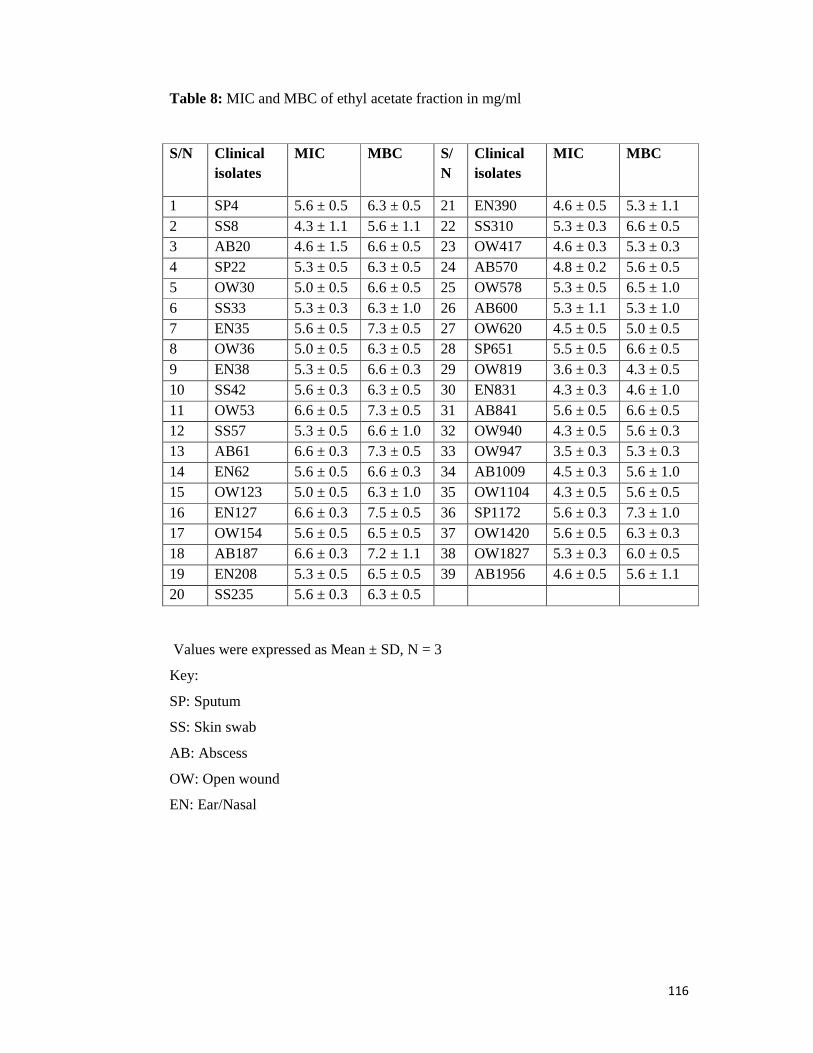
116
Table 8: MIC and MBC of ethyl acetate fraction in mg/ml
Values were expressed as Mean ± SD, N = 3
Key:
SP: Sputum
SS: Skin swab
AB: Abscess
OW: Open wound
EN: Ear/Nasal
S/N Clinical isolates
MIC MBC S/N
Clinical isolates
MIC MBC
1 SP4 5.6 ± 0.5 6.3 ± 0.5 21 EN390 4.6 ± 0.5 5.3 ± 1.1 2 SS8 4.3 ± 1.1 5.6 ± 1.1 22 SS310 5.3 ± 0.3 6.6 ± 0.5 3 AB20 4.6 ± 1.5 6.6 ± 0.5 23 OW417 4.6 ± 0.3 5.3 ± 0.3 4 SP22 5.3 ± 0.5 6.3 ± 0.5 24 AB570 4.8 ± 0.2 5.6 ± 0.5 5 OW30 5.0 ± 0.5 6.6 ± 0.5 25 OW578 5.3 ± 0.5 6.5 ± 1.0 6 SS33 5.3 ± 0.3 6.3 ± 1.0 26 AB600 5.3 ± 1.1 5.3 ± 1.0 7 EN35 5.6 ± 0.5 7.3 ± 0.5 27 OW620 4.5 ± 0.5 5.0 ± 0.5 8 OW36 5.0 ± 0.5 6.3 ± 0.5 28 SP651 5.5 ± 0.5 6.6 ± 0.5 9 EN38 5.3 ± 0.5 6.6 ± 0.3 29 OW819 3.6 ± 0.3 4.3 ± 0.5 10 SS42 5.6 ± 0.3 6.3 ± 0.5 30 EN831 4.3 ± 0.3 4.6 ± 1.0 11 OW53 6.6 ± 0.5 7.3 ± 0.5 31 AB841 5.6 ± 0.5 6.6 ± 0.5 12 SS57 5.3 ± 0.5 6.6 ± 1.0 32 OW940 4.3 ± 0.5 5.6 ± 0.3 13 AB61 6.6 ± 0.3 7.3 ± 0.5 33 OW947 3.5 ± 0.3 5.3 ± 0.3 14 EN62 5.6 ± 0.5 6.6 ± 0.3 34 AB1009 4.5 ± 0.3 5.6 ± 1.0 15 OW123 5.0 ± 0.5 6.3 ± 1.0 35 OW1104 4.3 ± 0.5 5.6 ± 0.5 16 EN127 6.6 ± 0.3 7.5 ± 0.5 36 SP1172 5.6 ± 0.3 7.3 ± 1.0 17 OW154 5.6 ± 0.5 6.5 ± 0.5 37 OW1420 5.6 ± 0.5 6.3 ± 0.3 18 AB187 6.6 ± 0.3 7.2 ± 1.1 38 OW1827 5.3 ± 0.3 6.0 ± 0.5 19 EN208 5.3 ± 0.5 6.5 ± 0.5 39 AB1956 4.6 ± 0.5 5.6 ± 1.1 20 SS235 5.6 ± 0.3 6.3 ± 0.5

117
Table 9: MIC and MBC of n-hexane fraction in mg/ml
Values were expressed as Mean ± SD, N = 3
Key:
SP: Sputum
SS: Skin swab
AB: Abscess
OW: Open wound
EN: Ear/Nasal
S/N
Clinical isolates
MIC MBC S/N Clinical isolates
MIC MBC
1 SP4 6.3 ± 0.5 7.5 ± 0.5 21 EN390 7.5 ± 0.5 8.6 ± 1.1 2 SS8 5.5 ± 1.1 6.5 ± 1.1 22 SS310 6.3 ± 0.5 7.5 ± 0.5 3 AB20 5.3 ± 1.5 6.6 ± 0.5 23 OW417 5.6 ± 0.5 6.6 ± 0.5 4 SP22 6.5 ± 0.5 7.3 ± 0.5 24 AB570 6.5 ± 0.5 7.6 ± 0.5 5 OW30 7.3 ± 1.5 8.5 ± 0.5 25 OW578 6.7 ± 0.5 8.5 ± 1.0 6 SS33 5.6 ± 0.5 6.3 ± 1.0 26 AB600 7.5 ± 1.1 8.7 ± 1.0 7 EN35 7.3 ± 1.1 8.3 ± 0.5 27 OW620 6.8 ± 0.5 8.5 ± 0.5 8 OW36 6.5 ± 1.1 7.6 ± 0.5 28 SP651 7.6 ± 0.5 8.8 ± 0.5 9 EN38 6.7 ± 0.5 8.3 ± 0.5 29 OW819 5.8 ± 0.5 6.6 ± 0.5 10 SS42 7.3 ± 1.0 8.5 ± 0.5 30 EN831 7.5 ± 0.5 7.5 ± 1.1 11 OW53 6.8 ± 0.5 7.5 ± 0.5 31 AB841 6.8 ± 0.5 8.5 ± 0.5 12 SS57 7.3 ± 0.5 8.3 ± 1.0 32 OW940 7.5 ± 0.5 8.7 ± 0.5 13 AB61 5.6 ± 0.5 6.6 ± 0.5 33 OW947 6.9 ± 0.5 8.5 ± 0.3 14 EN62 6.5 ± 0.5 7.3 ± 0.5 34 AB1009 7.5 ± 0.5 7.6 ± 1.1 15 OW123 5.6 ± 0.5 5.6 ± 1.0 35 OW1104 6.3 ± 0.5 7.5 ± 0.5 16 EN127 6.7 ± 0.5 7,5 ± 0.5 36 SP1172 7.5 ± 0.5 8.6 ± 1.0 17 OW154 7.3 ± 0.5 7.3 ± 0.5 37 OW1420 6.8 ± 0.5 7.8 ± 0.5 18 AB187 6.8 ± 0.5 8.5 ± 1.1 38 OW1827 7.5 ± 0.35 7.5 ± 0.5 19 EN208 5.6 ± 0.5 6.5 ± 0.5 39 AB1956 6.5 ± 0.5 7.6 ± 1.1 20 SS235 6.6 ± 0.5 7.3 ± 0.5
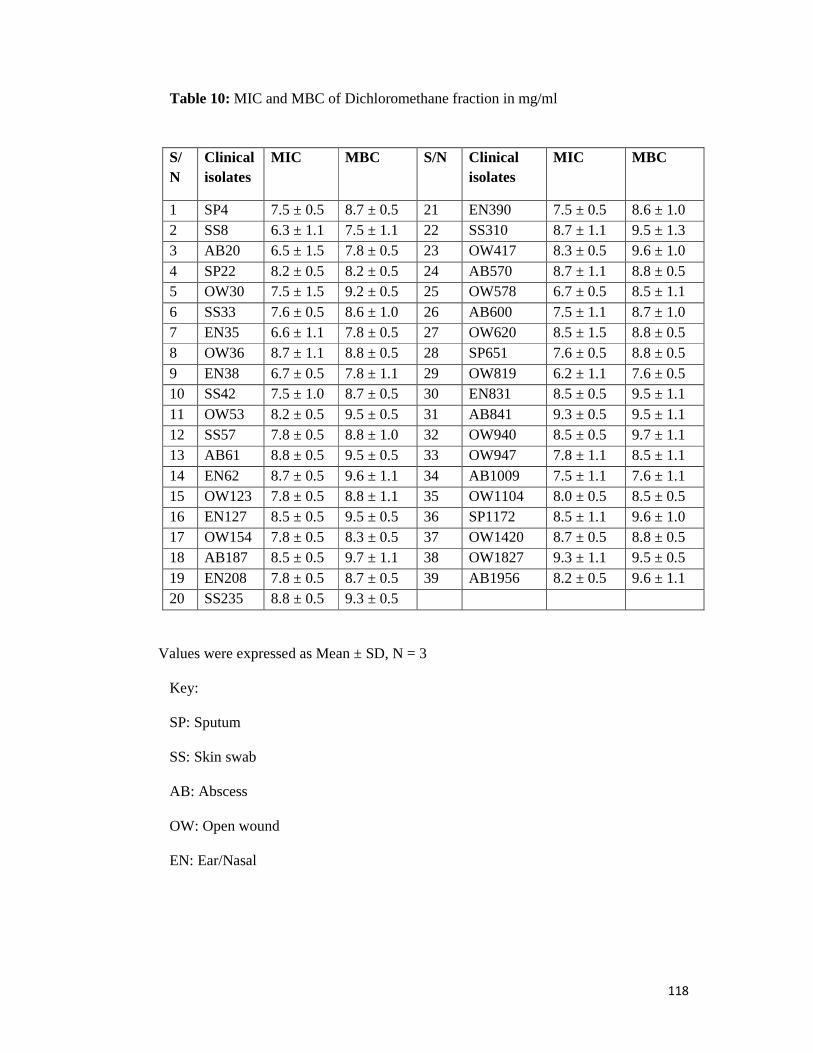
118
Table 10: MIC and MBC of Dichloromethane fraction in mg/ml
Values were expressed as Mean ± SD, N = 3
Key:
SP: Sputum
SS: Skin swab
AB: Abscess
OW: Open wound
EN: Ear/Nasal
S/N
Clinical isolates
MIC MBC S/N Clinical isolates
MIC MBC
1 SP4 7.5 ± 0.5 8.7 ± 0.5 21 EN390 7.5 ± 0.5 8.6 ± 1.0 2 SS8 6.3 ± 1.1 7.5 ± 1.1 22 SS310 8.7 ± 1.1 9.5 ± 1.3 3 AB20 6.5 ± 1.5 7.8 ± 0.5 23 OW417 8.3 ± 0.5 9.6 ± 1.0 4 SP22 8.2 ± 0.5 8.2 ± 0.5 24 AB570 8.7 ± 1.1 8.8 ± 0.5 5 OW30 7.5 ± 1.5 9.2 ± 0.5 25 OW578 6.7 ± 0.5 8.5 ± 1.1 6 SS33 7.6 ± 0.5 8.6 ± 1.0 26 AB600 7.5 ± 1.1 8.7 ± 1.0 7 EN35 6.6 ± 1.1 7.8 ± 0.5 27 OW620 8.5 ± 1.5 8.8 ± 0.5 8 OW36 8.7 ± 1.1 8.8 ± 0.5 28 SP651 7.6 ± 0.5 8.8 ± 0.5 9 EN38 6.7 ± 0.5 7.8 ± 1.1 29 OW819 6.2 ± 1.1 7.6 ± 0.5 10 SS42 7.5 ± 1.0 8.7 ± 0.5 30 EN831 8.5 ± 0.5 9.5 ± 1.1 11 OW53 8.2 ± 0.5 9.5 ± 0.5 31 AB841 9.3 ± 0.5 9.5 ± 1.1 12 SS57 7.8 ± 0.5 8.8 ± 1.0 32 OW940 8.5 ± 0.5 9.7 ± 1.1 13 AB61 8.8 ± 0.5 9.5 ± 0.5 33 OW947 7.8 ± 1.1 8.5 ± 1.1 14 EN62 8.7 ± 0.5 9.6 ± 1.1 34 AB1009 7.5 ± 1.1 7.6 ± 1.1 15 OW123 7.8 ± 0.5 8.8 ± 1.1 35 OW1104 8.0 ± 0.5 8.5 ± 0.5 16 EN127 8.5 ± 0.5 9.5 ± 0.5 36 SP1172 8.5 ± 1.1 9.6 ± 1.0 17 OW154 7.8 ± 0.5 8.3 ± 0.5 37 OW1420 8.7 ± 0.5 8.8 ± 0.5 18 AB187 8.5 ± 0.5 9.7 ± 1.1 38 OW1827 9.3 ± 1.1 9.5 ± 0.5 19 EN208 7.8 ± 0.5 8.7 ± 0.5 39 AB1956 8.2 ± 0.5 9.6 ± 1.1 20 SS235 8.8 ± 0.5 9.3 ± 0.5

119
Table 11: MIC and MBC of methanol fraction in mg/ml
Values were expressed as Mean ± SD, N = 3
Key:
SP: Sputum
SS: Skin swab
AB: Abscess
OW: Open wound
EN: Ear/Nasal
S/N
Clinical isolates
MIC MBC S/N Clinical isolates
MIC MBC
1 SP4 9.7 ± 1.1 9.8 ± 0.5 21 EN390 - - 2 SS8 8.03± 1.0 9.5 ± 1.1 22 SS310 - - 3 AB20 9.5 ± 0.5 10 ± 1.1 23 OW417 9.3 ± 0.5 9.6 ± 1.1 4 SP22 8.2 ± 1.1 9.2 ± 0.5 24 AB570 9.7 ± 1.1 9.8 ± 1.1 5 OW30 9.8 ± 0.5 10 ± 0.5 25 OW578 9.8 ± 1.0 - 6 SS33 8.6 ± 1.0 9.8 ± 1.1 26 AB600 - - 7 EN35 9.6 ± 1.1 9.8 ± 0.5 27 OW620 - - 8 OW36 8.7 ± 1.1 10 ± 0.5 28 SP651 9.7 ± 0.5 - 9 EN38 9.7 ± 1.0 - 29 OW819 9.5 ± 1.1 9.6 ± 0.5 10 SS42 8.5 ± 1.1 9.7 ± 0.5 30 EN831 - - 11 OW53 9.2 ± 0.5 - 31 AB841 9.7 ± 0.5 9.9 ± 1.1 12 SS57 8.8 ± 1.1 9.8 ± 1.0 32 OW940 - - 13 AB61 8.8 ± 1.1 - 33 OW947 9.8 ± 1.1 - 14 EN62 8.7 ± 0.5 9.6 ± 1.1 34 AB1009 - - 15 OW123 8.8 ± 0.5 9.8 ± 1.1 35 OW1104 9.0 ± 0.5 10 ± 0.5 16 EN127 8.5 ± 1.1 10 ± 0.5 36 SP1172 - - 17 OW154 9.8 ± 1.0 - 37 OW1420 - - 18 AB187 8.5 ± 1.0 9.7 ± 1.1 38 OW1827 9.7 ± 1.1 9.9 ± 0.5 19 EN208 9.8 ± 0.5 - 39 AB1956 8.9 ± 0.5 9.8 ± 1.1 20 SS235 8.8 ± 0.5 9.3 ± 0.5
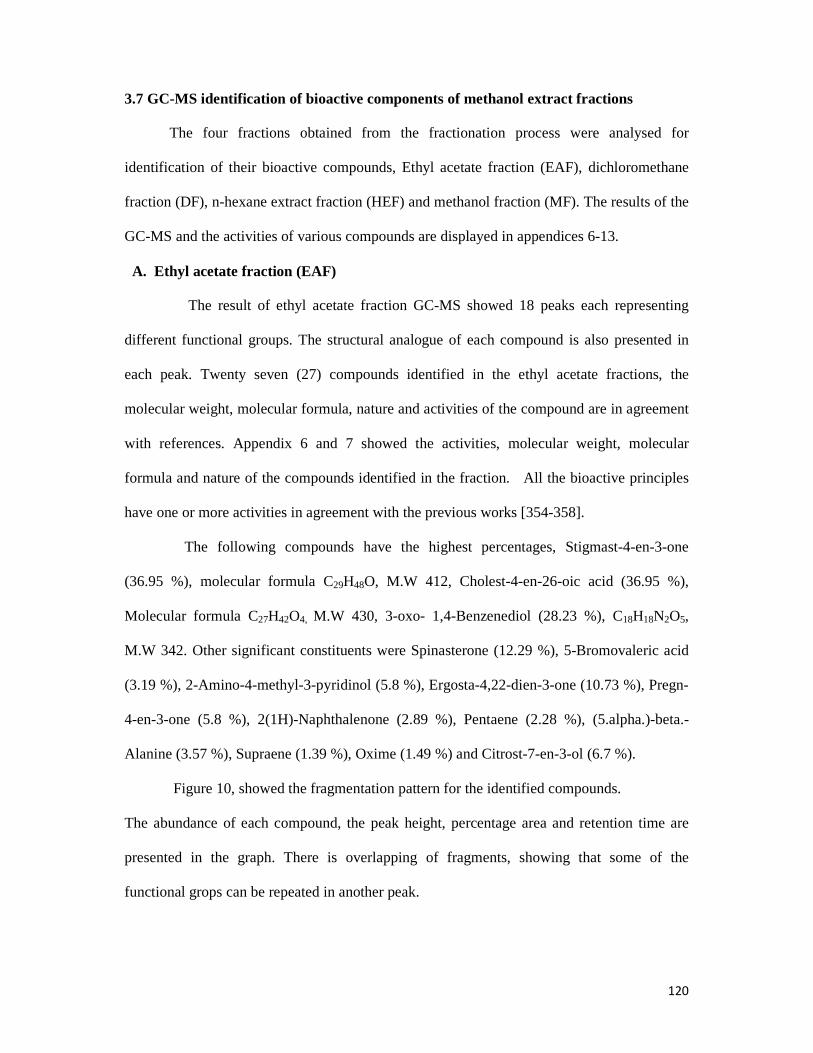
120
3.7 GC-MS identification of bioactive components of methanol extract fractions
The four fractions obtained from the fractionation process were analysed for
identification of their bioactive compounds, Ethyl acetate fraction (EAF), dichloromethane
fraction (DF), n-hexane extract fraction (HEF) and methanol fraction (MF). The results of the
GC-MS and the activities of various compounds are displayed in appendices 6-13.
A. Ethyl acetate fraction (EAF)
The result of ethyl acetate fraction GC-MS showed 18 peaks each representing
different functional groups. The structural analogue of each compound is also presented in
each peak. Twenty seven (27) compounds identified in the ethyl acetate fractions, the
molecular weight, molecular formula, nature and activities of the compound are in agreement
with references. Appendix 6 and 7 showed the activities, molecular weight, molecular
formula and nature of the compounds identified in the fraction. All the bioactive principles
have one or more activities in agreement with the previous works [354-358].
The following compounds have the highest percentages, Stigmast-4-en-3-one
(36.95 %), molecular formula C29H48O, M.W 412, Cholest-4-en-26-oic acid (36.95 %),
Molecular formula C27H42O4, M.W 430, 3-oxo- 1,4-Benzenediol (28.23 %), C18H18N2O5,
M.W 342. Other significant constituents were Spinasterone (12.29 %), 5-Bromovaleric acid
(3.19 %), 2-Amino-4-methyl-3-pyridinol (5.8 %), Ergosta-4,22-dien-3-one (10.73 %), Pregn-
4-en-3-one (5.8 %), 2(1H)-Naphthalenone (2.89 %), Pentaene (2.28 %), (5.alpha.)-beta.-
Alanine (3.57 %), Supraene (1.39 %), Oxime (1.49 %) and Citrost-7-en-3-ol (6.7 %).
Figure 10, showed the fragmentation pattern for the identified compounds.
The abundance of each compound, the peak height, percentage area and retention time are
presented in the graph. There is overlapping of fragments, showing that some of the
functional grops can be repeated in another peak.

121
B. Dichloromethane fraction (DF)
The compounds identified in dichloromethane fraction are as shown in the tables in
appendices 8 and 9, with their retention time (RT), Percentage area (% Area), height amd
peak representing each functional group. Forty seven (47) functional groups are identified
from the GC-MS report of DMF according to the peak number, with different compounds
structural analogue in each peak.
A total of 80 compounds were identified in the dichloromethane fractions, the
molecular weight, molecular formula, nature and activities of the compounds in agreement
with references are as displayed in appendix 9. The compounds with high percentages in this
fraction are 5-bromovaleric acid (89.57 %), 2, 6-dimethylnon-1-en-3-yn-5-yl ester (89.57 %),
stigmast-4-en-3-one (12.33 %), Testosterone (12.33 %), Ergosta-4, 22-dien-3-one (11.91 %),
Hexadecanoic acid (7.31 %), beta.-Tocopherol (2.59%).
Fragmentation pattern for the identified compounds are as presented in Figure 11.
The abundance of each compound, the peak height, percentage areas and retention time are
presented in the graph.
C. N-hexane extract fraction (HEF)
The compounds in n-hexane fraction are as shown in appendices 10 and 11.
Forty one (41) functional groups and different structural analogue of the compounds
according to their peak are presented in the tables, with the retention time and percentage
area.
Forty five (45) compounds were identified in the n-hexane fraction, the molecular
weight, molecular formula, nature and activities of the compound are in accordance with the
references. The compounds with high percentages in this fraction are 9, 12-octadecadienoic
acid (41.08 %), 2-Chloroethyl linoleate (41.08 %), n-hexadecanoicacid (17.35 %),
stigmasterol (4.44%), ergost-22-en-3-one (4.44%), Campesterol (3.46%).

122
The mass spectrophotometric fragments in Figure 12 showed the abundance of each
compound, the peak height, percentage areas and retention time. There is an overlapping of
fragments, showing that some of the functional groups are repeated in another peak.
D. Methanol fraction (MF)
The compounds in methanol fraction are as presented in appendices 12 and 13, The
MF is having the least number of peaks, with the least functional groups and structural
analogue of the compounds according to their peak are presented in appendix 13, with the
retention time and percentage area.Only twelve (12) functional groups were identified in the
fraction.
Fourteen (14) compounds were identified in the methanol fraction with their
molecular weight, molecular formula, nature and activities. The compounds with high
percentages in this fraction are 3, 7-dimethyl-1, 6-Octadien-3-ol, (37.09 %), Eugenol (29.12
%), Terpinen-4-ol (7.46 %), Bicyclo[3.1.1]hept-2-ene (7.21 %), (+)-epi-
Bicyclosesquiphellandrene (5.28 %), Naphthalene (5.28 %), 1,3,3 trimethyl- L-Fenchone (1.53
%). The mass spectrophotometric fragments in Figure 13 showed the abundance of each
compound, the peak height, percentage areas and retention time. The methanol fraction gave
the least fragments out of the four fractions with the least compounds.
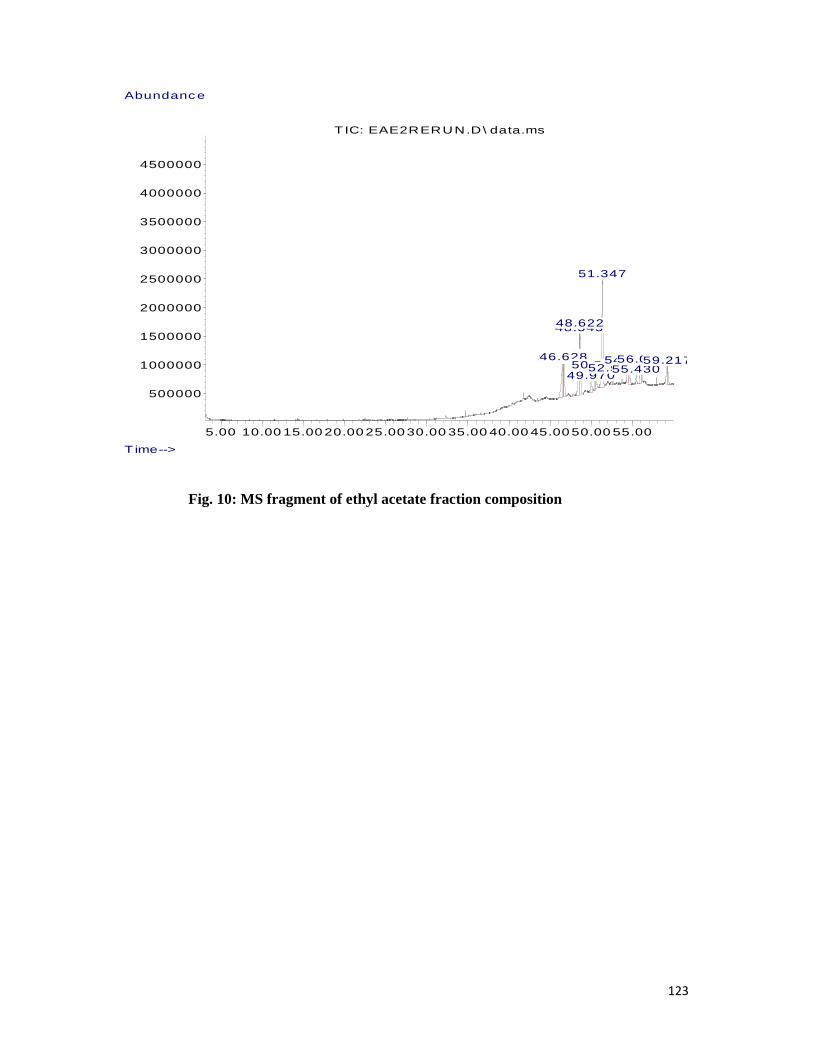
123
5.00 10.00 15.00 20.00 25.00 30.00 35.00 40.00 45.00 50.00 55.00
500000
1000000
1500000
2000000
2500000
3000000
3500000
4000000
4500000
T ime-->
Abundance
TIC: EAE2RERUN.D\ data.ms
46.49846.58146.628
48.54548.622
49.97050.49850.522
51.347
52.51052.52854.48754.51655.43056.02456.05359.18159.217
Fig. 10: MS fragment of ethyl acetate fraction composition
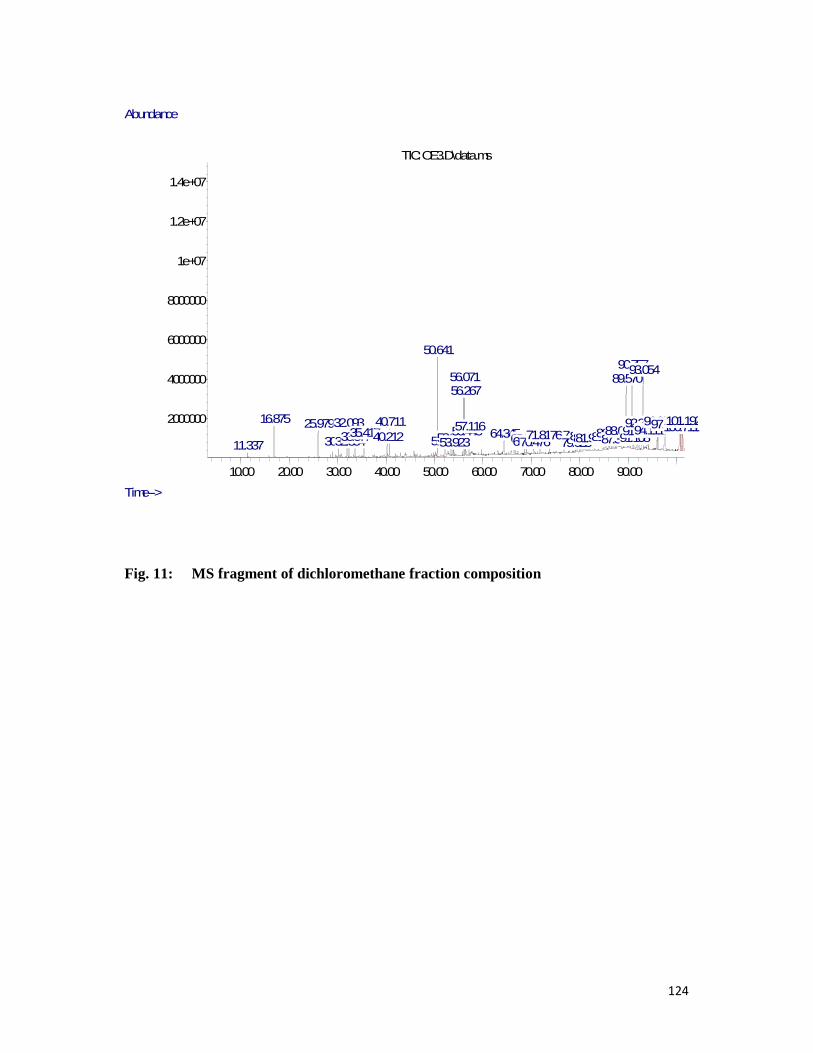
124
10.00 20.00 30.00 40.00 50.00 60.00 70.00 80.00 90.00
2000000
4000000
6000000
8000000
1e+07
1.2e+07
1.4e+07
Time-->
Abundance
TIC: OE3.D\data.ms
11.337
16.875 25.979
30.217
32.093
32.35433.57735.41740.21240.711
50.641
52.16053.39553.923
56.07156.267
56.44557.11664.34568.62569.05270.47671.81876.720
79.02380.83481.51681.97385.32786.28287.33388.063
89.57090.757
91.10891.70192.217
93.054
94.09394.11196.05896.08197.577100.669100.711101.156101.192
Fig. 11: MS fragment of dichloromethane fraction composition

125
5.00 10.00 15.00 20.00 25.00 30.00 35.00 40.00 45.00 50.00 55.00
5000000
1e+07
1.5e+07
2e+07
2.5e+07
Time-->
Abundance
TIC: OE4N-PASTORAYO.D\data.ms
19.267 25.22027.32130.41931.87334.01035.06635.14435.701
36.592
37.38737.92138.52138.63939.286
40.30740.33140.384
40.574
43.12645.37646.40346.51646.955
48.11248.534
49.685
49.81651.222
52.91453.01553.329
53.715
53.905
54.326
54.75455.027
55.508
56.344
58.70159.615
Fig. 12: MS fragment of n-hexane fraction composition

126
5.00 10.00 15.00 20.00 25.00 30.00 35.00 40.00 45.00 50.00 55.00
500000
1000000
1500000
2000000
2500000
3000000
3500000
4000000
4500000
Time-->
Abundance
T IC: SS1-RERUN.D\ data.ms
13.064
13.580
16.115
18.32318.578
21.575
23.70028.965
31.315 41.72643.429
55.430
Fig 13: MS fragment of methanol fraction composition

127
3.8 STRUCTURE OF SOME PHYTOCHEMICALCOMPONENTS IDENTIFIED FROM MASS SPECTOMETRY REPORT IN MORINGA OLEIFERA ROOT BARK WITH REFERENCE TO: CHEMSPIDER, PUBCHEM, NIST, LOOKCHEM AND CHEMBOOK DATABASES [359-364].
Stigmast-4-en-3-one 7 alpha-Hydroxy-3-oxo-4-cholestenoate 3,methyl 5(2,6,6trimethylcyclohex- 1-en-1-yl) pent-1-yn-3-ol
5-bromovaleric acid 3,4-dihydro-1(2H)-Naphthalenone 2,2-Dimethylpropanoic acid, 2,6- dimethylnon-1-en-3-yn-5-yl ester
Phthalimidine Ergosta-4, 22-dien-3-one (E, E, E)-3, 7, 11, 15-Tetramethylhexadeca-1,3,6- 10, 14-pentaene
ETHISTERONE alpha.-amino-Benzene acetic acid 2-Thiazolamine

128
9-Octadecenoicacid,methylester (1,2,6)-phosphadiazine UREA 2-Phenyl-2,3-dihydro-1H- naphtho[1,8de][1,3,2]diazaphosphinine - 2-sulfide
Cis- muurola-3,5-diene Pentadecanoic acid Palmitic Acid
a-alanine 4-methoxy- beta-naphthylamide Dimethyl(ethenyl)silyloxy-3-phenylpropane 1, 3-Dioxolane
Cyclohexanecarboxylic acid Ergost-25-ene-3, 5, 6, 12-tetrol Dodecanoic acid

129
Benzofran-3-one C(14a)-Homo-27-nor-14.beta- Carboxamide 1,3,3trimethyl-L-Fenchon Gammaceran-3.alpha.-ol
7H-pyrazolo [4, 3-e][1,2,4] Triazolo [1, 5-c] pyrimidine, Trimethyl(propoxy)silane, C (14a)-Homo-27- Gammaceran-3.alpha-ol Terpinen-4-ol
Isopropyl 2-benzyl-2- PropenylBenzene Geraniol Benzenemethanamine
Isopropyl 2-benzyl-2-propenyl Ether Benzylisocyanate Eugenol
Fig. 14: The structures of some of the identified components from mass spectometry report were presented with reference to the following data base: Chemspider, Pubchem, National institute of science and technology (NIST), Lookchem and Chembook.
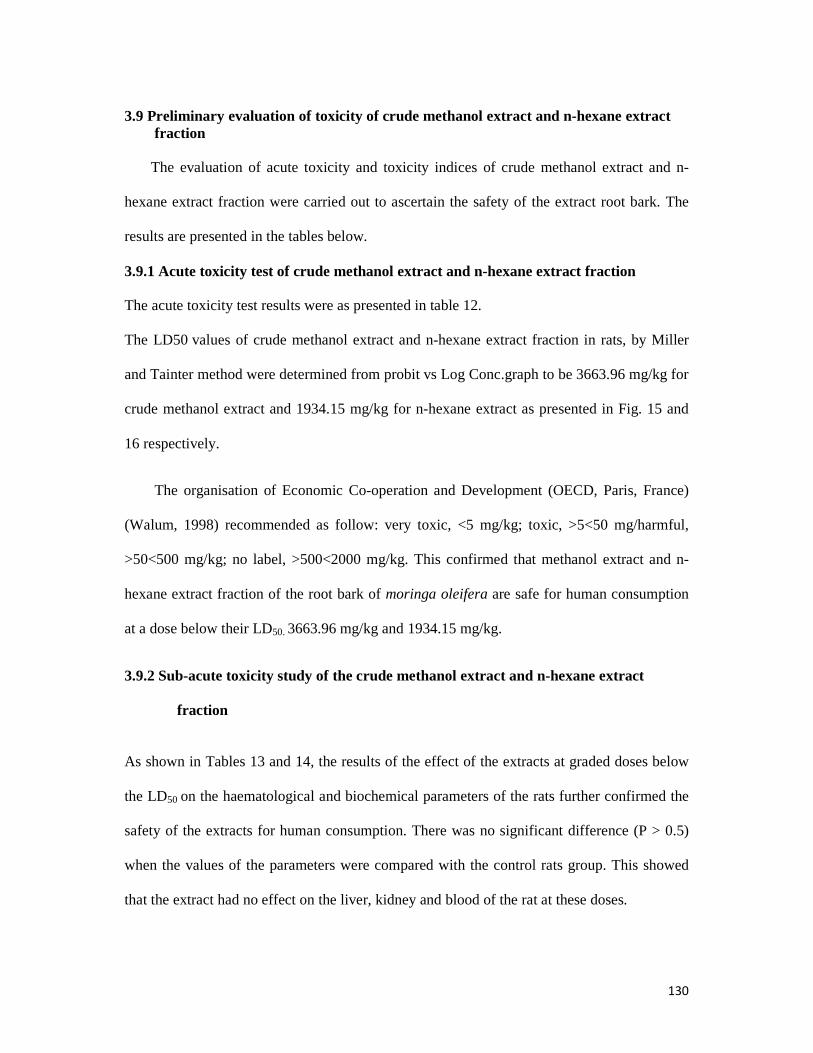
130
3.9 Preliminary evaluation of toxicity of crude methanol extract and n-hexane extract fraction The evaluation of acute toxicity and toxicity indices of crude methanol extract and n-
hexane extract fraction were carried out to ascertain the safety of the extract root bark. The
results are presented in the tables below.
3.9.1 Acute toxicity test of crude methanol extract and n-hexane extract fraction
The acute toxicity test results were as presented in table 12.
The LD50 values of crude methanol extract and n-hexane extract fraction in rats, by Miller
and Tainter method were determined from probit vs Log Conc.graph to be 3663.96 mg/kg for
crude methanol extract and 1934.15 mg/kg for n-hexane extract as presented in Fig. 15 and
16 respectively.
The organisation of Economic Co-operation and Development (OECD, Paris, France)
(Walum, 1998) recommended as follow: very toxic, <5 mg/kg; toxic, >5<50 mg/harmful,
>50<500 mg/kg; no label, >500<2000 mg/kg. This confirmed that methanol extract and n-
hexane extract fraction of the root bark of moringa oleifera are safe for human consumption
at a dose below their LD50. 3663.96 mg/kg and 1934.15 mg/kg.
3.9.2 Sub-acute toxicity study of the crude methanol extract and n-hexane extract
fraction As shown in Tables 13 and 14, the results of the effect of the extracts at graded doses below
the LD50 on the haematological and biochemical parameters of the rats further confirmed the
safety of the extracts for human consumption. There was no significant difference (P > 0.5)
when the values of the parameters were compared with the control rats group. This showed
that the extract had no effect on the liver, kidney and blood of the rat at these doses.

131
3.9.3 Effects of graded doses of crude methanol extract and n-hexane extract fraction
on body weights of rats
As shown in Table 15, there was general increase in the body weight of the animals except at
1000 mg/kg for crude methanol extract when some of the animals in the group showed little
weekness and later recovered. This may explain the little drop in weight at the dose of 1000
mg/kg of the crude methanol extract with little behavioral change.
The n-hexane extract fraction also showed increase in body weight but some of the animals
in the group showed weekness due to loose stools observed at a dose of 1000mg/kg, this was
not obvious with the group of 500 mg/kg but with a marked behavioural change with the
group of 1000 mg/kg.

132
Table 12: Acute toxicity test of crude methanol extract and n-hexane extract Fraction
Group Dose mg/kg N/D % Mortality
Observation Period (h)
Symptoms of Toxicity
Crude methanol extract 1 50 mg 6/0 0 24 No toxic symptoms 2 250 mg 6/0 0 24 No toxic symptoms 3 500 mg 6/1 16.6
24 Slow movement and dullness of animals
4 1000 mg 6/2 33.3 24 Weak and less active 5 5000 mg 6/2 33.3
24 Marked behavioral change, restlessness and gradual death
6 1 g 6/4 66.6 24 restlessness and gradual death 7 (control)
2 ml distlled water 6/0 0 24
No change observed
N-hexane extract fraction 1 50 mg 6/0 0 24 No toxic symptoms 2 250 mg 6/0 0 24 No toxic symptoms 3 500 mg 6/1 16.6 24 Weak, less active 4 1000 mg 6/2 33.3 24 Weak, less active and loose stool 5 5000 mg 6/4 66.6 24 Weak, loose stool and gradual
death 6 1 g 6/6 100 24 Death 7 (control)
2 ml distlled water 6/0 0 24 No change observed
N = no. of rats, D = no. of Deaths
The LD50 for crude methanol extract is 3663.96 mg/kg and n-hexane extract is 1934.15.
Determined from probit graph analysis on SPSS v17.

133
Fig. 15: Determination of LD50 value of crude methanol extract in rats
LD50 = 3663.96 mg/kg
Determined from probit analysis onSPSS v17

134
Fig 16: Determination of LD50 value of n-hexane extract fraction
LD50 = 1934.15 from probit graph. Determined from probit analysis onSPSS v17

135
Table 13: Effects of the graded doses of the extracts on haematological parameters of rats
Parameters Control
(A)
50 mg/kg
(B)
250 mg/kg
(C)
500 mg/kg
(D)
1000 mg/kg
(E)
Crude methanol extract
PCV% 44.6 ± 0.6 42.2 ± 0.9 45.3 ± 0.3 45.1 ± 0.2 46.2 ± 0.4
RBC% 7.1 ± 0.9 7.3 ± 0.2 7.40 ± 0.5 7.4 ± 0.5 7.5 ± 0.5
WBC% 13.2 ± 0.1 13.9 ± 0.1 13.75 ± 0.1 13.8 ± 0.2 14.2 ± 0.2
MCV% 51.2 ± 0.2 51.1 ± 0.1 49.1 ± 0.1 48.8 ± 0.2 50.2 ± 0.1
PLT% 409.1 ± 8.1 409.0 ± 7.5 406.22 ± 8.1 399.1 ± 8.2 388.40 ± 8.2
N-hexane extract fraction
PCV% 44.6 ± 0.2 41.24 ± 0.1 43.20 ± 0.2 44.50 ± 0.4 45.10 ± 0.6
RBC% 7.1 ± 0.1 7.00 ± 0.3 7.21 ± 0.2 7.32 ± 0.2 7.40 ± 0.4 WBC%
13.2 ± 0.2 13.60 ± 0.2 13.67 ± 0.1 13.78 ± 0.2 13.90 ± 0.2 MCV%
51.2 ± 0.1 50.10 ± 0.2 49.50 ± 0.2 49.90 ± 0.2 49.95 ± 0.2 PLT%
409.1 ± 8.2 409.0 ± 7.2 407.22 ± 7.5 405.10 ± 8.1 398.50 ± 8.2
Values were expressed as Mean ± SD, N = 6

136
Table 14: Effects of the graded doses on biochemical parameters of rats
Parameters Control
(A)
50 mg/kg
(B)
250 mg/kg
(C)
500 mg/kg
(D)
1000 mg/kg (E)
Crude methanol extract BILURIBIN 1.60 ± 0.01 1.63 ± 0.02 1.61 ± 0.01 1.60 ± 0.02 1.58 ± 0.01
CREATININE 0.73 ± 0.01 0.69 ± 0.01 0.71 ± 0.01 0.69 ± 0.01 0.69 ± 0.01
ALT 34.11 ± 0.02 33.17 ± 0.02 33.02 ± 0.15 31.40 ± 0.15 32.60 ± 0.02
ALP 129.4 ± 0.15 129.88 ± 0.15 129.31 ± 0.21 130.11 ± 0.22 132.11 ± 0.20
AST 63.1 ± 0.1 66.1 ± 0.2 64.41 ± 0.2 63.22 ± 0.2 66..53 ± 0.2
N-hexane extract fraction BILURIBIN 1.62 ± 0.01 1.62 ± 0.01 1,60 ± 0.02 1.58 ± 0.01 1.59 ± 0.01
CREATININE 0.74± 0.02 0.70 ± 0.01 0.71± 0.02 0.69 ± 0.01 0.68 ± 0.01
ALT 34.11 ± 0.01 33.17 ± 0.02 33.02 ± 0.15 31.40 ± 0.01 32.60 ± 0.01
ALP 129.41± 0.20 129.88± 0.20 129.31 ± 0.15 130.11 ± 0.20 132.11 ± 0.2
AST 63.11 ± 0.2 66.24± 0.2 64.41 ± 0.2 63.22 ± 0.1 66..53 ± 0.2
Values were expressed as Mean ± SD, N = 6
Key:
AST: Aspatate amino transferace
ALTS: Alanine amino transferace
ALP: Alkaline phosphate.

137
Table 15: Effects of graded doses of the extracts on body weights of rats
Parameters Control 50 mg/kg 250 mg/kg 500 mg/kg 1000 mg/kg
Crude methanol extract Weight before extract administration (g)
95.3 ± 4.2 110.2 ± 6.2 115.3 ± 8.2 120.4 ± 9.2 150.7 ± 8.2
Weight after 21days (g)
150 ± 10.3 155 ± 9.2 145 ± 11.4 135 ± 12.5 95 ± 8.2
% weight difference 57.89 % 53.46 % 38.09 % 35 % Weight lost 3 %
N-hexane extract fraction Weight before extract administration (g)
95.2 ± 4.1 101.4 ± 3.2 105.7 ± 4.3 100.6 ± 5.2 98.8 ± 3.1
Weight after 21days (g)
150 ± 7.2 145 ± 7.6 130 ± 9.7 95 ± 8.2 80 ± 12.7
% weight difference 57.89 % 43.56 % 23.80 % Weight lost 5 %
Weight lost 18.36 %
Values were expressed as Mean ± SD, N = 6

138
3.10 Discussion
3.10.1 Percentage yield of extracts and fractions
The extractive values are useful to evaluate the chemical constituents present in the
crude drug and also help in estimation of specific constituents soluble in a particular solvent
(Ozarkar) [103]. In this study, the percentage yield of the extract and fractions indicate a
good yield with methanol crude extract 850.60 ± 20.8 g (28.35 %) compared to n-hexane
extract faction of 68.80 ± 13.7 g (2.29 %). There was significant (p > 0.05) difference in the
percentage yield of the various fractions, methanol fraction having the highest (31.21 %) and
n-hexane, the lowest (2.29 %). The fact that methanol fraction, dichloromethane fraction and
ethylacetate fraction yields are more than n-hexane yield means there are more polar
phytochemical constituents in the roots of Moringa oleifera than non polar [103-105]
3.10.2 Qualitative phytochemical analysis of methanol extract and fractions
Phyto chemical compounds may inhibit bacterial growth by mechanisms different from
presently used treatment regimens, and could be of clinical value in the treatment of resistant
bacteria, including MRSA. Tannins, flavonoids, alkaloids, essential oils and many phenolic
compounds serve as plant defence mechanisms against predation by insects, herbivores and
infection by microorganisms (Cowan) [120]. It is, therefore, not surprising that these
compounds have been found to exhibit profound antimicrobial activities in-vitro against this
multi drug resistant MRSA. Moringa oleifera is already highly esteemed by people in the
tropics and sub-tropics for the many ways it is used nutritionally and medicinally by local
herbalist. Some of these traditional uses reflect the nutritional content of the various tree plant
parts. The following are but some of the ways the tree plant parts is used in Asia, Africa and
America. In recent years, laboratory investigations have confirmed the efficacy of some of
these applications as found in leaves, flowers, pods, roots, root bark and stem bark, gum,
seeds and seed oil [116-120].

139
The roots of Moringa oleifera have been known to be used in the treatment of dental
caries, common cold, fever, diarrhea, flatulence and edema [117]. There is an increasing
awareness that many components of traditional medicine are beneficial while others are
harmful, hence WHO encourages and supports countries to identify and provide safe and
effective remedies for use in the public and private health services [118].
The present study showed that the root bark of Moringa oleifera have pharmacologically
important chemical compounds such as carbohydrates, saponins, cardiac glycosides, terpenes,
steroids, flavonoids and alkaloids. Alkaloids were abundantly present, proteins and
carbohydrates are present in high concentrations, tannins, resins, glycosides, steroids,
flavoinoids, reducing sugars, fats and oil, sapponins are present in moderately high
concentrations with terpenoids present in low concentrations. These findings agrees with the
review of (Fahey) [125]. The fractions of the extracts showed varying concentrations of
phytochemical constituents: n-hexane fraction is very rich in steroids, terpenoids, fats and
oils, dichloromethane fraction is rich in resins with moderate concentration of steroids and
fats and oil and low concentration of steroids, ethyl acetate fraction is rich in flavonoids
which is abundantly present, with low concentrations of steroids, terpenoids and
carbohydrates, methanol fractions is with low concentrations of alkaloids, tannins, resins,
glycosides. Alkaloids have pharmacological effects and are used as local anesthetic and
stimulants [340]. Cocaine, caffeine, nicotine, the analgesic morphine, the anti-bacterial
berberine and antimalarial drug quinine are all alkaloids. The alkaloid spirachin (a nerve
paralysant) has been found in the roots of Moringa oleifera. [341]. Flavonoids, according to
the research by [346] may modify allergens, viruses and carcinogens, thereby, acting like a
biological response modifier. Also, in vitro studies showed that flavonoids could also posses
anti-microbial [346], anti-allergic and anti-inflammatory properties. Steroids are used in the
stimulation of bone marrow and growth. It stimulates lean body mass and also play vital roles

140
in the prevention of bone loss in elderly men [133]. Tannins could be an effective
ameliorative agent of the kidney [130].
Moringa oleifera fats and oil are used traditionally to treat stomach disorders. They are
used in perfume and hair oil [128]. Glycosides from Moringa oleifera were found to be
responsible for the blood pressure lowering effect of the root (Faizi et al) [128].
Carbohydrates, one of the most common groups of natural products, are construction
materials for plant (cellulose, hemicelluloses and pectin) and animal tissues. They are the
sources of energy and storage material in flora (starch, insulin) and fauna (glycogen). Several
specific carbohydrates are utilized in nature, for instance, as water maintaining hydrocolloids,
sex attractants (pheromones), and others formed by photosynthesis and associated processes.
Some of them are subsequently utilized by plants which transform them into other products;
for instance, some plants may turn D-galactose into ascorbic acid [123]. The presence of
these phytochemicals in the extracts and fractions support the antimicrobial activities of the
Moringa oleifera root bark on MRSA (HA-MRSA) isolates used in this study.
3.10.3 Prevalence of clinical isolates of Staphylococcus aureus Staphylococcus aureus was found to be prominent in cases of wound sepsis [350].
Many studies have shown that open wond is a reservoir for transmission of S. aureus. A study
[351] at Ilorin, Nigeria reported wound infections of 38 % as the highest frequency of S.
aureus isolates. This agrees with the result of the present study where the order of the
Coagulase positive S. aureus, MSSA and MRSA prevalence is as follow: Open wound 19
(58) (32.75 %), greater than abscess 11 (58) (18.96 %), greater than Ear/Nasal swab 11 (58)
(18.96 %), greater than Skin swab 10 (58) (17.24 %), greater than Sputum 7 (58) (12.06 %)
except the little difference between the abscess and ear/nasal in the staphylase positive S.
aureus and MRSA prevalence.

141
The association of MRSA with therapeutic challenges, complications, deaths and cost
related to longer hospital stay compared with MSSA has been widely documented [35-351].
More importantly, the multidrug resistant hospital-acquired MRSA (HA-MRSA) strains and
their intrinsic resistance to beta-lactam antibiotics confer limited treatment options to the
most available and less costly antibiotics in developing countries [351]. In agreement with the
previous study by (Olowo) [315]. Open wound has the highest prevalence of S.aureus and
MRSA.
3.10.4 Antimicrobial susceptibility parttern of the clinical isolates
The susceptibility and resistance pattern of the 58 clinical isolates S. aureus were as seen in
the Table 8. Susceptibility test profile revealed a high level of resistance amongst the S.
aureus to all the commonly used antimicrobials, ciprofloxacin, gentamicin, clindamycin,
levfloxacin, cephalexcin, tetracycline, rifampicin cotrimoxazole, oxacillin and vancomycin.
The results were comparable to those in a previous study carried out by Nwankwo and Nasiru
[326], but not as high as in this study. For many years vancomycin was the drug of choice for
MRSA infections, until the first S. aureus isolate with reduced sensitivity to vancomycin
(vancomycin intermediate Staphylococcus aureus (VISA) was reported in Japan in 1997.
Thereafter, several reports of VISA from USA , France , Brazil , Korea , and other parts of
the world [319-323] were published and resulted in increasing concerns about the
effectiveness of vancomycin therapy in serious staphylococcal infections. Reduced sensitivity
to vancomycin in S. aureus occurs due to several genetic and phenotypic alterations in wild-
type bacteria including altered expression of regulatory genetic elements, thickness of cell
wall, changes in the penicillin binding protein (PBP) profiles, and decreased cell wall
autolysis [324]. Since 2002, there have been also several reports of vancomycin resistant
Staphylococcus aureus (VRSA) strains, mainly from the United States, India, and Iran [322-
324]. The majority of the reported VISA isolates are MRSA strains with reduced

142
susceptibility to vancomycin even though a few reports have also shown this phenomenon in
methicillin sensitive Staphylococcus aureus (MSSA) isolates [321-323]. In the present study,
Staphylococcus aureus susceptibility and resistance seems not to conform to usual norm of
having Vancomycin as the most sensitive drug, The susceptibility and resistance parterns of
these clinical isolates in oxacillin and vancomycin was not different, almost no significance
difference (P > 0.05). Hence, most of the MRSA among these isolates were also VISA and
VIRA as it is revealed from table 9. It was discouraging to note that vancomycin resistance
was higly observed among the isolates.
The MRSA showed a high level of resistance to all antimicrobials in general in
comparison to the MSSA. Also most of the MRSA in this study were actually resistant to
many classes of antimicrobials at the same time and thus qualify as multiply drug resistant
Staphylococcus aureus (MDR-MRSA).[325] in agreement with [263]. This mechanism of
resistance to glycopeptides is believed to be due to the presence of the vanA gene
complex[.9] Isolates with this gene complex are noted to have a thicker cell wall with a
decreased production of PBPs.[325]. Heterogeneous vancomycin-intermediate S. aureus
(hVISA) is defined as being susceptible to vancomycin, but contain subpopulations of MRSA
which confer intermediate resistance to vancomycin [319]. It likely precedes the development
of vancomy intermediate S. aureus. Since screening for hVISA is not routinely performed in
the clinical microbiology laboratory, many cases go undetected [320]. In recent studies, the
rate of hVISA was approximately 6-11 percent of all MRSA isolates. [302 - 305] One study
determined that hVISA bacteremia infections were associated with prolonged duration of
bacteremia and increased number of complications [302]. Infection-related mortality due to
hVISA and MRSA was similar. [305]. In this study levfloxacin and cephalexcin are the least
resistant antibiotics, while tetracycline and cotrimoxazole are the highest resisted antibiotics
[324-326].

143
3.10.5 Penicilin – binding protein (PBP2́) latex agglutination test
Staphylococci are a leading cause of nosocomial and community acquired infections
worldwide. In many institutions, approximately 25% - 50% of S.aureus strains and 75% of
coagulase – negative staphylococci (CNS) are resistant to methicillin [266]. MRSA are of
particular concern because of the ease with which certain epidemic strains spread and
colonise debilitated patients. The methicillin-resistant phenotype can be highly
heterogeneous, making it difficult to detect by conventional anti-microbial susceptibility test
methods, such as minimum inhibitory concentration (MIC), disc and agar screen. The
accuracy of these methods is affected by 143noculums size, incubation time and temperature,
medium, pH, salt concentration and other factors [282, 284]. Detection of the mecA gene has
been considered the gold standard in the determination of methicillin-resistance because of its
accuracy, but this method is labour – intensive and expensive to perform [232, 233]. The
Oxoid PBP2́ latex test has the advantage of direct detection of the PBP2́ protein performed
in a rapid timeframe with minimal labour. It has the potential for being even more accurate
than the detection of the mecA gene, as false –positive results will not occur with strains that
possess mecA gene but are unable to produce the protein product of the gene. This is why
PBP21 latex agglutination test is used in this study for the confirmation of the MRSA isolates.
In the present study it was observed that out of 58 clinical isolates of S.aureus tested for
resistance, 39 isolates were confirmed MRSA and 19 MSSA prevalence of 32.75 % and
MRSA 67.24 % using PBP2ʹ latex agglutination test. It is believed that the high percentage of
MRSA is due to long stay of the patient in the hospital as they are vulnerable and easily
infected by MRSA of different clonal structure or hetrogenous MRSA especially when
hospitalized for long period [282]. The specimen used for this study was collected from
hospitalized patient for over six months. Increasing antibiotic resistance in major S. aureus
clones intensifies precautionary policies for public health care systems. In this study, we have

144
shown the upward trend of MRSA probably due to dissemination of resistance by clonal
spread and horizontal transfer of mecA genes and regulatory sequences. Our study suggest
that there are VISA strains from some of the hospitalized patients that serve as reservoir for
the transmission of this MRSA and it has been reported that vancomycin resistance has the
potential to become a widespread problem in both MRSA and MSSA strains [302].
3.11 MIC and MBC of methanol extract and fractions An examination of the phytochemicals of Moringa species affords one the opportunity to
examine a range of fairly unique compounds. In particular, this plant family is rich in
compounds containing the simple sugar, rhamnose, and it is rich in a fairly unique group of
compounds called glucosinolates and isothiocyanates [10, 84]. These components of Moringa
preparations have been reported to have hypo-tensive, anticancer, and antibacterial activity.
The antibacterial activity of Moringa oleifera root bark extract agrees with the findings
of many authors on the antimicrobial activities of this great plant [19-22]. The antimicrobial
activities demonstrated by the extract and fractions in this study is quite remarkable,
particularly as standard antibiotics are in the purified and concentrated form, yet the MRSA
isolates resisted them, whereas the extracts are crude and may 144arbor both
pharmacologically and non-pharmacologically active compounds with the chance of some
compounds having a masking effect over others but the extract and fractions still exhibit a
strong antmicrobial activity over 30 µg/ml vancomycin [23, 194]. There is the possibility of a
number of compounds working synergistically or additively within the extract, thereby
resulting in a significantly greater antimicrobial effect of the crude extract than the fractions,
which is the case in this study. However, this explanation remains highly hypothetical, as the
exact mechanisms of action of many phytomedicines are as yet unknown. Only once a full
explanation of this mechanism is available, will conclusive evidence regarding the identity of
the compounds responsible for biological activity is established. All plant species with MIC

145
values of up to 8 mg/ml are considered to possess some degree of inhibitory effect, and any
concentration exceeding this should not be considered effective, according to Fabry [23]. The
extract and all the fractions except methanol fraction (MF) from the resul showed MIC and
MBC lower than 8 mg/ml with few exceptions that are above 8 mg/ml.The MIC and MBC
result confirms the moringa root bark as a potential herbal remedy for infection by MRSA.
3.11.1 MIC and MBC of crude methanol extract
The results of the MIC and MBC of the crude extract as shown in table 12, confirmed
the antimicrobial activity of the extract on the MRSA isolates, thus, support the traditional
use of Moringa oleifera root bark [20]. The MRSA isolates selected for the study, in addition
to being resistant to oxacillin and vancomycin, also resisted other antibiotics like levfloxacin,
tetracycline, gentamicin, clindamycin, cotrimoxazole, rimfampicin, cephalexcin and
ciprofloxacin, showing that the isolates are multi drug resistant, but this isolates were
effectively inhibited by the methanol crude extract at concentration as low as 3.0 mg/ml as
the least MIC and 4.0 mg/ml as the least MBC and the highest MIC and MBC are 5.0 mg/ml
and 5.6 mg/ml respectively.The result confirm the potency of methanol extract of the root
bark over the standard antibiotics used in the treatment of the infections caused by MRSA in
the hospital and other health care facilities. Probably due to the heterogenous nature of the
isolates and secondary metabolites of present in the fractions [9-12] the isolates shows
different susceptibilities to each fraction.
3.11.2 MIC and MBC of ethyl acetate fraction
The results of the antibacterial testing of the ethyl acetate fraction against all the
MRSA clinical isolate as displayed in Table 14, ethyl acetate fraction (EF) showed better
activity next to the methanol crude extract than the remaining fractions, possibly because of
the presence of high concentration of flavonoids and other secondary metabolites eluted by
the solvent, which has been shown to enhance antimicrobial property of a plant [13-15]. The

146
MRSA isolates for this study restricted all the popular antibiotics used in the hospitals in
varying degrees, but was inhibited by ethyl acetate fraction at concentrations of 3.5 mg/ml as
the least MIC, 4.3 mg/ml as the least MBC and 6.6 mg/ml and 7.5 mg/ml as the highest MIC
and MBC. This confirms the presence of bioactive principles that can be formulated for the
treatment of infections by the MRSA isolates in the hospitals.
3.11.3 MIC and MBC of N-hexan extract fraction (HEF) in mg/ml
The results of the antibacterial testing of the hexane extract fraction against all the MRSA
clinical isolates. HEF shows good activity next to ethyl acetate fraction possibly because of
the presence of high concentration of fatty acids, terpenoids and phenols which was in
agreement with previous studies to enhance antimicrobial property of a plant [22 – 25]. The
fraction as shown in table 14 inhibited the MRSA isolates at least MIC and MBC of 5.3
mg/ml and 5.6 mg/ml while the highest MIC and MBC are 7.6 mg/ml and 8.8 mg/ml. This
confirms the presence of some non-polar contents present in the n-hexane fraction as seen in
the phytochemical analysis and the GC-MS report.
3.11.4 MIC and MBC of dichloromethane fraction (DMF) in mg/ml
The results of the antibacterial testing of the dichloromethane fraction (DMF) against
all the MRSA isolates seems to show low activity compared to the n-hexane and ethyl acetate
fractions, thi can be due to reduction in the concentrations of active principles [23] in the
fraction. The antibacterial results in table 15 indicated that the (DF) still maintain some level
of activities against the MRSA clinical isolates possibly because of the presence of an
antibacterial compound from the GC-MS report known as benzylisocyanate[10,84] in
agreement with previous study of (Fahey) [84] that the compound has potent antibacterial
property. The MIC and MBC of the fraction ranges from 6.3 ± 1.1 – 9.3 ± 0.5 and 7.5 ± 1.0 –
9.7 ± 1.1, respectively.

147
3.11.5 MIC and MBC of methanol fraction (MF) in mg/ml
All the fractions showed varying degrees of inhibition on the tested organisms the
results of the antibacterial testing of the methanol fraction against all the MRSA isolates is
the least potent of the fractions, this is probably as a result of low concentration of active
principles after elutetion of the crude extracts by other solvents [23]. The fraction from the
phytochemical and GC-MS shows the presence of Terpinen-4ol and Eugenol which were
repoted to be strong antibacterial compounds [353]. MF has activity against some of the
isolates but not all, some resisted the MF fraction at the concentration range of 1mg/ml -
10mg/ml used for this study. Ethyl acetate fraction, N-hexane extract fraction,
Dichloromethane fraction clearly demonstrated far more superior effect than methanol
fraction. The change in susceptibility and resistance of these isolates is not well understood
but it might be due to the fact that some of the MRSA may be hVRSA (hetrogenous
vancomycin staphylococcus aureus), that has different resistant ability towards different
antibiotics, since they were from different specimen [302, 320, 321]. The MIC and MBC for
the susceptible isolates ranges from 8.3 ± 1.1 – 9.8 ± 1.1 and 9.3 ± 0.5 – 10 ± 1.1,
respectively. There was no inhibition produced by the dimethyl sulfoxide (DMSO) used as
the solvent, indicating non involvement of the solvent in the activity of the extract and
fractions.
3.12 GC-MS Identification of bioactive compounds of methanol extract fractions
The possible presence of synergistic interactions between the bioactive constituents of the
methanol crude extract is responsible for the strong antibacterial activity exhibited by the
extract against this multi drug resistant MRSA isolated in thi study. These consequences
suggest that M. oleifera root bark used, contain bioactive substances whose antibacterial
potentials are higher than that of antibiotics used in sensitivity test against MRSA isolates.
The activity of plants against microorganisms may be indicative of the presence of broad-
148
spectrum antibiotic compounds in that plant [329, 330]]. Failure of some of the extracts to
exert antibacterial effect on the test organism is not enough to conclude that the extract does
not contain substances that can exert antibacterial activity against the test organism because
the potency of the extract depends on the method used to obtain the extract [320]. Research
has also shown that the difference in antimicrobial properties of the plant extracts might be
attributable to the age of the plant used, freshness of the plant material, physical factor
(temperature, light or water), contamination by field microbes, and incorrect preparation of
the plant etc[337]. Today, most pathogenic organisms are becoming resistant to antibiotic
[333]. Moringa oliefera have been reported to be a good source of natural antioxidants such
as ascorbic acid, phenolic and carotenoids [331]. To overcome this alarming problem, the
discovery of novel active compounds against new targets is a matter of urgency. Thus M.
oleifera Lam. could become promising natural antimicrobial agents with potential
applications in pharmaceutical industry for controlling the pathogenic bacteria.
The GC-MS analysis revealed the content of the fractions that possibly account for
the activity of the methanol extract and its fractions. In this study the nature of the
compounds identified in the methanol extract fractions are listed in the tables of results and
their activities. [354-358] The following compounds are common in all the fractions. This
may explain why all the fractions had one activity or the other. Oxime, stigmast -4-en-3-one,
5- Bromovaleric acid, Ergost-4-22-dien-3-one, Cholest-4-en-26-oic acid, stigmasterol,
Naphthalenone, 4, 22-stigmastadiene-3-one, Pyridine-3-carboxamide.
Methanol fraction (MF) has the least compound, with only oxime and Pyridine-3-
carboxamide in common with others, this may also account for the low activity shown by the
fraction against the MRSA clinical isolates. Over 100 hundred dinstict compounds were
identified from the fractions of the methanol extract of M. oleifera root bark.

149
3.12.1 Gas chromatography-mass spectrometry (GC-MS) of ethyl acetate fraction
In this study a total of twenty seven (27) compounds were identified in the fraction
with these three compounds having the highest percentages, Stigmast-4-en-3-one (36.95 %),
molecular formula C29H48O, M.W 412, a ketone steroid with antimicrobial activities,
antioxidant, anti-inflammatory, antiarthritic, antiasthma and diuretic activities John and
Kumar [355], Jennings and shibamoto [357], Cholest-4-en-26-oic acid (36.95 %) Molecular
formula C27H42O4, M.W 430, Aliphatic acid sesterterpenes that regulates the metabolism of
cholesterol and homeostasis [356], 3-oxo- 1,4-Benzenediol (28.23 %), C18H18N2O5, M.W
342, Oxygenated aldehyde with antimicrobial and antioxidant properties, antimycobacterial
activity [353]. Other significant constituents with bioactivities are Spinasterone (12.29 %), a
seroid compound with antibacterial and antifungal activities [354], 5-Bromovaleric acid
(3.19%), 2-Amino-4-methyl-3-pyridinol (5.8%), Ergosta-4,22-dien-3-one (10.73%), Pregn-4-
en-3-one (5.8%), 2(1H)-Naphthalenone (2.89%), Pentaene (2.28%), (5.alpha.)-beta.-Alanine
(3.57 %), Supraene (1.39 %), Oxime (1.49 %) and Citrost-7-en-3-ol (6.7%), [354-358].
3.12.2 Gas chromatography-mass spectrometry (GC-MS) of dichloromethane fraction
In this study, DF contains the highest number of bioactive principles 80, but next to
ethyl acetate fraction in the antimicrobial susceptibility test, showing that there is a potent
compound in EAF that is probably not in DF or a synergistic effect of the compounds in EAF
but not exhibited in DF. The compounds with high percentages in this fraction are 5-
Bromovaleric acid (89.57 %) , 2, 6-dimethylnon-1-en-3-yn-5-yl ester (89.57 %,) Stigmast-4-
en-3-one (12.33 %), Testosterone (12.33 %), Ergosta-4, 22-dien-3-one (11.91 %),
Hexadecanoic acid (7.31 %) nature and activities of the compound agrees with references
[356, 357].

150
3.12.3 Gas chromatography-mass spectrometry (GC-MS) of n-hexane fraction
The HF fraction activity is also encouraging against the MRSA isolates, 45
compounds identified with the following compounds dominating the fraction 9,12-
Octadecadienoic acid (41.08 %), 2-Chloroethyl linoleate (41.08 %), n-Hexadecanoicacid
(17.35 %), 12-Octadecadienoic acid (8.55 %), Stigmasterol (4.44 %), Ergost-22-en-3-one
(4.44 %), Campesterol (3.46 %). The molecular formula, M.W., nature and activities of all
the compounds are included in Table 21. The fractions contain high content of Fatty acids,
terpenoids and steroids their nature and activities of the compound agrees with references
[354-357].
3.12.4 Gas chromatography-mass spectrometry (GC-MS) of methanol fraction
In this study, 14 compounds were identified in the methanol fraction (MF). It has the
least bioactive compounds and least concentrations of these compounds; this may also
explain the low antibacterial activity displayed against the MRSA isolates. The compounds
with high percentages in this fraction are 3,7-dimethyl-1,6-Octadien-3-ol (37.09 %), Eugenol
(29.12 %), Terpinen-4-ol (7.46 %), Bicyclo[3.1.1]hept-2-ene (7.21 %), (+)-epi-
Bicyclosesquiphellandrene (5.28 %), (6-bromohexyl)- 2-Butanol (3.49 %), Naphthalene (5.28
%), 1,3,3 trimethyl- L-Fenchone (1.53 %). Nature and activities of the compound agrees with
references [356,357].
3.12.5 Structure of some phytochemical components.
The structures of some of the identified components from mass spectometry report in
Moringa oleifera lam. Fam. Moringacea root bark were presented with reference to the
following data base: Chemspider, Pubchem, National institute of Science and Technology
(NIST), Look chem and Chem book.

151
3.13 Acute toxicity test of crude methanol extract
The acute toxicity of the crude methanol extract and n-hexane extract fraction of the root
bark of Moringa oleifera in this study agrees with previous finding of kasolol et al [366]. The
extracts are safe for human consumption at a dose below the LD50 which is 3663.96 mg/kg
for crude methanol extract and 1934.15 mg/kg for n-hexane extract fraction and also with
reference to LD50 values recommended by the organisation of Economic Co-operation and
Development (OECD, Paris, France) (Walum, 1998) are as follow: very toxic, < 5 mg/kg;
toxic, > 5 <5 0 mg/harmful, > 50 <500 mg/kg; no label, > 500 < 2000 mg/kg.
3.13.1 Sub-acute toxicity study of the crude methanol extract and n-hexane extract fraction
The result of this study showed that there was no significant difference (p > 0.05)
when the values of the parameters were compared with the control rat group. This shows that
the extracts had no effect on the liver, kidney and blood of the rat at these doses below the
LD50. This agrees with kasolol et al [365,366].
3.13.2 Effects of graded doses of crude methanol extract and n-hexane extract fraction on body weight of rats
The result showed general increase in body weight of the animals except at
1000mg/kg where some of the animals in the group showed little weekness and later
recovered. This may explain the little drop in weight at the dose of 1000mg/kg with little
behavioural changes [365, 366]. In the n-hexane extract fraction, some of the animals in the
group showed weekness due to loose stools, this was not obvious with the group of 500mg/kg
dose but it was so obvious in the group of 1000mg/kg dose. The weekness due to loose stool
by these animals was possibly due to the high Fats and oil content in n-hexane extract
fraction; these effects are time-dependent and dose-dependent Paul and Didia [366].

152
CHAPTER FOUR
4.0. CONCLUSIONS AND RECOMMENDATIONS
4.1. Conclusions
The discovery of effective antibiotics, vaccines and other products or methods have
decreased the devastating impact of infectious diseases and improved quality of life.
However, the efficacy of many antibiotics is being threatened by the emergence of
microbial resistance to existing chemotherapeutic agents because of their indiscriminate
and inappropriate use [37]. The use of some antibiotics is associated with side effects,
including allergy, immune suppression, and hypersensitivity [38].
Many populations who live in developing countries are deprived of the advantages of
modern medicine because of its high cost; hence, poor people are more vulnerable to
infectious diseases. Besides these, co-infection with multiple diseases is an obstacle to
infection prevention and treatment. For all these reasons, there is a pressing need to
identify new, safe, and cost-effective antimicrobial agents that would help to alleviate the
problems of infectious diseases. Plant-derived natural products represent an attractive
source of antimicrobial agents because they are natural and affordable, especially for rural
societies [39].
Acceptance of medicines from such plant origins as an alternative form of healthcare
is increasing because they are serving as promising sources of novel antibiotic prototypes.
Moreover, these compounds may have different mechanisms of action than conventional
drugs and could be of clinical importance to improve health care [40 - 42]. Some of the
phytochemical compounds e.g., glycoside, saponin, tannin, flavonoids, terpenoid, and
alkaloids, have been reported to have antimicrobial activity [43, 44]. Medicinal plants
have formed the basis of health care since earliest times of humanity and are still being
widely used. The clinical, pharmaceutical and economic value continues to

153
grow, varying between countries. Chemo-diversity in plants has proven to be important in
pharmacological research and drug development, not only for the isolation of bio-active
compounds used directly as therapeutic agents, but also as leads to the synthesis of drugs
or as models for pharmacologically active compounds.
The rapid identification of these bio-active compounds, however, is critical if this
tool of drug discovery is to compete with developments in technology. Plant preparations
are distinguished from chemical drugs by their complexity-mixtures containing large
numbers of bio-active compounds. This brings about the challenge of drug discovery
from natural sources. Approximately 9000 different flavonoids have been reported from
plant sources, and with almost certainty many more are still to be discovered, as they
continue to capture the interests of scientists from numerous disciplines. Based on the 10-
carbon skeleton o flavonoids, they can be substituted by a range of different groups, viz.
hydroxyl, methoxyl, methyl, isoprenyl and bezyl substituents. This study confirmed S.
aureus to be prevalent in open wound than other specimens considered having 24.13 % of
the MRSA isolates out of 67.2 % of the MRSA.
This suggests that in Hospital Acquired MRSA ((HA-MRSA) health personnel are
one of the major source of transmission and this phenomenon should be properly addressed.
The GC-MS revealed the presence of over 100 distinct bioactive compounds among which
are: Stigmast-4-en-3-one, sitosterol, 7alpha-Hydroxy-3-oxo-4-cholestenoate,
3,methyl5(2,6,6trimethylcyclohex-1-en-1-yl)pent-1-yn-3-ol, 5-bromovaleric acid, 3,4-
dihydro-1(2H)-Naphthalenone, Ergosta-4, 22-dien-3-one, Phthalimidine, pentaene,
Ethisterone, alpha.-amino-Benzene acetic acid, 2-Thiazolamine, 9-Octadecenoic acid, Cis-
muurola-3,5-diene, Pentadecanoic acid, Palmitic Acid, a-alanine 4-methoxy-beta-
naphthylamide, Cyclohexanecarboxylic acid, Ergost-25-ene-3, 5, 6, 12-tetrol, Dodecanoic
acid, Benzofran-3-one, Carboxamide, 1,3,3 trimethyl- L-Fenchone, Gammaceran-3.alpha.-ol,
154
Terpinen-4-ol, Propenylbenzene, Geraniol, Eugenol etc. Most of these compounds had been
reported to have pharmacological and antimicrobial activities [354-357]. This can also
explain the antimicrobial activity against the MRSA clinical isolates used for this study. The
LD50 of methanol and n-hexane extracts were 3663.96 mg/kg and 1934.15 mg/kg
respectively showing that the root bark of moringa oleifera is safe for human consumption at
a dose below the LD50, This is in agreement with previous work (Ayi) [86], though his study
was on aqueous extract of Moringa oleifera root bark. .
However, further studies should be undertaken to isolate the extract pure compound,
elucidate the structure and the mechanism of action by which the compound exert their
antimicrobial effect against the MRSA.
4.2 Recommendations
It has been established that MRSA has continued to be a public health threat since it
was first discovered. Currently, MRSA is not only a prominent healthcare-associated
pathogen, but also an important cause of community-associated infections. Populations at-
risk for MRSA have also expanded to include young, healthy individuals, in addition to
vulnerable patients in healthcare facilities. The pathogen itself has evolved and showed its
ability to resist all classes of antibiotics currently used.
It is, therefore, recommended that an effective infection control strategy should
include combination of multiple interventions with a multidisciplinary approach requiring.
participation from all levels, ranging from patients themselves to health workers.
Moreover, many advances in study, methodology, including mathematical modeling
and computer simulations should be made to allow better understanding of transmission
systems and infection control measures.
There is an increasing awareness that many components of traditional medicine are
beneficial while others are harmful, hence WHO encourages and supports countries to

155
identify and provide safe and effective remedies for use in the public and private health
services (Sofowora) [97]. In view of this it is recommended that more research should be
directed towards natural products for remedy to combat this super bug resistant bacteria..
4.3 Contribution to knowledge
This study evaluated the antimicrobial efficiency of the methanol extract and fractions of
Moringa oleifera root bark against MRSA clinical isolates. The extract and fractions were
found to possess significant antimicrobial activity against MRSA clinical isolates used for the
study comparable to the standard antibiotics.
From this study, it was discovered that Moringa oleifera root bark can be used to
develop new drugs for the treatment of infectious diseases with particular reference to those
caused by methicillin resistant Staphylococcus aureus (MRSA), especially hospital acquired
strain.
156
REFERENCES
1. Oliveira JTA, Silveira SB, Vasconcelos IM, Cavada BS, Moreira RA. 1999.
Compositional and nutritional attributes of seeds from the multipurpose tree Moringa
oleifera Lamarck. J Sci Food Agric 79: 815–820.
2. Nikkon F, Saud ZA, Rehman MH, Haque ME. 2003. In vitro antimicrobial activity of
the compound isolated from chloroform extract of Moringa oleifera Lam. Pak J Biol
Sci 22: 1888–1890.
3. Mughal MH, Ali G, Srivastava PS, Iqbal M. 1999. Improvement of drumstick [M.
pterygosperma Gaertn.] – a unique source of food and medicine through tissue
culture. Hamdard Med 42: 37–42.
4. Dahot M. U. 1988. Vitamin contents of flowers and seeds of Moringa oleifera. Pak J
Biochem 21: 1–24.
5. Faizi S, Siddiqui B, Saleem R, Saddiqui S, Aftab K. 1994a. Isolation and structure
elucidation of new nitrile and mustard oil glycosides from M. oleifera and their effect
on blood pressure. J. Nat Prod 57: 1256–1261.
6. Faizi S, Siddiqui B, Saleem R, Siddiqui S, Aftab K, Gilani A. 1994b. Novel
hypotensive agents, niazimin A, niazimin B, niazicin A and niazicin B from Moringa
oleifera; Isolation of first naturally occurring carbamates. J Chem Soc Perkin Trans I:
3035–3640.
7. Faizi S, Siddiqui BS, Saleem R, Siddiqui S, Aftab K, Gilani AH. 1995. Fully
acetylated carbamate and hypotensive thiocarbamate glycosides from M. oleifera.
Phytochemistry 38:957–963.
8. Gilani AH, Janbaz KH, Lateef A, Zaman M. 1994b. Ca channel blocking activity
of Artemisia scoparia extract. Phytother Res 8: 161–165.

157
9. Faizi S, Siddiqui BS, Saleem R, Aftab K, Shaheen F, Gilani AH. 1998. Hypotensive
constituents from the pods of M. oleifera. Planta Med. 64: 225–228.
10. Bennett RN, FA Mellon, N Foidl, JH Pratt, MS DuPont, L Perkins and PA Kroon
(2003) Profiling glucosinolates and phenolics in vegetative and reproductive tissues
of the multi-purpose trees M. oleifera L. (Horseradish tree) and M.
stenopetala L. J. Agric. Food Chem. 51: 3546-3553.
11. Morton J. F. 1991. The horseradish tree, Moringa pterigosperma [Moringaceae]. A
boon to arid lands. Econ Bot 45: 318–333.
12. Ghasi S, Nwobodo E, Ofili JO. 2000. Hypocholesterolemic effects of crude extract of
leaf of Moringa oleifera Lam in high-fat diet fed Wistar rats. J. Ethnopharmacol. 69:
21–25.
13. Mehta LK, Balaraman R, Amin AH, Bafna PA, Gulati OD. 2003. Effect of fruits of
M. oleifera on the lipid profile of normal and hypercholesterolaemic rabbits. J.
Ethnopharmacol 86: 191–195.
14. Gilani AH, Aftab K, Shaheen F et al. 1992. Antispasmodic activity of active principle
from Moringa oleifera. In Nat. Drugs and Digest. Tract, Capasso F, Mascolo N [Eds].
EMSI: Rome, 60–63.
15. Dangi SY, Jolly CI, Narayana S. 2002. Antihypertensive activity of the total alkaloids
from the leaves of M. oleifera. Pharm Biol 40: 144–148.
16. Gilani AH, Aftab K, Suria A et al. 1994a. Pharmacological studies on hypotensive
and spasmodic activities of pure compounds from Moringa oleifera. Phytother Res 8:
87–91.
17. Pal SK, Mukherjee PK, Saha BP. 1995a. Studies on the antiulcer activity of Moringa
oleifera leaf extract on gastric ulcer models in rats. Phytother Res 9: 463–465.
158
18. Gilani AH, Janbaz KH, Shah BH. 1997. Quercetin exhibits hepatoprotective activity
in rats. Biochem. Soc. Trans 25: 85.
19. Das BR, Kurup PA, Rao PL, Narasimha Rao PL. 1957. Antibiotic principle from
Moringa pterygosperma. VII. Antibacterial activity and chemical structure of
compounds related to pterygospermin. Indian J. Med. Res 45: 191–196.
20. Eilert U, Wolters B, Nadrtedt A. 1981. The antibiotic principle of seeds of Moringa
oleifera and Moringa stenopetala. Planta. Med 42: 55–61.
21. Bhatnagar SS, Santapau H, Desai JDH, Yellore S, Rao TNS 1961. Biological activity
of Indian medicinal plants. Part 1. Antibacterial, antitubercular and antifungal action.
Indian J Med Res 49: 799–805.
22. Caceres A, Cabrera O, Morales O, Mollinedo P, Mendia P. 1991.Pharmacological
properties of Moringa oleifera. 1: Preliminaryscreening for antimicrobial activity. J
Ethnopharmacol 33: 213–216.
23. Fabry, W., Okemo, P.O. and Ansorg, R. 1998. Antibacterial activity of East African
Medicinal plants, J Ethnopharmacol 60 (1): 79-84.
24. Nikkon F, Saud ZA, Rehman MH, Haque ME. 2003. In vitro antimicrobial activity of
the compound isolated from chloroform extract of Moringa oleifera Lam. Pak J Biol
Sci 22: 1888–1890.
25. Guevara AP, Vargas C, Sakurai H et al. 1999. An antitumor promoter from Moringa
oleifera Lam. Mutat Res 440: 181–188.
26. Bharali R, Tabassum J, Azad MRH. 2003. Chemomodulatory effect of Moringa
oleifera, Lam, on hepatic carcinogen metabolizing enzymes, anti-oxidant parameters
and skin papillomagenesis in mice. Asia Pacific J Cancer Prev4: 131–139.
27. Caceres A, Lopez S. 1991. Pharmacologic properties of Moringa oleifera: 3: Effect of
seed extracts in the treatment of experimental Pyodermia. Fitoterapia 62: 449–450.

159
28. Murakami A, Kitazono Y, Jiwajinda S, Koshimizu K, Ohigashi H. 1998. Niaziminin,
a thiocarbamate from the leaves of Moringa oleifera, holds a strict structural
requirement for inhibition of tumor-promoter-induced Epstein-Barr virus activation.
Planta Med 64: 319–323.
29. Pal SK, Mukherjee PK, Saha K, Pal M, Saha BP. 1995b. Antimicrobial action of the
leaf extract of Moringa oleifera Lam. Ancient Science of Life 14: 197–199.
30. Tahiliani P, Kar A. 2000. Role of Moringa oleifera leaf extract in the regulation of
thyroid hormone status in adult male and female rats. Pharmacol Res 41: 319–323.
31. Makonnen E, Hunde A, Damecha G. 1997. Hypoglycaemic effect of Moringa
stenopetala aqueous extract in rabbits. Phytother Res 11: 147–148.
32. Lipipun V, Kurokawa M, Suttisri R et al. 2003. Efficacy of Thai medicinal plant
extracts against herpes simplex virus type1 infection in vitro and in vivo. Antiviral
Res 60: 175–180.
33. Bhattacharya SB, Das AK, Banerji N. 1982. Chemical investigations on the gum
exudates from Sonja [Moringa oleifera]. Carbohydr Res 102: 253–262.
34. Ndabigengesere A, Narasiah KS, Talbot BG. 1995. Active agents and mechanism of
coagulation of turbid waters using Moringa oleifera. Water Res 29: 703–710.
35. Kalogo Y, Rosillon F, Hammes F, Verstraete W. 2000. Effect of a water extract of
Moringa oleifera seeds on the hydrolytic microbial species diversity of a UASB
reactor treating domestic wastewater. Lett Appl Microbiol 31: 259–264.
36. Muyibi SA, Evison LM. 1995b. Optimizing physical parameters affecting coagulation
of turbid water with Moringa oleifera seeds. Water Res 29: 2689–2695.
37. Crapper DR, Krishnan SS, Dalton AJ. 1973. Brain aluminum distribution in
Alzheimer’s disease and experimental neurofibrillary degeneration. Science 180:
511–513.

160
38. Martyn CN, Barker DJP, Osmond C, Harris EC, Edwardson JA, Lacey RF. 1989.
Geographical relation between Alzheimer’s disease and aluminum in drinking water.
Lancet 1: 59–62.
39. Miller RG, Kopfler FC, Kelty KC, Stober JA, Ulmer NS. 1984. The occurrence of
aluminum in drinking water. J Am Water Works Assoc 76: 84–91.
40. Obioma UN, Adikwu MU. 1997. Investigation on some physiochemical antioxidant
and toxicological properties of Moringa oleifera seed oil. Acta Pharm 47: 287–290.
41. Jahn SAA. 1984. Effectiveness of traditional flocculants asprimary coagulants and
coagulant aids for the treatment of tropical waters with more than a thousand fold
flocculation in turbidity. Water Supply 2: 8–10.
42. Okuda T, Baes AU, Nishijima W, Okada M. 1999. Improvement of extraction method
of coagulation active components from Moringa oleifera seed. Water Res 33: 3373–
3378.
43. Gassenschmidt U, Jany KD, Tauscher B, Niebergall H. 1995. Isolation and
characterization of a flocculating protein from Moringa oleifera Lam. Biochim
Biophys Acta 1243: 477– 481.
44. Muyibi SA, Evison LM. 1995a. Moringa oleifera seeds for softening hard water.
Water Res 29: 1099–1104.
45. Broin M, Santaella C, Cuine S, Kokou K, Peltier G, Joet T. 2002. Flocculent activity
of a recombinant protein from Moringa oleifera Lam. seeds. Appl Microbiol
Biotechnol 60: 114–119.
46. Madsen M, Schlundt J, Omer El-FE. 1987. Effect of water coagulation by seeds of
Moringa oleifera on bacterial concentration. J Trop Med Hyg 90: 101–109
161
47. Olsen A. 1987. Low technology water purification by bentonite clay and Moringa
oleifera seed flocculation as performed in Sudanese villages: effects on Schistosoma
mansoni cercariae. Water Res 21: 517–522.
48. Casey TJ. 1997. Unit Treatment Processes in Water and Waste water Engineering.
John Wiley & Sons: London.
49. Silvestro L, Weiser JN, Axelsen PH. 2000. Antibacterial and antimembrane activities
of cecropin A in Escherichia coli. Antimicrob Agents Chemother 44: 602–607.
50. Suarez M, Entenza JM, Doerries C et al. 2003. Expression of a plant-derived peptide
harbouring water-cleaning and antimicrobial activities. Biotechnol Bioeng 81: 13–20.
51. Sutherland JP, Folkard G, Grant WD. 1990. Natural coagulants for appropriate water
treatment: a novel approach. Waterlines 8: 30–32.
52. Eilert U, Wolters B, Nadrtedt A. 1981. The antibiotic principle of seeds of Moringa
oleifera and Moringa stenopetala. PlantaMed 42: 55–61.
53. Sharma P, Kumari P, Srivastava MM, Srivastava S. 2006. Removal of cadmium from
aqueous system by shelled Moringa oleifera Lam. seed powder. Bioresour Technol
97: 299–305.
54. Brostlap AC, Schuurmans J. 1988. Kinetics of valine uptake in tobacco leaf disc.
Comparison of wild types the digenic mutant and its monogenic derivatives.Planta
176: 42–50.
55. Sharma P, Kumari P, Srivastava M, Srivastava S. 2006. Removal of cadmium from
aqueous system by shelled Moringa oleifera Lam. seed powder. Bioresour Technol
97: 299–305.
56. Roberts M. Edible and Medicinal Flowers 2000; New Africa Books, Claremont. p. 52.
57. Sastri BN. The Wealth of India 1962; Council of Scientific and Industrial Research,
New Delhi. p.425.

162
58. Chatterjee A, Pakrashi SC. In: The treatise on Indian medicinal plants 1991; Vol. 1.
Publication and Information Directorate. p. 159.
59. The Ayurvedic Pharmacopoeia of India 1999; Part 1,1st Ed. Vol. 2. Ministry of
Health and Family Welfare, Govt. of India, New Delhi. p.155-157.
60. The Ayurvedic Pharmacopoeia of India 2004; Part1, 1st Ed. Vol. 4. Ministry of
Health and Family Welfare, Govt. of India, New Delhi. p. 110-115.
61. Morton JF (1991) the horseradish tree, Moringa pterigosperma (Moringaceae). A
boon to Arid lands? Economic Botany 45: 318–333.
62. Mughal MH, Ali G, Srivastava PS, Iqbal M (1999) Improvement of drumstick
(Moringa pterygosperma Gaertn.) – A unique source of food and medicine through
tissue culture. Hamdard Med 42: 37–42.
63. Qaiser M. Moringaceae 1973; In Flora of West Pakistan, Nasir E, Ali SI (Editors),
University of Karachi Press, Karachi. p. 1–4.
64. Somali MA, Bajnedi MA, Al-Faimani SS (1984) Chemical composition and
characteristics of Moringa peregrina seeds and seed oil. J Am Oil Chem Soc 61: 85–
86.
65. Sofowora A (1982) Medicinal plants and traditional medicine in Africa. John Wiley
and Sons Ltd, New York. p. 214-218.
66. Price M (1985) Vegetables from a tree. ECHO 8: 1.
67. Parrotta JA. In: Healing plants of peninsular India 2001; CABI publication, New
York. p. 528-530.
68. Kader Mohidean, Shanmugavelu KG (1982) Studies on the performance of annual
drumstick at Coimbatore. SHF 30: 95-98.
69. Sundarajan JS, Muthusamy S, Shanmugavelu KG, Balakrishnan R. A guide to
horticulture 1970; Velan pathippagam, Coimbatore. p. 261-262.

163
70. Tsaknis J, Lalas S, Gergis V, Spiliotis V, Dourtoglou V (1998) Characterization of
Moringa oleifera variety Mbololo seed oil of Kenya. J Agric Food Chem 47: 4495-
4499.
71. Lalas S, Tsaknis J (2002) Characterization of Moringa oleifera Seed Oil Variety
“Periyakulum 1”. Journal of Food Compost Analysis 15: 65-77.
72. Duke J (2000) Handbook of Nuts: Herbal Reference Library; CRC Press, USA. p.
214-215.
73. Chopra RN (1938) Indigenous drugs of India: their medicinal and economic aspects;
Art press, Calcutta. p. 344-347.
74. Lako J, Trenerry VC, et al. (2007) Phytochemical flavonols, carotenoids and the
antioxidant properties of a wide selection of Fijian fruit, vegetables and other readily
available foods. Food Chemistry 101: 1727-1741.
75. Verma S.C, Banerji R, Misra G, Nigam SK (1976) Nutritional value of moringa.
Current Sci 45:769–770.
76. Shanker K, Gupta MM, Srivastava SK, Bawankule DU, Pal A, et al. (2007)
Determination of bioactive nitrile glycoside(s) in drumstick (Moringa oleifera) by
reverse phase HPLC. Food Chemistry 105: 376-382.
77. Jadhav SL, Sharma SR, Pal SC, Kasture SB, et al. (2000) Chemistry and
pharmacology of Moringa oleifera and Moringa concanescens Niro. Indian Drugs 37:
139-144.
78. Siddhuraju P, Becker K (2003) Antioxidant properties of various solvent extracts of
total phenolic constituents from three different agroclimatic origins of drumstick tree
(Moringa oleifera Lam.) leaves. J Agric Food Chem 51: 21442155.
79. Ruckmani K, Kavimani S, Anandan R, Jaykar B (1998) Effect of Moringa oleifera
Lam on paracetamol-Induced Hepatoxicity. Indian J Pharm Sci 60: 33–35.

164
80. S´anchez-Machado DI, L´opez-Cervantes J, V´azquez NJ (2006) High-performance
liquid chromatography method to measure alpha-and gamma-tocopherol in leaves,
flowers and fresh beans from Moringa oleifera. J Chromatogr A 1105: 111–114.
81. Guevara AP, Vargas C, Sakurai H, Fujiwara Y, Hashimoto K, et al. (1999). An
antitumor promoter from Moringa oleifera Lam. Mutat Res 440: 181–188.
82. Bennett RN, Mellon FA, Foidl N, Pratt JH, Dupont MS et al. (2003) Profiling
glucosinolates and phenolics in vegetative and reproductive tissues of the
multipurpose trees Moringa oleifera L. (horseradish tree) and Moringa stenopetala L.
J Agric Food Chem 51: 3546-3553.
83. Katre UV, Suresh CG, Khan MI, Gaikwad SM (2008) Structure–activity relationship
of a hemagglutinin from Moringa oleifera seeds. Int J Biol Macromol 42: 203-207.
84. Fahey JW, Zalcmann AT, Talalay P (2001) the chemical diversity and distribution of
glucosinolates and isothiocyanates among plants. Phytochemistry 56: 5-51.
85. Anwar F, Bhanger MI (2003) Analytical Characterization of Moringa oleifera seed oil
grown in temperate region of Pakistan. J Agric Food Chem 51: 6558–6563.
86. Ayi, K.V. (2008). Toxicity and in-vitro anti-bacterial activities of fractionated
aqueous leaf extract of Moringa oleifera in chickens. MVSc desertation, University of
Maiduguri.
87. Cho, E.J., Yokozawa, T., Rhyu, D.Y., Kim, S.C., Shibahara, N. and Park, J.C. (2003).
Study on the inhibitory effects of Korean medicinal plants and their main compounds
on the 1, 1-diphenyl.-2-picrylhydrazyl radical. Phytomedicine 10:544-557.
88. Cordell, G. A. (2000). Biodiversity and drug discovery-a symbiotic relationship.
Phytochem, 55, 463-480.
89. Farnsworth, N. R. and Morries, R. W. (1976). Higher plants- the sleeping giant of
drug development. AMJ Pharm., 148, 46-52.

165
90. Frantisek, S. S. (1991): The natural guide to medicinal herbs and plants. Tiger Barks
Institute Twickenham, U.K. PP 1-8.
91. Fuglie, L. J. (1999). The miracle tree: Moringa oleifera: Natural nutrition for the
tropics. Church world service, Dakar. 68 pp; revised in 2001 and published as the
miracle tree: The multiple attributes of Moringa, 172 pp.
92. Gupta, S.S. (1994). Prospects and perspective of natural products in Medicine. Indian
Journal of Pharmacology, 26:1-12.
93. Hong-Xi Xu and Song F. L, (2001). Activity of plant flavonoids against antibiotic
resistant bacteria. Phytother, Res. 15, 39-41.
94. Motohashi, N., Wakabayashi, H., Kurihara, T., Fukushima, H., Yamada, T., Kawase.
Sohara, M. Y., Tarira, S., Shimtaki, Y., Sakagami, H., Satoh, K., Nakashima, H.,
Molnar, A., Spengler, G., Gyemant, N., Ugoesai, K. and Molnar, J. (2004).
Biological activity of Barbados Cherry (Acerola fruits of Malpighia emarginata DC)
extracts and fractions. Phytotheraphy Research.18:212-223.
95. Akinpelu, D.A., Adegboye, M.F., Adeloye, O.A. and Okoh, A.I. (2008). Biocidal
activity of partially purified fractions from methanolic extract of Garcinia kola
(Heckel) seeds on bacterial isolates. Biological Research. 41: 277-287.
96. Prakash, S. A. (2006). Effects of herbal extracts towards microbicidal activity against
Pathogenic Escherichia coil in Poultry. Int. J. Poult. Sci. 5:259-261. Saxena, M. J.
(2003). www.ayuruet.com. Relevance of Herbs in improving health index of livestock
animals. National Veterinary Medical Association. Conference. Ibadan 2003.
97. Sofowora, A. (1993). Medicinal Plants and Traditional Medicine in Africa, 2nd
Edition, Ibadan, Spectrum Books Limited.

166
98. Fahey, Sc.D., Moringa oleifera: A review of themedical evidence for its nutritional,
therapeutic and prophylactic properties, Part1.http://www.TFLJournal.org. 2005, 1(5):
1‐15.
99. Guevara AP, Vargas C, Sakurai H. An antitumor promoter from Moringa oleifera
Lam. Mutat Re 1999; 440: 181–188.
100. Pal SK, Mukherjee PK, Saha BP. Studies on the antiulcer activity of Moringa oleifera
leaf extract on gastric ulcer models in rats. Phytother Res 1995; 9:463–465.
101. Caceres A, Saravia A, Rizzo S, Zabala L, Leon ED, Nave F. Pharmacologic
properties of Moringa oleifera: 2: Screening for antispasmodic, anti-inflammatory and
diuretic activity. J Ethnopharmacol 1992; 36:233–237.
102. Manguro, L.O., Ugi, I. and Lemmen, P. 2003. Dammarene triterpenes of Commiphora
confuse resin. Chemistry and Pharmaceutical Bulletin 51: 483-486.
103. Ozarkar, K. R., 2005 Studies on anti-inflammatory effects of two herbs Cissus
quadrangularis Linn. and Valeriana wallichi DC usingmousemodel. Ph.D.
Thesis,University of Mumbai, Mumbai.
104. Mughal MH, Ali G, Srivastava PS, Iqbal M. Improvement of drumstick [Moringa
pterygosperma Gaertn.] – a unique source of food and medicine through tissue
culture. Hamdard Med 1999; 42:37–42.
105. Metha A, Aggarawal B. Antiashmatic activity of Moringa oleifera Lam. Indian
Journal of Pharmacology 2008; 40:28‐31.
106. Gupta R, Kannan GM, Sharma M, Flora SJS. Therapeutic effects of Moringa oleifera
on arsenicinduced toxicity in rats. Environmental Toxicology and Pharmacology
2005; 20(3): 456‐464.Chuang PH, Lee CW, Chou JY, Murugan
107. Shieh M. BJ, Hueih‐Minchen. Antifungal activity of crude extracts and essential oil of
Moringa oleifera Lam. Bioresource Technology 2007; 98:232‐ 236.
167
108. Gilani AH, Aftab K , Suria A, Siddiqui S, Saleem R, Siddiqui BS et at.
Pharmacological studies on hypotensive and spasmolytic activities of pure
compounds form Moringa oleifera. Phytother Rese 1994; 8(2):87‐91.
109. Kerharo PJ. Moringa oleifera (Lam.) employs therapeutiques en milieu African
chimie et pharmacologie. Plantes Med Phytother 1969.
110. Gupta M, Mazumder UK, Chakrabarti S. CNS activities of methanolic extract of
Moringa oleifera root in mice. Fitoterapia 1999(3); 70: 244‐250.
111. Shukla S, Matur R, Prakash AO. Antifertility profile of the aqueous extract of
Moringa oleifera roots. Journal of Ethnopharmacology 1998; 22(1): 51‐62.
112. Lurling M and Beekman W, Anti‐cyanobacterial activity of Moringa oleifera seeds.
Journal Appl Phycol 2010; 22(4):503‐510.
113. Panya C. K, Yupin S, Srichan P, Morales NP, Laddawal P et al. The In vitro and ex
vivo antioxidant properties, hypolipidemic and antiatheroscleortic activities of water
extract of Moringa oleifera (Lam.) Leaves. Journal of Ethanopharmacology 2008;
116:439‐446.
114. Ndabigengesere AA, Narasiah SK, Talbot BG. Active agents and mechanism of
coagulation of turbid waters using Moringa oleifera. Water Research 1995;
29(2):703‐710.
115. Kumar S, Kumar D, Singh N, Vasisht BD. In vitro Free Radical Scavenging and
antioxidant activity of Moringa oleifera pods. Journal of Herbal Medicine and
Toxicology 2007; 1(2):17‐
116. Bauer AW, Kibry WM, Sherris JC, Turck M. Antibiotic susceptibility testing by a
single disc method. Am J Clin Pathol 1966; 45:493‐496.
117. Barry AL. Procedure for testing antimicrobial agent in agar media. In V. Lorian (ed)
Antibiotica in laboratory medicines. Willims and Wilkins Co, Baltimore, 1980, 1‐23.
168
118. Nadkarni AK. 1976. Indian Materia Medica. Popular Prakashan: Bombay, 810–816.
The Wealth of India (A Dictionary of Indian Raw Materials and Industrial Products).
962. Raw Materials, Vol. VI: L-M; Council of Scientific and Industrial Research:
New Delhi, 425– 429.
119. Palada MC, Changl LC. 2003. Suggested cultural practices for Moringa. International
Cooperators’ Guide AVRDC. AVRD pub # 03–545 www.avrdc.org.
120. Cowan, M.M. (1999). Plant products as antimicrobial agents. Clinical Microbiology
Reviews. 12:564-582.
121. Estrella MCP, Mantaring JBV, David GZ. 2000. A double blind, randomised
controlled trial on the use of malunggay (Moringa oleifera) for augmentation of the
volume of breast milk among non-nursing mothers of preterm infants. Philipp J
Pediatr 49: 3–6.
122. Siddhuraju P, Becker K. 2003. Antioxidant properties of various solvent extracts of
total phenolic constituents from three different Agro-climatic origins of drumstick
tree (Moringa oleifera Lam.). J Agric Food Chem 15: 2144–2155.
123. Akinpelu, D.A., Aiyegoro, A.O. and Okoh, A.I. (2009). Studies on the biocidal and
cell membrane disruption potentials of stem bark extracts of Afzelia africana (Smith).
Biological Research. 42: 339-349.
124. Ndabigengesere A, Narasiah KS. 1998. Quality of water treated by coagulation using
Moringa oleifera seeds. Water Res 32:781–791.
125. Fahey JW, Zalcmann AT, Talalay P. 2001. The chemical diversi and distribution of
glucosinolates and isothiocyanates among plants. Phytochemistry 56: 5–51.
126. Kerharo PJ. 1969. Un remede populaire Sengalais: Le ‘Nebreday’(Moringa oleifera
lann.) employs therapeutiques en milieu Africain chimie et pharmacologie. Plantes
Med Phytother 3:14–219.
169
127. Faizi S, Siddiqui B, Saleem R, Saddiqui S, Aftab K. 1994a.lation and structure
elucidation of new nitrile and mustard oil glycosides from Moringa oleifera and their
effect on blood presure. J Nat Prod 57: 1256–1261.
128. Faizi S, Siddiqui BS, Saleem R, Aftab K, Shaheen F, Gilani AH.1998. Hypotensive
constituents from the pods of Moringa oleifera. Planta Med 64: 225–228.
129. Guevara AP, Vargas C, Sakurai H et al. 1999. An antitumor promoter from Moringa
oleifera Lam. Mutat Res 440: 181– 188.
130. Makkar HPS, Becker K. 1996. Nutritional value and antinutritional components of
whole and ethanol extracted Moringa oleifera leaves. Anim Feed Sci Technol 63:
211–228.
131. Anwar F, Bhanger MI. 2003. Analytical characterization of Moringa oleifera seed oil
grown in temperate regions of Pakistan. J Agric Food Chem 51: 6558–6563.
132. Faizi S, Siddiqui B, Saleem R, Siddiqui S, Aftab K, Gilani A. 1994b. Novel
hypotensive agents, niazimin A, niazimin B, niazicin A and niazicin B from Moringa
oleifera; Isolation of first naturally occurring carbamates. J Chem Soc Perkin Trans I:
3035–3640.
133. Faizi S, Siddiqui BS, Saleem R, Siddiqui S, Aftab K, Gilani AH. 1995. Fully
acetylated carbamate and hypotensive thiocarbamate glycosides from Moringa
oleifera. Phytochemistry 38: 957–963.
134. Mehta LK, Balaraman R, Amin AH, Bafna PA, Gulati OD. 2003. Effect of fruits of
Moringa oleifera on the lipid profile of normal and hypercholesterolaemic rabbits. J
Ethnopharmaco l86: 191–195.
135. Gilani AH, Aftab K, Suria A et al. 1994a. Pharmacological studies on hypotensive
and spasmodic activities of pure compounds from Moringa oleifera. Phytother Res 8:
87–91.

170
136. Pal SK, Mukherjee PK, Saha BP. 1995a. Studies on the antiulcer activity of Moringa
oleifera leaf extract on gastric ulcer models in rats. Phytother Res 9: 463–465.
137. Gilani AH, Janbaz KH, Shah BH. 1997. Quercetin exhibits hepatoprotective activity
in rats. Biochem Soc Trans 25: 85.
138. Ramiah N, Nair GN (1977) Amino acid and sugars in the flowers and fruits of
Moringa oleifera.Lam. J Inst. Chem 49:163.
139. Das BR, Kurup PA, Rao PL, Narasimha Rao PL. 1957. Antibiotic principle from
Moringa pterygosperma. VII. Antibacterial activity and chemical structure of
compounds related to pterygospermin. Indian J Med Res 45: 191–196.
140. Eilert U, Wolters B, Nadrtedt A. 1981. The antibiotic principle of seeds of Moringa
oleifere and Moringa stenopetala. Planta Med 42: 55–61.
141. Bhatnagar SS, Santapau H, Desai JDH, Yellore S, Rao TNS.1961. Biological activity
of Indian medicinal plants. Part 1.Antibacterial, antitubercular and antifungal action.
Indian JMed Res 49: 799–805.
142. Caceres A, Cabrera O, Morales O, Mollinedo P, Mendia P. 1991.Pharmacological
properties of Moringa oleifera. 1: Preliminary screening for antimicrobial activity. J
Ethnopharmacol 33: 213– 216.
143. Caceres A, Lopez S. 1991. Pharmacologic properties of Moringa oleifera: 3: Effect of
seed extracts in the treatment of experimental Pyodermia. Fitoterapia 62: 449–450.
144. Tahiliani P, Kar A. 2000. Role of Moringa oleifera leaf extract in the regulation of
thyroid hormone status in adult male and female rats. Pharmacol Res 41: 319–323.
145. Trapti R, Vijay B, Komal , Aswar P, and Khadabadi S. Comparative Studies on
Anthelmintic Activity of Moringa Oleifera and Vitex Negundo. Asian J. Research
Chem. 2(2): April.-June, 2009.
171
146. Bhakdi S, Tranum-Jensen J. Alpha-toxin of Staphylococcus aureus. Microbiol Rev.
1991; 55:733.: 1779933
147. Easmon CSF, Adlam C: Staphylococci and staphylococcal infections. Vols 1 and 2.
Academic Press, London, 1983.
148. Foster TJ. Potential for vaccination against infections caused by Staphylococcus
aureus. Vaccine. 1991; 9:221.
149. Foster TJ, McDevitt D: Molecular basis of adherence of staphylococci to
biomaterials. p. 31, In Bisno AL, Waldvogel FA (eds): Infections Associated with
Indwelling Medical Devices, 2nd Edition. American Society for Microbiology,
Washington, D.C., 1994.
150. Lyon BR, Skurray R. Antimicrobial resistance in Staphylococcus aureus: genetic
basis. Microbiol Reviews. 1987; 51:88.
151. Prevost G, Couppie P, Prevost P. et al. Epidemiological data on Staphylococcus
aureus strains producing synergohymenotropic toxins. J Med Microbiol. 1995;
42:237.
152. Rupp ME, Archer GL. Coagulase-negative staphylococci: pathogens associated with
medical progress. Clin Infect Dis. 1994; 19:231.
153. Schlievert PM. Role of superantigens in human disease. J Infect Dis. 1993; 167:997
Skinner GRB, Ahmad, A: Staphylococcal vaccines - present status and future
prospects p. 537. In Mollby R, Flock JI, Nord CE, Christensson B (eds):
Staphylococci and Staphylococcal Infections. Zbl. Bakt. Suppl. 26, Fischer Verlag,
Stuttgart, 1994.
154. Tenover F, Arbeit R, Archer G. et al. Comparison of traditional and molecular
methods of typing isolates of Staphylococcus aureus. J Clin Microbiol. 1994; 32:407

172
155. Vaudaux PE, Lew DP, Waldvogel FA: Host factors predisposing to and influencing
therapy of foreign body infections. p. 1. In Bisno AL, Waldvogel FA (eds): Infections
Associated with Indwelling Medical Devices. 2nd Ed. American Society for
Microbiology, Washington. D. C. 1994.
156. Skov R. et al, Phenotypic Detection of Methicillin Resistance in Staphylococcus
aureus by Disk Diffusion Testing and Etest on Mueller-Hinton Agar, Journal of
Clinical Microbiology, Dec. 2006, p. 4395–4399.
157. Becker, K., Harmsen, D., Mellmann, A., Meier, C., Schumann, P., Peters, G., & von
Eiff, C. (2004). Development and evaluation of a quality-controlled ribosomal
sequence database for 16S ribosomal DNA-based identification of Staphylococcus
species. Journal of Clinical Microbiology, 42(11), 4988-4995.
doi:10.1128/JCM.42.11.4988-4995.2004
158. Murray, P. R., Baron, E. J., Jorgensen, J. H., Landry, M. L., Pfaller, M. A., & Yolken,
R. H. (Eds.). (2003). Manual of Clinical Microbiology (8th ed.). Herdon, VA, United
States of America: American Society for Microbiology.
159. Kluytmans, J., van Belkum, A., & Verbrugh, H. (1997). Nasal carriage of
Staphylococcus aureus: epidemiology, underlying mechanisms, and associated risks.
Clinical Microbiology Reviews, 10(3), 505-520.
160. Le Loir, Y., Baron, F., & Gautier, M. (2003). Staphylococcus aureus and food
poisoning. Genetics and Molecular Research: GMR, 2(1), 63-76.
161. Goldstein, E. J., Citron, D. M., Wield, B., Blachman, U., Sutter, V. L., Miller, T. A.,
& Finegold, S. M. (1978). Bacteriology of human and animal bite wounds. Journal of
Clinical Microbiology, 8(6), 667.
162. Eisenstein, B. I. (2008). Treatment challenges in the management of complicated skin
and soft-tissue infections. Clinical Microbiology and Infection: The Official

173
Publication of the European Society of Clinical Microbiology and Infectious
Diseases, 14 Suppl 2, 17-25. doi:10.1111/j.1469-0691.2008.01922.x
163. Fridkin, S. K., Hageman, J. C., Morrison, M., Sanza, L. T., Como-Sabetti, K.,
Jernigan, J. A., Harriman, K., Harrison, L. H., Lynfield, R., & Farley, M. M. (2005).
Methicillin-resistant Staphylococcus aureus disease in three communities. The New
England Journal of Medicine, 352(14), 1436.
164. Miller, L. G., Perdreau-Remington, F., Rieg, G., Mehdi, S., Perlroth, J., Bayer, A. S.,
Tang, A. W., Phung, T. O., & Spellberg, B. (2005). Necrotizing fasciitis caused by
community-associated methicillin-resistant Staphylococcus aureus in Los Angeles.
The New England Journal of Medicine, 352(14), 1445.
165. Chen, C., Tang, J., Dong, W., Wang, C., Feng, Y., Wang, J., Zheng, F., Pan, X., Liu,
D., Li, M., Song, Y., Zhu, X., Sun, H., Feng, T., Guo, Z., Ju, A., Ge, J., Dong, Y.,
Sun, W., Jiang, Y., Wang, J., Yan, J., Yang, H., Wang, X., Gao, G. F., Yang, R.,
Wang, J., & Yu, J. (2007). A glimpse of streptococcal toxic shock syndrome from
comparative genomics of S. suis 2 Chinese isolates. PloS One, 2(3), e315.
doi:10.1371/journal.pone.0000315
166. Parsonnet, J., Hansmann, M. A., Delaney, M. L., Modern, P. A., DuBois, A. M.,
Wieland-Alter, W., Wissemann, K. W., Wild, J. E., Jones, M. B., & Seymour, J. L.
(2005). Prevalence of toxic shock syndrome toxin 1-producing Staphylococcus aureus
and the presence of antibodies to this superantigen in menstruating women. Journal of
Clinical Microbiology, 43(9), 4628.
167. David, M. D., Kearns, A. M., Gossain, S., Ganner, M., & Holmes, A. (2006).
Community-associated meticillin-resistant Staphylococcus aureus: nosocomial
transmission in a neonatal unit. The Journal of Hospital Infection, 64(3), 244-250.
doi:10.1016/j.jhin.2006.06.022
174
168. Hughes, C. M., Smith, M. B., & Tunney, M. M. (2008). Infection control strategies
for preventing the transmission of meticillin-resistant Staphylococcus aureus (MRSA)
in nursing homes for older people. Cochrane Database of Systematic Reviews
(Online), (1)(1), CD006354. doi:10.1002/14651858.CD006354.pub2
169. Fitzgerald, J. R., Sturdevant, D. E., Mackie, S. M., Gill, S. R., & Musser, J. M.
(2001). Evolutionary genomics of Staphylococcus aureus: insights into the origin of
methicillin-resistant strains and the toxic shock syndrome epidemic. Proceedings of
the National Academy of Sciences of the United States of America, 98(15), 8821-
8826. doi:10.1073/pnas.161098098
170. Schmid-Hempel, P., & Frank, S. A. (2007). Pathogenesis, virulence, and infective
dose. PLoS Pathogens, 3(10)
171. Reusch, M., Ghosh, P., Ham, C., Klotchko, A., Singapuri, S., & Everett, G. (2008).
Prevalence of MRSA colonization in peripartum mothers and their newborn infants.
Scandinavian Journal of Infectious Diseases, 40(8), 667-67.
172. Stevens, A. M., Hennessy, T., Baggett, H. C., Bruden, D., Parks, D., & Klejka, J.
(2010). Methicillin-Resistant Staphylococcus aureus Carriage and Risk Factors for
Skin Infections, Southwestern Alaska, USA. Emerging Infectious Diseases, 16(5),
797.
173. van Belkum, A., Emonts, M., Wertheim, H., de Jongh, C., Nouwen, J., Bartels, H.,
Cole, A., Cole, A., Hermans, P., Boelens, H., Toom, N. L., Snijders, S., Verbrugh, H.,
& van Leeuwen, W. (2007). The role of human innate immune factors in nasal
colonization by Staphylococcus aureus. Microbes and Infection / Institut Pasteur,
9(12-13), 1471-1477. doi:10.1016/j.micinf.2007.08.003
174. Spendlove, J. C., & Fannin, K. F. (1983). Source, significance, and control of indoor
microbial aerosols: human health aspects. Public Health Reports, 98(3), 229.

175
175. Sharma, S., & Verma, K. K. (2001). Skin and soft tissue infection. Indian Journal of
Pediatrics, 68 Suppl 3, S46-50.
176. Hansra, N. K., & Shinkai, K. (2011). Cutaneous community-acquired and hospital-
acquired methicillin-resistant Staphylococcus aureus. Dermatologic Therapy, 24(2),
263-272. doi:10.1111/j.1529-8019.2011.01402.x; 10.1111/j.1529-8019.2011.01402.x
177. Collins, C. H., & Kennedy, D. A. (1999). Laboratory-acquired infections. Laboratory-
acquired Infections: History, incidence, causes and prevention. (4th ed., pp. 234).
Oxford, UK: Butterworth Heinemann.
178. Sinha, B., François, P. P., Nüße, O., Foti, M., Hartford, O. M., Vaudaux, P., Foster, T.
J., Lew, D. P., Herrmann, M., & Krause, K. H. (1999). Fibronectin-binding protein
acts as Staphylococcus aureus invasin via fibronectin bridging to integrin α5β1.
Cellular Microbiology, 1(2), 101-117.
179. Egusa, H., Watamoto, T., Matsumoto, T., Abe, K., Kobayashi, M., Akashi, Y., &
Yatani, H. (2008). Clinical evaluation of the efficacy of removing microorganisms to
disinfect patient-derived dental impressions. The International Journal of
Prosthodontics, 21(6), 531-538.
180. Moesby, L., Hansen, E. W., Christensen, J. D., Hoyer, C. H., Juhl, G. L., & Olsen, H.
B. (2005). Dry and moist heat sterilisation cannot inactivate pyrogenicity of Gram
positive microorganisms. European Journal of Pharmaceutical Sciences: Official
Journal of the European Federation for Pharmaceutical Sciences, 26(3-4), 318-323.
doi:10.1016/j.ejps.2005.07.003
181. Neely, A. N., & Maley, M. P. (2000). Survival of enterococci and staphylococci on
hospital fabrics and plastic. Journal of Clinical Microbiology, 38(2), 724-726.
182. Pike, R. M. (1976). Laboratory-associated infections: summary and analysis of 3921
cases. Health Laboratory Science, 13(2), 105-114.

176
183. Human Pathogens and Toxins Act. S.C. 2009, c. 24. Government of Canada, Second
Session, Fortieth Parliament, 57-58 Elizabeth II, 2009, (2009).
184. Best M., Graham M. L., Leitner R., Ouellette M. and Ugwu K. (Eds.), Laboratory
Biosafety Guidelines (3rd ed.). Canada: Public Health Agency of Canada.
185. Yoneyama H., Katsumata R., Antibiotic resistance in bacteria and its future for novel
antibiotic development, Biosci. Biotechnol. Biochem., 2006, 70, 1060-1075
186. Wright G.D., Bacterial resistance to antibiotics: enzymatic degradation and
modification, Adv. Drug Deliv. Rev., 2005, 57, 1451-1470
187. Rachakonda S., Cartee L., Challenges in antimicrobial drug discovery and the
potential of nucleoside antibiotics, Curr. Med. Chem., 2004, 11, 775-793
188. Silver L.L., Novel inhibitors of bacterial cell wall synthesis, Curr. Opin. Microbiol.,
2003, 6, 431-438
189. Wise R., A review of the mechanisms of action and resistance of antimicrobial agents,
Can. Respir. J.,1999, 6 Suppl A, 20A-22A
190. Langton K.P., Henderson P.J., Herbert R.B., Antibiotic resistance: multidrug efflux
proteins, a common transport mechanism?, Nat. Prod. Rep., 2005, 22, 439-451
191. Lambert P.A., Bacterial resistance to antibiotics: modified target sites, Adv. Drug
Deliv. Rev., 2005, 57, 1471-1485
192. Kahne D., Leimkuhler C., Lu W., Walsh C.,Glycopeptide and lipoglycopeptide
antibiotics, Chem. Rev., 2005, 105, 425-448
193. Reynolds P.E., Structure, biochemistry and mechanism of action of glycopeptide
antibiotics, Eur. J. Clin. Microbiol. Infect. Dis., 1989, 8, 943-950
194. Wilke M.S., Lovering A.L., Strynadka N.C., Betalactam antibiotic resistance: a
current structural perspective, Curr. Opin. Microbiol., 2005, 8, 525-533

177
195. Poole K., Resistance to beta-lactam antibiotics, Cell Mol. Life Sci., 2004, 61, 2200
2223
196. Fisher J.F., Meroueh S.O., Mobashery S., Bacterial resistance to beta-lactam
antibiotics: compelling opportunism, compelling opportunity, Chem. Rev.,2005, 105,
395-424
197. Bambeke F., Laethem Y., Courvalin P.,Tulkens P.M., Glycopeptide antibiotics: from
conventional molecules to new derivatives, Drugs, 2004, 64, 913-936
198. Williams D.H., The glycopeptide story--how to kill the deadly 'superbugs', Nat. Prod.
Rep., 1996, 13,469-477
199. Sussmuth R.D., Vancomycin resistance: small molecule approaches targeting the
bacterial cell wall biosynthesis, Chembiochem., 2002, 3, 295-298
200. Schmitz F.J., Higgins P.G., Mayer S., Fluit A.C., Dalhoff A., Activity of quinolones
against Grampositive cocci: mechanisms of drug action and bacterial resistance, Eur.
J. Clin. Microbiol. Infect.Dis., 2002, 21, 647-659
201. Hooper D.C., Mechanisms of action of antimicrobials: focus on fluoroquinolones,
Clin. Infect. Dis., 2001,Suppl 1, S9-S15
202. Higgins P.G., Fluit A.C., Schmitz F.J., Fluoroquinolones: structure and target sites,
Curr. Drug Targets., 2003, 4, 181-190
203. Dougherty T.J., Beaulieu D., Barrett J.F., New quinolones and the impact on
resistance, Drug Discov. Today, 2001, 6, 529-536
204. Woodford N., Biological counterstrike: antibiotic resistance mechanisms of Gram-
positive cocci, Clin. Microbiol. Infect., 2005, 11 Suppl 3, 2-21
205. Eliopoulos G.M., Quinolone resistance mechanisms in pneumococci, Clin. Infect.
Dis., 2004, 38 Suppl 4, S350-S356
178
206. Vannuffel P., Cocito C., Mechanism of action of streptogramins and macrolides,
Drugs, 1996, 51 Suppl 1, 20-30
207. Johnston N.J., Mukhtar T.A., Wright G.D., K. Bockstael, A.V. Aerschot.
Streptogramin antibiotics: mode of action and resistance, Curr. Drug Targets., 2002,
3, 335-344
208. Shahid M., Aminoglycosidic aminocyclitol antibiotics-A wonder, but toxic drugs:
Developments and clinical implications, Anti-infect. Agents Med. Chem., 2007, 6,
107-117
209. Jana S., Deb J.K., Molecular understanding of aminoglycoside action and resistance,
Appl.Microbiol. Biotechnol., 2006, 70, 140-150
210. Kotra L.P., Haddad J., Mobashery S.,Aminoglycosides: perspectives on mechanisms
of action and resistance and strategies to counter resistance, Antimicrob. Agents
Chemother., 2000, 44, 3249-3256
211. Speer B.S., Shoemaker N.B., Salyers A.A., Bacterial resistance to tetracycline:
mechanisms, transfer, and clinical significance, Clin. Microbiol. Rev.,1992, 5, 387-
399
212. Roberts M.C., Update on acquired tetracycline resistance genes, FEMS Microbiol.
Lett., 2005, 245, 195-203
213. Chopra I., Roberts M., Tetracycline antibiotics: mode of action, applications,
molecular biology and epidemiology of bacterial resistance, Microbiol. Mol. Biol.
Rev., 2001, 65, 232-260
214. Maravic G., Macrolide resistance based on the Ermmediated rRNA methylation, Curr.
Drug Targets. Infect. Disord., 2004, 4, 193-202
215. Weisblum B., Erythromycin resistance by ribosome modification, Antimicrob. Agents
Chemother., 1995, 39, 577-585

179
216. Rezanka T., Spizek J., Sigler K., Medicinal use of lincosamides and microbial
resistance to them, Anti-infect. Agents Med. Chem., 2007, 6, 133-144
217. Bozdogan B., Appelbaum P.C., Oxazolidinones: activity, mode of action, and
mechanism of resistance, Int. J. Antimicrob. Agents, 2004, 23,113-119
218. Toh S.M., Xiong L., Arias C.A., Villegas M.V., Lolans K., Quinn J., Mankin A.S.,
Acquisition of a natural resistance gene renders a clinical strain of methicillin-
resistant Staphylococcus aureus resistant to the synthetic antibiotic linezolid, Mol.
Microbiol., 2007, 64, 1506-1514
219. Enoch D.A., Bygott J.M., Daly M.L., Karas J.A., Daptomycin, J. Infect., 2007, 55,
205-213
220. Johnson A., Daptomycin in the treatment of skin, soft-tissue and invasive infections
due to Gram positive bacteria, Future. Microbiol., 2006, 1, 255-265
221. Lange R.P., Locher H.H., Wyss P.C., Then R.L., The targets of currently use
antibacterial agents: lessons for drug discovery, Curr. Pharm. Des, 2007, 13, 3140-
3154.
222. Kuhrt, M. F. Fancher, m. J. Mckinlay, m. A. and Lennert S. D. Antimicrobial agents
and chemotherapy, Dec. 1984, p. 924-927 Vol. 26, No. 6.
223. Kallen AJ, Mu Y, Bulens S, Reingold A, Petit S, Gershman K, Ray SM, Harrison LH,
Lynfield R, Dumyati G, Townes JM, Schaffner W, Patel PR, Fridkin SK; Active
Bacterial Core surveillance (ABCs) MRSA Investigators of the Emerging Infections
Program.Health care-associated invasive MRSA infections, 2005–2008.JAMA.2010
224. Sievert DM, Ricks P, Edwards JR, Schneider A, Patel J, Srinivasan A, Kallen A,
Limbago B, Fridkin S; National Healthcare Safety Network (NHSN) Team and
Participating NHSN Facilities.Antimicrobial-resistant pathogens associated with
healthcare-associated infections: summary of data reported to the National Healthcare
180
Safety Network at the Centers for Disease Control and Prevention, 2009–2010.Infect
Control Hosp Epidemiol.2013 Jan;34(1):1–14
225. Akdis, C. A. Akdis, M. Bieber T. et al., “Diagnosis and treatment of atopic dermatitis
in children and adults: European academy of allergology and clinical
immunology/American academy of allergy, asthma and immunology/PRACTALL
consensus report,” Journal of Allergy and Clinical Immunology, vol. 118, no. 1, pp.
152–169, 2006.
226. Palmer, C. N. A., Irvine A. D., Terron-Kwiatkowski A. et al., “Common loss-of-
function variants of the epidermal barrier protein filaggrin are a major predisposing
factor for atopic dermatitis,” Nature Genetics, vol. 38, no. 4, pp. 441–446, 2006.
227. Illi, S. E. Von Mutius, S. Lau et al., “The natural course of atopic dermatitis from
birth to age 7 years and the association with asthma,” Journal of Allergy and Clinical
Immunology, vol. 113, no. 5, pp. 925– 931, 2004.
228. Girolomoni, G. Abeni, D. Masini C. et al., “The epidemiology of atopic dermatitis
in Italian schoolchildren,” Allergy, vol. 58, no. 5, pp. 420–425, 2003.
229. Bieber, T. “Atopic dermatitis,” The New England Journal of Medicine, vol. 358, no.
14, pp. 1483–1494, 2008.
230. Guzik, T. J., Bzowska, M. Kasprowicz A. et al., “Persistent skin colonization with
Staphylococcus aureus in atopic dermatitis: relationship to clinical and
immunological parameters,” Clinical and Experimental Allergy, vol. 35, no. 4, pp.
448–455, 2005.
231. Gong, J. Q. Lin, L. Lin T. et al., “Skin colonization by Staphylococcus aureus in
patients with eczema and atopic dermatitis and relevant combined topical therapy: a
doubleblindmulticentre randomized controlled trial,” British Journal of Dermatology,
vol. 155, no. 4, pp. 680–687, 2006.
181
232. Bignardi G.E., Woodford N., Chapman A., et al (1996). J.Antimicrobiol. Chemother.,
37:53-63
233. Murakami K., Minamide W., Wada K., et al (1991). J. Clin. Microbiol.,
29: 224 0 -2244.
234. Arslanagic N. and Arslanagic, R. “Atopic dermatitis and Staphylococcus aureus,”
Medicinski Arhiv, vol. 58, no. 6, pp. 363–365, 2004.
235. Goh, C. L. Wong, J. S. and Giam, Y. C. “Skin colonization of Staphylococcus
aureus in atopic dermatitis patients seen at the national skin centre, Singapore,”
International Journal of Dermatology, vol. 36, no. 9, pp. 653–657, 1997.
236. Williams, R. E. A. Gibson, A. G. Aitchison, T. C. Lever, R. and Mackie, R. M.
“Assessment of a contact-plate sampling technique and subsequent quantitative
bacterial studies in atopic dermatitis,” British Journal of Dermatology,vol. 123, no.4,
pp. 493–501, 1990.
237. Higaki S., Morohashi M., Yamagishi T. and Hasegawa Y. “Comparative study of
staphylococci from the skin of atopic dermatitis patients and from healthy subjects,”
International Journal of Dermatology, vol. 38, no. 4, pp. 265–269, 1999.
238. Sharp M. J., Rowe J., Kusel M., Sly P. D. and Holt P. G. “Specific patterns of
responsiveness to microbial antigens staphylococcal enterotoxin B and purified
protein derivative by cord blood mononuclear cells are predictive of risk for
development of atopic dermatitis,” Clinical and Experimental Allergy, vol. 33, no. 4,
pp. 435–441, 2003.
239. Nomura, K. Tanaka, H. Tomita et al., “Evaluation of the staphylococcal exotoxins
and their specific IgE in childhood atopic dermatitis,” Journal of Allergy and Clinical
Immunology, vol. 104, no. 2, pp. 441–446, 1999.

182
240. Leyden J. J., Marples R. R. and Kligman, A. M. “Treatment of atopic dermatitis,”
Allergy, vol. 59, pp. 86–92, 2004.
241. Shah M. and Mohanraj M. “High levels of fusidic acidresistant Staphylococcus
aureus in dermatology patients,” British Journal of Dermatology, vol. 148, no. 5, pp.
1018–1020, 2003.
242. Suh, L. M. Honig, P. J. and Yan, A. C. “Methicillin-resistant Staphylococcus aureus
skin abscesses in a pediatric patient with atopic dermatitis: a case report,” Cutis, vol.
78, no. 2, pp. 113–116, 2006.
243. Hoeger P. H. “Antimicrobial susceptibility of skin-colonizing S. aureus strains in
children with atopic dermatitis,” Pediatric Allergy and Immunology, vol. 15, no. 5,
pp. 474–477, 2004.
244. Hanifin J. M. and Rajka, G. “Diagnostic features of atopic dermatitis,” Acta Derm
Venereol, vol. 92, pp. 44–47, 1980.
245. Campbell, S. J., Deshmukh, H. S., Nelson C. L. et al., “Genotypic characteristics of
Staphylococcus aureus isolates from a multinational trial of complicated skin and skin
structure infections,” Journal of Clinical Microbiology, vol. 46, no. 2, pp. 678–684,
2008.
246. Mulvey M. R., MacDougall L., Cholin B. et al., “Community associated methicillin-
resistant Staphylococcus aureus, Canada,” Emerging Infectious Diseases, vol. 11,
no. 6, pp. 844–850, 2005.
247. Cafiso V., Bertuccio T., Spina D., Purrello, S. and Stefani, S. “Tigecycline inhibition
of a mature biofilm in clinical isolates of Staphylococcus aureus: comparison with
other drugs,” FEMS Immunology and Medical Microbiology, vol. 59, no. 3, pp. 466–
469, 2010.
183
248. Christensen, B. B. Sternberg, C. Andersen J. B. et al., “Molecular tools for study of
biofilm physiology,” Methods in Enzymology, vol. 310, pp. 20–42, 1999.
249. Center of Disease Control and Prevention, “Short protocol for Staphylococcus aureus
PFGE,” pp. 23-24, 2001..
250. Bieber T. and Novak, N. “Pathogenesis of atopic dermatitis: new developments,”
Current Allergy and Asthma Reports, vol. 9, no. 4, pp. 291–294, 2009.
251. White M. I. and Noble W. C. “The cutaneous reaction to staphylococcal protein A in
normal subjects and patients with atopic dermatitis or psoriasis,” British Journal of
Dermatology, vol. 113, no. 2, pp. 179–183, 1985.
252. McFadden J. P. Noble W. C. and Camp R. D., “Superantigenic exotoxin-secreting
potential of staphylococci isolated from atopic eczematous skin,” British Journal of
Dermatology, vol. 128, no. 6, pp. 631–632, 1993.
253. Patel G. K., Wyatt H., Kubiak E. M., Clark S. M. and Mills C. M., “Staphylococcus
aureus colonization of children with atopic eczema and their parents,” Acta Dermato-
Venereologica, vol. 81, no. 5, pp. 366–367, 2001.
254. Ricci G., Patrizi A., Neri I., Bendandi B. and Masi M. “Frequency and clinical role of
Staphylococcus aureus overinfection in atopic dermatitis in children,” Pediatric
Dermatology, vol. 20, no. 5, pp. 389–392, 2003.
255. Chiu, L. S., Chow, V. C., Ling, J. M. and Hon, K. L. “Staphylococcus aureus
carriage in the anterior nares of close contacts of patients with atopic dermatitis,”
Archives of Dermatology, vol.146, no. 7, pp. 748–752, 2010.
256. Gilani, S.J., Gonzalez, M., Hussain I., Finlay, A. Y. and Patel, G. K. “Staphylococcus
aureus re-colonization in atopic dermatitis: beyond the skin,” Clinical and
Experimental Dermatology, vol. 30, no. 1, pp. 10–13, 2005.

184
257. Zollner T. M., Wichelhaus T. A., Hartung A. et al., “Colonization with superantigen-
producing Staphylococcus aureus is associated with increased severity of atopic
dermatitis,” Clinical and Experimental Allergy, vol. 30, no. 7, pp. 994–1000, 2000.
258. Mangram AJ, Horan TC, Pearson ML, Silver LC, Jarvis WR (1999) Guideline for
Prevention of Surgical Site Infection, 1999. Centers for Disease Control and
Prevention (CDC) Hospital Infection Control Practices Advisory Committee. Am J
Infect Control 27: 97–132; quiz 133–134; discussion 196.
259. Wenzel RP, Perl TM (1995). The significance of nasal carriage of Staphylococcus
aureus and the incidence of postoperative wound infection. J Hosp Infect 31: 13–24.
260. Kluytmans J, van Belkum A, Verbrugh H (1997) Nasal carriage of Staphylococcus
aureus: epidemiology, underlying mechanisms, and associated risks. Clin Microbiol
Rev 10: 505–520.
261. Diekema DJ, Pfaller MA, Schmitz FJ, Smayevsky J, Bell J, et al. (2001) Survey of
infections due to Staphylococcus species: frequency of occurrence and antimicrobial
susceptibility of isolates collected in the United States, Canada, Latin America,
Europe, and the Western Pacific region for the SENTRYAntimicrobial Surveillance
Program, 1997–1999. Clin Infect Dis 32 Suppl 2: S114–132.
262. NNIS (2004) National Nosocomial Infections Surveillance (NNIS) System Report,
data summary from January 1992 through June 2004. Am J Infect Control 2: 470–
485.
263. Kesah C, Ben Redjeb S, Odugbemi TO, Boye CS, Dosso M, et al. (2003) Prevalence
of methicillin-resistant Staphylococcus aureus in eight African hospitals and Malta.
Clin Microbiol Infect 9: 153–156.
264. Shittu AO, Lin J (2006) Antimicrobial susceptibility patterns and characterization of
clinical isolates of Staphylococcus aureus in KwaZulu-Natal province, South Africa.
185
BMC Infect Dis 6: 125. Afifi IK, Baghagho EA (2010) Three months study of
orthopaedic surgical site infections in an Egyptian University hospital. Int J Infect
Control v6: i1 doi:.
265. Mawalla B, Mshana SE, Chalya PL, Imirzalioglu C, Mahalu W (2011) Predictors of
surgical site infections among patients undergoing major surgery at Bugando Medical
Centre in Northwestern Tanzania. BMC Surg 11: 21.
266. York M.K., Gibbs. s, Chehab F. et al (1996). J. Clin. Microbiol., 34: 249 – 253.
267. Ojulong J, Mwambu TP, Joloba M, Bwanga F, Kaddu-Mulindwa DH (2009)
Relative prevalence of methicillin resistant Staphylococcus aureus and its
susceptibility pattern in Mulago Hospital, Kampala, Uganda. Tanzan J Health,
Res 11: 149–153.
268. Rubin RJ, Harrington CA, Poon A, Dietrich K, Greene JA, et al. (1999) The economic
impact of Staphylococcus aureus infection in New York City hospitals. Emerg Infect
Dis 5: 9–17.
269. Cosgrove SE, Sakoulas G, Perencevich EN, Schwaber MJ, Karchmer AW, et al.
(2003) Comparison of mortality associated with methicillin-resistant and methicillin-
susceptible Staphylococcus aureus bacteremia: a meta-analysis. Clin Infect Dis 36:
53–59. Staphylococcus aureus from Surgical Infections.
270. Engemann JJ, Carmeli Y, Cosgrove SE, Fowler VG, Bronstein MZ, et al. (2003)
Adverse clinical and economic outcomes attributable to methicillin resistance among
patients with Staphylococcus aureus surgical site infection. Clin Infect Dis 36:592–
598.
271. Moremi N, Mshana SE, Kamugisha E, Kataraihya J, Tappe D, et al. (2012)
Predominance of methicillin resistant Staphylococcus aureus -ST88 and new ST1797
causing wound infection and abscesses. J Infect Dev Ctries 6: 620–625.

186
272. Shopsin B, Kreiswirth BN (2001) Molecular epidemiology of methicillin-resistant
Staphylococcus aureus. Emerg Infect Dis 7: 323–326.
273. Struelens MJ, Hawkey PM, French GL, Witte W, Tacconelli E (2009) Laboratory
tools and strategies for methicillin-resistant Staphylococcus aureus screening,
surveillance and typing: state of the art and unmet needs. Clin Microbiol Infect 15:
112–119.
274. Oliveira DC, Tomasz A, de Lencastre H (2001) The evolution of pandemic clones of
methicillin-resistant Staphylococcus aureus: identification of two ancestral genetic
backgrounds and the associated mec elements. Microb Drug Resist 7: 349–361.
275. Koreen L, Ramaswamy SV, Graviss EA, Naidich S, Musser JM, et al. (2004) spa
typing method for discriminating among Staphylococcus aureus isolates: implications
for use of a single marker to detect genetic micro- and macrovariation. J Clin
Microbiol 42: 792–799.
276. Strommenger B, Kettlitz C, Weniger T, Harmsen D, Friedrich AW, et al. (2006)
Assignment of Staphylococcus isolates to groups by spa typing, SmaI
macrorestriction analysis, and multilocus sequence typing. J Clin Microbiol 44: 2533–
2540.
277. Deurenberg RH, Vink C, Kalenic S, Friedrich AW, Bruggeman CA, et al. (2007) The
molecular evolution of methicillin-resistant Staphylococcus aureus. Clin Microbiol
Infect 13: 222–235.
278. Boye K, Bartels MD, Andersen IS, Moller JA, Westh H (2007) A new multiplex PCR
for easy screening of methicillin-resistant Staphylococcus aureus SCCmec types I–V.
Clin Microbiol Infect 13: 725–727.

187
279. Wang JL, Wang JT, Chen SY, Chen YC, Chang SC (2010) Distribution of
Staphylococcal cassette chromosome mec Types and correlation with comorbidity
and infection type in patients with MRSA bacteremia. PLoS One 5:e9489.
280. Onyango MD, Ghebremedhin B, Waindi EN, Kakai R, Rabsch W, et al. (2009)
Phenotypic and genotypic analysis of clinical isolates Salmonella serovar
Typhimurium in western Kenya. J Infect Dev Ctries 3: 685–694.
281. Harmsen D, Claus H, Witte W, Rothganger J, Turnwald D, et al. (2003) Typing of
methicillin-resistant Staphylococcus aureus in a university hospital setting by using
novel software for spa repeat determination and database management. J Clin
Microbiol 41: 5442–5448.
282. Tenover F.C., Jones R.N., Swenson J.M., et al (1999). J. Clin. Microbiol.,
37:4051-4058.
283. Koneman EW, Allen SD, Janda WM, Schreckenberger PC, Winn WC, editors (1997)
Color Atlas and Textbook of Diagnostic Microbiology: Lippincott.
284. CLSI (2011) Perfomance Standards for Antimicrobial Susceptibility Testing; Twenty
first information supplement. Wayne, PA: Clinical and Laboratory Standards Institute.
285. Brakstad OG, Aasbakk K, Maeland JA (1992) Detection of Staphylococcus aureus by
polymerase chain reaction amplification of the nuc gene. J Clin Microbiol 30: 1654–
1660.
286. Kateete DP, Kimani CN, Katabazi FA, Okeng A, Okee MS, et al. (2010)
Identification of Staphylococcus aureus: DNase and Mannitol salt agar improve the
efficiency of the tube coagulase test. Ann Clin Microbiol Antimicrob 9: 23.
287. McClure JA, Conly JM, Lau V, Elsayed S, Louie T, et al. (2006) Novel multiplex
PCR assay for detection of the staphylococcal virulence marker Panton-Valentine
188
leukocidin genes and simultaneous discrimination of methicillinsusceptible from -
resistant staphylococci. J Clin Microbiol 44: 1141–1144.
288. Anguzu JR, Olila D (2007) Drug sensitivity patterns of bacterial isolates from septic
post-operative wounds in a regional referral hospital in Uganda. Afr Health Sci 7:
148–154.
289. Peng Q, Hou B, Zhou S, Huang Y, Hua D, et al. (2010) Staphylococcal cassette
chromosome mec (SCCmec) analysis and antimicrobial susceptibility profiles of
methicillin-resistant Staphylococcus aureus (MRSA) isolates in a teaching hospital,
Shantou, China. African Journal of Microbiology Research 4.
290. Shittu AO, Okon K, Adesida S, Oyedara O, Witte W, et al. (2011) Antibiotic
resistance and molecular epidemiology of Staphylococcus aureus in Nigeria. BMC
Microbiol 11: 92.
291. Mshana SE, Kamugisha E, Mirambo M, Chalya P, Rambau P, et al. (2009)
Prevalence of clindamycin inducible resistance among methicillin-resistant
Staphylococcus aureus at Bugando Medical Centre, Mwanza, Tanzania. Tanzania
Journal of Health Research 11: 59–64.
292. Khandavilli S, Wilson P, Cookson B, Cepeda J, Bellingan G, et al. (2009) Utility of
spa typing for investigating the local epidemiology of MRSA on a UK intensive care
ward. J Hosp Infect 71: 29–35.
293. Kateete DP, Namazzi S, Okee M, Okeng A, Baluku H, et al. (2011) High prevalence
of methicillin resistant Staphylococcus aureus in the surgical units of Mulago hospital
in Kampala, Uganda. BMC Res Notes 4: 326.
294. Chambers HF (2001) The changing epidemiology of Staphylococcus aureus? Emerg
Infect Dis 7: 178–182.Staphylococcus aureus from Surgical Infections.

189
295. Francisco Canindé de Sousa Júnior et al, Evaluation of different methods for
detecting methicillin resistance in staphylococcus aureus isolates in a university
hospital located in the northeast of Brazil, Brazilian Journal of Microbiology (2010)
41: 316-320
296. Clinical and Laboratory Standards Institute. Performance standards for antimicrobial
susceptibility testing: 17th informational supplement. Document M100-S17. Wayne,
PA: Clinical and Laboratory Standards Institute, 2007.
297. Walsh TR, Bolmstro¨m A, Qwa¨rnstro¨m A, et al. Evaluation of current methods for
detection of staphylococci with reduced susceptibility to glycopeptides. J Clin
Microbiol 2001; 39:2439–44.
298. Zhang K, McClure JA, Elsayed S, Louie T, Conly JM. Novel multiplex PCR assay for
characterization and concomitant subtyping of staphylococcal cassette chromosome
mec types I to V in methicillin-resistant Staphylococcus aureus. J Clin Microbiol
2005; 43:5026–33.
299. Harbarth S, Masuet-Aumatell C, Schrenzel J, et al. Evaluation of rapid screening and
pre-emptive contact isolation for detecting and controlling methicillin-resistant
Staphylococcus aureus in critical care: an interventional cohort study. Crit Care 2006;
10:R25.
300. Hiramatsu K, Aritaka N, Hanaki H, et al. Dissemination in Japanese hospitals of
strains of Staphylococcus aureus heterogeneously resistant to vancomycin. Lancet
1997; 350:1670–3.
301. de Lassence A, Hidri N, Timsit JF, et al. Control and outcome of a large outbreak of
colonization and infection with glycopeptide-intermediate Staphylococcus aureus in
an intensive care unit. Clin Infect Dis 2006; 42:170–8.

190
302. Sancak B, Ercis S, Menemenlioglu D, Colakoglu S, Hascelik G. Methicillin- resistant
Staphylococcus aureus heterogeneously resistant to vancomycin in a Turkish
university hospital. J Antimicrob Chemother 2005; 56:519–23.
303. Anupurba S, Sen M.R, Nath G, Sharma B.M, Gulati A.K, Mohapatra T.M. Prevalence
of Methicillin resistant Staphylococcus aureus in a tertiary referral hospital in Eastern
Utter Pradesh. Indian J Med Microbiol 2003; 21:49-51.
304. Bauer A.W, Kirby W.M.M, Sherris J.C, Turck M. Antibiotic susceptibility testing by
a standardised single disk method. Am J Clin Path 1966; 45:493-496.
305. Chaudhary U, Anupama. Prevalence report of methicillin resistance in
Staphylococcus aureus. Ind J. Med. Microbiol.1999; 17: 154-5
306. Cowan and Steel's Manual for the Identification of Medical Bacteria. Author(s), K J
Steel, S T Cowan. Date of Edition, April 2004, 3rd edition.
307. Adam J. Singer, M.D., and David A. Talan, M.D.: Management of Skin Abscesses in
the Era of Methicillin-Resistant Staphylococcus aureus, N Engl J Med ; 370:1039-
1047 March 13, 2014
308. Taiwo S.S, Bamidele M, Akinside K.A, Omonigbehin E.A, Smith S.I, Onile B.A,
Olowe O.A, molecular epidemiology of methicillin resistant staphylococcus aureus
in ilorin, nigeria. West African Journal of Medicine. Wajm Vol 24 No. 2, April-June
2005 (ajol) http://www.ajol.info/journals/wajm.
309. Tahnkiwale S.S, Roy S, Jalgaonkar S.V. Methicilin resistance among isolates of
Staphylococcus aureus; Antibiotic sensitivity pattern and phage typing. Indian J.Med
Sci 2002; 56; 330-334.
310. Vidhani S, Mendiratta PL, Mathur M.D. Study of methicillin resistant S.aureus
isolates from high risk patrients. Ind J Med Microbiol 2001; 19: 87-90. Zaman R,

191
Dibb W.L. MRSA isolated in Saudi Arabia: Epidemiology and antimicrobial
resistance pattern. J Hosp.Infect, 1994; 26: 297-300.
311. Costa AM, Kay I, Palladino S. Rapid detection of mecA and nuc genes in
staphylococci by real-time multiplex polymerase chain reaction. Diagn Microbiol
Infect Dis. 2005; 51:13–7.
312. Townsend DE, Grubb WB, Ashdown N. Gentamicin resistance in methicillin-resistant
Staphylococcus aureus. Pathology. 1983; 15:169–74.
313. Townsend DE, Ashdown N, Pearman JW, Annear DI, Grubb WB. Genetics and
epidemiology of methicillin-resistant Staphylococcus aureus in a Western Australian
hospital. Med J Aust. 1985; 142:108–11.
314. Goh, S-H, Bryne S.K, Zhang J.L, Chow AW. Molecular typing of Staphylococcus
aureus on the basis of coagulase gene polymorphisms. J Clin Microbiol. 1992;
30:1642–5.
315. Olowo O.A., Eniola K.I.T., Olowe R.A., Olayemi A.B, Antimicrobial Susceptibility
and Beta-lactamase detection of MRSA in Osogbo. SW Nigeria, Nature and Science,
5(3), 2007.
316. Geoffrey W. C. et al. Methicillin resistant Staphylococcus aureus Clones, western
Australia Emerging Infectious Diseases, www.cdc.gov/eid • Vol. 12, No.2, February
2006.
317. Cauwelier, B.; Gordts, B.; Descheemaecker, P.; Van Landuyt, H. (2004). Evaluation
of a disk diffusion method with cefoxitin (30 microg) for detection of methicillin-
resistant Staphylococcus aureus. Eur. J. Clin. Microbiol. Infect. Dis. 23 (5), 389-392.
318. Mark C. Enright, D. Ashley Robinson et al, The evolutionary history of methicillin-
resistant Staphylococcus aureus (MRSA), Proc Natl Acad Sci U S A. May 28, 2002;
99(11): 7687–7692.
192
319. Geoffrey W. Coombs et al, Methicillin-resistant Staphylococcus aureus Clones,
Western Australia, Emerging Infectious Diseases • www.cdc.gov/eid • Vol. 12, No. 2,
February 2006.
320. Teresa Conceic¸a˜o, Hamdad, F.; Donda, F.; Lefebvre, J.F.; Laurans, G.; Biendo, M.;
Thomas, D.; Canarelli, B.; Rousseau, F.; Eb, F. (2006). Detection of
methicillin/oxacillin resistance and typing in aminoglycoside-susceptible methicillin-
resistant and kanamycin-tobramycin-resistant methicilinsusceptible Staphylococcus
aureus. Microb. Drug Resist. 12 (3), 177-185.
321. Tomasz Chroboczek et. al, West Indies MRSA Clones: Do They Travel With Their
Hosts? Journal of Travel Medicine 2013; Volume 20 (Issue 5): 283–288, 2013.
International Society of Travel Medicine, 1195-1982
322. Hanssen, A.M.; Ericson Sollid, J.U. (2006). SCCmec in staphylococci: genes on the
move. FEMS Immunol Med Microbiol. 46(1), 8-20.
323. Kluytmans, J.; Struelens, M. (2009). Meticillin resistant Staphylococcus aureus in the
hospital. BMJ. 12 (1), 338-364.
324. Melo, M.C.N.; Silva-Carvalho, M.C.; Ferreira, R.L.; Coelho, L.R.;Souza, R.R.;
Gobbi, C.N.; Rozenbaum, R.; Solari, C.A.; Ferreira- Carvalho, B.T.; Figueiredo,
A.M.S. (2004). Detection and molecular characterization of a gentamicin-susceptible,
methicillin-resistant Staphylococcus aureus (MRSA) clone in Rio de Janeiro that
resembles the NewYork/Japanese clone. J. Hosp. Infec. 58 (4), 276-285.
325. Oliveira, D.C.; de Lencastre, H. (2002). Multiplex PCR strategy for rapid
identification of structural types and variants of the mec element in methicillin-
resistant Staphylococcus aureus. Antimicrob. Agents Chemother. 46 (7), 2155-2161.

193
326. Nwankwo E. O., Nasiru M. S., Antibiotic sensitivity pattern of Staphylococcus
aureus from clinical isolates in a tertiary health institution in Kano, Northwestern
Nigeria, Pan African Medical Journal. 2011; 8:4.
http://www.panafrican-med-journal.com/content/article/8/4/full/
327. Shiota, H. Volatile components in the peel oil from fingered citron (Citrus medica L.
var.sarcodactylis Swingle). Flav. Frag. J. 1990, 5, 33–37.
328. Malarvizhi and Ramakrishan.N. GC-MS Analysis of biological active compound in
leaves of calophyllum inophyllum L. nternational journal of chem. Tech research.
2011; 806-809.
329. Aqil, F., Ahmad, I., Owais, M.(2006). Evaluation of anti-methicillin-resistant
Staphylococcus aureus (MRSA) activity and synergy of some bioactive plant extracts.
Biotechnol J. 1(10): 1093-1102.
330. Alemayehu Toma and Serawit Deyno, Phytochemistry and pharmacological activities
of moringa oleifera, international Journal of Pharmacognosy IJP, 2014; Vol. 1(4):
222-231.
331. Dorothy J. Seibert , Karen Gabel Speroni, Kyeung Mi Oh , Mary C. DeVoe,
Preventing transmission of MRSA: A qualitative study of health care workers’
attitudes and suggestions, America. J. Inf. Control (AJIC), Published Online:
February 20, 2014.
332. Struelens MJ. The epidemiology of antimicrobial resistance in hospital-acquired
infections: problems and possible solutions. BMJ, 1998, 317:652–654.
333. Health Canada. Preventing the transmission of bloodborne pathogens in health care
and public services. Can Commun Dis Rep, 1997, 23 Suppl 3: i–vii, 1–43; i–vii, 1–
52.

194
334. T. Shomura, S. M. Omoto, K. Ohba, and H. Ogino, “SF-1961, a new antibiotic
related to bleomycin,” Journal of Antibiotics, vol. 33, no. 11, pp. 1243–1248,1980.
335. Demain A. L and Davies J. E. Manual of Industrial Microbiology and
Biotechnology,chapter 1, American Society for Microbiology,Washington, DC, USA,
2nd edition, 1999.
336. Arifuzzaman M., Khatun M.R. and Rahman H., “Isolation and screening of
actinomycetes from Sundarbans soil for antibacterial activity,” African Journal of
Biotechnology, vol. 9, no. 29, pp. 4615–4619, 2010.
337. Rahman M. A., Islam M. Z., Khondkar P. and Islam M. A. “Characterization and
antimicrobial activities of a polypeptide antibiotic isolated froma new strain of
Streptomyces parvulus,” Bangladesh Pharmaceutical Journal, vol. 13, no. 1, pp. 14–
16, 2010.
338. AndersonA. S. and Wellington E. M. H. “The taxonomy of Streptomyces and related
genera,” International Journal of Systematic and Evolutionary Microbiology, vol. 51,
no. 3, pp. 797–814, 2001.
339. Vining L. C. “Functions of secondary metabolites,” Annual Review of Microbiology,
vol.44, pp. 395–427,1990.
340 Eloff, J.N., Katerere, D.R. and Mcgaw, L.J. (2008). The biological activity and
chemistry of the Southern African Combretaceae. Journal of Ethnopharmacology.
119:686-699.
341 CLSI (Clinical and Laboratory Standards Institute). (2007). Performance standards
for antimicrobial disk susceptibility tests, 9th edn. Approved Standard M2-A9.Wayne,
PA: document M100-S17.
342 Agboke A. A. and Esimone C. O., Antimicrobial evaluation of the interaction between
methanol extract of the lichen, Ramalina Farinacea (Ramalinacea) and Ampicilin

195
against clinical isolates of Staphylococcus aureus,Journal of Medicinal Plants Research
Vol. 5(4), pp. 644-648, 18 February, 2011
343 Okore V. C. (2005). Principles of the pharmaceutical applications of antimicrobialial
agents, Pharmaceutical Microbiology.2nd Ed. EL ‘DEMAK (Publishers), Enugu State,
Nigeria, pp.90-98.
344 (Orga- nization of Economic Cooperation and Development) 423 guide-line (Acute
toxic class method), adopted 24 Feb 1987.
345 Oliver, B. (1960). Medicinal Plants in Nigeria.,Nigerian College of Arts, Sciences and
Technology, Ibadan, Nigeria, P. 49-50.
346 Trease, G.E and Evans, W.C, (1996). Textbook of Pharmacognosy. 14th Ed. W.B.
347 Harborne, J.B.C. (1973). Phytochemical Methods, Chapman and Hall, London, p.279.
348 Iwu, M.M. (1978). Practical Pharmacognosy manual of Natural Products.
349 Nwoire A. et al, Incidence of Staphylococcus aureus in clinical specimens in Federal
Teaching Hospital, Abakaliki, Ebonyi State. Merit Research Journal of Medicine and
Medical Sciences Vol. 1(3) pp. 043-046, October, 2013. Available online
http://www.meritresearchjournals.org/mms/index.htm
350 National Committee for Clinical Laboratory Standards. (2000) Approved Standard Fifth
Edition. Example of preparing the dilutions of antimicrobial agents used in agar dilution.
(NCCLS M100-S12 table 5).
351 Vladimir Mihailović et al, Studies on the antimicrobial activity and chemical
composition of the essential oils and alcoholic extracts of Gentiana asclepiadea L., J.
Med. Plants Res. Vol. 5(7), pp. 1164-1174, 4 April, 2011.
352 Fagbohun Adebisi et al, Instrumental and Chemical characterization of Moringa oleifera
root starch as an industrial biomaterial. Res. Pharm. Biotech.17 march, 2014.
196
353 Ahmed S. John, Kumar P., GC-MS Study of the Excoecaria agollocha Leaf extract
from Pitchavaram, Tamil nadu , India, Researcher 2012;4(6):10-14]. (ISSN: 1553-
9865). http://www.sciencepub.net/researcher. 3
354 Prabhadevi V, Sahaya Sathish S, Johnson M, Venkatramani B, Janakiraman
Phytochemical studies on Allamanda cathartica L. using GC-MS, Asian Pacific
Journal of Tropical Biomedicine (2012)S550-S554.
355 Jennings W. and Shibamoto T: Qualitative Analysis of Flavor and Fragrance
Volatiles by Glass Capillary Gas Chromatography. 465 Seiten. Academic Press, New
York, London, Sydney, Toronto, San Francisco 1980.
356 Adams 2007 r1, Release Guide, MSC.Software Corporation, 2 MacArthur Place,
Santa Ana, CA 92707, USA. www.mscsoftware.com.
357 The NIST 14 Mass Spectral Library & Search Software (NIST 2014/EPA/NIH)
(previously NIST 2011/NIST11/NIST 2008/NIST08)
358 Harry E. Pence and Antony Williams, J. Chem. Educ., 2010, 87 (11), pp 1123–1124,
ChemSpider, Royal Society of Chemistry, U.S. Office, Wake Forest, North Carolina
27587.
359 The National Institute of Standards and Technology (NIST)
Gaithersburg, Md.(headquarters), agency of the U.S. Department of Commerce.
360 LookChem Data base Product Library 80G, No. 1 Building, Guodu Development
Mansion, No. 182 Chaohui Road,Hangzhou China. hangzhou, zhejiang China
361 Pub.Chem (NCBI) Data base, The National Center for Biotechnology Information
advances science and health by providing access to biomedical and genomic
information, National, Library of Medicine, Building 38A Bethesda, MD 20894.

197
362 Chembook data base, ChemicalBook Inc, ,Capot Chemical Co.,Ltd, Hangzhou,
P.R.China
363 Miller, L.C. and Tainter, M.L., Proc. Soc. Exp. Biol. Med. NY , 57, 261-264, 1944
364 Adedapo A. A., Mogbojuri O. M. and Emikpe B. O., Safety evaluations of the
aqueous extract of the leaves of Moringa oleifera in rats, Journal of Medicinal Plants
Research Vol. 3(8). pp. 586-591, August, 2009.
365 Kasolo1 J. N. Bimenya, G. S. Ojok L. and Ogwal-okeng J. W., Phytochemicals and
acute toxicity of Moringa oleifera roots in mice, Journal of Pharmacognosy and
Phytotherapy Vol. 3(3), pp. 38-42, April 2011.
366 Paul C.W. and Didia B.C. The Effect of Methanolic Extract of Moringa oleifera Lam
Roots on the Histology of Kidney and Liver of Guinea Pigs, Asian Journal of Medical
Sciences 4(1): 55-60, February 25, 20122012.
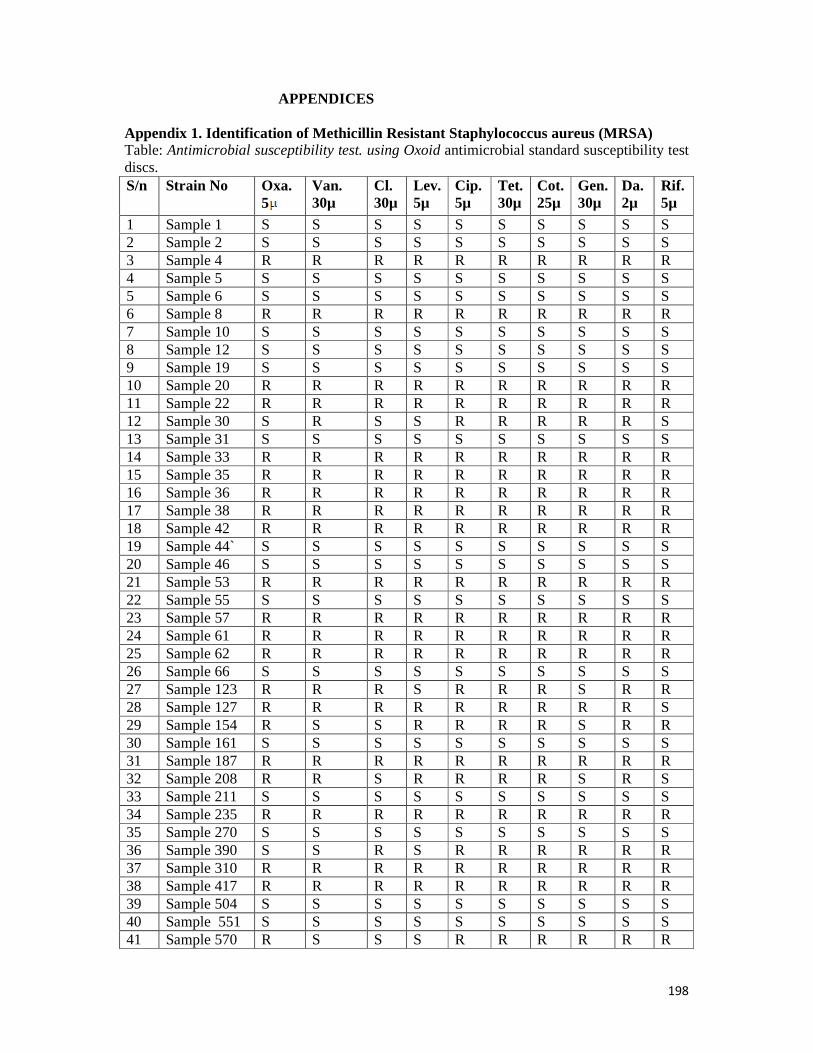
198
APPENDICES
Appendix 1. Identification of Methicillin Resistant Staphylococcus aureus (MRSA) Table: Antimicrobial susceptibility test. using Oxoid antimicrobial standard susceptibility test discs. S/n Strain No Oxa.
5 Van. 30µ
Cl. 30µ
Lev. 5µ
Cip. 5µ
Tet. 30µ
Cot. 25µ
Gen. 30µ
Da. 2µ
Rif. 5µ
1 Sample 1 S S S S S S S S S S 2 Sample 2 S S S S S S S S S S 3 Sample 4 R R R R R R R R R R 4 Sample 5 S S S S S S S S S S 5 Sample 6 S S S S S S S S S S 6 Sample 8 R R R R R R R R R R 7 Sample 10 S S S S S S S S S S 8 Sample 12 S S S S S S S S S S 9 Sample 19 S S S S S S S S S S 10 Sample 20 R R R R R R R R R R 11 Sample 22 R R R R R R R R R R 12 Sample 30 S R S S R R R R R S 13 Sample 31 S S S S S S S S S S 14 Sample 33 R R R R R R R R R R 15 Sample 35 R R R R R R R R R R 16 Sample 36 R R R R R R R R R R 17 Sample 38 R R R R R R R R R R 18 Sample 42 R R R R R R R R R R 19 Sample 44` S S S S S S S S S S 20 Sample 46 S S S S S S S S S S 21 Sample 53 R R R R R R R R R R 22 Sample 55 S S S S S S S S S S 23 Sample 57 R R R R R R R R R R 24 Sample 61 R R R R R R R R R R 25 Sample 62 R R R R R R R R R R 26 Sample 66 S S S S S S S S S S 27 Sample 123 R R R S R R R S R R 28 Sample 127 R R R R R R R R R S 29 Sample 154 R S S R R R R S R R 30 Sample 161 S S S S S S S S S S 31 Sample 187 R R R R R R R R R R 32 Sample 208 R R S R R R R S R S 33 Sample 211 S S S S S S S S S S 34 Sample 235 R R R R R R R R R R 35 Sample 270 S S S S S S S S S S 36 Sample 390 S S R S R R R R R R 37 Sample 310 R R R R R R R R R R 38 Sample 417 R R R R R R R R R R 39 Sample 504 S S S S S S S S S S 40 Sample 551 S S S S S S S S S S 41 Sample 570 R S S S R R R R R R
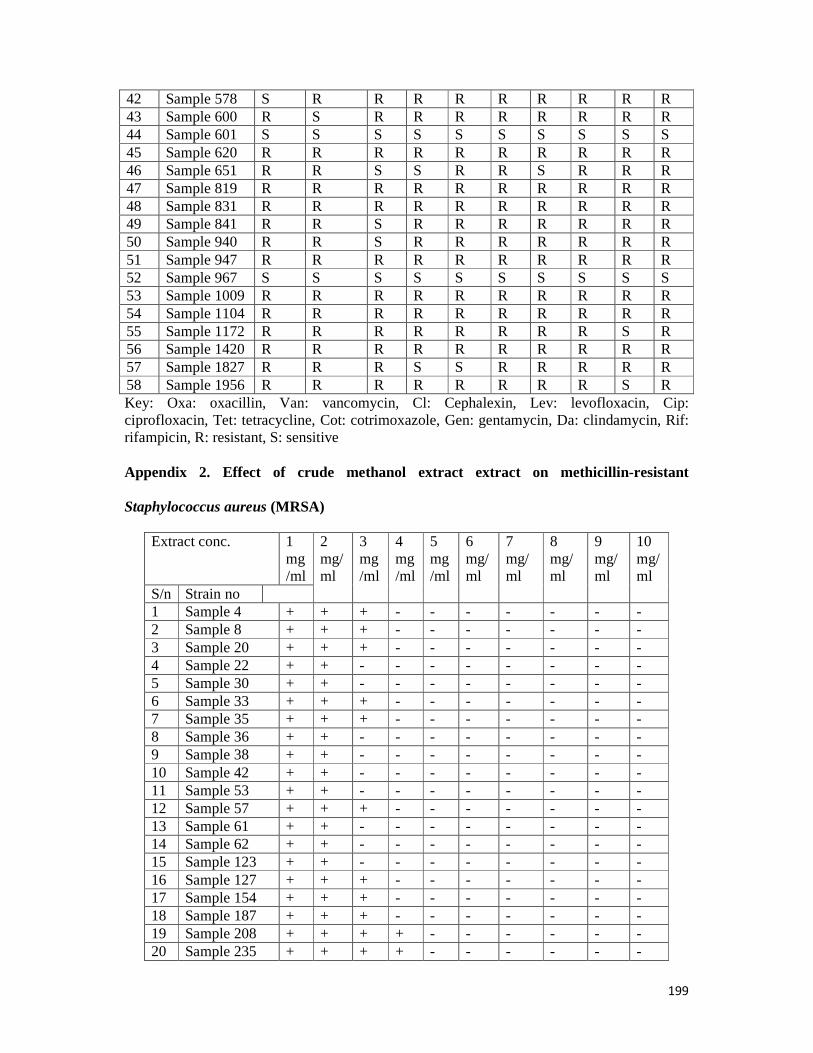
199
42 Sample 578 S R R R R R R R R R 43 Sample 600 R S R R R R R R R R 44 Sample 601 S S S S S S S S S S 45 Sample 620 R R R R R R R R R R 46 Sample 651 R R S S R R S R R R 47 Sample 819 R R R R R R R R R R 48 Sample 831 R R R R R R R R R R 49 Sample 841 R R S R R R R R R R 50 Sample 940 R R S R R R R R R R 51 Sample 947 R R R R R R R R R R 52 Sample 967 S S S S S S S S S S 53 Sample 1009 R R R R R R R R R R 54 Sample 1104 R R R R R R R R R R 55 Sample 1172 R R R R R R R R S R 56 Sample 1420 R R R R R R R R R R 57 Sample 1827 R R R S S R R R R R 58 Sample 1956 R R R R R R R R S R Key: Oxa: oxacillin, Van: vancomycin, Cl: Cephalexin, Lev: levofloxacin, Cip: ciprofloxacin, Tet: tetracycline, Cot: cotrimoxazole, Gen: gentamycin, Da: clindamycin, Rif: rifampicin, R: resistant, S: sensitive Appendix 2. Effect of crude methanol extract extract on methicillin-resistant
Staphylococcus aureus (MRSA)
Extract conc. 1 mg/ml
2 mg/ml
3 mg/ml
4 mg/ml
5 mg/ml
6 mg/ml
7 mg/ml
8 mg/ml
9 mg/ml
10 mg/ml
S/n Strain no 1 Sample 4 + + + - - - - - - - 2 Sample 8 + + + - - - - - - - 3 Sample 20 + + + - - - - - - - 4 Sample 22 + + - - - - - - - - 5 Sample 30 + + - - - - - - - - 6 Sample 33 + + + - - - - - - - 7 Sample 35 + + + - - - - - - - 8 Sample 36 + + - - - - - - - - 9 Sample 38 + + - - - - - - - - 10 Sample 42 + + - - - - - - - - 11 Sample 53 + + - - - - - - - - 12 Sample 57 + + + - - - - - - - 13 Sample 61 + + - - - - - - - - 14 Sample 62 + + - - - - - - - - 15 Sample 123 + + - - - - - - - - 16 Sample 127 + + + - - - - - - - 17 Sample 154 + + + - - - - - - - 18 Sample 187 + + + - - - - - - - 19 Sample 208 + + + + - - - - - - 20 Sample 235 + + + + - - - - - -
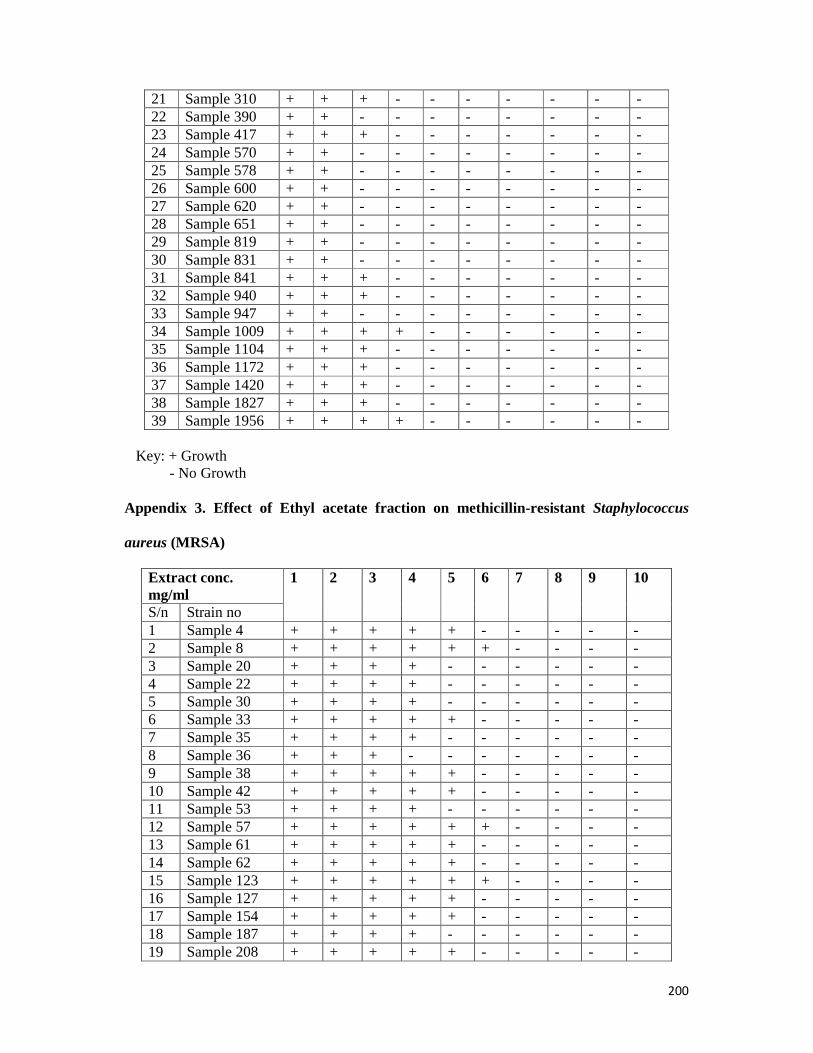
200
21 Sample 310 + + + - - - - - - - 22 Sample 390 + + - - - - - - - - 23 Sample 417 + + + - - - - - - - 24 Sample 570 + + - - - - - - - - 25 Sample 578 + + - - - - - - - - 26 Sample 600 + + - - - - - - - - 27 Sample 620 + + - - - - - - - - 28 Sample 651 + + - - - - - - - - 29 Sample 819 + + - - - - - - - - 30 Sample 831 + + - - - - - - - - 31 Sample 841 + + + - - - - - - - 32 Sample 940 + + + - - - - - - - 33 Sample 947 + + - - - - - - - - 34 Sample 1009 + + + + - - - - - - 35 Sample 1104 + + + - - - - - - - 36 Sample 1172 + + + - - - - - - - 37 Sample 1420 + + + - - - - - - - 38 Sample 1827 + + + - - - - - - - 39 Sample 1956 + + + + - - - - - -
Key: + Growth
- No Growth Appendix 3. Effect of Ethyl acetate fraction on methicillin-resistant Staphylococcus
aureus (MRSA)
Extract conc. mg/ml
1 2
3
4
5
6
7
8 9 10
S/n Strain no 1 Sample 4 + + + + + - - - - - 2 Sample 8 + + + + + + - - - - 3 Sample 20 + + + + - - - - - - 4 Sample 22 + + + + - - - - - - 5 Sample 30 + + + + - - - - - - 6 Sample 33 + + + + + - - - - - 7 Sample 35 + + + + - - - - - - 8 Sample 36 + + + - - - - - - - 9 Sample 38 + + + + + - - - - - 10 Sample 42 + + + + + - - - - - 11 Sample 53 + + + + - - - - - - 12 Sample 57 + + + + + + - - - - 13 Sample 61 + + + + + - - - - - 14 Sample 62 + + + + + - - - - - 15 Sample 123 + + + + + + - - - - 16 Sample 127 + + + + + - - - - - 17 Sample 154 + + + + + - - - - - 18 Sample 187 + + + + - - - - - - 19 Sample 208 + + + + + - - - - -

201
20 Sample 235 + + + + + - - - - - 21 Sample 390 + + + + + - - - - - 22 Sample 310 + + + + - - - - - - 23 Sample 417 + + + + - - - - - - 24 Sample 570 + + + + - - - - - - 25 Sample 578 + + + + - - - - - - 26 Sample 600 + + + + - - - - - - 27 Sample 620 + + + + - - - - - - 28 Sample 651 + + + + - - - - - - 29 Sample 819 + + + + - - - - - - 30 Sample 831 + + + + - - - - - - 31 Sample 841 + + + + + - - - - - 32 Sample 940 + + + + + + + - - - 33 Sample 947 + + + + + - - - - - 34 Sample 1009 + + + + - - - - - - 35 Sample 1104 + + + + + - - - - - 36 Sample 1172 + + + - - - - - - - 37 Sample 1420 + + + + - - - - - - 38 Sample 1827 + + + + + - - - - - 39 Sample 1956 + + + + + + - - - -
Key: + Growth
- No Growth
3 Sample 20 + + + + + + + + - - 4 Sample 22 + + + + + + + - - - 5 Sample 30 + + + + + + + + - - 6 Sample 33 + + + + + + + + - - 7 Sample 35 + + + + + + + + - - 8 Sample 36 + + + + + + + - - - 9 Sample 38 + + + + + + + - - - 10 Sample 42 + + + + + + + - - - 11 Sample 53 + + + + + + + - - - 12 Sample 57 + + + + + + + + - - 13 Sample 61 + + + + + + + + - - 14 Sample 62 + + + + + + + + - - 15 Sample 123 + + + + + + + + - - 16 Sample 127 + + + + + + + + - - 17 Sample 154 + + + + + + + + - - 18 Sample 187 + + + + + + + + - - 19 Sample 208 + + + + + + + + + - 20 Sample 235 + + + + + + + + + - 21 Sample 310 + + + + + + + - - - 22 Sample 390 + + + + + + + + - - 23 Sample 417 + + + + + + + + - - 24 Sample 570 + + + + + + + + - - 25 Sample 578 + + + + + + + + - - 26 Sample 600 + + + + + + + + - -

202
27 Sample 620 + + + + + + + - - - 28 Sample 651 + + + + + + + - - - 29 Sample 819 + + + + + + + + - - 30 Sample 831 + + + + + + + + - - 31 Sample 841 + + + + + + + + - - 32 Sample 940 + + + + + + + + - - 33 Sample 947 + + + + + + + + - - 34 Sample
1009 + + + + + + + + - -
35 Sample 1104
+ + + + + + - - - -
36 Sample 1172
+ + + + + + + - - -
37 Sample 1420
+ + + + + + + + - -
38 Sample 1827
+ + + + + + + + - -
39 Sample 1956
+ + + + + + + + - -
Key: + Growth
- No growth Appendix 4. Effect of n- hexane fraction on methicillin-resistant Staphylococcus aureus
(MRSA)
Extract conc. mg/ml
1 2
3
4
5
6
7
8 9 10
S/n Strain no 1 Sample 4 + + + + + + + - - - 2 Sample 8 + + + + + + + - - - 3 Sample 20 + + + + + + + - - - 4 Sample 22 + + + + + + - - - - 5 Sample 30 + + + + + + - - - - 6 Sample 33 + + + + + + + - - - 7 Sample 35 + + + + + + + - - - 8 Sample 36 + + + + + + + - - - 9 Sample 38 + + + + + + - - - - 10 Sample 42 + + + + + + - - - - 11 Sample 53 + + + + + + + - - - 12 Sample 57 + + + + + + + - - - 13 Sample 61 + + + + + + + - - - 14 Sample 62 + + + + + + - - - - 15 Sample 123 + + + + + + + - - - 16 Sample 127 + + + + + + + - - - 17 Sample 154 + + + + + + + - - - 18 Sample 187 + + + + + + + - - -

203
19 Sample 208 + + + + + + + - - - 20 Sample 235 + + + + + + + - - - 21 Sample 310 + + + + + + + - - - 22 Sample 390 + + + + + + + - - - 23 Sample 417 + + + + + + - - - - 24 Sample 570 + + + + + + - - - - 25 Sample 578 + + + + + + - - - - 26 Sample 600 + + + + + + - - - - 27 Sample 620 + + + + + + - - - - 28 Sample 651 + + + + + + - - - - 29 Sample 819 + + + + + + - - - - 30 Sample 831 + + + + + + - - - - 31 Sample 841 + + + + + + + - - - 32 Sample 940 + + + + + + + - - - 33 Sample 947 + + + + + + + - - - 34 Sample 1009 + + + + + + + - - - 35 Sample 1104 + + + + + + - - - - 36 Sample 1172 + + + + + + - - - - 37 Sample 1420 + + + + + + - - - - 38 Sample 1827 + + + + + + + - - - 39 Sample 1956 + + + + + + + - - - Key: + Growth
- No Growth -
Appendix 5. Effect of methanol fraction on methicillin-resistant Staphylococcus aureus (MRSA)
Extract conc. mg/ml
1 2
3
4
5
6
7
8 9 10
S/n Strain no 1 Sample 4 + + + + + + + + + + 2 Sample 8 + + + + + + + + + + 3 Sample 20 + + + + + + + + + + 4 Sample 22 + + + + + + + + + - 5 Sample 30 + + + + + + + + + - 6 Sample 33 + + + + + + + + + + 7 Sample 35 + + + + + + + + + + 8 Sample 36 + + + + + + + + + - 9 Sample 38 + + + + + + + + + - 10 Sample 42 + + + + + + + + + - 11 Sample 53 + + + + + + + + + - 12 Sample 57 + + + + + + + + + + 13 Sample 61 + + + + + + + + + - 14 Sample 62 + + + + + + + + + - 15 Sample 123 + + + + + + + + + - 16 Sample 127 + + + + + + + + + + 17 Sample 154 + + + + + + + + + + 18 Sample 187 + + + + + + + + + +

204
19 Sample 208 + + + + + + + + + + 20 Sample 235 + + + + + + + + + + 21 Sample 310 + + + + + + + + + + 22 Sample 390 + + + + + + + + + - 23 Sample 417 + + + + + + + + - - 24 Sample 570 + + + + + + + + - - 25 Sample 578 + + + + + + + + - - 26 Sample 600 + + + + + + + + - - 27 Sample 620 + + + + + + + + - - 28 Sample 651 + + + + + + + + + + 29 Sample 819 + + + + + + + + + + 30 Sample 831 + + + + + + + + + + 31 Sample 841 + + + + + + + + + + 32 Sample 940 + + + + + + + + + + 33 Sample 947 + + + + + + + + + + 34 Sample 1009 + + + + + + + + - - 35 Sample 1104 + + + + + + + + + - 36 Sample 1172 + + + + + + + + + - 37 Sample 1420 + + + + + + + + + - 38 Sample 1827 + + + + + + + + + - 39 Sample 1956 + + + + + + + + - -
Appendix 6. GC-MS report of ethyl acetate fraction
Structural analogue Rt (min) Area % Peak Stigmast-4-en-3-one , Cholest-4-en-26-oic acid, 3-oxo-Cholest-4-en-3-one
46.49 8.72 1
5-Bromovaleric acid, 2,6-dimethylnon-1-en-3-yn-5-yl ester , Cyclobuta [1,2:3,4]dicyclooctene-1,7(2H,6bH)-dione.
46.58 3.19 2
3-Chloropropionic acid, 2,6-dimethylnon-1-en-3-yn-5-yl ester, 2-Amino-4-methyl-3-pyridinol, Pregn-4-en-3-one.
46.62 5.80 3
4,22-Stigmastadiene-3-one, 24S--Ethyl-5.alpha.-cholesta-2-dien-6-one, Spinasterone
48.54 12.29 4
4,22-Stigmastadiene-3-one, 4,22-Cholestadien-3-one , Ergosta-4,22-dien-3-one
48.62 10.73 5
9,19-Cycloergost-24(28)-en-3-ol, 4 ,14-dimethyl-,(3.beta.,4.alpha.,5 .alpha.)-7-(1,3-Dimethylbuta-1,3-dienyl)-1,6,6-trimethyl-3,8-dioxatricyclo[5. (2,4)]Octane 2(1H)-Naphthalenone.
49.97 2.89 6
11,13-Dimethyl-12-tetradecen-1-ol, Bicyclo[5.2.0]nonane, 4-methylene-2,8,8-trimethyl-2-vinyl(E,E,E)-3,7,11,15-Tetramethylhexadeca1,3,6,10,14-pentaene.
50.49 2.28 7
9,19-Cycloergost-24(28)-en-3-ol ,14-dimethyl-(3.beta.,4 .alpha.,5.alpha.)-9,19-Cyclolanostan-3-ol,
50.52 2.57 8
Stigmast-4-en-3-one, Cholest-4-en-26-oic acid, 3-oxo- 1,4-Benzenediol, 51.34 28.23 9 Supraene, Octasiloxane, 1,1,3,3,5,5,7,7,9,92511,11,13,13,15,15-hexadecamethyl-17-(1,5-Dimethylhexyl)-10,13 dimethyl4vinylhexadecahydrocyclopenta [a]phenanthren-3-ol
52.51 1.39 10
17-(1,5-Dimethylhexyl)-10,13-dimethyl4vinylhexadecahydrocyclopenta [a]phenanthren-3-ol, Stigma sterol , 2,2-Dimethylpropanoic acid, 2,6-
52.52 1.18 11
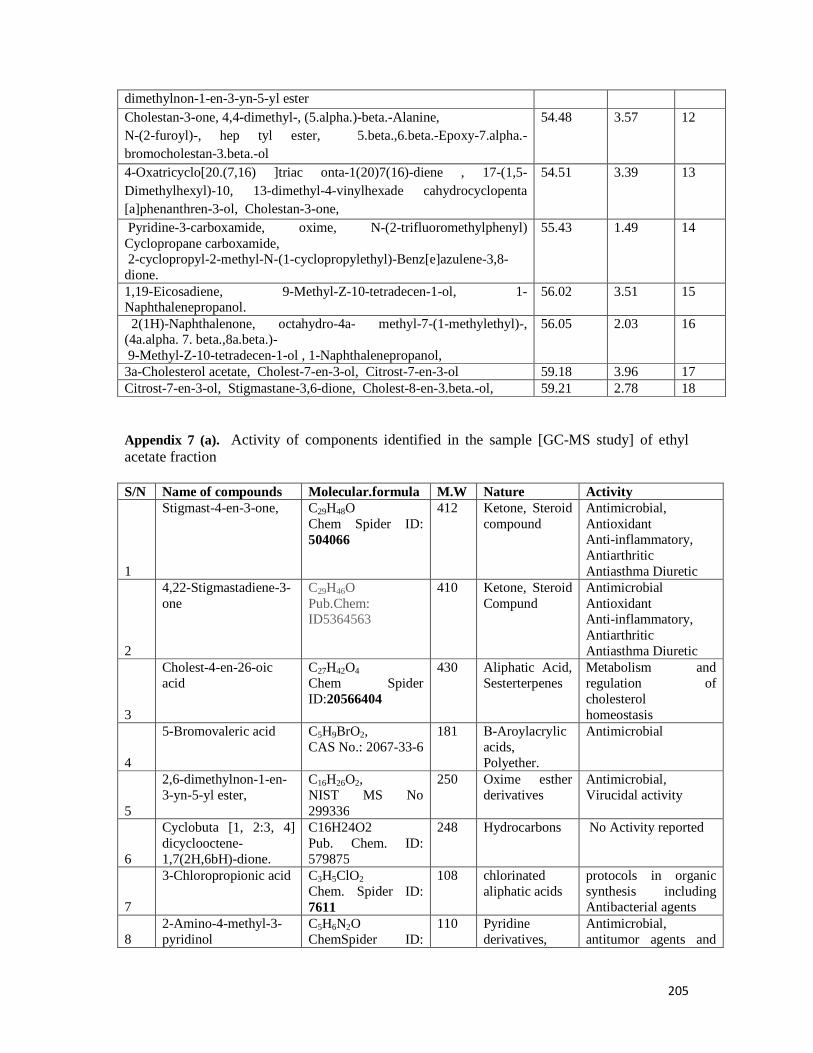
205
Appendix 7 (a). Activity of components identified in the sample [GC-MS study] of ethyl acetate fraction S/N Name of compounds Molecular.formula M.W Nature Activity
1
Stigmast-4-en-3-one,
C29H48O Chem Spider ID: 504066
412 Ketone, Steroid compound
Antimicrobial, Antioxidant Anti-inflammatory, Antiarthritic Antiasthma Diuretic
2
4,22-Stigmastadiene-3-one
C29H46O Pub.Chem: ID5364563
410 Ketone, Steroid Compund
Antimicrobial Antioxidant Anti-inflammatory, Antiarthritic Antiasthma Diuretic
3
Cholest-4-en-26-oic acid
C27H42O4
Chem Spider ID:20566404
430 Aliphatic Acid, Sesterterpenes
Metabolism and regulation of cholesterol homeostasis
4
5-Bromovaleric acid C5H9BrO2, CAS No.: 2067-33-6
181 Β-Aroylacrylic acids, Polyether.
Antimicrobial
5
2,6-dimethylnon-1-en-3-yn-5-yl ester,
C16H26O2, NIST MS No 299336
250 Oxime esther derivatives
Antimicrobial, Virucidal activity
6
Cyclobuta [1, 2:3, 4] dicyclooctene-1,7(2H,6bH)-dione.
C16H24O2 Pub. Chem. ID: 579875
248 Hydrocarbons No Activity reported
7
3-Chloropropionic acid C3H5ClO2
Chem. Spider ID: 7611
108 chlorinated aliphatic acids
protocols in organic synthesis including Antibacterial agents
8 2-Amino-4-methyl-3-pyridinol
C5H6N2O ChemSpider ID:
110 Pyridine derivatives,
Antimicrobial, antitumor agents and
dimethylnon-1-en-3-yn-5-yl ester Cholestan-3-one, 4,4-dimethyl-, (5.alpha.)-beta.-Alanine, N-(2-furoyl)-, hep tyl ester, 5.beta.,6.beta.-Epoxy-7.alpha.-bromocholestan-3.beta.-ol
54.48 3.57 12
4-Oxatricyclo[20.(7,16) ]triac onta-1(20)7(16)-diene , 17-(1,5-Dimethylhexyl)-10, 13-dimethyl-4-vinylhexade cahydrocyclopenta [a]phenanthren-3-ol, Cholestan-3-one,
54.51 3.39 13
Pyridine-3-carboxamide, oxime, N-(2-trifluoromethylphenyl) Cyclopropane carboxamide, 2-cyclopropyl-2-methyl-N-(1-cyclopropylethyl)-Benz[e]azulene-3,8-dione.
55.43 1.49 14
1,19-Eicosadiene, 9-Methyl-Z-10-tetradecen-1-ol, 1-Naphthalenepropanol.
56.02 3.51 15
2(1H)-Naphthalenone, octahydro-4a- methyl-7-(1-methylethyl)-, (4a.alpha. 7. beta.,8a.beta.)- 9-Methyl-Z-10-tetradecen-1-ol , 1-Naphthalenepropanol,
56.05 2.03 16
3a-Cholesterol acetate, Cholest-7-en-3-ol, Citrost-7-en-3-ol 59.18 3.96 17 Citrost-7-en-3-ol, Stigmastane-3,6-dione, Cholest-8-en-3.beta.-ol, 59.21 2.78 18
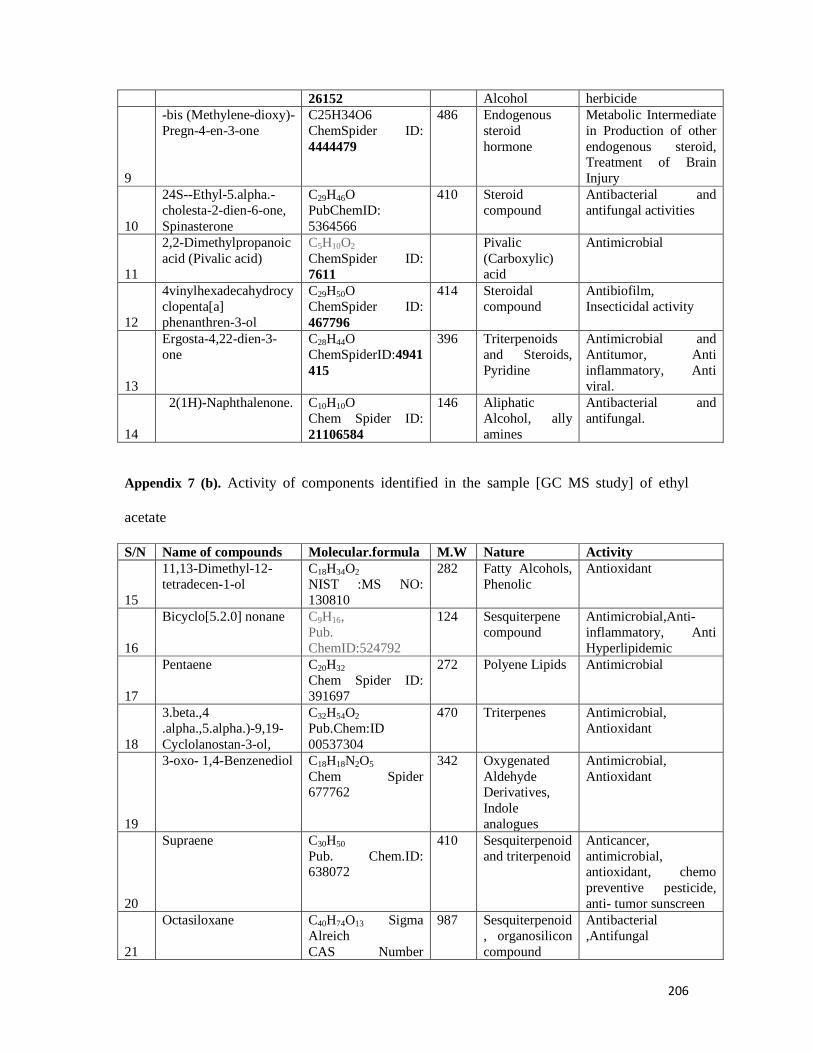
206
26152 Alcohol herbicide
9
-bis (Methylene-dioxy)-Pregn-4-en-3-one
C25H34O6 ChemSpider ID: 4444479
486 Endogenous steroid hormone
Metabolic Intermediate in Production of other endogenous steroid, Treatment of Brain Injury
10
24S--Ethyl-5.alpha.-cholesta-2-dien-6-one, Spinasterone
C29H46O PubChemID: 5364566
410 Steroid compound
Antibacterial and antifungal activities
11
2,2-Dimethylpropanoic acid (Pivalic acid)
C5H10O2
ChemSpider ID: 7611
Pivalic (Carboxylic) acid
Antimicrobial
12
4vinylhexadecahydrocyclopenta[a] phenanthren-3-ol
C29H50O ChemSpider ID: 467796
414 Steroidal compound
Antibiofilm, Insecticidal activity
13
Ergosta-4,22-dien-3-one
C28H44O ChemSpiderID:4941415
396 Triterpenoids and Steroids, Pyridine
Antimicrobial and Antitumor, Anti inflammatory, Anti viral.
14
2(1H)-Naphthalenone. C10H10O Chem Spider ID: 21106584
146 Aliphatic Alcohol, ally amines
Antibacterial and antifungal.
Appendix 7 (b). Activity of components identified in the sample [GC MS study] of ethyl
acetate
S/N Name of compounds Molecular.formula M.W Nature Activity
15
11,13-Dimethyl-12-tetradecen-1-ol
C18H34O2 NIST :MS NO: 130810
282 Fatty Alcohols, Phenolic
Antioxidant
16
Bicyclo[5.2.0] nonane C9H16, Pub. ChemID:524792
124 Sesquiterpene compound
Antimicrobial,Anti-inflammatory, Anti Hyperlipidemic
17
Pentaene C20H32 Chem Spider ID: 391697
272 Polyene Lipids Antimicrobial
18
3.beta.,4 .alpha.,5.alpha.)-9,19-Cyclolanostan-3-ol,
C32H54O2 Pub.Chem:ID 00537304
470 Triterpenes Antimicrobial, Antioxidant
19
3-oxo- 1,4-Benzenediol C18H18N2O5 Chem Spider 677762
342 Oxygenated Aldehyde Derivatives, Indole analogues
Antimicrobial, Antioxidant
20
Supraene C30H50 Pub. Chem.ID: 638072
410 Sesquiterpenoid and triterpenoid
Anticancer, antimicrobial, antioxidant, chemo preventive pesticide, anti- tumor sunscreen
21
Octasiloxane C40H74O13 Sigma Alreich CAS Number
987 Sesquiterpenoid, organosilicon compound
Antibacterial ,Antifungal

207
352538-83-1
22
4, 4-dimethyl-, (5.alpha.)-beta.-Alanine (3-aminopropanoic acid)
C14H16N2O2 ChemSpider ID: 580864
244 Organ peptide macro cyclic compounds
Antimicrobial
23
Pyridine-3-carboxamide
C6H6N218O ChemSpider ID: 9334423
124 Nicotinamide, Nicotine Amines.
Antiviral, Anticancer , antiprotozoa
24
Oxime C3H7NO ChemSpider ID: 60524
73 Natural Phenolic compound
Antioxidant, Antibacteria and anticancer agent
25
N-(2-trifluoromethylphenyl) Cyclopropane carboxamide,
C15H18F3NO Pub. Chem ID 00722477
285 Aliphatic Hydrocarbon
Pesticides in domestic animals
26
Citrost-7-en-3-ol C30H52O Pub. Chem.ID: 541368
428 Aliphatic Alcohol Compound
Antimicrobial, Antioxidants
27
1-Naphthalenepropanol C13 H15 N O CAS No.: 19352-04-6
201 Phenolic compound
Antimicrobial and Antifungal
Appendix 8 (a). GC-MS report of dichloromethane fraction
Structural analogue Rt(min) Area % Peak Benzylamine 11.33 0.46 1 Benzyl isocyanate, Phthalimidin 16.87 1.96 2 3-Methyl-4-isopropylphenol , Thymol , 2-methyl-5-(1-methylethyl) Phenol
25.97 1.57 3
N-Benzylformamide 30.21 0.68 4 Acetamide, N-(phenyl methyl)- 2-Methyl-5-butylpyridine , Dimethyl (1E)-N-hydroxyethanimidoy lphosphonate
32.09 2.78 5
Humulene 32.35 0.56 6 1,6-Cyclodecadiene, 1-methyl-5-methylene-8-(1-methylethyl)-1H Cyclopenta[1,3]cyclopropa[1,2]benzene, octahydro-7-methyl-3-methylene-4-(1-methylethyl)-[3aS-(3a alpha.,3b.beta.,4.beta.,7.alpha.,7 aS*)]-.beta.-copaene
33.57 0.77 7
1, 2, 3, 5, 6, 8a-hexahydr-4,7-dimethyl-1-(1-methylethyl)-,(1S-cis)-Naphthalene.
35.41 1.06 8
tau.-Muurolol, alpha-Cadinol , cis-muurola-3,5-diene 40.21 0.99 9 .alpha-Cadinol, Cyclohexane, 1-ethenyl-1-methyl-2- (1-methylethenyl)-4-(1-methylethylidene)-Epiglobulol
40.71 1.70 10
Hexadecanoic acid, Pentadecanoic acid, 14-methyl-,methyl ester 50.64 5.89 11 n-Hexadecanoic acid 52.16 1.42 12 Cyclopropaneoctanoic acid, 2- methyl ester 9-Octadecenoic acid, (Z)-methyl Ster,cis-10-Heptadecenoic acid.
53.39 0.67 13
Heptadecanoic acid, Hexadecanoic acid. 53.92 0.39 14 9,12-Octadecadienoic acid, 10,13-Octadecadienoic acid, 56.07 4.29 15 9-Octadecenoic acid , 8-Octadecenoic acid, methyl ester 56.26 3.32 16 9-Octadecenoic acid, 11-Octadecenoic acid, 56.44 0.96 17 Methyl stearate 57.11 1.28 18 Urea, N,N'-bis(phenyl methyl)-Benzeneacetamide, alpha.-amino-Benzene acetic acid,
64.34 1.87 19
Docosanoic acid, methyl ester, Tricosanoic acid, methyl ester 68.62 0.53 20
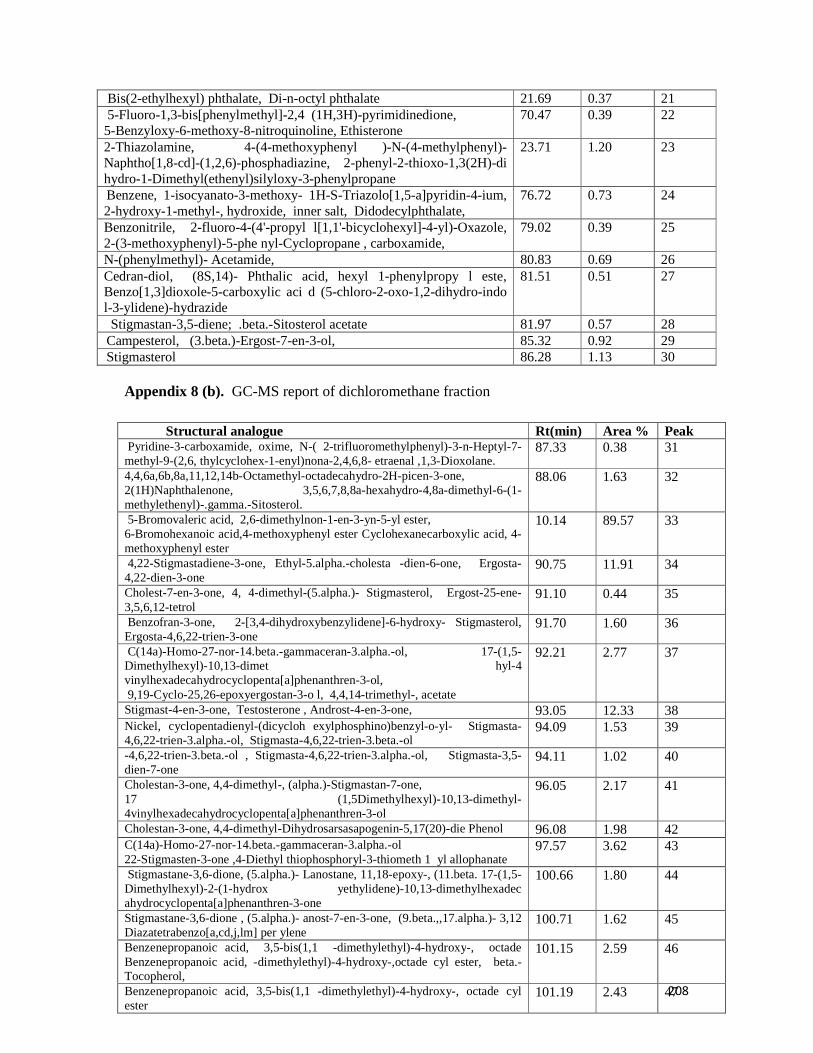
208
Appendix 8 (b). GC-MS report of dichloromethane fraction
Bis(2-ethylhexyl) phthalate, Di-n-octyl phthalate 21.69 0.37 21 5-Fluoro-1,3-bis[phenylmethyl]-2,4 (1H,3H)-pyrimidinedione, 5-Benzyloxy-6-methoxy-8-nitroquinoline, Ethisterone
70.47 0.39 22
2-Thiazolamine, 4-(4-methoxyphenyl )-N-(4-methylphenyl)-Naphtho[1,8-cd]-(1,2,6)-phosphadiazine, 2-phenyl-2-thioxo-1,3(2H)-di hydro-1-Dimethyl(ethenyl)silyloxy-3-phenylpropane
23.71 1.20 23
Benzene, 1-isocyanato-3-methoxy- 1H-S-Triazolo[1,5-a]pyridin-4-ium, 2-hydroxy-1-methyl-, hydroxide, inner salt, Didodecylphthalate,
76.72 0.73 24
Benzonitrile, 2-fluoro-4-(4'-propyl l[1,1'-bicyclohexyl]-4-yl)-Oxazole, 2-(3-methoxyphenyl)-5-phe nyl-Cyclopropane , carboxamide,
79.02 0.39 25
N-(phenylmethyl)- Acetamide, 80.83 0.69 26 Cedran-diol, (8S,14)- Phthalic acid, hexyl 1-phenylpropy l este, Benzo[1,3]dioxole-5-carboxylic aci d (5-chloro-2-oxo-1,2-dihydro-indo l-3-ylidene)-hydrazide
81.51 0.51 27
Stigmastan-3,5-diene; .beta.-Sitosterol acetate 81.97 0.57 28 Campesterol, (3.beta.)-Ergost-7-en-3-ol, 85.32 0.92 29 Stigmasterol 86.28 1.13 30
Structural analogue Rt(min) Area % Peak Pyridine-3-carboxamide, oxime, N-( 2-trifluoromethylphenyl)-3-n-Heptyl-7-methyl-9-(2,6, thylcyclohex-1-enyl)nona-2,4,6,8- etraenal ,1,3-Dioxolane.
87.33 0.38 31
4,4,6a,6b,8a,11,12,14b-Octamethyl-octadecahydro-2H-picen-3-one, 2(1H)Naphthalenone, 3,5,6,7,8,8a-hexahydro-4,8a-dimethyl-6-(1-methylethenyl)-.gamma.-Sitosterol.
88.06 1.63 32
5-Bromovaleric acid, 2,6-dimethylnon-1-en-3-yn-5-yl ester, 6-Bromohexanoic acid,4-methoxyphenyl ester Cyclohexanecarboxylic acid, 4-methoxyphenyl ester
10.14 89.57 33
4,22-Stigmastadiene-3-one, Ethyl-5.alpha.-cholesta -dien-6-one, Ergosta-4,22-dien-3-one
90.75 11.91 34
Cholest-7-en-3-one, 4, 4-dimethyl-(5.alpha.)- Stigmasterol, Ergost-25-ene-3,5,6,12-tetrol
91.10 0.44 35
Benzofran-3-one, 2-[3,4-dihydroxybenzylidene]-6-hydroxy- Stigmasterol, Ergosta-4,6,22-trien-3-one
91.70 1.60 36
C(14a)-Homo-27-nor-14.beta.-gammaceran-3.alpha.-ol, 17-(1,5-Dimethylhexyl)-10,13-dimet hyl-4 vinylhexadecahydrocyclopenta[a]phenanthren-3-ol, 9,19-Cyclo-25,26-epoxyergostan-3-o l, 4,4,14-trimethyl-, acetate
92.21 2.77 37
Stigmast-4-en-3-one, Testosterone , Androst-4-en-3-one, 93.05 12.33 38 Nickel, cyclopentadienyl-(dicycloh exylphosphino)benzyl-o-yl- Stigmasta-4,6,22-trien-3.alpha.-ol, Stigmasta-4,6,22-trien-3.beta.-ol
94.09 1.53 39
-4,6,22-trien-3.beta.-ol , Stigmasta-4,6,22-trien-3.alpha.-ol, Stigmasta-3,5-dien-7-one
94.11 1.02 40
Cholestan-3-one, 4,4-dimethyl-, (alpha.)-Stigmastan-7-one, 17 (1,5Dimethylhexyl)-10,13-dimethyl-4vinylhexadecahydrocyclopenta[a]phenanthren-3-ol
96.05 2.17 41
Cholestan-3-one, 4,4-dimethyl-Dihydrosarsasapogenin-5,17(20)-die Phenol 96.08 1.98 42 C(14a)-Homo-27-nor-14.beta.-gammaceran-3.alpha.-ol 22-Stigmasten-3-one ,4-Diethyl thiophosphoryl-3-thiometh 1 yl allophanate
97.57 3.62 43
Stigmastane-3,6-dione, (5.alpha.)- Lanostane, 11,18-epoxy-, (11.beta. 17-(1,5-Dimethylhexyl)-2-(1-hydrox yethylidene)-10,13-dimethylhexadec ahydrocyclopenta[a]phenanthren-3-one
100.66 1.80 44
Stigmastane-3,6-dione , (5.alpha.)- anost-7-en-3-one, (9.beta.,,17.alpha.)- 3,12 Diazatetrabenzo[a,cd,j,lm] per ylene
100.71 1.62 45
Benzenepropanoic acid, 3,5-bis(1,1 -dimethylethyl)-4-hydroxy-, octade Benzenepropanoic acid, -dimethylethyl)-4-hydroxy-,octade cyl ester, beta.-Tocopherol,
101.15 2.59 46
Benzenepropanoic acid, 3,5-bis(1,1 -dimethylethyl)-4-hydroxy-, octade cyl ester
101.19 2.43 47

209
Appendix 9 (a). Activity of components identified in the sample [GC MS study] DCM fraction
S/N Name of Compounds Molecular Formula
M.W Nature Activity
1 Benzylamine C7H9N Chem Spider ID7223 107
Alkaloids Antimicrobial
2 Benzyl isocyanate C10H14O Chem.Bk:2491615 150
Aromatic compound
Antimicrobial, Antitumor, Antiviral
3 Phthalimidin C8H7NO2
Pub. Chem ID171091 149
Organic Compound, phthalic anhydride
Antibacterial, Antifungal
4 3-Methyl-4-isopropylphenol, Thymol, 2-methyl-5-(1-methylethyl) Phenol
C10H14O Lun.Chem:3228-02-2
150
Aromatic Alcohol, Monoterpines, Phenol Derivative
Antiviral, Antibacterial and Antifungal Activities
5 N-Benzylformamide C8H9NO Pub. chem. ID:80654 135
Peptide, Amide Derivatives
Antimicrobial, Antimalaria[
6 Acetamide C2H5NO Pub. Chem: ID 178 59
Peptide, Amide Derivative
Anti cancer, Anti inflammatory, Antioxidant
7 N-(phenyl methyl)- 2-Methyl-5-butylpyridine
C12H11N,Guide.Chem CAS27012-22-2 169
Esther, Pyridine Derivative
Antimicrobial analogues
8 Dimethyl (1E)-N-hydroxyethanimidoy lphosphonate
C10H21ClN2O2
MFCD08457445 236
Piperidine carboxylic acid, Isoprenoid
Antibacterial and Ant parasitic drug
9 Humulene C15H24 Pub Chem:5281520 204
monocyclic sesquiterpene
Antimicrobial and Antitumor activity
10 1,6-Cyclodecadiene C10H16 Chem Spider ID: 4517601 136
Antimicrobial and Antifungal activity
11 1-methyl-5-methylene-8-(1-methylethyl)-1H Cyclopenta[1,3]cyclopropa[1,2]benzene
C15H24 Look Chem
CAS 13744-15-5
204
Aromatic compound
Antioxidant, Antimicrobial and Insecticidal agent,
12 7 aS*)]-.beta-copaene C15H24ChemSpider ID: 10306774 204
A tricyclic sesquiterpene
Antimicrobial
13 1, 2, 3, 5, 6, 8a-hexahydr-4,7-dimethyl-1-(1-methylethyl)-,(1S-cis)-Naphthalene
C15H24 ChemSpider ID: 389830
204
Aliphatic Alcohol Antimicrobial and Antifungal Activity
14 alpha-Cadinol C15H26O ChemSpider ID: 8574094 222
Phenol Antimicrobial, Antifungal, Anticancer
15 cis-muurola-3,5-diene C15H24 (CHEBI:61687) 204
carbobicyclic compound ,sesquiterpene
Antibacterial, Antioxidants
16 Hexadecanoic acid (Palmitic Acid)
C16H32O2 ChemSpider ID: 960
256
Ester, Fatty Acid Antibacterial, Anti-inflammatory, Antitumor
17 Pentadecanoic acid C15H30O2 ChemSpider ID: 13249 242
Saturated Fatty Acid
Antibacterial, Antifungal activity
18 Cyclohexane, 1-ethenyl-1-methyl-2- (1-methylethenyl)-4-(1-methylethylidene)-Epiglobulol
C6H12 ChemSpider ID: 7787
84
Aromatic Phenols Cytotoxic, Antimicrobial, Antifungal, Antioxidant

210
Appendix 9 (b). Activity of components identified in the sample [GC MS study] of DCM fraction
S/N Name of Compounds Molecular Formula
M.W Nature Activity
19 Cyclopropaneoctanoic acid C22H38O2 NIST
CAS 10152-71-3 334 Natural alicyclic fatty acids
Antimicrobial [370]
20 2-methyl ester 9-Octadecenoic acid, Methyl stearate
C19H36O2, NIST
CAS 1937-62-8 296 Ester Antioxidant activity,
Ant carcinogenic,-exist in human blood and urine and serve as endogenous peroxisome proliferatoractivated receptor ligand, dermatitigenic flavor
21 Heptadecenoic acid C17H32O2. Pub. Chem CID 5312435 268
Fatty Acid Antifungal
22 Urea CH4N2O Chem
Spider ID: 1143 60 Organic Compound
Antimicrobial
23
N,N'-bis(phenyl methyl)-Benzeneacetamide
C14H21 N O, Guide Chem CAS. 34251-46-2 219
Endogenous Peptide
Antimicrobials, Herbicidal
24 alpha.-amino-Benzene acetic acid
C8H9NO2. Chemical Book CAS 2835-06-5 151
Carboxylic Acid, Amino Acid, Ester
Antibacterial and Antifungal
25 Docosanoic acid (Behenic Acid)
C22H44O2 Pub. Chem ID 8215 340
Saturated Fatty Acid
Antibacterial
26
Tricosanoic acid C23H46O2. Pub. Chem CID 17085 354
Long Chain Fatty Acid
Antimicrobial and Insecticidal activity
27
5-Fluoro-1,3-bis[phenylmethyl]-2,4 (1H,3H)-pyrimidinedione,
C18H15FN2O2 ChemSpider ID: 309662 310
Peptides Antiglioma, Antimicrobial, Cytotoxic
28
5-Benzyloxy-6-methoxy-8-nitroquinoline
C17H14N2O4.
Pub. Chem 563944 310 Quinolines, Ethyl
Esther Antitumor Antibiotic, Antimalarial, Antileishmanial, Antimicrobial
29 Ethisterone C21H28O2
Pub Chem 5284557 312 Steroid Hormone Antibacterial and Antitumor
30
2-Thiazolamine C3H4N2S CAS 96-50-4
100 Hydrazine derivatives, Heterocyclic Amine
Antimicrobial, Anti-infective and Antioxidant
31
]-(1,2,6)-phosphadiazine
C16H13N2PS Chem Spider 544268
296 Hydrazine derivatives
Antimicrobial(Topical) Agents
32
Dimethyl(ethenyl)silyloxy-3-phenylpropane
C13H20OS Pub. Chem 00576332
220 Pyridine Derivatives
Antimicrobial
33
Didodecylphthalate C24H38O4 ChemSpider ID: 8043
390 Carboxylic Acid Antimicrobial, Food Preservative
34
Cedran-diol C15H26O2
Pub Chem 536384 238 Flavonoids Antimicrobial
anti inflammatory, anticancer

211
Appendix 9 (c). Activity of components identified in the sample [GC MS study] of DCM fraction
S/N Name of Compounds Molecular Formula
M.W Nature Activity
35
Inner salt C11H23COHNSO3
EC N0 226-003-9 292 sulfonium salts Antimicrobial and
Antifunga l
36
2-fluoro-4-(4'-propyl l[1,1'-bicyclohexyl]-4-yl)-Oxazole
C26H40O5, CAS 913258-34-1
432 Carboxylic Acids, Diterpines
Antimicrobial
37
Benzonitrile C7H5N Chem Spider ID: 7224
103 benzo and naphthonitrile derivatives.
Antibacterial and Antifungal
38 Benzene C6H6 78 Aromatic
Compound Antibacterial and Antifungal
39
2-(3-methoxyphenyl)-5-phenyl-Cyclopropan-1- carboxamide
C24H20FNO4
Pub. ChemID 59206456
405 Carboxylic Acid Anticonvulsant, Antituberculosis
40
N-(phenylmethyl)-Acetamide,
C9H11NO ChemSpider ID: 11016
149 Peptide Amide Derivative
Trypanosidal, Antibacterial Antifungal
41
(5-chloro-2-oxo-1,2-dihydro-indo l-3-ylidene)-hydrazide
Isatin, Imidazoline Antibacterial, antifungal, Anticancer, Antihelmintic
42
Stigmastan-3,5-diene C29H48
Pub Chem ID 00525918
396 Steroid compound Antifungal, Antibacterial Antioxidant
43 beta.-Sitosterol acetate C29H50O
CAS 83-46-5 414 Plant Sterols Benign prostatic
hyperplasia, Antimicrobial
44 Campesterol C28H48O 400 Steroidal
compound Antimicrobial, Antileishmanial
45
(3.beta.)-Ergost-7-en-3-ol, C28H48O Pub. Chem ID 86509
400 Fatty Alcohols, Steroid compound
Antibacterial, Anticandidasis, Antioxidant.
46
Stigmasterol C29H48O Chem Spider ID: 504066
412 Fatty Alcohols, Steroid compound
Antimicrobial Antioxidant Anti-inflammatory, Antiarthritic Antiasthma Diuretic
47 Pyridine-3-carboxamide C8H7N3O
Pub.Chem CID 80322 161 Nicotinamide,
Nicotine Amines. Antiviral, Anticancer, antiprotozoa
48
Oxime C3H7NO ChemSpider ID: 60524
73 Natural Phenolic flavonoid
Antioxidant, Antibacteria and anticancer agent
49
N-( 2-trifluoromethylphenyl)-3-n-Heptyl-7-methyl-9-(2,6, thylcyclohex-1-enyl)nona-2,4,6,8- etraenal
Alkyl Esthers useful for inhibiting the delta isoform of PI3K, and for treating disorders mediated by lipid kinases such as inflammation, immunological, and cancer .
50
1,3-Dioxolane C3H6O2 CB 5712494
74 Aprotic solvent, Ether
Intermediate for the preparation of Acyclovir-d4, Antibacterial
51 14b-Octamethyl-octadecahydro-2H-picen-3-
C30H48O Pub.Chem ID 612782
424 Triterpine Antibiotic Prototype, Antioxidant
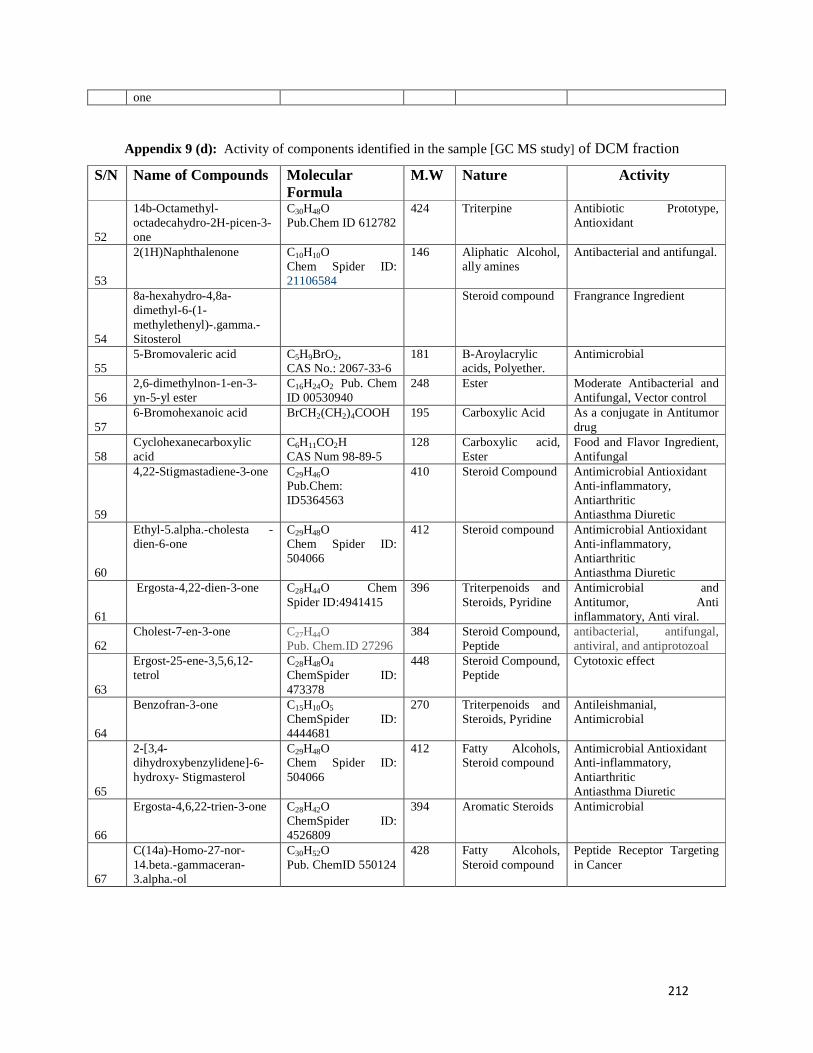
212
one
Appendix 9 (d): Activity of components identified in the sample [GC MS study] of DCM fraction
S/N Name of Compounds Molecular Formula
M.W Nature Activity
52
14b-Octamethyl-octadecahydro-2H-picen-3-one
C30H48O Pub.Chem ID 612782
424 Triterpine Antibiotic Prototype, Antioxidant
53
2(1H)Naphthalenone C10H10O Chem Spider ID: 21106584
146 Aliphatic Alcohol, ally amines
Antibacterial and antifungal.
54
8a-hexahydro-4,8a-dimethyl-6-(1-methylethenyl)-.gamma.-Sitosterol
Steroid compound Frangrance Ingredient
55 5-Bromovaleric acid C5H9BrO2,
CAS No.: 2067-33-6 181 Β-Aroylacrylic
acids, Polyether. Antimicrobial
56 2,6-dimethylnon-1-en-3-yn-5-yl ester
C16H24O2 Pub. Chem ID 00530940
248 Ester Moderate Antibacterial and Antifungal, Vector control
57 6-Bromohexanoic acid BrCH2(CH2)4COOH 195 Carboxylic Acid As a conjugate in Antitumor
drug
58 Cyclohexanecarboxylic acid
C6H11CO2H CAS Num 98-89-5
128 Carboxylic acid, Ester
Food and Flavor Ingredient, Antifungal
59
4,22-Stigmastadiene-3-one C29H46O Pub.Chem: ID5364563
410 Steroid Compound Antimicrobial Antioxidant Anti-inflammatory, Antiarthritic Antiasthma Diuretic
60
Ethyl-5.alpha.-cholesta -dien-6-one
C29H48O Chem Spider ID: 504066
412 Steroid compound Antimicrobial Antioxidant Anti-inflammatory, Antiarthritic Antiasthma Diuretic
61
Ergosta-4,22-dien-3-one C28H44O Chem Spider ID:4941415
396 Triterpenoids and Steroids, Pyridine
Antimicrobial and Antitumor, Anti inflammatory, Anti viral.
62 Cholest-7-en-3-one C27H44O
Pub. Chem.ID 27296 384 Steroid Compound,
Peptide antibacterial, antifungal, antiviral, and antiprotozoal
63
Ergost-25-ene-3,5,6,12-tetrol
C28H48O4 ChemSpider ID: 473378
448 Steroid Compound, Peptide
Cytotoxic effect
64
Benzofran-3-one C15H10O5 ChemSpider ID: 4444681
270 Triterpenoids and Steroids, Pyridine
Antileishmanial, Antimicrobial
65
2-[3,4-dihydroxybenzylidene]-6-hydroxy- Stigmasterol
C29H48O Chem Spider ID: 504066
412 Fatty Alcohols, Steroid compound
Antimicrobial Antioxidant Anti-inflammatory, Antiarthritic Antiasthma Diuretic
66
Ergosta-4,6,22-trien-3-one C28H42O ChemSpider ID: 4526809
394 Aromatic Steroids Antimicrobial
67
C(14a)-Homo-27-nor-14.beta.-gammaceran-3.alpha.-ol
C30H52O Pub. ChemID 550124
428 Fatty Alcohols, Steroid compound
Peptide Receptor Targeting in Cancer

213
Appendix 9 (e). Activity of components identified in the sample [GC MS study] of DCM fraction
68
Dimethylhexyl)-10,13-dimet hyl-4 vinylhexadecahydrocyclopenta[a]phenanthren-3-ol
C29H50O ChemSpider ID: 467796
414 Steroid compound Antibiofilm, Insecticidal activity
69
9,19-Cyclo-25,26-epoxyergostan-3-ol4,4,14-trimethyl-, acetate
C33H54O3
Pub Chem 565753 498 Steroid compound Anti inflammatory
70
Stigmast-4-en-3-one C29H48O Chem Spider ID: 504066
412 Steroid compound Antimicrobial Antioxidant Anti-inflammatory, Ant arthritic Antiasthma Diuretic
71 Testosterone, Androst-4-en-3-one
C19H28O2
Pub. Chem:ID 6013 288 Androgenic
Steroid Anti-inflammatory
72
Nickel, cyclopentadienyl-(dicycloh exylphosphino)benzyl-o-yl-
C24H34NiP- Pub. Chem ID 11987286
412 Isoflavones, Flavonoids
Chiral Langand in synthesis of drugs
73
Stigmasta-4,6,22-trien-3.alpha.-ol, Stigmasta-4,6,22-trien-3.beta.-ol, Stigmasta-3,5-dien-7-one , 4,4-dimethyl-, (alpha.)-Stigmastan-7-one
C29H46O Pub. Chem ID 5379793
410 Fatty Alcohols, Steroid compound
Antimicrobial Antioxidant Anti-inflammatory
74
Cholestan-3-one C27H46O ChemSpider ID: 77468
386 Fatty Alcohols, Steroid compound
Antimicrobial Antioxidant Anti-inflammatory
75
C(14a)-Homo-27-nor-14.beta.-gammaceran-3.alpha.-ol
C30H52O Pub. Chem ID 550124
428 Chenodeoxycholic acid, steroid acid
cholagogue, a choleretic laxative
76 (5.alpha.)- Lanostane C30H54 Chem Spider
ID:7827588 414 Triterpines
compound Antibacterial, Antiinflammatory
77
10,13-dimethylhexadec ahydrocyclopenta[a]phenanthren-3-one
C23H35NO3 Chem. Book
373 Phenyl Ester Antibiofilm Agent
78 5.alpha.)- anost-7-en-3-one C19H28O
CB1139907 272 Androgenic
Steroid Antimicrobial, Anti-inflammatory
79
Benzenepropanoic acid-dimethylethyl)-4-hydroxy-,octadecyl ester
C37H66O3 Chem. Net CAS 56823-64-4
558 Acid Ester Ester Prodrugs and Antiviral Activity
80 beta.-Tocopherol C28H48O2.
Pub.hem 86052 416 Beta Carotene Cancer Prevention,
Antioxidants

214
Appendix 10 (a). A GC-MS report of n-hexane fraction Structural analogue Rt(min) Area % Peak Dodecane, 2,6,11-trimethyl- Tridecane, 1-iodo- 1,3-Dimethylcyclopentanol
18.26 0.22 1
Heneicosane, Pentadecane, Dodecane 25.22 0.27 2 Dodecanoic acid 27.32 0.29 3 Heneicosane , 2-Bromo dodecane, Nonane, 30.41 0.32 4 Tetradecanoic acid 31.87 0.40 5 Pentadecanoic acid 34.01 0.43 6 Heptacosane Heneicosan, Hexadecane 35.06 0.33 7 Hexadecanoic acid, Pentadecanoic acid, 35.14 0.24 8 Palmitoleic acid, 9-Hexadecenoic acid , 4-Methyl-dodec-3-en-1-ol 35.70 0.31 9 n-Hexadecanoic acid 36.59 17.35 10 n-Hexadecanoic acid , Cyclic octaatomic sulfur7-Amino-7H-S-triazolo[5,1-c]-S-tri azole-3-thiol
37.38 0.25 11
cis-Vaccenic acid, Cyclopentadecanone, 2-hydroxy- 9-Hexadecenoic acid 37.92 0.23 12 9,12-Octadecadienoic acid, methyl ester 38.52 0.56 13 9-Octadecenoic acid 38.63 0.30 14 Hexacosane , Octadecane, 2-methyltetracosane 39.28 0.22 15 9,12-Octadecadienoic acid, 2-Chloroethyl linoleate 40.30 41.08 16 9,12-Octadecadienoic acid (Z,Z)-2-Chloroethyl linoleate 40.33 1.73 17 40.384 8.55 C 9,12-Octadecadienoic acid 40.38 8.55 18 9,12-Octadecadienoic acid 40.57 1.35 19 9,12-Octadecadienoic acid 43.12 0.47 20 Oleic Acid, 2-Methyl-Z,Z-3,13-octadecadienol, 1-Naphthalenol, 1,2,3,4-tetrahydroacetate
45.37 0.38 21
Octadecane, 1-(ethenyloxy)- 9,17-Octadecadienal, (Z)-Z,E-3,13-Octadecadien-1-ol
46.40 0.25 22
Bis(2-ethylhexyl) phthalate 46.51 0.54 23 Dodecanoic acid, Phenyl methyl ester, Undecanoic acid, phenyl methyl ester, Octadecanoic acid, phenyl methyl ester
46.95 0.63 24
Difluoro(methylamino)phosphine sulfide, Cinnamylcinnamate 48.11 0.52 25 Difluoro(methylamino)phosphine sulfide, Cinnamyl cinnamate, Naphthalene, 1,2,3,4-tetrahydro-1
48.53 0.26 26
Morpholine, 4-[2-phenyl-1-(phenylethyl)ethenyl]- (N-(Benzyloxycarbonyl)glycyl)-l-rine hydrazide 1,3-Benzoxazin-2-one,
49.68 1.55 2;7
12-Methyl-E,E-2,13-octadecadien-1-Ol , Cyclohexane ethanol, 4-methyl-.beta-methylene-trans-4,9-Decadienoic acid, 2-nitro-ethyl ester
49.81 0.25 28
Dibut-3-enyl phthalate, Benzothiazole, 2-methyl-Phthalic acid, 3,4-dimethylphenyl isobutyl ester
51.22 0.82 29
1-Bromo-11-iodoundecane, C(14a)-Homo-27-nor-14.beta.-gammaceran-3.alpha-ol, Oxalic acid, pentadecyl propyl ester
52.91 0.23 30
9-(3-Fluorobenzyl)-9-hydroxy-3,6,10,10-tetramethyl-9,10-dihydrophena, Nthrene, 2,3-Dimethoxy-5-methyl-6-dekaisoprenyl-chinon, 7H-Pyrazolo[4,3-E][1,2,4]triazolo[ 1,5-c] pyrimidine.
53.01 1.13 31
Cyclopropane, carboxamide, 2-cyclopropyl-2-methyl-N-(1-cyclopropylethyl)-2,4,4-Trimethyl-3-hydroxymethyl-5a-(3-methyl-but-2-enyl)-cyclohexene beta. Carotene
53.32 0.41 32
Cholest-5-en-3-ol, (3.beta.)-carbonochloridate, Cholest-5-en-3-ol (3.beta.)-, propanoate1H-Isoindole,
53.71 2.24 33

215
Appendix 10 (b). A GC-MS report of n-hexane fraction
Structural analogue Rt(min) Area % Peak Silane, [[(3.beta.)-lanosta-9(11), 24-dien-3-yl]oxy]trimethyl- 3.beta.-Hydroxy-5-cholen-24-oic acid, 9,19-Cyclolanost-23-ene-3,25-diol,
53.90 0.31 34
Cholesta-6,22,24-triene, 4,4-dimethyl, Stigmasteryl tosylate Stigmastan-6,22-dien
54.32 3.42 35
Stigmastan-3,5-diene, Hexacosanoic acid, A-Norcholestan-3-one
54.75 0.64 36
Stigmasteryltosylate Oxazole, 5-(2-furfurylamino)-2-(4- methyl phenyl)-4-phenylsulfonyl- Stigmasta-5,22-dien-3-ol.
55.02 0.39 37
Stigmastan-3,5-diene, .beta.-Sitosterol acetate, Ergosta-4,6,22-trien-3.beta.-ol
55.50 2.97 38
1-Nonadecene , 1,14-Dibromotetradecane, 2-Dodecen-1-yl(-)succinic anhydrid
56.34 0.26 39
Campesterol 58.70 3.46 40 Stigmasterol, Ergost-22-en-3-one, 59.61 4.44 41 Appendix 11 (a). Activity of components identified in the sample [GC MS study] of HEF
S/N
Name of compounds Molecular Formula M.W Nature Activity
1 2,6,11-trimethyl-Tridecane, 1-iodo-1,3-Dimethylcyclopentanol
C16H34
CAS RN 3891-99-4 226 Aliphatic
Hydrocarbon Antibacterial, cardio toning properties and anti-hyperlipidemic
2 Dodecane C12H26 ChemSpider ID: 7890
170 Aliphatic Hydrocarbon
Antibacterial and Antioxidants
3 Heneicosane, C21H44 CH.BK CAS 629-94-7
296 Aliphatic Hydrocarbon
Antibacterial, Vector control
4 Dodecanoic acid C12H24O2 CHEBI:30813
172 Fatty Acid, Ester
Antibacterial, Anti inflammatory, Plant metabolite
5 Pentadecane, C15H32 ChemSpider ID: 11885
212 Aliphatic Hydrocarbon
Antimicrobial, Antitumor, Antioxidant
6 2-Bromododecane, C12H25Br Pub.ChemID 98299
249 Aliphatic Hydrocarbon, Fatty Acid
Antimicrobial
7 Nonane, C9H20 ChemSpider ID: 7849
128 Aliphatic Hydrocarbon
Antimicrobial and Hemolytic activity
8 Tetradecanoic acid (Myristic Acid)
C14H28O2
Pub. Chem ID 11005 228 Fatty Acid Antimicrobial
9 Pentadecanoic acid C15H30O2
Pub. Chem ID 13849 242 saturated fatty
acid, Methyl Ester
Antibacterial, Antifungal
10 Heptacosane , C27H56 Chem Spider ID: 11146
380 Aliphatic Hydrocarbon, Fatty Acid
Antimicrobial, Anticancer

216
Appendix 11(b). Activity of components identified in the sample [GC MS study] of HEF fraction.
S/N
Name of compounds Molecular Formula M.W Nature Activity
11 Hexadecane C16H34 Pub. ChemID 11006
226 Aliphatic Hydrocarbon
Antimicrobial , Antifungal
12 Hexadecanoic acid, , Palmitoleic acid
C16H32O2 ChemSpider ID: 960
256 Fatty Acid, Methyl Ester
Antimicrobial
13 4-Methyl-dodec-3-en-1-ol
C13H26O ChemSpider ID: 4516810
198 Phenol, Methyl Ester
Antimicrobial, Antileishmanial
14 Cyclic octaatomic sulfur7-Amino-7H-S triazolo[5,1-c]-S-tri azole-3-thiol
S-alkylated-3-mercapto-1,2,4-triazole
Alkylated Pyridine Derivative
Antimicrobial and Insecticidal, Anticancer
15 cis-Vaccenic acid, C18H34O2
Pub.Chem ID 5282761 282 Fatty Acid,
Sterol
Antimicrobial
16 9,12-Octadecadienoic acid, methyl ester
C18H32O2 NIST CAS 2462-85-3
280 Esther Antimicrobial
17 Cyclopentadecanone C15H28O ChemSpider ID: 9980
224 Aliphatic Hydrocarbon
Antimicrobial
18 2-methyltetracosane C25H52 ChemSpider ID: 459700
352 Aliphatic Hydrocarbon
Antimicrobial and Antioxidative
19 2-Chloroethyl linoleate C20H35ClO2Pub. Chem ID 6433897
342 Fatty Acid, Ester
Antimicrobial and Anticancer
20 Oleic Acid (cis-9-Octadecenoic acid)
C18H34O2
Pub.Chem ID 445639 282 Fatty Acid Antimicrobial Agents
21 1-Naphthalenol, 1,2,3,4-tetrahydroacetate
C12H14O2 LookChem CAS 21503-12-8
190 Aliphatic Alcohol, ally amines
Antibacterial and Antioxidant
22 Bis(2-ethylhexyl) phthalate (phthalic acid)
C24H38O4ChemSpider ID: 21106505
390 Fatty Acid Antimicrobial and Cytotoxic agent
23 Difluoro(methylamino)phosphine sulfide (Morpholine)
C4H9NOChemSpider ID: 13837537
87 Pyrimidine, Ether
Antiinflammatory, Analgesic, Antipyretic,Antimicrobial
24 Cinnamylcinnamate C18H16O2 CB N0:5174225
264 Diterpenic Acid, Carboxylic Acid Derivative
Antibacterial, Antifungal, Anticancer
25 Naphthalene C10H8 ChemSpider ID: 906
128 Bicyclic Aromatic Hydrocarbon
Antibacterial and Antiplatyhelmintic, Pesticide
26 (N-(Benzyloxycarbonyl)glycyl)-l-rine hydrazide
C12H15NO5 Look Chem CAS 1676-81-9
Peptide Hydrides, Phenyl Esters
Antitumor Activity
27 1,3-Benzoxazin-2-one C8H7NO2 Pub. Chem ID 121020
149 Aliphatic Hydrocarbon, Ester
Antibacterial, Antifungal
28 Benzothiazole C7H5NS Pub.Chem ID 7222
135 Aromatic heterocyclic compound
Antimicrobial, Anticancer
29 C(14a)-Homo-27-nor-14.beta.-gammaceran-3.alpha-ol
C30H52O Pub. Chem ID 550124
428 Fatty Alcohols, Steroid compound
Peptide Receptor Targeting in Cancer

217
Appendix 11(c). Activity of components identified in the sample [GC MS study] of HEF fraction S/N Name of compounds Molecular
Formula M.W
Nature Activity
30 Oxalic acid C2H2O4 Chem Spider ID: 946
90 Carboxylic Acid
Antibacterial Activity
31 7H-Pyrazolo[4,3-E][1,2,4]triazolo[ 1,5-c] pyrimidine.
C18H13N7 ChemSpider ID: 4090727
327 Primidine Derivatives
Antimicrobial and Antifungal Activity
32 Cyclopropane, C3H6 ChemSpider ID: 6111
42 Aliphatic Hydrocarbon, , Fatty Acid, Cyclic Alkane
Anesthetic, Antimicrobial
33 Carboxamide, 1H-indole-3-carboxamide
C9H8N2O ChemSpider ID: 1636821
160 carboxylic acid Fungicide, Antiviral and Antibacterial Activity
34 cyclohexene beta. Carotene
C40H56 ChemSpider ID:4444129
536 Aromatic Hydrocarbon
Antioxidant, Vitamin, Antimicrobial
35 Cholest-5-en-3-ol, (3.beta.)-carbonochloridate,
C28H45ClO2 Pub. Chem
ID 12451
449 Steroid Alcohol Plasticizer, antihelminthic and antimicrobial activities
36 Cholest-5-en-3-ol (3.beta.)-, propanoate
C30H50O2 Chem.BK CB5243420
442 Steroid Alcohol Antiulcer , anti-inflammatory and antimicrobial activity
37 Stigmastan-3,5-diene, Stigmasta-5,22-dien-3-ol
C29H48 Pub. Chem CID 00525918
396 Steroid Compound
anti-inflammatory and antimicrobial activity
38 A-Norcholestan-3-one C26H44O Pub. Chem ID 242347
372 Steroid Compound
antimicrobial, antioxidant, anticancer activities
39 Stigmasteryltosylate Oxazole, beta.-Sitosterol acetate
C29H50O CAS 83-46-5
414 steroid compounds
Benign prostatic hyperplasia, Antimicrobial
40 Ergosta-4,6,22-trien-3.beta.-ol
C28H42O ChemSpider ID: 4526809
394 Aromatic Steroids
Antimicrobial
41 1,14-Dibromotetradecane
C14H28Br2 ChemSpider ID: 148624
356 Alkyl bis Esters Antimicrobial, Antifungal Activity
42 2-Dodecen-1-yl(-)succinic anhydrid
C16H26O3 Pub. Chem
ID 29772
266 Anhydride Bactericidal and Antifungal Activity
43 Campesterol C28H48O 400 Steroidal compound
Antimicrobial, Antileishmanial
44 Stigmasterol C29H48O Chem Spider ID: 504066
412 Fatty Alcohols, Steroid compound
Antimicrobial Antioxidant Anti-inflammatory, Antiarthritic Antiasthma Diuretic
45 Ergost-22-en-3-one C28H46O ChemSpider ID: 4516831
398 Fatty Alcohols, Steroid compound
Antimicrobial Antioxidant Anti-inflammatory, Antiarthritic Antiasthma Diuretic
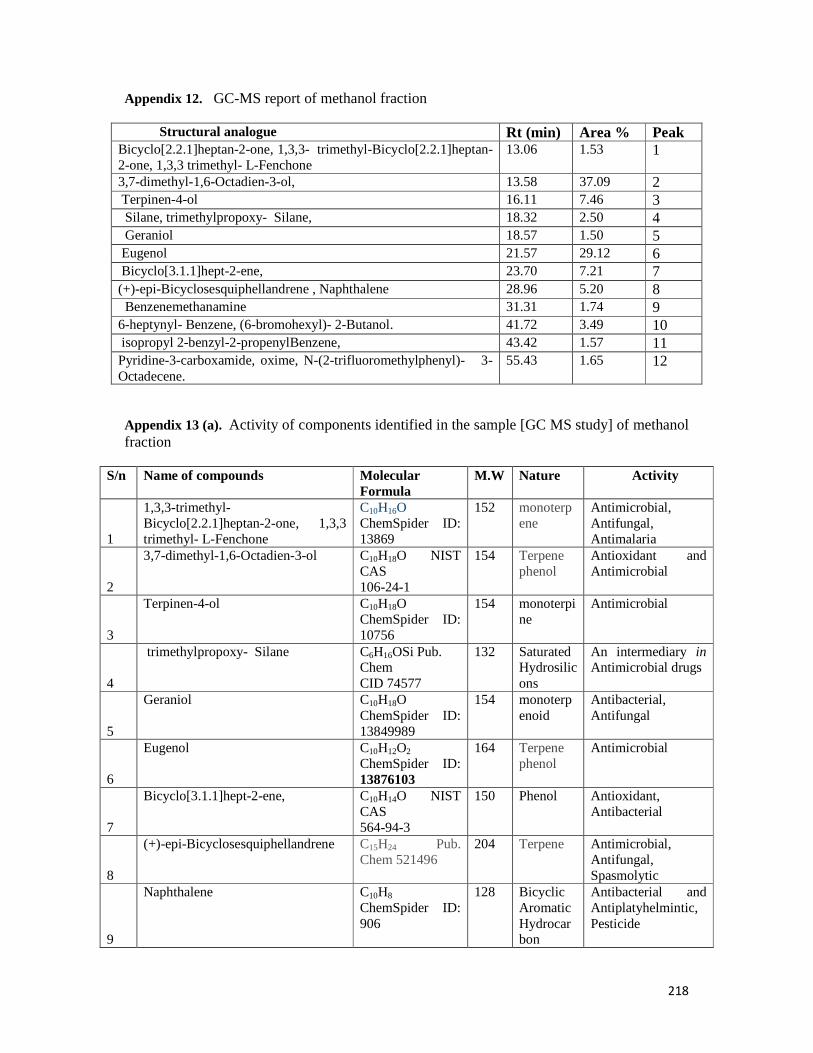
218
Appendix 12. GC-MS report of methanol fraction
Structural analogue Rt (min) Area % Peak Bicyclo[2.2.1]heptan-2-one, 1,3,3- trimethyl-Bicyclo[2.2.1]heptan-2-one, 1,3,3 trimethyl- L-Fenchone
13.06 1.53 1
3,7-dimethyl-1,6-Octadien-3-ol, 13.58 37.09 2 Terpinen-4-ol 16.11 7.46 3 Silane, trimethylpropoxy- Silane, 18.32 2.50 4 Geraniol 18.57 1.50 5 Eugenol 21.57 29.12 6 Bicyclo[3.1.1]hept-2-ene, 23.70 7.21 7 (+)-epi-Bicyclosesquiphellandrene , Naphthalene 28.96 5.20 8 Benzenemethanamine 31.31 1.74 9 6-heptynyl- Benzene, (6-bromohexyl)- 2-Butanol. 41.72 3.49 10 isopropyl 2-benzyl-2-propenylBenzene, 43.42 1.57 11 Pyridine-3-carboxamide, oxime, N-(2-trifluoromethylphenyl)- 3-Octadecene.
55.43 1.65 12
Appendix 13 (a). Activity of components identified in the sample [GC MS study] of methanol fraction
S/n Name of compounds Molecular Formula
M.W Nature Activity
1
1,3,3-trimethyl-Bicyclo[2.2.1]heptan-2-one, 1,3,3 trimethyl- L-Fenchone
C10H16O ChemSpider ID: 13869
152 monoterpene
Antimicrobial, Antifungal, Antimalaria
2
3,7-dimethyl-1,6-Octadien-3-ol C10H18O NIST CAS 106-24-1
154 Terpene phenol
Antioxidant and Antimicrobial
3
Terpinen-4-ol C10H18O ChemSpider ID: 10756
154 monoterpine
Antimicrobial
4
trimethylpropoxy- Silane C6H16OSi Pub. Chem CID 74577
132 Saturated Hydrosilicons
An intermediary in Antimicrobial drugs
5
Geraniol C10H18O ChemSpider ID: 13849989
154 monoterpenoid
Antibacterial, Antifungal
6
Eugenol C10H12O2 ChemSpider ID: 13876103
164 Terpene phenol
Antimicrobial
7
Bicyclo[3.1.1]hept-2-ene, C10H14O NIST CAS 564-94-3
150 Phenol Antioxidant, Antibacterial
8
(+)-epi-Bicyclosesquiphellandrene C15H24 Pub. Chem 521496
204 Terpene Antimicrobial, Antifungal, Spasmolytic
9
Naphthalene C10H8 ChemSpider ID: 906
128 Bicyclic Aromatic Hydrocarbon
Antibacterial and Antiplatyhelmintic, Pesticide

219
Appendix 13 (b). Activity of components identified in the sample [GC MS study] of methanol fraction S/n Name of compounds Molecular
Formula M.W Nature Activity
10 Benzenemethanamine C9H13N NIST CAS
103-83-3 135 Antipyretic,
Antimicrobial
11
Isopropyl2-benzyl-2-propenylBenzene
C13H18O ChemSpider ID: 506324
190 Ether, Aromatic Alcohol
Antioxidant, Antibacterial
12
Pyridine-3-carboxamide C6H6N218O ChemSpider ID: 9334423
124 Nicotinamide, Nicotine Amines.
Antiviral, Anticancer , antiprotozoa
13
Oxime C3H7NO ChemSpider ID: 60524
73 Natural Phenolic flavonoid
Antioxidant, Antibacteria and anticancer agent
14 N-( 2-trifluoromethylphenyl)- 3-Octadecene
C25H40O3 CAS 114275-39-7
388 Ester Antioxidant, Antibacterial
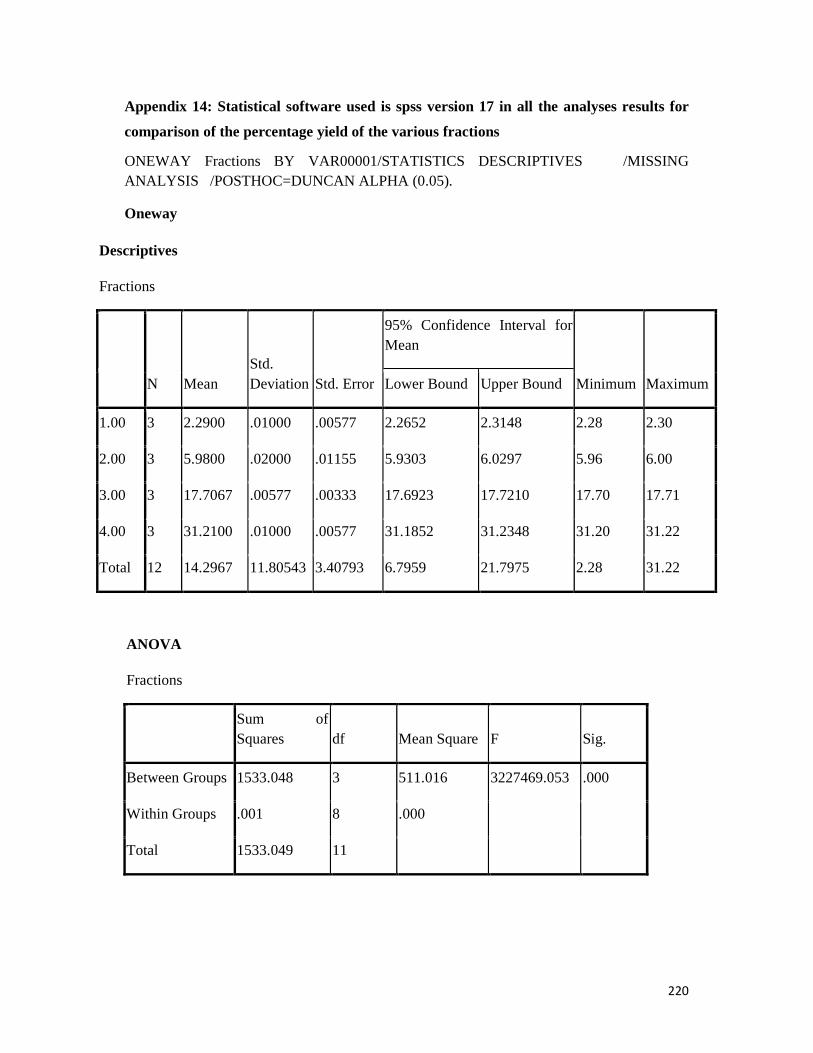
220
Appendix 14: Statistical software used is spss version 17 in all the analyses results for
comparison of the percentage yield of the various fractions
ONEWAY Fractions BY VAR00001/STATISTICS DESCRIPTIVES /MISSING ANALYSIS /POSTHOC=DUNCAN ALPHA (0.05).
Oneway
Descriptives
Fractions
N Mean Std. Deviation Std. Error
95% Confidence Interval for Mean
Minimum Maximum Lower Bound Upper Bound
1.00 3 2.2900 .01000 .00577 2.2652 2.3148 2.28 2.30
2.00 3 5.9800 .02000 .01155 5.9303 6.0297 5.96 6.00
3.00 3 17.7067 .00577 .00333 17.6923 17.7210 17.70 17.71
4.00 3 31.2100 .01000 .00577 31.1852 31.2348 31.20 31.22
Total 12 14.2967 11.80543 3.40793 6.7959 21.7975 2.28 31.22
ANOVA
Fractions
Sum of Squares df Mean Square F Sig.
Between Groups 1533.048 3 511.016 3227469.053 .000
Within Groups .001 8 .000
Total 1533.049 11
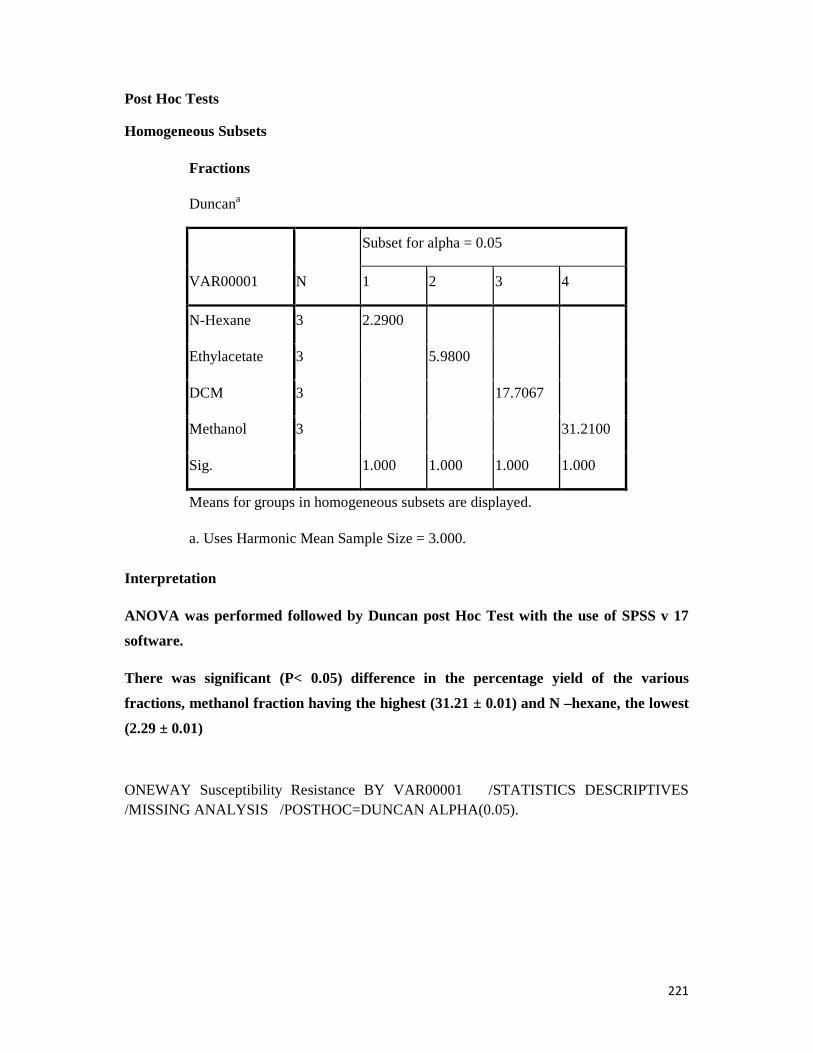
221
Post Hoc Tests
Homogeneous Subsets
Fractions
Duncana
VAR00001 N
Subset for alpha = 0.05
1 2 3 4
N-Hexane 3 2.2900
Ethylacetate 3 5.9800
DCM 3 17.7067
Methanol 3 31.2100
Sig. 1.000 1.000 1.000 1.000
Means for groups in homogeneous subsets are displayed.
a. Uses Harmonic Mean Sample Size = 3.000.
Interpretation
ANOVA was performed followed by Duncan post Hoc Test with the use of SPSS v 17
software.
There was significant (P< 0.05) difference in the percentage yield of the various
fractions, methanol fraction having the highest (31.21 ± 0.01) and N –hexane, the lowest
(2.29 ± 0.01)
ONEWAY Susceptibility Resistance BY VAR00001 /STATISTICS DESCRIPTIVES /MISSING ANALYSIS /POSTHOC=DUNCAN ALPHA(0.05).
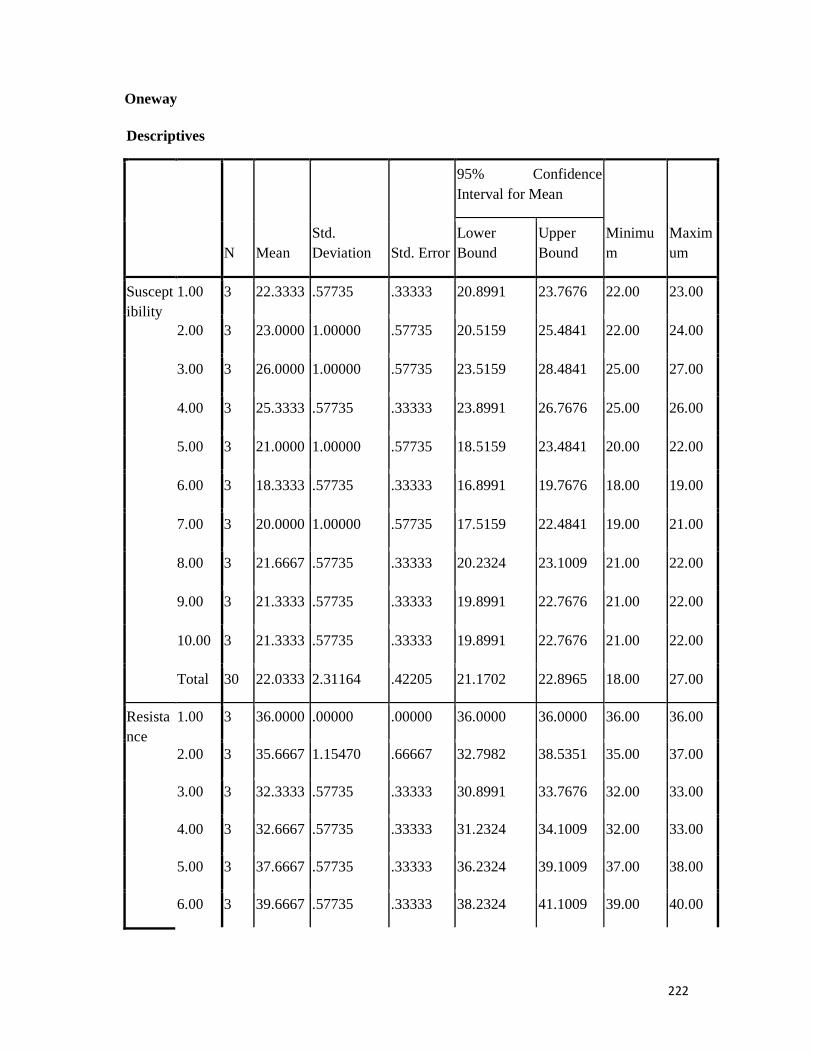
222
Oneway
Descriptives
N Mean Std. Deviation Std. Error
95% Confidence Interval for Mean
Minimum
Maximum
Lower Bound
Upper Bound
Susceptibility
1.00 3 22.3333 .57735 .33333 20.8991 23.7676 22.00 23.00
2.00 3 23.0000 1.00000 .57735 20.5159 25.4841 22.00 24.00
3.00 3 26.0000 1.00000 .57735 23.5159 28.4841 25.00 27.00
4.00 3 25.3333 .57735 .33333 23.8991 26.7676 25.00 26.00
5.00 3 21.0000 1.00000 .57735 18.5159 23.4841 20.00 22.00
6.00 3 18.3333 .57735 .33333 16.8991 19.7676 18.00 19.00
7.00 3 20.0000 1.00000 .57735 17.5159 22.4841 19.00 21.00
8.00 3 21.6667 .57735 .33333 20.2324 23.1009 21.00 22.00
9.00 3 21.3333 .57735 .33333 19.8991 22.7676 21.00 22.00
10.00 3 21.3333 .57735 .33333 19.8991 22.7676 21.00 22.00
Total 30 22.0333 2.31164 .42205 21.1702 22.8965 18.00 27.00
Resistance
1.00 3 36.0000 .00000 .00000 36.0000 36.0000 36.00 36.00
2.00 3 35.6667 1.15470 .66667 32.7982 38.5351 35.00 37.00
3.00 3 32.3333 .57735 .33333 30.8991 33.7676 32.00 33.00
4.00 3 32.6667 .57735 .33333 31.2324 34.1009 32.00 33.00
5.00 3 37.6667 .57735 .33333 36.2324 39.1009 37.00 38.00
6.00 3 39.6667 .57735 .33333 38.2324 41.1009 39.00 40.00

223
7.00 3 39.3333 .57735 .33333 37.8991 40.7676 39.00 40.00
8.00 3 36.3333 .57735 .33333 34.8991 37.7676 36.00 37.00
9.00 3 37.3333 .57735 .33333 35.8991 38.7676 37.00 38.00
10.00 3 36.3333 .57735 .33333 34.8991 37.7676 36.00 37.00
Total 30 36.3333 2.39732 .43769 35.4382 37.2285 32.00 40.00
ANOVA
Sum of Squares df Mean Square F Sig.
Susceptibility Between Groups 142.967 9 15.885 26.475 .000
Within Groups 12.000 20 .600
Total 154.967 29
Resistance Between Groups 158.667 9 17.630 44.074 .000
Within Groups 8.000 20 .400
Total 166.667 29
Post Hoc Tests
Homogeneous Subsets
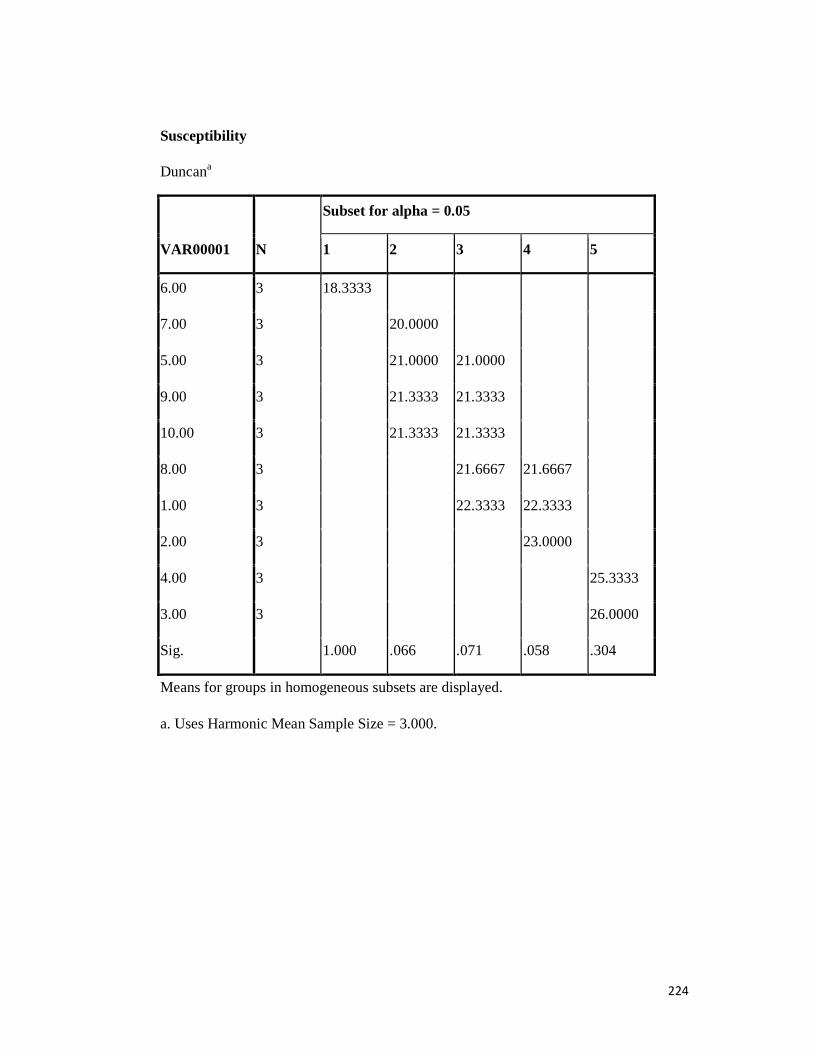
224
Susceptibility
Duncana
VAR00001 N
Subset for alpha = 0.05
1 2 3 4 5
6.00 3 18.3333
7.00 3 20.0000
5.00 3 21.0000 21.0000
9.00 3 21.3333 21.3333
10.00 3 21.3333 21.3333
8.00 3 21.6667 21.6667
1.00 3 22.3333 22.3333
2.00 3 23.0000
4.00 3 25.3333
3.00 3 26.0000
Sig. 1.000 .066 .071 .058 .304
Means for groups in homogeneous subsets are displayed.
a. Uses Harmonic Mean Sample Size = 3.000.

225
Resistance
Duncana
VAR00001 N
Subset for alpha = 0.05
1 2 3 4 5
3.00 3 32.3333
4.00 3 32.6667
2.00 3 35.6667
1.00 3 36.0000
8.00 3 36.3333 36.3333
10.00 3 36.3333 36.3333
9.00 3 37.3333 37.3333
5.00 3 37.6667
7.00 3 39.3333
6.00 3 39.6667
Sig. .526 .250 .080 .526 .526
Means for groups in homogeneous subsets are displayed.
a. Uses Harmonic Mean Sample Size = 3.000.
Key s; 1= Oxacilin, 2= Vancomycin, 3= Cephalexin, 4= Levofloxacin, 5= Ciprofloxacin, 6= Tetracycline, 7 = Cotrimoxazole, 8= Gentamycin,
9 = Clindamycin, 10 = Rifampicin

226
Interpretation
Susceptibility and Resistance
ANOVA was performed followed by Duncan post Hoc Test with the use of SPSS v 17
software.
There was significant (P< 0.05) difference in the susceptibility of the various antimicrobials,
Cephalexin having the highest (26.00 ± 1.00) and Tetracycline, the lowest (18.33 ± 0.58).
However, there was no significant (P>0.05) difference in susceptibility between Cephalexin
and Levofloxacin.
On the other hand, the reverse is the case in the resistance test. There was also significant (P<
0.05) difference among the various antimicrobials, Tetracycline having the highest (39.67 ±
0.58) and Cephalexin, the least (32.33 ± 0.58). Cotrimoxazole had similar resistance to
tetracycline (P>0.05)
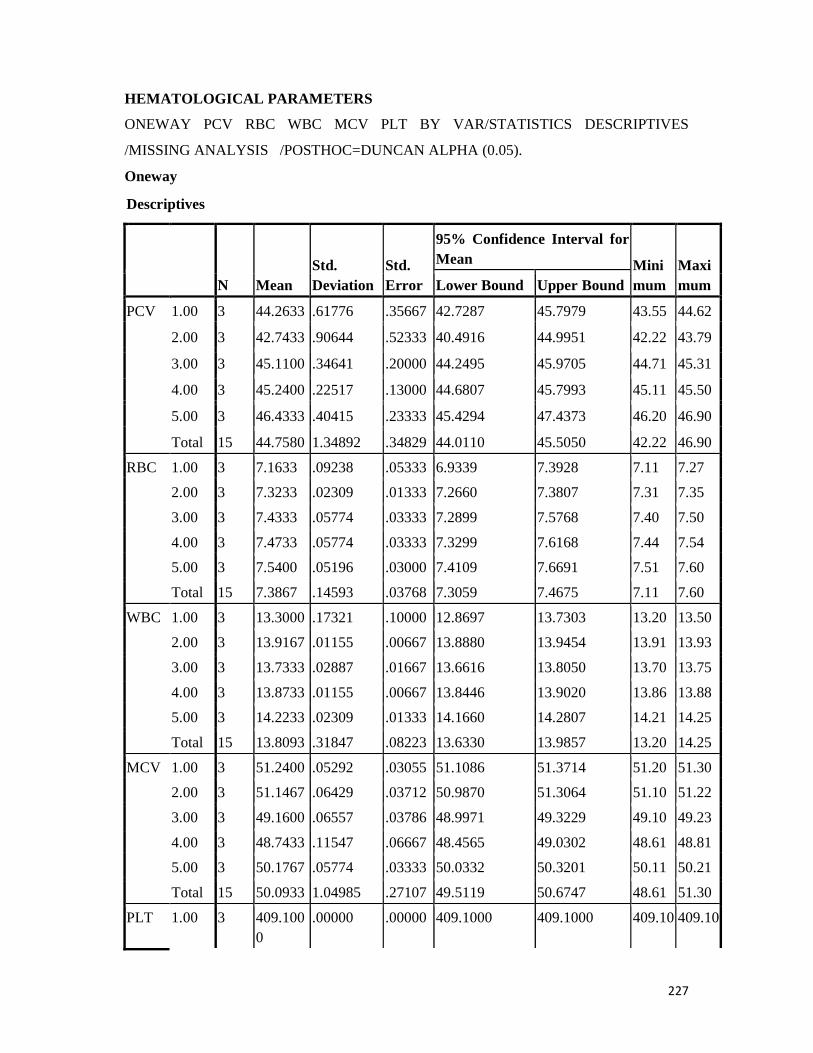
227
HEMATOLOGICAL PARAMETERS
ONEWAY PCV RBC WBC MCV PLT BY VAR/STATISTICS DESCRIPTIVES
/MISSING ANALYSIS /POSTHOC=DUNCAN ALPHA (0.05).
Oneway
Descriptives
N Mean Std. Deviation
Std. Error
95% Confidence Interval for Mean Mini
mum Maximum Lower Bound Upper Bound
PCV 1.00 3 44.2633 .61776 .35667 42.7287 45.7979 43.55 44.62
2.00 3 42.7433 .90644 .52333 40.4916 44.9951 42.22 43.79
3.00 3 45.1100 .34641 .20000 44.2495 45.9705 44.71 45.31
4.00 3 45.2400 .22517 .13000 44.6807 45.7993 45.11 45.50
5.00 3 46.4333 .40415 .23333 45.4294 47.4373 46.20 46.90
Total 15 44.7580 1.34892 .34829 44.0110 45.5050 42.22 46.90
RBC 1.00 3 7.1633 .09238 .05333 6.9339 7.3928 7.11 7.27
2.00 3 7.3233 .02309 .01333 7.2660 7.3807 7.31 7.35
3.00 3 7.4333 .05774 .03333 7.2899 7.5768 7.40 7.50
4.00 3 7.4733 .05774 .03333 7.3299 7.6168 7.44 7.54
5.00 3 7.5400 .05196 .03000 7.4109 7.6691 7.51 7.60
Total 15 7.3867 .14593 .03768 7.3059 7.4675 7.11 7.60
WBC 1.00 3 13.3000 .17321 .10000 12.8697 13.7303 13.20 13.50
2.00 3 13.9167 .01155 .00667 13.8880 13.9454 13.91 13.93
3.00 3 13.7333 .02887 .01667 13.6616 13.8050 13.70 13.75
4.00 3 13.8733 .01155 .00667 13.8446 13.9020 13.86 13.88
5.00 3 14.2233 .02309 .01333 14.1660 14.2807 14.21 14.25
Total 15 13.8093 .31847 .08223 13.6330 13.9857 13.20 14.25
MCV 1.00 3 51.2400 .05292 .03055 51.1086 51.3714 51.20 51.30
2.00 3 51.1467 .06429 .03712 50.9870 51.3064 51.10 51.22
3.00 3 49.1600 .06557 .03786 48.9971 49.3229 49.10 49.23
4.00 3 48.7433 .11547 .06667 48.4565 49.0302 48.61 48.81
5.00 3 50.1767 .05774 .03333 50.0332 50.3201 50.11 50.21
Total 15 50.0933 1.04985 .27107 49.5119 50.6747 48.61 51.30
PLT 1.00 3 409.1000
.00000 .00000 409.1000 409.1000 409.10 409.10
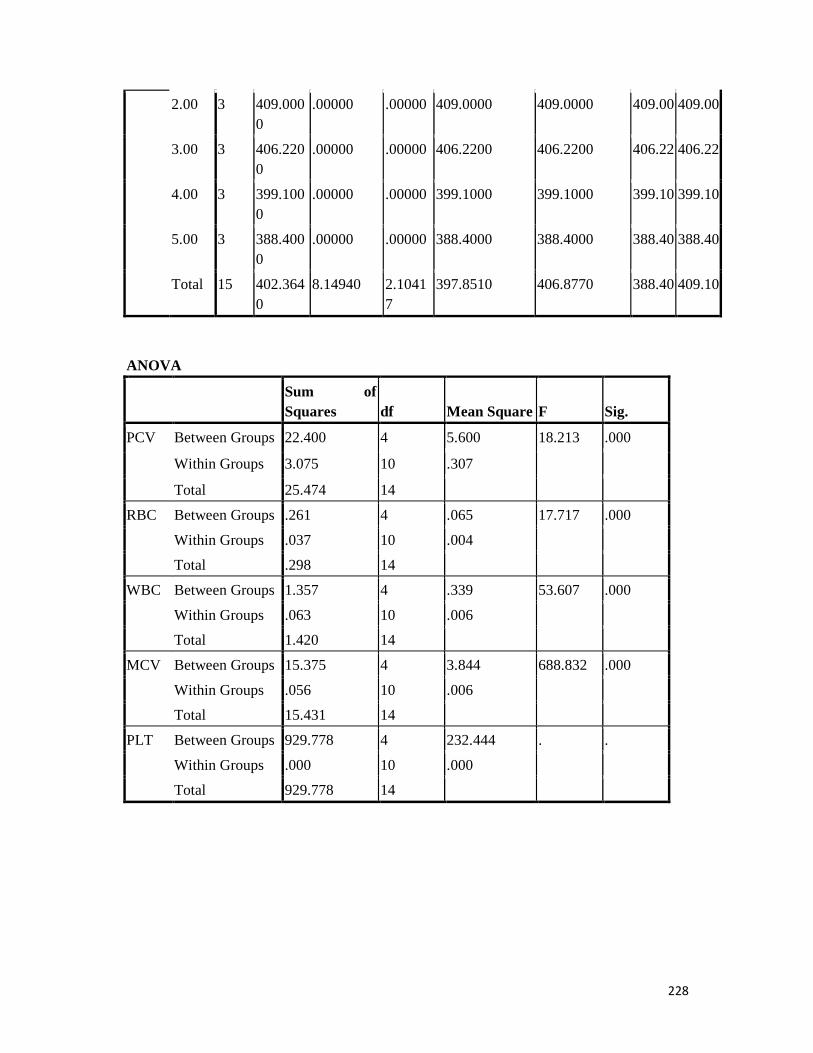
228
2.00 3 409.0000
.00000 .00000 409.0000 409.0000 409.00 409.00
3.00 3 406.2200
.00000 .00000 406.2200 406.2200 406.22 406.22
4.00 3 399.1000
.00000 .00000 399.1000 399.1000 399.10 399.10
5.00 3 388.4000
.00000 .00000 388.4000 388.4000 388.40 388.40
Total 15 402.3640
8.14940 2.10417
397.8510 406.8770 388.40 409.10
ANOVA
Sum of Squares df Mean Square F Sig.
PCV Between Groups 22.400 4 5.600 18.213 .000
Within Groups 3.075 10 .307
Total 25.474 14
RBC Between Groups .261 4 .065 17.717 .000
Within Groups .037 10 .004
Total .298 14
WBC Between Groups 1.357 4 .339 53.607 .000
Within Groups .063 10 .006
Total 1.420 14
MCV Between Groups 15.375 4 3.844 688.832 .000
Within Groups .056 10 .006
Total 15.431 14
PLT Between Groups 929.778 4 232.444 . .
Within Groups .000 10 .000
Total 929.778 14
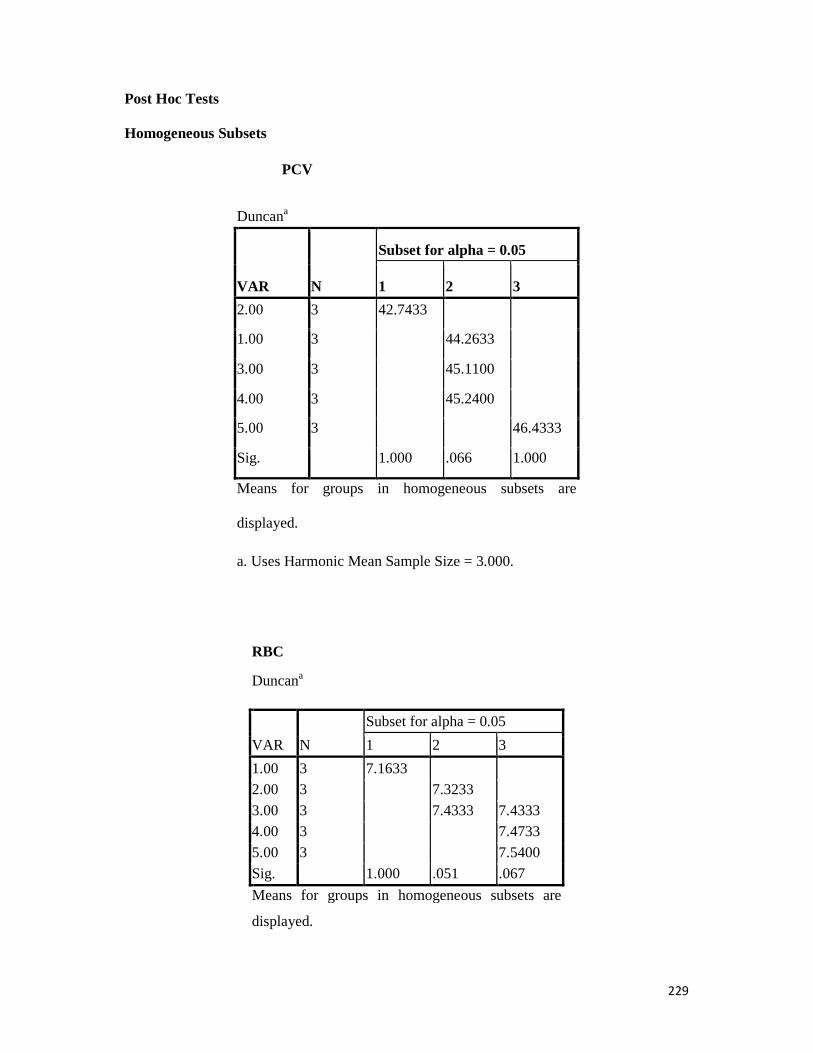
229
Post Hoc Tests
Homogeneous Subsets
PCV
Duncana
VAR N
Subset for alpha = 0.05
1 2 3
2.00 3 42.7433
1.00 3 44.2633
3.00 3 45.1100
4.00 3 45.2400
5.00 3 46.4333
Sig. 1.000 .066 1.000
Means for groups in homogeneous subsets are
displayed.
a. Uses Harmonic Mean Sample Size = 3.000.
RBC
Duncana
VAR N
Subset for alpha = 0.05
1 2 3
1.00 3 7.1633 2.00 3 7.3233
3.00 3 7.4333 7.4333 4.00 3 7.4733
5.00 3 7.5400
Sig. 1.000 .051 .067
Means for groups in homogeneous subsets are
displayed.

230
RBC
Duncana
VAR N
Subset for alpha = 0.05
1 2 3
1.00 3 7.1633
2.00 3 7.3233 3.00 3 7.4333 7.4333
4.00 3 7.4733 5.00 3 7.5400
Sig. 1.000 .051 .067
Means for groups in homogeneous subsets are
displayed.
a. Uses Harmonic Mean Sample Size = 3.000.
WBC
Duncana
VAR N
Subset for alpha = 0.05
1 2 3 4
1.00 3 13.3000
3.00 3 13.7333
4.00 3 13.8733 13.8733
2.00 3 13.9167
5.00 3 14.2233
Sig. 1.000 .057 .520 1.000
Means for groups in homogeneous subsets are displayed.
a. Uses Harmonic Mean Sample Size = 3.000.
MCV
Duncana
VAR N Subset for alpha = 0.05

231
1 2 3 4
4.00 3 48.7433
3.00 3 49.1600
5.00 3 50.1767
2.00 3 51.1467
1.00 3 51.2400
Sig. 1.000 1.000 1.000 .157
Means for groups in homogeneous subsets are displayed.
a. Uses Harmonic Mean Sample Size = 3.000.
BIOCHEMICAL PARAMETERS
ONEWAY BILIRUBIN CREATININE ALT ALP AST BY VAR /STATISTICS
DESCRIPTIVES /MISSING ANALYSIS /POSTHOC=DUNCAN ALPHA(0.05).
Oneway
Descriptives
N Mean Std. Deviation
Std. Error
95% Confidence Interval for Mean
Minimum Maximum
Lower Bound
Upper Bound
BILIRUBIN 1.00 3 1.6000 .02000 .01155 1.5503 1.6497 1.58 1.62
2.00 3 1.6167 .01528 .00882 1.5787 1.6546 1.60 1.63
3.00 3 1.6000 .01000 .00577 1.5752 1.6248 1.59 1.61
4.00 3 1.5900 .01000 .00577 1.5652 1.6148 1.58 1.60
5.00 3 1.5900 .01000 .00577 1.5652 1.6148 1.58 1.60
Total 15 1.5993 .01534 .00396 1.5908 1.6078 1.58 1.63
CREATININE 1.00 3 .7300 .01000 .00577 .7052 .7548 .72 .74
2.00 3 .7000 .01000 .00577 .6752 .7248 .69 .71
3.00 3 .7200 .01000 .00577 .6952 .7448 .71 .73
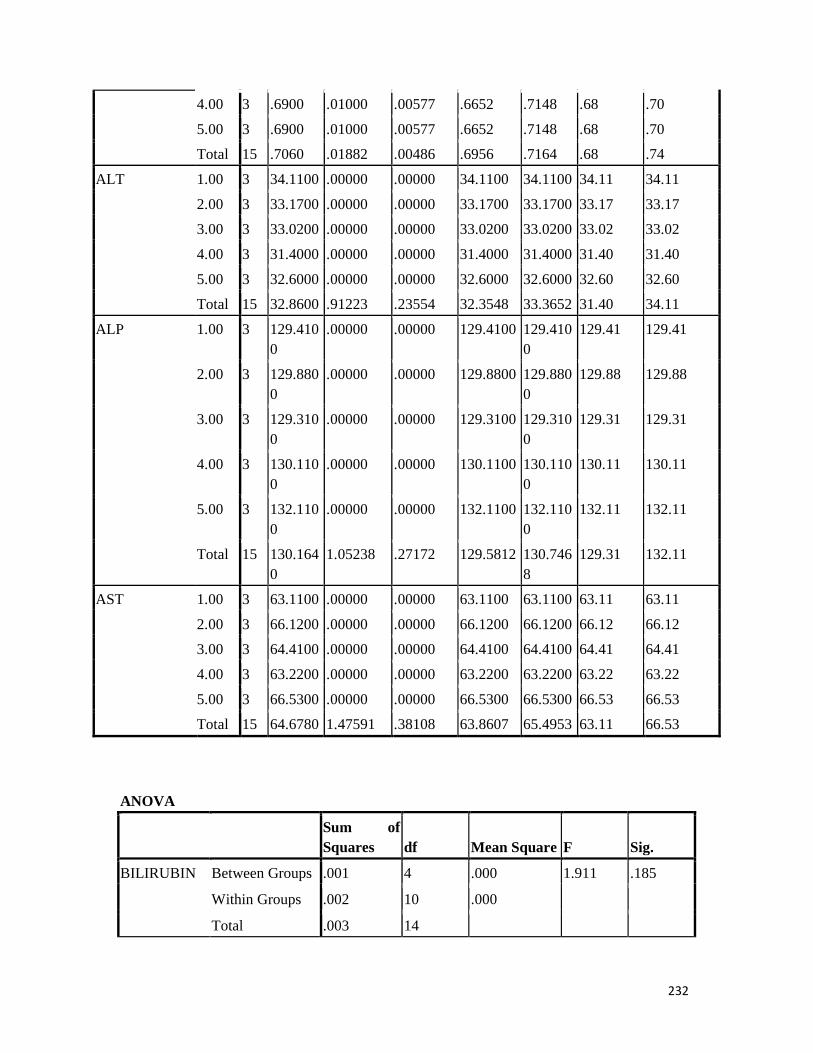
232
4.00 3 .6900 .01000 .00577 .6652 .7148 .68 .70
5.00 3 .6900 .01000 .00577 .6652 .7148 .68 .70
Total 15 .7060 .01882 .00486 .6956 .7164 .68 .74
ALT 1.00 3 34.1100 .00000 .00000 34.1100 34.1100 34.11 34.11
2.00 3 33.1700 .00000 .00000 33.1700 33.1700 33.17 33.17
3.00 3 33.0200 .00000 .00000 33.0200 33.0200 33.02 33.02
4.00 3 31.4000 .00000 .00000 31.4000 31.4000 31.40 31.40
5.00 3 32.6000 .00000 .00000 32.6000 32.6000 32.60 32.60
Total 15 32.8600 .91223 .23554 32.3548 33.3652 31.40 34.11
ALP 1.00 3 129.4100
.00000 .00000 129.4100 129.4100
129.41 129.41
2.00 3 129.8800
.00000 .00000 129.8800 129.8800
129.88 129.88
3.00 3 129.3100
.00000 .00000 129.3100 129.3100
129.31 129.31
4.00 3 130.1100
.00000 .00000 130.1100 130.1100
130.11 130.11
5.00 3 132.1100
.00000 .00000 132.1100 132.1100
132.11 132.11
Total 15 130.1640
1.05238 .27172 129.5812 130.7468
129.31 132.11
AST 1.00 3 63.1100 .00000 .00000 63.1100 63.1100 63.11 63.11
2.00 3 66.1200 .00000 .00000 66.1200 66.1200 66.12 66.12
3.00 3 64.4100 .00000 .00000 64.4100 64.4100 64.41 64.41
4.00 3 63.2200 .00000 .00000 63.2200 63.2200 63.22 63.22
5.00 3 66.5300 .00000 .00000 66.5300 66.5300 66.53 66.53
Total 15 64.6780 1.47591 .38108 63.8607 65.4953 63.11 66.53
ANOVA
Sum of Squares df Mean Square F Sig.
BILIRUBIN Between Groups .001 4 .000 1.911 .185
Within Groups .002 10 .000
Total .003 14
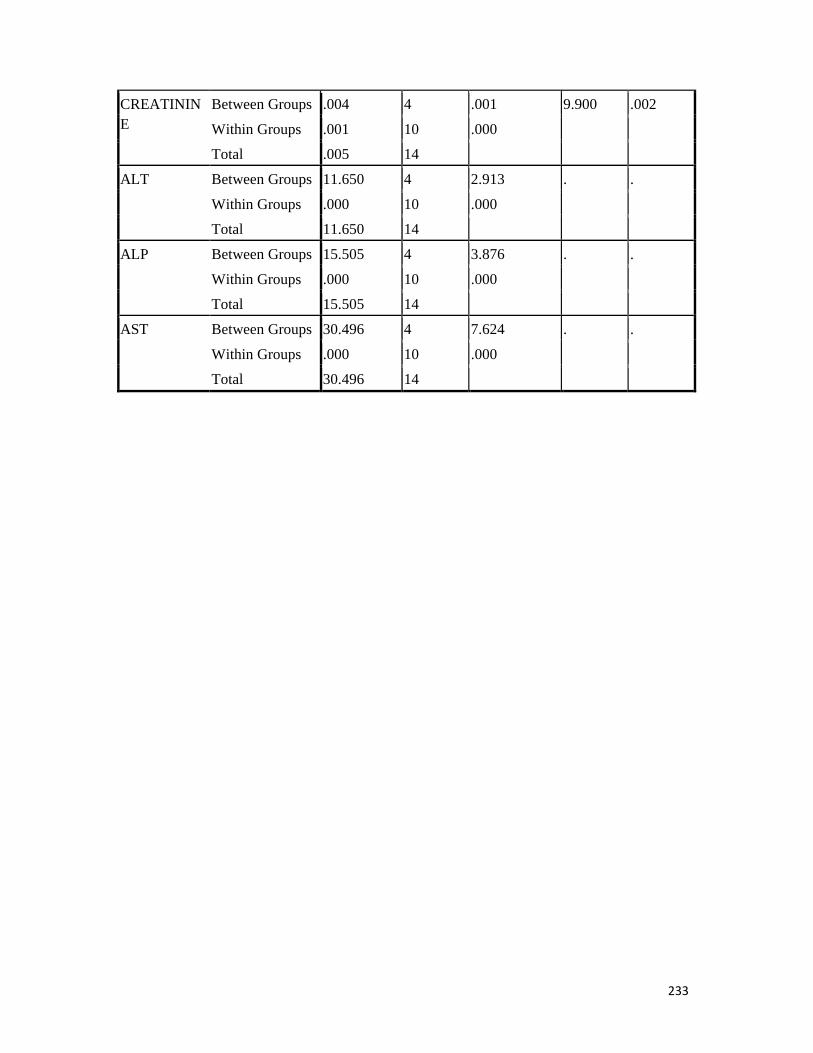
233
CREATININE
Between Groups .004 4 .001 9.900 .002
Within Groups .001 10 .000
Total .005 14
ALT Between Groups 11.650 4 2.913 . .
Within Groups .000 10 .000
Total 11.650 14
ALP Between Groups 15.505 4 3.876 . .
Within Groups .000 10 .000
Total 15.505 14
AST Between Groups 30.496 4 7.624 . .
Within Groups .000 10 .000
Total 30.496 14

234
Post Hoc Tests Homogeneous Subsets
BILIRUBIN
Duncana
VAR N
Subset for alpha = 0.05
1
4.00 3 1.5900
5.00 3 1.5900
1.00 3 1.6000
3.00 3 1.6000
2.00 3 1.6167
Sig. .053
Means for groups in homogeneous subsets are displayed.
a. Uses Harmonic Mean Sample Size = 3.000.
CREATININE
Duncana
VAR N
Subset for alpha = 0.05
1 2
4.00 3 .6900
5.00 3 .6900
2.00 3 .7000
3.00 3 .7200
1.00 3 .7300
Sig. .269 .249
Means for groups in homogeneous subsets are displayed.
a. Uses Harmonic Mean Sample Size = 3.000.

235
Descriptives
N Mean Std. Deviation Std. Error
95% Confidence Interval for Mean
Minimum Maximum
Lower Bound
Upper Bound
S4 1.00 3 4.3333 .57735 .33333 2.8991 5.7676 4.00 5.00
2.00 3 5.6667 .57735 .33333 4.2324 7.1009 5.00 6.00
3.00 3 8.3333 .57735 .33333 6.8991 9.7676 8.00 9.00
4.00 3 8.6667 .57735 .33333 7.2324 10.1009 8.00 9.00
5.00 3 6.6667 5.77350 3.33333 -7.6755 21.0088 .00 10.00
Total 15 6.7333 2.78944 .72023 5.1886 8.2781 .00 10.00
S8 1.00 3 4.6667 .57735 .33333 3.2324 6.1009 4.00 5.00
2.00 3 6.6667 .57735 .33333 5.2324 8.1009 6.00 7.00
3.00 3 8.3333 .57735 .33333 6.8991 9.7676 8.00 9.00
4.00 3 8.6667 .57735 .33333 7.2324 10.1009 8.00 9.00
5.00 3 6.3333 5.50757 3.17980 -7.3482 20.0149 .00 10.00
Total 15 6.9333 2.60403 .67236 5.4913 8.3754 .00 10.00
S20 1.00 3 4.0000 .00000 .00000 4.0000 4.0000 4.00 4.00
2.00 3 5.6667 .57735 .33333 4.2324 7.1009 5.00 6.00
3.00 3 7.6667 .57735 .33333 6.2324 9.1009 7.00 8.00
4.00 3 9.3333 .57735 .33333 7.8991 10.7676 9.00 10.00
5.00 3 6.6667 5.77350 3.33333 -7.6755 21.0088 .00 10.00
Total 15 6.6667 2.89499 .74748 5.0635 8.2699 .00 10.00
S22 1.00 3 3.3333 .57735 .33333 1.8991 4.7676 3.00 4.00
2.00 3 5.3333 .57735 .33333 3.8991 6.7676 5.00 6.00
3.00 3 6.6667 .57735 .33333 5.2324 8.1009 6.00 7.00
4.00 3 7.3333 .57735 .33333 5.8991 8.7676 7.00 8.00
5.00 3 9.3333 .57735 .33333 7.8991 10.7676 9.00 10.00
Total 15 6.4000 2.13140 .55032 5.2197 7.5803 3.00 10.00
S30 1.00 3 3.3333 .57735 .33333 1.8991 4.7676 3.00 4.00
2.00 3 6.0000 1.00000 .57735 3.5159 8.4841 5.00 7.00
3.00 3 6.6667 .57735 .33333 5.2324 8.1009 6.00 7.00
4.00 3 7.6667 1.15470 .66667 4.7982 10.5351 7.00 9.00
5.00 3 9.6667 .57735 .33333 8.2324 11.1009 9.00 10.00
Total 15 6.6667 2.25726 .58282 5.4166 7.9167 3.00 10.00
S33 1.00 3 4.3333 .57735 .33333 2.8991 5.7676 4.00 5.00
2.00 3 6.6667 .57735 .33333 5.2324 8.1009 6.00 7.00
3.00 3 7.3333 .57735 .33333 5.8991 8.7676 7.00 8.00

236
4.00 3 8.0000 1.00000 .57735 5.5159 10.4841 7.00 9.00
5.00 3 6.6667 5.77350 3.33333 -7.6755 21.0088 .00 10.00
Total 15 6.6000 2.58567 .66762 5.1681 8.0319 .00 10.00
S35 1.00 3 4.0000 .00000 .00000 4.0000 4.0000 4.00 4.00
2.00 3 5.6667 .57735 .33333 4.2324 7.1009 5.00 6.00
3.00 3 7.6667 .57735 .33333 6.2324 9.1009 7.00 8.00
4.00 3 7.6667 .57735 .33333 6.2324 9.1009 7.00 8.00
5.00 3 6.3333 5.50757 3.17980 -7.3482 20.0149 .00 10.00
Total 15 6.2667 2.54858 .65804 4.8553 7.6780 .00 10.00
S36 1.00 3 3.0000 .00000 .00000 3.0000 3.0000 3.00 3.00
2.00 3 5.0000 .00000 .00000 5.0000 5.0000 5.00 5.00
3.00 3 6.3333 .57735 .33333 4.8991 7.7676 6.00 7.00
4.00 3 7.6667 .57735 .33333 6.2324 9.1009 7.00 8.00
5.00 3 9.6667 .57735 .33333 8.2324 11.1009 9.00 10.00
Total 15 6.3333 2.38048 .61464 5.0151 7.6516 3.00 10.00
S38 1.00 3 3.3333 .57735 .33333 1.8991 4.7676 3.00 4.00
2.00 3 5.6667 .57735 .33333 4.2324 7.1009 5.00 6.00
3.00 3 6.6667 .57735 .33333 5.2324 8.1009 6.00 7.00
4.00 3 7.3333 .57735 .33333 5.8991 8.7676 7.00 8.00
5.00 3 9.6667 .57735 .33333 8.2324 11.1009 9.00 10.00
Total 15 6.5333 2.19957 .56793 5.3153 7.7514 3.00 10.00
S42 1.00 3 3.3333 .57735 .33333 1.8991 4.7676 3.00 4.00
2.00 3 5.6667 .57735 .33333 4.2324 7.1009 5.00 6.00
3.00 3 6.6667 1.15470 .66667 3.7982 9.5351 6.00 8.00
4.00 3 7.6667 1.15470 .66667 4.7982 10.5351 7.00 9.00
5.00 3 6.6667 5.77350 3.33333 -7.6755 21.0088 .00 10.00
Total 15 6.0000 2.75162 .71047 4.4762 7.5238 .00 10.00
S53 1.00 3 3.3333 .57735 .33333 1.8991 4.7676 3.00 4.00
2.00 3 5.3333 .57735 .33333 3.8991 6.7676 5.00 6.00
3.00 3 7.3333 .57735 .33333 5.8991 8.7676 7.00 8.00
4.00 3 8.0000 1.00000 .57735 5.5159 10.4841 7.00 9.00
5.00 3 6.6667 5.77350 3.33333 -7.6755 21.0088 .00 10.00
Total 15 6.1333 2.82506 .72943 4.5689 7.6978 .00 10.00
S57 1.00 3 4.3333 .57735 .33333 2.8991 5.7676 4.00 5.00
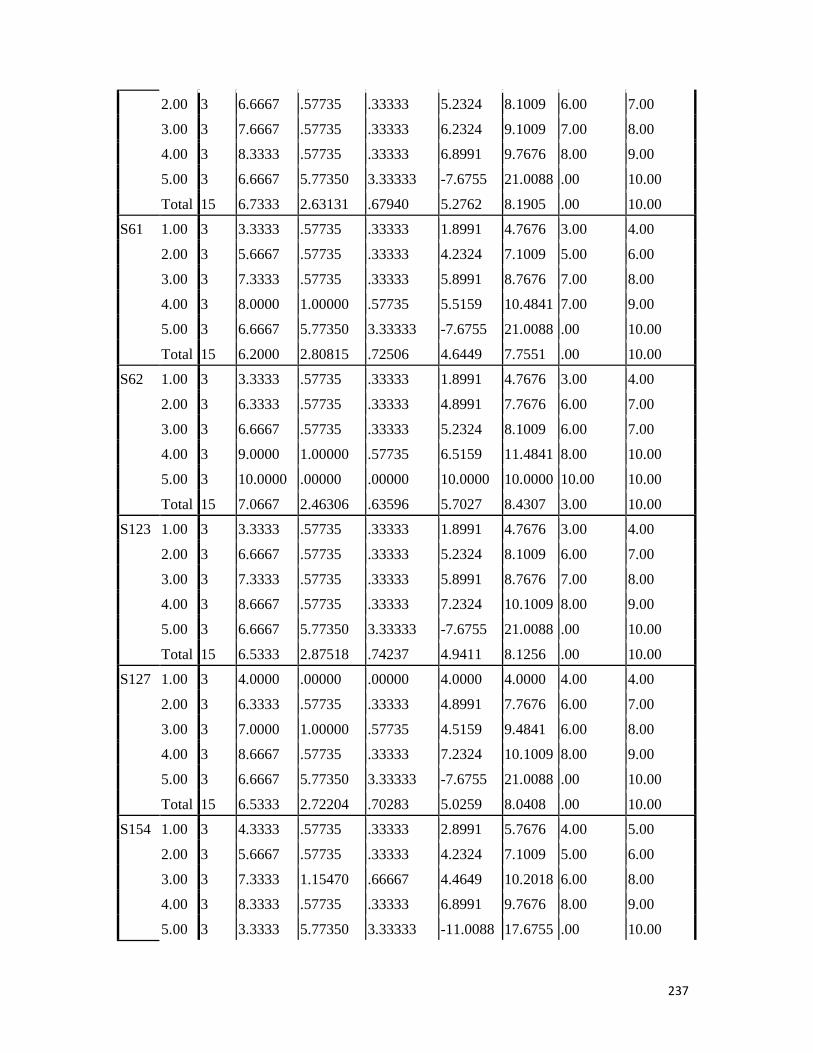
237
2.00 3 6.6667 .57735 .33333 5.2324 8.1009 6.00 7.00
3.00 3 7.6667 .57735 .33333 6.2324 9.1009 7.00 8.00
4.00 3 8.3333 .57735 .33333 6.8991 9.7676 8.00 9.00
5.00 3 6.6667 5.77350 3.33333 -7.6755 21.0088 .00 10.00
Total 15 6.7333 2.63131 .67940 5.2762 8.1905 .00 10.00
S61 1.00 3 3.3333 .57735 .33333 1.8991 4.7676 3.00 4.00
2.00 3 5.6667 .57735 .33333 4.2324 7.1009 5.00 6.00
3.00 3 7.3333 .57735 .33333 5.8991 8.7676 7.00 8.00
4.00 3 8.0000 1.00000 .57735 5.5159 10.4841 7.00 9.00
5.00 3 6.6667 5.77350 3.33333 -7.6755 21.0088 .00 10.00
Total 15 6.2000 2.80815 .72506 4.6449 7.7551 .00 10.00
S62 1.00 3 3.3333 .57735 .33333 1.8991 4.7676 3.00 4.00
2.00 3 6.3333 .57735 .33333 4.8991 7.7676 6.00 7.00
3.00 3 6.6667 .57735 .33333 5.2324 8.1009 6.00 7.00
4.00 3 9.0000 1.00000 .57735 6.5159 11.4841 8.00 10.00
5.00 3 10.0000 .00000 .00000 10.0000 10.0000 10.00 10.00
Total 15 7.0667 2.46306 .63596 5.7027 8.4307 3.00 10.00
S123 1.00 3 3.3333 .57735 .33333 1.8991 4.7676 3.00 4.00
2.00 3 6.6667 .57735 .33333 5.2324 8.1009 6.00 7.00
3.00 3 7.3333 .57735 .33333 5.8991 8.7676 7.00 8.00
4.00 3 8.6667 .57735 .33333 7.2324 10.1009 8.00 9.00
5.00 3 6.6667 5.77350 3.33333 -7.6755 21.0088 .00 10.00
Total 15 6.5333 2.87518 .74237 4.9411 8.1256 .00 10.00
S127 1.00 3 4.0000 .00000 .00000 4.0000 4.0000 4.00 4.00
2.00 3 6.3333 .57735 .33333 4.8991 7.7676 6.00 7.00
3.00 3 7.0000 1.00000 .57735 4.5159 9.4841 6.00 8.00
4.00 3 8.6667 .57735 .33333 7.2324 10.1009 8.00 9.00
5.00 3 6.6667 5.77350 3.33333 -7.6755 21.0088 .00 10.00
Total 15 6.5333 2.72204 .70283 5.0259 8.0408 .00 10.00
S154 1.00 3 4.3333 .57735 .33333 2.8991 5.7676 4.00 5.00
2.00 3 5.6667 .57735 .33333 4.2324 7.1009 5.00 6.00
3.00 3 7.3333 1.15470 .66667 4.4649 10.2018 6.00 8.00
4.00 3 8.3333 .57735 .33333 6.8991 9.7676 8.00 9.00
5.00 3 3.3333 5.77350 3.33333 -11.0088 17.6755 .00 10.00

238
Total 15 5.8000 2.95683 .76345 4.1626 7.4374 .00 10.00
S187 1.00 3 4.3333 .57735 .33333 2.8991 5.7676 4.00 5.00
2.00 3 6.0000 1.00000 .57735 3.5159 8.4841 5.00 7.00
3.00 3 7.0000 1.00000 .57735 4.5159 9.4841 6.00 8.00
4.00 3 8.3333 1.15470 .66667 5.4649 11.2018 7.00 9.00
5.00 3 .0000 .00000 .00000 .0000 .0000 .00 .00
Total 15 5.1333 3.06749 .79202 3.4346 6.8321 .00 9.00
S208 1.00 3 5.0000 .00000 .00000 5.0000 5.0000 5.00 5.00
2.00 3 6.3333 .57735 .33333 4.8991 7.7676 6.00 7.00
3.00 3 7.6667 .57735 .33333 6.2324 9.1009 7.00 8.00
4.00 3 9.0000 1.00000 .57735 6.5159 11.4841 8.00 10.00
5.00 3 3.3333 5.77350 3.33333 -11.0088 17.6755 .00 10.00
Total 15 6.2667 3.03472 .78356 4.5861 7.9472 .00 10.00
S235 1.00 3 4.6667 .57735 .33333 3.2324 6.1009 4.00 5.00
2.00 3 5.6667 .57735 .33333 4.2324 7.1009 5.00 6.00
3.00 3 7.6667 .57735 .33333 6.2324 9.1009 7.00 8.00
4.00 3 9.3333 .57735 .33333 7.8991 10.7676 9.00 10.00
5.00 3 6.6667 5.77350 3.33333 -7.6755 21.0088 .00 10.00
Total 15 6.8000 2.78260 .71846 5.2590 8.3410 .00 10.00
S310 1.00 3 4.3333 .57735 .33333 2.8991 5.7676 4.00 5.00
2.00 3 5.6667 .57735 .33333 4.2324 7.1009 5.00 6.00
3.00 3 7.3333 .57735 .33333 5.8991 8.7676 7.00 8.00
4.00 3 8.3333 .57735 .33333 6.8991 9.7676 8.00 9.00
5.00 3 3.3333 5.77350 3.33333 -11.0088 17.6755 .00 10.00
Total 15 5.8000 2.93258 .75719 4.1760 7.4240 .00 10.00
S390 1.00 3 3.3333 .57735 .33333 1.8991 4.7676 3.00 4.00
2.00 3 5.3333 .57735 .33333 3.8991 6.7676 5.00 6.00
3.00 3 7.6667 .57735 .33333 6.2324 9.1009 7.00 8.00
4.00 3 7.6667 .57735 .33333 6.2324 9.1009 7.00 8.00
5.00 3 9.6667 .57735 .33333 8.2324 11.1009 9.00 10.00
Total 15 6.7333 2.31352 .59735 5.4521 8.0145 3.00 10.00
S417 1.00 3 3.0000 .00000 .00000 3.0000 3.0000 3.00 3.00
2.00 3 5.3333 .57735 .33333 3.8991 6.7676 5.00 6.00
3.00 3 6.6667 .57735 .33333 5.2324 8.1009 6.00 7.00

239
4.00 3 7.6667 1.15470 .66667 4.7982 10.5351 7.00 9.00
5.00 3 8.6667 .57735 .33333 7.2324 10.1009 8.00 9.00
Total 15 6.2667 2.12020 .54743 5.0925 7.4408 3.00 9.00
S570 1.00 3 3.3333 .57735 .33333 1.8991 4.7676 3.00 4.00
2.00 3 5.0000 .00000 .00000 5.0000 5.0000 5.00 5.00
3.00 3 6.6667 .57735 .33333 5.2324 8.1009 6.00 7.00
4.00 3 8.3333 .57735 .33333 6.8991 9.7676 8.00 9.00
5.00 3 8.3333 .57735 .33333 6.8991 9.7676 8.00 9.00
Total 15 6.3333 2.05866 .53154 5.1933 7.4734 3.00 9.00
S578 1.00 3 3.3333 .57735 .33333 1.8991 4.7676 3.00 4.00
2.00 3 5.3333 .57735 .33333 3.8991 6.7676 5.00 6.00
3.00 3 7.0000 .00000 .00000 7.0000 7.0000 7.00 7.00
4.00 3 8.6667 .57735 .33333 7.2324 10.1009 8.00 9.00
5.00 3 8.6667 .57735 .33333 7.2324 10.1009 8.00 9.00
Total 15 6.6000 2.16465 .55891 5.4013 7.7987 3.00 9.00
S600 1.00 3 3.0000 .00000 .00000 3.0000 3.0000 3.00 3.00
2.00 3 5.3333 .57735 .33333 3.8991 6.7676 5.00 6.00
3.00 3 7.3333 .57735 .33333 5.8991 8.7676 7.00 8.00
4.00 3 8.3333 .57735 .33333 6.8991 9.7676 8.00 9.00
5.00 3 8.6667 .57735 .33333 7.2324 10.1009 8.00 9.00
Total 15 6.5333 2.23180 .57625 5.2974 7.7693 3.00 9.00
S620 1.00 3 3.6667 .57735 .33333 2.2324 5.1009 3.00 4.00
2.00 3 5.6667 .57735 .33333 4.2324 7.1009 5.00 6.00
3.00 3 6.6667 .57735 .33333 5.2324 8.1009 6.00 7.00
4.00 3 8.6667 .57735 .33333 7.2324 10.1009 8.00 9.00
5.00 3 8.3333 .57735 .33333 6.8991 9.7676 8.00 9.00
Total 15 6.6000 1.95667 .50521 5.5164 7.6836 3.00 9.00
S651 1.00 3 3.3333 .57735 .33333 1.8991 4.7676 3.00 4.00
2.00 3 5.3333 .57735 .33333 3.8991 6.7676 5.00 6.00
3.00 3 6.6667 .57735 .33333 5.2324 8.1009 6.00 7.00
4.00 3 8.6667 .57735 .33333 7.2324 10.1009 8.00 9.00
5.00 3 6.3333 5.50757 3.17980 -7.3482 20.0149 .00 10.00
Total 15 6.0667 2.78944 .72023 4.5219 7.6114 .00 10.00
S819 1.00 3 3.6667 .57735 .33333 2.2324 5.1009 3.00 4.00

240
2.00 3 5.6667 .57735 .33333 4.2324 7.1009 5.00 6.00
3.00 3 7.3333 .57735 .33333 5.8991 8.7676 7.00 8.00
4.00 3 8.3333 .57735 .33333 6.8991 9.7676 8.00 9.00
5.00 3 6.6667 5.77350 3.33333 -7.6755 21.0088 .00 10.00
Total 15 6.3333 2.76887 .71492 4.8000 7.8667 .00 10.00
S831 1.00 3 3.3333 .57735 .33333 1.8991 4.7676 3.00 4.00
2.00 3 5.0000 .00000 .00000 5.0000 5.0000 5.00 5.00
3.00 3 7.3333 .57735 .33333 5.8991 8.7676 7.00 8.00
4.00 3 8.6667 .57735 .33333 7.2324 10.1009 8.00 9.00
5.00 3 6.6667 5.77350 3.33333 -7.6755 21.0088 .00 10.00
Total 15 6.2000 2.93258 .75719 4.5760 7.8240 .00 10.00
S841 1.00 3 3.6667 .57735 .33333 2.2324 5.1009 3.00 4.00
2.00 3 5.6667 .57735 .33333 4.2324 7.1009 5.00 6.00
3.00 3 7.6667 .57735 .33333 6.2324 9.1009 7.00 8.00
4.00 3 8.0000 1.00000 .57735 5.5159 10.4841 7.00 9.00
5.00 3 .0000 .00000 .00000 .0000 .0000 .00 .00
Total 15 5.0000 3.09377 .79881 3.2867 6.7133 .00 9.00
S940 1.00 3 4.0000 1.00000 .57735 1.5159 6.4841 3.00 5.00
2.00 3 7.3333 .57735 .33333 5.8991 8.7676 7.00 8.00
3.00 3 7.3333 .57735 .33333 5.8991 8.7676 7.00 8.00
4.00 3 9.0000 .00000 .00000 9.0000 9.0000 9.00 9.00
5.00 3 .0000 .00000 .00000 .0000 .0000 .00 .00
Total 15 5.5333 3.35659 .86667 3.6745 7.3921 .00 9.00
S947 1.00 3 4.3333 .57735 .33333 2.8991 5.7676 4.00 5.00
2.00 3 5.6667 .57735 .33333 4.2324 7.1009 5.00 6.00
3.00 3 7.0000 1.00000 .57735 4.5159 9.4841 6.00 8.00
4.00 3 8.6667 .57735 .33333 7.2324 10.1009 8.00 9.00
5.00 3 6.6667 5.77350 3.33333 -7.6755 21.0088 .00 10.00
Total 15 6.4667 2.69568 .69602 4.9739 7.9595 .00 10.00
S1009
1.00 3 3.6667 1.15470 .66667 .7982 6.5351 3.00 5.00
2.00 3 5.3333 .57735 .33333 3.8991 6.7676 5.00 6.00
3.00 3 7.3333 .57735 .33333 5.8991 8.7676 7.00 8.00
4.00 3 9.0000 1.00000 .57735 6.5159 11.4841 8.00 10.00
5.00 3 8.6667 .57735 .33333 7.2324 10.1009 8.00 9.00
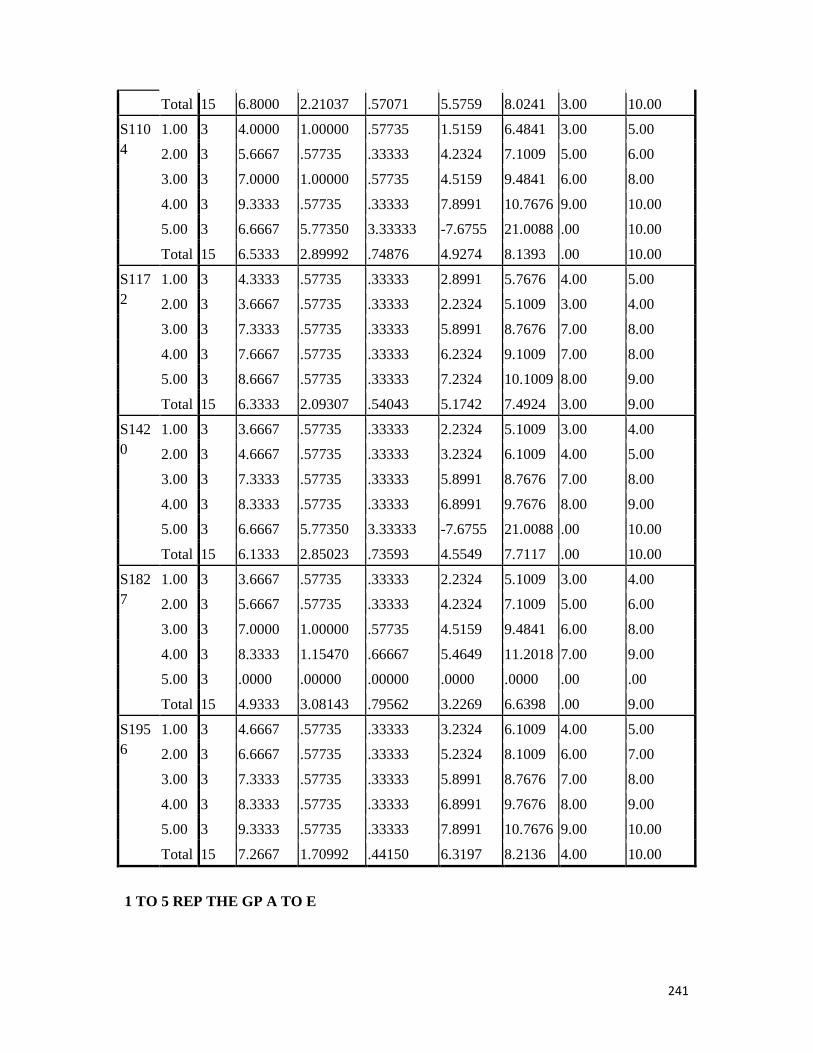
241
1 TO 5 REP THE GP A TO E
Total 15 6.8000 2.21037 .57071 5.5759 8.0241 3.00 10.00
S1104
1.00 3 4.0000 1.00000 .57735 1.5159 6.4841 3.00 5.00
2.00 3 5.6667 .57735 .33333 4.2324 7.1009 5.00 6.00
3.00 3 7.0000 1.00000 .57735 4.5159 9.4841 6.00 8.00
4.00 3 9.3333 .57735 .33333 7.8991 10.7676 9.00 10.00
5.00 3 6.6667 5.77350 3.33333 -7.6755 21.0088 .00 10.00
Total 15 6.5333 2.89992 .74876 4.9274 8.1393 .00 10.00
S1172
1.00 3 4.3333 .57735 .33333 2.8991 5.7676 4.00 5.00
2.00 3 3.6667 .57735 .33333 2.2324 5.1009 3.00 4.00
3.00 3 7.3333 .57735 .33333 5.8991 8.7676 7.00 8.00
4.00 3 7.6667 .57735 .33333 6.2324 9.1009 7.00 8.00
5.00 3 8.6667 .57735 .33333 7.2324 10.1009 8.00 9.00
Total 15 6.3333 2.09307 .54043 5.1742 7.4924 3.00 9.00
S1420
1.00 3 3.6667 .57735 .33333 2.2324 5.1009 3.00 4.00
2.00 3 4.6667 .57735 .33333 3.2324 6.1009 4.00 5.00
3.00 3 7.3333 .57735 .33333 5.8991 8.7676 7.00 8.00
4.00 3 8.3333 .57735 .33333 6.8991 9.7676 8.00 9.00
5.00 3 6.6667 5.77350 3.33333 -7.6755 21.0088 .00 10.00
Total 15 6.1333 2.85023 .73593 4.5549 7.7117 .00 10.00
S1827
1.00 3 3.6667 .57735 .33333 2.2324 5.1009 3.00 4.00
2.00 3 5.6667 .57735 .33333 4.2324 7.1009 5.00 6.00
3.00 3 7.0000 1.00000 .57735 4.5159 9.4841 6.00 8.00
4.00 3 8.3333 1.15470 .66667 5.4649 11.2018 7.00 9.00
5.00 3 .0000 .00000 .00000 .0000 .0000 .00 .00
Total 15 4.9333 3.08143 .79562 3.2269 6.6398 .00 9.00
S1956
1.00 3 4.6667 .57735 .33333 3.2324 6.1009 4.00 5.00
2.00 3 6.6667 .57735 .33333 5.2324 8.1009 6.00 7.00
3.00 3 7.3333 .57735 .33333 5.8991 8.7676 7.00 8.00
4.00 3 8.3333 .57735 .33333 6.8991 9.7676 8.00 9.00
5.00 3 9.3333 .57735 .33333 7.8991 10.7676 9.00 10.00
Total 15 7.2667 1.70992 .44150 6.3197 8.2136 4.00 10.00

242
ANALYSIS FOR MIC ONEWAY S4 S8 S20 S22 S30 S33 S35 S36 S38 S42 S53 S57 S61 S62 S123 S127 S154 S187 S208 S235 S310 S390 S417 S570 S578 S600 S620 S651 S 819 S831 S841 S940 S947 S1009 S1104 S1172 S1420 S1827 S1956 BY VAR00001 /STATISTICS DESCRIPTIVES /MISSING ANALYSIS /POSTHOC=DUNCAN ALPHA(0.05).
Oneway
ANOVA
Sum of Squares df Mean Square F Sig.
S4 Between Groups 39.600 4 9.900 1.428 .294
Within Groups 69.333 10 6.933
Total 108.933 14
S8 Between Groups 31.600 4 7.900 1.247 .352
Within Groups 63.333 10 6.333
Total 94.933 14
S20 Between Groups 48.667 4 12.167 1.772 .211
Within Groups 68.667 10 6.867
Total 117.333 14
S22 Between Groups 60.267 4 15.067 45.200 .000
Within Groups 3.333 10 .333
Total 63.600 14
S30 Between Groups 64.667 4 16.167 24.250 .000
Within Groups 6.667 10 .667
Total 71.333 14

243
S33 Between Groups 22.933 4 5.733 .811 .546
Within Groups 70.667 10 7.067
Total 93.600 14
S35 Between Groups 28.267 4 7.067 1.128 .397
Within Groups 62.667 10 6.267
Total 90.933 14
S36 Between Groups 77.333 4 19.333 96.667 .000
Within Groups 2.000 10 .200
Total 79.333 14
S38 Between Groups 64.400 4 16.100 48.300 .000
Within Groups 3.333 10 .333
Total 67.733 14
S42 Between Groups 32.667 4 8.167 1.114 .403
Within Groups 73.333 10 7.333
Total 106.000 14
S53 Between Groups 41.067 4 10.267 1.453 .287
Within Groups 70.667 10 7.067
Total 111.733 14
S57 Between Groups 27.600 4 6.900 .995 .454
Within Groups 69.333 10 6.933
Total 96.933 14
S61 Between Groups 39.733 4 9.933 1.406 .301
Within Groups 70.667 10 7.067

244
Total 110.400 14
S62 Between Groups 80.933 4 20.233 50.583 .000
Within Groups 4.000 10 .400
Total 84.933 14
S123 Between Groups 46.400 4 11.600 1.673 .232
Within Groups 69.333 10 6.933
Total 115.733 14
S127 Between Groups 33.733 4 8.433 1.205 .367
Within Groups 70.000 10 7.000
Total 103.733 14
S154 Between Groups 51.067 4 12.767 1.790 .207
Within Groups 71.333 10 7.133
Total 122.400 14
S187 Between Groups 124.400 4 31.100 42.409 .000
Within Groups 7.333 10 .733
Total 131.733 14
S208 Between Groups 58.933 4 14.733 2.105 .155
Within Groups 70.000 10 7.000
Total 128.933 14
S235 Between Groups 39.067 4 9.767 1.409 .300
Within Groups 69.333 10 6.933
Total 108.400 14
S310 Between Groups 51.067 4 12.767 1.841 .198

245
Within Groups 69.333 10 6.933
Total 120.400 14
S390 Between Groups 71.600 4 17.900 53.700 .000
Within Groups 3.333 10 .333
Total 74.933 14
S417 Between Groups 58.267 4 14.567 31.214 .000
Within Groups 4.667 10 .467
Total 62.933 14
S570 Between Groups 56.667 4 14.167 53.125 .000
Within Groups 2.667 10 .267
Total 59.333 14
S578 Between Groups 62.933 4 15.733 59.000 .000
Within Groups 2.667 10 .267
Total 65.600 14
S600 Between Groups 67.067 4 16.767 62.875 .000
Within Groups 2.667 10 .267
Total 69.733 14
S620 Between Groups 50.267 4 12.567 37.700 .000
Within Groups 3.333 10 .333
Total 53.600 14
S651 Between Groups 45.600 4 11.400 1.800 .205
Within Groups 63.333 10 6.333
Total 108.933 14

246
S819 Between Groups 38.000 4 9.500 1.370 .312
Within Groups 69.333 10 6.933
Total 107.333 14
S831 Between Groups 51.733 4 12.933 1.883 .190
Within Groups 68.667 10 6.867
Total 120.400 14
S841 Between Groups 130.000 4 32.500 81.250 .000
Within Groups 4.000 10 .400
Total 134.000 14
S940 Between Groups 154.400 4 38.600 115.800 .000
Within Groups 3.333 10 .333
Total 157.733 14
S947 Between Groups 31.067 4 7.767 1.099 .409
Within Groups 70.667 10 7.067
Total 101.733 14
S1009 Between Groups 61.733 4 15.433 23.150 .000
Within Groups 6.667 10 .667
Total 68.400 14
S1104 Between Groups 45.733 4 11.433 1.588 .252
Within Groups 72.000 10 7.200
Total 117.733 14
S1172 Between Groups 58.000 4 14.500 43.500 .000
Within Groups 3.333 10 .333

247
Total 61.333 14
S1420 Between Groups 44.400 4 11.100 1.601 .249
Within Groups 69.333 10 6.933
Total 113.733 14
S1827 Between Groups 126.933 4 31.733 52.889 .000
Within Groups 6.000 10 .600
Total 132.933 14
S1956 Between Groups 37.600 4 9.400 28.200 .000
Within Groups 3.333 10 .333
Total 40.933 14
Post Hoc Tests
Homogeneous Subsets
S4
Duncana
VAR00001 N Subset for alpha = 0.05
1
1.00 3 4.3333
2.00 3 5.6667
5.00 3 6.6667
3.00 3 8.3333
4.00 3 8.6667
Sig. .094
Means for groups in homogeneous subsets are displayed.
a. Uses Harmonic Mean Sample Size = 3.000.

248
S8
Duncana
VAR00001 N
Subset for alpha = 0.05
1
1.00 3 4.6667
5.00 3 6.3333
2.00 3 6.6667
3.00 3 8.3333
4.00 3 8.6667
Sig. .104
Means for groups in homogeneous subsets are displayed.
a. Uses Harmonic Mean Sample Size = 3.000.
S20
Duncana
VAR00001 N
Subset for alpha = 0.05
1 2
1.00 3 4.0000
2.00 3 5.6667 5.6667
5.00 3 6.6667 6.6667
3.00 3 7.6667 7.6667
4.00 3 9.3333
Sig. .141 .141
Means for groups in homogeneous subsets are displayed.
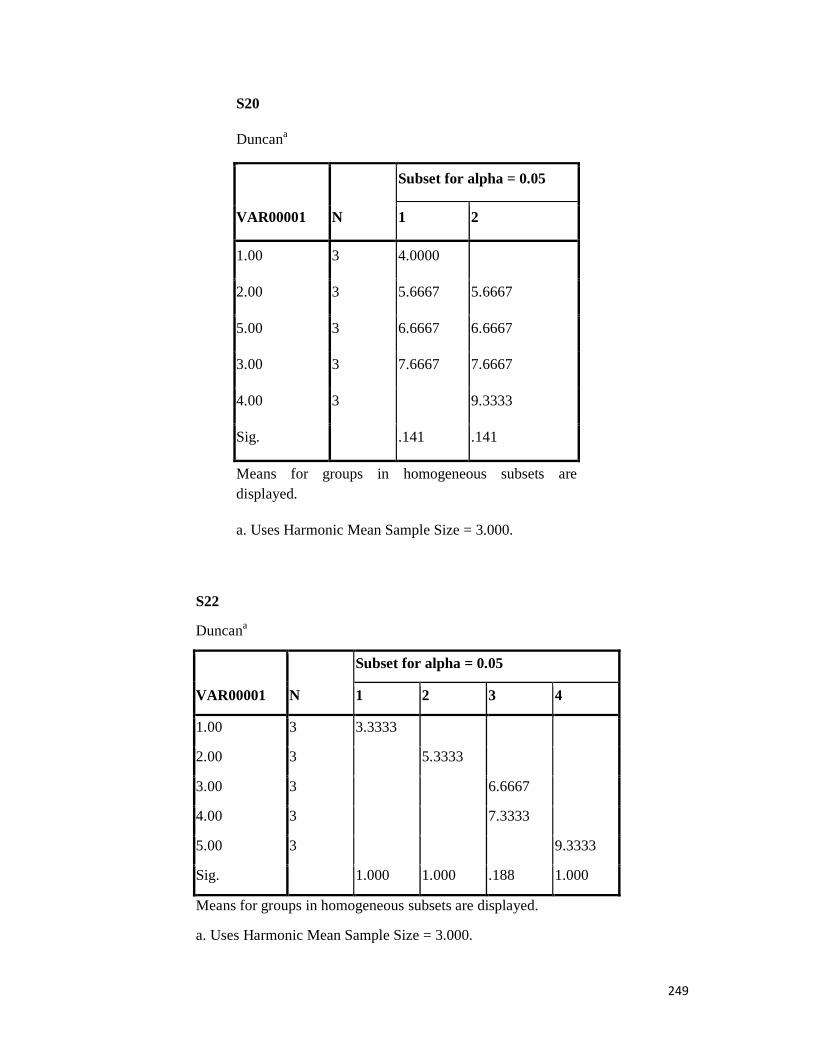
249
S20
Duncana
VAR00001 N
Subset for alpha = 0.05
1 2
1.00 3 4.0000
2.00 3 5.6667 5.6667
5.00 3 6.6667 6.6667
3.00 3 7.6667 7.6667
4.00 3 9.3333
Sig. .141 .141
Means for groups in homogeneous subsets are displayed.
a. Uses Harmonic Mean Sample Size = 3.000.
S22
Duncana
VAR00001 N
Subset for alpha = 0.05
1 2 3 4
1.00 3 3.3333
2.00 3 5.3333
3.00 3 6.6667
4.00 3 7.3333
5.00 3 9.3333
Sig. 1.000 1.000 .188 1.000
Means for groups in homogeneous subsets are displayed.
a. Uses Harmonic Mean Sample Size = 3.000.

250
S30
Duncana
VAR00001 N
Subset for alpha = 0.05
1 2 3 4
1.00 3 3.3333
2.00 3 6.0000
3.00 3 6.6667 6.6667
4.00 3 7.6667
5.00 3 9.6667
Sig. 1.000 .341 .165 1.000
Means for groups in homogeneous subsets are displayed.
a. Uses Harmonic Mean Sample Size = 3.000.
S33
Duncana
VAR00001 N
Subset for alpha = 0.05
1
1.00 3 4.3333
2.00 3 6.6667
5.00 3 6.6667
3.00 3 7.3333
4.00 3 8.0000
Sig. .151
Means for groups in homogeneous subsets are displayed.
a. Uses Harmonic Mean Sample Size = 3.000.

251
S35
Duncana
VAR00001 N
Subset for alpha = 0.05
1
1.00 3 4.0000
2.00 3 5.6667
5.00 3 6.3333
3.00 3 7.6667
4.00 3 7.6667
Sig. .130
Means for groups in homogeneous subsets are displayed.
a. Uses Harmonic Mean Sample Size = 3.000.
S36
Duncana
VAR00001 N
Subset for alpha = 0.05
1 2 3 4 5
1.00 3 3.0000
2.00 3 5.0000
3.00 3 6.3333
4.00 3 7.6667
5.00 3 9.6667

252
Sig. 1.000 1.000 1.000 1.000 1.000
Means for groups in homogeneous subsets are displayed.
a. Uses Harmonic Mean Sample Size = 3.000.
S38
Duncana
VAR00001 N
Subset for alpha = 0.05
1 2 3 4
1.00 3 3.3333
2.00 3 5.6667
3.00 3 6.6667 6.6667
4.00 3 7.3333
5.00 3 9.6667
Sig. 1.000 .060 .188 1.000
Means for groups in homogeneous subsets are displayed.
a. Uses Harmonic Mean Sample Size = 3.000.
S42
Duncana
VAR00001 N
Subset for alpha = 0.05
1
1.00 3 3.3333

253
2.00 3 5.6667
3.00 3 6.6667
5.00 3 6.6667
4.00 3 7.6667
Sig. .102
Means for groups in homogeneous subsets are displayed.
a. Uses Harmonic Mean Sample Size = 3.000.
S53
Duncana
VAR00001 N
Subset for alpha = 0.05
1
1.00 3 3.3333
2.00 3 5.3333
5.00 3 6.6667
3.00 3 7.3333
4.00 3 8.0000
Sig. .076
Means for groups in homogeneous subsets are displayed.
a. Uses Harmonic Mean Sample Size = 3.000.
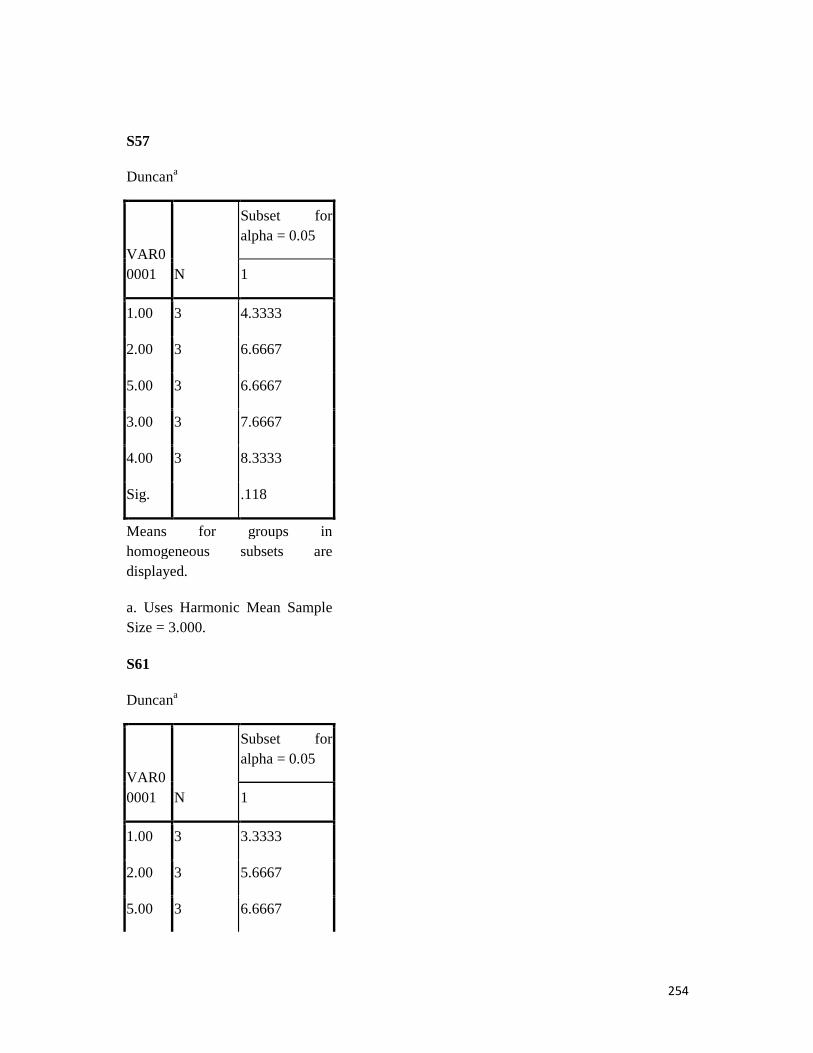
254
S57
Duncana
VAR00001 N
Subset for alpha = 0.05
1
1.00 3 4.3333
2.00 3 6.6667
5.00 3 6.6667
3.00 3 7.6667
4.00 3 8.3333
Sig. .118
Means for groups in homogeneous subsets are displayed.
a. Uses Harmonic Mean Sample Size = 3.000.
S61
Duncana
VAR00001 N
Subset for alpha = 0.05
1
1.00 3 3.3333
2.00 3 5.6667
5.00 3 6.6667

255
3.00 3 7.3333
4.00 3 8.0000
Sig. .076
Means for groups in homogeneous subsets are displayed.
a. Uses Harmonic Mean Sample Size = 3.000.
S62
Duncana
VAR00001 N
Subset for alpha = 0.05
1 2 3
1.00 3 3.3333
2.00 3 6.3333
3.00 3 6.6667
4.00 3 9.0000
5.00 3 10.0000
Sig. 1.000 .533 .082
Means for groups in homogeneous subsets are displayed.
a. Uses Harmonic Mean Sample Size = 3.000.

256
S123
Duncana
VAR00001 N
Subset for alpha = 0.05
1 2
1.00 3 3.3333
2.00 3 6.6667 6.6667
5.00 3 6.6667 6.6667
3.00 3 7.3333 7.3333
4.00 3 8.6667
Sig. .113 .405
Means for groups in homogeneous subsets are displayed.
a. Uses Harmonic Mean Sample Size = 3.000.
S127
Duncana
VAR00001 N
Subset for alpha = 0.05
1
1.00 3 4.0000
2.00 3 6.3333
5.00 3 6.6667
3.00 3 7.0000
4.00 3 8.6667

257
Sig. .075
Means for groups in homogeneous subsets are displayed.
a. Uses Harmonic Mean Sample Size = 3.000.
S154
Duncana
VAR00001 N
Subset for alpha = 0.05
1
5.00 3 3.3333
1.00 3 4.3333
2.00 3 5.6667
3.00 3 7.3333
4.00 3 8.3333
Sig. .061
Means for groups in homogeneous subsets are displayed.
a. Uses Harmonic Mean Sample Size = 3.000.

258
S187
Duncana
VAR00001 N
Subset for alpha = 0.05
1 2 3 4
5.00 3 .0000
1.00 3 4.3333
2.00 3 6.0000
3.00 3 7.0000 7.0000
4.00 3 8.3333
Sig. 1.000 1.000 .183 .086
Means for groups in homogeneous subsets are displayed.
a. Uses Harmonic Mean Sample Size = 3.000.
S208
Duncana
VAR00001 N
Subset for alpha = 0.05
1 2
5.00 3 3.3333
1.00 3 5.0000 5.0000
2.00 3 6.3333 6.3333
3.00 3 7.6667 7.6667
4.00 3 9.0000
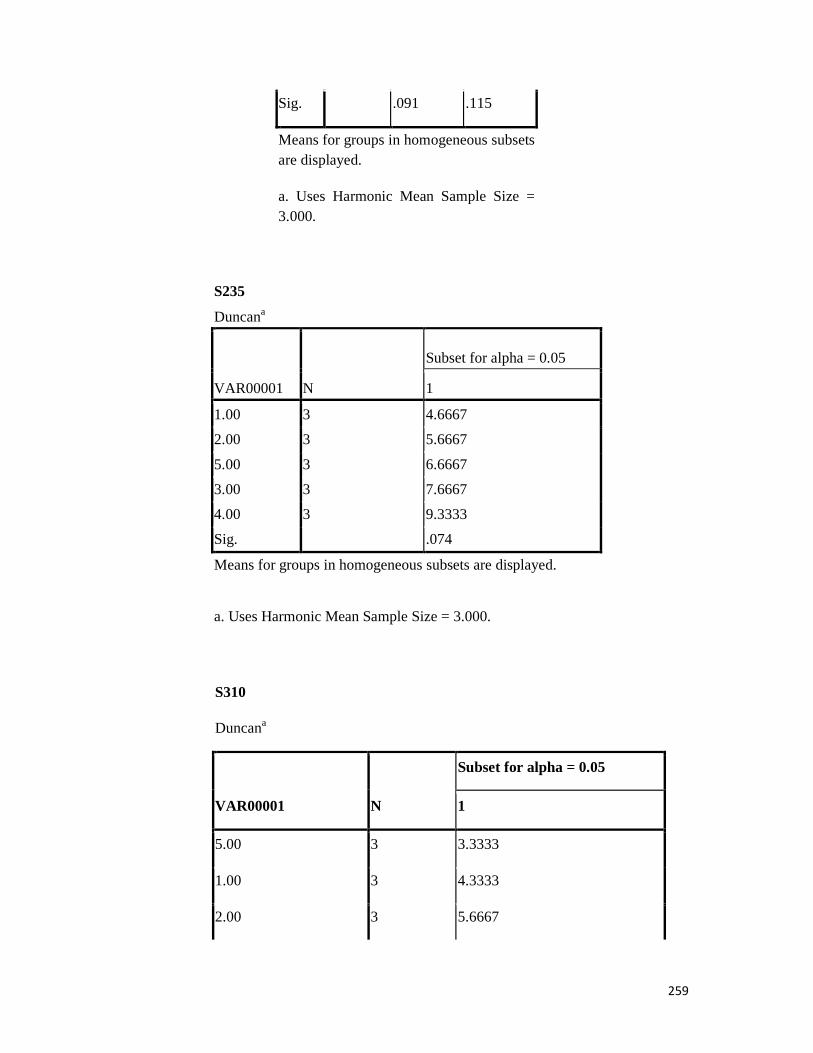
259
Sig. .091 .115
Means for groups in homogeneous subsets are displayed.
a. Uses Harmonic Mean Sample Size = 3.000.
S235
Duncana
VAR00001 N
Subset for alpha = 0.05
1
1.00 3 4.6667
2.00 3 5.6667
5.00 3 6.6667
3.00 3 7.6667
4.00 3 9.3333
Sig. .074
Means for groups in homogeneous subsets are displayed.
a. Uses Harmonic Mean Sample Size = 3.000.
S310
Duncana
VAR00001 N
Subset for alpha = 0.05
1
5.00 3 3.3333
1.00 3 4.3333
2.00 3 5.6667

260
3.00 3 7.3333
4.00 3 8.3333
Sig. .058
Means for groups in homogeneous subsets are displayed.
a. Uses Harmonic Mean Sample Size = 3.000.
S390
Duncana
VAR00001 N
Subset for alpha = 0.05
1 2 3 4
1.00 3 3.3333
2.00 3 5.3333
3.00 3 7.6667
4.00 3 7.6667
5.00 3 9.6667
Sig. 1.000 1.000 1.000 1.000
Means for groups in homogeneous subsets are displayed.
a. Uses Harmonic Mean Sample Size = 3.000.
S417
Duncana
VAR00001 N
Subset for alpha = 0.05
1 2 3 4
1.00 3 3.0000
2.00 3 5.3333

261
3.00 3 6.6667
4.00 3 7.6667 7.6667
5.00 3 8.6667
Sig. 1.000 1.000 .103 .103
Means for groups in homogeneous subsets are displayed.
a. Uses Harmonic Mean Sample Size = 3.000.
S570
Duncana
VAR00001 N
Subset for alpha = 0.05
1 2 3 4
1.00 3 3.3333
2.00 3 5.0000
3.00 3 6.6667
4.00 3 8.3333
5.00 3 8.3333
Sig. 1.000 1.000 1.000 1.000
Means for groups in homogeneous subsets are displayed.
a. Uses Harmonic Mean Sample Size = 3.000.
S578
Duncana
VAR00001 N
Subset for alpha = 0.05
1 2 3 4
1.00 3 3.3333
2.00 3 5.3333
3.00 3 7.0000
4.00 3 8.6667
5.00 3 8.6667
Sig. 1.000 1.000 1.000 1.000
Means for groups in homogeneous subsets are displayed.
a. Uses Harmonic Mean Sample Size = 3.000.

262
S600
Duncana
VAR00001 N
Subset for alpha = 0.05
1 2 3 4
1.00 3 3.0000
2.00 3 5.3333
3.00 3 7.3333
4.00 3 8.3333
5.00 3 8.6667
Sig. 1.000 1.000 1.000 .448
Means for groups in homogeneous subsets are displayed.
a. Uses Harmonic Mean Sample Size = 3.000.
S620
Duncana
VAR00001 N
Subset for alpha = 0.05
1 2 3
1.00 3 3.6667
2.00 3 5.6667
3.00 3 6.6667
5.00 3 8.3333
4.00 3 8.6667
Sig. 1.000 .060 .496
Means for groups in homogeneous subsets are displayed.
a. Uses Harmonic Mean Sample Size = 3.000.

263
S651
Duncana
VAR00001 N
Subset for alpha = 0.05
1 2
1.00 3 3.3333
2.00 3 5.3333 5.3333
5.00 3 6.3333 6.3333
3.00 3 6.6667 6.6667
4.00 3 8.6667
Sig. .161 .161
Means for groups in homogeneous subsets are displayed.
a. Uses Harmonic Mean Sample Size = 3.000.
S819
Duncana
VAR00001 N
Subset for alpha = 0.05
1
1.00 3 3.6667
2.00 3 5.6667
5.00 3 6.6667
3.00 3 7.3333
4.00 3 8.3333
Sig. .074
Means for groups in homogeneous subsets are displayed.
a. Uses Harmonic Mean Sample Size = 3.000.

264
S831
Duncana
VAR00001 N
Subset for alpha = 0.05
1 2
1.00 3 3.3333
2.00 3 5.0000 5.0000
5.00 3 6.6667 6.6667
3.00 3 7.3333 7.3333
4.00 3 8.6667
Sig. .112 .141
Means for groups in homogeneous subsets are displayed.
a. Uses Harmonic Mean Sample Size = 3.000.
S841
Duncana
VAR00001 N
Subset for alpha = 0.05
1 2 3 4
5.00 3 .0000
1.00 3 3.6667
2.00 3 5.6667
3.00 3 7.6667
4.00 3 8.0000
Sig. 1.000 1.000 1.000 .533
Means for groups in homogeneous subsets are displayed.
a. Uses Harmonic Mean Sample Size = 3.000.
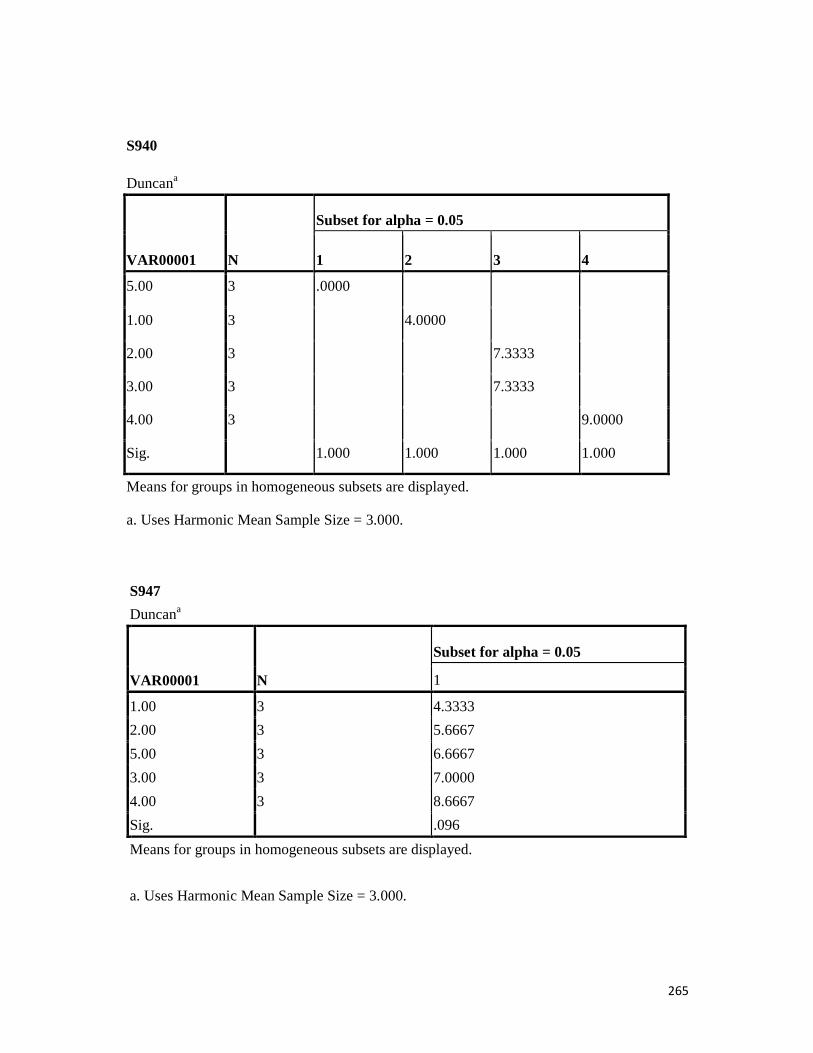
265
S940
Duncana
VAR00001 N
Subset for alpha = 0.05
1 2 3 4
5.00 3 .0000
1.00 3 4.0000
2.00 3 7.3333
3.00 3 7.3333
4.00 3 9.0000
Sig. 1.000 1.000 1.000 1.000
Means for groups in homogeneous subsets are displayed.
a. Uses Harmonic Mean Sample Size = 3.000.
S947
Duncana
VAR00001 N
Subset for alpha = 0.05
1
1.00 3 4.3333
2.00 3 5.6667
5.00 3 6.6667
3.00 3 7.0000
4.00 3 8.6667
Sig. .096
Means for groups in homogeneous subsets are displayed.
a. Uses Harmonic Mean Sample Size = 3.000.

266
S1009
Duncana
VAR00001 N
Subset for alpha = 0.05
1 2 3 4
1.00 3 3.6667
2.00 3 5.3333
3.00 3 7.3333
5.00 3 8.6667 8.6667
4.00 3 9.0000
Sig. 1.000 1.000 .073 .628
Means for groups in homogeneous subsets are displayed.
a. Uses Harmonic Mean Sample Size = 3.000.
S1104
Duncana
VAR00001 N
Subset for alpha = 0.05
1 2
1.00 3 4.0000
2.00 3 5.6667 5.6667
5.00 3 6.6667 6.6667
3.00 3 7.0000 7.0000
4.00 3 9.3333
Sig. .230 .150
Means for groups in homogeneous subsets are displayed.

267
S1104
Duncana
VAR00001 N
Subset for alpha = 0.05
1 2
1.00 3 4.0000
2.00 3 5.6667 5.6667
5.00 3 6.6667 6.6667
3.00 3 7.0000 7.0000
4.00 3 9.3333
Sig. .230 .150
Means for groups in homogeneous subsets are displayed.
a. Uses Harmonic Mean Sample Size = 3.000.
172
Duncana
VAR00001 N
Subset for alpha = 0.05
1 2 3
2.00 3 3.6667
1.00 3 4.3333
3.00 3 7.3333
4.00 3 7.6667 7.6667
5.00 3 8.6667
Sig. .188 .496 .060
Means for groups in homogeneous subsets are displayed.
a. Uses Harmonic Mean Sample Size = 3.000.

268
S1420
Duncana
VAR00001 N
Subset for alpha = 0.05
1
1.00 3 3.6667
2.00 3 4.6667
5.00 3 6.6667
3.00 3 7.3333
4.00 3 8.3333
Sig. .074
Means for groups in homogeneous subsets are displayed.
a. Uses Harmonic Mean Sample Size = 3.000.
S1827
Duncana
VAR00001 N
Subset for alpha = 0.05
1 2 3 4
5.00 3 .0000
1.00 3 3.6667
2.00 3 5.6667
3.00 3 7.0000 7.0000
4.00 3 8.3333
Sig. 1.000 1.000 .061 .061
Means for groups in homogeneous subsets are displayed.
a. Uses Harmonic Mean Sample Size = 3.000.
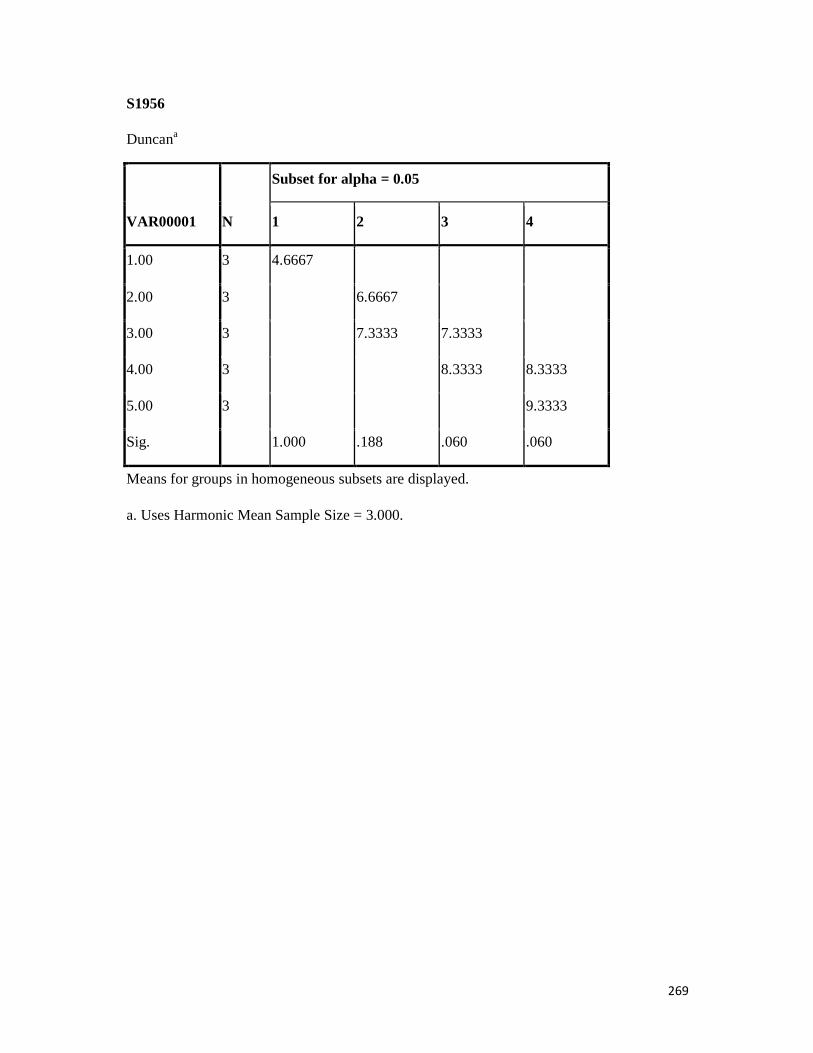
269
S1956
Duncana
VAR00001 N
Subset for alpha = 0.05
1 2 3 4
1.00 3 4.6667
2.00 3 6.6667
3.00 3 7.3333 7.3333
4.00 3 8.3333 8.3333
5.00 3 9.3333
Sig. 1.000 .188 .060 .060
Means for groups in homogeneous subsets are displayed.
a. Uses Harmonic Mean Sample Size = 3.000.

270
ANALYSIS FOR MBC
THR
ONEWAY S4 S8 S20 S22 S30 S33 S35 S36 S38 S42 S53 S57 S61 S62 S123 S127 S154 S187 S208 S235 S310 S390 S417 S570 S578 S600 S620 S651 S 819 S831 S841 S940 S947 S1009 S1104 S1172 S1420 S1827 S1956 BY VAR00001 /STATISTICS DESCRIPTIVES /MISSING ANALYSIS /POSTHOC=DUNCAN ALPHA (0.05).
Oneway
Descriptives
N Mean Std. Deviation
Std. Error
95% Confidence Interval for Mean
Minimum
Maximum
Lower Bound
Upper Bound
S4 1.00 3 5.0000 .00000 .00000 5.0000 5.0000 5.00 5.00
2.00 3 6.0000 .00000 .00000 6.0000 6.0000 6.00 6.00
3.00 3 8.6667 .57735 .33333 7.2324 10.1009 8.00 9.00
4.00 3 9.0000 .00000 .00000 9.0000 9.0000 9.00 9.00
5.00 3 6.6667 5.77350 3.33333 -7.6755 21.0088 .00 10.00
Total 15 7.0667 2.71153 .70011 5.5651 8.5683 .00 10.00
S8 1.00 3 5.3333 .57735 .33333 3.8991 6.7676 5.00 6.00
2.00 3 7.3333 .57735 .33333 5.8991 8.7676 7.00 8.00
3.00 3 8.6667 .57735 .33333 7.2324 10.1009 8.00 9.00
4.00 3 8.6667 .57735 .33333 7.2324 10.1009 8.00 9.00
5.00 3 6.6667 5.77350 3.33333 -7.6755 21.0088 .00 10.00
Total 15 7.3333 2.58199 .66667 5.9035 8.7632 .00 10.00
S20 1.00 3 4.0000 .00000 .00000 4.0000 4.0000 4.00 4.00
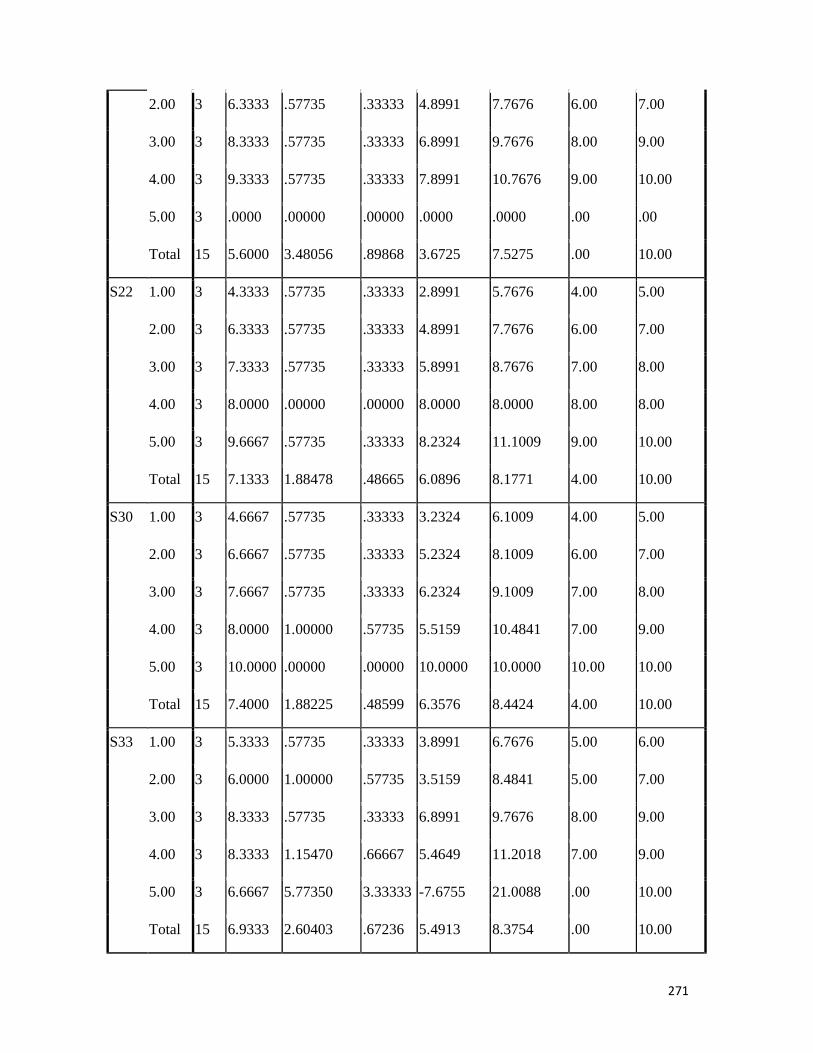
271
2.00 3 6.3333 .57735 .33333 4.8991 7.7676 6.00 7.00
3.00 3 8.3333 .57735 .33333 6.8991 9.7676 8.00 9.00
4.00 3 9.3333 .57735 .33333 7.8991 10.7676 9.00 10.00
5.00 3 .0000 .00000 .00000 .0000 .0000 .00 .00
Total 15 5.6000 3.48056 .89868 3.6725 7.5275 .00 10.00
S22 1.00 3 4.3333 .57735 .33333 2.8991 5.7676 4.00 5.00
2.00 3 6.3333 .57735 .33333 4.8991 7.7676 6.00 7.00
3.00 3 7.3333 .57735 .33333 5.8991 8.7676 7.00 8.00
4.00 3 8.0000 .00000 .00000 8.0000 8.0000 8.00 8.00
5.00 3 9.6667 .57735 .33333 8.2324 11.1009 9.00 10.00
Total 15 7.1333 1.88478 .48665 6.0896 8.1771 4.00 10.00
S30 1.00 3 4.6667 .57735 .33333 3.2324 6.1009 4.00 5.00
2.00 3 6.6667 .57735 .33333 5.2324 8.1009 6.00 7.00
3.00 3 7.6667 .57735 .33333 6.2324 9.1009 7.00 8.00
4.00 3 8.0000 1.00000 .57735 5.5159 10.4841 7.00 9.00
5.00 3 10.0000 .00000 .00000 10.0000 10.0000 10.00 10.00
Total 15 7.4000 1.88225 .48599 6.3576 8.4424 4.00 10.00
S33 1.00 3 5.3333 .57735 .33333 3.8991 6.7676 5.00 6.00
2.00 3 6.0000 1.00000 .57735 3.5159 8.4841 5.00 7.00
3.00 3 8.3333 .57735 .33333 6.8991 9.7676 8.00 9.00
4.00 3 8.3333 1.15470 .66667 5.4649 11.2018 7.00 9.00
5.00 3 6.6667 5.77350 3.33333 -7.6755 21.0088 .00 10.00
Total 15 6.9333 2.60403 .67236 5.4913 8.3754 .00 10.00
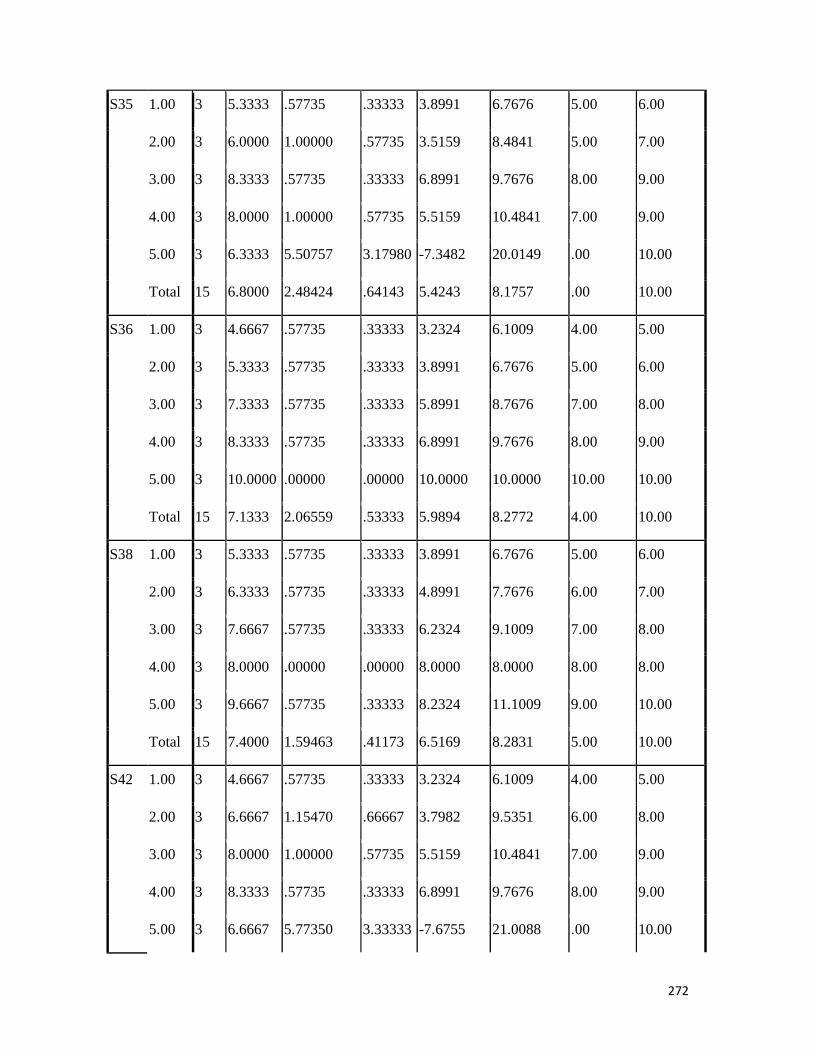
272
S35 1.00 3 5.3333 .57735 .33333 3.8991 6.7676 5.00 6.00
2.00 3 6.0000 1.00000 .57735 3.5159 8.4841 5.00 7.00
3.00 3 8.3333 .57735 .33333 6.8991 9.7676 8.00 9.00
4.00 3 8.0000 1.00000 .57735 5.5159 10.4841 7.00 9.00
5.00 3 6.3333 5.50757 3.17980 -7.3482 20.0149 .00 10.00
Total 15 6.8000 2.48424 .64143 5.4243 8.1757 .00 10.00
S36 1.00 3 4.6667 .57735 .33333 3.2324 6.1009 4.00 5.00
2.00 3 5.3333 .57735 .33333 3.8991 6.7676 5.00 6.00
3.00 3 7.3333 .57735 .33333 5.8991 8.7676 7.00 8.00
4.00 3 8.3333 .57735 .33333 6.8991 9.7676 8.00 9.00
5.00 3 10.0000 .00000 .00000 10.0000 10.0000 10.00 10.00
Total 15 7.1333 2.06559 .53333 5.9894 8.2772 4.00 10.00
S38 1.00 3 5.3333 .57735 .33333 3.8991 6.7676 5.00 6.00
2.00 3 6.3333 .57735 .33333 4.8991 7.7676 6.00 7.00
3.00 3 7.6667 .57735 .33333 6.2324 9.1009 7.00 8.00
4.00 3 8.0000 .00000 .00000 8.0000 8.0000 8.00 8.00
5.00 3 9.6667 .57735 .33333 8.2324 11.1009 9.00 10.00
Total 15 7.4000 1.59463 .41173 6.5169 8.2831 5.00 10.00
S42 1.00 3 4.6667 .57735 .33333 3.2324 6.1009 4.00 5.00
2.00 3 6.6667 1.15470 .66667 3.7982 9.5351 6.00 8.00
3.00 3 8.0000 1.00000 .57735 5.5159 10.4841 7.00 9.00
4.00 3 8.3333 .57735 .33333 6.8991 9.7676 8.00 9.00
5.00 3 6.6667 5.77350 3.33333 -7.6755 21.0088 .00 10.00
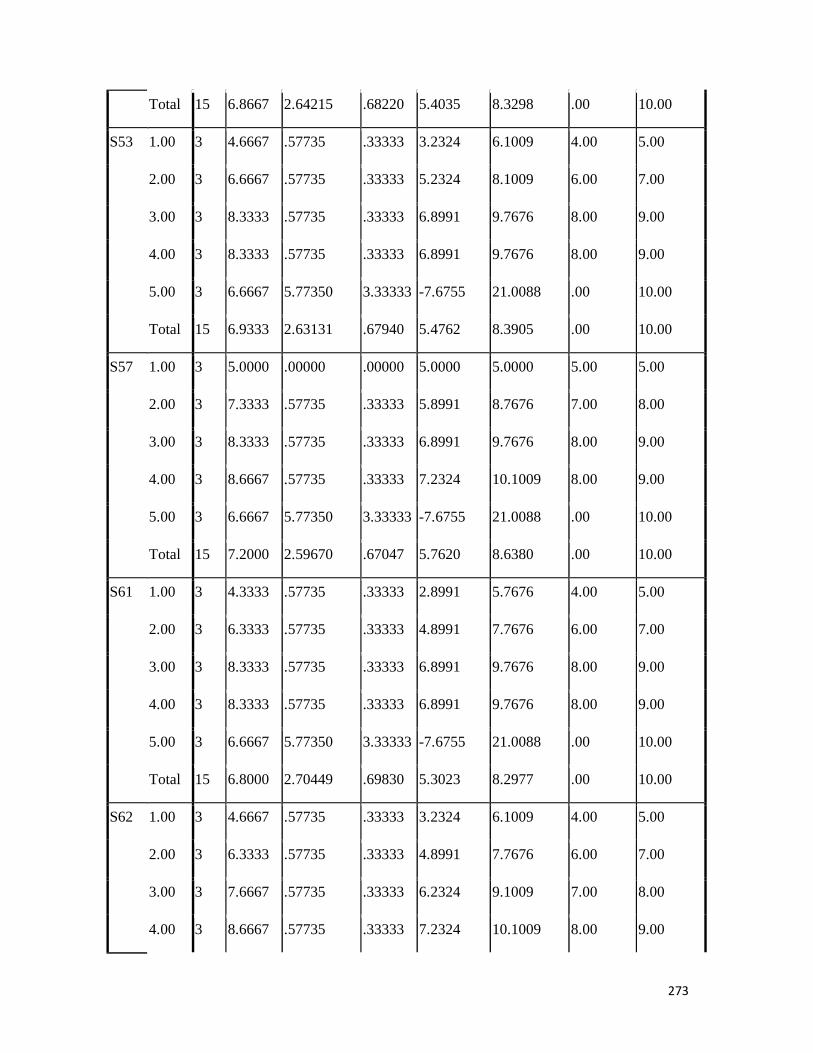
273
Total 15 6.8667 2.64215 .68220 5.4035 8.3298 .00 10.00
S53 1.00 3 4.6667 .57735 .33333 3.2324 6.1009 4.00 5.00
2.00 3 6.6667 .57735 .33333 5.2324 8.1009 6.00 7.00
3.00 3 8.3333 .57735 .33333 6.8991 9.7676 8.00 9.00
4.00 3 8.3333 .57735 .33333 6.8991 9.7676 8.00 9.00
5.00 3 6.6667 5.77350 3.33333 -7.6755 21.0088 .00 10.00
Total 15 6.9333 2.63131 .67940 5.4762 8.3905 .00 10.00
S57 1.00 3 5.0000 .00000 .00000 5.0000 5.0000 5.00 5.00
2.00 3 7.3333 .57735 .33333 5.8991 8.7676 7.00 8.00
3.00 3 8.3333 .57735 .33333 6.8991 9.7676 8.00 9.00
4.00 3 8.6667 .57735 .33333 7.2324 10.1009 8.00 9.00
5.00 3 6.6667 5.77350 3.33333 -7.6755 21.0088 .00 10.00
Total 15 7.2000 2.59670 .67047 5.7620 8.6380 .00 10.00
S61 1.00 3 4.3333 .57735 .33333 2.8991 5.7676 4.00 5.00
2.00 3 6.3333 .57735 .33333 4.8991 7.7676 6.00 7.00
3.00 3 8.3333 .57735 .33333 6.8991 9.7676 8.00 9.00
4.00 3 8.3333 .57735 .33333 6.8991 9.7676 8.00 9.00
5.00 3 6.6667 5.77350 3.33333 -7.6755 21.0088 .00 10.00
Total 15 6.8000 2.70449 .69830 5.3023 8.2977 .00 10.00
S62 1.00 3 4.6667 .57735 .33333 3.2324 6.1009 4.00 5.00
2.00 3 6.3333 .57735 .33333 4.8991 7.7676 6.00 7.00
3.00 3 7.6667 .57735 .33333 6.2324 9.1009 7.00 8.00
4.00 3 8.6667 .57735 .33333 7.2324 10.1009 8.00 9.00

274
5.00 3 10.0000 .00000 .00000 10.0000 10.0000 10.00 10.00
Total 15 7.4667 1.95911 .50584 6.3818 8.5516 4.00 10.00
S123 1.00 3 5.3333 .57735 .33333 3.8991 6.7676 5.00 6.00
2.00 3 6.6667 .57735 .33333 5.2324 8.1009 6.00 7.00
3.00 3 7.6667 .57735 .33333 6.2324 9.1009 7.00 8.00
4.00 3 8.6667 .57735 .33333 7.2324 10.1009 8.00 9.00
5.00 3 6.6667 5.77350 3.33333 -7.6755 21.0088 .00 10.00
Total 15 7.0000 2.50713 .64734 5.6116 8.3884 .00 10.00
S127 1.00 3 4.3333 .57735 .33333 2.8991 5.7676 4.00 5.00
2.00 3 7.0000 .00000 .00000 7.0000 7.0000 7.00 7.00
3.00 3 8.0000 1.00000 .57735 5.5159 10.4841 7.00 9.00
4.00 3 8.6667 .57735 .33333 7.2324 10.1009 8.00 9.00
5.00 3 6.6667 5.77350 3.33333 -7.6755 21.0088 .00 10.00
Total 15 6.9333 2.71153 .70011 5.4317 8.4349 .00 10.00
S154 1.00 3 5.3333 .57735 .33333 3.8991 6.7676 5.00 6.00
2.00 3 6.3333 .57735 .33333 4.8991 7.7676 6.00 7.00
3.00 3 8.0000 1.00000 .57735 5.5159 10.4841 7.00 9.00
4.00 3 8.6667 .57735 .33333 7.2324 10.1009 8.00 9.00
5.00 3 6.6667 5.77350 3.33333 -7.6755 21.0088 .00 10.00
Total 15 7.0000 2.56348 .66189 5.5804 8.4196 .00 10.00
S187 1.00 3 5.6667 .57735 .33333 4.2324 7.1009 5.00 6.00
2.00 3 6.3333 .57735 .33333 4.8991 7.7676 6.00 7.00
3.00 3 8.0000 1.00000 .57735 5.5159 10.4841 7.00 9.00

275
4.00 3 8.6667 .57735 .33333 7.2324 10.1009 8.00 9.00
5.00 3 .0000 .00000 .00000 .0000 .0000 .00 .00
Total 15 5.7333 3.21751 .83076 3.9515 7.5151 .00 9.00
S208 1.00 3 5.3333 .57735 .33333 3.8991 6.7676 5.00 6.00
2.00 3 6.6667 .57735 .33333 5.2324 8.1009 6.00 7.00
3.00 3 8.6667 .57735 .33333 7.2324 10.1009 8.00 9.00
4.00 3 9.3333 .57735 .33333 7.8991 10.7676 9.00 10.00
5.00 3 .0000 .00000 .00000 .0000 .0000 .00 .00
Total 15 6.0000 3.46410 .89443 4.0816 7.9184 .00 10.00
S235 1.00 3 5.3333 .57735 .33333 3.8991 6.7676 5.00 6.00
2.00 3 6.3333 .57735 .33333 4.8991 7.7676 6.00 7.00
3.00 3 8.3333 .57735 .33333 6.8991 9.7676 8.00 9.00
4.00 3 9.3333 .57735 .33333 7.8991 10.7676 9.00 10.00
5.00 3 6.6667 5.77350 3.33333 -7.6755 21.0088 .00 10.00
Total 15 7.2000 2.67795 .69144 5.7170 8.6830 .00 10.00
S310 1.00 3 5.3333 .57735 .33333 3.8991 6.7676 5.00 6.00
2.00 3 6.3333 .57735 .33333 4.8991 7.7676 6.00 7.00
3.00 3 7.6667 .57735 .33333 6.2324 9.1009 7.00 8.00
4.00 3 8.6667 .57735 .33333 7.2324 10.1009 8.00 9.00
5.00 3 .0000 .00000 .00000 .0000 .0000 .00 .00
Total 15 5.6000 3.15776 .81533 3.8513 7.3487 .00 9.00
S390 1.00 3 4.6667 .57735 .33333 3.2324 6.1009 4.00 5.00
2.00 3 6.6667 .57735 .33333 5.2324 8.1009 6.00 7.00
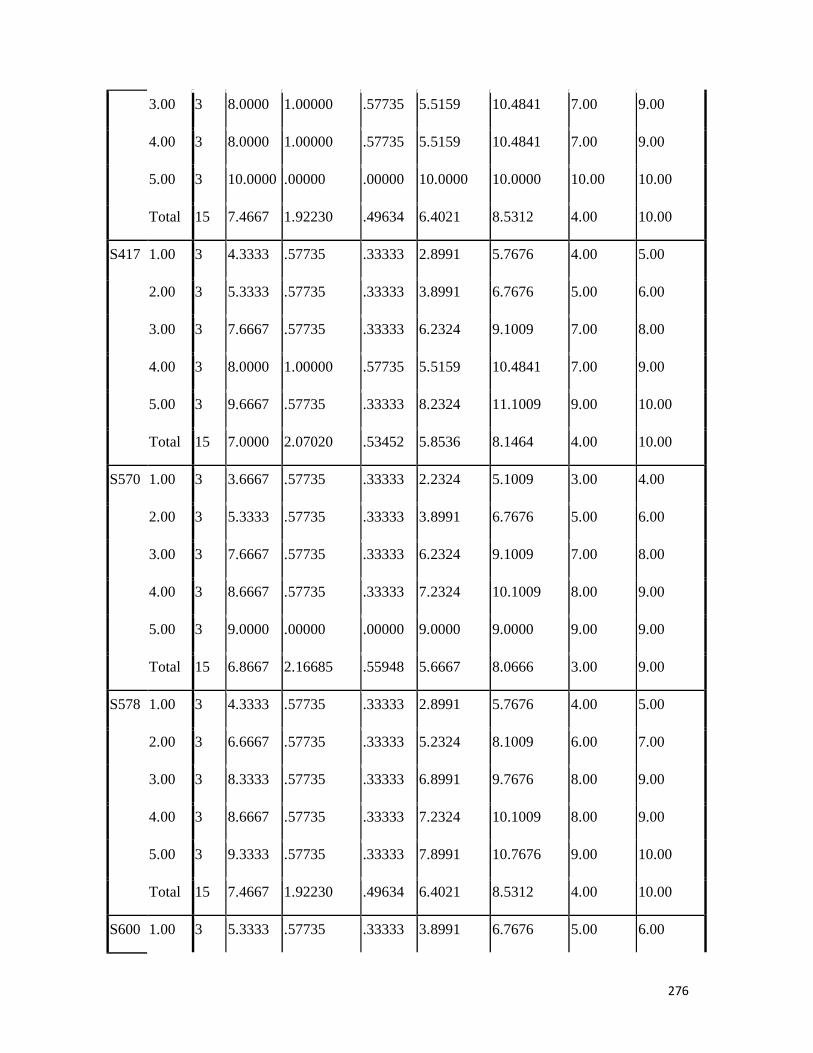
276
3.00 3 8.0000 1.00000 .57735 5.5159 10.4841 7.00 9.00
4.00 3 8.0000 1.00000 .57735 5.5159 10.4841 7.00 9.00
5.00 3 10.0000 .00000 .00000 10.0000 10.0000 10.00 10.00
Total 15 7.4667 1.92230 .49634 6.4021 8.5312 4.00 10.00
S417 1.00 3 4.3333 .57735 .33333 2.8991 5.7676 4.00 5.00
2.00 3 5.3333 .57735 .33333 3.8991 6.7676 5.00 6.00
3.00 3 7.6667 .57735 .33333 6.2324 9.1009 7.00 8.00
4.00 3 8.0000 1.00000 .57735 5.5159 10.4841 7.00 9.00
5.00 3 9.6667 .57735 .33333 8.2324 11.1009 9.00 10.00
Total 15 7.0000 2.07020 .53452 5.8536 8.1464 4.00 10.00
S570 1.00 3 3.6667 .57735 .33333 2.2324 5.1009 3.00 4.00
2.00 3 5.3333 .57735 .33333 3.8991 6.7676 5.00 6.00
3.00 3 7.6667 .57735 .33333 6.2324 9.1009 7.00 8.00
4.00 3 8.6667 .57735 .33333 7.2324 10.1009 8.00 9.00
5.00 3 9.0000 .00000 .00000 9.0000 9.0000 9.00 9.00
Total 15 6.8667 2.16685 .55948 5.6667 8.0666 3.00 9.00
S578 1.00 3 4.3333 .57735 .33333 2.8991 5.7676 4.00 5.00
2.00 3 6.6667 .57735 .33333 5.2324 8.1009 6.00 7.00
3.00 3 8.3333 .57735 .33333 6.8991 9.7676 8.00 9.00
4.00 3 8.6667 .57735 .33333 7.2324 10.1009 8.00 9.00
5.00 3 9.3333 .57735 .33333 7.8991 10.7676 9.00 10.00
Total 15 7.4667 1.92230 .49634 6.4021 8.5312 4.00 10.00
S600 1.00 3 5.3333 .57735 .33333 3.8991 6.7676 5.00 6.00

277
2.00 3 6.0000 .00000 .00000 6.0000 6.0000 6.00 6.00
3.00 3 8.3333 .57735 .33333 6.8991 9.7676 8.00 9.00
4.00 3 8.6667 .57735 .33333 7.2324 10.1009 8.00 9.00
5.00 3 9.3333 .57735 .33333 7.8991 10.7676 9.00 10.00
Total 15 7.5333 1.68466 .43498 6.6004 8.4663 5.00 10.00
S620 1.00 3 5.0000 .00000 .00000 5.0000 5.0000 5.00 5.00
2.00 3 5.6667 .57735 .33333 4.2324 7.1009 5.00 6.00
3.00 3 7.6667 .57735 .33333 6.2324 9.1009 7.00 8.00
4.00 3 9.0000 .00000 .00000 9.0000 9.0000 9.00 9.00
5.00 3 9.3333 .57735 .33333 7.8991 10.7676 9.00 10.00
Total 15 7.3333 1.83874 .47476 6.3151 8.3516 5.00 10.00
S651 1.00 3 4.3333 .57735 .33333 2.8991 5.7676 4.00 5.00
2.00 3 5.6667 .57735 .33333 4.2324 7.1009 5.00 6.00
3.00 3 7.6667 .57735 .33333 6.2324 9.1009 7.00 8.00
4.00 3 8.6667 .57735 .33333 7.2324 10.1009 8.00 9.00
5.00 3 6.3333 5.50757 3.17980 -7.3482 20.0149 .00 10.00
Total 15 6.5333 2.64215 .68220 5.0702 7.9965 .00 10.00
S819 1.00 3 4.3333 .57735 .33333 2.8991 5.7676 4.00 5.00
2.00 3 5.6667 1.15470 .66667 2.7982 8.5351 5.00 7.00
3.00 3 7.6667 .57735 .33333 6.2324 9.1009 7.00 8.00
4.00 3 8.6667 .57735 .33333 7.2324 10.1009 8.00 9.00
5.00 3 6.6667 5.77350 3.33333 -7.6755 21.0088 .00 10.00
Total 15 6.6000 2.74643 .70912 5.0791 8.1209 .00 10.00

278
S831 1.00 3 4.6667 .57735 .33333 3.2324 6.1009 4.00 5.00
2.00 3 5.6667 .57735 .33333 4.2324 7.1009 5.00 6.00
3.00 3 8.3333 .57735 .33333 6.8991 9.7676 8.00 9.00
4.00 3 9.0000 .00000 .00000 9.0000 9.0000 9.00 9.00
5.00 3 6.6667 5.77350 3.33333 -7.6755 21.0088 .00 10.00
Total 15 6.8667 2.77403 .71625 5.3305 8.4029 .00 10.00
S841 1.00 3 4.6667 .57735 .33333 3.2324 6.1009 4.00 5.00
2.00 3 6.0000 1.00000 .57735 3.5159 8.4841 5.00 7.00
3.00 3 8.3333 .57735 .33333 6.8991 9.7676 8.00 9.00
4.00 3 8.6667 .57735 .33333 7.2324 10.1009 8.00 9.00
5.00 3 .0000 .00000 .00000 .0000 .0000 .00 .00
Total 15 5.5333 3.29213 .85002 3.7102 7.3565 .00 9.00
S940 1.00 3 5.6667 .57735 .33333 4.2324 7.1009 5.00 6.00
2.00 3 7.6667 .57735 .33333 6.2324 9.1009 7.00 8.00
3.00 3 8.3333 .57735 .33333 6.8991 9.7676 8.00 9.00
4.00 3 9.3333 .57735 .33333 7.8991 10.7676 9.00 10.00
5.00 3 .0000 .00000 .00000 .0000 .0000 .00 .00
Total 15 6.2000 3.46822 .89549 4.2794 8.1206 .00 10.00
S947 1.00 3 5.3333 .57735 .33333 3.8991 6.7676 5.00 6.00
2.00 3 7.3333 .57735 .33333 5.8991 8.7676 7.00 8.00
3.00 3 8.0000 1.00000 .57735 5.5159 10.4841 7.00 9.00
4.00 3 8.6667 .57735 .33333 7.2324 10.1009 8.00 9.00
5.00 3 6.6667 5.77350 3.33333 -7.6755 21.0088 .00 10.00
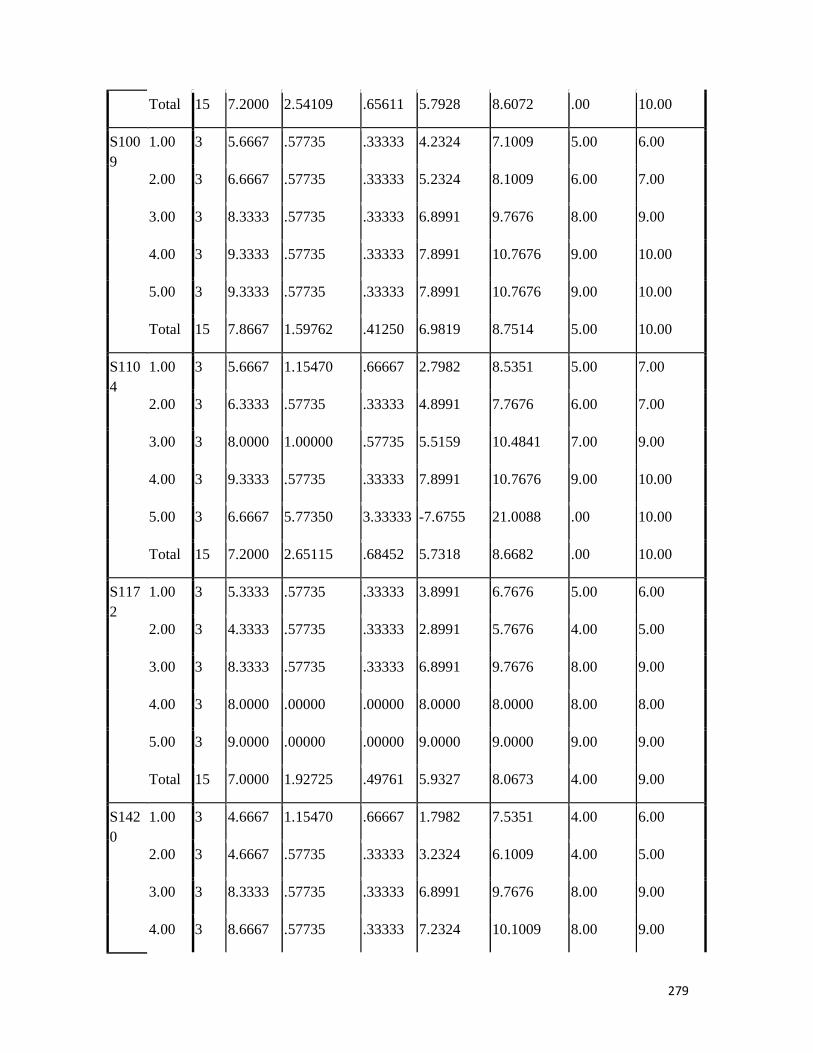
279
Total 15 7.2000 2.54109 .65611 5.7928 8.6072 .00 10.00
S1009
1.00 3 5.6667 .57735 .33333 4.2324 7.1009 5.00 6.00
2.00 3 6.6667 .57735 .33333 5.2324 8.1009 6.00 7.00
3.00 3 8.3333 .57735 .33333 6.8991 9.7676 8.00 9.00
4.00 3 9.3333 .57735 .33333 7.8991 10.7676 9.00 10.00
5.00 3 9.3333 .57735 .33333 7.8991 10.7676 9.00 10.00
Total 15 7.8667 1.59762 .41250 6.9819 8.7514 5.00 10.00
S1104
1.00 3 5.6667 1.15470 .66667 2.7982 8.5351 5.00 7.00
2.00 3 6.3333 .57735 .33333 4.8991 7.7676 6.00 7.00
3.00 3 8.0000 1.00000 .57735 5.5159 10.4841 7.00 9.00
4.00 3 9.3333 .57735 .33333 7.8991 10.7676 9.00 10.00
5.00 3 6.6667 5.77350 3.33333 -7.6755 21.0088 .00 10.00
Total 15 7.2000 2.65115 .68452 5.7318 8.6682 .00 10.00
S1172
1.00 3 5.3333 .57735 .33333 3.8991 6.7676 5.00 6.00
2.00 3 4.3333 .57735 .33333 2.8991 5.7676 4.00 5.00
3.00 3 8.3333 .57735 .33333 6.8991 9.7676 8.00 9.00
4.00 3 8.0000 .00000 .00000 8.0000 8.0000 8.00 8.00
5.00 3 9.0000 .00000 .00000 9.0000 9.0000 9.00 9.00
Total 15 7.0000 1.92725 .49761 5.9327 8.0673 4.00 9.00
S1420
1.00 3 4.6667 1.15470 .66667 1.7982 7.5351 4.00 6.00
2.00 3 4.6667 .57735 .33333 3.2324 6.1009 4.00 5.00
3.00 3 8.3333 .57735 .33333 6.8991 9.7676 8.00 9.00
4.00 3 8.6667 .57735 .33333 7.2324 10.1009 8.00 9.00

280
5.00 3 6.6667 5.77350 3.33333 -7.6755 21.0088 .00 10.00
Total 15 6.6000 2.87352 .74194 5.0087 8.1913 .00 10.00
S1827
1.00 3 5.0000 1.00000 .57735 2.5159 7.4841 4.00 6.00
2.00 3 5.6667 .57735 .33333 4.2324 7.1009 5.00 6.00
3.00 3 8.0000 1.00000 .57735 5.5159 10.4841 7.00 9.00
4.00 3 8.6667 .57735 .33333 7.2324 10.1009 8.00 9.00
5.00 3 .0000 .00000 .00000 .0000 .0000 .00 .00
Total 15 5.4667 3.22638 .83305 3.6800 7.2534 .00 9.00
S1956
1.00 3 5.6667 1.15470 .66667 2.7982 8.5351 5.00 7.00
2.00 3 7.3333 .57735 .33333 5.8991 8.7676 7.00 8.00
3.00 3 8.3333 .57735 .33333 6.8991 9.7676 8.00 9.00
4.00 3 8.6667 .57735 .33333 7.2324 10.1009 8.00 9.00
5.00 3 6.6667 5.77350 3.33333 -7.6755 21.0088 .00 10.00
Total 15 7.3333 2.52605 .65222 5.9345 8.7322 .00 10.00
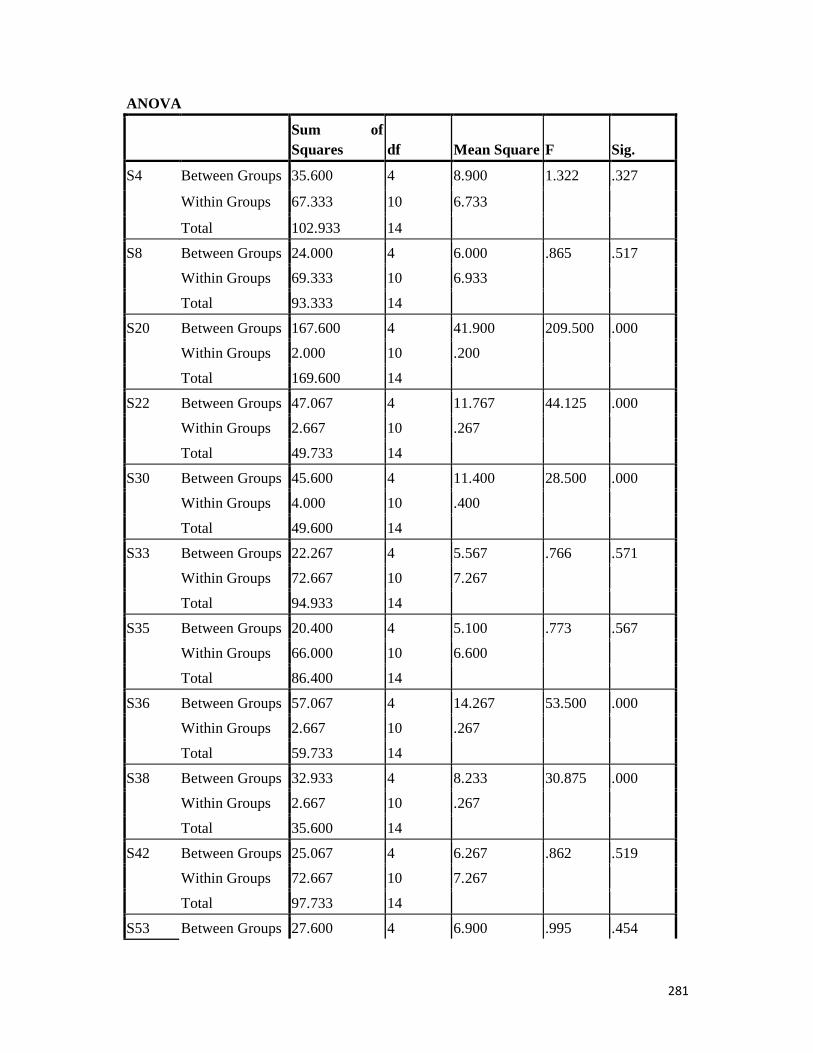
281
ANOVA
Sum of Squares df Mean Square F Sig.
S4 Between Groups 35.600 4 8.900 1.322 .327
Within Groups 67.333 10 6.733
Total 102.933 14
S8 Between Groups 24.000 4 6.000 .865 .517
Within Groups 69.333 10 6.933
Total 93.333 14
S20 Between Groups 167.600 4 41.900 209.500 .000
Within Groups 2.000 10 .200
Total 169.600 14
S22 Between Groups 47.067 4 11.767 44.125 .000
Within Groups 2.667 10 .267
Total 49.733 14
S30 Between Groups 45.600 4 11.400 28.500 .000
Within Groups 4.000 10 .400
Total 49.600 14
S33 Between Groups 22.267 4 5.567 .766 .571
Within Groups 72.667 10 7.267
Total 94.933 14
S35 Between Groups 20.400 4 5.100 .773 .567
Within Groups 66.000 10 6.600
Total 86.400 14
S36 Between Groups 57.067 4 14.267 53.500 .000
Within Groups 2.667 10 .267
Total 59.733 14
S38 Between Groups 32.933 4 8.233 30.875 .000
Within Groups 2.667 10 .267
Total 35.600 14
S42 Between Groups 25.067 4 6.267 .862 .519
Within Groups 72.667 10 7.267
Total 97.733 14
S53 Between Groups 27.600 4 6.900 .995 .454

282
Within Groups 69.333 10 6.933
Total 96.933 14
S57 Between Groups 25.733 4 6.433 .937 .481
Within Groups 68.667 10 6.867
Total 94.400 14
S61 Between Groups 33.067 4 8.267 1.192 .372
Within Groups 69.333 10 6.933
Total 102.400 14
S62 Between Groups 51.067 4 12.767 47.875 .000
Within Groups 2.667 10 .267
Total 53.733 14
S123 Between Groups 18.667 4 4.667 .673 .626
Within Groups 69.333 10 6.933
Total 88.000 14
S127 Between Groups 32.933 4 8.233 1.176 .378
Within Groups 70.000 10 7.000
Total 102.933 14
S154 Between Groups 21.333 4 5.333 .755 .577
Within Groups 70.667 10 7.067
Total 92.000 14
S187 Between Groups 140.933 4 35.233 88.083 .000
Within Groups 4.000 10 .400
Total 144.933 14
S208 Between Groups 165.333 4 41.333 155.000 .000
Within Groups 2.667 10 .267
Total 168.000 14
S235 Between Groups 31.067 4 7.767 1.120 .400
Within Groups 69.333 10 6.933
Total 100.400 14
S310 Between Groups 136.933 4 34.233 128.375 .000
Within Groups 2.667 10 .267
Total 139.600 14
S390 Between Groups 46.400 4 11.600 21.750 .000
Within Groups 5.333 10 .533

283
Total 51.733 14
S417 Between Groups 55.333 4 13.833 29.643 .000
Within Groups 4.667 10 .467
Total 60.000 14
S570 Between Groups 63.067 4 15.767 59.125 .000
Within Groups 2.667 10 .267
Total 65.733 14
S578 Between Groups 48.400 4 12.100 36.300 .000
Within Groups 3.333 10 .333
Total 51.733 14
S600 Between Groups 37.067 4 9.267 34.750 .000
Within Groups 2.667 10 .267
Total 39.733 14
S620 Between Groups 45.333 4 11.333 56.667 .000
Within Groups 2.000 10 .200
Total 47.333 14
S651 Between Groups 34.400 4 8.600 1.358 .315
Within Groups 63.333 10 6.333
Total 97.733 14
S819 Between Groups 34.267 4 8.567 1.201 .369
Within Groups 71.333 10 7.133
Total 105.600 14
S831 Between Groups 39.067 4 9.767 1.422 .296
Within Groups 68.667 10 6.867
Total 107.733 14
S841 Between Groups 147.733 4 36.933 92.333 .000
Within Groups 4.000 10 .400
Total 151.733 14
S940 Between Groups 165.733 4 41.433 155.375 .000
Within Groups 2.667 10 .267
Total 168.400 14
S947 Between Groups 19.733 4 4.933 .698 .610
Within Groups 70.667 10 7.067
Total 90.400 14

284
S1009 Between Groups 32.400 4 8.100 24.300 .000
Within Groups 3.333 10 .333
Total 35.733 14
S1104 Between Groups 25.733 4 6.433 .885 .507
Within Groups 72.667 10 7.267
Total 98.400 14
S1172 Between Groups 50.000 4 12.500 62.500 .000
Within Groups 2.000 10 .200
Total 52.000 14
S1420 Between Groups 44.267 4 11.067 1.551 .261
Within Groups 71.333 10 7.133
Total 115.600 14
S1827 Between Groups 140.400 4 35.100 65.813 .000
Within Groups 5.333 10 .533
Total 145.733 14
S1956 Between Groups 18.000 4 4.500 .631 .652
Within Groups 71.333 10 7.133
Total 89.333 14

285
Post Hoc Tests Homogeneous Subsets
S4 Duncana
VAR00001 N
Subset for alpha = 0.05
1
1.00 3 5.0000
2.00 3 6.0000
5.00 3 6.6667
3.00 3 8.6667
4.00 3 9.0000
Sig. .113
Means for groups in homogeneous subsets are displayed.
a. Uses Harmonic Mean Sample Size = 3.000.
S8
Duncana
VAR00001 N
Subset for alpha = 0.05
1
1.00 3 5.3333
5.00 3 6.6667
2.00 3 7.3333
3.00 3 8.6667
4.00 3 8.6667
Sig. .184
Means for groups in homogeneous subsets are displayed.
a. Uses Harmonic Mean Sample Size = 3.000.
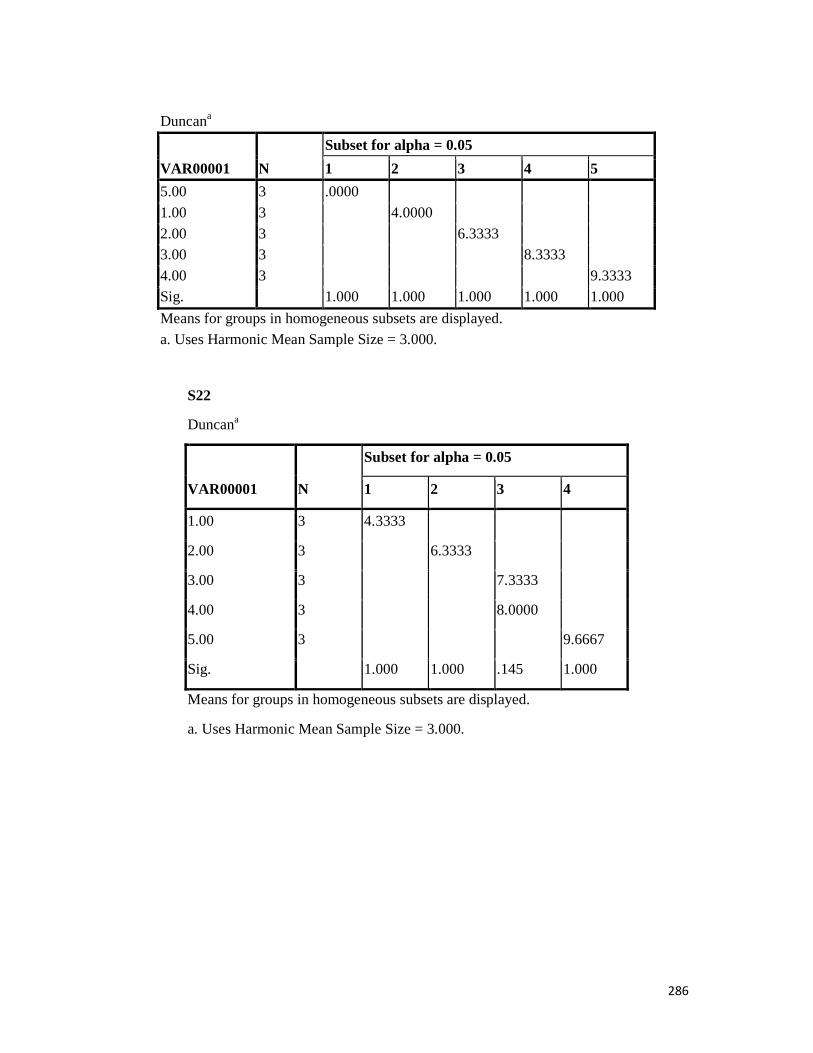
286
Duncana
VAR00001 N
Subset for alpha = 0.05
1 2 3 4 5
5.00 3 .0000
1.00 3 4.0000
2.00 3 6.3333 3.00 3 8.3333
4.00 3 9.3333 Sig. 1.000 1.000 1.000 1.000 1.000
Means for groups in homogeneous subsets are displayed. a. Uses Harmonic Mean Sample Size = 3.000.
S22
Duncana
VAR00001 N
Subset for alpha = 0.05
1 2 3 4
1.00 3 4.3333
2.00 3 6.3333
3.00 3 7.3333
4.00 3 8.0000
5.00 3 9.6667
Sig. 1.000 1.000 .145 1.000
Means for groups in homogeneous subsets are displayed.
a. Uses Harmonic Mean Sample Size = 3.000.

287
S30
Duncana
VAR00001 N
Subset for alpha = 0.05
1 2 3 4
1.00 3 4.6667
2.00 3 6.6667
3.00 3 7.6667 7.6667
4.00 3 8.0000
5.00 3 10.0000
Sig. 1.000 .082 .533 1.000
Means for groups in homogeneous subsets are displayed.
a. Uses Harmonic Mean Sample Size = 3.000. S33 Duncana
VAR00001 N
Subset for alpha = 0.05
1
1.00 3 5.3333
2.00 3 6.0000 5.00 3 6.6667
3.00 3 8.3333
4.00 3 8.3333 Sig. .238
Means for groups in homogeneous subsets are displayed.
a. Uses Harmonic Mean Sample Size = 3.000.

288
S35 Duncana
VAR00001 N
Subset for alpha = 0.05
1
1.00 3 5.3333
2.00 3 6.0000
5.00 3 6.3333
4.00 3 8.0000
3.00 3 8.3333
Sig. .217
Means for groups in homogeneous subsets are displayed.
a. Uses Harmonic Mean Sample Size = 3.000.
S36
Duncana
VAR00001 N
Subset for alpha = 0.05
1 2 3 4
1.00 3 4.6667
2.00 3 5.3333
3.00 3 7.3333
4.00 3 8.3333
5.00 3 10.0000
Sig. .145 1.000 1.000 1.000
Means for groups in homogeneous subsets are displayed.
a. Uses Harmonic Mean Sample Size = 3.000.
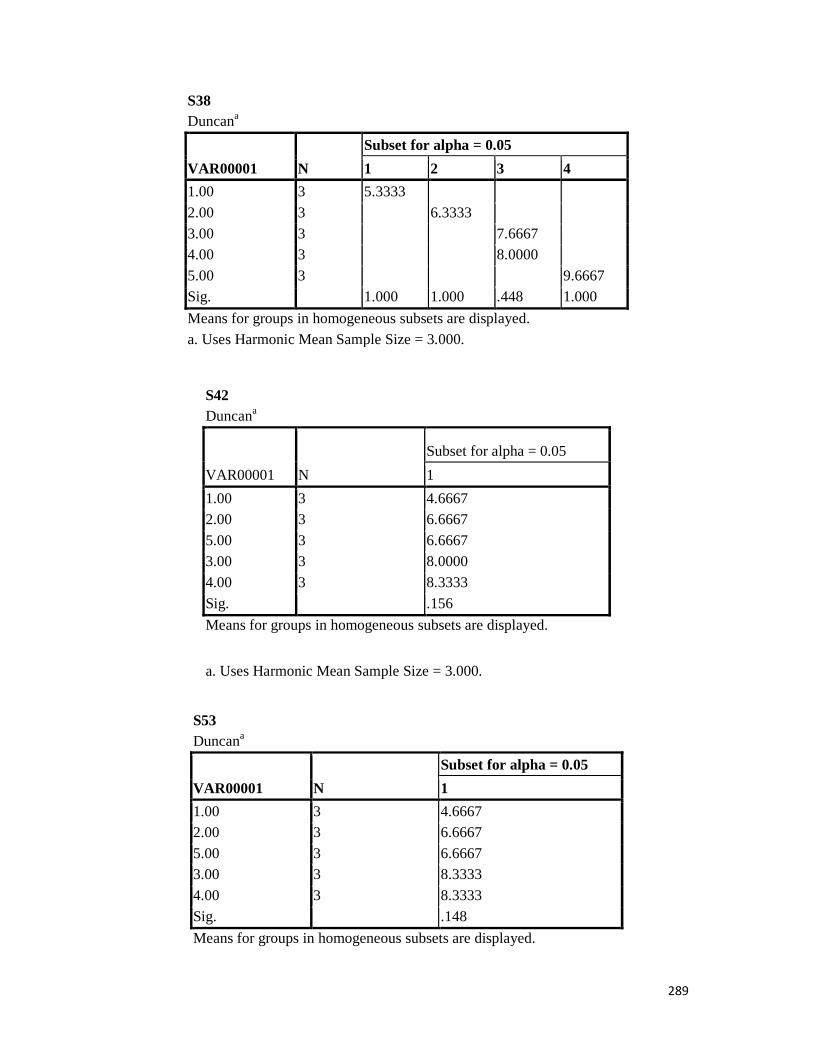
289
S38 Duncana
VAR00001 N
Subset for alpha = 0.05
1 2 3 4
1.00 3 5.3333
2.00 3 6.3333
3.00 3 7.6667 4.00 3 8.0000
5.00 3 9.6667 Sig. 1.000 1.000 .448 1.000
Means for groups in homogeneous subsets are displayed. a. Uses Harmonic Mean Sample Size = 3.000.
S42 Duncana
VAR00001 N
Subset for alpha = 0.05
1
1.00 3 4.6667 2.00 3 6.6667
5.00 3 6.6667 3.00 3 8.0000
4.00 3 8.3333
Sig. .156
Means for groups in homogeneous subsets are displayed.
a. Uses Harmonic Mean Sample Size = 3.000.
S53 Duncana
VAR00001 N
Subset for alpha = 0.05
1
1.00 3 4.6667 2.00 3 6.6667
5.00 3 6.6667 3.00 3 8.3333
4.00 3 8.3333
Sig. .148
Means for groups in homogeneous subsets are displayed.
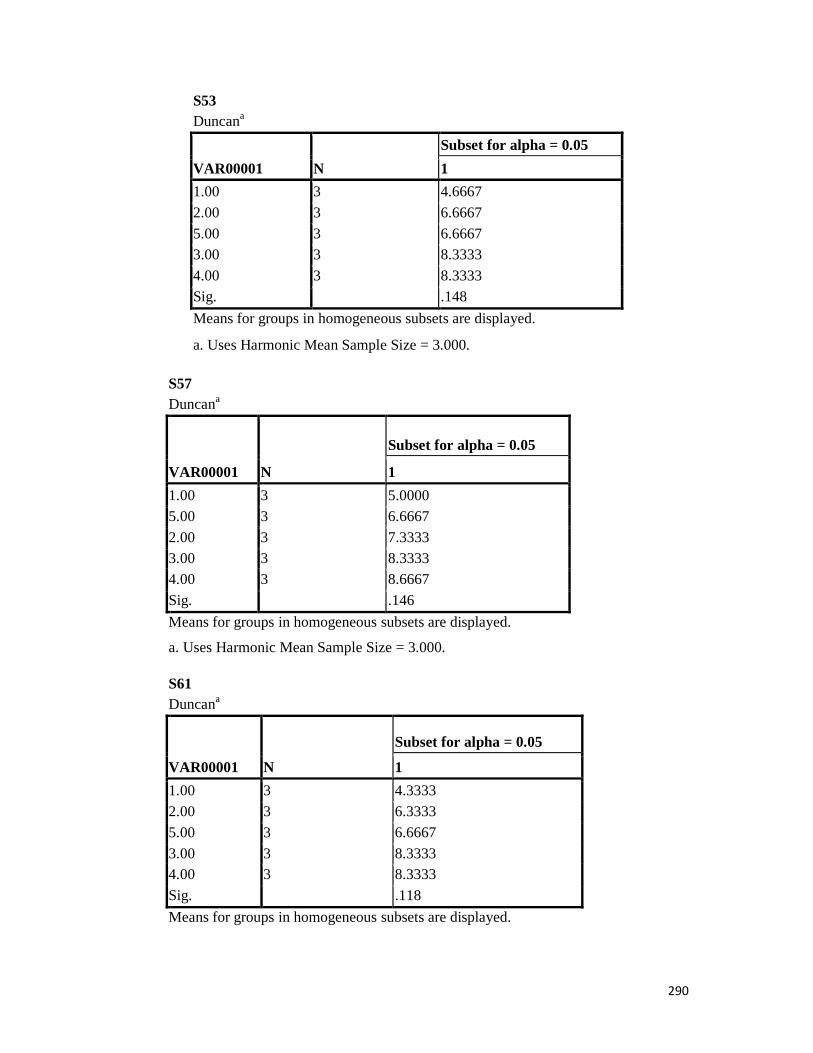
290
S53 Duncana
VAR00001 N
Subset for alpha = 0.05
1
1.00 3 4.6667
2.00 3 6.6667
5.00 3 6.6667 3.00 3 8.3333
4.00 3 8.3333 Sig. .148
Means for groups in homogeneous subsets are displayed.
a. Uses Harmonic Mean Sample Size = 3.000.
S57 Duncana
VAR00001 N
Subset for alpha = 0.05
1
1.00 3 5.0000 5.00 3 6.6667
2.00 3 7.3333 3.00 3 8.3333 4.00 3 8.6667
Sig. .146
Means for groups in homogeneous subsets are displayed.
a. Uses Harmonic Mean Sample Size = 3.000.
S61 Duncana
VAR00001 N
Subset for alpha = 0.05
1
1.00 3 4.3333 2.00 3 6.3333
5.00 3 6.6667
3.00 3 8.3333 4.00 3 8.3333
Sig. .118
Means for groups in homogeneous subsets are displayed.
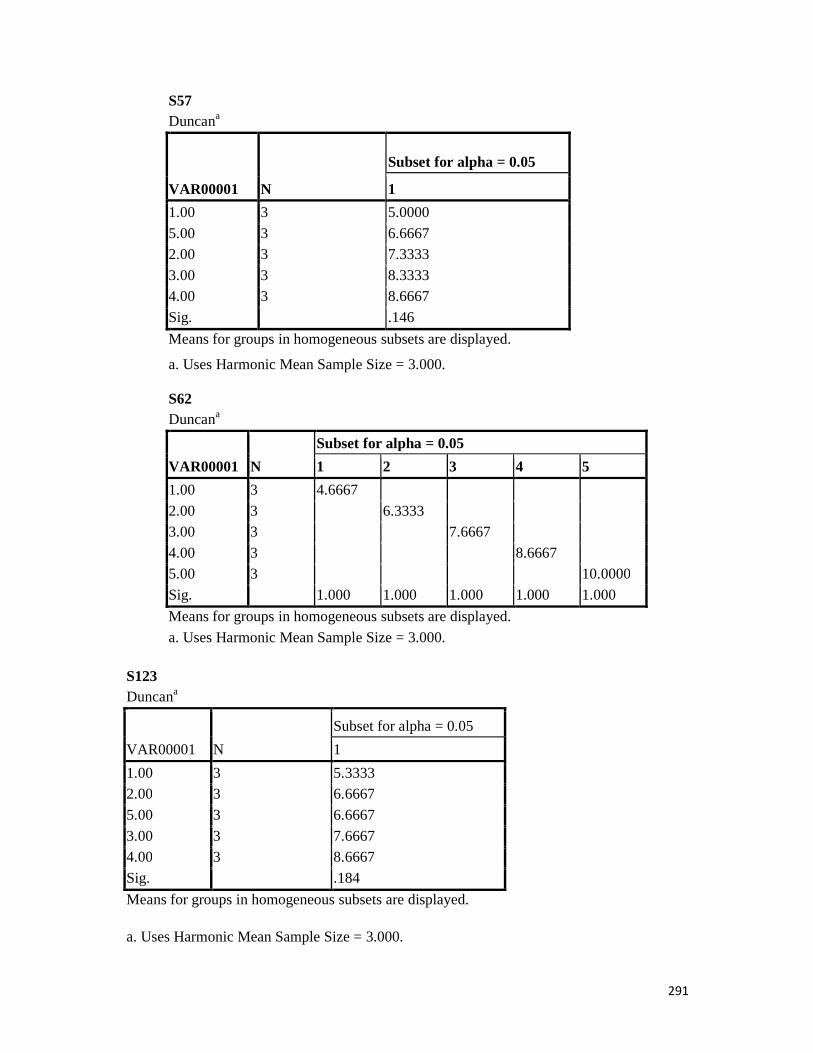
291
S57 Duncana
VAR00001 N
Subset for alpha = 0.05
1
1.00 3 5.0000
5.00 3 6.6667 2.00 3 7.3333
3.00 3 8.3333 4.00 3 8.6667
Sig. .146
Means for groups in homogeneous subsets are displayed.
a. Uses Harmonic Mean Sample Size = 3.000.
S62 Duncana
VAR00001 N
Subset for alpha = 0.05
1 2 3 4 5
1.00 3 4.6667
2.00 3 6.3333 3.00 3 7.6667
4.00 3 8.6667 5.00 3 10.0000
Sig. 1.000 1.000 1.000 1.000 1.000
Means for groups in homogeneous subsets are displayed.
a. Uses Harmonic Mean Sample Size = 3.000. S123 Duncana
VAR00001 N
Subset for alpha = 0.05
1
1.00 3 5.3333 2.00 3 6.6667
5.00 3 6.6667
3.00 3 7.6667 4.00 3 8.6667
Sig. .184
Means for groups in homogeneous subsets are displayed.
a. Uses Harmonic Mean Sample Size = 3.000.
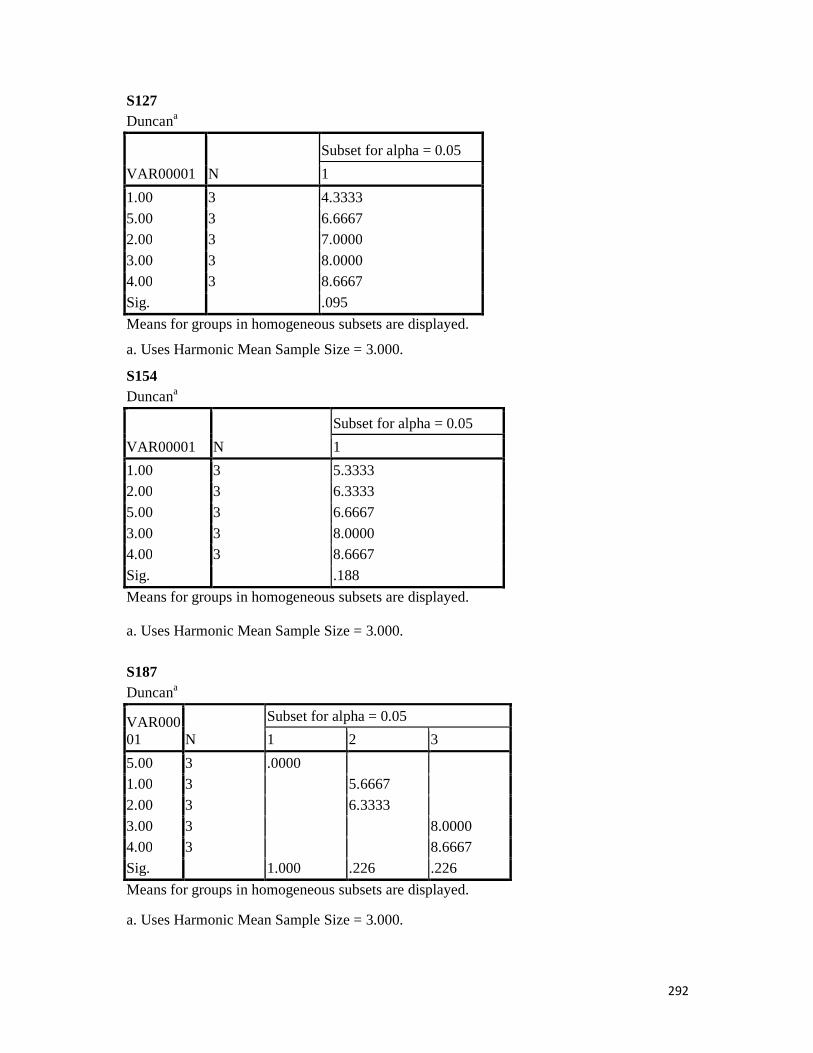
292
S127 Duncana
VAR00001 N
Subset for alpha = 0.05
1
1.00 3 4.3333
5.00 3 6.6667 2.00 3 7.0000
3.00 3 8.0000 4.00 3 8.6667
Sig. .095
Means for groups in homogeneous subsets are displayed.
a. Uses Harmonic Mean Sample Size = 3.000.
S154 Duncana
VAR00001 N
Subset for alpha = 0.05
1
1.00 3 5.3333 2.00 3 6.3333
5.00 3 6.6667
3.00 3 8.0000 4.00 3 8.6667
Sig. .188
Means for groups in homogeneous subsets are displayed.
a. Uses Harmonic Mean Sample Size = 3.000.
S187 Duncana
VAR00001 N
Subset for alpha = 0.05
1 2 3
5.00 3 .0000 1.00 3 5.6667
2.00 3 6.3333
3.00 3 8.0000 4.00 3 8.6667
Sig. 1.000 .226 .226
Means for groups in homogeneous subsets are displayed.
a. Uses Harmonic Mean Sample Size = 3.000.

293
S208 Duncana
VAR00001 N
Subset for alpha = 0.05
1 2 3 4
5.00 3 .0000
1.00 3 5.3333
2.00 3 6.6667 3.00 3 8.6667
4.00 3 9.3333 Sig. 1.000 1.000 1.000 .145
Means for groups in homogeneous subsets are displayed. a. Uses Harmonic Mean Sample Size = 3.000. S235 Duncana
VAR00001 N
Subset for alpha = 0.05
1
1.00 3 5.3333 2.00 3 6.3333
5.00 3 6.6667 3.00 3 8.3333
4.00 3 9.3333
Sig. .118
Means for groups in homogeneous subsets are displayed.
a. Uses Harmonic Mean Sample Size = 3.000.
S310 Duncana
VAR00001 N
Subset for alpha = 0.05
1 2 3 4 5
5.00 3 .0000
1.00 3 5.3333 2.00 3 6.3333
3.00 3 7.6667
4.00 3 8.6667 Sig. 1.000 1.000 1.000 1.000 1.000
Means for groups in homogeneous subsets are displayed. a. Uses Harmonic Mean Sample Size = 3.000.
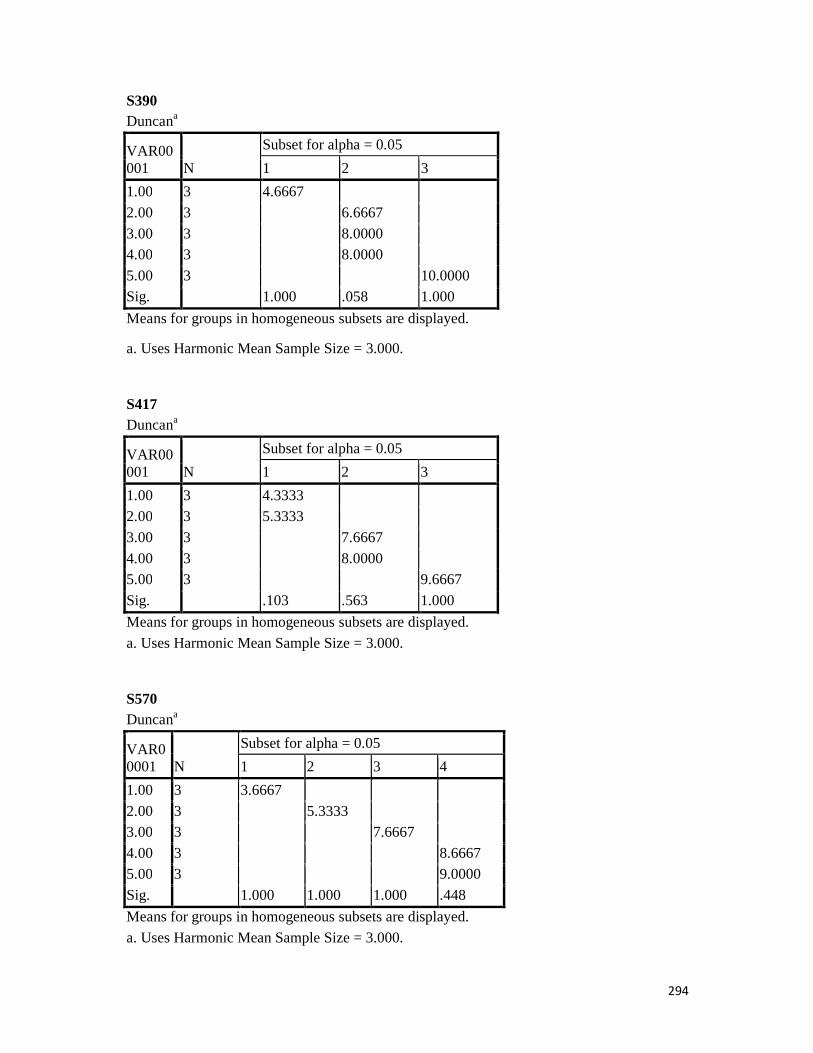
294
S390 Duncana
VAR00001 N
Subset for alpha = 0.05
1 2 3
1.00 3 4.6667
2.00 3 6.6667
3.00 3 8.0000 4.00 3 8.0000
5.00 3 10.0000 Sig. 1.000 .058 1.000
Means for groups in homogeneous subsets are displayed.
a. Uses Harmonic Mean Sample Size = 3.000. S417 Duncana
VAR00001 N
Subset for alpha = 0.05
1 2 3
1.00 3 4.3333 2.00 3 5.3333
3.00 3 7.6667
4.00 3 8.0000 5.00 3 9.6667
Sig. .103 .563 1.000
Means for groups in homogeneous subsets are displayed.
a. Uses Harmonic Mean Sample Size = 3.000. S570 Duncana
VAR00001 N
Subset for alpha = 0.05
1 2 3 4
1.00 3 3.6667
2.00 3 5.3333 3.00 3 7.6667
4.00 3 8.6667 5.00 3 9.0000
Sig. 1.000 1.000 1.000 .448
Means for groups in homogeneous subsets are displayed.
a. Uses Harmonic Mean Sample Size = 3.000.

295
S578 Duncana
VAR00001 N
Subset for alpha = 0.05
1 2 3
1.00 3 4.3333
2.00 3 6.6667
3.00 3 8.3333 4.00 3 8.6667
5.00 3 9.3333 Sig. 1.000 1.000 .070
Means for groups in homogeneous subsets are displayed. a. Uses Harmonic Mean Sample Size = 3.000. S600 Duncana
VAR00001 N
Subset for alpha = 0.05
1 2 3
1.00 3 5.3333 2.00 3 6.0000
3.00 3 8.3333 4.00 3 8.6667 8.6667
5.00 3 9.3333
Sig. .145 .448 .145
Means for groups in homogeneous subsets are displayed.
a. Uses Harmonic Mean Sample Size = 3.000. S620 Duncana
VAR00001 N
Subset for alpha = 0.05
1 2 3
1.00 3 5.0000 2.00 3 5.6667
3.00 3 7.6667 4.00 3 9.0000
5.00 3 9.3333
Sig. .098 1.000 .383
Means for groups in homogeneous subsets are displayed.
a. Uses Harmonic Mean Sample Size = 3.000.

296
S651 Duncana
VAR00001 N
Subset for alpha = 0.05
1
1.00 3 4.3333 2.00 3 5.6667
5.00 3 6.3333
3.00 3 7.6667 4.00 3 8.6667
Sig. .081
Means for groups in homogeneous subsets are displayed.
a. Uses Harmonic Mean Sample Size = 3.000.
S819 Duncana
VAR00001 N
Subset for alpha = 0.05
1
1.00 3 4.3333
2.00 3 5.6667 5.00 3 6.6667
3.00 3 7.6667 4.00 3 8.6667
Sig. .098
Means for groups in homogeneous subsets are displayed.
a. Uses Harmonic Mean Sample Size = 3.000.
S831 Duncana
VAR00001 N
Subset for alpha = 0.05
1
1.00 3 4.6667
2.00 3 5.6667 5.00 3 6.6667
3.00 3 8.3333 4.00 3 9.0000
Sig. .092
Means for groups in homogeneous subsets are displayed.
a. Uses Harmonic Mean Sample Size = 3.000.

297
S841 Duncana
VAR00001 N
Subset for alpha = 0.05
1 2 3 4
5.00 3 .0000
1.00 3 4.6667
2.00 3 6.0000 3.00 3 8.3333
4.00 3 8.6667 Sig. 1.000 1.000 1.000 .533
Means for groups in homogeneous subsets are displayed. a. Uses Harmonic Mean Sample Size = 3.000. S940 Duncana
VAR00001 N
Subset for alpha = 0.05
1 2 3 4
5.00 3 .0000 1.00 3 5.6667
2.00 3 7.6667 3.00 3 8.3333
4.00 3 9.3333
Sig. 1.000 1.000 .145 1.000
Means for groups in homogeneous subsets are displayed.
a. Uses Harmonic Mean Sample Size = 3.000. S947 Duncana
VAR00001 N
Subset for alpha = 0.05
1
1.00 3 5.3333 5.00 3 6.6667
2.00 3 7.3333 3.00 3 8.0000
4.00 3 8.6667
Sig. .188
Means for groups in homogeneous subsets are displayed.
a. Uses Harmonic Mean Sample Size = 3.000.

298
S1009 Duncana
VAR00001 N
Subset for alpha = 0.05
1 2
1.00 3 5.6667
2.00 3 6.6667
3.00 3 8.3333 4.00 3 9.3333
5.00 3 9.3333 Sig. .060 .070
Means for groups in homogeneous subsets are displayed. a. Uses Harmonic Mean Sample Size = 3.000. S1104 Duncana
VAR00001 N
Subset for alpha = 0.05
1
1.00 3 5.6667
2.00 3 6.3333
5.00 3 6.6667 3.00 3 8.0000
4.00 3 9.3333 Sig. .156
Means for groups in homogeneous subsets are displayed.
a. Uses Harmonic Mean Sample Size = 3.000.
S1172 Duncana
VAR00001 N
Subset for alpha = 0.05
1 2 3 4
2.00 3 4.3333
1.00 3 5.3333 4.00 3 8.0000
3.00 3 8.3333 8.3333
5.00 3 9.0000 Sig. 1.000 1.000 .383 .098
Means for groups in homogeneous subsets are displayed. a. Uses Harmonic Mean Sample Size = 3.000.

299
S1420
Duncana
VAR00001 N
Subset for alpha = 0.05
1
1.00 3 4.6667
2.00 3 4.6667
5.00 3 6.6667
3.00 3 8.3333
4.00 3 8.6667
Sig. .122
Means for groups in homogeneous subsets are displayed.
a. Uses Harmonic Mean Sample Size = 3.000.
S1827
Duncana
VAR00001 N
Subset for alpha = 0.05
1 2 3
5.00 3 .0000
1.00 3 5.0000
2.00 3 5.6667
3.00 3 8.0000
4.00 3 8.6667
Sig. 1.000 .290 .290
Means for groups in homogeneous subsets are displayed.
a. Uses Harmonic Mean Sample Size = 3.000. S1956 Duncana
VAR00001 N
Subset for alpha = 0.05
1
1.00 3 5.6667
5.00 3 6.6667
2.00 3 7.3333
3.00 3 8.3333
4.00 3 8.6667
Sig. .234
Means for groups in homogeneous subsets are displayed.

300
S1956 Duncana
VAR00001 N
Subset for alpha = 0.05
1
1.00 3 5.6667
5.00 3 6.6667
2.00 3 7.3333
3.00 3 8.3333
4.00 3 8.6667
Sig. .234
Means for groups in homogeneous subsets are displayed. a. Uses Harmonic Mean Sample Size = 3.000.