Water dew-pointing with subsea gas dehydration to improve ...
Upload
independentCategory
view
0download
0
1844 Bull. Korean Chem. Soc. 2006, Vol. 27, No. 11 Syed T. Hussain et al.
Dehydration of Methanol to Dimethyl ether, Ethylene and
Propylene over Silica-Doped Sulfated Zirconia
Syed T. Hussain,* M. Mazhar, Sheraz Gul, Karl T Chuang,† and Alan R. Sanger†
Department of Chemistry, Quaid-e-Azam University, Islamabad 45320, Pakistan. *E-mail: [email protected]†Department of Chemical Engineering, University of Alberta, Alberta, Canada T6G 2G6
Received August 28, 2006
Two types of catalyst samples were prepared, one sulfated zirconia and the other silica doped sulfated zirconia.
The acidity tests indicate that sulfated zirconia doped with silica has higher concentration and strength of acidic
catalyst sites than undoped sulfated zirconia. The acidic surface sites have been characterized using FTIR,
NMR, pyridine adsorption, TPD, XRD and nitrogen adsorption. Doping with silica increased the concentration
of surface Lewis and Brφnsted acid sites and resulted in generation of proximate acid sites. The activity test
indicates that doping sulfated zirconia with silica increases both the acidity and catalytic activity for liquid
phase dehydration of methanol at 413-453 K. Methanol is sequentially dehydrated to dimethyl ether and
ethylene over both catalysts. Significant amounts of propylene are also formed over the silica-doped catalyst,
but not over the undoped catalyst.
Key Words : Sulfated zirconia, Dehydration of methanol, Dimethyl ether, Ethylene, Propylene
Introduction
Solid acid catalysts play an important role in hydrocarbon
conversion reactions in the petroleum and chemical
industries.1 In particular, the solid super-acid properties and
activity of sulfated zirconia were first described over a
decade ago,2 which led to intense research in this area.
Rational design of solid acid catalysts for a specific appli-
cation requires control of acid site type (Lewis, Brφnsted),
density, and strength. To this end, there are two general
strategies for modification of the acidic properties of cataly-
tic oxides. One approach is to dope the oxide with anions.
Anionic dopants can increase the electron-withdrawing
capability of the doped surface, thereby enhancing the
ability of neighboring hydroxyl groups to act as proton
donors. A second approach is to dope an oxide catalyst with
a second oxide. Modeling of the performance and acidity of
mixed oxides show that strongly acidic sites form when
large localized charge imbalances develop at M-O-M' link-
ages (M and M' are different cations).3,4 The high catalytic
activity of sulfated zirconia has been attributed to super-
acidity.5-7
The goal of the present research is formulation of highly
active acidic catalytic materials. To this end we are prepar-
ing, characterizing and testing modified zirconium sulfate
based catalysts having Lewis and Brφnsted acid sites with
different concentrations and strengths. We have now found
that doping zirconium sulfate with silica increases both the
strength and density of surface acidic sites, and their cata-
lytic activity. Herein we will compare the catalytic activity
of silica-doped sulfated zirconia (SZS) with that of undoped
sulfated zirconia (SZ) using, as a probe reaction, methanol
dehydration to sequentially form dimethyl ether and ethylene.
We will show that significant amounts of propylene are also
formed when the catalyst is SZS, but not when it is SZ. A
detailed comparison of the physical properties of SZS and
SZ and the respective surface acidic sites using spectro-
scopic and microscopic techniques and chemical probes has
also been described.
Experimental Details
Catalyst Preparation. Zirconium oxynitrate [ZrO(NO3)2]
was dissolved in 10 N nitric acid solution. Aqueous
ammonia was then slowly added to the stirred solution to
precipitate zirconium hydroxide, until the pH was ca. 11.
The precipitate was recovered by filtration, washed with
water and calcined at 573 K for 4 hours under atmospheric
conditions to form zirconia.
Sulfated zirconia (SZ) was prepared by suspending 5 g
zirconia in 100 mL of an aqueous solution containing 50
wt% sulfuric acid. The solution was then heated to evaporate
water using a hotplate. The solid formed by drying the
mixture over the hot plate for ca. 2 h was calcined at 923 K
for 4 hours under atmospheric conditions.
Silica-doped sulfated zirconia (SZS) was prepared using
substantially the same procedure as described above, except
that a weighed amount of silica was added to the stirred
reaction mixture before heating.
Catalyst Characterization. BET surface areas of fresh
and used catalysts were determined by nitrogen adsorption
at 77 K (Table 1). Crystallite sizes of fresh and used samples
were determined using the Scherer equation and presented in
Table 2. Pyridine adsorption was used to determine the
acidic sites using FTIR, TPD and NMR and then their
consequent effect on the catalytic activity was discussed.
The amount of sulfate leached from SZ or SZS during
catalytic tests was determined by acid-base titration of the
residual liquid reaction mixture.
Catalytic Activity Testing. Reactions were performed in

Dehydration of Methanol to Dimethyl ether, Ethylene, and Propylene Bull. Korean Chem. Soc. 2006, Vol. 27, No. 11 1845
a batch slurry reactor system (Figure 1). The reactor was a
high pressure SS-316 reactor with a volume of 320 mL
(model 4841, Parr Instruments Inc. USA), equipped with an
impeller. A J-type thermocouple was immersed into the
liquid phase to measure the reactor temperature, and was
connected to a heater/controller to maintain the reactor
temperature within ± 1 K. Liquid samples were collected
using a 1/8 inch o.d. stainless steel tube connected to a
stainless steel sampling valve. A pressure transducer
(Foxboro electronic transmitter, Model 84 GM-D) was used
to measure pressure in the reactor with an accuracy of ± 4.0
kPa.
Analyses of Reaction Mixtures. Liquid and gas samples
were analyzed using a Hewlett Packard 5890 Series II Gas
Chromatograph (GC) equipped with a TCD detector and a
0.914 m long column with Poropak R packing (50-80 mesh),
operated at a constant column temperature of 423 K.
The GC was calibrated for ethylene, propylene, dimethyl
ether (DME), water and methanol using standard mixtures
having different concentrations of ethylene, propylene and
dimethyl ether (DME). The exit gasses were analyzed for
DME, ethylene and propylene.
Liquid samples (1 mL) were taken hourly and analyzed
using GC. Analyses of the vapor phase were performed
online. Compositions of gas and liquid phase product
mixtures were determined by comparison of GC data with
standard mixtures.
Procedure. First, 150 mL of methanol (analytical grade,
BDH) and 2.0 g of catalyst were loaded into the reactor, so
that initially about one half of the vessel was filled with
liquid. The liquid expanded at high temperatures; hence
space was allocated to accommodate this expansion. The
reactor was then purged with helium to remove any air
initially present in the reactor, and to provide an inert
atmosphere. The inlet and outlet of the reactor were then
closed. The amount of helium initially present in the reactor
prior to heating was determined from the initial reactor
temperature, pressure and vapor volume after sealing the
reactor, and was used as an internal standard to calculate
material balance in kinetic studies.
The reactor contents were then heated to a reaction
temperature pre-selected from 373, 413, 433 and 453 K. The
range 373-453 K was selected for two reasons. First, the
reaction rate was sufficiently fast to allow experiments to be
completed within hours. Second, pressures developed within
this range could be reproducibly determined with good
accuracy using the present experimental equipment. The
pressure in the closed reactor rose from 260 psig at 413 K to
375 psig at 433 K and 575 psig at 453 K. The temperature
range 413-453 K was then selected for more detailed
investigation because a significant amount of alkene reaction
product was produced in this range.
Negligible amounts of reaction products were produced
during the time required to heat the reaction mixture to the
pre-selected temperature as monitored by on line GC during
the ramp.
The reaction mixture was stirred at 1080 rpm for the
duration of the reaction (1-3 hours) to minimize the influ-
ence of external mass transfer. Selectivity and conversion
were calculated from GC analytical results.
After the reaction, the residual product liquid was filtered
and the catalyst was recovered, dried and could be used
again for further reaction.
Catalyst Characterization Using XRD and BET. The
increase in surface area of fresh SZS compared to fresh SZ
was attributed to modification of the catalyst structure as a
consequence of doping with silica. SZS had a higher surface
area than SZ, but had a slightly smaller pore volume. Doping
SZ with silica reduced the average pore size.
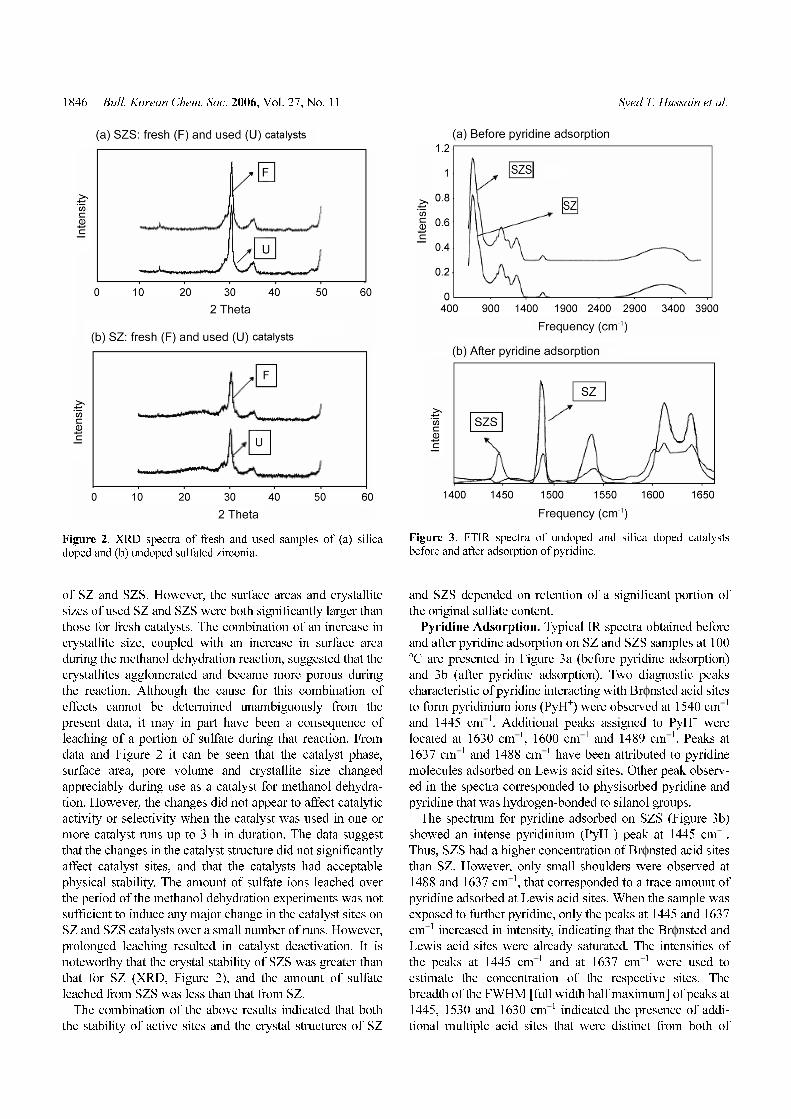
Figure 2 shows the crystalline XRD for fresh and used
samples of SZS and SZ, respectively. The XRD data showed
that the physical structure of SZS differed from that of SZ.
Comparison of the XRD of fresh and used samples of each
catalyst showed that the structure of SZS was more stable
than that of SZ. The XRD of SZS showed much more
intense peaks for 2θ at 30o and 34o in comparison with SZ.
This suggested that SiO2 doping not only resulted in a more
stable crystal structure, but also in modification of catalyst
physical characteristics (Figure 2b). The differences between
the XRD data for the two fresh samples were consistent with
a combination of a change in crystal structure resulting from
doping SZ with SiO2, and a minor change in size of crystal-
lites. There were similar differences between used samples
Table 1. BET area and pore volume for fresh and used catalysts
Catalyst
sample
Surface area
m2/g (Fresh)
Surface area
m2/g (Used)
Pore Volume
mL/g (Fresh)
Pore Volume
mL/g (Used)
SZ 191.58 146.83 0.1082 0.1744
SZS 223.14 172.98 0.09231 0.1443
Table 2. Crystallite size (XRD data)
Catalyst
sample
Crystallite size (nm)
(Fresh)
Crystallite size (nm)
(Used)
SZ 14.60 31.5
SZS 13.60 30.0
Figure 1. Schematic diagram of the equipment.
1846 Bull. Korean Chem. Soc. 2006, Vol. 27, No. 11 Syed T. Hussain et al.
of SZ and SZS. However, the surface areas and crystallite
sizes of used SZ and SZS were both significantly larger than
those for fresh catalysts. The combination of an increase in
crystallite size, coupled with an increase in surface area
during the methanol dehydration reaction, suggested that the
crystallites agglomerated and became more porous during
the reaction. Although the cause for this combination of
effects cannot be determined unambiguously from the
present data, it may in part have been a consequence of
leaching of a portion of sulfate during that reaction. From
data and Figure 2 it can be seen that the catalyst phase,
surface area, pore volume and crystallite size changed
appreciably during use as a catalyst for methanol dehydra-
tion. However, the changes did not appear to affect catalytic
activity or selectivity when the catalyst was used in one or
more catalyst runs up to 3 h in duration. The data suggest
that the changes in the catalyst structure did not significantly
affect catalyst sites, and that the catalysts had acceptable
physical stability. The amount of sulfate ions leached over
the period of the methanol dehydration experiments was not
sufficient to induce any major change in the catalyst sites on
SZ and SZS catalysts over a small number of runs. However,
prolonged leaching resulted in catalyst deactivation. It is
noteworthy that the crystal stability of SZS was greater than
that for SZ (XRD, Figure 2), and the amount of sulfate
leached from SZS was less than that from SZ.
The combination of the above results indicated that both
the stability of active sites and the crystal structures of SZ
and SZS depended on retention of a significant portion of
the original sulfate content.
Pyridine Adsorption. Typical IR spectra obtained before
and after pyridine adsorption on SZ and SZS samples at 100oC are presented in Figure 3a (before pyridine adsorption)
and 3b (after pyridine adsorption). Two diagnostic peaks
characteristic of pyridine interacting with Brφnsted acid sites
to form pyridinium ions (PyH+) were observed at 1540 cm−1
and 1445 cm−1. Additional peaks assigned to PyH+ were
located at 1630 cm−1, 1600 cm−1 and 1489 cm−1. Peaks at
1637 cm−1 and 1488 cm−1 have been attributed to pyridine
molecules adsorbed on Lewis acid sites. Other peak observ-
ed in the spectra corresponded to physisorbed pyridine and
pyridine that was hydrogen-bonded to silanol groups.
The spectrum for pyridine adsorbed on SZS (Figure 3b)
showed an intense pyridinium (PyH+) peak at 1445 cm−1.
Thus, SZS had a higher concentration of Brφnsted acid sites
than SZ. However, only small shoulders were observed at
1488 and 1637 cm−1, that corresponded to a trace amount of
pyridine adsorbed at Lewis acid sites. When the sample was
exposed to further pyridine, only the peaks at 1445 and 1637
cm−1 increased in intensity, indicating that the Brφnsted and
Lewis acid sites were already saturated. The intensities of
the peaks at 1445 cm−1 and at 1637 cm−1 were used to
estimate the concentration of the respective sites. The
breadth of the FWHM [full width half maximum] of peaks at
1445, 1530 and 1630 cm−1 indicated the presence of addi-
tional multiple acid sites that were distinct from both of
Figure 2. XRD spectra of fresh and used samples of (a) silicadoped and (b) undoped sulfated zirconia.
Figure 3. FTIR spectra of undoped and silica doped catalystsbefore and after adsorption of pyridine.

Dehydration of Methanol to Dimethyl ether, Ethylene, and Propylene Bull. Korean Chem. Soc. 2006, Vol. 27, No. 11 1847
isolated Brφnsted and Lewis acid sites. Both the IR peak at
1375 cm−1 and a 1H NMR signal at 5.75 ppm, assigned to
super-acid protons, lost intensity after pyridine adsorption.
Thus, Brφnsted, Lewis and combinations of proximate
acid sites were all available as potentially active acidic
catalyst sites.
The concentration of Brφnsted acid sites determined for
the SZS sample, in accordance with the method of
reference,8 was found to be 1.1 × 10²⁰ ions.g−1. Both SZ and
SZS samples displayed a prominent feature (Figure 3a) at
1375 cm−1, arising from increased S=O double bond
character for sulfate ions at high temperature.
Temperature Programmed Desorption of Pyridine.
Figure 4 shows the TPD of pyridine on SZ and SZS. It was
found that the strength of adsorption of pyridine on SZS was
higher than on SZ. SZ did not adsorb pyridine at Brφnsted
acid sites at 423 K. The acidity of Brφnsted acid sites of SZS
was stronger after activation at 923 K.
The TPD of pyridine on SZS displayed two features at 650
and 720 K that were not present in TPD of pyridine on SZ.
Detection of these additional features indicated that
combinations of proximate acid sites were present only on
SZS. In addition, SZS was found to have a higher total acid
sties density, 2.4 mmol·m−2, compared with 1.8 mmol·m−2
on SZ. Thus, the overall concentration of surface acidic
sites, their strengths, and the distribution of types of site
were all enhanced by doping SZ with silica to form SZS.
Characterization of Acid Sites Using NMR. 1H NMR
data of SZ and SZS before and after pyridine adsorption are
presented in Table 5. Three distinct NMR resonances were
detected, one at 5.75 ppm and two other signals at 2.1 and
1.2 ppm. The signal at 5.75 ppm was in the range
attributable to super-acid protons. The intensity of the signal
at 5.75 ppm was much more in the spectrum of SZS when
compared with the spectrum of SZ, indicating that the
concentration of strongly acid sites was higher on SZS.
Pyridine adsorption on either SZ or SZS reduced the
intensity of the signal at 5.75 ppm. The reduction in intensity
was greater for SZ than for SZS (Table 5). The spectrum of
SZS treated with pyridine showed a new signal at 1.9 ppm
that was assigned to pyridine adsorption at a combination of
proximate acid sites. Together with the FTIR and TPD data
above, the NMR data supported the proposal that SZS
catalyst had complex proximate acid sites in addition to
Brφnsted and Lewis acid sites, and that these complex sites
on SZS were more acidic than the acid sites on SZ.
Results and Discussions
Methanol dehydration was used as a model reaction for
comparing the catalytic properties of SZ and SZS for
reactions in the temperature range 373-453 K. The results
are presented in Table 3. Methanol was dehydrated to DME
at all temperatures 373-453 K over either SZ or SZS.
Ethylene and propylene were produced only in reactions at
413-453 K. Formation of propylene occurred only over SZS
catalyst. No other hydrocarbon products were detected.
Dehydration of Methanol to DME. Direct dehydration
of methanol produced DME as the sole primary product at
373-453 K (Eq. 1). When alkenes were formed as secondary
products, the concentration of DME did not increase linearly
with time, as it was consumed to form ethylene or propyl-
ene.
2CH3OH ⎯⎯→ (CH3)2O + H2O (1)
Table 3 shows the compositions of the reaction mixture after
reaction for 1-3 h at different temperatures. Conversion to
dehydration products over SZS catalyst was higher at all
temperatures than reaction over SZ. This effect showed that
the acidity of SZS was higher than that of SZ.
Dehydration of DME to Ethylene. Conversion of DME
to ethylene was a secondary reaction (Eq. 2; * represents a
surface site). The characteristics of catalytic sites for conver-
sion of alcohols to olefins have been studied intensely. The
mechanism for elimination of water from a C2+ alcohol, in
which the C-C bond already exists, differs from dehydration
of methanol to ethylene, or to propylene. Nevertheless,
similar intermediates may be formed at the catalyst surface,
and so studies of conversion of aliphatic primary C2+
alcohols to olefins on catalysts possessing acidic centers
provide useful insights.9-11 It is well known that Brφnsted
Figure 4. Temperature programmed desorption (TPD) of pyridinepre-adsorped on undoped and silica-doped catalysts (numbers aretemperature (K) corresponding to maxima).
Figure 5. FTIR analysis of spent SZS sample.
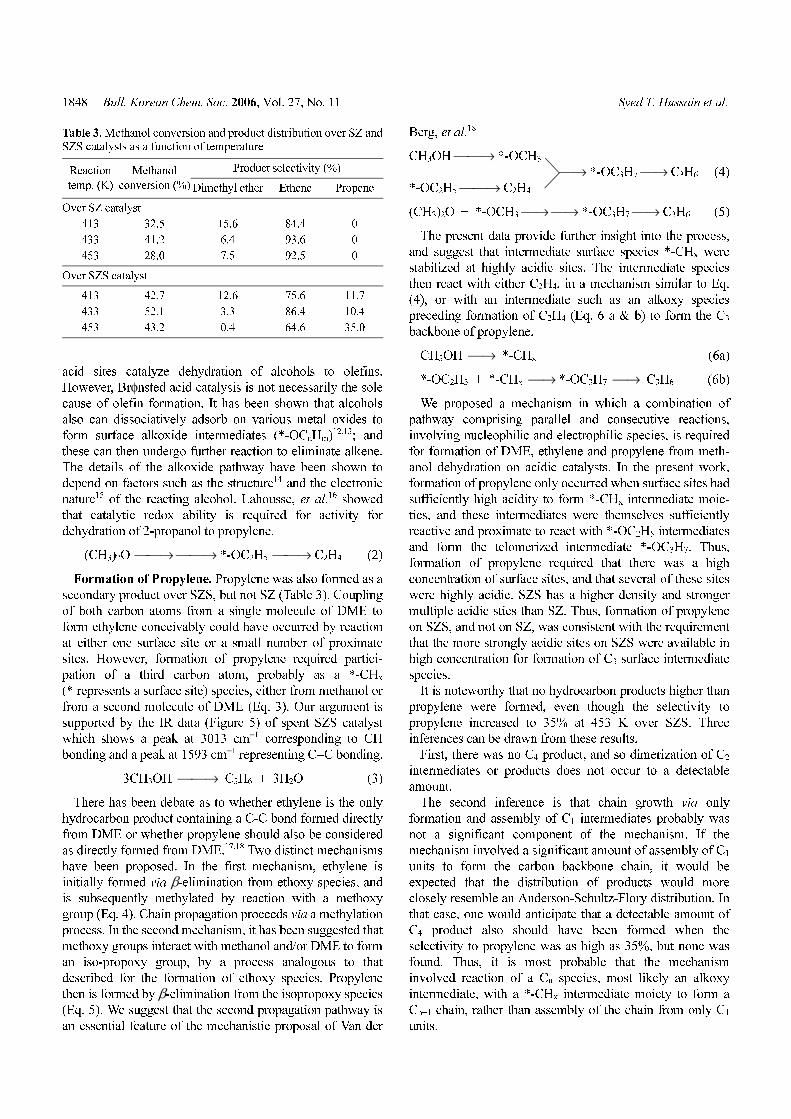
1848 Bull. Korean Chem. Soc. 2006, Vol. 27, No. 11 Syed T. Hussain et al.
acid sites catalyze dehydration of alcohols to olefins.
However, Brφnsted acid catalysis is not necessarily the sole
cause of olefin formation. It has been shown that alcohols
also can dissociatively adsorb on various metal oxides to
form surface alkoxide intermediates (*-OCnHm)12,13; and
these can then undergo further reaction to eliminate alkene.
The details of the alkoxide pathway have been shown to
depend on factors such as the structure14 and the electronic
nature15 of the reacting alcohol. Lahousse, et al.16 showed
that catalytic redox ability is required for activity for
dehydration of 2-propanol to propylene.
(CH3)2O ⎯⎯→ ⎯⎯→ *-OC2H5 ⎯⎯→ C2H4 (2)
Formation of Propylene. Propylene was also formed as a
secondary product over SZS, but not SZ (Table 3). Coupling
of both carbon atoms from a single molecule of DME to
form ethylene conceivably could have occurred by reaction
at either one surface site or a small number of proximate
sites. However, formation of propylene required partici-
pation of a third carbon atom, probably as a *-CHx
(* represents a surface site) species, either from methanol or
from a second molecule of DME (Eq. 3). Our argument is
supported by the IR data (Figure 5) of spent SZS catalyst
which shows a peak at 3013 cm−1 corresponding to CH
bonding and a peak at 1593 cm−1 representing C=C bonding.
3CH3OH ⎯⎯→ C3H6 + 3H2O (3)
There has been debate as to whether ethylene is the only
hydrocarbon product containing a C-C bond formed directly
from DME or whether propylene should also be considered
as directly formed from DME.17,18 Two distinct mechanisms
have been proposed. In the first mechanism, ethylene is
initially formed via β-elimination from ethoxy species, and
is subsequently methylated by reaction with a methoxy
group (Eq. 4). Chain propagation proceeds via a methylation
process. In the second mechanism, it has been suggested that
methoxy groups interact with methanol and/or DME to form
an iso-propoxy group, by a process analogous to that
described for the formation of ethoxy species. Propylene
then is formed by β-elimination from the isopropoxy species
(Eq. 5). We suggest that the second propagation pathway is
an essential feature of the mechanistic proposal of Van der
Berg, et al.18
CH3OH ⎯⎯→ *-OCH3
⎯→ *-OC3H7 ⎯→ C3H6 (4)
*-OC2H5 ⎯⎯→ C2H4
(CH3)2O + *-OCH3 ⎯→ ⎯→ *-OC3H7 ⎯→ C3H6 (5)
The present data provide further insight into the process,
and suggest that intermediate surface species *-CHx were
stabilized at highly acidic sites. The intermediate species
then react with either C2H4, in a mechanism similar to Eq.
(4), or with an intermediate such as an alkoxy species
preceding formation of C2H4 (Eq. 6 a & b) to form the C3
backbone of propylene.
CH3OH ⎯→ *-CHx (6a)
*-OC2H5 + *-CHx ⎯→ *-OC3H7 ⎯→ C3H6 (6b)
We proposed a mechanism in which a combination of
pathway comprising parallel and consecutive reactions,
involving nucleophilic and electrophilic species, is required
for formation of DME, ethylene and propylene from meth-
anol dehydration on acidic catalysts. In the present work,
formation of propylene only occurred when surface sites had
sufficiently high acidity to form *-CHx intermediate moie-
ties, and these intermediates were themselves sufficiently
reactive and proximate to react with *-OC2H5 intermediates
and form the telomerized intermediate *-OC3H7. Thus,
formation of propylene required that there was a high
concentration of surface sites, and that several of these sites
were highly acidic. SZS has a higher density and stronger
multiple acidic sties than SZ. Thus, formation of propylene
on SZS, and not on SZ, was consistent with the requirement
that the more strongly acidic sites on SZS were available in
high concentration for formation of C3 surface intermediate
species.
It is noteworthy that no hydrocarbon products higher than
propylene were formed, even though the selectivity to
propylene increased to 35% at 453 K over SZS. Three
inferences can be drawn from these results.
First, there was no C4 product, and so dimerization of C2
intermediates or products does not occur to a detectable
amount.
The second inference is that chain growth via only
formation and assembly of C1 intermediates probably was
not a significant component of the mechanism. If the
mechanism involved a significant amount of assembly of C1
units to form the carbon backbone chain, it would be
expected that the distribution of products would more
closely resemble an Anderson-Schultz-Flory distribution. In
that case, one would anticipate that a detectable amount of
C4 product also should have been formed when the
selectivity to propylene was as high as 35%, but none was
found. Thus, it is most probable that the mechanism
involved reaction of a Cn species, most likely an alkoxy
intermediate, with a *-CHx intermediate moiety to form a
Cn+1 chain, rather than assembly of the chain from only C1
units.
Table 3. Methanol conversion and product distribution over SZ andSZS catalysts as a function of temperature
Reaction
temp. (K)
Methanol
conversion (%)
Product selectivity (%)
Dimethyl ether Ethene Propene
Over SZ catalyst
413 32.5 15.6 84.4 0
433 41.2 6.4 93.6 0
453 28.0 7.5 92.5 0
Over SZS catalyst
413 42.7 12.6 75.6 11.7
433 52.1 3.3 86.4 10.4
453 43.2 0.4 64.6 35.0

Dehydration of Methanol to Dimethyl ether, Ethylene, and Propylene Bull. Korean Chem. Soc. 2006, Vol. 27, No. 11 1849
The third inference is that if, indeed, the mechanism
required chain growth through reaction of a Cn chain with
*-CHx to form a Cn+1 chain, then formation of a surface
bonded C4 intermediate was unfavoured. A limitation of this
nature would be consistent with a mechanism in which the
chain growth process occurred by nucleophilic attack at a
secondary carbon in the present chain (CnH2n or *-OCnH2n+1)
to form a branched product, and that there was steric
constraint to formation of *-OC4H9 as a branched chain
intermediate (Eq. 7).
*OC3H7 (or C3H6) + *-CHx ⎯⎯→ *-OC4H9 (7)
Apparent Rate Constants. Methanol conversion reaction
data for all SZ and SZS catalyst tests were found to fit the
Bassett-Habgood rate equation (Eq. 8) for first order
reactions in which the reactant partial pressure is in the range
260-575 psig. The adsorption rate is faster than the rate of
reaction, the latter being the rate-determining step.
ln[1/(1−X)] = kaRT(W/F) (8)
Where X is total conversion, ka is the apparent rate constant,
W is the weight of catalyst, and F is the weight of methanol
in the reactor.
Plots of ln[1/(1-X)] Vs F−1 are linear for either SZ or SZS
catalysts, and pass through the origin, as expected from Eq.
(8). Therefore, the reaction is first order in methanol.
Apparent rate constants, ka, obtained from the slopes of the
linear plots of ln[1/(1-X)] Vs F−1 and activation parameters
calculated using the rate law equation (Eq. 8) are shown in
Table 4.
Gas phase dehydration of alcohols to the corresponding
olefins proceeds on acid catalysts via the reaction scheme
presented in reference.19 The mechanism proposed above
proceeds via alkene elimination from surface alkoxy species.
The data obtained in this study are consistent with a
mechanism of product formation that is substantially similar
to that proposed for reaction in the gas phase.
On the basis of discussions presented above we proposed
that Lewis and Brφnsted acid sites are in equilibrium on SZ
and SZS, as shown in Eq. (9).
Dehydration of an alcohol to an alkene includes elimina-
tion of the β-hydrogen atom from an adsorbed substrate. The
nominally weak acidic OH groups in cation exchanged
catalyst are sufficiently active to catalyze alcohol dehydr-
ation. Both SZ and SZS catalysts are more active for alcohol
dehydration than other acid catalysts screened during a
parallel study such as Zeolite 3A, Zeolite 5A dispersed on
silica or alumina; sulfuric acid; Ce and Al phosphate
catalysts dispersed on silica or alumina; Amberlyst 16 and
Amberlyst 36 dispersed on silica or alumina, and alumina-
silica catalysts having different alumina-silica ratios ranging
between 20-80%.
Further reaction to form propylene occurred only over
SZS. Thus, higher acidity and increased concentration of
acidic sites on SZS compared to SZ enhanced activity for
additional C-C bond formation reactions.
Correlation of Activity with Surface Properties. Dop-
ing of SZ with SiO2 produced a SZS catalyst that was
slightly more active for dehydrating methanol to dimethyl
ether and ethylene than undoped SZ, and also produced
propylene. A slight increase in selectivity to ethylene was
also observed with SZS.
The TPD of pyridine adsorbed on SZS displayed features
that characterized the presence of combinations of proxi-
mate acid sites in SZS, which were not present in TPD of
pyridine on SZ. In addition, SZS was found to have a higher
total acid site density, 2.4 mmol·m−2, compared with 1.8
mmol·m−2 on SZ. Our study clearly indicates that concen-
trations of Brφnsted and Lewis acid sites determine catalytic
activity and selectivity. Thus, the increase in catalytic
activity of SZS compared to SZ, and the differences between
the products obtained for the present reaction, were entirely
consistent with the presence of a high concentration of
proximate and strongly acidic sites only on SZS.
Sulfate Ion Leaching and Catalyst Stability. From
Tables 1 and 2, it can be seen that the area, pore volume and
crystallite size changed appreciably with use of either SZ or
SZS as catalyst. However, the changes did not appear to
affect catalytic activity or selectivity during a catalyst run.
This indicated that the catalysts had acceptable physical
stability over the duration of runs under the present
experimental conditions.
Small amounts of sulfate ions and other oxyanion species
within the catalyst phase were leached during the catalytic
runs. The amount of sulfate leached from SZ (0.075 g
(SO42−)/g(cat) and from SZS (0.025 g (SO4
2−)/g(cat) was
determined by acid-base titration of the residual liquid
reaction mixture. Leaching caused a significant change in
crystallite size and, to a lesser degree, change in surface area.
Table 4. Apparent rate constants (ka) and activation parameters (Ea
and ln A) for methanol conversion on SZ and SZS catalysts, asderived from the Bassett-Habgood rate equation [20]
Temperature
(K)
Ka (Apparent rate
constant)
(106 mol/atm.g.s.)
Ea (Activation
energy)
(kcal/mol)
ln A
SZ catalyst
413 14.1 106 ± 3 −0.2
433 16.4 123 ± 4 0.6
453 12.0 100 ± 4 −1.8
SZS catalyst
413 20.3 120 ± 3 −0.8
433 35.4 134 ± 4 1.4
453 18.7 110 ± 4 −2.0
(9)

1850 Bull. Korean Chem. Soc. 2006, Vol. 27, No. 11 Syed T. Hussain et al.
These data suggested that particles became aggregated
during use. The amount of sulfate ions leached over the
period of the experiments reported was not sufficient to
induce any major change in the concentration or nature of
catalyst sites on SZ and SZS catalysts during each run. The
lesser amount of sulfate that was leached from SZS than
from a same quantity of SZ showed that silica dopant
increased the resistance of the catalyst to leaching.
Conclusion
Propylene was formed over sulfated zirconia doped with
silica, but not over undoped sulfated zirconia. Formation of
propylene is attributed to formation of intermediate *-CHx
species at strongly acidic sites, which react with either ethyl-
ene, or with an alkoxy intermediate leading to formation of
ethylene, in a chain propagation step. The catalytic activity
and product selectivity show that doping sulfated zirconia
with silica resulted in an increase in both acidity and concen-
tration of surface acidic sites, and formation of proximate
acid sites.
No hydrocarbon products higher than propylene were
formed. This suggested that the mechanism proceeded via
nucleophilic attack on the carbon chain of the intermediate,
and that there was steric constraint to formation of branched
C4 or higher intermediates that would have been formed as a
result of such a reaction.
The kinetics of ethylene formation are consistent with a β-
elimination mechanism from a surface intermediate alkoxy
species derived from methanol.
Sulfated zirconia doped with silica was more stable than
undoped catalyst, and less prone to leaching of sulfate.
FTIR, NMR and pyridine adsorption showed that doping
sulfated zirconia with silica resulted in an increase in both
acidity and concentration of Brφnsted acid sites, and
formation of proximate acid sites.
Correlation of spectroscopic data with differences be-
tween reaction data for dehydration of methanol to dimethyl
ether, ethylene and propylene over the doped and undoped
catalysts showed that the highly acidic sites were related to
the higher catalytic activity of the doped catalyst.
Formation of propylene over sulfated zirconia doped with
silica, but not over undoped sulfated zirconia, was attributed
to formation of intermediate CHx species at strongly acidic
sites. Differences between the combination and relative
strengths of Lewis, Brφnsted and complex proximate acid
sites on the surfaces of undoped sulfated zirconia and
sulfated zirconia doped with silica determined their relative
catalytic activity and selectivity.
References
1. Baiker, A.; Kijenski, J. Catal. Today 1989, 5, 1.
2. Hino, M.; Kobayashi, M.; Arata, K. J. Am. Chem. Soc. 1986, 108,6439.
3. Kung, H. H. Solid State Chem. 1984, 52, 191.
4. Tanabe, K.; Sumiyoshi, T.; Shibata, K.; Kiyoura, T. Bull. Chem.Soc. Jpn. 1974, 47, 1064.
5. Tanabe, K.; Itoh, M.; Morishige, K.; Hattori, H. in Preparation of
Catalysts; Delmon, B.; Jacobs, P. A.; Poncelet, G., Eds.; Elsevier:Amsterdam, 1976; p 65.
6. Arata, K. Adv. Catal. 1990, 37, 165.
7. Corma, A. Chem. Rev. 1995, 95, 559. 8. Willams, C.; Makarova, M. A.; Malysheva, L. V.; Paukshits, E.
A.; Thomas, J. M.; Zamaraev, K. I. J. Chem. Soc. Farady Trans.
1990, 86, 3473. 9. Kanazirev, V.; Tsoncheva, T. Minchev, Chr, Z. Phys. Chem. N.F.
1986, 149, 237.
10. Tanabe, K.; Misono, M.; Ono, Y.; Hattori, H. In New Solid Acidsand Bases, Their Catalytic Properties; Delmon, B.; Yates, J. T.,
Eds.; Elsevier: Amsterdam, 1989; Vol. 51.
11. Gervasini, A.; Auroux, A. J. Catal. 1991, 131, 190.12. Vohs, J. M.; Barteau, M. A. Surf. Sci. 1989, 221, 5909.
13. Vohs, J. M.; Barteau, M. A. J. Phys. Chem. 1991, 95, 227.
14. Cunningham, J.; Hodnett, B. K.; Illyas, M.; Tobin, J.; Leahy, E.L.; Fierro, J. L. G. Discuss. Farady Soc. 1981, 72, 283.
15. Parrot, S. L.; Rogers, Jr. J. W.; White, J. M. Appl. Surf. Sci. 1978,
1, 443.16. Lahousse, C.; Bachelier, J.; Lavally, J. C.; Lauron-Pernot, H.;
LeGovie, A. M. J. Mol. Cata. 1994, 87, 329.
17. Kannan, S. V.; Pillai, C. N. Curr. Sci. 1968, 23, 665.18. Bassett, D.; Habgood, H. W. J. Phys. Chem. 1960, 64, 769.
19. Buchang, S.; Burton, H. D. J. Catal. 1995, 57, 359.
Table 5. 1H NMR of undoped and silica-doped sulfated zirconia, before and after pyridine (Py) adsorption
SZ SZS
RemarksBefore Py ads. After Py ads. Before Py ads. After Py ads.
ppm Intensity ppm Intensity ppm Intensity ppm Intensity
8.58+ 79.3+ 8.58+ 66.2+ +Pyridine peaks
7.81+ 44.6+ 7.81+ 21.9+
7.40+ 137.5+ 7.40+ 100.8+
5.75 62.9 5.75 13.4 5.75 151.0 5.75 48.4 *Solvent (DMSO)
peaks3.35* 1050 3.35* 1049 3.35* 1046 3.35* 1047
2.51* 260 2.51* 250 2.51* 258 2.51* 261
2.1 23.1 2.1 30.0 2.1 6.8 2.1 93.3
1.2 9.6 1.2 9.6 1.2 2.4 1.9 30.4
1.2 2.9
Copyright © 2022 FDOKUMEN