Design and optimization of an ethanol dehydration process using stochastic methods
Upload
khangminh22Category
view
0download
0
1
Towards the dehydration of ethanol using pervaporation cross-linked poly(vinyl 1
alcohol)/graphene oxide membranes 2
3
Roberto Castro-Muñoza, b, c, Juan Buera-Gonzáleza, Óscar de la Iglesiaa, d, Francesco 4
Galianob, Vlastimil Fílac, Magdalena Malankowskaa, César Rubioa, Alberto Figolib, Carlos 5
Télleza, Joaquín Coronasa,* 6
7
(a) Chemical and Environmental Engineering Department, Instituto de Nanociencia de 8
Aragón (INA) and Instituto de Ciencia de Materiales de Aragón (ICMA), Universidad de 9
Zaragoza-CSIC, 50018 Zaragoza, Spain. Email: [email protected] 10
(b) Institute on Membrane Technology, ITM-CNR, c/o University of Calabria, P. Bucci 17c, 11
87030 Rende (CS), Italy 12
(c) University of Chemistry and Technology Prague, Technická 5, 166 28 Prague 6, 13
Czech Republic 14
(d) Centro Universitario de la Defensa Zaragoza, Academia General Militar, 50090 15
Zaragoza, Spain 16
17
Abstract 18
Highly hydrophilic inorganic material graphene oxide (GO) was successfully prepared and 19
incorporated into a cross-linked poly(vinyl alcohol) (PVA) matrix. The obtained mixed 20
matrix membranes (MMMs) have been used for the dehydration of ethanol (10:90% 21
water-ethanol) by pervaporation (PV), monitoring their performance in terms of total 22
permeate flux, partial components fluxes, as well as their separation factor. The effect of 23
filler was analyzed by doubling the GO content (at 0.5, 1.0, and 2.0 wt.%) in the MMMs. 24

2
A complete analysis of the operating temperature (between 40-70 ºC) was carried out by 25
means of Arrhenius relationship. Moreover, the membranes were characterized by field 26
emission scanning electron microscopy (FESEM), transmission electron microscopy 27
(TEM), differential scanning calorimetry (DSC), thermo-gravimetric analysis (TGA), X-ray 28
diffraction (XRD), Fourier transformed infrared spectroscopy (FTIR), measurements of 29
degree of swelling (uptake), water contact angle (CA) and mechanical properties. At 40 30
ºC, the best performance was provided by the MMMs containing 1 wt.% GO, showing a 31
separation factor of 263 and a permeate flux of about 0.137 kg·m-2·h-1 (in which 0.133 32
kg·m-2·h-1 corresponds to water). This represents a 75 % enhancement of the original 33
permeation rate of pristine cross-linked PVA membranes. Taking into account the 34
promising results, it is likely that these MMMs will provide featured benefits in green 35
processes, e.g. ethanol purification by means of less-energy consumption. 36
37
Keywords: pervaporation; poly (vinyl alcohol); cross-linking; mixed matrix membrane; 38
ethanol dehydration; graphene oxide. 39
40
Nomenclature 41
PV: Pervaporation 42
PVA: Poly(vinyl alcohol) 43
CA: water contact angle 44
J: Permeate flux, kg·m-2·h-1 45
α: Separation factor 46
FESEM: Field emission scanning electron microscopy 47
DSC: Differential scanning calorimetry 48
MMM: Mixed matrix membrane 49
TGA: Thermo-gravimetric analysis 50

3
GO: Graphene oxide 51
XRD: X-ray diffraction 52
53
1. Introduction 54
Membrane-based technologies have attracted considerable attention for different types 55
of applications (e.g. in food, petrochemical and environmental fields). In particular, 56
pervaporation (PV), as a merge of evaporation and permeation processes, has been 57
consistently proposed for the separation of different types of azeotropic and close-boiling 58
compounds mixtures. The benefit of using this membrane process for such purposes is 59
due to its high selectivity, efficiency and low-energy requirements [1,2]; the latest being 60
the main feature of PV that indeed makes it attractive to be considered as a “Green” 61
process. These mechanisms are currently encouraged to meet the “Twelve Principles of 62
Green Chemistry”. Such principles, well-established by Anastas and Warner [3], are 63
aimed to preserve the environment through implementation of green chemistry methods. 64
Moreover, PV is a good candidate for the replacement of the conventional distillation, 65
which, for instance, carries out the separation of azeotropic mixtures at large-scale in 66
petrochemical industry. PV has demonstrated the ability to separate different types of 67
azeotropic mixtures, including organic-water, organic-organic and water-organic [4,5]. At 68
industrial level, PV has found its growing use in industry towards water-organic mixtures, 69
which implies the dehydration of organics to reach higher purification degrees, e.g. in 70
ethanol [6], isopropanol [7] and acetonitrile [8]. To date, the dehydration of ethanol is the 71
most sought application due to its direct impact on commercial value. According to the 72
IEA (Industrial Ethanol Association, http://www.industrial-ethanol.org), the main market 73
for ethanol concerns the manufacture of beverages, fuels and a multiple of industrial 74
4
applications related to pharmaceuticals, cosmetics, detergents, printing inks, paints, 75
coatings, medical uses, production of polymers and chemicals, to mention just a few. This 76
makes the ethanol production continuously grow, e.g. over 100 billion liters demand was 77
reported by 2017 [9], and its demands is expected to increase in coming years. Typically, 78
ethanol can be produced by fermentation or from direct hydration of ethylene. Moreover, 79
regardless of its production process, the final product is usually a diluted aqueous solution 80
and at a large-scale level, the ethanol is processed by distillation in order to concentrate 81
it. The separation of ethanol and water is complicated due to the fact that ethanol and 82
water form an azeotrope at 95.6 wt.% of ethanol [10]. Thereby, it is a difficult task to 83
produce pure ethanol from an azeotropic mixture by conventional distillation: at the 84
azeotrope vapor and liquid compositions are the same. Herein, the PV has been 85
introduced as a promising alternative towards such purpose. When dealing with the 86
dehydration of any organic (e.g. ethanol), it is inevitable to address the use of hydrophilic 87
membranes. At this point, several types of hydrophilic polymers have been proposed and 88
investigated as membrane materials, such as polyimides [6], sodium alginate [11], 89
polybenzimidazole (PBI) [12], chitosan [13], polyacrylonitrile (PAN) [14] and poly(vinyl 90
alcohol) (PVA) [7]. Among all these polymers, PVA has been the only one to be 91
consolidated at industrial level. For instance, DeltaMem AG (http://www.deltamem.ch) is 92
a company that currently manufactures and commercializes cross-linked PVA 93
membranes for PV applications. Nowadays, one of the most successful trends in 94
enhancing the performance of polymeric membranes implies the embedding of inorganic 95
materials, generating the so-called mixed matrix membranes (MMMs). These combine 96
the strengths of inorganic and polymeric membranes to ideally reach an enhanced 97

5
synergistic performance. To date, some MMMs based on PVA have been proposed for 98
ethanol dehydration displaying acceptable separation performance, e.g. those containing 99
MWCNT (J= 0.080 kg·m-2·h-1, α=500) [15] and ZIF-8-NH2 (J=0.120 kg·m-2·h-1, α=200) 100
[16]. In this work, the possibility of incorporating a highly hydrophilic material, like 101
graphene oxide (GO), into cross-linked PVA membranes, to achieve better performance, 102
was studied. GO is a layered material produced by the oxidation of graphite. GO sheets 103
are highly oxygenated having hydroxyl and epoxy functional groups on their basal planes, 104
in addition to carbonyl and carboxyl groups located at the sheet edges. These functional 105
groups provide a high hydrophilic profile to the material [17], which has been noted in 106
PVA during organic-organic separations [18,19]. Thereby, the aim of this work was to 107
analyze the effect of GO on the performance of cross-linked PVA MMMs used in ethanol 108
dehydration. To the best of our knowledge, there is no report about this [5]. The effect of 109
operating temperature on total permeate flux and separation factor was investigated by 110
doubling the GO content (at 0.5, 1.0, and 2.0 wt.%) in the MMMs. Moreover, the pristine 111
membrane and MMMs were characterized by thermogravimetric analysis (TGA), 112
differential scanning calorimetry (DSC), field emission scanning electron microscopy 113
(FESEM), transmission electron microscopy (TEM), degree of swelling (uptake), X-ray 114
diffraction (XRD), Fourier transformed infrared spectroscopy (FTIR), measurements of 115
water contact angle and mechanical properties. 116
117
2. Experimental 118
2.1. Materials 119

6
Poly (vinyl alcohol) (PVA, MW:130,000), glutaraldehyde (grade II, 25 wt.%) and 120
hydrochloric acid (HCl) were acquired from Sigma-Aldrich and used without further 121
purification. 122
123
2.2. Synthesis of graphene oxide 124
Graphene oxide (GO) was synthesized following the procedure described by Castarlenas 125
et al. [20], according to the Hummers’ method [21]. Basically, the graphite is oxidized by 126
treatment with KMnO4 and NaNO3 in concentrated H2SO4. In a round bottom flask, 127
sodium nitrate (1.5 g) was dissolved in 70 mL of concentrated sulfuric acid. The dispersion 128
was put under stirring at room temperature until the NaNO3 was totally dissolved 129
(approximately 5-10 min). Therefore, graphite (3.0 g) (with a particle size of ca. 5 μm, 130
supplied by Richard Anton KG) was added to the solution under gentle stirring for about 131
30 min to facilitate a homogeneous suspension. Later, KMnO4 (9.0 g) was gradually 132
added to the suspension to avoid the increase of the flask temperature due to the heat 133
generated during redox reaction. Once the addition of KMnO4 was completed, the 134
temperature of the solution was slowly raised up to 35 ºC and maintained for 30 min under 135
stirring. To facilitate the control of the exothermic reaction an ice bath was put under the 136
glass balloon. A brownish gray paste was formed. Then, by means of a Pasteur pipette, 137
140 mL of deionized water was slowly added to the slurry considering that the smoke 138
production was very fast. Once the deionized water was added, the suspension was kept 139
stirring overnight at 95 ºC and later, 500 mL of deionized water was added followed by 140
20 mL H2O2 that reduced the residual permanganate. The round bottom flask was kept 141
under stirring at 95 ºC for 3 h. The resulting mixture was filtered and washed using a 10 142

7
wt.% aqueous HCl solution. Finally, GO was centrifuged and washed with water 4 times 143
at 10000 rpm for 15 min (Beckman Coulter, Allegra x-15 R), reaching the neutral pH, and 144
dried at 80 ºC overnight obtaining 4.2 g of a light brown solid. 145
146
2.3. Mixed matrix membrane preparation 147
PVA/GO MMMs were prepared by dense-film casting method and solvent evaporation. 148
PVA powder (3 g) was dissolved under stirring in 100 mL of distilled water at 90 ºC. The 149
obtained solution was filtered to remove any insoluble impurities. GO was added to the 150
PVA solution to produce the dope suspension that was stirred during 12 h and processed 151
by sonication twice (30 min each). Afterwards, the in situ cross-linking procedure was 152
performed by adding 0.1 mL of GA and 0.1 mL of HCl to the dope. This was stirred during 153
15 min, cast on a clean glass plate and then dried in an oven at 40 ºC during 2 days. 154
Finally, the MMMs were peeled off of the glass plate. The GO loading for the MMMs was 155
varied at 0.5, 1, and 2 wt.%. Figure 1 shows typical examples of the prepared membranes 156
for this study, with a membrane thickness of 40±2 μm (measured with digital micrometer 157
Mitutoyo with an accuracy of 1 μm). It can be observed that the presence of GO particles 158
provides a darker colour on the MMM surface. 159
160
Figure 1. Pure cross-linked PVA membrane and its MMMs-GO with 1 wt.% of filler. 161
162
2.3.1. Membrane characterization 163
Field emission scanning electron microscopy (FESEM). The morphological structure of 164
the membrane surface and cross-section of the cross-linked-PVA and its MMMs were 165

8
evaluated using a field emission scanning electron microscope (FEI Inspect, F50 166
operated at 20 kV). The cross-sections were obtained by cryogenic fracture immersion of 167
the samples in liquid N2. The samples were attached to SEM carbon stubs with a diameter 168
of 2.54 cm using two-sided adhesive tape. The samples were coated through a sputtering 169
process with gold-palladium (Au / Pd). The corresponding images were captured at 170
suitable magnification. 171
Transmission electron microscopy (TEM). The distribution and dimensions of GO sheets 172
in cross-linked PVA-GO 1 wt.% membrane were obtained from TEM images (FEI TECNAI 173
T20 transmission microscope at 200 kV). The membrane sample was embedded in a 174
polymeric resin and cut with an ultramicrotome to the required size. 175
Differential scanning calorimetry (DSC). Differential scanning calorimetry (DSC) was 176
conducted on a ca. 10 mg sample using a Mettler Toledo DSC822e system. The Tg 177
routine was performed in two cycles from room temperature up to 450 °C at the 178
temperature ramping of 20 °C·min−1. The Tg determination was done in triplicate. 179
Thermo-gravimetric analysis (TGA). Thermogravimetric analysis (TGA) was performed 180
using a Mettler Toledo TGA/SDTA 851e. The analysis was carried out by placing the 181
sample (approximately 10 mg) in an alumina crucible and heating the samples up to 750 182
°C at a ramp of 10 °C·min−1 under air flow of 40 mL(STP)·min−1. 183
X-ray diffraction (XRD). X-ray diffraction (XRD) patterns of the GO and membranes were 184
obtained by using a Pananalytical Empyrean multipurpose diffractometer (40 kV, 20 mA) 185
with a Cu-Kα (λ = 0.1542 nm) anode, from 2θ of 2.5° to 40° with a 0.03° step·s−1. 186
Fourier transformed infrared spectroscopy (FTIR). FTIR was performed on GO, 187
glutaraldehyde, pristine PVA, cross-linked PVA and the cross-linked PVA-GO 1 wt.% 188

9
samples, using a Bruker Vertex 70 FTIR spectrometer equipped with a DTGS detector 189
and a Golden Gate diamond ATR accessory. The spectra were recorded in the 4000–190
600 cm−1 wavenumber range at a resolution of 4 cm−1. 191
Uptake. The uptake, known as swelling degree, of the cross-linked PVA and MMM 192
membranes was investigated for the 10:90 wt.% water-ethanol mixture following the 193
procedure previously reported by Choi et al. [15]. Three small pieces of membranes (1x5 194
cm) were weighed and immersed in the mixture at 40 ºC for 48 h. The wet membranes 195
were quickly wiped with tissue paper to remove the excess of free liquid on their surface 196
and weighed with a digital balance (Kern, ABJ220-4NM, Germany) with an accuracy of 197
0.001 g. The uptake was calculated as follows: 198
(1) 199
where Ww and Wd were the weights of the wet and dry membranes, respectively. 200
Water contact angle (CA). The water contact angle measurements were performed using 201
ultrapure water by the method of the sessile drop using the Krüss DSA 10 MK2 202
instrument. The average and standard deviation values were determined for three 203
measurements. 204
Mechanical properties. Mechanical properties of pristine cross-linked PVA membranes 205
and PVA MMMs were determined using a Zwick/Roell Z2.5 test unit (BTC-FR2.5TN-D09, 206
Germany). Measurements were carried out at room temperature (25 °C) using a 207
membrane sample of 1x5 cm. The samples were extended at the constant elongation 208
rate of 5 mm·min-1 until their break. Elongation at break, Young’s modulus and tensile 209
strength were therefore determined. For each membrane, at least four samples were 210
Uptake(%) = Ww-W
d
Wd
x 100

10
analyzed and the average and standard deviation were calculated. Mechanical tests were 211
carried out on all the investigated membranes before and after soaking them in a water-212
ethanol solution (10:90 wt.%) at 25 ºC for 24 h. 213
214
2.3.2. Pervaporation performance 215
The PV tests were performed in a semi-continuous laboratory-scale setup. A 10:90 wt.% 216
water-ethanol feed solution (1000 mL) was poured in the feed tank. The operating 217
temperature (at 40, 50, 60 and 70 ºC) was controlled with an accuracy of 0.01 ºC using a 218
thermometer, which was placed inside the membrane cell (in contact with the azeotropic 219
mixture). The vacuum on permeate side was set at 3-4 mbar using a RV3 two-stage 220
vacuum pump (Edwards, UK). 221
The membranes, with an area of 11.7 cm2, were located on a porous support within the 222
membrane cell. The permeated vapor was condensed and collected in a glass trap placed 223
in a liquid nitrogen condenser. Up to reach the steady-state, the permeates were collected 224
for 8 h and weighted to calculate the total permeate flux (J) as follows: 225
(2) 226
where Q is the weight of the permeate (kg), A is the membrane area (m2) and t is the 227
operating time (h). The partial flux (Ji) for component i was determined by multiplying its 228
weight fraction (yi) in the collected permeate by the total permeate flux (J), as Eq. (3) 229
describes: 230
(3) 231
The separation factor (α) was calculated according to Eq. 4: 232
J = Q
A×t
Ji= y
i×J

11
(4) 233
where y and x are the weight fractions of the components in the permeate and feed, 234
respectively. The permeate samples were weighed to determine the membrane flux and 235
analyzed with a gas chromatograph (Agilent Technologies, 7820A) equipped with a 236
PORAPAK Q80/100 column using TCD and FID detectors. The J and α values are the 237
averages of more than two runs of 8 h to ensure the accuracy of the results. Every 238
membrane sample was analysed twice which means that the membrane tested as a 239
function of temperature was stable for at least ca. 60 h. 240
Pervaporation separation factor (PSI) was also calculated as the separation ability of the 241
membranes. PSI is typically expressed as a product of total permeate flux and separation 242
factor, as Eq. (5) describes: 243
PSI= J ·α (5) 244
245
3. Results and discussion 246
3.1. Membrane characterization 247
The glass transition temperature (Tg) for cross-linked PVA membranes was around 248
95.6±2.8 ºC, as it is displayed in Table 1. This value is included in the range (69-110 ºC) 249
that was reported by previous studies [7,15,22]. Furthermore, the MMMs exhibited higher 250
Tg values (around 104-110 ºC) than the pristine PVA membranes. It is well documented 251
that the incorporation of inorganic fillers into a polymer may cause an increase in Tg if 252
there are strong attractive forces between the filler surface and the polymer. Particularly, 253
this change could be attributed to the hydrogen bonding among multiple oxygen 254
a = ywater
yethanol
xwater
xethanol

12
containing functional groups of the GO sheets and the PVA chains rich in alcohol groups 255
[22]. Figure S1 (supplementary material) shows the TGA curves that can be related to 256
the thermal degradation and stability of the GO and the cross-linked PVA-GO 257
membranes. The first weight loss visible in GO sheets start around 55 °C. Such 258
degradation is attributed to the loss of the water molecules that were retained in its 259
structure and it accounts for 17.7% by weight of the total sample that was analyzed. The 260
second weight loss took place at 200 ºC, and was presumably due to pyrolysis of the 261
labile oxygen-containing functional groups yielding CO, CO2 and steam [23]. Moreover, it 262
is quite possible that the weight loss may come from the combustion of carbon. Therefore, 263
the decomposition of GO can be accompanied by a vigorous expansion of the gas 264
resulting from the rapid thermal expansion of the material [24] in agreement with the 265
abrupt step observed. This weight loss corresponds to 72.4% by weight of the total 266
material. The last weight loss took place at 550 ºC and it is due to the combustion process. 267
As observed, once dehydrated at ca. 100 ºC, the pristine cross-linked PVA membrane 268
has its degradation step between 300-510 ºC, which corresponds to the complete 269
decomposition of the PVA (weight loss around 85%). Similarly, its MMM-GO membranes 270
presented a first gradual weight-loss (15-19%) starting at 55 ºC, which is more remarkable 271
at the high GO loading. This is probably attributed to the loss of the guest water molecules 272
that could be retained in the GO structure, e.g. water molecules trapped in graphitic 273
domains of GO [25], as well as the water retained in the possible interfacial voids between 274
the GO and PVA matrix. Moreover, there was a weight-loss (between 175-275 ºC) for the 275
MMMs, which was more pronounced as the filler loading increased. This can be related 276

13
to the GO decomposition. Moreover, the MMMs also presented their degradation step 277
starting at 300 ºC up to 500 ºC. This represents a weight-loss of about 80-85%. 278
279
Table 1. Tg and contact angle (CA) values of the pure cross-linked PVA membranes and 280
its MMMs-GO. 281
282
Figure 2 shows the surface and cross-section FESEM images of the membranes. In case 283
of a surface view, the pure cross-linked PVA membrane (see Figure 2a) showed a 284
uniform and smooth surface characteristic without signs of plastic deformation, which is 285
common for cross-linked PVA dense membranes [26]. Whereas the MMMs-GO 286
containing 1 and 2 wt.% slightly lost the uniform surface by increasing the GO content 287
(see Figure 2c&e), which could be attributable to the exposure of GO flakes on 288
membrane surface. 289
In cross-sectional view, pure cross-linked PVA membrane presents a typical crater-like 290
pattern which has been already reported by Amirilargani and Sadatnia (2014). Typically, 291
this crater-like pattern is generated during deformation by the freeze fracture of polymeric 292
membranes [27]. Moreover, this pure PVA membrane exhibits a skin layer, or better-293
known as “top layer”, of about 2.6 μm in thickness. This dense surface layer commonly 294
appears by an extremely short-term reduction of solvent concentration on the surface 295
contacting the air. Such layer tended to be dissipated by incorporating the GO in MMMs. 296
The cross-sectional view also displayed an increase in roughness with an increment in 297
GO loading. When GO concentration reached 2 wt.% the structure showed a tendency of 298
assembling to the membrane surface (see Figure 2f), similar to a segregation 299

14
phenomenon which has been reported during the GO embedding into chitosan [28]. In 300
fact, in case of cross-linked PVA- GO 2 wt.% membrane, Figure S2 shows the XRD 301
patterns obtained from its top (with the mentioned skin layer) and bottom layers of the 302
dense membrane, where it can be seen that the presence of GO shifted slightly the PVA 303
signal. This, more evident at the highest GO loading, is in agreement with the floating 304
suffered by the GO sheets during MMM preparation that tend to be accumulated on the 305
top of the MMM. Furthermore, the GO seems to be parallelly deposited to the membrane 306
surface, this pattern has been observed when embedding into polyimide [29] and PVDF 307
[30]. This particular orientation can be related to the remaining functional groups on the 308
edges of GO on every side. Therefore, it is quite probable that GO sheets would have this 309
preferred alignment over the membrane [22,30]. 310
311
Figure 2. Surface and cross-section FESEM images of pure cross-linked PVA (a, b) and 312
MMMs at 1 wt.% (c, d) and 2 wt.% (e, f) GO content, respectively. 313
314
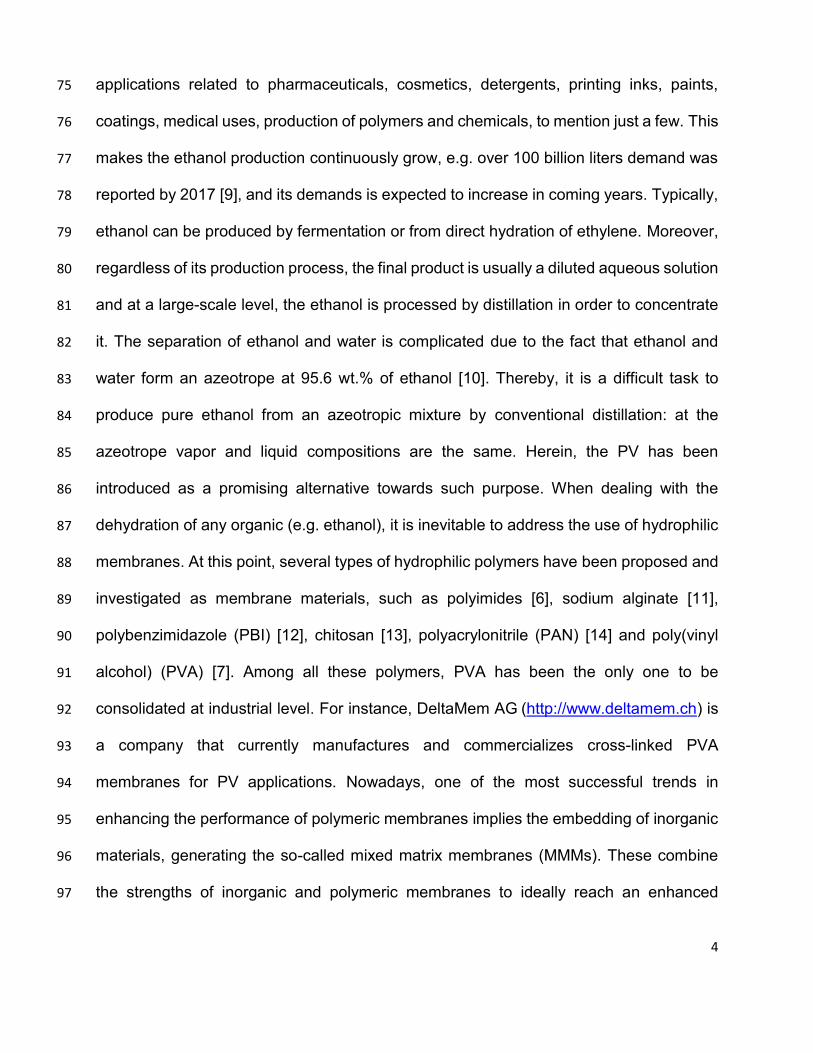
The morphology of GO flakes was investigated by TEM. Figure 3a shows a single GO 315
flake with sheet-like multilayer structure, typical for GO, with approximately 200 nm in 316
diameter and evident high aspect ratio. GO sheets are regularly distributed in cross-linked 317
PVA-GO 1 wt.% membrane (see Figure 3b) that is in agreement with the homogeneous 318
color of the membrane shown in Figure 1. Figure 3c presents TEM images of GO sheets 319
in cross-linked PVA-GO 1 wt.% membrane with an angle of observation of -26º, 0º and 320
27º, respectively. The target of measuring at different angles was to confirm that the 321
material possesses high aspect ratio and sheet-like multilayer structure. This is not so 322

15
evident in the dark GO agglomerates of Figure 3c. However, near such GO agglomerates 323
thin GO flakes are envisaged, and their form changes with the angle producing “shadows” 324
of different shape, size and greyscale due to their different alignment to the electron 325
beam. This is usually considered as a proof of lamellar nature of the filler in these kind of 326
membranes [31,32]. 327
Continuing with the TEM observation, as can be seen in the inset of Figure 3d the 328
electron diffraction pattern of particles embedded in the membrane corresponds to an 329
ordered material with three reticular planes parallel to the electron beam. In fact, six spots 330
can be observed in the reciprocal space that correspond to planes (1 0 0), (1 -1 0) and (0 331
1 0) of graphene oxide. The d-spacings of such planes have been measured, resulting in 332
a mean value of 0.20 ± 0.01 nm. The side of the hexagons is ca. 0.12 nm, which is 333
consistent with the length of the covalent bonds between carbon atoms in graphene oxide 334
[33]. The inset of Figure 3e shows a GO flake in the MMM and its reciprocal space (inset). 335
Two spots can be observed that correspond to planes (0 0 2), with a d-spacing equal to 336
0.38 ± 0.00 nm. Moreover, the d-spacing between (0 0 1) reticular planes is 0.76 nm, 337
similar to that reported by Strankowski et al. [34]. Finally, in the images of the Fourier 338
transform (insets of Figure 3d and 3e), the bright circles are due to a destructive 339
interference of diffracted electrons, indicating the presence of an amorphous material, in 340
this case the PVA matrix. 341
342
Figure 3. TEM images of GO flakes (a), distribution of GO flakes in MMM (b), GO flake 343
in MMM observed at different angles -26º, 0o and 27o (c), GO flakes in MMM and Fourier 344
transform of the selected zone. 345

16
346
The X-ray diffractogram of the GO exhibited a sharp diffraction peak at 2·θ=11.8º 347
corresponding to d-spacing of 0.75 nm, that agrees with the reported values [35] (see 348
Figure 4). Furthermore, this value is in good agreement with that calculated by TEM. The 349
shift of the GO peak position from its primary material (graphite) is due to the presence 350
of oxygen-containing functional groups that intercalate into the space between individual 351
graphene sheets provoking an increase of the d-spacing [36]. Moreover, the pure PVA 352
displays a strong diffraction peak at 2·θ=19.6º, which was less intense after the cross-353
linking procedure. Furthermore, some peaks at 12º and 22º in PVA were identified. These 354
peaks disappeared later, what is normally attributed to the reduction of crystallinity of PVA 355
membranes by the cross-linking [7]. The cross-linked PVA-GO MMMs also exhibited 356
similar features with a slight change compared to the pure one. No peak corresponding 357
to GO sheets was discernible, which can be due to the low loading of the material in the 358
MMMs, in agreement with analogous GO-PVA reinforced composites [22]. Moreover, the 359
absence of diffraction peaks related to the GO interlayer spacing may also be due to the 360
lack of preferential orientation of the GO flakes [37]. However, the GO loading could be 361
enough to modify the spacing of polymer chains [7]. 362
363
Figure 4. XRD patterns of the pure PVA, pure GO, cross-linked PVA and its MMMs-GO. 364
365
Regarding the FTIR spectra, Figure 5 exhibits standard absorption peaks for the PVA 366
polymer. The presence of characteristic absorption peaks at ~1100 cm-1 and ~1150 cm-1 367
can be seen. A modest change was noticed a distinct and broad -OH stretch at ~3200 368

17
cm-1 that appeared due to the cross-linking procedure using glutaraldehyde. Such change 369
can be attributed to the presence of alcohols for intermolecular hydrogen bonds in the 370
polymer. Moreover, as reported by Kashyap et al. [22], the PVA-GO MMMs exhibited 371
similar features with a slight shift of the peak to lower wavenumbers, displaying strong 372
interfacial interactions between the polymer matrix and GO. 373
374
Figure 5. FTIR spectroscopy of the GO, glutaraldehyde, pristine PVA, cross-linked PVA 375
and the PVA-GO 1 wt.% samples. 376
377
The measured water contact angle value for cross-linked PVA membrane was around 378
69.6º±0.5º, as it is reported in Table 1. The obtained value which is within the range of 379
57º-77º is in agreement with that reported by several authors [26,38]. The hydrophilicity 380
depends on the type of cross-linker used and the consumption of –OH groups during the 381
cross-linking [26,38]. However, the hydrophilic nature was still confirmed in the cross-382
linked membranes. On the other hand, the cross-linked PVA displayed an enhanced 383
hydrophilicity by embedding GO into its matrix, e.g. up to 58.4º±0.5º for the MMMs-GO 2 384
wt.%. Generally, the water contact angle decreased with an increase of GO content. This 385
is related to the abundant oxygen-containing functional groups on the wrinkled GO sheets 386
[28]. In addition, the enhancement of water contact angle of MMMs was leveled off when 387
GO content was higher than 1 wt.%, whereas it did not show strong change in case of 2 388
wt.%. GO caused a decrease of water contact angle also in other MMMs based on 389
chitosan [28,39] and polyimides [40]. In theory, the wettability of a membrane is directly 390
associated with the water adsorption rate on the membrane surface, which is highly 391

18
important in PV since it is considered as the first step of water transport through the 392
membrane based on the solution-diffusion mass transfer mechanism. 393
The uptake of membranes was carried out from their contact with 10/90 wt.% water-394
ethanol solution (the same concentration used in the PV experiments). The calculated 395
uptake results are depicted in Figure 6. It can be seen that the uptake decreased with an 396
increase of the GO content. This tendency has been reported during the incorporation of 397
GO into hydrophilic chitosan membranes [28]. Basically, the decrease in uptake is related 398
to the strong GO-polymer interactions which, besides reducing the availability of 399
hydrophilic groups, could restrict the mobility of PVA chains and decrease even more the 400
free volume of the cross-linked PVA. GO has demonstrated, as multi-walled carbon 401
nanotubes [15], to suppress the swelling degree of these PVA membranes. Therefore, 402
GO provides better stability in the cross-linked PVA against the swelling phenomenon. 403
Finally, it is worth to mention that the cross-linking made the membrane more resistant to 404
the ethanol-water mixture that would otherwise dissolve. 405
406
Figure 6. Uptake of the cross-linked PVA and MMMs-GO membranes at 10:90 wt.% 407
water-ethanol (at 40 ºC). 408
409
As can be seen from Figure 7, the addition of GO has a relevant effect on the mechanical 410
properties of the pristine cross-linked PVA membranes. The incorporation of GO led to a 411
general improvement of the mechanical behavior of the pristine membranes in terms of 412
Young’s modulus, tensile strength and elongation at break. The tensile strength value, for 413
instance, displayed in Figure 7c, increased from 27 N·mm-2 for the pristine PVA 414
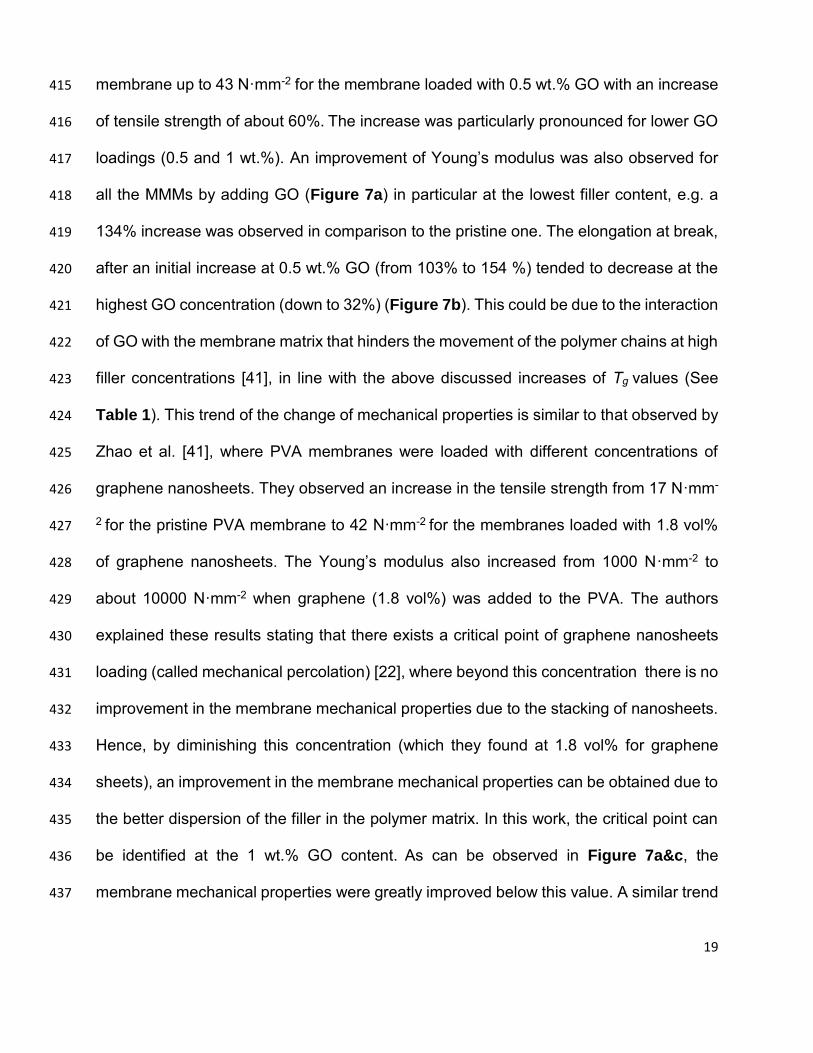
19
membrane up to 43 N·mm-2 for the membrane loaded with 0.5 wt.% GO with an increase 415
of tensile strength of about 60%. The increase was particularly pronounced for lower GO 416
loadings (0.5 and 1 wt.%). An improvement of Young’s modulus was also observed for 417
all the MMMs by adding GO (Figure 7a) in particular at the lowest filler content, e.g. a 418
134% increase was observed in comparison to the pristine one. The elongation at break, 419
after an initial increase at 0.5 wt.% GO (from 103% to 154 %) tended to decrease at the 420
highest GO concentration (down to 32%) (Figure 7b). This could be due to the interaction 421
of GO with the membrane matrix that hinders the movement of the polymer chains at high 422
filler concentrations [41], in line with the above discussed increases of Tg values (See 423
Table 1). This trend of the change of mechanical properties is similar to that observed by 424
Zhao et al. [41], where PVA membranes were loaded with different concentrations of 425
graphene nanosheets. They observed an increase in the tensile strength from 17 N·mm-426
2 for the pristine PVA membrane to 42 N·mm-2 for the membranes loaded with 1.8 vol% 427
of graphene nanosheets. The Young’s modulus also increased from 1000 N·mm-2 to 428
about 10000 N·mm-2 when graphene (1.8 vol%) was added to the PVA. The authors 429
explained these results stating that there exists a critical point of graphene nanosheets 430
loading (called mechanical percolation) [22], where beyond this concentration there is no 431
improvement in the membrane mechanical properties due to the stacking of nanosheets. 432
Hence, by diminishing this concentration (which they found at 1.8 vol% for graphene 433
sheets), an improvement in the membrane mechanical properties can be obtained due to 434
the better dispersion of the filler in the polymer matrix. In this work, the critical point can 435
be identified at the 1 wt.% GO content. As can be observed in Figure 7a&c, the 436
membrane mechanical properties were greatly improved below this value. A similar trend 437

20
was also observed and reported by Kashyap et al. [22] during the reinforcement of PVA 438
polymer matrices, where at low GO concentrations (0.3 wt.% only) the mechanical 439
properties of PVA membranes were enhanced. This improvement was attributed to the 440
uniform dispersion of the GO in the membrane and to the strong hydrogen bonding 441
interfacial interaction between the filler and membrane matrix. 442
443
Figure 7. Mechanical properties of cross-linked PVA membrane and MMMs-GO before 444
and after exposure to water-ethanol (10:90 wt.%) mixture. 445
446
Moreover, the mechanical properties were also measured for the pristine PVA membrane 447
and its MMMs after soaking them in a water-ethanol solution (10:90 wt.%) during 24 h. A 448
general decrease of the mechanical properties in terms of Young’s modulus and tensile 449
strength was observed after exposure of the membranes to the solution. The mechanical 450
properties of the membranes, therefore, may be subjected to a plasticization effect due 451
to the hydrogen bonds formation between polar molecules (i.e. from ethanol and water) 452
and PVA polymer. As a consequence, in the swollen state, the chain-chain polymer 453
interactions decreased resulting in a contraction of the membranes. Commonly, the 454
exposure to the water-ethanol solution led to a swelling phenomenon in membranes of 455
poly(lactic acid)/poly(vinyl pyrrolidone) [42]. On the contrary, the elongation at break of 456
the MMMs containing 0.5 and 1 wt.% GO was slightly enhanced after soaking (Figure 457
7b). 458
459
460

21
3.2. Pervaporation tests 461
3.2.1. Effect of GO loading and temperature on PV performance 462
Figure 8 displays the effect on GO content of the total permeate flux during the PV 463
performance as a function of the operating temperature (data available in supplementary 464
material, Table S1). Essentially, an increment in the total permeation rate was observed 465
with a double increase of GO loading. This tendency is commonly observed during the 466
incorporation of the inorganic materials into polymer membranes, which may be a result 467
of the free volume increase as well as the possible interfacial selective gaps between GO 468
sheets and PVA matrix, while the highly hydrophilic nature of the filler can also produce 469
a raise in the permeation rates by preferential adsorption of the more polar compound 470
(water). Moreover, an escalation on the total permeation was observed with temperature 471
increase (40-70 ºC). In theory, the polymer chains tend to be more flexible at higher 472
temperatures promoting the sorption ability of the components, leading to the increase of 473
permeating compounds through the intermolecular distances of the polymeric membrane. 474
Also, the viscosity of the liquid feed diminishes with temperature favoring the permeate 475
transport through the membrane. 476
477
Figure 8. Total permeate flux as a function of the GO loading at different operating 478
temperatures (10:90 wt.% water-ethanol). The curves are only guides to the eye. 479
480
The effect of the temperature on total permeate flux can be analyzed by using the so-481
called Arrhenius relationship (Eq. 5) [43], as follows: 482

22
(5) 483
Where Jo is the pre-exponential factor, Ea is the apparent activation energy for permeation 484
(for the overall mixture and each component) and R·T is the common energy term. The 485
linearization of the Eq. (5) through logarithmic laws leads to the plot of Figure S3, which 486
displays the total fluxes as a function of the reciprocal of temperature at azeotropic 487
conditions. The figure confirms that an Arrhenius relationship exists between total fluxes 488
and operating temperature. i.e. the total flux tends to raise with an increase of the 489
temperature. Furthermore, the apparent activation energy (Ea), which can be calculated 490
as the slope of the curve (Figure S3), and using the Eq. (5), can provide an outlook on 491
the relationship between the total flux and the GO content. From Table 2, it can be seen 492
that the Ea values for total flux gradually decrease with an increase of filler loading, e.g. 493
7.0 kJ/mol in the pristine PVA membranes to 1.9 kJ/mol in the MMMs-2 wt.% GO. At this 494
point, the Ea decrease towards water was more influenced than that for ethanol in the 495
range of handled temperature (40-70°C). Importantly, the PV process in the handled 496
temperature affects mainly the permeation rate of water, and does influence minimally 497
the ethanol permeation. While the presence of GO contributes to the reduction of the 498
energy needed for the components to permeate across the membranes [44]; similar 499
behavior was recently reported by Qian et al. [28] during the PV desalination of water 500
through chitosan-GO membranes. 501
502
TREexpJJ a
o

23
Table 2. Apparent activation energies for total permeate, water and ethanol partial fluxes 503
of the PVA membrane and its MMMs at different GO loadings (Data obtained from 504
Figures S3-S5). 505
506
Regarding the separation factor (water selectivity), see Figure 9, a decrease as a function 507
of the temperature for pure cross-linked PVA membrane as well as its MMMs has been 508
observed. Certainly, the decrease of separation factor in the MMMs might be due to the 509
combined effect of several factors, such as characteristics of GO (e.g. GO structure and 510
the influence of its preparation procedure), polymer properties, the effect of the cross-511
linking procedure on the adsorption capacity of the polymer, and of course, the operating 512
temperature. In principle, high separation factors and lower permeation rates were 513
obtained at the lowest temperatures for all membranes. Based on the free volume theory, 514
the thermal motion of polymer chains in the amorphous regions results in free volume. As 515
temperature increases, the frequency and amplitude of the chain jumping (i.e. thermal 516
agitation) increase and the resulting free volume becomes larger [45]. Therefore, this 517
thermal motion of the polymeric chains may facilitate the diffusion of larger molecules (like 518
ethanol) through the membrane causing a decrease in separation factor, in agreement 519
with the fact that activation energy values for ethanol are always larger than those of 520
water (see Table 2). The absence of negative values for the activation energy data 521
reveals that the permeation of the species presented in these MMMs is less governed by 522
the adsorption [44]; indeed, polymer cross-linking strongly tends to affect the membrane 523
adsorption, e.g. in PVA [46]. Moreover, the diffusion of a binary liquid mixture is typically 524
characterized by self- and cross (coupled) - plasticization of a permeant. At this point, 525

24
self-plasticization of permeants means that the flux of one component is affected only by 526
its own sorption amount. 527
The effect of crystallinity of the PVA membrane also plays an important role in the 528
transport of species. The crystalline regions act as giant cross-linking regions with respect 529
to chains that are partially embedded in several crystallites. The swelling and diffusion 530
are reduced in comparison to those in the totally amorphous polymer. The restriction of 531
crosslinking regions on segmental mobility makes the diffusion process more difficult and 532
dependent on the shape and size of the molecules [47]. In this way, the crystallinity of the 533
PVA can be strongly affected by the cross-linking procedure, as well as the incorporation 534
of inorganic materials into its matrix [15]. 535
It is worth mentioning, as Figure 9 displays, that the separation factor at any of the 536
temperatures did not follow a continuous decreasing trend. From the strict point of view 537
in case of separation factor values (Table S2 and Figure 9), the first addition of GO (0.5 538
wt.%) was not enough to compensate the distortion in the PVA chains that caused the 539
formation of non- selective pores (but hydrophilic), and it was necessary to double the 540
filler amount (1 wt.%) to compensate in part the loss of selectivity. In other words, at 1 541
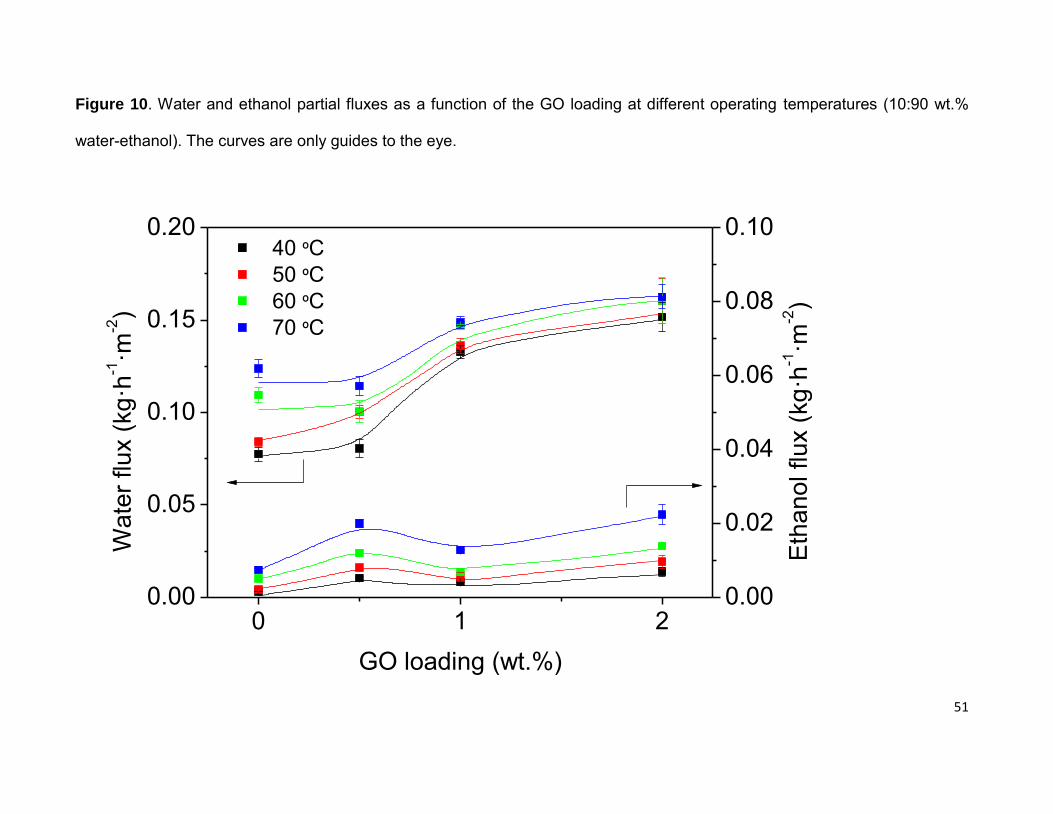
wt.% GO, the concentration of sheets in the MMMs is high enough as to exert an 542
additional barrier effect to bulkier ethanol molecules (decreasing the ethanol PV flux 543
through the membrane, see Figure 10) and thus to recover part of the separation factor 544
of the bare cross-linked PVA membrane. Nevertheless, the MMMs-2 wt.% GO had an 545
excess of filler and the separation factor worsened in agreement with the loss of 546
mechanical properties seen above. 547
548

25
Figure 9. Separation factor as a function of the GO loading at different operating 549
temperatures (10: 90 wt.% water-ethanol). The lines are only guides to the eye. 550
551
Figure 10. Water and ethanol partial fluxes as a function of the GO loading at different 552
operating temperatures (10:90 wt.% water-ethanol). The curves are only guides to the 553
eye. 554
555
Definitely, the modification of PVA with GO filler favors the preferential transport of water. 556
This is due to the fact that GO laminates simultaneously have oxidized (proper GO, 557
hydrophilic) and non-oxidized (graphene, hydrophobic) regions. The non-oxidized regions 558
of graphene sheets possess a d-spacing of ca. 5 A [48], which is enough to host a 559
monolayer of water (kinetic diameter=2.68 A). It has been speculated that these empty 560
spaces form a network of pristine-graphene capillaries within GO laminates [49], which 561
would facilitate the water transport. Figure 11 shows a scheme of the possible water 562
permeation mechanism involving GO species. It has been reported that, even when the 563
mixture of water and other compounds (e.g. gases and liquids) was fed, the water 564
permeation rate was at least five orders of magnitude higher than that of the other 565
components [49,50]. In fact, using equilibrium molecular dynamics simulations, it has 566
been stated that water can easily flow through graphene nano-channels (e.g., the non-567
oxidized region of GO) [51]. Importantly, taking into account that graphene sheets 568
possess a d-spacing of ca. 5 A, this d-spacing is still slightly larger than the kinetic 569
diameter of the ethanol molecules (4.5 A) [15], which may allow them passing through. 570
However, interestingly, this characteristic d-spacing of GO can be enlarged in the 571

26
presence of water. For instance, the interlayer spacing can vary from ≈6.4 to 9.8 A with 572
relative humidity changes from 0 to 100% [37]. Thereby, water and ethanol molecules 573
can surely pass through the channels of GO; however, according to our findings and the 574
ones in literature, GO is still displaying a preferential transport of water [25]. 575
576
577
Figure 11. Schematic drawing of the possible water permeation mechanism through GO 578
laminates. Inspired by Nair et al. (2012). 579
580
To date, it is clear that the water transport mechanism in the GO laminar structure is still 581
not well understood and established, particularly in pervaporation which involves selective 582
permeation and evaporation [25]. Especially, when using GO membranes, the separation 583
of water from organics is mainly related to preferential adsorption of water in GO [52], 584
such preferential adsorption has been attributed to the large amount of hydrophilic 585
functional groups in GO and the low water condensation partial pressure according to the 586
fine laminar structure. Herein, solution–diffusion (also known as adsorption–diffusion) 587
model has been widely sought to explain such phenomenon. However, while the 588
preferential adsorption of water has been repeatedly confirmed by many researchers, the 589
diffusion of water in GO membranes is not much discussed in terms of adsorption–590
diffusion model [52,53]. This description addressing the adsorption phenomenon 591
(governed by concentration gradient) compromise the hypothesis provided by Nair et al. 592
[49], in which the explanation about the transport of water in the interlayer space follows 593
a pore flow model (governed by pressure difference). In this sense, Chong et al. [25] 594

27
analyzed the water transport through GO membranes using two different modes: 595
pressure-driven permeation and pervaporation. Basically, the authors stated that pure 596
water flux is 1–2 orders of magnitude higher in PV due to the large capillary pressure 597
induced by evaporation. 598
Finally, the decrease in separation efficiency can also be affected by the synthesis of GO. 599
According to Hung et al. [53], it is extremely challenging to form highly ordered and 600
precise GO laminates. It has been reported that the repulsive electrostatic interactions 601
produced by negatively charged carboxyl groups might create some out-of-order 602
accumulation (i.e. wrinkles). Also, a large number of nonselective defects (basic plane 603
holes) derived from the strong oxidization conditions applied to obtain GO may penalize 604
the membrane separation performance [50]. 605
606
3.2.2. Comparison of cross-linked PVA-GO MMMs with other studies 607
The performance of polymeric and MMMs for any water-organic separation, like water-608
ethanol, through PV, depends directly on: i) the polymer characteristics (e.g. material 609
type, nature, structure, thickness); the filler features (e.g. shape, size, 610
hydrophilicity/hydrophobicity, morphology); iii) the physico-chemical properties and 611
concentration of the compounds in the mixture to be separated; and iv) the operating 612
conditions (e.g. temperature, vacuum pressure, feed flow rate) [54,55]. This makes 613
difficult to fairly compare PV data with works where different conditions have been 614
applied, bearing also in mind that our work is the first one dealing with the use of cross-615
linked PVA-GO membranes for water-ethanol separation by PV. Having said that, Table 616

28
3 compares water-ethanol PV performances of a number of MMMs filled with 617
carbonaceous materials, zeolites, MOFs and several porous and non-porous oxides. 618
619
Table 3. Comparison of the cross-linked PVA-GO MMMs performance with other studies 620
for the dehydration of ethanol. 621
622
It is a challenging task selecting the best performance of cross-linked PVA-GO MMMs 623
obtained in the current work in terms of permeate flux and separation factor, because 624
cross-linked PVA membrane itself possesses high separation efficiencies (α =163-518 625
with total PV fluxes= 0.079-0.131 kg·m-2·h-1, see Tables S1 and S2 and Figures 8 and 626
9) depending on handled temperature. Considering the MMMs containing 1 wt.% GO as 627
the optimum loading (α=88.2-263 with total PV fluxes=0.137-0.162 kg·m-2·h-1, see Tables 628
S1 and S2 and Figures 8 and 9), their separation factors are higher than those of other 629
membranes based on chitosan-H-ZSM-5 [13], chitosan-TiO2 [56], cross-linked PVA-ZIF-630
8-NH2 [16] and polyimide-MSS-1 [6]; but lower than those corresponding to membranes of 631
cross-linked sodium alginate-beta zeolite [11], polyimide-ZIF-8 [6], cross-linked sodium 632
alginate-zeolite [57], PVA-MWCNT [15], and cross-linked chitosan-silica [58]. 633
Moreover, the pristine cross-linked PVA displays relatively acceptable total permeate flux 634
(J=0.079-0.131 kg·m-2·h-1), while its MMMs containing 2 wt.% GO have shown the highest 635
permeate flux values of about 0.185 kg·m-2·h-1 (at 70 ºC). Such fluxes are higher than the 636
reported ones using cross-linked sodium alginate-beta zeolite [11], PVA-MWCNT [15], 637
and cross-linked sodium alginate-zeolite [57]; however, other MMMs provided even 638
higher permeation fluxes than the ones presented in this study, such as chitosan-H-ZSM-639

29
5 [13], polyimide-ZIF-8 [6], chitosan- TiO2 [56], polyimide-MSS-1 [6] and cross-linked 640
chitosan-silica [58]. It is important to highlight that the current PV flux enhancements 641
obtained with the cross-linked PVA-GO MMMs that enlarge permeate flux (mainly 642
towards water) were obtained by incorporating a small amount of GO filler, which is much 643
lower compared to previous studies. Finally, regardless of the amount of GO used for the 644
preparation of these membranes, the right choice of the MMM will depend on the final 645
purpose (high productivity or high separation efficiency), as well as the feasibility of the 646
process considering primordially its operating conditions, e.g. temperature, that indeed 647
influences on the PV performance. 648
When dealing with the separation performance of PV membranes, it is useful to compare 649
their separation ability by means of PSI (see Table 3). It can be seen that the PVA-GO 650
MMMs (1 wt.%) display better PSI values in comparison to some MMMs based on 651
chitosan-H-ZSM-5, cross-linked PVA-ZIF-8-NH2, and some commercial membranes 652
(PVA composites). However, there are still some other membranes that present superior 653
performances, such as cross-linked sodium alginate-zeolite beta, chitosan-TiO2, 654
polyimide-MSS-1, cross-linked chitosan-silica and polyimide-ZIF-8. Finally, permeance 655
and selectivity are the best way of reporting pervaporation results when a fair comparison 656
of different studies is needed (considering experiments at different feed concentrations, 657
feed temperatures and permeate pressures) [55]. Permeance should be independent on 658
the driving force and should just describe the system membrane/permeating component. 659
In this way, the PV data for all MMMs are also provided for the readers (data available in 660
supplementary material; Table S5). 661
662

30
4. Conclusions 663
Cross-linked-PVA membranes containing GO have been successfully tested for the PV 664
separation of the water-ethanol azeotropic mixture. The effect of operating temperature 665
has been evaluated. The best performance of cross-linked PVA-GO membranes has 666
been provided by the one containing 1 wt.% filler, displaying an acceptable separation 667
factor (263, at 40 ºC) with a high permeate total flux of about 0.137 kg·m-2·h-1 (in which 668
0.133 kg·m-2·h-1 corresponds to water). At this point, these MMMs, having only 1 wt.% 669
GO, have demonstrated the enhancement of the permeation performance of pristine 670
cross-linked PVA membranes, by over 75 % compared to their original permeation rates. 671
Of course, higher permeate fluxes can be obtained by increasing i) the temperature, since 672
the total, water and ethanol fluxes have shown a positive temperature dependence; and 673
ii) filler loading, e.g. 2 wt.% GO. Based on the obtained results, it is possible to conclude 674
that these PVA MMMs membranes have a promising potential to be used in PV for the 675
dehydration of ethanol. Moreover, regarding the use of these MMMs in a “green” process, 676
the incorporation of GO has satisfactorily enhanced the water transport of cross-linked 677
PVA membranes, displaying losses on selectivity. However, the high water permeation 678
fluxes could contribute to use less energy-requirement due to the less operating time may 679
be needed to reach pure ethanol. 680
Finally, MMMs containing 1 wt.% GO have been considered as the optimum membranes 681
with a good PV flux-separation factor ratio. This is in good agreement with better thermal 682
(Tg) and mechanical properties (Young’ modulus, elongation at break and tensile 683
strength) exhibited by these MMMs in comparison to those at 0.5 and 1 wt.% GO loading. 684
685

31
Associated content 686
TGA curves of the cross-linked PVA membranes and its MMMs. XRD patterns of the 687
cross-linked PVA-GO 2 wt.% membrane (top and bottom layer) and GO. Pervaporation 688
data (total flux, water flux, ethanol flux, separation factor, water permeance, ethanol 689
permeance, and selectivity) as a function of the GO loading at different operating 690
temperatures. Temperature dependence curves of total permeate, water and ethanol flux 691
by Arrhenius plot at different GO loadings. 692
693
Acknowledgments 694
R. Castro-Muñoz acknowledges the European Commission - Education, Audiovisual and 695
Culture Executive Agency (EACEA) for his PhD scholarship under the program: Erasmus 696
Mundus Doctorate in Membrane Engineering – EUDIME (FPA No 2011-0014, Edition V, 697
http:/eudime.unical.it). This work was partially supported by the Operational Program 698
Prague – Competitiveness (CZ.2.16/3.1.00/24501) and the “National Program of 699
Sustainability“ (NPU I LO1613) MSMT-43760/2015. Financial support from the Spanish 700
MINECO and FEDER (MAT2016-77290-R), the Aragón Government (T43-17R) and the 701
ESF is also gratefully acknowledged. 702
703
Note 704
The authors declare no conflict of interest. 705
706
References 707
[1] P. Luis, B. Van Der Bruggen, The driving force as key element to evaluate the 708

32
pervaporation performance of multicomponent mixtures, Sep. Purif. Technol. 148 709
(2015) 94–102. 710
[2] J. Crespo, C. Brazinha, Fundamentals of pervaporation, in: A. Basile, A. Figoli, M. 711
Khayet (Eds.), Pervaporation, Vap. Permeat. Membr. Distill., Elsevier Ltd., 712
Cambridge UK, 2015: pp. 1–17. 713
[3] P.T. Anastas, J.C. Warner, Green Chemistry: Theory and Practice, Oxford 714
University Press, New York, 1998. 715
[4] Y.K. Ong, G.M. Shi, N.L. Le, Y.P. Tang, J. Zuo, S.P. Nunes, T.S. Chung, Recent 716
membrane development for pervaporation processes, Prog. Polym. Sci. 57 (2016) 717
1–31. 718
[5] R. Castro-Muñoz, F. Galiano, V. Fíla, E. Drioli, A. Figoli, Mixed matrix membranes 719
( MMMs ) for ethanol purification through pervaporation : current state of the art, 720
Rev. Chem. Eng. https//doi.org/10.1515/revce-2017-0115. (2018). 721
[6] A. Kudasheva, S. Sorribas, B. Zornoza, C. Téllez, J. Coronas, Pervaporation of 722
water/ethanol mixtures through polyimide based mixed matrix membranes 723
containing ZIF-8, ordered mesoporous silica and ZIF-8-silica core-shell spheres, 724
J. Chem. Technol. Biotechnol. 90 (2015) 669–677. 725
[7] M. Amirilargani, B. Sadatnia, Poly ( vinyl alcohol )/ zeolitic imidazolate frameworks 726
( ZIF-8 ) mixed matrix membranes for pervaporation dehydration of isopropanol, 727
J. Memb. Sci. 469 (2014) 1–10. 728
[8] V. Van Hoof, C. Dotremont, A. Buekenhoudt, Performance of Mitsui NaA type 729
zeolite membranes for the dehydration of organic solvents in comparison with 730
commercial polymeric pervaporation membranes, Sep. Purif. Technol. 48 (2006) 731

33
304–309. 732
[9] RFA, World Fuel Ethanol Production, Renew. Fuels Assoc. (2017). 733
http://www.ethanolrfa.org/resources/industry/statistics/#1454098996479-734
8715d404-e546 (accessed January 22, 2018). 735
[10] J.-H. Chang, J.-K. Yoo, S.-H. Ahn, K.-H. Lee, S.-M. Ko, Simulation of 736
pervaporation process for ethanol dehydration by using pilot test results, Korean 737
J. Chem. Eng. 15 (1998) 28–36. 738
[11] S.G. Adoor, L.S. Manjeshwar, S.D. Bhat, T.M. Aminabhavi, Aluminum-rich zeolite 739
beta incorporated sodium alginate mixed matrix membranes for pervaporation 740
dehydration and esterification of ethanol and acetic acid, J. Memb. Sci. 318 741
(2008) 233–246. 742
[12] G.M. Shi, T. Yang, T.S. Chung, Polybenzimidazole (PBI)/zeolitic imidazolate 743
frameworks (ZIF-8) mixed matrix membranes for pervaporation dehydration of 744
alcohols, J. Memb. Sci. 415–416 (2012) 577–586. 745
[13] H. Sun, L. Lu, X. Chen, Z. Jiang, Pervaporation dehydration of aqueous ethanol 746
solution using H-ZSM-5 filled chitosan membranes, Sep. Purif. Technol. 58 (2008) 747
429–436. 748
[14] E. Okumuş, T. Gürkan, L. Yilmaz, Effect of fabrication and process parameters on 749
the morphology and performance of a PAN-based zeolite-filled pervaporation 750
membrane, J. Memb. Sci. 223 (2003) 23–38. 751
[15] J.H. Choi, J. Jegal, W.N. Kim, H.S. Choi, Incorporation of Multiwalled Carbon 752
Nanotubes into Poly(vinyl alcohol) Membranes for Use in the Pervaporation of 753
Water/Ethanol Mixtures, J. Appl. Polym. Sci. 111 (2008) 2186–2193. 754

34
[16] Y. Zhang, H., Wang, Poly(vinyl alcohol)/ZIF-8 NH2 Mixed Matrix Membranes for 755
Ethanol Dehydration via Pervaporation, AIChE J. 62 (2016) 1728–1739. 756
[17] V. Singh, D. Joung, L. Zhai, S. Das, S.I. Khondaker, S. Seal, Graphene based 757
materials: Past, present and future, Prog. Mater. Sci. 56 (2011) 1178–1271. 758
[18] H.K. Dave, K. Nath, Graphene oxide incorporated novel polyvinyl alcohol 759
composite membrane for pervaporative recovery of acetic acid from vinegar 760
wastewater, J. Water Process Eng. 14 (2016) 124–134. 761
[19] N. Wang, S. Ji, J. Li, R. Zhang, G. Zhang, Poly(vinyl alcohol)-graphene oxide 762
nanohybrid “pore-filling” membrane for pervaporation of toluene/n-heptane 763
mixtures, J. Memb. Sci. 455 (2014) 113–120. 764
[20] S. Castarlenas, C. Téllez, J. Coronas, Gas separation with mixed matrix 765
membranes obtained from MOF UiO-66-graphite oxide hybrids, J. Memb. Sci. 526 766
(2017) 205–211. 767
[21] W.S. Hummers, R.E. Offeman, Preparation of Graphitic Oxide, J. Am. Chem. Soc. 768
80 (1958) 1339. 769
[22] S. Kashyap, S.K. Pratihar, S.K. Behera, Strong and ductile graphene oxide 770
reinforced PVA nanocomposites, J. Alloys Compd. 684 (2016) 254–260. 771
[23] G. Wang, Z. Yang, X. Li, C. Li, Synthesis of poly(aniline-co-o-anisidine)-772
intercalated graphite oxide composite by delamination/reassembling method, 773
Carbon N. Y. 43 (2005) 2564–2570. 774
[24] S. Stankovich, D.A. Dikin, R.D. Piner, K.A. Kohlhaas, A. Kleinhammes, Y. Jia, Y. 775
Wu, S.B.T. Nguyen, R.S. Ruoff, Synthesis of graphene-based nanosheets via 776
chemical reduction of exfoliated graphite oxide, Carbon N. Y. 45 (2007) 1558–777

35
1565. 778
[25] J.Y. Chong, B. Wang, K. Li, Water transport through graphene oxide membranes : 779
the roles of driving forces, Chem. Commun. 54 (2018) 2554–2557. 780
[26] R. Zhang, X. Xu, B. Cao, P. Li, Fabrication of high-performance PVA / PAN 781
composite pervaporation membranes crosslinked by PMDA for wastewater 782
desalination, Pet. Sci. 15 (2018) 146–156. 783
[27] F. Dorosti, M. Omidkhah, R. Abedini, Fabrication and characterization of 784
Matrimid/MIL-53 mixed matrix membrane for CO2/CH4 separation, Chem. Eng. 785
Res. Des. 92 (2014) 2439–2448. 786
[28] X. Qian, N. Li, Q. Wang, S. Ji, Chitosan/graphene oxide mixed matrix membrane 787
with enhanced water permeability for high-salinity water desalination by 788
pervaporation, Desalination. 438 (2018) 83–96. 789
[29] X. Li, L. Ma, H. Zhang, S. Wang, Z. Jiang, R. Guo, H. Wu, X.Z. Cao, J. Yang, B. 790
Wang, Synergistic effect of combining carbon nanotubes and graphene oxide in 791
mixed matrix membranes for efficient CO2separation, J. Memb. Sci. 479 (2015) 792
1–10. 793
[30] E.A. Feijani, A. Tavassoli, H. Mahdavi, H. Molavi, Effective gas separation 794
through graphene oxide containing mixed matrix membranes, J. Appl. Polym. Sci. 795
135 (2018) 1–11. 796
[31] C. Rubio, C. Casado, P. Gorgojo, F. Etayo, S. Uriel, C. Téllez, J. Coronas, 797
Exfoliated Titanosilicate Material UZAR-S1 Obtained from JDF-L1, Eur. J. Inorg. 798
Chem. 1 (2010) 159–163. 799
[32] S. Choi, J. Coronas, E. Jordan, W. Oh, S. Nair, F. Onorato, D.F. Shantz, M. 800

36
Tsapatsis, Layered Silicates by Swelling of AMH-3 and Nanocomposite 801
Membranes **, Angew. Chem. Int. Ed. 47 (2008) 552–555. 802
[33] N.R. Wilson, P.A. Pandey, R. Beanland, R.J. Young, I.A. Kinloch, L. Gong, Z. Liu, 803
Ќ.K. Suenaga, Ќ.J.P. Rourke, S.J. York, J. Sloan, Graphene Oxide : Structural 804
Analysis and Application as a Highly Transparent Support for Electron 805
Microscopy, ACS Nano. 3 (2009) 2547–2556. 806
[34] M.B. Strankowski, W.B. Damian, A. Piszczyk, J. Strankowska, Polyurethane 807
Nanocomposites Containing Reduced Graphene Oxide, FTIR, Raman, and XRD 808
Studies, J. Spectrosc. 2016 (2016) 1–6. 809
[35] K. Krishnamoorthy, M. Veerapandian, K. Yun, S.J. Kim, The chemical and 810
structural analysis of graphene oxide with different degrees of oxidation, Carbon 811
N. Y. 53 (2013) 38–49. 812
[36] D.R. Dreyer, S. Park, C.W. Bielawski, R.S. Ruoff, The chemistry of Graphite 813
oxide, Chem. Soc. Rev. 39 (2010) 228–240. 814
[37] J. Abraham, K.S. Vasu, C.D. Williams, K. Gopinadhan, Y. Su, C.T. Cherian, J. 815
Dix, E. Prestat, S.J. Haigh, I. V Grigorieva, P. Carbone, A.K. Geim, R.R. Nair, 816
Tunable sieving of ions using graphene oxide membranes, Nat. Nanotechnol. 817
(2017) 1–6. 818
[38] R. Zhang, B. Liang, T. Qu, B. Cao, P. Li, High-performance sulfosuccinic acid 819
cross-linked PVA composite pervaporation membrane for desalination, Environ. 820
Technol. (United Kingdom). 3330 (2017) 1–9. 821
[39] S.P. Dharupaneedi, R. V. Anjanapura, J.M. Han, T.M. Aminabhavi, Functionalized 822
graphene sheets embedded in chitosan nanocomposite membranes for ethanol 823

37
and isopropanol dehydration via pervaporation, Ind. Eng. Chem. Res. 53 (2014) 824
14474–14484. 825
[40] B. Feng, K. Xu, A. Huang, Synthesis of graphene oxide/polyimide mixed matrix 826
membranes for desalination, RSC Adv. 7 (2017) 2211–2217. 827
[41] X. Zhao, O. Zhang, D. Chen, Enhanced Mechanical Properties of Graphene-828
Based Poly(vinyl alcohol) Composites, Macromolecules. 43 (2010) 2357–2363. 829
[42] S. Zereshki, A. Figoli, S.S. Madaeni, S. Simone, J.C. Jansen, M. Esmailinezhad, 830
E. Drioli, Poly(lactic acid)/poly(vinyl pyrrolidone) blend membranes: Effect of 831
membrane composition on pervaporation separation of ethanol/cyclohexane 832
mixture, J. Memb. Sci. 362 (2010) 105–112. 833
[43] R. Castro-Muñoz, F. Galiano, V. Fíla, E. Drioli, A. Figoli, Matrimid®5218 dense 834
membrane for the separation of azeotropic MeOH-MTBE mixtures by 835
pervaporation, Sep. Purif. Technol. 199 (2018) 27–36. 836
[44] D.S.M. Constantino, R.P.V. Faria, A.M. Ribeiro, J.M. Loureiro, A.E. Rodrigues, 837
Performance Evaluation of Pervaporation Technology for Process Intensification 838
of Butyl Acrylate Synthesis, Ind. Eng. Chem. Res. 56 (2017) 13064–13074. 839
[45] R. Huang, C. Yeom, Pervaporation separation of aqueous mixtures using 840
crosslinked poly(vinyl alcohol)(pva). II. Permeation of ethanol-water mixtures, J. 841
Memb. Sci. 51 (1990) 273–292. 842
[46] T.F. Ceia, A.G. Silva, C.S. Ribeiro, J. V. Pinto, M.H. Casimiro, A.M. Ramos, J. 843
Vital, PVA composite catalytic membranes for hyacinth flavour synthesis in a 844
pervaporation membrane reactor, Catal. Today. 236 (2014) 98–107. 845
[47] C.H. Lee, W.H. Hong, Influence of different degrees of hydrolysis of poly ( vinyl 846

38
alcohol ) membrane on transport properties in pervaporation of IPA / water 847
mixture, J. Memb. Sci. 135 (1997) 187–193. 848
[48] S. Homaeigohar, M. Elbahri, Graphene membranes for water desalination, NPG 849
Asia Mater. 9 (2017) e427. 850
[49] R.R. Nair, H.A. Wu, P.N. Jayaram, I.V. Grigorieva, A.K. Geim, Unimpeded 851
Permeation of Water Through Helium-Leak–Tight Graphene-Based Membranes, 852
Science (80-. ). 335 (2012) 442–445. 853
[50] K. Huang, G. Liu, W. Jin, Vapor transport in graphene oxide laminates and their 854
application in pervaporation, Curr. Opin. Chem. Eng. 16 (2017) 56–64. 855
[51] S. Kumar Kannam, B.D. Todd, J.S. Hansen, P.J. Daivis, Slip length of water on 856
graphene: Limitations of non-equilibrium molecular dynamics simulations, J. 857
Chem. Phys. 136 (2012). 858
[52] K. Huang, G. Liu, Y. Lou, Z. Dong, J. Shen, W. Jin, A Graphene Oxide Membrane 859
with Highly Selective Molecular Separation of Aqueous Organic Solution, Angew. 860
Chemie - Int. Ed. 53 (2014) 6929–6932. 861
[53] W.S. Hung, Q.F. An, M. De Guzman, H.Y. Lin, S.H. Huang, W.R. Liu, C.C. Hu, 862
K.R. Lee, J.Y. Lai, Pressure-assisted self-assembly technique for fabricating 863
composite membranes consisting of highly ordered selective laminate layers of 864
amphiphilic graphene oxide, Carbon N. Y. 68 (2014) 670–677. 865
[54] F. Galiano, F. Falbo, A. Figoli, Polymeric Pervaporation Membranes : Organic-866
Organic Separation, in: O. Visakh, P. Nazarenko (Eds.), Nanostructured Polym. 867
Membr., Scrivener Publishing LLC, Massachusetts, United States, 2016: pp. 281–868
304. 869

39
[55] R.W. Baker, J.G. Wijmans, Y. Huang, Permeability, permeance and selectivity: A 870
preferred way of reporting pervaporation performance data, J. Memb. Sci. 348 871
(2010) 346–352. 872
[56] D. Yang, J. Li, Z. Jiang, L. Lu, X. Chen, Chitosan/TiO2 nanocomposite 873
pervaporation membranes for ethanol dehydration, Chem. Eng. Sci. 64 (2009) 874
3130–3137. 875
[57] S.D. Bhat, T.M. Aminabhavi, Pervaporation-Aided Dehydration and Esterification 876
of Acetic Acid with Ethanol Using 4A Zeolite-Filled Cross-linked Sodium Alginate-877
Mixed Matrix Membranes, J. Appl. Polym. Sci. 113 (2009) 157–168. 878
[58] Y.L. Liu, C.Y. Hsu, Y.H. Su, J.Y. Lai, Chitosan-silica complex membranes from 879
sulfonic acid functionalized silica nanoparticles for pervaporation dehydration of 880
ethanol-water solutions, Biomacromolecules. 6 (2005) 368–373. 881
[59] M.S. Schehlmann, E. Wiedemann, R.N. Lichtenthaler, Pervaporation and vapor 882
permeation at the azeotropic point or in the vicinity of the LLE boundary phases of 883
organic / aqueous mixtures, J. Memb. Sci. 107 (1995) 277–282. 884
[60] D. Van Baelen, B. Van Der Bruggen, K. Van Den Dungen, J. Degreve, C. 885
Vandecasteele, Pervaporation of water – alcohol mixtures and acetic acid – water 886
mixtures, Chem. Eng. Sci. 60 (2005) 1583–1590. 887
888

40
Figure 1. Pure cross-linked PVA membrane and its MMMs-GO with 1 wt.% of filler.

41
Table 1. Tg and contact angle (CA) values of the pure cross-linked PVA membranes and
its MMMs-GO.
Membrane Tg (ºC) CA (º)
Pure cross-linked PVA 95.6±2.8 69.6±0.5
Cross-linked PVA + 1 wt.% GO 104.3±0.9 59.9±1.2
Cross-linked PVA + 2 wt.% GO 109.6±1.4 58.4±0.5

42
Figure 2. Surface and cross-section FESEM images of pure cross-linked PVA (a, b) and
MMMs at 1 wt.% (c, d) and 2 wt.% (e, f) GO content, respectively.
a b
c d
30 m 5 m
10 m 10 m
e
10 m 10 m
f

43
Figure 3. TEM images of GO flakes (a), distribution of GO flakes in MMM (b), GO flake
in MMM observed at different angles -26º, 0o and 27o (c), GO flakes in MMM and Fourier
transform of the selected zone.
b a
c
-26° 0° 27°
d e
200 nm 1000 nm
100 nm 100 nm 100 nm
10 nm 10 nm

44
Figure 4. XRD patterns of the pure PVA, pure GO, cross-linked PVA and its MMMs-GO.
10 20 30 40
Crosslinked PVA
PVA
PVA-GO 2 wt.%
Inte
nsity (
a.u
.)
2 (º)
GO
PVA-GO 1 wt.%

45
Figure 5. FTIR spectroscopy of the GO, glutaraldehyde, pristine PVA, cross-linked PVA and the PVA-GO 1 wt.% samples.
4000 3000 2000 1000
PVA-GO 1 wt.%
Glutaraldehyde
GO
Crosslinked PVA
PVA
Absorb
ance (
a.u
.)
Wavenumber (cm-1)

46
Figure 6. Uptake of the cross-linked PVA membrane and MMMs-GO at 10:90 wt.% water-ethanol (at 40 ºC).
0 1 210
12
14
16
Upta
ke (
wt.%
)
GO loading (wt.%)

47
Figure 7. Mechanical properties of cross-linked PVA membrane and MMMs-GO before
and after exposure to water-ethanol (10:90 wt.%) mixture.
a
b
c
0.0 wt.% 0.5 wt.% 1.0 wt.% 2.0 wt.%0
10
20
30
40
50
Ten
sile
str
engt
h (N
·mm
-2)
Membrane
Before
After
0.0 wt.% 0.5 wt.% 1.0 wt.% 2.0 wt.%0
40
80
120
160
200
240
Elo
ngat
ion
at b
reak
(%
)
Membrane
Before
After
0.0 wt.% 0.5 wt.% 1.0 wt.% 2.0 wt.%0
200
400
600
800
1000
1200
1400
You
ng's
mod
ulus
(N
·mm
-2)
Membrane
Before
After

48
Figure 8. Total permeate flux as a function of the GO loading at different operating temperatures (10: 90 wt.% water-ethanol).
The curves are only guides to the eye.
0 1 20.00
0.05
0.10
0.15
0.20
Perm
eate
flu
x (
kg·h
-1·m
-2)
GO loading (wt.%)
40 ºC
50 ºC
60 ºC
70 ºC

49
Table 2. Apparent activation energies for total permeate, water and ethanol partial fluxes of the PVA membrane and its MMMs
at different GO loadings (Data obtained from Figures S3-S5).
GO loading (wt.%)
Activation energy values
(kJ/mol)
Total Water Ethanol
0 7.0 6.5 22.0
0.5 5.3 5.3 17.3
1 2.2 1.6 15.2
2 1.9 0.82 14.1

50
Figure 9. Separation factor as a function of the GO loading at different operating temperatures (10:90 wt.% water-ethanol). The
lines are only guides to the eye.
0 1 20
200
400
600 40 ºC
50 ºC
60 ºC
70 ºC
Se
pa
ratio
n f
acto
r
GO loading (wt.%)
51
Figure 10. Water and ethanol partial fluxes as a function of the GO loading at different operating temperatures (10:90 wt.%
water-ethanol). The curves are only guides to the eye.
0 1 20.00
0.05
0.10
0.15
0.20
Wa
ter
flu
x (
kg·h
-1·m
-2)
GO loading (wt.%)
0.00
0.02
0.04
0.06
0.08
0.10 40 ºC
50 ºC
60 ºC
70 ºC
Eth
an
ol flux (
kg
·h-1·m
-2)

52
Figure11. Schematic drawing of the hypothetic water permeation mechanism through GO laminates.Inspired by Nair et al. [49]

53
Table 3. Comparison of the cross-linked PVA-GO MMMs performance with other studies for the dehydration of ethanol.
Mixed matrix membrane Filler loading: Mixture concentration: Operating conditions: J
(kg m-2 h-1)
Separation factor
(α)
PSI Reference:
Cross-linked PVA-filled GO
1 wt.% 10 wt.% H2O
90 wt.% EtOH
40 ºC, 3 mbar 0.137
263 36.0 This work
Cross-linked PVA-filled GO
2 wt.% 10 wt.% H2O
90 wt.% EtOH
70 ºC, 3 mbar 0.185 65.9 12.2 This work
Chitosan-filled H-ZSM-5
8 wt.% 10 wt.% H2O
90 wt.% EtOH
80 ºC, 10 mbar 0.230 152 35.0 [13]
Cross-linked sodium alginate-filled beta zeolite
10 wt.% 10 wt.% H2O
90 wt.% EtOH
30 ºC, 0.6 mbar 0.130 1600 208.0 [11]
Polyimide-filled ZIF-8
12 wt.% 10 wt.% H2O
90 wt.% EtOH
42 ºC, 44 mbar 0.260 300 78.0 [6]
Cross-linked sodium alginate-filled beta zeolite
10 wt.% 10 wt.% H2O
90 wt.% EtOH
30 ºC, 0.6 mbar 0.138 1334 184.1 [57]
PVA-filled MWCNT
5 wt.% 10 wt.% H2O
90 wt.% EtOH
40 ºC, 1.3 mbar 0.080 500 40.0 [15]

54
Chitosan-filled TiO2
6 wt.% 10 wt.% H2O
90 wt.% EtOH
80 ºC, 50 mbar 0.340 196 66.6 [56]
Polyimide-filled MSS-1
12 wt.% 10 wt.% H2O
90 wt.% EtOH
42 ºC, 44 mbar 0.310 190 58.9 [6]
Cross-linked chitosan-filled silica
5 wt.% 10 wt.% H2O
90 wt.% EtOH
70 ºC, 10 mbar 0.410 919 376.8 [58]
Cross-linked PVA-filled ZIF-8-NH2
7.5 wt.% 15 wt.% H2O
85 wt.% EtOH
40 ºC, 1 mbar 0.120 200 24.0 [16]
PVA composite membrane (Deutsche Carbone AG/GFT)
- 10 wt.% H2O
90 wt.% EtOH
60 ºC, 5 mbar 0.140 170 23.8 [59]
PVA composite membrane (PERVAP 2201, Sulzer Chemtech)
- 10 wt.% H2O
90 wt.% EtOH
60 ºC, 10 mbar 0.100 100 10.0 [60]
Copyright © 2022 FDOKUMEN