Ligand selectivity by seeking hydrophobicity in thyroid hormone receptor
PLEASE SCROLL DOWN FOR ARTICLE
This article was downloaded by:On: 17 January 2011Access details: Access Details: Free AccessPublisher Taylor & FrancisInforma Ltd Registered in England and Wales Registered Number: 1072954 Registered office: Mortimer House, 37-41 Mortimer Street, London W1T 3JH, UK
Separation Science and TechnologyPublication details, including instructions for authors and subscription information:http://www.informaworld.com/smpp/title~content=t713708471
Membrane Selectivity in PervaporationWojciech Kujawskia
a FACULTY OF CHEMISTRY, NICOLAUS COPERNICUS UNIVERSITY, TORUŃ, POLAND
To cite this Article Kujawski, Wojciech(1996) 'Membrane Selectivity in Pervaporation', Separation Science andTechnology, 31: 11, 1555 — 1571To link to this Article: DOI: 10.1080/01496399608001413URL: http://dx.doi.org/10.1080/01496399608001413
Full terms and conditions of use: http://www.informaworld.com/terms-and-conditions-of-access.pdf
This article may be used for research, teaching and private study purposes. Any substantial orsystematic reproduction, re-distribution, re-selling, loan or sub-licensing, systematic supply ordistribution in any form to anyone is expressly forbidden.
The publisher does not give any warranty express or implied or make any representation that the contentswill be complete or accurate or up to date. The accuracy of any instructions, formulae and drug dosesshould be independently verified with primary sources. The publisher shall not be liable for any loss,actions, claims, proceedings, demand or costs or damages whatsoever or howsoever caused arising directlyor indirectly in connection with or arising out of the use of this material.

SEPARATION SCIENCE AND TECHNOLOGY, 31(17), pp. 1555-1571,1996
Membrane Selectivity in Pervaporation
WOJCIECH KUJAWSKI FACULTY OF CHEMISTRY NICOLAUS COPERNICUS UNIVERSITY UL. GAGARINA 7,87-100 TORUN, POLAND
ABSTRACT
A qualitative description is presented of pervaporation which discusses the ini- tial preferential sorption into the membrane, diffusion of liquid, phase transition from liquid to vapor phase, followed by diffusion of vapors and fast desorption from the other side of the membrane. The overall separation of each pervaporation step was calculated in terms of separation factor a. The results show that in the case of hydrophilic membranes (i.e., dense polyamide-6 membrane and ion-ex- change membrane PESS-1) and water-ethanol mixtures, the phase transition step decreases the overall separation. Also, diffusion through the membrane is unfavor- able to water at a low concentration range.
INTRODUCTION
Pervaporation is a membrane separation technique used for dehydration of organic solvents, for breaking down azeotropic and close-boiling mix- tures, and for removal of organics from water streams. This technique is regarded as one of the most promising separation processes (1-4).
However, despite a number of potential practical applications, the trans- port mechanism in pervaporation has not been elucidated. Generally, solu- tion-diffusion (5,6) and pore-flow (7,8) models are used to describe mass transfer in pervaporation, although alternative approaches have been pre- sented (9- 13). According to the commonly used qualitative description of pervaporation, the overall separation of the process is affected by the preferential sorption of one of the components into the membrane, diffu- sion of the sorbed components across the membrane, and fast desorption
1555
Copyright 0 1996 by Marcel Dekker, Inc.
Downloaded At: 18:26 17 January 2011

1556 KUJAWSKI
of vapors into the vacuum or sweeping gas (3). One must remember, however, that during pervaporation the phase transition from liquid to vapor states takes place within the membrane, and this phase transition brings its own selectivity to the overall selectivity attained by the system (12).
In the present paper, separation in the pervaporation process in terms of the separation factors will be described, taking into account the phase transition step in a manner proposed previously (12).
THEORETICAL
Pervaporation can be qualitatively described as a process which pro- ceeds by the following successive steps (12):
1. Preferential sorption into the membrane on the feed side 2. Diffusion of the liquid components through the membrane 3. Phase transition from liquid to vapor state 4. Diffusion of vapors to the permeate side of the membrane 5 . Desorption into vacuum or sweeping gas on the permeate side
This 5-step model is presented schematically in Fig. 1, with the molar fractions of permeating species A and B defined at each step. In this approach it was assumed, as in the pore-flow model, that there is a bound- ary of liquid and vapor phases inside the membrane (7, 8). The transport of sorbed liquid within a membrane from feed side to phase transition point was assumed to be nonselective zA = XL; xB = (Fig. 1) (see the Symbols section for definitions). Moreover, it is generally accepted that desorption of vapors into the permeate side is a fast and nonselective step (3), so the following relations are valid:
- YB = YB (la)
The performance of a membrane in pervaporation processes can be described in terms of selectivity parameters (14):
Separation factor a‘” (Eq. 2) Enrichment factor p‘” (Eq. 3) McCabe-Thiele separation diagram
Downloaded At: 18:26 17 January 2011
MEMBRANE SELECTIVITY IN PERVAPORATION 1557
'A
X B
MEMBRANE
LIQUID
- - 'A ': - - 'B xi
VAPOUR
Y A
y,
PERMEATE
PHASE TRANSITION
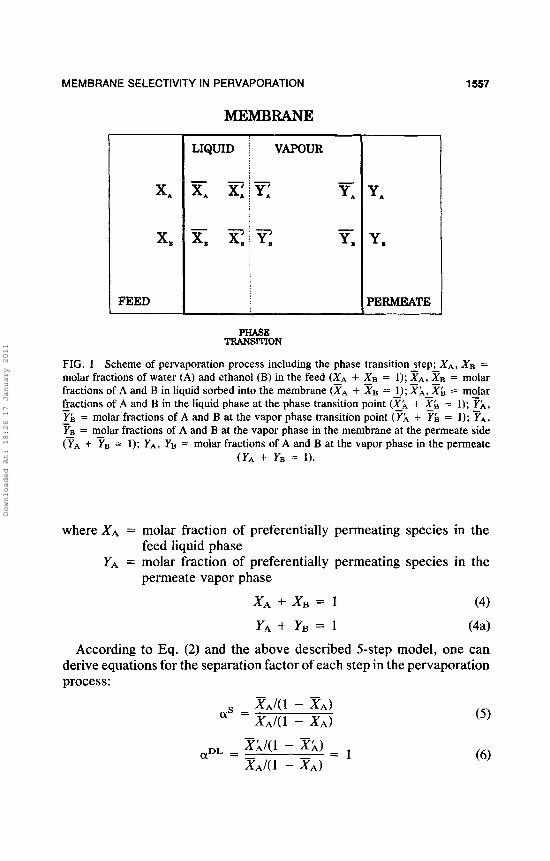
FIG. 1 Scheme of pervaporation process including the phase transitionstep;XA, XB = molar fractions of water (A) and ethanol (B) in the feed (ZA + ZB = 1); ZA, ZB = molar fractions of A and B in liquid sorbed into the membrane ( X A + XB = 1); XLLXb = molar fractions of A and B in the liquid phase at the phase transition point (x_;\ + gh = 1); ?A, Yb = molar fractions of A and B at the vapor phase transition point (YL + Yb = 1); YA, YB = m_olar fractions of A and B at the vapor phase in the membrane at the permeate side (TA + YB = 1); Y A , YB = molar fractions of A and B at the vapor phase in the permeate
-
(YA + YB = 1).
where XA = molar fraction of preferentially permeating species in the
YA = molar fraction of preferentially permeating species in the
XA + x, = 1 (4) YA + Yj3 = 1 (44
According to Eq. (2) and the above described 5-step model, one can derive equations for the separation factor of each step in the pervaporation process :
feed liquid phase
permeate vapor phase
Downloaded At: 18:26 17 January 2011

1558 KUJAWSKI
Combining Eq. (2) with Eqs. (4)-(9) leads to the following expression for the components of separation selectivity in the pervaporation process:
(10) (yPV = aSaDLaEVaDV(yDES
According to this equation, the overall separation factor in pervapora- tion depends both on the properties of the membrane (sorption, diffusion, and desorption: aM) and thermodynamic properties of penetrating mixture (evaporation: aEV):
( 1 1)
(12) The above equation can be rearrange taking into account Eqs. (6) and
aPV = aMDLEV
with &M = (yS(yDLaDVaDES
(9) :
(yM = (yS(yD (13)
where for the simplicity of further notation, the vapors diffusion separa- tion factor aDv is replaced by aD:
(yD = (yDV (14)
EXPERIMENTAL
Membranes
PESS- I ion-exchange membrane and polyamide-6 (PA-6) dense mem- brane were used as the separating barriers.
PESS- 1 was prepared by the sulfonation of polyethylene/poly(styrene- co-DVB) interpolymer (15). The ion-exchange capacity (IEC) of PESS-1 membrane was 2.9 +- 0.1 (mmol sulfonic groups/g dry membrane). The IEC was measured for a membrane in the hydrogen form equilibrated with water. The IEC shows the total amount of ion-exchange groups per gram of dry membrane. The thickness of the dry PESS-1 membrane in its hydro- gen form was 120 f 2 pm. Samples of PESS-1 membrane were kindly supplied by the Technical University of Wroctaw (Poland).
Downloaded At: 18:26 17 January 2011

MEMBRANE SELECTIVITY IN PERVAPORATION 1559
PA-6 membrane was prepared in our laboratory by casting the polymer solution on a glass plate followed by solvent evaporation at 40°C. A 10 wt% solution of polyamide-6 in tetrafluoroethanol was used as the casting solution. The thickness of the dry PA-6 membrane was 10 ? 0.5 pm (16).
Membrane Swelling
Membrane swelling caused by the sorption of liquids into the membrane was determined gravimetrically. The total swelling weight ratio (SRw) was calculated according to
SRW = (m, - m&zd (g liquidlg dry membrane) (15)
Swelling measurements were performed for PESS- 1 and PA-6 mem- branes in contact with water-ethanol solutions in the whole concentration range (0-1 molar fraction of water in feed). The composition of the sorbed mixture was determined by using the desorption method proposed by Uragami (17). Analysis of the sorbed mixture was performed by using a Varian 3300 gas chromatograph.
Pervaporation
The vacuum pervaporation experiments were performed by using the set-up described elsewhere (18). The system was operated at 25°C and at a pressure on the permeate side below 1 mbar. Water-ethanol mixtures in the whole concentration range were used as the feed. The permeate flux and the permeate composition were determined for each feed mixture and for both membranes. The permeate analysis was performed by using a gas chromatograph.
RESULTS AND DISCUSSION
Membrane Swelling
Figure 2 shows the results of membrane swelling experiments for PESS- 1 and PA-6 membranes. Swelling increased for both membranes with in- creasing water concentration in the feed solution. Both membranes sorbed water much better than ethanol. The swelling from water was 45 (moll kg dry membrane) for PESS-1 and 20 (moVkg dry membrane) for PA-6 membranes, but the swelling from ethanol was 12 and 6 mol/kg, respec- tively. The total amount of sorbed liquids was two to threefold higher for PESS-1 than for PA-6 membranes (Fig. 2).
Figure 3 shows a McCabe-Thiele separation diagram of sorption. It was found that both membranes preferentially sorbed water. The sorption
Downloaded At: 18:26 17 January 2011

1560 KUJAWSKI
0 0.1 0.2 0.3 0.4 0.5 0.6 0.7 0.8 0.9 Water mole fraction in feed [mol/mol]
FIG. 2 Total molar swelling of PA-6 (m) and PESS-1 (0) membranes in water-ethanol solutions vs concentration of feed solution.
FIG. 3 McCabe-Thiele diagram for the preferential sorption. PA-6 membrane (0) and PESS-1 membrane (m) in contact with water-ethanol mixtures.
Downloaded At: 18:26 17 January 2011
MEMBRANE SELECTIVITY IN PERVAPORATION 1561
selectivity of the PESS-1 membrane was slightly higher than that of the PA-6 membrane.
The concentration of sorbed water was practically constant for the PA- 6 membrane in contact with water-ethanol feed mixtures with composi- tions of 0.5-0.8 water mole fraction; this suggests a drop of sorption selec- tivity in that concentration range (Figs. 2 and 3).
Pervaporation of Water-Ethanol Mixtures
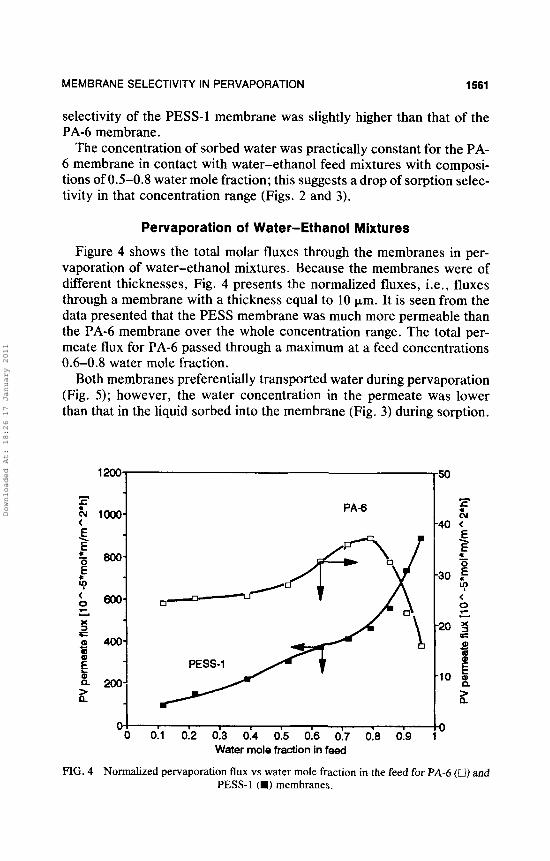
Figure 4 shows the total molar fluxes through the membranes in per- vaporation of water-ethanol mixtures. Because the membranes were of different thicknesses, Fig. 4 presents the normalized fluxes, i.e., fluxes through a membrane with a thickness equal to 10 pm. It is seen from the data presented that the PESS membrane was much more permeable than the PA-6 membrane over the whole concentration range. The total per- meate flux for PA-6 passed through a maximum at a feed concentrations 0.6-0.8 water mole fraction.
Both membranes preferentially transported water during pervaporation (Fig. 5) ; however, the water concentration in the permeate was lower than that in the liquid sorbed into the membrane (Fig. 3) during sorption.
800-
600-
400-
PA4
! O 0 0.1 0.2 0.3 0.4 0.5 0.6 0.7 0.8 0.9 1
Water mole fraction in feed
FIG. 4 Normalized pervaporation flux vs water mole fraction in the feed for PA-6 (0) and PESS-1 (m) membranes.
Downloaded At: 18:26 17 January 2011
1562 KUJAWSKI
Water mole fraction it? feed
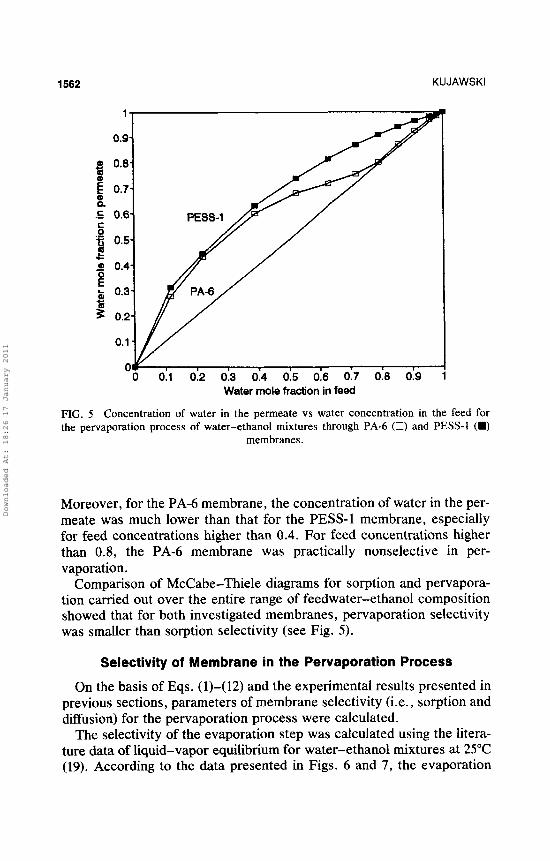
FIG. 5 Concentration of water in the permeate vs water concentration in the feed for the pervaporation process of water-ethanol mixtures through PA-6 (0) and PESS-I (U)
membranes.
Moreover, for the PA-6 membrane, the concentration of water in the per- meate was much lower than that for the PESS-1 membrane, especially for feed concentrations higher than 0.4. For feed concentrations higher than 0.8, the PA-6 membrane was practically nonselective in per- vaporation.
Comparison of McCabe-Thiele diagrams for sorption and pervapora- tion carried out over the entire range of feedwater-ethanol composition showed that for both investigated membranes, pervaporation selectivity was smaller than sorption selectivity (see Fig. 5).
Selectivity of Membrane in the Pervaporation Process
On the basis of Eqs. (1)-(12) and the experimental results presented in previous sections, parameters of membrane selectivity (i.e., sorption and diffusion) for the pervaporation process were calculated.
The selectivity of the evaporation step was calculated using the litera- ture data of liquid-vapor equilibrium for water-ethanol mixtures at 25°C (19). According to the data presented in Figs. 6 and 7, the evaporation
Downloaded At: 18:26 17 January 2011
MEMBRANE SELECTIVITY IN PERVAPORATION
1-
0.9
0.8-
0.7-
.E 0.6-
I!?
E
0 0.1 0.2 0.3 0.4 0.5 0.6 0.7 0.8 0.9 Water mole fraction in liquid
1563
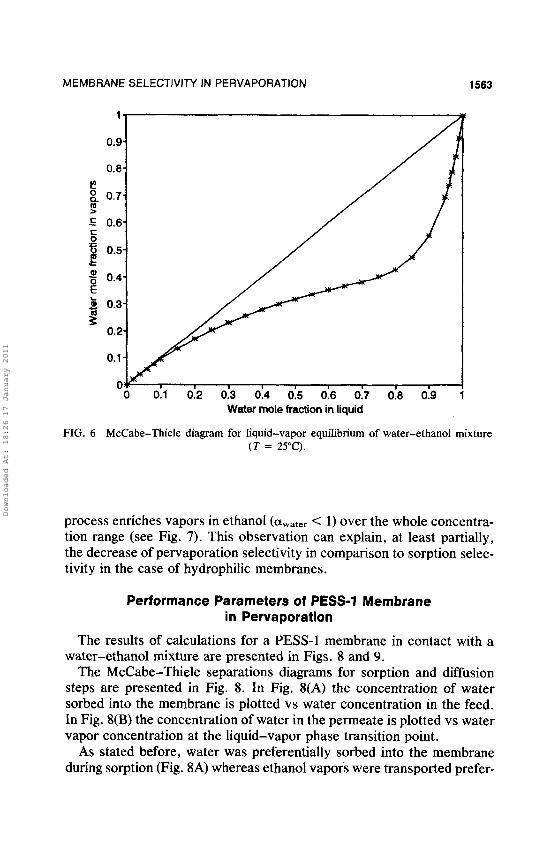
FIG. 6 McCabe-Thiele diagram for liquid-vapor equilibrium of water-ethanol mixture ( T = 25°C).
process enriches vapors in ethanol (awat,, < 1) over the whole concentra- tion range (see Fig. 7). This observation can explain, at least partially, the decrease of pervaporation selectivity in comparison to sorption selec- tivity in the case of hydrophilic membranes.
Performance Parameters of PESS-1 Membrane in Pervaporation
The results of calculations for a PESS-1 membrane in contact with a water-ethanol mixture are presented in Figs. 8 and 9.
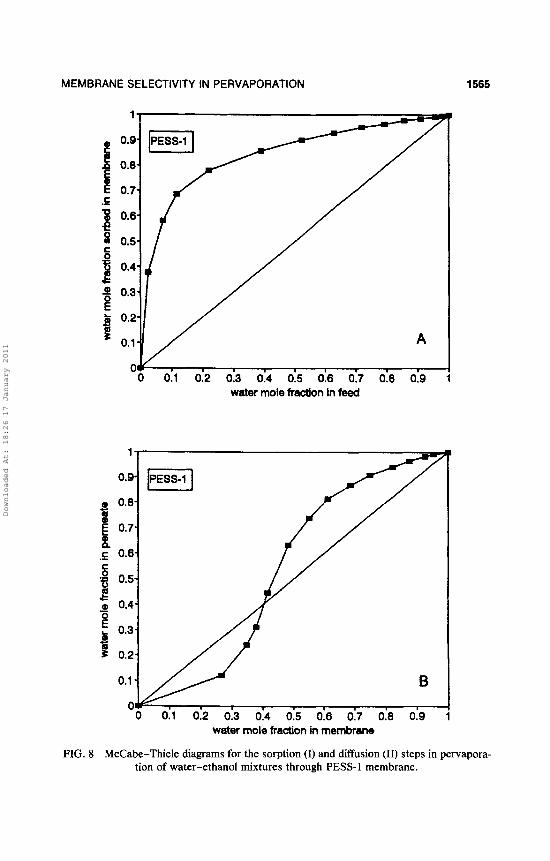
The McCabe-Thiele separations diagrams for sorption and diffusion steps are presented in Fig. 8. In Fig. 8(A) the concentration of water sorbed into the membrane is plotted vs water concentration in the feed. In Fig. 8(B) the concentration of water in the permeate is plotted vs water vapor concentration at the liquid-vapor phase transition point.
As stated before, water was preferentially sorbed into the membrane during sorption (Fig. 8A) whereas ethanol vapors were transported prefer-
Downloaded At: 18:26 17 January 2011

1564 KUJAWSKI
0 -
0.9
0.8-
0.7-
>̂ 0.6- Y 8 0.5-
' 0.4-
0.3-
0.2-
0.1 -
c
01 I I
0 0.1 0.2 0.3 0.4 0.5 0.6 0.7 0.8 0.9 Water mole fraction in liquid
04 I I
0 0.1 0.2 0.3 0.4 0.5 0.6 0.7 0.8 0.9 Water mole fraction in liquid
FIG. 7 Concentration dependence of the evaporation separation factor (aEV) for the water-ethanol mixture ( T = 25°C).
entially during the diffusion step in a concentration range lower than 0.4 (Fig. 8B).
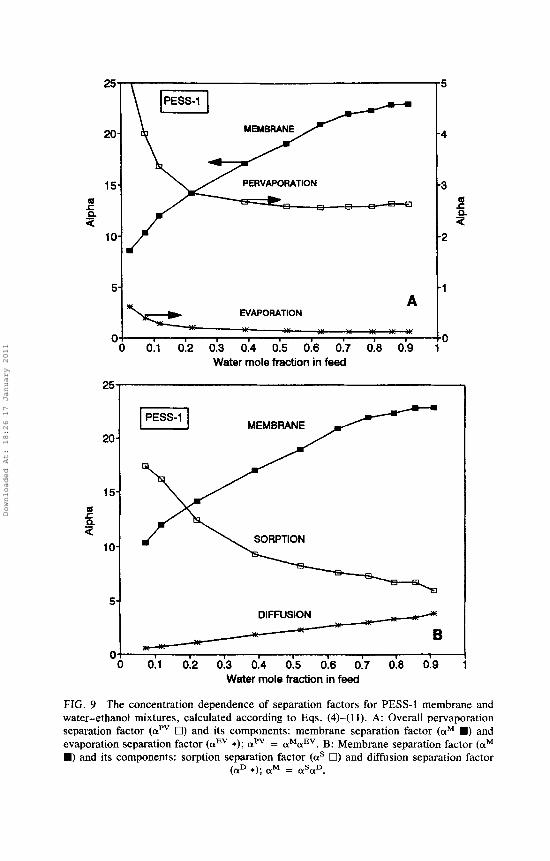
Calculated separation factors for each step in the pervaporation of water-ethanol mixtures using the PESS-1 membrane are presented in Figs. 9(A) and 9(B).
Figure 9(A) presents the overall pervaporation separation factor (apv) and its two main components, i.e., membrane separation factor (aM) and evaporation separation factor (aEV), vs the feed concentration. The over- all pervaporation separation factor (aPV) decreased in the whole concen- tration range due to the phase transition step (aEV < 1) . On the other hand, the membrane separation factor increased with increasing water content in the feed, suggesting an improvement of membrane selectivity for the PESS-1 membrane.
According to Eq. (13), the membrane separation factor (aM) has two components, the sorption separation factor (a') and the diffusion separa- tion factor (aD), as presented in Fig. 9(B). It is seen that the sorption separation factor (as) decreased with increasing external water concentra-
Downloaded At: 18:26 17 January 2011
MEMBRANE SELECTIVITY IN PERVAPORATION 1565
water mole fraction in feed
I
water mole fraction in membrane
FIG. 8 McCabe-Thiele diagrams for the sorption (I) and diffusion (11) steps in pervapora- tion of water-ethanol mixtures through PESS-1 membrane.
Downloaded At: 18:26 17 January 2011
25-
20-
PERVAPORATION 15- 6 r P a
03
l o r 5 A
EVAPORATION - - .,, . , , Y - - - -
DIFFUSION
5
4
3 6 r 0. a
2
1
0
53 0 0 0.1 0.2 0.3 Water 0.4 mole fraction 0.5 0.6 in feed 0.7 0.8 0.9
FIG. 9 The concentration dependence of separation factors for PESS-1 membrane and water-ethanol mixtures, calculated according to Eqs. (4)-( I 1 ) . A: Overall pervaporation separation factor (apv 0) and its components: membrane separation factor (aM W) and evaporation separation factor (aEV *); apv = aMaEV. B: Membrane separation factor (aM W) and its components: sorption separation factor (as 0) and diffusion separation factor
(aD *); aM = aSaD.
Downloaded At: 18:26 17 January 2011

MEMBRANE SELECTIVITY IN PERVAPORATION 1567
tion but it was always above unity, confirming data presented in the McCabe-Thiele separation diagram (Fig. 8A). Contrary to as, the diffu- sion separation factor increased with increasing water concentration in the feed, but diffusion was favorable to water only at concentrations higher than 0.2 (Figs. 8B and 9B).
Performance Parameters of PA-6 Membrane in Pervaporation
Components of the performance parameters of the PA-6 membrane in the pervaporation of a water-ethanol mixture are presented in Figs. 10 and 11.
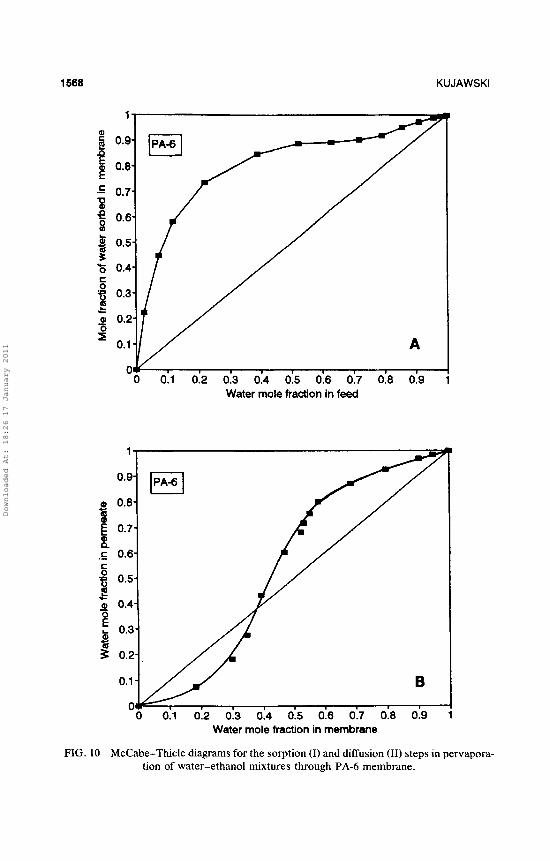
The McCabe-Thiele diagrams of sorption and diffusion steps for the PA-6 membrane (Figs. 10A and IOB, respectively) resembled those ob- tained for the PESS-I membrane (Figs. 8A and 8B). Diffusion of water-ethanol vapors through the PA-6 membrane was favorable to ethanol vapors in the low concentration range (Fig. l0B).
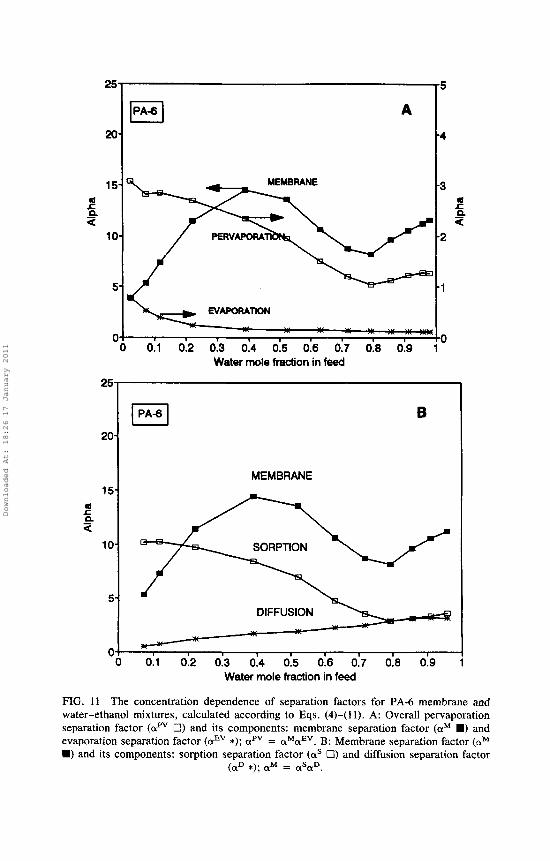
Figure 11(A) presents the separation factors of each pervaporation step calculated according to Eq. (13). The overall separation factor (apv) for the PA-6 membrane was lower than that for the PESS-1 membrane. aPv decreased with increasing water content in the feed, passing the flat mini- mum at a water mole fraction equal to 0.8 (Fig. 11A). Such changes of apv were caused not only by unfavorable selectivity during the evapora- tion step but also by the strong decrease of the membrane separation factor (aM) within the feed concentration of 0.4-0.8 (Fig. 11A).
Both components of the membrane separation factor, i.e., as and aD, are shown in Fig. 1 I(B). It can be seen that the diffusion separation factor aD increases with increasing water concentration in the feed, but at the low concentration range its value is below unity. On the other hand, the sorption separation factor as decreases in the whole concentration range but its value is always greater than 1. Sorption selectivity becomes much less favorable to water when the mole fraction of water in feed exceeded 0.5 (Fig. 11B).
Comparison of the results obtained for PESS-1 and PA-6 membranes leads to the conclusion that both membranes show similar selectivity when they are in contact with water-ethanol mixtures with a water content lower than 0.5 mole fraction, although the PESS-1 membrane is more permeable during pervaporation than the PA-6 membrane. At a water mole fraction in the feed higher than 0.5, the PA-6 membrane is much less selective to water, primarily because of its weaker sorption selectivity. As discussed in detail elsewhere (16), strong interactions of fluxes also occur during pervaporation in the same concentration region.
Downloaded At: 18:26 17 January 2011
1568 KUJAWSKI
A
0 0.1 0.2 0.3 0.4 0.5 0.6 0.7 0.0 0.9 Water mole fraction in feed
Water mole fraction in membrane
FIG. 10 McCabe-Thiele diagrams for the sorption (1) and diffusion (11) steps in pervapora- tion of water-ethanol mixtures through PA-6 membrane.
Downloaded At: 18:26 17 January 2011
25
20
15 0 t P U -
10
5
a
IpA-61 A
-4
3 6
P
2
1
0 0.1 0.2 0.3 0.4 0.5 0.6 0.7 0.8 0.9 1
Water mole fraction in feed
10-
5-
B
MEMBRANE w * SORPTION
DIFFUSION \ -
I 1
0 0.1 0.2 0.3 0.4 0.5 0.6 0.7 0.8 0.9 Water mole fraction in feed
FIG. 1 1 The concentration dependence of separation factors for PA-6 membrane and water-ethanol mixtures, calculated according to Eqs. (4)-(11). A: Overall pervaporation separation factor (aPV 0) and its components: membrane separation factor (aM W) and evaporation separation factor faEV *); apv = aMaEV. B: Membrane separation factor (aM M) and its components: sorption separation factor (aS 0) and diffusion separation factor
(aD *); aM = a S a D .
Downloaded At: 18:26 17 January 2011

1570 KUJAWSKI
CONCLUSIONS
In the case of pervaporation of water-ethanol mixtures with hydrophilic membranes, the phase transition step substantially decreases the overall separation. By comparing other results obtained for PA-6 and PESS-1 membranes, it can be seen that the presence of strongly hydrophilic groups in the PESS-1 membrane results in much higher sorption selectivity of this membrane (see Figs. 9B and 1 IB). However, diffusion selectivity is comparable for both membranes. Moreover, in the low water concentra- tion range, diffusion is unfavorable to water molecules for both investi- gated membranes (Figs. 9B and 11B). Because of higher ionic interactions with the membrane phase in this concentration range, the diffusivity of the aqueous phase is lower than the diffusivity of the ethanol phase, which results in a water diffusion selectivity smaller than unity (20, 21).
Our approach to pervaporation includes consideration of the liquid-va- por phase transition as one of the factors influencing overall separation in this process. Thus, the model explains and allows evaluation of the various contributions to pervaporation separation, i.e., preferential sorp- tion and evaporation.
For a given membrane in contact with different liquid mixtures, this solution, which excludes evaporation selectivity, should allow for compar- ison of the properties of the membrane itself, i.e., those resulting only from the sorption and diffusion properties. Moreover, the information provided by the model should give important insight into which changes in the membrane structure (e.g., kind of polymeric backbone, kind of ion-exchange sites, and/or kind of counterions in charged membranes) improve membrane performance. A detailed discussion of the application of this model to different cases will be presented in a future paper.
ACKNOWLEDGMENT
The support of this work by KBN grant within Project 2 0871 91 01 is gratefully acknowledged.
SYMBOLS
ms md SRw Xi xi
weight of swollen membrane (g) weight of dry membrane (g) swelling weight ratio (g liquid/g of dry membrane) molar fraction of i liquid in the feed (mol/mol), (i = A, B) molar fraction of i liquid in the membrane at the feed/membrane boundary
Downloaded At: 18:26 17 January 2011

MEMBRANE SELECTIVITY IN PERVAPORATION 1571
x: Y: -
Yi QD
QDL
QDV
QEV
QM QPV
as PPV
#ES
molar fraction of i liquid in the membrane at the phase transition point molar fraction of i vapors in the membrane at the phase transi- tion point molar fraction of i vapors in the membrane at the membrane/ permeate boundary molar fraction of i vapors in the permeate diffusion separation factor (= aDV), (Eq. 14) desorption separation factor (= l), (Eq. 9) liquid diffusion separation factor (= l), (Eq. 6) vapors diffusion separation factor (Eq. 8) evaporation separation factor (Eq. 7) membranes separation factor (Eqs. 12 and 13) overall pervaporation separation factor (Eq. 2) sorption separation factor (Eq. 5) overall pervaporation enrichment factor (Eq. 3)
REFERENCES
1 . P. Aptel, N. Challard, J. Cuny, and J. Neel, J. Membr. Sci., 1 , 271 (1976). 2. R. Rautenbach and R. Albrecht, Zbid., 7 , 203 (1980). 3. J. Neel, P. Aptel, and R. Clement, Desalination, 53, 297 (1985). 4. H. L. Fleming and C. S. Slater, “Pervaporation,” in Membrane Handbook, Part I11
(W. S. Winston Ho and K. K. Sirkar, Eds.), Van Nostrand Reinhold, New York, 1992,
5. C. H. Lee, J. Appl. Polym. Sci., 19, 83 (1975). 6. F. W. Greenlaw, W. D. Prince, R. A. Shelden, and E. V. Thompson, J. Membr. Sci.,
2 , 141 (1977). 7. T. Okada, M. Yoshikawa, and T. Matsuura, Ibid., 59, 151 (1991). 8. T. Okada and T. Matsuura, Zbid., 70, 163 (1992). 9. M. Yoshikawa, T. Yukoshi, K. Sanuik, and N. Ogata, Membrane, 10, 247 (1985).
10. M. H. V. Mulder and C. A. Smolders, Sep. Sci. Technol., 26, 85 (1991). 11 . P. Schaetzel, E. Favre, Q. T. Nguyen, and J. Neel, Desalination, 90, 259 (1993). 12. W. Kujawski, Technol. Today, 1 , 27 (1992). 13. J . G. Wijmans and R. W. Baker, J. Membr. Sci., 79, 101 (1993). 14. K. Boddeker, Terminology in Pervaporation, European Society of Membrane Science
and Technology, 1989. 15. G. Poiniak and W. Trochimczuk, Angew. Makromol. Chem., 127, 171 (1984). 16. W. Kujawski, M. Waczynski, and M. Lasota, Sep. Sci. Technol., 31, 953 (1996). 17. T. Uragami, T. Morikawa, and H. Okuno, Polymer, 30, 1117 (1989). 18. W. Kujawski, Q. T. Nguyen, and J. Neel, Sep. Sci. Technol., 26, 1109 (1991). 19. J. A. Larkin and R. C. Pemberton, Nut. Phys. Lab. Rep., Chem., 43, 1 (1976). 20. A. Wenzlaff, K. W. Boeddeker, and K. Hattenbach, J. Membr. Sci., 22, 333 (1985). 21. W. Kujawski, Q. T. Nguyen, and J. Neel, J . Appl. Polym. Sci., 44, 951 (1992).
Received by editor March 23, 1994 Revision received October 9 , 1995
pp. 103-160.
Downloaded At: 18:26 17 January 2011
Copyright © 2022 FDOKUMEN