
Stimulus Selectivity of Figural Aftereffects for Faces
18
This document is copyrighted by the American Psychological Association or one of its allied publishers. This article is intended solely for the personal use of the individual user and is not to be disseminated broadly. Stimulus Selectivity of Figural Aftereffects for Faces Jill A. Yamashita University of Nevada, Reno Joseph L. Hardy and Karen K. De Valois University of California, Berkeley Michael A. Webster University of Nevada, Reno Viewing a distorted face induces large aftereffects in the appearance of an undistorted face. The authors examined the processes underlying this adaptation by comparing how selective the aftereffects are for different dimensions of the images including size, spatial frequency content, contrast, and color. Face aftereffects had weaker selectivity for changes in the size, contrast, or color of the images and stronger selectivity for changes in contrast polarity or spatial frequency. This pattern could arise if the adaptation is contingent on the perceived similarity of the stimuli as faces. Consistent with this, changing contrast polarity or spatial frequency had larger effects on the perceived identity of a face, and aftereffects were also selective for different individual faces. These results suggest that part of the sensitivity changes underlying the adaptation may arise at visual levels closely associated with the representation of faces. Keywords: face adaptation, face perception, face processing, selective aftereffects, figural aftereffects Face recognition is among the most exquisite capacities of human form perception. We typically have little trouble identify- ing and discriminating familiar faces, even though as a class of objects human faces are highly similar to each other, and even though the image presented by the same individual can vary widely (e.g., because of changes in lighting, viewpoint, expression, or age). It is uncertain to what extent this ability is innate or develops through experience and to what extent it represents mechanisms specialized for faces versus a more generic potential for expert object recognition (Diamond & Carey, 1986; Farah, Wilson, Drain, & Tanaka, 1998; Gauthier & Tarr, 1997). Yet, in any case, it seems evident that humans normally possess a spe- cialized capacity for face perception and that this involves special- ized, high-level mechanisms in the visual system. Evidence for these specialized mechanisms has been suggested by physiological, clinical, and behavioral approaches. For exam- ple, a number of studies have documented responses of neurons in the inferotemporal cortex that appear specifically responsive to faces (Desimone, 1991; Perrett, Mistlin, & Chitty, 1987), and neural imaging approaches have identified distinct cortical areas that are selectively activated during face perception (Kanwisher, McDermott, & Chun, 1997; Sergent, Ohta, & MacDonald, 1992). Specific extrastriate areas important to face coding are also im- plied by the clinical deficit of prosopagnosia, in which patients show selective losses in face recognition (Farah, Wilson, Drain, & Tanaka, 1995). Finally, psychophysical tests have shown that faces tend to be processed in ways that are distinct from other classes of objects. For example, compared with other objects, faces appear much more difficult to recognize or discriminate when presented upside down (Yin, 1969) or contrast reversed as in a photographic negative (Galper, 1970). Inversion is thought to disrupt face rec- ognition because it hinders the processing of configural informa- tion—and specifically the spatial relationships between facial fea- tures (Freire, Lee, & Symons, 2000). Psychophysical studies have also revealed that faces are processed holistically such that the perception and recognition of parts of the face are strongly influ- enced by the overall face context in which they appear. For example, individual facial features (such as the nose) are more accurately recognized when they are shown as part of the whole face (Tanaka & Farah, 1993); however, an image of half a face becomes less recognizable when it is combined with a half image of a different face (Young, Hellawell, & Hay, 1987). Such results suggest that face perception depends strongly on coding the overall configuration of the face rather than a piecemeal representation of its individual features (Maurer, Le Grand, & Mondloch, 2002; Peterson & Rhodes, 2003). In the present study, we explored properties of configural coding in face perception by examining how face perception is altered by adaptation. Visual perception is constantly recalibrated by pro- cesses of adaptation that adjust to the stimuli people are currently exposed to, and these adjustments can strongly affect how stimuli look (Webster, 2003). The perceptual aftereffects of adaptation can reveal the stimulus dimensions that are important for a given perceptual task by revealing which aspects of the stimuli the visual system can adjust to. Webster and MacLin (1999) investigated adaptation aftereffects in face perception by measuring how the perceived configuration of a face was altered after observers were exposed to a distorted version of the face. The distortions were formed by locally expanding or contracting the image to form punched or pinched versions of the original face (see Figure 1). Jill A. Yamashita and Michael A. Webster, Department of Psychology, University of Nevada, Reno; Joseph L. Hardy and Karen K. De Valois, Department of Psychology, University of California, Berkeley. We thank Yoko Mizokami, Aaron Bilson, Jennifer Muskat, and Carrie Paras for their valuable time and assistance. This research was supported by National Eye Institute Grant EY10834 awarded to Michael A. Webster. Correspondence concerning this article should be addressed to Michael A. Webster, University of Nevada, Reno, Department of Psychology/296, Reno, NV 89557. E-mail: [email protected] Journal of Experimental Psychology: Copyright 2005 by the American Psychological Association Human Perception and Performance 2005, Vol. 31, No. 3, 420 – 437 0096-1523/05/$12.00 DOI: 10.1037/0096-1523.31.3.420 420
Transcript of Stimulus Selectivity of Figural Aftereffects for Faces
This
doc
umen
t is c
opyr
ight
ed b
y th
e A
mer
ican
Psy
chol
ogic
al A
ssoc
iatio
n or
one
of i
ts a
llied
pub
lishe
rs.
This
arti
cle
is in
tend
ed so
lely
for t
he p
erso
nal u
se o
f the
indi
vidu
al u
ser a
nd is
not
to b
e di
ssem
inat
ed b
road
ly.
Stimulus Selectivity of Figural Aftereffects for Faces
Jill A. YamashitaUniversity of Nevada, Reno
Joseph L. Hardy and Karen K. De ValoisUniversity of California, Berkeley
Michael A. WebsterUniversity of Nevada, Reno
Viewing a distorted face induces large aftereffects in the appearance of an undistorted face. The authorsexamined the processes underlying this adaptation by comparing how selective the aftereffects are fordifferent dimensions of the images including size, spatial frequency content, contrast, and color. Faceaftereffects had weaker selectivity for changes in the size, contrast, or color of the images and strongerselectivity for changes in contrast polarity or spatial frequency. This pattern could arise if the adaptationis contingent on the perceived similarity of the stimuli as faces. Consistent with this, changing contrastpolarity or spatial frequency had larger effects on the perceived identity of a face, and aftereffects werealso selective for different individual faces. These results suggest that part of the sensitivity changesunderlying the adaptation may arise at visual levels closely associated with the representation of faces.
Keywords: face adaptation, face perception, face processing, selective aftereffects, figural aftereffects
Face recognition is among the most exquisite capacities ofhuman form perception. We typically have little trouble identify-ing and discriminating familiar faces, even though as a class ofobjects human faces are highly similar to each other, and eventhough the image presented by the same individual can varywidely (e.g., because of changes in lighting, viewpoint, expression,or age). It is uncertain to what extent this ability is innate ordevelops through experience and to what extent it representsmechanisms specialized for faces versus a more generic potentialfor expert object recognition (Diamond & Carey, 1986; Farah,Wilson, Drain, & Tanaka, 1998; Gauthier & Tarr, 1997). Yet, inany case, it seems evident that humans normally possess a spe-cialized capacity for face perception and that this involves special-ized, high-level mechanisms in the visual system.
Evidence for these specialized mechanisms has been suggestedby physiological, clinical, and behavioral approaches. For exam-ple, a number of studies have documented responses of neurons inthe inferotemporal cortex that appear specifically responsive tofaces (Desimone, 1991; Perrett, Mistlin, & Chitty, 1987), andneural imaging approaches have identified distinct cortical areasthat are selectively activated during face perception (Kanwisher,McDermott, & Chun, 1997; Sergent, Ohta, & MacDonald, 1992).Specific extrastriate areas important to face coding are also im-plied by the clinical deficit of prosopagnosia, in which patientsshow selective losses in face recognition (Farah, Wilson, Drain, &
Tanaka, 1995). Finally, psychophysical tests have shown that facestend to be processed in ways that are distinct from other classes ofobjects. For example, compared with other objects, faces appearmuch more difficult to recognize or discriminate when presentedupside down (Yin, 1969) or contrast reversed as in a photographicnegative (Galper, 1970). Inversion is thought to disrupt face rec-ognition because it hinders the processing of configural informa-tion—and specifically the spatial relationships between facial fea-tures (Freire, Lee, & Symons, 2000). Psychophysical studies havealso revealed that faces are processed holistically such that theperception and recognition of parts of the face are strongly influ-enced by the overall face context in which they appear. Forexample, individual facial features (such as the nose) are moreaccurately recognized when they are shown as part of the wholeface (Tanaka & Farah, 1993); however, an image of half a facebecomes less recognizable when it is combined with a half imageof a different face (Young, Hellawell, & Hay, 1987). Such resultssuggest that face perception depends strongly on coding the overallconfiguration of the face rather than a piecemeal representation ofits individual features (Maurer, Le Grand, & Mondloch, 2002;Peterson & Rhodes, 2003).
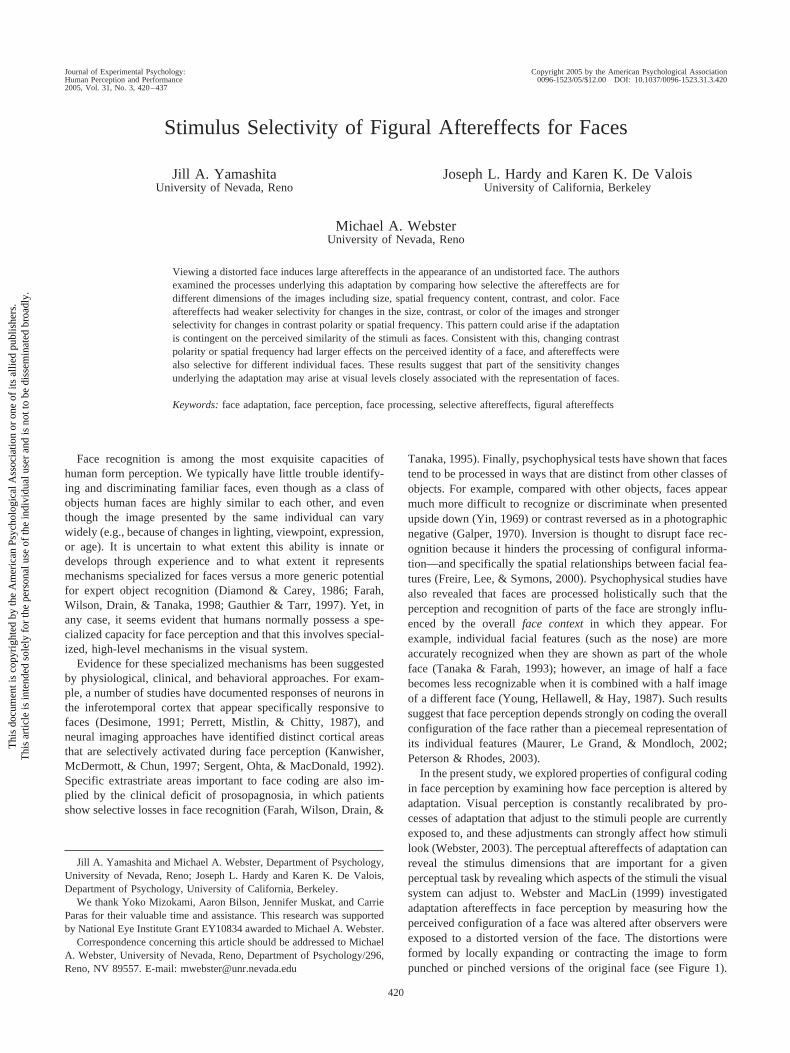
In the present study, we explored properties of configural codingin face perception by examining how face perception is altered byadaptation. Visual perception is constantly recalibrated by pro-cesses of adaptation that adjust to the stimuli people are currentlyexposed to, and these adjustments can strongly affect how stimulilook (Webster, 2003). The perceptual aftereffects of adaptation canreveal the stimulus dimensions that are important for a givenperceptual task by revealing which aspects of the stimuli the visualsystem can adjust to. Webster and MacLin (1999) investigatedadaptation aftereffects in face perception by measuring how theperceived configuration of a face was altered after observers wereexposed to a distorted version of the face. The distortions wereformed by locally expanding or contracting the image to formpunched or pinched versions of the original face (see Figure 1).
Jill A. Yamashita and Michael A. Webster, Department of Psychology,University of Nevada, Reno; Joseph L. Hardy and Karen K. De Valois,Department of Psychology, University of California, Berkeley.
We thank Yoko Mizokami, Aaron Bilson, Jennifer Muskat, and CarrieParas for their valuable time and assistance. This research was supportedby National Eye Institute Grant EY10834 awarded to Michael A. Webster.
Correspondence concerning this article should be addressed to MichaelA. Webster, University of Nevada, Reno, Department of Psychology/296,Reno, NV 89557. E-mail: [email protected]
Journal of Experimental Psychology: Copyright 2005 by the American Psychological AssociationHuman Perception and Performance2005, Vol. 31, No. 3, 420–437
0096-1523/05/$12.00 DOI: 10.1037/0096-1523.31.3.420
420
This
doc
umen
t is c
opyr
ight
ed b
y th
e A
mer
ican
Psy
chol
ogic
al A
ssoc
iatio
n or
one
of i
ts a
llied
pub
lishe
rs.
This
arti
cle
is in
tend
ed so
lely
for t
he p
erso
nal u
se o
f the
indi
vidu
al u
ser a
nd is
not
to b
e di
ssem
inat
ed b
road
ly.
Subjects first viewed the altered configurations for a few minutesand then physically adjusted the distortion in a test image until itappeared undistorted (i.e., like the original). Their study revealedpronounced negative aftereffects in the perceived configuration.For example, after viewing an expanded face, the original faceappeared too contracted. To null this perceptual contraction, sub-jects therefore had to choose a test face that was physicallymoderately expanded. A contracted adapting stimulus induced theopposite aftereffect, causing the original face to appear too ex-panded (so that a physically contracted face was now perceptuallyundistorted). The results thus suggested that face perception can bestrongly biased by even brief periods of adaptation. Moreover,strong adaptation effects occur for images defined by the naturalvariations characteristic of actual faces (e.g., the image distortionsthat distinguish individual identity or attributes such as gender;Leopold, O’Toole, Vetter, & Blanz, 2001; Webster, Kaping,Mizokami, & Duhamel, 2004). This means that the adaptation mayplay an important role in face perception under everyday viewingconditions.
Several lines of evidence suggest that face adaptation is alteringsensitivity at a high level of perceptual encoding. First, Websterand MacLin (1999) found that the figural aftereffects for faceswere asymmetric—adaptation to a distorted face strongly affectedthe appearance of the original face, yet adapting to the original hadno effect on the distorted face. This asymmetry would not bepredicted if adaptation were adjusting only to low-level features inthe stimuli (e.g., to the separation between eyes), because in thatcase there is no reason to expect the original face to be special.Second, Zhao and Chubb (2001) and Leopold et al. (2001) foundthat the adaptation transferred across large changes in stimulussize, whereas Leopold et al. also found transfer across retinalposition. Third, Rhodes, Jeffery, Watson, Clifford, and Nakayama
(2003) and Watson and Clifford (2003) found that the aftereffectstransfer across large changes in stimulus orientation (e.g., betweenfaces presented 45° clockwise or counterclockwise from vertical).These results suggest that the adaptation is altering sensitivity atsites at which shape or configuration are represented more or lessindependently of absolute size or position, again implying that theadaptation is affecting configural and perhaps face-specific levelsof processing. Consistent with this, the responses of face-selectiveneurons can be largely independent of stimulus size (Rolls &Baylis, 1986). However, countering these results is the finding thatequally strong aftereffects are also observed when the faces arepresented upside down. As noted, inverting the face is thought todisrupt configural encoding, and inversion effects are thus consid-ered a hallmark of configural processing. The failure to observe aninversion effect in face adaptation therefore remains a puzzle andraises the question of what specifically the adaptation is adjust-ing to.
As the examples above illustrate, measurements of how adap-tation generalizes across different face images—and which aspectsof the images it is instead selective for—can provide importantclues about how face information is represented at the level of thevisual system at which the adaptation occurs. In the present study,we compared how the adaptation transfers across a range ofdifferent stimulus dimensions. The tuning of the aftereffects wasevaluated with two different paradigms, one that tests for transferacross stimulus levels and a second that tests for selectivity be-tween levels. In the first case, observers were adapted to a singleface and then tested with a pair of different faces. For example,they might adapt to a red–expanded face and then make settingsfor a red face or a green face. This is a common paradigm inadaptation, and it allows one to evaluate how readily the adaptationcan generalize across different stimuli. In the example, a nonse-
Figure 1. An example of the face images from the Matsumoto & Ekman (1988) set that were distorted, similarto the Webster & MacLin (1999) study. Adaptation to an expanded face causes the original test to appear toocontracted. In order to null this perceptual contraction, subjects must choose an image that is physicallyexpanded (top row). Contracted adapting faces induce the opposite aftereffect: The original appears tooexpanded and thus must be nulled by an image that is physically contracted (bottom row).
421SELECTIVE AFTEREFFECTS IN FACE PERCEPTION

This
doc
umen
t is c
opyr
ight
ed b
y th
e A
mer
ican
Psy
chol
ogic
al A
ssoc
iatio
n or
one
of i
ts a
llied
pub
lishe
rs.
This
arti
cle
is in
tend
ed so
lely
for t
he p
erso
nal u
se o
f the
indi
vidu
al u
ser a
nd is
not
to b
e di
ssem
inat
ed b
road
ly.
lective adaptation effect would be suggested if the aftereffectswere identical for the red and green test faces, whereas a sensitivitychange that was completely selective for the stimulus color wouldresult in an aftereffect from the red adapt face only in the red testface. We also used a second procedure in which observers simul-taneously adapted to two different stimuli and were then testedwith stimuli defined by these differences. For example, they mightadapt to a red–expanded face alternated in time with a green–contracted face and then rate the appearance of a red or green testface. The two adaptors were always distorted in opposite ways(i.e., one expanded and the other contracted) so that they shouldinduce opposite aftereffects. This procedure is frequently used intests of contingent adaptation (Stromeyer, 1978), for in this caseany common aftereffects should cancel and directly reveal anyselective sensitivity change by shifts of the opposite sign in thedifferent test stimuli. For example, if the adapted mechanismswere insensitive to a color change, then the expanded and con-tracted adaptors should (if appropriately matched) have no neteffect, whereas any selective aftereffects would result in oppositeshifts in the appearance of the red and green test faces.
We used these tasks to compare the relative selectivity of theaftereffects for differences in both the color and form of theadapting and test stimuli. One goal of the present study was todetermine whether the pattern of aftereffects for faces is betterexplained directly by the low-level changes in the stimulus or byhow these changes alter the higher-level interpretations of theimages. The image properties we tested are ones that have beenwidely used to characterize adaptation effects in simple visualpatterns and include differences in mean color or contrast, contrastpolarity, size, and spatial frequency. Traditionally, adaptation ef-fects are interpreted in terms of visual channels directly tuned toencode the dimensions along which the stimuli are varied (Gra-ham, 1989; Webster, 2003). For example, if a spatial aftereffectwas selective for the color of the stimulus, then this could implythat the adapted channels were jointly tuned to both color andspatial pattern. Such contingent aftereffects have been widelystudied and have revealed joint tuning for a variety of stimulusdimensions (Stromeyer, 1978). Our measurements test whethersimilar contingent aftereffects occur for complex spatial patternslike faces.
In contrast to the channel models that are common in studies ofpattern adaptation, studies of face perception have instead focusedon how the stimuli alter the perception of the images as faces. Inparticular, this approach has emphasized how a given manipulationalters featural versus configural processing of the images (Peterson& Rhodes, 2003). This provides a very different perspective forinterpreting visual aftereffects. For example, changing the color ofthe face can be thought of as altering a facial feature. If theaftereffect is selective for this alteration, then this could imply thatthe feature of color is important in the mechanisms mediating faceperception and that adaptation is altering sensitivity at the level offeatural coding. Alternatively, scrambling the location of featuresor masking features with local noise are methods that have beenused to isolate configural processing (McKone, Martini, & Na-kayama, 2001; Tanaka & Farah, 1993). Selective aftereffects formanipulations that influence configuration could therefore be in-terpreted as revealing response changes at the level of configuralencoding. Notably, there are a number of distinct ways in whichchanging the stimulus might change configural processing andthereby influence the adaptation (Maurer et al., 2002). For some
manipulations (e.g., scrambling the parts), the stimulus is nolonger perceived as a face at all. For others (e.g., inverting theimage), the image is still seen as a face but observers lose theability to distinguish the spatial relationships between the features(Thompson, 1980). Finally, manipulations might change the iden-tity of a face by changing the features or their configuration. Forexample, a new individual could potentially be created by alteringeither the position or the shape of the eyes. The identity of the facemay be represented relative to a prototypical reference face(Leopold et al., 2001), though the stimulus properties on whichface prototypes depend remain elusive.
The stimulus changes we examined represent global changes inthe image (e.g., in the average color or size of the face) and thusdo not map in a simple way onto the distinction between a localfeature (e.g., the shape of the nose) versus a global configuration.However, although each of the manipulations changes the lowerlevel properties of the images and thus their features, they differ inthe degree to which they alter facial configuration. For example,changing the size of the image has no effect on the configurationof the face, yet changing contrast polarity has a large effect. Wetested whether these configural differences influence the pattern ofadaptation, and we also evaluated this possibility by testingwhether the adaptation is selective for images of actual faces. Theresults of these experiments may thus help to reveal the kinds ofvisual processes that are being adapted when we look at faces.
Method
Subjects
Subjects included two of the authors (JY and MW) and four additionalobservers (CP, JM, YM, and AB) who were unaware of the specific aimsof the experiment. Except where noted, at least three of the naive observerswere tested for each experiment. All had normal or corrected-to-normalvision acuity, and subjects in the color experiments were screened fornormal color vision.
Stimuli
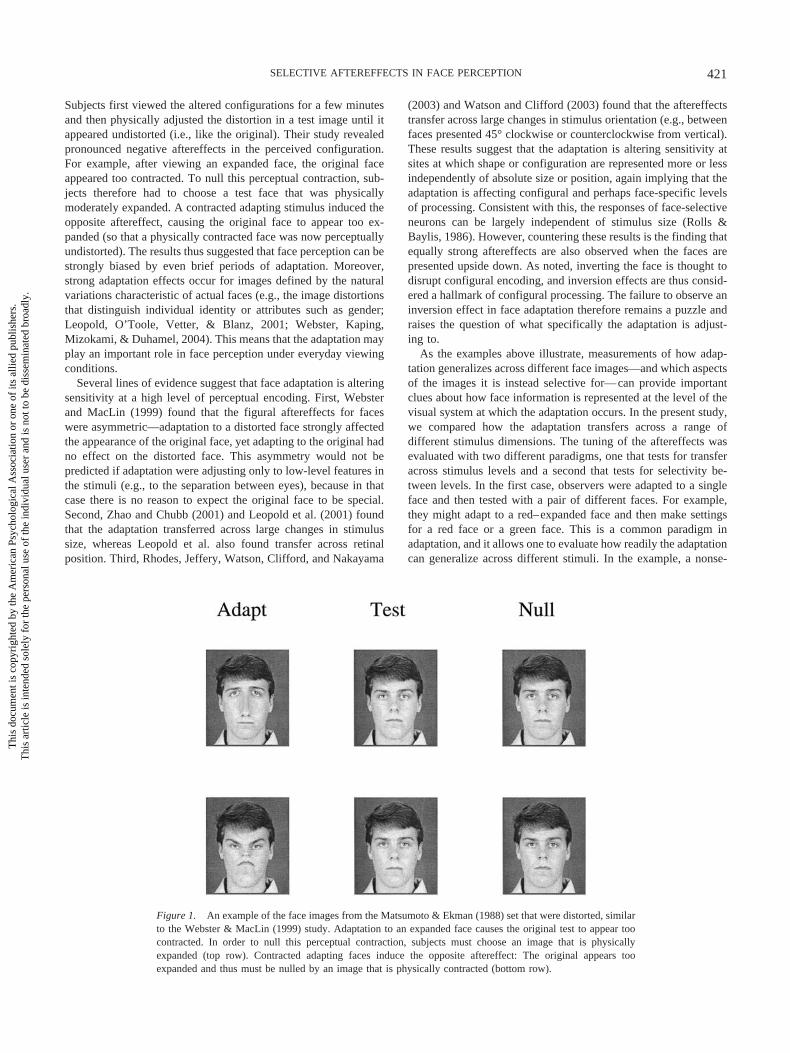
Gray-scale face images were taken from the frontal view, neutral-expression face set of Matsumoto and Ekman (Matsumoto & Ekman,1988). For most experiments, the images were shown at the full resolutionof 512 � 512 pixels. The faces were locally distorted by expanding orcontracting the original image along the vertical axis using the metric andprocedures described by Webster and MacLin (1999). As in their study, thedistortions were relative to a midpoint on the nose and weighted by acircular Gaussian envelope so that changes were largest near the center ofthe face and negligible near the outline of the head. By varying themagnitude of the distortion in small steps (from � � �1 to � 1 in .025increments; see Webster & MacLin, 1999), an array of 80 images wascreated that varied in finely graded steps from fully contracted to fullyexpanded. A subset of images from this array is illustrated in Figure 2.
Procedure
Images were presented on a Sony Trinitron color monitor controlled bya Cambridge Research Systems VSG graphics card (Rochester, England).The images subtended an angle of 4° and were displayed within a graybackground of �20 cd/m2 (close to the mean luminance of the faceimages). Subjects free viewed the images binocularly in a darkened roomfrom a distance of 250 cm.
A daily session consisted of two neutral adaptation runs followed by fouradaptation runs. In the neutral runs, the subject first adapted to a gray
422 YAMASHITA, HARDY, DE VALOIS, AND WEBSTER
This
doc
umen
t is c
opyr
ight
ed b
y th
e A
mer
ican
Psy
chol
ogic
al A
ssoc
iatio
n or
one
of i
ts a
llied
pub
lishe
rs.
This
arti
cle
is in
tend
ed so
lely
for t
he p
erso
nal u
se o
f the
indi
vidu
al u
ser a
nd is
not
to b
e di
ssem
inat
ed b
road
ly.
screen for 120 s and was then tested with distorted faces with the selectedcolor (e.g., green) or form (e.g., low spatial frequency) properties thatcorresponded to specific adapting conditions. In the adaptation run, theyinstead made settings for the same stimuli after viewing distorted adaptingimages for 120 s. The neutral runs provided a baseline measure of whichimage from the face array looked least distorted to the observer, and theadaptation runs probed how this judgment was influenced by prior expo-sure to distorted images. In most of the figures below we plotted thedifferences between the pre- and postadaptation settings as a measure ofthe adaptation effect. To avoid crossover of the adaptation effects, eachobserver participated in only one session per day with a single adaptingcondition.
The subjects were presented with a single face for 1 s, and we measuredthe image that appeared the least distorted, after the initial adaptationperiod, by using a forced-choice response to indicate whether the faceappeared “too expanded” or “too contracted.” The test face was initiallydrawn from a random value within the image array and then varied overtrials in two randomly interleaved staircases that converged on the sub-ject’s neutral point. Each successive trial was preceded by a further 6-speriod of exposure to the adapting stimuli in order to maintain a constantstate of adaptation. Settings were based on the average of the last sixreversals from each of the two staircases. For unopposed adapting condi-tions, subjects were exposed to a single static adapting image (e.g., ared–expanded face), and for the opposing adaptation condition theyviewed a pair of images alternated at a rate of one image per second (e.g.,red–expanded face alternated with a green–contracted face). We havefound previously that this alternation rate is fast relative to the integrationtime of the adaptation, so that during the test presentation observers are notsimply adapted to the last presented image (Muskat, Paras, & Webster,2000). In both the opposed and unopposed conditions, subjects madesettings for two different test stimuli (e.g., a red test face and a green testface) that were randomly alternated across trials with each in twostaircases.
Experiment 1: Image Size
In the following experiments, we first evaluate the adaptationeffects for individual dimensions and then assess their relativeinfluence. In the first case, we examined how the aftereffectstransferred across changes in the size of the adapting and testimages, similar to the experiments reported by Zhao and Chubb(2001) and Leopold et al. (2001). Again, strong transfer is impor-tant because it implies that the adaptation alters sensitivity inprocesses that represent shape or configuration independent of theactual spatial location of the features making up the configuration,thus implying higher levels of visual coding. Alternatively, strongselectivity might instead imply sites of adaptation that are moredirectly tied to simple properties of the stimuli such as their retinallocation. To test between these alternatives, we assessed the after-
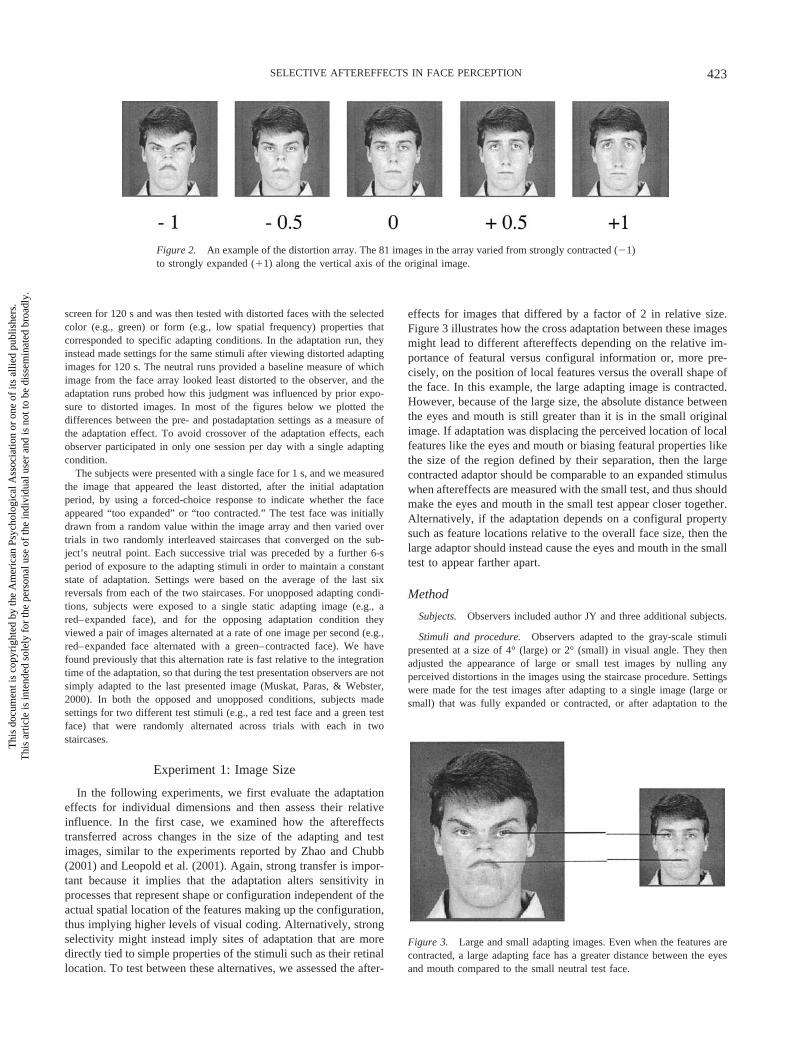
effects for images that differed by a factor of 2 in relative size.Figure 3 illustrates how the cross adaptation between these imagesmight lead to different aftereffects depending on the relative im-portance of featural versus configural information or, more pre-cisely, on the position of local features versus the overall shape ofthe face. In this example, the large adapting image is contracted.However, because of the large size, the absolute distance betweenthe eyes and mouth is still greater than it is in the small originalimage. If adaptation was displacing the perceived location of localfeatures like the eyes and mouth or biasing featural properties likethe size of the region defined by their separation, then the largecontracted adaptor should be comparable to an expanded stimuluswhen aftereffects are measured with the small test, and thus shouldmake the eyes and mouth in the small test appear closer together.Alternatively, if the adaptation depends on a configural propertysuch as feature locations relative to the overall face size, then thelarge adaptor should instead cause the eyes and mouth in the smalltest to appear farther apart.
Method
Subjects. Observers included author JY and three additional subjects.
Stimuli and procedure. Observers adapted to the gray-scale stimulipresented at a size of 4° (large) or 2° (small) in visual angle. They thenadjusted the appearance of large or small test images by nulling anyperceived distortions in the images using the staircase procedure. Settingswere made for the test images after adapting to a single image (large orsmall) that was fully expanded or contracted, or after adaptation to the
Figure 2. An example of the distortion array. The 81 images in the array varied from strongly contracted (�1)to strongly expanded (�1) along the vertical axis of the original image.
Figure 3. Large and small adapting images. Even when the features arecontracted, a large adapting face has a greater distance between the eyesand mouth compared to the small neutral test face.
423SELECTIVE AFTEREFFECTS IN FACE PERCEPTION
This
doc
umen
t is c
opyr
ight
ed b
y th
e A
mer
ican
Psy
chol
ogic
al A
ssoc
iatio
n or
one
of i
ts a
llied
pub
lishe
rs.
This
arti
cle
is in
tend
ed so
lely
for t
he p
erso
nal u
se o
f the
indi
vidu
al u
ser a
nd is
not
to b
e di
ssem
inat
ed b
road
ly.
opposing pair of a large–contracted and small–expanded face or viceversa.
Results
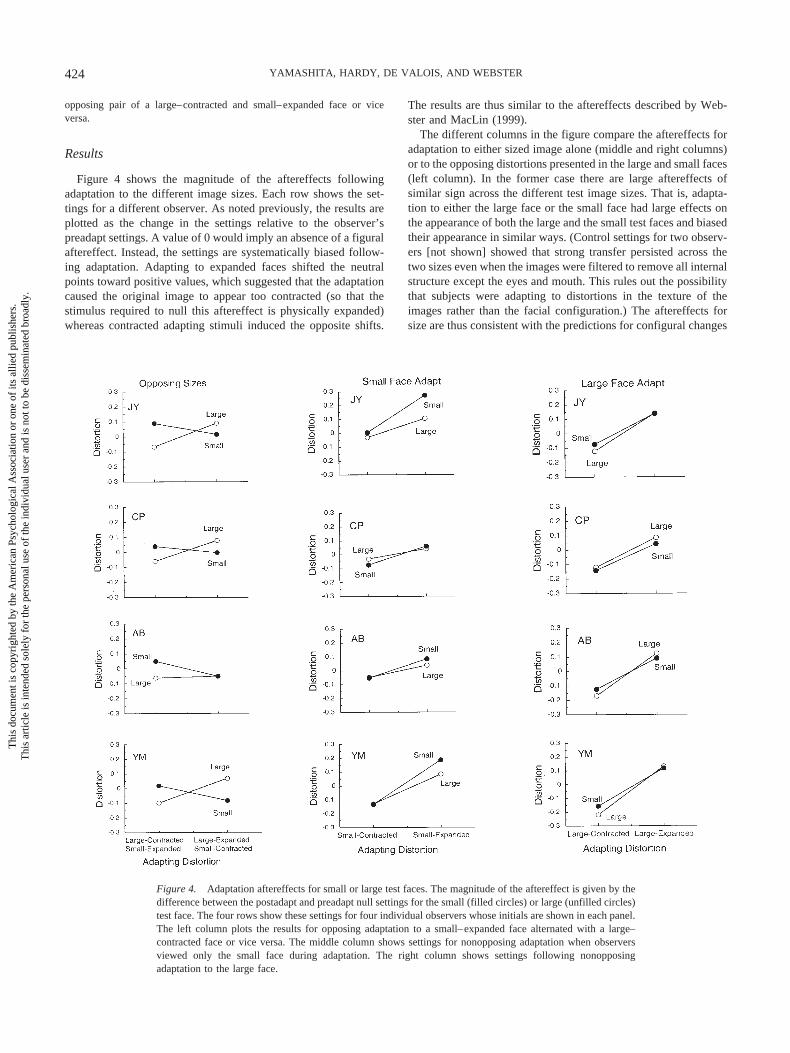
Figure 4 shows the magnitude of the aftereffects followingadaptation to the different image sizes. Each row shows the set-tings for a different observer. As noted previously, the results areplotted as the change in the settings relative to the observer’spreadapt settings. A value of 0 would imply an absence of a figuralaftereffect. Instead, the settings are systematically biased follow-ing adaptation. Adapting to expanded faces shifted the neutralpoints toward positive values, which suggested that the adaptationcaused the original image to appear too contracted (so that thestimulus required to null this aftereffect is physically expanded)whereas contracted adapting stimuli induced the opposite shifts.
The results are thus similar to the aftereffects described by Web-ster and MacLin (1999).
The different columns in the figure compare the aftereffects foradaptation to either sized image alone (middle and right columns)or to the opposing distortions presented in the large and small faces(left column). In the former case there are large aftereffects ofsimilar sign across the different test image sizes. That is, adapta-tion to either the large face or the small face had large effects onthe appearance of both the large and the small test faces and biasedtheir appearance in similar ways. (Control settings for two observ-ers [not shown] showed that strong transfer persisted across thetwo sizes even when the images were filtered to remove all internalstructure except the eyes and mouth. This rules out the possibilitythat subjects were adapting to distortions in the texture of theimages rather than the facial configuration.) The aftereffects forsize are thus consistent with the predictions for configural changes
Figure 4. Adaptation aftereffects for small or large test faces. The magnitude of the aftereffect is given by thedifference between the postadapt and preadapt null settings for the small (filled circles) or large (unfilled circles)test face. The four rows show these settings for four individual observers whose initials are shown in each panel.The left column plots the results for opposing adaptation to a small–expanded face alternated with a large–contracted face or vice versa. The middle column shows settings for nonopposing adaptation when observersviewed only the small face during adaptation. The right column shows settings following nonopposingadaptation to the large face.
424 YAMASHITA, HARDY, DE VALOIS, AND WEBSTER

This
doc
umen
t is c
opyr
ight
ed b
y th
e A
mer
ican
Psy
chol
ogic
al A
ssoc
iatio
n or
one
of i
ts a
llied
pub
lishe
rs.
This
arti
cle
is in
tend
ed so
lely
for t
he p
erso
nal u
se o
f the
indi
vidu
al u
ser a
nd is
not
to b
e di
ssem
inat
ed b
road
ly.
in the stimuli rather than the predictions for distortions in thepositions of the local features (see Figure 3) and replicate theresults of Zhao and Chubb (2001) and Leopold et al. (2001).
The crossing curves in the left-hand panels of Figure 4 show thatthere is also selectivity for size in the aftereffects. Specifically, inthe opposing condition opposite aftereffects were simultaneouslyinduced in the appearance of the large and small test faces. Forexample, adaptation to the large–contracted face made the largetest face appear expanded, and at the same time adaptation to thesmall–expanded face made the small face appear contracted.These results indicate that the adapted mechanisms are not com-pletely insensitive to absolute stimulus size, which is a finding thatis also consistent with the results of Zhao and Chubb (2001).
To better evaluate the role of stimulus size in the aftereffect, wecalculated indices of selectivity from each observer’s results(Hardy & De Valois, 2002). For the nonopposing adaptationconditions, the index was defined as
Selectivity � ��As � �Ad�/�As,
in which �As equals the difference between the observer’s settingsfor expanded and contracted adaptation when the adapt and teststimuli were the same (e.g., both large or both small), and �Ad
equals the corresponding difference when the adapt and test stim-uli differed (e.g., large test and small adapt or vice versa).
By this measure, a completely selective aftereffect would havea value of 1.0 (i.e., no aftereffect when the test and adapt differed),and a completely nonselective aftereffect would have a value of 0(i.e., same aftereffect whether the adapt and test were the same ordifferent). A value less than 0 would mean that adaptation wasactually stronger when the adapt and test stimuli differed. Forexample, this could happen if a large adapting face had largereffects than a small adapting face on small test faces, perhapsbecause the large face adapted a larger visual area and thus a largerpool of mechanisms.
For the opposing adaptation, we used an unnormalized indexbased on only the difference in the null settings for each test face(small or large) following adaptation to an expansion or contrac-tion in the corresponding adapting face (small or large). Thus, inthis case: change in null setting equals the difference between theobserver’s settings for a small (large) test face when the small(large) adapting face was expanded or contracted.
Here again, positive values correspond to a selective aftereffect,a value of 0 corresponds to a nonselective effect, and negativevalues suggest that the different-adapt stimulus dominated over thesame-adapt stimulus. The actual size of this difference is less easyto interpret because the opposing conditions do not provide a wayto normalize for the overall magnitude of the aftereffect (andmeasurements of this magnitude from nonopposing conditionswere collected for a different subset of observers and conditions).Nevertheless, we show below that the two measures lead to verysimilar interpretations about the selectivity for the different stim-ulus dimensions.
Figure 5 plots these indices for the individual observers. The toppanel shows the size of the shifts in the nulls for opposing adap-tation, and the bottom panel plots the indices derived from theresults for the unopposed adaptation. In each case, the bar chartsshow the values for both the large and small stimuli and theirmean. We evaluated these indices using within-subject analyses ofvariance (ANOVAs) based on the mean settings for each observerin each adapting and test condition. The opposing aftereffects were
assessed with a two-way ANOVA comparing adapting condition(large–expanded and small–contracted vs. large–contracted andsmall–expanded) and test size (large vs. small); see Table 1. Maineffects for the adapt condition and test size were not significant,which suggests that the two image sizes were equally potent underthese conditions. On the other hand, the interaction was highlysignificant, which confirms that the aftereffects are selective forthe relative size of the adapt and test images.
For the nonopposing adaptation, the results also suggest partialselectivity for the two sizes (i.e., the indices are consistentlygreater than zero but less than one). Aftereffects for the nonop-posing conditions were assessed by evaluating the observers’ meansettings in a three-way ANOVA comparing adapt size (large vs.small), test size (large vs. small), and adapt distortion (expandedvs. contracted); see Table 2. In this case, there is a significanteffect of the distortion (showing that significant figural aftereffectswere indeed induced in the faces), and a significant effect of theadapt size. This is likely to reflect less selective adaptation fol-lowing exposure to the large adapt faces, an asymmetry which was
Figure 5. Estimates of the selectivity of the adaptation for the sizedifferences in the images. Each bar shows the selectivity of the aftereffectmeasured for a single observer for the small or large images or the meanselectivity for both. The upper panel plots the size of the aftereffects foropposing adaptation as represented by the difference between the nullsettings for the expanded or contracted adapting conditions for either thesmall or large test. The lower panel plots the selectivity index for thenonopposing adaptation (see text).
425SELECTIVE AFTEREFFECTS IN FACE PERCEPTION
This
doc
umen
t is c
opyr
ight
ed b
y th
e A
mer
ican
Psy
chol
ogic
al A
ssoc
iatio
n or
one
of i
ts a
llied
pub
lishe
rs.
This
arti
cle
is in
tend
ed so
lely
for t
he p
erso
nal u
se o
f the
indi
vidu
al u
ser a
nd is
not
to b
e di
ssem
inat
ed b
road
ly.
also reported by Zhao and Chubb (2001), and which was con-firmed by comparing the indices for the large and small adaptconditions, t(6) � �4.21, p .01. Note that in this ANOVA, theselectivity for size is tested by the three-way interaction betweenthe factors. (This is because the two-way interaction between adaptand test size pools across the two distortion levels, which induceopposite aftereffects and thus cancel each other.) This interactionis again significant and thus again confirms selectivity for sizeeven in the case of nonopposing adaptation. Finally, a significantinteraction was also found between the adapt size and the adaptingdistortion, though the basis for this is unclear.
Experiment 2: Spatial Frequency
The preceding results confirmed that adaptation could alter theappearance of faces even if they differed in stimulus size. In thenext experiment, we examined a different form of scaling bytesting the influence of the spatial frequency content of the stimuli,or the size of the spatial structure making up the images. Specif-ically, we examined whether a distortion presented at one fre-quency range (e.g., high) could produce aftereffects in imagespresented at different ranges (e.g., low). Lower level pattern ad-aptation effects can be strongly selective for spatial frequency,(Graham, 1989) yet it is unclear how filtering the images mightinfluence adaptation in face processing. Previous studies haveshown that medium spatial frequencies may be especially impor-tant for face recognition (Costen, Parker, & Craw, 1996; Gold,Bennett, & Sekuler, 1999; Nasanen, 1999), though some capacityfor recognition persists even for images that are strongly blurred(Yip & Sinha, 2002). If filtering leaves the basic facial configu-ration intact, then we might expect little selectivity for frequency.On the other hand, if frequency was an important feature in therepresentation of faces, or if changing this feature also alteredconfigural processing, then aftereffects might be strongly selectivefor this dimension.
Method
Subjects. Observers included authors JY and MW and three additionalsubjects.
Stimuli and procedure. The gray-scale image arrays were filtered intodifferent frequency ranges to form two new arrays that corresponded to ahigh-pass and low-pass image set. These had frequency ranges of 1–8 and16–128 cycles per image (equal to 0.25–2 and 4–32 cycles per degree inthe display; see Figure 6). The high- and low-frequency sets were thus eachthree octaves wide with one octave gap between them. For technicalreasons the image size was reduced to 256 � 256 pixels. For this exper-
iment, we therefore halved the viewing distance so that the displayedimages still subtended 4°. Procedures were otherwise identical to Experi-ment 1.
Results
The bar charts in Figure 7 again illustrate the aftereffects foreach subject for both opposing and nonopposing adaptation. Com-pared to the effects of image size, aftereffects for the filteredimages showed less transfer across the two frequency ranges. Theindices varied widely for individual subjects, but averaged roughly0.6 for the low- and high-frequency nonopposing conditions com-pared to a mean of 0.3 for the large and small size conditions, adifference which was significant, t(16) � �3.35, p .01. There isalso no evidence for an asymmetry between the selectivity for thelow- and high-frequency images, t(8) � �.83, ns. Again, theeffects of frequency were assessed with within-subject ANOVAs.Significant interactions for both opposing and nonopposing adap-tation confirmed that the adaptation was selective for the spatialfrequency content of the face images (Tables 3 and 4).
The clear selectivity for the frequency content of the stimulicould be because the low-pass and high-pass images adaptedmechanisms tuned to different spatial frequencies, or becausefiltering the images altered other properties of the faces that theadaptation is selective for. We consider the latter possibility inExperiment 6.
Experiment 3: Contrast Polarity
In the next three experiments, we kept the spatial properties ofthe images the same but varied the contrast or color of the faces.The present experiment assessed the influence of contrast polarity.Early visual mechanisms are known to include distinct on and offpathways encoding contrast increments and decrements, and fig-ural aftereffects for simple two-dimensional patterns have beenshown to be polarity-selective (Burton, Nagshineh, & Ruddock,1977; De Valois, 1977). Sensitivity changes tied to this type ofchannel structure might therefore show strong selectivity for thesign of the image contrast. However, as noted earlier, in the caseof faces, inverting the contrast strongly hinders recognition(Galper, 1970). This suggests that the mechanisms subserving facerecognition are specialized for encoding positive contrast, perhapsbecause the inversion disrupts shape from shading cues or becauseof differential experience with positive contrast images (George etal., 1999). A figural aftereffect that was tied closely to the stage of
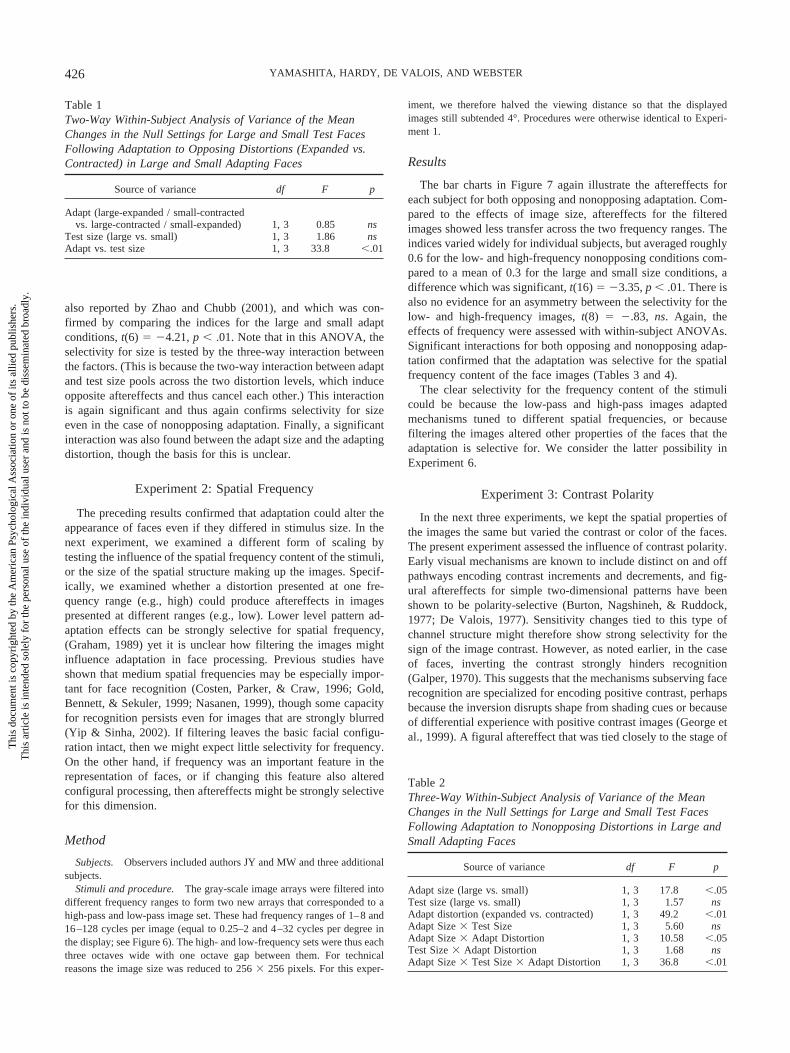
Table 1Two-Way Within-Subject Analysis of Variance of the MeanChanges in the Null Settings for Large and Small Test FacesFollowing Adaptation to Opposing Distortions (Expanded vs.Contracted) in Large and Small Adapting Faces
Source of variance df F p
Adapt (large-expanded / small-contractedvs. large-contracted / small-expanded) 1, 3 0.85 ns
Test size (large vs. small) 1, 3 1.86 nsAdapt vs. test size 1, 3 33.8 .01
Table 2Three-Way Within-Subject Analysis of Variance of the MeanChanges in the Null Settings for Large and Small Test FacesFollowing Adaptation to Nonopposing Distortions in Large andSmall Adapting Faces
Source of variance df F p
Adapt size (large vs. small) 1, 3 17.8 .05Test size (large vs. small) 1, 3 1.57 nsAdapt distortion (expanded vs. contracted) 1, 3 49.2 .01Adapt Size � Test Size 1, 3 5.60 nsAdapt Size � Adapt Distortion 1, 3 10.58 .05Test Size � Adapt Distortion 1, 3 1.68 nsAdapt Size � Test Size � Adapt Distortion 1, 3 36.8 .01
426 YAMASHITA, HARDY, DE VALOIS, AND WEBSTER

This
doc
umen
t is c
opyr
ight
ed b
y th
e A
mer
ican
Psy
chol
ogic
al A
ssoc
iatio
n or
one
of i
ts a
llied
pub
lishe
rs.
This
arti
cle
is in
tend
ed so
lely
for t
he p
erso
nal u
se o
f the
indi
vidu
al u
ser a
nd is
not
to b
e di
ssem
inat
ed b
road
ly.
face recognition might therefore show asymmetric aftereffects forpositive and negative contrast images. For example, the distortionsmight be more salient in the positive images, so that positivecontrast adapting and test images might lead to larger aftereffects.
Method
Subjects. Observers included authors JY and MW and three additionalsubjects.
Stimuli and procedure. Images from the array of distortions for theface in Figure 1 were shown as positive gray-scale images or with thecontrasts inverted by inverting the pixel luminance values (relative to theimage mean; Figure 8). Aftereffects were then assessed as before for bothopposing adaptation to opposite distortions in the negative and positiveimages and simple adaptation to either the positive or negative distortion.
Results
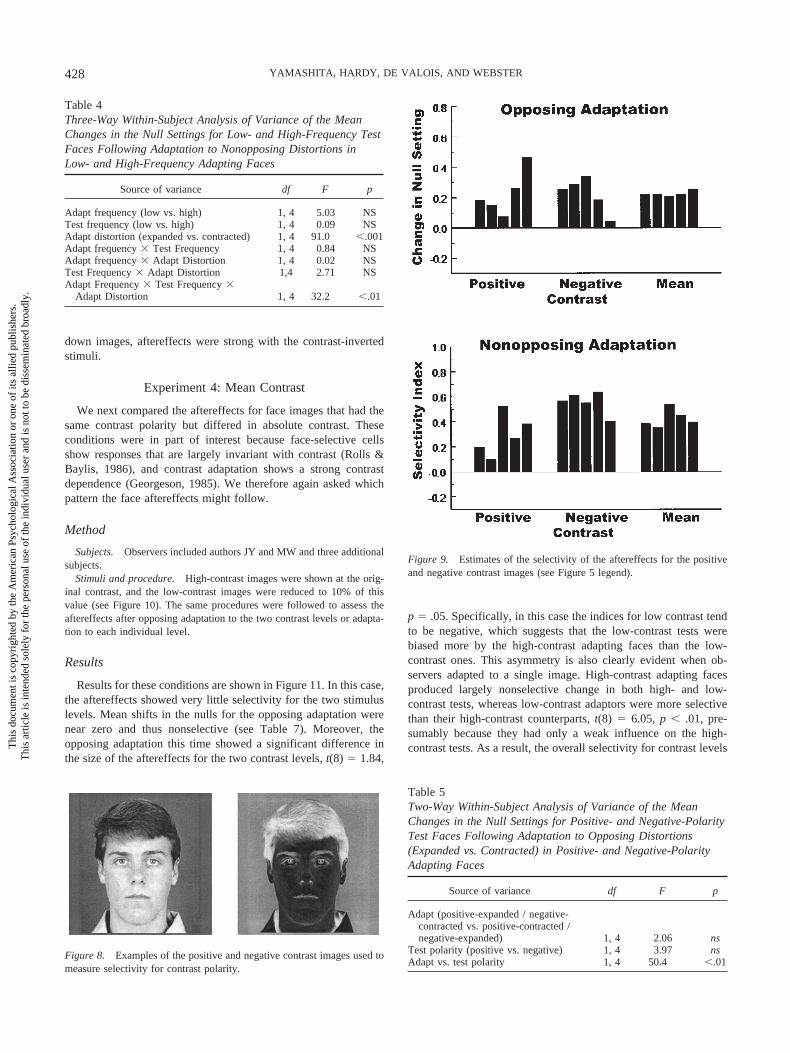
Figure 9 plots the pattern of the aftereffects following adaptationto the positive and negative faces. Opposing adaptation inducedsimultaneous shifts in opposite directions for the two types ofimages, thus resulting in changes in the null settings that wereclearly selective for the adapting polarity (see Table 5). Thus, likespatial frequency and size, the adaptation aftereffect was alsocontingent on contrast polarity. Moderately strong selectivity isalso suggested by the results for nonopposing adaptation, as againconfirmed by a significant three-way interaction between adaptpolarity, test polarity, and adapt distortion (see Table 6). In thiscase, adaptation to positive contrast showed more transfer to testimages of negative contrast than vice versa, t(8) � �3.09, p .01.This asymmetry may parallel the asymmetries in contrast coding inface recognition. However, like the previous reports for upside-
Figure 7. Estimates of selectivity of the aftereffects for the highpass andlowpass filtered images (see Figure 5 legend).
Table 3Two-Way Within-Subject Analysis of Variance of the MeanChanges in the Null Settings for Low- and High-Frequency TestFaces Following Adaptation to Opposing Distortions (Expandedvs. Contracted) in Low- and High-Frequency Adapting Faces
Source of variance df F p
Adapt (low-expanded / high-contractedvs. low-contracted / high-expanded) 1, 4 0 ns
Test frequency (low vs. high) 1, 4 4.39 nsAdapt vs. test frequency 1, 4 19.5 .05
Figure 6. Examples of the highpass or lowpass filtered images used to measure selectivity for spatial frequency.
427SELECTIVE AFTEREFFECTS IN FACE PERCEPTION
This
doc
umen
t is c
opyr
ight
ed b
y th
e A
mer
ican
Psy
chol
ogic
al A
ssoc
iatio
n or
one
of i
ts a
llied
pub
lishe
rs.
This
arti
cle
is in
tend
ed so
lely
for t
he p
erso
nal u
se o
f the
indi
vidu
al u
ser a
nd is
not
to b
e di
ssem
inat
ed b
road
ly.
down images, aftereffects were strong with the contrast-invertedstimuli.
Experiment 4: Mean Contrast
We next compared the aftereffects for face images that had thesame contrast polarity but differed in absolute contrast. Theseconditions were in part of interest because face-selective cellsshow responses that are largely invariant with contrast (Rolls &Baylis, 1986), and contrast adaptation shows a strong contrastdependence (Georgeson, 1985). We therefore again asked whichpattern the face aftereffects might follow.
Method
Subjects. Observers included authors JY and MW and three additionalsubjects.
Stimuli and procedure. High-contrast images were shown at the orig-inal contrast, and the low-contrast images were reduced to 10% of thisvalue (see Figure 10). The same procedures were followed to assess theaftereffects after opposing adaptation to the two contrast levels or adapta-tion to each individual level.
Results
Results for these conditions are shown in Figure 11. In this case,the aftereffects showed very little selectivity for the two stimuluslevels. Mean shifts in the nulls for the opposing adaptation werenear zero and thus nonselective (see Table 7). Moreover, theopposing adaptation this time showed a significant difference inthe size of the aftereffects for the two contrast levels, t(8) � 1.84,
p � .05. Specifically, in this case the indices for low contrast tendto be negative, which suggests that the low-contrast tests werebiased more by the high-contrast adapting faces than the low-contrast ones. This asymmetry is also clearly evident when ob-servers adapted to a single image. High-contrast adapting facesproduced largely nonselective change in both high- and low-contrast tests, whereas low-contrast adaptors were more selectivethan their high-contrast counterparts, t(8) � 6.05, p .01, pre-sumably because they had only a weak influence on the high-contrast tests. As a result, the overall selectivity for contrast levels
Figure 8. Examples of the positive and negative contrast images used tomeasure selectivity for contrast polarity.
Table 4Three-Way Within-Subject Analysis of Variance of the MeanChanges in the Null Settings for Low- and High-Frequency TestFaces Following Adaptation to Nonopposing Distortions inLow- and High-Frequency Adapting Faces
Source of variance df F p
Adapt frequency (low vs. high) 1, 4 5.03 NSTest frequency (low vs. high) 1, 4 0.09 NSAdapt distortion (expanded vs. contracted) 1, 4 91.0 .001Adapt frequency � Test Frequency 1, 4 0.84 NSAdapt frequency � Adapt Distortion 1, 4 0.02 NSTest Frequency � Adapt Distortion 1,4 2.71 NSAdapt Frequency � Test Frequency �
Adapt Distortion 1, 4 32.2 .01
Table 5Two-Way Within-Subject Analysis of Variance of the MeanChanges in the Null Settings for Positive- and Negative-PolarityTest Faces Following Adaptation to Opposing Distortions(Expanded vs. Contracted) in Positive- and Negative-PolarityAdapting Faces
Source of variance df F p
Adapt (positive-expanded / negative-contracted vs. positive-contracted /negative-expanded) 1, 4 2.06 ns
Test polarity (positive vs. negative) 1, 4 3.97 nsAdapt vs. test polarity 1, 4 50.4 .01
Figure 9. Estimates of the selectivity of the aftereffects for the positiveand negative contrast images (see Figure 5 legend).
428 YAMASHITA, HARDY, DE VALOIS, AND WEBSTER
This
doc
umen
t is c
opyr
ight
ed b
y th
e A
mer
ican
Psy
chol
ogic
al A
ssoc
iatio
n or
one
of i
ts a
llied
pub
lishe
rs.
This
arti
cle
is in
tend
ed so
lely
for t
he p
erso
nal u
se o
f the
indi
vidu
al u
ser a
nd is
not
to b
e di
ssem
inat
ed b
road
ly.
was not significant (see Table 8). Thus, the results suggest thatthere is in fact little selectivity for contrast, and that aftereffects arestronger for higher contrast adaptation, which is a pattern that issimilar for grating contrast (Georgeson, 1985).
Experiment 5: Color
The final image property that we examined was stimulus color.In this case, the gray-scale images were replaced by images thatagain varied in luminance but differed in mean chromaticity.Orientation and size aftereffects for simple two-dimensional pat-terns such as gratings show selectivity for mean color (Hardy & DeValois, 2002), so that aftereffects for complex naturalistic imageslike faces might similarly show a contingency for color. On theother hand, shape-from-shading cues are largely restricted to lu-minance variations in the stimulus and thus are not carried by color(Cavanagh & LeClerc, 1989). Thus, aftereffects that were moretied to the three-dimensional interpretation of the patterns might beexpected to show little dependence on color.
Method
Subjects. Observers included authors JY and MW and three additionalsubjects. MW made settings only for opposing adaptation.
Stimuli and procedure. Selectivity for color was tested by opposingadaptation to pairs of distortions defined by red and green images. The redand green chromaticities were chosen from the monitor’s phosphors. Thisprovided the largest attainable color differences in the images, and thusshould be the most likely to produce a measurable effect. These are also thecolors typically used in studies of contingent color aftereffects like theMcCollough effect, as described next (Stromeyer, 1978). The red and greenimages were equated for luminance by flicker-photometric matching be-
tween green and red faces presented in rapid alternation. Specifically, thered image was shown at the highest luminance available, and then observ-ers adjusted the luminance of the green face in order to minimize lumi-nance flicker between the red and green images.
Results
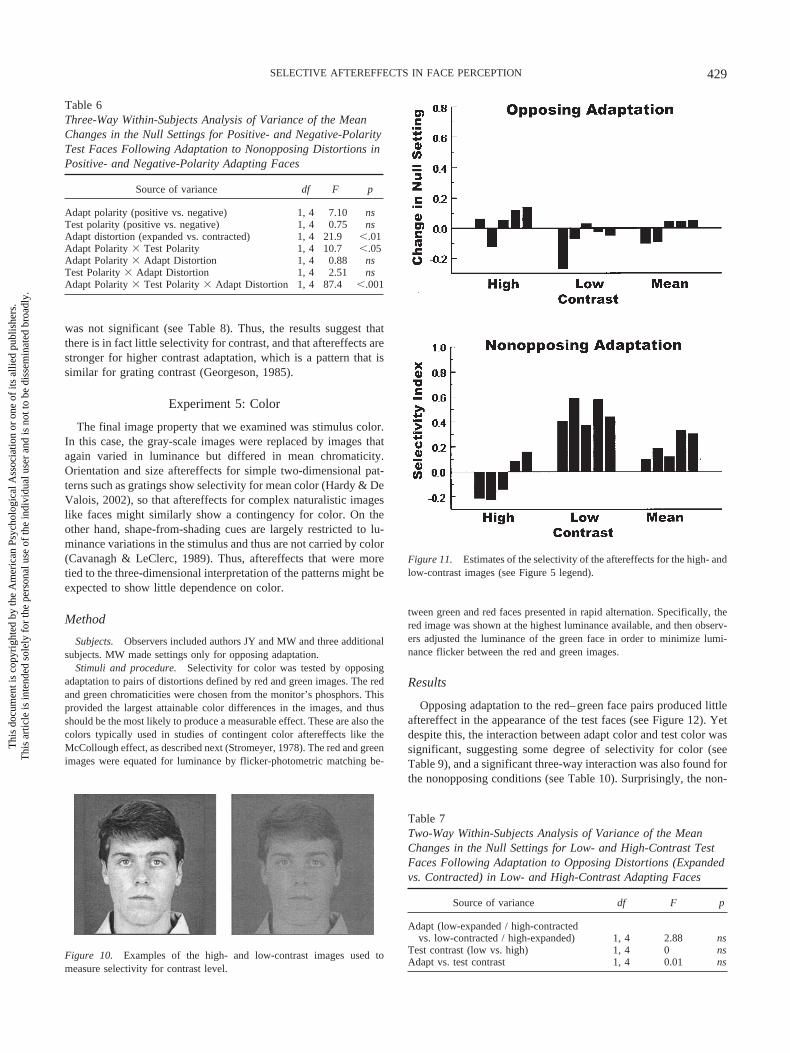
Opposing adaptation to the red–green face pairs produced littleaftereffect in the appearance of the test faces (see Figure 12). Yetdespite this, the interaction between adapt color and test color wassignificant, suggesting some degree of selectivity for color (seeTable 9), and a significant three-way interaction was also found forthe nonopposing conditions (see Table 10). Surprisingly, the non-
Figure 10. Examples of the high- and low-contrast images used tomeasure selectivity for contrast level.
Table 7Two-Way Within-Subjects Analysis of Variance of the MeanChanges in the Null Settings for Low- and High-Contrast TestFaces Following Adaptation to Opposing Distortions (Expandedvs. Contracted) in Low- and High-Contrast Adapting Faces
Source of variance df F p
Adapt (low-expanded / high-contractedvs. low-contracted / high-expanded) 1, 4 2.88 ns
Test contrast (low vs. high) 1, 4 0 nsAdapt vs. test contrast 1, 4 0.01 ns
Table 6Three-Way Within-Subjects Analysis of Variance of the MeanChanges in the Null Settings for Positive- and Negative-PolarityTest Faces Following Adaptation to Nonopposing Distortions inPositive- and Negative-Polarity Adapting Faces
Source of variance df F p
Adapt polarity (positive vs. negative) 1, 4 7.10 nsTest polarity (positive vs. negative) 1, 4 0.75 nsAdapt distortion (expanded vs. contracted) 1, 4 21.9 .01Adapt Polarity � Test Polarity 1, 4 10.7 .05Adapt Polarity � Adapt Distortion 1, 4 0.88 nsTest Polarity � Adapt Distortion 1, 4 2.51 nsAdapt Polarity � Test Polarity � Adapt Distortion 1, 4 87.4 .001
Figure 11. Estimates of the selectivity of the aftereffects for the high- andlow-contrast images (see Figure 5 legend).
429SELECTIVE AFTEREFFECTS IN FACE PERCEPTION
This
doc
umen
t is c
opyr
ight
ed b
y th
e A
mer
ican
Psy
chol
ogic
al A
ssoc
iatio
n or
one
of i
ts a
llied
pub
lishe
rs.
This
arti
cle
is in
tend
ed so
lely
for t
he p
erso
nal u
se o
f the
indi
vidu
al u
ser a
nd is
not
to b
e di
ssem
inat
ed b
road
ly.
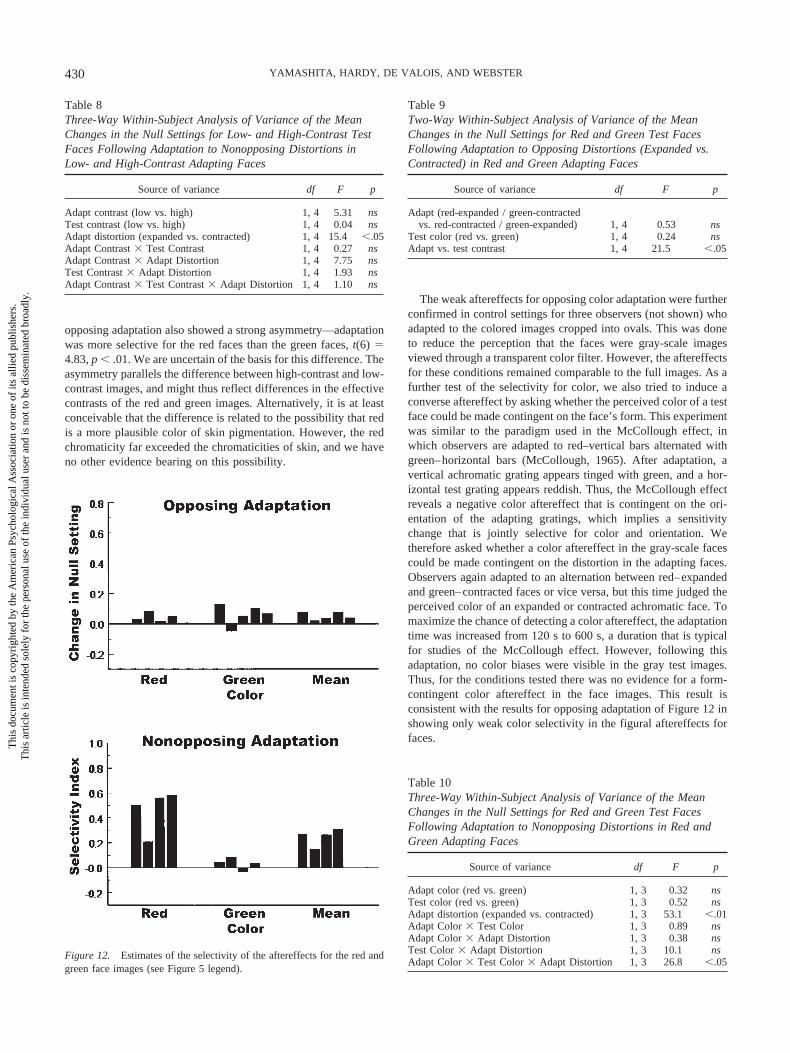
opposing adaptation also showed a strong asymmetry—adaptationwas more selective for the red faces than the green faces, t(6) �4.83, p .01. We are uncertain of the basis for this difference. Theasymmetry parallels the difference between high-contrast and low-contrast images, and might thus reflect differences in the effectivecontrasts of the red and green images. Alternatively, it is at leastconceivable that the difference is related to the possibility that redis a more plausible color of skin pigmentation. However, the redchromaticity far exceeded the chromaticities of skin, and we haveno other evidence bearing on this possibility.
The weak aftereffects for opposing color adaptation were furtherconfirmed in control settings for three observers (not shown) whoadapted to the colored images cropped into ovals. This was doneto reduce the perception that the faces were gray-scale imagesviewed through a transparent color filter. However, the aftereffectsfor these conditions remained comparable to the full images. As afurther test of the selectivity for color, we also tried to induce aconverse aftereffect by asking whether the perceived color of a testface could be made contingent on the face’s form. This experimentwas similar to the paradigm used in the McCollough effect, inwhich observers are adapted to red–vertical bars alternated withgreen–horizontal bars (McCollough, 1965). After adaptation, avertical achromatic grating appears tinged with green, and a hor-izontal test grating appears reddish. Thus, the McCollough effectreveals a negative color aftereffect that is contingent on the ori-entation of the adapting gratings, which implies a sensitivitychange that is jointly selective for color and orientation. Wetherefore asked whether a color aftereffect in the gray-scale facescould be made contingent on the distortion in the adapting faces.Observers again adapted to an alternation between red–expandedand green–contracted faces or vice versa, but this time judged theperceived color of an expanded or contracted achromatic face. Tomaximize the chance of detecting a color aftereffect, the adaptationtime was increased from 120 s to 600 s, a duration that is typicalfor studies of the McCollough effect. However, following thisadaptation, no color biases were visible in the gray test images.Thus, for the conditions tested there was no evidence for a form-contingent color aftereffect in the face images. This result isconsistent with the results for opposing adaptation of Figure 12 inshowing only weak color selectivity in the figural aftereffects forfaces.
Figure 12. Estimates of the selectivity of the aftereffects for the red andgreen face images (see Figure 5 legend).
Table 10Three-Way Within-Subject Analysis of Variance of the MeanChanges in the Null Settings for Red and Green Test FacesFollowing Adaptation to Nonopposing Distortions in Red andGreen Adapting Faces
Source of variance df F p
Adapt color (red vs. green) 1, 3 0.32 nsTest color (red vs. green) 1, 3 0.52 nsAdapt distortion (expanded vs. contracted) 1, 3 53.1 .01Adapt Color � Test Color 1, 3 0.89 nsAdapt Color � Adapt Distortion 1, 3 0.38 nsTest Color � Adapt Distortion 1, 3 10.1 nsAdapt Color � Test Color � Adapt Distortion 1, 3 26.8 .05
Table 8Three-Way Within-Subject Analysis of Variance of the MeanChanges in the Null Settings for Low- and High-Contrast TestFaces Following Adaptation to Nonopposing Distortions inLow- and High-Contrast Adapting Faces
Source of variance df F p
Adapt contrast (low vs. high) 1, 4 5.31 nsTest contrast (low vs. high) 1, 4 0.04 nsAdapt distortion (expanded vs. contracted) 1, 4 15.4 .05Adapt Contrast � Test Contrast 1, 4 0.27 nsAdapt Contrast � Adapt Distortion 1, 4 7.75 nsTest Contrast � Adapt Distortion 1, 4 1.93 nsAdapt Contrast � Test Contrast � Adapt Distortion 1, 4 1.10 ns
Table 9Two-Way Within-Subject Analysis of Variance of the MeanChanges in the Null Settings for Red and Green Test FacesFollowing Adaptation to Opposing Distortions (Expanded vs.Contracted) in Red and Green Adapting Faces
Source of variance df F p
Adapt (red-expanded / green-contractedvs. red-contracted / green-expanded) 1, 4 0.53 ns
Test color (red vs. green) 1, 4 0.24 nsAdapt vs. test contrast 1, 4 21.5 .05
430 YAMASHITA, HARDY, DE VALOIS, AND WEBSTER
This
doc
umen
t is c
opyr
ight
ed b
y th
e A
mer
ican
Psy
chol
ogic
al A
ssoc
iatio
n or
one
of i
ts a
llied
pub
lishe
rs.
This
arti
cle
is in
tend
ed so
lely
for t
he p
erso
nal u
se o
f the
indi
vidu
al u
ser a
nd is
not
to b
e di
ssem
inat
ed b
road
ly.
Experiment 6: Stimulus Selectivity and SubjectiveSimilarity
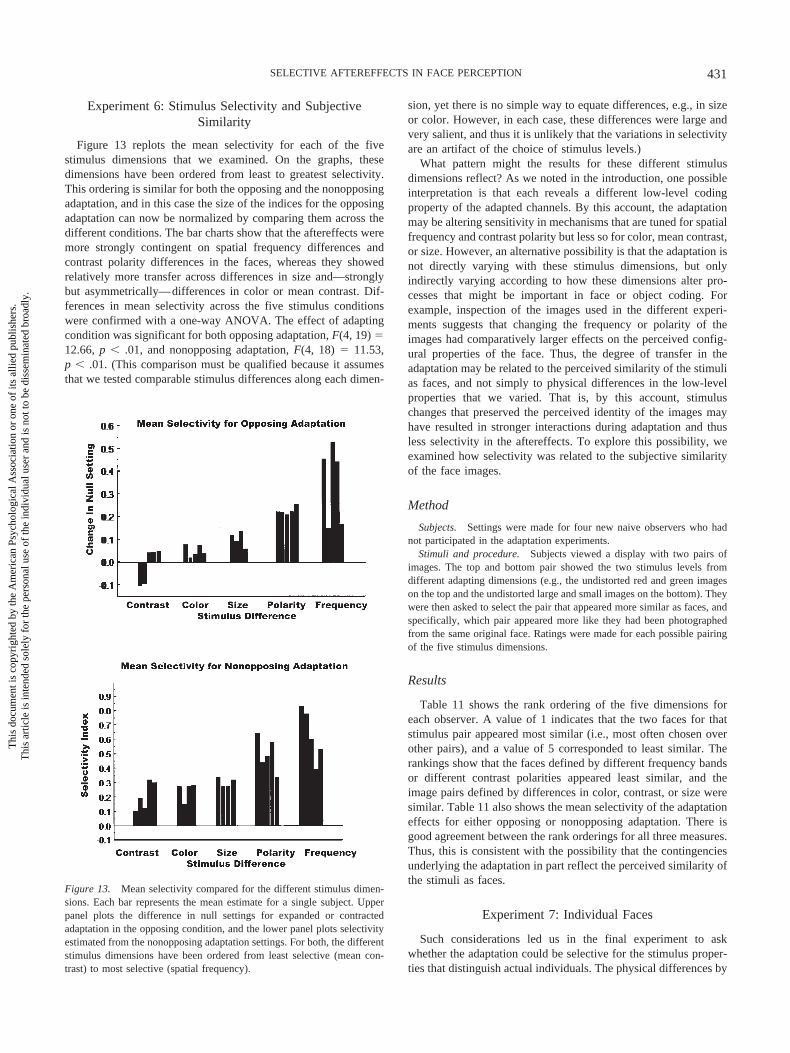
Figure 13 replots the mean selectivity for each of the fivestimulus dimensions that we examined. On the graphs, thesedimensions have been ordered from least to greatest selectivity.This ordering is similar for both the opposing and the nonopposingadaptation, and in this case the size of the indices for the opposingadaptation can now be normalized by comparing them across thedifferent conditions. The bar charts show that the aftereffects weremore strongly contingent on spatial frequency differences andcontrast polarity differences in the faces, whereas they showedrelatively more transfer across differences in size and—stronglybut asymmetrically—differences in color or mean contrast. Dif-ferences in mean selectivity across the five stimulus conditionswere confirmed with a one-way ANOVA. The effect of adaptingcondition was significant for both opposing adaptation, F(4, 19) �12.66, p .01, and nonopposing adaptation, F(4, 18) � 11.53,p .01. (This comparison must be qualified because it assumesthat we tested comparable stimulus differences along each dimen-
sion, yet there is no simple way to equate differences, e.g., in sizeor color. However, in each case, these differences were large andvery salient, and thus it is unlikely that the variations in selectivityare an artifact of the choice of stimulus levels.)
What pattern might the results for these different stimulusdimensions reflect? As we noted in the introduction, one possibleinterpretation is that each reveals a different low-level codingproperty of the adapted channels. By this account, the adaptationmay be altering sensitivity in mechanisms that are tuned for spatialfrequency and contrast polarity but less so for color, mean contrast,or size. However, an alternative possibility is that the adaptation isnot directly varying with these stimulus dimensions, but onlyindirectly varying according to how these dimensions alter pro-cesses that might be important in face or object coding. Forexample, inspection of the images used in the different experi-ments suggests that changing the frequency or polarity of theimages had comparatively larger effects on the perceived config-ural properties of the face. Thus, the degree of transfer in theadaptation may be related to the perceived similarity of the stimulias faces, and not simply to physical differences in the low-levelproperties that we varied. That is, by this account, stimuluschanges that preserved the perceived identity of the images mayhave resulted in stronger interactions during adaptation and thusless selectivity in the aftereffects. To explore this possibility, weexamined how selectivity was related to the subjective similarityof the face images.
Method
Subjects. Settings were made for four new naive observers who hadnot participated in the adaptation experiments.
Stimuli and procedure. Subjects viewed a display with two pairs ofimages. The top and bottom pair showed the two stimulus levels fromdifferent adapting dimensions (e.g., the undistorted red and green imageson the top and the undistorted large and small images on the bottom). Theywere then asked to select the pair that appeared more similar as faces, andspecifically, which pair appeared more like they had been photographedfrom the same original face. Ratings were made for each possible pairingof the five stimulus dimensions.
Results
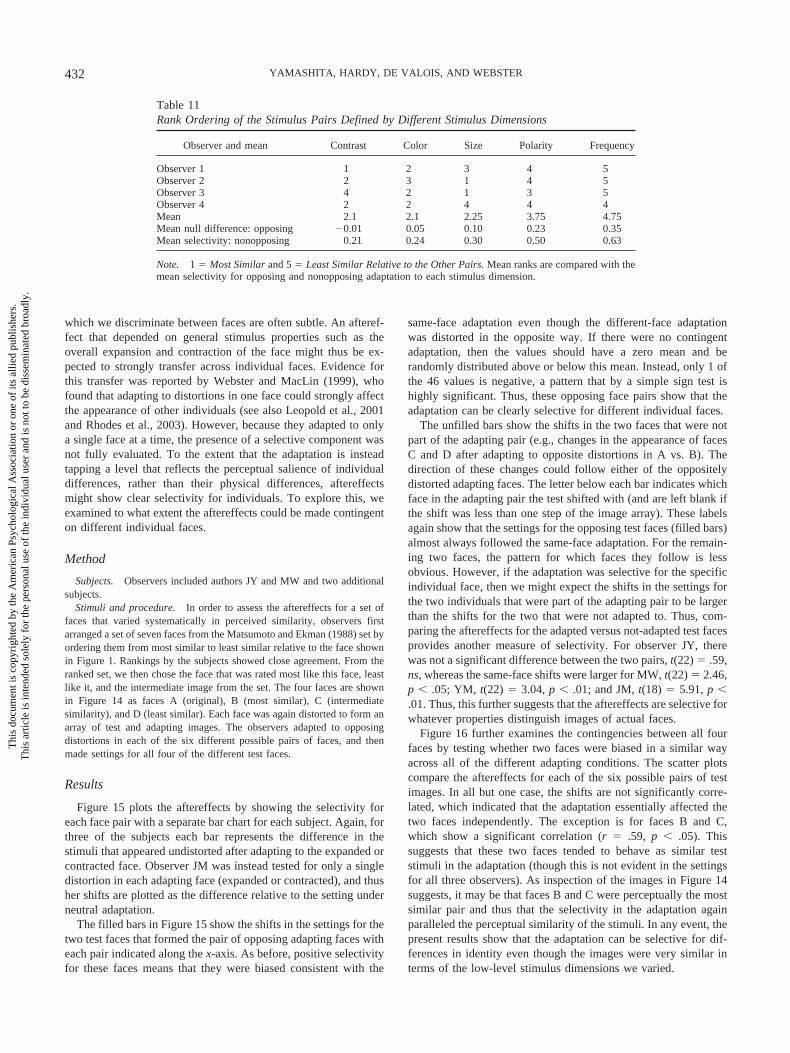
Table 11 shows the rank ordering of the five dimensions foreach observer. A value of 1 indicates that the two faces for thatstimulus pair appeared most similar (i.e., most often chosen overother pairs), and a value of 5 corresponded to least similar. Therankings show that the faces defined by different frequency bandsor different contrast polarities appeared least similar, and theimage pairs defined by differences in color, contrast, or size weresimilar. Table 11 also shows the mean selectivity of the adaptationeffects for either opposing or nonopposing adaptation. There isgood agreement between the rank orderings for all three measures.Thus, this is consistent with the possibility that the contingenciesunderlying the adaptation in part reflect the perceived similarity ofthe stimuli as faces.
Experiment 7: Individual Faces
Such considerations led us in the final experiment to askwhether the adaptation could be selective for the stimulus proper-ties that distinguish actual individuals. The physical differences by
Figure 13. Mean selectivity compared for the different stimulus dimen-sions. Each bar represents the mean estimate for a single subject. Upperpanel plots the difference in null settings for expanded or contractedadaptation in the opposing condition, and the lower panel plots selectivityestimated from the nonopposing adaptation settings. For both, the differentstimulus dimensions have been ordered from least selective (mean con-trast) to most selective (spatial frequency).
431SELECTIVE AFTEREFFECTS IN FACE PERCEPTION
This
doc
umen
t is c
opyr
ight
ed b
y th
e A
mer
ican
Psy
chol
ogic
al A
ssoc
iatio
n or
one
of i
ts a
llied
pub
lishe
rs.
This
arti
cle
is in
tend
ed so
lely
for t
he p
erso
nal u
se o
f the
indi
vidu
al u
ser a
nd is
not
to b
e di
ssem
inat
ed b
road
ly.
which we discriminate between faces are often subtle. An afteref-fect that depended on general stimulus properties such as theoverall expansion and contraction of the face might thus be ex-pected to strongly transfer across individual faces. Evidence forthis transfer was reported by Webster and MacLin (1999), whofound that adapting to distortions in one face could strongly affectthe appearance of other individuals (see also Leopold et al., 2001and Rhodes et al., 2003). However, because they adapted to onlya single face at a time, the presence of a selective component wasnot fully evaluated. To the extent that the adaptation is insteadtapping a level that reflects the perceptual salience of individualdifferences, rather than their physical differences, aftereffectsmight show clear selectivity for individuals. To explore this, weexamined to what extent the aftereffects could be made contingenton different individual faces.
Method
Subjects. Observers included authors JY and MW and two additionalsubjects.
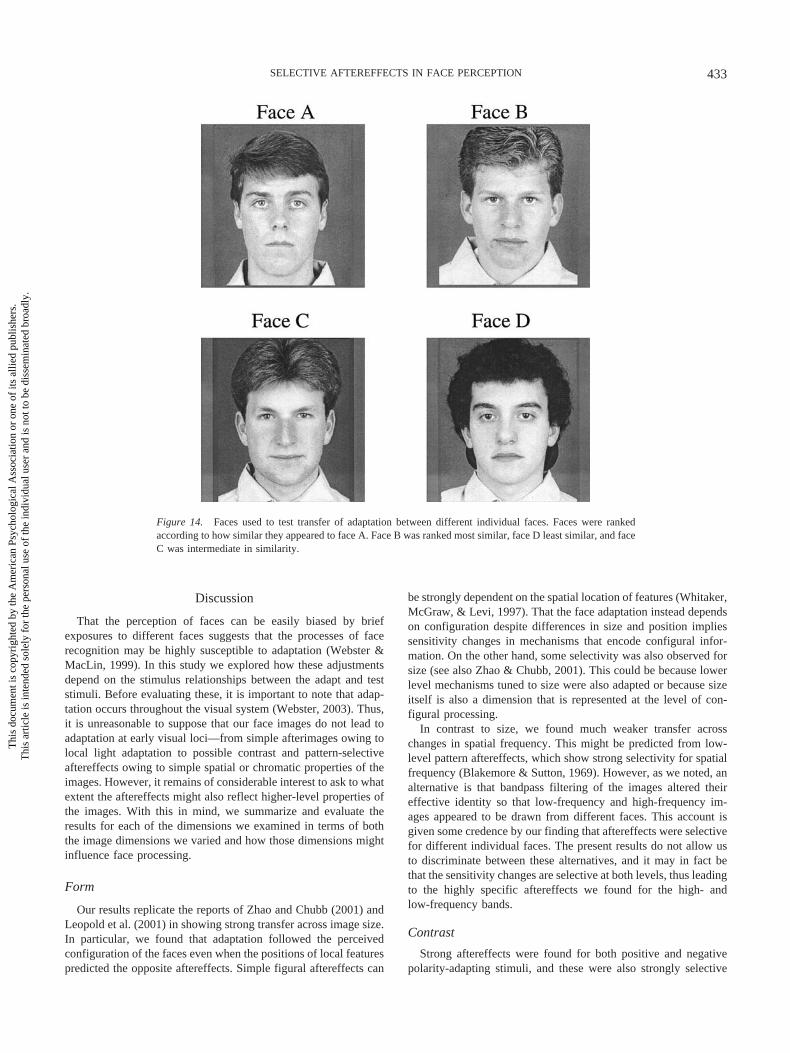
Stimuli and procedure. In order to assess the aftereffects for a set offaces that varied systematically in perceived similarity, observers firstarranged a set of seven faces from the Matsumoto and Ekman (1988) set byordering them from most similar to least similar relative to the face shownin Figure 1. Rankings by the subjects showed close agreement. From theranked set, we then chose the face that was rated most like this face, leastlike it, and the intermediate image from the set. The four faces are shownin Figure 14 as faces A (original), B (most similar), C (intermediatesimilarity), and D (least similar). Each face was again distorted to form anarray of test and adapting images. The observers adapted to opposingdistortions in each of the six different possible pairs of faces, and thenmade settings for all four of the different test faces.
Results
Figure 15 plots the aftereffects by showing the selectivity foreach face pair with a separate bar chart for each subject. Again, forthree of the subjects each bar represents the difference in thestimuli that appeared undistorted after adapting to the expanded orcontracted face. Observer JM was instead tested for only a singledistortion in each adapting face (expanded or contracted), and thusher shifts are plotted as the difference relative to the setting underneutral adaptation.
The filled bars in Figure 15 show the shifts in the settings for thetwo test faces that formed the pair of opposing adapting faces witheach pair indicated along the x-axis. As before, positive selectivityfor these faces means that they were biased consistent with the
same-face adaptation even though the different-face adaptationwas distorted in the opposite way. If there were no contingentadaptation, then the values should have a zero mean and berandomly distributed above or below this mean. Instead, only 1 ofthe 46 values is negative, a pattern that by a simple sign test ishighly significant. Thus, these opposing face pairs show that theadaptation can be clearly selective for different individual faces.
The unfilled bars show the shifts in the two faces that were notpart of the adapting pair (e.g., changes in the appearance of facesC and D after adapting to opposite distortions in A vs. B). Thedirection of these changes could follow either of the oppositelydistorted adapting faces. The letter below each bar indicates whichface in the adapting pair the test shifted with (and are left blank ifthe shift was less than one step of the image array). These labelsagain show that the settings for the opposing test faces (filled bars)almost always followed the same-face adaptation. For the remain-ing two faces, the pattern for which faces they follow is lessobvious. However, if the adaptation was selective for the specificindividual face, then we might expect the shifts in the settings forthe two individuals that were part of the adapting pair to be largerthan the shifts for the two that were not adapted to. Thus, com-paring the aftereffects for the adapted versus not-adapted test facesprovides another measure of selectivity. For observer JY, therewas not a significant difference between the two pairs, t(22) � .59,ns, whereas the same-face shifts were larger for MW, t(22) � 2.46,p .05; YM, t(22) � 3.04, p .01; and JM, t(18) � 5.91, p .01. Thus, this further suggests that the aftereffects are selective forwhatever properties distinguish images of actual faces.
Figure 16 further examines the contingencies between all fourfaces by testing whether two faces were biased in a similar wayacross all of the different adapting conditions. The scatter plotscompare the aftereffects for each of the six possible pairs of testimages. In all but one case, the shifts are not significantly corre-lated, which indicated that the adaptation essentially affected thetwo faces independently. The exception is for faces B and C,which show a significant correlation (r � .59, p .05). Thissuggests that these two faces tended to behave as similar teststimuli in the adaptation (though this is not evident in the settingsfor all three observers). As inspection of the images in Figure 14suggests, it may be that faces B and C were perceptually the mostsimilar pair and thus that the selectivity in the adaptation againparalleled the perceptual similarity of the stimuli. In any event, thepresent results show that the adaptation can be selective for dif-ferences in identity even though the images were very similar interms of the low-level stimulus dimensions we varied.
Table 11Rank Ordering of the Stimulus Pairs Defined by Different Stimulus Dimensions
Observer and mean Contrast Color Size Polarity Frequency
Observer 1 1 2 3 4 5Observer 2 2 3 1 4 5Observer 3 4 2 1 3 5Observer 4 2 2 4 4 4Mean 2.1 2.1 2.25 3.75 4.75Mean null difference: opposing �0.01 0.05 0.10 0.23 0.35Mean selectivity: nonopposing 0.21 0.24 0.30 0.50 0.63
Note. 1 � Most Similar and 5 � Least Similar Relative to the Other Pairs. Mean ranks are compared with themean selectivity for opposing and nonopposing adaptation to each stimulus dimension.
432 YAMASHITA, HARDY, DE VALOIS, AND WEBSTER
This
doc
umen
t is c
opyr
ight
ed b
y th
e A
mer
ican
Psy
chol
ogic
al A
ssoc
iatio
n or
one
of i
ts a
llied
pub
lishe
rs.
This
arti
cle
is in
tend
ed so
lely
for t
he p
erso
nal u
se o
f the
indi
vidu
al u
ser a
nd is
not
to b
e di
ssem
inat
ed b
road
ly.
Discussion
That the perception of faces can be easily biased by briefexposures to different faces suggests that the processes of facerecognition may be highly susceptible to adaptation (Webster &MacLin, 1999). In this study we explored how these adjustmentsdepend on the stimulus relationships between the adapt and teststimuli. Before evaluating these, it is important to note that adap-tation occurs throughout the visual system (Webster, 2003). Thus,it is unreasonable to suppose that our face images do not lead toadaptation at early visual loci—from simple afterimages owing tolocal light adaptation to possible contrast and pattern-selectiveaftereffects owing to simple spatial or chromatic properties of theimages. However, it remains of considerable interest to ask to whatextent the aftereffects might also reflect higher-level properties ofthe images. With this in mind, we summarize and evaluate theresults for each of the dimensions we examined in terms of boththe image dimensions we varied and how those dimensions mightinfluence face processing.
Form
Our results replicate the reports of Zhao and Chubb (2001) andLeopold et al. (2001) in showing strong transfer across image size.In particular, we found that adaptation followed the perceivedconfiguration of the faces even when the positions of local featurespredicted the opposite aftereffects. Simple figural aftereffects can
be strongly dependent on the spatial location of features (Whitaker,McGraw, & Levi, 1997). That the face adaptation instead dependson configuration despite differences in size and position impliessensitivity changes in mechanisms that encode configural infor-mation. On the other hand, some selectivity was also observed forsize (see also Zhao & Chubb, 2001). This could be because lowerlevel mechanisms tuned to size were also adapted or because sizeitself is also a dimension that is represented at the level of con-figural processing.
In contrast to size, we found much weaker transfer acrosschanges in spatial frequency. This might be predicted from low-level pattern aftereffects, which show strong selectivity for spatialfrequency (Blakemore & Sutton, 1969). However, as we noted, analternative is that bandpass filtering of the images altered theireffective identity so that low-frequency and high-frequency im-ages appeared to be drawn from different faces. This account isgiven some credence by our finding that aftereffects were selectivefor different individual faces. The present results do not allow usto discriminate between these alternatives, and it may in fact bethat the sensitivity changes are selective at both levels, thus leadingto the highly specific aftereffects we found for the high- andlow-frequency bands.
Contrast
Strong aftereffects were found for both positive and negativepolarity-adapting stimuli, and these were also strongly selective
Figure 14. Faces used to test transfer of adaptation between different individual faces. Faces were rankedaccording to how similar they appeared to face A. Face B was ranked most similar, face D least similar, and faceC was intermediate in similarity.
433SELECTIVE AFTEREFFECTS IN FACE PERCEPTION
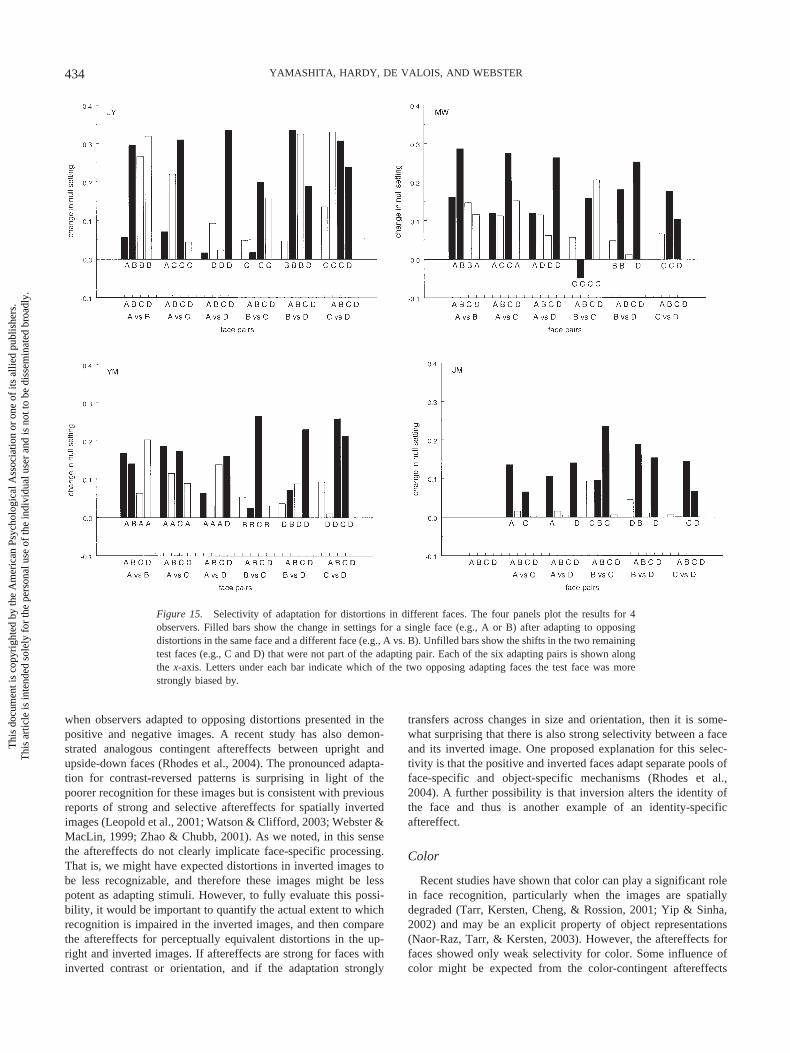
This
doc
umen
t is c
opyr
ight
ed b
y th
e A
mer
ican
Psy
chol
ogic
al A
ssoc
iatio
n or
one
of i
ts a
llied
pub
lishe
rs.
This
arti
cle
is in
tend
ed so
lely
for t
he p
erso
nal u
se o
f the
indi
vidu
al u
ser a
nd is
not
to b
e di
ssem
inat
ed b
road
ly.
when observers adapted to opposing distortions presented in thepositive and negative images. A recent study has also demon-strated analogous contingent aftereffects between upright andupside-down faces (Rhodes et al., 2004). The pronounced adapta-tion for contrast-reversed patterns is surprising in light of thepoorer recognition for these images but is consistent with previousreports of strong and selective aftereffects for spatially invertedimages (Leopold et al., 2001; Watson & Clifford, 2003; Webster &MacLin, 1999; Zhao & Chubb, 2001). As we noted, in this sensethe aftereffects do not clearly implicate face-specific processing.That is, we might have expected distortions in inverted images tobe less recognizable, and therefore these images might be lesspotent as adapting stimuli. However, to fully evaluate this possi-bility, it would be important to quantify the actual extent to whichrecognition is impaired in the inverted images, and then comparethe aftereffects for perceptually equivalent distortions in the up-right and inverted images. If aftereffects are strong for faces withinverted contrast or orientation, and if the adaptation strongly
transfers across changes in size and orientation, then it is some-what surprising that there is also strong selectivity between a faceand its inverted image. One proposed explanation for this selec-tivity is that the positive and inverted faces adapt separate pools offace-specific and object-specific mechanisms (Rhodes et al.,2004). A further possibility is that inversion alters the identity ofthe face and thus is another example of an identity-specificaftereffect.
Color
Recent studies have shown that color can play a significant rolein face recognition, particularly when the images are spatiallydegraded (Tarr, Kersten, Cheng, & Rossion, 2001; Yip & Sinha,2002) and may be an explicit property of object representations(Naor-Raz, Tarr, & Kersten, 2003). However, the aftereffects forfaces showed only weak selectivity for color. Some influence ofcolor might be expected from the color-contingent aftereffects
Figure 15. Selectivity of adaptation for distortions in different faces. The four panels plot the results for 4observers. Filled bars show the change in settings for a single face (e.g., A or B) after adapting to opposingdistortions in the same face and a different face (e.g., A vs. B). Unfilled bars show the shifts in the two remainingtest faces (e.g., C and D) that were not part of the adapting pair. Each of the six adapting pairs is shown alongthe x-axis. Letters under each bar indicate which of the two opposing adapting faces the test face was morestrongly biased by.
434 YAMASHITA, HARDY, DE VALOIS, AND WEBSTER
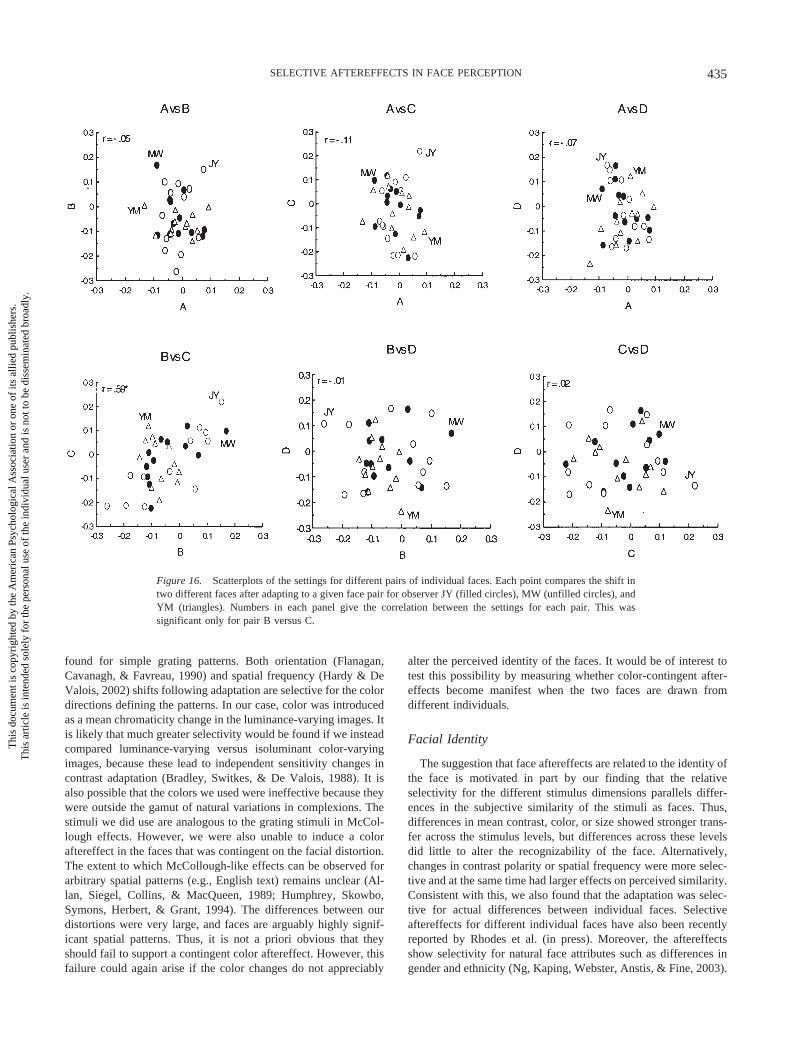
This
doc
umen
t is c
opyr
ight
ed b
y th
e A
mer
ican
Psy
chol
ogic
al A
ssoc
iatio
n or
one
of i
ts a
llied
pub
lishe
rs.
This
arti
cle
is in
tend
ed so
lely
for t
he p
erso
nal u
se o
f the
indi
vidu
al u
ser a
nd is
not
to b
e di
ssem
inat
ed b
road
ly.
found for simple grating patterns. Both orientation (Flanagan,Cavanagh, & Favreau, 1990) and spatial frequency (Hardy & DeValois, 2002) shifts following adaptation are selective for the colordirections defining the patterns. In our case, color was introducedas a mean chromaticity change in the luminance-varying images. Itis likely that much greater selectivity would be found if we insteadcompared luminance-varying versus isoluminant color-varyingimages, because these lead to independent sensitivity changes incontrast adaptation (Bradley, Switkes, & De Valois, 1988). It isalso possible that the colors we used were ineffective because theywere outside the gamut of natural variations in complexions. Thestimuli we did use are analogous to the grating stimuli in McCol-lough effects. However, we were also unable to induce a coloraftereffect in the faces that was contingent on the facial distortion.The extent to which McCollough-like effects can be observed forarbitrary spatial patterns (e.g., English text) remains unclear (Al-lan, Siegel, Collins, & MacQueen, 1989; Humphrey, Skowbo,Symons, Herbert, & Grant, 1994). The differences between ourdistortions were very large, and faces are arguably highly signif-icant spatial patterns. Thus, it is not a priori obvious that theyshould fail to support a contingent color aftereffect. However, thisfailure could again arise if the color changes do not appreciably
alter the perceived identity of the faces. It would be of interest totest this possibility by measuring whether color-contingent after-effects become manifest when the two faces are drawn fromdifferent individuals.
Facial Identity
The suggestion that face aftereffects are related to the identity ofthe face is motivated in part by our finding that the relativeselectivity for the different stimulus dimensions parallels differ-ences in the subjective similarity of the stimuli as faces. Thus,differences in mean contrast, color, or size showed stronger trans-fer across the stimulus levels, but differences across these levelsdid little to alter the recognizability of the face. Alternatively,changes in contrast polarity or spatial frequency were more selec-tive and at the same time had larger effects on perceived similarity.Consistent with this, we also found that the adaptation was selec-tive for actual differences between individual faces. Selectiveaftereffects for different individual faces have also been recentlyreported by Rhodes et al. (in press). Moreover, the aftereffectsshow selectivity for natural face attributes such as differences ingender and ethnicity (Ng, Kaping, Webster, Anstis, & Fine, 2003).
Figure 16. Scatterplots of the settings for different pairs of individual faces. Each point compares the shift intwo different faces after adapting to a given face pair for observer JY (filled circles), MW (unfilled circles), andYM (triangles). Numbers in each panel give the correlation between the settings for each pair. This wassignificant only for pair B versus C.
435SELECTIVE AFTEREFFECTS IN FACE PERCEPTION
This
doc
umen
t is c
opyr
ight
ed b
y th
e A
mer
ican
Psy
chol
ogic
al A
ssoc
iatio
n or
one
of i
ts a
llied
pub
lishe
rs.
This
arti
cle
is in
tend
ed so
lely
for t
he p
erso
nal u
se o
f the
indi
vidu
al u
ser a
nd is
not
to b
e di
ssem
inat
ed b
road
ly.
If the aftereffects are tuned for identity, it remains unclear whichaspects of the image this depends on, for the featural and config-ural information that determine face recognition remains itselfvery poorly understood. For the stimuli we examined, the afteref-fect depends on adapting to an image that has been distorted intoa new configuration (and which also alters the shapes of features,e.g., by differentially contracting or expanding the nose). Thus,these configural (and featural) differences alone cannot be thebasis for the selectivity. Yet the distorted faces remain perceptuallysimilar in the way, for example, that an individual appears similardespite changes in expression. Presumably it is this similarity thatallows the test and adapting images to interact. This is consistentwith accounts of face processing that assume that the representa-tion depends upon coding faces relative to a norm or prototype,and with the idea that these prototypes can be updated through newexamples and thus biased by adaptation to a specific example(Hurlbert, 2001; Leopold et al., 2001; Rhodes et al., in press). Theprototype for a face must be extracted from a set of distributedsamples, for any given instance of the face is highly variable(Bruce, 1994; Solso & McCarthy, 1981). This raises the intriguingquestion of which images should contribute to the development orfine-tuning of a prototype, because these should be chosen onlyfrom the set of stimuli that fall within the appropriate category(Rosch, 1975). Clearly, a generic prototype for faces should bebuilt on images that are in some way classified as a face. In thesame way, the norm for a specific face or a specific attribute (suchas gender) should in part be based on the subset of images that areadmitted as possible examples of the relevant face or attribute. Bythis account, the distortions we introduced to measure the afteref-fects are influencing both generic and identity-specific prototypesfor faces. Generic norms are suggested because adaptation to oneset of faces can strongly bias the appearance of a different set offaces (Rhodes et al., 2003; Webster et al., 2004; Webster &MacLin, 1999). (If the distortions were instead so extreme thatthey destroyed the impression that the adapting image was a face,then we might instead expect little aftereffect, or alternatively,aftereffects that were not tied to face coding.) However, becausethese distortions are also introduced into a specific face, theaftereffects for them may also reflect identity-specific aftereffects.Changes in color, mean contrast, or size may represent smallerdeviations from the identity-specific prototype and thus allowstronger interactions between the adapt and test stimuli, whereaschanges in frequency or contrast polarity may more readily tran-scend face-specific boundaries and consequently lead to weakerinteractions. Finally, to the extent that the distortions themselvescreated new faces, the aftereffects we measured may have morestrongly biased generic face norms. That is, the selectivity foridentity (e.g., between actual face images) might be even strongerwhen the adapting distortions are weaker because the adaptingfaces might then be tied more closely to the specific face that wasdistorted.
Although this hypothesis remains tentative, it at least raises thepossibility that the aftereffects for faces reflect adjustments inprocesses that are tied closely to face perception—and in particu-lar, to processes that must allow us to differentiate between facesbased on very small physical differences while allowing us torecognize the same face from physically very different images. Asnoted in the introduction, there is a wealth of evidence for mech-anisms specialized for face coding, and it seems plausible toassume that these mechanisms can adapt—in the same way as
other cortical processes—to adjust to the specific stimulus dimen-sions that they encode. Selectivity of the adaptation for the per-ceived similarity or identity of faces would be a natural conse-quence of adaptation at such sites.
References
Allan, L. G., Siegel, S., Collins, J. C., & MacQueen, G. M. (1989). Coloraftereffect contingent on text. Perception & Psychophysics, 46, 105–113.
Blakemore, C., & Sutton, P. (1969, October 10). Size adaptation: A newaftereffect. Science, 166, 245–247.
Bradley, A., Switkes, E., & De Valois, K. K. (1988). Orientation andspatial frequency selectivity of adaptation to color and luminance grat-ings. Vision Research, 28, 841–856.
Bruce, V. (1994). Stability from variation: The case of face recognition.Quarterly Journal of Experimental Psychology: Human ExperimentalPsychology, 47(A), 5–28.
Burton, G. J., Nagshineh, S., & Ruddock, K. H. (1977). Processing by thehuman visual system of the light and dark contrast components of theretinal image. Biological Cybernetics, 27, 189–197.
Cavanagh, P., & LeClerc, Y. G. (1989). Shape from shadows. Journal ofExperimental Psychology: Human Perception and Performance, 15,3–27.
Costen, N. P., Parker, D. M., & Craw, I. (1996). Effect of highpass andlowpass spatial filtering on face identification. Perception & Psycho-physics, 58, 602–612.
Desimone, R. (1991). Face-selective cells in the temporal cortex of mon-keys. Journal of Cognitive Neuroscience, 3, 1–8.
De Valois, K. K. (1977). Independence of black and white: Phase-specificadaptation. Vision Research, 17, 209–215.
Diamond, R., & Carey, S. (1986). Why faces are and are not special: Aneffect of expertise. Journal of Experimental Psychology: General, 115,107–117.
Farah, M. J., Wilson, K. D., Drain, H. M., & Tanaka, J. R. (1995). Theinverted face inversion effect in prosopagnosia: Evidence for mandatory,face-specific perceptual mechanisms. Vision Research, 35, 2089–2093.
Farah, M. J., Wilson, K. D., Drain, M., & Tanaka, J. N. (1998). What is“special” about face perception? Psychological Review, 105, 482–498.
Flanagan, P., Cavanagh, P., & Favreau, O. E. (1990). Independentorientation-selective mechanisms for the cardinal directions of colorspace. Vision Research, 30, 769–778.
Freire, A., Lee, K., & Symons, L. A. (2000). The face-inversion effect asa deficit in the encoding of configural information: Direct evidence.Perception, 29, 159–170.
Galper, R. E. (1970). Recognition of faces in photographic negative.Psychonomic Science, 19, 207–208.
Gauthier, I., & Tarr, M. J. (1997). Becoming a “Greeble” expert: Exploringmechanisms for face recognition. Vision Research, 37, 1673–1682.
George, N., Dolan, R. J., Fink, G. R., Baylis, G. C., Russell, C., & Driver,J. (1999). Contrast polarity and face recognition in the human fusiformgyrus. Nature Neuroscience, 2, 574–580.
Georgeson, M. A. (1985). The effect of spatial adaptation on perceivedcontrast. Spatial Vision, 1, 103–112.
Gold, J., Bennett, P. J., & Sekuler, A. B. (1999). Identification of band-passfiltered letters and faces by human and ideal observers. Vision Research,39, 3537–3560.
Graham, N. (1989). Visual pattern analyzers. Oxford, United Kingdom:Oxford University Press.
Hardy, J. L., & De Valois, K. K. (2002). Color-selective analysis ofluminance-varying stimuli. Vision Research, 42, 1941–1951.
Humphrey, G. K., Skowbo, D., Symons, L. A., Herbert, A. M., & Grant,C. L. (1994). Text-contingent color aftereffects: A reexamination. Per-ception & Psychophysics, 56, 405–413.
Hurlbert, A. (2001). Trading faces. Nature Neuroscience, 4, 3–5.
436 YAMASHITA, HARDY, DE VALOIS, AND WEBSTER
This
doc
umen
t is c
opyr
ight
ed b
y th
e A
mer
ican
Psy
chol
ogic
al A
ssoc
iatio
n or
one
of i
ts a
llied
pub
lishe
rs.
This
arti
cle
is in
tend
ed so
lely
for t
he p
erso
nal u
se o
f the
indi
vidu
al u
ser a
nd is
not
to b
e di
ssem
inat
ed b
road
ly.
Kanwisher, N., McDermott, J., & Chun, M. M. (1997). The fusiform facearea: A module in human extrastriate cortex specialized for face per-ception. Journal of Neuroscience, 17, 4302.
Leopold, D. A., O’Toole, A. J., Vetter, T., & Blanz, V. (2001). Prototype-referenced shape encoding revealed by high-level aftereffects. NatureNeuroscience, 4, 89–94.
Matsumoto, D., & Ekman, P. (1988). Japanese and Caucasian facialexpressions of emotion (JACFEE) and neutral faces (JACNeuF). SanFrancisco: Department of Psychology, San Francisco State University.
Maurer, D., Le Grand, R., & Mondloch, C. J. (2002). The many faces ofconfigural processing. Trends in Cognitive Sciences, 6, 255–260.
McCollough, C. (1965, September 3). Color adaptation of edge-detectorsin the human visual system. Science, 149, 1115–1116.
McKone, E., Martini, P., & Nakayama, K. (2001). Category perception offace identity in noise isolates configural processing. Journal of Experi-mental Psychology: Human Perception and Performance, 27, 573–599.
Muskat, J. A., Paras, C. L., & Webster, M. A. (2000). Adaptation tocollections of faces. Investigative Ophthalmology and Visual Science,41, S222.
Naor-Raz, G., Tarr, M. J., & Kersten, D. (2003). Is color an intrinsicproperty of object representation? Perception, 32, 667–680.
Nasanen, R. (1999). The spatial frequency bandwidth used in the recog-nition of facial images. Vision Research, 39, 3824–3833.
Ng, M., Kaping, D., Webster, M. A., Anstis, S., & Fine, I. (2003). Selectivetuning of face perception. Journal of Vision, 2, 33a.
Perrett, D. I., Mistlin, A. J., & Chitty, A. J. (1987). Visual neuronesresponsive to faces. Trends in Neurosciences, 10, 358–364.
Peterson, M., & Rhodes, G. (2003). Perception of faces, objects andscenes: Analytic and holistic processing. Cambridge, MA: Oxford Uni-versity Press.
Rhodes, G., Jeffery, L., Watson, T. L., Clifford, C. W. G., & Nakayama, K.(2003). Fitting the mind to the world: Face adaptation and attractivenessaftereffects. Psychological Science, 14, 558–566.
Rhodes, G., Jeffery, L., Watson, T. L., Jaquet, E., Winkler, C., & Clifford,C. W. (2004). Orientation-contingent face aftereffects and implicationsfor face-coding mechanisms. Current Biology, 14, 2119–2123.
Rhodes, G., Robbins, R., Jaquet, E., McKone, E., Jeffery, L., & Clifford,C. (2005). Adaptation and face perception. In C. Clifford & G. Rhodes(Eds.), Fitting the mind to the world: Adaptation and aftereffects in highlevel vision: Vol 2. Advances in visual cognition. Cambridge, MA:Oxford University Press.
Rolls, E. T., & Baylis, G. C. (1986). Size and contrast have only smalleffects on the responses to faces of neurons in the cortex of the superior
temporal sulcus of the monkey. Experimental Brain Research, 65, 38–48.
Rosch, E. (1975). Cognitive reference points. Cognitive Psychology, 4,328–350.
Sergent, J., Ohta, S., & MacDonald, B. (1992). Functional neuroanatomyof face and object processing. A positron emission topography study.Brain, 115, 15–36.
Solso, R. L., & McCarthy, J. E. (1981). Prototype formation of faces: Acase of pseudomemory. British Journal of Psychology, 72, 499–503.
Stromeyer, C. F. I. (1978). Form-color aftereffects in human vision. In R.Held, H. W. Leibowitz, & H. L. Teuber (Eds.), Handbook of sensoryphysiology (Vol. 8, pp. 97–142). New York: Springer-Verlag.
Tanaka, J. W., & Farah, M. J. (1993). Parts and wholes in face recognition.Quarterly Journal of Experimental Psychology: Human ExperimentalPsychology, 46(A), 225–245.
Tarr, M. J., Kersten, D., Cheng, Y., & Rossion, B. (2001). It’s Pat! Sexingfaces using only red and green. Journal of Vision, 1, 337a.
Thompson, P. (1980). Margaret Thatcher: A new illusion. Perception, 9,483–484.
Watson, T. L., & Clifford, C. W. G. (2003). Pulling faces: An investigationof the face-distortion aftereffect. Perception, 32, 1109–1116.
Webster, M. A. (2003). Pattern selective adaptation in color and formperception. In L. M. Chalupa & J. S. Werner (Eds.), The visual neuro-sciences (Vol. 2, pp. 936–947). Cambridge, MA: MIT Press.
Webster, M. A., Kaping, D., Mizokami, Y., & Duhamel, P. (2004, April 1).Adaptation to natural facial categories. Nature, 428, 558–561.
Webster, M. A., & MacLin, O. H. (1999). Figural after-effects in theperception of faces. Psychonomic Bulletin & Review, 6, 647–653.
Whitaker, D., McGraw, P. V., & Levi, D. M. (1997). The influence ofadaptation on perceived visual location. Vision Research, 37, 2207–2216.
Yin, R. K. (1969). Looking at upside down faces. Journal of ExperimentalPsychology, 81, 141–145.
Yip, A. W., & Sinha, P. (2002). Contribution of color to face recognition.Perception, 31, 995–1003.
Young, A. W., Hellawell, D., & Hay, D. C. (1987). Configurationalinformation in face perception. Perception, 16, 747–759.
Zhao, L., & Chubb, C. F. (2001). The size-tuning of the face-distortionaftereffect. Vision Research, 41, 2979–2994.
Received October 7, 2002Revision received May 6, 2004
Accepted October 18, 2004 �
437SELECTIVE AFTEREFFECTS IN FACE PERCEPTION