Fiscal Stimulus for an Inclusive, Green and Forward-Looking ...
80
1 Fiscal Stimulus for an Inclusive, Green and Forward-Looking Recovery, Leveraging the SDG Agenda MACROECONOMIC POLICY AND FINANCING FOR DEVELOPMENT DIVISION Fiscal Stimulus for an Inclusive, Green and Forward-Looking Recovery, Leveraging the SDG Agenda An Assessment for Pakistan Sajid Amin Javed, Sara Zafar Cheema and Dawn Holland WORKING PAPER SERIES MONTH YEAR WORKING PAPER SERIES FEBRUARY 2022
-
Upload
khangminh22 -
Category
Documents
-
view
1 -
download
0
Transcript of Fiscal Stimulus for an Inclusive, Green and Forward-Looking ...

1 Fiscal Stimulus for an Inclusive, Green and Forward-Looking Recovery, Leveraging the SDG Agenda
MACROECONOMIC POLICY AND FINANCING FOR DEVELOPMENT DIVISION
Fiscal Stimulus for an Inclusive, Green and Forward-Looking Recovery, Leveraging the SDG Agenda
An Assessment for Pakistan
Sajid Amin Javed, Sara Zafar Cheema and Dawn Holland
WORKING PAPER SERIES MONTH YEAR
WORKING PAPER SERIES FEBRUARY 2022

2 Fiscal Stimulus for an Inclusive, Green and Forward-Looking Recovery, Leveraging the SDG Agenda
Disclaimer: The views expressed through the Macroeconomic Policy and Financing for Development
(MPFD) Working Paper Series should not be reported as representing the views of the United Nations,
but as views of the author(s). Working Papers describe research in progress by the author(s) and are
published to elicit comments for further debate. They are issued without formal editing. The shaded areas
of the map indicate ESCAP members and associate members. The designations employed and the
presentation of material on this map do not imply the expression of any opinion whatsoever on the
part of the Secretariat of the United Nations concerning the legal status of any country, territory,
city or area or of its authorities, or concerning the delimitation of its frontiers or boundaries. The
United Nations bears no responsibility for the availability or functioning of URLs. Opinions, figures
and estimates set forth in this publication are the responsibility of the authors and should not necessarily
be considered as reflecting the views or carrying the endorsement of the United Nations. Any errors are
the responsibility of the authors. Mention of firm names and commercial products does not imply the
endorsement of the United Nations.

3 Fiscal Stimulus for an Inclusive, Green and Forward-Looking Recovery, Leveraging the SDG Agenda
Please cite this paper as: Javed,
Sajid Amin, Sara Zafar Cheema, and Dawn
Holland (2022). Fiscal stimulus for an inclusive,
green and forward-looking recovery, leveraging
the SDG agenda: an assessment for Pakistan.
MPFD Working Paper Series, No. WP/22/01.
Bangkok: ESCAP.
Available at: http://www.unescap.org/kp
Tracking number: ESCAP / 1-WP / 38
About the authors: Dr. Sajid Amin Javed is a
Research Fellow at the Sustainable Development
Policy Institute (SDPI) and heads its Policy
Solutions Lab. Sara Zafar Cheema is a Research
Consultant at the Sustainable Development Policy
Institute (SDPI). Dawn Holland is a Consultant on
macroeconomic modelling and forecasting and a
Fellow of the National Institute of Economic and
Social Research (NIESR). She is former Chief of the
Global Economic Monitoring Branch at UN DESA.
The graphic layout was created by Pannipa
Jangvithaya.

4 Fiscal Stimulus for an Inclusive, Green and Forward-Looking Recovery, Leveraging the SDG Agenda
Table of Contents
List of Acronyms ..................................................................................................................... 7
Abstract ................................................................................................................................. 8
1. Introduction ................................................................................................................... 9
2. The socio-economic and environmental impacts of the covid-19 pandemic
on Pakistan ................................................................................................................. 11
2.1. Economic consequences ..................................................................................... 11
2.2. Social consequences ........................................................................................... 12
2.3. Environmental consequences: ............................................................................ 12
3. Building towards an inclusive, green and resilient recovery - assessing Pakistan’s
current fiscal stimulus ................................................................................................. 14
3.1. Pakistan’s current fiscal stimulus measures ....................................................... 16
3.1.1. Fiscal stimulus measures promoting an inclusive recovery: .................... 16
3.1.2. Fiscal stimulus measures promoting a green recovery: ........................... 18
3.1.3. Fiscal stimulus measures promoting a resilient & forward-looking
recovery: ................................................................................................. 19
4. Impact of policy measures under the fiscal stimulus on priority SDGs ....................... 21
4.1. Impact of measures promoting an inclusive recovery on priority SDGSs ............ 22
4.2. Impact of measures promoting a green recovery on priority SDGs .................... 27
4.3. Impact of measures promoting a forward-looking recovery on priority SDGs: .... 31
5. Policy actions needed to secure a resilient, inclusive and green recovery in Pakistan 34
5.1. Pakistan must increase social spending and expand social protection ............... 34
5.2. Pakistan must role out a mass vaccination policy................................................ 35
5.3. Greater gender sensitivity in fiscal stimulus measures is required ...................... 35
5.4. Pakistan needs to ensure balanced green funding in order to ensure transition
towards green recovery energy ........................................................................... 36
5.5. An Inclusive digital transformation is needed to achieve a resilient and future
Looking Recovery ............................................................................................... 39
6. Financing needs to support inclusive, green and resilient recovery ........................... 42
6.1. Financing needs for an inclusive recovery .......................................................... 43
6.2. Financing needs for a green recovery................................................................. 47
6.3. Financing needs for a resilient & future-looking recovery .................................... 49

5 Fiscal Stimulus for an Inclusive, Green and Forward-Looking Recovery, Leveraging the SDG Agenda
7. Modelling the macroeconomic, social and environmental impacts of the proposed
policy actions to secure an inclusive, green and resilient recovery in Pakistan .......... 52
7.1. The ESCAP macroeconomic model ..................................................................... 52
7.2. Increased social spending and expanded social protection ................................. 54
7.3. Increased female labour force participation ......................................................... 56
7.4. Invest in a green recovery ................................................................................... 57
7.5. Digital transformation .......................................................................................... 59
8. Proposals to mobilize resources to meet financing needs .......................................... 61
9. Conclusion .................................................................................................................. 66
References ......................................................................................................................... 67
Appendix I ........................................................................................................................... 75
Appendix II .......................................................................................................................... 78
List of Tables Table 1: Pre and post-COVID medium-term projections of macroeconomic indicators
for Pakistan ....................................................................................................... 11
Table 2: Impact of Ehsaas Emergency Cash Programme .............................................. 22
Table 3: Impact of healthcare support measures ............................................................ 24
Table 4: Impact of construction sector tax package ........................................................ 25
Table 5: Impact of firm liquidity supports, electricity & gas relief packages .................... 25
Table 6: Impact of green stimulus package .................................................................... 27
Table 7: Impact of Debt for Nature’ Swap Scheme & Ecosystem Restoration Fund ...... 29
Table 8: Impact of Green Euro Bonds ............................................................................ 30
Table 9: Impact of digital Pakistan Vision & Universal Service Fund .............................. 31
Table 10: Impact of e-taleem ............................................................................................ 32
Table 11: Financing COVID-19 vaccine for total population ............................................. 47
Table 12: Possible major sources of additional investments ............................................ 61
Table 13: Export scenarios for Pakistan ........................................................................... 64

6 Fiscal Stimulus for an Inclusive, Green and Forward-Looking Recovery, Leveraging the SDG Agenda
List of Figures
Figure 1: NO2 levels in cities across Pakistan before (1st March - 23 March 2020) and
after (24 March - 15 April 2020) the national lockdown ..................................... 13
Figure 2: Conceptual framework for a post COVID-19 recovery package ....................... 16
Figure 3: Pakistan’s SDG assessment 2020 .................................................................... 21
Figure 4: Poverty rates, with & without EECP .................................................................. 23
Figure 5: Gender equality in COVID-19 policy measures ................................................ 36
Figure 6: Country score card ........................................................................................... 37
Figure 7: Barriers to digital transformation ....................................................................... 40
Figure 8: Total social protection spending (% of GDP) .................................................... 43
Figure 9: Total healthcare spending (% of GDP) ............................................................. 44
Figure 10: Composition of health spending (% of GDP) .................................................... 45
Figure 11: Total educational spending (% of GDP) ............................................................ 45
Figure 12: Composition of educational spending (% of GDP) ............................................ 46
Figure 13: Power sector investments required under different scenarios .......................... 48
Figure 14: Total investment required for green transport till 2030 (billon USD) ................. 49
Figure 15: Composition of green transport investment till 2030 (USD billion) .................... 49
Figure 16: Potential investment per capita needed for universal digital access in
South Asia, total amount till 2030 (billion USD) ................................................ 50
Figure 17: Composition of digital infrastructure investment till 2030 (USD billion) ............. 50
Figure 18: Digital access rate in South Asia in 2020 .......................................................... 50
Figure 19: Impact of spending of social protection, health and education, in the absence of
financing constraints, on key indicators (%) ...................................................... 55
Figure 20: Impact of spending of social protection, health and education, financed
and unfinanced scenarios, on key indicators (%) .............................................. 56
Figure 21: Impact of rise in female labour force participation on key indicators (%) .......... 57
Figure 22: Impact of green recovery programme on key indicators (%) ............................ 58
Figure 23: Impact of digital transformation programme on key indicators (%) ................... 60
Figure 24: Annual savings from eliminating fossil fuel subsidies (USD Millions) ................ 63
Figure 25: Annual savings from minimising inefficiency costs in power and transport
sector (USD billions) ......................................................................................... 63
Figure 26: Annual additional resources available through exports ..................................... 65

7 Fiscal Stimulus for an Inclusive, Green and Forward-Looking Recovery, Leveraging the SDG Agenda
List of Acronyms
BBB Building Back Better
CHW Community Health Worker
CNIC Citizen National Identification Card
CPEC China Pakistan Economic Corridor
CPI Consumer Price Index
DHS Demographic and Health Survey
ECC Economic Coordination Committee
EECP Ehsaas Emergency Cash programme
FLFP Female Labour Force Participation
GBV Gender-based Violence
GOP Government of Pakistan
LFPR Labour Force Participation Rate
LSM Learning Management System
MDG Millennium Development Goal
MoITT Ministry of Information Technology and Telecommunication
NDMA National Disaster Management Authority
PPE Personal Protective Equipment
PTCL Pakistan Telecommunication Company Ltd.
SAARC South Asian Association for Regional Cooperation
SDGs Sustainable Development Goals
SMEs Small and Medium Enterprises
SOPs Standard Operating Procedures
USF Universal Service Fund
VRE Variable Renewable Energy
WAPDA Water and Power Development Authority

8 Fiscal Stimulus for an Inclusive, Green and Forward-Looking Recovery, Leveraging the SDG Agenda
Abstract
This study assesses Pakistan’s fiscal stimulus
response to the COVID-19 pandemic, evaluating
the degree to which it has managed to support a
recovery, which is inclusive, green and forward-
looking. In oreder to align recovery from
COVID19 to SDGs agenda of the country, it is
crucial for Pakistan to; expand social protection,
mainstream gender in all approaches and measures,
roll-out a mass COVID-19 vaccination campaign,
shift to green transport, cut fossil fuel subsidies and
achieve an inclusive digital transformation. The
study identifies the estimated costs and outlines
financing options of these recommendations.
Finally, the study simulates macroeconomic, social
and environmental impacts of investment in people,
green energy and digsital infarstrture on key
macroeconomic indicators of the country which
include public debt, GDP growth, (un)employment,
poverty and CO2 emissions. Findings from these
simulations, using the ESCAP’s Macroeconomic
Model, support a strong economic and environment
case for invesmnets recommended in this study.
Keywords: Building Back Better, Fiscal Stimulus,
Inclusive, Green, Forward-Looking, Digital
Transformation, COVID-19 Recovery, SDGs,
Fiscal Space, Macroeconomic Model
JEL classification: C82, E00, E60, O23, Q01

9 Fiscal Stimulus for an Inclusive, Green and Forward-Looking Recovery, Leveraging the SDG Agenda
1. Introduction
The novel coronavirus pandemic, commonly
known as COVID-19, has now entered its second
year,1 infecting nearly 172.2 million people globally
and claiming 3.7 million lives (WHO, 2021). In the
beginning, governments of the world attempted to
contain domestic outbreaks of the virus through
tight restrictions on movement. As national
lockdowns, flight bans, and shelter-in-place
measures were enforced globally, business and
trade took a hit, bringing economic activity to a
virtual standstill.
As the crisis intensified, countries shifted their
attention towards containing infections and
implementing economic rescue plans, and away
from long-term sustainable development. As a
result of the COVID-19 pandemic, between 119 and
124 million new poor are expected to have been
created (Gerszon Mahler, et al., 2021). Millions face
major disruptions to their livelihoods, health and
education, with key indicators regressing for the
first time since the end of the twentieth century
(UN, 2020). If this trend continues, evidence
suggests post-pandemic recovery will likely leave
the poor worse off than before. To prevent this,
countries must re-evaluate the traditional policy-
making processes that are predominantly structured
to favour economic growth whilst failing to protect
both people and the environment (ESCAP, 2021).
As COVID-19 recovery plans are fashioned, fiscal
policy responses must be realigned to the SDG
agenda once again, which will require recovery to
be inclusive, green and resilient.
Pakistan, which registered its first confirmed cases
on 26th February 2020, 2 appears to have better
handled the pandemic relative to most of its
neighbours. Till now, infections and loss of human
life have remained subdued, contrary to the
1 Earliest COVID-19 case detected in November 2019 in
China. Globally however, the World Health Organisation
officially declared the outbreak to be a pandemic on 11
devastation unravelling beyond its borders e.g., in
India and Nepal – by November 2021, confirmed
deaths per million in India and Nepal were reported
at 329.32 and 384.7 respectively, while in Pakistan
they were 126.40 per million (Ritchie, et al., 2021a).
Nonetheless, COVID-19 has undoubtedly left a
mark on the country, with the pandemic
anticipated to have single-handedly reversed much
of the progress achieved in poverty over the last two
decades, pushing levels up to 40 percent (UNDP,
2020).
Since March 2020, Pakistan has commenced a string
of policy interventions designed to minimise the
socio-economic fallout from the pandemic, thereby
cushioning its population from adversity amidst a
global health emergency. The country
implemented a fiscal stimulus of PKR 1.2 trillion -
roughly 3 percent of its GDP - in the form of direct
cash transfers to poor households, health
infrastructure expenditures, support to SMEs etc.
(Javed, 2021a). Additionally, an accommodative
monetary policy was adopted, with the policy rate
being cut down from 13.25 to 7 percent within less
than two months of the start of the pandemic. The
State Bank of Pakistan (SBP) also undertook a wide
range of measures to ensure market liquidity within
the country.
In light of these developments, this study will assess
Pakistan’s fiscal stimulus response to the COVID-19
pandemic, evaluating the degree to which recovery
measures remain congruent to the country’s
priority SDG agenda - specifically, how well the
fiscal stimulus has managed to support an inclusive,
green and resilient recovery. The study carries out
this reconciliation by employing the popularised
paradigm of ‘building back better’.
,March 2020.
2 (Hassan, 2020)

10 Fiscal Stimulus for an Inclusive, Green and Forward-Looking Recovery, Leveraging the SDG Agenda
Section 2 provides a brief overview of the extent to
which the COVID-19 pandemic has disrupted the
country’s economic and social fabric. Section 3 then
introduces the concept of building back better,
delving into how this can be conceptualised to help
Pakistan rebuild itself in a socially, environmentally
and economically sustainable manner. It also
highlights several measures that are part and parcel
of the country’s current fiscal stimulus. Section 4
assesses the impacts of these measures on Pakistan’s
priority SDG agenda, and where, if so, they fall
short. Following this review, section 5 draws
lessons on how to better reconcile Pakistan’s
recovery with its long-term sustainable
development priorities, recommending additional
policy actions needed. The study estimates the
potential cost of such a policy package for Pakistan
in section 6, while section 7 estimates its
macroeconomic, social and environmental impact
using the ESCAP’s Macroeconomic Model. Finally,
section 8 proposes a number of strategies for
mobilising the necessary resources.

11 Fiscal Stimulus for an Inclusive, Green and Forward-Looking Recovery, Leveraging the SDG Agenda
2. The Socio-Economic and Environmental Impacts of the COVID-19 Pandemic on Pakistan
As of mid-March 2021, local cases have escalated at
an alarming rate after a third and deadlier3 wave of
the virus emerged. While infections spread slowly
at first, they were enough to strain the country’s
chronically underfunded and underdeveloped
healthcare sector, as well as its fragile economy -
which was overstretched long before the onset of
the pandemic. COVID-19 has caused severe and
extensive damage to both society and economy,
such that, were Pakistan to successfully recover
from the pandemic in a single year, it would
continue to incur an estimated loss of $19 billion
till 2025; even more if recovery is slower (Aslam,
et al., 2021).
2.1. ECONOMIC CONSEQUENCES
With closures ensuing, Pakistan’s growth took a
tumble: GDP suffered a steep contraction, falling
from 1.9 percent in 2019, down to -0.5 percent
(table 1) – making it the first time since 1952 that
the economy exhibited a negative economic growth
(Javed, 2021a).
As pandemic-related expenditures rose in the face
of diminishing revenues, more loans were taken by
the government and the concentration of debt in
the economy increased from 85.6 to 87.2 percent.
Gross Debt is projected to continue rising in 2021
and is only anticipated to fall beyond 2022. National
inflation surged considerably, with CPI climbing to
10.7 percent from pre-pandemic levels (table 1).
While CPI is projected to begin falling again in
2021, it is not expected to reach pre-pandemic levels
till 2024.
Table 1: Pre and post-COVID medium-term projections of macroeconomic indicators for
Pakistan .
Source: Data obtained from IMF reports (2019a, 2019b, 2020, 2021) and World Bank (2021).
Note: a Projections.
3 3 @Asad_Umar. (2021, March 18). Available at https://twitter.com/Asad_Umar/status/1372427416468131
842
2020 2021a 2022 a 2023 a
Pre
COVID estimates
Post COVID
estimates
Pre COVID
estimates
Post COVID
estimates
Pre COVID
estimates
Post COVID
estimates
Pre COVID
estimates
Post COVID
estimates
Real GDP Growth 2.4 -0.5 3.0 1.3 4.5 2.0 5.0 3.4
Inflation (CPI) 11.1 10.7 8.0 8.7 6.0 8.01 5.0 7.3
General government net
lending/borrowing
(% of GDP)
-7.4 -8.01 -5.4 -7.1 -3.9 -5.5 -2.8 -3.9
General government
gross debt
(% of GDP)
78.6 87.2 76.1 87.7 72.5 83.3 69.0 77.7
Unemployment
(%) 4.5 6.2 5.1 5.0 -- 4.8 -- 4.7

12 Fiscal Stimulus for an Inclusive, Green and Forward-Looking Recovery, Leveraging the SDG Agenda
2.2. SOCIAL CONSEQUENCES
As infections rose, shortages were faced in
everything from ICUs and ventilators to PPEs,
masks and testing kits. Lockdown measures also
disrupted several economic sectors – the
unemployment rate surged to 42 percent in urban
areas and 38 percent in the rural non-farm economy,
while average incomes of people in these areas fell
by 48.7 and 47.2 percent respectively (Cheema &
Rehman, 2021).
Additionally, the pandemic uncovered a digital
divide within the country. Nearly 40 million
students were affected as a result of school closures
due to the pandemic (UNICEF, 2021). While most
big-city private and elite schools switched to
distance learning with ease, schools in poorer rural
localities were unable to follow suit. Likewise,
overwhelmed with a tailback of COVID-19 patients
and unable to shift functions online, most public
hospitals were forced to shut-down non-emergency
outpatient departments. This imbalance in the
ability of certain groups over others in adapting to
the pandemic serves as a stark reminder of the
inequitable access to technology that still exists in
Pakistan.
The pandemic also perpetuated many existing
inequalities e.g., unemployment disproportionally
impacted specific vulnerable groups, such as the
elderly, disabled, informal-sector workers and
women – who experienced high poverty rates even
before the pandemic (Rasheed, et al., 2021).
Likewise, the gender divide widened as restrictions
triggered layoffs across a number of women-
intensive sectors e.g., agriculture, manufacturing
and the domestic-service industry - exposing
women to socio-economic vulnerabilities. As stay-
at-home orders commenced nationwide, women
also faced a registered rise in gender-based violence
(GBV), as well as restricted access to reproductive
healthcare (Majid & Siegmann, 2021, UNODC, 2020,
Munir, et al., 2021).
Moreover, extended school closures put many
adolescent and young girls at greater risk of early
marriages and pregnancies, many of whom may
never return to school again (Javed, 2021a). In fact,
of the almost 50 percent of enrolled students who
did not return when schools briefly reopened last
year, 60 percent were girls (Ali, 2020). A survey
revealed that 63 percent of respondents did not
intend to send their daughters back to school, while
94 percent were willing to do so in the case of their
sons (Ibid).
2.3. ENVIRONMENTAL CONSEQUENCES
While difficult to imagine, the pandemic has had a
few silver linings – which unfortunately come at the
expense of large socio-economic costs. As
lockdowns and travel bans were extended, energy
demand patterns altered: manufacturing and
industrial activities slowed, fewer people drove to
work, and even fewer flew. As a result, CO2
emissions gradually dropped and air quality
drastically improved in major cities (figure 1)
(Awais, et al., 2020). Additionally, electricity
demand in Pakistan’s commercial and industrial
sectors fell by 75 and 65 percent respectively, while
residential areas reported an increase. Overall,
energy demand fell by 8.4 percent in 2020 (Aslam,
et al., 2021).
Although a win for the environment, restrictions
have adversely impacted the economy, as revenues
dwindled, and power bills could not be recovered.
Much of the environmental gains remain temporary
and come at the cost of rising poverty and
unemployment, as many economic structures
experienced complete shutdowns. In fact, most of
the reported decline in emissions and pollution
levels is expected to reverse when lockdowns end.
For example, in Karachi, after an initial decline
during lockdowns, NO2 emissions grew 48 percent
by May 2021 in comparison to May 2020. Likewise,
Islamabad too reported a sharp increase, though
comparatively less (Mercer-Blackman & Norton,
2021). Globally, carbon emissions were seen to
rebound strongly after dropping in early 2020, with
levels rising above those recorded in 2019 – year-on-
year emissions reported for December 2020 alone
were 60 tonnes above those in 2019 (IEA, 2021).
Unless we are able to permanently restructure our
consumption and production systems towards
sustainable green growth, much of the
environmental gains from COVID-19 will not
remain long-term.

13 Fiscal Stimulus for an Inclusive, Green and Forward-Looking Recovery, Leveraging the SDG Agenda
Figure 1. NO2 levels in cities across pakistan before (1st March - 23 March 2020) and after (24
March - 15 April 2020) the national lockdown
Source: (Awais, et al., 2020)

14 Fiscal Stimulus for an Inclusive, Green and Forward-Looking Recovery, Leveraging the SDG Agenda
3. Building Towards an Inclusive, Green and Resilient Recovery - Assessing Pakistan’s Current Fiscal Stimulus
Before assessing the efficacy of Pakistan’s fiscal
response in ensuring an inclusive, green and
resilient economy, it is worth understanding what
it takes to ensure such a recovery in the first place.
Response strategies aimed at alleviating the
immediate suffering of people must also emanate
long-term welfare and prosperity. For this,
COVID-19 reveals both the need and the
opportunity to build back better.
The notion of building back better is not new. It
has been proposed time and again, as an all-
encompassing approach to post-disaster response.
Against the backdrop of COVID-19, the concept
delineates a meaningful framework for post-
pandemic recovery, requiring national
governments to adopt a multifaceted approach to
the crisis - leveraging SDGs while simultaneously
striking a balance between temporary relief
measures and sustainable developmental efforts.
While the slogan has become exceedingly popular
in development policy literature, its practical
application remains abstract, providing
governments with the autonomy to charter their
own individual approaches. For the purpose of this
study, a more explicit conceptualization has been
utilized (
15 Fiscal Stimulus for an Inclusive, Green and Forward-Looking Recovery, Leveraging the SDG Agenda
Figure 2 below) – which compartmentalizes
recovery measures into three distinct categories
i.e., inclusive, green and forward-looking (ESCAP,
2021). Based on this framework, post-pandemic
policy packages have the ability to restore
economic processes while effectively positioning
economies onto a fairer, more environmentally-
friendly and far more resilient path than before.
Overall, BBB provides a well-defined framework
for post-pandemic recovery - protecting the
economy, people and the environment. If
executed correctly, it can reduce poverty and
unemployment, curb carbon emissions and raise
potential output levels (ESCAP, 2021).
Please note that, while the discussion
characterises recovery as being distinctly either
inclusive, green or forward-looking, there exists a
degree of interchangeability between all three
components which must be acknowledged when
designing future strategies, e.g., a gender lens must
be present in all green and forward-looking
policies, while inclusive policy measures must be
on the table when advocating for green growth,
etc.
As countries begin to tackle the extensive
economic and social damage sustained over the
last year, the practical application of building back
better will require recovery plans to be shaped by
different considerations (Figure 2). Current fiscal
stimulus measures pertaining to each category
(inclusive, green and forward-looking) are
discussed below:

16 Fiscal Stimulus for an Inclusive, Green and Forward-Looking Recovery, Leveraging the SDG Agenda
Figure 2: Conceptual framework for a post COVID-19 recovery package
Source: Author’s elaborations based on ESCAP’s (2021) “building forward better” package.
3.1. PAKISTAN’S CURRENT FISCAL STIMULUS MEASURES
By March 2020, the Government of Pakistan had
approved a PKR 1.2 trillion fiscal stimulus package
in response to the pandemic (with an additional
PKR 100 billion supplementary grant introduced
later on) (Javed, 2021a).4 The announced relief
package was used by both the federal and
provincial governments in containing the
outbreak and protecting citizens from its fallout.
In this section, some prominent programmes and
measures under Pakistan’s COVID-19 fiscal
stimulus response have been highlighted - of
which some have either commenced or are in the
pipeline. These measures have been categorised as
either inclusive, green or forward-looking, based
on the nature of their impacts.
3.1.1. Fiscal Stimulus Measures Promoting an Inclusive Recovery
4 For a detailed assessment of the fiscal stimulus package
and associated fiscal space, please refer to: Javed, S.A.
(2021), Socioeconomic Impact of COVID-19 in South
Asia-Fiscal Policy Response and Fiscal Needs for
Fiscal stimulus measures have aided in alleviating
many of the pandemic’s adverse impacts. They
have been instrumental in reducing household
vulnerability and poverty, particularly at a time
when high food inflation constituted greater food
insecurity. Additionally, measures directed at
healthcare ensured the availability (albeit
delayed) of many life-saving medical equipment
and medicines, helping hospitals better cope with
the tailback of patients.
1) Ehsaas Emergency Cash Programme
The Ehsaas Emergency Cash Programme (EECP)
was launched in April 2020 as a social protection
measure, making cash transfers of PKR 12,000 to
approximately 15 million people at risk of extreme
poverty. Under EECP, a total of PKR 203 billion
was disbursed in two phases, aimed at raising
household resilience to pandemic-induced
economic shocks (GOP, 2020a).
Supporting Economic Recovery. Islamabad: United
Nations Economic and Social Commissions for Asia and
the Pacific (UNESCAP).

17 Fiscal Stimulus for an Inclusive, Green and Forward-Looking Recovery, Leveraging the SDG Agenda
On 25th March 2021, the World Bank approved
$600 million to expand the programme. This will
fund the development of the upcoming Crisis-
Resilient Social Protection Programme (CRISP)
(World Bank, 2021), which will leverage a
number of initiatives under Ehsaas, e.g., widening
current scope to reach more beneficiaries and
creating a hybrid saving scheme that beneficiaries
can utilise, on top of cash transfers, during
economic downturns (Ibid).
2) Strengthening Healthcare Capacity
In healthcare, the government undertook steps to
build the sector’s capacity against the pandemic.
Import tariffs on emergency health equipment
were lifted early into the outbreak, which lowered
the cost of essential items needed in combating the
spread of the virus, e.g., PPEs, masks and
ventilators etc. (Khan, 2020). Additionally,
NDMA was allocated PKR 25 billion for the
additional purchase of necessary medical
equipment (Javed, 2021a).
The government also attempted to reduce supply
chain disruptions by undertaking domestic
production of certain essential items, e.g.,
ventilators, sanitisers, drugs approved for use in
COVID-19 treatment (KPMG, 2020a ). Overall,
nearly PKR 144 billion was injected into
healthcare which, though a sporadic reaction to
the crisis, is still impressive considering the 2019-
20 budget allocation to health was merely PKR
11.06 billion (Ministry of Finance, 2019).
Comparatively, the 2021 budgetary allocations to
the health sector5 have almost doubled to PKR
21.72 billion, with an additional PKR 100 billion
to the COVID-19 Emergency Fund and PKR 175.4
billion ($1.1 billion) for vaccines (Qasim, 2021) –
signalling the importance of the health sector, and
its central role in eventually reopening the
country’s economy.
5 It is to be noted that, health in Pakistan is devolved to
provincial governments, and is subject to provincial
budgetary allocations. Punjab, for example, the
country’s largest province by population, earmarked
PKR 106 billion for its COVID-19 relief package, PKR
80 billion for universal health insurance and PKR 10
billion for vaccinations in the Budget 2021-22 (Lodhi,
3) Employment Retention: Construction Sector
Tax Package
By April 2020, the GOP announced its decision to
introduce a special incentive package to kickstart
economic activity, after a severe downturn amidst
nationwide lockdowns. The PKR 100 billion
package was targeted at the construction industry,
where a sizable portion of the country’s daily-
wage and low-skilled labour is employed, many of
whom had been laid off as a result of pandemic-
related restrictions (Ministry of Finance, 2020).
Under this package, the construction sector was
provided: 1) an exemption from all lockdown
restrictions (which also applied to all associated
industries) so activities could once again fully
resume and millions of labourers could return to
work, 2) an increased public spending on the
sector, and 3) a number of tax relief measures, e.g.,
a fixed tax regime for builders and developers
alike, and tax exemptions on the
purchase/construction of people’s first house
(KPMG, 2020b). Moreover, the sector was also
presented a unique amnesty measure under the
Naya Pakistan Housing and Development
Authority (NAPHDA),6 encouraging investment
by adopting a ‘no-questions-asked’ policy
regarding the source of funds used.
4) Firm Liquidity Support
Countless businesses faced challenges in meeting
their financial needs and obligations during the
pandemic. In a bid to assist these organisations in
remaining operational, the government
introduced liquidity support measures tallying
PKR 250 billion, which included:
1. A PKR 100 billion tax refund to export-
oriented sectors.
2. Deferment in loan repayments, provided to
various sectors e.g., agriculture,
manufacturing, energy, export and import
2021).
6 “Construction Sector Amnesty Ordinance” - Naya
Pakistan Housing and Development Authority (January
21, 2021): https://naphda.gov.pk/naphda.gov.pk/docs/
Construction%20Sector%20Amnesty%20Ordinance.
pdf.

18 Fiscal Stimulus for an Inclusive, Green and Forward-Looking Recovery, Leveraging the SDG Agenda
oriented sectors etc.
3. Raising the regulatory limit of credit
extension to SMEs.
4. Additional financial support of PKR 100
billion to SMEs and agriculture, including
subsidies, utility-bill payment extensions
and various tax incentives etc.
5. A PKR 50 billion allotment to Utility Stores,
to provide subsidized essential food items to
the poor (Javed, 2021; KPMG, 2020a).
5) Electricity & Gas Relief Package
To counter rising unemployment and income
insecurity, the ECC rolled out a PKR 110 billion
utility-bill assistance plan, allowing consumers to
defer their electricity and gas bills and repay them
in instalments at a later date. Additionally, PKR
50.69 billion was also provided in electricity relief
to commercial and industrial MSMEs through the
governments ‘Chota Karobar o Sannat Imadadi’
Package (GOP, 2020).
3.1.2. Fiscal Stimulus Measures Promoting a Green Recovery
Pakistan took the opportunity provided by
COVID-19 to amalgamate its economic
development into its environment. For this, it
used a number of innovative financial
instruments:
1) The Green Stimulus Package
Introduced in early 2020, the ‘Green Stimulus
Package’ is a concerted effort to address rising
pandemic-induced unemployment, while
simultaneously resuming climate action.
Expanding on the ‘10 Billion Tree Tsunami’
initiative, the government gave the forestry sector
a green light to resume activities by employing
thousands of out-of-work labourers to plant trees
and protect national parks (and conversation
7 Figures have been provided for the sake of comparison
only and are not a precise estimation of the
environmental benefits experienced by Pakistan under
its Green Stimulus Package. Calculations on the ability
areas) from illegal logging and accidental fires.
While it may be too early to ascertain the direct
environmental impact of this fiscal response,
afforestation, on the whole, has been pushed for
its role in climate change mitigation, being known
to help prevent flooding, cool temperatures and
capture CO2 emissions. In China, for example, the
World Bank-supported Shandong Ecological
Afforestation Project, which managed to plant
trees across 66,915 hectares from 2010 to 2016. It
also aided in increasing forest cover and
sequestering approximately 12 million metric tons
of CO2, over the project’s 30-year lifetime (World
Bank, 2017). In the case of the Green Stimulus
Package, work is being carried out on
approximately 6000 hectares of state-owned land.
Based on the Shandong Afforestation Project’s
example, where each hectare absorbed
approximately 179.33 metric tons of CO2 over 30
years, Pakistan’s own project may anticipate an
absorption of approximately 1.076 million metric
tons of CO2 across the same period7. While this
may not seem much in comparison, however, with
approximately 50 million samplings anticipated to
be planted by the end of 2021, the initiative is
expected to generate significant gains for
ecosystem restoration (Khan, 2020).
The package has effectively created a pool of
employment opportunities, spending nearly PKR
10 billion to generate 85,000 jobs so far, with plans
to bring in 115,000 additional placements in the
coming months (Khan, 2021). Furthermore, the
World Bank also pledged $120 million this year
(2021) to support the initiative (Achakzai, 2021).
2) ‘Debt for Nature’ Swap Scheme
The ‘Debt for Nature’ swap scheme was
introduced as a financing tool to aid countries in
making headway on their debt crisis, while
concurrently allowing them to continue
undertaking climate action. In exchange for some
form of debt relief (whether a discount on the
principal amount, lowered interest rate or
of these projects to sequester carbon are subject to a
number of limitations: the species of samplings used,
lifespan of plantations and other ecological differences
etc.

19 Fiscal Stimulus for an Inclusive, Green and Forward-Looking Recovery, Leveraging the SDG Agenda
complete debt forgiveness), Pakistan would be
able to locally fund domestic conservation and
climate change initiatives through money saved
from the exchange. The scheme remains in the
pipeline, with efforts being undertaken to attain
$1 billion in funding.8
In the past, Pakistan has entered into debt swap
agreements with a number of Paris Club donor
countries. In 2006 for example, Italy cancelled one
half of its debt to Pakistan in exchange for projects
for Afghan refugees in the country, while for the
remaining half, a debt swap was signed
(operational from 2009) for development which
included financing basic infrastructure projects
for environmental protection. The timeline for the
Pak-Italian Debt Swap Agreement (PIDSA) was
extended till 2020. To date, debt worth
approximately PKR 6.41 billion has been
cancelled (The Nation, 2018). Pakistan is currently
set to sign debt-for-nature swap agreements with
Germany, the United Kingdom, Italy and Canada
in 2021 (Ahmed, 2021).
3) Ecosystem Restoration Fund (ERF)
The ERF was launched to help Pakistan
incorporate serious restoration and conversation
efforts into its post-COVID-19 recovery (Aslam, et
al., 2021). Initiatives include the development of
ecotourism, afforestation, ocean and land
biodiversity conservation, etc. ERF will also
support the ‘Recharge Pakistan’ initiative, which
intends to redirect floodwater to restore 14
wetland ecosystems along the Indus basin.
Additionally, $188 million has also been signed
under the Pakistan Hydromet and Ecosystem
Restoration Services Project for afforestation and
ecological preservation efforts (Ibid). The
initiative is anticipated to create almost 200,000
jobs (Khan, 2021).
4) Green Euro Bond
Pakistan kickstarted its entrance into green and
sustainable investment by issuing green euro
bonds, with plans already underway to issue bonds
8 For a detailed assessment of Debt Swaps in Pakistan,
refer to: Javed et al., 2021. Debt Swap for Green
Recovery: Options, challenges and way forward for
for $500 million through Water and Power
Development Authority (WAPDA). These funds
will be utilized for the development of
hydroelectric power.
3.1.3. Fiscal Stimulus Measures Promoting a Resilient & Forward-Looking Recovery
1) Digital Pakistan Vision
Despite over half of Pakistan’s population residing
in rural areas, by 2018 internet usage in villages
was reported at merely 8 percent (GISWatch,
2018), with most rural and remote areas lacking
basic internet connectivity. As a result, the Digital
Pakistan Policy was introduced in 2018 to create a
digitally inclusive country. Under the policy, 8
projects were approved in 2021, worth almost
PKR 5.85 billion. Some of these include:
1. ICT Internship programmes, providing fresh
graduates with the skills necessary to join the
labour market.
2. The creation of 72 telehealth facilities in
various rural areas across all provinces.
3. Data protection and cyber security measures
(MoITT, 2021a).
Furthermore, in response to the current
pandemic, an online telemedicine service ‘Yaran-
e-Watan’9 was launched, bringing in volunteering
overseas physicians to provide free health services
(online and through WhatsApp) to patients and
collaborate with local medical professionals for
research (Maqbool, 2020). Additionally,
partnerships with private EdTech companies were
made to share high-quality educational content,
e.g., Taleemabad (Orenda) and Sabaq Foundation.
2) Universal Service Fund
The USF is a subsidiary project of Digital Pakistan,
created in 2006 to promote universal access to fast
and affordable telecommunication and broadband
services in rural and remote areas. Since March
2020, the USF has awarded contracts worth over
Pakistan, Sustainable Development Policy Institute.
9 Urdu for Friends of the Country

20 Fiscal Stimulus for an Inclusive, Green and Forward-Looking Recovery, Leveraging the SDG Agenda
PKR 8 billion to various cellular service providers
under its ‘Next Generation Broadband for
Sustainable Development’ initiative, aimed at
expanding mobile broadband services to nearly 6
million individuals in previously unconnected
remote areas across Pakistan (MoITT, 2021b).
Its most recent initiative (in April 2021) included
a PKR 2.07 billion contract with Ufone (a local
cellular service provider owned by the country’s
national telecommunication company PTCL), to
provide services in Balochistan. Additionally, it
also awarded contracts for Optic Fibre Cable
projects (Ibid).
3) e-Taleem
As lockdowns forced nationwide school closures,
access to education was greatly disrupted. To help
students continue learning, the Ministry of
Education launched e-Taleem, which broadcasted
educational lessons through televisions and radios.
Lessons are available for a number of different
grades and subjects, with the transmission of
lessons for each respective grade allotted one hour
and carried out one after another.

21 Fiscal Stimulus for an Inclusive, Green and Forward-Looking Recovery, Leveraging the SDG Agenda
4. Impact of Policy Measures under the Fiscal Stimulus on Priority SDGs
The Sustainable Development Goals (SDGs) were
unveiled by the United Nations in 2015, in an
attempt to set the stage for what future progress
should embody. Today the 17 goals (to be achieved
by 2030) have become an integral part of modern-
age development, shaping both policy and
discourse. Unfortunately, post-COVID-19, the
momentum on achieving these targets has stalled.
Pakistan was among the first countries to endorse
the SDGs, integrating them into its national
development agenda in 2016 and kick-starting
their localisation through specialised support units.
Since then, work has commenced on a number of
priority SDGs (SDGPakistan, 2021):
• Priority I: goals 2 (zero hunger), 3 (good
health & wellbeing), 4 (quality education), 7
(affordable and clean energy) etc.
• Priority II: goals 1 (no poverty), 5 (gender
equality), 10 (reduced inequalities) etc.
• Priority III: goals 12 (responsible
consumption and production), 13 (climate
action) etc (SDGPakistan, 2021).
In 2020, Pakistan ranked 134th on the SDG index,
down four places from the year before, while its
score dropped by 0.01. The country has
accomplished only 1 out of its 17 SDGs, i.e., goal 13
on climate action, though arguably this remains a
hollow achievement as the goal itself is a measure
of the country’s commitment to climate action -
gauged by the implementation of relevant
environmental policies and legislation - rather than
their actual ground impact (Nabeel, 2020). As for
the rest of the goals, Pakistan remains severely off-
track for the majority, lacking the resource and
institutional capacity needed to achieve them
(figure 3). In order for Pakistan to truly build back
better, these goals must be prioritized and
effectively addressed in its post-pandemic recovery
plans.
Figure 3: Pakistan’s SDG assessment 2020
Source: SDG Index Dashboard (2020).

22 Fiscal Stimulus for an Inclusive, Green and Forward-Looking Recovery, Leveraging the SDG Agenda
In this section, the fiscal policy impacts detailed in
the previous section will be evaluated against a
number of Pakistan’s priority SDGs (specified
above). These include SDGs pertaining to poverty,
hunger, inclusion, gender quality, quality
education and the environment.
4.1. IMPACT OF MEASURES PROMOTING AN INCLUSIVE RECOVERY ON PRIORITY SDGS
Of the five measures highlighted in the previous
section, four successfully raised household
purchasing power to a great extent, with a greater
share of the consumption expenditure now used
on food and other essential commodities,
potentially saving many households from acute
hunger and poverty. This proved fortunate at a
time when food inflation had resulted in greater
food insecurity, especially for the poor, who
typically spend a larger portion of their incomes
on purchasing food.
Please note that, as some measures are very recent,
it is still fairly early to be certain of their impact
on the economy. Therefore, their expected
outcomes have been reasonably deduced
theoretically through a review of the literature.
These measures have been indicated below.
1) Ehsaas Emergency Cash Programme (EECP)
EECP has played a great role in relieving many of
the negative impacts experienced by the poor and
the vulnerable during the pandemic. The direct
cash transfers have been instrumental in
facilitating significant progress on a number of
national SDGs (Table 2 below). However, the
programme suffered setbacks and did not reach
beneficiaries promptly, many of whom remained
vulnerable to acute hunger and poverty for three
to four weeks following the lockdown (Javed,
2021a). Cash transfers also largely overlooked the
vulnerable non-poor (Ibid). Moreover,
disbursement centres failed to adequately enforce
SOPs and social distancing guidelines, with large
crowds gathering to collect their cash transfers.
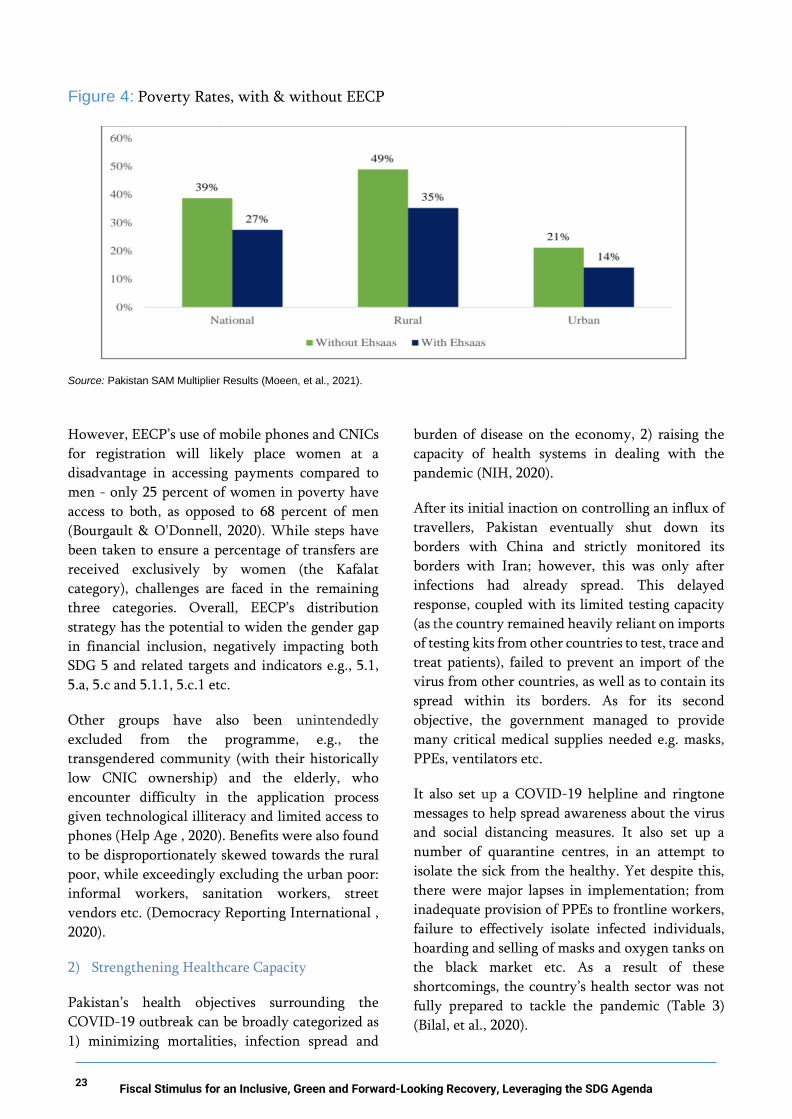
EECP proved highly effective in reducing poverty
during the pandemic, bringing 23.95 million
people out of poverty (Moeen, et al., 2021). In fact,
the national poverty rate fell by 11.2 percent, as a
result of these direct cash transfers (Figure 4),
greater so for rural areas than urban.
Table 2: Impact of Ehsaas Emergency Cash Programme
Target Group
Affected SDG
Target
Affected SDG
Indicator
Impact of Measure
Major Transmission
Channel
Perceived Impact
Strength
Source
• Vulnerable
low-income
households
• Women
1.1, 1.3,
1.5, 1.b,
2.1
1.1.1,
1.2.1,
1.3.1,
1.a.2,
1.b.1,
2.1.1,
2.1.2
Reduction
in poverty &
vulnerability
Less
hunger
Cash handouts
Higher household
purchasing power
Greater household
food consumption
Reduced hunger
and poverty
Poverty
= strong &
temporarya
Hunger
= Strong
(Moeen, et
al., 2021)b
(Democracy
Reporting
International ,
2020)
Notes: a While the study indicates a strong impact, it is anticipated to remain temporary in nature, as cash transfers under the fiscal stimulus
were a one-time injection, aimed at raising consumption during the pandemic by providing ‘temporary relief’ and do not address structural issues nor the general lack of social safety nets in the country (Democracy Reporting International , 2020).
b The study assumes fixed prices, therefore changes in consumption witnessed during the pandemic, are not accompanied by price
changes, rather only by altered production quantities, assuming demand changes are matched by supply.
23 Fiscal Stimulus for an Inclusive, Green and Forward-Looking Recovery, Leveraging the SDG Agenda
Figure 4: Poverty Rates, with & without EECP
Source: Pakistan SAM Multiplier Results (Moeen, et al., 2021).
However, EECP’s use of mobile phones and CNICs
for registration will likely place women at a
disadvantage in accessing payments compared to
men - only 25 percent of women in poverty have
access to both, as opposed to 68 percent of men
(Bourgault & O'Donnell, 2020). While steps have
been taken to ensure a percentage of transfers are
received exclusively by women (the Kafalat
category), challenges are faced in the remaining
three categories. Overall, EECP’s distribution
strategy has the potential to widen the gender gap
in financial inclusion, negatively impacting both
SDG 5 and related targets and indicators e.g., 5.1,
5.a, 5.c and 5.1.1, 5.c.1 etc.
Other groups have also been unintendedly
excluded from the programme, e.g., the
transgendered community (with their historically
low CNIC ownership) and the elderly, who
encounter difficulty in the application process
given technological illiteracy and limited access to
phones (Help Age , 2020). Benefits were also found
to be disproportionately skewed towards the rural
poor, while exceedingly excluding the urban poor:
informal workers, sanitation workers, street
vendors etc. (Democracy Reporting International ,
2020).
2) Strengthening Healthcare Capacity
Pakistan’s health objectives surrounding the
COVID-19 outbreak can be broadly categorized as
1) minimizing mortalities, infection spread and
burden of disease on the economy, 2) raising the
capacity of health systems in dealing with the
pandemic (NIH, 2020).
After its initial inaction on controlling an influx of
travellers, Pakistan eventually shut down its
borders with China and strictly monitored its
borders with Iran; however, this was only after
infections had already spread. This delayed
response, coupled with its limited testing capacity
(as the country remained heavily reliant on imports
of testing kits from other countries to test, trace and
treat patients), failed to prevent an import of the
virus from other countries, as well as to contain its
spread within its borders. As for its second
objective, the government managed to provide
many critical medical supplies needed e.g. masks,
PPEs, ventilators etc.
It also set up a COVID-19 helpline and ringtone
messages to help spread awareness about the virus
and social distancing measures. It also set up a
number of quarantine centres, in an attempt to
isolate the sick from the healthy. Yet despite this,
there were major lapses in implementation; from
inadequate provision of PPEs to frontline workers,
failure to effectively isolate infected individuals,
hoarding and selling of masks and oxygen tanks on
the black market etc. As a result of these
shortcomings, the country’s health sector was not
fully prepared to tackle the pandemic (Table 3)
(Bilal, et al., 2020).

24 Fiscal Stimulus for an Inclusive, Green and Forward-Looking Recovery, Leveraging the SDG Agenda
Though a great deal has been done to raise the
resilience of the healthcare sector (Table 3), policy
measures fail to address inequalities in accessing
healthcare services. While the government and
other public entities (e.g., the military, WAPDA)
provide healthcare to their employees (and family
members) through independent systems, nearly 90
percent of the general population remains
uncovered by such schemes; e.g., most of the
country’s informal sector faces limited access to
healthcare despite having one of highest labour
force absorption rates outside of agriculture
(Shaikh, 2020).
Additionally, maternal and child health was badly
impacted due to a disruption in healthcare facilities
amidst the pandemic, with many women unable to
avail reproductive healthcare and contraceptives.
Furthermore, rural communities remain
exceedingly exposed to COVID-19, due to
pervasive non-compliance to health guidelines,
lack of awareness, and inadequate healthcare
facilities that lack the training and capacity needed
to effectively curtail the disease (Atif & Malik,
2020).
Table 3: Impact of healthcare support measures
Target Group
Affected
SDG
Target
Affected
SDG
Indicator
Impact of
Measure
Major Transmission
Channel
Perceived
Impact
Strength
Source
• Vulnerable
individuals:
elderly,
people with
pre-existing
conditions,
pregnant
women etc
1.5, 3.b,
3.d
1.5.1,
1.5.2,
1.a.2,
1.b.1,
3.b.3,
3.d.1
Raising
capacity of
health
systems
against the
pandemic
Containing
the spread
of
infections
Injecting money into the
health sector
More medical supplies,
medicines and
equipment
Augmented sector
capacity to combat
COVID-19
Fewer mortalities and
better health
-----
Large scale testing,
tracing and quarantine
measures
Separating the sick from
the health
minimizing mortalities
and spread of infections
Weak
Weak
(Moeen, et
al., 2021)
(Bilal, et
al., 2020).

25 Fiscal Stimulus for an Inclusive, Green and Forward-Looking Recovery, Leveraging the SDG Agenda
3) Employment Retention: Construction Sector
Tax Package
The Construction Sector Tax Package will
undoubtedly be effective in tackling the country’s
rising unemployment problem, which resulted due
to the pandemic (Table 4). Theoretically,
stimulating construction and infrastructure
development has demonstrated a positive and
statistically significant correlation to
improvements in employment and economic
growth in developing countries, with potential for
the industry to create sustained employment
opportunities (Pheng & Hou, 2019). As the
Construction sector remains a major employer of
daily wage and low-skilled workers in Pakistan, the
policy measure successfully enabled millions of
labourers to return to work and resume making a
living, which is anticipated to have a favourable
impact on the country’s poverty and hunger
indicators.
However, it fails to be green and inclusive. Firstly,
the global construction industry is one of the
largest drivers of carbon emissions, responsible for
nearly 40 percent of all energy-related emissions
worldwide (Hageneder, 2020). Therefore, as
construction activity is accelerated, so will its
impact on the environment. Encouragingly, many
initiatives have been undertaken over the years to
green the construction sector. For example,
Punjab’s Environmental Protection Department
(EPD) worked closely alongside the country’s
Bricks Kiln Owners Association to introduce
environmentally friendly brick kiln technology in
2018 (CCAC, 2018). Practices such as zig-zag firing
and Vertical Shift Brick Kiln were promoted, in
order to reduce emissions and improve energy
efficiency, as were sustainable mining practices for
raw material etc. (Ibid). However, there remains a
long way to go before such practices are
substantially adopted throughout the industry,
enough to make a discernible difference.
Secondly, the industry remains overwhelmingly
male-dominated and any employment women may
acquire in its value-chain tends to pay poorly, with
terrible working conditions. Therefore, any plans
solely targeted at improving employment
opportunities within this sector, threaten to leave
women behind.
Table 4: Impact of construction sector tax package
Target Group
Affected
SDG
Target
Affected
SDG
Indicator
Impact of
Measure
Major Transmission
Channel
Perceived
Impact
Strength
Source
• Daily-wage
and low-skilled workers
• Builders and developers
1.1, 1.5, 2.1, 8.2, 8.3, 8.6, 9.1,
1.1.1, 1.5.2, 1.5.4, 1.b.1, 2.1.2, 8.3.1, 8.5.2, 9.a.1
Job
generation
Poverty reduction
Boost in
economic activity
Greater reemployment
Restored household
incomes
Greater household food consumption
Reducing hunger and
poverty ---
Tax reduction
Greater investment in construction and linked industries
Economic growth
Employment = strong
Poverty
= moderate to strong
Economic activity
=moderate
(Pheng & Hou, 2019)
*Expected results.

26 Fiscal Stimulus for an Inclusive, Green and Forward-Looking Recovery, Leveraging the SDG Agenda
4) Firm Liquidity Supports and Electricity & Gas
Relief Packages.
Liquidity support measures are anticipated to
protect businesses and households against
pandemic-induced shocks, by supporting them
during periods of reduced cash inflow and large
losses. Without them, many businesses would have
struggled to stay afloat, with little choice but to
terminate employees and eventually close up shop.
This in turn would have been disastrous for the
income security of households and their ability to
protect themselves against adversity (ESRB, 2021).
Pakistan’s timely use of liquidity support and relief
packages is therefore expected to support the real
economy and minimize economic hardships that
would have otherwise resulted. Measures are
anticipated to stem income and job losses, raise
household resilience, and in turn bear positively on
poverty and hunger indicators (table 5). How
gender and socially inclusive these measures are,
however, still remains to be seen.
Table 5: Impact of firm liquidity supports, electricity & gas relief packages
Target Group
Affected SDG Target
Affected SDG
Indicator
Impact of Measure
Major Transmission Channel
Perceived Impact
Strength Source
• SMEs • export-
oriented sectors
• Low-income households
1.1, 1.5, 2.1, 8.3
1.1.1, 1.5.2, 1.a.2, 1.b.1, 2.1.2
Less redundancy
Reduction in
poverty & vulnerability
Less hunger
Increased liquidity and cash-inflows for
businesses
Fewer layoffs and unemployment
Raising household
incomes
Greater household food consumption
Reducing hunger and
poverty
Employment = weak
Poverty = weak
Hunger
= moderate
(ESRB, 2021).
• consumers,
low-income households
1.1, 1.5, 2.1
1.1.1, 1.5.2, 1.a.2, 1.b.1, 2.1.2
Reduction in poverty &
vulnerability
Less hunger
Boost in economic activity
Electricity & gas payment relief to
consumers
More income available for essential
items
Increased household spending on food and
essential items
Reducing hunger and poverty
--- Electricity & gas payment relief to
industries
Low input costs
Increased production
Better economic growth
Poverty = moderate
Hunger = strong
Economic activity =weak
(ESRB, 2021).
*Expected results.

27 Fiscal Stimulus for an Inclusive, Green and Forward-Looking Recovery, Leveraging the SDG Agenda
4.2. IMPACT OF MEASURES PROMOTING A GREEN RECOVERY ON PRIORITY SDGS:
Fiscal policy responses aimed at ensuring a green
recovery are anticipated to impact a wide variety of
SDGs. Together, such innovative measures have the
ability to boost economic growth while protecting
the environment, rather than at its expense.
1) Green Stimulus Package
The Green Stimulus Package is anticipated to
improve SDGs on poverty and hunger, as more jobs
and incomes are slowly recovered (table 6).
Attempts to keep the measure inclusive have been
made, with job creation increasingly targeted at
women and idle daily-wage workers returning to
rural areas as big cities faced lockdowns (Table 6)
(Khan, 2020). Moreover, there are ongoing
proposals to guarantee sustainability moving
forward, e.g., expanding the initiative’s scope to
generate hundreds of thousands of jobs in various
cities, covering a number of climate-related
activities such as green transport, clean energy, etc
(Ibid).
Table 6: Impact of green stimulus package
Target
Group
Affected
SDG
Target
Affected
SDG
Indicator
Impact of
Measure
Major Transmission
Channel
Perceived
Impact
Strength
Source
• Out-of-
work low
wage
skilled and
daily wage
labourers
• Youth
• Women
1.1, 1.5,
2.1, 8.3,
8.5, 13.1,
13.2,15.1,
15.2,15.4,
15.5,
15.a,
15.b,
1.1.1, 1.5.1,
1.5.2,
2.1.1,8.3.1,
8.5.2,
13.1.1,13.2.2,
15.1.1,
15.2.1,
15.4.2,15.5.1,
15.a.1,
15.b.1,
Job creation
Reduction in
poverty &
vulnerability
Less hunger
Climate
Change
Mitigation
Environmental
Conservation
Reemployment of
workers
Raised household
incomes
Increased household
spending
Reduced food
insecurity
Reduced hunger and
poverty
---
Mass afforestation
drives
More trees
More CO2 Absorption
Less biodiversity loss
Reduced water runoff
and erosion
Environmental
Protection
Employment
= strong
Poverty
= moderate to weak
Hunger
= strong
Climate Action
= Though the impact of
afforestation itself is
strong, the overall
impact may emerge as
weak to moderate (see
below)
(ILO,
2021),
(Harris
&
Gibbs,
2021)
*Expected results.

28 Fiscal Stimulus for an Inclusive, Green and Forward-Looking Recovery, Leveraging the SDG Agenda
On the climate front, planting trees is a welcomed
initiative in Pakistan - a forest poor nation, with
one the highest deforestation rates in Asia (WWF,
2020). Previously, under ‘10 Billion Tree Tsunami’,
nearly 30 million saplings were planted. With the
Green Stimulus Package, this number is expected to
be brought up to 50 million by the end of 2021
(Khan, 2020). As forests remain effective carbon
sinks, capable of absorbing an average of 16 billion
metric tons of CO2 every year (Harris & Gibbs,
2021), an accelerated afforestation drive would be
valuable in raising resilience against extreme
weather events and global warming. Additionally,
afforestation is reported to reduce soil erosion and
biodiversity loss, as seen in China, through the
Shandong Ecological Afforestation Project. As a
result of this project, trees and shrubs planted on
36,897 hectares of highlight degraded hillsides,
helped reduce soil erosion by 68 percent and
enriched biodiversity by 40 percent (World Bank,
2017).
Nonetheless, though in isolation afforestation
through the Green Stimulus Package has the
potential to produce a strong impact on climate
change, in light of policy inconsistency by the GOP
found in this regard, the overall impact is left weak
to moderate (Table 6). This is because, while
millions of trees are being planted through this
fiscal response, they are also simultaneously being
cut down elsewhere in the country, for the
construction of large infrastructural projects,
thereby minimizing the overall actual benefit of
such an initiative. Likewise, while trees are being
planted for their ability to sequester carbon and
increase resilience to extreme climate events, the
country continues to invest heavily in coal – an
energy source responsible for a large amount of CO2
emissions.
2) ‘Debt for Nature’ Swap Scheme & the
Ecosystem Restoration Fund
Debt remains a pressing issue for Pakistan, made
worse by the recent pandemic-induced recession.
As the country struggles to reduce its debt burden,
less and less money is available each year for
sustainable development. As the climate
emergency intensifies, more ambitious debt relief
plans will be needed to help Pakistan combat
climate change. The ‘Debt for Nature’ swap scheme
provides this (Javed, et al., 2021). By lowering a
country’s debt stock, swap schemes have proven
effective in stimulating economic growth and
maintaining macroeconomic stability (Steele &
Patel, 2020). In Pakistan’s case, it is anticipated to
reduce poverty and hunger (through job creation,
as more people are employed in domestic
conservation and environmental projects), improve
public health indicators (cleaner air, better
sanitation and access to water) and raise the
country’s climate resilience, all the while making
headway on a number of crucial SDGs (table 7).
Similarly, the ERF provides Pakistan with the
opportunity to recover previously destroyed and
degraded ecosystems. It is anticipated to improve
both biodiversity and public health, as well as
advance climate change mitigations efforts by
keeping global temperatures down. Investments
can also stimulate business activity and generate
jobs, especially in rural and local communities,
pushing down poverty and hunger (Table 7)
(Thomas, et al., 2016). Both Debt Swaps and ERF
can potentially improve gender equality and social
inclusion, so long as greater FLFP in conservation
projects is ensured and more women are included
in decision-making and leadership positions.
While initiatives like debt swaps and ERFs have
been used across the globe to reduce carbon
emissions across a number of key economic sectors,
in the case of Pakistan however, these remain
limited to domestic conservation and
environmental projects. Nonetheless, with such
instruments beginning to spark interest in the
country, there is potential for these to expand into
other crucial sectors, such as the energy sector,
transport, agriculture or industry, etc. Of course,
swaps will likely face a number of challenges, such
as the alignment of incentives between Pakistan
and any potential creditor, weak monitoring and
governance, uneven ownership of swaps across
different governmental levels that can impact
implementation, etc., all of which will need to be
addressed if the country hopes to maximise on
benefits from such agreements (Javed , et al., 2021).

29 Fiscal Stimulus for an Inclusive, Green and Forward-Looking Recovery, Leveraging the SDG Agenda
Table 7: Impact of Debt for Nature’ swap scheme & Ecosystem Restoration Fund
Target Group Affected
SDG Target
Affected SDG
Indicator
Impact of Measure
Major Transmission Channel
Perceived Impact
Strength
Source
• Out-of-work low wage skilled and daily wage labourers
• Youth • Local
surrounding communities
• Forestry Sector • Wetland
Ecosystems
1.1, 1.5, 2.1, 3.9,
6.3, 8.3,8.5,
8.6, 13.1, 13.2, 13.b, 14.1, 14.2,
14.c,
15.1, 15.2, 15.3, 15.5, 15.a, 15.b,
1.1.1, 1.5.1, 1.5.2,
2.1.1,3.9.1, 3.9.2, 6.3.1,
6.3.2, 8.3.1, 8.5.2,
13.2.1, 13.2.2, 13.b.1, 14.5.1,
15.1.1, 15.1.2, 15.2.1, 15.3.1, 15.4.1, 15.5.1, 15.a.1 (a)(b), 15.b.1 (a)(b),
Job creation
Reduction in poverty &
vulnerability
Economic
growth
Climate Change
Resilience and
mitigation
Gender Equality
Better health
outcomes
More conservation and environmental projects
More jobs
raises household
incomes
Increases household spending
Reduces food insecurity
Reduces hunger and poverty
---
Reduced debt burden
stimulating economic growth and maintaining
macroeconomic stability
-----
Greater number of domestic conservation
and environmental projects
Improved biodiversity Recovered Ecosystems
Keeping global
temperatures down ---
Inclusion of women in projects
More jobs for women
Income generation for women
Greater economic, social and political empowerment for
women ---
Environmental Conservation
cleaner air, better
sanitation, access to water
Longer life expectancy, fewer mortalities, less
disease
Employment = strong
Poverty = strong to moderate
Hunger = strong
Economic growth = strong
Climate action
= strong
Gender Equality = weak
Health = weak
(Javed, et al., 2021)
(Thomas, et al., 2016)
*Expected results.

30 Fiscal Stimulus for an Inclusive, Green and Forward-Looking Recovery, Leveraging the SDG Agenda
3) Green Euro Bond
Green bonds are a great means of securing funding
for environmental projects, with its market
witnessing exponential growth over the years. In
Pakistan, green bonds will be employed to fund
hydropower.
Lowering the country’s fossil fuel dependency by
switching over to renewables is not only a win for
the environment (Table 8), but could also improve
the efficiency of the power sector, thereby saving
enormous costs – which can in turn be used to fund
social and health programmes (Zhang, 2019).
Table 8: Impact of Green Euro Bonds
Target Group
Affected SDG
Target
Affected SDG
Indicator
Impact of Measure
Major Transmission Channel
Perceived Impact
Strength Source
▪ Local surrounding communities
▪ Poor and vulnerable communities
7.2, 7.3, 7.a, 7.b,
13.1, 13.2, 13.b, 15.a,
1.1, 1.5, 2.1, 3.9
7.2.1, 7.a.1, 7.b.1, 13.2.1, 13.2.2, 13.b.1
1.1.1, 1.5.1, 1.5.2,
2.1.1,3.9.1, 3.9.2
Climate Change
Resilience and
mitigation
Greater fiscal space for
sustainable development
Betterment
in Development
Indicators
Better health outcomes
Greater hydropower projects
Greater Renewable
Energy
Less dependency on fossil fuels for
electricity generation
Less CO2 emissions Improved biodiversity Recovered Ecosystems
Keeping global
temperatures down ----
Greater power sector efficiency
Less distortion costs
More national savings
Greater resources available for
investment in development
Improvement in
development ---
Decreased emissions and pollution
cleaner air, better
sanitation and access to water
Longer life
expectancy, less mortalities, less
disease
Climate action
= strong
Sustainable Development
= strong
Health = weak to moderate
(Zhang, 2019)
*Expected results.

31 Fiscal Stimulus for an Inclusive, Green and Forward-Looking Recovery, Leveraging the SDG Agenda
4.3. IMPACT OF MEASURES PROMOTING A FORWARD-LOOKING RECOVERY ON PRIORITY SDGS Fiscal policy responses aimed at ensuring a
forward-looking recovery are anticipated to
generate a digital transformation, resulting in
improvements across a range of SDGs. Once again,
as most of the work under the three stated measures
is still underway, it is still too early to assess their
actual developmental impact. Therefore, expected
outcomes based on literature review and peer
benchmarking have been provided in the tables
below.
Table 9: Impact of digital Pakistan vision & Universal Service Fund
Target Group
Affected
SDG
Target
Affected
SDG
Indicator
Impact of
Measure
Major Transmission
Channel
Perceived
Impact
Strength
Source
• Rural and
remote
localities
• Previously
unconnected
regions.
• Women
1.1, 1.5,
2.1, 3.1,
3.2, 3.4,
3.7, 3.c,
5.b, 8.2,
8.3, 8.6,
9.c
1.1.1,
1.5.2,1.5.4,
1.b.1,
2.1.2,
3.1.1,
3.1.2,
3.2.1,
3.2.2,
3.c.1,
5.b.1,
8.3.1,
8.6.1,
9.c.1
Reduction in
poverty &
vulnerability
Increased
employment
and
educational
opportunities
Good health
and
Well-being
Gender
Equality
E-commerce
expanded access to
larger markets
income growth in
poor households
Increases household
purchasing power
poverty and hunger
reduction
----
Tele-medicine
Greater access to
health services
in rural remote areas
---
Equal access to
employment and
educational
opportunities for
women
Better and more jobs
greater economic
power for women
greater political and
social power for
women
Poverty
=Permanent,
strong
Employment
= strong
Economic
activity
= strong
Health
= strong
Gender
equality
= strong
(Xiheng
&
Changyu,
2020)
(Zaballos
, et al.,
2019).
*Expected results.

32 Fiscal Stimulus for an Inclusive, Green and Forward-Looking Recovery, Leveraging the SDG Agenda
1) Digital Pakistan Vision & Universal Service
Fund
Digital infrastructure improvements are known to
have a significantly positive impact on several key
SDGs. 10 Pakistan’s commitment to expanding
internet access in rural and remote regions (USF
initiative) can potentially bring numerous
communities out of poverty by generating
employment and education opportunities, as seen
by China’s experience (table 9) (Xiheng &
Changyu, 2020). Additionally, digital
infrastructure investments can enhance
productivity and resilience in key economic
sectors, such as agriculture, where advancements
can improve food security11 (Zaballos , et al., 2019).
While a gender and residence lens has been
mainstreamed into Digital Pakistan and USF, both
fail to address existing inequalities, in turn
potentially further limiting access to numerous
social and economic opportunities. For instance,
the free telehealth service portal via WhatsApp
fails to account for inequitable technology access in
Pakistan. WhatsApp’s use among older people (as a
share of total visitors) is low and progressively
declines after age 34, with people 65 and older
constituting only 6 percent of users (Hootsuite &
We Are Social, 2021). Additionally, women’s share
of total users is far behind that of men (31.2 and
68.8 percent respectively) (Ibid). Therefore,
measures facilitating medical consultations through
applications like WhatsApp will likely have a
limited audience.
2) E-taleem
Sudden school closures provided the government
wit a small window of opportunity to implement
measures minimizing collateral damage to
education, e.g., e-taleem.
Virtual learning undoubtedly has its benefits; e.g.,
it can widen educational opportunities for
countries like Pakistan, whose existing educational
infrastructure cannot effectively cater to its ever-
growing population. Addressing physical capacity
shortages in educational facilities (e.g., schools and
universities) is both costly and time-consuming.
Instead, virtual learning can efficiently expand
access to education for millions, raise literacy
rates 12 and increase employment opportunities
whilst reducing costs (over traditional brick-and-
mortar education) (Trines, 2018). Additionally, e-
learning measures can advance gender equality by
schooling more young girls and women. Raising the
number of schooling years provided to girls reduces
the likelihood of child marriage (table 10): each
year of secondary education reduces the chance of
a girl marrying before the age of 19 by 5 percent
(World Bank, 2017).
Once again, however, e-taleem failed to account for
regional and gender disparities in television
ownerships. According to the DHS (2019), 86
percent of urban households owned a television set,
while the same was true for only 48 percent of rural
households. An even greater difference existed in
television ownership between the wealthiest and
poorest quintiles. These inequalities resulted in e-
learning initiatives excluding many poor and rural
children. Additionally, as girls in rural areas also
face restricted access to technology, such oversights
threaten to widen the gender divide further
(Aslam, 2021).
10 As seen from the experience of several Latin American
and Caribbean countries (Zaballos , et al., 2019).
11 Ibid.
12 (2019) ‘Technology to be used to raise literacy rates:
Minister” -Dawn, April 16,
https://www.dawn.com/news/1476418.

33 Fiscal Stimulus for an Inclusive, Green and Forward-Looking Recovery, Leveraging the SDG Agenda
Table 10: Impact of E-taleem
Target
Group
Affected
SDG
Target
Affected
SDG
Indicator
Impact of
Measures
Major Transmission
Channel
Perceived
Impact
Strength
Source
Students 1.1 1.5, 2.1, 3.1, 4.1, 4.2,
4.3, 4.4, 4.5, 4.6,
5.3,
1.1.1, 1.5.2,1.5.4,
1.b.1, 2.1.2,
3.1.1, 1.1.1,
1.5.2,1.5.4, 1.b.1, 2.1.2,
4.1.1, 4.2.2, 4.3.1, 4.4.1, 4.5.1, 4.6.1, 5.3.1,
Quality Education
Increased employment opportunities
Reduction in poverty &
vulnerability
Gender Equality
Undisrupted schooling
Lower dropout Rates
Higher Enrolment
Rates
Higher Literacy Levels -----
Widening
educational opportunities
Better and more jobs
Raises household
incomes
Increases household spending
Reduces food
insecurity
Reduces hunger and poverty ------
More years of undisrupted
education for young girls
Reduced chance of
child marriages
Better health and reproductive
outcomes for women
Literacy = strong
Broadening access to education = strong
Reduced
learning losses during crises
=strong
Employment = moderate
Poverty reduction
= moderate to strong
Gender Equality
= moderate to strong
Greater access to education
for girls= strong
Greater access to economic opportunities for women=
strong
(Trines, 2018)
(World Bank, 2017).
*Expected results.

34 Fiscal Stimulus for an Inclusive, Green and Forward-Looking Recovery, Leveraging the SDG Agenda
5. Policy Actions Needed to Secure a Resilient, Inclusive and Green Recovery in Pakistan
This section proposes 5 key actionable
recommendations that can be implemented to
better reconcile Pakistan’s recovery with its long-
term sustainable development priorities. Please
note that all figures pertaining to the potential costs
associated with the recommended policy actions
have been provided in the following section.
5.1. PAKISTAN MUST INCREASE SOCIAL SPENDING AND EXPAND SOCIAL PROTECTION On average, South Asian countries have lower
social spending (comprising of health, education
and social assistance) than any other region13. In
2019, the region spent an average of 3.37, 0.95 and
0.90 percent of its GDP on education, health and
social assistance respectively (Bloch, 2020). In
comparison, the global social spending average on
education, health and social assistance in the same
year stood at 4.81, 5.84 and 1.54 percent,
respectively. Pakistan’s own social spending falls
even below the regional average, spending a mere
2.8, 0.7 and 0.6 percent of its GDP on education,
health and social assistance in 2019 (WHO, 2019,
UNESCO, 2019, World Bank, 2019).
Moreover, the Population Situation Analysis (PSA)
shows social spending in Pakistan to have declined
over time. Health expenditures fell from 1 percent
of the GDP in 1980 to 0.7 percent of the GDP in
2019. Educational expenditures observed a similar
pattern. Even social assistance spending continues
to remain low, despite the country being in dire
need of an expanded social assistance programme
(Bloch, 2020). In 2019, Pakistan’s total provincial
expenditure on social protection amounted to
13 Regions: Europe & Central Asia, Sub-Saharan Africa,
Latin America and Caribbean, East Asia and Pacific,
Middle East and North Africa.
14 ILO’s calculations indicate that spending at least 2.74%
of GDP on social protection is necessary to provide
basic income security to children under the age of five,
approximately 1 percent of its GDP (ILO, 2019),
despite the country’s draft National Social
Protection Framework recommending it spend 3.9
percent of its GDP.14
Pakistan’s existing fiscal policies remain inadequate
in improving social indicators. While a limited
fiscal space is often cited as a key reason for low
social spending, the argument, albeit valid, no
longer suffices. Pakistan must increase social
spending if it wishes to sustain poverty reduction,
create jobs and improve the lives of its ever-
growing population. 15 The gains from doing so
greatly overweigh the costs, especially against the
backdrop of the current pandemic which has left
many vulnerable to hunger and destitution.
To begin with, Pakistan must guarantee social
protection, that is affordable, universally accessible
and ample enough to make a difference, to all
citizens. Concrete steps must be taken to remove
systematic barriers faced by vulnerable segments in
accessing social welfare (UN DESA, 2018). For
Ehsaas, this entails simplifying the registration
process to cater to digitally illiterate individuals,
accounting for existing inequalities that resultantly
exclude women and transgender people etc.
Additionally, as part of its post-COVID recovery
plans, Pakistan must provide affordable and high-
quality healthcare to all citizens (ESCAP, 2021).
Although healthcare’s capacity to deal with
COVID-19 has improved, unless services remain
fully accessible to all in need such measures remain
unconstructive. Moreover, creating a universal
healthcare system need not break the bank.
persons with disabilities and person over the age of 65”.
15 Refer to Javed (2021) for detailed assessment of
socioeconomic impact of increased social
spending/social protection. The paper simulates the
impact of increased social spending on GDP growth,
inflation, poverty, employment and inequality.
35 Fiscal Stimulus for an Inclusive, Green and Forward-Looking Recovery, Leveraging the SDG Agenda
Pakistan can cover its population against health
risks while saving costs by 1) using a hybrid of
contributory and non-contributory approaches to
lower the burden on public resources, while also
using co-payment mechanisms to prevent overuse;
2) raising efficiency, which can save more than 30
percent in healthcare expenditures across Asian-
Pacific developing countries; 3) initially providing
basic and primary health services, prescriptions and
vaccines (that generate high impacts at lower costs)
and then gradually expanding facilities (ESCAP,
2019).
Furthermore, as the likelihood of future
occurrences of infectious diseases and pandemics
increases, Pakistan gains from substantially
increasing its domestic health infrastructure
spending. Raising public healthcare capacity
against pandemics is crucial if the system is to
withstand both current and future health
emergencies. For this, the government must direct
the fiscal stimulus towards augmenting national
testing capacity against infectious diseases, by:
1. Developing the scope for domestic
manufacturing of diagnostic equipment
to guarantee a smooth and low-cost
future supply stream, with mechanisms in
place to ensure quality standards of
locally produced kits – a problem the
country regularly encounters.
2. Encouraging private and bilateral
partnerships for the transfer and
exchange of R&D technology to enable
local development. This is necessary as
Pakistan does not possess its own strong
local capacity for R&D (WHO, 2011).
5.2. PAKISTAN MUST ROLE OUT A MASS VACCINATION POLICY While COVID-19 vaccine development has been
unprecedentedly fast, obstacles are being faced
worldwide in its distribution; 1 out of 4 people in
rich countries are already vaccinated, while the
same is true only for 1 out of 500 people in poor
countries as rich countries buy up more than half
of the future supply of vaccines (Oxfam, 2020). The
speed and scale with which vaccines can be mass-
produced and rolled out to the general public is
critical to how well a pandemic is handled. As
vaccines become permanent fixtures in global
healthcare strategies against future pandemics,
Pakistan must ensure its own local production and
distribution of vaccines. Ramping up domestic
production of vaccines will increase the pace and
cost-effectiveness with which the country is able
towh manage all future epidemics and pandemics
independently (Rey-Jurado, et al., 2018).
Vaccination policy must remain an economic
policy (Javed, 2021b). As pandemic-induced stress
on the country’s economic and health systems
continues to mount, Pakistan must map out a clear
national strategy for vaccinating its population
against COVID-19 quickly and fairly (Ibid).
Vaccination must be a priority spending area, with
the government laying out a clear national road
map for inoculating all citizens. The COVID-19
vaccine is more than just a vaccine - it is the key to
resuming economic activity within the country and
alleviating the overwhelming stress currently being
faced by the healthcare system.
Successful immunisation is key to post-pandemic
employment, as reopening will inevitably
encourage re-employment and create new job
opportunities. The vaccine’s long-term gains are far
greater than its one-time cost. While Pakistan’s
relatively lower spread and mortality rate have
mistakenly encouraged the government’s sluggish
action on vaccinating its citizens, there is no doubt
that further delays will make eventually re-
opening even costlier, due to the economy
continuing to operate below potential. Until and
unless Pakistan implements a well-designed
vaccination policy, future waves of the virus will
continue to come.
5.3. GREATER GENDER SENSITIVITY IN FISCAL STIMULUS MEASURES IS REQUIRED
Despite global calls to make women equal
beneficiaries in all post-pandemic recovery plans,
efforts have largely missed the benchmark. Most
economic and social measures across the world
continue to remain gender insensitive (Figure 5)
while failing to adjust for pre-existing inequalities,
thereby inadvertently exacerbating gender
exclusion even further.

36 Fiscal Stimulus for an Inclusive, Green and Forward-Looking Recovery, Leveraging the SDG Agenda
Figure 5: Gender equality in COVID-19 policy measures
Source: ESCAP, based on UNDP-UNW COVID-19 Global Gender Response Tracker.
Pakistan has been no different in this regard. As the
crisis warranted an urgency in the rollout of
support measures, due consideration was not given
to ensuring that measures remained gender-
sensitive, resulting in many oversights and gaps.
This was evident from the review in the previous
section where, in the case of Ehsaas, the
distribution strategy remained inherently flawed in
ensuring women equal access to hand-outs. The
high gender inequity in ownership of mobile
phones and identification cards in the country
meant fewer women would be able to register to
such programmes (excluding the Kafalat category,
which is exclusively for women). Mechanisms must
therefore be devised to guarantee programme
accessibility, so that women are not excluded from
social welfare. In the case of Ehsaas, short-run
efforts can include allotting greater slots to women
in all categories and prioritizing female applicants.
Long-run efforts involve reducing the gender gap
in citizen registration by removing barriers faced
by women in obtaining CNICS etc.
The importance of mainstreaming gender into
fiscal stimulus measures cannot be understated. In
2005, the GOP introduced mandatory gender-
responsive budgeting in an attempt to reduce
gender disparities, which has been associated with
an almost 485 percent rise in gender-sensitive
expenditures between 2007-08 to 2008-09 (Oxfam,
2020). By 2008, gender-responsive budgeting had
been introduced at all governmental labels and
ministries (Ibid). However, most work remains
surface level, and for most public offices the
commitment towards gender equality is not
reflected in the implementation of policies and
projects. In most cases, women remain subsidiaries
rather than primary beneficiaries.
Economic opportunities are extremely restricted
for women in Pakistan, with only one-fourth
participating in the labour force as opposed to 85
percent of men. Pakistan ranked 151 out of 153
countries on the Gender Inequality Index last year
and placed 150 out of 153 countries in the
Economic Participation and Opportunity sub
index, having closed only 32.7 percent of its
existing gender gap (Figure 6) (World Economic
Forum, 2020).
As discussed, the government attempted to
counteract the pandemic-induced rise in
unemployment by boosting activities within the
construction and forestry sectors – both of which
remain largely male-dominated. As women
continue to fare poorly across all indicators, it is
incumbent upon the state to double down on
efforts to instil gender parity across all recovery
measures. For this, the government must first
accurately identify where women are employed.
Female labour force participation (FLFP) is
generally higher in rural areas than urban, with the
majority of women working in agriculture,
manufacturing and domestic services (Pakistan
Bureau of Statistics, 2018).

37 Fiscal Stimulus for an Inclusive, Green and Forward-Looking Recovery, Leveraging the SDG Agenda
Figure 6: Country score card
Source: (World Economic Forum, 2020).
Much of this employment remains informal,
unregulated and highly vulnerable to pandemic-
induced shocks, leaving many women without
income, healthcare or any form of social protection.
The government must, therefore, target recovery
and stimulus packages at such sectors. In the short
run, this may be achieved through income-support
measures, grants and credits, financing for women
entrepreneurs and small business owners. In the
long run, reforms can be introduced to cement
better pays and benefits (paid sick leave, maternity
leave, health insurance and pensions) in female-
dominant sectors etc. (UN, 2020).
Bringing girls back to school is another critical task
in mainstreaming gender into post-pandemic
recovery. Once schools reopen, ensuring female re-
enrolment should be of the utmost importance. The
government can ensure young girls and women
continue their education by 1) removing the
financial barriers faced by girls in accessing
education (e.g., subsiding or waiving tuition fees for
girls and providing financial incentives such as cash
transfers to encourage parents to send their girls
back to school), 2) creating social awareness on the
importance of education for girls and women, with
community outreach campaigns targeted at
bringing girls back into classrooms, and 3) by
addressing the gender parity in distance learning,
e.g., accessing e-learning technology (Jenkins &
Winthrop, 2020, Botea & Friedson-Ridenour,
2020).
5.4. PAKISTAN NEEDS TO ENSURE BALANCED GREEN FUNDING IN ORDER TO ENSURE TRANSITION TOWARDS GREEN RECOVERY ENERGY Recovery efforts appear to be producing a net
negative environmental impact, with trillions
being injected into carbon-intensive activities in
the hopes of minimizing the fallout from the crisis.
Even as countries invest in a green recovery, green
spending is often greatly overshadowed by non-
green spending (Vivid Economics, 2020). In
Pakistan for instance, on one hand, measures such
as the Green Stimulus Package are praised for
generating employment and being eco-friendly,
while on the other hand, other measures continue
to harm the environment (e.g., injecting money
into the construction sector, which has a
notoriously high carbon footprint). Similarly, while
trees are planted through ‘10 Billion Tree Tsunami’,
thousands are logged to make way for large-scale
infrastructural projects. Such contradictory
measures signal policy incoherence in recovery
plans, resulting in an overall loss for the
environment as costs outweigh benefits.
To counter this, at least 30 percent of the fiscal
stimulus moving forward must be geared towards
green recovery in conformity with international
commitments (e.g., the EU) (IISD, 2020).
Moreover, spending earmarked for non-green
purposes must not harm the environment nor
dwarf green spending. Additionally, non-green

38 Fiscal Stimulus for an Inclusive, Green and Forward-Looking Recovery, Leveraging the SDG Agenda
projects should be priced differentially, to
discourage investments in them.
While the cost of a green recovery is high, the gains
are higher. Evidence suggests that $1 million spent
on fossil fuels has the potential to generate 2.7 jobs,
whilst the same amount can potentially produce 7.5
jobs in renewables and 7.7 in energy efficiency
(Hughes & Roy, 2020). Pakistan must appreciate
the social gains of climate action i.e., saving
millions of lives and preventing avoidable large-
scale destruction – a vision that must drive its
support for a green recovery no matter the cost. To
this end, Pakistan’s green recovery will require
prioritising the following three dimensions:
1) Eliminating Fuel Price Subsidies
As recovery reinforces support for climate action,
eliminating fuel subsidies is an important step in
working towards a carbon-free future (ESCAP,
2021). Fossil fuel emissions wreak havoc on both
the environment and human life. Lowering their
consumption is key to tackling climate change and
must be done with immediate effect. Yet their
active subsidisation continues to encourage
overconsumption - making this harder to achieve.
Moreover, energy subsidies prompt under-
investment in renewables, disproportionately
benefit the wealthy and channel public money
away from productive and sustainable causes
(World Bank, 2020a). While entirely removing
subsidies is politically unviable, it is crucial for a
greener future.
For Pakistan, fuel subsidies remain a permanent
fixture in the national budget. In 2019, the country
paid $1.7 billion and $0.2 billion in coal and oil
subsidies respectively (IEA, 2020). Subsidies have
historically been provided in Pakistan as a cheaper
alternative to social benefits, with violent riots
erupting whenever attempts to slash or withdraw
these incentives are made. Eliminating subsidies
can be done peacefully, however, as shown by
Indonesia, which introduced successful subsidy
reforms from 2014 to 2017 after decades of heavily
subsidising fossil fuels. This was accomplished by
President Joko Widodo’s ability to sway public
support for these reforms by promising the poor
free access to healthcare and education
(Chelminski, 2018). Eliminating subsidies saved
Indonesia $15.6 billion – 10 percent of its total
expenditure - which in turn was routed towards
social welfare, resulting in a win for both the
environment and sustainable development (IISD,
2016).
This, however, may be easier said than done in the
case of Pakistan. The success of fuel subsidy reforms
within a country is dependent upon a number of
factors: sound governance, corruption, political
stability, rule of law and transparency, etc. (Foo, et
al., 2020). Key differences in this regard between
the two countries may make it difficult for Pakistan
to replicate Indonesia’s success. For instance,
Pakistan ranked 120th out of 128 countries in terms
of rule of law in 2020, while Indonesia ranked 59th
(WJP, 2020). The absence of corruption is
perceived to be far lower in Pakistan (ranking
116th) than Indonesia (ranking 92nd), with the
former facing greater problems with
misappropriated public funds which have in turn
weakened the public’s confidence in any assurance
from the government to channel money saved from
subsidy cuts towards increased social spending.
Likewise, Pakistan also fares worse than Indonesia
in regard to regulatory enforcement and justice
(Ibid). It also faces far more political instability than
Indonesia (World Bank, 2019). All in all, in the case
of Indonesia, the public had far more confidence in
both the government and its political leaders to use
public funds for social welfare, transparently,
equitably and effectively, which is not the case in
Pakistan. Given the general public’s complete lack
of trust in governance structures and political
figures, as well as little to no public accountability
in Pakistan, managing a transition from fossil fuel
subsidization to universal social protection,
healthcare and education will require the GOP to
rebuild trust with its citizens, garnering social
acceptance for such reforms through strong
political leadership, good public relations, and by
compensating the poor for their increased financial
burden.
2) Shifting to Green Transport
Green transportation is vital to green growth.
Pakistan can make a breakthrough on SDGs 9 and
11 by constructing a low-carbon public transport
system. For this, Brazil’s Bus Rapid Transit (BRT)

39 Fiscal Stimulus for an Inclusive, Green and Forward-Looking Recovery, Leveraging the SDG Agenda
system in the city of Curitiba provides a model
example of sustainable urban planning in a city
where the population tripled in the span of 20
years. Curitiba’s BRT is used today by nearly 75
percent of its population, carrying over 1.3 million
passengers daily across 359 stations and through
integrated bus lanes which have dramatically
reduced commute times and costs. It also
successfully cut emissions and improved the air
quality and well-being of residents, while
supporting employment generation as new
businesses and industries developed along its route
(Development Asia , 2016).
While Pakistan already has a BRT Metro Line in a
number of cities, it operates at limited capacity and
fails to provide an adequate solution to public
transport. It remains underutilized and ineffective
in reducing emissions, as most people still require
the use of cars and private transport (vans, taxis and
rickshaws) to complete their journey. In fixing this,
Pakistan can learn a number of lessons from
Curitiba. Firstly, it can complement the existing
system with connecting bus services to expand
route coverage, using low emission buses, a
dedicated bus lane (on the same road, without
separation) with roadside bus stops, stalls and
benches (ensuring safety for women and girls), and
real-time route and wait information.
Additionally, bicycle or e-scooter posts can be
provided at main Metro Stations as alternative
green modes of transport, with docking stations
provided throughout the city for their easy return
(Ul Haque & Rizwan, 2020). Efforts must not stop
here, however: a push and pull approach must be
utilised to sway people towards public transport by
1) ensuring it is affordable, convenient to use, safe
(especially for women travelling alone) and socially
inclusive, 2) marketing the economic, social and
health benefits of greener modes of transport (e.g.,
more walking and cycling), 3) creating pedestrian
and cycling spaces (e.g., broader footpaths and
cycle lanes), and 4) discouraging car use within city
limits by removing fuel subsidies, adding gas
guzzler taxes, congestion charges and creating low-
emission zones, etc. (Bongardt, et al., 2010).
16 Actual figure is anticipated to be higher as social loss to
3) Transitioning to Renewable Energy
Energy is central to Pakistan’s ability to reduce its
vulnerability to climate change. The current system
remains financially unsustainable and causes
billions in losses annually. In 2015, distortions cost
the country approximately $17.69 billion (Zhang,
2019). In the same year, frequent and lengthy
power shortages cost households and businesses
almost $12.87 billion.16 For context, these losses are
two to three times larger than Pakistan’s recent $6
billion IMF bailout package.
Transitioning to renewable energy can help cut
these costs whilst simultaneously fulfilling a
number of SDGs in energy, poverty, water,
sustainable cities, etc. Pakistan has great potential
in renewables, with wind being a particularly
abundant resource. However, despite this, solar and
wind continue to operate at only 4 percent capacity
and account for merely 2 percent of total power
generation (World Bank, 2020b).
With recovery efforts underway, incentives for
Pakistan to fall back into conventional policy
measures are high. Fossil fuel dependency could
potentially worsen as CPEC progresses, as
construction of the corridor demands more coal-
fired power plants to meet energy needs, and
emission-belching road transportation is
anticipated to release up to 36.5 million tons of CO2
emissions daily along with mass-scale deforestation
drives, etc. As Pakistan continues to commit
investments in a myriad of carbon-intensive
infrastructures, it risks a carbon lock-in, making
shifting to cleaner energy even trickier (Kouser, et
al., 2020, Khwaja, et al., 2018). Furthermore, as oil
prices drop, generating renewable energy becomes
economically less attractive for net importing
countries such as Pakistan, where recent price
changes have had a weakening effect on renewable
energy growth (Aslam, et al., 2021).
While Pakistan has stated its intention to shift away
from conventional energy pathways and towards
more renewable sources, its reliance on fossil fuel
continues to rise. Pakistan must accelerate its
efforts to transition to cleaner energy, scaling up its
education and health (especially for women) cannot be
quantified (Zhang, 2019).

40 Fiscal Stimulus for an Inclusive, Green and Forward-Looking Recovery, Leveraging the SDG Agenda
solar and wind generation in order to achieve a 30
percent share of Variable Renewable Energy (VRE)
by 2030. Doing so would be momentously
beneficial in 1) lowering vulnerability to global
warming, 2) reducing its crippling circular debt, 3)
improving energy security as sources are diversified
and dependency on fuel imports is reduced, and 4)
saving nearly $5 billion in costs over the coming 20
years (Aslam, et al., 2021, World Bank, 2020).
5.5. AN INCLUSIVE DIGITAL TRANSFORMATION IS NEEDED TO ACHIEVE A RESILIENT AND FUTURE LOOKING RECOVERY Despite efforts to expand digital infrastructure and
broadband access, Pakistan’s digital transformation
is yet to materialize. The digital divide is not merely
about access, but also affordability, coverage and
capacity (ESCAP, 2019). For Pakistan to get a
considerable portion of its population online by
2030, it must look beyond expanding physical
infrastructure and address the barriers faced by
people in using digital services (Figure 7).
Pakistan can address these barriers by 1) making
the internet affordable for all, 2) improving
availability and affordability of technologies
needed to access the internet, 3) creating awareness
on benefits of internet use and teaching skills
needed to go online through ICT and digital
literacy programmes (whether for education, e-
commerce, communication or leisure), 4)
increasing cultural acceptability of the internet by
making it safer for both women and children
through strong data privacy, anti-cyberbullying
and online harassment laws and regulations.
Supply chain resilience is another crucial
component of digital transformation. Adapting
supply chains against future potential disruptions is
crucial to a resilient recovery, particularly for
sectors that cannot afford to shut down even amidst
an emergency, e.g., the electricity sector,
agriculture and the health sector, etc. Fiscal
stimulus can raise supply chain resilience by 1)
introducing contactless and electronic systems
across the chain and at border-checking points in
the case of international supply chains (enabling
operations to be undertaken with minimum
physical interaction, thereby ensuring the health
and safety of personnel), and 2) developing
automation technology and other digital solutions
to ensure production and transport lines remain
functional during emergencies (ESCAP, 2020). An
inclusive digital transformation must also focus on:
Figure 7: Barriers to digital transformation
Availability
Do not own mobile phones or relevant devices
lack of digital infrastructure in rural and remote
areas
Affordability
Internet is too expensive
Devices needed to access the internet are too expensive
Digital literacy
Lack of basic literacy skills &
understanding of the internet is.
lack of cultural and social acceptance

41 Fiscal Stimulus for an Inclusive, Green and Forward-Looking Recovery, Leveraging the SDG Agenda
1) Minimizing the digital gender divide
As the digital gender gap is in itself an extension of
broader inequalities, improvements in digital
infrastructure and access are unlikely to reduce
gender inequity if they continue to remain gender-
neutral. Rather, a digital transformation must
explicitly promote gender equality at every step of
the way. Unfortunately, in Pakistan, most
initiatives to bridge the digital gap include a mere
rhetorical commitment to gender equality and fail
to reflect it in their implementation. In most cases,
women remain subsidiaries rather than primary
beneficiaries. Therefore, instead of merely focusing
on ‘connecting everyone’, programmes should
target women and girls by:
• Promoting digital skills and ICT
education for women and girls
• Supporting greater female participation
in technology development, local content
creation and ICT innovation, where
women constitute an insignificant
portion of the taskforce
• Making the internet safer for women and
girls, who hesitate to come online due to
online harassment, violence and personal
data breaches (World Wide Web
Foundation, 2020).
2) Minimizing pre-existing inequalities in e-
learning and telehealth
While minimizing damage from the pandemic,
numerous fiscal stimulus measures were
undertaken hurriedly, failing to adjust for pre-
existing inequalities (e.g., E-taleem, Digital
Pakistan, etc.). Though well-intentioned, these
measures failed to account for large regional and
gender disparities in television and technology
ownership. Going forward, fiscal stimulus measures
facilitating distanced learning and telemedicine
across the country must adopt clear mechanisms to
avoid further marginalization of the country’s
poorest and vulnerable segments by 1) utilising
disaggregated data in designing e-learning policies,
e.g., mapping students into groups based on gender,
location and household incomes, especially at-risk
students, 2) ensuring high re-enrolment rates once
schools reopen (Malik, 2020), and 3) enhancing
rural accessibility to e-learning technologies, along
with ICT and digital literacy training.

42 Fiscal Stimulus for an Inclusive, Green and Forward-Looking Recovery, Leveraging the SDG Agenda
6. Financing Needs to Support Inclusive, Green and Resilient Recovery
In this section, the cost of Pakistan’s post-COVID-
19 recovery plans has been estimated, with a
central focus on the five recommended policy
actions provided in the previous section. These
policy actions are guided by the concept of building back better, delineated throughout the study, and
pertain to three key areas: 1) an inclusive recovery,
2) a green recovery and 3) recovery which is
resilient and forward-looking.
Costing estimates have been broken down into
both the current level of spending, as well as the
additional spending needed to adequately fulfil
each respective policy action. Additionally, the
corresponding public and private allocations of
these spending needs have been provided, where
available. Moreover, as certain recommendations
cover a broad range of objectives, proxies have been
used to represent more feasible and tangible end
goals.
For example, in ensuring recovery from COVID-19
remains resilient and forward-looking, the study
recommends Pakistan concentrate its efforts on
achieving an inclusive digital transformation aimed
at minimising any pre-existing inequalities found.
However, as Pakistan still remains in the early
phase of its digital maturity, in need of sizable
digital infrastructure and networks, the digital
access rate would provide a better assessment at this
stage of the country’s ability to accomplish this
recommendation.
Before proceeding, it is important to clarify a few
further points:
• Certain goals overlap: for instance, goal 5
(gender equality) requires prioritizing
women across all SDGs; similarly, goals 2
(zero hunger) and 6 (clean water and
sanitation) will be easier to achieve if
significant progress is already attained in
goal 13 (climate action). Therefore,
specifying a clear solitary cost for each
goal may not be feasible; instead,
aggregating investments in such cases is
far more effective.
• Costs remain subject to future changes in
prices, GDP growth, population growth,
etc. For example, as renewable
technology becomes cheaper in the
future, the cost of shifting to green energy
will be lower.
• Where Pakistan-specific outlays are
unavailable, peer benchmarking and
adjustments will be useful in estimating
costs.
• To avoid a spill-over of COVID-19
impacts, Pakistan’s 2018 GDP ($314.6
billion) is used throughout the section,
unless stated otherwise.
• For certain parameters, data in the
context of Pakistan is not always readily
available and, where it is, may not
necessarily be the most up to date. For
example, the composition of additional
spending needs (i.e., public and private
allocations) for components such as social
protection and green energy was not
present and therefore has not been
included in the cost analysis. Likewise,
where the investment path for each
financing need is not available, the study
assumes investments to remain steady
each year, till 2030.
• Finally, Figures and estimates used
throughout the section have been derived

43 Fiscal Stimulus for an Inclusive, Green and Forward-Looking Recovery, Leveraging the SDG Agenda
from data collected through various
national, regional and international
studies, reports and published literature.
It is important to note that although
compounding together a wide variety of
reports, studies and existing literature has
been helpful in creating a comprehensive
picture for the cost estimation of
Pakistan’s recovery from COVID-19,
there are certain limitations to doing this.
For more details of the different
methodologies used by studies included
in this section, please refer to Appendix I.
6.1. FINANCING NEEDS FOR AN INCLUSIVE RECOVERY
For most countries, financing COVID-19 recovery
plans will be a mammoth task. For Asian-Pacific
countries, an estimated annual investment of $1.5
trillion will be required to achieve SDGs,
equivalent to 5 percent of their combined GDP in
2018 – tallying to almost $1 per day, per person. For
South Asian and least developed countries, this
figure rises to $2 to $3 per day, per person (ESCAP,
2019). For Pakistan, this may entail spending
anywhere from $164.4 billion to $246.6 billion per
annum till 2030 – an inconceivable amount for the
resource-constrained country. Between its fast-
rising population, and extremely low tax collection
– under 2.2 million are active taxpayers (Rana,
2021) – Pakistan’s fiscal space is extremely
restricted. As a result, the country is left to borrow
more and more, with the concentration of debt in
the economy at 87.2 percent in 2020 (MOF, 2020).
6.1.1. Increasing Social Spending and Expand Social Protection
Pakistan’s expenditure on its social sectors is
considerably less than most developing countries,
both globally and within the context of South Asia.
Higher investments across social protection, health
and education, can help Pakistan not only tackle
poverty but also improve economic growth and
tackle inequality. In fact, increasing social spending
in all three sectors to match global standards could
help the country improve GDP growth rates by 50
percent (ESCAP, 2018) – which will be
instrumental in helping both its economy and
population recover from the COVID-19 pandemic.
With these benefits in mind, Pakistan must
significantly boost expenditures in the following
three areas:
Social Protection
For a country like Pakistan, raising spending on
social protection has a high potential for impact on
its GDP growth rate (Ibid). It may also be one of the
most effective ways to lift a large proportion of its
population out of poverty. Despite this, the country
has consistently spent a minuscule amount on
social safety nets over the years – approximately 0.6
percent of its GDP, which is 1.7 times below the
South Asian average of 1 percent of the GDP and
2.5 times below that of most other developing
countries, which on average are seen to spend 1.5
percent of their GDP (ADB, 2019).
Figure 8: Total social protection spending (% of GDP)
Source: Author’s elaborations based on data from (ADB, 2019) and (ILO, 2019).
0.6
2.74
2.14
0
0.5
1
1.5
2
2.5
3
Current Spending Required Spending (2030) Additonal Spending (till2030)

44 Fiscal Stimulus for an Inclusive, Green and Forward-Looking Recovery, Leveraging the SDG Agenda
Spending on social protection programmes was
seen to rise during the pandemic, with around PKR
203 billion spent through EECP so far (GOP, 2020a)
and a PKR 260 billion proposed for the
continuation of the Ehsaas programme in fiscal year
2022. However, for substantial and long-lasting
reductions across poverty and inequality indicators
to be achieved, Pakistan’s social protection
spending must sustainably rise to at least 2.74
percent of the GDP (ILO, 2019). This additional
spending of 2.14 percent of the GDP (figure 8)17,
will be vital in ensuring a basic level of income
security to children under 5 years of age,
individuals with disabilities and those aged 65 and
over. This recommended spending level would
represent the beginning of a social protection floor
for Pakistan, whereby its citizens are provided basic
welfare, pulled out of poverty and allowed to
participate in inclusive and sustainable
development (Ibid).
Health
Pakistan’s health system remains severely
underfunded and inefficient, falling short of
providing good quality and universal healthcare to
its ever-growing population. From 2010 to 2018,
the country spent an average of 2.7 percent on
health expenditures (as a percentage of GDP)
(WDI, 2018). However, this level of investment has
been inadequate in building the sector’s capacity
against the pandemic, which became evident when
an uncontrolled boom in COVID-19 infections
soon overwhelmed the sector, bringing to light
many of its inherent vulnerabilities and shortfalls.
In fulfilling the first policy action and achieving
SDG 3 (good health and wellbeing) and all related
targets, Pakistan will need to significant raise
healthcare spending as a percentage of its GDP,
from 2018 levels of 2.8 percent to 8.2 percent by the
year 2030 (Figure 9) (Brollo, et al., 2021).18
Of this additional 5.4 percent of the GDP 19
spending requirement, public investment will
cover a slightly larger share. Presently, public
spending is reported at 0.9 percent of the GDP, and
will need to increase nearly five-fold to 4.3 percent
of the GDP by 2030. Private spending currently
overshadows public spending levels quite
significantly, standing at 1.9 percent of the GDP
and will also need to be brought up to 4 percent by
2030 in order to sufficiently meet SDG 3 (figure 10)
(Ibid). On the whole, per capita spending will need
to almost quadruple from $41 to $15120.
Figure 9: Total healthcare spending (% of GDP)
Source: (Brollo, et al., 2021)
17 Assuming additional spending to commence from 2020
till 2030, arise entirely from the public sector (as per the
existing trend) and remain steady every year.
18 This study estimates additional spending needs based
on input-outcome approach, one that determines
development outcomes to be a function of mixed inputs.
In the case of health and education in particular, the
study sets key inputs and their associated unit costs at
the values for countries with similar GDP per capita that
perform well in their SDG index scores. For more details,
refer to: Brollo, F., Hanedar, E., & Walker, S. (2021).
Pakistan: Spending Needs for Reaching the Sustainable
Development Goals (SDGs).
19 Once again, the study assumes this additional spending
to be steady each year till 2030.
20 USD 2018.
0
2
4
6
8
10
Current Spending (2018) Required Spending (2030) Additional Spending (till 2030)

45 Fiscal Stimulus for an Inclusive, Green and Forward-Looking Recovery, Leveraging the SDG Agenda
Figure 10: Composition of health spending (% of GDP)
Source: (Brollo, et al., 2021).
Education
Out of its total social spending, Pakistan has
consistently allocated a relatively bigger portion to
education over the years. Nonetheless, the sector’s
spending continues to remain far below the level
that is needed to help the country achieve
significant improvements in learning outcomes: the
literacy rate has risen by merely 2 percent between
2013 to 2018, with the latest figures reported at 60
percent (PBS, 2018). The country’s weak
performance across a number of educational
outcomes can be attributed to this low level of
spending, coupled with a high population growth –
one of the highest in South Asia (WDI, 2020) -
among other factors. As a result, large investments
are required to improve both the quality of
education provided, as well as its accessibility. In
2018, the country spent approximately 3.9 percent
of the GDP on education, which will need to
increase to 9.6 percent by 2030 if the country is to
achieve its targets for Education SDG 4 (figure 11)
(Brollo, et al., 2021).
The bulk of this additional investment21 will need
to come from public sources, with government
spending rising from current levels of 2.4 percent
of the GDP to 7.7 percent. The private sector, on
the other hand, will be required to raise spending
to a relatively lesser extent, from 1.5 percent
presently to 1.9 percent of the GDP by 2030 (Figure
12). Overall, spending per student will more than
double, from $244 in 2018 to $570 by 2030 (Brollo,
et al., 2021).
This higher spending will be essential in improving
enrolment rates, hiring more teachers by providing
attractive compensation packages and resultantly
reducing classroom sizes. Greater educational
spending can also be used to enhance
infrastructure, such as building more schools
and/or renovating existing ones to include basic
facilities etc, especially in rural and remote areas.
As mentioned, Pakistan’s existing educational
infrastructure is not capable of effectively catering
to its growing population. A lack of access to good
quality public schools in the country over the years
has given rise to a highly profitable private
schooling sector, resulting in a dual educational
system in the country that continues to exacerbate
economic and social inequality. A higher level of
educational spending (spearheaded by the public
sector) will be fundamental in addressing such
capacity shortages and the roots of educational
inequities in the country.
Figure 11: Total educational spending (% of GDP)
Source: (Brollo, et al., 2021).
21 Assumed to be steady each year till 2030.
0
5
Public Sector Private SectorCurrent Spending (2018)
0
5
10
15
Current Spending (2018) Required Spending (2030) Additonal Spending (till2030)

46 Fiscal Stimulus for an Inclusive, Green and Forward-Looking Recovery, Leveraging the SDG Agenda
Figure 12: Composition of educational spending (% of GDP)
Source: (Brollo, et al., 2021).
6.1.2. Rolling Out a Mass Vaccination Policy
Economies worldwide now face an additional
financial burden - the cost of the COVID-19
vaccine. While Pakistan has till now mainly relied
upon vaccinations received as gifts and grants,
these remain insufficient in covering its domestic
requirement. Currently, the country is spending
approximately PKR 24 billion ($150 million) for
COVID-19 vaccinations; for the upcoming fiscal
year 2021-22, the GOP has proposed to set aside
$1.1 billion for vaccines. While this is a substantial
amount, it is still not nearly enough.
In order to purchase enough vaccines to cover its
population, it is recommended that Pakistan spends
roughly 1 percent of its total GDP (Nayab, 2021) –
approximately $2.64 billion22. However, such an
estimate fails to incorporate the additional costs
associated with vaccines, such as costs of cold
supply chain, transportation, human resources, etc.
Once these are considered, the total amount needed
to fully vaccinate Pakistan’s remaining eligible
population23 rises (Table 11).
Currently, two different types of vaccines are
available to Pakistan: the AstraZeneca vaccine,
which costs $6 per dose, and the Sputnik V vaccine,
which costs $10 per dose. Assuming a mix of
vaccines is utilised by the GOP (a more realistic
scenario) to vaccinate its population, these costs
could amount to $12.76 per dose (including the cost
of the vaccine itself) (Pearson, et al., 2021) 24 .
Therefore, a total of $3.6 billion or 1.37 percent of
the GDP will be required to vaccinate Pakistan’s
remaining eligible population.
To prevent vaccine inequality, vaccinations are
expected to predominantly arise from the public
sector. Additionally, though the government plans
to vaccinate 70 million individuals by the end of
2021 (Haider, 2021), this provided timeframe is
improbable given past experiences with vaccines in
the country. At present, Pakistan’s vaccination
drive is moving rather slowly; in fact, as of July
2021 only 1.96 percent of the population has been
vaccinated (Ritchie, et al., 2021b). Given this slow
rate, it may be more realistic to assume Pakistan
will achieve 70 percent of its immunization target
by the end of 2024. Likewise, for costs, the first year
alone may require almost 40 percent of total
spending, given many up-front costs that will be
required to kick-start the drive (e.g., training and
cold chain costs), after which the remaining
amount can be spread evenly across the remaining
years.
22 GDP 2020: $263.687 (USD) (WDI, 2020).
23 Total eligible population has been estimated as all those
individuals remaining to be vaccinated, aged 15 and
over.
24 Refer to Appendix II for details on cost estimation.
0
2
4
6
8
10
Public Sector Private Sector
Current Spending (2018) Required Spending (2030)

47 Fiscal Stimulus for an Inclusive, Green and Forward-Looking Recovery, Leveraging the SDG Agenda
Table 11: Financing COVID-19 vaccine for total population
6.1.3. Greater Gender Sensitivity in Fiscal Stimulus Measures Is Required
As mentioned, certain goals cannot be individually
priced, given their excessive intersection across
other areas. Achieving SDG 5 requires
mainstreaming gender across all investment areas
and recalibrating all existing initiates to remain
inclusive to women. Therefore, no explicit cost for
gender equality is provided; instead, fiscal stimulus
should as a whole remain gender-sensitive to
ensure that women continue to be uplifted and
empowered across all development areas (ESCAP,
2019).
6.2. FINANCING NEEDS FOR A GREEN RECOVERY
6.2.1. Financing Needs for Renewable Energy
Pakistan’s plan for transitioning towards clean
energy involves attaining a 30 percent share of
Variable Renewable Energy (VRE) by 2030
(excluding hydropower) (World Bank, 2020b). Pre-
COVID, Pakistan would have needed a total of
$108 billion by 2030 to get its energy sector back
on track towards a green recovery (Figure 11). As a
result of the pandemic, investment needs have
fallen by $10 billion; consequently, the country
would now require a total of $98 billion by 2030
25 The study estimates green recovery cost through a
scenario-based approach, analysing energy
consumption patterns in a number of post COVID-19
scenarios through an optimized LEAP modelling
(Aslam, et al., 2021). 25 However, investment
requirements will likely increase after 2028, when
business-as-usual is no longer a viable option for
the country’s energy sector. In this case, an
additional $12 billion will be required in 2030,
‘with an increasing trend afterwards’ (Ibid) (figure
13).
Additionally, a World Bank (2020) study analysed
18 different energy scenarios in an attempt to
calculate Pakistan’s optimal energy mix and the
capital investment needed to achieve it. It found
that if government policy targets for renewable
energy are followed, Pakistan could attain a 30
percent VRE by 2030, through a 9 percent wind
and 21 percent solar mix, which would cost a total
of $110.02 billion (World Bank, 2020b).
However, an optimized energy mix will require a
greater utilization of renewables, with VRE
constituting 30 to 33 percent of total capacity,
through a 7.7 percent wind and 25.3 percent solar
mix by 2030. This would cost a total of $106. 5
billion (total costs including emissions costs) - 3.3
percent cheaper than the government policy target
scenario (Ibid). The optimum VRE scenario will not
only save costs in the future but would generate
lower emission levels, less negative externalities
and remain economically and environmentally
more beneficial.
framework. For more details, refer to: Aslam, H., &
Javed, S.A. (2021) Green recovery from COVID 19:
Outlook for Pakistan’s Energy sector. Sustainable
Development Policy Institute.
Scenario 1 (If AstraZeneca is used)
Scenario 2 (If Sputnik V is used)
Scenario 3 (Mix of I & II)
Cost of Vaccine Procurement (USD) (Per Dose)
6 10 8
Additional Costs (USD) (Per Dose)
3.68 5.84 4.76
Total Cost of Vaccine (USD) (Per Dose)
9.68
15.84
12.76
Total Cost of Vaccination (Billion USD)
(Total cost * Total eligible Population)
2.74 4.48 3.60
Percentage of GDP (per annum spending/GDP x 100)
1.03
1.69
1.37
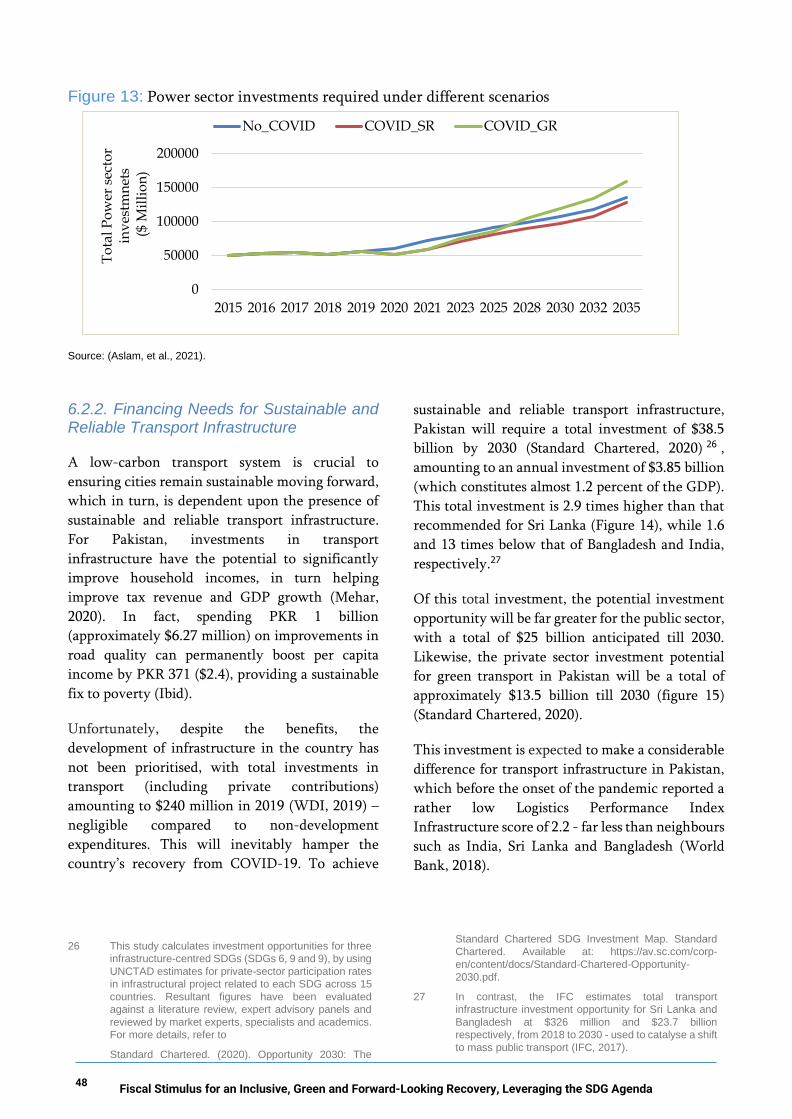
48 Fiscal Stimulus for an Inclusive, Green and Forward-Looking Recovery, Leveraging the SDG Agenda
Figure 13: Power sector investments required under different scenarios
Source: (Aslam, et al., 2021).
6.2.2. Financing Needs for Sustainable and Reliable Transport Infrastructure
A low-carbon transport system is crucial to
ensuring cities remain sustainable moving forward,
which in turn, is dependent upon the presence of
sustainable and reliable transport infrastructure.
For Pakistan, investments in transport
infrastructure have the potential to significantly
improve household incomes, in turn helping
improve tax revenue and GDP growth (Mehar,
2020). In fact, spending PKR 1 billion
(approximately $6.27 million) on improvements in
road quality can permanently boost per capita
income by PKR 371 ($2.4), providing a sustainable
fix to poverty (Ibid).
Unfortunately, despite the benefits, the
development of infrastructure in the country has
not been prioritised, with total investments in
transport (including private contributions)
amounting to $240 million in 2019 (WDI, 2019) –
negligible compared to non-development
expenditures. This will inevitably hamper the
country’s recovery from COVID-19. To achieve
26 This study calculates investment opportunities for three
infrastructure-centred SDGs (SDGs 6, 9 and 9), by using
UNCTAD estimates for private-sector participation rates
in infrastructural project related to each SDG across 15
countries. Resultant figures have been evaluated
against a literature review, expert advisory panels and
reviewed by market experts, specialists and academics.
For more details, refer to
Standard Chartered. (2020). Opportunity 2030: The
sustainable and reliable transport infrastructure,
Pakistan will require a total investment of $38.5
billion by 2030 (Standard Chartered, 2020) 26 ,
amounting to an annual investment of $3.85 billion
(which constitutes almost 1.2 percent of the GDP).
This total investment is 2.9 times higher than that
recommended for Sri Lanka (Figure 14), while 1.6
and 13 times below that of Bangladesh and India,
respectively.27
Of this total investment, the potential investment
opportunity will be far greater for the public sector,
with a total of $25 billion anticipated till 2030.
Likewise, the private sector investment potential
for green transport in Pakistan will be a total of
approximately $13.5 billion till 2030 (figure 15)
(Standard Chartered, 2020).
This investment is expected to make a considerable
difference for transport infrastructure in Pakistan,
which before the onset of the pandemic reported a
rather low Logistics Performance Index
Infrastructure score of 2.2 - far less than neighbours
such as India, Sri Lanka and Bangladesh (World
Bank, 2018).
Standard Chartered SDG Investment Map. Standard
Chartered. Available at: https://av.sc.com/corp-
en/content/docs/Standard-Chartered-Opportunity-
2030.pdf.
27 In contrast, the IFC estimates total transport
infrastructure investment opportunity for Sri Lanka and
Bangladesh at $326 million and $23.7 billion
respectively, from 2018 to 2030 - used to catalyse a shift
to mass public transport (IFC, 2017).
0
50000
100000
150000
200000
2015 2016 2017 2018 2019 2020 2021 2023 2025 2028 2030 2032 2035
To
tal
Po
wer
sec
tor
inv
estm
net
s($
Mil
lio
n)
No_COVID COVID_SR COVID_GR

49 Fiscal Stimulus for an Inclusive, Green and Forward-Looking Recovery, Leveraging the SDG Agenda
Figure 14: Total investment required for green transport till 2030 (billon USD)
Figure 15: Composition of green transport investment till 2030 (USD billion)
Source: (Standard Chartered, 2020).
6.3. FINANCING NEEDS FOR A RESILIENT & FUTURE-LOOKING RECOVERY
6.3.1. An Inclusive Digital Transformation Is Needed to Achieve a Resilient and Future Looking Recovery
As mentioned, Pakistan is still in the early stages of
its digital maturity, with only 27.5 percent of its
population using the internet (Figure 18) (Kemp,
2021). With the country’s digital transformation
yet to materialize, it is in need of large-scale digital
infrastructural investments in order to boost
broadband access. To this end, this study employs
the universal digital access rate as a proxy to reflect
the country’s progress on its fifth and final
recommended policy action.
Public spending allocated to enhancing country-
wide broadband access through the Universal
Service Fund, for the incoming fiscal year 2022, is
PKR 5.95 billion ($37.3 million)28. This is almost 34
percent higher than that for 2021, which was PKR
28 Currency rates for 16th July 2021 used to convert local
4.45 billion ($27.8 million) (GOP, 2021). The
private current spending in this regard has been
greater than public spending, with the sector being
provided over PKR 8 billion (approximately $50
million) worth of contracts to expand broadband
services to approximately 6 million individuals in
remote areas (MoITT, 2021b).
To achieve universal digital access, Pakistan will
require a total investment of $56.6 billion till 2030
(Standard Chartered, 2020), amounting to an
annual investment of $5.66 billion. Similar
investments per capita are needed by other South
Asian countries such as India, Sri Lanka and
Bangladesh (Figure 16 below).
The private sector has a larger role to play in
Pakistan’s pursuit of attaining this universal digital
access rate. In fact, out of this total required
investment, the private sector’s investment
opportunity is anticipated at $34 billion, while the
remaining public sector investment makes up $22.6
billion (figure 17) (Ibid).
currency into United States Dollar (USD), in this sub-
section.
61.6
505.5
38.5 13.1
Bangladesh India Pakistan Sri Lanka
0
10
20
30
40
50
Total Public Sector Private Sector
Till 2030

50 Fiscal Stimulus for an Inclusive, Green and Forward-Looking Recovery, Leveraging the SDG Agenda
Such an investment entails making significant
progress towards SDG 9, which in turn will require
substantial work in increasing digital infrastructure
in order to boost mobile phone subscriptions and
internet connectivity levels, bringing more and
more of Pakistan’s online.
Figure 16: Potential investment per capita needed for universal digital access in South Asia, total
amount till 2030 (billion USD)
Source: Author’s elaboration, based on (Standard Chartered, 2020)
Figure 17: Composition of digital infrastructure investment till 2030 (USD billion)
Source: (Standard Chartered, 2020).
Figure 18: Digital access rate in South Asia in 2020
Source: (Standard Chartered, 2020).
333.7
270.84 251.3
316.27
0
100
200
300
400
Bangladesh India Pakistan Sri lanka
0
10
20
30
40
50
60
Total Public Sector Private Sector
32
45
27
47
Bangladesh India Pakistan Sri Lanka
51 Fiscal Stimulus for an Inclusive, Green and Forward-Looking Recovery, Leveraging the SDG Agenda
In contrast, instead of a total investment, ESCAP’s
estimates require Asian-Pacific developing
countries to make an additional annual investment
of $56 billion in ICT infrastructure from 2016 to
2030 (ESCAP, 2019). Correspondingly, this
investment also entails the ‘provision, maintenance and climate-proofing’ of digital infrastructure in
the country in order to boost broadband and mobile
phone subscriptions, with a greater proportion of
the investment dedicated to the former category29.
In light of the similarities between the two
suggested investments, the study recommends the
first scenario (total investment of $56.6 billion till
2030) which remains far more feasible for a
resource-constrained Pakistan.
29 ESCAP (2019) recommends spending 82 percent of the
total investment on infrastructure to boost broadband
subscriptions and the remaining 18 percent on mobile
phone subscriptions.

52 Fiscal Stimulus for an Inclusive, Green and Forward-Looking Recovery, Leveraging the SDG Agenda
7. Modelling the Macroeconomic, Social and Environmental Impacts of the Proposed Policy Actions to Secure an Inclusive, Green and Resilient Recovery in Pakistan
In this section, we apply the United Nations
Economic and Social Commission for Asia and the
Pacific’s (ESCAP) Macroeconomic Model 30 to
assess some of the macroeconomic, social and
environmental impacts of the policy actions
proposed in Section 5 of this study. First, a brief
overview of the model is provided. After which, the
study considers a series of scenarios to illustrate the
potential impacts on key indicators from (1)
increased social spending and expanded social
protection, (2) rising female participation in the
labour force, (3) eliminating fossil fuel price
subsidies, (4) investing in renewable energy, (5)
investment in sustainable transport infrastructure,
and finally, (6) investment in digital infrastructure.
We consider the various financing options and how
these may interact with the proposed policy
measures.
7.1. THE ESCAP MACROECONOMIC MODEL
The ESCAP Macroeconomic Model is a global
model, comprising of 46 individual full-country
models for the Asia-Pacific region (including a
model for Pakistan), as well as smaller models for 9
key trading partners outside of the region, plus
aggregate models for the world’s remaining
economies (which have been grouped into 4
regions). The individual country models are linked
together via trade, remittances, financial markets,
30 The ESCAP Macroeconomic Model was developed to
support the design of economic recovery packages for
countries in the Asia and Pacific region and offer insights
into how countries can build resilience in the post-
COVID-19, while enhancing sustainability along
economic, social and environmental dimensions. The
and global energy markets.
The country models are characterized by a short-
run Keynesian demand side and a long-run neo-
classical supply side. In the model, households
consume, save and supply labour, while firms
produce output, hire labour and invest.
Governments pursue fiscal policy by spending and
taxing, while monetary authorities conduct
monetary policy by setting the short-term interest
rate and exchange rate policy. The balance of
demand and supply, together with tax policy,
global commodity prices and other imported prices,
determine inflation. Higher prices constrain
consumption and dampen the net trade balance.
Most of the key behavioural relationships are
specified in an error-correction framework, which
allows us to distinguish short- and long-term
relationships between variables.
In the short run, GDP is driven by aggregate
demand, which comprises private and public
consumption, private and public investment and
net foreign trade. Household consumption depends
on real personal disposable income, financial
inclusion (proxied by the share of population with
a bank account) and the gap between actual and
expected inflation rates. Private investment is
determined by potential output, user cost of capital,
financial inclusion and gross domestic income
(which captures terms-of-trade shocks). Public
model runs within the EViews software and is fully global
in scope. For more details, visit:
www.unescap.org/sites/default/files/Introduction%20to
%20ESCAP%20Macroeconomic%20model_19%20No
v%20.pdf.

53 Fiscal Stimulus for an Inclusive, Green and Forward-Looking Recovery, Leveraging the SDG Agenda
consumption and investment and policy variables
are disaggregated into spending on health,
environmental protection and other areas. Exports
depend on external demand and relative non-
commodity export prices, both of which are
derived from a global bilateral trade matrix. Finally,
imports depend on domestic demand, the output
gap, the relative price of imported goods and oil
imports.
In the long term, each country’s potential output
level is driven by its aggregate supply, which is
determined by the labour force, capital stock,
energy use, energy efficiency, trend productivity
growth and damage from climate shocks. The
labour force depends on demographic factors and
the labour force participation rate. The capital stock
is driven by the accumulation of investment, after
allowing for depreciation. The capital depreciation
rate depends on global carbon emissions to capture
the impact of climate change on the erosion of
capital. Total energy demand depends on output,
energy prices and energy efficiency. The energy
mix depends on relative prices of oil, gas, coal and
renewables. Trend productivity growth is modelled
as a function of the global productivity frontier
(which is related to global trade), inequality, air
pollution and government expenditure on health.
Finally, damage from climate shocks is exogenous,
although in this study it is linked to spending on
climate-resilient infrastructure.
Deviations of actual output from potential output
will activate adjustment processes that bring the
economy back to potential in the long run. Among
other channels, the gap between demand and
supply, or output gap, feeds through prices. For
example, a positive output gap will put upward
pressure on prices, resulting in slower consumption
growth and a deterioration of the trade balance, so
that demand falls towards available supply.
In the fiscal module, government spending is
disaggregated into spending on social protection,
spending on health, spending on environmental
protection, fossil fuel subsidies, other government
consumption, other government investment and
interest payments. Government revenue is
disaggregated into income tax revenue, corporate
tax revenue, indirect tax revenue, taxes on
international transactions, carbon tax revenue,
commodity revenue and other net revenue. The
fiscal deficit is financed by an increase in
government debt, and debt service payments flow
back onto the fiscal balance. In the model, an
increase in the government debt-to-GDP ratio
leads to a higher risk premium for that country. In
this way, running a large fiscal deficit for an
extended period of time can cause government debt
to spiral and become unsustainable. Countries with
a higher initial level of risk premium are more
sensitive to any rise in public debt. A rise in the risk
premium pushes up inflation and increases
borrowing costs, which results in lower
investment.
In addition to economic relationships, the model
has additional channels to capture interactions
with key social and environmental variables, such
as poverty, income inequality, carbon emissions
and air quality. Relationships between variables are
econometrically estimated where appropriate or
guided by the academic literature. For example,
losses associated with climate shocks are
underpinned by benchmarks contained in World
Bank (2019), in which an investment in resilience,
valued at 1 percent of the GDP, reduces annual
damage by 5 percent. Other major studies that are
used for developing relationships among the
variables include Botev, Egert and Jawadi (2019),
Briceño-Garmendia, Estache and Shafik (2004),
ECB (2017), Griscom and others (2017), IEA (2019,
2020), OECD (2019) and Wang (2015).
The poverty model is based on the assumption that
income follows approximately a log-normal
distribution. The cumulative density function of
log income is calculated based on estimates of mean
income and income inequality and evaluated at the
poverty benchmarks of $1.90/day and $5.50/day.
Income inequality is measured according to the
after-tax Gini coefficient. It declines in response to
a rise in government spending on social protection,
or a rise in financial inclusion.
Carbon emissions depend on the composition of
energy consumption, which in turn depends on the
relative (after carbon tax) price of coal, gas, oil and
renewables. Air pollution (PM2.5) also depends on
the composition of energy consumption, especially
the consumption of coal and oil. Air pollution feeds
into trend productivity growth to reflect the

54 Fiscal Stimulus for an Inclusive, Green and Forward-Looking Recovery, Leveraging the SDG Agenda
relationship between pollution, health and
productivity.
7.2. INCREASED SOCIAL SPENDING AND EXPANDED SOCIAL PROTECTION
Social Protection
Achieving a basic social protection floor in Pakistan
is estimated to require a permanent increase in
government spending on social protection
equivalent to 2.14 percent of the GDP. This
increase in social protection spending will raise real
personal disposable incomes of households, which
in turn will increase personal consumption
spending and the GDP. It will also reduce
inequality and poverty, as there will be a
redistribution of income towards the poorest of
households. However, it will worsen government
finances, although the rise in GDP will partially
offset some of the costs of the programme.
Health
To provide good quality universal healthcare to all
citizens, health expenditures in Pakistan will need
to rise by approximately 5.4 percent of the GDP. Of
this, approximately two-thirds would be expected
to be financed by the public sector, with the
remainder financed by the private sector.
The social returns of investments in healthcare are
well-documented. A healthy workforce is more
productive, which translates into higher levels of
GDP, higher levels of government revenue, lower
unemployment and higher real personal disposable
incomes. Based on estimates from Wang (2015), a
rise in health spending by 1 percent of the GDP
would be expected to increase labour productivity
by about 1.7 percent by 2030. This rise in long-run
potential and government revenue will partially
offset some of the costs associated with expanding
access to high-quality healthcare.
Additional spending on health acts as a short-term
stimulus to economic activity, as well as delivering
longer-term benefits. The longer-term impacts will
depend partly on how the spending is split between
consumption (for example, salaries of health
personnel) and investment (for example, building
hospitals). Both raise GDP in the short-term, but
investment also accumulates as capital stock,
raising potential output over the longer term. For
the purpose of these scenarios, we treat roughly
half of the investment in health as investment and
the other half as consumption.
Education
To achieve significant improvements in learning
outcomes, and to improve the quality and
accessibility of education, education expenditure in
Pakistan needs to rise by an estimated 5.7 percent
of the GDP, with about 93 percent of this spending
being financed by the government. We treat
roughly half of the spending as investment (for
example, building schools) and the other half as
consumption (for example, the salaries of teachers).
The returns to education have been widely studied
in academic literature. We can assume a
benchmark estimate that: a rise in education
spending by 1 percent of the GDP, adds about 0.1
percentage points to trend productivity growth per
year, calibrated with reference to the social returns
to education reported by Botev, Égert, Smidova and
Turner (2019). Broader access to education is also
expected to reduce income inequality. The
modelling assumption applied is that, a rise in
education spending by 1 percent of the GDP
delivers a 0.1 percentage point decline in the Gini
coefficient, which in turn raises trend productivity
by roughly 0.13 percent.
Model-based Scenarios
The social protection, health and education
programmes outlined above will cumulatively cost
the government roughly 10.9 percent of the GDP
per annum. This is clearly an enormous jump in
spending for a resource-constrained economy like
Pakistan. We first illustrate the potential impact of
these policies on key macroeconomic variables
under a hypothetical assumption that there are no
resource constraints, and funds are readily
available. The measures are introduced gradually
over a 3-year period, starting in 2022. We then
consider more realistic financing options to meet
these needs.
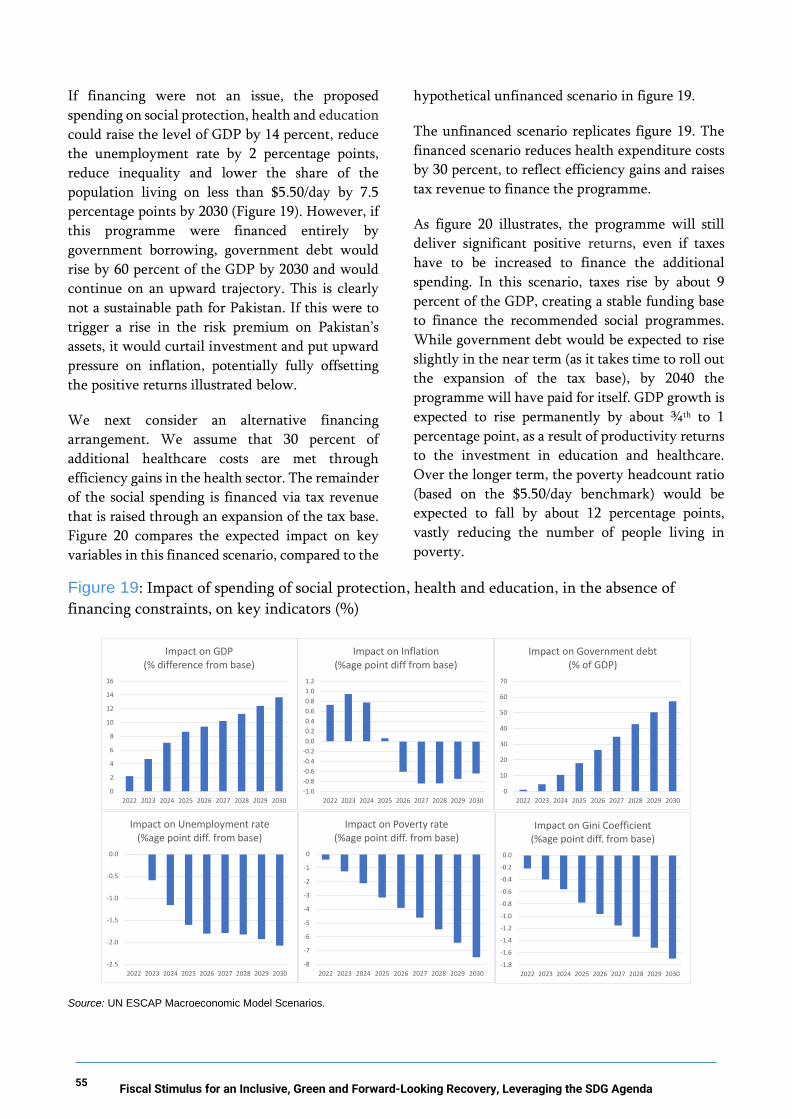
55 Fiscal Stimulus for an Inclusive, Green and Forward-Looking Recovery, Leveraging the SDG Agenda
If financing were not an issue, the proposed
spending on social protection, health and education
could raise the level of GDP by 14 percent, reduce
the unemployment rate by 2 percentage points,
reduce inequality and lower the share of the
population living on less than $5.50/day by 7.5
percentage points by 2030 (Figure 19). However, if
this programme were financed entirely by
government borrowing, government debt would
rise by 60 percent of the GDP by 2030 and would
continue on an upward trajectory. This is clearly
not a sustainable path for Pakistan. If this were to
trigger a rise in the risk premium on Pakistan’s
assets, it would curtail investment and put upward
pressure on inflation, potentially fully offsetting
the positive returns illustrated below.
We next consider an alternative financing
arrangement. We assume that 30 percent of
additional healthcare costs are met through
efficiency gains in the health sector. The remainder
of the social spending is financed via tax revenue
that is raised through an expansion of the tax base.
Figure 20 compares the expected impact on key
variables in this financed scenario, compared to the
hypothetical unfinanced scenario in figure 19.
The unfinanced scenario replicates figure 19. The
financed scenario reduces health expenditure costs
by 30 percent, to reflect efficiency gains and raises
tax revenue to finance the programme.
As figure 20 illustrates, the programme will still
deliver significant positive returns, even if taxes
have to be increased to finance the additional
spending. In this scenario, taxes rise by about 9
percent of the GDP, creating a stable funding base
to finance the recommended social programmes.
While government debt would be expected to rise
slightly in the near term (as it takes time to roll out
the expansion of the tax base), by 2040 the
programme will have paid for itself. GDP growth is
expected to rise permanently by about ¾th to 1
percentage point, as a result of productivity returns
to the investment in education and healthcare.
Over the longer term, the poverty headcount ratio
(based on the $5.50/day benchmark) would be
expected to fall by about 12 percentage points,
vastly reducing the number of people living in
poverty.
Figure 19: Impact of spending of social protection, health and education, in the absence of
financing constraints, on key indicators (%)
Source: UN ESCAP Macroeconomic Model Scenarios.
0
2
4
6
8
10
12
14
16
2022 2023 2024 2025 2026 2027 2028 2029 2030
Impact on GDP (% difference from base)
-1.0
-0.8
-0.6
-0.4
-0.2
0.0
0.2
0.4
0.6
0.8
1.0
1.2
2022 2023 2024 2025 2026 2027 2028 2029 2030
Impact on Inflation (%age point diff from base)
0
10
20
30
40
50
60
70
2022 2023 2024 2025 2026 2027 2028 2029 2030
Impact on Government debt(% of GDP)
-2.5
-2.0
-1.5
-1.0
-0.5
0.0
2022 2023 2024 2025 2026 2027 2028 2029 2030
Impact on Unemployment rate(%age point diff. from base)
-8
-7
-6
-5
-4
-3
-2
-1
0
2022 2023 2024 2025 2026 2027 2028 2029 2030
Impact on Poverty rate(%age point diff. from base)
-1.8
-1.6
-1.4
-1.2
-1.0
-0.8
-0.6
-0.4
-0.2
0.0
2022 2023 2024 2025 2026 2027 2028 2029 2030
Impact on Gini Coefficient(%age point diff. from base)

56 Fiscal Stimulus for an Inclusive, Green and Forward-Looking Recovery, Leveraging the SDG Agenda
Figure 20: Impact of spending of social protection, health and education, financed and
unfinanced scenarios, on key indicators (%)
Source: UN ESCAP Macroeconomic Model Scenarios.
7.3. INCREASED FEMALE LABOUR FORCE PARTICIPATION
Achieving SDG 5 will require mainstreaming
gender across all investment areas and recalibrating
all existing initiates to remain inclusive to women.
Mainstreaming gender issues will not only redress
deep social inequities but will also bring strong
economic returns to Pakistan.
Economic opportunities are extremely restricted
for women in Pakistan, with only 25 percent
participating in the labour force as opposed to 85
percent of men. Raising female participation in the
labour force would reduce inequality, reduce
poverty and increase the productive capacity of the
economy, generating fiscal revenue and creating
jobs.
Policies to promote gender equality in the labour
market and workplace could increase female labour
force participation. In order to assess the potential
impact of a rise in female labour force participation,
we model a gradual 10 percentage point rise in
female participation, phased in over 10 years. This
would raise the size of the available workforce by
9.7 percent by 2031. An expansion of productive
capacity would put downward pressure on
inflation, encourage investment in new capital, and
raise household consumption as new labour market
entrants secure employment.
Figure 21 below illustrate the expected impact of a
rise in female labour force participation on key
indicators. The GDP could rise by about 2.5 percent
by 2030, and 6 percent by 2050. Inflation would be
expected to fall slightly in the near term, by about
0.25 percentage points. Higher GDP reflects a rise
in both household consumption and investment. A
rise in economic activity would also improve the
fiscal balance, allowing government debt to decline
by nearly 5 percent of the GDP. The
unemployment rate would be expected to rise
slightly in the near term, as it takes time to fully
integrate new labour market entrants into their
jobs, however about 5 million new jobs by 2030 can
be expected, and over 10 million by 2050. Rising
employment would pull many out of poverty,
allowing the poverty headcount rate to decline. A
rise in female participation in the labour market
can significantly raise the productive capacity,
economic growth and development potential of
Pakistan.
0
2
4
6
8
10
12
14
16
2022 2023 2024 2025 2026 2027 2028 2029 2030
Impact on GDP (% difference from base)
Unfinanced Financed
-1.5
-1.0
-0.5
0.0
0.5
1.0
1.5
2022 2023 2024 2025 2026 2027 2028 2029 2030
Impact on Inflation (%age point diff from base)
Unfinanced Financed
0
10
20
30
40
50
60
70
2022 2023 2024 2025 2026 2027 2028 2029 2030
Impact on Government debt(% of GDP)
Unfinanced Financed
-2.5
-2.0
-1.5
-1.0
-0.5
0.0
2022 2023 2024 2025 2026 2027 2028 2029 2030
Impact on Unemployment rate(%age point diff. from base)
Unfinanced Financed
-8
-7
-6
-5
-4
-3
-2
-1
0
2022 2023 2024 2025 2026 2027 2028 2029 2030
Impact on Poverty rate(%age point diff. from base)
Unfinanced Financed
-2.0
-1.5
-1.0
-0.5
0.0
2022 2023 2024 2025 2026 2027 2028 2029 2030
Impact on Gini Coefficient(%age point diff. from base)
Unfinanced Financed

57 Fiscal Stimulus for an Inclusive, Green and Forward-Looking Recovery, Leveraging the SDG Agenda
Figure 21: Impact of rise in female labour force participation on key indicators (%)
Source: UN ESCAP Macroeconomic Model Scenarios.
7.4. INVEST IN A GREEN RECOVERY
Eliminating Fossil Fuel Subsidies
Fossil Fuel subsidies in Pakistan amounted to
roughly $1.9 billion in 2019, which is equivalent to
roughly $7.6 per tonne of CO2 emitted. Reducing
fossil fuel subsidies would improve the government
budget balance, creating space to finance new
government programmes. It would align incentives
with the need to transition towards cleaner energy
sources where feasible and increase energy
efficiency. A $1 carbon tax adds about 9.6 cents to
the price of coal, about 5.7 cents to the price of gas
and about 6.7 cents to the price of oil. The shift in
relative prices will gradually encourage a shift in
the energy mix away from fossil fuels and towards
renewable energy. Using cleaner energy will
reduce carbon emissions and reduce air pollution,
with important health benefits. But it will also
come at a cost. Removing subsidies would push up
inflation and the user cost of capital (for example,
the cost of operating machinery). Higher inflation
and a higher cost of capital will reduce household
consumption and private sector investment.
In the scenario, fossil fuel subsidies are phased out
gradually, so that 75 per cent of the subsidies are
lifted by 2030.
Investing in Green Energy
Attaining the target of a 30 percent share of
renewables in the power sector by 2030 is estimated
to require annual power sector investment to rise
from $60 billion in 2021 to about $98 billion in
2030, or a rise of about $4 billion per annum. Such
a rise in the share of renewables could reduce CO2
emissions by about 8 percent. Efficiency gains in
the energy sector could fully offset the additional
investment costs. These would bring further
reductions in emissions.
Investment in renewable power, rather than fossil
fuels, can also be expected to create jobs. Diverting
each $1 million away from investment in fossil
fuels, and towards renewables, has the potential to
generate 4.8 additional jobs. If we treat ¼th of the
additional investment in renewables as a diversion,
this could create over 4000 additional jobs per year.
0
1
2
3
4
5
6
7
20
22
20
24
20
26
20
28
20
30
20
32
20
34
20
36
20
38
20
40
20
42
20
44
20
46
20
48
20
50
Impact on GDP (% difference from base)
-0.40
-0.35
-0.30
-0.25
-0.20
-0.15
-0.10
-0.05
0.00
0.05
0.10
0.15
20
22
20
24
20
26
20
28
20
30
20
32
20
34
20
36
20
38
20
40
20
42
20
44
20
46
20
48
20
50
Impact on Inflation (%age point diff from base)
-5
-4
-3
-2
-1
0
1
20
22
20
24
20
26
20
28
20
30
20
32
20
34
20
36
20
38
20
40
20
42
20
44
20
46
20
48
20
50
Impact on Government debt(% of GDP)
-0.5
0.0
0.5
1.0
1.5
2.0
20
22
20
24
20
26
20
28
20
30
20
32
20
34
20
36
20
38
20
40
20
42
20
44
20
46
20
48
20
50
Impact on Unemployment rate(%age point diff. from base)
-4.0
-3.5
-3.0
-2.5
-2.0
-1.5
-1.0
-0.5
0.0
20
22
20
24
20
26
20
28
20
30
20
32
20
34
20
36
20
38
20
40
20
42
20
44
20
46
20
48
20
50
Impact on Poverty rate(%age point diff. from base)
-0.6
-0.5
-0.4
-0.3
-0.2
-0.1
0.0
20
22
20
24
20
26
20
28
20
30
20
32
20
34
20
36
20
38
20
40
20
42
20
44
20
46
20
48
20
50
Impact on Gini Coefficient(%age point diff. from base)

58 Fiscal Stimulus for an Inclusive, Green and Forward-Looking Recovery, Leveraging the SDG Agenda
Invest in Green Transport Infrastructure
To achieve sustainable and reliable transport
infrastructure, Pakistan will require an annual
investment of approximately $3.85 billion, or 1.2
percent of its GDP. Efficiency gains in the transport
sector could save at least $5.5 billion a year, which
would fully cover the costs of the additional
investment needs.
Investing in green transport infrastructure can
reduce CO2 emissions, reduce pollution, and raise
productivity. Based on benchmark estimates from
Sánchez-Triana et al (2014), improving transport
infrastructure has the potential to reduce emissions
from the transport sector by 30 percent, or total
emissions by about 8 percent. Meanwhile,
productivity impacts benchmarked from Fedderke
and Bogetic (2009), estimate the elasticity of Total
Factor Productivity (TFP) to infrastructure
investment to be 0.04, with the estimate robust
across different specifications. The specification of
their empirical work indicates that a 1 percentage
point increase in the ratio of infrastructure
investment to GDP increases TFP growth by 0.04
percentage points.
Model-based Scenarios
The green recovery programmes outlined in this
study are assumed to be fully financed via
efficiency gains, while the removal of carbon
subsidies also creates some additional fiscal space.
Figure 22 illustrates the estimated impacts of the
combined scenario on key indicators in Pakistan.
The GDP is expected to rise slightly in response to
energy efficiency gains and the impact of lower
pollution on health. The unemployment rate would
fall, reflecting the labour intensity of renewable
energy services relative to fossil fuels. Government
debt would decline relative to the GDP, as a result
of both stronger growth and a reduction in fossil
fuel subsidies. This would free up resources that
could be used, for example, to finance the social
spending programmes. Poverty would also decline
slightly as a result of the stronger growth. The most
significant impact of this scenario is on CO2
emissions, which would be expected to fall by
about 15 percent, relative to the baseline. This
reflects the shift in energy mix towards renewables,
as well as energy efficiency gains. Pollution is
expected to decline by about 9 percent, which in
turn would raise labour productivity by about 1.3
percent.
Figure 22: Impact of green recovery programme on key indicators (%)
Source: UN ESCAP Macroeconomic Model Scenarios.
0
0.2
0.4
0.6
0.8
1
1.2
1.4
1.6
1.8
2
20
22
20
24
20
26
20
28
20
30
20
32
20
34
20
36
20
38
20
40
20
42
20
44
20
46
20
48
20
50
Impact on GDP (% difference from base)
-0.35
-0.30
-0.25
-0.20
-0.15
-0.10
-0.05
0.00
20
22
20
24
20
26
20
28
20
30
20
32
20
34
20
36
20
38
20
40
20
42
20
44
20
46
20
48
20
50
Impact on Unemployment rate(%age point diff. from base)
-5.0
-4.5
-4.0
-3.5
-3.0
-2.5
-2.0
-1.5
-1.0
-0.5
0.0
20
22
20
24
20
26
20
28
20
30
20
32
20
34
20
36
20
38
20
40
20
42
20
44
20
46
20
48
20
50
Impact on Government debt(% of GDP)
-0.7
-0.6
-0.5
-0.4
-0.3
-0.2
-0.1
0.0
20
22
20
24
20
26
20
28
20
30
20
32
20
34
20
36
20
38
20
40
20
42
20
44
20
46
20
48
20
50
Impact on Poverty rate(%age point diff. from base)
-10
-9
-8
-7
-6
-5
-4
-3
-2
-1
0
20
22
20
24
20
26
20
28
20
30
20
32
20
34
20
36
20
38
20
40
20
42
20
44
20
46
20
48
20
50
Impact on pollution (PM2.5)(% difference from base)
-18
-16
-14
-12
-10
-8
-6
-4
-2
0
20
22
20
24
20
26
20
28
20
30
20
32
20
34
20
36
20
38
20
40
20
42
20
44
20
46
20
48
20
50
Impact on CO2 emissions(% difference from base)

59 Fiscal Stimulus for an Inclusive, Green and Forward-Looking Recovery, Leveraging the SDG Agenda
7.5. DIGITAL TRANSFORMATION
Only 27.5 percent of the population in Pakistan
uses the internet. To achieve universal digital
access, Pakistan will require an annual investment
of $5.66 billion (2.2 percent of its GDP). Of this, we
assume 60 percent is financed by the private sector,
with the remainder financed by the public sector.
The programme is introduced gradually over a 3-
year period.
Providing universal access to mobile and
broadband services across Pakistan has the
potential to deliver high economic returns.
Investment in Information and Communications
Technology (ICT) can raise economy-wide
productivity by improving access to information,
facilitating business-to-business interactions and
reducing transaction costs. This, in turn, may push
up potential output and personal income.
Improvements in the ease of doing business may
also attract higher levels of inward Foreign Direct
Investment (FDI). Wider broadband access may
also improve access to finance through greater use
of online financial services. Improved broadband
access would speed up financial transactions, while
better access to finance would reduce liquidity
constraints of both households and firms and
reduce inequality.
Private sector financing can be undertaken in a
variety of ways, for example by diverting other
planned investment to ICT (this has very limited
short-term implications for the GDP) or by
borrowing to undertake additional investment.
While the latter would involve a significant short-
term stimulus to the GDP, access to finance may be
costly or difficult. For the purpose of this scenario,
we assume that the private sector investment is
diverted towards ICT investments, whereas
government investment is treated as additional
government expenditure, financed via government
debt. We assume that the rise in debt does not put
undue pressure on borrowing costs in Pakistan -
noting the fiscal space that would be potentially
created through green recovery and rising female
labour force participation scenarios - and that
financing for ICT investments may be available
through multilateral lending at preferential rates.
The impact of ICT investments on trend
productivity in Pakistan is calibrated with
reference to the social rates of return to
telecommunication and information projects in
Briceno-Garmendia et al (2004), which estimates a
20 percent return to investment in ICT. An
additional shock is also applied to the index of
financial inclusion. This is calibrated so that a 1
percent of the GDP rise in ICT investment raises
financial inclusion by 0.4 percentage points.
Figure 23 illustrates the expected impacts on key
variables in Pakistan, in response to the digital
transformation programme. The GDP would be
expected to rise by about 3 percent relative to
baseline by 2030, and by over 6 percent in the long
run. Inflation would decline temporarily in
response to the additional capacity, and
unemployment would also be expected to decline.
Stronger growth and more jobs will reduce poverty.
If the rise in ICT investment is not accompanied by
policies shifting the energy mix towards cleaner
energy, carbon emissions would rise in response to
the increase in economic activity. Government
debt would rise slightly, but the financing needs
will remain relatively small when compared to the
potential fiscal space that can be created in the
previous scenarios.

60 Fiscal Stimulus for an Inclusive, Green and Forward-Looking Recovery, Leveraging the SDG Agenda
Figure 23: Impact of digital transformation programme on key indicators (%)
Source: UN ESCAP Macroeconomic model scenario.
0
1
2
3
4
5
6
7
20
22
20
24
20
26
20
28
20
30
20
32
20
34
20
36
20
38
20
40
20
42
20
44
20
46
20
48
20
50
Impact on GDP (% difference from base)
-0.25
-0.20
-0.15
-0.10
-0.05
0.00
0.05
0.10
0.15
20
22
20
24
20
26
20
28
20
30
20
32
20
34
20
36
20
38
20
40
20
42
20
44
20
46
20
48
20
50
Impact on Inflation (%age point diff from base)
0.0
0.5
1.0
1.5
2.0
2.5
3.0
3.5
4.0
4.5
5.0
20
22
20
24
20
26
20
28
20
30
20
32
20
34
20
36
20
38
20
40
20
42
20
44
20
46
20
48
20
50
Impact on Government debt(% of GDP)
-1.00
-0.90
-0.80
-0.70
-0.60
-0.50
-0.40
-0.30
-0.20
-0.10
0.00
20
22
20
24
20
26
20
28
20
30
20
32
20
34
20
36
20
38
20
40
20
42
20
44
20
46
20
48
20
50
Impact on Unemployment rate(%age point diff. from base)
-3.5
-3.0
-2.5
-2.0
-1.5
-1.0
-0.5
0.0
20
22
20
24
20
26
20
28
20
30
20
32
20
34
20
36
20
38
20
40
20
42
20
44
20
46
20
48
20
50
Impact on Poverty rate(%age point diff. from base)
0
1
2
3
4
5
6
7
20
22
20
24
20
26
20
28
20
30
20
32
20
34
20
36
20
38
20
40
20
42
20
44
20
46
20
48
20
50
Impact on CO2 emissions(% difference from base)

61 Fiscal Stimulus for an Inclusive, Green and Forward-Looking Recovery, Leveraging the SDG Agenda
8. Proposals to Mobilize Resources to Meet Financing Needs
While trillions are being pumped across the
developed world in anticipation of a strong post-
pandemic recovery, most of the Global South does
not have an equal shot at building back better. For
Pakistan, a robust recovery will require substantial
investments. This chapter highlights a number of
ways in which Pakistan may create the fiscal space
it requires to meet these financing needs (table 12).
Table 12: Possible major sources of additional investments
Policy Action Required Investment Major Suitable Source
Social Spending -Social Protection: Additional
Investment of 2.14 percent of the
GDP
- Health: Additional Investment
of 5.4 percent of the GDP
- Education: Additional
Investment of 5.7 percent of GDP
- Tax Revenue
Mass
Vaccination
Drive
- - 1.37 percent of the GDP (total
required investment)
- - External Funding: COVAX Facility, grants and
highly concessional loans etc
- - Private sector philanthropy: traditional and
corporate foundations e.g. the Bill & Melinda
Gates Foundation, Rockefeller Philanthropy,
Novo Nordisk Foundation etc. (Javed, 2021a).
Gender - N/A - -Reprioritizing Expenditures
- -Mainstreaming Gender across all spending
Green Energy - -$98 billion (total investment by
2030)
- - Resources saved from elimination of fossil-fuel
subsidies
- - Resources saved from the elimination of power
sector inefficiencies
- - Debt Swap Agreements
- - Private Sector Investments
- - Increasing Export Competitiveness /FDI
Sustainable and
Reliable
Transport
Infrastructure
-Total investment of $38.5 billion
till 2030
- - Resources saved from elimination of transport
sector inefficiencies
- - Private-Public Partnerships
- - Bilateral cooperation, e.g. CPEC
- - Tax revenues
Inclusive Digital
Transformation
(digital
infrastructure)
- -Total investment of $56.6 billion
till 2030
- Private Sector Investments, e.g.
telecommunication industry
- - Multilateral lending, e.g. Asian Infrastructure Investment Bank (AIIB)

62 Fiscal Stimulus for an Inclusive, Green and Forward-Looking Recovery, Leveraging the SDG Agenda
As discussed in the previous section, the
recommended policy actions will require large
amounts of investments. In financing these, the
country will have the opportunity to explore a
number of possible investment sources to meet its
needs. Some of these key sources provided in table
12 have been explained in detail below:
1. REPRIORITIZING EXPENDITURES CAN MOBILIZE RESOURCES IN THE SHORT RUN
Given structural issues, Pakistan will likely
maintain its poor export performance and low
growth trajectory in the short to medium term.
Therefore, to meet immediate financing needs, it
can expand fiscal space through reprioritizing
available resources by increasing productivity of
expenditures, ultimately freeing up resources
(Javed, 2021a). This involves focusing on sectors
that enhance the system’s capacity against crises,
and those with higher distributional impacts, such
as social protection, which reduces both poverty
and unemployment. (Ibid). Reprioritizing
expenditures will require:
• redirecting resources from low priority
and unproductive areas to areas to high
priority areas that are productive; from
the military to development.
• spending on sectors that enhance people’s
capacity to withstand the pandemic’s
fallout; health and social security.
• focusing on expenditures with higher
distributional impacts; reducing
inequalities and the gender divide.
2. IMPROVING THE TAX SYSTEM CAN PROVIDE FISCAL SPACE OF UP TO 10 PERCENT OF THE GDP
Taxes are a major source of income globally and
have immense potential to raise the resources
needed for a post-pandemic recovery. In Pakistan
however, where the tax base remains very low,
31 Calculations based on Pakistan’s 2019 subsidy
expenditure data, where $1.7 billion and $0.2 billion in
coal and oil subsidies were provided. Chosen timeframe
for subsidy phase-out is in line with Pakistan’s existing
commitments on green energy.
only 1 percent paid taxes in 2019 – lower than most
South Asian peers (Haider, 2019). In 2016, the
country reported a ‘tax revenue gap’ of $28 billion
(10 percent of its GDP) which, if reduced, can help
double the tax revenue-to-GDP ratio (Javed,
2021a). To achieve this, the tax base must be
expanded in a number of ways which may include:
• digitalising tax processes
• simplifying tax processes by introducing
user-friendly ICT systems
• minimizing tax evasion by strengthening
anti-corruption measures and
incentivizing tax collectors to raise more
revenue.
3. PHASING OUT COAL AND OIL
SUBSIDIES CAN SAVE A TOTAL OF
$9.14 BILLION, AN AVERAGE OF $914
MILLION ANNUALLY, IN THE SHORT TO
MEDIUM TERM
Frequently provided as an alternative to social
protection, subsidies remain a major expenditure
policy in Pakistan. Most subsidies only generate
short-run gains and are counterproductive in the
medium to long run. Eliminating fossil fuel
subsidies, for instance, can provide a number of
benefits, such as creating fiscal space, transitioning
towards a carbon-free future etc. However, as
entirely eliminating subsidies overnight is not
politically viable, Pakistan may adopt a more
gradual approach31: phasing out 35 percent of coal
and oil subsidies from 2022 to 2024 can save
Pakistan nearly $665 million annually - and $1.99
billion in total across the period32 (figure 24).
Cutting subsidies down to 50 percent from 2025 to
2027 can raise annual savings to $950 million – a
total of $2.85 billion across the period. Finally,
removing 75 percent of subsidies from 2028 to 2030
will save $1.43 billion annually – a total of $4.29
across the 3 years. Overall, complete savings across
32 Another method for calculating subsidy savings may
involve subtracting the relevant percentage from each
individual year in order to reflect the remaining
inefficiencies.

63 Fiscal Stimulus for an Inclusive, Green and Forward-Looking Recovery, Leveraging the SDG Agenda
the entire 10 years tally in at $9.14 billion. These
savings can be redirected towards sustainable
development.
4. MINIMIZING POWER & TRANSPORT SECTOR INEFFICIENCIES CAN CREATE FISCAL SPACE EQUAL TO 4-6% OF THE GDP, IN SHORT TO MEDIUM TERM
Pakistan suffers from inefficiencies in many key
sectors, reducing performance and generating huge
losses for the economy every year. For instance,
Pakistan’s current power sector is financially
unsustainable, causing billions in losses annually.
In 2015, distortion costs equalled approximately
$17.69 billion (Zhang, 2019). Likewise, transport
sector inefficiencies cost the economy 4 to 6
percent of its GDP every year, i.e., between $12.58
billion to $18.88 billion annually ($15.73 billion on
average) (Sohail, et al., 2021).
Transitioning towards a greener economy,
alongside strong reforms, can help Pakistan
minimise such distortions, in turn cutting costs and
saving billions (Figure 25). For example, if Pakistan
cuts inefficiency costs by 35 percent between 2022
to 2024, it can potentially save around $6.19 billion
and $5.51 billion every year in the power and
transport sector respectively (figure 25) – a total of
$18.57 billion and $16.53 billion in each sector
across the 3 years.
Gradually continuing to cut costs down to 50
percent from 2025 to 2027 will help save $8.85
billion and $7.87 billion in the power and transport
sector every year, respectively (Figure 25) – a total
of $26.55 and $23.61 in each sector across the
period. Finally, if from 2028 to 2030 the country is
able to reduce costs by 75 percent, it can annually
save $13.27 billion and $9.44 billion respectively
(Figure 25) – a total of $39.81 billion and $28.32
billion across the 3 years. Overall, complete savings
across the entire 10 years tallies in at $84.93 billion
and $68.46 in the power and transport sector,
respectively. Overcoming inefficiencies can,
therefore, generate a great deal of fiscal space.
Figure 24: Annual savings from eliminating fossil fuel subsidies (USD millions)
Source: Based on Author’s own calculations, using the above-stated timeframe for subsidy phase-out and 2019 subsidy expenditure data for Pakistan.
Figure25: Annual savings from minimising inefficiency costs in power and transport sector (USD
billions)
665 665 665
950 950 950
1430 1430 1430
0
500
1000
1500
2000
2022 2023 2024 2025 2026 2027 2028 2029 2030
0
5
10
15
20
25
2022 2023 2024 2025 2026 2027 2028 2029 2030
Power Tranport

64 Fiscal Stimulus for an Inclusive, Green and Forward-Looking Recovery, Leveraging the SDG Agenda
5. PRIVATE SECTOR CAN BRING IN ADDITIONAL $96 BILLION BY 2030
While there is a volume of private-sector
investment available for Pakistan, it must however
be incentivized. From global banks looking to make
sustainable investments, to bilateral and
multilateral private sources specializing in
developmental investments, Pakistan has many
opportunities. In fact, SDG goals 6, 7 and 9 alone
can potentially bring in a total of $96.2 billion in
private investment in the country till 2030 33
(Standard Chartered, 2020).
Pakistan’s total private sector investment
opportunity till 2030 is: SDG 6 ($4 billion), SDG 7
($44.7 billion), SDG 9 ($47.5 billion). Tapping into
this requires creating an encouraging environment
for investors by 1) maintaining macroeconomic and
political stability, 2) redesigning tax and other
regulatory policies to encourage a business
environment, and 3) undertaking key reforms in
problematic sectors such as power (Waheed &
Ghumman , 2019).
6. INNOVATIVE FINANCIAL TOOLS LIKE DEBT SWAPS CAN BRING IN ADDITIONAL RESOURCES
While the country has already been working to
acquire and implement debt-for-nature swaps and
green bonds, there is potential to expand beyond
this. Debt-for-development swaps can free up
resources for investment in many crucial areas e.g.,
health, education, tackling infectious diseases (HIV
AIDS) etc. Additionally, Debt Conversion
Development Bonds allow budgetary room through
debt cancellation and by issuing bonds for
development in local capital markets (Rana, 2021).
Pakistan can learn from countries such as
Colombia, which deployed Social Impact Bonds to
provide support and training to unemployed
individuals, and India, which undertook
Development Impact Bonds to invest in girls’
education in Rajasthan (Ortiz, et al., 2017). Overall,
such innovative financial tools ensure more
resources are directed towards development while
still helping Pakistan manage its debt problem.
7. RAISING EXPORTS TO 14.80 PERCENT OF THE GDP CAN BRING IN AN ADDITIONAL $19.19 BILLION ANNUALLY, IN THE MEDIUM TO LONG RUN
Exports are a major source of national income. An
emerging economy, Pakistan has considerable
potential in improving foreign trade (Varela, 2020).
Exports as a total share of the economy were
reported at 8.97 percent in 2018 - lower than other
South Asian countries such as Bangladesh, India
and Sri Lanka, for whom exports constituted 14.80
percent, 19.85 percent and 22.91 percent of their
GDPs, respectively (table 13) (WDI, 2018b). Based
on this, regional scenarios have been constructed to
assess how much Pakistan (baseline scenario) can
potentially raise by increasing its exports (table 13).
Increasing Pakistan’s share of exports to 14.8
percent of its GDP can generate an additional
$19.19 billion annually. Similarly, raising export
share to 19.85 percent and 22.91 percent can
generate additional resources of $35.07 billion and
$44.7 billion respectively, every year (figure 26).
Table 13: Export scenarios for Pakistan
33 Pakistan’s total private sector investment opportunity till 2030: SDG 6 ($4 billion), SDG 7 ($44.7 billion), SDG 9
($47.5 billion).
(Baseline)
(Exports at 8.7
percent of GDP)
Scenario 1
(Exports at
14.80 percent of
GDP)
Scenario 2
(Exports at
19.85 percent
of GDP)
Scenario 3
(Exports at
22.91 percent
of GDP)
Total Exports per annum
(Billion USD)
(Share of Exports in GDP x
Pakistan’s GDP in 2018)
27.37 46.56 62.44 72.07
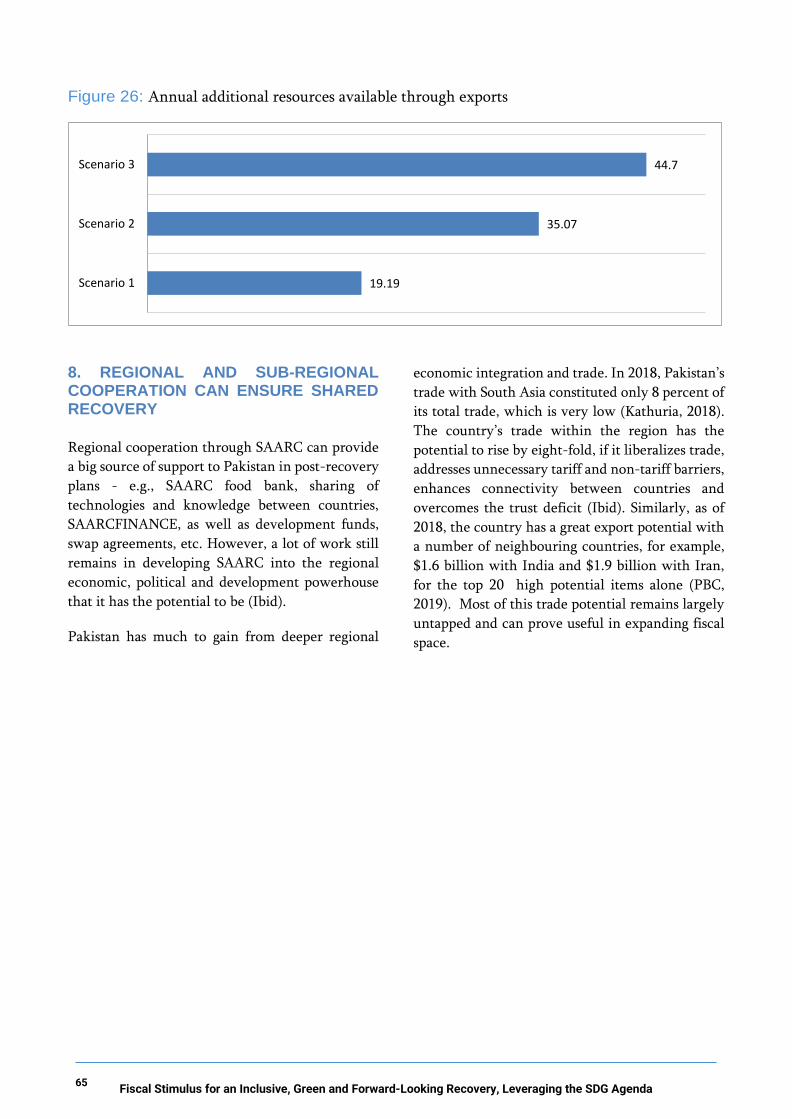
65 Fiscal Stimulus for an Inclusive, Green and Forward-Looking Recovery, Leveraging the SDG Agenda
Figure 26: Annual additional resources available through exports
8. REGIONAL AND SUB-REGIONAL COOPERATION CAN ENSURE SHARED RECOVERY
Regional cooperation through SAARC can provide
a big source of support to Pakistan in post-recovery
plans - e.g., SAARC food bank, sharing of
technologies and knowledge between countries,
SAARCFINANCE, as well as development funds,
swap agreements, etc. However, a lot of work still
remains in developing SAARC into the regional
economic, political and development powerhouse
that it has the potential to be (Ibid).
Pakistan has much to gain from deeper regional
economic integration and trade. In 2018, Pakistan’s
trade with South Asia constituted only 8 percent of
its total trade, which is very low (Kathuria, 2018).
The country’s trade within the region has the
potential to rise by eight-fold, if it liberalizes trade,
addresses unnecessary tariff and non-tariff barriers,
enhances connectivity between countries and
overcomes the trust deficit (Ibid). Similarly, as of
2018, the country has a great export potential with
a number of neighbouring countries, for example,
$1.6 billion with India and $1.9 billion with Iran,
for the top 20 high potential items alone (PBC,
2019). Most of this trade potential remains largely
untapped and can prove useful in expanding fiscal
space.
19.19
35.07
44.7
Scenario 1
Scenario 2
Scenario 3

66 Fiscal Stimulus for an Inclusive, Green and Forward-Looking Recovery, Leveraging the SDG Agenda
9. Conclusion
Overall, we argue that as the pandemic brought the
global economy to a screeching halt, the world was
provided with a unique opportunity to hit the reset
button. How we choose to act in this moment will
have momentous repercussions for decades to
come. There is a need for countries worldwide to
realign themselves once again to the SDG agenda,
shifting from emergency relief mode to long term
sustainable recovery. For this, the BBB framework
provides countries with an effective toolbox to
design their fiscal stimulus for a post-COVID world
- building a more inclusive, green, resilient and
forward-looking economy.
While the phrase ‘building back better’ has become
a popular addition to the lexicon of international
development, its practical application may prove a
daunting task. A wholly inclusive, green and
resilient post-pandemic recovery will undoubtedly
require concerted action at all levels. To finance
such an ambitious endeavour, will require
enormous levels of international support and
investment.
While the three general themes delineated
throughout this study provided a rough checklist
for what recovery can and should embody,
ultimately, what is achieved will rely heavily on
the political and economic priorities of individual
governments. While Pakistan has demonstrated
great tenacity in responding to the pandemic up till
now, much work lies ahead. As post-pandemic
recovery efforts are kick-started, how well the
country manages to build back better, is to be seen.

67 Fiscal Stimulus for an Inclusive, Green and Forward-Looking Recovery, Leveraging the SDG Agenda
References
Achakzai, J. (2021). WB okays $120m for PM’s Green Stimulus initiative, The News. Available at
www.thenews.com.pk/print/813508-wb-okays-120m-for-pm-s-green-stimulus-initiative. Accessed
on 13 April 2021.
ADB (2019). Social Protection Development Project (Additional Financing): Report and Recommendation of the President. Asian Development Bank.
__________ (2019). The Social Protection Indicator for Asia: Assessing Progress. Manila: Asian
Development Bank.
__________ (2020). COVID- 19 Impact on farm households in Punjab, Pakistan: analysis of data from a
cross-sectional survey. Brief No. 149 , August.
Ahmed, K. (2021). Pakistan to ink debt-for-nature swap deals with UK, Canada, Germany, Italy. Available at www.arabnews.pk/node/1867931/pakistan
Ali, O. R. (2020). Opportunity international edufinance. Available at https://edufinance.org/latest/blog/
2020/more-girls-dropout-and-school-close-due-to-covid-19-key-insights-from-covid-19-study-
pakistan. Accessed on 8 April 2020.
Aslam, H., Javed, S. A. & Et, A. (2021). Green Recovery from COVID 19: Outlook for Pakistan’s Energy Sector. Sustainable Development Policy Institute.
Aslam, Z. (2021). Mitigating Learning Losses During the Pandemic. Available at
https://devpakblog.com/2021/04/28/mitigating-learning-losses-during-the-pandemic/.
Atif, M., & Malik, I. (2020). Why is Pakistan vulnerable to COVID‐19 associated morbidity and mortality?
A scoping review. The International Journal of Health Planning and Management, 35(5), pp. 1045-
46.
Awais, M., and others (2020). Impact of environmental pollution on COVID-19 pandemic in Pakistan.
Open Access Journal of Waste Management & Xenobiotics.
Bilal, J., Sarwer, A., Soto , E. B. & Mashwani , Z.-u.-R. (2020). Is Pakistan's Response to Coronavirus
(SARS-CoV-2) Adequate to Prevent an Outbreak?. Frontiers in Medicine , Volume 7, p. 158.
Bloch, C. (2020). Social spending in South Asia — an overview of government expenditure on health,
education and social assistance. Research Report No. 44. Brasilia and Katmandu: International Policy
Centre for Inclusive Growth and UNICEF Regional Office for South Asia.
Bongardt, D., Breithaupt, M. & Creutzig, F. (2010). Beyond the fossil city: towards low carbon transport
and green growth. Sustainable Urban Transport Technical Document # 6.
Botev, J., Balazs, E. & Jawadi, F. (2019). The non-linear relationships between economic growth and
financial development: evidence from developing, emerging and advanced economies.
International Economics, 160(1), pp. 3-13.
Bourgault, S. & O'Donnell, M. (2020). Women’s Access to Cash Transfers in Light of COVID-19: The Case of Pakistan. Center for Global Development.
Brollo, F., Hanedar, E. & Walker, S. (2021). Pakistan: spending needs for reaching the Sustainable
Development Goals (SDGs). IMF, pp. 1-21.
CCAC (2018). Pakistan moves toward environmentally friendly and cost-effective brick kilns.
Available at www.ccacoalition.org/en/news/pakistan-moves-toward-environmentally-friendly-and-
cost-effective-brick-kilns. Accessed on 30 June 2021.

68 Fiscal Stimulus for an Inclusive, Green and Forward-Looking Recovery, Leveraging the SDG Agenda
Cheema, A. & Rehman, M. (2021). Covid-19 pandemic's economic burden in Pakistan, Pakistan Dialogues, LUMS. Available at https://mhrc.lums.edu.pk/pakistan-dialogues/covid-19-pandemic-economic-
burden-in-pakistan.html.
Cheema, I., and others (2020). Benazir Income Support Programme, Evaluation Report. Oxford: Oxford
Policy Management.
Chelminski, K. (2018). Fossil Fuel subsidy reform in Indonesia. In The Politics of Fossil Fuel Subsidies and their Reform, J. Skovgaard, ed. Cambridge : Cambridge University Press.
D. A. (2016). What the World's First Bus Rapid Transit System Can Teach Us. Available at
https://development.asia/case-study/what-worlds-first-bus-rapid-transit-system-can-teach-us.
Accessed on 19 April 2021.
Dawn (2020). Literacy rate increased by only 2pc in last four years. Available at
www.dawn.com/news/1563338. Accessed on 7 July 2021.
Democracy Reporting International (2020). Evaluating Ehsaas Emergency Cash Transfer Program –
successes, oversights and possibilities. COVID-19 Policy Brief Series. Democracy Reporting
International.
ECB (2017). Does Trade play a role in helping to explain productivity growth? European Central Bank
Issue Economic Bulletin, Issue 7.
ESCAP (2021). Economic and Social Survey of Asia And The Pacific 2021: Towards Post-COVID-19 Resilient Economies. Bangkok: United Nations Economic and Social Commission for Asia and the
Pacific.
ESCAP (2018). Social Outlook for Asia and the Pacific Poorly Protected. Bangkok: UNESCAP.
ESCAP (2019). Economic and Social Survey of Asia and the Pacific 2019: Ambitions Beyond Growth. Bangkok: United Nations Economic and Social Commission for Asia and the Pacific.
ESCAP (2020). Turning to the Covid-10 Pandemic Crisis into Collective SDG Actions in North-East Asia. Covid-19 Response. United Nations Economic and Social Commission for Asia and the Pacific.
ESRB (2021). Financial stability implications of support measures to protect the real economy from the
COVID-19 pandemic. European Systemic Risk Board.
WJP (2020). WJP Rule of Law Index®. Available at https://worldjusticeproject.org/rule-of-law-
index/country/2020/Pakistan/. Accessed on 30 June 2021.
Foo, N., Lean, H. H. & Salim, R. (2020). What are the determinants of fuel subsidies in asia-pacific
economic cooperation countries? ADBI Working Paper ,1176. Tokyo: Asian Development Bank
Institute.
Gerszon Mahler, D., and others (2021). Updated estimates of the impact of COVID-19 on global poverty:
Turning the corner on the pandemic in 2021?. Available at
https://blogs.worldbank.org/opendata/updated-estimates-impact-covid-19-global-poverty-turning-
corner-pandemic-2021.
GISWatch (2018). Community Networks, Wireless For Communities (W4C) Pakistan. Global Information
Society Watch .
GOP (2020a). Ehsaas Emergency Cash, Poverty Alleviation and Social Safety Division. Available at
www.pass.gov.pk/Detailf90ce1f7-083a-4d85-b3e8-60f75ba0d788. Accessed on 11 April 2021.
GOP (2021). Federal Budget 2021-22. Budget in Brief (June). Available at
www.finance.gov.pk/budget/Budget_2021_22/6_Budget_in_Brief_English_2021_22.pdf.
Government of Pakistan, Finance Division.

69 Fiscal Stimulus for an Inclusive, Green and Forward-Looking Recovery, Leveraging the SDG Agenda
Griscom, B. W., and others (2017). Natural climate solutions. Proceedings of the National Academy of
Science of the United States of America, vol. 114, No. 44, pp. 11645 - 11650.
H. &. W. A. S. (2021). Digital 2021: Pakistan, Digital 2021 Global Digital Overview. Available at
https://datareportal.com/reports/digital-2021-pakistan
H. A. (2020). A Review of Inclusion of Older People in Ehsaas Emergency Cash Programme. HelpAge
International.
Hageneder, C. (2020). COVID-19 Stimulus spending for green construction means building back better,
international institute for sustainable development. Available at
https://sdg.iisd.org/commentary/guest-articles/covid-19-stimulus-spending-for-green-construction-
means-building-back-better/. Accessed on 15 April 2021.
Haider, M. (2019). Only one percent Pakistanis pay taxes: FBR. Available at
www.thenews.com.pk/print/425729-only-one-percent-pakistanis-pay-taxes-fbr.
__________ (2021). Government Wants to Vaccinate 70m People by End of 2021: Report. Available at
www.geo.tv/latest/347330-governments-wants-to-vaccinate-70m-by-end-of-2021-report. Accessed
on 15 July 2021.
Harris, N. & Gibbs, D. (2021). Forests Absorb Twice As Much Carbon As They Emit Each Year. Available
at www.wri.org/insights/forests-absorb-twice-much-carbon-they-emit-each-year. Accessed on 30
June 2021.
Hassan, S. R. (2020). Pakistan confirms first two cases of coronavirus, in travellers from Iran: Minister’,
Reuters. Available at www.reuters.com/article/us-china-health-pakistan-idUSKCN20K2M2.
Hughes, K. & Roy, A. S. (2020). COVID-19 RECOVERY A Pathway to a Low-Carbon and Resilient Future. Asian Development Bank.
IISD (2016). Indonesia uses savings from fossil fuel subsidy reform to finance development. International
Institute For Sustainable Development. Available at www.iisd.org/articles/indonesia-uses-savings-
fossil-fuel-subsidy-reform-finance-development. Accessed on 20 April 2021.
IEA (2019). World Energy Outlook. International Energy Agency.
__________ (2020). Value of fossil-fuel subsidies by fuel in the top 25 countries, 2019. Available at www.iea.org/data-and-statistics/charts/value-of-fossil-fuel-subsidies-by-fuel-in-the-top-
25-countries-2019. Accessed on 20 April 2021.
__________ (2020). World Energy Outlook. International Energy Agency.
__________ (2021). After steep drop in early 2020, global carbon dioxide emissions have rebounded
strongly. Available at www.iea.org/news/after-steep-drop-in-early-2020-global-carbon-dioxide-
emissions-have-rebounded-strongly. Accessed on 15 July 2021.
IFC (2017). Climate Investment Opportunities in South Asia, An IFC Analysis. Washington, D.C:
International Finance Corporation.
IISD (2020). New EU Budget and Recovery Fund: green stimulus and climate budget cuts. International
Institute for Sustainable Development. Available at www.iisd.org/sustainable-recovery/news/new-
eu-budget-and-recovery-fund-green-stimulus-and-climate-budget-cuts/.
ILO (2019). Mapping Social Protection Systems in Pakistan: The Status of current Systems in Line with the UN Social Protection Floor Concept. Geneva : International Labour Organisation.
__________ (2021). Emergency Employment, Employment-Intensive Investment Programme (EIIP) Technical Brief. Available at www.ilo.org/global/topics/employment-intensive-
investment/themes/emergency-employment/lang--en/index.htm. Accessed on 14 April 2021.

70 Fiscal Stimulus for an Inclusive, Green and Forward-Looking Recovery, Leveraging the SDG Agenda
International Monetary Fund (IMF) (2019). Fiscal Monitor, October 2019 : How to Mitigate Climate Change, Washington, D.C.
__________ (2019). Pakistan : First review under the extended arrangement under the extended fund
facility and request for modification of performance criteria. Press Release; Staff Report; and
Statement by the Executive Director for Pakistan. IMF Country Report No. 19/380. Washington,
D.C.: International Monetary Fund.
__________ (2020). Request for purchase under the rapid financing instrument. Press Release; Staff Report;
and Statement by the Executive Director for Pakistan. IMF Country Report No. 20/114 ,
Washington, D.C.: IMF.
__________ (2021). FISCAL MONITOR REPORTS, Fiscal Monitor April 2021, Washington, DC:
International Monetary Fund.
__________ (2021). World Economic and Financial Surveys: World Economic Outlook Database. Available at www.imf.org/en/Publications/WEO/weo-database/2021/April/select-country-group.
Javed , S. A., Ayaz, M. U. & Aslam, H. (2021). Debt Swap for Green Recovery: Options, Challenges and Way Forward for Pakistan. Islamabad: Sustainable Development Policy Institute.
Javed , S. A., Ayyaz, U. & Aslam, H. (2021). Debt Swap for Green Recovery: Options, Challenges and the Way Forward for Pakistan (forthcoming paper). Islamabad: Sustainable Development Policy
Institute.
Javed, S. A. (2021a). Socioeconomic Impact of COVID-19 in South Asia-Fiscal Policy Response and Fiscal Needs for Supporting Economic Recovery. Islamabad: United Nations Economic and Social
Commissions for Asia and the Pacific (UNESCAP).
Javed, S. A. (2021b). Budget dilemma. Available at www.thenews.com.pk/tns/detail/807252-budget-
dilemma.
Kathuria, S. (2018). Pakistan’s Trade with South Asia Can Rise by Eight-fold – A new World Bank report. Available at www.worldbank.org/en/news/press-release/2018/12/05/pakistan-could-boost-trade-
with-south-asia-eight-fold.
Kemp, S. (2021). Digital 2021: Pakistan, Digital 2021 Global Digital Overview. Available at
https://datareportal.com/reports/digital-2021-pakistan. Accessed on 15 July 2021.
Khan, M. A. A. (2020). Opinion: Pakistan’s ‘Green Stimulus’ to Combat Covid-19, Protect Nature. Available at www.thethirdpole.net/en/energy/pakistans-green-stimulus-to-combat-covid-19-
protect-nature/. Accessed on 14 April 2021.
Khan, M. A. A. (2021). How Pakistan is Aiming for a Green Recovery from the Pandemic. World Economic Forum. Available at www.weforum.org/agenda/2021/02/pakistan-green-recovery/.
Accessed on 13 April 2021.
Khan, M. Z. (2020). Medical Equipment to Be Exempted from Taxes - Dawn. Available at
www.dawn.com/news/1542544. Accessed on 12 April 2021.
Khan, R. S. (2020). As a 'green stimulus', Pakistan sets virus-idled to work planting trees. Thomson Reuters Foundation. Available at www.reuters.com/article/us-health-coronavirus-pakistan-trees-fea/as-a-
green-stimulus-pakistan-sets-virus-idled-to-work-planting-trees-idUSKCN22A369. Accessed on 14
April 2021.
KPMG (2020a). Pakistan: Government and institution measures in response to COVID-19.
Available at https://home.kpmg/xx/en/home/insights/2020/04/pakistan-government-and-institution-
measures-in-response-to-covid.html. Accessed on 11 April 2021.

71 Fiscal Stimulus for an Inclusive, Green and Forward-Looking Recovery, Leveraging the SDG Agenda
KPMG (2020b). Pakistan: Tax relief for construction sector (COVID-19). Available at
https://home.kpmg/us/en/home/insights/2020/05/tnf-pakistan-tax-relief-construction-sector.html.
Accessed on 12 April 2021.
Lodhi, A. (2021). Rs370 billion set aside for health sector. Available at https://tribune.com.pk/story/
2305331/rs370-billion-set-aside-for-health-sector. Accessed on 18 July 2021.
Malik, R. (2020). Challenges and opportunities for Pakistan education systems in the COVID-19 response. Available at: www.ukfiet.org/2020/challenges-and-opportunities-for-pakistan-education-systems-in-
the-covid-19-response/.
Maqbool, S. (2020). ‘Yaran-e-Watan’ launched amidst hopes to fill health workforce gap. Available at
www.thenews.com.pk/print/649616-yaran-e-watan-launched-amidst-hopes-to-fill-health-
workforce-gap.
Mehar, M. A. (2020). Infrastructure development and public–private partnership: measuring impacts of
urban transport infrastructure in Pakistan. ADBI Working Paper 1149. Tokyo: Asian Development
Bank Institute.
Mercer-Blackman, V. & Norton, M. (2021). What nitrogen dioxide emissions tell us about the fragile
recovery in South Asia. Available at https://blogs.worldbank.org/developmenttalk/what-nitrogen-
dioxide-emissions-tell-us-about-fragile-recovery-south-asia. Accessed on 17 July 2021.
Moeen, M. S., and others (2021). Estimating the economic impacts of the first wave of COVID-19 in
Pakistan using a SAM Multiplier Model. International Food Policy Research Institute, Issue IFPRI
Discussion Paper 02001.
M.o.F. (2019). Budget in Brief - Federal Budget 2019-20. Ministry of Finance, Government of Pakistan.
__________ (2020). Annual Debt Review Debt Bulletin FY2019-20. Available at
www.finance.gov.pk/dpco/Annual_Debt_Review_Debt_Bulletin_Jun_2020.pdf. Ministry of
Finance.
__________ (2020). Pakistan Economic Survey 2019-20. Ministry of Finance, Government of Pakistan.
MoITT (2021a). DDWP approves 8 projects worth Rs. 5,850.134 million. Available at
https://moitt.gov.pk/NewsDetail/YzRmYWNiODctOGExMS00ODM4LWE2Y2MtYzIxNTVlNTI3N2
Ex. Accessed on 12 April 2021.
__________ (2021b). USF awards contract worth PKR 2.07 billion to Ufone for providing high speed
mobile broadband services in Kech District. Federal Minister for It & Telecommunication Syed Amin
Ul Haque, Minister For Defence Production, Zubaida Jalal Witness Contract Signin. Available at
https://moitt.gov.pk/NewsDetail/Zjg3MTgzMWYtYTgwNy00OTVmLWFhNTYtZjQ1MmMxNDg4N
jNm. Accessed on 12 April 2021.
Nabeel, F. (2020). Opinion: Pakistan meets climate SDG, but that is not enough. Available at
www.thethirdpole.net/en/climate/pakistan-meets-climate/.
The Nation (2018). Pakistan, Italy agree to extend timeline of PIDSA. Available at
https://nation.com.pk/04-Oct-2018/pakistan-italy-agree-to-extend-timeline-of-pidsa. Accessed on 30
June 2021.
Nayab, D. (2021). PIDE COVID-19 BULLETIN - Vaccine for All. Islamabad: PIDE.
The News (2021). Financing for ecosystem restoration in Pakistan discussed. Available at
www.thenews.com.pk/print/844301-financing-for-ecosystem-restoration-in-pakistan-discussed.
Accessed on 30 June 2021.
NIH (2020). National Action Plan for Corona Virus Disease (COVID-19) Pakistan. Ministry of National
Health Services, Regulation and Coordination. Government of Pakistan.
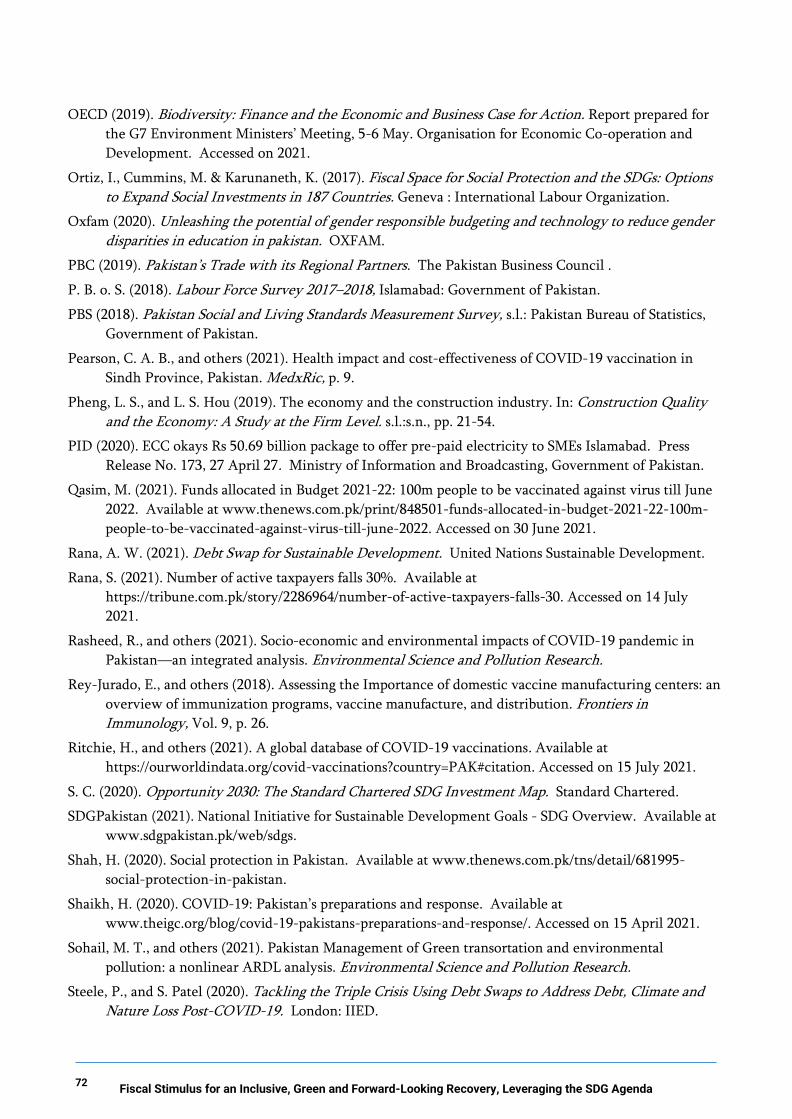
72 Fiscal Stimulus for an Inclusive, Green and Forward-Looking Recovery, Leveraging the SDG Agenda
OECD (2019). Biodiversity: Finance and the Economic and Business Case for Action. Report prepared for
the G7 Environment Ministers’ Meeting, 5-6 May. Organisation for Economic Co-operation and
Development. Accessed on 2021.
Ortiz, I., Cummins, M. & Karunaneth, K. (2017). Fiscal Space for Social Protection and the SDGs: Options to Expand Social Investments in 187 Countries. Geneva : International Labour Organization.
Oxfam (2020). Unleashing the potential of gender responsible budgeting and technology to reduce gender disparities in education in pakistan. OXFAM.
PBC (2019). Pakistan’s Trade with its Regional Partners. The Pakistan Business Council .
P. B. o. S. (2018). Labour Force Survey 2017–2018, Islamabad: Government of Pakistan.
PBS (2018). Pakistan Social and Living Standards Measurement Survey, s.l.: Pakistan Bureau of Statistics,
Government of Pakistan.
Pearson, C. A. B., and others (2021). Health impact and cost-effectiveness of COVID-19 vaccination in
Sindh Province, Pakistan. MedxRic, p. 9.
Pheng, L. S., and L. S. Hou (2019). The economy and the construction industry. In: Construction Quality and the Economy: A Study at the Firm Level. s.l.:s.n., pp. 21-54.
PID (2020). ECC okays Rs 50.69 billion package to offer pre-paid electricity to SMEs Islamabad. Press
Release No. 173, 27 April 27. Ministry of Information and Broadcasting, Government of Pakistan.
Qasim, M. (2021). Funds allocated in Budget 2021-22: 100m people to be vaccinated against virus till June
2022. Available at www.thenews.com.pk/print/848501-funds-allocated-in-budget-2021-22-100m-
people-to-be-vaccinated-against-virus-till-june-2022. Accessed on 30 June 2021.
Rana, A. W. (2021). Debt Swap for Sustainable Development. United Nations Sustainable Development.
Rana, S. (2021). Number of active taxpayers falls 30%. Available at
https://tribune.com.pk/story/2286964/number-of-active-taxpayers-falls-30. Accessed on 14 July
2021.
Rasheed, R., and others (2021). Socio-economic and environmental impacts of COVID-19 pandemic in
Pakistan—an integrated analysis. Environmental Science and Pollution Research.
Rey-Jurado, E., and others (2018). Assessing the Importance of domestic vaccine manufacturing centers: an
overview of immunization programs, vaccine manufacture, and distribution. Frontiers in Immunology, Vol. 9, p. 26.
Ritchie, H., and others (2021). A global database of COVID-19 vaccinations. Available at
https://ourworldindata.org/covid-vaccinations?country=PAK#citation. Accessed on 15 July 2021.
S. C. (2020). Opportunity 2030: The Standard Chartered SDG Investment Map. Standard Chartered.
SDGPakistan (2021). National Initiative for Sustainable Development Goals - SDG Overview. Available at
www.sdgpakistan.pk/web/sdgs.
Shah, H. (2020). Social protection in Pakistan. Available at www.thenews.com.pk/tns/detail/681995-
social-protection-in-pakistan.
Shaikh, H. (2020). COVID-19: Pakistan’s preparations and response. Available at
www.theigc.org/blog/covid-19-pakistans-preparations-and-response/. Accessed on 15 April 2021.
Sohail, M. T., and others (2021). Pakistan Management of Green transortation and environmental
pollution: a nonlinear ARDL analysis. Environmental Science and Pollution Research.
Steele, P., and S. Patel (2020). Tackling the Triple Crisis Using Debt Swaps to Address Debt, Climate and Nature Loss Post-COVID-19. London: IIED.
73 Fiscal Stimulus for an Inclusive, Green and Forward-Looking Recovery, Leveraging the SDG Agenda
Thomas, C. C., and others (2016). Estimating the Economic Impacts of Ecosystem Restoration—Methods and Case Studies. U.S. Geological Survey Open-File Report 2016–1016.
Trines, S. (2018). World Education, News & Reviews, Educating the Masses: the Rise of Online Education in Sub-Saharan Africa and South Asia. Available at https://wenr.wes.org/2018/08/educating-the-
masses-the-rise-of-online-education.
U. D. (2018). Promoting Inclusion Through Social Protection, Report on the World Social Situation 2018. New York: United Nations Department of Economic and Social Affairs.
Ul Haque, N., and M. Rizwan (2020). Rethinking mobility (urban transport policy) in Pakistan. PIDE
Urban Monograph Series, No.2 . Pakistan Institute of Development Economics (PIDE).
UN (2020a). The Sustainable Development Goals Report 2020. United Nations.
UN (2020). The impact of COVID-19 on women. Policy Brief. United Nations.
UNDP (2020). Covid-19: Pakistan Socio- Economic Impact Assessment & Response Plan. United Nations
Development Programme.
UNFPA (2021). World Population Dashboard Pakistan. Available at www.unfpa.org/data/world-
population/PK.
UNFPA (2021). World Population Dashboard Sri Lanka. Available at www.unfpa.org/data/world-
population/LK.
UNICEF (2021). Brief on Learning Continuity Amidst COVID-19 School Closures. Available at
www.unicef.org/pakistan/media/3761/file/Pakistan%20Brief%20on%20learning%20continuity%20a
midst%20COVID19.pdf.
Varela, G. (2020). Four actions to speed up Pakistan’s export recovery. Available at
https://blogs.worldbank.org/endpovertyinsouthasia/four-actions-speed-pakistans-export-recovery
V. E. (2020). Greenness of Stimulus Index: an assessment of COVID-19 stimulus by G20 countries and
other major economies in relation to climate action and biodiversity goals. Available at
www.vivideconomics.com/casestudy/greenness-for-stimulus-index/.
Waheed, M., and A. A. Ghumman (2019). Improving Pakistan’s public and private investment. Available at https://blogs.worldbank.org/endpovertyinsouthasia/improving-pakistan-s-public-and-
private-investment.
Wang, F. (2015). More health expenditure, better economic performance? Empirical evidence from
OECD countries. Inquiry, Vol. 52, pp. 1-5.
WDI (2018a). Current health expenditure (% of GDP). Available at https://data.worldbank.org/
indicator/SH.XPD.CHEX.GD.ZS.
WDI (2018b). Exports of goods and services (% of GDP). Available at https://data.worldbank.org/
indicator/NE.EXP.GNFS.ZS
WDI (2018). Current Health Expenditure (% of GDP) - Pakistan. Available at https://data.worldbank.org/
indicator/SH.XPD.CHEX.GD.ZS?locations=PK. Accessed on 15 July 2021.
WDI (2019). Investment in Transport with Private Participation (Current USD$) - Pakistan. Available at
https://data.worldbank.org/indicator/IE.PPI.TRAN.CD?locations=PK. Accessed on 16 July 2021.
WDI (2020). Population Growth (annual %) - Pakistan. Available at https://data.worldbank.org/indicator/
SP.POP.GROW?locations=PK&name_desc=false. Accessed on 15 July 2021.
World Bank (2017a). Educating Girls, Ending Child Marriage. Available at
www.worldbank.org/en/news/immersive-story/2017/08/22/educating-girls-ending-child-marriage.
__________ (2017b). China: Afforestation Project in Shandong Improves Environment and Farmers’
74 Fiscal Stimulus for an Inclusive, Green and Forward-Looking Recovery, Leveraging the SDG Agenda
Incomes. Available at www.worldbank.org/en/results/2017/07/26/china-afforestation-project-in-
shandong-improves-environment-and-farmers-incomes.
__________ (2018). International LPI, Global Ranking 2018. Available at https://lpi.worldbank.org/
international/global/2018?sort=asc&order=Infrastructure#datatable. Accessed on 9 July 2021]
__________ (2019a). Worldwide Governance Indicators. Available at https://databank.worldbank.org/
source/worldwide-governance-indicators. Accessed on 30 June 2021.
__________ (2019b). Labor force participation rate, female (% of female population ages 15+) (modeled
ILO estimate). Available at https://data.worldbank.org/indicator/SL.TLF.CACT.FE.ZS?
locations=PK&name_desc=false.
__________ (2019c). Lifelines: the resilient infrastructure opportunity. Sustainable Infrastructure Series.
__________ (2020a). Energy subsidy reform facility: generates knowledge to support governments to
design and implement sustainable energy subsidy reforms while safeguarding the welfare of the
poor. Available at www.worldbank.org/en/results/2020/11/12/energy-subsidy-reform-facility-
generates-knowledge-to-support-governments-to-design-and-implement-sustainable-energy-
subsidy-reforms-while-safeguarding-the-welfare-of-the-poor. Accessed on 20 April 2021.
__________ (2020b). Variable Renewable Energy Integration and Planning Study. Washington, DC:
World Bank.
__________ (2021). World Bank supports expansion of the Ehsass Social Protection Program in Pakistan
to increase household resilience to economic shocks. Available at
www.worldbank.org/en/news/press-release/2021/03/25/pakistan-expands-ehsaas-social-protection-
programs-to-increase-household-resilience-to-economic-shocks-with-world-bank-s. Accessed on 11
April 2021.
__________ (2021). Pakistan development update: navigating in uncertain times. World Bank.
World Economic Forum (2020). Global Gender Gap Report 2020. Geneva.
World Health Organization (2011). Increasing Access to Diagnostics Through Technology Transfer and Local Production. Geneva.
__________ (2021). WHO Coronavirus (COVID-19) Dashboard. Available at https://covid19.who.int
WWF (2020). Annual Report - WWF-Pakistan's Yearly Progress. WWF.
W. W. W. F. (2020). Women’s Rights Online: Closing the Digital Gender Gap for a More Equal World. s.l.: Web Foundation.
Xiheng, J., and L. Changyu (2020). How Digital Technology Contributes to Poverty Reduction in China. Center for International Knowledge on Development. Available at
www.cikd.org/English/detail?leafId=217&docId=1573.
Zaballos , A. G., and E. Iglesias, and A. Adamowicz (2019). The Impact of Digital Infrastructure on the Sustainable Development Goals. A Study for Selected Latin American and Caribbean Countries. s.l.: Inter-American Development Bank.
Zhang, F. (2019). In the Dark: How Much Do Power Sector Distortions Cost South Asia?. Washington,
D.C.: World Bank.

75 Fiscal Stimulus for an Inclusive, Green and Forward-Looking Recovery, Leveraging the SDG Agenda
APPENDIX I
The table below encompasses all information on the financing needs delineated throughout section 6 of this
study. In particular, it highlights the key policy actions recommended in this study that need to be
implemented to better reconcile Pakistan’s recovery from the COVID-19 pandemic, with its long-term
sustainable development priorities. Studies used to provide cost estimates for each policy action have also
been provided below, as well as their methodologies. Please note that policy action 3 (greater gender
sensitivity in fiscal stimulus measures) has not been included, as it requires mainstreaming across all
investments.
Recommended
Policy Action
Current
Investment
Investment
Required
Private Public
Share Source Methodology
Social
Protection
0.6 percent
of
the GDP
(average
over the
years)
Source:
(ADB,
2019).
Additional
Investment of
2.14 percent of
the GDP by
2030
Path of Investment: Steady each
year
Time path: till 2030
Assuming
additional
spending to
commence
from 2020 till
2030, arise
entirely from
the public
sector
(ILO, 2019)
This study utilises extensive
secondary data and key informant
interviews with individuals from
the federal and all provincial
governments. Based on the
information of the different types
of social protection schemes in the
country, total number of
beneficiaries and the approximate
expenditures of such schemes, the
study was able to provide as
estimate for basic social
protection floor in Pakistan. This
recommended spending level
represents the beginning of a
social protection floor for
Pakistan, whereby its citizens are
provided basic welfare, pulled out
of poverty and allowed to
participate in inclusive and
sustainable development.
Health 2.8 percent
of the GDP
(2018)
Additional
Investment of
5.4 percent of
the GDP by
2030
Path of Investment: Steady each
year
Public share =
4.3 percent of
the GDP by
2030
Private share =
4 percent of
the GDP by
2030
(Brollo, et
al., 2021)
This study estimates additional
spending needs based on input-
outcome approach, one that
determines development
outcomes to be a function of
mixed inputs. In the case of
health, the study sets key inputs
and their associated unit costs at
the values for countries with
similar GDP per capita that
perform well in their SDG index
scores.
Inputs for health include:

76 Fiscal Stimulus for an Inclusive, Green and Forward-Looking Recovery, Leveraging the SDG Agenda
Recommended
Policy Action
Current
Investment
Investment
Required
Private Public
Share Source Methodology
Time path: till 2030
- Total Health Spending
- Doctors per 1,000 population
- Other medical personnel per
1,000 population
For more details, refer to: Brollo,
F., Hanedar, E., & Walker, S.
(2021). Pakistan: Spending Needs
for Reaching the Sustainable
Development Goals (SDGs).
Education
3.9 percent
of the GDP
(2018)
Additional
Investment of
5.7 percent of
GDP by 2030
Path of Investment: Steady each
year
Time path: till 2030
Public share =
7.7 percent of
the GDP by
2030
Private share =
1.9 percent of
the GDP by
2030
(Brollo, et
al., 2021)
This study estimates additional
spending needs based on input-
outcome approach, one that
determines development
outcomes to be a function of
mixed inputs. In the case of
education, the study sets key
inputs and their associated unit
costs at the values for countries
with similar GDP per capita that
perform well in their SDG index
scores.
Inputs for education include:
- Total spending (in % of GDP)
- Average Teacher Wage (as % of
GDP per capita)
- Student-teacher ratio
For more details, refer to: Brollo,
F., Hanedar, E., & Walker, S.
(2021). Pakistan: Spending Needs
for Reaching the Sustainable
Development Goals (SDGs).
Mass
Vaccination
Drive
PKR 24
billion
($150
million)
Source:
(GOP,
2021)
1.37 percent of
the GDP (total
required
investment)
Path of Investment: 40 percent of total investment till
2024, then
vaccinations
are expected to
predominantly
arise from the
public sector.
(Pearson, et
al., 2021)
This study uses a detailed
economic model to analyse the
cost-effectiveness and health
impact of COVID-19 vaccinations
in Sindh, Pakistan. It estimates the
annual economic costs of vaccine
introduction, diagnosis and
treatment in 2020 values. Costing
has been calculated using a
bottom-up ingredient based
approach and includes various
costs associated with vaccine
drives, such as delivery costs,

77 Fiscal Stimulus for an Inclusive, Green and Forward-Looking Recovery, Leveraging the SDG Agenda
Recommended
Policy Action
Current
Investment
Investment
Required
Private Public
Share Source Methodology
steady each year after
Time path: 70 percent of
immunisation till 2024.
social mobilisation using data
from polio campaign budgetary
allocations, transport cost using
the UNICEF model and micro-
costing of human resource costs
using data from Disease Control
Priorities project etc.
Green Energy N/A
$98 billion
(total
investment by
2030)
N/A (Aslam, et
al., 2021)
The study estimates green
recovery cost through a scenario-
based approach, analysing energy
consumption patterns in a
number of post COVID-19
scenarios through an optimized
LEAP modelling framework.
For more details, refer to: Aslam,
H., & Javed, S.A. (2021) Green recovery from COVID 19: Outlook for Pakistan’s Energy sector. Sustainable Development
Policy Institute.
Sustainable
and Reliable
Transport
Infrastructure
$240
million
(2019)
Source:
(WDI,
2019)
Total
investment of
$38.5 billion till
2030
Path of Investment: Steady each
year
Time path: till 2030
Public share =
total of $25
billion
anticipated till
2030
Private share =
total of $13.5
billion
anticipated till
2030
(Standard
Chartered,
2020)
This study calculates investment
opportunities for three
infrastructure-centred SDGs
(SDGs 6, 9 and 9), by using
UNCTAD estimates for private-
sector participation rates in
infrastructural project related to
each SDG across 15 countries.
Resultant figures have been
evaluated against a literature
review, expert advisory panels
and reviewed by market experts,
specialists and academics.
The case of Green Transport, the
study analyses the availability of
‘’quality, reliable, sustainable and resilient transport infrastructure’’. This is, in turn, measured by the
Logistics Performance Index
Infrastructure score
For more details, refer to:
Standard Chartered. (2020).
Opportunity 2030: The Standard

78 Fiscal Stimulus for an Inclusive, Green and Forward-Looking Recovery, Leveraging the SDG Agenda
Recommended
Policy Action
Current
Investment
Investment
Required
Private Public
Share Source Methodology
Chartered SDG Investment Map.
Standard Chartered. Available at
https://av.sc.com/corp-
en/content/docs/Standard-
Chartered-Opportunity-2030.pdf.
Inclusive
Digital
Transformatio
n
PKR 12.45
billion
($77.8
million)
Source:
(GOP,
2021).
(MoITT,
2021b).
Total
investment of
$56.6 billion till
2030
Path of Investment: Steady each
year
Time path: till 2030
Public share =
total of $22.6
billion
anticipated till
2030
private share =
total of $34
billion till
2030
(Standard
Chartered,
2020)
This study calculates investment
opportunities for three
infrastructure-centred SDGs
(SDGs 6, 9 and 9), by using
UNCTAD estimates for private-
sector participation rates in
infrastructural project related to
each SDG across 15 countries.
Resultant figures have been
evaluated against a literature
review, expert advisory panels
and reviewed by market experts,
specialists and academics.
In the case of Inclusive Digital
Transformation, the study
analyses the digital access rate.
This is, in turn, measured by ‘’a
weighted blend of:
1) Percentage of population using
the internet (80 per cent
weighting
2)Number of mobile-cellular
subscriptions per 100 inhabitants
(20 per cent weighting)’’.
For more details, refer to:
Standard Chartered. (2020).
Opportunity 2030: The Standard
Chartered SDG Investment Map.
Standard Chartered. Available at
https://av.sc.com/corp-
en/content/docs/Standard-
Chartered-Opportunity-2030.pdf.

79 Fiscal Stimulus for an Inclusive, Green and Forward-Looking Recovery, Leveraging the SDG Agenda
APPENDIX II
The below provided cost estimates have been utilised in calculating the additional vaccinations costs for
Pakistan.
Economic Parameters Cost Per Dose
Vaccine Procurement x
Wastage 10%
Freight 10% of Procurement Cost
Cold chain costs, per dose (national level) USD 0.013
Cold chain costs per dose (service level) USD 0.031
Human resource (per dose) Campaign-based: USD 0.38
Transport (per dose) Campaign-based: USD 0.001
Source: (Pearson, et al., 2021)
Costs have been calculated based on these estimates and using two different types of vaccines are available
to Pakistan: the AstraZeneca vaccine, which costs $6 per dose, and the Sputnik V vaccine, which costs $10
per dose. Assuming a mix of vaccines is utilised by the GOP (a more realistic scenario) to vaccinate its
population, these costs could amount to $12.76 per dose (including cost of the vaccine itself).

Get connected. Follow us.
www.unescap.org
facebook.com/unescap
twitter.com/unescap
instagram.com/unitednationses
cap youtube.com/unescap
linkedin.com/company/united-nations-escap