Membrane tension and peripheral protein density mediate membrane shape transitions
44
1 Membrane tension and peripheral protein density mediate membrane shape transitions Zheng Shi 1 , Tobias Baumgart 1* 1 Department of Chemistry, University of Pennsylvania, 231 S. 34th St., Philadelphia, PA 19104, USA *To whom correspondence should be addressed: T. Baumgart, Department of Chemistry, University of Pennsylvania, 231 South 34th Street, 19104, Philadelphia, PA, USA, Tel.: 215 573 7539; E-mail: [email protected]
-
Upload
independent -
Category
Documents
-
view
0 -
download
0
Transcript of Membrane tension and peripheral protein density mediate membrane shape transitions
1
Membrane tension and peripheral protein density mediate
membrane shape transitions
Zheng Shi1, Tobias Baumgart1*
1Department of Chemistry, University of Pennsylvania, 231 S. 34th St., Philadelphia, PA 19104,
USA
*To whom correspondence should be addressed: T. Baumgart, Department of Chemistry,
University of Pennsylvania, 231 South 34th Street, 19104, Philadelphia, PA, USA, Tel.: 215 573
7539; E-mail: [email protected]
2
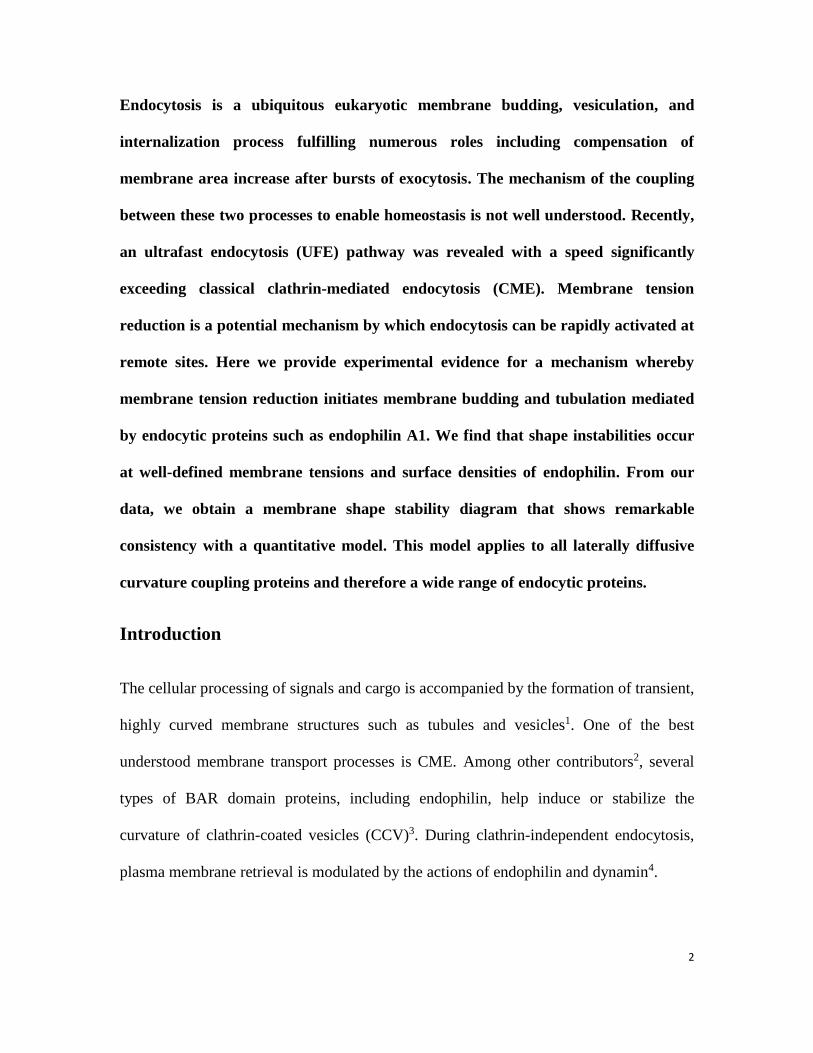
Endocytosis is a ubiquitous eukaryotic membrane budding, vesiculation, and
internalization process fulfilling numerous roles including compensation of
membrane area increase after bursts of exocytosis. The mechanism of the coupling
between these two processes to enable homeostasis is not well understood. Recently,
an ultrafast endocytosis (UFE) pathway was revealed with a speed significantly
exceeding classical clathrin-mediated endocytosis (CME). Membrane tension
reduction is a potential mechanism by which endocytosis can be rapidly activated at
remote sites. Here we provide experimental evidence for a mechanism whereby
membrane tension reduction initiates membrane budding and tubulation mediated
by endocytic proteins such as endophilin A1. We find that shape instabilities occur
at well-defined membrane tensions and surface densities of endophilin. From our
data, we obtain a membrane shape stability diagram that shows remarkable
consistency with a quantitative model. This model applies to all laterally diffusive
curvature coupling proteins and therefore a wide range of endocytic proteins.
Introduction
The cellular processing of signals and cargo is accompanied by the formation of transient,
highly curved membrane structures such as tubules and vesicles1. One of the best
understood membrane transport processes is CME. Among other contributors2, several
types of BAR domain proteins, including endophilin, help induce or stabilize the
curvature of clathrin-coated vesicles (CCV)3. During clathrin-independent endocytosis,
plasma membrane retrieval is modulated by the actions of endophilin and dynamin4.
3
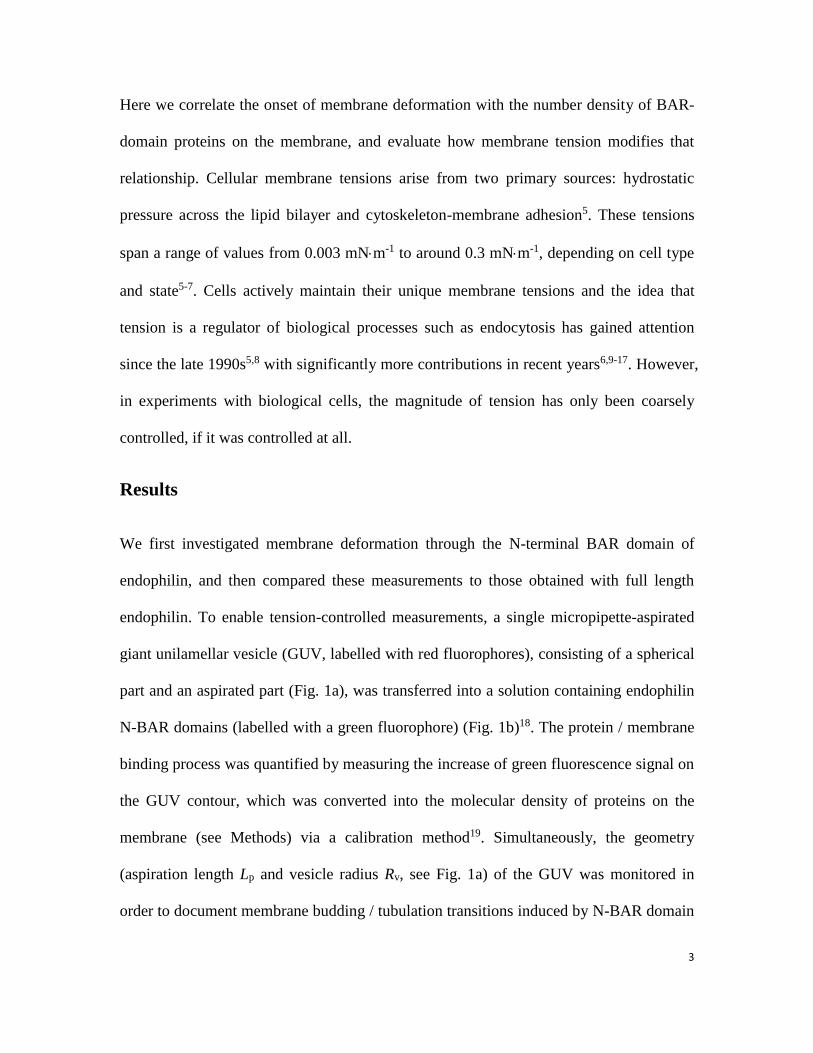
Here we correlate the onset of membrane deformation with the number density of BAR-
domain proteins on the membrane, and evaluate how membrane tension modifies that
relationship. Cellular membrane tensions arise from two primary sources: hydrostatic
pressure across the lipid bilayer and cytoskeleton-membrane adhesion5. These tensions
span a range of values from 0.003 mNm-1 to around 0.3 mNm-1, depending on cell type
and state5-7. Cells actively maintain their unique membrane tensions and the idea that
tension is a regulator of biological processes such as endocytosis has gained attention
since the late 1990s5,8 with significantly more contributions in recent years6,9-17. However,
in experiments with biological cells, the magnitude of tension has only been coarsely
controlled, if it was controlled at all.
Results
We first investigated membrane deformation through the N-terminal BAR domain of
endophilin, and then compared these measurements to those obtained with full length
endophilin. To enable tension-controlled measurements, a single micropipette-aspirated
giant unilamellar vesicle (GUV, labelled with red fluorophores), consisting of a spherical
part and an aspirated part (Fig. 1a), was transferred into a solution containing endophilin
N-BAR domains (labelled with a green fluorophore) (Fig. 1b)18. The protein / membrane
binding process was quantified by measuring the increase of green fluorescence signal on
the GUV contour, which was converted into the molecular density of proteins on the
membrane (see Methods) via a calibration method19. Simultaneously, the geometry
(aspiration length Lp and vesicle radius Rv, see Fig. 1a) of the GUV was monitored in
order to document membrane budding / tubulation transitions induced by N-BAR domain
4
binding. Diameters of membrane tubes induced by N-BAR domains are typically below
optical resolution20, rendering them challenging to image directly, especially during their
emergence. However, in our setup, the change in GUV geometry provides a precise
indicator for the onset of the membrane shape transition.
Effects of protein density and membrane tension
When a certain amount of endophilin N-BAR domains was bound on the GUV
membrane, the aspiration length Lp decreased and membrane tubes grew towards the
vesicle exterior until all pipette-aspirated membrane area was consumed (aspiration
length Lp=0) (Fig. 1c and Supplementary Figure 1). The observed membrane tube
formation is consistent with the known capacity of N-BAR proteins to generate
membrane curvature21. In contrast to the tubulation and corresponding GUV geometry
change observed at a membrane tension of 0.05mNm-1 (Fig. 1c), we found that the
endophilin N-BAR induced shape instability can be suppressed (Fig.1d) by subjecting
vesicles to larger lateral tensions (≥ 0.25mNm-1, see Supplementary theory).
In order to investigate how membrane tension affects tubulation, GUVs covered with
endophilin N-BAR were subjected to a range of tensions by varying the pipette aspiration
pressures. A vesicle under high tension was first equilibrated in the protein chamber to
ensure constant coverage of endophilin N-BAR domain, while suppressing tubulation.
The tension of the vesicle was then decreased about threefold within two seconds. When
the GUV experienced lower membrane tension, membrane tubes emerged around the
vesicle, concomitant with a decrease in Lp (Fig. 1d).
5
Monitoring vesicle radius and aspiration length allows assessing reductions of visible
membrane area as growing tubes consume membrane area from the vesicle geometry.
Both the protein-induced and tension change-induced membrane tubulations are
correlated with a decrease in visible GUV membrane area, as calculated from changes in
aspiration length and vesicle radius (Fig. 2 and Supplementary Figure 2, also see
Methods). However, besides tubulation, the visible membrane area decrease induced by
tension reduction has an additional contribution from entropic membrane fluctuations.
We show and discuss in Supplementary Figure 3 that effects related to membrane
fluctuations are substantially smaller than protein effects.
Determining a shape stability diagram
To obtain an experimental membrane shape stability diagram correlating protein density
and membrane tension at the shape transition, GUVs aspirated at a range of membrane
tensions were transferred into endophilin N-BAR solutions (Fig. 2). Potential osmotic
contributions to changes in vesicle geometry were carefully excluded (Supplementary
Figure 2 and Supplementary Figure 4). Consistently, we observed formation of
membrane tubes, and the associated decrease in visible membrane area, only after the
protein density on GUVs reached a well-defined threshold level, indicating the existence
of a protein transition-density required for inducing membrane tubulation. We define the
transition-density as the protein density at which visible membrane area of GUVs begins
to decrease, as indicated by the arrows in Figure 2. The transition-density has no
observable dependence on the protein concentration in the bulk solution (Supplementary
Figure 5a). However, comparison between a high tension GUV (Fig. 2a) and a low
tension GUV (Fig. 2b) reveals a striking influence of membrane tension on the transition-
6
density with minimal effect on protein-membrane binding (Supplementary Figure 5b).
We constructed a membrane shape stability diagram by systematically determining the
transition-densities of the protein for GUVs under various membrane tensions (Fig. 3).
This stability diagram was obtained for GUVs with the composition
DOPS/DOPE/DOPC=45/30/25 with membrane-bound endophilin N-BAR domains. This
lipid composition was chosen to mimic the innerleaflet headgroup composition of plasma
membranes, where endocytic events take place22. Di-oleoyl lipid chains were chosen in
order to suppress demixing of lipid mixtures.
We found that full length endophilin shows a qualitatively similar membrane tubulation
behaviour as its N-BAR domain, albeit with higher transition-densities compared to the
N-BAR domain (Fig. 4), consistent with a potential auto-inhibition of endophilin
function23.
The stability diagram (Fig. 3) illustrates how two factors, density increase (horizontal
arrows) and tension decrease (vertical arrows), can be used to control the transformation
of lipid membranes from a planar (white) to tubular (dark gray) state. These two
trajectories in the stability diagram correspond to the scenarios in Figure 1c and Figure 1d
respectively. The stability diagram shows a positive intercept ρ0 of the stability boundary
on the x-axis (displaying number density of N-BAR dimers on the membrane). This is
consistent with the fact that at vanishing membrane tension, GUVs with identical lipid
compositions in both leaflets are stable towards tubulation in the absence of curvature-
inducing proteins.
Analytical model based on three adjustable parameters
7
We next aim to fit a biophysical model to our data, with the goal to illuminate molecular
details of the curvature instability induced by endophilin. We seek the following features
of a suitable model: a) it should allow for locally varying protein densities on the
membrane in a temperature-dependent manner, to account for entropic contributions to
shape stability; b) it should feature a coupling between local protein density and
membrane curvature; c) the exact geometry of the membrane after deformation does not
need to be prescribed by the model, because we focus on the onset of the shape instability.
While several theories have been developed to explain spontaneous budding/tubulation of
membranes24-26, only the linear stability theory27 used in the following is consistent with
the requirements listed above. Note that the shape of the membrane after undergoing the
instability would have to be described with a non-linear approach28.
Using σ to represent the membrane tension, and to represent the average cover fraction
of proteins on the membrane (experimentally the cover fraction is obtained by dividing
the measured N-BAR dimer density to its close-packed density max = 30000 μm-2 29), the
instability criterion can be written as (see Supplementary theory for details),
)2
()1(
12
2
02
2
0
bb
C
b
Tk
b
C B
(1)
Here κ is the bending rigidity, C0 describes the spontaneous curvature of the membrane
induced by protein binding (positive for N-BAR domains), kB is the Boltzmann constant
and the T is the temperature. The parameter b is normally a constant and can be expressed
in a simple lattice model as b=λ(βkBT)-1 where β is the excluded area of the protein and λ
represents an effective ‘interaction area’ for molecular interactions in a protein density
8
gradient30. The parameter α represents the attraction strength between protein molecules
in the two-dimensional Van der Waals model31.
It follows from Eq. 1 that the experimentally determined stability limit can be fitted with
the expression3
2
1
21
21 )1( aaaa , with ai being parameters that are
optimized to yield the best fit with the experimental data. These three fit parameters, a1 to
a3, are directly related to three molecular properties of the protein: C0, b, and α
(Supplementary equation 11). Furthermore, these molecular properties can be correlated
with a set of three measurable physical properties: the protein’s membrane curvature
coupling strength: κC0, the maximal tension that allows the curvature instability: σ*, and
the protein density required for tubulating a tensionless membrane: ρ0 (Supplementary
equation 12).
As shown in Figure 3, the model is in good agreement with the measured relation
between transition-density and membrane tension. In order to be able to obtain the
spontaneous curvature from the value of the curvature coupling strength κC0, we
measured the bending rigidity of the membrane used here
(DOPS/DOPE/DOPC=45/30/25) as κ = 23±3kBT (Mean±SD, repeated for five GUVs,
also see Methods and Supplementary Figure 6). Assuming β = 50nm2 19, the fit results
correspond to a spontaneous curvature C0-1 = 5.1±0.7nm (here and where not further
specified below, uncertainties result from the standard error of fit parameters and error
propagation) agreeing well with values inferred from N-BAR protein curvature sorting
experiments performed on a GUV-tether system19,31. The upper tension limit for enabling
membrane shape transitions through endophilin N-BAR for the lipid composition used
9
here is σ* = 0.19±0.04mNm-1. Finally, the protein transition-density required for
tubulating a tensionless membrane is ρ0 = 650±150μm-2, corresponding to about 7.5
protein dimers on a CCV-sized membrane (assuming a CCV radius of 30 nm).
Interestingly, the number of endophilin molecules in synaptic boutons was measured in a
recent study32. An endophilin dimer density of 546±36μm-2 on the synaptosome surface
can then be estimated (see Supplementary theory for details). This endophilin density
turns out to be within the stable regime of the stability diagram (for any membrane
tension), but is localized close to the stability boundary (assuming typical neuronal
membrane tensions of 0.003mNm-1 to 0.04mNm-1 5). This suggests that under
physiological conditions, the plasma membrane of neuronal cells can easily switch
between stable (endocytosis suppressed) and unstable (endocytosis activated) states by
changing membrane tension or locally concentrating proteins such as endophilin.
We reiterate in passing that our shape stability theory describes the capacity of a
peripheral protein to generate curvature not only with the well-known spontaneous
curvature, but with two additional parameters related to molecular details of the protein /
membrane system: the protein density for tubulating a tensionless membrane, and the
maximal tubulation tension. In future contributions we will demonstrate that these
parameters can vary significantly, comparing different types of proteins.
Shape stability boundary is unaffected by binding kinetics
We note that the biophysical shape stability fitted to our experimental data is valid only
under thermodynamic equilibrium conditions – an assumption that needs verification. We
10
therefore investigated if binding kinetics of proteins to the membrane measurably affects
the transition-density.
Negatively charged PS lipids can affect the binding kinetics of proteins both in vivo and
in vitro18,33. Specifically, a larger fraction of PS lipids in the membrane is known to
increase the membrane binding rate of the endophilin N-BAR domain18. In order to test
the thermodynamic equilibrium hypothesis, we measured the membrane shape transition
points for vesicles containing different amounts of negatively charged lipids.
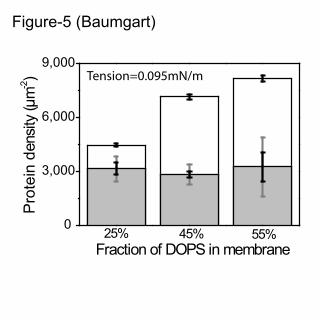
Not surprisingly, the equilibrium density of proteins on the membrane significantly
increases with an increasing amount of PS lipids in GUVs (Fig. 5). Interestingly however,
transition-densities, as well as the tension dependence, are identical within uncertainties
for the three lipid compositions tested (Fig. 5 and Supplementary Figure 7). Equivalently,
for the same lipid composition, only equilibrium densities, but not transition-densities,
depend on bulk protein concentration (Supplementary Figure 5a). To further validate the
hypothesis that membrane binding kinetics do not affect our results, we measured an
apparent protein binding rate by determining the slope of the protein binding curve in a
time interval close to the shape instability (Supplementary Figure 8a). Using GUVs under
the same membrane tension (0.110±0.007mNm-1, Mean±SD), we found that transition-
densities exhibit no dependence on the apparent protein binding rate (see Supplementary
Figure 8b, showing a zero slope within statistical error (7.5±10s)). We therefore conclude
that under our conditions, protein-membrane binding kinetics plays a negligible role in
controlling the membrane curvature instability.
Lipid shape as an additional control parameter
11
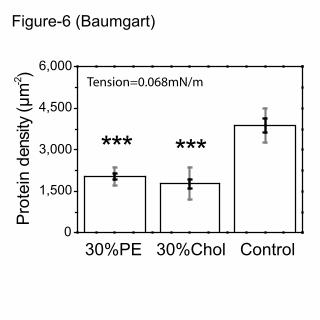
We finally asked if lipid shape can affect the shape transition-density for endophilin N-
BAR. Figure 6 shows that the cone-shaped lipids cholesterol and DOPE both
significantly reduce the transition-density at constant membrane tension. This
amplification effect of cone-shaped lipids on membrane tubulation is consistent with
previous observations in a different experimental system26. However, only the presence
of DOPE but not cholesterol lowers the bending rigidity of the membrane
(Supplementary Figure 6). Therefore, at least for cholesterol, we can attribute its effect on
the transition-density to the conical lipid shape34,35. It is well known that proteins with
membrane curvature insertion ability will lead to different spontaneous curvature of the
membrane depending on the protein’s insertion depth36. Therefore, in the presence of
conical lipids, the protein’s coupling strength to membrane curvature may be altered by
allowing the protein to insert more deeply into the lipid bilayer – a hypothesis that
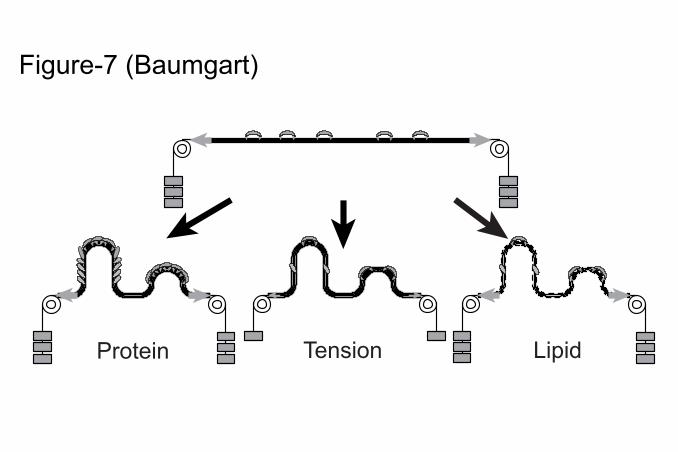
remains to be tested. In addition to membrane tension and protein density, lipid shape
provides a third level of control that cells can use to regulate membrane shape transitions
(Fig. 7).
Discussion
It has to be emphasized that we have used the simplest thermodynamic theory of
membrane stability in the presence of curvature-inducing proteins, which neglects the
highly anisotropic spontaneous curvature and significant oligomerization tendency of N-
BAR domain proteins18,37-40. Nevertheless, our model accurately describes the shape
transition. Precisely because the model does not assume details about the protein other
12
than the curvature-coupling strength and an excluded area for the protein, it likely applies
to all endocytic proteins.
The presence of a well-defined membrane shape transition-density provides an attractive
explanation for how endocytic protein recruitment can control plasma membrane
deformation during CME: the initiation of membrane buds and the formation of a CCV
may proceed only after establishing well defined transition-densities of endocytic
proteins. For UFE, however, the endocytic vesicle formation route of a 10 millisecond
duration leaves little time for a plasma membrane patch to undergo a sequential protein
recruitment process as in CME (typically 10~20s 2). Thus, instead of recruiting additional
curvature generating proteins to the membrane, for the case of UFE, a more plausible
signal that triggers membrane budding is the lowering of membrane tension in the
presence of already membrane-bound peripheral proteins. Due to the membrane fluidity,
tension changes propagate at a speed of about 106μms-1 11,41. Therefore, a tension
reduction caused by processes such as the fusion of exocytic vesicles into the plasma
membrane can likely trigger endocytosis at a much faster rate compared to the process of
recruiting peripheral curvature-inducing proteins. For classical endocytosis, a checkpoint
that separates abortive from propagating endocytic pits has been identified42,43. It is
possible that the stability boundary identified in our shape diagram provides a
mechanistic explanation for this phenomenon. Abortive endocytic pits might assemble
due to local fluctuations in protein density and membrane tension, but in situations where
the stability boundary is not passed such fluctuations will eventually decay without
producing vesicles.
13
Our findings provide new insights into how cellular membrane shapes and dynamics are
controlled by interacting with curvature-coupling proteins as well as via the regulation of
membrane physical properties such as tension and lipid shape. We suggest that the
coupling of membrane tension and density of curvature-coupling proteins determined
here plays modulatory roles in all forms of endocytosis.
14
Figure Captions
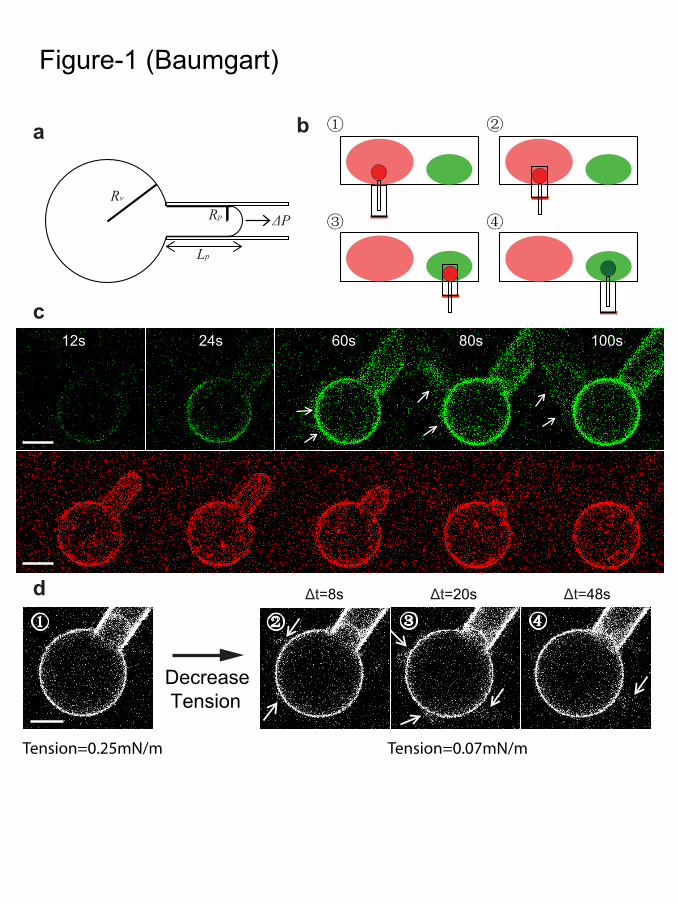
Figure 1. Endophilin N-BAR domain induced membrane tubulation of GUV
(a) Sketch of a micro-pipette aspirated GUV. ΔP is the pressure difference between inside and
outside of the pipette used for GUV aspiration. Rp and Rv represent the pipette radius and the
radius of the spherical part of the GUV, respectively, Lp represents the aspiration length of the
GUV. (b) The process of transferring an aspirated GUV from the GUV dispersion (red) into a
protein solution (green) (also see Methods). (c) Time lapse confocal images showing the
formation of tubes (after t=24s, as indicated by arrows) and the change in aspiration length
during endophilin N-BAR binding. Membrane tension was held constant at 0.05mNm-1. Green:
protein channel; Red: lipid channel. (d) A GUV incubated to equilibrium with endophilin N-
BAR under high tension (0.25mNm-1). After equilibration, tension was reduced to 0.07mNm-1
within 2 seconds. Membrane tubes as indicated by arrows can be observed on the GUV under
low membrane tension (0.07 mNm-1) for Δt equal to 8s; 20s; 48s (Δt=0 is defined as the
time point of tension reduction). Scale bars: 10 μm.
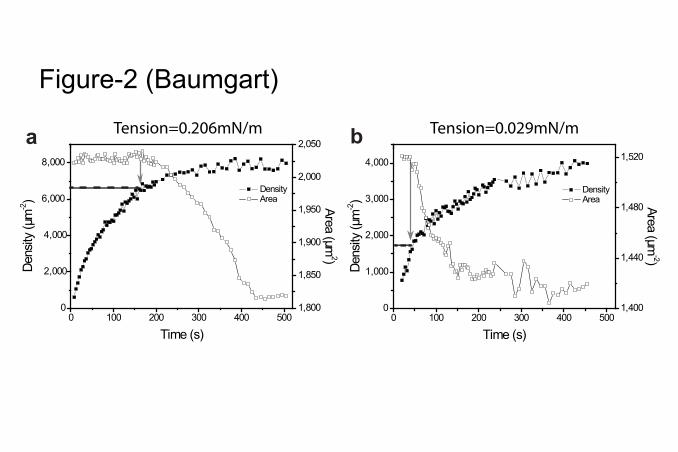
Figure 2. Membrane tension and bound protein density modulate membrane shape transition
(a) A representative trial with high (0.206mNm-1) membrane tension, the membrane-bound
endophilin N-BAR density at the onset of area decrease (as indicated by the arrow) genuinely
reveals the shape transition point. The area is calculated from the time-dependent aspiration
length and vesicle radius as shown in Supplementary Figure 2b. (b) A representative trial with
low (0.029mNm-1) membrane tension. Transition-density (marked by the dashed lines)
decreased significantly compared to the high tension case shown in (a). Bulk concentrations of
endophilin N-BAR are 150nM in (a) and 75nM in (b). Potential influence of bulk protein
concentration on transition-densities was eliminated by comparing the transition-densities of
similar tension GUVs in endophilin N-BAR solutions of various bulk concentrations
(Supplementary Figure 5a). Additionally, there was no observable influence of membrane tension
on the endophilin N-BAR’s equilibrium density on GUVs (Supplementary Figure 5b).
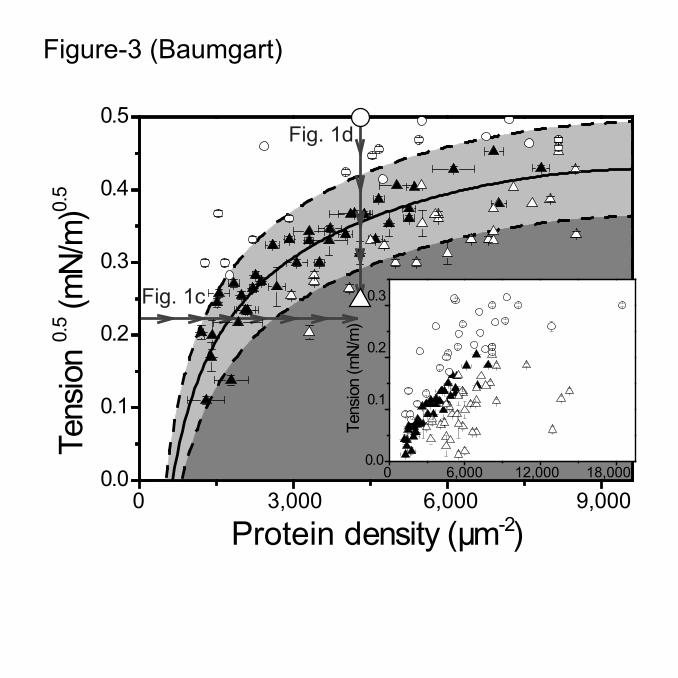
Figure 3. Experimental shape stability diagram agrees well with curvature instability theory
Filled triangles represent the measured transition-density (expressed as a cover fraction, using
the close-packed N-BAR dimer density of 30000 μm-2)29 of GUVs under corresponding tensions.
The open data points represent the maximum protein cover fraction reached by a GUV with
(triangle) or without (circle) tubulation during protein-membrane binding. The solid line
represents the best fit of experimental data with the proposed curvature instability model
(r2=0.85). The dashed lines are 95% confidence intervals for the fit. The shaded area represents
the region where the membrane is tubulated by endophilin N-BAR. The arrows indicate two ways
of inducing membrane tubulation: 1), by increasing protein coverage on the membrane at
constant tension or 2), by decreasing membrane tension at constant coverage. The large circle
(non-tubulated state), and triangle (tubulated state), represent the state of the membrane before
and after tension reduction (compare Figure 1d), respectively. The inset shows the same data
using linear axes. Error bars represent the standard errors associated with determining each
15
data point. Concentrations of endophilin N-BAR used in the experiment ranged from 25nM to
400nM (also note Supplementary Figure 5a).
Figure 4. Full length protein shows smaller curvature generation capacity than N-BAR
Transition-densities of full length endophilin (blue triangles) as well as the best fit with our
curvature instability model (blue line, r2=0.75) are plotted on top of the stability diagram of N-
BAR displayed in Figure 3 for GUVs with the same lipid composition (DOPS/DOPE/DOPC =
45/30/25). The physical properties resulting from fitting the endophilin full length data are: the
spontaneous curvature C0-1 = 6.1±1.1nm; the upper tension limit σ* = 0.17±0.04mNm-1; the
protein transition-density required for tubulating a tensionless membrane ρ0 = 850±300μm-2.
P=0.035 between the stability boundaries of endophilin full length and N-BAR via f-test. Error
bars represent the standard errors associated with determining each data point.
Figure 5. Membrane charge affects equilibrium density, not transition density
Equilibrium densities of endophilin N-BAR (open bars) increase significantly for increasing
amounts of DOPS in the GUV (for each composition pair P<10-4, Student t test). No significant
difference can be found among the transition densities (gray bars, for each composition pair,
P>0.5, Student t test). Concentration of endophilin N-BAR domain: 100nM. GUV compositions:
DOPS/DOPE/DOPC = X/30/(70-X). All GUVs considered here are at the membrane tension of
0.095 ± 0.013mNm-1 (Mean ± SD). Gray error bars are standard deviations (SD) of the data
and black error bars are standard errors of the mean (SEM), same below.
Figure 6. The effect of conical lipids on membrane shape transitions
Under the same membrane tension (0.068 ± 0.007mNm-1 (Mean ± SD))), the presence of 30%
conical lipids, either DOPE or cholesterol, significantly lowers the transition-density of
endophilin N-BAR domain. ***P<10-4, Student t test.
Figure 7. Three ways of mediating membrane curvature instability
Three regulatory elements are identified in this contribution that can modulate membrane shape
transitions induced by the binding of curvature coupling proteins. Notably, membrane budding
and tubulation is not solely induced by protein association (left arrow). The effects of lowering
membrane tension (middle arrow) and changing membrane lipid composition (right arrow) also
control membrane shape transition without the assistance of additional proteins. The
contribution of peripheral proteins is defined by their density on the membrane, emphasizing a
thermodynamic role played by protein molecules in mediating membrane shape transitions. The
tension effect may explain an ultrafast pathway cells can utilize to control membrane shape
transformations such as endocytosis.
16
Methods
Materials
Lipids 1,2-dioleoyl-sn-glycero-3-phosphocholine (DOPC), 1,2-dioleoyl-sn-glycero-3-phospho-L-
serine (DOPS), 1,2-dioleoyl-sn-glycero-3-phosphoethanolamine (DOPE), Cholesterol (Chol),
and Distearoylphosphatidylethanolamine-N-(biotinyl(polyethylene glycol)2000) (DSPE-Bio-574
PEG2000) were obtained from Avanti Polar Lipids (Alabaster,AL). Alexa Fluor® 488 (AF-488)
C5-maleimide, BODIPY® FL DHPE (N-(4,4-Difluoro-5,7-Dimethyl-4-Bora-3a,4a-Diaza-s-
Indacene-3-Propionyl)-1,2-Dihexadecanoyl-sn-Glycero-3-Phosphoethanolamine,
Triethylammonium Salt) and Texas Red-1,2-dihexadecanoyl-sn-glycero-3 phosphoethanolamine
(triethylammonium salt) were from Invitrogen/Life Technologies (Grand Island, NY). Casein,
Tris, HEPES, and EDTA were obtained from Fisher Scientific (Rochester, NY). All commercial
reagents were used without further purification. Streptavidin conjugated microspheres with mean
diameter of ~6μm were from Polysciences, Inc. (Warrington, PA). An additional 0.5% DSPE-
Bio-574 PEG2000 was added into the lipid mixture when preparing GUVs for membrane bending
rigidity measurements through tether pulling. Rat endophilin A1 N-BAR_C241 (residues 1-247)
and full-length endophilin A1 were expressed, purified and labelled with AF-488 as described18,23.
Protein concentrations were determined by Bradford analysis using bovine serum albumin
(Thermo) as a standard. Concentrations indicated refer to total concentration of endophilin in
terms of dimeric units.
Imaging chamber preparation and GUV transfer procedures
GUVs were prepared in 300mM sucrose solution by the standard method of electroformation
with 0.3%Texas Red-DHPE in desired lipid compositions, using indium tin oxide covered glass
slides onto which thin films of lipids were prepared from chloroform solutions44. Two imaging
17
chambers, GUV chamber and protein chamber, were formed between two coverslips
(20mm×40mm, pre-treated with 2μL of 2.5mgml-1 casein, 20mM Tris, and 2mM EDTA)
overhanging a glass microscope slide (2mm thick). The GUV chamber has a total volume of
375μL and is made by diluting 5~8μL of the GUV stock solutions into a buffer containing
glucose, sucrose, NaCl and HEPES. The osmolarity of the buffer was selected to be 20% higher
than the GUV stock solution (measured with a micro-osmometer Advanced Instruments Inc.
(Norwood, MA)) to ensure that the vesicles had enough excess area for micropipette aspiration.
The protein chamber had a total volume of 187.5μL. The protein stock solution was diluted to
designated concentrations, using the same buffer as used for diluting GUVs. For both chambers,
we chose pH = 7 and NaCl was kept at 50mM, with 7mM HEPES. Sucrose and glucose (1:1)
concentrations were adjusted to yield total osmolarities of the desired values. Micropipettes and
transfer capillaries were prepared and casein-treated through incubation with saturated casein
solutions followed by rinsing18,44. Occasionally, GUV membranes were observed to stick to
pipette walls. Data from such vesicles were discarded.
The GUV transfer was a four-step process as shown in Figure 1b: ① A GUV was aspirated into a
micropipette to adjust the desired membrane tension. ② The transfer capillary was manually
positioned to cover the GUV. ③ The GUV was transferred from the GUV chamber into the
protein chamber using a motor-controlled micromanipulator (Luigs and Neumann, Ratingen,
Germany). ④ The transfer capillary was removed to expose the GUV to protein. The moment
when the GUV was not protected anymore by the transfer capillary was defined as time zero in
the protein-GUV association analysis. Zero aspiration pressure was checked before and after the
protein-GUV association process to ensure absence of pressure drifts45. All the transfer and
imaging processes were carried out at room temperature (23.7±0.3 ℃; Mean±SD measured on
different days).
18
Microscopy and data analysis
The protein-membrane association process and the membrane geometry changes were monitored
with a confocal fluorescence microscope44, using a 60x 1.1 N.A. objective (Olympus, Center
Valley, PA). The aspiration length, Lp, micropipette radius, Rp and GUV radius, Rv were
measured with Image J, as illustrated in Figure 1a. The GUV geometry was calculated as Area(t)
= 4πRv(t)2 + 2πRp Lp(t), Volume(t) = 4πRv(t)3/3 + πRp
2Lp(t). The average protein fluorescence
intensity was determined by fitting a Gaussian ring to the GUV contour (excluding the aspirated
region) using MATLAB. Rv can also be obtained from the fitting and was checked with the direct
measurement in Image J.
The measured fluorescence intensity was then converted to protein number density ρ(t) on the
membrane, using the method of Ref. 19, as follows. GUVs containing x% BODIPY and (100-x)%
DOPC were prepared (x: 0.1~0.7) and at least ten independent GUVs were imaged under the
same settings as during the recording of GUV-protein association. A linear fit (r2=0.99) was
carried out to get the relation between measured GUV fluorescence intensity and BODIPY
density on the membrane. The quantum yield difference between BODIPY and AF-488 was
determined to be BODIPY/‘AF-488’=0.5, by imaging bulk solution intensity of SUVs
(containing BODIPY) and AF-488 labelled proteins under the same solution conditions as in our
experiments (50mM NaCl, pH 7)46. The average lipid headgroup area was assumed as 0.7 nm2.
The relation between imaged average fluorescence intensity (FL, in arbitrary units for 16-bit
images) and dimeric endophilin N-BAR density (ρ in the unit of μm-2 and with a labelling
efficiency LE) on GUVs is: FL/LE =( 4.9±0.2)×ρ.
The membrane shape transition point tc was defined as the time point when Area(t) begins to
decrease (Fig. 2), and the corresponding protein density ρ(tc) was defined as the transition-density.
Membrane bending rigidity measurements
19
A 1mm thick sample chamber was formed by overhanging two coverslips on both sides of a
microscope glass slide. The bottom of the chamber was pre-treated with 2μL of 2.5mgml-1 casein
in 20mM Tris-HCl and 2mM EDTA to prevent adhesion of beads and GUVs to the coverslip. The
chamber was filled with 1μL of microsphere dispersion, 5μL of GUV dispersion, and 90~100μL
of the same sucrose, glucose, NaCl and HEPES mixture as described above, resulting a final
environment containing 50mM NaCl. The chamber was mounted on an inverted microscope
(1X71; Olympus, Center Valley, PA) equipped with a home built optical trap as described in refs
45,46. A GUV (about 10μm in radius) was aspirated at a constant pressure and subsequently
brought into contact with a trapped bead. Then the bead was moved at 10μms-1 to pull out a
membrane tether of 20μm in length. The tether pulling force f is determined as for a Hookean
spring: f = kx, where k is the trap stiffness and x is the displacement of the bead relative to its
equilibrium position. The stiffness of the trap with a typical value of 0.05pNnm-1 was calibrated
by the drag-force method47 for multiple beads. Aspiration pressure was changed after the
formation of a stable tether to obtain the relation between tether pulling force and membrane
lateral tension. Each lateral tension was maintained until the pulling forces reached equilibrium
(typically a few seconds). Membrane bending rigidity was subsequently extracted from the
relation: 22f 48. For each lipid composition used, force-tension relations and thus
bending rigidities were measured on tethers pulled from at least five independent GUVs.
References
1 Bonifacino, J. S. & Glick, B. S. The mechanisms of vesicle budding and fusion. Cell 116, 153-166, doi:10.1016/s0092-8674(03)01079-1 (2004).
2 Taylor, M. J., Perrais, D. & Merrifield, C. J. A High Precision Survey of the Molecular Dynamics of Mammalian Clathrin-Mediated Endocytosis. Plos Biology 9, doi:e100060410.1371/journal.pbio.1000604 (2011).
3 McMahon, H. T. & Boucrot, E. Molecular mechanism and physiological functions of clathrin-mediated endocytosis. Nature Reviews Molecular Cell Biology 12, 517-533, doi:10.1038/nrm3151 (2011).
20
4 Kononenko, Natalia L. et al. Clathrin/AP-2 Mediate Synaptic Vesicle Reformation from Endosome-like Vacuoles but Are Not Essential for Membrane Retrieval at Central Synapses. Neuron 82, 981-988, doi:10.1016/j.neuron.2014.05.007 (2014).
5 Morris, C. E. & Homann, U. Cell Surface Area Regulation and Membrane Tension. The Journal of Membrane Biology 179, 79-102, doi:10.1007/s002320010040 (2001).
6 Schweitzer, Y., Lieber, Arnon D., Keren, K. & Kozlov, Michael M. Theoretical Analysis of Membrane Tension in Moving Cells. Biophys J 106, 84-92 (2014).
7 Pietuch, A., Bruckner, B. R., Fine, T., Mey, I. & Janshoff, A. Elastic properties of cells in the context of confluent cell monolayers: impact of tension and surface area regulation. Soft Matter 9, 11490-11502, doi:10.1039/c3sm51610e (2013).
8 Raucher, D. & Sheetz, M. P. Membrane expansion increases endocytosis rate during mitosis. Journal of Cell Biology 144, 497-506, doi:10.1083/jcb.144.3.497 (1999).
9 Masters, T. A., Pontes, B., Viasnoff, V., Li, Y. & Gauthier, N. C. Plasma membrane tension orchestrates membrane trafficking, cytoskeletal remodeling, and biochemical signaling during phagocytosis. Proceedings of the National Academy of Sciences of the United States of America 110, 11875-11880, doi:10.1073/pnas.1301766110 (2013).
10 Diz-Munoz, A., Fletcher, D. A. & Weiner, O. D. Use the force: membrane tension as an organizer of cell shape and motility. Trends in Cell Biology 23, 47-53, doi:10.1016/j.tcb.2012.09.006 (2013).
11 Keren, K. et al. Mechanism of shape determination in motile cells. Nature 453, 475-U471, doi:10.1038/nature06952 (2008).
12 Gauthier, N. C., Fardin, M. A., Roca-Cusachs, P. & Sheetz, M. P. Temporary increase in plasma membrane tension coordinates the activation of exocytosis and contraction during cell spreading. Proceedings of the National Academy of Sciences of the United States of America 108, 14467-14472, doi:10.1073/pnas.1105845108 (2011).
13 Watanabe, S. et al. Ultrafast endocytosis at mouse hippocampal synapses. Nature 504, 242-247, doi:10.1038/nature12809 (2013).
14 Thiam, A. R. et al. COPI buds 60-nm lipid droplets from reconstituted water-phospholipid-triacylglyceride interfaces, suggesting a tension clamp function. Proceedings of the National Academy of Sciences of the United States of America 110, 13244-13249, doi:10.1073/pnas.1307685110 (2013).
15 Boulant, S., Kural, C., Zeeh, J. C., Ubelmann, F. & Kirchhausen, T. Actin dynamics counteract membrane tension during clathrin-mediated endocytosis. Nature Cell Biology 13, 1124-U1158, doi:Doi 10.1038/Ncb2307 (2011).
16 Houk, Andrew R. et al. Membrane Tension Maintains Cell Polarity by Confining Signals to the Leading Edge during Neutrophil Migration. Cell 148, 175-188 (2012).
17 Manneville, J. B. et al. COPI coat assembly occurs on liquid-disordered domains and the associated membrane deformations are limited by membrane tension. Proceedings of the National Academy of Sciences of the United States of America 105, 16946-16951, doi:DOI 10.1073/pnas.0807102105 (2008).
18 Capraro, B. R. et al. Kinetics of endophilin N-BAR domain dimerization and membrane interactions. Journal of Biological Chemistry, doi:10.1074/jbc.M112.435511 (2013).
19 Sorre, B. et al. Nature of curvature coupling of amphiphysin with membranes depends on its bound density. Proceedings of the National Academy of Sciences of the United States of America 109, 173-178, doi:10.1073/pnas.1103594108 (2012).
20 Mim, C. et al. Structural Basis of Membrane Bending by the N-BAR Protein Endophilin. Cell 149, 137-145, doi:DOI 10.1016/j.cell.2012.01.048 (2012).
21
21 Baumgart, T., Capraro, B. R., Zhu, C. & Das, S. L. in Annual Review of Physical Chemistry, Vol 62 Vol. 62 Annual Review of Physical Chemistry (eds S. R. Leone, P. S. Cremer, J. T. Groves, & M. A. Johnson) 483-506 (2011).
22 van Meer, G., Voelker, D. R. & Feigenson, G. W. Membrane lipids: where they are and how they behave. Nature Reviews Molecular Cell Biology 9, 112-124, doi:10.1038/nrm2330 (2008).
23 Chen, Z. et al. Intradimer/Intermolecular Interactions Suggest Autoinhibition Mechanism in Endophilin A1. Journal of the American Chemical Society 136, 4557-4564, doi:10.1021/ja411607b (2014).
24 Sens, P. & Turner, M. S. Budded membrane microdomains as tension regulators. Physical Review E 73, doi:03191810.1103/PhysRevE.73.031918 (2006).
25 Lipowsky, R. Spontaneous tubulation of membranes and vesicles reveals membrane tension generated by spontaneous curvature. Faraday Discussions 161, 305-331, doi:10.1039/c2fd20105d (2013).
26 Stachowiak, J. C., Hayden, C. C. & Sasaki, D. Y. Steric confinement of proteins on lipid membranes can drive curvature and tubulation. Proceedings of the National Academy of Sciences of the United States of America 107, 7781-7786, doi:10.1073/pnas.0913306107 (2010).
27 Shi, Z. & Baumgart, T. Dynamics and instabilities of lipid bilayer membrane shapes. Advances in Colloid and Interface Science (2014).
28 Seifert, U. Configurations of fluid membranes and vesicles. Advances in Physics 46, 13-137, doi:10.1080/00018739700101488 (1997).
29 Bhatia, V. K. et al. Amphipathic motifs in BAR domains are essential for membrane curvature sensing. Embo Journal 28, 3303-3314, doi:10.1038/emboj.2009.261 (2009).
30 Cahn, J. W. & Hilliard, J. E. FREE ENERGY OF A NONUNIFORM SYSTEM .1. INTERFACIAL FREE ENERGY. Journal of Chemical Physics 28, 258-267, doi:10.1063/1.1744102 (1958).
31 Zhu, C., Das, S. L. & Baumgart, T. Nonlinear Sorting, Curvature Generation, and Crowding of Endophilin N-BAR on Tubular Membranes. Biophysical Journal 102, 1837-1845, doi:DOI 10.1016/j.bpj.2012.03.039 (2012).
32 Wilhelm, B. G. et al. Composition of isolated synaptic boutons reveals the amounts of vesicle trafficking proteins. Science 344, 1023-1028, doi:10.1126/science.1252884 (2014).
33 Bohdanowicz, M. & Grinstein, S. ROLE OF PHOSPHOLIPIDS IN ENDOCYTOSIS, PHAGOCYTOSIS, AND MACROPINOCYTOSIS. Physiological Reviews 93, 69-106, doi:10.1152/physrev.00002.2012 (2013).
34 Zimmerberg, J. & Kozlov, M. M. How proteins produce cellular membrane curvature. Nature Reviews Molecular Cell Biology 7, 9-19 (2006).
35 Chen, Z. & Rand, R. P. The influence of cholesterol on phospholipid membrane curvature and bending elasticity. Biophys J 73, 267-276 (1997).
36 Campelo, F., McMahon, H. T. & Kozlov, M. M. The hydrophobic insertion mechanism of membrane curvature generation by proteins. Biophys J 95, 2325-2339, doi:10.1529/biophysj.108.133173 (2008).
37 Kabaso, D. et al. On the role of membrane anisotropy and BAR proteins in the stability of tubular membrane structures. Journal of Biomechanics 45, 231-238, doi:10.1016/j.jbiomech.2011.10.039 (2012).
38 Walani, N., Torres, J. & Agrawal, A. Anisotropic spontaneous curvatures in lipid membranes. Physical Review E 89, doi:06271510.1103/PhysRevE.89.062715 (2014).
22
39 Cui, H. et al. Understanding the Role of Amphipathic Helices in N-BAR Domain Driven Membrane Remodeling. Biophysical Journal 104, 404-411.
40 Hiroshi, N. Two- or three-step assembly of banana-shaped proteins coupled with shape transformation of lipid membranes. EPL (Europhysics Letters) 108, 48001 (2014).
41 Dommersnes, P. G., Orwar, O., Brochard-Wyart, F. & Joanny, J. F. Marangoni transport in lipid nanotubes. Europhysics Letters 70, 271-277 (2005).
42 Ehrlich, M. et al. Endocytosis by random initiation and stabilization of clathrin-coated pits. Cell 118, 591-605, doi:10.1016/j.cell.2004.08.017 (2004).
43 Loerke, D. et al. Cargo and Dynamin Regulate Clathrin-Coated Pit Maturation. Plos Biology 7, 628-639, doi:e100005710.1371/journal.pbio.1000057 (2009).
44 Tian, A. & Baumgart, T. Sorting of lipids and proteins in membrane curvature gradients. Biophysical Journal 96, 2676-2688 (2009).
45 Heinrich, M., Tian, A., Esposito, C. & Baumgart, T. Dynamic sorting of lipids and proteins in membrane tubes with a moving phase boundary. Proceedings of the National Academy of Sciences of the United States of America 107, 7208-7213, doi:10.1073/pnas.0913997107 (2010).
46 Wu, T., Shi, Z. & Baumgart, T. Mutations in BIN1 Associated with Centronuclear Myopathy Disrupt Membrane Remodeling by Affecting Protein Density and Oligomerization. PLoS ONE 9, e93060, doi:10.1371/journal.pone.0093060 (2014).
47 Svoboda, K. & Block, S. M. Biological Applications of Optical Forces. Annu Rev Bioph Biom 23, 247-285 (1994).
48 Derenyi, I., Julicher, F. & Prost, J. Formation and interaction of membrane tubes (vol 88, art no 238101, 2002). Physical Review Letters 89, doi:20990110.1103/PhysRevLett.89.209901 (2002).
23
Acknowledgments
We are grateful for funding from NIH grant GM 097552 and NSF grant CBET 1053857.
Furthermore we thank Z. Chen and B. Capraro for the help with protein preparations and
thank T. Wu and N. Li for comments on a manuscript draft.
Author contributions
ZS and TB planned research, ZS conducted experiments, ZS and TB analysed results, ZS
and TB wrote manuscript.
Rv
Rp ΔP
Lp
12s 24s 60s 80s 100s
①
③ ④
②a b
c
Decrease Tension
① ② ③
d④
Figure-1 (Baumgart)
Tension=0.25mN/m Tension=0.07mN/m
Δt=8s Δt=20s Δt=48s
0 100 200 300 400 5000
1,000
2,000
3,000
4,000
Time (s)De
nsity
(µm
-2)
1,400
1,440
1,480
1,520
Density Area Area (µm
-2)
0 100 200 300 400 5000
2,000
4,000
6,000
8,000
Density Area
Time (s)
Dens
ity (µ
m-2)
1,800
1,850
1,900
1,950
2,000
2,050
Area (µm2)
a b
Figure-2 (Baumgart)
Tension=0.206mN/m Tension=0.029mN/m
0 3,000 6,000 9,0000.0
0.1
0.2
0.3
0.4
0.5
Tens
ion
0.5 (m
N/m
)0.5
Fig. 1d
Fig. 1c
0 6,000 12,000 18,0000.0
0.1
0.2
0.3
Tens
ion
(mN/
m)
Figure-3 (Baumgart)
Protein density (µm-2)
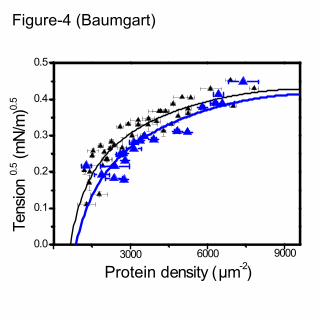
Figure-4 (Baumgart)
0.0
0.1
0.2
0.3
0.4
0.5
90006000
Tens
ion
0.5 (m
N/m
)0.5
3000
Protein density (µm-2)
0
3,000
6,000
9,000
45% 55%Fraction of DOPS in membrane
25%
Pro
tein
den
sity
(µm-2
)Figure-5 (Baumgart)
Tension=0.095mN/m
6,000
*** ***
Pro
tein
den
sity
(µm
-2)
4,500
3,000
1,500
030%PE 30%Chol Control
Figure-6 (Baumgart)
Tension=0.068mN/m
LipidProtein Tension
Figure-7 (Baumgart)
1
Supplementary Figures
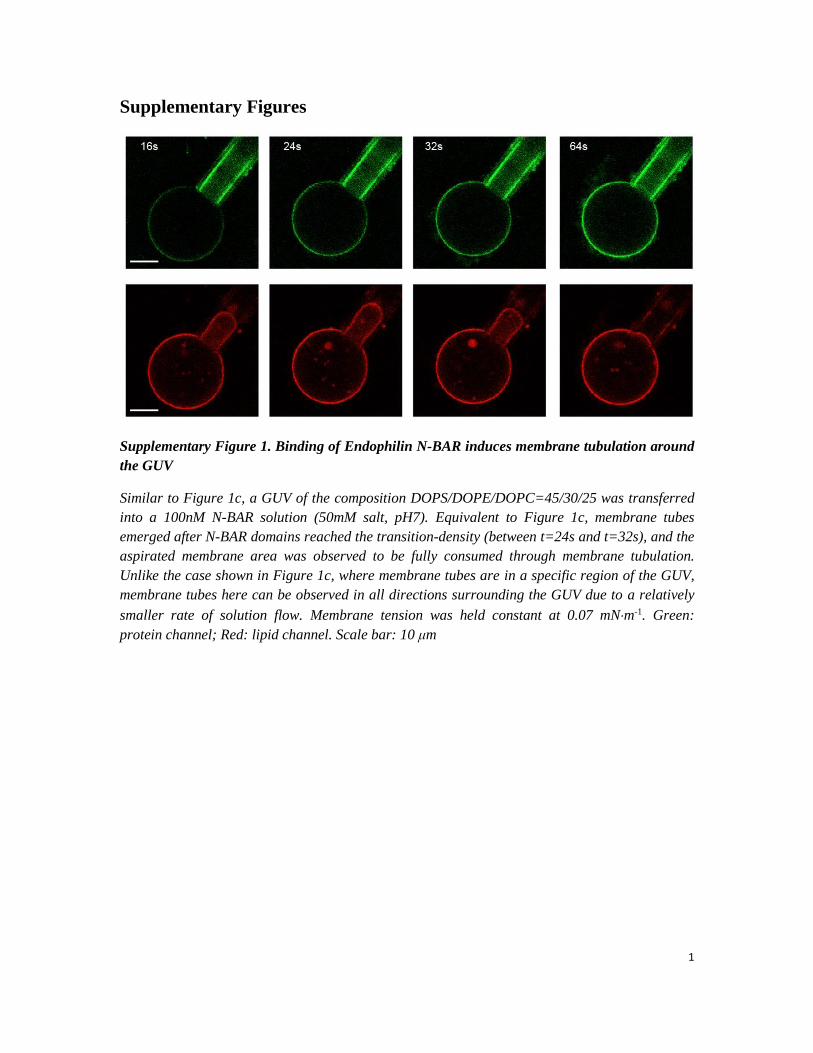
Supplementary Figure 1. Binding of Endophilin N-BAR induces membrane tubulation around
the GUV
Similar to Figure 1c, a GUV of the composition DOPS/DOPE/DOPC=45/30/25 was transferred
into a 100nM N-BAR solution (50mM salt, pH7). Equivalent to Figure 1c, membrane tubes
emerged after N-BAR domains reached the transition-density (between t=24s and t=32s), and the
aspirated membrane area was observed to be fully consumed through membrane tubulation.
Unlike the case shown in Figure 1c, where membrane tubes are in a specific region of the GUV,
membrane tubes here can be observed in all directions surrounding the GUV due to a relatively
smaller rate of solution flow. Membrane tension was held constant at 0.07 mNm-1. Green:
protein channel; Red: lipid channel. Scale bar: 10 μm
2
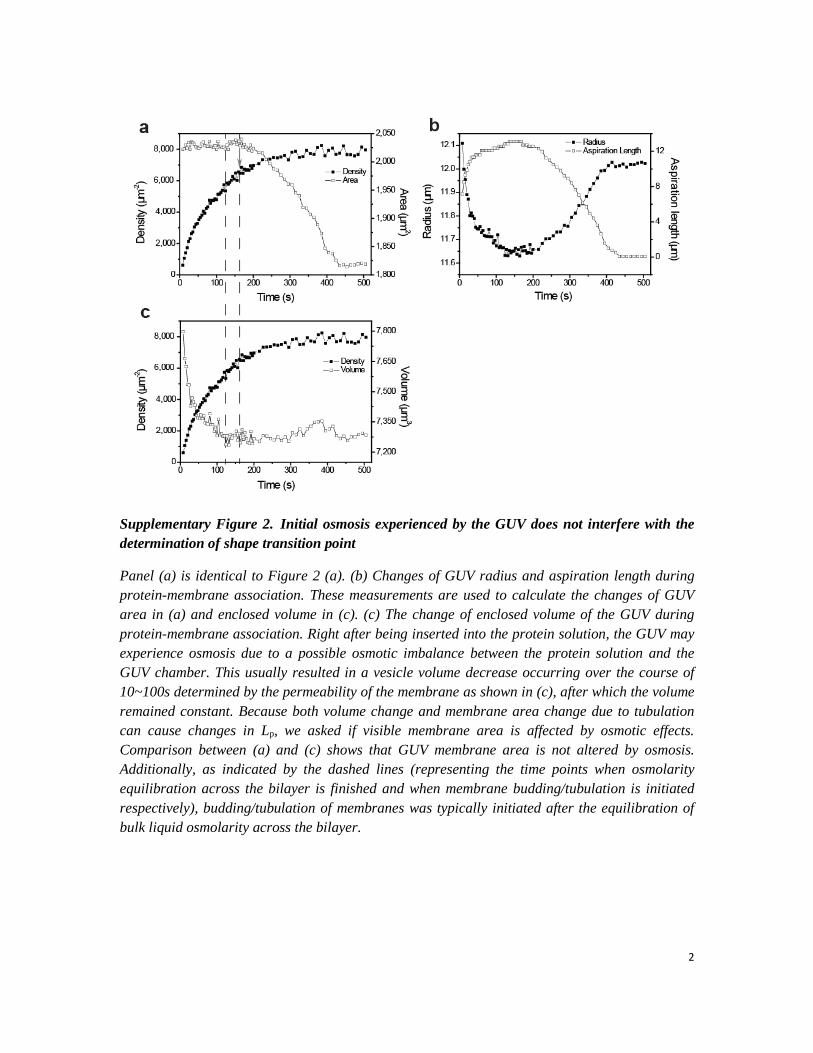
Supplementary Figure 2. Initial osmosis experienced by the GUV does not interfere with the
determination of shape transition point
Panel (a) is identical to Figure 2 (a). (b) Changes of GUV radius and aspiration length during
protein-membrane association. These measurements are used to calculate the changes of GUV
area in (a) and enclosed volume in (c). (c) The change of enclosed volume of the GUV during
protein-membrane association. Right after being inserted into the protein solution, the GUV may
experience osmosis due to a possible osmotic imbalance between the protein solution and the
GUV chamber. This usually resulted in a vesicle volume decrease occurring over the course of
10~100s determined by the permeability of the membrane as shown in (c), after which the volume
remained constant. Because both volume change and membrane area change due to tubulation
can cause changes in Lp, we asked if visible membrane area is affected by osmotic effects.
Comparison between (a) and (c) shows that GUV membrane area is not altered by osmosis.
Additionally, as indicated by the dashed lines (representing the time points when osmolarity
equilibration across the bilayer is finished and when membrane budding/tubulation is initiated
respectively), budding/tubulation of membranes was typically initiated after the equilibration of
bulk liquid osmolarity across the bilayer.
3
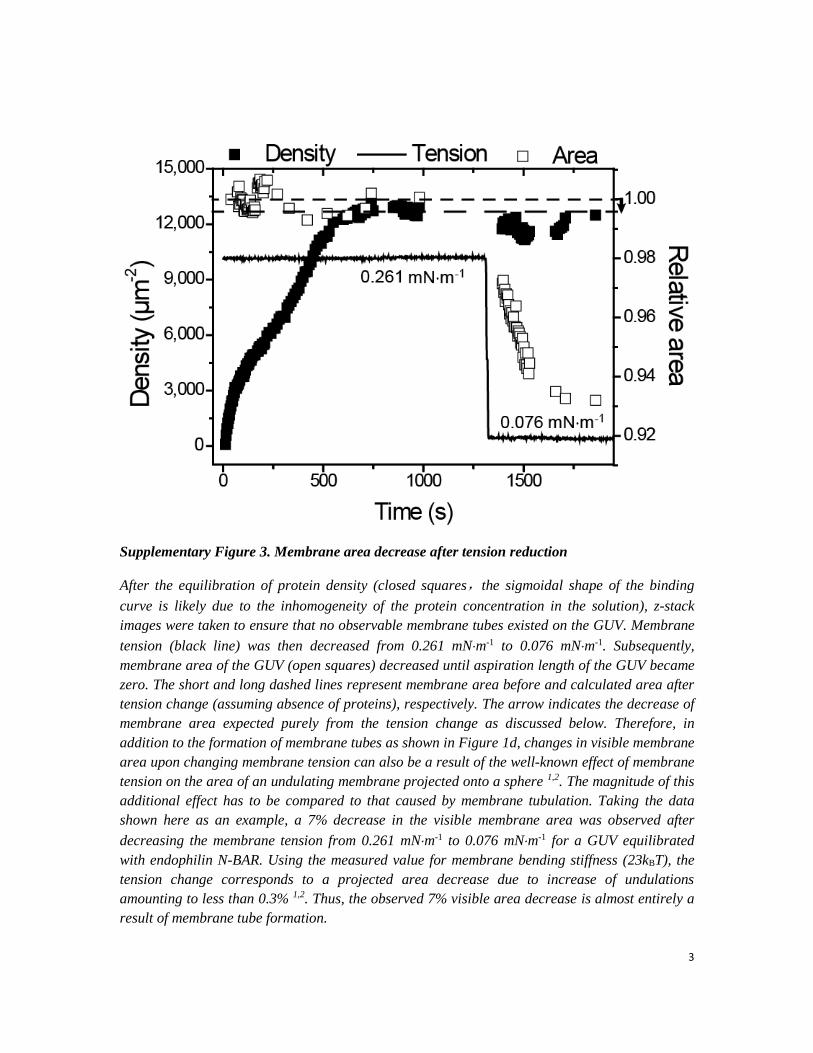
Supplementary Figure 3. Membrane area decrease after tension reduction
After the equilibration of protein density (closed squares,the sigmoidal shape of the binding
curve is likely due to the inhomogeneity of the protein concentration in the solution), z-stack
images were taken to ensure that no observable membrane tubes existed on the GUV. Membrane
tension (black line) was then decreased from 0.261 mNm-1 to 0.076 mNm-1. Subsequently,
membrane area of the GUV (open squares) decreased until aspiration length of the GUV became
zero. The short and long dashed lines represent membrane area before and calculated area after
tension change (assuming absence of proteins), respectively. The arrow indicates the decrease of
membrane area expected purely from the tension change as discussed below. Therefore, in
addition to the formation of membrane tubes as shown in Figure 1d, changes in visible membrane
area upon changing membrane tension can also be a result of the well-known effect of membrane
tension on the area of an undulating membrane projected onto a sphere 1,2. The magnitude of this
additional effect has to be compared to that caused by membrane tubulation. Taking the data
shown here as an example, a 7% decrease in the visible membrane area was observed after
decreasing the membrane tension from 0.261 mNm-1 to 0.076 mNm-1 for a GUV equilibrated
with endophilin N-BAR. Using the measured value for membrane bending stiffness (23kBT), the
tension change corresponds to a projected area decrease due to increase of undulations
amounting to less than 0.3% 1,2. Thus, the observed 7% visible area decrease is almost entirely a
result of membrane tube formation.
4
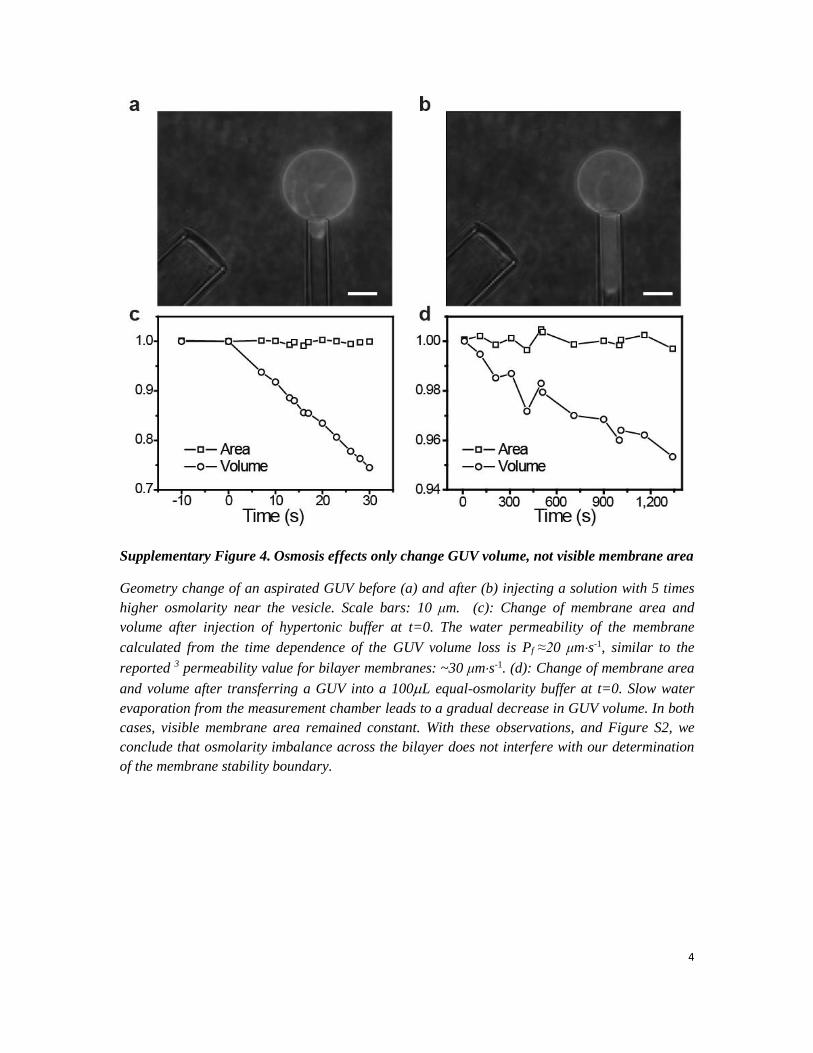
Supplementary Figure 4. Osmosis effects only change GUV volume, not visible membrane area
Geometry change of an aspirated GUV before (a) and after (b) injecting a solution with 5 times
higher osmolarity near the vesicle. Scale bars: 10 μm. (c): Change of membrane area and
volume after injection of hypertonic buffer at t=0. The water permeability of the membrane
calculated from the time dependence of the GUV volume loss is Pf ≈20 μms-1, similar to the
reported 3 permeability value for bilayer membranes: ~30 μms-1. (d): Change of membrane area
and volume after transferring a GUV into a 100L equal-osmolarity buffer at t=0. Slow water
evaporation from the measurement chamber leads to a gradual decrease in GUV volume. In both
cases, visible membrane area remained constant. With these observations, and Figure S2, we
conclude that osmolarity imbalance across the bilayer does not interfere with our determination
of the membrane stability boundary.
5
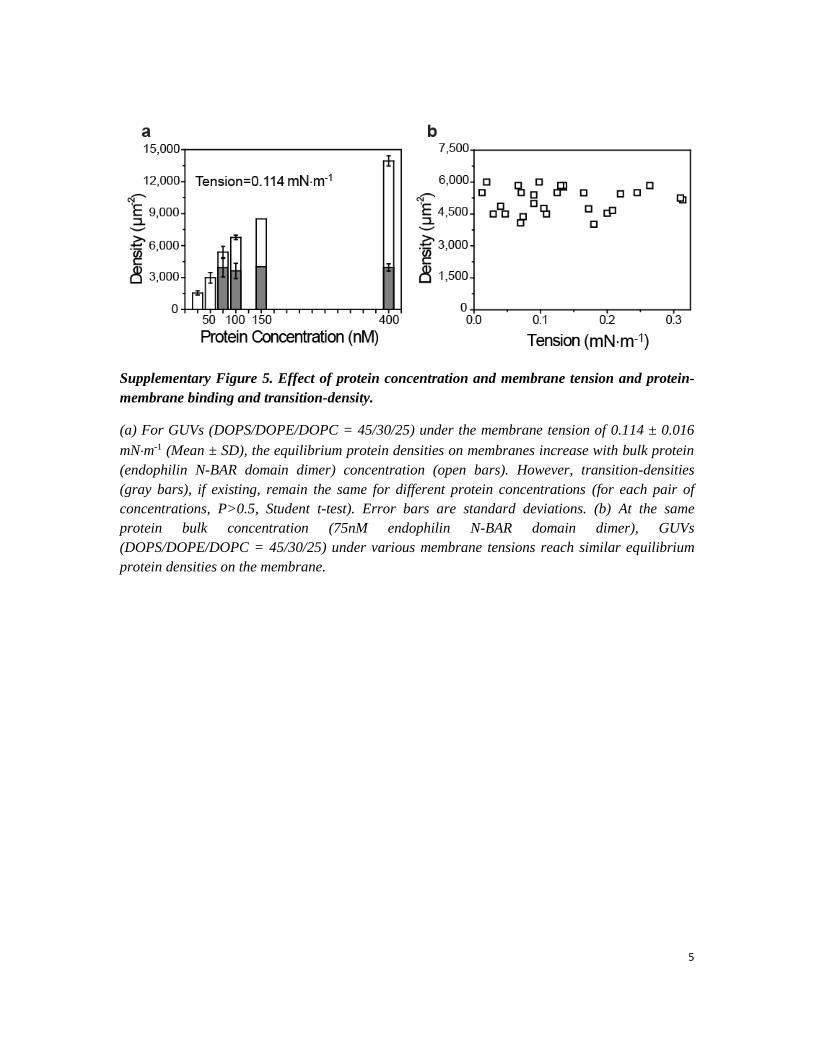
Supplementary Figure 5. Effect of protein concentration and membrane tension and protein-
membrane binding and transition-density.
(a) For GUVs (DOPS/DOPE/DOPC = 45/30/25) under the membrane tension of 0.114 ± 0.016
mNm-1 (Mean ± SD), the equilibrium protein densities on membranes increase with bulk protein
(endophilin N-BAR domain dimer) concentration (open bars). However, transition-densities
(gray bars), if existing, remain the same for different protein concentrations (for each pair of
concentrations, P>0.5, Student t-test). Error bars are standard deviations. (b) At the same
protein bulk concentration (75nM endophilin N-BAR domain dimer), GUVs
(DOPS/DOPE/DOPC = 45/30/25) under various membrane tensions reach similar equilibrium
protein densities on the membrane.
6
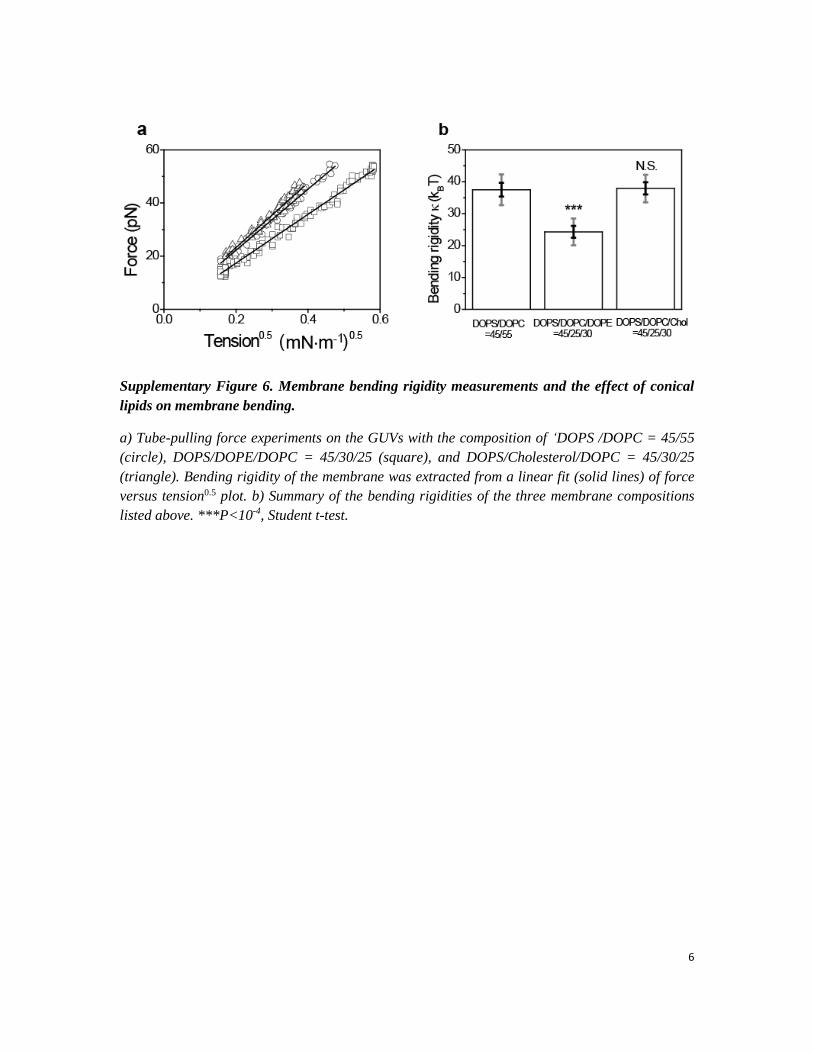
Supplementary Figure 6. Membrane bending rigidity measurements and the effect of conical
lipids on membrane bending.
a) Tube-pulling force experiments on the GUVs with the composition of ‘DOPS /DOPC = 45/55
(circle), DOPS/DOPE/DOPC = 45/30/25 (square), and DOPS/Cholesterol/DOPC = 45/30/25
(triangle). Bending rigidity of the membrane was extracted from a linear fit (solid lines) of force
versus tension0.5 plot. b) Summary of the bending rigidities of the three membrane compositions
listed above. ***P<10-4, Student t-test.
7
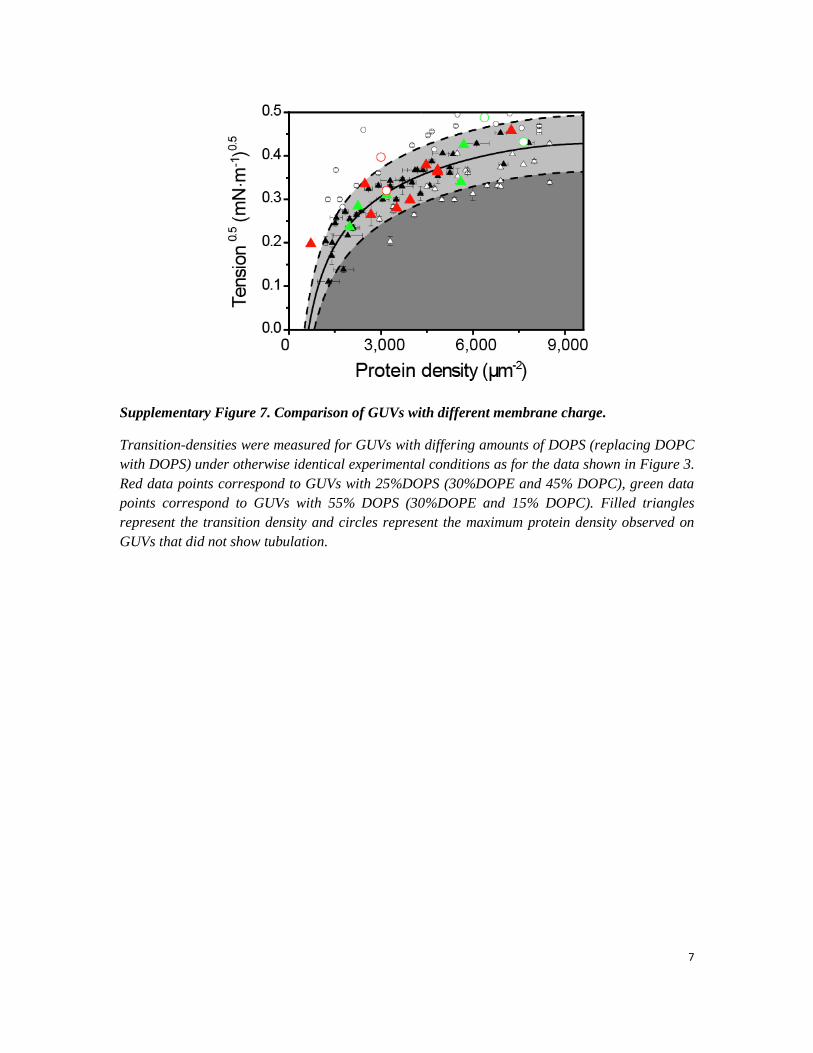
Supplementary Figure 7. Comparison of GUVs with different membrane charge.
Transition-densities were measured for GUVs with differing amounts of DOPS (replacing DOPC
with DOPS) under otherwise identical experimental conditions as for the data shown in Figure 3.
Red data points correspond to GUVs with 25%DOPS (30%DOPE and 45% DOPC), green data
points correspond to GUVs with 55% DOPS (30%DOPE and 15% DOPC). Filled triangles
represent the transition density and circles represent the maximum protein density observed on
GUVs that did not show tubulation.
8
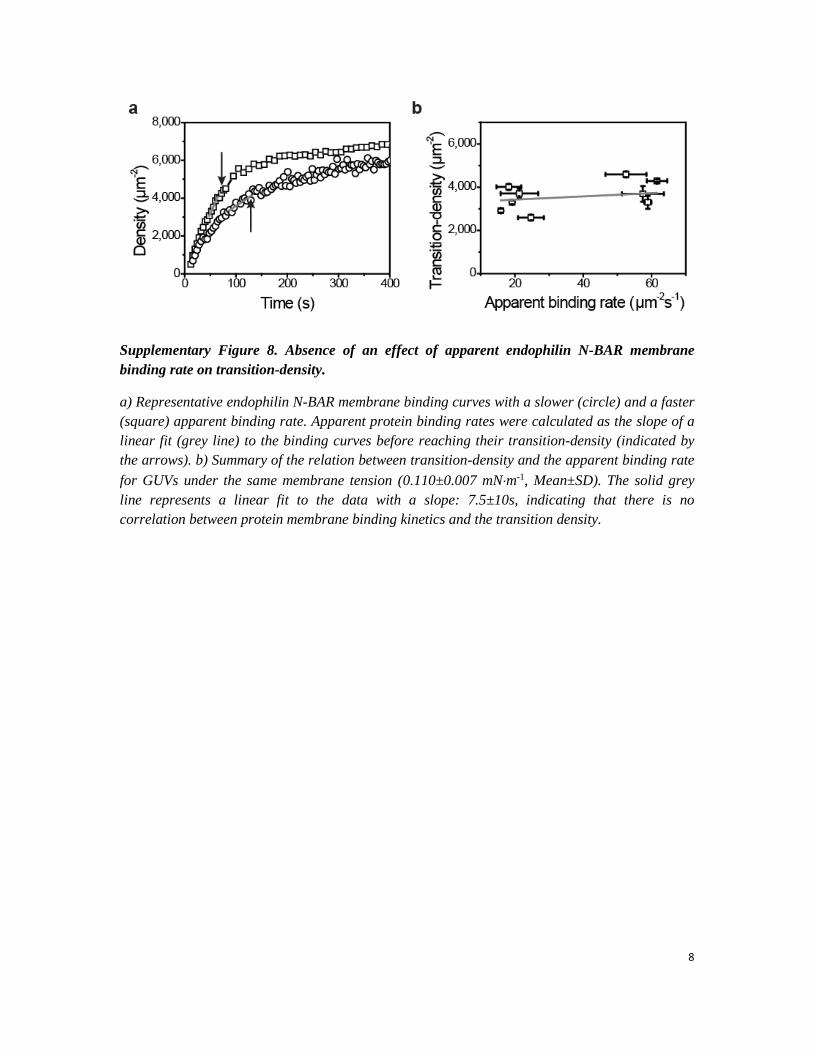
Supplementary Figure 8. Absence of an effect of apparent endophilin N-BAR membrane
binding rate on transition-density.
a) Representative endophilin N-BAR membrane binding curves with a slower (circle) and a faster
(square) apparent binding rate. Apparent protein binding rates were calculated as the slope of a
linear fit (grey line) to the binding curves before reaching their transition-density (indicated by
the arrows). b) Summary of the relation between transition-density and the apparent binding rate
for GUVs under the same membrane tension (0.110±0.007 mNm-1, Mean±SD). The solid grey
line represents a linear fit to the data with a slope: 7.5±10s, indicating that there is no
correlation between protein membrane binding kinetics and the transition density.
9
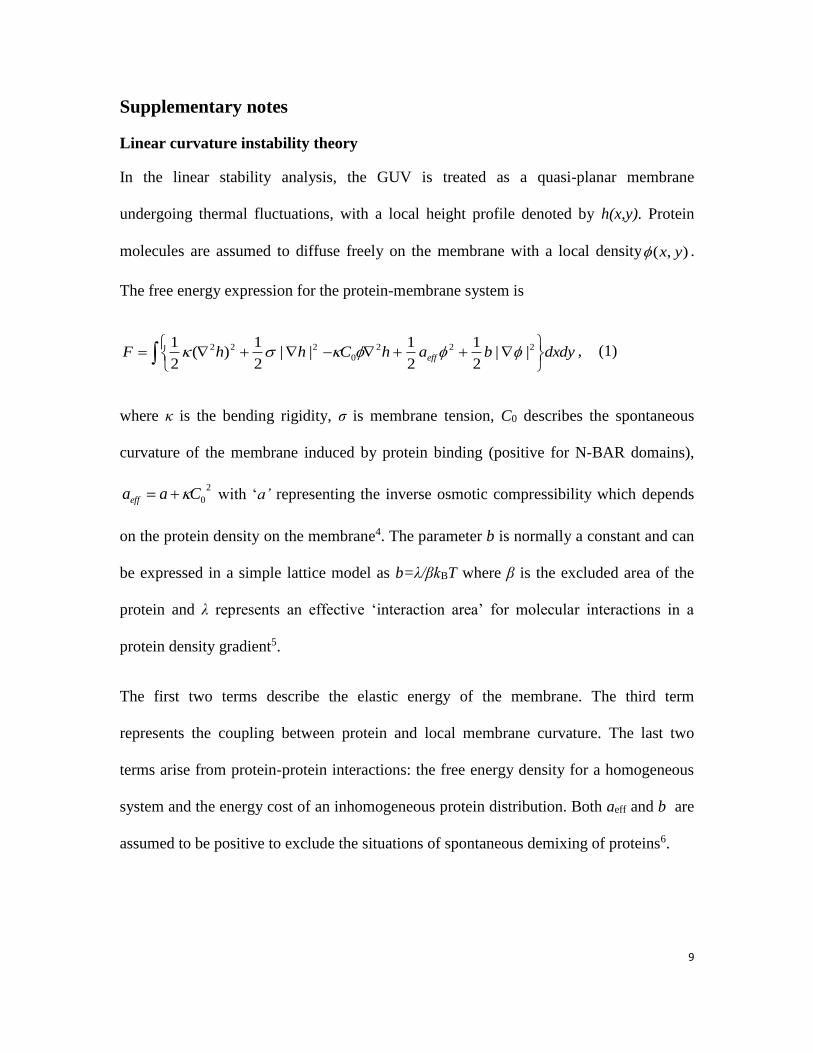
Supplementary notes
Linear curvature instability theory
In the linear stability analysis, the GUV is treated as a quasi-planar membrane
undergoing thermal fluctuations, with a local height profile denoted by h(x,y). Protein
molecules are assumed to diffuse freely on the membrane with a local density ),( yx .
The free energy expression for the protein-membrane system is
dxdybahChhF eff
222
0
222 ||2
1
2
1||
2
1)(
2
1 , (1)
where κ is the bending rigidity, σ is membrane tension, C0 describes the spontaneous
curvature of the membrane induced by protein binding (positive for N-BAR domains),
2
0Caaeff with ‘a’ representing the inverse osmotic compressibility which depends
on the protein density on the membrane4. The parameter b is normally a constant and can
be expressed in a simple lattice model as b=λ/βkBT where β is the excluded area of the
protein and λ represents an effective ‘interaction area’ for molecular interactions in a
protein density gradient5.
The first two terms describe the elastic energy of the membrane. The third term
represents the coupling between protein and local membrane curvature. The last two
terms arise from protein-protein interactions: the free energy density for a homogeneous
system and the energy cost of an inhomogeneous protein distribution. Both aeff and b are
assumed to be positive to exclude the situations of spontaneous demixing of proteins6.
10
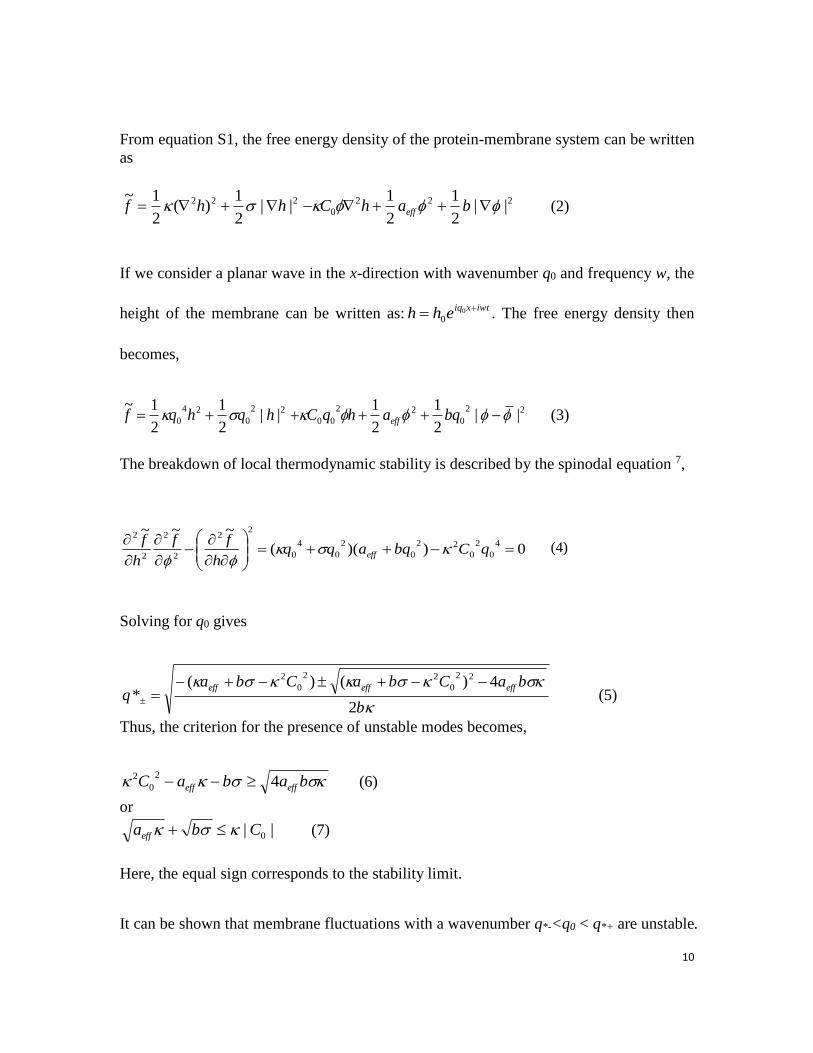
From equation S1, the free energy density of the protein-membrane system can be written
as
222
0
222 ||2
1
2
1||
2
1)(
2
1~ bahChhf eff (2)
If we consider a planar wave in the x-direction with wavenumber q0 and frequency w, the
height of the membrane can be written as:iwtxiq
ehh
0
0 . The free energy density then
becomes,
22
0
22
00
22
0
24
0 ||2
1
2
1||
2
1
2
1~ bqahqChqhqf eff (3)
The breakdown of local thermodynamic stability is described by the spinodal equation 7,
0))((
~~~4
0
2
0
22
0
2
0
4
0
22
2
2
2
2
qCbqaqq
h
ff
h
feff
(4)
Solving for q0 gives
b
baCbaCbaq
effeffeff
2
4)()(*
22
0
22
0
2 (5)
Thus, the criterion for the presence of unstable modes becomes,
babaC effeff 42
0
2 (6)
or
|| 0Cbaeff (7)
Here, the equal sign corresponds to the stability limit.
It can be shown that membrane fluctuations with a wavenumber q*-<q0 < q*+ are unstable.
11
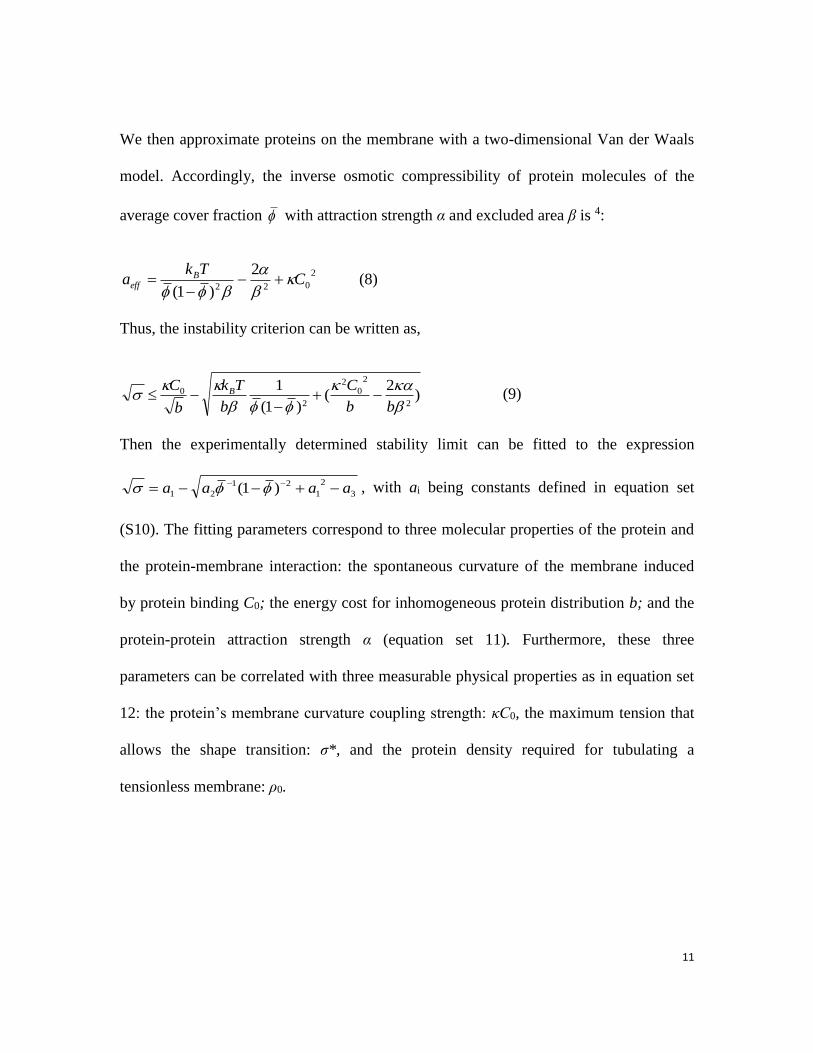
We then approximate proteins on the membrane with a two-dimensional Van der Waals
model. Accordingly, the inverse osmotic compressibility of protein molecules of the
average cover fraction with attraction strength α and excluded area β is 4:
2
022
2
)1(C
Tka B
eff
(8)
Thus, the instability criterion can be written as,
)2
()1(
12
2
02
2
0
bb
C
b
Tk
b
C B
(9)
Then the experimentally determined stability limit can be fitted to the expression
3
2
1
21
21 )1( aaaa , with ai being constants defined in equation set
(S10). The fitting parameters correspond to three molecular properties of the protein and
the protein-membrane interaction: the spontaneous curvature of the membrane induced
by protein binding C0; the energy cost for inhomogeneous protein distribution b; and the
protein-protein attraction strength α (equation set 11). Furthermore, these three
parameters can be correlated with three measurable physical properties as in equation set
12: the protein’s membrane curvature coupling strength: κC0, the maximum tension that
allows the shape transition: σ*, and the protein density required for tubulating a
tensionless membrane: ρ0.
12
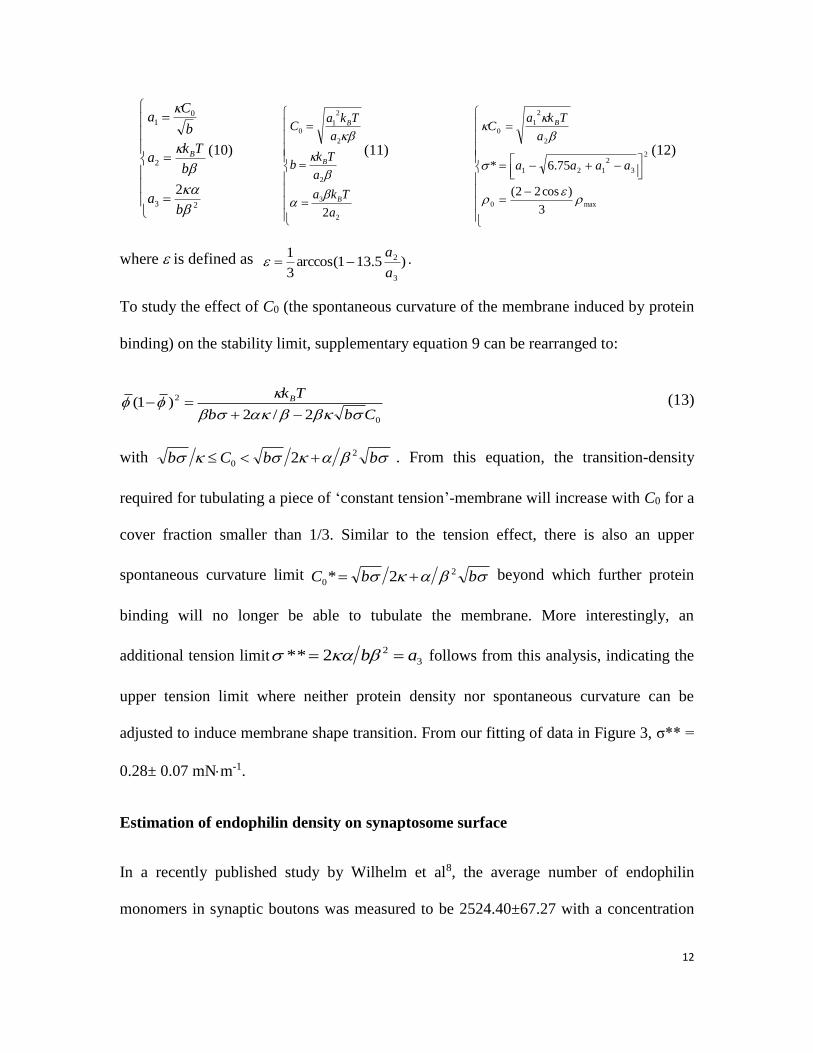
23
2
01
2
ba
b
Tka
b
Ca
B (10)
2
3
2
2
2
10
2a
Tka
a
Tkb
a
TkaC
B
B
B
(11)
max0
2
3
2
121
2
2
10
3
)cos22(
75.6*
aaaa
a
TkaC B
(12)
where is defined as )5.131arccos(3
1
3
2
a
a .
To study the effect of C0 (the spontaneous curvature of the membrane induced by protein
binding) on the stability limit, supplementary equation 9 can be rearranged to:
0
2
2/2)1(
Cbb
TkB
(13)
with bbCb 2
0 2 . From this equation, the transition-density
required for tubulating a piece of ‘constant tension’-membrane will increase with C0 for a
cover fraction smaller than 1/3. Similar to the tension effect, there is also an upper
spontaneous curvature limit bbC 2
0 2* beyond which further protein
binding will no longer be able to tubulate the membrane. More interestingly, an
additional tension limit 3
22** ab follows from this analysis, indicating the
upper tension limit where neither protein density nor spontaneous curvature can be
adjusted to induce membrane shape transition. From our fitting of data in Figure 3, σ** =
0.28± 0.07 mNm-1.
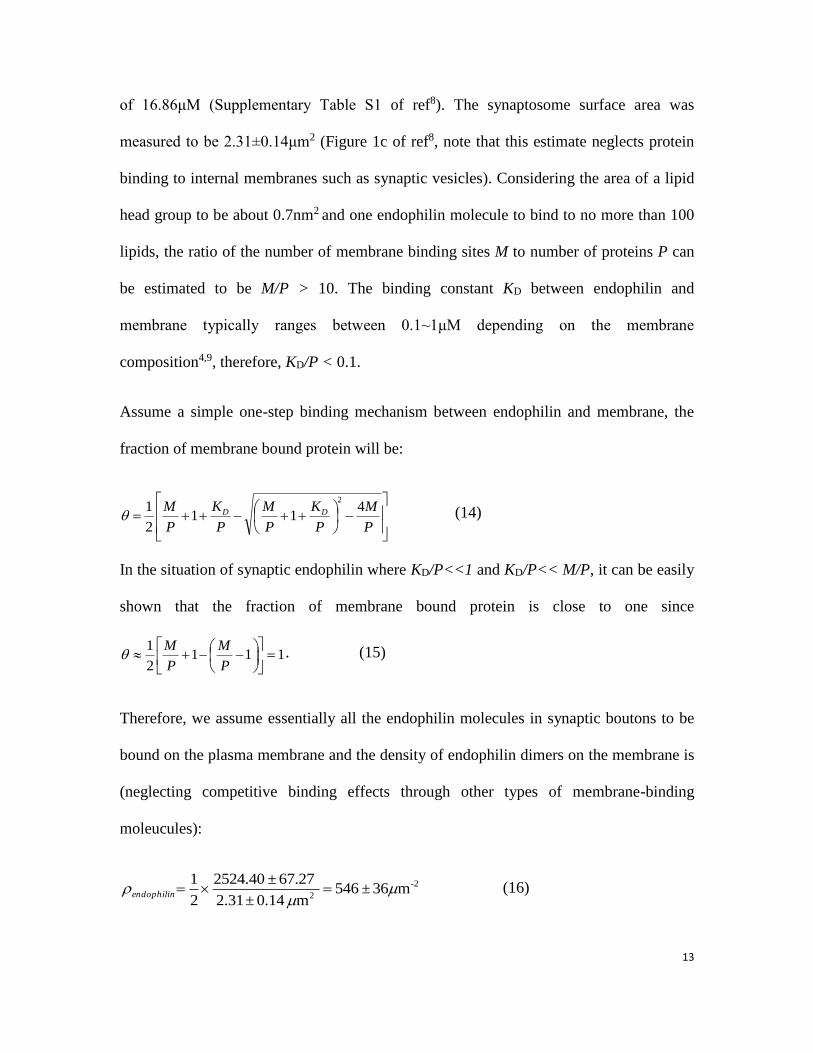
Estimation of endophilin density on synaptosome surface
In a recently published study by Wilhelm et al8, the average number of endophilin
monomers in synaptic boutons was measured to be 2524.40±67.27 with a concentration
13
of 16.86μM (Supplementary Table S1 of ref8). The synaptosome surface area was
measured to be 2.31±0.14μm2 (Figure 1c of ref8, note that this estimate neglects protein
binding to internal membranes such as synaptic vesicles). Considering the area of a lipid
head group to be about 0.7nm2 and one endophilin molecule to bind to no more than 100
lipids, the ratio of the number of membrane binding sites M to number of proteins P can
be estimated to be M/P > 10. The binding constant KD between endophilin and
membrane typically ranges between 0.1~1μM depending on the membrane
composition4,9, therefore, KD/P < 0.1.
Assume a simple one-step binding mechanism between endophilin and membrane, the
fraction of membrane bound protein will be:
P
M
P
K
P
M
P
K
P
M DD 411
2
12
(14)
In the situation of synaptic endophilin where KD/P<<1 and KD/P<< M/P, it can be easily
shown that the fraction of membrane bound protein is close to one since
1112
1
P
M
P
M . (15)
Therefore, we assume essentially all the endophilin molecules in synaptic boutons to be
bound on the plasma membrane and the density of endophilin dimers on the membrane is
(neglecting competitive binding effects through other types of membrane-binding
moleucules):
2-
2m36±546
m 0.14±2.31
67.27±2524.40
2
1
endophilin
(16)
14
Supplementary references
1 Helfrich, W. & Servuss, R. M. UNDULATIONS, STERIC INTERACTION AND
COHESION OF FLUID MEMBRANES. Nuovo Cimento Della Societa Italiana Di
Fisica D-Condensed Matter Atomic Molecular and Chemical Physics Fluids Plasmas
Biophysics 3, 137-151, doi:10.1007/bf02452208 (1984).
2 Evans, E. & Rawicz, W. ENTROPY-DRIVEN TENSION AND BENDING
ELASTICITY IN CONDENSED-FLUID MEMBRANES. Physical Review Letters 64,
2094-2097, doi:10.1103/PhysRevLett.64.2094 (1990).
3 Olbrich, K., Rawicz, W., Needham, D. & Evans, E. Water Permeability and
Mechanical Strength of Polyunsaturated Lipid Bilayers. Biophysical Journal 79,
321-327 (2000).
4 Zhu, C., Das, S. L. & Baumgart, T. Nonlinear Sorting, Curvature Generation, and
Crowding of Endophilin N-BAR on Tubular Membranes. Biophysical Journal 102,
1837-1845, doi:10.1016/j.bpj.2012.03.039 (2012).
5 Cahn, J. W. & Hilliard, J. E. FREE ENERGY OF A NONUNIFORM SYSTEM .1.
INTERFACIAL FREE ENERGY. Journal of Chemical Physics 28, 258-267,
doi:10.1063/1.1744102 (1958).
6 Leibler, S. CURVATURE INSTABILITY IN MEMBRANES. Journal De Physique
47, 507-516, doi:10.1051/jphys:01986004703050700 (1986).
7 Loew, S., Hinderliter, A. & May, S. Stability of protein-decorated mixed lipid
membranes: The interplay of lipid-lipid, lipid-protein, and protein-protein
interactions. Journal of Chemical Physics 130, doi:04510210.1063/1.3063117 (2009).
8 Wilhelm, B. G. et al. Composition of isolated synaptic boutons reveals the amounts
of vesicle trafficking proteins. Science 344, 1023-1028, doi:10.1126/science.1252884
(2014).
9 Yoon, Y., Zhang, X. & Cho, W. Phosphatidylinositol 4,5-Bisphosphate
(PtdIns(4,5)P2) Specifically Induces Membrane Penetration and Deformation by
Bin/Amphiphysin/Rvs (BAR) Domains. Journal of Biological Chemistry 287, 34078-
34090, doi:10.1074/jbc.M112.372789 (2012).