Fundamentals of Torque- tension and Coefficient of Friction ...
15
pcb.com | 1 800 828 8840 Written By Jeff Drumheller Fundamentals of Torque- tension and Coefficient of Friction Testing
-
Upload
khangminh22 -
Category
Documents
-
view
0 -
download
0
Transcript of Fundamentals of Torque- tension and Coefficient of Friction ...

pcb.com | 1 800 828 8840
Written By
Jeff Drumheller
Fundamentals of Torque- tension and Coefficient of Friction Testing

SENSORS FOR RESEARCH & DEVELOPMENT
M T S S Y S T E M S C O R P O R A T I O Nwww.PCB.com | [email protected] | 800.828.8840
W H I T E P A P E R | # 2 1
FUNDAMENTALS OF TORQUE-TENSION AND COEFFICIENT OF FRICTION TESTING
Written By Jeff Drumheller

PCB LOAD & TORQUE, INC. 24350 Indoplex Circle, Farmington Hills, MI 48335 USA
Phone: 866-684-7107 Fax: 716-684-0987 Email: [email protected] www.pcbloadtorque.com ISO 9001 CERTIFIED A2LA Accredited to ISO 17025
1
Fundamentals of Torque-Tension and Coefficient of Friction Testing
Understanding the Basics of Tightening Threaded Fasteners aBy:
More and more fastener coatings are being required to not only comply with corrosion specifications, but to also fulfill specified tightening characteristic requirements. These requirements include at least a torque-tension test and at times a coefficient of friction test. The torque-tension test usually consists of an acceptance input torque window at a specified tension or clamp load value, while the coefficient of friction test requires an acceptance coefficient of friction window (typically the reference coefficient of friction µges) at a specified tension or clamp load value. Prior to understanding the “whys” of this testing it is necessary to know some of the “hows” and “whats” of basic tightening of threaded fasteners. The following sections will attempt to answer all of these questions. Fastener Loads During Tightening When a bolt is tightened, by applying a torque to the bolt head or nut, the bolt gets stretched causing the clamping plates to be compressed together. The nomenclature used to describe the loads remains true to its German roots from the VDI and DIN specifications where: FM: bolt tension or preload prior to any joint settling. FK: clamp load in the clamped pieces MA: applied torque or input torque MG: thread torque or the reaction torque to the input torque The thread torque can be described as the torque it takes to keep the nut from turning when an input torque is applied to the bolt head.
FK FK
FM
FM
MA
MG
Figure 1: Fastener Loads during Tightening

PCB LOAD & TORQUE, INC. 24350 Indoplex Circle, Farmington Hills, MI 48335 USA
Phone: 866-684-7107 Fax: 716-684-0987 Email: [email protected] www.pcbloadtorque.com ISO 9001 CERTIFIED A2LA Accredited to ISO 17025
2
Note: During the tightening process the bolt tension is equal to the clamp load and these value
are often interchanged. This is perfectly correct until the joint is in service and external loads are applied.
Bolt Tension and Clamp Load As the bolt is being tightened, the bolt is actually being stretched causing tension while the clamped pieces are being compressed causing clamp load. This phenomenon can be shown in the traditional joint diagram in Figure 2. The slope of the curve represents the resilience (elasticity) of the material being stretched or compressed. Note: The resilience is the inverse of the spring rate given in units of length/force (i.e. in/lb,
mm/N). The slope is a function of the material properties of the part being stretched or compressed along with the length of the part being stretched or compressed and remains a constant until the material experiences yield or permanent deformation. This being the case, it can be shown that to obtain a certain bolt stretch, for a given material and geometry, it will always require the same amount of bolt tension. The following equation is the basic equation for the elastic resilience δδδδ: Elastic Resilience l: Length E: Young’s Modulus A: Cross-Sectional Area
Compression Bolt Elongation
Clamp Load
Bolt Tension
Figure 2: Joint Diagram
δ = l
E * A

PCB LOAD & TORQUE, INC. 24350 Indoplex Circle, Farmington Hills, MI 48335 USA
Phone: 866-684-7107 Fax: 716-684-0987 Email: [email protected] www.pcbloadtorque.com ISO 9001 CERTIFIED A2LA Accredited to ISO 17025
3
The length and cross-sectional area are strictly taken from the geometry of the bolt or clamped parts and the Young’s Modulus is a material property describing elasticity. Based on this the slope of the joint diagram will change when permanent deformation sets in due to possible changes in both length and area. The bolt elongation can be directly correlated to the angle of turn in a bolt when a torque is applied. The elongation of the bolt is measured in degrees of rotation rather than units of length. Much like the joint diagram the slope of the clamp load-angle curve is only a function of the resilience of the material. The difference being that the slope is a combination of resilience between both the bolt and clamped parts. A permanent deformation of either the bolt or the clamped parts will cause a change in slope in the clamp load-angle curve. The following figure shows a clamp load-angle curve tightened to joint failure. Figure 3 describes the key points on the clamp load-angle curve; the methods to measure the points are as follows: Proof Load: A projection is made tangent to the linear portion of the clamp load-angle curve.
The point at which the slope of the curve deviates from the projection is known as the Proof Load. It is in this linear range that the entire lot of equations regarding fastener tightening and friction are valid. Staying within the elastic range also provides the most consistent torque-tension and angle relationship between common fasteners.
Yield Load: The projection made to determine the proof load is offset a given number of
degrees (based on the resilience of the joint). The point at which the offset projection intersects the clamp load-angle curve is known as the Yield Load.
Ultimate Load: The Ultimate Load is measured as the peak clamp load value.
0
10000
20000
30000
40000
50000
60000
-100 100 300 500 700
Angle (deg)
Proof
Yield
Ultimate
Yield Offset
Figure 3: Clamp Load-Angle Failure Curve
PCB LOAD & TORQUE, INC. 24350 Indoplex Circle, Farmington Hills, MI 48335 USA
Phone: 866-684-7107 Fax: 716-684-0987 Email: [email protected] www.pcbloadtorque.com ISO 9001 CERTIFIED A2LA Accredited to ISO 17025
4
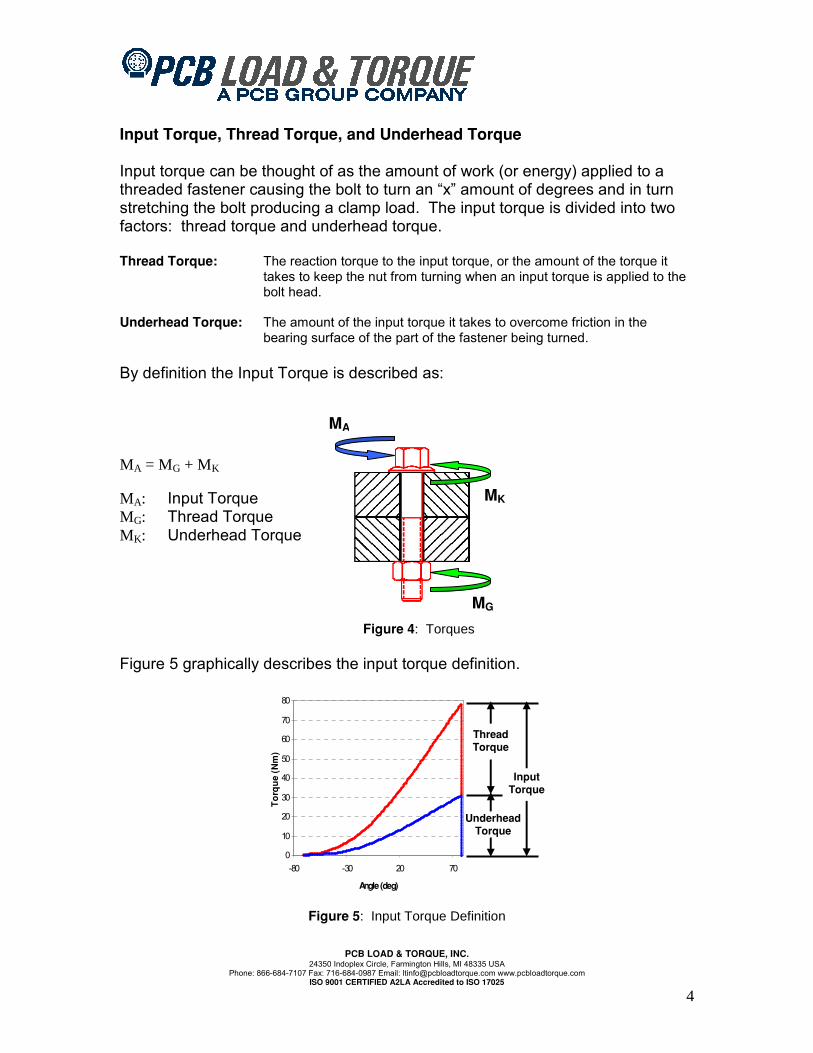
Input Torque, Thread Torque, and Underhead Torque Input torque can be thought of as the amount of work (or energy) applied to a threaded fastener causing the bolt to turn an “x” amount of degrees and in turn stretching the bolt producing a clamp load. The input torque is divided into two factors: thread torque and underhead torque. Thread Torque: The reaction torque to the input torque, or the amount of the torque it
takes to keep the nut from turning when an input torque is applied to the bolt head.
Underhead Torque: The amount of the input torque it takes to overcome friction in the
bearing surface of the part of the fastener being turned. By definition the Input Torque is described as: MA = MG + MK
MA: Input Torque MG: Thread Torque MK: Underhead Torque
Figure 5 graphically describes the input torque definition.
Figure 4: Torques
MA
MG
MK
0
10
20
30
40
50
60
70
80
-80 -30 20 70
Angle (deg)
To
rqu
e (N
m)
Underhead Torque
Input Torque
Thread Torque
Figure 5: Input Torque Definition

PCB LOAD & TORQUE, INC. 24350 Indoplex Circle, Farmington Hills, MI 48335 USA
Phone: 866-684-7107 Fax: 716-684-0987 Email: [email protected] www.pcbloadtorque.com ISO 9001 CERTIFIED A2LA Accredited to ISO 17025
5
The thread torque is a combination of two factors: thread friction torque, pitch torque. Thread Friction Torque: The frictional portion of the thread torque describing the amount of
torque it takes to overcome the friction in the engaged threads. Pitch Torque: The geometrical factor of the thread torque describing the amount of torque that
is used to stretch the bolt. The pitch torque is calculated by the following equation: The thread friction torque is then calculated by subtracting the pitch torque from the thread torque. Graphically, this makes the input torque definition look like Figure 6. Thread, Underhead, and Reference Friction Coefficients The amount of thread torque and underhead torque present in a given tightening can be described using friction coefficients. Friction coefficients are always described in terms of two materials, platings, coatings, etc., and are defined as follows: Thread Friction Coefficient: The value describing the friction between mating threads.
0
10
20
30
40
50
60
70
80
-80 -30 20 70
Angle (deg)
To
rqu
e (N
m)
Underhead Torque
Input Torque
Thread Friction Torque
Pitch Torque
Figure 6: Expanded Input Torque Definition
Pitch Torque = Thread Pitch * Clamp Load
2π
PCB LOAD & TORQUE, INC. 24350 Indoplex Circle, Farmington Hills, MI 48335 USA
Phone: 866-684-7107 Fax: 716-684-0987 Email: [email protected] www.pcbloadtorque.com ISO 9001 CERTIFIED A2LA Accredited to ISO 17025
6
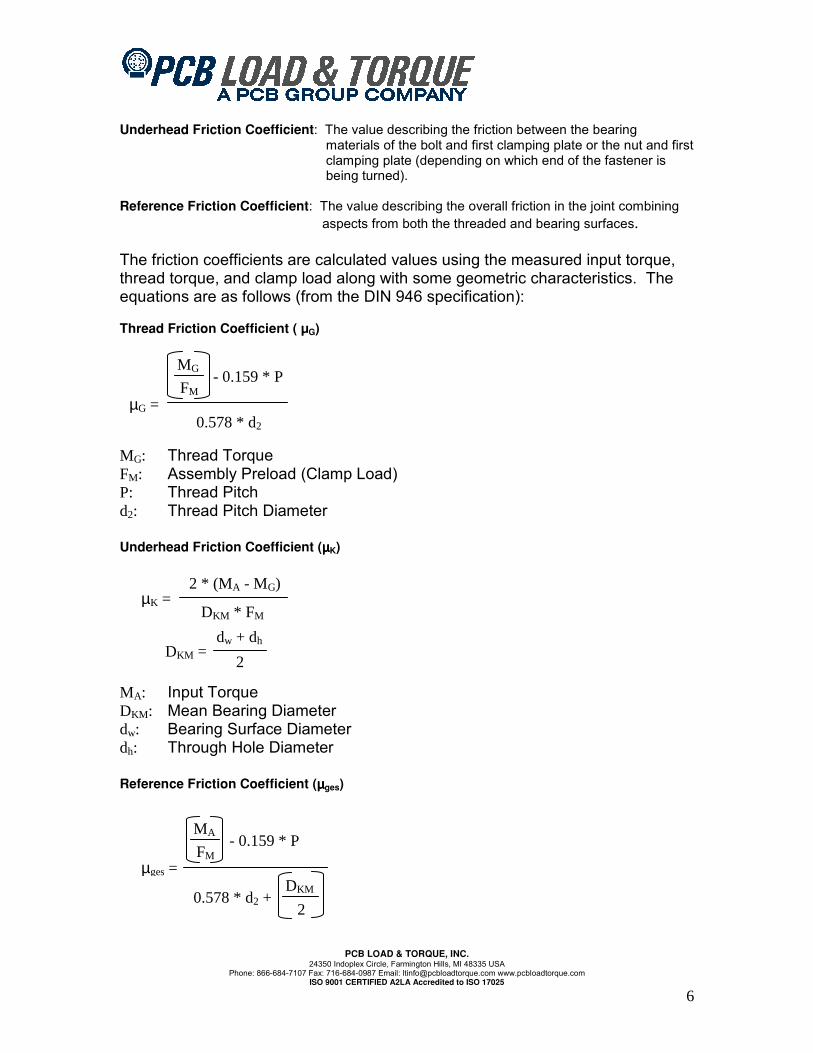
Underhead Friction Coefficient: The value describing the friction between the bearing
materials of the bolt and first clamping plate or the nut and first clamping plate (depending on which end of the fastener is being turned).
Reference Friction Coefficient: The value describing the overall friction in the joint combining
aspects from both the threaded and bearing surfaces.
The friction coefficients are calculated values using the measured input torque, thread torque, and clamp load along with some geometric characteristics. The equations are as follows (from the DIN 946 specification): Thread Friction Coefficient ( µG) MG: Thread Torque FM: Assembly Preload (Clamp Load) P: Thread Pitch d2: Thread Pitch Diameter Underhead Friction Coefficient (µµµµK) MA: Input Torque DKM: Mean Bearing Diameter dw: Bearing Surface Diameter dh: Through Hole Diameter Reference Friction Coefficient (µµµµges)
µG = 0.578 * d2
- 0.159 * P MG
FM
DKM * FM µK =
2 * (MA - MG)
dw + dh
2 DKM =
MA
FM - 0.159 * P
DKM
2 0.578 * d2 +
µges =

PCB LOAD & TORQUE, INC. 24350 Indoplex Circle, Farmington Hills, MI 48335 USA
Phone: 866-684-7107 Fax: 716-684-0987 Email: [email protected] www.pcbloadtorque.com ISO 9001 CERTIFIED A2LA Accredited to ISO 17025
7
Typically, 80% – 90% of the input torque is used to overcome friction in the threaded and underhead regions leaving only 10% – 20% of the input torque left to stretch the bolt producing clamp load. The distribution of which area (thread or underhead) that will take more torque to overcome friction depends on the bearing surface area along with the friction coefficient between the mating surfaces. Knowing that pitch torque is directly related to clamp load (for a given bolted joint), if the pitch torque is increased (by lowering friction in the thread or underhead areas) more clamp load will be attained at a given torque value. Controlling the friction coefficients, in both the thread and underhead regions, will result in more consistent and predictable clamp load values.
Effects of Varying Friction Coefficients
Consider the example of tightening a certain fastener to 50 Nm and view the effects of changing the friction coefficients have on the attained clamp load. Four test samples of the same lot were tested under different lubrication conditions: no lubrication, lubricated underhead, lubricated threads, and lubricated underhead and threads
80-90% of
Input Torque
10-20% of Input Torque
Figure 7: Input Torque Usage
0
5000
10000
15000
20000
25000
30000
35000
40000
45000
0 10 20 30 40 50
Torque (Nm)
Cla
mp
Load
(N)
No Lube Lube Head Lube Thread Lube Head & Thread
Figure 8: 4 Samples Tightened to 50 Nm

PCB LOAD & TORQUE, INC. 24350 Indoplex Circle, Farmington Hills, MI 48335 USA
Phone: 866-684-7107 Fax: 716-684-0987 Email: [email protected] www.pcbloadtorque.com ISO 9001 CERTIFIED A2LA Accredited to ISO 17025
8
Each sample had the torque separated into its three parts giving the following: Figure 9 shows the torque breakdown of the sample with no lubrication. This will be considered that baseline sample. Figures 10 and 11 give the torque breakdown for samples with lubricated underhead and threads respectively. Figure 12 shows the sample with both the underhead and thread regions lubricated.
No Lube
0
10
20
30
40
50
-80 -30 20 70
Angle (deg)
To
rqu
e (N
m)
Input Torque Thread Friction Torque Underhead Torque
Lube Head
0
10
20
30
40
50
-80 -30 20 70
Angle (deg)
To
rqu
e (N
m)
Input Torque Thread Friction Torque Underhead Torque
Lube Thread
0
10
20
30
40
50
-80 -30 20 70
Angle (deg)
To
rqu
e (N
m)
Input Torque Thread Friction Torque Underhead Torque
Lube Head & Thread
0
10
20
30
40
50
-80 -30 20 70
Angle (deg)
To
rqu
e (N
m)
Input Torque Thread Friction Torque Underhead Torque
Figure 9: No Lubrication
Figure 10: Lubricated Underhead Figure 11: Lubricated Threads
Figure 12: Lubricated Underhead and Threads

PCB LOAD & TORQUE, INC. 24350 Indoplex Circle, Farmington Hills, MI 48335 USA
Phone: 866-684-7107 Fax: 716-684-0987 Email: [email protected] www.pcbloadtorque.com ISO 9001 CERTIFIED A2LA Accredited to ISO 17025
9
Reviewing Figures 8-12 it can be seen that increasing the pitch torque by lowering the friction coefficients will cause an increase in clamp load.
Sample Clamp Load Pitch Torque No
Lubrication 20752 N 5.0 Nm
Lubricated Underhead 24425 N 5.8 Nm
Lubricated Threads 24235 N 5.7 Nm
Lubricated Underhead & Threads
38953 N 9.2 Nm
Friction Coefficient Ranges It is important to note that for each coating/coating, material/material combination there is a range of values that define the frictional characteristics. These ranges are determined by calculating the ±3-sigma friction coefficient values from a particular lot of samples tested. Using the calculated standard deviation (n-1 formula) of the lot tested and assuming a normal distribution of results the ±3-sigma friction values can be calculated using the following equations: Standard Deviation (σσσσ) x: Data Value x: Mean of Data Values (average) n: Number of Samples Mean (x)
Table 1: Example Data (Samples Tightened to 50 Nm)
σ = n - 1
∑(x – x)2
∑x
n x =

PCB LOAD & TORQUE, INC. 24350 Indoplex Circle, Farmington Hills, MI 48335 USA
Phone: 866-684-7107 Fax: 716-684-0987 Email: [email protected] www.pcbloadtorque.com ISO 9001 CERTIFIED A2LA Accredited to ISO 17025
10
±±±±3 Sigma Values (±±±±3σσσσ) Typically a test lot with 10-30 samples will be tested to determine the friction range. The ±3-sigma values estimate the range limits that the entire population will fall into based on the small number of samples tested. The model will allow for 99.73% of the population to fall within the limits. The following figure graphically describes a normal distribution with the calculated values. Note: The larger the sample size the better the distribution model will be. The increase in the
confidence of the model becomes negligible after 30 samples. With geometric parameters assumed constant and using a highly capable tightening tool, the ±3 sigma clamp load range at a given torque value will be directly proportional to the ±3 sigma range in the friction coefficients (from the variances in the three torque factors). Some friction ranges will be wider than others resulting in wider clamp load ranges at a given torque. The following two figures describe both a wide range and thin range of friction coefficients.
x + 3 * σ +3σ =
x - 3 * σ -3σ =
Figure 13: Normal Distribution
x -3σσσσ +3σσσσ
99.73% of Population between ±±±±3σσσσ

PCB LOAD & TORQUE, INC. 24350 Indoplex Circle, Farmington Hills, MI 48335 USA
Phone: 866-684-7107 Fax: 716-684-0987 Email: [email protected] www.pcbloadtorque.com ISO 9001 CERTIFIED A2LA Accredited to ISO 17025
11
The wider the friction coefficient range the wider the clamp load range will be at a given torque value. It is important to control the friction coefficient range in order to obtain a more consistent bolted joint. Torque-Tension Testing Most torque-tension specifications will require tightening a specified bolt/nut/washer combination to a given clamp load value and returning a torque value. The nut and washer will typically have finish/plating, material, and dimensional requirements, while the bolt will have requirements for the material and dimensions. This reduces all of the variances in the joint to the bolt plating or coating.
0
5000
10000
15000
20000
25000
30000
35000
40000
45000
0 10 20 30 40 50
Torque (Nm)
Cla
mp
Lo
ad (
N)
+3 Sigma Mean -3 Sigma
+3σσσσ
-3σσσσ
0
5000
10000
15000
20000
25000
30000
35000
40000
45000
0 10 20 30 40 50
Torque (Nm)
Cla
mp
Lo
ad (
N)
+3 Sigma Mean -3 Sigma
-3σσσσ
+3σσσσ
Figure 14: Wide Friction Range at Given Torque Figure 15: Thin Friction Range at Given Torque
0
5000
10000
15000
20000
25000
30000
0 20 40 60 80
Torque (Nm)
Cla
mp
Lo
ad (
N)
+3 Sigma Mean -3 Sigma
-3σσσσ +3σσσσ
Figure 16: Torque-Tension Test
PCB LOAD & TORQUE, INC. 24350 Indoplex Circle, Farmington Hills, MI 48335 USA
Phone: 866-684-7107 Fax: 716-684-0987 Email: [email protected] www.pcbloadtorque.com ISO 9001 CERTIFIED A2LA Accredited to ISO 17025
12
Figure 16 shows the results of a sample lot being tested and returning the ±3 sigma torque values at a specified tension value. The distribution will be compared to the specified acceptance distribution to determine torque-tension acceptance. The coefficient of friction values can be calculated using the previously described equations along with the torque-tension data. The calculated data will be compared to the specified acceptance distribution data to determine coefficient of friction acceptance. Conclusion Torque values are strictly based on the friction present in the bolted joint assembly. Variances in the friction will lead to variances in the amount of clamp load/tension attained at a specified torque value. Friction variances that can affect the tightening of a bolted joint occur in the underhead/bearing area and in the threads. The friction variances are always a function of two materials or platings of the mating parts. Coefficient of frictions can never be given in terms of one material or plating. Testing of platings/coatings is used to limit the amount of variance allowed in the friction coefficients against a specified material. This allows for the end user to have confidence that the plating/coating being used will have a consistent relationship between torque and tension.

3425 Walden Avenue, Depew, NY 14043 USA pcb.com | [email protected] | 800 828 8840 | +1 716 684 0001
© 2021 PCB Piezotronics - all rights reserved. PCB Piezotronics is a wholly-owned subsidiary of Amphenol Corporation. Endevco is an assumed name of PCB Piezotronics of North Carolina, Inc., which is a wholly-owned subsidiary of PCB Piezotronics, Inc. Accumetrics, Inc. and The Modal Shop, Inc. are wholly-owned subsidiaries of PCB Piezotronics, Inc. IMI Sensors and Larson Davis are Divisions of PCB Piezotronics, Inc. Except for any third party marks for which attribution is provided herein, the company names and product names used in this document may be the registered trademarks or unregistered trademarks of PCB Piezotronics, Inc., PCB Piezotronics of North Carolina, Inc. (d/b/a Endevco), The Modal Shop, Inc. or Accumetrics, Inc. Detailed trademark ownership information is available at www.pcb.com/trademarkownership.
WPL_21_1121