Optimizing TEG Dehydration Process under Metamodel ...
20
energies Article Optimizing TEG Dehydration Process under Metamodel Uncertainty Rajib Mukherjee 1,2 and Urmila M. Diwekar 2, * Citation: Mukherjee, R.; Diwekar, U.M. Optimizing TEG Dehydration Process under Metamodel Uncertainty. Energies 2021, 14, 6177. https://doi.org/10.3390/ en14196177 Academic Editor: Claudio Mele Received: 29 July 2021 Accepted: 23 September 2021 Published: 28 September 2021 Publisher’s Note: MDPI stays neutral with regard to jurisdictional claims in published maps and institutional affil- iations. Copyright: © 2021 by the authors. Licensee MDPI, Basel, Switzerland. This article is an open access article distributed under the terms and conditions of the Creative Commons Attribution (CC BY) license (https:// creativecommons.org/licenses/by/ 4.0/). 1 Department of Chemical Engineering, The University of Texas Permian Basin, Odessa, TX 79762, USA; [email protected] 2 Vishwamitra Research Institute, Crystal Lake, IL 60012, USA * Correspondence: [email protected]; Tel.: +1-630-886-3047 Abstract: Natural gas processing requires the removal of acidic gases and dehydration using absorp- tion, mainly conducted in tri-ethylene glycol (TEG). The dehydration process is accompanied by the emission of volatile organic compounds, including BTEX. In our previous work, multi-objective optimization was undertaken to determine the optimal operating conditions in terms of the process parameters that can mitigate BTEX emission using data-driven metamodeling and metaheuristic op- timization. Data obtained from a process simulation conducted using the ProMax ® process simulator were used to develop a metamodel with machine learning techniques to reduce the computational time of the iterations in a robust process simulation. The metamodels were created using limited samples and some underlying phenomena must therefore be excluded. This introduces the so-called metamodeling uncertainty. Thus, the performance of the resulting optimized process variables may be compromised by the lack of adequately accounting for the uncertainty introduced by the metamodel. In the present work, the bias of the metamodel uncertainty was addressed for parameter optimization. An algorithmic framework was developed for parameter optimization, given these uncertainties. In this framework, metamodel uncertainties are quantified using real model data to generate distribution functions. We then use the novel Better Optimization of Nonlinear Uncertain Systems (BONUS) algorithm to solve the problem. BTEX mitigation is used as the objective of the optimization. Our algorithm allows the determination of the optimal process condition for BTEX emission mitigation from the TEG dehydration process under metamodel uncertainty. The BONUS algorithm determines optimal process conditions compared to those from the metaheuristic method, resulting in BTEX emission mitigation up to 405.25 ton/yr. Keywords: TEG dehydration process; BTEX mitigation; metamodeling uncertainty; support vector regression (SVR); BONUS algorithm; Value of Stochastic Solution (VSS) 1. Introduction Natural gas (NG) obtained from oil and gas wells needs to be sweetened, followed by dehydration for preprocessing to meet sales gas requirements. Dehydration is mainly performed by absorption in tri-ethylene glycol (TEG). The process consists of an absorp- tion column, a flash tank, a stripping column, and a reboiler. The wet gas from the NG sweetening process contains, in addition to water, different volatile organic compounds (VOCs), such as toluene, benzene, ethylbenzene, and isomers of xylene, known as BTEX, and is transported to the absorption column where it comes into contact with lean TEG. Rich TEG with water and BTEX flows through a flash tank from the absorption column to the regeneration column. The total BTEX and other VOC emissions from the dehydration process originate from the flash tank and regeneration unit. In our previous work, meta- models were developed from the simulated process data and metaheuristic optimization to optimize different process variables for BTEX emission reduction and maintain the dry gas specification [1]. The uncertainty involved in the optimization process is either Energies 2021, 14, 6177. https://doi.org/10.3390/en14196177 https://www.mdpi.com/journal/energies
-
Upload
khangminh22 -
Category
Documents
-
view
7 -
download
0
Transcript of Optimizing TEG Dehydration Process under Metamodel ...
energies
Article
Optimizing TEG Dehydration Process underMetamodel Uncertainty
Rajib Mukherjee 1,2 and Urmila M. Diwekar 2,*
�����������������
Citation: Mukherjee, R.; Diwekar,
U.M. Optimizing TEG Dehydration
Process under Metamodel
Uncertainty. Energies 2021, 14, 6177.
https://doi.org/10.3390/
en14196177
Academic Editor: Claudio Mele
Received: 29 July 2021
Accepted: 23 September 2021
Published: 28 September 2021
Publisher’s Note: MDPI stays neutral
with regard to jurisdictional claims in
published maps and institutional affil-
iations.
Copyright: © 2021 by the authors.
Licensee MDPI, Basel, Switzerland.
This article is an open access article
distributed under the terms and
conditions of the Creative Commons
Attribution (CC BY) license (https://
creativecommons.org/licenses/by/
4.0/).
1 Department of Chemical Engineering, The University of Texas Permian Basin, Odessa, TX 79762, USA;[email protected]
2 Vishwamitra Research Institute, Crystal Lake, IL 60012, USA* Correspondence: [email protected]; Tel.: +1-630-886-3047
Abstract: Natural gas processing requires the removal of acidic gases and dehydration using absorp-tion, mainly conducted in tri-ethylene glycol (TEG). The dehydration process is accompanied bythe emission of volatile organic compounds, including BTEX. In our previous work, multi-objectiveoptimization was undertaken to determine the optimal operating conditions in terms of the processparameters that can mitigate BTEX emission using data-driven metamodeling and metaheuristic op-timization. Data obtained from a process simulation conducted using the ProMax® process simulatorwere used to develop a metamodel with machine learning techniques to reduce the computationaltime of the iterations in a robust process simulation. The metamodels were created using limitedsamples and some underlying phenomena must therefore be excluded. This introduces the so-calledmetamodeling uncertainty. Thus, the performance of the resulting optimized process variablesmay be compromised by the lack of adequately accounting for the uncertainty introduced by themetamodel. In the present work, the bias of the metamodel uncertainty was addressed for parameteroptimization. An algorithmic framework was developed for parameter optimization, given theseuncertainties. In this framework, metamodel uncertainties are quantified using real model data togenerate distribution functions. We then use the novel Better Optimization of Nonlinear UncertainSystems (BONUS) algorithm to solve the problem. BTEX mitigation is used as the objective of theoptimization. Our algorithm allows the determination of the optimal process condition for BTEXemission mitigation from the TEG dehydration process under metamodel uncertainty. The BONUSalgorithm determines optimal process conditions compared to those from the metaheuristic method,resulting in BTEX emission mitigation up to 405.25 ton/yr.
Keywords: TEG dehydration process; BTEX mitigation; metamodeling uncertainty; support vectorregression (SVR); BONUS algorithm; Value of Stochastic Solution (VSS)
1. Introduction
Natural gas (NG) obtained from oil and gas wells needs to be sweetened, followedby dehydration for preprocessing to meet sales gas requirements. Dehydration is mainlyperformed by absorption in tri-ethylene glycol (TEG). The process consists of an absorp-tion column, a flash tank, a stripping column, and a reboiler. The wet gas from the NGsweetening process contains, in addition to water, different volatile organic compounds(VOCs), such as toluene, benzene, ethylbenzene, and isomers of xylene, known as BTEX,and is transported to the absorption column where it comes into contact with lean TEG.Rich TEG with water and BTEX flows through a flash tank from the absorption column tothe regeneration column. The total BTEX and other VOC emissions from the dehydrationprocess originate from the flash tank and regeneration unit. In our previous work, meta-models were developed from the simulated process data and metaheuristic optimizationto optimize different process variables for BTEX emission reduction and maintain thedry gas specification [1]. The uncertainty involved in the optimization process is either
Energies 2021, 14, 6177. https://doi.org/10.3390/en14196177 https://www.mdpi.com/journal/energies
Energies 2021, 14, 6177 2 of 20
related to data, including inlet feed composition, flow rate, or metamodeling [2]. Themetamodel-based design of the system treated the metamodel as the real model, ignor-ing the influence of metamodeling uncertainty. Thus, the resulting optimized processvariables may be compromised by the lack of adequately accounting for the uncertaintyintroduced by the metamodel. In the present work, the bias of metamodel uncertainty wasaddressed for process variable optimization. An algorithmic framework was developedto address the problem of process variable optimization under metamodel uncertainties.In this framework, we use the novel Better Optimization of Nonlinear Uncertain Systems(BONUS) algorithm to solve the problem [3,4]. The objective of the optimization process isto mitigate BTEX emission with dry gas water content as a constraint. The effectiveness ofour algorithm is shown by the increased value of the stochastic solution (VSS) at lower drygas water content.
Aromatics are often present in natural gas in trace amounts. Research findings ofthe CDC revealed severe health impacts of BTEX [5]. BTEX compounds are toxic innature, and can produce neurological complications and carcinogenic effects. During thedehydration process, water and BTEX are absorbed in glycol in the absorption unit, whichis later released to the atmosphere from the regenerator. Thus, sustainable natural gasprocessing requires the mitigation of BTEX emissions. The US Clean Air Act Amendments(CAAA) from 1990 regulates BTEX emissions of more than ten tons per year for any givenfacility, or more than twenty-five tons per year for the total hazardous air pollutants (HAP).Accordingly, several dehydration plants are classified as major BTEX polluters [6,7]. TEGhas the highest BTEX affinity among different glycol dehydrates, which results in maximumemissions from the process.
The existing literature on optimizing the natural gas dehydration process primarilycomprises sensitivity analysis for determining the influence of different process parameters.Gupta et al. [8] carried out a sensitivity analysis to obtain process conditions that canoptimally reduce loss of TEG. A parametric study was performed by Gandhidasan [9] todetermine the effect of parameters such as pressure, temperature, and TEG circulation rateon the design of the dehydration unit. Rahimpour et al. [10] improved the dehydrationunit’s performance using process simulations. Jacob [11] found that the stripping gas flowrate has a larger impact on drying than the reboiler temperature by studying the effect ofthe number of plates in the absorber and TEG circulation rates on dry gas water. Ranjbaret al. [12] used relative sensitivity analysis to optimize the TEG plants. HYSYS® processsimulator data was used for their analysis. Kamin et al. [13] used Design Expert softwareand the HYSYS® simulator for data generation and subsequent optimization of the glycolcirculation rate, reboiler temperature, and the number of trays in the absorber. Neagu andCursaru [14] considered the effect of the reboiler temperature and stripping gas flow rate,and found that the optimum stripping gas flow rate can enhance TEG regeneration andreduce dry gas water content. Chebbi et al. [15] optimized both the process and design pa-rameters. TEG concentration and circulation rate, and the number of trays in the absorber,were optimized to minimize the capital cost, TEG pumping, utility requirements for thereboiler, and stripping gas rate. Mukherjee and Diwekar [1] performed a multi-objectiveoptimization (MOO) of the dehydration process with economic and environmental objec-tives using a metamodel of the process. Traditionally, sustainable process design estimatesdesign parameters based on economic, environmental, and societal aspects, using processsustainability assessment tools in a retroactive manner [16,17]. Traditionally, greenhousegas (GHG) emissions are considered for environmental impact assessment [18,19]. Mukher-jee and Diwekar [1] addressed environmental sustainability through BTEX mitigation withprocess parameter optimization. Process data was generated using the ProMax® simulator,which was used to derive the surrogate model for optimization. However, the surrogatemodel considered was subjected to metamodeling uncertainty, which arises due to the errorbetween the process model and the metamodel at unsampled locations [20]. Metamodelinguncertainty is often overlooked in model-based optimization. To address the MOO problemunder metamodeling uncertainties, this study developed a new framework called MOO
Energies 2021, 14, 6177 3 of 20
under metamodeling uncertainties (MOOMU). The selected process data are employed toconstruct the support vector regression (SVR) metamodels of the objective and constraint.Hammersley sequence sampling (HSS) of the error distributions is adopted to quantify theimpact of metamodeling uncertainties. The MOOMU framework is employed to explorethe optimum TEG dehydration process.
Essential variables differ among chemical systems due to the difference in their type,scale, and properties. In cases in which many variables are present, important variableselection is required; variables can be selected using multivariate statistics or machinelearning [21–23]. In the present problem, important variables selected through lasso, asfound in Mukherjee and Diwekar (2021), were used [1]. Surrogate models are generated toquantify the effects of the important variables on the corresponding dependent variablesof the process. In the present work, support vector regression (SVR), which is a machinelearning technique, was applied for metamodel generation. The SVR-based metamodelthus developed is used for the optimization of the process with the BONUS algorithm.Through optimization, the optimal process operating variables that minimize BTEX/VOCemissions at the different dry gas water content limits were determined.
Metamodel uncertainty arises due to the dispersed nature of the input-output dataused for developing the model. In this work, optimization of the input space of the SVRmetamodel was performed with a stochastic optimization known as Better Optimization forNonlinear Uncertain Systems (BONUS). The BONUS algorithm uses a reweighting schemeto obtain the value of the stochastic objective function and constraints and derivatives.In our previous work, the metamodel generated from the simulated data was used foroptimization without considering its uncertainty. In this work, we quantify the uncertain-ties as error function distributions. The objective function and constraints were changedfrom deterministic values to expected values. Previously, BONUS has been extensivelyused to solve chemical engineering problems, including network optimization [24] andspatiotemporal sensor placement [25,26]. In the present work, we developed an algorithmicframework for a robust metamodel-based chemical process optimization that significantlyreduces the impact of metamodel uncertainty using BONUS.
This paper is organized as follows. The next section describes the dehydration processin natural gas processing and emissions from the process. The solution methodologysection explains process simulation for data generation, modeling using SVR, and multi-objective optimization using BONUS. This is followed by presentation of the results fromthe application of the SVR-BONUS-based algorithm for dehydration process optimizationand the effect on different process variables, followed by conclusions.
2. Materials and Methods2.1. Problem Description
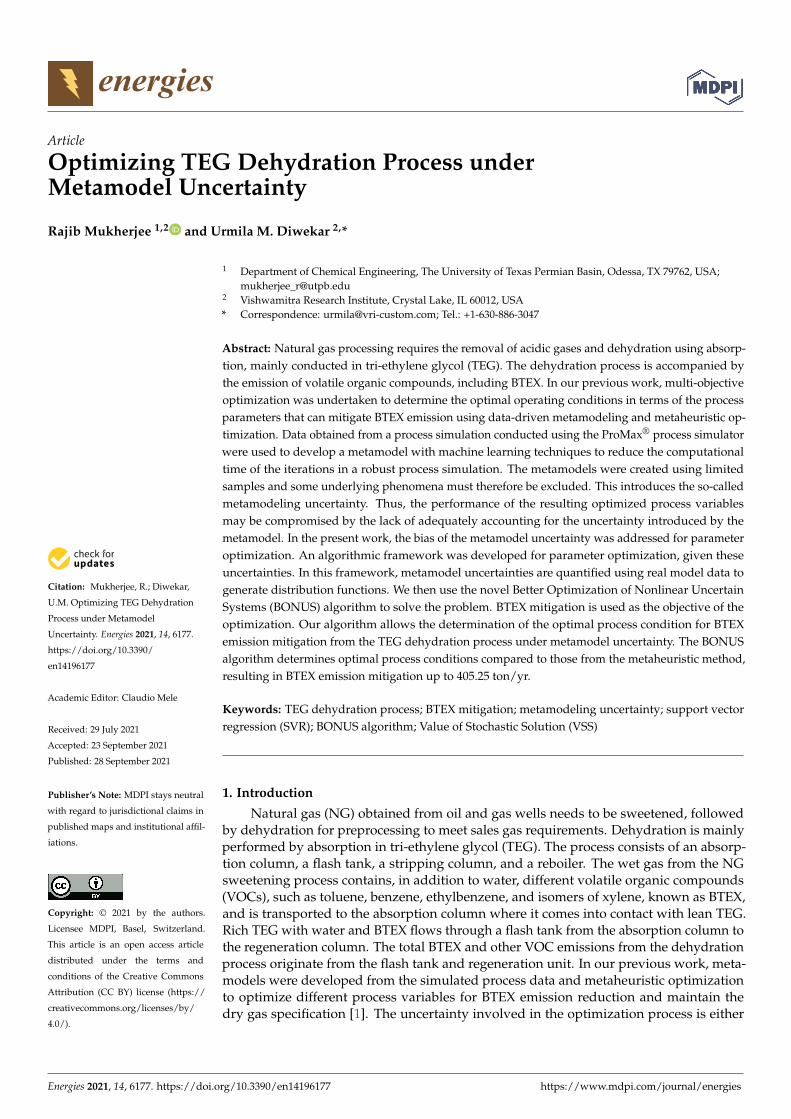
Natural gas processing comprises two process units: acid gas removal and dehydra-tion. Dehydration can be performed by different methods, including via the use of liquidhygroscopic substances such as glycols, solid hygroscopic substances, and condensation.Glycol as a dehydrating agent has several advantages, including dehydration capacity,VOC absorption, and loss. TEG is the most-used glycol in industrial applications andis the subject of our analysis. TEG dehydration process has an absorption section and astripping section. Lean TEG entering the tower in the absorption section absorbs waterfrom wet gas. Rich TEG solvent leaving the absorber is regenerated by a stripper moisterin a regenerator. Stripping gas is injected into the reboiler by drawing from the dry gasstream. The regenerated TEG is sent back to the absorber for desiccation. A schematicdiagram of the TEG dehydration process is shown in Figure 1.
Energies 2021, 14, 6177 4 of 20Energies 2021, 14, x FOR PEER REVIEW 4 of 20
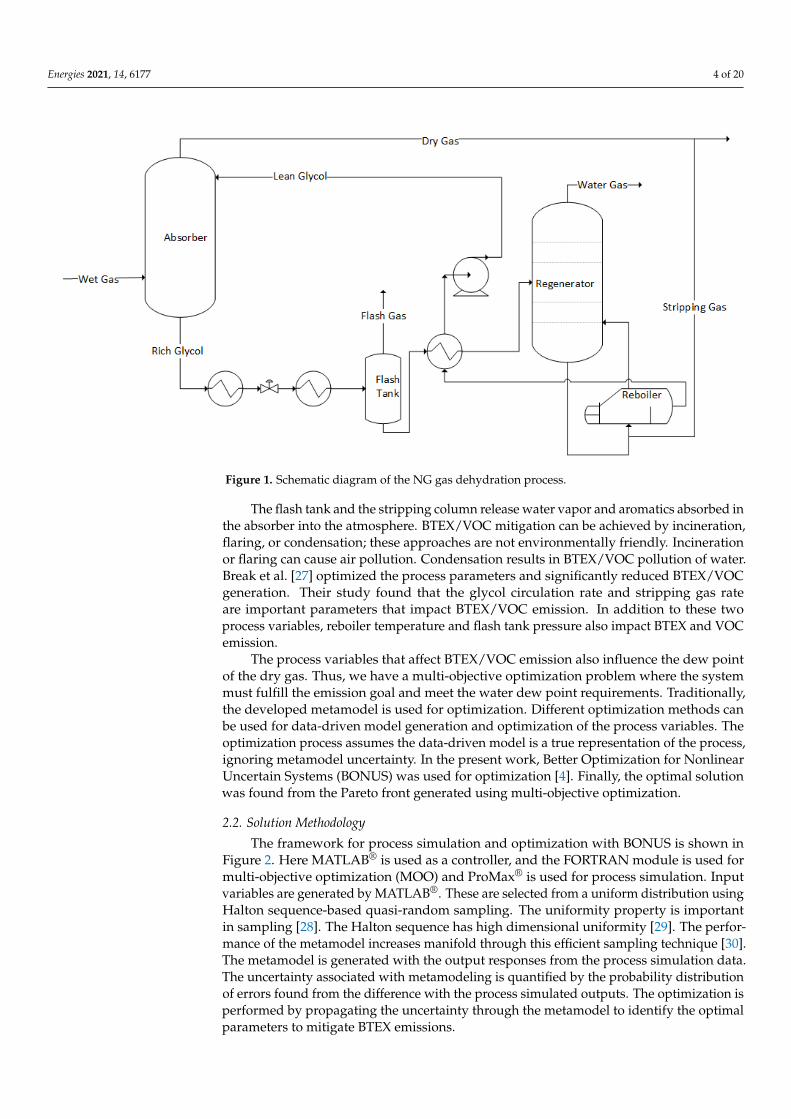
Figure 1. Schematic diagram of the NG gas dehydration process.
The flash tank and the stripping column release water vapor and aromatics absorbed
in the absorber into the atmosphere. BTEX/VOC mitigation can be achieved by incinera-
tion, flaring, or condensation; these approaches are not environmentally friendly. Incin-
eration or flaring can cause air pollution. Condensation results in BTEX/VOC pollution of
water. Break et al. [27] optimized the process parameters and significantly reduced
BTEX/VOC generation. Their study found that the glycol circulation rate and stripping
gas rate are important parameters that impact BTEX/VOC emission. In addition to these
two process variables, reboiler temperature and flash tank pressure also impact BTEX and
VOC emission.
The process variables that affect BTEX/VOC emission also influence the dew point
of the dry gas. Thus, we have a multi-objective optimization problem where the system
must fulfill the emission goal and meet the water dew point requirements. Traditionally,
the developed metamodel is used for optimization. Different optimization methods can
be used for data-driven model generation and optimization of the process variables. The
optimization process assumes the data-driven model is a true representation of the pro-
cess, ignoring metamodel uncertainty. In the present work, Better Optimization for Non-
linear Uncertain Systems (BONUS) was used for optimization [4]. Finally, the optimal so-
lution was found from the Pareto front generated using multi-objective optimization.
2.2. Solution Methodology
The framework for process simulation and optimization with BONUS is shown in
Figure 2. Here MATLAB® is used as a controller, and the FORTRAN module is used for
multi-objective optimization (MOO) and ProMax® is used for process simulation. Input
variables are generated by MATLAB® . These are selected from a uniform distribution us-
ing Halton sequence-based quasi-random sampling. The uniformity property is im-
portant in sampling [28]. The Halton sequence has high dimensional uniformity [29]. The
performance of the metamodel increases manifold through this efficient sampling tech-
nique [30]. The metamodel is generated with the output responses from the process sim-
ulation data. The uncertainty associated with metamodeling is quantified by the proba-
bility distribution of errors found from the difference with the process simulated outputs.
Figure 1. Schematic diagram of the NG gas dehydration process.
The flash tank and the stripping column release water vapor and aromatics absorbed inthe absorber into the atmosphere. BTEX/VOC mitigation can be achieved by incineration,flaring, or condensation; these approaches are not environmentally friendly. Incinerationor flaring can cause air pollution. Condensation results in BTEX/VOC pollution of water.Break et al. [27] optimized the process parameters and significantly reduced BTEX/VOCgeneration. Their study found that the glycol circulation rate and stripping gas rateare important parameters that impact BTEX/VOC emission. In addition to these twoprocess variables, reboiler temperature and flash tank pressure also impact BTEX and VOCemission.
The process variables that affect BTEX/VOC emission also influence the dew pointof the dry gas. Thus, we have a multi-objective optimization problem where the systemmust fulfill the emission goal and meet the water dew point requirements. Traditionally,the developed metamodel is used for optimization. Different optimization methods canbe used for data-driven model generation and optimization of the process variables. Theoptimization process assumes the data-driven model is a true representation of the process,ignoring metamodel uncertainty. In the present work, Better Optimization for NonlinearUncertain Systems (BONUS) was used for optimization [4]. Finally, the optimal solutionwas found from the Pareto front generated using multi-objective optimization.
2.2. Solution Methodology
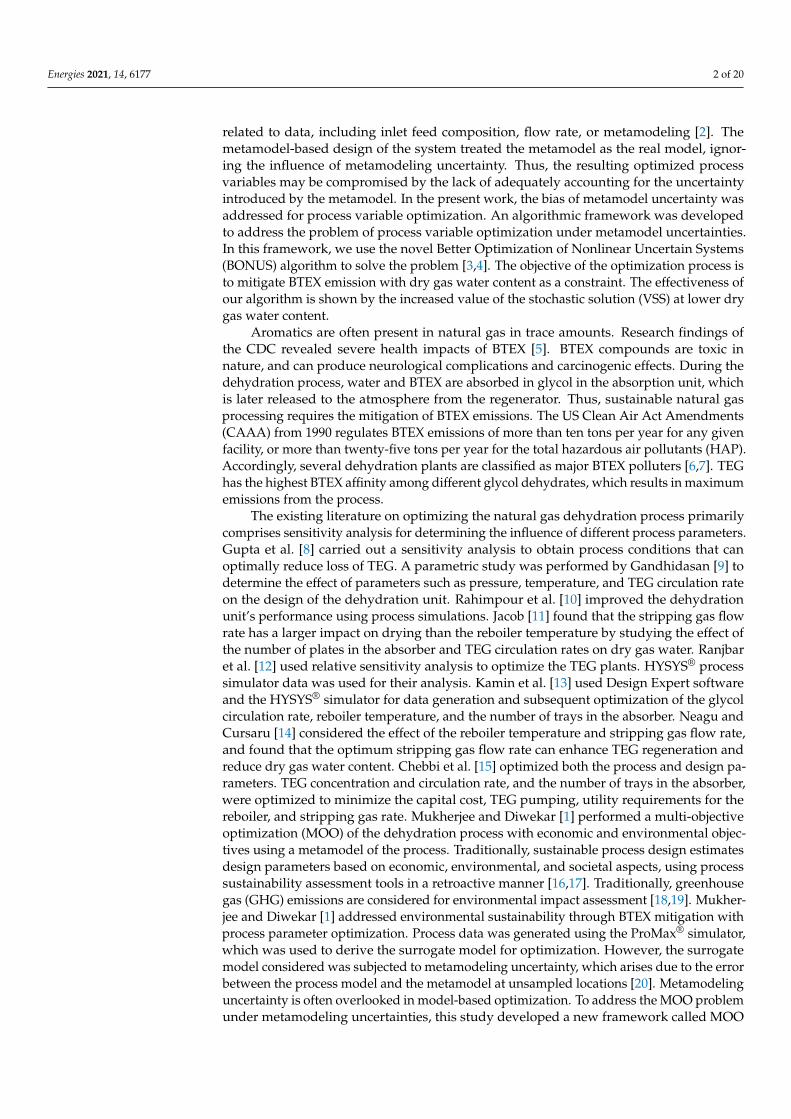
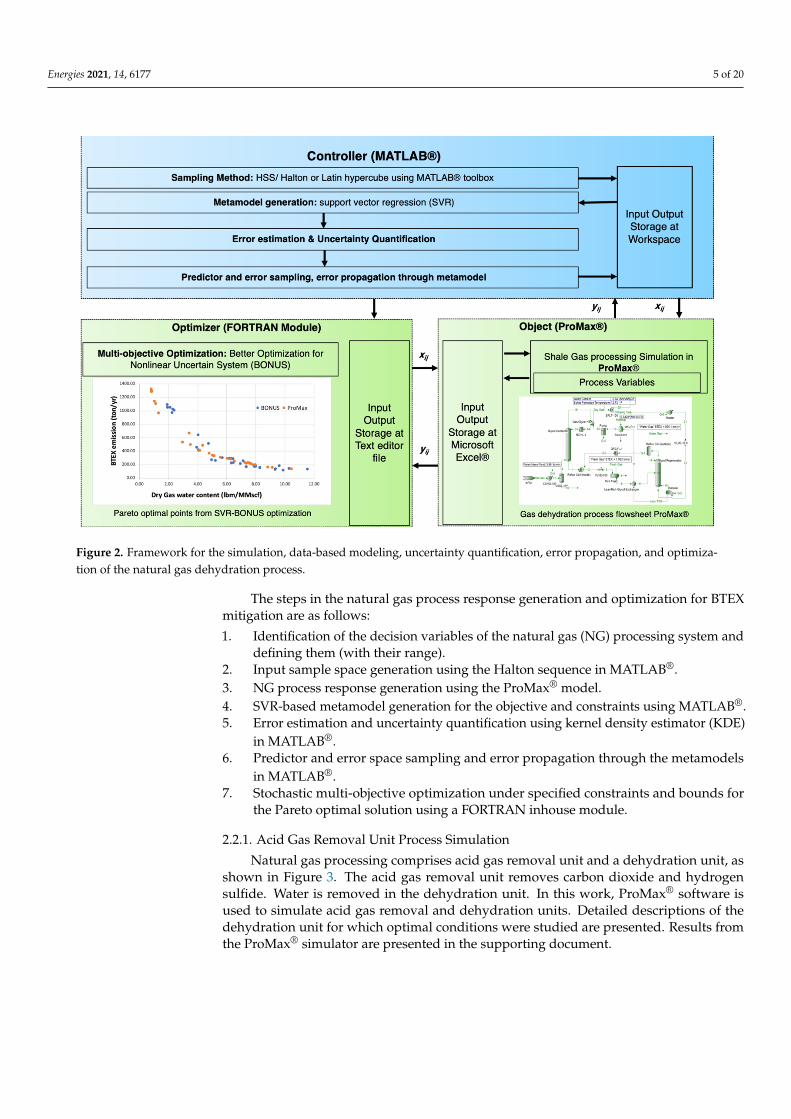
The framework for process simulation and optimization with BONUS is shown inFigure 2. Here MATLAB® is used as a controller, and the FORTRAN module is used formulti-objective optimization (MOO) and ProMax® is used for process simulation. Inputvariables are generated by MATLAB®. These are selected from a uniform distribution usingHalton sequence-based quasi-random sampling. The uniformity property is importantin sampling [28]. The Halton sequence has high dimensional uniformity [29]. The perfor-mance of the metamodel increases manifold through this efficient sampling technique [30].The metamodel is generated with the output responses from the process simulation data.The uncertainty associated with metamodeling is quantified by the probability distributionof errors found from the difference with the process simulated outputs. The optimization isperformed by propagating the uncertainty through the metamodel to identify the optimalparameters to mitigate BTEX emissions.
Energies 2021, 14, 6177 5 of 20
Energies 2021, 14, x FOR PEER REVIEW 5 of 20
The optimization is performed by propagating the uncertainty through the metamodel to
identify the optimal parameters to mitigate BTEX emissions.
Figure 2. Framework for the simulation, data-based modeling, uncertainty quantification, error propagation, and optimi-
zation of the natural gas dehydration process.
The steps in the natural gas process response generation and optimization for BTEX
mitigation are as follows:
1. Identification of the decision variables of the natural gas (NG) processing system and
defining them (with their range).
2. Input sample space generation using the Halton sequence in MATLAB® .
3. NG process response generation using the ProMax® model.
4. SVR-based metamodel generation for the objective and constraints using MATLAB® .
5. Error estimation and uncertainty quantification using kernel density estimator (KDE)
in MATLAB® .
6. Predictor and error space sampling and error propagation through the metamodels
in MATLAB® .
7. Stochastic multi-objective optimization under specified constraints and bounds for
the Pareto optimal solution using a FORTRAN inhouse module.
2.2.1. Acid Gas Removal Unit Process Simulation
Natural gas processing comprises acid gas removal unit and a dehydration unit, as
shown in Figure 3. The acid gas removal unit removes carbon dioxide and hydrogen sul-
fide. Water is removed in the dehydration unit. In this work, ProMax® software is used to
simulate acid gas removal and dehydration units. Detailed descriptions of the dehydra-
tion unit for which optimal conditions were studied are presented. Results from the Pro-
Max® simulator are presented in the supporting document.
Figure 2. Framework for the simulation, data-based modeling, uncertainty quantification, error propagation, and optimiza-tion of the natural gas dehydration process.
The steps in the natural gas process response generation and optimization for BTEXmitigation are as follows:
1. Identification of the decision variables of the natural gas (NG) processing system anddefining them (with their range).
2. Input sample space generation using the Halton sequence in MATLAB®.3. NG process response generation using the ProMax® model.4. SVR-based metamodel generation for the objective and constraints using MATLAB®.5. Error estimation and uncertainty quantification using kernel density estimator (KDE)
in MATLAB®.6. Predictor and error space sampling and error propagation through the metamodels
in MATLAB®.7. Stochastic multi-objective optimization under specified constraints and bounds for
the Pareto optimal solution using a FORTRAN inhouse module.
2.2.1. Acid Gas Removal Unit Process Simulation
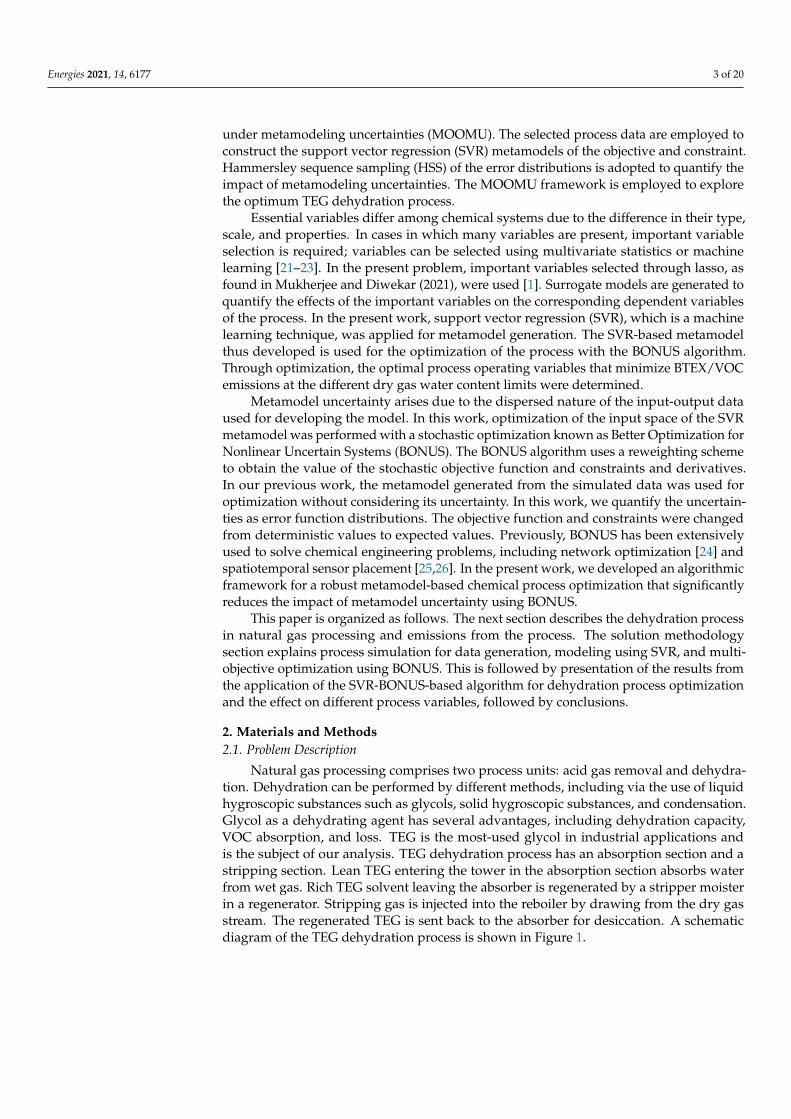
Natural gas processing comprises acid gas removal unit and a dehydration unit, asshown in Figure 3. The acid gas removal unit removes carbon dioxide and hydrogensulfide. Water is removed in the dehydration unit. In this work, ProMax® software isused to simulate acid gas removal and dehydration units. Detailed descriptions of thedehydration unit for which optimal conditions were studied are presented. Results fromthe ProMax® simulator are presented in the supporting document.
Energies 2021, 14, 6177 6 of 20Energies 2021, 14, x FOR PEER REVIEW 6 of 20
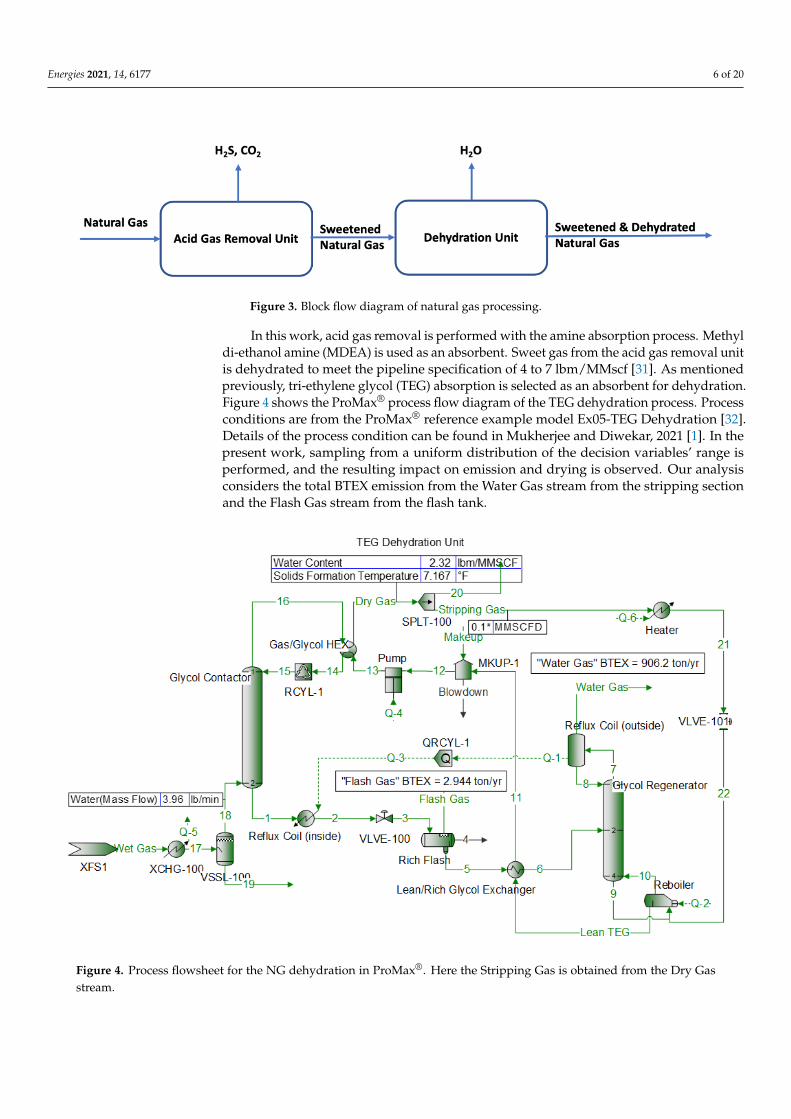
Figure 3. Block flow diagram of natural gas processing.
In this work, acid gas removal is performed with the amine absorption process. Me-
thyl di-ethanol amine (MDEA) is used as an absorbent. Sweet gas from the acid gas re-
moval unit is dehydrated to meet the pipeline specification of 4 to 7 lbm/MMscf [31]. As
mentioned previously, tri-ethylene glycol (TEG) absorption is selected as an absorbent for
dehydration. Figure 4 shows the ProMax® process flow diagram of the TEG dehydration
process. Process conditions are from the ProMax® reference example model Ex05-TEG De-
hydration [32]. Details of the process condition can be found in Mukherjee and Diwekar,
2021 [1]. In the present work, sampling from a uniform distribution of the decision varia-
bles’ range is performed, and the resulting impact on emission and drying is observed.
Our analysis considers the total BTEX emission from the Water Gas stream from the strip-
ping section and the Flash Gas stream from the flash tank.
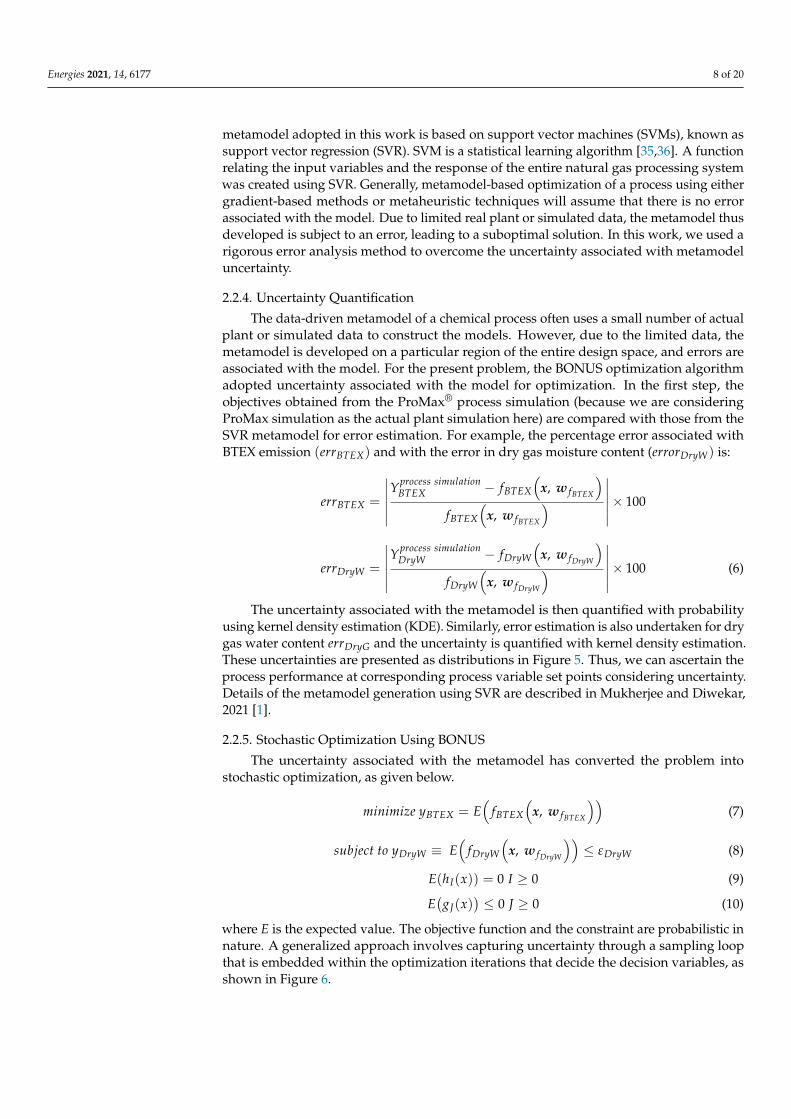
Figure 4. Process flowsheet for the NG dehydration in ProMax® . Here the Stripping Gas is obtained from the Dry Gas
stream.
Figure 3. Block flow diagram of natural gas processing.
In this work, acid gas removal is performed with the amine absorption process. Methyldi-ethanol amine (MDEA) is used as an absorbent. Sweet gas from the acid gas removal unitis dehydrated to meet the pipeline specification of 4 to 7 lbm/MMscf [31]. As mentionedpreviously, tri-ethylene glycol (TEG) absorption is selected as an absorbent for dehydration.Figure 4 shows the ProMax® process flow diagram of the TEG dehydration process. Processconditions are from the ProMax® reference example model Ex05-TEG Dehydration [32].Details of the process condition can be found in Mukherjee and Diwekar, 2021 [1]. In thepresent work, sampling from a uniform distribution of the decision variables’ range isperformed, and the resulting impact on emission and drying is observed. Our analysisconsiders the total BTEX emission from the Water Gas stream from the stripping sectionand the Flash Gas stream from the flash tank.
Energies 2021, 14, x FOR PEER REVIEW 6 of 20
Figure 3. Block flow diagram of natural gas processing.
In this work, acid gas removal is performed with the amine absorption process. Me-
thyl di-ethanol amine (MDEA) is used as an absorbent. Sweet gas from the acid gas re-
moval unit is dehydrated to meet the pipeline specification of 4 to 7 lbm/MMscf [31]. As
mentioned previously, tri-ethylene glycol (TEG) absorption is selected as an absorbent for
dehydration. Figure 4 shows the ProMax® process flow diagram of the TEG dehydration
process. Process conditions are from the ProMax® reference example model Ex05-TEG De-
hydration [32]. Details of the process condition can be found in Mukherjee and Diwekar,
2021 [1]. In the present work, sampling from a uniform distribution of the decision varia-
bles’ range is performed, and the resulting impact on emission and drying is observed.
Our analysis considers the total BTEX emission from the Water Gas stream from the strip-
ping section and the Flash Gas stream from the flash tank.
Figure 4. Process flowsheet for the NG dehydration in ProMax® . Here the Stripping Gas is obtained from the Dry Gas
stream.
Figure 4. Process flowsheet for the NG dehydration in ProMax®. Here the Stripping Gas is obtained from the Dry Gasstream.

Energies 2021, 14, 6177 7 of 20
2.2.2. Data Generation and Process Optimization
The present work aims to determine the optimal operating conditions in a glycoldehydration unit that will minimize BTEX emission and fulfill the dew point requirementusing an efficient data-driven optimization method. In most TEG dehydration plants, theglycol circulation is more glycol than the minimum required. Thus, it is imperative tooptimize circulation. The other process variables, including stripping gas flow rate, reboilertemperature, absorber pressure, flash gas pressure, and lean solvent temperature, may alsoimpact BTEX/VOC emission. In this work, as identified by Mukherjee and Diwekar (2021),the process variables that have a significant impact on BTEX emission are used [1].
For a natural gas dehydration unit, two different goals need to be achieved. The pro-cess should have a high drying efficiency and be environmentally friendly with minimumtoxic release, resulting in a multi-objective optimization (MOO) problem. The solution ofMOO is typically achieved by quantifying the trade-offs between the two conflicting objec-tives. The economic objective, drying efficiency, and the environmental objective, BTEXmitigation, are conflicting in nature. Thus, the impact of the different process variablescan show completely different trends. MOO is solved by either preference-based methodsor generating methods [33]. The weighting and constraint method, as used in the presentwork, is a generating method. Here we can generate a set of solutions known as the Paretoset. The Pareto set provides the trade-off surface between the conflicting objectives. Ourgoal is to minimize the emission within the dry gas water content specifications, which isbetween 4 and 7 lbm/MMscf [31]. The ε− constraint method that shows the Pareto pointsis used.
The process optimization objective in the present problem needs to find the optimalvalues of the process variables where the BTEX emission (yBTEX). is minimized while maxi-mizing drying, i.e., minimizing dry gas water content (yDryW). The constraint optimizationmethod is formulated as:
minimize yBTEX = fBTEX
(x, w fBTEX
)(1)
Subject to yDryW ≡ fDryW
(x, w fDryW
)≤ εDryW (2)
hI(x) = 0 I ≥ 0 (3)
gJ(x) ≤ 0 J ≥ 0 (4)
li ≤ xi ≤ ui i = 1, 2, . . . ..n. (5)
where the objective functions yBTEX and yDryW denote BTEX emission and dry gas watercontent respectively, x = [x1, x2, . . . ., xn]
T is the n− dimensional vector of process operatingvariables, fBTEX is the function correlating BTEX emission and fDryW is that correlatingdry gas water content with the inputs estimated with machine learning, and w fBTEX andw fDryW are the parameter vector of the functions fBTEX and fDryW respectively; h and g areequality and inequality constraints, respectively, and ui and li are the upper and the lowerbound of xi, respectively. Equations (1)–(5) describe an ε-constrained method.
The optimization problem is solved multiple times by changing the value of the param-eter on the right-hand side as in Equation (2) to generate the Pareto set. The optimizationis performed in two steps. Firstly, the support vector regression-based process models,fBTEX
(x, w fBTEX
)and fDryW
(x, w fDryW
), is developed, followed by error analysis with
estimation, uncertainty quantification, variable sampling error propagation, and finallyoptimizing the input space (x) of the process using BONUS to minimize the objectivefunction as given in Equation (1).
2.2.3. Metamodel Generation with Support Vector Regression (SVR)
Metamodeling of complex chemical process phenomena has been used in multipleapplications [34]. Traditionally, metamodels are statistical or polynomial in nature. The
Energies 2021, 14, 6177 8 of 20
metamodel adopted in this work is based on support vector machines (SVMs), known assupport vector regression (SVR). SVM is a statistical learning algorithm [35,36]. A functionrelating the input variables and the response of the entire natural gas processing systemwas created using SVR. Generally, metamodel-based optimization of a process using eithergradient-based methods or metaheuristic techniques will assume that there is no errorassociated with the model. Due to limited real plant or simulated data, the metamodel thusdeveloped is subject to an error, leading to a suboptimal solution. In this work, we used arigorous error analysis method to overcome the uncertainty associated with metamodeluncertainty.
2.2.4. Uncertainty Quantification
The data-driven metamodel of a chemical process often uses a small number of actualplant or simulated data to construct the models. However, due to the limited data, themetamodel is developed on a particular region of the entire design space, and errors areassociated with the model. For the present problem, the BONUS optimization algorithmadopted uncertainty associated with the model for optimization. In the first step, theobjectives obtained from the ProMax® process simulation (because we are consideringProMax simulation as the actual plant simulation here) are compared with those from theSVR metamodel for error estimation. For example, the percentage error associated withBTEX emission (errBTEX) and with the error in dry gas moisture content (errorDryW) is:
errBTEX =
∣∣∣∣∣∣Yprocess simulation
BTEX − fBTEX
(x, w fBTEX
)fBTEX
(x, w fBTEX
)∣∣∣∣∣∣× 100
errDryW =
∣∣∣∣∣∣Yprocess simulation
DryW − fDryW
(x, w fDryW
)fDryW
(x, w fDryW
)∣∣∣∣∣∣× 100 (6)
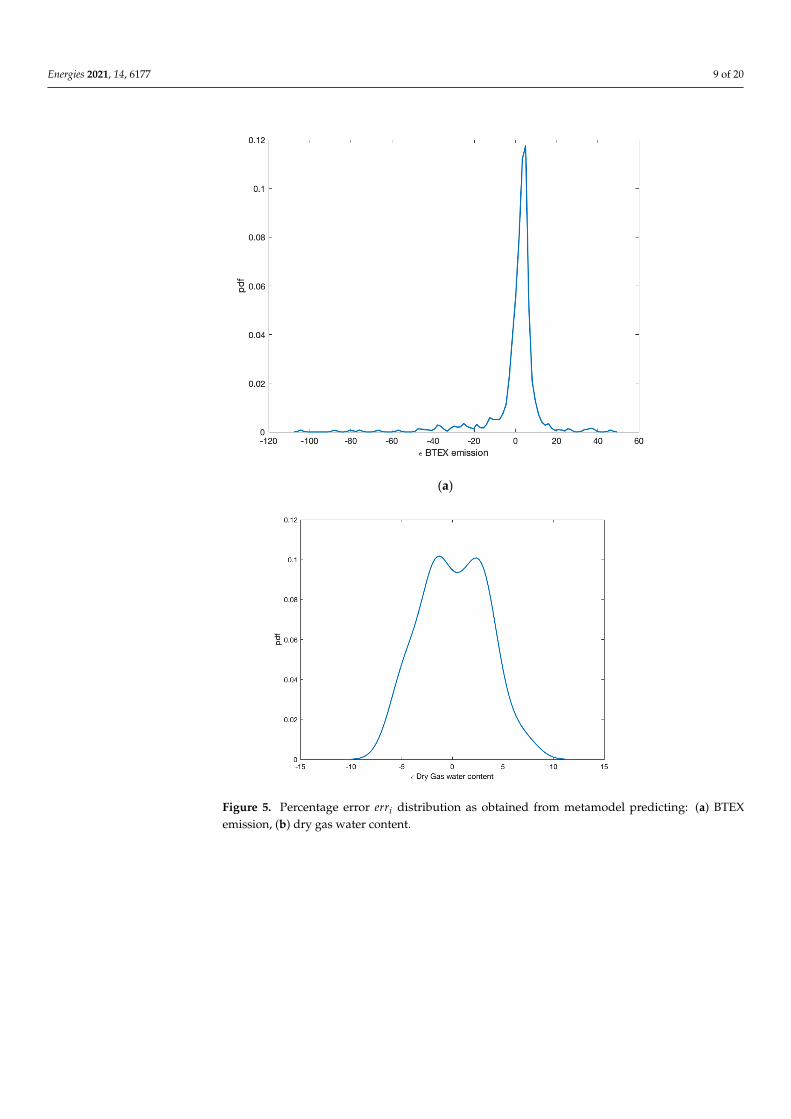
The uncertainty associated with the metamodel is then quantified with probabilityusing kernel density estimation (KDE). Similarly, error estimation is also undertaken for drygas water content errDryG and the uncertainty is quantified with kernel density estimation.These uncertainties are presented as distributions in Figure 5. Thus, we can ascertain theprocess performance at corresponding process variable set points considering uncertainty.Details of the metamodel generation using SVR are described in Mukherjee and Diwekar,2021 [1].
2.2.5. Stochastic Optimization Using BONUS
The uncertainty associated with the metamodel has converted the problem intostochastic optimization, as given below.
minimize yBTEX = E(
fBTEX
(x, w fBTEX
))(7)
subject to yDryW ≡ E(
fDryW
(x, w fDryW
))≤ εDryW (8)
E(hI(x)) = 0 I ≥ 0 (9)
E(
gJ(x))≤ 0 J ≥ 0 (10)
where E is the expected value. The objective function and the constraint are probabilistic innature. A generalized approach involves capturing uncertainty through a sampling loopthat is embedded within the optimization iterations that decide the decision variables, asshown in Figure 6.
Energies 2021, 14, 6177 9 of 20Energies 2021, 14, x FOR PEER REVIEW 9 of 20
(a)
(b)
Figure 5. Percentage error 𝑒𝑟𝑟𝑖 distribution as obtained from metamodel predicting: (a) BTEX emission, (b) dry gas water
content.
2.2.5. Stochastic Optimization Using BONUS
The uncertainty associated with the metamodel has converted the problem into sto-
chastic optimization, as given below.
𝑚𝑖𝑛𝑖𝑚𝑖𝑧𝑒 𝑦𝐵𝑇𝐸𝑋 = 𝐸 (𝑓𝐵𝑇𝐸𝑋(𝒙, 𝒘𝑓𝐵𝑇𝐸𝑋)) (7)
𝑠𝑢𝑏𝑗𝑒𝑐𝑡 𝑡𝑜 𝑦𝐷𝑟𝑦𝑊 ≡ 𝐸 (𝑓𝐷𝑟𝑦𝑊 (𝒙, 𝒘𝑓𝐷𝑟𝑦𝑊)) ≤ 휀𝐷𝑟𝑦𝑊 (8)
𝐸(ℎ𝐼(𝑥)) = 0 𝐼 ≥ 0 (9)
Figure 5. Percentage error erri distribution as obtained from metamodel predicting: (a) BTEXemission, (b) dry gas water content.

Energies 2021, 14, 6177 10 of 20
Energies 2021, 14, x FOR PEER REVIEW 10 of 20
𝐸 (𝑔𝐽(𝑥)) ≤ 0 𝐽 ≥ 0 (10)
where E is the expected value. The objective function and the constraint are probabilistic
in nature. A generalized approach involves capturing uncertainty through a sampling
loop that is embedded within the optimization iterations that decide the decision varia-
bles, as shown in Figure 6.
Figure 6. Generalized calculation procedure for a stochastic optimization problem.
Here, the outer optimization loop finds the values of the decision variables, and the
inner loop obtains a probabilistic representation of the objective function and constraints
using the sampling loop or scenario loop. For each iteration, the decision variables se-
lected by the optimization loop are used in the inner loop where a sample set or scenario
set of uncertain variables is generated, and the model is run for each of these sample (sce-
nario) points to obtain probabilistic objective and constraint values. The derivative infor-
mation is also needed for nonlinear programming problems, which involves perturbation
of each decision variable, and also to perform the sampling. The computational burden of
this method is heavy. The Better Optimization of Nonlinear Uncertain Systems (BONUS)
algorithm was proposed by Sahin and Diwekar (2004) [3] to avoid this problem.
BONUS requires the sampling loop to be run only for the first iteration (Figure 6). In
this first iteration, the decision variables (the four variables in our problem) are assumed
to have uniform distributions between upper and lower bounds. Specified probability dis-
tributions of uncertain variables (the error distribution of the two predicted variables),
together with the uniform distribution of the decision variables, form the base distribu-
tions for analysis and are used in the first iteration. As the optimization proceeds, the
decision variables change, and the underlying distributions for the objective function and
constraints also change. Here, instead of again using the sampling loop, a reweighting
scheme based on the ratios of the probabilities for the current and the base distributions
is used to determine the values of the objective function and constraints for that iteration.
Please refer to Figure 7 for the reweighting approach. To ensure a smooth function for the
probabilities, we approximate the distributions using kernel density estimation tech-
niques. Please refer to Diwekar and David (2015) [4].
Figure 6. Generalized calculation procedure for a stochastic optimization problem.
Here, the outer optimization loop finds the values of the decision variables, and theinner loop obtains a probabilistic representation of the objective function and constraintsusing the sampling loop or scenario loop. For each iteration, the decision variables selectedby the optimization loop are used in the inner loop where a sample set or scenario set ofuncertain variables is generated, and the model is run for each of these sample (scenario)points to obtain probabilistic objective and constraint values. The derivative information isalso needed for nonlinear programming problems, which involves perturbation of eachdecision variable, and also to perform the sampling. The computational burden of thismethod is heavy. The Better Optimization of Nonlinear Uncertain Systems (BONUS)algorithm was proposed by Sahin and Diwekar (2004) [3] to avoid this problem.
BONUS requires the sampling loop to be run only for the first iteration (Figure 6). Inthis first iteration, the decision variables (the four variables in our problem) are assumedto have uniform distributions between upper and lower bounds. Specified probabilitydistributions of uncertain variables (the error distribution of the two predicted variables),together with the uniform distribution of the decision variables, form the base distributionsfor analysis and are used in the first iteration. As the optimization proceeds, the decisionvariables change, and the underlying distributions for the objective function and constraintsalso change. Here, instead of again using the sampling loop, a reweighting scheme basedon the ratios of the probabilities for the current and the base distributions is used todetermine the values of the objective function and constraints for that iteration. Please referto Figure 7 for the reweighting approach. To ensure a smooth function for the probabilities,we approximate the distributions using kernel density estimation techniques. Please referto Diwekar and David (2015) [4].
Energies 2021, 14, 6177 11 of 20Energies 2021, 14, x FOR PEER REVIEW 11 of 20
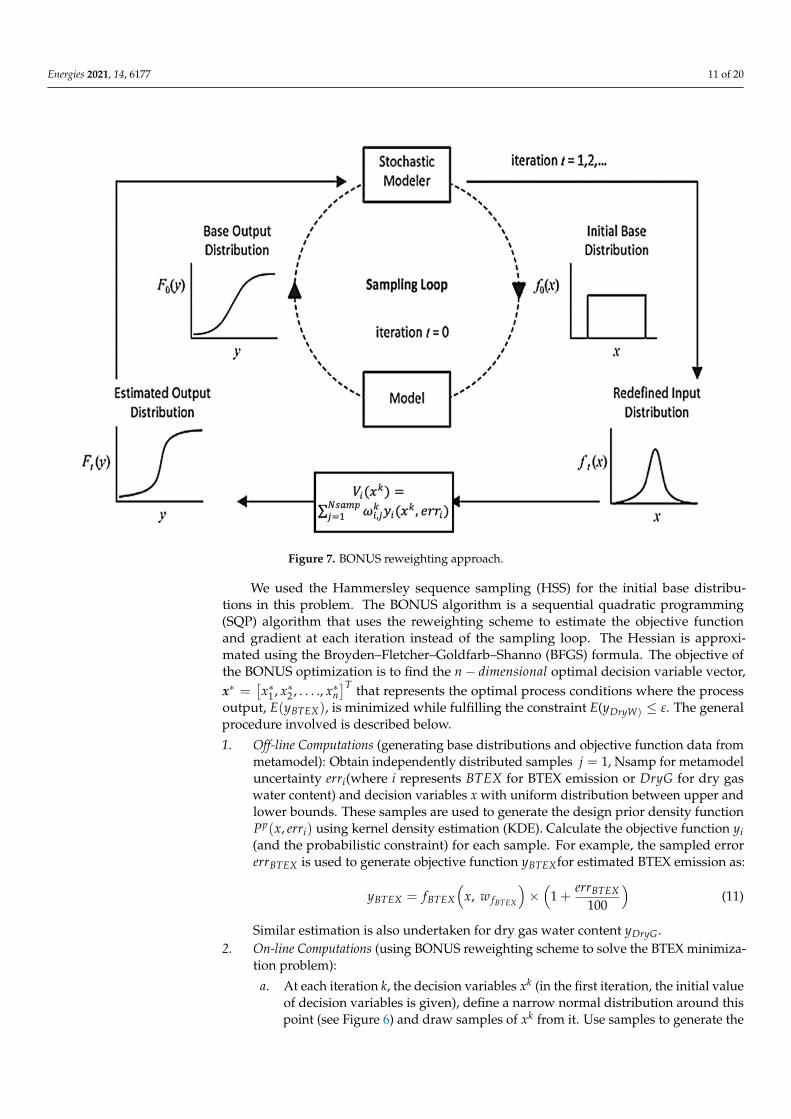
Figure 7. BONUS reweighting approach.
We used the Hammersley sequence sampling (HSS) for the initial base distributions
in this problem. The BONUS algorithm is a sequential quadratic programming (SQP) al-
gorithm that uses the reweighting scheme to estimate the objective function and gradient
at each iteration instead of the sampling loop. The Hessian is approximated using the
Broyden–Fletcher–Goldfarb–Shanno (BFGS) formula. The objective of the BONUS opti-
mization is to find the 𝑛 − 𝑑𝑖𝑚𝑒𝑛𝑠𝑖𝑜𝑛𝑎𝑙 optimal decision variable vector, 𝒙∗ =[𝑥1
∗, 𝑥2∗, … . , 𝑥𝑛
∗ ]𝑇 that represents the optimal process conditions where the process output,
𝐸(𝑦𝐵𝑇𝐸𝑋), is minimized while fulfilling the constraint E(𝑦𝐷𝑟𝑦𝑊) ≤ 휀. The general procedure
involved is described below.
1. Off-line Computations (generating base distributions and objective function data from
metamodel): Obtain independently distributed samples 𝑗 = 1 , Nsamp for meta-
model uncertainty 𝑒𝑟𝑟𝑖 (where 𝑖 represents 𝐵𝑇𝐸𝑋 for BTEX emission or 𝐷𝑟𝑦𝐺
for dry gas water content) and decision variables x with uniform distribution be-
tween upper and lower bounds. These samples are used to generate the design prior
density function 𝑃𝑝(𝑥, 𝑒𝑟𝑟𝑖) using kernel density estimation (KDE). Calculate the
objective function 𝑦𝑖 (and the probabilistic constraint) for each sample. For example,
the sampled error 𝑒𝑟𝑟𝐵𝑇𝐸𝑋 is used to generate objective function 𝑦𝐵𝑇𝐸𝑋 for esti-
mated BTEX emission as:
𝑦𝐵𝑇𝐸𝑋 = 𝑓𝐵𝑇𝐸𝑋(𝒙, 𝒘𝑓𝐵𝑇𝐸𝑋) × (1 +
𝑒𝑟𝑟𝐵𝑇𝐸𝑋
100) (11)
Similar estimation is also undertaken for dry gas water content 𝑦𝐷𝑟𝑦𝐺.
2. On-line Computations (using BONUS reweighting scheme to solve the BTEX minimi-
zation problem):
a. At each iteration k, the decision variables 𝑥𝑘 (in the first iteration, the initial
value of decision variables is given), define a narrow normal distribution
around this point (see Figure 6) and draw samples of 𝑥𝑘 from it. Use samples
Figure 7. BONUS reweighting approach.
We used the Hammersley sequence sampling (HSS) for the initial base distribu-tions in this problem. The BONUS algorithm is a sequential quadratic programming(SQP) algorithm that uses the reweighting scheme to estimate the objective functionand gradient at each iteration instead of the sampling loop. The Hessian is approxi-mated using the Broyden–Fletcher–Goldfarb–Shanno (BFGS) formula. The objective ofthe BONUS optimization is to find the n− dimensional optimal decision variable vector,x∗ =
[x∗1 , x∗2 , . . . ., x∗n
]T that represents the optimal process conditions where the processoutput, E(yBTEX), is minimized while fulfilling the constraint E(yDryW) ≤ ε. The generalprocedure involved is described below.
1. Off-line Computations (generating base distributions and objective function data frommetamodel): Obtain independently distributed samples j = 1, Nsamp for metamodeluncertainty erri(where i represents BTEX for BTEX emission or DryG for dry gaswater content) and decision variables x with uniform distribution between upper andlower bounds. These samples are used to generate the design prior density functionPp(x, erri) using kernel density estimation (KDE). Calculate the objective function yi(and the probabilistic constraint) for each sample. For example, the sampled errorerrBTEX is used to generate objective function yBTEXfor estimated BTEX emission as:
yBTEX = fBTEX
(x, w fBTEX
)×
(1 +
errBTEX100
)(11)
Similar estimation is also undertaken for dry gas water content yDryG.2. On-line Computations (using BONUS reweighting scheme to solve the BTEX minimiza-
tion problem):
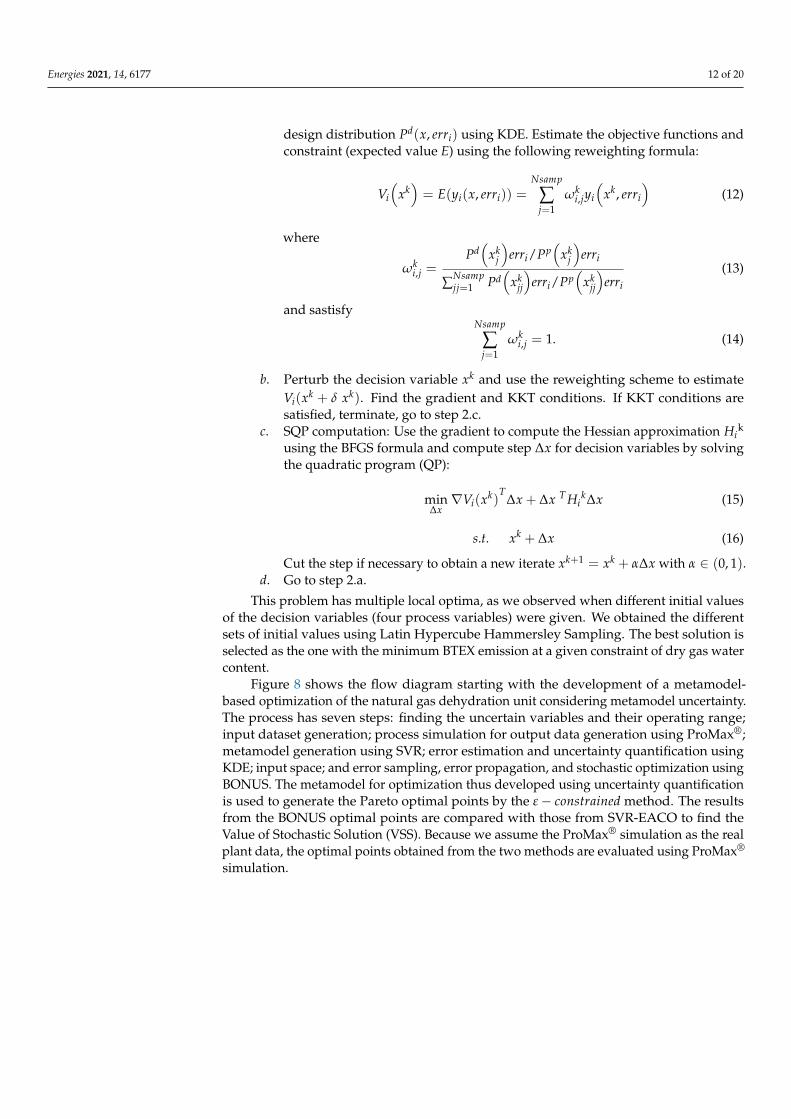
a. At each iteration k, the decision variables xk (in the first iteration, the initial valueof decision variables is given), define a narrow normal distribution around thispoint (see Figure 6) and draw samples of xk from it. Use samples to generate the
Energies 2021, 14, 6177 12 of 20
design distribution Pd(x, erri) using KDE. Estimate the objective functions andconstraint (expected value E) using the following reweighting formula:
Vi
(xk)= E(yi(x, erri)) =
Nsamp
∑j=1
ωki,jyi
(xk, erri
)(12)
where
ωki,j =
Pd(
xkj
)erri/Pp
(xk
j
)erri
∑Nsampjj=1 Pd
(xk
jj
)erri/Pp
(xk
jj
)erri
(13)
and sastisfyNsamp
∑j=1
ωki,j = 1. (14)
b. Perturb the decision variable xk and use the reweighting scheme to estimateVi(xk + δ xk). Find the gradient and KKT conditions. If KKT conditions aresatisfied, terminate, go to step 2.c.
c. SQP computation: Use the gradient to compute the Hessian approximation Hik
using the BFGS formula and compute step ∆x for decision variables by solvingthe quadratic program (QP):
min∆x∇Vi(xk)
T∆x + ∆x T Hi
k∆x (15)
s.t. xk + ∆x (16)
Cut the step if necessary to obtain a new iterate xk+1 = xk + α∆x with α ∈ (0, 1).d. Go to step 2.a.
This problem has multiple local optima, as we observed when different initial valuesof the decision variables (four process variables) were given. We obtained the differentsets of initial values using Latin Hypercube Hammersley Sampling. The best solution isselected as the one with the minimum BTEX emission at a given constraint of dry gas watercontent.
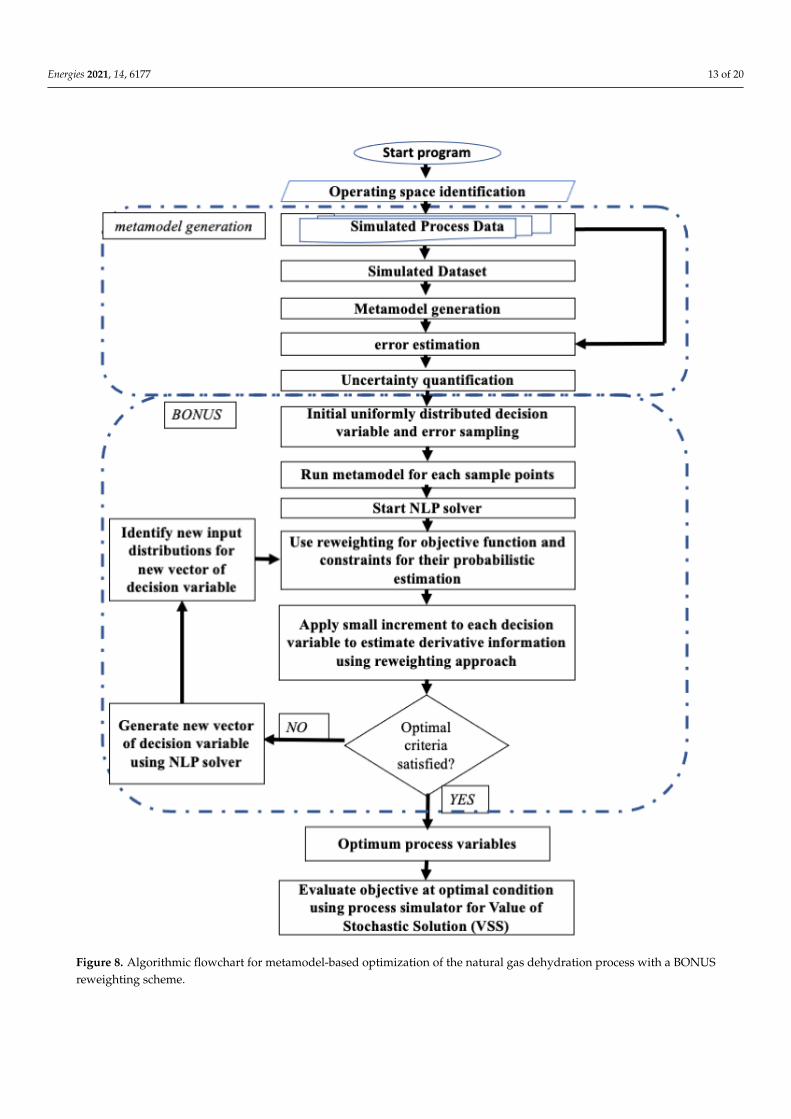
Figure 8 shows the flow diagram starting with the development of a metamodel-based optimization of the natural gas dehydration unit considering metamodel uncertainty.The process has seven steps: finding the uncertain variables and their operating range;input dataset generation; process simulation for output data generation using ProMax®;metamodel generation using SVR; error estimation and uncertainty quantification usingKDE; input space; and error sampling, error propagation, and stochastic optimization usingBONUS. The metamodel for optimization thus developed using uncertainty quantificationis used to generate the Pareto optimal points by the ε− constrained method. The resultsfrom the BONUS optimal points are compared with those from SVR-EACO to find theValue of Stochastic Solution (VSS). Because we assume the ProMax® simulation as the realplant data, the optimal points obtained from the two methods are evaluated using ProMax®
simulation.
Energies 2021, 14, 6177 13 of 20
Energies 2021, 14, x FOR PEER REVIEW 13 of 20
Figure 8. Algorithmic flowchart for metamodel-based optimization of the natural gas dehydration process with a BONUS
reweighting scheme.
3. Results
Five hundred scenarios were used for the metamodel generation. The data are pro-
vided in the supplementary material. Table 1 shows the two scenarios, from these 500
Figure 8. Algorithmic flowchart for metamodel-based optimization of the natural gas dehydration process with a BONUSreweighting scheme.

Energies 2021, 14, 6177 14 of 20
3. Results
Five hundred scenarios were used for the metamodel generation. The data are pro-vided in the supplementary material. Table 1 shows the two scenarios, from these 500 sce-narios simulations, with the highest amount of dry gas water content and BTEX emission.The first scenario shows that BTEX emission can be as low as 65.58 ton/yr with the corre-sponding moisture content of dry gas of 13.89 lbm/MMscf. This value of water content ishigher than the maximum permissible limit of 7 lbm/MMscf. The second scenario showsBTEX emission can be as high as 1238.21 ton/yr, and the corresponding moisture content is2.41 lbm/MMscf. The constrained optimization problem, as shown in Equations (3)–(5),(7), and (8), was solved. The SVR-based metamodels of the process were optimized usingthe BONUS algorithm. BONUS was performed for 32 optimal points by changing the con-straint to obtain the Pareto set. Process simulation was conducted in ProMax®; metamodelgeneration, error estimation, and uncertainty quantification were performed in MATLAB®;and BONUS was conducted in an inhouse optimization module in FORTRAN, installed ina Windows® environment. In this process, we were able to compare SVR-BONUS-basedmetamodeling and optimization performance.
Table 1. The maximum and minimum value of BTEX and Dry Gas water content as obtained from process simulation [1].
No.Glycol
Circ. Rate(sgpm)
AbsorberPressure
(psig)
Inlet GlycolTemp.
(Fahrenheit)
Flash GasPressure
(psig)
ReboilerTemp.
(Fahrenheit)
StrippingGas Rate(MSCFD)
BTEXEmission(ton/yr)
Dry GasWater
(LBM/MMscf)
1. 1.01 563.80 124.69 51.93 389.11 5.96 65.58 13.89
2. 9.91 501.97 110.66 71.74 375.27 88.91 1238.21 2.41
The base distribution consisting of the distribution of the decision and uncertainvariables as used for optimization is shown in Table 2.
Table 2. Variables and their type of distributions as used in BONUS optimization.
Variable Name Variable Type Distribution Type Distribution Characteristics
TEG Circulation Rate (GPM) Decision variable Uniform ‘lower’, 1, ’upper’, 10
Absorber Pressure (psig) Decision variable Uniform ‘lower’, 500, ’upper’, 600
Reboiler Temp. (Fahrenheit) Decision variable Uniform ‘lower’, 360, ’upper’, 400
Stripping Gas flow rate(Mscfd) Decision variable Uniform ‘lower’, 0.0, ’upper’, 100
errBTEX (%) Uncertain variable Normal Mean, 0Standard deviation, 13.33
errDryG (%) Uncertain variable Uniform ‘lower’, −10, ’upper’, 10
3.1. Pareto Front Generation
Dehydration of natural gas is undertaken to prevent hydrate formation and/or liquidwater deposition in the pipelines and to avoid condensation in the compressors. Thus,both the environmental objective of BTEX minimization and the reduction in the moisturecontent as an economic objective must be considered. Using the ε− constrained method,Pareto optimal points were generated to compare BTEX emissions with dry gas watercontent. Results from the optimization are shown in Table 3.
Energies 2021, 14, 6177 15 of 20
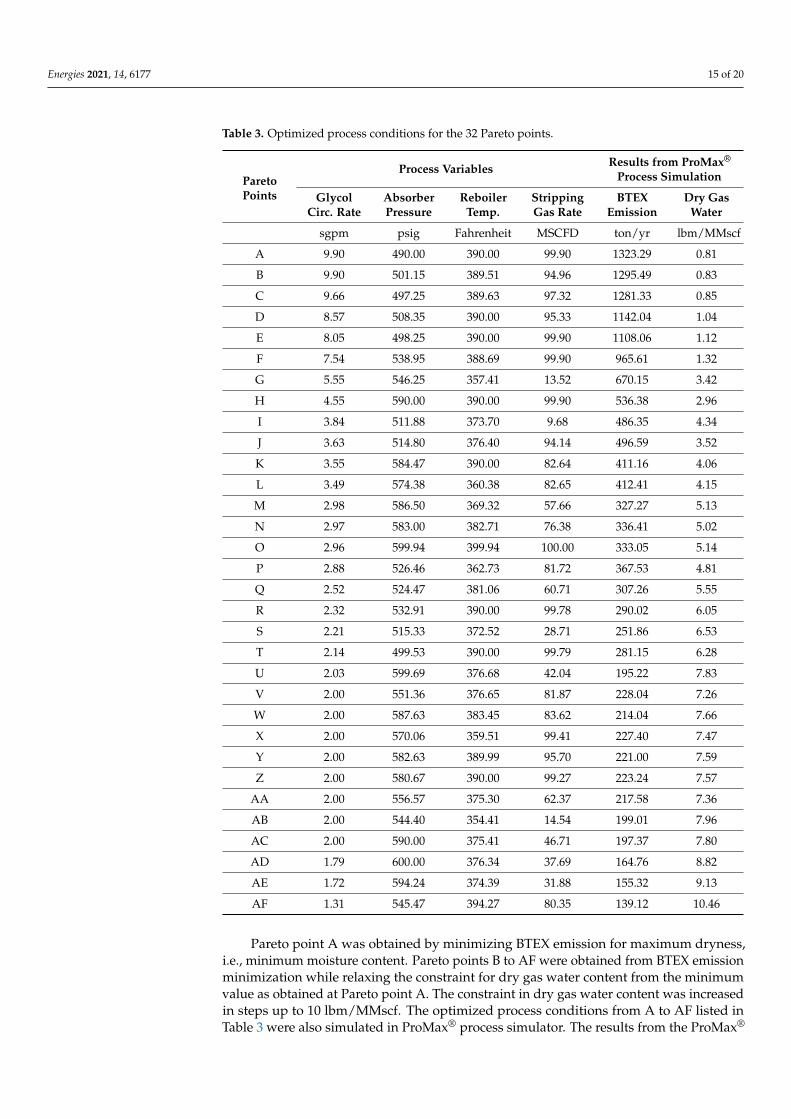
Table 3. Optimized process conditions for the 32 Pareto points.
ParetoPoints
Process Variables Results from ProMax®
Process Simulation
GlycolCirc. Rate
AbsorberPressure
ReboilerTemp.
StrippingGas Rate
BTEXEmission
Dry GasWater
sgpm psig Fahrenheit MSCFD ton/yr lbm/MMscf
A 9.90 490.00 390.00 99.90 1323.29 0.81
B 9.90 501.15 389.51 94.96 1295.49 0.83
C 9.66 497.25 389.63 97.32 1281.33 0.85
D 8.57 508.35 390.00 95.33 1142.04 1.04
E 8.05 498.25 390.00 99.90 1108.06 1.12
F 7.54 538.95 388.69 99.90 965.61 1.32
G 5.55 546.25 357.41 13.52 670.15 3.42
H 4.55 590.00 390.00 99.90 536.38 2.96
I 3.84 511.88 373.70 9.68 486.35 4.34
J 3.63 514.80 376.40 94.14 496.59 3.52
K 3.55 584.47 390.00 82.64 411.16 4.06
L 3.49 574.38 360.38 82.65 412.41 4.15
M 2.98 586.50 369.32 57.66 327.27 5.13
N 2.97 583.00 382.71 76.38 336.41 5.02
O 2.96 599.94 399.94 100.00 333.05 5.14
P 2.88 526.46 362.73 81.72 367.53 4.81
Q 2.52 524.47 381.06 60.71 307.26 5.55
R 2.32 532.91 390.00 99.78 290.02 6.05
S 2.21 515.33 372.52 28.71 251.86 6.53
T 2.14 499.53 390.00 99.79 281.15 6.28
U 2.03 599.69 376.68 42.04 195.22 7.83
V 2.00 551.36 376.65 81.87 228.04 7.26
W 2.00 587.63 383.45 83.62 214.04 7.66
X 2.00 570.06 359.51 99.41 227.40 7.47
Y 2.00 582.63 389.99 95.70 221.00 7.59
Z 2.00 580.67 390.00 99.27 223.24 7.57
AA 2.00 556.57 375.30 62.37 217.58 7.36
AB 2.00 544.40 354.41 14.54 199.01 7.96
AC 2.00 590.00 375.41 46.71 197.37 7.80
AD 1.79 600.00 376.34 37.69 164.76 8.82
AE 1.72 594.24 374.39 31.88 155.32 9.13
AF 1.31 545.47 394.27 80.35 139.12 10.46
Pareto point A was obtained by minimizing BTEX emission for maximum dryness,i.e., minimum moisture content. Pareto points B to AF were obtained from BTEX emissionminimization while relaxing the constraint for dry gas water content from the minimumvalue as obtained at Pareto point A. The constraint in dry gas water content was increasedin steps up to 10 lbm/MMscf. The optimized process conditions from A to AF listed inTable 3 were also simulated in ProMax® process simulator. The results from the ProMax®
Energies 2021, 14, 6177 16 of 20
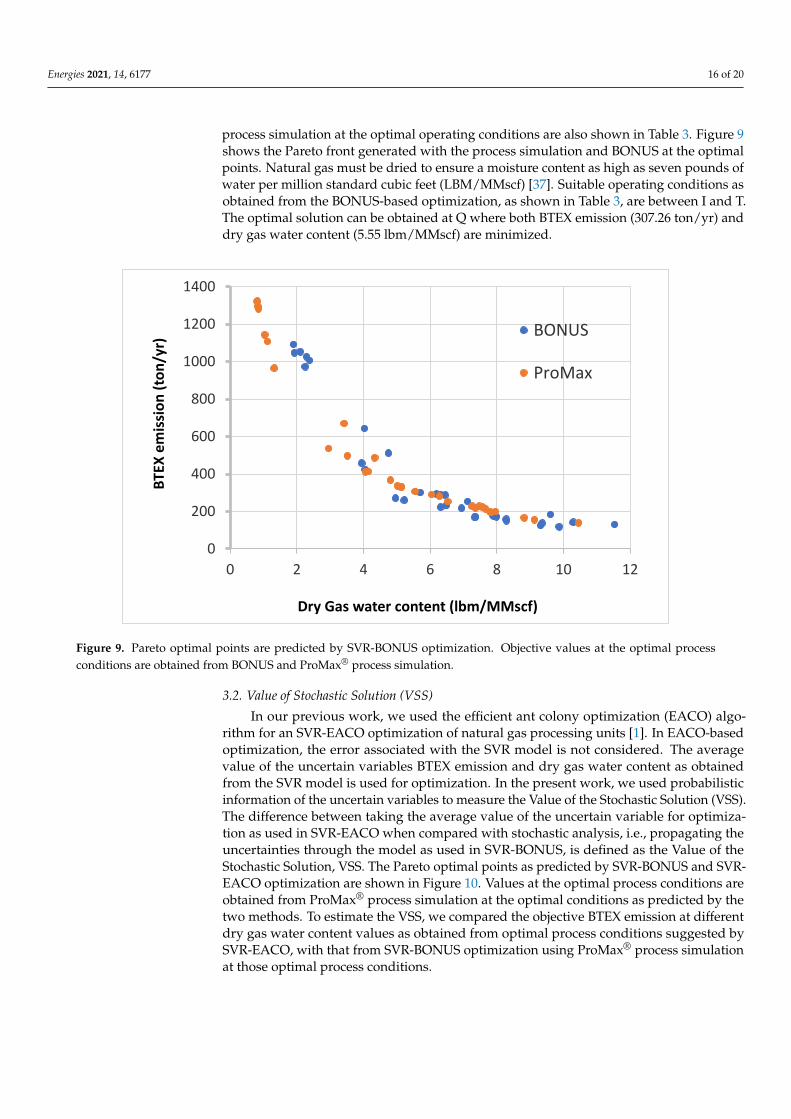
process simulation at the optimal operating conditions are also shown in Table 3. Figure 9shows the Pareto front generated with the process simulation and BONUS at the optimalpoints. Natural gas must be dried to ensure a moisture content as high as seven pounds ofwater per million standard cubic feet (LBM/MMscf) [37]. Suitable operating conditions asobtained from the BONUS-based optimization, as shown in Table 3, are between I and T.The optimal solution can be obtained at Q where both BTEX emission (307.26 ton/yr) anddry gas water content (5.55 lbm/MMscf) are minimized.
Energies 2021, 14, x FOR PEER REVIEW 16 of 20
Figure 9. Pareto optimal points are predicted by SVR-BONUS optimization. Objective values at the optimal process con-
ditions are obtained from BONUS and ProMax® process simulation.
3.2. Value of Stochastic Solution (VSS)
In our previous work, we used the efficient ant colony optimization (EACO) algo-
rithm for an SVR-EACO optimization of natural gas processing units [1]. In EACO-based
optimization, the error associated with the SVR model is not considered. The average
value of the uncertain variables BTEX emission and dry gas water content as obtained
from the SVR model is used for optimization. In the present work, we used probabilistic
information of the uncertain variables to measure the Value of the Stochastic Solution
(VSS). The difference between taking the average value of the uncertain variable for opti-
mization as used in SVR-EACO when compared with stochastic analysis, i.e., propagating
the uncertainties through the model as used in SVR-BONUS, is defined as the Value of
the Stochastic Solution, VSS. The Pareto optimal points as predicted by SVR-BONUS and
SVR-EACO optimization are shown in Figure 10. Values at the optimal process conditions
are obtained from ProMax® process simulation at the optimal conditions as predicted by
the two methods. To estimate the VSS, we compared the objective BTEX emission at dif-
ferent dry gas water content values as obtained from optimal process conditions sug-
gested by SVR-EACO, with that from SVR-BONUS optimization using ProMax® process
simulation at those optimal process conditions.
0
200
400
600
800
1000
1200
1400
0 2 4 6 8 10 12
BTE
X e
mis
sio
n (
ton
/yr)
Dry Gas water content (lbm/MMscf)
BONUS
ProMax
Figure 9. Pareto optimal points are predicted by SVR-BONUS optimization. Objective values at the optimal processconditions are obtained from BONUS and ProMax® process simulation.
3.2. Value of Stochastic Solution (VSS)
In our previous work, we used the efficient ant colony optimization (EACO) algo-rithm for an SVR-EACO optimization of natural gas processing units [1]. In EACO-basedoptimization, the error associated with the SVR model is not considered. The averagevalue of the uncertain variables BTEX emission and dry gas water content as obtainedfrom the SVR model is used for optimization. In the present work, we used probabilisticinformation of the uncertain variables to measure the Value of the Stochastic Solution (VSS).The difference between taking the average value of the uncertain variable for optimiza-tion as used in SVR-EACO when compared with stochastic analysis, i.e., propagating theuncertainties through the model as used in SVR-BONUS, is defined as the Value of theStochastic Solution, VSS. The Pareto optimal points as predicted by SVR-BONUS and SVR-EACO optimization are shown in Figure 10. Values at the optimal process conditions areobtained from ProMax® process simulation at the optimal conditions as predicted by thetwo methods. To estimate the VSS, we compared the objective BTEX emission at differentdry gas water content values as obtained from optimal process conditions suggested bySVR-EACO, with that from SVR-BONUS optimization using ProMax® process simulationat those optimal process conditions.
Energies 2021, 14, 6177 17 of 20Energies 2021, 14, x FOR PEER REVIEW 17 of 20
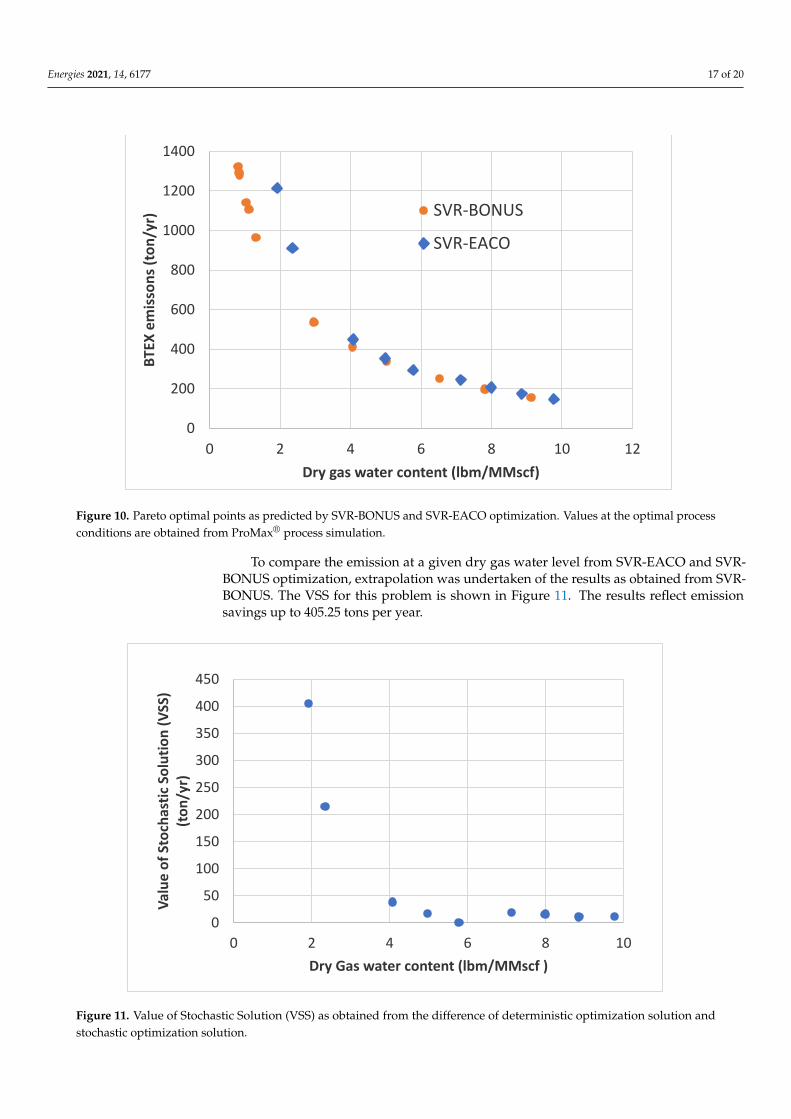
Figure 10. Pareto optimal points as predicted by SVR-BONUS and SVR-EACO optimization. Values at the optimal process
conditions are obtained from ProMax® process simulation.
To compare the emission at a given dry gas water level from SVR-EACO and SVR-
BONUS optimization, extrapolation was undertaken of the results as obtained from SVR-
BONUS. The VSS for this problem is shown in Figure 11. The results reflect emission sav-
ings up to 405.25 tons per year.
Figure 11. Value of Stochastic Solution (VSS) as obtained from the difference of deterministic optimization solution and
stochastic optimization solution.
0
200
400
600
800
1000
1200
1400
0 2 4 6 8 10 12
BTE
X e
mis
son
s (t
on
/yr)
Dry gas water content (lbm/MMscf)
SVR-BONUS
SVR-EACO
0
50
100
150
200
250
300
350
400
450
0 2 4 6 8 10
Val
ue
of
Sto
chas
tic
Solu
tio
n (
VSS
) (t
on
/yr)
Dry Gas water content (lbm/MMscf )
Figure 10. Pareto optimal points as predicted by SVR-BONUS and SVR-EACO optimization. Values at the optimal processconditions are obtained from ProMax® process simulation.
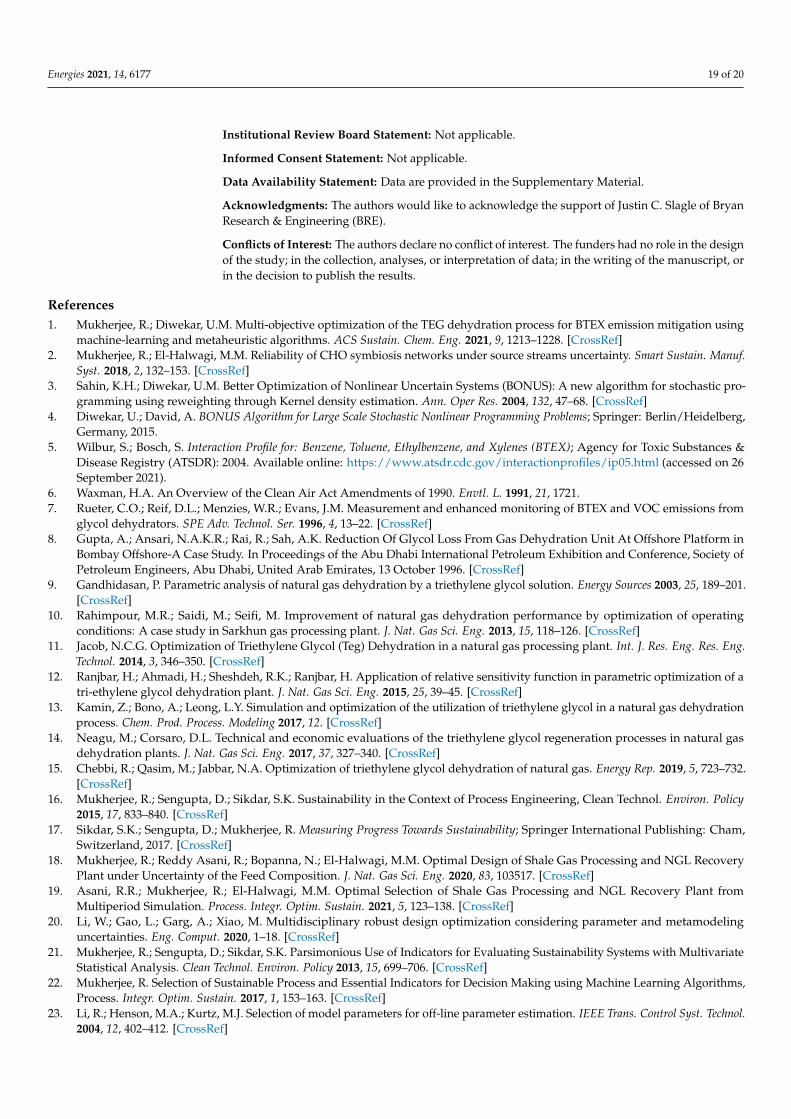
To compare the emission at a given dry gas water level from SVR-EACO and SVR-BONUS optimization, extrapolation was undertaken of the results as obtained from SVR-BONUS. The VSS for this problem is shown in Figure 11. The results reflect emissionsavings up to 405.25 tons per year.
Energies 2021, 14, x FOR PEER REVIEW 17 of 20
Figure 10. Pareto optimal points as predicted by SVR-BONUS and SVR-EACO optimization. Values at the optimal process
conditions are obtained from ProMax® process simulation.
To compare the emission at a given dry gas water level from SVR-EACO and SVR-
BONUS optimization, extrapolation was undertaken of the results as obtained from SVR-
BONUS. The VSS for this problem is shown in Figure 11. The results reflect emission sav-
ings up to 405.25 tons per year.
Figure 11. Value of Stochastic Solution (VSS) as obtained from the difference of deterministic optimization solution and
stochastic optimization solution.
0
200
400
600
800
1000
1200
1400
0 2 4 6 8 10 12
BTE
X e
mis
son
s (t
on
/yr)
Dry gas water content (lbm/MMscf)
SVR-BONUS
SVR-EACO
0
50
100
150
200
250
300
350
400
450
0 2 4 6 8 10
Val
ue
of
Sto
chas
tic
Solu
tio
n (
VSS
) (t
on
/yr)
Dry Gas water content (lbm/MMscf )
Figure 11. Value of Stochastic Solution (VSS) as obtained from the difference of deterministic optimization solution andstochastic optimization solution.

Energies 2021, 14, 6177 18 of 20
4. Discussion
From the Pareto front, as shown in Figures 9 and 10, it can be found that the dry gasmoisture content decreases at the cost of increased BTEX emission. From the 500 simulatedscenarios, BTEX emission was found to be as high as 1238.21 ton/yr, and that of drygas water content was 13.89 lbm/MMscf, shown in Table 1. Comparing the maximumvalues with that from the Pareto optimal point Q reveals that optimal operating conditionsreduced the BTEX emission and dry gas water content by 75.19% and 60.04%, respectively,from the highest possible value.
Break et al. [27] considered glycol circulation rate, stripping gas flow rate, flash tankpressure, and reboiler temperature to optimize the dehydration process. Simulating thepresent process with 100 MMSCFD at the optimal conditions found by Break et al. [27]resulted in an emission of 585.06 ton/yr and a dry gas water content of 3.89 lbm/MMscf.Compared to the optimal solution obtained at Pareto point Q, we find BTEX emissionas low as 307.26 ton/yr, resulting in a significant reduction in emission, by 47.5%, whilekeeping the dry gas water content within the permissible limit. Because BTEX emissiondepends on the process throughput and natural gas composition, it is imperative to obtainthe optimal values of the process variables that mitigate emission.
The Pareto points from I to T, as shown in Table 3 are found to be in accordance withdry gas water content limits between 4 to 7 lbm/MMscf, as recommended, while keeping amoderate BTEX emission. Through the process of stochastic optimization, we obtained therange of process variables at which Pareto optimal solutions for BTEX emission mitigationare feasible. BONUS optimizes by propagating the uncertainty through the model, andidentified optimal process conditions that mitigate BTEX emission up to 405.25 ton/yrcompared to that from deterministic optimization.
5. Conclusions
A hybrid algorithm was applied in this work that incorporates support vector regres-sion with the BONUS algorithm for the modeling and optimization of the TEG dehydrationprocess. Support vector regression is a machine learning technique for nonlinear regres-sion. Using SVR, two different process models were developed. One correlates processvariables with BTEX emission, and the other correlates dry gas water content with thesame. We quantified modeling uncertainties due to machine learning and carried out themulti-objective stochastic optimization problem using BONUS, so that the BTEX emissionwas minimized with a constraint on the maximum water content in the processed gas.The ε-constraint method is used to obtain a Pareto optimal solution. The algorithm thatinvolves SVR and BONUS is a novel method used for process optimization that considersuncertainty associated with the metamodel. The superior performance of the BONUSalgorithm at low water content limits is attributed to the metamodel generated usinglimited data with low dry gas water content for the SVR model development, and thegeneral model uncertainties associated with the machine learning model. To the best of ourknowledge, this is the first time machine learning model uncertainties have been includedin optimization to determine realistic Pareto solutions to a problem.
Supplementary Materials: The following are available online at https://www.mdpi.com/article/10.3390/en14196177/s1, Table S1: ProMax®simulated and Machine learning model generated BTEXemission and dry gas water content data at random realizations of the natural gas dehydrationprocessing unit.
Author Contributions: Conceptualization, R.M. and U.M.D.; methodology, R.M. and U.M.D.; soft-ware, R.M. and U.M.D.; validation, R.M. and U.M.D.; formal analysis, U.M.D.; investigation, R.M. andU.M.D.; resources, R.M. and U.M.D.; data curation, R.M.; writing—original draft preparation, R.M.;writing—review and editing, U.M.D.; visualization, R.M. and U.M.D.; supervision, U.M.D.; fundingacquisition, R.M. All authors have read and agreed to the published version of the manuscript.
Funding: This research was supported by the UT System’s Rising STARs Grant Program, (grantnumber P5011032 34) awarded to RM.
Energies 2021, 14, 6177 19 of 20
Institutional Review Board Statement: Not applicable.
Informed Consent Statement: Not applicable.
Data Availability Statement: Data are provided in the Supplementary Material.
Acknowledgments: The authors would like to acknowledge the support of Justin C. Slagle of BryanResearch & Engineering (BRE).
Conflicts of Interest: The authors declare no conflict of interest. The funders had no role in the designof the study; in the collection, analyses, or interpretation of data; in the writing of the manuscript, orin the decision to publish the results.
References1. Mukherjee, R.; Diwekar, U.M. Multi-objective optimization of the TEG dehydration process for BTEX emission mitigation using
machine-learning and metaheuristic algorithms. ACS Sustain. Chem. Eng. 2021, 9, 1213–1228. [CrossRef]2. Mukherjee, R.; El-Halwagi, M.M. Reliability of CHO symbiosis networks under source streams uncertainty. Smart Sustain. Manuf.
Syst. 2018, 2, 132–153. [CrossRef]3. Sahin, K.H.; Diwekar, U.M. Better Optimization of Nonlinear Uncertain Systems (BONUS): A new algorithm for stochastic pro-
gramming using reweighting through Kernel density estimation. Ann. Oper Res. 2004, 132, 47–68. [CrossRef]4. Diwekar, U.; David, A. BONUS Algorithm for Large Scale Stochastic Nonlinear Programming Problems; Springer: Berlin/Heidelberg,
Germany, 2015.5. Wilbur, S.; Bosch, S. Interaction Profile for: Benzene, Toluene, Ethylbenzene, and Xylenes (BTEX); Agency for Toxic Substances &
Disease Registry (ATSDR): 2004. Available online: https://www.atsdr.cdc.gov/interactionprofiles/ip05.html (accessed on 26September 2021).
6. Waxman, H.A. An Overview of the Clean Air Act Amendments of 1990. Envtl. L. 1991, 21, 1721.7. Rueter, C.O.; Reif, D.L.; Menzies, W.R.; Evans, J.M. Measurement and enhanced monitoring of BTEX and VOC emissions from
glycol dehydrators. SPE Adv. Technol. Ser. 1996, 4, 13–22. [CrossRef]8. Gupta, A.; Ansari, N.A.K.R.; Rai, R.; Sah, A.K. Reduction Of Glycol Loss From Gas Dehydration Unit At Offshore Platform in
Bombay Offshore-A Case Study. In Proceedings of the Abu Dhabi International Petroleum Exhibition and Conference, Society ofPetroleum Engineers, Abu Dhabi, United Arab Emirates, 13 October 1996. [CrossRef]
9. Gandhidasan, P. Parametric analysis of natural gas dehydration by a triethylene glycol solution. Energy Sources 2003, 25, 189–201.[CrossRef]
10. Rahimpour, M.R.; Saidi, M.; Seifi, M. Improvement of natural gas dehydration performance by optimization of operatingconditions: A case study in Sarkhun gas processing plant. J. Nat. Gas Sci. Eng. 2013, 15, 118–126. [CrossRef]
11. Jacob, N.C.G. Optimization of Triethylene Glycol (Teg) Dehydration in a natural gas processing plant. Int. J. Res. Eng. Res. Eng.Technol. 2014, 3, 346–350. [CrossRef]
12. Ranjbar, H.; Ahmadi, H.; Sheshdeh, R.K.; Ranjbar, H. Application of relative sensitivity function in parametric optimization of atri-ethylene glycol dehydration plant. J. Nat. Gas Sci. Eng. 2015, 25, 39–45. [CrossRef]
13. Kamin, Z.; Bono, A.; Leong, L.Y. Simulation and optimization of the utilization of triethylene glycol in a natural gas dehydrationprocess. Chem. Prod. Process. Modeling 2017, 12. [CrossRef]
14. Neagu, M.; Corsaro, D.L. Technical and economic evaluations of the triethylene glycol regeneration processes in natural gasdehydration plants. J. Nat. Gas Sci. Eng. 2017, 37, 327–340. [CrossRef]
15. Chebbi, R.; Qasim, M.; Jabbar, N.A. Optimization of triethylene glycol dehydration of natural gas. Energy Rep. 2019, 5, 723–732.[CrossRef]
16. Mukherjee, R.; Sengupta, D.; Sikdar, S.K. Sustainability in the Context of Process Engineering, Clean Technol. Environ. Policy2015, 17, 833–840. [CrossRef]
17. Sikdar, S.K.; Sengupta, D.; Mukherjee, R. Measuring Progress Towards Sustainability; Springer International Publishing: Cham,Switzerland, 2017. [CrossRef]
18. Mukherjee, R.; Reddy Asani, R.; Bopanna, N.; El-Halwagi, M.M. Optimal Design of Shale Gas Processing and NGL RecoveryPlant under Uncertainty of the Feed Composition. J. Nat. Gas Sci. Eng. 2020, 83, 103517. [CrossRef]
19. Asani, R.R.; Mukherjee, R.; El-Halwagi, M.M. Optimal Selection of Shale Gas Processing and NGL Recovery Plant fromMultiperiod Simulation. Process. Integr. Optim. Sustain. 2021, 5, 123–138. [CrossRef]
20. Li, W.; Gao, L.; Garg, A.; Xiao, M. Multidisciplinary robust design optimization considering parameter and metamodelinguncertainties. Eng. Comput. 2020, 1–18. [CrossRef]
21. Mukherjee, R.; Sengupta, D.; Sikdar, S.K. Parsimonious Use of Indicators for Evaluating Sustainability Systems with MultivariateStatistical Analysis. Clean Technol. Environ. Policy 2013, 15, 699–706. [CrossRef]
22. Mukherjee, R. Selection of Sustainable Process and Essential Indicators for Decision Making using Machine Learning Algorithms,Process. Integr. Optim. Sustain. 2017, 1, 153–163. [CrossRef]
23. Li, R.; Henson, M.A.; Kurtz, M.J. Selection of model parameters for off-line parameter estimation. IEEE Trans. Control Syst. Technol.2004, 12, 402–412. [CrossRef]
Energies 2021, 14, 6177 20 of 20
24. Mukherjee, R.; Diwekar, U.M.; Vaseashta, A. Optimal sensor placement with mitigation strategy for water network systemsunder uncertainty. Comput. Chem. Eng. 2017, 103, 91–102. [CrossRef]
25. Diwekar, U.; Mukherjee, R. Optimizing spatiotemporal sensors placement for nutrient monitoring: A stochastic optimizationframework. Clean Technol. Environ. Policy 2017, 19, 2305–2316. [CrossRef]
26. Mukherjee, R.; Diwekar, U.M.; Kumar, N. Real-time optimal spatiotemporal sensor placement for monitoring air pollutants. CleanTechnol. Environ. Policy 2020, 22, 2091–2105. [CrossRef]
27. Break, A.M.; Almehaideb, R.A.; Darwish, N.; Hughes, R. Optimization of process parameters for glycol unit to mitigate theemission of BTEX/VOCs. Process. Saf. Environ. Prot. 2001, 79, 218–232. [CrossRef]
28. Mukherjee, R.; Diwekar, U.M. Comparison of Monte Carlo and quasi-Monte Carlo technique in Structure and Relaxing Dynamicsof Polymer in Dilute Solution. Comput. Chem. Eng. 2016, 84, 28–35. [CrossRef]
29. Wang, X.; Hickernell, F.J. Randomized Halton sequences. Math. Comput. Model. 2000, 32, 887–899. [CrossRef]30. Ibrahim, M.; Al-Sobhi, S.A.; Mukherjee, R.; AlNouss, A. Influence of Sampling Technique on the Performance of Surrogate Model
using ANN: A Case Study of Natural Gas Stabilization Unit. Energies 2019, 12, 1906. [CrossRef]31. Mokhatab, S.; Poe, W.A.; Mak, J.Y. Chapter 7—Natural Gas Dehydration in Handbook of Natural Gas Transmission and Processing:
Principles and Practices, 3rd ed.; Gulf Professional Publishing: Oxford, UK, 2015.32. ProMax Foundations; Bryan Research & Engineering, Inc.: 2015. Available online: http://www.bre.com/PDF/Foundations-
Manual-En.pdf. (accessed on 26 September 2021).33. Diwekar, U. Introduction to Applied Optimization; Springer Science & Business Media: Berlin/Heidelberg, Germany, 2008;
Volume 22. [CrossRef]34. Nandi, S.; Badhe, Y.; Lonari, J.; Sridevi, U.; Rao, B.S.; Tambe, S.S.; Kulkarni, B.D. Hybrid process modeling and optimization
strategies integrating neural networks/support vector regression and genetic algorithms: Study of benzene isopropylation onHbeta catalyst. Chem. Eng. J. 2004, 97, 115–129. [CrossRef]
35. Vapnik, V. The Nature of Statistical Learning Theory, 2nd ed.; Springer: New York, NY, USA, 1999. [CrossRef]36. Vapnik, V.; Golowich, S.; Smola, A. Support vector method for function approximation, regression estimation and signal
processing. Adv. Neural Inform. Process. Syst. 1996, 9, 281–287.37. Phymetrix. Available online: http://www.phymetrix.com/industries-applications/natural-gas/ (accessed on 9 September 2021).