Northeastern California Ethanol Manufacturing Feasibility Study
549
Northeastern California Ethanol Manufacturing Feasibility Study Prepared by: Quincy Library Group California Energy Commission California Institute of Food and Agricultural Research -f Plumas Corporation TSS Consultants National Renewable Energy Laboratory November 1997 'tt NREIJTP-580-24676
-
Upload
khangminh22 -
Category
Documents
-
view
2 -
download
0
Transcript of Northeastern California Ethanol Manufacturing Feasibility Study

Northeastern California Ethanol Manufacturing Feasibility Study
Prepared by:
Quincy Library Group
California Energy Commission
California Institute of Food and Agricultural Research - f
Plumas Corporation
TSS Consultants
National Renewable Energy Laboratory
November 1997
'tt NREIJTP-580-24676

EXECUTIVE SUMMARY
The State of California is faced with several critical issues related to how its biomass resources are used and managed. In particular, due to suppression of forest fires, large quantities of dead/diseased trees and underbrush have accumulated in the forest, creating dangerous fuel loading which threatens human life and property. Resulting fires are so intense that they destroy the forest ecosystem. In addition, the unnatural ecosystem produced by fire suppression is endangering forest health.
To deal with these issues, the Quincy Library Group has put forth a plan to strategically thin the forests so as to reduce fire danger, improve forest health, and restore ecosystem balance. However, a key question is what will be done with the smaller trees (both live and dead) once they are removed from the forests. This report presents the results of one potential use of the biomass - conversion to fuel ethanol and cogenerated electricity. This option has appeal in that the technology for ethanol production from biomass is ready for demonstration and the demand for fuel oxygenates, such as ethanol and ETBE, is growing in California. In addition, there are synergistic benefits to the existing biomass-electricity industry. Finally, the technology is ecologically sound.
The Quincy Library Group (QLG), with the assistance of the California Resources Agency, assembled a very capable project team with the expertise needed to successfully carry out the feasibility study. The project was directed by the Quincy Library Group with assistance fiom the National Renewable Energy Laboratory (NREL). The following companies, organizations and agencies have contributed their time, effort and financial support to the Northeastern California Ethanol Manufacturing Feasibility Study:
Arkenol, hc., Biomass Processors Association, CA Air Resources Board, CA Department of Forestry and Fire Protection, CA Department of Food and Agriculture, CA Department of Water Resources, CA Energy Commission, CA Integrated Waste Management Board, CA Resources Agency, CA Institute of Food and Agricultural Research (CIFAR), City of Anderson, Collins Pine Company, DOE Office of Fuels Development,
Grant & Resource Center of Northern CA, HFTAAJniversity of California Forest Products Lab, E g h Sierra Resource Conservation Development Area, James h i n e Foundation, Lead Partnership Group, National Renewable Energy Laboratory, Pacific Wood Fuels, Plumas Corporation, Sierra Economic Development District, Sierra Paclifc Industries, TSS Consultants, USDA Forest Service (Lassen, Tahoe, and Plumas National Forests).
Each project task is summarized below. Additional details can be found in the report following the Executive Summary.
ES-1

Feedstock Supply and Delivev Systems
Greenville
TSS Consultants concluded that there is adequate biomass available in the QLG area for one or more biomass to ethanol and power facilities. The study area includes most of the Lassen and Plumas National Forests and the Siemaville Ranger District of the Tahoe National Forest. The amount of biomass available at each site within the QLG study area is shown in TabIe ES-I. The amount of biomass available ranges from 186,880 bone dry tons (BDT) within a 25-mile radius of Loyalton to 335,7 16 BDT within a 25 mile radius of Greenville.
99,26 1 236,455 335,716
Table ES-1. 25-Mile Radius Biomass Feedstock Availability
Site Fuel treatment Timber harvest Total Feedstock 1 (BDTNear) 1 (BDTNear) I (BDTNear)
1 h y d t o n 1 64,773 I 122,107 I 186,880 I I Chester I 54,822 r 2 12,905
I Westwood I 87,80 1 I 3 82,67 1 1 270,472 I
Anderson and Martell were not included in the feedstock study, but it is assumed that adequate supplies exist in those areas also. With the closure of several biomass power plants in the last several years, there is currently an oversupply of biomass available in California.
Site Characterization . _
The California Energy Commission's Energy 'Facilities Siting & Environmental Protection Division conducted a site characterization study of the six sites identified for the feasibility study (see Figure ES-1). The proposed sites are associated with existing or former sawmill sites located in the towns of Anderson, Chester, Greenville, Loyalton, Martell, and Westwood. All of the sites with the exception of Greenville, have access to existing biomass power plants, and all are large enough to accommodate a new .biomass to ethanol facility with associated feedstock storage. While all the sites appear to be feasible sites for the project, the Greenville site has the most constraints. This is because it does not have an existing power plant or biomass facility. Development of tbis site would bear the highest cost and cause the greatest change to the environment at the site.
Eihunol Facility Design and Cost Estimate
NREL prepared design and-cost estimates for each of the six study sites and three different biomass to ethanol conversion technologies. The conversion technologies included in the study are by no means the only technology options, but are a good representation of the near-term opportunities. The technologies considered in this report a:
ES-2


a concentrated sulfuric acid (includes technology patented by Arkenol, Inc.) dilute sulfuric acid (contains no patented technology) dilute nitric acid (includes technology with licensing available from HFTA) 0
Site
Anderson
Many assumptions enter into the design and economic analyses presented in this report and the reader is warned that additional investigations and testing are strongly recommended before selecting a biomass to ethanol conversion technology. The major areas of concern with respect to the biomass to ethanol process design and technology performance parameters are discussed at the end of each of the three technology sections of the Biomss to Ethanol FuciEio Design, Cost Estimate, and Financial Evaluation report.
Concentrated Acid Dilute Sulfuric Acid Dilute Nitric Acid
5% 5% 11%
The size of the ethanol facility at each site is based on the amount of feedstock available within a 25- mile radius of the site according to the feedstock assessment report plus mill residue that may be available at the site. The resulting ethanol plant sizes range fkom 11.8 million gallons per year at the Lnyalton site (with dilute acid technology) to 28.2 million gallons per year at the Greenville site (with concentrated acid technology).
Chester
Greenville
Economic Analysis
7% 5 % 11%
4% -3% 3%
Internal rate of return (IRR) was calculated for each technology at each site resulting in 18 combinations of technologies and sites (Table ES-2). A 20-year project life, 100% owner equity, a feedstock cost of $20 per BDT, and an ethanol selling price of $1.20 per gallon was assumed to calculate the XRs. Adhtional financial assumptions are included in the report.
Table ES-2. Internal Rate of Return (IRR) for 100% Owner Equity
Loyalton
Martell
Westwood
~~
5% 2% 9%
6% 4% lU%
6% 4% 10%
Projects of this magnitude are rarely financed with 100% owner equity. It is well known that favorable financing terms can be used to leverage the owner's equity and dramatically improve the IRR. A scenario with 25% owner equity and 75% debt financing was evaluated (Table ES-3). A loan interest rate of 7% and a 10 year loan term was chosen to represent perhaps the best possible financing scenario. A 7% interest rate loan may be available through the new electric utility
ES-4

restructuring Public Interest Energy Research (PIER) Program (to be administered by the California Energy Commission), through the California Pollution Control Financing Authority.
Table ES-3. Internal Rate of Return (IRR) for 25% Owner Equity
Anderson
Chester
1 site 1 Concentrated Acid I Dilute Sulfuric Acid I Dilute Nitric Acid
8% 9% 25%
15% 9% 25%
Greenville
Loyalton
7% -4% 6%
9% 4% 18%
1 Martell I 12% I 7% I 22%
Westwood 12% I 7% 23%
Sensitivity Analysis
I 11% to 50% (39%)
The sensitivity of project profitability (as measured by IIW) to the variables listed in Table ES-4 was evaluated. The results indicate that the IRR is most sensitive to feedstock cost and owner equity. Ethanol plant size, annual manufacturing cost, ethanol selling price, ethanol facility capital cost, and feedstock composition all display moderate sensitivities. A 30% increase or decrease in direct labor cost has relatively little effect on the IRR.
TabIe ES4. Summary of sensitivities for Chester site and dilute nitric acid process.
3. Ethanol plant size
4. Annual manufacturing cost
Sensitivity Variable and Rank - High to Low
6 - 19 Illillion gal. ethandyear 0% to 31% (31%)
+/- 20% of manufacturing cost 9% to 38% (29%)
Sensitivity Range
5. Ethanol selling price
6. Ethanol facility capital cost
Corresponding IRR Range (A %)
$1 .OO - $1.40 per gal. ethanol 11% to 36% (25%)
+/- 30% of capital cost 17% to 37% (20%)
I 1. Delivered feedstock cost I $38 - $0 per BDT feedstock I 1% to44% (43%)
I 2. Owner equity I 100% to 5% equity
I 7. Feedstock composition I 33 - 53% glucan in feedstock I 14% to 34% (20%)
I 8. Annual direct labor cost 1 +/- 30% of direct labor cost I 23% to 28% (5%)
ES-5

Environmental Issues
The potential environmental effects of operating a commercial-scale biomass-to-ethanol plant include both the on-site and off-site impacts surrounding the production facility.
The on-site environmental impacts (as well as local community impacts) are discussed in the site- specific evaluations conducted by the California Energy Commission in the Site Characterization Study issued in April 1997. The CEC study reviewed various environmental and infrastructure factors at the six study sites in Northeastern California.
Cellulose biomass material will be generated from both public and private forest lands within at least a 25-mile radius of the ethanol facility. TSS Consultants' Feedstuck Supply and Delivery Systems report (June 1997) predicts an available and sustainable, annual supply of between 187,000 and 336,000 Bone Dry Tons (BDT), dependent upon site. Sources of biomass will be timber harvesting by-products, certain lumber mill residues as well as forest fuels reduction treatments. The same report, using the Fire and Resource Assessment Program (FRAP) of the Califomia Department of Forestry and Fire Protection, defined that USFS holdings (within 25 miles of the four QLG sites) ranged between 53% to 64%. This includes all lands, not just forested lands. Federally managed forest lands are expected to be a higher percentage.
Environmental reviews and public participation processes that are prerequisites for authorizing biomass harvest differ between land ownership types. On private timberlands, California Forest Practice Rules govern timber harvest practices. Biomass harvest activities on National Forest System lands - the presumed primary source for my ethanol facility within the Quincy Library Group's area of interest since the majority of the forest lands are federally administered - must be subjected to National Environmental Policy Act (NEPA) reviews and public participation processes of the U.S. Forest Service. Projects on federal lands must also have the environmental review conducted within the current regional or national context, which must take into account the "latest science. I'
The plan proposed by the QLG intentionally reduces the environmental impacts of the large scale- thinning program that is proposed (>50,000 acres per year for five years) through adoption of various measures on US Forest Service lands designed to reduce those impacts. These measures include:
a Use of the Scientific Assessment Team (SAT) riparian standards for timber harvest activities, which typically preclude timber harvest within two "site tree'' lengths of a perennial stream;
a Precluding timber harvests on the primary old growth and anadromous fish stream areas of the forest by defining those areas as "Off-Base" or "Defened" from timber harvests;
a Adoption of the California Spotted Owl guidelines (1993), which preclude trees over 30 from harvesting as well as limit basal area and tree canopy reductions from thinning programs; and
ES-6

Precluding timber harvests in so-called "Spotted Owl Protected Activity Centers" (PACs) and "Spotted Owl Habitat Areas" (SOHAs).
The typical environmental concerns that arise from timber harvest and biomass harvest activities include the effects of roads and landings, riparian zone and water quality impacts, fuel loadings and arrangements, wildlife disturbances, and changes in suitability of wildlife habitats. Generically, these can be grouped into soil, water and wildlife impacts. The Plumas, Lassen, and Tahoe National Forest Plans have standards and guidelines applicable to the protection of soil, water, and wildlife resources and the USFS region has adopted a series of best management practices (BMPs).
Monitoring the results of biomass harvest will be critical to the overall success of the biomass removal program. The Quincy Library Group calls for an active and comprehensive monitoring program at various temporal and landscape scales. The USDA Forest Service has received funds from the Secretary of Agriculture, as part of the USDA support of the Quincy Library Group proposal, to develop and implement these monitoring programs. The QLG bills call for a "science based assessment."
The monitoring plan is designed to answer a series of questions:
0 Implementation
Are projects implemented as designed?
Effectiveness at Site Scale
Are soil quality standards met? What are the impacts in streamside zones? Are BMPs implementedeffective? Is fire behavior modified? How is vegetation modified in short term and long term? How are fuels modified in short term and long term? Wow is terrestrial habitat modified in short and long term? Are watershed restoration projects effective? Are Hypogeous fungi modified? What are air quality effects of controlled burns?
0 Larger Scale Effects
Is aquatic habitat improved? What are vegetation trends? What are size and intensity of wildfire trends?
ES -7

Market Issues
state
CA
A2
Ethanol demand in the western states of California, Arizona, Nevada, Oregon and Washington increased from 154 million to 214 million gallons per year from 1992 to 1995. In 1996, ethanol demand dropped to 124 million gallons per year with the loss of the California market and a significant decrease in the Washington market. Ethanol demand is driven primarily by federal and state Clean Air Act requirements mandating the use of oxygenates in winter gasoline to lower carbon monoxide emissions. The annual gasoline demand, required oxygenate level in the state's RFG or winter gasoline, and the estimated winter oxygenate season ethanol sales for 1992 through 1997 are
Annual OXY Ehanol Gasoline Level E s t . s a l ~ Demand (% by 92-93 (1000 gal) wt.) (1000 gal)
13,000,000 2.0 50,000
1,800,000 2.7 9,300
shown in Table ES-5 below.
Table ES-5. WistoricaI West Coast Ethanol Demand (1992 through 1997).
Ethanoi Est. sales
(1000 gal) 93-94
Ethanol Ethanol Est, sales EsL sales
(1000 gal) (1000 gal) 94-95 95-96
50,000
15,500
50,000 50,000
46,500 62,000
N v
WA
OR
Totals
9,750 1 18,000 I 26,750 4,900
2,400,000 2.7 60,000
1,500,OOO 2.7 30,000
19,450,000 154,200
60,000 1 50,000 I 50,000
25,000 25,000 25,000
160,250 189,500 213,750
- Ethanol Est. sales
96-97 (1000 gal)
-
0 - 62,000
-
29,000
7,500
25,000
123,500
Current ethanol production capacity on the west coast is only 14 million gallons per year- approximately 6 million gallons per year is produced in California and 8 million gallons per year in Washington. The remainder is imported from the midwest. Production of ethanol in California would result in significantly lower transportation costs to the west coast ethanol markets providing an advantage for projects such as a biomass to ethanol project in the QLG area. California ethanol producers could have up to a $0.20 per gallon cost advantage over midwest producers due to transportation costs.
Ethanol pricing is impacted by variables such as corn prices, MTBE prices, gasoline prices, and clean air act regulations. In the last five years, wholesale delivered prices to western ethanol markets have ranged between $1.18-and $1.55 per gallon. Given the seasonal nature of the demand, winter prices tend to be significantly higher than summer prices. 1996 was an exceptional year due to historically high corn prices resulting in high ethanol prices throughout the year. In 1997, ethanol prices have returned to traditional levels of $1.25 to $1.30 per gallon.
ES-8

The current market for California ethanol is outside of California due to the policy issues discussed in the report. The current west coast market is approximately 125 million gallons of ethanol per year. California ethanol should enjoy a cost advantage due to siagn.ificantly lower transportation costs compared to ethanol produced in the Midwest. The west coast ethanol market is projected to parallel the growth of the U.S. ethanol market at 3% per year.
The west coast ethanol market could expand dramatically if the California W G market becomes available to ethanol. California legislation or poky changes could create a market potential of 750 million gallons per year for ethanol produced in California and utilized as El0 in existing vehicles. The wide spread use of flexible fuel vehicles and alternative fuel buses utilizing E85 (85% ethanol blended with 15% gasoline) could increase this amount. Feedstock availability limitations and resultant feedstock cost growth could impact the economics and reduce the rate of market penetration. Energy crops could become economic and contribute to additional growth.
Socioeconomic Issues
The socioeconomic report, prepared by Plumas Corporation and QLG, reviews the local, regional and statewide implications of building and operating a forest biomass to ethanol manufacturing facility at specified sites in the Quincy Library Group area (Lassen, Plumas and Sierra counties in the Sierra Nevada) or other sites in Northern California. The report fust sets the current socioeconomic context in this natural resource dependent area. It then reviews the effect of an ethanol plant on employment, personal incomes, state and local taxes, construction jobs, and local infrastructure (particularly roads, schools and utilities). It also reviews the implications of such a facility in Amador or Shasta County.
A modest sized forest biomass to ethanol demonstration plant (e.g. producing 15 million gallons per year) will create at least 28 direct jobs at the plant, if it is co-located with an existing biomass electricity energy plant. Additional jobs would be created if a biomass electric energy plant was built along with the ethanol manufacturing facility. The furnishing of forest biomass feedstock to this plant would employ 63-100 additional employees to gather, process and transport the cellulose material to the plant. These 91-128 direct jobs would be augmented by an additional 93-122 indirect or multiplier jobs. One 15 million gallon per year ethanol plant would thus generate between 184- 250 total jobs.
The total direct payroll for the ethanol facility and the feedstock collection, processing and transportation is estimated to be $2,623,080. Total direct and indirect payroll is estimated to be $4,884,240. Construction jobs are estimated at 88 jobs with a payroll of approximately $2,OOO,OOO.
ES-9

Feasibility Study Conclusions and Recommendations
Conversion of forest thinnings and timber harvest residues to ethanol and cogenerated electricity appears to be economically feasible at the five sites in the study that have an existing biomass power plant and other infrastructure available. Colocation with an existing biomass power pIant is essential at this time.
The undeveloped ~f "greenfield" site in Greenville requires the instailation of a boiler to provide steam to the ethanol process as well as buildings and other infrastructure that adds significantly to the total capital cost making this site less appealing at this time.
There appears to be an adequate supply of feedstock for one or more biomass to ethanol facilities in the Quincy feasibility study area.
The California reformulated gas (CA RFG) market is potentially a huge market for ethanol or ETBE at almost 1 billion gallons of oxygenate per year. However, ethanol is not currently used in California due to the 2% cap on oxygen in CA RFG. Other West Coast markets, although much smaller than the California market, are still significant and estimated to be approximately 125 million gallons ethanol per year.
Forest biomass can be removed from the forest with acceptable impact to the environment and thinning the forest in the study area will improve the overall forest health and ecosystem balance.
Many technical, economic, and other assumptions have been made to perfom the analyses reported in this study. Additional work Is needed to prove or disprove these assumption and reduce the uncertainty of the results. The following next steps are recommended:
Identify Potential Owner/Operators
Quincy Libmy Group will identify potential owners/uperators of the ethanol manufacturing facility. This will entail reviewing the feasibility study with the current site owners to detennine whether this project would fit into their own development plans. This task will also consist of discussions with current operators of ethanol manufacturing facilities (as well as other operators) to determine whether this new feedstock source (forest biomass) fits with their expansion plans.
Secure Site Commitments
Quincy Library Group will solicit Letters of Intent from the site owners in this feasibility report (by the end of 1997) to quantify and qualify the general terms and conditions under which they would enter into the development phase of the project. QLG and NREL will also begin introducing prospective operators to the site owners and to ethanol technology purveyors.
ES-10

h n g Tern Supply Agreements
The delivered feedstock supply and price are the most sensitive economic factors in the feasibility study. QLG will investigate specific opportunities and seek the development of long term agreements on both public (particularly USDA Forest Service) and private lands.
Design and Cost Estimates
A variety of further engineering and design tasks were identified for each of the three technologies studied. W L will pursue partnerships and funding for these subsequent tasks.
Report StructurdOrganization
The remainder of this report is organized as follows. The Introduction discusses the major issues and project objectives, and introduces the project participants. The seven major tasks are then summarized so that the reader can get an overview of the project scope and results without reading al l of the individual task reports. If the reader needs more information on a particular task, the task report can then be consulted. Conclusion and recommendations follow the task summary section. This is then followed by the complete task reports.
If you have downloaded the Executive Summary from the Internet and would like a copy of the complete report or any of the individual task reports, please contact Sally Neufeld or Mark Yancey of the National Renewable Energy Laboratory at (303) 275-3000.
ES-I 1

TABLE OF CONTENTS
I . INTRODUCTION . . . . . . . . . . . . . . . . . . . . . . . . . . . . . . . . . . . . . . . . . . . . . . . . . . . . . . . . . . . 1
II . PROJECT OBJECTIVES & PROJECT TEAM ................................... 2 Project Objective . . . . . . . . . . . . . . . . . . . . . . . . . . . . . . . . . . . . . . . . . . . . . . . . . . . . . . . . 2 ProjectTeam . . . . . . . . . . . . . . . . . . . . . . . . . . . . . . . . . . . . . . . . . . . . . . . . . . . . . . . . . . . 3 ProjectTaskSummary . . . . . . . . . . . . . . . . . . . . . . . . . . . . . . . . . . . . . . . . . . . . . . . . . . . . 3
III . SUMMARY OFTASKS .................................................... 4 Feedstock Supply and Delivery Systems ...................................... 4 Site Characterization ..................................................... 7 Design and Cost Estimate ................................................. 8
Biomass to Ethanol Conversion Technology ............................. 8 Ethanol Facility Size and Capital Cost ................................ 10
FinancialEvahation .................................................... 12 Project Financing ................................................. 13 Cash Cost of Production and Net Production Cost ....................... 14 Maximum Feedstock Cost .......................................... 15 Sensitivity Analyses ............................................... 16
Environmentalksues .................................................... 24 Off-Site Environmental Impacts ..................................... 24 Project Environmental Permits ...................................... 26
Marketksues .......................................................... 28 Ethanol Market Issues ............................................. 28 Carbon Dioxide Market Issues ....................................... 30
Socioeconomichpacts .................................................. 32
IV . CONCLUSIONS AM> RECOMMENDATIONS ................................ 33
V . TASKREPORTS .......................................................... 34
i

I. INTRODUCTION
People have intervened in California's forest ecosystems since before recorded history, but during the past hundred years the interventions have changed radically in nature. Due to California's geography and climate, fire has always been a factor in California's forests. Around the turn of the century, California began a major and long-term commitment to suppressing fxes in the state's forests, with great success. One of the most significant, unexpected results of the forest fKe fighting efforts has been a long-term build-up of biomass in the forests, which causes a variety of undesirable consequences:
b The extent and severity of forest fires in overstocked forests is much greater than in the native ecosystem environment, turning fxes with positive ecosystem functions into infernos that destroy everything in vast areas.
High densities of growing stock prevent the growth of healthy, high-quality, individual trees, and diminish the wildlife habitat of the forest.
Overstocking of biomass in the forest increases evapotranspiration, and diminishes the amount of ground water available for summer runoff, as compared with the native forest ecosys tern.
In the absence of energy markets or other beneficial uses, most in-forest residues are left in place in the forest, Both the California Department of Forestry, and the USDA Forest Service, recognize this as a major impedment to maintaining forest health in California. These agencies also see the consequences of fuel loading on their fEe fighting budgets, which have sky-rocketed in recent years. The cheapest means of reducing the fuel loading problem in the forests is prescribed burns, and both state and federal forest managers are carrying out limited burns in order to reduce the problem. The amount of prescribed burning that is allowed, however, is limited due to environmental concerns. Harvesting, processing, and transporting the material to biomass power plants is more expensive, but provides a beneficial use for the material, and virtually eliminates the pollution associated with open burning. The amount of forest biomass that can be utilized by the biomass power industry is limited and is not adequate for the large volumes of biomass to be removed from California's forests.
Converting forest biomass to ethanol may be a beneficial use that can utilize all of the biomass that needs to be removed from California's forests. The reason for this is that ethanol is a higher value product than electricity produced fiom biomass, and ethanol can be used in the huge California transportation fuels market. If ethanol were blended in 80% of California's reformulated gasoline, ethanol use in Califomia would be almost 800 million gallons per year'. Thinning just 2% of California's 16 million acres of commercial forests2 each year and converting the biomass to ethanol
SWAN Biomass Company, Ethanol Market Assessment, Dowers Grove, L, 1997.
Western Wood Products Association, 1992 data.
1
2
1

would produce 226 million gallons of ethanol, 28% of the maximum potential ethanol market in the state3.
Forestry officials would like to see large areas of California’s forests thlnned over the next severd years and decades. The USDA Forest Service, which manages approximately one-half of the state’s forest land, states that at least 250,000 acres per year of the land under their jurisdiction needs to be thinned in order to fully realize the fire suppression, forest health, and water yield increases that are desirable4.
To deal with these issues, the Quincy Library Group has put forth a plan to strategically thin the forests so as to reduce frre danger, improve forest health, and restore ecosystem balance. However, a key question is what will be done with the smaller trees once they are removed fkom the forests. This report presents the results of one potential use of the biomass - conversion to fuel ethanol and cogenerated electricity. This option has appeal in that the technology for ethanol production from biomass is ready for demonstration and the demand for fuel oxygenates, such as ethanol and ETBE, is growing in California. In addition, there are synergistic benefits to the existing biomass-electricity industry. Finally, the technology is ecologically sound.
11. PROJECT O B J E C m S & PROJECT TlEAM
Projeci Objective
The objective of this project is to determine the economic, environmental and regulatory feasibility of siting one or more forest biomass to ethanol manufacturing facilities in Northeastern California. The study area includes most of the Lassen and flumas National Forests and the Sierraville Ranger District of the Tahoe National Forest. The study will identify and evaluate several sites in the study area which have the greatest potential for long-term operation of a financially attractive biomass-to- ethanol production facility. The effort will evaluate biomass supply as well as ethanol and power generation market issues which could impact the long term viability of the facilities. Several biomass conversion process options will be evaluated from both a technical and economic perspective as well.
3 Assumptions include 10 BDT biomass yield per acre and 87 gallons ethanol produced per BDT biomass (concentrated acid technology ethanol yield).
Moms, G., The Environmental Costs and Benefits of Biomass Energy Use in CaliJomiu, Berkeley, CA, 1997.
4
2

Project Team
The Quincy Library Group (QLG), with the assistance of the California Resources Agency, assembled a very capable project team with the expertise needed to successfully carry out the feasibility study. The project was directed by the Quincy Library Group with assistance from the National Renewable Energy Laboratory (NREL). The folIowing companies, organizations and agencies have contributed their time, effort and financial support to the Northeastern California Ethanol Manufacturing Feasibility Study:
Arkenol, Inc., Biomass Processors Association, CA Air Resources Board, CA Department of Forestry and Fire Protection, CA Department of Food and A@culture, CA Department of Water Resources, CA Energy Commission, CA Integrated Waste Management Board, CA Resources Agency, CA Institute of Food and Agricultural Research (CIFAR), City of Anderson, Collins Pine Company, DOE Office of Fuels Development,
Grant & Resource Center of Northern CA, €€FTA/University of California Forest Products Lab, High Sierra Resource Conservation Development Area, James Irvine Foundation, Lead Partnership Group, National Renewable Energy Laboratory, Pacific Wood Fuels, Plumas Corporation, Sierra Economic Development District, Sierra Pacific Industries, TSS Consultants, USDA Forest Service (Lassen, Tahoe, and Plumas National Forests).
Project Task Summary
The project includes the following seven tasks with the lead organization for each task listed:
0 Feedstock supply and delivery systems, TSS Consultants
Ethanol facility design and cost estimate, NREL Financial evaluation and sensitivity analysis, NREL Environmental and permitting issues, QLGKEC Market issues, CFAR Socioeconomic issues, Plumas CorporatiodQLG
Site selection, QLGPlumas CorporatiodCEC 0
a
The results of each task is summarized in the following Summary of Tasks section. The complete task reports are included in the Tusk Reports section which follows the Conclusions and Recommendations.
3

111. SUMMARY OF TASKS
Feedstock Supply and Delivery Systems
TSS Consultants (TSS) established the resource and supply system needed to support sustainable ethanoUcogeneration plant operation. Feedstocks, harvesting and delivery requirements were defined and used to establish costs for feedstock that support the economic assessment of the project.
The feedstock supply study area includes most of the Lassen and Plumas National Forests and the Sierraville District of the Tahoe National Forest, which encompasses approximately 2.4 million acres. This forest area has been severely affected by previous drought years and insect infestation, resulting in extensive buildup of biomass hels. In the study area, one hundred years of fire exclusion and various management activities combine to result in stand conditions which support large stand-replacing fires.
To address these issues, the Quincy Library Group (QLG) put forth a plan to strategically thin the forests to; improve forest health, restore ecosystem balance, and reduce fxe danger.
The Quincy Library Group Forest Recovery and Economic Stability Act of 1997 was introduced during the Is Session of the 105* Congress. This legislation will direct the Secretary of Agriculture to conduct a five-year pilot project on designated lands within the Plumas, Lassen, and Tahoe National Forests in the State of California to demonstrate the effectiveness of the resource management activities proposed by the Quincy Library Group and to amend curent land and resource management plans for these national forests to consider the incorporation of these resource management activities.
TSS is of the opinion that biomass feedstock for the QLG project can be recovered from fuel reduction strategies carried out on national forest lands such as creating Defensible Fuel Profile Zones, Community Defense Zones and Fuel Reduction Zones as well as from collecting and processing biomass fiom timber harvesting operations.
TSS estimated the quantity of biomass that could be available in the entire QLG project area from fuel treatment activities and fiom timber harvesting operations. Assuming that the Forest Service conducts the proposed pilot project on designated lands within the Plumas, Lassen, and Tahoe National Forests and that timber harvest levels are equal to the previous 4 years average, TSS estimates that during the period of years I. -5, a total of 1 , 100,OOO BDT will be available annually and during the period of years 6-20, a total of approximately 706,250 BDT annually will be available to the QLG project. The division in projected biomass generation between timber harvest operations and fuel treatment for years- 1-5 and 6-20 is shown in Table 1.
4

Table 1. Estimated Biomass Feedstock Generation within the QLG Area
Site
I Biomass Source
Fuel treatment Timber harvest Total Feedstock
(BDTTYear) (BDT/Year) (BDT/Year)
Year 1 - 5 (BDTNear) 1
Westwood
Chester
Year 6 - 20 (BDT/Year) 1
87,801 182,67 1 270,472
54,822 2 12,905 267,727
I Timber harvest operations I 475,000 1
Loyalton
475,000 1
64,773 122,107 186,880
1 Fuel treatment I 625,000 I 231,250 1 1 Total I 1,100,000 I 706,000 I
TSS made an assessment of the biomass feedstock that could be available to each of the biomass to ethanol plant sites in the QLG area from a fuel. treatment program as well as from collecting and processing biomass from timber harvesting operations. The sites for this assessment were determined to be; Westwood, Chester, Greenville and Loyalton. Estimates of the annual amounts of biomass feedstock available witbin a 25-mile radius of each site are shown in Table 2. Greenville has the most biomass available within a 25-mile radius, followed by Westwood, Chester, and Loyalton. The year 6-20 fuel treatment biomass generation estimates were used for the site feedstock availability estimates. Note that there is considerable overlap in the 25-mile radius feedstock collection areas for Westwood, Chester, and Greenville.
Table 2. 25-Mile Radius Biomass Feedstock Availability
I Greenville I 99,261 I 236,455 I 335,716 I
Based upon the analysis conducted by TSS, we can conclude that adequate quantities of biomass feedstock are available within the QLG supply area.
Systems for the collection, processing, and transportation of biomass are well established within this area. The estimated total costs for collection, processing and transportation of biomass feedstock to the QLG project is expected to average $40 per BDT. The cost to the project can be reduced to a range of $20 to $25 per BDT by continued and expanded subsidies from the landowner for fuel treatment activities. In addition, many national forest offerings of timber sales or service contracts
5

containing biomass material also have a sufficient amount of sawlogs with sufficient value to effectively subsidize the removal of the biomass at a cost that ranges between $20 to $30 per BDT. The total cost of feedstock delivered to the Facility will vary depending upon the amount of subsidy that can be achieved through ongoing programs such as the Forest Health Pilot Prograrn as well as the amount of sawlogs that is offered for safe along with the biomass. The cost of collection and processing (shearing, skidding and chipping) can vary F a t l y from job to job depending upon factors such as tree size and density, slope of the ground and the size of the project. These costs can range between $30 to $40 per BDT, FOB truck,
Transportation costs will vary based upon the distance to the facility, (i.e. the amount of time required as current inforest biomass transportation rates vary from $50 to $55 per hour) the quality of the transportation system as well as the cost of maintenance of private or Forest Service roads and the moisture content of the biomass feedstock, which will determine the average number of BDT per load. Transportation costs are expected to range from $9 to $20 per BDT.
The ultimate cost of transportation will be related to the size of the biomass to ethanol project, as the size will determine the transportation distance that will be required to supply the project. Future biomass feedstock cost could also vary depending upon the competition for biomass feedstock from other uses during the life of the project.
6

Site Characterization
Utilities Available
The California Energy Commission's Energy Facilities Siting & Environmental Protection Division (EFS & EPD) provided assistance in selecting a site for a biomass to ethanol facility in Northeastern California. CEC Staff conducted a site characterization study of seven sites (includes two sites at Anderson, CA) identified by the QLG. The sites are associated with existing or former sawmill sites located in the towns of Loyalton, Chester, Greenville, Westwood, Martell, and Anderson.
Other Considerations
All of the sites with the exception of Greenville, have access to existing biomass power plants, and all are large enough to accommodate a new biomass to ethanol facility with associated feedstock storage. While all the sites appear to be feasible sites for the project, the Greenville site has the most constraints. This is because it does not have an existing power piant or biomass facility. Development of this site would bear the highest cost and cause the greatest change to the environment at the site.
~ ~~
Anderson, Roseburg Industries
The six sites included in the feasibility study and the existing infrastructure available at each site are listed in Table 3 below.
~~~~
49.9 Mw *
Table 3. Site ]Data and Infrastructure
Biomass electricity Steam, Water Wastewater treatment
Site, Owner
Stand-alone biomass power plant Pulp and paper mill
Biomass electricity Steam, Water
Chester, Collins Pine Co.
Lumber mill I lZMW
Electricity fkom grid, Water
Greenville, Carl Pew
Former lumber mill site
no biomass power at this site
Biomass electricity Steam, Water I 2oMw
Loyalton, Sierra Pacific hd.
Lumber mill
I l*bAw* Martell, Sierra Pacific Ind.
Biomass electricity Steam, Water
Westwood, Mt. Lassen Power
Lumber mill (closed)
Biomass electricity Steam, Water
Stand-alone biomass power plant
* biomass power plant is owned and operated by Wheelabrator Environmental Systems Inc.
7

Design and Cost Estimde
NREL examined three different biomass to ethanol conversion technologies and then developed preliminary process designs and performed standard economic analyses for these designs applied to the six sites previously identified for the feasibility study. Many assumptions enter into the design and economic analyses presented in this report and the reader is warned' that additional investigations and testing are strongly recommended before selecting and attempting to commercialize any biomass to ethanol conversion technology.
No attempt has been made to rank the technologies evaluated in this report due to the large uncertainties in the process design and process performance, especially with respect to the dilute sulfuric and nitric acid technologies considered. There are also other technologies available that should be considered for biomass to ethanol conversion projects.
Likewise, NREt has made no attempt to rank the six sites in the study except to point out that the Greenville site requires significantly more infrastructure deveIopment and therefore has a much higher capital cost than the other sites which have biomass power available.
The study concludes that converting forest thinnings and timber harvest residues appears to be economically feasible at the five sites in the study that have an existing biomass power plant and other infrastructure available. The undeveloped or "greenfield" site in Greenville requires the installation of a boiler to provide steam to the ethanol process as well as buildings and other infrastructure that adds significantly to the total capital cost making this site less appealing.
Biomass to Ethanol Conversion Technology
Historically, production of ethanol has been limited to using sources of soluble sugar or starch (primarily in the Midwest using corn). New technologies have been developed which now allow for the production of ethanol fiom "lignocellulosic biomass." Lignocellulosic biomass is the leafy or woody part of plants: wood, wood waste, paper, corn residual, sugar cane residual, etc. Lignocellulosic biomass can be processed to produce sugars that can, in turn, be fermented to ethanol.
The primary components of lignocellulosic biomass are cellulose, hemicellulose, and lignin. There are many different methods of extracting and depolymerizing the cellulose and hemicellulose to produce fermentable sugars. However, once produced, the six carbon sugars that make up the cellulose and predominate in softwood hemicellulose can be easily fermented to ethanol. The five- carbon sugars that comprise about 15% of the sugars in softwoods can also be fermented to ethanol, but the five-carbon sugars (xylose and arabinose) require mixtures of naturally occurring yeasts or genetically engineered microorganisms.
NREL has prepared design and cost estimates for tbree different variations of biomass to ethanol conversion technologies. The conversion technologies included in this study are:
8

0 concentrated sulfuric acid (includes technology patented by Arkenol, Inc.) dilute sulfuric acid (contains no patented technology) dilute nitric acid (includes technology with licensing available from €ETA)
0
Concentrated Acid Process
This is by no means an exhaustive list of the technology options, but is a good representation of the near-term technology options for an ethanol facility in Northeastern California. However, there are considerable differences with respect to technology maturity even among the three technologies listed above and reviewed in this report, Arkenol reports that its concentrated acid technology is ready for commercial deployment with process guaranties and efficacy insurance readily available. The stage of technology deployment can be illustrated by reviewing the list of "process concerns and recommendations" at the end of each technology section of this report. The process concerns for each of the three technologies are summarized in Table 4 below. The lack of process concerns for the concentrated acid technology indicates the more advanced state of technology development for the Arkenol process.
Dilute Sulfuric Acid Dilute Nitric Acid Process Process
Table 4. Process concerns for biomass conversion technologies. A "yes" entry indicates that additional investigation is recommended. A "no" entry indicates that the process area is not a concern with respect to technology commercialization.
NO Hydrolysis Sugar Yields
Process Area
YeS Yes
Hydrolysis Reactor Materials of No YeS NO
€I ydrol yzate Fermentability
Fermentation Ethanol Yield
NO YeS YeS
YeS YeS No for yield c 85% Yes for yield > 85%
Fermenter Yeast Propagation
Neutralizing Base
NO
No YeS No
YeS YeS
Facility Thermal Design No YeS YeS
9

Process Area Concentrated Acid Process
SolidLiquid Separation Equipment
DiIute Sulfuric Acid Process
LignidCellulose Residuals YeS
Fuse1 Oil Production
YeS
Water Recycle
NO Wastewater Treatment YeS
No I
No 1 YeS
NO I YeS
Dilute Nitric Acid Process
NO
YeS
YeS
YeS ~ ~ -~
Note: A "yes" entry in the above table indicates additional investigation is recommended prior to technology deployment - see technology sections of the report for details.
Ethanol Facility Size and Capital Cost
For this study, the size of the ethanol facility at each site is based on the amount of forest thinnings and timber harvest residue available within a 25-mile radius of the site according to the feedstock assessment report, plus any mill residue that may be available at the site. The Anderson and Martell sites were not included in the feedstock assessment so it was assumed that 265,000 bone dry tons (BDT) per year is available at these sites. This is the average biomass available at the four sites in the QLG area. If projects are to be pursued at Anderson or Martell, the feedstock availability and feedstock cost will need to be verified.
The feedstock available at each site and the resulting ethanol plant capacity (in terms of annual ethanol production) for each site and technology is shown in Table 5. "he estimated facility capital cost for each technology is also shown. Capital cost is heavily influenced by the availability of existing infrastructure at each site. The capital costs were estimated by the cost estimating method known as a "factored" cost estimate which is typically used for this type of feasibility study. The accuracy of this type of cost estimate is +/-30%. At the request of NREL, Memck Engineers and Architects of Denver, Coiorado, performed a technical review of M L s dilute sulfuric acid process design as well as the capital and operating cost estimates for the Greenville site. Memck's comments and suggestions were incorporated into all three technology designs and cost estimates where appropriate. Memcks report is included in Volume 13 of the Biomass to Ethanol Facilitv Design, Cost Estimate, and Financial Evaluation report.
In the far right column of Table 5, the "installed cost per gallon ethanol" is shown. This is a common measure of the capital cost versus the ethanol production capacity of an ethanol facility and ranges
10

from $2.50 to $5.43 for this study. A fairly large corn ethanol dry mill facility (40 million gallons per year) can be built for $1 .OO to $2.00 per gallon ethanol capacity. The installed cost for the dilute nitric acid biomass to ethanol technology drops to about $1.75 per gallon ethanol when the size of the facility is increased to 40 million gallons per year. This compares favorably to the corn ethanol industry capital cost.
Table 5. Feedstock Available, Ethanol Plant Size, and Facility Capital Cost (1997 dollars)
Feedstock Feedrate
(BDWyear)
Plant Size (million gallon ethanollyear)
Facility Capital Cost
(million $)
Installed Cost per Gallon
Ethanol
Site Technology
245,000 $90.2 $46.7 $34.4
Anderson Concentrated acid Dilute sulfixic Dilute nitric
22.3 13.8 13.8
$4.04 $3.39 $2.49
298,000 (includes
30,000 BDT of mill residue)
Chester Concentrated acid Dilute sulfuric Dilute nitric
25.1 15.5 15.5
$99.5 $55.1 $40.4
$3.97 $3.55 $2.6 1
335,000 GreenvilIe Concentrated acid Dilute sulfuric Dilute nitric
28.2 17.4 17.4
$1 14.4 $69.2 $52.2
$4.06 $3.98 $3 -00
228,000 (includes
41,000 BDT of mill residue)
Loyalton Concentrated acid Dilute sulfuric Dilute nitric
19.1 11.8 11.8
$87.7 $4.59 $48.0 $4.07 $34.8 $2.95
265,000 Martell Concentrated acid Dilute sulfuric Dilute nitric
22.3 13.8 13.8
$94.1 $5 1.9 $37.8
$4.22 $3.76 $2.74
27 1 ,OOO Westwood Concentrated acid Dilute sulfuric Dilute nitric
22.8 14.1 14.1
$95.1 $52.5 $38.2
$4.17 $3.72 $2.7 1
* Plant size €or various technologies based on respective yields from the same feedstock feedrate. Facility Capital Cost includes total fixed capital investment and working capital. The accuracy of the capital cost estimate is +/- 30%.
2

Financial BvuZuation
Plant life
Reference year
Internal rate of return (XR) was calculated for each technology and each site resulting in 18 combinations of technologies and sites. Assumptions made to conduct the financial analysis include 20-year project life, 100% owner equity financing, 95% on-line factor (345 operating days per year), ethanol selling price of $1.20 per gallon, and a feedstock cost of $20 per bone dry ton (BDT).
~~ ~~ ~~~ ~ ~~
20 years
1997
Additionally, all. scenarios for sites with a biomass boiler assume that the lignidcelIu1ose residue from fermentation is sold to the host site owner for biomass boiler fuel. The selling price for the lignidcelluluse residue is assumed to be $25 per BDT (slightly higher than the base feedstock cost due to the higher energy content of the residue). For the Greenville site, the selling price of the residue has been reduced to $15 per BDT to cover the cost of transportation to a nearby biomass power facility.
Design, construction and startup period
Owner equity
Feedstock cost, delivered
Credit for carbon dioxide (COJ sales is not included in any of the scenarios except for those for the Anderson site. Up to two tons per hour of C02 could potentially be sold to Simpson Paper and pfizer Specialty Chemicals at the Anderson site (R. Bell, Simpson Paper Company). A selling price of $10 per ton for two tons per hour of unprocessed CO, (not purified or liquified) has been assumed for the Anderson site.
~ -~ ~~
2 years
100%
$20.00 per BDT
Additional key economic assumptions are shown in Table 6 below.
Ethanol selling price
Operating days per year
Table 6. Key Economic Assumptions
$1 20 per gallon
345
Parameter I Assumed value 1
Federal income tax rate
California income tax rate
34%
6%
12

Results of the economic analysis reported as internal rate of return (IRR) for each site and each technology are shown in Table 7. The IRR for the concentrated acid and the dilute nitric acid technologies are nearly the same, and both are significantly higher than the dilute sulfuric acid technology.
Greenville
Loyalton
Table 7. Internal Rate of Return (IRR) for 100% Owner Equity
4% -3% 3%
5% 2% 9%
I site
Chester 7%
Martell 6%
Westwood 6%
I Concentrated Acid 1 Dilute Sulfuric Acid I Dilute N i t r i z l
5% 11%
4% 10%
4% 10%
1 Anderson I 5% I 5% I 11% I
Project Financing
Projects of this magnitude are rarely financed with 100% owner equity. It is well known that favorable financing terms can be used to leverage the owner's equity and dramatically improve the IRR. A scenario with 25% owner equity and 75% debt financing was evaluated. A loan interest rate of 7% and a 10 year loan term was chosen to represent perhaps the best possible financing scenario. A 7% interest rate loan may be available through the new electric utility restructuring Public Interest Energy Research (PIER) Program (to be administered by the California Energy Commission), through the California Pollution Control Financing Authority, or the California Alternative Energy Financing Authority.
Results of the RR calculations with 25% owner equity and 75% debt financing at 7% interest rate are shown in Table 8. Leveraging effects are not significant unless the IRR at 100% owner equity is higher than the net loan interest rate (the "after tax" interest rate). These results demonstrate that strong IRRs are possible. However, these projects are capital intensive and with relatively high risk and may, therefore be difficult to finance.
13

Table 8. Internal Rate of Return (IRR) for 25% Owner Equity
Anderson
Chester
Greenville
Loyalton
Martell
Westwood
8% 9% 25%
15% 9% 25%
7% -4% 6%
9% 4%
12% 7% 22%
12% 7% 23%
i 18%
Cash Cost of Production and Net Production Cost
The full cash cost of production and net ethanol production cost with 25% owner equity was determined. Full cash cost and net production cost are defined as follows:
variable costs (raw materials and utilities) + fixedcosts (labor and labor related costs, plant overhead,
maintenance, supplies, local taxes and insurance)
- coproduct credits (for lignin, CO,, and cell mass) = full cash cost of production
+ capital depreciation
+ financing costs (net interest on debt financing) = net ethanol production cost
The resulting full cash cost of production and net production costs for each technology and each site are shown in the Table 9 below.
14

Table 9. Full Cash Cost / Net Ethanol Production Cost, $1 gal. ethanol, 25% owner equity
Anderson
Chester
Maximum Feedstock Cost
$7.79 $14.23 $26.73
$19.17 $14.55 $27.58
One of the objectives of the Quincy Library Group is to facilitate W i n g the forests in the area to reduce wildfire threat and improve forest health. One of the major obstacles to thinning large numbers of acres each year is the cost. Ethanol production utilizing the forest thinnings as feedstock may be a way to offset all or a significant portion of the thinning costs. A scenario was evaluated to determine the maximum feedstock cost that an ethanol facility could pay and still return 15% IRR on the owner's equity for the ethanol facility. The 15% IRR in this type of analysis is also known as the "hurdle rate.'' Again, owner equity was assumed to be 25% with 7% interest on the remaining debt. The results are shown in Table 10 for each site and technology.
Greenville
Loyalton
Table 10. Maximum Feedstock Cost, 15% Hurdle Rate and 25% Owner Equity
$6.50 - $0.58 $12.36
$7.56 $7.64 $22.40
1 site I Concentrated Acid I Dilute Sulfuric Acid I DiIute Nitric Acid I
Martell
Westwood
$14.34 $11.67 $25.44
$15.33 $12.21 $25.87
15

Sensitivity Amlyses
Sensitivity VariabIe and Rank - High to LOW
1. Delivered feedstock cost
The sensitivity of project profitability (as measured by IRR) to the following critical variables was also evaluated:
Sensitivity Range Corresponding IRR Range (A%)
$38 - $0 per BDT feedstock 1% to44% (43%)
Ethanol plant size Delivered feedstock cost Feedstock composition (% glucan) Ethanol selling price Owner equity Ethanol. facility capital cost Annual manufacturing cost Annual direct labor cost
2. Owner equity
3. Ethanol plant size
4. Annual manufacturing cost
5. Ethanol selling price
6. Ethanol facility capital Cost
Sensitivity analyses were pedomed for the dilute nitric acid process at the Chester site only because this site and process has a high IRR and the sensitivity analyses are very time intensive. Again, owner equity was assumed to be 25% with 7% interest on the remaining debt. The results are summarized in Table 1 1 below. Graphs of the IRR versus the above sensitivity variables are included in the Biomass to Ethanol F u c i l i ~ Design, Cost Estimte, and Financial Evaluation report.
~
100% to 5% equity 11% to 50% (39%)
6 - 19 million gal. ethanol/year 0% to 31% (31%)
+/- 20% of manufacturing cost 9% to 38% (29%)
$1 .OO - $1.40 per gal. ethanol 11% to 36% (25%)
+/- 30% of capital cost 17% to 37% (20%)
The IliR is most sensitive to feedstock cost and owner equity. Ethanol plant size, annual
all dispIay moderate sensitivities. A 30% change in direct Iabor cost has relatively little effect on the IIUZ. A graph of the IRR versus feedstock cost for the dilute nitric acid technology at the Chester site follows (Figure 2).
manufacturing cost, ethanol selling price, ethanol facility capital cost, and feedstock composition , I
7. Feedstock composition
8. Annual direct labor cost
33 - 53% glucan in feedstock
+/- 30% of direct labor cost
Table 11. Summary of sensitivities for Chester site and dilute nitric acid process.
14% to 34% (20%)
23% to 28% (5%) d
16


Environmental Issues
Off-Site Environmental Impacts
The potential environmental effects of operating a commercial-scale biomass-to-ethanol plant include both the on-site and off-site impacts surrounding the production facility.
The on-site environmental impacts (as well as local community impacts) are discussed in the site- specific evaluations conducted by the California Energy Commission in the Site Characterization Study issued in April 1997. The CEC study reviewed various environmental and inhastructure factors at the six study sites in Northeastern California.
Cellulose biomass material will be generated from both public and private forest lands within at least a 25-mile radius of the ethanol facility. TSS Consultants' Feedstock Supply and Delivery Systems report (June 1997) predicts an available and sustainable, annual supply of between 187,000 and 336,000 Bone Dry Tons (BDT), dependent upon site. Sources of biomass will be timber harvesting by-products, certain lumber d l residues as well as forest fuels reduction treatments. The same report, using the Fire and Resource Assessment Program 0;RAP) of the California Department of Forestry and Fire Protection, defined that USFS holdings (within 25 miles of the four QLG sites) ranged between 53% to 64%. This includes all lands, not just forested lands. Federally managed forest lands are expected to be a higher percentage.
Environmental reviews and public participation processes that are prerequisites for authorizing biomass havest differ between land ownership types. On private timberlands, California Forest Practice Rules govern timber harvest practices. Biomass harvest activities on National Forest System lands - the presumed primary source for any ethanol facility within the Quincy Library Group's area of interest since the majority of the forest lands are federally administered - must be subjected to National Environmental Policy Act (NEPA) reviews and public participation processes of the U.S. Forest Service. Projects on federal lands must also have the environmental review conducted within the current regional or national context, which must take into account the "latest science."
The Sierra Nevada Ekosystem Project Report (Davis: University of California, Centers for Water and Wildland Resources, 1996)-referred to as SNEP- was a multi year Congressionally mandated, interdisciplinary, scientific review of the status of the Sierran ecosystem. It is the most recent science on a broad scale. The SNEP Summary notes that:
0 Live and dead fuels in today's conifer forests are more abundant and continuous than in the past. (P.26).
Timber harvest, through its effect upon forest structure, local microclimate, and fuel accumulation, has increased fire severity more than any recent human activity. If not accompanied by adequate reduction of fuels, logging (including salvage of dead and dying
24

trees) increases fire hazard by increasing surface dead fuels and changing the local microclimate. Fire intensity and expected fire spread rates thus increase locally and in areas adjacent to harvest. However, logging can serve as a tool to help reduce fire hazard when slash is adequately treated and treatments are maintained. (P.26).
Human activities, particularly timber harvest.. . and fire suppression, have drastically reduced the extent of late successional forests through the removal of large trees.. .(PA).
0 The aquatdriparian systems are the most altered and impaired habitats in the Sierra. (P.8).
The plan proposed by the QLG intentionally reduces the environmental impacts of the large scale-thinning program that is proposed (> 50,000 acres per year for five years) through adoption of various measures on US Forest Service lands designed to reduce those impacts. These measures include:
0 Use of the Scientific Assessment Team (SAT) riparian standards for timber harvest activities, which typically preclude timber harvest within two "site tree" lengths of a perennial stream;
0 Precluding timber harvests on the primary old growth and anadromous fish stream areas of the forest by defining those areas as "Off-Base" or "Deferred" from timber harvests;
0 Adoption of the California Spotted Owl guidelines (1993), which preclude trees over 30 'I from harvesting as well as limit basal area and tree canopy reductions from thinning programs; and
Precluding timber harvests in so-called "Spotted Owl Protected Activity Centers" (PACs) and "Spotted Owl Habitat Areas" (SOHAS).
The typical kinds of environmental concerns that arise from timber harvest and biomass harvest activities include the effects of roads and landings, riparian zone and water quality impacts, fuel loadings and arrangements, wildlife disturbances, and changes in suitability of wildlife habitats. Generically, these can be grouped into soil, water and wildlife impacts. The Plumas, Lassen, and Tahoe National Forest Plans have standards and guidelines applicable to the protection of soil, water, and wildlife resources and the USFS region has adopted a series of BMPs.
The two Quincy Library Group bills currently in the US Congress (HR 858 was approved by the US House of Representatives on 7/10/97 and S 1028 was introduced on 7/17/97) both call for an Environmental Impact Statement on the forestry portion of the QLG plan. This EIS would be developed and finalized within 200 days fiom enactment of the QLG bill. This EIS would allow d1 specific projects to be "tiered" to the QLG EIS, thus allowing for a simpler environmental analysis for individual projects (e.g. archaeology, seasonal botany, on-site nesting areas, etc.) that focuses on the site-specific issues present in any Iand disturbing process. Monitoring would take place and the larger temporal and landscape scdes.
25

Project Environmental Permits
Local Air Quality Management District
The CEC Energy Facilities Siting and Environmental Protection staff provided information on the types and time required to obtain the environmental permits required for a project such as the biomass to ethanol facility proposed here. The air quality, biology, transmission system evaluation, and water quality permits listed in Table 12 will be required. The CEC estimates that each of these prmits will require about six months to obtain. There may be additional permits required from local communities where the project may be located. The CEC can identify these additional permits once more specific project details are known.
Application
Letter of Completeness 30 days
Authority to Construct 180 days
Table 12. Environmental permits required for a biomass to ethanol facility.
Regional Water Quality Control Board (RWQCW
1 Technical Area
National Pollutant Discharge 6 months Elimination System Permit - NPDES (wastewater discharged to surface water)
I Biology2
WDR (underground injection)
Transmission System Evaluation
~~~~ ~
6 months
Water
Regulatory Agency I Permit/Applcation -1TimePeeZiq
I I 1 Permit to Operate
6 months I California Department of Fish and Game
1. Streambed Alteration Agreement I 2. Endangered Species Take
United States Fish and Endangered Species Take Wildlife Service I
~~ ~
6 months I Army Corp of Engineers Headwaters and Isolated Waters I Discharge
6 months I Pacific Gas & Electric I Special Facilities Agreement I 120days I
I Interconnection Facilities Agreement I 120 days I
Waste Discharge Requirement - WDR 6 months I (discharges to land) I ' All time periods listed areapproximations Permits associated with biology can be obtained simultaneously
3Biomass-to-ethanol projects may need the special or interconnection facility agreement with PG&E. ' bid.
26

With the threat of global warming and energy crises in today's environment, the need for clean, "green" fuels is quickly becoming a necessity. Ethanol is an environmentally friendly fuel that is used in 10% blends without engine modifications or in 85% blends in specially designed engines. A blend of 10% ethanol with gas is an approved motor fuel outside of California and is included in all engine warranties that require unleaded gasoline. Motorboats, snowmobiles, motorcycles, lawn-mowers, chainsaws etc. can all utilize the cleaner gasolindethanol fuel blend. Most importantly, millions of automobiles on the road today use this improved fuel.
Ethanol is a liquid alcohol that is manufactured by the fementation of grains such as wheat, barley, corn, wood, and sugar cane (in Brazil). Although it has been traditionally thought of as a beverage product for use in spirits, beer and wine, ethanol is an important, viable alternative to unleaded gasoline fuel. It is a high-octane fuel with high oxygen content (35% oxygen by weight) arid when blended properly in gasoline produces a cleaner, and more complete combustion.
The use of ethanol in gasoline has several environmental benefits:
0 CO, hydrocarbon and NOx reductions: the use of ethanol causes reductions of 8% to 24% in emissions of carbon monoxide (CO) with a 10% ethanol blend. Hydrocarbon emissions are also reduced with ethanol fuel blends. Emissions of nitrogen oxides (NOx) may be slightly reduced or slightly increased in some cases?
CO, reduction: although carbon dioxide is released when ethanol bums, it is recycled into organic tissue during plant growth; ethanol use in gasoline can result in a net reduction in atmospheric carbon dioxide levels.
0 Renewable resource: ethanol is derived from renewable biological feedstocks such as agricultural crops and forestry by-products.
5 Office of Science and Technology Policy, Executive Office of the President, Air Quality Benefits of the Winter O&el Program, March 1996.
27

Market Issues
Ethanol Market Issues
This section on Ethanol Market Issues contains information provided by the California Institute of Food and Agricultural Research at the University of California, Davis; Parallel Products of Davis, CA; and SWAN Biomass Company of Dowers Grove, IL.
To improve the security of liquid fuel supplies, while creating jobs and businesses in rural areas, the federal government has provided a tax incentive to promote the use of ethanol in gasoline. In addition, many states also provide an ethanol production tax incentive or a tax incentive to build ethanol plants. As a result of the federal and state incentives, annual fuel ethanol production by fermentation of glucose fiom corn has increased to approximately 2.5 billion gallons in the United States; current annual domestic ethanol sales are over $1 billion and are expected to increase. Roughly 10% of the total U.S. gasoline supply is now El0 or "gasohol," a blend of 10% ethanol with 40% gasoline. Initially, the value of El0 was seen primarily as a gasoline extender to reduce dependence on imported petroleum while stimulating the U.S. economy, especially in the underdeveloped rural areas. With current regulations on the composition of gasoline in areas where air pollution has been a problem, fuel ethanol has taken on its most valuable role as an oxygenated gasoline additive. Additionally, the use of ethanol as an a n h o c k additive to replace lead formerly added to premium gasoline has also been recognized.
In California regulatory policies of the California Air Resources Board (CAREi) have essentially precluded ethanol from the oxygenate market for California reformulated gasoline (CA RFG). California state law provides for a vapor pressure allowance for ethanol when blended with gasoline at a level of 10% by volume (this produces 3.5% oxygen in the gasoline). However, CARB policy limits the amount of oxygen in CA RFG to a maximum of 2% oxygen, thus preventing the utilization of the vapor pressure aIlowance for ethanol. Refiners are unwilling and in some cases incapable of producing a base gasoline that can be combined with ethanol at 2% oxygen and meet the vapor pressure requirement of CA RFG without the vapor pressure allowance. Blending ethanol at less than 10% by volume also reduces the value of the federal tax incentive, which effectively increases the cost of the ethanol.
Consequently, ethanol (which historically has enjoyed a significant market presence in California) has not been used in California gasoline since CA RFG was introduced in 1996. This has created a virtual monopoly for MTBE in California. Removing' the regulatory barriers to the use of ethanol in CA RFG will create greater flexibility for refiners and gasoline blenders in meeting CAR€$ regulations. This would encourage the use of renewable fuels and the development of a large etfiano1 production industry in California. The potential size of this new industry is discussed below.
Ethanol demand in the western states of California, Arizona, Nevada, Oregon and Washington increased from 154 million to 214 million gallons per year fiom 1992 to 1995. In 1996, ethanol demand dropped to 124 million gallons per year with the loss of the CaIifomia market and a
28

si,onificant decrease in the Washington market. Ethanol demand is driven primarily by federal and state Clean Air Act requirements mandating the use of oxygenates in winter gasoline to lower carbon monoxide emissions. The annual gasoline demand, required oxygenate level in the state's W G or winter gasoline, and the estimated winter oxygenate season ethanol sales for 1992 through 1997 are shown in Table 13 below.
Table 13. Historical West Coast Ethanol Demand (1992 through 1997).
State
CA
Az
Annual OW Ethanol Gasoline Level Est. sales Demand (% by 92-93 (1000 gal) WL) (1000 gal)
13,000,000 2.0 50,000
1,800,000 2.7 9,300
N v I 750,000 I 3.5 I 4,900
Est. sales
(1000 gal) 93-94
WA I 2,400,000 I 2.7 I 60,000
Est. sales Est. saIes Est. saIes
(1000 gal) (I000 gal) (1000 gal) 94-95 95-96 96-97
OR I 1,500,000 I 2.7 I 30,000
Ethanol Ethanol
Totals I 19,450,000 I 1 154,200
Ethanol Ethanol
50,000
15,500
50,000 50,000 0
46,500 62,000 42,000
25,000
160,250 I 189,500 1 213,750 I 123,500
Current ethanol production capacity on the west coast is only 14 million gallons per year- approximately 6 million gallons per year is produced in California and 8 million gdlons per year in Washington. The remainder is imported from the midwest. Production of ethanol in California would result in significantly lower transportation costs to the west coast ethanol markets providing an advantage for projects such as a biomass to ethanol project in the QLG area. California ethanol producers could have up to a $0.20 per gallon cost advantage over midwest producers due to transportation costs.
Ethanol pricing is impacted by variables such as corn prices, MTBE prices, gasoline prices, and clean air act regulations. In the last five years, wholesale delivered prices to western ethanol markets have ranged between $1.18 and $1.55 per gallon (Table 14). Given the seasonal nature of the demand, winter prices tend to be significantly higher than summer prices. 1996 was an exceptional year due to historicdy high corn prices resulting in high ethanol prices throughout the year. In 1997, ethanol prices have returned to traditional levels of $1 .25 to $1.30 per gallon. The expansion of ethanol production based on forest thinnings and agricultural wastes would promote the W G and oxygenated fuel programs in the western U.S. and would lead to more stable ethanol pricing.
The current market for California ethanol is outside of California due to the policy issues discussed above. The current west coast market is approximately 125 million gallons of ethanol per year.
29

California ethanol should enjoy a cost advantage due to significantly lower transportation costs compared to ethanol produced in the Midwest. The west coast ethanol market is projected to parallel the growth of the U.S. ethanol market at 3% per year.
Year
Table 14. Average Wholesale Ethanol Prices Delivered to West Coast Markets
Mandate Season Non-Mandate Season Average Price per Average Annual Price
per Gallon Average Price per Gallon Gallon
1992
1993
$1.55 $1.25 $1.38
$I .35 $1.20 $1.26
1994
1995
1996
Average
The west coast ethanol market could expand dramatically if the California RFG market becomes available to ethanol. California legislation or policy changes could create a market potential of 750 million gallons per year for ethanol produced in California and utilized as El0 in existing vehicles. The wide spread use of flexible fuel vehicles and alternative fuel buses utilizing E85 (85% ethanol blended with 15% gasoline) could increase this amount. Feedstock availability limitations and resultant feedstock cost growth could impact the economics and reduce the rate of market penetration. Energy crops could become economic and contribute to additional g~owth.
~~ ~ ~
$1.40 $1.24 $1.30
$1.25 $1.18 $1.21
$1 S O $1 S O $1. .50
$1.41 $1.27 $1.33
In addition to El0 and E85, ethanol can be used as a feedstock for production of ethyl tertiary butyl ether (ETE%E). ETBE is a premium ether that can be used instead of ethanol or MTBE to oxygenate gasoline. The use of MTBE is being challenged in California and elsewhere because of ground water contamination and other potentid environmental and health impacts stemming from its use. Thus, expanded use of MTBE or ETBE may not be popular with policy makers or the public. However, ETBE has characteristics that might make it less harmful to the environment, so its use may be endorsed as a "bridge" to atlow time for the installation of greater capacity to manufacture renewable fuels like ethanol.
Carbon Dioxide Market Issues
Carbon dioxide is normally recovered for industrial purposes from combustion flue gases ox as a by-product of ammonia or hydrogen production. Large quantities of CO, are also produced as a byproduct of ethanol fermentation. CO, is unusual in that it only exists as a Iiquid under pressure
30

and normally sublimes as a gas straight from its Solid form. Like a number of other gases, carbon dioxide's inert qualities make it useful for preventing or suppressing combustion or oxidation. Its major use, however, is as a refrigerant or cooling agent. Solid carbon dioxide at -80°C is used for chilling and freezing in the food industry. .
Carbon dioxide gas dissolves easily in water, making the resultant solution slightly acidic. As a result, it is often used to balance the pH of water in preference to the addition of mineral acids. Its solubility also makes it the preferred method for putting the "fizz" into drinks of all kinds.
Applications of carbon dioxide include:
Food freezing, chilling and refrigeration Fire suppression Alkali neutralization, waste treatment Mould setting Inert gas pressurization Beverage carbonation Tobacco expansion Oil well recovery
Carrier gas for deodorants, odorants, pesticides and the like Breathing stimulant
Plant growth
It appears that the existing CO, production capacity far exceeds the demand in northern California. Most of the CO, market for th is area is in the beverage market for carbonization and for poultry freezing. A beverage facility could use as much as 40,000 to 50,000 tons per year. R. Bell of Simpson Paper in Anderson, California reports that Simpson and Pfizer Speciality Chemicals may be able to utilize 15,000 to 20,000 tons of CO, per year produced at a biomass ethanol facility at the Anderson site. The ethanol plants under consideration for the QLG area would produce 13,000 to 35,000 tons of CO, per year.
The market price for carbon dioxide is approximately $75/ton, FOB the customer, nationwide. Small markets for welding supplies could be as high as $150 to $160/ton. The estimated capital required to build a facility to liquefy CO, production of approximately 100 tons per day is approximately $2.5 to $3 million plus an additional $200,000 to $500,000 to clean up the CO,. The cleanup is dependent upon the amount of sulfur and hydrocarbons in the gas. Fernentation CO, contains no sulfur and very little hydrocarbons.
Because of the oversupply of CO, in northern California, no credit for CO, sales is assumed in the economic analyses except for the Anderson site where two existing users are already in place. h may be possible to develap CO, markets in Sacrarnento and Reno for the fermentation CO, produced by the proposed ethanol facilities, but this is beyond the scope of the current feasibility study.
31

Socioeconomic Impacts
The socioeconomic report reviews the local, regional and statewide implications of building and operating a forest biomass to ethanol manufacturing facility at specified sites in the Quincy Library Group area (Lassen, Plumas and Sierra counties in the Sierra Nevada) or other sites in Northern California. The report fust sets the current socioeconomic context in th is natural resource dependent area. It then reviews the effect of an ethanol plant on employment, personal incomes, state and local taxes, construction jobs, and local infrastructure (particularly roads, schools and utilities). lt also reviews the implications of such a facility in Amador or Shasta County.
A modest sized forest biomass to ethanol demonstration plant (e.g. producing 15 million gallons per year) will create at least 28 direct jobs at the plant, if it is co-located with an existing biomass electricity energy plant. Additional jobs would be created if a biomass electric energy plant was built along with the ethanol manufacturing facility. The furnishing of forest biomass feedstock to th is plant would employ 63-100 additional employees to gather, process and transport the cellulose material to the plant. These 91-128 direct jobs would be augmented by an additional 93-122 indirect or multiplier jobs. One 15 million gallon per year ethanol plant would thus generate between 184- 250 total jobs.
The total direct payroll for the ethanol facility and the feedstock collection, processing and transportation is estimated to be $2,623,080. Total direct and indirect payroll is estimated to be $4,884,240. Construction jobs are estimated at 88 jobs with a payroll of approximately $2,000,000.
The ethanol plant's operations will have varying effects upon the road systems, depending upon the size and location of the plant and access road (e.g. interstate, state highway, paved county road, urban or rural setting). The primary initiators of road effects are the feedstock delivery to the plant and the subsequent shipping of ethanol and other products from the plant. Other major effects will be from the workers commuting to the operational plant as well as the short term construction activity to build the plant. The underlying traffic generator is the delivery of cellulose material to the plant.
An ethanol plant utilizing 240,000 BDT per year of forest biomass will require approximately 17,800 truckloads of biomass delivered to the facility annually. Assuming feedstock collection in the woods is limited to eight months out of the year and a six day per week, 12-hour per day delivery regime for the material, equates to 85 truckloads a day to the facility, seven truckloads per hour for a 12 hour day, or a truckload every eight and a half minutes. The CEC Site Churucterizatiun Shcdy pointed out possible road limitations at Greenville and Loyalton.
32

IV. CONCLUSIONS AND RECOMMENDATIONS
Conversion of forest thinnings and timber harvest residues to ethanol and cogenerated electricity appears to be economically feasible at the five sites in the study that have an existing biomass power plant and other infiastxucture available. Colocation with an existing biomass power plant is essential at this time.
The undeveloped or "greenfield" site in Greenville requires the installation of a boiler to provide steam to the ethanol process as well as buildings and other infrastructure that adds significantly to the total capital cost making this site less appealing at this time.
There appears to be an adequate supply of feedstock for one or more biomass to ethanol facilities in the Quincy feasibility study area.
The California refonnulated gas (CA RFG) market is potentially a huge market for ethanol or ETBE (almost 1 billion gallons of oxygenate per year). However, ethanol is not currently used in California due to the 2% cap on oxygenate in CA RFG. Other West Coast markets such as Reno, Las Vegas and Phoenix are available, but are much smaller than the California market.
Forest biomass can be removed fiom the forest with acceptable impact to the environment and thinning the forest in the study area will improve the overail forest health and ecosystem balance.
Many technical, economic, and other assumptions have been made to perform the analyses reported in this study. Additional work is needed to prove or disprove these assumption and reduce the uncertainty of the results. The following next steps are recommended:
Identify Potential Owner/Operators
Quincy Library Group will identlfy potential ownerdoperators of the ethanol manufacturing facility. This will entail reviewing the feasibility study with the current site owners to determine whether this project would fit into their own development plans. This task will also consist of discussions with current operators of ethanol manufacturing facilities (as well as other operators) to determine whether this new feedstock source (forest biomass) fits with their expansion plans.
Secure Site Commitments
Quincy Libmy Group will solicit Letters of Intent from the site owners in this feasibility report (by the end of 1997) to quantify and qualify the general terns and conditions under which they would enter into the development phase of the project. QLG and NREL will also begin introducing prospective operators to the site Owners and to ethanol technology purveyors.
33

* brig Term Supply Agreements
The delivered feedstock supply and price are the most sensitive economic factors in the feasibility study. QLG will investigate specific opportunities and seek the development of long term agreements on both public (particularly USDA Forest Service) and private lands.
Design and Cost Estimates
A variety of further engineering and design tasks were identified for each of the three technologies studied. NREL will pursue partnerships and funding for these subsequent tasks.
V. TASK IWPORTS
The complete task reports follow. The task reports include:
Feedstock Supply and Delivery Systems
Site Charucterizaiiun Study
Biomass to Ethanol Facility Design, Cost Estimate, and Financial E v a l d n
California Ethanul Market Assessment
Environmental Effects Report - Ethanol Feasibility Study
Northeatern California Ethanol Manufucfuring FemibZLiry Study: Socioeconomic Report
If you have downloaded the Executive Summa~y fiom the Internet and would like a copy of the complete report or any of the above task reports, please contact Sally Neufeld or Mark Yancey of the National Renewable Energy Laboratory at (303) 275-3000.
34

QUINCY LIBRARY GROUP
NORTHEASTERN CALIFORNIA ETHANOL
MANUFACTURING FEASIBILITY STUDY
FEEDSTOCK SUPPLY AND DELIVERY SYSTEMS
FINAL REPORT
TSS CONSULTANTS 2890 Kilgore Road, Suite B
Rancho Cordova, CA 95670 (916) 638-8811
June 3,1997

FEEDSTOCK SUPPLY AND DELIVERY SYSTEMS P U N
TABLE OF CONTENTS
INTRODUCTION ........................................................................................................................................... i OBJECTIVE ................................................................................................................................................... -2 FINDINGS ...................................................................................................................................................... 2
Legislative Efforts ....................................................................................................................................... 3 Quincy Library Group Forest Recovery and Economic Stability Act of 1997 ........................................ 3 The Forest Thinning Bill ......................................................................................................................... 4
Wildfires ...................................................................................................................................................... 4 Fuel Reduction Strategy ............................................................................................................................... 5 Support For FueI Reduction ......................................................................................................................... 8 Biomass Availability ................................................................................................................................. 10 Fuel Reduction ........................................................................................................................................... 1 1 Integrated Timber Harvesting .................................................................................................................... 14 Primary Timber Types ............................................................................................................................... 14 Biomass Availability For Each Site ........................................................................................................... 26
Analysis of Slopes Within Fuel Reduction Areas ...................................................................................... 29 Analysis of Forested vs . Non Forested Areas ............................................................................................ 31 Factors Influencing Biomass Feedstock Availability and Cost ................................................................. 31 Collection, Processing and Transportation ................................................................................................ 33
Land Ownership ........................................................................................................................................ 28
TSS Consultants

FEEDSTOCK SUPPLY AND DELIVERY SYSTEMS PLAN
QUINCY LIEiR4RY GROUP
NORTHEASTERN CALIFORNIA ETHANOL MANUFACTURING
FEASIBILITY STUDY
FEEDSTOCK AND DELIVERY SYSTEM
INTRODUCTION
The study area includes most of the Lassen and Plumas National Forests and the Sierraville
District of the Tahoe National Forest, which encompasses approximately 2.4 million acres. This
forest area has been severely affected by previous drought years and insect infestation, resulting
in extensive buildup of biomass fuels. Given the general absence of frequent, low intensity fire
there is possibly a greater fuel accumulation and dead trees than anytime in history. In the study
area, one hundred years of fire exclusion and various management activities combine to result in
stand conditions which support large stand-replacing fires. Fires that have burned in forests with
conditions of excessive fuels have been larger, hotter and more destructive than ever before.
Suppression of these fires is difficult, hazardous, and expensive.
California’s forests are at risk, the direct result of too many trees competing for growing space,
rainfall, and soil nutrients. Restrictions on general harvest activities and the removal of salvage trees
has resulted in forests that are not only dense, but are weak, dry, and extremely flammable.
Scattered throughout the study area are numerous small rural communities most of which have
been threatened by wildfire at least once in the last 20 years. As more homes are built in the
wildlandurban interface, firefighting becomes increasingly complex. More fires occur from the
increased association with the urban interface. It is often necessary to divert wildland firefighting
resources to protect improvements, resulting in additional wildland loss.
To address these issues, the Quincy Library Group (QLG) put forth a plan to strategically thin the
forests to; improve forest health, restore ecosystem balance, and reduce fire danger. The QLG
proposal is a grass roots effort among members of the timber industry, the county governments of
Lassen, Plumas and Sierra, fisheries and environmental groups to agree on how selected local
national forest resources should be managed. The QLG has described the desired future forest
TSS Consultants 1

FEEDSTOCK SUPPLY AND DELIVERY SYSTEMS PLAN
condition as: “all age, multi-story, fire-resistant forest approximating pre-settlement conditions.”
The silvicultural strategies recommended by the QLG to achieve this condition are intermediate
thinning and regeneration harvest using group selection and single tree selection.
Discussions between the QLG and the various Forests led to changes in projects proposed for
funding through the $4.7 million redirected to the Forest Health Pilot (M) project. Fuel
reduction, watershed restoration, monitoring, and land management planning projects are
included in the FMP.
OBJECTIVE
The objective of the Feasibility Study is to determine the economic, environmental and regulatory
feasibility of siting one or more Forest Biomass to Ethanol manufacturing facilities in
Northeastern California. This assessment by TSS Consultants (TSS) will address the availability
of biomass and the economics of collection, processing and transporting the biomass material to
potential project sites for use as a feedstock in the conversion to fueI ethanol and cogenerated
electricity.
FINDINGS
TSS has prepared the following assessment by reviewing available data provided by the U.S.
Forest Service, contacting other individuals knowledgeable of biomass available within the study
area and by making field visits to the project area. TSS’s past knowledge and experience in
biomass supply within this geographic area was used as a basis for the assessment.
The assurance of a long term biomass feedstock supply at a reasonable price is a critical element
in the successful operation of this proposed biomass to ethanol facility. This report reviews the
estimated biomass feedstock generated on an annual basis, the economics of collection,
processing and transportation of the biomass feedstock and the level of risk associated with the
supply of biomass feedstock.
TSS Consultants 2

FEEDSTOCK SUPPLY AND DELIVERY SYSTEMS PLAN
Legislative Efforts
Quincv Librarv Group Forest Recovev and Economic Stability Act of 1997
During the lst Session of the 105* CONGRESS, (February 27, 1997) local Congressman Wally
Herger introduced H.R. 858. As of the date of this report, this legislation is in the Committee on
Resources. This legislation was originally introduced during the 104* CONGRESS 2nd Session,
by Congressman Herger as, H.R. 4082 (introduced 9/17/96). This legislation will direct the
Secretary of Agriculture to conduct a pilot project on designated lands within the Plumas, Lassen,
and Tahoe National Forests in the State of California to demonstrate the effectiveness of the
resource management activities proposed by the Quincy Library Group and to amend current land
and resource management plans for these national forests to consider the incorporation of these
resource management activities. This federal legislation aims to reduce the risk of catastrophic
wildfire in northern Sierra Nevada forests by using a resource management approach recognized by
the Quincy Library Group as more appropriate than the past even-age management approach. The
QLG approach is designed to focus all treatment activities in a strategic manner that results in the
network of defensible fuel profile zones in a short time frame. The measure would establish a five-
year pilot project on three national forests to test a "common-sense plan" by the alliance of
environmentalists, timber industry, and local officials said Rep. Wally Herger (R-CA). The measure
would require the Forest Service to reduce forest fuels on 50,000 acres a year through logging the
smaller, crowded trees to provide enough material to keep local sawmills in operation.
During the 104* Congress this legislation was referred to the Committee on Resources and
Agriculture as well as the Subcommittee on Resource Conservation, Research and Forestry and
the Subcommittee on National Parks, Forests and Lands, then withdrawn by the QLG because of
the need to work with environmental interests.
TSS Consultants 3

FEEDSTOCK SUPPLY AND DELIVERY SYSTEMS PLAN
The Forest Thinning Bill
Another effort in California during 1996 was, AB 1357 (Knowles), “the Forest Thinning Bill”
which provides incentives for all landowners to care for their property by thinning out dense,
suppressed trees without the costly and bureaucratic Timber Harvest Plan paperwork. This
legislation was signed by the Governor on September 19, 1996. Like other exemptions, AB 1357
would require all scientifically proven forest practice rules authorized under existing law to be
followed with the direction of a licensed professional forester. California has the most
comprehensive forest practice rules regulating ma11 ownership and commercial timberland
management in the world.
Thinning activities under this bill would be limited to only those which will “reduce the rate of
spread, duration and intensity of a wildfire.” The bill also mandates compiiance with recent
forest rule developments that result in the development of timber stands with higher basal areas
than required by the minimum standards. The Iegislation will result in the retention of larger
trees by focusing on the smaller trees that contribute to the overstocked conditions. This
approach will result in the retained trees being more free to grow and less susceptible to stand
replacing fire.
Wildfires
There are still residual effects of the drought during the late 1980’s and early 90’s. California
wildfires burned larger and hotter during 1996. According to the National Interagency
Coordination Center in Boise, Idaho more than 600,000 acres were burned, almost 11 percent of
the nation’s burned area, accounting for the worst fire season in 4 decades.
The following Table I . I reflects the fire history for the previous five years by direct protection
area. Direct protection area refers to those areas where the agencies actually provide the people
and equipment to put the fire out.
TSS Consultants 4

FEEDSTOCK SUPPLY AND DELIVERY SYSTEMS PLAN
1993
Acres
122,606
I 1,753
1 19,527
49, I39
6,754
309,779
242,109
Table 1.1
California Fire History By Direct Protection Area
1994 1995
Acres Acres
140,792 121,198
239,3 13 20,055
26,200 10,203
115,537 40,480
4,377 17,879
526,219 209,815
232,734 305,629
I 1991 1 1992 Direct Protection Area
CDF USFS Contract Counties
US BLM National Park Service
Total
5 - Year Average
Acres Acres
23,100 19 1,490
10,100 66,050
2,300 4,915
2,700 19,169
6,000 1,121
44400 282,745
287,072 360,160 I I I I 1
Fuel Reduction Strategy
Feedstock for one or more ethanol manufacturing facilities to be located in northeastern
California is readily available from thinning the forest to reduce fire danger, improve forest health
and from timber harvesting residues. In July of 1995, the Forest Service prepared the “Technical
Fuels Report” addressing fire hazard as a major concern. The purpose of the report was to
recommend strategies with the potential to increase fire-fighter safety; reduce loss of life and
property at the wildlandcommunity interface; improve forest health and vigor; reduce fire size,
severity, and level of resource damage; and protect ecosystems.
The eastern portions of the Lassen and Plumas National Forests were targeted in the report, as
well as the eastern portion of the Sierraville District of the Tahoe National Forest. Three fuel
reduction strategies were recommended: defensible fuel profile zones; community defense
zones; and fuel reduction zones. Together they comprise the basis for a strategic fuels
management program.
TSS Consultants 5

FEEDSTOCK SUPPLY AND DELIVERY SYSTEMS PLAN
From National Forest lands, feedstock can be generated in the development of three types of fuels
management strategies. These three fuel reduction strategies are described as follows:
Defensible Fuel Profile Zones
A defensible fuel profile zone (DFPZ) is a strategically located strip or block of land on which
fuels, both living and dead, have been modified. The objective is to reduce the potential for a
crown fire and to allow fire suppression personnel a safer location from which to take action
against a wildfire. They are generally located in conjunction with a road system. Defensible fuel
profile zones are not intended to stop long-range spotting. They are also not intended to take the
place of widespread fuel treatment. They are, however, intended to reduce the rate of spread of a
wind-driven fire. They will facilitate follow-up and treatment of adjacent areas. DFPZ’s can also
serve as control lines for prescribed burning.
A defensible fuel profile zone design will be site specific and will vary with fuel type and terrain.
A defensible fuel profile zone may be any size, shape, or width. They may be located along
roads, on a ridgetop, or in a canyon bottom. It is desirable that a DFPZ be located on lands less
than 30 percent slope in conjunction with a road system to provide for fire suppression and
maintenance.
Communitv Defense Zones
A community defense zone (CDZ) is an area around or within a community where fuels have
been modified to increase protection of the community from wildfire. It will also reduce the
chance of fire spreading into the wildland from the community. Direct treatment may not occur
over the whole area, but fuels are reduced, ladders are removed, and canopy closure is reduced to
slow an approaching fire. CDZ’s provide defensible space to increase effectiveness of
suppression actions and firefighter safely.
Involvement and cooperation of local communities is necessary in the development of CDZ’s
since most of the land near the communities is privately owned. Local communities may enter
into cooperative agreements with the Forest Service and other agencies to develop community
defense zones. Some communities have already initiated these projects.
TSS Consultants 6

FEEDSTOCK SUPPLY AND DELIVERY SYSTEMS PLAN
Each community defense zone needs to be planned in a site-specific manner, utilizing one or
more of the following concepts:
1. Develop a defensible fuel profile zone around the community, or in the area at greatest risk from fire.
2. Reduce fuels within the community defense zone to a level that will not support high
intensity fire.
3. Use the standards for fuel treatment immediately adjacent to structures found in California
Public Resource Code 4291.
4. Consider a fuel reduction zone in the general forest area upwind of the community defense
zone.
5. Work with cooperators to treat state and private land adjacent to the community defense zone.
Fire managers considered: structure density, access, fuel type, slope, fire history, fire occurrence,
fire protection resources, previous or planned treatments, and land ownership when
recommending community defense zones.
Fuel Reduction Zones
A fuel reduction zone (FRZ) is an area in which continuous high hazard fuels are broken up.
They are designed to increase firefighter safety and reduce resistance to fire control efforts. A
fuel reduction zone may be of any size or shape. They may have a higher number of snags, down
logs, and canopy closure than defensible fuel profile zones. Work may be accomplished by any
treatment method or combination of treatment methods.
TSS Consultants 7

FEEDSTOCK SUPPLY AND DELIVERY SYSTEMS PLAN
Support For Fuel Reduction
The Western Forest Health Initiative, chartered by former Chief of the U.S. Forest Service,
Thomas in 1994 states:
"Reducing fuel continuity involves an interconnected network of natural fire barriers and treated
stands as zones for controlling wildfires. Following un upprupriute level of landscape analysis,
management practices should focus on creating "breaks" in the landscape while reducing hazard
to the entire area. The
challenge is to make these breaks part of the range of variability fur the landscape rather than
increase forest frugmentation. "
Breakup of cuntinuity is the key; not treatment of the entire area.
"Reducing fuel levels involves the rate of spread of crown fires. To limit the acreage involved in
natural wildfire, it is prudent to reduce fuel levels in order to minimize catustronhic loss. ' j
On March 18, 1997, Forest Service Chief Dombeck outlined Forest Health Priorities in the
following news release:
WASHINGTON (March IS, 1997) -Increasing prescribed fire, reducing exotic pests, restoring
streamside functions, and _increased forest thinning and monitoring, are some USDA Forest
Service priorities for restoring forest health, accurding to Forest Service Chief Mike Dombeck.
"While our forests are generally healthy, some timber practices of the past and the elimination of
fire from firedependent ecosvstems have increased the risk of catastrophic wildfires, and
increased the severity of drought, insect infestation, and disease," Dombeck said today in
testimony before the United States House of Representatives' Subcommittee on Forests and
Forest Health.
"We must look at restoration of forest health as an investment: an investment in the land, an
investment for our children's future; an investment that will ensure productive, healthy and
diverse national forests," he said.
TSS Consultants 8

FEEDSTOCK SUPPLY AND RELIVERY SYSTEMS P U N
'X healthy forest is one that maintains the function, diversity, and resiliency of all its components,
such as wildlife and fish habitat, riparian areas, soils, rangelands, and economic potential and
will require active management. It will require road maintenance and obliteration; use of
prescribe fire; grazing management; thinnina of green trees; salvage; and other forest
managemenr practices. We must use all available tools and continue our search for new ones."
In addition, Dombeck emphasized that the Forest Service must eflectively communicate the many
environmental and economic benefits of restoring forest health as well as the consequences of
inaction. '7f people do not support restoration of forest health, then all of our best eflorts will be
wasted, he said.
Dornbeck said the 1998 budget proposes funding increases to reduce forest fuels that have the
potential to erupt into devastating wildfires. ' I We have also proposed increases for timber stand
improvement activities and forest vegetation management," he said.
He alss said the Forest Service will soon release a proposal to create a new permanent fund
called the 'IFurest Ecosystem Restoration arzd Maintenance Fund." This fund will provide
additional resources for reducing fire kzurds and improving the structure and health of the
forest.
On March 25, 1997, Forest Service Chief Dornbeck outlined his vision for Forest Health and a
more accountable Forest Service to the Senate. The following are some excerpts:
WASHINGTON DC (February 25, 1997) -USDA Forest Service Chief Mike Dombeck says he
is committed to restoriw forest health, increasing employee accountability, and getting the
agency's financial house in order.
' B y the end of 2001, I expect the Forest Service to have efective and wellaccepted individual
accountability in every aspect of the agency," said Dombeck before the Senate Committee on
Energy and Nurural Resources. !'I also expect the Forest Service to have the clearest record of
improving the health of the land in the world, while having created true sustainability with
regard to natural resource extraction."
TSS Consultants 9

FEEDSTOCK SUPPLY AND DELIVERY SYSTEMS PLAN
"But the fact is that many of our forests are sick," he said. "We can accelerate the healing
through a balanced and measured approach. This is nut about "cutting it to save it." I t is about
sitting down at the same table with regulatory agencies, other local managers, and citizens and
taking action before we are confronted with incrediblv costlv fires."
He also said the restoration of ecosystems would nut be quick, nor inexpensive.
'Yt took many decades fur today's unhealthy forest conditions to develop ... and it will take an
equally long time to reverse them," Dombeck said. 'But we must look at these sorts of activities
as investments in the land. Investments that will ofien not pay dividends until our children's
children are born.
Dombeck's prescription for restoring forest ecosystem health includes such things as prescribed
fire, thinninc noxious weed management? fuel obliteration and maintenance, and grazing
management.
The new Chief also said the Forest Service must become more focused on providing a stable
supply of p o d s and services within the ecological limits of the land. "We must accomplish this in
a manner that is ecologically responsive and fiscally responsible. I'
Biomass Availability
TSS is of the opinion that biomass feedstock for the QLG project can be recovered from fuel
reduction strategies canied out on national forest lands such as creating Defensible Fuel Profile
Zones, Community Defense Zones and Fuel Reduction Zones as well as from collecting and
processing biomass from timber harvesting operations. For the purposes of this analysis the
acreage of Community Defense Zones reflected in the Technical Fuels Report has been adjusted
to reflect only the acreage on national forest lands.
TSS Consultants 10

FEEDSTOCK SUPPLYAND DELIVERY SYSTEMS PLAN
DFPZ DFPZ
Forest Acres BDT
Lassen 84,676 1,058,450
Piumas 49,451 618,138
Tahoe 20,111 25 1,388
Total 154,WS 1,927,975
Fuel Reduction
CDZ CDZ FRZ FRZ Total Total
Acres BDT Acres BDT Acres BDT
57,018 712,725 106,548 1,331,850 248,242 3,103,025
88,935 1,111,688 106,841 1,3353 13 245,227 3,065,339
745 9,3 13 23,057 163,213 33,913 423,914
146,698 1,333,726 226,446 2,830,575 527,382 6,592,278
TSS has evaluated the amount of biomass feedstock that could be removed from performing these
fuel reduction strategies within the areas that are tributary to the QLG supply area. TSS has
assumed that an aggressive program of treating 50,000 acres per year for the first five years could
be initiated, followed by a program of treating approximately 18,500 acres per year for the next
15 years to effectively treat all of the identified acres within a 20 year period. The following
Table 1.2 reflects the acreage of each treatment for each forest and the estimated BDT of biomass
feedstock that can be recovered. For purposes of this initial assessment, TSS has assumed that an
average of approximately one load of chips can be recovered per acre from these treatments, or
approximately 12.5 BDT per acre. This estimate of biomass generation is based on data received
from the Forest Service from fuel treatment projects as well as TSS’s experience. The actual
biomass generation has ranged from one-half load per acre to over two loads per acre (6.25 - 25
BDT).
Table 1.2
Estimated Fuel Treatment Acreage and Biomass Feedstock Availability
Implementation of a fuels reduction strategy as described above within the QLG supply area
could generate an annual volume of 625,000 BDT of biomass feedstock during the first five year
period and sustain an annual volume of approximately 23 1,250 BDT of biomass feedstock during
the next 15 years by treating all of the acres identified in the Technical Fuels Report that occur on
national forest lands.
TSS Consultants 11

FEEDSTOCK SUPPLY AND DELIVERY SYSTEMS PLAN
Source Years 1 - 5 (BDTTYear)
Fuel Treatment 625,000
This level of biomass feedstock (231,250 BDT) generation per year could produce over 17
million gallons of ethanol per year at an assumed conversion rate of 75 gallonsA3DT. The
following Table 1.3 reflects the estimated annual biomass feedstock available from fuel treatment
on national forest lands within the QLG supply area.
Year 6 - 20 (BDTNear)
23 1,250
Table 1.3
Estimated Annual Biomass Feedstock Availabilty From Fuel Treatment
The combined Ey97 Forest Health Pilot Program for the Lassen and Plumas National Forests and
the Sierraville District of the Tahoe National Forest will accomplish approximately 20,000 acres.
The results of the FY96 Forest Health Pilot Program Fire Hazard Reduction are reflected in the
following Table 1.4.
TSS Consultants 12

FEEDSTOCK SUPPLY A N D DELIVERY SYSTEMS PL. i
Lassen Mineral CDZ 2,300 8,000 80/20 Done Jun-97 Needs sale prep work Bailey DFPZ 3,400 7,000 80/20 Apr-97 Jun-97 EA done, DN not signed Wheel DFPZ 1,800 4,000 80/20 Done Apr-97 Antelope Biomass 797 2,000 0/100 Done Done Service contract, awarded Almanor/PratviHe CDZ * 400 0 NA Done Inhouse Done
Dow Wells DFPZ * Done Service contract, awarded ManzanitdChutes CDZ ** 363 0 NA Done Done Service contract, awarded
---
127 0 NA Done -- NA Jobs-in-woods, done
Table 1.4
PIumas Willow CDZ, FRZ Robinson FRZ Hungry DFPZ, FRZ Wilcox FRZ Spike DFPZ
96 Forest Health Pilot
No bids, will re-advertise Done 2,500 5,500 50/50 Done 420 1,540 85/15 Done Apr-97
2,050 51 7 1,700 100/00 Done Done Awarded
1,700 3,000 80/20 Done Done Awarded
5,500 55/45 Done Done Service contract, no award
Lassen and Plumas National Forests and the Sierraville District of the Tahoe National Forest
1 --- Summit DFPZ 900 3,900 75/25 Done No bids, service contract 97 Corridor DFPZ 1,341 14,000 15/85 Done Service contract, awarded Highway 89 * 150 0 NA fnhouse Fuelwood/underburn needed Cafpine CDZ *** 80 0 NA 1 Inhouse Done
Note: * Hand Thinning ** Tractor Piling *** Underburn
TSS Consultants 13

FEEDSTOCK SUPPLY AND DELIVERY SYSTEMS PLAN
Integrated Timber Harvesting
In addition, biomass feedstock is available to the project from the residue generated as a by-
product of timber harvesting operations. The quantity of this material that remains in the forest
varies depending on the species, type of soil, terrain, utilization standards of forest management, and
actual loggmg operations. This forest material, which can be used as feedstock, typically takes the
form of tree tops, branches and limbs, whole trees too small for sawmill processing, and defective
logs. Forest residues having biomass feedstock potential are derived from integrated logging.
The available forest residue within the QLG fuel supply area is defined as the quantity of residue that
could be generated annually from logging operations. Average forest residue moisture content is
estimated to range from 45 to 50 percent, depending upon species harvested and the time of the year.
Primary Timber Types
The ethanol plant processes are sensitive to the species of trees that make up the potential feedstock.
The tree composition of the commercial forest land within the QLG supply area is primarily mixed
conifer forest type consisting of varying mixtures of white fir, Douglas-fir, ponderosa pine, sugar
pine, jeffrey pine and incense cedar with scattered oak. With increasing elevation, the mixed conifer
zone gives way to a fir belt - then predominately red fir. Within the eastside forest type the tree
composition consists primarily of jeffrey and ponderosa pine with various mixtures of other conifers
depending upon location. To quantify the variety of timber types within the QLG supply area, TSS
obtained the data available for existing timber types within each national forest from the U.S. Forest
Service. The following Tables 1.5 through 1.7 reflect the percentage of existing timber types by
national forest. Table 1.5 reflects the percentage of existing timber types for the Lassen National
Forest.
TSS Consultants I4

FEEDSTOCK SUPPLY AND DELIVERY SYSTEMS PLAN
Timber Type
Table 1.5
Lassen National Forest Timber Types
Percent by Type
Mixed conifer 57.0%
Eastside pine
Red frr
29 .O% 10.0%
The following Table 1.6 reflects the existing timber types on the Plumas National Forest.
t
Lodgepole pine 4.0%
Total 100.0%
Table 1.6
Plumas National Forest Timber Types
Timber Types
Westside Mixed conifer
Percent by Type
67 .O% I I Eastside Mixed conifer I 9.0% I
&stside pine
Red fir
Hardwood
Total
14.0%
6.0%
4.0%
100.0%
TSS Consultants 15

FEEDSTOCK SUPPLY AND DELIVERY SYSTEMS P U N
Timber Types
The following Table 1.7 reflects the existing timber types for the Tahoe National Forest. This data
reflects the entire Tahoe National Forest and not just the Sierraville District.
Percent by T’ype
Table 1.7
Tahw National Forest Timber Types
Red fir
Eastside pine
16.0%
16.6%
I Mixed conifer 1 57.5%
Hardwdconifer
Other
Total
5.8%
2.6%
100.0%
1.5% I I Lodgepolepine
1 I
Based upon the wide variety of tree species within the QLG supply area, additional analysis may be
required to determine the ethanoI recovery potential from the available feedstock for a specific plant
Site.
The following Figure 1.1 provides a review of historic timber harvest data from the California
Board of Equalization, Timber Tax Division, indicating that during the period of 1992 through
1995, timber harvest from public and private timbedands within the QLG area has averaged
approximately 240.9 million board feet (MMBF), ranging from a low of 207.1 MMBF in 1994 to
a high of 290.7 MMBF in 1992. For this period, the harvest levels on public lands have ranged
from a low of 40.1 percent in 1994 to a high of 50.2 percent in 1995.
TSS Consultants 16

FEEDSTOCK SUPPLY AND DELIVERY SYSTEMS PLAN
Figure 1.1
Total Public and Private Timber Harvest Within QLG Area
MMBF
1992 1993 1994 Year
1995
Wood residue is generated as a part of n o m l logging operations of merchantable timber sales.
Typical logging operations in this area remove the larger high quality portion of the trees for sale to
sawmills. The remaining tops, limbs, and undersized trees too small for sawlogs can be chipped for
biomass feedstock or left in the forest. The amount of material generated for biomass depends on the
particular stand of timber and the harvesting prescription and ranges from 6 to 25 BDT per acre. The
amount of biomass feedstock from forest residue sources was determined by analyzing the
volume of timber harvested within the area tributary to the QLG Project Area during the past 4
years. TSS also estimated the amount of biomass that is generated from the various types of
timber harvests occurring within the area in relation to the sawlog timber harvest. On the
average, TSS estimated that 1.97 BDT of recoverable forest residue is generated for each
thousand board feet (MBF) of sawlogs harvested. This estimate is based the assumption that if a
chipper was available on the logging operation to chip tops and damaged trees, one load of chips
could be generated for each load of logs that was removed. TSS further assumed a 4.75 MBF log
TSS Consultants 17

FEEDSTOCK SUPPLY AND DELIVERY SYSTEMS PLAN
load average and a 12.5 BDT chip load average, then assumed 75 percent of the residue is
recoverable to arrive at the factor of L97BDTMBF. TSS estimates that an average of
approximately 475,000 BDT of residue has been generated each year for the past four years from
timber harvesting operations within the QLG supply area. This amount of residue has ranged from a
low of approximately 410,000 BDT in 1994 to a high of over 570,000 BDT in 1992. The following
Figure 1.2 reflects the estimated biomass generated annually during the period of 1992 through 1995
from public and private timber harvest within the QLG area.
Figure 1.2
Estimated Biomass Generated Annually From Public and Private Timber Harvest Within QLG Area
6oo.oO0-
500,0oo-
400.000.
BDT 300,000.
200,000
100,000
Q 1992 1993 1994
Year 1995
The following Table 1.8 summarizes TSS’s estimate of the quantity of biomass that could be
available in the entire QLG project area from fuel treatment activities and from timber harvesting
operations. Based upon the previous assumptions regarding fuel treatment strategies and
assuming continued timber harvest levels equal to the past 4 years average, TSS estimates that
during the period of years 1 - 5 , a total of 1,100,000 BDT will be available annually and during
the period of years 6 - 20, a total of approximately 706,250 BDT annually wiIl be available to the
TSS Consultants 18

FEEDSTOCK SUPPLY AND DELIVERY SYSTEMS PLAN
Source
Timber Harvest Operations
Fuel Treatment
QLG project. This level of biomass feedstock (706,250 BDT) generation per year could produce
almost 53 million gallons of ethanol per year at an assumed conversion rate of 75 gallons/BDT.
Year 1 - 5 (BDTNear) Year 6- 20 (BDTNear)
475,000 475,000
625,000 23 1,250
Table 1.8
Estimated Biomass Feedstock Generation
1,100,000 I 706,250 I I I Total
Although data is not readily available for quantifying the public and private timber harvest within a
25 - mile radius of each of the proposed sites, TSS was asked to make this estimate based upon the
best data available in conjunction with information from individuals knowledgeable within the QLG area. TSS used the last 4 years average public and private timber harvest data previously calculated
within the QLG area, then estimated the percentage of harvest within a 25 - mile radius of each of
the sites to calculate an estimate of the timber harvest.
As was done for the estimate for the entire QLG area, TSS estimated the amount of biomass that
would be generated from this harvest on an annual basis. The following Tables 1.9 through 1.12
reflect the public and private timber harvest estimate within a 25 - mile radius of each site and TSS’s
estimate of the BDT of biomass generated on an annual basis.
TSS Consultants 19

FEEDSTOCK SUPPLY AND DELIVERY SYSTEMS PLAN
County
Lassen
Table 1.9
Estimated Biomass Generated Annually From Timber Harvest Within A 25 - Mile Radius
Westwood Site
Estimated Average Estimated Biomass
Timber Harvest (MBF) Generation (BDT)
42.97
Plumas
Total
49.76
92.73 182,678
I Estimated Average
I County I TimberHarvest(MBF) I Generation (BDT)
Estimated Biomass
Lassen
Plumas
Total
TabIe 1.11
31.66
76.4 1
108.07 212,898
Estimated Biomass Generated Annually From Timber Harvest Within a 25- Mile Radius
Estimated Average Estimated Biomass
Lassen
Plumas
16.96
103.07 I I
Total I 120.03 I 236,459 I
TSS Consultants 20

FEEDSTOCK SUPPLY AND DELIVERY SYSTEMS PLAN
County
Lassen
Plumas
Table 1.12
Timber Harvest (MBF) Generation (BDT)
1.13
26.66
Estimated Biomass Generated Annually From Timber Harvest Within a 25- Mile Radius
Loyalton Site
Sierra
Total
I EstimatedAverage I EstimatedBiomass I I
35.33
63.12 124,346
The following Figure 1.3 reflects the combined historic timber sale offerings for the Lassen and
Plumas National Forests and the Sierraville District of the Tahoe National Forest for the period of
1991 - 1995. This data reflects the impacts of governmental action on the supply of biomass
feedstock availability associated with timber harvests from national forest lands.
TSS Consultants 21

FEEDSTOCK SUPPLY AND DEWVERY SYSTEMS PLAN
Figure 1 3
Historic Timber Sale Offerings for Lassen and Plumas National Forests and the Sierraville District of the Tahoe National Forest
350.0
MMBF
I
1992 1993 1994 1995 1991 Year
TSS Consultants L
22

FEEDSTOCK SUPPLY AND DELIVERY SYSTEMS PLAN
Each National Forest has had various degrees of success in getting timber sales offered for sale on a
consistent basis. The following Figure 1.4 reflects the historic timber sale offerings for the Lassen
National Forest.
Figure 1.4
Lassen National Forest Timber Offerings
MM BF
1991 1992 1993 Year
1994 1995
TSS Consultants 23

FEEDSTOCK SUPPLY AND DELIVERY SYSTEMS PLAN
The following Figure 1.5 reflects the Plumas National Forest historic timber sale offerings for the
period of 1991 - 1995.
Figure 1.5
Plumas National Forest Timber Offerings
140.0-
120.0-
100.0-
80.0-
MMBF
60.0-
40.0-
20.0-
0.0 - 199t 1992 1993
Year 1994 1995
TSS Consultants 24

FEEDSTOCK SUPPLY AND DELIVERY SYSTEMS P U N
The following Figure 1.6 reflects the Sierraville District of the Tahoe National Forest historic timber
sale offerings for the period of 1991 - 1995. The increase in 1995 reflects the timber sale associated
with the salvage of the Cottonwood fire.
Figure 1.6
Sierraville District of the Tahoe National Forest Timber Offerings
MMBF
I t I 1 -.- 1991 I992 1993 1994 1995
Year
TSS Consultants 25

FEEDSTOCK SUPPLY AND DEWVERY SYSTEMS PLAN
Fuel Treatment
Biomass Availability For Each Site
Westwood Site Chester Site Greenville Site Loyalton Site
TSS has made an assessment of the biomass feedstock that could be available to each of the
biomass to ethanol plant sites in the QLG area from the fuel treatment program on national forest
lands. The sites for this assessment were determined to be; Westwood, Chester, Greenville and
Loyalton. For purposes of assessing the quantities of biomass feedstock tributary to each of these
sites, TSS requested that the Plumas National Forest determine the acreage of the various planned
fuel treatment strategies within a 25 - mile radius of each of the plant sites through the use of their
GIS database. Maps of each of this biomass feedstock areas are included within the appendix.
DF'PZ 67,595
The following Table 1.13 reflects the estimated acreage of each fuel treatment strategy within a 25 - mile radius of each site.
64,248 56,576 3 1,724
Table 1.13
Estimated Acreage of Fuel Treatment Strategies By Site
CDZ 40,202 36,773 45,113 45,577
FRZ Total
90,997 23,105 123,052 69,354
19 8,794 124,126 224,741 146,655
The QLG program approach of requiring the Forest Service to reduce forest fuels on 50,000 acres
a year for a five year period, followed by a program of treating approximately 18,500 acres per
year for the next 15 years couId potentially generate a total of approximately 6.5 rniIlion BDT of
biomass feedstock during the 20 year period. For the purpose of estimating the amount of
biomass that could be generated within a 25 - mile radius of each site, TSS has assumed that these
planned treatments will be spread equally throughout the entire QLG area.
TSS Consultants 26

FEEDSTOCK SUPPLY AND DELIVERY SYSTEMS PLAN
Site
Westwood
Chester
Greenville
Loyalton
The following Table 1.14 reflects the BDT that will be generated on an annual basis during the
first five year period as well as for the next 15 years.
Year 1 - 5 (BDT) Year 6 - 20 (BDT) 233,583 87,801
145,848 54,822
264,07 1 99,26 1
172,320 64,773
Site
The following Table 1.15 reflects the estimated total biomass feedstock generation from fuel
treatment strategies and from timber harvesting. The annual volume of biomass from fuel
treatment assumes that the volume available during years 6 - 20 will be available during the life
of the project. The annual volume of biomass from timber harvesting assumes that the average
level of timber harvesting during the past 4 years will be sustained during the life of the project.
Fuel Treatment Timber Harvesting Total Feedstock
/ (BDT) (BDT) (BDT)
Table 1.15
Estimated Annual Biomass Feedstock Generation From Fuel Treatment and Timber
Harvesting
Westwood
Chester
87,801 182,67 1 270,472
54,822 2 12,905 267,727
Greenville
Loyalton
99,26 1 236,455 335,7 16
64,773 122,107 186,880
TSS Consultants 27

FEEDSTOCK SUPPLY AND DELIVERY SYSTEMS PLAN
Site
The following Table 1.16 reflects the estimated total biomass feedstock available for each site as
well as the estimated gallons of ethanol that could be generated from that amount of biomass.
Total Feedstock Ethanol Potential '
@DT) MM Gallons
Table 1.16
Estimated Feedstock and Ethanol Potential By Site
Chester
Greenville
Loyalton
267,727 20.1
335,7 16 25.2
186,880 14.0
I West wood I 270,472 I 20.3 1
It should be noted that the above table provides a representation of the available biomass
feedstock within a 25 - mile radius of each site and the potential ethanol generation from that
feedstock for each site. This is shown for comparative purposes only and does not represent the
total biomass feedstock that would be tributary to any one site, as the biomass supply for any one
site would likely come from distances greater than the 25 - mile radius. It is also important to
consider that the available biomass feedstock supply must be a multiple of that required to
account for year to year variances in fuel treatment programs and timber harvesting operations as
well as additional uses for biomass feedstock that may occur during the life of the project.
Land Ownership
The ownership of the timberland within each of these 25 - mile radius supply circles is an important
consideration when assessing which site should be selected for the proposed project. There are
different factors that enter into the decisions by the respective land managers regarding the
management of these lands and how this management impact the potential biomass feedstock supply
for a project.
TSS Consultants 28

FEEDSTOCK SUPPLY AND DELIVERY SYSTEMS PLAN
Site
Westwood
Chester
Greenvil le
Loyalton
The Fire and Resource Assessment Program (FRAP) office of the Department of Forestry and Fire
Protection assisted TSS by determining the percentage of public and private ownership within each
of these supply circles. The results of this analysis by FRAP is reflected in the following Table 1.17.
National Forest Private Other Public
53% 42% 5%
54% 37% 9%
64% 35% 1%
54% 41% 5%
Table 1.17
Land Ownership Within Each Supply Area
FueI Treatment
DFFZ
CDZ
Total Acreage % Acreage Over 40% Slopes
67,595 0
40,202 35
Analysis of Slopes Within Fuel Reduction Areas
TSS has made an analysis of the impact of conducting fuel reduction treatments on slopes that are
in excess of 40 percent. Based upon the past operating history of biomass harvesting, collection
costs (shearing and skidding) are known to increase as slope steepness increases. TSS has
reviewed the topography within each of the 25 - mile radius supply areas to estimate the
percentage of the fuel reduction areas that are planned on slopes in excess of 40 percent. The
following Tables 1.18 through 1.21 reflect the acreage of each fuel treatment and the estimated
percent of acreage of slopes in excess of 40 percent.
Table 1.18
Estimated Percentage of Slopes Over 40% For Westwood Site Fuel Reduction
35 I 90,997 1 I = I I Total I 198,794 I 23.1 I
TSS Consultants 29

FEEDSTOCK SUPPLY AND DELIVERY SYSTEMS P U N
DFPZ
Table 1.19
64,248 0
Estimated Percentage of Slopes Over 40% For Chester Site Fuel Reduction
Fuel Treatment Total Acreage % Acreage Over 40% Slopes
39 I 36,773 1 I 1 CDZ
FRZ
Total
23,105 39
124,126 18.8
Table 1.20
Estimated Percentage of Slopes Over 40% For Greenville Site Fuel Reduction
FRZ
Total Acreage I % Acreage Over 40% Slopes 1 I I Fuel Treatment
123,052 39
O I 56,576 I I 1 DFPZ
Total
I CDZ
224,74 1 29.2
45,i 13 I
DFF’Z
CDZ
39 I
3 1,724 0
45,577 15
FRZ I
69,354 I 15
I I I
Total
Table 1.21
Estimated Percentage of Slopes Over 40% For Loyalton Site Fuel Reduction
146,655 1 11.8
Acreage I % Acreage Over 40% Slopes I I Fuel Treatment
TSS Consultants 30

FEEDSTOCK SUPPLY AND DELIVERY SYSTEMS PLAN
Site
Westwood
Chester
Greenville
Analysis of Forested vs. Non Forested Areas
% Forested
79%
76%
82%
Through the use of USGS maps at a scale of 1:250,000, TSS overlayed the 25 - mile radius
supply areas and estimated the percentage of forested area. The following Table 1.22 reflects the
estimated percentage of forested area within each of the 25 - mile radius supply areas.
Loyalton
Table 1.22
Estimated Forested Area Within a 25 - Mile Radius of Each Site
65 %
Based upon the analysis conducted by TSS, we can conclude that adequate quantities of biomass
feedstock are available within the QLG supply area. However, it is important to understand the
various factors that can influence the availability and cost of biomass feedstock in the future.
Factors Influencing Biomass Feedstock Availability and Cost
Although there are presently considerable quantities of forest residue available in the QLG supply
area to be used as biomass feedstock, it is important to understand factors that will influence the
amount and cost of biomass feedstock available. Some of the factors that will influence the biomass
feedstock availability and cost are:
Weather - The weather will influence the seasonable availability of forest residue as feedstock. This
area can have winter rain and snows. The weather will not influence the quantity available; however,
winter rain and snows will limit forest operations and may increase costs.
TSS Consultants *
31

FEEDSTOCK SUPPLY A N D DEUVERY SYSTEMS PLAN
Wood Products Industry - The wood products industry will influence the amount of biomass
available from timber harvesting operations. This industry has a cyclical history and during
depressed times, mills may either reduce production or close. However, within the QLG area, the
wood products industry has operated more consistently than in many other areas of the country.
Governmental Action - Certain governmental action could influence the amount of commercial
timber available for harvesting; funding for public forest management and thinning and changes in
logging practices; all of which could influence the volume and cost of woodwaste available from
forest sources.
Legislative Action - Legislation such as H.R. 858 introduced by Wally Herger in 1997 will positively
influence the management of the local national forests and provide a measure of security in the
supply of biomass feedstock for the QLG project.
TSS Consultants 32

FEEDSTOCK SUPPLYAND DELIVERY SYSTEMS PLAN
Collection, Processing and Transportation
Forest biomass is anticipated to be the primary feedstock for the QLG biomass to ethanol Project.
Systems for the coIlection, processing, and transportation of biomass are well established within
this area and have been used for over 13 years.
The estimated total costs for collection, processing and transportation of biomass feedstock to the
QLC project is expected to average $40 per BDT. The cost to the project can be reduced to a
range of $20 to $25 per BDT by continued and expanded subsidies from the landowner for fuel
treatment activities. In addition, many national forest offerings of timber sales or service
contracts containing biomass material also have a sufficient amount of sawlogs with sufficient
value to effectively subsidize the removal of the biomass at a cost that ranges between $20 to $30
per BDT.
The total cost of feedstock delivered to the Facility will vary depending upon the amount of
subsidy that can be achieved through ongoing programs such as the Forest Health Pilot Program
as well as the amount of sawIogs that is offered for sale along with the biomass. The cost of
collection and processing (shearing, skidding and chipping) can vary greatly from job to job
depending upon factors such as tree size and density, slope of the ground and the size of the
project. These costs can range between $30 to $40 per BDT, FOB truck. The lower range of cost
represents average harvesting conditions, (recovery of 12.5 BDT per acre on slopes less than 40
percent) the higher range represents operations on slopes in excess of 40 percent, and harvesting
lower volumes per acre.
TSS Consultants 33

FEEDSTOCK SUPPLY AND DELIVERY SYSTEMS PLAN
Cost Item
The following Table 1.23 reflects the estimated range of cost for collection and processing.
- LOW - $BDT 1 High - $/BDT 1
Table 1.23
Estimated Cost of Collection and Processing
Shearing $10.00 $13.75
Rate/Hr
BDTLoad
RT Time
$10.00 1 $13.75 I I 1 Skidding
$50.00 $55 .OO 14.0 14.0
2.5 4.5
I Chipping I $10.00 I $12.50 I
CostLoad
CostA'on
$30.00 1 $40.00 1 I I Subtotal FOB Truck
$1 25 .OO $247 -50
$8.93 $19.80
Transportation costs will vary based upon the distance to the facility, ( ie . the amount of time
required as current inforest biomass transportation rates vary from $50 to $55 per hour) the
quality of the transportation system as well as the cost of maintenance of private or Forest Service
roads and the moisture content of the biomass feedstock, which will determine the average
number of BDT per load. Transportation costs are expected to range from $9 to $20 per BDT.
The lower cost of $9/BDT would be for a 2.5 hour round trip time and a load average of 14 BDT. The higher cost of $20/BDT cost would be for a 4.5 hour round trip time and a load average of
12.5 BDT.
Table 1.24
Estimated Cost of Transportation
Low I High I I 1 Assumption
TSS Consu Ltanrs 34

FEEDSTOCK SUPPLY AND DELIVERY SYSTEMS PLAN
The ultimate cost of transportation will be related to the size of the biomass to ethanol project, as
the size will determine the transportation distance that will be required to supply the project.
Future biomass feedstock cost could also vary depending upon the competition for biomass
feedstock from other uses during the life of the project.
'
TSS Consultants 35


CALlFORNIA ENERGY COMMlSSlON
Ellenfownsend Smith, Project Manager Shawn Pittard, Supervisor Dave Maul. Actinq Office Manacrer
Robert L. Therkelsen, DeDuhr Director ENERGY FACILITIES SITING & ENVIRONMENTAL PROTECTION DlVlSlON

TABLE OF CONTENTS
EXECUTIVESUMMARY . . . . . . . . . . . . . . . . . . . . . . . . . . . . . . . . . . . . . . 1 INTRODUCTION . . . . . . . . . . . . . . . . . . . . . . . . . . . . . . . . . . . . . . . 1 CONCLUSIONS . . . . . . . . . . . . . . . . . . . . . . . . . . . . . . . . . . . . . . . 5 DEREGULATION . . . . . . . . . . . . . . . . . . . . . . . . . . . . . . . . . . . . . . 8
LAND USE AND TRANSPORTATION . . . . . . . . . . . . . . . . . . . . . . . . . . . . . 9 INTRODUCTION . . . . . . . . . . . . . . . . . . . . . . . . . . . . . . . . . . . . . . . 9 ANALYSIS . . . . . . . . . . . . . . . . . . . . . . . . . . . . . . . . . . . . . . . . . . 9 CONCLUSIONS . . . . . . . . . . . . . . . . . . . . . . . . . . . . . . . . . . . . . . . 15
AIRQUALITY . . . . . . . . . . . . . . . . . . . . . . . . . . . . . . . . . . . . . . . . . . . . . 17 INTRODUCTION . . . . . . . . . . . . . . . . . . . . . . . . . . . . . . . . . . . . . . . 17 ANALYSIS . . . . . . . . . . . . . . . . . . . . . . . . . . . . . . . . . . . . . . . . . . 17 . CONCLUSION . . . . . . . . . . . . . . . . . . . . . . . . . . . . . . . . . . . . . . . . 1 9
BIOLOGICAL RESOURCES . . . . . . . . . . . . . . . . . . . . . . . . . . . . . . . . . . . . 21 INTRODUCTION . . . . . . . . . . . . . . . . . . . . . . . . . . . . . . . . . . . . . . . 21 ANALYSIS . . . . . . . . . . . . . . . . . . . . . . . . . . . . . . . . . . . . . . . . . . 21 CONCLUSIONS . . . . . . . . . . . . . . . . . . . . . . . . . . . . . . . . . . . . . . . 24 RECOMMENDATIONS . . . . . . . . . . . . . . . . . . . . . . . . . . . . . . . . . . . . 26
HAZARDOUS MATERIALS MANAGEMENT . . . . . . . . . . . . . . . . . . . . . . . . 27 INTRODUCTION . . . . . . . . . . . . . . . . . . . . . . . . . . . . . . . . . . . . . . . 27 ANALYSIS . . . . . . . . . . . . . . . . . . . . . . . . . . . . . . . . . . . . . . . . . . 27 CONCLWStONS . . . . . . . . . . . . . . . . . . . . . . . . . . . . . . . . . . . . . . . 28
NOISE IMPACTS . . . . . . . . . . . . . . . . . . . . . . . . . . . . . . . . . . . . . . . . . . . 29 INTRODUCTION . . . . . . . . . . . . . . . . . . . . . . . . . . . . . . . . . . . . . . . 29
. ANALYSIS . . . . . . . . . . . . . . . . . . . . . . . . . . . . . . . . . . . . . . . . . . 29 CONCLUSION . . . . . . . . . . . . . . . . . . . . . . . . . . . . . . . . . . . . . . . . 33
SOCIOECONOMIC RESOURCES . . . . . . . . . . . . . . . . . . . . . . . . . . . . . . . . 35 INTRODUCTION . . . . . . . . . . . . . . . . . . . . . . . . . . . . . . . . . . . . . . . 35 ANALYSIS . . . . . . . . . . . . . . . . . . . . . . . . . . . . . . . . . . . . . . . . . . 35 CONCLUSIONS AND RECOMMENDATIONS . . . . . . . . . . . . . . . . . . . . 39
PUBLICHEALTH . . . . . . . . . . . . . . . . . . . . . . . . . . . . . . . . . . . . . . . . . . . 41 INTRODUCTION . . . . . . . . . . . . . . . . . . . . . . . . . . . . . . . . . . . . . . . 41 ANALYSIS . . . . . . . . . . . . . . . . . . . . . . . . . . . . . . . . . . . . . . . . . . 41 CONCLUSION . . . . . . . . . . . . . . . . . . . . . . . . . . . . . . . . . . . . . . . . 41
November 5. 1997 I TABLE OF CONTENTS

WASTE . . . . . . . . . . . . . . . . . . . . . . . . . . . . . . . . . . . . . . . . . . . . . . . . . 43 INTRODUCTION . . . . . . . . . . . . . . . . . . . . . . . . . . . . . . . . . . . . . . . 43 ANALYSIS . . . . . . . . . . . . . . . . . . . . . . . . . . . . . . . . . . . . . . . . . . . . 43 CONCLUSION . . . . . . . . . . . . . . . . . . . . . . . . . . . . . . . . . . . . . . . . 43
TRANSMISSION SYSTEM ENGINEERING . . . . . . . . . . . . . . . . . . . . . . . . . . 45 INTRODUCTION AND ANALYSIS . . . . . . . . . . . . . . . . . . . . . . . . . . . 45 CONCLUSION . . . . . . . . . . . . . . . . . . . . . . . . . . . . . . . . . . . . . . . . 49
TRANSMISSION SYSTEM ENGINEERING . APPENDIX A . . . . . . . . . . . . . . . . 51 INTRODUCTION . . . . . . . . . . . . . . . . . . . . . . . . . . . . . . . . . . . . . . . 51
WATER RESOURCES . . . . . . . . . . . . . . . . . . . . . . . . . . . . . . . . . . . . . . . . 55 INTRODUCTION . . . . . . . . . . . . . . . . . . . . . . . . . . . . . . . . . . . . . . . 55 ANALYSIS . . . . . . . . . . . . . . . . . . . . . . . . . . . . . . . . . . . . . . . . . . 55 CONCLUSIONS . . . . . . . . . . . . . . . . . . . . . . . . . . . . . . . . . . . . . . . 59
VISUAL RESOURCES . . . . . . . . . . . . . . . . . . . . . . . . . . . . . . . . . . . . . . . 61 INTRODUCTION . . . . . . . . . . . . . . . . . . . . . . . . . . . . . . . . . . . . . . . 61 ANALYSIS . . . . . . . . . . . . . . . . . . . . . . . . . . . . . . . . . . . . . . . . . . 61 CONCLUSION . . . . . . . . . . . . . . . . . . . . . . . . . . . . . . . . . . . . . . . . 81 RECOMMENDATION . . . . . . . . . . . . . . . . . . . . . . . . . . . . . . . . . . . 81
STAFFAUTHORS . . . . . . . . . . . . . . . . . . . . . . . . . . . . . . . . . . . . . . . . . . 82
TABLE OF CONTENTS ii November 5. 1997

LIST OF FIGURES
EXECUTIVE SUMMARY Figure 1 Proposed Project Locations . . . . . . . . . . . . . . . . . . . . . . . . . . .. . . . . . . . . 7
November 5, 1997 iii TABLE OF CONTENTS

LIST OF TABLES
EXECUTIVE SUMMARY Table 1 Quincy Library Proposed Project Sites . . . . . . . . . . . . . . . . . . . . . . . . . . . . . 2
EXECUTIVE SUMMARY Table 2 Existing Biomass Power Plants . . . . . . . . . . . . . . . . . . . . . . . . . . . . . . . . . 3
AIR QUALITY Table 1 Existing Air Quality Rules and Regulations . . . . . . . . . . . . . . . . . . . . . . . . . 17
BIOLOGICAL RESOURCES Table 1 Sensitive Species & Habitats . . . . . . . . . . . . . . . . . . . . . . . . . . . . . . . . . . 23
BIOLOGICAL RESOURCES Table 2 Site Rankings . . . . . . . . . . . . . . . . . . . . . . . . . . . . . . . . . . . . . . . . . . . . . 25
TRANSMISSION SYSTEM ENGINEERING Table 1 Anderson Site . . . . . . . . . . . . . . . . . . . . . . . . . . . . . . . . . . . . . . . . . . . . 46
TRANSMISSION SYSTEM ENGINEERtNG Table 2 Chester Site . . . . . . . . . . . . . . . . . . . . . . . . . . . . . . . . . . . . . . . . . . . . . . 46
TRANSMISSION SYSTEM ENGINEERING Table 3 Greenville Site . . . . . . . . . . . . . . . . . . . . . . . . . . . . . . . . . . . . . . . . . . . . 47
TRANSMISSION SYSTEM ENGINEERING Table 4 Loyalton Site . . . . . . . . . . . . . . . . . . . . . . . . . . . . . . . . . . . . . . . . . . . . . 47
TRANSMISSION SYSTEM ENGINEERING Table 5 Martell Site . . . . . . . . . . . . . . . . . . . . . . . . . . . . . . . . . . . . . . . . . . . . . . 48
TRANSMISSION SYSTEM ENGINEERING Table 6 Westwood S i t e . . . . . . . . . . . . . . . . . . . . . . . . . . . . . . . . . . . . . . . . . . . . 48
VISUAL RESOURCES Table 1 Visual Impact Susceptibility . . . . . . . . . . . . . . . . . . . . . . . . . . . . . . . . . . . 78
VISUAL RESOURCES Table 2 Visual Impact Severity . . . . . . . . . . . . . . . . . . . . . . . . . . . . . . . . . . . . . . . 79
VISUAL RESOURCES Table 3 Visual Impact . . . . . . . . . . . . . . . . . . . . . . . . . . . . '. . . . . . . . . . . . . . . . . 80
TABLE OF CONTENTS iv November 5, 1997

EXECUTIVE SUMMARY
The California Energy Commission's Energy Facilities Siting & Environmental Protection Division (EFS & EPD) is assisting the Quincy Library Group {QLG)' in selecting a site for a potential wood waste biomass-to-ethanol (BTE) electricity production facility. Staff conducted a site characterization study of seven sites identified by the QLG. The characterizations for each site will assist in determining if it is economically and environmentally feasible to build one or more 8TE electricity generating projects.
The ethanol in this project will be produced by using forest management and wood products facility residues as fuel. This supports the United States Forest Service's attempt to reduce the amount of woody debris and forest slash that accumulates on the forest floor. Decreasing the amount of woody debris reduces the fuel source for catastrophic wildfires.
The sites identified by QLG are associated with existing or former sawmill sites located in the towns of Loyalton, Chester, Greenville, Westwood, Martell, and Anderson. Six of the seven potential project sites have access to existing biomass power plants, and all are large enough to accommodate a new BTE facility with associated feedstock storage.
While all the sites appear to be feasible sites for the project, Greenville has the most constraints, because it does not have an existing power plant or biomass facility. Development of this site would bear the highest cost and cause the greatest change to the existing environment.
INTRODUCTION
PURPOSE OF THIS REPORT
In 1995, the Quincy Library Group (QLG) started discussions with the National Renewable Energy Laboratory' (NREL) on evaluating the potential for producing ethanol from forest residues either in a retrofit (with an existing biomass power plant) or a stand-alone situation. In May 1996, the Resources Subcommittee of the
'The Quincy Library Group is an ad hoc association of tocal environmentalists, timber industry representatives, elected officials, trade associations and residents that started meeting in 1993 to devise a plan to retain comrnunlty economic stability which is based on the timber industry. Also included in the goals of the group is improvement of forest health and reduction of the risk of catastrophic wildfires.
'The U. S. Department of Energy's National Renewable Energy Laboratory (NREL), along with other institutions, has technology under development directed toward the economical production of fuel grade ethanol from biomass.
November 5, 1997 1 EXECUTIVE SUMMARY

Biomass Collaborative3 decided that participation in the QLG project was an ideal fit with a key recommendation by the subcommittee earlier to empirically measure the benefits of biomass through a demonstration project.
The QLG and NREL are preparing a biomass-to-ethanol (BTE) electricity project feasibility study. EFS & EPD staff {staff) participated in Task 3, site selection, of the eight-task Feasibility Study. The Feasibility Study is expected to be completed
Site Owner or Operator
Sierra Pacific Industries
Collins Pine Company
Herman & Saretta Pew
by late Spring 1997.
City County
Loyalton Sierra
Chester Plumas
Greenville Plumas
Staff developed a site characterization of the seven sites identified by the QLG. Site characterizations determined the economic and environmental feasibility of each site for one or more BTE electric projects. The project or projects would be located in timber-based industrial areas in the northeastern portion of California. See Table 1 for the list of potential project locations.
I
EXECUTIVE SUMMARY Table 1 Quincy Library Proposed Project Sites
r 1
Mount Lassen Power Westwood Lassen
Sierra Pacific Industries *
Kenneth Roseburg (2 sites)
Martell Arnador
Anderson Shasta
*Facility previously owned by Georgia-Pacific 'West. Wheelabrator owns and operates the cogeneration power plant facility. Wheelabrator also owns a facility a t the Anderson site.
Biomass fuel comes from wood products manufacturing residues, agricultural operations, urban wood waste, and forest management residues. The ethanol from this project would be produced by using forest management residues and wood products facilities residues as fuel. The United States Forest Service is attempting to reduce the amount of woody debris and logging slash that accumulates on the
'The Biomass Collaborative was an ad hoc group consisting of representatives of the biomass industry - producers of biomass residues, processors, power plant owners/operators, trade association technology developers, research organizations and universities, utilities and local state and federal governments.
EXECUTIVE SUMMARY 2 November 5, 1997

forest floor. Decreasing the amount of woody debris reduces the fuel source for catastrophic fires.
Facility Site
Sierra Pacific Industries (Loyalton)
Collins Pine Company (Chester)
In their analysis, staff assumed that a biomass-to-ethanol facility producing ten million gallons per year (GPY) of ethanol will be built at one or more of seven potential sites. Both smaller (five million GPY) and larger (up to 50 million GPY) plants are difficult to justify econ~mical ly .~ The benefits from the smaller plant are limited, and the cost to transport biomass feedstock longer distances to larger facilities becomes economically prohibitive.
Maximum Generating Current Typical Output Capacity (Megawatts, MW)
(Megawatts, MW)
20 15
12 5 - 1 1
The analysis further assumed that the biomass-to-ethanol facility will be located adjacent to, and operated in conjunction with, an existing biomass-fueled electric power plant, preferably a cogeneration plant which produces steam as well as electricity. The biomass-to-ethanol process requires both electricity and steam and produces wastes which can serve as boiler fuel in a power plant. The economic advantages of collocating with an existing power plant are great and could be the difference between a feasible project and an infeasible one. Table 2 lists the facilities that operate a cogeneration facility on site.
Sierra Pacific/ Wheelabrator (Mattell)
EXECUTIVE SUMMARY Table 2 Existing Biomass Power Plants
18 10
Mount Lassen Power (Westwoodl 13 12.5
Roseburg Industries/Wheelabrator (Anderson 1
49.9"
42 *
49.9
33
* Wheelrabator Environmental Systems Inc. owns and operates two cogeneration facilities adjacent to the two Roseburg industrial 140 acre sites. The 49.9 MW plant is on the Wheelabrator site while the 42 MW cogeneration plant is located on the Simpson Paper facility site.
' A: a December 18, 1996 meeting, Mark Yancey of NREL provided staff with the parameters of the project plant size.
November 5, 1997 3 EXECUTIVE SUMMARY

BACKGROUND
The biomass industry started making the State of California aware, as early as 1994, of the threat of Year 1 l5 and the effect deregulation represents for biomass power plants. The Governors’ Office directed the Resources Agency and the California Energy Commission (Commission) to evaluate the issues facing the biomass industry and evaluate potential solutions. This led to the formation of the State Agency Summit Group, comprised of the heads of the State agencies with a stake in preserving and enhancing the energy and non-energy benefits provided to California by all segments of the biomass industry.
The Summit Group met four times. The last meeting culminated in a Transition Copayment ProposaI from the California Biomass Energy Alliance (CBEA) with a funding requirement of $530 million over a five-year transition period. CBEA projected that the industry would be sustainable if fuel costs to the power plants could be reduced to zero through institutional mechanisms. CBEA changed its strategy with AB 1202, which would have enacted a minimum renewable energy purchase requirement in a restructured environment. In the end, the Legislature rejected a separate power pool for renewable energy in favor of a $540 million fund for existing, new and emerging renewable energy over a four-year transition period.
The Commission contracted with Brown, Vence & Associates (BVA) in November 1995, to prepare a report on the status of the biomass industry and how benefits might be retained. Because of biomass industry problems, the Biomass Collaborative was created in late 1995. After the BVA report was completed, t he collaborative began identifying issues and formulating potential solutions. The Biomass Collaborative created four subcommittees, including the Resources Subcommittee which was chaired by the Resources Agency.
The Resources Subcommittee addressed the issues related to preserving and enhancing environmentaVresource benefits, such as air quality, forest health, water supply and quality, and agricultural benefits. The members of this subcommittee supported this feasibility study for the QLG project through both in-house services and through monetary contributions.
The Commission provided support to the QLG by preparing a site characterization of seven sites identified in the QLG Feasibility Study (refer to Table I). The Commission’s Energy Facilities Siting and Environmental Protection Division has the responsibility for ensuring that energy facilities sited under the Commission’s jurisdiction are located, designed, constructed, operated and closed in a manner that
’Biomass plant power purchase agreements were commonly structured with a 10-year leveliied purchase price for electricity generation. During the life of these contracts the actual cost of electricity generation has gone down, thus ensuring that the required reversion to market pricing in year 11 would yield a sudden decline in price.
EXECUTIVE SUMMARY 4 November 5, 1997

provides environmental, public health, and safety protection. EFS & EPD actively supports other Commission programs by applying its technical expertise to technical issues and policy analysis regarding environmental protection, public health and safety, land use planning, and generation and transmission system efficiency and re I ia bi I ity .
METHODOLOGY
For the purpose of this study, staff conducted a site characterization for each site. The goal was to provide basic data and identify potential site constraints using the information currently available.
With the information available, staff was able to provide comparative rankings of sites in the areas of biology and visual resources. Other technical areas were able to provide basic data or make general comparisons that will be a starting point for the next phase of the feasibility study, which will occur when the project description is completed (selection of technology, etc.). Each technical subject area analysis is developed in one of three ways, depending on the appropriateness, to form a complete QLG site characterization. In the first method each technicat staff person determined what aspects need to be evaluated in order to ascertain if a site is a good, fair or poor site. Second, staff provided QLG with a narrative description of the basis for a site’s criteria being considered as good, fair or poor; some staff provided a summation of site characteristics that would affect all sites equatly. Third, staff provided QLG with quantitative data, linked to the criteria, for the site’s characteristics.
This report compiles information from these three methods, including a summary that identifies project obstacles, benefits or show stoppers.
The main data resources used to complete the site assessments for the project include the California Environmenta t Quality Act (CEQA) Appendix G, information from staff site visits, and the NREL report dated October 18, 1996.
CONCLUSIONS
Eleven technical subject areas were evaluated to analyze the seven QLG project locations. The Greenville site has the most constraints because it would require the most new construction and affect the largest number of acres. Martell is the least constrained with respect to transportation impacts and land use compatibility. Depending on the number of vehicles required to serve the site during construction and operation of the facility, all sites could be acceptable with varying degrees of mitigation. It is feasible to construct a project at all sites.
November 5, 1997 5 EXECUTIVE SUMMARY

At a minimum, all of the projects will require an air quality screening model. All of the projects may be exempt from Best Available Control Technology (BACT) and air quality emission offset requirements. Biology staff found that the Chester, Westwood , Martell and Anderson sites are better locations to build a BTE facility. The Greenville location is the only site that does not have access to an existing biomass facility. Therefore, currently undisturbed habitat will need to be impacted to develop the site. Adequate water supplies exist at each of the six sites under consideration for the BTE facility.
Each site is equally suited for a BTE facility from a socioeconomic perspective. Although an increase in air emissions is greatest for the Greenville site, conclusions regarding related impacts upon public health would still depend on the results of a
' screening health risk assessment.
Staff does not anticipate that the use of hazardous materials at any of the proposed sites will play a significant role in site selection. Plant design can prevent any significant adverse noise impacts. Additional noise mitigation measures may be necessary at the Greenville site.
Construction and operation of a BTE facility could generate both hazardous and nonhazardous wastes. Staff does not expect any of the byproducts (lignin, boiler ash, and wastewater treatment solids) to be classified as hazardous; however, the boiler ash should be tested to ensure nonhazardous classification.
From the standpoint of electric transmission facilities, all sites are feasible up to a 30 megawatt net increase in power output, and feasible for up to 250 megawatt increase for the Anderson site. No new transmission system facilities are expected outside existing utility easements.
If the project is constructed at the Loyalton, Anderson or Greenville sites, mitigation for potential visual impacts should be considered. Visual impacts at the Chester and Martell sites are likely to be insignificant.
EXECUTIVE SUMMARY 6 November 5, 1997


DEREGULATION
Significant new legislation affecting the electricity industry was enacted in 1996. Assembly Bill 1890, signed by Governor Wlson on September 23, 1996, intends to make California’s electric generating industry competitive. The California Public Utility Commission is planning a four-year transition to this new competitive market. Competition will initially begin in 1998, and the industry will be fully open to competition by 2002.
Beginning January I , 1998, consumers from all customer categories (residential, commercial, agricultural, industrial) will be able to buy electricity from either their current utility or an alternative electricity supplier. If deregulation leads to lower electricity prices, it will challenge all electricity generators to be more competitive.
The legislation:
0
0
0
0
0 0
0
0
recognizes that new technology and new federal laws allow us to change today’s highly regulated market structure to one that relies on competition to set the price of the generation component of electricity bills; creates two new market entities, one to oversee the high voltage transmission system, and one to create an auction market for buying and selling of electricity; authorizes retail competition, which allows customers to choose their electricity supplier (beginning with some users January 1, 1998) and encompassing all customers no later than 2002; permits new business opportunities to develop in buying, selling or brokering electricity for individual customers or customer groups; permits utilities to recover their transition costs from ratepayers; mandates a I 0 percent rate reduction for small residential and commercial Customers by January 1, 1998, with a goal of an additional I 0 percent by 2002; provides funds for continuation of utility energy conservation; research, development and demonstrate (RD&D); public assistance; and renewable energy-based electricity generation activities; and allows customers to continue to rely on service from local utility companies as they have in the past, if they choose not to participate in the competitive market .
EXECUTIVE SUMMARY 8 November 5, 1997

LAND USE AND TRANSPORTATION
INTRODUCTION
This analysis provides an overview of the land use and transportation issues of each of the proposed sites. This analysis does not include a thorough identification and review of all relevant laws, ordinances, regulations, standards and policies (LORS). Many local LORS include site design criteria and other project specific requirements such as floor to area ratios (FAR), setbacks, height limitations, etc., which can only be evaiuated when the specific parameters of a proposal are known.
In addition, this analysis does not include detailed evaluations of potential transportation impacts resulting from the project. Roadway Levels of Service (LOS) caiculations have not been included simply because minimal project specific data, i.e. , number of construction employees, number of operational employees, daily number of feedstock shipments is available.
ANALYSIS
LOYALTON (Sierra Pacific Facility)
Assessors' Parcel Number 16-0090-024, and unspecified portions of 16-0040-083 and 16-0040-084.
Size: 236.83 acres.
Location: Adjacent to the incorporated boundaries of the City uf Loyalton, approximately 2800 feet south of State Highway 49.
Zoning: The site is currently designated "A", and "A-'I'', Agriculture in the Sierra County General Plan and Zoning Code, respectively. The zoning does allow for the biomass cogeneration plant as an ancillary or auxiliary use to a timber processing operation. However, because the ethanol production plant will involve potentially explosive or hazardous materials, it appears that a use permit would be required to construct and operate such a facility.
Since the site is currently used as a timber-related industry, an argument could be made that the cogeneration/ethanol production facility would be an auxiliary use to a permitted use. However, the current facility was, in 1987, subject to challenge by neighboring residents when the operator requested a variance from a 45 foot height limitation. The court dismissed the case; it determined that the plaintiffs had failed to exhaust all administrative remedies prior to initiating a legal challenge. Therefore, any portion of the facility that exceeds the height limitation stated in the Sierra County Zoning Code may trigger the need for another variance.
I
November 5, 7997 9 LAND USE AND TRANSPORTATION

Land Use
Site: Sawmill and associated cogeneration facility.
North: A large residential subdivision is located approximately 114 mile north of the SP Industries project site. The facility is set back from the property tine, thus expanding this setback to approximately 112 mile.
South: Undeveloped rangeland and cleared forest areas are located immediately south of this site.
East: Undeveloped rangeland is located to the east of the site.
West: Adjacent to the western boundary of this site, and serving as a buffer to residences located further to the west, are two land intensive uses: a cemetery and a sand and gravel operation.
Compatibility Issues:
Construction of a cogeneration and ethanol production facility would intensify the activities of the existing plant, which may create additional nuisances that could be opposed by residents to the north of the site. -
The possibility of obtaining a variance is of concern. To grant a variance, the legislative or hearing authority must find that, I) there exists something peculiar to the subject parcel that, without the variance, would prohibit its use as entitled by the zoning code, and 2) the variance does not constitute a special privilege that other property owners or uses, similarly situated, could not obtain. A variance from the height requirement was approved by the local authority in 1987. Some consider this a precedent that would eliminate judicial review under the ‘special privilege’ clause, however, the decision was challenged and resolved on a technicality, not the particular merits of the entitlement. It may, therefore, be subject to adjudication, if granted.
Primary Roadway: A two lane paved road provides primary access along the eastern boundary of the existing facility. Capacity and utilization data are unknown at this time.
Secondary Roadway: An unimproved logging truck access road connecting the log laydownareas in the southern and western portions of the site with State Highway 49 provides secondary access.
State Highway 49: This road is the primary connection to all areas outside the. Loyalton area. It is a four lane improved highway maintained by the State Department of Transportation.
LAND USE AND TRANSPORTATION 10 November 5, 1997

Primary Railway: Western Pacific Railroad operates a line that serves the site along an alignment that runs southeast-north along the south and west boundaries of the site.
Access and Circulation Issues: Impacts to the transportation system and circulation pattern are of concern as well. Depending on the size of the facility, more than 400 workers per day could commute to the site during the peak construction period. The number of large material-laden trucks and heavy construction equipment will create other types of circulation impacts that will need to be considered in greater depth when more detailed information about the project is available. It is questionable as to whether or not the rural road system can accommodate this amount of additional trafic, even for a short period of 6-8 months.
Operational impacts will be much less than those experienced during construction, largely because each facility is likely to employ less than 150 persons on an on-going basis. However, even 100 additional cars per day on small-capacity area roadways might stress the system beyond capacity. Even a few additional trucks transporting feedstock to the plant may be enough to degrade these roadways beyond the local agencies capability to assign resources (personnel or budgetary) to on-going main tena n ce .
From a positive standpoint, the site is currently being operated as a timber processing facility with an operating cogeneration plant. Proximity to the raitway may mitigate some of the transportation concerns discussed above. However, possible mitigation of all concerns cannot be assessed until a more concrete proposal has been proposed.
CHESTER (Collins Pine Facility)
Assessors' Parcel Number: 001-0140-045
Size: 70.07 acres
General PlanEoning: Prime industrial/l-1 . Electric generation is permitted in an 1-1 zone with some limitations.
Location: Approximately 1/4 mile northwest of Highway 36 in the town of Chestert Plumas County
Land Use
Site: A portion of the site is currently occupied by a timber processing operation operated by Collins Pine. A cogeneration plant is associated with the sawmill.
North: Undeveloped woodlands.
South: Single family residents, many owned by Collins Pine, are located in an area just north of and adjacent to Highway 36.
November 5, 4997 11 LAND USE AND TRANSPORTATION

East: Undeveloped woodlands,
West: Single family residences along Jensen Road. Further to the east are uninhabited woodlands.
Compatibility Issues: Irrigation ditch on eastern side of the project.
Access and Circulation
Primary: State Highway 36 is a two lane paved and maintained state highway and is located to the south and adjacent to the Cotlins Pine property.
Secondary: A two lane paved and maintained roadway (112 mile long) becomes an unpaved and graded dirt road for approximately one mile and connects to a restricted log truck route. This entire route connects with Highway 36 at a point located across from Watson Road, approximately 3/4 mile west of the Collins Pine main entrance.
Restricted: The restricted logging road referred to above is an unpaved, graded dirt road that enters the Collins Pine facility at the northwest fence.
GREENVILLE (Setrer Road Site)
Assessors' Parcel Number: I 10-0270-014
Size: 29.59 acres
Location: West side of Indian Creek, north of Greenville and approximately 1 mile from the intersection of highway 89 in Greenville, Ptumas County.
General Planltoning : Prime industrial/l-l . Electric generation is permitted in an 1-1 zone with some limitations.
Land Use
Site: The site is a former sawmill site. Outbuildings a caretakers' mobile home occupy the site.
such as a large storage barn and
North: Undeveloped wooded area and wetlandsfloodplain of Wolf Creek.
South: Some large lot residences close to the roadway. Town of Greenvile lies roughly a mile south/southeast. Further south is an extensive woodlandfiorest.
East: Wolf Creek runs to the immediate east; beyond the creek are some agricultural/industrial uses and a number of residences (apartments and single family homes).
West: Agriculturalfindustrial uses and undeveloped land.
LAND USE AND TRANSPORTATION 12 November 5, A997

. Compatibility Issues: Proximity of flowing water of Wolf Creek requires discharge prevention measures -
Access and Circulation
Primary: Setzer Road connects the site to Highway 89 to the east and northwest. . Setzer Road is a two lane rural arterial outside of town and a two lane collector within the town's boundaries. The connection with Highway 89 to the west is problematic because it loops through town. The connection with Highway 89 to the east appears much more viable because of less intensive land uses along that section of the roadway. While use of two lane roadways for forest waste transportation can cause problems with road maintenance, there is evidence that substantial use by logging trucks has only caused minimal degradation of the roadway.
Primary Rail: A Southern Pacific railroad line runs along a southeast to west alignment within I 50 feet of the site. Use of this rail line for the transportation of forest wastes could mitigate potential roadway impacts discussed above.
Access and Circulation Issues: As discussed above, access to the site for feedstock trucks appears to be the primary issue.
WESTWOOD (Mt. Lassen Power)
Assessor's Parcel Number: 123-090-078
Size: 59.52 acres
Location: Three hundred sixty four feet south of County Road A-21 (Mooney Road), 7/2 mile west of the unincorporated town of Westwood in Lassen County.
Zoning: Industrial. The Westwood Community Plan (I 968) identifies "...wood chip production and other by-product manufacture ..." as permitted uses in this area. The Lassen County Board of Supervisor's already determined that steam and electrical production from wood chips is an 'other by-product' but will have to determine if ethanol production also fatls under this category.
Land Use
Site: A wood chip processing and wood chip fired electrical generation plant currently occupies a portion of the site.
North: Undeveloped commercial (C-2) sites with water and electrical utility easements are located between the site and County Road A-21.
South: Westwood Community Services District land including sewage evaporation ponds and Union Pacific Railroad (active).
November 5, 1997 13 LAND USE AND TRANSPORTATION

East: Union Pacific Railroad siding (abandoned; inactive) and undeveloped commercial (C-2) zoned land.
West: Timber Production zoned private forest.
Compatibility Issues: Some local opposition may occur if environmental issues are not properly addressed and communicated to the community. This is probably true of all potential sites in study.
Access and Circulation
Primary Access: A two fane improved dirt and paved road (non-exclusive right to use easement) south from State Highway 36 to the facility provides primary access. The road is currently used and maintained only by the facility.
The paved two lane Lassen County Road A-2? (Mooney Road) from State Highway 36 to the east via Westwood or State Highway 147 to the west provides secondary roadway access.
State Highway 36 is the primafy connection to all areas outside Westwood. It is a two lane improved highway maintained by Caltrans which connects to other state highways in the area.
Primary Rail: Union Pacific Railroad. A line that runs along the southeast corner of the facility with an abandoned siding which would have to be reconstructed.
Access and Circulation Issues: Contact Larry Bradshaw of Lassen County Roads Department at 256-3445.
MARTELL (Sierra Pacific Industries Site)
Assessor's Parcel Numbers: 44-010-006, -008, -013, -056, -058, -059, -060
Size: 370 acres
Location: The northwest corner of the intersection of State Highways 49 and 88 in the town of Martell, Arnador County.
Zoning: "M", manufacturing. Section 18.46.O30(2) of the Arnador County Zoning Code indicates that uses which involve "...incineration or reduction of garbage ... or refuse.. . or involving the handling of explosive or dangerous materials" are permitted in the "MI' zone upon issuance of a use permit. It appears that the section pertains to both the biomass facility (incineration of forest waste or refuse) and the ethanol production and storage facility (explosive or dangerous material).
LAND USE AND TRANSPORTATION 14 . November 5, 1997

In addition, Section 18.46.040 limits the height of buildings in the "M" zone to a maximum of 75 feet. If the project were to exceed this limit, a variance must first be obtained from- the local zoning authority.
Land Use
Site: The site is currently used as a timber processing and timber product manufacturing plant. An I 8 mw biomass-based cogeneration plant is part of the existing facility. However, the property owner/ operator, Sierra-Pacific Industries, has announced its decision to close the sawmill in the near future.
North: Undeveloped industrial area immediately adjacent to the proposed site. Farther north are residential parcels within the incorporated boundaries of the City of Sutter Creek.
South: Primarily commercial and light industrial-manufacturing uses.
East: The County Airport and other related industrial uses.
West: Across the railroad tracks are a number of developed residential, commercial, and light industrial-manufacturing uses.
Compatibility Issues: None
Access and Circulation
Primary Access: There are two routes that can be considered primary site access routes: State Highway 49 and State Highway 88. These highways become one as they merge just to the south of the site. Both are four lane paved highways maintained by Caltrans.
Primary Railway: Amador Central Railroad operates a line that runs along the project sites' eastern boundary on a north-south alignment. The Sierra-Pacific facility is sewed directly via a dedicated rail spur.
Access and Circulation Issues: None
CONCLUSIONS
The scope of the analysis conducted by staff is limited by the absence of a specific project, to: 1) a characterization of each site, and 2) an identification of probable areas of concern. Once a site or sites have been chosen and a decision has been reached relating to facility size, design, etc., staff can conduct a more detailed analysis that could:
1, identify specific laws, ordinances, regulations, and standards with which the project must comply (all technical areas);
November 5, 1997 15 LAND USE AND TRANSPORTATION

2. identify all permits that the project will require from local, state, and federal agencies (all technical areas); and
3. identify specific project-related impacts on capacity and levels of service for all roadways within the project vicinity (Transportation and Circulation).
LAND USE AND TRANSPORTATION 16 November 5, 1997

AIR QUALITY
District
Modeling
BACT
INTRODUCTION
Loyalton Chester Greenville Westwoad Anderson Martell
NSierra NSierra NSierra Lassen Redding Amador
Screening Screening Screen in g Screening Screening Screening
May not May not Needed May not be May not be May not be be needed be needed needed needed needed
All proposed facilities will have to obtain an Authority to Construct and Permit to Operate from the local air pollution control or air quality management district. in general, the granting of an Authority to Construct requires district staff to make a determination that the new air pollutant emissions from a source will neither cause a new violation nor contribute to an existing violation of any ambient air quality sta nd a rds .
Offsets
ANALY S IS
May be May be May be May be May be May be exempt exempt exempt exempt exempt exempt
The site characterization, described in Table 1 below, was based on the assumption that the new ethanol production facility will have a production capacity of 20 MM gallons of ethanol per year or less, and that the air pollutant emissions are those listed in the NREL October 17, 1996 study provided by Mark Yancey (4 Tons Per Year (TPY) organic compounds, 20 TPY particulate matter, 96 TPY oxides of nitrogen, and 40 TPY sulfur dioxide). The results presented in Table 1 reflect all of the local air quality management districts' existing air quality rules and regulations.
AIR QUALITY Table I Existing Air Quality Rules and Regulations
Explanation of information in Table 1:
1. Modeling:
An air quality impact analysis will be required by local air pollution control districts to determine the project's emission impacts on the existing air quality. Based on past siting experiences of other similar emission producing facilities, staff does not expect that the project emissions would cause any significant concerns.
November 5,1997 #
17 AIR QUALITY

2. Best Available Control Technology (BACT):
Best availablekontrol technology (BACT) means for any source, stationary source or emission unit the most stringent of Health and Safety Codes, § 40405:
(a) The most effective emissions control technique which has been achieved in practice, for such category or class of source; or
(b) Any other emissions control technique found, after public hearing, by the Air Pollution Control Officer or the Air Resources Board to be technologically feasible and cost effective for such class or category of sources or for a specific source; or
(c) The most effective emission limitation which the EPA certifies is contained in the implementation plan of any state approved under the Clean Air Act for such class or category of source, unless the owner or operator of the proposed source demonstrates that such limitations are not achievable.
In no event shall the emission rate reflected by the control technique or limitation exceed the amount allowable under applicable new source performance standards.
BACT may not be required for projects at the Loyalton, Chester, Westwood, and Martell sites because there are existing facilities. BACT wit1 be required if the project is located at Greenville because this site does not have an existing facility. The implementation of BACT equipment, possibly Selective Non- Catalytic Reduction6 (SNCR), at any of the sites, should not be a concern because the control devices are commonly used and are available at a reasonable cost,
3. Offsets:
In general, offsets may be required for all sites although they may be different in quantity because of the existing equipment at the sites. However, each air district has rule provisions (N.Sierra: Rule 422; Lassen: Rule 6.8; Amador: Rule 422; and Shasta: Rule 203) that exempt a facility from providing offsets if the facility is a resource recovery project. A resource recovery project is a project designed to burn refuse-derived or biomass-derived solid waste fuel, which in this case would be logging slash and forest biomass. Because the
‘Selective Non-Catalytic Reduction (SNR) is .a process that relies on the intimate contact between flue gas and the injected ammonia at a precise temperature range to reduce NOx emissions. Ammonia must be injected at an area inside the boiler where temperature approaches between 870 to 980 degrees Celsius (1600 to 1800 degrees F) to achieve the optimum NOx reduction. (Higher temperature range will cause the ammonia to form more NOx, and lower temperature range will cause ammonia to escape unconverted, which wit1 cause unnecessary ammonia emissions).
AIR QUALIW 18 November 5, 1997

proposed project could be defined by a district as a resource recovery project, it is likely that it would be exempt from providing offsets.
CONCLUSION
None of the projects, except for the Greenville site, exhibited any major differences. All will require, at a minimum, a screening modeling analysis, and will likely be exempt from offsets. Except for the Greenville site, all may be exempt from BACT offsets.
November 5, 1997 19 AIR QUALITY

BIOLOGICAL RESOURCES
f NTRODUCTION
BIOLOGICAL RESOURCE ISSUES AND LAWS
An impact to a sensitive species and its habitat is often the major biological resource issue associated with a proposed project, and therefore must be properly addressed in any biological resource impact analysis. Sensitive species include those species designated by the California Department of Fish and Game (CDFG) as rare, threatened, or endangered and those designated as threatened or endangered by the U.S. Fish and Wildlife Service (USFWS), but can also include those species that can be shown to meet the state or federal criteria for state or federal listing. In addition, sensitive species include those species that are designated Species of Special Concern or candidates for state or federal listing by CDFG or the USFWS. Species considered of economic importance to the local economy are also considered sensitive species. The USFWS also maintains a sensitive species list. And lastly, sensitive species include those species identified by a county or city government entity, such as a county planning department, as needing protection.
State and federal endangered species acts require that potential impacts to state and federally listed species be addressed in an environmental analysis. The California Endangered Species Act (Fish and Game Code section 2050 through section 2098) protects California's rare, threatened , and endangered species, and federally listed species are protected by the federal Endangered Species Act of 1973 (Title 16 of the United States Code, section 1531 et seq., Code of Federal Regulations 17.1 et seq.).
In addition to the state and federal endangered species acts, the California Environmental Quality Act (CEQA) (Public Resources Code, section 21000 et seq.) identifies the need to protect California's environmental quality and provide public procedures for identification of significant adverse environmental impacts. 1 n addition, the Guidelines for Implementation of the California Environmental Quality Act (CEQA Guidelines), Title 14 California Code of Regulations section 15065 ("Mandatory Findings of Significance") requires that a reduction in the numbers of a rare, threatened, or endangered species, or any other species that can be proven to be a sensitive species, be considered a significant impact.
ANALYSIS
POTENTIAL BIOLOGICAL RESOURCE IMPACTS ASSOCIATED WITH AN ENERGY FACl LlTY
Loss of habitat is the primary reason for the long list of sensitive species in California, and the construction and operation of an energy facility, and its appurtenant linear facilities (gas, water, and transmission lines), can have significant, long-term, biological resource impacts when a sensitive species and/or its habitat are found in
November 5, I997 21 BI OLOGl CAL RESOU RC ES #

the vicinity of proposed power plant development. impacts to sensitive species often occur when undisturbed habitat is impacted, however significant impacts can also occur when currently undeveloped, but disturbed sites are developed. It is important to remember that a sensitive species need not actually be seen at a project site for impacts to be assumed. If suitable sensitive species habitat exists at a project site, and the project will impact the habitat, then sensitive species impacts may occur. For this reason, it is important that CDFG and the USFWS be regularly consulted throughout the energy facility siting process to avoid project delays and implement appropriate mitigation measures.
Where and how a power plant gets its water, and what it does with its wastewater, can also have negative biological resource implications. If an energy facility needs to utilize ground water in an area that is already overdrafted, there can be significant impacts to local plant communities in the overdrafted area. If surface water from a local water supply such as a lake, river or ocean is utilized, fish and other aquatic organisms may be impacted by the pumps which withdraw the water. Once the facility is finished with the water, disposal of the resulting wastewater can also have negative implications if not done properly.
Linear facilities, such as gas and water lines and transmission lines, can also have significant impacts to common and sensitive species. When gas and water lines are installed (buried) there may temporary, but still significant, impacts if meadows and wetlands can not be avoided during construction. In particular, riparian forests may be impacted, requiring the restoration of trees and shrubs and restoration effectiveness monitoring. Vegetation clearances necessary for power line safety also can fragment and degrade interior forest habitats.
Transmission lines often have long-term negative implications since they pose a collision hazard to local birds. In addition, birds of prey, including protected species such as the goshawk, golden eagle and bald eagle, with large wing-spans risk electrocution if the lines and towers are not designed and built to effectively prevent such occurrences.
POTENTIAL BIOLOGICAL RESOURCE ISSUES
To identify the potential biological resource implications for each of the seven proposed biomass-to-ethanol facility locations, staff performed data base searches (Rare Find) of CDFG's California Natural Diversity Data Base (CNDDB) for the region of each potential project location. The CNDDB is a geographic information system that manages and provides sensitive species and natural community location and ecological information. For additional information about the CNDDB or more information about sensitive species information provided in this report, contact the CNDDB in Sacramento at (916) 324-3812.
BIOLOGICAL RESOURCES 22 November 5, 1997

BIOLOGICAL RESOURCES Table I Sensitive Species & Habitats
II LOCATION
LOYALTON (Sierra County) Sierra Pacific Industries
CHESTER (Plumas County) Collins Pine Company
GREENVILLE (Plumas County)- Private landowner
WESTWOOD (Lassen County) Mt. Lassen Power Company
- ~ ~
MARTELL (Amador County) I/ Sierra Pacific I ndustriesMlheela brator
11 ANDERSON (Shasta County) Roseburg Lumber Company
BIOLOGICAL RESOURCE ISSUES & STATUS
Prairie falcon (Species of Special Concern) Sierra Valley ivesia (California Native Plant Society List 1 B)
Osprey (Species of Special Concern) Bald eagle (State-Endangered, Federal-Threatened)
* Greater sandhi// crane (State-Threatened) . Sierra Nevada red fox (State-Threatened) Pacfic fisher (Species of Special Concern) Suksdorfs rnilk-wetch (California Native Plant Society List 1 B) marsh skullcap (California Native Plant Society List 2)
Bald eagle (State-Endangered, Federal-Threatened) Greater sandhill crane (State-Threatened) . Pacific fisher (Species of Special Concern) Constance's rock cress (California Native Plant Society List I B) . Quincy lupine (California Native Plant Society List 1 B) Sheldon's sedge (California Native Plant Society List 2) Webbets ivesia (California Native Plant Society List 18)
Northern goshawk (Species of Special Concern)
Osprey (Species of Special Concern} Bald eagle (State-Endangered, Federal-Threatened) Greater sandhill crane (State-Threatened) wi/ow flycatcher (State-Endangered) Pacific fisher (Species of Special Concern)
Trico/ored blackbird (Species of Special Concern Prairie wedgegrass (California Native Plant Society List 2)
Osprey (Species of Special Concern) Bald eagle (State-Endangered, Federal-Threatened) Tn'co/ored blackbird (Species of Special Concern) Winter run chinook salmon (StatelFederal-Endangered) California red-legged frog (Federal-Threatened) Great Valley cottonwood riparian forest Great Valley valley oak riparian forest Great Valley willow scrub Vernal pool faify shrimp (Federal-Threatened) Vernal pool tadpole shrimp (Federal-Endangered) Valley elderbeny longhorn beetle (Federal-Threatened) silky cryptantha (California Native Plant Society List IB) fox sedge (California Native Plant Society List 2) slender o ~ u t f grass (State-Endangered, Federal-Proposed
Threatened)
November 5, 1997 23 BIOLOGICAL RESOURCES

The results of these data base searches (See Table 1) should only be considered a "short" list of the potential biological resource issues for each project area. To completely identify all of the potential issues, a suitably trained biologist(s) must: I) contact CDFG and the USFWS to receive guidance on the biological resource issues for the region of each proposed project site, and 2) perform field surveys at the correct time(s) of year following approved field survey protocols. Even though few amphibians and reptiles were identified in the data base search results, these sensitive species must be identified as well. Field surveys must include not only the proposed biomass-to-ethanol site, but all linear facility corridors if applicable. Only after completing the field surveys, and combining the resulting field data with data from the CNDDB, will the list of potential issues be identified.
SITE ANALYSES
To decide which potential project sites might rank higher (have fewer potential biological resource impacts) than other sites, staff identified which projects would need to I) expand beyond the existing borders of the current power plantlmill property, i.e. impact currently undisturbed habitat, 2) impact off-site habitat due to the construction of a new water line or transmission line, 3) utilize a tocal water source (e.g. a local creek) and impact local aquatic wildlife species and/or 4) sites adjacent to important biological resources, e.g. creeks (Greenville), ditches (Chester), and lakes (Westwood). If any of the above items are required, staff assumes there will be short- term and possibly long-term biological resource impacts. IMPORTANT NOTE: It is not possible at this stage of project development to determine whether or not any of the sensitive species identified in Table I will be impacted if a biomass-to-ethanol facility is constructed at any of potential project sites. To make this determination, a trained biologist(s) must complete thorough field surveys at the proper time(s) of year following accepted field survey techniques. Only after all areas to be impacted are properly surveyed can a determination be made regarding whether or not sensitive species or their habitat will be impacted.
In Table 2 each potential project site is subjectively evaluated and given a rank of "Good", "Fair" or "Poor". A "Good" site appears to lack any negative on-site or off-site habitat impacts. On and ofl-site habitat impacts include, but are not restricted to, the need to build a power plant and/or the ethanol production facilities and feed stock storage area on currently undisturbed land. A "Fair" site may have on and/or off-site habitat implications; however, the impacts will only be temporary (e.g. the project may need to install a larger water line). If a project site is deemed "Poor," staff assumes that there will be permanent loss of currently undisturbed habitat combined with a need to construct a new off-site linear facility such as a transmission line as well.
BIOLOGICAL RESOURCES 24 November 5, 1997

BIOLOGICAL RESOURCES Table 2 Site Rankings
LOCATION
LOYALTON (Sierra County)
CHESTER (Plumas County)
GREENVILLE (Plumas County)
WESTWOOD (Lassen County)
MARTELL (Amador County)
ANDERSON (Shasta County)
GOOD
POOR
GOOD
GOOD
GOOD
REASONS FOR RANK ~~ ~- ~~ ~ ~
Site has a biomass power plant, but will probably need to expand beyond existing fence line to accommodate new ethanot production facilities and feed stock storage. The need to expand beyond the existing project boundary represents additional loss of habitat. The existing water line is currently of adequate size, so no temporary impacts are expected since the water line will not need to be upgraded. However, an ethanol facility at this site will probably require the use of additional creek water which increases the likelihood of impacts to the local fishery in the creek. Existing transmission line is adequate.
Large site with a biomass power plant and plenty of room for ethanol production facilities and associated feed stock storage. May continue to withdraw surface water from local canal (Stover Ditch). If additional water is needed, additional fishery impacts may occur if fish occur in Stover Ditch. Existing transmission lines are OK.
Site once contained a lumber mill, but is currently only periodically disturbed by private landowner. Wll need a power plant in addition to the ethanol production facility and feed stock storage area. May choose to withdraw surface water from adjacent Wolf Creek which would result in new impacts to the local fishery. May need 4 to 5 miles of new transmission line in addition to a new water line of unknown length. These off-site facilities will resutt in temporary and permanent biological resource impacts.
Site has an operating biomass power plant and enough room for ethanol facilities and feed stock storage. City water is already available; high capacity deep well is current water source. No need for major upgrades to existing transmission lines.
Large site containing an operating biomass power plant with adequate room 'for an ethanol production facility and feed stock storage area. May need to upgrade existing transmission line and water line@) on and off-site, but biological resource (habitat) impacts should only be temporary.
Two large sites (each -140 acres) evaluated for ethanol facility and feed stock storage. Wheelabrator Shasta Energy Company owns/operates biomass power plant on adjacent parcel. May need to upgrade existing transmission lines, and steam line will need to be installed between power plant and ethanol facility. Off-site impacts associated with steam line installation should be temporary. No water-related biological resource impacts are expected since water needs will be satisfied by existing on-site groundwater wells.
November 5, 1997 25 BIOLOGICAL RESOURCES

The "Good" sites (Chester, Westwood, Martell, and Anderson) have three important things in common. First, each "Good" site has an operating biomass power plant, so a new power plant will not need to be built. Second, each site is large enough to accommodate a new ethanol production facility and an associated feedstock storage area. And third, any anticipated off-site impacts appear to be temporary, not permanent, in nature, and implementation of accepted mitigation measures would further lessen the significance of these impacts.
By comparison, the Loyalton site is considered to be only "Fair" because the site appears to be too small. The existing lumber mill facilities and biomass power plant occupy much of the site, so adjacent undisturbed habitat will probably need to be permanently impacted to accommodate a new ethanol facility and feedstock storage area.
The Greenville site lacks a biomass power plant and transmission lines,' so both would need to be constructed in addition to a new ethanol production facility and feedstock storage area. In addition, staff was told that surface water from Wolf Creek may be needed.if this site is utilized. When compared to the other potential project sites, construction of the project in Greenville will permanently impact the largest number of acres, and will have the largest number of long-term wildlife and aquatic resource impacts.
RECOMMENDATIONS
Once a project location is chosen the developer should contact the appropriate CDFG regional office to find out the issues the local CDFG biologist feels are important. The Anderson project site is located within CDFG's Region I. Region 1 Headquarters, located in Redding, can be contacted at (916) 225-2300. The Loyalton, Chester, Greenville, Westwood, and Martell project sites are within CDFG's Region 2. Region 2 Headquarters, located in ,Rancho Cordova, can be contacted at (916) 355-0978.
In addition, the developer should contact CDFG's Natural Diversity Data Base at (916) 324-3812 to find out which sensitive species and/or habitats are known from the region of project site. This CDFG input, plus suitable field surveys by a trained biologist, will help lessen project delays.
Contacting the USFVVS is also highly recommended, especially if there is any likelihood that a federally listed species and/or its habitat may be impacted by the project. All of the proposed project sites fall within the Sacramento Field Office service area, which can be contacted at (916) 979-2749.
BIOLOGICAL RESOURCES 26 November 5, 1997

HAZARDOUS MATERIALS MANAGEMENT
INTRODUCTION
The operation of powerplants and other energy projects usually requires the use of hazardous materials. Such materials can be hazardous due to their toxicity, flammability, explosivibility, or corrosivity. Materials that are toxic or explosive pose the greatest potential for impacting surrounding populations. In many cases, such risks can be reduced to insignificant levels by using less hazardous materials, engineered controls, or by implementing effective safety management practices. The materials typically associated with energy-related facilities that can result in off-site impacts include fuels, water treatment chemicals, chemicals used in emission control, and heat transfer fluids. Some types of energy projects can also involve processes which require the handling and use of hazardous materials or can produce hazardous materials as intermediate products.
The proposed ethanol production facilities may require the use of either natural gas or propane as a fuel and the use of water treatment chemicals, including sulfuric acid and some form of chlorine. It is not anticipated that ammonia or any other hazardous materials will be used to control emissions from the ethanol facility. However, if a brownfield site is selected for the ethanol project it may also be necessary to construct a cogeneration power plant at the site. If such a site is selected, it is likely that non- selective catalytic reduction will be required to control NOx emissions from the power plant. This can be accomplished by using either aqueous ammonia or urea, both of which can be handled with minimal risk to the surrounding population. It is unlikely that the proposed facility will require the use of any hazardous heat transfer fluids. The project will produce ethanol as a product, which is a flammable material.
ANALYSIS
POTENTIAL FOR IMPACTS AND EFFECTS ON SITE SELECTION
It is not anticipated that any hazardous materials handling facilities will be located closer than 1,000 ft from schools, hospitals, convalescent homes or any other facility h o using se ns i t ive receptors .
Based on the information available, sulfuric acid will probably be the only extremely or acutely hazardous materiaf used by the proposed project. The pure form of sulfuric acid (oleurn) has significant vapor pressure, and thus significant potential to cause off- site impacts. However, the proposed facility will not use oleurn, but rather a diluted form with very low vapor pressure and no potential to cause off-site impacts. The facility will also require the use of chlorine, but not in the anhydrous form which could cause off-site impacts if released. As an alternative to anhydrous chlorine, the facility can use either sodium hypochlorite or solid forms of chlorine, which will not pose any potential for off-site impacts. The facility may also require the use of liquified propane as a fuel, thus posing a hazard of an explosion. However, it is unlikely that such an
November 5, 1997 27 HAZARDOUS MATERIALS

explosion would produce significant impacts at distances of more than 500 ft. The only other potential hazard would be the production and storage of ethanol, and the storage and use of gasoline to denature the ethanol. While these materials pose a significant fire hazard, it is unlikely that a fire involving these materials would result in off-site impacts.
Based on the above analysis, staff does not anticipate that the use of hazardous materials at the proposed facility will play a significant role in site selection. However, hazardous materials management issues should be seriously considered in facility design in order to avoid impacts off-site and minimize risks to workers. A final consideration should be the potential need for outside assistance from local fire departments which may not be in close proximity or have adequate staffing, equipment or training to respond to a major fire involving the materials used or stored at the proposed facility.
CONCLUSIONS
REGULATORY REQUIREMENTS
The proposed facility will be required to prepare a Business Plan and may be required to prepare a Risk Management Prevention Plan (RMPP) pursuant to Sections I8200 et. seq. of the California Health and Safety Code. The proposed facility may also require the preparation of a plan for Process Safety Management pursuant to Section 51 89, California Code of Regulations. Compliance with these requirements should not be difficult based on the types and quantities of hazardous materials involved and should not be a significant impediment to development of the project.
HAZARDOUS MATERIALS 28 November 5, 'l997

NOISE IMPACTS
INTRODUCTION
NOISE LIMITS
Noise is unwanted sound. Where noise impacts have the potential to adversely affect human receptors, these impacts must be held within legally acceptable limits. Federal and state Occupational Health and Safety laws and regulations (29 U.S.C. § 651 et seq.; 29 C.F.R. § 1910.95; Tit. 8, Cal. Code Regs., § 5095 et seq.) control noise levels to which workers in the facility may be exposed. In California, legal limits for noise exposure of the surrounding community are commonly set and enforced at the county and local level.
Each county in California is required to produce a General Plan, and this Plan must include an element dealing with noise (Gov. Code, Q 65302). The noise element typically sets limits for the noise which may be produced by any new facility, and is usually enforced by the county planning department. Permissible noise limits are generally higher in the daytime and lower at night when most people sleep and are more sensitive to noise.
Additionally, many local jurisdictions have a noise ordinance to control disturbing noises. Such ordinances typically set numerical limits for noisy events, and are usually enforced by the police or sheriff.
ANALYSIS
NOISE IMPACTS OF A BIOMASS-TO-ETHANOL FACILITY
Noise can be produced by both the construction and the operation of a facility, such as a biomass-to-ethanol plant and its attendant facilities.
Construction Noise
Primary noise sources during the construction of a biomass-to-ethanol plant would include diesel-powered trucks and construction equipment (earthmovers, cranes, etc.), pneumatically powered tools such as jackhammers and torque wrenches, and pile drivers. Noise from these sources is typically controlled in two ways. First, vehicles and motorized equipment are equipped with effective mufflers to limit noise emissions. Second, noisy construction work is commonly limited to daytime hours by the General Plan Noise Element. This eliminates adverse noise impacts on nearby receptors during the nighttime. Note that distance from receptors can be an effective mitigation measure. If no sensitive receptors (hospitals, schools, churches, libraries or residences) are within hearing range of the project site, no adverse noise impacts are like f y .
November 5, 1997 29 NOISE

Operational Noise
A biomass-to-ethanol facility can be expected to operate around the clock. As such, noise emissions must be controlled to permissible nighttime levels. Some operations, such as maintenance work or fuel gathering and processing, can be performed solely during the day so that noise emissions from these operations can be limited to less stringent daytime levels.
As with construction, if the distance to the nearest receptors is great enough, noise emissions should not be problematic. If receptors are nearby, noise emissions from the operating biomass-to-ethanol plant can be controlled by various means.
Equipment can be purchased which produces less noise than standard grade hardware. Machinery can be placed within buildings or behind sound barriers to control noise propagation offsite. Natural or man-made features such as hills, berms or walls can be utilized to attenuate sound. Finally, the noisiest equipment can be located on the portion of the site farthest from any sensitive receptors.
Noise-producing equipment will include: diesel-powered trucks delivering biomass and other supplies; forklifts or front end loaders to move the biomass onto conveyors; conveyors to transport biomass to the plant; biomass shredding/rnilling equipment; electrically powered pumps, fans, compressors, mixers and screw feeders; centrifuges; and diesel-powered trucks or trains to carry away the finished products and byproducts.
Inherent in all the proposed Quincy Library Group projects is the fact that where unemployment levels are high, any facilities which offer jobs to local residents (such as the Quincy Library Group projects) are likely to be more tolerated than in places with low unemployment. Noise levels which might gamer complaints to the police in Sacramento, for example, would likely occasion no response in Chester or Westwood. While this does not allow violation of existing noise element provisions or noise ordinances, it seems likely that simply complying with these limits will prove adequate, and no extraordinary noise suppression measures will be required.
THE INDIVIDUAL SITES
Noise considerations at each of the seven proposed sites are summarized below.
Sierra Pacific Industries, Lovalton
A biomass-to-ethanol plant at the Sierra .Pacific Industries (SPI) lumber mill at Loyatton would most likely be located near the existing 20 MW biomass-fueled cogeneration power plant. The nearest noise receptors would be SPI employees; the added noise of the plant would likely be indistinguishable next to the existing lumber mill and power plant sounds. The nearest off-site receptors would be a residential neighborhood approximately one-quarter mile north of the plant site. At this distance, the added noise from the plant would probably be noticed. Proper attention to plant
NOISE 30 November 5, 4 997

design would assure no significant adverse noise impacts on these residences. The nearest sensitive receptors appear to be schools and a hospital that lie over one-half mile north and west of the site. At this distance, no significant adverse noise impacts from the plant are likely.
For information on county General Plan Noise Element restrictions, contact the Sierra County Planning Department in Loyalton at (916) 993-0423, or in Downieville at (916) 289-3251. For infomation on local noise ordinances, contact the Sierra County Sherifs Office in Downieville at (916) 289-3700. . Collins Pine Company, Chester
An ethanol plant at the Collins Pine Company lumber mill at Chester would likely be located adjacent to the existing I 2 MW biomass-fueled cogeneration power plant. Nearest noise receptors would be Collins Pine employees; the added noise of the plant would likely be unnoticeable among the other mill and power plant sounds. The nearest off-site receptors include other businesses, a restaurant and a motel. These structures are located mostly across the highway from Collins' lumberyard, nearly one- quarter mile from the biomass-to-ethanol plant, and would be largely shielded from the plant by existing buildings on the Collins property. Proper attention to plant design would assure that no significant adverse noise impacts would affect these receptors.
For information on county General Plan Noise Element restrictions, contact the Plumas County Planning Department in Quincy at (916) 283-6210. For information on local noise ordinances, contact the Plumas County Sheriffs Office in Quincy at (916) 283-6375.
Greenville
A biomass-to-ethanol plant at the site in Greenville would be located between one- quarter and one-half mile from the nearest residences, with the exception of the property owner's house. Proper attention to plant design and layout should prevent significant adverse noise impacts upon any off-site receptors. The property owner would be expected to willingly tolerate noise impacts from the facility. If such is not the case, appropriate mitigation measures (investing more money in quieting the facility, or moving the owner's mobile home to a more distant location) would be required.
For information on county General Plan Noise Element restrictions, contact the Plumas County Planning Department in Quincy at (916) 283-6210. For information on local noise ordinances, contact the Plumas County Sheriffs Office in Quincy at (916) 283-6375.
November 5, 1997 31 NOISE

Mt. Lassen Power Plant, Westwood
A biomass-to-ethanol plant located on the Mt. Lassen Power Plant site near Westwood would produce minor additional noise impacts for site employees. The nearest off-site receptors are residences on the west end of Westwood; these lie nearly one-half mile away. Proper attention to plant design and layout would probably adequately prevent any significant adverse noise impacts upon these receptors.
For information on county General Plan Noise Element restrictions, contact the Lassen County Planning Department in Susanville at (916) 251-8269.
W h ee I a bra to r/S i e r ra Pacific Industries, Ma rte I I
An ethanol facility at the Sierra Pacific Industries (formerly Georgia Pacific) lumber mill in Martell would likely be located adjacent to the Weelabrator I 8 MW biomass-fueled cogeneration power plant. Noise impacts on facility personnel would be minimal and largely unnoticeable. Nearest off-site receptors consist of businesses and some residences approximately onequarter mile to the southeast of the plant site. Nearest sensitive receptors appear to be a school one-half mile north of the site, and the Jackson High School one mile south-southeast of the site. Wth proper attention to plant design, it is unlikely that any significant adverse noise impacts would be created.
For information on county General Plan Noise Element restrictions, contact the Amador County Planning Department in Jackson at (209) 223-6380. For information on local noise ordinances, contact the Amador County Sheriffs Office in Jackson at (209) 223-6500.
Mill Site, Anderson
Two possible sites, both owned by Roseburg Lumber Co., are under consideration in Anderson. One, the "Paul Bunyon" site, lies on the south side of the SP rail line and adjacent to and southeast of Wheelabrator's Shasta Energy plant. The other, the "Roseburg" site, lies on the north side of the SP rail line and adjacent to and west of the Simpson Paper Company facility. Simpson Paper's plant includes a cogeneration power plant owned by VVheelabrator. It is possible that a biomass-to-ethanol facility built at either site could cooperate with the adjacent Weelabrator power plant to buy electricrty and steam, and sell lignin.
At the "Paul Bunyon" site, nearest noise receptor is a rural housing tract nearly one- half mile to the south-southwest. At the "Roseburg" site, the nearest housing tract lies over one-half mile to the west and across Interstate 5. There are several residences, some houses and some mobile homes, directly across the road which borders the north side of the "Roseburg" site. The site, however, measures nearly one-half mile from north to south, affording the opportunity to locate the biomass-to-ethanol facilrty an adequate distance from these residences. With proper attention to plant design, it is unlikely that any significant adverse noise impacts would be created.
NOISE 32 November 5, 1997

For information on county General Plan Noise Element restrictions, contact the Anderson Planning Department at (91 6) 378-6636 or the Shasta County Resource Management Department, Planning Division in Redding at (91 6) 225-5532. For information on local noise ordinances, contact the Anderson Police Department at (916) 378-6622.
CONCLUSlON
At five of the sites, we expect that proper plant design will prevent any significant adverse noise impacts. At the Greenville site, additional mitigation may be necessary. All sites are feasible.
November 5, 1997 I
33 NOISE

INTRODUCTION
The technical area of Socioeconomic Resources typically evaluates the effects of project-related population changes on local schools, housing availability, medical and protective services, public utilities, and the fiscal and physical capability of local governmental agencies to meet the needs of project-related changes in population. Because the project could be sited within five different counties, staff will review each county's general plan for policies as they relate to Socioeconomic Resources.
This analysis discusses each of the seven sites identified by the QLG as to the site's suitability for a biomass/ethanol facility based on the above criteria. Because the number of construction and operation workers, and project construction schedule has not been determined by the QLG, for purposes of this analysis, staff will assume that the majority of construction and operation workers will come from local areas where the facility or facilities will be constructed. If this is the case, impacts on locat schools, housing availability, medical, fire, and police services, public utilities, and other governmental services are expected to be minimized because no project-related changes in population due to in-migrating workers are expected. In addition, QLG has stated that one objective of the project is to increase local employment in the lumber and service employment sectors within the QLG target area.
The QLG provided staff an Economic Monitoring Report (December 1995) which serves as a baseline for monitoring and evaluating the economies of Plumas, Lassen, and Sierra Counties. It contains historical and current information on the role of the timber industry and other sectors of the QLG area economy, and statistical comparisons with other areas. Information from this document was used in this report. However, any project-related cost benefit analysis based on economic indicators, trends or timber industry statistics would be beyond the scope of a typical socioeconomic analysis.
ANALYSIS
Sierra Pacific Industries - Lovalton, Sierra Countv
Loyakon is an incorporated city within Sierra County. The 1990 population of Loyalton was 931 and is projected to grow to 1,214 by 2012 (Sierra County 1992 General Plan). All planning for the city is provided by the Sierra County Planning Department; all public services (school, police, fire, medical) are provided by Sierra County.
November 5, 1997 35 SOCIOECONOMIC RESOURCES

Schools - The Sierra-Plurnas Joint Unified School District encompasses all of Sierra County and 30 percent of Plumas County. District wide enrollment in 1992 was 826 students; district staff consisted of 47 full-time teachers, six special education teachers, and one part-time teacher. The Loyalton Elementary School's (K-5) 1992 student capacity and enrollment was 175 and 250, respectively. In 1992, the school was operating at a capacity of 143 percent. The Loyalton Intermediate School's (6-8) 1992 student capacity and enrollment was 175 and 145, respectively. In 1992, the school was operating at a capacity of 83 percent. The Loyalton High School's (9-12) 1992 student capacity and enrollment was 248 and 140, respectively. In 1992, the school was operating at a capacity of 56 percent. As stated in the 1992 general plan, while the Loyalton Intermediate Schoot is in need of replacement, the District does not have the money necessary to build or replace school facilities currently needed. The District has no immediate plans to attempt to raise funds through tax overrides or bond measures. To reduce costs, the School Board is drafting a new policy to require non-school related use of District facilities to reimburse the District for heating, lighting, and custodial costs.
Police - The Sierra County Sheriffs Department provides services to the entire County including the City of Loyalton. Existing levels of service are approximately one sworn personnel per 350 residents, with one officer on duty on either side of the county at all times. The Department is staffed by I 0 full-time sworn personnel, four full-time and part-time dispatcherdjailers, and five reserve deputy sheriffs. As stated in the 1992 general plan, the radio communication system was designed in I972 to cover the major population centers of the county at a minimal cost. Any substantial development within the county should consider the overall impact to the system. Financing recommendations for future facilitiesfimprovements would be in the form of an impact fee on new developments, which would pay for costs of delivering current levels of service.
Fire - Fire protection services to the City of Loyalton and the Sierra Stooks subdivision are provided by the Loyalton Fire Department. The Department maintains one station in Loyalton and one in Sierra Brooks. The Department staff consists of a chief and 27 volunteer firefighters. Approximately ct 4 firefighters are available between the hours of 8:OO am and 6:OO pm. The equipment housed in Loyalton consists of two Class A 1250 GPM pumpers, one Office of Emergency Services 1000 GPM pumper, one utility squad truck, one brush fire truck, one 2500 gallon water tender, and one 4x4 Bronco command truck. The Department has mutual aid agreements with the USFS and Sierraville. Sierra County has no comprehensive fire services master plan (Sierra County General Plan Background Document, Volume I, July 1996).
Medical services - The Sierra Valley District Hospital (SVDH) is located in Loyalton and provides emergency medical services for Sierra County residents living east of the Yuba Pass. SVDH consists of 40 beds, including six acute care beds; beds per capita total one bed per 88 residents. SVDH provides emergency room services, a skilled nursing facility, two medical clinics staffed with two doctors, an x-ray department, a
SOCIOECONOMIC RESOURCES 36 November 5, 1997

medical lab, an ambulance service, and a life-line to the advanced medical services in
Reno, Nevada. SVDH is facing budget cutbacks due to a reduction in federal and state medical room rate reimbursements. Emergency medical technicians, ambulance and fire emergency services are supplied by volunteer organizations.
Housing and Population - The 1992 population for Sierra County was 3,338 persons; number of housing units was 2,202; vacancy rate is 39.1 percent (Sierra County General Plan Background Document, Volume 1, July 1996). No specific housing information for the City of Loyalton is available.
Project impact on fiscal resources and local economy - The capital cost and the annual operating and maintenance costs of the project are undetermined, therefore increases to the local economy through sales tax, payroll, and property tax are unknown. Although project specifics are unknown, due to the nature of the project and the high unemployment rate in Sierra County, the proposed project is expected to have a positive effect on the county's economy.
Collins Pine Companv, Chester: Greenville - Plumas Countv
Schools - Schools in the Chester area and 1995-1 996 enrollment are as follows: Chester Elementary, 394; Chester High, 298; Atmanor Continuation, 20. Schools in the Greenville area and 95-96 enrollment are as follows: Greenville Elementary, 21 8; Taylorsville Elementary, 56; Greenville High, 195; Indian Valley Continuation, 18. Although enrollments in the Plumas Unified School District have begun to grow, they are still down from a few years ago and could absorb some increase before additional classrooms would be needed. Funding for facility expansion is done through developer impact fees, residential $1.72 per square foot and commercial $0.28 per square foot (Personal communication, Kris Campbell, Director of Business Services, Plumas Unified School District, January 1997).
Police - The Plumas County Sheriff's Department has a total of 37 sworn officers for the entire county. The towns of Chester and Greenville have their own sheriffs office with one officer per 800 people for the town of Chester and one officer per 800 people for the town of Greenville (Personal communication, Bob Minert, Administration, Plumas County Sheriffs Department January 1997).
Fire - The Collins Pine site does not have their own fire brigade. Fire protection to the Collins Pine site is provided through an agreement with the Chester Fire Protection District. The District operates with 2 full time staff and 20 volunteers. The District has three Class A triple combination pumps; a 1500 gallon per minute (gpm) pumper with an 800 gallon tank; a I000 gpm pumper with a 750 gallon tank; and a 750 gpm pumper with a 750 gallon tank. The response time to the site is three to five minutes; they average two engines per call. Because the Chester Fire Protection District receives no revenue from the Collins Pine Mill through property taxes for services to the Collins site, any new development on this site would require annexation to the
November 5, 9997 37 SOCIOECONOMIC RESOURCES

District to ensure continuation of fire protection services (Personal communication, Jay Newman, Chief, Chester Fire Protection District, January 1997).
Medical services - Seneca Hospital provides medical services to the town of Chester. They have 10 acute beds and 16 long-term beds, four physicians are contracted to the clinic and two physicians are contracted to the hospital. Seneca Hospital provides emergency medical services, three ambulances, and a clinic (Personal communication, Terry Schroeder, Director of Nursing, Seneca Hospital, January 4997).
Indian Valley Hospital provides medical services to the town of Greenvitle and the Indian Valley. The hospital has 26 beds of which 17 are long-term care beds. They provide emergency services, surgery, an ambulance, and a rural health clinic (Personal communication, Sherry Whipple, 8usiness Services Manager, January 1997).
Housing and Population - The 1992 population for Plumas County was 18,045 persons. The 1992 population for the Almanor planning area (includes the town of Chester) was 4,292; the number of housing units for the Almanor planning area was 3,775 (Plumas County General Plan).
The I992 population for the Indian Valley planning area (includes the town of Greenville) is 2,924; the number of housing units for the Indian Valley planning area is 1,431 (Plumas County General Plan).
Project impact on fiscal resources and local economy - The capital cost and the annual operating and maintenance costs of the project are undetermined, therefore increases to the local economy through sales tax, payroll, and property tax are unknown. Although project specifics are unknown, due to the nature of the project and the high unemployment rate in Plumas County, the proposed project is expected to have a positive effect on the county's economy. There is a greater potential for significant construction-related impacts to occur at the Greenville site because the site does not have an existing power plant or biomass facility.
Mt. Lassen Power Plant - Westwood, Lassen Countv
Westwood is an unincorporated town in Lassen County. All planning services for Westwood are provided by the Lassen County Community Development Department. The Westwood Plan was adopted by the Lassen County Planning Commission in September 1968 and is therefore no longer pertinent in determining baseline information for the Westwood community.
Project impact on fiscal resources and local economy - The capital cost and the annual operating and maintenance costs of the project are undetermined, therefore increases to the local economy through sales tax, payroll, and property tax are unknown. Afthough project specifics are unknown, due to the nature of the project and the high unemployment rate in Lassen County, the proposed project is expected to have a positive effect on the county's economy.
SOClOECONOMlC RESOURCES 38 November 5, 1997

WheelabratodSierra Pacific Industries - Martell, Amador County
Information from Amador County is not available at this time. If local information is provided, because project specifics are unknown, only baseline data can be used for this assessment.
Project impact on fiscal resources and local economy - The capital cost and the annuat operating and maintenance costs of the project are undetermined, therefore increases to the local economy through sales tax, payroll, and property tax are unknown. Although project specifics are unknown, the proposed project is expected to have a positive effect on the county's economy if local labor is employed.
Anderson, Shasta County
Two sites, Roseburg and Paul Bunyon, are proposed for the project in the City of Anderson.
Project impact on fiscal resources and local economy - Using a regional input-output model (IMPIAN), information from the City of Anderson Planning Department shows the total economic changes to the county's economy from the operation of a reconstituted wood products plant. The QLG is proposing a biomass/ethanol facility. Therefore, it cannot be assumed that county-wide economic benefits derived from the operation of a reconstituted wood products plant would be the same for the QLG project.
The capital cost and the annual operating and maintenance costs of the project are undetermined; therefore, increases to the local economy through sales tax, payroll, and property tax are unknown. Although project specifics are unknown, the proposed project is expected to have a positive effect on the county's economy if local labor is employed.
CONCLUSIONS AND RECOMMENDATIONS
The threshold of impacts to socioeconomic resources is triggered when project-related changes in population affect local governments' ability to provide current levels of service to the community where a project is sited. Impacts to schools, housing availability, medical, fire, and police services, and other governmental services can be minimized by recruiting construction and other employees, and procuring materials and supplies within the local area.
It should be noted that construction and operation of energy projects can cause impacts to local school districts which are at or over capacity by adding to the enrollment of those districts. To adequately address increases in enrollment, those districts must incur additional costs for additional teachers and classrooms. If construction crews are hired from outside the area, the project or projects would have
November 5, 1997 39 SOCIOECONOMIC RESOURCES

the potential to cause some increase in local school enrollment due to the children of relocating construction workers, and thus may cause districts at capacity to incur additional costs.
Based on resource documents and personal communication, each site identified by the QLG is equally suited for a biomass/ethanol facility from a socioeconomic perspective. However, there is a greater potential for significant construction-related impacts to occur at the Greenville site because the site does not have an existing power plant or biomass facility. Additionally, because some of the sites are more isolated and have fewer economic resources than others (Greenville, Chester, Loyalton, Westwood) it is important that the QLG work closely with local governments if the proposed facility is located in these communities.
SOCIOECONOMIC RESOURCES 40 November 5, 1997

PlJSLlC HEALTH
I NTRODUCTI 0 N
The technical area of Public Health is concerned with the analysis of routine emissions of potentially harmful substances during normal plant operations. A potential analysis will attempt to determine if these emissions will have the potential to cause significant adverse public health impacts or to violate standards for public health protection.
ANALYSIS
Public health implications from siting a BTE facility can be analyzed by performing screening health risk assessments for each site. Such assessments require detailed site specific information such as tocal meteorological data and terrain characteristics in addition to detailed faciMy information such as stack height, emission exhaust temperature, and plant operating profile. At the present time, staff do not have such detailed information. However, based on visits to each site and preliminary estimates of emissions characteristics, some general observations regarding public health impacts may be made.
For those sites with existing combustion facilities (Loyalton, Westwood, Chester, Martell, and Anderson), increases in emissions associated with the addition of an ethanol facility would likely be minor relative to current levels. Increases would include emissions from the ethanol portion of the plant, such as fugitive ethanol or particulate matter emissions, as well as any increases in stack emissions from the existing facility if higher combustion rates become necessary. Since the Greenville site has no existing power plant, siting a biomass to ethanol facility would result in emissions from both the ethanol portion of the plant as well as the combustion portion, assuming a power plant is built.
CONCLUSION
Although the increase in emissions would thus be greatest for the Greenville site, definitive conclusions regarding impacts upon public health would still depend on the results of a screening health risk assessment, and the rules of the local air pollution control district regarding the emission control technology and the amount of offsets required. As pointed out in the air quality section, each district has provisions to exempt a facility from providing offsets if it qualifies as a resource recovery project.
November 5, 1997 41 PUBLIC HEALTH

WASTE
INTRODUCTION
Staff analyzes waste management issues to ensure that wastes generated during construction and operation of a proposed project will be managed in an environmentally safe manner, and that disposal of project wastes will not result in significant adverse impacts to existing waste disposal facilities.
ANALYSIS
Construction and operation of a biomass to ethanol facility will generate both hazardous and nonhazardous wastes. Hazardous wastes will include those normally found in the construction and operation of similar types of industrial projects such as waste oil and grease, used solvent, contaminated clean up materials, and excess chemicals. Hazardous wastes which cannot be recycled may be sent to one of several landfills either in California or out of state specifically permitted to accept such wastes. The location of the biomass project will not significantly affect either the types of hazardous wastes generated or the landfill likely to be used. Building at a site without an existing combustion facility would generate somewhat larger waste quantities, but disposal of such additional waste is not likely to pose any significant problems.
Nonhazardous wastes from project construction are also similar to those from other industrial projects and may include scrap building materials and empty containers. As with hazardous construction wastes, quantities of nonhazardous wastes generated would be greater at a site without an existing combustion facility. Non-recyclable construction waste would be added to the existing municipal waste stream for disposal.
In addition to normal nonhazardous wastes from facifity operations such as trash, empty containers, and used packing materials, operation of a biomass to ethanol facility will generate solid byproducts including lignin, boiler ash, and wastewater treatment solids. Additionally, gypsum may be produced if the pretreatment technology utilizes dilute sulfuric acid neutralized with lime.
CONCLUSION
It is not expected that any of the above byproducts would be classified as hazardous, although the boiler ash should be tested to ensure its nonhazardous classification. The bulk of the byproducts is lignin, which is estimated to be produced at the rate of 63 bone dry tons (BAT) per day for a five million gallon per year facility up to about 250 BAT daily for a 20 million gallon per year facility. This compares to a production rate of one to four BAT per day each for ash and wastewater treatment solids for the two facility sizes, respectively. Although the byproducts may be safely landfilled, alternative uses may allow them to be diverted from the waste stream. Lignin has a
November 5, 1997 43 WASTE

heating value of about 11,000 BTU per pound, making it suitable for use as a boiler fuel. Ash is useful as an agricultural or forest soit amendment, as is gypsum. Since ash is already produced at tbose sites with existing operating boilers (the ethanol facility itself would not produce additional ash), the additional operation of a biomass to ethanol facility will not significantly increase the quantity of solid wastes produced. However, locating a plant at the Greenville site which lacks an operating facility would thus yield a larger increase in the solid waste stream, if a cogeneration power plant were built.
WASTE 44 November 5, 1997

TRANSMISSION SYSTEM ENGINEERING
INTRODUCTION AND ANALYSIS
SUMMARY OF PROPOSED SITES AND RELATED SYSTEM AND OUTLET COSTS
The proposed sites are located on the Pacific Gas and Electric Company (PG&E) system. A table for each site lists the existing PG&E substation that is the point of interconnection for that site. No significant new downstream system facilities are expected for a project that results in a net change in site power transfers of under 30 megawatts. New or modified facilities from the project switchyard to the first point of interconnection on the PG&E system (generation tie facilities) located within existing distribution line easements are to be expected for all sites except Martelband Anderson, which would likely require no significant new generation tie facilities for projects under 30 megawatts.
Tables 1-6 for the six sites evaluated show estimated system reinforcement costs, system capacity loss adjustment factors, and generation tie costs for levels of increased net generation. The system reinforcement costs in dollars per kilowatt are for site characterization purposes from the 1993 PG&E Transmission Cost Tables known as volume two of the "Location Table Handbook". See Transmission System Engineering -Appendix A for a discussion of the Handbook. These numbers are in 1998 dollars. Reinforcement costs reflect the need for operations and maintenance, line, and substation reinforcement to the PG&E system to accommodate the project. Typical reinforcement costs for the PG&E system , listed in the "handbook", range from slightly negative (reduced OSlM), to well over two hundred dollars per kilowatt, and indicate the degree of new facilities required to accommodate new generation. The tables show that for these sites the numbers are relatively low, indicating an unlikely need for new facilities outside existing utility easements for all sites. As a result, the numbers are an indicator that system improvements required to accommodate project power beyond the substation of interconnection are likely to be insubstantial and within existing utility easements.
The capacity loss adjustment factor (CLAF) is used to identify the amount of power that will actually be delivered to market from the site. For example, a one megawatt plant at a site with a 0.9 CLAF delivers ninety per cent of its power to the market, with ten percent being lost in heat due to resistance on its way to market. The CIAF is an indicator of the distributed utility benefit. A CLAF greater than one would indicate a decrease in losses and a distributed utility benefit for the project, while a CIAF less than one indicates losses will occur since the power will be delivered to loads in metropolitan areas remote from the sites. For all the sites, no distributed utility benefits are expected to be realized.
November 5, 9997 45 TRANSMISSION SYSTEM ENGINEERING

TRANSMISSION SYSTEM ENGINEERING Table I Anderson Site
~ 16.75
Proposed Site ANDERSON
Megawatt (MW)
under 30
30 - 90
90 - 250
System ReinforcementSk W
$/kW
16.75
22.00
System Capacity Loss Adjustment Factor
Generation Tie k$/mi - miles
CLAF I Church and Mills
0.87 I Not Required
Cottonwood- Trefoil Ln ld5 kV $175 - 15 mi
0.92 Cottonwood- Trefoil Ln 230 kV $225 - 15 mi
TRANSMISSlON SYSTEM ENGINEERING Table 2 Chester Site
Proposed Site CHESTER
System Reinforcement $/kW
System Capacity Loss Adjustment Factor
Generation Tie k$/mi - miles
Megawatt (MW) I $/kW I CLAF I 1st St -Collins Pine RR
under 10 I 27.00 I 0.81 I $90 - 2 mi
I 28.00 I 0.81 I $90 - 2 mi I 0 - 20 I 40.00 I 0.81 . I $90 - 2 mi 20 - 30
TRANSMISSION SYSTEM ENGINEERING 46 November 5, 1997

TRANSMISSION SYSTEM ENGINEERING Table 3 Greenville Site
Proposed Site GREENVILLE
Megawatt (MW)
under 10
10 -20
20 - 30
System System Capacity Generation Tie Reinforcement Loss Adjustment k$/mi - miles $/kW Factor 60 kV
$/kW CLAF Loopin existing Circuit
20.00 0.87 $90 - 0.5 mi
38.00 0.87 $90 - 0.5 mi
50.00 0.87 $90 - 0.5 mi
TRANSMISSION SYSTEM ENGINEERING Table 4 Loyalton Site
System Reinforcement$/k W
Proposed Site LOYALTON
System Capacity Loss Adjustment Factor
Megawatt (MW)
under 10
Generation Tie k$/mi - miles 60 kV
' $/kW CLAF Plumas Sierra
21 .oo 0.89 $90 - 2 mi
10 -20 I 22.00 I 0.89 I $90 - 2mi
20 - 30 I 27.00 I 0.89 I $90 - 2mi
November 5, 1997 47 TRANSMISSION SYSTEM ENGINEERING

TRANSMISSION SYSTEM ENGINEERING Table 5 Martell Site
System Reinforcement$/k W
Proposed Site MARTELL
System Capacity Loss Adjustment Factor
Generation Tie k$/mi - miles
Megawatt (MW) I CLAF
under 10 I 4.00 1 Not Required
I 0 - 20 I 4.00 I 0.99 I Not Required
20 - 30 I 4.00 I 0.99 I Not Required
TRANSMISSION SYSTEM ENGINEERING Table 6 Westwood Site
Proposed Site WESTWOOD
~~~~ ~~~~ ~~
System Capacity
Factor Loss Adjustment
System
W
~~
Generation Tie k$/rni - miles
Megawatt (MW) I $/kW 1 CLAF I 2nd St- Birch St
under 10 I 27.00 1 0.81 I $90 - 2 mi I 0 - 20 I 28.00 I 0.81 I $90 - 2 mi
20 - 30 40.00 0.81 $90 - 2 mi
TRANSMISSION SYSTEM ENGINEERING 48 November 5, 1997

Projects over 30 megawatts at sites other than Anderson may be infeasible. The PG&E Transmission Cost Tables indicate that existing transmission facilities at sites other than Anderson would need to be specially studied for projects with greater thana 30 megawatt increase in power. The special studies would identify potential transmission system impacts that could result in cost increases that would likely have significant effects on project feasibility.
Generation tie costs shown on the table are estimated values for new circuits, and represent a high end estimate of generation tie capital costs. Visual inspection suggests that any required new generation ties or system additions and upgrades for under or over a 30 megawatt increase woutd likely be located within existing distribution system easements to the indicated interconnection substation. A project over a 30 megawatt increase and up to a 250 megawatt increase in output for Anderson is feasible, but likely with a generation tie resulting in interconnection at Cottonwood, a distance of about 15 miles. A larger project would require a special study to determine feasibility and new facility requirements. However, visual inspection suggests that any required new generation ties or system additions and upgrades for a 30 to 250 megawatt increase would likely be located within existing transmission or distribution system right-of-way.
CONCLUSION
All sites are feasible up to a 30 megawatt net increase in power output, and feasible for up to 250 megawatt increase for the Anderson site. For all sites, no new system facilities are expected outside utility easements. For all project sizes, no distributed utility benefits are expected at any of the sites. The short generation ties for under a 30 megawatt increase would likely be located within existing distribution line easements. A larger project at Anderson would require a new generation tie to Cottonwood, a distance of 15 miles, likely within to existing transmission easements.
November 5, 1997 49 TRANSMISSION SYSTEM ENGINEERING

TRANSMISSION SYSTEM ENGINEERING - APPENDIX A
INTRODUCTION
The Pacific Gas and Electric Company (PG&E) Transmission Cost Tables were developed in 1993 to aid potential bidders in the bidding for Standard Offer No. 4 power purchase agreements. The cost tables represent ranges of non-binding estimates of PG&E substation termination equipment costs. The values are estimates and proxies for the impacts of new generation on the PG&E system. The system reinforcement adjustment values in the tables are expressed in 1998 dollars per kilowatt and were developed expressly for use in bid evaluation. The numbers were used in the body of this report to provide an indication of general project feasibility, since the numbers in the tables suggest that the substation was studied as an acceptable interconnection point for new generating, and give a rough estimate of the potential costs that may result if a project were to interconnect to the PG&E system. This appendix presents selected pages from the reference to provide the reader background information.
No significant new facilities or system modifications in the project site areas are known to have been made since the reference was developed in 1993 that would significantly affect the findings in this report. The costs are proxies and estimates only, and are applied in the body of the report to discuss project feasibility. As for all projects to be interconnected to the PG&E system, an interconnection study is required to be performed to develop accurate costs and to assure reliability and safety. The remaining sections of this appendix are taken directly from Volume 2 of the "Location Table Handbook".
TRANSMISSION COST TABLES
BACKGROUND
PG&E developed these transmission cost tables for consideration of the potential transmission-related costs of purchasing power from Qualified Facilities bidding for Final Standard Offer No. 4 (FS04) power purchase agreements. PG&E will use the information published herein to adjust and rank bidders scores. These tables are also know as "LOCATION 'I tables, which refers to tbe computer model that PG&E developed to derive the values that make up the tables. The CPUC sanctioned the principles underlying the development of these tables in Decisions 92-1 1-060, 92-1 2- 021, 92-09-078, and 93-03-020. Underlined terms refer to definitions set forth in Section 2 of FS04.
USE OF THE LOCATION TABLES
The values in the LOCATION tables are estimates and proxies for the impacts of new generation on the PG&E transmission system for bid evaluation purposes.
November 5, 1997 51 TRANSMlSSION ENGINEERING - APPENDIX A

The LOCATION tables specify, for several hundred transmission level buses in the PG&E system, an energy loss adjustment factor (EMF), a capacity loss adjustment factor (CLAF), a system reinforcement adjustment (SRA), and a MW limitation (maximum allowable new generation at the particular bus).
The SRAs in the LOCATION tables are proxies of the total costs of up to three levels (tiers) of upgrades. The last tier in the LOCATION tables represents the MW limitation at the substation. The SRAs will be adjusted for use in bid evaluation. PG&E will first convert the total costs SRAs from PG&E's cost tables to incremental cost SRAs (ISRA) for each substation using the methodology outlined and approved in CPUC Decision 92-1 1-060. For bid locations where I S M S decline with increasing MW tiers, PG&E will average the BRAS of the two tiers that make up the decline. For bidders whose capacity straddles two or three tiers, PG&E will prorate ERAS for application to that bidder.
If metering at a winning bidder's Point of Delivery is impractical, PG&E will use subtractive "line loss" metering to account for energy and capacity losses between the metering and delivery points. Subtractive line loss metering is necessary only if metering is located at other than the Point of Deliverv. Subtractive metering would affect payments for Enerqv. ERCC, Air Emissions Adder, Subtracter and Shortage - Cost in FS04.
SUSSTATIONS NOT OWNED BY PG&E
Some substations listed in the transmission cost tables are not owned or controlled by PG&E. PG&E shall have no obligation to acquire any right for Seller to interconnect to a privately owned substation. Please refer to Section 10.2 of the FS04 contract for more detail. Nevertheless, these substations are connected to PG&E's transmission system and EMF, CLAF and SRA values for these substations are included in the transmission cost tables.
SUBSTATION TERMINATION COSTS
Substation termination costs are the responsibility of bidders. Because bidders will need to make all arrangements necessary with third party owners regarding interconnection to these substations, if permission to interconnect is not granted by the third party owner, additional termination equipment or land rights may be required.
With respect to hardware for electric interconnections to substations with the PG&E system, winning bidders are responsible for the costs for equipment in their switchyards and for tying their generating facilities into the particular PG&E substation indicated in the LOCATION Tables. Bidders should factor their own estimate for the cost of these facilities into their bids. The equipment for which winning bidders are responsible typically includes:
TRANSMtSSlON ENGINEERING - APPENDIX A 52 November 5, 1997

In the QFs switchvard:
- dedicated power transformer;
- genera tor circuit breaker; - protection equipment;
- disconnect switches on both sides of the metering;
voltage and power factor regulation; metering (depending on outlet ownership) and telemetering ; and high side circuit breaker at the point of ownership change.
- - -
Throuah to the PG&E substation of interconnection:
c transmission line to the PG&E substation; switches and protection equipment; and terminal equipment that may be needed due to increased fault duties.
- -
This listing is not necessarily complete, and bidders should refer to PG&Es "Power Producer's Interconnection Handbook" for more specific information on electric system requirements7 Interconnection costs and the actual point of interconnection can only be determined in detailed interconnection studies after winning bidders are selected. PG&E retains the option of choosing a point of interconnection different from that specified by the bidder in its Bid Package. PG&E will work with a winning bidder to mitigate any negative cost impacts such a change may have on the bidder's project (relative to bid location only). The reason for the changed location of interconnection and associated economic impacts on both ratepayers and the winning bidder will be reported in the interconnection report and subject top CPUC approval.
To aid potential bidders in developing their bids, PG&E has included with the LOCATION tables, ranges of non-binding estimates of substation termination eq u i p me n t co sts. By submitting its bid, bidder accepts the terms that PG&E cannot be held responsible for any detriment whatsoever incurred by bidders if they rely on these non-binding estimates. See page ix of these transmission cost tables.
SYSTEM REINFORCEMENT ADJUSTMENT COSTS
The SRA values in the LOCATION Tables are expressed in "ramped" 1998 $/kW units, consistent with the values that PG&E will use for bid evaluation according to the "Settlement Agreement Regarding Changes to Final Standard Offer No. 4 and Bid Evaluation Methodology I' filed by PG&E in the CPUC's docket 1.89-07-004 on February 14, 1992. The SRA values are converted to first-year ramped $/kW units consistent with the IDR bid against for use in bid evaluation.
~~
7T0 obtain a copy of PG8E's Power Producer's Interconnection Handbook, contact Catherine Calpotura at (415) 973-6789.
November 5,1997 53 TRANSMISSION ENGlNEERtNG - APPENDIX A

The SRA values in the LOCATION Tables cover transmission system betterment or upgrades, beyond the substation of interconnection, that would be required to accommodate delivery of power from winning bidders into the PG&E system. Such Equipment includes:
- Reconductoring - Shunt and series capacitors
- New power transformers I New overhead transmission lines beyond the substation of interconnecting
Network re-arrangements within the PG&E system Line terminal equipment modifications at PG&E substations other than the
- -
substation of interconnection
The SRA values includes, in addition to transmission hardware, some proxy costs for land, overhead, O&M, and ad valorem taxes.
SPECIALIZED TRANSMISSION STUDIES
A specialized study is a transmission study that a potential bidder would request and pay for if its proposed project were greater than the MW limit indicated at the proposed substation bus of interconnection. A specialized study would be performed by analyzing transmission system upgrade requirements, beyond the substation of interconnection, that would be needed to accommodate delivery of power from potential bidder into the PG&E system8
%e results of the specialized study are not a substitute for a detailed interconnection study that will be required of each winning bidder to determine the hardware needed for the direct interconnecting of winning bidders to the PG8E system.
TRANSMISSION ENGINEERING - APPENDIX A 54 November 5, 1997

WATER RESOURCES
INTRODUCTION
This discussion reviews water resource issues associated with siting a biomass-to- ethanol facility at one or more of seven potential sites. Water resource issues addressed in this discussion include water supply, flooding and wastewater disposal. The biomass facility will utilize a fermentation process to convert wood chips to ethanol. Although the plant size has not been determined yet, a facility producing from five to ten million gallons of ethanol per year is likely. This information is intended to provide an initial screening analysis. Specific water supply and quality requirements, water treatment and discharge facilities will be identified when more information becomes available.
ANALYSIS
WATER SUPPLY
Water is required in the proposed facility for process water makeup and the production of steam that will be used in the pretreatment and the ethanol distillation processes (Yancey 1996). NREL (Yancey 1996) estimates minimum water requirements for a facility producing five-million gallons per year of ethanol range from 40 to 'I60 gallons per minute. A facility producing ten-million gallons per year will require twice as much water; from 80 to 320 gallons per minute. The facility will operate approximately 345 days per year; therefore, the estimated annual water requirements for a five or ten- million gallons per year facility will range from a low of 60 acre feet to a high of 488 acre feet.
In comparison, an ethanol facility producing ten-rnillion gallons per year planned for Sioux City, South Dakota will require approximately 267 acre feet per year. This facility, which will use switchgrass as a feedstock, will not be associated with a power plant and will generate its own steam.
As noted above, until a specific project design is determined, the actual amount of water needed is unknown. Recycling water as makeup for the distillation and fermentation processes will reduce the amount of water needed (NREL 1995). In addition, if a new power plant is built to provide steam for the ethanol facility, additional water will be needed. At six of the seven sites, however, an existing power plant is present. The water demand for a power plant is determined by the type and size of the facility, the amount of water recycled, the quality of the source water and the cooling technology used.
Quality of the source water for the ethanol facility should be sufficient to protect fermenting bacteria from toxic water contaminants and to avoid the fouling of heat exchangers by dissolved solids. Water treatment will be necessary to ensure the necessary quality.
November 5, 1997 55 WATER RESOURCES

WASTEWATER DISPOSAL
Wastewater generated by the ethanol facility will range from I 30 gallons per minute for a five-million gallons per year plant to 260 gallons per minute for the ten-million gallons per year plant (Yancey 1996). Actual wastewater quantities will be determined during the design phase of the project. Factors that will influence the amount of wastewater produced are the quality of the water supply, the treatment process and the amount of water recycling. Complete recycling of all wastewater streams from the facility is possible if capital costs associated with treatment facilities are acceptable. Wastewater streams will be high in organics and suspended solids and low in chemically and biologically available oxygen (COD and BOD, respectively). Treatment will consist of anaerobic and aerobic treatment that will convert organics to a biogas which can be burned within the boiler (Yancey 1996). Solids from the wastewater stream will be separated and disposed.
Wastewater disposal can be either through discharge to surface water, land or evaporation pond. Environmental issues associated with wastewater disposal must wait until additional project and site information is known. Discharge to surface water or land are less expensive than the use of evaporation ponds. Monitoring costs are probably similar for all three alternatives.
A power plant at the Greenville site to accompany the ethanol facility would generate an additional 25 to 45 acre feet per year of wastewater, mainly cooling tower blowdown. An additional consideration for wastewater disposal to evaporation ponds is the need for additional land for the ponds. Even those sites with power plants discharging to ponds may require new or expanded facilities to handle the biomass wastewater flows.
FLOODING
Permanent structures are prohibited from being built within the hundred-year floodplain. The flooding potential at each site is discussed below.
PROPOSED SITES
The following discussions for each of the seven proposed sites are based upon information collected through site visits, review of documents and discussions with facility operators and agency representatives.
MARTELL SITE
The Martell Site is located at the Sierra Pacific Industries Lumber Mill in Amador County, adjacent to the Cities of Sutter Creek and Jackson. An 18-MW biomass fueled power plant at the site is owned and operated by VVheelabrator, The lumber mill is closed, although the power plant and a particle board facilities continue to operate. The Amador County Water Agency supplies water for the power plant and the other facilities at the site, mainly from the Mokelumne River. The biomass power plant uses
WATER RESOURCES 56 November 5, 1997

about two million gallons per month of this nonpotable water. Water consumed by all facilities at the site in 1995 and 1996 averaged about 325 acre feet per year (Amador County Water Agency 1997). Cooling tower blowdown and storm water runoff make up most of the wastewater. This wastewater is discharged along with the runoff and process water from the other facilities at the site, under a National Pollutant Discharge Elimination System (NPDES) Permit to a local stream. Discharge is allowed between November 1 and April 30 (Scott 1996). Holding ponds retain the wastewater before discharge. Some of the wastewater is used for spraying the stockpiled lumber and for dust suppression.
Sufficient water, either potable or nonpotable, is available from the Amador County Water Agency (I 997) to supply a biomass-to-ethanol facility. With closure of the mill, use of the existing nonpotable water supply is possible. Use of potable water by the biomass facility may require enlargement of the existing pipeline. A new or revised NPDES permit is necessary for facility wastewater discharge. Flooding is not a concern at the site.
ANDERSON SITE
The location of the two Anderson Sites is in Shasta County, adjacent to the City of Anderson. The sites are also in the immediate vicinity of the existing Wheelabrator's 49 and 33-MW power plants. Fuel for the 49-MW facility consists of mill and paper waste and forest residue. The 49-MW facility has been a stand alone plant, but will begin to supply the Simpson Paper Mill with steam. Groundwater use by this facility is approximately 700 gallons per minute (Buchanan 1997). The 42 MW facility is a gas fired cogeneration plant associated with the Simpson Paper Mill. VVheelabrator has another biomass plant in Anderson, a seven-MW facility associated with a mill. The quality of the groundwater is good, with a total dissolved-solids level of about 140 mg/l. Blowdown from the cooling towers at the 49-MW plant is used to either irrigate land on-site or discharged into an Anderson-Cottonwood 1 rrigation District ditch where the water is used for farm irrigation. Flooding is not a problem at either site (Tillman 1 997).
WESTWOOD SITE
The location of the Mt. Lassen Power Plant is west of the City of Westwood in Lassen County. Fuel for this I U-MW biomass power plant is wood chips. Groundwater from an on-site well supplies the facility at about 200 gallons per minute. Since the power plant currently operates half of the year, annual water consumption is 160 acre feet. Groundwater quality is apparently good. An evaporation pond is used for disposal of cooling tower blowdown and storm water and runoff. Sanitary waste is discharged to the City's wastewater stabilization ponds. The community water system supplies drinking water for the plant and serves as a backup supply for the facility. Groundwater supply and quallty in the area are good. Sufficient capacity exists in the existing wells and evaporation ponds to meet the needs of the ethanol facility. Potable water from Westwood is also available for an ethanol facitity. Flooding is not a concern at the site.
November 5, 1997 57 WATER RESOURCES

GREENVILLE SITE
The Greenville site is located in Plumas County along Wolf Creek. A lumber mill previously occupied the site, but most of these facilities have been removed. The Bidwell Water Company supplies water from the Round Valley Reservoir for the community of Greenville. A 750,000 gallon tank is used for local water storage. An eight-inch main that supplied water to the mill is still present and the water company could provide up to 1,000 gallons per minute of water (Jernigan 1997). Alternative sources of water for the project may be groundwater or a diversion from Wolf Creek. An unlined pond used for holding logs for the mill is still present but may be unsuitable for wastewater disposal. Wastewater from the project, if of suitable quality, could be discharged to Wolf Creek under an NPDES permit. Flooding at the mill site has not been a problem, although Plumas County has designated a primary and secondary flood hazard zone along both sides of Wolf Creek through the Greenville area.
LOYALTON SITE
The location ofthe Loyalton site is at the Sierra Pacific Lumber Mill in the City of Loyalton, in Sierra County. An 18-MW biomass power plant is also present at the site. This plant utilizes wood chips and mill waste. Water requirements for the biomass plant range from 200 to 400 gallons per minute. Water for the biomass plant and the lumber yard is from a diversion on Smithneck Creek. Due to a recent fire within the Smithneck Creek watershed, Sierra Pacific plans on switching to groundwater for the water supply. Potable water for the City of Loyalton is from a spring and two wells. Groundwater in Sierra Valley is of variable quality with some areas producing water with high concentrations of total dissolved soiids. An evaporation pond is used to dispose of wastewater and storm water runoff at the site. The evaporation pond is sized twice the volume currently required, so that there may be capacity in the pond for wastewater from an ethanol facility. Flooding from Smithneck Creek is a problem in areas adjacent to the site. On-site, some flooding apparently occurs near the evaporation pond.
CHESTER SITE
The location of the Chester Site is in Plumas County along the North Fork of the Feather River. The site location is occupied by the Collins Pine Lumber Mill. Also present is a 12-MW biomass power plant. The Chester Public Utilities District supplies some groundwater to the Collins Pine Facility. About 2.57 million gallons per day of North Fork of the Feather River water is diverted to the site through the Shover Ditch (Poets 1997). This water is used for fire suppression, process water and cooling tower makeup (Poets 1997). A holding pond retains wastewater to allow sediment to settle out prior to discharge to the Shover Ditch and back into the Feather River. Flooding is not a problem at the site. The Utility district indicates it could supply a biomass-to-ethanol facility. Since more water is diverted from the river by the lumber mill than actually used, sufficient water may be available from the river for the ethanol facility. Wastewater from the ethanol facility may also be may also be discharged to the river under an NPDES permit.
WATER RESOURCES 58 November 5, 1997

CONCLUSIONS
Sufficient water is available at each of the seven sites under consideration to supply the ethanol facility. Wastewater disposal options are also similar at all sites. Site preferences cannot be identified at this time because of a lack of sufficient information about the project design and the capacity of existing facilities at the study sites.
November 5, 1997 , 59 WATER RESOURCES

VISUAL RESOURCES
INTRODUCTION
This analysis is based on the assumption that a biomass-to-ethanol facility producing approximately ten million gallons per year of ethanol will be built at one or more of seven potential sites, described below. This analysis also assumes that the biomass- to-ethanol facility will be located close to, and operated in conjunction with, a biomass- fueled electric power plant. Finally, this analysis assumes that the purpose of the analysis is to provide a screening level evaluation rather than a detailed assessment of the project.
ANALYSIS
The many unknown characteristics of the project preclude staff from performing the detailed analysis of this project that is normally performed for a power plant project. Therefore, the discussion of methodology is likewise abbreviated in this analysis. This analysis focuses on whether the Quincy Library Group project is likely to cause significant adverse visual impacts, and, if so, what measures may substantially reduce such impacts.
This anatysis assesses the visual setting of the proposed project sites, evaluates the visual impact of the proposed project on each existing setting, and describes measures needed to mitigate any potential significant adverse impacts of the proposed project at each site.
METHODOLOGY FOR ASSESSING VISUAL SETTING
Visual Factors
Commission staff evaluated a number of factors in assessing the visual setting of the proposed project. These factors include visual quality, viewer sensitivity, visibility, and viewer exposure.
Visual Quality
The visual quality of a setting is the value of visual resources in that setting. The relevant physical properties of the environment include landform, vegetation, water, color, scarcity, and cultural modifications.
Viewer Sensitivity
One of the principal factors evaluated in assessing the potential for visual impacts is the sensitivity levef of potential viewers. Viewer sensitivity is a measurement of the level of interest or concern of viewers regarding the visual resources of an area. It is generally expressed as high, moderate, or low. In situations where direct information
November 5, 1997 61 VISUAL RESOURCES

on viewer sensitivity cannot be feasibly obtained, indirect methods are typically used in the visual profession to gain an insight as to viewers' sensitivity regarding visual resources. Land use is considered a useful indirect indicator of likely viewer response, and activities associated with some uses can result in an increased awareness of visual or scenic resources. Use activities associated with I ) designated parks, monuments, and wilderness areas, 2) scenic highways and corridors, 3) recreational areas, and 4) residential areas are usually highly sensitive. Commercial uses are generally less sensitive as activities, and views are often focused on those commercial activities. Large scale industrial or agricultural processing facility uses are usually the least sensitive because workers are focused on their work, and often are working in surroundings with relatively low visual value.
Visibility
Another important factor in assessing the existing visual setting (and thus potential impact) is the visibility of the project. Visibilrty can differ substantially between view locations, depending on screening and the effect of the location of the visual change in the view. The smaller the degree of screening, the higher the visibility usually is, and the greater the potential impact is likely to be.
Viewer Exposure
The degree to which viewers are exposed to a view by (a) their distance from the feature or view in question, (b) the number of viewers, and (c) the duration of view, is called viewer exposure (Grinde and Kopf 1986). Viewer exposure is important in determining the potential for a change in the visual setting to be significant.
As the distance between the viewer and the feature viewed increases, the perceived size of the feature and the abillty to see details decreases. Distance zones may be usefully categorized as follows: foreground, or close-range; middle ground, or mid- range; and background, or long-range. Within close-range distances, details such as surface textures and the fullest range of surface colors are clearly perceptible. Mid- range distances are characterized by visualization of complete surface features such as tree stands, building clusters, and small land forms. Long-range distances are dominated by the horizon and major land forms (Felleman 1986).
Numbers of Viewers
Two measures of the number of viewers are important to consider in assessing the potential visual impact of a project. One is the absolute number of viewers. The other is the proportion of viewers in a viewshed who can see the project.
Duration of View
The length of time that a view is visible is another factor in determining the importance of a view and the potential impact of a project. For a given activity, the longer the
VISUAL RESOURCES 62 November 5, 1997

view duration, the greater the potential importance or impact. View durations range from a few seconds, as in the case of some travelers in motor vehicles, to a number of hours per day, in some residential situations.
METHODOLOGY FOR ASSESSING VISUAL IMPACTS
Maior ImDact Evaluation Factors
For each site, staff considered visual impact susceptibility and severity to determine the significance of impact. The following sections explain how these two major factors are assessed and considered.
Susceptibility to Impact
The first step in evaluating the visual impact of a project is to consider the elements of the existing visual setting (discussed previously), including visual quality, viewer sensitivity, visibility, and viewer exposure. Each of these factors is assessed as either high, moderate, or low. Staff combines these factors into a measure of the susceptibility to visual impact.
Impact Severity
As previously discussed, the degree of visual impact that a project will cause depends on the degree of change resulting from the project upon visual character or visual quality, here called the impact severity. Commission staff considers both the relationship of the project to the other components visible in the landscape, and blockage from view or elimination by the project of any previously visible components.
Relationship of the Project to Other Visible Components
Landscape Components
The three basic landscape components are land and water, vegetation, and structures.
Visual Elements
The basic elements of each physical component of a view include color, form, line, -texture, scale, and spatial character. The impact of a project is assessed in terms of contrast in color, form, line, texture, and scale, as well as scale dominance and spatial dominance. Scale is the proportionate size relationship between an object and its surroundings. Absolute scale is the size of an object obtained by relating its size to a definitely defined standard (i.e., measurement). Relative scale is the relative size of objects; the apparent size relationship between landscape components. Sub-elements of scale include scale dominance (the scale of an object relative to the visible expanse of the landscape and to the total field of view of the human eye or camera) and scale contrast (the scale of an object relative to other distinct objects or areas in the landscape). Spatial dominance is the measure of the dominance of an object due to
November 5, 1997 63 VISUAL RESOURCES I

its location in the landscape. Regarding these three factors, a change has the greatest potential to cause impacts in regard to scale dominance, and the least potential in regard to scale contrast.
Assessment of Contrast
Staff assesses contrast with existing structures, vegetation, and land/water in regard to color, form, line, texture, and scale. Regarding these factors, contrast in color, form, or line has greater potential to cause impacts than contrast in texture or scale.
The magnitude of the visual impact of a project is measured by the degree of change that it causes. In regard to contrast, the degree of change depends partly on the existing levels and types of contrast. For instance, if existing structures already contrast strongly with natural features, the addition of a similar structure tends to cause a smaller change than if no structures already existed. In addition, the degree of contrast depends on the proximity of the project to the landscape component to which it is compared. If a project is superimposed on a component (such as body of water), the potential for contrast is greater than if the project is near such a landscape component, and even greater than if the project is far from the landscape component.
Factors Affecting Contrast
Among the basic characteristics of the visual setting previously discussed, distance is a factor in determining the visual contrast that a project will create. Increasing distance can decrease perceived contrast both by reducing the apparent size of project structures and by reducing clarity of view due to atmospheric conditions.
Blockage or Elimination of Existing Elements
In regard to obstruction or elimination of previously visible components, the analysis evaluates any change between the visual quality of those components compared to the visual quality of the project. Blockage of higher quality visual elements by lower quality elements can cause impacts potentially as great as those regarding scale dominance.
SIERRA PACIFIC INDUSTRIES (LOYALTON) SITE
ENVIRONMENTAL SETTING
Visual Qualitv
VISUAL RESOURCES 64 November 5, 1997

Views toward the site have the existing mill facilities seen as prominent in the foreground and middleground with the natural mountainous landscape in the background. Considering these factors, visual quality is low to moderate for this site.
Viewer Sensitivity
Because this site is adjacent to a residential neighborhood, viewer sensitivity is considered high.
Visi bilitv
Depending on the specific location of the facility, views unobstructed or partially screened by existing facilities, moderate to high.
Viewer Exposure \
I of the site are either so visibility ranges from
0 Distance Depending on the specific location of the facility, view distance will be foreground or midd leg round.
0 Number of Viewers This view area contains several hundred residences.
Duration of View Because the view area is a residential neighborhood, duration of view is long.
0 Overall Viewer Exposure Considering the foreground to middle-range view distances, the substantial number of residences in the view area, and the long duration of view, viewer exposure is high for this site.
ENVIRONMENTAL IMPACTS
As discussed in the previous section on methodology, staff considers the susceptibility to visual impact and the severity of impact together to determine the significance of impact.
Visual Impact Susceotibility
The values for visual quality, viewer sensitivity, visibility, and viewer exposure are discussed previously in the setting section for the Sierra Pacific Industries site. Considering the low to moderate visual quality, the high viewer sensitivity, the moderate to high visibility, and the high visual exposure, the resultant value for visual impact susceptibility is moderate for this site.
November 5, 1997 65 VISUAL RESOURCES

Visual Impact Severity
Contrast
The project will be in strong contrast to the natural elements in the setting, which consists of mountains with conifers, in regard to color, form, line, and texture. However, due to the existing mill facilities, the project will cause little additional contrast in these categories. The contrast in scale will range from low to high, depending on the location of the project on the site.
Dominance
Scale Dominance
Depending on the specific location of the project, it will create low to strong scale dominance.
Spatial Dominance
Depending on the specific location of the project, it will be inconspicuous to prominent in regard to composition. Spatial dominance will be negligible to dominant in regard to position. Spatial dominance in regard to backdrop will be negligible to dominant. The overall spatial dominance therefore will range from negligible to dominant.
a View Blockage
Depending on the specific location of the project, view blockage could range from almost nothing to blocking the existing facilities as well as the natural setting in the background. Because of the low to moderate visual quality of the setting, the severity of view blockage will range from negligible to moderate.
Visual Impact Severity
Because a) the overall contrast rating will range from low to high, b) scale dominance will range from low to strong, c) the overall spatial dominance will range from negligible to dominant, and d) the severity of view blockage will range from negligible to moderate, the project's visualmimpact severity will be range from low to high.
Visual Impact
Because visual impact susceptibility is moderate and visual impact severity will be range from low to high, visual impact will range from insignificant to significant, depending on the specific location of the project on the Sierra Pacific Industry site.
VISUAL RESOURCES 66 November 5, 1997

COLLINS PINE COMPANY (CHESTER) SITE
ENVIRONMENTAL SETTING
Visual Qualitv
Views toward the site are dominated by the existing mill facilities, so visual quality is low for this site.
Viewer Sensitivitv
Because this site is near a residential area, viewer sensitivity is considered high.
Vis i bi I itv
Views of the site are largely screened by existing facilities, so visibility is low.
Viewer ExPosure
0 Distance
View distance is middleground.
0 Number of Viewers
This view area contains severat dozen residences.
Duration of View
Because the view area is a residential neighborhood, duration of view is long.
Overall Viewer Exposure
Considering the middleground view distance, the moderate number of residences in the view area, and the long duration of view, viewer exposure is moderate to high for this site.
ENVIRONMENTAL IMPACTS
Visual tmpact SusceDtibility
The values for visual quality, viewer sensitivity, visibility, and viewer exposure are discussed previously in the setting section are for the Collins Pine Company site.
November 5, 1997 67 VISUAL RESOURCES

Considering the low visual quality, the high viewer sensitivity, the low visibility, and the moderate to high visual exposure, the resultant value for visual impact susceptibility is low for this site.
Visual Impact Severitv
Contrast
The project will be similar to the existing mill facilities in regard to color, form, line, texture, and scale, so contrast will be low.
Dominance
Scale Dominance
The project will appear substantially smaller than the existing mill facilities, so it will create low scale dominance.
Spatial Dominance
The project will be inconspicuous in regard to composition. Spatial dominance will be negligible in regard to position. Spatial dominance in regard to backdrop will be negligible. The overall spatial dominance therefore will be negligible.
View Blockage
The project stack may block a small portion of the view of the sky seen above the mill facilities, so view blockage will be low.
Visual Impact Severity
Because a) the overall contrast rating will be low, b) scale dominance will be low, c) the overall spatial dominance will be negligible, and d) the severity of view blockage will be low, the project's visual impact severity will be low.
Visual Impact
Because visual impact susceptibility is low and visual impact severity is expected to be low, visual impact is likely to be insignificant for the Collins Pine site.
GREENVILLE SITE
VISUAL RESOURCES 68 November 5, 1997

ENVIRONMENTAL SETTING
Visual Quality
Views toward the site have the cleared site of the former mill, with one residence and two moderate sized sheds, in the foreground, and rural residential uses in the middleground. Background views are blocked by trees. Considering these factors, visual quality is moderate for this site.
Viewer Sensitivitv
Because this site is near rural residences, viewer sensitivity is considered high.
Visi bilitv
Views of the site from nearby residences and a public road are generally unobstructed but intermittently screened by trees, so visibility is moderate to high.
Viewer Exposure
0 Distance
View distances are foreground to middleground.
m Number of Viewers
This view area contains several dozen residences and a rural road with low use.
Duration of View
Duration of view is long for the residences and short for travelers on the road.
Overall Viewer Exposure
Considering the foreground to middleground view distances, the moderate number of residences, and the long duration of view for the residents, viewer exposure is high for this site.
ENVIRONMENTAL IMPACTS
Visual Impact SusceDtibility
The values for visual quality, viewer sensitivity, visibility, and viewer exposure are discussed previously in the setting section are for the Greenville site. Considering the moderate visual quality, the high viewer sensitivity, the moderate to high visibility, and
November 5, 1997 69 VISUAL RESOURCES

the high visual exposure, the resultant value for visual impact susceptibility is moderate to high for this site.
Visual Impact Severity
Because no biomass-fueled electric power plant exists at the site, this analysis assumes that such a facility would be built in conjunction with the project.
8 Contrast
The project and the power plant will be in strong contrast to the natural elements in the setting, which consists of conifers, in regard to color, form, line, and texture. The contrast in scale will be strong because existing structures on the site are relatively small.
Dominance
Scale Dominance
Depending on the specific location of the project and the power plant, they will create moderate to strong scale dominance.
Spatial Dom i nance
Depending on the specific location of the project and the power plant, they will be prominent to dominant in regard to composition, position, and backdrop, so the overall spatial dominance will be prominent to dominant.
View Blockage
Depending on the specific location of the project and the power plant, view blockage could range from blocking a small to a large portion of the forested rural residential setting surrounding the site. Because of this and the moderate visual quality of the setting, the severity of view blockage will be moderate to high.
Visual Impact Severitv
Because a) the overall contrast rating will be strong, b) scale dominance will range from moderate to strong, c) the overall spatial dominance will range from prominent to dominant, and d) the severity of view blockage will range from moderate to high, the project's visual impact severity will be high.
Visual Impact
VISUAL RESOURCES 70 November 5, 1997

Because visual impact susceptibility is moderate to high and visual impact severity is expected to be high, visual impact is likely to be significant at the Greenville site.
MOUNT lASSEN POWER (WESlWOOD) SITE
ENVIRONMENTAL SETTING
Visual Qualitv
Views toward the site are dominated by the existing power plant facilities, with conifers and mountains in the background. Given this combination of factors, visual quality is low to moderate for this site.
Viewer Sensitivity
Because this site is near a residential area, viewer sensitivity is considered high.
Visibility
Views of the site are largely screened by trees, so visibility is low.
Viewer Exposure
0 Distance
View distance is middleground.
0 Number of Viewers
The view area contains several dozen residences.
a Duration of View
Because the view area is a residential neighborhood, duration of view is long.
Overall Viewer Exposure
Considering the middleground view distance, the moderate number of residences in the view area, and the long duration of view, viewer exposure is moderate to high for this site.
ENVIRONMENTAL IMPACTS
November 5, 1997 71 VISUAL RESOURCES

Visual Impact Susceptibility
The values for visual quality, viewer sensitivity, visibility, and viewer exposure are discussed previously in the setting section are for the Mount Lassen Power site. Considering the moderate visual quality, the high viewer sensitivity, the low visibility, and the moderate to high visual exposure, the resultant value for visual impact susceptibility is low to moderate for this site.
Visual Impact Severity
Contrast
The project will be simiiar to the existing power plant facilities in regard to color, form, line, texture, and scale, so contrast will be low.
Dominance
Scale Dominance
The project will appear somewhat smaller than the existing mill facilities, so it will create low scale dominance.
Spatial Dominance
The project will be inconspicuous in regard to composition. Spatial dominance will be negligible in regard to position. Spatial dominance in regard to backdrop will be negligible. The overall spatial dominance therefore will be negligible.
View Blockage
The project may block the view of some trees in the middleground so view blockage is likely to be moderate.
Visual Impact Severitv
Because a) the overall contrast rating will be low, b) scale dominance will be low, c) the overall spatial dominance will be negligible, and d) the severity of view blockage will be low, the project's visual impact severity will be low to moderate.
Visual Impact
Because visual impact susceptibility is low and visual impact severity is expected to be low to moderate, visual impact is likely to be less than significant for the Mount Lassen Power (Westwood) site.
WHEELABRATOWSIERRA PACIFIC (MARTELL) SITE
VISUAL RESOURCES 4
72 November 5, 1997

ENVIRONMENTAL SEITING
Visuaf Qualitv
Views toward the site are dominated by the existing mill facilities, so visual quality is low for this site.
Viewer Sensitivity
Because this site is near a residential area, viewer sensitivity is considered high.
Visibility
Views of the site are largely screened by existing facilities, so visibility is low.
Viewer Exposure
Distance
View distance is middleground.
Number of Viewers
This view area contains about a dozen residences.
Duration of View
Because the view area is a residential neighborhood, duration of view is long.
Overall Viewer Exposure
Considering the middleground view distance, the moderate number of residences in the view area, and the long duration of view, viewer exposure is moderate to high for this site.
ENVIRONMENTAL IMPACTS
Visuaf Impact Susceptibilitv
The values for visual quality, viewer sensitivity, visibility, and viewer exposure are discussed previously in the setting section for the VVheelabrator/Sierra Pacific site. Considering the low visual quality, the high viewer sensitivity, the low visibility, and the moderate to high visual exposure, the resultant value for visual impact susceptibility is low for this site.
November 5, I997 73 VISUAL RESOURCES

Visual Impact Severity
Contrast
The project will be similar to the existing mill facilities in regard to color, form, tine, texture, and scale, so contrast will be low.
0 Dominance
Scale Dominance
The project will appear substantially smaller than the existing mill facilities, so it will create low scale dominance.
Spatial Dominance
The project, will be inconspicuous in regard to composition. Spatial dominance will bemegligible in regard to position. Spatial dominance in regard to backdrop will be negligible. The overall spatial dominance therefore will be negligible.
0 View Blockage
The project stack may block a small portion of the view of the sky seen above the mill facilities, so view blockage will be low.
Visual IrnPact Severitv
Because a) the overall contrast rating will be low, b) scale dominance will be low, c) the overall spatial dominance will be negligible, and d) the severity of view blockage will be low, the project's visual impact severity will be low.
Visual Impact
Because visual impact susceptibility is low and visual impact severity is expected to be low, visual impact is likely to be insignificant for the VVheelabrator/Sierra Pacific site.
MILL SITE (ANDERSON)
ENVIRONMENTAL SETTING
This site consists of two parcels, either of which could be used for the project.
VISUAL RESOURCES 74 November 5, 1997

Visual Qualitv
Visual quality for the northern parcel varies with the direction of the views. Views from Highway 99 have existing industrial development in the foreground with natural landscape and mountains in the background. Visual quality from this view is moderate. Views from the roads to the east of the northern parcel site have cleared areas in the foreground and the remaining mill facilities in the middleground with other industrial development in the view area. Considering these factors, visual quality for the northern parcel is moderate.
Views of the southern parcel from the east include the cleared mill site in the foreground with industrial development in the background, so visual quality is low to moderate. Views of the southern parcel from the west have the cleared mill site in the foreground with rural land uses in the middleground and mountains in the background, so visual quality is moderate. Overall, visual quality for the southern parcel is moderate.
Viewer Sensitivity
Because both parcels are near several rural residences, viewer sensitivity is considered high.
Visi bilitv
Visibility is high for both parcels.
Viewer ExPosure
Distance
Depending on the specific location of the facility, view distance will be foreground or middleground.
Number of Viewers
This view area for each parcel contains about a dozen residences.
Duration of View
Because the view area contains residences, duration of view is long.
Overall Viewer Exposure
Considering the foreground to middle-range view distances, the moderate number of residences in the view area, and the long duration of view, viewer exposure is high for this site.
November 5, 1997 L
75 VISUAL RESOURCES

ENVIRONMENTAL IMPACTS
As discussed in the previous section on methodology, staff considers the susceptibility to visual impact and the severity of impact together to determine the significance of impact.
Visual Impact Susceptibility
The values for visual quality, viewer sensitivity, visibility, and viewer exposure are discussed previously in the setting section for the Mill Site parcels. Considering the moderate visual quality, the high viewer sensitivity, the high visibility, and the high visual exposure, the resultant value for visual impact susceptibility is moderate to high for these parcels.
Visual Impact Severitv
Contrast
The project will be in strong contrast to h e natural elements in the setting regard to color, form, line, and texture. However, due to the existing mill facilities the project will cause little additional contrast in these categories.
in
The contrast in scale will range from low to high, depending on the tocation of the project on the site.
Dominance
Scale Dominance
Depending on the specific location of the project, it will create low to strong scale dominance.
Spatial Dominance
Depending on the specific location of the project, it will be inconspicuous to prominent in regard to composition. Spatial dominance will be negligible to dominant in regard to position. Spatial dominance in regard to backdrop will be negligible to dominant. The overall spatial dominance therefore will range from negligible to dominant.
View Blockage
Depending on the specific location of the project, it could block views of the existing facilities or of the rural middleground and the mountains in the background. Because the visual quality of the existing facilities is low, the severity of blocking views of those facilities would be negligible, while the severity of view blockage of the rural middleground and the mountains would be high.
VISUAL RESOURCES 76 November 5, 1997

Visual Impact Severity
Because a) the overall contrast rating will range from low to high, b) scale dominance will range from low to strong, c) the overall spatial dominance will range from negligible to dominant, and d) the severity of view blockage will range from negligible to high, the project's visual impact severity will be range from low to high.
Visual Impact
Because visual impact susceptibility is moderate to high and visual impact severity is expected to range from low to, high, visual impact will range from insignificant to significant, depending on the specific location of the project on the Anderson parcels.
SUMMARY OF VISUAL IMPACT ASSESSMENT
0 Visual Impact Susceptibility
Visual Resources Table 1 summarizes the visual impact susceptibility for each site,
0 Visual Impact Severity
Visual Resources Table 2 summarizes the visual impact severity for each site.
Visual Impact
Visual Resources Table 3 summarizes the visual impact for each site.
November 5, 1997 77 VISUAL RESOURCES
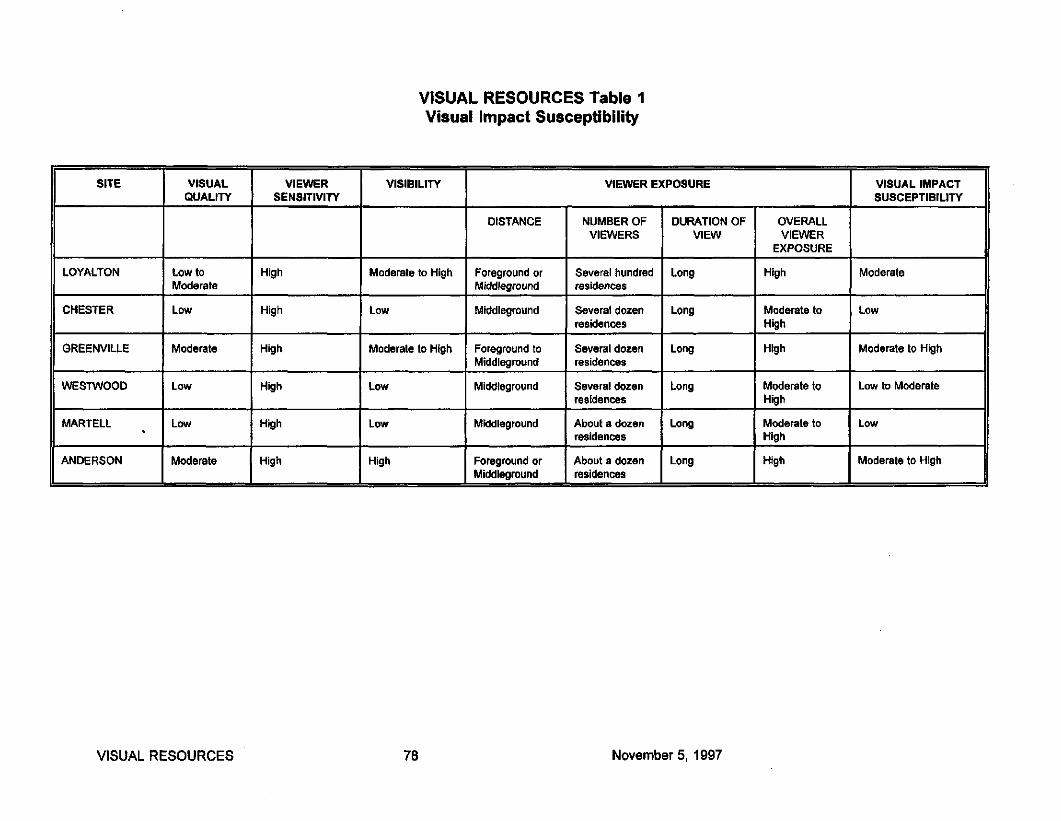
VISUAL RESOURCES Table I Visual Impact Susceptibility
1 VISUAL IMPACT VIEWER EXPOSURE QUALtTY SENSITIVITY
LOYALTON Low to High Moderate
High I CHESTER I Low
Moderate High I GREENVILLE
WESTWOOD Low High
MARTELL Low High
ANDERSON Moderate High
I
DISTANCE
Moderate to High Foreground or Middleground
tow M idd leg rou n d
Moderate to High Foreground to I Middleground
Low 1- Middleground
Low ~~~~ ~
M idd leg ro u nd I Foreground or I Middleground
High
NUMBER OF VIEWERS
Several hundred residences
Several dozen residences
Several dozen residences
Several dozen residences
~
About a dozen residences
About a dozen residences
I SUSCEPTIBILITY
DURATION OF OVERALL VIEW I VIEWER I
EXPOSURE
Long High I Moderate I Moderate to I Low I High
Long
Long Moderate to High I High I Long Low to Moderate I Moderate to I High
Moderate to 1 Low I High Long
High I Long Moderate to High I
VISUAL RESOURCES 78 November 5, 1997

VISUAL RESOURCES Table 2 Visual Impact Severity
~ SITE 1 CONTRAST
I LOYALTON Low to High
CHESTER Low
GREENVILLE Strong
WESTWOOD Low
MARTELL Low
ANDERSON Low to High
E
I
SCALE DOMINANCE
Low to Strong
Low
Moderate to Strong
Low
Low
DOMINANCE
SPATIAL DOMINANCE
Negligible to Dominant
Negligible
Prominent to Dominant
Negligible
Nenligible
Low to Strong 1 Negligibte to Dominant
VfEW BLOCKAGE
Negligible to Moderate
Low
Moderate to High
Moderate
Low
Negligible to High
VlSUAL IMPACT SEVERtN
Low to High
Low
High
Low to Moderate
Low
Low to High
Nownber 5, 1997 79 VISUAL RESOURCES

VISUAL RESOURCES Table 3 Visual Impact
low
SITE
cow
LOYALTON
~ ~~~~
Low to Moderate
Low
CHESTER
Low to Moderate
Low
GREENVILLE
WESTWOOD
MARTELL
ANDERSON
VISUAL IMPACT SUSCEPTIBILITY I VISUAL IMPACT SEVERITY
I LOW to High
~~ ~~
Moderate to Hiah 1 Hiah
Moderate to High Low to High I
VISUAL RESOURCES 80 November 5, 1997
VISUAL IMPACT
Insignificant to Significant
lnsignificant
Significant
Less than Significant ~~ ~~
Insignificant
Insignificant to Significant

CONCLUSION
Visual impacts at the Collins Pine Company (Chester) site and the VVheelabrator/Sierra Pacific (Martell) site are likely to be insignificant. Visual impacts at the Mount Lassen Power (Westwood) site are likely to be less than significant. Visual impacts at the Sierra Pacific Industry (Loyalton) site and the Mill site (Anderson) will range from insignificant to significant, depending on the specific location of the project on the site. Visual impacts are likely to be significant at the Greenville site.
RECOMMENDATION
If the project is constructed at the Loyalton, Anderson, or Greenville sites, mitigation for potential visual impacts should be considered. Potentially effective forms of mitigation include screening, lighting controls, painting to harmonize with the setting, and minimizing the size and duration of cooling tower plumes.
November 5, 1997 81 VISUAL RESOURCES

STAFF AUTHORS
Ellen Townsend-Smith Dave Maul Tuan Ngo Rick York Kathy Matthews Rick Tyler Jeff Evans Steve Baker Amanda Stennick Linda Davis Mike Ringer Joe O'Hagan Gary Walker
Project Manager Project Advisor Air Quality Biological Resources Cultural and Paleo Hazardous Materials Management Land Use, Traffic and Transportation Noise Impacts Socioeconomic Resources Transmission Line System Engineering Waste and Public Health Resources Water Resources Visual Resources
STAFF AUTHORS 82 November 5, 1997

Biomass to Ethanol Facility Design, Cost Estimate,
and Financial Evaluation
Volume I
Mark A. Yancey and Khan L. Kadam National Renewable Energy Laboratory
1617 Cole Blvd. Golden, CO 80401
November 1997

Disclaimer
NOTICE: This report was prepared as an account of work sponsored by an agency of the United States government. Neither the United States government nor any agency thereof, nor any of their employees, makes any warranty, express or implied, or assumes any legal liability or responsibility for the accuracy, completeness, or usefulness of any information, apparatus, product, or process disclosed, or represents that its use would not infringe privately owned rights. Reference herein to any specific commercial product, process, or service by trade name, trademark, manufacturer, or otherwise does not necessarily constitute or imply its endorsement, recommendation, or favoring by the United States government or any agency thereof. The views and opinions of authors expressed herein do not necessarily state or reflect those of the United States government or any agency thereof.
This work was funded by the Bioconversion Element of the Office of Fuels development of the U.S. Department of Energy.

EXECUTIVE SUMMARY
This report is part of a larger effort to determine the economic, environmental and regulatory feasibility of siting one or more forest biomass to ethanol manufacturing facilities in Northeastern California. The study area includes most of the Lassen and Plumas National Forests and the Sierraville Ranger District of the Tahoe National Forest.
NREL examined three different biomass to ethanol conversion technologies and then developed preliminary process designs and performed standard economic analyses for these designs applied to the six sites previously identified €or the feasibility study. Many assumptions enter into the design and economic analyses presented in this report and the reader is warned that additional investigations and testing are strongly recommended before selecting and attempting to commercialize any biomass to ethanol conversion technology.
Please note that no attempt has been made to rank the technologies evaluated in this report due to the large uncertainties in the process design and process performance, especially with respect to the dilute sulfuric and nitric acid technologies considered. There are also other technologies available that should be considered for biomass to ethanol conversion projects.
Likewise, NREL has made no attempt to rank the six sites in the study except to point out that the Greenville site requires significantly more infrastructure development and therefore has a much higher capital cost than the other sites which have biomass power available.
The study concludes that converting forest thinnings and timber harvest residues appears to be economically feasible at the five sites in the study that have an existing biomass power plant and other infrastructure available. The undeveloped or "greenfield" site in Greenville requires the installation of a boiler to provide steam to the ethanol process as well as buildings and other infrastructure that adds significantly to the total capital cost making this site less appealing.
Follow-on engineering design and biomass to ethanol experimental studies are recommended to confirm the design and process performance assumptions made in this study. The major ares of concern with respect to the biomass to ethanol process design and technology perfomance parameters are discussed at the end of each of the three technology sections of this report.
ES- 1

Study Sites and Infrastructure
The six sites included in the feasibility study and the existing infrastructure available at each site are listed in Table ES-1 below.
Table ES-I. Site Data and Infrastructure
Utilities Available Site, I Owner Other Considerations
Anderson, Roseburg Industries
Biomass electricity Steam, Water Wastewater treatment
~~ ~
Chester, r Collins Pine Co.
Stand-alone biomass power plant Pulp and paper mill
Greenville, Carl Pew
Biomass electricity Steam, Water
Loyalton, Sierra Pacific hd.
Lumber mill
Martell, Sierra Pacific Ind.
no biomass power at this site
Westwood, Mt. Lassen Power
Electricity from grid, Water site
Former lumber mill
Biomass Power (gross MW)
Biomass electricity Steam, Water
Lumber mill
49.9 Mw *
Biomass electricity Steam, Water
Lumber mill (closed)
12 M w
13 MW Biomass electricity Stand-alone biomass Steam, Water power plant
20 M w
18Mw"
f biomass power plant is owned and operated by Wheelabrator Environmental Systems Inc.
Biomass to Ethanol Conversion Technology
Historically, production of ethanol has been limited to using sources of soluble sugar or starch (primarily in the Midwest using corn). New technologies have been developed which now allow for the production of ethanol from "lignocellulosic biomass." Lignocellulosic biomass is the leafy or woody part of plants: wood, wood waste, paper, corn residual, sugar cane residual, etc. Lignocellulosic biomass can be processed to produce sugars that can, in turn, be fermented to ethanol.
The primary components of lignocellulosic biomass are cellulose, hemicellulose, and lignin. ' There are many different methods of extracting and depolymerizing the cellulose and hemicellulose to produce fermentable sugars. However, once produced, the six carbon sugars that make up the
ES -2

cellulose and predominate in softwood hemicellulose can be easily fermented to ethanol. The five- carbon sugars that comprise about 15% of the sugars in softwoods can also be fermented to ethanol, but the five-carbon sugars (xylose and arabinose) require mixtures of naturally occurring yeasts or genetically engineered microorganisms.
NREL has prepared design and cost estimates for three different variations of biomass to ethanol conversion technologies. The conversion technologies included in this study are:
concentrated sulfuric acid (includes technology patented by Arkenol, Inc.) 0 dilute sulfuric acid (contains no patented technology)
dilute nitric acid (includes technology with licensing available from €€ETA)
This is by no means an exhaustive list of the technology options, but is a good representation of the near-term technology options for an ethanol facility in Northeastern California. However, there are considerable differences with respect to technology maturity even among the three technologies listed above and reviewed in this report. Arkenol reports that its concentrated acid technology is ready for commercial deployment with process guarantees and efficacy insurance readily available. The stage of technology deployment can be illustrated by reviewing the list of "process concerns and recommendations" at the end of each technology section of this report. The process concerns for each of the three technologies are summarized in Table ES-2 below. The lack of process concerns for the concentrated acid technology indicates the more advanced state of technology development for the Arkenol process.
Table ES-2. Process concerns for biomass conversion technologies. A "yes" entry indicates that additional investigation is recommended. A "no" entry indicates that the process area is not a concern with respect to technology commercialization.
Process Area Concentrated Acid Process
Hydrolysis Sugar Yields NO
Hydrolysis Reactor Materials of Construction
No
H ydrol yzate Ferment ability No
Fermentation Ethanol Yield
No for yield < 85% Yes for yield > 85%
Fermenter Yeast Propagation No
Dilute Sulfuric Acid Process
Dilute Nitric Acid Process
Yes YeS
ES-3

Process Area
Neutralizing Base
Facility Thermal Design
SolidLiquid
Equipment Separation
1 LignidCellulose I Residuals
Concentrated Acid Dilute Sulfuric Acid Process process
NO YeS
Nu YeS
No YeS
YeS YeS
I Water Recycle I No I YeS
Dilute Nitric Acid Process
No
YeS
N O
YeS
YeS
Note: A "yes" entry in the above table indicates additional investigation is recommended prior to technology deployment - see technology sections of the report for details.
Ethanol Facility Size and Capital Cost
For this study, the size of the ethanol facility at each site is based on the amount of forest thinnings and timber harvest residue available within a 25-mile radius of the site according to the feedstock assessment report, plus any mill residue that may be available at the site. The Anderson and Martell sites were not included in the feedstock assessment so it was assumed that 265,000 bone dry tons (BDT) per year is available at these sites. This is the average biomass available at the four sites in the QLG area. If projects are to be pursued at Anderson or Martell, the feedstock availability and feedstock cost will need to be verified.
The feedstock available at each site and the resulting ethanol plant capacity (in terms of annual ethanol production) for each site and technology is shown in Table ES-3. The estimated facility capital cost for each technology is also shown. Capital cost is heavily influenced by the availability of existing infrastructure at each site. The capital costs were estimated by the cost estimating method known as a "factored" cost estimate which is typically used for this type of feasibility study. The accuracy of this type of cost estimate is +/-30%. At the request of NREL, Memck Engineers and Architects of Denver, Colorado, performed a technical review of NREL's dilute sulfuric acid process design as well as the capital and operating cost estimates for the Greenville site. Menicks comments and suggestions were incorporated into all three technology designs and cost estimates where appropriate. Memck's report is included in Volume II of the Biomss to Ethanol Fucility Design, Cost Estimate, and Financial Evaluation report.
In the far right column of Table 5, the "installed cost per gallon ethanol" is shown. This is a c o m o n measure of the capital cost versus the ethanol production capacity of an ethanol facility and ranges
ES-4

from $2.50 to $5-43 for this study. A fairly large corn ethanol dry mill facility (40 million gallons per year) can be built for $1.00 to $2.00 per gallon ethanol capacity. The installed cost for the dilute nitric acid biomass to ethanol technology drops to about $1.75 per gallon ethanol when the size of the facility is increased to 40 million gallons per year. This compares favorably to the corn ethanol industry capital cost.
Feedstock Feedrate
(BDT/year)
265,000
Table ES-3. Feedstock Available, Ethanol Plant Size, and Facility Capital Cost (1997 dollars)
Plant size (million gallon ethanoyyear)
22.3 13.8 13.8
1 $3.97 $3.55 $2.61
$4.06 $3.98
1 $3.00
1
~ $4.59 $4.07 $2.95
1 $4.22 $3.76 $2.74
Site Technology
Facility Installted Cost
Anderson Concentrated acid Dilute sulfuric Dilute nitric
$90.2 $46.7 $34.4
$4.04 $3.39 $2.49
298,000 (includes
30,000 BDT of mill residue)
Chester Concentrated acid Dilute sulfuric Dilute nitric
$99.5 $55.1 $40.4
25.1 15.5 15.5
335,000 GreenviIle Concentrated acid Dilute sulfuric Dilute nitric
28.2 17.4 17.4
$1 14.4 $69.2 $52.2
228,000 (includes
41,OoO BDT of mill residue)
Loyalton Concentrated acid Dilute sulfuric Dilute nitric
19.1 11.8 11.8
$87.7 $48.0 $34.8
265,000 MarteU Concentrated acid Dilute sulfuric Dilute nitric
22.3 13.8 13.8
$94.1 $5 1.9 $37.8
27 1 ,OOO westwood Concentrated acid Dilute sulfuric Dilute nitric
22.8 14.1 14.1
$95.1 $52.5 $38.2
$4.17 $3.72 $2.7 1
Plant size for various technologies based on respective yields from the same feedstock feedrate.
* Facility Capital Cost includes total fixed capital investment and working capital. The accuracy of the capital cost estimate is +/- 30%.
ES-5

Financial Evaluation
~ ~ _ _ _ _
Plant life
Reference year
Design, construction and startup period
Owner equity
Feedstock cost, delivered
Ethanol selling pnce
Operating days per year
Inflation rate
Federal income tax rate
California income tax rate
Internal rate of return (KR) was calculated for each technology and each site resulting in 18 combinations of technologies and sites. Assumptions made to conduct the financial analysis include 20-year project life, 100% owner equity financing, 94.5% on-line factor (345 operating days per year), ethanol selling price of $1.20 per gallon, and a feedstock cost of $20 per bone dry ton (BDT).
~ ~ ~ _ _ _ ~ _ _ _ _ _
20 years
1997
2 years
100%
$20.00 per BDT
$1.20 per gallon
345
3%
34%
6%
Additionally, all scenarios for sites with a biomass boiler assume that the lignidcellulose residue is sold to the host site owner for biomass boiler fuel. The selling price for the lignidcellulose residue is assumed to be $25 per BDT (slightly higher than the base feedstock cost due to the higher energy content of the residue). For the Greenville site, the selling price of the residue has been reduced to $15 per BDT to cover the cost of transportation to a nearby biomass power facility.
Credit for carbon dioxide (COJ sales is not included in any of the scenarios except for those for the Anderson site. Up to two tons per hour of CO, could potentially be sold to Simpson Paper and Hier Specialty Chemicals at the Anderson site (R. Bell, Simpson Paper Company). A selling price of $10 per ton for two tons per hour of unprocessed CO, (not purified or liquified) has been assumed for the Anderson site.
Additional key economic assumptions are shown in Table ES-4 below.
Table ES-4. Key Economic Assumptions
Parameter I Assumed value
ES-6

Results of the economic analysis reported as internal rate of return (IRR) for each site and each technology are shown in Table ES-5.
Table ES-5. Internal Rate of Return (In) for 100% Owner Equity
Site Concentrated Acid Dilute Sulfuric Acid Dilute Nitric Acid I I I I
I I I Anderson 5% 5% 11%
I Chester I 7% I 5% I 11%
Loyalton
Martell
Westwood
I Greenville I 4% I -3% I 3%
5% 2% 9%
6% 4% 10%
6% 4% 10%
Project Financing
Projects of this magnitude are rarely financed with 100% owner equity. It is well known that favorable financing terms can be used to leverage the owner's equity and dramatically improve the IRR. A scenario with 25% owner equity and 75% debt financing was evaluated. A loan interest rate of 7% and a 10 year loan term was chosen to represent perhaps the best possible financing scenario. A 7% interest rate loan may be available through the new electric utility restructturing Public Interest Energy Research (PIER) Program (to be administered by the California Energy Commission), through the California Pollution Control Financing Authority, or the California Alternative Energy Financing Authority.
Results of the IRR calculations with 25% owner equity and 75% debt financing at 7% interest rate are shown in Table ES-6. Leveraging effects are not significant unless the IRR at 100% owner equity is higher than the net loan interest rate (the kfter tax" interest rate). These results demonstrate that strong IRRs are possible. However, financing of potential projects may be encumbered by new technology risks and high capital requirements. Spreading new technology risks amongst all beneficiaries of the project, including the public, can expedite financing. Public and private partnerships can play a significant role in accelerating the development of forest biomass to ethanol in northeastern California and as such should be an integral component of the efforts to advance the opportunities.
ES-7

Table ES-6. Internal Rate of Return (IRR) for 25% Owner Equity
Site
Anderson
Chester
Greenville
byalton
Martell
W es twood
Concentrated Acid Dilute Sulfuric Acid Dilute Nitric Acid
8% 9% 25%
15% 9% 25%
7% -4% 6%
9% 4% 18%
12% 7% 22%
12% 7% 23%
Cash Cost of Production and Net Production Cost
The full cash cost of production and net ethanol production cost with 25% owner equity was Full cash cost and net production cost are defined as follows: determined.
variable costs (raw materials and utilities)
+ fixed costs (labor and labor related costs, plant overhead, maintenance, supplies, local taxes and insurance)
coproduct credits
full cash cost of production capital depreciation financing costs net ethanol production cost
(for lignin, CO,, and yeast cell mass)
(net interest on debt financing)
The resulting full cash cost of production and net production costs for each technology and each site are shown in the table below.
ES-8

Table Es-7. Full Cash Cost / Net Ethanol Production Cost, $/ gal. ethanol, 25% owner equity
Site
Anderson
Chester
Greenville
Loyalton
Martell
Westwood
Concentrated Acid Dilute Sulfuric Acid Dilute Nitric Acid
Cash Net Cash Net Cash Net
$0.74 $1.03 $0.83 $1.06 $0.7 1 $0.89
$0.62 $0.90 $0.80 $1.05 $0.68 $0.86
$0.76 $1.05 $1.04 $1.31 $0.93 $1.13
$0.67 $1 .oo $0.87 $1.15 $0.74 $0.94
$0.64 $0.94 $0.83 $1.09 $0.70 $0.89
$0.64 $0.94 $0.82 $1.08 $0.70 $0.89
Maximum Feedstock Cost
Chester
Greenville
Loyalton
One of the objectives of the Quincy Library Group is to facilitate thinning the forests in the area to reduce wildfire threat and improve forest health. One of the major obstacles to thinning large numbers of acres each year is the cost. Ethanol production utilizing the forest thinnings as feedstock may be a way to offset all or a significant portion of the thinning costs. A scenario was evaluated to determine the maximum feedstock cost that an ethanol facility could pay and still return 15% IRR on the owner's equity for the ethanol facility. The 15% IRR in this type of analysis is also known as the "hurdle rate." Again, owner equity was assumed to be 25% with 7% interest on the remaining debt. The results are shown in Table ES-8 for each site and technology.
$19.17 $14.55 $27.58
$6.50 - $0.58 $12.36
$7.56 $7.64 $22.40
Table ES-8. Maximum Feedstock Cost, 15% Hurdle Rate and 25% Owner Equity
Martell
West wood
I site I Concentrated Acid I Dilute Sulfuric Acid I Dilute Nitric Acid I
$14.34 $1 1.67 $25.44
$15.33 $12.21 $25.87
I Anderson I $7.79 ~~ -7- ___ $14.23
I I I I I
ES-9

Sensitivity Analyses
Sensitivity Variable and Rank - High to Low
1. Delivered feedstock cost
The sensitivity of project profitability (as measured by IRR) to the following critical variables was also evaluated:
Sensitivity Range Corresponding IRR Range (A %)
$38 - $0 per BDT feedstock 1% to44% (43%)
Ethanol plant size Delivered feedstock cost Feedstock composition (% glucan) Ethanol selling price Owner equity Ethanol facility capital cost Annual manufacturing cost Annual direct labor cost
2. Owner equity
3. Ethanol plant size
Sensitivity analyses were performed for the dilute nitric acid process at the Chester site only because this site and process has a high IRli and the sensitivity analyses are very time intensive. Again, owner equity was assumed to be 25% with 7% interest on the remaining debt. The results are summarized in Table ES-8 below. Graphs of the IRR versus the above sensitivity variables are included in the Sensitivity AnaZysis section of this report.
100% to 5% equity 11% to 50% (39%)
6 - 19 million gal. ethanoVyear 0% to 31% (31%)
The JRR is most sensitive to feedstock cost and owner equity. Ethanol plant size, annual manufacturing cost, ethanol selling price, ethanol facility capital cost, and feedstock composition all display moderate sensitivities. A 30% change in direct labor cost has relatively little effect on the IRR.
5. Ethanol selling price
6. Ethanol facility capital cost
Table ES-8. Summary of sensitivities for Chester site and dilute nitric acid process.
$1 .OO - $1.40 per gal. ethanol 11% to 36% (25%)
+/- 30% of capital cost 17% to 37% (20%)
I 4. Annual manufacturing cost I +/- 20% of manufacturing cost I 9% to 38% (29%) I
7. Feedstock composition 33 - 53% glucan in feedstock 14% to 34% (20%)
8. Annual direct labor cost +/- 30% of direct labor cost 23% to 28% (5%)
ES-10
.

Conclusions and Recommendations
Conversion of forest thinnings and timber harvest residues appears to be economically feasible at the five sites in the study that have an existing biomass power plant and other infrastructure available. The undeveloped or "greenfield" site in Greenville requires the installation of a boiler to provide steam to the ethanol process as well as buildings and other infrastructure that adds significantly to the total capital cost making this site less appealing at this time.
Many technical, economic, and other assumptions have been made to perfom the analyses reported in this study. Additional work is certainly warranted to prove or disprove these assumptions and reduce the uncertainty of the results.
ES-11

Table of Contents
VOLUME I
I . Introduction ............................................................ 1 Biomass to Ethanol Conversion Technology ............................. 2
II . Concentrated Acid Technology ............................................ - 4 Process Concerns and Recommendations .............................. 10
IU . Dilute Sulfuric Acid Technology ........................................... 1 1 Process Concerns and Recommendations .............................. 14
IV . Dilute Nitric Acid Technology ............................................. 18 Process Concerns and Recommendations ............................. - 2 1
V . BiomassFeedstock ...................................................... 24
VI . Site Specific Design and Cost Estimates ..................................... 25
VII . AndersonSite .......................................................... 27
Vm . ChesterSite ........................................................... 34
IX . Greenville Site ......................................................... 40
X . Loyaltonsite .......................................................... 46
XI . MartellSite ............................................................ 52
XII . WestwoodSite ......................................................... .8
XIII . Sensitivity Analyses ..................................................... 64
VOLUME I1
Appendix A . J
1

I. Introduction
This report is part of a larger effort to determine the economic, environmental and regulatory feasibility of siting one or more forest biomass to ethanol manufacturing facilities in Northeastern California. The study area includes most of the Lassen and Plumas National Forests and the Sierraville Ranger District of the Tahoe National Forest. In this report NREL examines three different biomass to ethanol conversion technologies and calculates the economic viability of each for six different sites previously identified for the feasibility study. Many assumptions enter into the design and economic analyses presented in this report and the reader is warned that additional investigations and testing are strongly recommended before selecting a biomass to ethanol conversion technology.
An ethanol production facility located in Northeastern California would provide many benefits to the region including jobs, utilization of low value biomass, in-state production of ethanol, export opportunities, and utilization of steam and electricity from existing biomass power plants in the region. In addition, production of ethanol from biomass is a relatively clean and environmentally friendly process which produces a product that reduces automobile tail pipe emissions and recycles carbon dioxide, a green house gas. The biomass to ethanol fuel cycle and recycle of CO, is ihstrated in Figure 1.
Biomass-to-Ethanol Fuel Cycle CO released during conversion and use is absorbed during regrowth
Photosynthesis
C,HloOS Cellulose 2 C *H,OH Ethanol
Figure 1 Illustration of carbon dioxide recycle.
1

Biomass to Ethanol. Conversion Technology
Historically, production of ethanol has been limited to using sources of soluble sugar or starch (primarily in the Midwest using corn). Since these forms of sugar are edible, their relative value. tends to be higher than the rest of the plant (leaves, stalks, etc.) which usually has a much lower value. New technologies have been developed which now allow for the production of ethanol from "lignocellulosic biomass." Lignocellulosic biomass is the leafy or woody part of plants: wood, wood waste, paper, corn residual, sugar cane residual, etc. Lignocellulosic biomass can be processed to produce sugars that can, in turn, be fermented to ethanol.
The primary components of lignocellulosic biomass are cellulose, hemicellulose, and lignin (Figure 2). Cellulose is the primary component of most plant cell walls and is composed of long chains of glucose, a six-carbon sugar. The cellulose is interlinked with the second major component of the plant biomass, hemicellulose. In hardwoods and herbaceous crops, the hemicellulose is primarily composed of the five-carbon sugar, xylose. However, in softwoods the hemicellulose is composed of several six carbon sugars, primarily mannose, glucose and small amounts of galactose, in addition to the five carbon xylose.
The last major component of biomass is lignin which gives the plant its structural strength. Lignin is the precursor to coal, has nearly the same energy content as coal, but does not contain the sulfur found in coal. Lignin is, therefore, a clean-burning source of energy that can supply the steam and electricity needs of the ethanol plant.
There are many different methods of extracting and depolymerizing the cellulose and hemicellulose to produce fermentable sugars. However, once produced, the six
CelIulose Other
Hemi- cellulose
25%
carbon sugars that make up the cellulose and Figure 2 Typical biomass composition. predominate in softwood hemicellulose can be easily fermented to ethanol. Fermenting the five carbon sugars is much more difficult and will most likely require a genetically engineered microorganisms to efficiently ferment the five carbon sugars that predominate the hemicellulose in hardwoods and herbaceous biomass.
NREL has prepared design and cost estimates for three different variations of biomass to ethanol conversion technologies. The conversion technologies included in this study are:
a concentrated sulfuric acid (includes technology patented by Arkenol, Inc.) 0 dilute sulfuric acid (contains no patented technology) a dilute nitric acid (includes technology with licensing available from MTA)
2

This is by no means an exhaustive list of the technology options, but is a good representation of the near-term technology options for an ethanol facility in Northeastern California. Enzymatic technologies employing cellulase enzymes to hydrolyze biomass cellulose have not been included in this study due to the prohibitively high cost of commercially available cellulase enzymes. Enzymatic based processes should be reviewed if inexpensive cellulase enzyme becomes available or can be manufactured on-site at a reasonable cost. Current cellulase enzyme prices range from $6 per liter to over $14 per liter. To be economical for ethanol production, the price would have to be under $2 per liter. Enzyme recycle is another strategy that may be feasible, but is not included in this study due to the relatively immature status of this technology with respect to biomass hydrolysis.
3

II. Concentrated Acid Technology
The concentrated acid technology presented in this report is the technology patented and available for license from Arkenol, hc. of Mission Viejo, California. NREL has worked closely with Arkenol engineers to ensure that the information presented here accurately represents the concentrated acid technology applied to Northern California softwoods. However, the design and cost estimates presented in this report were prepared by NREL engineers and may not necessarily reflect the design and costs that would be developed by Arkenol for the project. Those interested in Arkenol's technology should contact Mark Carver of Arkenol at (714) 588-3767.
Much of the following concentrated acid process description is from the Arkenol Internet home page. Additional information about Arkenol, Inc., its technology and patents can be found on the world wide web at www.arkenol.com.
The production of chemicals by fermenting various sugars is a well-accepted science. Its use ranges from producing beverage alcohol and fuel-ethanol to making citric acid and xantham gum for food uses. However, the high price of sugar and the relatively low cost of competing petroleum based fuel has kept the production of chemicals mainly confined to producing ethanol from corn sugar - until now.
Arkenol Inc. has developed significant proprietary improvements to a well known conversion technology known as concentrated acid hydrolysis such that the process is ready for commercial implementation. The technology is unique in that it enables widely available cellulosic materials, or more commonly, biomass, to be converted into'sugar in an economically viable manner, thereby providing an inexpensive raw material for fermentation or chemical conversion into any of a hundred different specialty and/or commodity chemicals.
The ability to utilize low cost feedstocks, and/or those that command tipping fees, to produce products that sell into highly efficient markets provides a viable business that can be sited in almost any geographic area, urban or rural. Due to its moderate use of thermal energy, the production of no waste streams, its significant environmental benefits, and minimal permitting requirements, the technology also makes an ideal "thermal host" for cogeneration facilities.
The Technology
Development History - It has been known for over 100 years that acids act as catalyst to convert ("hydrolyze") cellulose and hemicellulose into simple sugars (hexose and pentose, or "C6 and C5" sugars). The Gennans and Russians used this simple procedure in the early part of this century to produce alcohol fuels and chemicals from wood in order to supply their war efforts. During this same period, a similar plant was operated in the United States in Oregon. However they all shared a similar characteristic - they were not economically competitive with low cost petroleum products because of poor yields, high wastage, and the large volume of unmarketable by-products. Except for a few plants in Russia, the technology fell out of use after World War II.
4

However, interest in the conversion of biomass-to-sugars picked up in the mid 1970's due to the oil embargo and the United States' desire to lessen its dependence on foreign chemical and fuel feedstocks. Further interest was stirred in 1983 when DuPont published an article in Science magazine detailing the variety of chemical products that could be produced via fermentation of sugar. Since that time many universities and government laboratories have been studying the hydrolysis of cellulose, either through the application of various acids or enzymes. Most notable in regard to concentrated acid hydrolysis has been the work undertaken at the Tennessee Valley Authority and Mississippi State University.
In 1989 Arkenol, as a related company to ARK Energy, began researching several technologies in order to develop thermal hosts for siting in conjunction with ARK Energy power plant projects that were being bid into local utilities. Arkenol determined that the concentrated acid hydrolysis process could be made economically viable through the use of new technology, modern control methods, and newer materials of construction (see the Simplified Flow Diagram - Figure 3). Detailed process flow diagrams for the concentrated acid process which include fermentation and distillation are included in Appendix A. The detailed process flow diagrams were used to develop the capital and operating cost estimates for this report. An equipment list is also included in Appendix A.
Arkenol engineers and their consultants were able to solve the problems with the following proprietary improvements that now make the process economically viable:
0
a
efficient acid recovery and reconcentration; high sugar concentration at high purity; the ability to ferment C6 and C5 sugars efficiently with conventional microbes; the ability to handle silica in biomass feedstocks; and, all by-products are usable and marketable.
To demonstrate the efficacy of the technology to the financial community, Arkenol has constructed a pilot plant near its Southern California offices.
The Process
The Arkenol concentrated acid process is an integrated, Wl-scale commercial process plant consists of five basic unit operations:
1. Feedstock preparation; 2. Hydrolysis; 3. 4. 5. Product purification.
Separation of the acid and sugars; Fermentation of the sugars; and,
Simply put, the process separates the biomass into two main constituents: cellulose and hemicellulose (the main building blocks of plant life) and lignin (the ''glue'' that holds the building
5

blocks together), converts the cellulose and hemicellulose to sugars, ferments them and purifies the fermentation liquids into products. If there is no power plant present from which to obtain steam, the production facility would use natural gas or lignin as fuel for its own boilers.
The Arkenol process provides a means for producing sugars from biomass using concentrated sulfuric acid, which is recovered and recycled. In addition, a high yield of sugar is obtained from the hydrolysis of the biomass, making concentration of the sugar streams prior to fermentation unnecessary.
Other features of the process include the use of atmospheric pressure and relatively low temperatures. The process does not result in the production of furfural and similar undesirable by-products which are toxic and inhibit fernentation. The process does not require the use of exotic and expensive materials of construction such as titanium.
First Decrystallbation and Hydrolysis
As an optional fmt step in the process, the biomass can be washed with water to remove gross dirt and contamination. After the washing is complete, the wash water would be transferred to a settling pond, to allow dirt and other sediment to collect at the bottom, after which the water could be reused to wash the next batch of biomass. Biomass washing is not included in the design presented here.
Prior to acid hydrolysis, the biomass is dried to a moisture content of approximately 10%. After drying, the material is ground to particles ranging in size fiom 15 mm to 25 mm, with an average size of 20 mm. For some materials, the order of these two steps should be reversed, i.e., the material may be wet gound using a device such as a hydropulper and then dried. Boiler flue gas is utilized to dry the biomass.
The feedstock, now ready for the decrystallization stage, is first mixed with concentrated sulfuric acid at a concentration of 70%-77%. The acid should be added to achieve a weight ratio of pure acid to cellulose plus hemicellulose of 1.25 to 1. The addition of acid to the biomass results in the formation of a thick gel. This step results in the disruption of the bonds between the cellulose and hemicellulose chains, making the long chain cellulose accessible for hydrolysis.
The decrystallization is per€ormed at temperatures not exceeding 5OoC, and is in the range of 30 to 50°C. If the temperature during decrystallization exceeds 5OoC, much of the five carbon sugars will be lost in the subsequent hydrolysis. The conditions used in the process conserve the more reactive sugars that are produced earlier in the hydrolysis process. The decrystallization step prevents premature hydrolysis, and consequently, increased degradation of the sugars.
In the first hydrolysis, the acid is diluted to a concentration of 30% (20%-30%) using recycled water. The mixture of acid and biomass is then heated to 100°C for 60 minutes to hydrolyze the cellulose. The resulting gel is pressed to obtain an acid-sugar stream (17% sugar, 35% acid, depends on feedstock composition).
6


Second Hydrolysis
The solids remaining after the first hydrolysis are mixed with concentrated sulfuric acid at a concentration of 70%-77% until a concentration of 30% is again reached. The second hydrolysis step is very similar to the fust hydrolysis step. The mixture is heated for 50 minutes at 100°C to effect further cellulose hydrolysis. The resulting gel is pressed to obtain a second acid-sugar stream (1 8% sugar, 30% acid, depends on feedstock composition), and the streams from the two hydrolysis steps are combined. The remaining lignin-rich solids are collected and optionally pelletized for fuel.
Overall Hydrolysis Performance Hemicellulose conversion: 98% Hemicellulosic sugar yield: 85% Cellulose conversion: 90% Glucose yield: >85% (95% hemicellulose conversion is assumed during the first decrystallization)
Chromatographic Separation of Acid and Sugar
The acid-sugar stream is further processed through a chromatographic separation column packed with a strong-acid polystyrene-divinylbenzene resin. The resin is cross-linked with divinylbenzene, which is at a concentration of between 6%-8%, and treated with sulhric acid such that it has a strong acid capacity of at least 2 meq/g. The resin is in the form of beads, 200-300 mp in diameter. The flow rate of the resin bed is 2-5 m/h, and the bed has a tapped bed density of between 0.6 and 0.9 g/mL The resin bed is heated to a temperature of 25"-35"C. Higher temperatures can be used, but will result in premature degradation of the resin bed. Lower temperatures will result in separations which are not as effective.
Chromatographic separation of acid and sugar occurs when acid is weakly adsorbed on the resin and sugar repulsed as the solution moves through the column. Once the acid and sugar has entered the column, the resin is purged with water which is substantially free of oxygen (i.e., less than 0.1 pprn dissolved oxygen). This water acts to push acid out of the resin and separate the acid and sugar components, resulting in a cleaner separation. The physical process is further improved and equipment size reduced if the resin can be moved counterflow to the feed stream in a process known as "pseudo eluted moving bed technology."
If the "moving" resin carries the acid at a faster rate than it draws through the resin but the sugar passes through the resin at a speed greater than the resin appears to move, pure acid can be collected at the top of the column and sugar at the bottom.
As a result of the separation process, two streams are collected: the 25% concentrated acid stream and the 1245% concentrated sugar stream. The acid stream is reconcentrated and recycled for reuse. The 90-96% pure sugar stream, which contains at least 15% sugar and not more than 1% acid, can then be fermented after the pH has been adjusted. The purity of the sugar is calculated as a
8

percentage of the nonaqueous components of the sugar stream. Thus, any sugar purity of above 83.3% (lOOx15/18) is suitable for fermentation. The inclusion of acid concentration as high as 1% in the sugar stream does not cause problems for further processing. Residual acid in the sugar stream is neutralized by adding lime to purge gypsum. This neutralization has the added benefit of precipitating unwanted metal hydroxides and other fermentation inhibitors if they could have come in with the feedstock.
A typical elution for a 100 gram sample solution (15 g sugar, 30 g acid, 55 g water) would require that about 150 g of water be added to the column. For perfect separation, the sugar stream is 100 grams with a 15% sugar concentration, and the acid stream is 150 grams with a 20% acid concentration. Thus, if the acid stream were 98% pure with an acid concentration of 20%, approximately 0.75 grams of sugar would be lost with the acid with every elution. If the sugar stream were 95% pure at a 15% concentration, only 0.6 grams of acid would be lost with every elution. This difference is due to the fact that the acid stream is twice as large as the sugar stream. Thus, the purity of the acid stream is a more important factor than the purity of the sugar stream.
Acid/Sugar separation
Acid recovery: 98% Sugar recovery: 95%
Concentration and Recycling of Acid
The acid solution recovered from the separation unit can be concentrated and recycled to the earlier stages of the process. Concentration of the acid to 70-77% is achieved through the use of a triple effect evaporator. The water recovered in the concentrator can be used as elution water in the resin separator unit.
In an ethanol production plant, naturally-occumng yeast, which Arkenol has specifically cultured by a proprietary method to ferment the mixed sugar stream, is mixed with nutrients and added to the sugar solution where it efficiently converts both the C6 and C5 sugars to fermentation beer (an ethanol, yeast and water mixture) and carbon dioxide. The yeast culture is separated from the fermentation beer by a centrifuge and returned to the fermentation tanks for reuse. Ethanol is separated from the now clear fermentation beer by conventional distillation technology, dehydrated to 200 proof with conventional molecular sieve technology, and denatured with unleaded gasoline to produce the final fuel-grade ethanol product. The still bottoms, containing principally water and unfermented pentose sugar, is returned to the process for economic water use and for further conversion of the recycled pentose sugars.
Arkenol has also tested the effectiveness of using genetically engineered bacteria (Zymomonus mobilis) developed at NREL. The effectiveness and fernentation time approach the naturally occurring yeast results, but have not been optimized for the higher concentration of sugars in Arkenol's hydrolysate. Further improvement is anticipated in both yield and time for genetically engineered bacteria or yeast.
9

proCess Concerns and Recommendations
The concentrated acid process design presented here was prepared by W L engineers in cooperation with Arkenol and is preliminary. Arkenol has conducted extensive pilot scale testing to establish the design and perfonnance of the concentrated acid process. The process appears to be ready for commercial demonstration. Arkenol reports that an international chemical engineering firm is prepared to construct a plant and provide process guarantees. The reader should contact Arkenol for further information with regard to commercial readiness.
Fermentation Ethanol Yield
The fermentation ethanol yield directly effects the plant's ethanol production capacity and, therefore, the facility's profitability. For the concentrated acid process, we have assumed a 92% yield for d l six carbon sugars and 85% yield for all five-carbon sugars. These yields are optimistic, but have been achieved by Arkenol in their pilot plant on several occasions. Arkenol is confident that their technology can easily achieve a more conservative 85% overall yield on all sugars. The yield is based on the amount of available five and six-carbon sugars entering the fermenters. &keno1 reports that its fermentations are conducted with defined media so it is assumed that this fermentation yield can be achieved without adding expensive nutrients, such as corn steep liquor, to the fermenters.
Lignin/Cellulose Residuals
The lignidcellulose residuals removed after the second hydrolysis step are assumed to be sold for boiler fuel for $25 per bone dry ton (BDT). Arkenol has proximate and ultimate analyses for lignin residue produced in their pilot plant utilizing other feedstocks. Representative residue samples from Quincy area softwood feedstock need to be produced for characterization tests (composition and heating value). Larger quantities of residue need to be produced for test bums to determine if this fuel would cause boiler fouling or problems with boiler emissions or ash characteristics (hazardous waste).
10

III. Dilute Sulfuric Acid Technology
Dilute sulfuric acid technology has been studied for many years and research results are extensively published in the literature. The USDA Forest Products Laboratory in Madison Wisconsin conducted considerable research on two-stage dilute sulfuric acid hydrolysis of hardwoods and softwoods in the 1980's. However, little data is available for this technology applied to softwoods especially the species that predominate in the Quincy area. NREL is, therefore, conducting bench scale experiments with softwoods from the Quincy area, The two-stage dilute sulfuric acid technology design presented here is based on the preliminary results obtained from the experimental work being conducted at NREL.
A simplified process flow diagram for the two-stage dilute sulfuric acid process is presented in Figure 4. Detailed process flow diagrams which were used to develop the material and energy balance and capital cost estimate for the process are included in Appendix B. An equipment list for the dilute sulfuric acid process is also included in Appendix B.
Forest thinnings and other biomass residue that have been chipped in the forest are received at the ethanol plant. The wood chips are conveyed from the chip pile past a magnetic cleaner and through a screen to ensure a chip size of 1" or smaller. Over size chips are sent to a tub grinder and returned to the screen. A second conveyor moves the chips to the primary (or first stage) acid impregnator. Here the chips are heated to approximately 100°C and soaked in water containing about 0.4% sulfuric acid. The residence time is 5 minutes.
From the impregnator the chips enter the primary acid hydrolysis reactor where the temperature is raised to approximately 180" C. The exact temperature will depend upon the residence time in the reactor and the acid concentration used. NREL is conducting experiments to determine the time, temperature and residence time needed to obtain high sugar yields. Approximately 85% of the hemicellulose and a small fraction of the cellulose are hydrolyzed in the first reactor. The stream leaving the first hydrolysis reactor (hydrolyzate) contains about 30% total solids (suspended and dissolved solids).
The hydrolyzate pressure is reduced in the flash drum producing steam and reducing the temperature of the hydrolyzate to about 100°C. Following the flash drum, the hydrolyzate enters the primary counter-cument slurry washer where the solids and liquids are separated and the solids are washed to remove the sugars and other soluble compounds. Efficient washing is critical to maximize sugar recovery and to minimize the dilution of the sugar stream. Too much wash water will increase the size and cost of the fementers and distillation system. A wash water flow rate of 2.5 times the weight of solids being washed is assumed. The combined liquid hydrolyzate and wash water are sent to the hydrolyzate neutralization tank. The solid steam (30% solids) from the washer is further dewatered by a screw press. Pressate is returned to the slurry washer and the solids, now at about 50% solids, are sent to the second hydrolysis reactor.
11

In the second hydrolysis reactor the temperature is raised to about 220°C and more dilute acid is added to the stream. About 60% of the remaining cellulose is hydrolyzed with about 70% going to glucose and 30% degraded to HMF and other degradation products. Following the second hydrolysis, the hydrolyzate is flashed, filtered and washed like after the first hydrolysis. The solids, at about 50% moisture, are sent to the biomass boiler (if one is on-site) or sold as boiler fuel. The liquid hydrolyzate from the second counter-current slurry washer is combined with the first stage hydrolyzate in the hydrolyzate neutralization tank.
Lime is added to the neutralization tank to neutralize the sulfuric acid and raise the pH of the hydrolyzate to about 5.5. The tank is also heated to maintain a temperature of about 90°C. This causes most of the calcium sulfate (gypsum) to precipitate out of the solution. The calcium sulfate is removed by a filter and sold or sent to disposal. The neutralization step also provides some degree of detoxification of the hydrolyzate (possibly by removal of some organic compounds with the gypsum).
The relatively solids free sugar stream is cooled to 35°C and sent to the first fermenter. Total fennenter volume is set to provide 24 horn fermentation time. This should be more than adequate for the relatively clean sugar stream, however, the presence of compounds that may be toxic or inhibitory to the yeast (sacchromycs cerevisiae) could increase the required fermentation time. If inhibition is too great, then further detoxification of the hydrolyzate would be required. This additional "detox" step is not included in the present design. The need for detox needs to be determined through additional tests.
Ammonia, and if necessary nutrients like corn steep liquor, are added to the fernenters along with recycle yeast recovered from the fermentation broth leaving the last fennenter. Overall ethanol yield in the fernenters is 85% of the six-carbon sugars entering the fennenters. No ethanol is produced from the five-carbon sugars. In the future it may be possible to substitute a genetically engineered yeast or bacteria for the yeast to ferment both the five and six carbon sugars.
The fernentation broth, also know as "beer," is sent to the distillatiodmolecular sieve dehydration systems where the ethanol is separated from the water. The ethanol distillatioddehydration technology is well developed and will not be described in detail here. The 99.9% ethanol is denatured with 5% gasoline and sent to storage. The water fiom the distillation column is sent to the process water storage tank for recycle. A 20% purge stream is sent to wastewater treatment (at the Anderson site) or to wastewater recovery (all other sites).
A small amount of fusel oils (higher alcohols) will be produced as fermentation byproducts. The fusel oils are removed from the rectification column (in the distillation area), decanted to remove water and mixed with the ethanol going to the ethanol storage tank. The fusel oils add to the volume of product and, therefore, improve the economics of the process. Approximately 1% of the glucose going to the fernenters is assumed to be converted to fuse1 oil.
12


Fermentation also produces a large amount of carbon dioxide (CO,) which is removed from the fermenter and washed with water to remove ethanol vapors. The wash water containing a small amount of ethanol is sent to the distillation column €or ethanol recovery. CO, is either recovered and sold (Anderson site only) or vented to the atmosphere (all other sites).
Process Concerns and Recommendations
The two-stage dilute sulfuric acid process presented here is not overly complicated, but there are several assumptions made in the process design and performance that need to be resolved before a commercial facility is built. NREL recommends additional design investigations and test work be conducted to resolve the following issues.
Hydrolysis Sugar Yields
The hydrolysis sugar yields used in the process design presented here are based on published data and NREL's on-going bench-scale test work on softwood hydrolysis. Some of the sugar yields assumed for this study are higher than those obtained by NREL in the lab to date, but are equal to or slightly lower than the published data. Hydrolysis sugar yield is an important parameter which directly effects the ethanol yield and should be confirmed by bench and pilot scale tests.
Hydrolysis Reactor Materials of Construction
Use of dilute sulfuric acid at elevated temperatures requires special alloys such as hastelloy, titanium, or zirconium, or an acid brick reactor lining. 3 16 stainless steel is not adequate for the primary and secondary hydrolysis reactors' wetted parts. Titanium and zirconium are much too expensive to consider until other options have been exhausted. The suitability of hastelloy is questionable and needs to be confirmed through corrosion tests. Acid brick lined reactors have been assumed for costing purposes. Use of an acid that is less corrosive to stainless steel, such as nitric acid or sulfur dioxide is another option.
H ydrolyzate Fermen tability
The combined hydrolyzate produced from the first and second stage hydrolysis reactions may be toxic to the fermentation yeast. The design and economic analysis presented here assumes that the hydrolyzate is not toxic and does not adversely impact the assumed fennentation time (24 hours) or ethanol yield (85% of available six carbon sugars).
If the hydrolyzate is toxic to the yeast or adversely affects the fennentation time or yield, then detoxification of the hydrolyzate would be required. Detoxification would be accomplished by removing unwanted compounds such as acetic acid, furfkal, and hydroxymethyl furfural (€€MF') from the hydrolyzate. There are several ways to do the detoxification, but all would most likely add additional complexity and cost to the ethanol facility.
14

Fermentation Ethanol Yield
Like the hydrolysis sugar yield, the fermentation ethanol yield directly effects the plant's ethanol production capacity and, therefore, the facility's profitability. The 85% overall fermentation yield used for the dilute sulfuric acid process needs to be confirmed at the bench and pilot scale. The yield is based on the amount of available six-carbon sugars entering the fermenters. It is also assumed that this fermentation yield can be achieved without adding expensive nutrients, such as corn steep liquor, to the fermenters.
Fermenter Yeast Propagation
A small percentage of the glucose entering the fermenters is converted to yeast cell mass; 2% has been assumed for this design. The amount of cell mass produced impacts the ethanol yield and the 2% value needs to be confirmed. On the other hand, if yeast production is relatively high, it may be possible to remove excess yeast and sell it as animal feed which has a relatively high value.
The design also assumes that a yeast seed train is not needed to provide fresh yeast to the fermenters. This is a fairly safe assumption for the fermentation considered here, but needs to be confirmed by continuous bench or pilot scale fermentation tests.
Neutralizing Base
The use of lime to neutralize sulfuric acid will produce calcium precipitates (mainly calcium sulfate - gypsum) which may foul the distillation column and the heat exchanger surfaces throughout the ethanol facility. This could cause serious operating problems and reduce the capacity of the ethanol plant. Use of ammonia to neutralize the sulfuric acid would eliminate the potential fouling problem, but would increase the raw materials cost. Likewise, using nitric acid with lime or ammonia would eliminate the potential fouling problem, but would also increase the raw materials cost for the plant. The potential for fouling due to calcium sulfate in the system needs to be carefully evaluated.
Facility Thermal Design
The overall plant thermal design and energy use for the process presented has not been optimized. It is assumed that a chilled water system is required to maintain the fernenter temperature at 35°C. lcn the Quincy area, it may be possible to maintain the fernenter temperature with the cooling water system (cooling tower) only. This could result in significant capital and operating cost savings. Thermal optimization of the facility design is recommended when conducting follow on engineering work.
15

Solid/Liquid Separation Equipment
Three solid/liquid separations are included in the process design: following the first stage hydrolysis, after the second stage hydrolysis, and following the neutralization step. Separating the hydrolyzate liquids from the remaining solid biomass can be very difficult. A rotary vacuum drum filter with counter current washing has been selected for all three applications in this study. However, the perfonnance of this equipment in this application has not been established and needs to be demonstrated at the pilot scale.
Li g nidcellulose Residuals
The lignidcellulose residuals removed after the second hydrolysis step are assumed to be sold for boiler fuel for $25 per bone dry ton (BDT) at all study sites except Greenville where the value has been reduced to $15/BDT to cover transportation costs. Representative residue samples need to be produced for characterization tests (composition and heating value). Larger quantities of residue need to be produced for test burns to determine if this fuel would cause boiler fouling or problems with boiler emissions or ash characteristics (hazardous waste).
Water Recycle
The amount of process water recycle that is feasible needs to be determined. Buildup of byproducts in the recycle water could adversely affect the fermentation time and ethanol yield. An 80% recycle rate has been assumed for the design presented here. If the amount of recycle water is reduced, additional makeup water will be required. The impact on overall costs and economics should not be significant.
16

Iv. Dilute Nitric Acid Technology
The dilute nitric acid technology presented here has been developed over more than 20 years at the University of California's Forest Products Laboratory at Richmond, California, and is protected by several patents held by the University. In recent years, funding for further development of the process and the prosecution of the University's patents has been provided by HFTA, a corporation initiated by the inventors. The design and cost estimates presented here were prepared by NREL engineers in cooperation with HFTA and are preliminary. HFTA has exclusive rights to negotiate licenses for the technology. There are no royalty charges included in the financial evaluation for the HFTA technology which follows. Royalties are unknown at this time and would likely be negotiated based on the economics of the planned project. Interested parties should contact George Craig of HFTA at (510) 893-9657.
A simple process flow diagram for the HFI'A dilute nitric acid process is shown in Figure 5. The detailed process flow diagrams which were used to develop the material and energy balance and the capital cost estimate for the process are included in Appendix C. An equipment list for the dilute nitric acid process is also included in Appendix C.
The hydrolysis of cellulose and hemicellulose is carried out in one stage (unlike the dilute sulfuric acid process which uses a two-stage hydrolysis process). Wood chips are mixed with acid and fed to a hydrolysis reactor. All parts of the reactor (as well as other items of equipment in the flow diagram) that come in contact with the process stream are made of either 304 or 316 stainless steel, which are inert to dilute nitric acid at the temperatures of the process. The tub grinder has been eliminated based on HITA's evaluation of wood chips obtained from the Quincy area.
The gross feed to the hydrolysis reactor is preimpregnated with dilute nitric acid and compressed into the reactor at about 33% suspended solids by a screw feeder. Sufficient steam is added to raise the temperature to 2 10-220°C; the corresponding saturation pressure is 18 to 23 atmospheres. In l h s temperature range, the hydrolysis of the hemicellulose to Cs and C, sugars (primarily the latter) is very rapid. A large fraction (less than 85%) of the C, sugars (about 7.8% of the gross feed) will then be converted to furfural, its decomposition products and water. After a residence time of the order of 5 minutes, about 75% of the cellulose in the solids will also be hydrolyzed. The yield of C, sugars is equivdent to about 50% of the glucan (ceuulose plus hemicellulosic c6 sugars); the remainder of the hydrolyzed C, sugars are converted to hydroxymethyl furfural (HMF), its degradation products and water.
The hydrolyzed biomass leaves the reactor and is flashed in two (or possibly three) stages to atmospheric pressure. The steam released from the first flash shown, although at a relatively low pressure, is significantly more in energy content than will be required for distillation of the alcohol that will be fomed by fennentation of the c6 sugars produced by the wood hydrolysis. If additional low-pressure steam can be utilized, optimization will detennine the pressures of the flashes to be employed. It should be noted that some of the soluble organic compounds, such as methanol and furfural, will be volatilized during the flash steps. The fractions of these materials that report in the
17

vapor streams have not yet been estimated quantitatively, but their total is expected to be of the order of 1-2 rnol % in the vapor stream. This quantity would not prevent use of the vapor as steam for heating, but would place some constraints on the use of the condensate.
The chips leaving the reactor will retain much of their original shape but will have become very friable. During the flash steps there will be some disintegration of the chips into particles. The slurry leaving the second flash drum will be fed to a disintegrator as shown, to reduce the particle size and thereby improve sugar recovery in the centrifugal filter. It is not known at this time whether the disintegration due to the flash steps will be sufficient to allow recovery of a high fraction of the sugar solution from the solid material during the drainage and washing steps in the centrifugal filter. If this is the case, then the disintegrator shown on the flow diagram will not be needed.
The solids content of the slurry leaving the atmospheric-flash vessel is 11-12 % by weight and the C,-sugar content of the solution is 12-14 wt%. The method of solifliquid separation that will keep the sugar content of the solution at its maximum value is centrifugal filtration, with provision for two separate wash steps and separate collection of the wash liquid. An automated basket centrifuge has been specified for the solidfliquid separation equipment. Another option would be a pusher-type centrifuge. From laboratory filtration data it is estimated that about 95% of the solution entering the centrifugal filter can be recovered with minimal dilution. The remainder will be recycled, diluted with wash water to form the makeup water feed to the process.
The solids content of the cake solids leaving the centrifuge is 25-33%. Because the solid particles, unlike wood fibers, have a relatively high settling velocity, the higher number is more probable. The solid content of the solids stream after passing through a screw press or similar equipment, is specified to be about 50% and will serve as a fuel.
The sugar stream and some of the wash water from the automated basket centrifuge is sent to the neutralization tank. Ammonia is added to the neutralization tank to neutralize the nitric acid and raise the pH to the fermentation pH (about 5.5). If the hydrolyzate is toxic to the yeast, then a detoxification step would be added to the design at this point.
The relatively solids free sugar stream is cooled to 35°C and sent to the first fermenter. Total fermenter volume is set to provide 24 hours fernentation time. This should be more than adequate for the relatively clean sugar stream, however, the presence of compounds that may be toxic or inhibitory to the yeast (succhromyces cerevisiae) could increase the required fermentation time. If inhibition is too great, then detoxification of the hydrolyzate would be required. This additional "detox" step is not included in the present design.
Ammonia is added to the fementers along with recycle yeast recovered fiom the fermentation broth leaving the last fernenter. It is assumed that corn steep liquor is not required. Overall ethanol yield in the fermenters is 85% of the six-carbon sugars entering the fermenters. No ethanol is produced from the five-carbon sugars. In the future it may be possible to substitute a genetically engineered yeast or bacteria for the yeast to ferment both the five and six carbon sugars.
18


The fermentation broth, also know as "beer," is sent to the distilIation/molecular sieve dehydration systems where the ethanol and water are separated. The ethanol distillationldehydration technology is well developed and will not be described in detail here. The 99.9% ethanol is denatured with 5% gasoline and sent to storage. The water fiom the distillation column is sent to the process water tank for reuse. A 20% purge stream is sent to wastewater treatment (at the Anderson site) or to wastewater recovery (all other sites).
A small amount of fusel oils (higher alcohols) will be produced as fermentation byproducts. The fusel oils are removed from the rectification column (in the distillation area), decanted to remove water and mixed with the ethanol going to the ethanol storage tank. The fusel oils add to the volume of product and, therefore, improve the economics of the process, Approximately 1 % of the glucose going to the fermenters is assumed to be converted to fuse1 oil.
Fermentation also produces a large amount of carbon dioxide (CO,) which is removed from the fermenter and washed with water to remove ethanol vapors. The wash water containing a small amount of ethanol is sent to the distillation column for ethanol recovery. CO, is either recovered and sold (Anderson site only) or vented to the atmosphere (all other sites).
Process Concerns and Recommendations
The dilute nitric acid process design presented here was prepared by NREL engineers in cooperation with HFTA and is preliminary. There are several assumptions made in the process design and performance that need to be resolved before a commercial facility is built. NREL recommends additional design investigations and test work be conducted to resolve the following issues.
Hydrolysis Sugar Yields
?'he projected hydrolysis sugar yields presented here are preliminary. Hydrolysis sugar yield is an important parameter which directly effects the ethanol yield and should be confirmed by bench and pilot scale tests.
H ydrol yz ate Ferrnen t ability
The filtered hydrolyzate produced by the dilute nitric acid hydrolysis may be toxic to the fermentation yeast. The design and economic analysis presented here assumes that the hydrolyzate is not toxic and does not adversely impact the assumed fermentation time (24 hours) or ethanol yield (85% of available six carbon sugars). If the hydrolyzate is toxic to the yeast or adversely affects the fermentation time or yield, then detoxification of the hydrolyzate would be required. €BTA has developed detoxification technology that could remove unwanted compounds fiom the hydrolyzate. The reader should contact m A for more information.
Fermentation Ethanol Yield
20

Like the hydrolysis sugar yield, the fermentation ethanol yield directly effects the plant's ethanol production capacity and, therefore, the facility's profitability. The 85 % overall fermentation yield used for the dilute nitric acid process needs to be confirmed at the bench and pilot scale. The yield is based on the amount of available six-carbon sugars entering the fermenters. It is also assumed that this fermentation yield can be achieved without adding expensive nutrients, such as corn steep liquor, to the fermenters.
Fennenter Yeast Propagation
A small percentage of the glucose entering the fementers is converted to yeast cell mass; 2% has been assumed for this design. This decreases the ethanol yield and the 2% value needs to be confinned. If yeast production is relatively high, it may be possible to remove excess yeast and sell it as animal feed which has a relatively high value.
The design also assumes that a yeast seed train is not needed to provide fresh yeast to the fermenters. This is a fairly safe assumption for the fermentation considered here, but needs to be confirmed by continuous bench or pilot scale fermentation tests.
Facility Thermal Design
The overall plant thermal design and energy use for the process presented has not been optimized. It is assumed that a chilled water system is required to maintain the fennenter temperature at 35" C or less. In the Quincy area, it may be possible to maintain the fernenter temperature with the cooling water system (cooling tower) only. This could result in significant capital and operating cost savings. Thermal optimization of the facility design is recommended when conducting follow on engineering work.
LignidCellulose Residuals
The lignidcellulose residuals removed by the centrifuge are assumed to be sold for boiler fuel for $25 per bone dry ton (BDT) at all study sites except Greenville where the price has been reduced to $15 per BDT to cover transportation costs. Representative residue samples need to be produced for characterization tests (composition and heating value). Larger quantities of residue need to be produced for test burns to determine if this fuel would cause boiler fouling or problems with boiler emissions or ash characteristics (hazardous waste).
Water Recycle
The amount of process water recycle that is feasible needs to be detennined. Buildup of byproducts in the recycle water could adversely affect the fernentation time and ethanol yield. An 80% recycle rate has been assumed for the design presented here. If the amount of recycle water is reduced, additional makeup water will be required. The impact on overall costs and economics should not be significant.
21

V. BiomassFeedstock
Ponderosa Pine
For this study it is assumed that the biomass feedstock for the ethanol facility will be whole tree chips fiom forest thinning and timber harvest operations. It is also assumed that the species mix will be 70% (by weight) white fir and 30% ponderosa pine. The composition of white fx, ponderosa pine and the 70/30 mix is shown in Table 1. For this study the fermentable sugar precursors of interest are the glucan, mmnan, and galactan. These components of the wood produce six carbon sugars when hydrolyzed. The six carbon sugars can be easily fermented to ethanol with several different naturally occumng yeasts. The xylan and arabinan in the wood produce five carbon sugars when hydrolyzed. These sugars are fermented to ethanol in the Arkenol concentrated acid process, but not in the dilute sulfuric and dilute nitric acid processes. The hydolysates produced by the dilute sulfuric and nitric acid processes will likely be more toxic and difficult to ferment than the relatively "clean" sugar stream produced by the Arkenol concentrated acid process. The more toxic hydrolyzate with the two dilute acid processes makes it impractical to use with the Arkenol fermentation technology.
70/30 Mixed Feedstock (dry wt)
Table 1. Biomass Feedstock Composition - Whole tree chips
GIucan
Mannan
Galactan
Xylm
Feedstock I Component
43% 38% 40.5%
11% 10% 10.5%
3% 5% 4.0%
6% 6% 6.0%
Lignin
Extractives
28% 25% 26.5%
5% 10% 7.5%
Arabinan I 2% I 4% I 3.0% I
Ash
Total
2% 2% 2.0%
100% 100% 100%
Changes in the biomass feedstock composition can have significant impacts on the facility's ethanol yield. For example, delimbed trees will have a higher percentage of cellulose and hemicellulose (because the limbs and needles contain more lignin and extractives than the trunk of the tree). This will increase the ethanol yield per bone dry ton of wood, but delimbing will undoubtedly increase the cost of the feedstock and may negate the improved economics due to the higher ethanol yield. Delimbing would also benefit the forest by leaving tree nutrients to become part of the soil.
22
,

Another example of the impact of the feedstock composition would be an increase in the percentage of white fir in the feedstock mix relative to pine. White fir contains more fermentable sugars than ponderosa pine so, again, the ethanol yield would increase if there is more white fir versus pine in the feedstock. Inclusion of Douglas Fir in the feedstock at the expense of pine would also increase the ethanol yield. Hardwoods such as oak and manzanita in the feedstock mix would reduce the ethanol yield. The results of sensitivity analyses for the feedstock glucan composition are presented in the following Sensitivity section of the report.
The delivered feedstock cost is assumed to be $20 per BDT. This is less than the cost to thin the forest (about $40 per BDT), but more than the current market price for biomass in the study area. A sensitivity was run for feedstock cost from $0 to $40 per BDT to determine the effects on the ethanol facility profitability. The Internal Rate of Return (RR) is more sensitive to the feedstock cost than any other variable. Each $5 change in feedstock cost changes the K R about 5% (in the opposite direction as the change in the feedstock cost).
VI. Site Specific Design and Cost Estimates
The size of the ethanol facility at each site is based on the amount of forest thinnings and timber harvest residue available within a 25-mile radius of the site according to the feedstock assessment report, plus any mill residue that may be available at the site. The Anderson and Martell sites were not included in the feedstock assessment so it was assumed that 265,000 bone dry ton (BDT) per year is available at these sites. This is the average biomass availability for the four sites in the QLG area. If projects are to be pursued at Anderson or Martell, the feedstock availability and feedstock cost will need to be verified.
Material and energy balances for the ethanol conversion process and the ethanol facility equipment costs were developed based on the detailed process flow diagrams in Appendices A, B, and C. Inputs and outputs from the material and energy balances were used to determine the raw material costs for the ethanol facility. Equipment costs were obtained from vendor quotes or from cost estimating software. Standard cost estimating factors for shipping, foundations, piping, electrical, instrumentation, painting, insulation were applied to the equipment costs to obtain the installed equipment costs. Additional factors were then applied to the installed equipment cost to obtain the fixed capital investment (FBI) and total capital investment (FBI plus working capital) for the ethanol facility. Equipment lists for each process are included in Appendices A, B and C.
The reference design and cost estimates were then customized for each of the six sites in the study to take advantage of the existing infrastructure available at most of the sites. Some of the site specific data and available infrastructure used to develop the design and cost estimates are shown in Table 2 below. Additional site infrastructure assumptions for each site are included in the individual site design and analysis sections which follow this section.
23

Table 2. Site Data and Infrastructure
~ Steam Water
l Wastewater treatment
Site, Owner
I
Anderson, Roseburg Industries
Steam ~ Water
Chester, Collins Pine Co.
no biomass power at this site
Greenville, Carl Pew
Water
Loyal t on, Sierra Pacific Ind.
18MW* Water
Martell, Sierra Pacific hd.
lumber mill (closed)
Westwood, Mt. Lassen Power
-~
Water
Biomass Power (gross M w )
stand-alone biomass power plant
49.9 Mw *
12 Mw
Other Utilities Available
Other Considerations
stand-alone biomass power plant + pulp and paper mill. C02 could be sold to Simpson or Pfizer
lumber mill
former lumber mill site
20 M w I Steam Water
lumber mill
13 M W
* biomass power plant is owned and operated by Wheelabrator Environmental Systems Inc.
The block flow diagrams in the following site analysis sections of the report show the possible exchange of raw materials and utilities between a new ethanol facility and existing facilities at each site. For example, at the Chester site (Figure 7), the Collins Pine Company lumber mill could provide perhaps 30,000 BDT per year of mill residue to the ethanol plant in addition to the forest thinnings and timber harvest residue discussed in the feedstock supply report. The existing biomass plant at this site could provide electricity, steam, process water and potable water to the ethanol plant. The ethanol plant could provide Iignin to the biomass plant for boiler fuel.
The Manufacturing Cost Summary Reports (Appendices D through I) for each of the following site analyses provides a detailed breakdown of the ethanol facility capital and operating costs.
In the following sections, utility requirements at each site include low pressure steam at a pressure of 50 psi and high pressure steam at 600 psi. These pressures are approximate and could be adjusted up or down during detailed design to optimize energy use. Energy use within the ethanol facility has not been optimized for this study, so there may be room for significant improvement and cost savings in utility (steam, cooling water and chilled water) use.
24

Vn. Anderson Site
The Anderson site is owned by Roseburg Forest Products and is located near the City of Anderson in Shasta County. The site is immediately adjacent to the 49 megawatt ( M W ) Wheelabrator biomass power plant and the Simpson Paper Company's pulp and paper mill. The Anderson site, therefore, may have access to steam, electricity, process water, and wastewater treatment from the existing facilities. There are few, if any, useable facilities on the Roseburg property.
The key economic assumptions used to develop the Anderson site capital and operating cost estimates are listed in Table 3. Assumptions for available infrastructure at the Anderson site and the costs assumed for utilities and new infrastructure are shown in Table 4 below.
Infrastructure available at the Anderson site that will have a significant positive impact on the project economics include steam and electricity from the Wheelabrator biomass power plant. The biomass plant could also provide a reIatively high-value use for the ethanol plant's lignin residue as boiler fuel. Use of the wastewater treatment facilities at the Simpson Paper Company pulp and paper mill would save several million dollars in capital for the ethanol facility.
Available infrastructure that will have a moderate to low impact on the process economics include process and potable water from both Wheelabrator and Simpson, sanitary sewer treatment facility at Simpson, and a small amount of cellulose sludge and undersized wood chips which may be available from Simpson at a relatively low cost. Investigation of possible environmental impacts of using cellulose sludge from the Simpson facility is recommended if this feedstock is considered.
Because of the existing infrastructure available at the Anderson site, the ethanol facility capital cost estimate does not include the cost of a boiler, wastewater treatment facility, and process and potable water systems. The capital costs do include an office building and lunch room, maintenance facilities, yard lighting, fire protection, etc. Some of these capital expenditures could be avoided if Wheelabrator operated the ethanol facility and used their existing administration and maintenance facilities to support the ethanol facility.
The annual operating costs include costs for buying utilities (electricity, steam, potable and process water, and wastewater treatment) from Wheelabrator and/or Simpson Paper Co. It is assumed that the value of the lignin residue is $25 per BDT (sold to Wheelabrator) and the value of the CO, is $10 per ton (2 tons per hour sold to Simpson and/or Pfizer).
25
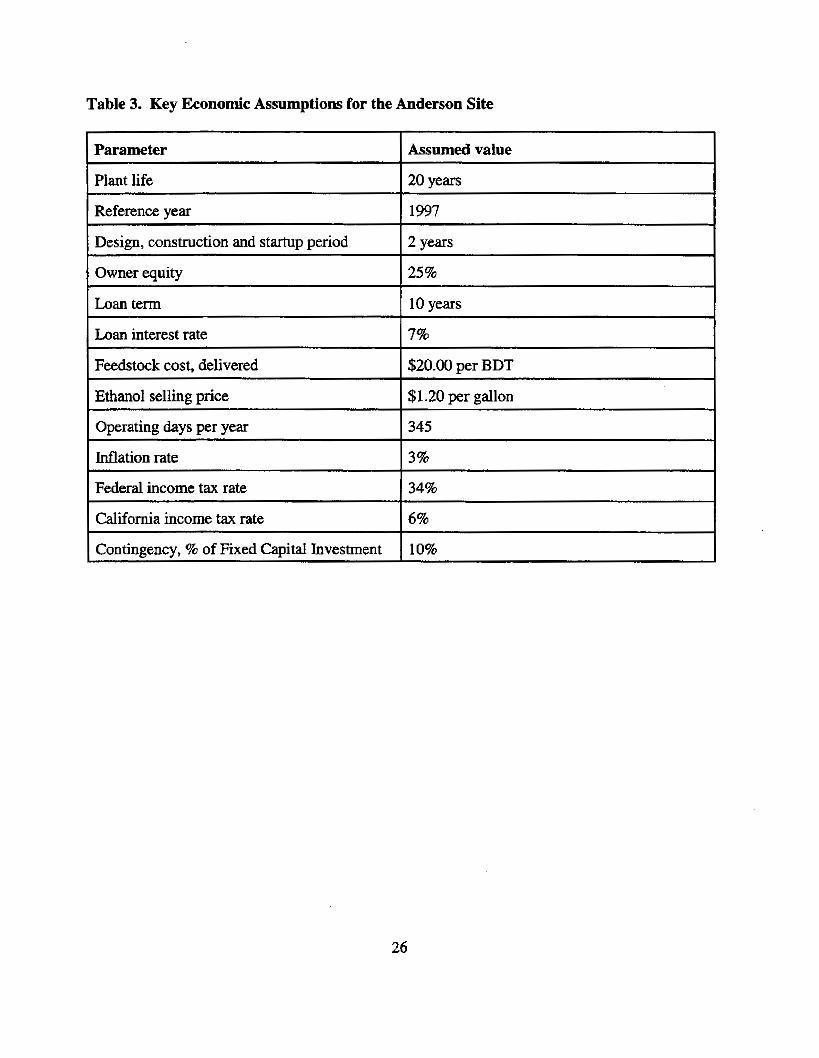
Table 3. Key Economic Assumptions for the Anderson Site
Plant life
Reference year
I Parameter I A S S U ~ ~ value ... - .~
20 years
1997
Design, construction and startup period
Owner equity
Loan term
Loan interest rate
Feedstock cost, delivered
I I
2 years
25%
10 years
7%
$20.00 per BDT
Ethanol selling price
Operating days per year
$1.20 per gallon
345 ~~
I Inflation rate 13%
Federal income tax rate 34% ~~
I I
California income tax rate
Contingency, % of Fixed Capital Investment
6%
10%
26

Table 4. Anderson Site Infrastructure and Utility Costs
Infrastructure
Electricity
Operating Cost Available Capital Cost
Yes $0
Steam distribution
Process water
no 0.5% of FCI $0
Yes 0. I % of FCI $0.31 per 1000 gal.
1-1.5% of FCI
1% of FCI
$0.09 per 1000 gal.
$5.49 per 1OOO gal.
Instrument air
Process buildings
no 0.5% of FCI $0
no 2% of FCI $0
Rail siding Yes $0 $0
~~ ~~
$0.05 per kW-hr
Electrical substation and distribution
1-2% of FC1 $0
Low pressure steam $1 .OO per 1 OOO Ibs.
High pressure steam Yes 1 $0 I $3.00 per lo00 lbs.
Potable water Yes I 0.1% of FCI 1 $0.31 per 1000 gal.
Cooling water I no
Chilled water I no
wastewater treatment I Yes I $0 1 $0.58 per lo00 gal.
Plant air I no I OS%ofFCI $0
Non-process buildings I no I l%ofFCI I $0
Building WAC 1 no 0.2%ofFCI I $0
Fire protection I no I O.S%ofFCI I $0
Yard lighting and communications
0.15% of FCI $0 no
Fences and gatehouse Yes I $0 I $0
Capital Costs are expressed as a percentage of the fixed capital investment and are approximate. See page 5 of the Manufacturing Cost Summary Reports in Volume II for actual costs.
27

Design and Economic Analysis Results
The ethanol facility design for the Anderson site is based on a feedrate of 265,000 bone dry tons (BDT) of feedstock per year. T h i s results in annual production capacities ranging from 13.8 million to 22.3 million gallons of ethanol for the three different biomass conversion technologies. The feedstock is assumed to be forest thinnings and timber harvest residues at a cost of $20.00 per BDT delivered to the ethanol facility.
Results of the design and capital cost estimates for the Anderson site are summarized below. Manufacturing Cost Summary Reports for the three biomass conversion technologies for the Anderson site are included in Appendix D. The Manufacturing Cost Summary Reports provide a detailed breakdown of the facility capital and operating costs.
Technology Ethanol Plant Size Total Capital Investment
Concentrated Acid 22,300,000 gallondyear $90,200,000
Dilute Sulfuric Acid 13,8OO,OOO gallons/year $46,700,000
Dilute Nitric Acid 13,800,000 gallondyear $34,400,000
The internal rate of return (IRR), also known as discounted cash flow rate of return, is reported below for each technology with facility owner equity at 100%.
IRR with 100% Equity for the Anderson Site
Concentrated Acid 5%
Dilute Sulfuric Acid 5%
Dilute Nitric Acid 11%
Projects of this magnitude are rarely financed with 100% owner equity. It is well known that favorable financing can leverage the owner's equity and dramatically increase the IRR. A scenario with 25% owner equity and 75% debt financing was evaluated. A loan interest rate of 7% with a 10 year loan term was chosen to represent perhaps the best possible financing scenario. A loan with very low interest may be available from the following three sources: the new electric utility restructuring Public Interest Energy Research (PIER) Program, the California Pollution Control Financing Authority, or the California Alternative Energy Financing Authority.
28

Results of the IRR calculations with 25% owner equity and 75% debt financing at 7% interest rate are shown below. Leveraging effects are not significant unless the IRR at 100% owner equity is higher than the net loan interest rate.
IRR with 25% Equity for the Anderson Site
Concentrated Acid 8%
Dilute Sulfuric Acid 9%
Dilute Nitric Acid 25%
The full cash cost of production and net ethanol production cost with 25% owner equity was determined. Full cash cost and net production cost are defined as follows:
variable costs (raw materials and utilities) + fixedcosts (labor and labor related costs, plant overhead,
maintenance, supplies, local taxes and insurance)
- coproduct credits (for lignin, CO,, and yeast cell mass) = full cash cost of production + capital depreciation
+ financing costs (net interest on debt financing) = net ethanol production cost
The resulting full cash cost of production and net production costs for the Anderson site for each technology are shown below.
Cash Cost and Net Ethanol Production Cost for the Anderson Site $ per gallon ethanol, 25% owner equity
Cash Cost Net Production Cost Concentrated Acid $0.74 $1.03
Dilute Sulfuric Acid $0.83 $1.06
Dilute Nitric Acid $0.7 1 $0.89
29

One of the objectives of the Quincy Library Group is to facilitate thinning the forests in the area to reduce wildfire threat and improve forest health. One of the major obstacles to thinning large numbers of acres each year is the cost. Ethanol production utilizing the forest thinnings as feedstock may be a way to offset all or a significant portion of the thinning costs. A scenario was evaluated to determine the maximum feedstock cost that an ethanol facility could pay and still return 15% IRR on the ownefs equity for the ethanol facility. The 15% IRR in this type of analysis is also known as the "hurdle rate. Again, owner equity was assumed to be 25 % with 7% interest on the remaining debt. The results are shown below for the Anderson site and each technology.
Utility *
electricity, MW
Maximum Feedstock Cost with 25 % Equity and 15 % Hurdle Rate for the Anderson Site
Concentrated Acid Sulfuric Acid Nitric Acid Process Process Process
3.9 2.9 2.4
Concentrated Acid $7.79 per BDT
Carbon dioxide, l b h
Yeast cell mass, l b h
Dilute Sulfuric Acid $14.23 per BDT
4,000 4,000 4,000
37 I 87 89
Dilute Nitric Acid $26.73 per BDT
Utility Requirements
The utility requirements for an ethanol plant utilizing the concentrated acid, dilute nitric acid, and dilute sulfuric acid at the Anderson site are listed in Table 5. The cost for the utilities, feedstock, lignin and CO, assumed for the process and economic analysis are shown in Table 4 and Figure 6.
Table 5. Utility Requirements and Coproducts for the Anderson Site
1 low pressure steam, lblhr I 125,300 I 39,900 I 28,060 I I high pressure steam, i b h I 11,100 I 7 1,600 I 5 1,200 I wastewater, gpm I 34 I 24 1 I 91
process water, gpm I 51 I 36 1- ~ 27
Copmducts I I I Lignin residue, l b h I 57,846 I 53,034 I 58,3 14
30

Figure 6
Anderson, California Site
Roseburg Forest Products
Forest thinninns, 53.000 bdt/yr, $20/bdt
rces avail-: Resou I I Wood chips, 0 bdt/yr Concentrated Acid Technology
-o r -
Dilute Nitric Acid Technology
-o r -
Two-Stage Dllute Sulfuric Acid
5 MW biomass electricity
50,000 lbhr 100 psi steam (note 1)
Zurn travelling-grate biomass boilers
500 gpm water from well 200 tonlday chipper I Administrative and support facilities
Lignin, $25/bdt Technology
Resou rces avai lable: Wastewater treatment facility
500 gpm water from well
Potable water, sanitary sewer
Cellulose sludge and undersized chlps
Undersized chlps, 2,000 bdt/yr, $20/bdt
Process water. $0.31/1000 aal
Potable water (note 2), $0.31/1000 gal
Wastewater, $0.58/1000 Rat
Sanitaw sewer (note 2). $0.60/1000 aal Carbon dioxide (note 31, $O.O05/Ib C02
1
4 ,,
0 sum $O/bdt fi
Notes: (1) 200,585 and 900 psi steam also available.
(2) Piping is in place for potable water and sanitary sewer from Simpson site.
(3) C02 could also be sold to the Pfizer Specialty Minerals facility.
31

VIII. Chester Site
Contingency, % of Fixed Capital Investment
The Chester site is located at the Collins Pine Company lumber mill in Chester, California. Infrastructure available at this site includes steam and electricity from the mill's 12 MW biomass power plant, process and potable water and sanitary sewer facilities, existing office buildings and maintenance facilities, and mill residue (sawdust and wood chips) which may be available from the Collins Pine mill at a relatively low cost. The biomass power plant could also utilize the ethanol plant's lignin residue as boiler fbel.
10%
Significant quantities of CO, will be produced by the ethanol facility, but it is assumed that no CO, is sold at this site. It may be possible to develop a market for the CO,, but this is outside the scope of the current project.
The key economic assumptions used to develop the Chester site capital and operating cost estimates are listed in Table 6. Infrastructure available at the Chester site and the costs assumed for utilities and new infrastructure are shown in Table 7 below.
Table 6. Key Economic Assumptions for the Chester Site
1 Parameter I Assumed value
I Reference year 11997 I I Design, construction and startup period I2years I
I b a n interest rate 17% I I Feedstock cost, delivered I $20.00 per BDT
1 Operating days per year I345 1 I Inflation rate 13% I
I California income tax rate 16% 1
32

Table 7. Chester Site Infrastructure and Utility Costs
Infrastructure
Electricity
Electrical substation and distribution
Low pressure steam
High pressure steam
Steam distribution
Process water
Potable water
Cooling water
Chilled water
Wastewater recovery
Plant air
Instrument air
Process buildings
Non-process buildings
Building W A C
Fire protection
Yard lighting and
Fences and gatehouse
Rail siding
communications
Available CapiM Cost Operating Cost
Yes $0 $0.05 per kW-hr
no 1-3% of FCI $0
Yes $0 $1.00 per lo00 lbs.
Yes $0 $3.00 per loo0 Ibs.
no 0.5% of FCI $0
Yes 0.1% of FCI $0.31 per 1000 gal.
Yes 0.1% of FCI $0.31 per 1000 gal.
no 1.5% of FCI $0.09 per lo00 gal.
no 1% of FCI $5.49 per 1000 gal.
no 5% included in elec,
Yes 0.3% of FCI $0
Yes 0.5% of FCI $0
no 2-3% of FCI $0
Yes $0 $0
no .25% of FCI $0
no .5% of FCI $0
no 0.2% of FCI $0
Yes $0 $0
yes $0 $0
Capital Costs are expressed as a percentage of the fixed capital investment and are approximate. See the page 5 of the Manufacturing Cost Summary Reports in Volume 101 for actual costs. The concentrated acid cost estimate includes a low pressure boiler due to the high steam demand.
33

Design and Economic Analysis Results
The ethanol facility design for the Chester site is based on a feedrate of 298,000 bone dry tons (BDT) of feedstock per year. This results in annual production capacities ranging from 15.5 million to 25.1 million gallons of ethanol for the three different biomass conversion technologies. The feedstock is assumed to be forest thinnings and timber harvest residues at st cost of $20.00 per BDT delivered to the ethanol facility.
Results of the design and capital cost estimates for the Chester site are summarized below. Manufacturing Cost Summary Reports for the three biomass conversion technologies for the Chester site are included in Appendix E. The Manufacturing Cost Summary Reports provide a detailed breakdown of the facility capital and operating costs.
Technology Ethanol Plant Size Total Capital Investment
Concentrated Acid 25,1-00,000 gdlons/year $99,500,000
Dilute Sulfuric Acid 15,500,ooO gallons/year $55,100,000
Dilute Nitric Acid 1 5,500,000 gallons/year $40,400,000
The internal rate of return (IRR), also known as discounted cash flow rate of return, is reported below for each technology with facility owner equity at 100%.
IRR with 100% Equity for the Chester Site
Concentrated Acid 7%
Dilute Sulfuric Acid 5%
Dilute Nitric Acid 11%
Projects of this magnitude are rarely financed with 100% owner equity. It is well known that favorable financing can leverage the owner's equity and dramatically increase the IRR. A scenario with 25% owner equity and 75% debt financing was evaluated. A loan interest rate of 7% with a 10 year loan term was chosen to represent perhaps the best possible financing scenario. A loan with very low interest may be available from the following three sources: the new electric utility restructuring Public Interest Energy Research (PIER) Program, the California Pollution Control Financing Authority, or the California Alternative Energy Financing Authority.
34

Results of the IRR calculations with 25% owner equity and 75% debt financing at 7% interest rate are shown below. Leveraging effects are not significant unless the IRR at 100% owner equity is higher than the loan interest rate.
IRR with 25% Equity for the Chester Site
Concentrated Acid 15%
Dilute Sulfuric Acid 9%
Dilute Nitric Acid 25%
The full cash cost of production and net ethanol production cost with 25% owner equity was determined. Full cash cost and net production cost are defined as follows:
variable costs (raw materials and utilities) + fixedcosts (labor and labor related costs, plant overhead,
maintenance, supplies, local taxes and insurance)
- coproduct credits (for lignin and yeast cell mass) = full cash cost of production + capital depreciation + financing costs (net interest on debt financing) = net ethanol production cost
The resulting full cash cost of production and net production costs for the Chester site for each technology are shown below.
Cash Cost and Net Ethanol Production Cost for the Chester Site $ per gallon ethanol, 25% owner equity
Cash Cost Net Production Cost Concentrated Acid $0.62 $0.90
Dilute Sulfuric Acid $0.80 $1.05
Dilute Nitric Acid $0.68 $0.86
35

One of the objectives of the Quincy Library Group is to facilitate thinning the forests in the area to reduce wildfire threat and improve forest health. One of the major obstacles to thinning large numbers of acres each year is the cost. Ethanol production utilizing the forest thmnings as feedstock may be a way to offset all or a significant portion of the thinning costs. A scenario was evaluated to determine the maximum feedstock cost that an ethanol facility could pay and still return 15% IRR on the owner's equity for the ethanol facility. The 15% IRR in this type of analysis is also known as the "hurdle rate." Again, owner equity was assumed to be 25% with 7% interest on the remaining debt. The resuIts are shown below for the Chester site and each technology.
Concentrated Acid . Sulfuric Acid I Process Utility
Process
Maximum Feedstock Cost with 25% Equity and 15% Hurdle Rate €or the Chester Site
Nitric Acid Process
Concentrated Acid $19.17 per BDT
low pressure steam, I b h
high pressure steam, l b h
wastewater, gpm
Dilute Sulfuric Acid $14.55 per BDT
140,400 44,370 3 1,070
12,500 80,525 57,600
38 0 0
Dilute Nitric Acid $27.58 per BDT
process water, gpm
Coproducts
Utility Requirements
58 0 30
The utility requirements for an ethanol plant utilizing the concentrated acid, dilute nitric acid, and dilute sulfuric acid at the Chester site are listed in Table 5 . The cost for the utilities, feedstock, lignin and CO, assumed for the process and economic analysis are shown in Table 4 and Figure 6.
Lignin residue, b/hr 65,050 59,640 65,575
Carbon dioxide, lb/hr 0 0 0
Yeast celI mass, I b h 418 100 100
r r - p -
Table 5. Utility Requirements and Coproducts for the Chester Site
I electricity, MW I 4.4 I 4.3 I 3.6 I
36

Figure 7
Chester, California Site
Collins Pine Co.
Timber harvest residue, 21 3,000 bdtlyr, $20/bdt
Forest thinnings, 55,000 bdt/yr, $20/bdt
Resources a Concentrated Acid Technology
- or - Dilute Nitric Acid Technotogy
-or -
vailable:
7.5 MW biomass electricity
high and low pressure steam
Zurn fixed-grate biomass boiler
Two-Stage Dilute Sulfuric Acid Technology
500+ gpm water from Stover Ditch
Administrative and support facilities
1 I I
Ethanol, $1.20/aal Treated Wastewater
Gypsum, $O/bdt
C02, $O/ton
37

Lx. Greenville Site
h a n term
The Greenville site is owned by Carl Pew and was previously occupied by a lumber mill, but most of those facilities have been removed. This is a "greenfield" site as there is no infrastructure at the site. Electricity could be generated on site with a new turbine generator or purchased from the grid. Purchase from the grid is assumed for the analysis of t h i s site. A natural gas fired packaged boiler will be purchased for steam generation. The capital cost for other utilities as well as buildings, yard improvements, etc. is included in the analysis.
10 years
Significant quantities of CO, will be produced by the ethanol facility, but it is assumed that no CO, is sold at this site. It may be possible to develop a market for the CO,, but this is outside the scope of the current project.
Operating days per year
Inflation rate
The key economic assumptions used to develop the Greenville site capital and operating cost estimates are listed in Table 10. infrastructure available at the Greenville site and the costs assumed for utilities and new infrastructure are shown in Table 11 below.
345
3%
Table 10. Key Economic Assumptions for the Greenville Site
I Parameter I Assumed value I I Plant life I20years
I Reference year I 1997
I Design, construction and startup period I2years I I Ownerequity 125%
I b a n interest rate 17%
I Feedstock cost, delivered 1 $20.00 per BDT 1 ~ -7 ~ ~~ ~ I Ethanol selling price I $1.20 per gallon
I Federal income tax rate 134% 1 I California income tax rate 16% I I Contingency, % of Fixed Capital Investment I 10% I
38

Table 11. Greenville Site Infrastructure and Utility Costs
Electricity
Infrastructure
Yes $0 $0.05 per kW-hr
Available I Capital Cost I Operating Cost
I
l%ofFCI I $0
Process water
Potable water
Electrical substation and distribution
no 1% of FCI $0.31 per 1000 gal.
DO 1% of FCI $0.31 per loo0 gal.
no
Plant air
Instrument air
Process buildings
5% of FCI
~ ~ _ _ _ _ _ _ ~ __ ~~~~
no 0.5% of FCI $0
no 0.5% of FCI $0
no 2.5% of FCI $0
b w pressure steam I no
Yard lighting and communications
5% I $1.00per 1OOOlbs.
~~~~~~~ ~ ~
no 0.25% of FCI $0
High pressure steam I no 1 included above I $3.00 per lo00 Ibs.
Fences and gatehouse no
Steam distribution
0.5% $0
no
Cooling water I no I l%ofFCI
Chilled water 1 no I l%ofFCI
$0.09 per 1OOO gal.
$5.49 per 1000 gal.
Wastewater recovery no I 5% of FCI I included in elec.
Non-process buildings no I lS%ofFCI I $0
Building W A C I no I l%ofFCI I $0
Fire protection no I 2%ofFCI I $0
Rail siding I no I 0.5% I $0
* Capital Costs are expressed as a percentage of the fixed capital investment and are approximate. See page 5 of the Manufacturing Cost Summary Reports in Volume II for actual costs.
39

Design and Economic Analysis Results
The ethanol facility design for the Greenville site is based on a feedrate of 335,000 bone dry tons (BDT) of feedstock per year. This results in annual production capacities ranging from 17.4 million to 28.2 million gallons of ethanol for the three different biomass conversion technologies. The feedstock is assumed to be forest hnnings and timber harvest residues at a cost of $20.00 per BDT delivered to the ethanol facility.
Results of the design and capital cost estimates for the Greenville site are summarized below. Manufacturing Cost Summary Reports for the three biomass conversion technologies for the Greenville site are included in Appendix F. The Manufacturing Cost Summary Reports provide a detailed breakdown of the facility capital and operating costs.
Technology Ethanol Plant Size Total Capital Investment
Concentrated Acid 28,200,000 gallons/year $1 14,400,000
Dilute Sulfuric Acid 17,400,000 gallondyear $69,200,000
Dilute Nitric Acid 17,400,000 gallons/year $52,200,000
The internal rate of return (IRR), also known as discounted cash flow rate of return, is reported below for each technology with facility owner equity at 100%.
IRR with 100% Equity for the Greenville Site
Concentrated Acid 4%
Dilute Sulfuric Acid -3%
Dilute Nitric Acid 3%
Projects of this magnitude are rarely financed with 100% owner equity. It is well known that favorable financing can leverage the owner's equity and dramatically increase the IRR. A scenario with 25% owner equity and 75% debt financing was evaluated. A loan interest rate of 7% with a 10 year loan term was chosen to represent perhaps the best possible financing scenario. A loan with very low interest may be available from the following three sources: the new electric utility restructuring Public Interest Energy Research (PIER) Program, the California Pollution Control Financing Authority, or the California Alternative Energy Financing Authority.
40

Results of the IRR cdculations with 25% owner equity and 75% debt financing at 7% interest rate are shown below. Leveraging effects are not significant unless the JRR at 100% owner equity is higher than the loan interest rate.
IRR with 25% Equity for the Greenville Site
Concentrated Acid 7%
Dilute Sulfuric Acid -4%
Dilute Nitric Acid 6%
The full cash cost of production and net ethanol production cost with 25% owner equity was determined. Full cash cost and net production cost are defined as follows:
variable costs (raw materials and utilities)
maintenance, supplies, local taxes and insurance) + fixedcosts (labor and labor related costs, plant overhead,
- coproduct credits (for lignin and yeast cell mass) = full cash cost of production + capital depreciation
+ financing costs (net interest on debt financing) = net ethanol production cost
The resulting full cash cost of production and net production costs for the Greenville site for each technology are shown below.
Cash Cost and Net Ethanol Production Cost for the Greenville Site $ per gallon ethanol, 25% owner equity
Cash Cost Net Production Cost Concentrated Acid $0.76 $1.05
Dilute Sulfuric Acid $1.04 $1.31
Dilute Nitric Acid $0.93 $1.13
41

One of the objectives of the Quincy Library Group is to facilitate thinning the forests in the area to reduce wildfire threat and improve forest health. One of the major obstacles to thinning large numbers of acres each year is the cost. Ethanol production utilizing the forest thinnings as feedstock may be a way to offset all or a significant portion of the thinning costs. A scenario was evaluated to determine the maximum feedstock cost that an ethanol facility could pay and still return 15% IRR on the owner's equity for the ethanol facility. The 15% IRR in this type of analysis is also known as the "hurdle rate." Again, owner equity was assumed to be 25% with 7% interest on the remaining debt. The results are shown below for the Greenville site and each technology.
Utility
electricity, MW
low pressure steam, lbkr
Maximum Feedstock Cost with 25% Equity and 15% HurdIe Rate for the Greenville Site
Concentrated Acid . Sulfuric Acid Nitric Acid Process Process process
4.9 4.7 4.0
157,340 49,370 34,440
Concentrated Acid $6.50 per BDT
high pressure steam, lbhr
wastewater, gpm
Dilute Sulfuric Acid -$0.58 per BDT
14,050 90,525 64,770
43 0 0
Dilute Nitric Acid $12.36 per BDT
process water, gpm
Utility Requirements
The utility requirements for an ethanol plant utilizing the concentrated acid, dilute nitric acid, and dilute sulfuric acid at the Greenville site are listed in Table 12. The cost for the utilities, feedstock, lignin and CO, assumed for the process and economic analysis are shown in Table 11 and Figure 8.
Table 12. Utility Requirements and Coproducts for the Greenville Site
-
65 0 35
Coproducts
Lignin residue, I b h 73,125 67,040 73,720
Carbon dioxide, lb/hr
Yeast cell mass, l b h
0 0 0
470 112 112
42

Figure 8
Potable Water, $0.31/1000 gal
Lignin, $15/bdt (note 1) b
GreenviIIe, California Site
Carl Pew Property
Two-Stage Dilute Sulfuric Acid Technology
Notes: (1) Lignin to be sold to a nearby biomass power plant.
43

X. Loyalton Site
Parameter
Plant life
Reference year
The Loyalton site is located at the Sierra Pacific Industry lumber mill in ]Loyalton, California. Infrastructure available at th is site includes steam and electricity from the mill's 20 MW biomass power plant, process and potable water and sanitary sewer facilities, existing office buildings and maintenance facilities, and mill residue (sawdust and wood chips) which may be available from the Sierra Pacific Industry mill at a relatively low cost. The biomass power plant could also utilize the ethanol plant's lignin residue as boiler fuel.
Assumed value
20 years
1997
Significant quantities of CO, will be produced by the ethanol facility, but it is assumed that no CO, is sold at this site. It may be possible to develop a market for the CO,, but this is outside the scope of the current project.
Design, construction and startup period
Owner equity
The key economic assumptions used to develop the Loyalton site capital and operating cost estimates are listed in Table 13. Infrastructure available at the Loyalton site and the costs assumed for utilities and new infrastructure are shown in Table 14 below.
2 years
25%.
Table 13. Key Economic Assumptions for the Loyalton Site
Loan term
Loan interest rate
10 years
7%
Contingency, % of Fixed Capital Investment 10%
I Feedstock cost, delivered I $20.00 per BDT
I Ethanol selling price I $1.20 per galion
I Operating days per year I345
I Inflation rate ] 3%
1 Federal income tax rate 134%
I California income tax rate 16%
44

Table 14. Loyalton Site Infrastructure and Utility Costs
Infrastructure
Electricity
Electrical substation and distribution
Low pressure steam
High pressure steam
Steam distribution
Process water
Potable water
Cooling water
Chilled water
Wastewater recoveIy
Plant air
Instrument air
Process buildings
Non-process buildings
Building W A C
Fire protection
Yard lighting and communications
Fences and gatehouse
Rail siding
Available Capital Cost Operating Cost
Yes $0 $0.05 per kW-hr
no 1-3% O f FCI $0
Yes $0 $1 .OO per loo0 Ibs.
Yes $0 $3.00 per 1OOO lbs.
no 0.5% of FCI $0
0.1% of FCI $0.31 per lo00 gal. Yes
Yes 0.1% of FCI $0.31 per 1000 gal.
no 1.5% of FCI $0.09 per lo00 gal.
no 1% of FCI $5.49 per 1000 gal.
no 5% included in elec.
Yes 0.3% of FCI $0
Yes 0.5% of FCI $0
no 2-3% of FCI $0
Yes $0 $0
no .25% of FCI $0
no .5% of FCI $0
no 0.2% of FCI $0
Yes $0 $0
Yes $0 $0
Capital Costs are expressed as a percentage of the fixed capital investment and are approximate. See page 5 of the Manufacturing Cost Summary Reports in Volume II for actual costs. The concentrated acid cost estimate includes a low pressure boiler due to the high steam demand.
45

Design and Economic Analysis Results
The ethanol facility design for the Loyalton site is based on a feedrate of 228,000 bone dry tons (BDT) of feedstock per year. This results in annual production capacities ranging from 11.8 million to 19.1 million gallons of ethanol for the three different biomass conversion technologies. The feedstock is assumed to be forest thinnings and timber harvest residues at a cost of $20.00 per BDT delivered to the ethanol facility.
Results of the design and capital cost estimates for the Loyalton site are summarized below. Manufacturing Cost Summary Reports for the three biomass conversion technologies for the Loyalton site are included in Appendix G. The Manufacturing Cost Summw Reports provide a detailed breakdown of the facility capital and operating costs.
Technology Ethanol Plant Size Total Capital Investment
Concentrated Acid 19,100,OOO gallons/year $87,7OO,OOo
Dilute Sulfuric Acid 1 1,800,000 gallons/year $48,000,000
Dilute Nitric Acid 1 1,800,000 gallons/year $34,800,000
The internal rate of return (IRR), also known as discounted cash flow rate of return, is reported below for each technology with facility owner equity at 100%.
IRR with 100% Equity for the Loyalton Site
Concentrated Acid 5%
Dilute Sulfuric Acid 2%
Dilute Nitric Acid 9%
Projects of this magnitude are rarely financed with 100% owner equity. It is well known that favorable financing can leverage the owner's equity and dramatically increase the IRR. A scenario with 25% owner equity and 75% debt financing was evaluated. A loan interest rate of 7% with a 10 year loan term was chosen to represent perhaps the best possible financing scenario. A loan with very low interest may be available from the following three sources: the new electric utility restructuring Public Interest Energy Research (PIER) Program, the California Pollution Control Financing Authority, or the California Alternative Energy Financing Authority.
46

Results of the IRR calculations with 25% owner equity and 75% debt financing at 7% interest rate are shown below. Leveraging effects are not significant unless the IRR at 100% owner equity is higher than the loan interest rate.
IRR with 25 % Equity for the Loyalton Site
Concentrated Acid 9%
Dilute Sulfuric Acid 4%
Dilute Nitric Acid 18%
The full cash cost of production and net ethanol production cost with 25% owner equity was determined. Full cash cost and net production cost are defined as follows:
variable costs (raw materials and utilities)
maintenance, supplies, local taxes and insurance) + fixedcosts (labor and labor related costs, plant overhead,
- coproduct credits (for lignin and yeast cell mass) = full cash cost of production + capital depreciation
+ financing costs (net interest on debt financing) = net ethanol production cost
The resulting full cash cost of production and net production costs for the Loyalton site for each technology are shown below.
Cash Cost and Net Ethanol Production Cost for the Loyalton Site $ per gallon ethanol, 25% owner equity
Cash Cost Net Production Cost Concentrated Acid $0.67 $1.00
Dilute Sulfuric Acid $0.87 $1.15
Dilute Nitric Acid $0.74 $0.94
47

One of the objectives of the Quincy Library Group is to facilitate thinning the forests in the area to reduce wildfire threat and improve forest health. One of the major obstacles to thinning large numbers of acres each year is the cost. Ethanol production utilizing the forest thinnings as feedstock may be a way to offset all or a significant portion of the thinning costs. A scenario was evaluated to determine the maximum feedstock cost that an ethanol facility could pay and stil l return 15% I[RR on the owner's equity for the ethanol facility. The 15% IRR in this type of analysis is also known as the "hurdle rate." Again, owner equity was assumed to be 25% with 7% interest on the remaining debt. The results are shown below for the Loyalton site and each technology.
l Utility
Maximum Feedstock Cost with 25% Equity and 15% Hurdle Rate for the Loyalton Site
1 ~ electricity, MW 3.4 3.4 2.8
low pressure steam, l b h 1 08,4 10 34,9 15 24,690
Concentrated Acid $7.56 per BDT
t I I I
I I t I
Dilute Sulfuric Acid $7.64 per BDT
' high pressure steam, lb/hr 9,575 61,615 44,085
wastewater, gpm 29 0 0
process water, gpm 44 0 23
Dilute Nitric Acid $22.40 per BDT
Concentrated Acid Process
Utility Requirements
. Sulfuric Acid Process
The utility requirements for an ethanol plant utilizing the concentrated acid, dilute nitric acid, and dilute sulfuric acid at the Loyalton site are listed in Table 15. The cost for the utilities, feedstock, lignin and CO, assumed for the process and economic analysis are shown in Table 14 and Figure 9.
Coproducts
Lignin residue, I b h
Carbon dioxide, lbhr
Yeast cell mass, lb/hr
Table 15. Utility Requirements and Coproducts for the Loyalton Site
49,770 45,630 50,170
0 0 0
320 76 76
Nitric Acid Process
48

Figure 9
Loyalton, California Site
Sierra Pacific Industries
Timber harvest residue, 122,000 bdt/yr, $20/bdt i
1 I Forest thinnings, 65,000 bdt/yr, $20/bdt
Pesou rces ava ilable:
10 MW biomass electricity
50,000 Ibhr 90 psi steam (note 1)
Fixed-grate biomass boiler
Concentrated Acid Technology
- or - Dilute Nitric Acid Technology
= or - Two-Stage Dilute Sulfuric Acid
Technology 400 gpm water from creek and well
Administrative and support facilities
L I I
Ethanol, $1.20/aal
Treated Wastewater
Gypsum, $Olbdt C02, $O/ton
b
Notes: (1) 865 psi steam is available from the boiler -- this pressure and temperature cart be reduced with a steam attemperator.
49

XI. Martell Site
Reference year
Design, construction and startup period
The Martell site is located at the Sierra Pacific Industry lumber mill in Martell, California. Infrastructure available at this site includes steam and electricity from Wheelabrator's 18 MW biomass power plant, process and potable water and sanitary sewer facilities, and existing office buildings and maintenance facilities. The biomass power plant could also utilize the ethanol plant's lignin residue boiler fuel.
1997
2 years
Significant quantities of CO, will be produced by the ethanol facility, but it is assumed that no CO, is sold at th is site. It may be possible to develop a market for the CO,, but h s is outside the scope of the current project.
Owner equity
Loan term
The key economic assumptions used to develop the Martell site capital and operating cost estimates are listed in Table 16. Infrastructure available at the Martell site and the costs assumed for utilities and new infrastructure are shown in Table 17 below.
25%.
10 years
Table 16. Key Economic Assumptions for the Martell Site
Operating days per year 345 ?
I Parameter I Assumed value
California income tax rate
Contingency, % of Fixed Capital Investment
~~
6%
10%
I b a n interest rate 17%
I Feedstock cost, delivered
1 Ethanol selling price I $1.20 per gdlon
1 hflationrate 13%
I Federal income tax rate 134%
50

Table 17. Martell Site Infrastructure and Utility Costs
1-3% of FCI I no Electrical substation and distribution
Infrastructure 1 AvaiIable I Capital Cost I Operating Cost
$0
$0 I $0.05 per kW-hr Electricity I Yes I
Potable water
Cooling water
Yes 0.1 % of FCI $0.31 per loo0 gal.
no 1.5% of FCI $0.09 per lo00 gal.
h w pressure steam I Yes I $0 I $1.00 per lo00 lbs.
Chilled water
Wastewater recovery
High pressure steam 1
no 1% of FCI $5.49 per lo00 gal.
no 5% included in elec.
Yes I $0 I $3.00 per lo00 lbs.
Process buildings
Non-process buildings
Steam distribution
no 2-3% of FCI $0
Yes $0 $0
no I OS%ofFCI I $0
0.2% of FCI
Process water
$0
0.1% of FCI 1 $0.31 per 1000 gal.
Rail siding Yes $0 $0
Plant air I Yes 0.3%ofFCI I $0
Instrument air I Yes 0.5%ofFCI 1 $0
Building HVAC 1 no I .25%ofFCI I $0
Fire protection I no
I no Yard lighting and communications
.5%ofFCI - 1 $0
Fences and gatehouse I Yes I $0 I $0
Capital Costs are expressed as a percentage of the fixed capital investment and are approximate. See page 5 of the Manufacturing Cost Summary Reports in Volume II for actual costs. ’ The concentrated acid cost estimate includes a low pressure boiler due to the high steam demand.
51
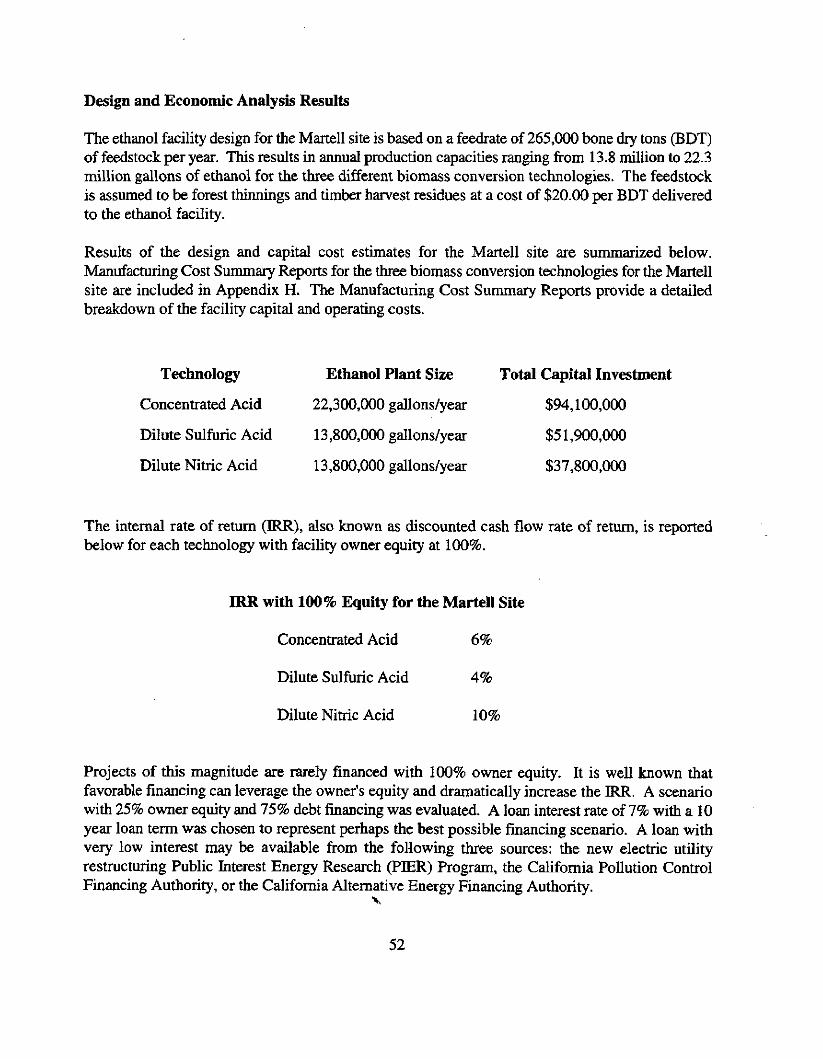
Design and Economic Analysis Results
The ethanol facility design for the Martell site is based on a feedrate of 265,000 bone dry tons (BDT) of feedstock per year. This results in annual production capacities ranging from 13.8 million to 22.3 million gallons of ethanol for the three different biomass conversion technologies. The feedstock is assumed to be forest thinnings and timber hamest residues at a cost of $20.00 per BDT delivered to the ethanol facility.
Results of the design and capital cost estimates for the Martell site are summarized below. Manufacturing Cost Summary Reports for the three biomass conversion technologies for the Martell site are included in Appendix H. The Manufacturing Cost Summary Reports provide a detailed breakdown of the facility capital and operating costs.
Technology Ethanol Plant Size Total Capital Investment
Concentrated Acid 22,300,000 gallons/year $94,100,000
Dilute Sulfuric Acid 13,800,000 gaIlons/year $5 1,900,000
Dilute Nitric Acid 13,8OO,OOO gallondyear $37,800,000
The internal rate of return (IRR), also known as discounted cash flow rate of return, is reported below for each technology with facility owner equity at 100%.
IRR with 100% Equity for the Martell Site
Concentrated Acid 6%
Dilute Sulfuric Acid 4%
Dilute Nitric Acid 10%
Projects of this magnitude are rarely financed with 100% owner equity. It is well known that favorable financing can leverage the owner's equity and dramatically increase the IRR. A scenario with 25% owner equity and 75% debt financing was evaluated. A loan interest rate of 7% with a 10 year loan term was chosen to represent perhaps the best possible financing scenario. A loan with very low interest may be available from the following three sources: the new electric utility restructuring Public Interest Energy Research (PIER) Program, the California Pollution Control Financing Authority, or the California Alternative Energy Financing Authority.
%
52

Results of the IRR calculations with 25% owner equity and 75% debt financing at 7% interest rate are shown below. Leveraging effects are not significant unless the IRR at 100% owner equity is higher than the loan interest rate.
IRR with 25% Equity for the Martell Site
Concentrated Acid 12%
Dilute Sulfuric Acid 7%
Dilute Nitric Acid 22%
The full cash cost of production and net ethanol production cost with 25% owner equity was determined. Full cash cost and net production cost are defined as follows:
variable costs (raw materials and utilities)
maintenance, supplies, local taxes and insurance) + fixedcosts (labor and labor related costs, plant overhead,
- coproduct credits (for lignin and yeast cell mass) = full cash cost of production + capital depreciation
+ financing costs (net interest on debt financing)
= net ethanol production cost
The resulting full cash cost of production and net production costs for the Martell site for each technology are shown below.
Cash Cost and Net Ethanol Production Cost for the Martell Site $ per gallon ethanol, 25% owner equity
Cash Cost Net Production Cost Concentrated Acid $0.64 $0.94
Dilute Sulfuric Acid $0.83
Dilute Nitric Acid $0.70
$1.09
$0.89
53

One of the objectives of the Quincy Library Group is to facilitate thinning the forests in the area to reduce wildfire threat and improve forest health. One of the major obstacles to thinning large numbers of acres each year is the cost. Ethanol production utilizing the forest thinnings as feedstock may be a way to offset all or a significant portion of the thinning costs. A scenario was evaluated to determine the maximum feedstock cost that an ethanol facility could pay and still return 15% IRR on the owner's equity for the ethanol facility. The 15% TRR in this type of analysis is also known as the "hurdle rate." Again, owner equity was assumed to be 25% with 7% interest on the remaining debt. The results are shown below for the Martell site and each technology.
Maximum Feedstock Cost with 25% Equity and 15% Hurdle Rate for the Martell Site
Concentrated Acid $14.34 per BDT
Dilute Sulfuric Acid $1 1.67 per BDT
Dilute Nitric Acid $25.44 per BDT
Utility Requirements
The utility requirements for an ethanol plant utilizing the concentrated acid, dilute nitric acid, and dilute sulfuric acid at the Martell site are listed in Table 18. The cost for the utilities, feedstock, lignin and CO, assumed for the process and economic analysis are shown in Table 17 and Figure 10.
Table 18. Utility Requirements and Coproducts for the Martell Site

Figure 10
Resources a vailable:
18 MW biomass electricity
high 8 low pressure steam
biomass boiler
Martell, California Site
Sierra Pacific Industries
Wood chips, 0 bdt/yr, $20/bdt
Electricity, $0.05/kw-hr - or - Steam, $1 .OO & $3.00/1000 Ibs Dilute Nitric Acid Technofogy
Process Water, $0.31/1000 gal - or -
Concentrated Acid Technology b b
b
,
Timber hatvest residue, 200,000 bdt/yr, $20/bdt
Forest thinnings, 65,000 bdtlyr, $20/bdt
Ethanol. $1.20/gal
Treated Wastewater
Gypsum, $Oh& C02, $Ohon

XII. Westwood Site
The Westwood site is located at the Mt. h s e n Power Plant near Westwood, California. Infrastructure available at this site includes steam and electricity from the 13 M W biomass power plant, process and potable water and sanitary sewer facilities. The biomass power plant provides a relatively high-value use for the ethanol plant's lignin residue as boiler fuel. Use of the existing office buildings and maintenance facilities will lower the capital cost of the ethanol facility.
Significant quantities of CO, will be produced by the ethanol facility, but it is assumed that no CO, is sold at this site. It may be possible to develop a market for the CO,, but this is outside the scope of the current project.
The key economic assumptions used to develop the Westwood site capital and operating cost estimates are listed in Table 19. Infrastructure available at the Westwood site and the costs assumed for utilities and new infrastructure are shown in Table 20 below.
Table 19. Key Economic Assumptions for the Westwood Site
Parameter
Plant life
Reference year
Design, construction and startup period
Owner equity
Loan term
Loan interest rate
Feedstock cost, delivered
Ethanol selling price
Operating days per year
Inflation rate
Federal income tax rate
California income tax rate
Contingency, % of Fixed Capital Investment
Assumed value I 20 years I 1997 I 2 years I 25% I 10 years I 7% I $20.00 per BDT I $1.20 per gallon I 345 I 3%
34%
6% I 10%
56

Process water
Potable water
Yes 0.1% of FCI $0.31 per lo00 gal.
Yes 0.1% of FCI $0.31 per 1000 gal.
Cooling water
Chilled water
no 1.5% of FCI
no 1% of FCI
Non-process buildings
Building HVAC
Yes $0 $0
no .25% of FCI $0
Table 20. W e s t w d Site Infrastructure and Utility Costs
Infrastructure I Available I Capital Cost I Operating Cost
Electricity I Yes I $0 $0.05 per kW-hr
Electrical substation and distribution
1-3% of FCI $0 no
LOW pressure steam I Yes $0 $1.00 per 1000 lbs.
High pressure steam I Yes I $0 I $3.OOper 1OOOlbs.
Steam distribution I no I OS%ofFCI I $0
$0.09 per lo00 gal.
$5.49 per IOOO gal.
wastewater recovery I no I 5% I included in elec.
Fire protection 1 no I .5%ofFCI I $0
Yard lighting and communications
0.2% of FCI $0 no
Fences and gatehouse Yes I $0
Rail siding I Yes I $0 I $0
' Capital Costs are expressed as a percentage of the fixed capital investment and are approximate. See page 5 of the Manufacturing Cost Summary Reports in Volume It for actual costs. The concentrated acid cost estimate includes a low pressure boiler due to the high steam demand.
57

Design and Economic Analysis Results
The ethanol facility design for the Westwood site is based on a feedrate of 27 1,000 bone dry tons (BDT) of feedstock per year. This results in annual production capacities ranging from 14.1 million to 22.8 million gallons of ethanol for the three different biomass conversion technologies. The feedstock is assumed to be forest thinnings and timber harvest residues at a cost of $20.00 per BDT delivered to the ethanol facility.
Results of the design and capital cost estimates for the Westwood site are summarized below. Manufacturing Cost Summary Reports for the three biomass conversion technologies for the Westwood site are included in Appendix I. The Manufacturing Cost Summary Reports provide a detailed breakdown of the facility capital and operating costs.
Technology Ethanol Piant Size Total Capital Investment
Concentrated Acid 22,800,000 gallons/year $95,100,000
Dilute Sulfuric Acid 14,100,000 gallons/year $52,500,000
Dilute Nitric Acid 14,100,000 gallons/year $38,200,000
The internal rate of return (IRR), also known as discounted cash flow rate of return, is reported below for each technology with facility owner equity at 100%.
IRR with 100% Equity for the Westwood Site
Concentrated Acid 6%
Dilute Sulfuric Acid 4%
Dilute Nitric Acid 10%
Projects of this magnitude are rarely financed with 100% owner equity. It is well known that favorable financing can leverage the owner's equity and dramatically increase the IRR. A scenario with 25% owner equity and 75% debt financing was evaluated. A loan interest rate of 7% with a 10 year loan term was chosen to represent perhaps the best possible financing scenario. A loan with very low interest may be available from the following three sources: the new electric utility restructuring Public Interest Energy Research (PIER) Program, the California Pollution Control Financing Authority, or the California Alternative Energy Financing Authority.
58

Results of the JRR calculations with 25% owner equity and 75% debt financing at 7% interest rate are shown below. Leveraging effects are not significant unless the IRR at 100% owner equity is higher than the loan interest rate.
IRR with 25% Equity for the Westwood Site
Concentrated Acid 12%
Dilute Sulfuric Acid 7%
Dilute Nitric Acid 23%
The full cash cost of production and net ethanol production cost with 25% owner equity was detennined. Full cash cost and net production cost are defined as follows:
variable costs (raw materials and utilities)
maintenance, supplies, local taxes and insurance) + fixedcosts (labor and labor related costs, plant overhead,
- coproduct credits (for lignin and yeast cell mass) = full cash cost of production + capital depreciation + financing costs (net interest on debt financing)
= net ethanol production cost
The resulting full cash cost of production and net production costs for the Westwood site for each technology are shown below.
Cash Cost and Net Ethanol Production Cost for the Westwood Site $ per gallon ethanol, 25% owner equity
Cash Cost Net Production Cost Concentrated Acid $0.64 $0.94
Dilute Sulfuric Acid $0.82 $1.08
Dilute Nitric Acid $0.70 $0.89
59

One of the objectives of the Quincy Library Group is to facilitate thinning the forests in the area to reduce wildfire threat and improve forest health. One of the major obstacles to thinning large numbers of acres each year is the cost. Ethanol production utilizing the forest thinnings as feedstock may be a way to offset all or a significant portion of the thinning costs. A scenario was evaluated to determine the maximum feedstock cost that an ethanol facility could pay and still return 15% IRIi on the owner's equity for the ethanol facility. The 15% IRR in this type of analysis is also known as the "hurdle rate." Again, owner equity was assumed to be 25% with 7% interest on the remaining debt+ The results are shown below for the Westwood site and each technology.
Concentrated Acid Process
Maximum Feedstock Cost with 25 % Equity and 15 % Hurdle Rate for the Westwood Site
Sulfuric Acid process
Concentrated Acid $15.33 per BDT
electricity, M W
low pressure steam, l b h
Dilute Sulfuric Acid $12.21 per BDT
4.0 3.9 3.3
128,075 40,725 28,6 10
Dilute Nitric Acid $25.87 per BDT
high pressure steam, l b h
Utility Requirements
1 1,370 73,230 52,400
The utility requirements for an ethanol plant utilizing the concentrated acid, dilute nitric acid, and dilute sulfuric acid at the Westwood site are listed in Table 21. The cost for the utilities, feedstock, lignin and CO, assumed for the process and economic analysis are shown in Table 20 and Figure 1 1.
process water, gpm
Coproducts
Lignin residue, l b h
Carbon dioxide, l b h
Yeast cell mass, l b h
Table 21. Utility Requirements and Coproducts for the Westwood Site
52 0 28
59,155 54,235 59,635
0 0 0
380 91 91
Utility Nitric Acid Process
I wastewater, gpm I 35 I 0 I 0 I
60

Figure 11
Westwood, California Site
Mt. Lassen Power
Concentrated Acid Technology
- or - Dilute Nitric Acid Technology
- or -
Resources available:
10 MW biomass electricity
150 psi steam (note 1 )
Zurn traveling grate biomass boiler
Two-Stage Dilute Sulfuric Acid Technology
300 gpm water from well
Administrative and support facilities
I I I
Ethanol, $1.20/nal
Treated Wastewater
Gypsum, $O/bdt
b b
b C02, $O/ton b
Notes: (1) Each 10,000 pound per hour (pph) of steam used, decreases net electricity output by 1 MW. e.g. at 40,000 pph steam use, net electricity output is 6 MW.
Superheat can also be added to the steam.
61

XIII. Sensitivity Analyses
Parameter
Ethanol Plant Size, million gal ethanol/year
Delivered Feedstock Cost, $/BDT
Feedstock Composition,
Ethanol Selling Price,
Owner Equity, %
Facility Capital Cost, % of reference case cost
Annual Manufacturing Cost, % of ref. case cost
Annual Direct Labor Cost, % of ref. case cost
%glucan
$/gal
Sensitivity analyses were performed to determine the economic impact of critical variables such as ethanol plant size, feedstock cost and composition, ethanol selling price, percent owner equity, plant capital cost, annual operating costs, and direzt labor costs. Sensitivity analyses were performed for the dilute nitric acid process at the Chester site only because this site and process combination has a high IRR and the sensitivity analyses are very time consuming. Again, owner equity was assumed to be 25% with 7% interest on the remaining debt.
Minimum Reference Value Maximum
6.0 15.5 19.0
$0.00 $20.00 $38.00
32.9% 42.9% 52.9%
$1.00 $1.20 $1.40
5% 25% 100%
70% 100% 130%
80% 100% 120%
70% 100% 130%
The reference values and the minimum and maximums used for the sensitivity analyses are shown in Table 8 below. Graphs of the results of the sensitivity analyses are at the end of this section.
The IRR is most sensitive to feedstock cost and owner equity. Ethanol plant size, annual manufacturing cost, ethanol selling price, ethanol facility capital cost, and feedstock composition all display moderate sensitivities. A 30% change in direct labor cost has relatively little effect on the IRR.
Table 8. Sensitivity Parameters for the Chester Site, Dilute Nitric Acid Process
62
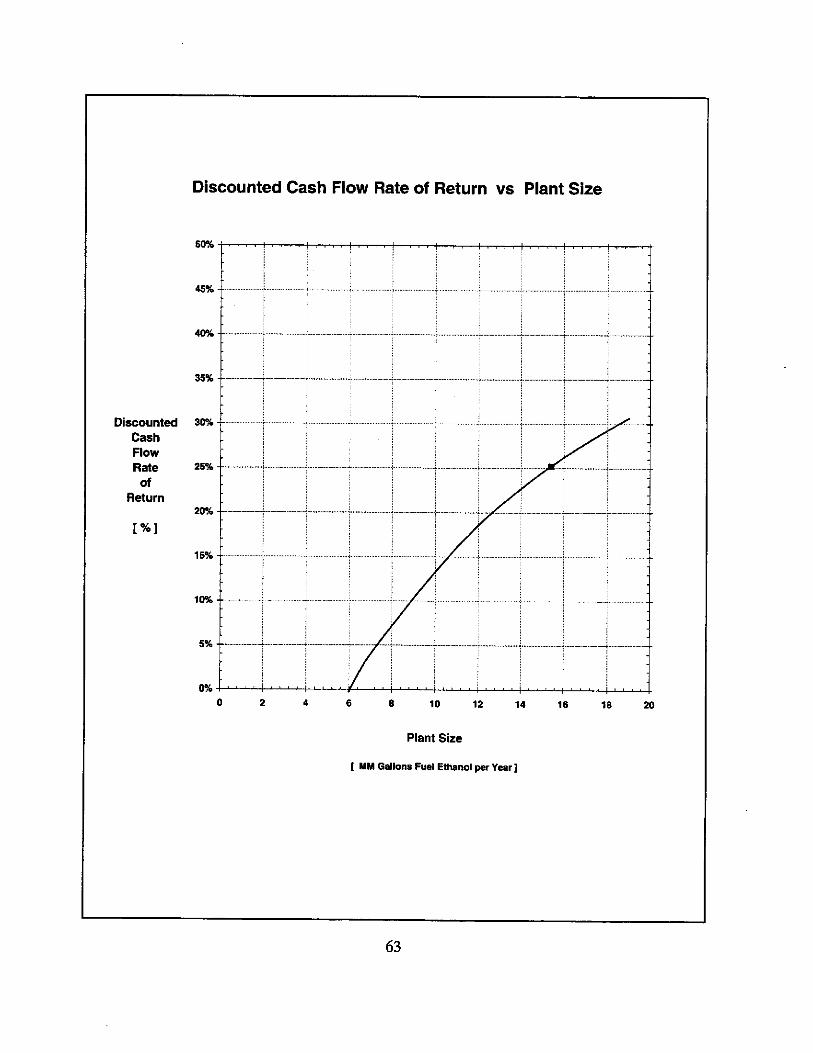


XIV. Conclusions and Recommendations
Conversion of forest thinnings and timber harvest residues appears to be economically feasible at the five sites in the study that have an existing biomass power plant and other infrastructure available. The undeveloped or "greenfield" site in Greenville requires the installation of a boiler to provide steam to the ethanol process as well as buildings and other infrastructure that adds significantly to the total capital cost making this site less appealing at this time.
Many technical, economic, and other assumptions have been made to perform the analyses reported in this study. Additional work is recommended to prove or disprove these assumptions and reduce the uncertainty of the results.
71

Biomass to Ethanol Facility Design, Cost Estimate,
and Financial Evaluation
Volume 11
Mark A. Yancey and Kiran L. Kadam National Renewable Energy Laboratory
1617 Cole Blvd. Golden, CO 80401
October 1997
Disclaimer
NOTICE: This report was prepared as an account of work sponsored by an agency of the United States government. Neither the United States government nor any agency thereof, nor any of their employees, makes any wmanty, express or implied, or assumes any legal liability or responsibility for the accuracy, completeness, or usefulness of any infomation, apparatus, product, or process disclosed, or represents that its use would not infringe privately owned rights. Reference herein to any specific commercial product, process, or service by trade name, trademark, manufacturer, or otherwise does not necessarily constitute or imply its endorsement, recommendation, or favoring by the United States government or any agency thereof. The views and opinions of authors expressed herein do not necessarily state or reflect those of the United States government or any agency thereof.
This work was funded by the Bioconversion Element of the Office of Fuels development of the U.S. Department of Energy.

APPENDIX A
ARKENOL CONCENTRATED SULFURIC ACID
PROCESS FLOW DIAGRAMS
AND
EQUIPMENT LIST


APPENDIX B
TWO-STAGE DILUTE SULFURIC ACID
PROCESS FLOW DIAGRAMS
AND
EQUIPMENT LIST
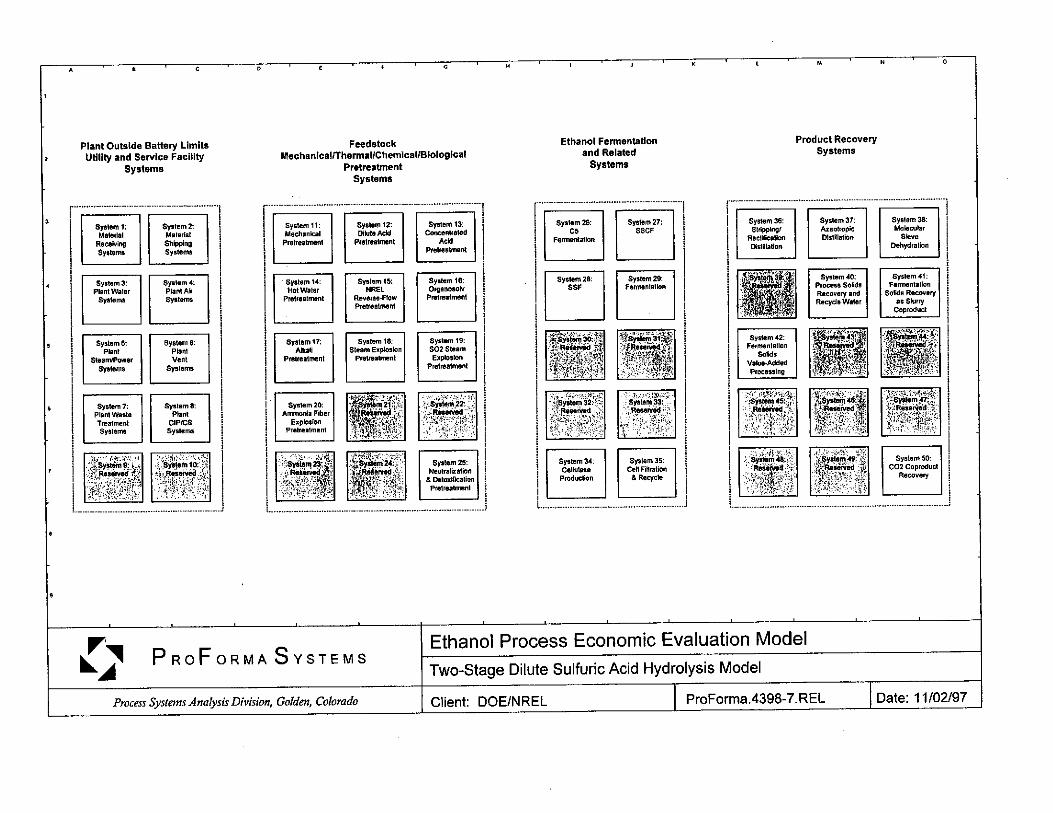


APPENDIX C
HF'TA SINGLE-STAGE DILUTE NITRIC ACID
PROCESS FLOW DIAGRAMS
AND
EQUIPMENT LIST

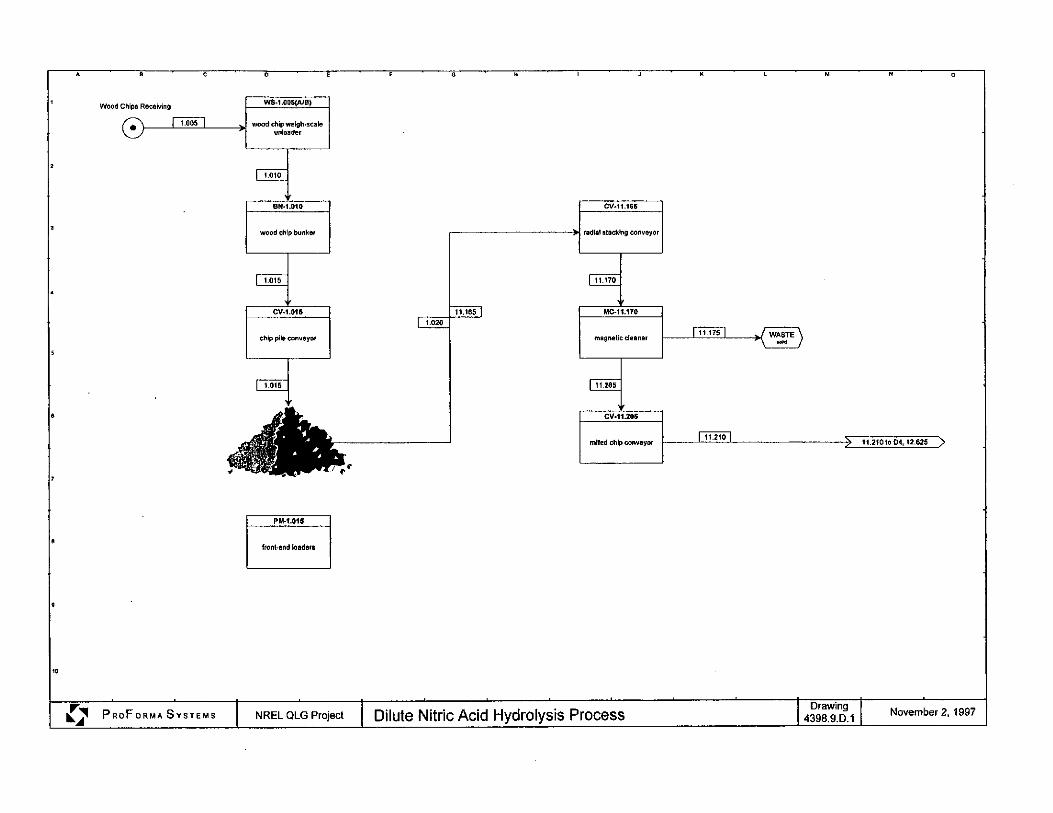


APPENDIX D
MANUFACTURING COST SUMMARY REPORTS
ANDERSON SITE

Biofuels Economic Assessment Model
Arkenol Concentrated Sulfuric Acid Hydrolysis Process, Anderson site
M a n u f a c t u r i n g C o s t S u m m a r y R e p o r t
This report was prepared by Proforma Systems, lnc. in cooperation with the United States Department of Energy's National Renewable Energy Laboratory. The material in it reflects Proforma Systems' best judgement in light of the information available at the time of preparation. Any use which a third party makes of this report, or any reliance on or decisions to be made based on it, are the responsibility of such third party. ProFoma Systems accepts no responsibility for damages, if any, suffered by any third parfy as a result of decisions made or actions taken
based on this repori.

Manufacturing Cost Summary Report for the Northeastern California Ethanol Manufacturing Feasibility Study
Case Study: Atkenol Concentrated Sulfuric Acid Hydrolysis Process, Anderson site
Key Economic Assumptions Plant location
Plant life Plant start up
Reference year Plant construction cost index
Index value for reference date
Hurdle Rate I Internat Rate of Return Net present worth at end of project life
lnffation rate
Federal income tax rate State income tax rate
Combined federal and state income tax rate
California Plant namepfate product capacity 20 years
1997 1997 Plant nameplate feedstock capacity
CE 385
8.20% $0
Facility Capital Cost Fixed capital investment
Working capital investment Total capital investment
3.00% Facility installed cost
34.00% 6.00%
37.96%
Owner equity financing 25% Effective toan rate 7.0%
Annuitized loan payment $9,783,000
Notes: (f) BDT = bone-dry short ton (2,000 Ibs.)
Case Study: Arkenol Concentrated Sulfuric Acid Hydrolysis Process, Anderson site
ProForr /stems, Inc.
Assumed fuel ethanol selling price
Assumed feedstock cost
Ethanol yield per BDT feedstock
Facility electrical power requirement
22,300,000 gallons per year
265,000 BDT per year 768 8DT per day
$86,486,000 $3,668,000
$90,154,000
$4.04 per annual gaflon
$1.20 per gallon
$20.00 per BDT
84.2 gallon per BDT
3.90 MW
NREL.BEAM.Pb, 1 ill 7/97, a g e f


Biofuels Economic Assessment Model
2-Stage Dilute Sulfuric Acid Hydrolysis, Anderson site
M a n u f a c t u r i n g C o s t S u m m a r y R e p o r t
This report was prepared by ProFoma Systems, Inc. in cooperation with the United States Department of Energy's National Renewab/e €nergy Laboratory. The material in it reflecfs PruForma Systems' best judgement in light of the information available at the time of preparation. Any use which a fhird party makes of this report, or any reliance on or decisions to be made based on it, are the responsibility of such third party. ProForma Systems accepts no responsibikty for damages, if any, suffered by any third party as a result of decisions made or actions taken
based on this report.

Manufacturing Cost Summary Report for the Northeastern California Ethanol Manufactwing Feasibility Study
Case Study: 2-Stage Dilute Sulfuric Acid Hydrolysis, Anderson site
Key Economic Assumptions Plant location
Plant life Plant start up
Reference year Plant construction cost index
Index value for reference date
Hurdle Rate / Internal Rate of Return Net present worth at end of project life
Inflation rate
Federal income tax rate State income tax rate
Combined federal and state income tax rate
California
1997 1997
CE 385
20 years
8.59% $0
3.00%
34.00% 6.00%
37.96%
Owner equity financing 25% Effective loan rate 7.0%
Annuitized loan payment $4,886,000
Notes: {I) BDT = bone-dry short ton (2.000 Ibs.)
Case Studv: 2-Stage Dilute Sulfuric Acid Hydrolysis, Anderson site
ProFor, ystems, Inc.
Plant nameplate product capacity
Plant nameplate feedstock capacity
Facility Capital Cost Fixed capital investment
Working capital investment Total capital investment
Facility instafled cost
Assumed fuel ethanol selling price
Assumed feedstock cost
Ethanol yield per BDT feedstock
Facility electrical Dower requirement
13,800,000 gallons per year
265,000 BDT per year 768 BDT per day
$44,374,000 $2,374,000
$46,749,000
$3.39 per annual gatlon
$1.20 per gatlon
$20.00 per BDT
51.9 gallon per BDT
2.00 MW
NREL.BEAM.1 .XIS, 1116/97, ,- a g 8 I


P R O F O R M A S Y S T E M S
Biofuels Economic Assessment Model
Single-Stage Dilute Nitric Acid Hydrolysis, Anderson site
M a n u f a c t u r i n g C o s t S u m m a r y R e p o r t
This report was prepared by ProForma Systems, lnc. in cooperation with fhe United States Department of Energy's National Renewable Energy Laboratow. The material in it reflects PtvForma Systems' best judgement in light of the information available at the time of preparation. Any use which a third patty makes of this repotf, or any reliance on or decisions to be made based on it, are the responsibility of such third party. ProForma Systems accepts no responsibility for damages, if any, suffered by any third party as a result of decisions made or actions taken
based on this report.

Manufacturing Cost Summary Report for the Northeastern California Ethanol Manufacturing Feasibility Study
Case Study: Single-Stage Dilute Nitric Acid Hydrolysis, Anderson site
Key Economic Assumptions Plant location
Plant life Plant start up
Reference year Plant construction cost index
Index value for reference date
Hurdle Rate / Internal Rate of Return Net present worth at end of project life
Inflation rate
Federal income tax rate State income tax rate
Combined federal and state income tax rate
California
1997 4997
CE 385
20 years
24.54% $0
3.00%
34.00% 6.00%
37.96%
Owner equity financing 25% Effective loan rate 7.0%
Annuitized loan payment $3,597,000
Notes: (1) BDT = bone-dry short ton (2,000 Ibs.)
Case Studv: Single-Stage Dilute Nitric Acid Hydrolysis, Anderson site
ProFor, Jystems, Inc.
Plant nameplate product capacity
Plant nameplate feedstock capacity
Facility Capital Cost Fixed capital investment
Working capital investment Total capital investment
Facility installed cost
Assumed fuel ethanol selling price
Assumed feedstock cost
Ethanol yield per BDT feedstock
facility electrical power requirement
‘l3,800,000 gallons per year
265,000 BDT per year 768 BDT per day
$32,403,000 $2,3Of,OOO
$34,404,000
$2.49 per annual gallon
$1.20 per gallon
$20.00 per BDT
51.9 gallon per BDT
2.39 MW
NREL.BEAMa2a, 91/6/97, a g e 1


APPENDIX E
MANUFACTURING COST SUlMhilARY REPORTS
CHESTER SITE

Biofuels Economic Assessment Model
Arkenol Concentrated Sulfuric Acid Hydrolysis Process, Chester site
M a n u f a c t u r i n g C o s t S u m m a r y R e p o r t
This reporf was prepared by Prof o m a Systems, lnc. in cooperafion with the United States Department of &nergy's National Renewable Energy Laboratory. The material in it reflects PmForma Systems' bedjudgement in light of the information available at the time of preparation. Any use which B third party makes of this report, or any reliance on or decisions to be made based on it, are the responsibility of such third party. ProForma Systems accepts no responsibility for damages, if any, suffered by any third party as a result of decisions made or actions faken
based on this repoff.

Manufacturing Cost Summary Report for the Northeastern California Ethanol Manufacturing Feasibility Study
Case Study: Arkenol Concentrated Sulfuric Acid Hydrolysis Process, Chester site
Key Economic Assumptions Plant location California Plant nameplate product capacity
Plant start up 1997
Plant construction cost index CE
Plant life 20 years
Reference year 1997 Plant nameplate feedstock capacity
Index value for reference date 385
Facility Capital Cost Fixed capital investment
Working capital investment Total capital investment
Hurdle Rate I Internal Rate of Return Net present worth at end of project life
14.56% $0
Inflation rate
Federal income tax rate State income tax rate
Combined federal and state income tax rate
3.00%
34.00% 6.00%
37.96%
Owner equity financing 25% Effective loan rate 7.0%
Annuitized loan payment $10,785,000
Notes: (1) BDT = bone-dry short ton (2,000 Ibs.)
Case Sta0av: Arkenol Concentrated Sulfuric Acid Hydrolysis Process, Chester site
ProFo. . Systems, Inc.
Facility installed cost
Assumed fuel ethanol selling price
Assumed feedstock cost
Ethanol yield per BDT feedstock
Facility electrical power requirement
25,100,000 gallons per year
298,000 BDT per year 864 BDT per day
$95,450,000 $4,084,000
$99,534,000
$3.97 per annual gallon
$1.20 per gallon
$20.00 per BDT
84.2 gallon per BDT
4.36 MW
NREL.BEAM.Zb, 11/11/97, P a g e I


P R O F O R M A S Y S T E M S
Biofuels Economic Assessment Model
2-Stage Dilute Sulfuric Acid Hydrolysis, Chester site
M a n u f a c t u r i n g C o s t S u m m a r y R e p o r t
This reporf was prepared by ProForma Systems, Inc. in cooperation with the United States Department of Energy's National Renewable Energy Laboratory. The material in it reflects ProForma Systems' best judgement in light of the information available at the time of preparation. Any use which a third party makes of this report, or any reliance on or decisions to be made based on it, are the responsibility of such third party. Proforma Systems accepts no responsibility for damages, if any, suffered by any third party as a result of decisions made or actions taken
based on this report.

Manufacturing Cost Summary Report for the Northeastern California Ethanol Manufacturing Feasibility Study
Case Study: 2-Stage Dilute Sulfuric Acid Hydrolysis, Chester site
Key Economic Assumptions Plant location California Plant nameplate product capacity 95,500,000 gallons per year
Plant life 20 years Plant start up 199f
Reference year 1997 Plant nameplate feedstock capacity 298,000 BDT per year Plant construction cost index CE 864 8DT per day
Index value for reference date 385
Hurdle Rate / Internal Rate of Return Net present worth at end of project life
Inflation rate
Federal income tax rate State income tax rate
Combined federal and state income tax rate
9.22% $0
3.00%
34.00% 6.00%
37.96%
Owner equity financing 25% Effective loan rate 7.0%
Annuitized loan payment $5,758,000
Notes: (1) BDT = bone-dly short ton (2,000 Ibs.)
Case S t W : 2-Stage Dilute Sulfuric Acib Hydrolysis, Chester site
ProFo, Systems, Inc.
Facility Capital Cost Fixed capital investment $52,419,000
Working capital investment $2,675,000 Total capital investment $55,094,000
Facitity installed cost
Assumed fuel ethanol selling price
Assumed feedstock cost
Ethanol yield per BDT feedstock
Facility electrical power requirement
$3.55 per annual gallon
$1.20 per gallon
$20.00 per BDT
51.9 gallon per BDT
4.25 MW
NREL.BEAM.Sb, 11111/97, 8 a g e 1


P R O F O R M A S Y S T E M S
Biofuels Economic Assessment Model
Single-Stage Dilute Nitric Acid Hydrolysis, Chester site
M a n u f a c t u r i n g C o s t S u m m a r y R e p o r t
This report was prepared by ProForma Systems, lnc. in cooperaiion with the United States Department of Energy's National Renewable Energy Laboratory. The material in it reflects ProForma Systems' best judgement in light of the information available at fhe time of preparation. Any use which a third party makes of this report, or any reliance on or decisions to be made based on it, are the responsibility of such third party. ProForma Systems accepts no responsibility for damages, if any, suffered by any third party as a result of decisions made or actions taken
based on this report.

Manufacturing Cost Summary Report for the Northeastern California Ethanol Manufacturing Feasibility Study
Case Study: Single-Stage Dilute Nitric Acid Hydrolysis, Chester site
Key Economic Assumptions Plant location
Plant life Plant start up
Reference year Plant construction cost index
Index value for reference date
Hurdle Rate / Internal Rate of Return Net present worth at end of project life
California
1997 1997
CE 385
20 years
25.26% $0
Pfant nameplate product capacity 15,500,000 gallons per year
Pfant nameplate feedstock capacity 298,000 BDT per year 864 BDT per day
Facility Capital Cost Fixed capital investment $39,811,000
Working capital investment $2,588,000 Totaf capital investment $40,400,000
Inflation rate 3.00% Facility installed cost $2.61 per annual gallon
Federal income tax rate 34.00% State income tax rate 6.00%
37.96% Combined federal and state income tax rate
Owner equity financing 25% Effective loan rate 7.0%
Annuitized loan payment $4,224,000
Notes: (1) BDT = bone-dry short ton (2,000 lbs.)
Case S’ . -. Single-Stage Dilute Nitric Acid Hydrolysis, Chester site
Assumed fuel ethanol selling price $1.20 per gallon
Assumed feedstock cost $20.00 per BDT
Ethanol yield per 8DT feedstock 51.9 gallon per BDT
Facility electrical power requirement 3.55 MW
ProForrm.U Systems, Inc. NREL.BEAM.2a, 11/6/97, P a g 8 1


APPENDIX F
MANUFACTURING COST SUMMARY REPORTS
GREENVILLE SITE

I
Biofuels Economic Assessment Model
Arkenol Concentrated Sulfuric Acid Hydrolysis Process, Greenville site
M a n u f a c t u r i n g C o s t S u m m a r y R e p o r t
This report was prepared by Proforma Systems, Inc. in cooperation with the United States Department of Energy's National Renewable €nergy Laboratory. The material in it reflects ProForma Systems' best judgement in right of the information available at the time of pmparafion. Any use which a third party makes of this report, or any reliance on or decisions to be made based on it, are the responsibility of such fhird party. Proforma Systems accepts no responsibility for damages, if any, suffered by any third party as a result of decisions made or actions taken
based on this report.

. .
Manufacturing Cost Summary Report for the Northeastern California Ethanol Manufacturing Feasibility Study
Case Study: Arkenol Concentrated Sulfuric Acid Hydrolysis Process, Greenville site
Key Economic Assumptions Plant location California Plant nameplate product capacity 28,200,000 gallons per year
Plant start up 1997 Plant life 20 years
Reference year 1997 Plant nameplate feedstock capacity 335,000 8DT per year Plant construction cost index CE 971 BDT per day
tndex value for reference date 385
Hurdle Rate / Internal Rate of Return Net present worth at end of project life
7.47% $0
Facility Capital Cost Fixed capital investment $109,939,000
Working capital investment $4,478,000 Total capital investment $1 14,417,000
Inflation rate 3.00% Facility installed cost $4.06 per annual gallon
Federal income tax rate 34.00% State income tax rate 6.00%
37.96% Combined federal and state income tax rate
Owner equity financing 25% Effective loan rate 7.0%
Annuitized loan payment $1 2,363,000
Notes: (1) BDT = bone-dry short ton (2,000 Ibs.)
Case F’.-k Arkenol Concentrated Sulfuric Acid Hydrolysis Process, Greenville site
ProFol .. .., Systems, Inc.
Assumed fuel ethanol selling price $1.20 per gallon
Assumed feedstock cost $20.00 per BDT
Ethanol yiefd per BDT feedstock 84.2 gallon per BDT
Facility electrical power requirement 4.87 MW
NREL.BEAM.Zb, 11/11/97, P a g e 1


P R O F O R M A S Y S T E M S
Biofuels Economic Assessment Model
2-Stage Dilute Sulfuric Acid Hydrolysis, Greenville site
M a n u f a c t u r i n g C o s t S u m m a r y R e p o r t
This report was prepared by ProForma Systems, Inc. in cooperation with the United States Department of Energy's National Renewable €nergy Laboratory. The material in it reflects ProForma Systems' best judgement in light of the information available at the time of preparation. Any use which a third party makes of this report, or any reliance on or decisions to be made based on it, are the responsibility of such third party. ProForma Systems accepts no responsibility for damages, if any, suffered by any fhird pady as a result of decisions made or actions taken
based on this report.

Manufacturing Cost Summary Report for the Northeastern California Ethanol Manufacturing Feasibility Study
Case Study: 2-Stage Dilute Sulfuric Acid Hydrolysis, Greenville site
Key Economic Assumptions Plant location
Plant life Plant start up
Reference year Plant construction cost index
Index value for reference date
Hurdle Rate / Internal Rate of Return Net present worth at end of project life
Inflation rate
Federal income tax rate State income tax rate
Combined federal and state income tax rate
California
1997 t 997
CE 385
20 years
-3.68% $0
3.00%
34.00% 6.00%
37.96%
Owner equity financing 25% Effective loan rate 7.0%
Annuitized loan payment $7,235,000
Notes: (1) BDT = bone-dry short ton (2,000 Ibs.)
Case Study: 2-Stage Dilute Sulfuric Acid Hydrolysis, Greenville site
ProFot, jstems, Inc.
Plant nameplate product capacity
Plant nameplate feedstock capacity
Facility Capital Cost Fixed capital investment
Working capital investment Total capital investment
Facility instafled cost
Assumed fuef ethanol selling price
Assumed feedstock cost
Ethanol yield per BDT feedstock
Facility electrical power requirement
17,400,000 gallons per year
335,000 BDT per year 971 BDT per day
$66,461,000 $2,779,000
$69,240 $0 0
$3.98 per annual gallon
$1.20 per gallon
$20.00 per 8DT
51.9 gallon per BDT
4.73 MW
NREL.BEAM.Zb, 11/11/97, d g e I


P R O F O R M A S Y S T E M S
0iofuels Economic Assessment Model
Single-Stage Dilute Nitric Acid Hydrolysis, Greenville site
M a n u f a c t u r i n g C o s t S u m m a r y R e p o r t
This report was prepared by ProForma Systems, Inc. in cooperafion with the Unif8d States Deparfment of Energy's National Renewable Energy laboratory. The material in it reflects ProForma Systems' best judgement in light of the information available at the time of preparation. Any use which a third party makes of this report, or any reliance on or d8CiSiOnS to be made based on it, are the responsibility of such third party. Proforme Systems accepts no responsibility for damages, if any, suffered by any third party as a result of decisions made or actions taken
based on this report.

Manufacturing Cost Summary Report for the Northeastern California Ethanol Manufacturing Feasibility Study
Case Study: Single-Stage Dilute Nitric Acid Hydrolysis, Greenville site
Key Economic Assumptions Plant location Ca tifornia Ptant namepiate product capacity 17,400,000 gallons per year
Plant start up 1997 Plant life 20 years
Reference year 1997 Plant nameplate feedstock capacity 335,000 BDT per year Plant construction cost index CE 971 BDT per day
Index value for reference date 385
Hurdle Rate / Internal Rate of Return Net present worth at end of project life
Inflation rate
Federal income tax rate State income tax rate
Combined federal and state income tax rate
5.55% $0
3.00%
34.00%
37.96% 6.00%
Owner equity financing 25% Effective loan rate 7.0%
Annuitized loan payment $5,452,000
Notes: (1) BDT = bone-dry short ton (2,000 Ibs.)
Case Study: Single-Stage Dilute Nitric Acid Hydrolysis, Greenviile site
ProFoi ,ystems, Inc.
Facility Capital Cost Fixed capital investment $49,359,000
Working capital investment $2,804,000 Total capital investment $52,163,000
Facility installed cost $3.00 per annual gallon
Assumed fuel ethanol selling price $1.20 per gallon
Assumed feedstock cost $20.00 per BDT
Ethanol yield per BDT feedstock 51.9 gatlon per BDT
Facility electrical power requirement 3.95 MW
NREL.BEAM.Pb, 19/6/97, a g e 1


APPENDIX G
MANUFACTURING COST SUMMARY REPORTS
LOYALTON SITE

Biofuels Economic Assessment Model
Arkenol Concentrated Sulfuric Acid Hydrolysis Process, Loyalton site
M a n u f a c t u r i n g C o s t S u m m a r y R e p o r t
This reporf was prepared by ProForma Systems, lnc. in cooperation with the United States Deparfment of Energy's National Renewable Energy Laboratory. The material in it reflects PmFoma Sysfems' best judgement in light of the information available af the time of preparation. Any use which a third patfy makes of this report, of any reliance on or decisions to be made based on it, are the responsibility of such third party. ProForma Systems accepts no responsibility for damages, if any, suffered by any third pafly as a result of decisions made or actions taken
based on this report.

Manufacturing Cost Summary Report for the Northeastern California Ethanol Manufacturing Feasibility Study
Case Study: Arkenol Concentrated Sulfuric Acid Hydrolysis Process, Loyalton site
Key Economic Assumptions Plant location California Plant nameplate product capacity 19,100,000 gallons per year
Plant start up 1997 Plant life 20 years
Reference year 1997 Plant nameplate feedstock capacity 228,000 BDT per year Plant construction cost index CE 661 8DT per day
Index value for reference date 385
0.71 % $0
Hurdle Rate / Internal Rate of Return Net present worth at end of project life
Inflation rate 3.00%
Federal income tax rate 34.00% State income tax rate 6.00%
Combined federal and state income tax rate 37.96%
Owner equity financing 25% Effective loan rate 7.0%
Annuitized loan payment $9,497,000
Notes: (1) BDT = bone-dry short ton (2,000 Ibs.)
Case $' -'Y Arkenol Concentrated Sulfuric Acid Hydrorysis Process, Loyalton site
ProFot I. Systems, Inc.
Facility Capital Cost
Working capital investment Fixed capital investment $84,480,000
$3, f 86,000 Total capital investment $87,666,000
Facility installed cost $4.59 per annual gallon
Assumed fuel ethanol selling price $1.20 per gallon
Assumed feedstock cost $20.00 per BDT
Ethanol yield per BDT feedstock 84.1 gallon per BDT
Facility electrical power requirement 3.39 MW
NREL.BEAM.2b, 11/11197, P a g e 1


_- ,
Biofuels Economic Assessment Model
2-Stage Dilute Sulfuric Acid Hydrolysis, Loyalton site
M a n u f a c t u r i n g C o s t S u m m a r y R e p o r t
This report was prepared by Proforma Systems, Inc. in cooperation with the United States Department of Energy's National Renewable Energy Laboratory. The material in it reflects ProForma Systems' besf judgement in light of the information available af the time of preparation. Any use which a third party makes of this report, or any reliance on or decisions to be made based on it, are the responsibility of such third party. ProForma Systems accepts no responsibility for damages, if any, suffered by any third party as a result of decisions made or actions taken
based on fhis report.

' . i
Manufacturing Cost Summary Report for the Northeastern California Ethanol Manufacturing Feasibility Study
Case Study: 2-Stage Dilute Sulfuric Acid Hydrolysis, Loyalton site
Key Economic Assumptions Plant location
Plant life Plant start up
Reference year Plant construction cost index
Index value for reference date
Hurdle Rate / Internal Rate of Return Net present worth at end of project life
Inflation rate
Federal income tax rate State income tax rate
Combined federal and state income tax rate
California Plant nameplate product capacity 20 years
1997 1997 Plant nameplate feedstock capacity
CE 385
3.84% $0
Facility Capital Cost Fixed capitaf investment
Working capital investment Total capital investment
3.00% Facility installed cost
34.00% 6.00%
37.96%
Owner equity financing 25% Effective loan rate 7.0%
Annuitized loan payment $5,015,000
Notes: (1) BDT = bone-dry short ton (2,000 Ibs.)
Case S* * -k 2-Stage Dilute Sulfuric Acid Hydrolysis, Loyalton site
ProFor ...-. Systems, Inc.
Assumed fuel ethanol selling price
Assumed feedstock cost
Ethanol yield per BDT feedstock
Facility electrical power requirement
1 1,800,000 gallons per year
228,000 BDT per year 661 BDT per day
$45,942,000 $2,051,000
$47,994,000
$4.07 per annual gallon
$1.20 per gallon
$20.00 per BDT
51.9 gallon per BDT
3.38 MW
NREL.BEAM.Zb, 11/11/97, P a g e 1


P R O F O R M A S Y S T E M S
Biofuels Economic Assessment Model
Single-Stage Dilute Nitric Acid Hydrolysis, Loyalton site
M a n u f a c t u r i n g C o s t S u m m a r y R e p o r t
This report was prepared by ProForma Systems, lnc. in cooperation with the United States Department of Energy's National Renewable Energy Laboratory. The material in it reflects PmForma Systems' best judgement in light of the information available at the time of preparation. Any use which a third party makes of this report, or any reliance on or decisions to be made based on it, are the responsibility of such third parfy. ProForma Systems accepts no responsibility for damages, if any, suffered by any fhird patfy as a result of decisions made or acfions taken
based on this report.

Manufacturing Cost Summary Report for the Northeastern California Ethanol Manufacturing Feasibility Study
Case Study: Single-Stage Dilute Nitric Acid Hydrolysis, Loyalton site
Key Economic Assumptions Plant location California Plant nameplate product capacity
Plant start up 1997
Plant construction cost index CE 385
Plant life 20 years
Reference year 1997 Plant nameplate feedstock capacity
Index value for reference date
Hurdle Rate / Internal Rate of Return Net present worth at end of project life
Infiation rate
Federal income tax rate State income tax rate
Combined federal and state income tax rate
97.96% $0
3.00%
34.00% 6.00%
37.96%
Owner equity financing 25% Effective loan rate 7.0%
Annuitized loan payment $3,633,000
Notes: (1) BDT = bone-dry short ton (2,000 Ibs.)
Case ,C.. 'Y Single-Stage Dilute Nitric Acid Hydrolysis, Loyalton site
ProFot,,.d Systems, Inc.
Facility Capital Cost Fixed capital investment
Working capital investment Total capital investment
Facility installed cost
Assumed fuel ethanol selling price
Assumed feedstock cost
Ethanol yield per BDT feedstock
Facility electrical power requirement
1 1,800,000 gallons per year
228,000 BDT per year 661 BDT per day
$32,747,000 $2,003,000
$34,751,000
$2.95 per annual gallon
$1.20 per gallon
$20.00 per BDT
51.9 gallon per BDT
2.78 MW
NREL.BEAM.2b, 1f/41/97, 3 a g e -l


APPENDIX H
MANUFACTURING COST SUMMARY =PORTS
MARTELL SITE

P R O F O R M A S Y S T E M S
Biofuels Economic Assessment Model
Arkenol Concentrated Sulfuric Acid Hydrolysis Process, Martell site
M a n u f a c t u r i n g C o s t S u m m a r y R e p o r t
This report was prepared by ProForma Systems, hc. in cooperation with the United States Department of Energy's National Renewable Energy Laboratory. The material in it reflects ProForma Systems' best judgement in light of the information available at the time of preparation. Any use which a third party makes of this report, or any reliance on or decisions to be made based on it, are the responsibility of such third party. ProForma Systems accepts no responsibility for damages, if any, suffered by any third party as a result of d8CiSiOnS made or actions taken
based on this report.

Manufacturing Cost Summary Report for the Northeastern California Ethanol Manufacturing Feasibility Study
Case Study: Arkenol Concentrated Sulfuric Acid Hydrolysis Process, Martell site
Key Economic Assumptions Plant location California
Plant start up 1997 Reference year 1997
Plant construction cost index CE 385
Plant life 20 years
Index value for reference date
Hurdle Rate I Internal Rate of Return Net present worth at end of project life
inflation rate
Federal income tax rate State income tax rate
Combined federal and state income tax rate
12.03% $0
3.00%
34.00% 6.00%
37.96%
Owner equity financing 25% Effective loan rate 7.0%
Annuitized loan payment $1 0,196,OOO
Notes: (1) BDT = bone-dry short ton (2,000 Ibs.)
Case Studv: Arkenol Concentrated Sulfuric Acid Hydrolysis Process, Martell site
ProFob dystems, Inc.
Plant nameplate product capacity
Plant nameplate feedstock capacity
Facility Capital Cost Fixed capital investment
Working capital investment Total capital investment
Facility installed cost
Assumed fuel ethanol selling price
Assumed feedstock cost
Ethanol yield per BDT feedstock
Facility electrical power requirement
22,300,000 gallons per year
265,000 . BDT per year 768 BDT per day
$90,447,000 $3,665,000
$94,113,000
$4.22 per annual gallon
$1.20 per gallon
$20.00 per BDT
84.2 gallon per BDT
3.90 MW
NREL.BEAM.Zb, 11/11/97, a g e I


P R O F . O R M A S Y S T E M S
Biofuels Economic Assessment Model
2-Stage Dilute Sulfuric Acid Hydrolysis, Martell site
M a n u f a c t u r i n g C o s t S u m m a r y R e p o r t
This report was prepared by ProForma Systems, Inc. in cooperation with the United States Department of Energy's National Renewable Energy Laboratory. The material in it reflects ProForma Systems' best judgement in light of the information available at the time of preparation. Any use which a third party makes of this report, or any reliance on or decisions to be made based on it, are the responsibility of such third party. PrvForma Systems accepts no responsibility for damages, if any, suffered by any third party as a result of decisions made or actions taken
based on this report.

Manufacturing Cost Summary Report for the Northeastern California Ethanol Manufacturing Feasibility Study
Case Study: 2-Stage Dilute Sulfuric Acid Hydrolysis, Martell site
Key Economic Assumptions Plant location
Plant life Plant start up
Reference year Plant construction cost index
Index value for reference date
Hurdle Rate / Internal Rate of Return Net present worth at end of project life
Inflation rate
Federal income tax rate State income tax rate
Combined federal and state income tax rate
California Plant nameplate product capacity 20 years
1997 1997 Plant nameplate feedstock capacity
CE 385
6.67% $0
Facility Capital Cost Fixed capital investment
Working capital investment Total capital investment
3.00% Facility installed cost
34.00% 6.00%
37.96%
Owner equity financing 25% Effective loan rate 7.0%
Annuitized loan payment $5,419,000
Notes: (1) BDT = bone-dry short ton (2,000 Ibs.)
Case Studv. 2-Stage Dilute Sulfuric Acid Hydrolysis, Martell site
ProFort, jsfems, Inc.
Assumed fuel ethanol selling price
Assumed feedstock cost
Ethanol yiefd per BDT feedstock
Facility electrical power requirement
13,800,000 gallons per year
265,000 BDT per year 768 BDT per day
$49,465,000 $2,394,000
$51,858,000
$3.76 per annual gallon
$1.20 per gallon
$20.00 per BDT
51.9 gallon per BDT
3.84 MW
NREL.BEAM.2b, 11/11/97, . a g e 1


P R O F O R M A S Y S T E M S
Biofuels Economic Assessment Model
Single-Stage Dilute Nitric Acid Hydrolysis, Martell site
M a n u f a c t u r i n g C o s t S u m m a r y R e p o r t
This report was prepared by ProForma Systems, lnc. in cooperation with the United States Department of Energy's National Renewable Energy Laborafory. The material in it reflecfs Proforma Systems' best judgement in right of the information available at the time of preparation. Any use which a third parfy makes of this report, or any reliance on or decisions to be made based on if, am the responsibility of such third patty. ProForma Systems accepts no responsibilify for damages, if any, suffered by any third party as a result of decisions made or actions taken
based on this report.

Manufacturing Cost Summary Report for the Northeastern California Ethanol Manufacturing Feasibility Study
Case Study: Single-Stage Dilute Nitric Acid Hydrolysis, Martell site
Key Economic Assumptions Plant location
Plant life Plant start up
Reference year Plant construction cost index
Index value for reference date
Hurdle Rate / Internal Rate of Return Net present worth at end of project life
Inflation rate
Federal income tax rate State income tax rate
Combined federal and state income tax rate
California Plant nameplate product capacity 20 years
1997 1997 Plant nameplate feedstock capacity
CE 385
22.14% $0
Facility Capitat Cost Fixed capital investment
Working capital investment Total capital investment
3.00% Facility installed cost
34.00% 6.00%
37.96%
Owner equity financing 25% Effective loan rate 7.0%
Annuitized loan payment $3,949,000
Notes: (1) BDT = bone-dry short ton (2,000 Ibs.)
Case Stu+ Single-Stage Dilute Nitric Acid Hydrolysis, Madell site
ProForm- ,ystems, Inc.
Assumed fuel ethanol sefling price
Assumed feedstock cost
Ethanol yield per BDT feedstock
Facility electrical power requirement
13,800,OOO gallons per year
265,000 BDT per year 768 BDT per day
$35,462,000 -$2,314,000 $37,776,000
$2.74 per annual gallon
$1.20 per gallon
$20.00 per BDT
51.9 gallon per BDT
3.19 MW
NREL.BEAM.Pb, 11/11/97, r a g e 1


APPENDIX I
MANUFACTUFUNG COST SUMMARY REPORTS
WESTWOOD SITE

” - - - .
Biofuels Economic Assessment Model
Arkenol Concentrated Sulfuric Acid Hydrolysis Process, Westwood site
M a n u f a c t u r i n g C o s t S u m m a r y R e p o r t
This report was prepared by Proforma Systems, Inc. in cooperation with the United States Department of Energy‘s National Renewable Energy Laboratory. The material in it reflects ProForma Systems’ best judgement in light of the information available at the time of preparation. Any use which a third party makes of this report, ot any reliance on or decisions to be made based on ifl are the responsibility of such third party. ProForma Systems accepts no responsibilify for damages, if any, suffered by any third party as a result of decisions made or actions taken
based on this report.

Manufacturing Cost Summary Report for the Northeastern California Ethanol Manufacturing Feasibility Study
Case Study: Arkenol Concentrated Sulfuric Acid Hydrolysis Process, Westwood site
Key Economic Assumptions Plant location
Plant life Pfant start up
Reference year Plant construction cost index
Index value for reference date
Hurdle Rate / Internal Rate of Return Net present worth at end of project life
Inflation rate
Federal income tax rate State income tax rate
Combined federal and state income tax rate
Ca tifornia
1997 f 997
CE 385
20 years
12.48% $0
3.00%
34.00% 6.00%
37.96%
Owner equity financing 25%
Annuitized loan payment $1 0,302,000 Effective loan rate 7.0%
Notes: (1) BDT = bone-dry short ton (2,000 Ibs.)
Case 7’ * *: Arkenol Concentrated Sulfuric Acid Hydrolysis Process, Westwood site
ProForl .ystems, Inc.
Plant nameplate product capacity
Plant nameplate feedstock capacity
Facility Capital Cost Fixed capital investment
Working capital investment Total capital investment
Facility installed cost
Assumed fuel ethanol selling price
Assumed feedstock cost
Ethanol yield per BDT feedstock
Facility electrical power requirement
22,800,000 gallons per year
271,000 BDT per year 786 BDT per day
$91,343,000 $3,740,000
$95,083,000
$4.17 per annual gallon
$1.20 per gallon
$20.00 per BDT
84.2 gallon per 8DT
3.98 MW
NREL.BEAM.Zb, 11/11/97, a - a g e I


P R O F O R M A S Y S T E M S
Biofuels Economic Assessment Model
2-Stage Dilute Sulfuric Acid Hydrolysis, Westwood site
M a n u f a c t u r i n g C o s t S u m m a r y R e p o r t
This report was prepared by Proforma Systems, Inc. in cooperation with the United States Department of Energy's National Renewable Energy Laboratow. The material in il feflects ProFofma Systems' best judgement in light of the information available at the time of preparation. Any use which a third party makes of this report, or any reliance on or decisions to be made based on if, are the responsibilify of such third party. Proforma Systems accepts no responsibility for damages, if any, suffered by any third party as a result of decisions made or actions faken
based on this report.

Manufacturing Cost Summary Report for the Northeastern California Ethanol Manufacturing Feasibility Study
Case Study: 2-Stage Dilute Sulfuric Acid Hydrolysis, Westwood site
Key Economic Assumptions Plant location
Plant life Plant start up
Reference year Plant construction cost index
Index value for reference date
Hurdle Rate I Internal Rate of Return Net present worth at end of project life
Inflation rate
Federal income tax rate State income tax rate
Combined federal and state income tax rate
California
1997 1997
CE 385
20 years
7.09% $0
3.00%
34.00% 6,00%
37.96%
Owner equity financing 25% Effective loan rate 7.0%
Annuitized loan payment $5,487,000
Notes: (1) 80T = bone-dry short ton (2,000 Ibs.)
Case F' I r e . 2-Stage Dilute Sulfuric Acid Hydrolysis, Westwood site
ProFoi. .. dysterns, Inc.
Plant nameplate product capacity 14,100,000 gallons per year
Plant nameplate feedstock capacity 271,000 BDT per year 706 6DT per day
Facility Capital Cost
Working capital investment Fixed capital investment $50,054,000
$2,448,000 Total capital investment $52,502,000
Facility installed cost $3.72 per annual gallon
Assumed fuel ethanol selling price $1.20 per gallon
Assumed feedstock cost $20.00 per BDT
Ethanol yield per BDT feedstock 51.9 gallon per BDT
Facility efectrical power requirement 3.93 MW
NREL.BEAM.Zb, 11141/97, P a g 8 1


P R O F O R M A S Y S T E M S
Biofuels Economic Assessment Model
Single-Stage Dilute Nitric Acid Hydrolysis, Westwood site
M a n u f a c t u r i n - g C o s t S u m m a r y R e p o r t
This report was prepared by ProForma Systems, lnc. in cooperation with the United States Department of Energy's National Renewable Energy Laboratory. The material in it reflects ProFonna Systems' best judgement in right of the information available at the time of preparation. Any use which a third patty makes of this report, or any reliance on or decisions to be made based on it, are the responsibility of such third party. ProForma Systems accepts no responsibility for damages, if any, suffered by any third party as a result of decisions made or actions taken
based on this report.

Manufacturing Cost Summary Report for the Northeastern California Ethanol Manufacturing Feasibility Study
Case Study: Single-Stage Dilute Nitric Acid Hydrolysis, Westwood site
Key Economic Assumptions Plant location California Plant nameplate product capacity
Plant start up 1997
Plant construction cost index CE 385
Plant life 20 years
Reference year 1997 Pfant nameplate feedstock capacity
Index value for reference date
Hurdle Rate / Internal Rate of Return 22.71 % $0 Net present worth at end of project life
Facility Capital Cost Fixed capital investment
Working capitaf investment Total capital investment
Inflation rate 3.00% Facility installed cost
Federal income tax rate 34.00% State income tax rate 6.00%
37.96% Combined federal and state income tax rate
Owner equity financing 25%
Annuitized loan payment $3,998,000 Effective loan rate 7.0%
Notes: (1) BDT = bone-dry short ton (2,000 Ibs.)
Case Stl d v : Single-Stage Dilute Nitric Acid Hydrolysis, Westwood site
ProFo. _,)rsfems, Inc.
Assumed fuel ethanol selling price
Assumed feedstock cost
Ethanol yield per BDT feedstock
Facility electrical power requirement
14,100,000 gallons per year
271,000 BDT per year 786 BDT per day
$35,881,000 $2,363,000
$38,244,000
$2.71 per annual gallon
$1.20 per gallon
$20.00 per BDT
51.9 gallon per BDT
3.26 MW
NREL.BEAM.Sb, 1111f197, a g e 1


APPENDIX J
TECHNICAL REVIEW OF THE DILUTE SULFURIC ACID PROCESS DESIGN
FOR THE GREENVILLE SITE
BY M%FUUCK ENGINEERS AND ARCHITECTS

Menick 6 Company Mail: PO Box 22026 / D m r . CO I80222 / USA Dalivery: 2450 S. Peoria St. /Ama. CO / 80014 .................................................. mnsi-0741/ F ~ X 30~51-2581
October 3, 1997
Project No.: 190 12956 Letter No.: MCL-001
Mr. Mark Yancey NREL 1617 Cole Boulevard Golden, CO 80401-3393
Subject: Technical Review of Greenvilte Site Ethanol Manufacturing Feasibility Study
Dear Mark:
On September 15, 1997, we met to discuss a technical review of an Ethanol Plant design and cost estimate. Via P.O. Number 159126, NREL authorized the review and evaluation of the Ethanol MaFufacturing Feasibility Study for a site in Gree~ville, CA. Merrick and Company (Merrick) received two draft copies of the Study #7 Project Cost SuMh!ary Report covering the example 2-Stage Dilute Sulfuric Acid Hydrolysis process to be located in Greenville
On September 25, 1997, we met to discuss Merrick’s preliminsry :eview of the exzrnple procesdsite capital and operating costs and advise items of concern. Merrick hereby completes the task to document these results in the attached written report. A s you know, Merrick is continuing to evaluate other processes which can economically produce ethanol products. We will remain in contact with you regarding new d eve I op rn en ts .
If you have any questions about the report or other developments, please call me at (303) 751-0747.
Very truly yours,
MERRICK & COMPANY
Fran Ferraro
Attachment
t\PROCESS\2956\ETHl FINL.DOC 1 . . . . . . . . . . . . . . . . . . . . . . . . . . . . . . . . . . . . . . . . . . .
An Employee-Owned Cornpzny

Technical Review
of
Greenville Site Et h an ol Man u f a ct u ri ng
Feasibility Study
for
NREL
by
Merrick and Company
October 3, 1997 2
.. . . . . . . . -.* . . . . . .

'l. Executive Summary
2. Process Technical Review 2-Stage Dilute Sulfuric Acid Hydrolysis Process Process Equipment
3, Non-Process Technical Review U ti tities Ofisites Facilities
4. Cost Estimate Review Key Assumptions Capital Costs Operating Costs
l:PROCESSi2956\ETHl FINL.DOC 3

1. Executive Summary
NREL requested a technical review of an Ethanol Manufacturing Feasibility Study for a site in Greenville, CA. Merrick reviewed draft copies of the Study #7 Project Cost SuMMary Report covering the example 2-Stagz Dilute Sulfuric Acid Hydrolysis process to be located in Greenville. Merrick is familiar with the requirements of similar plants. As you know, through a subsidiary, Merrick owns and operates a waste beer-to-ethanol plant in Golden, CO. Merrick has also studied potential ethanol plants using various f2edstocks, such as, cheese whey, forest waste, waste paper, etc.
Merrick has performed a technical review of the example procesdsite capital and operating costs. In a recent meeting with NREL and ProForrna Systems, Inc., we were ab!e to advise and discuss items of concern. Based on our discussions, we have completed the review and incorporated the results into this report.
The major conclusions of the report are: The 2-Stage Dhte Sulfuric Acid Hydrolysis Process appears to be properly
evaluated and the assockied risks are accounted for in the’Draft Study Report. Potential adverse (or positive) impacts of the fate of 5-carbon sugars and
emissions of the residual ligninkellulose should be studied as soon as practicable. Certsin of the Process Equipment types (especially slurry pumps and other
solids handiing equipment items) are susceptible to outages that will affect plant on- spec production. Judicious application of installed and warehoused spares should minimize lost production. However, spare equipment can not prevent all unplanned outages. The model should allow for both additional capital spares and expected lost prod u cti on.
Maintenance and Operating Costs generally cover most expected aspects of the
8
0
9
. - . . _ _ - - ...._ .-.--- _ _ ” _ .-.- -----. *_ -* * plant and associated systems and services. Certain line items should be adjusted to . . cover the aspects discussed in our meeting and listed below.
The Non-Process Technical Review showed that certain utility systems need better definition for the actual site chosen. The availability and quality of the makeup water can significantIy affect the operating costs. In addition to steam condensate recovery, a wastewater processing system should minimize costs by reclaiming as much water as possible for boiler makeup.
9 Adequate utilities and offsite facilities should require somewhat reduced capital costs.
We have identified a few key assumptions in the cost estimate that should be adjusted for the expected operation at the site. Overall, the analysis will properly reflect the expected costs and returns after the adjustments are made.
I:\PROCESS\2956ETHl FINL.DOC 4

2. Process Technical Review
a. 2-Staqe Dilute Sulfuric Acid Hvdrolvsis Process
I . Process Uncertainties
The process uncertainties for the two-stage dilute sulfuric acid process for production of ethanol from softwoods are correctly and completely identified.
The principal uncertainties are related to the fate of five-carbon sugars that restrlt from softwood hydrolysis. As noted in the Feasibilify Study, it is essential to rule out adverse impacts from these sugars on'fermentation as soon as practicable, with bench or pilot scale studies. It is also possible that thc five-carbon sugars may be fermented to ethanol or another marketable compound, such as methanol, thus improving the overall process yield.
Lignin and cellulose residuals are assumed to be disposed of as boiler fuel at a nearby Biomes germation facility. As noted i R the Feasibil,;ty Sfudy, confirmation of the heating value of the Iigninkellulose is needed, as is analysis and testing (perhaps including a test burn) to demonstrate that emissions from this fuel are within the existing permit limits.
2. Product Yields The ethanol yield of 49.4 gallons per Bone Dry Ton (BDT) of feedstock appears conservative. As actual test information becomes available, a higher yield may be applicable.
I.
b. Process Equipment
Plant Reliability
Currently, the process design does not have spare process equipment to maintain operations during the outage of any one important process equipment item. Frequently, simple vessels and tanks are not normally spared since their availability is near ?OO% except during a planned (plant-wide) outage such as an annual turnaround. However, rotating equipment items and other items subject to plugging, etc. are often spared to allow continuation of production during the to-be-expected outages.
The most frequently spared type of equipment is pumps that are required to maintain production. Pumps may be shutdown for numerous reasons, such as, process operationskafety, equipment component failure, motor driver failure, loss of the electricity supply, etc. Individual process pump availability is typically about 92-98%,
5 I:\PROCESSK956\FTHl FINL.DOC
. . . - . . . . _ _ . - .

with a Mean Time Between Failures (MTBF) for the pump itself of about 6-24 months. The lower availability and shorter MTSF applies to slurry type pumps, the type used in portions of this process. Other rotating machinery may be subject to unexpected outages that affect production, but may be impractical to spare, such as, tank agitators (may require spare tankage capacity with smaller size units), and very expensive machinery.
On the process side, there are over 50 pumps and other machinery items, many of which may stop production if out-of-service for longer than a few minutes. (Transfer pumps can be out-of-service for an extended period if sufficient tankage is provided.) Additionally, any production upset in the continuous process areas may prevent delivery of on-spec product for hours after the piece of equipment has been (replaced, if necessary, and) restarted. To properly estimate plant on-spec production, an additional 20-40 days of lost production may be appropriate.
Alternatively, if the lost production value warrants instalied or warehoused spares, capital costs for the equipmentlinstallations should be included. A more complete evaluation of the expected lost production due to equipment outages should be done to confirm the desirability c;f sljared equipment or not. Until more detail is available, capital costs should be increased about $ A MM for the expected additional spare equipment items and the sides of product should be reduced about 5 6 % for lost production during unplanned outages of unspared equipment.
2. Materials of Construction
Acid process streams will require an upgraded material to resist excessive corrosion in pipinglequipment. For the pipinglequipment in contact with the sulfuric acid, Carpenter-20 material We recoMMend that the capital costs of the process equipment in Unit I 2 be increased about $7 OQk to cover the additional cost of equipmentlpiping in Carpenter-20 material.
costs 3 - 4 ~ . . the currently specified 31 6SS material.
3. Pumping Equipment
. . , - , - - ..... _.._ .
The process model appears to need pumps and pressure letdown equipment between the impregnator and reactor. Per our discussion, the equipment and its costs are included in package systems that are shown on the model as the “impregnator” and the “ re actor . ”
I:\PROCESW956ETHl FINL.DOC 6

4. Solids Process Equipment
Presses, conveyors, feeders, centrifuges, etc. are relatively unreliable mmpared to clean liquid processing equipment. Expected availability should be reduced to about 88-9296 for equipment that will encounter wear/plugging associated with handling solid msteriais. Maintenance for this equipment should be expected to be greater than 2% of capital, probably more like 4-5% for this portion (only) of the plant. Note that overall plant maintenance costs are addressed elsewhere with a percentage of capital for the non-labor portion and separate cost lines for the labor portion.
I:\PROCESSW56\ETHI FINLDOC 7

3. Non-Process Technical Review
a. UtiIitv Svstems
I. Steam Svstem An estimate of the process steam requirements was made from the process and material flow diagrams. Total steam requirements were calculated as 90,000 Ib/hr low pressure (50 PSIG) and 70,000 Ib/hr high pressure (600 PSIG). Of the total, only 60,000 Ib/hr is returned to the steam cycle as low pressure condensate. The balance of approximately ~00,000 Ib/hr must be made up from a water treatment system. Depending on the raw water quaIity, boiler make up condensate can be accomplished with a nixed bed dernineralizer train, a reverse osmosis system and/or a waste water recta m at ion system. Generally for large quantity of waste water processing, a RCC (vapor compression cycle) is used. A quality system will reclaim approximately 95% high quality water for bAer make up as condensate. Per Joe Bostjanic of RCC, the cost of a I 50 GPM vapor compression cycle waste water evaporator is approximately $2,000,000 plus another $1,000,000 for instaliation. The compressor has a 800 HP motor plus another 200 HP for small motors. Joe estimated power consumption at approximately 850 KW. He will send literature.
2. Waste Water In most cases, disposal of waste water becomes a serious problem if any adverse chemicals are present. The water can not be returned to a creek or river without proper treatment .
For the proposed Greenville site, waste water reprocessing (RCC) probably will be very cost effective. Boiler quality water (condensate) can be generated at a considerably lower cost than by all raw water processing for boiler makeup.
3. Equipment Required and Costs. An equipment list and cost estimate was made for the steam plant and water treatment equipment. See Attachment 4.
b. Offsites Facilities
1. Offsites Cost Items
A review of the Project Cost SuMMary Report for Case 7: 2- Stage Dilute Sulfuric Acid Hydrolysis, Greenville site was undertaken to check the validity of various assumptions and factors used in the conceptual design estimate and proforma with special emphasis
8 I:UJROCESS\2956\ETHl FINLDOC

given to the Outside 8attery Limits (OSBL) portions of this site. Using the Infrastructure and Utility Costs assumptions (page 49), the costs for individual items and systems were calculated using the percentages provided and the total for the OSBL from page 6 of the suMMary roll-up(Attach I). In an independent evaluation of utility requirements based on our best understanding of the process, we found the OSBL to be high by a factor of two or more. Potential savings of $10-15MM in these costs are probable (Attach 2).
2.
A square foot artzlysis of the Process, Lab and Office buildings also indicated that, based on the level of personnel and the process as we understand it, the dollar amount would indicate many more square feet of space than required (ref. Means Square Foot Costs A997). A cursory site layout, with building requirements could lead to additional savings. See Attachment 1.
4. Cost Estimate Review
a. Key Assumotions
I . On page 4 cf the cost estimate, the credit for fuel product should be adjusted to account for lost production from unplanned outages. Since there are portions of the plant that will be impractical to have installed spares, there will be lost production periods that result from even a short duration outage of a single piece of equipment, its power supply, etc. After a stoppage of plant flow, full on-spec production may not resume for hours. We estimate that an additional 30-40 days of lost production could occur if no spares are provided.
To minimize the effect of unplanned outages, the project should include installed or warehouse spares of certain equipment items. Judicious application of spares, on the order of $IMM of additional capital, could reduce the lost production from unplanned outages to about 20 days. We recoMMend that the capital costs and lost production estimate include these estimates.
2. reasonable.
A construction schedule of 48 months and start-up duration of 6 months is
l:\PROCESSQ956\ETHl FtNL.DOC 9

b. Capital Costs
1. On page 3 of the cost estimate, the line of informationkosts re Plant System 29 Fermentation v ~ s not piinted, but the numbers have been included in the totals and appear a p p rop riate.
2. quarter. the listed flows.
Cooling Tower water quantities appear large and are now approximated at one-
3. The Waste Water quantities requiring treatment appear small. The model will now establish the purge and rnzkeup quantities at 50% of normal flow. Note that the RCC type waste water processing system will handle these quantities.
4. a!lowance of $300,000 be used to cover equipment and piping.
The estimated cost for insulation in the plant appears low. We recoMMend an
5. As described above, the allowance for spare parts should be increased to prevent unnecessary total plant outages due to the loss of a single equipment item. We estimate that an additional $ A MM should be s~pl ied to criticsf rotating equipment items to minimize downtime. This allowance should cover both installed spares (especially process pumps) and warehouse spares for the process area. Spare equipment for the utilities and offsites areas are covered in their capital cost estimates.
6. We recoMMend 8-10% of the total fixed capital investment.
Engineering and design (Pg. 6) seems low for a solids/slurry/one-of-a-kind plant.
C. Operatinq Costs " . . - -
I. Total electricity consumption will average the currently listed 3.4MW for the ISBL process equipment plus 1.2 MW for utilities and other OSBL electricity users for a total of 4.6 MW.
2. annually. This will cover product and co-product sales efforts.
Per our discussion, the sales related cost is expected to be about $114k
3. Natural Gas estimated cost of $2.50 per MMBtu appears reasonable.
4. Under Labor and other Factored costs (Pg. 5) the plant manager, plant engineers, shippingheceiving, payroll/HR and administration personnel will probably be on a 5-day single shift work schedule.
10 t\PROCESS\2956\ETHl FINL.DOC

5. Laboratory supplies (over and above chemist labor) should be at least $20,00O/year.
6. e Is ew he re.
Maintenance at 2% of plant cost is acceptable given that hboi is covered
7. coproduct net value must account for these costs by the purchaser.
The coproduct storage cost basis is currently zero net cost. Therefore, the
8. the labor covered elsewhere. Suggested value is 0.5% of annual sales.
Qistribution and sales related costs (Pg. 5) should be greater than $0, even with
9. R&D costs are currently listed as zero, with the expectation that outside organizations, such as NREL, will be providing that function. However, we would expect that the operating plant will have improvement studies of its own 2nd will also incur costs to develop field data for study by others. We would recoMMend that an a!iowance of $50,000 be included for msite testing.
10. No compressor(s) for handling the C02 is currently included in the cost estimate, The basis being used is that the coproduct purchaser will cover these costs. Therefore, the value assigned to the CO, coproduct should reflect this.
11. The Steam Costs on page 49 represent costs for a boiler fueled by Biomes at another site. Since the Greenville site does not have a Biomes boiler, the appropriate higher costs are used in the Cost SuMMary , page 4.
j2. Attachments 3 through 7.
Additional detail of the Outside Battery Limits Equipment, and costs are given in
13. The allowance of $2,908,000 for working capital appears reasonable but obvious I y depends on actu a I business a rrang erne n ts.
. . . + .
* I:PROCESSU956lETHl FINL-DOC 11

FACTORS
NREL ETHANOL MANUFACTURING FACILITY EENVILLE SITE INFRASTRUCTURE COST ANALYSIS
ATTACHMENT 4
INFRASTRUCTURE ELECTRICAL SS & DISTRIBUTION STEAM (LOW & HIGH) STEAM DlSTRl BUTlON PROCESS WATER POTABLE WATER COOLING WATER SYSTEM WASTE WATER TREATMENT PLANT AIR INSTRUMENT AIR OFFICE BUILDING MAlNTENANCE FACl LITY LA9 3 RATORY (WjEQU I PM ENT?) LUNCH ROOM PROCESS BUILDING BUILDING HVAC FIRE PROTECTION LIGHTS 8 COMMUNICATIONS FENCES & GATE HOUSE RAIL SIDlNG
TAL
OSBL PAGE 6 BASE @ 37.25%
PROCESS BLDG PG. 6 BASE @ 4.0%
PCT OF FCI 2.00% 8.00% 2.00% 0.50% 0.50% 5.00% 7.50% 0.50% 0.50% 0.50% 1 .OO% 0.50% 0.50% 4.00% 2.0Wo 1 .OO% 0.50% 0.25% 0.50%
COST $1,512,591 $6,050,362 $1,512,591
$378,148 $3,781,477 $5,672,215
$378,148 $378,148 $7 56,295 $378,148 $378 , 1 48
$3,025,181 $1,512,591
$756,295 $378 ,I 48 $189,074 $378 , 1 48
$ 3 7 8 , ~
$378,14a
37.25% $28,172,000
$28,172,000 $75,629,530
SUGGESTED DELTA UNITS UNIT COST CHANGE SAVINGS
$3,000,000 $3,050,362 $1,000,000 $512,591
$2,000,000 $1,781,477 $3,000,000 $2,672,215
$200,000 $178,148
3,781 SF @ IOO/SF SF?, EQUIP?
2,363 SF @ 160/SF 3,781 SF @ 1OO/SF $200,000 $178,148
50,420 SF @ 601SF $400,000 $1,112,591
SF?
LF? LF?
4.00% $2,765,000 46,083 SF @ 60SF $69,125,000
$9,485,530
Page I

FACTORS
ATTACHMENT 2
INDEPENDENT CSBL ANALYSIS
ITEM BOILER COOLING TOWER 600# FEED WATER (200 GPM)
PUMPS (CT, BFW, COND) CONDENSATE TANK DEAREATOR CHEMICAL FEED WASTE WATER POND OTHER PUMPS (WW, SUMP, FW) OTHER STEAM ELECTRCAUSUBSTATION BUILDINGS
W P - RCC (150 GPM)
TOTAL
$M $700 $1 00 $500
$2,000 $50 $300 $100
$50 I $250
$50 $50
$? ,300 $100
$5,550
Page I
FACTOR 1.7 1.7 -7
1.4 3.0 1.2 2.0 2.0 1.2 2.0 3.0 I .4 2.0
1.5
TIC $M $1 ,I 90
$170 $850
$2,800 $150 $360 $200 $1 00 $300 $100 $1 50
$1,820 $200
$8,390
file:f:\project\2956ana!.xls
. . .. - _ . . . ..

NREL 'l9012956
.I. 2. 3. 4. 5. 6. 7. 8. 9,
EQUIPMENT
Attachment 3 Additional Equipment for Greenvilte Site
200,000 LBIHR, 600 PSlG Boiler Deaerator Boiler Feed Water Pump 400 GPM, I 88 HP Condensate Pump 200 GPM, 4.2 HP Condensate Storage Tank 300,000 Gal. Water Treatment Plant Boiler Chemical Feed Pump & Storage Tanks Cooling Tower Cooling Tower Circulating Water Pump
NO. IN USE P?O. COST INSTALLED
I I $700,00 -I I 100,00 I 2 50,000 I 2 20,000 1 I 300,000 'I I 500,000 I I 75,000 I I 100,000 -l 2 30,000
INSTALLED COST
$1,190,000 170,OOO 100,000 40,000
360,000 850,000 128,000 'l70,OOO 60,000
MODULE FACTOR
1.7 A .7 2 2
1.2 I .7 I .7
.7 2
10. Cooling Tower Chemical Treatment Package I 1 50,000 100,000 2
12. Waste Water Holding Pond or Tank 1 I 250,000 300,000 1.2 13. Waste Water Reclaim Pump -I 2 50,000 I00,000 2 44. Buildings - - 100,000 100,000 -I 15. Electrical / Substation - - 1,300,000 1,820,000 1.4
1 1. Waste Water Concentrator - RCC Type 1000 HP 1 1 2,000,000 3,000,000 I .5
TOTALS $5,125,000 $8,488,000
' I U'ROCESS\295~\NREL.DOC


California Ethanol Market Assessment
prepared
by
CaIifornia Institute of Food and Agricultural Research
College of Agricultural and Environmental Sciences
University of California, Davis
December, 1996

California Ethanol Market Assessment
Preface
This report was requested by the California Energy Commission as part of their support of the California Institute of Food and Agricultural Research at the University of California, Davis. The aim of the report is to provide an assessment of the market and market potential for ethanol and its ether derivative, ETBE, for use in transportation fuel in California. Dr. Sharon Shoemaker and Dr. Alexander Gusakov of ClFAR have utilized expertise on campus and consulted with national experts in the preparation of this report. In particular, Dr. Raphael Katzen, Mr. Steve Shaffer and and Mr+ Loyd Forrest provided significant input to this report. Appreciation also to Mr. Neil Koehler for his review of the final draft of this report.

Table of Contents
Executive Summary
Introduction
Background f h m a National Perspective
Ethanol in Tranprtation Fuel
Ethanol as a 10% Blend
Ethanol as a 22% Blend
Ethanol as an Alternative Fuel (E85)
Ethanol as a Neat Alcohol Fuel (E95-El00)
m E
Ethanol Production
Ethanol Price
California Perspective, including other West Coast States
Ethanol Production
Existing Infrastructure
Future Outlook for W o m i a
Biomass-to-Ethanol Industry
Public Benefits of California Biomass-to-Ethanol Industry
Uses of Ethanol
Market Demand Projections
Future Recommendations
Tables and Figures
References
List of Abbreviations
1
4
5
6
6
6
7
7
7
8
9
10
11
12
13
14
15
16
17
18
19
25
26

Executive Summary
F e d 4 and state regulations have mandated the use of cleaner burning fuels and an increase in low-ernission vehicles on the road as well as reductions in practices of open-field burning and reductions in solid waste in landfills, These trends, together with the increased cost of solid and liquid waste disposal, provide a basis for re-examining current agricultural and industrial practices. Also, it is important for the State of California to have multiple sowes of energy and fuel, and maximize domestically derived energy h m califomia resources.
California should further assess the potential for California biomass-to-ethanol for transportation fuel in lieu of continuing to import ethanol produced from corn in the Midwest. Based upon this initial assessment, the following scenarios for using biomass-to-ethanol have the potential to provide multiple public benefits:
Ethanol used as a primary transportation fuel (E85, E95, Elm) Ethanol as an oxygenate (ETEiE, El0 and E22)
A11 of these ethanol fuel alternatives can be made from agricultural residues such as rice straw and orchard prunings; food and beverage production wastes; energy crops; urban wood wastes, cellulose fraction of municipal wastes; and forest residues such as sawmill wastes, logging residue and fuel loading reduction.
The public benefits of California biomass-to-ethanol industry are the following: Economic
Improves energy security and diversity Reduces dependence on imported transporntion fuels Rural economic development Employment multipfiex effect New capitat investment Increases sales’ revenues, taxes Reduces wildfire suppression costs and public/private losses Complements the needs of AEW390 Reduces agriculturaI, forestry and urban waste disposal cost Reduces industrial processors’ water effluent disposal costs
Environment Renewable resource of low reactivity and low toxicity Reduces agricultural and forest open field burning Reduces PMlO and toxic emissions Reduces greenhouse gases Reduces hydrocarbon, carbon monoxide emissions Benefits quality of soil, water, air and Wildlife with energy crops Extends landfill capacity Reduces effluent loading to surface water Reduces wildfire fuel. loading and related environmental impacts Positive energy balance
1

Historically, there has been variable market demand for the use of ethanol for a msportation fuel in California. Although there is not good data available, recently there has been up to 50M gallons per year used for gasohol (EN), additional levels associated with ETBE by ARCO, and other uses
such as neat ethanol (E95) at the Los Angeles bus fleet involving 300 buses. The future market demand for ethanol will be primarily dependent on public policies and private sector actions. In the
short term, 1-15 years, there appears to be a potential market demand of up to 700 million gallons of ethanol because of the 2% oxygenate requirement in fuels in California refomulated gasoline. This market is currently being met by MTBE, therefore ethanol and ETBE will have to compete with MTBE and other potential oxygenates.
Timeframe Market Status Uncertaiaties o 1 o ~ 1 o ~ . w w o . ~ 1 o . w ~ . 1 . ~ ~ ~ w . o . . - ~ o ~ ~ . o . ~ ~ ~ ~ ~ ~ o ~ o w w ~ w . ~ ~ ~ ~ o o . w - w ~
Exist ing ETBE lrg. potential vol. market cost and availability technically proven meets environmental acceptance and regulatory requirements CARB study to determine actual emissions technically proven
interchangeable with M85
refiners, blenders
E6-El0 0 compstility with R F G 2
E85 infrastructure exists, cost and avilability needs LEV certification further demonstration
E95 300 buses operating cost and availability vehicle type limited broader ve hide manufacturer warrantee
. 1 ) o 1 o ~ 1 ~ o m 1 1 - ~ ~ ~ ~ ~ o ~ 1 ~ ~ ~ ~ ~ - ~ w ~ ~ ~ ~ ~ e ~ w ~ ~ ~ ~ D D ~ ~ ~ o ~ ~ ~ ~ ~ ~ ~ ~ m o 9 o ~ ~ ~
Short Term E22 in use in Brazil needs manufacturers (1-15Y) 9 RVP neutral warranty
needs demonstration cost and availability
E85 infrastructure exists, cost and availability interchangeable witb M85 9 needs LEV certification
* further demonstration, ~ ~ o ~ ~ ~ ~ ~ ~ ~ o ~ o o ~ o - ~ ~ o o ~ ~ ~ ~ o w o ~ ~ v ~ w ~ o ~ ~ ~ o ~ o ~ ~ o ~ ~ ~ ~ o o o ~ ~ - a ~ m o - o ~ ~
Medium Term E85 ( 1 5 - 2 5 ~ )
infrastructure exists, cost and availability interchangeable witb M85 needs LEV certification
further demonstration Hybrid Vehicle ethanol is a candidate needs technical
fuel development Fuel Ceil ethanol is a candidate needs technical
feedstock development
Long Term Hybrid vehicle ethanol is a candidate needs technical (25 -50~) fuel development
Fuel Cell ethanol is a candidate needs technical feedstock development
. ~ o o ~ ~ ~ ~ o ~ o o ~ 1 1 w o ~ m ~ ~ ~ ~ ~ ~ . . ~ . o ~ - - ~ . . ~ o u ~ ~ ~ o . w ~ ~ ~ ~ ~ ~ ~ ~ ~ ~ ~ ~ w ~ ~ ~ -
. ~ ~ ~ ~ ~ ~ D ~ ~ ~ ~ ~ L ~ I ~ I O ~ ~ ~ ~ ~ D ~ ~ ~ ~ ~ ~ ~ D D ~ ~ ~ ~ ~ ~ ~ R ~ ~ ~ I ~ ~ ~ ~ ~ ~ ~ ~ ~ ~ ~ ~ ~ ~ R ~
2

A growing number of pre-commercialization biomass-to-ethanol projects are being evaluated in California, e.g. Gridley project (rice straw), SEPCO (rice straw), Quincy Library Group Project (forest wastes), Step 2 Project and STAR Project (wood waste and fiber fraction of MSW). Most are in an early stage of determining feasibility and one, the S E E 0 project, was placed on hold during 1995 after being permitted.
This mostly qualitative analysis of ethanol markets should be followed up with additional quantitative studies. The following recommendations are provided to the California Energy Commission in consideration of viable options for California’s sources of transportation fuel and energy.
1.
2.
3.
4.
5.
6.
7.
8.
9.
Forecast should be developed for each potential market use of ethanol (E10, E22, E85, E95, ETBE) including a range of scenarios (high, medium and low demand scenarios). This should include more detailed economic and environmental impact infomation to better assess public benefits to California state agency programs. Conduct a life-cycle analysis of biomass-to-ethanol production to provide additional technical data covering environmental impacts, economic and mass energy balance compared with other fuels. Identify what is needed to attract the equity investors and debt financing to expand this new biomass-to-ethanol industry in California. I d e n w what are appropriate and cost effective actions by the state and local agencies as well as by forestry, agricultural and urban waste industries to support development of California biomass-to-ethanol industry. Include California renewable fuel industry input in the California Energy Commission Greenhouse Gas Mitigation Report Strategy. Assist in the development of a predictive model for use by The California Air Resources Board that assesses El0 and E22 reformulated gasoline in California reformulated gasoline. Encourage automobile manufacturers to work with The California Air Resources Board to certify E85 low emission vehicles. Implement test demonstmtion projects involving E22 and E85 in order to collect data in California. Commit a xasonable amount of funds from AB1890 in support of further research and commercialization of integrated processes that incorporate both electricity and fuel ethanol from biomass as a more effective way of supporting both biomass power generation and transportation fuel.
10. Need to revisit the waste management hierarchy established in AB939.
3

Introduction
Ethanol is a simple two carbon alcohol, with the chemical formula, C H , q O H , that can be produced by chemical synthesis by direct hydration of ethylene (ethylene derived from petroleum), or produced by fermentation using microorganisms. Major end uses of ethanol include transportation fuel, industrial markets (solvents, chemical intermediates), food and pharmaceutical, and potables. The presentday capacity and market size for these uses in the United States are given in Table 1. The largest market for ethanol is as a transportation fuel, either used directly, as a blend or as an ether derivative.
Ethanol as a transportation fuel has been considered since the early days of the automobile, but only since the early 1970’s has its use been seriously promoted in the United States. Ethanol is a high-octane fuel (rating of 106 compared to 87 for regular gasoline) and has little, if any corrosive properties. It can be used as an oxygenate, either directly or as its ether derivative. Oxygenates are fuel additives that promote cleaner combustion by adding oxygen to gasoline. Renewable oxygenates are produced from commodities such as corn, biomass and cellulosic frslction of garbage.
Ethanol can be produced from almost any raw material containing carbohydrates or sugars. Currently, most ethanol is produced, via fermentation, from corn in the Midwest region of the United States (Figure 1-2, Table 2). In 1995, of the 1.4 billion gallons of corn ethanol produced in the U.S. @om 553 million bushels of corn) about 60% was made in “wet milling” plants that
also produced sweeteners, starches and corn oil. The remaining 40% was made in corn “dry milling” plants that also produce distillers gains, corn meal, and other food ingredients [l].
A challenge is that the corn ethanol industry predominates and that corn processing relates to world market demand for animal feed corn, which is also affected by weather and crop yield. On the other hand, fuel ethanoI prices, as regarded by the petroleum industry and blenders, must be related for the “rack-pice” of gasoline, recently 60-70$ per gallon, plus the %$/gallon ethanol Federal excise tax remission.
In the future, many consider that ethanol will be derived more from a wide variety of plant biomass sources. Cellulose, the earth’s most abundant renewable resource, is a carbohydrate polymer made up of sugars (glucose) which many think will ultimately be the primary some of ethanol and other chemicals. Cellulose, because of its relatively intractable nature (it is not easily broken down
4

to simple sugars in nature), ends up as a waste material on agricultural lands (e.g. rice straw, orchard prunings), forest waste(e.g. slash, sawdust) and in urban axeas and landfiils (e.g. newspaper, garbage, yard waste). Investment in research, over the last several decades, has provided a basis for making rational decisions for cost effectively generating sugars from cellulose for production of chemicals, such as ethanol. Such processes require the integration of several technologies to minimize energy and waste and maximize product yield
The State of California only produces a modest amount of ethanol (6 million gdy) for transportation fuel. The development of an ethanol industry could help to provide alternative sources of energy and fuel to enhance the state’s fuel independence and security and also, to help to solve existing environmental problems related to open-field burning of crops, landfill saturation (over 50% is cellulose based) and improved air quality. The industry also complements the existing wine, beer and biotechnology industries in the state. Industrial ethanol fermentations are
robust processes that typically can handle a wide variety of feedstocks. Thus, there is a potential to utilize mixed waste materials, that are psently being burned in open fields, or conbibuting to the
bulk of solid waste in the state, or to water pollution or to ever increasing cost to processors for their disposal. The KEY question then becomes is there a market for ethanol and if yes, is it cost competitive? This report addresses the question of markets for ethanol, fbm both a national and State of California perspective.
Background From A National Perspective
Ethanol has become an important fuel component in the United States during the past two decades. In 1988, the United States passed the Alternative Motor Fuels Act as part of the drive to reduce dependence on imported petroleum. In 1990, the United States further enhanced its commitment to clean air witb the Clean Air Act Amendments, which mandated the use of cleaner burning fuels in specific regions and seasons, to reduce emissions of carbon monoxide (CO) and ozone-producing compounds. Additional regulation in 1992 with passage of The National Energy Policy Act @PACT‘) requires Fedend and State government fleets, energy supplier fleets, and other public and private fleets to acquire increasing numbers of alternative fuel’vehicles (AFV’s) as part of their total fleet composition. EPACT quires that AFV’s be at least 75 percent of Federal and State fleet purchases and 90 percent of fuel-provider f l e t purchases of light duty vehicles by year 2000 [ref. 13, page 36-37]. At the state level, the California Air Resources Board enacted low-emission vehicle regulations requiring auto makers to seJ1 increasing numbers of vehicles with much lower emissions, including a smaU fraction of zero emission vehicles [ref. 13, page 371.
5

There have been several approaches to producing cleaner burning fuels. They include the use of imported compressed natural gas, the use of liquid petroleum gas (LPG), the use of electric vehicles, the use of fuel cells and hybrid vehicles and the use of fuel alcohols, directly and as oxygenates.
Ethanol is used in transportation fuel directly as a neat fuel (E95, Elm), as an alternative fuel (E85), as a blend (El0 and E22), or as its ether derivative, ethyl tertiary butyl ether (ETElE). Automobiles are being manufactured which can use variable fuel sources, ranging from pure gasoline to blends of ethanol or methanol up to 85%. Ethanol may be used as a neat fuel or as near neat as E85 to power flexible fuel vehicles 0. FFV is a vehicle that can operate on either alcohol fuels (rnethbol or ethanol) or regular unleaded gasoline or any combination of the two
from the same tank. Ethanol-powered FFV’s produce about 3040% less smog-fonning emissions than a similar model gasoline-powered vehicle [ref 2, page 441.
Starting from the late 198O’s, thousands of FFV’s have been produced by major US automobile companies (including Ford, General Motors, Chrysler), most of them being dedicated to methanol. Methanol-powered FFV’s can also use ethanol as a fuel, but they must be calibrated differently, because of the differences in energy content and other minor differences in the fuels [ref. 2, page 43). By 1996, approximately 14,900 cars (number revised by personal communication with B. Blackburn,CEC), along with about 500 buses and trucks, were capable of running on methanol in Califomia [ref. 2, page 481. Both Ford and General Motors have announced that they will manufacture FFV’s (E85) in 1997- 1998. Ford will produce 12,000 Taurus in 1997 and GM plans to produce 250,000 Chevrolet S-10 pickup trucks.
Ethanol as a 10% Blend (ElO) Ethanol has been widely used as a 10% by volume blend in gasoline, commonly referred to as gasohol or E10, since the 1980’s. El0 contains 3.5% oxygen and is used primarily in the Midwest. It is not used in California because it is not compatible with California reformulated gasoline.
Ethanol as a 22% Blend (E22) Ethanol as a 22% volume blend has superior qualities because it reduces the RVP and gives a 6 point improvement in octane, compared to 3 points for E10. The more oxygen, the lower the
6

carbon monoxide and hydrocarbon emissions but the higher the potential for NO, emissions. The oxygen content of E22 is 7.7%. This blend has been used in Brazil over the past two decades[3].
Ethanol as an alternative fuel (E85) Ethanol at 85% by volume (a mixture of 85% ethanol and 15% unleaded gasoline) referred to as E85 exists [ref. 2, pqge 433 and will continue to expand over the next decade and beyond. The FFV’s produced by Ford and the VFV’s being produced by GM operate on straight gasoline and ethanol or methanol blends up to 85% alcohol. The ethanol blends give higher fuel mileage than methand blends because of the higher energy density of ethanol, compared to methanol.
Ethanol as a neat alcohol fuei (E95 - Elm) Ethanol for use in fuel must be denatured and is denatured typically with 5% gasoline. Future adjustments to automobiles and pumping stations are required in order to use this fuel. The example h m Brazil has shown that significantly higher mileage can be attained with a neat ethanol fuel, compared to compressed natural gas and gasohol [4]. This type of fuel is not used as yet in the United States in light duty vehicles. Diesel engines in buses opemting in Detroit are utilizing E9S or MlOO (personal communication, B. Harris, Governors Ethanol Coalition). Three hundred buses in Los Angeles are operating successfully, as are other operations in the Midwest.
ETBE ETBE is ethyl tertiary butyl ether. ETBE is produced by the reaction of ethanol with isobutylene, and can be used as an additive to gasoline up to a level of approximately 17% by volume [ref+ 2, page 921. It is used as a blending agent for Federal and California reformulated gasolines (WG) because
It is an oxygenate - oxygen content is 15.7% (wt). It has desirable blending properties, such as low volatility ( 3 4 psi blending RVP) and high Octane (1 10-112 (R + M)/2), and increased mid point distillation for improved drivability and volatile organic compounds control period blending. It is produced from the domestic raw materials, ethanol (a renewable liquid fuel) and isobutylene (either produced from domestic natural gas liquids or obtained as a cc+
product in domestic oil refining and petro chemical production), or is produced from butanes (a more complicated and costly process).
MTBE is methyl tertiary butyl ether. It is currently the primary blending agent for Federal and California refomulated gasolines. MTBE is preferred over ETEtE due to low price of methanol, currently one-third of its peak (sometime in 1994-1995) and due to the tax exemption problem for ethanol witb ETBE (see below).
7

E'TBE is becoming one of the ethers of choice for refiners competing in the FWG markeL Compared to MTBE, its main competitor, ETBE has a slightly higher Octane rating and much lower blending Reid vapor pressure (RVP) - see Table 3 [5]. The high octane rating reduces the need for carcinogenic hydrocarbon-based aromatic octane enhancers, such as benzene, which is proven to cause cancer. The lower blend RVP reduces ozone forming evaporative emission. Most notably, the ETBE's low RVP becomes extremely important when ETBE is used for blending in RFG during the summer with conditions of high temperature. Gasoline and blend RVP's are regulated by EPA and CARB with regional and seasonal hits.
ETBE's oxygen content is lower than that of MTBE. So, an RFG blender can use a larger volume of ETBE than MTBE to achieve a given weight percent oxygen content. The higher volume of ETBE means:
ETBE blends may prove to be one of the most cost-effective means of bringing the use of ethanol fuels to the market place, consistent with new environmental and energy policy @ P A W demand being placed on US refiners;
ETBE blends contain more volume derived from renewable, domestic energy sources, since both components used for ETBE synthesis (ethanol and isobutylene) can be produced domestically.
ETBE could be more costly than MTBE (for equal oxygenation, a higher volume of ETBE is required than MTISE.)
As a result of increasing demand for oxygenates, generated by the Clean Air Act, and blenders decisions for the most economical and profitable oxygenate available in each of the blenders marketing areas, MTBE, ETBE and ethanol compete in specific areas; MTBE being predominant in the market, ethanol second, and ETBE t h i d
With respect to subsidies, petroleum as the source of gasoline has been heavily subsidized throughout United States history 163. The fuel ethanol tax exemption helped to level the playing field for ethanol. ETBE would be in the same situation, except for the fact that allowance of the ethanol tax remission of 54$ per gallon of ethanol incorporated in ETBE has been complicated by incomplete and even conflicting rules placed by federal government agencies on the means of applying this tax credit to the ETBE producer or blender. These can be two different parties, or one and the same.
8

Ethanol production in the United States has grown dramatically during 1980-1995 because of increasing demand for oxygenates in gasoline (Figure 1) [5,7]. Most ethanol has been produced in the Midwest from corn and consumed in the form of gasohol, and mostly in the same region [8]. A much smaller portion of ethanol bas been produced by direct hydration of ethylene (in 1991, 15% of the total amount produced) [9]. Ethanol produced from ethylene is not used in gasohol, because it is not entitled to the 54$/gd excise tax exemption. This tax benefit can only be applied to ethanol from renewable raw materials, which ethylene from petroleum or natural gas is not. Ethanol from ethylene is sold as industrial ethanol, at a higher cost and price ($2.70-3.00) than motor fuel ethanol, Due to the rising costs of ethylene, amounting to $1 .OO per gallon of ethanol, fermentation industrial grade ethanol is gradually replacing synthetic ethanol, without tax benefits. Amongst other applications of ethanol is its use in solvents, chemical intemediates and food processing 191.
With the recent sharp increase in the corn prices, major ethanol producing companies in the
Midwest announced a substantial reduction in ethanol production. In 1995 - 1996, remaining producers of motor fuel grade ethanol have reduced production to about 50% of capacity, due to corn prices going from $2.50 to as high as $5+W per bushel. Only recently have corn prices and futures dropped to a range of $2.75 to $3.00 per bushel At seven large ethanol producing facilities, the shutdown capacity totaled 130 million gallons per year [lo]. Some companies are presently not operating or went out of business including Roquette America, Manildra, and Jonton Alcohol [personal communication, Steve Lewis, Genencor International, Inc.]
The mean price of ethanol in 19844990 was between 1.18 and 1.29 $/gal (data from 1 I states) [8]. Fuel ethanol sold anywhere in the United States was federally subsidized at 54 $/gal and also subsidized by some states (from zero to 40 cents per gallon in different states and in Werent years) [83. The net cost of ethanol to fuel producers was significantly lower. However, state tax benefits have almost disappeared, except for Alaska., Minnesota and Nebraska, which still provide about a 20e per gallon subsidy. Due to the recent increase in the price of corn feedstock, the ethanol price has risen and in the August 1996 was in the range of 1.42-1.57 $/gal in different states (1.53-1.55 $/gal in CA and 1.55 $/gal in Seattle, WA) fll]. With decreasing corn price, ethanol is now selling for I. 18- 1.42 $/gal nationally (I .40 $/gal in CA and 1.42 $/gal in WA). It should be noted that the selling price of fuel ethanol is that paid by the blender to the ethanol producer or marketer. The blender then keeps in his pocket the 54$/gal ethanol Fedeml Excise Tax exemption.
9

California Perspective, Including Other West Coast States
In California and other West Coast states (Oregon, Washington, Nevada, Arizona, and Alaska) ethanol, as a fuel or oxygenated gasoline blending component, has not received as much attention as in the Midwest. However, a total of nearly 500 million gallons of gasohol were consumed in California in 1991 [ref. 2, page 441. This corresponds to 50 million gallons of neat ethanol. This use of ethanol in the blend, however, dropped off dramabically in 1992 when an independent gasoline distributor (Ultramar) stopped selling gasohol. California has no subsidy on fuel ethanol but does give tax credits in the fonns of California reformulated gasoline (RFG). Current data is not available, but in recent years fuel ethanol has been shipped by rail from the Midwest (primarily ADM) to California both for blending, and for ETBE production by ARCO,
Today, California uses 19 billion gallons per year of fuel in the fom of gasoline and diesel. About 47% of the crude oil originates inside the state, 3% originates from foreign sources and the rest is imported from Alaska. [12]. Presently, there are about 45 million vehicles registered in the state
and it is expected that this number will double over the next 25 years. The demand for fuel per capita in California far exceeds that in any other state.
Starting in 1996, new California Air Resources Board (CARB) regulations require the use of RFG for the entire state [ref. 13, page 233. California RFG is required to contain between 1.8 and 2.2 percent oxygen by weight [ref. 13, page 311. Under the Califomia reformulated predictive model, however, up to 2.7 percent by weight oxygen m y be used if it is proved that the fuel doesn’t affect emissions. The regulations can be met by blending one of several types of oxygenates with gasoline. Efforts are underway to expand the predictive model to include 3.5% oxygen. MBTE and ethanol are the two main oxygenates that refiners have used to meet the wintertime oxygenate
requirement in California prior to the requirement of Calilfomia RFG. Restrictions in R W and NO, emissions have made it impossible to blend El0 in California reformutated gasoline. CARB is currently conducting a 125 vehicle emission study to evaluate the performance of El0 in the context of RFG.
Some California refineries currently have the ability to produce a certain amount of their required oxygenate on site, but this only amounts to about 15 percent of state demand [ref. 13, page 311. The remaining balance of the state’s oxygenate is imported from domestic or foreign sources.
According to California Energy Commission (CEC) estimates, the need for Phase 2 RFG in California will be rather stable until 2015, making up approximately 12.7 billion gallons per year
10

of oxygenated gasoline [ref. 13, page 4-41. Thus, assuming ethanol is economically competitive with MBTE, then ethanol need only be used as an oxygenate blending component and could potentially qu i re about 700 million gallons a year when used at 2 % ~ level of oxygen in RFG, or even up to 1.27 billion gal when used at 3.5%~ level of oxygen (as a 10% vol blend to gasoline). Also, using 10% ethanol in a blend can allow refiners to use 84 Octane gasoline, which gives the highest yield to refiners, and then with blend ethanol increase octane to 87 [personal communication, R. Katzen]. MTBE and ETBE production facilities are interchangeable, with 0.5% incremente!d capital investment to an MTBE plant, an additional $1 million for a $200 million plant investment [statement from W. Piel, ARCOJ.
According to the CEC forecasts, up to 29% of the lightduty vehicles in California could be fueled by something other than gasoline or diesel by 2010 [ref. 2, page 891. Transportation fuel ethanol market in the state can be potentidly even higher, provided that ethanol could be produced at low cost and used more widely in blends, and as a neat fuel or E85 in flexible fuel vehicles. In order to achieve t h i s potential need, the Air Resources Board and automobile manufacturers must work to certify blends for use in low emission vehicles in ralifomia. It seems likely that to a limited extent, electric vehicles will be adopted in California. Also ethanol can be used as a fuel cell feedstock for future electric vehicles.
At present, ethanol production in California is relatively limited In 1993, a total of 20,580 gallons of ethanol were produced per day [ref. 2, page 441. This totaled 7.5 million gallons per year. Most of the ethanol feedstock is from the state’s wine industry, food wastes, and from other liquid products, such as cheese whey. The largest ethanol-producing companies in California are Parallel Products and Golden Cheese of California [7,14].
.
Parallel Products was formed in 1982 as a small producer of chemical and fuel grade ethanol. Located in an industrial sector in suburban Los Angeles, the company accepts waste beverages and other food related products, that do not meet the manufacturers’ specifications and must be disposed of, and convert these products to ethanol 1151. The company therefore is able to obtain low cost feedstocks, which allows the company to produce ethanol competitively. The annual ethanol production capacity of Parallel Products is 2-3 million gallons (according to different sources) [7, 14,151. Golden Cheese of California produced 2.6 million gallons of ethanol annually in 1994-1995 [7,14,15].
11

Amongst other ethanol producers in the West Coast are Georgia Pacific Cop. (Bellingham, WA) and Pabst Brewing Company (Olympia, WA) with an annual production capacity of 3.5 and 0.7 million gallons, respectively [7,14, 151.
An increase in California production of ethanol might have been realized with the construction of the Sacramento Ethanol and Power Cogeneration Plant (SEPCO) by 1999 [16]. This project combined a power plant that would make electricity for the Sacramento Municipal Utility District (SMUD) with a plant that would use rice straw to produce ethanol. The S E X 0 plant was expected to produce about 12 million gallons of ethanol a year. However, in May 1996, the project was terminated by SMUD directors [ 171. SMUD determined that it could buy power cheaper than generating it at the ethanol plant An official from ARK Energy (the organization partnering with SMUD) said “Despite what’s hagpened, the logic of a cogeneration plant at that site is still overwhelming. It brings together the economies of combustion of natural gas power and the
environmental aspects of renewable power.”[ 17 J
Several biomass-to-ethanol feasibility studies are currently underway in California, including the
City of Gridley Rice Straw to Ethanol and Energy study, the Quincy Library Group study (forest waste to ethanol), the University of California Strategic Targets for Alliances in Research (mixed wood waste and the cellulose fixtion of urban waste) and the CEC-Peda Corporation project with the National Renewable Energy Laboratory (wood waste). There are additional activities in examining ethanol plant sites and permitting in Elk Grove and Stockton.
Availability of F ” s and fueling stations exists to a limited degree in California for M85 automobiles and MlOO buses. This infrastructure can be extended to include E85 without modification of the M85 fueling stations. The further development of an alcohol fuel distribution infrastructure would benefit both fuels. Additionally, methanol FFV’s incorporate nearly identical technology as ethanol FFV’s operated in other parts of the United States.
In July 1996, the Los Angeles Metropolitan Transit Agency (LAMTA) switched its almost 330 alcohol bus fleet from running on neat methanol to 95% ethanol [1 I, 181. In 1995, LAMTA converted 60 of the buses when methanol prices began to skyrocket, but success with buses on ethanol, and an ethanol fuel contract with Brea-based Regent International, led the agency to
convert the rest of the fleet. The future choice of fuel remains uncertain at this time [12].
12

Methanol is corrosive (especially to certain elastomers, such as rubber and plastic), and modifications must be made to methanol storage and dispensing equipment and the automotive fuel system The corrosive properties of the methanol fuels require equipment such as that installed at M85 retail service stations and methanol storage and delivery equipment. In March 1996, fifty- four retail service stations selling MI35 were available in California [ref. 2, page 521. Most of them are concentrated in Southern California, the Sacramento region, and the San Francisco Bay area. Also, the= are about fifty methanol fueling facilities in the state operated by caltmns, private and public fleets, and school and transit districts that are not open to the public.
Future Outlook For California
Cellulose h m ethanol can impact Califonzia and the United States economy by an initial modest reduction in petroleum imports, which add substantially to our national debt. Also, a major development of the cellulose-to-ethanol industry over the next 20 to 40 years would result in increased construction activity, new community development and creation of several hundred thousand jobs (agricultural and industrial) with increasing income and tax benefits to locd state and federal governments. Part of the dollar drain by petroleum imports would be converted to revenue recycling in local, state and national economics.
Ethanol demand is expected to increase by 7.7% annually until the year 2000. This estimate is down from the 10% annual growth rate of the last decade. The reasons for the slower growth in the next decade reflect the maturing market for gasoline oxygenates and the overturning of the Renewable Oxygenate Standad, according to the Cleveland-based Freedonia Group. The estimate also acknowledges that the ethanol market is full of uncertainty. The political influence of industry groups such as the American Petroleum Institute, the National Corn Growers Association, the Oxygenated Fuel Association and the Renewable Fuels Association for legislation and tax exemptions is credited with making motor fuel production one of the most politically influenced industries in the U.S. f19J
The future potential for increasing ethanol markets in California is tremendous; however, i t won’t happen without changes in existing state policies and tax structures, which presently do not support the development of an ethanol fuel industry. Because of the highly concentrated areas for agricultural (e.g. rice straw, wood waste, orchard prunings), industrial (food processing, textiles)
and urban (municipal solid waste, newsprint) feedstock sources, the economics are that much more
13

favorable in support of a fermentation ethanol industry. Also, such processes match well the pre- existing and growing fermentation industry in the state (biotechnology manufacturing companies, winene s, brew enes).
Ethanol will be produced fkom cellulosic wastes from different sources, based on local economics.
Greatest potential lies in the cellulosic fraction of municipal solid waste (MSW), already collected and transported to central points in urban areas. With appropriate separation of the 50% cellulosic content, and co-generation of power from residual unconverted MSW, this is potentially the largest volume, lowest cost cellulose-clerived ethanol.
In forest and wood processing areas (lumber, pulp, etc.) this can be the next largest and next lowest cost ethanol. Rice-straw in California can be collected and transported to a few central processing plants, with co-generation, and with a d t for environmental improvemnt over straw-burning, this can be a source of low-cost ethanol in the state.
A growing number of precommercialization biomass-to-ethanol projects are being evaluated in California, e.g, Gridley project (rice straw), SEPCO (rice straw), Quincy Library Group Project (forest wastes), Step 2 Project and STAR Project (wood waste and fiber fraction of MSW). Most are in an early stage of determining feasibility and one, the S E X 0 project, was placed on hold during 1995 after being permitted. A conservative estimate of the California resource base shows feedsrock availability for over 2 billion g u y [24.
14

The following Scenarios for using biomass-to-ethanol have the potential to provide multiple public benefits:
Ethanol used as a primary transportation fuel (E85, E95, Elm) Ethanol as an oxygenate (ETBE, El0 and E22)
Specific benefits reIated to economic and environmental factors are the following: Economic
Improves energy security and diversity Reduces dependence on imported transportation fuels Rural economic development Employment multiplier effect New capital investment Increases sales’ revenues, taxes Reduces wildfire suppression costs and public/private losses Complememts the needs of AE31890 Reduces agricultural, forestry and urban waste disposal cost Reduces industrial processors’ water effluent disposal costs
Environment Renewable resource of low reactivity and low toxicity Reduces agricultural and forest open field burning Reduces PMlO and toxic emissions Reduces greenhouse gases Reduces hydrocarbon and carbon monoxide emissions Benefits quality of soil, water, air and wildlife with energy crops Extends landfill capacity Reduces effluent loading to surface water Reduces wildfire fuel loading and related environmental impacts Positive energy balance
15

Existing ETBE lrg. potential vol. market technically proven meets environmental and regulatory requirements CARB study to determine actual emissions technically proven
interchangeable with M85
E6-El0
E85 infrastructure exists,
E95 300 buses operating
cost and availability refiners, blenders acceptance
compatility with RFG2
cost and avilsbility needs LEV certification further demonstration cost and availability vehicle type limited broader vehicle manufacturer warrantee
Short Term E22 (1-15Y)
E85
in use in Brazil RVP neutral
needs manufacturers warranty needs demonstration cost and availability
infrastructure exists, cost and availability interchangeable with M85 needs LEV certification
Medium Term E85 (IS-ZSy)
infrastructure exists, cost and availability interchangeable with M85 needs LEV certification
further demonstration Hybrid Vehicle 9 ethanol is a candidate needs technical
Fuel Cell ethanol is a candidate needs technical fuel development
Long Term Hybrid vehicle ethanol is a candidate needs technical (25 -50~) fuel development
Fuel Cell ethanol is a candidate needs technical feedstock development
16

Historically, there has k e n variable market demand for the use of ethanol for a transportation fuel in California. Although, there is not good data available, recently there has been up to 5OM gallons per year used for gasohol (EM), and additional levels associated with ETBE by ARCO, and other uses such as neat ethanol (E95) at the Los Angeles bus fleet involving 300 buses. The future market demand for ethanol will be primarily dependent on public policies and private sector actions. In the short term, 1-15 years, there appears to be a potential market demand of up to 700 million gallons because of the 2% oxygenate requirement in fuels in California reformulated gasoline.
It is difficult to project ethanol and ETBE fuel market demands. If and when ethanol is produced from cellulosic wastes at less than $1.00 per gallon, and reduced subsides are available, its use in the United States could reach 20 billion gallons per year, which compares with a present production capacity of 1.5 billion gallons per year [personal communication, R. Katzen].
There will be a range of choices for transportation fuel, including electric, alcohol (ethanol and methanol), LPG and compressed natural gas. Also, fuel cells and hybrid vehicles will continue to
be developed Amongst these fuel options, ethanol seem to fit with the needs of the state Ethanol can be derived via fermentation from a wide range of biomass materials (energy crops and wastes). Its use as an oxygenate will increase the size of the market as long as regulations allow. Having ethanol as a fuel derived fkom in-state renewable fesomes will strengthen the State’s economy.
The present level of ethanol produced in the state is extremely low as is its m k e t penetration (Table 4). Relative to other states, California has not encouraged growth of this industry. In states where such development is encouraged (e.g. Nebraska, Minnesota), there is considerable penetration of the ethanol market in the state. A scenario similar to the one in Minnesota could happen in California as the indusfry is more of a biomass-to-ethanol and not a corn-to-ethanol industry. Given the difference and uniqueness of California in having a much higher demand on fuel per capita, relative to the populations in any other state, one can envision significant development of the alternative fuels industry. The use of ethanol, directly or as ETBE, with
refiners to enhance octane and yield is promising. Also, California’s need for clean fuels to address air quality problems and California consumer demand for environmentally-friendly fuel will also drive development of the industry.
17

Future Recommendations
1.
2.
3.
4.
5.
6.
7.
8.
9.
Forecast should be developed for each potential market use of ethanol (E10, E22, E85, E95, ETBE) including a range of scenarios (high, medium and low demand scenarios). This should include more detailed economic and environmental impact information to better assess public benefits to CaJifomia state agency programs. Conduct a life-cycle analysis of biomass-to-ethanol production to provide additiod technical data covering environmental impacts, economic and mass energy balance compared with othm fuels. Identlfy what is needed to attract the equity investors and debt financing to expand this new biomass-to-ethanol industry in California. Identify what are appropriate and cost effective actions by the state and local agencies as well as by forestry, agricultural and urban waste industries to support development of W o m b biomass-to-ethanol industry. Include California renewable fuel industry input in the California Energy Commission Greenhouse Gas Mitigation Strategy Report. Assist in the development of a predictive model for use by The California Air Resources Board
that assesses El0 and E22 reformulated gasoline in California reformulated gasoline. Encourage automobile manufacturers to work with The California Air Resources Board to certify E85 low emission vehicles. Implement test demonstration projects involving E22 and E85 in order to collect data in California. Commit a reasonable amount of funds from AB1890 in support of further research and
commercialization of integrated processes that incorporate both electricity and fuel ethanol from biomass as a more effective way of supporting both biomass power generation and transportation fuel.
.
10. Need to revisit the waste management hierarchy established in AB939.
18

Table 1
U.S. Ethanol Markets in Existing Plants (data from R. Katzen, 1996 )
Markets Current Annual Current Annual Price . Capacity Market Per Gallon
Transportation fuel 1SB gal. 0.8B gal. $ I. 1 8- 1.42
Industrial Markets'
Food and Pharmaceutical*
potables3
300M gat. 250M gal.
l50M gal. 120M gal.
125M gal. lOOM gal.
$2.70
$3.00
$3.00
'Industrial markets are based on 60% synthetic and 40% fermentation processes.
2Food and Pharmaceutical uses requires that ethanol is pure (<50 ppm impurities) and dry (QOO PP* H2W
3Potable applications (e.g., vodka) requires labeling and purity.
19

Table 2. U.S. Ethanol Plant Capacity [21]
Company Location
Archer Daniels Midland
Minnesota Corn Rocessors
cargilf Pekin Energy Company New Energy Company Midwest Grain
A.E.Staley High Plains Corporation Chief Ethanol High Plains Corporation corn Plus Roquetre America AlClleIll Heartland Corn Products Reeve Agri-Energy Heartland Grain Fuel Georgia-Pacific Corp. Broin Enterprises MaIlikb Moms Ag Energy Wyoming Ethanol J.R.Simplot J.R.Simplot Parallel Products Golden Cheese of CA Kraft, Inc. Permeate R e f k g Ag Power of Colorado Minnesota Clean Fuels ESE Alcohol Jonton Alcohol Pabst Brewing Vienna Comtional TOTAL
Decatur, IL Peoria, IL Cedar Rapids, IA Clinton, IA Columbus, NE Marshall, MN Blair, NE a d w e , IA Pekin, IL South Bend, IN Pekin, IL Atchison, KS Louden, TN York, NE Hastings, NE Colwich, KS Winnebago, MN Keokuk, IA Grafton, ND Winthrop, MN Garden City, KS Aberdeen, SD Bellingham, WA Scotland, SD Hamburg, IA Moms, MN Torington, WY CalcIweU, ID Burley, ID Rancho Cucamonga, CA Corona, CA Melrose, MN Hopkinton, IA Golden, CO Dundas, MN Leoti, KS Edinburg, TX Olympia, WA Vienna, IL 39 plants
750
115
110
100 85 78
42 38 30 20 15 14.5 10.5 10 10 8 7 7 6 5 4 3 3 3 3 1.5 1.5 1.4 1.2 1.1 1.1 0.7 0.5
1,486.0
20

Table 3. Properties of oxygenates [S]
Ethers: MTBE 0.744 58 131 7.8 8-10 118 100 109.0 18.2 ETBE 0.747 58 161 1.5 3-5 118 102 110.0 15.7 TAME 0.770 52 187 1.5 3-5 111 98 104.5 15.7
Alcohols: Methanol 0.796 46 149 4.6 50-60 133 99 116.0 49.9 Ethanol 0.794 46 172 2.3 17-22 130 96 113.0 34*7 TBA 0.791 47 181 1.8 10-15 109 93 101,O 21.6
'All blend values are estimates from average data and vary with hydrocarbon type of gasoline and concentmtion of oxygenate.
Abbreviations: MTBE, methyl tertiary butyl ether EnE, ethyl tertiary butyl ether TAME, tertiary my1 methyl ether TBA, tertiary butyl alcohol
21

Table 4 Breakdown in Ethanol Production Ethanol Demand by State (1993)
State Barrels of Ethanol/Daya % Market Penetrationb
Aiasica California Colorado Florida Illinois Indiana Iowa Idaho Kansas Minnesota Montana Nebraska New Mexico North Dakota Ohio Oregon South Dakota Tennessee
Washington Virginia
374 103 361
58,409C 5,000 5,387C
392 2,386 2,869
143 5,260 3,220 5w
3,914
535 3,095
326 398
0.36 3.4 1
14+70 1-23
31.28 19-14 38.97 12+29 5.96
50.45 3.32
38.65 15.72 24.94 29.98 37.24 35.2 1 7.87 5.49
34.46
Totai 90,672
a data from reference 1.
b datafromreference7.
C Capacity for Illinois includes plants operated by Archer Daniels Midland Company located in Decatur and Peoria, Illinois; Cedar Rapids and Clinton, Iowa: and Wahalla, North Dakota.
22


References
1.
2.
3.
4.
5 .
6.
7.
8.
9.
Doidge, B.R., and Burgess, B.D. Corn Ethanol in Ontario. A profile of Ontario’s Corn Ethanol Industry. Agricultural Economics and Business Section, Ridgetown College of Agricultural Technology, July 1996
A guide to alternative fuel vehicles. California Energy Commission, April 1996
Chemical and Engineering News, Oct 18,1993 .
Oxy-Fuels News, Feb 26,1996
Unzeiman, G.H. US. Clean Air Act expands role for oxygenates. oil & Gas Journal, Apr 15, 1991, pp.44-48
An anaylsis of federal incentives used to stimulate energy production. Batteelle Pacific Northwest Laboratories (FNL-2410-1,2 Volumes), June, 1978
Renewable OxygedEthanol Reference Guide: The Map @reduced by 21st Century Fuels & Oxy-Fuel News in association with Delta-T Corporation), 1995
Rask, K.N., and Rask, N. The economic characteristics of the U.S. fuel ethanol market, 1993
Chemical h-ofile, Ethanol, March 25,1991
10. Oxy-Fuel News, May 6,1996
11. Oxy-Fuel News, August 5,1996
12. Blackburn, B. & Teague, J. Promoting waste to alcohol fuel production in California:
13. Fuels report. California Energy Commission, December 1995
14. US Ethanol Plants Map & Data from R-Katzen
1 5. Biofuels Update. Special Report. Volume 3, issue 1, winter 1995
16. Little, A.D. Feasibility review of the Sacramento ethanol partners project. December 16,1994
17. Moy, K.A. SMUD ends two ‘clean energy’ plants. The Sacramento Bee METRO, May 15,
18. Los Angeles Converts Buses to Ethanol, National Ethanol Vehicle Coalition, pp 6, Fall 1996
19. Oxy-Fuel News, December 16,1996
20. Potential feedstock and production capacity for ethanol in California. CDFA, 1990
2 1 Bryan & Bryan Inc., October 1995
developing a program for coordinating key organizations. Draft of the whole paper, 1996
1996
25

List of Abbreviations
AB, Assembly Bill AFV, Alternative fuel vehicle CARB, California Air Resources Board CEC, California Energy Commission CIFAR, California Institute of Food and Agriculutral Research CO, Carbon monoxide E10, gasohol, 10% ethanol blend in gasoline E22,22% ethanol blend in gasoline E85,85% ethanol in gasoline E95,95% ethanol in gasoline EPACT, National Energy Policy Act ETBE, Ethyl tertiary butyl ether FFV, Flexible fuel vehicle LEV, low emission vehicle LPG, liquid petroleum gasoline M85,85% methanol in gasoline MTBE, Methyl tertiary butyl ether
PM 10, Particulate matter, 10 microns RFG, Reformulated gasoline RVP, Reid vapor pressure SEPCO, Sacramento Ethanol and Power Cogeneration Plant SMUD, Sacramento Municipal Utility District STAR, Strategic targets for alliances h research TAME, Tertiary amyl methyl ether TBE, Tertiary butyl alcohol VFV, Variable fuel vehicle WOR, Wintertime oxygen requirement
26

Northeastern California Ethanol Manufacturing Feasibility Study Environmental Effects Report
November, 1997
Plumas Corporation and Quincy Library Group
John Sheehan and Linda Blum
Contents
General 1 Key Environmental Issues 2 Soils 3 Water Quality 5 Wildlife 10 Monitoring 11 Environmental Analyses 12
General The potential environmental effects of operating a commercial-scale biomass-to-ethanol plant include both the on-site and off-site impacts surrounding the production facility.
The on site environmental impacts (as well as local community impacts) are discussed in the site-specific evaluations conducted by the California Energy Commission in the Site Characterization Study issued in April 1997. The CEC study is a component of this overall ethanol manufacturing feasibility study. The CEC study reviewed various environmental and infrastructure factors at six sites in or adjacent to the Sierra Nevada mountain range in Northeastern California. CEC also defined the permits required for siting such a facility. The prospective sites for the ethanol manufacturing facility are:
Luyalton in Sierra County, Greenville and Chester in Plumas County, Westwood in Lassen County, Martell in Amador County, and Anderson in Shasta County.
The types of potential effects that might occur in the forestlands from which biomass is harvested are outlined below. The prospective monitoring program for U.S. Forest Service (USFS) lands, and the environmental reviews that will be required by state and federal law, are also discussed. This report can be used to help frame the USFS’s environmental analyses on federal lands, which must comply with the National
1 .

Environmental Policy Act (NEPA) and other laws and regulations. Environmental analyses on private lands must conform with the California Environmental Quality Act (CEQA) and other Iaws and regulations, primarily under the California Forest Practices Act, which by law is considered to be the “equivalent” of CEQA. This report is a statement of what the key environmental issues are expected to be and how serious these issues are considered to be.
Cellulose biomass material will be generated from both public and private forestlands within at least a 25-mile radius of the ethanol facility. The cost-effective transportation distance will vary with the market price of the ethanol product and other factors such as type of road, harvesting costs, slope, access to roads and season. Projected amounts of biomass feedstock available from forest lands within a 25-mile radius of each of four potential facility locations in the Quincy Library Group area are shown (Tables 1.14 and 1.15 on page 26) in the report prepared by TSS Consultants: Feedstock Supply and Delivery Systems, June, 1997. The report predicts an available and sustainable, annud supply of between 187,000 and 336,000 Bone Dry Tons (BDT), dependent upon site. Sources of biomass will be timber harvesting by-products, certain lumber mill residues as well as forest fuels reduction treatments. The same report, using the Forest and Resource Assessment Program (FRAP) of the California Department of Forestry and Fire Protection, defined that USFS holdings (within 25 miles of the four QLG sites) ranged from 53% to 64%. This includes all lands, not just forested lands. Of the forested lands within each site’s 25-mile radius, most are Federally managed.
Environmental reviews and public participation processes that are prerequisites for authorizing biomass harvest differ between land ownership types. On private timberlands, California Forest Practice Rules govern timber harvest practices. The California Department of Forestry and Fire Protection (CDF) is primarily responsible for regulating and enforcing timber harvests, with the regulation of stream crossings or alterations performed by the California Department of Fish and Game. CDF has an environmental checklist for CEQA compliance, requires a Timber Harvest Plan for each project over a certain size, and enforces Best Management Practices (BMPs). Such precautions address timber production sustainability, water quality, soil erosion and other concerns.
Biomass harvest activities on National Forest System lands - the presumed primary source for any ethanol facility within the Quincy Library Group’s area of interest, since the majority of the forest lands are federally administered - must be subjected to National Environmental Policy Act (NEPA) reviews and public participation processes of the U.S. Forest Service. Like CDF, the USFS typically requires the use of BMPs to prevent or mitigate environmental impacts.
A. Key Environmental Issues
The QLG plan intentionally reduces the environmental impacts of the large scale-thinning program that is proposed (approximately 40,000 acres per year for five years on US. Forest Service lands) through adoption of various measures designed to reduce those impacts. These measures include:
2

- Use of the Scientific Assessment Team (SAT) riparian standards for timber harvest activities, which typically preclude timber harvest within two “site tree” lengths of a perennial stream;
- Precluding timber harvests on the primary old growth forest and anadromous fish stream areas of the forest by defining those areas as “Off-Base” or “Deferred” from timber harvests;
- Adoption of the California Spotted Owl guidelines (1993), which preclude harvesting trees over 30 ” diameter at breast (d.b.h.) as well as limit basal area and tree canopy reductions from thinning programs; and
- Precluding timber harvests in so-called “Spotted Owl Protected Activity Centers” (PACs) and “Spotted Owl Habitat Areas” (SOHAS).
The typical kinds of environmental concerns that arise from timber harvest and biomass harvest activities include the effects of roads and landings, riparian zone and water quality impacts, fuel loadings, wildlife disturbances, and changes in suitability of wildlife habitats. Generically, these are grouped here into soil, water and wildlife impacts. The Plumas, Lassen, and Tahoe National Forest Plans have standards and guidelines applicable to the protection of soil, water, and wildlife resources and the USFS region has adopted a series of BMPs.
1. SOILS
Soil concerns are expected to be heightened for biomass harvest and thinnings at the proposed scale. Merchantable logs (generally between 10” to 30”d.b.h.) will be harvested. In the same or subsequent operations, biomass operators using (for example) feller bunchers and chippers wiIl take the smaller trees and logging slash and chip them on site. These operations will then either transport some of the chips for further use ( e g , ethanol, electric generation, particleboard, etc.) or broadcast the chips on site. Future fuels maintenance treatments, at appropriate times of year, will usually include prescribed burning.
Soil compaction, soil surface disturbances, introduction of soil pathogens such as tree root rot diseases, accelerated erosion, and loss of nutrients are issues that require special attention and monitoring.
An example of the fuel treatments advocated by QLG is the “Highway 89 Defensible Fuel Profile Zone” currently underway south of Sierraville on the Tahoe National Forest’s Sierraville Ranger District. This project, using funds allocated to the QLG area national forests by the Secretary of Agriculture, has currently (1O/97) completed 300 of the 1341 acres scheduled in the project. 18,000 green tons of biomass material (chips) have been removed (average yield has been 60 tons per acre), From an administrative standpoint, it uses “service contracts” (biomass operators are paid to remove the material) and hand thinning by USFS crews to accomplish the project goals, prior to the reintroduction of
3
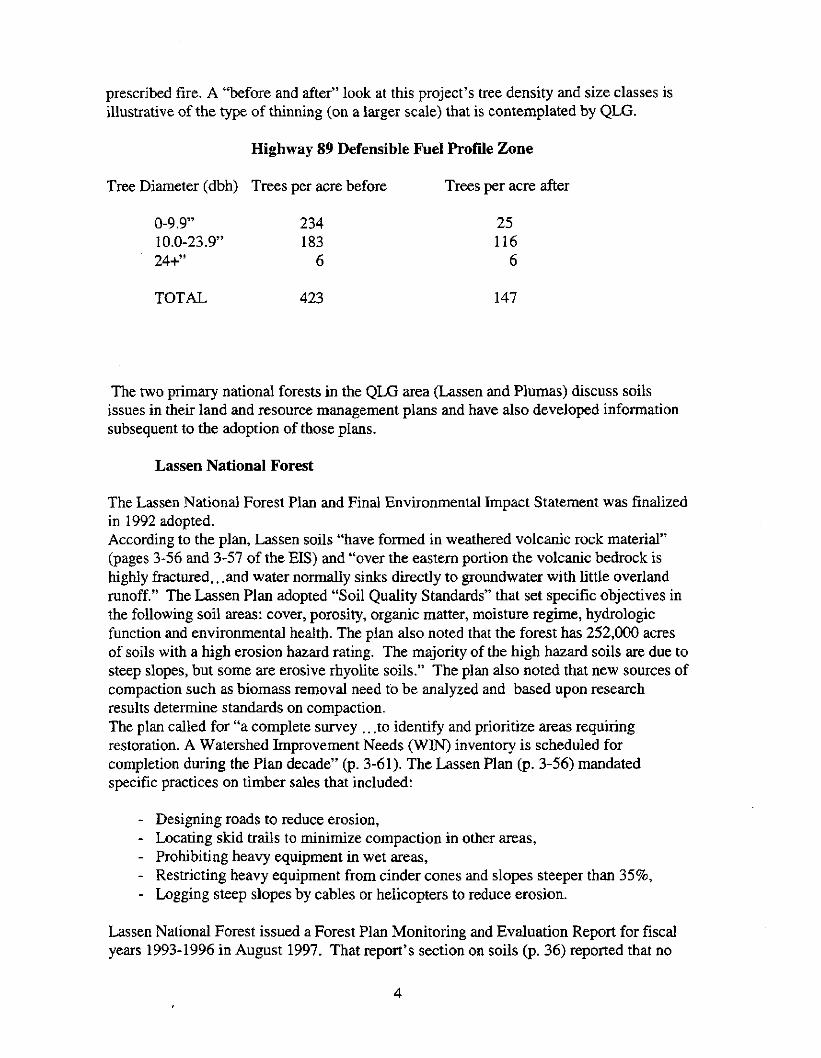
prescribed fire. A “before and after” look at this project’s tree density and size classes is illustrative of the type of thinning (on a larger scale) that is contemplated by QLG.
Highway 89 Defensible Fuel Profile Zone
Tree Diameter (dbh) Trees per acre before Trees per acre after
0-9.9” 234 10.0-23.9” 183 24+” 6
25 116
6
TOTAL 423 147
The two primary national forests in the QLG area (Lassen and Plumas) discuss soils issues in their land and resource management plans and have also developed information subsequent to the adoption of those plans.
Lassen National Forest
The Lassen National Forest Plan and Final Environmental Impact Statement was finalized in 1992 adopted. According to the plan, Lassen soils “have formed in weathered volcanic rock material” (pages 3-56 and 3-57 of the EIS) and “over the eastern portion the volcanic bedrock is highly fractured.. .and water normally sinks directly to groundwater with little overland runoff.” The Lassen Plan adopted “Soil Quality Standards’’ that set specific objectives in the following soil areas: cover, porosity, organic matter, moisture regime, hydrologic function and environmental health. The plan also noted that the forest has 252,000 acres of soils with a high erosion hazard rating. The majority of the high hazard soils are due to steep slopes, but some are erosive rhyolite soils.” The plan also noted that new sources of compaction such as biomass removal need to be analyzed and based upon research results determine standards on compaction. The plan called for “a complete survey . . .to identify and prioritize areas requiring restoration. A Watershed Improvement Needs (WIN) inventory is scheduled for completion during the Plan decade” (p. 3-61). The Lassen Plan (p. 3-56) mandated specific practices on timber sales that included:
- Designing roads to reduce erosion, - Locating skid trails to minimize compaction in other areas, - Prohibiting heavy equipment in wet areas, - Restricting heavy equipment from cinder cones and slopes steeper than 35%, - Lugging steep slopes by cables or helicopters to reduce erosion.
Lassen National Forest issued a Forest Plan Monitoring and Evaluation Report for fiscal years 1993-1996 in August 1997. That report’s section on soils (p. 36) reported that no
4 I

soil productivity monitoring has yet been accomplished but that some compaction monitoring (with a long shafted penetrometer) was accomplished in 1994 and 1995 on individual timber sales. No evaluations were given, other than a recommendation to amend the Forest Plan to incorporate monitoring strategies for soil compaction and soil productivity. Pacific Southwest Research Station of USFS is currently conducting field tests of soil compaction at its Blacks Mountain Experimental Forest in the Lassen NF that may provide strategies in this area.
Plumas National Forest
The Plumas National Forest Plan and EIS were issued in 1988 and finalized in 1989. The Plumas, in contrast to the Lassen, has “a wide variety of rock types (including). . . metamorphic, granitic, volcanic and sedimentary” (p.3-3 of the EIS). These rocks “have resulted in diverse soils on the P W . Generally, the warmer and more humid westside has deeper, more productive soils; the cooler, arid eastside has shallow, less productive soils.” These conditions led to management prescriptions that focused upon use of “the field verified Soil Resource Inventory (SRI) , . .the evaluation of productivity potential (total biomass production) and erosion hazard.. . . Management focuses on limiting disturbances to reduce soil erosion and compaction. Management practices include maintenance of ground cover to reduce soil loss, limitation of heavy equipment use on moisture sensitive soils to reduce compaction and use of low and moderate intensity fires during prescribed burning to reduce loss of nutrients and soil structure.” (p.3-85) The EIS showed 33% of the forest (387,000 acres) as having high or extreme soil erodibility potential. The 44,OOO acres having extreme erodibility were defined as losing .96 inch of soil per year and over 150 tons per acre.
The Plumas National Forest is in the process of printing its monitoring report (10/97) entitled “Plumas National Forest Monitoring and Evaluation Report FY 1989- 1996.” Along with the Lassen National Forest’s monitoring results, the Plumas’s monitoring data are expected to be useful in identifying specific soil-related concerns for further attention and adaptive management.
2. WATER QUALITY
The Plumas National Forest Plan addresses the myriad and often competing uses of water in the area. “Water supports timber, range, fish and wildlife and other resources. Runoff is used for power generation, recreation, irrigation and domestic consumption both on the forest and downstream. {Water} consumption occurs as far south as the Los Angeles metropolitan area.” (p.3-79). The condition of waters in the Quincy Library Group area thus have implications throughout California. The Feather River is the largest river emanating from the Sierra Nevada mountain chain. It drains the Sierraville Ranger District and most of the Plumas National Forest. The Feather, gathered at Lake Oroville, provides more than half the water for the State Water project’s aqueducts to Southern California. The Feather is also used at Lake Oroville and upstream for major hydroelectric facilities. The Middle Fork of the Feather is also a federally designated Wild and Scenic River. Certain westside streams on the Lassen NF (Deer, Antelope and Mill Creeks) also are the lone remaining spawning streams for spring run Chinook
5

salmon in the Sacramento River system. The QLG proposal and bill, as has been discussed earlier, take two steps (SAT, off - base/deferred lands) that should have important implications for water quality in the QLG area.
Adoption of SAT Standards
The Scientific Assessment Team (SAT) standards (adopted as part of the President’s Northwest Plan) have five components relating to timber harvest practices in riparian areas. These are included in the QLG bill and agreement. Absent a site-specific watershed assessment that recommends tree removal for aquatic ecosystem purposes, the SAT standards preclude timber management in streamside zones and other aquatic resource areas as follows:
Area Treatment
* Fish -bearing Streams on both sides
No tree harvest within 300 feet of streams
* Permanent non-fish-bearing Streams both sides
No tree harvest within 150 feet of stream on
* Lakes No harvest within 300 feet of lake
* Ponds and wetlands above one acre No harvest within 150 feet
* Seasonal Flowing Streams No harvest within 100 feet
* Wetlands under one acre No harvest within 100 feet
* Landslide areas No harvest within 100 feet
Off Base and Deferred Areas
A major proposed change in each of the three National Forest Plans would have certain areas (beyond current wilderness areas) precluded from timber harvest for at least the five-year term of the Quincy Library Group project. The proposed land allocation (as well as a digitized map) was included in the 1993 QLG agreement. The map was developed by VESTRA Resources (Redding, CA) and is also a component of the QLG bill. The QLG map was based upon mapping done in the 1980’s as components of the three “environrnentalist” alternatives to the three Forest plans (which were then under development). These earlier maps were not adopted by the national forests in question in their final forest plans. The QLG land allocation proposal is as follows:
6

The QLG Landbase
Land Class
Available for Management
Off-Base
Deferred
Owl Protected Activity Centers
Existing Wilderness
Total
Lassen N.F. lOOOs acres (’3%)
674 (66)
174 (17)
59 (6)
40 (4)
77 (7)
1,024 (45)
Plumas N.F. 1000s acres (%)
768 (68)
172 (15)
78 (7)
24 (2)
1,122 (49)
Sierravilte R,D. 1000s acres (%)
122 (88)
0
11 (8)
5 (4)
0
138 (6)
Totals 1000s acres (%)
1,564 (68)
346 (15)
148 (6)
125 (5)
101 (4)
2,284 (100)
Current forest plans, law and regulations mandate that logging be precluded in wilderness areas and spotted owl sites (SOHAs and PACs). The QLG proposal would add 21 96 of the national forests (slightly less than 500,000 acres) to areas where logging is precluded, at least during the five years of the QLG project proposal contemplated in the bill and the original 1993 QLG agreement.
These additional areas are primarily in large blocks of “Late SeraV Old Growth” stands, high elevation red fir zones, botanical or special interest areas as well as important fisheries. Areas where logging would be precluded include, for example,
- the upper tributaries of Independence Lake on the Sierraville Ranger District, - all of the Lakes Basin area above Graeagle on the Plumas National Forest, - the entire canyon of the Middle Fork Feather River, ridge to ridge, from south of
- the entire watershed of Nelson Creek (a tributary to the MFFR), and - the entire watersheds of Deer, Mill and Antelope Creeks on the Lassen National
Quincy to Oroville Lake,
Forest .
It is anticipated that these logging provisions, as well as the active watershed restoration activities called for in the QLG proposal and bill, will have beneficial and protective effects upon the waterways in the QLG area, immediately and over various time scales. The QLG thinning program itself is intended to lessen the propagation of large, stand- destroying fires and their attendant accelerated releases of sediments and debris in precipitation events.
The national forests themselves have adopted various protections in their forest plans to improve and protect water quality.
7

Lassen National Forest
The Lassen National Forest Plan (1992) states that “water quality is acceptable in all streams and lakes.. . road construction and clearcutting tend to cause sedimentation, which lowers their water quality. . . .Other potential problems are.. .giardia contamination,. . .nutrient loading, bank erosion and shade reduction from livestock grazing,. . .hazardous spills from highways and septic tank drainage,. . .temperature and sedimentation effects from geothermal and small hydroelectric development.” (pp. 3-84- 85). The Lassen Forest Plan calls for 1,500 acres of watershed improvements per year on the forest.
The previously noted Lassen National Forest monitoring report (8/97) states that Lassen water quality meets the standards set up in the 1992 plan. The report notes that BMPs were applied on 77% of sampled sites and that those were 90% effective. The same report calls for improved project planning and implementation. The riparian and watershed sections of the same report suggest amendments to the Forest Plan in the areas of changes in watershed condition and cumulative watershed effects (pps. 61-62). The same report (p.59) recommends “amendments to the forest plan to provide long term direction for anadromous watersheds [e.g. Deer, Mill and Antelope Creeks] and an ACS for areas outside existing ACS [Aquatic Conservation Strategy] areas”
Plumas National Forest
The Plumas National Forest Plan ( 1989) paints a different picture of water quality than the Lassen National Forest Plan. “An estimated 70% of the water draining PNF lands meets State Water Quality objectives. However, due to degradation of water from private lands outside of the PNF boundaries, only 40% of the water flowing through and from the PNF meets State Water Quality objectives” (p. 3-82).
“Mine waste discharge and sediment from roads, mining and overgrazed meadows have been the most persistent degraders, but sediment yields from other sources are now causing additional degradation. The current average sediment yield from Feather River watersheds is about triple that of the Sierra Nevada Mountains in pristine condition. Sediment yield in the most degraded watersheds is seven-fold that of the pristine condition. Erosion and sedimentation are important problems in Spanish and Indian Creeks, the South Fork of the Feather River, and Slate and Canyon Creeks. Sedimentation damages aquatic habitats, hydroelectric facilities, and the State Water Project and increases flooding potentials.” (pp. 3-82-83).
The erosion problems identified in the Forest Plan have led to increased activity in this area by the Plumas National Forest and others. Plumas National Forest was a charter member of the Feather River Coordinated Resource Management (CRM) group, active since 1985 and formalized in 1989. The CRM includes 21 distinct entities (e.g. Plumas County, Pacific Gas and Electric Co., Central Valley Regional Water Quality Control Board, etc.) that have entered into a long term cooperative agreement. The CRM goals include:
8

Identifying erosion sources, Coordinating between public and private landowners, Implementing erosion control projects where practical, Ensuring project cost-effectiveness for contributors, and Developing a cooperative regional erosion control plan.
The CRM (with USFS involvement) developed a variety of documents designed to guide activities to address erosion (and other riparian issues) in the Feather River. These commenced with :
US. Soil Conservation Service, East Branch North Fork Feather River, Erosion Inventory Report-1 989.
This report categorized the various creeks according to their sediment contribution and identified Spanish, Wolf, Indian and Last Chance Creeks as the largest sediment sources. The CRM followed up this study with a more detailed look at two of the creeks:
Plumas Corporation, East Branch North Fork Feather River, Spanish Creek and Last Chance Creek, Nun Point Source Water Pollution Study, 1992 and its companion publication
US Forest Service, Stream Classification and Channel Condition Survey, with an Inventory of Sediment Sources from Roads and Stream Crossings, Conducted in the Spanish and Last Chance Creek Watersheds, 1992.
These two studies developed detailed information for these creeks and a priority mechanism for restoration.
The CRM, based upon these previous studies, then developed an overall strategy designed to guide restoration work in the broader East Branch watershed (600,000 acres covering 24 subwatersheds- approximately one half of the national forest):
US Forest Service, Eust Branch North Fork Feather River Erosion Control Strategy, 1994
This report, signed by the agency heads of the cooperators, is guiding restoration work on the East Branch. The report has been used on the other Feather River areas in the Plumas National Forest (e.g. Middle Fork, South Fork). The overall strategy is also used, preliminarily, on the Feather River drainages in the Lassen National Forest (North Fork) and Sierraville Ranger District of the Tahoe National Forest (Middle Fork).
The Feather River CRM has also accomplished forty stream restoration projects since 1985 on both public and private lands. Cooperatively funded and designed projects have included fish ladders, restoration of an urban stream and abandoned mine tailings, meadow rewatering, bank fencing, revegetation and check dam building. These projects have used over $5 million from the cooperators, including, since 1995, funds provided to the local national forests by the Secretary of Agriculture for QLG-related activities.
9

Plumas National Forest also did resource assessments for all 48 subwatersheds across the PNF from December 1993-mid 1994. These unpublished resource assessments used standard criteria for assessing conditions, documented assumptions and criteria, developed “vision statements” for the subwatersheds and finally ranked watersheds for priority of work.
3. WILDLIFE
The three national forests in the QLG area have a great richness of wildlife in general and also contain a variety of wildlife (and flora) that have state or federal protections. Federal and State Endangered Species on the two main national forests (Lassen and Plumas) include the peregrine falcon, bald eagle, northern spotted owl (only on the Lassen NF, north of Hwy. 299 and outside of the QLG boundary), Shasta crayfish (Hat Creek and Pit River on the Lassen NF), spring run Chinook salmon (Antelope, Mill and Deer Creeks on the Lassen NF) and red legged frog . Sensitive species include the California spotted owl, goshawk, great gray owl, fisher, Sierra Nevada red fox, American marten and willow flycatcher (Sources: Lassen Plan pp. 3-99 to 3-101, Plumas Plan p. 3-41).
Each of these species is generally recognized to have habitat associations (although different studies continue to debate the implications of these habitat associations for different species). The Lassen Plan (3-98) and the Plumas Plan (3-39 to 3-54) note the habitat associations and forest successional stages apparently preferred by these species. These associations and stages are listed in the following chart dong with an explanation of how the overall QLG project (as proposed in 1993) would treat these particular species.
Quincy Library Group Wildlife Review (USFS Lands)
Species Successional Stage Habitat
Peregrine falcon
Bald eagle
California spotted owl
Chinook salmon N/A
Red-legged frog
NIA ponds, lakes snags and fish
Late lakes, isolation, snags large trees, open multilayered stands
Late large conifers with >40 9% closure, snags, dead and down logs
graveled streams, stream cover, flows, no dams
not defined none defined
QLG Treatment
SAT standards riparian restoration
SAT, CASPO, thinning Off base and Deferred (refugia)
CASPO, Off base and Deferred
SAT, PACF’ISH standards. Entire remaining habitat is in Off base or Deferred areas
USFWS protocols, SAT
10

Species Successional Stage
S hasta crayfish NA
SN red fox
Goshawk
general
Late
Great gray owl Late
American marten Late
Will0 w flycatcher not defined
Fisher Late
Habitat
spring fed streams and lakes
general
dense, mature conifers, Meadows, riparian, dead and down logs
overmature timber w. snags, meadows
Dense mature conifers Dead and down logs
none defined
Climax coniferous, multi species
QLG Treatment
SAT and restoration
Off base and deferred
SAT, Off base & deferred, CASPO restoration
Off base and deferred, CASPO
Off base and deferred
SAT
SAT, contiguous Off base and deferred.
Specific prescriptions must address specific habitat concerns (see also SNEP, Ch.56). The QLG bills mandate an EIS process as well as initiation of the process for amendment or revisions to the Land and Resource Management Plans on the pertinent Forests. The planning processes must identify the protocols, standards and guidelines for fuels management prescriptions to minimize potential impacts upon these species.
The extent to which the use of BMPs and other standard forestry management practices will effectively mitigate the effects of mechanical removal of vegetation is arguable, and will probably vary greatly with different practices, specific resources and different equipment operators. Implementation monitoring, training, and adaptive management will be used to improve mitigation efforts.
Monitoring Plan
Monitoring the results of biomass harvest will be critical to the overall success of the biomass removal program. The Quincy Library Group calls for an active and comprehensive monitoring program at various temporal and landscape scales. The USDA Forest Service has received funds from the Secretary of Agriculture, as part of the USDA support of the Quincy Library Group proposal, to develop and implement these monitoring programs. The QLG bills cdl for a “science based assessment”
The three National Forests (after discussions with QLG) presented a draft monitoring program to the QLG in March, 1997 (see attached Forest Health Pilot -Draft Monitoring Plan, version 2.6 -36 pps.). The three forest supervisors are currently (October, 1997) reviewing this plan in order to determine whether further revisions to the draft plan are advisable in order to comport the final monitoring plan with the monitoring and reporting requirements contained within the proposed QLG legislation.
11

The outline of the draft plan is an attachment to this report. The plan is designed to answer a series of questions:
ImDlemen t at ion
Are projects implemented as designed?
Effectiveness at Site Scale
Are soil quality standards met? What are the impacts in streamside zones? Are BMPs implemented/effective? Is fire behavior modified? How is vegetation modified in short term and long term? How are fuels modified in short term and long term? How is terrestrial habitat modified in short and long term? Are watershed restoration projects effective? Are Hypogeous fungi modified? What are air quality effects of controlled bums?
Larger Scale Effects
Is aquatic habitat improved? What are vegetation trends? What are size and intensity of wildfire trends?
For the national forests in the QLG area, the road systems are pretty much already in place, and currently roadless areas will be not be entered under the QLG management prop0 s al .
Environmental Analyses
Any particular project on federal lands has its environmental review conducted within the cument regional or national context, which must take into account the latest and best available scientific information. The Sierra Nevada Ecosystem Project Report (Davis: University of California, Centers for Water and Wildland Resources, 1996)---referred to as SNEP--- was a multi-year, Congressionally mandated, interdisciplinary, scientific review of the status of the Sierran ecosystem. It is the most recent science on a broad scale. The SNEP Summary notes that:
Live and dead fuels in today’s conifer forests are more abundant and continuous than in the past. (p.26). * .. Timber harvest, through its effect upon forest structure, local microclimate, and fuel accumulation, has increased fire severity more than any recent human activity. If not accompanied by adequate reduction of fuels, logging (including salvage of dead and
12

dying trees) increases fire hazard by increasing surface dead fuels and changing the local microclimate. Fire intensity and expected fire spread rates thus increase locally and in areas adjacent to harvest. However, logging can serve as a tool to help reduce fire hazard when slash is adequately treated and treatments are maintained. (p.26).
Human activities, particularly timber harvest.. .and fire suppression, have drastically reduced the extent of late successional forests through the removal of large trees.. 4p.6).
...
...
. . . The DFPZs reduce the extent of [severe] fire by up to 1/3 over fifty years. (Johnson, Sessions, Franklin: Initial Results from Simulation of Alternative Forest Management Strategies for Two National Forests of the Sierra Nevada, SNEP Addendum, Chapter 6, p. 187.)
As hinted at in these brief quotes, the SNEP Report provides substantial scientific and professional support for the forest fuels management strategy proposed by the QLG. SNEP documents, along with other recently available scientific information, may be drawn upon for background and guidance in identifying and evaluating environmental effects associated with the forest biomass production side of the biomass-to-ethanol project.
13

Northeastern California Ethanol Manufacturing Feasibility Study: Socioeconomic Report
July 8,1997
by Plumas Corporation- John Sheehan
Contents
Executive Summary 1 A.Current Context 1 B. Employment 7 C. PayroIl Impacts 11 D. Tax Revenues 11 E. Infrastructure 12
Executive Summary
This socioeconomic report reviews the local, regional and statewide implications of building and operating a forest biomass to ethanol manufacturing facility at specified sites in the Quincy Library Group area (Lassen, Plumas and Sierra counties in the Sierra Nevada) or other sites in Northern California. The report first sets the current socioeconomic context in this natural resource dependent area. It then reviews the effect of an ethanol plant on employment, personal incomes, state and local taxes, construction jobs, and local infrastructure (particularly roads, schools and utiIities). It also reviews the implications of such a facility in Amador or Shasta County.
A modest sized forest biomass to Ethanol pilot plant (e.g. producing 15 million gallons per year) will create at least 28 direct jobs at the plant, if it is co-located with an existing biomass electric energy plant. Additional jobs would be created if a biomass electric energy plant was built along with the ethanol manufacturing facility. The provision of forest biomass feedstock to this plant would employ 63-100 additional employees to gather, process and transport the cellulose material to the plant. This direct employment will generate an annual payroll of more than $2.6 million. These 91-128 direct jobs (in total) would be augmented by an additional 93-122 indirect or multiplier jobs in the surrounding communities.
A. Current Socioeconomic Context within the Quincy Library Group area and other sites.
A variety of previous studies are reviewed below to give the current and historical socioeconomic status of the areas involved in this ethanol study* The overall Northeastern California Ethanol Manufacturing Feasibility Study (of which this Socioeconomic Report is one section) looks at six sites for possible location of an ethanol manufacturing facility. There are four sites within the three county Quincy Library Group area (i-e. the towns of Greenville and Chester in Plumas County, the City of Loyalton in Sierra County and the town of Westwood in Lassen County) as well as two other sites: the town of Martell in Amador County (primarily an industrial community) and the City of Anderson in Shasta County. The implications of the data (according to the author) are highlighted by bullets,
1. Sierra Business Council
Sierra Business Council is an "association of businesses working to secure the economic and environmental health of the Sierra Nevada for this and future generations." The SBC published its Sierra Nevada Wealth Index in 1996. The report refers to "capital investment'' as being made up of three forms of capital: natural, social and financial. The Wealth Index uses a wide variety of indicators (more than 27) to define these

forms of capital. The data is presented by sub region within the Sierra and by county (twelve counties) as well as over varying time scales. The information is intended to be regularly updated from available sources. Three of the five ethanol study counties ( less Shasta and Lassen) are included in the report. A sampling of that data is included here.
lndicuto r
Social Capital
High School Dropout Rate
1980 1990
Combined SAT Scores
1988 1994
Per Pupil Expenditures (1993)
Voting Percentage
1994
County Plumas Sierra Amador
21.6 17.3
902 866
5,305
56
22.0 23.2 24.5 17.5
936 912 864 899
8,O 16 4,082
69 50
Library Use (Borrowers per 100-1995)
14,165 (included with Plumas) 24,041
Total Violent Crimes
60 10 59
Natural Capital
Acres in Williamson Act
1991 1995
Timber Harvest (MMBF)
1978 1994
82,203 82,970
238 105
37,035 95,456 37,108 94,7 18
1 29 34 35 26
2

Financial Capital
Number of Small Businesses
1978 1993
Total Jobs
1990 1995
436 839
52 74
459 754
8,720 1,530 10,990 8,890 1,780 11,980
*The three Sierran counties studied have had relatively anemic job growth, a decreasing timber sector yet a stable agricultural sector, increasing " mom and pop" businesses, few crimes, high voter participation and low drop out rates. Schools are spottily funded.
2. DoaWKusel in SNEP
Another study of socioeconomic issues in the Sierra Nevada was published in 1996 (S. Doak and J. Kusel: Well Being in Forest Dependent Communities, Volume 11, Chapter 13, Sierra Nevada Ecosystem Project: Final Report to Congress, Davis, University of California, Centers for Water and Wildland Resources, 1996) as part of the multi volume "SNEP" report. Doak and KuseI gathered available data for all the 720 U.S. Census "Block Groups" in the Sierra and aggregated them into 182 groupings that are spatially linked and associated with a single town. The aggregates were defined with the help of local residents. The authors' rationale was primariIy that County level data masked disparities between distinct communities within the County.
They then blended census statistics (poverty, housing tenure, educational status, welfare, employment and incomes) to develop a "Socioeconomic" rating, They also developed more subjective analyses for each of these geographic groupings. These latter analyses were developed after meetings with groups of local leaders, using a defined format. The resultant " Community Capacity" is defined by Do& and Kusel as the " collective ability of residents in a community to respond to internal and external stresses, to create and take advantage of opportunities and to meet the needs of the residents". This capacity consists of similar broad categories as those used in the previously described Sierra Business Council study- physical capital, human capital and social capital. Each town was given two ratings: "Community Capacity" and "Socioeconomic". For example, an upscale area like Lake Almanor West in Plumas County received the highest rating possible (7) on the Socioeconomic scale and a high rating (4 out of a possible 5 ) on the Community Capacity scale--apparently because the sense of community and institutions were well developed. On the other end of the spectrum, Kings Beach at Lake Tahoe--a very low income, unincorporated community --- rated only 1 on the Socioeconomic Scale and 2 on the Community Capacity scale.
The towns within the Sierra that are the focus of this ethanoI study rated as follows:
Town Nearest DoaWKusel Population Socioeconomic Community Capacity Aggregate
Greenville Greenvillehdian Valley 2,907 3 Chester Chester 2,I 15 2 Westwood WestwodClear Creek 2,25 I 1 Loyalton Sierra ValleyNerdi 2,029 4 Martell Sutter CreekNolcano 3,324 4
Jackson 4,901 4
3

Two aggregates are shown for the Martell site since it did not have its own aggregate and is located between the towns noted.
*The implications of this data are that most of the communities in the study area are in the low (Westwood) to moderate (Loyalto< etc.) range in terms of socioeconomic standing. At least two of the communities (Westwood and Loyalton) have deficient community capacity, according to Doak and Kusel.
3. County Level Data/ California Employment Development Department
A county by county comparison of various statistics is one way to bring in data pertaining to the City of Anderson (Shasta County), since it is outside of the Sierra Nevada.
county
Data Set Shasta
1983 Employment 43,700
2/97 Employment 65,400
2/97 Unemployment Rate 11.1
2/96 Unemployment Rate 12.9
2/97 Manufac. Employees 4,400
2/96 Manufac. Employees 4,200
Amador
7,200
12,270
7 .O
8.3
1,130
1,160
Sierra
1,350
1,440
15.7
18.3
280"
210"
Plumas
7,030
8,360
16.4
20.1
840
670
Lassen
7,770
10,570
13.2
15.9
400
420
*all Durable Goods (including manufacturing)
*Sham is the largest county in rural northern California and has grown significantly in the last decade. Amador has almost doubled in employees in the last fifteen years due to its proximity to Sacramen to.
*The three QLG counties currently have higher unemployment than the other two counties. Lassen County has fewer manufacturing employees than the other counties (relative to total employment).
4. Quincy Library Group Economic Monitoring Report: The Baseline
The above report was issued in December, 1995 by Plumas Corporation (using USDA Forest Service funds). The economic framework in the three county Quincy Library Group area is described. The report contains a variety of socioeconomic analyses, presented both regionally and focusing on the three county Quincy Library Group area. Selected data is presented here on the QLG counties. Additional data is presented that represents the QLG counties plus at least one of the two other counties.
4

Median Family Income 1990
California $40,5 5 9 Lassen County 32,000 Plumas County 30,000 Sierra County 30,000 Chester' 24,000 Greenville 16,000 Loyalton 36,000
*The QLG counties, and particularly the towns with proposed ethanol sites, have much lower incomes than other California residents.
Selected Counties Lumber Products Employment Dependence
% of lumber employees ('92) Plumas Sierra Lassen
13 14 6
*Plumas and Sierra counties have high dependence upon forestry jobs. *
Ratio of Service Jobs to Woods ProducWLumber Jobs
County
Plumas Lassen Sierra Amador
Year 1998 1992
-97 I .53 -5 2.2
1.48 2.18 .37 2.26
Shasta
4
.Amador and Lassen counties have increased their service economy in recent years.
Role of Federal Timber Harvests
The federal timber harvest value is a percentage of all annual timber values in each county. Each county has some percentage of its employees engaged in timber and wood products. As of 1992, the combined percentages for each of the six study counties is as follows:
County 96 Wood Products Employees Imputed Federal Harvest Employment %
Sierra Plumas Lassen Shasta Amador
10 9 5.5 3.6 5 -9
4.7 3.96 2.25 0.14 0. I77
5

Federal timber harvests play a much higher role in the QLG economies than in the other two counties. Sierra and Plumas counties have high percentages of employees in the wood products area.
5. California Department of Finance: Economic Profile
This Department issues annual information on cities and counties from their own research as well as using other state and federal economic and employment data.
County City
Shasta
Sierra
Plumas Lassen Amador
Anderson
Loyal ton
Jackson
County
Shasta Sierra Plumas Lassen Amador
Shasta Sierra Plumas Lassen Amador
Per Capita 1994
$ 18,323 18,318 18,772 15,699 17,161
POPULATION 1/96
161,600 8,650 3,390
890 20,450 3 1,050 34,000
3,880
INCOME
Median Family 1990 Census
$30,333 29,911 29,667 3 1,803 35,062
EARNINGS Per Job 1994
$25,340 22,476 22,840 25,030 246 10
Amador has the highest family incomes but its earnings per job are about average among these counties. The large prison in Lassen leads to low per capita incomes (prisoners included) but, conversely, high earnings per job (guards included). Shasta is a metropolitan area, with the highest earnings per job of these counties.
6

6. Bureau of Economic Analysis: Per Capita Transfer Payments and Incomes from Dividends, Interest and Rents
1979 1989 1993 % Change '79-'93
County
Amador Shasta Sierra Plumas Lassen
DIR$ 'IT$ DIR$ TP$ DIR$ TP$ DIR TIP
2,200 1,629 3,807 2,785 3,569 3,576 62 119 1,331 1,553 2,787 3,196 2,389 4,394 79 182 1,351 1,656 2,579 3,415 2,294 4,632 69 179 1,330 1,522 3,763 3,302 3,635 4,460 173 I93 1,018 1,519 1,700 2,904 1,579 4,005 55 163
A high level of "Dividends, Interest and Rent" income is usually a sign of both a more affluent and usually an older population: at that age where those incomes start to become the significant results of a lifetime of investments. Plumas clearly had greater increases in these types of incomes, although Sierra still has the highest per capita level. All counties except Amador had significant increases in Transfer Payments (Social Security, SSI, AFDC, etc.).
7. Summary of Current Context
The three Quincy Library Group counties are generally more timber dependent than the other two counties. Unemployment is particularly high in the QLG counties. Amador has experienced significant population growth as it becomes more a part of Greater Sacramento. Shasta County has also grown significantly . Lassen has a low per capita income due to a large state prison, but a high earnings per job.
B. Employment Impacts
1. Employment at the Facility
The National Renewable Energy Laboratory has provided estimates, by job class and pay rate, for an ethanol manufacturing facility. NREL uses as their benchmark a 15 million gallon per year facility. The TSS Consultants report prepared as part of this overall ethanol feasibility study (Feedstock Supply and Delivery Systems), posited that an available supply exists for a 14 million to 25 million gallon plant at the four sites within the Quincy Library Group area. These jobs can generically be referred to as "plant" jobs. NREL posited two circumstances for employment generation. One is where an existing electric generation facility would be co located with the ethanol plant (such as the current situation at five of the six sites reviewed in this feasibility study). The other circumstance is where such electric generation facilities do not now exist. The jobs at the facility are as follows:
7

Direct Jobs at Ethanol Plant (15 miVgaVyr.)
Job Description Ethanol Plant Ethanol Plant Direct Hourly without existing Biomass Electric with existing Biomass Electric Wage .$
Operations operators chemical tech. 1 aborer shift supervisor operations super.
Maintenance mechanic pipe fitter welder electrician instrument. tech. maint. super.
Management and OH plant manager engineer chemist/microbio,l. biomass buyer shippingheceiving pa yrol Yacc t'g . administrative
Total
15 3
12 3 1
4 2 2 2 2 1
1 2 2 1 2 3 3
61
9 10-15 3 10-15 6 6-10
15-20 20-25
1 2
1
28
15-20 15-20 15-20 15-20 15-20 20-25
25-30 20-25 15-20 15-20 10-15 10-15 6-10
2, Employment in Gathering and Transporting Biomass Material
Three sources are used to define the jobs involved in gathering and bringing cellulose materials to the ethanol plant. Estimates are presented from Wheelabrator Shasta Energy (Wheelabrator owns biomass electric facilities in Anderson and Martell, two of the six target sites in this feasibility study), Pacific Wood Fuels (which provides biomass to the Westwood facility in the feasibility study [along with other facilities] ) and Plumas Corporation. For the sake of this discussion, these jobs are referred to as "woods" jobs. The methodology used is to give the job production ranges shown from each source in the finaI summary.
Wheelabrator
Wheelabrator has estimated to NREL that one woods job is created for each 2,400 Bone Dry Tons of biomass delivered to the plant site. A rough estimate (according to NREL) is that each BDT will provide Feedstock for 62.5 gallons of ethanol.
Plant Size BDT Woods Jobs
5 MGY 80,000 10 MGY 160,000 15 MGY 240,000 20 MGY 320,000 25 MGY 400,000
33 66 99
I32 165
8

Plumas Corporation
Plumas Corporation, the local economic development group, carried out a study for USDA Forest Service in 1995 entitled Establishing a Wood Pellet Manufacturing Mill in P l u m s County. The subject of this earlier study, while different from this Ethanol Plant study, necessitated an extensive look at the biomass collection industry in Plumas County. This industry has grown up in response to the development of a number of biomass fueled electric plants in the area during the late 1980s (e.g. Loyalton, Quincy, Chester, Westwood, Wendell, Susanville, Burney, Bieber). The 1995 report focused on the high level of capitalization that had developed in this industry. The report included a section entitled "Economics of Biomass in Plumas County" which looked at various independent woods operators in the industry, their techniques and the equipment they used. The report showed that a typical woods crew (called a "side" in the industry) produced approximately 30,000 BDT per year and was composed of eight to nine persons. These jobs were broken up into the following categories:
Job Description Jobs per "Side"
Chipper 1 Skidder Operator 2 Feller Buncher Operators 2 Chip Van Operator 3-4
Total 8-9
The basic operation consists of the "feller buncher", a very mobile three wheeled vehicle which shears off small trees ( generally c lo") close to the ground, grabs a number of the trees upright with a hydraulic grappler and puts them in a pile. The "skidder" (a four wheel vehicle with a grappler) then hauls the tree piles to a central point where they are conveyed into the "chipper" and then blown into the "chip van". This consolidated operation can generally take place anywhere with < 30 percent slope. Other equipment is necessary on steeper slopes.
This definition of work tasks has the following woods jobs for the prospective 15 million gallon per year ethanol manufac turing plant.
Plant Size BDT Woods Jobs 15 MGY 240,000 64-72
Pacific Wood Fuels
This firm supplies biomass for electric plants in Westwood, Oroville, Burney and China Camp.
Pacific Wood shows the following job description breakout and wage rate for a typical side. They estimate that a side can produce 20,000 to 28,000 BDT per year and an average is used (24,000 BDT). The typical side has ten persons in the following categories. This is the same ratio of BDT per jobs as was used by Wheelabrator. The 15 MGY facility would use 1 0 0 persons in the woods jobs. Pacific Wood Fuels notes that these woods jobs do not include the resource professionals that do the necessary environmental , contractural, layout and project development work for the field workers described below.
Job Description Jobs per "Side" Direct Hr. Wage $
Chipper Operator 1 S kidder Operator 2 Feller Buncher Operator 2 Truck Driver 3 Mechanic 1 Foreman 1
Total 10
13-15 10-12 14-16 8-10
14-17 13-20
9

Range of Woods Jobs (Wheelabrator, Pacific Wood, Plurnas Corporation)
Plant Size (MGY) Estimated Woods Jobs
15 64- 1 00
3. Indirect Employment and Multipliers
Jobs in any industry create additional, indirect jobs in two ways. The first is through industry spending, those are the indirect jobs generated by any particular industry as it purchases goods and services from other local businesses. The second type of indirect jobs are those that result from all the jobs generated by the industry employees' consumer spending in their area The combination of these two types is called the Industry and Consumer Spending Multiplier. This multiplier ranges greatly between the types of industry that generates these indirect jobs. Statewide averages, previously compiled by the California Trade and Commerce Agency (using IMPLAN, a system developed by the University of Minnesota), show a range of between 0.23 jobs for "personal services'' on the low end up to 4.41 jobs for "petroleum and coal products" on the high end of the scale. Neither of these multipliers include the underlying industry job. County by County multipliers were also prepared by the State Department of Commerce. The statewide figures are used here since the proposed sites are in five different counties.
There are two primary types of industry jobs that are directly created as part of the ethanol facility. These have been previously called the ethanol "plant" jobs and the "woods" jobs. The ethanol manufacturing plant "Standard Industrial Classification (S?C) is part of "chemicals and allied products" and it is SIC #/ 2869 ('Industrial Organic Chemicals, Not Elsewhere Classified'). California Department of Commerce shows a statewide job multiplier of 1.47 (not including the underlying ethanol plant job). The woods jobs are included within "lumber and woods products manufacturing" and are SIC # 241 1- Logging with a 0.82 multiplier. All job fractions are rounded to the nearest.
Size of Facility # plant jobs plant multiplier # woods jobs woods multiplier Total Multiplier MGY (8 1.47 @ 0.82 Jobs
15 28
4. Total Employment Generated
41 64- 100 52-82 93- 123
The following employment figures assume that the ethanol plant is co-located with a biomass electric generation station. For sites without such generation facilities, at least 28 additional direct jobs will be created at the generation station to generate the needed electricity. Employment is a function of plant size. A moderate sized pilot facility (1 SMGY) will generate between 9 1 - 127 direct "plant" and "woods" jobs plus an additional 93-123 multiplier or indirect jobs. This plant will thus generate between 184-250 total jobs.
10

C. Payroll Impacts
1. Direct Payrolls
The payrolls of the proposed plant and wood jobs can be determined through the wage and job class information provided by NREL (plant jobs) and Pacific Wood Fuels (woods jobs). Since both entities provided ranges of wages per classification, an average is used for each job classification.
Plant Jobs
The estimated 28 positions at the plant will generate an annual payroll of $766,480, based upon the classifications and an average of the wage rates provided by NREL for a 2080 hour year.
Woods Jobs
Approximately ten Ten (10) person crews will be needed to generate the 240,000 BDT estimated for the 15 MGY facility (100 jobs). Woods work is seasonal work and a figure of 8 months (or 66 per cent of a year) is used here for calculating annual wages. The annual payroll , based upon the Pacific Wood Fuels wages by classification, would be $1,856,600.
Total Direct Payroll
The total direct payroll will be $2,623,080.
2. Indirect or Multiplier Payroll
The multiplier payroll is a function of the average annual wage for all industries in the county affected. Previous data (see AS above) reviewed 1994 Earnings per Job by County, provided by California Department of Finance. The average job earnings amount for Plumas County (by way of example) was $22,840. The low estimate given above for the number of multiplier jobs was 99. The ethanol plant, therefore would generate an indirect payroll of $2,261,160 (if all expenditures and employees were in Plumas). This indirect payroll income (according to methodology from the California Commerce Agency [ 19955 ) will actually be smaller in rural Lassen, Plumas, Sierra and Amador counties for two reasons. The above counties do not have fully evolved economies with comprehensive goods and services (in contrast to Anderson in the ReddingIShasta County metropolitan area) and so some purchases will be made elsewhere. Some portion of indirect employment will also (more than likely) be outside of those rural counties noted above.
3. Total Direct and Indirect Payroll
The total estimated direct and indirect payroll for the ethanol facility is $4,884,240.
D. Tax Revenues
Sales Tax Revenues
The Sales Tax Rate varies from jurisdiction to jurisdiction. The underlying rate mandated by California is currently 7.25 percent. California Commerce Agency (CCA) estimates that 40 percent of payrolls are spent on items subject to sales tax. Based upon this formula, the total sales tax revenue will be $141,643.
11

State Sales Tax Revenues
The State of California receives all of the sales tax. The state returns (at minimum) 1.75 percent to the localities and thus keeps 5.5 percent of the 7.25 percent (75.8 %) or $107,453.
Local Sales Tax Revenues
The counties receive (at minimum) 1.75 of the total sale tax. receipts (24.2%) or $34,190
State Personal Income Tax Revenues
The average personal income tax is 4 percent of revenues (according to CCA). The state income tax revenues would be $195,370.
Corporate Income Tax Revenues
Corporate Income Tax is payroll times the ratio of total state corporate income tax revenues to total California wages and salaries (1 percent) or $48,842.
D. Construction Jobs and Payroll
Construction Payroll
The construction payroll can be expressed as a percentage of construction costs of the facility. Equipment costs are approximately 112 the costs of the facility and will be purchased elsewhere. W L estimates that a relatively small facility (e.g. 10 million gallon per year of ethanol production) would cost approximately $20,000,000. Excluding purchased equipment, land and design costs from that amount leaves approximately $10,000,000 as the construction costs. Twenty percent of that figure would lead to a $2,000,000 construction payroll.
Construction Jobs
The average Plumas County job (for example) pays $22,840. The $2,000,000 payroll will create 88 construction jobs.
E. Infrastructure
The effects of the prospective ethanol plant is reviewed for three types of community infrastructure: roads, schools and community services such as sewer and water service.
1. Roads
The plant's operations will have varying effects upon the road systems, depending upon the type and location of the plant and access road ( e g . interstate, state highway, paved county road, urban or rural setting). The primary initiators of road effects are the delivery of cellulose to the plant and the subsequent shipping of ethanol and other products from the plant. Other major effects wiIl be felt from the workers commuting to the operational plant and well as the short term construction activity to build the plant. The underlying traffic generator is the delivery of cellulose material to the plant.
12

The 240,000 Bone Dry Tons (BDT) delivered for a 15 million gallon per year ethanol facility will generally be delivered by so-called "possum belly trailers" directly from the woods operations. These trucks carry approximately 25 green tons per truckload or 13-14 Bone Dry Tons. This equates to approximately 17,800 truckloads delivered to the site annually. It is anticipated that this delivery stream will operate for only eight months of the year in most of the studied locations, where biomass gathering is seasonal due to winter, mountain, weather conditions. Thus a normal 2080 hour workyear becomes, for this biomass delivery system, a 1,385 hour year in that eight month period (a 243 day work season). Assuming a six day per week delivery regime for the material, then 85.7 % of the days available are delivery days. There is a total delivery "window" of 208 days. This equates to 85 truckloads a day to the site, 7 truckloads per hour for a 12 hour day or a truckload every eight and a half minutes.
The Site Characterizution Study, developed by California Energy Commission (CEC-April, 1997) as a component of the overall Feasibility Study, defined and reviewed the road and transportation system for each of the six sites. CEC had no plant size information when it conducted the study but pointed out that each of the sites has nearby rail access that would ease the road related traffic impacts for bulk material in and out of the ethanol plant. The CEC report did point out possible road limitations at Greenville ("access to site for Feedstock trucks appears to be primary issue") and Loyalton ("trucks transporting Feedstock ... may be of quantity to degrade these roadways"). CEC will initiate further review in order to "identify specific project-related impacts on capacity and levels of service for all roadways within the vicinity."
Currently, five of the six sites have operational biomass power plants, are permitted for and receive cellulose biomass that is burned as "hog fuel" at the plants. Each plant has a Maximum Generating Capacity expressed in megawatts (see Site Characterization Study, p . 7). Each megawatt, according to Pacific Wood Fuels, uses approximately 8,000 BDT. The wood biomass to ethanol manufacturing project includes the separation of sugars from lignin. The lignin, a much more efficient fuel than hog fuel, would be burned in the electric boilers. The sugars are further processed into ethanol. The maximum current permitted MW and thus the BDTs necessary to supply those megawatts are given in the following chart for each site. These maximum BDTs can be translated to the "effective permitted traffic" supplying the current facilities. This effective maximum BDT can be related to the proposed 240,000 BDT ethanol facility.
Site Maximum MW Maximum BDT to MW
Loyalton 20 160,OOO Chester 12 96,000 Westwood 13 104,OOO Martell 18 .. 144,Ooo Anderson 49 392,000
. . . .
.. I. J , " '
Traffic generated by a 15 MGY ethanol facility would range between more than twice that now effectively permitted at Chester (for the biomass electric plant alone) to less than 65 percent of that effectively 1 * r
permitted at the Anderson site.
2. Schools
The capacity of the local schools to absorb new students and the level of developer site to site. The following reviews the situation for each site and builds on the CEC
: i ._. , I.. ! f ' I . .
, : , , ;'.. I . , _.. i , . . . :. . . - , .
fees (if any) varies from information cited above. '
13

Site School
W estwood Elem HS
Chester . : . Elem
HS
Greenville Elem HS
Loyalton Elem Middle HS
Anderson Elem HS
Martell Jackson Elem Jackson Middle Jackson RS
Enrollment
292 258
394 298
218 195
250 145 140
1,952 2,307
420 466 495
Capacity
Temporary Buildings same . .
at capacity some room
some room some room
Commercial Development Fee
$ 0.26Isq.R. same
$ .28/ sq. ft. same
same same
175 175 248
1,896 2,840
Temporary Buildings Temporary . Temporary
none none none
$0.30/sq.ft. $0.30/sq A.
$0.30/sq. ft. same same
3. Water Supply and Wastewater
Each of the six prospective sites has differing Water and Wastewater facilities and arrangements. These are reviewed briefly in the CEC Site Characterization Study (pps. 56-60]. What follows is a’ review of these finRings and in particular the effect ( or lack’ thereof ) bn commun&y owned systems.
. . . I .
Supply
The Chester, Martell, Loyalton, Anderson and Westwood sites all have adequate process water supplies in use that have been .developed from gtoundwater (Westwood, Loyalton, Anderson) or surface supplies (Loyalton, Ghester, Martell). These indeperident (of non’community) supplies are either on the site (groundwater wells), are. non potable water fiom’other purveyors or are held’water rights. The GreenviIle site wpuld use community water, nearby wells or surface water from at3jacent Wolf Creek. The CEC report predicts fiat-ihe -ethanol mamfacturing project would have no serious impacts on community water supplies at any of the sites reviewed. . ’
Wastewater
”
Process wastewater is currently disposed of (through on site percolation ponds) at Chester, Loyalton, Greenville, Westwood and Martell: Martell and Chester have EPA (NPDES) permits aid Greenville may need an NPDES permit. Anderson uses ogsite agriculture irrigation as the disposal .method forprgcess wastewater. CEC predicted there Would be no necessity to expand existing employ& related wastewater facilities at any of the sites although on site disposal/ treatment would be necessary .for process wastewater.
I4