Cook County Biomass Feasibility Study
219
PreFeasibility Financial and Wood Supply Analysis for Biomass District Heating in Ely and Cook County, MN: University of Minnesota Report to Dovetail Partners, Inc. Dennis R. Becker (Forest Resources), Steve Taff (Applied Economics), and David Wilson (Forest Resources) September 27, 2012 Table of Contents List of Figures ................................................................................................................................... ii List of Tables .................................................................................................................................... ii Glossary ........................................................................................................................................... iii Common Conversions ...................................................................................................................... v 1.0 Introduction and Background .............................................................................................. 1 1.1 Report Purpose and Background .................................................................................. 1 2.0 Existing Energy Use and System Options ............................................................................. 2 2.1 Heat Load ʹ Ely.............................................................................................................. 2 2.2 Biomass System Options ʹ Ely ...................................................................................... 4 2.3 Heat Load ʹ Cook County.............................................................................................. 6 2.4 Biomass System Options ʹ Cook County ...................................................................... 7 3.0 Financial Performance ......................................................................................................... 9 4.0 Forest Biomass Availabilty and Price ................................................................................. 14 4.1 Physical Availability ʹ Ely ................................................................................................... 16 4.2 Physicial Availabilty ʹ Cook County ................................................................................... 21 4.3 Competition ....................................................................................................................... 25 4.4 Biomass Harvesting and Transport Costs .......................................................................... 25 4.5 Forest Operations .............................................................................................................. 26 Appendix A. Ely District Energy Engineering Study (LHB, Inc.) .................................................... 27 Appendix B. Ely Minnesota Biomass District Energy System (Wilson Eng Services) ................... 57 Appendix C. Forest Biomass Heating and Electricity in Cook County: Phase I Report (Dovetail & UMN) ................................................................................................. 132 Appendix D. Review of Grand Marais Biomass District Heating System (FVB Energy, Inc.)...... 187 Appendix E. Reference Biomass Harvest Costs ......................................................................... 213
-
Upload
khangminh22 -
Category
Documents
-
view
2 -
download
0
Transcript of Cook County Biomass Feasibility Study
Pre-‐Feasibility Financial and Wood Supply Analysis for Biomass District Heating in Ely and Cook County, MN: University of Minnesota Report to Dovetail Partners, Inc. Dennis R. Becker (Forest Resources), Steve Taff (Applied Economics), and David Wilson (Forest Resources) September 27, 2012 Table of Contents List of Figures ................................................................................................................................... ii List of Tables .................................................................................................................................... ii Glossary ........................................................................................................................................... iii Common Conversions ...................................................................................................................... v 1.0 Introduction and Background .............................................................................................. 1
1.1 Report Purpose and Background .................................................................................. 1
2.0 Existing Energy Use and System Options ............................................................................. 2 2.1 Heat Load Ely .............................................................................................................. 2 2.2 Biomass System Options Ely ...................................................................................... 4 2.3 Heat Load Cook County .............................................................................................. 6 2.4 Biomass System Options Cook County ...................................................................... 7
3.0 Financial Performance ......................................................................................................... 9 4.0 Forest Biomass Availabilty and Price ................................................................................. 14 4.1 Physical Availability Ely ................................................................................................... 16 4.2 Physicial Availabilty Cook County ................................................................................... 21 4.3 Competition ....................................................................................................................... 25 4.4 Biomass Harvesting and Transport Costs .......................................................................... 25 4.5 Forest Operations .............................................................................................................. 26 Appendix A. Ely District Energy Engineering Study (LHB, Inc.) .................................................... 27 Appendix B. Ely Minnesota Biomass District Energy System (Wilson Eng Services) ................... 57 Appendix C. Forest Biomass Heating and Electricity in Cook County: Phase I Report
(Dovetail & UMN) ................................................................................................. 132 Appendix D. Review of Grand Marais Biomass District Heating System (FVB Energy, Inc.)...... 187 Appendix E. Reference Biomass Harvest Costs ......................................................................... 213
katiee
Stamp small

UMN Report to Dovetail Partners September 27, 2012 Final Draft ii
List of Figures Figure 1. Cook County Coverage map of the Site 2 scenarios ....................................................... 4 Figure 2. Cook County Coverage map of the L3, Hybrid and L6 Scenarios .................................... 7 Figure 3. Ely Composition of the Levelized Cost of Energy (LCOE) by site option ....................... 12 Figure 4. Cook County Composition of the Levelized Cost of Energy (LCOE) by site option ....... 12 Figure 5. Biomass cost versus volume within the 60-‐mile supply zone around Ely .................... 20 Figure 6. Biomass supply service areas around Ely...................................................................... 20 Figure 7. Biomass cost versus volume within the 60-‐mile supply zone around Grand Marais ... 24 Figure 8. Biomass supply service areas around Grand Marais .................................................... 24 Figure 9. Overlap of 60-‐mile biomass supply zones for Laurentian Energy Authority, Ely,
and Grand Marais ......................................................................................................... 25 List of Tables Table 1. Modeled biomass systems and equipment specifications for Ely ................................... 5 Table 2. Estimate of initial capital and annual operating costs for Ely scenarios .......................... 5 Table 3. Modeled biomass systems and equipment specifications for Cook County ................... 8 Table 4. Estimate of initial capital and annual operating costs for Cook County scenarios .......... 8 Table 5. Non-‐fuel investment and financing assumptions ............................................................ 9 Table 6. Average fossil fuel price, 20-‐year price escalation, and furnace efficienciess ............... 10 Table 7. Financial performance of proposed options for Ely ....................................................... 11 Table 8. Financial performance of proposed options for Cook County ....................................... 11 Table 9. Change in financial performance for options assessed in Ely ........................................ 13 Table 10. Change in financial performance for options assessed in Cook County ...................... 14 Table 11. Timberland acres by age class and forest type in the Ely 60-‐mile biomass
supply zone ................................................................................................................. 16 Table 12. Dry tons living biomass by stand attribute and ownership within 60-‐miles of Ely ...... 17 Table 13. FACCS estimate of biomass volume available by ownership within 60-‐miles of Ely ... 17 Table 14. Average haul distance, cost, and annually available biomass volume for supply
zones surrounding Ely ................................................................................................. 19 Table 15. Timberland acres by age class and forest type in the Grand Marais 60-‐
mile biomass supply zone ........................................................................................... 21 Table 16. Dry tons of living biomass by stand attribute and ownership within 60-‐miles of
Grand Marais .............................................................................................................. 21 Table 17. FACCS estimate of biomass volume available by ownership within 60-‐miles of
Grand Marais .............................................................................................................. 22 Table 18. Average haul distance, cost, and annually available biomass volume for supply
zones surrounding Grand Marais ............................................................................... 23 Table 19. Biomass resources potentially subject to competition within overlapping 60-‐mile
supply zones ................................................................................................................ 25

UMN Report to Dovetail Partners September 27, 2012 Final Draft iii
Glossary As received wood waste and chips paid
regard to moisture content. Bioenergy heat or electricity produced from biomass energy systems.
Biomass Cost of heat (Levelized Cost of Energy) the cost per unit of energy that when held constant through the analysis period results in an NPV equal to zero.
Bole the main trunk of the tree, above the stump and below the crown/top.
Btu British thermal unit. Standard unit of energy equal to the heat required to increase the temperature of one pound of water one degree Fahrenheit.
Chips a type of wood fuel. Clean chips are wood fiber processed by chipping, are free of contaminants like bark and needles, and generally include only the bolewood of a tree. Clean chips are suitable for residential and small industrial heating applications.
Co-‐firing combustion of two types of materials, e.g., biomass with coal.
Co-‐generation simultaneous production of heat and electricity from one or more fuels, also called combined heat and power (CHP).
Condensing power power generated through a steam turbine where the steam is exhausted into a condenser, cooled to a liquid, and recycled back into a boiler.
Cord stack of round or split wood consisting of 128 cubic ft of wood, bark, and air space (measures 4ft x 4ft x 8 ft).
Cordwood equivalent to 4-‐ft lengths of roundwood cut and stacked into cords, or stacks of 4-‐ft x 4-‐ft x 8-‐ft. Cordwood is used for firewood in conventional fireplaces, wood-‐burning stoves, or boilers for home heating purposes.
DBH diameter at breast height, used to measure trees.
Discount Rate the rate used to determine the present value of future cash flows, which takes into account both the expected interest that could be earned on present money plus any uncertainty surrounding the future cash flows.
Forest biomass the accumulated above-‐ and belowground mass (bark, leaves, and wood) from living and dead woody shrubs and trees.
Forest residues the aboveground material generated from logging during harvesting, e.g., leaves, bark, and tree tops (see also Slash )
Hog (hogged) fuel a type of wood fuel generated by grinding wood and wood waste, including bark, leaves, branches, and tops of trees. Wildfire fuels reduction treatments and whole tree harvesting produce hog fuel, which is used for industrial, district heating and CHP applications.
Landing the site where harvested trees are accumulated for loading onto trucks or further processing.
Maximum annual outlay -‐ the largest amount of money that the project investor would have to come up with in any single year. Typically, this occurs in the first year of the project.
Net Present Value (NPV) given a desired rate of return, the current worth of a future stream of cash flows (or savings) minus its current cost. Future cash flows (or savings) are discounted at the discount rate, and the higher the discount rate, the lower the present value of the future cash flows.

UMN Report to Dovetail Partners September 27, 2012 Final Draft iv
Organic Rankine Cycle (ORC) pressurizing, heating, vaporizing, condensing, and re-‐heating an organic fluid (e.g., propane, octamethyltrisiloxane (OMTS) in a closed cycle to generate electricity and 180°F hot water.
Oven-‐dry ton (odt) ton of biomass or wood assuming zero percent moisture content by weight. Also referred to as dry ton and bone-‐dry ton.
Productive machine hour time during scheduled operating hours when a machine performs its designated function; excluded downtime for maintenance, weather, and other delays.
Pulpwood trees and wood suitable for manufacturing paper.
Rotation number of years required to establish and grow trees to a specified size, product, or condition of maturity.
Roundwood sawtimber, pulpwood, and other round sections cut from the tree.
Saw timber log or tree meeting minimum diameter and stem quality requirements to be sawed into lumber.
Simple Payback Period the number of years required to recover the cost of an investment with future cash flows discounted (see also NPV).
Skidding moving trees from a felling site to a loading area or landing using specialized logging equipment.
Slagging the formation of deposits on boiler tubes, usually due to the presence of chemical contaminants.
Slash tree tops, branches, bark, or other residue left on the ground after forestry operations (see also Forest Residues ).
Stumpage value or volume of uncut trees in the woods.
Thinning partial harvesting of a stand of trees to accelerate the growth of the trees left standing.
Timberland forested land capable of producing in excess of 20 cubic ft/acre per year of industrial wood crops under natural conditions.
Wildland-‐urban interface (WUI) forest areas with increased human influence and land use conversion.
Wood Pellets type of wood fuel made from compacted sawdust or pulverized wood chips. Premium pellets are made from sawdust and clean chips free of contaminants and are highly dense with low moisture content (below 10%) that are burned with greater combustion efficiency in residential and small industrial applications. Industrial grade pellets have higher ash content and are used in industrial applications with larger boilers and higher combustion temperatures than residential scale boilers.

UMN Report to Dovetail Partners September 27, 2012 Final Draft v
Common Conversions Energy Heating Values
Energy source
Factor
Unit
Moisture by weight
Coal 19,000,000 Btu/ton -‐-‐ Electric 3,413 Btu/kWh -‐-‐ Off-‐Peak Electric 3,413 Btu/kWh -‐-‐ #2 Heating Oil 140,000 Btu/gal -‐-‐ Kerosene 136,000 Btu/gal -‐-‐ Natural Gas 100,000 Btu/therm -‐-‐ Natural Gas 91,600 Btu/th. cu.ft. -‐-‐ Propane 91,600 Btu/gal -‐-‐ Cordwood 9,400,000 Btu/ton 35% Clean Chips 9,600,000 Btu/ton 40% Hog Fuel 8,800,000 Btu/ton 40% Pellets 16,600,000 Btu/ton 10% Common Forest Biomass Conversions1 Unit Conversion 1 truckload of wood 23-‐26 green tons 1 green ton of wood (40% moisture content) 0.60 dry tons of wood 1 cord of roundwood 1.2 dry tons of wood (128 cu ft) 1 megawatt (MW) per year 5,300 7,000 dry tons of wood per year
85,000 110,000 million Btu per year powers approximately 750-‐900 homes per year
1 One English (short) ton equals 2,000 lbs

UMN Report to Dovetail Partners September 27, 2012 Final Draft 1
1.0 INTRODUCTION 1.1 Report Purpose and Background This report synthesizes findings of previous preliminary analyses conducted for biomass district energy systems in Ely, MN and Cook County, MN and presents financial scenarios upon which to compare options. Preliminary financial and wood supply impacts are presented for both locations to assist in making well-‐informed decisions about converting from fossil fuels to biomass energy. This phase of the study is funded by the Minnesota Environment and Natural Resources Trust Fund as recommended by the Legislative Citizen Commission on Minnesota Resources (LCCMR). It includes coordination and subsequent analyses of the following reports:
Ely, Minnesota Ely District Energy Engineering Study (LHB, Inc.; November 22, 2010) preliminary
analyses of capital costs and project structure establishing a biomass-‐fired 30 mmBtu/hr district heating system and 1 MW co-‐generation system in downtown and residential Ely. Project paid for by the U.S. Department of Energy and the Minnesota Department of Commerce through the American Recovery and Reinvestment Act of 2009 (Appendix A).
Preliminary Feasibility Report: Ely Minnesota Biomass District Energy System (Wilson Engineering Services, PC; July 6, 2012) preliminary feasibility study evaluated a biomass-‐combined heat and power for a) Vermillion Community College, and b) the
696. Project paid for by the Wood Education and Resource Center, U.S. Department of Agriculture, Northeastern Area State and Private Forestry (Appendix B).
Grand Marais, Minnesota Forest Biomass Heating and Electricity in Cook County, MN: Phase I Report
(Dovetail Partners and University of Minnesota; September 2011, updated February 2012) results of preliminary scoping, technical feasibility, wood supply and air quality impacts of using locally generated forest biomass as an energy source for businesses and communities. Report commissioned by the Cook County Board of Commissioners (Appendix C).
Review of Grand Marais Biomass District Heating System Feasibility Analysis (FVB Energy, Inc.; August 3, 2012) technical review of the above Phase I Report that presents recommendations to the City of Grand Marais on the technical and financial feasibility of a public facilities district heating system and a business district heating system. Technical review funded by the University of Minnesota, Swedish Bioenergy Association, and the BioBusiness Alliance of Minnesota (Appendix D).

UMN Report to Dovetail Partners September 27, 2012 Final Draft 2
2.0 EXISTING ENERGY USE AND SYSTEM OPTIONS 2.1 Heat Load ELY LHB, Inc. first examined the feasibility of biomass energy systems in Ely in 2010, which included a district heating and combined heat-‐and-‐power (CHP) option for the residential and business core of the community. Five additional options for two smaller sites were analyzed by Wilson Engineering Services during the spring of 2012. Drawing from these two studies, this report considers seven total options for biomass energy systems in Ely. Option 1, referenced as Site 1: Biomass Heating (Hot Water) in the Wilson Engineering report consists of a 3.3 mmBtu/hour biomass combustion unit and hot water boiler to generate domestic hot water and space heating at Vermillion Community College (VCC). The new boiler would connect directly to the existing VCC central heating plant and distribution system and offset approximately 85% of current heat consumption of 7,227 MMBtu/yr. Option 2, referenced as Site 2: Biomass Heating (Steam and Hot Water) in the Wilson Engineering report consists of a 5 mmBtu/hour biomass combustion unit and steam boiler for the Ely-‐Bloomenson Community Hospital (EBCH), Sibley Manor, and Independent School District 696 (ISD 696) (Figure 1). The new boiler located south of Sibley Manor would generate low pressure steam (30 psig) to offset approximately 95% of current heat consumption of 16,235 MMBtu/yr. Low pressure steam would be directly distributed to EBCH and the Sibley Manor for heating and domestic hot water, and a shell and tube heat exchanger would use steam to heat a hot water thermal storage tank to distribute hot water for heating ISD 696. A radiator would be installed allowing the system to offset fossil fuel usage during low load summer conditions. Incidental connections to residents and businesses in proximity to the proposed pipeline were not assessed. Option 3, referenced as Site 2: Biomass Heating (Hot Water) in the Wilson Engineering report consists of the same 5 mmBtu/hour biomass combustion unit described in the second option, but with a hot water boiler to generate hot water for space heating and domestic hot water at EBCH, Sibley Manor, and ISD 696. The system would require conversion of EBCH to hydronic heating from steam. A radiator would be installed allowing the system to offset fossil fuel usage during low load summer conditions. This system would offset an estimated 95% of current heat consumption of 16,235 MMBtu/yr. The system in this option and Option 2 is sized to accommodate additional heat load to serve nearby businesses if deemed feasible. Option 4, referenced as Site 2: Biomass Backpressure Steam CHP (Thermal Oil, Steam, Hot Water) in the Wilson Engineering report, consists of a 5 mmBtu/hour biomass fueled vented thermal oil heater with an -‐pressure steam turbine/generator at EBCH, Sibley Manor, and ISD 696. The system would offset approximately 95% of current heat consumption of 16,235 MMBtu/yr and generate 412,965 kWh of renewable electricity. Low pressure steam would be distributed to EBCH and Sibley Manor for heating and domestic hot water. A shell and tube heat exchanger would also utilize steam to heat a hot water thermal storage tank, which would be distributed to ISD 696. The

UMN Report to Dovetail Partners September 27, 2012 Final Draft 3
system demand for heat. A radiator would be installed downstream of the turbine allowing the system to offset fossil fuel usage during low load summer conditions. Option 5, referenced as Site 2: Biomass ORC CHP (Thermal Oil and Hot Water) in the Wilson Engineering report, consists of a 10 mmBtu/hour biomass combustion unit and vented thermal oil heater with a 600 kW Organic Rankine Cycle (ORC) CHP system at EBCH, Sibley Manor, and ISD 696. The system would offset approximately 95% of current heat consumption of 16,235 MMBtu/yr and generate 1,622,087 kWh of renewable electricity. The system would require conversion of the EBCH to hydronic heating from steam. and electric generation would be dictated by the demand for heat. A radiator would be installed downstream of the ORC system allowing the system to offset fossil fuel usage during low load summer conditions. Option 6, wa Base Projectwith a 25 mmBtu/hour biomass combustion unit and steam boiler. This consists of the district heat portion of a CHP system in the next option, Option 7. A stand-‐alone district heating system was not analyzed in the LHB report. The base project would serve VCC, ISD 696, Sibley Manor, EBCH, City Hall, and Zenith apartments. Build-‐out of the base project could eventually include 15 businesses and 365 residential customers located within the business and residential core of Ely. The new boiler would be located on South 17th Avenue East (south of Old Airport
). Option 7, was generated from the 2010 LHB, Inc. report and consists o Base Projectwith a 25 MMBtu/hour biomass combustion unit and thermal oil heater in conjunction with a 1 MW ORC combined heat and power system. The base project would serve VCC, ISD 696, Sibley Manor, EBCH, City Hall, and HRA apartments. Build-‐out of the base project would eventually include 15 businesses and 365 residential customers located within the business and residential core of Ely. The system would generate 1,043 kWh of renewable electricity.

UMN Report to Dovetail Partners September 27, 2012 Final Draft 4
Figure 1. Coverage map of the Site 2 scenarios. 2.2 Biomass System Options ELY Table 1 provides site information on boiler, fuel type demand, piping, and buildings serviced in each scenario. Table 2 provides a preliminary cost estimate summary of capital, installation, operations and maintenance (O&M), buildings, piping, and related potential project development costs for each system modeled. Competitive quotes and industry knowledge of LHB, Inc. and Wilson Engineering Services were used to determine O&M estimates for each option.

UMN Report to Dovetail Partners September 27, 2012 Final Draft 5
Table 1. Modeled biomass systems and equipment specifications for Ely.
Configuration
Heat demand (non-‐peak) (MMBtu/yr)
Boiler capacity (max/hr)
Boiler efficiency
Piping (trench ft)
Building connections
Fuel type
Annual biomass demand dry tons (wet tons)
Option 1: VCC Hot Water 7,680 3.3 MMBtu/hr 65% 0 0 Chips/Hog 527 (878) Option 2: Steam & Hot Water 23,424 5.0 MMBtu/hr 65% 3,200 3 Chips/Hog 1,754 (2,924) Option 3: Hot Water 23,614 5.0 MMBtu/hr 65% 3,200 3 Chips/Hog 1,754 (2,924) Option 4: Backpressure Steam CHP 35,772 5.0 MMBtu/hr 65% 3,200 3 Chips/Hog 1,904 (3,174) Option 5: ORC CHP 41,272 10.0 MMBtu/hr 65% 3,200 3 Chips/Hog 2,838 (4,730) Option 6: Ely District Heating (base)1 45,740 25.0 MMBtu/hr 73% 12,036 6 Hog fuel 5,974 (9,957) Option 7: Ely ORC CHP (base) 79,490 25.0 MMBtu/hr 73% 12,036 6 Hog fuel 7,858 (13,096)
1 Assumes 55-‐60% of heat load with peaking backup for coldest days. 2District heating portion of a CHP system; a stand-‐alone district heating system was not analyzed in the LHB report. Table 2. Estimate of initial capital and annual operating costs for Ely scenarios.
Cost Option 1: Hot Water
Option 2: Steam-‐HW
Option 3: Hot Water1
Option 4: Steam-‐CHP
Option 5: ORC-‐CHP
Option 6: District Heat
Option 7: ORC-‐CHP
Initial capital costs Plant $1,904,318 $3,063,002 $3,045,866 $3,944,050 $6,494,786 $4,692,500 $12,622,003 Distribution $0 $640,000 $640,000 $640,000 $640,000 $4,225,000 $4,373,493 Interconnection $30,000 $80,000 $80,000 $80,000 $30,0001 not assessed not assessed Total capital costs $1,934,318 $3,783,002 $3,765,866 $4,664,050 $7,164,786 $8,917,500 $16,996,485 Annual operating costs Biomass fuel ($/dry ton) $37 $37 $37 $37 $37 $37 $37 Biomass fuel (total) $26,331 $87,734 $87,734 $95,207 $141,912 $229,546 $299,223 Fuel oil/propane $31,201 $21,673 $21,673 $21,673 $21,673 $40,000 $40,000 Electricity $4,000 $6,000 $7,000 $6,000 $9,000 $60,152 $79,113 Maintenance $5,600 $9,100 $7,100 $11,800 $17,100 $65,620 $105,000 Ash disposal $1,000 $3,100 $3,100 $3,400 $5,000 not assessed not assessed Additional labor $0 $0 $0 $0 $0 $53,223 $70,000 Total annual operating costs $68,132 $127,607 $126,607 $138,080 $194,685 $448,541 $593,336
1 Conversion of EBCH distribution from steam to hot water (Not Included in this study)

UMN Report to Dovetail Partners September 27, 2012 Final Draft 6
2.3 Heat Load COOK COUNTY Several sites were analyzed in the Phase I report and narrowed to a smaller subset considered in this analysis. The first option, reference as M1 in the Phase I Report, consists of the main building and guest cabins at Lutsen Resort on the south side of the Poplar River, approximately 20 miles south of Grand Marais on Hwy 61. Lutsen Resort serves as a proxy for similar sized, large resorts and small business clusters in the county. Total annual heat consumption of 5,200 MMBtu is assumed. The second option, referenced as L3 in the Phase I Report, consists of a distributed hot water heating system for the public buildings north of 5th Street. The L3 scenario would serve 10 large customers, including the Cook County Hospital and Care Center, Sawtooth Mountain Clinic, Cook County Law Enforcement Center, and Cook County Schools. The L3 scenario analyzed herein would be extended from the hot water pipe configuration in the Phase I Report to include the County Courthouse and North Shore Laundry Mat. Total annual heat consumption of 11,796 MMBtu and a non-‐coincident peak demand of 6.2 MMBtu/hr are assumed. The third option, referenced as L6 in the Phase I Report, consists of a distributed hot water heating system for the above described L3 option and the downtown business district. FVB Energy assumed a seasonal average fuel efficiency of 70% for annual heat consumption of MMBtu 30,562 MMBtu by the 75 potential customers included in the L6 scenario 61% of that is consumed by downtown businesses and 39% by public buildings and adjacent properties described in the L3 scenario. Eighteen customers are responsible for 80% of the load. An adjusted peak demand of 14.6 MMBtu/hr is used in the analysis. The fourth option included in this report consists of a hybrid of the L3 and L6 options, referenced as Hybrid in the FVB Energy technical review. A total of 21 customers could be served in the Hybrid Scenario with a combined annual heating consumption of 24,186 and a non-‐coincident peak demand of 12.8 MMBtu/hr. The potential heat load would be nearly equal for the downtown (51%) and 5th St. area (49%). Figure 2 shows the preliminary routing of distribution piping, with the boiler facility assumed to be located east of the intersection of Gunflint Trail and 4th Ave. East. This location allows for the addition of future customers in conjunction with other scenarios analyzed.

UMN Report to Dovetail Partners September 27, 2012 Final Draft 7
Figure 2. Coverage map of the L3 (dotted line), Hybrid (dotted and solid lines), and L6 Scenarios (solid and starred lines) 2.4 Biomass System Options COOK COUNTY Table 3 provides site information on boiler, fuel type demand, piping, and buildings serviced in each scenario. Table 4 provides a preliminary cost estimate summary of capital, installation, operations and maintenance (O&M), buildings, piping, and related potential project development costs for each system modeled. Competitive quotes and industry knowledge of LHB, Inc. was used to determine O&M estimates for each option. Where available, capital cost and O&M estimates were updated using information from the FVB Energy technical review.
Boiler facility

UMN Report to Dovetail Partners September 27, 2012 Final Draft 8
Table 3. Modeled biomass systems and equipment specifications for Cook County.
Configuration
Heat demand (non-‐peak) (MMBtu/yr)
Boiler capacity (max/hr)
Boiler efficiency
Piping (trench ft)
Building connections
Fuel type
Annual biomass demand dry tons (wet tons)
M1: Heat for main lodge and guest cabins at Lutsen Resort 5,200 4.4 MMBtu/hr 70% 1,100 12 Chips 390 (650)
L3: Public buildings north of 5th Street N and CC Courthouse 11,796 3.4 MMBtu/hr 70% 6,750 10 Chips/Hog 940 (1,567)
L6: District heat for downtown business district and L3 30,562 8.5 MMBtu/hr 70% 28,745 75 Chips/Hog 2,450 (4,083)
Hybrid: Combination of L3 and L6 scenarios for largest users 24,186 6.8 MMBtu/hr 70% 12,425 21 Clean chips
Hog fuel 1,940 (3,233) 1 Assumes 55-‐60% of heat load with peaking backup for coldest days. Table 4. Estimate of initial capital and annual operating costs for Cook County scenarios. Cost M1 L3 L6 Hybrid Initial capital costs Plant $748,000 $2,150,000 $4,910,000 $3,960,000 Distribution $242,000 $1,520,000 $5,640,000 $2,630,000 Interconnection $5,000 $370,000 $1,250,000 $740,000 Total capital costs $995,000 $4,040,000 $11,800,000 $7,330,000 Annual operating costs Biomass fuel ($/dry ton) $36 $36 $37 $37 Biomass fuel (total) $38,500 $76,672 $202,324 $157,203 Fuel oil/propane $0 $45,136 $119,105 $92,543 Electricity $0 $3,397 $11,736 $6,501 Maintenance $15,300 $18,089 $53,377 $32,427 Ash disposal not assessed $656 $1,731 $1,345 Additional labor $0 $35,000 $140,000 $70,000 Total annual operating costs $51,500 $178,950 $528,273 $360,019

UMN Report to Dovetail Partners September 27, 2012 Final Draft 9
3.0 FINANCIAL PERFORMANCE Table 5 shows the key financial assumptions used in the analysis. All prices are in real dollars for 2012 (not inflated), and are held constant for each scenario. equipment modeled was assumed to be 20 years. All costs and revenues are pre-‐tax.
invested elsewhere) and the risk associated with the project. Higher discount rates make projects appear less attractive, meaning the investor believes an alternative project would be more profitable or that expected future cash flows from the current project are highly uncertain. One typically finds discount rates between 4%-‐8% for energy efficiency projects.1 We adopt a discount rate of 4.5% for all scenarios. Energy values for fossil fuels and for biomass fuels are shown in the Common Conversions table at the beginning of this report. While the energy contents for the fossil fuels are relatively constant, wood fuels fluctuate depending on the type of wood and moisture content. Non-‐fuel factors such as labor, operating costs, and fuel costs change over time, directly affecting the delivered cost for biomass. Tables 6 and 7 show the average current fossil fuel prices for the study area and 20-‐year rates of change as projected by the Energy Information Administration (EIA) of the U.S. Department of Energy. The EIA projects fossil fuel prices in northern Minnesota will track the rest of the northern Midwest over the next 20 years (2011-‐2030).2 The starting price from which to escalate future prices uses averages of the most recent fuel receipts obtained from each site. Table 5. Non-‐fuel investment and financing assumptions. Assumption Useful life of plant (years) 20 Years of depreciation on investment 10 Discount rate 4.5% Average income tax rate (federal & state) 35% Amount financed (percent of capital) 100% Financing term (years) 20 Loan interest rate 4.0% Power Purchase Agreement (PPA) Price ($/kWh) 0.075 O&M cost rate (compared to inflation) 0.00% Biomass cost rate (compared to inflation) 0.00% Avg. current fuel price rate (compared to inflation) 1.36%
1 Fuller, M. 2008. Enabling investments in energy efficiency: A study of energy efficiency programs that reduce first-‐cost barriers in the residential sector. Energy & Resources Group, UC Berkeley, Berkeley, CA. Website [http://www.eelriver.org/pdf/pge/Exhibit%2015%20CD-‐6%20(Fuller).pdf].
2 US Energy Information Administration. 2010. Annual Energy Outlook 2010. DOE/EIA-‐0383. US Department of Energy, Washington, D.C. Available online at: http://www.eia.gov/oiaf/archive/aeo10/pdf/0383%282010%29.pdf.

UMN Report to Dovetail Partners September 27, 2012 Final Draft 10
Table 6. Average fossil fuel price, 20-‐year price escalation rate, and furnace efficiencies. Local price with
delivery Rate of price escalation
Furnace efficiency
Coal $4.48/mmBtu 3.0% 80% Electric $0.13/kWh -‐0.6% 80% Off-‐peak electric $0.06/kWh -‐0.6% 80% #2 heating oil $3.10/gal 1.0% 70% Kerosene $3.06/gal 1.8% 80% Natural gas $0.83/therm 0.8% 90% Propane $2.18/gal 1.8% 70% Source: US Energy Information Administration. 2010. Annual Energy Outlook 2010. DOE/EIA-‐0383. US Department of Energy, Washington, D.C. Available online at: http://www.eia.gov/oiaf/archive/aeo10/pdf/0383%282010%29.pdf. There are several ways to measure the financial performance of an alternative energy project. Key metrics provided for each option are defined below:
Biomass cost of heat the cost per unit of energy that when held constant through the analysis period results in an NPV equal to zero. as the necessary average annual price paid to pay off all costs over the life of the project. Also known as the Levelized Cost of Energy (LCOE), this is calculated as the discounted lifetime capital and O&M costs divided by the total energy produced.
Net Present Value (NPV) given a desired rate of return, NPV is the current worth of a future stream of cash flows (or savings) minus its current cost. Future cash flows (or savings) are discounted at the discount rate, and the higher the discount rate, the lower the present value of the future cash flows. NPV is also the value of the total lifetime savings (avoided expenditure on fossil fuels) from the project if offered to the investor today as one lump sum, minus the total cost of the project. If the value of the lump sum is greater than the cost of the project, then the NPV is positive.
Simple payback period the number of years required to recover the cost of an investment with future cash flows discounted (see also NPV). Simple payback period is the number of years it would take for the savings from a project to pay off the initial cost (not adjusted for the time value of money). This is the year in which cumulative net revenues become positive, and the project generates a positive financial return.
Maximum annual outlay the largest amount of money the project investor would have to come up with in any single year (usually the first year). Equal to the annual O&M and investment costs minus fuel cost savings from switching to biomass.
Tables 7 and 8 present cumulative and disaggregated cost data for each site in Ely and Grand Marais respectively, organized by capital construction costs and annual operating costs. Figures 3 and 4 show components of the biomass cost of heat for each option in Ely and Grand Marais. Tables 10 and 11 show how financial performance varies with a) a 50% increase in the price of delivered biomass ($37/dry ton base rate), b) 50% increase in interest rates (4.0% base rate), and c) 10% grant reflecting the third-‐party write-‐down of the cost of capital.

UMN Report to Dovetail Partners September 27, 2012 Final Draft 11
Table 7. Financial performance of proposed options for Ely.
Option 1: Hot Water
Option 2: Steam-‐HW
Option 3: Hot Water
Option 4: Steam-‐CHP
Option 5: ORC-‐CHP
Option 6: District Heat
Option 6: ORC-‐CHP
Capital costs including hookup ($) $1,934,318 $3,783,002 $3,765,866 $4,664,050 $7,164,786 $8,917,500 $16,996,485 Annual electricity sales ($) $0 $0 $0 $7,106,000 $412,965 $0 $1,622,087 NPV project cost ($) $2,601,514 $4,856,236 $4,832,649 $6,124,099 $8,822,533 $14,555,989 $24,402,762 NPV savings (including PPA) ($) $2,666,281 $5,996,704 $6,051,390 $6,454,276 $7,633,890 $13,495,720 $20,427,970 Net Present Value ($) $64,767 $1,140,469 $1,218,741 $330,177 $(1,188,643) $(1,060,268) $(3,974,792) Simple payback period (years) 12 0 0 9 >20 >20 >20 Biomass cost of heat ($/mmBtu) $32 $26 $26 $31 $39 $35 $42 Current fossil fuel price ($/mmBtu) $30 $29 $29 $29 $29 $29 $29 Maximum annual outlay ($) $10,861 $0 $0 $23,339 $140,100 $193,248 $417,305
1Including Power Purchase Agreement (PPA) for electricity sold. 2Cost of fossil fuel only; does not include the full cost of heating. Table 8. Financial performance of proposed options for Cook County. M1 L3 Hybrid L6 Capital costs including hookup ($) $994,700 $4,040,000 $7,330,000 $13,050,000 Annual electricity sales ($) $0 $0 $0 $0 NPV project cost ($) $1,303,533 $5,639,484 $10,586,839 $17,922,468 NPV savings (including PPA) ($)1 $2,316,000 $5,848,000 $11,894,000 $15,094,000 Net Present Value ($) $1,012,158 $208,098 $1,306,862 $(2,828,098) Simple payback period (years) 0 12 0 >20 Biomass cost of heat ($/mmBtu) $23 $36 $33 $44 Current fossil fuel price ($/mmBtu)2 $34 $33 $33 $33 Maximum annual outlay ($) $0 $33,453 $0 $342,679
1Including Power Purchase Agreement (PPA) for electricity sold. 2Cost of fossil fuel only; does not include the full cost of heating.

UMN Report to Dovetail Partners September 27, 2012 Final Draft 12
Figure 3. Ely Composition of Biomass Levelized Cost of Energy (LCOE) by site option.
Figure 4. Cook County Composition of Biomass Levelized Cost of Energy (LCOE) by site option.

UMN Report to Dovetail Partners September 27, 2012 Final Draft 13
Table 9. Change in financial performance for options assessed in Ely.
Base Case
50% increase in delivered biomass price (base: $37/odt)
50% increase in interest rate (base: 4.0%)
10% grant to write-‐down cost
of capital Site 1: VCC Hot Water Biomass cost of heat ($/MMBtu) $32 $33 $36 $27 Net Present Value ($) $64,767 $(46,339) $(277,500) $435,052 Simple payback period (years) 12 >20 >20 0 Maximum annual outlay ($) $10,861 $19,403 $37,173 $0 Site 2: EBCH, Sibley Manor, and ISD 696 (Steam-‐Hot Water) Biomass cost of heat ($/MMBtu) $26 $28 $30 $22 Net Present Value ($) $1,140,469 $793,399 $471,088 $1,864,646 Simple payback period (years) 0 0 5 0 Maximum annual outlay ($) $0 $0 $11,912 $0 Site 2: EBCH, Sibley Manor, and ISD 696 (Hot Water) Biomass cost of heat ($/MMBtu) $26 $28 $29 $22 Net Present Value ($) $1,218,741 $868,760 $552,392 $1,939,638 Simple payback period (years) 0 0 3 0 Maximum annual outlay ($) $0 $0 $6,256 $0 Site 2: EBCH, Sibley Manor, and ISD 696 (Steam-‐CHP) Biomass cost of heat ($/MMBtu) $31 $34 $35 $26 Net Present Value ($) $330,177 $(209,667) $(495,101) $1,223,013 Simple payback period (years) 9 >20 >20 0 Maximum annual outlay ($) $23,339 $64,840 $86,783 $0 Site 2: EBCH, Sibley Manor, and ISD 696 (ORC CHP) Biomass cost of heat ($/MMBtu) $39 $42 $46 $31 Net Present Value ($) $(1,188,643) $(1,816,528) $(2,456,412) $182,908 Simple payback period (years) >20 >20 >20 12 Maximum annual outlay ($) $140,100 $188,370 $237,561 $34,661 Site 3: Ely District Heating (base project) Biomass cost of heat ($/MMBtu) $35 $38 $39 $31 Net Present Value ($) $(1,060,268) $(2,536,747) $(2,638,171) $646,803 Simple payback period (years) >20 >20 >20 10 Maximum annual outlay ($) $193,248 $306,754 $314,551 $62,015 Site 3: Ely ORC CHP (base project) Biomass cost of heat ($/MMBtu) $42 $47 $49 $34 Net Present Value ($) $(3,974,792) $(5,916,903) $(6,982,226) $(721,166) Simple payback period (years) >20 >20 >20 >20 Maximum annual outlay ($) $417,305 $566,607 $648,505 $167,179

UMN Report to Dovetail Partners September 27, 2012 Final Draft 14
Table 10. Change in financial performance for options assessed in Cook County.
Base Case
50% increase in delivered biomass price (base: $37/odt)
50% increase in interest rate (base: 4.0%)
10% grant to write-‐down cost of capital
M1: Lutsen Resort Biomass cost of heat ($/MMBtu) $23 $24 $26 $19 Net Present Value ($) $1,012,158 $920,986 $836,149 $1,202,575 Simple payback period (years) 0 0 0 0 Maximum annual outlay ($) $0 $0 $0 $0 L3: Cook County Public Buildings Biomass cost of heat ($/MMBtu) $36 $38 $41 $29 Net Present Value ($) $208,098 $(12,994) $(506,757) $668,388 Simple payback period (years) 12 17 >20 0 Maximum annual outlay ($) $33,453 $50,449 $88,408 $0 L6: Cook County Public Buildings and Downtown Business Core Biomass cost of heat ($/MMBtu) $44 $46 $50 $31 Net Present Value ($) $(2,828,098) $(3,423,988) $(5,137,223) $981,473 Simple payback period (years) >20 >20 >20 0 Maximum annual outlay ($) $342,679 $388,488 $520,195 $0 Hybrid: Cook County Public Buildings and Largest Businesses Biomass cost of heat ($/MMBtu) $33 $34 $37 $29 Net Present Value ($) $1,306,862 $840,495 $9,860 $2,710,040 Simple payback period (years) 0 6 17 0 Maximum annual outlay ($) $0 $31,748 $95,604 $0 4.0 FOREST BIOMASS AVAILABILITY AND PRICE Although the Arrowhead Region of Minnesota has extensive forest resources, how much biomass is ultimately available for energy production is dictated by factors like forest conditions, timber harvest levels, ownership objectives, wood product markets, and wood processing capacity. The removal of vegetation from around homes and businesses to reduce hazardous fuels also produces wood waste that, in the past, was burned without energy capture but that could provide feedstock for heating and CHP systems. In the following analysis, an estimation of annual biomass availability and price is based on annual tonnage from management activities and the cost of converting and transporting biomass as usable feedstocks to energy facilities. This assessment uses Forest Inventory and Analysis (FIA) data3 provided by the USDA Forest Service, combined with a Forest Age Class Change Simulator (FACCS) model developed by researchers at the University of Minnesota, 4 to assess potentially available biomass from supply zones surrounding Ely and Grand Marais.
3 USDA Forest Service. 2011. FIADB Version 4.1. Available online at: http://apps.fs.fed.us/fiadb-‐downloads/datamart.html. 4 Domke, G.M. 2010. Resource assessment and analysis of aspen-‐dominated ecosystems in the Lake States. University of Minnesota, Ph.D. dissertation.

UMN Report to Dovetail Partners September 27, 2012 Final Draft 15
Target harvest rotation ages of 50 to 75 years are used, depending on species. 50% of available residual biomass is assumed left on site for soil nutrification, water management and wildlife habitat. The Minnesota Forest Resources Council (MFRC) guidelines on biomass harvesting recommend a 33% retention rate, that stumps and roots not be removed, and these materials are assumed to also be left on site and are excluded from the analysis.5 FIA data characterize forest resources in terms of forest type, species distribution, age, and general forest health. Bolewood and biomass yield curves were developed for the 3-‐county region (St. Louis, Lake, Cook) by forest type and age class. Combining FIA estimates of yield with the FACCS model analysis allows for the calculation of annual biomass yields based on forest type and age distribution within the area of interest. For the purposes of this analysis, available biomass is converted into four primary feedstocks:
Cordwood is equivalent to 4-‐ft lengths of roundwood cut and stacked into cords, or stacks of 4-‐ft x 4-‐ft x 8-‐ft. Cordwood is used for firewood in conventional fireplaces, wood-‐burning stoves, or boilers for home heating purposes.
Chips are a type of wood fuel. Clean chips are wood fiber processed by chipping and that is free of contaminants like bark and needles, and generally includes only the bolewood of a tree. Clean chips are suitable for residential and small industrial heating.
Hog (hogged) fuel is a type of wood fuel generated by grinding wood and wood waste, including bark, leaves, branches, and tops of trees. Wildfire fuels reduction treatments and whole tree harvesting produce hog fuel, which is used for industrial, district heating, and CHP applications.
Wood pellets are a type of wood fuel made from compacted sawdust or pulverized chips. Premium pellets are made from sawdust and clean chips free of contaminants and are highly dense with low moisture content allowing them to be burned with greater combustion efficiency in residential and small industrial applications. Industrial grade pellets have higher ash content and are used in industrial applications with larger boilers and higher combustion temperatures than residential scale boilers.
We examine bolewood (clean chips) and harvest residuals (e.g. tops and limbs) with an emphasis on residuals (hog fuel) at an annual timber harvest rate. A five-‐year average timber harvest rate was determined for the years 2006 2010 for each area. We also calculated an estimated threshold of sustainability based upon the Final Generic Environmental Impact Statement on Timber Harvesting and Forest Management in Minnesota (GEIS).6 We use a conservative statewide rate of 4 million cords proportionally applied by species type to the supply regions assessed. A delivered biomass cost curve was developed for each region based 5 Minnesota Forest Resources Council (MFRC). 2007. Biomass harvesting guidelines for forestlands, brushlands, and open lands. St. Paul, MN: Minnesota Forest Resources Council. Available online at: http://www.frc.state.mn.us/initiatives_sitelevel_management.html. 6 Jaakko Pöyry Consulting, Inc. 1994. Final generic environmental impact statement on timber harvesting and forest management in Minnesota. Prepared for the Minnesota Environmental Quality Board. Tarrytown, NY: Jaakko Pöyry Consulting, Inc.

UMN Report to Dovetail Partners September 27, 2012 Final Draft 16
upon an average transport distance and biomass availability within three mutually exclusive supply zones: 0-‐30 miles; 31-‐45 miles; and 46-‐60 miles. The analysis then links yield estimates generated using the FACCS model with biomass supply zones calculated using ArcGIS Network Analyst and current roads data (Census 2010 Street Centerlines). Biomass supply zones were calculated using the Service Area Calculator in ArcGIS Network Analyst with distance as the accumulating impedance variable. Service area polygons were generalized and trimmed to include only locations within 1-‐mile of the existing road networks. The tables and figures below summarize this analysis for each region. 4.1. Physical Availability Ely Table 11 provides a breakdown of timberland acres in the 0-‐60 mile Ely biomass supply zone by age class and forest type for the most recent FIA reporting period (2006-‐2010). The Aspen-‐birch forest type occupies 646,730 acres (40% of timberland) and Spruce-‐fir occupies 560,647 acres (35% of timberland). Of those acres, 37% and 62% respectively, are greater than 60-‐years old and are either at or beyond their target harvest rotation age. Designated wilderness areas, old-‐growth reserves, wildlife management areas, state parks, and towns are not included in this analysis. Table 12 displays FIA estimates of the average oven-‐dry tons (dry tons) of biomass by type and ownership within the Ely 0-‐60 mile biomass supply zone. Table 13 presents the estimated volume of hog fuel and clean chips by ownership within 60-‐miles of Ely based on the 2011 harvest rate for the region. The majority of 2011 bolewood was harvested from federal (153,747 cords) and private lands (145,391 cords). State and county lands provided another 137,681 cords. Total harvest residuals with 50% retention were approximately 59,856 dry tons, of which only a small portion was utilized. Table 11. Timberland acres by age class and forest type in the Ely, MN 60-‐mile biomass supply zone (2006-‐20010 inventory cycle; non-‐stocked areas excluded).
Age class White-‐red-‐jack pine Spruce-‐fir Oak-‐pine
Lowland hardwoods
Northern hardwoods Aspen-‐birch
0-‐10 2,355 21,116 2,184 1,620 18,979 73,276 11-‐20 14,819 24,463 3,061 6,852 6,212 102,385 21-‐30 33,409 34,537 1,670 2,487 5,501 67,327 31-‐40 34,669 30,376 2,912 3,826 6,990 60,465 41-‐50 33,893 40,139 0 6,131 8,120 43,238 51-‐60 12,938 60,551 0 728 5,013 57,996 61-‐70 18,639 103,918 728 12,089 8,886 106,335 71-‐80 13,263 66,059 0 28,933 14,711 79,573 81-‐90 27,535 39,867 0 10,834 2,912 22,207 91-‐100 0 29,938 0 3,889 2,184 15,973 100+ 28,343 109,683 3,061 3,982 10,117 17,955 Total 219,863 560,647 13,616 81,371 89,625 646,730

UMN Report to Dovetail Partners September 27, 2012 Final Draft 17
Table 12. Dry tons of living biomass by stand attribute and ownership within 60-‐miles of Ely.1
Volume by Ownership (dry tons) Biomass Attribute Federal State County Private2 Total
11,266,241 2,617,958 3,490,632 5,079,502 22,454,332 Tops and limbs 2,666,193 593,142 846,531 1,232,756 5,338,620 Saplings (1-‐4.9 in. dbh) 3,611,847 852,085 1,444,004 2,166,918 8,074,854 Stumps 690,230 166,942 210,350 322,079 1,389,601 Belowground roots 3,978,542 934,937 1,301,923 1,930,763 8,146,167
1 No significant difference in site-‐level variation. Tree size is a function of diameter at breast height (dbh). 2Tribal lands are included in the Private lands category by FIA. Table 13. FACCS estimate of biomass volume available by ownership within 60-‐miles of Ely. Biomass harvest estimate average for the first 30 years based upon 2011 harvest rate reported for different ownerships.
Ownership
2011 harvest (cords)
2011 harvest (dry tons)
50% of tops & limbs (dry tons)
10% of bole harvest (dry tons)
Fuel treatment removals (dry tons)9
Federal1,2 153,747 176,373 20,016 17,637 n/a State3 53,032 60,625 6,764 6,063 n/a County4,5 84,649 97,222 11,576 9,722 n/a Private6,7 145,391 168,178 21,499 16,818 n/a Total8 436,820 502,398 59,856 50,240 n/a
1Rate based on reported harvests from Superior National Forest West Zone for 2011 (Laurentian, LaCroix, and Kawishiwi Districts). 76,438 cords harvested from 338,000 acres in 2011.
2Rate based on reported harvests from Superior National Forest West Zone for 2001 -‐ 2011 (Laurentian, LaCroix, and Kawishiwi Districts). Average of 86,003 cords harvested annually from 338,000 acres.
3Rate based on average harvests reported by Mike Magnuson (DNR Forestry Supervisor) for DNR lands in the Orr (241) and Tower (245) Areas outside of the Boundary Waters Canoe and Wilderness Area. Average of 81,000 cords per year harvested from 301,000 acres.
4Rate based on 2011 harvest information reported by Tom Zeisler (Resource Data Supervisor) for St Louis County. Average of 188,388 cords harvested from 572,215 acres of timberland.
5Rate based on 2001-‐2011 harvest information reported by Tom Zeisler (Resource Data Supervisor) for St. Louis County. Average of 176,631 cords harvested annually from 572,215 acres of timberland.
6Rate based on removal estimates provided by FIA for the 2006-‐2010 inventory cycle. 7Rate based on 7-‐year average removal estimates provided by FIA for 2004-‐2010 inventory period. 8Totals may differ slightly from those presented in other tables due to differences in harvests modeled by ownerships versus forest type or biomass supply zone.
9Fuel treatment removals include wildfire fuels reduction efforts on public lands as well as additional Firewise fuels reduction on non-‐public lands in 2010. Future removals assumed constant.

UMN Report to Dovetail Partners September 27, 2012 Final Draft 18
By combining biomass volumes with the haul distances from FIA sample plots to prospective energy facilities, we calculate an average haul distance and delivery cost for each supply zone in Table 14. Cost assessments for each supply zone around Ely are based on the Origin-‐Destination analysis. Total biomass costs for hog fuel and clean chips are presented. Total delivered cost includes stumpage, market premium, processed cost at the landing, and delivery. Delivery costs include round-‐trip transport cost with no backhaul ($4.25/mile), 25-‐green tons maximum per load, and 40% moisture content. Availability of hog fuel and clean chips are presented based on the proportion of the land area harvested at the GEIS 4 million cord statewide harvest rate, which is comparable to the 2011 harvest rate for this area. Figure 5 presents a biomass cost curve based on the information presented in Table 14. The Ely cost curve was developed by extrapolating supply costs based upon the price and volume available at known distances from the proposed facility. Prices assume a static rate without consideration for competition or the premium paid for the quality of material delivered. These prices are used to model the biomass energy/heat production scenarios presented in Table 9. Figure 6 shows the geographic distribution of biomass resources calculated in Table 14 for the existing road network and distance from the proposed Ely facility.

UMN Report to Dovetail Partners September 27, 2012 Final Draft 19
Table 14. Average haul distance, cost, and annually available biomass volume for supply zones surrounding Ely. Based on average harvest estimate for the first 30 years of the project at GEIS 4 million cord statewide harvests.
Annual harvest
Avg. haul distance
Hog fuel3 -‐-‐-‐-‐-‐-‐-‐-‐-‐(50% tops & limbs) -‐-‐-‐-‐-‐-‐-‐-‐-‐
Clean chips -‐-‐-‐-‐-‐-‐-‐-‐(10% of annual harvest) -‐-‐-‐-‐-‐-‐-‐-‐
Supply zone (cords)1 (miles)2 green tons ($/ton)4,5 dry tons ($/ton)5 green tons ($/ton)4,5 dry tons ($/ton)5 2006 2010 average harvest
0 30 miles 63,815 18.2 16,148 ($22.00) 9,689 ($36.67) 12,422 ($29.02) 7,453 ($48.37) 31 45 miles 82,190 37.6 21,625 ($28.61) 12,975 ($47.68) 16,112 ($35.63) 9,667 ($59.38) 46 60 miles 145,293 53.2 36,692 ($33.91) 22,015 ($56.52) 28,648 ($40.93) 17,189 ($68.22) Total 291,298 -‐-‐ 74,465 44,679 57,182 34,309 GEIS harvest7 0 30 miles 102,523 18.2 22,601 ($22.00) 13,561 ($36.67) 19,665 ($29.02) 11,799 ($48.37) 31 45 miles 124,928 37.6 28,207 ($28.61) 16,924 ($47.68) 23,916 ($35.63) 14,350 ($59.38) 46 60 miles 209,363 53.2 46,640 ($33.91) 27,984 ($56.52) 40,102 ($40.93) 24,061 ($68.22) Total 436,814 -‐-‐ 97,448 58,469 83,683 50,210
1 Assumes an average of 1.2 dry tons per cord of wood. Actual conversions will vary by species. 2 Average one-‐way haul distance to city center from FIA plots within the delineated zone. Actual haul distances will vary by harvest site location. 3 Hog fuel is the tops, limbs, branches, small trees and needles as defined by the USDA Forest Service FIA biomass attributes. A conservative estimate of 50% is retained on site to meet the MFRC Biomass Harvest Guidelines.
4 Assumes 40% moisture content at time of transport. 5 Delivered cost of biomass reflects a hypothetical market price with assumed transportation cost of $4.25 per mile (25-‐green ton load at 40% moisture content with return trip) with in-‐woods processing costs of $11.47/dry ton (hog fuel) and $23.17/dry ton (clean chips).
7 Biomass removal estimates based upon the proportion of a statewide timber harvest rate of 4.0 million cords as estimated in the 1990 Base Scenario analyzed in the Final Generic Environmental Impact Statement (GEIS) for Minnesota.

UMN Report to Dovetail Partners September 27, 2012 Final Draft 20
Figure 5. Biomass cost versus volume within the 60-‐mile supply zone around Ely. Prices do not account for potential competition for biomass.
Figure 6. Biomass supply service areas around Ely.

UMN Report to Dovetail Partners September 27, 2012 Final Draft 21
4.2. Physical Availability Cook County Table 15 provides a breakdown of timberland acres in the 0-‐60 mile Grand Marais biomass supply zone by age class and forest type for the most recent FIA reporting period (2006-‐2010). The Aspen-‐birch forest type occupies 415,659 acres (51% of timberland) and Spruce-‐fir occupies 200,027 acres (25% of timberland). Of those acres, 53% and 42% respectively, are greater than 60-‐years and are either at or beyond their target harvest rotation age. Designated wilderness areas, old-‐growth reserves, wildlife management areas, state parks, and towns are not included in this analysis. Table 16 displays FIA estimates of the average oven-‐dry tons (dry tons) of biomass by type and ownership within the Grand Marais 0-‐60 mile biomass supply zone. Table 17 presents the estimated volume of hog fuel and clean chips by ownership within 60-‐miles of Grand Marais based on the 2006-‐2010 harvest rate for the region. The majority of 2006-‐2010 bolewood was harvested from private (27,644 cords) and county lands (24,292 cords). Federal and state lands provided another 34,057 cords. Total harvest residuals with 50% retention were approximately 12,576 dry tons, of which only a small portion was utilized. Table 15. Timberland acres by age class and forest type in the Grand Marais 60-‐mile biomass supply zone (2006-‐2010 inventory cycle; non-‐stocked areas excluded).
Age class White-‐red-‐jack pine Spruce-‐fir Oak-‐pine
Lowland hardwoods
Northern hardwoods Aspen-‐birch
0-‐10 8,680 2,625 6,449 2,495 4,531 47,766 11-‐20 11,606 17,706 0 0 3,240 34,578 21-‐30 12,597 25,040 5,095 0 5,440 29,803 31-‐40 4,940 19,860 0 0 3,450 15,894 41-‐50 5,202 21,754 6,136 0 2,912 18,437 51-‐60 6,971 29,900 0 0 3,641 48,540 61-‐70 5,461 15,291 0 3,383 22,091 93,417 71-‐80 0 9,957 2,682 5,093 23,848 68,548 81-‐90 0 7,200 0 9,559 11,218 35,570 91-‐100 728 17,763 2,912 0 0 8,875 100+ 3,370 32,931 0 993 10,346 14,231 Total 59,555 200,027 23,274 21,523 90,717 415,659 Table 16. Dry tons of living biomass by attribute and ownership within 60-‐miles of Grand Marais.1
Volume by Ownership (dry tons) Biomass Attribute Federal State County Private2 Total
8,077,619 2,189,163 1,261,951 3,274,078 14,802,811 Tops and limbs 1,983,803 566,898 332,851 848,939 3,732,492 Saplings (1-‐4.9 in. dbh) 2,148,922 546,475 283,814 737,914 3,717,125 Stumps 474,564 132,514 72,834 186,600 866,512 Belowground roots 2,697,582 726,210 398,939 1,044,310 4,867,042 1 No significant difference in site-‐level variation. Tree size is a function of diameter at breast height (dbh). 2Tribal lands are included in the Private lands category by FIA.

UMN Report to Dovetail Partners September 27, 2012 Final Draft 22
Table 17. FACCS estimate of biomass volume available by ownership within 60-‐miles of Grand Marais. Biomass harvest estimate average for the first 30 years based upon 2006-‐2010 FIA harvest rate reported for different ownerships.
Ownership
2006-‐2010 annual harvest
(cords)
2006-‐2010 annual harvest
(dry tons)
50% of tops & limbs (dry tons)
10% of bole harvest (dry tons)
Fuel treatment removals (dry tons)2
Federal 21,120 24,435 2,884 2,444 3,189 State 12,937 14,839 1,806 1,484 n/a County1 24,292 28,355 3,812 2,836 n/a Private 27,644 31,975 4,073 3,198 3,005
Total 85,992 99,603 12,576 9,960 6,194 1Majority of county land harvested within 60-‐miles from Lake County. FIA estimates that Cook County has 9,686 acres of County owned timberland while Lake County has 189,897 acres. Total county owned acres used to model harvests include 60,727 acres of timberland.
2Fuel treatment removals include wildfire fuels reduction efforts on public lands as well as additional Firewise fuels reduction on non-‐public lands in 2010. Future removals assumed constant. By combining biomass volumes with the haul distances from FIA sample plots to prospective energy facilities, we calculate an average haul distance and delivery cost for each supply zone in Table 18. Cost assessments for each supply zone around Grand Marais are based on the Origin-‐Destination analysis. Total biomass costs for hog fuel and clean chips are presented. Total delivered cost includes stumpage, market premium, processed cost at the landing, and delivery. Delivery costs include round-‐trip transport cost with no backhaul ($4.25/mile), 25-‐green tons maximum per load, and 40% moisture content. Availability of hog fuel and clean chips are also presented based on the proportion of the land harvested at the GEIS 4 million cord statewide harvest rate, which is significantly greater than the 2006-‐2010 harvest rate for this area. Figure 7 presents a biomass cost curve based on the information presented in Table 18. The Grand Marais cost curve was developed by extrapolating supply costs based upon the price and volume available at known distances from the proposed facility. Prices assume a static rate without consideration for competition or the premium paid for the quality of material delivered. These prices are used to model the biomass energy/heat production scenarios presented in Table 10. Figure 8 shows the geographic distribution of biomass resources calculated in Table 18 for the existing road network and distance from the proposed Grand Marais facility.

UMN Report to Dovetail Partners September 27, 2012 Final Draft 23
Table 18. Average haul distance, cost, and annually available biomass volume for supply zones surrounding Grand Marais. Based on average 2006-‐2010 harvest estimate for the first 30 years at GEIS 4 million cord harvest rates.
Annual harvest
Avg. haul distance
Hog fuel3 -‐-‐-‐-‐-‐-‐-‐-‐-‐(50% tops & limbs) -‐-‐-‐-‐-‐-‐-‐-‐-‐
Clean chips -‐-‐-‐-‐-‐-‐-‐-‐(10% of annual harvest) -‐-‐-‐-‐-‐-‐-‐-‐
Supply zone (cords)1 (miles)2 green tons ($/ton)4,5 dry tons ($/ton)5 green tons ($/ton)4,5 dry tons ($/ton)5 2006 2010 average harvest
0 30 miles 33,504 18.6 7,855 ($22.00) 4,713 ($36.67) 6,457 ($29.02) 3,874 ($48.37) 31 45 miles 27,055 36.4 6,620 ($28.05) 3,972 ($46.75) 5,271 ($35.07) 3,163 ($58.45) 46 60 miles 19,013 52.7 4,608 ($33.58) 2,765 ($55.97) 3,682 ($40.60) 2,209 ($67.67) Total 79,572 -‐-‐ 19,083 11,450 15,410 9,246 GEIS harvest7 0 30 miles 97,752 18.6 22,591 ($22.00) 13,555 ($36.67) 18,768 ($29.02) 11,261 ($48.37) 31 45 miles 70,675 36.4 17,135 ($28.05) 10,281 ($46.75) 13,714 ($35.07) 8,228 ($58.45) 46 60 miles 51,283 52.7 12,097 ($33.58) 7,258 ($55.97) 9,865 ($40.60) 5,919 ($67.67) Total 219,710 -‐-‐ 51,823 31,094 42,347 25,408
1 Assumes an average of 1.2 dry tons per cord of wood. Actual conversions will vary by species. 2 Average one-‐way haul distance to city center from FIA plots within the delineated zone. Actual haul distances will vary by harvest site location. 3 Hog fuel is the tops, limbs, branches, small trees and needles as defined by the USDA Forest Service FIA biomass attributes. A conservative estimate of 50% is retained on site to meet the MFRC Biomass Harvest Guidelines.
4 Assumes 40% moisture content at time of transport. 5 Delivered cost of biomass reflects a hypothetical market price with assumed transportation cost of $4.25 per mile (25-‐green ton load at 40% moisture content with return trip) with in-‐woods processing costs of $11.47/dry ton (hog fuel) and $23.17/dry ton (clean chips).
7 Biomass removal estimates based upon the proportion of a statewide timber harvest rate of 4.0 million cords as estimated in the 1990 Base Scenario analyzed in the Final Generic Environmental Impact Statement (GEIS) for Minnesota.

UMN Report to Dovetail Partners September 27, 2012 Final Draft 24
Figure 7. Biomass cost versus volume within the 60-‐mile supply zone around Grand Marais. Prices do not account for potential competition for biomass.
Figure 8. Biomass supply service areas around Grand Marais.

UMN Report to Dovetail Partners September 27, 2012 Final Draft 25
4.3 Competition To provide an estimate of potential competition for biomass, this analysis examined the overlap of each 60-‐mile supply zone for Ely and Grand Marais and the existing wood yard for the Virginia-‐Hibbing Laurentian Energy Authority in Mountain Iron, MN (Figure 9). The volume of sustainably harvestable biomass within overlapping supply zones was is calculated in Table 19.
Figure 9. Overlap of 60-‐mile biomass supply zones for Laurentian Energy Authority (Mountain Iron wood yard), Ely, and Grand Marais. Table 19. Biomass resources potentially subject to competition within overlapping 60-‐mile supply zones. Biomass harvest estimate average for the first 30 years based on GEIS 4 million cord annual harvests.
60-‐mile overlap
Annual bole harvest (dry tons)
50% of tops & limbs (dry tons)
Percent of overlapping
supply
Bole + 50% of tops & limbs (dry tons)
Ely -‐ Grand Marais 45,381 5,402 12% 50,783 Ely -‐ Laurentian 230,225 27,861 12% 258,085 Grand Marais Laurentian 0 0 0% 0 4.4 Biomass Harvesting and Transport Costs The costs of harvesting, handling, and transporting biomass to a processing facility are critical factors in the total price paid. These costs also vary widely based on operator and equipment productivity, tree species harvested, distance to processing facility, and whether co-‐products exist (e.g., pulpwood). For the purposes of this analysis, we assume separate harvest costs for bolewood chips and hog fuel. Bolewood chips, or clean chips, require the removal of the tree

UMN Report to Dovetail Partners September 27, 2012 Final Draft 26
for biomass production and subsequent costs are attributed to that market. For the hog fuel material, harvest and skidding costs associated with moving trees to a forest landing are a function of a primary pulpwood or sawlog market. Therefore, the price paid for residual hog fuel biomass collected and processed at the landing includes only the chipping/grinding operation. Wages, benefits, and employer costs for workers' compensation and unemployment insurance are held constant. Total fixed and variable costs are calculated at a rate of $183.72/PMH (productive machine hour), which are the total hours of use for scheduled purposes over the course of one year. Appendix E provides a breakdown of equipment costs used in the analysis.7 We used processing/chipping costs of $11.47/odt for hog fuel and $23.17/odt for clean chips. 4.5 Forest Operations For a logger to justify moving equipment to a site to process biomass there needs to be enough throughputs to offset hourly costs. Small parcel sizes, long mobilization distances between harvest sites, and long transport distances to a heating or CHP site are disincentives. Having the appropriate equipment to efficiently harvest and process biomass are also barriers. We conducted interviews with area loggers to determine their level of interest in participating in biomass markets, equipment capacity and needs, and the costs of production, including mobilization of equipment and biomass processing. Interest among those interviewed was high but tempered by the cost of equipment and lack of biomass harvesting volume to justify expenses. We foresee no new investment in biomass chipping equipment until sufficient volumes and consistent market prices warrant expansion.
7 Brinker RW, Kinard J, Rummer B, Lanford B. 2002. Machine rates for selected forest harvesting machines. Circular 296. Auburn, AL: Alabama Agricultural Experiment Station.

UMN Report to Dovetail Partners September 27, 2012 Final Draft 27
APPENDIX A. Ely District Energy Engineering Study (LHB, Inc.)

1
Ely District Energy Engineering Study
November 22, 2010
Prepared by:
21 West Superior Street, Suite 500 Duluth, Minnesota 55802218 727-8446Fax 218 727-8456www.LHBcorp.com
This project was made possible by a grant from the U.S. Department of Energy and the Minnesota Department of Commerce through the American Recovery and
Reinvestment Act of 2009 (ARRA).

2
Ely District Energy Engineering Study
Table of Contents
Forward
Glossary
Professional Certification
3
5
7
Executive Summary
Background Biomass Use for Energy
Findings
8 10
Process Flow: District Heat & Co-‐gen
Equipment Sizing
Plant Location
Piping
Cost Estimate
Project Schedule
District Energy Structures
District Heating Billing
Funding
12
17
19
20
21
22
23
25
26
Appendix Spreadsheet
Drawings (Piping, Rendering, Building, Flow and Electrical Single Line)
Budget Quotes
Major Equipment Supplier Brochures
District Energy Papers & Presentations
Thermal Renewable Energy Efficiency Act (TREEA) Reference Materials
District Heating Handbook Excerpts
C.E. Hartley and LHB Profile

3
Ely District Energy Engineering Study
Forward
LHB was contracted by Ely to complete a District Heat (DH) and Co-‐generation (together known as District Energy, DE), Engineering Study funded by an American Recovery and Reinvestment Act (ARRA) of 2009 and administered by the Minnesota Department of Commerce Office of Energy Security. The Study followed up on the November 2009 Summary Feasibility Study and subsequent May 2010 Addendum. The specific purpose of this Study was to gather equipment budget quotations and estimate construction costs for the DE plant, including:
1. A biomass fired Thermal Oil Heater (TOH) 2. Biomass (wood pellet) hot water peaking boiler(s) 3. Organic Rankine Cycle (ORC) co-‐generation 4. Fossil fuel (propane) back-‐up hot water boilers and 5. Hot water distribution piping system
Project structure, funding and billing recommendations are also included.
In addition to significant cost savings and renewable energy, the Ely DE facility offers 5 key benefits, including:
1. Showcasing New Technology: The plant will be the first District Heating facility in North America to use wood waste powered ORC CHP. Well proven in more than a hundred plants in Europe, wood waste DH reduces heating costs by about 50% when compared to propane and fuel oil. State of the art control systems for the TOH will minimize particulate matter (PM), oxides of nitrogen (NOx) and Carbon Monoxide (CO) emissions.
2. 9 New Jobs: Approximately 6 new logging and trucking jobs, 2 private plumbing and 1 DH plant jobs will be created.
3. More Dollars Stay Within Community: Studies have shown that 75% or more of biomass
energy dollars stay within the local community, as opposed to only 5% or less of fossil fuel energy dollars. At full build-‐out, about $2,500,000 more dollars will stay in the Ely area.
4. Enhanced Forest Management Practices: Permanent shutdown of three Orientated Strand
Board (OSB) plants in Minnesota has reduced wood harvest to less than 50% of sustainable growth. Mature trees are being left in the woods, creating wildfire hazards. This project will predominately use forest residue and underutilized species, and only about 23,000 tons per year from a very small radius, predominantly 15 miles or less.

4
Ely District Energy Engineering Study Forward (continued)
5. Reduced Imported Oil and Heating Related CO2 Emissions: At system full load, about
375,000 gallons/year of fuel oil and 550,000 gallons/year of propane will be displaced. The release of about 15,000 tons per year of Carbon Dioxide, equivalent to taking about 4,000 cars off the road, will be avoided.
The report is organized as follows:
Project Narrative (Word Document): Executive Summary, Background and Findings (Project Description, Sizing, Costs, Structure, etc.)
Project Spreadsheet (Excel Worksheets): 30 Worksheets containing summaries, calculations, including user inputted variables for; Grants, Interest Rate, Term, $/Rate, Infrastructure Payment, Wood Waste, Pellet, Fuel Oil and Propane Costs, estimates as
compared to Wind, Solar and Ground Source Heat Pumps Drawings: District Heating Piping Plans, District Energy Building/Layout/Flowsheet, Vendor
supplied drawings Written Budget Quotes for all major pieces of equipment Equipment Brochures and Manuals for all major pieces of equipment District Energy/District Heating Reference Materials from the Turboden (ORC supplier),
International District Energy Association (IDEA), Biomass Energy Resource Center (BERC), University of Minnesota Biomass Study (Digital Only)
TREEA Reference Material: Thermal Renewable Energy Efficiency Act sponsored by Senator Al Franken and Representative Betty McCollum
Excerpts from District Heating Handbook Profiles of primary author and LHB
LHB gratefully acknowledges the help of several Ely Alternative Energy Task Force (AETF) personnel who assisted in this effort, including City Operations Director Harold Langowski, Mayor Roger Skraba, Chairman Kurt Soderburg, Dave Olsen, Rebecca Spangler, Steve Piragis and the rest of the AETF as well as Bill Mittlefeldt of the NE Minnesota CERT and Jerry Pelofski and Bacon Reuille of the Duluth Steam Cooperative Association and the OES. We also gratefully appreciate the materials used by permission by Turboden, VAS, Biomass Energy Resource Center, International District Heating Association and others as well as funding by the DOE and Minnesota Office of Energy Security.
We sincerely appreciate the opportunity to be involved with Ely on this exciting project.

5
Ely District Energy Engineering Study
Glossary
Binary Power: Also known as Organic Rankine Cycle (ORC), the process of using 2 fluids to transfer heat and generate electricity. The second fluid is a low boiling point organic fluid that is pressurized, heated and vaporized, expanded in a turbine generator and condensed to a liquid to complete a closed cycle.
Co-‐generation: Sequential generation of thermal (usually steam) and electrical energy. Fuel Chargeable to Power (FCP) for co-‐generation electric power electric is between 4000 and 5000 Btu/kWh. Co-‐generation is also known as Combined Heat and Power (CHP).
Combustion: A heat generating (i.e., exothermic) reaction between a combustible and an oxidant (usually air).
Condensing Power: Electrical generation where the used steam is condensed, giving up a considerable amount of heat to an air or water cooled condenser. FCP for condensing power is usually about 12,000 for coal and as high as 17,000 Btu/kWh for biomass.
District Heating (DH): Supplying multiple building heating systems (and sometimes cooling) from a centralized plant. While very common in Northern Europe, District Heating is not as common in the US. Minnesota examples with co-‐generation include; Virginia, Hibbing and St. Paul. Duluth has District Heating without co-‐generation.
District Energy (DE): District Energy usually implies the combination of District Heating and some form of co-‐generation (steam, ORC, etc.).
Fuel Chargeable to Power (FCP): The incremental fuel for electric power generation. When only electrical power is produced, the FCP is equal to the Neat Heat Rate (NHR). US units are usually Btu/kWh. The co-‐generation owner would reimburse the heat source owner for FCP
Gasification: Converting carbon based material into carbon monoxide and hydrogen gases in an oxygen deficient (less than stoichiometric) environment.
H2/CO Ratio: The hydrogen to carbon monoxide ratio which determines the fuel content of synthetic gaseous fuels.
Heating Degree Day (HDD): average of an indices designed to reflect the heating requirement for a building. In sizing DH equipment, it can be useful in estimating the difference between winter peak and annual average loads.

6
Ely District Energy Engineering Study
Glossary (continued)
Higher Heating Value (HHV): The gross amount of heat released by a combusted fuel. HHV is commonly used in the U.S. and includes latent energy needed to evaporate water in the fuel.
Infrastructure Payment (IP): A fee paid by a co-‐generation owner to the host plant in consideration of the heat source infrastructure capital and operating expense.
Lower Heating Value (LHV): Is the net amount of heat energy released by a combusted fuel. LHV is commonly used in Europe and excludes latent energy needed to evaporate water in the fuel.
Net Heat Rate (NHR): The incremental fuel for electric power generation, usually in Btu/kWh.
Organic Rankine Cycle (ORC): Using an organic fluid such as iso-‐pentane, propane, butane, octamethyltrisiloxane (OMTS), etc in a binary power cycle to generate electricity.
Pelletizing: The process of mechanical densification of biomass into a uniform and dense form suitable for transportation and automatic feeding.
Pyrolysis: Chemical decomposition of organic material in the absence of oxygen. Biomass Pyrolysis can yield Pyrolysis oil, charcoal, and/or combustible gases.
Simple Cycle: Usually referring to a standalone Combustion Turbine Generator. Simple cycle electrical generation has a NHR of greater that 11,000 Btu/kWh.
Synthetic Gas: Sometimes referred to Synthetic Natural Gas (SNG), higher heating value than produced gas, approximately 300 Btu/cu ft. SNG can be produced from wood through the use of steam rather than oxygen.
Tri-‐generation: Sequential generation of thermal energy (steam or hot water), electrical energy and chilled water.
Wood Refuse: Bark, sawdust, brush, waste chips, dead or diseased wood, etc. In short, wood retrieved from the forest that is not used for lumber, Orientated Strand Board, paper, extractives, pellets, etc. Wood refuse is also known as hogged fuel, wood waste, logging residue, etc.

7
Ely District Energy Engineering Study
Professional Certification
I hereby certify that this report was prepared by me and that I am a duly Licensed Professional Engineer under the laws of the State of Minnesota.
Charles Eugene Hartley
November 22, 2010
License #43831

8
Ely District Energy Engineering Study
Executive Summary
The following report addresses the capital costs and project structure recommendations for the establishment of a biomass fired 30 mmBtu/hr District Heating (DH) and 1 Mega Watt (MW) Co-‐generation (aka Combined Heat and Power, CHP) system in Ely. Combined together, DH and Co-‐gen are District Energy (DE).
District Heating, i.e., a centralized heating plant serving multiple buildings, is not a new idea. Systems in major cities have been in operation decades, e.g. Philadelphia and New York City
nd reliable, especially where there is vertical density (tall buildings).
What is new in the US and for Ely is the adoption of proven European technology to produce DH and CHP electricity with wood waste on a community scale. Using 180°F condenser water from an Organic Rankine Cycle (ORC) turbine generator, a system can efficiency and cost effectively heat businesses, institutions and homes within communities with only a few thousand inhabitants.
This project would be the first of its kind in the United States, showcasing how the use of biomass fired ORC for district heat and CHP can be done at overall efficiencies of near 75% and with very low criteria pollutant emissions.
Besides demonstrating new technology, the project will create 9 jobs, keep about $2,500,000 energy dollars within the local community, decrease fossil fuel imports and carbon dioxide emissions by about 15,000 tons per year and enhance forest management practices.
The cost of the base project, defined as the plant, a piping main from the plant on Highway 1 near Old Airport Road to major DH users; Vermillion Community College (VCC) , ISD 696 school complex, Ely-‐Bloomenson Community Hospital (EBCH), HRA apartments and City Hall, is estimated at $16,990,000.
Including indirect costs, the total cost is broken down by about $720,000 for site work and plant utilities, $7,300,000 for the District Heat (Thermal Oil Heater, 2 Pellet Peaking Boilers, 2 Propane Back-‐up Boilers and the Building), $3,140,000 for Co-‐generation, and $5,830,000 for abouevery major piece of equipment was solicited and received.

9
Ely District Energy Engineering Study
Executive Summary (continued)
-‐ t, with potential grants and including financing, fees and taxes are about $19/mmBtu, while full load costs are about $14/mmBtu. End of financing term costs would be about $12/mmBtu.
Subsequent phases of the project include adding about 13,000 lateral transportation piping, estimated at a cost of $1,780,000, and some
require one additional pellet peaking boiler.
Once permitted and funded, the base project could be completed in about 16 months.
Connected electrical load for the district heating plant is about 0.655 MW while running load is about 0.182 MW.
It appears that a City owned Co-‐operative is the most common project structure here in the US and we believe that this would be the best course for Ely. A Co-‐op Board with an odd number of Directors made up of customers representing each user class with representation by the PUC would make recommendations to the City Council regarding operating, capital and billing issues. We believe that the co-‐generation system is more valuable to a utility and recommend that a utility partner be pursued for ownership with Ely reimbursed for fuel chargeable to power, ownership and maintenance costs and an infrastructure credit.
Billing might take the most common form of a demand and commodity charges. Demand, i.e., the rate of use during a peak time frame such as January, would typically cover fixed costs, serving to level user costs and producer revenues throughout the year. Commodity, i.e. the amount of use for a given time, would typically reflect variable costs, such as fuel. City management fee and taxes would typically be included.
Including large user hook-‐up ($1,000,000), individual homeowner equipment and piping (about $2,400,000), and the third pellet peaking boiler, the eventual total biomass District Energy cost will approach $27,500,000. While this is a large amount, it still is much more cost effective (better simple return without incentives) than ground source heat pumps, solar PV or wind.
In contrast to Biomass DE, the other renewable alternatives do not keep energy dollars within the community or create local jobs and only Biomass DE and ground source heat pumps displace any imported oil.

10
Ely District Energy Engineering Study
Findings: Background
Biomass Use for Energy: As the US addresses the need to reduce Greenhouse Gas (GHG), imported oil and fossil fuel environmental ramifications concurrently with the need for jobs, biomass for energy would seem to be poised for growth.
generation will grow more than solar and even wind.
Wood based biomass is renewable, but not unlimited and, especially in Northern Minnesota, is slow growing and should be used in high efficiency applications. Net cycle efficiency of biomass, i.e., the amount of useable energy per unit of as received fuel (usually at about 50% moisture), can vary from the mid-‐generation by utilities or mid 30% for gasification systems and Pyrolysis oil to over 70% for District Heat (centralized heating for multiple buildings) and Co-‐generation (simultaneous generation of electricity and heat) and pellets.

11
Premium wood pellet heating appliance efficiencies now exceed 75% with EPA Certified emissions lower than 1 gram/hr.

12
Ely District Energy Engineering Study
Findings: Background (continued)
When not used for paper and other value added forest products, good stewardship and basic economics would suggest that slow growing wood should be used for high efficiency energy conversion and, whenever possible, be used to displace high cost, non-‐renewable imported oil and propane. With this project, Ely is making a conscious effort to convert underutilized wood waste into energy in a high efficiency, low emission process. In doing so, Ely will enhance the local economy, forest, environment and national energy security.
There has been significant recent discussion regarding the carbon neutrality of energy from biomass. The author and a member of the AETF attended a recent forum where a representative of the Manomet Center for Conservation Sciences, authors of the controversial Massachusetts study on Biomass Energy, presented an overview.
The study looked at debt and dividend of woody biomass in Massachusetts, i.e., burning wood results in carbon emissions (debt) and as the replacement tree grows, absorbs CO2 (dividend). The study focused on electrical generation using low efficiency condensing power, but did acknowledge that the calculations are much more favorable when co-‐generation. In short, we
tate-‐of-‐the-‐art emission controls are significantly preferable to existing Ely energy systems.
in the attached spreadsheet, where we compared the simple return, without principle and interest payments and government incentives of the proposed Ground Source Heat Pump (geothermal) system for VCC, a recently installed Solar Photovoltaic system in NE Minnesota, the Taconite Ridge Wind Farm and the ELY DE project. Results are below:
Renewable Technology
Simple Return (yrs)
Benefits Comments
VCC Geothermal 34 Displaces foreign oil Does not include maintenance costs Minimal Carbon Reduction,
Solar PV 55 No emissions Does not include maintenance costs
Taconite Ridge 13 No emissions Does not include maintenance costs Does not include lease payments
Ely DE 18 Displaces foreign oil
Includes operations costs Includes maintenance costs

13
Creates jobs

14
Ely District Energy Engineering Study
Findings: Process Flow
Please refer to the flow diagram and equipment brochures included in the appendix and the schematics included below:
Thermal Oil Heater Fuel Receiving: Hogged fuel (chipped in the woods tops, branches, bark and whole tree chips) will be delivered to the DH plant by an average of 3 or 4 trucks per weekday (about 23,000 tons per year). Unloaded hogged fuel will be moved by a front end loader to a storage pile.
A scale and truck dumper will weigh and unload the incoming trucks. Empty trucks will be scaled to determine delivered amounts for invoicing. The scale and dumper will be operated by the truckers. The truck scale is fully automatic with Key Cards for each driver.
Thermal Oil Heater: The production of co-‐generation electricity and district heating hot water begins in the Thermal Oil Heater (see below schematic).
Courtesy of VAS-‐Energy Systems GmbH

15
Ely District Heat & Co-‐gen Engineering Study
Findings: Process Flow (continued)
The front end loader will feed a 3 day capacity storage bin (a), allowing for full weekend unattended operation. The bin will have a hydraulically driven walking floor or drag chain that continuously delivers fuel to the infeed conveyor (b), also hydraulically driven and driven by the centralized hydraulic system. Fuel is pushed up through a widening plenum and onto the grate of the refractory lined combustion chamber (c).
Pre-‐heated under-‐grate primary combustion air is provided by fans supplying different zones with flue gas recirculation and high pressure secondary air nozzles design for maximum turbulence, allowing for complete combustion and low NOx and CO emissions. Bottom ash is collected and discharged through conveyors (k) for collection and storage in a steel ash dumpster (m). An emergency bypass stack (d) is provided in case of a complete power loss.
1900°F combustion gases travel to the Thermal Oil (TO) heater (e). By not having radiation heat transfer and fluid temperatures lower than conventional Rankine (steam) boilers, tube corrosion and fouling is reduced, allowing for the use of air sootblowers and sonic horns to maintain the cleanliness of convection heat transfer surfaces. The thermal oil travels around the perimeter of the heater within concentric loops of tangent tubes, heated by the flue gas traveling on the outside of the tubes. Flow of the thermal oil and flue gas is counter-‐current to increase thermal efficiency, increasing thermal oil temperature to about 600°F.
Flue gas temperature is about 750°F as it exits the TO heater and enters the economizer sections (f) where the thermal oil is preheated in 2 stages for maximum efficiency. Fly ash from the economizer hopper is usually discharged into the bottom ash storage bin. Particulate emissions are controlled by both both a dust collector and an electrostatic precipitator (ESP, g) in series or an integral dust-‐collector/ESP with mechanical removal at turning vanes at the ESP inlet. ESP fly ash is discharged to a drag chain (i) and into another steel ash receptacle (m).
NOx, CO and Particulate Emissions are well below EPA standard factors (AP 42 Bark and Wet Wood Boiler, see Summary Feasibility Study for more detail).
Criteria Pollutant EPA AP 42 Factor (lbs/mmBtu)
Vender Guarantees (lbs/mmBtu)
Carbon Monoxide (CO) 0.60 0.08 Oxides of Nitrogen (NOx) 0.22 0.20 Particulate Matter (PM) 0.35 0.04
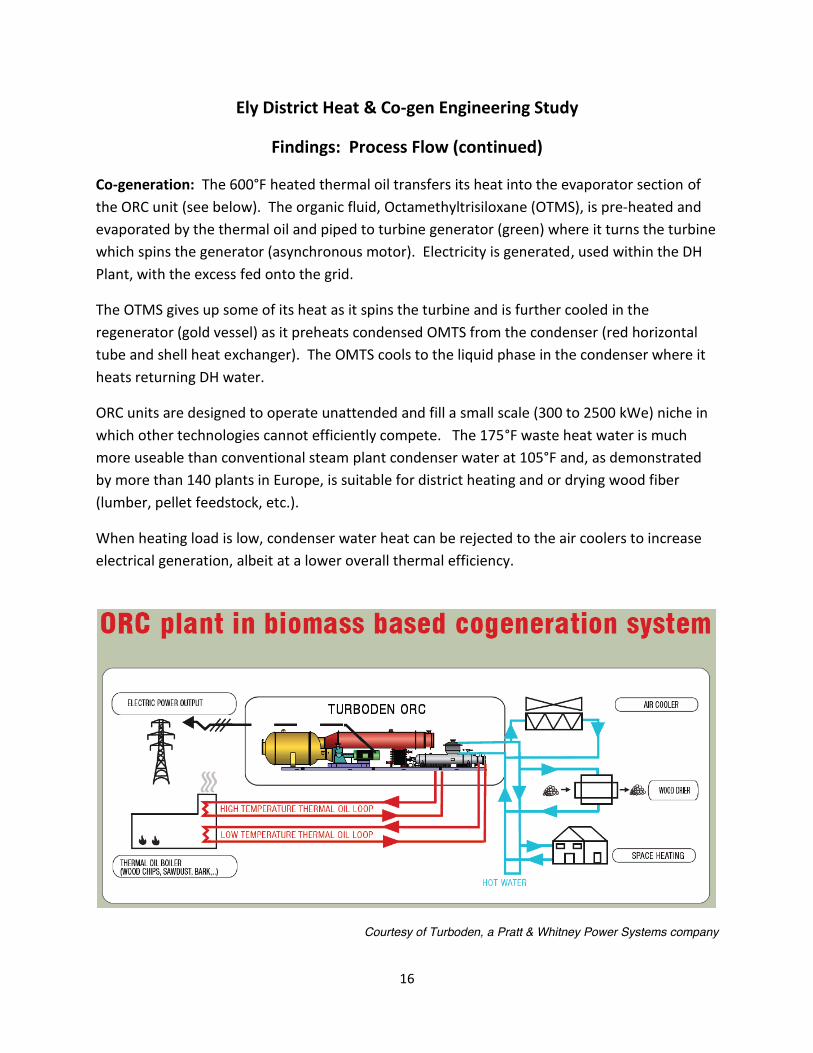
16
Ely District Heat & Co-‐gen Engineering Study
Findings: Process Flow (continued)
Co-‐generation: The 600°F heated thermal oil transfers its heat into the evaporator section of the ORC unit (see below). The organic fluid, Octamethyltrisiloxane (OTMS), is pre-‐heated and evaporated by the thermal oil and piped to turbine generator (green) where it turns the turbine which spins the generator (asynchronous motor). Electricity is generated, used within the DH Plant, with the excess fed onto the grid.
The OTMS gives up some of its heat as it spins the turbine and is further cooled in the regenerator (gold vessel) as it preheats condensed OMTS from the condenser (red horizontal tube and shell heat exchanger). The OMTS cools to the liquid phase in the condenser where it heats returning DH water.
ORC units are designed to operate unattended and fill a small scale (300 to 2500 kWe) niche in which other technologies cannot efficiently compete. The 175°F waste heat water is much more useable than conventional steam plant condenser water at 105°F and, as demonstrated by more than 140 plants in Europe, is suitable for district heating and or drying wood fiber (lumber, pellet feedstock, etc.).
When heating load is low, condenser water heat can be rejected to the air coolers to increase electrical generation, albeit at a lower overall thermal efficiency.
Courtesy of Turboden, a Pratt & Whitney Power Systems company

17
Ely District Heat & Co-‐gen Engineering Study
Findings: Process Flow (continued)
Pellet Peaking Boilers: Please see attached Wood Master Brochure.
For this study, we focused on the Wood Master (headquartered in Red Lake Falls, MN) BioMax series boiler to be manufactured in Superior, WI at Superior Steel under license from the Swedish Company ABioNova AB. The author has examined a 3.5 mmBtu/hr BioMax demonstration unit and judged it to be well built and quite suitable for this application.
The two base project (eventually three in total) peaking units are 3 pass fire-‐tube boilers. Pellet fuel is feed from individual 50 ton (2500 cubic feet) silos via a screw conveyor to the individual boiler feed bin.
Air locked screw conveyors feed pellets to the refractory lined hearth from the rear of the boiler. Individual primary and secondary air fans feed primary air to the hearth and secondary air through cast iron nozzles above the hearth.
Flue gas travels up the rear to the second pass tubes, then horizontally to the front of the boiler before turning 180° again to the 3rd pass tubes. The flue gas leaves the boiler out the back end to the dust collector via the negative pressure created by an induced draft fan. Cleaned flue gases are exhausted out individual stacks.
Heat transfer surfaces are kept clean by means of a high pressure air sootblower system. Turbulators (coiled springs) are installed in the fire tubes to spin the flue gas and maximize heat transfer, increasing efficiency. Ash is removed automatically and continuously by screw conveyors.
The full load analysis shows the pellet peaking boilers only operating December through February and during the Thermal Oil Heater annual shutdown. However, should demand warrant, they can be operated for a longer period.
We have included an allowance of $90,000 each for adding a propane burner to each peaking boiler for automatic start-‐up.

18
Ely District Heat & Co-‐gen Engineering Study
Findings: Process Flow (continued)
Propane Back-‐up Boilers: Please see attached Cleaver Brooks and Hurst quotes, brochures and manuals.
We solicited quotes from both Cleaver Brooks (CB) and Hurst for the fire-‐tube back-‐up boilers (flue gas flows horizontally through tubes immersed in a water pressure vessel). Both units are well proven and very common throughout the US and world.
The major difference between the CB and Hurst are the number of passes. CB offered a 4 pass unit while Hurst quoted a typically less efficient 3 pass unit, the difference being 1 extra pass (length of horizontal heat exchange tubes). Since the units would only operate in a rare back-‐up condition (one or more of the other units unavailable), the efficiency comparison is not critical. However, for the study we used the higher priced CB units for the capital estimate.
Although both back-‐up units are not really required until full build-‐out, we included both in the base project as the cost was not all that great ($150,000 each). Purchasing both at one time and installing together will most likely save the difference in working capital that delaying one of the units would provide.
District Heat Pumps: Please see attached Flowserve quote and pump data sheet.
Three pumps, each rated for 1000 gpm pumps and 250 ft of head (110 psig) with variable frequency drives were included in the study. The pumps are horizontally split with 125 hp motors.
The low or base project January flow is expected to be about 500 gpm.
Full load peak flow is expected to be less than 1800 gpm.

19
Ely District Heat & Co-‐gen Engineering Study
Findings: Equipment Sizing
Please see Degree Days, Heating Load and Heating Capacity & Fuel worksheets on pages 32 through 35.
at least 55% loaded in co-‐generation mode for the year, unless operated in the condensing mode where low heating load waste heat is rejected to the air coolers. We found that the 1
ORC load factor at full build-‐out.
With the ORC unit size verified, we assigned monthly average heating load based on percentages from degree days and actual usages for a variety of installations, e.g., 17.7% for January, 14.4% for February, etc. Subtracting the ORC full load thermal energy (14.4 mmBtu/hr) from the monthly heat load yields the peaking boiler(s) average load.
Co-‐generation and the variety of loads, i.e., VCC, the School, Hospital and homes as well as domestic hot water heating adds diversity which results in flatter peaks than just Degree Days,
-‐35°F heating peaks common in Northern Minnesota.
peaking boilers to provide for a 75% peak above the January average. Including the back-‐up boilers, the Ely installation will have twice as much (200%) capacity as the peak load.
breakdown of the largest geThe Ely installation will exceed both of these recommendations.
When compared to Vipiteno in the Italian Alps (see table below, one of the installations visited by the Dave Olsen of the AETF and the author), the Ely installation has much more reserve capacity as well as reserve diversity (3 peaking boilers versus 1 and 2 back-‐up boilers versus 1).

20
Ely District Heat & Co-‐gen Engineering Study
Findings: Equipment Sizing (continued)
Ely Low Load (mmBtu/hr)
Ely Full Load (mmBtu/hr)
Vipiteno
(mmBtu/hr)
Comments
CHP Capacity 1 MW 1 MW 1.2 MW Vipiteno, IT. 750 customers, pop. 8000
ORC Condenser
14.4 14.4 18.7 Some Condensing Power at Low Load
Peaking Unit(s)
13.6 20.4 29.2 2, 6.8 mmBtu/hr, add 3rd when load requires
Back-‐up Unit(s)
26.8 26.8 30.7 1, 13.4 mmBtu/hr, 2nd when load requires
Total 41.7 61.6 78.7
January Average
9.5 19.9 47.7
January Peak 14.3 29.8 74.8 150% of average for Ely, 157% for Vipiteno
Total Cap/ Peak
2.9 2.1 1.05
With the excess capacity and trend to improved weatherization comes the potential for customer growth exceeding the projections, i.e., perhaps 600 homes or more over time.

21
Ely District Heat & Co-‐gen Engineering Study
Findings: Plant Location
Please see attached Ely Aerial drawing.
The recommended plant location is on South 17th Avenue East (aka Highway 1), south of Old
While a few other sites were briefly discussed (e.g., in the Cithospital, North 17th Avenue East near VCC, etc.), the recommended location offers the following major advantages:
1. Easy truck access from a Class 1 road,
2. City owned unused land,
3. Short cable run to substation,
4. ea setting, and
5. Somewhat distant from existing homes, but the piping run to the main hot water
transportation route is still relatively short at 1200 feet.

22
Ely District Heat & Co-‐gen Engineering Study
Findings: Piping
Please see attached Piping Routing Plans labeled S1.00, S1.01 and S1.02.
The lay out for the Transportation piping in Ely is derived from the recommended location of the DE plant and the location of the 3 major Base Project heating customers, VCC, the ISD 696 school complex and the Ely-‐Bloomenson Community Hospital.
We researched several references and other installations, but could not find any other layout
running East/West along the length of Harvey Street.
North/South off
make even more sense.
will consist of 13,00nearly 43,000 feet (8.2 miles). In total, the project will consist of over 80,000 feet or nearly 16 miles of T&D pipe at an average cost of $135 per foot, or $270 per foot of piped trench (supply
assumed that each customer would be responsible for piping from the street connection to their building.
We conjecture that the project will most likconcurrently with road re-‐construction, sewer and other infrastructure projects and as further funding, incentives and customer commitments are available.

23
Ely District Heat & Co-‐gen Engineering Study
Findings: Cost Estimate
The cost of the base project is estimated at $16,990,000. Of that, about $720,000 is for site preparation and finishing, about $7,300,000 for the District Heat, $3,140,000 for Co-‐generation and $5,830,000 for the piping.
In preparing this estimate, we used budget quotes by multiple venders for all major equipment and detailed construction estimates by experienced LHB engineers and construction managers. Where multiple quotes were received for individual pieces of equipment, we used either the perceived industry leader or the higher priced unit.
people view continauthorization. We believe that there is some built-‐in contingency in that we used Budget
extra $270,000 for optional propane burners on the pellet peaking boilers as well as the higher priced 4 pass back-‐up boilers ($112,000).
Beyond the base project, the full build-‐out project is estimated to cost about $27,300,000, including; $800,000 for maj
, $2,370,000 for homeowner piping and $525,000 for the future 3rd pellet boiler.

24
Ely District Heat & Co-‐gen Engineering Study
Findings: Project Schedule
Please see attached detail schedule in the appendix (page 54).
We would expect 2011 to be consumed with garnering public and political support, negotiations with utility partners and funding activities, final scoping and permitting
Once the air permit application is submitted to the MPCA, we would expect approval within 3 months. We allowed another month in the schedule for final approval by the City Council.
quotes for shortlisted major equipment would be solicited with priority given to the longest lead time items; the Organic Rankine Cycle unit (11 months), the Thermal Oil Heater (9 months) and the Pellet Peaking Boilers (7 months).
Site preparation could begin with permit approval and Council authorization.
Depending on the time of year for the groundbreaking, we would anticipate a 16 month construction schedule.
As discussed in the piping section, full build-‐out will happen over a period of years, hopefully 5 or less, as road and other utility projects mesh with concentrations of customer commitments.

25
Ely District Heat & Co-‐gen Engineering Study
Findings: District Energy Structure
Analyses of District Energy Structures suggest that it be divided into 3 parts, i.e., the District Heating (DH) Plant, Piping System and Co-‐generation (CHP).
For DH and the Piping System, Municipal Ownership seems to be the most common in the US. Although alternative structures are discussed and sometimes considered, such as Consumer Co-‐operatives and Community Energy Trusts, most US systems follow the Municipal Ownership model.
St. Paul District Energy is only significant alternative as it is an independent non-‐profit organized as a (501 (c) (3). Over the years, St. Paul DE has garnered a variable line of credit that has resulted in an interest of less than 3%. Fifty per-‐revenue is in debt service.
In Europe, Private Ownership in the form of Corporations and Co-‐operatives are prevalent. Europe also has Public/Private Partnership Models where facilities are privately owned with publically owned transmission/distribution piping.
Duluth has had such a Municipal Ownership/Co-‐operative structure since the City bought the plant in the echair. Currently, there are only 10 members (one vacancy) and the chair is Tony Mancuso, the St. Louis County Property Management Director.
er representatives from a cross-‐section of the customer base. Each board member has only one vote, preventing large users from dictating policies that may not be fair to all customer classes. The City Council approves Co-‐op Board recommendations and has ultimate authority.
For the Co-‐generation part of the project, we still recommend Utility ownership, either Minnesota Power or Lake Country/Great River Energy, for the simple reason that, as the Utilities are required supply renewable electricity, the biomass co-‐generated output of the ORC unit is worth more to the Utility than it is to the City to displace lower cost coal based electricity.

26
Ely District Heat & Co-‐gen Engineering Study
Findings: District Energy Structure (continued)
The sub-‐structure for this type of arrangement is relatively straight forward. The Owning Electric Utility supplies the capital for the co-‐generation part of the project and reimburses the Municipal Ownership for Fuel Chargeable to Power, O&M and Infrastructure Credit, defined as:
Fuel Chargeable to Power (FCP): The incremental fuel for electric power generation. When only electrical power is produced, the FCP is equal to the Net Heat Rate. US units are usually Btu/kWh. The co-‐generation owner would reimburse the heat source owner for FCP based on the relative share of fuel cost. For example; if the FCP is 5000 Btu/kW and 700,000 kWh were produced in a particular month and the fuel cost was $3.06/mmBtu ($27/ton), the FCP would be:
5000 Btu/kW x 700,000 kW /1,000,000 Btu/mmBtu x $3.06/mmBtu = $10,710 or $0.0153/kWh
Operations & Maintenance (O&M): These costs can be pro-‐rated based on the heat share of the DE Plant. If the DH uses 75% of the energy in the Thermal Oil and the Co-‐gen uses 25%, then the ratio of the direct TOH system O&M costs would be 25% for the Co-‐generation. O&M costs for the Peaking and Back-‐up Boilers would not be included in the Co-‐gen cost share.
Infrastructure Payment (IP): The IP would be a fee paid by the Co-‐generation owner (electric utility) to the host plant in consideration of the heat source infrastructure capital and expense and building rent. A simple way to look at the IP is to consider the IP going towards a portion of the P&I payment for the DH plant, building & piping. Once the project loan or bonds are paid in full, the City and/or consumers could receive further revenues or savings. Numbers are calculated for these costs in the spreadsheet on the Ely Principle and Interest (P&I) worksheet.
Green Credits (e.g. Renewable Energy Credits, equal to 1 MWh) would be the property of the co-‐separated from the commodity and sold on the open market or used to fulfill a Renewable Portfolio Standard (RPS, Minne
some value, they are worth more to the Utility mandated to meet the RPS than they are to the City. The Co-‐gen Agreement, specifically the Infrastructure Payment language, can include
expectations. For example, the percentage of P&I that might make up the IP could graduate

27

28
Ely District Heat & Co-‐gen Engineering Study
Findings: Billing
spreadsheet (1st worksheet).
We interviewed Duluth Steam and found that most US District Heating Utilities use a two-‐part rate structure, i.e., a capacity charge to cover fixed costs (labor, maintenance, debt, etc.) and an energy charge to cover variable costs (fuel, chemicals, etc.).
The energy charge is based on the monthly meter reading of actual consumption. The capacity
day. Duluth uses the total annual consumption divided by 12. Units for both are typically in
the customer and the DH utility in that heating bills and thus revenues are somewhat flattened.
Some combination of the energy and capacity charge may be graduated based on load, i.e., larger users pay a lower unit cost and perhaps a lower capacity charge as well. This should be based on an actual analysis of comparable equipment and fossil fuel bulk delivery price differences for large versus residential customers.
The City of Duluth is paid an administration fee for billing services. If the utility is City owned, a Franchise Fee would not be appropriate. Sales taxes are paid as applicable.
The challenge for Ely during the load growth from the low load base plant to the full build-‐out is that initially the rates are only about 20% cheaper than fossil fuel, barring more than expected grant money.
Should the proposed Thermal Renewable Energy Efficiency Act (TREEA) be enacted, it could provide a Production Tax Credit of $6.15/mmBtu for closed loop biomass (energy crops, e.g. hybrid poplar) or about $3.20 for open loop biomass (logging residue). Using open loop biomass, TREEA could provide another $120,000/yr at Base Load and $260,000/yr at full build out. According to the International District Energy Association (IDEA), TREEA may be revised from a Production to an Investment Tax Credit.

29
Ely District Heat & Co-‐gen Engineering Study
Findings: Funding
Please see worksheets
Funding mechanisms for this type of major infrastructure project will probably include grants and bonds from a variety of sources as well as a strategic utility partner.
We envision that for the Ely DE project, a combination of all 3 might be used as follows:
Mechanism Amount Source/Comment
Site Work & Utilities Grant $750,000 County and State Economic Development
Unsolicited DE/CHP Grant $8,500,000 Department of Energy
Permitting and Detailed Engineering Grant
$770,000 Iron Range Resources, Blandin Foundation
Strategic Utility Partner
$2,600,000 MN Power or Lake Country Power/Great River Energy
Tax Exempt Bonds $4,400,000 Piping systems qualify for tax exemption.
es that, when altered, allow for immediate review of the results. Key variables include are:
1. Grants & Partnerships (%) 2. Interest Rate (%) 3. Term (years) 4. $/ 5. Co-‐gen Infrastructure Payment (% of P&I) 6. Wood Waste Cost/ton 7. Pellet Cost/ton 8. Fuel Oil Cost/gal 9. Propane Cost/gal
The Key Result is the detailed Demand and Energy unit cost for the Base project and at full load (P&I, O&M, fuel, etc.).

UMN Report to Dovetail Partners September 27, 2012 Final Draft 57
APPENDIX B. Ely Minnesota Biomass District Energy System (Wilson Engineering Services)

Wilson Engineering Services, PC9006 Mercer Pike �• Meadville, PA 16335P: (814) 337 8223 F: (814) 333 4342www.wilsonengineeringservices.com
Ely MinnesotaBiomass District Energy System
Version: Final
Date: July 6, 2012
Image Source: datagateway.nrcs.usda.gov

Preliminary Feasibility Report Version: Final Ely, MinnesotaDate Modified: July 6, 2012
The Wood Education and Resource Center is located in Princeton, W.Va., and administered bythe Northeastern Area State and Private Forestry unit of the U.S. Department of AgricultureForest Service. The Center's mission is to work with the forest products industry towardsustainable forest products production for the eastern hardwood forest region. It providesstate of the art training, technology transfer, networking opportunities, applied research, andinformation. Visit www.na.fs.fed.us/werc for more information about the Center.
The U.S. Department of Agriculture (USDA) prohibits discrimination in all its programs andactivities on the basis of race, color, national origin, age, disability, and where applicable, sex,marital status, familial status, parental status, religion, sexual orientation, genetic information,political beliefs, reprisal, or because all or part of an individual�’s income is derived from anypublic assistance program. (Not all prohibited bases apply to all programs.) Persons withdisabilities who require alternative means for communication of program information (Braille,large print, audiotape, etc.) should contact USDA�’s TARGET Center at (202) 720 2600 (voice andTDD). To file a complaint of discrimination, write to USDA, Director, Office of Civil Rights, 1400Independence Avenue, S.W., Washington, D.C. 20250 9410, or call (800) 795 3272 (voice) or(202) 720 6382 (TDD). USDA is an equal opportunity provider and employer.
The information contained herein creates no warranty either express or implied. The USDAForest Service, its officers, employees, and project partners assume no liability for itscontents or use thereof. Use of this information is at the sole discretion of the user.

Preliminary Feasibility Report Version: Final Ely, MinnesotaDate Modified: July 6, 2012
WERCWood Education and Resource Center Page 1 of 39
Table of Contents
1.0 Executive Summary.............................................................................................................. 2
2.0 Introduction ......................................................................................................................... 8
2.1 WERC Program ................................................................................................................. 8
2.2 Ely Opportunity ................................................................................................................ 8
3.0 Existing Energy Use, Cost, and Systems............................................................................... 8
3.1 Existing Heating Equipment ............................................................................................. 8
3.2 Existing Energy Usage....................................................................................................... 9
4.0 Biomass Availability and Price ........................................................................................... 14
5.0 Biomass System Options.................................................................................................... 15
5.1 Options Evaluated .......................................................................................................... 15
5.2 Option 1 �– Site 1: Biomass Heating................................................................................ 18
5.3 Option 2 �– Site 2: Biomass Heating................................................................................ 20
5.4 Option 3 �– Site 2: Biomass Heating................................................................................ 22
5.5 Option 4 �– Site 2: Biomass Backpressure Steam CHP .................................................... 24
5.6 Option 5 �– Site 2: Biomass ORC CHP .............................................................................. 26
5.7 Additional Large Buildings and Pipe Runs...................................................................... 29
5.8 Addition of Residential Loads......................................................................................... 31
5.9 Absorption Cooling......................................................................................................... 32
6.0 Analysis of Biomass Options .............................................................................................. 33
6.1 Capital Cost Estimate and Operational Costs................................................................. 33
6.2 Financial Analysis............................................................................................................ 35
6.3 Additional Benefits of Biomass System.......................................................................... 38
7.0 Conclusions and Recommendations.................................................................................. 38
Appendix A �– Drawings
Appendix B �– Capital Cost Estimates
Appendix C �– Detailed Financial Analysis

Preliminary Feasibility Report Version: Final Ely, MinnesotaDate Modified: July 6, 2012
WERCWood Education and Resource Center Page 2 of 39
1.0 EXECUTIVE SUMMARY
This preliminary feasibility study evaluates options for Ely, Minnesota to utilize renewablebiomass to supply energy. The options evaluated focus on biomass utilization for the majorheating loads within Ely. Should biomass utilization provide a viable option for the majorheating loads, Ely may consider the addition of smaller heating users to a comprehensivedistrict heating network. This report focuses evaluation on two potential sites for a biomassfueled district energy system consisting of thermal and thermally led combined heat and power(CHP) options. The major user for Site 1 is Vermillion Community College (VCC). The major usersfor Site 2 are Ely Bloomenson Community Hospital (EBCH), Sibley Manor, and IndependentSchool District 696 (ISD 696).
Existing Energy Usage and SystemsThe main sources of fuel for both sites are fuel oil and propane. Site 1 consisting of VCC, has acentral heating system firing on #2 fuel oil for heating and propane for domestic hot water(DHW). A district heating system circulates hot water for heating the campus. A wood chipcombustion unit and hot water boiler are currently installed in the heating plant, but have notbeen operational for over 10 years due to lack of fuel screening in the wood chip handlingsystem.
EBCH, Sibley Manor, and ISD 696 have separate heating systems and Site 2 includes tie in toeach of these facilities. EBCH has a central steam boiler plant firing on #2 fuel oil. The EBCHboiler plant provides low pressure steam for heating a nursing home, clinic, and hospital. Thenursing home utilizes a shell and tube heat exchanger to heat a radiant hot water heating loopwith steam; the hospital uses a combination of shell and tube heat exchangers and steam coilsfor heating; the clinic uses steam coils for heating. Domestic hot water is heated indirectly bythe central plant. Laundry services are performed off site. ISD 696 has a central propane firedheating plant that provides hot water for heating. Domestic hot water usage is minimal and isheated indirectly by the central plant. A biomass gasification system was retrofitted to apropane fired boiler and is located in a decommissioned central boiler plant. The plant has notbeen operational for over 20 years. Sibley Manor has a central propane fired boiler system thatprovides hot water for heating and domestic hot water. Table ES1 provides the current annualfuel usage targeted by the proposed biomass utilization options.
Biomass Availability and PriceBiomass boilers of the sizes to be installed for the Ely, MN project options would be capable ofutilizing multiple biomass fuel types. The biomass boiler and fuel transfer system shouldprovide fuel flexibility to be able to take advantage of low cost opportunity biomass fuels asthey become available. Wood chips have been focused on as the fuel source for this feasibilitystudy. Further investigation of other biomass supply should be performed if the biomassproject is pursued. Based on initial investigation, ample, sustainable biomass supply exists inthe region to provide for the proposed biomass options. Initial phone conversations withbiomass suppliers indicate a price range of $25 to $35 per green ton. The price for biomass fuelused as the basis for this report is $30 per green ton.

Preliminary Feasibility Report Version: Final Ely, MinnesotaDate Modified: July 6, 2012
WERCWood Education and Resource Center Page 3 of 39
Options EvaluatedFour options are evaluated in this study for district heating at major users in Ely, MN.
Option 1 �– Site 1: Biomass Heating (Hot Water): A 3.3 mmBtu/hour advanced biomasscombustion unit and hot water boiler will generate hot water for space heating anddomestic hot water at Vermillion Community College. This system would offset anestimated 85% of the fossil fuel currently used by the central heating plant at thecampus.
Option 2 �– Site 2: Biomass Heating (Steam and Hot Water): A 5 mmBtu/hour advancedbiomass combustion unit and steam boiler rated at 30 psig will generate low pressuresteam to offset 95% of the fossil fuel usage at EBCH, Sibley Manor, and ISD 696. Lowpressure steam would be directly distributed to EBCH and the Sibley Manor for heatingand domestic hot water, and a shell and tube heat exchanger would use steam to heat ahot water thermal storage tank to distribute hot water for heating ISD 696. A radiatorwill be installed allowing the system to offset fossil fuel usage during low load summerconditions.
Option 3 �– Site 2: Biomass Heating (Hot Water): A 5 mmBtu/hour advanced biomasscombustion unit and hot water boiler will generate hot water for space heating anddomestic hot water at EBCH, Sibley Manor, and ISD 696. The system would provide hotwater for district heating, and would require conversion of EBCH to hydronic heatingfrom steam. Buried pre insulated hot water distribution piping will be installedconnecting the biomass building to ISD 696, Sibley Manor, and EBCH. A radiator will beinstalled allowing the system to offset fossil fuel usage during low load summerconditions. This system would offset an estimated 95% of the fossil fuel currently usedat all three facilities.
Option 4 �– Site 2: Biomass Backpressure Steam CHP (Thermal Oil, Steam, Hot Water):A 5 mmBtu/hour biomass fueled vented thermal oil heater in conjunction with anunfired steam generator and 110 kW single stage backpressure steamturbine/generator would offset 95% of the fossil fuel usage at EBCH, Sibley Manor, andISD 696 and generate 412,965 kWh of renewable electricity. Low pressure steam wouldbe directly distributed to EBCH and Sibley Manor for heating and domestic hot water. Ashell and tube heat exchanger would also utilize steam to heat a hot water thermalstorage tank. Hot water from the thermal storage would be distributed to ISD 696. Thesystem would be thermally led and the turbine output would be dictated by thedemand for heat. A radiator will be installed downstream of the turbine allowing thesystem to offset fossil fuel usage during low load summer conditions.
Option 5 �– Site 2: Biomass ORC CHP (Thermal Oil and Hot Water): A 10 mmBtu/houradvanced biomass combustion unit and vented thermal oil heater in conjunction with a600 kW Organic Rankine Cycle (ORC) combined heat and power system would replace95% of the fossil fuel usage at EBCH, Sibley Manor, and ISD 696 with renewable biomassfuel. The system would provide hot water for district heating, and would requireconversion of EBCH to hydronic heating from steam. The system would be thermally ledand electric generation would be dictated by the demand for heat. The system would

Preliminary Feasibility Report Version: Final Ely, MinnesotaDate Modified: July 6, 2012
WERCWood Education and Resource Center Page 4 of 39
generate 1,622,087 kWh of renewable electricity annually from biomass. A radiator willbe installed downstream of the ORC system allowing the system to offset fossil fuelusage during low load summer conditions.
Biomass Project Cost and BenefitsThe capital cost associated with Option 1 is $1.9 million which includes the biomass combustionunit and boiler, boiler housing, fuel storage, multi cyclone for emission control, thermal storagetank, and interconnections with the existing VCC central boiler plant. Option 2 would cost $3.8million which includes the biomass combustion unit and steam boiler, boiler housing, fuelstorage, multi cyclone for emission control, thermal storage tank, buried pre insulateddistribution piping, and interconnections with the existing boiler systems. Option 3 would havea net deduct of approximately $17,000 for utilizing a hot water boiler with a larger thermalstorage tank for a total project cost of $3.8 million. Option 4 would have a net add ofapproximately $880,000 for utilizing a thermal oil heater, unfired steam generator,turbine/generator equipment, and electrical connections for a total project cost of $4.7 millionThe capital cost associated with Option 5 is $7.2 million which includes the biomass combustionunit and thermal oil heater, boiler housing, ORC generation system, fuel storage, dryelectrostatic precipitator (ESP) for emission control, buried pre insulated distribution piping,and interconnections with the existing boiler systems. The cost for Options 3 and 5 does notinclude the cost to convert steam heating sections of EBCH to hydronic heating.
A summary of the biomass system energy profile is provided in Table ES1 which shows existingfossil fuel usage, potential annual biomass and fossil fuel usage, and potential electricgeneration with a district biomass plant for each Option.
Table ES1 �– Current & Proposed Biomass System Energy Profile Summary
Option
Current Annual Potential Annual with Biomass
Fuel OilUsage,Gallons
PropaneUsage,Gallons
BiomassUsage,Tons
ElectricGenerated,
kWh
Fuel Oil Usage,Gallons1
PropaneUsage,Gallons1
1 62,357 3,332 878 9,680 02 81,246 99,729 2,924 5,486 2,8043 81,246 99,729 2,924 5,486 2,8044 81,246 99,729 3,174 412,965 5,486 2,8045 81,246 99,729 4,730 1,622,087 5,486 2,804
Note: Section 3.2 describes the development of current annual fuel usage values. Coverage of peak loads and lowloads will be accomplished with fuel oil for Option 1. This coverage will be provided by a combination of fuel oil andpropane for Options 2 4. Since maintenance on the biomass system will likely be completed in the summer months,it is assumed for the purposes of this report that ~75% of the fossil fuel coverage will be from fuel oil and ~25% willbe from propane for these options. Biomass usage is estimated using 10 mmBtu/ton and 40% moisture content(wet basis). The conversion from green tons to cords is 2.5 tons/cord for �“lighter northern hardwoods�”1
1 http://www.extension.umn.edu/distribution/naturalresources/DD2723.html

Preliminary Feasibility Report Version: Final Ely, MinnesotaDate Modified: July 6, 2012
WERCWood Education and Resource Center Page 5 of 39
Annual net operating savings were calculated for each option considering costs for fuel,electricity, and O&M costs. Table ES2 shows a summary of estimated first year annualoperating savings based on most recent fossil fuel prices.
Table ES2 �– Potential Annual Net Operating Savings
OptionCurrentAnnualFuel Cost
AnnualBiomassCost
AnnualElectric
Generation,kWh/Yr
AnnualElectricValue
Fossil FuelCost withBiomassSystem
BiomassSystemO&MCosts
PotentialSavings
1 $208,005 ($26,331) 0 $0 ($31,201) ($10,600) $139,8732 $433,461 ($87,734) 0 $0 ($21,673) ($18,200) $305,8543 $433,461 ($87,734) 0 $0 ($21,673) ($17,200) $306,8544 $433,461 ($95,207) 412,965 $29,733 ($21,673) ($21,200) $325,1155 $433,461 ($141,912) 1,622,087 $116,790 ($21,673) ($31,100) $355,566
A cash flow analysis was completed for financing the project over a 20 year term at 4.5%interest. Under this scenario, 25 yr net present values (NPV) were calculated at $1.5 M forOption 1, $3.8 M for Option 2, $3.9 M for Option 3, $3.3 M for Option 4, and $1.2 M for Option5. Table ES3 shows a summary of the results of this analysis.
Table ES3 �– Biomass System First Year Cash Flow Analysis Summary
Option FinancedAmount
Annual FinancingPayment
20 Year Financing,1st Year Cash Flow
25 Year NetPresentValue
1 $1,934,318 ($148,703) ($8,830) $1,484,6422 $3,783,002 ($290,823) $15,031 $3,832,1273 $3,765,866 ($289,505) $17,349 $3,877,8254 $4,664,050 ($358,554) ($33,439) $3,303,9925 $7,164,786 ($550,801) ($195,235) $1,204,394
Conclusions and RecommendationsWoody biomass utilization options present Ely, MN with an opportunity to reduce operatingcosts at major energy users within the city. Connection of additional residential andcommercial properties may be accomplished by direct payment by the owner on an �“opt in�”basis or encompassed in an expanded system with costs recovered through annual energysales. The benefits and costs associated with interconnecting smaller users are not evaluated indetail in this study. However, the study shows that residences adjacent to district heatingpipelines already justified by larger users should help to improve the overall economics ofproject options. The options evaluated in this report, with the assumption of 20 yr financing at4.5% interest rate would provide benefits as summarized:
Option 1 �– Site 1: Biomass Heating (Hot Water) would offset 85% of current fossil fuel usageby producing hot water for heating the existing central heating plant located at Vermillion

Preliminary Feasibility Report Version: Final Ely, MinnesotaDate Modified: July 6, 2012
WERCWood Education and Resource Center Page 6 of 39
Community College for a capital cost of $1.9 M and provide a first year net operatingsavings of $139,873 and 25 year Net Present Value (NPV) of $1.5 million.
Option 2 �– Site 2: Biomass Heating (Steam and Hot water) would offset 95% of current fossilfuel usage by generating steam for space heating and DHW at EBCH and the Sibley Manor,and heat a hot water thermal storage tank to provide heat and DHW to ISD 696. This optionwould produce a first year net operating savings of $305,854 and 25 year NPV of $3.8million for a capital cost of $3.8 M.
Option 3 �– Site 2: Biomass Heating (Hot Water) would offset 95% of current fossil fuel usageby generating hot water to heat a hot water thermal storage tank to provide heat and DHWto EBCH, Sibley Manor, and ISD 696. This option would produce a first year net operatingsavings of $306,854 and 25 year NPV of $3.9 million for a capital cost of $3.8 M. The cost toconvert EBCH to hot water from steam is not included in this cost estimate, and would needto be considered if this option is pursued.
Option 4 �– Site 2: Biomass Backpressure Steam CHP (Thermal Oil, Steam, Hot Water) wouldoffset 95% of fossil fuel usage and generate 412,965 kWh with a backpressure steamturbine/generator. Option 4 provides a first year net operating savings of $325,115 and 25year NPV of $3.3 million for a capital cost of $4.7 M.
Option 5 �– Site 2: Biomass ORC CHP (Thermal Oil and Hot Water) would offset 95% of fossilfuel usage and generate 1,622,087 kWh with an ORC generator. Option 5 provides a firstyear net operating savings of $355,566 and 25 year NPV of $1.2 million for a capital cost of$7.2 M.
Additional benefits that would be provided by a woody biomass project include:
Keeping dollars spent on energy within the local economy, between $30,000 and$140,000 annually, depending on option selected.
Decreased dependence on imported oil by replacing fuel oil and propane use withrenewable wood chip fuel;
A hedge against the volatility of the fossil fuel market; A reduction in net CO2 emissions of 553 metric tonnes for Site 1 and ranging from 1,321
�– 2,740 metric tonnes for Site 2 depending on the option selected. Credits generatedthrough this net reduction would be eligible for sale on the voluntary carbon market;
Educational opportunities for local students and opportunities for eco tourism.
The purpose of this study is to identify the benefits and costs of woody biomass system optionsserving the major thermal energy users within Ely. WERC recommends detailed investigation ofthe smaller residential and commercial loads within Ely, if it is determined the benefits warrantpursuit of a woody biomass project. WERC also recommends that personnel from the majorusers in Ely, MN visit existing biomass boiler installations to develop a detailed understanding ofthe equipment and its capabilities. WERC is available to assist in arranging tours of existingfacilities. As Ely, MN continues to pursue biomass renewable energy options, WERCrecommends that the next level of evaluation includes detailed consideration of the followingitems:

Preliminary Feasibility Report Version: Final Ely, MinnesotaDate Modified: July 6, 2012
WERCWood Education and Resource Center Page 7 of 39
System ownership and business model for ownership; Collection of energy use and energy system data for additional residential and
commercial owners along the main district heating pipeline routes and potentialadjustment to pipe and boiler sizing based on findings;
Inclusion of additional heat users based on parameters set by acceptable economicreturns for business models identified;
Utilization of existing employees at major users to maintain equipment and comply withlocal boiler licensing requirements;
Discussion of biomass plant siting with potential stakeholders within the city; Monitoring actual heating demand at major users to verify optimal biomass system
sizing; Performance of site investigations (utility, geotechnical, topographic) for site selected
based on stakeholder discussions, and further develop biomass project plant layout andcapital costs based on investigation results;
Identification of alternative funding sources (low interest loans, grants, and incentives).

Preliminary Feasibility Report Version: Final Ely, MinnesotaDate Modified: July 6, 2012
WERCWood Education and Resource Center Page 8 of 39
2.0 INTRODUCTION
2.1 WERC PROGRAMThe USDA Forest Service Wood Education and Resource Center (WERC), is providingprofessional services to promote and support projects utilizing wood energy in a sustainablemanner. This is being done through the Wood Energy Utilization Support Program. The goal ofthe program is to promote the Forest Service's Northeast Area Strategic Plan objective on thesustainable use of forest resources to provide efficient use of renewable energy resources andaccomplish greenhouse gas reduction. The services are available to public and private entities(clients) interested in and committed to efficient use of local wood for energy. This report isthe result of a prefeasibility level study and is developed under the WERC program by WilsonEngineering Services, PC.
2.2 ELY OPPORTUNITYEly, Minnesota is located in the eastern part of the state and has substantial renewable biomassresources. Currently fuel oil and propane are available for domestic hot water and spaceheating within the city. Ely, Minnesota has the opportunity to leverage local renewablebiomass resources to provide heat, hot water, and electricity while reducing its carbonfootprint through the use of district heating or combined heat and power (CHP). Utilization oflocal biomass would lower annual costs for each site evaluated and keep dollars spent onenergy in the local economy.
3.0 EXISTING ENERGY USE, COST, AND SYSTEMS
3.1 EXISTING HEATING EQUIPMENTTwo sites are considered in this analysis. Site 1, consisting of Vermillion Community College,has a central heating system firing on #2 fuel oil for heating and propane for DHW. The mainheating plant contains a 5 mmBtu/hour Hurst fuel oil boiler installed in 1998 and a 3.912mmBtu/hour Federal Boiler Company biomass boiler installed in 1985. The fuel oil boilerhandles 100% of the load under normal operation. The biomass boiler has not been functionalin over 10 years. A second hot water fuel oil boiler installed in 1971 is located in a building 100�’away. The Iron Fireman boiler is rated at 4 mmBtu/hour output and is used for emergencybackup. The smaller backup boiler cannot meet peak heating demands on the coldest days ofthe year.
The distribution piping arrangement is a primary secondary system. The boilers are connectedto the primary hot water loop which is manually maintained at 185 202°F. The primary loopheats a secondary heating loop with heat exchangers. The temperature of the secondary loop isadjusted based on outside air temperature. The secondary loop circulates water for heating the160,216 ft2 campus.
Site 2 consists of EBCH, ISD 696, and Sibley Manor, each of which has a separate heatingsystem. EBCH has a central steam boiler plant firing on #2 fuel oil. The boiler plant consists oftwo 4.8 mmBtu/hour Kewanee steam boilers installed in 1957 and a 4.2 mmBtu/hour Kewaneesteam boiler installed in 2002. All three boilers fire on #2 fuel oil. The central plant provideslow pressure steam for space heating and domestic hot water for a nursing home, clinic, and

Preliminary Feasibility Report Version: Final Ely, MinnesotaDate Modified: July 6, 2012
WERCWood Education and Resource Center Page 9 of 39
hospital. Steam is used directly in air handler steam coils and shell and tube heat exchangersto heat hydronic systems used for radiant heat, VAV reheat, and hot water heating coils in airhandlers. Higher pressure steam for autoclave sterilizers is produced by stand alone electricsteam generators. Humidification is produced using ultrasonic humidifiers located in the airstream of air handlers. Laundry services for the hospital are performed off site.
ISD 696 utilizes a central boiler plant for heating 211,618 ft2 in three buildings on campus. Three2.7 mmBtu/hour output Hydrotherm propane fired condensing boilers installed in 2011 heat aglycol and water mixture. The glycol mix is circulated to the Memorial, Washington, andIndustrial buildings for space and domestic hot water heating. The distribution looptemperature is adjusted based on outside air temperature. The boilers are shut down for thesummer months. A decommissioned central boiler plant that used to serve the school containsthree 11.76 mmBtu/hr output propane fired low pressure steam boilers, one of which wasconverted to burn gas created from pyrolizing wood chips. The biomass system consists of atwo bay below grade biomass storage pit with a hydraulic rake system. The chips aretransferred by auger and bucket elevator into a dryer, then transferred by auger to agasification chamber. Gas created by pyrolizing wood chips is burned in the retrofitted propaneboiler, and the ash is transferred by auger out of the gasification chamber. The propane boilerswere decommissioned when the new boiler plant was installed in 2011. The biomass systemhas not been operational for over 20 years.
The Sibley Manor utilizes two 522,000 btu/hour Crown Freeport propane fired hot waterboilers which feed a hydronic radiant heating system. The building is heated using baseboardradiators that are separated into 5 zones. Domestic hot water is heated by a 500,000 Btu/hrJarco hot water heater and stored in two 80 gallon DHW tanks.
3.2 EXISTING ENERGY USAGEAnnual fuel deliveries from 2009, 2010, and 2011 are listed in Table 1 for the major heat usersin Ely. Propane at VCC is mostly used by stand alone units for DHW heating. This studyevaluates the ability to offset 30% of the propane usage at VCC with biomass since a portion ofthe DHW load was recently interconnected to the central fuel oil heating system. Three yearaverage propane usage for ISD 696 would overestimate current heating demand since new highefficiency condensing boilers were installed in the summer of 2011. Calendar Year (CY) 2011usage was 38.6% lower than CY 2010 consumption with the new boilers operating half of theyear. Because of this, 50% of ISD 696�’s CY 2010 fuel delivery data is used as the basis forfinancial analysis and modeling instead of the 3 year average.
Table 1 �– Fuel Deliveries for Major Users and Values Used for Analysis of Biomass Options

Preliminary Feasibility Report Version: Final Ely, MinnesotaDate Modified: July 6, 2012
WERCWood Education and Resource Center Page 10 of 39
Year
Site 1 Site 2
VCC Fuel OilUsage
(Gallons/Yr)
VCC PropaneUsage
(Gallons/Yr)
EBCH FuelOil Usage
(Gallons/Yr)
ISD 696PropaneUsage
(Gallons/Yr)
SibleyPropaneUsage
(Gallons/Yr)2009 72,492 80,087 152,887 24,7882010 58,654 82,254 153,771 22,9242011 55,926 11,106 81,397 94,408 20,818
Average 62,357 11,106 81,246 133,688 22,843Value Used for Biomass
Options Analysis 62,357 3,332* 81,246 76,886** 22,843
Notes: *This is equivalent to 30% of reported 2011 propane usage. This value is included due to recent tie in ofdorm DHW to the central plant heating loop.** This value is equivalent to 50% of the 2010 usage. This is used due to heating system upgrades implemented in2011.
Using the values presented in the bottom row of Table 1, a daily heat demand model wasdeveloped individually for Site 1 and Site 2 to allow for estimating daily average heat demandthat could be offset by a central biomass plant. Energy demand was distributed daily based onheating degree days (HDD) calculated using average temperature data from the WeatherUnderground Station KELO in Ely, MN and the following assumptions:
HDD were based on 55 °F The fuel oil and propane boilers operate at a thermal efficiency of 80% The heat content of the available fuels are 91,300 Btu/gallon for propane and
140,000 Btu/gallon for #2 fuel oil The base load for Site 1 is assumed to be 1 mmBtu/day when the college is in
session. The central boiler plant is assumed to be shut down from June throughSeptember.
The base load for the facilities that makeup Site 2 is assumed to be 14.8mmBtu/day. This is equivalent to the hospital�’s base load in the summer, whichis carried through for the remainder of the year.
Figure 1 shows the resulting combined daily average heat demand for VCC in Site 1 during CY2010.

Preliminary Feasibility Report Version: Final Ely, MinnesotaDate Modified: July 6, 2012
WERCWood Education and Resource Center Page 11 of 39
Figure 1 �– Site 1 Daily Average Heat Demand (CY 2010)Note: The average output/demand model is based on local weather data and fuel delivery records provided byVermillion Community College in Ely, MN. The central plant is shut down during the summer months. A baseload of 1 mmBtu per day is used during the period when school is in session, outside of the summer months.
Figure 2 shows the load duration curve corresponding to data presented in Figure 1. It isimportant to note that the actual hourly demand will vary over the course of a 24 hr period.For the purposes of this report, the daily peak load is estimated to be 50% higher than the dailyaverage load and is represented by the red curve. Peak loads would be reached for a verylimited duration during a typical day.
0.50
1.00
1.50
2.00
2.50
3.00
3.50
4.00
4.50
5.00
Heat
Deman
d(m
mBtu/hr)
Month
Average Demand

Preliminary Feasibility Report Version: Final Ely, MinnesotaDate Modified: July 6, 2012
WERCWood Education and Resource Center Page 12 of 39
Figure 2 �– Site 1 Load Duration Curve (CY 2010)Note: The figure shows a load duration curve for an average output/demand model (Figure 1) based on localweather data and fuel delivery records provided by Vermillion Community College in Ely, MN. The central plant isshut down during the summer months. A base load of 1 mmBtu per day is used during the period when school isin session, outside of the summer months.
Figure 3 shows the modeled daily average heat demand for EBCH, ISD 696, and Sibley Manorcombined in Site 2 during CY 2010.
0.5
1.0
1.5
2.0
2.5
3.0
3.5
4.0
4.5
5.0
1 13 25 37 49 61 73 85 97 109
121
133
145
157
169
181
193
205
217
229
241
253
265
277
289
301
313
325
337
349
361
Heat
Deman
d(m
mBtu/hr)
Days
Average Load Estimated Peak Load

Preliminary Feasibility Report Version: Final Ely, MinnesotaDate Modified: July 6, 2012
WERCWood Education and Resource Center Page 13 of 39
Figure 3 �– Site 2 Daily Average Heat Demand (CY 2010)Note: The average output/demand model is based on local weather data and fuel delivery records provided bythe three major users. A base load of 14.8 mmBtu per day is developed based on summer deliveries as reportedby EBCH. This base load is carried through the entire year. Base loads for Sibley and ISD 696 are considered to benegligible for the purposes of developing the model.
Figure 4 shows the load duration curve corresponding to the CY 2010 average daily heatdemand for the data presented in Figure 3 for Site 2. It is important to note that the actualhourly demand will vary over the course of a 24 hr period. For the purposes of this report, thedaily peak load is estimated to be 50% higher than the daily average load and is represented bythe red curve. Peak loads would be reached for a very limited duration during a typical day.
0.0
1.0
2.0
3.0
4.0
5.0
6.0
7.0
8.0
9.0
10.0
Heat
Deman
d(m
mBtu/hr)
Month
Average Demand

Preliminary Feasibility Report Version: Final Ely, MinnesotaDate Modified: July 6, 2012
WERCWood Education and Resource Center Page 14 of 39
Figure 4 �– Site 2 Load Duration Curve (CY 2010)Note: The figure shows a load duration curve for an average output/demand model (Figure 3) based on localweather data and fuel delivery records provided by the three major users. A base load of 14.8 mmBtu per day isdeveloped based on summer deliveries as reported by EBCH. This base load is carried through the entire year.Base loads for Sibley and ISD 696 are considered to be negligible for the purposes of developing the model.
4.0 BIOMASS AVAILABILITY AND PRICE
Biomass boilers of the sizes to be installed for the Ely, MN project would be capable of utilizingmultiple biomass fuel types including hog fuel, whole tree chips, mill chips, and potentiallyother sources of biomass depending on air permitting restrictions and material handlingsystems installed. It is recommended that a biomass boiler system have fuel flexibility to beable to take advantage of low cost opportunity fuels as they become available. Wood chipshave been focused on as the fuel source for this feasibility study. Further investigation of otherbiomass supply should be performed if the biomass project is pursued. Based on initialinvestigation, ample, sustainable biomass supply exists in the region to provide for theproposed biomass options. Initial phone conversations by the University of MinnesotaDepartment Of Forest Resources with biomass suppliers indicate a price range of $25 to $35per green ton. The price for biomass fuel used as the basis for this report is $30 per green ton.
1.0
2.0
3.0
4.0
5.0
6.0
7.0
8.0
9.0
10.0
1 13 25 37 49 61 73 85 97 109
121
133
145
157
169
181
193
205
217
229
241
253
265
277
289
301
313
325
337
349
361
Heat
Deman
d(m
mBtu/hr)
Days
Average Load Estimated Peak Load

Preliminary Feasibility Report Version: Final Ely, MinnesotaDate Modified: July 6, 2012
WERCWood Education and Resource Center Page 15 of 39
The approximate costs of heating with fuel oil, propane, and wood chips are listed in Table 2based on thermal efficiencies of 70% for biomass boilers, 65% system efficiency for biomassboilers with a large piping distribution network including heat loss from piping, and 80% forfossil fuel boilers.
Table 2 �– Comparison of Delivered Heating Costs
Fuel UnitCost
Heating Value(Btu) per Unit
Input
DeliveryEfficiency
Cost permmBtuOutput
Biomass, Ton $30.00 10,000,000 70% $ 4.29Biomass, Ton $30.00 10,000,000 65% $ 4.62Fuel Oil, Gallon $ 3.24 140,000 80% $28.93Fuel Oil, Gallon $ 3.20 140,000 80% $28.57Propane, Gallon $ 1.80 91,300 80% $24.64Propane, Gallon $ 1.79 91,300 80% $24.51Propane, Gallon $ 1.72 91,300 80% $23.55
5.0 BIOMASS SYSTEM OPTIONS
5.1 OPTIONS EVALUATEDFive options are evaluated in this study for district heating at major users in Ely, MN. Anoverview of each option is listed below and detailed analysis provided in Sections 5.2 �– 5.6. Alloptions will require installing distribution pumps in the biomass plant and piping to theinterconnected buildings. The main distribution pumps should operate with a variable speeddrive to maintain loop pressure or temperature differential between supply and return lines asdesired.
Option 1 �– Site 1: Biomass Heating (Hot Water): A 3.3 mmBtu/hour advanced biomasscombustion unit and hot water boiler will generate hot water for space heating anddomestic hot water at Vermillion Community College. This system would offset anestimated 85% of the fossil fuel currently used by the central heating plant at thecampus.
Option 2 �– Site 2: Biomass Heating (Steam and Hot Water): A 5 mmBtu/hour advancedbiomass combustion unit and steam boiler rated at 30 psig will generate low pressuresteam to offset 95% of the fossil fuel usage at EBCH, Sibley Manor, and ISD 696. Lowpressure steam would be directly distributed to EBCH and the Sibley Manor for heatingand domestic hot water, and a shell and tube heat exchanger would use steam to heat ahot water thermal storage tank to distribute hot water for heating ISD 696. A radiatorwill be installed allowing the system to offset fossil fuel usage during low load summerconditions.
Option 3 �– Site 2: Biomass Heating (Hot Water): A 5 mmBtu/hour advanced biomasscombustion unit and hot water boiler will generate hot water for space heating anddomestic hot water at EBCH, Sibley Manor, and ISD 696. The system would provide hotwater for district heating, and would require conversion of EBCH to hydronic heatingfrom steam. Buried pre insulated hot water distribution piping will be installedconnecting the biomass building to ISD 696, Sibley Manor, and EBCH. A radiator will be

Preliminary Feasibility Report Version: Final Ely, MinnesotaDate Modified: July 6, 2012
WERCWood Education and Resource Center Page 16 of 39
installed allowing the system to offset fossil fuel usage during low load summerconditions. This system would offset an estimated 95% of the fossil fuel currently usedat all three facilities.
Option 4 �– Site 2: Biomass Backpressure Steam CHP (Thermal Oil, Steam, Hot Water):A 5 mmBtu/hour biomass fueled vented thermal oil heater in conjunction with anunfired steam generator and 110 kW single stage backpressure steamturbine/generator would offset 95% of the fossil fuel usage at EBCH, Sibley Manor, andISD 696 and generate 412,965 kWh of renewable electricity. Low pressure steam wouldbe directly distributed to EBCH and the Sibley Manor for heating and domestic hotwater. A shell and tube heat exchanger would also utilize steam to heat a hot waterthermal storage tank. Hot water from the thermal storage would be distributed to ISD696. The system would be thermally led and the turbine output would be dictated bythe demand for heat. A radiator will be installed downstream of the turbine allowingthe system to offset fossil fuel usage during low load summer conditions.
Option 5 �– Site 2: Biomass ORC CHP (Thermal Oil and Hot Water): A 10 mmBtu/houradvanced biomass combustion unit and vented thermal oil heater in conjunction with a600 kW Organic Rankine Cycle (ORC) combined heat and power system would replace95% of the fossil fuel usage at EBCH, Sibley Manor, and ISD 696 with renewable biomassfuel. The system would provide hot water for district heating, and would requireconversion of EBCH to hydronic heating from steam. The system would be thermally ledand electric generation would be dictated by the demand for heat. The system wouldgenerate 1,622,087 kWh of renewable electricity annually from biomass. A radiator willbe installed downstream of the ORC system allowing the system to offset fossil fuelusage during low load summer conditions.
Each biomass option includes construction of a new boiler plant. Appendix A shows aconceptual boiler plant location and layout for Site 1 and 2. A geotechnical analysis has notbeen completed at this level of study. The conceptual plant layout includes a storage buildingproviding 2 3 days of below grade chip storage at peak boiler output. Additional space in thebiomass building has been allocated for an additional biomass combustion unit and boilershould loads increase through future expansion. The building type for this analysis is assumedto be a pre engineered steel building. Should Ely, MN require a building with a brick façade orother aesthetic features, the cost of the building would be increased from what is presented inthe cost estimates shown in Appendix B.
An alternate location for the Site 2 biomass plant has been located to the south of Sibley Manoras shown in Appendix A.5. This location would add 834 linear feet of district heating piping,and additional costs for connection of utility services including electric, phone, internet, sewer,and water would be expected. District heating piping would add approximately $165,000 tothe project at an estimated cost of $200/linear foot, and costs for bringing in utilities wouldlikely add to project cost increases depending on the nearest access points. For the purposes ofthis analysis, the economics are run on the location nearer the major loads.
Central fossil fuel backup is not included in this study. It is assumed that existing fossil fuelboilers located at the major users would remain in place to provide backup should the biomasssystem go offline due to maintenance or emergency situations. The fossil fuel boilers would

Preliminary Feasibility Report Version: Final Ely, MinnesotaDate Modified: July 6, 2012
WERCWood Education and Resource Center Page 17 of 39
also boost distribution water temperature during the coldest days of the year when demand onthe district heating system exceeds the output of the biomass boiler.
The options proposed in this report consist of biomass boilers rated at 3.3, 5, and 10 mmBtu/hroutput. Federal rules impose emission limits on PM for wood boilers rated at 10 mmBtu perhour (input) and larger. The 3.3 and 5 mmBtu/hr boilers in Options 1, 2, 3, and 4 would havemaximum fuel inputs that are less than 10 mmBtu/hr. A multi cyclone is the standard emissioncontrol technology for use with advanced biomass combustion units in the size range of thosein Options 1, 2, 3, and 4. The advanced systems operating in their efficient firing range with amulti cyclone will have PM emission rates in the 0.1 0.25 lbs/mmBtu range. The 10 mmBtu/hroutput boiler in Option 5 would be required by federal rules to meet PM limits of 0.07lbs/mmBtu input. An electrostatic precipitator (ESP) is selected as the appropriate emissioncontrol technology for use with Option 5. The estimated capital costs associated with emissioncontrols have been included for all options in this report. Local air quality permitting andregulations vary by location and may dictate use of specific emission controls or operatingprocedures. An ESP could be added to Options 1 �– 4, and would add approximately $250,000$300,000 to the cost of each project. The added cost of an ESP is not included in this study forOptions 1 �– 4 for the purposes of developing system economics. Table 3 shows the comparisonof estimated emissions for the existing fossil fuel boilers, biomass system with a multi cyclone,and biomass system with an ESP. Option 5 only includes an ESP since this is what would berequired to meet federal emission limits.
Table 3 �– Estimated Emissions of Existing Fossil Fuel Boilers and Potential Biomass System
OptionEstimated Annual Emissions, Tons/yrPM NOx SOx Total
Existing Site 1 0.06 0.65 0.59 1.30Existing Site 2 0.12 1.46 0.77 2.35Option 1 0.89 0.89 0.10 1.88Option 2 2.93 2.70 0.08 5.72Option 2 ESP 0.45 2.70 0.08 3.23Option 3 2.93 2.70 0.08 5.72Option 3 ESP 0.45 2.70 0.08 3.23Option 4 3.18 2.93 0.08 6.19Option 4 ESP 0.48 2.93 0.08 3.50Option 5 ESP 0.72 4.33 0.10 5.15Note: Oil emission factors are taken from AP42 for <100mmBtu/hr, using values of 0.132% sulfur content and high heatingvalue of 0.14 Btu/gallon; Propane emission factors are taken fromAP42 with sulfur content of 0.2 g/100ft3; Wood chip emissionfactors are obtained from combustion test results.
Site plans showing loads, preliminary biomass plant placement, and potential distributionpiping routes and sizes are provided in Appendix A. Potential routes to buildings not included inthe analysis are shown with dashed lines. Hot water pipes are sized based on a 30°F T andestimated peak demand. The hot water supply and return lines to ISD 696 have been upsizedto 5�” to provide capacity for future expansion or connection to intermediate loads. The dashed

Preliminary Feasibility Report Version: Final Ely, MinnesotaDate Modified: July 6, 2012
WERCWood Education and Resource Center Page 18 of 39
pipe route from the Site 1 biomass plant to the Zenith and Pioneer Manor has been upsized to4�” to provide additional capacity should Ely, MN decide to include this pipe run into the project.Steam piping has been sized based on estimated peak loads and steam velocities between4,000 and 6,000 feet per minute.
A biomass plant at Site 1 would directly connect into VCC�’s existing central heating plant anddistribution system. Heat losses through pipes would already be accounted for in the fuel usagesupplied by VCC. Piping losses were considered for the distribution piping interconnecting Site2 users to a biomass plant. There would be an estimated 3,116 linear feet of distribution pipingconnecting major users based on the preliminary piping runs and biomass plant siting as shownin Appendix A. It was assumed that the thermal storage tank and hot water distribution lines toISD 696 would be shut down during summer months and piping losses are only included whenthe hot water system would be operational. Year round piping losses were included for thesteam (or hot water for Options 3 and 5) lines to EBCH and Sibley Manor. Table 4 shows thetotal annual heating and domestic hot water load that would be covered by the biomass systemat the district heating plant and existing fossil fuel boilers located at each building, the portionof the annual load covered by the biomass system, heat losses in the piping connecting thebiomass system to the buildings in each site, and the percentage of the piping heat lossescompared to the biomass coverage of the annual load.
Table 4 �– Estimated Distribution Piping Losses for Connection of Major Loads
Option
TotalAnnualHeatingLoad
(mmBtu)
BiomassCoverageof Annual
Load(mmBtu)
AnnualPipe Heat
Loss(mmBtu)
Percentageof BiomassCoverage
Lost
1 7,227 6,143 0 0.0%
2 16,235 15,424 857 5.6%
3 16,235 15,424 787 5.1%
4 16,235 15,424 857 5.6%
5 16,235 15,424 787 5.1%
The heat loss from distribution piping in Options 3 and 5 are lower since hot water distributionpiping to EBCH and Sibley Manor would have lower heat losses than steam piping based on thetemperatures of distributing steam at 10 psig. This study uses a biomass system efficiency of65% for Site 2 in Options 2, 3, 4, and 5 to account for these distribution piping losses.
5.2 OPTION 1 �– SITE 1: BIOMASS HEATING (HOTWATER)A 3.3 mmBtu/hour advanced biomass combustion unit and hot water boiler will be used to heata 3,500 gallon thermal storage tank located in the biomass building. Thermal storage tanks aretypically maintained above 195°F. This high temperature water in the tank will be blended withreturn water from the existing central heating plant to maintain the desired supply watertemperature set point. A schematic describing this system is provided in Appendix A.

Preliminary Feasibility Report Version: Final Ely, MinnesotaDate Modified: July 6, 2012
WERCWood Education and Resource Center Page 19 of 39
Wood chip fueled biomass boilers operate most efficiently between 25% and 100% of theirrated heating output (0.825 to 3.3 mmBtu/hour), which will enable this system to replace 85%of the fossil fuel used at VCC by the central plant with renewable biomass fuel. The existingfossil fuel boilers in the VCC boiler room will operate during periods of high and low heatingdemand to supplement the biomass system. The shaded area in Figure 5 illustrates theestimated biomass system coverage of the daily average heat demand.
Figure 5 �– Option 1 Biomass Coverage of CY 2010 Load Duration Curve for Site 1Note: The average output model is based on local weather data and fuel delivery records provided by VermillionCommunity College in Ely, MN. The biomass system is shown as being shut down during the summer months.Management of loads and the use of thermal storage may allow biomass coverage during times of low heatingdemand.
It is assumed for Option 1 that the boiler will be shut down during the summer months due toextended periods of low heating and domestic hot water demand. Management of loads andthe use of thermal storage may allow use of the biomass system during the low load periods ofthe shoulder seasons with the equipment identified. This possibility is ignored for the purposesof developing the economics in this report. Figure 5 shows 85% biomass coverage of the dailyaverage demand. Actual coverage will vary depending on weather conditions, peak demands,and periods when the boiler is shut down for maintenance. This report assumes 85% coveragefor Option 1 for the purpose of estimating fossil fuel offset.
0.0
0.5
1.0
1.5
2.0
2.5
3.0
3.5
4.0
4.5
5.0
1 13 25 37 49 61 73 85 97 109
121
133
145
157
169
181
193
205
217
229
241
253
265
277
289
301
313
325
337
349
361
Heat
Deman
dor
BoilerO
utpu
t(mmBtu/hr)
Days
Biomass Coverage Average Load

Preliminary Feasibility Report Version: Final Ely, MinnesotaDate Modified: July 6, 2012
WERCWood Education and Resource Center Page 20 of 39
5.3 OPTION 2 �– SITE 2: BIOMASS HEATING (STEAM AND HOTWATER)Option 2 will utilize a 5 mmBtu/hour advanced biomass combustion unit and steam boiler ratedat 30 psig and trimmed to generate steam at 10 psig. Steam from the boiler will be directlydistributed to EBCH and tie into the steam header located in the existing mechanical room. Ashell and tube heat exchanger will be installed at the Sibley Manor that will heat the existinghot water distribution system. Steam will also be utilized to heat a 4,000 gallon thermal storagetank with a shell and tube heat exchanger located in the biomass building. Buried pre insulatedhot water distribution piping will be installed connecting the biomass building to the boilerplant in ISD 696. Hot water from the thermal storage tank will blend with return water fromISD 696 to maintain the desired supply water temperature for heating the school. Distributionpumps will supply the hot water from the biomass plant to interconnect directly into theexisting central heating plant located at ISD 696. The existing boilers in ISD 696 and EBCH willoperate during periods of high heating demand to supplement the biomass system.
A radiator will be installed allowing the biomass system to dump heat to maintain minimumefficient fire during low load conditions. The savings are greater from offsetting the fuel oil andpropane usage at EBCH and the Sibley Manor with biomass fuel during periods of low heatingdemand than the cost of using additional biomass fuel and dumping heat to maintain minimumefficient fire throughout the summer.
The shaded area in Figure 6 illustrates the estimated biomass system coverage of the dailyaverage heat demand without a radiator at 83% and Figure 7 shows the biomass systemcoverage with a radiator at 99%. Coverage is shown with the biomass district heating systemoperating between 4.6 mmBtu/hour and 1.2 mmBtu/hour which includes the heat loss throughthe distribution pipes. Actual coverage will vary depending on weather conditions, peakdemands, and periods when the boiler is shut down for maintenance. This report assumesusage of a radiator and 95% coverage for Option 2 for the purpose of estimating fossil fueloffset.

Preliminary Feasibility Report Version: Final Ely, MinnesotaDate Modified: July 6, 2012
WERCWood Education and Resource Center Page 21 of 39
Figure 6 �– Option 2 Biomass Coverage of CY 2010 Load Duration Curve for Site 2Note: The average output model is based on local weather data and fuel delivery records provided by EBCH, SibleyManor, and ISD 696 in Ely, MN. The biomass district system is shown as delivering 4.6 to 1.2 mmBtu/hour due toheat losses in distribution piping and is not operational during low load conditions.
0.0
1.0
2.0
3.0
4.0
5.0
6.0
7.0
8.0
9.0
10.01 12 23 34 45 56 67 78 89 100
111
122
133
144
155
166
177
188
199
210
221
232
243
254
265
276
287
298
309
320
331
342
353
364
Heat
Deman
dor
BoilerO
utpu
t(mmBtu/hr)
Days
Biomass Coverage Average Load

Preliminary Feasibility Report Version: Final Ely, MinnesotaDate Modified: July 6, 2012
WERCWood Education and Resource Center Page 22 of 39
Figure 7 �– Option 2 Biomass Coverage of CY 2010 Load Duration Curve with Radiator for Site 2Note: The average output model is based on local weather data and fuel delivery records provided by EBCH, SibleyManor, and ISD 696 in Ely, MN. The biomass system is shown as being operational during the summer months anddelivering 4.6 to 1.2 mmBtu/hour due to heat losses in distribution piping. Management of loads and the use of aradiator to reject heat will allow biomass coverage during times of low heating demand. The biomass boiler outputis shown to be above the load during low load periods as a result of the minimum heating demand placed on thesystem by the radiator.
5.4 OPTION 3 �– SITE 2: BIOMASS HEATING (HOTWATER)Option 3 will utilize a 5 mmBtu/hour advanced biomass combustion unit and hot water boiler.Hot water generated by the boiler at 210°F will be pumped into a 5,000 gallon thermal storagetank located in the biomass building. Buried pre insulated hot water distribution piping will beinstalled connecting the biomass building to ISD 696, Sibley Manor, and EBCH. Option 3assumes that EBCH has converted their steam distribution system to hot water (costs andrequirements for conversion are not included in this study). Hot water from the thermalstorage tank will blend with return water from the three buildings to maintain the desiredsupply water temperature for heating. Distribution pumps will circulate the hot water from thebiomass plant to interconnect directly into the existing central heating plants located at ISD696, Sibley Manor, and EBCH. The existing boilers at ISD 696, Sibley Manor, and EBCH willremain in place for emergency backup and to supplement the biomass system during periodsthat exceed the biomass boiler output. A radiator will be installed allowing the biomass system
0.0
1.0
2.0
3.0
4.0
5.0
6.0
7.0
8.01 12 23 34 45 56 67 78 89 100
111
122
133
144
155
166
177
188
199
210
221
232
243
254
265
276
287
298
309
320
331
342
353
364
Heat
Deman
dor
BoilerO
utpu
t(mmBtu/hr)
Days
Biomass Coverage Average Load

Preliminary Feasibility Report Version: Final Ely, MinnesotaDate Modified: July 6, 2012
WERCWood Education and Resource Center Page 23 of 39
to reject heat to maintain minimum efficient fire during low load conditions. The savings aregreater from offsetting the fuel oil and propane usage at EBCH and the Sibley Manor withbiomass fuel during periods of low heating demand than the cost of using additional biomassfuel and dumping heat to maintain minimum fire throughout the summer.
The shaded area in Figure 8 illustrates the estimated biomass system coverage of the dailyaverage heat demand without a radiator at 83% and Figure 9 shows the biomass systemcoverage with a radiator at 99%. Coverage is shown with the biomass district heating systemoperating between 4.6 mmBtu/hour and 1.2 mmBtu/hour which includes the heat loss throughthe distribution pipes. Actual coverage will vary depending on weather conditions, peakdemands, and periods when the boiler is shut down for maintenance. This report assumesusage of a radiator and 95% coverage for Option 3 for the purpose of estimating fossil fueloffset.
Figure 8�– Option 3 Biomass Coverage of CY 2010 Load Duration Curve for Site 2Note: The average output model is based on local weather data and fuel delivery records provided by EBCH, SibleyManor, and ISD 696 in Ely, MN. The biomass district system is shown as delivering 4.6 to 1.2 mmBtu/hour due toheat losses in distribution piping and is not operational during low load conditions.
0.0
1.0
2.0
3.0
4.0
5.0
6.0
7.0
8.0
9.0
10.0
1 12 23 34 45 56 67 78 89 100
111
122
133
144
155
166
177
188
199
210
221
232
243
254
265
276
287
298
309
320
331
342
353
364
Heat
Deman
dor
BoilerO
utpu
t(mmBtu/hr)
Days
Biomass Coverage Average Load

Preliminary Feasibility Report Version: Final Ely, MinnesotaDate Modified: July 6, 2012
WERCWood Education and Resource Center Page 24 of 39
Figure 9 �– Option 3 Biomass Coverage of CY 2010 Load Duration Curve with Radiator for Site 2Note: The average output model is based on local weather data and fuel delivery records provided by EBCH, SibleyManor, and ISD 696 in Ely, MN. The biomass system is shown as being operational during the summer months anddelivering 4.6 to 1.2 mmBtu/hour due to heat losses in distribution piping. Management of loads and the use of aradiator to reject heat will allow biomass coverage during times of low heating demand. The biomass boiler outputis shown to be above the load during low load periods as a result of the minimum heating demand placed on thesystem by the radiator.
5.5 OPTION 4 �– SITE 2: BIOMASS BACKPRESSURE STEAM CHP (THERMAL OIL, STEAM, HOTWATER)Option 4 will utilize a 5 mmBtu/hour advanced biomass combustion unit and vented thermal oilheater to heat oil to a minimum of 575°F. Hot oil will be pumped into a heat exchanger toindirectly generate steam at 250 psig. Steam at 250 psig will flow into a single stage 110 kWbackpressure steam turbine/generator that will generate electricity while reducing steampressure to 10 psig. A slight upsizing of the 5 mmBtu/hr size may be required depending onlosses in the vented and backpressure steam system, and this should be investigated in detail ifthis option moves forward. This change in size would be minor and would not impact systemeconomics, and thus is not investigated in this report. A pressure reducing valve (PRV) wouldbe piped in parallel to the turbine to reduce the pressure of the steam when a shutdown of theturbine is required. Low pressure steam exiting the turbine would be able to flow to threedifferent locations. Steam would be piped directly to EBCH to tie into the steam header in thehospital mechanical room and to a shell and tube heat exchanger installed at the Sibley Manor
0.0
1.0
2.0
3.0
4.0
5.0
6.0
7.0
8.01 12 23 34 45 56 67 78 89 100
111
122
133
144
155
166
177
188
199
210
221
232
243
254
265
276
287
298
309
320
331
342
353
364
Heat
Deman
dor
BoilerO
utpu
t(mmBtu/hr)
Days
Biomass Coverage Average Load

Preliminary Feasibility Report Version: Final Ely, MinnesotaDate Modified: July 6, 2012
WERCWood Education and Resource Center Page 25 of 39
utilizing steam to heat the existing hot water distribution system. A shell and tube heatexchanger located in the biomass building would also utilize steam to heat a 4,000 gallon hotwater thermal storage tank.
Hot water from the thermal storage tank will be blended with return water from ISD 696. Theexisting boilers in ISD 696, EBCH, and Sibley Manor will operate during periods of high heatingdemand to supplement the biomass system. As described in Option 2, a radiator should beinstalled to reject heat for summer operation. The radiator should be located on thedownstream side of the backpressure steam turbine/generator to take advantage of generatingelectricity during times of heat rejection.
The shaded area in Figure 10 illustrates the estimated biomass system coverage of the dailyaverage heat demand without a radiator at 83% and Figure 11 shows the biomass systemcoverage with a radiator at 99%. Actual coverage will vary depending on weather conditions,peak demands, and periods when the boiler is shut down for maintenance. This reportassumes usage of a radiator and 95% coverage for Option 4 for the purpose of estimating fossilfuel offset.
Figure 10 �– Option 4 Biomass Coverage of CY 2010 Load Duration Curve for Site 2Note: The average output model is based on local weather data and fuel delivery records provided by EBCH, SibleyManor, and ISD 696 in Ely, MN. The biomass system is shown as not being operational during low load conditionsand delivering 4.6 to 1.2 mmBtu/hour due to heat losses in distribution piping.
0.0
1.0
2.0
3.0
4.0
5.0
6.0
7.0
8.0
9.0
10.0
1 12 23 34 45 56 67 78 89 100
111
122
133
144
155
166
177
188
199
210
221
232
243
254
265
276
287
298
309
320
331
342
353
364
Heat
Deman
dor
BoilerO
utpu
t(mmBtu/hr)
Days
Biomass Coverage Average Load

Preliminary Feasibility Report Version: Final Ely, MinnesotaDate Modified: July 6, 2012
WERCWood Education and Resource Center Page 26 of 39
Figure 11�–Option 4 Biomass Coverage of CY 2010 Load Duration Curve with Radiator for Site 2Note: The average output model is based on local weather data and fuel delivery records provided by EBCH, SibleyManor, and ISD 696 in Ely, MN. The biomass system is shown as being operational during the summer months anddelivering 4.6 to 1.2 mmBtu/hour due to heat losses in distribution piping. Management of loads and the use of aradiator to reject heat will allow biomass coverage during times of low heating demand. The biomass boiler outputis shown to be above the load during low load periods as a result of the heating demand placed on the system bythe radiator.
Minnesota boiler law requires a boiler of the size recommended in Option 4 that generatessteam at pressures higher than 15 psig to be inspected every two hours. This would requirehiring approximately 5 additional boiler operators at an annual cost of approximately $400,000.Utilizing a vented thermal oil heater that indirectly generates steam through an unfired steamgenerator would be required to be checked on daily. It is assumed that existing staff from thecity or major users would conduct daily inspections.
5.6 OPTION 5 �– SITE 2: BIOMASS ORC CHP (THERMAL OIL AND HOTWATER)Option 5 will utilize a 10 mmBtu/hour advanced biomass combustion unit and vented thermaloil heater that is connected to a 600 kW Organic Rankine Cycle (ORC) combined heat and powersystem. The biomass combustion unit will burn biomass fuel to heat oil that is selected towithstand high temperatures to 590°F. The hot oil will be pumped into the ORC system at590°F to generate electricity and heat a hot water distribution system for ISD 696, Sibley
0.0
1.0
2.0
3.0
4.0
5.0
6.0
7.0
8.01 12 23 34 45 56 67 78 89 100
111
122
133
144
155
166
177
188
199
210
221
232
243
254
265
276
287
298
309
320
331
342
353
364
Heat
Deman
dor
BoilerO
utpu
t(mmBtu/hr)
Days
Biomass Coverage Average Load
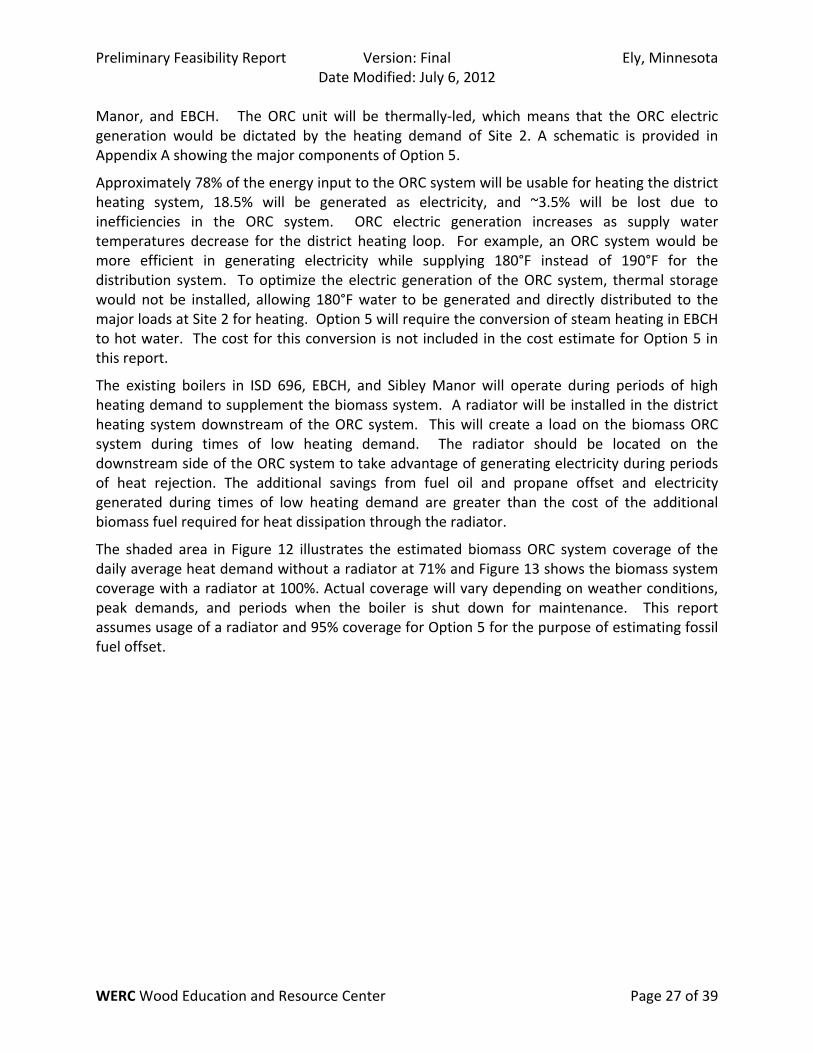
Preliminary Feasibility Report Version: Final Ely, MinnesotaDate Modified: July 6, 2012
WERCWood Education and Resource Center Page 27 of 39
Manor, and EBCH. The ORC unit will be thermally led, which means that the ORC electricgeneration would be dictated by the heating demand of Site 2. A schematic is provided inAppendix A showing the major components of Option 5.
Approximately 78% of the energy input to the ORC system will be usable for heating the districtheating system, 18.5% will be generated as electricity, and ~3.5% will be lost due toinefficiencies in the ORC system. ORC electric generation increases as supply watertemperatures decrease for the district heating loop. For example, an ORC system would bemore efficient in generating electricity while supplying 180°F instead of 190°F for thedistribution system. To optimize the electric generation of the ORC system, thermal storagewould not be installed, allowing 180°F water to be generated and directly distributed to themajor loads at Site 2 for heating. Option 5 will require the conversion of steam heating in EBCHto hot water. The cost for this conversion is not included in the cost estimate for Option 5 inthis report.
The existing boilers in ISD 696, EBCH, and Sibley Manor will operate during periods of highheating demand to supplement the biomass system. A radiator will be installed in the districtheating system downstream of the ORC system. This will create a load on the biomass ORCsystem during times of low heating demand. The radiator should be located on thedownstream side of the ORC system to take advantage of generating electricity during periodsof heat rejection. The additional savings from fuel oil and propane offset and electricitygenerated during times of low heating demand are greater than the cost of the additionalbiomass fuel required for heat dissipation through the radiator.
The shaded area in Figure 12 illustrates the estimated biomass ORC system coverage of thedaily average heat demand without a radiator at 71% and Figure 13 shows the biomass systemcoverage with a radiator at 100%. Actual coverage will vary depending on weather conditions,peak demands, and periods when the boiler is shut down for maintenance. This reportassumes usage of a radiator and 95% coverage for Option 5 for the purpose of estimating fossilfuel offset.

Preliminary Feasibility Report Version: Final Ely, MinnesotaDate Modified: July 6, 2012
WERCWood Education and Resource Center Page 28 of 39
Figure 12 �– Option 5 Biomass Coverage of CY 2010 Load Duration Curve for Site 2Note: The average output model is based on local weather data and fuel delivery records provided by EBCH, SibleyManor, and ISD 696 in Ely, MN. The biomass system is shown as not shut down during the summer months withthe ability to deliver 7.2 to 1.8 mmBtu/hour due to heat losses in distribution piping. ORC generations systems canmodulate down to 10% output, but biomass combustion unit efficiency drops off significantly below 25% of ratedboiler output.
0.0
1.0
2.0
3.0
4.0
5.0
6.0
7.0
8.01 12 23 34 45 56 67 78 89 100
111
122
133
144
155
166
177
188
199
210
221
232
243
254
265
276
287
298
309
320
331
342
353
364
Heat
Deman
dor
BoilerO
utpu
t(mmBtu/hr)
Days
Biomass Coverage Average Load

Preliminary Feasibility Report Version: Final Ely, MinnesotaDate Modified: July 6, 2012
WERCWood Education and Resource Center Page 29 of 39
Figure 13�–Option 5 Biomass Coverage of CY 2010 Load Duration Curve with Radiator for Site 2Note: The average output model is based on local weather data and fuel delivery records provided by EBCH, SibleyManor, and ISD 696 in Ely, MN. The biomass system is shown as being operational during the summer months withthe ability to deliver 7.2 to 1.8 mmBtu/hour due to heat losses in distribution piping. Management of loads and theuse of a radiator to reject heat will allow biomass coverage during times of low heating demand. The biomassboiler output is shown to be above the load during low load periods as a result of the heating demand placed onthe system by the radiator.
5.7 ADDITIONAL LARGE BUILDINGS AND PIPE RUNSAdditional capacity has been built into the piping system and increased system loads can beabsorbed by the biomass boilers specified in this report without the need for the addition ofadded boilers. It is estimated that an increase in annual heating demand of up to 50% could beabsorbed by the systems without the need for increase in biomass boiler capacity. This allowsefficient sizing of one unit now with flexibility in when additional boiler capacity would berequired. As an example, Figure 14 demonstrates what an increase of 50% in annual loadwould do to the system for Site 2 and Options 2 4. The blue curve shows the new demandcurve with a 50% increase in annual thermal load. The red shading shows the biomass systemcoverage for this new curve. The figure shows that the potential percentage covered woulddrop from approximately 99% to 89% when using the radiator to ensure the summer load iscaptured. Even though coverage percentage decreases, quantity of annual fossil fuel offset
0.0
1.0
2.0
3.0
4.0
5.0
6.0
7.0
8.01 12 23 34 45 56 67 78 89 100
111
122
133
144
155
166
177
188
199
210
221
232
243
254
265
276
287
298
309
320
331
342
353
364
Heat
Deman
dor
BoilerO
utpu
t(mmBtu/hr)
Days
Biomass Coverage Average Load

Preliminary Feasibility Report Version: Final Ely, MinnesotaDate Modified: July 6, 2012
WERCWood Education and Resource Center Page 30 of 39
would increase from 15,564 mmBtu to approximately 21,627 mmBtu. This would be anincrease in the quantity of fossil fuel offset by 39% without increasing the boiler size. Thisadditional load would dramatically improve the economics for the project. If it is deemed thatthe economics warrant, space has been left in the boiler plant to add another boiler to bumpthe potential coverage back up to 99%. The piping system will allow coverage of these loads.As further investigation of the system continues, initial pipe sizes could be increased if morepotential load is identified.
Figure 14 �– Potential Biomass Coverage of 50% Increase in Average Heat DemandNote: Curve and coverage is generated by increasing average heat demand for Site 2 by 50% over the course of theyear. The biomass system is shown as being operational during the summer months delivering 4.6 to 1.2mmBtu/hour due to heat losses in distribution piping. Management of loads and the use of a radiator to rejectheat will allow biomass coverage during times of low heating demand. The biomass boiler output is shown to beabove the load during low load periods as a result of the heating demand placed on the system by the radiator.
Connecting additional loads would also reduce the amount of heat dumped by the radiatorduring low load conditions. Additional space in the biomass building has been provided inOptions 1 through 4 for a second biomass boiler to be installed in the future should expansionof the district heating system require it. Additional space was not included in Option 5 to
0.0
1.0
2.0
3.0
4.0
5.0
6.0
7.0
8.0
9.0
10.0
1 13 25 37 49 61 73 85 97 109
121
133
145
157
169
181
193
205
217
229
241
253
265
277
289
301
313
325
337
349
361
Heat
Deman
dor
BoilerO
utpu
t(mmBtu/hr)
Days
Biomass Coverage Potential Average Demand

Preliminary Feasibility Report Version: Final Ely, MinnesotaDate Modified: July 6, 2012
WERCWood Education and Resource Center Page 31 of 39
optimize building capital costs since the biomass system output is much higher than Options 14.
Fuel usage was provided for additional locations in the vicinity of Site 1 and Site 2. Initialinvestigation shows that it may be cost prohibitive to include additional buildings to the districtheating system due to the distances and piping costs for interconnection. Table 5 provides thebuilding analyzed, pipe run label corresponding to the site plans in Appendix A, estimatedpiping lengths and installation costs at $200 per linear foot, current fuel costs using the mostrecent cost for the fuel provided, and the estimated maximum annual savings byinterconnecting to the district heating system.
Table 5 �– Analysis of Connecting Additional Buildings
Building Site PipeRun
EstimatedPipeLength
EstimatedPiping Cost
Current FuelCost
MaximumAnnualSavings
Zenith and Pioneer Site 1 H 4,239 $ 847,800 $ 73,450 $ 60,888Joint Garage Site 1 I 2,060 $ 412,000 $ 14,620 $ 11,246Kawishiwi Ranger Station (KRS) Site 1 J 1,955 $ 391,000 $ 24,417 $ 20,251International Wolf Center (IWC) Site 1 K 835 $ 167,000 $ 17,655 $ 14,643KRS and IWC Combined Site 1 J+K 2,790 $ 558,000 $ 42,072 $ 34,894Grahek Apartments Site 2 E 176 $ 35,200 Not Available Not AvailableCarefree Assisted Living Site 2 F 655 $ 131,000 Not Available Not AvailableNote: Values presented are meant to provide a general idea of connection potential. Maximum annual savings areequivalent to offsetting 100% of fossil fuel usage for each building, and does not account for operating costs. Thisis an overestimate of actual potential savings. Estimated piping costs do not include the costs associated with tie inof hydronic or steam district heating system.
Table 5 assumes that 100% of the fossil fuel load would be offset with biomass to show themaximum possible savings for each building. Parasitic losses from pumps, O&M costs, andpotential savings from CHP are not considered for this level of investigation. Actual savingscould vary depending on the portion of the load that could be offset for each building, fossilfuel costs, and biomass costs. The piping costs do not include tie in costs. These costs are notestimated for the purposes of this report. The buildings and savings listed in Table 5 are notincluded in the financial analysis of the Options in this study.
5.8 ADDITION OF RESIDENTIAL LOADSThe addition of residential loads is evaluated on an independent basis for the purposes of thisreport. Residential load and heating system data was provided for one residence along the hotwater distribution pipe route between the Site 2 biomass facility and the ISD 696 load. The1,200 square foot residence used 557 gallons of fuel oil in 2010 at a cost of $1,623($2.91/gallon). The house was weatherized in 2007 and has a central hydronic system. Theusage for the home is equivalent to 65,000 Btu/sf/yr of fuel oil input and an energy demand of52,000 Btu/sf/yr assuming a boiler/water heater efficiency of 80%.
The cost for this home to be connected to the district heating loop would be on the order of$10,000 $13,000. This includes the cost of laying pipe, installation of the necessary heat

Preliminary Feasibility Report Version: Final Ely, MinnesotaDate Modified: July 6, 2012
WERCWood Education and Resource Center Page 32 of 39
exchangers, valves, and metering equipment to tie into the existing hydronic space heatingsystem, and tie in to the existing domestic hot water system. Actual costs for interconnectionwill vary with distance from the district heating pipe route and ease of interconnection with theexisting heating system.
The business model for energy sales to residential or commercial units has not been evaluatedin this report. However, strictly on an energy cost basis, the district heating system couldprovide the same amount of energy as the existing fuel oil system for approximately $290/yr ofwood input costs. This is a reduction in fuel cost of $1,330 per year, which could provide asimple payback of 7.5 9.8 years to the home owner. In addition, homeowners and smallbusiness owners would avoid replacement costs of their existing heating equipment sincebackup will be maintained by boilers at the major users. Some of the fuel cost savings wouldneed to be apportioned to ownership and operation costs for the district heating system, andthus, this payback calculated here is slightly aggressive. However, this payback comparesfavorably to the simple payback for Option 2 (12.8 years). If the residence used as an examplewere added to Option 2, it would improve the overall economics of the project. Connection ofresidences with central heating systems that use over 500 gallons of fuel oil or 750 gallons ofpropane in close proximity to the district heating pipe route should improve overall projecteconomics. As additional piping is required to reach added residences further away from themain distribution line, the economic viability of adding residences would decrease.
Should Ely move forward with a district heating system, WERC recommends obtaining detailedfuel usage and heating system information from residences and businesses adjacent to pipe lineroutes that are justified by the key loads. WERC also recommends that Ely identify options forownership models and required economic returns for the system owner. The requiredeconomic returns for the owner will be a major factor in determining the extent to which adistrict system can be expanded beyond the major heating loads.
5.9 ABSORPTION COOLINGAbsorption cooling can provide operating savings for a biomass project as well as increaseboiler plant efficiency during low heating load periods. The magnitude of savings is dependenton the annual cooling load, cost of electricity, cost of biomass fuel, and the efficiency of theexisting chillers being replaced. Table 6 lists the costs per ton hour of cooling with single anddouble effect absorption chillers at a biomass cost of $30 per ton and two examples of watercooled electric chillers at an electric cost of $0.085 per kWh.

Preliminary Feasibility Report Version: Final Ely, MinnesotaDate Modified: July 6, 2012
WERCWood Education and Resource Center Page 33 of 39
Table 6 Cost of Cooling Comparison for Electric and Absorption Chillers
Chiller Compressor Technology EstimatedCOP
Cost / Ton Hour($30/ton chips& $0.085/kWh
electric)Single Effect Absorption Chiller 0.6 $0.086Double Effect Absorption Chiller 1.2 $0.043Reciprocating Electric Chiller 4.5 $0.066Centrifugal Electric Chiller 6.5 $0.046
Note: Table assumes a cost of $0.085 per kWh for electric chillers, $30/ton and 10mmBtu/ton wood chips, a biomass boiler efficiency of 70%, and the cost / ton houronly considers the Coefficient of Performance (COP) of the compressors. Parasitic loadsfor cooling towers, pumps, and ancillary equipment are not included in the cost/tonhour.
Other considerations to be analyzed between the chiller technologies are requirements foradditional cooling towers, pumps, controls, piping, and system interconnection. Capital costrequirements for installing and integrating absorption chillers can be substantial and can rangefrom $1,000 to $2,000+ per ton of installed capacity depending on the size and scope ofimplementation. Siting and placement of an absorption chiller plant can have a considerableimpact on a project�’s initial and operating costs. It would be difficult to justify the additionalcapital costs associated with absorption cooling based on the available energy savings usingcurrent average electric costs, biomass costs, and cooling loads for Ely, MN. Absorption coolingis not analyzed further in this study due to limited potential savings given current economics.
6.0 ANALYSIS OF BIOMASS OPTIONS
6.1 CAPITAL COST ESTIMATE AND OPERATIONAL COSTSCapital costs for each option are shown in Table 7. Estimates were established using recent bidresults from similar biomass projects and quotes from manufacturers. The capital cost estimatefor each option is based on the biomass building layout in Appendix A. The building is assumedto be a pre engineered steel building. Appendix B provides a breakdown of the capital costestimates for each option.
Table 7 �– Pre Feasibility Level Cost Estimates
Option Description EstimatedCapital Cost
1 Site 1: Biomass Heating (Hot Water) $1,934,3182 Site 2: Biomass Heating (Steam and Hot Water) $3,783,0023 Site 2: Biomass Heating (Hot Water) $3,765,866
4 Site 2: Biomass Backpressure Steam CHP(Thermal Oil, Steam, Hot Water) $4,664,050
5 Site 2: Biomass ORC CHP (Thermal Oil and Hot Water) $7,164,786

Preliminary Feasibility Report Version: Final Ely, MinnesotaDate Modified: July 6, 2012
WERCWood Education and Resource Center Page 34 of 39
Additional costs associated with a steam boiler system for Option 2 includes steam specialtiessuch as a deaerator tank, condensate return piping and pumps, automatic blow down, steamtraps, etc... Additional costs for CHP using backpressure steam in Option 4 include the installedcosts for an advanced biomass combustion unit and thermal oil heater, installed costs for anunfired steam generator, thermal oil pumps, deaerator tank, condensate return piping andpumps, blow downs, steam traps, pressure reducing valves to bypass the turbine/generator formaintenance or emergencies, and additional electrical equipment and requirements.
Capital costs for the ORC CHP system in Option 5 include installed costs for an advancedbiomass combustion unit and thermal oil heater, ORC generation system, thermal oil pumps,and controls. The capital costs to convert the steam distribution system at EBCH to hot waterare not included in the capital cost listed for Options 3 and 5.
Table 8 lists an estimate of annual operation and maintenance costs associated with thebiomass boiler options. The electricity line item covers added costs to run biomass equipmentand distribution pumps. The ash removal line item assumes that the city pays for removal ofthe ash at a cost of $70/ton. The ash is actually a valuable product that may be used as a soilamendment on city grounds, and much of this cost could likely be avoided. It is assumed for allfive options that a First Class Engineer Grade C would perform between 1 and 5 hours per weekof maintenance on the proposed boiler plant to coordinate deliveries, empty ash bins, andcheck on the system once per day. It is assumed in this study that existing facility or City staffwould fulfill this requirement.
Table 8 �– Estimated Annual O&M Costs
Items Option 1 Option 2 Option 3 Option 4 Option 5
Electricity $4,000 $6,000 $7,000 $6,000 $9,000
Maintenance / Wear Parts $5,600 $8,100 $7,100 $10,600 $17,100
Ash Removal $1,000 $3,100 $3,100 $3,400 $5,000Makeup Water Treatment(Steam System Only) $0 $1,000 $0 $1,200 $0
Boiler Operator $0 $0 $0 $0 $0
Total $10,600 $18,200 $17,200 $21,200 $31,100
Note: Table 8 assumes that existing staff from one of the major users or the City will check on thebiomass plant daily to meet Minnesota regulations. It is assumed that hiring of additional boileroperators will not be required.
Minnesota boiler regulations license boilers based on heating surface area instead of Btuoutput. The Minnesota Chief Boiler Inspector suggested that a 5 mmBtu/hour boiler would belicensed as a 75 hp boiler and a 10 mmBtu/hour boiler as a 150 hp boiler. To eliminateconfusion, boilers and oil heaters are sized in this study based on rated Btu output instead ofboiler horsepower.
Boilers that are vented to atmosphere are not regulated under Minnesota boiler pressurevessel regulations. Full time boiler operators would be required for Option 3 if a high pressuresteam boiler was utilized instead of thermal oil boiler indirectly generating steam through aheat exchanger and Option 4 if a non vented thermal oil system was utilized. Major users in Ely,

Preliminary Feasibility Report Version: Final Ely, MinnesotaDate Modified: July 6, 2012
WERCWood Education and Resource Center Page 35 of 39
MN should investigate boiler licensing requirements and utilizing existing staff should theyproceed with further investigation of any of the four biomass options presented in this report.
6.2 FINANCIAL ANALYSISThe first year net operating savings were calculated for all five biomass system options. Option1 would offset an estimated 85% of the current fossil fuel usage used by the existing centralheating plant at Vermillion Community College with renewable biomass fuel. Options 2, 3, 4,and 5 would offset an estimated 95% of the current fossil fuel usage for heating and domestichot water with biomass fuel at Ely Bloomenson Community Hospital, Independent SchoolDistrict 696, and Sibley Manor. The resulting energy profiles for each option are shown in Table9.
Table 9 �– Current & Proposed Biomass System Energy Profile Summary
Option
Current Annual Potential Annual with BiomassFuel OilUsage,Gallons
PropaneUsage,Gallons
BiomassUsage,Tons
ElectricGenerated,
kWh
Fuel OilUsage,Gallons
PropaneUsage,Gallons
1 62,357 3,332 878 9,680 02 81,246 99,729 2,924 5,486 2,8043 81,246 99,729 2,924 5,486 2,8044 81,246 99,729 3,174 412,965 5,486 2,8045 81,246 99,729 4,730 1,622,087 5,486 2,804
Note: Section 3.2 describes the development of current annual fuel usage values. Coverage of peak loadsand low loads will be accomplished with fuel oil for Option 1. This coverage will be provided by acombination of fuel oil and propane for Options 2 5. Since maintenance on the biomass system will likelybe completed in the summer months, it is assumed for the purposes of this report that ~75% of the fossilfuel coverage will be from fuel oil and ~25% will be from propane for these options. Biomass usage isestimated using 10 mmBtu/ton and 40% moisture content (wet basis). The conversion from green tons tocords is 2.5 tons/cord for �“lighter northern hardwoods�”2.
Table 10 contains the estimated net operating savings for each option. All savings values arebased on the most recent fuel prices supplied to WERC and $30 per ton for biomass as suppliedby the University of Minnesota Department Of Forest Resources. Annual savings for electricitygeneration through CHP have been estimated using an electric offset value of $0.072 per kWh.This was the average three year cost of electricity for ECBH after subtracting demand charge.
2 http://www.extension.umn.edu/distribution/naturalresources/DD2723.html

Preliminary Feasibility Report Version: Final Ely, MinnesotaDate Modified: July 6, 2012
WERCWood Education and Resource Center Page 36 of 39
Table 10 �– Potential Annual Net Operating Savings
OptionCurrentAnnualFuel Cost
AnnualBiomassCost
AnnualElectric
Generation,kWh/yr
AnnualElectricValue
Fossil FuelCost withBiomassSystem
BiomassSystemO&MCosts
PotentialSavings
1 $208,005 ($26,331) 0 $0 ($31,201) ($10,600) $139,8732 $433,461 ($87,734) 0 $0 ($21,673) ($18,200) $305,8543 $433,461 ($87,734) 0 $0 ($21,673) ($17,200) $306,8544 $433,461 ($95,207) 412,965 $29,733 ($21,673) ($21,200) $325,1155 $433,461 ($141,912) 1,622,087 $116,790 ($21,673) ($31,100) $355,566
Note: Annual fuel costs were calculated with the quantities and prices listed in Table 11. Electricity offset valuesare calculated using $0.072 per kWh. Potential savings do not include financing costs or annual payment of debtservice. Values in parenthesis are negative.
Table 11 shows the effect on 1st year net operating savings from doubling the current prices ofbiomass and fossil fuel costs.
Table 11 �– Sensitivity Analysis of Fossil Fuel and Biomass Prices
OptionPotential Savings atCurrent Biomass andFossil Fuel Prices
Potential Savingswith Biomass PriceDoubled (Fossil
Fixed)
Potential Savingswith Fossil FuelPrice Doubled(Biomass Fixed)
Option 1 $139,873 $113,542 $316,677Option 2 $305,854 $218,120 $717,642Option 3 $306,854 $219,120 $718,642Option 4 $325,115 $229,908 $736,903Option 5 $355,566 $213,654 $767,354
Note: Current fossil fuel costs are used to develop potential savings with biomass price doubled. Current biomassprices ($30/ton) are used to develop potential savings with fossil fuel price doubled.
The results of the sensitivity analysis show that project savings are more sensitive to fossil fuelprices than biomass prices. For example, the savings for Option 1 would be reduced 19% ifbiomass costs doubled versus a 126% increase in savings if fossil fuel prices doubled. Thereforethe project feasibility is more dependent on fossil fuel costs than biomass costs. A detailedsensitivity analysis for each option is provided in Appendix C showing the potential 1st year netoperating savings based on price changes of fossil fuel on a percentage basis to account for theuse of both fuel oil and propane compared to biomass prices. The highlighted cell in each tableidentifies the 1st year cash flow based on the prices assumed in this report.
A cash flow analysis was also completed for financing the project assuming a 20 year financingterm at a 4.5% interest rate. 25 Year Net Present Values for the biomass project are $1.5 millionfor Option 1, $3.8 million for Option 2, $3.9 million for Option 3, $3.3 million for Option 4, and$1.2 Million for Option 5. When comparing projects, a project with a higher Net Present Value

Preliminary Feasibility Report Version: Final Ely, MinnesotaDate Modified: July 6, 2012
WERCWood Education and Resource Center Page 37 of 39
typically means the project is better than a similar project with a lower Net Present Value. Table12 shows a summary of the results of this analysis and Table 13 provides the assumptions usedin the financial analysis. The detailed analyses are provided in Appendix C.
Table 12 �– Biomass System First Year Cash Flow Analysis Summary
Option FinancedAmount
AnnualFinancingPayment
20 YearFinancing, 1stYr Cash Flow
25 Year NetPresent Value
1 $1,934,318 ($148,703) ($8,830) $1,484,6422 $3,783,002 ($290,823) $15,031 $3,832,1273 $3,765,866 ($289,505) $17,349 $3,877,8254 $4,664,050 ($358,554) ($33,439) $3,303,9925 $7,164,786 ($550,801) ($195,235) $1,204,394
Table 13 �– Assumptions
Item Value UnitSite 1: Vermillion Community College (VCC) 3 Year Average Fuel Oil Usage 62,357 GallonsSite 1: VCC Most Recent Fuel Oil Price $3.24 Per GallonSite 1: VCC 2011 Total Propane Usage 11,106 GallonsSite 1: VCC 2011 Propane Usage offset by Central Plant (30% of total propane usage) 3,332 GallonsSite 1: VCC Most Recent Propane Price $1.79 Per GallonSite 2: Ely Bloomenson Community Hospital (EBCH) 3 Year Average Fuel Oil Usage 81,246 GallonsSite 2: EBCH Most Recent Fuel Oil Price $3.20 Per GallonSite 2: Independent School District (ISD) 696 Propane Usage (50% of CY 2010) 76,886 GallonsSite 2: ISD 696 Most Recent Propane Price $1.72 Per GallonSite 2: Sibley Manor 3 Year Propane Usage 22,843 GallonsSite 2: Sibley Manor Most Recent Propane Price $1.80 Per GallonPercent of Load Replaced with Biomass for Option 1 85% PercentPercent of Load Replaced with Biomass for Option 2 95% PercentPercent of Load Replaced with Biomass for Option 3 95% PercentPercent of Load Replaced with Biomass for Option 4 95% PercentPercent of Load Replaced with Biomass for Option 5 95% PercentBiomass Fuel Unit Cost $30 Per TonElectricity Generation Offset Value $0.072 Per kWhBiomass Boiler Efficiency 70% PercentSite 2 Biomass District Heating System Efficiency(Includes distribution pipe heating losses) 65% Percent
Fossil Fuel System Efficiency 80% Percent#2 Fuel Oil High Heating Value 0.1400 mmBtu/GallonPropane High Heating Value 0.0913 mmBtu/GallonBiomass Fuel High Heating Value (40% moisture content green wood chips) 10 mmBtu/Ton

Preliminary Feasibility Report Version: Final Ely, MinnesotaDate Modified: July 6, 2012
WERCWood Education and Resource Center Page 38 of 39
6.3 ADDITIONAL BENEFITS OF BIOMASS SYSTEMAdditional benefits that would be provided by a woody biomass project include:
Keeping dollars spent on energy within the local economy, between $30,000 and$140,000 annually, depending on option selected.
Decreased dependence on imported oil by replacing fuel oil and propane use withrenewable wood chip fuel;
A hedge against the volatility of the fossil fuel market; A reduction in net CO2 emissions of 553 metric tonnes for Site 1 and ranging from 1,321
�– 2,740 metric tonnes for Site 2 depending on the option selected. Credits generatedthrough this net reduction would be eligible for sale on the voluntary carbon market;
Educational opportunities for local students and opportunities for eco tourism.
7.0 CONCLUSIONS AND RECOMMENDATIONS
Woody biomass utilization options present Ely, MN with an opportunity to reduce operatingcosts at major energy users within the city. Connection of additional residential andcommercial properties may be accomplished by direct payment by the owner on an �“opt in�”basis or encompassed in an expanded system with costs recovered through annual energysales. The benefits and costs associated with interconnecting smaller users are not evaluated indetail in this study. However, the study shows that residences adjacent to district heatingpipelines already justified by larger users should help to improve the overall economics ofproject options. The options evaluated in this report, with the assumption of 20 yr financing at4.5% interest rate would provide benefits as summarized:
Option 1 �– Site 1: Biomass Heating (Hot Water) would offset 85% of current fossil fuel usageby producing hot water for heating the existing central heating plant located at VermillionCommunity College for a capital cost of $1.9 M and provide a first year net operatingsavings of $139,873 and 25 year Net Present Value (NPV) of $1.5 million.
Option 2 �– Site 2: Biomass Heating (Steam and Hot water) would offset 95% of current fossilfuel usage by generating steam for space heating and DHW at EBCH and the Sibley Manor,and heat a hot water thermal storage tank to provide heat and DHW to ISD 696. This optionwould produce a first year net operating savings of $305,854 and 25 year NPV of $3.8million for a capital cost of $3.8 M.
Option 3 �– Site 2: Biomass Heating (Hot Water) would offset 95% of current fossil fuel usageby generating hot water to heat a hot water thermal storage tank to provide heat and DHWto EBCH, Sibley Manor, and ISD 696. This option would produce a first year net operatingsavings of $306,854 and 25 year NPV of $3.9 million for a capital cost of $3.8 M. The cost toconvert EBCH to hot water from steam is not included in this cost estimate, and would needto be considered if this option is pursued.
Option 4 �– Site 2: Biomass Backpressure Steam CHP (Thermal Oil, Steam, Hot Water) wouldoffset 95% of fossil fuel usage and generate 412,965 kWh with a backpressure steamturbine/generator. Option 4 provides a first year net operating savings of $325,115 and 25year NPV of $3.3 million for a capital cost of $4.7 M.

Preliminary Feasibility Report Version: Final Ely, MinnesotaDate Modified: July 6, 2012
WERCWood Education and Resource Center Page 39 of 39
Option 5 �– Site 2: Biomass ORC CHP (Thermal Oil and Hot Water) would offset 95% of fossilfuel usage and generate 1,622,087 kWh with an ORC generator. Option 5 provides a firstyear net operating savings of $355,566 and 25 year NPV of $1.2 million for a capital cost of$7.2 M.
Additional benefits that would be provided by a woody biomass project include:
Keeping dollars spent on energy within the local economy, between $30,000 and$140,000 annually, depending on option selected.
Decreased dependence on imported oil by replacing fuel oil and propane use withrenewable wood chip fuel;
A hedge against the volatility of the fossil fuel market; A reduction in net CO2 emissions of 553 metric tonnes for Site 1 and ranging from 1,321
�– 2,740 metric tonnes for Site 2 depending on the option selected. Credits generatedthrough this net reduction would be eligible for sale on the voluntary carbon market;
Educational opportunities for local students and opportunities for eco tourism.
The purpose of this study is to identify the benefits and costs of woody biomass system optionsserving the major thermal energy users within Ely. WERC recommends detailed investigation ofthe smaller residential and commercial loads within Ely, if it is determined the benefits warrantpursuit of a woody biomass project. WERC also recommends that personnel from the majorusers in Ely, MN visit existing biomass boiler installations to develop a detailed understanding ofthe equipment and its capabilities. WERC is available to assist in arranging tours of existingfacilities. As Ely, MN continues to pursue biomass renewable energy options, WERCrecommends that the next level of evaluation includes detailed consideration of the followingitems:
System ownership and business model for ownership; Collection of energy use and energy system data for additional residential and
commercial owners along the main district heating pipeline routes and potentialadjustment to pipe and boiler sizing based on findings;
Inclusion of additional heat users based on parameters set by acceptable economicreturns for business models identified;
Utilization of existing employees at major users to maintain equipment and comply withlocal boiler licensing requirements;
Discussion of biomass plant siting with potential stakeholders within the city; Monitoring actual heating demand at major users to verify optimal biomass system
sizing; Performance of site investigations (utility, geotechnical, topographic) for site selected
based on stakeholder discussions, and further develop biomass project plant layout andcapital costs based on investigation results;
Identification of alternative funding sources (low interest loans, grants, and incentives).

Preliminary Feasibility Report Version: Final Ely, MinnesotaDate Modified: July 6, 2012
WERCWood Education and Resource Center
Appendix ADrawings
A.1 : Heating Load Site Plan A.2 : Site 1 Site Plan �– Option 1 Pipe Sizes A.3 : Site 2 Site Plan �– Option 2 and 4 Pipe Sizes A.4: Site 2 Site Plan �– Option 3 and 5 Pipe Sizes A.5: Site 2 �– Site Plan �– Alternate Biomass Plant Location A.6: Option 1 Biomass Building Layout A.7: Option 2 Biomass Building Layout A.8: Option 3 Biomass Building Layout A.9 Option 4 Biomass Building Layout A.10: Option 5 Biomass Building Layout A.11: Option 1 Biomass System Schematic A.12: Option 2 Biomass System Schematic A.13: Option 3 Biomass System Schematic A.14: Option 4 Biomass System Schematic A.15: Option 5 Biomass System Schematic

VCC7,227mmBtu
IWC713 mmBtu
KawishiwiRangerStation986 mmBtu
Joint Garage799 mmBtu
EBCH9,100
mmBtu
ISD 6965,616
mmBtuSibley1,668
mmBtu
Pioneer1,742mmBtu
Zenith1,231mmBtu
1,500' 0' 750' 1,500'
Scale
Hea
ting
Load
Site
Pla
nW
ER
CE
ly, M
inne
sota
sdfNotes:1. Assumes 140,000 btu/gallon of #2 fuel oil, 91,300
btu/gallon of propane, and 80% thermal efficiency forheating.
2. Numbers listed are three year average heating demandbased on fuel usage provided by end users.
Ely
Dis
trict
Ene
rgy
Sys
tem

500' 0' 250' 500'
Scale
4,239'
835'
2,060'
I
J
K
H
4" HWSupply/Return
2" HWSupply/Return
1.5" HWSupply/Return
1.5" HWSupply/Return
1.5" HWSupply/Return
1,674'
281'
Pioneer Apartments
Joint Garage
InternationalWolf Center
KawishiwiRanger Station
Biomass Plant
Zenith Apartments
Ely
Dis
trict
Ene
rgy
Sys
tem
Site
1: S
ite P
lan
WE
RC
Ely
, Min
neso
ta

500' 0' 250' 500'
Scale
2,610'345'
103'99'
138'
176'
565'
BiomassPlant
SibleyManor
EBCH CarefreeLivingCarefreeLivingCarefreeLiving
A
DE
B
C5" HWSupply/Return
F
8" Steam Supply1.25" Condensate Return
3" Steam Supply0.5" Condensate Return
6" Steam Supply1.25" Condensate Return
ISD 696
WE
RC
Ely
, Min
neso
taE
ly D
istri
ct E
nerg
y S
yste
m
Site
2 :
Site
Pla
nO
ptio
n 2
and
4 P
ipe
Siz
es

500' 0' 250' 500'
Scale
2,610'345'
103'99'
138'
176'
565'
BiomassPlant
SibleyManor
EBCH CarefreeLivingCarefreeLivingCarefreeLiving
A
DE
B
C5" HWSupply/Return
FISD 696
6" HWSupply/Return
2" HWSupply/Return
5" HWSupply/Return
Site
2 :
Site
Pla
nO
ptio
n 3
and
5 P
ipe
Siz
es
WE
RC
Ely
, Min
neso
taE
ly D
istri
ct E
nerg
y S
yste
m

500' 0' 250' 500'
Scale
3,245'
475'
105'100'
155'
40'
565'
Biomass Plant(Alternate Location)
SibleyManor
EBCH CarefreeLivingCarefreeLivingCarefreeLiving
A
DEB
C
FISD 696
185'
Site
2 :
Site
Pla
nA
ltern
ate
Bio
mas
s P
lant
Loc
atio
n
WE
RC
Ely
, Min
neso
taE
ly D
istri
ct E
nerg
y S
yste
m

FeedwaterTreatment
43'
MaintenanceO.H. Door
Ash Bin
DistributionPumps
3,500Gallon
ThermalStorage
Fuel
Con
veyo
r
Fuel
Con
veyo
r
Fuel Conveyor
HydraulicRam
RoomElev. -15'
Boiler RoomElev. 0'
81'
14' W x 16' HO.H. Door
14' W x 16' HO.H. Door
20'
15'Below Grade
StorageElev. -10'
TruckUnload
PlatformElev. 0'
TruckUnload
PlatformElev. 0'
3.3mmBtu/hrBiomass
HotWaterBoiler
MeteringBin
Breeching
27'
Stack
7'
MultiClone
MultiClone
MaintenanceO.H. Door
Overs Bin
10' 0' 5' 10'
Scale
57'
Ove
rs C
onve
yor
SpaceAvailable
For Future Biomass
Boiler
7'
Ely
Dis
trict
Ene
rgy
Sys
tem
Opt
ion
1 B
iom
ass
Bui
ldin
g La
yout
WE
RC
Ely
, Min
neso
ta
Note:This drawing is a conceptual layout for the purposes ofdeveloping surveying and geo-technIcal investigation plans.Actual footprints will vary depending on manufacturers andmaterials handling equipment selected.

5mmBtu/hr Biomass
SteamBoiler
FeedwaterTreatment
43'
Breeching
Ash Bin
DistributionPumps
4,000Gallon
ThermalStorage
Fuel
Con
veyo
r
Fuel
Con
veyo
r
Fuel Conveyor
HydraulicRam
RoomElev. -17'
Boiler RoomElev. 0'
81'
30'
Stack
8'
14' W x 16' HO.H. Door
14' W x 16' HO.H. Door
20'
15'
TruckUnload
PlatformElev. 0'
TruckUnload
PlatformElev. 0'
MultiClone
MeteringBin
8'
MultiClone
SpaceAvailable
For Future Biomass
Boiler
MaintenanceO.H. Door
MaintenanceO.H. Door
Steamto
HotWater
HX
ThermalStoragePump
Overs Bin
Below GradeStorage
Elev. -12'
10' 0' 5' 10'
Scale
Ove
rs C
onve
yor
59'
Opt
ion
2 B
iom
ass
Bui
ldin
g La
yout
WE
RC
Ely
, Min
neso
taE
ly D
istri
ct E
nerg
y S
yste
m
Note:This drawing is a conceptual layout for the purposes ofdeveloping surveying and geo-technIcal investigation plans.Actual footprints will vary depending on manufacturers andmaterials handling equipment selected.

5mmBtu/hr BiomassHot Water
Boiler
FeedwaterTreatment
43'
Breeching
Ash Bin
DistributionPumps
5,000Gallon
ThermalStorage
Fuel
Con
veyo
r
Fuel
Con
veyo
r
Fuel Conveyor
HydraulicRam
RoomElev. -17'
Boiler RoomElev. 0'
81'
30'
Stack
8'
14' W x 16' HO.H. Door
14' W x 16' HO.H. Door
20'
15'
TruckUnload
PlatformElev. 0'
TruckUnload
PlatformElev. 0'
MultiClone
MeteringBin
8'
MultiClone
SpaceAvailable
For Future Biomass
Boiler
MaintenanceO.H. Door
MaintenanceO.H. Door
ThermalStoragePump
Overs Bin
Below GradeStorage
Elev. -12'
10' 0' 5' 10'
Scale
Ove
rs C
onve
yor
59'
Opt
ion
3 B
iom
ass
Bui
ldin
g La
yout
WE
RC
Ely
, Min
neso
taE
ly D
istri
ct E
nerg
y S
yste
m
Note:This drawing is a conceptual layout for the purposes ofdeveloping surveying and geo-technIcal investigation plans.Actual footprints will vary depending on manufacturers andmaterials handling equipment selected.

Unfired250 psigSteam
Generator
5 mmBtu/hrBiomass
Vented OilBoiler
FeedwaterTreatment
43'
Breeching
Ash Bin
DistributionPumps 4,000
GallonThermalStorage
Fuel
Con
veyo
r
Fuel
Con
veyo
rFuel Conveyor
HydraulicRam
RoomElev. -17'
Boiler RoomElev. 0'
81'
30'
Stack
8'
14' W x 16' HO.H. Door
14' W x 16' HO.H. Door
20'
15'
TruckUnload
PlatformElev. 0'
TruckUnload
PlatformElev. 0'
MultiClone
MeteringBin
8'
MultiClone
SpaceAvailable
For Future Biomass
Boiler
MaintenanceO.H. Door
MaintenanceO.H. Door
Steamto
HotWater
HX
ThermalStoragePump
Overs Bin
Below GradeStorage
Elev. -12'
10' 0' 5' 10'
Scale
Ove
rs C
onve
yor
SteamTurbine
64'
WE
RC
Note:This drawing is a conceptual layout for the purposes ofdeveloping surveying and geo-technIcal investigation plans.Actual footprints will vary depending on manufacturers andmaterials handling equipment selected.
Opt
ion
4 B
iom
ass
Bui
ldin
g La
yout
Ely
, Min
neso
taE
ly D
istri
ct E
nerg
y S
yste
m

10mmBtu/hrBiomassVented
Oil Boiler
MeteringBin
55'
Bre
echi
ng
MaintenanceO.H. Door
ThermalOil
Pumps
Fuel
Con
veyo
r
Fuel
Con
veyo
r
Fuel Conveyor
HydraulicRam
RoomElev. -19'
Boiler RoomElev. 0'
33'
ESPStack AshBin
8'
14' W x 16' HO.H. Door
14' W x 16' HO.H. Door
20'
15'
TruckUnloadPlatformElev. 0'
TruckUnloadPlatformElev. 0'
600kW
ORCUnit
DistributionPumps
MaintenanceO.H. Door
61'
94'
Overs Bin
Below GradeStorage
Elev. -14'
10' 0' 5' 10'
Scale
Ove
rs C
onve
yor
WE
RC
Note:This drawing is a conceptual layout for the purposes ofdeveloping surveying and geo-technIcal investigation plans.Actual footprints will vary depending on manufacturers andmaterials handling equipment selected.
Opt
ion
5 B
iom
ass
Bui
ldin
g La
yout
Ely
, Min
neso
taE
ly D
istri
ct E
nerg
y S
yste
m

3.3mmBtu/hrHot WaterBiomass
Boiler
Hot Water
FeedwaterPump
3,500Gallon
ThermalStorage
Tank
VFD
ToVCC
Hot Water
Hot Water
ToBiomassBuilding
TCTT
TI
Mixing ValveVariable Set Point
TTTI
TTTI
Hot Water
5mmBtu/hrExistingFuel OilBoiler
VCC ExistingDistribution Pumps
VCC HeatingSupply
VCC HeatingReturn
Plate Frame HeatExchanger 4
mmBtu/hrExistingFuel OilBoiler
5mmBtu/hr
Existing WoodChip
Boiler(NOT IN USE)
Opt
ion
1 B
iom
ass
Sys
tem
Sch
emat
ic
TT
TITC
VFD
Temperature transmitter
Temperature indicatorTemperature control
Variable Frequency Drive
Legend:Three-way Control Valve
Ely
Dis
trict
Ene
rgy
Sys
tem
Ely
, Min
neso
ta
Notes:1. This is a conceptual drawing only. Detailed design of biomass system, distribution, and
tie-in is required.2. Mixing valve blends return water with high temperature water from thermal storage to
meet variable set point. Variable set point allows optimization thermal storage capacityand fuel offset.
3. Existing boilers remain to provide full backup and peaking.
WE
RC

5mmBtu/hr150 psig
RatedSteam
BiomassBoiler
FeedwaterPump
4,000Gallon
ThermalStorage
Tank
VFD
Hot Water
CondensateReturnTank
Steam toHot WaterHeat Exchanger
Hot WaterReturn
TCTT
TI
Mixing ValveVariable Set Point
TT
TI
ToISD 696
Hot Water
ToBiomassBuilding
Hot Water
3mmBtu/hrExistingPropane
Boiler
FeedwaterPump
ISD 696 ExistingDistribution Pumps
ISD 696 HeatingSupply
ISD 696 HeatingReturn
3mmBtu/hrExistingPropane
Boiler
3mmBtu/hrExistingPropane
Boiler
10 psig Steam
ToEBCH
10 psig SteamTie Into ExistingSteam Header in
EBCH BoilerRoom
EBCHCondensate
Return
ToSibleyManor
HeatExchanger
10 psig Steam
Sibley ManorCondensate
Return
TT
TITC
VFD
Temperature transmitter
Temperature indicatorTemperature control
Variable Frequency Drive
Legend:Three-way Control Valve
Opt
ion
2 B
iom
ass
Sys
tem
Sch
emat
ic
Ely
Dis
trict
Ene
rgy
Sys
tem
Ely
, Min
neso
ta
Notes:1. This is a conceptual drawing only. Detailed design of biomass system, distribution, and
tie-in is required.2. Mixing valve blends return water with high temperature water from thermal storage to
meet variable set point. Variable set point allows optimization thermal storage capacityand fuel offset.
3. Existing boilers remain to provide full backup and peaking.
WE
RC

5 mmBtu/hrHot WaterBiomass
Boiler
FeedwaterPump
ToISD 696
5,000Gallon
ThermalStorage
Tank
ToEBCH
ConvertedHot Water
HeatingSystem
FromISD 696
to BiomassPlant
From EBCHto Heating
Plant
Hot WaterSupply
Hot WaterSupply
Hot WaterReturn
Hot WaterReturn
From SibleyManor to
Heating Plant
Hot WaterReturn
ToSibley Manor
ConvertedHot Water
HeatingSystem
Hot WaterSupply
TTTI
Hot Water
VFD
TCTTTI
TTTI
Hot Water
Mixing ValveVariable Set Point
Opt
ion
3 B
iom
ass
Sys
tem
Sch
emat
ic
TT
TITC
Temperature transmitter
Temperature indicatorTemperature control
Legend:Three-way Control Valve Notes:
1. This is a conceptual drawing only. Detailed design of biomass system, distribution, andtie-in is required.
2. Existing boilers remain to provide full backup and peaking.
Ely
Dis
trict
Ene
rgy
Sys
tem
Ely
, Min
neso
taW
ER
C

PRV
150 kW Turbineand Gen Set
5mmBtu/hr
UnfiredSteam
Generator
FeedwaterPump
Low FlowBypass
250 psig Steam10 psigSteam
CondensateReturnTank
EBCHCondensate
Return
4,000Gallon
ThermalStorage
Tank
VFD
Hot Water
Steam toHot Water
HeatExchanger
TCTT
TI
Mixing ValveVariable Set Point
TT
TI
ToISD 696
Hot Water
ToBiomassBuilding
Hot Water
3mmBtu/hrExistingPropane
Boiler
ISD 696 ExistingDistribution Pumps
ISD 696 HeatingSupply
ISD 696 HeatingReturn
3mmBtu/hrExistingPropane
Boiler
3mmBtu/hrExistingPropane
Boiler
Sibley ManorCondensate
Return
ToEBCH
10 psig SteamTie Into ExistingSteam Header in
EBCH BoilerRoom
ToSibleyManor
HeatExchanger
10 psig Steam
5mmBtu/hrBiomassThermal
Oil Heater
Thermal OilPump
Thermal Oil
Opt
ion
4 B
iom
ass
Sys
tem
Sch
emat
ic
TT
TITC
VFD
Temperature transmitter
Temperature indicatorTemperature control
Variable Frequency Drive
Legend:Three-way Control Valve
Notes:1. This is a conceptual drawing only. Detailed design of biomass system, distribution, and
tie-in is required.2. Mixing valve blends return water with high temperature water from thermal storage to
meet variable set point. Variable set point allows optimization thermal storage capacityand fuel offset.
3. Existing boilers remain to provide full backup and peaking.
Ely
Dis
trict
Ene
rgy
Sys
tem
Ely
, Min
neso
taW
ER
C
PRV Pressure Reducing Valve

10mmBtu/hr
Thermal OilBiomass
Boiler
FeedwaterPump
ToISD 696
Hot Water
600 kWORCPlant
ToEBCH
ConvertedHot Water
HeatingSystem
FromISD 696
to BiomassPlant
From EBCHto Heating
Plant
Hot WaterSupply
Hot WaterSupply
Hot WaterReturn
Hot WaterReturn
From SibleyManor to
Heating Plant
Hot WaterReturn
ToSibley Manor
ConvertedHot Water
HeatingSystem
Hot WaterSupply
Opt
ion
5 B
iom
ass
Sys
tem
Sch
emat
ic
TT
TITC
Temperature transmitter
Temperature indicatorTemperature control
Legend:Three-way Control Valve Notes:
1. This is a conceptual drawing only. Detailed design of biomass system, distribution, andtie-in is required.
2. Existing boilers remain to provide full backup and peaking.
Ely
Dis
trict
Ene
rgy
Sys
tem
Ely
, Min
neso
taW
ER
C

Preliminary Feasibility Report Version: Final Ely, MinnesotaDate Modified: July 6, 2012
WERCWood Education and Resource Center
Appendix BCapital Cost Estimates
B.1 : Option 1 �– Site 1: Biomass Heating Project Cost Estimate B.2 : Option 2 �– Site 2: Biomass Heating (Steam and Hot Water) Project Cost Estimate B.3 : Option 3 �– Site 2: Biomass Heating (Hot Water) Project Cost Estimate B.4 : Option 4 �– Site 2: Biomass Backpressure Steam CHP Project Cost Estimate B.5 : Option 5 �– Site 2: Biomass ORC CHP Project Cost Estimate

Appendix B FinalDate Modified: July 6, 2012
Ely, Minnesota
Line Item Cost6,8
3.3 mmBtu/hr, biomass combustion unit, hot water boiler, boiler room controls, installed 300,000$Fuel bunker receiving, storage, material transfer, installed 150,000$3,500 gallon thermal storage tank 35,000$Biomass boiler room equipment and specialties, installed 75,000$Boiler platform, stairs, and ladders installed 15,000$Sub total 575,000$
Boiler Manufacturer Bid Bond and Insurance 2% 11,500$Total Boiler Manufacturer Contract 586,500$
Line Item Cost81,5Biomass boiler building and chip storage pit (2,500 sf @ $150 per sf) 375,000$Site work 100,000$2Interconnection with VCC boiler plant 30,000$Electrical 150,000$Mechanical 200,000$Sub Total 855,000$
Contractor profit overhead and insurance 16% 136,800$Sub Total 991,800$
Contingency 15% 148,770$Total General Contract Building and Site 1,140,570$
Line Item CostProject Sub Total (Boiler and General Contracts) 1,727,070$
Professional Services 3 12% 207,248$Total Project Cost4,6,7,8 1,934,318$
Notes:1 The building is assumed to be a simple pre engineered building. Aesthetic improvements will increase cost.2 Exact pipe routes and connections should be evaluated in additional detail as the project moves forward.3 Professional Services includes engineering, permitting, legal, and project management.4 Assumes that biomass boiler and general contract are bid seperately.5 GC costs are approximate. A detailed geotechnical study is required to identify final site and building costs.6 Estimate is based on competitive bidding.7 Integration of the biomass system into the existing BMS controls is not required and not included in the project cost.8 Boiler manufacturer contract includes all mechanical work associated with the boiler side of the distributionsystem through the thermal storage tank. GC mechanical responsibility starts at the demand side of the thermalstorage tank. GC is responsible for biomass building electrical, HVAC, plumbing, site work, foundations, and structures.Boiler manufacturer is responsible for all electrical and controls for boiler system from a panel provided by the GC.
Option 1 Site 1: Biomass Heating (Hot Water)Pre Feasibility Level Capital Cost Estimate
Biomass Boiler Manufacturer Contract
General Contract
Total Project Cost
WERCWood Education and Resource Center B.1

Appendix B FinalDate Modified: July 6, 2012
Ely, Minnesota
Line Item Cost1,2,3
5 mmBtu/hr, biomass combustion unit, 30 psig steam boiler, boiler controls, installed 375,000$Fuel bunker receiving, storage, material transfer, installed 175,000$4,000 gallon thermal storage tank serving ISD 696 system 40,000$Biomass boiler room equipment and specialties, installed 125,000$Boiler platform, stairs, and ladders installed 20,000$Sub total 735,000$
Boiler Manufacturer Bid Bond and Insurance 2% 14,700$Total Boiler Manufacturer Contract 749,700$
Line Item Cost4Biomass boiler building and chip storage pit (3,000 sf @ $150 per sf) 450,000$Site work 130,000$5Buried pre insulated distribution piping, installed (3,200 ft @ $200 per ft) 640,000$Interconnection with EBCH steam system 30,000$Interconnection with ISD 696 hot water distribution system 50,000$Electrical 350,000$Mechanical 300,000$Radiator for heat rejection, installed 20,000$Sub Total 1,970,000$
Contractor profit overhead and insurance 16% 315,200$Sub Total 2,285,200$
Contingency 15% 342,780$Total General Contract Building and Site 2,627,980$
Line Item CostProject Sub Total (Boiler and General Contracts) 3,377,680$
Professional Services 6 12% 405,322$Total Project Cost6,7,8 3,783,002$
Notes:1 The building is assumed to be a simple pre engineered building. Aesthetic improvements will increase cost.2 Exact pipe routes and connections should be evaluated in additional detail as the project moves forward.3 Professional Services includes engineering, permitting, legal, and project management.4 Assumes that biomass boiler and general contract are bid seperately.5 GC costs are approximate. A detailed geotechnical study is required to identify final site and building costs.6 Estimate is based on competitive bidding.7 Integration of the biomass system into the existing BMS controls is not required and not included in the project cost.8 Boiler manufacturer contract includes all mechanical work associated with the boiler side of the distributionsystem through the thermal storage tank. GC mechanical responsibility starts at the demand side of the thermalstorage tank. GC is responsible for biomass building electrical, HVAC, plumbing, site work, foundations, and structures.Boiler manufacturer is responsible for all electrical and controls for boiler system from a panel provided by the GC.
Option 2 Site 2: Biomass Heating (Steam and Hot Water)Pre Feasibility Level Capital Cost Estimate
Biomass Boiler Manufacturer Contract
General Contract
Total Project Cost
WERCWood Education and Resource Center B.2

Appendix B FinalDate Modified: July 6, 2012
Ely, Minnesota
Line Item Cost1,2,3
5 mmBtu/hr, biomass combustion unit, hot water boiler, boiler room controls, installed 350,000$Fuel bunker receiving, storage, material transfer, installed 175,000$5,000 gallon thermal storage tank serving ISD 696 system 50,000$Biomass boiler room equipment and specialties, installed 125,000$Boiler platform, stairs, and ladders installed 20,000$Sub total 720,000$
Boiler Manufacturer Bid Bond and Insurance 2% 14,400$Total Boiler Manufacturer Contract 734,400$
Line Item Cost4Biomass boiler building and chip storage pit (3,000 sf @ $150 per sf) 450,000$Site work 130,000$5Buried pre insulated distribution piping, installed (3,200 ft @ $200 per ft) 640,000$Interconnection with EBCH steam system 30,000$Interconnection with ISD 696 hot water distribution system 50,000$Electrical 350,000$Mechanical 300,000$Radiator for heat rejection, installed 20,000$Sub Total 1,970,000$
Contractor profit overhead and insurance 16% 315,200$Sub Total 2,285,200$
Contingency 15% 342,780$Total General Contract Building and Site 2,627,980$
Line Item CostProject Sub Total (Boiler and General Contracts) 3,362,380$
Professional Services 6 12% 403,486$Total Project Cost6,7,8 3,765,866$
Notes:1 The building is assumed to be a simple pre engineered building. Aesthetic improvements will increase cost.2 Exact pipe routes and connections should be evaluated in additional detail as the project moves forward.3 Professional Services includes engineering, permitting, legal, and project management.4 Assumes that biomass boiler and general contract are bid seperately.5 GC costs are approximate. A detailed geotechnical study is required to identify final site and building costs.6 Estimate is based on competitive bidding.7 Integration of the biomass system into the existing BMS controls is not required and not included in the project cost.8 Boiler manufacturer contract includes all mechanical work associated with the boiler side of the distributionsystem through the thermal storage tank. GC mechanical responsibility starts at the demand side of the thermalstorage tank. GC is responsible for biomass building electrical, HVAC, plumbing, site work, foundations, and structures.Boiler manufacturer is responsible for all electrical and controls for boiler system from a panel provided by the GC.
Option 3 Site 2: Biomass Heating (Hot Water)Pre Feasibility Level Capital Cost Estimate
Biomass Boiler Manufacturer Contract
General Contract
Total Project Cost
WERCWood Education and Resource Center B.3

Appendix B FinalDate Modified: July 6, 2012
Ely, Minnesota
Line Item Cost1,2,3
5 mmBtu/hr, biomass combustion unit, thermal oil boiler, boiler controls, installed 475,000$Fuel bunker receiving, storage, material transfer, installed 175,000$4,000 gallon thermal storage tank serving ISD 696 system 40,000$Biomass boiler room equipment and specialties, installed 175,000$Boiler platform, stairs, and ladders installed 20,000$Sub total 885,000$
Boiler Manufacturer Bid Bond and Insurance 2% 17,700$Total Boiler Manufacturer Contract 902,700$
Line Item Cost4Biomass boiler building and chip storage pit (3,000 sf @ $150 per sf) 450,000$Site work 130,000$5Buried pre insulated distribution piping, installed (3,200 ft @ $200 per ft) 640,000$Interconnection with EBCH steam system 30,000$Interconnection with ISD 696 hot water distribution system 50,000$5 mmBtu/hr unfired steam generator 175,000$150 kW backpressure steam turbine and switchgear, installed 250,000$Electrical 400,000$Mechanical 300,000$Radiator for heat rejection, installed 20,000$Sub Total 2,445,000$
Contractor profit overhead and insurance 16% 391,200$Sub Total 2,836,200$
Contingency 15% 425,430$Total General Contract Building and Site 3,261,630$
Line Item CostProject Sub Total (Boiler and General Contracts) 4,164,330$
Professional Services 6 12% 499,720$Total Project Cost6,7,8 4,664,050$
Notes:1 The building is assumed to be a simple pre engineered building. Aesthetic improvements will increase cost.2 Exact pipe routes and connections should be evaluated in additional detail as the project moves forward.3 Professional Services includes engineering, permitting, legal, and project management.4 Assumes that biomass boiler and general contract are bid seperately.5 GC costs are approximate. A detailed geotechnical study is required to identify final site and building costs.6 Estimate is based on competitive bidding.7 Integration of the biomass system into the existing BMS controls is not required and not included in the project cost.8 Boiler manufacturer contract includes all mechanical work associated with the boiler side of the distributionsystem through the thermal storage tank. GC mechanical responsibility starts at the demand side of the thermalstorage tank. GC is responsible for biomass building electrical, HVAC, plumbing, site work, foundations, and structures.Boiler manufacturer is responsible for all electrical and controls for boiler system from a panel provided by the GC.
Option 4 Site 2: Biomass Backpressure Steam CHP (Thermal Oil, Steam, Hot Water)Pre Feasibility Level Capital Cost Estimate
Biomass Boiler Manufacturer Contract
General Contract
Total Project Cost
WERCWood Education and Resource Center B.4

Appendix B FinalDate Modified: July 6, 2012
Ely, Minnesota
Line Item Cost1,2,3
10 mmBtu/hr, biomass combustion unit, thermal oil boiler, boiler controls, installed 750,000$Fuel bunker receiving, storage, material transfer, installed 175,000$8,000 gallon thermal storage tank serving ISD 696 and EBCH systems 70,000$Biomass boiler room equipment and specialties, installed 200,000$Dry ESP, Installed 350,000$Boiler platform, stairs, and ladders installed 25,000$Sub total 1,570,000$
Boiler Manufacturer Bid Bond and Insurance 2% 31,400$Total Boiler Manufacturer Contract 1,601,400$
Line Item Cost4Biomass boiler building and chip storage pit (3,500 sf @ $150 per sf) 525,000$Site work 130,000$5Buried pre insulated distribution piping, installed 640,000$Conversion of EBCH distribution from steam to hot water (Not Included in this study) $Interconnection with ISD 696 hot water distribution system 30,000$600 kW ORC Turbine and generator, installed 1,400,000$Electrical 500,000$Mechanical 350,000$Radiator for heat rejection, installed 20,000$Sub Total 3,595,000$
Contractor profit overhead and insurance 16% 575,200$Sub Total 4,170,200$
Contingency 15% 625,530$Total General Contract Building and Site 4,795,730$
Line Item CostProject Sub Total (Boiler and General Contracts) 6,397,130$
Professional Services 6 12% 767,656$Total Project Cost6,7,8 7,164,786$
Notes:1 The building is assumed to be a simple pre engineered building. Aesthetic improvements will increase cost.2 Exact pipe routes and connections should be evaluated in additional detail as the project moves forward.3 Professional Services includes engineering, permitting, legal, and project management.4 Assumes that biomass boiler and general contract are bid seperately.5 GC costs are approximate. A detailed geotechnical study is required to identify final site and building costs.6 Estimate is based on competitive bidding.7 Integration of the biomass system into the existing BMS controls is not required and not included in the project cost.8 Boiler manufacturer contract includes all mechanical work associated with the boiler side of the distributionsystem through the thermal storage tank. GC mechanical responsibility starts at the demand side of the thermalstorage tank. GC is responsible for biomass building electrical, HVAC, plumbing, site work, foundations, and structures.Boiler manufacturer is responsible for all electrical and controls for boiler system from a panel provided by the GC.
Option 5 Site 2: Biomass ORC CHP (Thermal Oil and Hot Water)Pre Feasibility Level Capital Cost Estimate
Biomass Boiler Manufacturer Contract
General Contract
Total Project Cost
WERCWood Education and Resource Center B.5

Preliminary Feasibility Report Version: Final Ely, MinnesotaDate Modified: July 6, 2012
WERCWood Education and Resource Center
Appendix CDetailed Financial Analysis
C.1 : 20 yr. 4.5% Financing Option 1 C.2 : Sensitivity Analysis Option 1 C.3 : 20 yr. 4.5% Financing Option 2 C.4 : Sensitivity Analysis Option 2 C.5 : 20 yr. 4.5% Financing Option 3 C.6 : Sensitivity Analysis Option 3 C.7 : 20 yr. 4.5% Financing Option 4 C.8 : Sensitivity Analysis Option 4 C.9 : 20 yr. 4.5% Financing Option 5 C.10 : Sensitivity Analysis Option 5

Appendix C Option 1 Site 1 : Biomass Heating (Hot Water)20 year, 4.5% Financing Analysis
Ely, Minnesota
Input Variables Value Units YearTotal Fossil FuelCost, Current
System
Wood ChipCost
Fossil FuelCost w/WoodSystem
AddedO&M Cost
NetOperatingSavings
AnnualFinancingPayment
Net CashFlow
PresentValue of NetCash Flow
Project Costs Financed 1,934,318 $ 1 208,005$ (26,331)$ (31,201)$ (10,600)$ 139,873$ (148,703)$ (8,830)$ (8,830)$Financing Term 20 # years 2 214,869$ (27,042)$ (32,230)$ (10,886)$ 144,710$ (148,703)$ (3,993)$ (3,889)$Financing Rate (apr) 4.5% Percent 3 221,960$ (27,773)$ (33,294)$ (11,180)$ 149,713$ (148,703)$ 1,011$ 957$3 Year Avg Fuel Oil Usage 62,357 Gallons 4 229,285$ (28,522)$ (34,393)$ (11,482)$ 154,888$ (148,703)$ 6,185$ 5,709$2010 Propane Usage 3,331 Gallons 5 236,851$ (29,292)$ (35,528)$ (11,792)$ 160,239$ (148,703)$ 11,536$ 10,369$Current Fuel Oil Price 3.24 $/gallon 6 244,667$ (30,083)$ (36,700)$ (12,110)$ 165,773$ (148,703)$ 17,070$ 14,940$Current Propane Price 1.79 $/gallon 7 252,741$ (30,896)$ (37,911)$ (12,437)$ 171,497$ (148,703)$ 22,794$ 19,426$Wood Chip Usage 878 tons/yr 8 261,082$ (31,730)$ (39,162)$ (12,773)$ 177,417$ (148,703)$ 28,714$ 23,827$Year 1 Wood Chip Purchase Price 30.00$ $/ton 9 269,697$ (32,587)$ (40,455)$ (13,118)$ 183,538$ (148,703)$ 34,835$ 28,148$Annual Fossil Fuel Usage w/ Wood System 15% Percent 10 278,597$ (33,466)$ (41,790)$ (13,472)$ 189,869$ (148,703)$ 41,166$ 32,389$Fossil Fuel Inflation Rate (apr) 3.3% Percent 11 287,791$ (34,370)$ (43,169)$ (13,836)$ 196,417$ (148,703)$ 47,714$ 36,553$Wood Chip Inflation Rate (apr) 2.7% Percent 12 297,288$ (35,298)$ (44,593)$ (14,210)$ 203,188$ (148,703)$ 54,485$ 40,643$General Inflation Rate (apr) 2.7% Percent 13 307,099$ (36,251)$ (46,065)$ (14,593)$ 210,190$ (148,703)$ 61,487$ 44,661$Added Annual O&M Costs for Biomass Plant 10,600$ $/year 14 317,233$ (37,230)$ (47,585)$ (14,987)$ 217,431$ (148,703)$ 68,728$ 48,608$
15 327,702$ (38,235)$ (49,155)$ (15,392)$ 224,920$ (148,703)$ 76,217$ 52,487$16 338,516$ (39,267)$ (50,777)$ (15,807)$ 232,664$ (148,703)$ 83,961$ 56,301$17 349,687$ (40,328)$ (52,453)$ (16,234)$ 240,672$ (148,703)$ 91,969$ 60,049$18 361,227$ (41,416)$ (54,184)$ (16,673)$ 248,954$ (148,703)$ 100,251$ 63,736$19 373,147$ (42,535)$ (55,972)$ (17,123)$ 257,518$ (148,703)$ 108,815$ 67,362$20 385,461$ (43,683)$ (57,819)$ (17,585)$ 266,374$ (148,703)$ 117,671$ 70,929$21 398,181$ (44,862)$ (59,727)$ (18,060)$ 275,532$ 275,532$ 161,719$22 411,321$ (46,074)$ (61,698)$ (18,547)$ 285,002$ 285,002$ 162,879$23 424,895$ (47,318)$ (63,734)$ (19,048)$ 294,795$ 294,795$ 164,047$24 438,916$ (48,595)$ (65,837)$ (19,563)$ 304,921$ 304,921$ 165,221$25 453,401$ (49,907)$ (68,010)$ (20,091)$ 315,392$ 315,392$ 166,402$
Net Present Value 1,484,642$
WERCWood Education and Resource CenterVersion: Final
Date Modified: July 6, 2012 C.1

Appendix C Option 1 Site 1 : Biomass Heating (Hot Water)Sensitivity Analysis
Ely, Minnesota
#REF! 15% 10% 5% 0% 5% 10% 15%$5 $135,295 $144,135 $152,976 $161,816 $170,656 $179,496 $188,337$10 $130,907 $139,747 $148,587 $157,427 $166,268 $175,108 $183,948$15 $126,518 $135,358 $144,199 $153,039 $161,879 $170,719 $179,559$20 $122,130 $130,970 $139,810 $148,650 $157,490 $166,331 $175,171$25 $117,741 $126,581 $135,421 $144,262 $153,102 $161,942 $170,782$30 $113,352 $122,193 $131,033 $139,873 $148,713 $157,553 $166,394$35 $108,964 $117,804 $126,644 $135,484 $144,325 $153,165 $162,005$40 $104,575 $113,415 $122,256 $131,096 $139,936 $148,776 $157,617$45 $100,187 $109,027 $117,867 $126,707 $135,548 $144,388 $153,228$50 $95,798 $104,638 $113,479 $122,319 $131,159 $139,999 $148,839$55 $91,410 $100,250 $109,090 $117,930 $126,770 $135,611 $144,451$60 $87,021 $95,861 $104,701 $113,542 $122,382 $131,222 $140,062$65 $82,632 $91,473 $100,313 $109,153 $117,993 $126,833 $135,674$70 $78,244 $87,084 $95,924 $104,764 $113,605 $122,445 $131,285
*Notes: All other costs fixed. Excludes financing costs.
Table Shows Sensitivity of Annual Operating Savings toChanges in Fossil Fuel and Wood Chip Prices
Fossil Fuel Price Change
Priceof
Woo
dCh
ips
perT
on
WERCWood Education and Resource CenterVersion: Final
Date Modified: July 6, 2012 C.2

Appendix C Option 2 Site 2 : Biomass Heating (Steam and Hot Water)20 year, 4.5% Financing Analysis
Ely, Minnesota
Input Variables Value Units YearTotal Fossil FuelCost, Current
System
Wood ChipCost
Fossil Costw/ WoodSystem
AddedO&M Cost
NetOperatingSavings
AnnualFinancingPayment
Net CashFlow
PresentValue of NetCash Flow
Project Costs Financed 3,783,002 $ 1 433,461$ (87,734)$ (21,673)$ (18,200)$ 305,854$ (290,823)$ 15,031$ 15,031$Financing Term 20 # years 2 447,765$ (90,103)$ (22,388)$ (18,691)$ 316,583$ (290,823)$ 25,760$ 25,082$Financing Rate (apr) 4.5% Percent 3 462,541$ (92,535)$ (23,127)$ (19,196)$ 327,683$ (290,823)$ 36,860$ 34,947$EBCH 3 Year Avg Fuel Oil Usage 81,246 Gallons 4 477,805$ (95,034)$ (23,890)$ (19,714)$ 339,167$ (290,823)$ 48,344$ 44,630$ISD696 3 Year Avg Propane Usage 76,886 Gallons 5 493,573$ (97,600)$ (24,679)$ (20,247)$ 351,048$ (290,823)$ 60,225$ 54,136$Sibley 2011 Propane Usage 22,843 Gallons 6 509,861$ (100,235)$ (25,493)$ (20,793)$ 363,339$ (290,823)$ 72,517$ 63,472$EBCH Current Fuel Oil Price 3.20 $/gallon 7 526,686$ (102,941)$ (26,334)$ (21,355)$ 376,056$ (290,823)$ 85,233$ 72,641$ISD 696 Current Propane Price 1.72 $/gallon 8 544,067$ (105,721)$ (27,203)$ (21,931)$ 389,211$ (290,823)$ 98,389$ 81,648$Sibley Current Propane Price 1.80 $/gallon 9 562,021$ (108,575)$ (28,101)$ (22,523)$ 402,821$ (290,823)$ 111,999$ 90,499$Wood Chip Usage 2,924 tons/yr 10 580,568$ (111,507)$ (29,028)$ (23,132)$ 416,901$ (290,823)$ 126,078$ 99,198$Year 1 Wood Chip Purchase Price 30.00$ $/ton 11 599,726$ (114,517)$ (29,986)$ (23,756)$ 431,466$ (290,823)$ 140,644$ 107,749$Annual Fossil Fuel Usage w/ Wood System 5% Percent 12 619,517$ (117,609)$ (30,976)$ (24,398)$ 446,534$ (290,823)$ 155,712$ 116,156$Fossil Fuel Inflation Rate (apr) 3.3% Percent 13 639,961$ (120,785)$ (31,998)$ (25,056)$ 462,122$ (290,823)$ 171,300$ 124,425$Wood Chip Inflation Rate (apr) 2.7% Percent 14 661,080$ (124,046)$ (33,054)$ (25,733)$ 478,247$ (290,823)$ 187,425$ 132,559$General Inflation Rate (apr) 2.7% Percent 15 682,896$ (127,395)$ (34,145)$ (26,428)$ 494,928$ (290,823)$ 204,105$ 140,561$Added Annual O&M Costs for Biomass Plant 18,200$ $/year 16 705,431$ (130,835)$ (35,272)$ (27,141)$ 512,184$ (290,823)$ 221,361$ 148,437$
17 728,710$ (134,368)$ (36,436)$ (27,874)$ 530,034$ (290,823)$ 239,211$ 156,189$18 752,758$ (137,995)$ (37,638)$ (28,627)$ 548,498$ (290,823)$ 257,675$ 163,822$19 777,599$ (141,721)$ (38,880)$ (29,399)$ 567,598$ (290,823)$ 276,776$ 171,339$20 803,260$ (145,548)$ (40,163)$ (30,193)$ 587,356$ (290,823)$ 296,533$ 178,744$21 829,767$ (149,478)$ (41,488)$ (31,008)$ 607,793$ 607,793$ 356,735$22 857,150$ (153,513)$ (42,857)$ (31,846)$ 628,933$ 628,933$ 359,438$23 885,436$ (157,658)$ (44,272)$ (32,706)$ 650,800$ 650,800$ 362,157$24 914,655$ (161,915)$ (45,733)$ (33,589)$ 673,418$ 673,418$ 364,891$25 944,839$ (166,287)$ (47,242)$ (34,495)$ 696,814$ 696,814$ 367,642$
Net Present Value 3,832,127$
WERCWood Education and Resource CenterVersion: Final
Date Modified: July 6, 2012 C.3

Appendix C Option 2 Site 2 : Biomass Heating (Steam and Hot Water)Sensitivity Analysis
Ely, Minnesota
#REF! 15% 10% 5% 0% 5% 10% 15%$5 $317,197 $337,787 $358,376 $378,965 $399,555 $420,144 $440,734$10 $302,575 $323,164 $343,754 $364,343 $384,933 $405,522 $426,111$15 $287,953 $308,542 $329,131 $349,721 $370,310 $390,900 $411,489$20 $273,330 $293,920 $314,509 $335,099 $355,688 $376,277 $396,867$25 $258,708 $279,297 $299,887 $320,476 $341,066 $361,655 $382,244$30 $244,086 $264,675 $285,265 $305,854 $326,443 $347,033 $367,622$35 $229,463 $250,053 $270,642 $291,232 $311,821 $332,410 $353,000$40 $214,841 $235,431 $256,020 $276,609 $297,199 $317,788 $338,378$45 $200,219 $220,808 $241,398 $261,987 $282,576 $303,166 $323,755$50 $185,597 $206,186 $226,775 $247,365 $267,954 $288,544 $309,133$55 $170,974 $191,564 $212,153 $232,742 $253,332 $273,921 $294,511$60 $156,352 $176,941 $197,531 $218,120 $238,710 $259,299 $279,888$65 $141,730 $162,319 $182,908 $203,498 $224,087 $244,677 $265,266$70 $127,107 $147,697 $168,286 $188,875 $209,465 $230,054 $250,644
*Notes: All other costs fixed. Excludes financing costs.
Table Shows Sensitivity of Annual Operating Savings toChanges in Fossil Fuel and Wood Chip Prices
Fossil Fuel Price Change
Priceof
Woo
dCh
ips
perT
on
WERCWood Education and Resource CenterVersion: Final
Date Modified: July 6, 2012 C.4

Appendix C Option 3 Site 2 : Biomass Heating (Hot Water)20 year, 4.5% Financing Analysis
Ely, Minnesota
Input Variables Value Units YearTotal Fossil FuelCost, Current
System
Wood ChipCost
Fossil Costw/ WoodSystem
AddedO&M Cost
NetOperatingSavings
AnnualFinancingPayment
Net CashFlow
PresentValue of NetCash Flow
Project Costs Financed 3,765,866 $ 1 433,461$ (87,734)$ (21,673)$ (17,200)$ 306,854$ (289,505)$ 17,349$ 17,349$Financing Term 20 # years 2 447,765$ (90,103)$ (22,388)$ (17,664)$ 317,610$ (289,505)$ 28,105$ 27,365$Financing Rate (apr) 4.5% Percent 3 462,541$ (92,535)$ (23,127)$ (18,141)$ 328,737$ (289,505)$ 39,232$ 37,196$EBCH 3 Year Avg Fuel Oil Usage 81,246 Gallons 4 477,805$ (95,034)$ (23,890)$ (18,631)$ 340,250$ (289,505)$ 50,745$ 46,846$ISD696 3 Year Avg Propane Usage 76,886 Gallons 5 493,573$ (97,600)$ (24,679)$ (19,134)$ 352,160$ (289,505)$ 62,655$ 56,320$Sibley 2011 Propane Usage 22,843 Gallons 6 509,861$ (100,235)$ (25,493)$ (19,651)$ 364,482$ (289,505)$ 74,977$ 65,625$EBCH Current Fuel Oil Price 3.20 $/gallon 7 526,686$ (102,941)$ (26,334)$ (20,181)$ 377,229$ (289,505)$ 87,724$ 74,763$ISD 696 Current Propane Price 1.72 $/gallon 8 544,067$ (105,721)$ (27,203)$ (20,726)$ 390,416$ (289,505)$ 100,911$ 83,741$Sibley Current Propane Price 1.80 $/gallon 9 562,021$ (108,575)$ (28,101)$ (21,286)$ 404,059$ (289,505)$ 114,553$ 92,564$Wood Chip Usage 2,924 tons/yr 10 580,568$ (111,507)$ (29,028)$ (21,861)$ 418,172$ (289,505)$ 128,667$ 101,234$Year 1 Wood Chip Purchase Price 30.00$ $/ton 11 599,726$ (114,517)$ (29,986)$ (22,451)$ 432,772$ (289,505)$ 143,266$ 109,758$Annual Fossil Fuel Usage w/ Wood System 5% Percent 12 619,517$ (117,609)$ (30,976)$ (23,057)$ 447,875$ (289,505)$ 158,370$ 118,139$Fossil Fuel Inflation Rate (apr) 3.3% Percent 13 639,961$ (120,785)$ (31,998)$ (23,680)$ 463,499$ (289,505)$ 173,994$ 126,382$Wood Chip Inflation Rate (apr) 2.7% Percent 14 661,080$ (124,046)$ (33,054)$ (24,319)$ 479,661$ (289,505)$ 190,156$ 134,490$General Inflation Rate (apr) 2.7% Percent 15 682,896$ (127,395)$ (34,145)$ (24,976)$ 496,380$ (289,505)$ 206,875$ 142,468$Added Annual O&M Costs for Biomass Plant 17,200$ $/year 16 705,431$ (130,835)$ (35,272)$ (25,650)$ 513,675$ (289,505)$ 224,170$ 150,320$
17 728,710$ (134,368)$ (36,436)$ (26,342)$ 531,565$ (289,505)$ 242,060$ 158,049$18 752,758$ (137,995)$ (37,638)$ (27,054)$ 550,071$ (289,505)$ 260,566$ 165,660$19 777,599$ (141,721)$ (38,880)$ (27,784)$ 569,214$ (289,505)$ 279,708$ 173,155$20 803,260$ (145,548)$ (40,163)$ (28,534)$ 589,015$ (289,505)$ 299,509$ 180,538$21 829,767$ (149,478)$ (41,488)$ (29,305)$ 609,497$ 609,497$ 357,735$22 857,150$ (153,513)$ (42,857)$ (30,096)$ 630,683$ 630,683$ 360,438$23 885,436$ (157,658)$ (44,272)$ (30,909)$ 652,597$ 652,597$ 363,157$24 914,655$ (161,915)$ (45,733)$ (31,743)$ 675,264$ 675,264$ 365,891$25 944,839$ (166,287)$ (47,242)$ (32,600)$ 698,710$ 698,710$ 368,642$
Net Present Value 3,877,825$
WERCWood Education and Resource CenterVersion: Final
Date Modified: July 6, 2012 C.5

Appendix C Option 3 Site 2 : Biomass Heating (Hot Water)Sensitivity Analysis
Ely, Minnesota
#REF! 15% 10% 5% 0% 5% 10% 15%$5 $318,197 $338,787 $359,376 $379,965 $400,555 $421,144 $441,734$10 $303,575 $324,164 $344,754 $365,343 $385,933 $406,522 $427,111$15 $288,953 $309,542 $330,131 $350,721 $371,310 $391,900 $412,489$20 $274,330 $294,920 $315,509 $336,099 $356,688 $377,277 $397,867$25 $259,708 $280,297 $300,887 $321,476 $342,066 $362,655 $383,244$30 $245,086 $265,675 $286,265 $306,854 $327,443 $348,033 $368,622$35 $230,463 $251,053 $271,642 $292,232 $312,821 $333,410 $354,000$40 $215,841 $236,431 $257,020 $277,609 $298,199 $318,788 $339,378$45 $201,219 $221,808 $242,398 $262,987 $283,576 $304,166 $324,755$50 $186,597 $207,186 $227,775 $248,365 $268,954 $289,544 $310,133$55 $171,974 $192,564 $213,153 $233,742 $254,332 $274,921 $295,511$60 $157,352 $177,941 $198,531 $219,120 $239,710 $260,299 $280,888$65 $142,730 $163,319 $183,908 $204,498 $225,087 $245,677 $266,266$70 $128,107 $148,697 $169,286 $189,875 $210,465 $231,054 $251,644
*Notes: All other costs fixed. Excludes financing costs.
Table Shows Sensitivity of Annual Operating Savings toChanges in Fossil Fuel and Wood Chip Prices
Fossil Fuel Price Change
Priceof
Woo
dCh
ips
perT
on
WERCWood Education and Resource CenterVersion: Final
Date Modified: July 6, 2012 C.6

Appendix C Option 4 Site 2 : Biomass Backpressure Steam CHP (Thermal Oil, Steam, Hot Water)20 year, 4.5% Financing Analysis
Ely, Minnesota
Input Variables Value Units Year
Total FossilFuel Cost,CurrentSystem
Wood ChipCost
Fossil FuelCost, w/WoodSystem
Value ofElectricityGeneration
AddedO&M Cost
NetOperatingSavings
AnnualFinancingPayment
Net CashFlow
PresentValue of NetCash Flow
Project Costs Financed 4,664,050 $ 1 433,461$ (95,207)$ (21,673)$ 29,733$ (21,200)$ 325,115$ (358,554)$ (33,439)$ (33,439)$Financing Term 20 # years 2 447,765$ (97,777)$ (22,388)$ 30,715$ (21,772)$ 336,542$ (358,554)$ (22,012)$ (21,434)$Financing Rate (apr) 4.5% Percent 3 462,541$ (100,417)$ (23,127)$ 31,728$ (22,360)$ 348,365$ (358,554)$ (10,189)$ (9,661)$EBCH 3 Year Avg Fuel Oil Usage 81,246 Gallons 4 477,805$ (103,128)$ (23,890)$ 32,775$ (22,964)$ 360,598$ (358,554)$ 2,044$ 1,886$ISD696 3 Year Avg Propane Usage 76,886 Gallons 5 493,573$ (105,913)$ (24,679)$ 33,857$ (23,584)$ 373,254$ (358,554)$ 14,700$ 13,213$Sibley 2011 Propane Usage 22,843 Gallons 6 509,861$ (108,772)$ (25,493)$ 34,974$ (24,221)$ 386,349$ (358,554)$ 27,794$ 24,327$EBCH Current Fuel Oil Price 3.20 $/gallon 7 526,686$ (111,709)$ (26,334)$ 36,128$ (24,875)$ 399,896$ (358,554)$ 41,342$ 35,233$ISD 696 Current Propane Price 1.72 $/gallon 8 544,067$ (114,725)$ (27,203)$ 37,321$ (25,546)$ 413,912$ (358,554)$ 55,358$ 45,939$Sibley Current Propane Price 1.80 $/gallon 9 562,021$ (117,823)$ (28,101)$ 38,552$ (26,236)$ 428,413$ (358,554)$ 69,859$ 56,448$Biomass Usage 3,174 tons/yr 10 580,568$ (121,004)$ (29,028)$ 39,824$ (26,944)$ 443,415$ (358,554)$ 84,861$ 66,768$Year 1 Wood Chip Purchase Price 30.00$ $/ton 11 599,726$ (124,271)$ (29,986)$ 41,139$ (27,672)$ 458,935$ (358,554)$ 100,381$ 76,903$Annual Fossil Fuel Usage w/ Wood System 5% Percent 12 619,517$ (127,627)$ (30,976)$ 42,496$ (28,419)$ 474,992$ (358,554)$ 116,437$ 86,859$Electric Generation 412,965 kWh 13 639,961$ (131,073)$ (31,998)$ 43,898$ (29,186)$ 491,603$ (358,554)$ 133,048$ 96,641$Year 1 Electricity Value 0.072 $/kWh 14 661,080$ (134,612)$ (33,054)$ 45,347$ (29,974)$ 508,787$ (358,554)$ 150,233$ 106,254$Fossil Fuel Inflation Rate (apr) 3.3% Percent 15 682,896$ (138,246)$ (34,145)$ 46,844$ (30,784)$ 526,565$ (358,554)$ 168,010$ 115,703$Electricity Inflation Rate (apr) 3.3% Percent 16 705,431$ (141,979)$ (35,272)$ 48,389$ (31,615)$ 544,955$ (358,554)$ 186,401$ 124,994$Wood Chip Inflation Rate (apr) 2.7% Percent 17 728,710$ (145,812)$ (36,436)$ 49,986$ (32,469)$ 563,980$ (358,554)$ 205,426$ 134,130$General Inflation Rate (apr) 2.7% Percent 18 752,758$ (149,749)$ (37,638)$ 51,636$ (33,345)$ 583,662$ (358,554)$ 225,107$ 143,116$Added Annual O&M Costs for Biomass Plant 21,200$ $/year 19 777,599$ (153,792)$ (38,880)$ 53,340$ (34,246)$ 604,021$ (358,554)$ 245,467$ 151,957$
20 803,260$ (157,945)$ (40,163)$ 55,100$ (35,170)$ 625,082$ (358,554)$ 266,528$ 160,658$21 829,767$ (162,209)$ (41,488)$ 56,918$ (36,120)$ 646,868$ 646,868$ 379,670$22 857,150$ (166,589)$ (42,857)$ 58,797$ (37,095)$ 669,405$ 669,405$ 382,568$23 885,436$ (171,087)$ (44,272)$ 60,737$ (38,097)$ 692,717$ 692,717$ 385,483$24 914,655$ (175,706)$ (45,733)$ 62,741$ (39,125)$ 716,832$ 716,832$ 388,415$25 944,839$ (180,450)$ (47,242)$ 64,812$ (40,182)$ 741,777$ 741,777$ 391,364$
Net Present Value 3,303,992$
WERCWood Education and Resource CenterVersion: Final
Date Modified: July 6, 2012 C.7

Appendix C Option 4 Site 2 : Biomass Backpressure Steam CHP (Thermal Oil, Steam, Hot Water)Sensitivity Analysis
Ely, Minnesota
#REF! 15% 10% 5% 0% 5% 10% 15%$5 $342,685 $363,275 $383,864 $404,454 $425,043 $445,632 $466,222$10 $326,818 $347,407 $367,996 $388,586 $409,175 $429,765 $450,354$15 $310,950 $331,539 $352,129 $372,718 $393,307 $413,897 $434,486$20 $295,082 $315,671 $336,261 $356,850 $377,440 $398,029 $418,618$25 $279,214 $299,804 $320,393 $340,982 $361,572 $382,161 $402,751$30 $263,347 $283,936 $304,525 $325,115 $345,704 $366,294 $386,883$35 $247,479 $268,068 $288,658 $309,247 $329,836 $350,426 $371,015$40 $231,611 $252,200 $272,790 $293,379 $313,969 $334,558 $355,147$45 $215,743 $236,333 $256,922 $277,511 $298,101 $318,690 $339,280$50 $199,876 $220,465 $241,054 $261,644 $282,233 $302,822 $323,412$55 $184,008 $204,597 $225,187 $245,776 $266,365 $286,955 $307,544$60 $168,140 $188,729 $209,319 $229,908 $250,498 $271,087 $291,676$65 $152,272 $172,862 $193,451 $214,040 $234,630 $255,219 $275,809$70 $136,405 $156,994 $177,583 $198,173 $218,762 $239,351 $259,941
*Notes: All other costs fixed. Excludes financing costs.
Table Shows Sensitivity of Annual Operating Savings toChanges in Fossil Fuel and Wood Chip Prices
Fossil Fuel Price Change
Priceof
Woo
dCh
ips
perT
on
WERCWood Education and Resource CenterVersion: Final
Date Modified: July 6, 2012 C.8

Appendix C Option 5 Site 2 : Biomass ORC CHP (Thermal Oil and Hot Water)20 year, 4.5% Financing Analysis
Ely, Minnesota
Input Variables Value Units Year
Total FossilFuel Cost,CurrentSystem
Wood ChipCost
Fossil FuelCost, w/WoodSystem
Value ofElectricityGeneration
AddedO&M Cost
NetOperatingSavings
AnnualFinancingPayment
Net CashFlow
PresentValue of NetCash Flow
Project Costs Financed 7,164,786 $ 1 433,461$ (141,912)$ (21,673)$ 116,790$ (31,100)$ 355,566$ (550,801)$ (195,235)$ (195,235)$Financing Term 20 # years 2 447,765$ (145,743)$ (22,388)$ 120,644$ (31,940)$ 368,338$ (550,801)$ (182,463)$ (177,667)$Financing Rate (apr) 4.5% Percent 3 462,541$ (149,679)$ (23,127)$ 124,626$ (32,802)$ 381,559$ (550,801)$ (169,242)$ (160,461)$EBCH 3 Year Avg Fuel Oil Usage 81,246 Gallons 4 477,805$ (153,720)$ (23,890)$ 128,738$ (33,688)$ 395,246$ (550,801)$ (155,555)$ (143,607)$ISD696 3 Year Avg Propane Usage 76,886 Gallons 5 493,573$ (157,870)$ (24,679)$ 132,987$ (34,597)$ 409,413$ (550,801)$ (141,388)$ (127,097)$Sibley 2011 Propane Usage 22,843 Gallons 6 509,861$ (162,133)$ (25,493)$ 137,375$ (35,531)$ 424,079$ (550,801)$ (126,723)$ (110,919)$EBCH Current Fuel Oil Price 3.20 $/gallon 7 526,686$ (166,510)$ (26,334)$ 141,909$ (36,491)$ 439,259$ (550,801)$ (111,542)$ (95,065)$ISD 696 Current Propane Price 1.72 $/gallon 8 544,067$ (171,006)$ (27,203)$ 146,592$ (37,476)$ 454,973$ (550,801)$ (95,828)$ (79,526)$Sibley Current Propane Price 1.80 $/gallon 9 562,021$ (175,623)$ (28,101)$ 151,429$ (38,488)$ 471,238$ (550,801)$ (79,563)$ (64,292)$Biomass Usage 4,730 tons/yr 10 580,568$ (180,365)$ (29,028)$ 156,426$ (39,527)$ 488,073$ (550,801)$ (62,728)$ (49,355)$Year 1 Wood Chip Purchase Price 30.00$ $/ton 11 599,726$ (185,235)$ (29,986)$ 161,588$ (40,594)$ 505,499$ (550,801)$ (45,302)$ (34,708)$Annual Fossil Fuel Usage w/ Wood System 5% Percent 12 619,517$ (190,236)$ (30,976)$ 166,921$ (41,690)$ 523,535$ (550,801)$ (27,266)$ (20,341)$Electric Generation 1,622,087 kWh 13 639,961$ (195,373)$ (31,998)$ 172,429$ (42,816)$ 542,204$ (550,801)$ (8,597)$ (6,246)$Year 1 Electricity Value 0.072 $/kWh 14 661,080$ (200,648)$ (33,054)$ 178,119$ (43,972)$ 561,526$ (550,801)$ 10,724$ 7,584$Fossil Fuel Inflation Rate (apr) 3.3% Percent 15 682,896$ (206,065)$ (34,145)$ 183,997$ (45,159)$ 581,524$ (550,801)$ 30,722$ 21,157$Electricity Inflation Rate (apr) 3.3% Percent 16 705,431$ (211,629)$ (35,272)$ 190,069$ (46,379)$ 602,221$ (550,801)$ 51,420$ 34,480$Wood Chip Inflation Rate (apr) 2.7% Percent 17 728,710$ (217,343)$ (36,436)$ 196,341$ (47,631)$ 623,643$ (550,801)$ 72,841$ 47,560$General Inflation Rate (apr) 2.7% Percent 18 752,758$ (223,211)$ (37,638)$ 202,821$ (48,917)$ 645,813$ (550,801)$ 95,012$ 60,405$Added Annual O&M Costs for Biomass Plant 31,100$ $/year 19 777,599$ (229,238)$ (38,880)$ 209,514$ (50,238)$ 668,757$ (550,801)$ 117,956$ 73,021$
20 803,260$ (235,427)$ (40,163)$ 216,428$ (51,594)$ 692,503$ (550,801)$ 141,702$ 85,415$21 829,767$ (241,784)$ (41,488)$ 223,570$ (52,987)$ 717,078$ 717,078$ 420,878$22 857,150$ (248,312)$ (42,857)$ 230,948$ (54,418)$ 742,510$ 742,510$ 424,348$23 885,436$ (255,017)$ (44,272)$ 238,569$ (55,887)$ 768,829$ 768,829$ 427,838$24 914,655$ (261,902)$ (45,733)$ 246,442$ (57,396)$ 796,066$ 796,066$ 431,348$25 944,839$ (268,973)$ (47,242)$ 254,574$ (58,946)$ 824,252$ 824,252$ 434,879$
Net Present Value 1,204,394$
WERCWood Education and Resource CenterVersion: Final
Date Modified: July 6, 2012 C.9

Appendix C Option 5 Site 2 : Biomass ORC CHP (Thermal Oil and Hot Water)Sensitivity Analysis
Ely, Minnesota
#REF! 15% 10% 5% 0% 5% 10% 15%$5 $412,058 $432,647 $453,237 $473,826 $494,415 $515,005 $535,594$10 $388,406 $408,995 $429,585 $450,174 $470,764 $491,353 $511,942$15 $364,754 $385,343 $405,933 $426,522 $447,112 $467,701 $488,290$20 $341,102 $361,691 $382,281 $402,870 $423,460 $444,049 $464,638$25 $317,450 $338,039 $358,629 $379,218 $399,808 $420,397 $440,986$30 $293,798 $314,387 $334,977 $355,566 $376,156 $396,745 $417,334$35 $270,146 $290,735 $311,325 $331,914 $352,504 $373,093 $393,682$40 $246,494 $267,084 $287,673 $308,262 $328,852 $349,441 $370,030$45 $222,842 $243,432 $264,021 $284,610 $305,200 $325,789 $346,379$50 $199,190 $219,780 $240,369 $260,958 $281,548 $302,137 $322,727$55 $175,538 $196,128 $216,717 $237,306 $257,896 $278,485 $299,075$60 $151,886 $172,476 $193,065 $213,654 $234,244 $254,833 $275,423$65 $128,234 $148,824 $169,413 $190,002 $210,592 $231,181 $251,771$70 $104,582 $125,172 $145,761 $166,350 $186,940 $207,529 $228,119
*Notes: All other costs fixed. Excludes financing costs.
Table Shows Sensitivity of Annual Operating Savings toChanges in Fossil Fuel and Wood Chip Prices
Fossil Fuel Price Change
Priceof
Woo
dCh
ips
perT
on
WERCWood Education and Resource CenterVersion: Final
Date Modified: July 6, 2012 C.10

UMN Report to Dovetail Partners September 27, 2012 Final Draft 132
APPENDIX C. Forest Biomass Heating and Electricity in Cook County: Phase I Report (Dovetail & University of Minnesota)

Forest Biomass Heating
and Electricity in Cook County, MN
Phase I Report
Presented to Cook County Board of Commissioners
September 2011
Last Update: February 2012

Phase I Report Revised February 6, 2012 ii
Report produced by Dovetail Partners, Inc. with a study team from the
University of Minnesota and LHB, Inc., and with oversight from the Cook County Local Energy Project (CCLEP)
This report was prepared through the collaborations of the following individuals and organizations. Special Thanks to: University of Minnesota: Dr. Dennis Becker, Dept of Forest Resources; Dr. Steven J. Taff and Andrew Smale, Dept of Applied Economics; David Wilson, Alan Ek, and Jon Klapperich, Dept of Forest Resources; LHB, Inc., Chuck Hartley; Dovetail Partners, Inc: Katie Fernholz, Steve Bratkovich, Jim Bowyer; Local Coordinator Gary Atwood; and Project Manager Cheryl Miller Cook County Local Energy Project: George Wilkes, Paul Nelson, John Bottger, Mike Garey, Patty Johnson, and Tim Kennedy For further information about this report, please contact: Dovetail Partners 528 Hennepin Ave, Suite 703 Minneapolis, MN 55403 Tel: 612-‐333-‐0430 Fax: 612-‐333-‐0432 Email: [email protected] Cover photo: Courtesy of Gunflint District -‐ U.S. Forest Service

Phase I Report Revised February 6, 2012 iii
Forest Biomass Heating and Electricity in Cook County, MN Phase I Report
Table of Contents List of Figures ............................................................................................................................. iv List of Tables ............................................................................................................................... v Executive Summary .................................................................................................................... vi Glossary .................................................................................................................................... xii Common Conversions .............................................................................................................. xiv 1.0 Introduction and Background ...........................................................................................1 2.0 Cook County Profile and Community Concerns .................................................................1 3.0 Forest Biomass Supply ......................................................................................................4
Physical Availability ..........................................................................................................4 Biomass Harvesting and Transport Costs ........................................................................10 Forest Operations ...........................................................................................................10
4.0 Site Selection and Engineering ........................................................................................11 5.0 Financial Performance ....................................................................................................19
Financial Assumptions ....................................................................................................19 Financial Performance Summary ....................................................................................22
6.0 Other Considerations......................................................................................................28
Measuring Economic Impacts .........................................................................................28 Environmental Permitting and Regulations .....................................................................31
Appendix A. Reference Biomass Harvest Costs .........................................................................33 Appendix B. Hypothetical Biomass Demand .............................................................................34 Appendix C. Financial Performance Metrics .............................................................................35 Appendix D. Pellet Production ..................................................................................................36 Appendix E. Renewable Energy Incentive Programs and Financing ...........................................38

Phase I Report Revised February 6, 2012 iv
List of Figures Figure 2.1. Cook County land ownership by type and amount ....................................................2 Figure 3.1. Dry tons of hog fuel from Superior National Forest timber sales and fuels
reduction treatments within 45-‐miles of Grand Marais, MN..................................... 7 Figure 4.1. Generic woody biomass thermal heating system ....................................................12 Figure 4.2. Organic Rankin Cycle (ORC) combined heat and power (CHP) system .....................12 Figure 4.3. Coverage map of configuration L4...........................................................................15 Figure 4.4. Coverage map of configuration L5 (without hospital) and L6 (with hospital) ........... 15 Figure 4.5. Coverage map of configuration L7 (district heat) and L8 (CHP) ................................16 Figure 5.1. Cook County historic and Midwest-‐US projected prices by fuel type .......................22 Figure 5.2. Composition of cost of heat, or LCOE, by site configureation ..................................26 Figure 5.3. Costs of Heat, 20 year projections, using the EIA Reference Scenario .....................27 Figure 5.4. Costs of Heat, 20 year projections, using High Oil Price Scenario ............................28 Figure 6.1. Relative emissions of fine particles (PM2.5) ............................................................31

Phase I Report Revised February 6, 2012 v
List of Tables Table 2.1. Fuel use in Cook County, MN, baseline information ...................................................3 Table 3.1. Timberland acres by age class and forest type in Cook County, MN ...........................5 Table 3.2. Dry tons of living biomass stand attribute and ownership in Cook County, MN ..........6 Table 3.3. Average annual timber harvest by forest type in Cook County, MN ............................6 Table 3.4. Current and potential biomass availabilty by ownership and management
scenario in Cook County, MN ..................................................................................... 9 Table 4.1. Modeled system configurations and equipment specifications ................................ 17 Table 4.2. Costs for small, medium, and large-‐scale configurations in Cook County, MN .......... 18 Table 5.1. Non-‐fuel investment and financing assumptions ......................................................21 Table 5.2. Average current fossil fuel prices and 20-‐year annual rates of change .....................21 Table 5.3. Average current biomass delivered fuel prices in Cook County, MN .........................21 Table 5.4. Financial performance of small (S), medium (M), and large (L) configurations .......... 23 Table 6.1. Local economic impact multipliers for biomass energy systems ............................... 30 Table 6.2. Maximum potential to emit (MPTE) for criteria pollutants from biomass
burning and comparison technologies ..................................................................... 32 Table A.1. Harvest costs for a conventional biomass harvesting system ................................... 33 Table B.1. Additional biomass demand if Cook County switched to wood heat,
2011 and 2030 ......................................................................................................... 34 Table D.1. Cost components of a 25,000-‐ton/year pellet plant ................................................. 37 Table E.1. Incentives for producing heat and electricity from biomass .....................................38

Phase I Report Revised February 6, 2012 vi
Executive Summary
This report covers the first phase of a two-‐part study of the technical and financial aspects of using forest biomass as an energy source in Cook County. The two-‐part study provides county residents with information about the impacts of biomass energy on local energy security and costs, utilization of wood waste and reduction of fire risk, and stewardship of regional forests, water and air quality, greenhouse gas emissions, and local economies. Phase I, which includes the following components, was funded by Cook County:
Availability of forest biomass for energy production in Cook County; Options for biomass combustion technology for small, medium, and large systems; and Financial implications of converting to biomass energy in various Cook County settings.
The Phase II report, funded by the Legislative Citizen Commission of Minnesota Resources (LCCMR), will provide additional information on biomass supply issues and impacts. It will describe life cycle impacts of biomass energy systems, including environmental impacts, and assess stakeholder and community attitudes about expanded conversion to these systems. The Phase II report will also present conclusions about the long-‐term viability of biomass energy in the county and recommendations for next steps. I. Biomass Availability for Energy Production Biomass used as heating fuel comes in four forms: 1) cordwood, 2) clean chips, 3) hog (hogged) fuel, and 4) wood pellets. The suitability of using one of these fuels in a particular facility depends on the physical properties and cleanliness of the biomass, its availability, size and efficiency of the heating system, handling and storage limitations, labor requirements, and community considerations. Cordwood is only evaluated for the smallest systems because of storage limitations and the labor requirements of larger systems. Alternatively, hog fuel generated from logging residue (bark, treetops, and branches) and mixed wood material generated by fire mitigation treatments is an option for large district energy systems, where mechanical feeding systems and high temperatures support increased efficiency and reduced emissions. Clean chips can be substituted for hog fuel to provide lower emissions, but are more expensive. Premium wood pellets are produced from roundwood (bole of the tree) and, because of convenient handling characteristics and consistent moisture content, offer lower initial equipment and operation costs, but are more expensive. The table below (Table A) summarizes the volume of biomass available annually for energy production and estimated demand for a range of heating options (Table B).

Phase I Report Revised February 6, 2012 vii
Table A. Current and potential biomass availability by ownership and management scenario Current availability Potential availability
Ownership
2010 bolewood harvest (odt)1
2010 residual biomass (odt)2
2010 Firewise removals (odt)3
10% of 2010 bolewood (odt)
20% of 2010 bolewood (odt)
Future Firewise removals (odt)3
Residuals from GEIS harvest (odt)4
Federal forests 16,021 1,851 3,189 1,602 3,204 3,189 14,014 State, county, and local 19,009 2,344 -‐-‐ 1,901 3,802 -‐-‐ 3,790
Private5 8,889 1,034 -‐-‐ 889 1,778 -‐-‐ 5,505 Total 43,919 5,229 3,189 4,392 8,784 3,189 23,309
1 A cord is equivalent to 1.2 dry tons. The total 2010 bolewood harvest is equivalent to 38,911 cords. 2 Residual biomass is the tops, limbs, branches and needles as defined by the USDA Forest Service FIA biomass attributes, and is in addition to the reported 2010 roundwood harvest rate for Cook County. Residual biomass availability assumes 50% retention on-‐site.
3 Firewise removals are estimated for Superior National Forest removals only of slash from fuels reductions efforts based on an estimated 12,599 cu. yards of slash generated in 2010. Future removals assumed equal to 2010 and not constrained by future budget allocations.
4 The highest level of sustainable biomass removal based upon the proportion of a statewide timber harvest level of 4.0 million cords as estimated in the Final Generic Environmental Impact Statement (GEIS) for Minnesota. This amount is residual biomass only assuming 50% retention on-‐site, and does not include bolewood potential.
5Includes corporate, non-‐governmental conservation/natural resources organizations, unincorporated local partnerships/associations/clubs, and tribal timberlands; also includes non-‐industrial private woodlands. II. Technical Analysis Thermal (heat) energy is the primary focus of this study. In the biomass systems analyzed, feedstocks are burned to heat water, which is then conveyed through insulated piping to heat one or more buildings. Cooled water is then returned to the heating plant where it is re-‐heated and re-‐circulated. All options, except individual buildings, assume the construction of a separate building to house the central heating boiler and a hot water delivery and return piping network. Pipes are 4 to 6-‐inches in diameter depending on heat load, and are typically buried 24-‐inches below ground level with 6-‐inches of sand beneath. Additional piping delivers the district heating fluid to each business or home, where it goes through a heat exchanger for use as hot water
supply may also be necessary. Thirteen technological options, or configurations, covering the diversity of sizes, locations, and heating needs in Cook County were analyzed in the study, ranging from single-‐family houses, medium-‐sized to large resorts or business clusters, and larger systems capable of heating part or all of Grand Marais. Three representative sites were assessed: Bearskin Lodge (small option, S1 -‐ 4), Lutsen Resort (medium, M1) and Grand Marais public buildings, business district, and residential area (large, L1 -‐ 8). One option assesses combined heat and electrical power (CHP) for Grand Marais. For each site, current heat use, multiple technical configurations, and different fuels were analyzed. The detailed assessment at each site provides data that can be extrapolated to the majority of sites in the county.

Phase I Report Revised February 6, 2012 viii
III. Financial Evaluation and Performance A financial evaluation of capital, operating, and maintenance costs of each configuration was conducted and compared to the cost of existing fossil fuel-‐based systems (Table B). Comparisons are based upon assumptions developed by the U.S. Energy Information Administration about fossil fuel prices in the next 20 years. fuel prices to be $100-‐$196/barrel by that time. Four different measures of financial performance are employed to estimate (1) energy cost per mmBtu (million British thermal units of heat energy); (2) simple payback period; (3) return on investment (ROI); and (4) outstanding capital needed in addition to the fuel cost savings. General considerations drawn from this analysis include: (1) piping is costly ($138 -‐ 220/foot), so configurations with more closely spaced buildings and simplified installation are most cost effective; (2) configurations with higher heat demand have lower costs per unit of energy; and (3) construction and operating costs (including fuel costs) sometimes run counter to one another. As noted above, pellet-‐based systems are less expensive to build, but are considerably higher than clean chips and hog fuel to operate because of the delivered cost of pellets. These comparisons do not capture non-‐financial benefits, (e.g., wildfire risk reduction) and drawbacks of conversion to biomass energy. The manner and cost of financing is also not included because of the variability involved and the method of financing is a separate decision from whether or not to invest.

Phase I Report Revised February 6, 2012 ix
Table B. Financial evaluation and performance of modeled configurations. Simple payback (yrs)
Configuration Annual heat load Fuel type
Biomass demand (dry ton/yr)
Capital construction costs
Annual O&M costs
Reference scenario
High oil price scenario
S1: Supplemental heat stove for single-‐family residence
35 mmBtu Cordwood Pellets
3.6 2.3
$4,000 $3,500
$800 $600
9 6
8 5
S2: Biomass furnace for single-‐family residence
70 mmBtu Cordwood Pellets
7.2 4.7
$15,000 $15,000
$1,500 $1,100
16 11
12 9
S3: Heat for main lodge only 500 mmBtu Cordwood 44 $162,000 $10,600 20+ 20+
S4: Heat for multiple cabins and main lodge
1,100 mmBtu
Clean chips Pellets
107 72
$649,000 $575,000
$17,000 $20,600
20+ 20+
M1: Heat for multiple buildings 5,200 mmBtu
Clean chips Pellets
510 342
$995,000 $909,000
$53,800 $87,100
9 12
8 10
L1: Heat for Cook County Courthouse 1,400 mmBtu
Clean chips Pellets
132 88
$336,000 $269,000
$13,200 $22,900
10 11
9 9
L2: Heat for public buildings north of 5th Street N (no hospital)
5,800 mmBtu
Clean chips Pellets
561 376
$1,443,000 $1,354,000
$46,000 $90,000
10 13
8 10
L3: Heat for public buildings north of 5th Street N (hospital)
12,100 mmBtu
Clean chips Pellets
1,178 790
$2,137,000 $1,964,000
$96,000 $188,500
7 10
7 8
L4: District heat for Grand Marais business district
19,700 mmBtu
Hog fuel Pellets
1,950 1,300
$7,058,000 $6,679,000
$210,000 $388,000
16 20+
13 18
L5: District heat for business district (L4) and public buildings (L2) (no hospital)
25,500 mmBtu
Hog fuel Pellets
2,500 1,700
$8,405,000 $7,992,000
$253,000 $494,000
14 20+
12 17
L6: District heat for business district (L4) and public buildings (L3) (hospital)
34,200 mmBtu
Hog fuel Pellets
3,400 1,520
$8,855,000 $8,457,000
$304,000 $645,000
11 18
10 15
L7: District heat for homes & businesses between 5th Ave W. and 6th Ave E.
45,000 mmBtu
Hog fuel Pellets
4,600 3,100
$13,226,000 $12,641,000
$437,000 $867,000
13 20+
11 17
L8: Combined heat and power (CHP) system for configuration L7
45,000 mmBtu
Hog fuel Pellets
8,750 6,850
$15,483,000 $17,751,000
$563,000 $1,758,000
15 20+
13 20+

Phase I Report Revised February 6, 2012 x
Phase I Findings
1. At current timber harvest and Firewise treatment levels in Cook County, approximately 8,500 dry tons of biomass is annually available, which is sufficient to supply various district heating configurations in Cook County and/or Grand Marais. Chipping bolewood for clean chips or pellet production could significantly increase feedstock availability but that could divert material from existing pulpwood markets and increase prices. Barring construction of a pellet production plant in Cook County, any option utilizing wood pellets would require purchase from an outside supplier.
2. All the slash generated from hazardous fuels reduction treatments within 50-‐miles of Grand Marais could be fully utilized by district heating and/or combined heat and power (CHP) for the Grand Marais business district and public buildings north of 5th Street North.
3. Future biomass availability is expected to continue to be dependent upon the level of production of higher valued co-‐products harvested from roundwood for pulp or sawlogs, which typically subsidize the removal of residuals to roadside or landing for processing. Future harvest rates are highly dependent upon market fluctuations and are thus difficult to predict. Supply contracts or other agreements may be needed.
4. Current harvest levels in Cook County are about 75% below the estimated Generic Environmental Impact Statement (GEIS) threshold for sustainable forest management in the state. Increasing timber harvesting to a sustainable threshold of 163,546 cords/year increases the availability of residual biomass to 23,309 dry tons annually, assuming 50% are retained on site for ecological purposes.
5. In all the configurations modeled, annual biomass fuel purchases and O&M (operating and maintenance) costs are lower than for a conventional fossil fuel heating system. However, all of the sites assessed already possess heating systems that could continue in operation, whereas new investment would be needed in order to burn biomass. At some point, new investment will be necessary to replace old fossil fuel boilers as well.
6. Financial performance of all options depends on assumptions about future fossil fuel prices and/or taxes. Under the reference or business-‐as-‐usual scenario, seven of the configurations would take more than 20 years to pay back, or the assumed life of the equipment. Under the high oil price scenario, payback time for 21 options is less than the 20-‐year threshold.
7. Small-‐scale biomass furnaces (70 1,200mmBtus annual heat demand) range from $15,000 for single-‐family homes and buildings, $120,000 for small lodges; and $340,000 -‐ $415,000 for small central heating systems for a lodge and several cabins (plus building and piping). For single-‐family homes or other relatively small buildings, free standing wood or pellet stoves producing 35 mmBtu/year costs about $4,000. Single building furnaces (without piping) are cost efficient, with payback periods between 5 9 years and high returns on investment. Low population densities can limit the size of energy systems due to high piping costs and the amount of heat loss resulting from moving hot water over long distances.

Phase I Report Revised February 6, 2012 xi
8. Medium-‐sized biomass heating systems for resorts, roughly the size of Lutsen Resort, or business clusters having annual heat demands approximating 6,000 mmBtu/year are $670,000 $770,000, not including building and piping. A system heating multiple, closely spaced buildings with clean chips provides a potentially return on investment of 134-‐234% over the 20-‐year life, which will vary depending on future fossil fuel costs and financing.
9. Large heating systems range from a single public building (County Courthouse) to systems heating the majority of public buildings, businesses, and residences in Grand Marais. Annual heat demand for district heating configurations is 20,000 45,000 mmBtu. Options providing heat to public buildings north of 5th Street are projected to pay for themselves in fuel savings alone in less than 10 years. Options that would expand to the business district are more feasible under the high oil price scenario. However, high piping costs because of low building density and an estimated $6,500 hook-‐up costs make district heating for all of Grand Marais less cost efficient.
10. CHP for the majority of buildings in Grand Marais has capital costs considerably more than other options. This technology produces approximately one unit of electricity for every four units of heat.
11. The Minnesota Pollution Control Agency requires the calculation of emissions associated with each of the district heating/CHP configurations, the largest of which
ation air permit and emissions tracking. An Option D issued when facilities have allowable emissions below federal thresholds, which is the case for each of the configurations assessed.
12. Although in-‐depth assessment of local manufacturing of pellets was not a formal part of this study, available information suggests that there is insufficient local demand to make such an enterprise profitable (see appendix D).
13. Phase I analysis did not include a local economic impact assessment of biomass conversion. However, findings from studies in other parts of the country indicate a range of economic impacts possible. Multipliers for bioenergy applications in different parts of the country indicate that for every dollar spent locally on bioenergy fuel, an additional $0.26 $0.83 is re-‐spent locally through indirect and induced spending. Actual impacts will depend on the type of system(s) employed and mix of local industries present.
14. The financial analysis does not include non-‐financial factors important for making decisions, including tradeoffs associated with the utilization of hazardous fuels, reduced emissions, wealth retention and job creation, fuel security, and others.
15. Phase II analyses will include more information on the various environmental and economic impacts of biomass energy systems assessed. It will also provide a formal process for considering the financial and non-‐financial factors important to making decisions at the household, community, and county levels, and the tradeoffs involved.

Phase I Report Revised February 6, 2012 xii
Glossary
As received wood waste and chips paid
regard to moisture content. Bioenergy heat and/or electricity produced from biomass energy systems.
Bole the main trunk of the tree, above the stump and below the crown/top.
Btu British thermal unit. Standard unit of energy equal to the heat required to increase the temperature of one pound of water one degree Fahrenheit.
Clean chips wood fiber processed into a wood chip that is free of contaminants like bark and needles, and generally includes only the bolewood of a tree.
Co-‐firing combustion of two types of materials, e.g., biomass with coal.
Co-‐generation simultaneous production of heat and electricity from one or more fuels, also called combined heat and power (CHP).
Condensing power power generated through a steam turbine where the steam is exhausted into a condenser, cooled to a liquid, and recycled back into a boiler.
Cord stack of round or split wood consisting of 128 cubic ft of wood, bark, and air space (measures 4ft x 4ft x 8 ft).
DBH diameter at breast height, used to measure trees.
Discount Rate the rate used to determine the present value of future cash flows, which takes into account both the expected interest that could be earned on present money plus any uncertainty surrounding the future cash flows.
Discounted Payback Period the number of years required to recover the cost of an investment with future cash flows discounted (see also NPV).
Forest biomass the accumulated above-‐ and belowground mass (bark, leaves, and
wood) from living and dead woody shrubs and trees.
Forest residues the aboveground material generated from logging during harvesting, e.g., leaves, bark, and tree tops.
Hog (hogged) fuel biomass generated by grinding wood and wood waste and used for energy production.
Internal Rate of Return (IRR) the discount rate that makes the net present value of all cash flows (or net savings) from a project equal to zero. More desirable
Landing the site where harvested trees are accumulated for loading onto trucks or processed for chips or hog fuel.
Levelized Cost of Energy (LCOE) the cost per unit of energy that, if held constant through the analysis period, would result in an NPV equal to zero.
Net Present Value (NPV) given a desired rate of return, the current worth of a future stream of cash flows (or savings) minus its current cost. Future cash flows (or savings) are discounted at the discount rate, and the higher the discount rate, the lower the present value of the future cash flows.
Organic Rankine Cycle (ORC) pressurizing, heating, vaporizing, condensing, and re-‐heating an organic fluid (e.g., propane, octamethyltrisiloxane (OMTS) in a closed cycle to generate electricity and 180°F district hot water.
Oven-‐dry ton (odt) ton of biomass or wood assuming zero percent moisture content by weight. Also referred to as dry ton and bone-‐dry ton.
Pellets type of wood fuel. Premium pellets are made from compacted sawdust that is a byproduct of sawmilling.

Phase I Report Revised February 6, 2012 xiii
Productive machine hour time during scheduled operating hours when a machine performs its designated function; excluded downtime for maintenance, weather, and other delays.
Pulpwood trees and wood suitable for manufacturing paper.
Rotation number of years required to establish and grow trees to a specified size, product, or condition of maturity.
Roundwood logs, bolts, and other round sections cut from the tree.
Sawtimber log or tree meeting minimum diameter and stem quality requirements to be sawed into lumber.
Skidding moving trees from a felling site to a loading area or landing using specialized logging equipment.
Slagging the formation of deposits on boiler tubes, usually due to the presence of chemical contaminants.
Slash tree tops, branches, bark, or other residue left on the ground after forestry operations.
Stumpage value or volume of uncut trees in the woods.
Thinning partial harvesting of a stand of trees to accelerate the growth of the trees left standing.
Timberland forested land capable of producing in excess of 20 cubic ft/acre per year of industrial wood crops under natural conditions.
Wildland-‐urban interface (WUI) areas of increased human influence and land use conversion in forests.

Phase I Report Revised February 6, 2012 xiv
Common Conversions
Energy Heating Values
Heat source Heat Value
Moisture percentage by wet weight (delivered average)
Electric/off-‐peak electric 3,413 Btu/kWh -‐-‐
#2 Heating Oil 135,000 Btu/gal -‐-‐
Propane 91,600 Btu/gal -‐-‐
Cordwood 9,400,000 Btu/ton 35%
Wood pellets 16,800,000 Btu/ton 10%
Clean wood chips 8,800,000 Btu/ton 40%
Hog fuel 8,800,000 Btu/ton 40%
Common Forest Biomass Conversions1 Unit Conversion 1 truckload of wood 23-‐26 green tons 1 green ton of wood 0.70 dry tons of wood (30% moisture content) 1 cord of roundwood 1.2 dry tons of wood (128 cu ft) 1 oven dry ton (odt) 7,600-‐9,600 Btu/lb (18-‐22 GJ/t) 1 megawatt (MW) per year 5,300 7,000 dry tons of wood per year
85,000 110,000 million Btu per year powers approximately 750-‐900 homes per year
1 One ton equals 2,000 lbs

Phase I Report Revised February 6, 2012 1
1.0 Introduction and Background
This report covers Phase I of a two-‐part study of short and long-‐term economic, social, and the environmental impacts of woody biomass energy systems in northeastern Minnesota. Phase I was commissioned by the Minnesota Cook County Board of Commissioners to provide preliminary information on the technical and financial feasibility of using locally generated forest biomass as an energy source for businesses and communities. Phase II, sponsored by the Legislative Citizen Commission on Minnesota Resources (LCCMR), considers life cycle, environmental, greenhouse gas emissions, and other impacts of locally sourced forest bioenergy. The goal of these studies is to assist the public in making well-‐informed decisions about converting from fossil fuels to biomass energy. Phase I analysis is organized into three steps. The first step characterizes forest biomass supplies in Cook County including the physical availability, cost, and logistics of producing and delivering biomass feedstocks. The second step examines biomass energy technology options for small, medium, and large energy systems. Stand-‐alone heating furnaces are considered for single buildings and small resorts, district heating for multiple buildings at larger resorts or business clusters, and community-‐scale heating or combined heat-‐and-‐power options focusing on Grand Marais. The third step evaluates the financial performance of alternative biomass energy systems and contrasts these to existing conventional fossil fuel systems. Air quality impacts and permitting, economic impacts, and renewable energy incentives are also discussed. The Phase II report will provide expanded analysis and community input, followed by a set of conclusions about the viability of biomass energy conversion in the county, and pathways for moving forward. 2.0 Cook County Profile and Community Concerns
Cook County covers approximately 3,340 square miles of which 950,207 acres (44%) is land cover and the rest water. 91,272 acres (9.6%) are privately owned with an additional 45,013 acres owned by the Grand Portage Tribe. The remaining acres are administered by the USDA Forest Service (Superior National Forest 400,777 ac; Boundary Waters Canoe Area 261,809 ac), State of Minnesota Department of Natural Resources (144,828 ac), and local and county government (6,508 ac) (Figure 2.1).1 Cook County has 5,176 residents living in 2,707 owner and renter-‐occupied households (Table 2.1) and population density of 6.4 people per mile. 2 Grand Marais is the county seat with 1,238 residents in 657 households. Other communities are Grand Portage (598 residents; 292 households), Lutsen (363 residents; 165 households), Hovland (272 residents; 122 households), Tofte (263 residents; 108 households), and Schroeder (220 residents; 105 households).3
1 2 US Census Bureau. 2011. 2005-‐2009 American Community Survey. US Census Bureau, Washington, DC. 3 Ibid

Phase I Report Revised February 6, 2012 2
US Census data show tourism and related services as the largest economic sectors in the county in terms of employment (23% of jobs). Retail (14%), education and health-‐social services (13%), and construction (11%) are the next largest. The US Bureau of Labor Statistics reports 3,282 individuals in the workforce in 2010 with a seasonally adjusted local area unemployment rate of 6.8%.4 The median household income in that year was $47,933. Population projections for Cook County were last made in 2007 by the Minnesota State Demographic Center based on 2000 US Census Bureau data.5 The projected 2010 population for the county using that data was 5,570, which was about 8% higher than measured. Adjusting future projections downward by 8%, Cook County is projected to grow to 6,320 individuals by 2030 (22% increase over 2010 population). Similar projections for Grand Marais estimated a 2010 population of 1,570 individuals, which was 21% higher than the actual population. Adjusting future projections downward by this factor, Grand Marais is projected to grow to 1,566 by 2030 (26% increase over 2010 population). Information on the impact of population growth on biomass demand can be found in Appendix B. However, it is not factored into the analysis on heat demand because of the uncertainty of the rate of change, and because heat demand would need to grow substantially to change the configurations as assessed. Projected growth is not such that significant new heating demand is expected.
4 US Department of Labor. 2011. Local Area Unemployment Statistics, 2010. US Dept of Labor, Washington, D.C. 5 Minnesota State Demographic Center. 2011. Projected population to 2030 for cities and townships outside the Twin Cities area. Available online at: http://www.demography.state.mn.us/projections.html.
Privately owned91,272 ac. (10%)
Grand Portage Tribe 45,013 ac. (5%)
USDA Forest Service Superior NF
400,777 ac. (42%)
USDA Forest ServiceBWCA
261,809 ac. (28%)
State of Minnesota -‐ DNR144,828 ac. (15%)
Local government6,508 ac. (1%)
Figure 1.1. Cook County land ownership by type and amount.

Phase I Report Revised February 6, 2012 3
According to US Census data, the most common form of owner-‐occupied home heating is propane followed by electricity and equal amounts of heating oil and wood. Propane was the most common heating source in rentals followed by electricity and small amounts of heating oil and wood. Table 2.1 shows the average delivered, in-‐home price of these fuel sources for 2010. Table 2.1. Fuel use in Cook County, MN baseline information.6 Housing 2010 fuel price Owner-‐occupied Renter-‐occupied Total (avg $/mmBtu) Residents -‐-‐ -‐-‐ 5,176 -‐-‐ Housing units 2,023 684 2,707 -‐-‐ Home heating (%)
Propane 40.9 49.4 36.4 $22.40/mmBtu Electricity (peak) 21.3 31.4 24.5 $28.10/mmBtu #2 heating oil 18.2 11.3 15.1 $22.90/mmBtu Wood (cord) 18.1 2.1 18.5 $14.63/mmBtu Other 1.5 5.8 5.5 -‐-‐
3.0 Forest Biomass Supply
The first step of analysis is development of realistic supply estimates of biomass that could be used for local energy production. Although Cook County has extensive forest resources, how much biomass is ultimately available for energy production is dictated by factors such as forest conditions, timber harvest levels, ownership objectives, wood product markets, and wood
6 US Census Bureau. 2011. 2005-‐2009 American Community Survey. US Census Bureau, Washington, DC.
Community Outreach Findings
Surveys of public opinion in Cook County reveal a variety of concerns driving interest in alternatives to existing home heating options, and prompting this study:
Volatile and rising prices for propane and heating oil, which are a significant portion of monthly household expenditures;
Utilization of waste wood and slash generated by wildfire hazardous fuels reduction projects around structures and communities. Developing markets for under-‐utilized biomass could pay for increased forest management and forest restoration activities;
Reducing greenhouse gases generated from burning of fossil fuels. Locally produced biomass for community-‐scale energy systems could contribute to meeting Minnesota 25% renewable energy consumption by 2025;
Local economic development and job opportunities in forest management, harvesting, processing, and energy operations;
Retention of money spent on energy within the county.
Public surveys also identified concerns about potential negative impacts of conversion to bioenergy that need careful analysis:
Negative impacts from rising demand for and over-‐harvest of forest biomass, including increased forest harvest to meet demands, extension of forest roads to access biomass, and the environmental impacts of biomass removal;
Impacts on air quality from biomass combustion, including changes in emissions of particulate matter (PM), NOx, sulfur dioxide (SO2), carbon (CO), and volatile organic compounds (VOC).
Phase I Report Revised February 6, 2012 4
processing capacity. The removal of vegetation from around homes and communities to reduce hazardous fuels also produces wood waste that, in the past, was burned but that could provide feedstock for heating and CHP systems. In the following analysis, a preliminary estimation of annual biomass availability is based on annual tonnage from different management activities and the cost of converting and transporting it as usable feedstocks to energy facilities. The tables below summarize the steps in this process. 3.1. Physical Availability
For the purposes of this analysis, available biomass can be converted into four types of feedstocks used in the combustion technologies in this report:
Cordwood is equivalent to 4-‐ft lengths of roundwood cut and stacked into cords, or stacks of 4-‐ft x 4-‐ft x 8-‐ft. Cordwood is used for firewood in conventional fireplaces, wood-‐burning stoves, or boilers for home heating purposes.
Clean chips are wood fiber, generally the bolewood of the tree, processed into chips free of contaminants like bark and needles. Clean chips are suitable for residential and small industrial heating applications.
Hog (hogged) fuel is wood fiber generated by grinding or chipping wood and wood waste including bark, leaves, branches, and tops of trees. Wildfire fuels reduction treatments and whole tree harvesting produces hog fuel, which is used for industrial and district heating and CHP applications.
Wood pellets are made from compacted sawdust or pulverized wood chips. Premium pellets are made from sawdust and clean chips free of contaminants and are highly dense with low moisture content (below 10%) allowing them to be burned with greater combustion efficiency in residential and small industrial applications. Industrial grade pellets have higher ash content and are used in industrial applications with larger boilers and higher combustion temperatures than residential scale boilers.
Table 3.1 provides a breakdown of timberland acres in Cook County by age class and forest type for the most recent Forest Inventory and Analysis (FIA) reporting period (2004-‐2008).7 This information was derived using the Forest Age Class Change Simulator (FACCS), which estimates total biomass by ownership type and tree species.8 The Aspen-‐birch forest type occupies 324,783 acres (53% of timberland) and Spruce-‐fir occupies 161,671 acres (26% of timberland). Of those acres, 48% and 41% respectively, are greater than 60 years old and are either at or 7 USDA Forest Service. 2011. FIADB Version 4.0. Available online at: http://199.128.173.17/fiadb4-‐downloads/datamart.html.
8 Domke, G.M. 2010. Resource assessment and analysis of aspen-‐dominated ecosystems in the Lake States. University of Minnesota, Ph.D. dissertation.

Phase I Report Revised February 6, 2012 5
beyond their target harvest rotation age. Designated wilderness areas, old-‐growth reserves, wildlife management areas, state parks, and towns are not included in this analysis. Table 3.1. Timberland acres by age class and forest type in Cook County, MN (2004-‐2008 inventory period; non-‐stocked areas excluded).
Age Class White-‐red-‐jack pine Spruce-‐fir1 Oak-‐pine
Oak-‐hickory
Elm-‐ash-‐cottonwood
Maple-‐beech-‐birch2 Aspen-‐birch
0-‐10 2,902 8,767 7,311 -‐ 2,486 4,973 41,034 11-‐20 13,462 13,082 -‐ -‐ -‐ -‐ 31,288 21-‐30 8,284 14,512 -‐ -‐ -‐ 5,455 21,003 31-‐40 4,820 14,491 -‐ -‐ -‐ 2,902 12,039 41-‐50 726 18,667 -‐ -‐ 597 5,590 20,958 51-‐60 3,500 26,201 -‐ -‐ 3,585 11,667 42,640 61-‐70 -‐ 14,249 -‐ -‐ 1,693 14,288 87,763 71-‐80 5,511 7,741 -‐ -‐ 2,902 10,061 43,490 81-‐90 -‐ 4,801 -‐ -‐ 3,241 12,603 14,498 91-‐100 726 14,559 -‐ -‐ -‐ -‐ 7,680 100+ -‐ 24,601 -‐ -‐ 1,840 726 2,390 TOTAL 39,931 161,671 7,311 0 16,344 68,265 324,783 1 Other softwoods combined with the Spruce-‐fir forest type. 2 Other hardwoods combined with the Maple-‐beech-‐birch forest type. Table 3.2 displays the average oven-‐dry tons (odt) per acre by type and ownership. Forest biomass is classified into bolewood (main stem roundwood), limbs and tops, saplings, stumps, and roots. The Minnesota Forest Resources Council (MFRC) guidelines on biomass harvesting recommend that stumps and roots, comprising 21% of total biomass, not be removed and are thus excluded from the analysis.9 Table 3.2. Dry tons of living biomass by stand attribute and ownership in Cook County, MN.1,2 Government
Biomass attribute Federal State Local Private industrial
Private non-‐industrial Total
Bolewood ( 4,127,594 840,203 75,967 887,021 344,490 6,275,275 Tops and limbs 1,138,389 230,814 24,542 258,656 103,253 1,755,654 Saplings (1-‐4.9 in. dbh) 1,971,652 494,522 58,354 382,320 201,886 3,108,735 Stumps 262,857 53,908 4,840 54,752 22,006 398,362 Belowground roots 1,656,088 365,096 37,814 345,168 150,159 2,554,326
9 Minnesota Forest Resources Council (MFRC). 2007. Biomass harvesting guidelines for forestlands, brushlands, and open lands. St. Paul, MN: Minnesota Forest Resources Council. Available online at: http://www.frc.state.mn.us/initiatives_sitelevel_management.html.

Phase I Report Revised February 6, 2012 6
1 Site-‐level variation does not differ significantly within forest types. 2 Size of trees measured in inches as a function of diameter at breast height (dbh). Table 3.3 presents FIA and Minnesota Department of Natural Resources (DNR) data showing the average annual timber harvest rate in Cook County between the years 2005 and 2009 was approximately 28,178 cords (32,290 odt).10,11 The 2010 harvest rate, which was used in Phase I analysis was 38,911 cords. The majority of the harvest was in the Aspen-‐birch and Spruce-‐fir forest type groups with more than 40% of the total harvest from the Pat Bayle and Grand Portage State Forests. Timber harvesting on public lands is expected to remain stable in the near future. Harvest by the Grand Portage Tribe could increase with expanding bioenergy applications. Future timber harvesting on private lands is unknown. Table 3.3. Average annual timber harvest by forest type in Cook County, MN 2005 2009.
Forest Type Avg harvest (cords)1
Oven-‐dry tons (odt)/cord
Avg harvest (odt)
Target rotation (yrs)2
White-‐red-‐jack pine 4,997 1.1417 5,705 100 Spruce-‐fir 4,214 1.0500 4,425 75 Oak-‐pine 633 1.3750 870 75 Oak-‐hickory 0 1.3750 0 75 Elm-‐ash-‐cottonwood 121 1.2917 156 75 Maple-‐beech-‐birch 414 1.2500 518 75 Aspen-‐birch 17,799 1.1583 20,617 50
TOTAL 28,178 -‐-‐ 32,290 -‐-‐ 1 Harvest data obtained from FIA and Minnesota DNR.12,13 2 Target harvest rotation age based upon a statewide assessment of silvicultural practices14 and the state Forest Development Manual guidelines.15
10 USDA Forest Service. 2011. FIADB Version 4.0. Available online at: http://199.128.173.17/fiadb4-‐downloads/datamart.html.
11 Don Deckard, Minnesota DNR Forest Economist. Personal communication. June 24, 2011. 12 USDA Forest Service. 2011. FIADB Version 4.0. Available online at: http://199.128.173.17/fiadb4-‐downloads/datamart.html.
13 Don Deckard, Minnesota DNR Forest Economist. Personal communication. June 24, 2011. 14 atus and long-‐term trends of silvicultural practices in Minnesota: A 2008 Assessment. Staff Paper 205. University of Minnesota, Department of Forest Resources.
15 Minnesota Department of Natural Resources. 1997. Forest Development Manual. St. Paul, MN: Department of Natural Resources, Division of Forestry.

Phase I Report Revised February 6, 2012 7
0
1,000
2,000
3,000
4,000
5,000
6,000
7,000
8,000
Within 15-‐miles Within 30-‐miles Within 45-‐miles
Biomass on unmaintained logging trails
Biomass on maintained rock roads
Biomass along paved roads
Miles to Grand Marais, MN
Firewise Biom
ass (d
rytons)
Figure 3.1. Dry tons of hog fuel from Superior National Forest timber sales and fuels reduction treatments within 45-‐miles of Grand Marais, MN. Table 3.4 shows total annual biomass generated from timber harvests reported in Table 3.3. Target harvest rotation ages of 50 to 100 years are used. A 50% retention rate of available residual biomass is assumed left on site (tops and limbs) for soil nutrification, water management and wildlife habitat, which is more than the 33% retention rate recommended in the MFRC biomass harvest guidelines. The analysis indicates 5,229 odt residual biomass from timber harvesting is available annually within the county at the 38,911-‐cord harvest level. Table 3.4 also presents annual biomass availability for different management scenarios. For instance, as timber harvesting for primary forest products (e.g., pulpwood) increases, the corresponding amount of residual biomass increases. Assuming a statewide harvest rate of 4.0 million cords, as calculated in the Final GEIS on Timber Harvesting and Forest Management in Minnesota,16 the annual sustainable harvest rate in Cook County increases to 163,546 cords/yr, nearly a 76% increase over the current year. Corresponding residual biomass increases to 23,309 odt/yr, assuming 50% retention on-‐site. These estimates assume no other constraints on harvest levels and are suggestive of possible removal rates only. They do not constitute a harvest plan and do not include estimates of available biomass outside the county.
16 Jaakko Pöyry Consulting, Inc. 1994. Final generic environmental impact statement on timber harvesting and forest management in Minnesota. Prepared for the Minnesota Environmental Quality Board. Tarrytown, NY: Jaakko Pöyry Consulting, Inc.

Phase I Report Revised February 6, 2012 8
Other management scenarios analyzed included chipping bolewood for clean chips, and wildfire fuels reduction treatments for hog fuel, referred to as Firewise removals.17 Early stand treatments (e.g., pre-‐commercial thinning) and use of under-‐utilized species were not analyzed because of the skewed distribution of forest age classes in the county, and in particular the abundance of standing aspen-‐birch and spruce-‐fir in older age-‐classes (Table 3.1). Table 3.4 shows scenarios in which 10% and 20% of available bolewood at the 2010 harvest rate is chipped for bioenergy (clean chips). Bolewood chipping increases availability by an additional 4,392 odt/yr and 8,784 odt/yr, respectively. Under the GEIS scenario of 163,546-‐odt harvest rate, 10% bolewood generates an 18,931 odt annually. Table 3.4 shows 3,189 odt (12,599 cu. yards) of biomass generated from Firewise removals on the Superior National Forest within Cook County. This material, which is classified as hog fuel because it includes bark, branches and needles, was generated from 1,425 acres of treatments in 2010 with an average removal rate of 3.72 odt/acre. Figure 3.1 shows the amount of this hog fuel available from the Superior National Forest within 15, 30, and 45-‐miles of Grand Marais by road type. Although higher removal rates are sustainable, future Firewise removals on Superior National Forest land are assumed equal to 2010 removal rates and are not constrained by budget allocations.
17 http://www.firewise.org/

Phase I Report Revised February 6, 2012 9
Table 3.4. Current and potential biomass availability by ownership and management scenario in Cook County, MN.
Current availability Potential availability
Ownership
2010 bolewood harvest (odt)1
2010 residual biomass (odt)2
2010 Firewise removals (odt)3
2010 total hog fuel (odt)
10% of 2010 bolewood (clean chips) (odt)
20% of 2010 bolewood (clean chips) (odt)
Future Firewise removals (odt)3
Residuals from GEIS harvest rate (odt)4
Federal forests 16,021 1,851 3,189 5,040 1,602 3,204 3,189 14,014 State, county, and local 19,009 2,344 -‐-‐ 2,344 1,901 3,802 -‐-‐ 3,790 Private5 8,889 1,034 -‐-‐ 1,034 889 1,778 -‐-‐ 5,505 Total 43,919 5,229 3,189 8,418 4,392 8,784 3,189 23,309
1 A cord is equivalent to 1.2 dry tons. The total 2010 bolewood harvest is equivalent to 38,911 cords. 2 Residual biomass is the tops, limbs, branches and needles as defined by the USDA Forest Service FIA biomass attributes, and is in addition to the reported 2010 roundwood harvest rate for Cook County. Residual biomass availability assumes 50% retention on-‐site.
3 Firewise removals are estimated for Superior National Forest removals only of slash from fuels reductions efforts based on an estimated 12,599 cu. yards of slash generated in 2010. Future removals assumed equal to 2010 and not constrained by future budget allocations.
4 The highest level of sustainable biomass removal based upon the proportion of a statewide timber harvest level of 4.0 million cords as estimated in the Final Generic Environmental Impact Statement (GEIS) for Minnesota.18 This amount is residual biomass only assuming 50% retention on-‐site, and does not include bolewood potential.
5Includes corporate, non-‐governmental conservation/natural resources organizations, unincorporated local partnerships/associations/clubs, and tribal timberlands; also includes non-‐industrial private woodlands.
18 Jaakko Pöyry Consulting, Inc. 1994. Final generic environmental impact statement on timber harvesting and forest management in Minnesota. Prepared for the Minnesota Environmental Quality Board. Tarrytown, NY: Jaakko Pöyry Consulting, Inc.

Phase I Report Revised February 6, 2012 10
3.2 Biomass Harvesting and Transport Costs
The costs of harvesting, handling, and transporting biomass to a processing facility are critical factors in the total price paid. These costs also vary widely based on operator and equipment productivity, tree species harvested, distance to processing facility, and whether co-‐products exist (e.g., pulpwood). For the purposes of this analysis, we assume all harvest and skidding costs associated with moving trees to a forest landing are a function of a primary pulpwood or sawlog market. Therefore, the price paid for residual biomass (tops and limbs) does not include harvest and skidding costs because they would not be incurred if it were not for those markets. Rather, the price paid at the landing includes only the chipping/grinding operation. Wages, benefits, and employer costs for workers' compensation and unemployment insurance are held constant. Total fixed and variable costs are calculated at a rate of $183.72/PMH (productive machine hour), which are the total hours of use for scheduled purposes over the course of one year (assumes $2.80/gal off-‐highway diesel fuel price). Assuming a productivity rate of 24 odt/PMH (approximately 2 truckloads/hr), chipping cost are $7.66/odt ($183.72/PMH ÷ 24 odt/PMH) at the landing. Appendix A provides a breakdown of equipment costs.19 Transportation costs are the costs of transporting biomass from the forest landing to the heating or CHP facility. Transportation costs are calculated as a function of distance traveled and highway diesel fuel cost of $3.32/gal (12-‐month Midwest average).20 Using a methodology developed by the Idaho National Laboratory,21 the average transport cost for a loaded semi-‐truck and trailer (25 tons) is $21.36/odt on improved roads. Within 50 miles, we therefore use a rate of $0.43/odt/mile to calculate the variable costs of transportation from the woods to the thermal heating or CHP sites analyzed in the next section. The delivered cost of biomass is the aggregate of the harvesting, processing/handling, and transportation costs to the assessed sites. It also includes the stumpage rate for biomass, which the Superior National Forest and Minnesota DNR set at approximately $0.80/odt. The average delivered cost of biomass up to 50 miles is $29.82/odt ($0.80/odt + $7.66/odt + $21.36/odt). A summary of these costs are included in Section 5, Financial Performance. 3.3 Forest Operations
For a logger to justify moving equipment to a site to process biomass there needs to be enough throughputs to offset hourly costs. Small parcel sizes, long mobilization distances between harvest sites, and long transport distances to a heating or CHP site are disincentives. Having the appropriate equipment to efficiently harvest and process biomass are also barriers. We
19 Brinker RW, Kinard J, Rummer B, Lanford B. 2002. Machine rates for selected forest harvesting machines. Circular 296. Auburn, AL: Alabama Agricultural Experiment Station.
20 US Energy Information Administration. 2011. Petroleum and other liquids: Annual retail gasoline and diesel prices. US Department of Energy, Washington, D.C. Available online at: http://www.eia.gov/dnav/pet/pet_pri_gnd_dcus_nus_a.htm.
21 Blackwelder, D.B., and E. Wilkerson. 2008. Supply system costs of slash, forest thinnings, and commercial energy wood crops. TM2008-‐008-‐0 (INL/MIS-‐09-‐15228). Idaho National Laboratory.

Phase I Report Revised February 6, 2012 11
conducted interviews with area loggers during the spring of 2011 to determine their level of interest in participating in biomass markets, equipment capacity and needs, and the costs of production, including mobilization of equipment and biomass processing. Interest among those interviewed was high but tempered by the cost of equipment and lack of biomass harvesting volume to justify expenses. None of the interviewed loggers was removing biomass generated from commercial timber harvests in Cook County at the time of interviews, but most were willing to do so if adequate markets developed for the material. One operator was conducting whole-‐tree chipping (bolewood/roundwood) of low value trees used for generating heat at the Grand Portage Casino in Grand Portage, MN. That same operator, who uses a stationary chipper, was the only one in the region with the equipment for processing biomass. In-‐woods chippers would best accommodate the types of biomass systems considered in this analysis, but biomass markets would need to expand substantially to justify additional investment. 4.0 Site Selection and Engineering
This study examines two principal methods for converting woody biomass to energy and then distributing that energy to individual buildings and businesses:
Thermal heating is generated by burning biomass in a stove/furnace/boiler to produce hot water or radiant convection heat, which is circulated through a single or multiple buildings via piping and then distributed as heat through a network of radiant units or through a heat exchanger using forced air (Figure 4.1).
Combined heat and power (CHP, or cogeneration) is a technology that employs a
vaporized, low boiling point, high molecular weight organic fluid to spin a turbine and generate electricity. The waste heat generated is sufficient to produce 175°F water, which is circulated to homes and businesses (Figure 4.2).
In both cases, insulated piping is required to convey the hot water to the building(s) and return the cooled water to the heating plant where it is re-‐heated and re-‐circulated. The piping will
r. Additional piping is also needed to connect each business or home to the main supply line. The district heating fluid goes through a heat exchanger at the
system to a hot water heat supply may also be necessary. A number of businesses in Cook County are seasonal and located in remote areas. This presents both opportunities and challenges. In areas such as Tofte and Lutsen, low population density limits the size of energy systems due to high piping costs and the amount of heat loss resulting from moving hot water over long distances. Even in Grand Marais the population density is low for the application of district heat. However, there is a potential for biomass to be used on a relatively small scale to provide energy to communities, or scaled to individual homes or resorts, using small district heating or individual biomass-‐powered furnaces.

Phase I Report Revised February 6, 2012 12
Figure 4.1. Generic woody biomass thermal heating system.
Figure 4.2. Organic Rankin Cycle (ORC) combined heat and power (CHP) system.

Phase I Report Revised February 6, 2012 13
The approach used in Phase I analysis was to develop proxy information that could be applied to different sites reflecting the diversity of size, location, and types of heating systems in Cook County. An initial selection of thirteen sites was made across three categories of relative scale small, medium and large. The team concluded that a detailed assessment of one site at each scale was sufficient to provide data that could be extrapolated to the majority of sites in the county. Within each site multiple configurations were modeled to approximate conditions in non-‐assessed sites. The final study sites selected were Individual homes & Bearskin Lodge (small), Lutsen Resort (medium), Grand Marais (large). Multiple combinations of scale and technology were modeled for each site to assess technical and financial performance. The mix of technologies were selected and sized to optimize financial and technical performance using cordwood, clean chips, hog fuel, or wood pellets. While these configurations are specific to actual facilities or clusters of buildings, the analysis can be applied to a variety of locations by altering site-‐specific variables like distance of hot water piping and mmBtu required. The following sections provide a breakdown of specific equipment and site factors modeled for the small, medium, and large configurations. See Table 4.1 for equipment specifications.
Small-‐scale configurations (S) modeled two types of buildings, a single-‐family residence and Bearskin Lodge. The single residence configuration (S1) was modeled for a free-‐standing stove using cordwood or wood pellets. A larger flex-‐fuel boiler that provides space heating and hot water using cordwood or wood pellets as the primary heat source was modeled as S2. Bearskin Lodge, which is 25 miles north of Grand Marais on the Gun Flint Trail (County Road 12), has 17 total buildings on site. A mix of propane fueled hot water and forced air heating are the primary heat sources. Two configurations were modeled for this scale, the first (S3) modeled a cordwood-‐boiler for the main lodge. The second configuration (S4) modeled a distributed heating system for the main lodge and guest cabins using clean chips and wood pellets as the primary heat source. Other buildings were omitted due to the distance of piping needed and small heating demand.
Medium-‐scale configuration (M) modeled Lutsen Resort on Lake Superior,
approximately 20 miles south of Grand Marais on Hwy 61, can serve as a proxy for larger resorts and business clusters in the county. Lutsen Resort has 30 buildings and approximately 133,000 sq ft of required heating space. Propane fueled hot water is the primary heat source. Only one configuration was modeled for this site (M1), which was a distributed heating system for the main building and guest cabins on the south side of the Poplar River using clean chips and wood pellets as the primary heat source. Included is the hot water load to heat the indoor pool in the main building. The Poplar River Condos on the north side of the river were excluded because of the distance of piping required, and the interruptible electricity rate in place for those buildings making it unlikely wood energy would compete financially. The S2 configuration would be similar to the Poplar River Condos in terms of heat load.

Phase I Report Revised February 6, 2012 14
Large-‐scale configurations (L) modeled various options in Grand Marais, with the potential to reach up to 45 commercial properties, hundreds of residences, three condominiums, three apartment complexes, hospital, county courthouse, existing community center, and law enforcement center.22 Hot water demand was included in the total demand load for each configuration. In total, eight configurations were modeled, the first (L1) being a thermal heating system for the Cook County Courthouse fueled by clean chips or wood pellets, which is similar to Bearskin Lodge but would require less underground piping. The second (L2), a distributed heating system for the public buildings north of 5th Street North excluding the hospital and clinic because of the need for 175-‐degree water for sterilization, and recent heating system upgrades to the clinic. Clean chips and pellets were modeled as the primary fuel source. The third configuration (L3) encompasses the same buildings as L2 plus adding the hospital and clinic. The fourth configuration (L4) modeled district heating for the downtown commercial district south of Hwy 61 bounded by 4th Ave East with total heating load of 19,500 mmBtu/yr (Figure 4.3). The fifth configuration (L5) includes the downtown commercial district plus the public buildings north of 5th Street North, excluding the hospital and clinic. Piping would run along Hwy 61, north on 6th Ave East and west on 5th St North bounded by 5th Ave West (Figure 4.4). The sixth configuration (L6) encompasses the same buildings and piping as L5 plus adding the hospital and clinic. The seventh (L7) modeled district heating for residential and commercial businesses in Grand Marais bounded by 5th Ave West and 6th Ave East with total heat usage of 45,000 mmBtu/year (Figure 4.5). The eighth configuration (L8) modeled the same area as in L7 but using an Organic Rankine Cycle (ORC) system to produce heat and electricity. Hog fuel and wood pellets were modeled as the primary fuel sources for L4-‐L8.
Fuel usage data for small and medium configurations were obtained from the owners of the assessed facilities, most of which are heated with propane and off-‐peak electricity. Household
23 Large users in Grand Marais, most of which use propane or heating oil, were surveyed to determine current use volumes by season. Fuel usage was in line with current statewide fossil fuel price averages and rates were confirmed with fuel suppliers in the Grand Marais area. Historic trends of the statewide average prices are shown in Figure 5.1. Table 4.2 provides a cost summary of capital, installation, operations and maintenance (O&M), buildings, piping, and related project development aspects for each system, scale, and configuration modeled. Competitive quotes were obtained for larger equipment. Industry knowledge of LHB, Inc. was used to determine O&M estimates for smaller configurations.
22 Proposed facilities were excluded from the analysis; any new facility could significantly alter results depending on size, location, and scheduled heat demand.
23 Factfinder.Census.gov. Fact Sheet Grand Marais city, 2000 Housing Characteristics. (2010 census data not yet available)

Phase I Report Revised February 6, 2012 15
Figure 4.3. Coverage map of configuration L4.
LLL555 LLL666
LLL444
Figure 4.4. Coverage map of configuration L5 (without hospital) and L6 (with hospital).

Phase I Report Revised February 6, 2012 16
LLL444
LLL222 LLL333
Figure 4.5. Coverage map of configuration L7 (district heat) and L8 (CHP).

Phase I Report Revised February 6, 2012 17
Table 4.1. Modeled system configurations and equipment specifications.
Configuration Annual heat load1
Boiler as priced (max/hr)2
Fuel type
Equipment efficiency
Biomass demand odt/yr (wet tons)
Peak boiler (gal/yr)
S1: Free-‐standing stove for single-‐family residence 35 mmBtu Free standing stove Cordwood Pellets
70% 83%
3.6 (5.5) 2.3 (2.6)
-‐-‐
S2: Biomass furnace for single-‐family residence 70 mmBtu Woodmaster Flex Fuel Furnace
Cordwood Pellets
70% 83%
7.2 (11.0) 4.7 (5.2)
-‐-‐
S3: Heat for main lodge only 500 mmBtu GARN 3200(0.42 mmBtu/hr) Cordwood 72% 44 (68) -‐-‐
S4: Heat for multiple cabins and main lodge 1,100 mmBtu Woodmaster Biomax(1.02 mmBtu/hr)
Clean chips Pellets
70% 82%
107 (179) 72 (80)
-‐-‐
M1: Heat for multiple buildings 5,200 mmBtu Woodmaster Biomax(4.4 mmBtu/hr)
Clean chips Pellets
70% 80%
510 (850) 342 (380)
-‐-‐
L1: Heat for Cook County Courthouse 1,400 mmBtu Woodmaster Biomax(1.02 mmBtu/hr)
Clean chips Pellets
70% 82%
132 (219) 88 (98)
-‐-‐
L2: Heat for public buildings north of 5th Street N (no hospital)
5,800 mmBtu Woodmaster Biomax(3.2 mmBtu/hr)
Clean chips Pellets
70% 80%
561 (935) 376 (418)
-‐-‐
L3: Heat for public buildings north of 5th Street N (hospital)
12,100 mmBtu Woodmaster Biomax(6.8 mmBtu/hr)
Clean chips Pellets
70% 82%
1,178 (1,963) 790 (878)
-‐-‐
L4: District heat for Grand Marais business district 19,700 mmBtu Hurst Woodmaster Biomax(13.3 mmBtu/hr)
Hog fuel Pellets
70% 80%
1,950 (3,250) 1,300 (1,450)
-‐-‐
L5: District heat for business district (L4) and public buildings (L2) (no hospital)
25,500 mmBtu Hurst Woodmaster Biomax(14.2 mmBtu/hr)
Hog fuel Pellets
70% 80%
2,500 (4,200) 1,700 (1,850)
-‐-‐
L6: District heat for business district (L4) and public buildings (L3) (hospital)
34,200 mmBtu Hurst Woodmaster Biomax(15.0 mmBtu/hr)
Hog fuel Pellets
70% 80%
3,400 (5,700) 1,520 (2,500)
-‐-‐
L7: District heat for homes & businesses between 5th Ave W. and 6th Ave E.
45,000 mmBtu Hurst Woodmaster Biomax(16.7 mmBtu/hr)
Hog fuel Pellets
70% 80%
4,600 (7,600) 3,100 (3,400)
8,800 (propane)
L8: Combined heat and power (CHP) system for configuration L7
45,000 mmBtu
VAS Thermal (heat) Turboden (CHP) 0.7 MW ORC; 1.1 mmBtu/hr peak boiler
Hog fuel Pellets
82% 82%
8,750 (14,600) 6,850 (7,600)
20,800 (propane)
1 Assumes 55-‐60% of heat load with peaking backup for coldest days. 2 Heat demand calculated for Grand Marais assumes 100-‐mmBtus annual demand per residence heating with propane (39%) or fuel oil (42%).

Phase I Report Revised February 6, 2012 18
Table 4.2. Generalized costs for small, medium, and large-‐scale configurations in Cook County, MN.
Configuration Fuel type Boiler capital & installation1
Annual O&M2
Building Only3 Piping4
Customer Hookup5
Tax, insur., freight
Engineering; const. mgt.
S1: Free-‐standing stove for single-‐family residence
Cordwood Pellets
$4,000 $3,500
$0 $0
n/a n/a
$0 -‐-‐ 0% 0%; 0%
S2: Biomass furnace for single-‐family residence
Cordwood Pellets
$15,000 $15,000
$0 $0
n/a n/a
$0 -‐-‐ 0% 0%; 0%
S3: Heat for main lodge only Cordwood $84,350 $1,000 $36,400
(364 sq ft) 250 ft
@ $165/ft -‐-‐ 10% 6%; 10%
S4: Heat for multiple cabins and main lodge
Clean chips Pellets
$385,550 $310,664
$8,000 $3,000
$36,400 (364 sq ft)
1,200 ft @ $190/ft
-‐-‐ 10% 6%; 10%
M1: Heat for multiple buildings Clean chips Pellets
$691,113 $610,620
$13,000 $5,000
$61,600 $56,000
1,100 ft @ $220/ft
-‐-‐ 10% 6%; 10%
L1: Heat for Cook County Courthouse Clean chips Pellets
$286,492 $218,906
$2,000 $1,000
$36,400 (364 sq ft)
60 ft @ $220/ft
-‐-‐ 10% 6%; 10%
L2: Heat for public buildings north of 5th Street N (no hospital)
Clean chips Pellets
$735,148 $652,145
$4,000 $2,000
$61,600 $56,000
3,400 ft @ $190/ft
-‐-‐ 10% 6%; 10%
L3: Heat for public buildings north of 5th Street N (hospital)
Clean chips Pellets
$1,272,507 $1,109,126
$7,000 $3,500
$104,720 $95,200
4,000 ft @ $190/ft
-‐-‐ 10% 6%; 10%
L4: District heat for Grand Marais business district
Hog fuel Pellets
$3,150,623 $2,835,560
$150,000 $75,000
$700,000 17,765 ft
@ $138/ft $750,000 3.2% 7%; 1.4%
L5: District heat for business district (L4) and public buildings (L2)(no hospital)
Hog fuel Pellets
$3,436,224 $3,092,600
$175,000 $87,500
$730,000 25,128 ft
@ $138/ft $800,000 3.2% 7%; 1.4%
L6: District heat for business district (L4) and public buildings (L3)(hospital)
Hog fuel Pellets
$3,617,078 $3,255,370
$200,000 $100,000
$730,000 26,450 ft
@ $138/ft $950,000 3.2% 7%; 1.4%
L7: District heat for homes, businesses between 5th Ave W. and 6th Ave E.
Hog fuel Pellets
$4,400,289 $3,960,260
$300,000 $150,000
$780,000 45,400 ft
@ $138/ft $1,767,500 3.2% 7%; 1.4%
L8: Combined heat and power (CHP) system for configuration L7
Hog fuel Pellets
$9,150,299 $8,235,269
$300,000 $150,000
$1,140,000 45,400 ft
@ $138/ft $1,767,500 3.2% 6.5%; 1.4%
1 All systems assume a 20-‐year usable life. Purchase price based on actual equipment supplier quotes. 2 Excludes fuel costs and incremental electrical. 3 Building costs assume $100/sq ft construction. Costs do not include site acquisition. 4 Average piping costs inclusive of materials (6-‐in pipe with insulation), trenching (2-‐ft cover with 6-‐in sand beneath), and labor. 5 Individual hookup costs assume $6,500 cost/homeowner, $10,000 cost/business; L7/L8 assume 70% of potential customers connect.

Phase I Report Revised February 6, 2012 19
5.0 Financial Performance
5.1 Financial Assumptions
Table 5.1 shows the assumptions used in the financial analysis. All prices are in real dollars for 2010 meaning prices change only if there are technological changes or if shifts occur in supply or demand. Prices are held constant for each configuration. See Appendix B for financial performance metrics and definitions.
energy-‐saving capital investments. Beyond 20 years, technological changes and costs for overhauls and repairs mean that most of the value of capital has depreciated. Also, the lower
are unlikely to influence present decisions. Discount rates vary depending on the iinvested elsewhere) and the risk associated with the project. Higher discount rates make projects appear less attractive, meaning the investor believes an alternative project would be profitable or that expected future cash flows from the current project are highly uncertain. One typically finds discount rates between 5%-‐8% for energy efficiency projects.24 We adopt a discount rate of 6.5% for all scenarios. Non-‐fuel factors such as labor, operating, and maintenance costs are assumed constant because it is not conceivable that the configurations assessed would have a noticeable impact on the labor supply in Cook County or on the market for heating equipment. However, fuel costs change over time directly affecting delivered costs for cordwood, clean chips, hog fuel, and wood pellets. About 20% of harvest, handling and processing costs are fuel-‐related so we inflate prices at 20% of the inflation rate of diesel fuel (See Appendix A cost breakdown). Energy values used are consistent with engineering assumptions and held constant across sites. While the energy contents for the fossil fuels are relatively constant, wood fuels fluctuate depending on the type of wood and moisture content. The energy value used for delivered cordwood is consistent with seasoned firewood, 9.4 mmBtu/ton. The energy value used for delivered clean chips and hog fuel is 8.8 mmBtu/ton, based on an average moisture content throughout the year. Wood pellets have a more consistent energy value of 16.8 mmBtu/ton. Table 5.2 shows the average current fossil fuel prices and 20-‐year projections. The Energy Information Administration (EIA) of the U.S. Department of Energy publishes annual forecasts of fossil fuel costs using supply, demand, and price projections on a per mmBtu basis for the West-‐North-‐
24 Fuller, M. 2008. Enabling investments in energy efficiency: A study of energy efficiency programs that reduce first-‐cost barriers in the residential sector. Energy & Resources Group, UC Berkeley, Berkeley, CA. Website [http://www.eelriver.org/pdf/pge/Exhibit%2015%20CD-‐6%20(Fuller).pdf].

Phase I Report Revised February 6, 2012 20
price change over the next 20 years (2011-‐2030), which assumes that fossil fuel prices in northern Minnesota will track the rest of the northern Midwest. 25 The starting price from which to escalate future prices uses averages of the most recent fuel receipts obtained from each site. Projected costs are in real 2010 dollars. Prices for the Reference Case are shown in Figure 5.1 with Minnesota and Midwest heating fuel prices over the past 10 years. We tested the sensitivity of results to future energy prices by modeling each configuration
2011 Annual Energy Outlook.26 Oil prices themselves are not included but are related to the prices of other fossil fuels. For comparison, in the Reference Case benchmark oil prices start at $100/barrel and increase to $123/barrel in 2030. In the High Oil Price scenario they increase to $196/barrel by 2030. Table 5.3 shows the average current biomass fuel prices and 20-‐year projections. Price quotes were obtained from local suppliers of cordwood, wood pellets, and clean chips. Because there is no local market for hog fuel, we developed a delivered price of $29.82/odt (Section 3.2), which equates to $17.89/ton at 40% moisture content by weight.27 The delivered price of cordwood was $165/cord (35% moisture content by weight) ($211/odt or $137.50/wet ton).28 The estimated delivered price of wood pellets was $210/ton (10% moisture by weight), which was derived from quarterly regional price reports compiled by the Pellet Fuels Institute over the past five years.29 Those data show the average price for bagged pellets is $149.50/ton and we add an average delivery charge of $60/ton, for a total delivered pellet price of $209.50/ton. As comparison, Birch Grove School in Tofte currently pays $133/ton for standard pellets plus $79/ton bulk delivery for a delivered price of $212/ton. To calculate future pellet prices, we used information on the fuel costs of producing pellets as a price escalator. Electricity comprises about 6.5% of the cost of pellet production, and drying fuel using pellet dust or hog fuel comprises 16%. To be consistent with other assumptions, we link the electricity portion of pellet production costs to the change in electricity prices and link the drying fuel portion to the change in hog fuel prices. As a result, the price of production increases by 0.1% per year in the Reference Case scenario and 0.4% per year in the High Oil Price scenario. We link the delivery portion of pellet prices to the EIA Reference Case for diesel fuel, which has an annual price increase of 1.4%. In the High Oil Price scenario, diesel fuel increases 3.3% annually.
25 US Energy Information Administration. 2010. Annual Energy Outlook 2010. DOE/EIA-‐0383. US Department of Energy, Washington, D.C. Available online at: http://www.eia.gov/oiaf/archive/aeo10/pdf/0383%282010%29.pdf.
26 Ibid 27 Formula for translating dry weight and wet weight: wet weight * (1 -‐ % moisture content by weight) = dry weight. 1 dry ton equals 1.67 tons at 40% moisture; $29.82/dry ton (1.67 wet tons/dry ton) = $17.89/wet ton.
28 1 wet cord * (1 -‐ .35 Moisture by weight) = .65 dry cords. With 1.2 dry tons per cord, this equals (.65 * 1.2) = .78 dry tons/wet cord. $165 .78 = $211/dry ton. $211/dry ton (1.54 wet tons/dry ton) = $137.50/wet ton.
29 Pellet Fuels Institute. 2010. PFI quarterly newsletters. Arlington, VA. Available online at: http://pelletheat.org/about-‐us/pfi-‐newsletter/.

Phase I Report Revised February 6, 2012 21
Finally, we estimated the delivered price of clean chips to be $45/ton (40% moisture by weight) with an average delivery distance of 50 miles. While there are limited markets for clean chips in the county, chip prices have been consistent over the past few years with most price changes occurring from the increased cost of delivery. Table 5.1. Non-‐fuel investment and financing assumptions. Financial metric Assumption Capital useful life 20 years Discount rate 6.5% Annual inflation rate (non-‐fuel) 0% Years tax depreciation (if applicable) 10 years Income tax rate (if applicable) 35% Financed amount 0% Financing term (if applicable) 10 years Interest rate on loan (if applicable) 6.7%
Table 5.2. Average current fossil fuel prices and 20-‐year annual rates of change.
Fuel type Statewide average price1
Cook County price used2
Annual change, reference case
Annual change, high oil price
Electric (¢/kWh) 10.4¢ 10.4¢ to 12.5¢ -‐0.65% -‐0.57% Off-‐peak electric (¢/kWh)3 n/a 6.0¢ -‐0.65% -‐0.57% #2 heating oil ($/gal) $3.09 $3.09 0.95% 2.89% Propane ($/gal) $2.18 $2.05 to $2.30 1.84% 4.26% Diesel fuel ($/gal) $3.32 $3.32 1.44% 3.34%
1 Based on Minnesota data from the Energy Information Administration
2 Prices approximate 2010/2011 averages, from current Cook County users. 3 Price from current Cook County, MN users; escalation rate same as regular electric. Table 5.3. Average current biomass delivered fuel prices in Cook County, MN
Biomass type
Cook County price $/dry ton (+delivery)
Cook County price $/wet ton (+delivery)
Annual % change, reference scenario (delivery)
Annual % change, high oil scenario (delivery)
Cordwood1 $154 ($58) $100 ($38) 0.3 (1.4) 0.7 (3.3) Pellets2 $167 ($67) $150 ($60) 0.1 (1.4) 0.4 (3.3) Clean chips3 $58 ($17) $35 ($10) 0.3 (1.4) 0.7 (3.3) Hog fuel4 $8.50 ($21) $5 ($13) 0.3 (1.4) 0.7 (3.3)
1 Price based on conversations with local suppliers 2 Price based on Pellet Fuels Institute data and conversations with local bulk pellet buyers 3 Price based on conversations with local buyers 4 Calculated via Section 3.2, Biomass Harvesting and Transport Costs.

Phase I Report Revised February 6, 2012 22
Figure 5.1. Cook County historic and Midwest-‐US projected prices by fuel type (2010 dollars). 5.2 Financial Performance Summary
Table 5.4 presents cumulative and disaggregated cost data for each configuration organized by capital construction costs and annual operating costs for the reference and high oil price scenarios for future projections. Shown at the bottom of the table, the performance metrics provided for each configuration are:
Cost of heat, also known as the Levelized Cost of Energy (LCOE), is the lifetime capital and O&M costs divided by the total energy united produced (see Appendix C);
Simple payback period is the number of years it would take for the savings from a project to pay off the initial cost (not adjusted for the time value of money);
Return on investment is the (undiscounted) financial return minus the cost of investment, divided by the cost of investment over the life of the project. The time value of money (discount rate) is not considered, but the simple undiscounted return on investment can be used to compare between projects of equal life.
Outstanding capital needed is the total amortized capital and annual operating cost of a new biomass system minus the savings on fuel over 20-‐years. The lower this figure is, the more attractive the biomass project.

Phase I Report Revised February 6, 2012 23
Table 5.4. Financial performance of small (S), medium (M), and large (L) configurations. S1
Free standing stove for single-‐family residence
S2 Biomass furnace for single-‐family residence
S3 Heat for main lodge
S4 Heat for multiple cabins and lodge
M1 Heat for multiple buildings
Thermal demand 35 mmBtu/yr 70 mmBtu/yr 500 mmBtu/yr 1,100 mmBtu/yr 5,200 mmBtu/yr 20-‐yr effective fossil fuel price2 $29.50/mmBtu $29.50/mmBtu $22.50/mmBtu $24.00/mmBtu $31.50/mmBtu Fuel type Cordwood Pellets Cordwood Pellets Cordwood Clean chips Pellets Clean chips Pellets Capital construction costs Site prep and& building $1,500 $1,000 $5,000 $5,000 $41,000 $97,000 $83,000 $149,000 $128,000 Boiler and fuel receiving $2,500 $2,500 $10,000 $10,000 $45,000 $185,000 $140,000 $397,000 $349,000 Back-‐up boilers -‐-‐ -‐-‐ -‐-‐ -‐-‐ -‐-‐ -‐-‐ -‐-‐ -‐-‐ -‐-‐ Piping & pumping -‐-‐ -‐-‐ -‐-‐ -‐-‐ $43,000 $233,000 $233,000 $247,000 $247,000 Other misc1 $0 $0 $0 $0 $33,000 $134,000 $119,000 $202,000 $185,000 Homeowner hookup -‐-‐ -‐-‐ -‐-‐ -‐-‐ -‐-‐ -‐-‐ -‐-‐ -‐-‐ -‐-‐ TOTAL $4,000 $3,500 $15,000 $15,000 $162,000 $649,000 $575,000 $995,000 $909,000 Annual operating costs (20 yrs) Delivered wood costs Reference scenario $800 $600 $1,500 $1,100 $9,400 $8,100 $16,900 $38,500 $80,300 High oil price scenario $800 $600 $1,500 $1,100 $9,500 $8,100 $17,000 $38,700 $80,800
O&M, utilities & electric $0 $0 $0 $0 $1,200 $8,900 $3,700 $15,300 $6,800 TOTAL Reference $800 $600 $1,500 $1,100 $10,600 $17,000 $20,600 $53,800 $87,100 TOTAL High Oil Price $800 $600 $1,500 $1,100 $10,700 $17,000 $20,700 $54,000 $87,600 Reference scenario Cost of heat ($/mmBtu)2 $32.00 $24.70 $40.80 $34.80 $55.90 $69.30 $66.70 $27.80 $32.90 Simple payback period 9 years 6 years 16 years 11 years >20 years >20 years >20 years 9 years 12 yrs Return on investment3 147% 310% 32% 91% -‐109% -‐71% -‐81% 134% 78% Outstanding capital needed 4 $0 $0 $4,900 $100 $170,200 $548,900 $517,700 $0 $76,100
High oil price scenario Cost of heat ($/mmBtu)2 $33.60 $25.70 $42.40 $35.80 $57.40 $69.80 $67.60 $28.30 $33.90 Simple payback period 8 years 5 years 12 years 9 years >20 years >20 years >20 years 8 years 10 years Return on investment3 312% 514% 120% 186% -‐105% -‐61% -‐72% 234% 181% Outstanding capital needed 4 $0 $0 $0 $0 $166,800 $519,300 $494,500 $0 $0
1 Other miscellaneous costs include taxes, insurance, freight, engineering services, and construction management. 2 The annual levelized cost of providing heat over the next 20 years, which is the capital and operating costs divided by the total units of energy produced (mmBtu) over that time period adjusted for furnace efficiency. Cost of heat does not include the replacement cost of existing boiler(s). For L8 configurations, this figure does not include credit for electricity sales; these are shown instead in Figure 5.2.
3 Total revenue divided by total expenses over 20-‐years (non-‐discounted rate, before taxes). 4 Amount of investment needed in addition to the fuel cost savings achieved over 20 years; includes all capital and operating costs amortized over 20 years.

Phase I Report Revised February 6, 2012 24
Table 5.4 (continued). Financial performance of small (S), medium (M), and large (L) configurations. L1
Heat for Cook County Courthouse
L2 Heat for public buildings north of 5th St N (no hospital)
L3 Heat for public buildings north of 5th St N (hospital)
L4 District heat for Grand Marais business district
Thermal demand 1,400 mmBtu/yr 5,800 mmBtu/yr 12,100 mmBtu/yr 19,700 mmBtu/yr 20-‐yr effective fossil fuel price2 $35.90/mmBtu $34.90/mmBtu $32.60/mmBtu $33.30/mmBtu Fuel type Clean chips Pellets Clean Chips Pellets Clean Chips Pellets Hog fuel Pellets Capital construction costs Site prep and& building $67,000 $58,000 $149,000 $128,000 $208,000 $180,000 $1,235,000 $1,112,000 Boiler and fuel receiving $185,000 $140,000 $350,000 $300,000 $520,000 $460,000 $1,360,000 $1,224,000 Back-‐up boilers -‐-‐ -‐-‐ -‐-‐ -‐-‐ $200,000 $150,000 $330,000 $297,000 Piping & pumping $15,000 $15,000 $651,000 $651,000 $775,000 $775,000 $2,522,000 $2,522,000 Other misc1 $69,000 $55,000 $293,000 $275,000 $434,000 $399,000 $861,000 $775,000 Homeowner hookup -‐-‐ -‐-‐ -‐-‐ -‐-‐ -‐-‐ -‐-‐ $750,000 $750,000 TOTAL $336,000 $269,000 $1,443,000 $1,354,000 $2,137,000 $1,964,000 $7,058,000 $6,679,000 Annual operating costs (20 yrs) Delivered wood costs Reference scenario $10,000 $21,000 $42,000 $88,000 $89,000 $185,000 $60,000 $313,000 High oil price scenario $10,000 $21,000 $42,000 $89,000 $89,000 $186,000 $61,000 $320,000
O&M, utilities & electric $3,200 $1,900 $4,000 $2,000 $7,000 $3,500 $150,000 $75,000 TOTAL Reference $13,200 $22,900 $46,000 $90,000 $96,000 $188,500 $210,000 $388,000 TOTAL High Oil Price $13,200 $22,900 $46,000 $91,000 $96,000 $189,500 $211,000 $395,000 Reference scenario Cost of heat ($/mmBtu)2 $32.80 $35.50 $31.00 $37.60 $24.20 $31.00 $43.50 $51.20 Simple payback period 10 yrs 11 yrs 10 yrs 13 yrs 7 yrs 10 yrs 16 yrs >20 yrs Return on investment3 117% 98% 122% 68% 186% 111% 30% -‐19% Outstanding capital needed 4 $0 $0 $0 $170,000 $0 $0 $2,217,000 $3,879,000
High oil price scenario Cost of heat ($/mmBtu)2 $33.20 $36.50 $31.40 $38.30 $24.60 $31.70 $44.00 $54.50 Simple payback period 9 yrs 9 yrs 8 yrs 10 yrs 7 yrs 8 yrs 13 yrs 18 yrs Return on investment3 205% 201% 205% 153% 283% 211% 80% 13% Outstanding capital needed 4 $0 $0 $0 $0 $0 $0 $701,000 $2,981,000
1 Other miscellaneous costs include taxes, insurance, freight, engineering services, and construction management. 2 The annual levelized cost of providing heat over the next 20 years, which is the capital and operating costs divided by the total units of energy produced (mmBtu) over that time period adjusted for furnace efficiency. Cost of heat does not include the replacement cost of existing boiler(s). For L8 configurations, this figure does not include credit for electricity sales; these are shown instead in Figure 5.2.
3 Total revenue divided by total expenses over 20-‐years (non-‐discounted rate, before taxes). 4 Amount of investment needed in addition to the fuel cost savings achieved over 20 years; includes all capital and operating costs amortized over 20 years.

Phase I Report Revised February 6, 2012 25
Table 5.4 (continued). Financial performance of small (S), medium (M), and large (L) configurations. L5
Business district plus public buildings (no hospital)
L6 Business district plus public buildings (with hospital)
L7 Grand Marais homes and businesses
L8 Combined heat and power system for Grand Marais
Thermal demand 25,500 mmBtu/yr 34,200 mmBtu/yr 45,000 mmBtu/yr 45,000 mmBtu/yr 20-‐yr eff. fossil fuel price2 $33.60/mmBtu $32.60/mmBtu $33.20/mmBtu $33.20/mmBtu Fuel type Hog fuel Pellets Hog fuel Pellets Hog fuel Pellets Hog fuel Pellets Capital construction costs Site prep and& building $1,264,000 $1,137,000 $1,330,000 $1,197,000 $1,485,000 $1,337,000 $1,945,000 $1,797,000 Boiler and fuel receiving $1,482,000 $1,334,000 $1,560,000 $1,404,000 $1,810,000 $1,629,000 $4,010,000 $5,819,000 Back-‐up boilers $333,000 $299,000 $350,000 $315,000 $374,000 $337,000 $374,000 $337,000 Piping & pumping $3,542,000 $3,542,000 $3,658,000 $3,658,000 $6,278,000 $6,278,000 $6,279,000 $6,278,000 Other misc1 $985,000 $887,000 $1,037,000 $933,000 $1,511,000 $1,292,000 $1,107,000 $1,752,000 Homeowner hookup $800,000 $800,000 $950,000 $950,000 $1,768,000 $1,768,000 $1,768,000 $1,768,000 TOTAL $8,405,000 $7,992,000 $8,855,000 $8,457,000 $13,226,000 $12,641,000 $15,483,000 $17,751,000 Annual op. costs (20 yrs) Delivered wood costs Reference scenario $78,000 $406,000 $104,000 $545,000 $137,000 $717,000 $263,000 $1,608,000 High oil price scenario $79,000 $414,000 $106,000 $556,000 $139,000 $731,000 $267,000 $1,641,000
O&M, utilities & electric $175,000 $88,000 $200,000 $100,000 $300,000 $150,000 $300,000 $150,000 TOTAL Reference $253,000 $494,000 $304,000 $645,000 $437,000 $867,000 $563,000 $1,758,000 TOTAL High Oil Price $254,000 $502,000 $306,000 $656,000 $439,000 $881,000 $567,000 $1,791,000 Reference scenario Cost of heat ($/mmBtu)2 $40.20 $48.50 $32.90 $42.10 $37.20 $46.10 $51.30 $77.70 Simple payback period 14 yrs >20 yrs 11 yrs 18 yrs 13 yrs >20 yrs 15 yrs >20 yrs Return on investment3 48% -‐7% 86% 12% 59% -‐5% 30% -‐106% Outst.cap. needed4 $1,837,000 $4,171,000 $113,000 $3,561,000 $1,996,000 $6,381,000 $8,972,000 $22,056,000
High oil price scenario Cost of heat ($/mmBtu)2 $40.60 $51.80 $33.40 $45.40 $37.80 $49.50 $52.50 $85.50 Simple payback period 12 yrs 17 yrs 10 yrs 15 yrs 11 yrs 17 yrs 13 yrs >20 yrs Return on investment3 104% 29% 151% 51% 112% 24% 65% -‐113% Outst. cap. needed 4 $0 $2,956,000 $0 $2,142,000 $0 $4,809,000 $6,283,000 $22,618,000
1 Other miscellaneous costs include taxes, insurance, freight, engineering services, and construction management. 2 The annual levelized cost of providing heat over the next 20 years, which is the capital and operating costs divided by the total units of energy produced (mmBtu) over that time period adjusted for furnace efficiency. Cost of heat does not include the replacement cost of existing boiler(s). For L8 configurations, this figure does not include credit for electricity sales; these are shown instead in Figure 5.2.
3 Total revenue divided by total expenses over 20-‐years (non-‐discounted rate, before taxes). 4 Amount of investment needed in addition to the fuel cost savings achieved over 20 years; includes all capital and operating costs amortized over 20 years.

Phase I Report Revised February 6, 2012 26
Figure 5.2 shows the cost of heat, or LCOE, for each configuration and the portion comprised by each cost component. Worth noting is the portion of the LCOE represented by piping costs, which can have a significant impact on profitability of small systems. In the CHP configurations (L8), the LCOE includes sales of electricity at $0.075/kWh. 4.2 million kWh would be produced annually, resulting in annual revenues of $315,000. Figure 5.3 shows the LCOE for each configuration assuming the EIA Reference Case. For comparison, the white stripe marks the average 20-‐year fossil fuel price (adjusted for furnace
-‐years or less. Figure 5.4 shows the same information, but under the assumption of high oil prices. The LCOE for the biomass configurations are relatively similar. However, there is a noticeable difference in the higher level of fossil fuel prices, which improves the savings from t
Figure 5.2. Composition of the Levelized Cost of Energy (LCOE) by site configuration.

Phase I Report Revised February 6, 2012 27
Figure 5.3. 20-‐year Levelized Cost of Energy by site configuration using the EIA Reference Scenario.

Phase I Report Revised February 6, 2012 28
Figure 5.4. 20-‐year levelized cost of heat by site configuration assuming high oil prices. 6.0 Other Considerations
6.1 Measuring Regional Economic Impacts
It is not within the scope of this study to conduct an economic impact analysis of biomass utilization in Cook County. However, we reference findings from studies in other parts of the country to identify a range of economic impacts possible (Table 6.1). We emphasize that the impacts reported may not be applicable to Cook County because of differences in the mix of local industries and the flow of goods and services into and out of the region. The results of these studies are also highly variable and depend upon the size of the region and diversity of goods and services available. An accurate analysis for Cook County would require a substantial investment to determine the

Phase I Report Revised February 6, 2012 29
to biomass energy. The greater the diversity of industrial sectors existing locally in which to absorb new spending, the greater the indirect and induced effects, which are referred to as multipliers. Multipliers are a calculation of the proportion of new spending re-‐circulating before eventually leaking out the economy and spent elsewhere. If bioenergy is locally produced, Cook County residences and businesses could use the money that would otherwise flow out of region in the form of fossil fuel payments for any variety of local goods and services, including bioenergy.30 The direct effect of converting to locally produced bioenergy is to increase local economic spending by the price of the replacement biomass fuel.31 Capital equipment purchased from outside the region would have zero direct effect on the local economy, so most studies cited only consider the labor portion of capital costs in their calculation of the direct effect. There are also additional indirect and induced effects, which result from the recirculation of bioenergy payments and the forgone fossil fuel payments, increasing local economic activity with each transaction where the dollars are retained locally.32 The total effect is the sum of the direct, indirect and induced effects, which can be measured in jobs, income, or spending. The output multiplier is the total effect divided by the direct effect. The total impact on the local economy of switching to bioenergy is calculated by multiplying biomass purchases by the output multiplier. or more diverse. Table 6.1 presents the range of multipliers for bioenergy applications in different parts of the country, each with a different mix of business sectors and subsequent economic impacts. Multipliers ranged from 1.26 to 1.83, meaning that for every dollar spent locally on bioenergy fuel an additional $0.26 $0.83 was re-‐spent locally through indirect and induced spending.
30 It is important to note that not all the price paid for fossil fuels flows out of the community. A 2005 study prepared for the city of Santa Fe, New Mexico, for instance, estimated that 14.49% of expenditures on natural gas remained in the local economy.
31 This is the gross direct effect, and does not take into account the portion of foregone fossil fuel payments that would have remained in the local economy.
32 The indirect and induced effects vary widely depending on the structure, diversity and purchasing habits of residents and businesses within the local economy. For example, saved money that is spent at a local business results in indirect and induced effects for the local economy. Saved money used to purchase a sweater through a mail-‐order catalogue results in near zero indirect and induced effects within the local economy.

Phase I Report Revised February 6, 2012 30
Table 6.1. Local economic impact multipliers for biomass energy systems.
Biomass system measured Study area Year Author
Direct purchases
Indirect & induced purchases Total effect
Output multiplier
District heating Santa Fe, NM 2005 Shuman33 $1.00 $0.26 $1.26 1.26
Heating Massachusetts 2004 Timmons, et al. 34 $66.5 $46.5 $113.0 1.70
Heating Northeast US 1992 Timmons, et al.35 $70.6 million $4.2mm 74.8mm 1.06
Heating Voralberg, Austria 2006 Madlener & Koller36 714,335 309,909 1,024,244 1.43
Electricity Southeast US 2004 English, et al. 37 $5,453 $1,896 $7,349 1.35
Electricity (100 MW) Mississippi 2008 Perez-‐Verdin et al. 38 $64.47 38.95 103.42 1.60
Electricity (3,200 MW) Florida 2010 Hodges, et al. 39 $1.2 billion $1.0 Billion $2.2 Billion 1.83
33 Shuman, Michael H. "Economics of Proposed Biomass-‐fired District Heating System for Santa Fe, New Mexico." Nov. 2005. <http://small-‐mart.org/files/Santa-‐Fe-‐Biomass-‐Paper.pdf>.
34 Timmons, David, David Damery and Geoff Allen. "Energy from Forest Biomass: Potential Economic Impacts in Massachusetts." Dec. 2007. <http://bct.eco.umass.edu/wp-‐content/uploads/2009/04/bio-‐eco-‐impact-‐biomass.pdf>.
35 Ibid 36 Madlener, Reinhard and Martin Koller. "Economic and CO2 mitigation impacts of promoting biomass heating systems: an input-‐output study for Vorarlberg, Austria." Sept. 2006. Centre for Energy Policy and Economics. <http://www.cepe.ethz.ch/publications/workingPapers/CEPE_WP50.pdf>.
37 English, Burton C., et al. "Economic Impacts Resulting from Co-‐firing Biomass Feedstocks in Southeastern United States Coal-‐Fired Plants." July 2004. <http://ageconsearch.umn.edu/bitstream/20200/1/sp04en01.pdf>.
38Perez-‐Verdin, Gustavo, et al. "Economic impacts of woody biomass utilization for bioenergy in Mississippi." 2008. Forest Products Journal. <http://www.fwrc.msstate.edu/pubs/10487.pdf>.
39 Hodges, Alan W., Thomas J. Stevens and Mohammad Rahmani. "Economic Impacts of Expanded Woody Biomass Utilization on the Bioenergy and Forest Products Industries in Florida." 23 Feb. 2010. University of Florida, Institute of Food and Agricultural Sciences. <http://www.fl-‐dof.com/forest_management/fm_pdfs/Final%20Report%20on%20Economic%20Impacts%20of%20Woody%20Biomass%20Utilization.pdf>.

Phase I Report Revised February 6, 2012 31
6.2 Environmental Permitting and Regulations
At the highest possible scale of district heat implementation, with and without CHP technologies, the Minnesota Pollution Control Agency (MPCA) requires the biomass utilizing
Federal permits and do not require a 45 day EPA review and do not expire. A State of Minnesota Registration Option D permits is issued when facilities have allowable emissions below federal thresholds. MPTE emissions are calculated using EPA AP42 (default)
used to determine the Biomass Hot Water Boiler MPTE and guarantees from VAS, an Austrian thermal oil heater, were used for the co-‐gen option. VAS uses a mechanical collector and electrostatic precipitator (ESP) for particulate matter control, flue gas recirculation for NOX, and over-‐fire air for CO control. Table 6.2 shows emissions rates for criteria pollutants for the configurations assessed. All emissions are below the Option D threshold and, with the exception of CO for the biomass hot water boiler, below the Reduced Recordkeeping Threshold allowing for annual versus monthly emission calculations. Depending on the hot water boiler size and manufacturer, it may be possible achieve a CO MPTE below the 25 tons/yr threshold. Emission records must be kept on site for five years. Dust collector pressure drop and ESP voltage and current readings are recorded daily. Emission fees ($30 per ton pollutant) are payable annually with submission of the emission inventory. Figure 6.1 shows relative emission rates of fine particles for woody biomass and fossil fuel burning.
Figure 6.1. Relative emissions of fine particles (PM2.5)40
40 US EPA. 2005. Clean burning wood stoves and fireplaces. http://www.epa.gov/burnwise/energyefficiency.html (Accessed August 31, 2011)

Phase I Report Revised February 6, 2012 32
Table 6.2. Maximum potential to emit (MPTE) for criteria pollutants from biomass burning and comparison technologies (tons/yr).
PM PM10 NOx SO2 CO VOC Total emissions
Single HAP
Total HAP
Option D permit thresholds Standard threshold 50 501 50 50 50 50 250 5 12.5 Reduced record keeping 25 25 25 25 25 25 125 2.5 6.25
Configurations S1: Supplemental heat stove for single-‐
family residence 0.01 0.01 -‐-‐ 0.01 0.04 0.01 0.06 0.01 0.01 S2: Biomass furnace for single-‐family
residence 0.01 0.01 0.02 0.01 0.03 0.01 0.05 0.01 0.01 S3: Heat main lodge only 0.03 0.02 -‐-‐ 0.01 0.13 0.01 0.16 0.01 0.01 S4: Heat multiple cabins and main lodge 0.04 0.04 0.07 0.01 0.30 0.01 0.42 0.01 0.02 M1: Heat multiple buildings 0.37 0.34 0.62 0.03 2.73 0.064 3.82 0.07 0.22 L1: Heat for Cook County Courthouse 0.10 0.09 0.16 0.01 0.71 0.02 0.99 0.02 0.06 L2: Heat public buildings north of 5th
Street N (no hospital) 0.41 0.37 0.68 0.034 3.00 0.07 4.20 0.08 0.24 L3: Heat public buildings north of 5th
Street N (hospital) 3.11 2.80 1.96 0.22 5.33 0.15 10.77 0.17 0.52 L4: District heat for Grand Marais
business district 6.90 6.21 4.34 0.49 11.83 0.34 23.89 0.34 1.15 L5: District heat for business district (L4)
and public buildings (L2)(no hospital) 6.51 5.86 4.09 0.47 11.16 0.32 22.55 0.36 1.09 L6: District heat for business district (L4)
and public buildings (L3)(hospital) 8.14 7.33 5.12 0.58 13.95 0.40 28.19 0.44 1.36 L7: District heat for homes, businesses
between 5th Ave W. and 6th Ave E. 11.57 10.42 7.27 0.83 19.84 0.56 40.08 0.63 1.93 L8: Combined heat and power (CHP)
system for configuration L7 2.80 2.52 14.02 1.75 5.61 1.19 25.37 1.34 4.10 Non-‐biomass burning references Oil boiler 0.0031 0.0028 0.0313 0.1095 0.0077 -‐-‐ -‐-‐ -‐-‐ -‐-‐ Propane boiler 0.0009 0.0008 0.0337 0.0035 0.0046 -‐-‐ -‐-‐ -‐-‐ -‐-‐ Taconite Harbor facility (2008) unknown 744 2351 4720 230 28 7328 -‐-‐ -‐-‐
1 25 non-‐attainment area

Phase I Report Revised February 6, 2012 33
Appendix A. Reference Biomass Harvest Costs
Table A.1. Harvest costs for a conventional biomass harvesting system.
Machine costs 200-‐hp feller/buncher
169-‐hp skidder
225-‐hp chain flail delimber
174-‐hp tracked loader
860-‐hp chipper (self-‐loading) 120 cu-‐yd van
Fixed cost inputs Purchase price $217,000 $227,000 $354,900 $181,030 $580,000 $125,000 Scheduled hours/yr (SMH) 2,000 2,000 2,000 2,000 2,000 2,000 Production hours/yr (PMH) 1,300 1,200 1,300 1,300 1,300 1,300 Machine life (yrs) 4 5 5 5 5 8 Salvage value (% of new) 0.2 0.25 0.2 0.2 0.2 0.2 Interest rate (%) 0.1 0.1 0.1 0.1 0.1 0.1 Insurance (annual premiums) $7,600 $10,200 $7,100 $3,600 $12,000 $6,000 Taxes/tags (% of new) 0 0 0 0 0 0
Operating cost inputs Tire cost (total) -‐-‐ -‐-‐ -‐-‐ -‐-‐ -‐-‐ $3,500 Local fuel cost ($/gal) $2.99 $2.99 $2.99 $2.99 $2.99 $2.99 Horsepower 200 169 225 174 860 450 Fuel consumption (g/hp-‐hr) 0.026 0.028 0.028 0.022 0.028 6 Oil and lube use (% of fuel) 0.37 0.037 0.37 0.37 0.13 0.1 Repair/maintenance (% of dep) 1 0.9 0.9 0.9 0.75 0.6 Misc consumables ($/op hr) -‐-‐ -‐-‐ -‐-‐ -‐-‐ $9.28 -‐-‐
Labor cost inputs Basic labor rate $18 $18 $18 $18 $18 $18 Benefits (% of base) 0.33 0.33 0.33 0.33 0.33 0.33
Total costs breakdown Fixed cost ($/PMH) $42.10 $41.40 $66.84 $35.02 $55.01 $13.62 Variable costs ($/PMH) $48.45 $42.80 $77.40 $32.70 $104.77 $17.15 Labor costs ($/PMH) $23.94 $23.94 $23.94 $23.94 $23.94 $23.94
Total $/PMH $114.49 $108.14 $168.18 $91.66 $183.72 $54.71

Phase I Report Revised February 6, 2012 34
Appendix B. Hypothetical Biomass Demand
Biomass demand was calculated for a hypothetical scenario in which it is assumed that all businesses and residences in Grand Marais and a portion of Cook County switch to one of the assessed biomass heating options: cordwood, clean chips, pellets, hog fuel. Of the 2,707 occupied housing units in the county, an estimated 500 already heating with wood and about half of those are in Grand Marais.41 We assume the remaining 2,207 housing units would require, on average, 100 mmBtu/year of usable heat. We also assume each of the 84 businesses in Grand Marais would require 579 mmBtu/year of usable heat, and an additional 40 businesses outside of Grand Marais would require 600 mmBtu/year. Table B.1 summarizes the amount of biomass that would be required if all 2,331 units transitioned to wood-‐based heating in 2011. The table also summarizes heating demand in 2030 assuming a 22% increase in population (Section 2.0). Table B.1. Additional biomass demand if Cook County switched to wood heat, 2011 and 2030. Biomass demand (dry tons/yr)1
Number of units
Heat demand (mmBtu/yr) Cordwood Clean chips Pellets Hog fuel
Housing units Grand Marais 250 25,000 1,060 1,331 1,488 1,331 Outside Grand Marais 1,957 195,700 8,299 10,420 11,649 -‐-‐3 Businesses Grand Marais 84 48,652 2,063 2,590 2,896 2,590 Outside Grand Marais 40 24,000 1,018 1,278 1,429 1,278 Total in 2011 2,331 293,352 12,440 15,620 17,462 5,200 Total in 20302 2,844 357,890 15,176 19,056 21,302 6,344
1 Demand is not cumulative; assumes all users switch to one biomass type only. 2 Assumes a 22% increase in Cook County population. 3 Not feasible to heat individual homes with hog fuel because of technology limitations.
41 US Census Bureau. 2011. 2005-‐2009 American Community Survey. US Census Bureau, Washington, DC.

Phase I Report Revised February 6, 2012 35
Appendix C. Financial Performance Metrics
There are several ways to measure the financial performance of an alternative energy project, and no single metric is best. One measurement is the cost of heat, or the Levelized Cost of Energy (LCOE). The LCOE represents the lifetime capital and operating costs of the equipment
production are discounted to account for the time value of money). The LCOE is a useful way of comparing technology alternatives prior to installation, but is less useful when comparing existing systems to planned installations. This is because the state of the existing system (and operating expenses associated with it) is not a factor in calculating the cost of energy for a new system. In all the configurations modeled, the annual biomass fuel and O&M (operating and maintenance) costs are lower than for a conventional fossil fuel heating system. However, all of the sites assessed already possess heating systems that could continue in operation, whereas entirely new capital would need to be purchased in order to burn biomass. The question, then, is whether the annual savings from the biomass heating system are sufficient to justify the initial purchase and installation of the new biomass heating capital. A simply understood measurement of these savings is the Discounted Payback Period (DPP). This is the number of years it would take for the savings from the alternative energy project to painitial cost (adjusted for the time value of money). Another measurement is the Net Present Value (NPV). The NPV is the value of the total lifetime savings from the project if they were offered to the investor today as one lump sum, minus the cost of the project. If the value of the lump sum is greater than the cost of the project then the NPV is positive. A weakness of the NPV is that it implicitly assumes a fixed discount rate, which may not be comparable between individual investors with different goals and risk tolerances. To avoid the drawbacks of using a discount rate, the Internal Rate of Return (IRR) is used, which assumes the NPV equals zero. If the IRR is greater than the desired return that the investor could achieve elsewhere, then they should undertake the project. Finally, for homeowners and businesses not planning to continue operating their current heating systems, the more appropriate metric is the Outstanding Capital Needed. If a home or business owner must decide whether to replace their current heating system with a similar fossil fuel-‐burning one or upgrade to a biomass heating system, they would choose the fossil fuel heating system only if its capital cost is lower than this initial capital threshold. One important assumption is that the efficiency of the replacement fossil fuel-‐burning system is similar to the efficiency of the current fossil fuel-‐burning system (assumed 82%). The metric takes into account the capital costs and fuel costs of both systems, as well as the additional (incremental) O&M costs of the biomass system.

Phase I Report Revised February 6, 2012 36
Appendix D. Pellet Production
According to the USDA, the North American Pellet Market grew from 1.1 million metric tons in 2003 to 4.2 million metric tons in 2008.42 European demand is predicted to reach 11 million metric tons in 2011 and 25 million metric tons by 2020.43 US pellet appliance sales, which are tracked by the Hearth, Patio and Barbecue Association (HPBA), have shown substantial volatility with oil and housing starts but overall the US pellet market is trending upward at about 5% per year.44 It is generally accepted that new pellet heating appliances are more reliable, efficient (75% or higher) and convenient while emitting very low emissions; often less than 1 gram per hour of particulate for an average home pellet stove. At present, pellets cost about half as much as propane or fuel oil on a Btu basis, often allowing the homeowner to recover equipment costs in about five years. While we believe that certified premium wood pellets (less than 1% ash and no bark) will be the growth heating fuel for all of Northern Minnesota, there are currently no significant pellet manufacturers in Minnesota. The closest US suppliers to Cook County are Great Lakes Renewable Energy in Hayward, WI (35,000-‐tpy capacity) and Indeck in Ladysmith, WI (90,000-‐tpy capacity). The City of Silver Bay and the Fond du Lac Band of Lake Superior Chippewa are both considering 100,000 tons per year premium pellet manufacturing facilities. The trend is for larger pellet plants that use de-‐barked roundwood, not dependent on local sawmills, that have an economy of scale that allows for year round operation. Greenfield scale (100,000 tpy) plants have capital costs approaching $20,000,00045 and create about 20 plant jobs, and 50 or more logging and trucking jobs. It has been suggested that Cook County build a pellet manufacturing facility. While the County has more than enough wood for even a large plant (100,000 tpy, requiring about 100,000 cords), the northern portion of Highway 61 product transportation logistics may preclude a scale plant, while a smaller plant (25,000 tpy) would cost over $9,000,000, nearly half as much as a 100,000 tpy plant. At about 6 tons (100 mmBtu) per year per home, even if all homes and businesses in Cook County switched to pellets, demand would only approach about 17,000 tpy.46 Table D.1 provides estimated cost breakdown for a 25,000-‐tpy pellet plant.
42 -‐RP-‐656. USDA Forest Service, Forest Products Laboratory, Madison, WI. Available at: http://www.fpl.fs.fed.us/documnts/fplrp/fpl_rp656.pdf.
43 Sikkema, R., Steiner, M., Junginger, M., Hiegl, W.,Hansen, M.T., Faaij, A. 2011. The European wood pellet markets: current status and prospects for 2020. Biofuels, Bioproducts and Biorefining, In press.
44 Valentas, K. J., V. Gauto, P. Gillitzer, M. von Keitz, C. Lehman, S. J. Taff, and D. Wyse. Chisago-‐Isanti-‐Pine Biofuels Feasibility Study. University of Minnesota. March 2009.
45 Chuck Hartley, LHB Inc., personal communication, July 19, 2011. 46 Ibid

Phase I Report Revised February 6, 2012 37
Table D.1. Cost components of a 25,000-‐ton/year pellet plant.
Component Equipment Materials & Labor Total
Site Work $0 $75,000 $75,000 Utilities $0 $300,000 $300,000 Product building (6,400 sq ft) $1,152,000 $25,000 $1,177,000 Mechanical (not incl in materials & labor) $25,000 $25,000 $50,000 Electric & instruments (not incl in materials & labor) $25,000 $25,000 $50,000 Civil (not incl in materials & labor) $25,000 $25,000 $50,000 Receiving & rolling stock $815,000 $390,000 $1,205,000 Debarking & chipping $1,000,000 $250,000 $1,250,000 Raw material in-‐feed & screen $85,000 $50,000 $135,000 Wet sizing $100,000 $100,000 $200,000 Drum dryer, combustor, cyclones $750,000 $250,000 $1,000,000 Dry raw material storage $40,000 $40,000 $80,000 Dry sizing $75,000 $75,000 $150,000 Sizing bag houses $35,000 $35,000 $70,000 Pelletizer $250,000 $50,000 $300,000 Cooler $20,000 $20,000 $40,000 Screen $16,000 $6,000 $22,000 Conveyors $325,000 $50,000 $375,000 Cyclone/air system $20,000 $8,000 $28,000 Bag filter $40,000 $60,000 $100,000 Bagging & palletizing $500,000 $38,000 $538,000 Bulk handling (not incl in other) $50,000 $10,000 $60,000 Pellet bin $45,000 $50,000 $95,000 Truck bin $50,000 $50,000 $100,000 Blacktop (40,000 @ $2.10) $84,000 $0 $84,000 Air comp, tools, office $200,000 $85,000 $285,000 Construction gen conditions $125,000 $125,000 $250,000 Ownership cost (tax, freight, ins) (4.5%) $564,830 $0 $564,830 Engineering (7.0%) $564,830 $0 $564,830 Construction management (1.0%) $80,690 $0 $80,690 TOTAL $7,062,350 $2,217,000 $9,279,350

Phase I Report Revised February 6, 2012 38
Appendix E. Renewable Energy Incentive Programs and Financing
Outline for State of Minnesota and federal policies which have the potential to offset initial investment costs or entice businesses and individuals to participate in a bioenergy market. Table E.1. Incentives for producing heat and electricity from biomass. Program/incentive Description Qualifying FEDERAL Residential Energy Efficiency Tax Credit
Biomass stoves (including pellets) receive a tax credit up to $300 in the year of purchase
Homeowner heating
Modified Accelerated Cost-‐Recovery System (MACRS)
Allows 7-‐year Modified Accelerated Cost-‐Recovery System on assets used to create hot water, gas, steam or electricity from biomass, and on equipment & structures to receive, handle, collect and process.
Industry heating
Business Energy Investment Tax Credit (ITC)
For Commercial, Industrial, Utility, and Agricultural entities
Industry electricity
Renewable Electricity Production Tax Credit
For Commercial and Industrial entities Industry electricity
Rural Energy for America Program (REAP)
Funds up to 25% of the project costs or loan guarantees up to 75% of project
General heating
Tribal Energy Program Grant Tribal heating Qualified Energy Conservation Bonds (QECBs)
Government heating
STATE of MINNESOTA Home Energy Loan Program Low-‐interest loan for energy
improvements; up to 49% of residence can be used for business; homes built prior to 1989.
Homeowner heating
MHFA Fix-‐up Fund Low-‐interest loan of up to $35,000 for energy efficiency and renewable energy technologies (income less than $96,000)
Homeowner heating
Various Utilities -‐ Residential Energy Efficiency Rebate Program
Most utilities offer a variety of heating system rebates to residential customers to make homes more energy efficient
Homeowner heating
MHFA Rental Rehabilitation Loan Program
Similar to the MHFA Fix-‐up Fund, but for landlords who rent out their properties
Homeowner heating
Rental Energy Loan Fund Similar to the MHFA Rental Rehabilitation Loan Program
Homeowner heating
Agricultural Improvement Loan Program
Borrowers with net worth of <$409,000 may apply for a loan with an interest rate of 4.5% for up to 45% of the project cost or $300,000 (whichever is less)
Landowner heating
Value-‐Added Stock Loan Participation Program
Like the Ag Improvement Loan Program but focused on purchasing stock in a renewable energy cooperative
Landowner heating

Phase I Report Revised February 6, 2012 39
Table 6.2 (continued). Incentives for producing heat and electricity from biomass. Program/incentive Description Qualifying STATE of MINNESOTA Sustainable Agriculture Loan Program
Low-‐interest loans to landowners for capital expenditures that enhance the environmental and economic viability
Landowner heating
Power Grant Program Grants up to $50,000 to Minnesota Power commercial, industrial, and ag customers for renewable energy products, new electro-‐technologies that lower energy costs per unit of production in a manufacturing process, innovative technologies that are new/underutilized, and the inclusion of energy-‐efficient options in the design phase of a project
General electricity
Net Metering & Interconnection Standards
Utilities must allow net metering for electricity facilities of less than 40 kW, essentially compensating producers at
Utilities electricity
Community-‐Based Energy Development (C-‐BED) Tariff
20-‐year power purchase agreement (PPA) for community-‐owned renewable energy projects; tariff rate must be higher in the first 10 years of the agreement than the last ten years
COOPs electricity

Forest Biomass Heating and Electricity in Cook County, MN Phase I Report September 2011 For further information about this report, please contact: Dovetail Partners 528 Hennepin Ave, Suite 703 Minneapolis, MN 55403 Tel: 612-‐333-‐0430 Fax: 612-‐333-‐0432 Email: [email protected]

UMN Report to Dovetail Partners September 27, 2012 Final Draft 187
APPENDIX D. Review of Grand Marais Biomass District Heating System (FVB Energy, Inc.)

Review of Grand Marais Biomass District Heating System
Feasibility Analysis
Funded by
Swedish Bioenergy Association and BioBusiness Alliance of Minnesota
Submitted by
222 South Ninth Street Minneapolis MN, 55402
Phone 612-338-4489 www.fvbenergy.com
Aug. 3, 2012

Review of Grand Marais Biomass District Heating System Feasibility Analysis Aug. 3, 2012
Page 2 of 26
Contents Executive Summary ............................................................................................3
Introduction .........................................................................................................6
Heat Load .............................................................................................................6
Capital Costs .......................................................................................................9
Operating Costs ................................................................................................ 10
Self-Generation Costs ....................................................................................... 12
Financial Analysis ............................................................................................. 14 Profit (Loss) .............................................................................................................................. 14 Net Present Value .................................................................................................................... 15 Internal Rate of Return ............................................................................................................ 15
Conclusions ....................................................................................................... 15
Recommendations ............................................................................................ 16
Phase II Study including Schematic Design and Full Business Plan ........... 17
Appendix 1 L6 Potential Customers ............................................................. 18
Appendix 2 L3 Potential Customers ............................................................. 21
Appendix 3 Hybrid Scenario Potential Customers ...................................... 22
Appendix 4 Financial Analysis ...................................................................... 24 Tables Table 1. FVB Initial Estimates of Capital Costs (million $) ............................................................... 9 Table 2. Key Parameters in FVB Initial Estimates .......................................................................... 10 Table 3. Operating Cost Estimates ................................................................................................ 12 Table 4. Split of Fuels Used by Potential Customers in Each Scenario ......................................... 12 Table 5. Summary of Net Present Value and Internal Rate of Return Analysis ............................ 15 Figures Figure 1. Split of Total L6 Fuel Consumption by Area ..................................................................... 6 Figure 2. Split of Top 80% of L6 Fuel Consumption by Area ........................................................... 7 Figure 3. Preliminary Routing of Hybrid Scenario Distribution System .......................................... 8 Figure 4. Hybrid Scenario Potential Customers by Type ................................................................. 9 Figure 5. L3 Scenario Heat Production Duration Curve ................................................................ 10 Figure 6. L6 Scenario Heat Production Duration Curve ................................................................ 11 Figure 7. Hybrid Scenario Heat Production Duration Curve ......................................................... 11 Figure 8. Fuel Cost of Delivered Heat............................................................................................ 13 Figure 9. Distillate Fuel Oil Price History 2002-‐2012 ..................................................................... 13 Figure 10. Propane Price History 2002-‐2012 ................................................................................ 14

Review of Grand Marais Biomass District Heating System Feasibility Analysis Aug. 3, 2012
Page 3 of 26
Executive Summary This review was undertaken by FVB Energy with funding provided by the partnership of the Swedish Bioenergy Association (Svebio) and the BioBusiness Alliance of Minnesota (BBAM). The Cook County Local Energy Project (CCLEP) is now interested in pursuing the development of a detailed design and
Dibuildings north of 5th Street and the hospital. The L6 scenario would serve the downtown Grand Marais business district as well as the L3 loads. Based on our review, we believe that service to all L6 customers is not viable at this time. Consequently, we examined the financial viability of the L3 scenario and a new Hybrid Scenario that combines the N. 5th St. loads with selected downtown loads. The figure below shows the preliminary routing of distribution piping mains for the Hybrid scenario, with the plant assumed to be located east of the intersection of Gunflint Trail and 4th Ave. East (green box). Service lines to individual customers are not shown. From this distribution system, 21 customers could be served, with a combined annual heating consumption of app. 24,000 MMBtu and a non-‐coincident peak demand of 12.8 MMBtu/hr.

Review of Grand Marais Biomass District Heating System Feasibility Analysis Aug. 3, 2012
Page 4 of 26
Twenty year financial projections were made for the three scenarios (L3, L6 and Hybrid). Costs were escalated based on U.S. Energy Information Administration projections in Annual Energy Outlook 2011. The sales price of heat was assumed to be 95% of the customer self-‐generation costs, with the heat price escalated two ways:
A. Based on the weighted average EIA escalation projections for fuel oil and propane, weighted according the Hybrid Scenario customer fuel split (54% fuel oil, 46% propane); or
B. Based on EIA general inflation rates. In the simplified financial analysis, debt service costs are based on 100% debt financing over 20 years at a rate of 3.8%, a rate that is slightly higher than the currently anticipated State of Minnesota bond interest rate. A number of financial criteria are addressed:
The annual profit or loss is shown. None of the scenarios shows positive cash flow the first year. However, for example, the Hybrid Scenario achieves positive cumulative cash flow in year 5 (Heat Price Escalation Scenario A). Projected early-‐year negative cash flow is typically handled by capitalizing a cash flow reserve fund.
A key financial performance criterion is Net Present Value (NPV), which discounts cash flows based on an assumed discount rate. In this analysis we assume a 3.8% discount rate. An NPV above zero is a potentially viable scenario. The NPV results are summarized in the table below.
Another financial test is Internal Rate of Return (IRR), which is the discount rate that exactly balanced the negative cash flow of the initial capital investment with the operating cash flows.
There are many variables that affect the ultimate financial viability of a biomass district heating system, and many uncertainties remain regarding key technical and economic parameters for this system. This report reflects a quick assessment based on avail s experience. With that context, we offer our conclusions:
1. The capital costs for implementing the L3 or L6 Scenarios are likely to be significantly higher than indicated in the Phase I study.
2. The L3 Scenario is potentially viable if the escalation rate for the price of heat rate is pegged to projected changes in the price of fuel oil and propane.
3. A Hybrid Scenario which combines the N. 5th St. loads and larger loads in the southeastern part of downtown is more cost-‐effective than the L3 scenario and is significantly more cost-‐effective than the L6 scenario.
4. The L3 Scenario includes 10 customers and the Hybrid Scenario as evaluated includes 21 customers.
5. There is likely a modified Hybrid Scenario that is viable with fewer than 21 customers.
L3 L6 Hybrid
Net Present ValueHeat rate escalation A 195,351$ (1,802,962)$ 1,427,461$ Heat rate escalation B (738,714)$ (4,222,968)$ (487,674)$
Internal rate of returnHeat rate escalation A 4.3% 2.2% 5.7%Heat rate escalation B 1.7% -‐0.7% 3.1%

Review of Grand Marais Biomass District Heating System Feasibility Analysis Aug. 3, 2012
Page 5 of 26
Ultimately, Grand Marais must determine its willingness to make a substantial capital investment in community infrastructure in order to:
Stabilize and reduce long-‐term energy costs; Reduce dependence on imported fossil fuel resources; Reduce fire risks and the costs associated with managing this risk; and Keep more energy dollars the local economy.
We recommend a step-‐wise process to study, refine, design and develop a plan for biomass district heating in Grand Marais. The first step should be the development of a complete Phase I feasibility study concurrent with informed and serious marketing efforts. It is critically important to develop a realistic Phase I assessment which results in a workable system technical concept (including distribution piping and building conversion and interconnection for viable customers) and accurate estimates of capital and operating costs. This can then provide the foundation for a business plan which establishes clear and realistic assumptions regarding financing the systems and which evaluates financial performance with accepted methodologies and calculations. Once the Phase I feasibility analysis has been completed in this manner, the County can then make an informed decision about spending additional funds for a Phase II study including development of a complete Schematic Design and full Business Plan, as proposed below. The Phase II study would include detailed recommendations for implementation, including:
Business organization, financing approach and rate structure; and Procurement alternatives and recommended procurement path for each major element in the
system (plant, distribution and building conversion/interconnection). The end result would be the technical, financial and business basis for financing the detailed design, procurement and construction of the system.

Review of Grand Marais Biomass District Heating System Feasibility Analysis Aug. 3, 2012
Page 6 of 26
Introduction The BioBusiness Alliance of Minnesota (BBAM) and the Swedish Bioenergy Association (Svebio) have worked in partnership over the past year with the overall objective to expand and accelerate biomass-‐to-‐energy opportunities in Minnesota. As peer not for-‐profit organizations, the establishment of the BBAM Svebio Bioenergy Partnership works to assist project owners and developers located in Minnesota to help ensure successful bioenergy project development. The partnership seeks to de-‐risk biomass-‐to-‐energy project development throughout the state by leveraging world-‐leading Swedish technology and know-‐how that includes decades of proven experience and a successful track-‐record. The partnership provides time, resources, and specific insights relevant to each unique project and opportunity through highly-‐customized project management and by offering access to its joint network of industry, government, academic, and other non-‐governmental organizational resources. The Grand Marais Biomass District Heating Project is viewed by the partnership as an exceptional opportunity to develop a community-‐scale biomass-‐to-‐energy installation to serve as a state-‐wide model, as well as, a nationally-‐recognized biomass district heating system. For this reason, the
The Cook County Local Energy Project (CCLEP) is now interested in pursuing the development of a
in
scenario would serve public buildings north of 5th Street and the hospital. The L6 scenario would serve the downtown Grand Marais business district as well as the L3 loads. Heat Load Appendix 1 shows data and estimates of fuel consumption by the 75 potential customers included in the L6 scenario, sorted by volume of fuel consumption in million Btu (MMBtu). Of the total fuel consumption, 61% is in the downtown and 39% is in the N. 5th St. area (Figure 1).
Figure 1. Split of Total L6 Fuel Consumption by Area
61%
39%
% of Heating Load by Area (All L6 Potential Customers)
Downtown
N. 5th St.

Review of Grand Marais Biomass District Heating System Feasibility Analysis Aug. 3, 2012
Page 7 of 26
The total annual fuel consumption is 43,660 MMBtu. At an assumed seasonal average fuel efficiency of 70%, the total annual heat consumption is 30,562 MMBtu. We estimate that the total of the individual
-‐coincident peak demand) is 16.2 MMBtu/hr. Accounting for the fact that not all building peak at the same time, we estimate that the peak demand on the district energy
Of the total L6 potential load, only 18 customers are responsible for 80% of the load, with the remaining 57 customers having 20% of the load. Of these top 18 customers, 54% are in downtown and 46% in the N. 5th St. area (Figure 2).
Figure 2. Split of Top 80% of L6 Fuel Consumption by Area
Based on the quick financial review presented below, we believe that service to all L6 customers is not viable at this time. Consequently, we examined the financial viability of the L3 scenario and a new Hybrid scenario that combines the N. 5th St. loads with selected downtown loads. The L3 scenario would serve 10 customers with a total annual heat consumption of 11,796 MMBtu and a non-‐coincident peak demand of 6.2 MMBtu/hr. Data on the L3 Scenario potential customers is provided in Appendix 2. County Services account for 97% of the heating load in the L3 scenario. Figure 3 shows the preliminary routing of distribution piping mains for the Hybrid scenario, with the plant assumed to be located east of the intersection of Gunflint Trail and 4th Ave. East (green box). Service lines to individual customers are not shown. From this distribution system, 21 customers could be served, with a combined annual heating consumption of 24,186 MMBtu and a non-‐coincident peak demand of 12.8 MMBtu/hr. Data on the Hybrid Scenario potential customers is provided in Appendix 3. 51% of the Hybrid Scenario potential heat load is in downtown and 49% is in the N. 5th St. area. The breakdown by customer type is shown in Figure 4. It is notable that nearly half of the load is County Services.
54%
46%
% of Heating Load by Area (Top 80% of L6 Potential Customers)
Downtown
N. 5th St.

Review of Grand Marais Biomass District Heating System Feasibility Analysis Aug. 3, 2012
Page 8 of 26
Figure 3. Preliminary Routing of Hybrid Scenario Distribution System

Review of Grand Marais Biomass District Heating System Feasibility Analysis Aug. 3, 2012
Page 9 of 26
Figure 4. Hybrid Scenario Potential Customers by Type
Capital Costs
Table 1. The L3 and L6 estimates differ significantly from the Phase 1 report estimates, as indicated. Key parameters upon which the FVB estimates were based are summarized in Table 2. The Phase I study plant capital cost estimates were based on biomass boiler capacities of 6.8 and 15.0 MMBtu/hr for Scenarios L3 and L6, respectively. The Phase I study indicates 4,000 and 26,450 trench feet of piping for the L3 and L6 scenarios, respectively. This appears to not have included service lines from the pipe mains to the buildings. The basis for the interconnection cost estimates is not clear.
Table 1. FVB Initial Estimates of Capital Costs (million $)
50%
47%
3%
% of Heating Load by Customer Type (Hybrid Scenario)
Lodging
County Services
Other
FVB Estimates L3 L6 HybridPlant 2.15$ 4.91$ 3.96$ Distribution 1.52$ 5.64$ 2.63$ Building interconnections 0.37$ 1.25$ 0.74$ Total 4.04$ 11.80$ 7.33$
Phase 1 Study Estimates L3 L6Plant 1.36$ 4.25$ Distribution 0.78$ 3.66$ Building interconnections -‐$ 0.95$ Total 2.14$ 8.86$

Review of Grand Marais Biomass District Heating System Feasibility Analysis Aug. 3, 2012
Page 10 of 26
Table 2. Key Parameters in FVB Initial Estimates
Operating Costs Operating costs include biomass fuel, peaking/backup fuel, electricity, maintenance, ash disposal and labor. Figure 5, Figure 6, and Figure 7 show the heating production duration curves for the L3, L6 and Hybrid scenarios, respectively. With the biomass capacity as assumed, biomass provides about 88% of the total annual heat production, with the remainder provided with back-‐up/peaking fuel oil boilers. Biomass fuel was assumed to cost $45 per delivered wet ton at 45% moisture. Fuel oil was assumed to cost $3.10 per gallon. Biomass and fuel oil boiler efficiencies were assumed to be 70% and 75%, respectively.
Figure 5. L3 Scenario Heat Production Duration Curve
L3 L6 HybridBiomass boiler capacity (MMBtu/hr) 3.4 8.5 6.8 Distribution and service lines (trench feet) 6,750 28,745 12,425 Building interconnections (#) 10 75 21
0.0
1.0
2.0
3.0
4.0
5.0
6.0
0 1000 2000 3000 4000 5000 6000 7000 8000
HEAT LO
AD (MMBtu/hr)
Hours
Peaking boiler
Biomass

Review of Grand Marais Biomass District Heating System Feasibility Analysis Aug. 3, 2012
Page 11 of 26
Figure 6. L6 Scenario Heat Production Duration Curve
Figure 7. Hybrid Scenario Heat Production Duration Curve
0.0
2.0
4.0
6.0
8.0
10.0
12.0
14.0
16.0
0 1000 2000 3000 4000 5000 6000 7000 8000
HEAT LO
AD (MMBtu/hr)
Hours
Peaking boiler
Biomass
0.0
2.0
4.0
6.0
8.0
10.0
12.0
0 1000 2000 3000 4000 5000 6000 7000 8000
HEAT LO
AD (MMBtu/hr)
Hours
Peaking boiler
Biomass

Review of Grand Marais Biomass District Heating System Feasibility Analysis Aug. 3, 2012
Page 12 of 26
Table 3. Operating Cost Estimates
Self-Generation Costs The costs for supplying heat from individual building systems will vary depending on many factors, including heating system type, fuel, age of facilities and maintenance practices. Current fuel oil and propane costs are $3.10 and 2.18 per gallon, respectively. This equates to $22.38 and 23.57 per MMBtu of fuel content. At a realistic annual fuel efficiency of 70%, the cost of production of heat with fuel oil or propane are $31.98 or $33.67 per MMBtu of heat. Given that the fuel split is about 50/50 (see Table 4), we will assume that the offset fuel cost for customers is about $33.00 per MMBtu of heat. Maintenance of boiler facilities will add another $1.40 per MMBtu of heat, for a total customer cost savings of $33.40 per MMBtu of delivered heat.
Table 4. Split of Fuels Used by Potential Customers in Each Scenario
The fuel cost of delivered biomass district heat (assuming $45 per delivered wet ton and including boiler efficiency and distribution losses) is dramatically lower than the current fuel costs of fuel oil and propane heat, as illustrated in Figure 8. During the last 10 years, the price of distillate fuel oil has increased 253%, as illustrated in Figure 9. In the same period, the price of propane has increased 155%, as illustrated in Figure 10.
L3 L6 HybridBiomass fuel 76,672$ 202,324$ 157,203$ Fuel oil 45,136$ 119,105$ 92,543$ Electricity 3,397$ 11,736$ 6,501$ Maintenance 18,089$ 53,377$ 32,427$ Ash disposal 656$ 1,731$ 1,345$ Labor 35,000$ 140,000$ 70,000$ Total 178,950$ 528,273$ 360,019$
L3 L6 HybridFuel Oil 47% 50% 54%Propane 53% 50% 46%

Review of Grand Marais Biomass District Heating System Feasibility Analysis Aug. 3, 2012
Page 13 of 26
Figure 8. Fuel Cost of Delivered Heat
Figure 9. Distillate Fuel Oil Price History 2002-‐2012
$-‐
$5
$10
$15
$20
$25
$30
$35
Biomass districtheat (clean chips)
Fuel oil Propane
Fuel co
st ($
/MMBtu de
livered
heat)
$0.00
$0.50
$1.00
$1.50
$2.00
$2.50
$3.00
$3.50
$4.00
$4.50
Mar 04, 200
2
Mar 04, 200
3
Mar 04, 200
4
Mar 04, 200
5
Mar 04, 200
6
Mar 04, 200
7
Mar 04, 200
8
Mar 04, 200
9
Mar 04, 201
0
Mar 04, 201
1
Mar 04, 201
2
AVerage Weekly U.S. Fue
l Oil Price ($/gal.)

Review of Grand Marais Biomass District Heating System Feasibility Analysis Aug. 3, 2012
Page 14 of 26
Figure 10. Propane Price History 2002-‐2012
Financial Analysis Twenty year financial projections were made for the three scenarios, as presented in Appendix 4. Costs were escalated based on U.S. Energy Information Administration projections in Annual Energy Outlook 2011. For simplicity, it was assumed that the system would be constructed in 2013 and all customer connections made in 2013, with year 1 starting in late 2013. The sales price of heat was assumed to be 95% of the self-‐generation costs presented above, with the heat price escalated two ways:
A. Based on the weighted average EIA escalation projections for fuel oil and propane, weighted according the Hybrid Scenario customer fuel split (54% fuel oil, 46% propane); or
B. Based on EIA general inflation rates. In the simplified financial analysis, debt service costs are based on 100% debt financing over 20 years at a rate of 3.8%, a rate that is slightly higher than the currently anticipated State of Minnesota bond interest rate. A number of financial criteria are addressed.
Profit (Loss) The annual profit or loss is shown. None of the scenarios shows positive cash flow the first year. However, for example, the Hybrid Scenario achieves positive cumulative cash flow in year 4 for Heat Price Escalation Scenario A. Projected early-‐year negative cash flow is typically handled by capitalizing a cash flow reserve fund.
$0.00
$0.50
$1.00
$1.50
$2.00
$2.50
$3.00
$3.50
Mar 04, 200
2
Mar 04, 200
3
Mar 04, 200
4
Mar 04, 200
5
Mar 04, 200
6
Mar 04, 200
7
Mar 04, 200
8
Mar 04, 200
9
Mar 04, 201
0
Mar 04, 201
1
Mar 04, 201
2
AVerage Weekly U.S. P
ropa
ne Pric
e ($/gal.)

Review of Grand Marais Biomass District Heating System Feasibility Analysis Aug. 3, 2012
Page 15 of 26
Net Present Value A key financial performance criterion is Net Present Value (NPV), which discounts cash flows based on an assumed discount rate. In this analysis we assume a 3.8% discount rate. An NPV above zero is a potentially viable scenario. The NPV results are summarized in Table 5.
Internal Rate of Return Another financial test is Internal Rate of Return (IRR), which is the discount rate that exactly balanced the negative cash flow of the initial capital investment with the operating cash flows. An IRR above an
discount rate is considered a potential viable scenario.
Table 5. Summary of Net Present Value and Internal Rate of Return Analysis
Conclusions There are many variables that affect the ultimate financial viability of a biomass district heating system, and many uncertainties remain regarding key technical and economic parameters for this system. This
context, we can offer our conclusions: 1. The capital costs for implementing the L3 or L6 Scenarios are estimated to be higher than
indicated in the Phase I study. 2. The L3 Scenario is potentially viable if the escalation rate for the price of heat rate is pegged to
projected changes in the price of fuel oil and propane. 3. A Hybrid Scenario which combines the N. 5th St. loads and larger loads in the southeastern part
of downtown is more cost-‐effective than the L3 scenario and is significantly more cost-‐effective than the L6 scenario.
4. The L3 Scenario includes 10 customers and the Hybrid Scenario as evaluated includes 21 customers.
5. There is likely a modified Hybrid Scenario that is viable with fewer than 21 customers. Ultimately, Grand Marais must determine its willingness to make a substantial capital investment in community infrastructure in order to:
Stabilize and reduce long-‐term energy costs; Reduce dependence on imported fossil fuel resources; Reduce fire risks and the costs associated with managing this risk; and Keep more energy dollars the local economy.
L3 L6 Hybrid
Net Present ValueHeat rate escalation A 195,351$ (1,802,962)$ 1,427,461$ Heat rate escalation B (738,714)$ (4,222,968)$ (487,674)$
Internal rate of returnHeat rate escalation A 4.3% 2.2% 5.7%Heat rate escalation B 1.7% -‐0.7% 3.1%

Review of Grand Marais Biomass District Heating System Feasibility Analysis Aug. 3, 2012
Page 16 of 26
Recommendations We recommend a step-‐wise process to study, refine, design and develop a plan for biomass district heating in Grand Marais. The first step should be the development of a complete Phase I feasibility study concurrent with informed and serious marketing efforts. The existing Phase I study is focused primarily on the plant facilities, whereas the (sometimes fatal) challenges in development of a district energy system (DES) to serve existing buildings lie in assessing the heating load and marketable price for district heat, and thus the systems revenues, and in determining the costs of converting and interconnecting numerous customer buildings. It is critically important to develop a realistic Phase I assessment which results in a workable system technical concept (including distribution piping and building conversion and interconnection for viable customers) and accurate estimates of capital and operating costs. This can then provide the foundation for a business plan which establishes clear and realistic assumptions regarding financing the systems and which evaluates financial performance with accepted methodologies and calculations. Once the Phase I feasibility analysis has been completed in this manner, the County can then make an informed decision about spending additional funds for a Phase II study including development of a complete Schematic Design and full Business Plan, as proposed below. The Phase II study would include detailed recommendations for implementation, including:
Business organization, financing approach and rate structure; and Procurement alternatives and recommended procurement path for each major element in the
system (plant, distribution and building conversion/interconnection). The recommended work plan for these efforts is as follows: Full Phase I Feasibility Analysis, Marketing and Draft Business Plan
1. Market Assessment
1.1. Load analysis 1.2. Load mapping 1.3. Building conversion/connection assessment 1.4. Self-‐generation cost comparison 1.5. Identify viable scenarios
2. Marketing and Customer Letters of Intent
2.1. Initial meetings with prospective customers 2.2. Data gathering and analysis 2.3. Preparation and presentation of draft Term Sheet 2.4. Obtain Letters of Intent
3. Revised Technical Concept 3.1. Plant site identification and assessment 3.2. Distribution system layout and pipe sizing 3.3. Fuel supply assessment 3.4. Plant design concept 3.5. Distribution and interconnection design concept
4. Draft Business Plan
Review of Grand Marais Biomass District Heating System Feasibility Analysis Aug. 3, 2012
Page 17 of 26
4.1. Capital and operating costs 4.2. Business model assessment 4.3. Economic proforma model 4.4. Alternative financing strategies 4.5. Conclusions and recommendations
Phase II Study including Schematic Design and Full Business Plan 1. Schematic Design
1.1. Plant design 1.2. Hot Water Distribution Piping System 1.3. Building Conversions and Interconnections
2. Business Plan
2.1. Confirm capital and operating cost parameters 2.2. Economic proforma model 2.3. Analyze costs and benefits 2.4. Detailed business plan
The end result would be the technical, financial and business basis for financing the detailed design, procurement and construction of the system.

Review of Grand Marais Biomass District Heating System Feasibility Analysis Aug. 3, 2012
Page 18 of 26
Appendix 1 L6 Potential Customers
L6 Potential Customers Fuel Consumption Heat Consumption (6)
Estimated Peak Demand (MMBtu/hr)
(7)
ETS cost estimates
Cou
nt
No. Business Name Fuel Type
Annual Usage (gal.)
Type of Business
Loca
tion
Code
1 =
Dow
ntow
n2
= N
. 5th
St (
Cty
7)
3 =
outs
ide
both
4 =
pote
ntia
l "2"
Annual mmBTUs
Cumul. Annual
mmBTUs
% of total
Annual mmBTUs
Cumul. Annual
mmBTUsCustomer Cumul.
1 80 Cook County Hospital & Care Center Fuel Oil 51,613 County Services 2 6,968 6,968 16% 4,877 4,877 2.58 2.58 2 56 Shoreline Motel Fuel Oil 50,000 Lodging 1 6,750 13,718 31% 4,725 9,602 2.50 5.08 3 57 Aspen Lodge Fuel Oil 29,000 Lodging 1 3,915 17,633 40% 2,741 12,343 1.45 6.53 4 1 Superior Best Western Propane 29,500 Lodging 1 2,702 20,335 47% 1,892 14,234 1.00 7.53 5 41 Cook County Schools Propane 25,000 County Services 2 2,290 22,625 52% 1,603 15,837 0.85 8.38 6 42 CC Law Enforcement Center Propane 20,000 County Services 2 1,832 24,457 56% 1,282 17,120 0.68 9.06 7 43 Cook County Courthouse Propane 18,000 County Services 2 1,649 26,106 60% 1,154 18,274 0.61 9.67 8 2 East Bay Condominuims Propane 15,000 Lodging 1 1,374 27,480 63% 962 19,236 0.51 10.18 9 44 Community Center Propane 12,500 County Services 2 1,145 28,625 66% 802 20,037 0.42 10.60 10 3 Cobblestone Cove Propane 12,000 Lodging 1 1,099 29,724 68% 769 20,807 0.41 11.01 11 81 County Garage 2 Fuel Oil 6,500 County Service 2 878 30,601 70% 614 21,421 0.33 11.33 12 4 Tourist Info, City Hall & Mun. Liquor Propane 9,500 City Services 1 870 31,472 72% 609 22,030 0.32 11.66 13 55 Sawtooth Mountain Clinic Propane 7,725 County Services 2 708 32,179 74% 495 22,525 0.26 11.92 14 5 NAPA Auto Propane 6,000 Retail 1 550 32,729 75% 385 22,910 0.20 12.12 15 48 North Shore Dairy/Laundramat Propane 6,000 Service 2 550 33,278 76% 385 23,295 0.20 12.33 16 58 Johnson Foods Fuel Oil 4,000 Groceries * 1 540 33,818 77% 378 23,673 0.20 12.53 17 6 Joynes Propane 5,700 Retail 1 522 34,341 79% 365 24,038 0.19 12.72 18 7 Lake Superior Trading Post Propane 5,000 Retail * 1 458 34,799 80% 321 24,359 0.17 12.89 19 45 County Garage 1 Propane 5,000 County Services 2 458 35,257 81% 321 24,680 0.17 13.06 20 46 Recycling Center Propane 4,100 County Services 2 376 35,632 82% 263 24,943 0.14 13.20 21 8 Hiway 61 Laundromat Propane 4,000 Service * 1 366 35,999 82% 256 25,199 0.14 13.33 22 49 Grand Marais Wastewater Treatment Propane 3,700 Utilities 1 339 36,337 83% 237 25,436 0.13 13.46 23 59 Harbor Inn Fuel Oil 2,500 Lodging 1 338 36,675 84% 236 25,672 0.13 13.58 24 9 Bluewater Café Propane 3,500 Food Service 1 321 36,996 85% 224 25,897 0.12 13.70 25 10 Grand Marais Auto Propane 3,000 Automotive Services 1 275 37,270 85% 192 26,089 0.10 13.80 26 11 Crooked Spoon Propane 3,000 Food Service 1 275 37,545 86% 192 26,282 0.10 13.91 27 12 Sister's Propane 3,000 Food Service * 1 275 37,820 87% 192 26,474 0.10 14.01 28 60 American Legion Fuel Oil 2,000 Food Service 1 270 38,090 87% 189 26,663 0.10 14.11 29 13 SOB Propane 2,275 Food Service 1 208 38,298 88% 146 26,809 0.08 14.18 30 14 Grand Marais State Bank Propane 2,200 Financial 1 202 38,500 88% 141 26,950 0.07 14.26 31 15 Subway Propane 2,100 Food Service * 1 192 38,692 89% 135 27,085 0.07 14.33 32 61 Eight Broadway Fuel Oil 1,400 Retail * 1 189 38,881 89% 132 27,217 0.07 14.40 33 16 Svens Propane 2,000 Food Service 1 183 39,064 89% 128 27,345 0.07 14.47 34 17 Gun Flint Tavern Propane 2,000 Food Service * 1 183 39,248 90% 128 27,473 0.07 14.54 35 18 Cook County Whole Foods Co-op Propane 2,000 Groceries * 1 183 39,431 90% 128 27,602 0.07 14.60 36 19 Cook County Historical Museum Propane 1,800 County Services 1 165 39,596 91% 115 27,717 0.06 14.67

Review of Grand Marais Biomass District Heating System Feasibility Analysis Aug. 3, 2012
Page 19 of 26
37 20 Almost Home Appliances Propane 1,800 Retail * 1 165 39,761 91% 115 27,832 0.06 14.73 38 21 Buck's Hardware Hank Propane 1,800 Retail/Fuel * 1 165 39,925 91% 115 27,948 0.06 14.79 39 62 Security State Bank Fuel Oil 1,150 Financial 1 155 40,081 92% 109 28,057 0.06 14.84 40 22 Senior Center Propane 1,650 County Services 1 151 40,232 92% 106 28,162 0.06 14.90 41 63 Sivertson Gallery Fuel Oil 1,100 Retail * 1 149 40,380 92% 104 28,266 0.06 14.96 42 64 The Market Fuel Oil 1,100 Retail * 1 149 40,529 93% 104 28,370 0.06 15.01 43 23 Tire & Auto Lodge Propane 1,500 Automotive Services * 1 137 40,666 93% 96 28,466 0.05 15.06 44 24 Post Office Propane 1,500 Federal 1 137 40,804 93% 96 28,563 0.05 15.11 45 25 NSFCU Propane 1,500 Financial 1 137 40,941 94% 96 28,659 0.05 15.16 46 26 Johnson Heritage Post Art Gallery Propane 1,500 Gallery * 1 137 41,078 94% 96 28,755 0.05 15.21 47 27 Mangy Moose Motel Propane 1,500 Lodging * 1 137 41,216 94% 96 28,851 0.05 15.27 48 65 Birchbark Books & Gifts Fuel Oil 1,000 Retail * 1 135 41,351 95% 95 28,946 0.05 15.32 49 66 Cook County News-Herald Fuel Oil 900 Professional Services * 1 122 41,472 95% 85 29,031 0.05 15.36 50 67 White Pine North Fuel Oil 900 Retail 1 122 41,594 95% 85 29,116 0.05 15.41 51 68 Superior Designs Jewelry Fuel Oil 900 Retail * 1 122 41,715 96% 85 29,201 0.05 15.45 52 28 Coldwell Banker Professional Bldg Propane 1,300 Professional Services * 1 119 41,834 96% 83 29,284 0.04 15.49 53 29 The Attic Propane 1,300 Retail 1 119 41,954 96% 83 29,367 0.04 15.54 54 30 Como Oil & Propane Propane 1,200 Utilities * 1 110 42,063 96% 77 29,444 0.04 15.58 55 69 Mike's Holiday Station Fuel Oil 800 Convenience * 1 108 42,171 97% 76 29,520 0.04 15.62 56 70 Pump House Fitness Center Bldg Fuel Oil 800 Personal Services * 1 108 42,279 97% 76 29,596 0.04 15.66 57 71 Beth's Fudge & Gifts Fuel Oil 800 Retail 1 108 42,387 97% 76 29,671 0.04 15.70 58 72 Grand Marais Dental Fuel Oil 700 Professional Services * 1 95 42,482 97% 66 29,737 0.04 15.73 59 31 Hughie's Propane 1,000 Food Service * 1 92 42,574 98% 64 29,801 0.03 15.77 60 32 Java Moose Propane 1,000 Food Service * 1 92 42,665 98% 64 29,866 0.03 15.80 61 33 Jill Terrill Clothing Propane 1,000 Retail * 1 92 42,757 98% 64 29,930 0.03 15.84 62 34 Superior North Outdoors/Superior Photo Propane 1,000 Retail * 1 92 42,848 98% 64 29,994 0.03 15.87 63 35 Grand Marais Public Library ** Propane 1,000 City Services * 1 92 42,940 98% 64 30,058 0.03 15.90 64 73 Gunflint Realty Fuel Oil 670 Professional Services * 1 90 43,030 99% 63 30,121 0.03 15.94 65 36 Arrowhead Pharmacy/Viking Hus Gifts Propane 900 Professional Services * 1 82 43,113 99% 58 30,179 0.03 15.97 66 74 Former Leng's Bldg Fuel Oil 600 Retail * 1 81 43,194 99% 57 30,236 0.03 16.00 67 75 1st & 2nd Resale Fuel Oil 600 Retail * 1 81 43,275 99% 57 30,292 0.03 16.03 68 37 Drury Lane Books Propane 750 Retail * 1 69 43,344 99% 48 30,340 0.03 16.05 69 76 Gunflint Merchantile Fuel Oil 500 Retail * 1 68 43,411 99% 47 30,388 0.03 16.08 70 77 Beaver House Fuel Oil 500 Retail * 1 68 43,479 100% 47 30,435 0.03 16.10 71 78 Country Insurance & Financial Fuel Oil 400 Professional Services * 1 54 43,533 100% 38 30,473 0.02 16.12 72 38 Sven & Ollie Annex Propane 400 Food Service * 1 37 43,569 100% 26 30,498 0.01 16.14 73 39 World's Best Donuts Propane 400 Food Service * 1 37 43,606 100% 26 30,524 0.01 16.15 74 40 Super America Propane 300 Convenience 1 27 43,633 100% 19 30,543 0.01 16.16 75 79 Chuck's Barber Shop Fuel Oil 200 Personal Services * 1 27 43,660 100% 19 30,562 0.01 16.17
Total 43,660 30,562 16.17

Review of Grand Marais Biomass District Heating System Feasibility Analysis Aug. 3, 2012
Page 20 of 26
NOTES: 1) The core area is defined by Lake Superior to the south, the new Gunflint Trail on the north, 4th Ave. E and 5th Ave. W.2) Number of businesses within the core area is derived from an actual count.3) Number of residences is based on a large-scale aerial photo of the core area. It may include small cabins or outbuildings which are not separate residences. The number may vary from the actual +/- 5%.4) Fuel usage for the entries marked with (*) were estimated based on similar businesses (type and hours of operation) in similarly sized buildings.5) The left-hand column "No." connects the property to its location on "Commercial Core DH Map."6) Assumes annual fuel efficiency of 70%7) Assumes individual building EFLH of 1,890 ** Grand Marais Public Library was electric baseboard heat when data was collected. It has since been converted to propane.

Review of Grand Marais Biomass District Heating System Feasibility Analysis Aug. 3, 2012
Page 21 of 26
Appendix 2 L3 Potential Customers
L3 Scenario Potential Customers Fuel Consumption Heat Consumption (6)
Estimated Peak Demand (MMBtu/hr)
(7)
ETS cost estimates
Cou
nt
No. Business Name Fuel Type
Annual Usage (gal.)
Type of Business
Loca
tion
Code
1 =
Dow
ntow
n2
= N
. 5th
St (
Cty
7)
Annual mmBTUs
Cumul. Annual
mmBTUs
% of total
Annual mmBTUs
Cumul. Annual
mmBTUsCustomer Cumul.
1 80 Cook County Hospital & Care Center Fuel Oil 51,613 County Services 2 6,968 6,968 41% 4,877 4,877 2.58 2.58 2 41 Cook County Schools Propane 25,000 County Services 2 2,290 9,258 55% 1,603 6,480 0.85 3.43 3 42 CC Law Enforcement Center Propane 20,000 County Services 2 1,832 11,090 66% 1,282 7,763 0.68 4.11 4 43 Cook County Courthouse Propane 18,000 County Services 2 1,649 12,739 76% 1,154 8,917 0.61 4.72 5 44 Community Center Propane 12,500 County Services 2 1,145 13,884 82% 802 9,718 0.42 5.14 6 81 County Garage 2 Fuel Oil 6,500 County Service 2 878 14,761 88% 614 10,333 0.33 5.47 7 55 Sawtooth Mountain Clinic Propane 7,725 County Services 2 708 15,469 92% 495 10,828 0.26 5.73 8 48 North Shore Dairy/Laundramat Propane 6,000 Service 2 550 16,018 95% 385 11,213 0.20 5.93 9 45 County Garage 1 Propane 5,000 County Services 2 458 16,476 98% 321 11,533 0.17 6.10 10 46 Recycling Center Propane 4,100 County Services 2 376 16,852 100% 263 11,796 0.14 6.24
Total 16,852 11,796 6.24 NOTES: 1) The core area is defined by Lake Superior to the south, the new Gunflint Trail on the north, 4th Ave. E and 5th Ave. W.2) Number of businesses within the core area is derived from an actual count.3) Number of residences is based on a large-scale aerial photo of the core area. It may include small cabins or outbuildings which are not separate residences. The number may vary from the actual +/- 5%.4) Fuel usage for the entries marked with (*) were estimated based on similar businesses (type and hours of operation) in similarly sized buildings.5) The left-hand column "No." connects the property to its location on "Commercial Core DH Map."6) Assumes annual fuel efficiency of 70%7) Assumes individual building EFLH of 1,890 ** Grand Marais Public Library was electric baseboard heat when data was collected. It has since been converted to propane.

Review of Grand Marais Biomass District Heating System Feasibility Analysis Aug. 3, 2012
Page 22 of 26
Appendix 3 Hybrid Scenario Potential Customers
Hybrid Scenario Potential Customers Fuel Consumption Heat Consumption (6)
Estimated Peak Demand (MMBtu/hr)
(7)
ETS cost estimates
Cou
nt
No. Business Name Fuel Type
Annual Usage (gal.)
Type of Business
Loca
tion
Code
1 =
Dow
ntow
n2
= N
. 5th
St (
Cty
7)
Annual mmBTUs
Cumul. Annual
mmBTUs
% of total
Annual mmBTUs
Cumul. Annual
mmBTUsCustomer Cumul.
1 80 Cook County Hospital & Care Center Fuel Oil 51,613 County Services 2 6,968 6,968 20% 4,877 4,877 2.58 2.58 2 56 Shoreline Motel Fuel Oil 50,000 Lodging 1 6,750 13,718 40% 4,725 9,602 2.50 5.08 3 57 Aspen Lodge Fuel Oil 29,000 Lodging 1 3,915 17,633 51% 2,741 12,343 1.45 6.53 4 1 Superior Best Western Propane 29,500 Lodging 1 2,702 20,335 59% 1,892 14,234 1.00 7.53 5 41 Cook County Schools Propane 25,000 County Services 2 2,290 22,625 65% 1,603 15,837 0.85 8.38 6 42 CC Law Enforcement Center Propane 20,000 County Services 2 1,832 24,457 71% 1,282 17,120 0.68 9.06 7 43 Cook County Courthouse Propane 18,000 County Services 2 1,649 26,106 76% 1,154 18,274 0.61 9.67 8 2 East Bay Condominuims Propane 15,000 Lodging 1 1,374 27,480 80% 962 19,236 0.51 10.18 9 44 Community Center Propane 12,500 County Services 2 1,145 28,625 83% 802 20,037 0.42 10.60 10 3 Cobblestone Cove Propane 12,000 Lodging 1 1,099 29,724 86% 769 20,807 0.41 11.01 11 81 County Garage 2 Fuel Oil 6,500 County Service 2 878 30,601 89% 614 21,421 0.33 11.33 12 55 Sawtooth Mountain Clinic Propane 7,725 County Services 2 708 31,309 91% 495 21,916 0.26 11.60 13 48 North Shore Dairy/Laundramat Propane 6,000 Service 2 550 31,859 92% 385 22,301 0.20 11.80 14 5 NAPA Auto Propane 6,000 Retail 1 550 32,408 94% 385 22,686 0.20 12.00 15 45 County Garage 1 Propane 5,000 County Services 2 458 32,866 95% 321 23,006 0.17 12.17 16 46 Recycling Center Propane 4,100 County Services 2 376 33,242 96% 263 23,269 0.14 12.31 17 8 Hiway 61 Laundromat Propane 4,000 Service * 1 366 33,608 97% 256 23,526 0.14 12.45 18 49 Grand Marais Wastewater Treatment Propane 3,700 Utilities 1 339 33,947 98% 237 23,763 0.13 12.57 19 10 Grand Marais Auto Propane 3,000 Automotive Services 1 275 34,222 99% 192 23,955 0.10 12.67 20 15 Subway Propane 2,100 Food Service * 1 192 34,414 100% 135 24,090 0.07 12.75 21 23 Tire & Auto Lodge Propane 1,500 Automotive Services * 1 137 34,552 100% 96 24,186 0.05 12.80
Total 34,552 24,186 12.80

Review of Grand Marais Biomass District Heating System Feasibility Analysis Aug. 3, 2012
Page 23 of 26
NOTES: 1) The core area is defined by Lake Superior to the south, the new Gunflint Trail on the north, 4th Ave. E and 5th Ave. W.2) Number of businesses within the core area is derived from an actual count.3) Number of residences is based on a large-scale aerial photo of the core area. It may include small cabins or outbuildings which are not separate residences. The number may vary from the actual +/- 5%.4) Fuel usage for the entries marked with (*) were estimated based on similar businesses (type and hours of operation) in similarly sized buildings.5) The left-hand column "No." connects the property to its location on "Commercial Core DH Map."6) Assumes annual fuel efficiency of 70%7) Assumes individual building EFLH of 1,890 ** Grand Marais Public Library was electric baseboard heat when data was collected. It has since been converted to propane.

Review of Grand Marais Biomass District Heating System Feasibility Analysis Aug. 3, 2012
Page 24 of 26
Appendix 4 Financial Analysis
Financial Analysis Scenario L3
Year -‐-‐-‐-‐> 0 1 2 3 4 5 6 7 8 9 10 11 12 13 14 15 16 17 18 19 20LOADS AND PRODUCTIONHeat consumption (MMBtu) 11,796 11,796 11,796 11,796 11,796 11,796 11,796 11,796 11,796 11,796 11,796 11,796 11,796 11,796 11,796 11,796 11,796 11,796 11,796 11,796 Heat production (MMBtu)Biomass 11,211 11,211 11,211 11,211 11,211 11,211 11,211 11,211 11,211 11,211 11,211 11,211 11,211 11,211 11,211 11,211 11,211 11,211 11,211 11,211 Fuel oil 1,529 1,529 1,529 1,529 1,529 1,529 1,529 1,529 1,529 1,529 1,529 1,529 1,529 1,529 1,529 1,529 1,529 1,529 1,529 1,529 Total 12,740 12,740 12,740 12,740 12,740 12,740 12,740 12,740 12,740 12,740 12,740 12,740 12,740 12,740 12,740 12,740 12,740 12,740 12,740 12,740 Fuel consumption (MMBtu)Biomass 16,016 16,016 16,016 16,016 16,016 16,016 16,016 16,016 16,016 16,016 16,016 16,016 16,016 16,016 16,016 16,016 16,016 16,016 16,016 16,016 Fuel oil 2,038 2,038 2,038 2,038 2,038 2,038 2,038 2,038 2,038 2,038 2,038 2,038 2,038 2,038 2,038 2,038 2,038 2,038 2,038 2,038 Total 18,054 18,054 18,054 18,054 18,054 18,054 18,054 18,054 18,054 18,054 18,054 18,054 18,054 18,054 18,054 18,054 18,054 18,054 18,054 18,054
OPERATING COSTSBiomass fuel 76,672 78,246 79,833 81,541 83,297 85,018 86,793 88,486 90,120 91,729 93,433 95,098 96,847 98,676 100,547 102,480 104,323 106,270 108,327 110,898Fuel oil 45,136 46,804 49,087 51,403 53,694 55,930 57,878 59,710 61,670 63,354 65,474 67,203 69,009 70,952 72,779 74,774 76,204 77,852 79,529 81,533Maintenance 18,089 18,460 18,835 19,238 19,652 20,058 20,477 20,876 21,262 21,641 22,043 22,436 22,849 23,280 23,722 24,178 24,612 25,072 25,557 26,164Labor 35,000 35,718 36,443 37,223 38,024 38,810 39,620 40,393 41,139 41,873 42,651 43,411 44,210 45,045 45,899 46,781 47,622 48,511 49,450 50,624Ash disposal 656 669 683 698 713 727 743 757 771 785 799 814 829 844 860 877 893 909 927 949Electricity 3,397 3,419 3,462 3,555 3,621 3,660 3,711 3,748 3,831 3,914 3,997 4,091 4,174 4,229 4,290 4,360 4,434 4,534 4,639 4,760 Total 178,950 183,317 188,343 193,658 199,002 204,203 209,221 213,970 218,794 223,295 228,398 233,053 237,917 243,026 248,097 253,450 258,088 263,148 268,429 274,927
REVENUE PER MMBTU SOLD 32.68 33.89 35.54 37.22 38.88 40.49 41.91 43.23 44.65 45.87 47.41 48.66 49.96 51.37 52.69 54.14 55.17 56.37 57.58 59.03
OPERATING REVENUE 385,502 399,749 419,246 439,032 458,600 477,690 494,334 509,981 526,721 541,098 559,210 573,977 589,400 605,995 621,603 638,642 650,853 664,926 679,248 696,364
NET OPERATING REVENUE 206,552 216,432 230,903 245,374 259,598 273,487 285,113 296,011 307,927 317,803 330,812 340,923 351,482 362,969 373,506 385,192 392,765 401,778 410,819 421,437
DEBT SERVICE COSTS 291,870 291,870 291,870 291,870 291,870 291,870 291,870 291,870 291,870 291,870 291,870 291,870 291,870 291,870 291,870 291,870 291,870 291,870 291,870 291,870
PROFIT (LOSS) (85,318) (75,438) (60,967) (46,496) (32,272) (18,383) (6,757) 4,141 16,057 25,933 38,942 49,053 59,612 71,099 81,636 93,322 100,895 109,908 118,949 129,567
Cumulative Profit (Loss) (85,318) (160,756) (221,723) (268,219) (300,491) (318,875) (325,632) (321,491) (305,434) (279,500) (240,559) (191,505) (131,893) (60,794) 20,842 114,164 215,059 324,967 443,916 573,483
INTERNAL RATE OF RETURN CALCULATIONCash flow (4,037,793) 206,552 216,432 230,903 245,374 259,598 273,487 285,113 296,011 307,927 317,803 330,812 340,923 351,482 362,969 373,506 385,192 392,765 401,778 410,819 421,437 Internal Rate of Return 4.3%
NET PRESENT VALUE CALCULATIONDiscount rate 3.80%Cash flow (4,037,793) 206,552 216,432 230,903 245,374 259,598 273,487 285,113 296,011 307,927 317,803 330,812 340,923 351,482 362,969 373,506 385,192 392,765 401,778 410,819 421,437 NPV 195,351 PV of savings 4,233,144

Review of Grand Marais Biomass District Heating System Feasibility Analysis Aug. 3, 2012
Page 25 of 26
Financial Analysis Scenario L6
Year -‐-‐-‐-‐> 0 1 2 3 4 5 6 7 8 9 10 11 12 13 14 15 16 17 18 19 20LOADS AND PRODUCTIONHeat consumption (MMBtu) 30,562 30,562 30,562 30,562 30,562 30,562 30,562 30,562 30,562 30,562 30,562 30,562 30,562 30,562 30,562 30,562 30,562 30,562 30,562 30,562 Heat production (MMBtu)Biomass 29,584 29,584 29,584 29,584 29,584 29,584 29,584 29,584 29,584 29,584 29,584 29,584 29,584 29,584 29,584 29,584 29,584 29,584 29,584 29,584 Fuel oil 4,034 4,034 4,034 4,034 4,034 4,034 4,034 4,034 4,034 4,034 4,034 4,034 4,034 4,034 4,034 4,034 4,034 4,034 4,034 4,034 Total 33,618 33,618 33,618 33,618 33,618 33,618 33,618 33,618 33,618 33,618 33,618 33,618 33,618 33,618 33,618 33,618 33,618 33,618 33,618 33,618 Fuel consumption (MMBtu)Biomass 42,263 42,263 42,263 42,263 42,263 42,263 42,263 42,263 42,263 42,263 42,263 42,263 42,263 42,263 42,263 42,263 42,263 42,263 42,263 42,263 Fuel oil 5,379 5,379 5,379 5,379 5,379 5,379 5,379 5,379 5,379 5,379 5,379 5,379 5,379 5,379 5,379 5,379 5,379 5,379 5,379 5,379 Total 47,642 47,642 47,642 47,642 47,642 47,642 47,642 47,642 47,642 47,642 47,642 47,642 47,642 47,642 47,642 47,642 47,642 47,642 47,642 47,642
OPERATING COSTSBiomass fuel 202,324 206,476 210,665 215,172 219,806 224,347 229,030 233,497 237,811 242,055 246,552 250,946 255,561 260,388 265,325 270,427 275,288 280,427 285,855 292,640Fuel oil 119,105 123,507 129,531 135,644 141,690 147,588 152,730 157,564 162,736 167,178 172,774 177,337 182,102 187,229 192,051 197,316 201,088 205,436 209,861 215,149Maintenance 53,377 54,472 55,577 56,766 57,989 59,187 60,422 61,601 62,739 63,858 65,045 66,204 67,422 68,695 69,998 71,344 72,626 73,982 75,414 77,204Labor 140,000 142,873 145,772 148,890 152,097 155,239 158,480 161,571 164,556 167,492 170,604 173,645 176,838 180,178 183,594 187,125 190,489 194,044 197,800 202,495Ash disposal 1,731 1,767 1,802 1,841 1,881 1,919 1,959 1,998 2,035 2,071 2,109 2,147 2,186 2,228 2,270 2,314 2,355 2,399 2,446 2,504Electricity 11,736 11,812 11,959 12,281 12,509 12,645 12,820 12,949 13,235 13,520 13,808 14,131 14,420 14,609 14,819 15,060 15,318 15,664 16,026 16,443 Total 528,273 540,908 555,307 570,594 585,972 600,925 615,441 629,179 643,111 656,174 670,893 684,410 698,529 713,327 728,057 743,584 757,165 771,952 787,402 806,435
REVENUE PER MMBTU SOLD 32.68 33.89 35.54 37.22 38.88 40.49 41.91 43.23 44.65 45.87 47.41 48.66 49.96 51.37 52.69 54.14 55.17 56.37 57.58 59.03
OPERATING REVENUE 998,773 1,035,684 1,086,197 1,137,458 1,188,157 1,237,616 1,280,739 1,321,276 1,364,646 1,401,896 1,448,820 1,487,078 1,527,037 1,570,033 1,610,470 1,654,616 1,686,252 1,722,714 1,759,821 1,804,164
NET OPERATING REVENUE 470,500 494,776 530,891 566,864 602,185 636,691 665,297 692,097 721,535 745,722 777,927 802,668 828,508 856,707 882,412 911,032 929,088 950,762 972,419 997,729
DEBT SERVICE COSTS 852,621 852,621 852,621 852,621 852,621 852,621 852,621 852,621 852,621 852,621 852,621 852,621 852,621 852,621 852,621 852,621 852,621 852,621 852,621 852,621
PROFIT (LOSS) (382,120) (357,844) (321,730) (285,757) (250,436) (215,930) (187,323) (160,523) (131,085) (106,899) (74,694) (49,953) (24,113) 4,086 29,792 58,412 76,467 98,141 119,798 145,108
Cumulative Profit (Loss) (382,120) (739,964) (1,061,695) (1,347,451) (1,597,887) (1,813,817) (2,001,140) (2,161,664) (2,292,749) (2,399,648) (2,474,341) (2,524,294) (2,548,407) (2,544,321) (2,514,529) (2,456,117) (2,379,650) (2,281,509) (2,161,711) (2,016,603)
INTERNAL RATE OF RETURN CALCULATIONCash flow (11,795,338) 470,500 494,776 530,891 566,864 602,185 636,691 665,297 692,097 721,535 745,722 777,927 802,668 828,508 856,707 882,412 911,032 929,088 950,762 972,419 997,729 Internal Rate of Return 2.2%
NET PRESENT VALUE CALCULATIONDiscount rate 3.80%Cash flow (11,795,338) 470,500 494,776 530,891 566,864 602,185 636,691 665,297 692,097 721,535 745,722 777,927 802,668 828,508 856,707 882,412 911,032 929,088 950,762 972,419 997,729 NPV (1,802,962) PV of savings 9,992,377

Review of Grand Marais Biomass District Heating System Feasibility Analysis Aug. 3, 2012
Page 26 of 26
Financial Analysis Scenario Hybrid
Year -‐-‐-‐-‐> 0 1 2 3 4 5 6 7 8 9 10 11 12 13 14 15 16 17 18 19 20LOADS AND PRODUCTIONHeat consumption (MMBtu) 24,186 24,186 24,186 24,186 24,186 24,186 24,186 24,186 24,186 24,186 24,186 24,186 24,186 24,186 24,186 24,186 24,186 24,186 24,186 24,186 Heat production (MMBtu)Biomass 22,987 22,987 22,987 22,987 22,987 22,987 22,987 22,987 22,987 22,987 22,987 22,987 22,987 22,987 22,987 22,987 22,987 22,987 22,987 22,987 Fuel oil 3,135 3,135 3,135 3,135 3,135 3,135 3,135 3,135 3,135 3,135 3,135 3,135 3,135 3,135 3,135 3,135 3,135 3,135 3,135 3,135 Total 26,121 26,121 26,121 26,121 26,121 26,121 26,121 26,121 26,121 26,121 26,121 26,121 26,121 26,121 26,121 26,121 26,121 26,121 26,121 26,121 Fuel consumption (MMBtu)Biomass 32,838 32,838 32,838 32,838 32,838 32,838 32,838 32,838 32,838 32,838 32,838 32,838 32,838 32,838 32,838 32,838 32,838 32,838 32,838 32,838 Fuel oil 4,179 4,179 4,179 4,179 4,179 4,179 4,179 4,179 4,179 4,179 4,179 4,179 4,179 4,179 4,179 4,179 4,179 4,179 4,179 4,179 Total 37,017 37,017 37,017 37,017 37,017 37,017 37,017 37,017 37,017 37,017 37,017 37,017 37,017 37,017 37,017 37,017 37,017 37,017 37,017 37,017
OPERATING COSTSBiomass fuel 157,203 160,429 163,684 167,186 170,787 174,315 177,953 181,424 184,776 188,073 191,568 194,982 198,568 202,318 206,154 210,118 213,896 217,888 222,106 227,377Fuel oil 92,543 95,963 100,644 105,393 110,091 114,674 118,669 122,425 126,444 129,895 134,243 137,788 141,491 145,475 149,221 153,312 156,243 159,621 163,060 167,168Maintenance 32,427 33,093 33,764 34,486 35,229 35,957 36,707 37,423 38,115 38,795 39,516 40,220 40,960 41,733 42,524 43,342 44,121 44,945 45,815 46,902Labor 70,000 71,437 72,886 74,445 76,049 77,620 79,240 80,785 82,278 83,746 85,302 86,823 88,419 90,089 91,797 93,562 95,244 97,022 98,900 101,248Ash disposal 1,345 1,373 1,400 1,430 1,461 1,491 1,522 1,552 1,581 1,609 1,639 1,668 1,699 1,731 1,764 1,798 1,830 1,864 1,900 1,945Electricity 6,501 6,544 6,625 6,803 6,930 7,005 7,102 7,173 7,332 7,490 7,649 7,828 7,988 8,093 8,209 8,343 8,485 8,677 8,878 9,109 Total 360,019 368,838 379,003 389,744 400,546 411,061 421,194 430,783 440,525 449,608 459,917 469,309 479,124 489,439 499,670 510,475 519,820 530,018 540,658 553,750
REVENUE PER MMBTU SOLD 32.68 33.89 35.54 37.22 38.88 40.49 41.91 43.23 44.65 45.87 47.41 48.66 49.96 51.37 52.69 54.14 55.17 56.37 57.58 59.03
OPERATING REVENUE 790,405 819,616 859,590 900,157 940,279 979,419 1,013,546 1,045,626 1,079,948 1,109,427 1,146,561 1,176,838 1,208,460 1,242,487 1,274,487 1,309,424 1,334,459 1,363,314 1,392,680 1,427,772
NET OPERATING REVENUE 430,385 450,777 480,587 510,413 539,732 568,358 592,352 614,843 639,423 659,819 686,644 707,529 729,336 753,048 774,817 798,949 814,640 833,297 852,021 874,022
DEBT SERVICE COSTS 529,514 529,514 529,514 529,514 529,514 529,514 529,514 529,514 529,514 529,514 529,514 529,514 529,514 529,514 529,514 529,514 529,514 529,514 529,514 529,514
PROFIT (LOSS) (99,128) (78,736) (48,926) (19,101) 10,219 38,845 62,838 85,329 109,910 130,305 157,130 178,015 199,823 223,534 245,303 269,435 285,126 303,783 322,508 344,508
Cumulative Profit (Loss) (99,128) (177,865) (226,791) (245,892) (235,673) (196,828) (133,990) (48,661) 61,249 191,554 348,684 526,700 726,522 950,057 1,195,360 1,464,795 1,749,921 2,053,704 2,376,212 2,720,720
INTERNAL RATE OF RETURN CALCULATIONCash flow (7,325,406) 430,385 450,777 480,587 510,413 539,732 568,358 592,352 614,843 639,423 659,819 686,644 707,529 729,336 753,048 774,817 798,949 814,640 833,297 852,021 874,022 Internal Rate of Return 5.7%
NET PRESENT VALUE CALCULATIONDiscount rate 3.80%Cash flow (7,325,406) 430,385 450,777 480,587 510,413 539,732 568,358 592,352 614,843 639,423 659,819 686,644 707,529 729,336 753,048 774,817 798,949 814,640 833,297 852,021 874,022 NPV 1,427,461 PV of savings 8,752,867

UMN Report to Dovetail Partners September 27, 2012 Final Draft 213
Appendix E. Reference Biomass Harvest Costs Table E.1. Harvest costs for a conventional biomass harvesting system.
Machine costs 200-‐hp feller/buncher
169-‐hp skidder
225-‐hp chain flail delimber
174-‐hp tracked loader
860-‐hp chipper (self-‐loading) 120 cu-‐yd van
Fixed cost inputs Purchase price $217,000 $227,000 $354,900 $181,030 $580,000 $125,000 Scheduled hours/yr (SMH) 2,000 2,000 2,000 2,000 2,000 2,000 Production hours/yr (PMH) 1,300 1,200 1,300 1,300 1,300 1,300 Machine life (yrs) 4 5 5 5 5 8 Salvage value (% of new) 0.2 0.25 0.2 0.2 0.2 0.2 Interest rate (%) 0.1 0.1 0.1 0.1 0.1 0.1 Insurance (annual premiums) $7,600 $10,200 $7,100 $3,600 $12,000 $6,000 Taxes/tags (% of new) 0 0 0 0 0 0
Operating cost inputs Tire cost (total) -‐-‐ -‐-‐ -‐-‐ -‐-‐ -‐-‐ $3,500 Local fuel cost ($/gal) $2.99 $2.99 $2.99 $2.99 $2.99 $2.99 Horsepower 200 169 225 174 860 450 Fuel consumption (g/hp-‐hr) 0.026 0.028 0.028 0.022 0.028 6 Oil and lube use (% of fuel) 0.37 0.037 0.37 0.37 0.13 0.1 Repair/maintenance (% of dep) 1 0.9 0.9 0.9 0.75 0.6 Misc consumables ($/op hr) -‐-‐ -‐-‐ -‐-‐ -‐-‐ $9.28 -‐-‐
Labor cost inputs Basic labor rate $18 $18 $18 $18 $18 $18 Benefits (% of base) 0.33 0.33 0.33 0.33 0.33 0.33
Total costs breakdown Fixed cost ($/PMH) $42.10 $41.40 $66.84 $35.02 $55.01 $13.62 Variable costs ($/PMH) $48.45 $42.80 $77.40 $32.70 $104.77 $17.15 Labor costs ($/PMH) $23.94 $23.94 $23.94 $23.94 $23.94 $23.94
Total $/PMH $114.49 $108.14 $168.18 $91.66 $183.72 $54.71