
The effects of deoxynivalenol on gene expression in the murine thymus
13
The effects of deoxynivalenol on gene expression in the murine thymus Sandra W.M. van Kol a,c,d , Peter J.M. Hendriksen a,d , Henk van Loveren b,c,d , Ad Peijnenburg a,d, ⁎ a RIKILT-Institute of Food Safety, Wageningen University and Research Centre, Wageningen, The Netherlands b National Institute for Public Health and the Environment (RIVM), Bilthoven, The Netherlands c Department of Health Risk Analysis and Toxicology, Maastricht University, The Netherlands d Netherlands Toxicogenomics Centre, The Netherlands abstract article info Article history: Received 30 June 2010 Revised 16 October 2010 Accepted 2 November 2010 Available online 11 November 2010 Keywords: Deoxynivalenol Lymphocyte activation Thymus Transcriptomics Deoxynivalenol (DON) is a mycotoxin produced by several Fusarium species and is often detected in grains. Because of its high abundance, there has been a large interest in the effects of DON in animals and humans. DON is known to be immunosuppressive at high concentrations and immunostimulatory at low concentrations. The present study aimed to acquire insight into the modes of action of DON. For this, C57Bl6 mice were orally exposed to 5, 10, or 25 mg/kg bw DON for 3, 6, or 24 h and thymuses were subjected to genome-wide expression microarray analysis. Gene set enrichment analysis (GSEA) demonstrated that DON downregulated genes involved in proliferation, mitochondria, protein synthesis, and ribosomal proteins. Furthermore, GSEA showed a selective downregulation of genes highly expressed at the early precursor thymocytes stage. This indicates that early precursor thymocytes, particularly at the double-positive CD4+ CD8+ stage, are more vulnerable to DON than very early or late precursor thymocytes. There was a large overlap of genes upregulated by DON with genes previously reported to be either upregulated during T cell activation or upregulated during negative selection of thymocytes that recognize “self-antigens”. This indicates that DON induces cellular events that also occur after activation of the T cell receptor, for example, release of calcium from the endoplasmatic reticulum. This T cell activation in the thymus then evokes negative selection and depletion of thymocytes, which provides a plausible explanation for the high sensitivity of the thymus for DON exposure. The expression patterns of four genes indicative for some of the processes that were affected after DON treatment were confirmed using real-time PCR. Immunocytological experiments with primary mouse thymocytes demonstrated the translocation of NFAT from the cytoplasm into the nucleus upon exposure top DON, thus providing further evidence for the involvement of T cell activation. © 2010 Elsevier Inc. Introduction Approximately 25% of the world's food crops are affected by fungal produced toxins (mycotoxins) (Rotter et al., 1996). Deoxynivalenol (DON, vomitoxin) belongs to the trichothecene mycotoxins, which are capable of generating toxic effects upon ingestion of mould-contaminated cereal grains in humans and farm animals. DON is produced by strains of Fusarium graminearum and Fusarium culmorum, which are common pathogens of cereals (Richard, 2007). Although DON is not as toxic as other trichothecenes such as T-2 toxin, it is considered as one of the most common toxic contaminants of wheat, corn, and barley. DON remains stable during storage and processing and does not degrade at high temperature (Rotter et al., 1996). Orally dosed mice show a peak uptake of DON within 30 min along with distribution in plasma and many tissues. In mice orally exposed to 25 mg/kg bw DON, the toxin was detected after 30 min in several organs including spleen and thymus with a rapid decrease to concentrations close to control levels occurring over 24 h (Azconaolivera et al., 1995; Pestka et al., 2008). DON undergoes de- epoxidation by gut-microflora and is conjugated to glucuronides in the liver. Resultant metabolites are excreted from the body via urine and feces (Pestka, 2007; Amuzie et al., 2008). DON has a major effect on actively dividing cells including bone marrow, spleen, and thymus cells, and, as a consequence, it has a large effect on the immune system (Pestka et al., 2004). DON induces thymus atrophy at concentrations above 10 mg/kg fed to BALB/c mice daily for a week. Spleen weight was decreased, but less then thymus weight (Robbana-Barnat et al., 1988). This finding was one of the first indications that the immune system is a primary target of DON. The effects of exposure to DON can be either immunosuppressive or immunostimu- latory, depending on the length of exposure and dosage concentration. Low doses of DON promote the expression of various cytokines and chemokines in vitro and in vivo, which involves transcriptional or post- transcriptional mechanisms (Zhou et al., 1997; Kinser et al., 2004; Pestka et al., 2004). Relevant immunostimulatory effects include an increase in Toxicology and Applied Pharmacology 250 (2011) 299–311 ⁎ Corresponding author. Ad Peijnenburg RIKILT-Institute of Food Safety, Wageningen UR, PO Box 230, 6700 AE Wageningen, The Netherlands. Fax: +31 317 417717. E-mail address: [email protected] (A. Peijnenburg). 0041-008X © 2010 Elsevier Inc. doi:10.1016/j.taap.2010.11.001 Contents lists available at ScienceDirect Toxicology and Applied Pharmacology journal homepage: www.elsevier.com/locate/ytaap Open access under the Elsevier OA license. Open access under the Elsevier OA license.
-
Upload
independent -
Category
Documents
-
view
2 -
download
0
Transcript of The effects of deoxynivalenol on gene expression in the murine thymus

Toxicology and Applied Pharmacology 250 (2011) 299–311
Contents lists available at ScienceDirect
Toxicology and Applied Pharmacology
j ourna l homepage: www.e lsev ie r.com/ locate /ytaap
The effects of deoxynivalenol on gene expression in the murine thymus
Sandra W.M. van Kol a,c,d, Peter J.M. Hendriksen a,d, Henk van Loveren b,c,d, Ad Peijnenburg a,d,⁎a RIKILT-Institute of Food Safety, Wageningen University and Research Centre, Wageningen, The Netherlandsb National Institute for Public Health and the Environment (RIVM), Bilthoven, The Netherlandsc Department of Health Risk Analysis and Toxicology, Maastricht University, The Netherlandsd Netherlands Toxicogenomics Centre, The Netherlands
⁎ Corresponding author. Ad Peijnenburg RIKILT-InstituUR, PO Box 230, 6700 AE Wageningen, The Netherlands
E-mail address: [email protected] (A. Peijnenb
0041-008X © 2010 Elsevier Inc.doi:10.1016/j.taap.2010.11.001
Open access under the Els
a b s t r a c t
a r t i c l e i n f oArticle history:Received 30 June 2010Revised 16 October 2010Accepted 2 November 2010Available online 11 November 2010
Keywords:DeoxynivalenolLymphocyte activationThymusTranscriptomics
Deoxynivalenol (DON) is a mycotoxin produced by several Fusarium species and is often detected in grains.Because of its high abundance, there has been a large interest in the effects of DON in animals and humans.DON is known to be immunosuppressive at high concentrations and immunostimulatory at lowconcentrations. The present study aimed to acquire insight into the modes of action of DON. For this,C57Bl6 mice were orally exposed to 5, 10, or 25 mg/kg bw DON for 3, 6, or 24 h and thymuses were subjectedto genome-wide expression microarray analysis. Gene set enrichment analysis (GSEA) demonstrated thatDON downregulated genes involved in proliferation, mitochondria, protein synthesis, and ribosomal proteins.Furthermore, GSEA showed a selective downregulation of genes highly expressed at the early precursorthymocytes stage. This indicates that early precursor thymocytes, particularly at the double-positive CD4+CD8+ stage, are more vulnerable to DON than very early or late precursor thymocytes. There was a largeoverlap of genes upregulated by DON with genes previously reported to be either upregulated during T cellactivation or upregulated during negative selection of thymocytes that recognize “self-antigens”. Thisindicates that DON induces cellular events that also occur after activation of the T cell receptor, for example,release of calcium from the endoplasmatic reticulum. This T cell activation in the thymus then evokes negativeselection and depletion of thymocytes, which provides a plausible explanation for the high sensitivity of thethymus for DON exposure. The expression patterns of four genes indicative for some of the processes thatwere affected after DON treatment were confirmed using real-time PCR. Immunocytological experimentswith primary mouse thymocytes demonstrated the translocation of NFAT from the cytoplasm into the nucleusupon exposure top DON, thus providing further evidence for the involvement of T cell activation.
te of Food Safety, Wageningen. Fax: +31 317 417717.urg).
evier OA license.
© 2010 Elsevier Inc. Open access under the Elsevier OA license.
Introduction
Approximately 25% of the world's food crops are affected by fungalproduced toxins (mycotoxins) (Rotteret al., 1996).Deoxynivalenol (DON,vomitoxin) belongs to the trichothecene mycotoxins, which are capableof generating toxic effects upon ingestion of mould-contaminated cerealgrains in humans and farm animals. DON is produced by strains ofFusarium graminearum and Fusarium culmorum, which are commonpathogens of cereals (Richard, 2007). Although DON is not as toxic asother trichothecenes such as T-2 toxin, it is considered as one of themostcommon toxic contaminants of wheat, corn, and barley. DON remainsstable during storage and processing and does not degrade at hightemperature (Rotter et al., 1996). Orally dosed mice show a peak uptakeofDONwithin30 minalongwithdistribution inplasmaandmany tissues.
Inmice orally exposed to 25 mg/kg bwDON, the toxinwas detected after30 min in several organs including spleen and thymus with a rapiddecrease to concentrations close to control levels occurring over 24 h(Azconaolivera et al., 1995; Pestka et al., 2008). DON undergoes de-epoxidation by gut-microflora and is conjugated to glucuronides in theliver. Resultantmetabolites are excreted fromthebodyviaurine and feces(Pestka, 2007; Amuzie et al., 2008).
DON has a major effect on actively dividing cells including bonemarrow, spleen, and thymus cells, and, as a consequence, it has a largeeffect on the immune system (Pestka et al., 2004). DON induces thymusatrophy at concentrations above 10 mg/kg fed to BALB/c mice daily for aweek. Spleen weight was decreased, but less then thymus weight(Robbana-Barnat et al., 1988). Thisfindingwas one of thefirst indicationsthat the immune system is a primary target of DON. The effects ofexposure to DON can be either immunosuppressive or immunostimu-latory, depending on the length of exposure and dosage concentration.Low doses of DON promote the expression of various cytokines andchemokines in vitro and in vivo, which involves transcriptional or post-transcriptional mechanisms (Zhou et al., 1997; Kinser et al., 2004; Pestkaet al., 2004). Relevant immunostimulatory effects include an increase in

300 S.W.M. van Kol et al. / Toxicology and Applied Pharmacology 250 (2011) 299–311
levels of serum IgA and IgE,which aremediated by cytokines excreted bymacrophages and T cells. High doses of DON cause rapid apoptosis ofleukocytes that manifests itself as immunosuppression. Extremely highdoses can cause a shock-like death in mice. When administeredintraperitoneally, the LD50 value for mice ranges from 49 to 70 mg/kgbw, andwhen administered orally, from46 to 78 mg/kg bw(Forsell et al.,1987; Pestka, 2007).
Kinser et al. (2004) performed a gene expression study on spleensof mice orally exposed to 25 mg/kg DON for 2 h. They found manygenes altered by acute DON exposure. Most of the upregulated geneswere immediate early genes involved in immunity and inflammation.A drawback of this study was the low number of genes on themicroarrays. So far, little data are available on the effect of DON ongene expression in the thymus. The thymus is an important organwhere T cell differentiation, selection, and maturation occur. During Tcell selection, lymphocytes expressing receptors that recognizeforeign proteins are positively selected and lymphocytes that reactto self-antigens are negatively selected and go into apoptosis (Starret al., 2003). Disturbance of the development of thymocytes has amajor effect on the defence system.
The aim of the present study was to obtain a better insight in themechanism of action of DON in the mouse thymus using wholegenome microarrays. Male C57Bl6 mice were gavaged with differentdoses of DON and were sacrificed after 3, 6, and 24 h. DON treatmentcaused a rapid induction of gene expression. The effect of DON on thenumber of affected genes (≥1.5× up- or downregulated, p valueb0.01) was highest after 3 h for the lowest andmiddle dose andmuchlower after 24 h, indicating a reversible effect. In contrast, the highestconcentration of 25 mg/kg DON had an irreversible effect on thenumber of genes affected. The biological interpretation of themicroarray data led to the hypothesis that DON induces thymocytedepletion via induction of the T cell activation response that is quicklyfollowed by negative selection of thymocytes.
Materials and methods
Animals. The DON in vivo study was performed with 7-week-oldmale C57BL/6 mice that were obtained from Harlan (Horst, TheNetherlands). Animals were kept at a housing temperature of 22 °Cand at a relative humidity of 30–70%. Lighting cycle was 12-h lightand 12-h dark. The treatment protocol was approved by the ethi-cal committee for animal experiments at Wageningen University,Wageningen, The Netherlands.
Treatment. The experiment included 60 mice, which were random-ly divided into 12 different groups. DON was dissolved in ethanol andthen diluted with endotoxin-free water. The amount of ethanol waskept the same for all mice (2.5 μl/g bw). Themice obtained one dose ofDON by oral gavage (5, 10, or 25 mg/kg bw). The control groups pertime point received only the vehicle ethanol. DON or vehicle wasadministered to one mouse each every 10 min to keep the treatmenttimes constant. After 3, 6, or 24 h, the mice were sacrificed by cervicaldislocation under isoflurane anesthesia. The thymus was isolated,immediately frozen in liquid nitrogen, and kept frozen until furthergene expression analysis. The doses used in this study were chosenbased on literature. The lowest dose used (5 mg/kg DON) was chosen,because it resembles the total daily consumption of DON in micedigesting a diet of 25 ppm DON. This level has been shown to result inan increase of circulating IgA and changes in the expression levels ofdifferent genes encoding cytokines, such as Il6 and TNFα, in the spleen(Azconaolivera et al., 1995; Amuzie et al., 2008). The highest dose of25 mg/kg DON is one-third of the LD50 of DON inmice (Azconaoliveraet al., 1995).
RNA isolation. Thymuses were homogenized in 1 ml of TRIzolreagent (Invitrogen, Breda, The Netherlands) per 50–100 mg tissue,
using a homogenizer (Pro Multi-Gen 7, PRO Scientific, Oxford, CT).Subsequently, RNA was isolated following supplier's instructions.After purification using the RNeasy Mini Kit (Qiagen, Venlo, TheNetherlands), integrity, purity, and concentration were assessed byautomated gel electrophoresis (Experion, Biorad, Veenendaal, TheNetherlands) and spectrophotometrically at wavelengths of 230,260, and 280 nm.
Preparation of labeled cRNA and microarray hybridization. One mi-crogram of each individual RNA sample was amplified using a lowRNA Input Fluorescent Linear Amplification Kit (Agilent Technologies,Amstelveen, The Netherlands). Subsequently, the common referencesample, Universal Mouse Reference RNA (Stratagene, Amsterdam, TheNetherlands), was labeled with Cy3 and the thymus RNAs werelabeled with Cy5. The labeled cRNAs were purified (QIAquick spincolumns, QIAGEN, Venlo, The Netherlands) and 1 μg of each samplewas hybridized to 4×44 K whole genome mouse oligo microarrays(G4122F, Agilent) according to manufacturer's instructions (two-color microarray-based gene expression analysis, Agilent). After a17-h incubation period, slides were washed using various dilutionsof SSPE (sodium chloride, sodium phosphate, EDTA) buffer accordingto the protocol provided by Agilent. Arrays were scanned using anAgilent microarray scanner (G2565B). The fluorescent readings fromthe scanner were converted to quantitative files using FeatureExtraction 9.1 software (Agilent Technologies). Quality check of thearrays was done using software package LimmaGUI in R version 2.3.1.Four samples were removed from the analysis due to technical failure.Data were imported in GeneMaths XT 1.5 (Applied Maths, St.MartensLatem, Belgium), and spots with signal intensities below twotimes background were excluded from subsequent analysis. Correcteddata were normalized and adjusted for random and systematic error(Pellis et al., 2003).
Overview of significantly up- and downregulated genes. Significanceanalysis ofmicroarrays (SAM) analysiswas applied to detect significantlyaffected genes for each treatment using the two-class unpairedcomparison (Tusher et al., 2001). The False Discovery Rate was set tob0.5%. No additional filtering on a threshold for up- or downregulationwas applied. Evaluation of the outcome of the SAM results showed thatthe minimal ratio for up- or downregulation was 1.5.
Hierarchical clustering. Hierarchical clustering was done with theprograms Cluster (uncentered correlation; average linkage clustering)and Treeview (Eisen et al., 1998).
Metacore. Metacore (GeneGo, St. Joseph, MI) is an online softwareprogram that provides, among other options, pathway analysis ofmicroarray data. Groups of co-clustering genes were analyzed foroverrepresentation of genes from signaling and metabolic pathwaysbased on hypergeometric distribution (Ekins et al., 2006). Pathwayswith a p valueb10−5 were considered significant.
GSEA. Gene set enrichment analysis (GSEA) was performed todiscover the differential expression of biologically relevant setsof genes that share common biological function or regulation (Sub-ramanian et al., 2005). GSEA has the advantage that no initial filtering isapplied to the data set to select for significantly differentially expressedgenes. GSEA first ranks all probe sets based on fold changes (algorithmsignal to noise) in expression between a treatment and the control.Subsequently, by using pre-defined sets of associated genes based onprior biological knowledge, GSEA calculateswhether sets as awhole areenriched at the top or bottom of the fold change-based ranking list, orrandomly distributed (Subramanian et al., 2005). This enables detectionof significantly affected gene sets, while the fold change of expression ofthe individual genes can be relatively modest. GSEA was performed forall treatment groups vs. controls at same time point. Gene sets with a p

301S.W.M. van Kol et al. / Toxicology and Applied Pharmacology 250 (2011) 299–311
valueb0.05 and an FDR valueb0.25 were considered being significantlyregulated. Up- and downregulation of significant gene sets werevisualized with heap maps. The p values were converted into Z valuesto enable clustering. Gene sets obtained positive or negative Z valueswhen up- or downregulated, respectively. Hierarchical clustering wasdone as described above.
For GSEA, five collections of gene sets were used:
1. Cell cycle: data taken from supplemental data of Whitfield et al.(2002) and Bar-Joseph et al. (2008). In these studies, cells were firstsynchronized at the G0 cell stage and then stimulated to retain thecell cycle. Microarray analysis was performed to detect genesupregulated during certain cell cycle stages. Up- or downregulationof these gene sets is indicative for a higher or lower proliferation rate.
2. Gene ontology: gene sets (mouse gene symbols) were downloadedfrom theGeneOntology Consortium(http://www.geneontology.org/).This collection contains gene sets related to general cellular processes.
3. Lymphocyte signature database: gene sets were taken over fromShaffer et al. (2001). A proportion of these gene sets are based onresults from expression profiling studies on lymphocytes.
4. Tissue-specific blood cell types: data taken from Su et al. (2004),Lyons et al. (2007), Du et al. (2006), and Hoffmann et al. (2003).This collection contains gene sets that are specifically highlyexpressed in certain blood cell types.
5. TOX TFS target genes: contains gene sets related to (1) toxic actionof compounds or (2) target genes of toxicity-related transcriptionfactors. These gene sets were deduced from microarray data.
Molecular concepts analysis. Molecular concepts analysis enables tovisualize networks in which the overlap between gene sets based onco-occurrence of genes are shown (Rhodes et al., 2007). This overlapwas calculated based on the genes that were responsible for a gene setto be significantly affected. For this, either the top 20% of the genesbeing upregulated or the top 20% of the genes being downregulatedwas used. Gene set selection for molecular concepts mapping wasmore stringent than used for making heat maps. Gene sets wereselected on a p value b0.01 in combination with an FDR value b0.25according to GSEA statistics. In addition, gene sets containing≤8genes were excluded from the analysis. After applying these criteria,74 upregulated and 80 downregulated gene sets remained. Thesignificance of overlap between the gene sets was calculated based onthe binomial distribution using Venn-Mapper (Smid et al., 2003).Gene sets showing significant overlap (Z value N2.72 that is equal topb0.0001) were connected in a network that was visualized usingCytoscape (Shannon et al., 2003).
Genes from the gene sets with high overlap (high Z values) wereclustered close to each other. Gene sets within a same cluster areexpected to have a similarity in biological effects. These gene setswere merged, and heat maps showing the effects of all treatments onthe genes of those merged gene sets were generated using GSEA.
Isolation of primary thymocytes. Seven-week-old male C57BL/6mice were obtained from the breeding colony of WageningenUniversity and sacrificed by CO2 without any preceding treatment.The protocol was approved by the ethical committee for animalexperiments at Wageningen University. The thymus was excisedaseptically and collected in 3 ml RPMI 1640 medium, containingHEPES (Invitrogen Life Science, Breda, The Netherlands) with 10%heat-inactivated Fetal Bovine Serum (FBS) (Invitrogen Life Science),100 U/ml Penicillin, and 100 μg/ml streptomycin (Invitrogen LifeScience) (standard medium). The thymus was gently pressedthrough a 70-μm nylon cell strainer (Falcon, Franklin Lakes, NJ) toprepare a single-cell suspension. After centrifuging (10 min,1200 rpm, 4 °C), the cell suspension was resuspended in 5 ml of redblood cell lysis buffer (NH4Cl 155 mM, KHCO3 10 mM, EDTA 1 mM;pH 7.4) and incubated for 5 min on ice. Cells were washed with
standard medium (10 min, 1200 rpm, 4 °C) and counted with aCoulter Counter (Beckman Coulter, Woerden, The Netherlands). Theconcentration of the cell suspensionswas adjusted to 0.25×10⁶ cells/ml using standard medium.
Immunocytology. Freshly prepared DON solutions in absoluteethanol were diluted in standard medium and added to the primarythymocyte cultures (in 6-well plates) to a final concentration of 0.5 μMDON. The final ethanol concentration was. Upon exposure for 1 h at37 °C, primary thymocytes were immobilized on poly-L-lysine-coatedslides (Menzel-Glaser, Braunschweig, Germany) using mild cytospincentrifugation (6 min at 600×g) followed by incubation in 4%paraformaldehyde with 0.025% glutaraldehyde in PBS for 30 min.After blocking cells with 1% BSA and 0.01% Triton-X 100 in PBS for45 min, they were washed in 0.1% acetylated BSA (AUrion,Wageningen,NL) in PBS and incubated overnight at 4 °C with 1/100dilution of a primary antibody directed against NFATC1 (Santa CruzBiotechnology) in 0.1% acetylated BSA in PBS. After extensive washingin 0.1% acetylated BSA in PBS, the cells were incubatedwith 1/300 goatanti-mouse–IgG1–FITC secondary antibody for 120 min at 37 °C. Slideswere washed in PBS, mounted in Vectashield containing DAPI(Vectashield, Amsterdam, The Netherlands), and imaged with anLSM510 (Carl Zeiss, Jena, Germany) confocal microscope.
Images of DAPI and FITC were acquired with 405- and 488-nmexcitation in multitrackmode to prevent cross-signals. Images wereobtained with 420- to 480-nm BP filter for DAPI and 505- to 530-nmBP filter for FITC with a 63× Plan Apochromat objective NA1.4 toobtain high z-resolution (b1.0 μm optical slice).
Real time RT-PCR. Expression levels of 4 genes in all samples used formicroarray analysisweremeasured bymeans of real time RT-PCR. Thesegenes were selected on the basis of the outcome of the microarray dataanalysis. PCR primers were designed using Beacon designer 7.00 (Pre-mier Biosoft International, Palo Alto, CA). Primers for CD80 were sense5′-CGACTCGCAACCACACCATTAAG-3′ and antisense 5′-CCCGAAGG-TAAGGCTGTTGTTTG-3′, for CD86 sense 5′-TCACAAGAAGCCGAA-TCAGCCTAG-3′, and antisense 5′-GCTCTCACTGCCTTCACTCTGC-3′ forATF3 sense 5′-ATAGAAGAGGTCCGTAAGGCAAGG-3′ and antisense 5′-TTATTACAGCAAACACAGCAACACAAG-3′ and for Ccl4 sense 5′-CCCACTTCCTGCTGTTTCTCTTAC-3′ and antisense 5′-GCTCAGTTCAA-CTCCAAGTCACTC-3′. One microgram RNA was converted into cDNAusing the iScript cDNA Synthesis Kit (bio-Rad). One sample was takenalong without reverse transcriptase to examine the presence of DNA(-RT reaction). RT-PCR reactions were performed in triplicate, usingthe Bio-Rad MyiQ Single-Color Real-Time PCR Detection System(Veenendaal, The Netherlands). The reaction mixture contained 2 μlof cDNA and 23 μl of iQ SYBR green super mix consisting of reactionbuffer with dNTPs, iTaq DNA polymerase, SYBER green I andfluorescein (Bio-Rad-170-8882). The reaction mixtures were incu-bated for 3 min at 95 °C, followed by 40 cycles of amplification. ThePCR settings were as follows: denaturation 15 s at 95 °C, annealing45 s at 60 °C, and extension 1 min at 65 °C, with single fluorescenceacquisition at 65 °C after each cycle. Hprt1 (sense 5′- TGGGCTTACC-TCACTGCTTTCC-3′ and antisense 5′- CCTGGTTCATCATCG-CTAATCACG-3′) and Actb (sense 5′- AGC CAT GTA CGT AGC CATCCA-3′ and antisense 5′- TCT CCG GAG TCC ATC ACA ATG-3′) wereselected as reference genes since these were not differentiallyregulated by DON as judged from the microarray results. Normali-zation was performed using the reference gene, and the relativeexpression of the target genes was calculated. Data were analyzed byMyQ5 software (Bio-Rad).
Results
Mice were gavaged with three different doses (5, 10, or 25 mg/kgbw) of DON for three time periods (3, 6, and 24 h) and the thymuswas

Table 1Relative thymus weight (mg/g bw) of mice treated with DON. Mice were treated with 0, 5, 10 and 25 mg/kg DON for 3, 6 and 24 hours.
Time DON(mg/kg bw)
Mouse weight(g)
SD Absolute thymus weight(mg)a
Relative thymus weight(mg/g BW)a
3 h 0 23,7 2.4 74,4 8.6 3,14 0.165 22,8 1.1 74,2 15.1 3,25 0.73
10 23,84 1.8 74,6 11.8 3,13 0.5525 23,18 0.7 73,5 16.7 3,17 0.66
6 h 0 23,16 1.3 76,4 8.7 3,3 0.215 22,94 1.9 78,6 30.0 3,43 1.10
10 21,46 3.0 78,4 20.4 3,66 0.7825 24,68 2.7 79,8 18.6 3,24 0.42
24 h 0 23,74 2.6 83,0 10.7 3,5 0.465 22,72 0.8 71,6 16.2 3,15 0.77
10 22,68 1.3 76,1 21.4 3,36 0.8225 20,78 1.5 48,8** 10.3 2,35* 0.46
a: *: Pb0.01; **: Pb0.001 (Student's T test).
302 S.W.M. van Kol et al. / Toxicology and Applied Pharmacology 250 (2011) 299–311
isolated and subjected to microarray analysis. Treatment with 25 mg/kg bw DON for 24 h resulted in a decrease of the ratio betweenthymus weight and body weight (Table 1). As determined by SAM,treatment with 5 mg/kg DON resulted in 634 genes to be significantlyaffected within 3 h already. At this dose, the number of affected genesdecreased to 65 after 6 h and to 0 genes after 24 h. This decrease ofnumber of affected genes was also observed for the treatment with10 mg/kg bw DON, i.e., 713, 117, and 23 genes affected after 3, 6 and24 h, respectively. This indicates that after exposure to 5 and 10 mg/kg DON, the mice recovered over time. This pattern was not observedfor the highest dose of 25 mg/kg, which is one-third of the LD50. Thisresulted in a constant number of affected genes, i.e., 924, 1124, and1707 after treatment for 3, 6, or 24 h, respectively.
Fig. 1. Hierarchical clustering of DON-affected genes. The heat map shows 2026 spots reprecontrol in at least 3 out of 32 arrays. Gene expression levels are indicated by colors, red: uprthe control. Basically, six clusters of genes can be distinguished based on gene expression lclusters.
Hierarchical clustering and pathway analysis
Fig. 1 shows a hierarchical clustering for genes that were at least2.6-fold up- or downregulated (2log ratio ofN |1.4|) vs. the average ofthe controls in≥3 of the 32 arrays (selection of 2026 spotsrepresenting 1555 genes). Six clusters can be distinguished. Cluster1 contains genes that were mainly upregulated by 10 and 25 mg/kgDON after 24 h. A large group of genes (cluster 2) were highlyupregulated by each of the DON doses within 3 h already. These geneswere also upregulated after 6 and 24 h by the highest DON dose butwere much less or not upregulated anymore by the lower doses atthese time points. The genes within cluster 3 were upregulated after24 h and variably expressed in the 3- and 6-h control samples. Cluster
senting 1555 genes that were ≥2.6 times up- or downregulated vs. the average of theegulation, black: no regulation, and green: downregulation compared to the average ofevels. The affected biological processes are indicated to the right of the corresponding

303S.W.M. van Kol et al. / Toxicology and Applied Pharmacology 250 (2011) 299–311
4 contains genes highly downregulated after exposure for 24 h. Aproportion of these genes were downregulated at 3 and 6 h, whereasother genes of this cluster were upregulated at 3 h. Cluster 5 containsgenes downregulated after 3 and 6 h of treatment but less down-regulated after 24 h. The genes of cluster 6 were first downregulatedafter 3 h and upregulated after 6 h.
Metacore analysis of the genes from the individual clusters revealed aclear difference in functionality between the genes of cluster 2, 4, and 6.
Fig. 2. DON treatment affects gene sets indicative for proliferation. (A) Overview of the effecdownregulation and red upregulation compared to controls. Black indicates no effect. Genesdownregulated after 6- and 24-h exposure to DON. (B) Heat map of the genes from the merratios of treatment vs. the average of the control at the same time point. For visualization,control samples. Colors represent relative gene expression levels, blue indicates low expres
Genes from cluster 2 were involved in immune pathways, including theIL-17 and IL-1 signallingpathway (pvalue: 10−13 and10−12, respectively)and the Toll-like receptor pathway (p value: 10−9). The genes that weredownregulated at the latest time point (cluster 4)were part of several cellcycle pathways, such as those involved in metaphase checkpoint controland APC-mediated cell cycle regulation (p value: 10−25 and 10−20,respectively). Genes from cluster 6were involved in the cell cycle aswell.The twomost significant pathwayswere “start of DNA replication in early
t of DON on gene sets specifically upregulated during a cell cycle stage. Green indicateshighly expressed during the G1–S phase of the cell cycle were upregulated after 3 h andged proliferation related gene sets of Supplementary Fig. 2. The heat map contains 2logsix columns containing zeros were added, representing the relative expression of thesion, red indicates high expression.

305S.W.M. van Kol et al. / Toxicology and Applied Pharmacology 250 (2011) 299–311
Sphase” (p value: 10−6) and “themetaphase checkpoint” (p value: 10−6).Metacore analysis of genes from clusters 1, 3, and 5 did not result insignificantly regulated pathways.
Gene set enrichment analysis (GSEA) and molecular conceptsmapping
Gene set enrichment analysis was used for the identification ofgene sets affected by DON in order to unravel mechanisms of DONtoxicity. This enables the comparison of our results with resultsalready published in literature or derived from microarray studies.
A three-step approach was followed. Firstly, GSEA was performedon each of the nine treatment groups in relation to the controlsamples at the same time point. Up- and downregulation of significantgene sets were visualized in heat maps enabling comparison betweenthe treatment groups. This resulted in 264 gene sets, obtained fromfive gene set collections, that were significantly affected by at leastone treatment. Secondly, molecular conceptsmappingwas performedto further facilitate the biological interpretation. This provided avisualization of the overlap in genes among the significant gene setsfrom the combined gene set collections. Based on clusters of highlysimilar gene sets, themain biological events were elucidated. Molecularconcepts mapping was performed for one treatment: 6-h exposure to10 mg/kg. This treatment was selected since nearly all gene setsaffected by any treatment were also affected by this dose at this timepoint. Thirdly, gene sets showing high overlap according to molecularconcepts mapping were merged. The rationale for this step was that ahigh overlap is indicative for comparable biological effects. Heat mapswere made to investigate the expression of the individual genes ofmerged gene sets for all treatment groups.
The results of the molecular concepts mapping for all gene sets areshown in Supplementary Fig. 1. The gene sets upregulated by 6-h exposure to 10 mg/kg DON clustered into five themes: lymphocyteactivation, inflammatory response, blood cell infiltration, late precursorT cells, and a combination of cell adhesion and cytoskeleton (Supple-mentary Fig. 1A). The gene sets downregulated by the same treatmentyielded five clusters as well: mitochondrion, ribosome, cytoplasm/nucleus, early-precursor T cells, and proliferation (SupplementaryFig. 1B).
Proliferation
A molecular concepts visualization of the gene sets that areindicative for the proliferation rate is shown in Supplementary Fig. 2.The downregulation of the cell cycle related gene sets indicates amajor inhibiting effect of DON on the proliferation. These gene setsinclude genes that are specifically upregulated during a particular cellcycle phase (Whitfield et al., 2002; Bar-Joseph et al., 2008).Interestingly, genes upregulated during the G1–S phase of the cellcycle were upregulated after 3-h treatment with 5 μg/kg andparticularly 10 μg/kg DON (Fig. 2A). This indicates that 10 mg/kgDON rapidly stimulates entry of cells into the G1–S phase of the cellcycle but inhibits cell division shortly thereafter. A heat map of theexpression of the genes of the merged proliferation-related gene setsis given in Fig. 2B. This figure (upper part of heat map at the left)shows that many of the cell cycle genes were temporarily upregulatedduring the first 3 h.
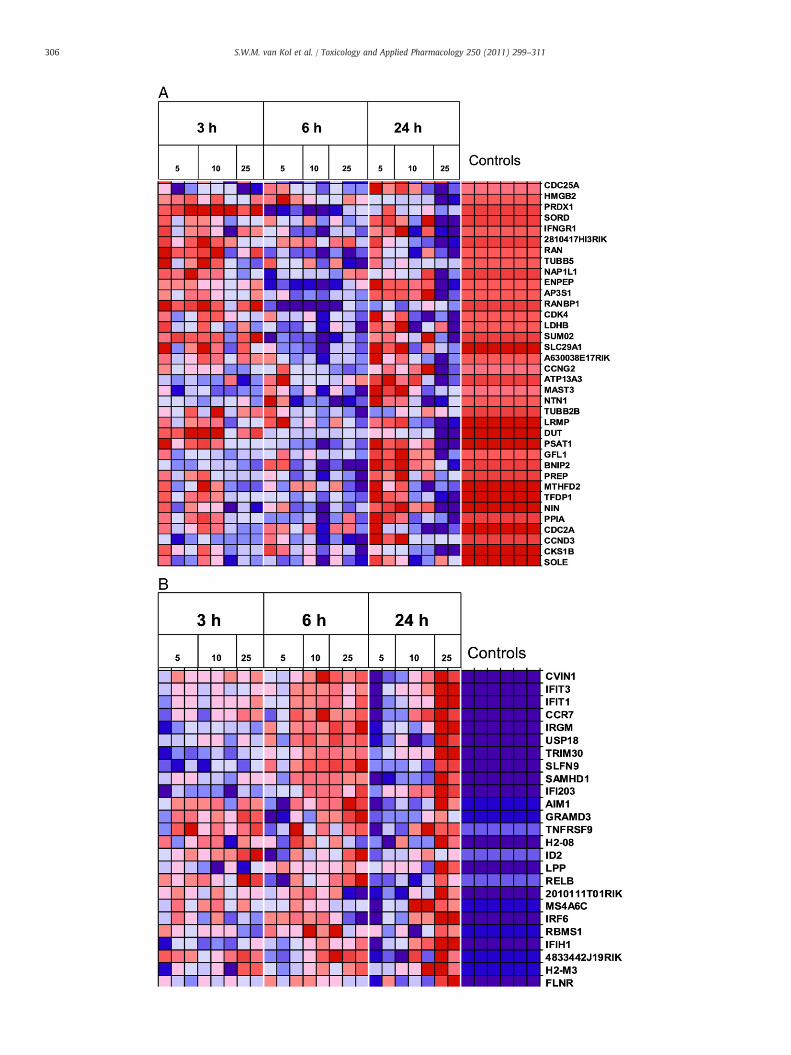
Fig. 3. DON upregulates gene sets related to lymphocyte activation. (A) Molecular conceptsgene sets were upregulated after 6-h exposure to 10 mg/kg DON. The size of the nodes coconnecting lines indicate the degree of overlap between the gene sets. The color of the nodlymphocyte signature database; yellow: TOX TFS target genes. (B) Heat map of genes involaverage of the control at the same time point. For visualization, six columns containing zrepresent relative gene expression levels, blue indicates low expression, red indicates high exFig. 3. T cell activation genes were upregulated within 3 h and remained upregulated afterupregulated anymore after 24-h treatment with 5 and 10 mg/kg bw DON.
T cell activation
As shown in Fig. 3A, genes that are upregulated in T lymphocytesduring the T cell activation response are also upregulated by DON.These gene sets include NFkB, CD40, Fos, and Jun (SupplementaryFig. 3), which are well-known for being induced by T cell activation(Gwack et al., 2007). In agreement with this, NFkB target genes andCD40 upregulated genes are also induced by DON (Fig. 3A). These Tcell activation-related genes were upregulated within 3 h. Thesegenes remain highly upregulated after 24 h for the highest dose ofDON but return within 24 h close to control levels for the lowest andmiddle dose of DON (Fig. 3B).
Inflammatory response, blood cell infiltration, cell adhesion–cytoskeleton
DONupregulatedofmany inflammatory response-relatedgene setsincluding chemokine activity, chemotaxis, inflammatory response, andacute phase response (Supplementary Fig. 4A). These gene setscontained many cytokine-related genes (Supplementary Fig. 4B). Theupregulation of gene sets such as dendritic cells, monocytes, andpolymorphonuclear leucocytes (Supplementary Fig. 5A and C) indi-cates an infiltration of blood cells with phagocytotic ability. One othercluster of gene sets upregulated by DON was related to cell adhesionand cytoskeleton (Supplementary Fig. 6A). The expression patternover time of inflammatory response, blood cell infiltration, and celladhesion–cytoskeleton genes was remarkable similar to that of the Tcell activation-induced genes (Supplementary Figs. 4B, 5B, D and 6B).
Precursor T lymphocytes
Genes highly expressed in either the very earliest precursor Tlymphocytes stage (DN2) or the late precursor stages (CD4+ or CD8+)were upregulated by DON treatment, while genes highly expressed inearly precursor cells of the double-positive stage (CD4+ and CD8+)were downregulated by DON (Supplementary Fig. 7A, B, and D).Genes highly expressed in early precursor stages DN3 and DN4 areupregulated at 3 h and downregulated at 6 and 24 h (SupplementaryFig. 7A and B). The downregulation of the early precursor markergenes and the upregulation of the late precursor marker genes weremost apparent at 6 h for all doses and at 24 h for the highest dose ofDON (Fig. 4A and B, Supplementary Fig. 7C and E). After 24 h, geneexpression in thymuses of mice exposed to 5 and 10 mg/kg DON wasfor the most part recovered. In marked contrast, the effects of 24-h exposure to 25 mg/kg DONwere more severe than those after 3 and6 h (Fig. 4, Supplementary Fig. 7C and E). These findings indicate thatthe early precursor T lymphocytes that are at or close to the double-positive stage are most sensitive for DON treatment.
Mitochondrion, ribosome, cytoplasm/nucleus
Genes encoding proteins for cellular components as mitochondria,ribosomes, and cytoplasm/nuclei were downregulated by DON. Themolecular concepts picture for ribosomes also contains gene setsrelated to mRNA splicing, nucleosome, protein synthesis, andribosomal RNA binding, indicating that genes involved in the entireroute for mRNA modification to protein translation were down-regulated (Fig. 5A). As shown in the heat map of Fig. 5B, this
visualization of gene sets containing genes upregulated during T cell activation. Theserresponds to the number of genes of the gene set, and the width and boldness of thees corresponds to the gene set collection from which the gene sets were taken. Green:ved in T lymphocyte activation. The heat map contains 2log ratios of treatment vs. theeros were added, representing the relative expression of the control samples. Colorspression. The picture for all genes including gene symbols is provided in Supplementary24-h treatment with 25 mg/kg bw DON. Most T cell activation-related genes were not

Fig. 5. DON downregulates ribosome- and protein translation-related genes. (A) Molecular concepts visualization of gene sets involved in the route for mRNA modification to proteintranslation. Genes from these gene sets were downregulated. This visualization method is explained in the legend of Fig. 3A. Green nodes: lymphocyte signature database; purple nodes:gene ontology. (B) Heat map of the genes from the merged gene sets of A. Downregulation of genes involved in ribosomal function was most severe after 6 h of exposure. The colors ofthe heat maps are explained in the legend of Fig. 3B.
307S.W.M. van Kol et al. / Toxicology and Applied Pharmacology 250 (2011) 299–311
downregulation was most apparent after 6 h. The expression patternsof the gene sets related to mitochondria and cytoplasm/nucleus wererather similar to that of the ribosome-related gene sets (Supplemen-tary Figs. 8 and 9, respectively). Again many genes were upregulatedafter 3 h and downregulated from 6 h onwards.
Fig. 4. DON affects the relative abundance of precursor T lymphocytes. (A) Bottom part of a hthe double-positive stage. For this, genes of the gene sets shown in Supplementary Fig. 7B wand remained downregulated after 24 h for the highest dose. Full heat map is shown in Sulymphocytes, showing upregulation of these genes at 3 and 6 h of treatment. After 24 h, this ukg DON. Full heat map is shown in Supplementary Fig. 7E. The colors of the heat maps are
Genes upregulated during negative selection of thymocytes
The finding that DON induces a T cell activation response is of highrelevance, since T cell activation in the thymus induces apoptosis andrapid depletion of the activated thymocyte (Starr et al., 2003). This
eat map of genes highly expressed in early precursor lymphocytes, for the largest part ofere merged. These genes were downregulated after treatment for 3 and 6 h for all dosespplementary Fig. 7C. (B). Top part of a heat map of marker genes for late precursor Tpregulation was less apparent for 5 and 10 mg/kg DON but was more severe for 25 mg/explained in the legend of Fig. 3B.

Fig. 6. Genes upregulated during negative selection of thymocytes are also upregulated by DON. Genes upregulated in double-positive thymocytes during negative selection weretaken from data published by Schmitz et al. (2003) The heat map shows the effect of DON on these genes. The majority of these genes were upregulated within 3 h of DON treatment.The colors of the heat maps are explained in the legend of Fig. 3B.
308 S.W.M. van Kol et al. / Toxicology and Applied Pharmacology 250 (2011) 299–311
process is normally induced in thymocytes that recognize “self-antigens”. This selection process occurs predominantly at the double-positive stage (Starr et al., 2003). Our expression data suggest that thedouble-positive precursor T lymphocytes are also themain target cellsof DON. These observations brought us to examinewhether genes thatwere normally upregulated during negative selection of double-positive thymocytes are also upregulated by DON in our experiment.For this, we used a previously published gene set of 58 genes that areupregulated within 2 h in mouse double-positive thymocytes afterinduction of negative selection in vivo (Schmitz et al., 2003). Fromthese 58 genes, 51 could be linked to ourmicroarray data. As shown inFig. 6, themajority of these genes were upregulated within 3 h of DONtreatment as well. This indicates that DON induces molecular eventssimilarly to those induced by negative selection on thymocytes withself-recognition.
Immunocytology
Many of the genes that are upregulated during negative selectionin the thymus (Schmitz et al., 2003) are also upregulated in ourexperiment by DON. Negative selection in the thymus is initiated by aT cell activation response to self-antigens. This finding, therefore,further supports the involvement of T cell activation in the mode of
action of DON. An essential step for T cell activation is the activation ofNFAT and translocation of NFAT from the cytoplasm to the nucleus(Shaffer et al., 2001; Gwack et al., 2007). Therefore, we assessedwhether DON exerts NFAT translocation in primary mouse thymo-cytes. As shown in Fig. 7, DON induced a rapid translocation of NFAT tothe nucleus within 1 h.
Real time RT-PCR
In order to confirm the expression profiles provided by themicroarray analysis, four genes were selected for expression analysisby quantitative RT-PCR. Genes were selected on basis of a key role ineither T cell activation, negative selection, or ER stress response:CD86, CD80, Ccl4, and ATF3. The expression patterns of these genes asassessed by quantitative RT-PCR were very similar to those providedby the microarray analysis (Fig. 8).
Discussion
This study shows the in vivo effects of DON on gene expression inmouse thymus cells. Biological interpretation of the gene expressionprofiles confirmed some already known pathways of DON toxicity butalso put forward yet unknown modes of action. Our results clearly

Fig. 7. Translocation of NFAT after treatment of primary thymocytes with DON. Panels A, B and E: control cells; panels C, D, and F: DON-treated cells. The green fluorescence in panelsA, C, E, and F represents FITC-stained NFAT. Panels B and D show DAPI-stained nuclei. Scale bar represent 15 μm (A–D) and 5 μm (E and F).
Ccl2
02468
1012141618
5 10 25 5 10 25 5 10 25
Rat
io c
om
par
ed t
o c
on
tro
l 3h 6h 24h
CD80
-2
-1
0
1
2
3
4
5
5 10 25 5 10 25 5 10 25
Rat
io c
om
par
ed t
o c
on
tro
l
ATF3
-505
1015202530354045
5 10 25 5 10 25 5 10 25Rat
io c
om
par
ed t
o c
on
tro
l
CD86
0
1
2
3
4
5
5 10 25 5 10 25 5 10 25Rat
io c
om
par
ed t
o c
on
tro
l
3h 6h 24h
3h 6h 24h 3h 6h 24h
Fig. 8. Real-time PCR. RT-PCR confirmation of microarray data. Quantitative real-time PCR was performed for ATF3, CD80, CD86, and Ccl4. The expression levels of the genes arerelative to Hprt1 and actB.
309S.W.M. van Kol et al. / Toxicology and Applied Pharmacology 250 (2011) 299–311

310 S.W.M. van Kol et al. / Toxicology and Applied Pharmacology 250 (2011) 299–311
indicate that DON induces a T cell activation response, which israpidly followed by apoptosis and depletion of thymocytes similarlyto the process of negative selection of precursor thymocytes with self-recognition. This is in agreement with the thymus being the mostsensitive target organ for DON exposure.
A high number of genes were significantly affected after 3 h ofexposure at all doses used. For the 5 and 10 mg/kg bw dose groups,the number of affected genes was considerably reduced after 6 h,while only a small number of genes was still affected after 24 h. Thisindicates that the effects of 5 and 10 mg/kg DON were reversible. Thelimited period of DON toxicity is likely related to the previouslydescribed rapid metabolization and clearance of DON (Pestka, 2007;Amuzie et al., 2008). In mice treated with 5 mg/kg bw DON,concentrations have been reported to reach a maximum in plasmaand tissues within 15–30 min and to be reduced by 75–90% after120 min already (Amuzie et al., 2008). The number of affected genesinduced by 25 mg/kg DON remained constant over time, indicatingthat this dose induces an irreversible effect, at least during a period of24 h.
DON stimulated within 3 h the expression of many genes that arealso activated during the T cell activation response. This conclusion ispartly based on the similarity of our data with those on Tlymphocytes that were activated with either PMA and IL2 or acombination of cytokines (Feske et al., 2001; Shaffer et al., 2001).These gene sets include calcium influx-dependent and NFkB targetgenes (Fig. 3A). Normally, T cell activation is induced by binding ofthe T cell receptor to an antigen. This induces depletion of theendoplasmatic reticulum calcium stores, which activates NFkB andevokes a larger calcium influx across the plasma membrane throughcalcium transporters. This rise in intracellular calcium activatescalcineurin to dephosphorylate NFAT, which subsequently is translo-cated to the nucleus where it activates many target genes leading to Tcell activation and proliferation (Gwack et al., 2007). In the presentstudy, we were able to demonstrate using immunohistochemicaltechniques that DON induces translocation of NFAT from thecytoplasm to the nucleus.
Since DON is not expected to activate the T cell receptor, it likelyinduces one of the downstream events after T cell receptor activation.DON is known to inhibit protein synthesis by binding to the 60 Sribosomal unit where it interferes with the activity of peptidyltransfer-ase, preventing polypeptide chain initiation, and elongation (Ueno andHsieh, 1985; Pestka, 2008). DON like other ribosome-binding transla-tional inhibitors also rapidly activates mitogen-activated proteinkinases (MAPKs) via a process termed the “ribotoxic stress response”.TheseMAPKs include P38MAPK and JNK (Pestka, 2008), which are alsoknown to be induced during T cell activation and negative selection ofthymocytes. (Rincón et al., 2000; Starr et al., 2003). Therefore, inductionof MAPKs by DON might be one route leading to T cell activation.Alternatively, the action of DON on the ribosomes at the endoplasmaticreticulum might cause the endoplasmatic reticulum to release calciumleading to a T cell activation response.
T cell activation in the thymus is known to induce negativeselection, and our data indicate that this process also occurs after DONexposure. Genes upregulated within 2 h after induction of negativeselection of mouse double-positive thymocytes in vivo were alsorapidly induced in our experiment by DON. The upregulation of CD40target genes further supports this finding (Fig. 3A). CD40 and its ligand(CD40L) are master regulators of negative selection of thymocytes.CD40 regulates the expression of different co-stimuli required fornegative selection like CD80, CD86, CD54, CD58, FasL, TNF, and IL-12.(Li and Page, 2001; Dong et al., 2002). Of those co-stimuli, CD54, CD80,and CD86 were significantly upregulated after 6-h exposure with10 mg/kg bw. The upregulation of CD80 and CD86 was confirmedusing real-time RT-PCR.
DON appears to induce a quick stimulus to cell activity before itexerts its toxic activity. Many gene sets related to proliferation
(particularly G1–S phase), mitochondria, and ribosomes wereupregulated at 3 h and highly downregulated at 6 and 24 h. Thismight be related to induction of T cell activation as well, which isknown to quickly stimulate cells divide (Onur et al., 2009).
GSEA analysis demonstrated downregulation of genes that arehighly expressed in early-precursor T lymphocytes of DN3 to double-positive stage and upregulation of genes that are highly expressed invery early or late-precursor T lymphocytes. The most likely explana-tion for this finding is that early-precursor T lymphocytes of DN3 todouble-positive stage are more vulnerable for DON treatment thanthe late precursor cells. This agrees with previously published findingsin mice that 12.5 mg/kg DON to induce a decrease of the number ofdouble-positive cells within 12 h, whereas the number of lateprecursor cells (either CD4+, CD8−, or CD4−, CD8+) remainedconstant (Islam et al., 2003). The high sensitivity of double-positivecells agrees with the presently proposed role of T cell activation inmediating the toxic activity of DON. In the normal thymus, depletionof precursor T lymphocytes that respond to auto-antigens occurs atthe double-positive stage as well (Starr et al., 2003). Therefore,double-positive T cells will be much more sensitive for DON-inducedT cell activation than the very early or late precursor T cells.
Genes encoding proteins for cellular components as mitochondria,ribosomes, and cytoplasm/nuclei were downregulated by DON. It istempting to relate the downregulation of ribosome- and proteintranslation-related genes to the ribotoxic stress response. Sincemitochondria- and cytoplasm/nuclei-related genes are downregu-lated as well, these findings aremore likely correlated to the depletionof early lymphocytes that have a higher metabolization rate than thethymus epithelial and stromal cells. Likewise, the upregulation ofgenes related to cell adhesion and cytoskeleton is most likely due tothe relative increase of the proportion of stromal cells.
In relation to the toxic effect of DON, it is surprising that theexpression data provide little indications for induction of apoptosis.This agrees, however, with previously published data showing thatafter 12-h treatment with 12.5 mg/kg DON less than 0.5% of the CD4+
CD8+ cells have apoptotic (subdiploid) nuclei (Islam et al., 2003). Atthis same time point, however, 25% of the CD4+ CD8+ cells aredepleted from the thymus. Therefore, depletion of DON-affected cellslikely precedes induction of apoptosis, meaning that there wereapoptotic cells present in the thymus, but before the end of thetreatment period, those cells were already depleted from the thymus.This rapid depletion likely occurs via phagocytosis, which agrees withour findings of a fast invasion of leucocytes and macrophages into theDON-treated thymus. Deletion via phagocytosis is also found duringnegative selection in the thymus (Sun and Shi; Elliott et al., 2009).
In summary, the present findings indicate that DON inducescellular events that also occur after activation of the T cell receptor,such as release of calcium from the endoplasmatic reticulum. This Tcell activation is rapidly followed by negative selection of thymocytes,particularly those at the double-positive stage. At lower exposurelevels (5 and 10 mg/kg), this effect is reversible, while it is irreversibleat least 24 h after exposure to 25 mg/kg. This provides a plausibleexplanation for the high sensitivity for DON of immune cells, above allthymocytes, compared to other cell types.
Supplementarymaterials related to this article can be found onlineat doi:10.1016/j.taap.2010.11.001.
Acknowledgments
The authors thank Hakan Baykus, Jenneke Riethoff-Poortman, andNorbert de Ruijter for their technical support and Wilma Blauw andBert Weijers of the Small Animal Center of Wageningen University(Wageningen, The Netherlands).
Sandra W.M van Kol is recipient of grant MFA6809 from the Dutchtechnology foundation STW.

311S.W.M. van Kol et al. / Toxicology and Applied Pharmacology 250 (2011) 299–311
References
Amuzie, C.J., Harkema, J.R., Pestka, J.J., 2008. Tissue distribution and proinflammatorycytokine induction by the trichothecene deoxynivalenol in the mouse: comparisonof nasal vs. oral exposure. Toxicology 248, 39–44.
Azconaolivera, J.I., Ouyang, Y., Murtha, J., Chu, F.S., Pestka, J.J., 1995. Induction ofcytokine mrnas in mice after oral exposure to the trichothecene vomitoxin(deoxynivalenol): relationship to toxin distribution and protein synthesisinhibition. Toxicol. Appl. Pharmacol. 133, 109–120.
Bar-Joseph, Z., Siegfried, Z., Brandeis, M., Brors, B., Lu, Y., Eils, R., Dynlacht, B.D., Simon, I.,2008. Genome-wide transcriptional analysis of the human cell cycle identifies genesdifferentially regulated in normal and cancer cells. Proc. Natl Acad. Sci. 105, 955–960.
Dong, C., Davis, R.J., Flavell, R.A., 2002. Map kinases in the immune response. Annu. Rev.Immunol. 20, 55–72.
Du, X., Tang, Y., Xu, H., Lit, L., Walker, W., Ashwood, P., Gregg, J.P., Sharp, F.R., 2006.Genomic profiles for human peripheral blood T cells, B cells, natural killer cells,monocytes, and polymorphonuclear cells: comparisons to ischemic stroke,migraine, and Tourette syndrome. Genomics 87, 693–703.
Eisen, M.B., Spellman, P.T., Brown, P.O., Botstein, D., 1998. Cluster analysis and display ofgenome-wide expression patterns. Proc. Natl. Acad. Sci. USA 95, 14863–14868.
Ekins, S., Bugrim, A., Brovold, L., Kirillov, E., Nikolsky, Y., Rakhmatulin, E., Sorokina, S.,Ryabov, A., Serebryiskaya, T., Melnikov, A., Metz, J., Nikolskaya, T., 2006. Algorithmsfor network analysis in systems-ADME/Tox using the MetaCore and MetaDrugplatforms. Xenobiotica 36, 877–901.
Elliott, M.R., Chekeni, F.B., Trampont, P.C., Lazarowski, E.R., Kadl, A., Walk, S.F., Park, D.,Woodson, R.I., Ostankovich, M., Sharma, P., Lysiak, J.J., Harden, T.K., Leitinger, N.,Ravichandran, K.S., 2009. Nucleotides released by apoptotic cells act as a find-mesignal to promote phagocytic clearance. Nature 461, 282–286.
Feske, S., Giltnane, J., Dolmetsch, R., Staudt, L.M., Rao, A., 2001. Gene regulationmediated by calcium signals in T lymphocytes. Nat. Immunol. 2, 316–324.
Forsell, J.H., Jensen, R., Tai, J.H., Witt, M., Lin, W.S., Pestka, J.J., 1987. Comparison of acutetoxicities of deoxynivalenol (vomitoxin) and 15-acetyldeoxynivalenol in theB6C3F1 mouse. Food Chem. Toxicol. 25, 155–162.
Gwack, Y., Feske, S., Srikanth, S.,Hogan, P.G., Rao, A., 2007. Signalling to transcription: store-operated Ca2+ entry and NFAT activation in lymphocytes. Cell Calcium 42, 145–156.
Hoffmann, R., Bruno, L., Seidl, T., Rolink, A., Melchers, F., 2003. Rules for gene usageinferred from a comparison of large-scale gene expression profiles of T and Blymphocyte development. J. Immunol. 170, 1339–1353.
Islam, Z., King, L.E., Fraker, P.J., Pestka, J.J., 2003. Differential induction of glucocorticoid-dependent apoptosis in murine lymphoid subpopulations in vivo followingcoexposure to lipopolysaccharide and vomitoxin (deoxynivalenol). Toxicol. Appl.Pharmacol. 187, 69–79.
Kinser, S., Jia, Q., Li, M., Laughter, A., Cornwell, P., Corton, J.C., Pestka, J., 2004. Geneexpression profiling in spleens of deoxynivalenol-exposed mice: immediate earlygenes as primary targets. J. Toxicol. Environ. Health A 67, 1423–1441.
Li, R., Page, D.M., 2001. Requirement for a complex array of costimulators in thenegative selection of autoreactive thymocytes in vivo. J. Immunol. 166, 6050–6056.
Lyons, P., Koukoulaki, M., Hatton, A., Doggett, K., Woffendin, H., Chaudhry, A., Smith, K.,2007. Microarray analysis of human leucocyte subsets: the advantages of positiveselection and rapid purification. BMC Genomics 8, 64.
Onur, B., Sven, L., Carsten, K., Jonathan, S., 2009. Homeostatic proliferation and survivalof naïve and memory T cells. Eur. J. Immunol. 39, 2088–2094.
Pellis, L., Franssen-van Hal, N.L.W., Burema, J., Keijer, J., 2003. The intraclass correlationcoefficient applied for evaluation of data correction, labeling methods, and rectalbiopsy sampling in DNA microarray experiments. Physiol. Genomics 16, 99–106.
Pestka, J.J., 2007. Deoxynivalenol: toxicity, mechanisms and animal health risks. Anim.Feed Sci. Technol. 137, 283–298.
Pestka, J.J., 2008. Mechanisms of deoxynivalenol-induced gene expression andapoptosis. Food Addit. Contam. A 25, 1128–1140.
Pestka, J.J., Islam, Z., Amuzie, C.J., 2008. Immunochemical assessment of deoxynivalenoltissue distribution following oral exposure in the mouse. Toxicol. Lett. 178, 83–87.
Pestka, J.J., Zhou, H.R., Moon, Y., Chung, Y.J., 2004. Cellular and molecular mechanismsfor immune modulation by deoxynivalenol and other trichothecenes: unraveling aparadox. Toxicol. Lett. 153, 61–73.
Rhodes, D.R., Kalyana-Sundaram, S., Tomlins, S.A., Mahavisno, V., Kasper, N.,Varambally, R., Barrette, T.R., Ghosh, D., Varambally, S., Chinnaiyan, A.M., 2007.Molecular concepts analysis links tumors, pathways, mechanisms, and drugs.Neoplasia 9, 443–454.
Richard, J.L., 2007. Some major mycotoxins and their mycotoxicoses—an overview. Int.J. Food Microbiol. 119, 3–10.
Rincón, M., Flavell, R.A., Davis, R.A., 2000. The JNK and P38 MAP kinase signalingpathways in T cell-mediated immune responses. Free Radic. Biol. Med. 28,1328–1337.
Robbana-Barnat, S., Lafarge-Frayssinet, C., Cohen, H., Neish, G.A., Frayssinet, C., 1988.Immunosuppressive properties of deoxynivalenol. Toxicology 48, 155–166.
Rotter, B.A., Prelusky, D.B., Pestka, J.J., 1996. Toxicology of deoxynivalenol (vomitoxin).J. Toxicol. Environ. Health 48, 1–34.
Schmitz, I., Clayton, L.K., Reinherz, E.L., 2003. Gene expression analysis of thymocyteselection in vivo. Int. Immunol. 15, 1237–1248.
Shaffer, A.L., Rosenwald, A., Hurt, E.M., Giltnane, J.M., Lam, L.T., Pickeral, O.K., Staudt, L.M.,2001. Signatures of the immune response. Immunity 15, 375–385.
Shannon, P., Markiel, A., Ozier, O., Baliga, N.S., Wang, J.T., Ramage, D., Amin, N.,Schwikowski, B., Ideker, T., 2003. Cytoscape: a software environment for integratedmodels of biomolecular interaction networks. Genome Res. 13, 2498–2504.
Smid, M., Dorssers, L.C.J., Jenster, G., 2003. Venn mapping: clustering of heterologousmicroarray data based on the number of co-occurring differentially expressedgenes. Bioinformatics 19, 2065–2071.
Starr, T.K., Jameson, S.C., Hogquist, K.A., 2003. Positive and negative selection of T cells.Annu. Rev. Immunol. 21, 139–176 (Epub 2002 Oct 2016).
Su, A.I., Wiltshire, T., Batalov, S., Lapp, H., Ching, K.A., Block, D., Zhang, J., Soden, R.,Hayakawa, M., Kreiman, G., Cooke, M.P., Walker, J.R., Hogenesch, J.B., 2004. A geneatlas of the mouse and human protein-encoding transcriptomes. Proc. Natl. Acad.Sci. USA 101, 6062–6067.
Subramanian, A., Tamayo, P., Mootha, V.K., Mukherjee, S., Ebert, B.L., Gillette, M.A.,Paulovich, A., Pomeroy, S.L., Golub, T.R., Lander, E.S., Mesirov, J.P., 2005. Gene setenrichment analysis: a knowledge-based approach for interpreting genome-wideexpression profiles. Proc. Natl. Acad. Sci. USA 102, 15545–15550.
Sun, E.W., Shi, Y.F., 2001. Apoptosis: the quiet death silences the immune system.Pharmacol. Ther. 92, 135–145.
Tusher, V.G., Tibshirani, R., Chu, G., 2001. Significance analysis of microarrays applied tothe ionizing radiation response. Proc. Natl. Acad. Sci. USA 98, 5116–5121.
Ueno, Y., Hsieh, D.P.H., 1985. The toxicology of mycotoxins. Crit. Rev. Toxicol. 14,99–132.
Whitfield, M.L., Sherlock, G., Saldanha, A.J., Murray, J.I., Ball, C.A., Alexander, K.E.,Matese, J.C., Perou, C.M., Hurt, M.M., Brown, P.O., Botstein, D., 2002. Identification ofgenes periodically expressed in the human cell cycle and their expression intumors. Mol. Biol. Cell 13, 1977–2000.
Zhou, H.R., Yan, D., Pestka, J.J., 1997. Differential cytokine mRNA expression in miceafter oral exposure to the trichothecene vomitoxin (deoxynivalenol): doseresponse and time course. Toxicol. Appl. Pharmacol. 144, 294–305.