
MicroRNA profiling of the murine hematopoietic system
15
Genome Biology 2005, 6:R71 comment reviews reports deposited research refereed research interactions information Open Access 2005 Monticelli et al. Volume 6, Issue 8, Article R71 Research MicroRNA profiling of the murine hematopoietic system Silvia Monticelli ¤*† , K Mark Ansel ¤* , Changchun Xiao ¤* , Nicholas D Socci ¤‡ , Anna M Krichevsky § , To-Ha Thai * , Nikolaus Rajewsky ¶ , Debora S Marks ¥ , Chris Sander ‡ , Klaus Rajewsky * , Anjana Rao * and Kenneth S Kosik §# Addresses: * Department of Pathology, Harvard Medical School, and CBR Institute for Biomedical Research, Boston, MA 02115, USA. † Department of Biology and Genetics of Medical Sciences, Universitá degli Studi di Milano, 20133 Milan, Italy. ‡ Computational Biology Center, Memorial Sloan-Kettering Cancer Center, New York, NY 10021, USA. § Department of Neurology, Brigham and Women's Hospital and Harvard Medical School, Boston, MA 02115, USA. ¶ Center for Functional Comparative Genomics, Department of Biology, New York University, New York, NY 10003, USA. ¥ Department of Systems Biology, Harvard Medical School, Boston, MA 02115, USA. # Neuroscience Research Institute, University of California Santa Barbara, Santa Barbara, CA 93106, USA. ¤ These authors contributed equally to this work. Correspondence: Silvia Monticelli. E-mail: [email protected] © 2005 Monticelli et al.; licensee BioMed Central Ltd. This is an Open Access article distributed under the terms of the Creative Commons Attribution License (http://creativecommons.org/licenses/by/2.0), which permits unrestricted use, distribution, and reproduction in any medium, provided the original work is properly cited. MiRNA profiling of the murine hematopoietic system <p>The first report of systematic miRNA profiling in cells of the hematopoietic system suggests that, in addition to regulating commitment to particular cellular lineages, miRNAs might have a general role in cell differentiation and cell identity.</p> Abstract Background: MicroRNAs (miRNAs) are a class of recently discovered noncoding RNA genes that post-transcriptionally regulate gene expression. It is becoming clear that miRNAs play an important role in the regulation of gene expression during development. However, in mammals, expression data are principally based on whole tissue analysis and are still very incomplete. Results: We used oligonucleotide arrays to analyze miRNA expression in the murine hematopoietic system. Complementary oligonucleotides capable of hybridizing to 181 miRNAs were immobilized on a membrane and probed with radiolabeled RNA derived from low molecular weight fractions of total RNA from several different hematopoietic and neuronal cells. This method allowed us to analyze cell type-specific patterns of miRNA expression and to identify miRNAs that might be important for cell lineage specification and/or cell effector functions. Conclusion: This is the first report of systematic miRNA gene profiling in cells of the hematopoietic system. As expected, miRNA expression patterns were very different between hematopoietic and non-hematopoietic cells, with further subtle differences observed within the hematopoietic group. Interestingly, the most pronounced similarities were observed among fully differentiated effector cells (Th1 and Th2 lymphocytes and mast cells) and precursors at comparable stages of differentiation (double negative thymocytes and pro-B cells), suggesting that in addition to regulating the process of commitment to particular cellular lineages, miRNAs might have an important general role in the mechanism of cell differentiation and maintenance of cell identity. Published: 1 August 2005 Genome Biology 2005, 6:R71 (doi:10.1186/gb-2005-6-8-r71) Received: 23 February 2005 Revised: 9 May 2005 Accepted: 1 July 2005 The electronic version of this article is the complete one and can be found online at http://genomebiology.com/2005/6/8/R71
-
Upload
independent -
Category
Documents
-
view
0 -
download
0
Transcript of MicroRNA profiling of the murine hematopoietic system

com
ment
reviews
reports
deposited research
refereed researchinteractio
nsinfo
rmatio
n
Open Access2005Monticelliet al.Volume 6, Issue 8, Article R71ResearchMicroRNA profiling of the murine hematopoietic systemSilvia Monticelli¤*†, K Mark Ansel¤*, Changchun Xiao¤*, Nicholas D Socci¤‡, Anna M Krichevsky§, To-Ha Thai*, Nikolaus Rajewsky¶, Debora S Marks¥, Chris Sander‡, Klaus Rajewsky*, Anjana Rao* and Kenneth S Kosik§#
Addresses: *Department of Pathology, Harvard Medical School, and CBR Institute for Biomedical Research, Boston, MA 02115, USA. †Department of Biology and Genetics of Medical Sciences, Universitá degli Studi di Milano, 20133 Milan, Italy. ‡Computational Biology Center, Memorial Sloan-Kettering Cancer Center, New York, NY 10021, USA. §Department of Neurology, Brigham and Women's Hospital and Harvard Medical School, Boston, MA 02115, USA. ¶Center for Functional Comparative Genomics, Department of Biology, New York University, New York, NY 10003, USA. ¥Department of Systems Biology, Harvard Medical School, Boston, MA 02115, USA. #Neuroscience Research Institute, University of California Santa Barbara, Santa Barbara, CA 93106, USA.
¤ These authors contributed equally to this work.
Correspondence: Silvia Monticelli. E-mail: [email protected]
© 2005 Monticelli et al.; licensee BioMed Central Ltd. This is an Open Access article distributed under the terms of the Creative Commons Attribution License (http://creativecommons.org/licenses/by/2.0), which permits unrestricted use, distribution, and reproduction in any medium, provided the original work is properly cited.MiRNA profiling of the murine hematopoietic system<p>The first report of systematic miRNA profiling in cells of the hematopoietic system suggests that, in addition to regulating commitment to particular cellular lineages, miRNAs might have a general role in cell differentiation and cell identity.</p>
Abstract
Background: MicroRNAs (miRNAs) are a class of recently discovered noncoding RNA genes thatpost-transcriptionally regulate gene expression. It is becoming clear that miRNAs play an importantrole in the regulation of gene expression during development. However, in mammals, expressiondata are principally based on whole tissue analysis and are still very incomplete.
Results: We used oligonucleotide arrays to analyze miRNA expression in the murinehematopoietic system. Complementary oligonucleotides capable of hybridizing to 181 miRNAswere immobilized on a membrane and probed with radiolabeled RNA derived from low molecularweight fractions of total RNA from several different hematopoietic and neuronal cells. This methodallowed us to analyze cell type-specific patterns of miRNA expression and to identify miRNAs thatmight be important for cell lineage specification and/or cell effector functions.
Conclusion: This is the first report of systematic miRNA gene profiling in cells of thehematopoietic system. As expected, miRNA expression patterns were very different betweenhematopoietic and non-hematopoietic cells, with further subtle differences observed within thehematopoietic group. Interestingly, the most pronounced similarities were observed among fullydifferentiated effector cells (Th1 and Th2 lymphocytes and mast cells) and precursors atcomparable stages of differentiation (double negative thymocytes and pro-B cells), suggesting thatin addition to regulating the process of commitment to particular cellular lineages, miRNAs mighthave an important general role in the mechanism of cell differentiation and maintenance of cellidentity.
Published: 1 August 2005
Genome Biology 2005, 6:R71 (doi:10.1186/gb-2005-6-8-r71)
Received: 23 February 2005Revised: 9 May 2005Accepted: 1 July 2005
The electronic version of this article is the complete one and can be found online at http://genomebiology.com/2005/6/8/R71
Genome Biology 2005, 6:R71

R71.2 Genome Biology 2005, Volume 6, Issue 8, Article R71 Monticelli et al. http://genomebiology.com/2005/6/8/R71
BackgroundMicroRNAs (miRNAs) represent a recently discovered classof small, noncoding RNAs, found in organisms ranging fromnematodes to plants to humans. Many individual miRNAs areconserved across widely diverse phyla, indicating their phys-iological importance. The primary transcript (pri-miRNA) isgenerally transcribed by RNA polymerase II; it contains a typ-ical stem-loop structure that is processed by a nuclear enzymecomplex including Drosha and Pasha, and releases a 60- to110-nucleotide pre-miRNA hairpin precursor [1]. The pre-miRNA is further processed by Dicer to yield the 19- to 22-nucleotide mature miRNA product, which is then incorpo-rated into the RNA-induced silencing complex (RISC) [2-4].RISC-bound miRNAs direct the cleavage and/or translationalrepression of messenger RNAs, thus providing post-tran-scriptional control of gene expression.
Like many transcription factors, miRNAs are importantdeterminants of cellular fate specification. One of the mostprominent and genetically best-studied examples is given bymiRNAs involved in neuronal fate determination inCaenorhabditis elegans, where a cascade of several miRNAsand transcription factors regulate each other's activity toinduce a different spectrum of putative chemoreceptors in thetwo main taste receptor neurons in C. elegans [5]. Further-more, many miRNA genes are located at fragile sites, minimalloss of heterozygosity regions, minimal regions of amplifica-tion, or common breakpoints in human cancers, suggestingthat miRNAs might play an important role in the pathogene-sis of human cancer [6,7].
Hundreds of miRNAs have been identified in plants and ani-mals, either through computational searches, RT-PCR-medi-ated cloning, or both. More than 200 human and rodentmiRNAs have been reported and tabulated in the miRNARegistry [8], accounting for an estimated 1-2% of expressedhuman genes. Recent evidence suggests that the actualnumber of miRNAs is likely to be even larger [9,10]. MiRNAshave been implicated in biological processes ranging from cellproliferation and cell death during development to stressresistance, fat metabolism, insulin secretion and hematopoi-esis [11]. However, for the most part, the regulation and func-tion of most mammalian miRNAs are unknown. The bulk ofthe existing data on miRNA expression in mammalian cellshas been derived from studies on whole tissues, which con-tain many heterogeneous cell types, or on transformed orestablished cell lines that may have diverged significantlyfrom the primary cell types that they are assumed to repre-sent [7,12-15]. To understand the role of miRNAs in mamma-lian development and differentiation, an important startingpoint is a systematic compilation of miRNAs expressed inindividual cell types, especially those derived by differentia-tion from a common precursor.
The cells of the immune system originate from hematopoieticstem cells in the bone marrow, where many of them also
mature. The hematopoietic stem cells give rise to both mye-loid and lymphoid progenitors. The myeloid progenitor is theprecursor of granulocytes, macrophages, dendritic cells, andmast cells of the innate immune system. Mast cells, whoseblood-borne precursors are not well defined, terminate theirdifferentiation in the body tissues, where they are widely dis-tributed and where they orchestrate allergic responses andplay a part in protecting mucosal surfaces against pathogens[16]. The common lymphoid progenitor gives rise to B and Tlymphocytes and to natural killer cells. B lymphocytes differ-entiate in the bone marrow and T lymphocytes in the thymus;the stages of B and T cell development are defined by sequen-tial rearrangement and expression of heavy- and light-chainimmunoglobulin genes and TCR α and β chains, respectively.Mature B and T lymphocytes that have emigrated to theperipheral lymphoid organs, including the spleen and lymphnodes, but have not yet encountered their specific antigen arecalled 'naïve'. In the event of an infection, T lymphocytes thatrecognize the infectious agent are arrested in the lymphoidorgans, where they proliferate and differentiate further intoeffector cells capable of combating the infection.
Because of the wealth of information available about the tran-scriptional and cellular networks involved in hematopoieticdifferentiation, the hematopoietic system is ideal for studyingcell lineage specification. Many of the common progenitors ofhematopoietic cells can be obtained as primary cells fromhumans and mice, and expanded and differentiated in vitro.Here we have performed a detailed analysis of miRNA expres-sion in diverse hematopoietic cell types from the mouse,using a high-throughput system that allows analysis of manysamples with minimal manipulation of the samples them-selves. This has allowed us to identify miRNAs that are highlyexpressed in the hematopoietic system. Our results are con-sistent with a model of hematopoiesis in which transcrip-tional regulators act in concert with differentially expressedmiRNAs to modulate the levels of mRNAs that control celldifferentiation pathways.
ResultsMicroarray designTo probe the expression of miRNAs in a variety of differentrelated and unrelated cell types, we chose to use miRNAarrays in preference to time-consuming Northern analysisthat cannot be used efficiently with many different probesand samples. In the past year, several microarray methodshave been developed [7,12,13,15,17-19]. Some of these groups[7,12,13,15,17] used cDNA or cRNA generated from total cel-lular RNA to apply to their microarrays. Other methods[18,19] rely heavily on several enzymatic steps, such as RNAligation [18], or Klenow synthesis and exonuclease I degrada-tion of ssDNA [19]. Instead, we chose a technique that doesnot involve reverse transcription of RNA and relies on onlyone enzymatic step ([20]; see Methods) thus reducing RNAmanipulation to a minimum. In designing the arrays, we
Genome Biology 2005, 6:R71
http://genomebiology.com/2005/6/8/R71 Genome Biology 2005, Volume 6, Issue 8, Article R71 Monticelli et al. R71.3
com
ment
reviews
reports
refereed researchdepo
sited researchinteractio
nsinfo
rmatio
n
expanded the array dataset already developed by Krichevskyet al. [20]. The new generation of arrays contains 181 gene-specific oligonucleotide probes, corresponding to human, rat,and mouse miRNAs as reported in the miRNA Registry [8].
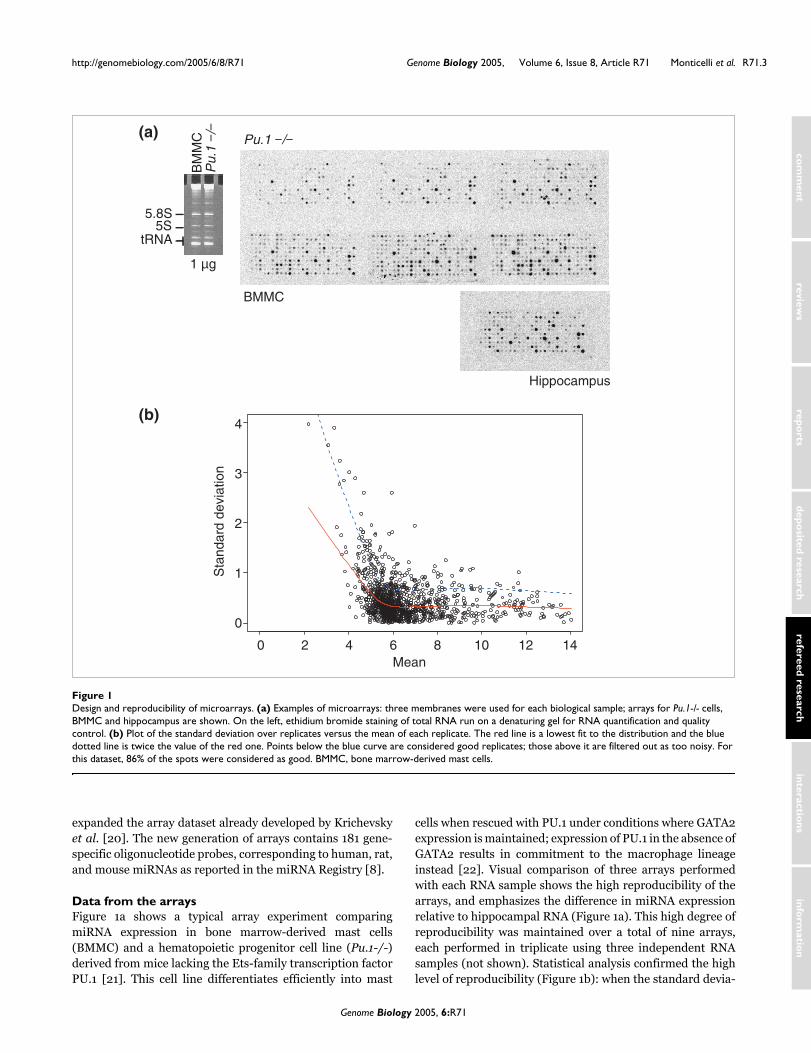
Data from the arraysFigure 1a shows a typical array experiment comparingmiRNA expression in bone marrow-derived mast cells(BMMC) and a hematopoietic progenitor cell line (Pu.1-/-)derived from mice lacking the Ets-family transcription factorPU.1 [21]. This cell line differentiates efficiently into mast
cells when rescued with PU.1 under conditions where GATA2expression is maintained; expression of PU.1 in the absence ofGATA2 results in commitment to the macrophage lineageinstead [22]. Visual comparison of three arrays performedwith each RNA sample shows the high reproducibility of thearrays, and emphasizes the difference in miRNA expressionrelative to hippocampal RNA (Figure 1a). This high degree ofreproducibility was maintained over a total of nine arrays,each performed in triplicate using three independent RNAsamples (not shown). Statistical analysis confirmed the highlevel of reproducibility (Figure 1b): when the standard devia-
Design and reproducibility of microarraysFigure 1Design and reproducibility of microarrays. (a) Examples of microarrays: three membranes were used for each biological sample; arrays for Pu.1-/- cells, BMMC and hippocampus are shown. On the left, ethidium bromide staining of total RNA run on a denaturing gel for RNA quantification and quality control. (b) Plot of the standard deviation over replicates versus the mean of each replicate. The red line is a lowest fit to the distribution and the blue dotted line is twice the value of the red one. Points below the blue curve are considered good replicates; those above it are filtered out as too noisy. For this dataset, 86% of the spots were considered as good. BMMC, bone marrow-derived mast cells.
BM
MC
Pu.
1 −/
−
BMMC
Pu.1 −/−
1 µg
Hippocampus
5S5.8S
tRNA
4
3
2
1
0
0 2 4 6 8Mean
Sta
ndar
d de
viat
ion
10 12 14
(a)
(b)
Genome Biology 2005, 6:R71
R71.4 Genome Biology 2005, Volume 6, Issue 8, Article R71 Monticelli et al. http://genomebiology.com/2005/6/8/R71
tion over replicates was plotted versus the mean of each rep-licate, 86% of the spots were considered good (see legend toFigure 1b for details). RNA loading for all arrays and North-ern blot experiments was evaluated by ethidium bromidestaining of a denaturing acrylamide gel as shown in Figures 1aand 2d.
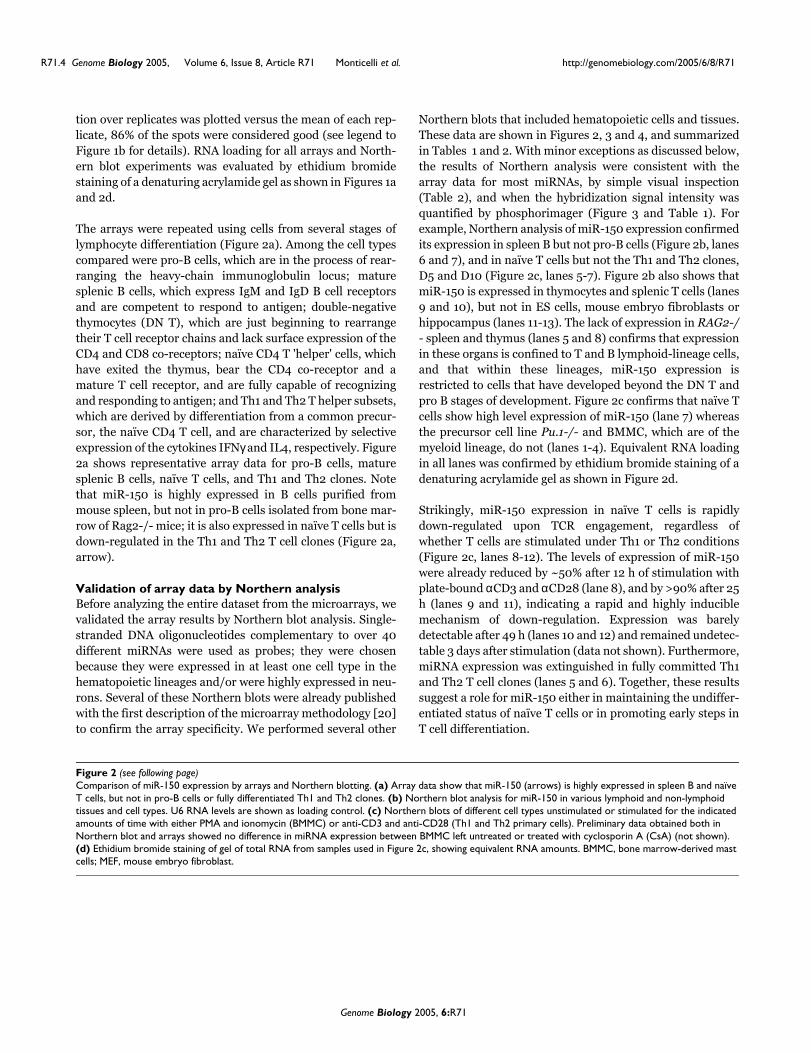
The arrays were repeated using cells from several stages oflymphocyte differentiation (Figure 2a). Among the cell typescompared were pro-B cells, which are in the process of rear-ranging the heavy-chain immunoglobulin locus; maturesplenic B cells, which express IgM and IgD B cell receptorsand are competent to respond to antigen; double-negativethymocytes (DN T), which are just beginning to rearrangetheir T cell receptor chains and lack surface expression of theCD4 and CD8 co-receptors; naïve CD4 T 'helper' cells, whichhave exited the thymus, bear the CD4 co-receptor and amature T cell receptor, and are fully capable of recognizingand responding to antigen; and Th1 and Th2 T helper subsets,which are derived by differentiation from a common precur-sor, the naïve CD4 T cell, and are characterized by selectiveexpression of the cytokines IFNγ and IL4, respectively. Figure2a shows representative array data for pro-B cells, maturesplenic B cells, naïve T cells, and Th1 and Th2 clones. Notethat miR-150 is highly expressed in B cells purified frommouse spleen, but not in pro-B cells isolated from bone mar-row of Rag2-/- mice; it is also expressed in naïve T cells but isdown-regulated in the Th1 and Th2 T cell clones (Figure 2a,arrow).
Validation of array data by Northern analysisBefore analyzing the entire dataset from the microarrays, wevalidated the array results by Northern blot analysis. Single-stranded DNA oligonucleotides complementary to over 40different miRNAs were used as probes; they were chosenbecause they were expressed in at least one cell type in thehematopoietic lineages and/or were highly expressed in neu-rons. Several of these Northern blots were already publishedwith the first description of the microarray methodology [20]to confirm the array specificity. We performed several other
Northern blots that included hematopoietic cells and tissues.These data are shown in Figures 2, 3 and 4, and summarizedin Tables 1 and 2. With minor exceptions as discussed below,the results of Northern analysis were consistent with thearray data for most miRNAs, by simple visual inspection(Table 2), and when the hybridization signal intensity wasquantified by phosphorimager (Figure 3 and Table 1). Forexample, Northern analysis of miR-150 expression confirmedits expression in spleen B but not pro-B cells (Figure 2b, lanes6 and 7), and in naïve T cells but not the Th1 and Th2 clones,D5 and D10 (Figure 2c, lanes 5-7). Figure 2b also shows thatmiR-150 is expressed in thymocytes and splenic T cells (lanes9 and 10), but not in ES cells, mouse embryo fibroblasts orhippocampus (lanes 11-13). The lack of expression in RAG2-/- spleen and thymus (lanes 5 and 8) confirms that expressionin these organs is confined to T and B lymphoid-lineage cells,and that within these lineages, miR-150 expression isrestricted to cells that have developed beyond the DN T andpro B stages of development. Figure 2c confirms that naïve Tcells show high level expression of miR-150 (lane 7) whereasthe precursor cell line Pu.1-/- and BMMC, which are of themyeloid lineage, do not (lanes 1-4). Equivalent RNA loadingin all lanes was confirmed by ethidium bromide staining of adenaturing acrylamide gel as shown in Figure 2d.
Strikingly, miR-150 expression in naïve T cells is rapidlydown-regulated upon TCR engagement, regardless ofwhether T cells are stimulated under Th1 or Th2 conditions(Figure 2c, lanes 8-12). The levels of expression of miR-150were already reduced by ~50% after 12 h of stimulation withplate-bound αCD3 and αCD28 (lane 8), and by >90% after 25h (lanes 9 and 11), indicating a rapid and highly induciblemechanism of down-regulation. Expression was barelydetectable after 49 h (lanes 10 and 12) and remained undetec-table 3 days after stimulation (data not shown). Furthermore,miRNA expression was extinguished in fully committed Th1and Th2 T cell clones (lanes 5 and 6). Together, these resultssuggest a role for miR-150 either in maintaining the undiffer-entiated status of naïve T cells or in promoting early steps inT cell differentiation.
Comparison of miR-150 expression by arrays and Northern blottingFigure 2 (see following page)Comparison of miR-150 expression by arrays and Northern blotting. (a) Array data show that miR-150 (arrows) is highly expressed in spleen B and naïve T cells, but not in pro-B cells or fully differentiated Th1 and Th2 clones. (b) Northern blot analysis for miR-150 in various lymphoid and non-lymphoid tissues and cell types. U6 RNA levels are shown as loading control. (c) Northern blots of different cell types unstimulated or stimulated for the indicated amounts of time with either PMA and ionomycin (BMMC) or anti-CD3 and anti-CD28 (Th1 and Th2 primary cells). Preliminary data obtained both in Northern blot and arrays showed no difference in miRNA expression between BMMC left untreated or treated with cyclosporin A (CsA) (not shown). (d) Ethidium bromide staining of gel of total RNA from samples used in Figure 2c, showing equivalent RNA amounts. BMMC, bone marrow-derived mast cells; MEF, mouse embryo fibroblast.
Genome Biology 2005, 6:R71
http://genomebiology.com/2005/6/8/R71 Genome Biology 2005, Volume 6, Issue 8, Article R71 Monticelli et al. R71.5
com
ment
reviews
reports
refereed researchdepo
sited researchinteractio
nsinfo
rmatio
n
Figure 2 (see legend on previous page)
BM R
ag2−
/−Bo
ne m
arro
wTh
ymus
Sple
enSp
leen
Rag
2−/−
Sple
en B
Thym
ocyt
es R
ag2−
/−
Thym
ocyt
esSp
leen
TES
cel
lsM
EFH
ippo
cam
pus
proB
CsA 4h 24h
PMA + Iono
BMMC
Pu.
1 −/
−
D5 D10 Nai
ve T
12 25 49 time (h)
Th1 Th2
25 49
1 2 3 4 5 6 7 8 9 10 11 12 13
1 2 3 4 5 6 7 8 9 10 11 12
CsA
4h 24h
P+I
Nai
ve T
Th1
12h
25h
49h
Th2
D5
(Th1
)
D10
(T
h2)
25h
49h
1 µg total RNA
Pu.
1 −/
−
BMMC
miR 150
U6
5S5.8S
tRNA
proB
Spleen B
D5 (Th1)
D10 (Th2)
Naive T
(a) (b)
(c)
(d)
Genome Biology 2005, 6:R71

R71.6 Genome Biology 2005, Volume 6, Issue 8, Article R71 Monticelli et al. http://genomebiology.com/2005/6/8/R71
Figure 3 extends the concordance of the array data with theNorthern analysis to five additional miRNAs, emphasizingthe cell type-specific changes that take place during differen-tiation. In the left panels of Figure 3, miRNA expression inBMMC treated with cyclosporin A to prevent activation, orstimulated with PMA and ionomycin for the indicated times,is compared with expression in the Pu.1-/- 'precursor' cellline, which gives rise to mast cells when reconstituted withboth PU.1 and GATA2 [22]. Three very different patterns areobserved, exemplified by: miR-146 and 142s, which areexpressed at essentially equivalent (low) levels in both thePu.1-/- precursor cells and the fully-differentiated BMMC;miR-26a and 27a, which are expressed at low levels in thePu.1-/- precursor cells and at three- to fourfold higher levelsin fully differentiated BMMC; and miR-223, which is mosthighly expressed in the Pu.1-/- precursor cells and is barelydetectable in the differentiated BMMC. The results of North-ern analysis for these two cell types show an overall good con-cordance with the values obtained from the arrays (Figures 2,3 and 4 and Table 1).
The right panels of Figure 3 compare expression of the samemiRNAs in naïve T cells and fully-differentiated Th1 and Th2cells (the D5 and D10 clones). Several expression patterns areevident: miR-146 is highest in Th1 cells and low in naïve Tcells and Th2 cells; miRNAs 142s and 26a are expressed athigher levels in the precursor naïve T cells; miR-27a is equiv-alently expressed in both the precursor naïve T cells and thedifferentiated Th1 and Th2 cells; and miR-223 is very poorlyexpressed in all these T cell types. The relative expression ofthese miRNAs in naïve versus differentiated T cells was con-firmed in primary cultures of Th1 and Th2 cells (see Table 1).There was full concordance of the Northern analysis with themiRNA array data for miRNAs 146, 142s, 26a and 223 (Figure3, Table 1); however, as discussed further below, the signal for27a and a handful of other miRNAs expressed at low levels innaïve T cells fell below the limit of detection on themicroarrays.
Table 1 summarizes the results from Northern analysis of themiRNAs shown in Figures 2 and 3, as well as showing data fortwo additional miRNAs, let7d (let7 family) and miR-222. ThemiRNA expression pattern of D5 and D10 T cell clones wascomparable with that of differentiated primary Th1 and Th2cells respectively, validating the use of D5 and D10 cells asmodels for fully differentiated Th1 and Th2 cells. Like miR-150, the expression of miR-142s, miR-26a and let7d showed arapid decline during differentiation of naïve T cells into Th1or Th2 effectors. miR-27a was expressed at equivalent levelsin naïve and differentiated T cells. miR-146 showed a Th1-skewed expression pattern: it's levels increased in Th1 cellsand decreased in Th2 cells relative to it's expression in naïveT cells. We have not yet detected an miRNA with the converseexpression pattern of high expression in Th2 cells relative toTh1. miR-222 was detectably expressed in BMMC, Pu.1-/-precursor cells and fully differentiated Th1 cells, but it's
Microarrays and Northern blots correlate qualitatively and quantitativelyFigure 3Microarrays and Northern blots correlate qualitatively and quantitatively. Northern blots for miRNA expression in mast cells (left panels), or T cells (right panels). BMMC were treated with cyclosporin A or PMA and ionomycin for the indicated amounts of time. Loading control is the same as Figure 2d. First row underneath the panels: ratio between the intensities of the Northern blot bands as assessed by phosphorimager and quantified by ImageQuant; all the samples are compared with Pu.1-/- cells except for miR-223, where each sample is compared with BMMC. Second row: these are also ratios between the intensities of the Northern blot bands, but the T cell samples are compared directly to each other. This allows a better direct comparison with the numbers on the third row, which are the ratios of BMMC versus Pu.1-/- cells (left panels) and D5 versus D10 versus naïve T cells as obtained from the arrays (right panels). BMMC, bone marrow-derived mast cells; CsA, cyclosporin A; n.d., not detectable.
CsA
4h 24h
P+I
Pu.
1 −/
−
D5
(Th1
)
D10
(T
h2)
Nai
ve
miR146
1.7 1.6 1.8 1.0 6.8 1.0 2.8
Arrays n.d
miR142s
1.0
2.0 1.8 1.7 1.0 3.8 3.9 3 2.0
BMMC
5.5 0.3 1.0
1.1 1.0 3.6
Northern
miR26a
3.1 3.5 2.3 1.0 3.0 2.5 13.8
30 nt
20
7.7 1.3 1.0 6.7
1.0 2.1 1.8 45.2 0.2 0.3 0.4
15.1
miR223
miR27a
4.4
3.9 3.7 3.1 1.0 1.4 1.5 1.3
Arrays
Northern
Arrays
Northern
Arrays
Northern
1.0
1.0
1.0
1.0
1.2 1.0 5.5
Arrays
Northern
2.4 0.3 1.0
0.9 1.0 8.2
1.0 1.4 n.d.
n.d.
1.1 1.2 1.0
Genome Biology 2005, 6:R71

http://genomebiology.com/2005/6/8/R71 Genome Biology 2005, Volume 6, Issue 8, Article R71 Monticelli et al. R71.7
com
ment
reviews
reports
refereed researchdepo
sited researchinteractio
nsinfo
rmatio
n
expression was not detectable in the other cell types tested(Table 1); in contrast, miR-16 was expressed in all cell typesanalyzed, but it's expression was relatively variable both inarrays and Northern blots, so quantification was notattempted (data not shown). Some of our data confirm pub-lished reports. For example, miR-223 is reported to beexpressed in myeloid cells [7,23]; miR-125 and 128 are highly
expressed in the brain [13,14]; and miR-16 is expressed in awide variety of tissues [7,14,23] (see also heat map of expres-sion in Figure 5a).
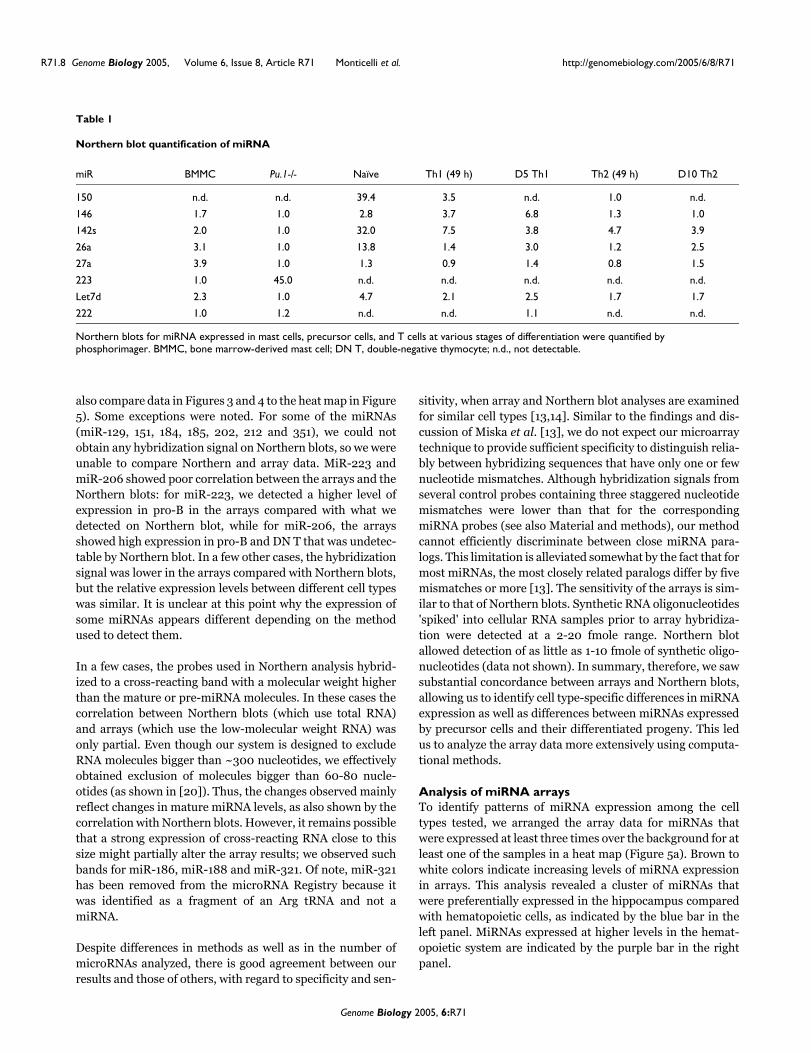
Figure 4 shows Northern blot data for additional miRNAs.Most of the data from Northern blots correlated at least qual-itatively with the expression data from the arrays (Table 2;
Additional Northern blots showing miRNA expression in various tissues and cell typesFigure 4Additional Northern blots showing miRNA expression in various tissues and cell types. Shown are Northern blot data for the indicated miRNAs in different unstimulated cell types. Asterisks indicate bands of the size of pre-miRNA (60-70 nucleotides), which were detected in Northern blot for only a subset of the miRNAs analyzed. There was a good correlation overall between Northern blot data and expression data from the arrays (see heat map in Figure 5 and Table 2), with some exceptions, as discussed in the text. BMMC, bone marrow-derived mast cells; DN T, double-negative thymocyte.
BM
Rag
2−/−
wt B
M
Thy
mus
wt s
plee
nS
plee
n R
ag2−
/−pr
o-B
Spl
een
BD
N T
Rag
2−/−
Thy
moc
ytes
Spl
een
TE
S c
ells
ME
FN
IN3T
3
BM
Rag
2−/−
wt B
M
Thy
mus
wt s
plee
n
Spl
een
Rag
2−/−
pro-
B E
4
Spl
een
B
DN
T R
ag2−
/−
Thy
moc
ytes
Spl
een
T
ES
cel
ls
ME
F
NIN
3T3
Hyp
poca
mpu
s
pro-
B E
6
BM
Rag
2−/−
wt B
M
Thy
mus
wt s
plee
nS
plee
n R
ag2−
/−B
rain
Lung
Live
rK
idne
yH
eart
Mus
cle
Test
is
pro-
B E
4pr
o-B
E6
Spl
een
BD
N T
Rag
2−/−
Thy
moc
ytes
Spl
een
TM
ast c
ells
ES
cel
lsM
EF
sN
IH 3
T3
Rat
bra
in c
orte
x
*
*
*
*
miR 142-3p
miR 142-5p
miR 206
miR 223
*
miR 7
miR 24
miR 26a
miR 93
miR 99a
miR 107
miR 127
miR 144
miR 148
miR 191
miR 199
miR 213
miR 342
miR 29a
miR 101
miR 181b
(a) (b)
(c)
Genome Biology 2005, 6:R71
R71.8 Genome Biology 2005, Volume 6, Issue 8, Article R71 Monticelli et al. http://genomebiology.com/2005/6/8/R71
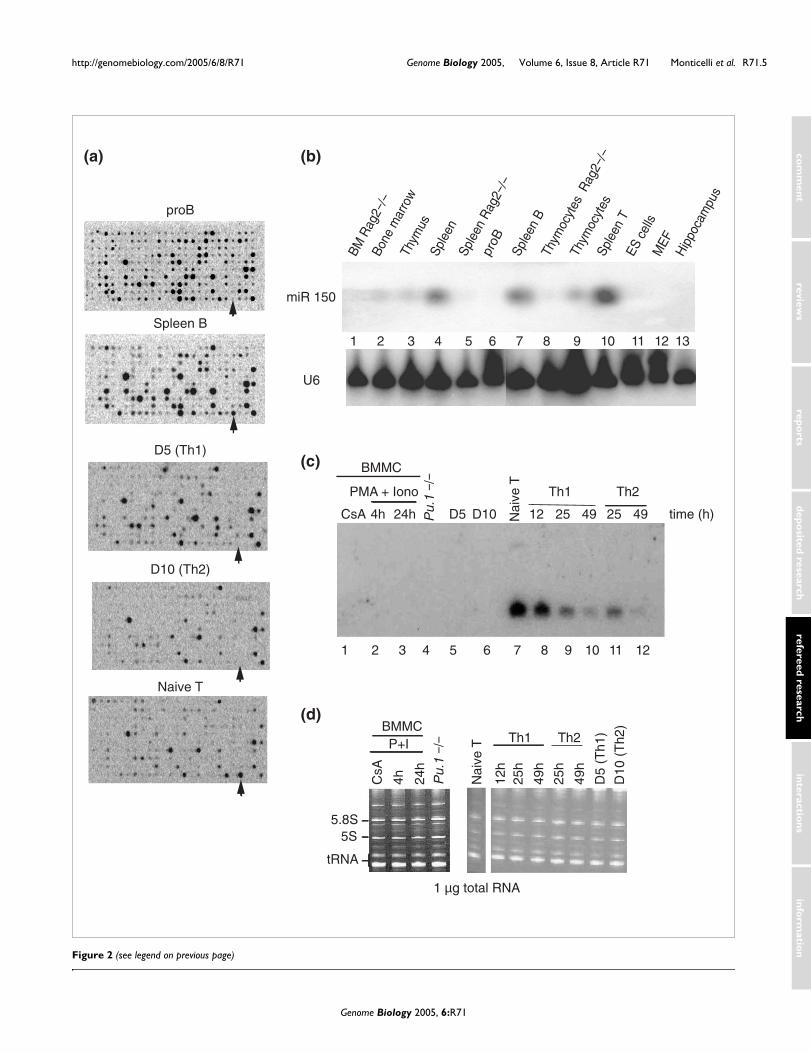
also compare data in Figures 3 and 4 to the heat map in Figure5). Some exceptions were noted. For some of the miRNAs(miR-129, 151, 184, 185, 202, 212 and 351), we could notobtain any hybridization signal on Northern blots, so we wereunable to compare Northern and array data. MiR-223 andmiR-206 showed poor correlation between the arrays and theNorthern blots: for miR-223, we detected a higher level ofexpression in pro-B in the arrays compared with what wedetected on Northern blot, while for miR-206, the arraysshowed high expression in pro-B and DN T that was undetec-table by Northern blot. In a few other cases, the hybridizationsignal was lower in the arrays compared with Northern blots,but the relative expression levels between different cell typeswas similar. It is unclear at this point why the expression ofsome miRNAs appears different depending on the methodused to detect them.
In a few cases, the probes used in Northern analysis hybrid-ized to a cross-reacting band with a molecular weight higherthan the mature or pre-miRNA molecules. In these cases thecorrelation between Northern blots (which use total RNA)and arrays (which use the low-molecular weight RNA) wasonly partial. Even though our system is designed to excludeRNA molecules bigger than ~300 nucleotides, we effectivelyobtained exclusion of molecules bigger than 60-80 nucle-otides (as shown in [20]). Thus, the changes observed mainlyreflect changes in mature miRNA levels, as also shown by thecorrelation with Northern blots. However, it remains possiblethat a strong expression of cross-reacting RNA close to thissize might partially alter the array results; we observed suchbands for miR-186, miR-188 and miR-321. Of note, miR-321has been removed from the microRNA Registry because itwas identified as a fragment of an Arg tRNA and not amiRNA.
Despite differences in methods as well as in the number ofmicroRNAs analyzed, there is good agreement between ourresults and those of others, with regard to specificity and sen-
sitivity, when array and Northern blot analyses are examinedfor similar cell types [13,14]. Similar to the findings and dis-cussion of Miska et al. [13], we do not expect our microarraytechnique to provide sufficient specificity to distinguish relia-bly between hybridizing sequences that have only one or fewnucleotide mismatches. Although hybridization signals fromseveral control probes containing three staggered nucleotidemismatches were lower than that for the correspondingmiRNA probes (see also Material and methods), our methodcannot efficiently discriminate between close miRNA para-logs. This limitation is alleviated somewhat by the fact that formost miRNAs, the most closely related paralogs differ by fivemismatches or more [13]. The sensitivity of the arrays is sim-ilar to that of Northern blots. Synthetic RNA oligonucleotides'spiked' into cellular RNA samples prior to array hybridiza-tion were detected at a 2-20 fmole range. Northern blotallowed detection of as little as 1-10 fmole of synthetic oligo-nucleotides (data not shown). In summary, therefore, we sawsubstantial concordance between arrays and Northern blots,allowing us to identify cell type-specific differences in miRNAexpression as well as differences between miRNAs expressedby precursor cells and their differentiated progeny. This ledus to analyze the array data more extensively using computa-tional methods.
Analysis of miRNA arraysTo identify patterns of miRNA expression among the celltypes tested, we arranged the array data for miRNAs thatwere expressed at least three times over the background for atleast one of the samples in a heat map (Figure 5a). Brown towhite colors indicate increasing levels of miRNA expressionin arrays. This analysis revealed a cluster of miRNAs thatwere preferentially expressed in the hippocampus comparedwith hematopoietic cells, as indicated by the blue bar in theleft panel. MiRNAs expressed at higher levels in the hemat-opoietic system are indicated by the purple bar in the rightpanel.
Table 1
Northern blot quantification of miRNA
miR BMMC Pu.1-/- Naïve Th1 (49 h) D5 Th1 Th2 (49 h) D10 Th2
150 n.d. n.d. 39.4 3.5 n.d. 1.0 n.d.
146 1.7 1.0 2.8 3.7 6.8 1.3 1.0
142s 2.0 1.0 32.0 7.5 3.8 4.7 3.9
26a 3.1 1.0 13.8 1.4 3.0 1.2 2.5
27a 3.9 1.0 1.3 0.9 1.4 0.8 1.5
223 1.0 45.0 n.d. n.d. n.d. n.d. n.d.
Let7d 2.3 1.0 4.7 2.1 2.5 1.7 1.7
222 1.0 1.2 n.d. n.d. 1.1 n.d. n.d.
Northern blots for miRNA expressed in mast cells, precursor cells, and T cells at various stages of differentiation were quantified by phosphorimager. BMMC, bone marrow-derived mast cell; DN T, double-negative thymocyte; n.d., not detectable.
Genome Biology 2005, 6:R71

http://genomebiology.com/2005/6/8/R71 Genome Biology 2005, Volume 6, Issue 8, Article R71 Monticelli et al. R71.9
com
ment
reviews
reports
refereed researchdepo
sited researchinteractio
nsinfo
rmatio
n
Table 2
Correlation between arrays and Northern blot data
DNT Pro-B Spleen B BMMC Hippocampus
MiR 7 Arrays + ++ ++ +/- ++
Northerns + +++ ++ n.a. n.a.
MiR 24 Arrays +++ ++++ +++ ++ ++
Northerns ++ ++++ +++ n.a. n.a.
MiR 26a Arrays + + ++ +++ +++
Northerns + ++ +++ n.a. n.a.
MiR 29a Arrays + + ++ ++ +++
Northerns + + ++ nd +++
MiR 93 Arrays ++ ++ +/- ++ +/-
Northerns + ++ + n.a. n.a.
MiR 99a Arrays n.s.s. n.s.s. n.s.s. n.s.s. n.s.s.
Northerns +/- +/- - nd nd
MiR 101 Arrays ++ +++ + +++ ++
Northerns + + + nd ++
MiR-107 Arrays +++ +++ ++ ++ ++
Northerns + ++ + n.a. n.a.
MiR-127 Arrays +/- + + +/- +
Northerns - - - n.a. n.a.
MiR-142-3p Arrays +++ +++ ++++ +++ +
Northerns ++ +++ ++++ ++ n.a.
MiR-142-5p Arrays ++ + +++ ++ +
Northerns + ++ +++ + n.a.
MiR-144 Arrays n.s.s. n.s.s. n.s.s. n.s.s. n.s.s.
Northerns - - - n.a. n.a.
MiR-148 Arrays + + + + +/-
Northerns + + + n.a. n.a.
MiR-150 Arrays - + +++ + +/-
Northerns - - +++ n.a. -
MiR-181b Arrays + + + + ++
Northerns + + - n.a. +
MiR-191 Arrays +/- + + + +
Northerns + ++ ++ n.a. n.a.
MiR-199 Arrays + + + + +/-
Northerns - + - n.a. n.a.
MiR-206 Arrays ++ +++ + +/- +/-
Northerns - - - - n.a.
MiR-213 Arrays n.s.s. n.s.s. n.s.s. n.s.s. n.s.s.
Northerns - +/- - n.a. n.a.
MiR-223 Arrays + +++ + +/- +
Northerns +/- - + + n.a.
MiR-342 Arrays + + + + +
Northerns + +++ ++ n.a. n.a.
The table summarizes and compares the Northern blot data shown in Figure 4 and the array data shown in the heat map in Figure 5. Northern blot and array data were scored independently using an arbitrary scale from undetectable (-) to strongly detected (++++) to indicate relative signal intensity in each case. BMMC, bone marrow-derived mast cell; DN T, double-negative thymocyte; n.s.s., non statistically significant hybridization signal; n.a., not analyzed.
Genome Biology 2005, 6:R71

R71.10 Genome Biology 2005, Volume 6, Issue 8, Article R71 Monticelli et al. http://genomebiology.com/2005/6/8/R71
To achieve a better understanding as to how miRNA expres-sion patterns correlate with hematopoietic cell differentia-tion, we performed a hierarchical clustering of the normalizedarray data for hematopoietic cell types (Figure 5b). The subsetof miRNAs detected in at least one hematopoietic cell samplewas used to compute the distance function from the Pearsoncorrelation between samples (Table 3). Standard hierarchicalclustering with average linkage was used, and bootstrapresampling was employed to assess the robustness of the clus-tering results. This analysis showed that fully differentiatedeffector cells (Th1, Th2 and BMMC) are more closely relatedto each other in their miRNA expression pattern than to theirrespective precursor cells (DN T and Pu.1-/- precursor cells).The miRNA expression patterns of pro-B and DN T, precur-sor cells for the B and T lymphocyte lineages respectively,were also very closely related. Although the detected miRNAexpression pattern of naïve T cells most closely resembledthat of splenic B cells (Table 3), naïve T cells were excluded
from the clustering analysis. This was because RNA isolatedfrom naïve T cells yielded much lower overall array hybridiza-tion signals compared with RNA from the other cell typesexamined, causing the signal for a handful of expressed miR-NAs to fall below the limit of detection for the microarrays(for example, miR-27a, see Figure 4 and Table 1), and makingit impossible to accurately normalize the array data for naïveT cells relative to the signal obtained from other cell types.
DiscussionIn summary, pairwise comparisons of the expression of 181mature miRNAs in selected highly purified hematopoietic celltypes at immature, mature, and effector stages revealed spe-cific differences between related cell types (see also Addi-tional Data Files 1, 2, 3). As described above, the differenceswere confirmed by Northern analyses (Figures 2, 3 and 4, andTables 1 and 2) and revealed a subset of miRNAs expressed at
Analysis of microarray dataFigure 5Analysis of microarray data. (a) Heat map of miRNAs expressed at least three times over the background for at least one of the samples. (b) Hierarchical clustering of hematopoietic samples (see analysis in Table 3). DN T, double-negative thymocyte; MEF, mouse embryo fibroblast.
Hip
poca
mp.
Hig
her
expr
essi
on in
hip
poca
mpu
s 972
1000
584
440
1000
Th2
Th1
BMMC
Spleen B
Pu.1 −/−
Pro-B
DNT
Hip
poca
mp.
Higher expression in hem
atopoietic cells
(a)
(b)
Genome Biology 2005, 6:R71

http://genomebiology.com/2005/6/8/R71 Genome Biology 2005, Volume 6, Issue 8, Article R71 Monticelli et al. R71.11
com
ment
reviews
reports
refereed researchdepo
sited researchinteractio
nsinfo
rmatio
n
higher levels in the hematopoietic system compared withneuronal tissue (Figure 5a). Figure 6 shows a schematichematopoietic lineage tree, where lymphoid and myeloid cellsderive from a common lymphoid and common myeloid pro-genitor, respectively. Both these cell types derive from a com-mon precursor further upstream in the differentiationprocess and we used the Pu.1-/- cells as a model for such pre-cursors. The figure also shows a summary of some confirmedchanges in miRNA expression in the different stages of celldifferentiation superimposed on the diagram, showing pre-cursor-progeny relationships in lymphocyte and mast cell dif-ferentiation. Even though only selected hematopoietic celllineages were analyzed, each differentiation step wascharacterized by changes in miRNA expression, with somemiRNAs showing increased and some showing decreasedexpression. MiR-150 expression is of particular interest: thismiRNA is up-regulated during the developmental stages of Band T cell maturation, but down-regulated again during thefurther differentiation of naïve T cells into effector Th1 andTh2 cells. miR-146 is also notable, since it is upregulated inTh1, but not Th2 cells. We therefore predict that these miR-NAs probably play a role in establishing and/or maintainingcell identity in lymphocytes.
Differentiation of naïve T cells into Th1 and Th2 effector cellsis a particularly tractable system for studying cell lineagespecification. Northern blot analyses indicated that severalmiRNAs are rapidly down-regulated following activation ofnaïve T cells under both Th1 and Th2 differentiation condi-tions. miR-146 was a clear exception to this pattern, being up-regulated in Th1, but not Th2 cells. In this respect, miR-146joins a group of Th1-associated genes that include cytokines(Ifnγ, Tnfα), chemokine receptors (Cxcr3, Ccr5), and tran-scription factors (Tbx21, Hlx) [6,24,25]. Our results suggesttwo hypotheses for further testing. Firstly, the transcriptionof pri-miRNAs may be controlled by the same transcriptionfactors known to control specific cell differentiation events.For example, T-bet directs Ifnγ expression, and may also acti-
vate transcription of pri-miR-146. Conversely, miRNAs thatare regulated during cell differentiation may target one ormore of the mRNAs known to be differentially expressedbetween Th1 and Th2 cells. Although the predicted targets ofconserved miRNAs represent a diverse array of gene products[26-30], targeting of key transcription factors would repre-sent a particularly efficient means for miRNA participation incell fate decisions.
Our results call to attention the 'common logic' and sharedroles of transcriptional regulation by transcription factorsand post-transcriptional regulation by miRNAs [5]. It is likelythat both pathways of regulation are integral to successfulregulation of hematopoietic cell differentiation. Decades ofresearch have been devoted to the elucidation of the tran-scriptional networks involved in hematopoiesis. For example,the Ets family transcription factor, PU.1, is necessary for thegeneration of certain hematopoietic lineages but not others: itdirects the differentiation of hematopoietic progenitors intomacrophages, neutrophils, B lymphocytes and mast cells, butis not involved in erythroid or megakaryocytic differentiation[21,22]. Lineage specification is controlled by the level of PU.1expression and by which partner transcription factors are co-expressed: for instance, low levels of PU.1 and co-expressionof early B-cell factor (EBF) control differentiation to the B celllineage, whereas high levels of PU.1 predispose to macro-phage differentiation unless GATA2 is co-expressed, in whichcase differentiation is tilted to the mast cell lineage[22,31,32]. It will be informative to compare miRNA expres-sion in Pu.1-/- progenitor cells that have been reconstitutedto promote differentiation along these various lineages. Fur-ther study of the expression and function of miRNAs inhematopoiesis will probably uncover additional complexityand subtlety, as well as interconnections between miRNA andtranscription factor networks [5].
Systematic analysis of miRNA expression patterns within ourdataset indicates that besides influencing the process of com-
Table 3
Correlation coefficients (Pearson correlation)
Naïve DN T Pro-B Pu.1-/- Spleen B BMMC Th1 Th2
Naïve 1.00
DN T 0.50 1.00
Pro-B 0.47 0.94 1.00
Pu.1-/- 0.56 0.83 0.78 1.00
Spleen B 0.76 0.87 0.80 0.81 1.00
BMMC 0.63 0.74 0.68 0.78 0.79 1.00
Th1 0.68 0.85 0.79 0.84 0.88 0.92 1.00
Th2 0.67 0.83 0.80 0.84 0.87 0.90 0.96 1.00
The table represents a standard statistical correlation between the indicated samples, where 1 = perfectly correlated and 0 = uncorrelated. BMMC, bone marrow-derived mast cell; DN T, double-negative thymocyte.
Genome Biology 2005, 6:R71

R71.12 Genome Biology 2005, Volume 6, Issue 8, Article R71 Monticelli et al. http://genomebiology.com/2005/6/8/R71
mitment to a particular cellular lineage, miRNAs may play animportant general role in the mechanism of cell differentia-tion and maintenance of cell identity. The highest degree ofcorrelation in the expression pattern of miRNAs wasobserved 'horizontally' between hematopoietic cell types at asimilar stage of differentiation. For instance, early B and Tcell precursors are more closely related to each other in theirmiRNA expression patterns than to their more differentiatedprogeny, mature splenic B cells and naïve T cells. Most strik-ingly, fully differentiated effector cells, including the closelyrelated Th1 and Th2 cells, but also the much more distantlyrelated BMMC, are more closely related to each other in theirmiRNA expression pattern than to their respective precursorcells. The high degree of correlation in the miRNA expressionpatterns of these distantly related immune effectors suggeststhat a common set of miRNAs may be employed in both line-ages to regulate similar effector functions, such as tissue
homing and cytokine production. Alternatively, these find-ings may reflect a general role for some of these miRNAs instabilizing gene expression and thereby lineage specification.This could be accomplished through the promiscuous target-ing of many transcripts or by specific targeting of genes thatregulate the plasticity of transcriptional states, such as chro-matin-modifying proteins. Similarly, miRNAs shared amongearly precursors may regulate precursor cell self-renewal andmaintenance of an undifferentiated state. The rapid loss ofseveral miRNAs early in the process of differentiation of Th1and Th2 effector cells from naïve T cell precursors is consist-ent with this concept.
ConclusionWe report miRNA expression patterns for diverse murinehematopoietic cells types, identify a subset of miRNAs prefer-
MiRNA expression and lineage commitmentFigure 6MiRNA expression and lineage commitment. Expression of miRNA in the hematopoietic system changes depending on the differentiation status. Part of the hematopoietic differentiation tree is represented: myeloid and lymphoid progenitors derive from a common progenitor, which is represented by the model Pu.1-/- cell line (see text). The common lymphoid progenitor gives rise to B and T lymphocytes and the common myeloid progenitor gives rise to mast cells and other cells types. Superimposed on this diagram are examples of miRNAs that were discovered to be differentially expressed between the indicated precursor/progeny pairs using array analysis with confirmation by Northern blot. DN, double-negative.
Hematopoietic stem cells
PU.1−/−
Common lymphoidprogenitors
Common myeloidprogenitors
Mast cells
DN thymocytesPro B
Naive
Th1 Th2
Spleen B
miR 26amiR 24miR 27amiR 223
miR 150miR 150miR 24miR 142-5pmiR 142-3p
miR 146miR 150
miR 146miR 150
Genome Biology 2005, 6:R71
http://genomebiology.com/2005/6/8/R71 Genome Biology 2005, Volume 6, Issue 8, Article R71 Monticelli et al. R71.13
com
ment
reviews
reports
refereed researchdepo
sited researchinteractio
nsinfo
rmatio
n
entially expressed in the hematopoietic system comparedwith neuronal cells, and identify individual miRNAexpression changes that occur during cell differentiation. Ourdata support the use of the miRNA microarray for detectionof patterns of miRNA expression and for quantification ofmiRNA expression, with the obvious advantage that theexpression of several hundred genes can be identified in thesame sample at once, and with relatively small amounts oftotal RNA. Deciphering the miRNA expression status of cellsunder different conditions of development and activation andin different disease states will be useful to identify miRNAtargets, and alterations in the pattern of miRNA expressionmay disclose new pathogenic pathways and new ways to tar-get diseases.
Materials and methodsTissue preparation, cells differentiation and RNA extractionHippocampi were dissected from 10-14 week old Balb/c mice.For pro-B cell preparation, bone marrow cells were isolatedfrom femurs and tibias of 6-12 week old Rag2-/- C57BL/6 ×129 mice and pro-B cells were isolated using CD19 MACSbeads. Spleen B cells were isolated using CD19 MACS beadsfrom splenocytes obtained from 6-12 week old C57BL/6 mice.Double-negative thymocytes (DN T) were obtained from thethymi of 4-6 week old Rag2-/- C57BL/6 × 129 mice withoutpurification; more than 90% of the cells were DN2 and DN3(not shown). Due to the low amount of cells that can beobtained from one mouse, proB and DN T cells were purifiedfrom 20 Rag-/- mice, while the spleen B cells were obtainedfrom 10 C57BL/6 mice, and the samples were pooled.
BMMC preparation and differentiation was as previouslydescribed [33,34]. Briefly, bone marrow cells were isolatedfrom femurs and tibias of 6-12 week old BALB/c mice andmaintained for 4-12 weeks in RPMI medium containing 50%WEHI-3 (American Type Culture Collection, VA, USA) condi-tioned supernatant as a source of IL-3.
Pu.1 knock-out cells were kindly provided by Dr HarinderSingh (University of Chicago), and were maintained in IMDMmedia supplemented with 10 ng/ml of recombinant IL-3(Peprotech Inc., NJ, USA). Naïve CD4 cells were purifiedfrom spleen and lymph nodes of Tcrα-/- DO11 TCR trans-genic mice by magnetic bead selection (Dynal, Oslo, Norway)as previously described [33]. Primary Th1 and Th2 cells weredifferentiated in culture for 7 days as previously described[35]. Murine Th1 (D5) and Th2 (D10) clones were maintainedas previously described [36]. RNA was prepared usingUltraspec or Trizol reagents following manufacturer'sinstructions.
Oligonucleotide array for miRNAThis method has been previously described (see [20]). Briefly,trimer oligonucleotides (antisense to miRNAs) of 54-72
nucleotides at a final concentration of 7 µM were spotted onGeneScreen Plus (NEN) membranes with a 1536 pin platereplicator (V&P Scientific, CA, USA). Oligonucleotides wereimmobilized in 100 mM NaOH, after which the membraneswere briefly neutralized in 5% SDS at room temperature andwith 0.2% SDS at 72°C. Arrays were stored in 0.2% SDS at -4°C.
Total RNA (5-10 µg) from hippocampus tissue and varioushematopoietic cell types was preheated at 80°C for 3 min,cooled on ice and filtered through Microcon YM-100 concen-trators to obtain a low molecular weight (LMW) fraction ofRNA enriched in molecules less than 60 nucleotides in size.The LMW RNA was end-labeled with 30 µCi of γ33P dATP(3000 Ci/mmole) with T4 polynucleotide kinase, andpurified using the QIAgen Nucleotide Removal kit (QIAgenInc., CA, USA).
For hybridization, membranes were first prehybridized inMicroHyb hybridization buffer (ResGen, AL, USA) at 37°C forat least 30 min, followed by an overnight hybridization in thesame solution containing the RNA probe. Followinghybridization, membranes were washed twice in 2 × SSC/0.5% SDS at 37°C and once in 1 × SSC/0.5% SDS at 37°C.Membranes were exposed to a phosphor storage screen,scanned using a Phosphor Imager, and signals were quanti-fied using the ImageQuant software (Molecular Dynamics,CA, USA). For reuse, membranes were stripped with 0.2%SDS at 72°C, tested again by exposure to phosphorimagerscreen, and rehybridized three to five times. Each experimentincluded two to three independent RNA samples and toensure accuracy of the hybridizations, each RNA sample washybridized with three membranes.
To confirm specificity, a series of oligonucleotides with threemismatches (G>C or C>A) were included on the array. Thesemismatches resulted in a significant drop in signal intensityas compared with their cognates. The melting temperature ofoligo probe:miRNA pairs could affect the sensitivity and spe-cificity of the arrays for different miRNAs. An analysis of thiscorrelation showed that hybridization signals significantlyabove background were obtained for probes in a wide range ofmelting temperatures (Additional Data File 4). Also, threesynthetic 21-nt RNA oligonucleotides with sequences that donot correspond to any known miRNA, but that are exact com-plements to randomly spotted sequences, were added to theRNA samples at a known concentration as a reference fornormalization.
Northern blot analysisTotal RNA (20 µg) was loaded and separated on a denaturing12-15% polyacrylamide gel and transferred electrophoreti-cally to a GeneScreen Plus or Nytran SuPerCharge membrane(Scheicher and Schuell, NH, USA). Membranes were UV-crosslinked. Probes were prepared by T4 polynucleotidekinase labeling of antisense oligonucleotides with γ32P dATP.
Genome Biology 2005, 6:R71

R71.14 Genome Biology 2005, Volume 6, Issue 8, Article R71 Monticelli et al. http://genomebiology.com/2005/6/8/R71
Hybridization was performed with UltraHyb Hybridizationbuffer (Ambion, TX, USA) or Denhardt's solution at 37-42°C.Blots were washed at the same temperature with 2 × SSC/0.1% SDS with a brief final wash with 0.1 × SSC/0.1% SDS.Radiolabeled Decade RNA markers (Ambion) were loaded assize markers. tRNA and 5S RNA stained with ethidium bro-mide served as a sample loading control. For reuse, blots werestripped by boiling in 0.1 × SSC/0.1% SDS twice for 10 minand reprobed.
Data analysisBefore analysis, the raw data needed to be processed in orderto handle overall scaling differences between the individualscans and negative values arising from the background sub-traction. Although these are common issues in array-basedexperiments, it is not obvious what the optimal preprocessingalgorithm should be. For the data presented here, the Vari-ance Stabilization Normalization method [37] was used. Themethod has a considerable advantage in that it uses a gener-alized log transformation that can deal directly with negativevalues, eliminating the need to artificially shift or truncatethese data points.
Standard hierarchical clustering with average linkage wasused to cluster the hematopoietic samples. A subset of themiRNAs was used to compute the distance function. ThesemiRNAs had to have a signal level of three times the back-ground standard deviation in at least one of the hematopoi-etic samples. The Pearson correlation was used to computethe distance function with dist = (1-ρ)/2 where ρ is the corre-lation. To assess the robustness of the results, bootstrap resa-mpling was carried out using a parametric method to addnoise to the data. Gaussian noise with zero mean and a stand-ard deviation equal to that for each spot's replicates wasadded to each point. One thousand resampled datasets werecreated and clustered with a consensus tree built from theresults. The number at each node indicates how often thatsubtree appeared in the 1000 replica trees.
To identify miRNAs that were differentially expressedbetween the various sample subtypes, a variation of thestandard t-test was used on the transformed expression val-ues. To handle the low number of samples, a Bayesian correc-tion method [38] was used to adjust the standard deviation.To account for the multiple testing problem, the False Discov-ery Rate (FDR) method was used and the lists were cut off atspecific values of the FDR. Additionally, the results were fil-tered to include only those miRNAs that were expressedthreefold above the background standard deviation in at leastone sample.
Data availabilityThe primary microarray data is deposited in the ArrayExpressdatabase with accession number E-MEXP-372.
Additional data filesThe following additional data are available with the onlineversion of this article: miRNAs differentially expressedbetween hippocampus and combined hematopoietic samples(Additional data file 1), miRNAs differentially expressedbetween BMMC and Th1, Th2 and Pu.1-/- cells (Additionaldata file 2), miRNAs differentially expressed between spleenB versus pro-B (Additional data file 3), and an analysis of theprobe melting temperatures (Tm) versus the average signalobtained in the arrays (Additional data file 4).Additional data file 1miRNAs differentially expressed between hippocampus and com-bined hematopoietic samples.For normalization the VSN method was used [37]. A standard t-test on the generalized log transformed expression levels was used to rank the miRNAs and compute p values. The results were filtered to discard any miRNA whose signal was not three times above the background in at least one of the two groups and whose absolute fold change was less than 3.Click here for fileAdditional data file 2MiRNAs differentially expressed between BMMC and Th1, Th2 and Pu.1-/- cells.To handle the low sample numbers, the Bayesian corrected t-test [38] was used to rank and compute p values. The different compar-isons had greatly varying significances, so different cut offs were used on each list. For the BMMC versus Th1 and Th2 comparisons, a FDR cutoff of 10-2 was used, with a filter of three times back-ground levels and a fold change of three. For the BMMC versus Pu.1-/- comparison a FDR of 10-6 and four times background filter was used.Click here for fileAdditional data file 3MiRNAs differentially expressed between spleen B versus pro-B.The FDR cut off was 10-6 and the background filter was four times.Click here for fileAdditional data file 4Analysis of the probe melting temperatures (Tm) versus the aver-age signal obtained in the arrays.There is a clear correlation between Tm and strength of signal for all the probes used (left panel). The same is true if only the probes for miRNAs that were identified as 'high in hematopoietic cells' (see Figure 5a) are considered (right panel). Also, the latter probes have Tm that span almost the entire range of Tm seen for all the probes, and have an average Tm (56°C) only slightly higher than the aver-age of all the probes (54°C). This means that overall, the use of these different oligos as probes in the arrays is in fact valid, even though we may have lost some of the low Tm miRNAs as false neg-ative signals, and some of the high Tm probes may have given a few false positive signals.Click here for file
AcknowledgementsWe thank Dr P Laslo and Dr H Singh for the Pu.1-/- cells. K.M.A. is a fellowof the Damon Runyon Cancer Research Fund (DRG-1682). C.X. is a Can-cer Research Institute postdoctoral fellow. A special thanks to Prof ASiccardi for help and support. This work was supported by NIH grants toA.R., K.R., and K.S.K., and a grant from the Sandler Program for AsthmaResearch to A.R.
References1. Denli AM, Tops BB, Plasterk RH, Ketting RF, Hannon GJ: Processing
of primary microRNAs by the Microprocessor complex.Nature 2004, 432:231-235.
2. Bartel DP: MicroRNAs: genomics, biogenesis, mechanism,and function. Cell 2004, 116:281-297.
3. Ambros V: The functions of animal microRNAs. Nature 2004,431:350-355.
4. Meister G, Tuschl T: Mechanisms of gene silencing by double-stranded RNA. Nature 2004, 431:343-349.
5. Hobert O: Common logic of transcription factor and micro-RNA action. Trends Biochem Sci 2004, 29:462-468.
6. Calin GA, Dumitru CD, Shimizu M, Bichi R, Zupo S, Noch E, AldlerH, Rattan S, Keating M, Rai K, et al.: Frequent deletions and down-regulation of micro-RNA genes miR15 and miR16 at 13q14in chronic lymphocytic leukemia. Proc Natl Acad Sci USA 2002,99:15524-15529.
7. Calin GA, Liu CG, Sevignani C, Ferracin M, Felli N, Dumitru CD,Shimizu M, Cimmino A, Zupo S, Dono M, et al.: MicroRNA profil-ing reveals distinct signatures in B cell chronic lymphocyticleukemias. Proc Natl Acad Sci USA 2004, 101:11755-117560.
8. Griffiths-Jones S: The microRNA Registry. Nucleic Acids Res 2004,32:D109-111.
9. Berezikov E, Guryev V, van de Belt J, Wienholds E, Plasterk RH, Cup-pen E: Phylogenetic shadowing and computational identifica-tion of human microRNA genes. Cell 2005, 120:21-24.
10. Xie X, Lu J, Kulbokas EJ, Golub TR, Mootha V, Lindblad-Toh K,Lander ES, Kellis M: Systematic discovery of regulatory motifsin human promoters and 3' UTRs by comparison of severalmammals. Nature 2005, 434:338-345.
11. Ambros V: MicroRNA pathways in flies and worms: growth,death, fat, stress, and timing. Cell 2003, 113:673-676.
12. Lim LP, Lau NC, Garrett-Engele P, Grimson A, Schelter JM, Castle J,Bartel DP, Linsley PS, Johnson JM: Microarray analysis shows thatsome microRNAs downregulate large numbers of targetmRNAs. Nature 2005, 433:769-773.
13. Miska EA, Alvarez-Saavedra E, Townsend M, Yoshii A, Sestan N, RakicP, Constantine-Paton M, Horvitz HR: Microarray analysis ofmicroRNA expression in the developing mammalian brain.Genome Biol 2004, 5:R68.
14. Sempere LF, Freemantle S, Pitha-Rowe I, Moss E, Dmitrovsky E,Ambros V: Expression profiling of mammalian microRNAsuncovers a subset of brain-expressed microRNAs with possi-ble roles in murine and human neuronal differentiation.Genome Biol 2004, 5:R13.
15. Baskerville S, Bartel DP: Microarray profiling of microRNAsreveals frequent coexpression with neighboring miRNAs andhost genes. RNA 2005, 11:241-247.
16. Galli SJ, Kalesnikoff J, Grimbaldeston MA, Piliponsky AM, WilliamsCM, Tsai M: Mast cells as 'tunable' effector and immunoregu-
Genome Biology 2005, 6:R71

http://genomebiology.com/2005/6/8/R71 Genome Biology 2005, Volume 6, Issue 8, Article R71 Monticelli et al. R71.15
com
ment
reviews
reports
refereed researchdepo
sited researchinteractio
nsinfo
rmatio
n
latory cells: recent advances. Annu Rev Immunol 2005,23:749-786.
17. Esau C, Kang X, Peralta E, Hanson E, Marcusson EG, Ravichandran LV,Sun Y, Koo S, Perera RJ, Jain R, et al.: MicroRNA-143 regulatesadipocyte differentiation. J Biol Chem 2004, 279:52361-52365.
18. Thomson JM, Parker J, Perou CM, Hammond SM: A custommicroarray platform for analysis of microRNA geneexpression. Nat Methods 2004, 1:47-53.
19. Nelson PT, Baldwin DA, Scearce LM, Oberholtzer JC, Tobias JW,Mourelatos Z: Microarray-based, high-throughput geneexpression profiling of microRNAs. Nat Methods 2004,1:155-161.
20. Krichevsky AM, King KS, Donahue CP, Khrapko K, Kosik KS: AmicroRNA array reveals extensive regulation of microRNAsduring brain development. RNA 2003, 9:1274-1281.
21. DeKoter RP, Walsh JC, Singh H: PU.1 regulates both cytokine-dependent proliferation and differentiation of granulocyte/macrophage progenitors. EMBO J 1998, 17:4456-4468.
22. Walsh JC, DeKoter RP, Lee H, Smith ED, Lancki DW, Gurish MF,Friend DS, Stevens RL, Anastasi J, Singh H: Cooperative and antag-onistic interplay between PU.1 and GATA-2 in thespecification of myeloid cell fates. Immunity 2002, 17:665-676.
23. Chen CZ, Li L, Lodish HF, Bartel DP: MicroRNAs modulatehematopoietic lineage differentiation. Science 2004, 303:83-86.
24. Ansel KM, Lee DU, Rao A: An epigenetic view of helper T celldifferentiation. Nat Immunol 2003, 4:616-623.
25. Murphy KM, Reiner SL: The lineage decisions of helper T cells.Nat Rev Immunol 2002, 2:933-944.
26. Lewis BP, Shih IH, Jones-Rhoades MW, Bartel DP, Burge CB: Predic-tion of mammalian microRNA targets. Cell 2003, 115:787-798.
27. Lewis BP, Burge CB, Bartel DP: Conserved seed pairing, oftenflanked by adenosines, indicates that thousands of humangenes are microrna targets. Cell 2005, 120:15-20.
28. Rajewsky N, Socci ND: Computational identification ofmicroRNA targets. Dev Biol 2004, 267:529-535.
29. John B, Enright AJ, Aravin A, Tuschl T, Sander C, Marks DS: HumanmicroRNA targets. PLoS Biol 2004, 2:e363.
30. Krek A, Grun D, Poy MN, Wolf R, Rosenberg L, Epstein EJ, Macme-namin P, da Piedade I, Gunsalus KC, Stoffel M, et al.: CombinatorialmicroRNA target predictions. Nat Genet 2005, 37:495-500.
31. Akashi K, Traver D, Miyamoto T, Weissman IL: A clonogenic com-mon myeloid progenitor that gives rise to all myeloidlineages. Nature 2000, 404:193-197.
32. DeKoter RP, Singh H: Regulation of B lymphocyte and macro-phage development by graded expression of PU.1. Science2000, 288:1439-1441.
33. Ansel KM, Greenwald RJ, Agarwal S, Bassing CH, Monticelli S, Inter-landi J, Djuretic IM, Lee DU, Sharpe AH, Alt FW, et al.: Deletion ofa conserved Il4 silencer impairs T helper type 1-mediatedimmunity. Nat Immunol 2004, 5:1251-1259.
34. Solymar DC, Agarwal S, Bassing CH, Alt FW, Rao A: A 3' enhancerin the IL-4 gene regulates cytokine production by Th2 cellsand mast cells. Immunity 2002, 17:41-50.
35. Avni O, Lee D, Macian F, Szabo SJ, Glimcher LH, Rao A: T(H) celldifferentiation is accompanied by dynamic changes in his-tone acetylation of cytokine genes. Nat Immunol 2002,3:643-651.
36. Agarwal S, Rao A: Modulation of chromatin structure regulatescytokine gene expression during T cell differentiation. Immu-nity 1998, 9:765-775.
37. Huber W, von Heydebreck A, Sultmann H, Poustka A, Vingron M:Variance stabilization applied to microarray data calibrationand to the quantification of differential expression. Bioinfor-matics 2002, 18:S96-S104.
38. Baldi P, Long AD: A Bayesian framework for the analysis ofmicroarray expression data: regularized t-test and statisticalinferences of gene changes. Bioinformatics 2001, 17:509-519.
Genome Biology 2005, 6:R71
http://www.ncbi.nlm.nih.gov/entrez/query.fcgi?cmd=Retrieve&db=PubMed&dopt=Abstract&list_uids=9687512
http://www.ncbi.nlm.nih.gov/entrez/query.fcgi?cmd=Retrieve&db=PubMed&dopt=Abstract&list_uids=9687512
http://www.ncbi.nlm.nih.gov/entrez/query.fcgi?cmd=Retrieve&db=PubMed&dopt=Abstract&list_uids=9687512
http://www.ncbi.nlm.nih.gov/entrez/query.fcgi?cmd=Retrieve&db=PubMed&dopt=Abstract&list_uids=9881967