PDCD2 controls hematopoietic stem cell differentiation during development
16
ORIGINAL RESEARCH REPORTS PDCD2 Controls Hematopoietic Stem Cell Differentiation During Development Joseph Kramer, 1–3 Celine J. Granier, 4 Stephani Davis, 5 Katherine Piso, 1,3 Jane Hand, 3,6 Arnold B. Rabson, 2,4,7,8 and Hatem E. Sabaawy 1,3,5 Programmed cell death 2 (Pdcd2) is a highly conserved protein of undefined function, and is widely expressed in embryonic and adult tissues. The observations that knockout of Pdcd2 in the mouse is embryonic lethal at preimplantation stages, and that in Drosophila, Zfrp8, the ortholog of Pdcd2, is required for normal lymph gland development suggest that Pdcd2 is important for regulating hematopoietic development. Through genetic and functional studies, we investigated pdcd2 function during the zebrafish ontogeny. Knockdown of pdcd2 ex- pression in zebrafish embryos resulted in defects in embryonic hematopoietic development. Loss of pdcd2 function caused increased expression of progenitor markers, and accumulation of erythroid progenitors during primitive hematopoiesis. Additionally, hematopoietic stem cells (HSCs) failed to appear in the aorta-gonad mesonephros, and were not able to terminally differentiate or reconstitute hematopoiesis. Pdcd2 effects on HSC emergence were cell autonomous and P53-independent, and loss of pdcd2 function was associated with mitotic defects and apoptosis. Restoration of runx1 function(s) and modulation of apoptosis through the inhibition of Jak/Stat signaling rescued the hematopoietic and erythroid defects resulting from pdcd2 knockdown. Our studies suggest that pdcd2 plays a critical role in regulating the transcriptional hierarchy controlling hemato- poietic lineage determination. Furthermore, the effects of pdcd2 in regulating mitotic cell death may contribute to its role(s) in directing hematopoietic differentiation during development. Introduction I n all vertebrates from zebrafish to human, hematopoi- esis is a dynamic process that occurs in successive stages and at distinct anatomic sites [1]. The successive hematopoi- etic waves are directed by morphogenetic movements, and by expression of transcription factors that regulate lineage com- mitment and cellular reprogramming [2]. In mammals, primitive hematopoiesis is characterized by generation of primitive macrophages and erythroid progenitors in the ex- traembryonic yolk sac. In zebrafish, this first hematopoietic wave occurs in 2 distinct regions in the anterior lateral me- soderm (ALM) and posterior lateral mesoderm (PLM) [2]. The bilateral stripes of cells in the PLM later converge at midline to form the intermediate cell mass (ICM), the zebrafish equiva- lent to mammalian yolk sac blood islands at the 20-somite stage or *19-hour postfertilization (hpf ) [2]. The specification of PLM-derived cells into hematopoietic lineages marked by scl, gata2, and lmo2, and endothelial lineages marked by flk1 and fli1 occurs before the morphogenetic movement of the PLM to form the ICM [3,4]. PLM-derived cells later differen- tiate into proerythroblasts and endothelial cells in the trunk vasculature. Within the ICM, proerythroblasts that are gata1 + enter the circulation between 24–26 hpf, and subsequently mature into primitive erythrocytes. A transient wave between primitive and definitive hema- topoiesis is reported to occur between 1 and 2 days post- fertilization (dpf) in the zebrafish posterior blood island, and is characterized by the appearance of bipotential erythromyeloid progenitors (EMP) [5]. In zebrafish as well as in the mouse, the close association between hematopoietic cells and the devel- oping endothelium suggests that both lineages arise from either a mesodermal progenitor(s) with endothelial and he- matopoietic potential called the hemangioblast [2], or from the hemogenic endothelium. Using single-cell labeling and live- cell imaging, hemangioblasts have been reported in zebrafish [6], and differentiation of hematopoietic cells from the hemo- genic endothelium was demonstrated [7–9]. The 2 views are not mutually exclusive and it has been proposed that flk1 + hemangioblasts first generate the hemogenic endothelium in a step that depends on scl expression, and then produce defin- itive hematopoietic cells through runx1 expression [10]. Departments of 1 Medicine and 2 Pathology and Laboratory Medicine, University of Medicine and Dentistry of New Jersey-Robert Wood Johnson Medical School, New Brunswick, New Jersey. 3 Cancer Institute of New Jersey, New Brunswick, New Jersey. 4 Child Health Institute of New Jersey, New Brunswick, New Jersey. Departments of 5 Pharmacology, 7 Pediatrics, and 8 Molecular Genetics, Microbiology, and Immunology, University of Medicine and Dentistry of New Jersey-Robert Wood Johnson Medical School, New Brunswick, New Jersey. 6 Rutgers School of Arts and Sciences, Rutgers University, New Brunswick, New Jersey. STEM CELLS AND DEVELOPMENT Volume 22, Number 1, 2013 ȑ Mary Ann Liebert, Inc. DOI: 10.1089/scd.2012.0074 58
Transcript of PDCD2 controls hematopoietic stem cell differentiation during development

ORIGINAL RESEARCH REPORTS
PDCD2 Controls HematopoieticStem Cell Differentiation During Development
Joseph Kramer,1–3 Celine J. Granier,4 Stephani Davis,5 Katherine Piso,1,3 Jane Hand,3,6
Arnold B. Rabson,2,4,7,8 and Hatem E. Sabaawy1,3,5
Programmed cell death 2 (Pdcd2) is a highly conserved protein of undefined function, and is widely expressed inembryonic and adult tissues. The observations that knockout of Pdcd2 in the mouse is embryonic lethal atpreimplantation stages, and that in Drosophila, Zfrp8, the ortholog of Pdcd2, is required for normal lymph glanddevelopment suggest that Pdcd2 is important for regulating hematopoietic development. Through genetic andfunctional studies, we investigated pdcd2 function during the zebrafish ontogeny. Knockdown of pdcd2 ex-pression in zebrafish embryos resulted in defects in embryonic hematopoietic development. Loss of pdcd2function caused increased expression of progenitor markers, and accumulation of erythroid progenitors duringprimitive hematopoiesis. Additionally, hematopoietic stem cells (HSCs) failed to appear in the aorta-gonadmesonephros, and were not able to terminally differentiate or reconstitute hematopoiesis. Pdcd2 effects on HSCemergence were cell autonomous and P53-independent, and loss of pdcd2 function was associated with mitoticdefects and apoptosis. Restoration of runx1 function(s) and modulation of apoptosis through the inhibition ofJak/Stat signaling rescued the hematopoietic and erythroid defects resulting from pdcd2 knockdown. Ourstudies suggest that pdcd2 plays a critical role in regulating the transcriptional hierarchy controlling hemato-poietic lineage determination. Furthermore, the effects of pdcd2 in regulating mitotic cell death may contribute toits role(s) in directing hematopoietic differentiation during development.
Introduction
In all vertebrates from zebrafish to human, hematopoi-esis is a dynamic process that occurs in successive stages
and at distinct anatomic sites [1]. The successive hematopoi-etic waves are directed by morphogenetic movements, and byexpression of transcription factors that regulate lineage com-mitment and cellular reprogramming [2]. In mammals,primitive hematopoiesis is characterized by generation ofprimitive macrophages and erythroid progenitors in the ex-traembryonic yolk sac. In zebrafish, this first hematopoieticwave occurs in 2 distinct regions in the anterior lateral me-soderm (ALM) and posterior lateral mesoderm (PLM) [2]. Thebilateral stripes of cells in the PLM later converge at midline toform the intermediate cell mass (ICM), the zebrafish equiva-lent to mammalian yolk sac blood islands at the 20-somitestage or *19-hour postfertilization (hpf) [2]. The specificationof PLM-derived cells into hematopoietic lineages marked byscl, gata2, and lmo2, and endothelial lineages marked by flk1and fli1 occurs before the morphogenetic movement of thePLM to form the ICM [3,4]. PLM-derived cells later differen-
tiate into proerythroblasts and endothelial cells in the trunkvasculature. Within the ICM, proerythroblasts that are gata1 +
enter the circulation between 24–26 hpf, and subsequentlymature into primitive erythrocytes.
A transient wave between primitive and definitive hema-topoiesis is reported to occur between 1 and 2 days post-fertilization (dpf) in the zebrafish posterior blood island, and ischaracterized by the appearance of bipotential erythromyeloidprogenitors (EMP) [5]. In zebrafish as well as in the mouse, theclose association between hematopoietic cells and the devel-oping endothelium suggests that both lineages arise fromeither a mesodermal progenitor(s) with endothelial and he-matopoietic potential called the hemangioblast [2], or from thehemogenic endothelium. Using single-cell labeling and live-cell imaging, hemangioblasts have been reported in zebrafish[6], and differentiation of hematopoietic cells from the hemo-genic endothelium was demonstrated [7–9]. The 2 views arenot mutually exclusive and it has been proposed that flk1 +
hemangioblasts first generate the hemogenic endothelium in astep that depends on scl expression, and then produce defin-itive hematopoietic cells through runx1 expression [10].
Departments of 1Medicine and 2Pathology and Laboratory Medicine, University of Medicine and Dentistry of New Jersey-Robert WoodJohnson Medical School, New Brunswick, New Jersey.
3Cancer Institute of New Jersey, New Brunswick, New Jersey.4Child Health Institute of New Jersey, New Brunswick, New Jersey.Departments of 5Pharmacology, 7Pediatrics, and 8Molecular Genetics, Microbiology, and Immunology, University of Medicine and
Dentistry of New Jersey-Robert Wood Johnson Medical School, New Brunswick, New Jersey.6Rutgers School of Arts and Sciences, Rutgers University, New Brunswick, New Jersey.
STEM CELLS AND DEVELOPMENT
Volume 22, Number 1, 2013
� Mary Ann Liebert, Inc.
DOI: 10.1089/scd.2012.0074
58

Multipotent definitive hematopoietic stem cells (HSCs)that express runx1 and c-myb [2], and are capable of self-renewal and generation of all definitive blood lineages firstemerge from a region between the dorsal aorta and theposterior cardinal vein equivalent to the aorta-gonad meso-nephros (AGM) region in mammals [11,12]. From 48 hpf,c-myb + cells are found in the posterior region in the tailcalled the caudal hematopoietic tissue (CHT) [13,14], a siteequivalent to mammalian fetal liver. These c-myb + cells laterappear in the thymus from 3 dpf and in the kidney marrowfrom 4 dpf [13,14], the sites for adult hematopoiesis in larvaland adult zebrafish.
Runx1 is a key regulator of definitive hematopoiesis in allvertebrates, including zebrafish [11,12]. Runx1 expressionmodulates both the efficiency of HSC emergence from thehemogenic endothelium as well as the survival of theseHSCs [8,15]. The formation of HSCs expressing runx1 andcmyb is known to require blood flow [16]. Further, hema-topoietic differentiation is regulated by equilibrium betweendownstream transcription factors, such as gata1 and pu.1that regulate myeloid versus erythroid progenitor cell fate[17], where gata1 promotes erythroid differentiation [18],while pu.1 marks early myelopoiesis and promotes myeloiddifferentiation [19].
Clearly, many important regulators of hematopoiesis andHSC function remain to be described. Programmed celldeath 2 (Pdcd2) was initially identified among genes upre-gulated in rat thymocytes triggered to undergo apoptosis byirradiation or dexamethasone treatment [20]. Studies inDrosophila suggested that pdcd2 plays an important role inhematopoiesis [21]. Mutations in the Drosophila ortholog ofpdcd2, zfrp8, resulted in hyperplasia of the fly lymph gland,and zfrp8 was subsequently shown to be essential for main-taining the stem cell population, but dispensable for theirdaughter progenitor cells [21,22]. Interestingly, transcrip-tional profiling of various stem cells identified Pdcd2 amonggenes enriched in mouse embryonic, neural, and HSCs [23].Pdcd2 is highly expressed in mouse blastocysts [24], and isrequired for ESC maintenance [25]. PDCD2 is also enrichedin human ESCs compared to their differentiated lineages[26]. Human PDCD2 is located on chromosome 6q27 in aregion involved in both translocations and deletions in leu-kemias and lymphomas [27]. This involvement suggests thatPDCD2 is a potential tumor suppressor gene [28] that mightbe required for myeloid and/or lymphoid cell fate.
Little is known of the function of PDCD2, although it hasbeen shown to physically interact with the host cell factor-1(hcf1) that controls cell cycle progression, and to bind toN-CoR through its MYND domain implying a possible rolein transcriptional regulation [29]. We hypothesized thatpdcd2 is required for normal hematopoiesis in zebrafish. Wedemonstrate that loss of pdcd2 perturbs embryonic hemato-poietic development, and this phenotype was associatedwith cell cycle defects and apoptosis, demonstrating a criticalrole for pdcd2 in regulating hematopoietic development.
Materials and Methods
Fish maintenance
The transgenic zebrafish Fli1:EGFP and gata1:dsRed, andthe P53 mutant zebrafish lines were purchased from thezebrafish international resource center (ZIRC) (University of
Oregon). Transgenic CD41:EGFP zebrafish were previouslydescribed [30]. Zebrafish were maintained at 28.5�C in arecirculating aquaculture system at the zebrafish facilityof Cancer Institute of New Jersey according to guidelinesestablished at UMDNJ.
mRNA synthesis, morpholinos, and microinjection
Capped pdcd2 mRNA was synthesized using the mMessagemMachine kit (Ambion). RNA synthesis for in situ probes wasperformed using either digoxigenin- or Fluorescein-UTP(Roche). Morpholino oligonucleotides (MO; Gene Tools LLC)were ATG-MO (5¢-TGTATTTGCAGCCATCTGTCAAACT-3¢), which targets the 5¢UTR of pdcd2, and 5ssMO (5¢-TAACATCTGTTTTGCATCACCTGGA-3¢), which targets splicingof intron 5. Control MO had 5 mismatched nucleotides to theATG-MO displayed in lower cases (5¢-TGTAaTTcCAGCg-ATCTGTgAAtCT-3¢). Each MO was injected into 1–2 cellembryos after titration at 5.5, 2, and 5.5 ng/embryo, respec-tively. A P53 MO (5¢-GCGCCATTGCTTTGCAAGAATTG-3¢)was used at 4.5 ng/embryo.
Whole-mount in situ hybridization, histology,and immunohistochemistry
RNA whole-mount in situ hybridization (WISH) for zeb-rafish pdcd2, scl, c-myb, pu.1, gata1, runx1, lmo2, rag1, hbae1,mpo, l-plastin, and lck were performed as described [31]. Im-munohistochemistry (IHC) for human, mouse, and zebrafishPDCD2 was performed as described [32] using a polyclonalanti-PDCD2 antibody (1:500; Proteintech). Mouse embryocollections, mouse Pdcd2 IHC, and 2,7-diaminofluorene (DAF)labeling for zebrafish were performed as described (Supple-mentary Data are available online at www.liebertpub.com/scd). Phospho-histone H3 (p-H3) was detected using apolyclonal anti-p-H3 antibody (1:750; Millipore), the Alexa-555secondary antibody (Invitrogen), and DAPI counterstaining.Periodic Acid Schiff (PAS) staining (Sigma) and Sudan Blacklabeling were performed as described [33]. Apoptosis assaysand BrdU labeling were performed as described [34].
Flow cytometry, fluorescent activated cell sorting,and cytology
Embryos were prepared for cytometry as described ([35],and Supplementary Data). Cell sorting of gata1:DsRed em-bryos was performed using a BD cell sorter, and transplan-tation was performed as described [16]. For cytology,DsRed + cells were spun for 3 min at 300 rpm using a cyto-spin3 centrifuge (Shandon), and slides were stained withMay-Grunwald Giemsa.
Generation of transgenic pdcd2 reporter zebrafish
Transgenesis was achieved by injection of pdcd2 ( - 1.6 kb):AcGFP in one-cell stage embryos as described ([32], andSupplementary Data). Multiple founder lines were estab-lished based on enhanced green fluorescent protein (EGFP)expression. RNA preparations for RT-PCR were done us-ing the RNAqueous kit (Ambion). Oligo-dT primed cDNAfrom embryonic stages and tissues were used for PCR usingpdcd2-, runx1-, and b-actin-specific primers (SupplementaryTable S1; Supplementary Data are available online at www.liebertpub.com/scd).
PDCD2 IN HEMATOPOIESIS 59

Results
Identification of the zebrafish pdcd2 geneand putative regulatory elements
We found the zebrafish pdcd2 gene [zgc:63685, designatedas ENSDARG00000007892 in Ensembl (zv8)] to be composedof 6 exons spanning 3,766 bp encoding a 358 aa protein(*47 kDa), which shares significant homology, a centralMYND, and a C-terminal PDCD2 domain with all pdcd2orthologs (Supplementary Fig. S1A, D). Phylogenetic analy-sis using the PDCD2 domain suggests that pdcd2 is con-served among all eukaryotes (Supplementary Fig. S1A–D).Zebrafish pdcd2 is located on chromosome 13, and despite asmaller zebrafish chromosome size, both pdcd2 and thesyntenic neighboring gene tbp are conserved (SupplementaryFig. S1C). To identify the zebrafish pdcd2 promoter andsubsequently characterize the in vivo expression of pdcd2, weperformed in silico promoter and transcription factor-bindingsite (TFBS) analyses. A minimal 1.6-Kb core promoter regionwas identified, and included a proximal 800-bp region con-
taining over 500 TFBS, including factors regulating hemato-poiesis, such as runx1, gata factors, c-myb, ap1, c/ebp, scl/tal1,p53, lmo2, ets factors, and stat (data not shown). We utilizedthis zebrafish pdcd2 promoter to drive EGFP expression in atransgenic reporter line, and the expression of EGFP in thesetransgenic embryos was detected ubiquitously throughoutembryonic development (Supplementary Fig. S2A, B). Im-portantly, EGFP was detected in circulating blood cells in thestable transgenic pdcd2 ( - 1.6 kb):EGFP embryos at *26 hpf(Supplementary Movie S1).
Expression of pdcd2 in human, mouse,and zebrafish during development
As noted above, it has been suggested that PDCD2 plays arole in development and hematopoiesis. We therefore in-vestigated pdcd2 expression in human, mouse, and zebrafishtissues using IHC and RNA WISH. Pdcd2 expression isubiquitous and expressed in hematopoietic tissues in normalhuman bone marrow (BM) (Fig. 1A, B), mouse fetal liver(Fig. 1C–E), and zebrafish embryonic stages (Fig. 1F–H).
FIG. 1. PDCD2 expression in human, mouse, and zebrafish tissues. IHC of PDCD2 expression in human BM (A, B), mouse fetalliver (C–E), and zebrafish embryos (F–H). (B) is a higher magnification of outlined area in (A). Notice the dense nuclear and cytoplasmicstaining in progenitor-like cells (arrow) compared with a lighter staining in surrounding differentiated cells, and in a megakaryocyte(arrowhead). (C) IHC of Pdcd2 expression in a sagital section of an E13.5 mouse embryo showing the fetal liver (outlined area) in (C), andhigher magnifications in (D) and (E). Strong Pdcd2 expression is seen in hematopoietic and dividing cells (arrows in E), but not in cellslining the liver sinusoids (arrowhead in E). Pdcd2 protein expression by IHC of zebrafish embryos with strong ubiquitous expression inearly embryonic stages at 18 hpf (F), 24 hpf (G), and 36 hpf (H). Insets are magnifications of the outlined areas in G and H). Arrows pointto hematopoietic cells in the ICM and AGM regions. Images are lateral view, anterior to the left, and dorsal upward. Scale bars are100mm in (A, F, and G), 20mm in (B, E, and H), and 500mm in (C, D, and F). Regions outlined include the AGM, and the tail region thatwould latter contain the CHT/PBI. nc, notochord; yt, yolk tube; DA/AV, dorsal aorta and axial vein region; AGM, aorta-gonadmesonephros; BM, bone marrow; CHT, caudal hematopoietic tissue; hpf, hour postfertilization; ICM, intermediate cell mass; IHC,immunohistochemistry; Pdcd2, programmed cell death 2. Color images available online at www.liebertpub.com/scd
60 KRAMER ET AL.

Using WISH of developing zebrafish embryos, pdcd2 mRNAwas found to be maternally expressed at the 4-cell stage(Supplementary Fig. S3A), and widely distributed duringgastrulation and somitogenesis (Supplementary Fig. S3B–F).In zebrafish embryos, pdcd2 mRNA was detected by RT-PCRduring the first 5 days of embryonic development (Supple-mentary Fig. S3G). Strong pdcd2 expression was detected inthe ICM (Fig. 1G), and at the AGM region, the site of HSCformation at later stages (Fig. 1H). In adult fish, pdcd2 ex-pression was also detectable in all tissues examined exceptmuscle, with a substantial enrichment in kidney marrow(Supplementary Fig. S3H). Collectively, pdcd2 expressionanalyses in mammals and zebrafish suggest that while pdcd2is expressed ubiquitously, it is highly enriched in both neuraland hematopoietic tissues.
Pdcd2 knockdown during zebrafish embryonicdevelopment
We assessed zebrafish development after pdcd2 site-directed knockdown using pdcd2-specific MO. We used mis-matched MOs as controls, and 2 pdcd2-specific MOs: ATGMO,which targets the translational start codon, and 5ssMO, whichrepresses the splicing of intron 5 of pdcd2 (SupplementaryFig. S4A).
Western blotting using the anti-pdcd2 antibody andRT-PCR analyses revealed reductions in the pdcd2 protein,or aberrant pdcd2 splicing in ATGMO- or 5ssMO-injectedembryos, respectively (Supplementary Fig. S4B, C). Giventhe widespread pdcd2 expression, we anticipated that pdcd2knockdown would produce severe developmental defects.However, pdcd2 ATGMO-injected embryos had no apparentdefects up to late somitogenesis. Starting at *18 hpf and upto 48 hpf, we noted that ATGMO-injected embryos displayedsmaller eyes, blocky rather than chevron-shaped somites,dilated brain ventricles, oblong-shaped yolk with shortenedyolk tube, and curly and thickened tails compared to controlembryos (Fig. 2A–D). None of the mismatch MO-injectedembryos displayed this phenotype. Injections of the pdcd2splice 5ssMO reproduced these defects at significantly lowerdoses (2 ng for 5ssMO vs. 5.5 ng for ATGMO). These phe-notypes were seen in *90% of ATGMO- or 5ssMO-injectedembryos. Given that 5ssMO was most efficient in repressingpdcd2 expression (Supplementary Fig. S4C), we used the5ssMO in most of our studies.
Loss of pdcd2 impairs primitive erythropoiesis
In zebrafish embryos, primitive erythroid cells undergosynchronized intravasation and release from vessel wallsinto the circulation at 23–26 hpf [36]. Pdcd2 ATGMO- and5ssMO-injected embryos ( pdcd2 morphants) exhibited adose-dependent failure in this process and only small num-bers of erythrocytes were observed in circulation even at30 hpf (n ‡ 500 embryos). We attempted to establish a dose–response curve to pdcd2 knockdown by examining thenumbers of erythrocytes in circulation through differentcomponents of the embryonic vasculature at 48 hpf (Fig. 2E).We observed a dose-dependent effect of pdcd2 knockdown inpdcd2 morphant embryos with high doses, resulting incomplete absence of circulating erythrocytes in both axialand intersegmental vessels. Importantly, these effects were
only seen in pdcd2 ATGMO- and 5ssMO-injected, but not inmismatch MO-injected embryos, and were rescued by theinjection pdcd2 mRNA (Fig. 2E), suggesting that the hema-topoietic phenotype is specific to pdcd2 knockdown. Circu-lation through intersegmental vessels appeared to be mostsensitive to pdcd2 knockdown with subtle patterning defectsin the number and position of intersegmental vessels. Therelease of primitive erythrocytes into the circulation must betightly coordinated with vascular organization and contrac-tions of the primitive heart tube [37,38]. Thus, the hemato-poietic circulatory defects in pdcd2 morphants might beattributable to defects in cardiac or vascular development,or due to the presence of defective primitive hematopoieticcells.
Circulating cells during early embryogenesis are com-prised mostly of primitive erythrocytes and a few primitivemacrophages [2]. Thus, we investigated the effects of pdcd2knockdown in gata1:DsRed transgenic fish [35] with DsRed-labeled erythrocytes. The initial defects were morphologi-cally visible at onset of circulation when DsRed + cells fromgata1:DsRed pdcd2 morphants showed delayed egress fromthe ICM (Fig. 2F–H). At a time when control embryos ex-hibited release of circulatory erythrocytes (from 26 hpf on-ward), very few erythrocytes were observed to be activelycirculating in pdcd2 morphant embryos (SupplementaryMovies S2 and S3). Exit of most erythrocytes from the ICMhad occurred in > 90% of the embryos by 36 hpf, and ga-ta1:DsRed + cells were observed to accumulate in the yolkvascular sinuses thereafter (n = 34; data not shown). By48 hpf, control embryos exhibited robust numbers of circu-lating primitive erythrocytes at the duct of Cuvier and trunkvessels, while gata1:DsRed + cells from pdcd2 morphants re-mained pooled at the yolk vascular sinuses, and only occa-sional DsRed + cells were observed in the trunk vessels andwithin the interstitial space coincident with the former ICM(Fig. 2J, K, Supplementary Movies S4 and S5). Thus, pdcd2knockdown results in aberrant erythroid cell movement withlimited numbers of cells intravasating into the circulationwithout the synchrony apparent in control embryos (Com-pare Supplementary Movie S5 to control in SupplementaryMovie S4). Moreover, once within the vasculature, pdcd2morphant erythrocytes fail to circulate freely, and the smallnumber of circulating erythrocytes present at 48 hpf occa-sionally traversed the trunk vasculature.
We sought to determine whether the effects upon ery-throid cell movements were a secondary consequence of anunderlying cardiac or vascular defect. Both light microscopicanalyses and microangiography indicate that heart functionis not grossly perturbed (Fig. 3A, B). Pdcd2 morphants dis-played regular cardiac development and contractions of theprimitive heart tubes. Heart rates were 98 – 4 beats/min inpdcd2 morphants compared to 100 – 3 beats/min in controlMO-injected embryos, and 99 – 4 beats/min in WT embryosat 32 hpf, which are comparable to previously reportedvalues [37]. Additionally, microangiography with fluor-esceinated carboxylated latex beads [39] indicated that pdcd2morphants had patent vasculature that exhibits plasma flow(compare Fig. 3A–A¢ and 3B–B¢).
To further assess any potential fine perturbations in vas-cular development, we examined the labeled vasculature inthe Fli1:EGFP transgenic embryos with reduced pdcd2 func-tion. Observations of embryos spanning the developmental
PDCD2 IN HEMATOPOIESIS 61
period during which the embryonic vasculature is estab-lished indicated that the major axial vessels in the trunkappear to develop normally (Fig. 3C, D). The number ofEGFP + cells detected in morphant embryos was similar tothat observed in controls, indicating that the expression ofEGFP from the fli1 promoter was unaffected by pdcd2knockdown (compare Fig. 3E–H). Similar to the effect ofpdcd2 knockdown on erythrocytes, Fli1:EGFP morphantsdisplayed an accumulation of circulatory cells at the yolk’sduct of Cuvier (data not shown). Endothelial expression ofEGFP cells in Fli1:EGFP morphants indicates that the majorvessels of the trunk, including the dorsal aorta and caudal
vein, were established at about the same developmentaltiming as seen in control embryos (Fig. 3E–H and data notshown). Arterial specification occurred, and mature endo-thelial cells expressing ephrinb2a (ephrb2a) were not affectedin pdcd2 morphants (Fig. 3I, J). Further, the expression of theVEGF receptor flk1 in endothelial sites was comparable be-tween pdcd2 morphants and controls (Fig. 3K–N). Interseg-mental vessels and the dorsal axial vein appeared to sproutand form fairly normally. Pdcd2 morphants displayed arrayof intersegmental vessels that are lacking the chevron-shapedpath exhibited by control intersegmental vessels. However,this is likely a reflection of the blocky nature of somite
FIG. 2. Developmental defects in primitive hematopoiesis in pdcd2 morphants. (A–D) Bright field images of control (A, C)and pdcd2 morpholino injected embryos (B, D) at 18 hpf (A, B) and 48 hpf (C, D). Pdcd2 morphants displayed significantlysmaller eyes (arrow), a slightly shorter axis, dilated brain ventricles (*) with brain necrosis, and curly and thickened tails atboth 18 and 48 hpf (**) (D). The yolk appeared oblong in shape due to accumulation of hematopoietic cells at the loweranterior part of the yolk sac. These phenotypes were seen in nearly 90% of > 5,000 ATGMO- or 5ssMO-injected pdcd2morphant embryos. (E) Scoring system based on the numbers of blood cells released to the circulation after injection ofcontrol-mismatch MO, or pdcd2 5ssMO alone or combined with pdcd2 mRNA to rescue the phenotype. Embryos wereclassified into 3 classes based on their flowing blood cell numbers: (i) indistinguishable from the control (normal) as indicatedby the gray bar, (ii) cell number reduction ( < 30 cells transiting the axial or intersegmental vessels) (reduction) compared tocontrol as indicated by the red bar, and (iii) severely deficient or almost no flowing blood cells ( < 10 cells transiting the axial orintersegmental vessels) (deficiency) compared to control as indicated by the blue bar (Bars—s.e.m., *three 5ssMO doses aresignificantly different than control, mRNA rescue of 5ssMO effects were significantly different than 5ssMO alone, P < 0.01).(F–K) Representative fluorescent DsRed images of control MO- (cont.), 5ssMO-, or ATGMO-injected gata1:DsRed embryos at24 or 48 hpf showing failure of hematopoietic cell release. Primitive erythrocytes have cleared the ICM and entered the majorvessels (outlined rectangle) and yolk circulation (outlined circle) in 24 hpf control embryos (F), while in pdcd2 morphant embryos(G, H), cells appear to remain in the ICM region. Gata1-DsRed + cells are distributed throughout the circulatory system at48 hpf in control embryos (I) partitioned between the yolk’s duct of Cuvier (I¢) and the vasculature (e.g., trunk vessels in I¢¢).DsRed + cells in pdcd2 morphant embryos ( J, K) accumulate at the duct of Cuvier ( J¢, K¢) and fail to continuously release intothe interstitial and major trunk vessels ( J¢¢, K¢¢). Data represent 6 independent experiments utilizing *100 embryos/variable,and phenotypes were seen in nearly 90% of control MO-, ATGMO-, or 5ssMO-injected pdcd2 morphant embryos. MO,morpholino oligonucleotides; s.e.m., standard error of the mean. Color images available online at www.liebertpub.com/scd
62 KRAMER ET AL.

boundaries in morphants that delineates the path that thesevessels follow, and it is unlikely a consequence of anyintrinsic angiogenic defect (see Fig. 3A–H). One notabledifference in morphant embryos was the formation of thecaudal venous plexus. Formation of this anastomosing net-work of vasculature is reported to begin at *32 hpf, and isbelieved to serve as a niche for both hematopoietic precursorand stem cells [40]. Pdcd2 morphants displayed a defect inthe formation of this vascular network that became moreapparent at later stages and may be a consequence of theinability of both hematopoietic precursor and phagocyticcells to efficiently colonize and remodel this site (Fig. 3O, P).Collectively, the analyses of endothelial markers coupledwith microangiography illustrate that knockdown of pdcd2does not appear to cause a primary defect in vasculogenesis,and that patent vessels capable of serving as a conduit for
blood cell circulation are formed. Moreover, the pdcd2 mor-phant phenotype appears to be distinct from that of silentheart mutants with defects in cardiac development andblood flow, where large numbers of blood cells are releasedand pooled in major vessels [16].
Pdcd2 has a cell autonomous function(s) requiredfor erythroid maturation and HSC formation
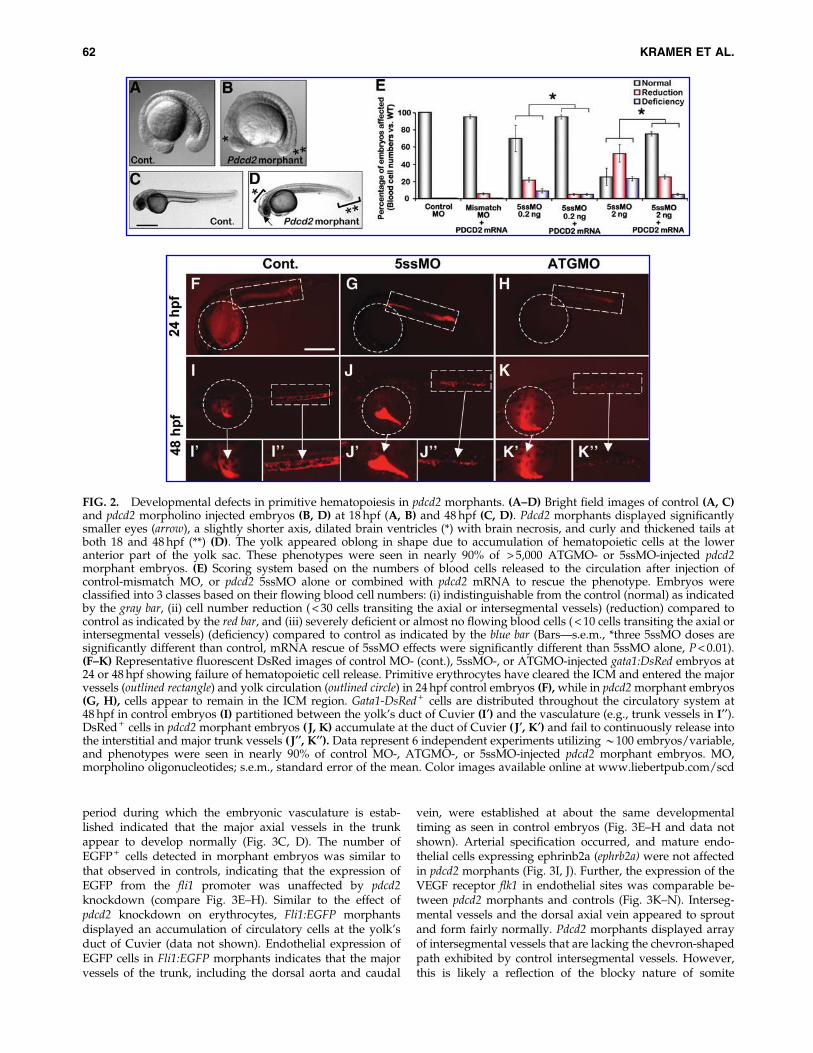
The defects in the release of erythroid cells were mirroredby defects in the expression of erythrocyte-specific markers:pdcd2 morphants had reduced expression of hemoglobin al-pha embryonic-1 marker (hbae1) (Fig. 4A, B), and lackedhemoglobin-stained erythrocytes as evidenced by the lack ofDAF-stained cells at both 48 and 120 hpf (Fig. 4C–F). Tostudy the morphological changes associated with loss of
FIG. 3. Analysis of vasculogenesis in pdcd2 morphant embryos. Microangiography of control (A, A¢) and 5ssMO-injectedwild-type embryos (B, B¢) injected with fluorescein-labeled beads at 48 hpf in the anterior yolk sinus. Images collected within30 min of injection indicate that the major vessels as well as the smaller ancillary vessels of the trunk are patent and permitblood flow. (C, D) H&E histological sections of the mid-trunk region of control MO-injected (C) and 5ssMO-injected (D)zebrafish embryos. The sections demonstrate the presence of comparable endothelial cell thickness and lumen size of majortrunk vessels (black arrows). NT, neural tube; DA, dorsal aorta; AV, axial vein. (E–H) Analysis of dose-dependent effects ofpdcd2 knockdown on vascular development in fli1:EGFP embryos shown at 48 hpf. Injection of control or 5ssMO pdcd2 MOhad no discernable effect on the presence of major vessels (DA and AV) in the trunk or head (E–H, E¢–H¢ and data notshown). Intersegmental vessels were present at intersomitic boundaries and appear to be slightly thicker in pdcd2 morphantsthan in controls (arrows). This may be a consequence of the deformed nature of the somites discussed earlier (Fig. 2B). Gaps inthe dorsal axial vein (DLAV) represent regions adjacent to the posterior tail somites that were irregular at higher morpholinoinputs (arrowheads). (I, J) WISH of mature endothelial cell marker; ephrin (ephrb2a) in 5ssMO-injected embryos ( J) comparedto controls (I) at 26 hpf (controls, n = 26/26 (100%) showed the displayed phenotype; 5ssMO, n = 24/25, 96% showed thedisplayed phenotype). Arterial specification occurred, and levels of ephrb2a + cells (arrowheads in inset) were comparablebetween control and 5ssMO-treated embryos. (K–N) Expression of the generalized endothelial cell marker, flk1, was com-parable at 26 hpf between control (K, M) and pdcd2 knockdown embryos (L, N) (control; n = 36 (97%) showed the displayedphenotype, 5ssMO; n = 47, 89% showed the displayed phenotype). (O, P) Formation of the caudal venous plexus (dashed boxesO, control and P, 5ssMO) in pdcd2 morphants at 72 hpf was defective as visualized in Fli1:EGFP. ISV, intersegmental vessels;AC, axial circulation; EGFP, enhanced green fluorescent protein; WISH, whole-mount in situ hybridization. Color imagesavailable online at www.liebertpub.com/scd
PDCD2 IN HEMATOPOIESIS 63
pdcd2 function(s) in erythrocytes, we examined cytospinpreparations from sorted DsRed + cells from gata1:DsRedpdcd2 morphants. Morphological examination revealed thatpdcd2 morphant cells have significantly larger polychro-matophilic proerythroblasts with open chromatin at 24 hpf(Fig. 4G, H). At 72 hpf, these cells frequently appeared aslarge multinucleated cells with highly condensed nuclear
chromatin and vacuolated cytoplasm that may representapoptotic cells (arrows in Fig. 4J). Many of the pdcd2 mor-phant cells failed to differentiate into mature primitiveerythrocytes (inset in Fig. 4J). Consistent with their classifi-cation as precursor erythroblasts, they were significantlylarger in size, and had higher nuclear/cytoplasmic ratioscompared to control cells (Fig. 4K). Additionally, at 72 hpf,
FIG. 4. Impaired erythropoiesis and HSC development in pdcd2 morphants. (A, B) WISH of the erythroid marker hbae1 incontrol (A) and 5ssMO-injected (B) 48 hpf embryos (arrow) (Control, n = 85/91, 93%; 5ssMO, n = 64/66, 97%). (C–F) ReducedDAF staining and hemoglobin containing erythrocytes in pdcd2 morphants compared to controls at 48 dpf (C vs. D) and 5 dpf(E vs. F). (G–J) Morphology of clusters of DsRed + cells sorted from pdcd2 morphants and control embryos at 24 hpf (G, H)and 72 hpf (I, J). Polychromatophilic erythroblasts (b) from controls (G), or pdcd2 morphants (H) at 24 hpf, and Proery-throcytes (p), immature erythrocytes (i), and mature erythrocytes (e in insert) from controls (I) and pdcd2 morphants ( J) areshown. (K) Average cell sizes, nuclear sizes (mean – s.e.m), and nuclear/cytoplasmic ratio (N/C) of sorted DsRed + cells at24 hpf from control MO or pdcd2 gata1:DsRed morphants. (L) Mean erythroid DsRed + cells ( – s.e.m) sorted from control andmorphant embryos at 72 hpf. Data were determined in 3 independent experiments (*P < 0.001). (M) Top, schematic illustrationof the blastula transplantation strategy used to investigate whether pdcd2 hematopoietic effects are cell-autonomous. Cellsfrom control MO- or 5ssMO-injected CD41-EGFP transgenic donor embryos were transplanted at the blastula stage of eitherWT or 5ssMO-injected gata1-DsRed recipients. Donor HSCs contribution (arrows) at the PBI/CHT region was detected fromcontrol MO-injected cells in gata1-DsRed recipients, but none of 5ssMO-treated donor cells contributed to recipient HSCformation (n = 12 embryos/transplant). Bottom, HSC chimerism determined according to percentage of embryos from eithercontrol MO- or 5ssMO–injected CD41- EGFP transplanted donor cells that contributed to either WT or gata1-DsRed recipientHSC formation in 3 independent experiments (*P < 0.001, Fisher’s exact test). DAF, 2,7-diaminofluorene; dpf, days post-fertilization; HSC, hematopoietic stem cell; WT, wild type. Color images available online at www.liebertpub.com/scd
64 KRAMER ET AL.

gata1:DsRed pdcd2 morphants had increased numbers ofpolychromatophilic erythroblasts and proerythroblasts thancontrols (Fig. 4L). Together, these data suggest that embryoswith reduced pdcd2 function accumulate hematopoieticprecursors, and that pdcd2 is required for completion of theerythroid differentiation program.
To test whether pdcd2 effects on erythroid developmentare cell-autonomous, DsRed + cells were sorted from mis-match- or 5ssMO-injected gata1-DsRed embryos at the 30-somite stage, and were transplanted into the dorsal aorticregion of age-matched nonfluorescent wild-type hosts. From20 recipient embryos transplanted each with 1–20 DsRed +
cells, 66% of cells from mismatch MO-treated embryos werereleased into the embryonic circulation, and contributedto the chimeric host erythropoiesis. In contrast, only 37%of transplanted cells from 5ssMO-treated embryos werereleased into the circulation, and the remaining cells accu-mulated at the yolk, and failed to contribute to host eryth-ropoiesis (Fisher’s exact test, P < 0.001, n ‡ 20). Thisobservation suggests that intrinsic functional defects withinthe erythroid lineage preclude the movements as well as themorphological and biochemical changes normally associatedwith erythroid differentiation.
We next sought to determine whether pdcd2’s effects onHSC emergence were cell-autonomous. We utilized aCD41:EGFP line, which labels both thrombocytes and HSCs.To investigate whether thrombocytes and HSCs are formedin pdcd2 morphants, we injected the 5ssMO into the CD41:EGFP embryos. In this transgenic line, HSCs are GFPlow, andappear first in the AGM at 33 hpf, while thrombocytes areGFPhigh and are detected first in the CHT at 48 hpf [30].Consistent with the effects of pdcd2 knockdown on the HSCmarkers, c-myb and runx1 (see below), CD41:EGFP pdcd2morphants exhibited a failure to populate the AGM with anyCD41:EGFP + HSCs at 36 hpf (Supplementary Fig. S5A, B).
Transplantation of cells at the blastula/early gastrulaboundary destined to form blood cell progenitors fromCD41-EGFP embryos treated with a control MO into eitherWT or gata1-DsRed 5ssMO-treated embryos revealed thatcells from control MO-treated embryos populate the PBI/CHT with donor-derived GFPlow HSCs or GFPhigh throm-bocytes in pdcd2 morphant recipient embryos (Supplemen-tary Fig. S5C–E). However, blastula cells from pdcd2morphants failed to populate recipient PBI/CHT with HSCsat 36 hpf or thrombocytes at 48 hpf either in WT or ingata1:DsRed recipients (Fig. 4M), therefore suggesting thatpdcd2 effects on HSC emergence and/or the appearance ofthrombocytes are cell-autonomous.
Pdcd2 is required for terminal differentiationof multiple hematopoietic lineages
We used WISH to assess hematopoietic specificationthrough the expression of transcription factors that constitutethe regulatory transcriptional hierarchy in pdcd2 morphants.Knockdown of pdcd2 had no significant effect on the expres-sion of either the paraxial mesoderm marker myod (Data notshown), the mesoderm marker ntl (Supplementary Fig. S6A,B), or the hematopoietic embryonic marker cdx4 (Supple-mentary Fig. S6C, D), suggesting that loss of pdcd2 has noclear effects on mesodermal differentiation and patterning.We then examined the effects of pdcd2 knockdown on theexpression of markers of the hemangioblast (scl/tal1), or HSCs(runx1 and c-myb) (Fig. 5A, B). The expression of scl indicatinghemangioblast formation [4] in both the ALM and PLM wasstronger in pdcd2 morphants than in controls (SupplementaryFig. S6G). The upregulation of scl upon pdcd2 knockdownwas further confirmed using quantitative real-time (RT)-PCR(Q-PCR) (Supplementary Fig. S6H). In contrast, pdcd2morphants demonstrated a reduction in c-myb expression
FIG. 5. Pdcd2 knockdown modulates the expression of hematopoietic transcription factors. (A) WISH of runx1 at the 10-somite stage (13.5 hpf) in WT, pdcd2 5ssMO-injected embryos, or pdcd2 mRNA-injected embryos. Note the upregulation ofrunx1 with mRNA injection (arrows). (B) WISH of cmyb and runx1 at 30 hpf demonstrating loss of HSCs in pdcd2 morphants andupregulation of runx1 transcript with the pdcd2 mRNA (cmyb control, n = 111/113, 98%; cmyb 5ssMO, n = 165/180, 92%; runx1control, n = 117/123, 95%; and runx1 5ssMO, n = 84/93, 90%). (C) WISH of mpo, and l-plastin at 30 hpf. (mpo control, n = 40/42,95%; mpo 5ssMO, n = 38/41, 93%; l-plastin control, n = 65/68, 96%; and l-plastin 5ssMO, n = 67/78, 86%). The mean numbers( – s.e.m) of mpo + and l-plastin + cells/embryo are significantly reduced in pdcd2 morphants (red bars) compared to WT (bluebars) (*P < 0.001). (D) WISH of lymphoid progenitor marker rag1 at 96 hpf, and mature T-cell marker lck at 5 dpf, respectively(rag1 control, n = 28/38, 74%; rag1 5ssMO, n = 49/51, 96%; lck control, n = 53/56, 95%; and lck 5ssMO, n = 46/46, 100%). Arrowspoint to the thymus. Scale bar, 500 mm. mpo, myeloperoxidase. Color images available online at www.liebertpub.com/scd
PDCD2 IN HEMATOPOIESIS 65

(Fig. 5B), and a near complete loss of runx1-expressing cells inthe ventral wall of the zebrafish dorsal aorta (Fig. 5B), sug-gesting failure of HSC initiation. On the contrary, the ex-pression of lmo2, an early hematopoietic and vascularendothelial cell marker, appeared to be relatively normal incomparison to control embryos (Supplementary Fig. S6E, F).The relationship between pdcd2 and runx1 became apparentfrom experiments increasing the dosage of pdcd2 throughmRNA injection. Injection of 350 pg of pdcd2 mRNA at the 1-cell stage caused upregulation of runx1 in the PLM at the 10somite stage and throughout the embryo at 30 hpf (Fig. 5A, B).Thus, there appears to be a correlation between pdcd2 ex-pression and runx1 levels and/or Runx1 expressing cells.These data suggest that HSC emergence was disrupted bypdcd2 deficiency, and that this effect may be, at least in part, aconsequence of pdcd2’s effects on runx1 expression.
The effects of pdcd2 on the expression of scl, runx1, and c-myb would likely result in changes in expression of theirdownstream targets and/or cell fate decisions. We assessedthese changes using WISH with lineage-specific hematopoi-etic makers. It is important to note that the effects on markersof myeloid differentiation at 30 hpf might represent an ag-gregate effect of pdcd2 knockdown on both primitive anddefinitive hematopoiesis, with a likely contribution fromshort-term progenitors (EMPs) [5]. There was a significantreduction in hematopoietic cell maturation (Fig. 5C) withreduced expression of both myeloid-specific myeloperoxidase(mpo) (184 – 12 mpo + cells/control vs. 102 – 8 mpo + cells/pdcd2 morphant), and macrophage/myeloid-specific markerl-plastin (75 – 8 l-plastin + cells/control vs. 38 – 11 l-plastin +
cells/pdcd2 morphant) indicating a failure of early embry-onic myelopoiesis. We have demonstrated that pdcd2 mor-phants display a strong reduction in hbae1 expression (Fig.2C, D). Furthermore, the expression of erythroid and mye-loid cells from both the primitive and definitive hematopoi-etic waves (hbae1, mpo, plastin) as well as definitive cell types,such as common lymphoid cell progenitors (rag1) and T-cells(lck), were markedly reduced in pdcd2 morphants (Fig. 5D).
Additionally, cells expressing the erythroid marker gata1failed to appear at the yolk and collected at the PBI/CHT(Supplementary Fig. S7A), while cells expressing the earlymyeloid progenitor marker pu.1 were reduced at 30 hpf, andpu.1 + cells failed to appear in the PBI/CHT in pdcd2 morphants(Supplementary Fig. S7B). These data were supported by di-minished Sudan Black staining of more mature neutrophils inthe PBI/CHT of pdcd2 morphants at 48 hpf (SupplementaryFig. S7B) (73 – 4 Sudan black+ cells/control embryo vs. 37 – 5Sudan black + cells/pdcd2 morphant). Pu.1 expression waspartially rescued with the forced expression of the zebrafishpdcd2 mRNA, suggesting that pdcd2 morphant phenotypeswere due to loss of pdcd2 function (Supplementary Fig. S7B).Collectively, these data support a model, where pdcd2 effectson bipotent EMPs [5] are essential for maintenance, but not theinitiation of these progenitors, while loss of pdcd2 function(s)interferes with the initiation and/or maintenance of HSCs.
Loss of pdcd2 results in mitotic defectsand ensuing P53-independent apoptosis
Given our observations with markers for hematopoieticdevelopment, we reasoned that the defect in hematopoieticcell maturation in pdcd2 morphants might be attributed to
aberrant progenitor maintenance and/or proliferation, apo-ptotic loss of differentiated cell types, or a combination ofboth of these processes. To help clarify the effects of pdcd2loss, we first assessed the mitotic index of cells derived frommorphant embryos using a mitosis-specific p-H3 antibody.We found a significant increase in the mitotic index in cells ofthe trunk and tail of the embryo proper at 24 hpf (Fig. 6A andSupplementary Fig. S8A–F). This difference could be attrib-uted to an increase in S-phase entry/progression, or delayedmitotic exit. BrdU labeling demonstrated similar levels of S-phase occupancy between morpholino and control embryosat 30 hpf, and examination of DNA content of cells fromcontrols and pdcd2 morphants by flow cytometry revealed nodifference in S-phase progression (Supplementary Fig. S8I).Cells from control embryos showed typical distribution ofnormal cycling cells at 24 hpf (G1 = 64%, S = 31%, and G2/M5%). In contrast, pdcd2 morphant cells had a significant in-crease in the sub-G1 population and a significant decrease inG1 subsets of cells consistent with cell death likely due toapoptosis (Fig. 6B). This effect extends out to 72 hpf, the latesttime point tested. Consistent with this observation, we foundthat the number of TUNEL + cells in pdcd2 morphants weresignificantly higher than controls at both 18 and 24 hpf(n = 120; effect seen in 95% – 3% of 5ssMO-injected embryos,P < 0.001) (Fig. 6C–G). The apoptotic effect observed appearsto occur via a caspase-dependent cascade as quantification ofactivated caspase-3-positive cells in 30 hpf embryo trunksshowed a 10-fold increase in the number present in mor-phant embryos relative to controls (Fig. 6F). While the apo-ptotic effect was clearly not restricted to regions of theembryo undergoing active hematopoiesis (e.g., PBI), we no-ted from examination of cytological preparations fromTUNEL-labeled embryos that regions known to be active sitesof hematopoiesis, such as the PBI, contained a larger numberof apoptotic cells (Fig. 6C–E). Moreover, our cytospin prep-arations of gata1:DsRed erythroid cells identified cells thatappeared apoptotic (Fig. 4J). Therefore, we attempted to de-termine whether the effect(s) of pdcd2 knockdown uponerythropoiesis might occur through an apoptotic mechanism.To this end, we sorted cells from gata1:DsRed embryos in-jected with pdcd2 and control morpholinos at 24 and 72 hpf,and determined the DNA content profile of DsRed + eryth-rocytes. As suggested from the previous cytology, pdcd2 losswas associated with increased levels of apoptosis in the ery-throid lineage with a large increase of sub-G1 cells in pdcd2knockdown embryos relative to controls (Fig. 6G).
Given the absence of evidence for increased proliferation,we deduced that the increase in mitotic index observed inpdcd2 morphants might be a function of failed mitoses or adelay in mitotic exit. Therefore, we stained pdcd2 morphantsembryos with antibodies to p-H3 and b-tubulin to determine ifthe spindle structure was affected. Interestingly, pdcd2 mor-phants often displayed defective spindle formation mostlikely derived from an inability to properly position chromo-somes at the metaphase plate (19% pdcd2 morphant vs. 3%control; P < 0.005; Fig. 6H). The presence of monotelic chro-mosome attachment is predictive of mitotic delay by virtue ofthe spindle assembly checkpoint [41], and the degree to whichsuch defective figures are present in pdcd2 morphant embryosprovides a likely explanation for the increase in mitotic index.
Since p53 is involved in the regulation of apoptosis inhematopoietic progenitors, and extensive cell death could
66 KRAMER ET AL.

FIG. 6. Mitotic defects in pdcd2 morphants are due to defective spindle assembly. (A) Quantification of IHC mitotic cells incontrol and pdcd2 knockdown embryos using p-H3 antibodies (see representative images; Supplementary Fig. S8A–F).Mitotic index calculated as p-H3 + cells over DAPI + cells in control and pdcd2 morphants at 24 hpf. (*P < 0.05). (B) Summary ofpropidium iodide DNA content profiles for both control and pdcd2 knockdown (5ssMO) as determined by flow cytometry orwhole dissociated embryos (for a representative profile, see Supplementary Fig. S8I). Pdcd2 morphants have significantlyfewer cells in G1 and increase in the number of sub-G1 cells presumed to be apoptotic based on further analyses. *Indicates anincrease, **indicates a decrease compared to control. *, **P < 0.01. (C, D) Whole mount TUNEL labeling of 48 hpf embryos.Dashed boxes highlight the region encompassing the CHT that is actively undergoing hematopoiesis at this time point. (E)Scoring of the mean number of TUNEL + cells in 48 hpf embryos (*P < 0.001). (F) Scoring of the mean number of activatedcaspase + cells in 48 hpf embryos (*P < 0.001). (G) Cell cycle stage analysis (24 and 72 hpf) based on DNA content profiles forsorted gata1:DsRed positive cells labeled with DAPI. Control and Pdcd2 knockdown gata1:DsRed embryos were dissociatedand labeled with DAPI and subjected to fluorescent activated cell sorting analysis to determine cell cycle stage. At both 24and 72 hpf, there was an increase in apoptotic erythroid cells (gata1 + ). (H) Immunofluorescence images of asynchronous cellsfrom control, and 5ssMO-injected 26 hpf embryos stained with b-tubulin (red), p-H3 (green), and DAPI (blue). Lower panels aremagnifications of the outlined area. Note the 2 examples of chromosomes with apparent monotelic attachment in cells frompdcd2 morphants. Scale bars are 100 mm in (C, D) and 10 mm in (H). p-H3, phospho-histone H3. Color images available onlineat www.liebertpub.com/scd
PDCD2 IN HEMATOPOIESIS 67

occur due to p53 activation as an off-target effect of mor-pholino injection [42], we investigated a possible role for p53in the hematopoietic defects seen in pdcd2 morphants. Wecoinjected the pdcd2 and p53 MOs, and we still observed asignificant reduction in the numbers of runx1 + cells in theICM at 30 hpf (Supplementary Fig. S9D) that could be re-stored by coinjection of the pdcd2 RNA (data not shown, andSupplementary Fig. S9E). These data suggest that pdcd2 ef-fects are specific, and that p53 loss cannot fully restore theimpairment of HSC formation. This was further confirmedby knockdown of pdcd2 in p53 homozygous mutantembryos. Injection of pdcd2 ATGMO or 5ssMO in p53 - / -
embryos led to impaired release of erythrocytes into thecirculation, and a significant reduction in runx1 expressingcells in the ICM at 30 hpf similar to that observed in p53wt/wt
embryos (Data not shown) further substantiating the evi-dence that pdcd2 effects on runx1 expressing HSCs and ery-throid maturation are specific and largely p53-independent.
Restoration of runx1 expression and inhibitionof apoptosis reverse the effects of pdcd2 losson erythropoiesis
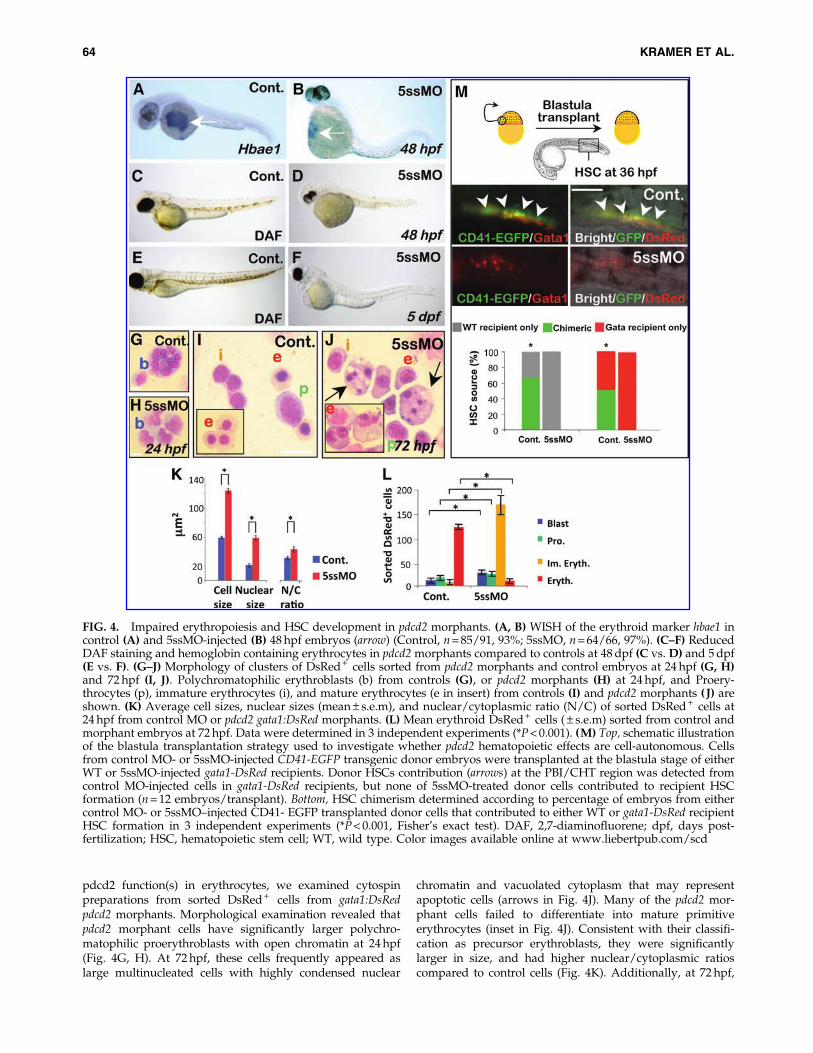
Jak2/Stat signaling transduces signals of hematopoieticcytokines to enhance erythroid cell proliferation. Treatmentof zebrafish embryos with the jak inhibitor AG490 reducedphosphorylated stat5 [43]. Reduction in phosphorylatedStat5 might result in upregulation of gene expression ofStat5-target genes that include runx1. Moreover, STAT5 co-immunoprecipitates with RUNX1, and inhibits RUNX1 nu-clear localization and transcriptional activity [44]. Thus, weinvestigated if pharmacological inhibition of stat5 activitymight restore runx1 function(s) in pdcd2 morphants. We firstdetermined whether AG490 treatment resulted in increasedrunx1 transcript levels in 30 hpf embryos. Examination ofrunx1 transcripts by WISH supports this observation withthe increase being most visible in the anterior aspect of theAGM (inset AG490, Fig. 7A). We then asked whether treat-ment with AG490 would de-repress the attenuated expres-sion of runx1 observed in pdcd2 knockdown embryos. First,we examined the expression of runx1 by WISH and observedthat runx1 transcripts are present throughout the AGM inpdcd2 morphant embryos treated with AG490 (Fig. 7A). Wedissected trunks and tails of embryos to minimize the con-tribution of neurally expressed runx1 and examined runx1transcript levels. Q-PCR analyses revealed a significant in-crease in runx1 expression in dissected trunks of AG490-treated morphant embryos (Fig. 7B). These data suggest thatpdcd2 effects possibly involve runx1-mediated maintenanceof HSCs.
We then attempted to determine whether the effects ofpdcd2 knockdown on erythroid differentiation were modu-lated by de-repression of runx1. We utilized DAF reactivity asa measure for the presence of mature hemoglobinated eryth-rocytes. Treatment of control embryos with 50mM AG490resulted in no apparent effect on the number of DAF +
erythrocytes at either 48 or 96 hpf. However, similar treatmentof pdcd2 morphant embryos revealed a dramatic increase inthe number of mature erythrocytes relative to vehicle-treatedembryos. These results suggest that the de-repression of runx1afforded by the inhibition of Jak/Stat activity relieves pdcd2’seffects on erythroid differentiation block.
The ability of jak/stat inhibition to rescue the effects ofpdcd2 knockdown may be attributed to downregulation of scland/or other progenitor genes, modulation of apoptosis, inaddition to increased runx1 expression after AG490 treat-ment (Fig. 7A, B). An increase in scl expression has beenpreviously reported for embryos with reduced runx1 func-tion [12], we found similar effects on scl expression in pdcd2morphants that could be reversed by injection of the pdcd2mRNA (Fig. S6H). Previous analysis of runx1 morphantsindicated defects both in definitive HSC formation, and anaccumulation of immature hematopoietic progenitors coin-cident with a block to erythroid differentiation [12]. Wereasoned that Jak/Stat inhibition might also have distincteffects on modulating apoptosis. Therefore, we examinedapoptosis through TUNEL labeling in both control and pdcd2morphant embryos in the presence of the Jak inhibitor. Weassessed apoptosis in 30 hpf embryos within a region en-compassing the AGM, including the posterior blood island.The analysis of these embryos indicated a significant de-crease in the number of apoptotic cells in pdcd2 morphantembryos when treated with Jak inhibitor versus vehiclecontrols, suggesting that inhibition of apoptosis is, at least inpart, responsible for the rescue observed in AG490-treatedembryos (Fig. 7D). Notably, in the absence of pdcd2 knock-down, AG490 treatment caused a slight, but not a significantincrease in TUNEL-positive cells in the AGM/PBI region ofcontrol embryos. Thus, we conclude that loss of pdcd2function(s) during zebrafish hematopoietic development re-sults in erythroid differentiation arrest, likely at the proery-throblast stages, and failure of HSC emergence. These effectscould be attributed to modulated runx1 expression and/orfunction (s), mitotic defects, and p53-independent caspase-dependent apoptosis.
Discussion
Hematopoietic progenitors have to rapidly integrate ex-trinsic and intrinsic cues that activate or repress transcriptionfactors controlling cell fate. Pdcd2 knockdown led to inef-fective hematopoiesis, pooling of hematopoietic progenitorcells that failed to release into circulation over the yolk, im-paired hematopoietic cell differentiation, mitotic defects, andapoptosis. The resulting pancytopenia was associated withupregulation of scl during primitive hematopoiesis, anddownregulation of the HSC markers, runx1 and cmyb. Theseresults are consistent with requirement of pdcd2 function(s)for maintenance, but not for initiation of primitive hemato-poietic progenitors. Moreover, loss of pdcd2 function(s) in-terferes with initiation and/or maintenance of HSCs. Thereare several possible mechanisms for the pdcd2 morphantphenotype. One is that reduced pdcd2 levels in the ICM af-fected hematopoietic differentiation through regulating theexpression of runx1, scl, their downstream targets, solublefactor(s), or other essential hematopoietic gene(s) that werenot examined in this study. Scl is essential for EMP lineagecommitment, but not for HSC maintenance in the adult hu-man BM [45]. In mouse studies, Scl and Runx1 were shownto be necessary for the initiation, but dispensable for themaintenance of HSCs [46]. The lack of hematopoietic clustersin the AGM of Runx1 - / - mice suggests that Runx1 regulateshematopoietic endothelial cell transition in the dorsal aorta.Indeed, knockdown of runx1 by morpholino in zebrafish
68 KRAMER ET AL.
FIG. 7. Upregulation of runx1 and modulation of apoptosis through inhibition of Jak reverses the effects of pdcd2 knock-down on erythropoiesis. (A) WISH of runx1 expressing cells in the arterial and AGM regions of treated embryos at 30 hpf.Treatment with AG490 resulted in increased runx1 expression in the arterial and AGM regions (upward arrowheads in theAG490 panel), and possibly expansion of the anterior myelopoietic compartment (downward arrowheads). Note the dramaticrescue of runx1 expression in the ICM with the combination of AG490 and 5ssMO compared to the combination of vehicleand 5ssMO on top. (Vehicle n = 35 (71%); AG490 n = 28 (86%); 5ssMO n = 34 (91%); and 5ssMO + AG490 n = 36 (14%) showedthe displayed phenotypes). (B) Q-PCR analyses of runx-1 expression relative to b-actin in the AGM region of pdcd2 morphantsafter AG490 treatment (mean – s.e.m, *P < 0.05). Scale bar, 500 mm. (C) DAF staining of hemoglobinated cells in WT, or 5ssMO-injected embryos at 48, or 96 hpf treated with either vehicle, 50 mM AG490, pdcd2 5ssMO, or combinations of 5ssMO andAG490. Numbers and percentages of embryos representing the demonstrated DAF + staining are for WT with vehicle ateither 48 or 96 hpf, n = 23 (100%), WT with AG490 at 48 hpf, n = 18 (100%), and at 96 hpf, n = 31 (100%). For 5ssMO treated withvehicle at 48 hpf, n = 20 (40%), and at 96 hpf, n = 24 (21%), and 5ssMO treated with AG490 at 48 hpf, n = 22 (68%), and at 96 hpf,n = 14 (86%). The effects of combined 5ssMO + AG490 treatments were significant when compared to individual treatment(P < 0.01). (D) Left, representative images from the 4 groups of TUNEL-stained 30-hpf embryos. Insets demonstrate the AGM/PBI region where hematopoietic cells were counted. Right, quantification of the antiapoptotic effects of Jak inhibition in pdcd2morphant embryos. Sixteen embryos were analyzed for each treatment from the AGM/PBI region highlighted in (A) in 3experiments with 3 investigators blinded to treatment performing the counts for TUNEL-positive cells. Data for each embryoare derived from a series of Z sections spanning the depth of the embryo, and then numbers of apoptotic cells were averagedfrom counts of 3 investigators. (*P < 0.01; **P < 10 - 4; bars s.e.m.). Scale bar, 500mm. Color images available online atwww.liebertpub.com/scd
PDCD2 IN HEMATOPOIESIS 69
decreases the hematopoietic endothelial transition and in-duces apoptosis in these cells [8]. Therefore, failure of pro-genitor cell circulatory release in pdcd2 morphants may occurdue to prolongation of an uncommitted progenitor statefrom persistent scl expression, or due to loss of runx1 ex-pression in the ICM. These 2 possibilities are interdependentas runx1 knockdown embryos exhibited persistent scl ex-pression in zebrafish [12]. Mouse yolk sac erythrocyte pro-genitors were shown to clump at the yolk, while other cellscirculate freely [38], suggesting a change of adhesive prop-erties of primitive blood cells as they are released to thecirculation. Similarly, zebrafish blood cells were recentlyshown to detach from the endothelial wall by cell-autonomousproteolytic degradation of extracellular adhesion molecules[36]. These coordinated events would likely require thatblood cells be released into circulation only when they reacha specific differentiation state, or that an inhibitory mecha-nism to hematopoietic cell intravasation is reversed. Whetherpdcd2 function(s) is involved in this regulatory process re-mains to be investigated.
Transplantation studies suggest that pdcd2 acts predom-inantly in a cell autonomous fashion to initiate and main-tain a definitive HSC pool in the CHT/PBI. Moreover,pdcd2 deficiency leads to abnormal HSC differentiation andapoptosis that occurs mostly independent of direct p53 ac-tivity. Studies in rat embryonic fibroblasts determined thatinduction of the pdcd2 homologue Rp8 is independent ofp53-mediated apoptosis [47]. Flies with mutations in thepdcd2 homologue, zfrp8, displayed lymph gland hyperplasiawith defects in hemocyte differentiation. Hyperplasia ofhemocytes that are confined within the drosophila lymphgland appears similar to the accumulation of cells over theyolk of zebrafish pdcd2 morphants. However, distinct sig-naling pathways and stages of differentiation during themultiple waves of hematopoiesis in vertebrates might ex-plain the differences between mutant fly and zebrafishphenotypes. Circulating cells during fly larval hematopoi-esis are mostly plasmatocytes that are destined to becomemacrophage-like cells, and there are no cellular equivalentsto red blood cells or lymphocytes [48]. The posterior sig-naling center (PSC) in fly lymph gland maintains bloodprecursors under control of signals, such as the runx1-homologue Lozenge [49]. Regulation of HSCs in zfrp8 mu-tants is dependent on these PSC signals [22]. Since zebrafishpdcd2 morphants showed increased expression of scl anddecreased expression of runx1, it appears that a conservedcross talk between pdcd2 and scl and/or runx1 might reg-ulate HSC maturation.
Jak/stat signaling is activated during intermediate stages oflineage commitment of developing zebrafish erythroid pro-genitors [50]. Erythropoietin (epo)-mediated activation ofstat/5, PI3K signaling, and bcl-xl response leads to modula-tion of apoptosis [51] through regulation of STAT-targetgenes encoding apoptosis inhibitors (e.g., Bcl-xL, Mcl-1, andsurvivin) and cell cycle regulators (e.g., cyclins D1/D2 and c-Myc) [52]. Loss of zebrafish stat5 blocked the expansion oferythrocytes by exogenous epo, demonstrating a conservedrole for stat5 in zebrafish erythropoiesis [53]. Treatment withAG490, a soluble jak2 inhibitor, reduced phosphorylatedstat5 [43], which is essential for bcl-xl induction and survival[54], and restored runx1 expression in rescued pdcd2 mor-phants. While inhibition of STAT3/5 signaling almost al-
ways results in growth inhibition and induction of apoptosisin tumor cells, disruption of Stat3 signaling in normal fi-broblasts causes growth arrest, but not apoptosis [55,56],suggesting that normal cells, unlike tumor cells, might notdepend on stat signaling to sustain their survival. Thus,restoration of runx1 expression, and inhibition of stat/5/bcl-xl-mediated apoptotic pathways during primitive erythro-poiesis are 2 potential mechanisms by which the effects ofpdcd2 were reversed with AG490 treatment. It will be criticalto identify pdcd2 interacting partners and determine themechanisms of cross talk between pdcd2, runx1, and Jak/Statsignaling.
Hematopoiesis migrates successively from the yolk sacand fetal liver or placenta in mammals, or from CHT/PBI inzebrafish, to the bone or kidney marrow. The properties ofyolk or CHT/PBI and marrow HSCs reflect diverse envi-ronments and intrinsic HSC features at each stage. For in-stance, fetal liver HSCs have active cell cycle, whereas adultmarrow HSCs are largely quiescent. Pdcd2 knockdown inembryos induced mitotic defects with a higher mitotic index.The spindle assembly checkpoint guards against chromo-some mis-segregation by delaying cell cycle progressionthrough mitosis, and defects in the mitotic checkpoint gen-erate aneuploidy and might facilitate tumorigenesis [57].Cells from pdcd2 morphants appeared to progress throughthe cell cycle, although with an aberrant mitosis and withfrequent monotelic chromosome orientation. Progressionfrom metaphase to anaphase with monotelic orientationproduces chronically activated checkpoints that provoke celldeath and subsequent apoptosis through an undefinedpathway [57]. Whether similar mitotic defects played a rolein the inviability of pdcd2 ESCs in mice [25] will be importantto investigate.
Deregulated pdcd2 expression has been implicated in hu-man leukemias and lymphomas [27]. Our studies suggestthat pdcd2 maintains progenitor cells through interactionswith runx1 and other cell fate-determining factors. Clearly,further studies will be necessary to more precisely determinethe functions of pdcd2 during hematopoietic cell differentia-tion and survival. Loss of pdcd2 function(s) in zebrafishperturbs HSC differentiation due to mitotic defects duringcell cycle progression and p53-independent apoptosis. Theseobservations, the findings that PDCD2 is strongly expressedin adult hematopoietic tissues, and our recent study dem-onstrating the requirement of human PDCD2 in erythroidprogenitor cell differentiation [58] suggest that PDCD2 con-trols transcriptional networks regulating hematopoietic andother progenitor cell development, and therefore wouldlikely participate widely in the oncogenic process. Thechallenge for future studies will be to elucidate the basicmechanisms of pdcd2 function, including the identification ofdirect targets and partners that allow pdcd2 to regulate HSCfate, to determine how pdcd2 repression or activation is dif-ferentially achieved in different cells, and to understand howpdcd2 might participate in tumor development.
Acknowledgments
We thank Leonard Zon for the Casper zebrafish, RobertHandin for the CD41-EGFP transgenic zebrafish, RamanSood for multiple ISH probes, Jesus Torres-Vazquez for theephrin probe, Neil Campbell for technical assistance, and
70 KRAMER ET AL.
Ruth Steward and Jennifer Rhodes for critical reading of thearticle.
This work was supported by funds from the Cancer In-stitute of New Jersey (H.E.S), and support of the RobertWood Johnson Foundation for the Child Health Institute ofNew Jersey (A.B.R).
Author Disclosure Statement
The authors declare no competing financial interests.
References
1. Medvinsky A, S Rybtsov and S Taoudi. (2011). Embryonicorigin of the adult hematopoietic system: advances andquestions. Development 138:1017–1031.
2. Orkin SH and LI Zon. (2008). Hematopoiesis: an evolvingparadigm for stem cell biology. Cell 132:631–644.
3. Gering M, AR Rodaway, B Gottgens, RK Patient and ARGreen. (1998). The SCL gene specifies haemangioblast de-velopment from early mesoderm. EMBO J 17:4029–4045.
4. Dooley KA, AJ Davidson and LI Zon. (2005). Zebrafish sclfunctions independently in hematopoietic and endothelialdevelopment. Dev Biol 277:522–536.
5. Bertrand JY, AD Kim, EP Violette, DL Stachura, JL Cissonand D Traver. (2007). Definitive hematopoiesis initiatesthrough a committed erythromyeloid progenitor in thezebrafish embryo. Development 134:4147–4156.
6. Vogeli KM, SW Jin, GR Martin and DY Stainier. (2006). Acommon progenitor for haematopoietic and endothelial lin-eages in the zebrafish gastrula. Nature 443:337–339.
7. Bertrand JY, NC Chi, B Santoso, S Teng, DY Stainier and DTraver. (2010). Haematopoietic stem cells derive directlyfrom aortic endothelium during development. Nature 464:108–111.
8. Kissa K and P Herbomel. (2010). Blood stem cells emergefrom aortic endothelium by a novel type of cell transition.Nature 464:112–115.
9. Boisset JC, W van Cappellen, C Andrieu-Soler, N Galjart, EDzierzak and C Robin. (2010). In vivo imaging of haema-topoietic cells emerging from the mouse aortic endothelium.Nature 464:116–120.
10. Lancrin C, P Sroczynska, C Stephenson, T Allen, V Kouskoffand G Lacaud. (2009). The haemangioblast generates hae-matopoietic cells through a haemogenic endothelium stage.Nature 457:892–895.
11. Burns CE, T DeBlasio, Y Zhou, J Zhang, L Zon and SD Ni-mer. (2002). Isolation and characterization of runxa andrunxb, zebrafish members of the runt family of transcrip-tional regulators. Exp Hematol 30:1381–1389.
12. Kalev-Zylinska ML, JA Horsfield, MV Flores, JH Post-lethwait, MR Vitas, AM Baas, PS Crosier and KE Crosier.(2002). Runx1 is required for zebrafish blood and vesseldevelopment and expression of a human RUNX1-CBF2T1transgene advances a model for studies of leukemogenesis.Development 129:2015–2030.
13. Murayama E, K Kissa, A Zapata, E Mordelet, V Briolat, HFLin, RI Handin and P Herbomel. (2006). Tracing hemato-poietic precursor migration to successive hematopoietic or-gans during zebrafish development. Immunity 25:963–975.
14. Jin H, J Xu and Z Wen. (2007). Migratory path of definitivehematopoietic stem/progenitor cells during zebrafish de-velopment. Blood 109:5208–5214.
15. Lam EY, CJ Hall, PS Crosier, KE Crosier and MV Flores.(2010). Live imaging of Runx1 expression in the dorsal aorta
tracks the emergence of blood progenitors from endothelialcells. Blood 116:909–914.
16. North TE, W Goessling, M Peeters, P Li, C Ceol, AM Lord,GJ Weber, J Harris, CC Cutting, et al. (2009). Hematopoieticstem cell development is dependent on blood flow. Cell137:736–748.
17. Rhodes J, A Hagen, K Hsu, M Deng, TX Liu, AT Look and JPKanki. (2005). Interplay of pu.1 and gata1 determines myelo-erythroid progenitor cell fate in zebrafish. Dev Cell 8:97–108.
18. Galloway JL, RA Wingert, C Thisse, B Thisse and LI Zon.(2005). Loss of gata1 but not gata2 converts erythropoiesis tomyelopoiesis in zebrafish embryos. Dev Cell 8:109–116.
19. Berman JN, JP Kanki and AT Look. (2005). Zebrafish as amodel for myelopoiesis during embryogenesis. Exp Hematol33:997–1006.
20. Owens GP, WE Hahn and JJ Cohen. (1991). Identification ofmRNAs associated with programmed cell death in imma-ture thymocytes. Mol Cell Biol 11:4177–4188.
21. Minakhina S, M Druzhinina and R Steward. (2007). Zfrp8,the Drosophila ortholog of PDCD2, functions in lymphgland development and controls cell proliferation. Devel-opment 134:2387–2396.
22. Minakhina S and R Steward. (2010). Hematopoietic stemcells in Drosophila. Development 137:27–31.
23. Ramalho-Santos M, S Yoon, Y Matsuzaki, RC Mulligan andDA Melton. (2002). ‘‘Stemness’’: transcriptional profiling ofembryonic and adult stem cells. Science 298:597–600.
24. Su AI, T Wiltshire, S Batalov, H Lapp, KA Ching, D Block, JZhang, R Soden, M Hayakawa, et al. (2004). A gene atlas ofthe mouse and human protein-encoding transcriptomes.Proc Natl Acad Sci U S A 101:6062–6067.
25. Mu W, RJ Munroe, AK Barker and JC Schimenti. (2010).PDCD2 is essential for inner cell mass development andembryonic stem cell maintenance. Dev Biol 347:279–288.
26. Skottman H, M Mikkola, K Lundin, C Olsson, AM Strom-berg, T Tuuri, T Otonkoski, O Hovatta and R Lahesmaa.(2005). Gene expression signatures of seven individual hu-man embryonic stem cell lines. Stem Cells 23:1343–1356.
27. Merup M, TC Moreno, M Heyman, K Ronnberg, D Grander,R Detlofsson, O Rasool, Y Liu, S Soderhall, et al. (1998). 6qdeletions in acute lymphoblastic leukemia and non-Hodg-kin’s lymphomas. Blood 91:3397–3400.
28. Steinemann D, S Gesk, Y Zhang, L Harder, C Pilarsky, BHinzmann, JI Martin-Subero, MJ Calasanz, A Mungall, et al.(2003). Identification of candidate tumor-suppressor genesin 6q27 by combined deletion mapping and electronic ex-pression profiling in lymphoid neoplasms. Genes Chromo-somes Cancer 37:421–426.
29. Scarr RB and PA Sharp. (2002). PDCD2 is a negative regu-lator of HCF-1 (C1). Oncogene 21:5245–5254.
30. Lin HF, D Traver, H Zhu, K Dooley, BH Paw, LI Zon and RIHandin. (2005). Analysis of thrombocyte development inCD41-GFP transgenic zebrafish. Blood 106:3803–3810.
31. Thisse C and B Thisse. (2008). High-resolution in situ hy-bridization to whole-mount zebrafish embryos. Nat Protoc3:59–69.
32. Sabaawy HE, M Azuma, LJ Embree, HJ Tsai, MF Starost andDD Hickstein. (2006). TEL-AML1 transgenic zebrafish modelof precursor B cell acute lymphoblastic leukemia. Proc NatlAcad Sci U S A 103:15166–15171.
33. Le Guyader D, MJ Redd, E Colucci-Guyon, E Murayama, KKissa, V Briolat, E Mordelet, A Zapata, H Shinomiya and PHerbomel. (2008). Origins and unconventional behavior ofneutrophils in developing zebrafish. Blood 111:132–141.
PDCD2 IN HEMATOPOIESIS 71

34. Shepard JL, HM Stern, KL Pfaff and JF Amatruda. (2004).Analysis of the cell cycle in zebrafish embryos. Methods CellBiol 76:109–125.
35. Traver D, BH Paw, KD Poss, WT Penberthy, S Lin and LIZon. (2003). Transplantation and in vivo imaging of multi-lineage engraftment in zebrafish bloodless mutants. NatImmunol 4:1238–1246.
36. Iida A, K Sakaguchi, K Sato, H Sakurai, D Nishimura, AIwaki, M Takeuchi, M Kobayashi, K Misaki, et al. (2010).Metalloprotease-dependent onset of blood circulation inzebrafish. Curr Biol 20:1110–1116.
37. Baker K, KS Warren, G Yellen and MC Fishman. (1997). De-fective ‘‘pacemaker’’ current (Ih) in a zebrafish mutant with aslow heart rate. Proc Natl Acad Sci U S A 94:4554–4559.
38. Lucitti JL, EA Jones, C Huang, J Chen, SE Fraser and MEDickinson. (2007). Vascular remodeling of the mouse yolk sacrequires hemodynamic force. Development 134:3317–3326.
39. Weinstein BM, DL Stemple, W Driever and MC Fishman.(1995). Gridlock, a localized heritable vascular patterningdefect in the zebrafish. Nat Med 1:1143–1147.
40. Herbomel P, B Thisse and C Thisse. (1999). Ontogeny andbehaviour of early macrophages in the zebrafish embryo.Development 126:3735–3745.
41. Musacchio A and ED Salmon. (2007). The spindle-assemblycheckpoint in space and time. Nat Rev Mol Cell Biol 8:379–393.
42. Robu ME, JD Larson, A Nasevicius, S Beiraghi, C Brenner,SA Farber and SC Ekker. (2007). p53 activation by knock-down technologies. PLoS Genet 3:e78.
43. Ma AC, AC Ward, R Liang and AY Leung. (2007). The roleof jak2a in zebrafish hematopoiesis. Blood 110:1824–1830.
44. Ogawa S, M Satake and K Ikuta. (2008). Physical and func-tional interactions between STAT5 and Runx transcriptionfactors. J Biochem 143:695–709.
45. Reynaud D, E Ravet, M Titeux, F Mazurier, L Renia, A Du-bart-Kupperschmitt, PH Romeo and F Pflumio. (2005). SCL/TAL1 expression level regulates human hematopoietic stemcell self-renewal and engraftment. Blood 106:2318–2328.
46. Ichikawa M, T Asai, T Saito, S Seo, I Yamazaki, T Yamagata,K Mitani, S Chiba, S Ogawa, M Kurokawa and H Hirai.(2004). AML-1 is required for megakaryocytic maturationand lymphocytic differentiation, but not for maintenance ofhematopoietic stem cells in adult hematopoiesis. Nat Med10:299–304.
47. Guenal I and B Mignotte. (1995). Studies of specific geneinduction during apoptosis of cell lines conditionally im-mortalized by SV40. FEBS Lett 374:384–386.
48. Williams MJ. (2007). Drosophila hemopoiesis and cellularimmunity. J Immunol 178:4711–4716.
49. Daga A, CA Karlovich, K Dumstrei and U Banerjee. (1996).Patterning of cells in the Drosophila eye by Lozenge, whichshares homologous domains with AML1. Genes Dev10:1194–1205.
50. Oates AC, A Brownlie, SJ Pratt, DV Irvine, EC Liao, BH Paw,KJ Dorian, SL Johnson, JH Postlethwait, LI Zon and AFWilks. (1999). Gene duplication of zebrafish JAK2 homologsis accompanied by divergent embryonic expression patterns:only jak2a is expressed during erythropoiesis. Blood 94:2622–2636.
51. Bao H, SM Jacobs-Helber, AE Lawson, K Penta, A Wickremaand ST Sawyer. (1999). Protein kinase B (c-Akt), phosphati-dylinositol 3-kinase, and STAT5 are activated by erythro-poietin (EPO) in HCD57 erythroid cells but are constitutivelyactive in an EPO-independent, apoptosis-resistant subclone(HCD57-SREI cells). Blood 93:3757–3773.
52. Buettner R, LB Mora and R Jove. (2002). Activated STATsignaling in human tumors provides novel molecular targetsfor therapeutic intervention. Clin Cancer Res 8:945–954.
53. Paffett-Lugassy N, N Hsia, PG Fraenkel, B Paw, I Leshinsky,B Barut, N Bahary, J Caro, R Handin and LI Zon. (2007).Functional conservation of erythropoietin signaling in zeb-rafish. Blood 110:2718–2726.
54. Socolovsky M, AE Fallon, S Wang, C Brugnara and HFLodish. (1999). Fetal anemia and apoptosis of red cell pro-genitors in Stat5a - / - 5b - / - mice: a direct role for Stat5 inBcl-X(L) induction. Cell 98:181–191.
55. Bowman T, MA Broome, D Sinibaldi, W Wharton, WJPledger, JM Sedivy, R Irby, T Yeatman, SA Courtneidge andR Jove. (2001). Stat3-mediated Myc expression is required forSrc transformation and PDGF-induced mitogenesis. ProcNatl Acad Sci U S A 98:7319–7324.
56. Niu G, R Heller, R Catlett-Falcone, D Coppola, M Jaroszeski,W Dalton, R Jove and H Yu. (1999). Gene therapy withdominant-negative Stat3 suppresses growth of the murinemelanoma B16 tumor in vivo. Cancer Res 59:5059–5063.
57. Fukasawa K. (2007). Oncogenes and tumour suppressorstake on centrosomes. Nat Rev Cancer 7:911–924.
58. Kokorina N, CJ Granier, SO Zakharkin, S Davis, AB Rabsonand HE Sabaawy. (2012). PDCD2 knockdown inhibits ery-throid but not megakaryocytic lineage differentiation ofhuman hematopoietic stem/progenitor cells. Exp Hematol(in press).
Address correspondence to:Dr. Hatem E. Sabaawy
Cancer Institute of New Jersey195 Little Albany Street
New Brunswick, NJ 08901
E-mail: [email protected]
Received for publication February 12, 2012Accepted after revision July 14, 2012
Prepublished on Liebert Instant Online July 16, 2012
72 KRAMER ET AL.

This article has been cited by:
1. B. Gornikiewicz, A. Ronowicz, J. Podolak, P. Madanecki, A. Stanislawska-Sachadyn, P. Sachadyn. 2013. Epigenetic Basis ofRegeneration: Analysis of Genomic DNA Methylation Profiles in the MRL/MpJ Mouse. DNA Research 20:6, 605-621. [CrossRef]
2. Nitu Bansal, Stephani Davis, Irina Tereshchenko, Tulin Budak-Alpdogan, Hua Zhong, Mark N. Stein, Isaac Yi Kim, Robert S.DiPaola, Joseph R. Bertino, Hatem E. Sabaawy. 2013. Enrichment of human prostate cancer cells with tumor initiating propertiesin mouse and zebrafish xenografts by differential adhesion. The Prostate n/a-n/a. [CrossRef]
3. Nora Barboza, Svetlana Minakhina, Daniel J. Medina, Binaifer Balsara, Sonya Greenwood, Lien Huzzy, Arnold B. Rabson, RuthSteward, Dale G. Schaar. 2013. PDCD2 functions in cancer cell proliferation and predicts relapsed leukemia. Cancer Biology &Therapy 14:6, 546-555. [CrossRef]
4. Natalia A. Kokorina, Celine J. Granier, Stanislav O. Zakharkin, Stephani Davis, Arnold B. Rabson, Hatem E. Sabaawy. 2012.PDCD2 knockdown inhibits erythroid but not megakaryocytic lineage differentiation of human hematopoietic stem/progenitorcells. Experimental Hematology 40:12, 1028-1042.e3. [CrossRef]