Valproic acid perturbs hematopoietic homeostasis by inhibition of erythroid differentiation and...
12
Valproic acid perturbs hematopoietic homeostasis by inhibition of erythroid differentiation and activation of the myelo-monocytic pathway Se ´ bastien Chateauvieux a,1 , Serge Eifes a,1 , Franck Morceau a , Christina Grigorakaki a , Michael Schnekenburger a , Estelle Henry a , Mario Dicato b , Marc Diederich a, * a Laboratoire de Biologie Mole ´culaire et Cellulaire du Cancer, Hoˆpital Kirchberg, L-2540 Luxembourg, Luxembourg b Luxembourg Medical Center, Luxembourg L-1210, Luxembourg 1. Introduction Valproic acid (2-propylpentanoic acid) (VPA), is a well known histone deacetylase inhibitor (HDACi). Independent of this property, it is being used as an anticonvulsant agent and is clinically effective as a mood stabilizer in the treatment of manic depression (bipolar affective disorder). Due to its HDAC inhibiting activity and its safe use as a drug for several years, VPA is considered to be a good candidate for anticancer therapy. Indeed, VPA inhibits angiogenesis in vitro and in vivo by decreasing the expression of nitric oxide synthase in endothelial cells following HDAC inhibition [1]. In a large series of preclinical studies, VPA induced differentiation and inhibited cell growth in several neoplastic cell lines [2]. Leukemic blasts isolated from patients with newly diagnosed acute myeloid leukemia differentiated in vitro at therapeutic concentrations of VPA and the cytotoxity of Cytarabine (Ara-C) in Philadelphia-positive and promyelocytic leukemia cell lines markedly increased under VPA treatment [3]. Nevertheless, VPA exhibits many controversial or non-beneficial effects for patients. Indeed, it is known to induce apoptosis in a limited number of cell types while being nontoxic or even cytoprotective in other cells [4,5]. Moreover, VPA stimulates activation of mitogen-activated protein kinase (MAPK) and in particular the survival factors extracellular signal-regulated kinase (ERK)-1/2 in different cells [6,7]. Interestingly, an induction of erythropoiesis was observed in epileptic patients following VPA treatment [7] while other studies revealed hematological toxicity of anticonvulsive drugs including VPA, resulting in aplastic anemia [8] and pure red cell aplasia [9,10]. More importantly, VPA was shown as triggering prominent adverse effects such as teratoge- nicity and liver toxicity. The HDAC inhibiting activity of VPA that may have anticancer activity may also be responsible for its teratogenic side effects [11]. Biochemical Pharmacology 81 (2011) 498–509 ARTICLE INFO Article history: Received 13 August 2010 Accepted 12 November 2010 Available online 23 November 2010 Keywords: Differentiation HDAC inhibitor Hematopoiesis Inflammation Stem cell ABSTRACT As a histone deacetylase inhibitor, valproic acid (VPA) is a candidate for anticancer therapy. Besides, VPA exhibits various mechanisms of action and its effects on the molecular basis of hematopoiesis remain unclear. To study the effects of VPA on the hematopoietic system, we performed microarray analysis using K562 cells treated with 1 mM VPA over a 72 h time course. The association between gene ontology (GO) terms and the lists of differentially expressed genes was tested using the Bioconductor package GOstats. Enrichment analysis for cellular differentiation pathways was performed based on manually curated gene lists. Results from microarray analysis were confirmed by studying cell differentiation features at the molecular and cellular levels using other hematopoietic cell lines as well as hematopoietic stem/progenitor CD34 + cells. Microarray analysis revealed 3440 modulated genes in the presence of VPA. Genes involved in the granulo-monocytic differentiation pathway were up-regulated while genes of the erythroid pathway were down-regulated. This was confirmed by analyzing erythrocytic and myeloid membrane markers and lineage-related gene expression in HEL, MEG01, HL60 as well as CD34 + cells. Moreover, GATA-1 and its co-factors (FOG1, SP1) were down-regulated, while myelopoiesis activator PU.1 was up-regulated, in agreement with an inhibition of erythropoiesis. Our functional profiling and cell phenotyping approach demonstrates that VPA is able to alter hematopoietic homeostasis by modifying the cell population balance in the myeloid compartment. This may lead to a potential failure of erythropoiesis in patients with cancer or chronic inflammatory diseases having a well-described propensity to anemia. ß 2010 Elsevier Inc. All rights reserved. * Corresponding author at: Laboratoire de Biologie Mole ´ culaire et Cellulaire du Cancer (LBMCC), Ho ˆpital Kirchberg, 9, rue Edward Steichen, L-2540 Luxembourg, Luxembourg. Tel.: +352 2468 4040; fax: +352 2468 4060. E-mail address: [email protected] (M. Diederich). 1 These authors contributed equally. Contents lists available at ScienceDirect Biochemical Pharmacology journal homepage: www.elsevier.com/locate/biochempharm 0006-2952/$ – see front matter ß 2010 Elsevier Inc. All rights reserved. doi:10.1016/j.bcp.2010.11.011
-
Upload
independent -
Category
Documents
-
view
2 -
download
0
Transcript of Valproic acid perturbs hematopoietic homeostasis by inhibition of erythroid differentiation and...

Biochemical Pharmacology 81 (2011) 498–509
Valproic acid perturbs hematopoietic homeostasis by inhibition of erythroiddifferentiation and activation of the myelo-monocytic pathway
Sebastien Chateauvieux a,1, Serge Eifes a,1, Franck Morceau a, Christina Grigorakaki a,Michael Schnekenburger a, Estelle Henry a, Mario Dicato b, Marc Diederich a,*a Laboratoire de Biologie Moleculaire et Cellulaire du Cancer, Hopital Kirchberg, L-2540 Luxembourg, Luxembourgb Luxembourg Medical Center, Luxembourg L-1210, Luxembourg
A R T I C L E I N F O
Article history:
Received 13 August 2010
Accepted 12 November 2010
Available online 23 November 2010
Keywords:
Differentiation
HDAC inhibitor
Hematopoiesis
Inflammation
Stem cell
A B S T R A C T
As a histone deacetylase inhibitor, valproic acid (VPA) is a candidate for anticancer therapy. Besides, VPA
exhibits various mechanisms of action and its effects on the molecular basis of hematopoiesis remain
unclear. To study the effects of VPA on the hematopoietic system, we performed microarray analysis
using K562 cells treated with 1 mM VPA over a 72 h time course. The association between gene ontology
(GO) terms and the lists of differentially expressed genes was tested using the Bioconductor package
GOstats. Enrichment analysis for cellular differentiation pathways was performed based on manually
curated gene lists. Results from microarray analysis were confirmed by studying cell differentiation
features at the molecular and cellular levels using other hematopoietic cell lines as well as hematopoietic
stem/progenitor CD34+ cells. Microarray analysis revealed 3440 modulated genes in the presence of VPA.
Genes involved in the granulo-monocytic differentiation pathway were up-regulated while genes of the
erythroid pathway were down-regulated. This was confirmed by analyzing erythrocytic and myeloid
membrane markers and lineage-related gene expression in HEL, MEG01, HL60 as well as CD34+ cells.
Moreover, GATA-1 and its co-factors (FOG1, SP1) were down-regulated, while myelopoiesis activator
PU.1 was up-regulated, in agreement with an inhibition of erythropoiesis. Our functional profiling and
cell phenotyping approach demonstrates that VPA is able to alter hematopoietic homeostasis by
modifying the cell population balance in the myeloid compartment. This may lead to a potential failure
of erythropoiesis in patients with cancer or chronic inflammatory diseases having a well-described
propensity to anemia.
� 2010 Elsevier Inc. All rights reserved.
Contents lists available at ScienceDirect
Biochemical Pharmacology
journa l homepage: www.e lsev ier .com/ locate /b iochempharm
1. Introduction
Valproic acid (2-propylpentanoic acid) (VPA), is a well knownhistone deacetylase inhibitor (HDACi). Independent of thisproperty, it is being used as an anticonvulsant agent and isclinically effective as a mood stabilizer in the treatment of manicdepression (bipolar affective disorder). Due to its HDAC inhibitingactivity and its safe use as a drug for several years, VPA isconsidered to be a good candidate for anticancer therapy. Indeed,VPA inhibits angiogenesis in vitro and in vivo by decreasing theexpression of nitric oxide synthase in endothelial cells followingHDAC inhibition [1]. In a large series of preclinical studies, VPAinduced differentiation and inhibited cell growth in several
* Corresponding author at: Laboratoire de Biologie Moleculaire et Cellulaire du
Cancer (LBMCC), Hopital Kirchberg, 9, rue Edward Steichen, L-2540 Luxembourg,
Luxembourg. Tel.: +352 2468 4040; fax: +352 2468 4060.
E-mail address: [email protected] (M. Diederich).1 These authors contributed equally.
0006-2952/$ – see front matter � 2010 Elsevier Inc. All rights reserved.
doi:10.1016/j.bcp.2010.11.011
neoplastic cell lines [2]. Leukemic blasts isolated from patientswith newly diagnosed acute myeloid leukemia differentiated in
vitro at therapeutic concentrations of VPA and the cytotoxity ofCytarabine (Ara-C) in Philadelphia-positive and promyelocyticleukemia cell lines markedly increased under VPA treatment [3].Nevertheless, VPA exhibits many controversial or non-beneficialeffects for patients. Indeed, it is known to induce apoptosis in alimited number of cell types while being nontoxic or evencytoprotective in other cells [4,5]. Moreover, VPA stimulatesactivation of mitogen-activated protein kinase (MAPK) and inparticular the survival factors extracellular signal-regulated kinase(ERK)-1/2 in different cells [6,7]. Interestingly, an induction oferythropoiesis was observed in epileptic patients following VPAtreatment [7] while other studies revealed hematological toxicityof anticonvulsive drugs including VPA, resulting in aplastic anemia[8] and pure red cell aplasia [9,10]. More importantly, VPA wasshown as triggering prominent adverse effects such as teratoge-nicity and liver toxicity. The HDAC inhibiting activity of VPA thatmay have anticancer activity may also be responsible for itsteratogenic side effects [11].

S. Chateauvieux et al. / Biochemical Pharmacology 81 (2011) 498–509 499
Hematopoiesis gives rise to all circulating blood cells with thecrucial role of maintaining hematopoietic homeostasis. Hematopoi-etic cells display lineage-related gene expression regulated byspecific transcription factors (TFs). Deregulation of TFs can triggerthe defect of hematopoietic homeostasis. The TFs GATA-1, NF-E2,EKLF, TAL-1 and SP1, among others, have been widely described askey regulators of erythroid-specific genes expression. High levels ofGATA-1 are required at the onset of erythropoiesis and the inhibitionof interaction between GATA-1 and its co-factor Friend of GATA(FOG1) [12] or the TF SP1 prevents erythropoiesis [13]. Lowexpression level of GATA-1 leads to elevated expression of GATA-2,inhibiting erythroid differentiation in favor of megakaryopoiesis[14]. Similarly, over-expression of PU.1 inhibits erythropoiesis byinteracting with GATA-1 and preventing its binding to target genes[15]. In addition, PU.1 has been reported as promoting granulo-monocytic differentiation [16]. This pathway specifically involvesthe CCAAT/enhancer binding protein alpha (CEBPA) TF, whichregulates PU.1 gene expression [17]. Thus, xenobiotic-mediatedchanges in growth factors, cytokines, and cellular receptors may leadto TF deregulation and hematopoietic homeostasis perturbation.
In order to provide new insights into the effects of VPA on themolecular basis of hematopoietic system, we performed micro-array experiments using the human chronic myelogenous leuke-mia K562 cell line. This is a multi-potent cell line with erythro-,megakaryo- and granulomonocytic features because it wasestablished from cells arrested at an early differentiation stage[18]. Microarray outcomes were corroborated by complementaryexperiments using other hematopoietic cell lines and CD34+ cells.This functional profiling and cell phenotyping approach demon-strates that VPA has a negative effect on erythroid differentiationand a positive effect on the myelo-monocytic pathway, thereforeaffecting the hematopoietic homeostasis.
2. Materials and methods
2.1. Reagents and antibodies
Details of reagents and antibodies can be found in supplementalMaterials and Methods.
2.2. Cell culture
Details of culture for the human chronic myeloid leukemia(CML) cell lines K562 and MEG01, the human acute myeloidleukemia (AML) cell lines HEL, HL60 and TF-1 (DeutscheSammlung von Microorganismen und Zellkulturen, Braunschweig,Germany), and for CD34+ hematopoietic stem progenitor cells(HSPC) purified from cord blood, are described in supplementalMaterials and Methods. Erythroid differentiation was scored bybenzidine staining as previously described [19].
2.3. Microarray experiments
Treatments with 1 mM VPA were started in the exponentialgrowth phase of 4 � 106 cells for early time points (2, 6 and 10 h)and 1 � 106 cells for late time points (48 and 72 h). A controlsample was performed for each time point. Total RNA wasextracted from a batch of 5 � 106 to 1 � 107 cells by TRIzol(Invitrogen, Merelbeke, Belgium) and cleanup was performed bythe RNeasy Mini Kit (Qiagen, Venlo, The Netherlands). Quantifica-tion of RNA was assessed by Nanodrop (Isogen Life science, Sint-Pieters-Leeuw, Belgium). RNA integrity value>9 was verified usingan Agilent Bioanalyzer 2100 (Agilent Technologies Belgium,Diegem). Microarray experiments using Agilent 4112F WholeHuman Genome Oligo microarrays (Agilent Technologies, Belgium,Diegem) were done according to the manufacturer’s protocol with
700 ng of total RNA for the preparation of cDNA probes and Cy5-and Cy3-labeled cRNA probes. The hybridized and washed probeson each glass slide were scanned by an Axon 4100A microarrayscanner (Sunnyvale, CA, USA). Axon GenePix Pro software version6.1 was used for feature extraction. Further details on themicroarray analysis procedure are described in supplementalMaterials and Methods. Microarray data reported here have beensubmitted to the Gene Expression Omnibus public data repositoryunder accession number GSE19939.
2.4. Gene ontology based over-representation analysis
The Bioconductor package GOstats [20] was used to test for theassociation between gene ontology (GO) terms [21] and the lists ofdifferentially expressed genes. Conditional over-representationanalysis (ORA) for the GO ‘‘Biological process’’ (BP) and ‘‘MolecularFunction’’ (MF) terms based on the lists of positively and negativelyregulated genes at the different time point was performed.
The set of genes encompassing all probes on the array with acorresponding ‘‘Entrez Gene ID’’ annotation and annotated with atleast one GO term in the tested ontology (BP or MF) was taken intoconsideration for the enrichment analysis-related gene universe. Asignificance threshold of p < 0.01 was applied.
2.5. Enrichment analysis for cellular differentiation pathways
To gain better insights into potentially induced or repressed celldifferentiation pathways, ORA was performed using differentia-tion-related gene sets. Gene lists for erythroid, megakaryocytic,monocytic or granulocytic differentiation pathways were retrievedby manual curation from PubMed abstracts and the correspondingscientific articles. Only genes that are known to be positivelyregulated in the related differentiation pathway or well describedcell differentiation markers were included into the gene sets (TableS1). Gene lists were curated in an unbiased manner independentlyof the lists of differentially expressed genes.
After the manual curation step, only genes that are mutuallyexclusive in the erythrocyte/megakaryocyte or the monocyte/granulocyte groups of gene sets were retained for enrichmentanalysis (Table S2). There are many genes commonly implicated inthe regulation of the erythrocyte/megakaryocyte and the mono-cyte/granulocyte differentiation pathways, respectively.
Enrichment analysis was performed in R [22] using the Fisherexact test by comparing the lists of significantly up- and down-regulated genes at different time points to a background set ofgenes encompassing all probes on the array with an ‘‘Entrez GeneID’’ annotation. A cut-off (p < 0.05) was applied to detectsignificantly enriched gene sets in the lists of differentiallyexpressed genes.
2.6. Enrichment analysis for in silico predicted transcription factor
binding site motifs
Promoter analysis for enrichment of in silico predictedtranscription factor binding sites (TFBS) was performed usingthe Clover software [23]. A statistical significance threshold ofp < 0.01 was applied for detecting enriched TFBS. Only TFBS motifsrelated to mono-, granulo-, erythro-, or megakaryopoiesis [16,24]were used for enrichment analysis. Details for the enrichmentanalysis of TFBS motifs are described in Supplemental Materialsand Methods and Table S3.
2.7. Reverse transcription and real-time PCR
Reverse transcription (RT) was performed on 5 mg total RNAusing random hexamer primers from the SuperScriptTM III first
Table 1Enriched hematopoietic differentiation-related gene sets for the lists of induced and
repressed genes in VPA-treated K562 cells.
2 h 6 h 10 h 48 h 72 h
Negative
Erythrocyte 0.345 0.0134 0.0134 0.0959 0.0211Megakaryocyte 1 1 1 1 1
Granulocyte 1 1 1 0.5870 0.7555
Monocyte 1 1 1 1 1
Positive
Erythrocyte 1 0.9593 0.7994 0.8790 0.3439
Megakaryocyte 1 0.6543 0.5002 0.7962 0.7680
Granulocyte 0.5851 0.7820 0.9266 0.4915 0.9499
Monocyte 0.0127 4.89E�06 0.0042 0.0141 0.0167
p-Values for the significant gene sets (p<0.05) at corresponding time points are
shown in boldface.
S. Chateauvieux et al. / Biochemical Pharmacology 81 (2011) 498–509500
strand synthesis system for RT-PCR (Invitrogen). Real-time PCRanalysis were performed using the Mesa Green qPCR MasterMixPlus for SYBR1 Assay (Eurogentec, Seraing, Belgium) according tothe manufacturer’s protocol or the custom BD QZym Assays (BDBiosciences) with provided primers. Real-time PCR were per-formed according to the manufacturer’s instructions using a 7300Real Time PCR System (Applied Biosystem, Lennik, Belgium).Quantification was performed in triplicate, and expression levelswere normalized using internal standards (Actb and Gapdh).Relative gene expression levels correspond to fold inductioncompared with untreated cells. The statistics used include average,standard error of the mean and Student t-test. Primer sequencesare shown in Table S4.
2.8. Colony forming unit assay (CFU assay)
CD34+ cells were cultured in MethoCult1 (StemCell Technolo-gies, Grenoble, France) with 1% penicillin-streptomycin, 2% L-glutamine, 50 ng/mL stem cell factor (SCF), 50 ng/mL IL-3, 10 U/mLEPO with or without 1 mM VPA, and were seeded at a concentrationof 500 cells/mL in a 6-well plate. Four wells contained 2 mL of semi-solid medium while 2 wells contained water. Culture wassupplemented with EPO every 4 days with or without VPA. Thecolonies consisting of 50 or more cells were counted and identifiedunder an inverted microscope (Leica, Lecuit, Luxembourg).
2.9. Electrophoretic mobility shift assay (EMSA), acid extraction of
histones, transfection and flow cytometry
Protocols are detailed in supplemental materials and methods.Western blot analysis and EMSA were performed as previouslydescribed [25].
3. Results
3.1. Gene ontology enrichment analysis reveals biological topics
related to cellular differentiation
Microarray analysis was performed using Agilent WholeHuman Genome Oligo Microarrays to identify early (2, 6 and10 h) and late (48 and 72 h) effects of VPA treatment on geneexpression in K562 cells. Cells were cultured with or without VPAtreatment over a 72 h period. Gene expression data were obtainedfrom three independent competitive hybridizations comparingtreated and untreated cells. To validate microarray gene expres-sion data we performed real-time PCR on 20 genes from the sametriplicate RNA samples as used for microarray experiments. Thegood correlation (R2 = 0.66) validates the quality of microarraydata (Table S5).
Using a FDR threshold of 0.001 and a fold change cut-off of 1.5, atotal of 3440 differentially expressed genes were identified forfurther analysis (Table S6). A progressive increase from 279 to2428 in the number of differentially expressed genes wasobserved between 2 and 48 h while this number decreased to1916 at 72 h. In a next step, ORA based on the lists of up- anddown-regulated genes by VPA treatment revealed a large numberof significant gene ontology (GO) biological process (BP) andmolecular function (MF) terms (Tables S7 and S8). Interestingly,many biological topics detected by GO enrichment analysis wererelated to differentiation. As can be seen in Table S9, the gene listsshow a significant association of numerous ‘‘apoptosis’’, ‘‘cellcycle and proliferation’’ and ‘‘cytoskeleton’’ related GO terms,including ‘‘anti-apoptosis’’, ‘‘caspase activator activity’’, ‘‘negativeregulation of cell proliferation’’, ‘‘regulation of actin cytoskeletonorganization’’ and ‘‘microtubule-based movement’’ among otherswith the lists of up- and down-regulated genes by VPA-treatment
over time. Other more differentiation-specific GO terms were alsosignificantly associated with the lists of induced and repressedgenes by VPA treatment. Among these GO terms, the presence ofhematopoiesis-related concepts, including ‘‘erythrocyte homeo-stasis’’ associated to the negative gene lists at 48 and 72 h, ‘‘hemebiosynthetic process’’, associated to the negative gene list at 48 hand ‘‘myeloid leukocyte differentiation’’ associated to the positivegene list at 48 h, led us to investigate in depth the modulatingeffects of VPA on hematopoiesis.
3.2. VPA induces monocytic and represses erythroid differentiation
pathways
In order to assess more precisely the effects of VPA on erythroid,megakaryocytic, monocytic and granulocytic differentiation path-ways, and due to the limited number of genes annotated in GO tothe respective processes, a list of 218 gene/differentiation pathwayrelationships were curated from the scientific literature. Thesegenes have been described as markers of these four hematopoieticpathways or as being positively implicated in the correspondingcell differentiation pathways (Table S2). Enrichment analysis wasperformed based on these gene sets to visualize the effects of VPAon differentiation pathways at the transcriptional level. As can beseen in Table 1, over-represented gene sets were detected over thewhole time scale. On one side, enrichment for the erythrocyte geneset was detected for the negatively regulated genes for time points6, 10 and 72 h. On the other side, the monocyte gene set showedenrichment for the up-regulated genes from 2 to 72 h. Enrichmentanalysis based on the different hematopoiesis pathway gene setsthus suggests an inhibition of the erythroid and an activation of themonocytic differentiation pathways at the transcriptomic level inK562 cells after VPA treatment.
3.3. VPA modulates hematopoiesis-related transcription factor
binding site motifs
To gain further insights into the effects of VPA on cellulardifferentiation at the level of transcriptional regulation, enrichedTFBS motifs were determined in the promoter sets of thesignificantly up- and down-regulated genes for the different timepoints. Sixty-six position weight matrices (PWMs) from TransFac2009.2 were used to detect enriched TFBS motifs specific to mono-,granulo-, erythro or megakaryopoiesis as described in Section 2.Motifs related to 28 PWMs were found to be significantly over-represented at one or more time points (Table 2). Among theseDNA motifs, members of the AP-1 family of TFs potentially bind 7of them. These AP-1-related motifs were significantly associatedwith the lists of up-regulated genes from 6 to 72 h. Furthermore,PWMs related to the TF CEBPA were significantly enriched in thepositive gene lists from 2 to 72 h. Interestingly, for the negative

Table 2Significantly over-represented transcription factor binding site motifs for the lists of induced and repressed genes in VPA-treated K562 cells.
Identifier Factor(s) 2 h 6 h 10 h 48 h 72 h
Neg Pos Neg Pos Neg Pos Neg Pos Neg Pos
V$AP1_01 AP1 0.608 0.054 0.785 0.054 0.273 0.038 0.591 0.000 0.953 0.002V$AP1_C AP1 0.689 0.239 0.938 0.211 0.518 0.076 0.695 0.008 0.911 0.001V$AP1_Q2 AP1 0.982 0.016 0.911 0.001 0.354 0.002 0.197 0.001 0.929 0.001V$AP1_Q2_01 AP1 0.480 0.022 0.546 0.011 0.566 0.020 0.696 0.000 0.699 0.000V$AP1_Q4_01 AP1 0.631 0.403 0.913 0.149 0.810 0.115 0.852 0.010 0.904 0.002V$AP1_Q6 AP1 0.876 0.082 0.899 0.045 0.508 0.012 0.639 0.009 0.872 0.002V$AP1FJ_Q2 AP1 0.973 0.096 0.746 0.004 0.472 0.006 0.350 0.002 0.968 0.011
V$CDPCR1_01 CDP 0.009 0.032 0.099 0.002 0.301 0.000 0.302 0.000 0.367 0.000V$CEBP_01 CEBPA 0.000 0.001 0.324 0.974 0.529 0.853 0.825 1.000 0.966 1.000
V$CEBP_C CEBPA 0.271 0.006 0.467 0.087 0.524 0.096 0.224 0.122 0.460 0.124
V$CEBP_Q2 CEBPA 0.004 0.000 0.036 0.000 0.141 0.000 0.016 0.000 0.069 0.001V$CEBPA_01 CEBPA 0.004 0.002 0.040 0.000 0.106 0.000 0.055 0.001 0.057 0.000V$CHOP_01 CEBPA 0.392 0.271 0.840 0.270 0.807 0.009 0.467 0.099 0.052 0.178
V$CEBP_Q2_01 CEBPA, CEBPE 0.171 0.007 0.541 0.000 0.864 0.000 0.794 0.987 0.264 0.022
V$CEBP_Q3 CEBPA, CEBPE 0.003 0.004 0.630 0.691 0.869 0.390 0.923 1.000 0.587 1.000
V$EGR1_01 EGR-1 0.852 0.280 0.490 0.465 0.477 0.502 0.278 0.040 0.987 0.009V$KROX_Q6 EGR-1, EGR-2 0.208 0.000 0.057 1.000 0.342 1.000 0.019 1.000 0.062 1.000
V$GATA1_02 GATA-1 0.006 0.013 0.290 0.080 0.154 0.014 0.005 0.003 0.011 0.005V$GATA1_04 GATA-1 0.004 0.073 0.307 0.089 0.278 0.111 0.122 0.000 0.125 0.024
V$GATA1_05 GATA-1 0.000 0.012 0.010 0.001 0.058 0.001 0.283 0.000 0.166 0.002V$GATA1_06 GATA-1 0.002 0.202 0.012 0.003 0.267 0.000 0.172 0.000 0.063 0.000V$GATA_C GATA-1, GATA-2 0.000 0.016 0.018 0.000 0.031 0.000 0.021 0.000 0.020 0.000V$GATA_Q6 GATA-1, GATA-2 0.018 0.073 0.070 0.000 0.101 0.000 0.180 0.000 0.056 0.000V$GATA2_02 GATA-2 0.006 0.135 0.132 0.003 0.451 0.000 0.319 0.000 0.058 0.000V$GATA2_03 GATA-2 0.035 0.309 0.598 0.078 0.813 0.017 0.487 0.056 0.144 0.009V$GFI1_01 GFI 0.003 0.000 0.122 0.000 0.582 0.000 0.201 0.003 0.191 0.002V$GFI1_Q6 GFI, GFI1B 0.073 0.113 0.279 0.001 0.592 0.002 0.297 0.035 0.009 0.072
V$CREL_01 NFKB 0.005 0.141 0.472 0.129 0.581 0.321 0.621 0.193 0.700 0.311
‘‘Identifier’’: indicates the identifier for the position weight matrix as found in TransFac 2009.2. ‘‘Factor(s)’’: human TF(s) implicated in mono-, granulo-, erythro- or
megakaryopoiesis known to bind to the corresponding DNA motifs. The p-values for positive and negative gene lists are shown and the p-values for significantly enriched
TFBS motifs (p<0.01) are set in boldface type. Only PWMs with a corresponding p-value below the significance threshold (p<0.01) at one or more time points are shown in
the table.
S. Chateauvieux et al. / Biochemical Pharmacology 81 (2011) 498–509 501
gene lists, only at time point 2 h a significant association withCEBPA-related matrixes (V$CEBP_01, V$CEBPA_01 and CEBP_Q3)was detected. The V$KROX_Q6 matrix, a PWM related to the earlygrowth response protein (EGR)-1 and -2 binding site motifs, isfound to be significantly over-represented in the promoter sets forthe list of positively regulated genes at 2 h. Additionally an EGR-1-specific PWM (V$EGR1_01) is enriched in the positive gene list at72 h. A total of eight GATA-1- and/or GATA-2-related PWMs weredetected as enriched at one or more time points in the positive andnegative gene lists. Among them, two GATA-1-specific PWMs(V$GATA1_05 and V$GATA1_06) were significantly enriched overthe whole time scale. Interestingly, for time point 2 h, the GATA-related PWMs were only associated to the negative gene list.Altogether, these data suggest a modulation of transactivationalactivity for hematopoiesis-related TFs by VPA.
3.4. VPA induces myelo-monocytic but not erythrocytic features in
hematopoietic cell lines
Based on the microarray results, we investigated the effect ofVPA on the myeloid branch of differentiation pathways using K562,MEG01, HEL, and HL60 hematopoietic cell lines. The effect of 1 mMVPA on cell cycle and cell death was analyzed by flow cytometry.VPA induced an increase in G0/G1 phase (from 52.4 � 5.1% to78.0 � 2.9%) and a decrease in S and G2/M phases (from 25.2 � 1.6%and 17.1 � 5.9% to 12.4 � 2.8% and 6.9 � 1.0%, respectively) in K562cells, which corresponds to a latency state and correlates with adecreased proliferation. No change was observed in K562 cell death.The cell cycles of HL60 and MEG01 cells were not significantlymodified, while a strong increase of cell death was observed for HL60cells (from 3.83 � 1.5% to 16.9 � 4.6%) (Figure S1A).
On one hand, we analyzed the effect of VPA on myeloblastic(CD11b), myelomonocytic (CD14), megakaryocytic (CD41a) and
erythrocytic (CD235a) markers by flow cytometry in K562, HL60and MEG01 cell lines. The phenotypes of the promyeloblastic HL60and the promegakaryoblastic MEG01 cells were modified by 1 mMVPA, with a significant increase in CD11b and CD235a for HL60(ratio of MFI: 3.81 � 0.8 and 2.64 � 0.56) as well as CD11b, CD41aincrease and CD235a decrease for MEG01 cells (1.68 � 0.08 and2.78 � 0.8 and 0.52 � 0.052, respectively) after 3 days. Conversely,the phenotype of K562 cells was not significantly altered by VPAtreatment (Fig. 1A). Moreover, the expression of genes belonging tothe monocytic differentiation network, including CD11b (Table S2)was analyzed by Real-time PCR. Results revealed a significantincrease (2�
DDCt > 2.0; p < 0.05) in the expression of these genes(Fig. 1B). On the other hand, the effect of VPA on erythroiddifferentiation has been studied. Hemoglobin synthesis has beenassessed by benzidin staining in K562 and HEL cells following 0.5, 1and 2 mM VPA treatments. Results showed no modification in therate of benzidine positive cells during 3 or 6 days of treatment (datanot shown). As shown in Fig. 1C, analysis of erythroid featuresshowed that the levels of globin (HBA and HBG) as well ashydroxymethylbilane synthase (HMBS) gene expression were notinduced in K562, MEG01 or HL60 cells. In fact, as shown in Fig. 2B,VPA did not induce g-globin (HBG) mRNA levels at any concentration,while another HDACi, apicidin (AP), induced a 6-fold increase in itsexpression. Nevertheless, the HDAC inhibiting activity of 1 mM VPAhas been confirmed in these cells as assessed by western blot analysisof acetylated histones (H3 and H4, Figure S2). As expected, this effectwas correlated to the increased expression of p21 in K562 cells in atime dependent manner (Figure S3).
3.5. VPA prevents induction of erythroid differentiation
To assess whether VPA promotes myeloid differentiation withdepend on erythroid differentiation, we analyzed its effect on the
[(Fig._1)TD$FIG]
Fig. 1. VPA induces myelocytic but not erythroid markers. (A) Flow cytometry analysis of lineage-related cell surface markers in K562, HL60, and MEG01 cells after 3 days of
culture with (black line) or without (gray area) 1 mM VPA. (B) Real-time PCR analysis of monocytic network gene expression in K562, HL60, and MEG01 cells (n = 3). (C) Real-
time PCR analysis of erythroid genes expression in K562, HL60, and MEG01 cells following 1 mM VPA treatment (n = 3). Statistical significance levels *p-values < 0.05; **p-
values < 0.01; ***p-values < 0.001.
S. Chateauvieux et al. / Biochemical Pharmacology 81 (2011) 498–509502
induction of hemoglobin production in K562 and HEL cell lines.Hemoglobinization of the cells was induced by using differentinducers, aclacinomycin A (AC), doxorubicin (DX) [26], radicicol(RD) [25] or hemin (HM). In the presence of 0.5, 1 or 2 mM VPA, AC-induced hemoglobinization of K562 cells was decreased in aconcentration dependent manner (data not shown). As shown inFig. 2A, 1 mM VPA significantly reduced the rate of benzidinepositive cells whatever the cell line and the inducer used. Indeed,the proportion of hemoglobin-producing cells decreased by morethan 50% as assessed by benzidine staining. The effect was similarwith a pre- or a post-treatment by VPA (data not shown).Furthermore, 1 mM VPA significantly abolished RD- and AC-induced over-expression of HBG mRNA in K562 cells as shown by
real-time PCR (Fig. 2B). In the same way, western blot analysisshowed that VPA inhibits the HBG protein in both cell lines(Fig. 2C). In agreement with reported cases of aplastic anemia inpatients treated with VPA and our microarray data, these resultssuggest a significant negative effect of VPA on the regulation oferythroid differentiation while myelo-monocytic as well asmegakaryocytic features were induced.
3.6. Expression of GATA-1 and co-factors is affected in VPA-treated cells
Given the effect of VPA on hematopoietic differentiationfeatures, we verified the impact of VPA on specific TFs especiallyinvolved in the regulation of erythroid differentiation. Western

[(Fig._2)TD$FIG]
Fig. 2. VPA prevents hemoglobin production and HBG gene expression in K562 and HEL cells. K562 and HEL cells were induced to differentiate towards the erythroid pathway
by aclacinomycin A (AC), doxorubicin (DX), radicicol (RD) or hemin (HM) in the presence or absence of 1 mM VPA (V) or with VPA alone at the indicated concentrations for 3
days. (A) Hemoglobin producing cells were identified and evaluated by benzidine staining (n = 3). (B) Real-time PCR analysis of globin-gamma (HBG) mRNA expression in
K562 cells. The HDACi apicidin (AP) was used as a positive control for induction of erythroid differentiation (n = 3). (C) Western blot analysis of HBG protein expression in
K562 and HEL cells (representative results of three independent experiments). Actin beta (Actb) was used as an internal control. Statistical significance levels *p-
values < 0.05; **p-values < 0.01.
S. Chateauvieux et al. / Biochemical Pharmacology 81 (2011) 498–509 503
blot analysis showed that VPA reduced constitutive expression ofGATA-1 in a concentration dependent manner. Moreover, 1 mMVPA inhibited the induction of GATA-1 expression in RD- and AC-treated K562 cells and HM-treated HEL cells after 3 days (Fig. 3A).Moreover, EMSA experiments showed a decrease in GATA-1 as wellas NF-E2 binding activity (Fig. 3B) in the presence of 1 mM VPA.For GATA-1 EMSA, K562 and HEL cells were treated for 72 h and24 h, respectively. In fact, GATA-1 expression and binding activityin HM-induced HEL cells (Fig. 3A, B), is in accordance with our
previous results in K562 cells that showed a transient induction ofGATA-1 expression following 24 h of treatment and a decrease atdays 2 and 3 [27]. The expression of the GATA-1 co-activators FOG1and SP1 was also decreased in VPA-treated K562 cells as assessed bywestern blot analysis (Fig. 3C), and RD-induced over-expression ofFOG1 and SP1 was also significantly prevented by VPA. Similarly, AC-induced SP1 expression was partially inhibited by VPA co-treatment.In contrast, expression of PU.1, which is a specific activator of themyelo-monocytic differentiation pathway as well as an inhibitor of

S. Chateauvieux et al. / Biochemical Pharmacology 81 (2011) 498–509504
erythroid differentiation, was induced by 1 mM VPA as depicted inFig. 3C. Moreover, RD inhibited PU.1 expression in K562 cells as werecently reported [25] and VPA totally abolished this inhibition.
3.7. GATA-1 transactivation activity is reduced in the presence of VPA
Considering that VPA modulated GATA-1 and co-factorsexpression, we assessed whether transactivation activity of
[(Fig._3)TD$FIG]
Fig. 3. VPA affects GATA-1 activity and cofactors expression. K562 and HEL cells were
doxorubicin (DX), radicicol (RD), or hemin (HM), in the presence or absence of 1 mM VPA
untreated cells. (A) Western blot analysis of GATA-1 protein expression (representative
binding activities using the TAL-1c (consensus) and the TAL-1m (mutated) oligonucleotid
(CG1, HMG1 and HMp45) were performed using GATA-1 (G1) and NF-E2p45 (p45) antibodi
nuclear protein extracts were used (representative results of three independent experim
SP1) in K562 cells (representative results of three independent experiment). Actin beta (A
(expressing GATA-1), pGL3-GATA-Luc (Luciferase expression, GATA-1 dependant) and ph
prior to measurement of GATA-1 activity (n = 3); Western blot shows the low basal level o
(representative results of three independent experiments). Statistical significance level
GATA-1 was affected. GATA-1 forced expression was performedin the human leukemia TF1 cell line by the GATA-1 expressingvector pXM-GATA1. TF1 cells were used as they exhibit a low basalexpression level for GATA-1when cultured in GM-CSF containingmedium as shown in Fig. 3D, compared to differentiated cells inthe presence of EPO. VPA 1 mM alone did not affect Luciferaseexpression from the reporter plasmid pGL3-GATA-Luc in accordwith the low basal level of GATA-1 in GM-CSF cultured cells.
induced to differentiate towards the erythroid pathway by aclacinomycin A (AC),
(V) or with VPA alone at the indicated concentrations for 3 days. (C) represents the
results of three independent experiments). (B) EMSA analysis of GATA-1 and NF-E2
e probes for GATA-1 and the HMBS probe for NF-E2. Immunodepletion experiments
es. To observe an increase in GATA-1 binding activity in HM-induced HEL cells, day 1
ents). (C) Western blot analysis for expression of GATA-1 cofactors (FOG-1, PU.1 and
ctb) was used as an internal control. (D) Co-transfected TF-1 cells with pXM-GATA1
RL-SV40 (expressing Renilla, internal control), were treated with 1 mM VPA for 6 h
f GATA-1 expression in TF-1 cells, which is significantly induced after Epo-treatment
s **p-values < 0.01.
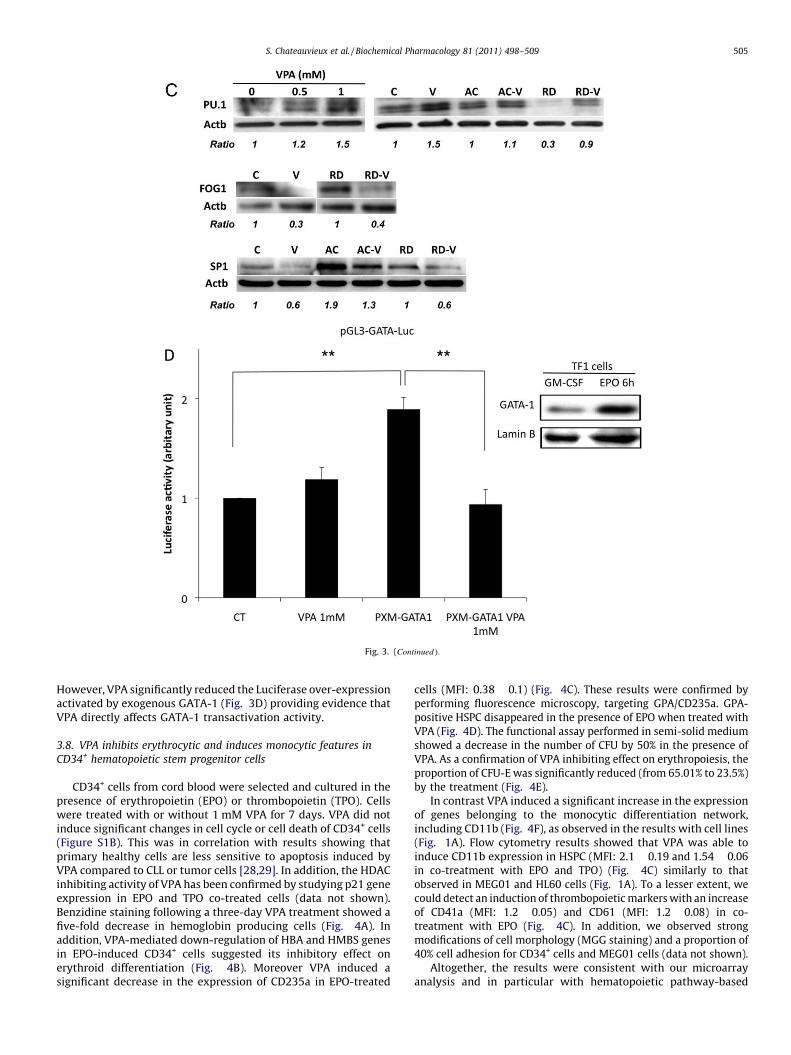
[(_)TD$FIG]
Fig. 3. (Continued ).
S. Chateauvieux et al. / Biochemical Pharmacology 81 (2011) 498–509 505
However, VPA significantly reduced the Luciferase over-expressionactivated by exogenous GATA-1 (Fig. 3D) providing evidence thatVPA directly affects GATA-1 transactivation activity.
3.8. VPA inhibits erythrocytic and induces monocytic features in
CD34+ hematopoietic stem progenitor cells
CD34+ cells from cord blood were selected and cultured in thepresence of erythropoietin (EPO) or thrombopoietin (TPO). Cellswere treated with or without 1 mM VPA for 7 days. VPA did notinduce significant changes in cell cycle or cell death of CD34+ cells(Figure S1B). This was in correlation with results showing thatprimary healthy cells are less sensitive to apoptosis induced byVPA compared to CLL or tumor cells [28,29]. In addition, the HDACinhibiting activity of VPA has been confirmed by studying p21 geneexpression in EPO and TPO co-treated cells (data not shown).Benzidine staining following a three-day VPA treatment showed afive-fold decrease in hemoglobin producing cells (Fig. 4A). Inaddition, VPA-mediated down-regulation of HBA and HMBS genesin EPO-induced CD34+ cells suggested its inhibitory effect onerythroid differentiation (Fig. 4B). Moreover VPA induced asignificant decrease in the expression of CD235a in EPO-treated
cells (MFI: 0.38 � 0.1) (Fig. 4C). These results were confirmed byperforming fluorescence microscopy, targeting GPA/CD235a. GPA-positive HSPC disappeared in the presence of EPO when treated withVPA (Fig. 4D). The functional assay performed in semi-solid mediumshowed a decrease in the number of CFU by 50% in the presence ofVPA. As a confirmation of VPA inhibiting effect on erythropoiesis, theproportion of CFU-E was significantly reduced (from 65.01% to 23.5%)by the treatment (Fig. 4E).
In contrast VPA induced a significant increase in the expressionof genes belonging to the monocytic differentiation network,including CD11b (Fig. 4F), as observed in the results with cell lines(Fig. 1A). Flow cytometry results showed that VPA was able toinduce CD11b expression in HSPC (MFI: 2.1 � 0.19 and 1.54 � 0.06in co-treatment with EPO and TPO) (Fig. 4C) similarly to thatobserved in MEG01 and HL60 cells (Fig. 1A). To a lesser extent, wecould detect an induction of thrombopoietic markers with an increaseof CD41a (MFI: 1.2 � 0.05) and CD61 (MFI: 1.2 � 0.08) in co-treatment with EPO (Fig. 4C). In addition, we observed strongmodifications of cell morphology (MGG staining) and a proportion of40% cell adhesion for CD34+ cells and MEG01 cells (data not shown).
Altogether, the results were consistent with our microarrayanalysis and in particular with hematopoietic pathway-based
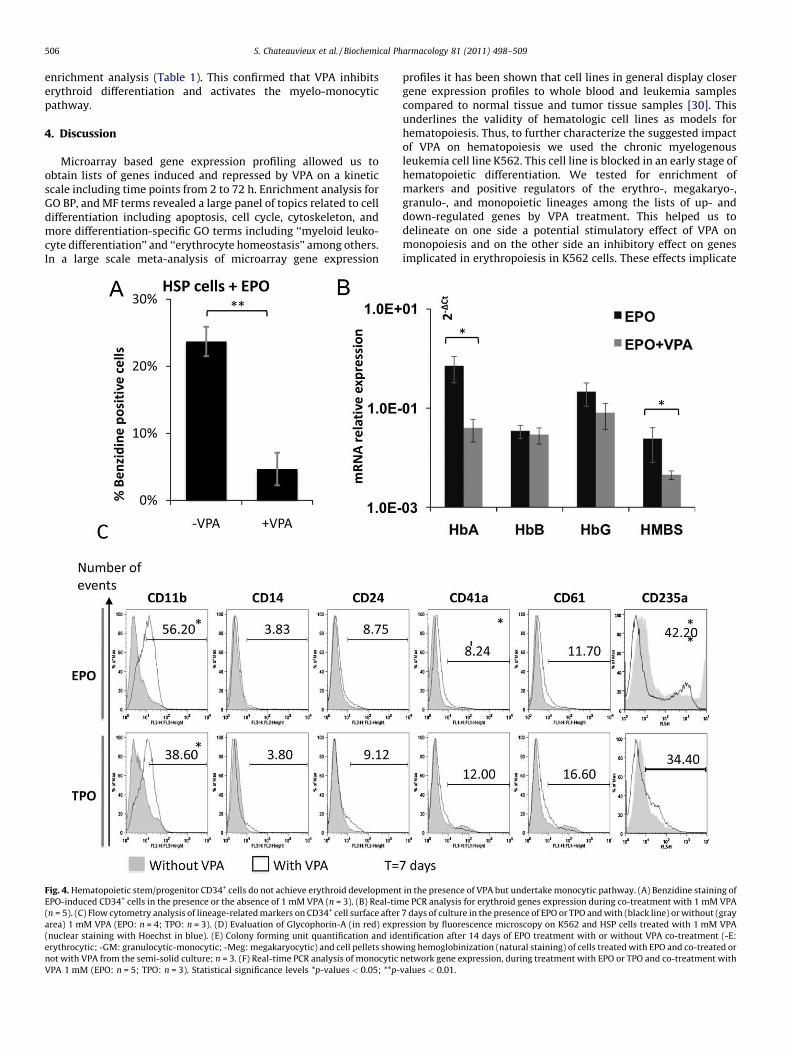
S. Chateauvieux et al. / Biochemical Pharmacology 81 (2011) 498–509506
enrichment analysis (Table 1). This confirmed that VPA inhibitserythroid differentiation and activates the myelo-monocyticpathway.
4. Discussion
Microarray based gene expression profiling allowed us toobtain lists of genes induced and repressed by VPA on a kineticscale including time points from 2 to 72 h. Enrichment analysis forGO BP, and MF terms revealed a large panel of topics related to celldifferentiation including apoptosis, cell cycle, cytoskeleton, andmore differentiation-specific GO terms including ‘‘myeloid leuko-cyte differentiation’’ and ‘‘erythrocyte homeostasis’’ among others.In a large scale meta-analysis of microarray gene expression[(Fig._4)TD$FIG]
Fig. 4. Hematopoietic stem/progenitor CD34+ cells do not achieve erythroid development
EPO-induced CD34+ cells in the presence or the absence of 1 mM VPA (n = 3). (B) Real-tim
(n = 5). (C) Flow cytometry analysis of lineage-related markers on CD34+ cell surface after
area) 1 mM VPA (EPO: n = 4; TPO: n = 3). (D) Evaluation of Glycophorin-A (in red) expr
(nuclear staining with Hoechst in blue). (E) Colony forming unit quantification and ide
erythrocytic; -GM: granulocytic-monocytic; -Meg: megakaryocytic) and cell pellets show
not with VPA from the semi-solid culture; n = 3. (F) Real-time PCR analysis of monocytic
VPA 1 mM (EPO: n = 5; TPO: n = 3). Statistical significance levels *p-values < 0.05; **p-
profiles it has been shown that cell lines in general display closergene expression profiles to whole blood and leukemia samplescompared to normal tissue and tumor tissue samples [30]. Thisunderlines the validity of hematologic cell lines as models forhematopoiesis. Thus, to further characterize the suggested impactof VPA on hematopoiesis we used the chronic myelogenousleukemia cell line K562. This cell line is blocked in an early stage ofhematopoietic differentiation. We tested for enrichment ofmarkers and positive regulators of the erythro-, megakaryo-,granulo-, and monopoietic lineages among the lists of up- anddown-regulated genes by VPA treatment. This helped us todelineate on one side a potential stimulatory effect of VPA onmonopoiesis and on the other side an inhibitory effect on genesimplicated in erythropoiesis in K562 cells. These effects implicate
in the presence of VPA but undertake monocytic pathway. (A) Benzidine staining of
e PCR analysis for erythroid genes expression during co-treatment with 1 mM VPA
7 days of culture in the presence of EPO or TPO and with (black line) or without (gray
ession by fluorescence microscopy on K562 and HSP cells treated with 1 mM VPA
ntification after 14 days of EPO treatment with or without VPA co-treatment (-E:
ing hemoglobinization (natural staining) of cells treated with EPO and co-treated or
network gene expression, during treatment with EPO or TPO and co-treatment with
values < 0.01.

[(_)TD$FIG]
Fig. 4. (Continued ).
S. Chateauvieux et al. / Biochemical Pharmacology 81 (2011) 498–509 507
the modulation of transcriptional regulators at early time points (2and 6 h) as suggested by the results for GO BP and MF enrichmentanalysis (Tables S7 and S8). Taken together these results indicatethat VPA is able to modulate hematopoiesis by affectingtranscriptional regulators at early time points.
In addition to the analysis for the effects of VPA on H3 and H4acetylation and p21 gene expression, its inhibitory activity onHDACs was confirmed by comparing our lists of differentiallyexpressed genes to a ‘‘core set of HDACi regulated genes’’ aspreviously described [31]. It was reported that a common set ofgenes is regulated by suberoylanilide hydroxamic acid (SAHA),trichostatin A (TSA) and MS-275 in human breast and bladdercarcinoma cell lines. Among the up-regulated core set genes, 6 outof 8 showed an identical differential expression pattern comparedto VPA treatment in K562 cells. These were CDKN1A, DHRS2,FUCA1, CLU, GLRX and MT1X. For the down-regulated core setgenes there were 3 out of 5 genes with an identical regulatorypattern, namely HDGF, ANP32B and CTPS. The effects of HDACi oncell cycle, apoptosis [32], cytoskeleton [33] and hematopoiesis[34,35], have already been described in the literature and stronglydepend on the cell type, the compound, and the experimentalconditions used [36]. Sodium butyrate, TSA, SAHA, HC-toxin, MS-
275 and apicidin (AP) as well as VPA [6,37] were reported aserythroid differentiation inducers [38]. However, hemoglobinproduction in VPA-treated cells remained much lower than thatdescribed for other classes of differentiating agents including AC,DX, RD, and HM or different HDACi [6], whose activity spectrum onHDACs are distinct from VPA. Moreover, in a comparative study often VPA derivatives only one induced hemoglobin production inK562 cells in a similar way to butyric acid [37]. These data showedthe low efficiency of VPA as an inducer of erythroid differentiationin vitro. Studies have even reported adverse effects of VPA onerythropoiesis. Handoko et al. pointed out the risk of aplasticanemia in patients treated with antiepileptic drugs [8]. Theyespecially reported that the use of carbamazepine and VPA wassignificantly associated with aplastic anemia in their study. Inaddition, The et al. reported one case of persistent suppression oferythropoietic elements in a patient with prolonged treatment ofVPA after discontinuing carbamazepine treatment [10]. Previousreports describing the hematological toxicity of anticonvulsivedrugs [8,9,39] showed pure red cell aplasia associated with VPAtherapy. Moreover, it was recently shown that VPA represses CFU-E development and promotes GM-colony formation [40]. It is notyet clear if VPA-mediated inhibition of HDACs is involved inerythroid gene down-regulation.
In this study, VPA induced a decrease in hemoglobin producingcells and globin gene expression in K562, HEL, and CD34+ HSPC, adecrease of CFU-E in the semi-solid medium functional assay and adecrease of the expression of CD235a/GPA in MEG01 and HSPC.This was in agreement with the analysis of TF expression involvedin erythropoiesis. Down-regulation of FOG1 as well as SP1 in VPA-treated K562 cells corroborated the inhibiting effect of VPA onerythroid differentiation. Furthermore, expression of the GATA-1inhibitor PU.1 was markedly increased. This supports both theinhibition of erythroid differentiation and the induction ofgranulo-monocytic differentiation. This later point was validatedby analysis of specific markers in MEG01 and HL60 cells as well asin CD34+ cells. VPA has been shown to induce myeloid specificmarkers in U937 leukemia cell line as well as in HL-60 cells andhuman primary acute myeloid leukemia cells [41]. Additionallyearly megakaryocytic markers were induced in UT-7 cells [35].
ORA for hematopoietic differentiation-related TFBS motifsrevealed motifs associated with CEBPA, as well as AP-1 and GATAfamily members, among others. Here it is important to point outthat AP-1 motifs are only significantly associated with the lists ofup-regulated genes over the whole time scale and no significantassociation with the lists of repressed genes was detected at anytime point. Furthermore, different members of the AP-1 family,including JUN, JUNB, JUND and FOS were also significantly inducedover the whole time scale (Table S6). The positive effect of the AP-1TF family members on monopoiesis has already been described inthe literature [42]. For the CEBPA binding sites we observed asignificant association of CEBPA-related PWMs to the lists ofdifferentially expressed genes over the whole time scale. Micro-array analysis revealed a significant induction of CEBPA at timepoints 6 and 10 h. CEBPA is required in the commitment togranulocyte–monocyte progenitor cells and regulates PU.1 genetranscription [43], whose protein was found over-expressed inVPA-treated K562 cells. CEBPA favors monocytic lineage commit-ment in primary myeloid progenitor cells [44], and it has beenshown to inhibit cell cycle transition in different phases includingG1 to S in the myeloid lineage and G0 to G1 in different breastcancer cell lines [45]. This effect may be mediated by the inductionof cyclin-dependent kinase inhibitor 1A (CDKN1A) [46]. A recentstudy has shown that CEBPA:JUN and CEBPA:FOS heterodimeriza-tion plays an important role in monocyte lineage commitment[47]. Considering the GATA-1 and -2 binding sites, the correspond-ing PWMs showed significant associations with the lists of up- and/

S. Chateauvieux et al. / Biochemical Pharmacology 81 (2011) 498–509508
or down-regulated genes for the time points from 6 to 72 h, whilefor time point 2 h a significant enrichment was only detected forthe negative gene list. GATA-1 and GATA-2 are essential TFs fornormal blood cell maturation. GATA-1 is implicated in thedifferentiation of erythrocytes, mast cells, eosinophils and mega-karyocytes [48], while GATA-2 is required for the proliferation ofearly hematopoietic cells as well as for megakaryocyte and mastcell development [49]. Expression of GATA-2 precedes that ofGATA-1 and its expression must decrease as GATA-1 expressionincreases to enable erythropoiesis [48].
Here it is important to point out that over-representation for aTFBS motif could correspond to a modulation of transactivationalactivity for a distinct TF than initially used to create thecorresponding PWM. Additionally, it is not possible to clearlydelineate the functional role of a TF as the corresponding bindingsites might act as transcriptional activator or repressor sites. So itwas important to delineate the functional role for the TFscorresponding to the TFBS motifs by EMSA and reporter genetransfection assays, in particular for the key transcription factorGATA-1. Altogether, these results suggest a stimulation of mono-poietic lineage commitment and confirm a repression of erythro-cytic lineage commitment by VPA as assessed by microarrayexperiments on K562 cells and validated on other hematopoietic celllines as well as hematopoietic progenitor cells. This process involveswell-known transcriptional regulators of hematopoiesis, includingamongst others AP-1 and CEBPA family members as well as GATA-1and its co-factors FOG1, SP1 and PU.1.
According to the incidence of cancer-associated anemia (30%),our results together with VPA-related clinical observations supportthe necessity to take into consideration the effect of VPA onerythropoiesis, especially in the case of its potential application incancer therapy.
Conflict of interest
The authors have no conflicting financial interests.
Acknowledgements
SC, SE, MS are supported by Televie fellowships and CG by a PhDgrant of the Fonds National pour la Recherche, Luxembourg.Research is supported by Televie, ‘‘Fondation de Recherche Canceret Sang’’, ‘‘Recherches Scientifiques Luxembourg’’, ‘‘Een Haerz firKriibskrank Kanner’’ and Action Lions ‘‘Vaincre le Cancer’’. Print costswere covered by the Fonds National de la Recherche Luxembourg.
Appendix A. Supplementary data
Supplementary data associated with this article can be found, inthe online version, at doi:10.1016/j.bcp.2010.11.011.
References
[1] Michaelis M, Michaelis UR, Fleming I, Suhan T, Cinatl J, Blaheta RA, et al.Valproic acid inhibits angiogenesis in vitro and in vivo. Mol Pharmacol2004;65:520–7.
[2] Blaheta RA, Cinatl Jr J. Anti-tumor mechanisms of valproate: a novel role for anold drug. Med Res Rev 2002;22:492–511.
[3] Tang R, Faussat AM, Majdak P, Perrot JY, Chaoui D, Legrand O, et al. Valproicacid inhibits proliferation and induces apoptosis in acute myeloid leukemiacells expressing P-gp and MRP1. Leukemia 2004;18:1246–51.
[4] Blaheta RA, Michaelis M, Driever PH, Cinatl Jr J. Evolving anticancer drugvalproic acid: insights into the mechanism and clinical studies. Med Res Rev2005;25:383–97.
[5] Facchetti F, Previdi S, Ballarini M, Minucci S, Perego P, La Porta CA. Modulationof pro- and anti-apoptotic factors in human melanoma cells exposed to histonedeacetylase inhibitors. Apoptosis 2004;9:573–82.
[6] Gurvich N, Tsygankova OM, Meinkoth JL, Klein PS. Histone deacetylase is atarget of valproic acid-mediated cellular differentiation. Cancer Res2004;64:1079–86.
[7] Kieslich M, Schwabe D, Cinatl Jr J, Driever PH. Increase of fetal hemoglobinsynthesis indicating differentiation induction in children receiving valproicacid. Pediatr Hematol Oncol 2003;20:15–22.
[8] Handoko KB, Souverein PC, van Staa TP, Meyboom RH, Leufkens HG, EgbertsTC, et al. Risk of aplastic anemia in patients using antiepileptic drugs. Epilepsia2006;47:1232–6.
[9] Farkas V, Szabo M, Renyi I, Kohlheb O, Benninger C. Temporary pure red-cellaplasia during valproate monotherapy: clinical observations and spectralelectroencephalographic aspects. J Child Neurol 2000;15:485–7.
[10] The T, Kolla R, Dawkins F, Trouth AJ. Pure red cell aplasia after 13 years ofsodium valproate, and bone marrow suppression after 17 years of carbamaz-epine. PLoS Med 2004;1:e51.
[11] Chateauvieux S, Morceau F, Dicato M, Diederich M. Molecular and therapeuticpotential and toxicity of valproic acid. J Biomed Biotechnol 2010.
[12] Tsang AP, Visvader JE, Turner CA, Fujiwara Y, Yu C, Weiss MJ, et al. FOG, amultitype zinc finger protein, acts as a cofactor for transcription factor GATA-1in erythroid and megakaryocytic differentiation. Cell 1997;90:109–19.
[13] Merika M, Orkin SH. Functional synergy and physical interactions of theerythroid transcription factor GATA-1 with the Kruppel family proteins Sp1and EKLF. Mol Cell Biol 1995;15:2437–47.
[14] Ikonomi P, Rivera CE, Riordan M, Washington G, Schechter AN, Noguchi CT.Overexpression of GATA-2 inhibits erythroid and promotes megakaryocytedifferentiation. Exp Hematol 2000;28:1423–31.
[15] Stopka T, Amanatullah DF, Papetti M, Skoultchi AI. PU.1 inhibits the erythroidprogram by binding to GATA-1 on DNA and creating a repressive chromatinstructure. EMBO J 2005;24:3712–23.
[16] Friedman AD. Transcriptional control of granulocyte and monocyte develop-ment. Oncogene 2007;26:6816–28.
[17] Kummalue T, Friedman AD. Cross-talk between regulators of myeloid devel-opment: C/EBPalpha binds and activates the promoter of the PU.1 gene. JLeukoc Biol 2003;74:464–70.
[18] Lozzio CB, Lozzio BB. Human chronic myelogenous leukemia cell-line withpositive Philadelphia chromosome. Blood 1975;45:321–34.
[19] Morceau F, Dupont C, Palissot V, Borde-Chiche P, Trentesaux C, Dicato M, et al.GTP-mediated differentiation of the human K562 cell line: transient over-expression of GATA-1 and stabilization of the gamma-globin mRNA. Leukemia2000;14:1589–97.
[20] Falcon S, Gentleman R. Using GOstats to test gene lists for GO term association.Bioinformatics 2007;23:257–8.
[21] Ashburner M, Ball CA, Blake JA, Botstein D, Butler H, Cherry JM, et al. Geneontology: tool for the unification of biology. The Gene Ontology Consortium.Nat Genet 2000;25:25–9.
[22] R Development Core Team. A language and environment for statistical com-puting. Vienna, Austria: R Foundation for Statistical Computing; 2007.
[23] Frith MC, Fu Y, Yu L, Chen JF, Hansen U, Weng Z. Detection of functional DNAmotifs via statistical over-representation. Nucleic Acids Res 2004;32:1372–81.
[24] Orkin SH, Zon LI. Hematopoiesis: an evolving paradigm for stem cell biology.Cell 2008;132:631–44.
[25] Morceau F, Buck I, Dicato M, Diederich M. Radicicol-mediated inhibition ofBcr-Abl in K562 cells induced p38-MAPK dependent erythroid differentiationand PU.1 down-regulation. Biofactors 2008;34:313–29.
[26] Morceau F, Chenais B, Gillet R, Jardillier JC, Jeannesson P, Trentesaux C.Transcriptional and posttranscriptional regulation of erythroid gene expres-sion in anthracycline-induced differentiation of human erythroleukemic cells.Cell Growth Differ 1996;7:1023–9.
[27] Schnekenburger M, Morceau F, Duvoix A, Delhalle S, Trentesaux C, Dicato M,et al. Increased glutathione S-transferase P1-1 expression by mRNA stabiliza-tion in hemin-induced differentiation of K562 cells. Biochem Pharmacol2004;68:1269–77.
[28] Armeanu S, Pathil A, Venturelli S, Mascagni P, Weiss TS, Gottlicher M, et al.Apoptosis on hepatoma cells but not on primary hepatocytes by histonedeacetylase inhibitors valproate and ITF2357. J Hepatol 2005;42:210–7.
[29] Bokelmann I, Mahlknecht U. Valproic acid sensitizes chronic lymphocyticleukemia cells to apoptosis and restores the balance between pro- andantiapoptotic proteins. Mol Med 2008;14:20–7.
[30] Sandberg R, Ernberg I. The molecular portrait of in vitro growth by meta-analysis of gene-expression profiles. Genome Biol 2005;6:R65.
[31] Glaser KB, Staver MJ, Waring JF, Stender J, Ulrich RG, Davidsen SK. Geneexpression profiling of multiple histone deacetylase (HDAC) inhibitors: defin-ing a common gene set produced by HDAC inhibition in T24 and MDAcarcinoma cell lines. Mol Cancer Ther 2003;2:151–63.
[32] Catalano MG, Fortunati N, Pugliese M, Costantino L, Poli R, Bosco O, et al.Valproic acid induces apoptosis and cell cycle arrest in poorly differentiatedthyroid cancer cells. J Clin Endocrinol Metab 2005;90:1383–9.
[33] Walmod PS, Skladchikova G, Kawa A, Berezin V, Bock E. Antiepileptic teratogenvalproic acid (VPA) modulates organisation and dynamics of the actin cyto-skeleton. Cell Motil Cytoskeleton 1999;42:241–55.
[34] Cao H, Stamatoyannopoulos G. Histone deacetylase inhibitor FK228 is a potentinducer of human fetal hemoglobin. Am J Hematol 2006;81:981–3.
[35] Vulcano F, Ciccarelli C, Mattia G, Marampon F, Giampiero M, Milazzo L, et al.HDAC inhibition is associated to valproic acid induction of early megakaryo-cytic markers. Exp Cell Res 2006;312:1590–7.

S. Chateauvieux et al. / Biochemical Pharmacology 81 (2011) 498–509 509
[36] Balasubramanian S, Verner E, Buggy JJ. Isoform-specific histone deacetylaseinhibitors: the next step? Cancer Lett 2009;280:211–21.
[37] Deubzer H, Busche B, Ronndahl G, Eikel D, Michaelis M, Cinatl J, et al. Novelvalproic acid derivatives with potent differentiation-inducing activity inmyeloid leukemia cells. Leuk Res 2006;30:1167–75.
[38] Witt O, Monkemeyer S, Ronndahl G, Erdlenbruch B, Reinhardt D, Kanbach K,et al. Induction of fetal hemoglobin expression by the histone deacetylaseinhibitor apicidin. Blood 2003;101:2001–7.
[39] MacDougall LG. Pure red cell aplasia associated with sodium valproate thera-py. J Am Med Assoc 1982;247:53–4.
[40] Bartels M, Geest CR, Bierings M, Buitenhuis M, Coffer PJ. Histone deacetylaseinhibition modulates cell fate decisions during myeloid differentiation. Hae-matologica 2010;95:1052–60.
[41] Cheng YC, Lin H, Huang MJ, Chow JM, Lin S, Liu HE. Downregulation of c-Myc iscritical for valproic acid-induced growth arrest and myeloid differentiation ofacute myeloid leukemia. Leuk Res 2007;31:1403–11.
[42] Szabo E, Preis LH, Birrer MJ. Constitutive cJun expression induces partialmacrophage differentiation in U-937 cells. Cell Growth Differ 1994;5:439–46.
[43] Wang X, Scott E, Sawyers CL, Friedman AD. C/EBPalpha bypasses granulocytecolony-stimulating factor signals to rapidly induce PU.1 gene expression,
stimulate granulocytic differentiation, and limit proliferation in 32D cl3myeloblasts. Blood 1999;94:560–71.
[44] Wang D, D’Costa J, Civin CI, Friedman AD. C/EBPalpha directs monocyticcommitment of primary myeloid progenitors. Blood 2006;108:1223–9.
[45] Gery S, Tanosaki S, Bose S, Bose N, Vadgama J, Koeffler HP. Down-regulationand growth inhibitory role of C/EBPalpha in breast cancer. Clin Cancer Res2005;11:3184–90.
[46] Johnson PF. Molecular stop signs: regulation of cell-cycle arrest by C/EBPtranscription factors. J Cell Sci 2005;118:2545–55.
[47] Cai DH, Wang D, Keefer J, Yeamans C, Hensley K, Friedman AD. C/EBP alpha:AP-1 leucine zipper heterodimers bind novel DNA elements, activate the PU.1promoter and direct monocyte lineage commitment more potently than C/EBPalpha homodimers or AP-1. Oncogene 2008;27:2772–9.
[48] Ferreira R, Ohneda K, Yamamoto M, Philipsen S. GATA1 function, a para-digm for transcription factors in hematopoiesis. Mol Cell Biol 2005;25:1215–27.
[49] Tsai FY, Orkin SH. Transcription factor GATA-2 is required for proliferation/survival of early hematopoietic cells and mast cell formation, but notfor erythroid and myeloid terminal differentiation. Blood 1997;89:3636–43.