Zebrafish hox genes: genomic organization and modified colinear expression patterns in the trunk
Upload
uni-tuebingen1Category
view
3download
0
doi:10.1182/blood-2007-04-085407Prepublished online September 12, 2007;
Karsten Spiekermann, Wolfgang Hiddemann, Michaela Feuring-Buske and Christian BuskeKonstantin Petropoulos, Aniruddha Deshpande, Leticia Quintanilla-Martinez, Stefan K. Bohlander, Vijay P.S. Rawat, Silvia Thoene, Vegi M. Naidu, Natalia Arseni, Bernhard Heilmeier, Klaus Metzeler, with deregulated HOX gene expression in human acute myeloid leukemiaprogenitors depending on its N-terminal domain and is closely correlated Overexpression of CDX2 perturbs HOX gene expression in murine
(4217 articles)Neoplasia � (3131 articles)Hematopoiesis and Stem Cells �
(1086 articles)Gene Expression �Articles on similar topics can be found in the following Blood collections
http://bloodjournal.hematologylibrary.org/site/misc/rights.xhtml#repub_requestsInformation about reproducing this article in parts or in its entirety may be found online at:
http://bloodjournal.hematologylibrary.org/site/misc/rights.xhtml#reprintsInformation about ordering reprints may be found online at:
http://bloodjournal.hematologylibrary.org/site/subscriptions/index.xhtmlInformation about subscriptions and ASH membership may be found online at:
digital object identifier (DOIs) and date of initial publication. theindexed by PubMed from initial publication. Citations to Advance online articles must include
final publication). Advance online articles are citable and establish publication priority; they areappeared in the paper journal (edited, typeset versions may be posted when available prior to Advance online articles have been peer reviewed and accepted for publication but have not yet
Copyright 2011 by The American Society of Hematology; all rights reserved.20036.the American Society of Hematology, 2021 L St, NW, Suite 900, Washington DC Blood (print ISSN 0006-4971, online ISSN 1528-0020), is published weekly by
For personal use only. by guest on June 5, 2013. bloodjournal.hematologylibrary.orgFrom

Overexpression of CDX2 perturbs HOX gene expression in murine progenitors depending
on its N-terminal domain and is closely correlated with deregulated HOX gene expression
in human acute myeloid leukemia
Vijay P. S. Rawat1,2, Silvia Thoene1,2, Vegi M. Naidu1,2, Natalia Arseni1,2, Bernhard
Heilmeier1, Klaus Metzeler1, Konstantin Petropoulos1,2, Aniruddha Deshpande1,2, Leticia
Quintanilla-Martinez3, Stefan K. Bohlander1,2, Karsten Spiekermann1,2, Wolfgang
Hiddemann1,2, Michaela Feuring-Buske1,2, Christian Buske1,2∗
1Department of Medicine III, Klinikum Grosshadern, Munich, Germany; 2Clinical Cooperative
Group Leukemia, GSF - National Research Center for Environment and Health, Munich,
Germany; 3Institute of Pathology, GSF, Neuherberg, Germany
∗To whom correspondence should be addressed. E-mail: [email protected]
Running Title: CDX2 in acute myeloid leukemia
1
Blood First Edition Paper, prepublished online September 12, 2007; DOI 10.1182/blood-2007-04-085407
Copyright © 2007 American Society of Hematology
For personal use only. by guest on June 5, 2013. bloodjournal.hematologylibrary.orgFrom

Abstract
The mechanisms underlying deregulation of HOX gene expression in AML are poorly
understood. The ParaHox gene CDX2 was shown to act as positive upstream regulator of several
HOX genes. In this study constitutive expression of Cdx2 caused perturbation of leukemogenic
Hox genes such as Hoxa10 and Hoxb8 in murine hematopoietic progenitors. Deletion of the N-
terminal domain of Cdx2 abrogated its ability to perturb Hox gene expression and to cause AML
in mice. In contrast inactivation of the putative Pbx interacting site of Cdx2 did not change the
leukemogenic potential of the gene. In an analysis of 115 AML patients expression levels of
CDX2 were closely correlated with deregulated HOX gene expression. Patients with normal
karyotype showed a 14fold higher expression of CDX2 and deregulated HOX gene expression
compared to patients with chromosomal translocations such as t(8:21) or t(15;17). All AML
patients with normal karyotype tested were negative for CDX1 and CDX4 expression. These data
link the leukemogenic potential of Cdx2 to its ability to dysregulate Hox genes. They
furthermore correlate the level of CDX2 expression with HOX gene expression in human AML
and support a potential role of CDX2 in the development of human AML with aberrant Hox gene
expression.
2
For personal use only. by guest on June 5, 2013. bloodjournal.hematologylibrary.orgFrom

Introduction
In the recent years substantial progress has been made in understanding the biology of
acute myeloid leukemia (AML). One of the pathogenetic hallmarks of AML are chromosomal
translocations generating leukemogenic fusion genes which often act as aberrant transcription
factors 1. The second key genetic characteristics in AML are mutations, particular found in
patients with normal karyotype and affecting the receptor tyrosine kinase FLT3 or the
nucleophosmin protein (NPM1). Beside these structural genetic changes large scale gene
expression analyses of cDNA samples from AML patients have demonstrated that deregulated
expression of non-altered genes characterizes many AML cases. The most prominent example
for this is the deregulated expression of homeobox genes in AML 2-4. Homeobox genes form a
highly conserved family of transcription factors known to be key regulators of normal
hematopoietic stem cell and progenitor development 5. Several studies have demonstrated that
aberrant HOX gene expression profoundly perturbs normal murine and human hematopoietic
development and causes leukemia in mice 5-9. The aberrant expression of homeobox genes such
as HOXA9 and HOXA10 is strongly associated with certain AML subtypes characterized by MLL
fusion genes, NPM1 mutations (NPMc+) and by more rare translocations such as the
translocation t(10;11)(p13q14) generating the CALM-AF10 fusion gene 4,10-13. All together,
deregulated homeobox gene expression characterizes more than every third case of AML. So far
it is largely unknown how the aberrant expression of homeobox genes is initiated in the
malignant clone. In cases with 11q23 chromosomal translocations it is thought that aberrant
function of the MLL gene, a known positive upstream regulator of HOX gene expression, is
responsible for the perturbed expression of these key regulatory genes of early hematopoietic
development 14. In contrast, the aberrant HOX gene expression in AML cases with normal
3
For personal use only. by guest on June 5, 2013. bloodjournal.hematologylibrary.orgFrom

karyotype and NPM1 mutation is not well understood 15. In particular the NPMc+ AML cases
demonstrate that aberrant HOX gene expression cannot be just explained by the stage of
differentiation at which the leukemic clone is arrested: NPMc+ cases are CD34-negative in more
than 95% of cases and represent therefore a cell stage in which HOX genes are normally silenced
8,16.
Another gene family critically involved in Hox gene regulation is the family of the so
called ParaHox genes, comprising the different ‘Caudal related homeobox genes’ such as CDX1,
CDX2 and CDX4 and the GSH2 homeobox gene 17. Several experimental systems have
demonstrated that loss of Cdx2 causes homeotic alterations and posterior shifts in Hox expression
domains 18 and that consensus binding sites for the three Cdx homologues are present in the
promoters of multiple Hox genes 19 20-22. Expression of Cdx2 is tightly restricted to intestinal
development in the adult 23. Aberrant expression of CDX2 is associated with intestinal metaplasia
24,25, Barrett’s epithelium 26 and gastric carcinoma 27. It was previously demonstrated in a single
AML case carrying the translocation t(12;13)(p13;q12) that this translocation can induce ectopic
expression of CDX2 in adult hematopoietic cells beside the expression of the ETV6-CDX2 fusion
gene generated by the translocation 28. We have previously shown in a murine leukemia model
that the ectopic expression of the Cdx2 and not the ETV6-CDX2 fusion gene is the key
transforming event in this type of leukemia 29.
We now demonstrate that the ParaHox gene Cdx2 dysregulates expression of
leukemogenic Hox genes such as Hoxa10 or Hoxb8 in murine hematopoietic progenitors.
Furthermore, we show that loss of the ability of Cdx2 to perturb Hox gene expression by deletion
of its N-terminal transactivation domain is paralleled by the inability of the gene to induce AML
4
For personal use only. by guest on June 5, 2013. bloodjournal.hematologylibrary.orgFrom

in vivo. We extended our analyses to human AML cases and demonstrate that high expression
levels of CDX2 were closely associated with HOX gene dysregulation in human AML.
5
For personal use only. by guest on June 5, 2013. bloodjournal.hematologylibrary.orgFrom

Material and Methods
Patient samples
Mononuclear cells prepared from diagnostic bone marrow or peripheral blood samples from 115
adult patients with AML were analyzed. The AML cases were classified according to the
French-American-British criteria and the World Health Organization classification 30. The study
was approved by the ethics committees of all participating institutions and all patients gave
informed consent before entering the study, in accordance with the tenets of the revised Helsinki
protocol (http://www.wma.net/e/policy/b3.htm). As a control, bone marrow mononuclear cells
(BMMCs)(CellSystem, Germany) from normal individuals were analyzed. Cytomorphology,
cytochemistry, cytogenetics, and molecular genetics were applied in all cases as described
below.
Cytogenetics, FISH analysis and molecular analysis
Cytogenetic analyses were performed using standard techniques. For fluorescence in situ
hybridization (FISH), commercially available AML1-ETO, PML-RARa, MLL-AF4, MLL-AF9,
MLL-AF10, MLL-AF6, CBFβ-MYH11 or BCR-ABL probes were used according to the
manufacturer’s instructions (Vysis, Bergisch-Gladbach, Germany)31- 32.
Microarray
Affymetrix HGU-133 A & B microarrays were used to compare the expression of HOX genes in
clinical specimens from patients with various subtypes of AML and in normal human bone
marrow samples. The expression of 22 genes from the HOX gene cluster, represented by 29
different probesets on the microarrays were analyzed. RNA extraction, cDNA preparation, in
6
For personal use only. by guest on June 5, 2013. bloodjournal.hematologylibrary.orgFrom

vitro transcription, hybridisation and microarray scanning were performed according to standard
protocols, as recommended by Affymetrix and as published previously 33. Data analysis was
performed using the R 2.4.0 software package (www.R-project.org) and routines from the
biostatistics software repository “Bioconductor” 34. Raw microarray data were normalized using
the variance stabilising normalisation (vsn) procedure 35 and probe-set expression values were
calculated by the median polish method. For the comparison between normal bone marrow and
AML specimens with normal karyotype and unmutated nucleophosmin gene, empirical p-values
and the local false discovery rate for each gene were calculated using the successive exclusion
procedure implemented in the twilight software package 36. To visualise the differences in HOX
gene expression, a heatmap showing the expression of the 22 selected genes (29 probesets) in 75
clinical samples was constructed. Unsupervised hierarchical clustering using euclidean distances
was performed to group patient samples according to the similarity of their HOX gene expression
profiles.
Quantitative PCR and Linker mediated (LM)-PCR LM-PCR
Expression of CDX1, CDX2 and CDX4 was assayed by the TaqMan RQ-PCR method in total
human BM, cord blood cells and mouse BM subpopulations. CDX1, CDX2 and CDX4 primer
and probes were used from Applied Biosystems (Assay ID; CDX1: Hs00156451_m1, CDX2:
Hs01078080_m1, CDX4: Hs01085517_m1). Quantification of CDX2 expression was performed
by real-time RQ-PCR with Applied Biosystems primers. For normalization, the TATA binding
protein (TBP) gene was used. Reactions were run in triplicates with 2.5 µl of cDNA in a total
reaction volume of 20 µl by using an ABI PRISM 7900 Sequence Detection System (Applied
Biosystems).
7
For personal use only. by guest on June 5, 2013. bloodjournal.hematologylibrary.orgFrom

For quantification of Hox gene expression in vitro, 5-FU murine BM progenitors were
transduced with MSCV-Cdx2-IRES-EYFP, MSCV-∆N-Cdx2-IRES-EGFP or MSCV-IRES-
EGFP. After transduction EGFP+ or EYFP+ cells were cultured in DMEM medium
supplemented with 15% FBS, IL3, IL6 and SCF for 24h. Expression levels of HOX genes were
determined by the RQ-PCR method as described above (Applied Biosystems) and fold
expression was determined by the CT method. For the linker-mediated PCR (LM-PCR),
integrated long-terminal repeats (LTRs) and flanking genomic sequences were amplified and
then isolated using a modification of the bubble LM-PCR strategy as previously described 13,37.
cDNA constructs and retroviral vectors
The cDNA of Cdx2 was kindly provided by D. G. Gilliland (Division of Hematology/Oncology,
Harvard Medical School, Boston) and N. Cross (Department of Haematology, Hammersmith
Hospital, London). Cloning strategies and retroviral vectors were used as described before 29.
Flow cytometry and histology
Immunophenotypic analysis of murine single cell suspensions was performed as previously
described 13. Antibodies used for FACS were labeled with phycoerythrin for Gr-1, CD11b
(Mac1), Sca-1, Ter119, CD4, CD19, and allophycocyanin conjugated CD11b (Mac-1), CD117
(c-kit), B220, and CD8 (BD Pharmingen, Heidelberg, Germany). For histological analyses,
sections of selected organs were prepared and stained at the Academic Pathology Laboratory,
GSF, Munich, using standard protocols as previously described 29.
8
For personal use only. by guest on June 5, 2013. bloodjournal.hematologylibrary.orgFrom

In vitro assays
GP+ E86 cells, NIH 3T3 cells and 293T cells were grown in DMEM medium with 10 % FBS and
1% Pen/Strep in a humidified incubator at 37° C and 5% CO2 (complete medium). Primary
murine bone marrow cells were plated in complete medium consisting of DMEM supplemented
with 15% FBS, 1% Pen/Strep, 6ng/ml IL3, 10ng/ml IL6 and 100ng/ml stem cell factor (Tebu-bio
GmbH, Offenbach, Germany). IL-3 dependent cell populations from leukemic Cdx2 mice were
cultured in vitro in RPMI 20% FBS supplemented with IL-3 (10 ng/ml). Differentiation of
clonogenic progenitors was analyzed by plating cells in methylcellulose supplemented with
cytokines (primary CFC – assays, 500 input cells per dish) (Methocult M3434, StemCell
Technologies, Vancouver, Canada). Serial CFC assays were performed by replating appropriate
aliquots of cells obtained by harvesting all of the cells present in the previous CFC assay.
Mice and retroviral infection of primary bone marrow (BM) cells
Primary mouse BM cells were transduced as previously described 29. For transduction of Cdx2,
W167A-Cdx2 and ∆N-Cdx2 cells were co-cultured in complete medium with irradiated (40Gy
from a 137
Cs γ-radiation) Cdx2, W167A-Cdx2 and ∆N-Cdx2 producer cells. All transductions
were performed with the addition of 5 μg/ml protamine sulfate.
BM transplantation and assessment of mice
Following transduction, cells were cultured in the complete medium for 48 hours. After this,
lethal irradiated (0.80 Gy) mice were transplanted with highly purified EYFP+/EYFP+ cells
alone (2.5-3 x 10⁵ cells per mouse transduced with Cdx2 and W167A-Cdx2 , 4-5 x 10⁵ cells per
mouse transduced with ∆N-Cdx2) without helper cells (FACSVantage, Becton Dickinson).
Lethally irradiated secondary recipients (0.80 Gy) were injected with 1 x 10⁶ BM cells from a
9
For personal use only. by guest on June 5, 2013. bloodjournal.hematologylibrary.orgFrom

primary diseased mouse with an equal number of non-transduced bone marrow cells from a
syngenic healthy animal.
Statistical analysis
Data were evaluated using the t-test for dependent or independent samples (SPSS). Differences
with p-values < 0.05 were considered statistically significant.
10
For personal use only. by guest on June 5, 2013. bloodjournal.hematologylibrary.orgFrom
Results
Cdx2 induced upregulation of Hox gene expression depends on its N-terminal
transactivation domain
As Cdx2 was shown to function as a positive HOX gene upstream regulator, it was analyzed
whether ectopic expression of Cdx2 induced upregulation of Hox genes in murine hematopoietic
progenitor cells. For this, Hox gene expression in murine progenitor cells isolated from 5-
fluorouracil-treated bone marrow was determined by quantitative PCR (qPCR) 24h after
successful retroviral transduction of the cells with the MSCV-Cdx2-IRES-EYFP or the MSCV-
IRES-EGFP (control) constructs. Before the qPCR analysis, cells were highly purified by
expression of EYFP or EGFP. Ectopic Cdx2 expression induced significant upregulation of Hox
genes with leukemogenic potential such as Hoxb3, Hoxb6, Hoxb8 or Hoxb9, Hoxa10, Hoxb5 and
Hoxa7. In contrast, Hoxb4 or Hoxd13 did not show any major changes in their expression levels
(Fig.1a). Thus, these results indicated that ectopic CDX2 is able to upregulate expression of
leukemogenic Hox genes in adult hematopoietic progenitors after a short time interval.
Furthermore, we also analyzed whether ectopic Cdx2 expression would alter Hox gene
expression in the progeny of clonogenic progenitors performing CFC assays in vitro: in
comparison to the EGFP control, primary colonies derived from Cdx2 transduced progenitors
showed substantial upregulation of leukemogenic Hox genes such as Hoxa7, Hoxa9, Hoxa10,
Hoxb6 and Hoxb8 (Fig.1b).
It was then tested whether deletion of this domain would affect the ability of Cdx2 to deregulate
Hox gene expression. Retroviral expression of the ∆N-Cdx2 mutant lacking the N-terminal
transactivation domain (1aa - 179aa) did not induce upregulation of Hoxb8, Hoxa9 and Hoxa10
in contrast to non-mutated Cdx2. Furthermore, deletion of the N-terminal domain clearly limited
11
For personal use only. by guest on June 5, 2013. bloodjournal.hematologylibrary.orgFrom
the ability of Cdx2 to upregulate expression of Hox genes such as Hoxa7, Hoxa9 and Hoxb3,
whereas the expression of the non-leukemogenic Hox genes Hoxb4 and Hoxd13 were not
changed by both Cdx2 constructs compared to the control (Fig.1a-b).
The transforming potential of Cdx2 is associated with its ability to perturb Hox gene
expression
To analyze whether the transforming potential of Cdx2 would correlate with its ability to perturb
Hox gene expression in normal hematopoietic progenitor cells, serial replating and in vivo
transplantation assays were performed with murine BM progenitor cells expressing Cdx2, ∆N-
Cdx2 or EGFP alone. Cells were highly purified based on EGFP or EYFP expression before
plating into methylcellulose. In the first CFC assay expression of Cdx2 resulted in a significantly
higher number of colonies compared to EGFP (138 ± 18 vs. 65 ± 11 per 500 initially plated cells,
respectively; n=8; p<0.02) and a significantly higher yield of cells generated per 500 initially
plated cells (2.2x10⁶ ± 4.4x10⁵ vs 1.6 x 10⁵± 5.2 x 10⁴, n=5; p<0.01)(Fig. 2a-b). Furthermore and
in contrast to the control, colonies expressing Cdx2 were serially replatable (at 2nd CFC assay
14000 ± 2403 vs. 374± 14 EGFP; n=8; p< 0.002) with a significant higher yield of cells
compared to the control (4.5x10⁸ ± 1.8x 10⁸ vs 7.4x10⁶ ± 4.0x10⁶ EGFP; n=8; p< 0.001) (Fig. 2a-
b). After three rounds of replating, on average 60 % (±10) of the Cdx2 expressing colonies were
classified as CFU-blasts (Fig. 2c). This was confirmed by cytospin preparations of colonies
demonstrating a primitive myelomonoblastic morphology of the clonogenic cells (Fig. 2d).
Immunophenotypic characterization of cells at that time point documented co-expression of the
myeloid markers Gr1 and Mac1 in 70% (±10) of the cells (n=3) and positivity for Sca-1 in 50%
(±7) of the cells, respectively, confirming the primitive phenotype of the colonies (Fig. 2e). Cells
12
For personal use only. by guest on June 5, 2013. bloodjournal.hematologylibrary.orgFrom

isolated from tertiary CFC assays showed unlimited growth in liquid culture supplemented with
IL3. In order to test the leukemic potential of cells isolated from tertiary CFC assays, lethally
irradiated mice were transplanted with 1x10⁶ (n=4): all the mice developed AML after a median
latency time of 8 weeks (data not shown). Thus, ectopic Cdx2 expression conferred
leukemogenic properties to hematopoietic progenitors after serial replating in vitro.
Although in the primary CFC assay expression of ∆N-Cdx2 in hematopoietic progenitor cells
increased the colony number and the yield of cells compared to the EGFP control (97±4 vs 65 ±
11 EGFP per 500 initially plated cells, respectively; n=5; p<0.03), N-terminal deletion resulted in
a significant loss of hematopoietic activity compared to Cdx2 (97±4 vs 138 ± 18; n=8;
p<0.01)(Fig.2a). In addition, hematopoietic progenitors expressing the N-terminal deleted mutant
did not achieve any serial replating capacity after the 1st round of replating or leukemogenic
potential after propagation in methylcellulose as observed for ectopic Cdx2 expression (Fig.2b).
Taken together, these data indicated that loss of the transforming activity of Cdx2 in vitro was
paralleled by its loss to upregulate expression of leukemogenic Hox genes.
To confirm the crucial role of the N-terminal transactivation domain for AML development in
vivo, murine hematopoietic progenitors constitutively expressing Cdx2 or ∆N-Cdx2 were highly
purified by EYFP+ or EGFP+ expression, respectively, and injected into lethally irradiated
recipient mice directly after sorting (2.5-3 x 10⁵ cells per mouse transduced with Cdx2 and
W167A-Cdx2 , 4-5 x 10⁵ cells per mouse transduced with ∆N-Cdx2). Mice transplanted with BM
cells expressing Cdx2 became moribund after a median of 116 days (n=25) post transplantation
(Fig.3). Furthermore, inactivation of the putative Pbx interacting site of Cdx2 (W167A-Cdx2
mutant) did not change the phenotype or the time until disease development significantly
(median latency time 172 days; n=14)(Fig.3). All the mice showed elevated peripheral white
13
For personal use only. by guest on June 5, 2013. bloodjournal.hematologylibrary.orgFrom

blood cell count, suffered from splenomegaly and were anemic. More detailed hematological
analyses demonstrated that the animals had developed AML with a high percentage of blasts in
BM, spleen and PB (table 1). Histological sections demonstrated infiltration of myeloid blasts in
multiple non-hematopoietic organs, including the testis. Immunohistochemistry showed
positivity of the blasts for myeloperoxidase and chloracetate esterase (Fig.4) and negativity for
B220 and CD3 (data not shown), indicating the myeloid nature of the blast population.
Immunophenotypic characterization of PB, BM and spleen in diseased mice confirmed the
predominance of myeloid Mac1+ and Gr-1+ cells and the reduction of lymphoid cells compared
to the EGFP control mice (Fig.5, table 1). Analysis of the clonality of the disease by Southern
blotting demonstrated different intensities and patterns of proviral signals in the different
hematopoietic organs consistent with an oligoclonal nature of the disease (Supplementary Fig.1).
Sequencing of retroviral integration sites (n=9; 3 independent transplantation experiments) in the
diseased mice transplanted with bone marrow cells expressing Cdx2 or W167A-Cdx2 did not
show any recurrent integration sites, arguing against insertional mutagenesis as a key factor in
this disease model (table 2).
In contrast, mice transplanted with hematopoietic progenitor cells expressing the ∆N-
Cdx2 (n=13) did not develop any disease in 11 of 13 cases (Fig.3-5)(table 1). Two mice
developed AML after a very long latency time of 365 and 400 days post transplantation (Fig.3).
To exclude that ∆N-Cdx2 perturbed hematopoiesis without obvious clinical symptoms three
mice without disease manifestations were sacrificed 120 days post transplantation. Engraftment
with ∆N-Cdx2 positive cells was 90% (±10) at that time point. There were no signs of
splenomegaly and the histopathology of the organs showed a normal tissue architecture (Fig. 4).
Moreover, cytospin preparations from BM and spleen showed differentiated myeloid and
14
For personal use only. by guest on June 5, 2013. bloodjournal.hematologylibrary.orgFrom

lymphoid cells and immunophenotyping did not demonstrate a myeloid infiltration in the spleen
as seen in mice transplanted with Cdx2 or the W167A mutant (Fig. 4-5). In summary, these
experiments indicated that deletion of the N-terminal transactivation domain of Cdx2 eliminates
its ability of the protein to dysregulate Hox gene expression and to transform hematopoietic
progenitors in vitro and in vivo.
CDX2 is highly expressed in AML cases with normal karyotype
As the experimental data in the murine system suggested that ectopic expression of CDX2 is
linked to dysregulated HOX gene expression in AML, we focused on patients with normal
karyotype and NPM1 mutation (NPMc+ AML), previously shown to aberrantly express HOX
genes12 (Supplementary table 1). We confirmed these data using oligonucleotide microarray
analysis and extended these findings to the patient group with normal karyotype without the
NPM1 mutation (NPMc-). A total of 24 patients with normal karyotype, 12 NPMc+ AML cases
and 12 NPMc- cases, was analyzed. Patients with normal karyotype and NPM1 mutation were
characterized by aberrant expression of multiple HOXA cluster genes such as HOXA10, HOXA9,
HOXA7 and HOXB cluster genes such as HOXB5 and HOXB6 (Figure 6a, b). However, also
NPMc- AML cases with normal karyotype showed dysregulated HOX gene expression compared
to AML cases expressing the PML-RARA (n=20) or AML1-ETO (n=20) fusion gene or compared
to normal healthy donors (n=11).
We performed unsupervised hierarchical clustering, using the expression levels of 21 genes from
the HOX gene cluster in the 64 patient samples and 11 healthy controls: in this analysis all 12
NPMc+ AML samples with normal karyotype and 9 of the 12 NPMc- samples with normal
karyotype formed one main cluster. The other main cluster consisted of all the samples with
15
For personal use only. by guest on June 5, 2013. bloodjournal.hematologylibrary.orgFrom

t(8;21) or t(15;17) translocations, the 11 normal bone marrow samples and the three NPMc-
samples with normal karyotype, which had shown no perturbation of HOX gene expression
(Supplementary table.1). Of note, only one of the 21 AML patients with normal karyotype
showed an upregulation of the MLL gene, which is known to be an upstream regulator of HOX
genes (Fig. 6a).
As AML with normal karyotype separated from the other cytogenetic AML subgroups by their
pattern of HOX gene expression, we analyzed expression of CDX2 and other members of the
CDX gene family in normal human and murine hematopoietic cells and different AML
subgroups using quantitative PCR. CDX1, CDX2 and CDX4 were not detectable in normal
human bone marrow (n=3), CD34+ human BM (n=3) and human cord blood cells (n=2). We also
could not detect the CDX2 transcript in human CD34+/CD38-, CD34+/CD38+ and CD34-/CD38+
BM cells from healthy donors in up to 45 cycles of qRT-PCR (n=3). Cdx1 and Cdx2 were also
not detectable in murine samples, whereas Cdx4 was expressed in murine BM and splenic cells
as previously reported 38 (Supplementary table 2, n=3). A total of 71 patients with normal
karyotype (AML NPMc+ = 45 cases; NPMc- = 26 cases) was analyzed for CDX2 expression.
89% of the AML NPMc+ cases showed aberrant expression of CDX2 as well as 88 % of the
cases without the NPM1 mutation (Figure 7a, table 3, Supplementary table 1). Sequencing of the
complete coding region of CDX2 in 5 patients with AML NPMc+ did not show any mutations or
deletions. To test whether FLT3 mutation would affect expression levels of CDX2 in the patients
with normal karyotype, we analyzed the four subgroups characterized by NPM1 mutation with
our without FLT3 mutation (AML NPMc+ +/- FLT3 mutation) and the NPMc- cases with or
without FLT3 mutation (AML NPMc- +/- FLT3 mutation): as illustrated in table 4 there was no
major difference in the expression level between the different patient cohorts.
16
For personal use only. by guest on June 5, 2013. bloodjournal.hematologylibrary.orgFrom

We extended this analysis to 44 patients with abnormal karyotype and detected aberrant CDX2
expression in 64% (28 out of 44) of the cases: 12 of 24 patients with the translocation
t(8;21)(q22;q22), 10 of 10 patients with the translocation t(15;17)(q22;q11), 3 of 4 patients with
inv16 and 3 of 6 patients with MLL-associated translocations showed expression of CDX2 (Fig
7b, table 3, Supplementary table 1).
Importantly, when the expression level of the CDX2 was compared between AML cases with
normal and abnormal karyotype, there was an over 14fold higher expression level in the patient
group with normal karyotype (n=42) compared to the group with aberrant karyotype
(n=28)(Ø CT 8.23 vs. Ø CT 11.66, respectively; p<0.0001). Three NPMc- cases with normal
karyotype showed the same low level of expression of CDX2 (range CT 10.55-11.55) as AML
cases with aberrant karyotype. Of note, these were the same three cases shown before to have no
perturbation of HOX gene expression and thereby falling into the same cluster as AML cases
with t(8;21) or t(15;17) according to HOX gene expression.
When the CDX2 expression level was analyzed in the different cytogenetic subgroups of patients
with aberrant karytoype, cases characterized by expression of the AML1-ETO, PML-RARA and
the CBFβ-Myh11 showed uniformly low expression levels. Interestingly, the three cases with
MLL fusion, a subgroup known to be characterized by HOX gene dysregulation, showed a higher
expression of CDX2 compared to the t(8;21) or t(15;17) cytogenetic subgroups. These data
indicated that high expression levels of CDX2 are associated with HOX gene dysregulation in
AML. To analyze whether expression of other members of the CDX gene family might be
associated with HOX gene dysregulation in patients with normal karyotype, we determined
transcription of CDX1 and CDX4 in 23 cases of this AML subgroup: in contrast to CDX2, CDX1
17
For personal use only. by guest on June 5, 2013. bloodjournal.hematologylibrary.orgFrom

and CDX4 were not detectable in any of the patients tested, pointing to a key role of CDX2 in
this patient group.
18
For personal use only. by guest on June 5, 2013. bloodjournal.hematologylibrary.orgFrom

Discussion
Leukemias are initiated by a minor fraction of leukemic stem cells (LSCs) that have maintained
or reacquired the capacity for indefinite proliferation through accumulated genetic alterations
mutations and/or epigenetic changes 39. Aberrant expression of homeobox genes, detectable in
more than every third case of acute myeloid leukemia, is thought to contribute to the infinite self-
renewal properties of LSCs. The molecular mechanisms that mediate aberrant HOX gene
expression in leukemias are known only for a minority of cases, namely those involving
rearrangements of specific HOX genes or rearrangements of the trithorax group gene MLL 14,38,40-
42. In this study we now demonstrate that the Cdx2 gene is able to upregulate several HoxA and
HoxB cluster genes such as Hoxa5, Hoxa7, Hoxa9, Hoxa10 or Hoxa8, Hoxa6 and Hoxb3
previously shown to induce AML in mice or perturb normal hematopoietic development 7,43-47.
Interestingly, Cdx2 did not change the expression of Hox genes with no reported leukemogenic
potential such as Hoxb4 or Hoxb13, suggesting that Cdx2 is able to perturb in particular
expression of Hox genes with transforming potential. Our findings are consistent with data in
non-hematopoietic cells which documented the ability of Cdx genes to alter Hox gene expression
patterns 48-50. The ability of Cdx2 to dysregulate Hox gene expression was clearly dependent on
its N-terminal transactivation domain. This is in line with data, which previously showed that the
N-terminal transactivation domain, in contrast to the portion C-terminal of the homeodomain, is
necessary for transcriptional activation of downstream target genes such as Hox genes and
directly interacts with the transcriptional co-factor CBP 51-53. Furthermore it was shown that
deletion of the N-terminal transactivation domain did not only abrogate the ability of Cdx2 to
perturb Hox gene expression but also eliminated the transforming activity of the gene in vitro
and in vivo. Particularly in serial replating assays, considered to be a surrogate test for the self-
19
For personal use only. by guest on June 5, 2013. bloodjournal.hematologylibrary.orgFrom

renewal of hematopoietic progenitors, the N-terminally deleted mutant did not transfer infinite
self–renewal properties to transduced progenitor cells as observed for Cdx2. Furthermore and in
contrast to the ∆N mutant, Cdx2 expressing cells acquired leukemia-initiating potential in
transplanted mice after serial replating. This clear difference in the transforming potential
between Cdx2 and its N-terminal deleted mutant was further confirmed by bone marrow
transplantation assays, showing rapid development of AML in Cdx2 transplanted mice in
contrast to mice transplanted with bone marrow cells expressing the ∆N mutant. Inactivation of
the putative Pbx interacting site in Cdx2, however, did not change the transforming potential of
the gene. These findings parallel data on the transforming activity of Cdx4: deletion of its N-
terminal transactivation domain but not the inactivation of the putative Pbx interacting site
resulted in loss of its hematopoietic activity and ability to perturb Hox gene expression 38. Like
Cdx2, Cdx4 upregulated leukemogenic Hox genes such as 5´-located HoxA cluster genes or
HoxB cluster genes such as Hoxb3 or Hoxb8 38. Taken together, these data indicate that the key
role of the N-terminal transactivation domain for the alteration of Hox gene expression is
conserved between the different Cdx family members. However, in the murine bone marrow
transplantation model, Cdx4 had a comparably low leukemogenic potential compared to Cdx2
with only half of the animals developing AML after a long-latency time of 300 days post
transplantation 38. The reason for this is not yet understood, but it is interesting to note that in
contrast to Cdx2, Cdx4 also upregulated Hox genes such as the non-leukemogenic Hoxb4.
Therefore it might be that ectopic expression of Cdx2 induces a more pronounced shift towards
the expression of 5´-located leukemogenic Hox genes compared to Cdx4.
Strikingly, in human AML high CDX2 expression levels were clearly correlated with perturbed
HOX gene expression: whereas ectopic expression of CDX2 was detected in AML subtypes with
20
For personal use only. by guest on June 5, 2013. bloodjournal.hematologylibrary.orgFrom

our without aberrant HOX gene expression, high transcript levels of the HOX upstream regulator
were closely associated with HOX gene dysregulation. This was in particular demonstrated for
the large group of patients with AML and normal karyotype independent of their NPM1
mutational status, counting for 50% of all cases in human AML. These cases had an more than
14fold higher expression of CDX2 compared to t(8;21) or t(15;17) positive cases. The
association of high CDX2 expression and HOX gene perturbation was further underlined by the
finding that the three NPMc- cases with low CDX2 expression did not show HOX gene
perturbation and fell into the same group as the t(8;21) or t(15;17) positive AML patients when
unsupervised clustering according to HOX gene expression was performed. Of note, in our study
expression of other members of the CDX gene family were not associated with dysregulated
HOX gene expression in human AML with normal karyotype, as all 23 samples tested were
negative for expression of CDX1 and CDX4. In a recent report Bansal et al. detected expression
of CDX4 in 3 out of 16 patients with AML and normal karyotype, indicating that expression of
CDX4 can occur in this AML subtype, but at low frequency 38.
Taking the well known role of Cdx2 as an upstream regulator of Hox genes and the close
correlation between high expression levels of CDX2 and HOX gene perturbation in human AML
into account it is intriguing to speculate that the initiation of high CDX2 expression levels might
be a key step in the development of AML with aberrant HOX gene expression. This concept
would provide a model for the biology of the large group of patients suffering from AML with
normal karyotype. Particularly in the NPMc+ cases, which are in over 95% CD34-negative,
induction of HOX gene dysregulation by high expression levels of CDX2 would be an intriguing
explanation, because in this AML subtype aberrant HOX gene expression cannot be explained by
the accumulation of CD34-positive myeloid blasts, which also express high levels of multiple
21
For personal use only. by guest on June 5, 2013. bloodjournal.hematologylibrary.orgFrom

Hox genes during normal hematopoiesis. Our data are in line with a most recent report, which
also analyzed the role of ectopic CDX2 in human AML 54: based on the observation that high-
level amplification of the CDX2 locus can occur in AML patients with complex karyotype, AML
cases with aberrant and normal karyotype were evaluated for ectopic CDX2 expression. As in
our data set, the vast majority of patients with normal karyotype or translocation t(15;17) showed
ectopic expression of CDX2. In contrast to our data in which 12 of the 24 AML1-ETO cases
were negative for CDX2, 8 of the 10 cases reported by Scholl et al. were positive. Consistent
with the presented data this report also documented that expression levels substantially vary
between different genetically defined AML subgroups, but did not correlate CDX2 expression
levels with HOX gene deregulation in AML.
Of note, in the report by Scholl et al., Cdx2 was able to upregulate HoxB8 transcript levels,
however, to a much lesser extent compared to the upregulation of HoxB8 observed in this study.
Furthermore, the authors did not see any change in expression of leukemogenic HoxA cluster
genes such as HoxA9. In addition, Hox genes associated with leukemogenesis such as HoxA10 or
HoxB3 were even downregulated compared to the control 54. In contrast, this study could
demonstrate that Cdx2 expression is associated with upregulation of leukemogenic Hox genes in
the murine experimental system as well as in patients with AML. Interestingly, recent data
described upregulation of HOXA9, HOXA2 and HOXA7 after stable transfection of the
esophageal squamous epithelial cell line HET1A with CDX2 and increased CDX2 and HOX gene
expression in primary tissues of patients suffering from esophageal cancer 50,55. This suggests
that CDX2 induced upregulation of leukemogenic HOX genes might be a common mechanism in
the development of cancer.
22
For personal use only. by guest on June 5, 2013. bloodjournal.hematologylibrary.orgFrom

However, despite the intriguing correlation between the expression levels of CDX2 and
perturbed HOX gene expression in human AML, it is still uncertain to which extent the observed
deregulation of this gene family is caused by CDX2: thus, although the transcript levels of CDX2
were comparable between NPMc+ and NPMc- cases, there was generally a higher expression
level of individual HOX genes in cases with NPM1 mutation. Therefore, other not yet defined
mechanisms might be responsible for HOX gene perturbation in these cases. Another aspect is
that most probably CDX2 is not exerting its transforming activity solely through induction of
aberrant HOX gene expression. Another key question is how the ectopic expression of CDX2 is
induced in human AML. Analyses of the promoter region of CDX2 in patients with AML did not
show any mutations or hypomethylation as an explanation for the aberrant expression of the gene
54. Another possible explanation could be that constitutive activation of upstream regulators of
CDX2 would induce high expression levels of the gene in human AML. It was shown that Cdx
genes are upstream regulated by the Wnt/β-catenin signaling pathway, the retinoic acid signaling
pathway, and the FGF pathway 56-58.
Taken together, our data underline that aberrant expression of CDX2 is widespread in
human AML. In addition, they show that high expression of this gene closely correlates with
aberrant HOX gene expression in AML patients, supporting a model in which CDX2 plays an
important role in the development of AML with dysregulated HOX gene expression.
23
For personal use only. by guest on June 5, 2013. bloodjournal.hematologylibrary.orgFrom

Acknowledgements:
We want to thank Bianka Ksienzyk and Nicole Behm for their excellent technical assistance and
the members of the GSF animal facility for excellent breeding and maintenance of animals.
Furthermore, we want to thank B. Falini for his fruitful discussions. V.P.S.R. and C.B. and their
work were supported by a grant of the DFG (SFB 684 project A7), M.F.B by the Deutsche
Krebshilfe (70-2968-Fe I to M.F.B.) and C.B. and M.F.B. by the Bundesministerium für Bildung
und Forschung (NGFN2 grant 01GS0448).
Author contributions:
V.P.S.R: Designed and performed experiments, wrote the manuscript; S.T, V.M.N, N.A, K.P,
K.S: performed experiments; B.H, K.M, S.K.B, A.D: performed data analysis; L.Q-M:
performed the histopathology; W.H, M.F-B: Designed experiments; C.B: Designed the study and
wrote the manuscript
The authors declare no competing financial interests.
24
For personal use only. by guest on June 5, 2013. bloodjournal.hematologylibrary.orgFrom

Figure Legends:
Figure 1. Aberrant expression of Cdx2 upregulates Hox gene expression in murine bone
marrow progenitors
a) Fold expression levels of Hox genes in murine bone marrow (BM) progenitors induced by
ectopic expression of Cdx2 or the ∆N-Cdx2 mutant (∆N) referred to the expression level in BM
progenitors transduced with the EGFP control vector 48h after the end of transduction. b) Fold
expression levels of Hox genes in primary colonies expressing Cdx2, ∆N-Cdx2 or the empty
control vector (EGFP). The fold expression was calculated by the CT method, based on the
expression level of the Hox genes in cells transduced with the EGFP control (* expression of
Hoxb6 and Hoxb8 were not detectable in EGFP control cells).
Figure 2. Cdx2 confers self-renewal properties to murine 5-FU BM progenitors
a) Serial replating capacity of BM progenitors constitutively expressing Cdx2, ∆N-Cdx2 or the
empty control vector (EGFP). b) Yield of cells generated in the serial replating assays of BM
progenitors constitutively expressing Cdx2, ∆N-Cdx2 or the empty control vector (EGFP). c)
Morphology of colonies obtained from Cdx2, ∆N-Cdx2 and EGFP expressing BM cells in
replating assays d) Blast morphology of cells after the 4th replating (May-Grunwald-Giemsa
stained cytospin preparations) e) Co-expression of the myeloid markers Gr1 and Mac1 on Cdx2
positive cells obtained from the 4th round of replating. p = plating
25
For personal use only. by guest on June 5, 2013. bloodjournal.hematologylibrary.orgFrom

Figure 3. Survival of transplanted mice
Survival curves of mice transplanted with BM cells expressing Cdx2 (n=25), the W167A-CDX2
mutant (n=14) or the ∆N-Cdx2 mutant (n=13). The control group was transplanted with BM
infected with the EGFP control retrovirus (n=10). The survival time of secondary recipient mice,
transplanted with BM from diseased primary animals from the Cdx2 or W167A-CDX2 cohort is
indicated. Tx = transplantation
Figure 4. Histology of transplanted mice
Immunohistological analyses of different organs of a representative leukemic Cdx2 or W167A-
Cdx2 mouse compared to a healthy animal from the ∆N-Cdx2 cohort. The spleen (Giemsa
staining, x 640) of the analyzed Cdx2 and W167A-Cdx2 animals shows an infiltration with blast
cells in contrast to the ∆N-Cdx2 transplanted animal. The liver of the Cdx2 and W167A-Cdx2
mice demonstrates perivascular infiltration with leukemic cells. Positivity for myeloperoxidase
(MPO) and chloracetate esterase (CAE) confirmed the myeloid nature of the cells (100x and
400x). May-Grunwald-Giemsa stained cytospin preparations of cells isolated from the spleen
(640x) or BM (1000x) of ∆N-Cdx2 transplanted mice show mature lymphoid and myeloid cells,
respectively.
LN = lymph node; RP = red pulp; WP = white pulp, MPO = myeloperoxidase, CAE =
chloracetate esterase
Figure 5. Immunophenotype of cells isolated from the spleen of transplanted mice
Expression of the myeloid markers Gr1 and Mac1 and the lymphoid marker B220 on cells
isolated from the spleen of representative animals transplanted with BM cells transduced with
26
For personal use only. by guest on June 5, 2013. bloodjournal.hematologylibrary.orgFrom

different constructs as indicated. The proportion of positive cells within the EGFP+ or EYFP+
compartment is indicated.
Figure 6. Hierarchically clustering of CDX2 positive AML samples according to HOX gene
expression
a) Unsupervised hierarchical clustering according to HOX gene expression demonstrates HOX
gene deregulation in patients with normal karyotype with or without NPM1 mutation compared
to samples with abnormal karyotype or normal bone marrow samples. The red arrows highlight
the boundary between the two main clusters. The genes and samples were permutated. b)
Expression of individual HOX genes in CDX2 positive AML samples with normal and abnormal
karyotype. Log expression levels of 6 different HOX genes in 75 clinical samples are shown in
‘Box-and-whisker-plots’. Expression was determined by Affymetrix HGU-133 A & B
microarrays. The plots show the normalized expression values in normal bone marrow samples
(n=11), AML with t(8;21)(n=20), AML with t(15;17)(n=20) and AML with normal karyotype
with (n=12) and without NPM1 mutation (n=12). The bar indicates the median expression levels,
the box shows the 25th and 75th percentile, while the whiskers show the maximum and minimum
values. Outliers (values that are more than 1.5 interquartile ranges above the 75th or below the
25th percentile) are represented by open circles.
Figure 7. Quantification of CDX2 expression in AML patients by RQ-PCR
a) Expression levels of CDX2 in AML patients with a normal karyotype with (NPMc+) or
without NPM1 mutation (NPMc-) or b) in different AML subgroups with abnormal karyotype. A
total of 115 samples were analyzed. The number of cases which were positive for CDX2
27
For personal use only. by guest on June 5, 2013. bloodjournal.hematologylibrary.orgFrom

expression and were therefore evaluated for expression levels are indicated. ΔCT values were
obtained by normalization for the housekeeping gene TBP, the mean values (+ SD) are shown.
The expression level of the gene is inversely correlated with the CT value.
28
For personal use only. by guest on June 5, 2013. bloodjournal.hematologylibrary.orgFrom

References:
1. Rowley JD. The critical role of chromosome translocations in human leukemias. Annu Rev
Genet. 1998;32:495-519.
2. Golub TR, Slonim DK, Tamayo P, et al. Molecular classification of cancer: class discovery
and class prediction by gene expression monitoring. Science. 1999;286:531-537.
3. Armstrong SA, Staunton JE, Silverman LB, et al. MLL translocations specify a distinct
gene expression profile that distinguishes a unique leukemia. Nat Genet. 2002;30:41-47.
4. Debernardi S, Lillington DM, Chaplin T, et al. Genome-wide analysis of acute myeloid
leukemia with normal karyotype reveals a unique pattern of homeobox gene expression
distinct from those with translocation-mediated fusion events. Genes Chromosomes Cancer.
2003;37:149-158.
5. Buske C, Humphries RK. Homeobox genes in leukemogenesis. Int J Hematol.
2000;71:301-308.
6. Thorsteinsdottir U, Kroon E, Jerome L, Blasi F, Sauvageau G. Defining roles for HOX and
MEIS1 genes in induction of acute myeloid leukemia. Mol Cell Biol. 2001;21:224-234.
7. Buske C, Feuring-Buske M, Antonchuk J, et al. Overexpression of HOXA10 perturbs
human lymphomyelopoiesis in vitro and in vivo. Blood. 2001;97:2286-2292.
8. Sauvageau G, Lansdorp PM, Eaves CJ, et al. Differential expression of homeobox genes in
functionally distinct CD34+ subpopulations of human bone marrow cells. Proc Natl Acad
Sci U S A. 1994;91:12223-12227.
9. Abramovich C, Pineault N, Ohta H, Humphries RK. Hox genes: from leukemia to
hematopoietic stem cell expansion. Ann N Y Acad Sci. 2005;1044:109-116.
29
For personal use only. by guest on June 5, 2013. bloodjournal.hematologylibrary.orgFrom
10. Okada Y, Jiang Q, Lemieux M, Jeannotte L, Su L, Zhang Y. Leukaemic transformation by
CALM-AF10 involves upregulation of Hoxa5 by hDOT1L. Nat Cell Biol. 2006;8:1017-
1024.
11. Kohlmann A, Schoch C, Dugas M, et al. New insights into MLL gene rearranged acute
leukemias using gene expression profiling: shared pathways, lineage commitment, and
partner genes. Leukemia. 2005;19:953-964.
12. Alcalay M, Tiacci E, Bergomas R, et al. Acute myeloid leukemia bearing cytoplasmic
nucleophosmin (NPMc+ AML) shows a distinct gene expression profile characterized by
up-regulation of genes involved in stem-cell maintenance. Blood. 2005;106:899-902.
13. Deshpande AJ, Cusan M, Rawat VP, et al. Acute myeloid leukemia is propagated by a
leukemic stem cell with lymphoid characteristics in a mouse model of CALM/AF10-
positive leukemia. Cancer Cell. 2006;10:363-374.
14. Slany RK. When epigenetics kills: MLL fusion proteins in leukemia. Hematol Oncol.
2005;23:1-9.
15. Verhaak RG, Goudswaard CS, van Putten W, et al. Mutations in nucleophosmin (NPM1) in
acute myeloid leukemia (AML): association with other gene abnormalities and previously
established gene expression signatures and their favorable prognostic significance. Blood.
2005;106:3747-3754.
16. Falini B, Nicoletti I, Martelli MF, Mecucci C. Acute myeloid leukemia carrying
cytoplasmic/mutated nucleophosmin (NPMc+ AML): biologic and clinical features. Blood.
2007;109:874-885.
30
For personal use only. by guest on June 5, 2013. bloodjournal.hematologylibrary.orgFrom

17. Brooke NM, Garcia-Fernandez J, Holland PW. The ParaHox gene cluster is an evolutionary
sister of the Hox gene cluster. Nature. 1998;392:920-922.
18. Chawengsaksophak K, de Graaff W, Rossant J, Deschamps J, Beck F. Cdx2 is essential for
axial elongation in mouse development. Proc Natl Acad Sci U S A. 2004;101:7641-7645.
19. Mlodzik M, Gehring WJ. Expression of the caudal gene in the germ line of Drosophila:
formation of an RNA and protein gradient during early embryogenesis. Cell. 1987;48:465-
478.
20. Charite J, de Graaff W, Consten D, Reijnen MJ, Korving J, Deschamps J. Transducing
positional information to the Hox genes: critical interaction of cdx gene products with
position-sensitive regulatory elements. Development. 1998;125:4349-4358.
21. Gehring WJ. Homeo boxes in the study of development. Science. 1987;236:1245-1252.
22. Davidson AJ, Ernst P, Wang Y, et al. cdx4 mutants fail to specify blood progenitors and
can be rescued by multiple hox genes. Nature. 2003;425:300-306.
23. Suh E, Traber PG. An intestine-specific homeobox gene regulates proliferation and
differentiation. Mol Cell Biol. 1996;16:619-625.
24. Satoh K, Mutoh H, Eda A, et al. Aberrant expression of CDX2 in the gastric mucosa with
and without intestinal metaplasia: effect of eradication of Helicobacter pylori. Helicobacter.
2002;7:192-198.
25. Ishikawa A, Sasaki M, Ohira S, et al. Aberrant expression of CDX2 is closely related to the
intestinal metaplasia and MUC2 expression in intraductal papillary neoplasm of the liver in
hepatolithiasis. Lab Invest. 2004.
31
For personal use only. by guest on June 5, 2013. bloodjournal.hematologylibrary.orgFrom

26. Eda A, Osawa H, Satoh K, et al. Aberrant expression of CDX2 in Barrett's epithelium and
inflammatory esophageal mucosa. J Gastroenterol. 2003;38:14-22.
27. Silberg DG, Sullivan J, Kang E, et al. Cdx2 ectopic expression induces gastric intestinal
metaplasia in transgenic mice. Gastroenterology. 2002;122:689-696.
28. Chase A, Reiter A, Burci L, et al. Fusion of ETV6 to the caudal-related homeobox gene
CDX2 in acute myeloid leukemia with the t(12;13)(p13;q12). Blood. 1999;93:1025-1031.
29. Rawat VP, Cusan M, Deshpande A, et al. Ectopic expression of the homeobox gene Cdx2 is
the transforming event in a mouse model of t(12;13)(p13;q12) acute myeloid leukemia.
Proc Natl Acad Sci U S A. 2004;101:817-822.
30. Bennett JM, Catovsky D, Daniel MT, et al. Proposed revised criteria for the classification
of acute myeloid leukemia. A report of the French-American-British Cooperative Group.
Ann Intern Med. 1985;103:620-625.
31. Schnittger S, Weisser M, Schoch C, Hiddemann W, Haferlach T, Kern W. New score
predicting for prognosis in PML-RARA+, AML1-ETO+, or CBFBMYH11+ acute myeloid
leukemia based on quantification of fusion transcripts. Blood. 2003;102:2746-2755.
32. Schnittger S, Schoch C, Dugas M, et al. Analysis of FLT3 length mutations in 1003 patients
with acute myeloid leukemia: correlation to cytogenetics, FAB subtype, and prognosis in
the AMLCG study and usefulness as a marker for the detection of minimal residual disease.
Blood. 2002;100:59-66.
33. Haferlach T, Kohlmann A, Schnittger S, et al. Global approach to the diagnosis of leukemia
using gene expression profiling. Blood. 2005;106:1189-1198.
32
For personal use only. by guest on June 5, 2013. bloodjournal.hematologylibrary.orgFrom

34. Gentleman RC, Carey VJ, Bates DM, et al. Bioconductor: open software development for
computational biology and bioinformatics. Genome Biol. 2004;5:R80.
35. Huber W, von Heydebreck A, Sultmann H, Poustka A, Vingron M. Variance stabilization
applied to microarray data calibration and to the quantification of differential expression.
Bioinformatics. 2002;18 Suppl 1:S96-104.
36. Scheid S, Spang R. A stochastic downhill search algorithm for estimating the local false
discovery rate. IEEE/ACM Trans Comput Biol Bioinform. 2004;1:98-108.
37. Imren S, Fabry ME, Westerman KA, et al. High-level beta-globin expression and preferred
intragenic integration after lentiviral transduction of human cord blood stem cells. J Clin
Invest. 2004;114:953-962.
38. Bansal D, Scholl C, Frohling S, et al. Cdx4 dysregulates Hox gene expression and generates
acute myeloid leukemia alone and in cooperation with Meis1a in a murine model. Proc Natl
Acad Sci U S A. 2006;103:16924-16929.
39. Passegue E, Weisman IL. Leukemic stem cells: where do they come from? Stem Cell Rev.
2005;1:181-188.
40. Armstrong SA, Golub TR, Korsmeyer SJ. MLL-rearranged leukemias: insights from gene
expression profiling. Semin Hematol. 2003;40:268-273.
41. Nakamura T, Largaespada DA, Lee MP, et al. Fusion of the nucleoporin gene NUP98 to
HOXA9 by the chromosome translocation t(7;11)(p15;p15) in human myeloid leukaemia.
Nat Genet. 1996;12:154-158.
33
For personal use only. by guest on June 5, 2013. bloodjournal.hematologylibrary.orgFrom

42. Pineault N, Buske C, Feuring-Buske M, et al. Induction of acute myeloid leukemia in mice
by the human leukemia-specific fusion gene NUP98-HOXD13 in concert with Meis1.
Blood. 2003;101:4529-4538.
43. Knoepfler PS, Sykes DB, Pasillas M, Kamps MP. HoxB8 requires its Pbx-interaction motif
to block differentiation of primary myeloid progenitors and of most cell line models of
myeloid differentiation. Oncogene. 2001;20:5440-5448.
44. Crooks GM, Fuller J, Petersen D, et al. Constitutive HOXA5 expression inhibits
erythropoiesis and increases myelopoiesis from human hematopoietic progenitors. Blood.
1999;94:519-528.
45. Sauvageau G, Thorsteinsdottir U, Hough MR, et al. Overexpression of HOXB3 in
hematopoietic cells causes defective lymphoid development and progressive
myeloproliferation. Immunity. 1997;6:13-22.
46. Thorsteinsdottir U, Sauvageau G, Hough MR, et al. Overexpression of HOXA10 in murine
hematopoietic cells perturbs both myeloid and lymphoid differentiation and leads to acute
myeloid leukemia. Mol Cell Biol. 1997;17:495-505.
47. Fischbach NA, Rozenfeld S, Shen W, et al. HOXB6 overexpression in murine bone marrow
immortalizes a myelomonocytic precursor in vitro and causes hematopoietic stem cell
expansion and acute myeloid leukemia in vivo. Blood. 2005;105:1456-1466.
48. Subramanian V, Meyer BI, Gruss P. Disruption of the murine homeobox gene Cdx1 affects
axial skeletal identities by altering the mesodermal expression domains of Hox genes. Cell.
1995;83:641-653.
34
For personal use only. by guest on June 5, 2013. bloodjournal.hematologylibrary.orgFrom

49. Suh E, Chen L, Taylor J, Traber PG. A homeodomain protein related to caudal regulates
intestine-specific gene transcription. Mol Cell Biol. 1994;14:7340-7351.
50. Liu T, Zhang X, So CK, et al. Regulation of Cdx2 expression by promoter methylation, and
effects of Cdx2 transfection on morphology and gene expression of human esophageal
epithelial cells. Carcinogenesis. 2007;28:488-496.
51. Calon A, Gross I, Davidson I, et al. Functional interaction between the homeoprotein CDX1
and the transcriptional machinery containing the TATA-binding protein. Nucleic Acids
Res. 2007;35:175-185.
52. Taylor JK, Levy T, Suh ER, Traber PG. Activation of enhancer elements by the homeobox
gene Cdx2 is cell line specific. Nucleic Acids Res. 1997;25:2293-2300.
53. Lorentz O, Suh ER, Taylor JK, Boudreau F, Traber PG. CREB-binding protein interacts
with the homeodomain protein Cdx2 and enhances transcriptional activity. J Biol Chem.
1999;274:7196-7199.
54. Scholl C, Bansal D, Dohner K, et al. The homeobox gene CDX2 is aberrantly expressed in
most cases of acute myeloid leukemia and promotes leukemogenesis. J Clin Invest. 2007.
55. Takahashi O, Hamada J, Abe M, et al. Dysregulated expression of HOX and ParaHOX
genes in human esophageal squamous cell carcinoma. Oncol Rep. 2007;17:753-760.
56. Simon M, Grandage VL, Linch DC, Khwaja A. Constitutive activation of the Wnt/beta-
catenin signalling pathway in acute myeloid leukaemia. Oncogene. 2005;24:2410-2420.
57. Karajannis MA, Vincent L, Direnzo R, et al. Activation of FGFR1beta signaling pathway
promotes survival, migration and resistance to chemotherapy in acute myeloid leukemia
cells. Leukemia. 2006;20:979-986.
35
For personal use only. by guest on June 5, 2013. bloodjournal.hematologylibrary.orgFrom

36
58. Piazza F, Gurrieri C, Pandolfi PP. The theory of APL. Oncogene. 2001;20:7216-7222.
For personal use only. by guest on June 5, 2013. bloodjournal.hematologylibrary.orgFrom

Table 1. Hematological parameters of experimental mice
Retroviral Total No. of
Day RBC/ml WBC/ml Spleen BM Spleen PB
Lymphoid/
Myeloid Ratio
construct mice analyzed
of sacrifice
(median) x109 x106 Weight (mg) % blasts % blasts % blasts in PB
EGFP 6 123.5 (85 – 127)* 5.67±0.93 3.37±2.61 156± 59# 0 0 0 5 : 1
Cdx2 15
111 (37 – 229) 1.22±0.43 22.87±14.68 546±195 45 ±15 38 ±15 18± 10 2 : 1
W167A 6 128.5 (46 – 381) 0.93±0.35 33.5±32.25 516±233 50± 12 34± 9 27± 2 2 : 1
∆N-Cdx2 3 330 (309-350) 4.4±0.75 5.3±1.42 210±90 6 0 0 4 : 1
* 4 of 6 healthy EGFP mice were sacrificed for analysis. 2 of the 6 control mice were analyzed by bone marrow biopsy and bleeding. # Average weight from 4 EGFP mice.
37
F
or personal use only. by guest on June 5, 2013.
bloodjournal.hematologylibrary.org
From

Table 2. Identity of retroviral integration sites in diseased mice.
No. Gene Description Genomic location
Experimental group (mouse number)
1 Intron of A930004K21Rik between Exon 2
and 3 n.a. 2E5 3438 B1
2 Intron of D930015E06Rik between Exon 26
and 27 n.a. 3F1 3432 B1 3 Intergenic region 11B1.3 3998 B3
4 Intron of PhC2 between Exon 8 and 9 'Polycomb' group
(PcG) genes 4D2.2 3998 B3 5 Intergenic region n.a. 2B 3998 B4 6 Intron of Armc2 between Exon 1 and 2 n.a. 10B2 3478 B2-1
7 Intergenic region Armadillo repeat
containing 2 6A3.3 * 3478 B2 -2
8 Intron of Pag1 between Exon 1 and 2
Phosphoprotein associated with
glycosphingolipid-enriched microdomains
1; pag1 3A1 * 3478 B2 -3
9 Exon 1 of Pigb Phosphatidylinositol
glycan, class b 9D 4057A Identified in or near regions (~50 kb) described as common integration sites (CIS) in the RTCGD database (http://rtcgd.ncifcrf.gov./) n.a. = not applicable
38
F
or personal use only. by guest on June 5, 2013.
bloodjournal.hematologylibrary.org
From

Table 3. Ectopic expression of CDX2
Diagnosis Group of Patients
Total number of sample tested
for CDX2 transcript
No of CDX2 positive samples % positive samples
AML NK, NPM1c+ 45 40 89
NK, NPM1c- 26 23 88
AML1-ETO 24 12 50
PML-RARα 10 10 100
MLL fusions 6 3 50
Inv16 4 3 75
Percentage of patients positive for CDX2. NK = normal karyotype.
39
F
or personal use only. by guest on June 5, 2013.
bloodjournal.hematologylibrary.org
From

Table 4. Expression level of CDX2 in patients with AML and normal karyotype (NK)
AML-NK Subgroup Analysis Average ΔCT ± SD
NPM+/FLT3+
8.26 ± 2.84
NPM+/FLT3-
7.74 ± 2.27
NPM-/FLT3+
7.27 ± 2.91
NPM-/FLT3-
7.18 ± 2.48
NK = normal karyotype; FLT3 = FLT3 mutation
40
F
or personal use only. by guest on June 5, 2013.
bloodjournal.hematologylibrary.org
From

Figure 1a
* *
*
*
-1,00-0,500,000,501,001,502,002,503,003,504,00
Hoxa1
Hoxa5
Hoxa7
Hoxa9
Hoxa10
Hoxb3
Hoxb4
Hoxb6
Hoxb8
Hoxd13
Meis1
Fold
exp
ress
ion
rela
tive
to E
GFP
con
trol
lo
g10
Cdx2ΔN-Cdx2
F
or personal use only. by guest on June 5, 2013.
bloodjournal.hematologylibrary.org
From
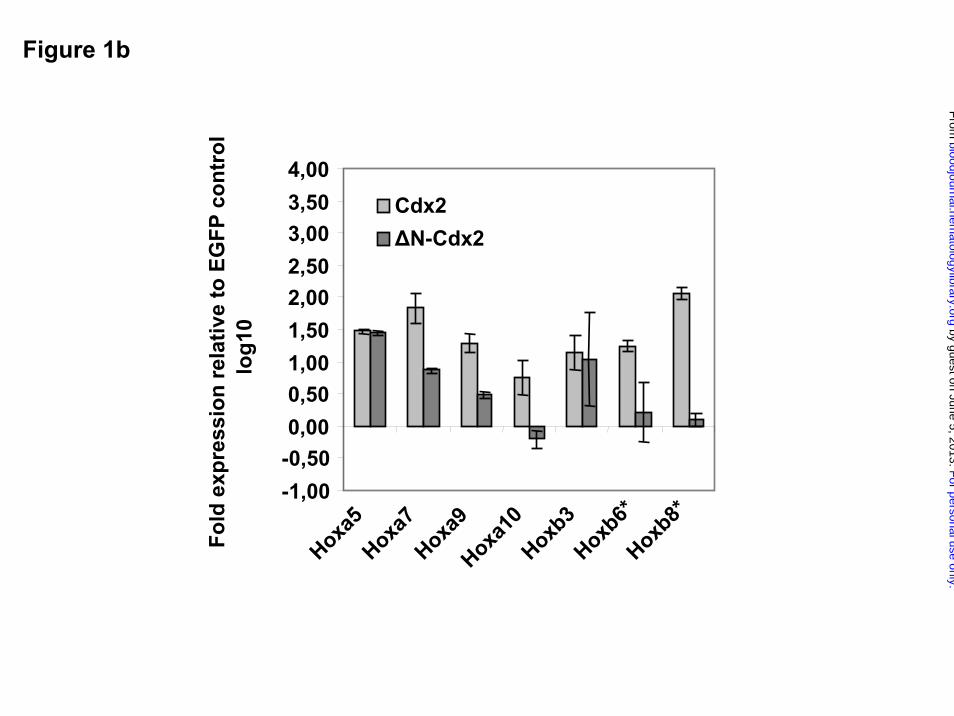
Figure 1b
*
*
*
*
-1,00-0,500,000,501,001,502,002,503,003,504,00
Hoxa5
Hoxa7
Hoxa9
Hoxa10
Hoxb3
Hoxb6*
Hoxb8*
Fold
exp
ress
ion
rela
tive
to E
GFP
con
trol
log1
0
Cdx2ΔN-Cdx2
F
or personal use only. by guest on June 5, 2013.
bloodjournal.hematologylibrary.org
From

Figure 2
e)
Mac
1 A
PC
Gr1 PE
65%
d)
110
100102
103
104
105
106
107
108
1p 2p 3p 4p
Cdx2
ΔN-Cdx2
EGFP
Tota
l No.
of c
ells
/500
inp
utce
lls
a) b)
010
100103104105106107108109101010111012
No.
of C
FC/5
00 i
nput
cells
in p
rimar
ypl
atin
g
1p 2p 3p 4p
Cdx2 ΔN-Cdx2
EGFP
1p CFC 2p CFC 4p CFC
c)
50XCdx2
50XN-Cdx2
EGFP 50X
F
or personal use only. by guest on June 5, 2013.
bloodjournal.hematologylibrary.org
From

% o
f Sur
viva
l
0 100 200 300 4000
20
40
60
80
100
W167A
Cdx2
2tx Cdx22tx W167A
∆N-Cdx2
EGFP (N=10) Cdx2 (N=25) W167A (N=14) ∆N-Cdx2 (N=13) 2tx Cdx2 2tx W167A
Figure 3
Days after transplantation
F
or personal use only. by guest on June 5, 2013.
bloodjournal.hematologylibrary.org
From

Cdx2 W167ACdx2 W167ACdx2 W167A
Spleen 640x
Cdx2 W167A ∆N-Cdx2
BM 1000X
Spleen 640x
Figure 4
F
or personal use only. by guest on June 5, 2013.
bloodjournal.hematologylibrary.org
From

Figure 5
Gr1
Mac1
B220
W167A ∆N-Cdx2 Cdx2 EGFP
1111
9393
9292 1212
3131
99
171717
848484
R295959595
4545
161616
1515
EGFP/EYFP F
or personal use only. by guest on June 5, 2013.
bloodjournal.hematologylibrary.org
From

Figure 6a
F
or personal use only. by guest on June 5, 2013.
bloodjournal.hematologylibrary.org
From

Figure 6b
F
or personal use only. by guest on June 5, 2013.
bloodjournal.hematologylibrary.org
From

F
or personal use only. by guest on June 5, 2013.
bloodjournal.hematologylibrary.org
From

Figure 7
0.02.04.06.08.0
10.012.014.016.0
AML1-ETO
(n=12)
PML-RARA(n=10)
MLL(n=3)
Inv16(n=3)
CT
(TB
P)
b)a)
0,02,04,06,08,0
10,012,014,016,0
normalkaryotype
(n=63)
NPMc+
(n=40)NPMc-
(n=23)
ΔC
T (T
BP)
F
or personal use only. by guest on June 5, 2013.
bloodjournal.hematologylibrary.org
From
Copyright © 2022 FDOKUMEN