Identification of MAMDC1 as a Candidate Susceptibility Gene for Systemic Lupus Erythematosus (SLE
Upload
independentCategory
view
0download
0
373
OMICS A Journal of Integrative Biology Volume 7 Number 4 2003copy Mary Ann Liebert Inc
Continuous-Time Identification of Gene Expression Models
DANIEL E ZAK1 RONALD K PEARSON2 RAJANIKANTH VADIGEPALLI2
GREGORY E GONYE2 JAMES S SCHWABER2 and FRANCIS J DOYLE III3
ABSTRACT
One objective of systems biology is to create predictive quantitative models of the tran-scriptional regulation networks that govern numerous cellular processes Gene expressionmeasurements as provided by microarrays are commonly used in studies that attempt toinfer the regulation underlying these processes At present most gene expression models thathave been derived from microarray data are based in discrete-time which have limited ap-plicability to common biological data sets and may impede the integration of gene expres-sion models with other models of biological processes that are formulated as ordinary dif-ferential equations (ODEs) To overcome these difficulties a continuous-time approach forprocess identification to identify gene expression models based in ODEs was developed Theapproach utilizes the modulating functions method of parameter identification The methodwas applied to three simulated systems (1) a linear gene expression model (2) an autoreg-ulatory gene expression model and (3) simulated microarray data from a nonlinear tran-scriptional network In general the approach was well suited for identifying models of geneexpression dynamics capable of accurately identifying parameters for small numbers of datasamples in the presence of modest experimental noise Additionally numerous insights aboutgene expression modeling were revealed by the case studies
INTRODUCTION
AFUNDAMENTAL GOAL OF SYSTEMS BIOLOGY is to understand quantitatively the logic and behavior of thetranscriptional regulatory networks that govern diverse cellular functions This process involves both
the construction and analysis of system-wide quantitative models of gene expression dynamics These mod-els of gene expression dynamics describe how inputs (eg transcription factor [TF] levels perturbations)influence transcriptional outputs (mRNA levels of various genes) over time The present work is concernedwith a key step in the process of constructing these models the estimation of their parameters This processis referred to in the present work as the identification of the models rather than modeling to make refer-
1Department of Chemical Engineering University of Delaware Newark Delaware2Daniel Baugh Institute for Functional Genomics and Computational Biology Department of Pathology Cell Biol-
ogy and Anatomy Thomas Jefferson University Philadelphia Pennsylvania3Department of Chemical Engineering University of California Santa Barbara CaliforniaOnline supplementary material available at wwwdbitjuedudbipublicationsomics03
ence to process identification Process identification is distinct from process modeling in that the formerinvolves the construction of empirical black-box models from the experimental data whereas the latter isconcerned with the development of models from fundamental physical principles (Ogunnaike and Ray1994 Ljung 1999) The present work is concerned with models that can be feasibly identified from sys-tem-wide measures of gene expression such as microarray data (cDNA and oligonucleotide arrays) Giventhat such data is characteristically limited to a few measurements per gene and is often corrupted by ex-perimental noise the models to be identified must be relatively simple An effort is made however to in-clude key features such as saturating nonlinearities and transcript degradation For this reason the modelsof the present work can be considered gray box models (Pearson and Pottman 2000) in that fundamentalunderstanding of gene expression is combined with empirical aspects to yield models that are well suitedto the data
Numerous groups have studied the dynamical properties of transcriptional regulatory networks and manyof these modeled gene expression as a continuous-time biochemical process expressed in ordinary differ-ential equations (ODEs) (Hargrove et al 1991 Goldbeter 1996 Smolen et al 1998 Cherry and Adler2000 De Jong 2002 Isaacs et al 2003) Similarly models of signal transduction pathways that may ul-timately be linked to gene expression models have been routinely formulated as sets of ODEs (Chen et al2000 Kholodenko et al 1999) ODEs provide a convenient framework to represent gene expression andsignaling given the wide array of analysis tools that are available such as DASSLDASPK (Maly and Pet-zold 1996) and MATLAB (Shampine and Reichelt 1997) A contrary trend however has been seen instudies that identify gene expression models from microarray data In these studies the models with fewexceptions (Chen et al 1999 Yeung et al 2002 Wahde and Hertz 2000) have been formulated often asdiscrete-time gray box models where time is not a continuous variable but rather one that moves forwardin finite steps (DrsquoHaeseleer et al 1999 Weaver et al 1999 Wessels et al 2001 Hartemink et al 2002)The use of a distinct framework for microarray-derived gene expression models disconnects gene expres-sion from other cellular processes that may ultimately lead to difficulty in integrating whole-cell modelsDiscrete-time models of gene expression suffer from other difficulties Exponentially spaced sampling ratherthan uniform sampling is often employed in biological experiments in an attempt to determine the orderof magnitude of the time required to exhibit a significant response Discrete-time models may not be read-ily identified from exponentially sampled data Additionally computational models of biochemical processesoften are assembled from multiple data sets that may not have been collected at a single sampling rate fur-ther complicating discrete approaches for creating integrated models Given these tendencies for biologicaldata to be asynchronous and for biological models to be constructed from multiple data sources continu-ous-time models that are robust to how the data is collected are preferable to discrete-time models that arenot Other arguments for continuous-time models of gene expression are that with some exceptions(McAdams and Arkin 1999) the physical principles that govern gene expression are most commonly for-mulated in continuous-time that discrete-time models may exhibit undue sensitivity to parameters in com-parison to continuous-time models (Unbehauen and Rao 1998) and that nonlinear discrete-time modelsmay have very different qualitative character (eg chaos multiplicity) from continuous-time systems (Un-behauen and Rao 1998 Pearson 1999)
Following the above arguments the present work is specifically concerned with the identification of con-tinuous-time models of gene expression from gene expression time course data The present work differsfrom previous continuous-time gene expression model identification efforts in that the method that is em-ployed neither involves the direct estimation of derivatives from data (Ronen et al 2002 Yeung et al2002) which can be undesirable due to noise corruption (Unbehauen and Rao 1998) nor complex non-linear optimization techniques (Wahde and Hertz 2000) and is not limited to linear models (Chen et al1999) Rather through the use of the modulating functions technique (Shinbrot 1957 Patra and Unbe-hauen 1995) parameters in nonlinear continuous-time ODE models of gene expression are identified us-ing linear regression
The modulating functions approach was developed by Shinbrot (1957) as a means to estimate parame-ters in continuous-time nonlinear systems by converting sets of differential equations into a linear regres-sion It has been employed in diverse process identification studies in the literature (Pearson and Lee 1985Co and Ydstie 1990 Patra and Unbehauen 1995 Daniel-Berhe and Unbehauen 1999 Balestrino et al
ZAK ET AL
374
2000) The advantages of the modulating functions approach in addition to the fact that parameter identi-fication is accomplished by linear regression are that it removes any need for approximating derivativesfrom data and there is no requirement for uniformly sampled data Disadvantages of the modulating func-tions approach are that it cannot be used to estimate parameters for all nonlinear model types and for somenonlinear models it cannot guarantee bias-free estimates (Niethammer et al 2001) In the present workthe Hartley modulating function (HMF) approach (Patra and Unbehauen 1995) is employed The HMF ap-proach is advantageous over other modulating function approaches in that HMFs are entirely real valued(Unbehauen and Rao 1998) which can give greater computational efficiency
In the present work the HMF method is used to identify several gene expression models from simulateddata Details about the implementation of the HMF method are provided in the online supplementary ma-terial In the first section the essential elements of modulating functions are illustrated with a simple lin-ear gene expression system In the second section a more complex nonlinear model for an autoregulatorygene capable of multiple steady states is considered In the final section a case study in identifying geneexpression models from microarray data using data generated by a previously described transcriptional net-work simulator (Zak et al 2001 2003) is presented The examples demonstrate that the HMF method iswell suited for identifying models from gene expression data
Before proceeding it must be noted that the problem of simultaneously identifying network structure andnetwork parameters is not the focus of the present work For the problem of network structure identifica-tion the reader is referred to techniques in promoter bioinformatics (for example Tavazoie et al 1999Vadigepalli et al 2003) and genome-wide location analysis (Ren et al 2000)
APPLICATIONS
Linear gene expression model
In the present section the problem of identifying the parameters a and d given a time course of x(t) andu(t) is considered for the following simple linear gene expression model
xb (t) 5 au(t) 2 dx(t) (1)
where x(t) is the mRNA level over time a 3 u(t) is the transcription rate of x a is the transcription rateconstant u(t) is the activity of a TF that binds to the promoter of the gene and d is the linear degradationrate constant for the transcript
The first step is to multiply both sides of equation 1 by the known modulating function fm(t) and in-tegrate from t 5 0 (the first time of the measurements) to t 5 T (the final measurement time)
ET
0fm xbdt 5 aET
0fmudt 2 dET
0fm xdt (2)
By applying integration by parts and requiring that the modulating function be differentiable and have theproperty fm(0) 5 fm(T) 5 0 equation 2 is simplified to
2ET
0fb m xdt 5 aET
0fmudt 2 dET
0fm xdt (3)
In equation 3 the derivative has been shifted from the data (x(t)) to the known smooth function fm(t)thereby avoiding the need to estimate derivatives from the data By using M different modulating functionsa linear expression for the parameters a and d is constructed that can be solved by linear regression
Y1 X1a 2X1d
Y2 X2a 2X2d a2 5
d (4) YM XMa 2XMd
GENE EXPRESSION MODEL IDENTIFICATION
375
eacuteecircecircecircecircecirceuml
eacuteecircecircecircecircecirceuml
eacuteecirceuml
ugraveuacuteuacuteuacuteuacuteuacuteucirc
ugraveuacuteuacuteuacuteuacuteuacuteucirc
ugraveuacuteucirc
whereYm 5 ET
0fb mxdt
Xma 5 ET
0fmudt (5)
Xmd 5 ET
0fm xdt
The integrals in equation 5 can be evaluated using one of several techniques for numerical quadrature (Heath1997) The particular quadrature approach employed in the present work as well as the approach taken toselect M is discussed in the online supplementary material Unlike discrete-time formalisms the data doesnot need to be sampled uniformly for the parameters to be estimated In fact for the simple model aboveu(t) and x(t) do not even need to be obtained at the same time points This flexibility with respect to sam-pling makes the modulating functions approach especially suitable for biological problems
The system in equation 1 was used to explore how the accuracy of the identification results from the HMFmethod depend on the number of samples and experimental noise A step input in u(t) from u 5 0 to u 5
10 at t 5 1 min was used to excite the system and the nominal parameter values were a 5 5 min2 and d 5
1 min21 There were five time points for x(t) and u(t) from t 5 0 to t 5 50 min sampled asynchronously(exponential with a minimum inter-sample time of 1 min) The accuracy of the identification was quanti-fied by unorm the summed squared relative error in the parameter estimates (online supplementary material)To simulate the experimental noise in microarray data the log-normal multiplicative model for noise givenby Rocke and Durbin (2001) was used The HMF method was benchmarked against a method that identi-fied the parameters through direct estimation (DE) of the derivatives from the data Figure la shows the re-sults as the number of samples is varied from 3 to 10 demonstrating clearly that within a realistic range ofsamples the parameter estimates from the HMF method are more accurate than those obtained by DE Fig-ure 1b shows the results for the two methods as a function of experimental noise (5 samples exponentialsampling) Median values of unorm 6 one median absolute deviation of the median (MAD) obtained from200 Monte Carlo runs are plotted against increasing noise magnitude sh MAD was used because it pro-vides an outlier-insensitive measure of spread in the data (Huber 1981) For a wide range of noise levelsthe HMF method gave more accurate estimates of the parameter values than DE with less variability It
ZAK ET AL
376
FIG 1 Impact of number of samples and noise on parameter identification accuracy for HMF and DE approachesExponentially sampled step response (a) Sum squared relative error in parameter estimates (unorm) versus the numberof samples demonstrating that the accuracy of the parameter identification using the HMF method is less sensitive tothe number of samples than that using DE Dashed line stars HMF dotted line circles DE (b) Median values of unorm 6 one MAD obtained from 200 Monte Carlo runsdata point are plotted against increasing noise magnitude sh
(log-normal model) five samples Solid lines HMF dotted line DE Over a wide range of noise levels the HMFmethod gives more accurate estimates of the parameter values with less variability At levels of noise similar to thatobserved in actual microarray studies (sh 0224) the accuracy and spread of the DE parameter estimates were morefavorable than those obtained using HMF however
should be noted that when the estimates of a and d were considered independently the variability was com-parable for the two methods At levels of noise similar to that observed in actual microarray studies (sh 0224) the DE parameter estimates were more favorable than those obtained from HMF At this high levelof noise however there was substantial error in the parameter estimates from both methods
These results indicate that the HMF method may provide accurate parameter estimates for low numbersof samples and a wide range of experimental noise levels At high levels of noise such as that typicallyobserved in microarray data parameter identification through direct estimation of derivatives may actuallybe favorable although the parameter estimates will be coarse To obtain accurate parameter estimates frommicroarray data it may be necessary to combine the HMF method with averaging over replicated mea-surements The online supplementary material contains all of the details for the computations performed inthis example as well as an additional example that demonstrates how asynchronous sampling can be prefer-able to uniform sampling for this system
Autoregulatory gene expression model
The modulating functions approach is extensible to systems that are more complex than equation 1 Oneexample is the bistable autoregulatory circuit described by Smolen and colleagues (1998) Their model de-scribes a TF that forms a homodimer and then activates its own transcription with the maximal rate of tran-scription being influenced by its degree of phosphorylation The objectives in studying this system were todemonstrate how the HMF method can be used to identify complex nonlinear models of gene expressionand to explore how the accuracy of the parameter identification depends on the number of samples the typeof input used to excite the system and the magnitude of measurement noise
The Smolen model is given by
yb (t) 5 av(t) 2 cy(t) 1 d (6)
where y(t) is the TF concentration a 3 v(t) is the maximal rate of transcription v(t) is the extent of phos-phorylation of the TF (the external input) b is the dissociation constant of the TF dimer from its promoterc is the linear degradation rate constant of the TF and d is the basal synthesis rate of the TF This systemis interesting because depending on the parameter values it can be toggled between insensitive and ex-citable steady states by varying v(t) (Smolen et al 1998) In the present work the nominal parameter val-ues used are those given by Smolen and colleagues (a 5 10 min21 b 5 10 concentration2 c 5 1 min21d 5 01 concentrationmin21 v(0) 5 1)
Using the modulating functions approach the system in equation 6 was converted to a form similar toequation 4 allowing the parameters to be estimated using linear regression
Ym 5 Xmaa 1 Xmbb 1 Xmbcbc 1 Xmcc 1 Smdd (7)
where the Y and X terms involve numerical quadrature and are similar to those in equation 5 (complete de-rivation given in the online supplementary material)
Using equation 7 and the HMF method the impact of varying the number of samples on the accuracyof the parameter identification was explored The input consisted of two pulses with the first driving thesystem from its insensitive steady state to its excitable steady state and the second providing further exci-tation Results of the parameter identification for 20 50 and 100 samples are shown in Figures 2a 2b and2c respectively (uniform sampling x(t) 5 y(t) 2 y(0) u(t) 5 v(t) 2 v(0)) With as few as 20 samples thegeneral bistable character of the system is captured although there is significant overshoot in the responseto the first pulse and the error in the parameter estimates is significant (unorm 5 237) Increasing the num-ber of samples to 50 only slightly reduces the overshoot but the parameter estimates are greatly improved(unorm 5 012) Finally increasing the number of samples to 100 gives excellent parameter estimates andcaptures the system dynamics very well This example demonstrates how for the more complex gene ex-pression model in equation 6 there can be significant disagreement between the observed and predicted be-havior even when there is reasonably good agreement between the estimated and actual parameter values
y(t)2b 1 y(t)2
GENE EXPRESSION MODEL IDENTIFICATION
377
It also demonstrates how a greater number of samples is required to obtain accurate parameter estimates ascompared to the simpler model (equation 1)
Equation 7 and the HMF method were also used to explore how the accuracy of the parameter identifi-cation was influenced by experimental noise and the type of input (v(t)) used to excite the system (numberof samples fixed at 50) The log-normal noise model was applied as above Three different inputs were con-sidered Two of the inputs were 10-min pulses with one being strong enough to drive the system to thehigher steady state (super-threshold pulse) and one too weak to do so (sub-threshold pulse) The third wasthe double pulse input from the previous example Median values from 50 Monte Carlo runs are shown inFigure 3 where it is clear that parameter identification accuracy is sensitive to both the input and the amountof noise in the data For the sub-threshold pulse the parameter identification results were the least sensi-tive to noise but were generally poor (unorm 34 where unorm 5 4 roughly corresponds to 100 error inthe parameter estimates for this system) The single pulse that drove the system to the higher steady statewas highly sensitive to noise giving accurate parameter estimates for only very low noise levels The dou-ble pulse input gave accurate parameter estimates for the widest noise range Beyond sh 005 howeverthe parameter estimates became worse than those obtained using the sub-threshold pulse None of the in-puts gave accurate parameter estimates for the experimentally-identified level of noise in microarray data(sh 5 0224) indicating that the noise in microarray data may be a significant impediment to its use in de-riving complex models of transcriptional regulation Rather alternative sources of gene expression data
ZAK ET AL
378
FIG 2 Influence of the number of samples on parameter identification accuracy for the autoregulatory model (a)20 samples (b) 50 samples (c) 100 samples x(t) 5 y(t) 2 y(0) u(t) 5 v(t) 2 v(0) Solid line x0(t) dashed line xE(t)dashed-dotted line u0(t) 3 5 The smallest number of samples captures the essential bistable nature of the system butdisplays significant overshoot and inaccurate parameter estimates At 50 samples the parameter estimates are reason-ably accurate but the system still displays overshoot At 100 samples the parameter estimates are highly accurate andthe dynamics of the system are captured
such as that used in (Ronen et al 2002) may be required The results for the sub-threshold and doublepulse inputs are also suggestive of previous results from the literature that showed that complex inputs arerequired for accurate system identification (Kauffman et al 2003) and that simpler inputs can be favorableat significant levels of noise (Zak et al 2003)
Identifying gene expression models from microarray data
There are several aspects of microarray data and transcriptional regulation that make the problem of iden-tifying dynamic gene expression models from microarray data particularly interesting As has already beendiscussed in the present work microarray time series often consist of a small number of asynchronouslysampled data points that are corrupted by significant amounts of noise In addition it must be recognizedthat that the time scale on which any mRNA level may respond to changes in transcription is determinedby that mRNArsquos half-life (Hargrove and Schmidt 1989) Also TF mRNAs do not directly interact withtheir target genes At the very least translation of the TF must occur first which introduces a delay Fi-nally TFs may influence transcription rates of their target genes in a manner that depends nonlinearly onthe active TF concentration with the transcriptional regulation of a single gene being governed by the co-ordinate activity of multiple TFs In the present section a model structure for gene expression is developedthat when combined with the HMF approach to model identification begins to address many of the aboveissues This model structure is applied to a case study using simulated microarray data generated from apreviously described transcriptional network simulator (Zak et al 2001 2003)
Model structure The simplest formulation for a gene expression model is similar to equation 1 and isreadily identified using the HMF approach
xb(t) 5 af (u(t)) 2 dx (t) (8)
where x(t) is the scaled (21 x(t) 1 x(0) 5 0) concentration of the mRNA from the target gene as mea-sured with the microarray and u(t) is the scaled (0 u(t) 1 u(0) THORN 0) concentration of the TF mRNA
GENE EXPRESSION MODEL IDENTIFICATION
379
FIG 3 Impact of noise and input on parameter identification for the autoregulatory model Median sum squared rel-ative error in parameter estimates (unorm) from 50 Monte Carlo runsdata point versus noise magnitude sh (log-nor-mal model) 50 samples Only the double pulse input gave accurate parameter estimates but for relatively low noiselevels None of the inputs gave accurate parameter estimates for an experimentally observed noise level in microarraydata (sh 5 0224) Parameters that were estimated using the sub-threshold pulse were generally not sensitive to noisebut were generally inaccurate (unorm 34)
concentration also measured with the microarray The details of the scaling procedures are given in the on-line supplementary material The function f() is a nonlinear function that describes how the transcriptionrate of the target gene depends on the TF concentration While equation 8 is appealing for its simplicity itmay not be realistic because it suggests that a change in the mRNA of the TF can instantaneously affectthe transcription rates of its targets without any delay for its conversion to functional protein An alterna-tive formulation can address this delay through an intermediate state p
xb(t) 5 ap(t) 2 dx(t)
pb(t) 5 f (u(t)) 2 ep(t) (9)
where e is the first order degradation rate constant for the intermediate state p By differentiating the topexpression in equation 9 and solving for p and its derivative in terms of x(t) the derivatives of x(t) andu(t) the following expression is obtained
xbb(t) 1 (d 1 e)xb (t) 1 dex(t) 5 af (u(t)) (10)
The parameters in equation 10 can be readily identified using the HMF approach given x(t) and u(t)The introduction of the lag between TF mRNA levels and the effect of the TF on the transcription rates
of its target genes could also have been accomplished with a discrete delay a technique that has been em-ployed in several models of gene expression (Smolen et al 1998 Lema et al 2000) Techniques have beendeveloped to estimate such discrete delay systems using the modulating functions approach (Balestrino etal 2000) It is the opinion of the present authors however that the type of delay introduced in equation 9is more realistic because it is more closely related to one of biophysical processes that is responsible forthe delay translation (first order) of transcript into protein Should the delay in equation 9 not be sufficientto describe the data due to the presence of other intermediate biochemical steps in addition to translationit is possible to include a longer delay by adding more intermediate states
The final step is to define a functional form for the nonlinearity f() Given that increasing concentrationof active TF generally has a saturating effect on the transcription rate of its target genes a natural func-tional form is
g(u) 5 (11)
where f(u) is related to g(u) by f(u(t)) 5 g(u(t)) 2 g(u(0)) Three values of K are considered in the presentwork corresponding to approximate linearity (K 5 10) weak nonlinearity (K 5 05) and strong nonlin-earity (K 5 01) A plot of g(u) for the three values of K is given in Figure 4
(K 1 1)u
K 1 u
ZAK ET AL
380
FIG 4 g(u) versus u for three different values of K As K is increased the extent of the nonlinearity is decreasedK 5 10 corresponds to approximate linearity K 5 05 corresponds to weak nonlinearity and K 5 01 corresponds tostrong nonlinearity
The approach to identifying gene expression models from microarray data proposed in the present workcan now be summarized
i Collect microarray time course data for TFs and their target genesii Scale the TF microarray data as u(t) and scale the target gene microarray data as x(t) (online sup-
plementary material) to give the scaled experimental data x0(t) and u0(t)iii Identification of the parameters a and d in the delay-free model (equation 8) and identification of
parameters a (d 1 e) and (ed) for the model with delay (equation 10) using the HMF method forall three values of K (a total of six sets of parameters are estimated)
iv For cases where mRNA half-life data is already available the parameter d for the models is esti-mated by d 5 ln(2)t12 where t12 is the mRNA half-life In this case only parameter a is estimatedin the delay free model and only parameters a and e are estimated in the delay model
v For all six models the sum of squared errors (SSE) between the scaled microarray data for the tar-get genes x0(t) and the expression data predicted using the modeling results (assuming that u(t)
varies linearly between samples) is calculated SSE(model) 5 ^n
i51(x0(ti) 2 xE (ti))2 The delay-non-
linearity combination that gives the smallest SSE(model) is selected The SSE(model) for this com-bination is retained as a measure of how well the best model could describe the data
vi Additionally the SSE between x0(t) and c(u(t) 2 u(0)) is calculated where c minimizes ^n
i51(x0(ti) 2
c(u0(ti) 2 u0(0)))2 This SSE called SSE(correlation) gives an estimate of how correlated x0(t) andu0(t) are that is useful in evaluating the identification results
Simulated microarray data The convenience of using simulated genetic regulatory networks to test andbenchmark gene network modeling techniques has been recognized by several authors (Wahde and Hertz2000 Zak et al 2001 2003 Smith et al 2002) In the present section a simulated genetic regulatory net-work is used to explore the approach to identifying gene expression models from microarray data outlinedabove The simulator has been described previously (Zak et al 2001 2003) It is a 10-gene network witha receptor that responds to ligand input with transcription rates that depend nonlinearly on TF levels andbiochemical delays between the appearance of TF transcripts and functional TFs It is described mathe-matically by 44 coupled nonlinear ODEs Additional information about the model is provided in the onlinesupplementary material The response of the network to a pulse of ligand was used as the source of simu-lated microarray data Ten data points (exponentially sampled minimum inter-sample time of 3 min) up to24 h after the injection of ligand were compiled
Representative results are shown in Figure 5 where C and E have been modeled as targets of the tran-scriptional repressor D The agreement between the simulation data and the predicted models was excel-
GENE EXPRESSION MODEL IDENTIFICATION
381
FIG 5 Modeling results for transcriptional targets of D showing excellent agreement (a) Gene C (SSE(model)DC 5
0027 strongly nonlinear delay-free model) (b) Gene D (SSE(model)DE 5 0032 linear delay-free model)
lent (SSE(model)DC 5 0027 SSE(model)DE 5 0032) although this is expected given that C and E are tar-gets of D in the actual underlying simulator network Interestingly the best fit model for regulation of Cby D was strongly nonlinear (K 5 01) while the best fit model for regulation of E by D was approximatelylinear (K 5 10) For both cases the delay-free model outperformed the delayed model
Another set of results is shown for gene B in Figure 6 B has been modeled as a target of the TFs F CA or D In the true underlying network B is a target of A and F B was modeled reasonably well as a tar-get of its true regulator F (SSE(model)FB 5 019 linear delay-free model) poorly modeled as a target ofC (that does not regulate it in the model) (SSE(model)CB 5 189 weakly nonlinear delayed model) andpoorly modeled as a target of its other true regulator A (SSE(model)AB 5 20 linear delayed model) Thepoor results for A may be due to the fact that B is actually a target of both A and F in the underlying net-work and modeling it as a target of either TF individually may not be sufficient They may be also due tothe fact that there are additional protein-protein interactions between A and B in the simulator that are notaccounted for in the model structure Interestingly B is best modeled as a target of D a gene that is co-regulated with B (D is also a target of F) (SSE(model)DB 5 0004 linear delay-free model) The fact thatB was more successfully modeled as a target of a co-regulated gene than the correct TF provides a mes-sage of caution for gene network identification studies in which the network structure is not known a pri-ori When the structure is not known care must be taken to avoid confusing correlation with causation The
ZAK ET AL
382
FIG 6 Modeling B as a target of F C A or D (a) B as a target of F one of its true regulators The agreement isreasonable (SSE(model)FB 5 019 linear delay-free model) (b) B as a target of C a TF it is not regulated by Theagreement is poor (SSE(model)CB 5 189 weakly nonlinear delayed model) (c) B as a target of A one of its true reg-ulators The agreement is poor (SSE(model)AB 5 20 linear delayed model) (d) B as a target of D a gene that it isco-regulated with There is strong agreement between the modeling result and the data as well as strong correlationbetween B and D (SSE(model)DB 5 0004 linear delay-free model SSE(correlation)DB 5 007)
correlation between D and B was also revealed by SSE(correlation)DB which is also much smaller than theSSE(model) for either of the true regulators (SSE(correlation)DB 5 007)
In the final example H was modeled as a target of G (its true regulator) C D or F Surprisingly H ismodeled well as a target of G (SSE(model)GH 5 0002 strongly nonlinear delayed model) as a target ofC (the upstream regulator of G) (SSE(model)CH 5 0002 weakly nonlinear delayed model) as a target ofD (SSE(model)DH 5 0006 linear delayed model) or as a target of F (SSE(model)FH 5 001 strongly non-linear delayed model) Interestingly the delayed model structure gave the best results for all combinationsIf this were an experimental system and no data in addition to the microarray data were available it wouldbe impossible to determine which TF actually regulates H A figure with these results is provided in theonline supplementary material (wwwdkitjuedudbipublicationsomics03)
DISCUSSION
In the present work an argument was made for the use of continuous-time identification methods par-ticularly the Hartley modulating functions (HMF) method for the identification of dynamic models of geneexpression The HMF method was applied to three example gene expression modeling problems of vary-ing complexity demonstrating the methodrsquos applicability and providing insights into the specific systems
Using the simplest gene expression model it was demonstrated that the HMF approach is well suited forparameter identification from asynchronous data It was also observed that the HMF method may provideaccurate parameter identification from a few samples and over a range of noise levels At high levels ofnoise comparable to that observed in microarray data however the preferred method for parameter iden-tification may be through direct estimation of derivatives although the parameter estimates will be coarseAccurate parameter estimates from microarray data can be obtained using the HMF method however byreducing experimental noise through averaging over replicated measurements and other means In the on-line supplementary material it also was demonstrated how asynchronous sampling can lead to improvedprocess identification even though it makes discrete-time modeling difficult
It was demonstrated using the bistable autoregulatory gene expression model how the HMF method isreadily applicable to more complex models of transcriptional regulation It was also shown how for themore complex model more samples must be collected for accurate parameter estimation Additionally morecomplex perturbations are required to excite the system a result that parallels those observed in anotherstudy (Kauffman et al 2003) This result was only applicable to the case of moderate noise however asa simpler input was preferable in cases of extreme noise a result also paralleled by previous results (Zaket al 2003) These requirements may preclude microarray data from being a sole data source to identifysuch complex models Alternative types of gene expression data such as that obtained in Ronen et al (2002)may be required
Using a network simulator it was observed that the HMF method can be used to identify gene expres-sion models using data of the type that is obtained in microarray studies Without information that may con-strain possible networks in addition to gene expression however it may be impossible to determine whichTFs actually regulate each gene The expression profiles of some downstream genes can be equally wellmodeled as targets of numerous transcription factors (TFs) in the system making it impossible without ad-ditional information to uncover the true underlying network Additional information could come in the formof additional time courses with different dynamic responses promoter bioinformatics (Tavazoie et al 1999Vadigepalli et al 2003) or alternative experimental techniques such as genome-wide location analysis (Renet al 2000) The results also have shown that flexibility in model structure is important for gene expres-sion modeling Even though the true underlying network contained delays and nonlinearities whether ornot there were delays or nonlinearities in the model that best explained the data was dependent on theTFndashtarget gene combination
The successes or failures of the gene expression model identification techniques considered in the pre-sent work may or may not be attributed to the particular functional forms chosen and the data consideredThe ability of the continuous-time HMF approach to identify models from asynchronously sampled datathat is very common in biology however is a feature of the approach itself The results of this modeling
GENE EXPRESSION MODEL IDENTIFICATION
383
approach may readily be integrated with models of upstream signaling networks that are formulated asODEs Similarly the approach can be adapted to include efforts for inferring network structures throughpromoter bioinformatics (Tavazoie et al 1999 Vadigepalli et al 2003) or approaches that attempt to in-fer network connectivity through imposing constraints on interconnections (Yeung et al 2002) Given theability of the approach to integrate existing models of related cellular processes and varied analysis meth-ods it can play an important role in integrative environments like BioSPICE
The present techniques fit well with the work of several other BioSPICE investigators The autoregula-tory gene results are directly relevant to efforts in the Byrne and Collins labs which have an interest innonlinear dynamical models of gene expression (Smolen et al 2000 Isaacs et al 2003) The ODE geneexpression models of the present work parallel the hybrid approaches the Kumar and Rubin labs use tomodel prokaryotic genetic regulation The dynamic microarray-based modeling approaches described aboveare complementary to the Liao labrsquos efforts in combining microarray data and operon information (Sabattiet al 2002) with Bayesian techniques to predict prokaryotic genetic regulatory networks and to the Collinslabrsquos efforts in predicting genetic regulatory networks using gene expression data and steady state models(Gardner et al 2003) The present modeling approaches may also be used with the dynamic gene expres-sion data from the Jett lab to generate hypothesis about the regulation underlying host responses to pathogensFinally the modeling approaches of the present work may be used to link the core circadian clock modelsemerging from the Bryne lab and Jewett Weaver and collaborators (Forger et al 1999 Smolen et al2001) with emerging circadian gene expression profiles in Drosophila (Etter and Ramaswami 2002) andmouse (Delaunay and Laudet 2002) into models that predict how the core clock regulates downstreamgenes and ultimately drives circadian changes in physiology
Future work will involve the extension of the modeling approach to include genes that are targets of morethan one transcription factor and evaluation of additional nonlinear functional forms that describe how tar-get gene transcription rates depend on TF concentration
ACKNOWLEDGMENTS
This work is supported by the DARPA BioComp Initiative under contract number DE-AC03-76SF00098(Francis J Doyle III PI) and contract number F30602-01-2-0578 (James Schwaber PI) FJD also ac-knowledges support from the Alexander von Humboldt Foundation and DEZ acknowledges the Universityof Delaware Department of Chemical Engineering for funding
REFERENCES
BALESTRINO A LANDI A and SANI L (2000) Identification of Hammerstein systems with inputoutput timedelay via modulating functions Proc IFAC Linear Time Delay Systems 2000 168ndash172
CHEN T HE HL and CHURCH GM (1999) Modeling gene expression with differential equations Proc PacSymp Biocomput 4 29ndash40
CHEN KC CSIKASZ-NAGY A GYORFFY B et al (2000) Kinetic analysis of a molecular model of the bud-ding yeast cell cycle Mol Biol Cell 11 369ndash391
CHERRY JL and ADLER FR (2000) How to make a biological switch J Theor Biol 203 117ndash133CO TB and YDSTIE BE (1990) System identification using modulating functions and fast Fourier transforms
Comput Chem Eng 14 1051ndash1066DANIEL-BERHE S and UNBEHAUEN H (1999) Physical parameters estimation of the nonlinear continuous-time
dynamics of a DC motor using Hartley modulating functions method J Franklin I 336 481ndash501DELAUNAY F and LAUDET V (2002) Circadian clock and microarrays mammalian genome gets rhythm Trends
Genet 18 595ndash597DE JOHG H (2002) Modeling and simulation of genetic regulatory systems a literature review J Comput Biol 9
67ndash103DrsquoHAESELEER P WEN X FUHRMAN S et al (1999) Linear modeling of mRNA expression levels during CNS
development and injury Proc Pac Symp Biocomput 4 41ndash52
ZAK ET AL
384
ETTER PD and RAMASWAMI M (2002) The ups and downs of daily life profiling circadian gene expression inDrosophila Bioessays 24 494ndash498
FORGER DB JEWETT ME and KRONAUER RE (1999) A simpler model of the human circadian pacemakerJ Biol Rhythms 14 532ndash537
GARDNER TS DI BERNARDO D LORENZ D et al (2003) Inferring genetic networks and identifying com-pound mode of action via expression profiling Science 301 102ndash105
GOLDBETER A (1996) Biochemical Oscillations and Cellular Rhythms The Molecular Bases of Periodic andChaotic Behaviour 2nd ed (Cambridge University Press Cambridge)
HARGROVE JL and SCHMIDT FH (1989) The role of mRNA and protein stability in gene expression FASEBJ 3 2360ndash2370
HARGROVE JL HULSEY MG and BEALE EG (1991) The kinetics of mammalian gene expression Bioes-says 13 667ndash674
HARTEMINK AJ GIFFORD DK JAAKOLA TS et al (2002) Combining location and expression data for prin-cipled discovery of genetic regulatory network models Proc Pac Symp Biocomput 7 437ndash449
HEATH MT (1997) Scientific Computing (McGraw-Hill New York)HUBER PJ (1981) Robust Statistics (John Wiley and Sons New York)ISAACS FJ HASTY J CANTOR CR et al (2003) Prediction and measurement of an autoregulatory genetic
module Proc Natl Acad Sci USA 100 7714ndash7719KAUFFMAN KJ OGUNNAIKE BA and EDWARDS JS (2003) Design of high-throughput profiling experi-
ments a mathematical analysis of network identification (submitted)KHOLODENKO BN DEMIN OV MOEHREN G et al (1999) Quantification of short-term signaling by the
epidermal growth factor receptor J Biol Chem 274 30169ndash30181LEMA MA GOLOMBEK DA and ECHAVE J (2000) Delay model of the circadian pacemaker J Theor Biol
204 565ndash573LJUNG L (1999) System Identification Theory for the User 2nd ed (Prentice Hall PTR Upper Saddle River NJ)MALY T and PETZOLD LR (1996) Numerical methods and software for sensitivity analysis of differential-alge-
braic systems Appl Numer Math 20 57ndash79MCADAMS HH and ARKIN A (1999) Itrsquos a noisy business genetic regulation at the nanomolar scale Trends
Genet 15 65ndash69NIETHAMMER MN MENOLD PH and ALLGOWER F (2001) Parameter and derivative estimation for non-
linear continuous-time system identification Presented at the 5th IFAC Symposium on Nonlinear SystemsOGUNNAIKE BA and RAY WH (1994) Process Dynamics Modeling and Control (Oxford University Press
New York)PATRA A and UNBEHAUSEN H (1995) Identification of a class of nonlinear continuous-time systems using Hart-
ley modulating functions Int J Control 62 1431ndash1451PEARSON RK (1999) Discrete-time dynamic models (Oxford University Press New York)PEARSON AE and LEE FC (1985) On the identification of polynomial input-output differential systems IEEE
Trans Automat Contr AC-30 778ndash782PEARSON RK and POTTMANN M (2000) Gray-box identification of block-oriented nonlinear models J Process
Contr 10 301ndash315REN B ROBERT F WYRICK JJ et al (2000) Genome-wide location and function of DNA binding proteins
Science 290 2306ndash2309ROCKE DM and DURBIN B (2001) A model for measurement error for gene expression arrays J Comput Biol
8 557ndash569RONEN M ROSENBERG R SHRAIMAN BI et al (2002) Assigning numbers to the arrows parameterizing a
gene regulation network by using accurate expression kinetics Proc Natl Acad Sci USA 99 10555ndash10560SABATTI C ROHLIN L OH MK et al (2002) Co-expression pattern from DNA microarray experiments as a
tool for operon prediction Nucleic Acids Res 30 2866ndash2893SHAMPINE LF and REICHELT MW (1997) The MATLAB ODE suite SIAM J Sci Comput 18 1ndash22SHINBROT M (1957) On the analysis of linear and nonlinear systems Trans Am Soc Mech Eng 79 547ndash552SMITH VA JARVIS ED and HARTEMINK AJ (2002) Evaluating functional network inference using simula-
tions of complex biological systems Bioinformatics 18 S216ndashS224SMOLEN P BAXTER DA and BYRNE JH (1998) Frequency selectivity multistability and oscillations emerge
from models of genetic regulatory systems Am J Physiol 274 C531ndashC542SMOLEN P BAXTER DA and BYRNE JH (2000) Mathematical modeling of gene networks Neuron 26
567ndash580
GENE EXPRESSION MODEL IDENTIFICATION
385
SMOLEN P BAXTER DA and BYRNE JH (2001) Modeling circadian oscillations with interlocking positiveand negative feedback loops J Neurosci 21 6644ndash6656
TAVAZOIE S HUGHES JD CAMPBELL MJ et al (1999) Systematic determination of genetic network ar-chitecture Nat Genet 22 281ndash285
UNBEHAUEN H and RAO GP (1998) A review of identification in continuous-time systems Annu Rev Con-trol 22 145ndash171
VADIGEPALLI R CHAKRAVARTHULA P ZAK DE et al (2003) PAINT A promoter analysis and interac-tion network generation tool for genetic regulatory network identification OMICS 7 235ndash252
WAHDE M and HERTZ J (2000) Coarse-grained reverse engineering of genetic regulatory networks Biosystems55 129ndash136
WEAVER DC WORKMAN CT and STORMO GD (1999) Modeling regualtory networks with weight matri-ces Proc Pac Symp on Biocomput 4 102ndash111
WESSELS LFA VAN SOMEREN EP and REINDERS MJT (2001) A comparison of genetic network mod-els Proc Pac Symp Biocomput 6 508ndash519
YEUNG MK TEGNER J and COLLINS JJ (2002) Reverse engineering gene networks using singular value de-composition and robust regression Proc Natl Acad Sci USA 99 6163ndash6168
ZAK DE DOYLE FJ III GONYE GE et al (2001) Simulation studies for the identification of genetic networksfrom cDNA array and regulatory activity data Presented at the 2nd International Conference on Systems Biology
ZAK DE GONYE GE SCHWABER JS et al (2003) Importance of input perturbations and stochastic gene ex-pression in the reverse engineering of genetic regulatory networks Insights from an identifiability analysis of an insilico network Genome Res 13 2396ndash2405
Address reprint requests toDr Francis J Doyle III
Department of Chemical EngineeringUniversity of California
Santa Barbara CA 93106
E-mail doyleengineeringucsbedu
ZAK ET AL
386
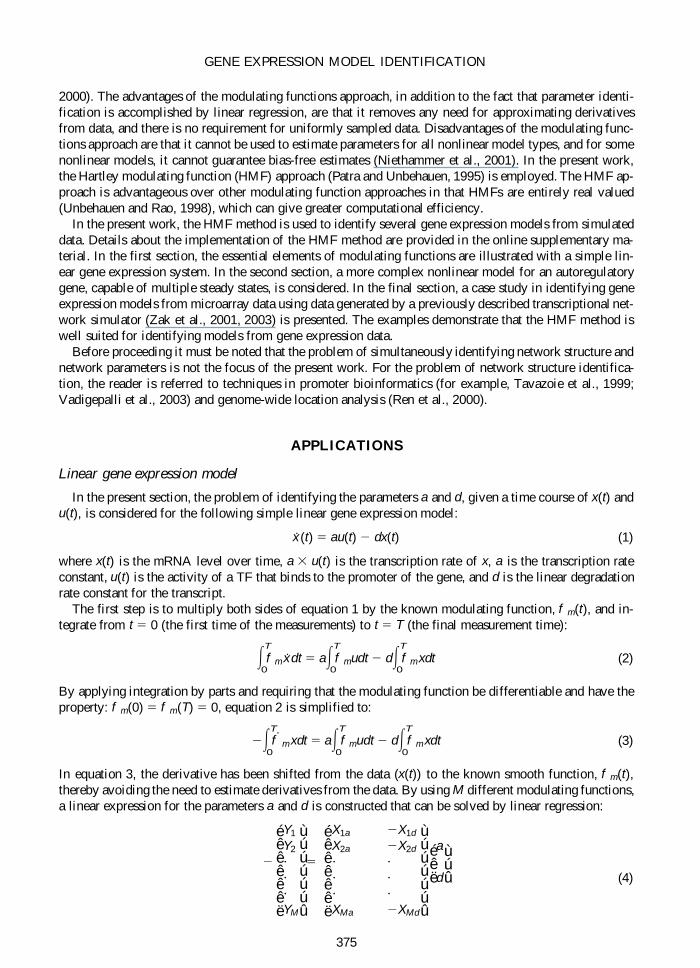
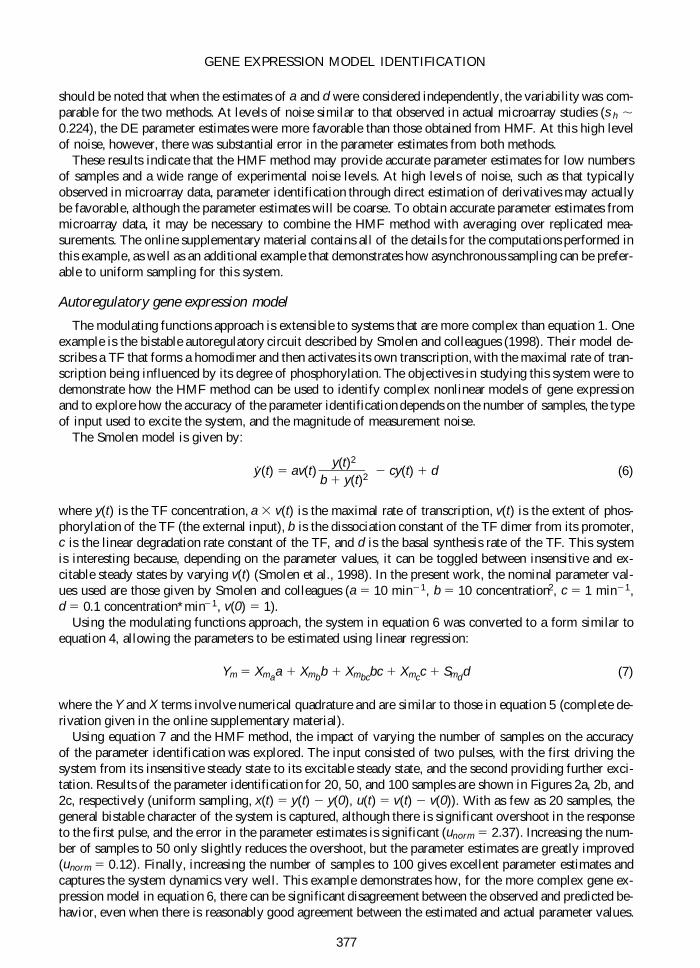
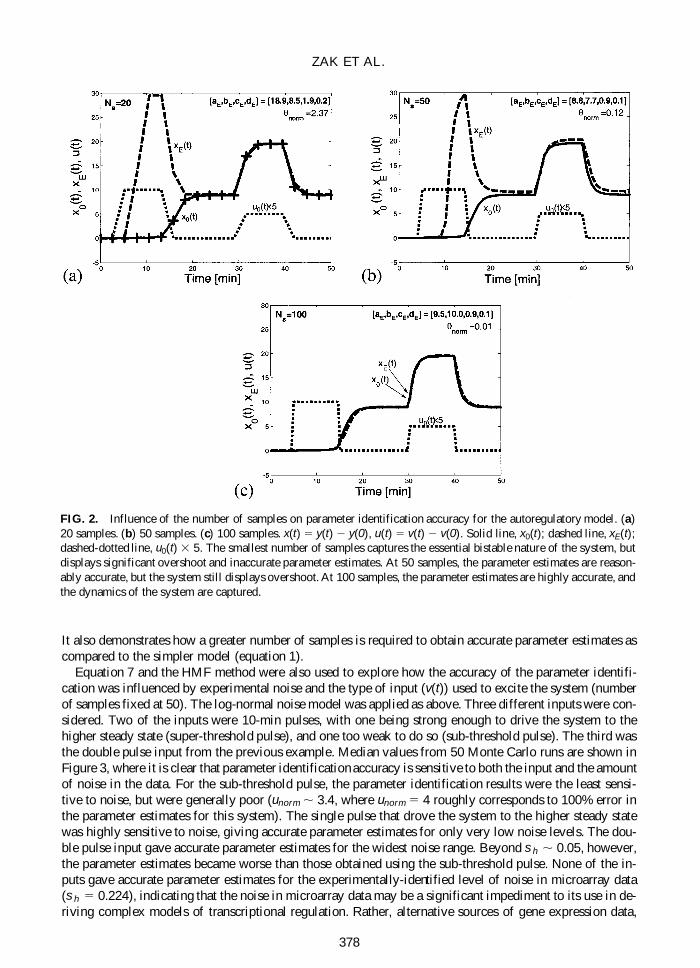
Copyright © 2022 FDOKUMEN