
Motif-guided sparse decomposition of gene expression data for regulatory module identification
16
METHODOLOGY ARTICLE Open Access Motif-guided sparse decomposition of gene expression data for regulatory module identification Ting Gong 1 , Jianhua Xuan 1* , Li Chen 1 , Rebecca B Riggins 2 , Huai Li 3 , Eric P Hoffman 4 , Robert Clarke 2 and Yue Wang 1 Abstract Background: Genes work coordinately as gene modules or gene networks. Various computational approaches have been proposed to find gene modules based on gene expression data; for example, gene clustering is a popular method for grouping genes with similar gene expression patterns. However, traditional gene clustering often yields unsatisfactory results for regulatory module identification because the resulting gene clusters are co- expressed but not necessarily co-regulated. Results: We propose a novel approach, motif-guided sparse decomposition (mSD), to identify gene regulatory modules by integrating gene expression data and DNA sequence motif information. The mSD approach is implemented as a two-step algorithm comprising estimates of (1) transcription factor activity and (2) the strength of the predicted gene regulation event(s). Specifically, a motif-guided clustering method is first developed to estimate the transcription factor activity of a gene module; sparse component analysis is then applied to estimate the regulation strength, and so predict the target genes of the transcription factors. The mSD approach was first tested for its improved performance in finding regulatory modules using simulated and real yeast data, revealing functionally distinct gene modules enriched with biologically validated transcription factors. We then demonstrated the efficacy of the mSD approach on breast cancer cell line data and uncovered several important gene regulatory modules related to endocrine therapy of breast cancer. Conclusion: We have developed a new integrated strategy, namely motif-guided sparse decomposition (mSD) of gene expression data, for regulatory module identification. The mSD method features a novel motif-guided clustering method for transcription factor activity estimation by finding a balance between co-regulation and co- expression. The mSD method further utilizes a sparse decomposition method for regulation strength estimation. The experimental results show that such a motif-guided strategy can provide context-specific regulatory modules in both yeast and breast cancer studies. Background Transcriptional gene regulation is a complex process that uses a network of interactions to [1]. A central pro- blem remains the accurate identification of transcrip- tional modules or gene sub-networks involved in the regulation of critical biological processes [2]. For cancer research, these sub-networks can help provide a signa- ture of the disease that is potentially useful for diagnosis, or suggests novel targets for drug interven- tion. The biomedical research literature and several spe- cific databases contain sequence information, gene expression profiling data, and small scale biological experiments that allow investigators to reconstruct gene regulatory networks and explore the direct effects of transcription factors on gene expression. Recently, the bioinformatics community has explored various computational approaches for transcriptional module identification [3-7]. These approaches can be classified into two major categories. The first category uses clustering methods to explore the similarity in gene * Correspondence: [email protected] 1 Bradley Department of Electrical and Computer Engineering, Virginia Tech, Arlington, VA 22203, USA Full list of author information is available at the end of the article Gong et al. BMC Bioinformatics 2011, 12:82 http://www.biomedcentral.com/1471-2105/12/82 © 2011 Gong et al; licensee BioMed Central Ltd. This is an Open Access article distributed under the terms of the Creative Commons Attribution License (http://creativecommons.org/licenses/by/2.0), which permits unrestricted use, distribution, and reproduction in any medium, provided the original work is properly cited.
Transcript of Motif-guided sparse decomposition of gene expression data for regulatory module identification

METHODOLOGY ARTICLE Open Access
Motif-guided sparse decomposition of geneexpression data for regulatory moduleidentificationTing Gong1, Jianhua Xuan1*, Li Chen1, Rebecca B Riggins2, Huai Li3, Eric P Hoffman4, Robert Clarke2 andYue Wang1
Abstract
Background: Genes work coordinately as gene modules or gene networks. Various computational approacheshave been proposed to find gene modules based on gene expression data; for example, gene clustering is apopular method for grouping genes with similar gene expression patterns. However, traditional gene clusteringoften yields unsatisfactory results for regulatory module identification because the resulting gene clusters are co-expressed but not necessarily co-regulated.
Results: We propose a novel approach, motif-guided sparse decomposition (mSD), to identify gene regulatorymodules by integrating gene expression data and DNA sequence motif information. The mSD approach isimplemented as a two-step algorithm comprising estimates of (1) transcription factor activity and (2) the strengthof the predicted gene regulation event(s). Specifically, a motif-guided clustering method is first developed toestimate the transcription factor activity of a gene module; sparse component analysis is then applied to estimatethe regulation strength, and so predict the target genes of the transcription factors. The mSD approach was firsttested for its improved performance in finding regulatory modules using simulated and real yeast data, revealingfunctionally distinct gene modules enriched with biologically validated transcription factors. We then demonstratedthe efficacy of the mSD approach on breast cancer cell line data and uncovered several important gene regulatorymodules related to endocrine therapy of breast cancer.
Conclusion: We have developed a new integrated strategy, namely motif-guided sparse decomposition (mSD) ofgene expression data, for regulatory module identification. The mSD method features a novel motif-guidedclustering method for transcription factor activity estimation by finding a balance between co-regulation and co-expression. The mSD method further utilizes a sparse decomposition method for regulation strength estimation.The experimental results show that such a motif-guided strategy can provide context-specific regulatory modulesin both yeast and breast cancer studies.
BackgroundTranscriptional gene regulation is a complex processthat uses a network of interactions to [1]. A central pro-blem remains the accurate identification of transcrip-tional modules or gene sub-networks involved in theregulation of critical biological processes [2]. For cancerresearch, these sub-networks can help provide a signa-ture of the disease that is potentially useful for
diagnosis, or suggests novel targets for drug interven-tion. The biomedical research literature and several spe-cific databases contain sequence information, geneexpression profiling data, and small scale biologicalexperiments that allow investigators to reconstruct generegulatory networks and explore the direct effects oftranscription factors on gene expression.Recently, the bioinformatics community has explored
various computational approaches for transcriptionalmodule identification [3-7]. These approaches can beclassified into two major categories. The first categoryuses clustering methods to explore the similarity in gene
* Correspondence: [email protected] Department of Electrical and Computer Engineering, Virginia Tech,Arlington, VA 22203, USAFull list of author information is available at the end of the article
Gong et al. BMC Bioinformatics 2011, 12:82http://www.biomedcentral.com/1471-2105/12/82
© 2011 Gong et al; licensee BioMed Central Ltd. This is an Open Access article distributed under the terms of the Creative CommonsAttribution License (http://creativecommons.org/licenses/by/2.0), which permits unrestricted use, distribution, and reproduction inany medium, provided the original work is properly cited.
expression patterns to form gene modules. The secondapproach uses projection methods to infer latent (hid-den) components with which to group genes into mod-ules. A growing literature documents attempts toreconstruct gene networks by applying clustering meth-ods [8,9] and their more sophisticated variants such asstatistical regression [10] and Bayesian networks [11].While this line of work is important to help formulatehypotheses, there are many limitations on using cluster-ing methods for regulatory module inference. One com-mon challenge is detecting the interactions betweentranscription factors and their target genes based ongene expression data alone. For regulatory module iden-tification, it is critical to distinguish ‘co-regulation’ from‘co-expression’, and to understand the relationshipbetween co-regulation and co-expression. Generally,genes with highly homologous regulatory sequences (co-regulation) should have a similar expression pattern (co-expression). However, the reverse is likely not true; co-expressed genes must not necessarily exhibit commonregulatory sequences [12]. Traditional clustering analysisoften returns clusters lacking shared regulatorysequences, thus making the biological relevance of theseclusters relatively low for the identification of regulatorymechanisms.A group of projection methods from the second cate-
gory, including principle component analysis (PCA),independent component analysis (ICA), and non-nega-tive matrix factorization (NMF) [13-15], have also beenextensively applied for transcriptional module identifica-tion. These methods decompose gene expression datainto components that are constrained to be mutuallyuncorrelated or independent, and then cluster genesbased on their loading in the components. Since thesemethods do not cluster genes based on their expressionsimilarity, they are better equipped to find co-regulatedgene modules. One major difficulty using such projec-tion approaches is that the components usually repre-sent the joint effects of many underlying transcriptionfactors. Thus, the components do not correspond toindividual known transcription factors (TFs), making thebiological interpretation of the components verydifficult.To overcome the above-mentioned shortcomings, sev-
eral integrative methods have been proposed that inte-grate TF-gene interaction data with gene expressiondata. For instance, network component analysis (NCA)has been recently developed to successfully estimate theTF activities of regulatory networks using both ChIP-on-chip and gene expression data [16]. Note that NCAheavily relies on ChIP-on-chip data for network connec-tivity information with which to define regulatory mod-ules. Thus, the NCA scheme is not readily applicable tomany biological studies where adequate network
connectivity information is not available (due to lack ofadequate ChIP-on-chip data). To deal with this diffi-culty, Sabatti and James [17] were among the first touse motif information as the initial network topology,subsequently adopting a Bayesian algorithm to recon-struct regulatory modules. While theoretically elegant,this approach needs to estimate the posterior probabil-ity, a joint distribution of network topology and tran-scription factor activity. Even using the Gibbs samplingtechnique, it is a formidable task to estimate the jointdistribution when the number of samples is limited.We now propose a novel approach, namely motif-
guided sparse decomposition (mSD), to identify co-regu-lated transcriptional modules by integrating motif infor-mation and gene expression data. The mSD method is aBayesian-principled method without the need to esti-mate the joint distribution. Instead, a two-step approachis used to first estimate transcription factor activity andthen regulation strength on the target genes. A motif-guided clustering method is developed to help estimatetranscription factor activity by taking into account bothco-expression and co-regulation. A sparse decomposi-tion step is then applied to estimate the regulationstrength of predicted regulatory networks. To evaluatethe performance of the proposed approach, we appliedthe mSD method to simulated and real yeast cell cycledata, showing an improved performance in identifyingthree kinds of coherent modules associated with knowncell cycle transcription factors. We then applied ourapproach to a molecular profiling study of estrogendependence in breast cancer cells, with the goal of reco-vering condition-specific transcriptional modules relatedto estrogen action. The results demonstrated that ourapproach effectively finds important condition-specificregulatory modules that are functionally relevant toestrogen signaling pathways.
MethodsThe overall scheme of the proposed mSD approach isillustrated in Figure 1. We start by extracting motifinformation from upstream DNA sequences of genes,followed by a two-stage approach to integrate motifinformation and gene expression data for regulatorymodule identification. In the first stage, we use a motif-guided clustering method for transcription factor activityestimation by maximizing the motif support for co-expressed gene modules. In the second stage, we use asparse decomposition method for regulation strengthestimation to enforce that the genes in a module arelikely regulated by a few transcription factors. Finally,regulatory modules are reconstructed from the detectedactive regulators and their target genes that exhibit largeregulation strengths. In this section, we will give adetailed description of each major component in the
Gong et al. BMC Bioinformatics 2011, 12:82http://www.biomedcentral.com/1471-2105/12/82
Page 2 of 16

mSD approach. Note that the mSD software package isimplemented and made available at http://www.cbil.ece.vt.edu/software.htm.
Latent variable modelWe adopt a latent variable model that has been used inLiao et al. [16] and Kao et al. [18] to establish a linkbetween gene expression data and motif information.The central theme of the model is that gene expressionmeasurements can be largely determined by theunknown activities of transcription factors acting onknown binding motifs (TFs). Using log-ratios of geneexpression measurements, a simplified, yet biologicallyjustified, linear model can be formulated as follows [16]:
xpg =∑
tapt · stg or X = AS, (1)
where xpg is defined as the logarithm of the expressionratio of gene g between data sample p and control sam-ple, apt the activity level of TF t in sample p and stg theregulation strength of TF t onto gene g. The log-ratiosof gene expression X Î Rm×N ,(N >> 1) are expressed asa linear combination of log-ratios of TF activity (A ÎRm×n ) weighted by their regulation strength (S Î Rn×N).Note that m is the number of samples, N is the numberof genes, and n is the number of TFs.In general, the number of TFs is much smaller than
the number of transcribed genes (n <<N) and mostgenes are regulated only by a small number of TFs.
Figure 1 A block diagram of the motif-guided sparse decomposition (mSD) approach. The mSD approach consists of the following twosteps: (1) transcription factor activity estimation by motif-guided clustering and (2) regulation strength estimation by sparse decomposition.
Gong et al. BMC Bioinformatics 2011, 12:82http://www.biomedcentral.com/1471-2105/12/82
Page 3 of 16

Hence, the matrix S that describes the regulationstrength between the TFs and their regulated genes issparse. Further, the number of TFs (n) is usually greaterthan the number of samples (m), i.e., n >m , such thatEquation (1) represents an underdetermined linear sys-tem (ULS). To obtain a sparse solution to this ULS,we develop a two-stage approach to estimate transcrip-tion factor activity (A) and regulation strength (S)sequentially.
Transcription factor activity estimationA generic approach for transcription factor activity esti-mation is to use a clustering method to find representa-tive genes whose expression profiles (columns of X) canbe utilized to estimate A [19]. For a theoretical justifica-tion of the identifiability of A, please refer to Section 1.1in the supplementary material. Many clustering techni-ques have been proposed to cluster gene expressiondata, such as k-means clustering [20] and self-organizingmaps [21], which are designed to find gene expressionpatterns by grouping genes with similar expression pro-files. Very recently, an affinity propagation (AP) algo-rithm has been proposed for data clustering that showsan improved performance [22]. Based on an ad hocpair-wise similarity function between data points, APseeks to identify each cluster by one of its elements, theso-called exemplar. AP takes as input a collection ofreal-valued similarities between data points, where thesimilarity s(i, k) indicates how well data point k is suitedto be the exemplar for data point i. The goal is to maxi-mize the similarity s(i, k) or equivalently, to minimizethe Euclidean distance [22], d(i, k) = ||xi - xk||
2, wherexi and xk are two column vectors of gene i and gene k,respectively, in X.However, direct application of the AP clustering tech-
nique to gene expression data will only give rise to co-expressed gene clusters. To identify gene regulatorymodules, we need a clustering technique to integratemotif information and gene expression data, aiming tofind co-regulated gene clusters with co-expressed pat-terns. We here propose a motif-guided clusteringmethod to find a group of genes that not only is of simi-lar expression pattern but also shares a common set ofbinding motifs as much as possible.
Motif-guided gene clustering with a joint similaritymeasureTo incorporate motif information, we propose a newsimilarity measure, taking into account both expressionsimilarity and motif binding similarity, for the AP clus-tering method. The motif information can be repre-sented by a TF-gene binding strength matrix, W = [w(t,g)], considering a set of n TFs binding onto a set of Ngenes. Each element of W, i.e., w(t, g), denotes the
binding strength of TF t onto gene g. As a commonpractice, the binding strength is usually approximatedby a position weight matrix (PWM) that contains log-odds weights for computing a match score between abinding site and an input DNA sequence [23]. For adetailed description of how to generate the bindingstrength matrix, please refer to Section S1.2 in the sup-plementary material of this paper. Given the bindingstrength of TF t onto gene i (w(t, i)) and that of TF tonto gene k (w(t , k)), the joint binding strength of TF tonto both gene i and gene k is proportional to w(t, i)×w(t, k), assuming that these two binding events are inde-pendent. Thus, for all possible TFs (TF t, t = 1,..., n)binding onto gene i and gene k, it is reasonable to usethe sum of their joint binding strengths to measure thelikelihood of gene i and gene k being co-regulated bythe possible set of TFs (TF t, t = 1,..., n):
sm(i, k) =n∑
t=1
w(t, i) × w(t, k). (2)
For motif-guided clustering, we propose the followingpair-wise similarity measure to simultaneously considerthe binding motif likelihood and gene expression simi-larity:
d(i, k) = −(1 − λ)||xi − xk||2 + λsm(i, k), (3)
where l is a trade-off parameter that controls the con-tribution from two different information sources: motifinformation and gene expression data. When incorpo-rated into an AP clustering method, the first term in Eq.(3) is used to find a group of genes with similar expres-sion pattern, while the second term estimates thosegenes that should share a common set of TFs.Ideally, the clustering result will generate a better
representation of the transcription factor activity thatunderlies a co-regulated group of genes. However, bothmotif information and gene expression data are noisybecause the binding motif is a very short DNAsequence [24] and there is often a low signal-to-noiseratio in gene expression measurements [25]. The impactof the noises can be clearly observed in two extremecases: (1) the gene cluster resulting from (noisy) motifinformation alone will show a noisy expression pattern;(2) the cluster resulting from gene expression dataalone will often gain little support in terms of beingregulated by a shared set of motifs. Therefore, it isimportant to understand the contribution of each datasource and assign its proper weight. The trade-off para-meter l in Eq. (3) is used to alleviate the effects ofnoise. In the following section, we will design anentropy-based measure, in conjunction with a non-uni-formity measure, to help find the optimal value for thetrade-off parameter l.
Gong et al. BMC Bioinformatics 2011, 12:82http://www.biomedcentral.com/1471-2105/12/82
Page 4 of 16

Determination of the trade-off parameterTo measure the relative contribution of motif informationto gene clustering, we propose an entropy-based measureto capture the property that a regulatory module shouldbe regulated by a unique set of active transcription factors.For each gene cluster, an enrichment analysis is first per-formed to identify the significant motifs associated withthe genes in the cluster. Specifically, a hyper-geometrictest is designed to calculate the significance value (p-value)of a motif (motif t) enriched in the cluster. The testingprocedure can be described as follows. The null distribu-tion is generated by randomly sampling the entire genepopulation (with N genes) as many times as possible(approximately 10,000 times) to form random gene clus-ters. Let us assume that the gene cluster j under examina-tion consists of Nj genes in which Nb genes have thesupport of motif t, while in the entire gene population thetotal number of genes that contain the motif t in their pro-moters is NB. For the randomly generated clusters (eachwith a size of Nj), we count the number of genes contain-ing motif t in each cluster, denoted as ir, to finally formthe null distribution. The p-value for motif t enriched incluster j can then be calculated as follows:
p − value = P(ir ≥ Nb) =min(NB,NJ)∑
ir=Nb
(NB
ir
)(N − NB
Nj − ir
)/(NNj
)(4)
With the p-value for each motif ’s enrichment, we calcu-late the motif emission frequency [26] for all the motifs ineach cluster. For a particular cluster index j, j = 1,..., J, aset of motif frequencies can be defined as θj = (θj1, θj2,...,θjn), where θjt = -log10 pjt, t = 1,..., n and pjt is the p-valueobtained from Eq. (4). We then normalize θj by∑n
t=1 θjt = 1 to ensure that each element in θj falls in therange of [0, 1]. Treating motif occupancy as a randomvariable associated with an appropriate probability space,we can quantitatively measure the ‘uncertainty’ of motifoccupancy in cluster j, from an information-theoretic per-spective, by the following entropy definition [27]:
H(θ j) = −n∑
t=1
θjtlog2(θjt). (5)
The entropy is then normalized to be in the range of[0, 1] as divided by the maximum entropy (Hmax (θj)),i.e., H̃(θ j) = H(θ j)/Hmax(θ j); the maximum entropy isacheived when the motif occupancy is uniformly distrib-uted. Summing over all the clusters, we can obtain themean entropy to measure the overall ‘uncertainty’ ofmotif occupancy in the clusters as follows:
H̃ =1J
J∑j=1
H̃(θ j). (6)
Conceptually, when motifs are randomly distributed(with an assumed uniform distribution) among the clus-ters, the mean entropy reaches its maximum; conversely,when motifs are uniquely distributed for each cluster(cluster-specific), the mean entropy reaches itsminimum.To measure the relative contribution of gene expres-
sion data to gene clustering, we adopt a non-uniformitymeasure [28] to characterize the co-expression nature ofthe genes in a cluster. The non-uniformity of expressionpattern is measured as inversely proportional to the var-iance of gene expression weighted by an appropriateweighting factor as shown in the following equation:
NonU =J∑
j=1
wjσ2j
σ 2max
, (7)
Where σ 2J is the variance of gene expression pattern
for cluster j(j = 1,..., j), σ 2max the maximum variance for
all clusters, and wj is the weight of cluster j defined asthe proportion of genes to the entire gene population.By varying the trade-off parameter l in Eq. (3), the AP
clustering method will generate different clusteringresults. This outcome is predictable because both themotif information and gene expression data are noisyand will affect the clustering results. Particularly, whenl is small, the contribution from gene expression datadominates, which will give rise to gene clusters withsmall non-uniformity of expression pattern but largeentropy of motif occupancy (not cluster-specific). Incontrast, when l is large, the contribution from motifinformation dominates, leading to gene clusters withlarge non-uniformity but small entropy of motif occu-pancy (cluster-specific). Therefore, it is important tofind the optimal l value to alleviate the noise impact onfinding regulatory modules. We propose to use the fol-lowing cost function to combine the measure of motifoccupancy (Eq. (6)) and that of expression pattern (Eq.(7)) as follows:
C(λ) = H̄(λ) + NonU(λ). (8)
Theoretically, the cost function C(l) is a U-shapedfunction; when l reaches its optimal value, the costfunction C(l) reaches its minimum. In other words, byminimizing C(l) we can find the optimal value of l totake advantage of both the motif information and geneexpression data, while alleviating the noise impact ongene clustering.We can extend this cost function to a weighted form
by using a trade-off parameter μ: C(μ, l) = μH(l)+(1-μ)NonU(l), where 0 ≤ μ ≤ 1. By controlling μ we canobtain different sets of gene clusters with different
Gong et al. BMC Bioinformatics 2011, 12:82http://www.biomedcentral.com/1471-2105/12/82
Page 5 of 16

degrees of motif occupancy and similarity in expressionpattern. To determine an appropriate parameter l, weuse a simplified version of the cost function C(μ, l):C(l) = H(l)+NonU(l) (which is equivalent to the caseof μ = 0.5), to help find an appropriate balance betweenmotif occupancy and expression pattern for regualtorymodule identification. A simplified assumption hereis that it is equally important to consider both co-regulation (measured by the entropy for motif occu-pancy) and co-expression (measured by non-uniformityof expression pattern) for regulatory module identifica-tion. Nevertheless, we use C(μ, l) to examine therobustness of parameter l for the microarray data ana-lyzed in this paper, ensuring that the selected parameterl is not sensitive to a particular choice of parameter μ.
Regulation strength estimationWe use the sparse component analysis (SCA) approach[19] to exploit a well-known biological constraint thatmost genes are likely regulated by a few transcriptionfactors, and then to estimate the regulation strengthmatrix S. Specifically, we have devised a projected“active subspace” algorithm for regulation strength esti-mation that can be described as follows:
(1) Initialize source S with a matrix W, which comesfrom either Chip-on-chip data or TF-gene bindingstrength matrix searched from TRANSFAC [29].
Loop(2) Iterate for every column of S (which is corre-sponding to each gene)
a. If sparseness constraints on the current col-umn of S (denote sg) apply, project sg to bedesired sparse by making its L1 norm larger thana predefined sparseness threshold, while havingthe L2 norm unchanged. (For the definition ofsparseness, please refer to [30].)b. In the projected space, detect approximatelywhich TFs are “active"; the term “active” is usedto refer to the TFs with “considerably nonzero”strengths.c. We assume that the first q TFs, {stg}, t = 1,... q,have been found to be inactive. Find the newestimation of sg by minimizing the cost function�
qt=1s2
tg subject to xg = Asg.Until convergenceNotice that a major step in the above algorithm (Step(2a)) requires a projection operator that enforces sparse-ness by explicitly setting both L1 and L2 norms. Thisoperator, fortunately, has been found by Hoyer [30] toincorporate sparseness constraint in the context of non-negative matrix factorization (NMF). We use this pro-jection operator in the SCA approach to find the closest
(in the Euclidean sense) sparse vector sg with a desiredL1 and L2 norm. The cost function in Step (2c) isdesigned to minimize the regulation strength of “inac-tive” TFs, while letting the regulation strength of“active” TFs to change freely in order to fulfil theimposed constraint xg = Asg . This can also be viewedas a form of projection into an active subspace [31],resulting in an elegant mathematical approach to obtainthe solution to a Karush-Kuhn-Tucker (KKT) system(for more details, please see Section S2 in the supple-mentary material).
Results and DiscussionSynthetic and real yeast dataTo validate the proposed integrative approach, weapplied mSD to synthetic and real yeast cell cycle datafor regulatory module identification, and then comparedits performance with those of other approaches includ-ing FastNCA [32] and sparse decomposition [19]. Forthe synthetic data set, we used a network generator,SynTReN [33], to produce a benchmark gene expressiondata set based on a synthetic S. cerevisiae transcriptionalregulatory network. SynTReN generated 15 samples ofexpression data with a set of 345 genes in different con-ditions. The genome-wide location data (ChIP-on-chipdata) [7] were then used to provide the binding informa-tion and these data were integrated with the geneexpression data to extract transcription factor activityand estimate regulation strength.To evaluate the performance of the mSD approach, we
compared its performance with those of other similarmethods, including FastNCA [32] and sparse decompo-sition (SD) [19]. Performances were measured by Recei-ver Operating Characteristic (ROC) analysis and thearea under the ROC curve (AUC). The ROC curve mea-sures the sensitivity and specificity of a method by cal-culating true-positive (TP) rate against false-positive(FP) rate. To generate a ROC curve, we first ranked thetarget genes for each TF according to their connectionstrengths in S, and then we calculated the true and falsepositive rates by running down the ranked gene list oneat a time. To investigate the impact of noise on therespective performances of mSD and FastNCA, thebinding information was obtained from the ChIP-on-chip data with different cut-off p-values (0.01, 0.05 and0.1); a large cut-off p-value results in a high false posi-tive rate in binding information (a high noise level).In this experiment, we selected the following 11 well
known regulatory TFs: ARG80, DAL82, GCN4, GCR2,HAP1, MIG1, RGT1, RTG1, RTG3, STE12 and XBP1,to calculate the averaged TP rates and FP rates for ROCanalysis. Additional file 1, Figure S1 shows the ROCcurves of three different approaches and Table 1 sum-marizes the AUCs of the ROC curves. For more analysis
Gong et al. BMC Bioinformatics 2011, 12:82http://www.biomedcentral.com/1471-2105/12/82
Page 6 of 16

results, please refer to Additional file 1, Figure S2, Addi-tional file 1, Figure S3 and Additional file 1, Table S1 inthe supplementary material, which show detailed perfor-mance information on gene module identification forseveral transcription factors. As can be seen from thefigures and tables, the mSD approach outperforms theother two methods in identifying co-regulated genes inall three cut-off p-values. Surprisingly, the performanceof FastNCA is worse than that of SD even though nobinding information is used in the SD approach. How-ever, FastNCA largely depends on correct networktopology, assuming noiseless binding information. Whenthe noise level in binding information is relatively large,the performance of FastNCA degrades to an unaccepta-ble degree. In contrast, the mSD approach finds a subsetof target genes to reinforce the consistency betweenbinding information and gene expression data, limitingthe noise impact from both binding information andgene expression data.To further evaluate our algorithm, we applied the mSDapproach to a cell cycle data set obtained under thecondition of arrest of a cdc15 temperature-sensitivemutant [34]. As a pre-processing step, we employedKNNimpute [35] to fill in missing values and then iden-tified 800 cell cycle-related genes as the gene subpopula-tion to test the mSD approach. For the mSD approach,we set the trade-off parameter l in Eq. (3) as 0.08 forthis experiment, since the cost function, C(l) (Eq. (8)),reached its minimum at l = 0.08 (see Additional file 1,Figure S4 in the supplementary material for the C(l)curve). The modified cost function C(μ, l) can also befound in Additional file 1, Figure S5 in the supplemen-tary material, which supports the robustness of theselected parameter l with respect to parameter μ. Sincethere is no ground truth of target genes available forthis experiment, we used the functional enrichment ofregulatory modules to compare the performance ofmSD with that of another method, COGRIM [36].COGRIM is derived from a Bayesian hierarchical modeland implemented using the Gibbs sampling technique.COGRIM can help infer the activation or inhibition ofTFs acting on their target genes, with an integration ofmicroarray gene expression data, ChIP-on-chip data,and motif information. The top GO enrichment p-valueswere transformed to negative logarithm values and aver-aged over all identified modules. The averaged
enrichment score for the mSD method is 3.900, which isslightly better than the score for COGRIM (3.894),demonstrating that the mSD method can help identifyfunctionally coherent gene clusters associated with spe-cific TFs.
Breast cancer cell line dataWe then applied the mSD approach to breast cancer cellline data to help understand estrogen signaling andaction in breast cancer cells. Greater than 70% of inva-sive breast cancers diagnosed each year in the U.S.express detectable levels of estrogen receptor alpha (ER,ER+) [37]. The most potent natural ligand for ER is17b-estradiol, which can regulate the proliferation ofbreast cancer cells and alter their cytoarchitectural andphenotypic properties [37,38]. Antiestrogens, such asTamoxifen and Fulvestrant, are widely used in the treat-ment of these breast cancers and they produce a signifi-cant survival benefit for some patients. However, half ofthese cancers will recur, and recurrent metastatic breastcancer remains an incurable disease. It is, therefore,clinically and biologically important to understand whattranscriptional programs regulate these recurrenceevents [39,40].To gain insights into the transcriptional programs that
drive tumor recurrence, we have collected and acquiredbreast cancer cell line data in estrogen-induced andestrogen-deprived conditions, respectively. The estrogeninduced data set is a time course microarray data setobtained from the ER+, estrogen-dependent breast can-cer cell line MCF-7, treated with 17b-estradiol (E2) [41].The estrogen-deprived data set consists of a series ofbreast cancer variants that closely reflect clinical pheno-types of endocrine sensitive tumors [39]. The breastcancer variants are also derived from the MCF-7 cellline, including MIII cells and LCC1 cells. MIII cellswere derived directly from MCF-7 and became estrogenindependent and proliferate aggressively after sixmonths of selection in vivo in ovariectomized athymicmice. LCC1 cells were derived from MIII followingfurther selection in vivo. Both cell lines remain ER+ andexhibit an estrogen-independent but antiestrogen sensi-tive phenotype [39,40].We focused on twenty six breast cancer and estrogen
receptor (ER) related transcription factors, which arelisted in Table 2. This set of key transcription factorswere previously identified and known to be involved inthe estrogen receptor signaling (AP-1, CREB, ERa,NF�B, STATs [42]); authentic cis binding sites in breastcancer cell lines (C/EBP, Forkhead [43]); or overex-pressed in estrogen receptor (ER)-positive breast tumors(EGR-1 [44,45], ETF [46], MYB [47], p53 [48]). Mean-while, we also included some motifs involved in cellcycle or apoptosis (MYC/MAX [49], NFY [50], PBX1
Table 1 AUCs of mSD, SD and FastNCA methods,respectively, under different cut-off p-values
mSD SD Fast NCA
cut-off p-value = 0.1 0.7160 0.6912 0.5707
cut-off p-value = 0.05 0.7799 0.6881 0.5891
cut-off p-value = 0.01 0.8024 0.6801 0.5547
Gong et al. BMC Bioinformatics 2011, 12:82http://www.biomedcentral.com/1471-2105/12/82
Page 7 of 16

[51]). For each identified TF, a position weight matrix(PWM) was chosen from the vertebrate non-redundantprofiles within the TRANSFAC database [29]. Furthermotif information was obtained from published ChIP-on-chip experiments [43], and we generated a final listof twenty six transcription factors (Table 2).The motif information was obtained from the
TRANSFAC database [29] and ChIP-on-chip experi-ments [43]. All human promoter DNA sequences wereobtained from the UCSC Genome database [52]; wesearched 5,000 bp upstream from the transcription startsite (TSS). With all vertebrate position weight matrices(PWMs) provided by the TRANSFAC 11.1 ProfessionalDatabase [29], the Match™ [53] algorithm was used togenerate a gene-motif binding strength matrix with cutoffs that minimize the false-positive rate.For the mSD approach, we optimized the trade-off
parameter l in Eq. (3) by examining the cost function C(l) (Eq. (8)) (see Additional file 1, Figure S6 in the sup-plementary material for the detailed C(l) curves). Asshown in Additional file 1, Figure S7 in the supplemen-tary material, the selected parameter l is robust againstthe parameter μ in the modified cost function C(μ, l).With the mSD approach to integrate motif informationand gene expression data, we identified several key regu-latory networks associated with estrogen signaling.Figure 2 shows the activities of five transcription factors(AP1, ETF, ER, STAT, NF�B) in estrogen-induced andestrogen-deprived conditions, respectively, that exhibitdistinctive patterns of regulation. Transcription factoractivities clearly show different actions in response toestrogen induction (Figure 2(a)). V$AP1_Q4_01 wasactivated within 1 hour after estrogen treatment; V$ETF_Q6 and V$ER_Q6 were also activated early, butshowed a subsequent decrease in activity followed by asecond activation event by 24 hours; V$STAT_Q6exhibited a response to estrogen induction within 2hours. This STAT activity estimation correlates wellwith previous findings that STATs are activated via thetyrosine phosphorylation cascade after ligand bindingand stimulation of the cytokine receptor-kinase complex[54]. One of the mechanisms by which ER signalingoccurs involves protein-protein interactions; activatedestrogen receptors interact directly with transcriptionfactors such as nuclear factor �B (NF�B), activator
protein-1 (AP-1), and specificity protein-1 (SP1), to acti-vate gene transcription [55]. As shown in Figure 2(a), anextended period of NF�B activation can be observedfrom 4 hours to 12 hours, which could be explained, atleast in part, by such a mechanism.Figure 2(b) shows the activities of these five transcrip-
tion factors in the estrogen-deprived condition. Activa-tion of ER can be clearly observed in LCC1 cells, alongwith activation of both ETF (V$ETF_Q6) and STAT (V$STAT_Q6), suggesting that the additional in vivo selec-tion has led to further adaptations in ER signaling inthese cells. To understand the mechanisms behind this,we examined both transcript factor activity (A) and reg-ulation strength (S) to gain some insights into condi-tion-specific regulation programs, particularly, theprogram in the estrogen-deprived condition for ETF andSTAT. For example, we examined the target genes ofEGFR-regulating transcription factor ETF (HUGO genesymbol: TEAD2, V$ETF_Q6) to understand its regula-tory role in estrogen-deprived condition; ETF is knownto stimulate EGFR transcription and might play a rolein the overexpression of this growth factor receptor[46]. As expected, there is a large overlap between theidentified ETF target gene sets in the two conditions,which are listed in Table 3 (see the supplementarymaterial, Additional file 2, for the target genes of theother four TFs (AP1, ER, STAT, NF�B)). These genesare enriched in the following Gene Ontology terms: ‘celladhesion’, ‘cell cycle process’, ‘negative regulation ofprogression through cell cycle’, ‘regulation of kinaseactivity’ and ‘regulation of transferase activity andapoptosis’.Notably, EGFR is among the overlapped genes, and
the expression of EGFR is upregulated in LCC1 cells.We then searched the String Database to find directneighbors of EGFR in the protein-protein interaction(PPI) network [56]. Figure 3(a) shows some of the puta-tive ETF target genes and their PPI networks from theString Database, which notably includes EGFR and sev-eral direct neighbors of EGFR: CBL, RASA1, PTPN1,SHC1, HBEGF, SRC, ERBB2, GREB2, PLCC1. OtherETF target genes and their PPI networks can be foundin the supplementary material (Fig. S8).Figure 3(b) shows the gene expression pattern of
EGFR and its direct neighbors under estrogen-deprived
Table 2 Twenty six breast cancer and ER-related transcription factors
V$AP1_Q2_01 V$AP1_Q4_01 V$CREBP1CJUN_01 V$CEBP_Q3 V$CEBPA_01
V$CEBPGAMMA_Q6 V$CREB_02 V$CREB_Q3 V$CREB_Q2 V$NFKB_Q6_01
V$SP1_Q6 V$ER_Q6 V$ETF_Q6 V$MYCMAX_03 V$STAT_Q6
V$STAT_01 V$EGR1_01 V$FOXJ2_02 V$FOXP1_01 V$MYB_Q3
V$P53_02 V$PBX_Q3 V$PBX1_03 V$NFY_Q6_01 V$NFY_01
V$CEBPDELTA_Q6
Gong et al. BMC Bioinformatics 2011, 12:82http://www.biomedcentral.com/1471-2105/12/82
Page 8 of 16

conditions. As we can see from the figure, the expres-sion level of CBL was largely suppressed in the estro-gen-deprived condition. Since CBL can promote theubiquitination and degradation of activated EGFR [57],we hypothesize that EGFR expression is increased inLCC1 cells due to both the activation of ETF and thedownregulation of CBL. Studies to explore these predic-tions are currently in progress.Overexpression and/or activation of the ErbB recep-
tors (ErbB1 = EGFR) may also promote proliferation,motility, adhesion, and differentiation [58]. Recent evi-dence has shown that increased growth factor (GF) sig-naling augments the ligand (estrogen)-independentactivity of ER [59], which may partially explain the activ-ity of ER (V$ER_Q6) in LCC1 cells as seen in Figure 2(b). In addition, the PLC-Gamma (PLCG1) and the JAK-STAT pathways are known to enhance the transcriptionof genes that regulate cell proliferation. This could con-tribute to the induced activity of STAT (V$STAT_Q6)(see Figure 2(b)), since one of the important signalingevents activated by EGFR involves tyrosine phosphoryla-tion of STAT. Stimulation of EGFR may induce tyrosine
phosphorylation of STAT1, STAT3 and STAT5, initiat-ing complex formation of these STATs with JAK1 andJAK2. JAKs are essential mediators of the interactionbetween EGFR and the STATs, which then translocateto the nucleus to stimulate gene transcription [60,61].Importantly, we have recently shown that EGFR signal-ing through p130Cas and the tyrosine kinase c-Src leadsto phosphorylation of STAT5B, and that this signaltransduction pathway induces Tamoxifen resistance inMCF-7 breast cancer cells [62].It is also important to validate the identified target
genes by biological experiments such as other breastcancer cell line data and ChIP-on-chip experiments.While many estrogen target genes have been identifiedthrough expression microarray studies [63], the resultsfrom ChIP-on-chip experiments are not currently com-plete. Nonetheless, our list of ER target genes includesthe following known direct targets: TFF1, GREB1[64,65]; VAMP3 [65,66]; PRKCSH, PLEC1, NT5C2,C19ORF2, TMOD3, and FLJ11286 [65]. Furthermore,Cicatiello et al. have recently performed a comprehen-sive genome-wide analysis to investigate ERa target
Figure 2 Transcription factor activity estimated by the mSD approach. (a) Estimated activities of the five transcription factors (AP1, ETF, ER,STAT and NF�B) in estrogen-induced condition. (b) Estimated activities of the five transcription factor bind sites in estrogen-deprived condition.
Gong et al. BMC Bioinformatics 2011, 12:82http://www.biomedcentral.com/1471-2105/12/82
Page 9 of 16
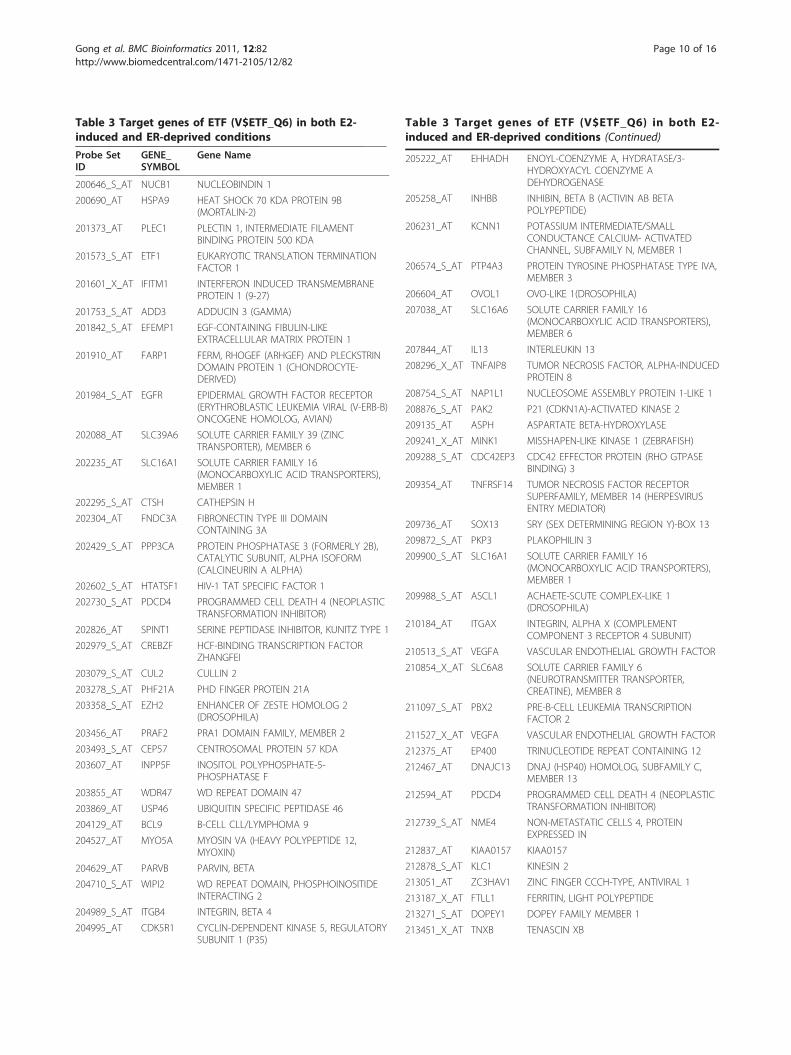
Table 3 Target genes of ETF (V$ETF_Q6) in both E2-induced and ER-deprived conditions
Probe SetID
GENE_SYMBOL
Gene Name
200646_S_AT NUCB1 NUCLEOBINDIN 1
200690_AT HSPA9 HEAT SHOCK 70 KDA PROTEIN 9B(MORTALIN-2)
201373_AT PLEC1 PLECTIN 1, INTERMEDIATE FILAMENTBINDING PROTEIN 500 KDA
201573_S_AT ETF1 EUKARYOTIC TRANSLATION TERMINATIONFACTOR 1
201601_X_AT IFITM1 INTERFERON INDUCED TRANSMEMBRANEPROTEIN 1 (9-27)
201753_S_AT ADD3 ADDUCIN 3 (GAMMA)
201842_S_AT EFEMP1 EGF-CONTAINING FIBULIN-LIKEEXTRACELLULAR MATRIX PROTEIN 1
201910_AT FARP1 FERM, RHOGEF (ARHGEF) AND PLECKSTRINDOMAIN PROTEIN 1 (CHONDROCYTE-DERIVED)
201984_S_AT EGFR EPIDERMAL GROWTH FACTOR RECEPTOR(ERYTHROBLASTIC LEUKEMIA VIRAL (V-ERB-B)ONCOGENE HOMOLOG, AVIAN)
202088_AT SLC39A6 SOLUTE CARRIER FAMILY 39 (ZINCTRANSPORTER), MEMBER 6
202235_AT SLC16A1 SOLUTE CARRIER FAMILY 16(MONOCARBOXYLIC ACID TRANSPORTERS),MEMBER 1
202295_S_AT CTSH CATHEPSIN H
202304_AT FNDC3A FIBRONECTIN TYPE III DOMAINCONTAINING 3A
202429_S_AT PPP3CA PROTEIN PHOSPHATASE 3 (FORMERLY 2B),CATALYTIC SUBUNIT, ALPHA ISOFORM(CALCINEURIN A ALPHA)
202602_S_AT HTATSF1 HIV-1 TAT SPECIFIC FACTOR 1
202730_S_AT PDCD4 PROGRAMMED CELL DEATH 4 (NEOPLASTICTRANSFORMATION INHIBITOR)
202826_AT SPINT1 SERINE PEPTIDASE INHIBITOR, KUNITZ TYPE 1
202979_S_AT CREBZF HCF-BINDING TRANSCRIPTION FACTORZHANGFEI
203079_S_AT CUL2 CULLIN 2
203278_S_AT PHF21A PHD FINGER PROTEIN 21A
203358_S_AT EZH2 ENHANCER OF ZESTE HOMOLOG 2(DROSOPHILA)
203456_AT PRAF2 PRA1 DOMAIN FAMILY, MEMBER 2
203493_S_AT CEP57 CENTROSOMAL PROTEIN 57 KDA
203607_AT INPP5F INOSITOL POLYPHOSPHATE-5-PHOSPHATASE F
203855_AT WDR47 WD REPEAT DOMAIN 47
203869_AT USP46 UBIQUITIN SPECIFIC PEPTIDASE 46
204129_AT BCL9 B-CELL CLL/LYMPHOMA 9
204527_AT MYO5A MYOSIN VA (HEAVY POLYPEPTIDE 12,MYOXIN)
204629_AT PARVB PARVIN, BETA
204710_S_AT WIPI2 WD REPEAT DOMAIN, PHOSPHOINOSITIDEINTERACTING 2
204989_S_AT ITGB4 INTEGRIN, BETA 4
204995_AT CDK5R1 CYCLIN-DEPENDENT KINASE 5, REGULATORYSUBUNIT 1 (P35)
Table 3 Target genes of ETF (V$ETF_Q6) in both E2-induced and ER-deprived conditions (Continued)
205222_AT EHHADH ENOYL-COENZYME A, HYDRATASE/3-HYDROXYACYL COENZYME ADEHYDROGENASE
205258_AT INHBB INHIBIN, BETA B (ACTIVIN AB BETAPOLYPEPTIDE)
206231_AT KCNN1 POTASSIUM INTERMEDIATE/SMALLCONDUCTANCE CALCIUM- ACTIVATEDCHANNEL, SUBFAMILY N, MEMBER 1
206574_S_AT PTP4A3 PROTEIN TYROSINE PHOSPHATASE TYPE IVA,MEMBER 3
206604_AT OVOL1 OVO-LIKE 1(DROSOPHILA)
207038_AT SLC16A6 SOLUTE CARRIER FAMILY 16(MONOCARBOXYLIC ACID TRANSPORTERS),MEMBER 6
207844_AT IL13 INTERLEUKIN 13
208296_X_AT TNFAIP8 TUMOR NECROSIS FACTOR, ALPHA-INDUCEDPROTEIN 8
208754_S_AT NAP1L1 NUCLEOSOME ASSEMBLY PROTEIN 1-LIKE 1
208876_S_AT PAK2 P21 (CDKN1A)-ACTIVATED KINASE 2
209135_AT ASPH ASPARTATE BETA-HYDROXYLASE
209241_X_AT MINK1 MISSHAPEN-LIKE KINASE 1 (ZEBRAFISH)
209288_S_AT CDC42EP3 CDC42 EFFECTOR PROTEIN (RHO GTPASEBINDING) 3
209354_AT TNFRSF14 TUMOR NECROSIS FACTOR RECEPTORSUPERFAMILY, MEMBER 14 (HERPESVIRUSENTRY MEDIATOR)
209736_AT SOX13 SRY (SEX DETERMINING REGION Y)-BOX 13
209872_S_AT PKP3 PLAKOPHILIN 3
209900_S_AT SLC16A1 SOLUTE CARRIER FAMILY 16(MONOCARBOXYLIC ACID TRANSPORTERS),MEMBER 1
209988_S_AT ASCL1 ACHAETE-SCUTE COMPLEX-LIKE 1(DROSOPHILA)
210184_AT ITGAX INTEGRIN, ALPHA X (COMPLEMENTCOMPONENT 3 RECEPTOR 4 SUBUNIT)
210513_S_AT VEGFA VASCULAR ENDOTHELIAL GROWTH FACTOR
210854_X_AT SLC6A8 SOLUTE CARRIER FAMILY 6(NEUROTRANSMITTER TRANSPORTER,CREATINE), MEMBER 8
211097_S_AT PBX2 PRE-B-CELL LEUKEMIA TRANSCRIPTIONFACTOR 2
211527_X_AT VEGFA VASCULAR ENDOTHELIAL GROWTH FACTOR
212375_AT EP400 TRINUCLEOTIDE REPEAT CONTAINING 12
212467_AT DNAJC13 DNAJ (HSP40) HOMOLOG, SUBFAMILY C,MEMBER 13
212594_AT PDCD4 PROGRAMMED CELL DEATH 4 (NEOPLASTICTRANSFORMATION INHIBITOR)
212739_S_AT NME4 NON-METASTATIC CELLS 4, PROTEINEXPRESSED IN
212837_AT KIAA0157 KIAA0157
212878_S_AT KLC1 KINESIN 2
213051_AT ZC3HAV1 ZINC FINGER CCCH-TYPE, ANTIVIRAL 1
213187_X_AT FTLL1 FERRITIN, LIGHT POLYPEPTIDE
213271_S_AT DOPEY1 DOPEY FAMILY MEMBER 1
213451_X_AT TNXB TENASCIN XB
Gong et al. BMC Bioinformatics 2011, 12:82http://www.biomedcentral.com/1471-2105/12/82
Page 10 of 16
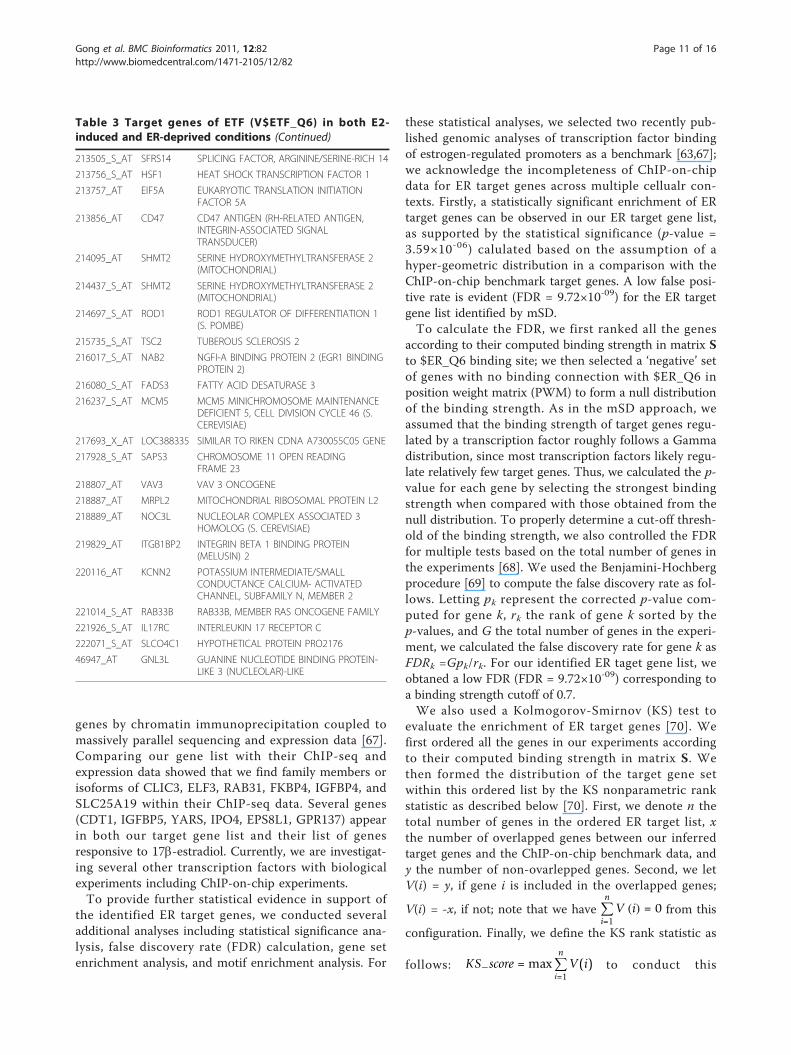
genes by chromatin immunoprecipitation coupled tomassively parallel sequencing and expression data [67].Comparing our gene list with their ChIP-seq andexpression data showed that we find family members orisoforms of CLIC3, ELF3, RAB31, FKBP4, IGFBP4, andSLC25A19 within their ChIP-seq data. Several genes(CDT1, IGFBP5, YARS, IPO4, EPS8L1, GPR137) appearin both our target gene list and their list of genesresponsive to 17b-estradiol. Currently, we are investigat-ing several other transcription factors with biologicalexperiments including ChIP-on-chip experiments.To provide further statistical evidence in support of
the identified ER target genes, we conducted severaladditional analyses including statistical significance ana-lysis, false discovery rate (FDR) calculation, gene setenrichment analysis, and motif enrichment analysis. For
these statistical analyses, we selected two recently pub-lished genomic analyses of transcription factor bindingof estrogen-regulated promoters as a benchmark [63,67];we acknowledge the incompleteness of ChIP-on-chipdata for ER target genes across multiple cellualr con-texts. Firstly, a statistically significant enrichment of ERtarget genes can be observed in our ER target gene list,as supported by the statistical significance (p-value =3.59×10-06) calulated based on the assumption of ahyper-geometric distribution in a comparison with theChIP-on-chip benchmark target genes. A low false posi-tive rate is evident (FDR = 9.72×10-09) for the ER targetgene list identified by mSD.To calculate the FDR, we first ranked all the genes
according to their computed binding strength in matrix Sto $ER_Q6 binding site; we then selected a ‘negative’ setof genes with no binding connection with $ER_Q6 inposition weight matrix (PWM) to form a null distributionof the binding strength. As in the mSD approach, weassumed that the binding strength of target genes regu-lated by a transcription factor roughly follows a Gammadistribution, since most transcription factors likely regu-late relatively few target genes. Thus, we calculated the p-value for each gene by selecting the strongest bindingstrength when compared with those obtained from thenull distribution. To properly determine a cut-off thresh-old of the binding strength, we also controlled the FDRfor multiple tests based on the total number of genes inthe experiments [68]. We used the Benjamini-Hochbergprocedure [69] to compute the false discovery rate as fol-lows. Letting pk represent the corrected p-value com-puted for gene k, rk the rank of gene k sorted by thep-values, and G the total number of genes in the experi-ment, we calculated the false discovery rate for gene k asFDRk =Gpk/rk. For our identified ER taget gene list, weobtaned a low FDR (FDR = 9.72×10-09) corresponding toa binding strength cutoff of 0.7.We also used a Kolmogorov-Smirnov (KS) test to
evaluate the enrichment of ER target genes [70]. Wefirst ordered all the genes in our experiments accordingto their computed binding strength in matrix S. Wethen formed the distribution of the target gene setwithin this ordered list by the KS nonparametric rankstatistic as described below [70]. First, we denote n thetotal number of genes in the ordered ER target list, xthe number of overlapped genes between our inferredtarget genes and the ChIP-on-chip benchmark data, andy the number of non-ovarlepped genes. Second, we letV(i) = y, if gene i is included in the overlapped genes;
V(i) = -x, if not; note that we haven∑
i=1V (i) = 0 from this
configuration. Finally, we define the KS rank statistic as
follows: KS−score = maxn∑
i=1V(i) to conduct this
Table 3 Target genes of ETF (V$ETF_Q6) in both E2-induced and ER-deprived conditions (Continued)
213505_S_AT SFRS14 SPLICING FACTOR, ARGININE/SERINE-RICH 14
213756_S_AT HSF1 HEAT SHOCK TRANSCRIPTION FACTOR 1
213757_AT EIF5A EUKARYOTIC TRANSLATION INITIATIONFACTOR 5A
213856_AT CD47 CD47 ANTIGEN (RH-RELATED ANTIGEN,INTEGRIN-ASSOCIATED SIGNALTRANSDUCER)
214095_AT SHMT2 SERINE HYDROXYMETHYLTRANSFERASE 2(MITOCHONDRIAL)
214437_S_AT SHMT2 SERINE HYDROXYMETHYLTRANSFERASE 2(MITOCHONDRIAL)
214697_S_AT ROD1 ROD1 REGULATOR OF DIFFERENTIATION 1(S. POMBE)
215735_S_AT TSC2 TUBEROUS SCLEROSIS 2
216017_S_AT NAB2 NGFI-A BINDING PROTEIN 2 (EGR1 BINDINGPROTEIN 2)
216080_S_AT FADS3 FATTY ACID DESATURASE 3
216237_S_AT MCM5 MCM5 MINICHROMOSOME MAINTENANCEDEFICIENT 5, CELL DIVISION CYCLE 46 (S.CEREVISIAE)
217693_X_AT LOC388335 SIMILAR TO RIKEN CDNA A730055C05 GENE
217928_S_AT SAPS3 CHROMOSOME 11 OPEN READINGFRAME 23
218807_AT VAV3 VAV 3 ONCOGENE
218887_AT MRPL2 MITOCHONDRIAL RIBOSOMAL PROTEIN L2
218889_AT NOC3L NUCLEOLAR COMPLEX ASSOCIATED 3HOMOLOG (S. CEREVISIAE)
219829_AT ITGB1BP2 INTEGRIN BETA 1 BINDING PROTEIN(MELUSIN) 2
220116_AT KCNN2 POTASSIUM INTERMEDIATE/SMALLCONDUCTANCE CALCIUM- ACTIVATEDCHANNEL, SUBFAMILY N, MEMBER 2
221014_S_AT RAB33B RAB33B, MEMBER RAS ONCOGENE FAMILY
221926_S_AT IL17RC INTERLEUKIN 17 RECEPTOR C
222071_S_AT SLCO4C1 HYPOTHETICAL PROTEIN PRO2176
46947_AT GNL3L GUANINE NUCLEOTIDE BINDING PROTEIN-LIKE 3 (NUCLEOLAR)-LIKE
Gong et al. BMC Bioinformatics 2011, 12:82http://www.biomedcentral.com/1471-2105/12/82
Page 11 of 16

Figure 3 Identified target genes of EGFR-specific transcription factor (ETF) in estrogen-induced and estrogen-deprived conditions. (a)Yellow diamond: target genes of ETF; purple circle: direct neighbors of the target genes from protein-protein interaction (PPI) data. (b) Geneexpression pattern of EGFR and its direct PPI in estrogen-deprived condition.
Gong et al. BMC Bioinformatics 2011, 12:82http://www.biomedcentral.com/1471-2105/12/82
Page 12 of 16

statistical test based on a permutation test [71]. For ourER target gene list, the KS score (KS_score = 208) is sig-nificantly higher than the scores in the null distributionbased on 10,000 randomly selected gene sets of thesame size as the inferred ER target genes (with a statisti-cal significance of p-value = 0.0099; see Fig. S9 in thesupplementary material).We evaluated the enrichment of ER binding sites in
the promoters of target genes identified by the mSDapproach using TRANSFAC [29]. A motif enrichmentanalysis procedure was used based on a permutationtest [72], which can be summarized as follows. Given agene set S extracted by any computational method suchas the mSD approach, a statistic to measure the enrich-
ment of a specific motif f is defined as ef =∑g∈S
mgf ,
where m is the motif binding score as defined by bothmatrix similarity score and core similarity score [29,72].To calculate the statistical significance (p-value), weneed to form a null distribution. The null hypothesis isthat the gene set is randomly generated from the genepopulation and there is no significant enrichment of themotif f. We randomly select gene sets with same size of
S from the baseline gene population, and repeat B timesto generate the corresponding null statistic enrichment
score e0bf , for b = 1,..., B. The null hypothesis distribution
is assumed to be symmetric in this study. The p-valuecan be obtained for each gene set by calculating theprobability that a null gene set has a larger statistic thanthe observed statistic. Mathematically, the p-value canbe calculated by
pS =numberofmembersin{b : e0b
f > ef , b = 1, . . . , B}B
. By
comparing our identified ER target gene list to a ran-domly selected gene list (repeated 10,000 times), weclearly demonstrated a statistically significant enrich-ment of ER binding site in the identified ER targetgenes (p-value < 10-04). The distribution of $ER_Q6binding site among the identified ER target genes isshown in Figure 4, along with the gene expression pat-tern of these ER target genes in MCF-7 cell line data.
ConclusionsTraditional clustering methods have been widely usedfor gene module identification by searching for similar
Figure 4 Expression pattern and $ER_Q6 binding distribution of ER target genes in estrogen-induced condition (MCF-7 cell line). (a)The identified ER target genes show a consistent gene expression pattern of either being early-induced (≤ 4 hours) or late-induced (4 - 24hours) by estrogen. (b) 52 out of 68 ER target genes have at least one $ER_Q6 binding site.
Gong et al. BMC Bioinformatics 2011, 12:82http://www.biomedcentral.com/1471-2105/12/82
Page 13 of 16

patterns in gene expression data. Clustering methods ongene expression data alone can only provide co-expressed gene modules. The expression pattern ofgenes in the same cluster may be correlated for reasonsother than co-regulation. To identify gene regulatorymodules, it is important to incorporate transcription fac-tor binding information based either on ChIP-on-chipdata or on motif information. The proposed method,namely, motif-guided sparse decomposition (mSD), is anintegrated approach to combine gene expression dataand binding information for regulatory moduleidentification.The main challenge is that the level of noise is high in
both of the data types to be integrated. If a simple inte-gration strategy is used, the method will result in manyfalse positive target genes due to noise. Two strategieswere developed in our mSD approach to mitigate theeffects of noise impact on target gene identification.Firstly, an affinity propagation (AP) clustering method[22] is used to estimate transcription factor activity byclustering gene expression data in conjunction withbinding information. Secondly, a sparse component ana-lysis (SCA) method [19] is applied to estimate regulationstrength by exploiting the constraint that most genes areregulated by only a few transcription factors. Since agene cluster formed using an AP method reflects a simi-lar pattern (from the gene expression data) and a sharedregulator (from the binding information), the transcrip-tion factor activity (TFA) estimated from the cluster is abetter starting point for regulatory module identification.Using a SCA method and the improved TFA estimatesfurther refines the gene cluster by estimating the regula-tion strength of a particular transcription factor.The mSD approach has been developed and imple-
mented as follows. Binding motif information is initiallyused to define potential target genes, providing priorknowledge of the regulatory network topology. A sparselatent variable model is then used to integrate geneexpression data and identify which of the potential tar-get genes are actually activated by transcription factors.The mSD approach was implemented as a two-stepalgorithm to perform (1) transcription factor activityestimation, and (2) regulation strength estimation. Inthe first step, we start to integrate binding motif infor-mation and gene expression data to identify co-regulatedgene clusters. A motif-guided gene cluster method wasdeveloped and used to find the gene clusters, based on ajoint similarity measure from both gene expression dataand motif information. To limit the impact of noise ongene clustering performance, the contribution of eachdata type to clustering is quantified. The optimal trade-off between data sources can then be determined byminimizing a cost function taking into account the fre-quency of motif occupancy and non-uniformity of
expression pattern. Subsequently, we use a sparsedecomposition method for regulation strengthestimation.Unlike the NCA method [16] that assumes the net-
work topology derived from ChIP-on-chip data or motifinformation is known without error, we consider bothnetwork configuration and connection strength estima-tion as integrative components of the decompositionmethod. The use of prior knowledge of binding motif-information provides a solid starting point. As in Sabat-ti’s work [17], we also incorporate a sparse constraint toachieve a biologically meaningful representation of regu-latory networks. The experimental results on syntheticand real yeast data have demonstrated that our methodcan effectively identify the target genes of transcriptionfactors. The application of mSD to breast cancer cellline data further revealed condition-specific regulatorymodules associated with estrogen signaling and actionin breast cancer, which are consistent with known genefunctions in this cellular context.The current work represents an important step toward
integrating available biological information for recon-structing complex biological networks. This goal will bebetter accomplished by incorporating an analysis of thesynergistic effect of regulators into the proposedmethod. Combinatorial analysis may help discover thecomplex interplay between different regulators in orderto assemble a complete map of regulatory networks forcomplex biological systems.
Additional material
Additional file 1: Supplementary material. Supplementary materialincludes supplementary method, tables and figures.
Additional file 2: Target genes of four transcript ion factors (i.e.,AP-1, ER, STAT and NF�B), respectively. The target gene lists can befound in ‘Target_Genes_TFs.xls’.
AcknowledgementsThis study is supported by the National Institutes of Health under Grants(CA139246, CA149147, CA109872, CA149653, NS29525, EB000830 andCA096483) and the Department of Defense under Grant (BC030280). Wethank Alan Zwart for his work in the acquisition of breast cancer cell linemicroarray data. We also thank the reviewers for their invaluable suggestionsthat lead to many improvements in the manuscript.
Author details1Bradley Department of Electrical and Computer Engineering, Virginia Tech,Arlington, VA 22203, USA. 2Lombardi Comprehensive Cancer Center andDepartment of Oncology, Physiology and Biophysics, Georgetown University,Washington, DC 20057, USA. 3Bioinformatics Unit, RRB, National Institute onAging, National Institutes of Health, Baltimore, MD 21224, USA. 4ResearchCenter for Genetic Medicine, Children’s National Medical Center, Washington,DC 20010, USA.
Authors’ contributionsTG and JX formulated the problem and developed the theoreticalframework of the algorithm. TG carried out the development and
Gong et al. BMC Bioinformatics 2011, 12:82http://www.biomedcentral.com/1471-2105/12/82
Page 14 of 16

implementation of the algorithm. LC, RBR, HL, YW, EPH and RC providedtechnical and biological support to the project. All authors participated inthe writing of the manuscript, and have read and approved the manuscript.
Received: 2 November 2010 Accepted: 22 March 2011Published: 22 March 2011
References1. Vaquerizas JM, Kummerfeld SK, Teichmann SA, Luscombe NM: A census of
human transcription factors: function, expression and evolution. Nat RevGenet 2009, 10(4):252-263.
2. Neame E: Gene networks: Network analysis gets dynamic. Nat Rev Genet2008, 9(12):897-897.
3. Clements M, Someren EPv, Knijnenburg TA, Reinders MJT: Integration ofKnown Transcription Factor Binding Site Information and GeneExpression Data to Advance from Co-Expression to Co-Regulation.Genomics, Proteomics & Bioinformatics 2007, 5(2):86-101.
4. Joung J-G, Shin D, Seong RH, Zhang B-T: Identification of regulatorymodules by coclustering latent variable models: stem cell differentiation.Bioinformatics 2006, 22(16):2005-2011.
5. Yang YL, Suen J, Brynildsen MP, Galbraith SJ, Liao JC: Inferring yeast cellcycle regulators and interactions using transcription factor activities.BMC Genomics 2005, 6:90.
6. Segal E, Shapira M, Regev A, Pe’er D, Botstein D, Koller D, Friedman N:Module networks: identifying regulatory modules and their condition-specific regulators from gene expression data. Nat Genet 2003,34(2):166-176.
7. Lee TI, Rinaldi NJ, Robert F, Odom DT, Bar-Joseph Z, Gerber GK,Hannett NM, Harbison CT, Thompson CM, Simon I, et al: TranscriptionalRegulatory Networks in Saccharomyces cerevisiae. Science 2002,298(5594):799-804.
8. Dembele D, Kastner P: Fuzzy C-means method for clustering microarraydata. Bioinformatics 2003, 19(8):973-980.
9. D’Haeseleer P, Liang S, Somogyi R: Genetic network inference: from co-expression clustering to reverse engineering. Bioinformatics 2000,16(8):707-726.
10. Yeung MKS, Tegnér J, Collins JJ: Reverse engineering gene networksusing singular value decomposition and robust regression. Proceedings ofthe National Academy of Sciences of the United States of America 2002,99(9):6163-6168.
11. Nachman I, Regev A, Friedman N: Inferring quantitative models ofregulatory networks from expression data. Bioinformatics 2004,20(suppl_1):i248-256.
12. Latchman DS: Transcription Factors as Potential Targets for TherapeuticDrugs. Current Pharmaceutical Biotechnology 2000, 1:57-61.
13. Yeung KY, Ruzzo WL: Principal component analysis for clustering geneexpression data. Bioinformatics 2001, 17(9):763-774.
14. Lee S-I, Batzoglou S: Application of independent component analysis tomicroarrays. Genome Biology 2003, 4(11):R76.
15. Brunet J-P, Tamayo P, Golub TR, Mesirov JP: Metagenes and molecularpattern discovery using matrix factorization. Proceedings of the NationalAcademy of Sciences of the United States of America 2004,101(12):4164-4169.
16. Liao JC, Boscolo R, Yang YL, Tran LM, Sabatti C, Roychowdhury VP: Networkcomponent analysis: reconstruction of regulatory signals in biologicalsystems. Proc Natl Acad Sci USA 2003, 100:15522-15527.
17. Sabatti C, James GM: Bayesian sparse hidden components analysis fortranscription regulation networks. Bioinformatics 2006, 22(6):739-746.
18. Zhou XJ, Kao M-CJ, Huang H, Wong A, Nunez-Iglesias J, Primig M,Aparicio OM, Finch CE, Morgan TE, Wong WH: Functional annotation andnetwork reconstruction through cross-platform integration of microarraydata. Nat Biotech 2005, 23(2):238-243.
19. Georgiev P, Theis F, Cichocki A: Sparse component analysis and blindsource separation of underdetermined mixtures. Neural Networks, IEEETransactions on 2005, 16(4):992-996.
20. Tavazoie S, Hughes JD, Campbell MJ, Cho RJ, Church GM: Systematicdetermination of genetic network architecture. Nat Genet 1999,22(3):281-285.
21. Tamayo P, Slonim D, Mesirov J, Zhu Q, Kitareewan S, Dmitrovsky E,Lander ES, Golub TR: Interpreting patterns of gene expression with self-organizing maps: Methods and application to hematopoietic
differentiation. Proceedings of the National Academy of Sciences of theUnited States of America 1999, 96(6):2907-2912.
22. Frey BJ, Dueck D: Clustering by Passing Messages Between Data Points.Science 2007, 315(5814):972-976.
23. Ben-Gal I, Shani A, Gohr A, Grau J, Arviv S, Shmilovici A, Posch S, Grosse I:Identification of transcription factor binding sites with variable-orderBayesian networks. Bioinformatics 2005, 21(11):2657-2666.
24. Jin VX, Rabinovich A, Squazzo SL, Green R, Farnham PJ: A computationalgenomics approach to identify cis-regulatory modules from chromatinimmunoprecipitation microarray data–A case study using E2F1. GenomeRes 2006, 16(12):1585-1595.
25. Tu Y, Stolovitzky G, Klein U: Quantitative noise analysis for geneexpression microarray experiments. Proceedings of the NationalAcademy of Sciences of the United States of America 2002,99(22):14031-14036.
26. Kundaje A, Kundaje A, Middendorf M, Feng G, Wiggins CAWC, Leslie CALC:Combining sequence and time series expression data to learntranscriptional modules. Computational Biology and Bioinformatics, IEEE/ACM Transactions on 2005, 2(3):194-202.
27. Cover TM, Thomas JA: Elements of Information Theory. 2 edition. Wiley-Interscience; 2006.
28. Levine MD, Nazif AM: Dynamic Measurement of Computer GeneratedImage Segmentations. Pattern Analysis and Machine Intelligence, IEEETransactions on 1985, PAMI-7(2):155-164.
29. Matys V, Kel-Margoulis OV, Fricke E, Liebich I, Land S, Barre-Dirrie A, Reuter I,Chekmenev D, Krull M, Hornischer K, et al: TRANSFAC(R) and its moduleTRANSCompel(R): transcriptional gene regulation in eukaryotes. NuclAcids Res 2006, 34(suppl_1):D108-110.
30. Hoyer PO: Non-negative Matrix Factorization with SparsenessConstraints. J Mach Learn Res 2004, 5:1457-1469.
31. Arash Ali A, Massoud B-Z, Christian J: A Fast Method for SparseComponent Analysis Based on Iterative Detection-Estimation. AIPConference Proceedings 2006, 872(1):123-130.
32. Chang C, Ding Z, Hung YS, Fung PCW: Fast network component analysis(FastNCA) for gene regulatory network reconstruction from microarraydata. Bioinformatics 2008, 24(11):1349-1358.
33. Van den Bulcke T, Van Leemput K, Naudts B, van Remortel P, Ma H,Verschoren A, De Moor B, Marchal K: SynTReN: a generator of syntheticgene expression data for design and analysis of structure learningalgorithms. BMC Bioinformatics 2006, 7(1):43.
34. Spellman PT, Sherlock G, Zhang MQ, Iyer VR, Anders K, Eisen MB, Brown PO,Botstein D, Futcher B: Comprehensive Identification of Cell Cycle-regulated Genes of the Yeast Saccharomyces cerevisiae by MicroarrayHybridization. Mol Biol Cell 1998, 9(12):3273-3297.
35. Troyanskaya O, Cantor M, Sherlock G, Brown P, Hastie T, Tibshirani R,Botstein D, Altman RB: Missing value estimation methods for DNAmicroarrays. Bioinformatics 2001, 17(6):520-525.
36. Chen G, Jensen S, Stoeckert C: Clustering of genes into regulons usingintegrated modeling-COGRIM. Genome Biology 2007, 8(1):R4.
37. Jemal A, Siegel R, Ward E, Hao Y, Xu J, Thun MJ: Cancer statistics, 2009. CACancer J Clin 2009, 59(4):225-249.
38. Musgrove EA, Sutherland RL: Biological determinants of endocrineresistance in breast cancer. Nat Rev Cancer 2009, 9(9):631-643.
39. Clarke R, Liu MC, Bouker KB, Gu Z, Lee RY, Zhu Y, Skaar TC, Gomez B,O’Brien K, Wang Y, et al: Antiestrogen resistance in breast cancer andthe role of estrogen receptor signaling. Oncogene 2003,22(47):7316-7339.
40. Clarke R, Shajahan AN, Riggins RB, Cho Y, Crawford A, Xuan J, Wang Y,Zwart A, Nehra R, Liu MC: Gene network signaling in hormoneresponsiveness modifies apoptosis and autophagy in breast cancer cells.J Steroid Biochem Mol Biol 2009, 114(1-2):8-20.
41. Creighton C, Cordero K, Larios J, Miller R, Johnson M, Chinnaiyan A,Lippman M, Rae J: Genes regulated by estrogen in breast tumor cells invitro are similarly regulated in vivo in tumor xenografts and humanbreast tumors. Genome Biology 2006, 7(4):R28.
42. Bjornstrom L, Sjoberg M: Mechanisms of Estrogen Receptor Signaling:Convergence of Genomic and Nongenomic Actions on Target Genes.Mol Endocrinol 2005, 19(4):833-842.
43. Carroll JS, Meyer CA, Song J, Li W, Geistlinger TR, Eeckhoute J, Brodsky AS,Keeton EK, Fertuck KC, Hall GF, et al: Genome-wide analysis of estrogenreceptor binding sites. Nat Genet 2006, 38(11):1289-1297.
Gong et al. BMC Bioinformatics 2011, 12:82http://www.biomedcentral.com/1471-2105/12/82
Page 15 of 16

44. Chen CC, Lee WR, Safe S: Egr-1 is activated by 17beta-estradiol in MCF-7cells by mitogen-activated protein kinase-dependent phosphorylation ofELK-1. J Cell Biochem 2004, 93(5):1063-1074.
45. Gu Z, Lee RY, Skaar TC, Bouker KB, Welch JN, Lu J, Liu A, Zhu Y, Davis N,Leonessa F, et al: Association of interferon regulatory factor-1,nucleophosmin, nuclear factor-kappaB, and cyclic AMP responseelement binding with acquired resistance to Faslodex (ICI 182,780).Cancer Res 2002, 62(12):3428-3437.
46. Kageyama R, Merlino GT, Pastan I: A transcription factor active on theepidermal growth factor receptor gene. Proc Natl Acad Sci USA 1988,85(14):5016-5020.
47. Niida A, Smith A, Imoto S, Tsutsumi S, Aburatani H, Zhang M, Akiyama T:Integrative bioinformatics analysis of transcriptional regulatory programsin breast cancer cells. BMC Bioinformatics 2008, 9(1):404.
48. Gasco M, Shami S, Crook T: The p53 pathway in breast cancer. BreastCancer Res 2002, 4(2):70-76.
49. Jansen-Durr P, Meichle A, Steiner P, Pagano M, Finke K, Botz J,Wessbecher J, Draetta G, Eilers M: Differential modulation of cyclin geneexpression by MYC. Proc Natl Acad Sci USA 1993, 90(8):3685-3689.
50. Zwicker J, Lucibello FC, Wolfraim LA, Gross C, Truss M, Engeland K, Muller R:Cell cycle regulation of the cyclin A, cdc25C and cdc2 genes is based ona common mechanism of transcriptional repression. Embo J 1995,14(18):4514-4522.
51. Dedera DA, Waller EK, LeBrun DP, Sen-Majumdar A, Stevens ME, Barsh GS,Cleary ML: Chimeric homeobox gene E2A-PBX1 induces proliferation,apoptosis, and malignant lymphomas in transgenic mice. Cell 1993,74(5):833-843.
52. Karolchik D, Baertsch R, Diekhans M, Furey TS, Hinrichs A, Lu YT, Roskin KM,Schwartz M, Sugnet CW, Thomas DJ, et al: The UCSC Genome BrowserDatabase. Nucleic Acids Res 2003, 31(1):51-54.
53. Kel AE, Gossling E, Reuter I, Cheremushkin E, Kel-Margoulis OV,Wingender E: MATCHTM: a tool for searching transcription factor bindingsites in DNA sequences. Nucl Acids Res 2003, 31(13):3576-3579.
54. Abell K, Watson CJ: The Jak/Stat Pathway: A Novel Way to Regulate PI3KActivity. Cell cycle 2005, 4(7):4.
55. Moggs JG, Orphanides G: Estrogen receptors: orchestrators of pleiotropiccellular responses. EMBO reports 2001, 2(9):7.
56. Jensen LJ, Kuhn M, Stark M, Chaffron S, Creevey C, Muller J, Doerks T,Julien P, Roth A, Simonovic M, et al: STRING 8–a global view on proteinsand their functional interactions in 630 organisms. Nucleic Acids Res 2009,37 Database: D412-416.
57. Muthuswamy SK, Gilman M, Brugge JS: Controlled dimerization of ErbBreceptors provides evidence for differential signaling by homo- andheterodimers. Mol Cell Biol 1999, 19(10):6845-6857.
58. Yarden Y, Sliwkowski MX: Untangling the ErbB signalling network. Nat RevMol Cell Biol 2001, 2(2):127-137.
59. Nicholson RI, McClelland RA, Robertson JF, Gee JM: Involvement of steroidhormone and growth factor cross-talk in endocrine response in breastcancer. Endocr Relat Cancer 1999, 6(3):373-387.
60. Alvarez JV, Greulich H, Sellers WR, Meyerson M, Frank DA: Signal transducerand activator of transcription 3 is required for the oncogenic effects ofnon-small-cell lung cancer-associated mutations of the epidermalgrowth factor receptor. Cancer Res 2006, 66(6):3162-3168.
61. Smith KD, Wells A, Lauffenburger DA: Multiple signaling pathwaysmediate compaction of collagen matrices by EGF-stimulated fibroblasts.Exp Cell Res 2006, 312(11):1970-1982.
62. Riggins RB, Thomas KS, Ta HQ, Wen J, Davis RJ, Schuh NR, Donelan SS,Owen KA, Gibson MA, Shupnik MA, et al: Physical and functionalinteractions between Cas and c-Src induce tamoxifen resistance ofbreast cancer cells through pathways involving epidermal growth factorreceptor and signal transducer and activator of transcription 5b. CancerRes 2006, 66(14):7007-7015.
63. Kininis M, Chen BS, Diehl AG, Isaacs GD, Zhang T, Siepel AC, Clark AG,Kraus WL: Genomic analyses of transcription factor binding, histoneacetylation, and gene expression reveal mechanistically distinct classesof estrogen-regulated promoters. Mol Cell Biol 2007, 27(14):5090-5104.
64. Reid G, Metivier R, Lin CY, Denger S, Ibberson D, Ivacevic T, Brand H,Benes V, Liu ET, Gannon F: Multiple mechanisms induce transcriptionalsilencing of a subset of genes, including oestrogen receptor alpha, inresponse to deacetylase inhibition by valproic acid and trichostatin A.Oncogene 2005, 24(31):4894-4907.
65. Carroll JS, Liu XS, Brodsky AS, Li W, Meyer CA, Szary AJ, Eeckhoute J,Shao W, Hestermann EV, Geistlinger TR, et al: Chromosome-wide mappingof estrogen receptor binding reveals long-range regulation requiring theforkhead protein FoxA1. Cell 2005, 122(1):33-43.
66. Lin CY, Strom A, Vega VB, Kong SL, Yeo AL, Thomsen JS, Chan WC, Doray B,Bangarusamy DK, Ramasamy A, et al: Discovery of estrogen receptoralpha target genes and response elements in breast tumor cells.Genome Biol 2004, 5(9):R66.
67. Cicatiello L, Mutarelli M, Grober OM, Paris O, Ferraro L, Ravo M, Tarallo R,Luo S, Schroth GP, Seifert M, et al: Estrogen receptor alpha controls agene network in luminal-like breast cancer cells comprising multipletranscription factors and microRNAs. Am J Pathol 2010, 176(5):2113-2130.
68. Shaffer JP: Multiple Hypothesis Testing. Ann Rev Psych 1995, 46:561-584.69. Benjamini Y, Hochberg Y: Controlling the False Discovery Rate: A Practical
and Powerful Approach to Multiple Testing. J R Statist Soc B 1995,57(1):289-300.
70. Marsaglia G, Tsang WW, Wang J: Evaluating Kolmogorov’s Distribution.Journal of Statistical Software 2003, 8(18):1-4.
71. Subramanian A, Tamayo P, Mootha VK, Mukherjee S, Ebert BL, Gillette MA,Paulovich A, Pomeroy SL, Golub TR, Lander ES, et al: Gene set enrichmentanalysis: a knowledge-based approach for interpreting genome-wideexpression profiles. Proc Natl Acad Sci USA 2005, 102(43):15545-15550.
72. Chen L, Xuan J, Wang C, Shih Ie M, Wang Y, Zhang Z, Hoffman E, Clarke R:Knowledge-guided multi-scale independent component analysis forbiomarker identification. BMC Bioinformatics 2008, 9:416.
doi:10.1186/1471-2105-12-82Cite this article as: Gong et al.: Motif-guided sparse decomposition ofgene expression data for regulatory module identification. BMCBioinformatics 2011 12:82.
Submit your next manuscript to BioMed Centraland take full advantage of:
• Convenient online submission
• Thorough peer review
• No space constraints or color figure charges
• Immediate publication on acceptance
• Inclusion in PubMed, CAS, Scopus and Google Scholar
• Research which is freely available for redistribution
Submit your manuscript at www.biomedcentral.com/submit
Gong et al. BMC Bioinformatics 2011, 12:82http://www.biomedcentral.com/1471-2105/12/82
Page 16 of 16